Embed Size (px)
Citation preview

64 © 2006 Association for Financial Counseling and Planning Education. All rights of reproduction in any form reserved.
Racial Differences in Risky Asset Ownership: A Two-Stage Model of the Investment Decision-Making Process Michael S. Gutter and Angela Fontes
The current study establishes a two-stage investment decision-making model in order to examine the impact of race on investment behavior. Results show that although Blacks are less likely to own stocks than Whites, once ownership is accounted for, there is no difference in the portfolio allocation to risky assets. The model indicates racial disparities in risky asset ownership, which may be attributable to differences in information exposure and barriers to investment markets. The results suggest that a voluntary savings initiative accompanied by a gradu-ated savings component could help remove investment barriers and enable access to more productive invest-ments. Key Words: investor behavior, portfolio allocation, race, risk tolerance, stocks
Michael S. Gutter, Assistant Professor, University of Wisconsin-Madison, Department of Consumer Science, 1300 Linden Drive Room 370F, Madison, WI 53706, [email protected], (608) 262-5498
Angela Fontes, Doctoral Student, University of Wisconsin-Madison, Department of Consumer Science, 1300 Linden Drive Room 385, Madison, WI 53706, [email protected], (608) 262-2291
Introduction The accumulation of wealth has been an essential step on the path to household financial security. Families have needed to acquire wealth in order to weather short-term financial resource shocks and fund long-term financial goals such as retirement. However, although household wealth has grown overall, there still has been substantial inequality between Blacks and Whites (Aizcorbe, Ken-nickell, & Moore, 2003; Darity, 1999). Kennickell (2003) found that the median wealth for Whites was about 6.4 times that of Blacks; similarly, the mean wealth for Whites was between 5 and 6 times that of Blacks. Although this represented an improvement over time, the disparity was still severe. The implications of such inequality affected not only policy issues such as privatization of Social Security but also may have impacted the financial security of future generations. The purpose of the current study was to examine differ-ences in investment behavior between Blacks and Whites, specifically, the decision to invest in riskier, higher yield-ing assets such as stocks and business ownership and the extent to which wealth was allocated to higher growth assets. The researchers proposed a two-stage model, which
built on previous research of racial differences in invest-ment ownership (Coleman, 2003; Gutter, Fox, & Montalto, 1999; Stevenson & Plath, 2002; Straight, 2001) by separat-ing the determinants for the acquisition decision from the portfolio allocation decision. The results suggested that the first stage (ownership) was tied more to access, relevance, and awareness, whereas the second stage (allocation) was tied to preferences as in more traditional portfolio alloca-tion models. The composition of wealth has played an important role in understanding the racial inequality in wealth (Keister, 2000). Previous research has indicated that Blacks were more likely to invest in personal residence and less likely to invest in risky assets such as equities that may grow and produce income (Stevenson & Plath, 2002). Other studies showed that Blacks were less invested in the stock market than Whites (Boyce, 1998; Hong, Kubik, & Stein, 2004; Loury, 1998; Mabry, 1999). This difference in asset com-position has had a considerable impact on net worth (Gittleman & Wolff, 2004), particularly during times such as the 1990s that saw higher than normal returns—up to 20% or greater (Ibbotson Associates, 1997)—for those who held equities. Although investments such as housing

Financial Counseling and Planning Volume 17, Issue 2 2006 65
may be relatively safe, risky assets have had greater long-term growth and income producing capacity and have yielded greater returns over longer time horizons. Determining if there were differences in the investment choices of Whites and Blacks may help lead to strategies for reducing both the inequality in risky asset ownership and the inequality in wealth distribution as asset allocation would have influenced the growth rate of wealth. Examin-ing these differences also may have implications for the Social Security reform proposals that include self-directed investment accounts. These proposed private accounts would allow investors choices about how to invest their funds. If there are overall differences in investor behavior in asset allocation as well as acquisition, then these ac-counts will further increase inequality in wealth and retire-ment preparedness. Although investment ownership has been important, it was essential to distinguish this issue from one of investment behavior (asset allocation) in considering the issue of racial wealth inequality. Rather than examine risky asset ownership as simply reflective of risk aversion, the present study examined portfolio behavior by considering risky assets as a percent-age of financial assets (including businesses). Risky assets were defined as equities, equity funds, and business assets. Although risk aversion—or the stable preference one has regarding desire to avoid risk—has been important in explaining the investment behavior of households, minor-ity households might have faced different levels of access to and awareness of financial investment services. Result-ing racial differences may not be related to differences in risk preferences. Because this study focused on race rather than simply including it as a demographic variable, it contributed to the growing body of literature on the finan-cial security of minority households. The study used data from the 2004 Survey of Consumer Finances (SCF), which provided a more recent empirical result than did previous studies. Although previous research using older data examined differences in either the acquisition of riskier assets or the proportion allocated to these types of assets between Black and White households, this study sought to understand these differences more fully by creating a model in which both the acquisition and allocation deci-sions were considered as separate decisions in the same model using newly released data. Background The first section of the review of literature highlighted empirical evidence relevant to both the acquisition and
the asset allocation decision points. The next section outlined how race might influence the portfolio holdings and allocation of households in terms of both access and preferences. This was followed with a discussion of the previous research examining both the likelihood of risky asset ownership and the factors related to portfolio alloca-tion. Investment Decision-Making Framework Traditional investment decision models have suggested that households will establish efficient portfolios where they maximize return for an acceptable level of risk (Markowitz, 1952). Samuelson (1969) suggested that individual risk aversion for all wealth levels does not change over the course of the investor’s lifetime. Using an expected utility framework, Friend and Blume (1975) indicated that although the investment choice was depend-ent on several factors, the investor’s risk aversion should drive such choices. They also indicated an inverse relation-ship between the proportion of wealth invested in risky assets and relative risk aversion when assuming several factors (constant relative risk aversion, equal market risk premium for all investors, homogeneous expectations about the returns, and absence of transactions or other frictions in the market place). In examining optimal port-folio scenarios based on life-cycle smoothing, Hanna and Chen (1997) found that households should have some level of equity ownership regardless of risk aversion and horizon. However, economic theory has been limited in its applica-bility to non-homogenous groups, as the different histories and values of diverse populations can be important prefer-ence shifters (Palm, 1972). In fact, one flaw of traditional economic models has been the perception that every- one would have homogenous expectations, beliefs, and familiarity about the market. This seems unlikely, given differences in information access and usage, as well as differences in financial socialization. It would seem that race has had two potential effects. One direct effect was either discrimination or some other exter-nal barrier to participation unique to a particular racial or ethnic group. In addition, a negative overall perception of financial services due to distrust or historical discrimina-tion may have acted to reduce the use of such services, to affect access to investments or credit markets, and to limit access to information (Vatter, 1972; Williams, 1999). As far back as 1959, Kreinin indicated that there was a posi-tive relationship between individuals’ level of knowledge

66 Financial Counseling and Planning Volume 17, Issue 2 2006
about the stock market and their acquisition and allocation of stock assets. A negative perception of financial service providers could have been the result of a history of under-utilization of financial services, lower levels of exposure to financial information, or both. The negative perception may have been passed on from parent or relative to child, which also indicates the importance of history on invest-ment choice. Lower levels of exposure between racial minorities also may have been the result of limited access to secondary education and the lowered likelihood of being targeted for marketing efforts by financial services and other providers of financial information, resulting in low-ered risky asset ownership (Choudhury, 2001). This also could have potentially prevented individuals from creating their own businesses, because many startups require some amount of borrowing for needed capital or willingness to go into business together. In other words, race may have been representative of differences in both access and awareness (Oliver & Shapiro, 1997). A second possible relationship to race on investing was differences attributable to culture. Cultural differences between racial groups may have existed, as the impact of historical oppression has shaped racial preferences in ways that may have impacted functioning within the current American financial system. One suggested goal was to have a standard of living comparable to their peers, both White and Black (Burlew, Banks, McAdoo, Ajani, & Azibo, 1992). Coles (1975) pointed out that the economic goals of Black society were more likely to be structured around closing Black-White gaps in earnings to improve the economic well-being of Blacks. Therefore, if Blacks have tended to have more myopic financial goals such as current consumption, they may have been more risk averse and therefore more likely to have held assets that were less volatile in the short run. Blacks also may have been less willing to place their wealth in stocks because of the increased uncertainty of the returns in the short run. It seems important to point out that although cultural differ-ences, such as familial orientation, may have negatively impacted the success of minority households in accumulat-ing financial wealth, the major factors that created barriers to financial markets were the ways in which the U.S. financial system was structured and the ethnic hierarchies that were established from socially created stereotypes (Hagendoorn, 1993). It may have been that each group’s relative similarities/differences in preferences from the primary majority or power-holding group resulted in the differences between Black and White households in fin-ancial success. These issues related to both access and
preferences may have impacted both the likelihood of owning risky assets and the level of allocation to such assets by Black households. Likelihood of Risky Asset Ownership Consistent with the life-cycle savings hypothesis, a posi-tive relationship between age and the likelihood of owning stocks has been found (Bertaut, 1998; Gutter et al., 1999; Kreinin, 1959; Zhong & Xiao, 1995). Gutter et al. indi-cated a slightly different result; they found that the likeli-hood of ownership was increasing with age but at a dimin-ishing rate. Gutter et al. also showed that having children and household size were not important determinants of investing in stocks and business ownership for Whites but were significantly related to investing in stocks and busi-ness ownership for Blacks. The probability of owning risky assets significantly increased as the level of educa-tion increased for investors (Bertaut, 1998; Gutter et al., 1999; Haliassos & Bertaut, 1995; Hong et al., 2004; Kreinin, 1959). In addition to demographic variables, financial indicators appeared important; income was found to be significantly and positively related to the probability of holding risky assets (Gutter et al., 1999; Haliassos & Bertaut, 1995; Kreinin, 1959), and those with higher net worth were more likely to have had some participation in the stock market (Haliassos & Bertaut, 1995; Hong et al., 2004). Several preference indicators appeared important in the discussion of the acquisition of riskier assets. Among the apparent differences, Blacks seemed to prefer more consumptive-oriented investments such as real-estate (Stevenson & Plath, 2002). Supporting this orientation toward consumptive assets, Brimmer (1988) found that equity in a home was the most important asset held by Black households; homeownership represented 65% of their total wealth, as opposed to 40% for White house-holds, which limited the ability of Black households to invest in riskier, potentially higher-yield assets. Factors Related to Portfolio Allocation Previous research indicated a negative relationship be-tween age and the level of portfolio allocation to riskier assets (Coleman, 2003). However, contrary to these find-ings, Wang and Hanna (1997) found that the percentage of net worth allocated to risky assets increased with age at a diminishing rate. Gender also has been associated with portfolio behavior. Men were shown to have more aggres-sive portfolios (Bajtelsmit & VanDerhei, 1997; Jianakop-los & Bernasek, 1998) and to allocate higher proportions

Financial Counseling and Planning Volume 17, Issue 2 2006 67
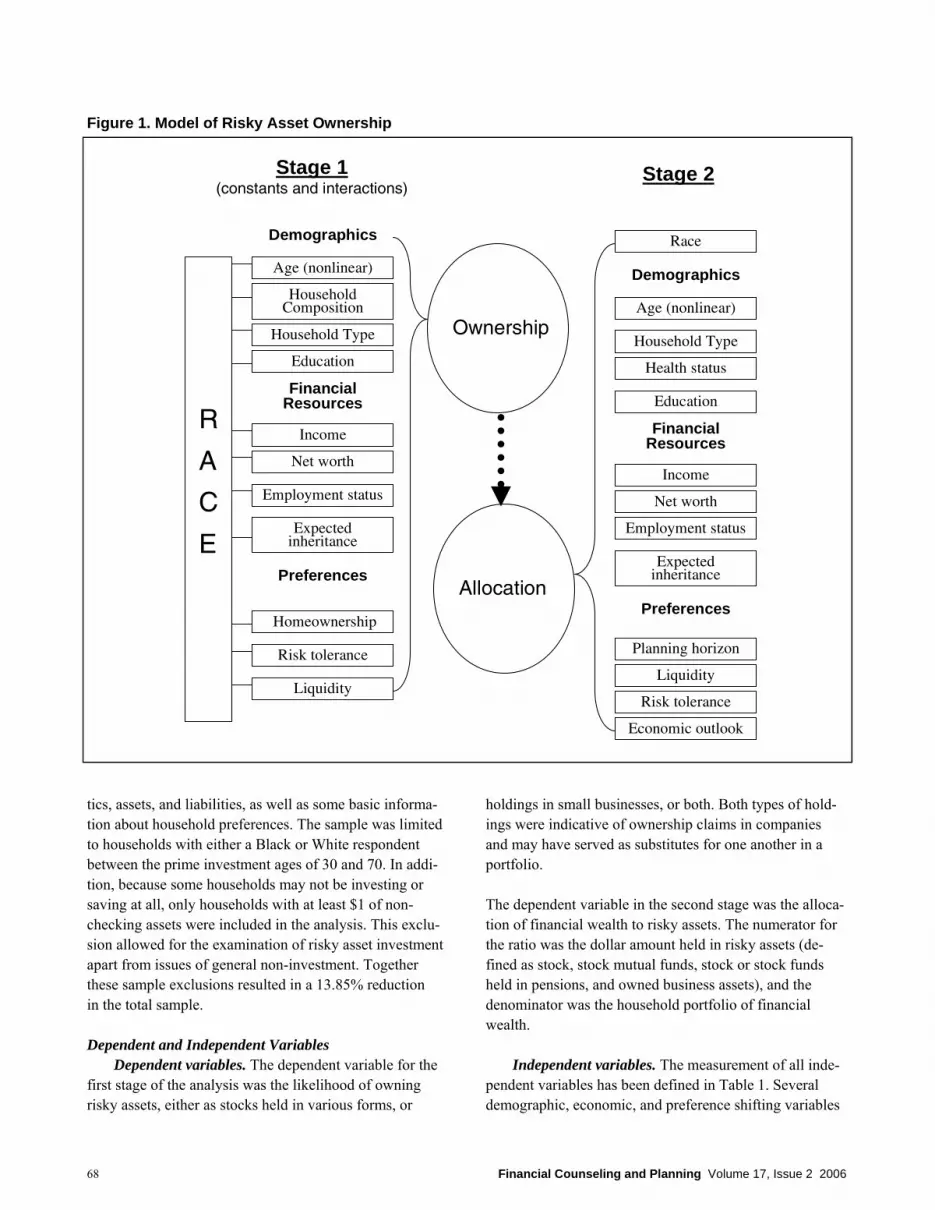
of their portfolios to risky assets (Coleman, 2003). The level of stock ownership significantly increased as the level of education increased for investors (Coleman, 2003; Wang & Hanna, 1997; Zhong & Xiao, 1995). Greater financial resources were associated with greater equity allocations. Coleman (2003) showed an increasing equity allocation with net worth. Zhong and Xiao (1995) found that the level of portfolio allocation to risky assets in-creased with income. Expectation of future inheritance increased this level as well (Wang & Hanna, 1997). Yao, Gutter, and Hanna (2005) examined racial differ-ences in willingness to take investment risk and found that Black households were less likely to have some (moderate) level of risk tolerance. That is they were more likely to have a substantial risk tolerance level. Zhong and Xiao (1995) found that having a financial planning horizon of a few months was associated with lower amounts of bonds and stocks held when compared with having a longer horizon of several years or more. Proposed Conceptual Model Previous research suggested that regardless of risk aver-sion, all households should own some stocks (Campbell & Viceira, 2002; Hanna & Chen, 1997). Therefore, the current study assumed that the likelihood of ownership should be related to issues affecting access and awareness of stocks as an investment option if one had some level of financial assets. Drawing from both the frameworks of investment decision making and previous studies, a two-stage model was utilized as illustrated in Figure 1. The two-stage model allowed for the individual determination of differences in the ownership decision and the allocation decision of White and Black households. Stage 1 exam-ined the likelihood of risky asset ownership, and Stage 2 examined the portfolio allocation of those with some in-investments. Although the first stage explored the owner-ship decision and can be indicative of access and aware-ness barriers due to possible discrimination or limited exposure, the second stage examined asset allocation and can be seen as reflective of preferences affected by culture. This study was unique in that the two-stage model allowed for this distinction. Further, previous studies on portfolio allocation often have ignored the potential for self-selection bias, whereas the current study tested for it. In addition to the two-stage structure of the model, the study included the estimation of two probit equations: a reduced equation with all variables included and a full equation with all variables and interaction terms of all
variables and race. These interaction terms allowed the effects of the independent variables to be different for Black and White households. In addition, the comparison of the full and reduced models indicated whether race was significant in itself or acted as a moderating variable on the relationship of other effects. Hypotheses A consideration of the influence of both cultural and historical access differences between Blacks and Whites on their economic choices may provide a better guide for explaining racial differences in risky asset ownership than would economic theory alone. The combination of the economic and cultural explanations of behavior was for-malized into several hypotheses:
H1: Previous research indicated the presence of struc-tural discrimination in the form of reduced access and awareness. This may have acted as a possible barrier for Black households in their ability to acquire risky assets. If this was the case, race should have been important in predicting the likelihood of risky asset ownership either directly or as a moderating variable for other independent indicators. The likelihood of owning risky assets would be affected by race, other things being equal. H2: If discrimination, rather than preferences, was the major barrier to entry into risky asset markets, then there should be no difference in the portfolio alloca-tion of Black and White investors once access and awareness issues were overcome. Thus, when ac-counting for the likelihood of asset ownership and other relevant determinants of portfolio allocation in the first equation, there would be no racial difference in actual portfolio allocation. There would be no differences in risky asset owner-ship between Black and White households when only households that hold some amount of risky assets are examined, other things being equal.
Methodology Data and Sampling The data used in the study came from the newly released 2004 SCF sponsored by the Federal Reserve Board with cooperation from the Department of the Treasury. The recent nature of these data provided a topical examination of financial decision making at the household level. The data set was an ideal choice for the study, because it con-tained detailed information about household characteris-
68 Financial Counseling and Planning Volume 17, Issue 2 2006
Ownership
Allocation
Demographics
Age (nonlinear)
Household Composition
Household Type
Financial Resources
Income
Net worth
Employment status
Race
Risk tolerance
Liquidity
Homeownership
Education
Preferences
Demographics
Age (nonlinear)
Household Type
Health status
Financial Resources
Net worth
Employment status
Planning horizon
Risk tolerance
Liquidity
Education
Economic outlook
Preferences
R
A
C
EExpected
inheritance
Expected inheritance
Income
Stage 1(constants and interactions)
Stage 2
tics, assets, and liabilities, as well as some basic informa-tion about household preferences. The sample was limited to households with either a Black or White respondent between the prime investment ages of 30 and 70. In addi-tion, because some households may not be investing or saving at all, only households with at least $1 of non-checking assets were included in the analysis. This exclu-sion allowed for the examination of risky asset investment apart from issues of general non-investment. Together these sample exclusions resulted in a 13.85% reduction in the total sample. Dependent and Independent Variables Dependent variables. The dependent variable for the first stage of the analysis was the likelihood of owning risky assets, either as stocks held in various forms, or
holdings in small businesses, or both. Both types of hold-ings were indicative of ownership claims in companies and may have served as substitutes for one another in a portfolio. The dependent variable in the second stage was the alloca-tion of financial wealth to risky assets. The numerator for the ratio was the dollar amount held in risky assets (de-fined as stock, stock mutual funds, stock or stock funds held in pensions, and owned business assets), and the denominator was the household portfolio of financial wealth. Independent variables. The measurement of all inde-pendent variables has been defined in Table 1. Several demographic, economic, and preference shifting variables
Figure 1. Model of Risky Asset Ownership

Financial Counseling and Planning Volume 17, Issue 2 2006 69
may have influenced both the decision to own and the level of ownership of risky assets by households. In the first stage, age (nonlinear), household composition, house-hold type, education, income, net worth, employment status, homeownership, expectation of an inheritance, willingness to take financial risk, and liquidity were in-cluded in the model. These variables were included inde-pendently to isolate the effects of race on the ownership
decision. In addition, interaction terms with race and all independent variables were estimated for the full model to allow for the effects of the independent variables to differ for Black and White households. The second estimation included many of the same inde-pendent variables including age (nonlinear), household type, education, income, net worth, employment status,
Variables Description Demographic variables
Race Indicator = 1 if the respondent is Black, 0 otherwise Age of household head Continuous measure of the age of the respondent Age of household head squared Continuous measure of the age of the respondent, squared Household size Continuous measure of the number of persons in the household Presence of children = 1 if there are children under 18 in the household, 0 otherwise Household type (reference category: married couple) Unmarried male = 1 if householder is unmarried male, 0 otherwise Unmarried female = 1 if householder is unmarried female, 0 otherwise Health status = 1 if the respondent or spouse is in poor/fair health, 0 otherwise Education (reference category: college graduate) Less than high school = 1 if years of education < 12, 0 otherwise High school = 1 if years of education = 12, 0 otherwise Some college = 1 if years of education > 12 but < 16, 0 otherwise
Financial variables Income (log) The log is taken for all nonzero values of income. All values less
than or equal to 0 remains at 0. Expects future inheritance = 1 if household expects future inheritance, 0 otherwise Net worth (log) The log is taken for all nonzero values of income. All values less
than or equal to 0 remains at 0. Not working = 1 if the respondent is not employed for pay, 0 otherwise Self-employed = 1 if the respondent is self-employed, 0 otherwise
Preference variables Homeownership = 1 if the household owns a home, 0 otherwise Willingness to take investment risk (reference category: average risk) (subjective)
Not willing to take risk = 1 if the respondent is not willing to take any investment risk Above average willingness to take risk = 1 if the respondent is willing to take above average risk to get
above average investment returns 3 month liquidity = 1 if liquid financial assets (savings, checking, money market)
divided by 3 months income is greater than or equal to 1, 0 otherwise
Planning horizon Discrete variable measuring the household’s most important time frame for planning: a few months = .25, a year = 1
Economic outlook (reference category: stable economy)
Positive outlook = 1 if household expects economy to improve over next 5 years, 0 otherwise
Negative outlook = 1 if household expects economy to do worse over next 5 years, 0 otherwise
Table 1. Description of the Variables

70 Financial Counseling and Planning Volume 17, Issue 2 2006
expectation of an inheritance, willingness to take financial risk, and liquidity. The second estimation differed from the first in the addition of variables that indicated plan-ning horizon, economic outlook, and health status. These variables were included in order to isolate more fully the effects of personal preferences on the allocation decision. Although some terms were added, the second estimation omitted household composition, eligibility for a retirement plan, and homeownership. Multivariate Analysis and Hypotheses Testing Race could have had two possible effects. The first could have been a constant effect, which is an overall or ho-mogenous effect of race on risky asset ownership. The second possible type of effect, a coefficient effect, implies that specific determinants of risky asset ownership had different effects on ownership for Blacks and Whites. These effects would have emerged if the effect of any one independent variable was different for Blacks and Whites (Jackson & Lindley, 1989). The cause of such differences may have been explained by discrepancies in values, norms, and preferences, as well as specific structural barriers tied to these coefficient effects. For example, it may have been that the effect of income on risky asset ownership was different for Whites and Blacks. Including these coefficient effects allowed for determination of such differences. There was likely to be self-selection bias in estimating the regression model for the ratio of risky assets to investment assets. This would be due to the number of households in the sample with no risky assets and therefore ratios that were equal to zero. In order to adjust the results for this bias, Heckman’s procedure was used, allowing for both the likelihood of owning risky assets and the level of ownership to have been modeled separately. In addition, the procedure allowed the factors affecting both ownership likelihood and ownership level to have been different (Heckman, 1974, 1976; Kennedy, 1997). The Heckman procedure also allowed for the influence of racial differ-ences in the relationships of the determinants and owner-ship of one aspect of the investment choice (either owner-ship or level of ownership) and not the other. Therefore, the first multivariate procedure was a Probit performed both to identify the determinants of the likelihood of risky asset ownership and to estimate the inverse Mills ratio. If it was statistically significant, the inverse Mills ratio, or lambda, could have been interpreted as the presence of self-selection bias. The inverse Mills ratio was then in-cluded as an explanatory variable in both ordinary least
squares (OLS) regression models to estimate the propor-tion of risky assets to wealth for the two measures of wealth. Because OLS was performed using only non-zero observations, it was expected that lambda would have a negative effect. That is, the estimate should have repre-sented the adjustment to the regression for self-selection and as such should have corrected the slope of the regres-sion for the excluded zeros. Because missing data in the SCF were estimated using multiple imputation techniques resulting in five implicates, the Heckman procedure was estimated for each implicate separately. Results were examined across implicates and found to be similar in significance. In addition, because the weight variable in the SCF may introduce endogeneity bias into the hypotheses testing, the multivariate results were not weighted (Yao, Hanna, & Lindamood, 2004). Results Sample Characteristics Black and White households were compared along several groups of characteristics (see Table 2). Descriptive statis-tics were both weighted to be nationally representative and adjusted using Rubin’s repeated imputation inference (RII) technique (Montalto & Sung, 1996; Rubin, 1987). The total sample contained 3,827 households and consisted of 400 Black households (10.5%) and 3,427 White house-holds (89.5%). As expected, there were numerous differ-ences in household characteristics between the Black and White samples. There were several significant differences among the demographic characteristics. With an average age of 51.27 years, White heads of households were older than Black heads of households who averaged 48.24 years. Black households more often were headed by single women (46.12%) than were White households (24.59%); heads of White households more frequently were married (55.65%) than were heads of Black households (29.29%). In addition, more Black households included children (49.24%) than did White households (40.59%). White household heads tended to be in better health, with fewer White households (27.12%) reporting a respondent or spouse in poor/fair health than Black households (31.81%). White households in the sample tended to be more educated, with fewer Black households holding a college education than their White counterparts. There were important differences among the financial resource variables of Black and White households in the

Financial Counseling and Planning Volume 17, Issue 2 2006 71
Table 2. Demographic Characteristics, Education, Financial Resources, Preferences, and Assets Between Black and White Households
*p < .05. **p < .01. ***p < .001.
Variables Whites (n = 3,427) Blacks (n = 400)
t X2 M % M %
Demographic characteristics Age of household head 51.27 48.24 193.42*** Presence of children 40.59 49.24 13.70*** Household size 2.43 2.42 -27.47 Marital status and gender
Married households 55.65 29.29 129.07*** Single female households 24.59 46.12 107.75*** Single male households 19.76 24.59 6.55*
Health status Respondent or spouse in poor/fair
health 27.12 31.81 4.83*
Education Less than high school 10.51 18.15 25.37*** High school 29.16 28.82 0.04 Some college 23.54 28.49 5.20* College graduate 36.83 24.54 27.55***
Financial resources Income ($) 78,681.40 42,448.85 116.17*** Expected inheritance 17.03 6.95 37.62*** Net worth ($) 576.69 130.40 13.34*** Eligible for retirement plan 7.93 11.25 5.02* Not working 28.35 29.68 0.36 Self-employed 13.89 5.59 28.31***
Preferences Homeowner 77.39 54.91 119.78*** Willingness to take financial risk Not willing to take risk 35.28 53.83 60.11*** Willing to take average risk 43.73 30.75 60.44*** Willing to take above average risk 20.99 15.42 9.00**
Liquidity (3 months on hand) 70.27 47.27 105.86*** Planning horizon (years) 5.34 3.68 159.58*** Economic expectations
Expects improvement 44.76 41.09 2.45 Expects stability 39.70 31.26 9.70*** Expects worsening 15.54 27.65 47.04***
Assets Own risky assets 25.12 13.24 98.86*** Risky assets with business/
investment assets 55.69 27.87 60.97***

72 Financial Counseling and Planning Volume 17, Issue 2 2006
sample. For Blacks, mean household income was approxi-mately $42,500 annually, and mean net worth was $130,400. These figures were significantly lower than those of White households, who reported a mean annual income of $78,700 and a mean net worth of $576,700. Black households were less likely to have expected to receive an inheritance (6.95%) than were White house-holds (17.03%), and Whites (13.89%) were more likely than were Blacks (5.59%) to report being self-employed. Although the majority of the sample owned a home, White households reported homeownership more frequently (77.39%) than did Black households (54.91%). Blacks reported unwillingness to take investment risk more than did Whites. White households more frequently reported 3 months of liquid assets on hand (70.27%) than did Blacks (47.27%) and on average reported a longer planning hori-zon. Whites had significantly more investment in risky assets (defined as the proportion of total portfolio invested in stock or business assets) than did Blacks (25.12% vs. 13.24%), and Whites reported owning risky assets (defined as stocks and business assets) at approximately double the rate that Black households did (M = .5569 vs. M = .2787). Likelihood of Risky Asset Ownership Stage 1 of the analysis used a Probit model to determine differences in the likelihood of risky asset ownership of Black and White households. The results of the analysis are presented in Table 3. The initial reduced model exam-ined the relationship between the predictor variables and the likelihood of holding risky assets accounting only for a constant effect of race. The results of this model are presented on the left side of Table 3. The additional full model allows the effects of the predictor variables on risky asset ownership to differ for Blacks and Whites. This is achieved by including interaction terms between each of the predictor variables and race, thus indicating that race has a moderating effect on other independent variables. The results of the full interaction model are presented on the right side of Table 3 and include columns for both the constant and interaction effects. The reduced model and the full model including interaction terms are compared using a likelihood ratio test for each implicate. Because the full model is the significant model, it was used to estimate the inverse Mills ratio (lambda) for the second stage. The result of this test showed that the significant model was the full interaction model in all five implicates (maximum p < .1), which allowed for the effects of the independent variables on risky asset ownership to differ by race. The finding is consistent with Gutter et al. (1999) and indicates
that race has a moderating effect on other independent variables rather than having an independent effect on the likelihood of owning risky assets. Although the main effect of race was not significant, several interaction terms that involved race and demo-graphics were. The presence of children in the home increased the likelihood of owning risky assets for both Black and White households. However, the decomposition indicated that this increase was larger for Black house-holds as evidenced by the significant positive interaction term. The result was somewhat consistent with the find-ings of Gutter et al. (1999) in which the presence of chil-dren had a positive effect on risky asset ownership for Blacks but not for Whites. In contrast to the simple pres-ence of children in the home, the addition of family mem-bers appeared to negatively impact risky asset ownership. Those with larger household sizes were less likely to own risky assets, possibly because households with larger family sizes need greater liquidity for current consump-tion, holding income constant. Non-married households also appeared to be less likely to own risky assets. This could be related to the fact that married households are able to share not only investment risk, but risk related to job loss and general financial security. Married households were more likely to have two incomes and, as such, have better opportunity to make up for investment losses. This effect was significant for single women with no difference by race. Education appeared to be a significant predictor of the likelihood of risky asset ownership. This could reflect that to some extent, education enables households to have more awareness and better access to financial markets. Thus regardless of race, education plays an important role to-ward improving investor behavior. However, actual differ-ences in education or access to education, formal or infor-mal, would likely lead to differences in investor behavior. As Table 3 indicates, income had a positive effect on the likelihood of owning risky assets. This result was consis-tent with previous literature indicating that risk tolerance increases with income (i.e., Zhong & Xiao, 1995). There was no difference in the effect of income for White and Black households. This was also the case with net worth; results indicated that the likelihood of owning risky assets increased with net worth equally for White and Black households. The effect of net worth was important because despite racial differences in wealth composition (Keister,

Financial Counseling and Planning Volume 17, Issue 2 2006 73
2000), greater wealth still increased the likelihood of owning risky assets for both. Not working had a large negative effect on the likelihood of owning risky assets for both Black and White house-holds. Although non-working Whites had a decreased likelihood of owning risky assets, the effect was even more pronounced for Black households. It seemed reason-able that those currently unwillingly unemployed would be less likely to invest in risky assets given their current employment uncertainty and would therefore hold more stable asset portfolios. Interestingly, having access to an employer-sponsored retirement account also decreased the likelihood of risky asset ownership for both Black and White households. It may be the case that those not invest-
ing in employer-sponsored plans are more motivated to aggressively invest. Many employer-provided plans pro-vide only a limited selection of asset investment choices. Those ineligible for employer-sponsored retirement plans may be more likely to hold risky assets than those invest-ing in a 401(k) or similar type of account. Of the preference variables, several appeared important in affecting the likelihood of owning risky assets. As ex-pected, compared to those willing to take average financial risk, those unwilling to take any risk were less likely to hold risky assets. Not being willing to take risk decreased the likelihood for both Blacks and Whites. However, the race interaction term was positive. When main and interac-tion terms were combined, the net result was that Blacks
Variables Reduced model Full model
Constants estimate Interactions estimate Intercept 5.6466 5.6466
Demographic characteristics Race (White) -0.3796*** -4.4946 Household head’s age 0.0000 0.0016 -0.0035 Presence of children 0.0410 0.3563** 0.3117* Household size -0.0497 -0.1684** -0.0915 Household composition (married households) Single female households -0.2163** -0.3157* 0.1284 Single male households -0.1782* -0.1160 -0.0398 Education (high school) Less than high school -0.3278** -0.3291 0.1314 Some college -0.1862* 0.3385** 0.1904 College graduate 0.3119 0.1511 -0.1443
Financial resources Income (log) 0.2429*** 0.3300*** 0.0819 Expected inheritance 0.1582* 0.0479 -0.0712 Net worth (log) 0.0417*** 0.0383*** 0.0003 Not working -0.3295*** -0.5529*** -0.3088* Self-employed 10.3917 10.6642 1.0724 Eligible for retirement plan -0.5438*** -0.7852*** -0.2766
Preferences Homeowner 0.1666* 0.1385 -0.0891 Willingness to take financial risk (average risk)
Not willing to take risk -0.6927*** -0.4619*** 0.2857** Willing to take above average risk 0.3144*** 0.3149* 0.0365 Liquidity (3 months on hand) -0.9540 1.8798 3.3176**
Estimate
Table 3. Probit Results for the Likelihood of Risky Asset Ownership
*p < .05. **p < .01. ***p < .001.

74 Financial Counseling and Planning Volume 17, Issue 2 2006
not willing to take investment risk were still more likely than Whites not willing to take investment risk to own risky assets. Conversely, those willing to take above aver-age risk compared to those willing to take average risk were more likely to own risky assets; there was no differ-ence between Black and White households in this relation-ship. Having 3 months worth of liquid assets on hand increased the likelihood of risky asset ownership. This increase was far greater for Black households than White households, indicating a significant racial difference in the effect of liquidity on risky asset ownership. It may be the case that there is a cultural preference for achieving a particular level of on-hand liquid assets or a threshold of available wealth that needs to be met before investing in less-accessible assets for Black households. Again, these find-ings suggest a preference for non-risky assets even when controlling for home ownership. Portfolio Allocation The second stage of the analysis used an OLS regression procedure to derive estimates of the effects of the demo-graphic, financial, and preference characteristics on the level of risky asset ownership for Black and White house-holds. The results are presented in Table 4. As previously mentioned, this ratio used the dollar amount held in risky assets (defined as all stock assets and owned business assets) as the numerator and the total financial assets of the household (including owned businesses) as the de-nominator. Race was not a significant determinant of a household’s level of allocation to risky assets. This indicated that once a household gained access to such assets, there is no differ-ence in the preference for financial resources held in these types of assets between Black and White households. Household demographics played little role in the portfolio allocation choice, but several financial variables were significant determinants of the level of risky asset owner-ship. Consistent with previous literature, income was positively related to the level of risky assets held (Gutter et al., 1999; Haliassos & Bertaut, 1995), as was net worth (Haliassos & Bertaut; Hong et al., 2004). As one can ensure basic savings needs will be met through relatively safe assets, it seems reasonable that higher income house-holds and those with higher net worth would be more willing to place a greater proportion of the discretionary savings into risky assets.
Estimates for the preference indicators were consistent with previous research. Those not willing to take any financial risk held significantly lower levels of risky assets than those willing to take average risk. Those willing to take above average risk had higher levels of risky assets. The relationship of willingness to take risk on actual risk taking was consistent with expectations established by the literature (e.g. Gutter et al., 1999); households with greater
Variables Proportion of asset holdings
estimate Intercept 0.4175*** Λ -0.0893***
Demographic characteristics Race (White) -3.82x10⁻⁶ Age of household head age -1.748x10⁻⁵
Age squared 0.0001 Household composition (married households)
Single female households -0.0028 Single male households 0.0009
Health status (Respondent or spouse has average health or better)
Respondent or spouse in poor/fair health
-0.0083
Education (high school) Less than high school 0.0035 Some college 0.0083 College graduate 0.0013
Financial resources Income (log) 0.0139*** Expected inheritance -0.0005 Net worth (log) 0.0028* Not working -0.0107 Self-employed 0.1783
Preferences Willingness to take financial risk (average risk)
Not willing to take risk -0.0136* Willing to take above average risk 0.0213***
Liquidity (3 months on hand) -0.1691*** Planning horizon (years) 0.0012 Economic expectations (stable)
Expects improvement 0.0016 Expects worsening 0.0040
Table 4. OLS Results for Asset Allocation
*p < .05. **p < .01. ***p < .001.

Financial Counseling and Planning Volume 17, Issue 2 2006 75
willingness to take risk were more likely to be doing so. Households with 3 months worth of financial liquidity on hand had lower levels of risky assets. This finding seemed counterintuitive, as one would expect that an adequate emergency fund would lead to greater investment in equi-ties. Perhaps, the liquidity measure may indicate that some households may have a greater need for liquidity and are likely to hold less in risky assets. More conservative inves-tors probably would maintain 3 months liquidity, whereas this may not be as important for risk takers. Lambda was statistically significant in the model. This in-dicated that the inclusion of inverse Mills ratio was related to the portfolio allocation when accounting for other factors, which was evidence of self-selection bias. Further, lambda had a negative slope, as anticipated, which would be a correction for the regression line based on the likeli-hood of having risky assets. Limitations Although the results appeared to be robust, there were several limitations of the study. Knowing whether the individual resided in a metropolitan or non-metropolitan area may have provided useful information. The residential area may have represented a possible proxy for the level of exposure to financial information or represented discrimi-nation in the financial services industry in the area. Fur-ther, as noted by Chiteji and Stafford (1999), the invest-ment behavior of parents may have been related to the investment behavior of the children. Information about the investment socialization of individuals also may have contributed to understanding risky asset ownership. To date, however, this type of information has not been made available in the various datasets used in examining house-hold financial behavior. Finally, the study was limited to a comparison of Black and White households. Although a more complete picture of the impact of race on risky asset ownership would include other ethnic groups, such as Asian and Latino households, the historic wealth disparity between Black and White households made this compari-son particularly important. Conclusions The continued disparity in the wealth of Black and White households has serious implications for the financial success of both current and future generations. Not only are wealth accumulation and asset growth important for current workers, but the intergenerational transfer of such wealth is one of the most important aspects in the human capital accumulation and financial success of future gen-
erations (Conley, 1999). The manner in which a house-hold’s financial portfolio is allocated can have serious implications for the long-term financial well-being of the household. The elevated long-term growth of risky assets makes these types of assets an important part of a wealth accumulation plan (Altonji & Doraszelski, 2005). The results indicate support for both hypotheses. The re-duced model of risky asset ownership is rejected in favor of the full model with racial interaction terms. And al-though the constant effects of race are not significant in the Probit model, there are several variables in which race is a moderating factor including the presence of children, not working, willingness to take risk, and liquidity. The results indicate that these specific variables have differing effects for Black and White households in the likelihood of risky assets ownership. It is likely that because these coefficient effects are not unidirectional in the decomposition of the overall racial effects, they act to cancel each other out and mitigate any constant effect in either the full or reduced model. The second hypothesis—that there should be no racial differences in the allocation to risky assets, once owned—is also supported by the data. Although several variables impacted the level of risky asset allocation, the results indicate that race was not a significant indicator. Simply stated, it appears that once a Black household overcomes the structural access and awareness barriers to owning risky assets, they own them at a level similar to that of White households. The major finding of the study is that although there are racial differences in the determinants of risky asset ownership, there is little evidence of racial differences in the proportion of wealth invested in risky assets when adjusting for ownership of risky assets and self-selection. This may indicate that the differences in risky assets ownership between Black and White house-holds are due in part largely to access and awareness barriers and not personal preferences. In summary, al-though Black households are less likely to own risky assets, there is no evidence of racial differences in the proportion of wealth invested in risky assets when owner-ship is controlled. Implications The current study indicates a disparity in the likelihood of owning risky, high-growth assets between Black and White households but not in the allocation of such assets within the portfolio. As the composition of wealth has been shown to be an important factor in determining the

76 Financial Counseling and Planning Volume 17, Issue 2 2006
growth rate of wealth, continued racial disparity in risky asset ownership may perpetuate ongoing wealth inequality; thus, it is important to consider how to improve access to equities or to financing for small businesses. One policy aimed at reducing wealth inequality is the Assets for Independence Act (1997). The act is designed to encourage projects with the purpose of helping individu-als with low net worth or low income to acquire an initial asset base. This would include setting up Individual Devel-opment Accounts (IDA), typically a savings account, with federally insured financial institutions that will provide for some matching of the funds put into the account. This program can provide a critical first step in getting someone into the decision to allocate money to the future. As the time horizon increases, individuals can invest this wealth in higher yielding assets. Thus, one improvement to the IDA program would be a component that facilitates a graduated savings component. The idea of a graduated savings component would involve building on the basic habits created while using basic savings accounts, but eventually enabling access to more productive assets. Mutual funds or similar assets would be a good choice for those with longer time horizons. Based on the results, removing a barrier to access would likely lead to more productive investing. In addition, proposals to privatize Social Security have been suggested that include a voluntary account, which could be invested in mutual funds or other investment vehicles. The results of the study suggest that if such a proposal moved forward, it would need to ensure that households would receive unbiased information on invest-ing principles and investment selection. Without such efforts, a policy shift could widen the inequality of wealth between Blacks and Whites and specifically impact finan-cial security in retirement. One of the possible explanations for racial differences in investment choice could be related to racial differences in exposure to investment fundamentals. This may put greater emphasis on the need for investor education, perhaps focusing on issues such as access points and account types as well as information about the securities themselves. With the findings of the present study indicating that different demographic, financial, and preference variables have differing impacts on Black and White households, it seems important that such efforts reflect differences in cultural worldviews and account for possible discrimina-tion and access barriers that may exist.
The study provides several implications to further this line of research. The noteworthy accounting for possible self-selection bias is relevant when examining portfolio behav-ior. The lack of significance for the effect of race at the allocation stage suggests that future research should not only account for self-selection bias, but also use the appro-priate two step model when accounting for race or other factors affecting access. Additional research including indicators of access to financial markets and household financial education would more fully address the impact of such barriers and their relationships to cultural preferences. Because Blacks are not the only ethnic group that may face such barriers, the inclusion of other ethnic groups includ-ing Asian and Latino households would provide additional insight into these important issues. References Aizcorbe, A. M., Kennickell, A. B., & Moore, K. B.
(2003). Recent changes in U.S. family finances: Evidence from the 1998 and 2001 Survey of Consumer Finances. Federal Reserve Bulletin, 89, 1-32.
Altonji, J. G., & Doraszelski, U. (2005). The role of per-manent income and demographics in Black/White difference in wealth. The Journal of Human Re-sources, 40, 1-30.
Assets for Independence Act of 1997. (1997). H.R. 2849, 105th Congress, 1st Session. Retrieved from http://thomas.loc.gov/cgi-bin/query/C?c105:./temp/~c105 mpMGox
Bajtelsmit, V., & VenDerhei, J. (1997). Risk aversion and pension investment choices. In M. Gordon, O. Mitch-ell, & M. Twinney (Eds.), Positioning pensions for the twenty-first century (pp. 45-66). Philadelphia, PA: Pension Research Council and University of Pennsyl-vania Press.
Bertaut, C. C. (1998). Stockholding behavior of U.S. households: Evidence from the 1983-1989 Survey of Consumer Finances. The Review of Economics and Statistics, 80(2), 263-275.
Boyce, J. N. (1998, April 9). Blacks are bearish on Wall Street says new survey. The Wall Street Journal.
Brimmer, A. F. (1988). Income, wealth, and investment behavior in the Black community. The American Economic Review, 78(2), 151-155.
Burlew, A. K., Banks, W. C., McAdoo, H., Ajani, D., & Azibo, Y. A. (1992). African American psychology. Newbury Park, CA: Sage Publications.
Campbell, J. Y., & Viceira, L. M. (2002). Strategic asset allocation. New York: Oxford University Press.

Financial Counseling and Planning Volume 17, Issue 2 2006 77
Chiteji, N., & Stafford, F. P. (1999). Portfolio choices of parents and their children as young adults: Asset accumulation by African-American families. Ameri-can Economic Review, 89(2), 377-380.
Choudhury, S. (2001). Racial and ethnic differences in wealth and asset choices. Social Security Bulletin, 64(4).
Coleman, S. (2003). Risk tolerance and the investment behavior of Black and Hispanic heads of household. Financial Counseling and Planning, 14(2). 43-52.
Coles, F., Jr. (1975). Black economic development. Chi-cago: Nelson Hall.
Conley, D. (1999). Being black, living in the red. Los Angeles, CA: University of California Press.
Darity, W., Jr. (1999). History, discrimination, and racial inequality. In W. Spriggs (Ed.), The state of Black America 1999: The impact of color-consciousness in the United States (pp. 153-166). New York: National Urban League.
Friend, I., & Blume, M. (1975). The demand for risky assets. The American Economic Review, 65(5), 900-922.
Gittleman, M., & Wolff, E. N. (2004). Racial differences in patterns of wealth accumulation. The Journal of Human Resources, 39, 193-224.
Gutter, M. S., Fox, J., & Montalto, C. P. (1999). Racial differences in investor decision making. Financial Services Review, 8(3), 149-162.
Hagendoorn, L. (1993). Ethnic categorization and out-group exclusion: Cultural values and social stereo-types in the construction of social hierarchies. Ethnic and Racial Studies, 16(1), 26-51.
Haliassos, M., & Bertaut, C. C. (1995). Why do so few hold stocks? The Economic Journal, 105, 1110-1129.
Hanna, S., & Chen, P. (1997). Subjective and objective risk tolerance: Implications for optimal portfolios. Financial Counseling and Planning, 8(2), 17-26.
Heckman, J. (1974). Shadow prices, market wages, and labor supply. Econometrica, 42(4), 679-694.
Heckman, J. (1976). The common structure of statistical models of truncation, sample selection and limited dependent variables and a sample estimator for such models. Annals of Economic and Social Measurement, 5, 475-92.
Hong, H., Kubik, J. D., & Stein, J. C. (2004). Social interaction and stock market participation. The Journal of Finance, 59(1), 137-163.
Ibbotson Associates. (1997). Stocks, bonds, bills, and inflation 1997 yearbook. Chicago: Ibbotson Associ-ates.
Jackson, J., & Lindley, J. (1989). Measuring the extent of wage discrimination: A statistical test and a caveat.
Applied Economics, 21, 515-540. Jianakoplos, N. A., & Bernasek, A. (1998). Are women
more risk averse? Economic Inquiry, 36(4), 620-30. Keister, L. A. (2000). Race and wealth inequality: The
impact of racial differences in assets ownership on the distribution of household wealth. Social Science Research, 29, 477-502.
Kennedy, P. (1997). A guide to econometrics (3rd ed.). Cambridge, MA: The MIT Press.
Kennickell, A. B. (2003). A rolling tide: Changes in the distribution of wealth in the U.S., 1989-2001 (Working Paper). Washington DC: The Federal Re-serve Board. Retrieved from http://federalreserve.gov/pubs/oss/oss2/scfindex.html
Kreinin, M. E. (1959). Factors associated with stock own-ership. The Review of Economics and Statistics, 41(1), 12-23.
Loury, G. C. (1998, June 7). Why more Blacks don’t invest. The New York Times Magazine.
Mabry, T. (1999, May 14). Black investors stay away from stocks. The Wall Street Journal.
Markowitz, H. (1952). Portfolio selection. The Journal of Finance, 7(1), 77-91.
Montalto, C. P., & Sung, J. (1996). Multiple imputation in the 1992 Survey of Consumer Finances. Financial Counseling and Planning, 7, 133-146.
Oliver, M. L., & Shapiro, T. M. (1997). Black wealth/White wealth: A new perspective on racial inequality. New York: Routledge.
Palm, T. (1972). The limitations of standard theory. In H. Vatter & T. Palm (Eds.), Economics of Black America (pp. 35-42). New York: Harcourt Brace Jovanovich, Inc.
Rubin, D. B. (1987). Multiple imputation for nonresponse in surveys. New York: John Wiley Sons.
Samuelson, P. A. (1969). Lifetime portfolio selection by dynamic stochastic programming. The Review of Eco-nomics and Statistics, 51(3), 239-246.
Stevenson, T. H., & Plath, D. A. (2002). Marketing finan-cial services to the African American consumer: A comparative analysis of investment portfolio con-sumption. California Management Review, 44(4), 39-64.
Straight, R. L. (2001). Survey of Consumer Finances: Asset accumulation differences by race. The Review
of Black Political Economy, 29(2), 67-81. Vatter, H. (1972). The differential status of Black Ameri-
cans. In H. Vatter & T. Palm (Eds.), Economics of

78 Financial Counseling and Planning Volume 17, Issue 2 2006
Black America (pp. 3-9). New York: Harcourt Brace Jovanovich, Inc.
Wang, H., & Hanna, S. (1997). Does risk tolerance de-crease with age? Financial Counseling and Planning, 8(2), 27-31.
Williams, R. M. (1999). Unfinished business: African-American political economy during the age of 'color-blind politics.’ In W. Spriggs (Ed.), The state of Black America 1999: The impact of color-consciousness in the United States (pp. 137-152). New York: National Urban League.
Yao, R., Gutter, M. S., & Hanna, S. D. (2005). The financial risk tolerance of Blacks, Hispanics, and Whites. Financial Counseling and Planning, 16(1), 51-62.
Yao, R., Hanna, S., & Lindamood, S. (2004). Changes in financial risk tolerance, 1983-2001. Financial Services Review, 13(4), 249-266.
Zhong, L. X., & Xiao, J. J. (1995). Determinants of family bond and stock holdings. Financial Counseling and Planning, 6, 107-114.


