Embed Size (px)
Citation preview
Addis Ababa University
Addis Ababa Institute of Technology
School of Electrical and Computer Engineering
Railway Security Monitoring System Using Vibration
Sensor and ZigBee for Addis Ababa Light Rail Transit
A Thesis Submitted to the Addis Ababa Institute of Technology, School of
Graduate Studies, Addis Ababa University
In Partial Fulfillment of the Requirements for the Degree of Master of Science in
Electrical Engineering (Railway Electrical Engineering)
By: Goitom Solomon
Advisors: Dr. Yalemzewd Negash
Mr. Abi Abate
August, 2015
Addis Ababa University
Addis Ababa Institute of Technology
School of Electrical and Computer Engineering
Railway Security Monitoring System Using Vibration
Sensor and ZigBee for Addis Ababa Light Rail Transit
By: Goitom Solomon
APPROVED BY BOARD OF EXAMINERS
_____________________________________ _______________
Chairman, Graduate Committee Signature
Dr. Yalemzewd Negash _________________
Advisor‟s Name
Signature
Mr. Abi Abate _________________
Advisor‟s Name
Signature
_________________________ __________________
Internal Examiner Signature
________________________ __________________
External Examiner Signature
Declaration
I, Goitom Solomon, declare that this thesis is my original work, has not been presented for a
degree in this or other universities. All sources of materials used for this thesis work have been
fully acknowledged.
Name: Goitom Solomon Signature: ________________
Place: Addis Ababa Institute of Technology, Addis Ababa University, Addis Ababa
Date of Submission: _____________________________________________
This thesis has been submitted for examination with my approval as a university advisor.
Dr. Yalemzewd Negash Signature: _________________
Advisor‟s Name
Mr. Abi Abate Signature: _________________
Advisor‟s Name
Master Thesis: Addis Ababa university SECE: 2015 I
Abstract
Railways are prime mode of transportation and large infrastructures in many countries.
Accidents occurring in railway transportation systems cause loss of precious lives and property.
One of the major accidents occurring on railway transportation is at level crossing. So to avoid
the level crossing accidents automatic gate control at a level crossing should be designed and
applied. In this thesis automatic gate opening/closing operation is developed using PIC16F877A
microcontroller and ZigBee technology.
The system consists of mainly two sub sections, the base station and the train station. The base
station receives an input from vibration sensor and feds to the microcontroller to be processed
and send to control center via ZigBee transceiver. The amount of vibration coming from the train
is measured using directional vibration sensor.
In this thesis to find the level of the vibration a data measured from Sweden city train is taken
and customized to fit the AA-LRT Salitemihret case. So using these data a corresponding analog
voltage is obtained. The analog voltage is then converted to equivalent binary digits into a way
the microcontroller is understood using ADC804. The binary digits are programmed in to away
they give information about the position of the trains.
Control central gets the position of the train then decision is made and a command to control the
train side signals, road user signals and to operate the gate is sent back Via ZigBee.
A voltage level 3.75 -5 volts (05 H) means the train is 282 meters away from the level crossing)
a Red signal is displayed to the cars and passengers and a message ‟‟ Away is clear you can
proceed with limited speed and care, thank you‟‟ is displayed to the driver. In this thesis the
simulation is done using Proteus software which is a nice interfacing environment and the
program for this thesis is embedded C program.
Key words: Microcontroller, PIC16F877A, ZigBee, CBI, Control center, Vibration sensor, Step
size, hex, embedded C

Master Thesis: Addis Ababa university SECE: 2015 II
Acknowledgment
I would like to express my appreciation to many people who have contributed to the Successful
completion of this thesis work, most especially I thank for the Railway community who has
helped me by providing resources. This thesis would have been very hard to accomplish without
the help of some individuals. I would like to express my gratitude and respect to all those who
gave their magnificent support and advice for the completion of this thesis.
I would like to express my deep and sincere gratitude to my advisor, Dr. Yalemzewd Negash and
Mr. Abi Abate for their guidance, optimism, and continuous support throughout the study. I like
to thank to all Addis Ababa university instructors, for their encouragement, unlimited technical
reviews, constructive ideas, and valuable suggestions and for scarifying their time during the
course of this thesis.
Master Thesis: Addis Ababa university SECE: 2015 III
Contents
Abstract ......................................................................................................................................................... I
Acknowledgment ......................................................................................................................................... II
Chapter 1 ...................................................................................................................................................... 1
Introduction .................................................................................................................................................. 1
1.1 Overview of railway system ........................................................................................................... 1
1.2 Overview of Railway system in Ethiopia ........................................................................................ 2
1.3 Introduction to AA-LRT Project (Thesis Area) ................................................................................ 3
1.3.1 East-West Line ......................................................................................................................... 3
1.3.2 North-South Line ..................................................................................................................... 3
1.3.3 Introduction to the shared line ............................................................................................... 4
1.3.4 Tramcar used in AA-LRT .......................................................................................................... 4
1.4 Statement of the Problem .............................................................................................................. 4
1.5 Objective of the thesis .................................................................................................................... 5
1.5.1 General Objective .................................................................................................................... 5
1.5.2 Specific Objective..................................................................................................................... 5
1.6 Methodology ...................................................................................................................................... 5
1.7 Scope of the thesis .......................................................................................................................... 6
1.8 Thesis Organization ........................................................................................................................ 6
Chapter 2 ...................................................................................................................................................... 8
PROPOSED SYSTEM ...................................................................................................................................... 8
2.1 Railway Security Monitoring Using Vibration Sensor and ZigBee ................................................ 8
2.2 Block diagram of the proposed system ......................................................................................... 8
2.2.1 Fundamental block diagram of base station side ................................................................... 9
2.2.2 Fundamental block diagram train side ................................................................................... 9
2.3 Detail description of the block diagram components ................................................................. 10
2.4 Hardware description of the block diagram components .......................................................... 11
2.4.1 Vibration sensor .................................................................................................................... 11
2.4.2 Signal Conditioning ............................................................................................................... 13
Master Thesis: Addis Ababa university SECE: 2015 IV
2.4.3 Signal Processing.................................................................................................................... 13
2.5 Automatic gate control working of model................................................................................... 17
Chapter 3 .................................................................................................................................................... 20
System Input Modeling .............................................................................................................................. 20
3.1 Vibration modeling ....................................................................................................................... 20
3.1.1 Train/Track Interaction ......................................................................................................... 21
3.1.2 Wheel/Rail Excitation ............................................................................................................ 22
3.1.3 Ground Response................................................................................................................... 23
3.1.4 Vibration propagation ........................................................................................................... 23
3.1.5 Effects of the Ground – Borne Vibration ............................................................................. 24
3.1.7 VT Calculations....................................................................................................................... 31
3.1.8 Applying the prediction formula ........................................................................................... 32
3.1.9 Calculation of braking distance ............................................................................................. 33
3.1.10 Calculation of the recommended speed. ............................................................................ 34
3.2 Serial communication ................................................................................................................... 37
3.2.1 Basics of serial communication ............................................................................................. 37
3.2.2 RS232 standard ...................................................................................................................... 39
3.2.3 Microcontroller connection to RS 232 .................................................................................. 42
3.2.4 Real world Sensor interfacing with PIC16f877A ................................................................... 43
3.2.3 Interfacing ADC and Sensors ................................................................................................. 44
3.2.4 Interfacing microcontroller and ADC804 .............................................................................. 44
3.2.5 Signal conditioning ................................................................................................................ 45
3.3 Microcontroller PIC16f877A ......................................................................................................... 46
3.3.1 Introduction to microcontroller: ........................................................................................... 46
3.3.2 PIC16f877A Microcontroller: ................................................................................................. 46
3.4 ZigBee ............................................................................................................................................ 50
3.4.1 Overview of ZigBee ................................................................................................................ 50
3.4.2 ZigBee Architecture ............................................................................................................... 51
3.5 Servomotor ................................................................................................................................... 53
3.6 Central control center................................................................................................................... 55
3.6.1 CBI structure & functions ...................................................................................................... 56
3.7 Train On board equipment ........................................................................................................... 57
Master Thesis: Addis Ababa university SECE: 2015 V
Chapter 4 .................................................................................................................................................... 58
Detail modeling of level crossing for LRT case .......................................................................................... 58
4.1 Vibration for LRT case ................................................................................................................... 58
4.2 VT Calculations .............................................................................................................................. 58
4.2.1 Calculating Vibration level Salitemihret level crossing (AA-LRT case) ................................. 59
4.2.2 Calculation of vibration for AA-LRT Salitemihret case ......................................................... 60
4.3 Level crossing sub system ............................................................................................................. 62
4.3.1 Composition of LX subsystem ............................................................................................... 62
4.4 Function of LX subsystem ............................................................................................................. 64
4.4.1 Approaching alarm notice ..................................................................................................... 64
4.4.2 Barrier control ........................................................................................................................ 65
4.4.4 Control principle for crossing ................................................................................................ 67
4.4.5 Train approaching notice ....................................................................................................... 71
4.5 Performance of LX subsystem ...................................................................................................... 71
4.5.1 Barrier control box ................................................................................................................ 71
4.5.2 Road Signal ............................................................................................................................. 72
Chapter 5 .................................................................................................................................................... 73
Software Development Proteus ................................................................................................................ 73
5.1 System Flow chart......................................................................................................................... 73
Chapter 6 .................................................................................................................................................... 81
Result and discussion ................................................................................................................................. 81
Chapter 7 .................................................................................................................................................... 87
Conclusion and Recommendation ............................................................................................................. 87
7.1 Conclusion ..................................................................................................................................... 87
7.2 Recommendation ......................................................................................................................... 87
7.3 Future enhancement .................................................................................................................... 88
Reference .................................................................................................................................................... 89
Master Thesis: Addis Ababa university SECE: 2015 VI
List of figures
Figure 1.1: Overall system methodology ………………………………………………….....6
Figure 2.1: block diagram of base station ……………………………………………………11
Figure 2.2: Block diagram of train side ………………………………………………………11
Figure 2.3: Vibration signal of approaching train ……………………………………………14
Figure 2.4: servo motor configuration ………………………………………………………..17
Figure 2.5: PWM switching of servo motor…………………………………………………..18
Figure 3.1: train/track interaction ……………………………………………………………..22
Figure 3.2 Parallel means of data transfer…………………………………………………….35
Figure 3.3 serial means of data transfer……………………………………………………….35
Figure 3.4 Pin description of RS 232………………………………………………………….37
Figure 3.5: Configuration layout of RS 232 pins ……………………………………………..37
Figure 3.6: Pin description of RS232…………………………………………………………38
Figure 3.7: Pin configuration of Max 232 …………………………………………………….40
Figure 3.8: Connection between PIC16f877A and ADC804………………………………….42
Figure 3.9: steps on signal conditioning ……………………………………………………….43
Master Thesis: Addis Ababa university SECE: 2015 VII
Figure 3.10: Pin details of PIC 16F877A ……………………………………………………...46
Figure 3.11: ZigBee architecture ………………………………………………………………48
Figure 3.12: Relationships between pulse duration and servomotor angular rotation …………51
Figure 3.13: CBI structure ………………………………………………………………………53
Figure 4.1: general level crossing layout ………………………………………………………..56
Figure 4.2: Schematic Diagram of Composition of LX Equipment at Type II Crossing ………61
Figure 4.3: Display of Crossing Plane …………………………………………………………67
Figure 5.1: System flow chart …………………………………………………………………..71
Figure 5.2 Proteus design of Analog to digital conversion...……………………………………73
Figure 5.3 Proteus design of the train side station ………………………………………………73
Figure 5.4 Proteus design of the base station ……………………………………………………74
Figure 5.5: Way side signal design using Proteus used in the simulation ………………………75
Figure 5.6 servo motor design using Proteus software ………………………………………....76
Figure 6.1 schematic design of the way side signals simulation ………………………………..78
Figure 6.2 Train side signal is RED road side is GREEN ………………………………………78
Figure 6.3 Train side displays yellow and road signal displays Yellow with Red ……………..79
Figure 6.4: When train is allowed to pass with green signal and red signal for road users …….79
Figure 6.5: Servo motor rotates to lower and up the gate barrier ……………………………….80
List of tables

Master Thesis: Addis Ababa university SECE: 2015 VIII
Table 4.1 Technical parameters specification …………………………………………………..70
Table 6.1 result of vibration level and corresponding voltage ………………………………….77
Table 6.2 Distance away from level crossing and condition of the gate ………………………..80
Table 6.3 Condition for clear during hazard …………………………………………………….81
List of symbols and abbreviation
AA-LRT Addis Ababa Light Rail Transit
ADC Analog to Digital Converter
PIC Peripheral Integrated Circuit
CBI Computer Based Interlocking
DAC Digital to Analog Converter
EW East-West
NS North-South
IC Integrated Circuit
KM kilo Meter
KMPH Kilo Meter Per Hour
LX Level Crossing Box
MCS Microcontrollers
TRANCEIVER Transmitter and receiver
Master Thesis: Addis Ababa university SECE: 2015 1
Chapter 1
Introduction
1.1 Overview of railway system
One of the most widely used and comfortable modes of transportation system is railway mode of
transportation, but occasionally, accidents are occur due to collision and by other reasons. It is
very difficult to stop such collisions because of speed of moving trains, which is needs a lead
distance to stop. Collisions are happened due to human errors and/or faulty equipment.
This thesis deals with automatic railway gate operation (i.e.,) automatic railway gate at a level
crossing replacing the gates operated by the gatekeepers. It deals with two things. Firstly it deals
with the reduction of time for which the gate is being kept closed and secondly, to provide safety
to the road users by reducing the accidents. By employing the automatic railway gate control at
the level crossing the arrival of the train is detected by the sensors placed near to the gate. Hence,
the time for which it is closed is less compared to the manually operated gates. The operation is
automatic; error due to manual operation is prevented. Automatic railway gate control is highly
microcontroller based arrangements, designed for use in almost all the unmanned level crossing
in the train. In this thesis work aims at designing and testing of working model entitled railway
security monitoring system using vibration sensor and it also provides an automatic railway gate
at a level crossing replacing the gates operated by the gatekeeper Level crossings cannot be used
simultaneously both by road traffic and trains, as this result in accidents leading to loss of
precious lives. This type of gates can be employed in an unmanned level crossing where the
chances of accidents are higher and reliable operation is required. Since, the operation is
automatic; error due to manual operation is prevented. The model of railway track controller is
designed by using PIC16F877A microcontroller by employing the automatic railway gate control
at the level crossing the arrival of the train is detected by the sensor placed near to the gate.
Hence, the time for which it is closed is less compared to the manually operated gates and also
Master Thesis: Addis Ababa university SECE: 2015 2
reduces the human labor. Automatic railway gate control is highly economical microcontroller
based arrangement, designed for use in almost all the unmanned level crossings in AA-LRT.
As the use of Railway is very essential for transportation, railway safety is a crucial aspect of rail
operation over the world. Malfunctions resulting in accidents usually get wide media coverage
even when the railway is not at fault and give to rail transport, among the uninformed public, an
undeserved image of inefficiency often fueling calls for immediate reforms. This paper is aimed
at helping the railway administrations concerned to strengthen their safety culture and develop
the monitoring tools required by modern safety management. Railroad intersections are very
unique, special, potentially dangerous and yet unavoidable in the World [1].
The railway accidents are happening due to the carelessness in manual operations or lack of
workers.
The other main reasons for the collisions of train are:
Train derailment in curves and bends
Running train collisions with the standing train
To this end, the thesis work found to be one of the efficient methods to prevent avoid train
collision for AA-LRT using simple electronic components and automatically control of railway
gates in an embedded platform. The system can be implemented and demonstrated by using
vibration sensor and ZigBee with the help of microcontroller.
1.2 Overview of Railway system in Ethiopia
Railway transportation system had been used as a major freight and passenger transport to the
eastern part of Ethiopia starting from 1917 to 2007 E.C. The system comes to existence during
the reign of Emperor Menelik II and covers a total of 781km powered by diesel engine and
jointly owned by Ethiopia and Djibouti. Great improvement of road network is prevailing in
Ethiopia, but with limited connectivity, high cost of transportation and poor quality of service.
The mobility need of the country population and the development of transportation system are
far from compatibility. Therefore; the country is in need of modern, economic, time saving and
Master Thesis: Addis Ababa university SECE: 2015 3
long lasting transportation which will ease import-export system and result fast development. To
this end, the government of Ethiopia has embarked on railway system. The main reasons for the
renewed interest in the railway are environmental, economical, and safety related issues [1] [2].
1.3 Introduction to AA-LRT Project (Thesis Area)
Addis Ababa Light Rail Transit (AA-LRT) Project is Ethiopian government plan of
Transformation plan to satisfy the demands of transportation shortage problem in Addis Ababa.
It is Electrified light rail transit with total length of 34.25 km (North-South line 16.9 km and
East-West line 17.35 km). To effectively solve the problem of urban transportation, especially
that of the Addis Ababa city, the government of Ethiopia decides to build a light rail in the city
of Addis Ababa. Currently this project has planned two lines, the east-west line and the south-
north line. About 3 km is the sharing section for both E-W route and N-S route, which has the
greatest passenger current. The altitude of the plateau is 2,400m.With an urban population of
over 3,400,000. The urban area is 530.14 km2, and the density reached 5,607.96 per km
2 [1].
1.3.1 East-West Line
The east-west line project starts from Ayat and ends at Torhailoch. The total length is 17.4km.
There are 22 stations, among which 5 are elevated stations, 1 underground station and 16 ground
stations. The 22 LRT stations are placed in phase one of E-W route project, 5 of which are
shared with N-S route. Average interval between two adjacent stations is 815 meters. The longest
interval is 1210 meters and the shortest interval is 525 meters [1].
1.3.2 North-South Line
The south-north line phase I project starts from Menelik II Square and ends at Kality. The total
length is 16.97km. There are 22 stations, five of which are shared with E-W route among which
9 are elevated stations 5 common stations at the common line), 2 underground station and 11
ground stations. Average interval between two adjacent stations is 793 meters. The longest
interval is 1370 meters and the shortest interval is 510 meters. The depot locates at the south end
Master Thesis: Addis Ababa university SECE: 2015 4
of the project. The control center (commonly used by both lines) is temporarily considered to be
placed inside the parking yard [1].
1.3.3 Introduction to the shared line
The AA-LRT project as said earlier has two routes and these route share a common route with
length of around 3 Km. EW line starts from Ayat is shares with the Kality line which meet at
EW16/NS16 at stadium and ends EW20/NS20 with 5 stations.
1.3.4 Tramcar used in AA-LRT
The tram cars used in AA-LRT project are 6-axel double-articulated 70% low floor light tramcar.
It allows bidirectional drive and it has the capacity of 286 passengers (64 seats and 6 passengers
per m2) with the life time of about 30 years. The design speed of the tramcar is 70kmphr [3]. The
dead weight (which is the crucial component for generating speed profile) of the tramcar is 59.42
tone with length of 28.4 meter and width of 2.65 meter.
At start up, tramcar has the chance to accelerate at maximum acceleration which is greater than
or equal to 1.0 m/s2, on the other hand, average braking deceleration is dependent on the type of
braking applied. It has to be greater than or equal to 1.1m/s2
for normal braking and greater than
or equal to 2.0m/s2for emergency braking.
1.4 Statement of the Problem
Despite the fact that railway is the cheapest modes of transportation and preferred over all other
means of transportation, there are challenges associated with this system. When we go through
the daily newspapers we come across many accidents in railroad railings. Railroad-related
accidents are more dangerous than other transportation accidents in terms of severity and death
rate etc. Therefore more efforts are necessary for improving safety. Collisions with train are
generally catastrophic in that the destructive forces of a train usually no match for any other type
of vehicle. Train collisions form a major catastrophe, as they cause severe damage to life and
Master Thesis: Addis Ababa university SECE: 2015 5
property. Train collisions occur frequently eluding all the latest technology. This system is to
manage the control system of railway gate using the microcontroller. The main purpose of this
system is about railway gate control system and level crossing between railroad and highway for
decreasing railroad-related accident and increasing safety. In addition, it also provides safety
road users by reducing the accidents that usually occur due to carelessness of road users and
errors made by the gatekeepers.
1.5 Objective of the thesis
1.5.1 General Objective
The general objective of this thesis is to make a railway transportation service make secure by
avoiding train collision on level crossing by automatic control of the railway gate.
1.5.2 Specific Objective
The specific aim of this thesis is to:
Review the conventional train detection schemes and analyze their role in railway
network.
To convert the amount of vibration level to distance /voltage and use the result for
assessment of level crossing safety performance and safety measures.
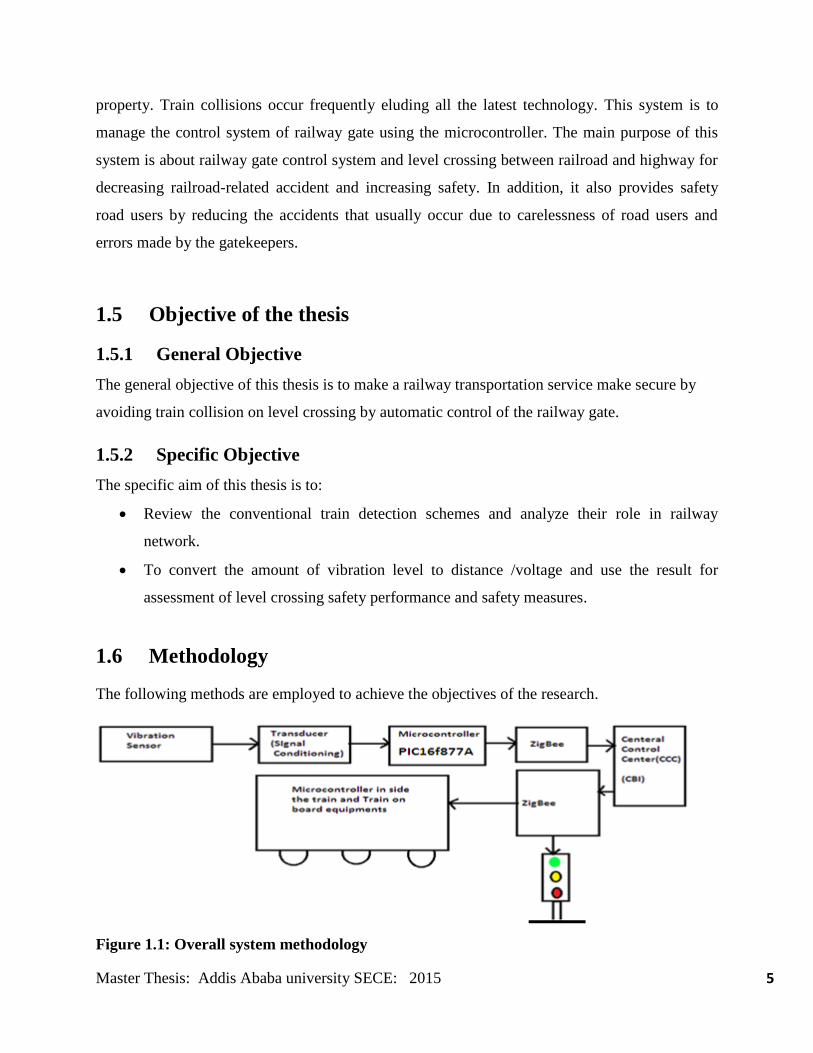
1.6 Methodology
The following methods are employed to achieve the objectives of the research.
Figure 1.1: Overall system methodology
Master Thesis: Addis Ababa university SECE: 2015 6
As it is shown on the figure above this thesis is mainly done based on PIC16f877A
microcontroller and ZigBee technology. First the vibration generated by the train is sensed by the
MINI sense 100 vibration sensors and recorded using Sony recorder and conditioned in a way
the PIC16f877A microcontroller understands using ADC converter and the vibration level is then
mapped in to a corresponding voltage and is given to the PIC16f877A.
The PIC16f877A is then makes a decision based on the voltage levels and the decision to the
control center via ZigBee. The control center is makes a decision based the command it gets
from the PIC16f877A and sends back the decision to the train on board equipment and the way
side signals. The train is then controlled by the command it display on the on board equipment
and the way side signal again the road user operates based on the way side signal that displayed
to them.
1.7 Scope of the thesis
Review the present status of level-crossing accidents and train collisions.
Present statistics, indicators, technology and problems relating to the systems adopted for
railway protection; in practice.
Analyze various alternative systems for train collision avoidance; and make
recommendations pertaining to the selection of cost-effective.
1.8 Thesis Organization
The thesis organization is as follows. In chapter 1 discuss introduction to level crossing and gives
high lights to the AA-LRT project. It also discusses the objective of the thesis, methodology of
the thesis and gives good insight to the history of railway transportation.
In the following chapter; chapter 2 we are going to discuss about the proposed system.it discuss
about the block diagram for both train station side and base station side and discuss the detail
working principle of both stations sides.

Master Thesis: Addis Ababa university SECE: 2015 7
In chapter 3 modeling of the vibration is done and different factors that affect the vibration are
discussed; in chapter 4 detail model of level crossing for AA-LRT case is presented. In chapter 5
the software development is discussed.
In chapter 6 Result and discussion are discussed and analyzed. In the last chapter 7 conclusion
and recommendation are discussed. Finally the different supporting materials are cited under the
reference section.
Master Thesis: Addis Ababa university SECE: 2015 8
Chapter 2
PROPOSED SYSTEM
2.1 Railway Security Monitoring Using Vibration Sensor and
ZigBee
The proposed Train Anti Collision and Level Crossing Protection System consists of a self-
acting microcontroller and two way ZigBee based data communication system which works
round-the-clock to avert train collisions and accidents at the level crosses. Thus enhances safety
in train operations by providing a NON-SIGNAL additional safety overlay over the existing
signaling system. The system operates without replacing any of the existing signaling and
nowhere affects the vital functioning of the present safety systems deployed for train operations.
The proposed system gets data from the vibration sensor. The efficiency of the system is
expected to be considerably increased as the proposed system takes inputs from the sensor and
also from the level crossing gates. As more relevant data are included, it is expected that the
present system may assist loco drivers in averting accidents efficiently. As no change is
necessary to be made to the infrastructure of the existing system, the cost of implementation of
this system is also less. The overall system block diagram is will be discussed next.
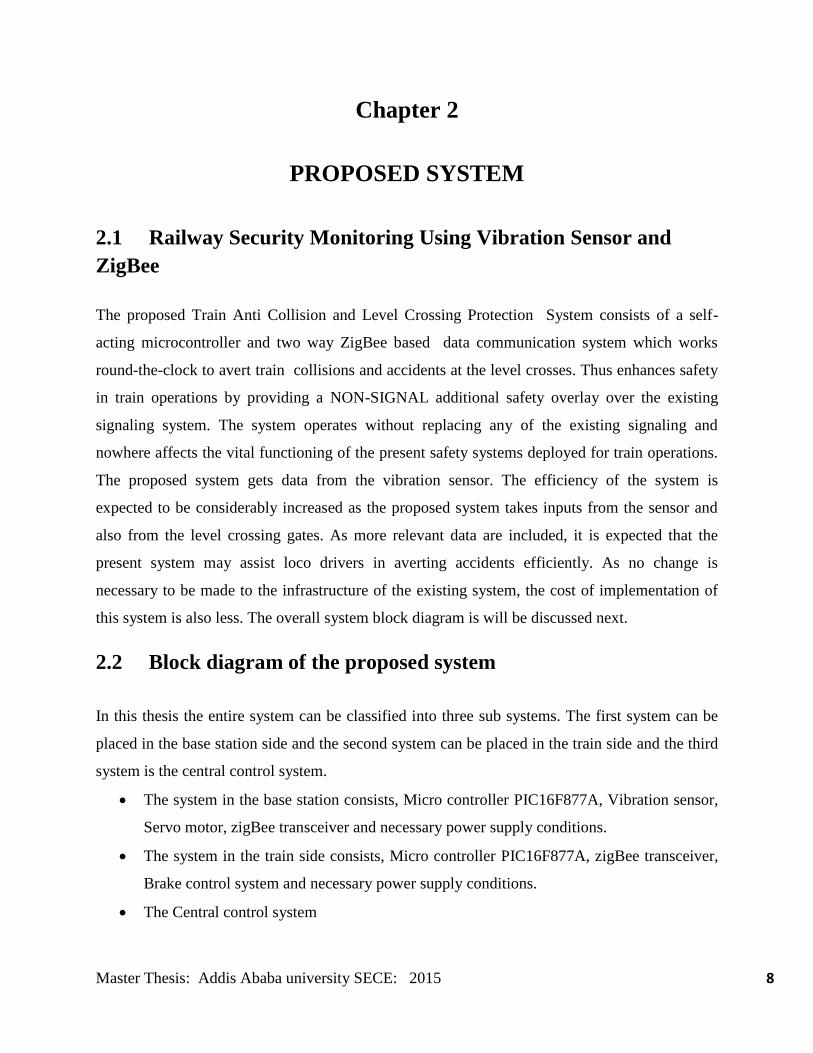
2.2 Block diagram of the proposed system
In this thesis the entire system can be classified into three sub systems. The first system can be
placed in the base station side and the second system can be placed in the train side and the third
system is the central control system.
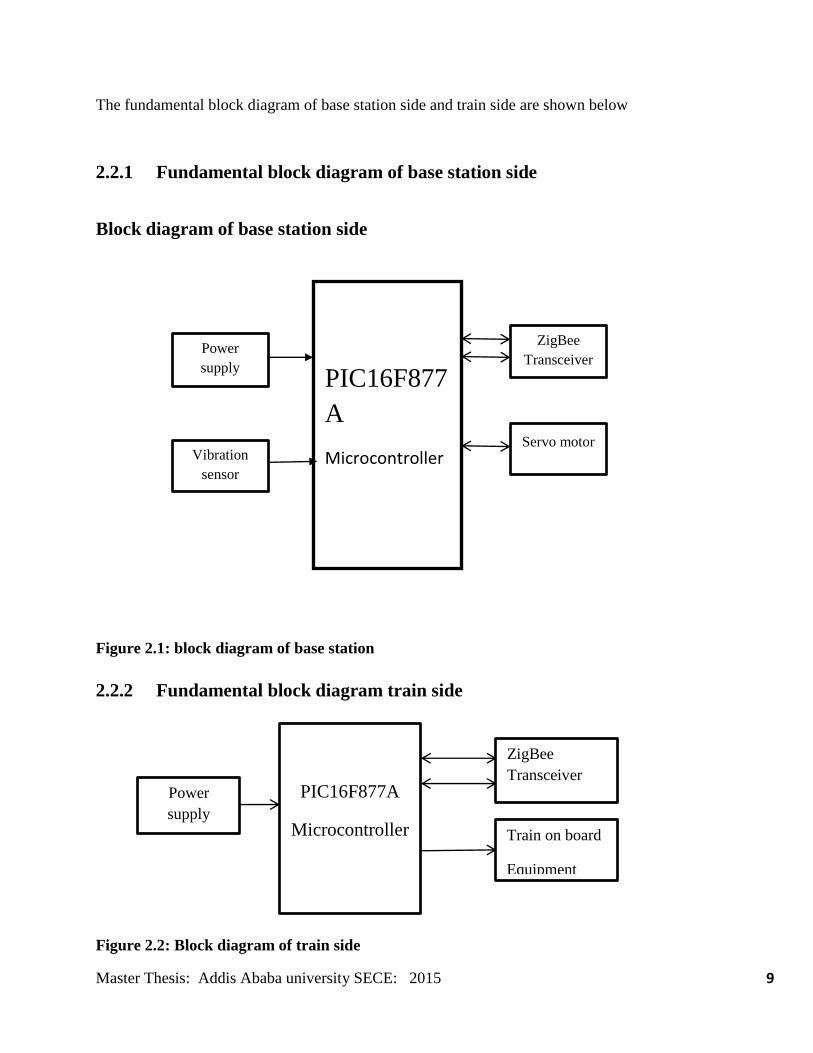
The system in the base station consists, Micro controller PIC16F877A, Vibration sensor,
Servo motor, zigBee transceiver and necessary power supply conditions.
The system in the train side consists, Micro controller PIC16F877A, zigBee transceiver,
Brake control system and necessary power supply conditions.
The Central control system
Master Thesis: Addis Ababa university SECE: 2015 9
The fundamental block diagram of base station side and train side are shown below
2.2.1 Fundamental block diagram of base station side
Block diagram of base station side
Zigbee
Figure 2.1: block diagram of base station
2.2.2 Fundamental block diagram train side
Figure 2.2: Block diagram of train side
PIC16F877
A
Microcontroller
Power
supply
Servo motor Vibration
sensor
ZigBee
Transceiver
PIC16F877A
Microcontroller
Power
supply
ZigBee
Transceiver
Train on board
Equipment
Master Thesis: Addis Ababa university SECE: 2015 10
2.3 Detail description of the block diagram components
Regulated Power supply to microcontroller
A variable regulated power supply, also called a variable bench power supply, is one which you
can continuously adjust the output voltage to your requirements. Varying the output of the power
supply is recommended way to test a project after having double checked parts placement against
circuit drawings and the parts placement.
This type of regulation is ideal for having a simple variable bench power supply. Actually this is
quite important because one of the first projects a hobbyist should undertake is the construction
of a variable regulated power supply. While a dedicated supply is quite handy e.g. 5V or 12V,
it‟s much handier to have a variable supply on hand, especially for testing. Most digital logic
circuits and processors need a 5 volt power supply. To use these parts we need to build a
regulated 5 volt source. Usually you start with an unregulated power to make a 5 volt power
supply; we use a LM7805 voltage regulator IC (Integrated Circuit).
Vibration sensor
The sensors sense the input and sends to the microcontroller, where it responds and gives
command to the particular component with predefined algorithm. The time parameters are
crucial which can be easily changed and modified using Micro-controllers. Thus, this device
would work in coherence would help to reduce the train collisions.
Sense the vibration of the train. According to the vibration it determines the train is
arriving or departure.
It works based on piezoelectric effect. That means it converts mechanical vibration of
train into electric pulses.
The vibration sensor used in this thesis is mini sense 100 vertical.
PIC16F877A microcontroller
The microcontroller employed in this thesis is AT89S5
Master Thesis: Addis Ababa university SECE: 2015 11
ZigBee transceiver
ZigBee devices are often used in mesh network form to transmit data over longer distances,
passing data through intermediate devices to reach more distant ones.
Why ZigBee is selected from other wireless data transmission networks?
Low power consumption.
Can cover 10-100 meters away from line of sight depending on output power and
environmental characteristics.
Can cover more distance by passing data through mesh networks of intermediate devices.
ZigBee is a specification for a suite of high level communication protocols
The IEEE specification of ZigBee is IEEE 802.15.4.
Servo motor
It is the modified form of DC motor
It consist DC motor, potentiometer, gearing system.
The servo motor works based on PWM switching
The main advantage of servo motor is precise control of angular position.
2.4 Hardware description of the block diagram components
2.4.1 Vibration sensor
2.4.1.1 Vibration
Every time a train hits a new piece of track it produces a vibration which travels down the track.
These vibrations are affected by many different factors, which make it necessary for the thesis to
be calibrated for each case as the speed and amplitude of the vibration is different for each case.
Different factors effecting the vibrations are:
Temperature of the surroundings and the track
Master Thesis: Addis Ababa university SECE: 2015 12
The materials the track consists of.
Installation method of the track.
The type and materials of the track joints.
Cracks and defects in rail track.
Defects in the trains wheels (eccentric wheels, unbalanced wheels, wheel flats)
Sleepers (railroad ties), placed at regular intervals.
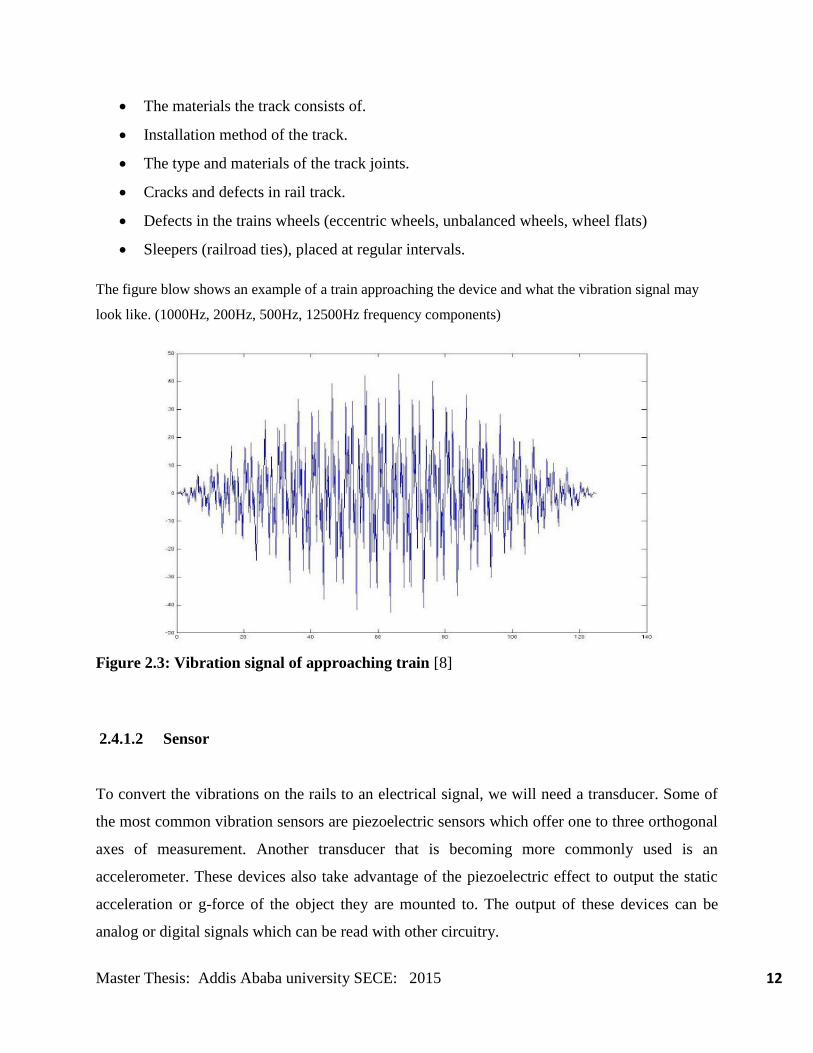
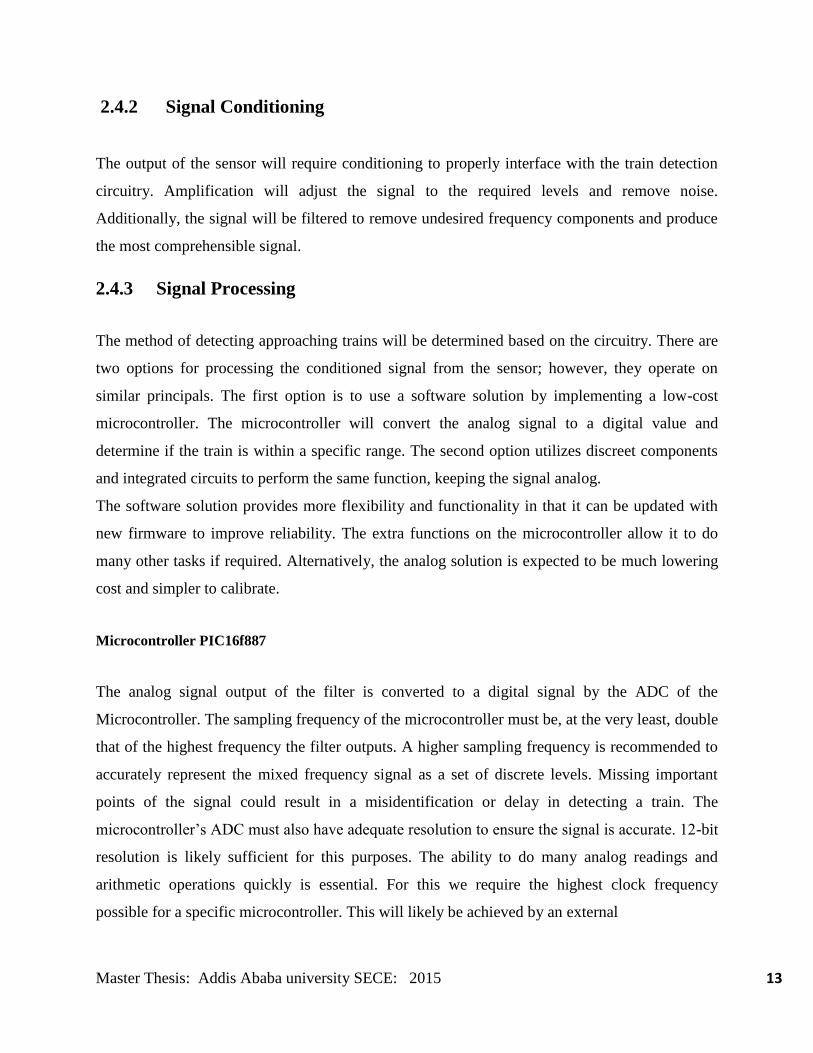
The figure blow shows an example of a train approaching the device and what the vibration signal may
look like. (1000Hz, 200Hz, 500Hz, 12500Hz frequency components)
Figure 2.3: Vibration signal of approaching train [8]
2.4.1.2 Sensor
To convert the vibrations on the rails to an electrical signal, we will need a transducer. Some of
the most common vibration sensors are piezoelectric sensors which offer one to three orthogonal
axes of measurement. Another transducer that is becoming more commonly used is an
accelerometer. These devices also take advantage of the piezoelectric effect to output the static
acceleration or g-force of the object they are mounted to. The output of these devices can be
analog or digital signals which can be read with other circuitry.
Master Thesis: Addis Ababa university SECE: 2015 13
2.4.2 Signal Conditioning
The output of the sensor will require conditioning to properly interface with the train detection
circuitry. Amplification will adjust the signal to the required levels and remove noise.
Additionally, the signal will be filtered to remove undesired frequency components and produce
the most comprehensible signal.
2.4.3 Signal Processing
The method of detecting approaching trains will be determined based on the circuitry. There are
two options for processing the conditioned signal from the sensor; however, they operate on
similar principals. The first option is to use a software solution by implementing a low-cost
microcontroller. The microcontroller will convert the analog signal to a digital value and
determine if the train is within a specific range. The second option utilizes discreet components
and integrated circuits to perform the same function, keeping the signal analog.
The software solution provides more flexibility and functionality in that it can be updated with
new firmware to improve reliability. The extra functions on the microcontroller allow it to do
many other tasks if required. Alternatively, the analog solution is expected to be much lowering
cost and simpler to calibrate.
Microcontroller PIC16f887
The analog signal output of the filter is converted to a digital signal by the ADC of the
Microcontroller. The sampling frequency of the microcontroller must be, at the very least, double
that of the highest frequency the filter outputs. A higher sampling frequency is recommended to
accurately represent the mixed frequency signal as a set of discrete levels. Missing important
points of the signal could result in a misidentification or delay in detecting a train. The
microcontroller‟s ADC must also have adequate resolution to ensure the signal is accurate. 12-bit
resolution is likely sufficient for this purposes. The ability to do many analog readings and
arithmetic operations quickly is essential. For this we require the highest clock frequency
possible for a specific microcontroller. This will likely be achieved by an external
Master Thesis: Addis Ababa university SECE: 2015 14
Crystal oscillator. These few requirements could easily be met by an 8-bit microcontroller and
give us many options to choose from for the final design. This type of microcontroller also has
the added advantage of being inexpensive.
It uses piezoelectric effect to detect the vibrations in the rails due to the arrival or departure of
train and the direction of vibration indicate the arrival or departure. This could sense the train‟s
position at roughly at 700m away. This input is fed to the microcontroller. This could help in
avoiding accidents between trains in slopes because the arrival of one train found out using
vibration sensor can be immediately sent to the Control Room and the power supply can be
switched off within 3 minutes so trains could be stopped without colliding each other. Vibration
or shock sensors are commonly used in alarm systems to activate an alarm whenever the devices
to which they are attached are touched, moved, or otherwise vibrated. Commercial vibration
sensors use a piezoelectric ceramic strain transducer attached to a metallic proof mass in order to
respond to an externally imposed acceleration. Piezoelectric vibration sensors used for detecting
vibration from various vibration sources are generally classified into two large types, resonant
type and no resonant type.
Vibration sensors are several types. Before selecting the vibration sensor must consider five
factors.
Its measuring range,
Frequency range,
Accuracy,
Transverse sensitivity
Ambient conditions.
Mini sense 100 Vibration sensor
The Mini sense 100 is a low-cost cantilever-type vibration sensor loaded by a mass to offer high
sensitivity at low frequencies. The pins are designed for easy installation and are solderable.
Horizontal and vertical mounting options are offered as well as a reduced height version. The
active sensor area is shielded for improved RFI/EMI rejection. Rugged, flexible PVDF sensing
Master Thesis: Addis Ababa university SECE: 2015 15
element withstands high shock overload. Sensor has excellent linearity and dynamic range, and
may be used for detecting either continuous vibration or impacts. The mass may be modified to
obtain alternative frequency response and sensitivity selection. It can be classified into two 1)
mini sense 100 vertical,2)mini sense 100 horizontal. The vibration sensor used here is mini sense
100 vertical
Why Servomotor for barrier control
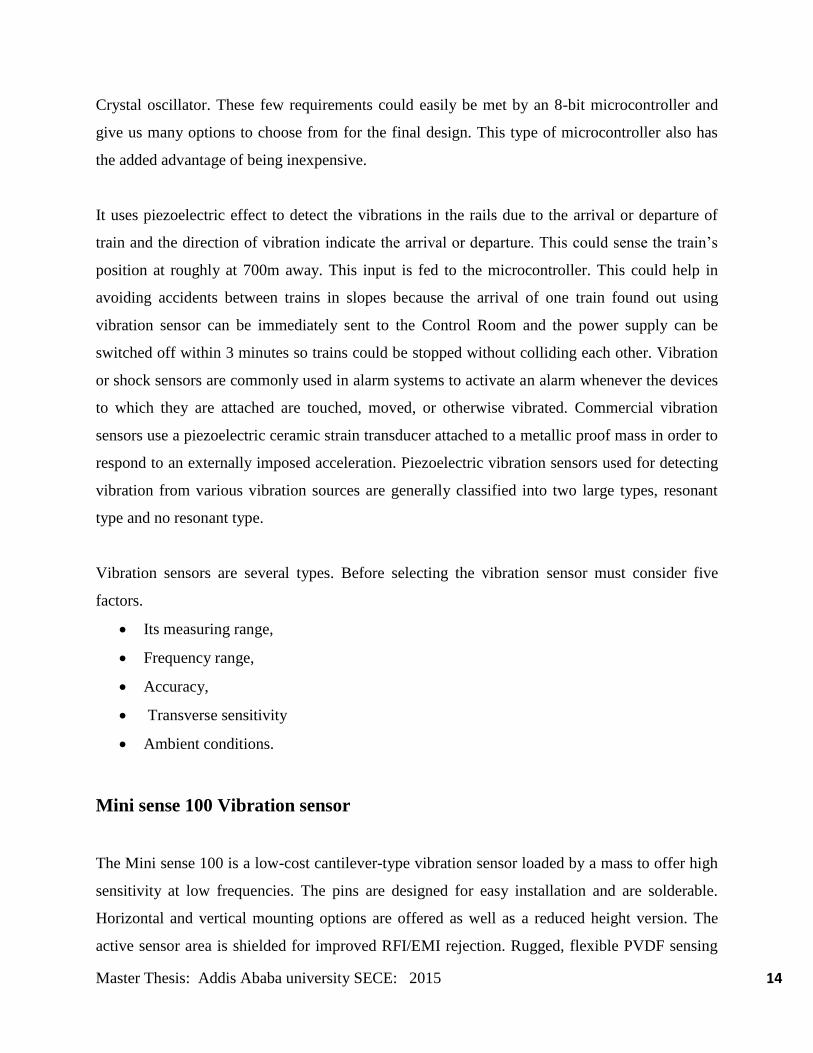
Servomotors are generally used as a high performance alternative to the stepper motor. Stepper
motors have some inherent ability to control position, as they have inbuilt output steps. This
often allows them to be used as an open loop position control, without any feedback encoder, as
their drive signal specifies the number of steps of movement to rotate. This lack of feedback
though limits their performance, as the stepper motor can only drive a load that is well within its
capacity, otherwise missed steps under load may lead to positioning errors.
The encoder and controller of a servomotor are an additional cost, but they optimize the
performance of the overall system (for all of speed, power and accuracy) relative to the capacity
of the basic motor. With larger systems, where a powerful motor represents an increasing
proportion of the system cost, servomotors have the advantage. Many applications, such as laser
cutting machines, may be offered in two ranges, the low-priced range using stepper motors and
the high-performance range using servomotors.
Figure 2.4: servo motor configuration [7]
Master Thesis: Addis Ababa university SECE: 2015 16
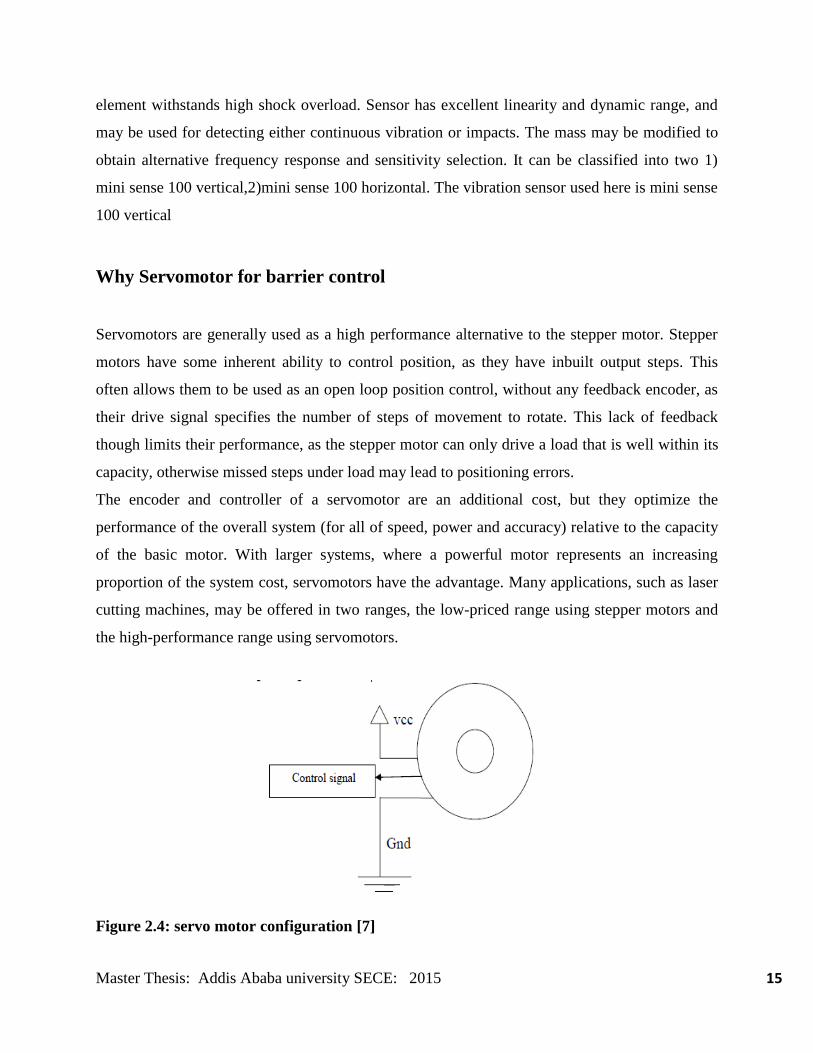
Working principle of servo motor
Servomechanism is used for controlling the servomotor. The servos are controlled by sending
them a pulse of variable width. The control wire is used to send this pulse. The parameters for
this pulse are that it has a minimum pulse, a maximum pulse, and a repetition rate. Given the
rotation constraints of the servo, neutral is defined to be the position where the servo has exactly
the same amount of potential rotation in the clockwise direction as it does in the counter
clockwise direction. It is important to note that different servos will have different constraints
on their rotation but they all have a neutral position, and that position is always around 1.5
milliseconds (ms). The angle is determined by the duration of a pulse that is applied to the
control wire. This is called Pulse width Modulation. The servo expects to see a pulse every 20
ms. The length of the pulse will determine how far the motor turns. For example, a 1.5 ms pulse
will make the motor turn to the 90 degree position (neutral position).
When these servos are commanded to move they will move to the position and hold that
position. If an external force pushes against the servo while the servo is holding a position, the
servo will resist from moving out of that position. The maximum amount of force the servo can
exert is the torque rating of the servo. Servos will not hold their position forever though; the
position pulse must be repeated to instruct the servo to stay in position.
Figure 2.5: PWM switching of servo motor
Master Thesis: Addis Ababa university SECE: 2015 17
When a pulse is sent to a servo that is less than about 0.6 ms the servo does not rotates to any
position and holds its output shaft at zero degree. If the pulse is wider than 0.6 ms the servo
rotates. For example, if pulse width is equal to 1,5ms servo will rotate 90 degrees and for pulse
width is equal or greater than 2
ms, servo will make rotation of 180 degrees. The minimal width and the maximum width of
pulse that will command the servo to turn to a valid position are functions of each servo.
Different brands, and even different servos of the same brand, will have different maximum and
minimums. Generally the minimum pulse will be about 1 ms wide and the maximum pulse will
be 2 ms wide. PWM switching This Light Weight Servo (1.5 Kg) can be used for this thesis
development. This comes with a standard 3 pin power, control cable. Can be used in Electric
aircraft, glider etc.
2.5 Automatic gate control working of model
It deals with two things. Firstly, it deals with the reduction of time for which the gate is being
kept closed. And secondly, to provide safety to the road users by reducing the accidents that
usually occur due to carelessness of road users and at times errors made by the gatekeepers.
By employing the automatic railway gate control at the level crossing the arrival of train is
detected by the sensor placed on either side of the gate. Once the arrival is sensed, the sensed
signal is sent to the microcontroller and it checks for possible presence of vehicle between the
gates, again using sensors. Subsequently, buzzer indication and light signals on either side are
provided to the road users indicating the closure of gates. Once, no vehicle is sensed in between
the gate the motor is activated and the gates are closed.
But, for the worst case if any obstacle is sensed, it is indicated to the train driver by signals
(RED) placed at about 1km, so as to bring it to halt well before the level crossing. When no
obstacle is sensed GREEN light is indicated, and the train is to free to move. The departure of the
train is detected by sensors placed at about 1km from the gate. The signal about the departure is
Master Thesis: Addis Ababa university SECE: 2015 18
sent to the microcontroller, which in turn operates the motor and opens the gate. Thus, the time
for which the gate is closed is less compared to the manually operated gates.
One of the main objectives of thesis is to control the unmanned rail gate automatically using
embedded platform to reduce maintenance expenditure, human mistakes, and accidents. An
Embedded system is a combination of computer hardware and software, and perhaps additional
mechanical or other parts, designed to perform a specific function.
The points or places where the Railway track crosses the road are called level crossings. Level
crossings cannot be used simultaneously both by road traffic and trains, as this result in accidents
leading to loss of precious lives. The program for this thesis is embedded in this Micro controller
Integrated Chip and interfaced to all the peripherals. Crossing gates, when closed to road traffic,
crossed the entire width of the road.
Existing System:-
Manual/Physical gate closing & opening.
Manual switch based gate closing & opening.
Limitations of exiting system:-
Chances of human error.
Time consuming.
A lot of human resource is required.
An automatic railway gate control at level crossing replaces the gates operated by the gatekeeper.
It deals with two things. Firstly, it deals with the reduction of time for which the gate is being
kept closed and secondly, to provide safety to the road users by reducing the accidents. By the
existing system once the train leaves the station, the stationmaster informs the gatekeeper about
the arrival of the train through the telephone. Once the gatekeeper receives the information, he
closes the gate depending on the timing at which the train arrives. Hence, if the train is late due
to certain reasons, then gate remain closed for a long time causing traffic near the gates. By
employing the automatic railway gate control at the level crossing the arrival of the train is
detected by the sensor placed near to the gate. Hence, the time for which it is closed is less
compared to the manually operated gates and also reduces the human labor.
This type of gates can be employed in an unmanned level crossing where the chances of
accidents are higher and reliable operation is required. Since, the operation is automatic; error

Master Thesis: Addis Ababa university SECE: 2015 19
due to manual operation is prevented. Automatic railway gate control is highly economical
microcontroller based arrangement, designed for use in almost all the unmanned level crossings
in the country”. It intends to attain the following objectives:
To design a system that will enhance the existing railway gate control system.
To incorporate C Programming in the design of the “Automatic Railway Gate Control”.
To show the application of automation in the miniature prototype of the “Automatic
Railway Gate Control”.
Master Thesis: Addis Ababa university SECE: 2015 20
Chapter 3
System Input Modeling
3.1 Vibration modeling
It is clear that when a train stands on the track, a stress pattern is produced in the ground beneath
and around the train, which is sufficient to support the train (or any other vehicle), When a train
moves the its stress pattern will move with it, although modified to a small extent by the finite
propagation velocity of the stress waves. This moving stress pattern must impress stress waves
into the surrounding ground even in the absence of any imperfections or periodic irregularities in
the vehicle or the track. Whether this basic moving stress pattern generates a sufficient response
in the surrounding soil property is unknown, but their particular geological conditions in which
this might happen. See [10].
Obviously the particular railway has many features, which are capable of supplementing the
basic stress field beneath the train. Any unsteady riding of the vehicle such as bouncing, rolling,
pitching and yawing must result in additional fluctuating forces on the track structure.
Recognized defects such as eccentric wheels, unbalanced wheels and wheel flats may also
contribute to ground disturbance. The track itself does not provide uniform support; the rails,
themselves of fixed length, are supported on sleepers placed at regular intervals, and the sleepers
are in turn surrounded by and resting upon stone ballast. This ballast bed may by very nature
provide a somewhat variable support, and void age below the occasional sleeper is a well-known
fault.
All of these track features can be expected to contribute to the stress field present in the ground
below and beside the train, and hence contributed to the vibration disturbances, which propagate
to the surrounding soil. Clearly some of these will produce a purely local effect in the case of
isolated features, whilst others will provide a regular pattern moving with the train. The extent to
which these features promote vibration can be expected to depend on the speed of the train and
the weights of the vehicles within it. The static weight of the train provides the basic stress field
Master Thesis: Addis Ababa university SECE: 2015 21
due to the train, whilst the unsprang masses and the suspension characteristics of the vehicles,
associated with their speed, will determine the extent to which track and rolling stock
characteristics enhance this stress field.
Sources of Vibration for trains
3.1.1 Train/Track Interaction
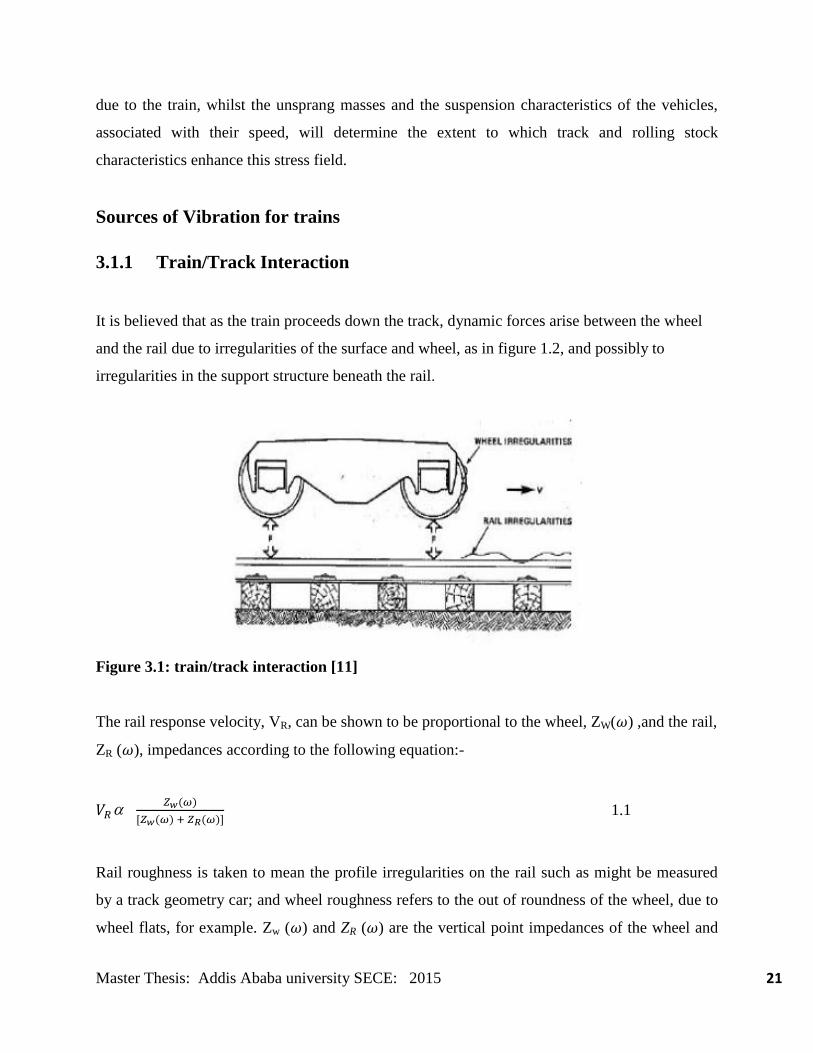
It is believed that as the train proceeds down the track, dynamic forces arise between the wheel
and the rail due to irregularities of the surface and wheel, as in figure 1.2, and possibly to
irregularities in the support structure beneath the rail.
Figure 3.1: train/track interaction [11]
The rail response velocity, VR, can be shown to be proportional to the wheel, ZW( ) ,and the rail,
ZR ( ), impedances according to the following equation:-
1.1
Rail roughness is taken to mean the profile irregularities on the rail such as might be measured
by a track geometry car; and wheel roughness refers to the out of roundness of the wheel, due to
wheel flats, for example. Zw ( ) and ZR ( ) are the vertical point impedances of the wheel and
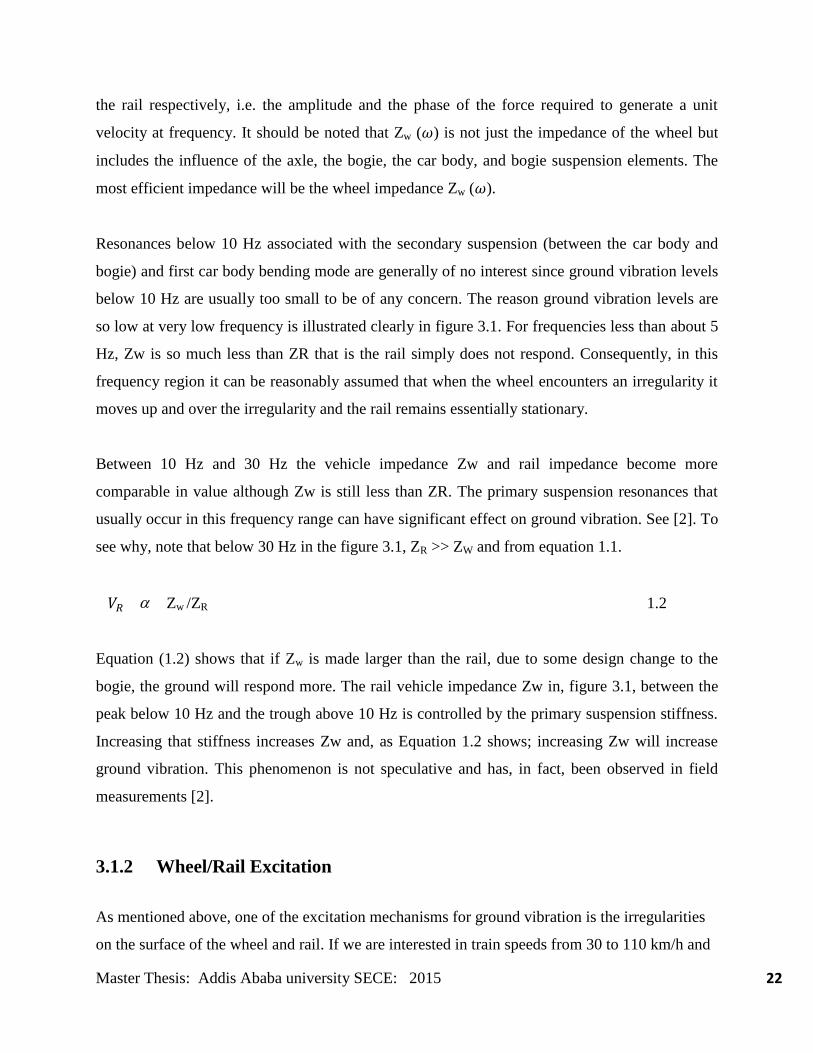
Master Thesis: Addis Ababa university SECE: 2015 22
the rail respectively, i.e. the amplitude and the phase of the force required to generate a unit
velocity at frequency. It should be noted that Zw ( ) is not just the impedance of the wheel but
includes the influence of the axle, the bogie, the car body, and bogie suspension elements. The
most efficient impedance will be the wheel impedance Zw ( ).
Resonances below 10 Hz associated with the secondary suspension (between the car body and
bogie) and first car body bending mode are generally of no interest since ground vibration levels
below 10 Hz are usually too small to be of any concern. The reason ground vibration levels are
so low at very low frequency is illustrated clearly in figure 3.1. For frequencies less than about 5
Hz, Zw is so much less than ZR that is the rail simply does not respond. Consequently, in this
frequency region it can be reasonably assumed that when the wheel encounters an irregularity it
moves up and over the irregularity and the rail remains essentially stationary.
Between 10 Hz and 30 Hz the vehicle impedance Zw and rail impedance become more
comparable in value although Zw is still less than ZR. The primary suspension resonances that
usually occur in this frequency range can have significant effect on ground vibration. See [2]. To
see why, note that below 30 Hz in the figure 3.1, ZR >> ZW and from equation 1.1.
Zw /ZR 1.2
Equation (1.2) shows that if Zw is made larger than the rail, due to some design change to the
bogie, the ground will respond more. The rail vehicle impedance Zw in, figure 3.1, between the
peak below 10 Hz and the trough above 10 Hz is controlled by the primary suspension stiffness.
Increasing that stiffness increases Zw and, as Equation 1.2 shows; increasing Zw will increase
ground vibration. This phenomenon is not speculative and has, in fact, been observed in field
measurements [2].
3.1.2 Wheel/Rail Excitation
As mentioned above, one of the excitation mechanisms for ground vibration is the irregularities
on the surface of the wheel and rail. If we are interested in train speeds from 30 to 110 km/h and
Master Thesis: Addis Ababa university SECE: 2015 23
frequencies of 10 – 250 Hz, then the irregularities with the wavelengths from 35 mm to 3 m are
of primary interest. For the wheel the irregularities of greatest importance are flat spots, which
are generated when the wheel slides during the braking. A full study is available in [3] and [4].
3.1.3 Ground Response
In the following we will consider a train moving with speed v on a welded track with sleeper
period d. The quasistatic pressure mechanism of excitation results from load forces applied to the
track from each wheel axle, causing downward deflection of the track. These deflections produce
a wave – like motion along the track with speed v that results in a distribution of each axle load
over all the sleepers, involved in the deflection distance. Each sleeper, in turn, acts as a vertical
force applied to the ground during the time necessary for a deflection curve to pass through the
sleeper and this results in generation of elastic ground vibration. Since, in the low frequency
band, the characteristics wavelengths of generated elastic waves are much larger than the sleeper
dimensions. Each sleeper can be considered as a point source. Calculating the vibration field
radiated by a moving train requires the superposition of fields generated by each sleeper
activated by all axles of all carriages, with the time and space difference between source
(sleepers) being taken into account.
3.1.4 Vibration propagation
3.1.4.1 Background
Once transient stress variation is produced in the ground below the track, they will propagate
away from the track as ground – borne vibration. A variety of modes of vibration are possible
within the ground, and the principal types are the following:-
Compression waves, (Longitudinal waves), with particle motion being an oscillation in
the direction of propagation;
Master Thesis: Addis Ababa university SECE: 2015 24
Shear waves; with particle motion being an oscillation in a plane normal to the direction
of propagation;
Rayleigh waves, which are surface waves, with a particle motion generally elliptical in a
vertical plane through the direction of propagation.
In the ideal case when the ground is homogenous the longitudinal and shear waves propagate in
all directions away from the source, and hence suffer substantial geometric attenuation, as well
as losses due to the damping properties of the ground. The Rayleigh waves, being surface waves,
do not suffer the same geometric attenuation, but are still subject to loss by damping. In practice
the ground is far from homogenous; it may well be stratified and possess discontinuities. In such
a case additional modes of vibration can propagate along the interfaces of strata, and mode
conversion from one type of wave to another may be encouraged.
The various modes have different propagation velocities. The compression waves travel at
typically 1000 m/s, whilst the shear and Rayleigh waves are much slower. Velocities for these
seem typically to be about 200 m/s, but Rayleigh waves have been reported as slow as 35 m/s,
see [29]. The vibration energy is not shared equally among the modes. Because of different
geometric attenuations, the Rayleigh wave carries most of the vibration energy at significant
distances away from the track. Reference [6] suggests that the ground vibrations generated by the
vertical oscillation of a flat plate on the ground is about two thirds of the total energy is carried
by the Rayleigh waves. A further significant factor is that high frequencies are attenuated much
more rapidly than low frequencies, so that low frequencies dominate the spectrum at distances of
more than a few meters from the source.
3.1.5 Effects of the Ground – Borne Vibration
3.1.5.1 Types of Vibrations
Whole-Body Vibration typically results from two types of forces acting on the operator. A
noncyclical force transmitted over a very short period of time, and for which the peak level is
reached instantaneously is called a shock load. A vehicle striking an obstacle or a sudden drop
into a hole may produce these shock loads. If these shock loads are sufficiently great, the
Master Thesis: Addis Ababa university SECE: 2015 25
operator may be thrown from his seat or struck by objects flying around in the car. Less sudden
forces are created by the vehicles regular motion over rough terrain. These are the most common
motion-induced vibration forces that an operator encounters during his daily work. The effects of
such forces vary with the duration of exposure. Thus they are more difficult to define than the
instantaneous damage caused by high shock loads. Whole-body Vibration considers these forces
in combination and defines the effects of repetitive forces acting in a specific frequency range.
To have an overview of the bandwidth spectrum for the ground vibration, which could be
expected for the railway, one should look on the geometrical properties of the train in relation to
its velocity. Typical dimensions are overall length of the car and axel distances. Axle distances
of a car may vary between 2 m and 10 m. a train with a velocity of 25 m/s (90 km/h) maybe
expected to produce axle passage frequency in the range of 2.5 Hz to 12.5 Hz [26]. If a typical
railway wheel, having a diameter of 0.75 m to 1.0 m, with a single wheel flat is considered, the
corresponding wheel flat occurrence frequencies may vary between approximately 8 Hz and 11
Hz. A railway wheel passing equidistant sleepers may generate what is often referred to as the
sleeper passing frequency. For Swedish railways, where the nominal centre – to – centre distance
of sleepers is 0.65 m, the corresponding sleeper passage frequency for a train with velocity of 25
m/s (90 km/h) becomes approximately 38.5 Hz.
Applying the equations below, the frequency ranges from the railways could be calculated.
The sleeper passing frequency can be found by, see [2]
= (U/ ) Hz 3.3
Where; U is the train speed in m/s and ls the sleeper distance in m.
The wheel passing frequency
= (U/ a) Hz 3.4
Where; a is the distance between two wheels in a bogie.
Bending wave speed in rails
Master Thesis: Addis Ababa university SECE: 2015 26
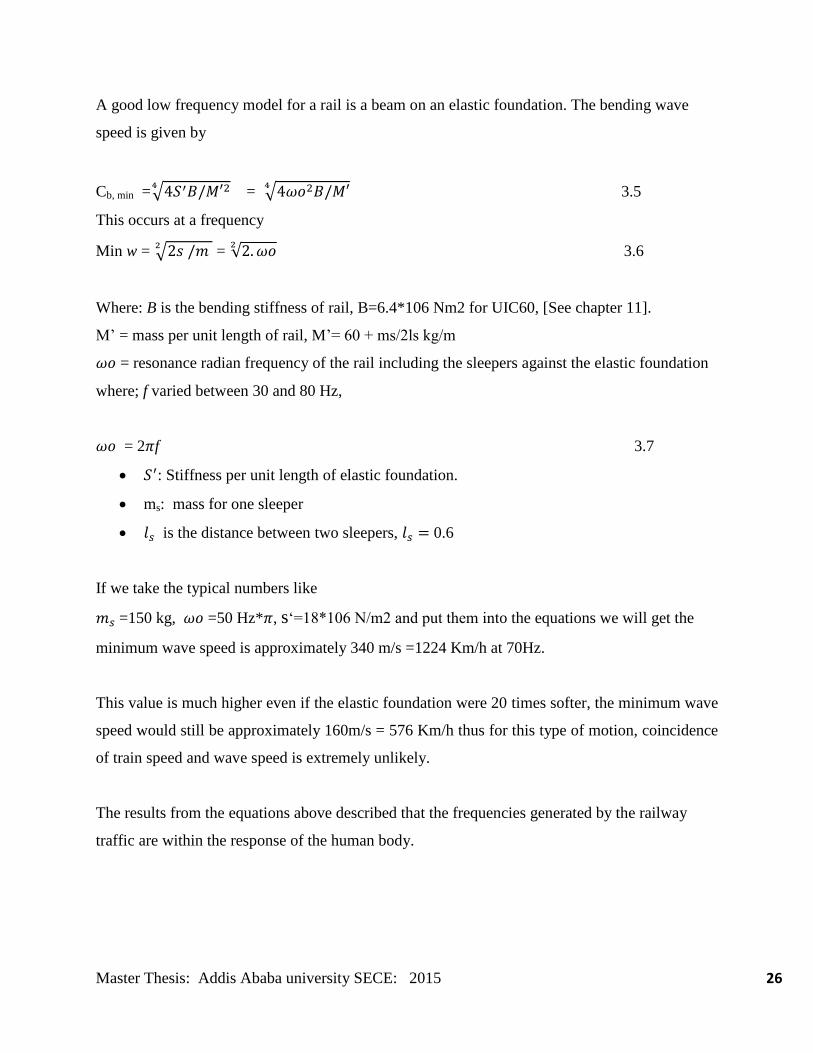
A good low frequency model for a rail is a beam on an elastic foundation. The bending wave
speed is given by
Cb, min =√
= √
3.5
This occurs at a frequency
Min w = √ = √
3.6
Where: B is the bending stiffness of rail, B=6.4*106 Nm2 for UIC60, [See chapter 11].
M‟ = mass per unit length of rail, M‟= 60 + ms/2ls kg/m
= resonance radian frequency of the rail including the sleepers against the elastic foundation
where; f varied between 30 and 80 Hz,
= 2 f 3.7
: Stiffness per unit length of elastic foundation.
ms: mass for one sleeper
is the distance between two sleepers, 0.6
If we take the typical numbers like
=150 kg, =50 Hz* , s„=18*106 N/m2 and put them into the equations we will get the
minimum wave speed is approximately 340 m/s =1224 Km/h at 70Hz.
This value is much higher even if the elastic foundation were 20 times softer, the minimum wave
speed would still be approximately 160m/s = 576 Km/h thus for this type of motion, coincidence
of train speed and wave speed is extremely unlikely.
The results from the equations above described that the frequencies generated by the railway
traffic are within the response of the human body.
Master Thesis: Addis Ababa university SECE: 2015 27
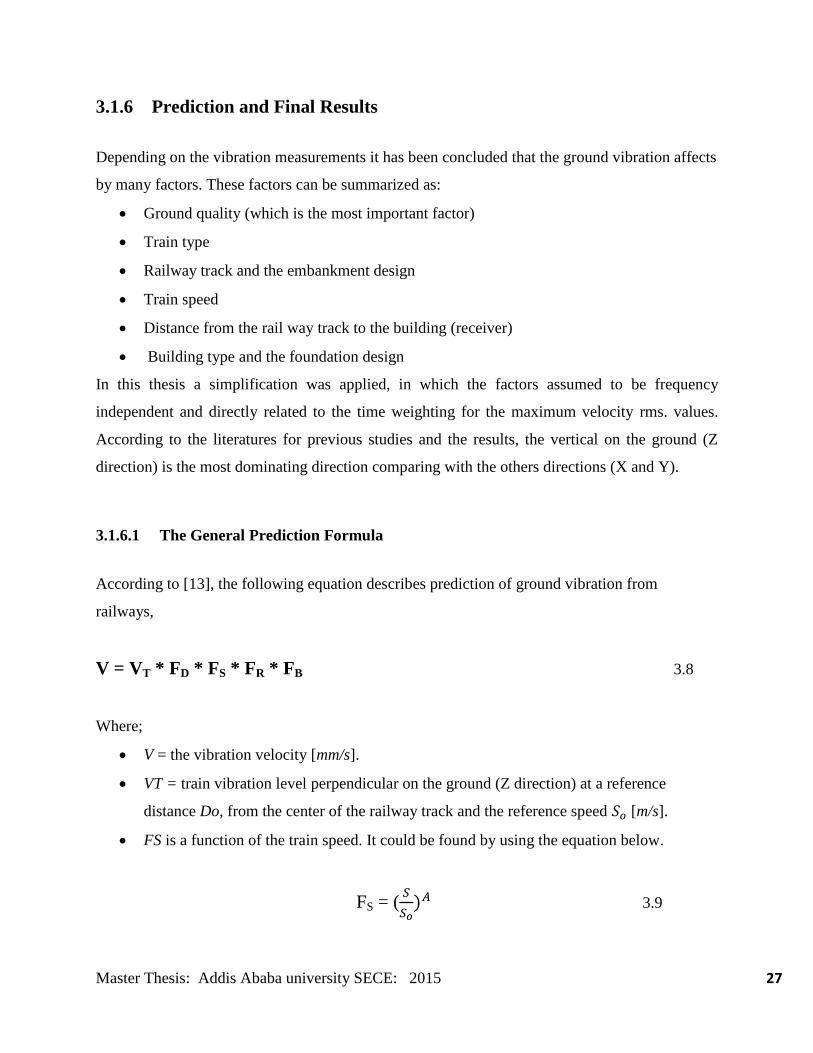
3.1.6 Prediction and Final Results
Depending on the vibration measurements it has been concluded that the ground vibration affects
by many factors. These factors can be summarized as:
Ground quality (which is the most important factor)
Train type
Railway track and the embankment design
Train speed
Distance from the rail way track to the building (receiver)
Building type and the foundation design
In this thesis a simplification was applied, in which the factors assumed to be frequency
independent and directly related to the time weighting for the maximum velocity rms. values.
According to the literatures for previous studies and the results, the vertical on the ground (Z
direction) is the most dominating direction comparing with the others directions (X and Y).
3.1.6.1 The General Prediction Formula
According to [13], the following equation describes prediction of ground vibration from
railways,
V = VT * FD * FS * FR * FB 3.8
Where;
V = the vibration velocity [mm/s].
VT = train vibration level perpendicular on the ground (Z direction) at a reference
distance Do, from the center of the railway track and the reference speed [m/s].
FS is a function of the train speed. It could be found by using the equation below.
FS = (
3.9
Master Thesis: Addis Ababa university SECE: 2015 28
Where; S is the train speed and S0 is the reference speed at which VT has been measured. A can
be between 0.5 – 1.5, we will later use A = 0.9.
FD is a function of the distance, which could be obtained by
FS = (
3.10
Where; D is the distance to the track and is the reference distance for which VT has been
measured. B will be calculated from the measurements results.
FR is a function of the bedrock. FR for the bedrock can be 0.7 – 1.3 depending on the
type of the railway track if it is single or doubled.
FB is a function of the buildings. For Swedish houses the resonance up to 3 floors, FB is
2 – 3.
Parameter A. When the train is moving on a “perfect” track and rail then there is a steady-
state condition. A passenger in the train observes a static deflection of the rail. This
deflection has a characteristic wavelength. If this deflection and the characteristic
wavelength are independent of the speed of the train then the exponential A is equal to
unity. But there are evidences that the deflection of the rail depends on the speed of the
train. The deflection increases with speed and the characteristic wavelength decrease with
speed. In that case the exponential A is greater than unity, say 1.3 - 1.51. To calculate the
exponential A, we need the same type of train in different speeds; unfortunately we were
unable to find cases with large enough differences in speed.
Exponential B. As vibrations of the ground mostly consist of Rayleigh waves the
exponential B should be 0.5 to fit the equation for FD. But there is also internal damping,
dissipation, in the material. So the parameter will be calculated from the obtained data.
As was mentioned before, these measurements were carried out for more than 160 trains from
different types, speeds and directions, the problem for these measurements is, one acquire a lot of
Master Thesis: Addis Ababa university SECE: 2015 29
data from each individual train. To summarize all these data, the trains will be categorized
according to the type. The analyses will be for three types of trains, X2000 (fast train), intercity,
and freight train (Heavy train).
The important factors for the prediction formula are, exponential A, and exponential B. If we can
determine these exponential factors from the measurement results for all the trains types then we
can use the formula (8.11) for prediction thus the measurements will be analyzed according to
find A and B, and the procedure of these calculation will be used for all types of trains
respectively.
3.1.6.2 Calculation of Vibration Levels V
The following data are collected for Swedish Intercity train (city trams with three coaches).
3.1.6.3 Distance Dependence FD
To calculate the Factor FD for each train, we should first find the exponential B.
3.1.6.4 Calculating the Exponential B Intercity train (city tram)
The exponential B will be calculated for each city tram/train individually. All Z direction for all
the trains were measured at least in two different distances from the railway track center, 20m is
the reference and the other distance were 10m, 40m and 80m.
By applying the equation V = VT * FD * FS * FR * FB , the exponential B will be calculated as
follow
⁄
3.11
Where; VT, FS, FR, and FB are constant for the same train. So
Master Thesis: Addis Ababa university SECE: 2015 30
⁄
⁄ 3.12
And
=( ⁄ )
Then with Do = 20m
⁄ ⁄
Log ( ⁄ ) = B *Log ( ⁄ ), solve for B gives
B =
⁄
⁄
3.1.6.5 Speed Dependence FS
FS is a speed factor, which account to for the effect of the train speed, S. this factor is given by
the equation (8.2)
The exponential A will be chose equal to 0.9, for calculating the factor FS
3.1.6.6 Calculating the Factor FS for Intercity Trains
To calculate FS, (function of train speed), from the equation below
=( ⁄ )
3.13
We need to use the average value of the exponential A, which is as mentioned before will be
equal to 0.9. The reference speed is chosen equal to, so = 70 km/h.
Master Thesis: Addis Ababa university SECE: 2015 31
By applying the eq. (3.13) one can calculate the factor FS, an example for that, we will calculate
FS for the fastest train and the slowest one for Intercity, see Appendix (1), where the train with
ID96 was driven with 71 Km/h, and the train with the ID31 was driven with 25 km/h.
3.1.6.7 The Factor FR
The track quality factor FR, takes into account the effect on the vibration of the quality of the
tracks and the embankment. A massive and stiff embankment below the railway tracks will
generally give less vibration than the “standard”, and a thin and flexible embankment or tracks
on grade will give more vibration than “standards”. Furthermore, smooth and well-adjusted
tracks with heavy rails gives less vibration compared to rough, low quality tracks.
FR is a function of the bedrock. The factor FR for the bedrock can be 0.7 – 1.3 depending on the
type of the railway track, if it is single or doubled. See [43].
For this purpose FR will be equal to 0.8. This value chose according to the railway track were
measurements took place, it was doubled track (with two direction) and the embankment was
assort of thick and deep, that means less generating of vibration, so the value should be less than
1, say 0.8.
3.1.6.8 The FB Factor
The building amplification factor FB is used to transform the free field ground vibration to floor
vibration at the most unfavorable place, due to ground foundation coupling and building
resonances. This factor is generally frequency dependent, the first natural frequency of the floor
in question being of greatest importance. This factor is different from house to house depending
on the number of the floors for example or if it is wooden house or rock house foundations.
According to reference [43], this factor found to be 2 to 3.
3.1.7 VT Calculations
As a last step to apply the prediction formula, VT should be calculated for the different trains.
After we found most of the parameters for the equation
V=VT * FD * FS * FR * FB
Master Thesis: Addis Ababa university SECE: 2015 32
Now, one could calculate VT for each type of train. VT will have a certain value at a certain
distance depending on the values of the exponential B.
By applying the equation above, VT was calculated for the measured X2000 trains, and as a
result of taking the average value for VT to these trains. VT found to be equal to 0.0337 [mm/s],
for distances 20m. The same procedure was followed by calculating VT for the intercity trains
and taking the average value for it. VT obtained to be equal to 0.0319 [mm/s], for distances ³
20m. For the last type of trains, freight trains, an equivalent method was followed for finding the
values of VT. By taking the average value for them, VT was obtained to be 0.047, for distances ³
20m. This is higher than the first type of trains.
3.1.8 Applying the prediction formula
From the previous chapters the most important parameter have been found and the information
which has been measured can be presented in general form by applying the equation below for
the obtained results for FR, FB, FD, Fs.
V=VT * ( ⁄ )
*( ⁄ )
* FR * FB 3.14
This equation could be applied to find the vibration velocities for different train types and at
different distances as well.
Where
VT: Measured vibration levels for the trains at 20m and 70 Km/h.
VT for intercity = 0.0319 [mm/s], for distances 20m.
D: Any distance from the center of the railway track.
Do: Selected to be 20m, to avoid the influence of the near field waves.
B: Calculated as a distance dependent, B varied also depending on the train type. The
exponential B was calculated at the reference distance 20m.
B: for intercity trains = -0.7, for distances 20m.
S: Any speed for any kind of trains.
So: Was chosen to be 70 Km/h, to be the reference for all train types
Master Thesis: Addis Ababa university SECE: 2015 33
A: Speed dependent exponential, its value has been assumed to be 0.9 according to [43],
unfortunately we couldn‟t calculate due to that we need more measurements for the trains
at very wide-ranging speeds, which we couldn‟t have it during the measurements stage.
FR: The track quality factor, according to [12] will be equal to 0.8 in this assignment.
FB: The building amplification factor, the typical value for it is 2 for the Swedish houses,
due to [13].
The vibration level I have found is changed to distance as shown above and the distance obtained
is converted to voltage using the following formula.
3.1.9 Calculation of braking distance
Stopping a train requires work. This work equals the change in the train‟s kinetic energy plus the
change in its potential energy (change in height due to the gradient of the track. Mathematically
this can be expressed as:
+
*M*
+ M*g* 3.15
Note: The change in height relates to the track gradient. The track gradient is the change of
vertical height over the corresponding change in horizontal distance i.e. where, the angle
of slope.
Solving for gives
3.16
= 680 m > 510 m
As we can see the braking distance is greater than the minimum station length so the speed 70
kmph is not practical so other practical recommended speed is calculated next. So to find the
distance that the warning signals to be placed is using the recommended speed of the trains.
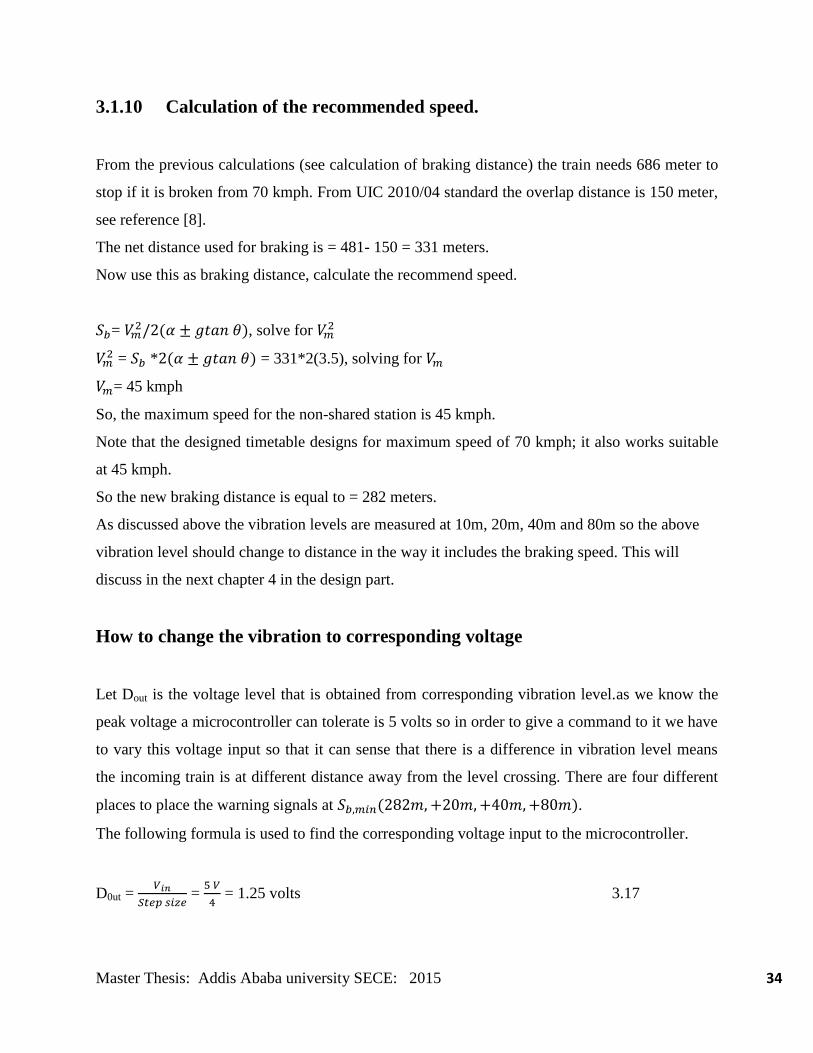
Master Thesis: Addis Ababa university SECE: 2015 34
3.1.10 Calculation of the recommended speed.
From the previous calculations (see calculation of braking distance) the train needs 686 meter to
stop if it is broken from 70 kmph. From UIC 2010/04 standard the overlap distance is 150 meter,
see reference [8].
The net distance used for braking is = 481- 150 = 331 meters.
Now use this as braking distance, calculate the recommend speed.
= , solve for
= * = 331*2(3.5), solving for
= 45 kmph
So, the maximum speed for the non-shared station is 45 kmph.
Note that the designed timetable designs for maximum speed of 70 kmph; it also works suitable
at 45 kmph.
So the new braking distance is equal to = 282 meters.
As discussed above the vibration levels are measured at 10m, 20m, 40m and 80m so the above
vibration level should change to distance in the way it includes the braking speed. This will
discuss in the next chapter 4 in the design part.
How to change the vibration to corresponding voltage
Let Dout is the voltage level that is obtained from corresponding vibration level.as we know the
peak voltage a microcontroller can tolerate is 5 volts so in order to give a command to it we have
to vary this voltage input so that it can sense that there is a difference in vibration level means
the incoming train is at different distance away from the level crossing. There are four different
places to place the warning signals at .
The following formula is used to find the corresponding voltage input to the microcontroller.
D0ut =
=
= 1.25 volts 3.17
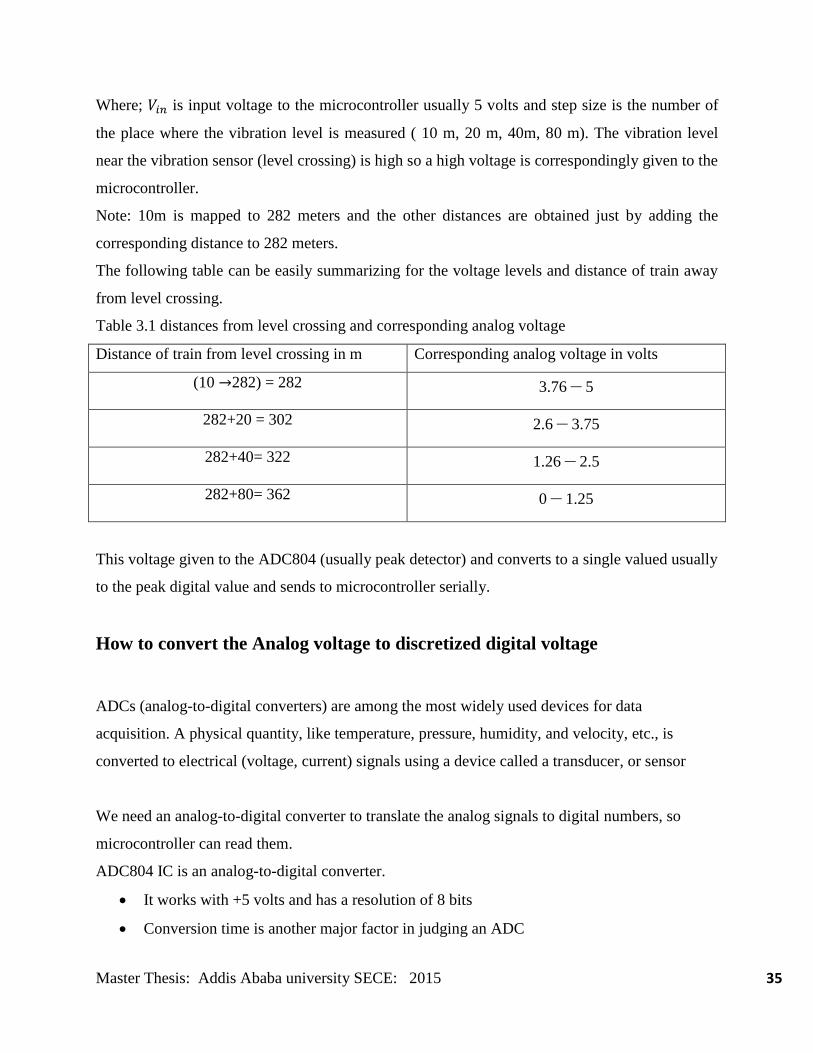
Master Thesis: Addis Ababa university SECE: 2015 35
Where; is input voltage to the microcontroller usually 5 volts and step size is the number of
the place where the vibration level is measured ( 10 m, 20 m, 40m, 80 m). The vibration level
near the vibration sensor (level crossing) is high so a high voltage is correspondingly given to the
microcontroller.
Note: 10m is mapped to 282 meters and the other distances are obtained just by adding the
corresponding distance to 282 meters.
The following table can be easily summarizing for the voltage levels and distance of train away
from level crossing.
Table 3.1 distances from level crossing and corresponding analog voltage
Distance of train from level crossing in m Corresponding analog voltage in volts
(10 282) = 282 3.76 – 5
282+20 = 302 2.6 – 3.75
282+40= 322 1.26 – 2.5
282+80= 362 0 – 1.25
This voltage given to the ADC804 (usually peak detector) and converts to a single valued usually
to the peak digital value and sends to microcontroller serially.
How to convert the Analog voltage to discretized digital voltage
ADCs (analog-to-digital converters) are among the most widely used devices for data
acquisition. A physical quantity, like temperature, pressure, humidity, and velocity, etc., is
converted to electrical (voltage, current) signals using a device called a transducer, or sensor
We need an analog-to-digital converter to translate the analog signals to digital numbers, so
microcontroller can read them.
ADC804 IC is an analog-to-digital converter.
It works with +5 volts and has a resolution of 8 bits
Conversion time is another major factor in judging an ADC
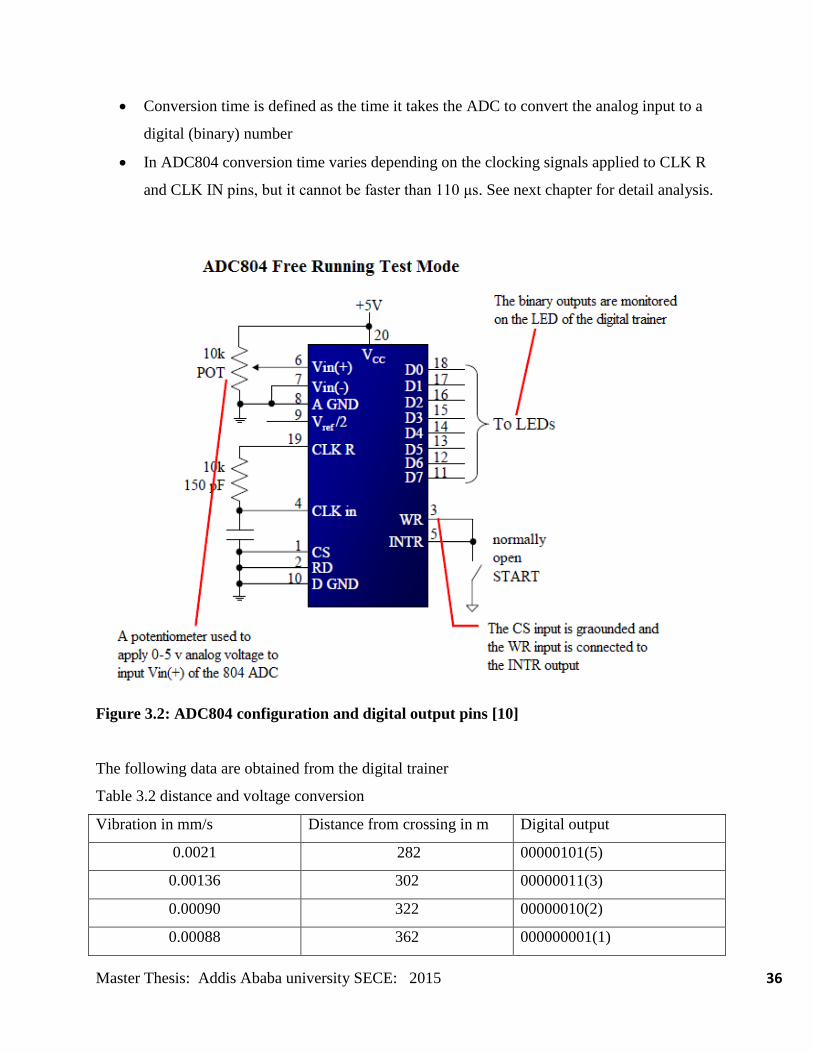
Master Thesis: Addis Ababa university SECE: 2015 36
Conversion time is defined as the time it takes the ADC to convert the analog input to a
digital (binary) number
In ADC804 conversion time varies depending on the clocking signals applied to CLK R
and CLK IN pins, but it cannot be faster than 110 μs. See next chapter for detail analysis.
Figure 3.2: ADC804 configuration and digital output pins [10]
The following data are obtained from the digital trainer
Table 3.2 distance and voltage conversion
Vibration in mm/s Distance from crossing in m Digital output
0.0021 282 00000101(5)
0.00136 302 00000011(3)
0.00090 322 00000010(2)
0.00088 362 000000001(1)
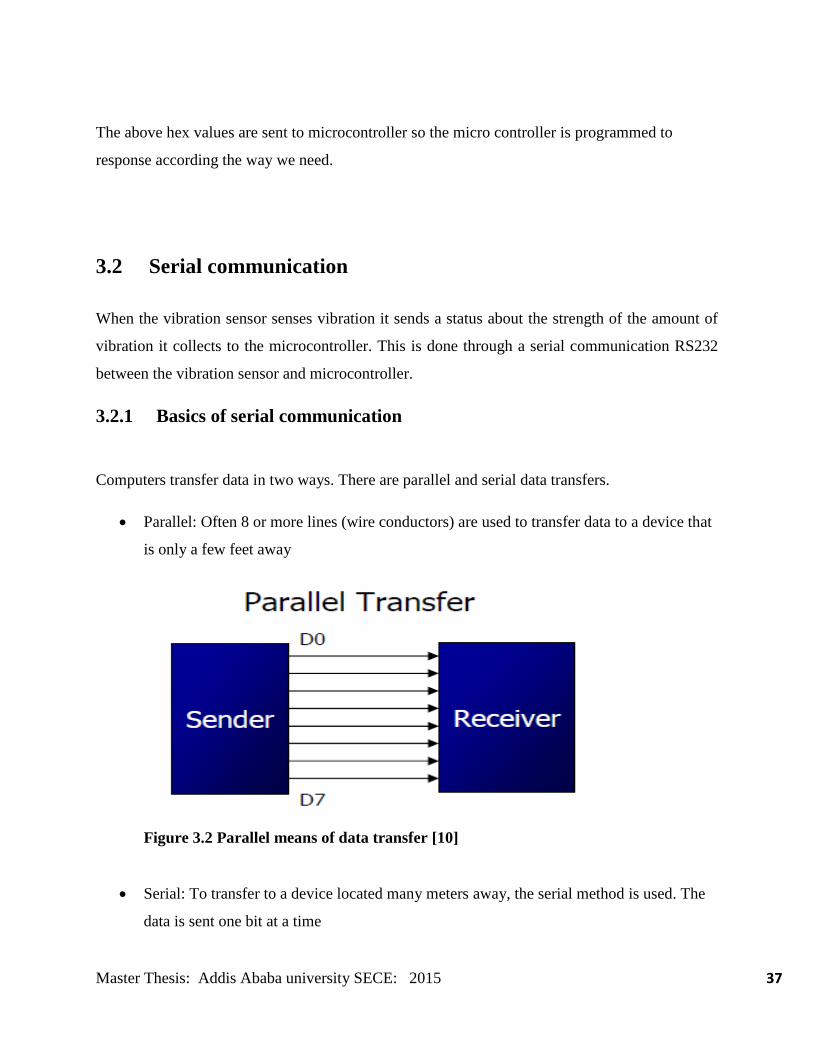
Master Thesis: Addis Ababa university SECE: 2015 37
The above hex values are sent to microcontroller so the micro controller is programmed to
response according the way we need.
3.2 Serial communication
When the vibration sensor senses vibration it sends a status about the strength of the amount of
vibration it collects to the microcontroller. This is done through a serial communication RS232
between the vibration sensor and microcontroller.
3.2.1 Basics of serial communication
Computers transfer data in two ways. There are parallel and serial data transfers.
Parallel: Often 8 or more lines (wire conductors) are used to transfer data to a device that
is only a few feet away
Figure 3.2 Parallel means of data transfer [10]
Serial: To transfer to a device located many meters away, the serial method is used. The
data is sent one bit at a time
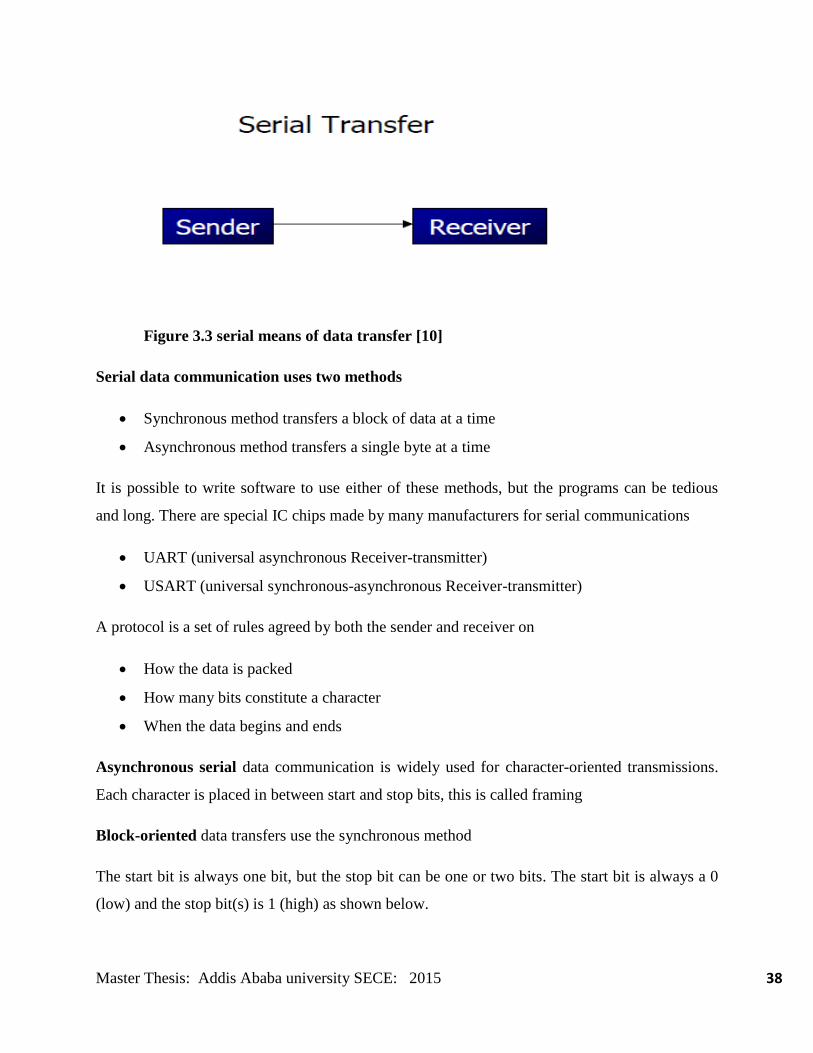
Master Thesis: Addis Ababa university SECE: 2015 38
Figure 3.3 serial means of data transfer [10]
Serial data communication uses two methods
Synchronous method transfers a block of data at a time
Asynchronous method transfers a single byte at a time
It is possible to write software to use either of these methods, but the programs can be tedious
and long. There are special IC chips made by many manufacturers for serial communications
UART (universal asynchronous Receiver-transmitter)
USART (universal synchronous-asynchronous Receiver-transmitter)
A protocol is a set of rules agreed by both the sender and receiver on
How the data is packed
How many bits constitute a character
When the data begins and ends
Asynchronous serial data communication is widely used for character-oriented transmissions.
Each character is placed in between start and stop bits, this is called framing
Block-oriented data transfers use the synchronous method
The start bit is always one bit, but the stop bit can be one or two bits. The start bit is always a 0
(low) and the stop bit(s) is 1 (high) as shown below.
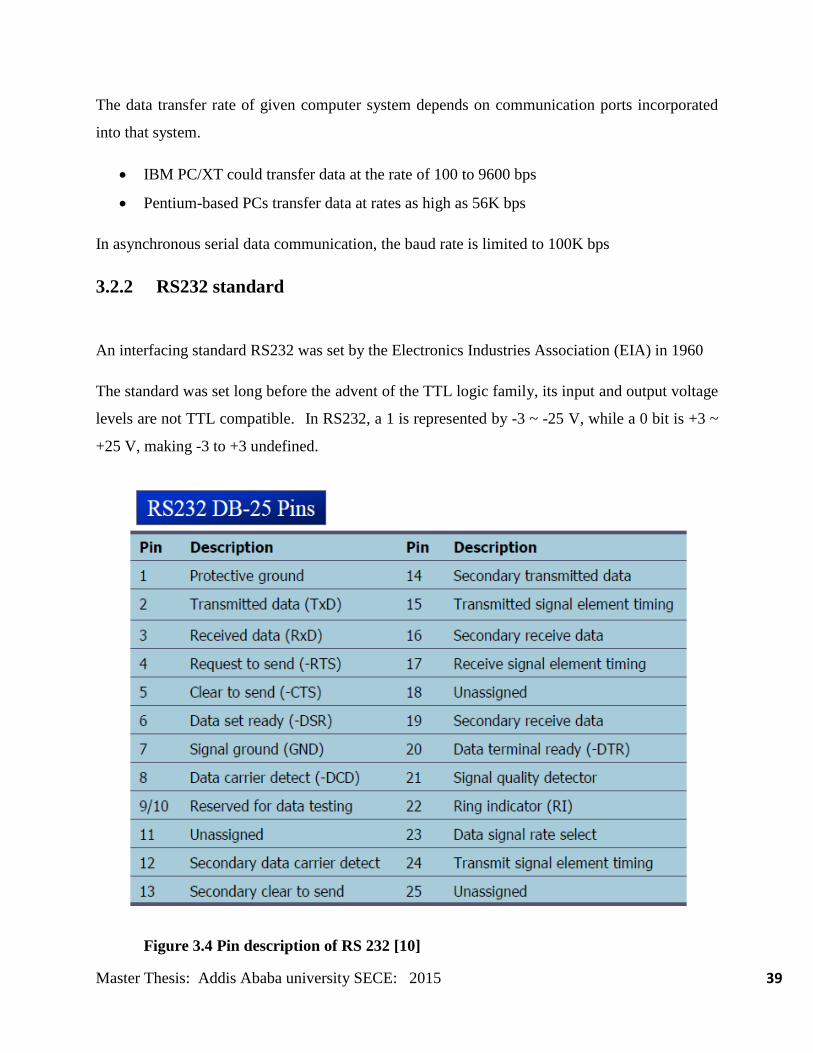
Master Thesis: Addis Ababa university SECE: 2015 39
The data transfer rate of given computer system depends on communication ports incorporated
into that system.
IBM PC/XT could transfer data at the rate of 100 to 9600 bps
Pentium-based PCs transfer data at rates as high as 56K bps
In asynchronous serial data communication, the baud rate is limited to 100K bps
3.2.2 RS232 standard
An interfacing standard RS232 was set by the Electronics Industries Association (EIA) in 1960
The standard was set long before the advent of the TTL logic family, its input and output voltage
levels are not TTL compatible. In RS232, a 1 is represented by -3 ~ -25 V, while a 0 bit is +3 ~
+25 V, making -3 to +3 undefined.
Figure 3.4 Pin description of RS 232 [10]
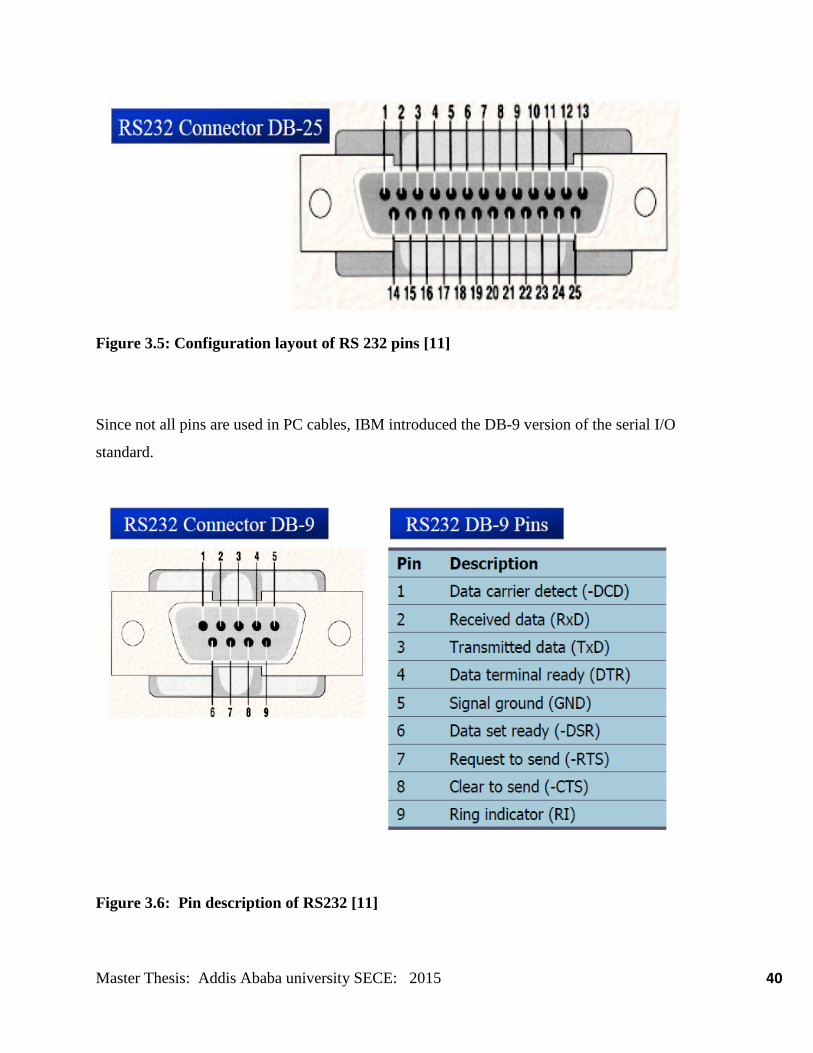
Master Thesis: Addis Ababa university SECE: 2015 40
Figure 3.5: Configuration layout of RS 232 pins [11]
Since not all pins are used in PC cables, IBM introduced the DB-9 version of the serial I/O
standard.
Figure 3.6: Pin description of RS232 [11]
Master Thesis: Addis Ababa university SECE: 2015 41
Current terminology classifies data communication equipment as
DTE (data terminal equipment) refers to terminal and computers that send and receive
data
DCE (data communication equipment) refers to communication equipment, such as
modems
The simplest connection between a Sensor and microcontroller requires a minimum of three pins,
TxD, RxD, and ground.
RS 232 Pin description
DTR (data terminal ready)
When terminal is turned on, it sends out signal DTR to indicate that it is ready for
communication
DSR (data set ready)
When DCE is turned on and has gone through the self-test, it assert DSR to indicate that it is
ready to communicate
RTS (request to send)
When the DTE device has byte to transmit, it assert RTS to signal the modem that it has a byte of
data to transmit
CTS (clear to send)
When the modem has room for storing the data it is to receive, it sends out signal CTS to DTE to
indicate that it can receive the data now
DCD (data carrier detect)
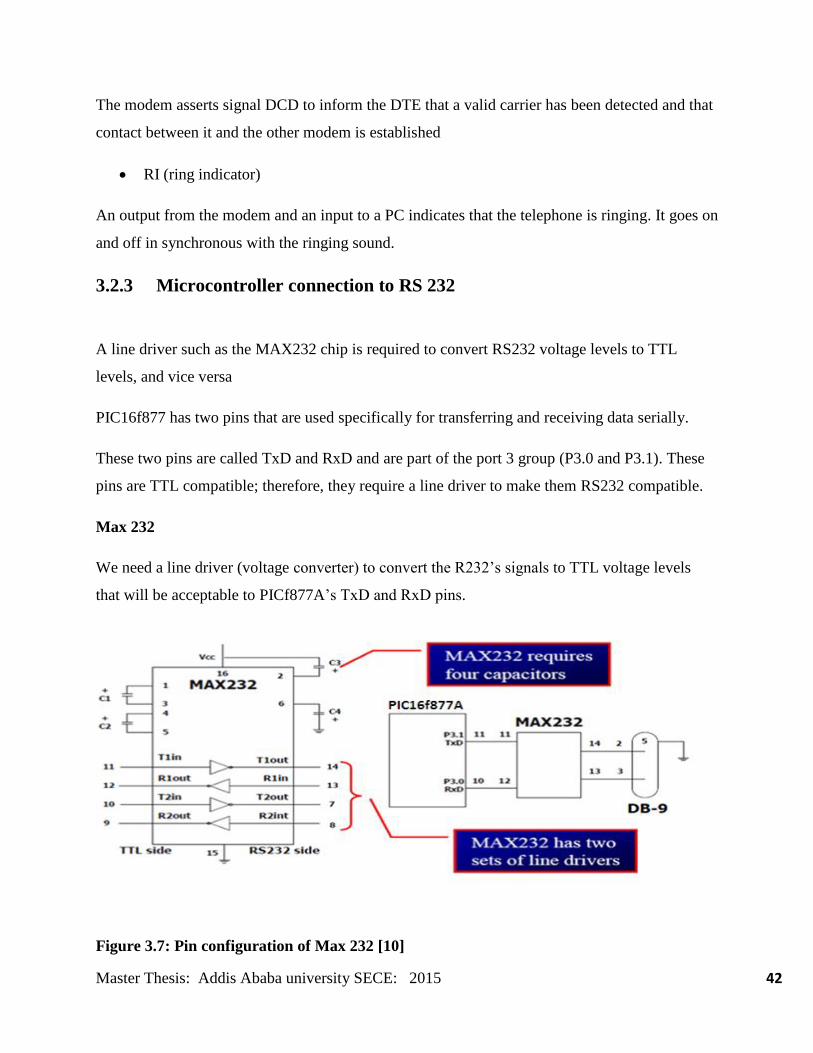
Master Thesis: Addis Ababa university SECE: 2015 42
The modem asserts signal DCD to inform the DTE that a valid carrier has been detected and that
contact between it and the other modem is established
RI (ring indicator)
An output from the modem and an input to a PC indicates that the telephone is ringing. It goes on
and off in synchronous with the ringing sound.
3.2.3 Microcontroller connection to RS 232
A line driver such as the MAX232 chip is required to convert RS232 voltage levels to TTL
levels, and vice versa
PIC16f877 has two pins that are used specifically for transferring and receiving data serially.
These two pins are called TxD and RxD and are part of the port 3 group (P3.0 and P3.1). These
pins are TTL compatible; therefore, they require a line driver to make them RS232 compatible.
Max 232
We need a line driver (voltage converter) to convert the R232‟s signals to TTL voltage levels
that will be acceptable to PICf877A‟s TxD and RxD pins.
Figure 3.7: Pin configuration of Max 232 [10]
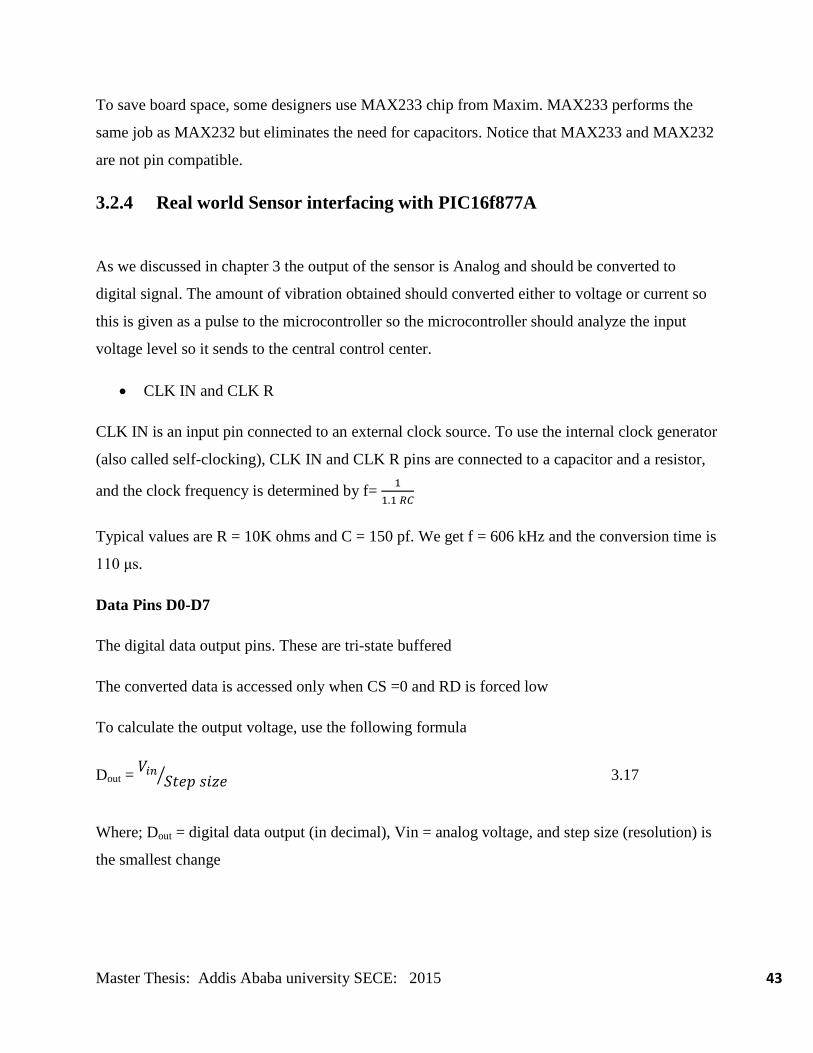
Master Thesis: Addis Ababa university SECE: 2015 43
To save board space, some designers use MAX233 chip from Maxim. MAX233 performs the
same job as MAX232 but eliminates the need for capacitors. Notice that MAX233 and MAX232
are not pin compatible.
3.2.4 Real world Sensor interfacing with PIC16f877A
As we discussed in chapter 3 the output of the sensor is Analog and should be converted to
digital signal. The amount of vibration obtained should converted either to voltage or current so
this is given as a pulse to the microcontroller so the microcontroller should analyze the input
voltage level so it sends to the central control center.
CLK IN and CLK R
CLK IN is an input pin connected to an external clock source. To use the internal clock generator
(also called self-clocking), CLK IN and CLK R pins are connected to a capacitor and a resistor,
and the clock frequency is determined by f=
Typical values are R = 10K ohms and C = 150 pf. We get f = 606 kHz and the conversion time is
110 μs.
Data Pins D0-D7
The digital data output pins. These are tri-state buffered
The converted data is accessed only when CS =0 and RD is forced low
To calculate the output voltage, use the following formula
Dout =
⁄ 3.17
Where; Dout = digital data output (in decimal), Vin = analog voltage, and step size (resolution) is
the smallest change
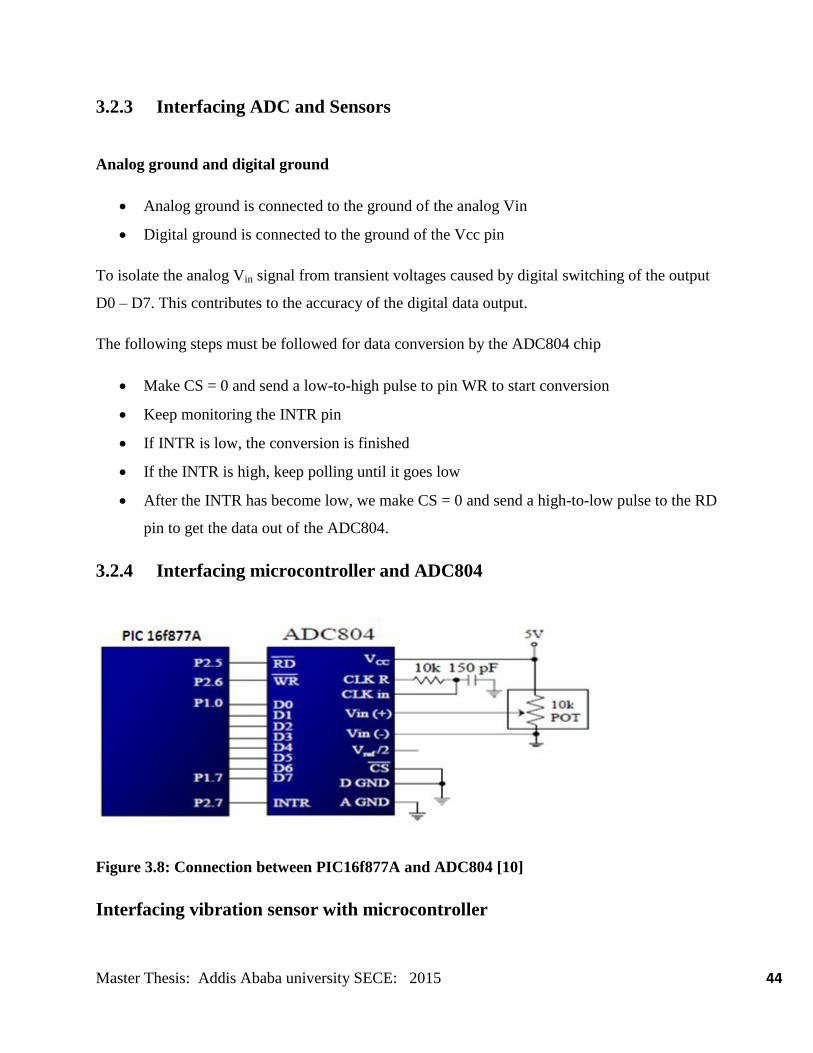
Master Thesis: Addis Ababa university SECE: 2015 44
3.2.3 Interfacing ADC and Sensors
Analog ground and digital ground
Analog ground is connected to the ground of the analog Vin
Digital ground is connected to the ground of the Vcc pin
To isolate the analog Vin signal from transient voltages caused by digital switching of the output
D0 – D7. This contributes to the accuracy of the digital data output.
The following steps must be followed for data conversion by the ADC804 chip
Make CS = 0 and send a low-to-high pulse to pin WR to start conversion
Keep monitoring the INTR pin
If INTR is low, the conversion is finished
If the INTR is high, keep polling until it goes low
After the INTR has become low, we make CS = 0 and send a high-to-low pulse to the RD
pin to get the data out of the ADC804.
3.2.4 Interfacing microcontroller and ADC804
Figure 3.8: Connection between PIC16f877A and ADC804 [10]
Interfacing vibration sensor with microcontroller
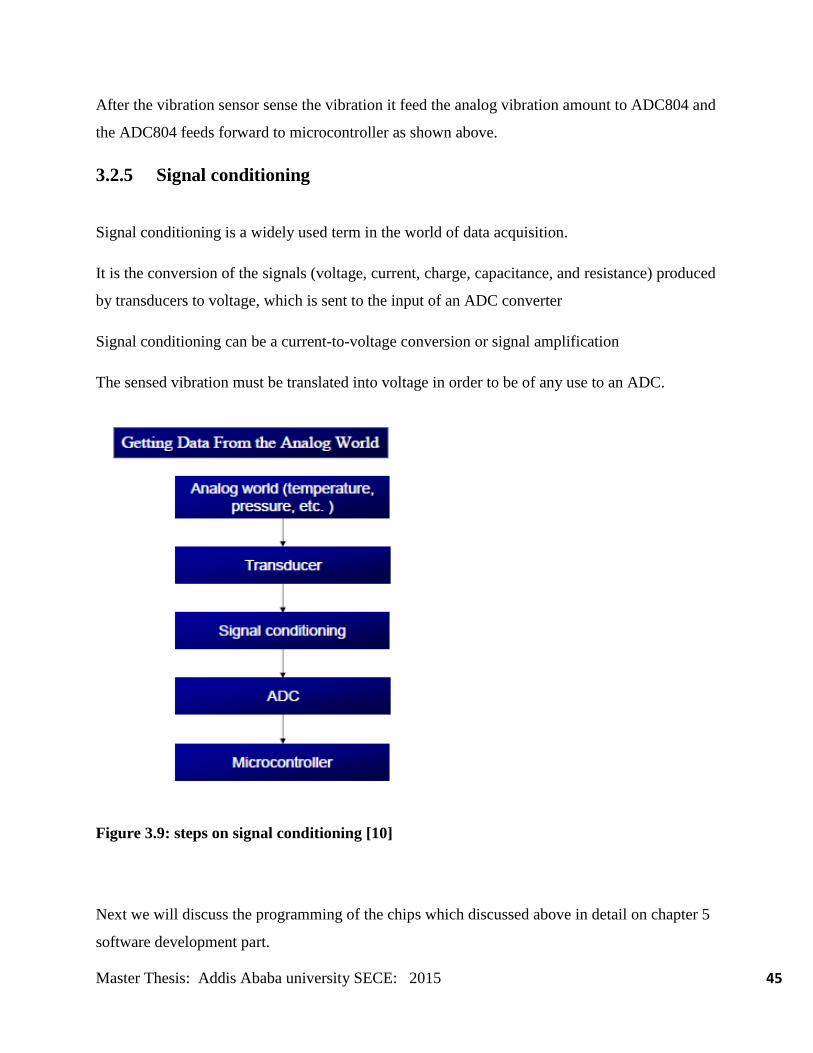
Master Thesis: Addis Ababa university SECE: 2015 45
After the vibration sensor sense the vibration it feed the analog vibration amount to ADC804 and
the ADC804 feeds forward to microcontroller as shown above.
3.2.5 Signal conditioning
Signal conditioning is a widely used term in the world of data acquisition.
It is the conversion of the signals (voltage, current, charge, capacitance, and resistance) produced
by transducers to voltage, which is sent to the input of an ADC converter
Signal conditioning can be a current-to-voltage conversion or signal amplification
The sensed vibration must be translated into voltage in order to be of any use to an ADC.
Figure 3.9: steps on signal conditioning [10]
Next we will discuss the programming of the chips which discussed above in detail on chapter 5
software development part.

Master Thesis: Addis Ababa university SECE: 2015 46
3.3 Microcontroller PIC16f877A
3.3.1 Introduction to microcontroller:
Microcontroller is a computer-on-a-chip is a variation of a microprocessor, which combines the
processor core (CPU), some memory, and I/O (input/output) lines, all on one chip. The
computer-on-a-chip is called the microcomputer whose proper meaning is a computer using a
(number of) microprocessor(s) as its CPUs, while the concept of the microcomputer is known to
be a microcontroller. A microcontroller can be viewed as a set of digital logic circuits integrated
on a single silicon chip. This chip is used for only specific applications.
Advantages of microcontroller:
A designer will use a Microcontroller to
Gather input from various sensors
Process this input into a set of actions
Use the output mechanisms on the Microcontroller to do something useful
RAM and ROM are inbuilt in the MC.
Multi machine control is possible simultaneously.
ROM, EPROM, [EEPROM] or Flash memory for program and operating parameter storage.
3.3.2 PIC16f877A Microcontroller:
3.3.2.1 PIC16f877A Microcontroller description
The microcontroller unit used here is a PIC16f877A .The core controller is a mid-range family
having a built-in SPI master. 16F877A have enough I/O lines for current need. It is capable of
initiating all intersystem communications.
The master controller controls each functions of the system with a supporting device. is an 8-bit,
fully static, EPROM/EPROM/ROM-based CMOS microcontroller.

Master Thesis: Addis Ababa university SECE: 2015 47
It employs RISC architecture with only 35 word/single cycle instructions. All these instructions
are single cycle (1ms) expect for program branches which takes two cycles. The PIC16f877A
products are supported by a full featured macro assembler, a software simulator C compiler etc.
Features:
High performance RISC CPU
Only 35 single word instructions to learn
Operating speed: DC - 20 MHz clock input DC - 200 ns instruction cycle
Up to 8K x 14 words of FLASH Program Memory, Up to 368 x 8 bytes of Data up to
Memory (RAM) 256 x 8 bytes of EEPROM Data Memory
Wide operating voltage range: 2.0V to 5.5V
High Sink/Source Current: 25 mA
Low-power consumption: - < 0.6 mA typical @ 3V, 4 MHz - 20 μA typical @ 3V, 32
kHz - < 1 μA typical standby current
Peripheral features:
Two Capture, Compare, PWM modules - Capture is 16-bit, max. Resolution is 12.5 ns -
Compare is 16-bit, max. Resolution is 200 ns PWM max. Resolution is 10-bit
10-bit multi-channel Analog-to-Digital converter
Synchronous Serial Port (SSP) with SPI (Master mode) and I2C(Master/Slave)
Analog features:
10-bit, up to 8-channel Analog-to-Digital Converter (A/D)
Brown-out Reset (BOR)
Analog Comparator module with: -Two analog comparators -
Special microcontroller features:
100,000 erase/write cycle Enhanced Flash program memory typical
1,000,000 erase/write cycle Data EEPROM memory typical
Data EEPROM Retention > 40 years
I/O ports
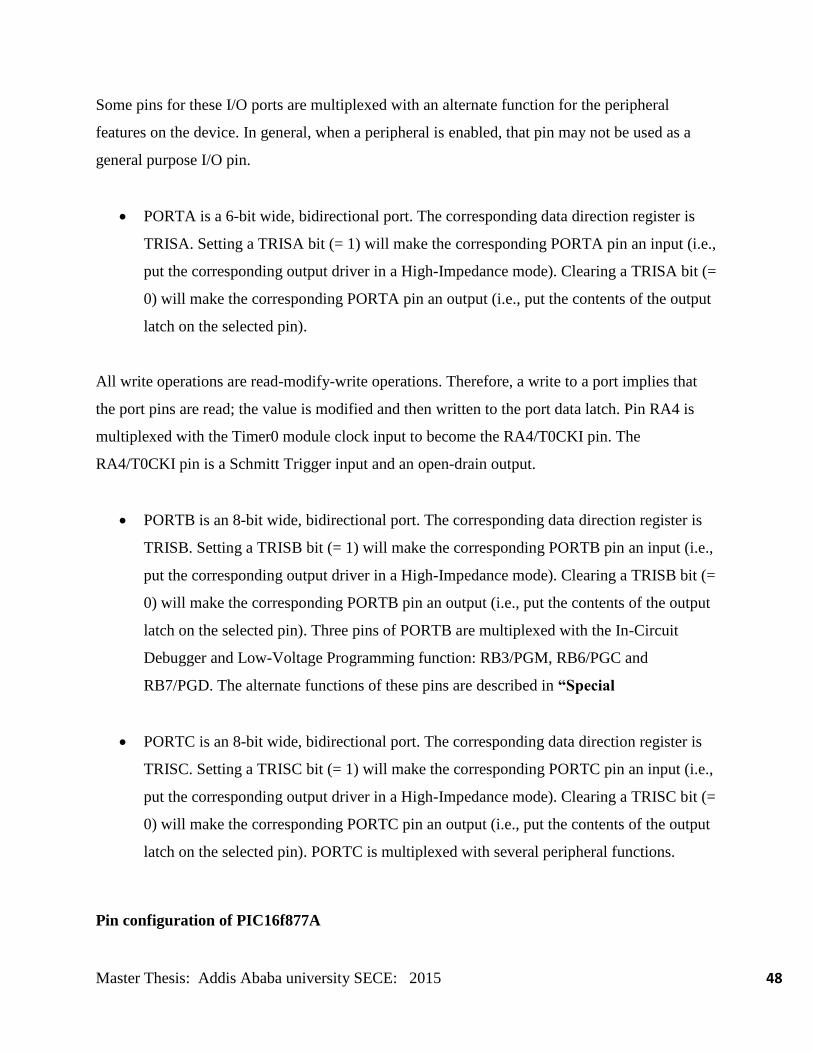
Master Thesis: Addis Ababa university SECE: 2015 48
Some pins for these I/O ports are multiplexed with an alternate function for the peripheral
features on the device. In general, when a peripheral is enabled, that pin may not be used as a
general purpose I/O pin.
PORTA is a 6-bit wide, bidirectional port. The corresponding data direction register is
TRISA. Setting a TRISA bit (= 1) will make the corresponding PORTA pin an input (i.e.,
put the corresponding output driver in a High-Impedance mode). Clearing a TRISA bit (=
0) will make the corresponding PORTA pin an output (i.e., put the contents of the output
latch on the selected pin).
All write operations are read-modify-write operations. Therefore, a write to a port implies that
the port pins are read; the value is modified and then written to the port data latch. Pin RA4 is
multiplexed with the Timer0 module clock input to become the RA4/T0CKI pin. The
RA4/T0CKI pin is a Schmitt Trigger input and an open-drain output.
PORTB is an 8-bit wide, bidirectional port. The corresponding data direction register is
TRISB. Setting a TRISB bit (= 1) will make the corresponding PORTB pin an input (i.e.,
put the corresponding output driver in a High-Impedance mode). Clearing a TRISB bit (=
0) will make the corresponding PORTB pin an output (i.e., put the contents of the output
latch on the selected pin). Three pins of PORTB are multiplexed with the In-Circuit
Debugger and Low-Voltage Programming function: RB3/PGM, RB6/PGC and
RB7/PGD. The alternate functions of these pins are described in “Special
PORTC is an 8-bit wide, bidirectional port. The corresponding data direction register is
TRISC. Setting a TRISC bit (= 1) will make the corresponding PORTC pin an input (i.e.,
put the corresponding output driver in a High-Impedance mode). Clearing a TRISC bit (=
0) will make the corresponding PORTC pin an output (i.e., put the contents of the output
latch on the selected pin). PORTC is multiplexed with several peripheral functions.
Pin configuration of PIC16f877A
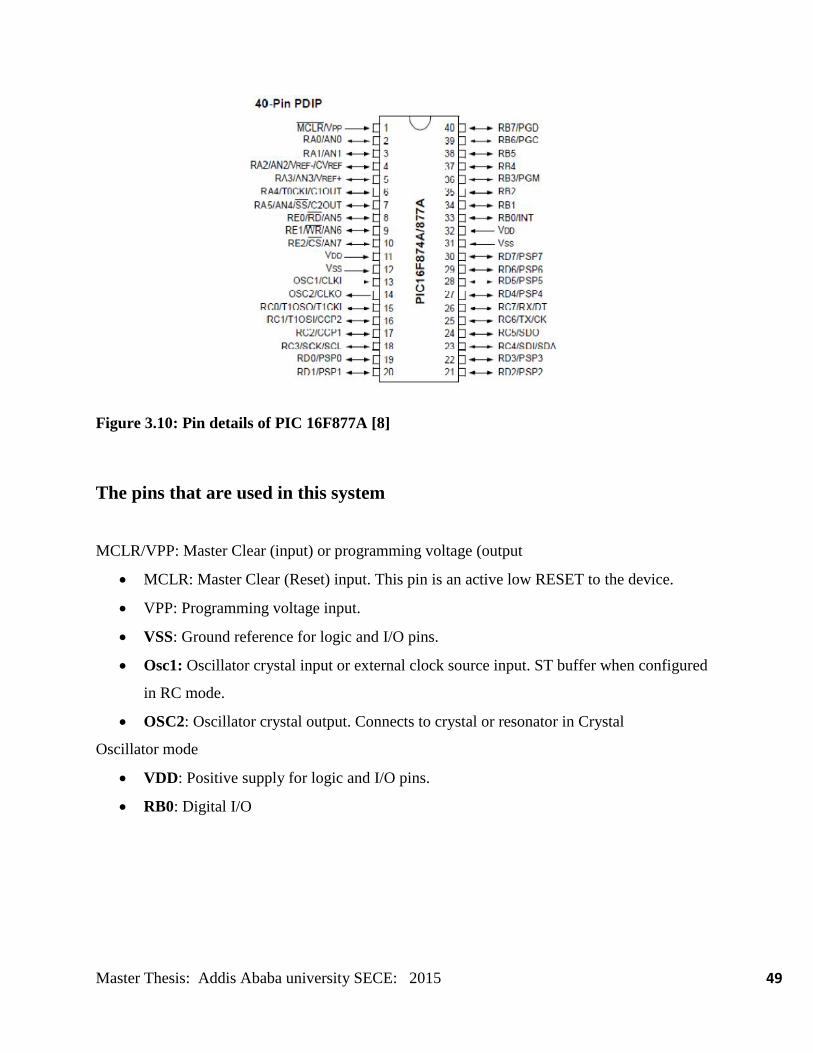
Master Thesis: Addis Ababa university SECE: 2015 49
Figure 3.10: Pin details of PIC 16F877A [8]
The pins that are used in this system
MCLR/VPP: Master Clear (input) or programming voltage (output
MCLR: Master Clear (Reset) input. This pin is an active low RESET to the device.
VPP: Programming voltage input.
VSS: Ground reference for logic and I/O pins.
Osc1: Oscillator crystal input or external clock source input. ST buffer when configured
in RC mode.
OSC2: Oscillator crystal output. Connects to crystal or resonator in Crystal
Oscillator mode
VDD: Positive supply for logic and I/O pins.
RB0: Digital I/O
Master Thesis: Addis Ababa university SECE: 2015 50
3.4 ZigBee
The name ZigBee refers to the waggle dance of honey bees after their return to the beehive. It
symbolizes the communication between nodes in a mesh network. So it is called as networking
protocol. The network components are analogous to queen bee, drones and worker bees. It is also
the technological Standard Created for Control and Sensor Networks based on the IEEE 802.15.4
Standard created by the ZigBee Alliance.
ZigBee is a specification for a suite of high level communication Protocols using small, low-
power digital radios based on an IEEE 802 standard for personal area networks. In the IEEE
802.15.4 standard the 802 refers to the network operations and technologies,15 refers to wireless
networking and 4 refers to the low data rate or low power consumption [10].
3.4.1 Overview of ZigBee
It is used in embedded application for low data rates, low power consumption and long battery
life. ZigBee lets battery powered devices can sleep for hours or even days, reducing battery use.
The duty cycle of battery powered nodes within a ZigBee network is designed to be very low,
offering even more energy efficiency and greater battery life. Once associated with a network, a
ZigBee node can wake up and communicate with other ZigBee devices and return to sleep. It is
the inexpensive small packet networks used for Home Entertainment and for Controlling
Wireless sensor networks. It is having the physical range of about 10-100 meters and data rate of
250kbits/sec.
ZigBee Operates in the Unlicensed ISM bands .2.4 GHz is Global Band at 250kbps, 868 MHz is
European Band at 20kbps and 915 MHz is North American Band at 40kbps. It mainly operates in
Personal Area Networks and device-to-device networks. The Low duty cycle of ZigBee provide
long battery life and Support for multiple network topologies like star and mesh up to 65000
nodes on a network. The 128-bit encryption standard provides secure connection. Collision can
also be avoided by using ZigBee.
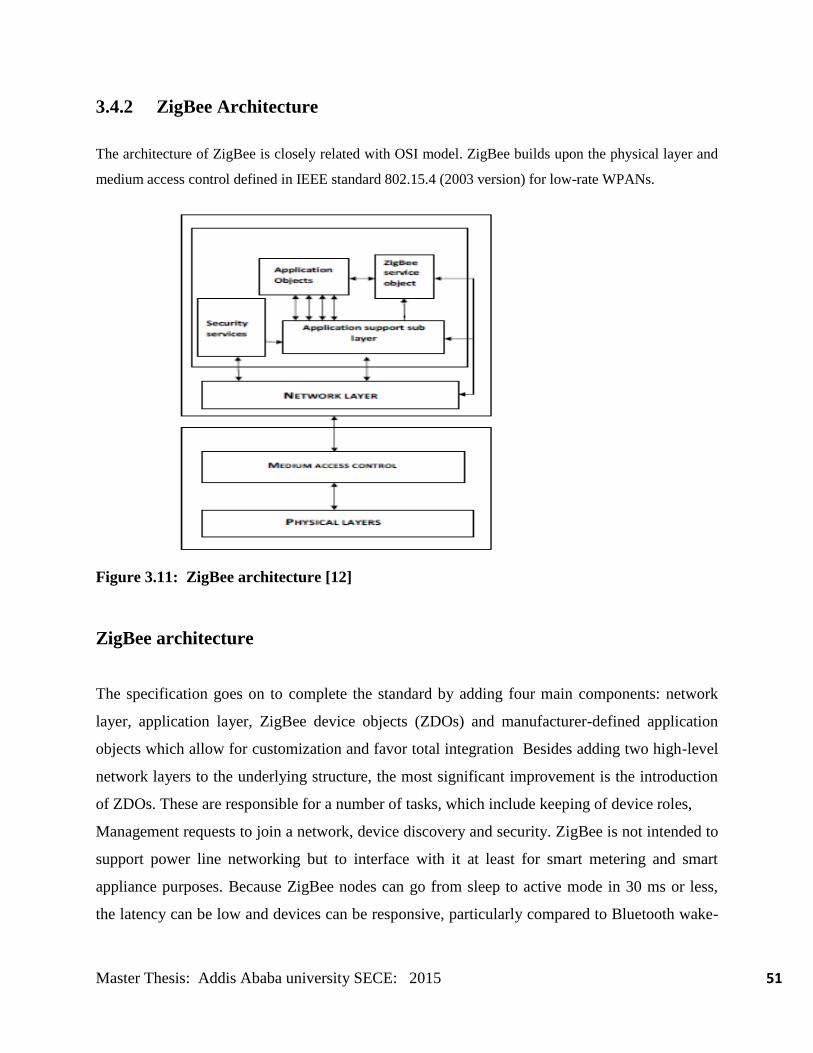
Master Thesis: Addis Ababa university SECE: 2015 51
3.4.2 ZigBee Architecture
The architecture of ZigBee is closely related with OSI model. ZigBee builds upon the physical layer and
medium access control defined in IEEE standard 802.15.4 (2003 version) for low-rate WPANs.
Figure 3.11: ZigBee architecture [12]
ZigBee architecture
The specification goes on to complete the standard by adding four main components: network
layer, application layer, ZigBee device objects (ZDOs) and manufacturer-defined application
objects which allow for customization and favor total integration Besides adding two high-level
network layers to the underlying structure, the most significant improvement is the introduction
of ZDOs. These are responsible for a number of tasks, which include keeping of device roles,
Management requests to join a network, device discovery and security. ZigBee is not intended to
support power line networking but to interface with it at least for smart metering and smart
appliance purposes. Because ZigBee nodes can go from sleep to active mode in 30 ms or less,
the latency can be low and devices can be responsive, particularly compared to Bluetooth wake-
Master Thesis: Addis Ababa university SECE: 2015 52
up delays, which are typically around three seconds. Because ZigBee nodes can sleep most of the
time, average power consumption can be low, resulting in long battery.
Physical layer: It contains electrical and physical specifications.
MAC layer: The channel access is primarily through CSMA/CA. It takes care of
transmitting data, scanning channels and encryption of data.
Network layer: Take care of network setup, device configuration, routing and
providing security.
Application layer: It is mainly used for end user software applications.
Advantages
Power saving: As a result of the short working period, low power consumption of
communication, and standby mode
Reliability: Collision avoidance is adopted, with a special time slot allocated for those
communications that need fixed bandwidth so that competition and conflict are avoided
when transmitting data. The MAC layer adopts completely confirmed data transmission,
that is, every data packet sent must wait for the confirmation from the receiver.
Low cost of the modules: The ZigBee protocol is patent fee free
Short time delay: Typically 30 ms for device searching, 15 ms for standby to
activation, and 15 ms for channel access of active devices
Large network capacity: One ZigBee network contains one master device and
maximum 254 slave devices. There can be as many as 100 ZigBee networks within one
area.
Safety: ZigBee provides a data integrity check and authentication function. AES-128 is
adopted and at the same time each application can flexibly determine its safety property.
Long battery life: The battery life is high compared to any other devices.
Security: The data can be protected from any external interference.
Disadvantages
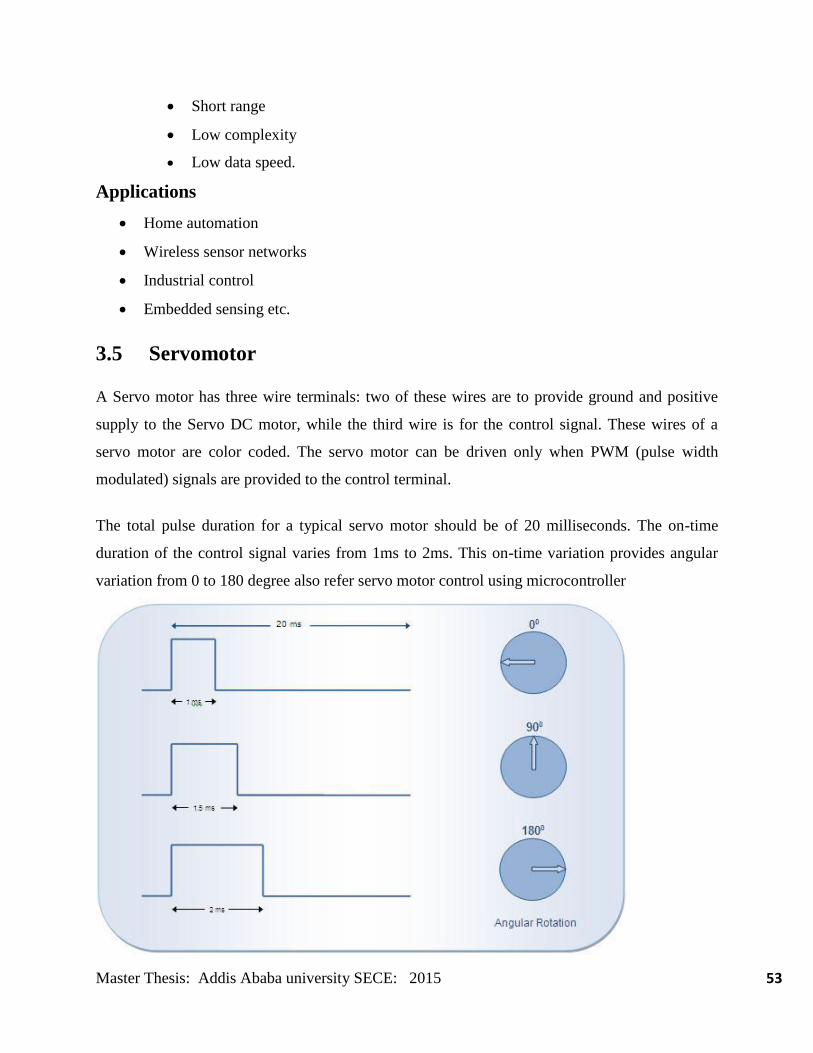
Master Thesis: Addis Ababa university SECE: 2015 53
Short range
Low complexity
Low data speed.
Applications
Home automation
Wireless sensor networks
Industrial control
Embedded sensing etc.
3.5 Servomotor
A Servo motor has three wire terminals: two of these wires are to provide ground and positive
supply to the Servo DC motor, while the third wire is for the control signal. These wires of a
servo motor are color coded. The servo motor can be driven only when PWM (pulse width
modulated) signals are provided to the control terminal.
The total pulse duration for a typical servo motor should be of 20 milliseconds. The on-time
duration of the control signal varies from 1ms to 2ms. This on-time variation provides angular
variation from 0 to 180 degree also refer servo motor control using microcontroller
Master Thesis: Addis Ababa university SECE: 2015 54
Figure 3.12: Relationships between pulse duration and servomotor angular rotation [11]
According to the above diagram, desired angular position can be calculated by simple
interpolations. For example, if the servo motor should be positioned at 45° angle, the desired
output control pulse can be obtained as follows:
180° angular displacement is achieved by the pulse duration = 1 ms
1° angular displacement is achieved by the pulse duration of = 1 /180 ms
45° angular displacement is achieved by the pulse duration of = (1/180) x 45 = 0.25 ms
So total on-time pulse will be = 1ms + 0.25ms =1.25 ms
Please note that the on-time duration of the control signal may vary based on the manufacturer or
certain other conditions. Therefore it is imperative that the on-time pulse for 0° and 180°
positions must be obtained (either from the datasheet or by hit-n-trial) before using a servo motor
for an application. The servo motor used here moves to 0° at 0.55 ms pulse.
Objective: To interface the servo motor with PIC16F877A microcontroller and generate pulses to
rotate the servo spline in step angles (of 45°) from 0° to 180°. Please check the Video tab to see
these rotations. After reaching 180° position, the spline is brought back to 0° position and the
rotation thus continues.
Programming Steps:
Calculate the on-time duration for 1° angular displacement.
Create delay function to calculate time duration.
Set the pin high at which control terminal of the servo motor is connected.
Call the delay function (mentioned in 3) and repeat it number of times as much angular
displacement needed.
Set the control pin low.
Generate delay of 18 ms.
Repeat the steps from 4 to 7 continuously for about 50 times to send a train of pulses.
Master Thesis: Addis Ababa university SECE: 2015 55
A servomotor is a rotary actuator that allows for precise control of angular position. It consists of
a motor coupled to a sensor for position feedback, through a reduction gearbox. It also requires a
relatively sophisticated controller, often a dedicated module designed specifically for use with
servomotors. Servomotors are used in applications such as robotics, CNC machinery or
automated manufacturing. It is the modified form of DC motor. As the name suggests, a
servomotor is a servomechanism. More specifically, it is a closed-loop servomechanism that uses
position feedback to control its motion and final position. The input to its control is some signal,
either analogue or digital, representing the position commanded for the output shaft.
The motor is paired with some type of encoder to provide position and speed feedback. In the
simplest case, only the position is measured. The measured position of the output is compared to
the command position, the external input to the controller. If the output position differs from that
required, an error signal is generated which then causes the motor to rotate in either direction, as
needed to bring the output shaft to the appropriate position. As the positions approach, the error
signal reduces to zero and the motor stops.
3.6 Central control center
This is the center of control of trains. It gets information about the strength of the vibration
sensed by the vibration sensor via the ZigBee and generates control command to the train and
way side signals.
Central control center
The function of central control system is control railway station signal devices by use of the
computer technology to finish the transportation tasks. The modern control center now a days is
known as computer based interlocking (CBI).
Attributes:
High-reliability: MTBF (mean time between failure) 106
h.
Fault-safety: Even if the signal devices occurred fault, the CBI system controls the
system to safety state.
Safety: Safe integrated level 4 (SIL-4, the highest level).
Real-time: the executive cycle ≤ 250ms.
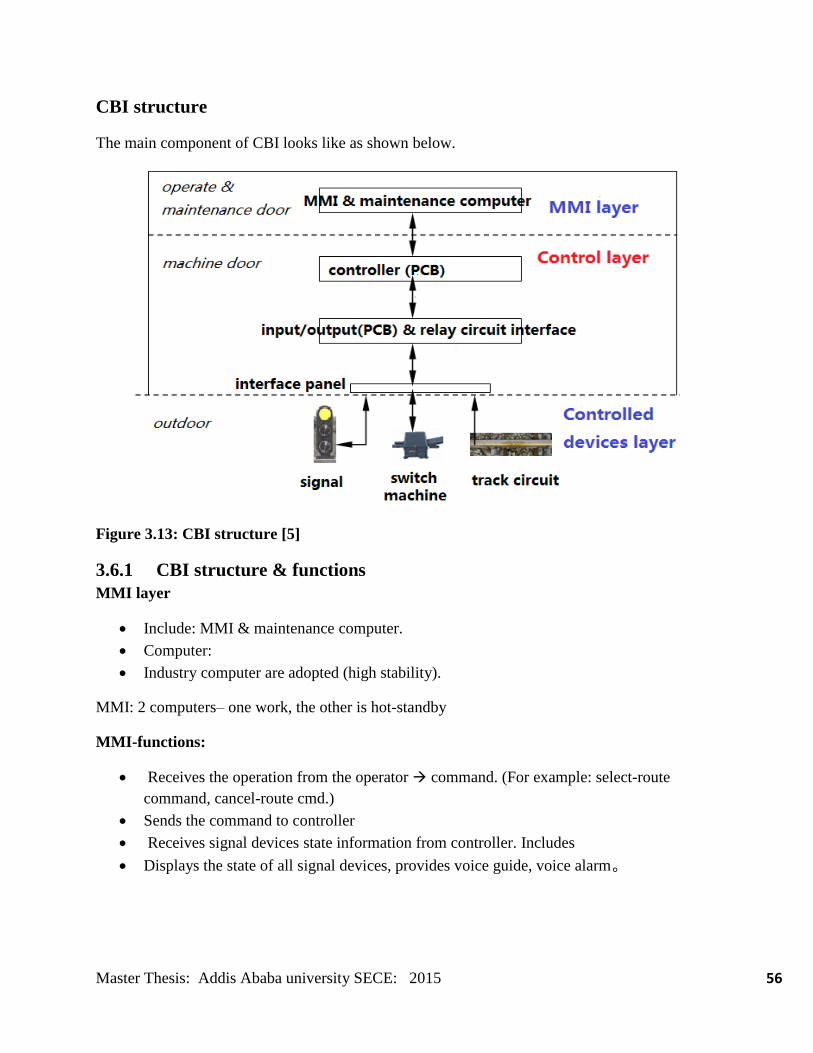
Master Thesis: Addis Ababa university SECE: 2015 56
CBI structure
The main component of CBI looks like as shown below.
Figure 3.13: CBI structure [5]
3.6.1 CBI structure & functions
MMI layer
Include: MMI & maintenance computer.
Computer:
Industry computer are adopted (high stability).
MMI: 2 computers– one work, the other is hot-standby
MMI-functions:
Receives the operation from the operator command. (For example: select-route
command, cancel-route cmd.)
Sends the command to controller
Receives signal devices state information from controller. Includes
Displays the state of all signal devices, provides voice guide, voice alarm。
Master Thesis: Addis Ababa university SECE: 2015 57
Maintenance computer
Control layer
Include: controller and interface circuit;
Controller:
Functions: interlocking logic control for signal switches and track circuits of a railway
station.
Includes: PCB( CPU board+ power supply board+ communication board)
Hardware attributes: redundancy (double of 2 of 2 votes)
Interface circuit
Includes: input/output boards (redundancy: 2 of 2 votes) & relay interface circuit.
Functions:
Output boards: receives commands from controller, and drives the related relays to
up/down.
Relay state change (up/down) the relay circuit switch on/off power supply on/off
signal devices works in different mode signal devices states change.
Input boards: get relay state change (up/down) send the state to controller
3.7 Train On board equipment
This includes devices that display the following important information to the driver
Speed limit
Status of way side signal
Alarm
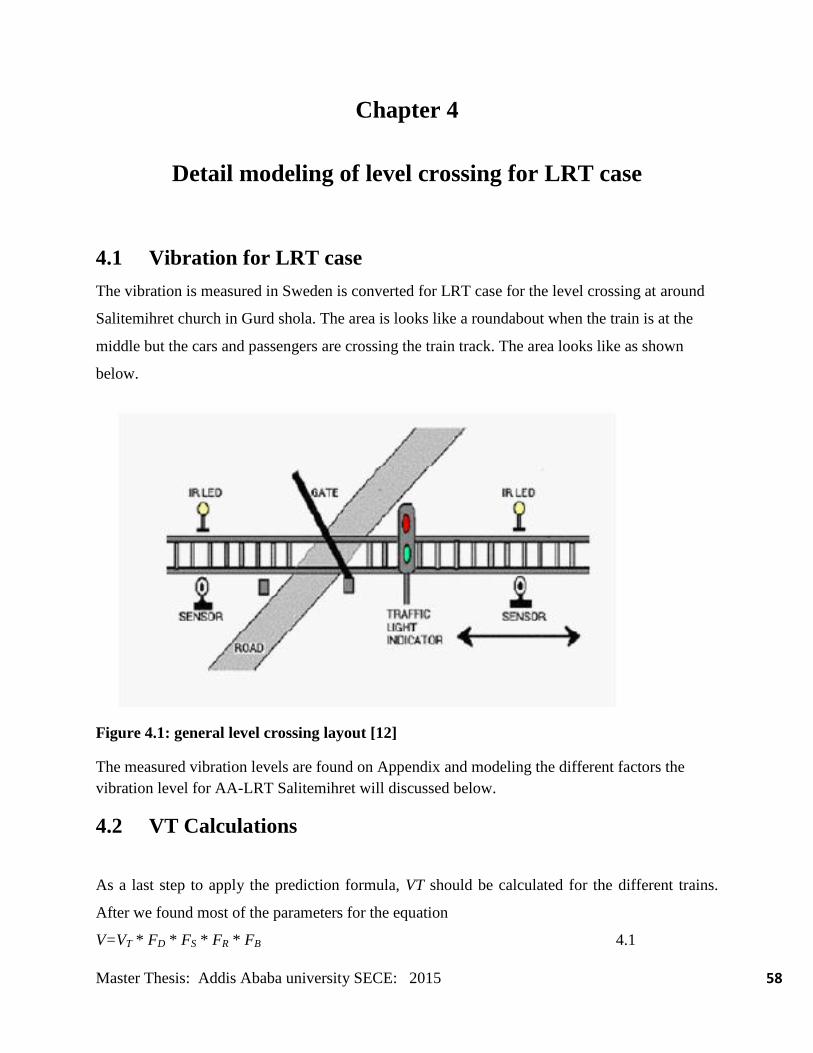
Master Thesis: Addis Ababa university SECE: 2015 58
Chapter 4
Detail modeling of level crossing for LRT case
4.1 Vibration for LRT case
The vibration is measured in Sweden is converted for LRT case for the level crossing at around
Salitemihret church in Gurd shola. The area is looks like a roundabout when the train is at the
middle but the cars and passengers are crossing the train track. The area looks like as shown
below.
Figure 4.1: general level crossing layout [12]
The measured vibration levels are found on Appendix and modeling the different factors the
vibration level for AA-LRT Salitemihret will discussed below.
4.2 VT Calculations
As a last step to apply the prediction formula, VT should be calculated for the different trains.
After we found most of the parameters for the equation
V=VT * FD * FS * FR * FB 4.1
Master Thesis: Addis Ababa university SECE: 2015 59
Now, one could calculate VT for each type of train. VT will have a certain value at a certain
distance depending on the values of the exponential B.
For the Intercity trains, the average value of the exponential B, at 40m and 80m was equal to –
1.0. Then the value –1.0 is for B 20m, because of the method that we used to calculate the
exponential B was to compare with the distance 20m all the time. The value of the exponential A
was assumed to be 0.9 according to the reference [43], so the factor FS was calculated for each
type of train individually. The values of the factors FR, and FB were found to be 0.8 and 2
respectively according to the same reference.
By applying the equation above, VT was calculated for the measured X2000 trains, and as a
result of taking the average value for VT to these trains. VT found to be equal to 0.0337 [mm/s],
for distances 20m. The same procedure was followed by calculating VT for the intercity trains
and taking the average value for it. VT obtained to be equal to 0.0319 [mm/s], for distances ³
20m. For the last type of trains, freight trains, an equivalent method was followed for finding the
values of VT. By taking the average value for them, VT was obtained to be 0.047, for distances ³
20m. This is higher than the first type of trains.
4.2.1 Calculating Vibration level Salitemihret level crossing (AA-LRT case)
Applying the prediction formula
From the previous chapter 3 the most important parameter have been found and the information
which has been measured can be presented in general form by applying the equation below for
the obtained results for FR, FB, FD, Fs .
V=VT * ( ⁄ )
*( ⁄ )
* FR * FB 4.1
This equation could be applied to find the vibration velocities for AA-LRT train type and at
different distances as well.
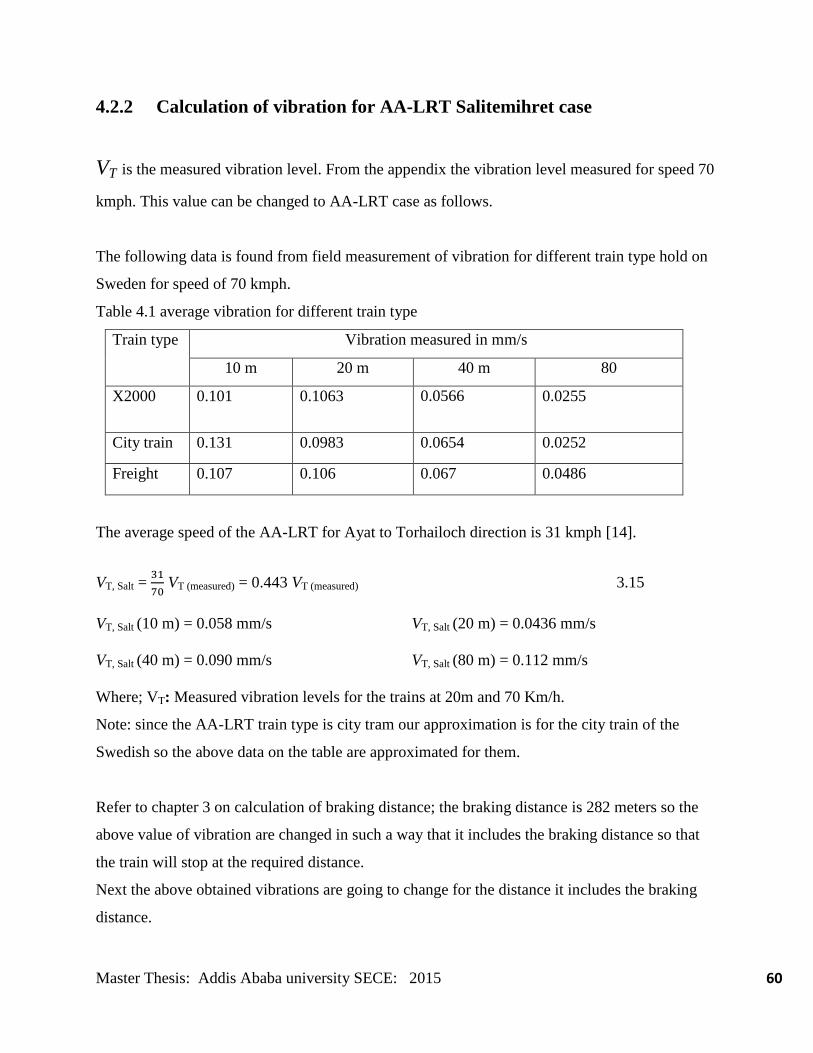
Master Thesis: Addis Ababa university SECE: 2015 60
4.2.2 Calculation of vibration for AA-LRT Salitemihret case
VT is the measured vibration level. From the appendix the vibration level measured for speed 70
kmph. This value can be changed to AA-LRT case as follows.
The following data is found from field measurement of vibration for different train type hold on
Sweden for speed of 70 kmph.
Table 4.1 average vibration for different train type
Train type Vibration measured in mm/s
10 m 20 m 40 m 80
X2000 0.101 0.1063 0.0566
0.0255
City train 0.131 0.0983 0.0654 0.0252
Freight 0.107 0.106 0.067 0.0486
The average speed of the AA-LRT for Ayat to Torhailoch direction is 31 kmph [14].
VT, Salt =
VT (measured) = 0.443 VT (measured) 3.15
VT, Salt (10 m) = 0.058 mm/s VT, Salt (20 m) = 0.0436 mm/s
VT, Salt (40 m) = 0.090 mm/s VT, Salt (80 m) = 0.112 mm/s
Where; VT: Measured vibration levels for the trains at 20m and 70 Km/h.
Note: since the AA-LRT train type is city tram our approximation is for the city train of the
Swedish so the above data on the table are approximated for them.
Refer to chapter 3 on calculation of braking distance; the braking distance is 282 meters so the
above value of vibration are changed in such a way that it includes the braking distance so that
the train will stop at the required distance.
Next the above obtained vibrations are going to change for the distance it includes the braking
distance.
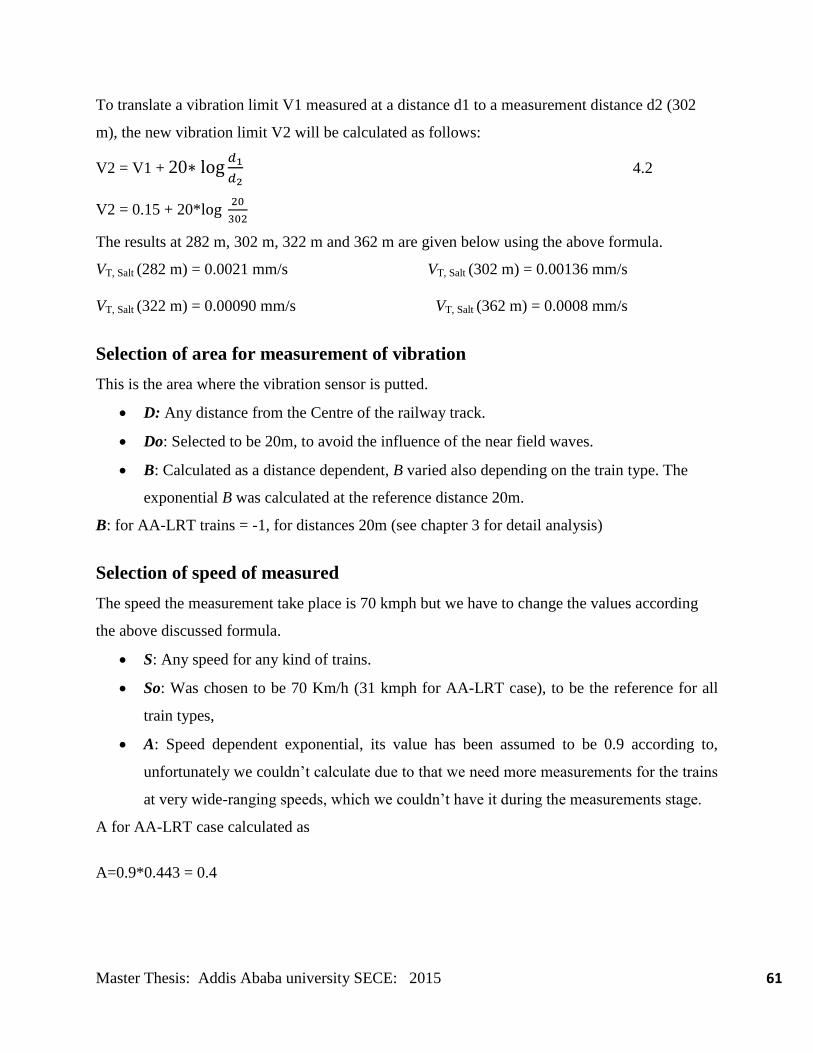
Master Thesis: Addis Ababa university SECE: 2015 61
To translate a vibration limit V1 measured at a distance d1 to a measurement distance d2 (302
m), the new vibration limit V2 will be calculated as follows:
V2 = V1 + 20
4.2
V2 = 0.15 + 20*
The results at 282 m, 302 m, 322 m and 362 m are given below using the above formula.
VT, Salt (282 m) = 0.0021 mm/s VT, Salt (302 m) = 0.00136 mm/s
VT, Salt (322 m) = 0.00090 mm/s VT, Salt (362 m) = 0.0008 mm/s
Selection of area for measurement of vibration
This is the area where the vibration sensor is putted.
D: Any distance from the Centre of the railway track.
Do: Selected to be 20m, to avoid the influence of the near field waves.
B: Calculated as a distance dependent, B varied also depending on the train type. The
exponential B was calculated at the reference distance 20m.
B: for AA-LRT trains = -1, for distances 20m (see chapter 3 for detail analysis)
Selection of speed of measured
The speed the measurement take place is 70 kmph but we have to change the values according
the above discussed formula.
S: Any speed for any kind of trains.
So: Was chosen to be 70 Km/h (31 kmph for AA-LRT case), to be the reference for all
train types,
A: Speed dependent exponential, its value has been assumed to be 0.9 according to,
unfortunately we couldn‟t calculate due to that we need more measurements for the trains
at very wide-ranging speeds, which we couldn‟t have it during the measurements stage.
A for AA-LRT case calculated as
A=0.9*0.443 = 0.4
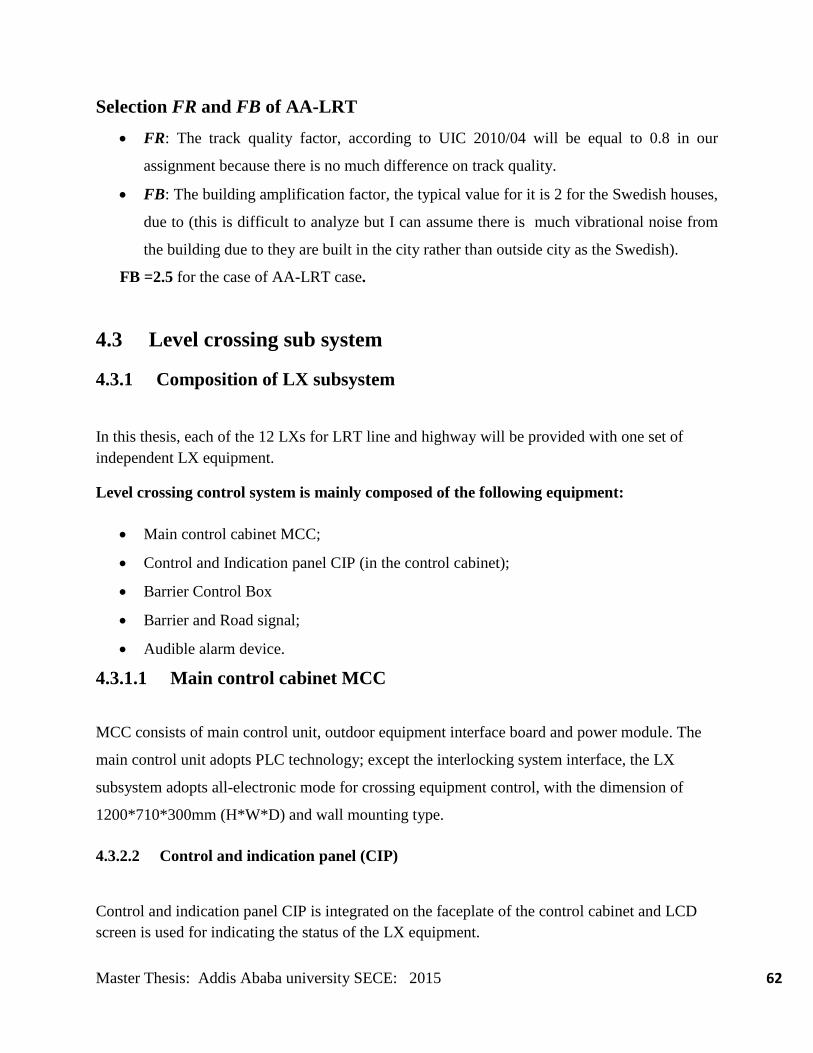
Master Thesis: Addis Ababa university SECE: 2015 62
Selection FR and FB of AA-LRT
FR: The track quality factor, according to UIC 2010/04 will be equal to 0.8 in our
assignment because there is no much difference on track quality.
FB: The building amplification factor, the typical value for it is 2 for the Swedish houses,
due to (this is difficult to analyze but I can assume there is much vibrational noise from
the building due to they are built in the city rather than outside city as the Swedish).
FB =2.5 for the case of AA-LRT case.
4.3 Level crossing sub system
4.3.1 Composition of LX subsystem
In this thesis, each of the 12 LXs for LRT line and highway will be provided with one set of
independent LX equipment.
Level crossing control system is mainly composed of the following equipment:
Main control cabinet MCC;
Control and Indication panel CIP (in the control cabinet);
Barrier Control Box
Barrier and Road signal;
Audible alarm device.
4.3.1.1 Main control cabinet MCC
MCC consists of main control unit, outdoor equipment interface board and power module. The
main control unit adopts PLC technology; except the interlocking system interface, the LX
subsystem adopts all-electronic mode for crossing equipment control, with the dimension of
1200*710*300mm (H*W*D) and wall mounting type.
4.3.2.2 Control and indication panel (CIP)
Control and indication panel CIP is integrated on the faceplate of the control cabinet and LCD
screen is used for indicating the status of the LX equipment.
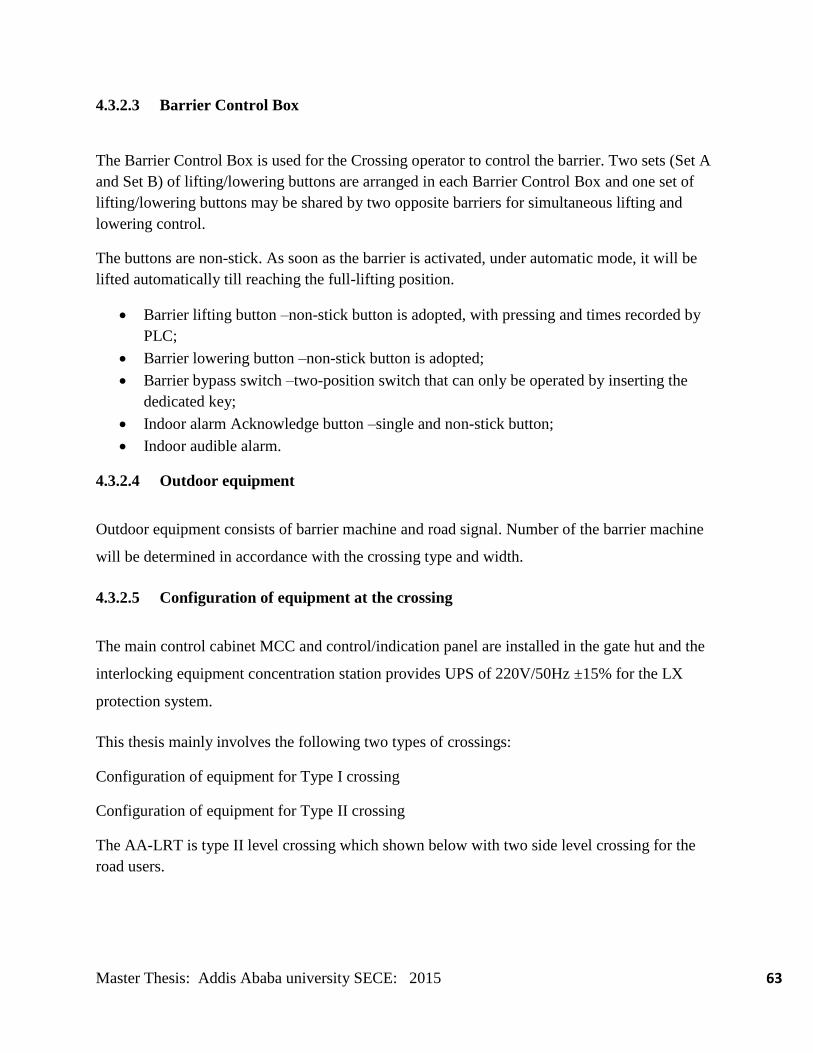
Master Thesis: Addis Ababa university SECE: 2015 63
4.3.2.3 Barrier Control Box
The Barrier Control Box is used for the Crossing operator to control the barrier. Two sets (Set A
and Set B) of lifting/lowering buttons are arranged in each Barrier Control Box and one set of
lifting/lowering buttons may be shared by two opposite barriers for simultaneous lifting and
lowering control.
The buttons are non-stick. As soon as the barrier is activated, under automatic mode, it will be
lifted automatically till reaching the full-lifting position.
Barrier lifting button –non-stick button is adopted, with pressing and times recorded by
PLC;
Barrier lowering button –non-stick button is adopted;
Barrier bypass switch –two-position switch that can only be operated by inserting the
dedicated key;
Indoor alarm Acknowledge button –single and non-stick button;
Indoor audible alarm.
4.3.2.4 Outdoor equipment
Outdoor equipment consists of barrier machine and road signal. Number of the barrier machine
will be determined in accordance with the crossing type and width.
4.3.2.5 Configuration of equipment at the crossing
The main control cabinet MCC and control/indication panel are installed in the gate hut and the
interlocking equipment concentration station provides UPS of 220V/50Hz ±15% for the LX
protection system.
This thesis mainly involves the following two types of crossings:
Configuration of equipment for Type I crossing
Configuration of equipment for Type II crossing
The AA-LRT is type II level crossing which shown below with two side level crossing for the
road users.
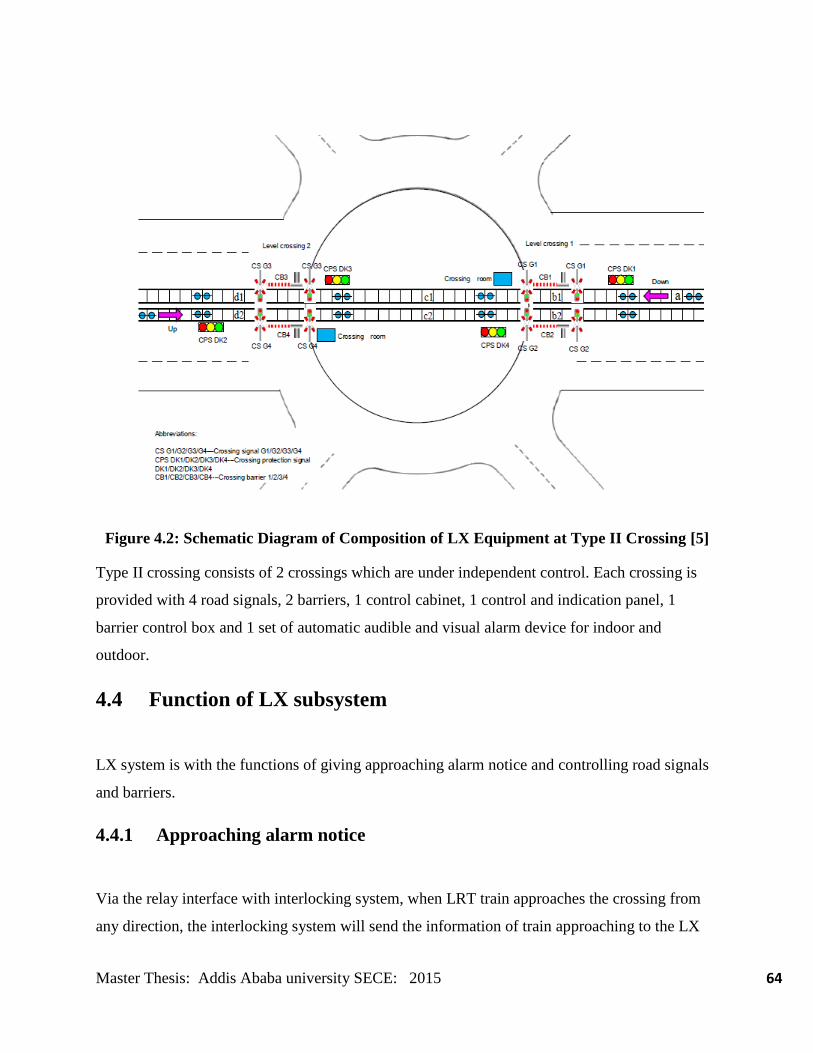
Master Thesis: Addis Ababa university SECE: 2015 64
Figure 4.2: Schematic Diagram of Composition of LX Equipment at Type II Crossing [5]
Type II crossing consists of 2 crossings which are under independent control. Each crossing is
provided with 4 road signals, 2 barriers, 1 control cabinet, 1 control and indication panel, 1
barrier control box and 1 set of automatic audible and visual alarm device for indoor and
outdoor.
4.4 Function of LX subsystem
LX system is with the functions of giving approaching alarm notice and controlling road signals
and barriers.
4.4.1 Approaching alarm notice
Via the relay interface with interlocking system, when LRT train approaches the crossing from
any direction, the interlocking system will send the information of train approaching to the LX
Master Thesis: Addis Ababa university SECE: 2015 65
subsystem according to the occupation condition of the approach section to the crossing or the
condition of route setting.
The LX subsystem will, according to the information of train approaching, automatically send
the indoor and outdoor train approaching alarm notices.
Buzzer alarm will be adopted for indoor train approaching alarm notice;
Audible and visual alarm and indication of signal are adopted for informing the
pedestrians and the vehicle on the road of train approaching and status of LX. The
outdoor audible alarm device is installed at the top of the road signal post and horn
loudspeaker is adopted, with the sound level of 50~80dB and volume adjustment device.
Voice alarm is adopted for audio alarm of the approaching notice.
If there are trains approaching the crossing in both up and down direction, the LX subsystem is
able to send the train approaching alarm notice continuously or send such alarm once again. The
indoor train approaching alarm notice can be canceled by the guard by pressing the
Acknowledge button on the control and indication panel.
4.4.2 Barrier control
Manned mode is adopted for the crossing in this project and there are 3 operating modes of the
barrier:
Automatic operating mode (automatic lifting and manual lowering)
All-manual operation mode
On-site manual mode.
The automatic operation mode or all-manual operation mode will be set after system
initialization and may be modified as required. Under normal condition, after train clearing out
of the crossing and relevant conditions are satisfied, the barrier will be controlled by the LX
subsystem to be lifted automatically.
When the barrier is lifted, it should be judged that the conditions for train approaching in up
/down from the interlocking system are all high level; after train leaves the crossing, the route at
the axle-counting section within the crossing area will be released.

Master Thesis: Addis Ababa university SECE: 2015 66
The interlocking system sends the high-level of train approaching and notice LX LRT train leave
the crossing and LX subsystem which will automatically stop the outdoor train approaching
alarm and lift the barrier.
If the conditions for lifting are not satisfied, the barrier will remain in the status of lowering and
the control circuit will cut off the operation of lifting. Both manual and automatic lifting of
barrier are not allowed.
Lowering of the barrier will be controlled manually by the Crossing operator. When the train
approaches the crossing, the Crossing operator will, according to the information of train
approaching alarm notice, press the lowering button for manual control of lowering of the barrier
after confirming that pedestrians and vehicles within the area of crossing road surface are
cleared.
If the barrier cannot be lowered for some reasons or the interlock system does not get the status
information about lowering of the crossing barrier for some reasons, the Crossing operator may
press the barrier by-pass switch on the control and indication panel, to send the lowering status
of crossing barrier to the interlock system, so as to control and open the road signal to allow LRT
train passing through the crossing.
In case of power failure or malfunction, the barrier may be lifted or lowered manually by the
hand crank at the site.
In case of power failure or malfunction during lifting or lowering, the barrier will stop and stay at
the current position, under which condition it may be lifted or lowered by manual control at the
site. In case of power failure or malfunction at the lifting or lowering position, it will stay at the
current position.
Under automatic mode, unless power failure or system malfunction, the system must ensure that
the crossing barrier will lift automatically until reaching the full lifting position.
Type II crossing consists of 2 crossings which are under independent control. At the same level
crossing, all the barriers on both sides of LRT line are controlled by the same barrier control box.

Master Thesis: Addis Ababa university SECE: 2015 67
4.4.3 Road signal control
The road signal will be controlled by the control cabinet. Its normal status will be displayed by
green light, under which condition the municipal road vehicles and pedestrians are allowed to
pass through the crossing.
When the train approaches the crossing, the road signal system will, after receiving the train
approaching information from the interlocking system, turn into red light after the green light
flickers for 5 seconds, reminding vehicles and pedestrians no entry of the LX or speed-up to pass
the LX which is within the crossing area, automatically, the road signal will be automatically
recovered to be in green light.
For the road signal with side indication, the lights at the front and at the side should be kept the
same without occurrence of inconsistency of the light at the front with that at the side.
Operation of Crossing operator and failure state of all the equipment can be recorded on the
indication panel:
Provide working condition of PLC and give the alarm;
Detect working condition of barrier: if the barrier does not reach the corresponding
position after operation for 30s, alarm will be given to inform failure of the barrier;
Detect the status of road signal and give the fault alarm upon 40% LED failure.
4.4.4 Control principle for crossing
The LX subsystem will provide a relative priority for LRT train‟s passing of level crossing.
According to the busy extent of traffic flow and actual condition on site, a shortest opening time
will be set for the control equipment at each crossing respectively.
If the shortest opening time is not met when a train approaches the crossing, the road signal
system will not trigger the train approaching alarm. The interlocking system will, according to
the lifting status of the barrier, maintain a close status of railway protective signal to allow no
passing of LRT train through the LX and continuously send the LX subsystem the train

Master Thesis: Addis Ababa university SECE: 2015 68
approaching alarm. Until the shortest opening time is met, the railway protective signal will then
be opened to allow passing of the LRT train through the crossing.
In this project, the level crossing is designed to be manned. The lowering of the crossing barrier
will be achieved by manual control of the Crossing operator who can adopt two modes for
control, i.e. the indoor manual control and the on-site manual operation:
Normally, when a train approaches the crossing, the operator should first make sure that
the crossing area is cleared (without people and vehicle), and then press the lowering
button of barrier for lowering control of the barrier;
The crossing barrier can be lowered by on-site manual control in case of power failure or
malfunction.
The lifting of the crossing barrier can be achieved by three control modes: automatic control,
indoor manual control and the on-site manual operation:
Normally, when a train is leave of a crossing and relevant requirements are met, the
protection system will stop the train approaching alarm in up/down direction and the road
signal system will make the barrier lifting automatically;
The crossing operator can adopt indoor manual control when the automatic-lifting
function is invalid. After confirming that the light for indicating the lifting of the barrier
is ON, he can then press the button on the crossing control panel to achieve manual-
control lifting.
The barrier can be made lifted by on-site manual control in case of power failure or
malfunction.
In case of power failure or malfunction during the lifting or In case of power failure or
malfunction during the lifting or lowering of crossing barrier, the action of the barrier will be
stopped and it will be kept at the current position. At this time, it can be made lifted or lowered
by on-site manual control.
When there is a train at the crossing area, or there is a train approaching the crossing and the
route locked in the same direction with the train pass through, the crossing barrier cannot be
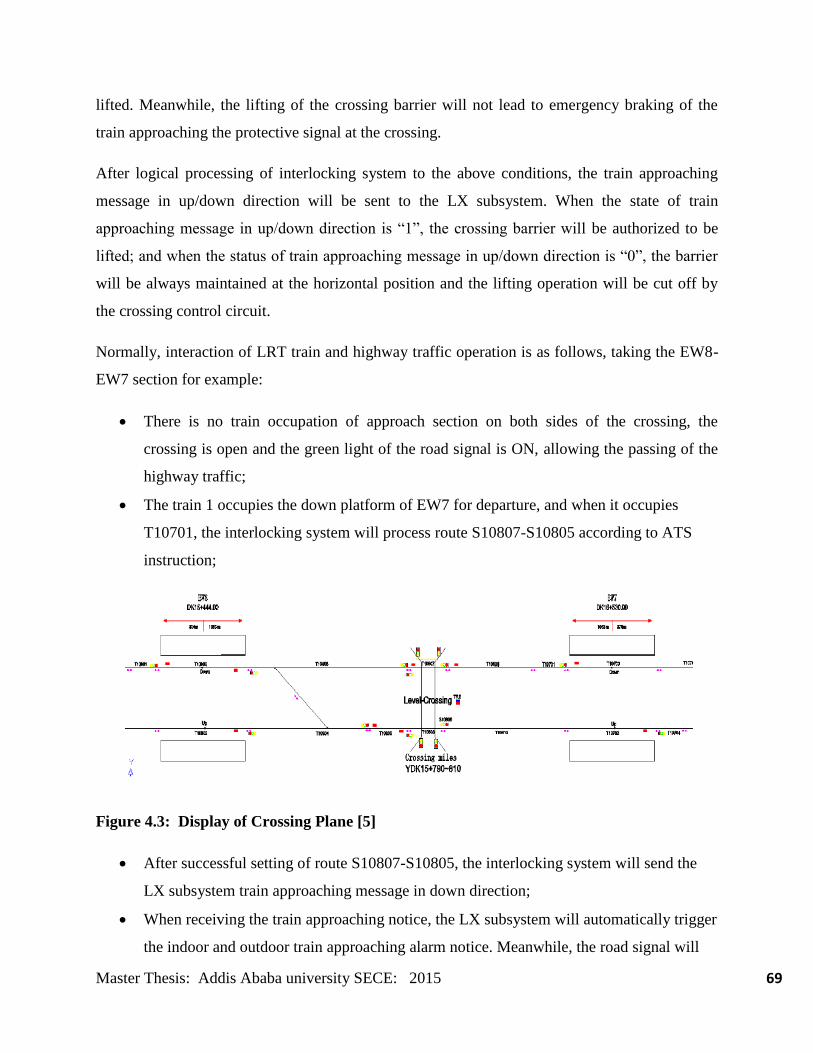
Master Thesis: Addis Ababa university SECE: 2015 69
lifted. Meanwhile, the lifting of the crossing barrier will not lead to emergency braking of the
train approaching the protective signal at the crossing.
After logical processing of interlocking system to the above conditions, the train approaching
message in up/down direction will be sent to the LX subsystem. When the state of train
approaching message in up/down direction is “1”, the crossing barrier will be authorized to be
lifted; and when the status of train approaching message in up/down direction is “0”, the barrier
will be always maintained at the horizontal position and the lifting operation will be cut off by
the crossing control circuit.
Normally, interaction of LRT train and highway traffic operation is as follows, taking the EW8-
EW7 section for example:
There is no train occupation of approach section on both sides of the crossing, the
crossing is open and the green light of the road signal is ON, allowing the passing of the
highway traffic;
The train 1 occupies the down platform of EW7 for departure, and when it occupies
T10701, the interlocking system will process route S10807-S10805 according to ATS
instruction;
Figure 4.3: Display of Crossing Plane [5]
After successful setting of route S10807-S10805, the interlocking system will send the
LX subsystem train approaching message in down direction;
When receiving the train approaching notice, the LX subsystem will automatically trigger
the indoor and outdoor train approaching alarm notice. Meanwhile, the road signal will
Master Thesis: Addis Ababa university SECE: 2015 70
automatically turn into flashing red light, reminding no entry of vehicles and pedestrians
on municipal highway to the crossing area and passing of vehicles and pedestrians on
municipal highway within the crossing area in an accelerating manner;
After confirming that pedestrians and vehicles on the highway side are cleared out, the
crossing operator should press the button on the barrier control box to lower of the
barrier;
When the barrier is horizontal position, the indoor train approaching alarm will be
stopped automatically (the crossing guard can cancel the alarm by pressing Acknowledge
Button on the control and indication panel), the road signal will turn into red light and the
interlocking system will collect the close of LX and locking information. Then the
railway protective signal S10807 at the LRT side will be opened immediately and
authorize the passing of LRT train through the LX;
When train 1 passes the crossing, the railway protective signal will light in red. After
clearing and unlocking the T10807 section, the interlocking system will cancel the train
approaching message in down direction. The LX subsystem will automatically stop the
outdoor train approaching alarm. If the outdoor train approaching alarm cannot be
cancelled due to malfunction, the Crossing operator can remove the alarm by manual
operation after confirming the clearing of train.
The LX subsystem automatically lifts the barrier, and the road signal will turn into green
light.
If, before the train 1 passes the crossing, and the train 2 departs from EW8 up platform, then:
When train 2 occupiesT10804, the interlocking system will process route S10804-S10806
according to ATS instruction, and the signal S10804 will be opened and meanwhile send
the LX subsystem the train approaching message in up direction;
The LX subsystem will again trigger the train approaching alarm notice. The Crossing
operator should press the acknowledge button on the control and indication panel to
cancel the indoor train approaching alarm;
When both train 1 and train 2 pass the crossing, the section T10807/T10808 will be
cleared and unlocked;
The LX subsystem automatically lifts the barrier, and the road signal will light in green.
Master Thesis: Addis Ababa university SECE: 2015 71
If, when a train approaches the crossing, the barrier cannot be lowered due to malfunction, or the
interlocking system does not obtain horizontal status information due to malfunction, the
Crossing operator can, after confirming the LX close , press the bypass button of barrier to make
the interlocking system open the railway protective signal, allowing passing of trains through the
crossing.
In conclusion, the interface function of the LX subsystem and the main line interlocking system
mainly includes: receiving train approaching message in up/down direction from the interlocking
system; and sending the interlocking system the close status of barrier and barrier bypass
information
4.4.5 Train approaching notice
When the LRT train approaches the crossing from any direction and the route for passing the
crossing is processed (the railway protective signal remains closed due to the crossing barrier
does not be lowered and locked), the interlocking system will send the LX subsystem train
approaching notification in up/down direction, then the road signal system will automatically
send out the indoor and outdoor train approaching alarm.
When there are trains approaching the crossing in both up and down direction, which means that
the train approaching notices both in up and down direction, the LX subsystem can continuously
or again send train approaching alarm notices. the train approaching alarm includes Audible
indoor and outdoor alarms.
4.5 Performance of LX subsystem
4.5.1 Barrier control box
The barrier control box and the control box could be installed indoor together with the control
cabinet. To facilitate real-time monitoring of the crossing by Crossing operator, and shall meet
the following requirement:
Master Thesis: Addis Ababa university SECE: 2015 72
Stainless metal material shall be used. The metal parts of the case shall be free of
corrosion and other mechanical damage. All the sliding or rotating components shall be
flexible as required and the fastening pieces shall not be loose. No sharp prominence or
corner likely to result in harm shall be found on the external surface of the case;
The control panel shall have sufficient internal space and be conductive to heat radiation,
easy for installation, use, maintenance and prevent water accumulation on the top face;
Be able to sustain predictable operations during transport, installation, handling,
maintenance, etc. under normal conditions and shall not be easily opened by general
tools;
A firm lock shall be equipped to prevent illegal opening. Protective device shall be set on
the lock. After the case is locked, no loosening or deformation shall occur.
The electrical endurance buttons set on the control box shall be more than 500,000 times.
4.5.2 Road Signal
The road signal is used to provide “no passing” and “passing” signals for pedestrians and
vehicles. It mainly consists of signal mechanism, LED light unit, visor, backboard, post , ladder,
cross board and outdoor sounder, etc. The signal mechanism is of combined aluminum alloy
structure with the bottom part directly fixed on the arm of the signal.

Master Thesis: Addis Ababa university SECE: 2015 73
Chapter 5
Software Development Proteus
5.1 System Flow chart
As discussed above the main objective of this thesis is to design a safe crossing of passengers
and vehicles on level crossing. This is done using a vibration sensor, microcontrollers and
ZigBee.
The system is designed using Proteus software and simulated to check its validity by controlling
(make it Green, Yellow, Red) the train side signal and road users side signal as well as by
rotating the servo motor such that it makes to move the barrier up and down. The above
simulation is build based on the following principle (flow chart)
Start: This is the idle state of the system it means the way is given to the road users and
passenger; the barrier is on up position, road user signal is Green but the train side signal is Red
there is no approaching signal or train is 362 m away from crossing.
Next the vibration is sensed/ detected and compared if its value is within the range of distance.
The flow chart also checks/ detects if there is an obstacle inside the level crossing and takes
appropriate measure to solve the problem.
End: This is the last step in the flow chart. If the system encounters the exit/ departure of a train
from the level crossing then the system ends and returns to the beginning of the flow chart i.e.
start.
The above ideas are shown on the following flow chart.
Note: the obstacle detector is a load sensor that senses if there is additional load greater than the
initial small load or no load. Strain gage is used to sense the load putted on the level crossing if
there is, it changes the corresponding load to voltage level.
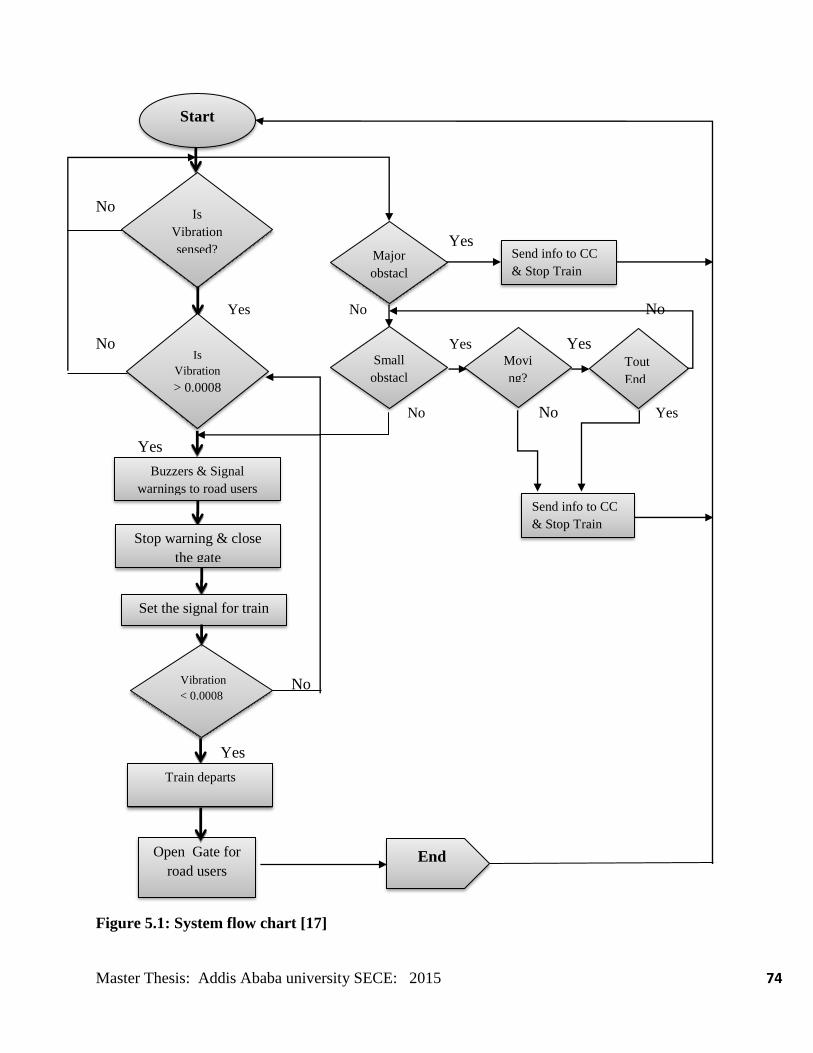
Master Thesis: Addis Ababa university SECE: 2015 74
No
Yes
Yes No No
No Yes Yes
No No Yes
Yes
No
Yes
Figure 5.1: System flow chart [17]
Is
Vibration
sensed?
Buzzers & Signal
warnings to road users
Open Gate for
road users
Start
End
Is
Vibration
> 0.0008
Stop warning & close
the gate
Vibration
< 0.0008
Set the signal for train
Major
obstacl
Send info to CC
& Stop Train
Small
obstacl
Tout
End
Movi
ng?
Send info to CC
& Stop Train
Train departs
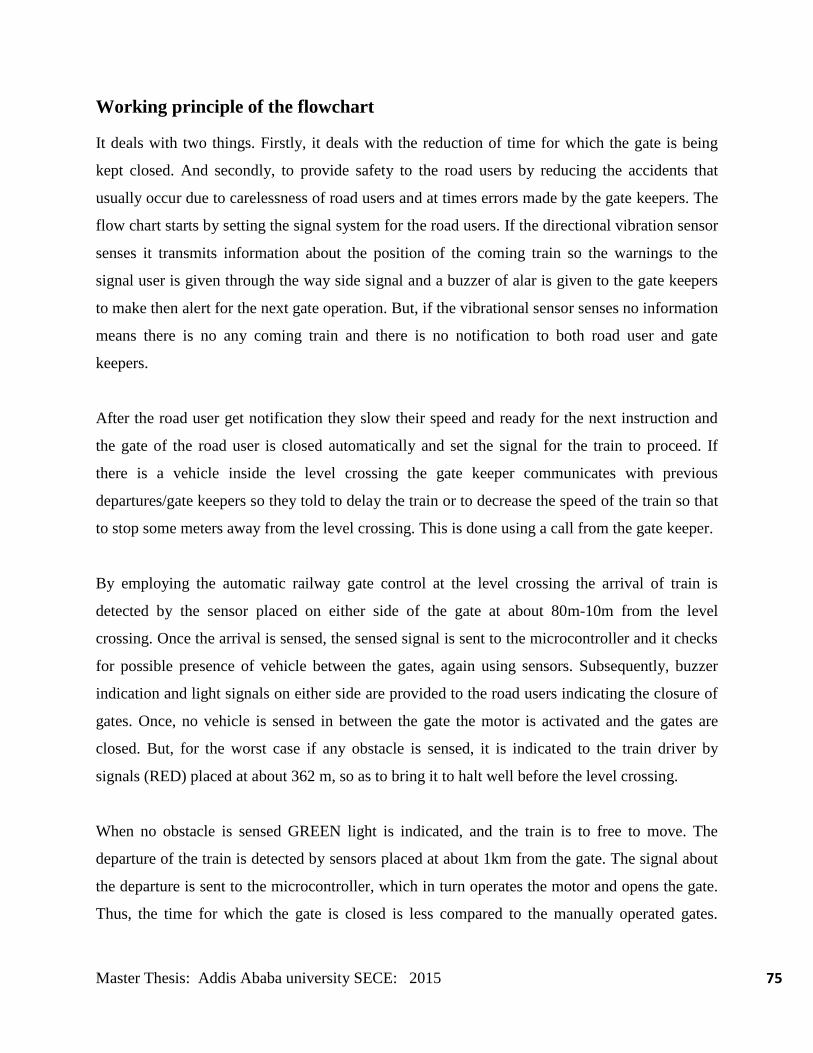
Master Thesis: Addis Ababa university SECE: 2015 75
Working principle of the flowchart
It deals with two things. Firstly, it deals with the reduction of time for which the gate is being
kept closed. And secondly, to provide safety to the road users by reducing the accidents that
usually occur due to carelessness of road users and at times errors made by the gate keepers. The
flow chart starts by setting the signal system for the road users. If the directional vibration sensor
senses it transmits information about the position of the coming train so the warnings to the
signal user is given through the way side signal and a buzzer of alar is given to the gate keepers
to make then alert for the next gate operation. But, if the vibrational sensor senses no information
means there is no any coming train and there is no notification to both road user and gate
keepers.
After the road user get notification they slow their speed and ready for the next instruction and
the gate of the road user is closed automatically and set the signal for the train to proceed. If
there is a vehicle inside the level crossing the gate keeper communicates with previous
departures/gate keepers so they told to delay the train or to decrease the speed of the train so that
to stop some meters away from the level crossing. This is done using a call from the gate keeper.
By employing the automatic railway gate control at the level crossing the arrival of train is
detected by the sensor placed on either side of the gate at about 80m-10m from the level
crossing. Once the arrival is sensed, the sensed signal is sent to the microcontroller and it checks
for possible presence of vehicle between the gates, again using sensors. Subsequently, buzzer
indication and light signals on either side are provided to the road users indicating the closure of
gates. Once, no vehicle is sensed in between the gate the motor is activated and the gates are
closed. But, for the worst case if any obstacle is sensed, it is indicated to the train driver by
signals (RED) placed at about 362 m, so as to bring it to halt well before the level crossing.
When no obstacle is sensed GREEN light is indicated, and the train is to free to move. The
departure of the train is detected by sensors placed at about 1km from the gate. The signal about
the departure is sent to the microcontroller, which in turn operates the motor and opens the gate.
Thus, the time for which the gate is closed is less compared to the manually operated gates.
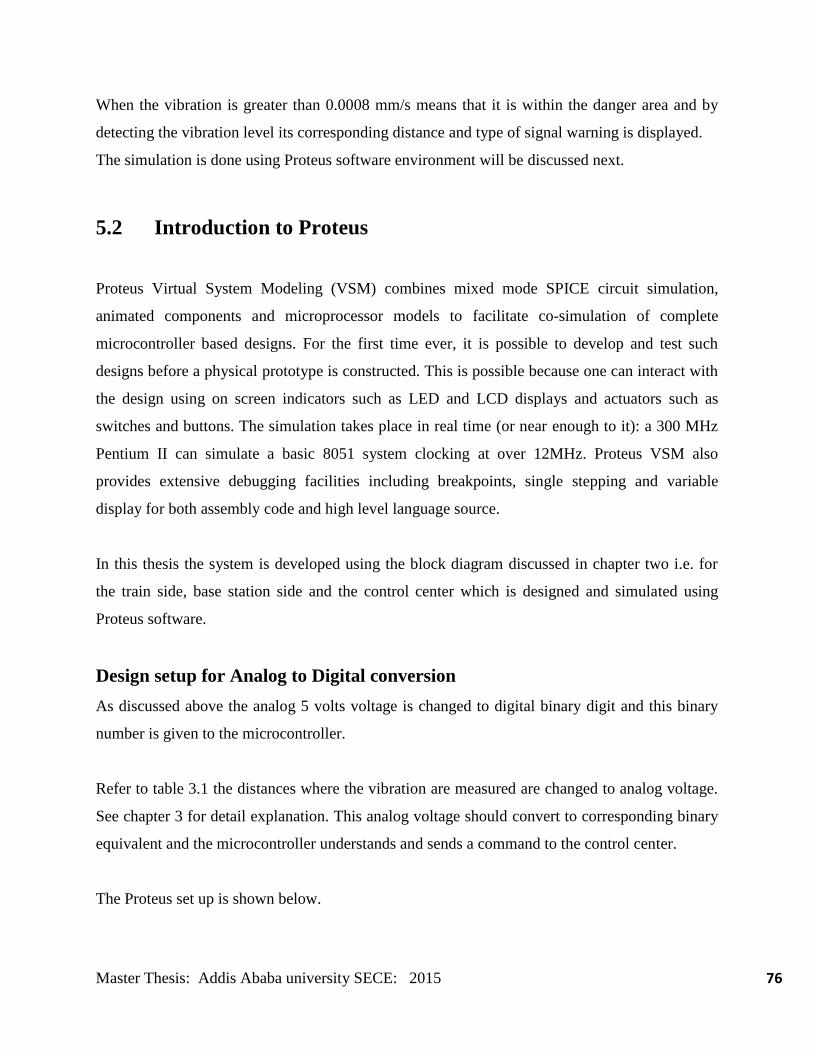
Master Thesis: Addis Ababa university SECE: 2015 76
When the vibration is greater than 0.0008 mm/s means that it is within the danger area and by
detecting the vibration level its corresponding distance and type of signal warning is displayed.
The simulation is done using Proteus software environment will be discussed next.
5.2 Introduction to Proteus
Proteus Virtual System Modeling (VSM) combines mixed mode SPICE circuit simulation,
animated components and microprocessor models to facilitate co-simulation of complete
microcontroller based designs. For the first time ever, it is possible to develop and test such
designs before a physical prototype is constructed. This is possible because one can interact with
the design using on screen indicators such as LED and LCD displays and actuators such as
switches and buttons. The simulation takes place in real time (or near enough to it): a 300 MHz
Pentium II can simulate a basic 8051 system clocking at over 12MHz. Proteus VSM also
provides extensive debugging facilities including breakpoints, single stepping and variable
display for both assembly code and high level language source.
In this thesis the system is developed using the block diagram discussed in chapter two i.e. for
the train side, base station side and the control center which is designed and simulated using
Proteus software.
Design setup for Analog to Digital conversion
As discussed above the analog 5 volts voltage is changed to digital binary digit and this binary
number is given to the microcontroller.
Refer to table 3.1 the distances where the vibration are measured are changed to analog voltage.
See chapter 3 for detail explanation. This analog voltage should convert to corresponding binary
equivalent and the microcontroller understands and sends a command to the control center.
The Proteus set up is shown below.
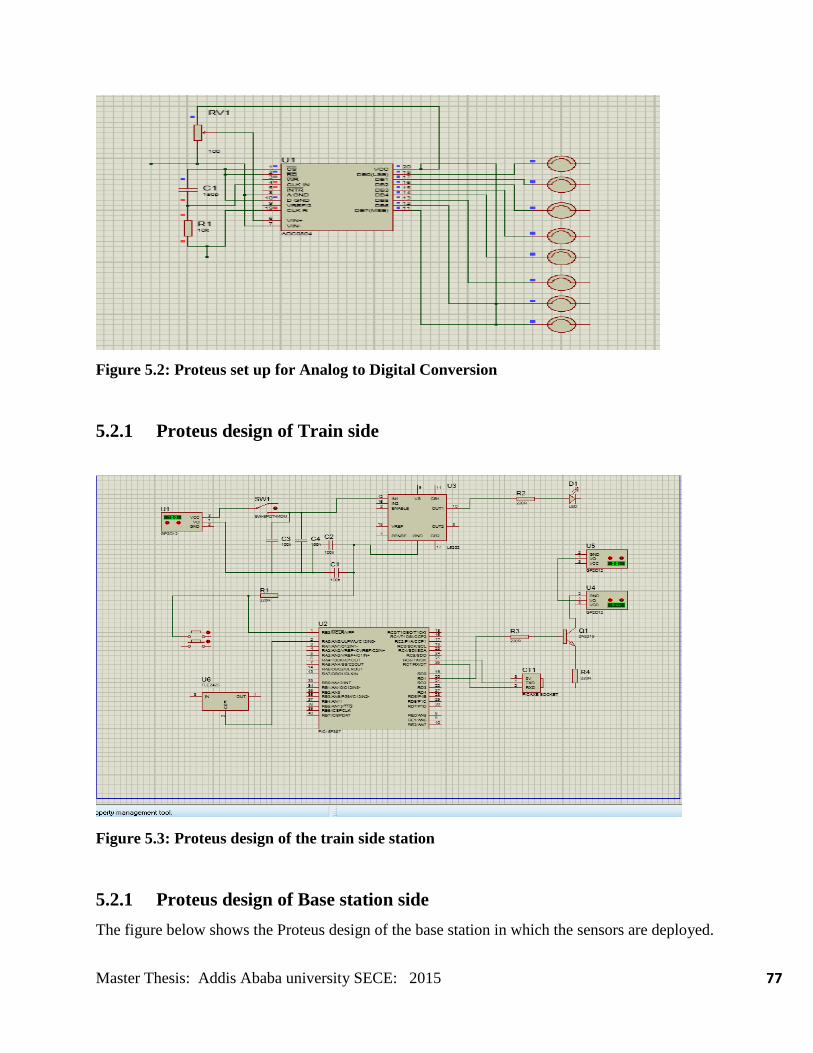
Master Thesis: Addis Ababa university SECE: 2015 77
Figure 5.2: Proteus set up for Analog to Digital Conversion
5.2.1 Proteus design of Train side
Figure 5.3: Proteus design of the train side station
5.2.1 Proteus design of Base station side
The figure below shows the Proteus design of the base station in which the sensors are deployed.
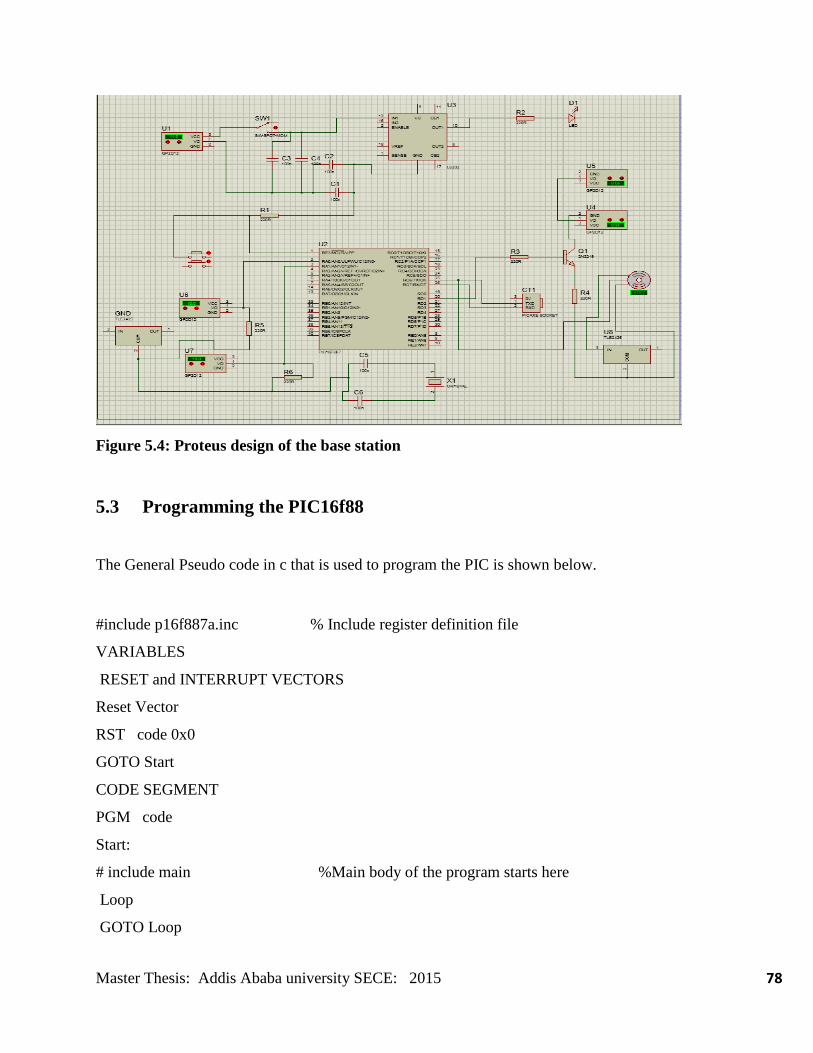
Master Thesis: Addis Ababa university SECE: 2015 78
Figure 5.4: Proteus design of the base station
5.3 Programming the PIC16f88
The General Pseudo code in c that is used to program the PIC is shown below.
#include p16f887a.inc % Include register definition file
VARIABLES
RESET and INTERRUPT VECTORS
Reset Vector
RST code 0x0
GOTO Start
CODE SEGMENT
PGM code
Start:
# include main %Main body of the program starts here
Loop
GOTO Loop
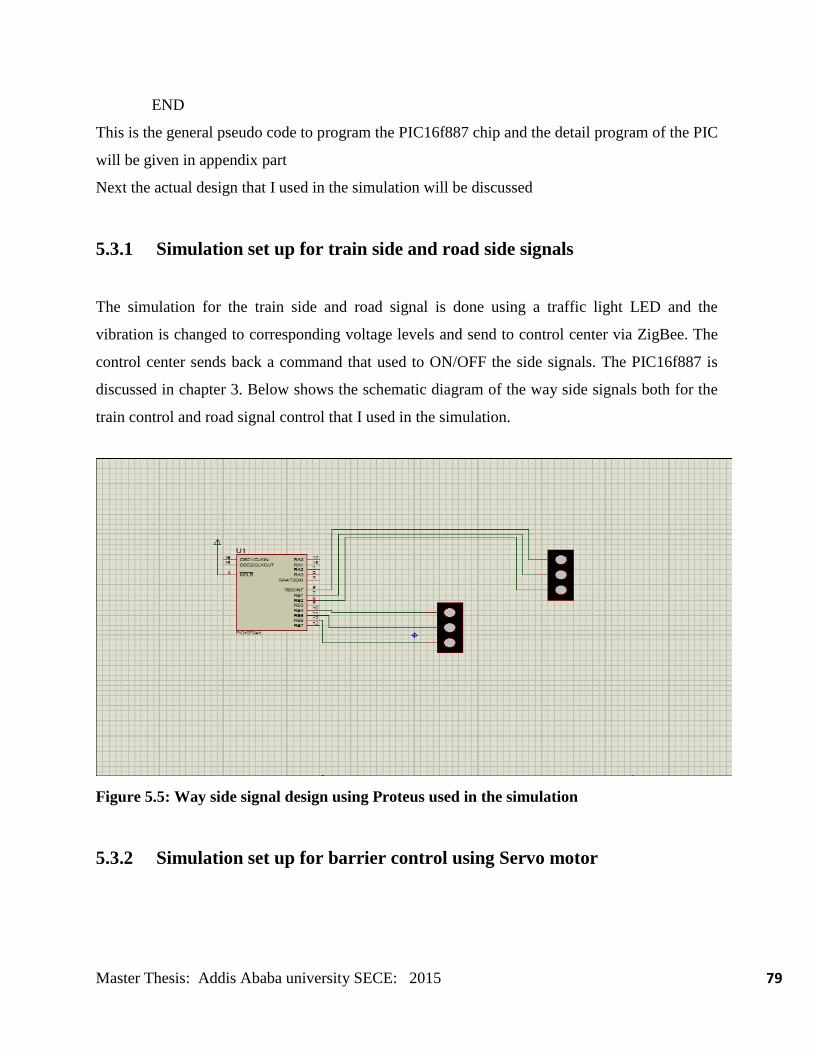
Master Thesis: Addis Ababa university SECE: 2015 79
END
This is the general pseudo code to program the PIC16f887 chip and the detail program of the PIC
will be given in appendix part
Next the actual design that I used in the simulation will be discussed
5.3.1 Simulation set up for train side and road side signals
The simulation for the train side and road signal is done using a traffic light LED and the
vibration is changed to corresponding voltage levels and send to control center via ZigBee. The
control center sends back a command that used to ON/OFF the side signals. The PIC16f887 is
discussed in chapter 3. Below shows the schematic diagram of the way side signals both for the
train control and road signal control that I used in the simulation.
Figure 5.5: Way side signal design using Proteus used in the simulation
5.3.2 Simulation set up for barrier control using Servo motor
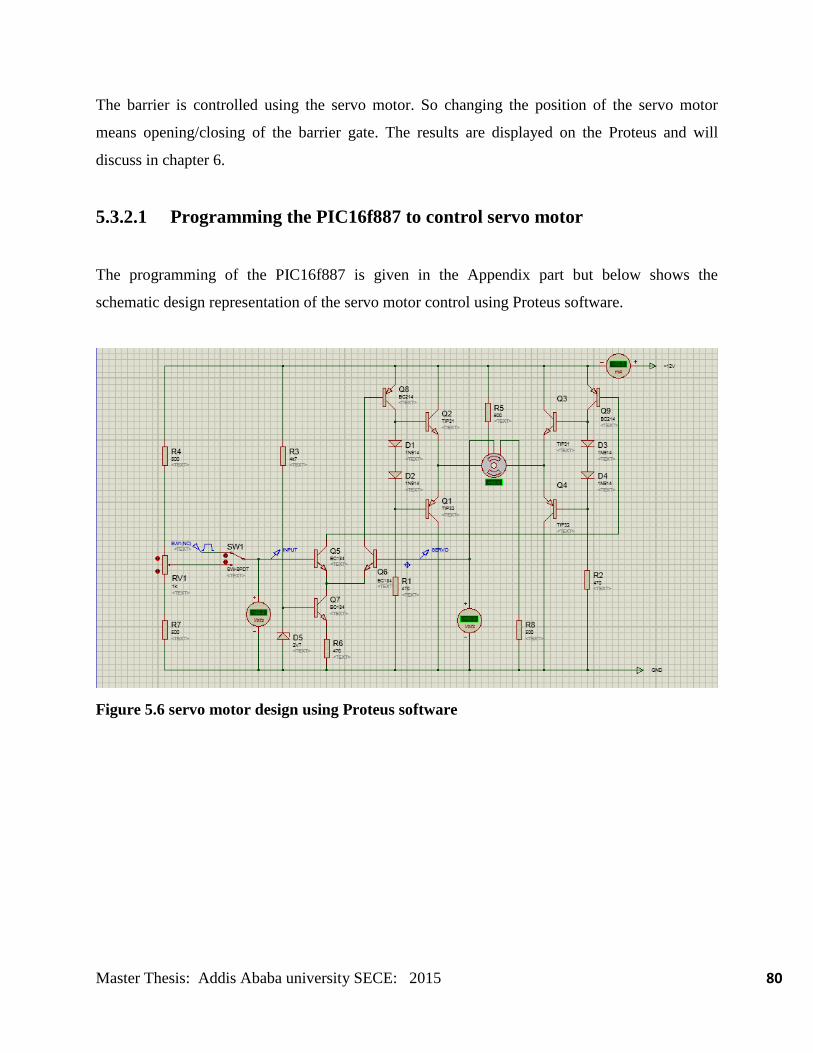
Master Thesis: Addis Ababa university SECE: 2015 80
The barrier is controlled using the servo motor. So changing the position of the servo motor
means opening/closing of the barrier gate. The results are displayed on the Proteus and will
discuss in chapter 6.
5.3.2.1 Programming the PIC16f887 to control servo motor
The programming of the PIC16f887 is given in the Appendix part but below shows the
schematic design representation of the servo motor control using Proteus software.
Figure 5.6 servo motor design using Proteus software
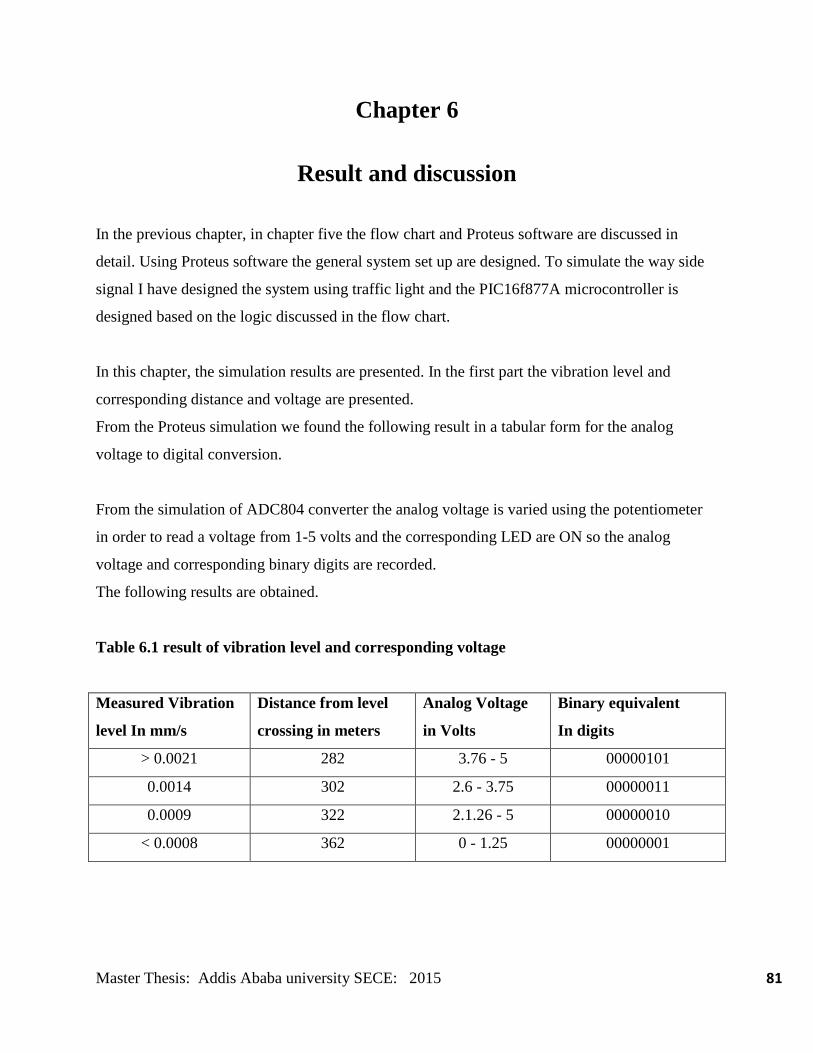
Master Thesis: Addis Ababa university SECE: 2015 81
Chapter 6
Result and discussion
In the previous chapter, in chapter five the flow chart and Proteus software are discussed in
detail. Using Proteus software the general system set up are designed. To simulate the way side
signal I have designed the system using traffic light and the PIC16f877A microcontroller is
designed based on the logic discussed in the flow chart.
In this chapter, the simulation results are presented. In the first part the vibration level and
corresponding distance and voltage are presented.
From the Proteus simulation we found the following result in a tabular form for the analog
voltage to digital conversion.
From the simulation of ADC804 converter the analog voltage is varied using the potentiometer
in order to read a voltage from 1-5 volts and the corresponding LED are ON so the analog
voltage and corresponding binary digits are recorded.
The following results are obtained.
Table 6.1 result of vibration level and corresponding voltage
Measured Vibration
level In mm/s
Distance from level
crossing in meters
Analog Voltage
in Volts
Binary equivalent
In digits
> 0.0021 282 3.76 - 5 00000101
0.0014 302 2.6 - 3.75 00000011
0.0009 322 2.1.26 - 5 00000010
< 0.0008 362 0 - 1.25 00000001
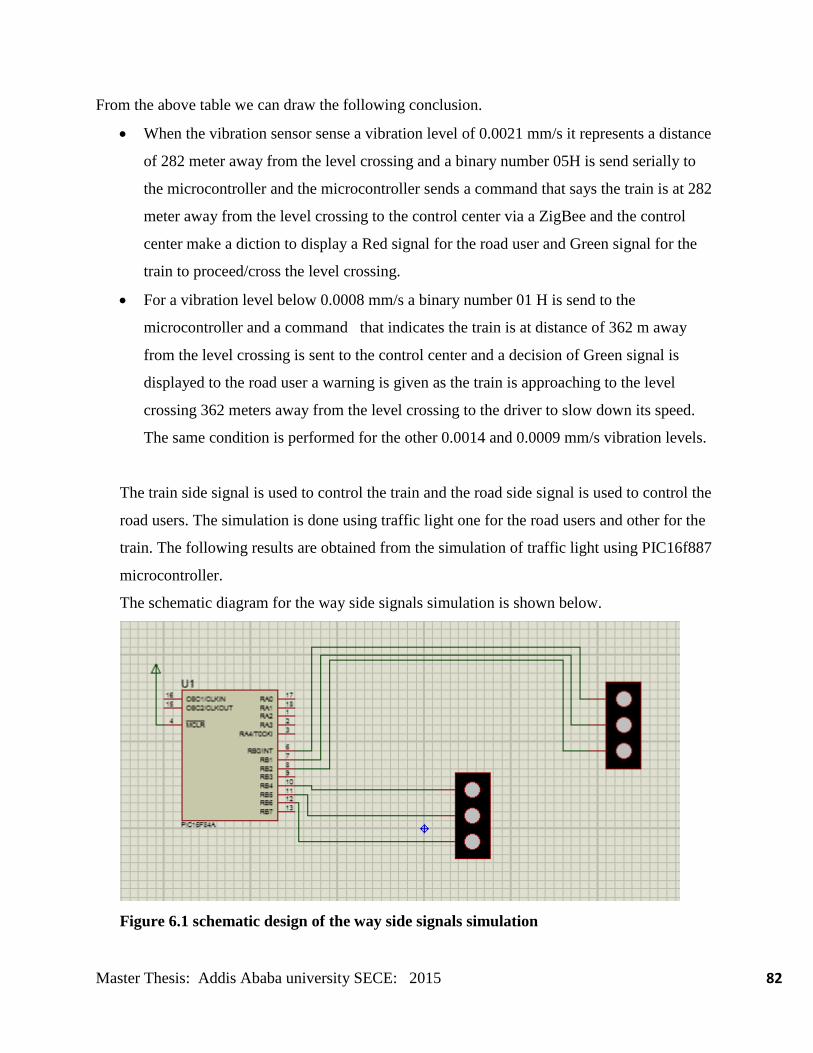
Master Thesis: Addis Ababa university SECE: 2015 82
From the above table we can draw the following conclusion.
When the vibration sensor sense a vibration level of 0.0021 mm/s it represents a distance
of 282 meter away from the level crossing and a binary number 05H is send serially to
the microcontroller and the microcontroller sends a command that says the train is at 282
meter away from the level crossing to the control center via a ZigBee and the control
center make a diction to display a Red signal for the road user and Green signal for the
train to proceed/cross the level crossing.
For a vibration level below 0.0008 mm/s a binary number 01 H is send to the
microcontroller and a command that indicates the train is at distance of 362 m away
from the level crossing is sent to the control center and a decision of Green signal is
displayed to the road user a warning is given as the train is approaching to the level
crossing 362 meters away from the level crossing to the driver to slow down its speed.
The same condition is performed for the other 0.0014 and 0.0009 mm/s vibration levels.
The train side signal is used to control the train and the road side signal is used to control the
road users. The simulation is done using traffic light one for the road users and other for the
train. The following results are obtained from the simulation of traffic light using PIC16f887
microcontroller.
The schematic diagram for the way side signals simulation is shown below.
Figure 6.1 schematic design of the way side signals simulation
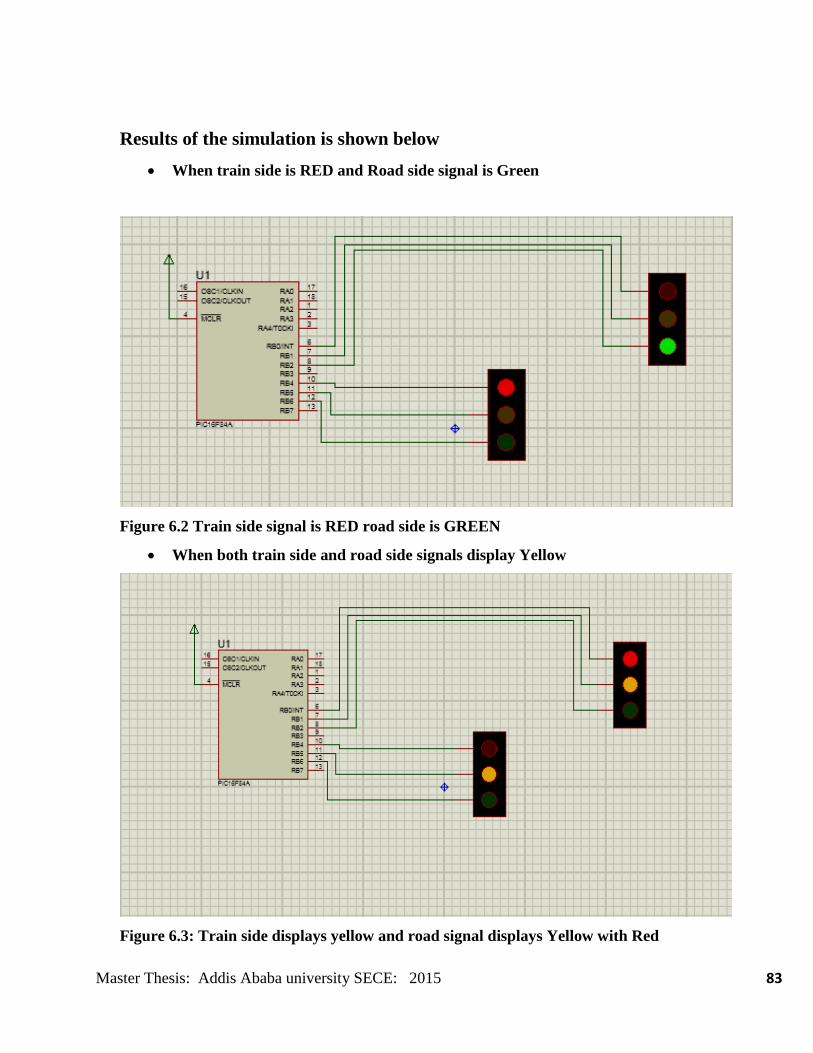
Master Thesis: Addis Ababa university SECE: 2015 83
Results of the simulation is shown below
When train side is RED and Road side signal is Green
Figure 6.2 Train side signal is RED road side is GREEN
When both train side and road side signals display Yellow
Figure 6.3: Train side displays yellow and road signal displays Yellow with Red
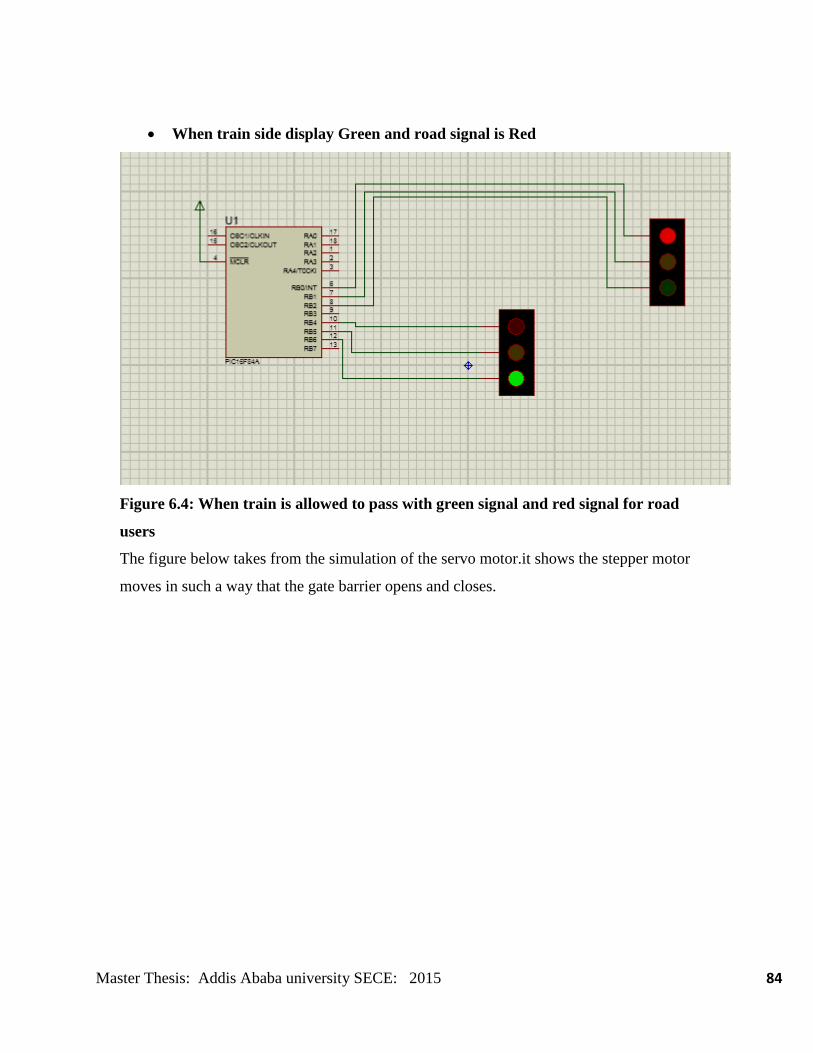
Master Thesis: Addis Ababa university SECE: 2015 84
When train side display Green and road signal is Red
Figure 6.4: When train is allowed to pass with green signal and red signal for road
users
The figure below takes from the simulation of the servo motor.it shows the stepper motor
moves in such a way that the gate barrier opens and closes.
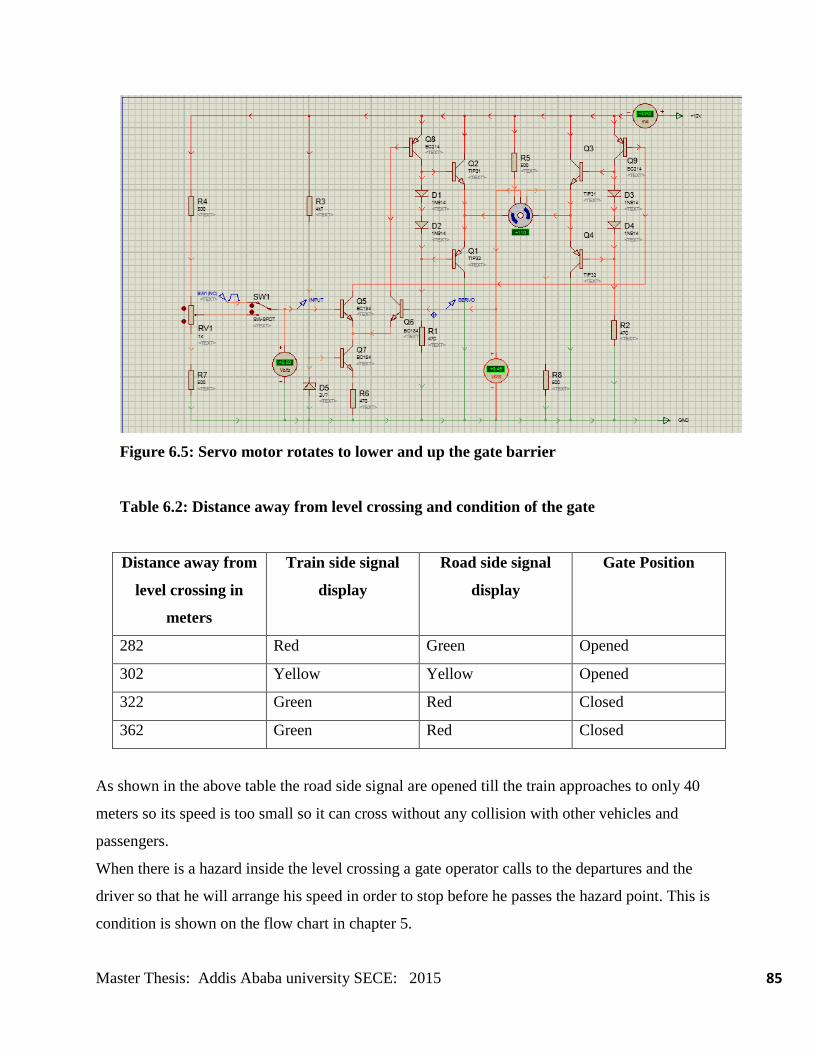
Master Thesis: Addis Ababa university SECE: 2015 85
Figure 6.5: Servo motor rotates to lower and up the gate barrier
Table 6.2: Distance away from level crossing and condition of the gate
Distance away from
level crossing in
meters
Train side signal
display
Road side signal
display
Gate Position
282 Red Green Opened
302 Yellow Yellow Opened
322 Green Red Closed
362 Green Red Closed
As shown in the above table the road side signal are opened till the train approaches to only 40
meters so its speed is too small so it can cross without any collision with other vehicles and
passengers.
When there is a hazard inside the level crossing a gate operator calls to the departures and the
driver so that he will arrange his speed in order to stop before he passes the hazard point. This is
condition is shown on the flow chart in chapter 5.
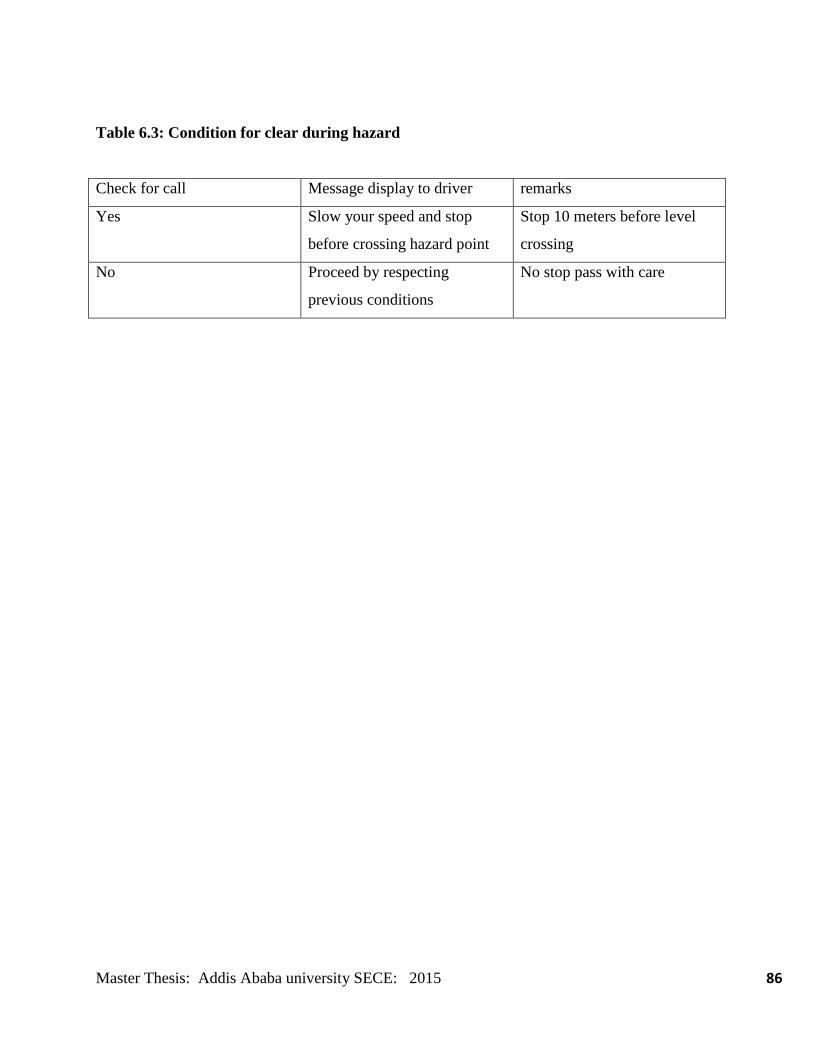
Master Thesis: Addis Ababa university SECE: 2015 86
Table 6.3: Condition for clear during hazard
Check for call Message display to driver remarks
Yes Slow your speed and stop
before crossing hazard point
Stop 10 meters before level
crossing
No Proceed by respecting
previous conditions
No stop pass with care
Master Thesis: Addis Ababa university SECE: 2015 87
Chapter 7
Conclusion and Recommendation
7.1 Conclusion
As the system is completely automated it avoids manual error and thus provides ultimate safety
to road users. Automatic gate control system of railway using ZigBee technology is discussed in
this thesis. A microcontroller PIC16F877A performs the complete operation sensing, gate
closing and opening operation is done by software code written for the controller.
Automatic gate control system offers an effective way to reduce the occurrence of railway
accidents. This system can contribute a lot of benefit either to the road users or to the railway
management. Since the design is completely automated it can be used in remote areas where no
station master or line man is present. This system uses the DC motor to open and close the gates
automatically when it is rotated clockwise or anticlockwise direction. The LED display shows
the status of the way side signal and railway gate is automatically closed using the command
from the control system. The system also generates buzzer and light indicators while the train
passing through the level crossing. In this thesis, when there is a hazard in side level crossing the
operator is calling to the driver so an alarm warning will display for the driver. This is properly
controlled by using Programmable Integrated Circuit (PIC) i.e. the microcontroller) and zigBee
technology. Future work will deal with the application of the designed approach for large-scale
applications
7.2 Recommendation
Based on the work of this thesis, we recommend for further researchers the below cited points.
Due to lack of real information, the mathematical models for the vibration levels
developed takes approximation and some datasheet from international railway standards
Master Thesis: Addis Ababa university SECE: 2015 88
(Swedish train experiment), assumptions and some planners experience are also used.
Thus, by considering the actual information we can improve the result obtained in this
thesis.
The distance converted from the vibration level are discreet but cannot exist in real world
so the microcontroller is assumed to take only fixed voltage levels so using the voltage
levels a corresponding LED signal is displayed Green, Red and Yellow.
As we conclude, or may someone guess the distance is too short for braking but the speed
is too small starting from 100 meters so the train is easy to pass without any accident with
the road users assuming that the road user are quickly cross or wait for the train to pass.
7.3 Future enhancement
As future expansion it is proposed that licensing procedures of satellite communications may be
initiated so as to implement a system upgrade whereby real time data of moving trains like speed
and current location may be tracked and monitored at the control station. Such real-time
information can be utilized for system upgrade so as to avert accidents due to natural calamities
such as land slide and anti-Collision Device/GPS based wireless Lx protection systems, the latest
innovation, will give additional safety shield at manned and unmanned level crossings, through
an audio-visual indication to road users. Moreover, in case of emergent needs, gate men at
manned level crossings will be able to reduce the speed of an approaching train to prevent an
accident at the crossing at a very nominal cost of procurement, installation and maintenance.
Master Thesis: Addis Ababa university SECE: 2015 89
Reference
[1]. Addis Ababa Light Rail Transit project east-west line, project study report, 2009.
[2]. www.erc.gov.et ; “construction of light rail project”, April 8; 2014
[3]. Arun.P, Saritha.S, K.M.Martin, Madhukumar.S ‟‟Simulation of ZigBee Based TACS for
collision detection and avoidance for railway traffic”. In International conference on advanced
computing & communication Technologies for high performance application, paper ID 51, June
2012.
[4]. Simon Hawkins, ‟‟Communication Systems.pdf‟‟, June 2012.
[5]. Jennic, JN-AN-1059 ‟‟ Deployment guidelines for IEEE 8 02.15.4/ZigBee wireless
networks, page 37-38, 2007
[6]. J.Ayala ”The 89C51 “Microcontroller Architecture programming And Applications”, Pen
ram International.
[7]. Olov Lindfeldt, ‟‟Railway Operation Analysis‟‟, Doctoral thesis in infrastructure
Stockholm, Sweden 2010.
[8]. Muhammad Ali Mazidi ‟‟The 8051 microcontroller and embedded systems.pdf”, Taiwan
university, 2010
[9]. V.Reddy, “Deployment of an integrated model for assessment of operational risk in railway
track”, Master Thesis, Queensland University of Technology School of Engineering Systems,
2007.
[10]. C. Esveld, “Modern railway Track”. Second Edition, MRT Productions. 2001
[11]. C. Campos-Castellanos, Y.Gharaibeh, P. Mudge , V. Kappatos, “The application of long
range ultrasonic testing (LRUT) for examination of hard to access areas on railway tracks”. IEEE
Railway Condition Monitoring and Non- Destructive Testing (RCM 2011), Nov 2011.
[12]. M. Singh, S.Singh1,J.Jaiswal, J. Hempshall “Autonomus rail track inspection using vision
based system” .IEEE International Conference on Computational Intelligence for Homeland
Security and Personal Safety .October 2006. pp 56- 59
[13]. S.Zheng, X.An, X.Chai, L. Li “Railway track gauge inspection method based on computer
vision” IEEE International Conference on Mechatronics and Automation, 2012. pp 1292-1296
Master Thesis: Addis Ababa university SECE: 2015 90
[14]. W. Al-Nuaimy , A. Eriksen and J. Gasgoyne “ Train-mounted gpr for high-speed rail
trackbed inspection” Tenth International Conference on Ground Penetrating Radal; 21 -24 June,
2004
[15]. A.Vanimiredd, D.A.Kumari “Automatic broken track detection using LED-LDR
assembly” International Journal of Engineering Trends and Technology (IJETT) - Volume4
Issue7- July 2013
[16]. Hayre, Harbhajan S., ‟‟Automatic Railroad Track Inspection‟‟,Industry Applications,
IEEE Transactions on , vol.IA-10, no.3, pp.380-384, May 1974
[17]. Z. Sam Daliri1, S. Shamshirband , M.A. Besheli “Railway security through the use of
wireless sensor networks basezd on fuzzy logic”. International Journal of the Physical Sciences
Vol. 6(3), pp. 448-458, 4 February, 2011
[18]. S. Ramesh, S. Gobinathans “Railway faults tolerance techniques using wireless sensor
networks”. IJECT Vol. 3, Issue 1, Jan. - March 2012.
[19]. A. Z Lorestani ,S. A Mousavi, R. Ebadaty, “Monitoring RailTraffic Using Wireless Sensor
Network (WSN)” IJCSET ,June 2012, Vol 2, Issue 6,1280-1282
[20]. Aboelela, E.Edberg, W.Papakonstantinou, C.Vokkarane, V, "Wireless sensor network
based model for secure railway opeerations," Performance, Computing, and Communications
[21]. Addis Ababa E-W & N-S (Phase I) Light Rail Transit Project, Preliminary Design,
Chapter XIII Communication System, Vol 1.
[22]. Final technical specification of AA-LRT project, Technical specification of vehicles,
South-north Line and East-west Line (Phase I) Light Rail EPC Project of Addis Ababa, Ethiopia
[23]. South-north Line and East-west Line (Phase I) Light Rail EPC Project of Addis
Ababa, Ethiopia, Technical Specifications of Vehicles, July 2013.
[24]. Ethiopian Railway Corporation, Project Brief Outline.


