Embed Size (px)
Citation preview

Rapid High-Resolution T1 Mapping by Variable FlipAngles: Accurate and Precise Measurements in thePresence of Radiofrequency Field Inhomogeneity
Hai-Ling Margaret Cheng1,2* and Graham A Wright3,4
Rapid 3D mapping of T1 relaxation times is valuable in diverseclinical applications. Recently, the variable flip angle (VFA)spoiled gradient recalled echo approach was shown to be apractical alternative to conventional methods, providing betterprecision and speed. However, the method is known to besensitive to transmit field (B1
�) inhomogeneity and can result insignificant systematic errors in T1 estimates, especially at highfield strengths. The main challenge is to improve the accuracyof the VFA approach without sacrificing speed. In this article,the VFA method was optimized for both accuracy and precisionby considering the influence of imperfect transmit fields, noisebias, and selection of flip angles. An analytic solution wasdeveloped for systematic B1
�-induced T1 errors and allowssimple correction of T1 measurements acquired with any imag-ing parameters. A noise threshold was also identified and pro-vided a guideline for avoiding T1 biases. Finally, it was shownthat three flip angles were the most efficient for maintainingaccuracy and high precision over large ranges of T1. A rapid B1
�
mapping sequence was employed in all phantom experimentsand high-field in vivo brain scans. Experimental results con-firmed the theory and validated the accuracy of the proposedmethod. Magn Reson Med 55:566–574, 2006. © 2006 Wiley-Liss, Inc.
Key words: T1 mapping; fast volumetric imaging; high-field MRI;quantitative MRI
Rapid and accurate measurement of the longitudinal, orT1, relaxation time has long challenged MRI scientists butremains an important goal because of its clinical relevanceacross a diverse range of applications. Many of these ap-plications, however, including dynamic contrast-en-hanced studies of cancer, perfusion studies of muscle,diagnosis of neurologic disorders such as multiple sclero-sis and epilepsy, and enhanced tissue discrimination forimage-guided procedures, require low-noise, high-resolu-tion mapping over a large volume. These requirementscannot be achieved in a clinically acceptable time frame(�30 min) using conventional methods of inversion- orsaturation-recovery (1–3). An alternative method (4) in-volves determining T1 from a set of two or more spoiled
gradient recalled-echo (SPGR) images acquired with var-ied flip angles. Advantages of this approach include lowpower deposition compared to spin echo techniques andlow spatial distortion compared to rapid echo planar im-aging. Most importantly, the accuracy has been shown tobe similar to that achieved with conventional and acceler-ated techniques but with a significant reduction in imagingtime (5,6).
A dominant source of error in the variable flip angle(VFA) approach is inaccurate knowledge of the flip anglesdue to transmit field B1
� inhomogeneity. Although theimpact on T1 accuracy is known (7,8), correction of mea-sured T1 has been reported in only a few studies (9,10),mainly due to the complexity and long scan time require-ments of mapping the B1
� field. A second source of sys-tematic error is noise-induced bias. The effect on T1 mea-surements is generally subtle and may be the reason it hasnot, to our knowledge, been previously reported. However,these errors can be appreciable below a certain signal-to-noise (SNR) threshold, particularly with multiple angles,and one must identify and image at a suitable SNR level toensure accurate measurements. Another consideration un-related to T1 accuracy is optimizing the efficiency (preci-sion per unit time) over the desired T1 range. Recent (6,11)and past (5) efforts on optimizing the VFA method haveinvestigated the influence of flip angles, using efficiency asthe performance metric—accuracy was not explicitly con-sidered. They concluded that dual angles were best forachieving the highest efficiency over a narrow T1 range,while multiple angles (11) achieved the most uniformefficiency over a wide T1 range. Ideally, we seek an angleset that will yield the highest and most uniform precisionacross large T1 ranges while maintaining accuracy.
In the present work, we describe a set of methods foraccurate and precise 3D T1 mapping across a large T1 range(50–3000 ms) in less than 15 s per slice. We first developan analytical expression for systematic T1 biases in thepresence of inaccurate flip angles. This yields a calibrationcurve that, together with a rapid method for mapping B1
�
field variations, is used to correct T1 measurements ac-quired with any choice of flip angles and repetition time(TR). Accuracy is further ensured by maintaining suffi-cient SNR. Furthermore, we show that a multiple-angleapproach based on three angles achieves higher and moreconsistent precision across a large T1 range, compared todual angles, and avoids the potential for noise-relatedbiases when imaging with an even larger angle set. Numer-ical simulations are performed to assess the validity of theanalytic expressions. The feasibility and accuracy of thetechnique are demonstrated in phantom studies. Finally,
1Department of Diagnostic Imaging & The Research Institute, The Hospital forSick Children, Toronto, Canada.2Department of Medical Imaging, University of Toronto, Toronto, Canada.3Sunnybrook and Women’s College Health Sciences Centre, Toronto, Can-ada.4Department of Medical Biophysics, University of Toronto, Toronto, Canada.*Correspondence to: Hai-Ling Margaret Cheng, Department of DiagnosticImaging, The Hospital for Sick Children, 555 University Avenue, Toronto,Ontario M5G 1X8, Canada. E-mail: [email protected] 26 August 2005; revised 20 October 2005; accepted 31 October2005DOI 10.1002/mrm.20791Published online 31 January 2006 in Wiley InterScience (www.interscience.wiley.com).
Magnetic Resonance in Medicine 55:566–574 (2006)
© 2006 Wiley-Liss, Inc. 566

T1 measurements in brains of healthy human volunteers at3 T are presented.
THEORY
The SPGR steady-state signal amplitude Si acquired at aflip angle �i is a function of the longitudinal relaxationtime T1, repetition time TR, and equilibrium magnetiza-tion M0 (12),
Si�M0sin�i
1�E1
1�cos�iE1, [1]
where E1 � exp(�TR/T1). By acquiring signal at differentflip angles, the T1 can be determined first by transformingEq [1]. into the linear form Yi � mXi � b,
Si
sin�i�E1
Si
tan�i�M0(1�E1), [2]
and then extracting T1 from the slope m � E1 as follows(5,6):
T1��TR/ln(m). [3]
We now derive the systematic error in the T1 estimate dueto inaccurate angles. Assuming that the angle error (d�) issmall, we can calculate to first order the error propagatedinto T1:
dT1��T1
��1d�1�
�T1
��2d�2�. . .�
�T1
��Nd�N��
i�1
N�T1
��id�i. [4]
Following the derivation shown in Appendix A, we obtainan expression for the T1 error due to inaccurate flip angles,
dT1��T1
2 exp(TR/T1)
TR � N(X2�X2)�i�1
N d�i
tan�i[Yi(Xi � X)�Xi(1�tan2�i)
� (Yi � Y�2exp(�TR/T1)(Xi � X))] [5]
where N is the number of flip angles, Xi � Si/tan ai,Yi �Si/sin ai, and X� ,Y� are mean values.
Random noise in the signal can also introduce system-atic T1 errors, as illustrated conceptually in Fig. 1. In theabsence of noise, signal acquired at two angles, aLand aH,are transformed according to Eq [2]., and the exact T1 canbe extracted from the slope of the fitted (solid) line. In thepresence of noise (�), the measured magnitude signal islarger than the true value A due to noise threshold and isapproximately (13)
MAVE � �A2��2. [6]
Graphically, data at aL and aH shift in the direction of thearrows (Fig. 1). Depending on whether noise bias affectsthe low or high angle signal, the fitted slope (dashed line)increases or decreases, resulting in over- or underestima-
tion of T1. This undesired influence of noise bias can bereduced by placing greater emphasis on high SNR pointsthrough weighted least-squares analysis. However, signalscollected at more than two angles need to be acquired.
The precision, or uncertainty �T1, in the T1 measure-ment is another important performance indicator andstems from propagation of random noise into the T1 cal-culation (see derivation in Appendix B). The precisionnormalized for a constant scan time is often used to com-pare the relative merits of different T1-mapping strategies(1). This metric, known as the efficiency, essentially de-scribes the T1-to-noise ratio (T1NR), or T1/�T1, per squareroot of the total imaging time Tseq (6). In this article, wedefine a relative efficiency,
� T1/�T1)/�Tseq�T1NR/�TR � NEX � N. [7]
MATERIALS AND METHODS
Choice of Flip Angles
Achieving the best precision for the T1 range of interestrequires judicious selection of flip angles, but the selectionprocess remains complex, particularly for multiple angles.However, a couple of key results from previous work onthis topic (5,6,11,14,15) serve as useful guidelines. Whenimaging for a single T1, precision can be optimized usingtwo “ideal” angles, defined as those whose signals are 71%of the Ernst angle signal (6). Multiple angles are preferredwhen imaging over a large T1 range, especially T1 �2000 ms, to achieve more uniform but lower precision(11).
In this study, we attempted to find the smallest angle setthat provided the high precision possible only with dualangle imaging but across a large T1 range. Sets were cre-ated on the premise that appropriate combinations of idealangles tuned to different T1’s may increase the range ofprecise measurements. The simplest solution combined
FIG. 1. T1 estimation from linear regression on low and high angledata points, aL and aH. Noise bias shifts data points to new locations(crosses) in the directions indicated (arrows). The result is a fittedline that overestimates (dashed) or underestimates (dotted) the trueslope (solid), leading to errors in T1.
Accurate and Precise VFA T1 Mapping 567

two pairs of ideal angles, each tuned to the minimum ormaximum T1 of interest. For example, for a TR � 5 ms, afour-angle set [2,3,9,19] (in degrees) was formed from idealangles, [3,19] and [2,9], tuned to 500 and 2500 ms, respec-tively. The actual T1 values to which angles were tunedwere adjusted, and more ideal angle pairs were incorpo-rated, to assess the effect on the precision profile. In anyset, similar values may be combined to reduce the numberof angles. For example, a three-angle set can be derivedfrom four angles, as the smaller two angles are often within1 point of each other and only one need to be retained. Tenangles optimized for TR � 5 ms from a genetic algorithm(11) were also evaluated, consisting of the set 10� '[2,3,4,5,7,9,11,14,17,22]. Although our straightforwardstrategy of combining appropriate ideal angles was not assophisticated as these other approaches for multiple angleselection, we showed that comparable precision profilescould be achieved.
Simulation Studies
Numerical simulations were performed to verify our the-oretical models and study the influence of flip angles,systematic angle biases, and noise on accuracy and preci-sion. The range T1 � 50–3000 ms was considered. Estima-tion of T1 began with signal generation (Eq. [1]) using thechosen angles, TR � 5 ms, and M0 � 1000. Gaussian-distributed, complex-valued random noise (zero mean,� � M0/SNR) was added prior to data averaging, whereSNR is the maximum signal-to-noise per pixel for an imageacquired with � � 90° and TR � 6 � T1. The SNR level wasvaried from 150 to 1000 to study noise-related biases.Furthermore, a fixed imaging time of 15 s or less per slicefor a 256 � 256 matrix was considered for a clinical set-ting. This time constraint, together with SNR � 250, wasused to evaluate different angle sets, where more SNR gainthrough averaging of multiple signal acquisitions was pos-sible for smaller sets. T1 was then determined through aweighted least-squares regression on Eq. [2], with weightsproportional to signal. The process was repeated 10000times to obtain a mean estimate (T� 1) and SD (�T1).
To study the influence of inaccurate flip angles, errorswere introduced such that true angle values varied be-tween 50 and 130% of the nominal. Simulations wereperformed as outlined above, using true angles for signalgeneration and nominal angles for estimating T1.
Transmit Field B1� Imaging
The transmit field B1� of a volume coil is generally quite
uniform. However, substantial inhomogeneity may arisewhen using separate transmit/receive coil systems orwhen imaging at field strengths above 1.5 T. An accurateapproach to account for these variations is to map the B1
�
field distribution using a double-angle method (16,17).Standard spin echo (SE) acquisitions are the most robust,as they are insensitive to B0 variations, but are impracticalin the clinic due to long scan times. Rapid B1
� mappinghas recently been demonstrated using a SE segmented-EPIsequence (18). Similar to conventional SE techniques, sig-nal is acquired at excitation angles of 60 and 120° formaximum sensitivity to small variations in B1
�. However,
because of sensitivity to B0 offsets, SE-EPI B1� maps need
to be corrected by normalizing against SE measurements.For simplicity, we assume a pure B0offset, which does notaffect the RF distribution. We have found that the speedadvantage of SE-EPI can be retained by determining thenormalization factor off-line, from calibration scans per-formed on a phantom.
The sequences employed were: SE-EPI � 8 shots, TE �18 ms, bandwidth (BW) � 250 kHz; SE � TE � 10 ms,BW � 15.6 kHz. Common parameters are TR � 4000 ms,128 � 128 matrix, slice thickness (SL) � 4 mm, 60 and120° excitation angles, 120 and 240° refocusing angles.
Phantom Studies
Quantitative T1 imaging was performed on a 1.5 T MRIsystem (Signa Excite TwinSpeed, GE Healthcare, Milwau-kee, WI, USA) using an eight-channel receive-only headarray coil (MRI Devices). Eight phantoms, one containingwater and seven doped with NC100150 (Nycomed Amer-sham), spanning an approximate T1 range of 50 to3000 ms, were used to test the accuracy of our proposedmethod. A cylindrical phantom (12 cm diameter, 20 cmlength) filled with distilled water and 3.33 g/liter NiCl and1.4 g/liter NaCl was also used to assess the accuracy of ourB1
� measurements. Transmit B1� maps were acquired as
described above. Data for T1 maps were acquired with a 3Dfast SPGR sequence: TR/TE � 4.4/1.1 ms, 256 � 256 � 28matrix, FOV � 20 cm, SL � 5 mm, BW � 31.25 kHz. Flipangles and number of signal averages (NEX) were chosento match those used in simulations, using 6 NEX for twinangles, 4 NEX for three angles, and so on. Systematic angleoffsets were also introduced to study the effects of RFpulse imperfection on T1 evaluation. The potential fornoise bias at lower SNR was assessed by reducing the slicethickness to 1 mm. Reference T1 values were measuredusing single-shot fast SE inversion-recovery (SSFSE-IR):TR/TE � 5000/32.4 ms, 256 � 256 matrix, FOV � 20 cm,SL � 5 mm, BW � 31.25 kHz, and TI � [50, 100, 150, 250,500, 750, 1000, 1500, 2000, 2500, 3000, 3500, 4000] ms.
Pixel-by-pixel T1 maps were calculated and then cor-rected for the measured B1
� field nonuniformity using Eq.[5] for calibration. The mean and SD of T1 were computedwithin each phantom to yield measures of accuracy andprecision, respectively.
In Vivo Studies
For final evaluation, brains of two volunteers were imagedon a 3.0 T MRI system (GE Signa Excite Eclipse) using aneight-channel receive-only head array coil (MRI Devices).T1 maps were acquired with 3D fast SPGR, with all param-eters the same as at 1.5 T with the following exceptions:FOV � 24 cm, TR/TE � 6.1/1.5 ms, NEX � 1. This resultedin a total scan time of 2 min 24 s for three angle acquisi-tions over 28 slices. In vivo B1
� maps were acquired usingSE-EPI in under 2 min, while calibration scans were takenoff-line on a phantom (15 cm diameter, 28 cm length).Pixel-by-pixel T1 maps, corrected for B1
� variation, werethen generated.
568 Cheng and Wright
RESULTS
Simulation Results
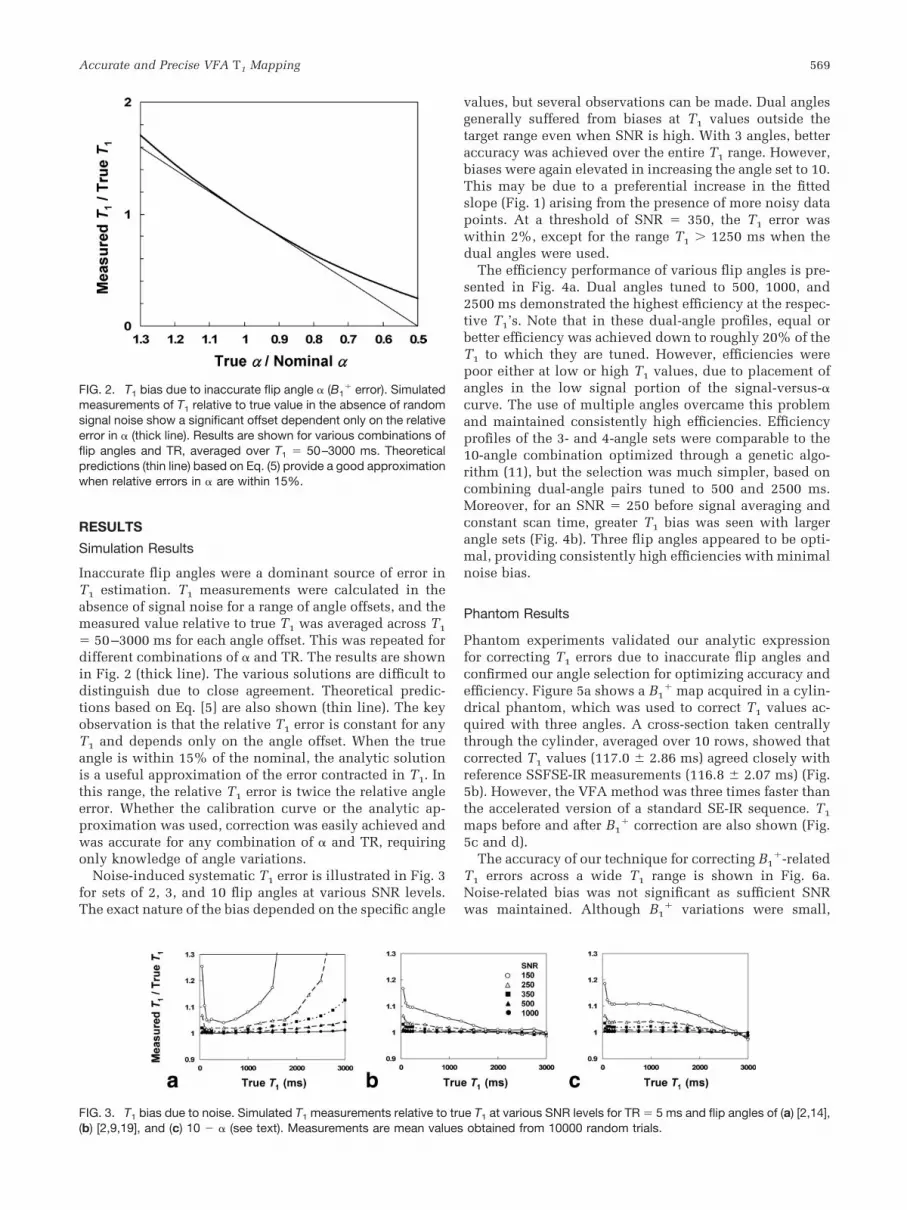
Inaccurate flip angles were a dominant source of error inT1 estimation. T1 measurements were calculated in theabsence of signal noise for a range of angle offsets, and themeasured value relative to true T1 was averaged across T1
� 50–3000 ms for each angle offset. This was repeated fordifferent combinations of � and TR. The results are shownin Fig. 2 (thick line). The various solutions are difficult todistinguish due to close agreement. Theoretical predic-tions based on Eq. [5] are also shown (thin line). The keyobservation is that the relative T1 error is constant for anyT1 and depends only on the angle offset. When the trueangle is within 15% of the nominal, the analytic solutionis a useful approximation of the error contracted in T1. Inthis range, the relative T1 error is twice the relative angleerror. Whether the calibration curve or the analytic ap-proximation was used, correction was easily achieved andwas accurate for any combination of � and TR, requiringonly knowledge of angle variations.
Noise-induced systematic T1 error is illustrated in Fig. 3for sets of 2, 3, and 10 flip angles at various SNR levels.The exact nature of the bias depended on the specific angle
values, but several observations can be made. Dual anglesgenerally suffered from biases at T1 values outside thetarget range even when SNR is high. With 3 angles, betteraccuracy was achieved over the entire T1 range. However,biases were again elevated in increasing the angle set to 10.This may be due to a preferential increase in the fittedslope (Fig. 1) arising from the presence of more noisy datapoints. At a threshold of SNR � 350, the T1 error waswithin 2%, except for the range T1 � 1250 ms when thedual angles were used.
The efficiency performance of various flip angles is pre-sented in Fig. 4a. Dual angles tuned to 500, 1000, and2500 ms demonstrated the highest efficiency at the respec-tive T1’s. Note that in these dual-angle profiles, equal orbetter efficiency was achieved down to roughly 20% of theT1 to which they are tuned. However, efficiencies werepoor either at low or high T1 values, due to placement ofangles in the low signal portion of the signal-versus-�curve. The use of multiple angles overcame this problemand maintained consistently high efficiencies. Efficiencyprofiles of the 3- and 4-angle sets were comparable to the10-angle combination optimized through a genetic algo-rithm (11), but the selection was much simpler, based oncombining dual-angle pairs tuned to 500 and 2500 ms.Moreover, for an SNR � 250 before signal averaging andconstant scan time, greater T1 bias was seen with largerangle sets (Fig. 4b). Three flip angles appeared to be opti-mal, providing consistently high efficiencies with minimalnoise bias.
Phantom Results
Phantom experiments validated our analytic expressionfor correcting T1 errors due to inaccurate flip angles andconfirmed our angle selection for optimizing accuracy andefficiency. Figure 5a shows a B1
� map acquired in a cylin-drical phantom, which was used to correct T1 values ac-quired with three angles. A cross-section taken centrallythrough the cylinder, averaged over 10 rows, showed thatcorrected T1 values (117.0 2.86 ms) agreed closely withreference SSFSE-IR measurements (116.8 2.07 ms) (Fig.5b). However, the VFA method was three times faster thanthe accelerated version of a standard SE-IR sequence. T1
maps before and after B1� correction are also shown (Fig.
5c and d).The accuracy of our technique for correcting B1
�-relatedT1 errors across a wide T1 range is shown in Fig. 6a.Noise-related bias was not significant as sufficient SNRwas maintained. Although B1
� variations were small,
FIG. 2. T1 bias due to inaccurate flip angle � (B1� error). Simulated
measurements of T1 relative to true value in the absence of randomsignal noise show a significant offset dependent only on the relativeerror in � (thick line). Results are shown for various combinations offlip angles and TR, averaged over T1 � 50–3000 ms. Theoreticalpredictions (thin line) based on Eq. (5) provide a good approximationwhen relative errors in � are within 15%.
FIG. 3. T1 bias due to noise. Simulated T1 measurements relative to true T1 at various SNR levels for TR � 5 ms and flip angles of (a) [2,14],(b) [2,9,19], and (c) 10 � � (see text). Measurements are mean values obtained from 10000 random trials.
Accurate and Precise VFA T1 Mapping 569

within 6%, the accuracy of T1 measurements improvedafter B1
� correction. Furthermore, consistent results wereobtained for different combinations of angles and TR,thereby confirming that the correction method is indepen-dent of imaging parameters. In Fig. 6b, additional offsets of10 and 20% were introduced into the nominal flip anglesto test further the accuracy of our correction method andillustrate the errors incurred in uncorrected T1 estimates.
Efficiencies obtained in phantoms followed the trendspredicted from simulations, with the three-angle set pro-viding the highest and most uniform efficiency overall.Figure 7 shows that both multiple-angle schemes (3 and 10angles) offered comparable efficiencies, while perfor-mance was degraded either at low or high T1 when dualangles were used.
Noise-induced bias predicted from simulations was con-firmed in vitro. Figure 8 shows that greater bias was ob-served when the slice thickness was reduced from 5 mm(SNR � 300) to 1 mm (SNR � 60), progressively worseningwith an increased number of angles. Dual angles were evenmore susceptible to noise-related errors, even for 5-mmslices, outside a limited T1 range.
In Vivo Results
Figure 9 shows B1� maps and corresponding T1 maps
obtained at 3.0 T. Note that T1 values in the correctedimages were more balanced within a slice and amongdifferent slices. Furthermore, measured T1 values agreedwith those reported in the literature (see Table 1).
DISCUSSION
The variable flip angle method allows rapid T1 quantifica-tion with better precision and accuracy than conventionalapproaches and was recently shown to be capable of gen-erating rapid 3D T1 maps in a clinical setting (6,7). Thevalue of quantitative imaging spans numerous clinical ap-plications, from quantifying vascular properties in dy-namic contrast studies to improved characterization ofneurologic diseases. T1 maps offer the advantage of remov-ing confounding influences of T2 effects, proton density,and coil sensitivity on T1-weighted images. Unfortunately,these advantages have remained largely unexplored in theclinic, since T1 mapping is not part of routine assessment.
FIG. 5. Correction of T1 map acquired inphantom at 1.5 T using the VFA approach(� � [2,9,19], 4 NEX). (a) Transmit field map.(b) Cross-section taken centrally throughuncorrected (dotted line) and corrected(solid line) T1 maps compared to referenceSSFSE-IR measurements (thick line). (c) Un-corrected and (d) corrected T1 maps. All T1
values are in milliseconds.
FIG. 4. Flip angles for optimal performance over a wide T1 range. (a) Efficiency measurements from 10000 simulation trials show thatmultiple angles maintain consistent efficiencies across the entire T1 range. Dual angles fail at either low or high T1 values. (b) Accuracy isbest ensured using fewer angles. An SNR � 250 prior to signal averaging and TR � 5 ms were used. Dual-angle acquisitions were averagedsix times, three angles averaged four times, and so on to maintain comparable total scan time.
570 Cheng and Wright

However, the combination of speed, volume, and highresolution possible with the VFA approach has made it apractical alternative. In fact, recent studies of breast (19)and brain (20) tumors have been reported using this ap-proach. With its growing popularity in the clinic, it isimportant to understand the limitations as well as theconditions under which accurate measurements are pos-sible.
The total scan time required for 3D T1 mapping dependson the specific clinical target. For brain imaging, largevolume coverage with high spatial resolution may require128 slices of 1 mm thickness. Unilateral breast imagingmay require as few as 28 slices. Regardless of the applica-tion, it is crucial to maintain the highest SNR possible dueto the sensitivity of the VFA approach to noise-relatederrors. Accuracy and short scan times are best ensuredwith high-resolution coils and, if possible, imaging withlarger voxels. An additional problem of B1
� field-relatederrors is encountered when imaging at field strengthshigher than 1.5 T, and correcting this error imposes moredemands on scan time. In this work, we obtained in under4 min a full 3D T1 map of the brain in vivo, with 1 � 1 �5 mm3 resolution, calibrated for B1
� variations, using aneight-channel head array coil on a 3.0 T system.
The first contribution of this work is an analytic solution(Eq. [5]) for the systematic error in T1 measurements due toinaccurate flip angles. Inaccurate angles can arise from two
sources: slice profile errors, which are minimized using 3Dsequences, and B1
� inhomogeneity. The latter problem isexacerbated at higher field strengths and needs to be cor-rected (16). Even some coil configurations at 1.5 T requirecorrection, as 25% deviations have been reported in cer-tain regions of a breast coil (19). Our results indicated thatthe relative T1 error is significant and is approximatelytwice the relative angle error for B1
� variations under15%. However, we have shown that correction requiresonly knowledge of the B1
� error and was accurate for T1
maps acquired with any choice of angles and TR.The second contribution is a better understanding of the
SNR threshold necessary to achieve accurate T1 measure-ments. An SNR � 350 (for � � 90° and TR � 6 � T1) wasshown to reduce T1 biases to less than 2% for the angle setsstudied. Three angles were better than dual angles, asweighted least-squares regression could be implementedto reduce the influence of noisy data points. Three angleswere also better than 10 optimized angles for two reasons:the presence of fewer data points to experience noise bias,even at the same SNR; and more time was available forsignal averaging to further improve SNR. Inadequate noisereduction results in characteristic biases in our T1 mea-surements, best evidenced in Fig. 3c. Here, the same set of10 angles are positioned mainly in the low angle portion ofthe signal-versus-� curve for small T1 measurements, but
FIG. 8. T1 bias in low SNR phantom experiments. Reduced SNRthrough thinner slices (5 mm, black; 1 mm, red) results in undesiredT1 bias. This bias is more severe with larger angle sets. However,even with 5-mm slices, bias is evident for dual angles beyond alimited T1 range.
FIG. 6. Accuracy of corrected T1 measure-ments in phantoms over T1 � 50–3000 ms.(a) Correction scheme is accurate and inde-pendent of parameter settings. (b) Errors inT1 measurements are significant when ad-ditional offsets of 10 and 20% are intro-duced into the flip angles. Corrected resultscorrespond closely to reference values.
FIG. 7. Efficiencies achieved in phantoms over T1 � 50–3000 ms.Three angles offer an efficiency profile comparable to a 10-angleacquisition and is significantly more uniform compared to any dualangle acquisition.
Accurate and Precise VFA T1 Mapping 571

mainly in the high angle portion for large T1. When noisedominates, the fitted slope of Eq. [2] preferentially in-creases or decreases, respectively (see Fig. 1). The averagetendency was to overestimate small T1 values and under-estimate large T1 values (Fig. 3c).
Finally, we offered a simple and practical method forchoosing flip angles to achieve accurate and precise T1
measurements. In contrast to most papers on this topic(5,6,11), which optimize the precision per unit time, wealso considered accuracy. Another distinction was that ourfocus was not to devise a systematic method for determin-ing optimal angles. Instead, we provided a set of guide-lines based on validated results from theory and experi-ments. Once the T1 range of interest has been determined,ideal angles tuned to the maximum T1 and at least fivetimes the minimum T1 are calculated. We found that tun-ing to this lower T1 threshold was sufficient, as the effi-ciency profile peaks over an even lower T1 range. In fact,tuning to the minimum T1 value resulted in poorer preci-sion overall. This process yields a four-angle set, and onlyone of the two smallest angles needs to be retained. Theaddition of more angles tuned to intermediate T1 valuesmay not offer better efficiency and can potentially causebias if SNR is insufficient.
Practical demonstration of our technique was given infull-brain T1 mapping at 3 T. Total scan time was under4 min, including correction for B1
� inhomogeneity. At this
field strength, RF miscalibration was significant. The fielddistribution was asymmetrical (Fig. 9a), resulting in low-ered T1 values in the right frontal and diametrically oppo-site regions (Fig. 9b). Corrected T1 maps showed improvedsymmetry within a slice and consistency among slices(Fig. 9c). Our measurements agreed well with literaturevalues, especially for white matter. Greater variability ex-ists in reported gray matter T1’s, possibly due to the diffi-culty of isolating gray matter regions without partial vol-ume effects from white matter or cerebral spinal fluid. Anadditional challenge with long T1 species, such as graymatter, is that accuracy is more dependent on experimen-tal conditions. With conventional inversion- or saturation-recovery methods, which are used in Refs. (24,25), oftenparameters adopted are optimized for measuring T1’s in alower range and/or TRs chosen are too short to allowsufficient recovery of magnetization. These factors repre-sent a potential source of T1 underestimation reported inthe literature for gray matter. In our approach, thesesources of biases are accounted for, which may explainhigher T1 measurements compared to those reported byEthofer et al. (24) and Wansapura et al. (25). In fact, ourvalues agree with those of Stanisz et al. (23), who alsoconsidered details related to T1 accuracy.
In addition to the choice of flip angles, noise threshold-ing, and B1
� inhomogeneity, other factors can influencethe accuracy of the VFA technique. Off-resonance effects
FIG. 9. In vivo brain 3D T1 mapping at 3.0 T. (a) Transmit field maps. (b) Uncorrected and (c) corrected T1 maps acquired with three flipangles (� � [2,9,19], 1 NEX).
TABLE 1T1 Values Measured in White and Gray Matter at 3.0 T in Two Healthy Volunteers
T1 (ms)Volunteer 1 Volunteer 2 Literature
White matter 1084 79 1087 49 1084 45 (23)1110 45 (24)832 10 (25)
Gray matter 1703 53 1732 70 1820 114 (23)1470 50 (24)1331 13 (25)
Note. Mean SD averaged across 20 anatomical regions in six consecutive 5-mm slices were obtained for both white (frontal, parietal, andoccipital regions) and gray matters (frontal, parasagittal, insular, parietal, and occipital regions).
572 Cheng and Wright

may become problematic at low bandwidths, but this isnot generally a concern for the short TRs employed. An-other important but subtle criterion for accuracy is that theequilibrium condition of Eq. [1] must be satisfied (14).Failure to drive the spin system to equilibrium prior todata sampling can occur if the number of pulses prior todata acquisition is inadequate, which is more likely intissues with very long T1 relaxation times. T1 mappingtechniques based on signal detection during the recoveryto equilibrium may circumvent this possible source oferror (3,21). Comparing the merit of VFA imaging againstother rapid sequences is a topic of future studies.
A major component of this work required that accu-rate B1
� maps of the transmit field be acquired rapidly topreserve the time advantage of the VFA T1 mappingapproach. The SE-EPI sequence we adopted (18) is sig-nificantly faster than traditional SE imaging and offerscomparable accuracy. However, the off-resonance offsetneeds to be determined and accounted for. We havefound this calibration can be performed in a phantom asa separate step to avoid additional scan time in vivo.Errors in the calibration will propagate into our correc-tion of T1. Sequences that are insensitive to off-reso-nance effects will obviate the need for off-line calibra-tion and need to be developed. Another possible sourceof error is slice profile effects. Slice-selective pulseswere used to obtain the transmit field maps, while the T1
sequence was non-slice-selective. To ensure high accu-racy in the correction, the pulses for both sequencesshould match. Since slice profile effects due to finite RFpulses are not corrected by field mapping, differencesbetween 2D and 3D acquisitions, if significant, will af-fect the accuracy of our T1 correction.
In conclusion, the results of this study suggest thataccurate and rapid 3D T1 mapping can be achieved withthe VFA approach across a wide range of T1’s encoun-tered in various clinical problems. Analytic and exper-imental results demonstrate significant sensitivity totransmit field B1
� (i.e., flip angles) errors, resulting inrelative T1 errors that are approximately twice the rela-tive angle error and are independent of imaging param-eters. This bias must be corrected, especially when im-aging at field strengths higher than 1.5 T or using spe-cialized coils with significant inhomogeneity. We haveproposed a method that retains the speed efficiency ofVFA by using a rapid B1
� mapping method and a simplecalibration curve to correct for these errors. Further-more, we have identified an SNR threshold and haveshown that imaging with three flip angles, tuned to thecover the T1 range of interest, ensures the best use ofscan time to achieve accurate and precise measurementsacross a large T1 range. Our T1 values were accurate andagreed closely with standard inversion-recovery mea-surements. Further validation was obtained from in vivobrain results at 3 Tesla, with T1 measurements in agree-ment with literature values.
APPENDIX A
In deriving the equation for the systematic error in T1 dueto errors in flip angles d�i, we begin with a first-orderapproximation:
dT1 ��T1
��1d�1 �
�T1
��2d�2�. . . �
�T1
��Nd�N � �
i�1
N�T1
��id�i.
[A1]
The T1 estimated depends on the signal Si through theordinates and slope defined in Eq. [2]. Using the chainrule, the dependence of T1 on flip angles �i can be obtainedas follows:
�T1
��i�
�T1
�m�m��i
��T1
�m ��m�Yi
�Yi
��i�
�m�Xi
�Xi
��i�. [A2]
Each term in Eq. [A2] will now be derived. The first termis obtained from Eq. [3]:
�T1
�m�
T12
TRexp(TR/T1). [A3]
Next, the definitions of Xi and Yi given in Eq. [2] are usedto find the two partial terms:
�Yi
��i�
�
��i� Si
sin�i���Yi/tan�i [A4]
�Xi
��i�
�
��i� Si
tan�i���Xi(tan�i�1/tan�i). [A5]
The last two partial terms in Eq. [A2] are determined fromthe definition of the slope m, which follows a least-squaresregression (22):
m�XY � X Y
X2�X2 . [A6]
Equation [A6], together with the definition for the operator
Z� �1N
�i�1
N Zi, are used to find the last two partial terms:
�m�Yi
�Xi � X�
N(X2�X2)[A7]
�m�Xi
�1
N(X2�X2)[Yi � Y� �2exp(�TR/T1)(Xi � X� )]. [A8]
Combining these expressions for partial derivatives intoEqs. [A1] and [A2] gives the final formula in Eq. [5].
APPENDIX B
The precision in T1 can be determined by deriving thevariance �T1
2 due to random errors in the signal. We beginwith the formula for noise propagation (22):
�T1
2 � �i�1
N
�i2��T1
�Si�2
, [A9]
Accurate and Precise VFA T1 Mapping 573

where �i is the noise level for the image acquired using flipangle �i. Assuming that �i is independent of flip angle andis equal to �, it can be factored outside the summationsign:
�T1
2 ��2�i�1
N ��T1
�Si�2
. [A10]
The partial derivative can be expanded according to thechain rule:
�T1
�Si�
�T1
�m�m�Si
��T1
�m ��m�Yi
�Yi
�Si�
�m�Xi
�Xi
�Si�. [A11]
Each term in Eq. [A11] can be derived in a similar fashionas was done in Appendix A. Equations [A3], [A7], and [A8]still hold, while the remaining two partial derivatives aregiven by
�Xi
�Si�
�
�Si� Si
tan�i� � 1/tan�i [A12]
�Yi
�Si�
�
�Si[
Si
sin�i] � 1/sin�i. [A13]
These expressions are combined into Eqs. [A10] and [A11]to yield
�T12�
�2T14exp(2TR/T1)
M02TR2N2(X2�X2)2
� �i�1
N �Xi � X�
sin�i�
Yi � Y� �2exp(�TR/T1)(Xi � X� )tan�i
�2
. [A14]
ACKNOWLEDGMENTS
The authors thank Eric Han (Applied Science LaboratoryWest, GE Healthcare, Menlo Park, CA, USA) for helpfuladvice on pulse sequence manipulation.
REFERENCES
1. Crawley AP, Henkelman RM. A comparison of one-shot and recoverymethods in T1 imaging. Magn Reson Med 1988;7:23–34.
2. Haase A. Snapshot FLASH MRI. Applications to T1, T2, and chemical-shift imaging. Magn Reson Med 1990;13:77–89.
3. Look DC, Locker DR. Time saving in measurement of NMR and EPRrelaxation times. Rev Sci Instrum 1970;41:250–251.
4. Christensen KA, Grand DM, Schulman EM, Walling C. Optimal deter-mination of relaxation times of Fourier transform nuclear magneticresonance. Determination of spin-lattice relaxation times in chemicallypolarized species. J Phys Chem 1974;78:1971–1977.
5. Wang HZ, Riederer SJ, Lee JN. Optimizing the precision in T1 relax-ation estimation using limited flip angles. Magn Reson Med 1987;5:399–416.
6. Deoni SC, Rutt BK, Peters TM. Rapid combined T1 and T2 mappingusing gradient recalled acquisition in the steady state. Magn Reson Med2003;49:515–526.
7. Deoni SC, Peters TM, Rutt BK. High-resolution T1 and T2 mapping ofthe brain in a clinically acceptable time with DESPOT1 and DESPOT2.Magn Reson Med 2005;53:237–241.
8. Kay I, Henkelman RM. Practical implementation and optimization ofone-shot T1 imaging. Magn Reson Med 1991;22:414–424.
9. Venkatesan R, Lin W, Haacke EM. Accurate determination of spin-density and T1 in the presence of RF-field inhomogeneities and flip-angle miscalibration. Magn Reson Med 1998;40:592–602.
10. Parker GJ, Barker GJ, Tofts PS. Accurate multislice gradient echo T(1)measurement in the presence of non-ideal RF pulse shape and RF fieldnonuniformity. Magn Reson Med 2001;45:838–845.
11. Deoni SC, Peters TM, Rutt BK. Determination of optimal angles forvariable nutation proton magnetic spin-lattice, T1, and spin-spin, T2,relaxation times measurement. Magn Reson Med 2004;51:194–199.
12. Zur Y, Stokar S, Bendel P. An analysis of fast imaging sequences withsteady-state transverse magnetization refocusing. Magn Reson Med1988;6:175–193.
13. Henkelman RM. Measurement of signal intensities in the presence ofnoise in MR images. Med Phys 1985;12:232–233.
14. Homer J, Beevers MS. Driver-equilibrium single-pulse observation ofT1 relaxation. A re-evaluation of a rapid “new” method for determiningNMR spin-lattice relaxation times. J Magn Reson 1985;63:287–297.
15. Homer J, Roberts JK. Conditions for the driven equilibrium single pulseobservation of spin-lattice relaxation times. J Magn Reson 1987;74:424–432.
16. Insko EK, Bolinger L. Mapping of the radiofrequency field. J MagnReson A 1993;103:82–85.
17. Stollberger R, Wach P. Imaging of the active B1 field in vivo. MagnReson Med 1996;35:246–251.
18. Wang J, Qiu M, Constable RT. In vivo method for correcting transmit/receive nonuniformities with phased array coils. Magn Reson Med2005;53:666–674.
19. Brookes JA, Redpath TW, Gilbert FJ, Murray AD, Staff RT. Accuracy ofT1 measurement in dynamic contrast-enhanced breast MRI using two-and three-dimensional variable flip angle fast low-angle shot. J MagnReson Imaging 1999;9:163–171.
20. Ishimori Y, Kimura H, Uematsu H, Matsuda T, Itoh H. Dynamic T1estimation of brain tumors using double-echo dynamic MR imaging. JMagn Reson Imaging 2003;18:113–120.
21. Scheffler K, Hennig J. T(1) quantification with inversion recovery True-FISP. Magn Reson Med 2001;45:720–723.
22. Bevington PR. Data reduction and error analysis for the physical sci-ences. McGraw–Hill, New York, 1969; pp. 99–108.
23. Stanisz GJ, Odrobina EE, Pun J, Escaravage M, Graham SJ, Bronskill MJ,Henkelman RM. T(1), T(2) relaxation and magnetization transfer intissue at 3T. Magn Reson Med 2005;54:507–512.
24. Ethofer T, Mader I, Seeger U, Helms G, Erb M, Grodd W, Ludolph A,Klose U. Comparison of longitudinal metabolite relaxation times indifferent regions of the human brain at 1.5 and 3 Tesla. Magn ResonMed 2003;50:1296–1301.
25. Wansapura JP, Holland SK, Dunn RS, Ball WS. NMR relaxation timesin the human brain at 3.0 tesla. J Magn Reson Imaging 1999;9:531–538.
574 Cheng and Wright


