Embed Size (px)
Citation preview

www.elsevier.com/locate/optmat
Optical Materials 27 (2005) 1762–1770
Rare earths in nanocrystalline glass–ceramics
F. Lahoz a, I.R. Martın a, U.R. Rodrıguez-Mendoza a, I. Iparraguirre b, J. Azkargorta b,A. Mendioroz b, R. Balda b,c,d, J. Fernandez b,c,d, V. Lavın a,*
a Departamento de Fısica Fundamental y Experimental, Electronica y Sistemas, Universidad de La Laguna, E-38200 La Laguna, Tenerife, Spainb Departamento de Fısica Aplicada I, Escuela Superior de Ingenieros, Alda, Urquijo s/n, 48013 Bilbao, Spain
c Centro Mixto CSIC-UPV/EHU, P. Manuel de Lardizabal 3, 20018 Donostia, Spaind Donostia International Physics Center (DIPC), P. Manuel de Lardizabal 3, 20018 Donostia, Spain
Received 3 September 2004; accepted 30 November 2004
Available online 19 March 2005
Abstract
The optical spectroscopic analysis of rare earth ions in transparent oxyfluoride glass–ceramics obtained from SiO2–Al2O3–PbF2–
CdF2 based precursor glasses is presented. The oscillator strengths of the optical transitions were measured from the absorption
spectra of glasses and glass–ceramics doped with rare earth ions. The results were analysed in the framework of the Judd–Ofelt the-
ory giving the values of the three X2, X4 and X6 intensity parameters over the rare earth series. On the other hand, high efficient
infrared-to-blue upconversion has been observed in Tm3+–Yb3+ codoped glass and glass–ceramic compared to the Tm3+ single
doped matrices. The contributions to the upconversion process of the rare earth ions in the nanocrystalline and in the vitreous phase
of the glass–ceramics have been distinguished. Finally, laser action in Nd3+-doped glass–ceramic has been studied. Losses due to UV
and visible upconverted emissions inside the laser cavity have been also estimated.
2005 Elsevier B.V. All rights reserved.
PACS: 42.70.a; 81.07.Bc; 78.47.+p; 42.70.Hj; 78.45.+h
Keywords: Spectral intensities; Upconversion; Stimulated emission; Energy transfer; Nanocrystals; Rare earths
1. Introduction
Nowadays, one of the most interesting fields of re-
search is focused on the development of optical devices
based on rare earth (RE) ions doped materials for their
use in telecommunication systems, such as upconversion
fibers, optical amplifiers, solid-state lasers and 3D dis-
plays [1–3]. Efforts have been focus on finding materials
with low-energy phonons, in order to reduce the mul-
tiphonon non-radiative de-excitation and improvecross-sections of the rare earth ions, being the fluoride
and chalcogenide based matrices the common choices.
0925-3467/$ - see front matter 2005 Elsevier B.V. All rights reserved.
doi:10.1016/j.optmat.2004.11.047
* Corresponding author.
E-mail address: [email protected] (Vıctor Lavın).
However, in 1993 Wang and Ohwaki [4] found a new
kind of suitable matrices, i.e. the transparent oxyfluorideglass–ceramics doped with RE ions. These matrices take
advantage of combining various remarkable properties
in one material, since the oxyfluoride glass–ceramic is
a multiphase material that consists of one aluminosili-
cate glassy phase and a fluoride nanocrystalline phase.
The combination of its ease of fabrication and manipu-
lation in air-atmosphere, its large transparency and the
ability to incorporate RE ions in fluoride type nanocrys-tals make this material unique in the field of optical
material engineering [1–3].
The RE-doped oxyfluoride glasses with composition
(in mol%) of 30 SiO2, 15 Al2O3, 29 CdF2, 22 PbF2,
(4 x) YF3 and x REF3 (RE = rare earth) used in this
work were prepared by melting and processing the thor-

F. Lahoz et al. / Optical Materials 27 (2005) 1762–1770 1763
oughly mixed composition in a platinum crucible at
1050 C for 2 h in air and then poured on a stainless
steel plate at room temperature (RT). Although no
controlled atmosphere is necessary and only conven-
tional manipulation cautions are needed, there are some
problems that must be taken into account during theprecursor glass preparation such as spontaneous devitri-
fication, rare-earth clustering or inhomogeneous dopant
distribution [5,6].
Nanocrystalline structures are obtained after a ther-
mally controlled growth of the crystal phase directly in
the glass [1–10]. The transparent oxyfluoride glass–cera-
mic under study was obtained after a thermal treatment
of the precursor glass at 470 C at the onset of the crys-tallization peak for 36 h. Both the precursor glass and
the subsequently obtained glass–ceramic show good
optical quality and a large transparency. Two possibili-
ties exist for producing a transparent glass–ceramic sys-
tem [1,3]. The crystals must be sufficiently small to
produce no effective scattering in the visible range or
optical isotropy must be achieved within the glass–cera-
mic. Tick et al. [7] have analysed the scattering losses ofa Tm3+-doped glass–ceramic optical fiber and concluded
that, although a relatively large refractive index mis-
match of about 0.06 exists between glassy and crystalline
phases, its transparency is because there is less than
10 vol% of crystals in the matrix with sizes of the order
of 10 nm or less. Thus the condition for high transpar-
ency is achieved by the existence of uniformly dispersed
nanocrystals with interparticle spacing of dimensionscomparable to the particle size.
The structural transition expected after a thermal
treatment of the precursor glass can be monitored by
X-ray diffraction. As shown in Fig. 1, along with two
broad curves, typical of structures without long-range
order like glasses, there is a number of narrow and rel-
atively intense peaks that reveals a diffraction pattern
of a crystalline phase. From the analysis of these peaksit has been concluded that this partially crystallized sam-
ple contains cubic fluoride nanocrystallites of the
25 50 75
Inte
nsity
(arb
. uni
ts)
2Theta
GC
G
Fig. 1. X-ray diffraction patterns of oxyfluoride glass (G) and glass–
ceramic (GC).
b-PbF2 phase. This result is in agreement with that
found by Silva et al. in SiO2–PbF2–CdF2 matrices [8],
although Tick et al. [7] have suggested that the crystal
phase in the glass–ceramic under study comprises
PbF2, YF3 and CdF2. From the X-ray diffraction peak
width and using the Scherrer formula, an average sizeof the crystals ranging from 15 to 25 nm has been found
[5,9,10].
On the other hand, Mendez-Ramos et al. [5] and Silva
et al. [8] have demonstrated that in the glass–ceramic the
formation of the b-PbF2 phase is favoured by the incor-
poration of RE ions in the crystalline phase, playing the
role of heterogeneous nucleating agents and partially
replacing the Pb2+ ions. Changes introduced in theRE local structure by the thermal treatment can be
monitored by optical spectroscopic studies, showing
properties that are mainly due to low-energy phonon
environments with higher quantum efficiencies than in
the precursor glass. In the b-PbF2 nanocrystals the lan-
thanide ions enter in two sites of low symmetry with
similar distribution profiles [5], but unfortunately de-
tailed information about the exact low point symmetryof the immediate environment is not available. For
higher doped glass–ceramics, in addition to diluted ions
it has been observed the presence of EuF3 clusters that
favour the energy transfer processes due to the shorten-
ing of distances between RE ions [5].
2. Results and discussion
2.1. Spectral intensities over the rare earth series
The intensities of bands in the absorption and lumi-
nescence spectra of matrices doped with trivalent RE
elements have been successfully characterized by the
Judd–Ofelt theory [11]. The main goal is that the
absorption and emission probabilities between any twostates are given as a function of three intensity, or
Judd–Ofelt, parameters (X2, X4 and X6) that character-
ize a given RE–matrix combination.
The theory considers that the intra-configurational
transitions between 4f states of the RE ions are
mainly electric-dipole in nature and are forced by in-
ter-configurational opposite-parity wave function mix-
ing. However, the physical meaning of the Judd–Ofeltpara- meters and the mechanisms that rule their behavi-
our is still a matter of discussion. In general, the X2
parameter, that describes the hypersensitive transitions,
depends on short-range effects, such as covalency and/or
local structural changes, whereas the X4 and X6 are
long-range parameters that can be related to the bulk
properties of the glass, such as the viscosity or the basi-
city of the matrix [12–14]. Since the f orbitals areshielded from the environment, correlations of the
intensity parameters with the chemical nature of the

1764 F. Lahoz et al. / Optical Materials 27 (2005) 1762–1770
lanthanide–ligand bond or the local structure of the RE
ions are difficult [14]. However, it is accepted that the X2
parameter increases with increasing covalency [12,13],
while Tanabe et al. [13] have found the opposite trend
for the X6 parameter.
The Judd–Ofelt parameters obtained for different REions (Pr3+, Nd3+, Ho3+, Er3+ and Tm3+) as a function of
the increasing number of electrons in the 4f shell in the
oxyfluoride glass and glass–ceramic under study are
shown in Fig. 2 [6,9,15–17]. For both matrices a decreas-
ing trend is observed for the X4 and X6 parameters as the
number of 4f-electrons increases. On the other hand, the
X2 parameter shows a slight increase, except for the Pr3+
ion, in contradiction to the scattered behaviour usuallyreported in other matrices [18]. Moreover, changes in
the values found in the glass–ceramic compared to that
in the glass are also clearly observed, especially for the
X2 hypersensitive parameter, which will be related to
changes in the nature of the local environment.
The Judd–Ofelt theory may explain the gradual de-
crease of the X4 and X6 parameters with the increasing
number of f-electrons [14,18]. Taking into account onlya static wave function mixing perturbation between the
ground and the excited configuration, the Judd–Ofelt
parameters are given by [18]
2 4 6 8 10 12
0
2
4
0
2
4
0
2
4
6
8
Number of f-electron
2
4
Rare earth ionPr 3+ Nd3+ Pm3+ Sm3+ Eu3+ Gd3+ Tb3+ Dy3+ Ho3+ Er3+ Tm3+
Ω
Ω
Ω
6
Judd
-Ofe
lt pa
ram
eter
(x 1
0-20
cm2 )
Fig. 2. Variations of the Judd–Ofelt parameters of rare earth doped
oxyfluoride glass (j) and glass–ceramic (h) with the number of 4f
electrons. X2 values for the rare earth doped fluorzincate glass (>)
have been also included for comparison.
Xk ¼ ð2kþ 1ÞX
k;q
1
2k þ 1jAkqj2N2ðk; kÞ
/X
k;q;l0jAkqj2
h4f jrjn0l0ihn0l0jrkj4fiDEðU00Þ ð1Þ
where the Akq are the odd crystal-field parameters
(Bkq = rkAkq) that depend on the nature, symmetry and
strength of the ion–ligand interaction in the host and
N(k,k) includes monoelectronic radial integrals, energy
difference between configurations and 3j and 6j symbolsthat characterizes the inter-configurational (4fN M
4fN1n 0l 0) interaction.
When analysing a series of RE ions doped into the
same matrix, ideally the crystal-field is constant and
the decrease in the values of the Judd–Ofelt parameters
has to be related to the decrease of the N parameter.
Krupke [19] analysed the variation of the inter-configu-
rational parameter and observed that the radial overlapintegrals in Eq. (1) decrease from Pr3+ to Tm3+ while the
energy gap between ground and excited configurations
increases, giving rise to an overall decrease of the X4
and X6 parameters. This behaviour is due to the lantha-
nide contraction and it has its origin in the fact that the
filling of the 4f orbitals through the RE series poorly
screens the increasing nuclear charge. Thus the increas-
ing effective nuclear charge strongly attracts the outerelectrons and gives rise to a decrease in the dimensions
of the RE electron shells and in the radial integrals over
the series. On the other hand, the anomalous behaviour
of the X2 parameter could be related to the influence of
the local environments through dynamic perturbation
mechanisms.
It is worth noting that, except for Pr3+, all the RE
hypersensitive bands systematically show a strong de-crease in their oscillator strengths in the glass–ceramic
compared to their values in the precursor glass
[6,9,15–17]. This overall decrease is reflected in the
change of the X2 parameter, which is known to show
hypersensitivy with the nature of the local environment.
On the contrary, all the other oscillator strengths in-
crease after the thermal treatment, giving rise to slightly
larger X4 and X6 parameters.As pointed out by Binnemans and Gorller-Walrand
[14], the Judd–Ofelt intensity parameters do not depend
to large extends on the cations (Al2O3, PbF2 or CdF2) in
the matrix but on the nature of the coordinating anions
around the RE ion. Since the analysis of the crystal-field
strength is not clear enough to draw a quantitative mea-
surement of the change in the strength of the RE–ligand
interaction in the glass and the glass–ceramic [5], thusthis overall decrease of the Judd–Ofelt parameters in
the glass–ceramic can be related to the incorporation
of the RE ions into fluoride nanocrystals. The change
from a covalent bond of RE ions with the oxide ligands
found in the glass to a more ionic (less covalent) bond

0
5
10
15
20
Tm3+ Yb3+
475
nm
ET
2F7/2
2F5/2
1G4
3F2,33H4
3H53F4
3H6
BT
GSA 10
00 n
m
Ener
gy (x
103
cm-1
)
Fig. 4. Energy level diagrams of the Tm3+ and Yb3+ ions. The ground
state absorption (GSA), the energy transfer (ET), backtransfer (BT)
and the emission channels are also included.
F. Lahoz et al. / Optical Materials 27 (2005) 1762–1770 1765
with fluoride ions in the nanocrystalline glass–ceramic
would explain the decrease of the X2 parameter and
the increase of the X6 (and X4) one [13]. Moreover, sur-
prisingly the RE-doped fluorzincate glasses practically
fit the Judd–Ofelt parameters over the RE series in the
glass–ceramic (also included in Fig. 2) [14].
2.2. Thulium–ytterbium upconversion mechanisms
Blue upconverted emission centred at 475 nm has
been observed in Tm3+ single-doped and Tm3+–Yb3+
codoped oxyfluoride glasses and glass–ceramics under
near-IR excitation at around 790 nm [20]. The most in-
tense emissions correspond to the Tm3+–Yb3+ codopedglasses, being three orders of magnitude larger than
the Yb3+-free glasses with low concentrations of Tm3+,
while the codoped glass–ceramics give place to an emis-
sion about four times weaker (Fig. 3). Moreover, the
emission from the Yb3+ ions can be also observed in
the codoped samples after IR excitation at 790 nm
(Fig. 3), showing that energy transfer processes from
Tm3+ to Yb3+ ions exist. In fact, measurements of theYb3+ ion luminescence decay as a function of the
Tm3+ concentration also confirm the existence of an en-
ergy backtransfer (BT) process from Yb3+ to Tm3+ ions.
For the Tm3+–Yb3+ codoped glasses the intensities of
these anti-Stokes and Stokes emissions have been stud-
ied as a function of the 790 nm pump power. A linear
dependence found for the Yb3+ emission suggests a
one-excitation photon process whereas the intensity ofthe blue Tm3+ emission increases with the excitation
density to the power of 1.5 indicating a two-excitation
photon process. The sequence of the processes involved
0.0 0.5 1.01
10
100
1000
450 500 1000 1100
GC
Upc
onve
rsio
n in
tens
ity (a
rb. u
nits
)
G
GC
GYb3+-free
2F5/22F7/2
1D23F4
GC
G
Inte
nsity
(arb
. uni
ts)
Wavelength (nm)
1G43H6
2.5 mol% Yb3+ Tm3+ upconversion Yb3+ emission
Tm3+ (mol%)
Fig. 3. Tm3+ upconverted emission and Yb3+ emission at RT under
excitation at 790 nm in a 1 mol% Tm3+–2.5 mol% Yb3+ oxyfluoride
glass (G) and glass–ceramic (GC). The dependence of the blue
upconverted emission on the Tm3+ concentration in single and
codoped matrices is also included.
is given in Fig. 4. Under direct excitation around 790 nm
a ground state absorption (GSA) populates the 3H4 level
of Tm3+, from which some Tm3+ ions initiate a non-res-
onant, phonon-assisted energy transfer (ET) to Yb3+
ions. Due to energy migration among Yb3+ ions, the
excitation energy travels from one Yb3+ to a neighbour
one until it reaches a Tm3+ ion in the 3H4 excited state,acting as a trap. Then, there is a backtransfer (BT) pro-
cess in which the de-excitation energy of an excited Yb3+
ion is transferred to the excited Tm3+ ion, which finally
promotes to the higher 1G4 level. This scheme agrees
with the mechanism proposed for the 475 nm emission
under excitation at about 800 nm in different Tm3+–
Yb3+ codoped matrices [21,22].
However, the different upconversion intensities ob-served in the glass–ceramic matrices compared to the
precursor glasses suggest a strong influence of the dop-
ant local environments, since different optical properties
are expected for the RE ions placed in glassy or in
crystalline phases. An additional factor is the dopant
concentration, which gives rise to important energy
transfer processes that also influence the optical proper-
ties of the RE ions. In fact, both effects are present in theglass–ceramic matrices, thus it is important to find out
the dopant distribution in the glassy and in the crystal-
line phases and their contributions to the upconversion
process.
As a first step in this analysis, room temperature opti-
cal absorption measurements have been carried out
in single Tm3+ and in Tm3+–Yb3+ codoped glass and
glass–ceramic samples with different dopant concentra-tions [20]. Similar spectra are observed for the 0.1 and
1 mol% Tm3+ doped and codoped glass and glass–cera-
mic matrices. The changes in the absorption bands be-
tween the glass and the glass–ceramic evidence a new
environment around the rare earth impurities in the
glass–ceramics which does not exist in the glasses. This
feature is evident in the absorption spectra of the
1 mol% Tm3+–2.5 mol% Yb3+ codoped glass and
750 770 790 810 750 770 790 810 830
G
Inte
nsity
(arb
. uni
ts)
Wavelength (nm)
3H63H4
abs
exc G
GC
GCexc
abs
3H63H4
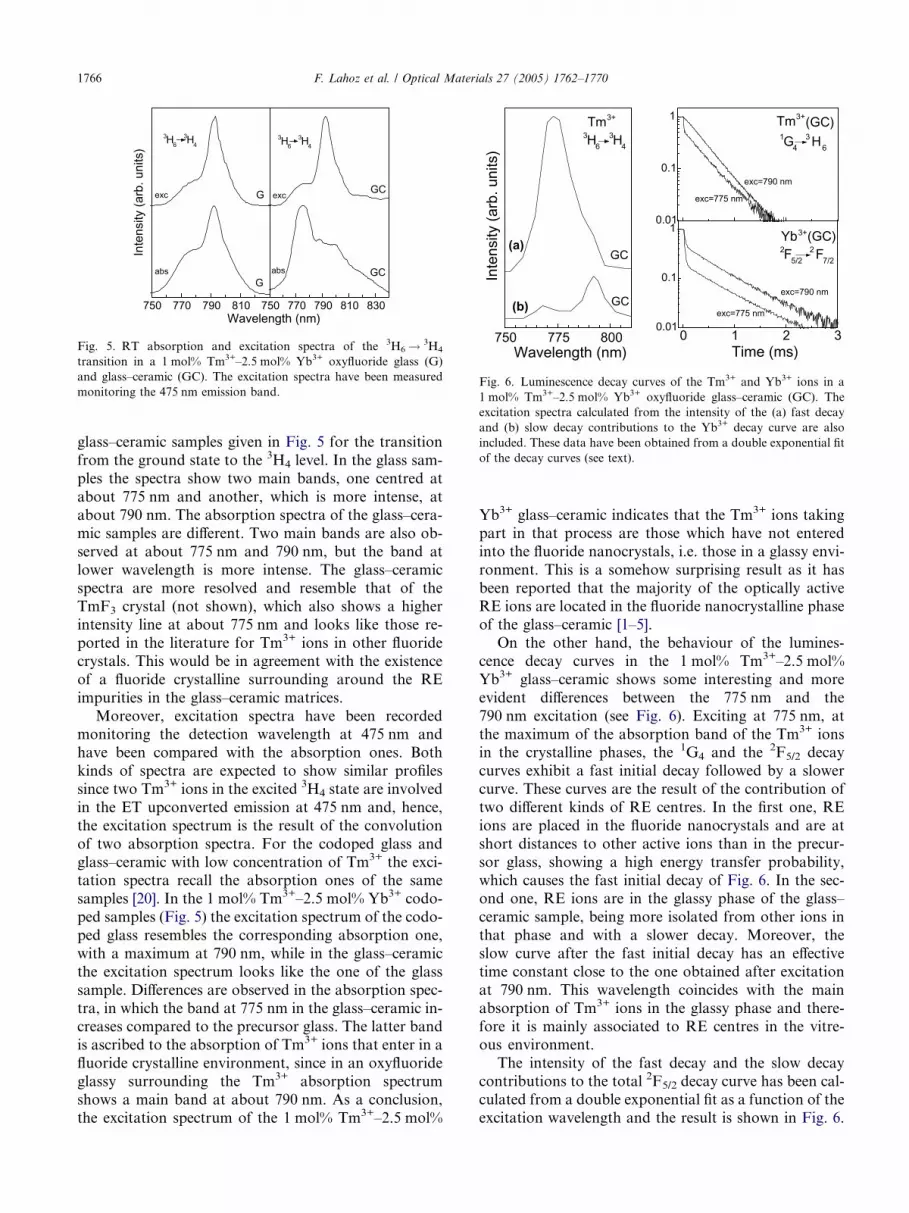
Fig. 5. RT absorption and excitation spectra of the 3H6 ! 3H4
transition in a 1 mol% Tm3+–2.5 mol% Yb3+ oxyfluoride glass (G)
and glass–ceramic (GC). The excitation spectra have been measured
monitoring the 475 nm emission band.
750 775 800 0 1 2 30.01
0.1
10.01
0.1
1
GC
Inte
nsity
(arb
. uni
ts)
Wavelength (nm)
3H63H4
Tm3+
GC
(a)
(b)
Time (ms)
2F5/22 F7/2
Yb3+ (GC)
exc=790 nm
exc=775 nm
1G43 H6
Tm3+ (GC)
exc=790 nm
exc=775 nm
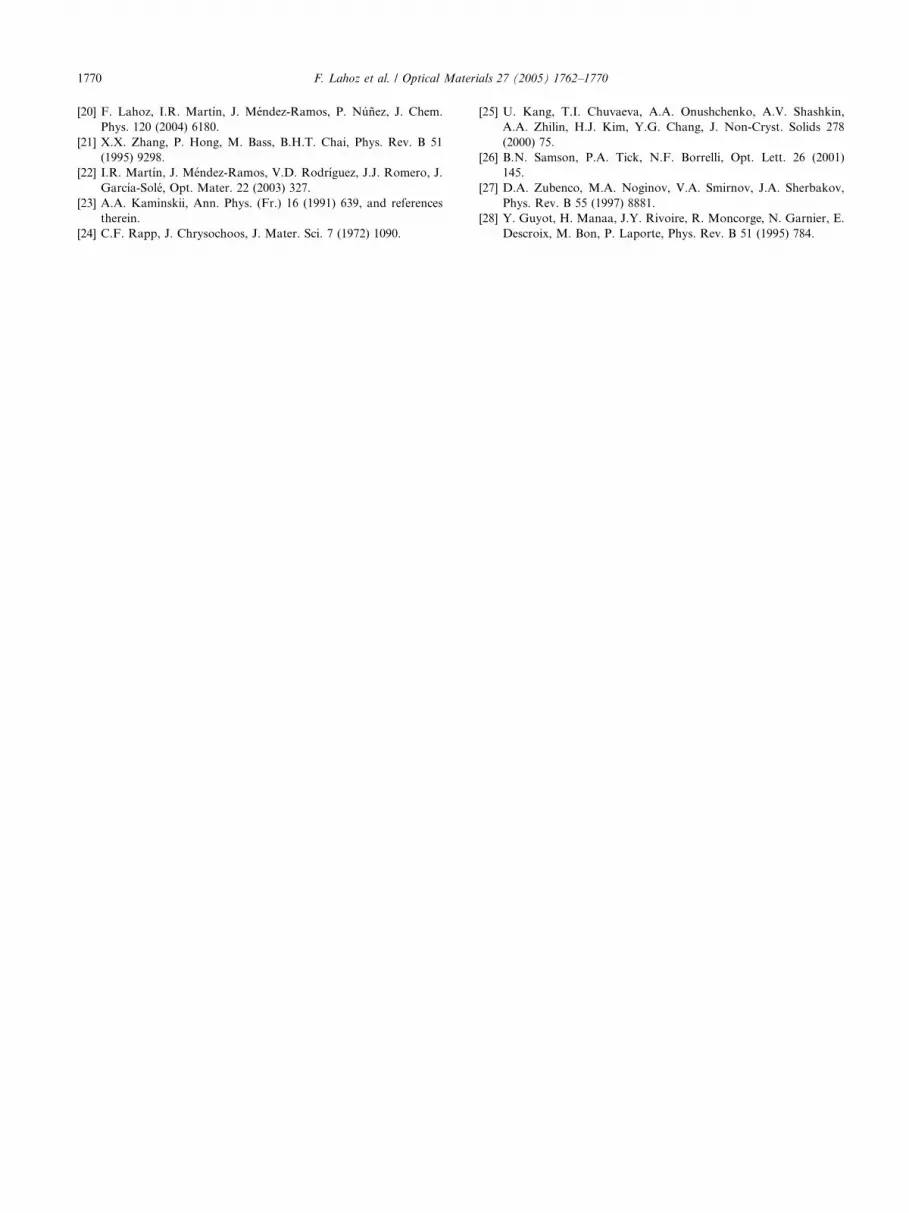
Fig. 6. Luminescence decay curves of the Tm3+ and Yb3+ ions in a
1 mol% Tm3+–2.5 mol% Yb3+ oxyfluoride glass–ceramic (GC). The
excitation spectra calculated from the intensity of the (a) fast decay
and (b) slow decay contributions to the Yb3+ decay curve are also
included. These data have been obtained from a double exponential fit
of the decay curves (see text).
1766 F. Lahoz et al. / Optical Materials 27 (2005) 1762–1770
glass–ceramic samples given in Fig. 5 for the transition
from the ground state to the 3H4 level. In the glass sam-
ples the spectra show two main bands, one centred at
about 775 nm and another, which is more intense, at
about 790 nm. The absorption spectra of the glass–cera-
mic samples are different. Two main bands are also ob-
served at about 775 nm and 790 nm, but the band at
lower wavelength is more intense. The glass–ceramicspectra are more resolved and resemble that of the
TmF3 crystal (not shown), which also shows a higher
intensity line at about 775 nm and looks like those re-
ported in the literature for Tm3+ ions in other fluoride
crystals. This would be in agreement with the existence
of a fluoride crystalline surrounding around the RE
impurities in the glass–ceramic matrices.
Moreover, excitation spectra have been recordedmonitoring the detection wavelength at 475 nm and
have been compared with the absorption ones. Both
kinds of spectra are expected to show similar profiles
since two Tm3+ ions in the excited 3H4 state are involved
in the ET upconverted emission at 475 nm and, hence,
the excitation spectrum is the result of the convolution
of two absorption spectra. For the codoped glass and
glass–ceramic with low concentration of Tm3+ the exci-tation spectra recall the absorption ones of the same
samples [20]. In the 1 mol% Tm3+–2.5 mol% Yb3+ codo-
ped samples (Fig. 5) the excitation spectrum of the codo-
ped glass resembles the corresponding absorption one,
with a maximum at 790 nm, while in the glass–ceramic
the excitation spectrum looks like the one of the glass
sample. Differences are observed in the absorption spec-
tra, in which the band at 775 nm in the glass–ceramic in-creases compared to the precursor glass. The latter band
is ascribed to the absorption of Tm3+ ions that enter in a
fluoride crystalline environment, since in an oxyfluoride
glassy surrounding the Tm3+ absorption spectrum
shows a main band at about 790 nm. As a conclusion,
the excitation spectrum of the 1 mol% Tm3+–2.5 mol%
Yb3+ glass–ceramic indicates that the Tm3+ ions taking
part in that process are those which have not entered
into the fluoride nanocrystals, i.e. those in a glassy envi-
ronment. This is a somehow surprising result as it has
been reported that the majority of the optically activeRE ions are located in the fluoride nanocrystalline phase
of the glass–ceramic [1–5].
On the other hand, the behaviour of the lumines-
cence decay curves in the 1 mol% Tm3+–2.5 mol%
Yb3+ glass–ceramic shows some interesting and more
evident differences between the 775 nm and the
790 nm excitation (see Fig. 6). Exciting at 775 nm, at
the maximum of the absorption band of the Tm3+ ionsin the crystalline phases, the 1G4 and the 2F5/2 decay
curves exhibit a fast initial decay followed by a slower
curve. These curves are the result of the contribution of
two different kinds of RE centres. In the first one, RE
ions are placed in the fluoride nanocrystals and are at
short distances to other active ions than in the precur-
sor glass, showing a high energy transfer probability,
which causes the fast initial decay of Fig. 6. In the sec-ond one, RE ions are in the glassy phase of the glass–
ceramic sample, being more isolated from other ions in
that phase and with a slower decay. Moreover, the
slow curve after the fast initial decay has an effective
time constant close to the one obtained after excitation
at 790 nm. This wavelength coincides with the main
absorption of Tm3+ ions in the glassy phase and there-
fore it is mainly associated to RE centres in the vitre-ous environment.
The intensity of the fast decay and the slow decay
contributions to the total 2F5/2 decay curve has been cal-
culated from a double exponential fit as a function of the
excitation wavelength and the result is shown in Fig. 6.

1049 1051 1053 1055 1057 1059
0 25 50 75 1000.01
0.1
1
Inte
nsity
(arb
. uni
ts)
Time ( µs)
Exc= 869 nmEm= 1057 nm
RT
20 30 40 500.0
0.5
1.0
Lase
r ene
rgy
(mJ)
NIR pump energy (mJ)
Inte
nsity
(arb
. uni
ts)
Wavelength (nm)
4 F3/24I11/2
Fig. 7. 4F3/2 ! 4I11/2 stimulated emission spectrum in the oxyfluoride
glass–ceramic doped with 1 mol% of Nd3+ ions at RT. Inset figures
give the laser energy of the oxyfluoride glass–ceramic as a function of
the pump energy by using a 90% reflectivity flat output mirror and the4F3/2 ! 4I11/2 fluorescence decay recorded after high-pumping power at
869 nm. The fit of the experimental result using Eq. (2) is also included.
F. Lahoz et al. / Optical Materials 27 (2005) 1762–1770 1767
The excitation spectra obtained from fast decay part of
the curve has a maximum at 775 nm and coincides with
the absorption spectrum of Tm3+ ions located in the
fluoride nanocrystals of the glass–ceramic, whereas the
excitation band obtained from the slow decay curve
has a minor band at 775 nm and a more intense one atabout 792 nm and agrees with the absorption of Tm3+
ions in a glassy environment [20]. These spectra defini-
tively confirm the above hypothesis of the different con-
tributions of RE in the fluoride nanocrystals and in the
glassy phase. The ratio of Tm3+ ions in the crystalline to
the glassy phases in the 1 mol% Tm3+–2.5 mol% Yb3+
glass–ceramic can be estimated from the spectra of
Fig. 6. The area of the spectrum calculated from theintensity of the fast decay curve is approximately 5.7
times larger than that calculated from the intensity of
the slow decay curve. Thus it can be concluded that
around 85% of the Tm3+ ions are located in the nano-
crystals and around 15% in the glassy phase. It is worth
noting that the same result has been found using time-
resolved measurements in NdF3-doped glass–ceramic
[6].The lower intensity of the blue upconverted emission
in the glass–ceramic compared to the glass sample can
be understood now in the frame of this Tm3+ ions distri-
bution analysis. The population of Tm3+ ions in the ex-
cited states in the nanocrystalline phase is depleted by
efficient cross-relaxation processes and, for this reason,
their probability to participate in the upconversion
mechanism is low. In fact, the excitation spectrum ofthe glass–ceramic (Fig. 5) indicates that the Tm3+ cen-
tres, which take part in the upconversion process, are
host in the glassy phase. As around 15% of the Tm3+
content in the precursor glass is located in the vitreous
phase of the glass–ceramic, this explains its relatively
lower intensity. On the other hand, it has been found
that RE ions in the nanocrystalline phase of the
0.1 mol% Tm3+–2.5 mol% Yb3+ glass–ceramic partici-pate in the upconversion mechanism and that the rela-
tive intensity of the blue emission is higher for the low
Tm3+ codoped samples [20], as shown in Fig. 3. The
lower upconversion intensity of the 0.1 mol% Tm3+–
2.5 mol% Yb3+ glass–ceramic compared to the precursor
glass is attributed to the lower energy phonons in the
fluoride environment of the precipitated nanocrystals
compared to the oxide vitreous surrounding, which im-plies more phonons in the non-resonant energy transfer
process and, therefore, the process becomes less efficient.
2.3. Stimulated emission in neodymium-doped
nanocrystals
Trivalent neodymium is the most widely studied lan-
thanide ion both in crystals and glasses, especially fortheir laser applications since it offers the possibility of
UV, blue, green, orange, red, and IR emission channels
according to a four-level scheme by direct excitation or
by upconversion processes [23]. However, to our knowl-
edge, only very few works are concerned with laserproperties of Nd3+ in glass–ceramics [24–26].
The laser output spectrum was measured for the cera-
mic and glass samples doped with 1 mol% of Nd3+ in-
side a 15 cm long symmetrical confocal resonator with
high reflectivity coated mirrors and longitudinally
pumped with a tunable Ti:sapphire laser (9 ns pulse
width) pumped by a frequency-doubled pulsed Nd:YAG
laser [10]. Fig. 7 shows the laser spectrum of the Nd3+
ions in the glass–ceramic, showing a maximum around
1056.5 nm. It is worth noting that the transition energy
is closer to that found in Nd:YLF at 1053 nm than to
the one in Nd:YAG at 1064 nm. The ceramic sample
showed a pumping threshold of around 10 mJ, signifi-
cantly lower than the value around 17 mJ found for
the glass. Moreover, using an output flat coupler of
90% reflectivity, the slope of the laser energy of theNd3+ ions in the glass–ceramic was measured as a func-
tion of pump energy (see upper inset in Fig. 7) giving rise
to a threshold pump energy of 18 mJ and a dynamical
slope about 5% in this resonator.
Together with the laser emission, the IR pumping
pulse also generates visible light with a white–yellow
colour. Since its origin is due to an IR photon flux exci-
tation, this UV–visible luminescence is produced byupconversion processes and is a photon loss source for
laser action in the system. The emission spectrum shows
three main bands in the visible centred around 530, 589,
and 660 nm together with less common UV-A and blue
emissions centred around 360, 390, 415, 430 and 450 nm
(Fig. 8). Calculations have been performed to place the
colour of the UV–visible upconverted emission of the

400 500 600 800 850 900
2P1/2 4I9/2
2P3/2 4I9/2
4D3/2 4I11/2
Inte
nsity
(arb
. uni
ts)
Wavelength (nm)
4G7/2 4I11/2
4G7/2 4I13/2
4G7/24I9/2
2P3/2 4I9/2
4D3/2 4I11/2
0.0 0.2 0.4 0.6 0.80.0
0.2
0.4
0.6
0.8
y
- chr
omat
icity
coo
rdin
ate
x - chromaticity coordinate
Red
Blue
Green
White
exc
exc
em= 411 nm
4I9/2 4F3/2
4I9/2 4F5/2
em= 589.5 nm
abs
λ
λ
Fig. 8. UV-A and visible emission spectra obtained under IR
excitation at 798 nm in resonance with the 4F5/2 level for the
oxyfluoride glass–ceramic doped with 1 mol% of Nd3+ at RT. Inset
figure shows the colour coordinate of the upconverted emission in the
CIE 1931 chromaticity diagram.
0
5
10
15
20
25
304D3/2
4D1/24D5/2,2I11/2
2P3/2
2D5/2,2P1/2
4G9/2,11/22G9/2,4G7/2
2D3/2
4G5/2,2G7/22H11/24F9/24F7/2,4S3/24F5/2,2H9/24F3/2
4I15/24I13/24I11/2
ETU
(3-N
d3+)
ESA
ETU
(2-N
d3+)
GSA
1056
.5 n
m
4I9/2
Ener
gy (x
103 c
m-1
)
Fig. 9. Energy level diagram of the Nd3+ ions. The ground state
absorption (GSA), the energy transfer (ET), the excited state absorp-
tion (ESA) and the emission channels are also included.
1768 F. Lahoz et al. / Optical Materials 27 (2005) 1762–1770
Nd3+-doped oxyfluoride glass–ceramic in the Commis-
sion Internationale de lEclairage (CIE 1931) x–y chro-
maticity diagram. The overall colour, due to all the
emission bands, has been characterized by the calcula-
tion of the chromaticity coordinates, i.e. x = 0.437 and
y = 0.462, giving rise to a point that lies just in the yel-
low border of the white region (see inset in Fig. 8). Thiskind of emission can only be expected in low-energy
phonon environments and confirms the effective parti-
tioning of the Nd3+ ions in the fluoride nanocrystals.
The dependence of the upconverted emission intensity
on the pump power under IR excitation for the visible
lines is nearly quadratic, indicating that a 2-photon or
a 2-Nd3+ ion upconversion process is the responsible
for the green, orange, and red lines, whereas it is higherthan two for the blue emissions. The latter therefore need
more than two infrared photons or Nd3+ ions to reach
the emitting levels. Excitation spectra in the 770–
900 nm range monitoring the blue (4D3/2 ! 4I13/2,2P3/2
! 4I11/2) and orange (4G7/2 ! 4I11/2) emission wave-
lengths have been measured and compared with the
absorption spectrum in Fig. 8. No significant differences
between these three spectra are observed for the 4I9/2! 4F3/2 transition, whereas appreciable changes in the
excitation spectra, monitoring both the blue and orange
emissions, with respect to the absorption spectrum are
observed for the 4I9/2 ! 4F5/2 transition. Thus it seems
that ETU is the main mechanism for both transitions,
although for the latter there could be some contribution
of ESA mechanism in the blue emissions. These results
are consistent with the increase in the energy transferprobabilities between RE ions in the glass–ceramic.
Taking into account the Nd3+ energy level diagram,
the dependencies of the emission intensities with IR
pumping power and the excitation energies, the se-
quence of events of the the 2- and 3-Nd3+ ion ETU pro-
cesses in this glass–ceramic can be tentatively drawn in
Fig. 9. Contributions of 2- and 3-photon ESA processes
have been also included.
On the other hand, the laser losses produced by these
upconversion emissions were also analysed by usingtime-resolved spectroscopy. As an example, Fig. 10
shows the decay curves of the blue upconverted emission
obtained with and without laser action inside the reso-
nator. As it can be observed, together with the laser
pulse a small increase of the emissions occurs, which
indicates that the losses produced by the laser action
are not very significant. The same behaviour was ob-
served for the rest of upconverted emissions.Finally, the influence of the ETU processes on the IR
(1056.5 nm) emission can be estimated by measuring the
lifetime of the 4F3/2 level under high-pumping powers
(see lower inset in Fig. 7). At the concentration used
in this work, and at weak excitation powers, the decay
curves have a nearly exponential shape giving a lifetime
of 27 ls, whereas as the excitation power increases the
ETU upconversion processes produce an increasingnon-exponentiality behaviour, as can be shown in Fig.
7. The evolution of the population of the 4F3/2 level
may be described by [27]
NðtÞ ¼ N 0 expðt=sÞ1þ W ETUN 0s½1 expðt=sÞ ð2Þ
where N0 is the initial population of the 4F3/2 level, s is
the natural lifetime, and WETU is the upconversionparameter.
As can be observed in Fig. 7, the quality of the fit is
quite good. The calculated upconversion parameter
WETU is about 1015 cm3/s, somewhat greater than

0 50 100 150 200 250
Inte
nsity
(arb
. uni
ts)
Time (ns)
λem= 411 nm
Fig. 10. Experimental decay curves of the blue upconversion emission
at 411 nm obtained under laser action inside the resonator (a) and
without lasing (b) at RT. The dashed line corresponds to the laser
pulse.
F. Lahoz et al. / Optical Materials 27 (2005) 1762–1770 1769
those found in other laser crystals such as Nd:YLF(1.7 · 1016 cm3/s) and Nd:YAG (2.8 · 1016 cm3/s)
[28]. Thus, this result indicates that the ETU processes
are important in the depopulation of the 4F3/2 level at
high-pumping powers and can be considered as a loss
mechanism for laser emission.
3. Summary
A systematic analysis of the RE spectral intensi-
ties in the oxyfluoride glass and glass–ceramic reveals
overall changes in the Judd–Ofelt parameters over
the RE series. The decrease of the X4 and X6 para-
meters with the number of the 4f electrons can be
explained within the frame of the Judd–Ofelt theory
for an isostructural local environment for the RE ionsand an inter-configurational perturbation of static nat-
ure. Structural changes in the nature of the local envi-
ronment, from covalent glassy surroundings to more
ionic fluoride nanocrystals, can explain the differences
observed in the glass–ceramic compared to the precur-
sor glass.
The spectroscopic properties of the Tm3+ and Yb3+
ions in the oxyfluoride glass and glass–ceramic havebeen a useful tool to study the dopant distribution in
the vitreous and crystalline phases in the glass ceramics
and their contribution to the IR-to-blue upconversion
emission observed. These analyses conclude that in the
glass–ceramic more than approximately 85% of the
Tm3+ ions are in the fluoride nanocrystals and less than
15% remain in a glassy surrounding, in good agreement
with time-resolved measurements in NdF3-doped glass–ceramic. This distribution of RE ions gives account for
the decrease of the upconversion intensity in the glass–
ceramic compared to the glass.
Stimulated laser emission at 1056.5 nm associated to
the 4F3/2 ! 4I11/2 transition has been observed in
Nd3+-doped oxyfluoride glass–ceramic with a higher
efficiency compared to the glass. Moreover, the IR exci-
tation also leads to energy transfer upconverted UV-A,
blue, green, orange, and red emissions that can be con-
sidered as loss channels for laser emission. The temporal
evolution of these emissions under lasing conditionsshows a strong intensity increase during the pump pulse
whereas there is no significant contribution from the
laser pulse.
Acknowledgments
This work has been partially supported by Universi-dad de La Laguna (ULL 2004) and Ministerio de
Educacion y Ciencia (MAT 2000–1135 and MAT
2004-6868).
References
[1] M.J. Dejneka, Mater. Res. Soc. Bull. 23 (1998) 57, and references
therein.
[2] W. Holand, G. Beall, Glass–ceramic Technology, The American
Ceramic Society, 2002.
[3] M. Clara Goncalves, L.F. Santos, R.M. Almeida, C.R. Chim. 5
(2002) 845.
[4] Y. Wang, H. Ohwaki, Appl. Phys. Lett. 63 (1993) 3268.
[5] J. Mendez-Ramos, V. Lavın, I.R. Martın, U.R. Rodrıguez-
Mendoza, V.D. Rodrıguez, A.D. Lozano-Gorrın, P. Nunez, J.
Appl. Phys. 89 (2001) 5307;
J. Mendez-Ramos, V. Lavın, I.R. Martın, U.R. Rodrıguez-
Mendoza, V.D. Rodrıguez, A.D. Lozano-Gorrın, P. Nunez, J.
Appl. Phys. 94 (2003) 2295.
[6] M. Abril, J. Mendez-Ramos, I.R. Martın, U.R. Rodrıguez-
Mendoza, V. Lavın, A. Delgado-Torres, V.D. Rodrıguez, P.
Nunez, A.D. Lozano-Gorrın, J. Appl. Phys. 95 (2004) 5271.
[7] P.A. Tick, N.F. Borrelli, I.M. Reaney, Opt. Mater. 15 (2000)
81.
[8] M.A.P. Silva, V. Briois, M. Poulain, Y. Messaddeq, S.L.J.
Ribeiro, J. Phys. Chem. Solids 64 (2003) 95.
[9] R.T. Genova, I.R. Martın, U.R. Rodrıguez-Mendoza, F. Lahoz,
A.D. Lozano-Gorrın, P. Nunez, J. Gonzalez-Platas, V. Lavın, J.
Alloys Compd. 380 (2004) 167.
[10] V. Lavın, I. Iparraguirre, J. Azkargorta, A. Mendioroz, J.
Gonzalez-Platas, R. Balda, J. Fernandez, Opt. Mater. 25 (2004)
201.
[11] B.R. Judd, Phys. Rev. 127 (1962) 750;
G.S. Ofelt, J. Chem. Phys. 37 (1962) 511.
[12] R. Reisfeld, C.K. Jørgensen, Handbook Phys. Chem. Rare Earths
9 (1987) 1.
[13] S. Tanabe, T. Ohyagi, S. Todoroki, T. Hanada, N. Soga, J. Appl.
Phys. 73 (1993) 8451.
[14] C. Gorller-Walrand, K. Binnemans, Handbook Phys. Chem.
Rare Earths 25 (1998) 101.
[15] J. Mendez-Ramos, V. Lavın, I.R. Martın, U.R. Rodrıguez-
Mendoza, J.A. Gonzalez-Almeida, V.D. Rodrıguez, A.D. Loz-
ano-Gorrın, P. Nunez, J. Alloys Compd. 323–324 (2001) 753.
[16] I.R. Martın, private communication (Ho3+).
[17] J. Mendez-Ramos, F. Lahoz, I.R. Martın, A.B. Soria, A.D.
Lozano-Gorrın, V.D. Rodrıguez, Mol. Phys. 101 (2003) 1057.
[18] R.D. Peacock, Struct. Bond. 22 (1975) 83.
[19] W.F. Krupke, Phys. Rev. 145 (1966) 325.
1770 F. Lahoz et al. / Optical Materials 27 (2005) 1762–1770
[20] F. Lahoz, I.R. Martın, J. Mendez-Ramos, P. Nunez, J. Chem.
Phys. 120 (2004) 6180.
[21] X.X. Zhang, P. Hong, M. Bass, B.H.T. Chai, Phys. Rev. B 51
(1995) 9298.
[22] I.R. Martın, J. Mendez-Ramos, V.D. Rodrıguez, J.J. Romero, J.
Garcıa-Sole, Opt. Mater. 22 (2003) 327.
[23] A.A. Kaminskii, Ann. Phys. (Fr.) 16 (1991) 639, and references
therein.
[24] C.F. Rapp, J. Chrysochoos, J. Mater. Sci. 7 (1972) 1090.
[25] U. Kang, T.I. Chuvaeva, A.A. Onushchenko, A.V. Shashkin,
A.A. Zhilin, H.J. Kim, Y.G. Chang, J. Non-Cryst. Solids 278
(2000) 75.
[26] B.N. Samson, P.A. Tick, N.F. Borrelli, Opt. Lett. 26 (2001)
145.
[27] D.A. Zubenco, M.A. Noginov, V.A. Smirnov, J.A. Sherbakov,
Phys. Rev. B 55 (1997) 8881.
[28] Y. Guyot, H. Manaa, J.Y. Rivoire, R. Moncorge, N. Garnier, E.
Descroix, M. Bon, P. Laporte, Phys. Rev. B 51 (1995) 784.


