Embed Size (px)
Citation preview

Durham E-Theses
Raster data structures and topographic data
Adams, Timothy A.
How to cite:
Adams, Timothy A. (1982) Raster data structures and topographic data, Durham theses, DurhamUniversity. Available at Durham E-Theses Online: http://etheses.dur.ac.uk/7689/
Use policy
The full-text may be used and/or reproduced, and given to third parties in any format or medium, without prior permission orcharge, for personal research or study, educational, or not-for-pro�t purposes provided that:
• a full bibliographic reference is made to the original source
• a link is made to the metadata record in Durham E-Theses
• the full-text is not changed in any way
The full-text must not be sold in any format or medium without the formal permission of the copyright holders.
Please consult the full Durham E-Theses policy for further details.
Academic Support O�ce, Durham University, University O�ce, Old Elvet, Durham DH1 3HPe-mail: [email protected] Tel: +44 0191 334 6107
http://etheses.dur.ac.uk

U n i v e r s i t y of Durham Department of Geography
Raster data s t r u c t u r e s and topographic data
A t h e s i s submitted f o r the degree of Doctor of Philosophy
i n the Faculty of Science
by
Timothy A. Adams B.Sc, M.Sc. Graduate Society
June 1982
The copyright of this thesis rests with the author.
No quotation from it should be published without
his prior written consent and information derived
from it should be acknowledged.

ABSTRACT
The use of computers t o a s s i s t i n map-making has been growing f o r two decades; t h e i r speed of o p e r a t i o n , l a r g e data storage c a p a c i t y and f l e x i b i l i t y of usage have been major f a c t o r s i n e s t a b l i s h i n g many development and working computer mapping systems throughout the w o r l d . I n B r i t a i n , the Ordnance Survey has supported a d i g i t a l s o l u t i o n t o the p r o d u c t i o n , storage and d i s p l a y o f l a r g e scale topographic maps since 1972. U n t i l now, the work of the Ordnance Survey - and, indeed, most topographic map-makers i n B r i t a i n who are i n v e s t i g a t i n g d i g i t a l techniques - have adopted a vector-based s t r a t e g y t o d i g i t a l mapping i n which the data are he l d as a se r i e s of c o o r d i n a t e - p o i n t s d e s c r i b i n g the l i n e s shown on the map images. Comparatively l i t t l e work has been undertaken i n B r i t a i n on the use o f raster-based methods o f data capture and storage i n which map images are resolved i n t o a rrays o f small c e l l s or p i c t u r e elements by a p p r o p r i a t e l y tuned scanning devices. This a l t e r n a t i v e s t r a t e g y i s known - from work c a r r i e d out i n other c o u n t r i e s , c h i e f l y the United States - t o be s u i t a b l e f o r some types o f data m a n i p u l a t i o n , although i t s s u i t a b i l i t y f o r Ordnance Survey mapping a p p l i c a t i o n s i s unknown. Very l i t t l e i n v e s t i g a t i o n has been made anywhere i n the world of the manipu l a t i o n o f r a s t e r data s t r u c t u r e s by the r e c e n t l y developed a r r a y processor computers; almost a l l e x i s t i n g work i s r e s t r i c t e d t o the use of t r a d i t i o n a l s e r i a l machines.
This t h e s i s r e p o r t s on a three year study c a r r i e d out i n the U n i v e r s i t y o f Durham t o i n v e s t i g a t e the a p p l i c a b i l i t y of r a s t e r data processing f o r the work o f the B r i t i s h n a t i o n a l mapping o r g a n i s a t i o n . In p a r t i c u l a r , i t describes the d i s t i n c t i o n between ve c t o r and r a s t e r a p p l i c a t i o n s w i t h geographic data and the l i k e l y c h a r a c t e r i s t i c s of s u i t a b l e r a s t e r data s t r u c t u r e s on both s e r i a l and p a r a l l e l computers. A s e c t i o n i s also in c l u d e d which describes the nature o f scanning t r i a l s c a r r i e d out on a number o f commercial devices; i t has thus been p o s s i b l e t o assess not o n l y the l i k e l y advantages and l i m i t a t i o n s o f h a n d l i n g B r i t i s h l a r g e scale map data i n r a s t e r form but also i t s t e c h n i c a l f e a s i b i l i t y . The work r e p o r t s on the l i k e l y volumes of data t o be expected and describes p a r a l l e l a l gorithms f o r operations such as polygon c r e a t i o n (and, i n d i r e c t l y , the c r e a t i o n o f node and l i n k vector f i l e s ) .

ACKNOWLEDGEMENTS
I am indebted t o many i n d i v i d u a l s and or g a n i s a t i o n s who gave f r e e l y of t h e i r time and resources t o enable me t o undertake t h i s research study. Chief amongst them are: The Ordnance Survey and Science and Engineering Research Council f o r j o i n t f i n a n c i a l support under the CASE scheme. Professor D.W. Rhind who has i n s p i r e d and supervised me throughout the e n t i r e p r o j e c t , p r o v i d i n g much patience, concern and d i r e c t i o n over the l a s t three years. B r i g a d i e r C.N. Thompson, Col. S.E.G. Fraser, Messers. P.W. Wesley, I.T. Logan, P.E. Haywood and N.S. Smith of the Ordnance Survey f o r valuable help and advice on survey, mapping and OS-related t e c h n i c a l matters. Dr. J.F. H a r r i s (Oxford U n i v e r s i t y ) , Mr. C. Lloyd (Kongsberg L t d . ) , Dr. W. Pferd ( B e l l L a b o r a t o r i e s ) , Mr. D.G. Smith (USGS) and Mr. R. Brown (Versatec E l e c t r o n i c s ) who provided r e a l assistance on the use of t h e i r r e s p e c t i v e systems w i t h data s p e c i f i c t o the needs of t h i s research.
Dr. R. H a r r i s o f the Geography Department, U n i v e r s i t y of Durham, f o r lengthy discussions on a l l aspects of the work and f o r reading p r e l i m i n a r y d r a f t s of the t h e s i s t e x t . Messers. M. Munro and N.F. H a l l of the Computer U n i t at the U n i v e r s i t y o f Durham f o r advice on a l l aspects of s e r i a l computer programming, t e x t - f o r m a t t i n g and graphics.
Mr. K.A. Smith of the DAP Support U n i t at Queen Mary College, London f o r many hours of help w i t h p a r a l l e l algorithms and DAP programming. Mr. D. Hudspeth who produced the photo-reductions of my computer p l o t s f o r i n c l u s i o n as f i g u r e s i n the t h e s i s . My f i n a l and perhaps g r e a t e s t debt i s to my fiancee, f a m i l y and f r i e n d s from Scunthorpe f o r t h e i r seemingly endless encouragement d u r i n g the l a s t seven years.
Timothy A. Adams June 1982

i
LIST OF CONTENTS
1 THE DIGITAL HANDLING OF TOPOGRAPHIC INFORMATION 1 1.1 The need f o r topographic mapping 1 1.2 A d i g i t a l approach t o topographic mapping 4
1.2.1 The b e n e f i t s o f d i g i t a l mapping 6 1.3 User requirements o f topographic maps 9 1.4 The r o l e o f the Ordnance Survey 11 1.5 The o b j e c t i v e s o f t h i s t h e s i s 16
2 VECTOR DATA STRUCTURES 17 2.1 I n t r o d u c t i o n 17
2.1.1 The view o f the United Kingdom 18 2.2 S p a t i a l data 19
2.2.1 The i n c o r p o r a t i o n o f a t t r i b u t e s 20 2.2.2 Data capture 21
2.3 D i g i t i s i n g procedures . 2 6 2.3.1 Data v a l i d a t i o n 28
2.4 Data o r g a n i s a t i o n and storage 31
2.4.1 A s u i t a b l e data s t r u c t u r e 33 2.4.2 Data c h a r a c t e r i s t i c s 38
2.5 The d i g i t a l mapping approach o f Ordnance Survey . . 44 2.5.1 Preparation stage . . . . . . . . . 48 2.5.2 D i g i t i s i n g stage . . . . . . . . . . . . . . . 49

1 1
2.5.3 E d i t stage 51 2.5.4 Examination and a r c h i v i n g stage 53 2.5.5 Cartographic enhancement stage 54
2.6 The need f o r topology i n the Ordnance Survey data s t r u c t u r e 56
2.7 The r e s t r u c t u r i n g p r o j e c t f o r Ordnance Survey d i g i t a l data 58 2.7.1 The f i l e s t r u c t u r e o f the PMA r e s t r u c t u r i n g
process 60 2.7.2 Uses of the r e s t r u c t u r e d l o w - l e v e l data . . . 63
2.8 The use o f f a s t - d i g i t i s i n g systems a t Ordnance
Survey 66 2.9 Data base management systems and topographic data . 70 2.10 The United States Geological Survey a l t e r n a t i v e f o r
vector-based d i g i t a l mapping 75 2.10.1 The r o l e o f the N a t i o n a l Mapping D i v i s i o n o f
USGS and the N a t i o n a l Mapping Program 77 2.10.2 The d a t a - s t r u c t u r e t o be adopted 79
2.11 Conclusions 82 Appendix 2.1 83
3 RASTER DATA STRUCTURES . 87 3.1 I n t r o d u c t i o n 87 3.2 Raster data r e p r e s e n t a t i o n s . . . . . . . . . . . . 89 3.3 The data capture stage 96
3.3.1 The drum-based p r i n c i p l e o f o p e r a t i o n . . . . 97

i i i
3.3.2 The f l a t - b e d p r i n c i p l e o f op e r a t i o n 98 3.3.3 Appropriate p i x e l r e s o l u t i o n 100
3.4 The implementation o f a raster-based data s t r u c t u r e
3.4.1 Data compaction methods 103 3.5 Some examples o f raster-based a p p l i c a t i o n s other
than ̂ mapping I l l 3.5.1 Grid square-based census mapping I l l 3.5.2 Handling m u l t i s p e c t r a l scanner data . . . . 116
3.6 The r e v i s i o n o f a raster-based topographic data s t r u c t u r e 120
3.7 Raster data h a n d l i n g a p p r o p r i a t e t o map data . . . 122 3.7.1 Basic image a n a l y s i s f o r f e a t u r e r e c o g n i t i o n 127
3.8 User experience 133 3.8.1 A United States view 135 3.8.2 The European view 138
3.9 Conclusions 141
4 COMPARISONS OP RASTER AND VECTOR REPRESENTATIONS . . . . 143 4.1 I n t r o d u c t i o n . . . . . . . . . . 143
4.2 The basic c h a r a c t e r i s t i c s o f data h a n d l i n g . . . . 146 4.2.1 Data e n t r y 146 4.2.2 Data manipulation . . . . . 160 4.2.3 Data p r e s e n t a t i o n . . . . . . . . 169 4.2.4 Data storage . . . . . . . . . . . . . . . . 174
4.3 Summary and conclusions . . . . . . 176

i v
5 THE MANIPULATION OF RASTER DATA ON A SERIAL COMPUTER . . 179 5.1 I n t r o d u c t i o n 179 5.2 A s e r i a l - t y p e computing environment 184 5.3 The development o f a v e c t o r - t o - r a s t e r conversion
system 187
5.3.1 Design aims 188 5.3.2 Theory 192 5.3.3 Some data t r a n s f e r c o n s i d e r a t i o n s 193 5.3.4 Development o f the v e c t o r - t o - r a s t e r conversion
a l g o r i t h m 196 5.3.5 Development o f associated u t i l i t y programs . 199 5.3.6 Software t u n i n g 203
5.4 Data compaction techniques f o r the r a s t e r image . 210
5.4.1 Develoment o f a coded-delta compaction
a l g o r i t h m 213 5.4.2 Software t u n i n g . . . . . 220
5.5 The choice o f p i x e l r e s o l u t i o n 222 5.6 Work a p p l i c a t i o n s r e l a t e d t o OS requirements . . . 232
5.6.1 Some a p p l i c a t i o n s toward l i n k and node d © t © C t X O n • • • o • o o « o • a o « • • o • e o 233
5.6.2 Attempts t o r e b u i l d the r a s t e r data image i n t o a vector f i l e . . . . . . . . . . 2 3 5
5.7 Conclusions . . . . . . . . . . . . . . . . . . . 242 Appendxx 5.1 . . . . . . . . . . . . . . . . . . . 245

V
6 THE MANIPULATION OF RASTER DATA ON A PARALLEL COMPUTER . 248 6.1 I n t r o d u c t i o n 248 6.2 An ar r a y - t y p e computing environment 250
6.2.1 The vect o r or p i p e l i n e a r r a y processor . . . 251 6.2.2 The D i s t r i b u t e d or c e l l u l a r Array Processor 257
6.3 A raster-based data s t r u c t u r e a p p r o p r i a t e t o the ICL DAP 270 6.3.1 The t r a n s f e r o f data t o the ICL 2980 . . . . 274 6.3.2 Data r e f o r m a t t i n g on the DAP 278
6.4 Raster-based mani p u l a t i o n a p p r o p r i a t e t o an array-processor 279 6.4.1 DAP-assisted r a s t e r graphics - an example o f a
p a r a l l e l image processing a l g o r i t h m 281 6.4.2 The automated a d d i t i o n o f topology t o a r a s t e r
image 290 6.5 Conclusions 310
Appendix 6.1 313
7 AN APPRAISAL OF RASTER-DRIVEN HARDWARE 316 7.1 I n t r o d u c t i o n 316
7.2 Scanning t e s t s o f Ordnance Survey l a r g e scale documents 319 7.2.1 The r o l e o f a r a s t e r - d r i v e n data e n t r y system
• • e o e * « e e * o « a o e « s « * a a o 323
7.3 De s c r i p t i o n s o f commercial ra s t e r - s c a n n i n g systems 327 7.3.1 Broomall I n d u s t r i e s I n c . . . . . . . . . . 327

v i
7.3.2 B e l l Telephone Laboratories I n c . 330 7.3.3 Kongsberg L t d . 332 7.3.4 Oxford U n i v e r s i t y Image Analysis Group . . . 336 7.3.5 Scitex Corporation 338 7.3.6 Other scanning devices 340
7.4 An a p p r a i s a l o f e x i s t i n g r a s t e r systems 343 7.4.1 The c h a r a c t e r i s t i c s o f the r a s t e r f i l e s . . 346 7.4.2 The c h a r a c t e r i s t i c s o f the r a s t e r - t o - v e c t o r
conversions 364 7.5 De s c r i p t i o n s o f r a s t e r - d r i v e n output devices . . . 400
7.5.1 Raster-driven r e f r e s h graphics d i s p l a y s . . 401 7.5.2 Raster-driven hard-copy p l o t t e r s 404
7.6 Conclusions 409 Appendix 7.1 416
8 CONCLUSIONS AND IMPLICATIONS FOR A NATIONAL DIGITAL RASTER TOPOGRAPHIC DATA BASE 419 8.1 Summary o f the work 419 8.2 I m p l i c a t i o n s from r e s u l t s o f st u d i e s i n t o the 'sta t e
of the a r t ' o f d i g i t i s i n g systems 421 8.3 I m p l i c a t i o n s from r e s u l t s o f stud i e s i n t o post hoc
manipula t i o n o f scanned data 426 8.4 I m p l i c a t i o n s f o r the n a t i o n a l topographic d i g i t a l
Clclil-Gl IDS S 6 • • • • • • • O » « » » « * » « O « « » « 431
8.4.1 A raster-based data base . . . . . . . . . . 435

v i i
8.4.2 The i n t e r r e l a t i o n between vector and r a s t e r data i n the data base 441
8.5 Suggested areas o f f u r t h e r study 445
BIBLIOGRAPHY 449 LIST OF PERSONAL COMMUNICATIONS 463 ANNEXURES TO CHAPTER 5 (software l i s t i n g s r e l a t i n g
t o t e x t ) 466 ANNEXURES TO CHAPTER 6 (software l i s t i n g s r e l a t i n g
t o t e x t ) 486
N.B. Appendices t o s p e c i f i c chapters appear a t the end of each chapter.
Annexures comprise software l i s t i n g s and appear at the end of the t h e s i s .

v i i i
LIST OF FIGURES
Figure D e s c r i p t i o n Page 1.1 Samples o f OS DMC d i g i t a l data produced w i t h
OS p l o t t i n g software 13+
2.1 Types o f moveable cursor on manual d i g i t i s i n g t a b l e s 23
2.3 D e s c r i p t i o n of the Ordnance Survey (DMB) large
scales d i g i t a l f l o w l i n e 47 2.4 An example o f OS data r e s t r u c t u r i n g 59 2.5 The s t r u c t u r e o f a r e l a t i o n a l data base 70 2.6 The c u r r e n t OS r e s t r u c t u r e d vector data s t r u c t u r e
expressed i n r e l a t i o n a l terms 72 2.7 A t r e e s t r u c t u r e t o store l i n k and node data . . . . 73 2.8 An example o f the complex data base schema
r e q u i r e d t o represent the simplest of vector l i n k and node s t r u c t u r e s 74
2.9 The Ordnance Survey r e s t r u c t u r e d vector data base . . 76 3.1 Some scanning s t r a t e g i e s used by f l a t - b e d scanners . 100 3.2 Indexing w i t h access vectors f o r jaggered arrays . . 107 3.7 The d i s t i n c t i o n between vector and r a s t e r n o t a t i o n . 123 3.8 The r e p r e s e n t a t i o n of p o i n t s , l i n e s and areas
i n r a s t e r mode 124 3.9 The e f f e c t s of four and e i g h t d i r e c t i o n p i x e l
connection 125
i x 3.10 An example of a simple distance t r a n s f o r m a t i o n to
recognise a road carriageway on an OS 1:1250 map . . 132 3.11 The use of distance t r a n s f o r m a t i o n s t o de t e c t a
road j u n c t i o n i n the OS Is 1250 data 133 4.1 Map f e a t u r e d e l i n e a t i o n by nodal end-points 15 7 5.2 C e n t r e - l i n e s o f roads on OS 1:1250 map shown as
(a) crude r a s t e r by l i n e p r i n t e r 200
5.4 The use of one-byte v a r i a b l e s f o r numerical data . . 204 5.6 Example o f a coded-delta compression scheme 213 5.11 The e f f e c t o f p i x e l size on compaction times . . . . 226 5.12 The e f f e c t of p i x e l size on compaction e f f i c i e n c y . . 227 5.13 Percentage r e d u c t i o n of r a s t e r image w i t h p i x e l
s i z e 227 5.14 The e f f e c t of p i x e l size on percentage s p a r s i t y . . . 228 5.15 Percentage s p a r s i t y against percentage r e d u c t i o n
o f r a s t e r b u f f e r 228 5.16 Section of a vector f i l e r e b u i l t from a simulated
r a s t e r image o f OS sheet SO 9283SE . . . . 238 6.1 The basic components of a p i p e l i n e a r r a y processor . 253 6.2 S i m p l i f i e d elements of the ICL D i s t r i b u t e d Array
6.3 A t y p i c a l ICL 2900 c o n f i g u r a t i o n w i t h D i s t r i b u t e d A j r r P r o c e s s o r • « « o o « « <» <> © « <> • « « « « « « 262
6.4 Block diagram showing the modular nature and the sep a r a t i o n between host- and DAP-related sections
(b) vectors on a p e n - p l o t t e r 201
Processor 259
o f t y p i c a l DAP software 268

X
6.5 A h i e r a r c h i c a l data s t r u c t u r e f o r r a s t e r data on a c e l l u l a r a r r a y processor . . . . 272
6.7 Magnetic tape format s u i t a b l e f o r DAP e n t r y . . . . . 276 6.8 A block summary of the graphics r o u t i n e s developed
f o r the DAP 284 6.9 The generation of an index a p p r o p r i a t e t o the
l e v e l 12 data f o r an OS 1:1250 map sheet . . . . . . 286 6.10 A p a r a l l e l a l g o r i t h m t o compress a 64 x 64 image
t o an 8 x 8 287 6.11 Raster d i s p l a y of two p u b l i c b u i l d i n g s at three
data scale l e v e l s 289 6.12 L i n e p r i n t e r r e p r e s e n t a t i o n of two DAP planes w h i l s t
e x t r a c t i n g sub-parcels from a master r a s t e r image o f map data 295
6.13 Raster-to-vector conversion o f sub-parcel boundaries before and a f t e r p o i n t f i l t e r i n g 302
6.14 Example of i n t e r a c t i v e d i s p l a y of Sigma r a s t e r screen showing sub-parcel references w i t h associated s p e c t r a l - t y p e signatures 306
6.15 Types of p i x e l p a t t e r n t o measure shape . 307 6.16 The i n t e r c o n n e c t i o n o f p i x e l c l u s t e r s t o determine
the shape of sub-parcel u n i t s 308 7.2 E x t r a c t of s p e c i a l OS source document used f o r
scanning t r i a l s w i t h t e x t and s t i p p l e removed . . . . 321 7.3 The e f f e c t o f i n c o r r e c t g r e y - l e v e l t h r e s h o l d i n g
w i t h OS map data 325

X I
7.6 E x t r a c t s o f r a s t e r image of OS map generated by B e l l L a b o r a t o r i e s ' EDAD scanner 347+
7.7 E x t r a c t s o f r a s t e r image ( g r e y - l e v e l s ) of OS map generated by Kongsberg KartoScan scanner 351
7.8 E x t r a c t s o f r a s t e r image generated by Scitex Corp. scanner at USGS 355+
7.9 Examples of vector data generated by B e l l L a b o r a t o r i e s conversion software from B e l l r a s t e r data 367+
7.11 Examples o f vector data generated by Kongsberg conversion software from Kongsberg r a s t e r data . . . 374+
7.12 Examples of vector data generated by Oxford U n i v e r s i t y conversion software from Oxford PEPR r a s t e r data 380+
7.13 Examples o f vector data generated by Oxford U n i v e r s i t y conversion software from S c i t e x r a s t e r data 383+
7.14 Examples of vector data generated by USGS conversion software from S c i t e x r a s t e r data 389+
7.15 B e l l Labs, vector data p l o t t e d on F e r r a n t i Master JP l O 1 1 6 2T clil. OS o « « « o * 6 0 o o o « o o « « o o » a 3 9 3
7.16 Kongsberg L t d . vector data p l o t t e d on F e r r a n t i Master p l o t t e r at OS . . . . . 393
7.17 Oxford University/PEPR scanner vector data p l o t t e d
on F e r r a n t i Master p l o t t e r at OS 394 7.18 Oxford University/USGS Scitex scanner vector data
p l o t t e d on F e r r a n t i Master p l o t t e r at OS . . . . . . 394

X l l
7.19 USGS/Scitex scanner vector data ( u n f i l t e r e d )
p l o t t e d on F e r r a n t i Master p l o t t e r at OS 395 7.20 USGS/Scitex scanner vector data ( f i l t e r e d )
p l o t t e d on F e r r a n t i Master p l o t t e r a t OS . . . . . . 395 7.22 E x t r a c t o f a 4096 x 4096 simulated r a s t e r image
p l o t t e d on a Versatec e l e c t r o s t a t i c r a s t e r p l o t t e r . 406 7.23 E x t r a c t o f a 8000 x 8000 Scitex r a s t e r image
p l o t t e d on a Versatec e l e c t r o s t a t i c r a s t e r p l o t t e r . 407 8.2 Suggested data s t r u c t u r e f o r a UK r a s t e r
topographic data base 437 8.3 The basic components of a raster-based topographic
data base system using p a r a l l e l processing techniques 443
N.B. A '+' s i g n attached t o page numbers shows f i g u r e s which overlap on t o consecutive pages.

x i i i LIST OF TABLES
Table D e s c r i p t i o n Page 2.2 E x t r a c t o f codes f o r d i s t r i c t s w i t h i n counties
w i t h i n regions 37 3.3 Comparison o f the bit-map and coded-delta schemas
f o r zero suppression of 100 per cent p o p u l a t i o n census data f o r Durham census county . . . 109
3.4 Comparison of the bit-map and coded-delta schemas f o r zero suppression of OS sheet SO 9283SE held as a 4096 x 4096 r a s t e r byte map 110
3.5 Levels o f index f o r the CRU data base o f 1971 UK p o p u l a t i o n census s t a t i s t i c s by 1 k i l o m e t r e grid-square 115
3.6 User options when requesting remote sensed data from the NASA EROS Data Centre at Sioux F a l l s 117+
5.1 Performance o f the conversion stage f o r a 1:1250 scale vector f i l e 195
5.3 Breakdown o f a 5000 x 5000 r a s t e r image of NZ 2642NE by u t i l i t y RASTER! 202
5.5 The e f f e c t s of software t u n i n g on the v e c t o r - t o -r a s t e r conversion of OS 1:1250 data 209
5.7 Comparison of the c e n t r a l processor times r e q u i r e d t o read a complete r a s t e r image of 5000 x 5000 p i x e l s , s c a n - l i n e by scan-line . . . . . . . . . . . 216
5.8 The e f f e c t s of data compaction on two OS 1:12 50 ITlcip S l * l 6 6 ^ S o © a A o o • • o « o o « e e e o o o • • 2 X 3

x i v
5.9 A summary of the c h a r a c t e r i s t i c s of each s c a n - l i n e
for sheet NZ 2642NE a f t e r coded-delta compaction . . 2 2 1
5.10 The e f f e c t s of p i x e l r e s o l u t i o n on the r a s t e r
image of sheet NZ 2542NE 225
5.17 DEC PDP-10 pr o c e s s times to convert a 4096 x 4096
r a s t e r image of a 1:1250 sheet i n t o v e c t o r form . . 239
6.6 A summary of the storage a s s o c i a t e d with the DAP
h i e r a r c h i c a l data s t r u c t u r e 274
7.1 Summary of^known e x i s t i n g r a s t e r - d r i v e n scanning
systems 318+
7.4 The e f f e c t of scanning r e s o l u t i o n on p i x e l swathes
on the Kongsberg KartoScan 334
7.5 Summary of the c h a r a c t e r i s t i c s of the r a s t e r f i l e s
generated by four t e s t e d scanning systems 345
7.10 Summary of the c h a r a c t e r i s t i c s of the ve c t o r f i l e s
produced by the t e s t e d commercial systems 372
7.21 Summary of the p r o c e s s i n g times n e c e s s a r y for
r a s t e r to vector conversion 398
8.1 E s t i m a t i o n of the l i k e l y s i z e of the GB b a s i c
s c a l e topographic data base 433
N.B. A '+' s i g n attached to page numbers shows t a b l e s
which overlap on to co n s e c u t i v e pages.

XV
GLOSSARY OF ABBREVIATIONS USED IN THE TEXT
DAP ICL D i s t r i b u t e d Array Processor
DMA D i g i t a l Mapping A - f i r s t d i g i t a l f l o w l i n e operated by the Ordnance Survey
DMB D i g i t a l Mapping B - c u r r e n t d i g i t a l f l o w l i n e at Ordnance Survey. Replaced the DMA system i n mid-1970's.
DMC Data format f o r d i g i t a l data s u p p l i e d on magnetic tape to customers by Ordnance Survey
DoE Department of the Environment
ECU NERC Experimental Cartography Unit, Swindon
ETL En g i n e e r i n g Topographic Laboratory, F o r t B e l v o i r
GIMMS Geographic Information Mapping and Manipulation System
GINIS Graphic I n t e r a c t i v e Information System. Data base management software by Kongsberg L t d .
HMSO Her Majesty's S t a t i o n e r y O f f i c e
IGES I n t e r a c t i v e Graphics E d i t i n g System developed by L a s e r - s c a n L a b o r a t o r i e s L t d .
MCE RE Mapping and C h a r t i n g Es t a b l i s h m e n t of the Royal Engineers
MSD Master Survey Document - master record of each b a s i c s c a l e map i n GB
NERC Natural Environmental Research C o u n c i l
NG Nat i o n a l G r i d
PEPR P r e c i s i o n Encoding P a t t e r n Recognition - High p r e c i s i o n r a s t e r scanner used at Oxford U n i v e r s i t y .
OS Ordnance Survey
QMC Queen Mary C o l l e g e , U n i v e r s i t y of London
SERC Science and Engineering Research C o u n c i l
TODDS Topographic D i g i t a l Development System - i n t e r a c t i v e d i g i t a l system c u r r e n t l y being t e s t e d by Ordnance Survey
USGS United S t a t e s G e o l o g i c a l Survey

- 1 -
1 ft THE DIGITAL HANDLING OF TOPOGRAPHIC INFORMATION
1.1.J THE NEED FOR TOPOGRAPHIC MAPPING
Over a time period spanning nineteen decades, the r o l e of
n a t i o n a l topographic mapping i n B r i t a i n has gained i n c r e a s i n g
importance, demanding a data content adequate and
s u f f i c i e n t l y f l e x i b l e f o r a wide v a r i e t y of u s e s . The design
and c r e a t i o n o f ap p r o p r i a t e mapping s e r i e s as a c o l l e c t i o n of
map sheets on f i l m or paper has thus had three major
m o t i v a t i o n s : as a n a t i o n a l a r c h i v e for topographic
information, as a method of d i s p l a y f o r t h i s a r c h i v e and as a
base on which to l i n k and d i s p l a y much other data such as
s o i l s , geology, census of population and other s t a t i s t i c s .
Arguably, we have a l r e a d y or are c o l l e c t i n g enough
information concerning the s u r f a c e of the e a r t h and human
a c t i v i t i e s on i t . Almost a l l developed c o u n t r i e s now provide
topographic mapping through one or more government-owned and
c o n t r o l l e d o r g a n i s a t i o n s (Bomford 1979). I n terms of human
r e s o u r c e s , w e l l i n excess of £2000 m i l l i o n i s spent each
year on survey and mapping (United Nations 1976). Yet, such
heavy commitment to the c o l l e c t i o n and o r g a n i s a t i o n of
environmental data seems e v i d e n t l y j u s t i f i e d ; t h e re i s an
Chapter one
5 OCT bo*

- 2 -
appa r e n t l y unceasing p r a c t i c a l requirement f o r more d e t a i l e d ,
more up-to-date or more a p p r o p r i a t e l y c l a s s i f i e d map s e r i e s .
Without them, planning s t r a t e g i e s and changes i n n a t i o n a l and
r e g i o n a l p o l i c y have t o be made on hunches r a t h e r than with
f a c t u a l evidence. Thus, i t i s not so much the q u a l i t y and
amount of data being c o l l e c t e d which i s q u e s t i o n a b l e , i t i s
the s t r a t e g i e s f o r t h e i r a p p r o p r i a t e storage and manipulation
which r e q u i r e c o n c i s e d e f i n i t i o n and adequate i n v e s t i g a t i o n
to serve the needs of a modern s t a t e .
Developments i n the ha n d l i n g of appropriate map data i n
re c e n t y e a r s have been r a p i d . On the more a p p l i e d s i d e of
B r i t i s h cartography, two developments stand out as being of
c r u c i a l importance i n the 1970's. The f i r s t of th e s e i s the
use of r e v i s e d photo-mechanical procedures to r e v o l u t i o n i s e
the c r e a t i o n and d i s t r i b u t i o n of maps. I n B r i t a i n , the
Ordnance Survey (OS) i s a l a r g e l y c e n t r a l i s e d source of
d e t a i l e d topographic data; these are used for a wide v a r i e t y
of purposes (Drewitt 1973). A consequence o f the d e t a i l e d
mapping coverage by the OS i s a l a r g e number of map sheets a t
the b a s i c s c a l e s ( s e c t i o n 2.5). The c o s t of storage and
d i s t r i b u t i o n of such v a s t numbers of l i t h o - p r i n t e d s h e e t s ,
a l l i e d with t h e i r r a p i d obsolesence i n a system which i s
based on continuous r e v i s i o n of the map d e t a i l , ensures t h a t
they are i n c r e a s i n g l y u n a t t r a c t i v e i n f i n a n c i a l terms and,
moreover, are bulky and d i f f i c u l t t o handle. The OS s o l u t i o n
Chapter one

- 3 -
(Maries 1971) has been to t r a n s f e r the b a s i c s c a l e s (1:1250
and 1:2500) maps on t o 35mm m i c r o f i l m and to s t o r e each sheet
as an i n s e r t on a punched c a r d . Complete coverage of those
areas of Great B r i t a i n served by 1:1250 and 1:2500 s c a l e
b a s i c maps can now be h e l d i n t h i s f a s h i o n i n one l a r g e
f i l i n g c a b i n e t and c o p i e s p r i n t e d immediately, on demand, by
every main agent i n the country.
I n e v i t a b l y , such procedures as these have disadvantages
(OS 1981b, Adams et a l 1980): the image q u a l i t y of the
printed-on-demand l a r g e s c a l e maps i s not as h i g h as
l i t h o g r a p h i c a l l y p r i n t e d s h e e t s . I n a r e c e n t study i n t o OS
r e v i s i o n procedures, art examination of the opinions of the
customers of OS mapping products have shown an apparent l o s s
of confidence i n the standards achieved w i t h the m i c r o f i l m i n g
procedures (OS 1981b). The r e s e a r c h team which performed
t h i s study recommended t h a t the use of m i c r o f i l m i n g for data
up-date and d i s p l a y should cease u n t i l improvements are made
i n the q u a l i t y of the p r e s e n t a t i o n of the data. Nonetheless,
the c r e a t i o n and d i s s e m i n a t i o n of the standard maps of Great
B r i t a i n have, w i t h i n a decade, been transformed by the use of
these methods. Indeed, t h e i r very success - a t l e a s t , for
the s h o r t term - has been a c o n t r i b u t o r y f a c t o r i n slowing
down the r a p i d adoption of the second of the major
developments i n B r i t i s h cartography - t h a t of computer
a s s i s t a n c e for the production and storage of map data.
Chapter one

- 4 -
1.2 A DIGITAL APPROACH TO TOPOGRAPHIC MAPPING
The methodologies to s t o r e and manipulate map data by
computer have been known f o r almost two decades. The
p r i n c i p l e s on which 'automated cartography' are based are
simple and were d e s c r i b e d i n a workable form as e a r l y as 1964
by Bickmore and Boyle. Chapter two of t h i s t h e s i s d e s c r i b e s
the t r a d i t i o n a l d i g i t a l method - a t l e a s t o u t s i d e some
American m i l i t a r y o p e r a t i o n s - f o r the d i g i t a l p o r t r a y a l of
topographic f e a t u r e s . To hold map data as a s e r i e s of l i n e s ,
each comprising numerous p a i r s of d i g i t a l c o ordinate v a l u e s -
a v e c t o r s t r a t e g y - has been commonplace; the p r e s e r v a t i o n of
l i n e a r e n t i t i e s w i t h i n a computer data s t r u c t u r e mimics the
human understanding of a map image. Much more r e c e n t l y ,
a t t e n t i o n has been focussed on a l t e r n a t i v e s to t h i s now
w e l l - e s t a b l i s h e d approach. A c e l l u l a r r e p r e s e n t a t i o n of
s p a t i a l data, i n which a map image i s r e s o l v e d i n t o a s e r i e s
of contiguous ( u s u a l l y square) c e l l s known as p i c t u r e
elements or p i x e l s - a r a s t e r s t r a t e g y - i s seen as having
much p o t e n t i a l i n t h i s a r e a of data o r g a n i s a t i o n . Though the
procedure has long been used i n l o w - q u a l i t y map production,
notably v i a use of the computer l i n e - p r i n t e r (e.g. see
Coppock 1975, Schmidt and Z a f f t 1975), developments i n
technology such as to permit h i g h - q u a l i t y reproduction on an
economic and r e l i a b l e b a s i s have only occurred r e c e n t l y .
Chapter three g i v e s an i n t r o d u c t i o n to the i n t r i c a c i e s of
Chapter one

- 5 -
t h i s approach to automation i n the mapping i n d u s t r y and l a t e r
c hapters g i v e accounts of i n v e s t i g a t i o n s i n t o i t s s u i t a b i l i t y
for the h a n d l i n g of the b a s i c s c a l e s mapping i n Great
B r i t a i n .
The advances of d i g i t a l techniques i n map production have
apparently been i n e v i t a b l e ; automation i s now i n c r e a s i n g l y
i n v o l v e d i n a l l stages of the mapping p r o c e s s . D i r e c t
d i g i t a l readout i s a v a i l a b l e from f i e l d instruments (Palmer
1980) , from s t e r e o - p l o t t e r s ( P e t r i e 1981) and from s a t e l l i t e s
( B a r r e t t and C u r t i s 1976). Almost a l l survey data r e d u c t i o n
i s done on c a l c u l a t o r s or mainframe and micro-computers
(Walker and Whiting 1980) and p l o t t i n g topographic data under
computer c o n t r o l has been p o s s i b l e for a t l e a s t a decade.
Even the c o n t r o l o f some l i t h o g r a p h i c p r i n t i n g p r o c e s s e s i s
now c a r r i e d - o u t by computer (e.g. C r o s f i e l d E l e c t r o n i c s
1981) . Reasons f o r t h i s apparent r a p i d adoption o f d i g i t a l
techniques are c l e a r . The r e a l c o s t s of computing power have
been f a l l i n g by an order o f magnitude every f i v e y e a r s f o r a t
l e a s t f i f t e e n y e a r s and t h i s t r e n d i s expected to continue i n
the 1980's. Such a diminution i n c o s t s ensures a c c e s s to
computer r e s o u r c e s by i n c r e a s i n g numbers of people; i t i s
a n t i c i p a t e d t h a t by 1985, some seventy per cent of the t o t a l
US work for c e w i l l have a c c e s s to a computer (Lord Avebury
1978). Given a l l t h i s , i t i s a l s o c l e a r t h a t the m a j o r i t y of
operations performed by mapping agencies (data capture,
Chapter one

- 6 -
p r o c e s s i n g , storage, p r e s e n t a t i o n and t r a n s m i s s i o n ) are
l i k e l y to be a f f e c t e d by the i n c r e a s i n g r a p i d r a t e o f
t e c h n o l o g i c a l change and i n p a r t i c u l a r by the f a l l i n
computing c o s t s .
1.2.1 The b e n e f i t s of d i g i t a l mapping
The many b e n e f i t s claimed f o r the use of computers i n
map-making have been i t e m i s e d and evalua t e d elsewhere (see
F r a s e r T a y l o r 1980, Rhind 1977). The primary advantage o f a
d i g i t a l approach t o mapping i s f l e x i b i l i t y : the a b i l i t y to
produce maps whose s c a l e , content and appearance i s s o l e l y
r e l a t e d to the needs of u s e r s has s e r i o u s i m p l i c a t i o n s f o r
the continued use of t r a d i t i o n a l l i t h o - p r i n t e d s h e e t s . In
essence, sheet edges should become t r a n s p a r e n t t o the us e r s
of d i g i t a l maps - the user can 'customise' the images being
produced to s u i t h i s exac t needs with f e a t u r e s , area of
i n t e r e s t and s c a l e being s e l e c t e d by parameters s u p p l i e d to
the c o n t r o l l i n g software. A speed-up i n production r a t e s
would a l s o seem i n e v i t a b l e given the p l o t t i n g speeds of
e x i s t i n g computer hardware; p l o t t e r s can operate a t perhaps
1000 times the speed of the average draughtsman (Rhind 1977)
and the use of s o p h i s t i c a t e d computer output on m i c r o f i l m
(COM) de v i c e s can improve upon these speeds even f u r t h e r
(Adams et a l 1980) .
Chapter one

- 7 -
I n p r i n c i p l e , the production of maps by computer can be
cheaper than w i t h conventioanl p r o c e s s e s although there i s
commercial evidence both to support ( L e a t h e r d a l e 1977) and to
undermine (Thompson 1978) t h i s h y p o t h e s i s . Rhind (1977)
pointed out the c o m p l e x i t i e s of c o s t i n g map-production; such
an e x e r c i s e i s only p o s s i b l e over an extended p e r i o d of time
and i s d i f f i c u l t to compare from i n s t i t u t i o n to i n s t i t u t i o n .
An u n d e r l y i n g f a c t o r which governs the c o s t - e f f e c t i v e n e s s of
a d i g i t a l s t r a t e g y i s the volume o f data i n v o l v e d . Many
n a t i o n a l mapping agencies have d i s c o v e r e d t h a t the h i g h data
volumes with which they are concerned (Adams and Rhind 1981)
can only be handled c o s t - e f f e c t i v e l y by the most
s o p h i s t i c a t e d of methods which have been developed r e c e n t l y
to enhance the speed and accuracy of the data capture and
p r e s e n t a t i o n p r o c e s s e s (McEwen 1980, Thompson 1978). A
d e s c r i p t i o n and a p p r a i s a l of e x i s t i n g d i g i t a l methods known
to the author i s given i n chapters two and t h r e e .
The storage o f a n a t i o n a l topographic a r c h i v e i n d i g i t a l
form o f f e r s - i n p r i n c i p l e - g r e a t e r s e c u r i t y , t i m e l i n e s s and
accuracy than h o l d i n g i t as a c o l l e c t i o n o f p r i n t e d s h e e t s .
Though much c r i t i c i s e d (eg. by Robinson and Petchennik 1975),
s t u d i e s of information theory have shown t h a t map images can
a c t as extremely dense s t o r e s of information. C l e a r l y , the
l i f e - e x p e c t e n c y of paper s h e e t s , or indeed a r c h i v e d f i l m
p o s i t i v e s , i s not i n d e f i n i t e , and the e f f e c t s of extremes of
Chapter one
- 8 -
temperature or humidity p l a c e s e r i o u s r i s k s on the s e c u r i t y
of the survey r e c o r d . To hold the same data as alphanumeric
c h a r a c t e r s i n computer form provides f o r more s e c u r i t y and
f l e x i b i l i t y ; a s e r i e s of numeric c o o r d i n a t e s can always be
r e c a l l e d to t h e i r o r i g i n a l a c c u r a c y and then rounded to s u i t
the needs of the user. Each copy i s then as good as the
o r i g i n a l - u n l i k e the photographic copying procedure.
The maintenance and r e v i s i o n of the topographic a r c h i v e i s
arduous f o r graphic data; every manual re-drawing i s l i k e l y
to continue and to compound e r r o r s . A d i g i t a l s t r a t e g y f o r
map r e v i s i o n i s only l i k e l y to be c o s t - e f f e c t i v e i f the data
are a l r e a d y h e l d i n d i g i t a l form; s e r i o u s overheads of c o s t
and time are i n h e r e n t i n the conversion p r o c e s s e s . Y e t , once
h e l d i n a computer form, the map data can be a r c h i v e d and
up-dated with r e l a t i v e ease to produce a more dependable
system. C l e a r l y , i t i s the conversion process from e x i s t i n g
formats to a d i g i t a l r e p r e s e n t a t i o n which i s p r o v i d i n g most
concern a t p r e s e n t and i t i s t h i s area where most a p p l i e d
e f f o r t i s being devoted i n an attempt to r e s o l v e some of the
o p e r a t i o n a l d i f f i c u l t i e s .
Chapter one

- 9 -
1.3 USER REQUIREMENTS OF TOPOGRAPHIC MAPS
A number of re c e n t market r e s e a r c h s t u d i e s to i n v e s t i g a t e
the needs of u s e r s of topographic maps i n B r i t a i n have
d e s c r i b e d the d i f f i c u l t i e s i n a c h i e v i n g any c l e a r and c o n c i s e
r e s u l t (OS 1981b, HMSO 1979). E s s e n t i a l l y , only the h i g h l y
motivated u s e r s tend to respond to the mechanisms of such
s t u d i e s , which i n i t s e l f produces 'biased' r e s u l t s s i n c e an
ac c u r a t e study should r e f l e c t the opinions and requirements
of a l l map u s e r s . Topographic maps are complex sources of
information comprising a wide v a r i e t y of i n d i v i d u a l f e a t u r e s .
Most u s e r s , however, do not a s s o c i a t e with any p a r t i c u l a r
f e a t u r e which i s most important to them but tend to seek a
f a i t h f u l and r e l i a b l e r e p r e s e n t a t i o n of the ground at t h a t
time (OS 1981b). G e n e r a l l y , i t i s c l e a r t h a t most user s
expect up-to-date information presented i n accordance with a
s e t of agreed conventions. With p a r t i c u l a r r e f e r e n c e to
B r i t a i n , i t i s apparent t h a t even the major u s e r s of OS
mapping (e.g. L o c a l A u t h o r i t i e s and P u b l i c U t i l i t i e s ) are
content to accept the s e r v i c e s o f f e r e d by the mapping agency
when they might be b e t t e r o f f with p r e s e n t i n g a case to
obtain a s e r v i c e t a i l o r e d to t h e i r needs (HMSO 1979).
Reasons for t h i s apparent apathy are un c l e a r , other than l a c k
of time t o prepare the case on the p a r t of l o c a l A u t h o r i t y
o f f i c e r s . E s s e n t i a l l y , many map us e r s are c o n s e r v a t i v e and
have not c l e a r l y d e f i n e d t h e i r future needs (OS 1981b).
Chapter one

- 10 -
I t does seem i n e v i t a b l e , however, t h a t g r e a t e r emphasis
and importance w i l l be pla c e d i n future upon geographical
information systems (GIS) g e n e r a l l y (Rhind 1976), although
much o p e r a t i o n a l experience i s l i m i t e d at present and hence a
d e t a i l e d d e f i n i t i o n of uses i s d i f f i c u l t to a c h i e v e . The
types of user r e q u e s t s to future d i g i t a l topographic a r c h i v e s
are bound to i n c r e a s e i n complexity, as u s e r s focus t h e i r
o p e r a t i o n a l requirements and d i s c o v e r the p o t e n t i a l b e n e f i t s
of computers i n mapping. I n order to provide adequate data
q u a n t i t y , w i t h s u f f i c i e n t v e r s a t i l i t y , the GIS of the f u t u r e
w i l l demand robust i n t e r f a c e s w ith topographic and much other
data. T h i s can only be a c h i e v a b l e with c l e a r i n t e r f a c e
s p e c i f i c a t i o n s and (probably) s i g n i f i c a n t s k i l l s from the
computer programmers. E s s e n t i a l l y , an i n t e r a c t i v e i n t e r f a c e
between the user and the data a r c h i v e i s a prime o b j e c t i v e .
With the use of a s u c c i n c t dialogue, the user should be a b l e
to ask a s e t of que s t i o n s which evoke a c o n v e r s a t i o n a l ,
t a b u l a r or graphic response from the system. A t y p i c a l
r e quest, for example, might be to produce a map of a l l
h o s p i t a l s i n the Midlands, s e r v i n g l e s s than 50,000 people,
which are l o c a t e d w i t h i n a f i v e m i l e r a d i u s of a motorway,
and to demarcate on the map the s h o r t e s t route between these
h o s p i t a l s and the motorway j u n c t i o n s . C l e a r l y , such a
request r e q u i r e s a c c e s s to Area Health data and population
data i n a d d i t i o n to the base topographic information. Such
complex i n t e r r o g a t i o n s as t h i s , i n v o l v i n g the
Chapter one

- 11 -
c r o s s - r e f e r e n c i n g of many data v a r i a b l e s i n s e v e r a l formats,
can - i n theory - b e s t be handled with s u f f i c i e n t speed and
e f f i c i e n c y by a computer. Indeed, many of the problems of
concatenating d i f f e r e n t data such as census enumeration
d i s t r i c t s w i th post-code s e c t o r s or l o c a l planning regions
can only be performed s u f f i c i e n t l y q u i c k l y by d i g i t a l
methods.
At p r e s e n t , i t i s u n c l e a r a t what r a t e t h e s e more
s o p h i s t i c a t e d GIS a p p l i c a t i o n s w i l l develop; hence a b a s i c
problem e x i s t s - t o what extent should the OS d i g i t a l mapping
be t a i l o r e d to e x i s t i n g , in-house, map reproduction
f a c i l i t i e s or be o r i e n t a t e d to multi-purpose d i g i t a l
topographic data b a s e s . Adoption of a s t r a t e g y based upon a
short term viewpoint may w e l l compromise future uses, yet the
c r e a t i o n of data i n s o p h i s t i c a t e d s t r u c t u r e s w i l l c e r t a i n l y
i n c r e a s e the s h o r t - r u n c o s t s .
1.4 THE ROLE OF THE ORDNANCE SURVEY
Ordnance Survey i s the n a t i o n a l mapping agency i n B r i t a i n .
T h i s country has arguably the b e s t map coverage i n the world,
c o n s i s t i n g of c. 220,000 b a s i c s c a l e (1:1250, 1:2500,
1:10000) maps and much s m a l l e r numbers of s m a l l (1:25000
( c . 2000), 1:50000 (204), 1:250000 ( 9 ) ) s c a l e maps, a l l
Chapter one

- 12 -
up-dated comparatively f r e q u e n t l y (OS 1981a). The nature o f
mapping - e s p e c i a l l y the l a r g e s c a l e s - undertaken by the OS
i s much d i f f e r e n t to th a t undertaken by other world mapping
agenci e s ; the b a s i c s c a l e of mapping produced by the United
S t a t e s G e o l o g i c a l Survey (USGS), f o r example, i s 1:24000
s c a l e which c l o s e l y resembles the 1:25000 s c a l e mapping of
the OS. To ac h i e v e i t s o p e r a t i o n a l programme, OS employs
3371 s t a f f , o f which 1171 are f i e l d s urveyors and 1048 are
c a r t o g r a p h i c draughtsmen (OS 1981a); comparative f i g u r e s f o r
map-making s t a f f i n the USGS a r e shown i n s e c t i o n 2.10.1. At
the p r e s e n t time, o n l y a small percentage of the work f o r c e
has any r e a l t r a i n i n g or e x p e r t i s e i n computer methods (HMSO
1979) and hence a c a r e f u l l y c o n t r o l l e d i n d u c t i o n scheme i s
e s s e n t i a l i f any s e r i o u s automation of the map-making process
i s to develop.
The f u t u r e of the OS was reviewed r e c e n t l y by the Ordnance
Survey Review Committee (or the S e r p e l l Committee, named
a f t e r i t s chairman). The r e p o r t (HMSO 1979) advocated the
need for f u r t h e r experiments then, depending on whether these
were s u c c e s s f u l , a r a p i d p r o g r e s s i o n towards the p r o v i s i o n of
two i n i t i a l d i g i t a l topographic data bases: one d e r i v e d from
b a s i c s c a l e s mapping and the other from the small s c a l e s
mapping. While the mechanics of c r e a t i n g f a c s i m i l i e s of
e x i s t i n g b a s i c s c a l e maps i n d i g i t a l form by l i n e - f o l l o w i n g
means are now w e l l - e s t a b l i s h e d (see chapter two and
Chapter one

- 13 -
F i g u r e 1.1a; Complete OS d i g i t a l map
p l o t t e d from a d i g i t a l t a pe w i t h the
customer p l o t t i n g program 'D09'.
Crown C o p y r i g h t R e s e r v e d .

- 14 -
7
c /
/ r /
/
r /
F i g u r e 1.1b: E n l a r g e d s e c t i o n o f OS
d i g i t a l map p l o t t e d from t h e same
s o u r c e d a t a as t h o s e used i n f i g . 1 . 1 a
Crown C o p y r i g h t R e s e r v e d .

- 15 -
f i g u r e s l . l a , b for examples of the r e s u l t s p o s s i b l e using OS
d i g i t a l data and p l o t t i n g s o f t w a r e ) , many fundamental
problems of a r e s e a r c h nature remain i n the c o l l e c t i o n ,
up-dating and use of topographic data i n d i g i t a l form (see
Rhind 1981, Thompson 1978). The problems i n v o l v e d are
fundamentally of a s c i e n t i f i c and computing kind, although
the d i f f i c u l t y of d e f i n i n g c l e a r l y the p o s i t i v e o b j e c t i v e s
f o r a working topographic information system, together with a
d e t a i l e d a p p r a i s a l of user needs a l s o has much importance.
There are, i n p r i n c i p l e , many t a s k s f o r which OS-type data
could be used other than simply making f a c s i m i l e maps ?
examples of non-graphic uses have been given elsewhere (see
Thompson 1978, Dale and Hollwey 1977). Almost a l l such
a p p l i c a t i o n s n e c e s s i t a t e complete coverage of the country and
f a s t and random a c c e s s to the data. E x i s t i n g OS procedures
to convert the map data to d i g i t a l form are proving to be
c o s t l y and slow (Thompson 1978); the sheer volume and
complexity of the data i n v o l v e d i n the b a s i c s c a l e s ( see
Adams and Rhind 1981) are not w e l l - s u i t e d to manual
l i n e - f o l l o w i n g d i g i t i s i n g (see Chapter two). A r a s t e r
scanning s t r a t e g y f o r d i g i t a l data capture i s seen as
o f f e r i n g s e r i o u s a l t e r n a t i v e s , p r o v i d i n g a f a s t and f u l l y
automated method of gen e r a t i n g a d i g i t a l f a c s i m i l e of a paper
map sheet.
Chapter one

- 16 -
1.5 THE OBJECTIVES OF THIS THESIS
Th i s t h e s i s , t h e r e f o r e , examines the p o t e n t i a l b e n e f i t s of
a r a s t e r a l t e r n a t i v e to the v e c t o r n o t a t i o n and technology
used and a n t i c i p a t e d f o r the B r i t i s h n a t i o n a l topographic
d i g i t a l data base. Although enormous investment, producing
c o n s i d e r a b l e progress, has a l r e a d y gone i n t o r a s t e r
d i g i t i s i n g , ( e s p e c i a l l y i n the US m i l i t a r y ) , comparatively
l i t t l e i n v e s t i g a t i o n has been made, u n t i l h i t h e r t o , on the
l i k e l y c h a r a c t e r i s t i c s and s u i t a b i l i t y of such a s t r a t e g y f o r
OS work methods. I n a d d i t i o n to an a p p r a i s a l o f the q u a l i t y
and s u i t a b i l i t y of r a s t e r - s c a n n e d data f o r s e r i o u s mapping,
emphasis i s a l s o given i n l a t e r c h a pters to the l i k e l y
c h a r a c t e r i s t i c s of these grid-based formats f o r the l a r g e
s c a l e s topographic data, w i t h c o n s i d e r a t i o n of the hardware
and software r e s o u r c e s n e c e s s a r y to produce a workable r a s t e r
system.
Chapter one

- 17 -
2 VECTOR DATA STRUCTURES
2.1 INTRODUCTION
In chapter one i t was shown how the e x p e c t a t i o n s and needs
of u s e r s r e q u i r i n g topographic information have become more
d e t a i l e d and h i g h l y s p e c i a l i s e d i n r e c e n t y e a r s . T h i s ,
together with the volumes and complexity of the data
i n v o l v e d , has n e c e s s i t a t e d a move towards the use of computer
techniques f o r the h a n d l i n g of topographic information
( G a r d i n e r - H i l l 1972, Thompson 1978, McEwen 1980). I t was
a l s o shown i n chapter one how the procedures f o r the capture
and management of the map data w i t h i n a computer system can
be sub-divided i n t o two types under the headings of v e c t o r
and r a s t e r n o t a t i o n •
Raster-based data s t r u c t u r e s w i l l be considered i n chapter
t h r e e . T h i s chapter w i l l examine v e c t o r methods of
c a r t o g r a p h i c data capture l e a d i n g to vector-based storage and
manipulation.
Chapter two

- 18 -
.1.1 The view of the United Kingdom
Comparatively l i t t l e work has been undertaken i n the UK
which i n v o l v e s a r a s t e r - b a s e d o r g a n i s a t i o n of topographic
information. By f a r the m a j o r i t y of a l l automated
c a r t o g r a p h i c p r o j e c t s i n B r i t a i n are based on the v e c t o r
p r o p e r t i e s and c h a r a c t e r i s t i c s of s p a t i a l d a t a . By t h e i r
very nature, computer algorithms are designed and w r i t t e n to
s o l v e problems i n a l o g i c a l and step-wise manner.
Consequently, much computer software w r i t t e n for t a s k s (not
n e c e s s a r i l y r e s t r i c t e d to c a r t o g r a p h i c a p p l i c a t i o n s ) attempts
to automate a system by r e p l i c a t i n g the stages of the manual
approach. T h i s notion i s probably one of the fundamental
reasons f o r the comparatively widespread abundance of
vector-based data s t r u c t u r e s f o r c a r t o g r a p h i c d e t a i l .
The procedures of d i g i t a l cartography s t i l l i n use today
are not new; i t was i n the middle s i x t i e s when work of t h i s
nature began to take shape. The work of the Experimental
Cartography U n i t (ECU) has made a major impact upon the
B r i t i s h and world c a r t o g r a p h i c f r a t e r n i t y s i n c e i t s formation
i n 1967 (Rhind and Adams 1980). Although very l i t t l e
p u b l i s h e d work has emanated from the u n i t , i t has been a
world leader i n the automation of the map-making process
using v e c t o r methods.
Chapter two

- 19 -
.2 SPATIAL DATA
A l l data contained w i t h i n a map sheet have s p e c i f i c
s p a t i a l p r o p e r t i e s (Tomlinson 1972); they can be c o n v e n i e n t l y
c l a s s i f i e d i n t o four c a t e g o r i e s as being POINT
(non-dimensional), LINE (one-dimensional), AREA
(two-dimensional), and VOLUME ( t h r e e - d i m e n s i o n a l ) . Any
geographical v a r i a b l e can be r e p r e s e n t e d i n a t l e a s t one of
the elements of t h i s schema: a l o c a t i o n (a p o i n t ) , a boundary
(a l i n e ) , a f o r e s t (an a r e a ) , or an a i r mass (a volume) are
a l l l e g i t i m a t e . However, i n d i g i t a l terms, the schema need
not be as complex as t h i s . E s s e n t i a l l y , any volume comprises
an area w i t h one added dimension. S i m i l a r l y an a r e a can be
represented by a c l o s e d l i n e (a polygon) and, g e n e r a l l y , l i n e
f e a t u r e s can be seen as a c o l l e c t i o n of connected point
l o c a t i o n s . I n essence, a map sheet can be r e p r e s e n t e d i n
d i g i t a l terms simply by a s e r i e s of p o i n t s and l i n e s .
Although the u s e f u l n e s s of such a data f i l e i s extremely
l i m i t e d (McEwen 1980), these concepts comprise the
fundamental p r o p e r t i e s of a v e c t o r data s t r u c t u r e . Since a
map i s a s e r i e s of p o i n t s and l i n e s , then most computer
algorithms have tended to p r e s e r v e these b a s i c e n t i t i e s i n
t h e i r design.
Chapter two

- 20 -
.2.1 The i n c o r p o r a t i o n of a t t r i b u t e s
Baxter (1976, pl 2 7 ) d i s t i n g u i s h e d between the th r e e
components: e n t i t i e s , a t t r i b u t e s and time. The l a s t was
considered to some ext e n t i n chapter one, but c e r t a i n l y the
d i s t i n c t i o n between e n t i t i e s and a t t r i b u t e s has importance
here. Baxter d e f i n e d an e n t i t y as a 'uniquely i d e n t i f i e d
o b s e r v a t i o n ' ( p o i n t s and l i n e s f a l l i n t o t h i s c a t e g o r y ) . The
c h a r a c t e r i s t i c s w ith which we choose to d e s c r i b e an e n t i t y
are termed a t t r i b u t e s . Thus by a t t a c h i n g some form of
a t t r i b u t e or d e s c r i p t i o n to the b a s i c e n t i t i e s i t becomes
p o s s i b l e to r e p r e s e n t and d e s c r i b e the component p a r t s of a
graphic medium (map sheet) i n a d i g i t a l format. I n summary,
a s i n g l e p o i n t l o c a t i o n can be re p r e s e n t e d i n three
dimensional space by four parameters: X, Y, Z and W. The
f i r s t t h r e e f i x the p o s i t i o n of the point i n geographical
space and the W term can be some s i n g u l a r or s t r i n g o f
a t t r i b u t e s or f e a t u r e codes from a pr e d e f i n e d c l a s s i f i c a t i o n .
W i s d i f f e r e n t i n c h a r a c t e r from X, Y, Z i n schemes which
inc o r p o r a t e m u l t i - f e a t u r e coding; i n such i n s t a n c e s W i t s e l f
w i l l be a v e c t o r q u a n t i t y .
Chapter two
- 21 -
2.2 Data capture
D i g i t a l encoding of topographic information can be c a r r i e d
out by v a r i o u s means, the s o p h i s t i c a t i o n o f which i s u s u a l l y
dependant on the volume of data to capture. The most simple
and s t r a i g h t forward approach could i n v o l v e the measurement
and coding of N a t i o n a l G r i d coordinates f o r subsequent
key-punching on to c a r d s . C l e a r l y such an approach could be
only considered i n very t r i v i a l p r o j e c t s but n e v e r t h e l e s s
could be c o s t e f f e c t i v e i n the r i g h t s i t u a t i o n . Rhind (1974)
suggests e m p i r i c a l evidence i n d i c a t i n g i t to be f a s t e r and
cheaper to u t i l i s e t h i s method where jobs occur s p a s m o d i c a l l y
and are l i m i t e d to approximately f i v e hundred p o i n t values or
l e s s .
Most d i g i t i s i n g p r o j e c t s today, however, u t i l i s e s p e c i f i c
hardware d e v i c e s designed f o r undertaking the
g r a p h i c - t o - d i g i t a l c o n v e r s i o n with r e l a t i v e ease.
Vector-based d i g i t i s e r s have t r a d i t i o n a l l y been manually
c o n t r o l l e d by t r a i n e d o p e r a t o r s , although much more r e c e n t l y
the t e c h n o l o g i c a l advances i n l a s e r s and s o l i d s t a t e
c i r c u i t a r y have seen the i n t r o d u c t i o n of semi-automatic
instruments. These w i l l be considered l a t e r , although f i r s t
an examination of manually operated d e v i c e s w i l l be given
s i n c e they have been commonplace i n most c a r t o g r a p h i c data
Chapter two

- 22 -
encoding f o r over a decade and a h a l f . Rogers and Dawson
(1979) g i v e an overview of hardware technology f o r manual
d i g i t i s i n g . E s s e n t i a l l y , the hardware design o f d i g i t i s e r s
has changed l i t t l e over the l a s t decade when compared with
the v a s t i n c r e a s e s i n computer power for the same c o s t .
Manual d i g i t i s i n g i s s t i l l predominantly c a r r i e d out on the
same type o f device t h a t was i n use i n the l a t e s i x t i e s
a l b e i t with more ' i n t e l l i g e n c e ' o f f e r e d with the advent of
micro-processor technology. Consequently, d i g i t i s i n g
procedures and i n t e r f a c i n g to computers have been much
improved, producing v a s t l y more e f f i c i e n t systems.
The p r i n c i p l e s behind manual d i g i t i s e r s are simple i n
concept. The p o s i t i o n on the t a b l e - t o p of a moveable c u r s o r
i s sensed by a mesh of w i r e s embedded w i t h i n the t a b l e .
D i g i t i s i n g t a b l e s are a v a i l a b l e i n a wide v a r i e t y of s i z e s
ranging from as sma l l as 25cm x 25cm to approximately 1.5m x
1.0m; the l a r g e r models have more d i r e c t uses i n c a r t o g r a p h i c
a p p l i c a t i o n s because they can accept the l a r g e s t of map
s h e e t s . There are two types of c u r s o r (see f i g u r e 2.1) i n
common use today: the s t y l u s which has an appearance s i m i l a r
to a normal b a l l - p o i n t pen and a c r o s s w i r e c u r s o r p r o v i d i n g
f o r more p r e c i s e p o i n t i n g s i n c e the body of the c u r s o r does
not obscure the l i n e being d i g i t i s e d . Although the c r o s s w i r e
type of c u r s o r i s more s u i t e d to c a r t o g r a p h i c work, the
s t y l u s type has much p o t e n t i a l i n the areas of computer
Chapter two

- 23 -
(a) cross-wire type
(b) stylus type
Figure 2.1: types of moveable cursor on manual d i g i t i s i n g tables

- 24 -
gr a p h i c s which r e q u i r e more a r t i s t i c f l a i r . R ecently
g r a p h i c s d e s i g n e r s a t the B r i t i s h B r o adcasting Corporation
(BBC) have been producing extremely c l e a r a r t i s t i c e f f e c t s
for t e l e v i s i o n g r a p h i c s u s i n g only small d i g i t i s i n g t a b l e t s
and a s t y l u s type c u r s o r (BBC pers comm 1980).
Manufacturers u s u a l l y provide some form of i n t e r f a c e with
t h e i r d e v i c e s i n order to connect them to data storage
f a c i l i t i e s , and these i n t e r f a c e s are now normally centred
around a micro-processor c o n t r o l which can perform s c a l i n g
and t r a n s f o r m a t i o n of t a b l e coordinates to the us e r ' s
r e f e r e n c e system. U n t i l the e a r l y s e v e n t i e s , i t was
commonplace t o t r e a t d i g i t i s e r s as o f f - l i n e p e r i p h e r a l s to
computers; attachment t o a magnetic tape d r i v e was thought to
be f a r more c o s t e f f e c t i v e than a d i r e c t l i n k to the c e n t r a l
p r o c e s s o r . As an o f f - l i n e process g e n e r a l l y , i t i s p o s s i b l e
to l i n k a d i g i t i s e r to any of the f o l l o w i n g items of
equipment: floppy d i s k d r i v e , paper tape punch, card punch,
video d i s p l a y d e v i c e , or magnetic tape d r i v e . The advent of
fa r more widespread i n t e r a c t i v e computing, together with the
dramatic c o s t r e d u c t i o n s of hardware and s o l i d s t a t e
c i r c u i t r y i n r e c e n t y e a r s , has made the i d e a of o n - l i n e
d i g i t i s e r s a much more worthwhile p r o p o s i t i o n . The
p r a c t i c a l i t i e s and p o t e n t i a l of i n t e r a c t i v e data e d i t i n g
could only have been r e a l i s e d w ith d i g i t i s e r s being connected
d i r e c t l y to an automated data p r o c e s s o r . With such an
Chapter two

- 25 -
i n s t a l l a t i o n , instantaneous responses are obtained from
keyboard or d i g i t i s e r i n s t r u c t i o n s p r o v i d i n g r e a l - t i m e data
v a l i d a t i o n and manipulation.
In g e n e r a l terms, there a r e two ways of c a p t u r i n g data i n
d i g i t a l form from a d i g i t i s e r under human c o n t r o l . F i r s t l y
i t i s p o s s i b l e t o d i g i t i s e i n d i v i d u a l p o i n t s a t the
d i s c r e t i o n of the operator. T h i s i s POINT DIGITISING and i s
u s u a l l y slower and more l a b o r i o u s than the second approach
which i s STREAM DIGITISING. I n t h i s second mode of
operation, the device w i l l continue to supply coordinates
w h i l s t the c u r s o r i s touching (or i n c l o s e p r o x i m i t y to) the
d i g i t i s i n g s u r f a c e of the t a b l e . I n stream mode more
coordinate p a i r s are generated f o r each f e a t u r e s i n c e there
no longer e x i s t s the s e l e c t i o n c a p a b i l i t y which an operator
can have i n p o i n t mode. However, on most modern d e v i c e s i t
i s p o s s i b l e to s e t the flow r a t e of the coordinate stream
from, say, one p o i n t to around one hundred p o i n t s per second
(Summagraphics Corporation D i g i t i s e r User Manual 1979). A
d e c i s i o n of the number of p o i n t s r e q u i r e d to r e p r e s e n t l i n e a r
e n t i t i e s i s arguable; most design schemes have t h e i r own
' r u l e s of thumb', although g e n e r a l l y more po i n t s are r e q u i r e d
for curve data w h i l s t s t r a i g h t l i n e s can comprise much lower
f r e q u e n c i e s ( f i g u r e 2 i n Adams and Rhind 1981). Rhind (1974)
has pointed out how such c o n s i d e r a t i o n s should be predefined
to ensure data u n i f o r m i t y .
Chapter two

- 26 -
Micro-processors have made the most s u b s t a n t i a l impact on
these hardware d e v i c e s i n r e c e n t y e a r s , p r o v i d i n g a more
f l e x i b l e o p e r a t i o n and ease of use. Some have the a b i l i t y to
suppress the supply of coordinates u n t i l they d i f f e r by a
p r e s e t t o l e r a n c e from the previous p a i r sent, thereby
reducing the chance of p o i n t r e p e t i t i o n and hence redundant
data. There a r e many models on the market today with v a r y i n g
c h a r a c t e r i s t i c s and s p e c i f i c a t i o n s (see Rogers and Dawson
1979). R e s o l u t i o n c a p a b i l i t i e s seem to range from 0.0025 to
0.5 m i l l i m e t r e s ; f o r most c a r t o g r a p h i c a p p l i c a t i o n s an
a c c e p t a b l e v a l u e would be i n the range 0.05 t o 0.25 mm. I n
quoting the r e q u i r e d r e s o l u t i o n o f the t a b l e s f o r
c a r t o g r a p h i c work i t i s e q u a l l y important to i n c l u d e a
mention of the a c c e p t a b l e a c c u r a c y of any f e a t u r e
p o s i t i o n i n g ; t h i s can be no b e t t e r than the r e s o l u t i o n and
w i l l r e q u i r e t o be i n the range 0.1 t o 0.5 mm.
2.3 DIGITISING PROCEDURES
There are many v a r i a t i o n s i n present day encoding
procedures and some examples of the major world mapping
systems - u s i n g v e c t o r d i g i t a l methods - w i l l be c onsidered
l a t e r i n t h i s chapter. G e n e r a l l y , only s u b t l e d i f f e r e n c e s i n
work methods have any importance; the b a s i c u n d e r l y i n g
operations remain the same i n any data c o l l e c t i o n system.
Chapter two

- 27 -
The s e t t i n g - u p procedure i s s i m i l a r i n most d i g i t i s i n g
a g e n c i e s : four or more c o n t r o l p o i n t s of known p o s i t i o n a r e
c a r e f u l l y d i g i t i s e d to enable such procedures as the s c a l i n g
and t r a n s f o r m a t i o n of l o c a l t a b l e c o o r d i n a t e s i n t o a more
u s e f u l coordinate system. When the s u i t a b l e t r a n s f o r m a t i o n
parameters have been computed, i t i s p o s s i b l e f o r f e a t u r e s on
the source document t o be d i g i t i s e d i n any d e s i r e d order;
some systems, however, r e q u i r e d i g i t i s i n g to be c a r r i e d out
w i t h i n a formal s e t of r u l e s .
The i n c l u s i o n o f f e a t u r e codes with the d i g i t i s e d p o i n t s
and l i n e s i s achieved by a number o f methods, although almost
a l l of them i n v o l v e data-tagging at the same time as
d i g i t i s i n g i s t a k i n g p l a c e . The s i m p l e s t technique from a
programming p o i n t of view i n v o l v e s t y p i n g i n t o an a d j a c e n t
keypunch the f e a t u r e types as they are being encoded.
Although s l i g h t l y d i f f e r e n t i n concept (the system uses a
photogrammetric form of data c a p t u r e ) , the d i g i t a l mapping
system i n use a t Huntings Surveys L t d . ( K e i r 1976) provides
a good example of such a system. T h i s approach can s e r i o u s l y
a f f e c t work throughput s i n c e the t a b l e operator has to
repe a t e d l y move between the keyboard and the moving c u r s o r .
A more u s e f u l technique i s a f a c i l i t y whereby a t t r i b u t e s can
be entered from the d i g i t i s i n g c u r s o r . Some c u r s o r s have a
number of buttons to f a c i l i t a t e t h i s ; c e r t a i n l y they can be
used for i n c l u d i n g complementary information such as s t a r t
Chapter two

- 28 -
and end of l i n e s , c u r v e s , polygons, e t c . However, i t i s the
use of menu techniques which has been the most commonplace
method of a s s i g n i n g f e a t u r e types on manual t a b l e s i n r e c e n t
y e a r s (see Coles 1974). The menu method i n v o l v e s a l l o c a t i n g
an a r e a of the d i g i t i s i n g t a b l e f o r a t t r i b u t e assignment.
The area i s sub-divided i n t o a s e r i e s of s m a l l square u n i t s ;
the p o s i t i o n o f each square i s programmed to r e p r e s e n t some
fe a t u r e type. D i g i t i s i n g a point w i t h i n the d e s i r e d square
i n the menu area i n s t r u c t e s the computer to a s s i g n a given
a t t r i b u t e to the f e a t u r e which i s to follow. The Ordnance
Survey has used menu techniques v e r y s u c c e s s f u l l y f o r the
l a s t decade i n t h e i r d i g i t a l data f l o w l i n e (Coles 1974).
2.3.1 Data v a l i d a t i o n
The d i s t i n c t i o n between data capture being e i t h e r o f f - l i n e
or o n - l i n e has been i n s t r u m e n t a l i n the way t h a t data
v a l i d a t i o n has developed i n the l a s t f i v e y e a r s . Most
d i g i t i s e d data s e t s c o n t a i n e r r o r s , e s p e c i a l l y those data
which have emanated from an o f f - l i n e t a b l e and are st o r e d
immediately. I t i s the aim of the e d i t i n g stage to d e t e c t
and e l i m i n a t e these e r r o r s , or reduce them to some ac c e p t a b l e
l e v e l . In many i n s t a n c e s , the l e v e l of t o l e r a b l e e r r o r
should be higher (and hence worse) than i s a t f i r s t thought
Chapter two

- 29 -
ne c e s s a r y s i n c e i t i s common to f i n d d i g i t a l data being used
at some l a t e r date for purposes which they were not
o r i g i n a l l y intended. Since the middle 1960's, o f f - l i n e data
e d i t i n g has been the primary data c o r r e c t i o n technique,
although more r e c e n t l y an o n - l i n e i n t e r a c t i v e approach has
been very s u c c e s s f u l i n improving e f f i c i e n c y and reducing
c o s t s . Today e r r o r d e t e c t i o n may be c a r r i e d out i n p a r t by
machine and i n p a r t by humans? i n c o n s i s t e n c i e s w i t h i n the
data such as an absence o f a f e a t u r e code or an i n c o r r e c t
t a l l y of s t a r t and end of f e a t u r e markers can be detected by
the computer i n some post-hoc p r o c e s s . These are brought to
the a t t e n t i o n o f an operator who w i l l be able to take some
appropriate a c t i o n . Complete omissions or e r r o r s which are
c o n s i s t e n t w i t h i n the schema of the system's s p e c i f i c a t i o n
cannot be det e c t e d by machine and r e q u i r e manual v a l i d a t i o n .
Such checking i s te d i o u s and error-prone; the use of o f f - l i n e
e d i t p l o t s and v i s u a l scans through coordinate l i s t i n g s
r e s u l t s i n a slow turn-around with many i n e f f i c i e n c i e s . T his
approach has not been c o s t - e f f e c t i v e for l a r g e data s e t s
(Thompson 1978). The ECU implemented an a l t e r n a t i v e
approach \r\ the e a r l y 1970's to attempt te» a l l e v i a t e the
i n e f f i c i e n c i e s of o f f - l i n e v e r i f i c a t i o n to some e x t e n t . This
invol v e d the automatic checking of double d i g i t i s e d d ata.
E s s e n t i a l l y ^ i t WcvS found ftofc. to b$, c o s t e f f e c t i v e
(Rhind 1974) to d i g i t i s e the data twice (by two d i f f e r e n t
o p e r a t o r s ) and then superimpose the data s e t s w i t h i n the
Chapter two

- 30 -
computer to s e a r c h f o r i n c o n s i s t e n c i e s
Once e r r o r s have been det e c t e d by procedures such as those
o u t l i n e d above, i t becomes n e c e s s a r y to make c o r r e c t i o n s t o
the data f i l e . Some c o r r e c t i o n s may need a r e t u r n to the
d i g i t i s i n g t a b l e , o t h e r s can be handled o f f - l i n e as a batch
job of i n s t r u c t i o n s . For example, such i n c o n s i s t e n c i e s as
m i s s i n g f e a t u r e codes or the mismatched end p o i n t s of
polygonal data can be c o r r e c t e d o f f - l i n e , but the i n s e r t i o n
or amendment of whole f e a t u r e s r e q u i r e a r e t u r n t o the t a b l e .
The c o s t s i n c u r r e d by data checking and e d i t stages are
a l a r m i n g l y high i n most systems (Thompson 1978).
I t i s here where the the e f f i c i e n c i e s of i n t e r a c t i v e
g r a p h i c s are proving to be most c o s t e f f e c t i v e ( A l l e n and
Morris 1980). Whole maps or s e l e c t e d p o r t i o n s can be
d i s p l a y e d very q u i c k l y on storage cathode r a y tubes.
Operators can r e f e r e n c e p a r t i c u l a r f e a t u r e s i n r e a l - t i m e by
c r o s s - h a i r s on the s c r e e n which are c o n t r o l l e d by some form
of j o y s t i c k on the t e r m i n a l panel. Once a f e a t u r e has been
i d e n t i f i e d , software can s e a r c h through the data f i l e and
perform most c o r r e c t i o n f u n c t i o n s on i t : d e l e t i o n , amendment,
r e d e f i n i t i o n o f f e a t u r e type are a l l p o s s i b l e . These systems
r e q u i r e h i g h l y s o p h i s t i c a t e d software and data s t r u c t u r e s .
T h i s , together with the high c o s t of g r a p h i c s t e r m i n a l s has
reduced t h e i r widespread a v a i l a b i l i t y w i t h i n the topographic
Chapter two

- 31 -
mapping community although t h i s s i t u a t i o n i s beginning to
change with the advent of computer systems designed for map
data. The F e r r a n t i - C e t e c CLUMIS system ( F e r r a n t i - C e t e c Ltd.,
1979) and L a s e r - s c a n L a b o r a t o r i e s IGES system ( L a s e r - s c a n
L a b o r a t o r i e s L t d . , 1981) a r e two B r i t i s h examples and there
are numerous systems emanating from the United S t a t e s such as
those from M and S I n c . , Broomall I n d u s t r i e s I n c .
DATA ORGANISATION AND STORAGE
Appropriate formatting and o r g a n i s a t i o n of data for
storage w i t h i n a computer system has g r e a t importance i n most
d i g i t a l mapping systems. At the data capture stage, for
i n s t a n c e , i t i s n e c e s s a r y to s t r u c t u r e the information i n
such a way so as t o f a c i l i t a t e easy v e r i f i c a t i o n and e d i t
t a s k s . However, t h i s i s not to suggest t h a t a data bank of
topographic information should be s t r u c t u r e d p u r e l y i n a
manner which s u i t s the data capture stage. Once a data f i l e
has reached an adequate standard w i t h i n the l i m i t s of the
system's t h r e s h o l d s , i t can and should be r e o r g a n i s e d i n such
a f a s h i o n as to f a c i l i t a t e e f f i c i e n t s torage and r e t r i e v a l
methods. Many d i g i t a l systems i n c o r p o r a t e two d i f f e r e n t data
s t r u c t u r e s f o r data capture and data banking purposes;
Ordnance Survey has used such an approach i n i t s d i g i t a l
system.
Chapter two

- 32 -
An e f f i c i e n t s t r u c t u r e for vector-based c a r t o g r a p h i c data
has been a s u b j e c t of much t h e o r e t i c a l debate. Data base
o r g a n i s a t i o n i s an area of the computing i n d u s t r y which i s
now beginning to reach a h i g h l e v e l of software e x p e r t i s e ?
the work of p i o n e e r s such as Edward Codd and James Martin has
been very i n f l u e n t i a l . However, vector-based c a r t o g r a p h i c
data do not f i t n e a t l y i n t o the r e l a t i o n a l and Codasyl ideas
of g e n e r a l data base systems (Martin 1976), although Cox e t
a l (1981) suggest a p o s s i b l e s o l u t i o n .
Data base software i s no longer a new concept; many
nationwide o r g a n i s a t i o n s , such as those connected with
banking, i n s u r a n c e and t r a v e l are i n c o r p o r a t i n g l a r g e and
e f f i c i e n t computerised data s t o r e s i n t o t h e i r b u s i n e s s as a
rudimentary p a r t of the system. Although t h e i r data have
somewhat d i f f e r e n t c h a r a c t e r i s t i c s to those of topographic
information, some l e s s o n s can be l e a r n t from these data base
management system (DBMS) p i o n e e r s . Indeed, the United S t a t e s
G e o l o g i c a l Survey (USGS p e r s comm 1980) are making use of a
p r o p r i e t r y commercial data base system f o r i n t e r i m
o p e r a t i o n s .
Chapter two

- 33 -
2.4.1 A s u i t a b l e data s t r u c t u r e
When d e s i g n i n g a s u i t a b l e s t r u c t u r e and method of
o r g a n i s a t i o n f o r vector-based coordinate data s t r i n g s , i t i s
important to c o n s i d e r the p o t e n t i a l needs of us e r s a t the
o u t s e t . Such an approach can expedite easy and e f f i c i e n t
r e t r i e v a l o p e r a t i o n s i n l a t e r s t a g e s . Chapter one has
attempted to c a t e g o r i s e the types of user r e q u e s t s expected
to be made to a topographic information s t o r e ; i n t h e i r
s i m p l e s t form, t y p i c a l r e q u e s t s w i l l i n v o l v e the r e c a l l of
s p e c i f i c a r e a l u n i t s or polygons from a complex network of
data for the whole country. Polygonal data s e t s of t h i s type
abound and almost a l l use vec t o r methods of s t r u c t u r e (DoE
1976, US Bureau of the Census, pers comm 1980). Requests f o r
polygonal data are extremely common f o r a r e a l - b a s e d a n a l y s e s
by s o c i a l s c i e n t i s t s and planners i n v o l v e d i n population
census s t a t i s t i c s (Rhind e t a l 1977), land use (Bickmore and
Molineux 1978, Rhind and Hudson 1980) and cl i m a t o l o g y and
me t e o r o l o g i c a l information ( H a r r i s and B a r r e t t 1978).
The r e p r e s e n t a t i o n of a r e a l data by v e c t o r s t r i n g s needs
c a r e f u l planning and s t r u c t u r e . Numerous suggestions for the
storage of are a s have been present though, i n essence, v e c t o r
s t r i n g s are only able to r e p r e s e n t the boundary between a r e a l
u n i t s . Some data s t r u c t u r e s handle the area i t s e l f as the
Chapter two

- 34 -
b a s i c s p a t i a l u n i t s (BSU) although i n a l l c a s e s these are
where the BSU's are of p r e d e f i n e d constant s i z e and shape.
G r i d square census data are a t y p i c a l example (Rhind et a l
1977, S o i l Survey of England and Wales pers comm 1981). I n
i n s t a n c e s where the boundary information i s the BSU then a l l
area manipulations must be der i v e d from these by c a r e f u l
s e l e c t i o n and aggregation of the d e s i r e d v e c t o r segments (DoE
1976).
Data s t r u c t u r e s r e p r e s e n t i n g a r e a l u n i t s s p e c i f i e d by the
boundary p o s i t i o n s r e q u i r e complex methods of data tagging.
The most common technique i n c u r r e n t use i s the a d d i t i o n of
two f e a t u r e codes, a l e f t and a r i g h t a t t r i b u t e , for each
boundary (DoE 1976, SDD 1978). I n order to pr e s e r v e a
convention a t the data capture stage, d i g i t i s i n g operators
are i n s t r u c t e d to encode the polygon boundaries i n a
continuous r o t a t i o n - c l o c k w i s e or a n t i c l o c k w i s e (Loomis
1965). Leaving a s i d e techniques where a r e a l information can
be r e f e r e n c e d by s i n g l e p o i n t s (see P f a l t z and Rosenfeld
1967) or by g r i d squares (see Rhind 1981), a l l polygons are
normally represented c o n c e p t u a l l y as s t r i n g s of s t r a i g h t l i n e
segments though a few systems have t r e a t e d polygons as
assemblages of parameterised c u r v e s , such as a r c s of c i r c l e s .
In g e n e r a l , such an approach can onl y approximate the r e a l
world s i t u a t i o n and the accurac y i s a f u n c t i o n of the length
of the segments chosen with r e s p e c t to the degree of
Chapter two

- 35 -
convolution of the polygon (DoE 1976, Adams and Rhind 1981).
The p o s i t i o n of each v e c t o r q u a n t i t y i s h e l d as a s e r i e s of
absolute r e c t a n g u l a r c a r t e s i a n c o o r d i n a t e s ( p r o v i d i n g the
d i f f e r e n c e between the end p o i n t s of the segments i n two
mutually r i g h t angle d i r e c t i o n s ) , or e x c e p t i o n a l l y as p o l a r
coordinates ( p r o v i d i n g an absolute p o s i t i o n , followed by a
v e c t o r r a d i a l q u a n t i t y and o r i e n t a t i o n ) .
*3
Rectangular C a r t e s i a n
6
N
Polar
Chapter two

- 36 -
There have been v a r i a n t s on these b a s i c themes such as
those o u t l i n e d i n Freeman (1961) and Tomlinson (1972) which
can, i n c e r t a i n s i t u a t i o n s , have d i s t i n c t advantages, though
Baxter (1976 p 137) has pointed out s e v e r a l l i m i t a t i o n s with
these t e c h n i q u e s . The storage of polygon boundaries as
c l o s e d c a r t e s i a n coordinate s t r i n g s i s w e l l s u i t e d to the
data capture stage although d i s t i n c t disadvantages do e x i s t
without appropriate data s t r u c t u r e s . Although the process
i n v o l v e s e x t r a d i g i t i s i n g , g e n e r a l l y there need be fewer
a t t r i b u t e s f o r the whole s t r u c t u r e . With such a method each
boundary has t o be h e l d twice - once for each a r e a l u n i t .
Apart from i n c r e a s i n g the storage requirements v i r t u a l l y by a
f a c t o r of two, the d u p l i c a t e d boundaries are u n l i k e l y to be
c o i n c i d e n t - a f a c t o r commonly a s s o c i a t e d with manual
d i g i t i s i n g . A more amenable approach o u t l i n e d by Loomis
(1965) and demonstrated by Baxter (DoE 1976) i s to r e p r e s e n t
boundaries as s e c t i o n s ? each s e c t i o n comprising the l i n e
segments between two a d j a c e n t areas together with the
a s s o c i a t e d l e f t and r i g h t f e a t u r e code. Baxter (DoE 1976)
has demonstrated a h i e r a r c h i c a l method of f e a t u r e coding f o r
polygonal data for a parsed data s e t of B r i t i s h L o c a l
A u t h o r i t y Boundaries. At the most disaggregated s p a t i a l
l e v e l are the Metropolitan and S h i r e d i s t r i c t s i n England and
Wales and Regional d i s t r i c t s i n S c o t l a n d . Superimposed upon
these u n i t s a r e the standard economic planning regions f o r
B r i t a i n . Each d i s t r i c t on the base map has a unique code
Chapter two

- 37 -
assigned to i t . These codes are c o n s t r u c t e d h i e r a r c h i c a l l y
i n order to provide a d d i t i o n a l information about the parent
region. Thus a s i x d i g i t code which r e p r e s e n t s the b a s i c
s p a t i a l u n i t has i t s two most s i g n i f i c a n t d i g i t s r e p r e s e n t i n g
the planning region, the middle two d i g i t s r e p r e s e n t i n g the
county and the two l e a s t s i g n i f i c a n t d i g i t s d e s i g n a t i n g the
d i s t r i c t w i t h i n t h a t country. Examples of t h i s coding scheme
are given i n t a b l e 2.2.
Table 2.2 ( a f t e r DoE 1976)
Codes for d i s t r i c t s w i t h i n c o u n t i e s w i t h i n r e g i o n s
Region County D i s t r i c t
E a s t Anglia 01 Cambridgeshire 0101 Cambridge 010101 E Cambridge Fenland
010102 010103 010104 010105 010106
Huntingdon Peterborough S Cambridge
Norfolk 0102 Brockland Broadland
010201 010202 010203 010204 010205 010206 010207
Gt. Yarmouth N Norfolk Norwich S Norfolk W Norfolk
S u f f o l k 0103 Babergh 010301 F o r e s t Heath 010302 Ipswich 010303 Mid S u f f o l k 010304 St Edmundsbry010305 S u f f o l k Coast010306 Waveney 010307
Chapter two

- 38 -
An a l t e r n a t i v e method f o r h o l d i n g a r e a l data has been to
approximate the polygon boundaries by mathematical f u n c t i o n s .
The use of such techniques (high order polynomials or F o u r i e r
t r a n s f o r m a t i o n s ) tends t o reduce the number of coordinate
s t r i n g s although the overheads r e q u i r e d for the accumulation
of the f u n c t i o n c o e f f i c i e n t s have a s i z e a b l e demand for
computer storage and p r o c e s s i n g m i l l - t i m e . Many vector-based
systems compromise between the use of many coordinate s t r i n g s
and the polynomial techniques. The Ordnance Survey approach,
f o r example, has been to s t o r e s t r a i g h t l i n e data as
coordinate s t r i n g s a t the capture stage and use s p l i n i n g
techniques t o generate the c u r v e s . The d i g i t i s i n g operator
has merely to d i g i t i s e t h r e e or four points f o r each curve
and f u r t h e r p o i n t s are generated post-hoc along the s p l i n e
f i t t e d to these p o i n t s . Even so, the Ordnance Survey has
found i t t o be more advantageous to s t o r e the generated
coordinate s t r i n g s i n t h e i r data bank as opposed to h o l d i n g
the polynomial f u n c t i o n s .
2.4.2 Data c h a r a c t e r i s t i c s
There i s i n c r e a s i n g evidence i n conference r e p o r t s and the
t e c h n i c a l p r e s s to suggest t h a t many o r g a n i s a t i o n s and
i n d i v i d u a l s throughout the world are e i t h e r c r e a t i n g or using
Chapter two

- 39 -
coordinate data bases. Although few i n v e n t o r i e s e x i s t , a
r e c e n t c o m p i l a t i o n has been attempted a t the U n i v e r s i t y of
Durham for the I n t e r n a t i o n a l F e d e r a t i o n of Data O r g a n i s a t i o n s
(IFDO). From t h i s and other evidence, i t i s known t h a t
numerous i n d i v i d u a l s have s e p a r a t e l y d i g i t i s e d c o ordinate
data s e t s f o r t h e i r own purposes from i d e n t i c a l source
documents. G e n e r a l l y , such u s e r s tend to t r e a t t h i s
topographic or c a r t o g r a p h i c information as a geometric
framework on which they can 'hang' t h e i r own s p e c i f i c
a t t r i b u t e s - t y p i c a l examples i n the UK are the p u b l i c
u t i l i t i e s : telecommunications, e l e c t r i c i t y and gas, a l l of
which superimpose t h e i r i nformation on to Ordnance Survey
base data ( G a r d i n e r - H i l l 1972).
I t seems i n c r e a s i n g l y evident (Rhind and Adams 1981) t h a t
many data base managers and c e r t a i n l y the m a j o r i t y of the
geographic community pay l i t t l e a t t e n t i o n to the s t a t i s t i c a l
c h a r a c t e r i s t i c s and p r o p e r t i e s of the base data with which
they are concerned. L i t t l e work of t h i s nature has been
reported i n t e c h n i c a l j o u r n a l s and conference proceedings.
C l e a r l y these c o n s i d e r a t i o n s are not an academic pastime; the
design or s e l e c t i o n of a s u i t a b l e development programme and
s a t i s f a c t o r y computer system becomes impo s s i b l e without some
s p e c i f i c a t i o n of t a s k and of data c h a r a c t e r i s t i c s . The
storage media, the r e t r i e v a l performance, the methods of
r e v i s i o n and the design of any p r o c e s s i n g software are a l l
Chapter two

- 40 -
dependant on the nature of the data and the volumes i n v o l v e d .
The United S t a t e s G e o l o g i c a l Survey (USGS) i s generating
70,000 megabits of information a n n u a l l y from t h e i r d i g i t a l
e l e v a t i o n model data alone. T h i s data volume f a c t o r w i l l be
a c r u c i a l problem i n the development of t h e i r c a r t o g r a p h i c
data base (DCDB) system (McEwen 1980). Even with the use of
high d e n s i t y 6250 bpi magnetic tapes, i t w i l l take a t l e a s t
one hundred storage volumes every year j u s t to hold t h i s
information (without backups) p r i o r to any post-hoc
p r o c e s s i n g which may take p l a c e . Such v a s t volumes of data
r e q u i r e an e f f e c t i v e data base management system t o expedite
a c o n t r o l l e d development and o p e r a t i o n a l programme for the
USGS.
The f i r s t attempt to c a t e g o r i s e and p r o j e c t the s i z e of a
d i g i t a l topographic data bank i n the UK was undertaken by
Howard (1968). Her study was based on manual measurements of
l i n e length and p o i n t counts of a n e c e s s a r i l y small sample
(0.5 per cent of area) of the 'one-inch' s e r i e s - now
superceded by the 1:50000 Landranger s e r i e s . Although her
somewhat generous assumption of d i g i t i s e d p o i n t f r e q u e n c i e s
(8 p o i n t s per m i l l i m e t r e ) do not concur with c u r r e n t OS
d i g i t i s i n g conventions, her r e s u l t s are s t i l l of i n t e r e s t :
555 m i l l i o n c o o r d i n a t e s were a n t i c i p a t e d to be n e c e s s a r y to
r e p r e s e n t the 1:63360 s c a l e map data i n d i g i t a l form. She
suggested t h a t the t o t a l l i n e length on the one-inch maps was
Chapter two

- 41 -
of the order of 70 k i l o m e t r e s and, of t h i s , about h a l f was
due to contours. A more r e c e n t comparative study (Haywood
pers comm 1980) f o r the 1:50000 s c a l e mapping s e r i e s has
suggested f i g u r e s of 57 km and 60 per cent r e s p e c t i v e l y f o r
these measures, although t h i s l a t e r p r o j e c t was based upon
d i f f e r e n t methodology and i n v o l v e d s p e c i f i c d i g i t i s i n g t a s k s .
S i m i l a r work has r e c e n t l y been c a r r i e d out to determine
the c h a r a c t e r i s t i c s f o r the Ordnance Survey b a s i c s c a l e s
topographic data i n B r i t a i n . Mapping at 1:1250 and 1:2500
s c a l e s comprise the bulk of the workload f o r the Na t i o n a l
Mapping Agency: t h i s f a c t o r , a l l i e d with suggestions (HMSO
1979) t h a t complete n a t i o n a l d i g i t a l coverage o f the s e l a r g e
s c a l e s data should be made a v a i l a b l e as soon as p o s s i b l e ,
makes a knowledge of such c h a r a c t e r i s t i c s h i g h l y d e s i r a b l e .
A r e c e n t study (Adams 1979, Adams and Rhind 1981) has
q u a n t i f i e d the nature and content of a sample of OS map
sheets which has l e d to a p r e d i c t i o n o f the l i k e l y s i z e and
c h a r a c t e r i s t i c s of a d i g i t a l topographic data base f o r the
whole of B r i t a i n . The study was based upon the s t a t i s t i c a l
a n a l y s i s of 478 map sheets s e l e c t e d as a s t r a t i f i e d sample
from the 7000 i n d i g i t a l form a t the end of 1978. The
p r o j e c t i o n s are based upon a number of important assumptions
which are i t e m i s e d i n Adams and Rhind (1981). I n summary,
however, the r e s u l t s are o u t l i n e d below:
Chapter two

- 42 -
1. I n terms of data volume, the 1:1250 urban sheets a r e more
dense than the 1:2500 r u r a l sheets by between two and
f i v e times: the 1:1250 data c o n t a i n f a r more linework
than do the 1:2500 data (on average 35m and 12m
r e s p e c t i v e l y ) .
2. Despite t h i s , the main component of the data bank w i l l be
the 1:2500 s c a l e maps s i n c e there are three times as many
of them (164,461) as the 1:1250 maps.
3. Apart from the s c a l e stratum, the e f f i c a c y of the a
p r i o r i s t r a t i f i c a t i o n was shown t o be dubious - a t t h i s
s c a l e of map, the data content appears not to be
p r e d i c t a b l e from i n t u i t i v e notions of topographic type or
population. L a t e r unpublished c o r r e l a t i o n s t u d i e s by the
author with topographic data and census of population
data have shown t h i s to be t r u e .
4. The v a s t bulk of the data i s linework and many of the
frequency d i s t r i b u t i o n s of p o i n t s w i t h i n l i n e s and some
point spacing are markedly skewed. (See t a b l e s 2 and 3
i n Adams and Rhind 1981). For t h i s reason, mean va l u e s
should be t r e a t e d with c a u t i o n .
5. No contour data are present i n the 1:1250 and 1:2500
s c a l e maps: on t h i s b a s i s , and a c c e p t i n g a l l the
Chapter two

- 43 -
l i m i t a t i o n s of the 0.1 per cent a r e a l sample, p r o j e c t i o n s
for the t o t a l data base were made (see t a b l e s 5 and 6 i n
Adams and Rhind 1981). I f updating were to f o l l o w
standard manual p r a c t i c e i t would be on a continuous
b a s i s , presumably sent from r e g i o n a l o f f i c e s ; much of the
p r i n c i p a l data ought to be o n - l i n e or a t l e a s t loadable
w i t h i n a s h o r t time.
6. Very Co«\«s\&e.f<.-vV>\e. amounts of data compaction are
p o s s i b l e u s i n g a b a t t e r y of t e c h n i q u e s . C e r t a i n l y
in-house data s t r u c t u r e s a t the Ordnance Survey can
achieve a f a c t o r o f f i v e times r e d u c t i o n i n storage
requirements over formats r e l e a s e d to customers.
Although there have been other s m a l l e r s t u d i e s of l a r g e
s c a l e topographic data bases, for example i n the Survey
Department of P u b l i c Works of The Netherlands ( T i e n s t r a and
van der Kraan 1975), no other s t u d i e s of a s i m i l a r l y d e t a i l e d
nature are known to the author. I n c o n c l u s i o n , i t i s
a n t i c i p a t e d t h a t the t o t a l b a s i c s c a l e s data a t 1:1250 and
1:2500 w i l l comprise 3200 k i l o m e t r e s of mapped l i n e length
being represented by 1200 m i l l i o n coordinate p o i n t s . I n
essence, using c u r r e n t customer export data formats w i l l
r e q u i r e of the order of 580 computer compatible magnetic
tapes (standard 2400 f e e t , 9 t r a c k , 1600 b p i ) to s t o r e one
Chapter two

- 44 -
copy of the n a t i o n a l l a r g e s c a l e s a r c h i v e . Even so, the data
volumes p r o j e c t e d are no l a r g e r than those h e l d by other
agencies such as bankers or a i r l i n e s and ac c e s s e d on a d a i l y
r o u t i n e b a s i s . New developments i n mass st o r a g e modules are
bound to be commonplace w i t h i n the next f i v e y e a r s . There i s
every reason to b e l i e v e , t h e r e f o r e , t h a t the storage and
r e t r i e v a l of a n a t i o n a l d i g i t a l topographic data base i s a
f e a s i b l e o p e r a t i o n w i t h i n the bounds of e x i s t i n g t e c h n i c a l
and management knowledge.
2.5 THE DIGITAL MAPPING APPROACH OF ORDNANCE SURVEY
Great B r i t a i n i s by f a r the most comprehensively mapped
country i n the world, and the Ordnance Survey i s
i n t e r n a t i o n a l l y r e c o g n i s e d as one of the b e s t o r g a n i s a t i o n s
of i t s kind ( H a r l e y 1975). Following the recommendations of
the Davidson Committee o f 1938, the terms of r e f e r e n c e under
which the OS has operated have been t o produce and maintain
b a s i c surveys a t 1:1250 s c a l e for major urban ar e a s and a t
1:2500 or, i n some i n s t a n c e s , a t 1:10,000 s c a l e for the
remainder of the country (Harley 1975, HMSO 1979, Seymour
1980) .
Around a decade ago and f o l l o w i n g i n t e n s e s t i m u l a t i o n from
o r g a n i s a t i o n s l i k e the ECU, the Na t i o n a l Mapping Agency
Chapter two

- 45 -
inaugurated a d i g i t a l mapping p i l o t scheme. The o b j e c t i v e s
at t h a t time were seen as the e v a l u a t i o n o f automated methods
from a t e c h n i c a l and economic point of view and to s t i m u l a t e
user i n t e r e s t and demand ( G a r d i n e r - H i l l 1972). Although a
v i s u a l product f o r the topographic data was l i k e l y to remain
a major requirement f o r the f o r s e e a b l e f u t u r e (maps produced
by d i g i t a l means were t o be made i n d i s t i n g u i s h a b l e from
c o n v e n t i o n a l l y c r e a t e d maps), i t had become obvious t h a t
demand was growing f o r the data to be made a v a i l a b l e i n
machine-readable form. From the Ordnance Survey p o i n t of
view, h o l d i n g the data bank i n d i g i t a l form was seen to o f f e r
the f o l l o w i n g b e n e f i t s :
1. Savings of space and c o s t s : the h a n d l i n g of over 200,000
paper sheets i s a daunting t a s k , although attempts had
a l r e a d y been made t o a l l e v i a t e these problems with the
use of m i c r o f i l m techniques (Maries 1971, Adams et a l
1980) .
2. S e c u r i t y of the survey r e c o r d : l a r g e s c a l e map d e t a i l
would no longer have t o be st o r e d on d i m e n s i o n a l l y s t a b l e
m a t e r i a l s . Coordinates h e l d i n computer f i l e s can always
be r e c a l l e d a t t h e i r o r i g i n a l accuracy.
3. Greater f l e x i b i l i t y of usage: customers could merge the
topographic base data f i l e s with t h e i r own s p e c i a l i s t
Chapter two

- 46 -
i n f o r m a t i o n f a r more q u i c k l y and e a s i l y .
4. Ease of d e r i v e d mapping s c a l e s : a t the time i t was
thought to be, a t l e a s t , c o n c e p t u a l l y p o s s i b l e to modify
the b a s i c s c a l e s to d e r i v e s m a l l e r s c a l e mapping. More
re c e n t experimentation has shown the d e r i v a t i o n of
1:25,000 mapping to be d i f f i c u l t because of the problems
of s e l e c t i v i t y and g e n e r a l i s a t i o n . However, q u i t e
s u c c e s s f u l 1:10,000 mapping has been p o s s i b l e with the
need for o n l y l i m i t e d a d d i t i o n a l e f f o r t by draughtsmen
( S e a r l e and Waters 1979).
The d i g i t a l mapping production f l o w l i n e has remained
v i r t u a l l y unchanged s i n c e i t s i n c e p t i o n , and i s based on what
can now be considered c o n v e n t i o n a l manual d i g i t i s i n g
procedures: batch p r o c e s s i n g of data and the production of
e d i t p l o t s from which the n e c e s s a r y c o r r e c t i o n s are made by
f u r t h e r d i g i t i s i n g and o f f - l i n e i n s t r u c t i o n s to the computer.
(See f i g u r e 2.3). The system can be c l a s s i f i e d i n t o f i v e
stages and these are d i s c u s s e d below.
Chapter two

- 47 -
Figure 2.3: Description of the Ordnance Survey (DMB) large s c a l e s d i g i t a l flowline
E d i t Xynetics
P l o t t e r cycle
D i g i t i s i n g table E d i t
cycle
Mini ICL
computer Mainframe
Mini D i g i t a l output computer
USER Graphical output Pe r r a n t i Master P l o t t e r

- 48 -
.5.1 P r e p a r a t i o n stage
The source documents used are the master survey documents
(MSD) - the d i m e n s i o n a l l y s t a b l e s u r v e y o r s ' working drawings.
I n order to a c h i e v e the g r e a t e s t p o s s i b l e a c c u r a c y at the
d i g i t i s i n g stage, the 1:1250 and 1:2500 MSD's which are h e l d
a t the c o r r e c t s c a l e , are p h o t o g r a p h i c a l l y converted to
negative form and enlarged by a r a t i o of 3:5. Thus the
1:1250 data a r e d i g i t i s e d a t 1:750 and the 1:2500 data a r e
d i g i t i s e d a t 1:1500 (thereby i n c r e a s i n g the linework to be
d i g i t i s e d by a f a c t o r o f 1.6). I n a d d i t i o n , two d i a z o c o p i e s
of the graphic are made: one of t h e s e i s to be the
p r o g r e s s - d i a z o which i s an a i d to the d i g i t i s i n g operator i n
monitoring the progress of the data capture. F i b r e t i p pens
are used to draw over the information as i t i s encoded; a
d i f f e r e n t c o l o u r to r e p r e s e n t each day's work. The second
diazo copy becomes the p r e - e d i t p l o t on which a l l t e x t data
are s e r i a l i s e d and t h e i r s t a r t p o s i t i o n s marked. T e x t u a l
information i n c l u d i n g the d e s i r e d t e x t s i z e and font i s
entered onto s p e c i a l l y prepared coding forms i n s e r i a l order
for subsequent key-punching i n t o the computer v i a a p r o c e s s o r
c o n t r o l l e d key-punch (PCK) system which comprises,
e s s e n t i a l l y , e i g h t video t e r m i n a l s connected to a c o n t r o l l i n g
mini-computer which i n t e r l e a v e s a l l input data on to a
magnetic tape d r i v e for t r a n s p o r t a t i o n to the mainframe
computer.
Chapter two

- 49 -
.5.2 D i g i t i s i n g stage
The Ordnance Survey has twenty four manual Frees c a n
d i g i t i s i n g t a b l e s manufactured by F e r r a n t i - C e t e c L t d . Nine
of the t a b l e s output coordinates d i r e c t l y on t o t h e i r own
magnetic tape d r i v e s and the remaining f i f t e e n a r e connected
to a p r o c e s s o r c o n t r o l l e d d i g i t i s i n g (PCD) system which i s
based on a D i g i t a l Equipment Corporation PDP 11/05
mini-computer. T h i s computer system i n t e r l e a v e s the output
from a l l 15 t a b l e s on to one magnetic tape which can be
sor t e d subsequently by the departmental mainframe computer a t
the end of the day ( H a r r i s 1980). I n essence, a PCD-based
system has the d i s t i n c t advantage of compacting the output of
a day's work on to one magnetic volume but i s h i g h l y
dependent on the r e l i a b i l i t y of the 11/05. Should the
proc e s s o r break down, then a l l f i f t e e n F r e e s c a n s a r e out of
commission; a three hour breakdown thus i m p l i e s f o r t y f i v e
hours of l o s t d i g i t i s i n g time. F o r t u n a t e l y , the 11/05 a t OS
has been extremely r e l i a b l e ( L i n k l a t e r pers coram 1979). The
d i g i t i s i n g procedures t h a t have been adopted over the l a s t
decade g e n e r a l l y f o l l o w normal conventions with predefined
s p e c i f i c a t i o n s : a t h i r t y - s i x p o int set-up process i s
performed for 1:1250 map sheets (nine p o i n t s f o r 1:2500).
Point d i g i t i s i n g methods are used with a data menu for
fe a t u r e code assignment (see s e c t i o n 2.3, Coles 1974).
Curves are encoded as a minimum of th r e e p o i n t s and s p l i n i n g
Chapter two

- 50 -
methods generate f u r t h e r p o i n t s as a post-hoc p r o c e s s . The
squaring of b u i l d i n g s i s a l s o c a r r i e d out as a
p o s t - d i g i t i s i n g b a s i s .
When the p r o g r e s s - d i a z o i n d i c a t e s the map sheet to have
been completed, the d i g i t a l v e r s i o n o f the data can e n t e r the
e d i t loop of the system. The time taken to complete a map
sheet a t the d i g i t s i n g stage i s a f u n c t i o n of the data
complexity and l i n e lengths i n v o l v e d . Personal r e s e a r c h by
the author during secondment t o Ordnance Survey headquarters
i n .1979 has shown d i g i t i s i n g times t o range from three hours
(sheet TQ 6693SW) with a l i n e length of 899 cm to around
f o r t y hours ( s h e e t SP 0689NE), with a l i n e length of 6192 cm.
Taking the t o t a l times ( p r e p a r a t i o n + d i g i t i s i n g + e d i t +
t e x t c o l l a t i o n ) f o r a s e l e c t i o n of the 478 map she e t s used i n
the Adams (1979) study, a l e a s t squares f i t was determined
for a g e n e r a l mathematical e x p r e s s i o n to l i n k d i g i t i s i n g
times with map l i n e length and f e a t u r e frequency. A
d e s c r i p t i o n o f the d e r i v a t i o n i s given i n Appendix 2.1. The
ex p r e s s i o n s d e r i v e d were as f o l l o w s :
Chapter two

- 51 -
(a) 1:1250 s c a l e : T L N
+ 1.75 144.1
(b) 1:2500 s c a l e :
T = L N +
1.10 128.2
where: T = t o t a l d i g i t i s i n g time i n hours L = l i n e length i n metres a t p l o t s c a l e N = number of f e a t u r e s per map s h e e t .
2.5.3 E d i t stage
The e d i t - l o o p process i n the production f l o w l i n e i s
i n e v i t a b l y slow: a l l v e r i f i c a t i o n and c o r r e c t i o n i s made by
o f f - l i n e p r o c e s s e s . The f i r s t e d i t p l o t i s produced i n a
s e r i e s of s t a g e s . The departmental mainframe computer - an
ICL 1906S - spools a p l o t d e s c r i p t o r f i l e (PDF) on to a
magnetic tape whence i t can be taken to one of two Hewlett
Packard mini-computers which d r i v e each of two X y n e t i c s model
1050/1150 p l o t t e r s . I n essence, a PDF i s a f i l e of b i n a r y
information which i s subsequently i n t e r p r e t e d by appropriate
software to d r i v e s p e c i f i c g r a p h i c s hardware, such as
hardcopy p l o t t e r s or storage tube t e r m i n a l d e v i c e s ; i t
i n c l u d e s a l l coordinate information, c o n t r o l s on the colour
of ink r e q u i r e d , the i n t e n s i t y of the p l o t t e d l i n e , the s i z e
Chapter two

- 52 -
of p l o t and so on. The X y n e t i c s S e r i e s 1000 are hi g h speed
f l a t - b e d p l o t t e r s capable of speeds of up to 40 inches per
second.
The f l o w - l i n e e d i t p l o t s are m u l t i - c o l o u r e d to a i d data
v e r i f i c a t i o n : b l u e i n k r e p r e s e n t s a l l b u i l d i n g s , fences are
shown i n b l a c k , road c a s i n g s are re p r e s e n t e d by green l i n e s
and a l l minor b u i l d i n g s and other data to be suppressed i n
de r i v e d s m a l l e r s c a l e s are shown i n red. These p l o t s a r e
u s e f u l f o r checking the c o n s i s t e n c y of the data, t h e i r
accuracy and appearance; t h e i r m u l t i - c o l o u r nature
f a c i l i t a t e s a v e r i f i c a t i o n t h a t f e a t u r e s have been coded
c o r r e c t l y .
C o r r e c t i o n s need to be made to the d i g i t a l f i l e s as they
are detected on the e d i t p l o t ; some may r e q u i r e a r e t u r n t o
the d i g i t i s i n g t a b l e , w h i l s t o t h e r s can be performed as a
batch job of computer i n s t r u c t i o n s . T h i s e d i t c y c l e i s
repeated c o n t i n u o u s l y u n t i l the d i g i t i s i n g draughtsmen
consid e r the data f i l e to be a c c e p t a b l e . On average 3 - 4
e d i t p l o t s a r e produced per sheet which takes approximately
20 minutes to p l o t on the X y n e t i c s p l o t t e r s (Smith pers coram
1979) though p l o t t i n g time i s dependant on data volume.
Chapter two

- 53 -
•5.4 Examination and a r c h i v i n g stage
As soon as a d i g i t a l f i l e has passed s c r u t i n y at the e d i t
stage, a m a s t e r - p l o t i s produced. Ordnance Survey operate
two high q u a l i t y F e r r a n t i Master f l a t b e d p l o t t e r s which are
c o n t r o l l e d i n a s i m i l a r way to the X y n e t i c s p l o t t e r s
' o f f - l i n e ' to the mainframe under the c o n t r o l of a PDP 11
mini-computer; they operate a t much slower speeds than the
X y n e t i c s p l o t t e r s ( t y p i c a l l y 4 inches per second) and p l o t
d i r e c t l y on to f i l m . These p l o t s are drawn a t c o r r e c t
p u b l i c a t i o n s c a l e ; t h i s i s the f i r s t time t h i s w i l l have
occured s i n c e the enlargement p r o c e s s , which was c a r r i e d out
p h o t o g r a p h i c a l l y a t the p r e p a r a t i o n stage. I n general terms,
the turn-around times of the e d i t stage a r e not a c c e p t a b l e
for a production system. The turn-around times of the
v a r i o u s s t ages f o r 1:1250 data of the Birmingham area - which
are i n c l i n e d to be voluminous (Adams and Rhind 1981) - are
shown below:
D i g i t i s i n g 3 4 days
X y n e t i c s e d i t p l o t request 8 - 1 0 days
Master p l o t request 4 6 weeks
(Source OS pers comm 1980).
Chapter two

- 54 -
When a d i g i t a l sheet has reached the master p l o t stage, i t
passes from the D i g i t i s i n g Branch of the Cartography D i v i s i o n
to a s p e c i a l Examinations Branch. T h i s branch checks a l l
1:1250 and 1:2500 conventional and d i g i t a l mapping for
accuracy, completeness and conformity with the s p e c i f i c a t i o n s
of the day p r i o r t o r e p r o d u c t i o n . At t h i s s t a g e most
c o r r e c t i o n s n e c e s s a r y are made by hand to the f i l m p o s i t i v e
although r e c o r d s are kept to ensure t h a t the d i g i t a l f i l e s
are updated at some time i n the f u t u r e . When the
Examinations Branch has approved the content of the d i g i t a l
f i l e s , they can be a r c h i v e d , which i n v o l v e s r e f o r m a t t i n g the
f i l e s on d i s k and transforming them to magnetic tape f o r
storage. The OS system i s h i g h l y dependant on magnetic
tapes: i n 1980, the mainframe had twelve t a p e - d r i v e s .
Information i s only h e l d o n - l i n e (magnetic d i s k ) w h i l s t i t i s
i n the d i g i t i s i n g and e d i t s t a g e s . For s e c u r i t y purposes,
three copies of the data a r c h i v e are h e l d : two are s t o r e d i n
d i f f e r e n t l o c a t i o n s w i t h i n the Southampton headquarters and
one i s sent t o the O f f i c e of Population Censuses and Surveys
(OPCS) i n T i t c h f i e l d .
.5.5 C a r t o g r a p h i c enhancement stage
There are s t i l l a number of enhancements t h a t have to be
included before the p u b l i s h e d plan can be reproduced and sold
Chapter two

- 55 -
i n i t s graphic form: v e g e t a t i o n , p a r c e l area values ( a t
1:2500 s c a l e ) and some marginal information are added by hand
and the b u i l d i n g i n f i l l mask i s c u t . The three components
are combined p h o t o g r a p h i c a l l y to produce a f i l m p o s i t i v e for
subsequent repro d u c t i o n by c o n v e n t i o n a l means.
The s t a t u s quo cannot be considered as p r o v i d i n g a
s a t i s f a c t o r y production f l o w l i n e : i t i s i n e f f i c i e n t and
expensive. The d i g i t a l f l o w l i n e r e q u i r e s 92 man hours per
sheet compared w i t h 68 man hours f o r the c o n v e n t i o n a l
f l o w l i n e (Thompson 1978) and hence c o s t s 1.6 times the
conventional system. The reasons f o r these unfavourable
comparisons with the c o n v e n t i o n a l p r o c e s s e s were o u t l i n e d i n
the Review Committee r e p o r t (HMSO 1979). The r e p o r t s t a t e d
(para 10.5) the main reasons appear to be:
a. "The l a r g e number of p r o c e s s e s i n v o l v e d . I n the p r e s e n t OS system d i g i t a l work has t o be p l o t t e d , checked and c o r r e c t e d , on average 2.5 times before the f i n a l map can be produced. Fourteen s e p a r a t e o p e r a t i o n s are i n v o l v e d , compared with e i g h t f o r the c o n v e n t i o n a l manual production system;
b. the r e l a t i v e l y l a r g e number o f conventional p r o c e s s e s s t i l l to be undertaken on each d i g i t a l map ( f o r example the s t i p p l e i n f i l l o f b u i l d i n g s ) ;
c. the c o s t s of checking ( p a r t i c u l a r l y i n the case of f e a t u r e codes attached to a l l l i n e s and p o i n t s ) . "
Chapter two

- 56 -
With a c u r r e n t throughput of 2000-3000 maps per year
(Logan 1981), the estimated t i m e s c a l e t o complete the d i g i t a l
c o n v e r s i o n alone without any e f f o r t being p l a c e d on the
r e v i s i o n of e x i s t i n g mapping i s approximately seventy y e a r s .
At l e a s t a s i x - f o l d i n c r e a s e i n work r a t e s would be r e q u i r e d
to complete d i g i t i s i n g w i t h i n a ten-year p e r i o d as has been
proposed i n the S e r p e l l Report (HMSO 1979). The achievement
of such a goal i s almost c e r t a i n l y a l l i e d to the adoption of
automated d i g i t i s i n g techniques, p a t i c u l a r l y s i n c e plans
announced i n e a r l y 1982 envisage a r e d u c t i o n o f one hundred
c a r t o g r a p h i c draughtsmen. There are two a l t e r n a t i v e s
a v a i l a b l e for automation: r a s t e r scan based techniques or
ve c t o r f o l l o w i n g t e c h n i q u e s . D e t a i l e d c o n s i d e r a t i o n of the s e
approaches w i l l be given l a t e r .
2.6 THE NEED FOR TOPOLOGY IN THE ORDNANCE SURVEY DATA STRUCTURE
OS d i g i t i s i n g procedures as o u t l i n e d e a r l i e r have been
organised i n such a way as t o provide a t o l e r a b l e job for the
d i g i t i s i n g operator; such terms of r e f e r e n c e made good sense
for the i n i t i a l o b j e c t i v e s of the system - the production of
hig h q u a l i t y g r a p h i c s ( G a r d i n e r - H i l l 1972). I t i s , for
example, unnecessary to have a d j a c e n t f e a t u r e s
c r o s s - r e f e r e n c e d i f f u r t h e r mapping i s the only d i g i t a l
a p p l i c a t i o n - the l i n e s may be drawn a t d i f f e r e n t times but
Chapter two

- 57 -
t h a t i s i r r e l e v a n t provided they are drawn i n c o r r e c t
r e l a t i o n s h i p to each other. V e r s a t i l i t y i n the type o f
graphic to be produced i s e a s i l y achieved with the present
data s t r u c t u r e (DMB)s customised images with s c a l e , area of
i n t e r e s t and f e a t u r e type can be produced economically and
e a s i l y .
The n a t i o n a l sapping cagency has been f u l l y aware of
growing i n t e r e s t amongst u s e r s wishing to use d i g i t a l
topographic data f o r other purposes. Thompson (1978)
suggests some t y p i c a l examples: g a z e t t e e r s , r u r a l and urban
property data bases, road and t r a n s p o r t data bases and p u b l i c
u t i l i t y networks. The need for e a s i l y a c c e s s i b l e and
c a r e f u l l y s t r u c t u r e d d i g i t a l land information has been long
argued by Dale (1977; Dale and Hollwey 1978); t h e r e i s no
reason why a topographic data base should not be coordinated
with land use s t u d i e s , p o l l u t i o n monitoring and t e r r e s t r i a l
ecology as w e l l as data provided from pop u l a t i o n censuses;
many (over f i f t y per c e n t ) of the boundaries of the census
Enumeration D i s t r i c t s have remained constant between 1971 and
1981 and many are defined along p h y s i c a l f e a t u r e s recorded on
OS maps. To achieve a n a l y t i c a l p o s s i b i l i t i e s such as these
i s i m p r a c t i c a b l e given the data s t r u c t u r e d e s c r i b e d above. A
t y p i c a l case i s the i d e n t i f i c a t i o n and r e t r i e v a l of land
p a r c e l boundaries, another i s the l a c k of any d e f i n i t e
l i n k a g e between t e x t and hard d e t a i l w i t h i n the data.
Chapter two

- 58 -
2.7 THE RESTRUCTURING PROJECT FOR ORDNANCE SURVEY DIGITAL DATA
The data s t r u c t u r e generated by the e x i s t i n g d i g i t a l
f l o w l i n e i s u n s u i t a b l e for any of the non-graphic uses
d i s c u s s e d i n s e c t i o n 2.6. For these reasons, a f e a s i b i l i t y
study was i n i t i a t e d by the OS to " i n v e s t i g a t e the d i f f e r e n t
needs of p o t e n t i a l u s e r s of OS l a r g e s c a l e d i g i t a l map data
i n l o c a l a u t h o r i t i e s , p u b l i c undertakings, c e n t r a l Government
and elsewhere" (Thompson 1978 p 11). In 1975, PMA
Consult a n t s L t d . (a commercial software house) was
commissioned to reformat e x i s t i n g data i n t o a format more
s u i t e d to a n a l y t i c a l p r o c e s s e s (Thompson 1978, HMSO 1979).
I n concept, r e s t r u c t u r i n g i s t r i v i a l ; the e x i s t i n g data
need to be broken down i n t o b a s i c e n t i t i e s and then
recombined i n t o u n i t s more app r o p r i a t e to user needs. In
general terms, the b a s i c e n t i t i e s of the map data are the
c o l l e c t i o n o f x,y p o i n t s and any r e s t r u c t u r i n g process
i n v o l v e s merely r e c o n n e c t i n g these p o i n t s i n t o more
appropriate u n i t s and regrouping the a t t r i b u t e s where
n e c e s s a r y .
Chapter two

- 59 -
Fi g u r e 2.4: An example of OS data r e s t r u c t u r i n g
(node d e t e c t i o n along a t e r r a c e f r o n t )
Unstructured DMB R e s t r u c t u r e d PMA v e c t o r s v e c t o r s i n l i n k and node format
I n summary, the r e s t r u c t u r i n g p r o j e c t adopted i n the PMA
software has i n v o l v e d the f o l l o w i n g :
a. Taking the OS i n t e r n a l data format as input, a l l records
are s o r t e d and reo r g a n i s e d so t h a t a l l information
p e r t a i n i n g to each 100 metre square on the N a t i o n a l G r i d
i s h e l d together as a s e r i e s of s u b - d i r e c t o r i e s f o r each
square. I n p a s s i n g , s t u d i e s by the author have shown
t h a t p l o t t i n g time f o r the s o r t e d ( r e s t r u c t u r e d ) data are
v a s t l y improved; t h e r e i s much to be s a i d f o r s o r t i n g a l l
vector-based geographic data before p l o t t i n g .
Chapter two

- 60 -
P r e l i m i n a r y t e s t s have shown c u r r e n t DMB data to be only
35 - 40 per cent e f f i c i e n t i . e . of the t o t a l pen t r a v e l
d i s t a n c e ( i n pen up or down p o s i t i o n ) , only 35 - 40 per
cent of the t r a v e l i s pen down.
b. Working s e q u e n t i a l l y on each 100 m square s u b - d i r e c t o r y
i n t u r n , the i n t e r s e c t i o n s of a l l l i n e f e a t u r e s are
detected and s t o r e d i n a secondary f i l e . These
i n t e r s e c t i o n s ( i n PMA terminology) are the nodes of the
data.
c. A l l support-data such as t e x t u a l information a r e
separated from the l i n e data and s t o r e d as se p a r a t e data
e n t i t i e s .
.7.1 The f i l e s t r u c t u r e of the PMA r e s t r u c t u r i n g p r o c e s s
The r e s t r u c t u r i n g software now implemented by the Ordnance
.Survey generates a data s t r u c t u r e s u i t e d to the ICL hardware
i n s t a l l e d i n the headquarters. Random ac c e s s memory ( d i s k s ,
drums, e t c . ) i s somewhat l i m i t e d for data storage and hence
much use i s made of s e q u e n t i a l storage d e v i c e s i n the form of
computer compatible t a p e s . A l l PMA data f i l e s have adopted a
s e r i a l a c c e s s thereby reducing c o s t s of data storage but
Chapter two

- 61 -
i n c r e a s i n g the storage and r e t r i e v a l a c c e s s times by a
( p r e s e n t l y ) unknown f a c t o r .
The methods of data o r g a n i s a t i o n i n c o r p o r a t e t h r e e types
of ' l o w - l e v e l ' data f i l e . These hold the 'atomic fragments'
of the more complex DMB ground f e a t u r e s as a s e r i e s of p o i n t s
and l i n e s (or nodes and l i n k s ) . ' H i g h - l e v e l ' f i l e s can then
be c o n s t r u c t e d s p e c i f i c to user requirements by aggregating
a c c o r d i n g l y only those l i n k s n e c e s s a r y to r e p r e s e n t the
f e a t u r e s requested.
The three l o w - l e v e l f i l e s a r e (PMA 1978):
- p o i n t and l i n e data f i l e ;
t e x t index f i l e ;
t e x t data f i l e .
These w i l l now be d i s c u s s e d s e p a r a t e l y -
1. Point and l i n e f i l e : The point and l i n e f i l e f or each map
sheet s t o r e s the bulk of the topographic i n f o r m a t i o n ; i t
i s here where the l i n k s and nodes data are s t o r e d . The
f i l e i s sub-divided i n t o three s e c t i o n s : the g r i d nodes,
Chapter two

- 62 -
the i n t e r n a l nodes and the l i n k s .
a. The g r i d nodes are a s p e c i a l category of po i n t which
are generated by the software each time a l i n k
c r o s s e s from one 100 metre g r i d square to the
adjacent square. I n t h i s way, i t i s p o s s i b l e to
l o g i c a l l y c hain f e a t u r e s when they pass from one
sheet to the next or from g r i d square to g r i d square
w i t h i n the same s h e e t .
b. I n t e r n a l nodes are those p o i n t s d e s c r i b e d by
C a r t e s i a n coordinates i n which one or more l i n k s
terminate. L i n k s r e p r e s e n t i n g "wiggly" f e a t u r e s can
comprise many p o i n t s but these are not nodes u n l e s s
the l i n k (or any other l i n k ) s t a r t s or ends t h e r e .
c. The l i n k s are the l i n e s which j o i n together the nodes
to r e p r e s e n t s e r i e s of topographic f e a t u r e s .
The point and l i n e f i l e h olds these t h r e e c a t e g o r i e s
of data i n the above order; s i n c e i t i s b u i l t up as a
s e q u e n t i a l s t r u c t u r e , then very l i t t l e topology can
e x i s t . Each node po i n t has p o i n t e r s t o i t s a s s o c i a t e d
l i n k data although no p o s i t o n a l information i s i n c l u d e d ;
the x,y p o i n t s comprising the line-work are h e l d i n the
Chapter two

- 63 -
l i n k s s e c t i o n only.
2. Text data f i l e s ; The t e x t u a l information i s h e l d i n two
f i l e t y p e s : The Text Index f i l e , e s s e n t i a l l y , speeds up
a c c e s s to the Text Data f i l e which h o l d s the s t r i n g s of
t e x t c h a r a c t e r s themselves. The index f i l e comprises a
s e r i e s of r e c o r d s of v a r y i n g l e n g t h ; each record provides
a p o i n t e r to one or more t e x t items i n the t e x t data
f i l e . The index e n t r i e s are sequenced by g r i d square
order. The t e x t data f i l e s t o r e s the t e x t s t r i n g s
together with t h e i r p o s i t i o n , s t y l e , h e i g h t , e t c .
.2 Uses of the r e s t r u c t u r e d l o w - l e v e l data
The r e s t r u c t u r i n g s t r a t e g y adopted by PMA has been to take
on two phases of development. Phase one i n v o l v e s the a c t u a l
r e s t r u c t u r i n g process as d e s c r i b e d above. After Considerate^ t h i s
process now works s u f f i c i e n t l y w e l l to provide a l i m i t e d
customer s e r v i c e although i t i s a f a i r l y time-consuming
operation (OS pers comm 1979). Phase two of the s t r a t e g y has
invol v e d the development of a User-language which can
i n t e r r o g a t e the l o w - l e v e l data and r e c o n s t r u c t u s e r - d e f i n e d
e n t i t i e s such as land p a r c e l boundaries, r a i l w a y or water
courses, a d m i n i s t r a t i v e boundaries, and so on; these are
Chapter two

- 64 -
termed ' h i g h - l e v e l * f i l e s . Thompson (1978) p o i n t s out t h a t
i n i t i a l t r i a l s a t w r i t i n g the user-language software have
attempted to r e b u i l d the l i n k and node data i n t o l a n d - p a r c e l
boundaries; these have d i r e c t r e l e v a n c e to H.M. Land
R e g i s t r y and L o c a l A u t h o r i t y p r o p e r t y records and are
considered to be the most arduous to develop. A number o f
t e c h n i c a l and conceptual problems do e x i s t i n any e n t i t y
r e b u i l d i n g : most other systems g e n e r a t i n g polygons (e.g.
GIMMS (Waugh 1979)) are aided c o n s i d e r a b l y by a d d i t i o n a l
information which OS data do not provide, namely what i s to
the r i g h t and l e f t of each l i n e . Furthermore, the d e c i s i o n
to r e t a i n the c h a r a c t e r i s t i c s of the o r i g i n a l data as they
have been d i g i t i s e d , although understandable, i s u n d e s i r a b l e
i n a data base co n t e x t . Two l i n e s j o i n i n g a t a common p o i n t ,
for example, need not n e c e s s a r i l y have e x a c t l y i d e n t i c a l
c o o r d i n a t e s f o r t h e i r end-points i n the Ordnance Survey
schema.
I d e a l l y , the h i g h - l e v e l f i l e s should be customised to s u i t
user needs with zone o f i n t e r e s t , data c l a s s i f i c a t i o n and any
supplementary information (e.g. c e n t r o i d r e f e r e n c e , and road
widths) being requested a t run-time. F u r t h e r , there has been
much c a l l f or v e r s a t i l e software to run on user's
i n s t a l l a t i o n s as and when r e q u i r e d . Sadly, some o f these
i n t e n t i o n s have had to be de f e r r e d i n p r a c t i c e : the user
language cannot be considered as t r a n s p o r t a b l e , i t i s h i g h l y
Chapter two

- 65 -
dependant on the ICL 1906S running under the GEORGE 3
e x e c u t i v e a t OS head q u a r t e r s . For u s e r s who wish t o s p e c i f y
t h e i r requirements i n d e t a i l on a o n c e - a n d - f o r - a l l b a s i s ,
t h e r e should be few problems; Ordnance Survey should be a b l e
to provide a magnetic tape of the r e s t r u c t u r e d data
comprising property and other zones s p e c i f i c to the user
r e q u e s t s , although e x i s t i n g software i s f a r from robust.
T h i s has been the case with the Dudley Metropolitan Borough
which i s attempting to use r e s t r u c t u r e d land p a r c e l data i n
t h e i r L o c a l A u t h o r i t y Management Information System (LAMIS -
see H a r r i s o n 1979); OS are d i g i t i s i n g the r e q u i r e d sheets i n
the production f l o w l i n e and r e s t r u c t u r i n g the r e s u l t s v i a the
user language i n house. As y e t th e r e remains s u b s t a n t i a l
unsolved problems where u s e r s wish to r e s t r u c t u r e t h e i r own
copies of the data, or indeed up-date or g e n e r a l l y combine
them with t h e i r own data s e t s . Arguably i t may be the r o l e
of the n a t i o n a l mapping agency or some other e x t e r n a l
i n s t i t u t i o n t o provide t h i s s e r v i c e . I f t h i s i s the c a s e ,
then there i s a need f o r s u b s t a n t i a l developments i n
s t a n d a r d i s a t i o n of exchange data formats and documentation on
the types of data manipulation p o s s i b l e ; these developments
are a l l i e d c l o s e l y with the needs of u s e r s as o u t l i n e d i n
chapter one.
Chapter two

- 66 -
.8 THE USE OF FAST-PIGITISING SYSTEMS AT ORDNANCE SURVEY
The elapsed time to encode d i g i t a l l y a l l 220,000 l a r g e
s c a l e p l a n s f o r n a t i o n a l coverage i s expected to be
approximately 60-70 ye a r s with c u r r e n t throughput r a t e s f o r
the e x i s t i n g production f l o w l i n e a t Ordnance Survey (Logan
1981). I n order to provide a N a t i o n a l D i g i t a l Topographic
Data Base i n a much more reasonable t i m e s c a l e (the S e r p e l l
Report (HMSO 1979) suggests ten y e a r s ) i t becomes n e c e s s a r y
to look towards f a s t e r , semi-automatic data capture methods.
I n 1979, The OS took d e l i v e r y of a F a s t r a k l i n e f o l l o w i n g
d i g i t i s e r manufactured by L a s e r - s c a n L a b o r a t o r i e s L i m i t e d o f
Cambridge, England. T h i s h i g h l y advanced d i g i t i s i n g hardware
has formed the f r o n t end o f the TODDS (Topographic Data base
Development System) p r o j e c t (Logan 1981) and i t i s hoped t h a t
such an approach t o the data capture stage w i l l i n c r e a s e
throughput r a t e s d r a m a t i c a l l y ( c . f i v e - f o l d ) . The hardware,
which i s h i g h l y ingenious, i n v o l v e s the use of a focussed
l a s e r beam which d e t e c t s l i g h t and dark d i f f e r e n c e s as i t
probes areas of f i l m to be d i g i t i s e d . The t r a n s i t i o n from
l i g h t to dark or dark to l i g h t r e p r e s e n t s the edges of the
l i n e to be d i g i t i s e d ? a p p r o p r i a t e d r i v i n g software i n s t r u c t s
the i n t e r n a l d e f l e c t i o n system how to move the l a s e r to
foll o w l o g i c a l l y each l i n e a u t o m a t i c a l l y (Hardy 1978). The
device operates i n a f u l l y i n t e r a c t i v e manner, stopping for
operator a s s i s t a n c e i f i t cannot see any l o g i c a l c o n t i n u a t i o n
Chapter two

- 67 -
of the l i n e being followed; data capture h a l t s a t the end of
open f e a t u r e s or when i t r e t u r n s t o the s t a r t of a c l o s e d
loop f e a t u r e . Operator i n t e r v e n t i o n enables f e a t u r e coding
and c l a s s i f i c a t i o n to take p l a c e a t the d i g i t i s i n g stage on a
s i m i l a r b a s i s t o the manual t a b l e s ; a keyboard console and
t r a c k e r b a l l i s used to i n d i c a t e the c l a s s of f e a t u r e ( p o i n t ,
curved l i n e , pecked l i n e ) and i t s p o s i t i o n . The operator
works i n f r o n t of a l a r g e 1.0 x 0.7 metre d i s p l a y s c r e e n
(based on the L a s e r scan HRD1 l a s e r d i s p l a y / p l o t t e r ) on which
i s p r o j e c t e d the map data to be d i g i t i s e d . Any l i m i t a t i o n s
stem l a r g e l y from the photographic r e d u c t i o n process of the
source document and hence l o s s of q u a l i t y and reduced l i n e
weight; the readable a r e a of the f i c h e i s 98 x 68 mm.
F a s t r a k has the added b e n e f i t of being able to d e t e c t the
j u n c t i o n s of two or more l i n e s ('nodes' i n the PMA schema)
and can, t h e r e f o r e , be programmed to d i g i t i s e d i r e c t l y i n t o
l i n k and node format, thereby removing the slow and c o s t l y
r e s t r u c t u r i n g stage ( f o r OS, i f not f o r customers who wish to
l i n k t h e i r own, e x i s t i n g d i g i t i s e d data to t h a t i n the OS
f i l e s ) .
The f i r s t production F a s t r a k to be i n s t a l l e d i n the UK was
at the Mapping and C h a r t i n g Establishment (MCE) of the Royal
Engineers i n March 1977 and r e p o r t s from there have been very
favourable (Howman and Woodsford 1978) f o r small s c a l e
topographic work. The device i s s a i d to r e t a i n
Chapter two

- 68 -
c a r t o g r a p h e r s ' i n t e r e s t and the e r r o r r a t e i s low. They
r e p o r t the c l e a n d i g i t i s i n g of 21.6 metres of contour data i n
one hour. D i g i t i s i n g r a t e s f o r more complex l a r g e s c a l e and
land-use maps are i n e v i t a b l y slower. Hardy (1978) has
suggested a u s e f u l e m p i r i c a l l y d e r i v e d formula f o r
approximate d i g i t i s i n g times on a v a r i e t y of map t y p e s . This
i s :
T = L N +
12.5 720
Where: T = approximate time i n hours L = l i n e length i n metres N = number of f e a t u r e s
Time estimates are s u b j e c t to v a r i a t i o n s due to operator
s k i l l and assumes the use of simple numeric f e a t u r e codes
only. Appendix 2.1 shows s i m i l a r e x p r e s s i o n s f o r manual
d i g i t i s i n g procedures f o r comparison purposes. Assuming a
t y p i c a l OS 1:1250 map sheet c o n t a i n i n g 40 metres of l i n e
length and 2100 f e a t u r e s (see Adams 1979 p 44-45) then
estimated d i g i t i s i n g time on the F a s t r a k would be s i x hours.
Manual d i g i t i s i n g of the same sheet (from Ordnance Survey
r e c o r d s ) show a time of 24 hours; thus, F a s t r a k r e p r e s e n t s a
four times i n c r e a s e . C l e a r l y , d i g i t i s i n g r a t e s w i l l be
s h e e t - s p e c i f i c but four to f i v e times i n c r e a s e s are to be
Chapter two

- 69 -
expected and many p r e l i m i n a r y t e s t s (Howraan and Woodsford
1978) suggest t h i s t o be probable.
In a d d i t i o n , the TODDS p r o j e c t has i n v o l v e d the t r i a l o f
two i n t e r a c t i v e g r a p h i c s work s t a t i o n s (Logan 1981). One
s t a t i o n supports the IGES software ( L a s e r - s c a n L a b o r a t o r i e s
1981) f o r map data v e r i f i c a t i o n and manipulation. The other
s t a t i o n supports the CLUMIS system ( F e r r a n t i - C e t e c L t d . 1979)
to e d i t land p a r c e l boundaries a f t e r the d i g i t i s e d data have
been r e s t r u c t u r e d i n t o l i n k s and nodes. Since the hardware
involve d with both t h e s e systems i s i d e n t i c a l , i t i s easy to
s e l e c t any combination of systems running sim u l t a n e o u s l y .
I t has been a n t i c i p a t e d t h a t t r i a l s with the TODDS system
over a p e r i o d of 12 - 14 months should g i v e some i n d i c a t i o n
of how such a system w i l l perform i n a production
environment. I n i t i a l t r i a l s have i n v o l v e d examining
a l t e r n a t i v e f l o w l i n e procedures and comparing c o s t s and
throughput r a t e s (Logan 1981). R e s u l t s a t the end of 1981
have suggested t h a t , by i n c o r p o r a t i n g F a s t r a k d i g i t i s i n g and
i n t e r a c t i v e e d i t f a c i l i t i e s i n t o the d i g i t a l f l o w l i n e , t h e r e
can be favourable developments: c o s t s w i l l be reduced
s u b s t a n t i a l l y f o r the i n i t i a l g e n e r a t i o n and maintenance of
the data base.
Chapter two

- 70 -
2.9 DATA BASE MANAGEMENT SYSTEMS AND TOPOGRAPHIC DATA
The ' r e l a t i o n a l data base' concept as suggested by
E. F. Codd (1970, Chamberlin 1976) have been shown t o be
widely a p p l i c a b l e t o commercial data base management systems.
These methods of data o r g a n i s a t i o n aim to optimise data
storage and information r e t r i e v a l times. The fundamental
concepts i n v o l v e a data s t r u c t u r e comprising a number of
f i l e s or ' r e l a t i o n s ' which are e q u i v a l e n t to a t a b l e of
f i g u r e s — see f i g u r e 2.5
Fi g u r e 2.5: The s t r u c t u r e o f a r e l a t i o n a l data base
/ /
i / /
a DOMAIN i s e q u i v a l e n t to a column or a s e r i e s of f i x e d length records
a TUPLE i s e q u i v a l e n t to a row i n the t a b l e
/ = Primary key
In order to enable c r o s s - r e f e r e n c i n g of t u p l e s i n
d i f f e r e n t r e l a t i o n s w i t h i n the data base, i t i s n e c e s s a r y to
a s s i g n to each t u p l e a 'primary key' to define and i d e n t i f y
Chapter two

- 71 -
i t uniquely. In t h i s way i t becomes p o s s i b l e to implement
the r e l a t i o n a l a l g e b r a theory developed by Codd for e f f i c i e n t
data manipulation and r e t r i e v a l . Since r e l a t i o n a l theory
assumes random a c c e s s f i l e storage methods, then i t i s
ne c e s s a r y to i n c o r p o r a t e magnetic d i s k or s i m i l a r storage
media i n t o the system.
Baxter (1980) has attempted to modify h i s DOE (1976) work
i n v o l v i n g a parsed data s e t of B r i t i s h L o c a l A u t h o r i t y
Boundaries to u t i l i s e a r e l a t i o n a l type o f data s t r u c t u r e ? he
a n t i c i p a t e s much improved r e t r i e v a l overheads and times f o r
u s e r - s e l e c t e d polygons.
In r e l a t i o n a l terms, the c u r r e n t f i l e o r g a n i s a t i o n o f the
r e s t r u c t u r e d OS data i s s i m i l a r to the schema o u t l i n e d i n
f i g u r e 2.6.
The d e s c r i p t i o n i n f i g u r e 2.6 i s an attempt to d e f i n e the
PMA r e s t r u c t u r e d data f i l e s i n t o a r e l a t i o n a l data base
s p e c i f i c a t i o n . The r e s u l t i s f a r from a c c e p t a b l e ; v a r i a b l e
length t u p l e s evident i n every r e l a t i o n are almost c e r t a i n l y
i n v a l i d i n the Codd schema. The need f o r t u p l e s of v a r i a b l e
length a r i s e s from the non-constant number of l i n k s
a s s o c i a t e d w i t h each node. The b e s t form of data
o r g a n i s a t i o n s u i t e d to these c h a r a c t e r i s t i c s i s probably a
t r e e s t r u c t u r e as shown i n f i g u r e 2.7, although each s u b - f i l e
Chapter two

- 72 -
a o •H -P nJ
rH 0) r t
Q) XJ O G
X i •H r t
x l 0) -p a)
•H o o CO CO cd
<n o J .
0) fclO
X l 0)
F-t CJ
03
* !» • CD o —V c X! -p CD • rH a CO tti
•H . 3 •H u n
k
^ N ft •H 0) ft) ^— rH CO
M e «t CD 0) o c T3 XI o o O CO
• r l O P p <A co C bo c3 •H 0) XJ !> {-j rH 0) <H
•H r-» cd O X ) •P •H X l
cd fH -H • a) d) fn O -p co bo c cd
X l II II II 3 I S H • 03 e> <U
X) •H r t
a?
> M o
•r t
c
o o CO CO a) X! o a a)
-p o
• 3
G o • r l •P cd
o G
0) r t d) X!
XI -p to G
• 8 •H r t nS >
3
03
ca
a> -p cd G o
• r l - P cd
t—i a> u
o r—
x! xt o o c M
G o •H
a rH 0) rH
a> xt o G cd
fi 0) -p G
o S_ CO r l CtJ
C^ CO
X) •H r l O "5P CO
0) • X )
r i O 0) O XI
U G 3 -p
rH 03 cd 0)
•H <M u CD -co x l -p
• 3 G e O -H
•H N m cd
•H >
•H X I cd -p a) x)
0) >
• r l bO c
a> > a>
o
•rH
G •H
O o CO CO cd XI o cd 0) -p o
• 3
G O
•H -P CtJ
o G
a> u cd
CT CO
U bO
0) u
bo G a>
Xi CC)
•H f-l cd >
I-H
03 C5
41= 03
-p cd G o
•H -P cd
rH 0) r l
rH
G O
•rt -P Cd
rH a>
r (
G •H
•H •H
r ( C5 41= 03
G
0) x ; - P
2 0) G 0)
- P
CO
t o o o
X! -p (JD G a>
Xi nj
•H fH
>
o o
03
G
••̂ o a> XJ CO o x ) o G a> fH «M 3 o •p ct) X! CD - P
a! CO II II *• O •
CM G •H rH
bo ^ G r— , •H
v • CO <; •H
r t r t P-
P I a> 6 c—i XI o 6 o •> o C G CO
o x) rH •H r t «} CO O
03 •rt •H o r t t> o 0) •H CO XJ
4t o 03 aj l-H +J •
N. • •rt n3 o H rH x< G
II II II • » CO o
rm
T,fi
NO
0) +» rH a) c u o 0) *H X 4̂ cd
G o
•H - P CSJ
rH 0) r t
- P X 0!
•H
CO U nj x l o «H o o
x i -p •§ N
o j iaO G
•H O ni ft
03
>5 - P 03
•H CU
« -p ft -p r t n) -p
03
•H X l XI P
co
«J
•rt
XJ
Oj •p A
0) r t ni P cr CO
X ) •r t r t O at 03 EH
X -p G CD
Xi ct3
•rt r t Cfl > bD G
•H r t
- P CO
- p X CD

- 73 -
can be t r e a t e d as 'chains', ' s t a c k s ' , or ' r i n g s ' (these a r e
terms used i n computer data s t r u c t u r e theory - see Page and
Wilson 1978).
Figu r e 2.7; A t r e e s t r u c t u r e t o s t o r e l i n k and node data
NODE
L i n k l L ink 4 Link 7 Li n k 8 Link 2 Link 6
The coordinate s t r i n g s w i t h i n the l i n k s u b - f i l e s w i l l always
be processed i n the same order; some l i n k s c l o s e back on
themselves su g g e s t i n g a r i n g s t r u c t u r e , w h i l s t o t h e r s have
two separate end nodes suggesting a s t a c k . An added
co m p l i c a t i o n i s introduced s i n c e a node may be a c c e s s e d by
more than one l i n k , suggesting a t r e e s t r u c t u r e to be
i n a p p r o p r i a t e ; a more complex m u l t i - d i r e c t i o n a l network (or
plex-network a f t e r Martin 1976 page 84) i s r e q u i r e d .
F u r t h e r , the ' r i n g s ' or ' s t a c k s ' w i l l need to be a c c e s s e d i n
both d i r e c t i o n s (ascending and descending order) suggesting
the n e c e s s i t y f o r m u l t i - d i r e c t i o n a l data f i l e s .
Consider an example shown i n f i g u r e 2.8:
Chapter two

- 74 -
F i g u r e 2-8: An example o f the complex data base schema r e q u i r e d to r e p r e s e n t the s i m p l e s t of
v e c t o r l i n k and node s t r u c t u r e s
Node 1
Link
P a r c e l 1 4 5
1 P a r c e l 2
Link 2
Node 2
P a r c e l 3
Lin k 4
(b) The d a t a base schema f o r the above;
( a ) R e a l i t y ; 3 l a n d p a r c e l s , i n v o l v i n g : 2 nodes, 4 l i n k s .
LINK 1 (A s t a c k )
V y i x2, y 2
x y y 3 V y 4 V y 5 x6' y6
NODE 1
LINK 2 (A s t a c k )
no i n t e r n a l p o i n t s
NODE 2
SIT LINK 3
(A s t a c k ) LINK 4
( A - r i n g )
V y1 L2' ^2 c3' y 3 V y4 V y5 :6' y6
X7, y7

- 75 -
F i g u r e s 2.8a and 2.8b p o r t r a y how even the s i m p l e s t o f
s i t u a t i o n s r e q u i r e a complex schema. R e l a t i o n a l ideas can
o f f e r a b e t t e r s o l u t i o n i f the r i n g or s t a c k s u b - f i l e s a r e
incorporated i n t o the system with some form of
hash-addressing (see Page and Wilson 1978 page 174). Since
i t i s the l i n k s u b - f i l e s which g i v e r i s e to t u p l e s of
v a r i a b l e length, then these can be h e l d as hash addressed
s t a c k s ; the node s e r i a l number i n c o n j u n c t i o n with some
cl o c k w i s e sequence l i n k number a t the node can provide the
seed f o r the hashing algorithm.
F i g u r e 2.9 shows the i n c o r p o r a t i o n o f hash addressed
s t a c k s f o r the l i n k s i n a suggested r e l a t i o n a l data base f o r
r e s t r u c t u r e d OS v e c t o r data. An a l t e r n a t i v e approach f o r
polygonal data has been suggested ( H a r r i s e t a l 1981) which
holds the data i n the form of h i e r a r c h i c a l l e v e l s : a t the
lowest l e v e l i s the i n d i v i d u a l l i n e segments with a p p r o p r i a t e
l i n k and node data s t o r e d higher up the h i e r a r c h y .
2.10 THE UNITED STATES GEOLOGICAL SURVEY ALTERNATIVE FOR
VECTOR-BASED DIGITAL MAPPING
At the o u t s e t , i t should be pointed out t h a t mapping
p r a c t i c e s and user needs i n the United S t a t e s d i f f e r q u i t e
d r a m a t i c a l l y from those i n the United Kingdom. However, USGS
Chapter two

- 76 -F i x e d - l e n g t h V a r i a b l e - l e n g t h R e l a t i o n s S t a c k s o r Rings
1 G r i d nodes
V e c t o r l i n k s
I n t e r n a l nodes
(Data highway)
F i g u r e 2.9: The Ordnance Survey r e s t r u c t u r e d v e c t o r d a t a base
- 77 -
p o l i c y on d i g i t a l mapping i s worthy of note s i n c e i t suggests
an i n t e r e s t i n g and p o t e n t i a l l y more a p p r o p r i a t e a l t e r n a t i v e
to v e c t o r data s t r u c t u r e s and user needs.
.10.1 The r o l e of the N a t i o n a l Mapping D i v i s i o n of USGS and
the N a t i o n a l Mapping Program
There are now four mapping c e n t r e s i n the USA and these
are based a t :
Merla Park, C a l i f o r n i a (Western) 325 S t a f f
Denver, Colorado (Rocky Mountains) 325 S t a f f
R o l l a , M i s s ouri (Mid-Continent) 325 S t a f f
Reston, V i r g i n i a ( E a s t e r n ) 360 S t a f f
The o b j e c t i v e of the N a t i o n a l Mapping Program i s to
prepare and make a v a i l a b l e multi-purpose maps and fundamental
c a r t o g r a p h i c data to meet the requirements of u s e r s
throughout the United S t a t e s (McEwen 1980). The b a s i c
mapping s c a l e p r o v i d i n g complete coverage o f the country i s
1:250,000 - t h i s comprises 468 map sheets (625 i n c l u d i n g
A laska and H a w a i i ) . The l a r g e s t s c a l e with which the
Chapter two
- 78 -
N a t i o n a l Mapping D i v i s i o n (NMD) i s i n v o l v e d 1:24,000.
Approximately 600-800 new sheets are produced e a c h ^ and are
r e v i s e d on a c y c l e between f i v e and f i f t e e n y e a r s (dependant
on the p r i o r i t y of the a r e a ; Washington DC, f o r example, i s
r e v i s e d every f i v e y e a r s ) . There are 54,000 sh e e t s i n the
1:24,000 s c a l e s e r i e s ; seventy per cent of t h e s e had been
publish e d by l a t e 1980, 21 per cent of which had been
produced as f i f t e e n - m i n u t e quads. Other s c a l e s c u r r e n t l y
being produced are the 1:250,000 s c a l e land-use s e r i e s
showing information a t ten and f o r t y a c r e r e s o l u t i o n s (see
Rhind and Hudson 1980), the 1:100,000 s e r i e s , of which t h e r e
are 1800 s h e e t s , and a 1:2 m i l l i o n s c a l e N a t i o n a l A t l a s .
A major a c t i v i t y of the N a t i o n a l Mapping Programme i s the
development of c a r t o g r a p h i c data i n d i g i t a l form with s p e c i a l
emphasis towards d i g i t a l coverage of the 1:24,000 s e r i e s . A
secondary a c t i v i t y i s to provide a s m a l l s c a l e data base fo r
a p p l i c a t i o n s such as s p e c i a l g r a p h i c s products, g a z e t t e e r s
and index g e n e r a t i o n .
The r e c e n t hardware a c q u i s i t i o n s f o r the d i g i t a l products
are i t e m i s e d i n McEwen (1980). Much more r e l i a n c e i s being
p l a c e d on photogrammetric methods than i n the Ordnance Survey
system, which i s r e f l e c t e d i n the famous orthophoto maps
emanating from the USA. Nine a n a l y t i c a l s t e r e o p l o t t i n g
systems have been ac q u i r e d based on Kern PG2 and Wild B8
Chapter two

- 79 -
s t e r e o p l o t t e r s and G e s t a l t GPM-2 photomappers. The need for
i n t e r a c t i v e data e d i t f a c i l i t i e s has been seen as c r u c i a l to
handle most needs; each s t a t i o n (produced by M & S Computing
In c . ) has a d i g i t i s i n g t a b l e , e d i t t a b l e t , dual T e k t r o n i x
4014 g r a p h i c d i s p l a y s c r e e n s and an alphnumeric c o n s o l e .
2.10.2 The d a t a - s t r u c t u r e t o be adopted
The N a t i o n a l Mapping Program makes a c l e a r d i s t i n c t i o n
between the uses of D i g i t a l E l e v a t i o n Models (DEM) and
D i g i t a l L i n e Graphs (DLG), both of which are seen as
important f o r s a t i s f y i n g user needs; Ordnance Survey only
concerns i t s e l f with the l a t t e r . McEwen (1980) p o i n t s out
how a h i e r a r c h i c a l conception of the DLG's can s a t i s f y most
a p p l i c a t i o n s :
DLG1 - l i n e map information c o l l e c t e d and coded to
p r e s c r i b e d standards and e d i t e d to remove a c q u i s i t i o n
b l u n d ers;
DLG2 - DLG1 + a d d i t i o n a l a t t r i b u t e codes and removal of
v i s u a l e r r o r s and i n c o n s i s t e n c i e s ;
DLG3 - DLG2 information t h a t has been s p a t i a l l y
Chapter two

- 80 -
s t r u c t u r e d to d e f i n e a l l topographic r e l a t i o n s .
DLG2 has only s u f f i c i e n t ' i n t e l l i g e n c e ' f o r the production
of graphic output and i s comparable with the Ordnance Survey
DMB production system. For any ge o g r a p h i c a l information
system (GIS) support, DLG3 data a r e r e q u i r e d and c u r r e n t
p i l o t p r o j e c t s have been e s t a b l i s h e d to c o l l e c t 1:2 m i l l i o n
data i n DLG3 format. The generation o f a data format with
such high degrees of s t r u c t u r e r e q u i r e s a h i g h l y ingenious
data base system and a mammoth d i g i t i s i n g t a s k . Most of the
topology of the Is 2 m i l l i o n mapping i s being b u i l t i n t o the
data s t r u c t u r e a t the capture stage i n the form of
m u l t i - a t t r i b u t e codes (Stephens 1980); a l l d i g i t i s i n g i s
being c a r r i e d out by hand on co n v e n t i o n a l moving c u r s o r
t a b l e s . As l i n e s a r e followed, f l a g s are added to show on
which s c a l e o f mapping they should appear; the t h r e s h o l d s are
dependant on such f a c t o r s as l i n e length, and polygon acreage
as w e l l as t a k i n g i n t o account the smoothing and f i l t e r i n g of
p o i n t s . A d d i t i o n a l a t t r i b u t e s are h e l d f o r each f e a t u r e ,
such as r a i l tonnage information, road types, f o r e s t lands as
w e l l as s i z e , and p o i n t e r s t o a d j a c e n t f e a t u r e s .
The information i s h e l d i n the data base as v e c t o r s and i s
aggregated on a sheet by sheet b a s i s . By mid-1980, twenty
one sheets of the 1:2 m i l l i o n s c a l e mapping had been
Chapter two

- 81 -
completed: there a r e seven o v e r l a y s per sheet to i n c l u d e a l l
the data t y p e s .
T h i s p r o j e c t i s the f i r s t of i t s k i n d . On no other
d i g i t i s i n g f l o w l i n e ( c . f . ECU g e o l o g i c a l coding on
experimental mapping production i n the e a r l y 1970's) has so
much a d d i t i o n a l information been b u i l t i n t o the data from the
o u t s e t . Experience has now shown t h a t e d i t i n g requirements
were i n i t i a l l y high, c h i e f l y as a r e s u l t of in e x p e r i e n c e d
personnel. These i n e f f i c i e n c i e s have g r a d u a l l y been reduced
as more experience has been gained by the d i g i t i s i n g s t a f f
and as a r e s u l t of c a r e f u l tuning of the system.
I t has been argued e a r l i e r ( s e c t i o n 2.4.2) t h a t a
knowledge of the l i k e l y c h a r a c t e r i s t i c s of p r o j e c t e d
topographic data bases i n d i g i t a l form i s of p r a c t i c a l
importance. USGS r e a d i l y agree t h a t the p r o j e c t e d
c h a r a c t e r i s t i c s on data q u a l i t y and volume are e s s e n t i a l f o r
an o r d e r l y and p r o d u c t i v e growth (USGS pers comm 1980).
Generation r a t e s f o r t h e i r d i g i t a l c a r t o g r a p h i c data w i l l
reach alarming p r o p o r t i o n s , t y p i c a l l y 70,000 megabits of
information per year or more from the DEM data alone.
Chapter two

- 82 -
2.11 CONCLUSIONS
The USGS d i g i t a l mapping p r o j e c t s are a f i r s t i n d i c a t i o n
of attempts to provide a f l e x i b l e computer mapping system
t h a t i s not dependant on s c a l e . I n most c a r t o g r a p h i c data
bases u n t i l r e c e n t l y , the arrangement and uses of data are
guided by the input stage (Peuker and Chrisman 1975); l i t t l e
m anipulation i s attempted once the data have been captured.
The most economic form of data storage w i l l depend e n t i r e l y
upon the c h a r a c t e r i s t i c s of the data themselves and the
r e p r e s e n t a t i o n used f o r storage. Vector data s t r u c t u r e s have
s u i t e d these r e p r e s e n t a t i o n s w e l l because of the i n h e r e n t
nature of inf o r m a t i o n presented on maps ? the conception of
connected p o i n t s to r e p r e s e n t a l i n e i s s t r a i g h t forward and
w e l l t e s t e d . For geometrical shapes (e.g. curves of
r a i l w a y s ) , the use of widely separated d i g i t i s e d p o i n t s
connected by s p l i n e s or s i m i l a r f u n c t i o n s i s m a n i f e s t l y
p o s s i b l e . Indeed many ingenious data s t r u c t u r e s have been
considered and t r i e d i n an attempt to provide more
i n t e l l i g e n c e to the r e s u l t i n g system. More p a r a d o x i c a l l y ,
very l i t t l e attempt has been made to combine d i f f e r e n t types
of c a r t o g r a p h i c information, for example census data or
s a t e l l i t e imagery, w i t h topographic data. T h i s i s almost
c e r t a i n l y a r e s u l t of inadequate and incompatible data
formats with c o s t l y c onversion processes being n e c e s s a r y to
a l l e v i a t e the problem.
Chapter two

- 83 -
APPENDIX 2.1
D e r i v a t i o n o f a d i g i t i s i n g time p r e d i c t i o n formula f o r the
Ordnance Survey DMB d i g i t a l f l o w l i n e by l e a s t square methods
Assumption: The time taken to d i g i t i s e an OS l a r g e s c a l e
p l a n by manual methods i s dependant on the t o t a l l i n e length
and t o t a l number of f e a t u r e s .
T = aL + bN
where T = d i g i t i s i n g time i n hours L = t o t a l l i n e length a t
s c a l e i n metres N = number of f e a t u r e s on map
a,b = constants
Theory:
T aL + bN (1) c c c
Let the s u f f i x c r e p r e s e n t the c o r r e c t or t r u e value L e t the s u f f i x e r e p r e s e n t an experimental v a l u e
There w i l l be a r e s i d u a l value between the t r u e value of T
and the experimental value of T, l e t t h i s be r .
Appendix 2.1

- 84 -
r = T - T e c
from ( 1 ) : r = T - (aL + bN ) e c c
i . e . r = T - aL - b N (2) e c c
The l e a s t squares s o l u t i o n s t i p u l a t e s t h a t the sum of the
squares of the r e s i d u a l s ( s ) must be a minimum.
i=n 2 s = 2 1 ( T - aL - bN ) should be a min (3)
i = l e i c i c i
The c o n d i t i o n s f o r s t o be a minimum a r e :
^ s O s = 0 (4) ; = 0 (5)
^ a 3b From (3) and (4) :
0 s = o
Oa i=n = ZD 2 ( T - aL - bN ) ( -L ) = 0 i = l e i c i c i c i
Divide both s i d e s by -2:
( T - aL - bN ) L e i c i c i c i
Expanding s
= a Y"* L + L N = ^ L . T (6) c i c i c i c i e i
Appendix 2.1
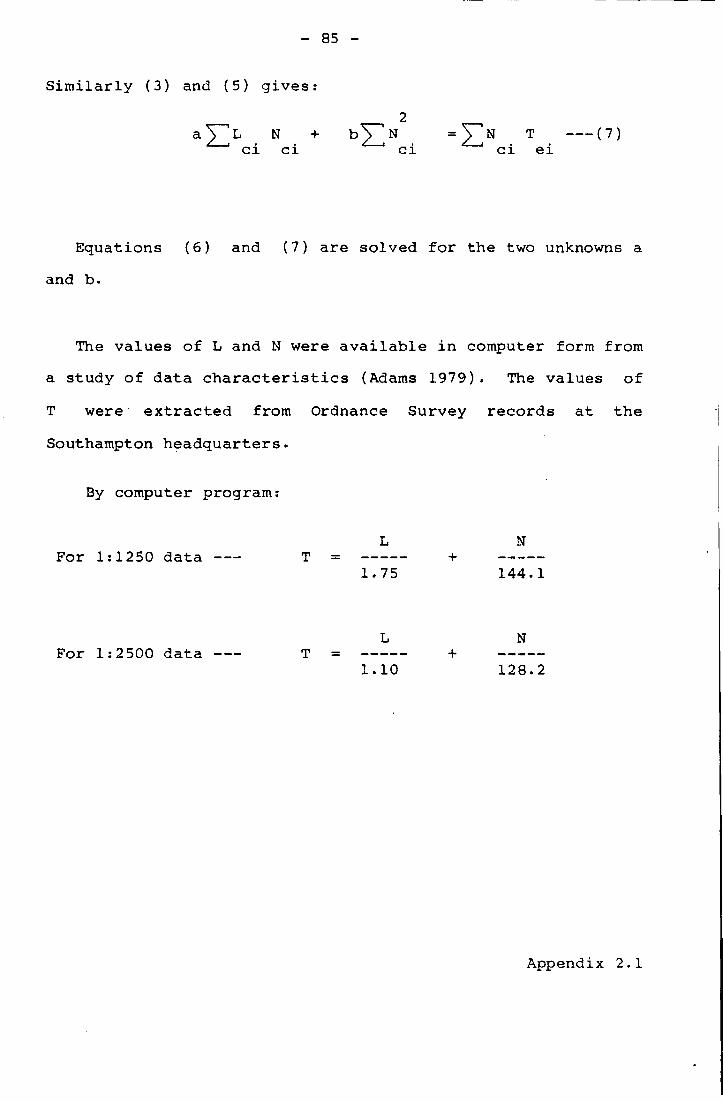
- 85 -
S i m i l a r l y (3) and (5) g i v e s :
2 y~*L N + b V N = T (7)
c i c i c i c i e i
Equations (6) and (7) are solv e d f o r the two unknowns a
and b.
The v a l u e s of L and N were a v a i l a b l e i n computer form from
a study of data c h a r a c t e r i s t i c s (Adams 1979). The values of
T were e x t r a c t e d from Ordnance Survey r e c o r d s a t the
Southampton headquarters.
By computer program:
L N For 1:1250 data T = +
1.75 144.1
For 1:2500 data T = 1.10
N
128.2
Appendix 2.1

- 86 -
The e f f e c t of the underlying assumptions i n the theory
The S t a t i s t i c a l Package for S o c i a l S c i e n t i s t s (SPSS) was
used to i n v e s t i g a t e the Pearson c o r r e l a t i o n c o e f f i c i e n t s
between N, L and T.
1:1250 s c a l e N L T
N 1.0000 0.9389 0.6786
L 0.9389 1.0000 0.6453
T 0.6786 0.6453 1.0000
1:2500 s c a l e N L T
N 1.0000 0.8844 0.7679
L 0.8844 1.0000 0.6930
T 0.7679 0.6930 1.0000
These f i g u r e s , together with scattergrams suggest t h a t
d i g i t i s i n g times cannot be wholly d e r i v e d from l i n e length
and f e a t u r e frequency. The r a t e s of output from d i f f e r e n t
o perators are bound to vary and t h i s f a c t o r was not taken
i n t o account. However, the r e s u l t s are of, a t l e a s t , some
use; they show t h a t some use of planning i s c e r t a i n l y b e t t e r
than no method at a l l .
Appendix 2.1

- 87 -
3 RASTER DATA STRUCTURES
3.1 INTRODUCTION
As we have s a i d i n chapter two, the d i g i t a l r e p r e s e n t a t i o n
and storage o f s p a t i a l data i n a computer has t r a d i t i o n a l l y
tended, i n B r i t a i n , to adopt a vector-based method o f
o r g a n i s a t i o n . Chapter two d e s c r i b e d the c u r r e n t
s t a t e - o f - t h e - a r t i n ve c t o r technology w i t h the a i d of v a r i o u s
examples from working and developing systems. Recently,
i n c r e a s i n g a t t e n t i o n has been focussed on a l t e r n a t i v e s to
t h i s now w e l l - e s t a b l i s h e d approach; i t has been argued
(Peuquet 1979a) t h a t r a s t e r data s t r u c t u r e s have much
p o t e n t i a l i n mapping and s p a t i a l a n a l y s i s . T h i s chapter
d e f i n e s the d i s t i n c t i o n s between v e c t o r and r a s t e r technology
and c o n s i d e r s some of the a p p l i c a t i o n s to which data i n these
r a s t e r forms can be put.
The term ' r a s t e r - f o r m a t ' has come to be a s s o c i a t e d with a
grid-based r e p r e s e n t a t i o n of s p a t i a l information which has
i t s o r i g i n s i n video t r a n s m i s s i o n s ( t e l e v i s i o n ) , r a s t e r
scanners used i n remote s e n s i n g and i n s i m i l a r d i s c i p l i n e s .
Conceptually, a graphic image can be represented as a matrix
of p i c t u r e elements or p i x e l s , the s i z e of which determines
Chapter three
- 88 -
the r e s o l u t i o n of the image. A r a s t e r - b a s e d r e p r e s e n t a t i o n
of s p a t i a l q u a n t i t i e s can be achieved by a number of means:
the s i m p l e s t of approaches w i l l i n v o l v e some form of manual
g r i d sampling, although more appropriate encoding methods
have been connected w i t h a n a l y t i c a l s t e r e o p l o t t e r s
(Burnside, 1979 page 231), s a t e l l i t e imagery ( B a r r e t t and
C u r t i s 1976) and optomechanical scanners (see chapter s e v e n ) .
Vector r e p r e s e n t a t i o n s of g r a p h i c a l data, then, are most
appropriate f o r the storage of l i n e a r f e a t u r e s : the technique
provides f o r e f f i c i e n t use of backing s t o r e and c o n v e n t i o n a l
g r a p h i c s d e v i c e s f o r output. Such an approach, however,
would be h i g h l y i n a p p r o p r i a t e f o r the r e p r e s e n t a t i o n of most
photographic images or hand-drawn p a i n t i n g s . By t h e i r very
nature, s e r i e s of contiguous p i c t u r e elements are more
appropriate f o r the p o r t r a y a l of these types of data - i . e .
an ' a r e a - f i l l ' r a t h e r than 'boundary-drawing' approach.
Indeed, the adoption of a g r i d based n o t a t i o n for the storage
of many geographic v a r i a b l e s w i t h i n a computer system can
expedite e a s i e r manipulation and f l e x i b i l i t y according to
Peuquet (1979a): counts of population, f r e q u e n c i e s of old age
pensioners, m o r t a l i t y r a t e s , unemployment data, e t c . , can be
h e l d on a g r i d square b a s i s (though they are o n l y r a r e l y made
a v a i l a b l e on t h i s b a s i s - see Rhind 1981). R a t i o information
can be determined l o g i c a l l y and e a s i l y i n software by
performing a r i t h m e t i c o p e r a t i o n s with two or more a r r a y s of
Chapter three

- 89 -
information on a g r i d square-by-grid square b a s i s . C l e a r l y
g r e a t care should be e x e r c i s e d on the type of measurement
s c a l e s being adopted. Rat i o data could no longer be v a l i d
f o r a r r a y s of land use codes, for example, s i n c e the data are
no longer on an i n t e r v a l s c a l e but a r e e s s e n t a l l y nominal i n
nature. I t w i l l be p o s s i b l e , of course, to manipulate the
data i n other ways and ob t a i n frequency counts, d i s p e r s i o n
s t a t i s t i c s and the l i k e ; f o r some a p p l i c a t i o n s of t h i s
nature, notably those i n v o l v i n g s p a t i a l o p e r a t o r s , q u i t e
complex data r e p r e s e n t a t i o n s are r e q u i r e d when the data
volume i s anything other than t r i v i a l .
3.2 RASTER DATA REPRESENTATIONS
The notion o f r e s o l v i n g images i n t o a s e r i e s of ( u s u a l l y
square) d i g i t a l p i c t u r e elements or p i x e l s was d e s c r i b e d i n
chapter one. I n f a c t , g r i d formats were f r e q u e n t l y used for
output purposes i n the e a r l y days of automated s p a t i a l data
manipulation and p r e s e n t a t i o n , long before v e c t o r p l o t t e r s
became g e n e r a l l y a v a i l a b l e : computer mapping by l i n e p r i n t e r
was commonplace i n the e a r l y s i x t i e s . SYMAP (Schmidt and
Z a f f t 1975) i s the most widely used mapping package o f t h i s
v a r i e t y where each g r i d v a l u e i s e a s i l y t r a n s l a t e d i n t o i t s
a s s o c i a t e d l i n e p r i n t e r c h a r a c t e r . I n the s i m p l e s t
topographic c a s e , each p i x e l can take on one of two b i n a r y
Chapter three

- 90 -
s t a t e s (on or o f f ) - the s o - c a l l e d b i t map s i n c e each data
element can be rep r e s e n t e d by one b i n a r y d i g i t only. Under
these c o n d i t i o n s , the storage overheads w i l l be a minimum
although the c h a r a c t e r i s t i c s of the graphic being represented
w i l l be n e c e s s a r i l y l i m i t e d s i n c e each data item w i l l be
r e s t r i c t e d to one of two d i s t i n c t s t a t e s only. T h i s i s
in a p p r o p r i a t e f o r the amounts of data i n h e r e n t i n the
Ordnance Survey l a r g e s c a l e s mapping. I n such circumstances
there can be no knowledge o f what the s e t (or b l a c k ) c e l l s
r e p r e s e n t and hence t h i s type o f no t a t i o n i s n e c e s s a r i l y
l i m i t e d i n i t s a p p l i c a t i o n s . B e l l L a b o r a t o r i e s i n the United
S t a t e s are f i n d i n g b i t map data h i g h l y a p p l i c a b l e for the
f i r s t s tages of d i g i t a l r e p r e s e n t a t i o n of t e c h n i c a l and
engineering drawings ( P f e r d , pers comm 1980) i n p a r t because
t h e i r immediate need i s to tr a n s m i t d e t a i l s of such g r a p h i c s
documents over telephone l i n e s . S i m i l a r s t r a t e g i e s were the
means used to encode more than one thousand maps by the
Canada Geographic Information System: the 'meaning' of the
c e l l s was provided a t a l a t e r stage (Tomlinson e t a l 1976).
Other a p p l i c a t i o n s f o r b i t map storage could i n v o l v e
i n s t a n c e s where the l o c a t i o n o f only one v a r i a b l e type on a
nominal s c a l e i s being d i s p l a y e d ; a common s i t u a t i o n i n data
being represented by dot maps and some simple choropleth
mapping which shows only two item t y p e s . Colour s e p a r a t i o n
masks are e s s e n t i a l l y b i n a r y maps and could be h e l d as b i t
maps, as could r e p r e s e n t a t i o n s of areas which meet b i n a r y
Chapter three

- 91 -
c o n d i t i o n s such as 'areas w i t h i n 1 km of a main road and over
300 metres above sea l e v e l ' .
Within f a i r l y s t r i n g e n t l i m i t a t i o n s , the b i t map provides
an a p p r o p r i a t e s t r a t e g y f o r s t o r i n g c e r t a i n data s e t s with
m a n i f e s t l y simple c h a r a c t e r i s t i c s . I n order to r e p r e s e n t
d i g i t a l l y the more complex types of information, such as the
examples of p o p u l a t i o n data c i t e d e a r l i e r , i t then becomes
n e c e s s a r y to add f u r t h e r information (or i n c r e a s e d
i n t e l l i g e n c e ) i n t o the coding schema. I n essence, t h i s
r e q u i r e s the c a p a b i l i t y of a t t a c h i n g a d d i t i o n a l d e t a i l to
each data element over and above the on/off s t a t e . T h i s can
only be achieved by a l l o c a t i n g a g r e a t e r number o f b i n a r y
d i g i t s f o r each r a s t e r element; the number of b i t s r e s e r v e d
w i l l i n c r e a s e storage requirements and slow r e t r i e v a l a c c e s s
times. Without some s p e c i f i c a t i o n o f t a s k and of e f f i c i e n c y
requirements a t the o u t s e t , data volumes could reach alarming
and unmanageable p r o p o r t i o n s . M u l t i - s e c t r a l data emanating
from Landsat 1 and 2 imagery, for i n s t a n c e , i s h e l d i n r a s t e r
form p r o v i d i n g up t o 128 d i f f e r e n t v a l u e s of grey l e v e l s : one
byte of e i g h t b i t s i s a l l o c a t e d to each c e l l i n the export
data format ( H a r r i s 1979). With data from these s a t e l l i t e s
being updated every eighteen days then the volumes being
generated are c l e a r l y s u b s t a n t i a l : some 7.6 x 10 b i t s of
information may be needed to s t o r e one Landsat frame, and
four such frames ( i n each of four wavebands 4,5,6 and 7 - see
Chapter three

- 92 -
B a r r e t t and C u r t i s 1976) are produced for every 185 x 185
k i l o m e t r e scene. The complexity of the coding scheme ( i n
t h i s case the number of grey l e v e l s which i t i s p o s s i b l e to
d i s t i n g u i s h ) i s undoubtedly an important governing f a c t o r i n
the volume c h a r a c t e r i s t i c s of a data s e t . Yet, the
fundamental f a c t o r which governs storage requirements i s the
r e s o l u t i o n o f the p i x e l s . C l e a r l y to reduce the number of
grey l e v e l s p o s s i b l e i n a Landsat image by a f a c t o r of two
would not h a l v e the storage requirements f o r an image s i n c e
t h i s could be achieved by merely removing the most
s i g n i f i c a n t b i t from each p i x e l . A s p e c i f i c a t i o n o f the
r e s o l u t i o n o f each p i x e l i s e q u i v a l e n t to d e s c r i b i n g the
number of p i x e l s n e c e s s a r y to r e p r e s e n t an image. The
i n c r e a s e i n storage overheads consequent on i n c r e a s i n g
r e s o l u t i o n w i l l r i s e as the square of the r e s o l u t i o n . As one
r ^^iSttg^1 tfu^lbfa are eadad *s 6*fcit» per pixel, \neifflnSS¥!efflKS!, 1HHUV ™ ™ ^ ' ^ s i a l ^ l ^ l i i p - -
A second example concerns GEC-Marconi Ltd., a l a r g e e l e c t r o n i c s
group i n the U.K., who have developed a h i g h l y s p e c i a l i s e d
r a s t e r scanner to simulate a data source f o r s i d e - l o o k i n g
a i r b o r n e radar i n l a b o r a t o r y c o n d i t i o n s . The p i x e l
r e s o l u t i o n i s f i x e d a t around 13 microns which i n 1981 was
generating severe storage problems: a 1.5 centimetre square
area f i l l e d a dual d e n s i t y floppy d i s k of 500,000 b y t e s .
ok
Chapter three

- 93 -
The i n c o r p o r a t i o n of colour information, or indeed any
feature coding techniques, i n t o the l i s t of a t t r i b u t e s i s a
l o g i c a l extension of the grey l e v e l technique. A
mul t i - c o l o u r e d graphic with up to s i x t e e n d i f f e r e n t hues can
be re p r e s e n t e d i n a ra s t e r - f o r m a t providing that each c e l l i s
assigned four b i t s . In p r i n c i p l e , t h i s i s inappropriate for
data with more than s i x t e e n c l a s s i f i c a t i o n types although
could s t i l l have p o t e n t i a l i f no more than s i x t e e n d i f f e r e n t
f e a t u r e codes need to be examined at any one time ( c f .
S c i t e x Response 250 - see chapter seven). To represent
d i g i t a l l y the 109 feature codes i n the schema of the Ordnance
Survey l a r g e s c a l e s DMB f l o w l i n e i n a r a s t e r form w i l l
r e q u i r e a t l e a s t one byte per p i x e l ; t h i s would a c t u a l l y
provide up t o 128 d i f f e r e n t f e a t u r e c a t e g o r i e s assuming one
b i t i s r e s e r v e d for system use such as ' p a r i t y validation'^.
T his provides a good example of the need for c a r e f u l system
design to meet present and p o t e n t i a l user needs. Without
some c l e a r l y defined s p e c i f i c a t i o n at t h i s e a r l y stage, q u i t e
c a t a s t r o p h i c problems could develop. I t would, for example,
be a major re f o r m a t t i n g task to extend to more than 128
feature types once a s i n g l e byte has been a l l o c a t e d to each
m u l t i - s p e c t r a l scanner i n an environmental remote s e n s i n g
s a t e l l i t e s i n c e these are u s u a l l y r e s t r i c t e d to some s e t
from the adder a r r a y ; 10-bit data are d i s p l a y e d f i n a l l y on the hardware's screen.

- 94 -
A s i n i W O^JUL. »i VikeUj^o eu^oe. with ' a r t i f i c i a l l y coded' p i x e l s
r e p r e s e n t i n g u s e r - d e f i n e d f e a t u r e s w i t h i n a data base
s t r u c t u r e . I n such circumstances, attempts are made to b u i l d
more and more i n t e l l i g e n c e i n t o the data s e t as experience
and user needs become more c l e a r l y defined. This has been
the case with the e x i s t i n g v e c t o r d i g i t a l encoding methods
used by the Ordnance Survey; the i n i t i a l catalogue of eighty
f e a t u r e types i n the prototype DMA system has n e c e s s a r i l y
r i s e n to over one hundred i n the improved (DMB) replacement
system to c a t e r for user needs. The a b i l i t y to i n c r e a s e the
l i s t of fe a t u r e codes i n a r a s t e r topographic data s t r u c t u r e
i s l e s s simple. Once a s e t number of b i t s has been assigned
to each p i x e l , ^» wo&osit- wwka&r w\ lL Cof^^cx
prw*$*U^ o»xk, ^>oiv^^a^ re^uxi-fc <^w.c*iaiA WJAWC*. Fortunately, the l i s t
of f e a t u r e codes developed for the e x i s t i n g vector f i l e s are
e q u a l l y r e l e v a n t to the r a s t e r f i l e s and hence the v a r i e t y of
fe a t u r e types i s u n l i k e l y to a l t e r d r a m a t i c a l l y a f t e r some
ten y e a r s of evo l u t i o n unless the s p e c i f i c a t i o n of data
c o l l e c t e d by Ordnance Survey i s changed. Nonetheless, the
importance of p r e - d e f i n i n g data s p e c i f i c a t i o n and tasks from
an e a r l y stage cannot be over-emphasised. Such factors/do raw
not have so much importance i n t h e ^ d i g i t a l r e p r e s e n t a t i o n s of
remotely-sensed data by s a t e l l i t e or by t e r r e s t r i a l
photogrammetry; i n a monochrome photograph for example, there
i s a f i n i t e number of d i s c e r n a b l y d i f f e r e n t grey l e v e l s .
S i m i l a r l y , h a l f - t o n e technology i n the p r i n t i n g industry need Chapter three

- 95 -
o n l y have t h e a b i l i t y t o h a n d l e l i m i t e d c o n t r a s t v a r i a t i o n s
(Keates 1973, p 101) t o be s u f f i c i e n t f o r most c o n d i t i o n s .
M u e l l e r (1970) and R o s e n f e l d and Kak (1976) d i s c u s s t h e
problems o f t h e human p e r c e p t i o n o f c o n t r a s t i n g g r e y tones i n
g r a p h i c s : i t i s g e n e r a l l y b e l i e v e d t h a t as few as e i g h t g r e y
l e v e l s i s a l l t h a t t h e human o p t i c a l system can d i s t i n q u i s h / L
p|p|ta. The subsequent image processing carried out on these raw data then ' -regenerates more useful, more complex data with varying bit-lengths per £SBBHgr.
Kxel* For example, the subsequent processing i s l i k e l y to rely not on :^g$::7 K •v; j
:. :",".s'' ••
sual discrimination, but rather on multi-dimensional s t a t i s t i c a l d i s c ^ y j ^ v ination. This i s l i k e l y to be j u s t as unpredictable as for f i e l d Inerated topographic data. However, the basic data archive for remote-gffiim*'•
phased data should remain the raw input data with fixed-length pixels. I t i s suggested that a si m i l a r case is l i k e l y f o r raster topograpft̂ ©£;
Jta. However, far less complex image analysis of such data is l i k e l y t<|̂ <g£;: fjjgpicessary i f the t o t a l l i s t of feature-types required to describe the . > •fpgpnceptual image of the environment' is established at the outset. Thifci"
m and must e v o l v e t o meet e v e r y s i t u a t i o n . T h i s has s e r i o u s
i m p l i c a t i o n s f o r automated data e n t r y i n t o a d i g i t a l
t o p o g r a p h i c mapping system; more codes are r e q u i r e d t o
d e s c r i b e t h e c o n c e p t u a l d a t a base than i s g e n e r a t e d i n d a t a
emanatinq f r o m a scanner w h i c h sees o n l y a p h y s i c a l image.
Chapter t h r e e

- 96 -
.3 THE DATA CAPTURE STAGE
The c o n v e r s i o n o f a g r a p h i c f o r m a t t o a g r i d o r
r a s t e r - b a s e d d i g i t a l r e p r e s e n t a t i o n f o r l a r g e d a t a volumes
must i n v o l v e t h e use o f some fo r m o f p h o t o - m e c h a n i c a l
s c a n n i n g d e v i c e . Any hardware d e s i g n w i l l be c e n t r e d around
a modulated l i g h t source w h i c h i s scanned over t h e g r a p h i c i n
some way t o d e t e c t t h e i n t e n s i t y and w a v e l e n g t h o f l i g h t
b e i n g r e f l e c t e d o r t r a n s m i t t e d . The c h o i c e o f l i g h t source
and t h e p r i n c i p l e o f o p e r a t i o n i s becoming more and more
s o p h i s t i c a t e d as i n g e n u i t y and e x p e r i e n c e advances. L i g h t
sources used t o d a t e i n c l u d e : p a n c h r o m a t i c w h i t e l i g h t ,
cathode r a y beams, l a s e r beams, q u a r t z h a l o g e n o r plasma
sources o r l i g h t - e m i t t i n g and l a s e r d i o d e s ; each has
advantages and l i m i t a t i o n s on such f a c t o r s as ease o f c o n t r o l
and m o d u l a t i o n , maintenance, l i f e t i m e and d u r a b i l i t y and
ba n d - w i d t h p r e c i s i o n . Such i m p o r t a n t t e c h n i c a l
c h a r a c t e r i s t i c s as t h e s e , added w i t h t h e o v e r a l l system
d e s i g n w h i c h c o n t r o l s t h e s c a n n i n g o p e r a t i o n , must be
c a r e f u l l y c o n s i d e r e d t o a c h i e v e optimum p e r f o r m a n c e .
I m p o r t a n t s p e c i f i c a t i o n s t a t i s t i c s f o r d e s c r i b i n g a scanner's
performance a r e r e p e a t a b i l i t y and accuracy? i n f o r m a t i o n w h i c h
has h i t h e r t o been a s s o c i a t e d more c l o s e l y w i t h o u t p u t
d e v i c e s . R e p e a t a b i l t y i s a g e o m e t r i c t o l e r a n c e v a l u e w i t h i n
w hich t h e d e v i c e w i l l r e p e a t i t s performance f o r g i v e n i n p u t -6
d a t a ; f i g u r e s o f t e n m i c r o n s (10 x 10 me t r e s ) and b e t t e r
Chapter t h r e e

- 97 -
a r e c u r r e n t l y p o s s i b l e on modern scanners. The t r a n s p o r t
mechanisms f o r t h e source documents t o be scanned have te n d e d
t o t a k e on e i t h e r a f l a t - b e d o r drum-based d e s i g n i n a
f a s h i o n s i m i l a r t o hardcopy v e c t o r p l o t t e r s . Both a r e
p r o v i n g t o be s u c c e s s f u l d e s i g n s ; examples a r e g i v e n i n
c h a p t e r seven o f commercial systems u s i n g b o t h methods w i t h
s p e c i f i c a t i o n s w h i c h a r e a c c e p t a b l e f o r c a r t o g r a p h i c
a p p l i c a t i o n s .
.3.1 The drum-based p r i n c i p l e o f o p e r a t i o n
Drum-based scanners o p e r a t e on p r i n c i p l e s s i m i l a r t o t h e
v e c t o r pen p l o t t i n g hardware emanating f r o m m a n u f a c t u r e r s
such as Calcomp, CIL and Benson. The g r a p h i c t o be scanned
i s a t t a c h e d t o a r o t a t i n g drum, sometimes by c l i p s b u t more
o f t e n on advanced models by vacuum p r e s s u r e . As t h e drum
r o t a t e s a t a c o n s t a n t ( s y n c h r o n o u s ) speed, a scan l i n e i n t h e
y - d i r e c t i o n i s c r e a t e d . I n c r e m e n t a l movement o f t h i s scan
l i n e i n an a s s o c i a t e d x - d i r e c t i o n i s f a c i l i t a t e d b y
c o n t r o l l e d movement o f t h e s c a n n i n g head a x i a l l y a l o n g t h e
l e n g t h o f t h e drum, u s u a l l y by some p r e c i s i o n s e r v o motor.
Under t h e c o n t r o l o f a p p r o p r i a t e s o f t w a r e , t h e drum r o t a t i o n
speed, t h e s t e p - w i s e movement o f t h e s c a n n i n g head and t h e
m o d u l a t i o n o f t h e l i g h t source can p r o v i d e t h e r e q u i r e d
r a s t e r s c a n n i n g c h a r a c t e r i s t i c s t o d e t e c t and p r o v i d e p i x e l
Chapter t h r e e

- 98 -
d a t a w h i c h d e s c r i b e t h e g r a p h i c under s c r u t i n y ; p r e - d e f i n e d
t h r e s h o l d s and t o l e r a n c e s w i l l be c o n s t r a i n e d by t h e hardware
s p e c i f i c a t i o n . ^ tWse t h r e s h o l d s a r e dependant on t h e
c h a r a c t e r i s t i c s o f t h e hardware such as t h e r o t a t i o n a l speed
o f t h e drum, t h e i n c r e m e n t a l s t e p movement o f t h e a x i a l head o r i t s r«A:wrt-ecV suy\«^
and t h e f r e q u e n c y m o d u l a t i o n o f t h e l i g h t source^. B o y l e
(1979) p o i n t s o u t t h a t a r o t a t i o n a l speed o f 300 rpm (5 r e v s
p e r sec) i s commonly chosen by d e s i g n e r s , w h i c h s u g g e s t s t h a t
one scan l i n e i s o u t p u t i n 0.2 seconds. A t o t a l s t e p - s i z e o f
10,000 i n c r e m e n t s o f t h e a x i a l s c a n n i n g head o v e r a d i s t a n c e
o f one m e t r e , w h i c h i s c e r t a i n l y w i t h i n t h e bounds o f
t e c h n i c a l c a p a b i l i t y , would t h u s suggest a t o t a l scan t i m e o f
a p p r o x i m a t e l y 40 m i n u t e s .
.2 The f l a t - b e d p r i n c i p l e o f o p e r a t i o n
G e n e r a l l y i t has come t o be e x p e c t e d t h a t h ardcopy v e c t o r
g r a p h - p l o t t e r s d e s i g n e d around t h e f l a t - b e d p r i n c i p l e can
produce computer p l o t s w i t h much improved q u a l i t y over
drum-based systems. T h i s i s n o t n e c e s s a r i l y t h e case w i t h
r a s t e r s c a n n i n g d e v i c e s ; systems do e x i s t w i t h v e r y s i m i l a r
r a t e s o f p e rformance u s i n g b o t h d e s i g n s t r a t e g i e s . However,
c o n s t r u c t i o n a l c o s t s can be l o w e r i n f l a t - b e d s c a n n e r s .
Chapter t h r e e

- 99 -
As t h e name s u g g e s t s , a f l a t - b e d scanner i s based upon a
t a b l e - t o p - l i k e s u r f a c e above w h i c h i s t h e o p t i c a l s c a n n i n g
head c a p a b l e o f moving i n two m u t u a l l y p e r p e n d i c u l a r
d i r e c t i o n s . The dimensions o f t h e s e d e v i c e s t e n d t o be
l a r g e r t h a n any drum-based e q u i v a l e n t and hence t h e y are
h i g h l y dependent on t h e a v a i l a b i l i t y o f f l o o r space.
However, some s p e c i a l c a t e g o r i e s o f scanners w h i c h t a k e as
t h e i r input-medium p h o t o g r a p h i c a l l y reduced images on f i l m o r
m i c r o f i c h e (eg t h e PEPR f r o m t h e Image A n a l y s i s Group o f
O x f o r d U n i v e r s i t y - see c h a p t e r seven) a l s o adopt a v a r i a n t
on t h e f l a t - b e d method o f o p e r a t i o n .
G e n e r a l l y , t h e g r a p h i c s t o be scanned a r e s e c u r e l y f i x e d
on t h e f l a t - b e d s c a n n i n g s u r f a c e by means o f some f o r m o f
g l a s s p r e s s u r e p l a t e w h i c h can be r a i s e d o r l o w e r e d . I n
p r i n c i p l e , t h e scanner's o p t i c a l head i s . t h e n made t o move
over t h e s u r f a c e o f t h e g r a p h i c i n a s e r i e s o f p a r a l l e l
swathes as d e p i c t e d i n f i g u r e 3.1a.
There are s e v e r a l advanced v a r i a n t s on t h i s b a s i c theme.
For example, e v e r y a l t e r n a t e scan l i n e can be scanned i n
r e v e r s e o r d e r as suggested i n f i g u r e 3.1b; such an approach
w i l l i n c r e a s e t h r o u g h p u t r a t e s v i r t u a l l y by a f a c t o r o f two.
More r e c e n t l y , push-broom scanners have become s e r i o u s d e s i g n
c o n t e n d e r s . These e s s e n t i a l l y have t h e a b i l i t y t o scan
s e v e r a l c o n t i g u o u s l i n e s s i m u l t a n e o u s l y ; t h i s v a r i a t i o n can
Chapter t h r e e

- 100 -
r e a d i l y improve t h r o u g h p u t r a t e s by a f a c t o r o f t e n ( B o y l e 1979) .
F i g u r e 3.1 Some s c a n n i n g s t r a t e g i e s used by f l a t - b e d scanners
A A A A
[ a ]
O m n i - d i r e c t i o n a l scan
[ b ]
A l t e r n a t e d i r e c t i o n
scan
He]
Push-broom scan
.3.3 A p p r o p r i a t e p i x e l r e s o l u t i o n
The c h o i c e o f a s u i t a b l e p i x e l r e s o u l t i o n t o r e p r e s e n t an
image i s a q u e s t i o n o f much t h e o r e t i c a l d e b a t e . A c a r e f u l
b a l a n c e has t o be e s t a b l i s h e d between a t o l e r a b l e volume o f
d a t a f o r subsequent computer p r o c e s s i n g and a s u f f i c i e n t l y
a c c u r a t e d e p i c t i o n o f a g r a p h i c i n d i g i t a l f o r m as i s
n e c e s s a r y f o r t h e t a s k i n q u e s t i o n . The r e s o l u t i o n o f a
r a s t e r image r e f e r s t o t h e number o f p i c t u r e elements p e r
u n i t l e n g t h o f l i n e , o f t e n q u o t e d i n i n v e r s e f o r m . Values
Chapter t h r e e

- 101
can range t o as f i n e as 13 m i c r o n s f o r h i g h l y s p e c i a l i s e d
work (eg t h e work o f GEC-Marconi - see c h a p t e r s e v e n ) . About
250 p i x e l s p e r i n c h i s n o t u n r e a s o n a b l e f o r most g r a p h i c
a p p l i c a t i o n s ( P f e r d and Ramachandran 1978, Tomlinson 1972)
w h i c h suggests t h e s p a c i n g o f t h e scan l i n e s t o be o f t h e
o r d e r o f 0.1 mm (0.004 i n c h ) . C e r t a i n l y t h e s e l e c t i o n o f
t h i s o r d e r o f r e s o l u t i o n i s a p p r o p r i a t e f o r a c c u r a t e l y
d e p i c t i n g documents t h a t have been drawn by hand o r i g i n a l l y .
A p p l i c a t i o n s a d o p t i n g t w i c e as h i g h a r e s o l u t i o n n e c e s s i t a t e
a q u a d r u p l e d r a t e o f d a t a h a n d l i n g and s t o r a g e : hence, a
r e s o l u t i o n o f 500 p i x e l s p e r i n c h r e q u i r e s a f o u r t i m e s
i n c r e a s e and 1000 p i x e l s per i n c h r e q u i r e s a s i x t e e n t i m e s
i n c r e a s e .
G e n e r a l i s a t i o n o f an image b e i n g r e p r e s e n t e d b y a r a s t e r
d a t a s e t i s a f u n c t i o n o f t h e p i x e l s i z e and c a r e s h o u l d be
t a k e n not t o o v e r - g e n e r a l i s e t h e image f o r a g i v e n t a s k .
However, i t i s d o u b t f u l whether any b e n e f i t s w i l l be g a i n e d
f r o m a r a s t e r image w i t h a p i x e l r e s o l u t i o n t h a t i s h i g h e r
t h a n i s n e c e s s a r y . The p r o d u c t i o n o f g r a p h i c s and d e t a i l e d
m a n i p u l a t i o n , . s t o r a g e and t r a n s p o r t a t i o n o f t h e d a t a w i l l be
f a r more arduous w i t h f i n e r p i x e l r e s o l u t i o n s , a l t h o u g h
p o s t - d i g i t i s i n g g e n e r a l i s a t i o n i s always p o s s i b l e .
Chapter t h r e e
5 OCT b

- 102 -
.4 THE IMPLEMENTATION OF A RASTER-BASED DATA STRUCTURE
The problems a s s o c i a t e d w i t h t h e l a r g e volumes o f d a t a
i n h e r e n t i n r a s t e r m e t h o d o l o g i e s have been mentioned i n
p a s s i n g . The c o n c e p t o f a b i t map c i t e d i n s e c t i o n 3.2
p r o v i d e s l e s s problems o f s t o r a g e and p r o c e s s i n g t h a n does
t h e a b i l i t y t o i n c o r p o r a t e g r e y l e v e l s , c o l o u r o r f e a t u r e
codes w i t h i n t h e d a t a . To r e p r e s e n t a t y p i c a l 40cm x 40cm
Ordnance Survey 1:1250 p l a n w i t h a p i x e l r e s o l u t i o n o f 20
l i n e s per m i l l i m e t r e (0.05mm) r e q u i r e s an a r r a y o f 8000 x
8000 e l e m e n t s . T h i s suggests a s t o r a g e r e q u i r e m e n t o f e i g h t
megabytes t o p o r t r a y t h e i n f o r m a t i o n i n b i n a r y f o r m . To
r e p r e s e n t each p i x e l w i t h a s e r i e s o f g r e y l e v e l s , as i s t h e
case w i t h Landsat d a t a , would n e c e s s i t a t e t h e a l l o c a t i o n o f
e i g h t b i t s p e r p i x e l . T h i s would expand t h e s i z e o f t h e
complete r a s t e r b u f f e r t o 64 megabytes w h i c h i s , e s s e n t i a l l y ,
l a r g e r t h a n t h e e a r l y s i x t y megabyte c a p a c i t y ICL EDS60 d i s k s
w h i c h were t h e s t a n d a r d random access s t o r a g e d e v i c e on ICL
machines u n t i l c i r c a f i v e y e a r s ago. G e n e r a l l y , however, i t
i s p o s s i b l e t o t r e a t t h e r a s t e r - b a s e d images as sparse a r r a y s
and compress them by s e v e r a l o r d e r s o f magnitude t o more
manageable d i m e n s i o n s . An 'average' 1:1250 OS p l a n w i t h t h e
o r d e r o f 2000 f e a t u r e s and 40 metres o f mapped l i n e l e n g t h
has been found t o be a p p r o x i m a t e l y 98 per c e n t sparse ( i . e .
98 p e r ce n t o f t h e p i x e l s i n t h e r a s t e r image a r e b l a n k and,
i n p r i n c i p l e , need n o t be s t o r e d ) . Y e t, t h e f a c t t h a t t h e s e
Chapter t h r e e

- 103 -
elements are b l a n k i s i m p o r t a n t ; t h e y p r o v i d e i n f o r m a t i o n on
w h i c h areas o f t h e map s h e e t s are empty a l t h o u g h i t i s
i n e f f i c i e n t t o h o l d them i n an uncompacted for m . There have
been a number o f t e c h n i q u e s suggested (Rose and W i l l o u g h b y
1972) t o d i s p e n s e w i t h t h e need t o s t o r e t h i s c o p i ous
i n f o r m a t i o n . G e n e r a l l y i t i s e a s i e r t o h a n d l e t h e d a t a i n
t h e i r uncompacted form, a l t h o u g h c o n c e p t u a l l y and p h y s i c a l l y
i t i s n o t a b l y more e f f i c i e n t t o adopt a compacted r a s t e r
f o r m a t w i t h i n any s i z e a b l e d a t a base.
.4.1 Data compaction methods
There have been numerous t e c h n i q u e s s u g g e s t e d f o r t h e
e f f i c i e n t h a n d l i n g o f sparse m a t r i c e s w i t h i n a computer
system; some a r e f a r more s u i t e d t o g e o g r a p h i c d a t a t h a n
o t h e r s .
To h o l d a r a s t e r f i l e w i t h a b i t - m a p approach u s i n g
a s s o c i a t e d l o o k - u p t a b l e s as suggested by Pooch and Neider
(1973; V i s v a l i n g a m 1976) would p r o v i d e a seven t i m e s
r e d u c t i o n i n s t o r a g e overheads f o r a 8000 x 8000 x 1 b y t e
p i x e l image w h i c h i s 98 p e r c e n t s p a r s e . I n a b i t - m a p
scheme, o n l y t h e non-zero p i x e l s a r e s t o r e d end t o end i n a
one d i m e n s i o n a l v e c t o r . The p o s i t i o n s o f t h e s e non-zero
terms w i t h i n t h e t w o - d i m e n s i o n a l r a s t e r image a r e d e f i n e d by
Chapter t h r e e

- 104 -
a 2-D a r r a y o f s e t s i n g l e b i t e l e m e n t s ; a l l unset b i t s i n t h e
a r r a y c o r r e s p o n d t o t h e p o s i t i o n s o f empty p i x e l s . A scheme
o f t h i s n a t u r e i s v e r y a p p r o p r i a t e t o m a t h e m a t i c a l l y - b a s e d
a p p l i c a t i o n s i n v o l v i n g sparse m a t r i c e s such as l i n e a r
programming t e c h n i q u e s and l e a s t squares methods i n w h i c h
each element o f t h e a r r a y i s u s u a l l y examined i n t u r n (Rose
and W i l l o u g h b y 1972). However, f o r g e o g r a p h i c a l l y - b a s e d
p r o c e s s i n g t h e t e c h n i q u e does have severe l i m i t a t i o n s s i n c e
t h e r e t r i e v a l o f t h e non-zero elements i s f r e q u e n t l y on a
random access b a s i s and t h i s w i l l n e c e s s i t a t e r e p e t i t i v e and
w a s t e f u l s c a n n i n g backwards and f o r w a r d s t o d e t e r m i n e t h e
address o f each l o c a t i o n r e q u i r e d . F u r t h e r m o r e , t h e m a j o r i t y
o f computer systems a v a i l a b l e t o d a y a r e b y t e o r i e n t e d . A
c o l l e c t i o n o f e i g h t b i t s i s t h e s m a l l e s t u n i t o f computer
s t o r a g e t h a t can be r e a d i l y accessed, f r o m most h i g h l e v e l
l anguages; b i t m a n i p u l a t i o n i s u s u a l l y p o s s i b l e o f course
w i t h low l e v e l assembly programming.
The r u n - l e n g t h e n c o d i n g scheme seems t o be f a r more
r e a d i l y a p p l i c a b l e t o g e o g r a p h i c a l d a t a p r o c e s s i n g ; s e v e r a l
r a s t e r - b a s e d systems i n e x i s t e n c e u t i l i s e t h i s approach (eg
Rhind and Evans, 1980). The i d e a s o f r u n - l e n g t h - c o d i n g
( a f t e r R o s e n f e l d 1969 p 16) a r e p a r t i c u l a r l y a p p l i c a b l e t o
p i c t u r e p r o c e s s i n g e s p e c i a l l y a f t e r t h e c l a s s i f i c a t i o n o f
p i x e l v a l u e s i n t o a s m a l l number o f g r o u p s . R o s e n f e l d p o i n t s
o u t t h e a p p a r e n t h i g h p r o b a b i l i t y o f s p e c i f i c p i x e l v a l u e s
Chapter t h r e e

- 105 -
o c c u r i n g i n ' r u n s ' . I n t h i s scheme, t h e s t a r t and end
addressess o f each 'run' a r e f l a g g e d r a t h e r t h a n e n c o d i n g
e v e r y v a l u e i n sequence. C l e a r l y no g e n e r a l r u l e o f thumb
can be g i v e n f o r t h e e f f i c i e n c i e s o f t h i s c ompaction
t e c h n i q u e s i n c e i t i s h i g h l y dependant on t h e c h a r a c t e r i s t i c s
o f t h e d a t a . The most a p p r o p r i a t e s i t u a t i o n w i l l o c c u r where
one scan l i n e c o n t a i n s a complete r u n o f i d e n t i c a l v a l u e s .
I n such an u n l i k e l y e v e n t i t w i l l be p o s s i b l e t o s t o r e a
complete l i n e w i t h two v a l u e s - t h e s t a r t and end p o s i t i o n s .
C o n v e r s e l y , t h e most i n a p p r o p r i a t e s i t u a t i o n w i l l o c c u r i n
t h e e q u a l l y u n l i k e l y e v e n t o f each c o n t i g u o u s p i x e l i n a scan
l i n e b e i n g coded d i f f e r e n t l y . I n such a case no r u n - l e n g t h s
can be coded a t a l l and t h e scan l i n e must remain i n i t s
uncompacted f o r m . U n d o u b t e d l y any scheme t h a t i s chosen must
be t u n e d t o s u i t b e s t t h e c h a r a c t e r i s t i c s o f t h e d a t a . For
example, i n t h e OS l a r g e s c a l e s d a t a t h e l o n g e s t r u n s o f
c o n t i g u o u s e q u i - c o d e d p i x e l s , e x c l u d i n g t h e h o r i z o n t a l g r i d
l i n e s , w i l l be t h e z e r o terms r e p r e s e n t i n g t h e empty a r e a s .
I n such c i r c u m s t a n c e s , i t w i l l be most a p p r o p r i a t e t o encode
t h e s e p i x e l s as r u n l e n g t h s . The r e v e r s e approach ( i . e . t o
encode t h e s e t p i x e l s as r u n - l e n g t h s ) w i l l be more b e n e f i c i a l
i n s m a l l e r s c a l e s mapping or more e x c e p t i o n a l l y i n g e o l o g i c a l
and t h e m a t i c mapping. The degrees o f compaction f o r l a r g e
s c a l e s r a s t e r d a t a a c h i e v a b l e w i t h a r u n - l e n g t h e n c o d i n g
s t r a t e g y i s a l m o s t c e r t a i n l y r e l a t e d t o t h e o r i e n t a t i o n o f
urban s t r e e t p a t t e r n s . For example, i n c e n t r a l E d i n b u r g h and
Chapter t h r e e

- 106 -
i n many American towns, t h e r e i s a h i g h e r degree o f s t r e e t s
r u n n i n g a p p r o x i m a t e l y e a s t t o west and hence such c o n d i t i o n s
w i l l b e n e f i t g r e a t l y f r o m r a s t e r scan l i n e s r u n n i n g i n a
s i m i l a r o r i e n t a t i o n . A l t h o u g h somewhat a r c a n e , t h i s p o i n t
does show t h e need o f c a r e f u l c h o i c e o f scan l i n e o r i e n t a t i o n
f o r any s i z e a b l e d a t a base. I n any event t h e use o f
r u n - l e n g t h e n c o d i n g t e c h n i q u e s w i l l produce a d a t a s t r u c t u r e
w h i c h , f r o m a programming p o i n t o f view, i s r a t h e r more
complex t h a n t h a t o f t h e uncompacted v e r s i o n . The a r r a y
w h i c h i s g e n e r a t e d w i l l no l o n g e r be r e g u l a r i n t h e
d i m e n s i o n a l sense. A j a g g e r e d a r r a y as o u t l i n e d i n f i g u r e
3.2a below w i l l r e s u l t w h i c h w i l l r e q u i r e some f o r m o f
a c c e s s - v e c t o r o r l o o k - u p t a b l e t o be i n c o r p o r a t e d i n t o t h e
r e t r i e v a l system w h i c h s u p p l i e s t h e d e t a i l s o f t h e s t a r t and
end addresses o f each scan l i n e , t h e i r l e n g t h i n b y t e s and so
on (see Page and W i l s o n 1978, page 5 9 ) .
I n s i t u a t i o n s o f t h i s n a t u r e i t w i l l be h i g h l y d e s i r a b l e
t o t r e a t t h e s t r u c t u r e as a s i n g l e d i m e n s i o n a l a r r a y w i t h i n
t h e computer w i t h t h e access v e c t o r g i v i n g a l l a s s o c i a t e d
scan l i n e a d d r e s s e s , and o t h e r r e l e v a n t i n f o r m a t i o n . (see
f i g u r e 3.2b).
Chapter t h r e e
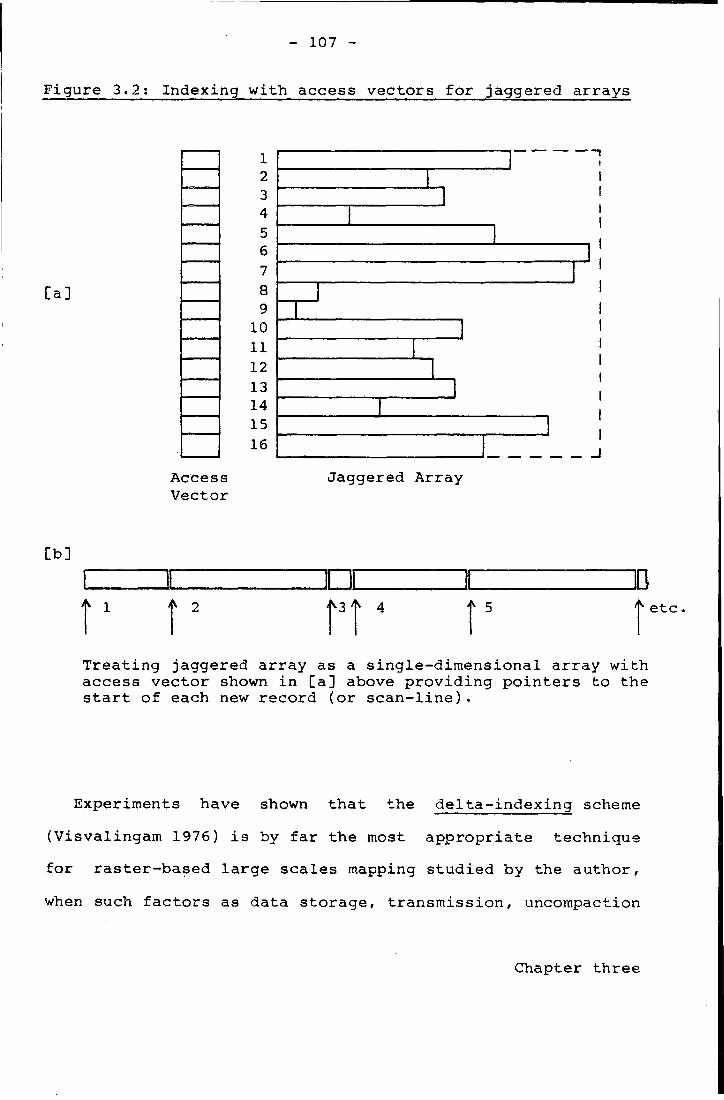
- 107 -
F i g u r e 3.2; I n d e x i n g w i t h access v e c t o r s f o r j a g g e r e d a r r a y s
C a ]
Access V e c t o r
1 2 3 4 5 6 7 8 9
10 11 12 13 14 15 16
Jaggered A r r a y
[ b ]
D i 3
5
T r e a t i n g j a g g e r e d a r r a y as a s i n g l e - d i m e n s i o n a l a r r a y w i t h access v e c t o r shown i n [ a ] above p r o v i d i n g p o i n t e r s t o t h e s t a r t o f each new r e c o r d ( o r s c a n - l i n e ) .
E x p e r i m e n t s have shown t h a t t h e d e l t a - i n d e x i n g scheme
( V i s v a l i n g a m 1976) i s by f a r t h e most a p p r o p r i a t e t e c h n i q u e
f o r r a s t e r - b a s e d l a r g e s c a l e s mapping s t u d i e d by t h e a u t h o r ,
when such f a c t o r s as d a t a s t o r a g e , t r a n s m i s s i o n , uncompaction
Chapter t h r e e

- 108 -
and g e n e r a l ease o f u n d e r s t a n d i n g and a p p l i c a b i l i t y are
concerned. The d e l t a i n d e x i n g scheme has many s i m i l a r i t i e s
t o t h e r u n - l e n g t h c o d i n g i d e a s o f R o s e n f e l d : o n l y non-zerc
i t e m s a r e s t o r e d t o g e t h e r w i t h t h e i r a b s o l u t e p o s i t i o n s i n
t h e a r r a y . The zero terms ( w h i c h a r e h i g h l y c o n t i g u o u s i n
t o p o g r a p h i c mapping i n p a r t i c u l a r ) a r e s t o r e d as r u n - l e n g t h s
t o r e p r e s e n t t h e d i f f e r e n c e ( o r d e l t a ) between each non-zero
t e r m . I n o r d e r t o d i s t i n g u i s h between a c t u a l d a t a i t e m s and
t h e coded d e l t a s w h i c h r e p r e s e n t t h e s e r i e s o f c o n t i g u o u s
zero e l e m e n t s , t h e l a t t e r a r e s t o r e d as n e g a t i v e v a l u e s .
T h i s i s s t i l l p o s s i b l e w i t h one b y t e per p i x e l : seven b i t s
enables up t o 128 a t t r i b u t e s and t h e e i g h t h (most
s i g n i f i c a n t ) b i t p r o v i d e s f o r a p o s i t i v e / n e g a t i v e
d i s t i n c t i o n . I n t h i s scheme, i t i s n o t a t i m e consuming t a s k
t o r e g e n e r a t e t h e a r r a y i n an uncompacted for m . Using ANSI
1966 FORTRAN on an IBM 370/168, a t y p i c a l 1:1250 map i n
compacted f o r m can be expanded i n t o i t s o r i g i n a l 4096 x 4096
p i x e l r a s t e r f o r m i n about 20 seconds o f CPU t i m e . Indeed,
i t i s p o s s i b l e t o scan t h r o u g h each row i n t h e a r r a y i n a
f o r w a r d or r e v e r s e o r d e r , s i n c e t h e coded d e l t a s a r e e q u a l l y
a p p l i c a b l e i n each d i r e c t i o n . V i s v a l i n g a m (1976) compared
t h e e f f i c i e n c y o f t h e b i t - m a p and coded d e l t a schemes f o r t h e
100 per c e n t p o p u l a t i o n census d a t a f o r Durham County (see
s e c t i o n 3.5.1). Her r e s u l t s a r e w o r t h y o f note and are shown
i n t a b l e 3.3.
Chapter t h r e e

- 109 -
Table 3.3 - Comparison o f t h e b i t map and coded d e l t a schemas f o r z e r o s u p p r e s s i o n o f 100 per c e n t p o p u l a t i o n d a t a f o r Durham census c o u n t y .
(From V i s v a l i n g a m 1976)
P r i o r t o zero B i t encoded Coded d e l t a s s u p p r e s s i o n
S i z e o f f i l e i n pages 249 121 124
E x e c u t i o n t i m e t o r e a d and 11.4 26.2 18.4
(where n e c e s s a r y ) r e g e n e r a t e f i l e
i n sees.
N.B. A page i n t h e MTS o p e r a t i n g system r e p r e s e n t s 4096 b y t e s
T h i s a u t h o r has p e r f o r m e d s i m i l a r comparisons f o r an OS
sheet and t h e r e s u l t s a r e shown i n t a b l e 3.4.
C l e a r l y t h e a b i l i t y t o compact an o t h e r w i s e voluminous
d a t a s e t l i k e a r a s t e r image t o r e a l i s t i c p r o p o r t i o n s i s an
area o f c o n s i d e r a b l e i m p o r t a n c e i n t h e t o p o g r a p h i c d a t a base
i n d u s t r y . The comparisons g i v e n above, i f t y p i c a l , would
s h r i n k a r a s t e r - b a s e d n a t i o n a l d i g i t a l t o p o g r a p h i c d a t a bank
from 22,000 magnetic tapes t o 1100 (no back-ups i n c l u d e d ,
6250 b p i t a p e s w i t h 220,000 OS map sheets assumed).
E s s e n t i a l l y , however, no s i n g l e t e c h n i q u e can be g e n e r a l l y
Chapter t h r e e

- 110 -
Table 3.4: Comparison o f t h e b i t map and coded d e l t a schemas f o r z e r o s u p p r e s s i o n o f OS sheet SO 9283SE h e l d as a 4096 x 4096 r a s t e r b y t e map.
P r i o r t o zero B i t encoded Coded d e l t a s s u p p r e s s i o n
S i z e o f f i l e i n pages 4096 631 208
E x e c u t i o n t i m e t o r e a d and 9.3 92.5 21.8
(where n e c e s s a r y ) r e g e n e r a t e f i l e
i n sees.
N.B. A page i n t h e MTS o p e r a t i n g system r e p r e s e n t s 4096 b y t e s
S o f t w a r e was w r i t t e n i n FORTRAN I V u s i n g an H-extended o p t i m i s i n g c o m p i l e r on an IBM 370/168
a p p l i c a b l e t o a l l t y p e s o f d a t a ; c a r e f u l system d e s i g n and
t u n i n g a r e e s s e n t i a l t o p r o v i d e an e f f i c i e n t w o r k i n g system
w i t h t o l e r a b l e s t o r a g e and r e t r i e v a l r a t e s . I n t h i s sense,
a l g o r i t h m i c s e l e c t i o n o f p a c k i n g p r o c e d u r e s may be w o r t h w h i l e
i n c o r p o r a t i o n s (as Amidon and A k i n 1970 d e s c r i b e d f o r v e c t o r
c o m p a c t i o n ) . I n any e v e n t , l e s s o n s can be l e a r n t f r o m o t h e r
areas o f r e s e a r c h w h i c h a r e u s i n g a r a s t e r - l i k e method o f
c h a r a c t e r i s i n g d a t a .
Chapter t h r e e

5 SOME EXAMPLES OF RASTER-BASED APPLICATIONS OTHER THAN
MAPPING
The t e c h n i c a l c o n s i d e r a t i o n s o f two data types which possess r a s t e r - t y p e c h a r a c t e r i s t i c s immediately s p r i n g t o mind: these are the storage and manipul a t i o n o f Landsat data and the work o f the Census Research U n i t a t the U n i v e r s i t y o f Durham which has s u c c e s s f u l l y s tored the whole o f the 1971 Great B r i t a i n Census Small Area S t a t i s t i c s organised by 1 k i l o m e t r e g r i d squares (Visvalingam 1975).
5.1 Grid square-based census mapping
Some 149,000 populated 1 k i l o m e t r e g r i d squares e x i s t w i t h i n Great B r i t a i n and the t o t a l amount o f 1971 census data i n v o l v e d was i n excess o f s i x hundred m i l l i o n b ytes. Moreover, as Visvalingam (1975) p o i n t e d o u t , i t i s d e s i r a b l e t o h o l d two or even three copies o f the data t o guard against a c c i d e n t a l c o r r u p t i o n . C l e a r l y , such l a r g e data volumes are c o s t l y t o st o r e and maintain and a s i g n i f i c a n t tape l i b r a r y i s bound t o r e s u l t .
The storage techniques adopted by Visvalingam i n her work are worthy o f note and can provide the basis f o r s i m i l a r management systems o f topographic data since g r i d square
Chapter three

- 112 -
census i n f o r m a t i o n i s not e x c e s s i v e l y d i s s i m i l a r so f a r as ph y s i c a l s t r u c t u r e i s concerned and has s i m i l a r s p a t i a l c h a r a c t e r i s t i c s . The uncompressed 1971 census data f o r 1 k i l o m e t r e squares i n B r i t a i n , as suppl i e d by the O f f i c e o f Population Censuses and Surveys (OPCS), r e q u i r e d a t l e a s t three double d e n s i t y IBM 3330 d i s k packs (each w i t h a storage c a p a c i t y o f 200 megabytes). C l e a r l y t o store the data o n - l i n e i n t h e i r uncompacted form would have been h i g h l y i n e f f i c i e n t and c o s t l y . A d d i t i o n a l l y , i t i s considered undesirable t o span a data base over two or more volumes wherever p o s s i b l e : the mounting and dismounting o f d i s k packs can be time-consuming and uneconomic i n most computer i n s t a l l a t i o n s . The computer system adopted f o r the work o f the C.R.U. was the N.U.M.A.C. IBM 370/168, a (then) s i x megabyte v i r t u a l memory machine o p e r a t i n g under the c o n t r o l of the Michigan Terminal System (MTS). Such a v i r t u a l memory environment can m a n i f e s t l y a i d a programmer concerned w i t h l a r g e data sets since, c o n c e p t u a l l y at l e a s t , i t i s p o s s i b l e t o seize l a r g e amounts o f f a s t core; i n r e a l i t y o n l y p a r t o f the a l l o c a t i o n resides i n main memory at any one time and the system a u t o m a t i c a l l y swaps p a r t i t i o n s o f the data or program t o and from backing s t o r e as r e q u i r e d . With l a r g e data sets t h i s can induce constant page swapping w i t h very l i t t l e progress on the job unless c a r e f u l thought i s given t o the or g a n i s a t i o n o f the i n f o r m a t i o n being handled (Day 1972). MacDougall (1976) has shown how, i n ha n d l i n g geographical
Chapter three

- 113 -
data on a v i r t u a l memory system, some a l t e r n a t i v e ways o f processing the data can d i f f e r enormously i n speed o f o p e r a t i o n .
The basic c h a r a c t e r i s t i c s o f the compaction procedures developed at Durham f o r the storage o f the 1971 census data aggregated by 1 k i l o m e t r e g r i d squares i n v o l v e d the suppression o f zero elements by the d e l t a i n d e x i n g scheme (see s e c t i o n 3.4.1) and t h i s accounted f o r a r e d u c t i o n t o between one t h i r d and one quarter o f the t o t a l volume o f data. The p h y s i c a l o r d e r i n g o f the data has some importance: i t a r r i v e d (spasmodically) ordered w i t h i n 100km squares, each of which contained a v a r i a b l e number o f records f o r the populated 1km squares t h e r e i n . Since the primary o b j e c t i v e s (eg. mapping) i n v o l v e d working w i t h s e l e c t e d v a r i a b l e s f o r a l l or l a r g e p r o p o r t i o n s o f the country, the data were reordered i n t o west t o east 1km squares across the countr y and a l l o f these s t r i p s were ordered from n o r t h t o south. C l e a r l y , t o r e t r i e v e i n f o r m a t i o n f o r south-eastern England could be a lengthy s e q u e n t i a l process since t h i s would i n v o l v e s k i p p i n g through many records t o reach the d e s i r e d address i n the f i l e . The use o f a l o c a t i o n a l index t o provide p o i n t e r s t o the bulk o f the data was found t o be advantageous. The o r g a n i s a t i o n o f the data has s p e c i f i c d i f f e r e n c e s t o a raster-based topographic image although these d i f f e r e n c e s are not unduly r e s o l u t e i n suggesting the
Chapter three

- 114 -
C.R.U. data s t r u c t u r e t o be completely u n s u i t a b l e f o r other data types.
Generally, census data can be considered as p r o v i d i n g patchy s p a t i a l coverage w i t h many (compactable) a t t r i b u t e s per area. Map data have complete s p a t i a l coverage although they comprise fewer a t t r i b u t e s than those h e l d i n census data. The compaction o f map data i s achieved by t r e a t i n g them l i k e census data and removing a l l c e l l s f o r which no data are a v a i l a b l e (e.g. white space i n map data or g r i d squares w i t h a p o p u l a t i o n o f twenty f i v e people or less - see Visvalingam 1977). The t o t a l area o f Great B r i t a i n covered by the census i s 903,000 square kms, although the t o t a l area f o r which data are a v a i l a b l e i s 149,000 square kms. Visvalingam (1977) has achieved a packing r a t e o f c. s i x times by v i r t u e o f removing g r i d c e l l s f o r unpopulated areas on land and sea. I n t h i s work, Visvalingam has discovered t h a t indexed s e q u e n t i a l data f i l e s w i t h a s e r i e s o f index-heading f i l e s provides a s u i t a b l e r e t r i e v a l system f o r the data. Her i n d e x i n g techniques, e s s e n t i a l l y , adopt a three t i e r e n t r y : f i g u r e 3.5 shows t h i s r e t r i e v a l process f o r a s p e c i f i c user-defined l o c a t i o n .
Chapter three

- 115 -
Table 3.5: Levels o f index f o r t h e CRU data base o f 1971 UK p o p u l a t i o n census s t a t i s t i c s by 1 k i l o m e t r e g r i d square.
Level 1: t e s t i f coordinates d e f i n e d by the user t o d e f i n e r e q u i r e d r e g i o n f a l l s w i t h i n the UK area.
Level 2: search index f i l e t o see what data are a v a i l a b l e i n the r e q u i r e d r e g i o n . I s t h i s adequate f o r the user's needs ?
Max y i g
Min y Level 3: go t o scan l i n e s i n question v i a a
look-up t a b l e t o e x t r a c t r e q u i r e d data.
The l o c a t i o n a l index ideas o f Visvalingam and the work of the C.R.U. provides ample evidence o f a system i n v o l v i n g grid-based data on a l a r g e scale which can work q u i c k l y and e f f i c i e n t l y . I n using the system, the methods of data o r g a n i s a t i o n are completely beyond the concern o f users who need only access some a p p r o p r i a t e subroutine from t h e i r own programs, p r o v i d i n g a r e t r e i v a l key (such as a g r i d reference) and hence p r o v i d i n g a working i n t e r f a c e w i t h the
Chapter three
- 116 -
census data. C l e a r l y a s i m i l a r approach w i l l be necessary f o r any raster-based topographic data s t r u c t u r e ; the work o f the CRU i s e s p e c i a l l y r e l e v a n t t o OS small scales mapping (Landranger s e r i e s and s m a l l e r ) .
.5.2 Handling m u l t i s p e c t r a l scanner data
A raster-based data s t r u c t u r e operated on a much l a r g e r scale i s the m u l t i s p e c t r a l scanner remotely sensed data s t o r e o f the NASA EROS Data Centre a t Sioux F a l l s , South Dakota. An i n d i c a t i o n o f the volume o f data i n v o l v e d can be q u i c k l y assessed from a summary o f the c h a r a c t e r i s t i c s of the Landsat programme:
ESSA (Environmental Survey S a t e l l i t e A d m i n i s t r a t i o n ) . a n d Landsat ( f o r m e r l y the Earth Resources Technology S a t e l l i t e o f the N a t i o n a l Aeronautics and Space A d m i n i s t r a t i o n ) scanners are capable o f generating 10 - 10 b i t s of i n f o r m a t i o n every day;
Landsat can produce up t o f i f t y thousand images every
B^mmd^r€n i t t t i f l f e i r f f c h m&h ^ e ^ n S ^ t ^ ^ i l i i S ^ t ^ s , with each linage <?©nsiSU3ig of four channels of, 7.£ J&illicrj, pne-byW
1
Chapter three

- 117 -
Between March and November 1975, the European Data Centre i n Rome (which u n l i k e EROS i s merely concerned w i t h European data) generated 700 k i l o m e t r e s o f magnetic tape of Landsat data.
C l e a r l y t o handle such l a r g e data volumes as do Sioux F a l l s and other data archives r e q u i r e s a c a r e f u l l y designed data s t r u c t u r e . A major f a c t o r i n the design i s the range o f permissable user requests. Table 3.6 ite m i s e s the choices a v a i l a b l e t o a user r e q u i r i n g remotely sensed environmental data i n d i g i t a l form.
Table 3.6: User o p t i o n s when re q u e s t i n g remote-sensed data from the NASA EROS Data Centre a t Sioux F a l l s
1. Area o f i n t e r e s t : requests may be s p e c i f i e d e i t h e r i n terms o f one coordinate p a i r ( l a t i t u d e and lo n g i t u d e coordinates) which defines the centre o f the area o f i n t e r e s t or as a re c t a n g u l a r area (by g i v i n g the maximum and minimum l a t i t u d e and l o n g i t u d e o f the frames p o s i t i o n ) .
continued o v e r l e a f .
Chapter three

- 118 -
2. P r e f e r r e d type o f coverage; EROS Data Centre o f f e r s f o u r types o f data coverage - Landsat, Skylab, NASA-Aircraft or A e r i a l mapping. For each o f these types monochrome, colour or c o l o u r i n f r a - r e d data are a v a i l a b l e .
3. P r e f e r r e d time i n year o f capture; o p t i o n s are a v a i l a b l e t o s p e c i f y the time i n the year a t which the data were captured; the year i s sub-divided on a q u a r t e r l y b a s i s .
4. Minimum q u a l i t y r a t i n g acceptable; the q u a l i t y o f remote sensed data can vary d r a m a t i c a l l y and f o u r o p t i o n s are given t o s p e c i f y the q u a l i t y acceptable; these range from very poor through poor through f a i r t o good.
5. Maximum cloud cover acceptable: presence o f cloud on remote-sensed data can s e r i o u s l y a f f e c t t h e i r uses; f i v e o p t i ons are given t o s p e c i f y the maximum amount o f t o l e r a b l e cloud cover: 10%, 30%, 50%, 70%, 90%.
C l e a r l y , t o o f f e r a user so many options r e f l e c t s an e f f i c i e n t c a t a l o g u i n g system. A l l the r a s t e r data h e l d by the centre are s t o r e d on h i g h d e n s i t y d i g i t a l tapes (HDDT) which have a packing d e n s i t y of 10,000 b i t s per i n c h . As soon as a user's request f o r data i s received, a query i s made t o
Chapter three

- 119 -
an o n - l i n e catalogue management system i n an attempt t o match up the user requirements t o those data which are a c t u a l l y a v a i l a b l e . The system i s somewhat more advanced than the C.R.U. data s t r u c t u r e discussed i n s e c t i o n 3.5.1 since the data a v a i l a b l e or s u i t a b l e a l t e r n a t i v e s can be l i s t e d and sent t o the user who can s e l e c t the most a p p r o p r i a t e images a v a i l a b l e t o s u i t h i s needs. These data are then r e t r i e v e d from the HDDT's and uncompacted from the i n t e r n a l EROS data formats on t o computer compatible tapes (CCT), t y p i c a l l y w i t h a packing d e n s i t y o f 1600 b i t s per i n c h , which the user can decipher on h i s own i n s t a l l a t i o n . H a r r i s (1979) gives an ap p r a i s a l o f the formats o f Landsat CCT formats.
The storage o f the 1971 U.K. census data and remote sensed m u l t i s p e c t r a l scanner data are two examples o f raster-based s p a t i a l i n f o r m a t i o n other than topographic data w i t h which the author has had personal experience. The two are h i g h l y d i s s i m i l a r i n terms o f data content and volume: nonetheless they p r o v i d e good examples of r a s t e r data h e l d both o n - l i n e and o f f - l i n e i n a working environment s e r v i n g user needs. To hold complete coverage o f the U.K. la r g e scales topographic data i n a r a s t e r - f o r m a t would be no l a r g e r than the q u a n t i t i e s handled by the EROS Data Centre as one p a r t o n l y o f t h e i r business. Thus, i t i s t e c h n i c a l l y f e a s i b l e t o h o l d topographic data i n such volumes and a precedent e x i s t s f o r the l o g i s t i c a l o perations needed t o run a se r v i c e based on
Chapter three

- 120 -
these data. Nonetheless, the a p p l i c a b i l i t y and usefulness o f s t o r i n g topographic data i n r a s t e r mode, compacted or otherwise, i s s t i l l an area o f much t h e o r e t i c a l debate and some c o n s i d e r a t i o n i s given t o t h i s i n chapter f o u r .
.6 THE REVISION OF A RASTER-BASED TOPOGRAPHIC DATA STRUCTURE
A fundamental f a c t o r governing the a p p l i c a b i l i t y o f any topographic data s t r u c t u r e must i n c l u d e p r o v i s i o n f o r the update of i n f o r m a t i o n h e l d i n the a r c h i v e . The l a r g e scales Ordnance Survey data are c o n t i n u a l l y i n a s t a t e o f t r a n s i t i o n , l a r g e l y as a r e s u l t o f the department's p o l i c y on resurvey. Since the implementation o f the Davidson Committee r e p o r t o f 1938, OS has adopted a system o f continuous r e v i s i o n . I t i s now ( i n theory) p o s s i b l e t o o b t a i n maps o f a l l p a r t s of the UK which are out o f date by no more than f i f t y u n i t s of change (each normally e q u i v a l e n t t o one new house) and o f t e n t o a l e v e l much b e t t e r than t h a t (see Simmonds 1978). I n the forseeable f u t u r e , OS a n t i c i p a t e t h a t the update o f the d i g i t a l f i l e s w i l l operate on a s i m i l a r basis t o the present g r a p h i c a l procedures (OS 1981b).
I t seems l i k e l y t h a t remotely sensed data j^U a s s i s t i n the r e v i s i o n o f a raster-based topographic data archive although t h i s KIAS, tvct WAA t<neA. cv\ ^>r&Au.c^>A SjsWftS a t
Chapter three

- 121 -
present. Any s a t e l l i t e - h o u s e d scanner w i t h a s p a t i a l r e s o l u t i o n o f 25 metres a t best and 80 metres as standard (such as the Landsat programme) i s h a r d l y o f i n t e r e s t when co n s i d e r i n g the storage o f topographic r a s t e r data compiled from basic scale maps and t y p i c a l l y w i t h s p a t i a l r e s o l u t i o n s of t en centimet r e s . Moreover, an o p e r a t i o n a l survey cannot base a s e r v i c e on systems w i t h i r r e g u l a r data supply or on experimental f a c i l i t i e s . At present, i t seems l i k e l y t h a t , by the m i d - n i n e t i e s , various techniques may o f f e r products which a l l o w r e g u l a r updating o f maps o f the Landranger s e r i e s (1:50,000) or o f smaller scales, although here too i t seems h i g h l y l i k e l y t h a t any i n t e r p r e t a t i o n methods f o r remote-sensed data w i l l s t i l l be centred around v i s u a l i n s p e c t i o n , perhaps i n c o n j u n c t i o n w i t h computer assistance. Thus, Ordnance Survey sees remote-sensing techniques o f f e r i n g a sup p o r t i n g r o l e f o r i n t e l l i g e n c e g a t h e r i n g and small scale map r e v i s i o n (Thompson and Shreeve 1978). C l e a r l y , p r i o r existence o f a l o n g - e s t a b l i s h e d system f o r d e t e c t i n g and i n c o r p o r a t i n g change plus the v i t a l need f o r a r e g u l a r and c o s t - e f f e c t i v e a c q u i s i t i o n o f i n f o r m a t i o n makes i t h i g h l y u n l i k e l y t h a t remote sensing w i l l provide more than a supplement t o e x i s t i n g methods.
Though the development of a t o t a l l y automated r e v i s i o n f a c i l i t y f o r topographic data i s h i g h l y u n l i k e l y f o r several decades y e t , the r e v i s i o n o f raster-based data i s , i n
Chapter three

- 122 -
general, f a r less i n v o l v e d than any vec t o r e q u i v a l e n t : the complexity o f a c e l l u l a r data a r c h i v e f o r topographic data i s simpler than the vector s t r a t e g i e s described i n chapter two. To amend, i n s e r t or d e l e t e a f e a t u r e i n r a s t e r mode i s a s t r a i g h t f o r w a r d s u b s t i t u t i o n o f p i x e l s whereas t o manipulate v e c t o r s t r i n g s w i t h t h e i r associated c r o s s - r e f e r e n c i n g t o other f e a t u r e s i s f a r more i n v o l v e d . Chapter four concentrates more c l o s e l y on the d i f f e r e n c e s between r a s t e r and vector n o t a t i o n s .
.7 RASTER DATA HANDLING APPROPRIATE TO MAP DATA
Thus f a r , a quick resume has been given on basic r a s t e r d e f i n i t i o n s w i t h the h e l p o f ap p r o p r i a t e examples and a p p l i c a t i o n s . For several years now researchers i n the f i e l d , c h i e f l y Americans and Europeans, have suggested t h a t the m a n i p u l a t i o n o f map data i n r a s t e r form i s as s t r a i g h t f o r w a r d and o f t e n easier than i s the h a n d l i n g o f vector q u a n t i t i e s , although c o n c e p t u a l l y the reverse i s more l i k e l y t o be expected. The use o f r a s t e r methods f o r handling map data w i l l now be discussed. Figure 3.7 shows an i d e n t i c a l f e a t u r e i n both r a s t e r and vec t o r mode. To convert from (a) t o (b) w i l l i n v o l v e a r a s t e r i s i n g process and t o convert from (b) t o (a) w i l l be a v e c t o r i s i n g process.
Chapter three

- 123 -
Rasterise
<3̂ _̂̂_ — . Vectorise '—'—'—'—'—'—'—'—'—'—'—'—'—
VECTOR RASTER
THE DISTINCTION BETWEEN VECTOR AND RASTER NOTATION
Figure 3.7

- 124 -
The use o f r a s t e r methods t o d e f i n e p o i n t s , l i n e s and areas i s as amenable as i s a vector n o t a t i o n ; indeed, the r e p r e s e n t a t i o n o f a r e a l data i s e s p e c i a l l y s u i t e d t o a c e l l u l a r s t r a t e g y . Figure 3.8 below shows an example o f the three cases of p o i n t s , l i n e s and areas and suggests t h a t the r e p r e s e n t a t i o n o f areas by r a s t e r i s more a p p r o p r i a t e than vector polygonal data as was o u t l i n e d i n chapter two.
Figure 3.8: The r e p r e s e n t a t i o n o f p o i n t s , l i n e s and areas i n r a s t e r mode * *—
** **** * **** ** **
* * * **** *** *** *********
* * ** ********* *** ************ * **** ************
* * * * ************ * *** ***********
* * *** *********** * ** *** *******
**** **** * **
Points Lines Area
As w i t h a vec t o r approach, i t i s important t o consider and item i s e a s e r i e s o f r u l e s governing the conventions f o r the d e f i n i t i o n o f l i n e a r f e a t u r e s i n r a s t e r mode. A t y p i c a l example i s the d e f i n i t i o n o f p i x e l connections i n e i t h e r f o u r or e i g h t d i r e c t i o n s ; the l a t t e r w i l l g i v e a more accurate r e p r e s e n t a t i o n . Figure 3.9 shows the e f f e c t s o f a f o u r and
Chapter three

- 125 -
e i g h t d i r e c t i o n p i x e l connection f o r a l i n e a r f e a t u r e . The convention adopted i s important i n the design o f m a n i p u l a t i o n software - i n p a r t i c u l a r the r a s t e r - t o - v e c t o r conversion process.
Figure 3.9; The e f f e c t s o f f o u r and e i g h t d i r e c t i o n p i x e l connection
W i t h i n s p e c i f i c t o l e r a n c e s , which can be d e f i n e d by the user, r a s t e r data can be made t o be as a p p l i c a b l e t o map data as are s t r i n g s o f v e c t o r s , a l b e i t w i t h d i f f e r e n t a l g o r i t h m design and software t a s k s . Problems which a r i s e l i e c h i e f l y at the data capture stage: s e c t i o n 3.3 describes techniques f o r the g r a p h i c - t o - r a s t e r conversion o f images and chapter seven gives an overview o f commercially a v a i l a b l e hardware t o perform the t a s k . L i t t l e or no e x p l i c i t d e f i n i t i o n o f r e a l - w o r l d e n t i t i e s and o f t h e i r c o n n e c t i v i t y e x i s t s w i t h i n the data emanating from the r a s t e r scanners? i n s h o r t , they
/ \
f o u r d i r e c t i o n e i g h t d i r e c t i o n
Chapter three
- 126 -
provide a r a s t e r e q u i v a l e n t o f vector ' s p a g h e t t i ' f i l e s (Peucker and Chrisman 1975). I t i s the a b i l i t y t o decipher these ' s p a g h e t t i ' f i l e s t o intr o d u c e some data c l a s s i f i c a t i o n and topology which i s fundamentally d i f f i c u l t a t the present time. Chapter s i x r e p o r t s on some work by the author which attempts t o in t r o d u c e some 'meaning' i n t o otherwise ' s p a g h e t t i ' data using a b a t t e r y o f a r r a y processing techniques.
Most attempts t o decipher scanned data have r e l i e d on the p a r t i a l i n t e l l i g e n c e o f f e r e d by grey l e v e l s . Today most advanced scanners (see chapter seven) have the a b i l i t y t o dete c t both p i x e l f e a t u r e p o s i t i o n and colour (or grey l e v e l ) although the l a t t e r can vary from image t o image. Grey l e v e l t h resholds have normally t o be set by a human operator t o s u i t the c h a r a c t e r i s t i c s o f the source document (see s e c t i o n 7.2.1). No known scanner has the a b i l i t y t o d e t e c t and c l a s s i f y a whole f e a t u r e by some unique s i g n a t u r e ; t h i s must be c a r r i e d out as a post-hoc stage u t i l i s i n g c o l o u r , l i n e thickness and ( u s u a l l y ) l a r g e amounts o f human i n t e r a c t i o n . C l e a r l y such an approach can be lengthy, c o s t l y and have a lar g e percentage o f e r r o r s . The e a r l y use o f colour scanners has been r e s t r i c t e d t o the pr o d u c t i o n o f col o u r separation p l a t e s f o r p r i n t i n g purposes: f o r example, e i g h t colour maps can be scanned t o produce d i g i t a l l y three process colour p l a t e s and black f o r other p r i n t i n g s p e c i f i c a t i o n s . Any
Chapter three

- 127 -
attempts to c l a s s i f y f e a t u r e types a u t o m a t i c a l l y have l a r g e l y
emanated from the work of image a n a l y s t s : the work of Weber
(1980) and the Image A n a l y s i s Group of Oxford U n i v e r s i t y
(B l a c k et a l 1979) are worthy of note.
.7.1 B a s i c image a n a l y s i s f o r f e a t u r e r e c o g n i t i o n
The process of s k e l e t o n i s i n g or t h i n n i n g l i n e s r e p r e s e n t e d
by a swathe of s e v e r a l p i x e l s wide to a s i n g l e p i x e l wide
ce n t r e l i n e can be used as a technique for c l a s s i f y i n g
f e a t u r e t y p e s . The number of p i x e l s r e q u i r e d to r e p r e s e n t
the t o t a l i t y of the width of a l i n e a r f e a t u r e on a map i s
dependent on the l i n e weight of the map line-work and the
chosen r e s o l u t i o n of the p i x e l s .
Scanned linework can vary from between one or two p i x e l s
i n width t o as many as a dozen or more; indeed, w i t h poor
q u a l i t y linework or with pecked l i n e s ( i n which the pecks are
of i r r e g u l a r length i f drawn by hand), they may even
disappear completely i n p l a c e s . I t i s the job of the human
operator to s e t the t h r e s h o l d grey v a l u e s to some app r o p r i a t e
l e v e l to ensure s u f f i c i e n t d i g i t a l r e p r e s e n t a t i o n of a l l
r e q u i r e d information on the source document to be scanned
with no r e c o r d i n g of extraneous 'noise'. A g e n e r a l
i n v e s t i g a t i o n of l i n e t h i n n i n g techniques by the author has
Chapter three

- 128 -
suggested t h a t no robust a l g o r i t h m e x i s t s . The d i v e r s i t y of
techniques have been developed l a r g e l y by r e s e a r c h groups or
commercial concerns i n t e r e s t e d i n t h i s work.
Since most r a s t e r data s e t s are voluminous, i t i s
advantageous to approach the l i n e t h i n n i n g problem with as
few passes as p o s s i b l e through the data. I t has been pointed
out by H a r r i s e t a l (1981) how l i n e t h i n n i n g algorithms p l a c e
r e s t r i c t i o n s on the number of p i x e l s a l l o w a b l e to r e p r e s e n t a
l i n e . T h i s (they c l a i m ) i s c h i e f l y to reduce the p r o c e s s i n g
time n e c e s s a r y to perform the l i n e t h i n n i n g p r o c e s s . Most
t h i n n i n g techniques seem to have taken e i t h e r a mid-point
algorithm approach or one which ' n i b b l e s ' away at each s i d e
of a l i n e u n t i l one p i x e l i s l e f t . Good d e s c r i p t i o n s of some
working systems have been given by Boyle (1979) and H a r r i s e t
a l (1981), although t h e r e are s e v e r a l o t h e r s : most
manufacturers of r a s t e r scanners can provide software, o f t e n
operating i n r e a l time, to t h i n the scanner data although
(not s u r p r i s i n g l y ) they are r e l u c t a n t to p u b l i s h d e s c r i p t i o n s
of t h e i r algorithms (see chapter s e v e n ) . Most techniques
adopted thus f a r have been designed for s e q u e n t i a l - t y p e
p r o c e s s o r s , o f t e n for mini-computers with a s t r i c t l y l i m i t e d
amount of a v a i l a b l e f a s t core and d i s k space. The m a j o r i t y
of r a s t e r scanners, g e n e r a l l y , r e q u i r e connection to a
c o n t r o l l i n g mini-computer for o p e r a t i o n . An i n t e r e s t i n g
a l t e r n a t i v e s o l u t i o n has been o f f e r e d by I C L (Hunt pers comm
Chapter three

- 129 -
1980) which adopts a p a r a l l e l a lgorithm to run on the ICL
D i s t r i b u t e d Array Processor (see chapter s i x ) . The Research
and Development team a t ICL are developing an e f f i c i e n t l i n e
t h i n n i n g algorithm to f a c i l i t a t e easy and p r e c i s e automated
hand-written c h a r a c t e r r e c o g n i t i o n for improved
u s e r - i n t e r f a c e with computers. The system w i l l be based on
r a s t e r scanning i d e a s a k i n to those i n use i n cartography.
Thus, l o c a l r a s t e r scans convert the handwritten c h a r a c t e r s
i n t o a d i g i t a l form then, a f t e r subsequent r a p i d l i n e
t h i n n i n g procedures o p e r a t i n g on the p a r a l l e l p r o c e s s o r ,
attempts are made to match the c h a r a c t e r s ( i n p i x e l form)
with a p a t t e r n l i b r a r y of alphanumeric c h a r a c t e r s h e l d as b i t
p a t t e r n s . The problems i n v o l v e d should be l e s s than the
topographic data examples because there i s a f i n i t e number of
c h a r a c a t e r shapes p o s s i b l e . I C L p r e d i c t a h i g h r a t e of
succ e s s i n r e c o g n i s i n g c h a r a c t e r s i n t h i s way; a d e s c r i p t i o n
of the methodology adopted i s given i n B r i t i s h Patent
s p e c i f i c a t i o n ( s e r i a l number 1345032 - dated 1974).
I n c o n c l u s i o n , l i n e t h i n n i n g i s a n e c e s s a r y p r e - r e q u i s i t e
to any f u r t h e r data p r o c e s s i n g although no complete and
robust s o l u t i o n e x i s t s . There have been s e v e r a l techniques
suggested by v a r i o u s r e s e a r c h groups although a l l have some
minor i d i o s y n c r a s i e s i n t h e i r r e s u l t s - see chapter seven.
Apart from reducing the c h a r a c t e r i s t i c s of the r a s t e r data to
more manageable volumes, the process of l i n e t h i n n i n g (or
Chapter three

- 130 -
s k e l e t o n i s i n g ) i n i t s e l f i s a powerful t o o l for image
a n a l y s i s and f e a t u r e c l a s s i f i c a t i o n . Simple f e a t u r e
c l a s s i f i c a t i o n s can be performed a u t o m a t i c a l l y where the
t h i c k n e s s of l i n e work i s known to d i f f e r s y s t e m a t i c a l l y
between f e a t u r e s w i t h i n the same image. With a p p r o p r i a t e
software/ i t i s p o s s i b l e to t h i n some l i n e s to the e x t e n t
t h a t they are removed completely, thereby l e a v i n g only the
t h i c k e r l i n e s i n the r a s t e r image. In t h i s way i t i s
p o s s i b l e to code the t h i c k e r l i n e s i n i s o l a t i o n from the
t h i n n e r l i n e s . The t h i n l i n e s can be i s o l a t e d too; by
s u b t r a c t i n g the t h i c k l i n e s i n i s o l a t i o n from the o r i g i n a l
image, only the t h i n l i n e s w i l l remain. A c y c l e of t h i s
nature can be performed s e v e r a l times; however, the amount of
f e a t u r e c l a s s i f i c a t i o n p o s s i b l e by t h i s method w i l l be
dependant on the v a r i a b l i l i t y of the scanned data. Such an
approach would be u n s u i t a b l e for most mapping produced by
Ordnance Survey. The cartography s p e c i f i c a t i o n f o r the
Landranger (1:.50,000) s e r i e s , f o r example, quotes the l i n e
weight to range from 0.15 m i l l i m e t r e s f o r most f e a t u r e s up t o
0.6 m i l l i m e t r e s . Since the m a j o r i t y of f e a t u r e s u t i l i s e the
narrower gauge of l i n e , then very l i t t l e f e a t u r e
d i f f e r e n t i a t i o n i s p o s s i b l e on l i n e weight alone, although
f e a t u r e s could probably be i s o l a t e d using a combination of
l i n e weight and c o l o u r . The l i n e width c h a r a c t e r i s t i c s of
the l a r g e r s c a l e plans are very s i m i l a r , and s i n c e they are
monochrome then no a s s i s t a n c e from c o l o u r s i s p o s s i b l e . Many
Chapter t h r e e

- 131 -
of the l i n e a r p a t t e r n s on the l a r g e r s c a l e plans are
repre s e n t e d by d u a l p a r a l l e l l i n e s : roads, r a i l w a y s and
footpaths are examples. The d e t e c t i o n of p a r a l l e l l i n e s i n a
r a s t e r mode, e s p e c i a l l y on a s e r i a l machine, although
d i f f i c u l t , i s p o s s i b l e according to Weber (1980) u s i n g
d i s t a n c e t r a n s f o r m a t i o n methods. He suggests q u i t e
s u c c e s s f u l f e a t u r e c l a s s i f i c a t i o n t o be p o s s i b l e by t h i s
technique, e s p e c i a l l y when a l l i e d to l i n e t h i c k n e s s of the
map f e a t u r e s . Rosenfeld (1969, p 141-147) d e s c r i b e s the
nature of d i s t a n c e t r a n s f o r m a t i o n techniques i n the
r e c o g n i t i o n process of f e a t u r e s i n a d i g i t a l image. A simple
example i s shown i n f i g u r e 3.10.
Taking the o r i g i n a l bit-map as shown i n f i g u r e 3.10a, a
d i s t a n c e t r a n s f o r m a t i o n technique i s used to a s s i g n p i x e l s
bounded by the p a r a l l e l l i n e s . The v a l u e s a s s i g n e d to each
p i x e l are a measure of the s h o r t e s t d i s t a n c e to the n e a r e s t
bounding l i n e . The examination, say, of the p i x e l s with
v a l u e s 2 or 3 gi v e i n d i c a t i o n of the course o f the f e a t u r e
and i t s t h i c k n e s s . T h i s i s repeated s e v e r a l times f o r
d i f f e r e n t p i x e l v a l u e s u n t i l a unique s i g n a t u r e i s determined
for the f e a t u r e under s c r u t i n y . Software to perform these
a n a l y s e s i s e i t h e r complex or i n e f f i c i e n t on a conventional
s e q u e n t i a l computer but i s much e a s i e r to produce on a
c e l l u l a r a r r a y p r o c e s s o r such as the Goodyear STARAN or the
ICL D i s t r i b u t e d Array Processor (see chapter s i x ) .
Chapter three
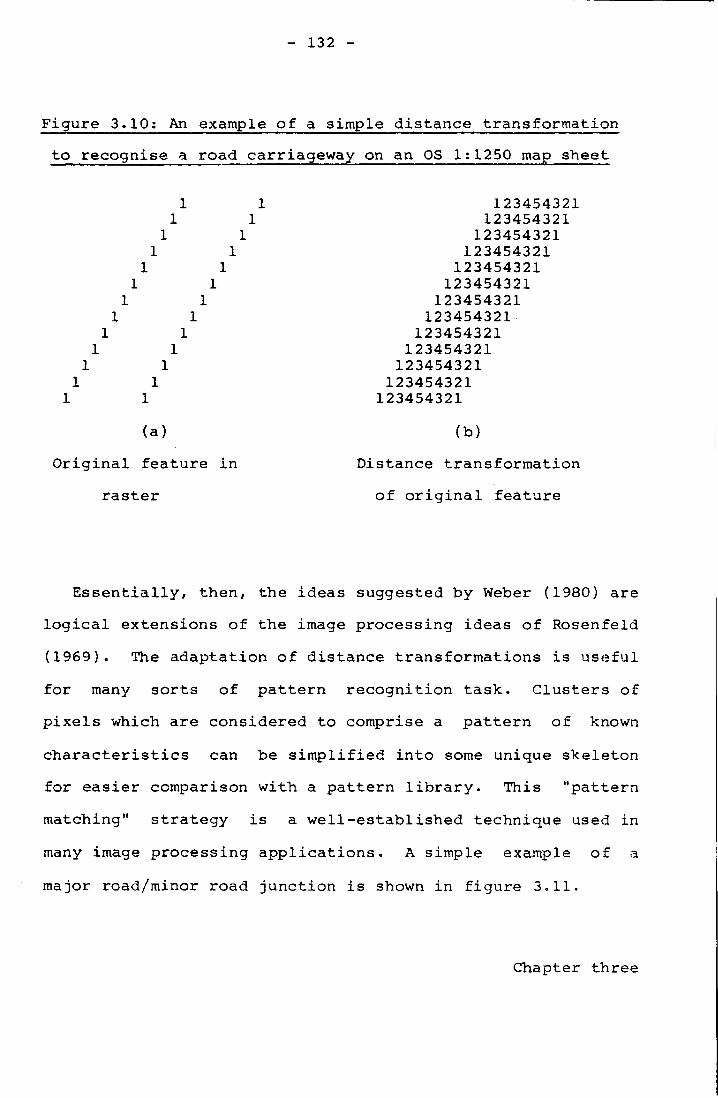
- 132 -
F i g u r e 3.10: An example of a simple d i s t a n c e t r a n s f o r m a t i o n
to r e c o g n i s e a road carriageway on an OS 1:1250 map sheet
1 1 1 1
1 1 1 1
1 1 1 1
1 1 1 1
1 1 1 1
1 1 1 1
1 1
(a)
O r i g i n a l f e a t u r e i n
r a s t e r
123454321 123454321
123454321 123454321
123454321 123454321
123454321 123454321
123454321 123454321
123454321 123454321
123454321
(b)
Distance t r a n s f o r m a t i o n
of o r i g i n a l f e a t u r e
E s s e n t i a l l y , then, the i d e a s suggested by Weber (1980) are
l o g i c a l e x t e n s i o n s of the image p r o c e s s i n g ideas of Rosenfeld
(1969). The adaptation o f d i s t a n c e t r a n s f o r m a t i o n s i s u s e f u l
for many s o r t s of p a t t e r n r e c o g n i t i o n t a s k . C l u s t e r s of
p i x e l s which a r e considered to comprise a p a t t e r n of known
c h a r a c t e r i s t i c s can be s i m p l i f i e d i n t o some unique s k e l e t o n
for e a s i e r comparison with a p a t t e r n l i b r a r y . T h i s "pattern
matching" s t r a t e g y i s a w e l l - e s t a b l i s h e d technique used i n
many image p r o c e s s i n g a p p l i c a t i o n s . A simple example of a
major road/minor road j u n c t i o n i s shown i n f i g u r e 3.11.
Chapter three

- 133 -
Figu r e 3.11; The use of d i s t a n c e t r a n s f o r m a t i o n s to d e t e c t
a road j u n c t i o n i n the OS 1;1250 s c a l e data.
( a f t e r Weber 1980, f i g u r e 14)
654433221 12211 554332211 1221 1 22 54432211 11211 1 2 4433211 11211 11 2 333221 11221 112 22 222211 12211 122 22 11111 11211 1111 2
11221 22 1111112111111111 111 2 11111
1221 22 11 11211 1111111 2 1 11211 11222222 2 11221 112233333 22 12211 122334444 22
11211 1123344555 2 2221 11223445566
Distance t r a n s f o r m a t i o n S k e l e t o n i s e the
of the r a s t e r image image to d e t e c t the f e a t u r e
3.8 USER EXPERIENCE
From a U.K. point of view, and to a c e r t a i n extent i n the
U.S.A. too, d i g i t a l cartography and remote sens i n g have u n t i l
r e c e n t l y been v i r t u a l l y separate s u b j e c t s . At p r e s e n t there
i s very l i t t l e user experience i n B r i t a i n a s s o c i a t e d with a
r a s t e r - b a s e d o r g a n i s a t i o n of c a r t o g r a p h i c data but see D i e l l o
Chapter three

- 134 -
et a l (1969) f o r e a r l y US examples of r a s t e r s t r a t e g i e s i n
cartography. G e n e r a l l y , i t i s the developments of other
d i s c i p l i n e s which have g r a d u a l l y i n f i l t r a t e d i n t o the
c a r t o g r a p h i c f r a t e r n i t y and accentuated any r e a l e f f o r t to
adopt a r a s t e r approach. Moreover, computer cartography has
tended to be dominated by the problems of d i g i t i s i n g and the
subsequent production of a c c e p t a b l e g r a p h i c a l output of data.
T h i s c o n c e n t r a t i o n on both the input and output has to some
degree d i v e r t e d a t t e n t i o n from the t h i r d of a s e t of c l o s e l y
r e l a t e d problems: the ap p r o p r i a t e o r g a n i s a t i o n o f an
e f f i c i e n t c a r t o g r a p h i c data s t r u c t u r e . Arguably the
c h a r a c t e r i s t i c s of the input stage and d e s i r e d output formats
are c l o s e l y a l l i e d w ith the i n t e r n a l storage and u t i l i s a t i o n
of the data. Rhind (1976) has s t r o n g l y r e j e c t e d these
p h i l o s o p h i e s c l a i m i n g t h a t input, storage and output need not
be connected.
I t was the American t e x t i l e p r i n t i n g i n d u s t r y which, i n
the l a t e 1960 's, s t i m u l a t e d the development of a r a s t e r
scanner with the a b i l i t y to d e t e c t s i x c o l o u r s : the company
commisioned f o r an i n i t i a l p r o j e c t was S c i e n t i f i c Technology
Ltd. (now S c i t e x C o r p o r a t i o n ) , now probably the world l e a d e r
i n the f i e l d of r a s t e r scanning hardware (see chapter s e v e n ) .
By 1972 hardware and appropriate software for a c o n t r o l l i n g
computer was made g e n e r a l l y a v a i l a b l e by S c i t e x Corp. a l b e i t
with r a t h e r l i m i t e d f a c i l i t i e s . I t was i n 1975 when the
Chapter three

- 135 -
S c i t e x Response 200 system was introduced; t h i s became the
f i r s t s u c c e s s f u l r a s t e r - s c a n system i n the t e x t i l e p r i n t i n g
and d e c o r a t i v e p r i n t i n g i n d u s t r y . There are now i n excess of
one hundred of thes e systems i n agencies a l l over the world
( S c i t e x Corp. pers comm 1981). Since the l a t e s e v e n t i e s ,
a p p l i c a t i o n s groups have begun to f i n d common l i n k s between
t h i s e a r l y technology and c a r t o g r a p h i c work; the i n t r o d u c t i o n
of a modified c a r t o g r a p h i c scanning system (the Response 250)
i s an example of thes e c l o s e l i n k s . There a r e , however,
other systems a v a i l a b l e with s i m i l a r c h a r a c t e r i s t i c s ; t h e s e
are reported i n chapter seven.
.8.1 A United S t a t e s view
The work of the U.S. Army Engineer Topographic
L a b o r a t o r i e s (ETL) at F o r t B e l v o i r , V i r g i n i a i s worthy of
note; they have gained experience i n both v e c t o r and r a s t e r
formats (Babcock 1978). The implementation of an
experimental drum s c a n n e r / p l o t t e r with v a r i a b l e scanning
r e s o l u t i o n s has provided a source of r a s t e r data. They c l a i m
t h a t the r a s t e r hardware o f f e r s advantages i n speed and
accuracy over t h e i r l i n e a r - o r i e n t e d systems although the
pr o c e s s i n g of such data i s proving to be a major problem.
Babcock (1978) p o i n t s out the sheer volume of data emanating
from the scanner. He quotes the t o t a l number of p o i n t s
Chapter three

- 136 -
generated f o r a graphic 24 x 30 inches to vary between 720 x & 6 10 to 45 x 10 , depending upon the r e s o l u t i o n chosen.
Using standard run length encoding techniques, i t has been
p o s s i b l e to reduce these volumes by a f a c t o r o f seven.
I t was a t the ETL where the f i r s t attempts to use a r r a y
p r o c e s s i n g techniques were c a r r i e d out. In an attempt to
reduce the l a r g e amounts of ' m i l l - t i m e ' being n e c e s s a r y f o r
data manipulation on a c o n v e n t i o n a l s e r i a l computer, software
was developed to run on the Goodyear Aerospace STARAN
a s s o c i a t i v e a r r a y p r o c e s s o r . More d e t a i l e d c o n s i d e r a t i o n of
these s p e c i a l i s e d p a r a l l e l p r o c e s s i n g techniques i s given i n
chapter s i x .
A number of r e l a t e d r e s e a r c h p r o j e c t s undertaken by ETL
which have examined t e c h i n i q u e s f o r the e f f i c i e n t h a n d l i n g of
l a r g e volumes of geographic data can be commended here.
T h e i r approach to the e f f i c i e n t h a n d l i n g of t e r r a i n e l e v a t i o n
data i s worthy of s p e c i a l mention. Such data may be
generated i n l i n e a r or r a s t e r form depending whether a
conventional d i g i t i s e r or a r a s t e r scanner i s used. However,
data s t o r e d as d i g i t i s e d contours, w h i l e most e f f i c i e n t f o r
a r c h i v i n g purposes, cannot r e a d i l y accommodate user needs
other than the r e c r e a t i o n of contours. The most a c t i v e l y
used format f o r t e r r a i n e l e v a t i o n data i n the United S t a t e s
i s a r a s t e r - b a s e d format; a matrix of spot e l e v a t i o n s (with
Chapter three

- 137 -
r e s o l u t i o n t y p i c a l l y one p o i n t per 0.01 inch at 1:50,000
s c a l e ) can expedite contour i n t e r p o l a t i o n , shaded r e l i e f
p a t t e r n s , slope g r a d i e n t and azimuth c a l c u l a t i o n s ,
determination of i n t e r v i s i b i l i t y and a number of other
r e l a t e d products. I n excess of t h r e e m i l l i o n p o i n t s are
r e q u i r e d f o r t h i s format and E.T.L. i n v e s t i g a t i o n s have
suggested t h a t c a r e f u l modelling techniques adopting
low-order polynomial c o e f f i c i e n t s centred over s e l e c t e d g r i d
p o i n t s can produce a compaction of up to 80:1. These
r e s u l t s , a l l i e d with advanced o p t i c a l d i g i t a l encoding of
data onto video d i g i t a l d i s c s , suggest t h a t w e l l over s i x
thousand t e r r a i n maps a t 1:50,000 could be s t o r e d on a s i n g l e
12-inch diameter volume (Babcock 1978).
In the Geography Programme of the United S t a t e s G e o l o g i c a l
Survey, land use mapping has been attempted with both polygon
and c e l l u l a r formats. M i t c h e l l et a_l (1977) i t e m i s e the
advantages of c e l l - b a s e d data f o r s e v e r a l m a n ipulative t a s k s :
l a t e r v e r s i o n s of GIRAS (a Geographic Information R e t r i e v a l
and A n a l y s i s System f o r h a n d l i n g land-use and land cover
data) have been modified to accept g r i d c e l l s as input and
a l s o to convert polygon s t r u c t u r e s to a r a s t e r format f o r
v a r i o u s a n a l y s e s . Furthermore, the Geography Programme has
i n v e s t i g a t e d the use of a r a s t e r scanning d e v i c e (an
I/O Metrics Corporation SWEEPNIK l a s e r scanner) i n a
' l i n e - f o l l o w i n g ' mode i n an attempt to speed d i g i t i s i n g r a t e s
Chapter three

- 138 -
and reduce many of the problems i n h e r e n t i n manual
procedures. U n f o r t u n a t e l y , M i t c h e l l e t a l (1977) found
s e v e r a l disadvantages with t h i s approach; weak l i n e s on the
o r i g i n a l can be missed and t h i c k e r l i n e s can merge together.
However, the r e s e a r c h e r s claimed t h a t such a system could be
e r r o r - f r e e and c o s t - e f f e c t i v e with source documents of high
q u a l i t y (e.g. s c r i b e d line-work p r o v i d i n g good c o n t r a s t with
the background).
.2 The European view
With the exception of image a n a l y s i s groups, r e s e a r c h i n t o
r a s t e r - b a s e d mapping i n Europe has tended to be p r i m a r i l y
concerned with map-production and a s s o c i a t e d techniques of
converting r a s t e r s p a g h e t t i i n t o v e c t o r s t r i n g s . The work of
IGN B r u s s e l s (Loodts 1981), IFAG F r a n k f u r t (Weber 1980) and
IAG Oxford ( H a r r i s e t a_l 1981) are examples of European
groups i n t e r e s t e d i n t h i s f i e l d . Most of these r e s e a r c h
workers, with the exception of Weber, suggest the r a p i d
conversion to v e c t o r s f o r manipulation and storage to be the
b e s t philosophy. T h i s author has detected no evidence of
European r e s e a r c h i n t o a long term, r a s t e r - b a s e d data
s t r u c t u r e f o r c a r t o g r a p h i c information. A l l European
production systems u s i n g r a s t e r methods are c h i e f l y concerned
with p r o v i d i n g more c o s t e f f e c t i v e data capture and e d i t
Chapter three

- 139 -
f a c i l i t i e s f o r the c r e a t i o n o f f u r t h e r , modified g r a p h i c s
r a t h e r than a r a s t e r - s t r u c t u r e d data base useable for a
v a r i e t y of t a s k s .
Kummerly and Fr e y AG, a much res p e c t e d Swiss map producer,
have found the p a r t i a l use of r a s t e r methods to be c o s t
e f f e c t i v e i n the c r e a t i o n and r e v i s i o n of road maps
(Kummerley and Frey pers comm 1981). T h e i r f l o w l i n e ,
although r a t h e r s i m p l i s t i c , s e r v e s as a good example o f the
use of S c i t e x hardware i n production: they operate a scanner,
a r a s t e r - d r i v e n l a s e r p l o t t e r and two r a s t e r - d r i v e n
i n t e r a c t i v e edit/work s t a t i o n s . E s s e n t i a l l y the r e v i s i o n
e x e r c i s e s have i n v o l v e d the scanning of up to twenty
' a s t r o f o i l ' map sh e e t s i n which t h e r e are t h i r t y - e i g h t
o v e r l a y s per she e t . Since the format of each map i s l a r g e r
than the dimensions of the scanner, then the data capture has
to be made i n two passes with a r e l i a n c e on the accurac y of
p i n - r e g i s t r a t i o n marks. Once i n p i x e l form, any map r e v i s i o n
has proved. to be easy and e f f i c i e n t . The maps are
mul t i - c o l o u r e d and w e l l s u i t e d to the S c i t e x f a c i l i t i e s .
Symbol placement and minor m o d i f i c a t i o n s are easy to ach i e v e
i n the r a s t e r data with the i n t e r a c t i v e work s t a t i o n .
Kummerly and Frey AG a l s o r e p o r t t h a t the production of
new road maps adopting a r a s t e r s t r a t e g y i s proving to be
cos t e f f e c t i v e (Kummerley and Frey pers comm 1981). E x i s t i n g
Chapter three

- 140 -
data are being scanned and d i g i t a l l y reduced and transformed
to an a p p r o p r i a t e p r o j e c t i o n for r e p l o t t i n g . This provides
the cartographers with a compilation sheet to be redrawn by
hand with any m o d i f i c a t i o n s where n e c e s s a r y . Symbols are
compiled on a s e p a r a t e s h e e t ; once rescanned, they are merged
with the line-work i n t e r a c t i v e l y on the e d i t s t a t i o n . A
f a s t e r turnaround of production i s claimed although t e x t
placement s t i l l r e l i e s on the r a s t e r scanning of l e t t e r s
which have been 'stuck' onto a sheet of a s t r o f o i l .
The s i m p l i s t i c uses of r a s t e r methods i n t h i s way are f a r
removed from the advanced a p p l i c a t i o n s as suggested by
academics such as Boyle, Peuquet and o t h e r s , but nonetheless
they do provide an example of a p i l o t production f l o w l i n e
adopting f a i r l y c o n t r o v e r s i a l techniques which i s reported to
be more c o s t e f f e c t i v e than c o n v e n t ional vector-based d i g i t a l
methods. The u s e r s of Kummerly and F r e y AG road maps have,
at p r e s e n t , no i n t e r e s t i n these new methods of production
and the map makers themselves are not a n t i c i p a t i n g uses of
t h e i r data other than map production, n e v e r t h e l e s s the s t a t u s
quo i s sure to change sooner r a t h e r than l a t e r as technology
i n image a n a l y s i s and improved mass storage d e v i c e s reach
m a t u r i t y .
Chapter three

- 141 -
.9 CONCLUSIONS
Th i s chapter has attempted to introduce the concepts of
r a s t e r technology with r e s p e c t to c a r t o g r a p h i c a p p l i c a t i o n s .
In p r i n c i p l e , a grid-based method of storage and manipulation
of environmental data can be as appropriate t o mapping t a s k s
as the more con v e n t i o n a l v e c t o r methodologies. However, with
the exception o f one or two r e s e a r c h groups and a few
commercially a v a i l a b l e systems, there are few working systems
from which to draw p o s i t i v e c o n c l u s i o n s on performance and
e f f i c i e n c i e s . C l e a r l y , software design and choice of
hardware i n a r a s t e r - b a s e d mapping system must be c a r e f u l l y
geared to s u i t the types of manipulative t a s k s and output
c h a r a c t e r i s t i c s r e q u i r e d .
Nonetheless, r a s t e r t e c h n o l o g i e s have a f u t u r e r o l e i n
mapping systems, although t h e r e i s a need for c a r e f u l
advancement of p r e s e n t techniques and knowledge. I t i s
a n t i c i p a t e d t h a t the data base management of such data w i l l
be u n l i k e l y to p r e s e n t many problems i f c o n t r o l l e d compaction
and indexing techniques are adopted. Major problems w i l l
a r i s e not so much because of the c o n s i d e r a b l e bulk of the
data s e t s but i n the e f f o r t s to convert the hard-copy map
sheets i n t o a d i g i t a l r e p r e s e n t a t i o n with adequate content
and s t r u c t u r e f o r future (unknown) purposes. Such problems
are not, of course, r e s t r i c t e d to r a s t e r t e c h n i q u e s ; s i m i l a r
Chapter three

- 142 -
dilemmas are a l r e a d y f a c i n g the vector-based methods of data
capture. There i s c h i e f l y a need for r e s e a r c h and a p p l i e d
e f f o r t to develop the post-hoc v a l i d a t i o n and refinement
p r o c e s s e s f o r the output from the r a s t e r s c a n n e r s . The
d e v i c e s now have more than adequate d e t e c t i o n s p e c i f i c a t i o n s
f o r most t a s k s . The next decade must.see much improved image
a n a l y s i s methods by both automatic and semi-automatic means.
Chapter three

- 143 -
4 COMPARISONS OF RASTER AND VECTOR REPRESENTATIONS
4.1 INTRODUCTION
The d i s t i n c t i o n between r a s t e r and vector-based r e p r e s e n t a t i o n s f o r geographic data has now been made: chapter two concentrates on d e s c r i p t i o n s and d e f i n i t i o n s associated w i t h v e c t o r n o t a t i o n s w i t h s p e c i f i c examples drawn from working systems and chapter three provides s i m i l a r c o n s i d e r a t i o n s f o r r a s t e r methods. I t has been suggested t h a t many a p p l i c a t i o n s are more s u i t e d t o one n o t a t i o n or the other although very l i t t l e c o n s i d e r a t i o n i n the past seems t o have been given t o i t e m i s i n g which r e p r e s e n t a t i o n i s best s u i t e d t o which f u n c t i o n . Such a d e f i c i e n c y i n a t t e n t i o n by research workers has a r i s e n , most probably, because o f an absence o f any s p e c i f i c a t i o n o f tasks a p p r o p r i a t e f o r a n a t i o n a l topographic d i g i t a l data base t o meet. I t i s the i n t e n t i o n o f t h i s chapter t o consider the s u i t a b i l i t y of the two techniques f o r a number o f def i n e d a p p l i c a t i o n s . A t t e n t i o n w i l l a l s o be given t o such f a c t o r s as r e v i s i o n o f the data base and the q u a l i t y and e f f i c i e n c y of data capture and p r e s e n t a t i o n .
Chapter f o u r

- 144 -
No data base system f o r topographic i n f o r m a t i o n i s known to the author which handles v e c t o r and raster-based formats and cross-references between each on a r o u t i n e b a s i s . A l l systems have taken on one methodology or the other w i t h a c l e a r d i s t i c t i o n between the two, although a number o f vector systems may use a ' g r i d d i n g ' technique t o compare data s e t s . Apart from t h i s , the uses of v e c t o r r e p r e s e n t a t i o n s seem t o be r a t h e r more abundant than are those o f grid-based systems. This predicament has a r i s e n by the domination o f the problems of d i g i t i s i n g i n computer cartography. I t i s n a t u r a l f o r cartographers t o f i n d s i m i l a r i t i e s between map drawing and manual d i g i t i s i n g methods and hence t o be p r e j u d i c e d i n favour of h o l d i n g i n f o r m a t i o n i n a l i n e a r f ashion on a f e a t u r e by f e a t u r e b a s i s . The e a r l y devices s p e c i f i c a l l y designed f o r data e n t r y and d i s p l a y l e n t themselves r e a d i l y t o t h i s method o f data o r g a n i s a t i o n : the manual d i g i t i s i n g t a b l e s (see chapter two) and the vector p l o t t e r s are notable examples. Moreover, by f a r the m a j o r i t y o f commonly known ca r t o g r a p h i c a l g o r i t h m s are v e c t o r - o r i e n t e d (e.g. Douglas no-date), thus very l i t t l e implementation work has been necessary t o develop q u i t e acceptable and u s e f u l p r o d u c t i o n systems. The work of Ordnance Survey over the l a s t decade demonstrates c o n v i n c i n g l y how t h i s p o l i c y i s q u i t e adequate f o r the storage o f map data intended p u r e l y f o r the generation o f graphic images on demand at some l a t e r date. I n c r e a s i n g l y , however, the need f o r r e l a t i o n a l l i n k s between
Chapter f o u r

- 145 -
topography and other environmental sciences i s becoming obvious. I t i s f o r t h i s reason, i n p a r t i c u l a r , t h a t the r e f o r m a t t i n g and d e t a i l e d manipulation o f data i n a r a s t e r format i s d e s i r a b l e t o f a c i l i t a t e easier l i n k s t o other data s e t s . The i n t e r f a c e between map and remote-sensed data serves as a u s e f u l example. For many years d i g i t a l cartography and remote sensing have been v i r t u a l l y separate s u b j e c t s : t h i s i s evident w i t h the establishment o f i n d i v i d u a l s o c i e t i e s f o r the two i n B r i t a i n - the B r i t i s h Cartographic Society and the Remote Sensing Society have very few l i n k s . There seems l i t t l e reason f o r such c l e a r d i s t i n c t i o n s between two d i s c i p l i n e s which are both concerned w i t h capture and management o f environmental i n f o r m a t i o n . The f a c t t h a t members of one tend t o produce d i g i t a l data i n vector form and those i n the other produce data i n r a s t e r form has probably accentuated t h i s u n r e a l dichotomy. Present i n d i c a t i o n s o f the i n c r e a s i n g r e s o l u t i o n o f p i x e l data t o be gained from the next generation o f s a t e l l i t e s (see Doyle 1978) g i v e more impetus t o the c o l l a b o r a t i o n between remote-sensing and topographic mapping and t o the d e s i r a b i l i t y o f being able t o move f l u e n t l y i n both d i r e c t i o n s between r a s t e r and vector data s e t s .
Chapter four

- 146 -
2 THE BASIC CHARACTERISTICS OF DATA HANDLING
I t has been suggested by Peuquet (1979a), Weber (1980), Davey et a l (1977) and others t h a t r a s t e r methods o f s p a t i a l data h a n d l i n g have as much p o t e n t i a l as any vector e q u i v a l e n t s . This chapter examines some o f the e f f e c t s t h a t these two approaches have on the many sections i n a topographic i n f o r m a t i o n system.
2.1 Data e n t r y
Chapters two and three have o u t l i n e d the processes i n v o l v e d i n c o n v e r t i n g a map sheet i n t o v ector and r a s t e r formats r e s p e c t i v e l y . To t r a n s f e r a map sheet i n t o a pixel-based s t r u c t u r e a u t o m a t i c a l l y w i l l r e q u i r e access t o one of the many scanning devices (see chapter seven). Automated vector capture seems less widespread; t h e r e are f a r fewer examples o f commercially a v a i l a b l e l i n e f o l l o w i n g devices: the Laser-scan Laboratory's Fastrak (see chapter two, Howman and Woodsford 1978, Rhind 1979) i s the o n l y device known t o the author which has proven t o be successful i n a p r o d u c t i o n environment, but see Wohlmut (1976) f o r the d e s c r i p t i o n o f a s i m i l a r device manufactured by i / o M e t r i c s . Vector methods have, o f course, long been w e l l - e s t a b l i s h e d w i t h the use o f manual x,y d i g i t i s i n g t a b l e s ; t h e r e i s no
Chapter four

- 147 -
raster-based c o u n t e r p a r t t o these and so any comparisons between the two methods should be r e s t r i c t e d t o the t e c h n o l o g y - i n t e n s i v e automatic methods.
C l e a r l y the time r e q u i r e d t o d i g i t i s e a map sheet i s c r u c i a l i n assessing the throughput r a t e s o f a data e n t r y system. Both automatic l i n e f o l l o w i n g and r a s t e r scanning o f f e r dramatic improvements over manual methods f o r some data (see s e c t i o n 2.5.2): i t i s d i f f i c u l t , however, t o compare e f f e c t i v e l y the speeds o f o p e r a t i o n f o r the two types o f system since both have a d i f f e r e n t c o l l e c t i o n o f stages. Current acceptance t e s t s being undertaken on the Fastrak i n the Ordnance Survey headquarters i n d i c a t e t h a t t y p i c a l 1:1250 plans i n the dense West Midlands area can be d i g i t i s e d i n between f o u r and twenty hours; t h i s i s only a marginal r e d u c t i o n i n the d i g i t i s i n g r a t e o f the conventional manual f l o w l i n e described i n chapter two. F u r t h e r , the p r o v i s i o n a l r e s u l t s being obtained from the Fastrak s t i l l comprise many e r r o r s and r e q u i r e l a r g e ( p r e s e n t l y unknown) amounts o f data e d i t i n g on the IGES i n t e r a c t i v e e d i t system implemented by OS. I n p r a c t i c e , i t i s d i f f i c u l t t o assess c l e a r l y the performance r a t e s o f a Fastrak w i t h p r o d u c t i o n work. Experience gained from the i n s t a l l a t i o n i n use a t the Mapping and Charting Establishment (MCE) has shown t h a t the speed o f d i g i t i s i n g v a r i e s enormously f o r d i f f e r i n g contour data? l i n e c u r v a t u r e , d e n s i t y and image q u a l i t y are a l l important i n
Chapter four

- 148 -
assessing throughput rates (Howman pers comm 1982). Generally, crude assessments o f the speed o f d i g i t i s i n g f o r contour data by the Fastrak a t MCE are quoted as being ten times f a s t e r than a manual d i g i t i s i n g process (Howman pers comm 1982).
The i n i t i a l set-up times f o r both Fastrak and the manual d i g i t i s i n g t a b l e s a t OS seem t o be o f a s i m i l a r orders ( c . 15 - 20 minutes), though the use o f a Fastrak method r e q u i r e s the c a l i b r a t i o n o f more parameters such as l i n e w i d t h thresholds and phase d e t e c t i o n . However, i t i s the nature o f the data being d i g i t i s e d which i s slowing the Fastrak down from i t s p o t e n t i a l l y h i g h l i n e - f o l l o w i n g r a t e s . The i n i t i a l t e s t s show i t t o be f a s t e r t o d i g i t i s e manually many f e a t u r e s than t o f o l l o w l i n e a r f eatures a u t o m a t i c a l l y , then v a l i d a t e the r e s u l t s , f i l t e r , smooth and so on. These p r o v i s i o n a l r e s u l t s (although l i m i t e d i n e x t e n t ) are d i s a p p o i n t i n g f o r pro d u c t i o n requirements. I n February 1982, the system r e q u i r e d c a r e f u l m o d i f i c a t i o n and extensive t u n i n g t o be s u i t a b l e f o r the co m p l e x i t i e s o f the la r g e scales data capture. I t i s hoped t h a t m o d i f i c a t i o n s t o the Laser-aid software (Laser-scan Laboratories 1981a) can improve upon these p r o v i s i o n a l f i g u r e s .
Undoubtedly, automatic d i g i t i s i n g by the Fastrak has the advantage o f being performed under operator c o n t r o l - any
Chapter fo u r

- 149 -
associated f e a t u r e - c o d i n g and checking being i n c l u d e d where necessary. The d i g i t i s i n g time on a r a s t e r scanning device i s o n l y a p r e - r e q u i s i t e t o much more l e n g t h y post-hoc v a l i d a t i o n , f e a t u r e - c o d i n g and general t i d y i n g - u p . I t i s h i g h l y l i k e l y t h a t the Fastrak system w i l l ( i n time) provide r e l a t i v e l y clean data s u i t a b l e f o r immediate e n t r y i n t o a data bank w i t h the need f o r o n l y l i m i t e d c o r r e c t i o n . The e f f e c t s o f decision-making and assistance by a t r a i n e d operator throughout the capture process, w i t h the i n c l u s i o n o f a t t r i b u t e codes and other i n f o r m a t i o n , i s expected t o be i n s t r u m e n t a l i n ensuring i n f o r m a t i o n f o r immediate a r c h i v i n g . However, at present, l a r g e r amounts of operator assistance and i n t e r v e n t i o n are necessary than i s considered d e s i r a b l e f o r a c o s t - e f f e c t i v e p r o d u c t i o n system. The need f o r c o n t i n u a l a l e r t n e s s on the p a r t of the operator, who must not only respond t o queries made by the system but a l s o i n t e r r u p t the l i n e f o l l o w i n g process when e r r o r s i n the s e l e c t e d route ( f r e q u e n t l y ) occur, suggests a h i g h l y demanding job both p h y s i c a l l y and m e n t a l l y . The automatic r e c o g n i t i o n o f j u n c t i o n s i s s t i l l inadequate a t t h i s e a r l y stage and Laser-
-scan Laboratories are a t t e m p t i n g intense development i n t o t h i s o p t i o n a t the present time (Wdodsford, pers comm 1981). Nonetheless, the f e a t u r e coding o f the l i n e work i s expected t o be less problematic by a Fastrak, than w i t h a r a s t e r approach since the operator has easy-to-use programmable f u n c t i o n buttons a t h i s d i s p o s a l f o r r a p i d r e a l time
Chapter four
- 150 -
i n t e r v e n t i o n .
Understandably, the throughput r a t e s o f d i g i t i s i n g w i t h a F a s t r a k - l i k e machine are e n t i r e l y dependant on the complexity and volume o f the data being d i g i t i s e d . This i s not the case i n r a s t e r scanning i n which the same time i s taken f o r map sheets o f a l l c o m p l e x i t i e s although s i z e o f the p l o t and r e s o l u t i o n o f the scan l i n e s w i l l be r e l e v a n t . Indeed some of the modern f l a t - b e d scanners (see chapter seven) have the a b i l i t y t o speed up and slow down as data c o m p l e x i t i e s vary, although t h i s should not have such a marked e f f e c t on throughput. Bench-mark t e s t s c a r r i e d out by the author w i t h the k i n d cooperation o f various r a s t e r s i t e s throughout the world are discussed i n chapter seven. A West Midland's sheet at 1:1250 scale was scanned on a Scitex Response 250 system at the United States Geological Survey i n Reston, V i r g i n i a w i t h a p i x e l r e s o l u t i o n o f twenty l i n e s per m i l l i m e t r e . The scanning time was r e p o r t e d t o be seventy-two minutes w i t h a f u r t h e r f i f t e e n minutes r e q u i r e d t o set-up the machine and •prepare i t f o r the j o b .
These more d e s i r a b l e r a t e s o f d i g i t i s i n g cannot be compared e x p l i c i t l y w i t h v ector methods since a r a s t e r s t r a t e g y has much d i f f e r e n t c h a r a c t e r i s t i c s o f o p e r a t i o n . I n p a r t i c u l a r , e f f i c i e n t o p e r a t i o n o f a raster-scan device can only by achieved i f i t i s u n i n t e r r u p t e d as scanning i s t a k i n g
Chapter f o u r

- 151 -
place. Operator c o n t r o l can o n l y be provided at the set-up stage when such parameters as p i x e l r e s o l u t i o n , d e t e c t i o n t h resholds and scan dimensions can be assigned. The r e s u l t i s a d i g i t a l r a s t e r image which r e q u i r e s f u r t h e r m a n i p u l a t i o n before i t can be compared w i t h the r e s u l t s from the Fastrak. Any data v a l i d a t i o n and s o r t i n g o f the disordered p i x e l s i s c a r r i e d - o u t post-hoc. The e x t e n t o f operator i n t e r v e n t i o n r e q u i r e d i n t h i s l a t e r manipulation stage i s unknown a t present, although i t w i l l be a lengthy process f o r the complex 1:1250 and 1:2500 mapping.
The three stages i n a r a s t e r - d r i v e n data e n t r y system a f t e r scanning are: the assignment o f a f e a t u r e coding scheme, l i n e t h i n n i n g and v e c t o r i s i n g . The a b i l i t y t o convert from r a s t e r t o vector n o t a t i o n i s d i f f i c u l t t o achieve e f f i c i e n t l y by computer and, although one or two are beginning t o show promise, no a p p r o p r i a t e s o l u t i o n e x i s t s a t present. With l i t t l e or no d e t a i l e d experience i n t h i s post hoc h a n d l i n g o f OS r a s t e r f i l e s , i t i s d i f f i c u l t t o assess the problems and c h a r a c t e r i s t i c s of the techniques i n v o l v e d . One must r e l y on the r e p o r t s from s i m i l a r research w i t h other map data; a number o f research workers have shown these stages t o be lengthy processes ( H a r r i s et a l 1981, Peuquet 1981). H a r r i s et aJL (1981) c i t e a 3000 x 5000 p i x e l image o f a polygon map as an example: 281 cpu seconds on a DEC 10 are r e q u i r e d f o r l i n e t h i n n i n g and 268 cpu seconds f o r node and
Chapter four

- 152 -
segment i d e n t i f i c a t i o n ( t h e r e were 3600 segments and 2260 nodes). C l e a r l y these are s i z e a b l e process jobs which w i l l c e r t a i n l y r e f l e c t i n the f i g u r e s o f elapsed time, e s p e c i a l l y i n a m u l t i - u s e r computing environment. I t i s d i f f i c u l t t o provide any r e a l comparisons f o r an OS map sheet since no t e s t s have been c a r r i e d out t o reproduce r e s u l t s s i m i l a r t o those being obtained by the Fastrak. A r a s t e r image o f an OS sheet was processed post hoc w i t h v e c t o r i s i n g software w r i t t e n at the Image Analysis Group a t Oxford U n i v e r s i t y (see H a r r i s et a l 1981) on b e h a l f o f the author i n order t o assess the f e a s i b i l i t y o f such an approach f o r serious map p r o d u c t i o n . The software introduces some topology i n t o the data, by generating v e c t o r s t r i n g s h e l d as l i n k and node data t o f a c i l i t a t e map-feature r e c o n s t r u c t i o n as polygon boundaries. The DEC 10 computer a t Oxford r e q u i r e d 1293 cpu seconds f o r l i n e t h i n n i n g , a f u r t h e r 992 cpu seconds f o r node and segment i d e n t i f i c a t i o n ( t h e r e were 9385 segments and 11357 nodes d e t e c t e d ) , and 100 cpu seconds f o r post hoc f i l t e r i n g and l i n e smoothing. C l e a r l y these processing times are l e n g t h y and are a good i n d i c a t i o n o f the computer access time r e q u i r e d f o r an 8000 x 8000 r a s t e r image which i s t o be expected f o r OS l a r g e scales data. An elapsed time o f three t o four hours would be t y p i c a l f o r any mainframe performing t h i s t a s k.
Chapter four

- 153 -
To consider the two systems ( l i n e - f o l l o w i n g and r a s t e r scanning) by speed o f capture alone suggests very s i m i l a r throughput r a t e s t o be p o s s i b l e . Indeed, from an Ordnance Survey p o i n t o f view, i t i s envisaged t h a t Fastrak w i l l be f a s t e r since the r e s u l t s from the r a s t e r scanners, even a f t e r any post-processing by some O x f o r d - l i k e software would f u r t h e r r e q u i r e considerable time t o be spent on an i n t e r a c t i v e work s t a t i o n f o r data v a l i d a t i o n and f e a t u r e code assignment. The complexity o f a map sheet i s u n l i k e l y t o a l t e r scanning times but w i l l have a considerable e f f e c t on post-processing r a t e s i n a s i m i l a r fashion t o i t s e f f e c t on the l i n e - f o l l o w i n g process. More d e t a i l e d c o n s i d e r a t i o n o f the q u a l i t y o f the r a s t e r scanning r e s u l t s are given i n chapter seven. No t e s t s have been made on the a b i l i t y t o a t t a c h f e a t u r e codes t o r a s t e r - c a p t u r e d OS data although t h i s i s expected t o be o p e r a t o r - i n t e n s i v e . Such a p r o j e c t would be h i g h l y d e s i r a b l e t o assess the f u l l c a p a b i l i t i e s o f raster-based systems. Nevertheless, on the basis o f v i s i t s t o seminars organised by two le a d i n g r a s t e r scanning manufacturers, i n f i n i t i v e assessments can be made o f many o f the problems i n v o l v e d and these are considered below.
Chapter four

- 154 -
4.2.1.1 The q u a l i t y o f the source document
Both approaches t o d i g i t i s i n g are h i g h l y dependant on the image q u a l i t y o f the source m a t e r i a l s : the Fastrak r e q u i r e s p h o t o g r a p h i c a l l y reduced m i c r o f i c h e s , t y p i c a l l y 98 x 68 mm, w i t h a h i g h c o n t r a s t o f linework. The source documents f o r scanners must vary t o s u i t each model: some u t i l i s e p h o t o g r a p h i c a l l y reduced m i c r o f i c h e s w h i l s t others can accept f u l l s i z e plans on f i l m or paper. A l l r e q u i r e t o be o f h i g h q u a l i t y w i t h a c l e a r c o n t r a s t between the l i n e work and the background. The q u a l i t y o f some Master Survey Documents (MSD) (see Maries 1971, Adams 1979, OS 1981b s e c t i o n 4.2) w i l l prove t o be u n s u i t a b l e f o r any r a s t e r scanning device: a s i t u a t i o n which i s l i k e l y t o a r i s e w i t h the Fastrak system too. C e r t a i n l y p r o v i s i o n a l t e s t s have shown t h i s t o be the case: c u r r e n t l y only the h i g h e s t q u a l i t y image i s s u i t a b l e . I t w i l l be necessary f o r OS t o enhance the q u a l i t y o f many o f the source documents before mass d i g i t i s a t i o n can begin. The q u a l i t y and d u r a b i l i t y o f many o f the MSD's comprising the n a t i o n a l survey arc h i v e i n B r i t a i n i s i n a p p r o p r i a t e f o r any photographic enhancement (Smith pers comm 1982). There are, f o r example, c u r r e n t l y c.11,000 MSD's which d i s p l a y the map line-work i n blue i n k (the r e s u l t o f e a r l y OS p o l i c y t o ho l d the survey record i n a form which cannot be photo-copied). In such instances, i t i s impossible t o manipulate the images p h o t o g r a p h i c a l l y f o r m o d i f i c a t i o n f o r automatic scanners or
Chapter f o u r

- 155 -
d i g i t i s e r s . No assessment o f the o v e r a l l image q u a l i t y o f the OS survey a r c h i v e i s a v a i l a b l e , although s t u d i e s of t h i s nature are c u r r e n t l y being undertaken by the OS; i t i s envisaged t h a t between f i v e and twenty f i v e per cent o f the t o t a l number o f basic scale MSD's are u n s u i t a b l e f o r any scanning process o r , indeed, any photographic enhancement (Wesley pers com 1982) .
The e f f e c t o f any p r e p a r a t i o n stages w i l l have importance i n assessing long term throughput r a t e s . C l e a r l y much c o s t l y c a r t o g r a p h i c redrawing w i l l be necessary i n many cases a t the o u t s e t , d i s r e g a r d i n g whether a l i n e - f o l l o w i n g or r a s t e r scanning s t r a t e g y i s adopted. E a r l y assessments (from discussions w i t h OS personnel and w i t h scanning manufacturers) seem t o suggest t h a t both automatic vector and r a s t e r devices r e q u i r e very s i m i l a r p r e p a r a t i o n stages. I n essence, i t i s more l i k e l y t o be the ease o f capture which has importance i n assessing the two methods.
4.2.1.2 Suggested raster-based work methods
Table 7.1 i t e m i s e s scanning systems known t o the author and which have been evaluated (by the author) f o r Ordnance Survey l a r g e scales a p p l i c a t i o n s . Their approach t o data handling, a f t e r the scanning stage, take on two p o s s i b l e
Chapter four

- 156 -
s t r a t e g i e s : some systems o f f e r immediate conversion o f the r a s t e r output t o vector form f o r v a l i d a t i o n , f e a t u r e coding and storage, w h i l s t others preserve r a s t e r data throughout { w i t h an o p t i o n t o convert t o vector i f r e q u i r e d ) . C l e a r l y both s t r a t e g i e s have advantages although n e i t h e r are completely t a i l o r e d t o the OS l a r g e scales. The Landranger (1:50000) s e r i e s or smaller are more a p p r o p r i a t e t o e f f e c t i v e m a nipulation i n r a s t e r since they c o n t a i n both c o l o u r and t o t a l symbology. The i n t e r a c t i v e placement o f symbols and colour recoding i s well-handled by r a s t e r w o r k - s t a t i o n s . Large scales mapping presents r a t h e r more problems f o r any raster-based hardware and software. C l e a r l y the scanners can capture the monochrome data s u c c e s s f u l l y (twenty l i n e s per m i l l i m e t r e i s a p p r o p r i a t e f o r OS l a r g e scale plans) although any o f the post hoc r e f o r m a t t i n g and manipulation i s arduous. There are a number o f work methods using r a s t e r methods open t o us :
1. Pass the b i n a r y r a s t e r image through a conversion t o vector process w i t h a l l i t s associated problems and then e d i t / f e a t u r e - c o d e the v e c t o r f i l e on an i n t e r a c t i v e vector-based graphics system. This has been the approach taken by almost a l l a v a i l a b l e systems and i s associated w i t h an o f t e n i n a p p r o p r i a t e r a s t e r t o vector conversion process (see chapter seven).
Chapter f o u r

- 157 -
2. I n the r a s t e r c o n t e x t , l i n e s drawn on the maps w i l l be several ( t y p i c a l l y s i x or seven) p i x e l s wide and hence can be considered as elongated a r e a l u n i t s . Feature codes can be assigned t o these areas i n the r a s t e r f i l e i n t e r a c t i v e l y . I n t h i s way, fea t u r e s can be coded i n the r a s t e r f i l e by the i d e n t i f i c a t i o n o f t h e i r s t a r t and end l o c a t i o n s . This w i l l ensure t h a t the recoding o f s p e c i f i c l i n e a r map f e a t u r e s does not ' r i p p l e ' throughout the e n t i r e network o f in t e r c o n n e c t e d p i x e l s . Conceptually, a t l e a s t , i t w i l l become necessary t o dete c t nodes i n the r a s t e r l i n e work (where two or more l i n e s j o i n ) . These must then be t e m p o r a r i l y masked as fe a t u r e t e r m i n a t o r s t o ensure t h a t f e a t u r e code assignment i s r e s t r i c t e d t o a s p e c i f i c r e g i o n o f p i x e l s . See f i g u r e 4.1 below:
Figure 4.1: Map f e a t u r e d e l i n e a t i o n by nodal end-points
* * * * * * * * * * * * * * * * .
******** ***************** *****************£££**** ### ###
******** ********** ****** * * * * * * * * * * * * * * * * * ^ * * * * * * * * * * * * * * * * * * * * * * * * * * * * * * * * * * * * * * * * * * * * * * * * * * * *
(a) Road f e a t u r e from (b) The i d e n t i f i c a t i o n o f scanner the node-points
Chapter fo u r

- 158 -
Wi t h i n l i m i t a t i o n s , l i n e weight can a s s i s t i n the automatic assignment o f f e a t u r e codes. During the set-up stage f o r the scanning device, t h r e s h o l d parameters need to be set t o d e f i n e the w i d t h o f l i n e s which the scanner w i l l 'see'. This stage c l e a r l y has serious i m p l i c a t i o n s f o r the q u a l i t y and accuracy o f the image emanating from the scanner. Two r a s t e r f i l e s o f the same map image could have very d i f f e r e n t c h a r a c t e r i s t i c s i f the scanner i s c a l i b r a t e d by d i f f e r e n t operators on each occasion. I n p r a c t i c e , human operators can become 'tuned' t o the types o f t h r e s h o l d s e t t i n g s r e q u i r e d f o r a p a r t i c u l a r map image (Smith pers comm 1980) which should r e l i e v e , t o some e x t e n t , the problems o f the s e n s i t i v e c a l i b r a t i o n o f the scanner. Weber (1980) and Loodts (1981) have shown how software can ca t e g o r i s e l i n e weights i n a r a s t e r image t o provide f e a t u r e coding assistance.
From an Ordnance Survey v i e w p o i n t , pecked l i n e s which comprise approximately twenty per cent o f l i n e work i n la r g e scale maps (Adams 1979) w i l l cause the bi g g e s t problems. With the exception o f recent r e s u l t s emanating from the USGS (Smith pers comm 1980), there appears t o be d i f f i c u l t i e s i n d e t e c t i n g and connecting pecked l i n e s i n a r a s t e r image ( S c i t e x Corp. pers comm 1981). The author considers t h i s not t o be such a f o r b i d d i n g problem on a p a r a l l e l computer as o u t l i n e d i n chapter s i x and, indeed,
Chapter f o u r

- 159 -
the use of push-broom scanners ( s e c t i o n 3.3.2) - which
can 'see' s e v e r a l s c a n - l i n e s s i m u l t a n e o u s l y - i s a l s o
expected to o f f e r robust d i g i t a l s o l u t i o n s i n the f u t u r e .
In essence, t h i s immediate i n a b i l i t y to c a t e g o r i s e pecks
i n the image suggests t h a t each peck must be e i t h e r coded
or connected i n d i v i d u a l l y ; t h i s i s p o s s i b l e a t the e d i t
stage but c l e a r l y too l a b o r i o u s to be a worthwhile
p r o p o s i t i o n .
3. The t h i r d approach i s l i k e l y to be the most i n t e r e s t i n g
a c a d e m i c a l l y a t t h i s stage and has been the b a s i s f o r
much development i n t h i s r e s e a r c h p r o j e c t (see chapter
s i x ) . T h i s i n v o l v e s coding areas (polygons) as c l u s t e r s
of r a s t e r p i c t u r e c e l l s r a t h e r than as boundaries ( l i n e
work). Such an approach w i l l be easy on an i n t e r a c t i v e
work s t a t i o n i n r a s t e r mode and could have the b a s i s f o r
semi-automated f e a t u r e coding of r a s t e r data on a
p a r a l l e l computer such as the ICL D i s t r i b u t e d Array
Processor (Parkinson 1978). The r e s u l t i n g data s t r u c t u r e
w i l l be a t r u e r a s t e r r e p r e s e n t a t i o n of the topographic
information.
Chapter four

- 160 -
.2.2 Data manipulation
The l a c k of any c l e a r s p e c i f i c a t i o n of user requirements
for a topographic data base makes the drawing up of a l i s t of
manipulative f u n c t i o n s d i f f i c u l t . That such a s i t u a t i o n
should occur i s a l l i e d to the need for user education of
"what i s p o s s i b l e " i n a d i g i t a l environment. G l i b l y , i t i s
reasonable to expect t h a t some data h a n d l i n g i s more
appropriate to one data n o t a t i o n or the o t h e r . C l e a r l y the
algorithms a s s o c i a t e d w i t h conventional v e c t o r data a r e w e l l
enough advanced to f a c i l i t a t e many r o u t i n e t a s k s ;
n e v e r t h e l e s s , few attempts by academic geographers (other
than the work of Peuquet, 1.979a) have been made to adopt a
r a s t e r s o l u t i o n . To handle numeric data i n a g r i d or a r r a y
form i s p e r f e c t l y a c c e p t a b l e i n computer p r o c e s s i n g ; indeed
most h i g h - l e v e l programming languages r e a d i l y c a t e r f o r t h i s
as the most e f f i c i e n t method for s t o r i n g and p r o c e s s i n g l a r g e
batches of numbers.
4.2.2.1 I n t e r f a c e to other data s e t s
I t i s the ease of o v e r l a y with other data s e t s which i s
showing most promise a t the present time. Remotely-sensed
data from Landsat imagery i s a major example although others
abound. Benny (1979) has demonstrated the a b i l i t y to o b t a i n
Chapter four

- 161 -
c o a s t a l d e f i n i t i o n from Landsat imagery. In doing so he
o u t l i n e s s e v e r a l manipulative t a s k s which can be performed
u s easily i n r a s t e r mode c\$ \s the case with
vector-based n o t a t i o n s : geometric t r a n s f o r m a t i o n s of the
r a s t e r image to s p e c i f i e d map p r o j e c t i o n s are p o s s i b l e based
on a s e r i e s of a c c u r a t e l y f i x e d ground c o n t r o l p o i n t s . T h i s
l e a d s to easy o v e r l a y with map data for comparison purposes.
Any t r a n s f o r m a t i o n process which i n v o l v e s a t r a n s l a t i o n ,
change of s c a l e and r o t a t i o n o f an image i s easy i n r a s t e r
p r o c e s s i n g .
Population census data by g r i d square aggregation can be
q u i c k l y i n t e r f a c e d with topographic base data f o r d e c i s i o n
making and planning. The American Domestic Information
D i s p l a y System (DIDS) i n o p e r a t i o n a l use a t the White House
c u r r e n t l y holds some 500 o f f i c i a l s t a t i s t i c a l data s e t s
organised i n some 3000 US c o u n t i e s (Marble and Peuquet 1980).
DIDS, which i s a r a s t e r system, provides data o v e r l a y
c a p a b i l i t i e s and r e t r i e v a l at random as colour maps w i t h i n
s i x seconds of the query being made to the data base.
I n c r e a s i n g l y , the h a n d l i n g of s p a t i a l data i n grid-based
n o t a t i o n i s becoming more commonplace i n other f i e l d s : the
S o i l Survey of England and Wales are p r e s e n t l y i n v e s t i g a t i n g
the f e a s i b i l i t y of s t o r i n g s o i l types i n r a s t e r form (Ragg
pers comm 1981).
Chapter four

- 162 -
E l e v a t i o n information h e l d as r a s t e r q u a n t i t i e s i s seen as
having much p o t e n t i a l (Adler 1978). H i t h e r t o , the use of
D i g i t a l T e r r a i n Models (DTM) i n the UK has been f a r l e s s
widespread than has been the case i n other c o u n t r i e s of the
world, notably the United S t a t e s (McEwen et a l 1979). T h i s
i s due, most probably, to the l a c k o f s u i t a b l e data s e t s of
t h i s nature i n B r i t a i n with the exception of a DTM of f a i r l y
crude r e s o l u t i o n developed at the Mapping and C h a r t i n g
E s t a b l i s h m e n t of the Royal Engineers (MCE RE) at Feltham,
Surrey. T e r r a i n information i n t h i s format i s u s e f u l f o r
many a p p l i c a t i o n s f o r mapping and planning purposes. Adler
(1978) g i v e s a good overview of the o r g a n i s a t i o n and
s t r u c t u r e of DTM's i n land information systems from a '
t h e o r e t i c a l s t a n d p o i n t . For g r a p h i c s a p p l i c a t i o n s , the
a b i l i t y to generate contour data from DTM's i s h i g h l y
d e s i r a b l e - a s p e c i f i c form of r a s t e r to v e c t o r c o n v e r s i o n .
Y o e l i (1977) g i v e s a comprehensive d e s c r i p t i o n o f the
problems and t h e o r i e s i n v o l v e d . From a more p r a c t i c a l
standpoint with s p e c i a l r e f e r e n c e to planning, DTM's are
being e x t e n s i v e l y used i n communications r e s e a r c h . The work
of GEC-Marconi i n Chelmsford - a l a r g e e l e c t r o n i c s group
s p e c i a l i s i n g i n most forms of communications, defense and
i n d u s t r i a l e l e c t r o n i c systems - i s worthy of note. From a
communications p o i n t of view, the propagation of t e l e v i s i o n
and r a d i o waves are h i g h l y a f f e c t e d by ground t e r r a i n . In
order to e s t a b l i s h the be s t s i t e for a TV/radio t r a n s m i t t e r
Chapter four

- 163 -
i t i s n e c e s s a r y to have a r e l i a b l e i n t e l l i g e n c e of the
surrounding topography i n the form of h e i g h t values over a
r e g u l a r g r i d . Since no data s e t to the r e q u i r e d f i n e
r e s o l u t i o n i s r e a d i l y a v a i l a b l e i n d i g i t a l form, GEC-Marconi
engage themselves i n the conversion of g r a p h i c contour data
to DTM format by manual methods. Thousands of a p p l i c a t i o n s
of t h i s nature a r e processed each year f o r such s e r v i c e s as
t a x i - c a b r a d i o c o n t r o l . They consi d e r t h e i r manual approach
to be h i g h l y a c c u r a t e and s i n c e no l a r g e s c a l e d i g i t a l
contours to t h e i r r e q u i r e d standards a r e a v a i l a b l e a t
p r e s e n t , they f o r e s e e the continued use of manual conversion
f o r , a t l e a s t , the next t h r e e or four y e a r s ( B l y t h e pers comm
1981). C l e a r l y t h i s i s j u s t one example of the need for more
e x t e n s i v e a p p l i c a t i o n s i n t o the mass d i g i t i s a t i o n of l a r g e
s c a l e s data i n c l u d i n g the 1:10000 contours i n r a s t e r form.
Such a s e r v i c e should be i n c l u d e d as p a r t of a t o t a l land
information system on a r o u t i n e b a s i s (Adler 1978) t o be
generated f o r repeated and multi-purpose use and not merely
as a one-time v e h i c l e f o r contour g e n e r a t i o n . The use of
photogrammetric methods w i l l a s s i s t i n t h i s type of work
( P e t r i e 1981), g i v i n g f u r t h e r support to a t o t a l l y
i n t e r r a l a t e d Land Information System as argued by Dale (1977)
for many y e a r s . The a b i l i t y to i n t e r f a c e information
emanating from a l l sources with the p o s s i b i l i t y of o v e r l a y i n g
a l l s p a t i a l data types i s seen as e s s e n t i a l i n any working
system. A r a s t e r approach w i l l o f f e r t h i s connection e a s i l y
Chapter four

- 164 -
by v i r t u e o f the common l i n k of symmetrical p i c t u r e elements
i n a l l the data t y p e s .
4.2.2.2 A n a l y t i c a l work
C l e a r l y any type of data o v e r l a y i s t r i v i a l i n r a s t e r but
f a r more arduous i n v e c t o r form, r e q u i r i n g d e t a i l e d
c r o s s - r e f e r e n c i n g of f e a t u r e s and c a r e f u l l y planned topology.
In a r a s t e r image i t i s the i m p l i c i t a b i l i t y to a c c e s s
neighbouring p i x e l s which has the most impact on a l g o r i t h m
design. Peuquet (1979a, t a b l e 2) i t e m i s e s some p r e s e n t l y
a v a i l a b l e r a s t e r algorithms f o r data manipulation: i r o n i c a l l y
the m a j o r i t y have t h e i r o r i g i n s i n image p r o c e s s i n g . The
l i s t i s not e x h a u s t i v e but provides adequate evidence to
suggest t h a t the development of f u r t h e r o p t i o n s , i n a r a s t e r
system, as and when r e q u i r e d , w i l l have much promise i f
c a r e f u l l y planned and explored.
From an OS viewpoint, the c a l c u l a t i o n o f areas and
p e r i p h e r y length f o r polygon data i s s t r a i g h t f o r w a r d i n
r a s t e r ; a count of the p i x e l s i n s i d e or around the edge of
the polygon g i v e s an i n d i c a t i o n of areas or boundary lengths
w i t h i n c e r t a i n c o n s t r a i n t s , which are dependant on the
r e s o l u t i o n o f the p i x e l s and on the o r i e n t a t i o n of t h e i r
connection. To perform the same ta s k with v e c t o r s r e q u i r e s
Chapter four

- 165 -
more complex a r i t h m e t i c o p e r a t i o n s , r e s u l t i n g i n slower
responses from the computer. The i n c l u s i o n of a r e a data i n
OS 1:2500 mapping p r e s e n t l y r e q u i r e s a department w i t h i n OS,
which i s d e d i c a t e d to the measuring of polygon areas by
semi-automated means. A l l 1:2500 s c a l e maps now pu b l i s h e d by
the department show a r e f e r e n c e and a value ( i n h e c t a r e s and
a c r e s ) for each a r e a measured. These areas comprise such
p a r c e l s as f i e l d s , s e c t i o n s of b u i l t - u p regions and so on.
In the measuring p r o c e s s , the draughtsmen use an Automatic
Reading Planimeter by which they t r a c e the perimeter o f each
a r e a . T h i s i s coupled to a c o u n t e r - u n i t and a t e l e p r i n t e r
which provides the measurement inform a t i o n as a p r i n t - o u t for
easy reading and a punched-tape to enable e n t r y to the
mainframe f o r the a c t u a l area c a l c u l a t i o n s t o be made. To
perform t h i s s o r t of work by manual means i s slow and c o s t l y .
To automate the t a s k f u r t h e r i s not without problems: any
ar e a l - b a s e d c a l c u l a t i o n s with boundary data i n vector form
tend to be to i l s o m e . The c l a s s i c a l example o f d e t e c t i n g
whether a p o i n t d e s c r i b e d by a s i n g l e coordinate p a i r l i e s
w i t h i n a polygon boundary now has many e s t a b l i s h e d
vector-based algorithms (Aldred 1972, Baxter 1976), although
the s o l u t i o n s are f a r from simple r e q u i r i n g e x t e n s i v e
computing by the c e n t r a l p r o c e s s o r . To execute a s i m i l a r
t a s k i n r a s t e r i s simple; the a b i l i t y to sea r c h i n a l l
d i r e c t i o n s from a given point f o r the polygon boundary makes
for an e f f i c i e n t and s t r a i g h t f o r w a r d s o l u t i o n .
Chapter four

- 166 -
4.2.2.3 Information g e n e r a l i s a t i o n
The g e n e r a l i s a t i o n o f map data f o r p l o t t i n g a t s m a l l e r
s c a l e s , t e x t placement and so on has been an a r e a i n need o f
development i n r e c e n t y e a r s . S p e c i f i c problems e x i s t with
v e c t o r data ( S e a r l e e t a l 1979) which, according to Weber
(1980), can be performed a u t o m a t i c a l l y f a r more e a s i l y with
r a s t e r data. Any such g e n e r a l i s a t i o n process r e q u i r e s some
form of i n t e l l i g e n c e about the surrounding a r e a s : t h i s i s
d i f f i c u l t to a c h i e v e i n vector form but i m p l i c i t l y a v a i l a b l e
i n a r a s t e r image. C i t y a r e a s , for example, can be
g e n e r a l i s e d to a s i n g l e p oint very e a s i l y a c cording to Weber,
almost by automatic means but c e r t a i n l y i n t e r a c t i v e l y with
appropriate software. This would be d i f f i c u l t with the OS
l a r g e s c a l e s data but has p o t e n t i a l f o r g e n e r a l i s i n g from
1:2500 to 1:25000 more n e a t l y than with the c u r r e n t vector
s t r a t e g y (see S e a r l e and Waters 1979).
With technology advancing r a p i d l y i n t h i s a r e a , i t i s
e s s e n t i a l to monitor developments c l o s e l y . The whole idea of
r a s t e r storage begs the question 'should we s t o r e the
topographic data, or r e p r e s e n t a t i o n s of t h a t d a t a ? ' I t i s
p o s s i b l e , for example, to s t o r e a c t u a l symbols w i t h i n the
data s t r u c t u r e : they could be h e l d w i t h i n the master f i l e
c o n t a i n i n g the r a s t e r image or as a c l u s t e r o f p i x e l s i n a
p a t t e r n l i b r a r y . I n t r i n s i c a l l y i t would seem odd to hold
Chapter four

- 167 -
r e p r e s e n t a t i o n s ; i t i s u s u a l to generate symbols and
r e p r e s e n t a t i o n s of the data a t the output stage. C e r t a i n l y
f o r a s m a l l e r s c a l e s data base such an approach seems
promising f o r the s h o r t term at l e a s t . The storage of
g r a p h i c s symbols w i t h i n the data w i l l a i d the g e n e r a l i s a t i o n
process although t h i s whole concept i m p l i e s the need for
complex p a t t e r n r e c o g n i t i o n processes a t the data capture
stage. Undoubtedly, the nature of the information s t o r e d
w i t h i n the computer, must r e f l e c t the p r o c e s s e s to which the
data s t r u c t u r e w i l l be put.
4.2.2.4 R e v i s i o n of the data content
The a b i l i t y to update an e x i s t i n g s p a t i a l data f i l e with
r e l a t i v e ease i s e s s e n t i a l for any d i g i t a l system to remain
u s e f u l . T h e o r e t i c a l l y , a r a s t e r - b a s e d method w i l l provide a
s o l u t i o n which i s e a s i e r and more e f f i c i e n t than amending and
r e p l a c i n g a s e r i e s of v e c t o r s t r i n g s with t h e i r a s s o c i a t e d
c r o s s - r e f e r e n c e s to other v e c t o r s . Techniques used for the
r e v i s i o n of c u r r e n t f i l e s i n the Ordnance Survey data bank
are lengthy and cumbersome. Li n e work and the p o s i t i o n of
t e x t often need to be r e d i g i t i s e d and then the ( l a b o r i o u s )
e d i t c y c l e begins once more (see 2.5.3) as l i n e s a r e checked,
amended and so on. At worst i t becomes n e c e s s a r y to
r e d i g i t i s e the whole sheet when the changes n e c e s s a r y cannot
Chapter four
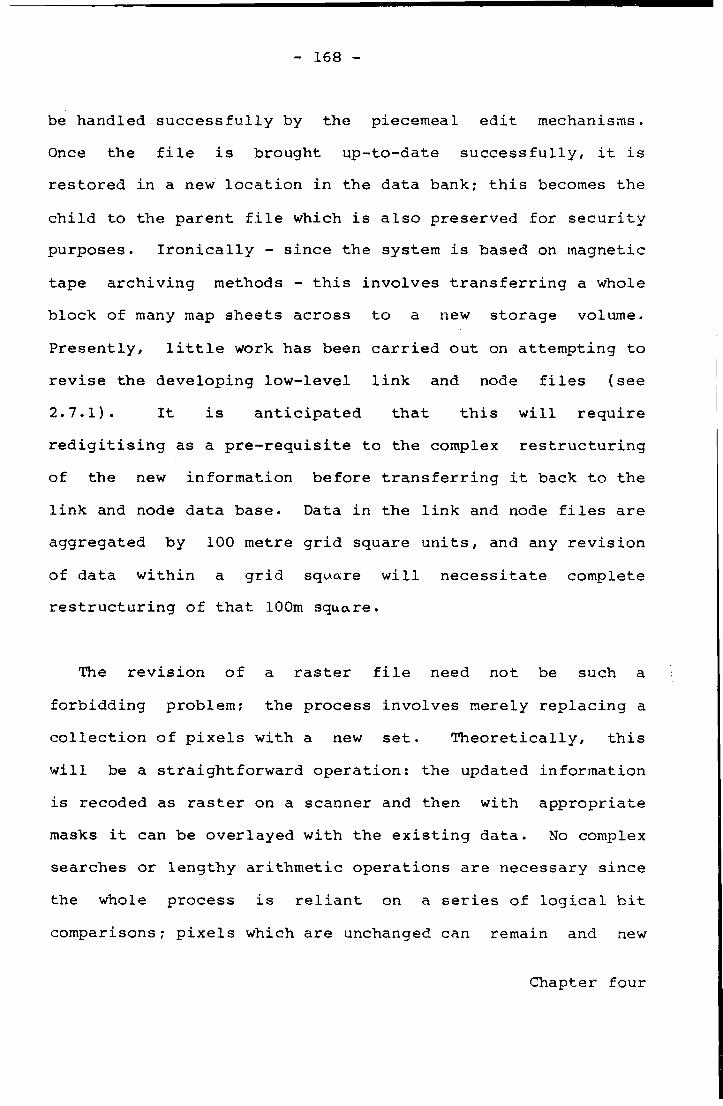
- 168 -
be handled s u c c e s s f u l l y by the piecemeal e d i t mechanisms.
Once the f i l e i s brought up-to-date s u c c e s s f u l l y , i t i s
r e s t o r e d i n a new l o c a t i o n i n the data bank; t h i s becomes the
c h i l d to the parent f i l e which i s a l s o preserved for s e c u r i t y
purposes. I r o n i c a l l y - s i n c e the system i s based on magnetic
tape a r c h i v i n g methods - t h i s i n v o l v e s t r a n s f e r r i n g a whole
block of many map sheets a c r o s s to a new storage volume.
P r e s e n t l y , l i t t l e work has been c a r r i e d out on attempting to
r e v i s e the developing l o w - l e v e l l i n k and node f i l e s (see
2.7.1). I t i s a n t i c i p a t e d t h a t t h i s w i l l r e q u i r e
r e d i g i t i s i n g as a p r e - r e q u i s i t e to the complex r e s t r u c t u r i n g
of the new information before t r a n s f e r r i n g i t back to the
l i n k and node data base. Data i n the l i n k and node f i l e s a r e
aggregated by 100 metre g r i d square u n i t s , and any r e v i s i o n
of data w i t h i n a g r i d square w i l l n e c e s s i t a t e complete
r e s t r u c t u r i n g of t h a t 100m square.
The r e v i s i o n o f a r a s t e r f i l e need not be such a
forbidding problem; the process i n v o l v e s merely r e p l a c i n g a
c o l l e c t i o n of p i x e l s with a new s e t . T h e o r e t i c a l l y , t h i s
w i l l be a s t r a i g h t f o r w a r d o p e r a t i o n : the updated information
i s recoded as r a s t e r on a scanner and then with a p p r o p r i a t e
masks i t can be o v e r l a y e d with the e x i s t i n g data. No complex
searches or lengthy a r i t h m e t i c o p e r a t i o n s are n e c e s s a r y s i n c e
the whole process i s r e l i a n t on a s e r i e s of l o g i c a l b i t
comparisons; p i x e l s which are unchanged can remain and new
Chapter four

- 169 -
elements can r e p l a c e the o l d . The s i m p l i c i t y i s e v i d e n t
s i n c e a r a s t e r data s t r u c t u r e r e q u i r e s no r e f e r e n c e t o other
f i l e s as i s the case with the l i n k and node s t r a t e g y .
Kummerly and Frey AG, S w i t z e r l a n d , are f i n d i n g the use of
r a s t e r methods based around a S c i t e x Response 250 system to
be c o s t - e f f e c t i v e for the r e v i s i o n o f the g r a p h i c s images of
t h e i r e x i s t i n g s m a l l s c a l e s mapping (Kummerley and Frey p e r s
comm 1981). These maps are m u l t i - c o l o u r e d and w e l l s u i t e d to
the f a c i l i t i e s o f f e r e d on the S c i t e x i n t e r a c t i v e work s t a t i o n
(see chapter s e v e n ) . T h e i r uses of the system are p u r e l y f o r
map production purposes: they do not s t o r e the i n f o r m a t i o n
for other t a s k s although such a f a c i l i t y could be a l o g i c a l
e x t e n s i o n i n the f u t u r e .
.3 Data p r e s e n t a t i o n
I t has been envisaged t h a t map data and s p a t i a l
i nformation i n g e n e r a l w i l l be r e q u i r e d i n hardcopy form fo r
the f o r s e e a b l e f u t u r e (HMSO 1979, s e c t i o n 10.10). H i t h e r t o ,
hardcopy computer p l o t t e r s have evolved around the
incremental pen or l i g h t spot p r i n c i p l e . T his form of
p l o t t i n g a r c h i t e c t u r e i s w e l l advanced and any newly r e l e a s e d
models merely provide f a s t e r p l o t t i n g r a t e s , e a s i e r
i n t e r f a c e s to computers and a d d i t i o n a l c o l o u r s or p l o t t i n g
o p t i ons. The nature of these p l o t t i n g d e v i c e s has w e l l
Chapter four

- 170 -
s u i t e d the v e c t o r n o t a t i o n of the data s t r u c t u r e s i n use a t
the p r e s e n t time. The q u a l i t y and t e c h n i c a l s p e c i f i c a t i o n o f
the expensive f l a t - b e d p l o t t e r s o p e r a t i o n a l i n most major
mapping agencies - e.g. OS ( S e a r l e e t a l 1979) and USGS
(McEwen et a_l 1979) - are s u f f i c i e n t l y well-developed to
enable the production of map-drawings s u i t a b l e for
p u b l i c a t i o n . I t may w e l l be the case t h a t these types of
device w i l l remain as the f i n a l copy producers f o r the
fo r e s e e a b l e f u t u r e , although the r a p i d development of
r a s t e r - d r i v e n ( c o l o u r ) computer g r a p h i c s technology i n r e c e n t
years suggests t h a t t h i s a l t e r n a t i v e s t r a t e g y has s e r i o u s
p o t e n t i a l i n f u t u r e mapping a p p l i c a t i o n s . I n e i t h e r c a s e ,
the methods of data e n t r y and p r e s e n t a t i o n should not d i c t a t e
the techniques adopted for the o r g a n i s a t i o n of the data
s t r u c t u r e ( see s e c t i o n 2.4). I t i s c l e a r t h a t robust
r a s t e r - t o - v e c t o r and v e c t o r - t o - r a s t e r p r o c e s s e s must be
developed now to ensure t h a t the be s t method of data input
and output can be taken t o s u i t a l l needs.
T e s t s made by the author have suggested i t to be
in a p p r o p r i a t e to p l o t r a s t e r data d i r e c t l y on to vector-based
output d e v i c e s . The examples of r a s t e r p l o t s given i n
chapter seven were produced on a sma l l f l a t - b e d Hewlett
Packard v e c t o r p l o t t e r . This device was used s i n c e no
ra s t e r - b a s e d p l o t t i n g d e v i c e s were a v a i l a b l e i n the
U n i v e r s i t y at t h a t time. P l o t t i n g time i s unreasonably slow
Chapter four

- 171 -
which a r i s e s from the i n e f f i c i e n t nature of the pen movement.
Furthermore, to attempt to p l o t r a s t e r scan l i n e s on an
incremental d e v i c e i s t a x i n g the hardware mechanisms to i t s
o p e r a t i o n a l l i m i t s which i s bound to r e f l e c t i n machine
f a i l u r e a f t e r a s h o r t time.
T h e o r e t i c a l l y , i t i s p o s s i b l e to p l o t r a s t e r - b a s e d
information on a vector-based g r a p h i c s d e v i c e s such as those
manufactured by T e k t r o n i x Corp. and o t h e r s . The r e s o u l t i o n
of these d e v i c e s i s high, the images are f l i c k e r f r e e and
although the c o n t r a s t i s r a t h e r poor, the q u a l i t y of the
d i s p l a y e d image i s g e n e r a l l y good. Since the c o s t s of these
d e v i c e s tend to be moderate, at l e a s t f o r the s m a l l e r - s i z e d
tubes, i t i s tempting to look upon them as being s u f f i c i e n t l y
f l e x i b l e for the d i s p l a y of both v e c t o r and r a s t e r d ata.
I n v e s t i g a t i o n s have shown t h i s not t o be the c a s e . Using a
Tektronix 4014 n i n e t e e n - i n c h g r a p h i c s t e r m i n a l attached to a
dedicated DEC PDP 11/34 minicomputer, t e s t s were made to p l o t
a 1:1250 s c a l e Ordnance Survey p l a n i n r a s t e r format. The
storage tube can, e f f e c t i v e l y , be t r e a t e d as a 4096 x 312.3
r a s t e r p l o t t i n g a r e a , although each r a s t e r p i x e l o v e rlaps
completely, i t s fe>ur neighbouring p i x e l s ( T e k t r o n i x I n c .
1974). Taking an OS sheet of 434000 s e t r a s t e r p i x e l s and
f o r t y metres of v e c t o r l i n e work, using a m u l t i - u s e r RT-11
BASIC system, i t took two hours to convert the vector data to
a r a s t e r format and a f u r t h e r 2.3 hours to generate a p l o t
Cnapter four

- 172 -
d e s c r i p t o r f i l e of the r e s u l t s . T h i s i s a f i l e which can be
i n t e r p r e t e d by the g r a p h i c s device to provide a l l coordinate
information, s i z e of p l o t , i n t e n s i t y of p l o t t i n g beam and so
on. The elapsed time for p l o t t i n g was d i s a p p o i n t i n g : i t took
c i r c a f i f t y minutes to p l o t the r a s t e r image on the storage
tube o p e r a t i n g a t a speed o f 2400 baud, compared with about
f i v e minutes t o p l o t the v e c t o r f i l e . The q u a l i t y of the
r e s u l t i n g r a s t e r image was encouraging but, non e t h e l e s s ,
p r o c e s s i n g and p l o t t i n g time i s u n s a t i s f a c t o r y . F u r t h e r
t r i a l s a t p l o t t i n g only s e l e c t e d p i x e l s reduced the time
l a p s e s by a f a c t o r o f four or more without s e r i o u s l o s s of
image q u a l i t y . The slow p r o c e s s i n g times quoted for p l o t
generation are a f u n c t i o n o f the i n e f f i c i e n c y of m u l t i - u s e r
BASIC under the DEC RT-11 e x e c u t i v e and to a c e r t a i n extent
of program code which has not been optimised. Y e t , d e s p i t e
t h i s , i t can be concluded from the e x e r c i s e t h a t the use of
ve c t o r storage tubes i s not app r o p r i a t e for the r a p i d d i s p l a y
of r a s t e r images.
C l e a r l y the e f f i c i e n t d i s p l a y of r a s t e r f i l e s f o r e d i t
purposes or other t a s k s r e q u i r e s a p p r o p r i a t e g r a p h i c s
hardware. Hardcopy r a s t e r p r i n t e r / p l o t t e r s and monochrome or
colour r a s t e r d i s p l a y s c r e e n s are becoming more popular as
computer g r a p h i c s systems gain importance and reach m a t u r i t y .
R a s t e r - d r i v e n g r a p h i c s d i s p l a y s are now well-developed,
r e l a t i v e l y i nexpensive and w e l l understood, s i n c e b a s i c a l l y
Chapter four

- 173 -
the technology which i s employed i n the a c t u a l d i s p l a y d e vice
i s s i m i l a r to t h a t used i n domestic t e l e v i s i o n s e t s . They
are p o t e n t i a l l y more f l e x i b l e than the vec t o r storage-tube
d e v i c e s s i n c e the problem of d i s p l a y i n g v e c t o r c o o r d i n a t e s
and c o n t i n u o u s l y r e f r e s h i n g the d i s p l a y has r e c e n t l y been
overcome with the a v a i l a b i l i t y of s u i t a b l e , i n e x p e n s i v e
m i c r o - p r o c e s s o r s . The r e s u l t has been a dramatic f a l l i n the
p r i c e of the s e d e v i c e s over the l a s t two or three y e a r s .
Many r a s t e r - d r i v e n r e f r e s h g r a p h i c s d i s p l a y s have appeared on
the market a t a p r i c e w e l l below t h a t of comparable s i z e d
storage tubes although t h e i r r e s o l u t i o n i s p r e s e n t l y
i n a p p r o p r i a t e for most mapping a p p l i c a t i o n s .
The production of hardcopy d i s p l a y s f o r r a s t e r images are
probably not as w e l l advanced and comparably inexp e n s i v e as
the d i s p l a y s c r e e n s ; they i n v o l v e f a r more by way of moving
p a r t s . N e v e r t h e l e s s , v i a b l e d e v i c e s are a v a i l a b l e and
in t e n s e development abounds. C u r r e n t l y a v a i l a b l e d e v i c e s
o f f e r p l o t t i n g c a p a b i l i t i e s of t y p i c a l l y 1000 l i n e s per
minute with h i g h r e s o l u t i o n (100 or 200 p o i n t s per i n c h ) .
They operate on an e l e c t r o s t a t i c p r i n c i p l e and are capable of
holding c h a r t widths between 8 and 42 i n c h e s , depending on
the model chosen: length i s l i m i t l e s s s i n c e the paper i s h e l d
on a continuous r o l l . These types of d e v i c e , manufactured by
Ve r s a t e c E l e c t r o n i c s L t d . are w e l l s u i t e d to e d i t or
development work. Experiments c a r r i e d out f o r c a r t o g r a p h i c
Chapter four

- 174 -
purposes are encouraging (see chapter s e v e n ) . Serious
a l t e r n a t i v e s are being o f f e r e d by l a s e r p l o t t i n g techniques
for a p p l i c a t i o n s r e q u i r i n g higher q u a l i t y r a s t e r images
comparable with those being produced from the extremely
a c c u r a t e v e c t o r p l o t t e r s . The l a s e r exposes the r a s t e r image
on to h i g h - c o n t r a s t , medium speed, l i t h f i l m a t high speed.
D e t a i l e d c o n s i d e r a t i o n of r a s t e r d e d i c a t e d hardware i s given
i n chapter seven. I t can be concluded here t h a t developments
i n r a s t e r e n t r y and d i s p l a y systems abound and are beginning
to provide s e r i o u s a l t e r n a t i v e s t o the v e c t o r systems which
have monopolised computer g r a p h i c s f o r a decade or more.
4.2.4 Data storage
I t has been shown i n chapters two and three how data
s t r u c t u r e s can be developed to s u i t both v e c t o r and
r a s t e r - b a s e d s p a t i a l data. I n most geographic data
s t r u c t u r e s q u i t e complex v e c t o r r e p r e s e n t a t i o n s have been
developed. The Canadian Geographic Information System
( S w i t z e r 1975) was probably one of the f i r s t and even today
seems to have h a r d l y outdated i t s e l f . Others such as the US
Census DIME f i l e s (Cook and Maxfield 1967), POLYVRT (Peucker
and Chrisman 1975), GEOGRAF (Peucker and Chrisman 1975) and
others are a l l extensions of these w e l l e s t a b l i s h e d l i n e
segment or polygonal i d e a s . More r e c e n t l y Shapiro e t a l
Chapter four

- 175 -
(1980) has attempted to compare and c o n t r a s t these systems.
I t i s a n t i c i p a t e d t h a t a l l s p a t i a l data s t o r e s on a n a t i o n a l
l e v e l w i l l be voluminous (see Adams e_t a l 1981 f o r the
Ordnance Survey example): i n i t i a l experiments with
r a s t e r - b a s e d e q u i v a l e n t s (see chapter f i v e ) suggest t h a t
volumes w i l l need to i n c r e a s e two or three f o l d . I t may w e l l
be the case t h a t to s t o r e topographic data i n r a s t e r form i s
too c o s t l y i n terms of backing s t o r e requirements. This w i l l
s u r e l y not be the case i f the inn o v a t i o n s promised by the
computing i n d u s t r y have any substance. One need merely
glance through the computing p r e s s each week to read o f the
planned h i g h - d e n s i t y a r c h i v a l storage d e v i c e s to be r e l e a s e d
i n the next f i v e or ten y e a r s . Computer bubble memory, video
d i s k s , h o l o g r a p h i c storage and so on are a l l being developed.
Some non-magnetic a r c h i v a l systems under i n v e s t i g a t i o n are LO L2.
capable of h o l d i n g 10 to 10 b i t s per square i n c h and
with low e r r o r r a t e s , of the order 10 or b e t t e r .
C l e a r l y the storage of r a s t e r information i s not going to
cause too many problems f o r the computer i n d u s t r y : the
s i m p l i c i t y of the data s t r u c t u r e s i n v o l v e d (see 3.2) are an
added stim u l u s to c o n t i n u a l l y monitor hardware developments.
Nonetheless, the a b i l i t y to ' f l i p ' between r a s t e r and v e c t o r
or v i c e v e r s a on a r o u t i n e b a s i s i s seen as e s s e n t i a l . The
two methods are not seen as i n v i o l a t e : they must be used i n
con j u n c t i o n for any system to remain f l e x i b l e . The
Chapter four
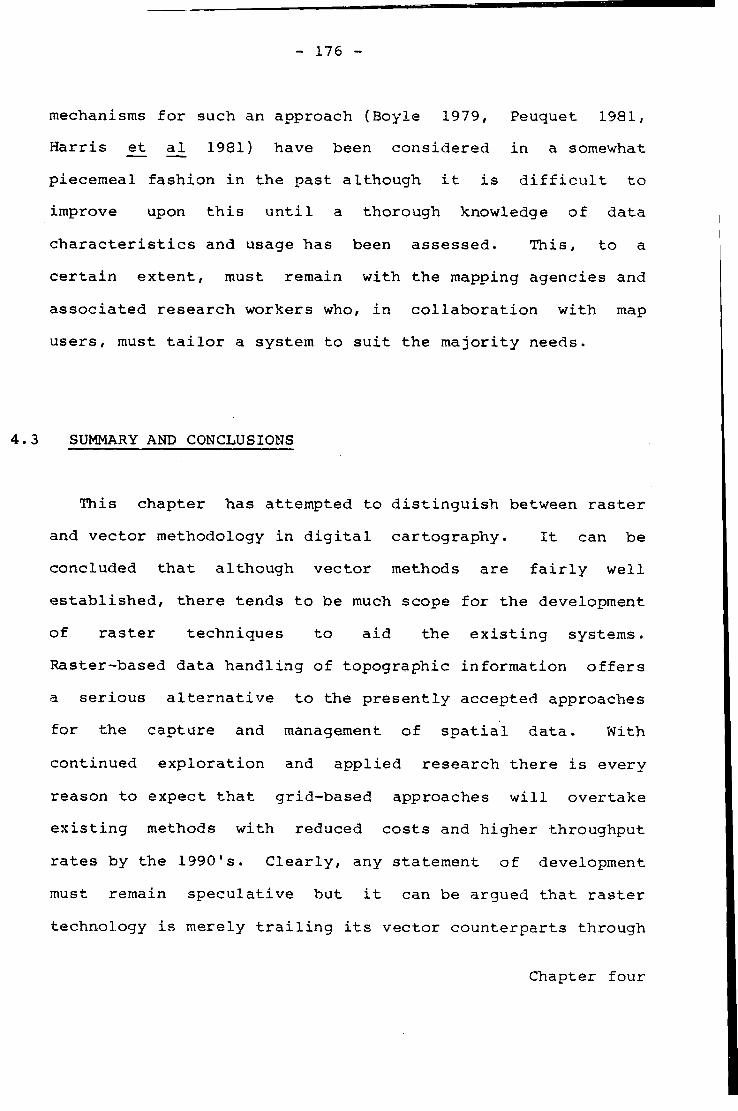
- 176 -
mechanisms f o r such an approach (Boyle 1979, Peuquet 1981,
H a r r i s et a_l 1981) have been c o n s i d e r e d i n a somewhat
piecemeal f a s h i o n i n the past although i t i s d i f f i c u l t t o
improve upon t h i s u n t i l a thorough knowledge of data
c h a r a c t e r i s t i c s and usage has been a s s e s s e d . T h i s , to a
c e r t a i n e x t e n t , must remain with the mapping agencies and
a s s o c i a t e d r e s e a r c h workers who, i n c o l l a b o r a t i o n with map
u s e r s , must t a i l o r a system to s u i t the m a j o r i t y needs.
.3 SUMMARY AND CONCLUSIONS
This chapter has attempted to d i s t i n g u i s h between r a s t e r
and v e c t o r methodology i n d i g i t a l cartography. I t can be
concluded t h a t although v e c t o r methods are f a i r l y w e l l
e s t a b l i s h e d , t h e r e tends to be much scope for the development
of r a s t e r techniques to a i d the e x i s t i n g systems.
Raster-based data h a n d l i n g of topographic information o f f e r s
a s e r i o u s a l t e r n a t i v e to the p r e s e n t l y accepted approaches
for the capture and management of s p a t i a l d a ta. With
continued e x p l o r a t i o n and a p p l i e d r e s e a r c h t h e r e i s every
reason to expect t h a t grid-based approaches w i l l overtake
e x i s t i n g methods with reduced c o s t s and higher throughput
r a t e s by the 1990's. C l e a r l y , any statement of development
must remain s p e c u l a t i v e but i t can be argued t h a t r a s t e r
technology i s merely t r a i l i n g i t s v e c t o r c o u n t e r p a r t s through
Chapter four

- 177 -
l a c k of s e r i o u s i n v e s t i g a t i o n . With the advent of working
r a s t e r systems and computer p e r i p h e r a l s (see chapter seven),
e x i s t i n g r a s t e r know-how and ideas on f u t u r e developments
(see chapter f i v e ) and the i n t r o d u c t i o n of extremely powerful
a r r a y p r o c e s s i n g techniques and hardware (see chapter s i x ) ,
i t remains only a matter of time before t h e s e methods p l a y a
major p a r t i n any working information systems on a r o u t i n e
b a s i s .
Thompson (1978 plO) has a s s e s s e d comparative c o s t s for a
r a s t e r and v e c t o r production f l o w l i n e for the Ordnance Survey
l a r g e s c a l e s d i g i t a l mapping system. The u n s p e c i f i e d r a s t e r
system i s a n t i c i p a t e d as m a r g i n a l l y more expensive than a
L a s e r scan F a s t r a k f l o w l i n e . I n 1978 t h i s may w e l l have been
the c a s e : c e r t a i n l y r a s t e r technology was f a r l e s s advanced
than the v e c t o r methods a t t h a t time. There i s every reason
to expect a r e v e r s a l o f r o l e s i n the medium term f u t u r e . I t
w i l l be easy to attempt to r e p l a c e e x i s t i n g systems
completely with these new methods. Such an approach would be
wrong; both have important r o l e s . I t i s seen as c r u c i a l t h a t
robust i n t e r f a c e s should be e s t a b l i s h e d between the two
methods. D u a l - e f f o r t s by both systems w i l l o f f e r many
b e n e f i t s when f l u e n t conversions between both r a s t e r and
v e c t o r n o t a t i o n s are p o s s i b l e .
Chapter four

- 178 -
Hi t h e r t o , no attempts "have been made to handle OS data i n
r a s t e r formats. U n e q u i v o c a l l y i t i s n e c e s s a r y to i n v e s t i g a t e
the s u i t a b i l i t y o f the s e present and fu t u r e techniques with
r e s p e c t to the c h a r a c t e r i s t i c s and requirements of OS
workloads. In the next t h r e e c h a p t e r s , r e p o r t s a r e made on
the nature of these t e s t s c a r r i e d - o u t , t o d i s c o v e r more about
r a s t e r p r o c e s s i n g and i t s v i a b i l i t y to s p e c i f i c mapping
problems.
Chapter four

- 179 -
THE MANIPULATION OF RASTER DATA ON A SERIAL COMPUTER
• 1 INTRODUCTION
The use of e l e c t r o n i c d i g i t a l computers i n the
environmental s c i e n c e s has been widespread f o r almost two
decades. The a p p l i c a t i o n s have been twofold: they have the
a b i l i t y to process v a s t and complex c a l c u l a t i o n s a t h i g h
speeds and they are a b l e r o u t i n e l y to s t o r e and a c c e s s l a r g e
q u a n t i t i e s of i n f o r m a t i o n . T h e i r computational c a p a b i l i t i e s
have enabled a n a l y s e s and c a l c u l a t i o n s p r e v i o u s l y t a k i n g
s e v e r a l man-days to be performed i n a few hours or l e s s .
Davis e_t a l (1972) provides ample evidence of the e f f e c t s of
computational power i n the readjustment of the 1970
s c i e n t i f i c t r i a n g u l a t i o n network of Great B r i t a i n .
Conversely, the use of d i g i t a l techniques for the storage and
maintenance of s p a t i a l data to develop f u l l y comprehensive
land information systems ( L I S ) r e q u i r e s d i f f e r e n t s t r a t e g i e s .
The use of computer i n s t a l l a t i o n s to host data base
management systems has tended to be l e s s concerned with
computational power and more tuned towards e f f i c i e n t data
s t r u c t u r e and t r a n s f e r . T h i s has been r e f l e c t e d i n the
nature of the t r a d i t i o n a l programming languages: FORTRAN and,
to a l e s s e r e x t e n t , ALGOL are e x t e n s i v e l y used for s c i e n t i f i c
Chapter f i v e
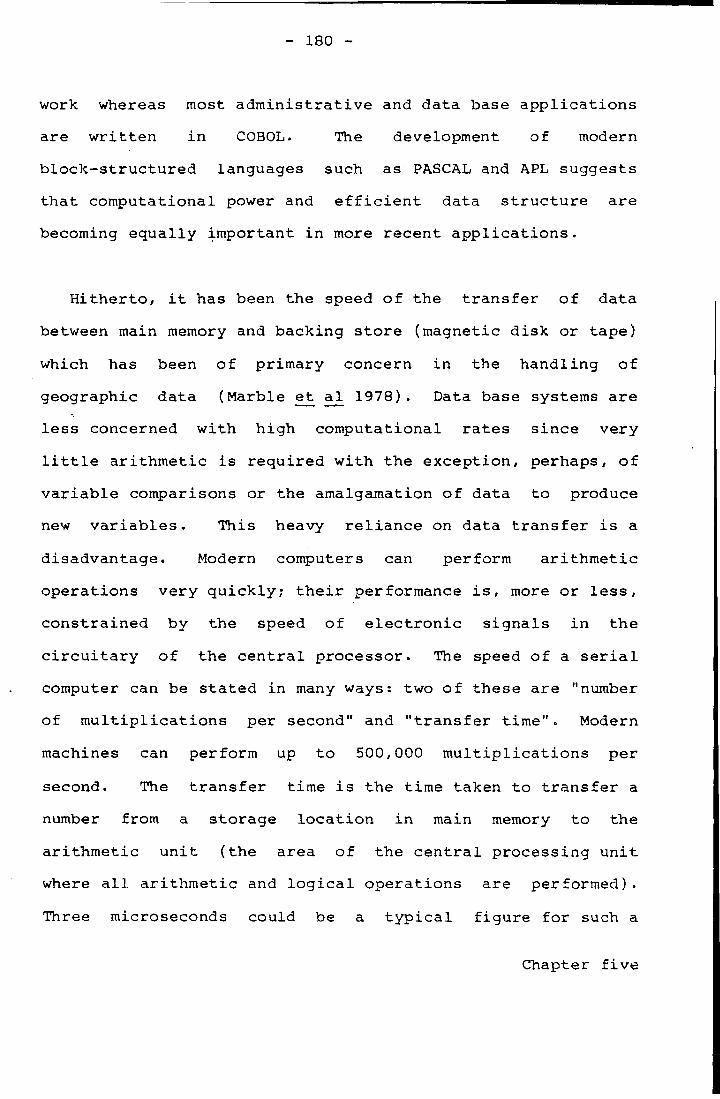
- 180 -
work whereas most a d m i n i s t r a t i v e and data base a p p l i c a t i o n s
are w r i t t e n i n COBOL. The development of modern
b l o c k - s t r u c t u r e d languages such as PASCAL and APL suggests
t h a t computational power and e f f i c i e n t data s t r u c t u r e a r e
becoming e q u a l l y important i n more r e c e n t a p p l i c a t i o n s .
H i t h e r t o , i t has been the speed of the t r a n s f e r o f data
between main memory and backing s t o r e (magnetic d i s k or tape)
which has been of primary concern i n the h a n d l i n g of
geographic data (Marble e_t al^ 1978). Data base systems a r e
l e s s concerned w i t h h i g h computational r a t e s s i n c e very
l i t t l e a r i t h m e t i c i s r e q u i r e d with the exception, perhaps, of
v a r i a b l e comparisons or the amalgamation of data to produce
new v a r i a b l e s . T h i s heavy r e l i a n c e on data t r a n s f e r i s a
disadvantage. Modern computers can perform a r i t h m e t i c
o p e r a t i o n s v e r y q u i c k l y ; t h e i r performance i s , more or l e s s ,
c o n s t r a i n e d by the speed of e l e c t r o n i c s i g n a l s i n the
c i r c u i t a r y of the c e n t r a l p r o c e s s o r . The speed of a s e r i a l
computer can be s t a t e d i n many ways: two o f these are "number
of m u l t i p l i c a t i o n s per second" and " t r a n s f e r time". Modern
machines can perform up to 500,000 m u l t i p l i c a t i o n s per
second. The t r a n s f e r time i s the time taken to t r a n s f e r a
number from a storage l o c a t i o n i n main memory to the
a r i t h m e t i c u n i t (the area of the c e n t r a l p r o c e s s i n g u n i t
where a l l a r i t h m e t i c and l o g i c a l o p e r a t i o n s are performed).
Three microseconds could be a t y p i c a l f i g u r e for such a
Chapter f i v e

- 181 -
t r a n s f e r although f a s t e r machines have a t r a n s f e r time of
l e s s than 500 nanoseconds.
The time r e q u i r e d to a c c e s s data elements a t s p e c i f i c
l o c a t i o n s i n the backing s t o r e i s dependant on moving p a r t s
and i s much slower and l e s s r e l i a b l e . To e x t r a c t i n f o r m a t i o n
from a magnetic tape r e q u i r e s a severe time l a p s e w h i l s t the
d r i v e spools the tape to the designated p o s i t i o n ; the time
l a p s e i s dependant on the nature of the data b l o c k i n g and on
the c h a r c t e r i s t i c s of the hardware, although ten to f i f t e e n
minutes i s not a t y p i c a l to read a f u l l standard 1600 bpi
9 t r a c k 2400 f e e t tape on a IBM 3420 tape d r i v e . The same
d r i v e i s able t o rewind the tape i n twenty or t h i r t y seconds
but i t i s unable t o read at these r a t e s . The t r a n s f e r r a t e s
a s s o c i a t e d w i t h magnetic d i s k s are f a s t e r than with t a p e s .
Each s u r f a c e has a number of c o n c e n t r i c t r a c k s on which
information i s s t o r e d a t a unique a d d r e s s . The time lapse to
r e t r i e v e a s p e c i f i c data element i s a f u n c t i o n of the
r o t a t i o n a l speed of the d i s k and the l i n e a r movement of the
heads to reach the d e s i r e d t r a c k . W h i l s t a c c e s s times are
measured i n m i l l i - s e c o n d s r a t h e r than i n micro- or
nanoseconds a s s o c i a t e d with main core, the l a r g e r c a p a c i t i e s
and lower c o s t s a s s o c i a t e d with backing s t o r e makes them more
a t t r a c t i v e for mass storage and high data volumes. The
adoption of modern Winchester technology (see Systems
I n t e r n a t i o n a l , Oct 1980 pp51-52) i n which the r e a d / w r i t e
Chapter f i v e

- 182 -
heads and d i s k u n i t s are combined i s enabling f a s t e r
r e t r i e v a l and higher data d e n s i t i e s t o be p o s s i b l e . ICL have
been l e a d e r s i n the development of " i n t e l l i g e n t "
b a c k i n g - s t o r e c o n t r o l l e r s . The Content Addressable F i l e
Store ( I C L CAFS) (see Mailer 1979) has the a b i l i t y to f i l t e r
the information before i t i s passed to the c e n t r a l p r o c e s s o r ,
thereby reducing the chance of t r a n s f e r r i n g i n a p p r o p r i a t e
data and speeding-up r e t r i e v a l times from a complex data
s t r u c t u r e . I n g e n e r a l , however, there are no i n d i c a t i o n s
t h a t the p a t t e r n o f the l a s t 20 y e a r s w i l l not be continued:
thus, f u r t h e r development and i n c r e a s e d performance o f such
computer storage technology can be expected to a l l e v i a t e (but
c e r t a i n l y not o b v i a t e ) the problems a s s o c i a t e d with l a r g e
geographic data s e t s i n the next decade.
P e r u s a l of the appropriate l i t e r a t u r e suggests t h a t the
i n t r o d u c t i o n o f r a s t e r techniques f o r the handling of
topographic data has generated a dichotomy i n e x i s t i n g s k i l l s
and r e s o u r c e s . Grid-based e q u i v a l e n t s to the complex v e c t o r
data s t r u c t u r e s are more voluminous and a l s o tend to r e q u i r e
f a r more by way of computational needs ( i n p a r t i c u l a r , data
t r a n s f e r s and a r i t h m e t i c o p e r a t i o n s ) . For example, the
process of co n v e r t i n g v e c t o r - t o - r a s t e r - t o - v e c t o r i s h i g h l y
c e n t r a l p r o c e s s o r dependant ( H a r r i s et a l 1981, Peuquet
1981). These f a c t o r s suggest the need for c a r e f u l l y
c o n t r o l l e d algorithm design and data volume.
Chapter f i v e
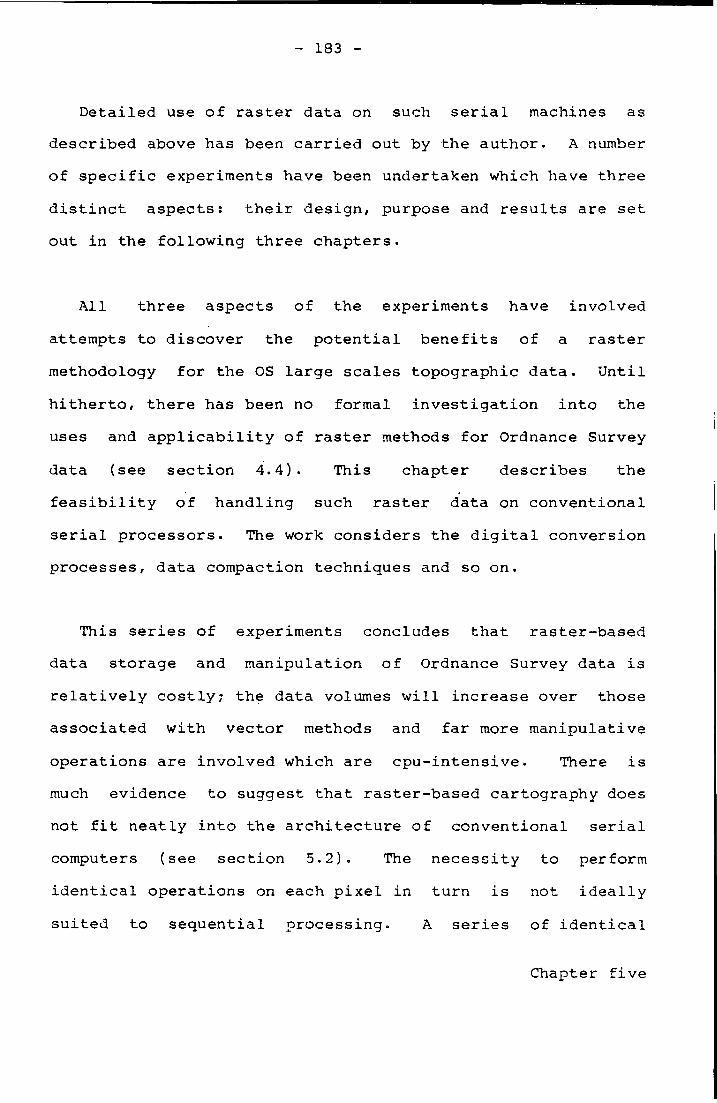
- 183 -
D e t a i l e d use of r a s t e r data on such s e r i a l machines as
d e s c r i b e d above has been c a r r i e d out by the author. A number
of s p e c i f i c experiments have been undertaken which have three
d i s t i n c t a s p e c t s : t h e i r design, purpose and r e s u l t s are s e t
out i n the f o l l o w i n g three c h a p t e r s .
A l l t h ree a s p e c t s of the experiments have i n v o l v e d
attempts to d i s c o v e r the p o t e n t i a l b e n e f i t s of a r a s t e r
methodology f o r the OS l a r g e s c a l e s topographic d a t a . U n t i l
h i t h e r t o , t h e r e has been no formal i n v e s t i g a t i o n i n t o the
uses and a p p l i c a b i l i t y of r a s t e r methods for Ordnance Survey
data (see s e c t i o n 4.4). T h i s chapter d e s c r i b e s the
f e a s i b i l i t y of h a n d l i n g such r a s t e r data on c o n v entional
s e r i a l p r o c e s s o r s . The work c o n s i d e r s the d i g i t a l c onversion
p r o c e s s e s , data compaction techniques and so on.
T h i s s e r i e s of experiments concludes t h a t r a s t e r - b a s e d
data storage and manipulation of Ordnance Survey data i s
r e l a t i v e l y c o s t l y ; the data volumes w i l l i n c r e a s e over those
a s s o c i a t e d w i t h v e c t o r methods and f a r more manipulative
o p e r a t i o n s are i n v o l v e d which are c p u - i n t e n s i v e . There i s
much evidence to suggest t h a t r a s t e r - b a s e d cartography does
not f i t n e a t l y i n t o the a r c h i t e c t u r e of conventional s e r i a l
computers (see s e c t i o n 5.2). The n e c e s s i t y to perform
i d e n t i c a l o p e r a t i o n s on each p i x e l i n t u r n i s not i d e a l l y
s u i t e d to s e q u e n t i a l p r o c e s s i n g . A s e r i e s of i d e n t i c a l
Chapter f i v e

- 184 -
c e n t r a l p r o c e s s o r s working s i m u l t a n e o u s l y i s expected to
i n c r e a s e throughput r a t e s one hundred f o l d or more; chapter
s i x d e s c r i b e s the design and nature o f some r a s t e r - b a s e d
manipulation using modern a r r a y - p r o c e s s i n g techniques on an
ICL D i s t r i b u t e d Array P r o c e s s o r .
However good the data manipulation c a p a b i l i t i e s of an
a r r a y p r o c e s s o r , appropriate d i g i t i s i n g c a p a b i l i t i e s are
c l e a r l y e s s e n t i a l . The t h i r d phase of experiments has
involved a p p r a i s i n g the s u i t a b i l i t y of commercially a v a i l a b l e
r a s t e r - s c a n systems f o r d i g i t i s i n g , then manipulating and
p l o t t i n g OS 1:1250 data. The study and i t s r e s u l t s are
o u t l i n e d i n chapter seven.
.2 A SERIAL-TYPE COMPUTING ENVIRONMENT
Comprehensive d e s c r i p t i o n s of the workings of modern
computer systems can be found i n app r o p r i a t e manuals; Nelder
(1975) and Baxter (1976) provide simple d e s c r i p t i o n s of the
va r i o u s p a r t s of a computer system. However, a d e s c r i p t i o n
of the new ge n e r a t i o n of p a r a l l e l - t y p e p r o c e s s o r s i s given i n
s e c t i o n 6.2 and, for comparison purposes, an o u t l i n e of the
conventional s e r i a l - t y p e c e n t r a l p r o c e s s o r w i l l be given
here. The h e a r t of a t r a d i t i o n a l , s e q u e n t i a l computing
system i s the c e n t r a l p r o c e s s o r ; t h i s u n i t houses three
Chapter f i v e

- 185 -
c o n s t i t u e n t p a r t s - i n a d d i t i o n to the main memory (or core
s t o r e ) , t here i s a " c o n t r o l a r e a " where a l l programs are
s t o r e d and an " a r i t h m e t i c u n i t " where a l l the a r i t h m e t i c i s
performed. The a r c h i t e c t u r e i s s e r i a l or s e q u e n t i a l i n
nature because the a r i t h m e t i c u n i t can o n l y perform one
c a l c u l a t i o n a t a time. For i n s t a n c e , when adding two numbers
together, the c o n t r o l l o c a t e s the address of the two numbers
i n the core s t o r e , t r a n s f e r s them to the a r i t h m e t i c u n i t f o r
adding and r e t u r n s the r e s u l t t o the d e s i r e d l o c a t i o n .
Repeated a d d i t i o n of an a r r a y of numbers as may be n e c e s s a r y
i n r a s t e r data w i l l i n v o l v e a c o n t i n u a l c y c l i n g through t h i s
o p e r a t i o n for each number i n t u r n . E l e c t r i c p u l s e s pass
through computer c i r c u i t s a t the speed of l i g h t (298,000 km
per second) and the time taken to run a p a r t i c u l a r program on
a computer i s a measure of the d i s t a n c e t r a v e l l e d by
e l e c t r i c a l c u r r e n t s i n s i d e the c e n t r a l p r o c e s s o r . From being
based on thermionic v a l v e s to p r i n t e d c i r c u i t s to i n t e g r a t e d
c i r c u i t s , computers have become p h y s i c a l l y s m a l l e r , hence
d i s t a n c e s t r a v e l l e d are l e s s and computational speeds have
r i s e n . Given p r e s e n t m i n i a t u r i s a t i o n , i t seems h i g h l y l i k e l y
t h a t the performance of f u t u r e r a s t e r - b a s e d systems w i l l
depend p r i m a r i l y upon the volume of data i n v o l v e d . Since the
i n t e r n a l mechanisms of computers cannot be f a s t e r than the
speed of l i g h t , any upgrade i n system performance so f a r as
r a s t e r - b a s e d cartography i s concerned must e i t h e r i n v o l v e a
r e d u c t i o n i n the volume of the data being processed or the
Chapter f i v e

- 186 -
use of a s e r i e s of c e n t r a l p r o c e s s o r s working s i m u l t a n e o u s l y
(see chapter s i x ) .
A l l e x i s t i n g r a s t e r r e s e a r c h , with the exception of ETL,
F o r t B e l v o i r (Babcock 1978), has adopted s e r i a l - b a s e d
algorithms with attempts to keep data volumes i n p e r s p e c t i v e
with the use of complex data compaction and storage methods.
Most commercially a v a i l a b l e r a s t e r systems are based on the
popular mini-computers, t y p i c a l l y D i g i t a l Equipment Corp.
(e.g. Kongsberg Kartoscan or those systems emanating from
Broomall I n d u s t r i e s I n c . ) or Hewlett Packard (e.g. S c i t e x
Response 250). In r e a l i t y , the power of these mini-computers
i s now as g r e a t as t h a t of many mainframe machines. Indeed,
the d i s t i n c t i o n between mini-computers and the t r a d i t i o n a l
mainframe seems to have become v i r t u a l l y n o n - e x i s t a n t i n
r e c e n t y e a r s ; comparatively cheap stand-alone machines today
have as much computational power as v a s t l y expensive systems
of the e a r l y s e v e n t i e s . Modern d i s t i n c t i o n s tend to be made
between machines r e q u i r i n g an a t m o s p h e r i c a l l y c o n t r o l l e d
environment with experienced operators and the r e l a t i v e l y
robust d i m e n s i o n a l l y - s m a l l e r machines used as p a r t of more
s p e c i a l i s e d d e v i c e s : a r a s t e r scanning system i s an example.
The s e r i a l - b a s e d computing system used f o r these
experiments was the Northumbrian U n i v e r s i t i e s M u l t i p l e Access
Computer (NUMAC), the only machine a v a i l a b l e to the author
Chapter f i v e

- 187 -
with adequate p e r i p h e r a l s such as ample d i s k space and tape
d r i v e s . The computing system i s based around an IBM 370/168
processor with e i g h t megabytes of v i r t u a l memory and a 32 b i t
word l e n g t h . The oper a t i n g system i s the Michigan Terminal
System (MTS), a v e r s a t i l e e x e c u t i v e supporting up t o 150
us e r s i n a m u l t i - u s e r environment without s e r i o u s l o s s i n
system performance. A l l software developed for experimental
purposes was w r i t t e n i n FORTRAN IV optimised where n e c e s s a r y
on a H - l e v e l extended IBM compiler; some assembler coding was
used where n e c e s s a r y .
5.3 THE DEVELOPMENT OF A VECTOR-TO-RASTER CONVERSION SYSTEM
S e v e r a l r e s e a r c h workers (Peuquet 1981, H a r r i s e t a_l 1981,
Weber 1980, Boyle 1979, Babcock 1978) have a l r e a d y devoted
much time and r e s o u r c e s to the i n v e s t i g a t i o n of adequate
conversion techniques to move f l u e n t l y between the two data
n o t a t i o n s . However, a l l e x i s t i n g systems are piecemeal; they
have developed g e n e r a l l y for s p e c i a l c l a s s e s of data only
(e.g. f o r thematic polygon mapping, contour mapping, e t c . ) .
C e r t a i n l y , no reasonably i n t e g r a t e d s o l u t i o n i s known t o
e x i s t a t pr e s e n t for the complex OS formats. Thus,
experiments to convert e x i s t i n g OS v e c t o r d i g i t a l data i n t o a
r a s t e r mode was seen as e s s e n t i a l for the f o l l o w i n g reasons:
Chapter f i v e

- 188 -
There were no systems a v a i l a b l e to transform the e x i s t i n g
OS vector-based data s t r u c t u r e i n t o a grid-based
r e p r e s e n t a t i o n .
I t was c onsidered d e s i r a b l e t o decant the e x i s t i n g OS
f e a t u r e coding scheme i n a r a s t e r f i l e ; no scanning
system g e n e r a l l y a v a i l a b l e can provide t h i s f a c i l i t y at
the p r e s e n t time.
Such an e x e r c i s e would provide a c o n t r o l data s e t with
which to compare r e s u l t s obtained from s c a n n e r s .
Such an e x e r c i s e would provide p r o v i s i o n a l data to
f a c i l i t a t e i n v e s t i g a t i o n s and design s t r a t e g i e s with
p a r a l l e l a l g o r i t h m s .
Design aims
These are o u t l i n e d below.
To ensure t h a t any conversion software i s as general i n
nature as p o s s i b l e . S p e c i f i c a l l y , input data formats
should not be r e s t r i c t i v e - p i x e l r e s o l u t i o n should be
parameterised for example.
Chapter f i v e

- 189 -
2. To generate 'complete' r a s t e r ( i . e . uncompacted) data as
output from the software.
3. To compact these as a secondary stage when n e c e s s a r y .
T h i s s t r a t e g y f a c i l i t a t e s i n v e s t i g a t i o n s i n t o data
c h a r a c t e r i s t i c s , s e r i a l p r o c e s s i n g times and g i v e s a
c l e a r e r a p p r a i s a l of the problems and b e n e f i t s of
adopting a r a s t e r s t r a t e g y f o r OS-type data.
To handle r a s t e r - b a s e d information i n i t s uncompacted form
g e n e r a l l y i s r e s o u r c e - i n t e n s i v e . Each 1:1250 s c a l e OS
graphic measures 400mm x 400mm; the minimum l i n e weight used
i s 0.18mm. Hence, to r e p r e s e n t each map sheet with a p i x e l
r e s o l u t i o n increment of 0.1mm ( c . h a l f the minimum l i n e
width) r e q u i r e s a r a s t e r b u f f e r o f 4000 x 4000 p i x e l s . The
choice of p i x e l r e s o l u t i o n must compromise between graphic
q u a l i t y and a v a i l a b l e computer storage? the choi c e o f h a l f
the minimum l i n e - w i d t h was an i n i t i a l compromise between
these two f a c t o r s . The i n e v i t a b l e 'stepping' e f f e c t of
line-work i s a s e r i o u s disadvantage although no per c e p t i o n
experiments are known which a p p r a i s e the s m a l l e s t s t e p - s i z e
d i s c e r n a b l e to the eye. I n i t i a l assessments of the storage
requirements f o r 0.1mm p i x e l s are l a r g e , as shown below.
Chapter f i v e
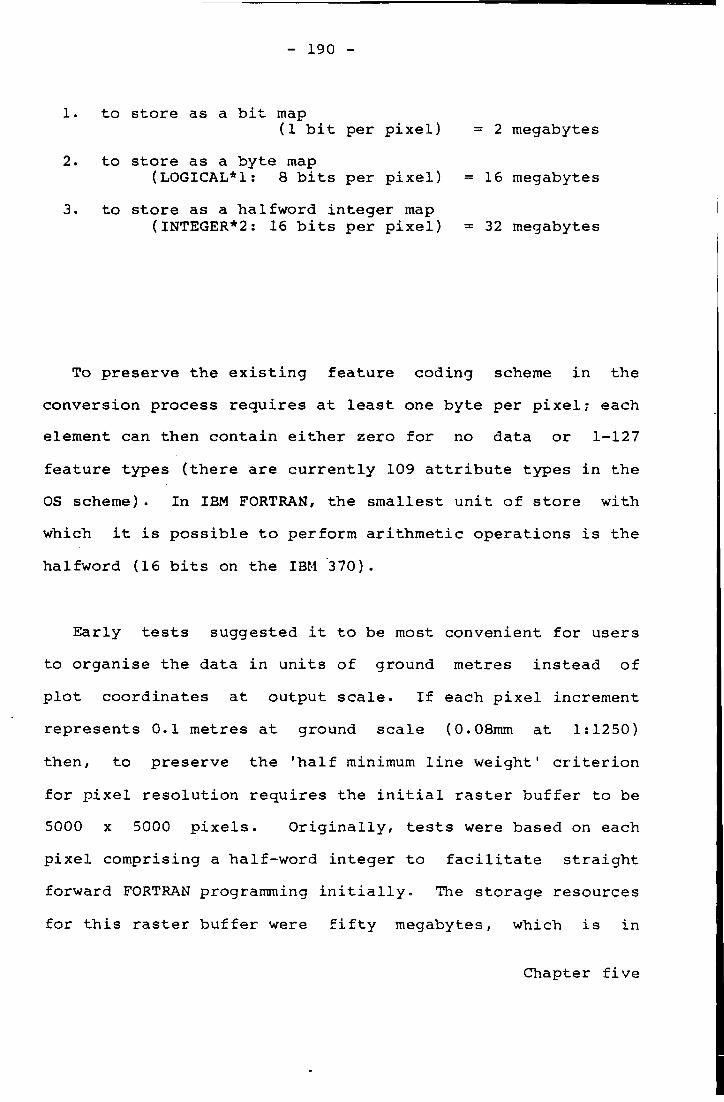
- 190 -
1. to s t o r e as a b i t t map (1 b i t per p i x e l ) 2 megabytes
2. to s t o r e as a byte map (LOGICAL*!: 8 b i t s per p i x e l ) 16 megabytes
3. to s t o r e as a haIfword i n t e g e r map (INTEGER*2: 16 b i t s per p i x e l ) 32 megabytes
To p r e s e r v e the e x i s t i n g f e a t u r e coding scheme i n the
conversion process r e q u i r e s a t l e a s t one byte per p i x e l ; each
element can then c o n t a i n e i t h e r zero f o r no data or 1-127
f e a t u r e types ( t h e r e are c u r r e n t l y 109 a t t r i b u t e types i n the
OS scheme). I n IBM FORTRAN, the s m a l l e s t u n i t of s t o r e with
which i t i s p o s s i b l e t o perform a r i t h m e t i c o p e r a t i o n s i s the
halfword (16 b i t s on the IBM 370).
E a r l y t e s t s suggested i t to be most convenient f o r u s e r s
to o r ganise the data i n u n i t s of ground metres i n s t e a d of
p l o t c o o r d i n a t e s a t output s c a l e . I f each p i x e l increment
r e p r e s e n t s 0.1 metres a t ground s c a l e (0.08mm at 1:1250)
then, to p r e s e r v e the ' h a l f minimum l i n e weight' c r i t e r i o n
for p i x e l r e s o l u t i o n r e q u i r e s the i n i t i a l r a s t e r b u f f e r to be
5000 x 5000 p i x e l s . O r i g i n a l l y , t e s t s were based on each
p i x e l comprising a half-word i n t e g e r to f a c i l i t a t e s t r a i g h t
forward FORTRAN programming i n i t i a l l y . The storage r e s o u r c e s
for t h i s r a s t e r b u f f e r were f i f t y megabytes, which i s i n
Chapter f i v e

- 191 -
excess of 12000 MTS pages (the basic u n i t of disk storage under the MTS executive i s 1 page = 4 Kbytes). Clearly, even the very large v i r t u a l memory of the IBM 370 cannot process t h i s amount of data i n one pass and hence i t i s necessary to p a r t i t i o n the bu f f e r i n t o s t r i p s or chunks.
Franklin (1979) gives a comprehensive summary of the methods of p a r t i t i o n i n g large raster images on a computer system. Most of the techniques which he has suggested involve an i t e r a t i o n of various algorithms over a series of consecutive s t r i p s , only one of which can be held i n core at a time. In the vector-to-raster conversion process, for example, the simplest approach i s to examine sequentially, the vector data f i l e and convert any of the vectors which l i e i n the current raster s t r i p t o a p i x e l notation. This procedure i s repeated i t e r a t i v a l l y f o r each s t r i p . Logical extensions of t h i s basic approach to speed-up the processes are also suggested by Franklin (1979). Examples include r e - w r i t i n g unused pieces of vector l i n e s t o a secondary f i l e for subsequent i t e r a t i o n s , or pre-sorting the vectors i n the vector data f i l e p r i o r t o the conversion process and sub-dividing i t by p r e - s p l i t t i n g the vectors i n t o a series of f i l e s which correspond to the number of l o g i c a l s t r i p s i n the complete raster b u f f e r . Evaluations of Franklin's ideas were made by the author with OS data i n a raster notation (see section 5.3.6). Such t r i a l s are i n e v i t a b l y constrained by
Chapter f i v e

- 192 -
l o c a l system f a c i l i t i e s : i t i s advisable t o r e s t r i c t the amount of main memory to around a h a l f megabyte on the NUMAC IBM 370/168 under MTS to avoid the degrading effe c t s of page thrashing i n a multi-user environment (see Visvalingam 1977), though i t i s a c t u a l l y possible for users to obtain up t o one megabyte of v i r t u a l memory under MTS f o r large jobs. Early tests were carried out i n p a r t i t i o n i n g the 5000 x 5000 raster image i n t o 50 s t r i p s (numbered 0-49) of 5000 x 100 dimension. This represents 50 one megabyte images, each based on two-byte p i x e l s : t h i s storage was subsequently reduced by a factor of two when software was w r i t t e n which could handle p i x e l s of one byte each.
5.3.2 Theory
The theory behind the vector to raster conversion i s manifestly s t r a i g h t forward; i t i s the volume of data which produces computational problems. Under Ordnance Survey conventions, each vector comprising the map l i n e work i s described by a series of x,y point locations. Appendix 5.1 outlines the mathematical derivation of the equation of each s t r a i g h t l i n e knowing two points on the l i n e . Any conversion of the vector-segments to a raster image requires repeated solution of t h i s derived equation i n increments which are dependant on the desired p i x e l r e s o l u t i on.
Chapter f i v e

- 193 -
.3.3 Some data transfer considerations
As a r e s u l t of the study of OS data c h a r a c t e r i s t i c s (Adams 1979), 478 Ordnance Survey d i g i t a l map sheets were available i n the customer export format (DMC). This data format has been developed to ease the problems of data transfer between the Ordnance Survey ICL 1900 computer s i t e and a wide range of user's i n s t a l l a t i o n s . Each l o g i c a l record comprises eight FORTRAN readable characters? i t i s unreasonably i n e f f i c i e n t for any serious development work. In order to make the data input and output (I/O) rates as e f f i c i e n t as possible for an already lengthy conversion algorithm, the DMC characters were reformatted i n t o National Grid (NG) coordinates which could be stored as blocks of data i n binary form: t h i s was expected to increase I/O speeds by f i f t y f o l d or more.
A special purpose u t i l i t y program ('FROMDMC') has been w r i t t e n i n FORTRAN as a front-end to the vector t o raster software. I t s i n t e n t i o n i s t o take the standard OS DMC records as input and reorganise them i n t o binary blocks of NG coordinates with t h e i r associated OS feature codes. A l i s t i n g of the source FORTRAN f o r t h i s u t i l i t y can be found in Annex 5a. The DMC export format provides a precision of 0.001 of a basic g r i d square for x,y coordinates: t h i s represents a p o s i t i o n a l accuracy of 0.05 metres on the ground for the 1:1250 data. Each NG coordinate comprises eight
Chapter f i v e
- 194 -
s i g n i f i c a n t figures with two decimal places; double precision i n FORTRAN (REAL*8) was used f o r storage on the IBM 370. In the large scales data the feature code l i s t never exceeds 109 types and hence half-word integers (INTEGER*2) were adopted for t h e i r storage. The u t i l i t y program groups together one thousand NG coordinates i n t o blocks f o r e f f i c i e n t use of backing store and I/O trans f e r s . This provides a temporary, intermediate data f i l e for entry i n t o the vector-to-raster software which i s formatted as:
X(1000), Y(1000), ICODE(IOOO)
where X,Y are REAL*8 NG coordinates; ICODE i s INTEGER*2 a t t r i b u t e code.
A simple technique was used to describe the s t a r t and end of each feature w i t h i n the blocking s t r u c t u r e ; the f i r s t occurence of ICODE (the feature code) i s made negative for the f i r s t x,y point. In t h i s way, i t i s t r i v i a l to detect point symbols too.
The results obtained from 'FROMDMC* were encouraging both i n terms of a reduction i n I/O speeds and a crude form of data compression. The performance of the technique i s shown
Chapter f i v e

- 195 -
in Table 5.1 for a Durham 1:1250 sheet (NZ 2642NE) where a seventy-fold increase i n I/O performance can be seen.
Table 5.1; Performance of the compression stage for a Is 1250 scale vector f i l e (N2 2642NE)
Before compaction; DMC character format
Number of records 31,115 Number of x,y points 14,789 MTS storage requirements 181 pages CPU time to read t o t a l f i l e 21.796 seconds Number of read operations 31,115
After compaction; blocked binary
Number of records 15 Number of x,y points 14,789 MTS storage requirements 96 pages CPU time to read t o t a l f i l e 0.309 seconds Number of read operations 15
Chapter f i v e

- 196 -
•̂ Development of the vector-to-raster conversion algorithm
The i n i t i a l t e s t was designed to be simple and consist of:
The raster b u f f e r allocated two bytes per p i x e l : t h i s required f i f t y megabytes of backing store which was made available on an IBM 3330 dual-density disk pack with a t o t a l capacity of three hundred megabytes.
The input vector data were read i n t h e i r e n t i r e t y f o r each raster s t r i p , although by far the biggest proportion of the data f o r each p a r t i t i o n w i l l be i r r e l e v a n t (see Franklin (1979) and section 5.3.6).
The input data, although i n binary form, were not sorted in any way and remained i n the same sequence as supplied by the Ordnance Survey.
A l i s t i n g of the f i n a l source FORTRAN code used for the conversion software can be found at Annex 5b. The algorithm reads each x,y point and associated a t t r i b u t e code i n d i v i d u a l l y from the input buffer as outlined i n section 5.3.3. I f the feature detected i s a point symbol then the appropriate address i n the raster buffer i s set with the a t t r i b u t e code for that feature (see lines 80-88 i n annex
Chapter f i v e

- 197 -
5b). Linear e n t i t i e s require a more involved approach. The notation adopted i s important: the f i r s t x,y point i s called X and Y with corresponding a t t r i b u t e code L. The next point i n the chain ( t o describe the f i r s t vector segment) i s read in to give XI, Yl, L I . The deri v a t i o n of the equation of a st r a i g h t l i n e knowing these two points i s given i n Appendix 5.1. The conversion of the vector segment i n t o a raster mode involves repeatedly solving the equation of the s t r a i g h t l i n e for each increment of the raster b u f f e r . There were four immediate problems i n the FORTRAN coding for t h i s algorithm:
1. The repeated solution of the equation must be transformed i n t o a c y c l i c loop i n s e r i a l code - the 'DO-loop' i n ANSI (1966) FORTRAN. Standard FORTRAN st i p u l a t e s t h a t the delim i t e r s of a loop must ascend from a lower t o a higher number. Thus the values of X, Y, XI and Yl must be pre-sorted i n t o XMAX, YMAX, XMIN and YMIN (see lines 92-100 i n annex 5b).
2. Since a DO-loop i n FORTRAN must have integer c o n t r o l l i n g variables, then t o handle a 0.1 increment requires m u l t i p l y i n g the X and Y values by ten to develop t h i s c o n t r o l l i n g variable and subsequently d i v i d i n g by ten once inside the loop.
3. To solve repeatedly the equation of the l i n e for y given
Chapter f i v e

- 198 -
each value of x alone i s inappropriate: some p i x e l assignments are missed out completely for l i n e s with orientations very near to v e r t i c a l . A robust algorithm must perform the solution i n two passes: i t solves the equation for y given x f i r s t (see lines 127-155 i n annex 5b), then performs a vector re-sort and solves the same equation for x given the y values (see lin e s 157-187 i n annex 5b). The two special cases of p e r f e c t l y v e r t i c a l lines (running N-S) and horiz o n t a l l i n e s (running E-W) must be trapped (see lines 103-120 i n annex 5b) and handled separately to ensure no attempts are made t o divide by zero i n the equation (see appendix 5.1).
By d e f i n i t i o n , each l i n e between two vertices w i l l have i t s l i m i t s described by the end points XMAX, YMAX, XMIN and YMIN. When solving the equation f o r x given y we can be sure that the values of y w i l l never exceed these l i m i t s although the computed values of x can exceed them. (A simil a r s i t u a t i o n arises f o r the y values when solving the equation knowing the values of x ) . To ensure that these l i m i t s are never exceeded, a tolerance threshold has to be defined which has been found em p i r i c a l l y to be ha l f the p i x e l r e s o l u t i o n . I f the values of y and x at each end of the l i n e are computed to exceed the end points by greater than a h a l f p i x e l , they are rejected (see lines 135-145, 177-187 i n annex 5b).
Chapter f i v e

- 199 -
•5 Development of associated u t i l i t y programs
At the time at which the experiments were carried out, the Durham University computing service had no means of displaying raster images as rasters ( c f . raster images simply shown as pen up/pen down movements on a vector p l o t t e r ) . For t h i s reason, i t was d i f f i c u l t t o appraise the ch a r a c t e r i s t i c s and q u a l i t y of the resultant vector data and a number of associated u t i l i t y programs were developed to aid analyses of the r e s u l t s generated: the FORTRAN source for these u t i l i t i e s can be referred t o i n Annex 5c
1. LPDRAW reads i n the raster image and reduces the resolution suitable for crude plots on a l i n e p r i n t e r . I t p r i n t s out a matrix of 100 x 100 elements: each element represents a 50 x 50 cluster of the raster p i x e l s i n the o r i g i n a l 5000 x 5000 buf f e r . The program was designed to search for and display only those feature types specified as input parameters. An example of the output generated can be seen i n figure 5.2a in which the centre-lines of roads for sheet NZ 2642NE are shown; for comparison, the equivalent vector data i s i n figure 5.2b.
2. RASTER.SCAN p r i n t s out the buffer address of each non-zero p i x e l .
Chapter f i v e

- 200 -o
0 0 0
0 0
to 0 44
00 8 00
t
0 00
8 8 86
« 8 6 8 6 6 8 0 8 0 0 0 0 8 8 6
84 « 0 ( 0 0 8 0 00 • s o « 88
88 88 88 88
88 88 88 88
BO 88 8 88
88 8 88
8
0 888 8 888 88888
88 88
8 88
8 8 84
8 88
8
888 88 8 68
88 8 88 8 88 8 88 8 88 8 88 8
88 8 88
8 8 *
8 88
88 8 88
8 88
88 84 4 4 848 4488 48
8 4 4 8 8 8 88 4 844 448
84 444 84844
8 08
8 48
88 8 8 88
8 8 8 8 8 8 4 8 8 8 8 8 8 4 8 4 4 8 4 4 4 4
48 8 48
8 88
4 44
888 8 8 8 88
8 8 00
8
88 8 8 8 8 8 8 8 8 8 8 8 8 8 8 8 4 4 4 8 8 8 8 4 4 4 4 4
8 8 8 88
0 8 8 88
8 8 0 88
8 8 8 8 0 88
8 88
88 8 *
88 8
88 8 8
88 4
44 8 44
48 88 88 88 4 88 8 8 8884
84
4 44 4
44 4
4444 4484 4844 48
4444 84
4
: 4 88 48
> 844 40
888 888
888 44
88 44
444 44 84 4
844 4 88 4
44 4 844 8
88 4 884 4
448 848888 88888444 88
8 88 88 4848
8 84 88 88
888 4 4 44
8 8 84
44 4
44 4
44 4
44 4
84 8
88 4
44 4
48884 4 4444
4444 4444
8 4 8 * 8 4 4448
44 84444 4
88 484 88 88
88 48 488
48
48 4844 84
444488 884
4 * 4 44 4
48 44
44 44
84 44
44 44
* * 4448
84 8844448 44
44 448
84 8 4 * 48
* * 4 44 444 * 4 * * *
* 44 44
8888884 88 8 4 8 4 4 4 4 4 4 8 8 4 8 8 8
88 88
44 4 488 8 8 * 8 8
44 4 4 4 4 * 8 8 4 4 4 4 4 4 4 4 8 84 88 888 88
48 88
488 08
44 48
808 0 *
88 08
888 88
8 8 8 8 48
0 0 8 0 0
4 4 4
44 4 4 4 8 4 8
44
448 88 8
8848 84 4
4 * 4 8 0 48 848
#8 * 44 44
48 84 84 88
08 80 04 8
08 00
8888 88 * 8 8
0 0 * 8 * 48
888400 84 888 88 88 88 88 888
8 8 * 88
88 88
84
88 8
4 6 8 8 8 8 0 0 8 8 8 8 04 4 4 »8 0008 80
6 44 448
0 84
F i g u r e 5.2a Crude r a s t e r r e p r e s e n t a t i o n
o f road c e n t r e - l i n e s i n OS d i g i t a l map
produced by u t i l i t y program LPDRAW on a
80 0 * 60 8 0860 600 8 * 0 * 6 4 64 6
8 8 8 8 « 4 848 0 84 6 4 8 6 8 46 6 88 8 6 4 4 4 6 0 6 66 0 4 6 0080 00008 6 60 46 8
00 06 60 6 8 6 66 00 0 8 6 6 6 6 0 0 6 0 6 6 6 0 6 0 6 6 0 0 0 0 0 060068600 0
00 8 000000 00 0 0 0 00 0 6 0 0
l i n e p r i n t e r . Crown C o p y r i g h t R e s e r v e d

- 261 -
^ \ \ \ \ I \ ! \ I
-\
\
\ \ \ \ \ \ \ \ \ \ \ \ \ \ \ \ \ \ \ \ \ \ \
~~ "A
/
v
V t 1
/
/ A. ' ' ̂ I Y
\ / 1 *
i / / / < w
_ ! i i /
F i g u r e 5.2b E q u i v a l e n t v e c t o r p l o t of
r o a d c e n t r e - l i n e s shown i n f i g . 5.2a.
Crown C o p y r i g h t R e s e r v e d .

- 202 -
3. RASTER% performs some elementary analyses on the raste b u f f e r ; i t reports the percentage sparsity of the imag and breaks down feature codes i n t o p i x e l counts A example of the output from RASTER% i s shown i n Table 5.3
Table 5.3: Break-down of 5000 x 5000 raster image of NZ 2fe42HE by u t i l i t y RASTER!
Total Number Percent Percent Feature l i n e of x,y Pixel set of t o t a l
description length points count p i x e l s buffer (mm)
Empty pix e l s 24458155 — 97. 833 Public buildings 816. 6 228 11445 2. 112 0. 046 Minor buildings 1176. 5 678 15839 2. 923 0. 063 Other buildings 5665. 1 1410 74589 13. 766 0. 298 Open buildings 216. 6 133 3057 0. 564 0. 012 Archway symbols 59. 6 20 716 0. 132 0. 003 Railway lines 1639. 3 134 28372 5. 236 0. 113 General boundary 347. 9 21 6076 1. 121 0. 024 Railway switch 1. 0 2 9 0. 002 0. 000 Road carriageway 4709. 2 1852 63120 11. 649 0. 252 Road centre l i n e 3560. 3 794 47486 8. 764 0. 190 Footpath 71. 8 55 963 0. 178 0. 004 Control point 1 1 0. 000 0. 000 Bench mark 9 9 0. 002 0. 000 Spot height 12 12 0. 002 0. 000 Road fence/wall 5425. 2 1504 71365 13. 171 0. 285 Genrl. fence/wall 10127. 3 3661 140945 26. 012 0. 564 Road casing 90. 4 55 1251 0. 231 0. 005 Banks/baulks 3720. 8 2001 50907 9. 395 0. 204 Subway 78. 5 23 795 0. 147 0. 003 Vegetation l i m i t s 160. 6 65 2115 0. 390 0. 008 GPO c a l l box 2 2 0. 000 0. 000 Step treads 1038. 4 1200 13684 2. 525 0. 055 Point feature 5 5 0. 001 0. 000 Stream 17. 0 4 52 0. 010 0. 000 Ward boundary 493. 6 99 3996 0. 737 0. 016 Pavement casing 376. 3 417 5027 0. 928 0. 020
Chapter f i v

- 203 -
3.6 Software tuning
I n i t i a l tests were attempted using a f i l e of road centre lines only. This f a c i l i t a t e d a rapid turnaround of results and easy v a l i d a t i o n during the development stages. Once the code was working successfully, a f u l l Ordnance Survey 1:1250 map sheet (NZ 2642NE) was converted to raster form. Out of the twenty-five m i l l i o n pixels i n the raster b u f f e r , only 541,845 were set ( i . e . had been assigned feature codes). These figures are, of course, hi g h l y dependant on p i x e l r e s o l u t i o n , map sheet complexity and so on although they suggest that OS large scales data i n raster format are of the order of 97.8 per cent sparse.
The actual conversion process was carried out i n f i f t y s t r i p s of 5000 x 100 p i x e l s : the c e n t r a l processor time on the IBM 370 to process each s t r i p was 10.5 seconds. The t o t a l time taken to r a s t e r i s e the map sheet i n t h i s crude way was 525 cpu seconds. I t i s the p a r t i t i o n i n g of the bu f f e r which has a fundamental e f f e c t on the process times; i f a hypothetical f i f t y megabytes of main memory could be acquired then the r a s t e r i s i n g would take l i t t l e over eleven seconds. A reduction i n the number of p a r t i t i o n s w i l l increase the process times dramatically. Hence, i n converting the raster buffer to allocate one byte per p i x e l , i t i s possible t o increase the size of the s t r i p s by a factor of two and halve
Chapter f i v e
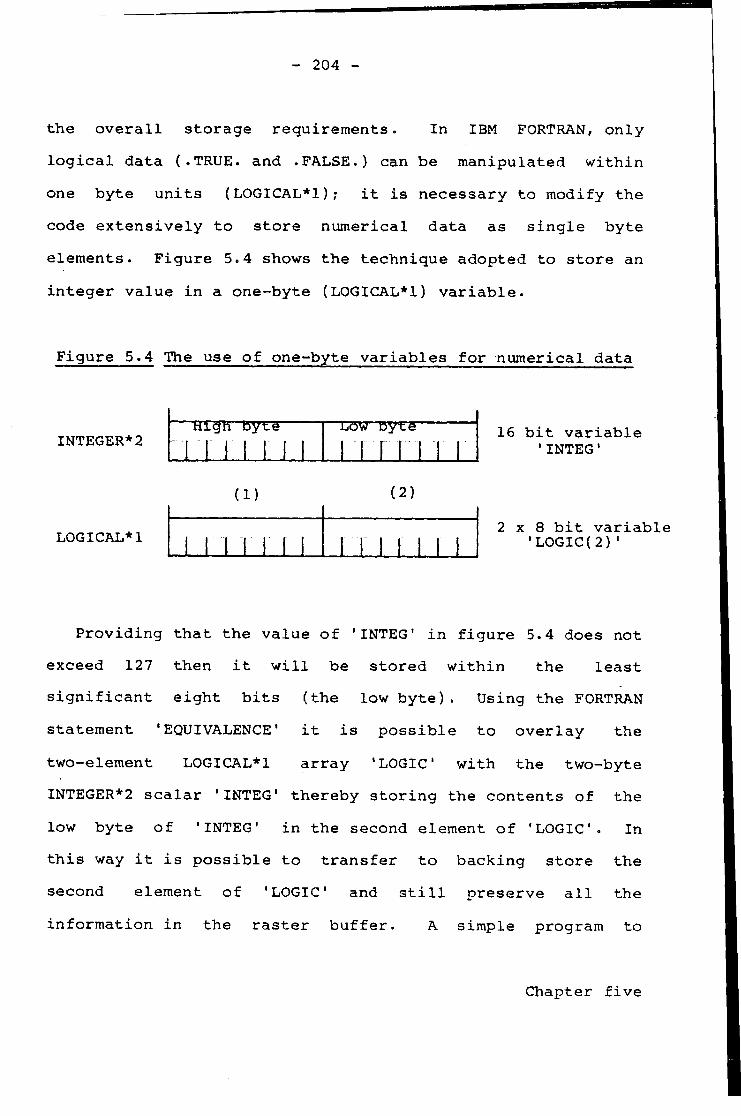
- 204 -
the o v e r a l l storage requirements. In IBM FORTRAN, only l o g i c a l data (.TRUE, and .FALSE.) can be manipulated w i t h i n one byte units (LOGICAL*l); i t i s necessary to modify the code extensively t o store numerical data as single byte elements. Figure 5.4 shows the technique adopted to store an integer value i n a one-byte (LOGICAL*!) variable.
Figure 5.4 The use of one-byte variables for numerical data
INTEGER*2
LOGICAL*!
wxgn byte T l M i l l
LOW Byte i r r i i i i
( i ) (2)
1 1 1 1 1 1 1 I I I M M
16 b i t variable 'INTEG'
x 8 b i t variable 'LOGIC(2)1
Providing that the value of 'INTEG' i n figure 5.4 does not exceed 127 then i t w i l l be stored w i t h i n the least s i g n i f i c a n t eight b i t s (the low byte). Using the FORTRAN statement 'EQUIVALENCE' i t i s possible to overlay the two-element LOGICAL*l array 'LOGIC with the two-byte INTEGER*2 scalar 'INTEG' thereby storing the contents of the low byte of 'INTEG' i n the second element of 'LOGIC. In t h i s way i t i s possible t o transfer t o backing store the second element of 'LOGIC and s t i l l preserve a l l the information i n the raster buffer. A simple program to
Chapter f i v e

- 205 -
transform a two-byte element raster image i n t o one byte per element i s shown below:
INTEGER*2 IRAST(5000,100), INTEG L0GICAL*1 LRAST(5000,100), L0GIC(2) EQUIVALENCE (INTEG, LOGIC(1))
1 READ ( 1 , END=3) IRAST DO 2 J=l,100 DO 2 1=1,5000 INTEG = IRAST(I,J) LRAST(I,J) = LOGIC(2)
2 CONTINUE WRITE (2) LRAST GO TO 1
3 STOP END
This w i l l reduce the storage requirements by a factor of two although i t w i l l be necessary to expand the pi x e l s back i n t o two-byte integers f o r any arithmetic manipulation. A l t e r n a t i v e l y , boolean operations such as searching w i t h i n s p a t i a l neighbourhoods for pre-defined patterns or s t r a i g h t l i n e features (e.g. b u i l d i n g walls or g r i d l i n e s ) w i l l not require unpacking of the compacted data. The unpacking stage i s , e s s e n t i a l l y , a reversal of the above process. In FORTRAN the left-most b i t of an integer variable i s the sign b i t which stip u l a t e s whether the integer value i s greater than or less than zero. This i s not the case with LOGICAL*1 variables: t o handle the storage of negative integers i n a
Chapter f i v e

- 206 -
single byte requires a t e s t t o be made at the unpacking stage. I f the stored number i s negative then an untested conversion back would produce a number greater than 127 since the left-most b i t would be included. In IBM representations, a negative number has the high-byte set to hexadecimal FF (binary 11111111) and t h i s must be assigned manually where necessary at the conversion stage. A simple program to expand LOGICAL*! p i x e l s back i n t o INTEGER*2 i s shown below.
INTEGER*2 IRAST(5000,100), INTEG LOGICAL*l LRAST(5000,100), LOGIC(2), FF/ZFF/ EQUIVALENCE (INTEG, LOGIC(l))
1 READ (2, END= 3) LRAST DO 2 J=l,100 DO 2 1=1,5000 INTEG = 0 L0GIC(2) = LRAST(I,J) IF (INTEG .GT. 127) LOGIC(l) = FF IRAST(I,J) = INTEG
2 CONTINUE GO TO 1
3 STOP END
Empirical evidence has shown that the use of t h i s technique enables the compaction and storage of any number wi t h i n the range -999 to +127 on the IBM 370/168, although t h e o r e t i c a l l y t h i s range should be r e s t r i c t e d to -127 to +127. I t s use has proved to be highly f l e x i b l e i n a number of raster-based s e r i a l algorithms developed by the author
Chapter f i v e

- 207 -
(see l a t e r ) . Evidence has suggested i t to be more
appr o p r i a t e to perform the conversion w i t h i n the main program
r a t h e r than i n c l u d i n g a subroutine for the purpose; t h i s i s
because o f the l a r g e number of conversions (and hence
subroutine c a l l s ) n e c e s s a r y . T e s t s have shown t h a t f o r each
5000 x 100 s t r i p , 9.4 a d d i t i o n a l cpu seconds are i n c l u d e d i n
the p r o c e s s i n g times f o r subroutine c a l l s a g a i n s t 3.3 seconds
for performing the compaction i n the main program.
O v e r a l l , p r o c e s s i n g times proved to be s l i g h t l y improved
over the two-byte p i x e l method; the added p r o c e s s i n g times
for the data compaction are compensated by much f a s t e r I/O
r a t e s s i n c e data t r a n s f e r between main memory and backing
s t o r e i s h alved. Hence, to r a s t e r i s e sheet NZ 2642NE with
the compaction method took on average of 10.1 seconds per
s t r i p g i v i n g a t o t a l cpu time of 505 seconds f o r the whole
sheet (a three per cent i n c r e a s e i n o v e r a l l speed).
With the i n t r o d u c t i o n of a LOGICAL*l r a s t e r b u f f e r , the
storage requirements of each 5000 x 100 s t r i p are reduced to
a half-megabyte. I t i s p o s s i b l e , t h e r e f o r e , to i n c r e a s e the
s t r i p s i z e to 5000 x 200 p i x e l s and hence reduce the number
of p a r t i t i o n s f o r t h i s r a s t e r image to twenty f i v e . The
v i r t u a l memory of the IBM 370 under the MTS e x e c u t i v e seems
to cope with a one megabyte a r r a y s u c c e s s f u l l y u sing
optimised software; p r o c e s s i n g r a t e s have proven to be h i g h l y
Chapter f i v e

- 208 -
favourable. The cpu time r e q u i r e d to r a s t e r i s e each
p a r t i t i o n of the b u f f e r i n c r e a s e d only s l i g h t l y to 11.5
seconds, although the r e d u c t i o n i n the number of p a r t i t i o n s
generated a f o r t y - f o u r per cent i n c r e a s e i n speed for the
t o t a l map sheet t o 288.244 seconds.
There i s much evidence t o suggest t h a t c a r e f u l tuning of
the software i s e s s e n t i a l to achieve reasonable use of
re s o u r c e s and of p r o c e s s i n g r a t e s . The e f f e c t of
i n a p p r o p r i a t e l y ordered input v e c t o r s i s c r i t i c a l i n slowing
the system down; to read the f u l l v e c t o r f i l e for each
p a r t i t i o n of the r a s t e r b u f f e r i s m a n i f e s t l y i n e f f i c i e n t
s i n c e over n i n e t y per cent of the data are o f t e n r e j e c t e d for
each s t r i p . F r a n k l i n (1979) has i t e m i s e d a s e r i e s of options
a v a i l a b l e to r e s t r u c t u r e v e c t o r data f o r r a s t e r p a r t i t i o n i n g .
Two of h i s suggestions were t e s t e d f o r r e l e v a n c e i n the
r a s t e r i s i n g of Ordnance Survey data: these were h i s al g o r i t h m
2 ( r e w r i t e r e j e c t e d v e c t o r s i n t o a secondary f i l e ) and
algorithm 3 ( s o r t the input v e c t o r s by s t r i p s f i r s t ) . A
summary of the e f f e c t s of the software and data tuning i s
given i n Table 5.5
Chapter f i v e

- 209 -
Table 5.5; The e f f e c t s of software tuning on the ve c t o r
to r a s t e r conversion o f OS 1:1250 data
Map she e t : NZ 2642NE Number of x,y p o i n t s = 14,789
Raster image: 5000 x 5000 elements
P i x e l r e s o l u t i o n : 0.1 ground metres
Storage No. of T o t a l T o t a l Input per s t r i p s torage cpu time data p i x e l p a r t i t i o n s f o r job
(b y t e s ) (Mbytes) ( s e e s )
Comments
Unsorted v e c t o r s 50 50 525
I n i t i a l t e s t s
Unsorted v e c t o r s 50 25
P i x e l data 510 compaction
Unsorted v e c t o r s
Unsorted v e c t o r s 1
with r e w r i t e to secondary f i l e
25
25
25
25
I n c r e a s e i n 278 p a r t i t i o n
s i z e
Much use o f 227 backing s t o r e
for v e c t o r data
Sorted v e c t o r s 25 25
I n c l u d e s 64 243 seconds f o r
ve c t o r p r e - s o r t
Chapter f i v e

- 210 -
.4 DATA COMPACTION TECHNIQUES FOR THE RASTER IMAGE
I t i s unreasonable to use t w e n t y - f i v e megabytes for the
storage of one 1:1250 r a s t e r image; even with c a r e f u l
b l o c k i n g techniques, such l a r g e volumes of data w i l l absorb
i n excess of s i x t y per cent of a standard 1600 bpi magnetic
tape. T h i s would imply a 300=fold i n c r e a s e i n storage of the
n a t i o n a l d i g i t a l topographic data base as compared with the
unpacked v e c t o r format d e s c r i b e d i n s e c t i o n 2.4.2. When
a l l i e d with degrees of s p a r s i t y of ninety-seven per cent or
more, a l l t h i s suggests t h a t e x p l o r a t i o n of e f f i c i e n t data
packing techniques i s e s s e n t i a l . I n the design of e f f e c t i v e
compression methods, an e f f e c t i v e balance has to be adopted
to ensure t h a t b e n e f i t s gained are not impeded by lengthy
c e n t r a l p r o c e s s o r o p e r a t i o n s to compact and to expand the
data. Thus, the use of the data i n t h e i r expanded form
ensures s t r a i g h t - f o r w a r d FORTRAN coding at the software input
and output s t a g e s . Under the MTS o p e r a t i n g system, a s i n g l e
READ or WRITE oper a t i o n i n v o l v i n g the t r a n s f e r o f a
one-megabyte s t r i p of the r a s t e r image has no dramatic
e f f e c t s on software performance when compared with
t r a n s f e r r i n g the same data i n packed form; t h i s t r a n s f e r
o peration t a k e s t h r e e m i l l i s e c o n d s of c e n t r a l p r o c e s s o r time
for unpacked data and two-and-a-haIf m i l l i s e c o n d s f o r packed
data. I t i s the r e d u c t i o n i n backing s t o r e requirements
which w i l l be the most s i g n i f i c a n t b e n e f i t from any
Chapter f i v e
- 211 -
compaction attempts.
The handling of l a r g e sparse m a t r i c e s i n a computer system
i s not a r e c e n t development? Pooch and Neider (1973) give a
u s e f u l summary of indexing techniques f o r mathematical
a p p l i c a t i o n s . More r e c e n t l y , Visvalingam (1976) has
i n v e s t i g a t e d some of these i d e a s for the e f f i c i e n t storage o f
the 1971 GB population census data ( see s e c t i o n 3.5.1).
These methods of compression are not e n t i r e l y s u i t e d to
p i c t u r e p r o c e s s i n g a p p l i c a t i o n s (Cederberg 1979) s i n c e many
of the r e l a t i o n a l l i n k s between n e a r e s t neighbouring p i x e l s -
e s p e c i a l l y a c r o s s s c a n - l i n e s - are l o s t . I n t s i t n c e , i t i s
ne c e s s a r y to adopt a h y b r i d s t r a t e g y which i s s u i t e d to both
a r c h i v i n g and a p p l i c a t i o n requirements. In p r a c t i c e , modern
computing equipment (e.g. t e r m i n a l s and r a s t e r d i s p l a y s ) i s
g r a d u a l l y a l l e v i a t i n g t h i s need to make t r a d e o f f s between
data storage and d i s p l a y ; A l l e n e t aj. (1980) d e s c r i b e the
developments of i n t e l l i g e n t m i c r o p r o c e s s o r - c o n t r o l l e d
t e r m i n a l s and d i s p l a y s which remove the burden of data
r e f o r m a t t i n g from the main computer f o r r a p i d and easy
i n t e r f a c e s between the user and the machine.
A s e r i e s of data compaction methods have been i n v e s t i g a t e d
for the Ordnance Survey data i n v o l v i n g such techniques as the
address-map scheme, the row-column scheme and the threaded
l i s t scheme (see Pooch and Neider 1973). G e n e r a l l y , though,
Chapter f i v e

- 212 -
only the bit-map scheme (Pooch and Neider 1973) and
run-length-encoding (Rosenfeld 1969) were expected to have
d i r e c t r e l e v a n c e s i n c e these s t r a t e g i e s s u i t the sh o r t - r u n s
of connected s e t p i x e l s i n h e r e n t i n each r a s t e r scan of the
l a r g e s c a l e s data. An i n i t i a l assessment of the performance
of the bit-map scheme can be made immediately f o r a
p a r t i c u l a r sheet once some f i g u r e s f o r the degree o f
sparseness i s known (see s e c t i o n 3.4.1 and Table 3.4),
although run-length-encoding methods are dependant on the
nature of each s c a n - l i n e . S e c t i o n 3.4.1 shows how the
c h a r a c t e r i s t i c s of the l a r g e s c a l e s map data do not f i t
n e a t l y i n t o run-lengths as would be the case with the s m a l l e r
s c a l e s . A m o d i f i c a t i o n to these ideas - the d e l t a - i n d e x i n g
scheme ( a f t e r Visvalingam) - i s considered to be h i g h l y
a p p r o priate f o r the compression of OS monochrome data. A
f u l l d e s c r i p t i o n of t h i s and s e v e r a l other techniques a r e
de s c r i b e d i n s e c t i o n 3.4.1. Robertson (1980 p 109) - i n h i s
M.Sc. d i s s e r t a t i o n d e s c r i b i n g the development of a scanning
system to handle 'simple' topographic maps - has suggested
t h a t a coded d e l t a l i k e method of compaction y i e l d s an
expansion r a t h e r than a compression of h i s r a s t e r storage for
contours, c u l t u r e and drainage data. T h i s c o n t r a d i c t s the
r e s u l t s of i n v e s t i g a t i o n s made i n t h i s r e s e a r c h ; the
technique seems h i g h l y s u i t e d to OS l a r g e s c a l e s data
c h a r a c t e r i s t i c s . T h i s apparant d i f f e r e n c e o f opinion
probably has a r i s e n because Robertson i s d i s c u s s i n g the
Chapter f i v e

- 213 -
e f f e c t s of b i t - s e q u e n t i a l s c a n - l i n e data d i r e c t from a
scanning d e v i c e i n which l i n e s have not been thinned to
one-pixel widths. The e f f e c t s of t h i s d i s t i n c t i o n are
unknown at p r e s e n t .
.4.1 Develoment of a coded-delta compaction a l g o r i t h m
The coded-delta method of r a s t e r compression i n v o l v e s
transforming the long runs of zero elements i n each scan l i n e
i n t o run-lengths t o separate the non-zero p i x e l s . The
d i s t i n c t i o n between these run-lengths and a t t r i b u t e codes i s
ensured by negating the run-length v a l u e s before storage.
F i g u r e 5.6 below shows the design of a coded-delta scheme for
the compaction of an OS l a r g e s c a l e s r a s t e r scan l i n e .
F i g u r e 5.6; Example of a coded-delta compression scheme
0010000000000000100000010000010000000000000000010000
becomes
-2, 1, -13, 1, -6, 1, -5, 1 -17, 1, -3
Chapter f i v e

- 214 -
In reducing the storage overheads a s s o c i a t e d with the
uncompacted r a s t e r images, i t i s n e c e s s a r y to run length
encode each scan l i n e p r i o r to storage. The v a r i a b l e lengths
of each s c a n - l i n e r e c o r d a f t e r compression p r e s e n t s problems
i n the data s t r u c t u r e and the input and output s t a g e s of the
software. S i n c e the r e c o r d lengths are no longer f i x e d , then
s t r a i g h t f o r w a r d unformatted FORTRAN block t r a n s f e r s of a r r a y s
to and from backing s t o r e a r e not p o s s i b l e ; t h i s technique i s
extremely r a p i d s i n c e , i n an IBM implementation, i t
n e c e s s i t a t e s only one c a l l to the IBCOM subroutine r a t h e r
than one c a l l f o r each element of the a r r a y . With such high
data volumes c a r e f u l c o n t r o l o f I/O methods i s c r u c i a l . Two
a l t e r n a t i v e s are a v a i l a b l e :
A header s e c t i o n i s attached to each scan l i n e g i v i n g
d e t a i l s of i t s length (the a c c e s s v e c t o r i d e a s d e s c r i b e d
i n f i g u r e 3.2a). In t h i s way, i m p l i e d DO-loops can be
used with each READ and WRITE statement to c o n t r o l the
length of each r e c o r d which i s t r a n s f e r r e d to the data
f i l e . T h i s technique has been r e j e c t e d because:
(a) a d d i t i o n a l storage i s n e c e s s a r y f o r each record
header, which i n c r e a s e s data volumes and the
complexity of the data s t r u c t u r e ;
(b) the use of i m p l i e d DO-loops i n FORTRAN I/O i s very
Chapter f i v e
- 215 -
slow (see Table 5.7) - hence, t h i s i s u n d e s i r a b l e
with many data t r a n s f e r s .
Most o p e r a t i n g systems provide a l o w - l e v e l method of data
t r a n s f e r known as e x e c u t i v e read and w r i t e s . T h e i r
f u n c t i o n i s to t r a n s f e r a s p e c i f i e d number of bytes from
a defined address i n the c e n t r a l p r o c e s s o r memory to
backing s t o r e . No header information i s i n c l u d e d and the
method i s ve r y f a s t s i n c e no v a l i d a t i o n o f the data
t r a n s f e r i s performed.
Table 5.7 compares the cpu time r e q u i r e d on the IBM
370/168 to read i n the t o t a l 5000 x 5000 r a s t e r image by the
three d e s c r i b e d methods. These i n v e s t i g a t i o n s i n d i c a t e t h a t
e x e c u t i v e reads and w r i t e s are f a s t e r than FORTRAN block
t r a n s f e r s , a t l e a s t on the IBM 370/168 running under MTS.
Chapter f i v e

- 216 -
Table 5.7; Comparison o f the c e n t r a l p r o c e s s o r times
r e q u i r e d to read a complete r a s t e r image o f
5000 x 5000 p i x e l s scan l i n e by scan l i n e
(N.B. SCAN i s an a r r a y of 5000 elements, each of one byte)
H y p o t h e t i c a l 370/168 cpu time
Method code ( s e e s )
FORTRAN block read 1
FORTRAN i m p l i e d DO-loop 1
E x e c u t i v e I/O t r a n s f e r 1
DO 1 1=1,5000 READ(l) SCAN 13.0
DO 1 1=1,5000
READ(1)(SCAN(J),J=l,5000) 175.0
DO 1 1=1,5000 CALL READ(SCAN,5000) 10.1
The a l l o c a t i o n of one byte per p i x e l w i t h i n the r a s t e r
b u f f e r n e c e s s i t a t e s a maximum run-length of zero elements
(the coded d e l t a s ) t o be 127: l a r g e r v a l u e s than t h i s cannot
be st o r e d i n e i g h t - b i t u n i t s . I t i s , however, p e r f e c t l y
f e a s i b l e t o p l a c e a s e r i e s of coded d e l t a s c o n s e c u t i v e l y i n
each scan l i n e image. For example, a r e c o r d comprising the
fo l l o w i n g p i x e l (numerical) sequence:
Chapter f i v e

- 217 -
30, -56, 6, -127, -127, -35, 22, -6 r e p r e s e n t s the f o l l o w i n g uncompacted s c a n - l i n e data
FC 30, 56 z e r o s , FC 6, 289 zero s , FC 22, 6 zer o s
where FC = f e a t u r e code
Two s e r i a l - b a s e d FORTRAN subroutines were w r i t t e n to
compact each scan l i n e i n t o a coded-delta format f o r storage
and expand i t back i n t o r a s t e r scan n o t a t i o n for any post hoc
p r o c e s s i n g and d i s p l a y . The source code can be found i n
Annex 5d: SUBROUTINE CODER tak e s each r a s t e r p a r t i t i o n and
compacts i t f o r storage and SUBROUTINE BUFF reads i n the
compacted scan data and unpacks i t .
The e f f i c i e n c y of any data compression technique i s
dependant on the c h a r a c t e r i s t i c s and complexity of the source
data; a map sheet with a high-frequency of l i n e a r f e a t u r e s
w i l l not compress to such an extent as would be the case with
a sheet of r e l a t i v e l y s p arse cover. The degrees of
compaction p o s s i b l e with the coded-delta scheme are c l o s e l y
a l l i e d to the o r i e n t a t i o n of the l i n e a r f e a t u r e s . A
h y p o t h e t i c a l map sheet comprising a l l h o r i z o n t a l l i n e s w i l l
Chapter f i v e

- 218 -
Table 5.8: The e f f e c t s of data compaction
on two O.S. 1:1250 map sheets
D e s c r i p t i o n
Map Sheet
NZ 2641NE NZ 2642NE Units
No. of v e c t o r p o i n t s 5005
T o t a l length of l i n e work a t p l o t - s c a l e 14.7
S i z e of v e c t o r data f i l e ( i n DMC format) 70224
Estimated v e c t o r storage i f compressed 18000
CPU time to convert t o r a s t e r (no compaction) 147.2
S i z e of r a s t e r image with 0.1m r e s o l u t i o n 25,000,000
Degree of s p a r s i t y 99.2
CPU time to convert to r a s t e r (compacted) 175.2
I n c r e a s e i n CPU time w i t h compaction 19
S i z e of r a s t e r image a f t e r compaction 469,297
Degree of compaction 53.3
S i z e of compacted r a s t e r image i n r e l a t i o n to compacted v e c t o r f i l e 26 S i z e of compacted r a s t e r image i n r e l a t i o n to DMC
format v e c t o r f i l e 6.7
14789
39.8
248920
63000
278.1
25,000,000
97.8
354.0
27
956,455
26.1
15
3.8
metres
bytes
bytes
seconds
bytes
percent
seconds
percent
bytes
times
times
times
Chapter f i v e

- 219 -
not compact to the same ext e n t as i s p o s s i b l e with a l l
v e r t i c a l l i n e s , assuming t h a t a l l the run-lengths were
arranged h o r i z o n t a l l y .
The performance of the compaction a l g o r i t h m has been
encouraging. Table 5.8 shows the r e s u l t s of the compaction
process on two d i s s i m i l a r 1:1250 map s h e e t s ; a comparison
with the uncompacted r a s t e r images i s made.
The evidence d e s c r i b e d i n t a b l e 5.8 suggests the
performance of any r a s t e r - b a s e d manipulation of data on a
s e r i a l - m a c h i n e i s c l o s e l y a l l i e d w i th the c h a r a c t e r i s t i c s and
volume of the v e c t o r d a t a . T h i s i s not so much the case with
p a r a l l e l algorithms {see chapter s i x ) . A twenty seven per
cent i n c r e a s e i n the c e n t r a l p rocessor time provided a twenty
s i x times r e d u c t i o n i n the storage overheads f o r the dense
sheet; f a r b e t t e r r e s u l t s were gained for the s p a r s e l y
covered sheet with f i g u r e s of 19 per cent and 53 times
r e s p e c t i v e l y . To some (unknown) extent t h i s w i l l be due to
the maximum compaction r a t e s p o s s i b l e w i t h i n O.S. r a s t e r
systems. Even a f t e r compaction the s i z e of the grid-based
data f i l e s are 3.8 and 6.7 times l a r g e r than the e q u i v a l e n t
unpacked v e c t o r formats f o r the dense and sparse data
r e s p e c t i v e l y .
Chapter f i v e

- 220 -
The r a t e s of compression achieved by these methods compare
favourably with those reported by other r e s e a r c h workers i n
the f i e l d . Robertson (1979) suggests the s i z e of h i s
compacted r a s t e r f i l e s to remain 3 or 4 times l a r g e r than h i s
e q u i v a l e n t v e c t o r f i l e s . Pferd and White (1981) r e p o r t a
f i v e times r e d u c t i o n i n the compaction of r a s t e r images of
engineering drawings u s i n g run-length-encoding t e c h n i q u e s .
The B e l l L a b o r a t o r i e s scanning system t h a t they d e s c r i b e (see
s e c t i o n 7.3.2) converts from r a s t e r to vector i n r e a l time
and hence the compaction scheme and r e s u l t i n g packing format
for the r a s t e r data i s kept simple to enable r a p i d and
s t r a i g h t - f o r w a r d conversion to v e c t o r s i n stages which
fol l o w .
.4.2 Software tuning
An i n v e s t i g a t i o n i n t o the degrees of compaction fo r each
scan l i n e i n the r a s t e r image of NZ 2642NE has d i s c o v e r e d
t h a t the lengths of the r e s u l t a n t r e c o r d s ( s c a n - l i n e s ) are
s t r o n g l y c o r r e l a t e d with the i n v e r s e of the frequency of zero
p i x e l s (-0.93 r ) . A summary of the c h a r a c t e r i s t i c s of the
compressed scan l i n e s i s given i n Table 5.9.
Chapter f i v e

- 221 -
Table 5.9 A summary of the c h a r a c t e r i s t i c s of each s c a n - l i n e
for sheet NZ 2642NE a f t e r coded-delta compaction
P i x e l r e s o l u t i o n 0.1 ground metres
No. of No. of No. of No. of
D e s c r i p t i o n bytes zeros s e t p i x e l s coded-deltas
Max. r e c o r d length 369 4723 277 (5.5%) 92
Mean r e c o r d length 223 4857 143 (2.9%) 80
Min. r e c o r d length 78 4957 43 (0.9%) 35
Since a n i n e t y three per cent r c o r r e l a t i o n e x i s t s between
the frequency of zero p i x e l s and the r e s u l t a n t r e c o r d lengths
i n each scan l i n e , then the remaining seven per cent i s taken
up by the unknown degree of contiguous coded-delta elements
( i . e . runs which are g r e a t e r i n length than 127 p i x e l s ) .
T h i s f a c t o r i s dependant on the c h a r a c t e r i s t i c s of each map
image; an i n v e s t i g a t i o n was made i n t o the e f f e c t s of extended
coded-delta l e n g t h s . The hypothesis developed was t h a t the
use of two-bytes per element a f t e r compaction would be more
e f f i c i e n t s i n c e the chance of contiguous coded-delta v a l u e s
would be n i l . A 16 b i t element provides for the storage of
any i n t e g e r i n the range -32768 to +32767. The
Chapter f i v e

- 222 -
r e p r e s e n t a t i o n of each s e t p i x e l ( i . e . those with a t t r i b u t e
codes) i n two-byte u n i t s would waste space: t a b l e 5.9 shows
t h a t on average only 2.9 per cent of each scan l i n e has s e t
p i x e l s ( i n a 5000 x 5000 p i x e l image for t h i s t e s t s h e e t ) ,
and hence the redundant space w i l l be minimal. These t e s t s
proved the h y p o t h e s i s to be wrong. I n v e s t i g a t i o n s i n t o the
use of two byte coded-deltas have produced compacted r a s t e r
f i l e s t h a t a r e almost t w i c e the s i z e o f the one-byte method.
The s i z e of the compressed 5000 x 5000 image of NZ 2642NE
rose to 1.7 megabytes (a 1.8 times i n c r e a s e ) . F u r t h e r
s t u d i e s have shown t h i s t o be the case with r a s t e r f i l e s of
v a r i o u s s i z e s and complexity. The b e n e f i t s of removing
contiguous coded-delta elements do not outweigh e x c e s s i v e
space taken for the s e t p i x e l s and r e l a t i v e l y s h o r t runs of
zero-elements.
THE CHOICE OF PIXEL RESOLUTION
The r e s o l u t i o n of each p i x e l i n d e s c r i b i n g a r a s t e r image
has c o n s i d e r a b l e importance. C a r e f u l c h o i c e of t h i s
c e l l - s i z e i s c r u c i a l ; i t d i c t a t e s the time n e c e s s a r y to scan
the map s h e e t s , the degrees of exactness of the d i g i t a l
r e p r e s e n t a t i o n , and the q u a l i t y and appearance of any output
g r a p h i c s . This does not suggest t h a t the choice of
r e s o l u t i o n a t the input (scanning) stage should n e c e s s a r i l y
Chapter f i v e

- 223 -
decree the c h a r a c t e r i s t i c s of the r e s u l t a n t d i s p l a y s or
d i g i t a l manipulation, although c a u t i o n should be e x e r c i s e d i n
any attempted s c a l e changes. C l e a r l y , though, the p r e c i s i o n
of any r a s t e r image can be no b e t t e r than the weakest l i n k i n
the system and, i n t h i s p r o j e c t , output q u a l i t y can be
g e n e r a l l y no b e t t e r than the a c c u r a c y of the input document.
I t i s p o s s i b l e t o produce simulated higher q u a l i t y by
r e g r i d d i n g i n p u t data on a h i g h e r r e s o l u t i o n r a s t e r and then
s k e l e t o n i s i n g the r e s u l t s - i . e . t h i n n i n g linework to one
p i x e l width.
A d e c i s i o n on the p i x e l s i z e to be adopted has an
e x p o n e n t i a l r e l a t i o n s h i p with uncompacted s i z e of the r a s t e r
f i l e s ; t h i s has s e r i o u s i m p l i c a t i o n s on data storage and
c e n t r a l p r o c e s s o r time. I n these c i r c u m s t a n c e s , i t i s f u t i l e
to develop and process r a s t e r images with a p r e c i s i o n t h a t i s
higher than r e q u i r e d f o r a n a l y t i c a l work and d i s p l a y .
Conversely, r a s t e r f i l e s with i n s u f f i c i e n t r e s o l u t i o n cannot
be used with any r e l i a b i l i t y for h i g h - p r e c i s i o n work.
The e f f e c t s of p i x e l s i z e s on the c h a r a c t e r i s t i c s and
handling techniques of topographic data i n a r a s t e r n o t a t i o n
have been i n v e s t i g a t e d e m p i r i c a l l y . The development of the
s e r i a l - b a s e d algorithm f o r v e c t o r - t o - r a s t e r c o n v e r s i o n
( s e c t i o n 5.3.4) was designed to f a c i l i t a t e u s e r - d e f i n e d p i x e l
s i z e s ? t h i s i nformation i s s u p p l i e d to the software as a
Chapter f i v e

- 224 -
s e r i e s of parameters, along with the input v e c t o r f i l e . A
s u c c e s s i o n of c o n v e r s i o n s t o r a s t e r were made on the Durham
1:1250 sheet (NZ 2642NE) i n which p i x e l s i z e s were amended to
range between 0.1 metres (0.08mm) and 5.0 metres (4.0mm).
The e f f e c t s on process times, f i l e s i z e s , degrees of s p a r s i t y
were monitored i n a d d i t i o n t o the performance of the
coded-delta compaction technique ( s e c t i o n 5.4.1). The extent
to which a r a s t e r f i l e has to be p a r t i t i o n e d during the
conversion process has severe e f f e c t s on cpu times s i n c e i t
r e q u i r e s many p a s s e s through the v e c t o r f i l e (one pass f o r
each p a r t i t i o n ) . As f a r as was p o s s i b l e , the number of
p a r t i t i o n s was kept s m a l l although no more than one megabyte
of main memory was used i n each run. The r e s u l t s of these
t e s t s are summarised i n Table 5.10.
The r e s u l t s provide c o n c l u s i v e evidence of the degradation
which i n c r e a s i n g p i x e l r e s o l u t i o n causes on the r a t e of
p r o c e s s i n g on a s e r i a l p r o c e s s o r . The c e n t r a l p rocessor time
i n c r e a s e s with the number of p i x e l s d e s c r i b i n g the image; the
degree of i n c r e a s e i s h i g h l y dependant on the number of
passes through the v e c t o r f i l e needed at the input stage.
F i g u r e 5.11 shows the e f f e c t s g r a p h i c a l l y . The r a p i d
i n c r e a s e i n the p r o c e s s i n g time can be seen to occur with
p i x e l r e s o l u t i o n s of 0.5 metres and l e s s : the high number of
p a r t i t i o n s n e c e s s a r y to s t o r e the l a r g e volumes of data
account for t h i s . There i s only a marginal r i s e i n
Chapter f i v e

- 225 -
V O CM
IS]
0)
o
u CU
m +> C o c o
•H.
o CO cu n
CO
CO CU o 8 «
C O V O
o KN
o
• H
CU +>
+» C cu CD
c o
i B O
o c o
c o o a) P. § o
cu X
cu CO c £3
a> +>
CO cu +> >> be
cu - p
r— (M KN ON V O V O o *— BN ON o co 0 0 v O CM KN KN BN e • • • a • e © • e 0 o
' T — CM V O CD l/N »— ON ON t—
KN CM
KN i T v
I/N C O CNJ •TV V O
CM K N C O
CM r—
O V O
V O K N
K N
CM CM K N K N O N ,- C D l / N C D
o
v o KN
o CM
I/N v o
CO C D
V O ON v O t l -
v O ON l/N •*»-
v O
CM CM l/N l/N
r— 0 0 ON KN v o
l/N CM
ON KN
V O
l/N
o t--
V O l/N ON
V O V O
CM l/N l / \ KN
CM C O
ON KN C O
CO KN V O l/N
ON CV)
KN CO
KN t~-l/N l/N
r-ON r-
KN C O
V O CO
ON CO
CM ON ON
V O ON SN SN
O •
o •
o •
o •
V O •
o •
o •
l/N •
o •
V O •
O •
O • o
V O
O l / N CM
O ON K N
O V O
o o o CM V O l/N
o o o i / \
v o
SN
o o o V O
o o o l/N CM
CU X
• H
P c« o CJ cu
<H cu cu E-t
•3 E-i
CM O
O 5 3
M CU 4->
o o o o o m o o u • H 10 o o o o CM o cu + J i-H —̂ C N I i r v V O 0 0 CU - p • H CU X X X X X N +> x o o o o I / N o • H u • H o o o o evi o CO Pa
P. —' 1— C V I l / N V O C O
CO c o c cu
o o o o l / N O CO o o o o CM O
xel «— CM l / N V O C O
xel
X X X X X X • H o o o o l / N o Pi o o o o CM o — *~ CVI ITN V O C O
o o o
o o
o o o
o o
i r v CM o
CM
i r \ evi
l/N o l/N o o CVI o CM o o V O •5* »— CM CM
X X X X X o o l /V o o l /N o CM o o CM o o o *~ evi K N •sf- ITS
o o l /N o o l /N o CM o o CM o o o —̂ CM K N l/\ X X X X X 6 o l/N 6 o l/N o CM o o CM o 1— o o *— CM K N l /N
CU 0 CM O
CO
B +» cu H
o o O o o l / N o o o 8 l / N o 8 o l / N 8 s CM o o l / N 8 CM o 8 l / N CM 8 s V O l / N CM T— T— • s 0 • 0 • 9 • e • 0 0 l / N CM *— o o o o o O o o

- 226 -
THE EFFECT OF PIXEL SIZE ON COMPACTION
i
1
I UJ
U J
1 CD
I
CO to
1 U J
a
o.oo 1.00 2.00 3.00 4.00 PIXEL RESOLUTION (M)
Figure 5.11

- 227 -THE EFFECT OF PIXEL SIZE ON COMPACTION EFFICIENCY
* 9
P i
0.00 .00 2.00 3.00 PIXEL RESOLUTION (M)
-©
.00 ~s!oo
Figure 5.12
Figure 5.13
PERCENTAGE REDUCTION OF RASTER IMAGE WITH PIXEL SIZE
1 0 J 0.00 — I 1 —
2.00 3.00 PIXEL RESOLUTION (TO
1.00 — t — 4.00 9.00

- 228 -THE EFFECT OF PIXEL SIZE ON PERCENTAGE SPARSITT
in
<r
0.00 1-00 2.00 3.00 PIXEL RESOLUTION M) — I — 4.00 5.00
Figure 5.14
Figure 5.15
PERCENTAGE SPARSITY AGAINST PERCENTAGE REDUCTION OF RASTER BUFFER
1 0 0 T
10 /REOUCTION OF4RVR5BUFFER68ITH SmcT& 3 5 ^°

- 229 -
conversion speeds with p i x e l r e s o l u t i o n s where the complete
task can be handled w i t h one data p a r t i t i o n .
There i s s i m i l a r evidence to suggest t h a t the performance
of the data compression methods are c l o s e l y a l l i e d with p i x e l
s i z e : f i g u r e s 5.12 and 5.13 d e s c r i b e the r e s u l t s . Both
f i g u r e s show s i m i l a r measures of performance: f i g u r e 5.12
d e s c r i b e s the degree of f i l e compaction with changing p i x e l
r e s o l u t i o n and f i g u r e 5.13 d i s p l a y s the same trend on a
percentage r e d u c t i o n b a s i s . These t r e n d s are encouraging.
The degrees of data compression i n c r e a s e q u i t e d r a m a t i c a l l y
as the p i x e l s i z e becomes s m a l l e r ; furthermore the r i s e i n
the s i z e of the compressed data f i l e s a r e nothing l i k e as
r a p i d as the r i s e i n the s i z e of the uncompacted b u f f e r
s i z e s . I f O.S. sheet NZ 2642NE i s assumed to be f a i r l y
t y p i c a l of the 1:1250 data s e t s i n v e s t i g a t e d and - h o p e f u l l y
of the n a t i o n a l s i t u a t i o n , then t h e r e a r e v a l i d reasons to
expect a compaction of between n i n e t y - f i v e and n i n e t y - n i n e
per cent of the unpacked data with p i x e l r e s o l u t i o n s adequate
for Ordnance Survey standards. The measures of compaction
performance r e f l e c t the degrees of empty space ( s p a r s i t y ) i n
the r a s t e r images. I t i s to be expected t h a t an i n c r e a s e i n
p i x e l r e s o l u t i o n w i l l i n c r e a s e the frequency of zero p i x e l s :
f i g u r e 5.14 shows t h i s t r e n d . The evidence suggests a steady
i n c r e a s e i n percentage s p a r s i t y with f i n e r (and hence a
g r e a t e r number o f ) p i x e l s . The i n c r e a s e s i n the measures of
Chapter f i v e

- 230 -
sparseness and the performance of the data compression i n the
r a s t e r image w i t h s m a l l e r p i x e l r e s o l u t i o n are not equal.
Evidence from the f i g u r e s shown i n Table 5.10 suggests a
marginal improvement i n the r a t e o f removal of empty p i x e l s
as t h e i r r e l a t i v e frequency i n c r e a s e s . T h i s t r e n d i s shown
g r a p h i c a l l y i n f i g u r e 5.15: the steady r e d u c t i o n i n the
g r a d i e n t of the l i n e i s a measure of the s l i g h t i n c r e a s e i n
the performance of the coded-delta method of compression.
The e x t e n t t o which t h i s i s dependent on the c h a r a c t e r i s t i c s
of the map s h e e t s i s unknown.
In c o n c l u s i o n , these r e s u l t s q u a n t i f y the i n t u i t i v e
e x p e c t a t i o n s of r a s t e r data handling, at l e a s t on a
c o n v e n t i o nal computer. An i n c r e a s e i n the s i z e o f the r a s t e r
image r e q u i r e s an e x t e n s i v e i n c r e a s e i n computing r e s o u r c e s .
The times r e q u i r e d f o r data manipulation i n c r e a s e
e x p o n e n t i a l l y with a r e d u c t i o n of p i x e l r e s o l u t i o n ; i n
c o n t r a s t , t h e r e i s evidence (see Chapter s i x ) to suggest t h a t
t h i s i n c r e a s e i s nearer to l i n e a r on a p a r a l l e l p r o c e s s o r .
These r e s u l t s s t r e s s the high d i v e r s i t y of performance r a t e s
i n r a s t e r data handling; any quoted s e r i a l - p r o c e s s o r times
are only r e l e v a n t i f a s s o c i a t e d d e t a i l s about the image are
supplied, such as p i x e l dimensions and degree of s p a r s e n e s s .
The a b i l i t y to compact the data for storage purposes
appears to be h i g h l y promising. The r a t e of i n c r e a s e i n the
Chapter f i v e

- 231 -
volumes of the compacted data with i n c r e a s i n g p i x e l
r e s o l u t i o n i s f a r l e s s than as i n the expanded r a s t e r f i l e .
Hence, the evidence suggests t h a t i t i s the p r o c e s s i n g times
which degrade any compaction technique and l i m i t the
r e s o l u t i o n which can r e a l i s t i c a l l y be u t i l i s e d . F i g u r e 5.11
shows the e f f e c t s of i n c r e a s e d p r o c e s s i n g times to compress
images with i n c r e a s e d r e s o l u t i o n . These r a t e s of i n c r e a s e
reach alarming proportions with high r e s o l u t i o n p i x e l s ; t h i s
i s a c l e a r i n d i c a t i o n o f the i n a p p r o p r i a t e a r c h i t e c t u r e o f a
s e r i a l computer f o r these a p p l i c a t i o n s . There a r e two
courses open to a l l e v i a t e t h e s e problems:
Wherever p o s s i b l e , expanding a r a s t e r image once i t has
been compressed should be avoided; t h i s seems to be
s t r o n g l y supported by the I n s t i t u t Geographique N a t i o n a l ,
Belgium (Loodts 1981), which i s undertaking i n t e n s i v e
r e s e a r c h i n t o r a s t e r methods on s e r i a l p r o c e s s o r s .
There i s a stro n g case for the s e r i o u s i n v e s t i g a t i o n and
development of a r r a y p r o c e s s i n g algorithms f o r t r u e
p a r a l l e l p r o c e s s o r s . Assessments made by t h i s author
suggest there t o be much p o t e n t i a l i n t h i s f i e l d : these
r e s u l t s are d e s c r i b e d i n chapter s i x .
Chapter f i v e
- 232 -
.6 WORK APPLICATIONS RELATED TO OS REQUIREMENTS
Se c t i o n 4.2.2 i t e m i s e s s e v e r a l o f the rudimentary
manipulative t a s k s which favour r a s t e r methods of data
o r g a n i s a t i o n . I n p a r t i c u l a r - i n the l i g h t of r e l a t e d
experimentation - i t has become c l e a r t h a t r a s t e r data
p r o c e s s i n g can provide an e f f i c i e n t a l t e r n a t i v e to the v e c t o r
s t r a t e g y d e s c r i b e d i n s e c t i o n 2.7 f o r the d e t e c t i o n of l i n k s
and nodal p o i n t s i n d i g i t a l map l i n e d ata. C o n s i d e r a t i o n of
t h i s i s given i n s e c t i o n 5.6.1.
Another a p p l i c a t i o n which has s e r i o u s i m p l i c a t i o n s f o r
f u t u r e r a s t e r s t r a t e g i e s w i t h i n the OS i s e f f i c i e n t
r a s t e r - t o - v e c t o r procedures. D e t a i l e d c o n s i d e r a t i o n of the
commercial s o l u t i o n s t o t h i s problem i s given i n chapter
seven, although t e s t s have a l s o been c a r r i e d - o u t i n t h i s
r e s e a r c h to examine the q u a l i t y and procedures n e c e s s a r y to
r e b u i l d the manually c r e a t e d r a s t e r f i l e s d i s c u s s e d i n t h i s
chapter back i n t o a v e c t o r form. The r e s u l t s of such an
e x e r c i s e provides a means of a p p r a i s i n g the r a s t e r - t o - v e c t o r
process when presented with e r r o r - f r e e , manually c r e a t e d t e s t
data. The d e t a i l s of t h i s e x e r c i s e are reported i n s e c t i o n
5.6.2.
Chapter f i v e

- 233 -
.6.1 Some a p p l i c a t i o n s toward l i n k and node d e t e c t i o n
There i s much evidence from the r e s e a r c h to suggest t h a t
the r e s t r u c t u r i n g of Ordnance Survey v e c t o r data i s f a r more
s t r a i g h t forward with a r a s t e r s t r a t e g y - an approach which
has h i t h e r t o been ignored by the p r o j e c t team i n the n a t i o n a l
mapping o r g a n i s a t i o n (see Thompson 1978).
S e c t i o n 2.7 d e s c r i b e s the OS r e s t r u c t u r i n g p r o j e c t which
aims to generate v e c t o r data with much t o p o l o g i c a l s t r u c t u r e .
The process i n v o l v e s r e f o r m a t t i n g the e x i s t i n g data n o t a t i o n
i n t o a s e r i e s of l o w - l e v e l l i n k s and nodes. I n p r i n c i p l e ,
the i d e n t i f i c a t i o n o f such node p o s i t i o n s during a
v e c t o r - t o - r a s t e r c o n v e r s i o n i s m a n i f e s t l y simple; i n
c o n t r a s t , i t has proved to be c o s t l y and slow with the OS
vector-based s t r a t e g y .
I n v e s t i g a t i o n s have shown the r a s t e r - b a s e d concepts f o r
node and l i n k e x t r a c t i o n to be simple to implement. As the
v e c t o r to r a s t e r c o n v e r s i o n i s t a k i n g p l a c e , the software can
check to see i f each p i x e l has a l r e a d y been assigned a
f e a t u r e code. I f the t e s t proves to be p o s i t i v e , then the
p i x e l l o c a t i o n must be a node p o s i t i o n . Each time a node i s
detected, i t s address can be appended to a node r e g i s t e r
w i t h i n the computer system. T e s t s performed on these notions
have proven to be favourable although a s e r i e s of
Chapter f i v e

- 234 -
r e s e r v a t i o n s do e x i s t :
1. The design o f the v e c t o r - t o - r a s t e r a l g o r i t h m ( s e c t i o n
5.3) i n i t s p r e s e n t form i s i n a p p r o p r i a t e for such an
a p p l i c a t i o n . The equation for each v e c t o r i s s o l v e d
f i r s t i n the x d i r e c t i o n and then i n y to ensure p i x e l
c o n t i n u i t y along each l i n e . As a consequence, f e a t u r e
codes are f r e q u e n t l y , but not i n v a r i a b l y , a s s i g n e d twice
to the same p i x e l - once i n each pass f o r x and y - and
hence the software can become confused when s e a r c h i n g for
nodal p o i n t s . Two s o l u t i o n s have been c o n s i d e r e d :
(a) the i n c o r p o r a t i o n o f f e a t u r e s e r i a l numbers with the
a t t r i b u t e v a l u e s can d i s t i n g u i s h each l i n e a r e n t i t y
i n the r a s t e r image although the c u r r e n t storage
conventions do not a l l o w t h i s s t r a t e g y ;
(b) p i x e l s are not t r a n s f e r r e d to the r a s t e r b u f f e r u n t i l
the v e c t o r has been processed completely. This
method works w e l l although c e r t a i n v e c t o r s are
s u f f i c i e n t l y long to cause s e r i o u s storage problems
i n a temporary b u f f e r .
2. Current s p e c i f i c a t i o n s of the Ordnance Survey data are
not adequate for such d i g i t a l manipulation. For example,
polygon f e a t u r e s ( b u i l d i n g s , e t c . ) have not been modified
Chapter f i v e

- 235 -
to ensure t h a t s t a r t and end p o i n t s are c o i n c i d e n t . For
these reasons, some node l o c a t i o n s can be missed
completely. The s t r a t e g y adopted i n the Ordnance Survey
r e s t r u c t u r i n g p r o j e c t has i n v o l v e d the i n t r o d u c t i o n o f
complex p o s i t i o n a l t o l e r a n c e s to d i s t i n g u i s h p o i n t
c o i n c i d e n c e . C l e a r l y any r a s t e r a l t e r n a t i v e must be
c l o s e l y a l l i e d w ith p i x e l r e s o l u t i o n .
I n s h o r t , these t e s t s have been promising. The r a s t e r
method of d e t e c t i n g nodes has i d e n t i f i e d s i x t y e i g h t per cent
of a l l nodes i n a t e s t map-sheet. The t e s t s have attempted
no method of c o n t r o l l i n g the problems d i s c u s s e d i n p o i n t 2
above. This w i l l r e q u i r e c a r e f u l tuning and m o d i f i c a t i o n s to
the software; s i m i l a r amendments have been lengthy i n the
vector-based approach by the Ordnance Survey.
.2 Attempts to r e b u i l d the r a s t e r data image i n t o a v e c t o r
f i l e
Most manufacturers of scanning equipment o f f e r options to
convert the r a s t e r data i n t o v e c t o r s t r i n g s f o r conventional
p r o c e s s i n g , data-tagging and e a s i e r i n t e r a c t i v e v a l i d a t i o n .
Chapter seven p o i n t s out how most of these software options
are piecemeal, p r o v i d i n g ad-hoc line-work with an inadequate
Chapter f i v e
- 236 -
s t r u c t u r e f o r much d i g i t a l manipulation. G e n e r a l l y , the
q u a l i t y of the d e r i v e d v e c t o r s i s not only dependant on the
design of the c o n v e r s i o n a l g o r i t h m but a l s o on the q u a l i t y of
the r a s t e r data provided at the input stage. C l e a r examples
of these f a c t o r s are given i n f i g u r e s 7.6 to 7.14 (see
chapter s e v e n ) . The raster-images which have been generated
d i r e c t l y from the Ordnance Survey d i g i t a l v e c t o r f i l e s
( d e s c r i b e d i n s e c t i o n 5.3.4) have provided a datum with which
to compare the r e s u l t s achieved by scanners and post-hoc
v e c t o r i s i n g . T e s t s have been c a r r i e d - o u t with the kind
cooperation of the Image A n a l y s i s Group at Oxford U n i v e r s i t y
to convert t h e s e simulated r a s t e r images back i n t o
vector-form. The process i n v o l v e s t h i n n i n g each l i n e a r
f e a t u r e ( i n r a s t e r ) to a s i n g l e p i x e l width, l i n k i n g them
together and then f i l t e r i n g - o u t s u p e r f l u o u s p o i n t s (see
f i g u r e 6.13).
The Oxford method of r a s t e r - t o - v e c t o r conversion ( o u t l i n e d
i n H a r r i s e t a_l 1981) i s one of the few known procedures
which has attempted to i n c o r p o r a t e some topology i n the
r e s u l t i n g v e c t o r data s t r u c t u r e . T h i s i s provided by the
d e t e c t i o n of each node (and a s s o c i a t e d segments or l i n k s ) i n
the r e s u l t i n g network of l i n e s . The generation of separate
node and l i n k f i l e s - with appropriate c r o s s - r e f e r e n c i n g
between the two - provides s u f f i c i e n t s t r u c t u r e for e n t i t y
r e b u i l d i n g i n l a t e r s t a g e s . The Oxford software has been
Chapter f i v e

- 237 -
tuned towards the ha n d l i n g of polygon data t o s u i t the needs
of d i g i t i s i n g i n the Department of the Environment (see Davey
et a l 1977). The r e s u l t a n t output i s a f i l e of coo r d i n a t e s
r e p r e s e n t i n g polygon boundaries i n vector-form with t h e i r
a s s o c i a t e d f e a t u r e - t y p e s p r i n t e d a l o n g - s i d e them. The
polygon r e c o g n i t i o n process i s achieved by amalgamating the
appropriate nodal-points with t h e i r a s s o c i a t e d segment data.
Feature-code assignment i s accomplished by i n t e r a c t i v e means
once the polygon f i l e s have been c o n s t r u c t e d .
C l e a r l y the data s t r u c t u r e d e r i v e d from the software i s
not d i r e c t l y comparable with the OS l a r g e s c a l e s data i n
which c e r t a i n f e a t u r e s are i n h e r e n t l y l i n e a r , although t h e r e
are a number o f s i m i l a r i t i e s with the R e s t r u c t u r i n g P r o j e c t
d i s c u s s e d i n s e c t i o n s 2.7 and 5.6.1. Attempts were made to
r e b u i l d a simulated raster-image using the Oxford f a c i l i t i e s ?
f i g u r e 5.16 shows a s e c t i o n o f the v e c t o r - f i l e a f t e r
c o nversion from r a s t e r . The r e s u l t s are encouraging; there
i s no evidence of f e a t u r e omissions and the connection of
po i n t s i s a c c u r a t e and r e l a t i v e l y smooth. There are
i n s t a n c e s where the stepping e f f e c t of the line-work
( a s s o c i a t e d with r a s t e r images) i s evi d e n t although t h i s i s
r e s t r i c t e d to l i n e s nearing a n o r t h - e a s t e r l y and
no r t h - w e s t e r l y d i r e c t i o n and i s a f u n c t i o n of the p i x e l
r e s o l u t i o n adopted (0.1mm at l s l 2 5 0 s c a l e ) .
Chapter f i v e

- 238 -
acne P
1 oc
I AOO
0 1 *C0
1 200
V 1 oco
800
* o o \ \
s 20
L A aoo aoo <iOC 200 ooo 400 6CC 20
F i g u r e 5.16 S e c t i o n of a v e c t o r f i l e
r e b u i l t from a s i m u l a t e d r a s t e r image
o f OS s h e e t SO 9283SE.
Crown C o p y r i g h t R e s e r v e d .

- 239 -
There has been l i t t l e n e c e s s i t y t o t h i n these r a s t e r l i n e s ( t o s i n g l e p i x e l w i d t h s ) since the d i g i t a l v e c t o r - t o - r a s t e r software already provides the data i n an a p p r o p r i a t e form i . e . one p i x e l wide; the Oxford software need o n l y v a l i d a t e the p i x e l data and l o g i c a l l y chain them tog e t h e r . This f a c t o r w i l l have enhanced the q u a l i t y o f the r e s u l t s considerably since i t i s the l i n e t h i n n i n g stage which i s most arduous (Boyle 1979). The cpu times f o r the conversion on the Oxford DEC PDP10 computer are given i n t a b l e 5.17:
Table 5.17: DEC PDP10 process times t o convert 4096 x 4096 r a s t e r image o f 1:1250 sheet SO 9283SE i n t o vector form.
P i x e l i n p u t 142 seconds S k e l e t o n i s i n g 335 seconds Node and segment formation 408 seconds Output 70 seconds
C l e a r l y the v e c t o r i s i n g stage i s a lengthy process -excluding the time taken f o r data i n p u t and o u t p u t , the conversion has taken i n excess o f 740 cpu seconds. The considerable times associated w i t h the data I/O are a l l i e d w i t h the volumes i n v o l v e d ( F r a n k l i n 1979) and these account a f u r t h e r 22 per cent o f the t o t a l time. I t i s d i f f i c u l t t o compare the processing times quoted here w i t h those given e a r l i e r d e s c r i b i n g work c a r r i e d out on the IBM 370/168 at
Chapter f i v e
- 240 -
NUMAC; i t i s l i k e l y t h a t the IBM machine i s 2-3-4 times as f a s t as a DEC 10 computer (depending on the model). Such la r g e processing times f o r a r e l a t i v e l y low p i x e l r e s o l u t i o n and l i n e - w o r k which i s already s k e l e t o n i s e d ( t h i n n e d ) i s i n t o l e r a b l e f o r a p r o d u c t i o n system. An increase o f c f o r t y per cent i n the processing times i s t o be expected w i t h data c o l l e c t e d d i r e c t l y from a scanning device? e x t e n s i v e l i n e t h i n n i n g and v a l i d a t i o n w i l l be r e q u i r e d before any p i x e l - c h a i n i n g and node and segment i d e n t i f i c a t i o n can begin. The e x t e n t t o which these times are dependant on i n a p p r o p r i a t e s o f t w a r e - t u n i n g i s unknown; c e r t a i n l y , more favourable speeds may be a t t a i n e d w i t h software which i s designed t o s u i t the c h a r a c t e r i s t i c s o f the i n p u t data more c l o s e l y . The work o f the Oxford team i s admirable given the volume of data i n v o l v e d and complexity o f the Ordnance Survey polygons. The q u a l i t y o f the r e s u l t a n t v e c t o r s and the c h a r a c t e r i s t i c s o f the data s t r u c t u r e has p o t e n t i a l i n f u t u r e d i g i t a l r e p r e s e n t a t i o n s o f topographic i n f o r m a t i o n ; Ordnance Survey has monitored a l i n k and node s t r a t e g y since the mid-seventies (Thompson 1978). However, evidence from these t e s t s show t h a t the e x i s t i n g processing rates f o r post hoc manipulation o f scanned data are i n a p p r o p r i a t e i n a commercial environment. These rates are l a r g e l y a r e s u l t o f the i n a p p r o p r i a t e design o f e x i s t i n g computer systems and a l g o r i t h m s .
Chapter f i v e

- 241 -
For the complete map-image, the Oxford r a s t e r - t o - v e c t o r program produced 4671 segments and 3440 nodes: i t would have been i n s t r u c t i v e t o compare t h i s summary w i t h e q u i v a l e n t i n f o r m a t i o n from the Ordnance Survey r e s t r u c t u r i n g software. This i s not p o s s i b l e , however, since the PMA schema (See s e c t i o n 2.7.1) introduces a d d i t i o n a l node-points a t each 100 metre g r i d square boundary. Further, i t i s not the c u r r e n t p r a c t i c e f o r the Ordnance Survey r e s t r u c t u r i n g software t o provide a summary of the t o t a l number o f nodes and l i n k s d e s c r i b i n g a map-image.
Generally, the d e s c r i p t i o n o f a n o d a l - p o i n t i s s p e c u l a t i v e , p a r t i c u l a r l y i n the Oxford v e c t o r i s i n g software. The node-count o f 3440 f o r the t e s t 1:1250 data comprises nodes having two or more segments attached. An example o f a two-order-node occurs w i t h closed, i s o l a t e d b u i l d i n g polygons
where two l i n e s w i l l enter one node i n t h a t f e a t u r e . Post hoc software can remove two-order-nodes i f r e q u i r e d : t h i s has taken an e x t r a 110 cpu seconds and r e s u l t s i n 2730 nodes and 3996 segments. I n t h i s way, i t i s p o s s i b l e t o reduce the complexity o f the d i g i t a l ' map data since l i t t l e over twenty per cent o f the o r i g i n a l node-count comprises two-order-nodes.
Chapter f i v e

- 242 -
5.7 CONCLUSIONS
The i n v e s t i g a t i o n s described i n t h i s chapter on the generation o f r a s t e r images from d i g i t a l v e c t o r f i l e s o f topographic data and t h e i r subsequent packing and unpacking have served s e v e r a l purposes:
1. They have given an i n s i g h t i n t o the techniques and problems associated w i t h h a n d l i n g l a r g e arrays o f image data i n a s e r i a l processing environment.
2. I t has been p o s s i b l e t o q u a n t i f y the ex t e n t o f computer resources necessary - a t l e a s t f o r the ve c t o r t o r a s t e r conversion.
3. E r r o r - f r e e r a s t e r data sets have been developed which have f a c i l i t a t e d many a n c i l l i a r y i n v e s t i g a t i o n s :
(a) comparisons w i t h r a s t e r images obtained from t r u e scanning sources;
(b) e s s e n t i a l s t a t i s t i c a l analyses t o determine c h a r a c t e r i s t i c s and contents o f the data;
(c) t e s t s on the q u a l i t y and p r e c i s i o n o f raster-based d i s p l a y devices;
Chapter f i v e

- 243 -
(d) i n p u t data known t o be 'clean' have been made a v a i l a b l e t o study the f e a s i b i l i t y o f a r r a y processing techniques and t o discover the types o f manipulation p o s s i b l e on these new gene r a t i o n machines, i n c l u d i n g a p p r a i s a l s o f r a s t e r - t o - v e c t o r conversion software.
I t has not been the i n t e n t i o n o f t h i s work t o develop a robust, h i g h l y advanced method o f producing r a s t e r f i l e s from OS vector-based customer data s e t s . Indeed t h i s work has made extensive use o f the f a c i l i t i e s provided on a powerful mainframe computer; comparative software f o r smaller mini-computer i n s t a l l a t i o n s w i l l n e c e s s i t a t e f u r t h e r amendments and t u n i n g t o be made.
G r a p h i c a l l y , a t l e a s t , the r e s u l t s have provided a means of comparison w i t h those achieveable through conventional OS pro d u c t i o n methods and w i t h the r e s u l t s p o s s i b l e by p u r e l y automatic means - these are described i n d e t a i l i n chapter seven.
The exercise has proven i t t o be t e c h n i c a l l y p o s s i b l e t o tran s f o r m d i g i t a l r e p r e s e n t a t i o n s between vector and r a s t e r n o t a t i o n s a l b e i t w i t h modified s t r u c t u r e and much cent r a l - p r o c e s s o r resources. There i s evidence t o suggest
Chapter f i v e

- 244 -
t h a t the problems associated w i t h a r a s t e r - t o - v e c t o r conversion f o r p u r e l y scanned data f a r outweigh those in h e r e n t i n the conversion o f simulated-images as has been the case here. Nevertheless, i t i s t o be a n t i c i p a t e d t h a t f l u e n t r a s t e r - t o - v e c t o r - t o - r a s t e r t r a n s f o r m a t i o n s w i l l become necessary and more robust i n the next few years.
Chapter f i v e

- 245 -
APPENDIX 5.1
Determination o f the equation o f a s t r a i g h t l i n e knowing two p o i n t s on t h a t l i n e
The general equation o f a s t r a i g h t l i n e i s :
y = m * x + c (1)
where m i s the g r a d i e n t c i s the value o f y when x = 0
At l e a s t two p o i n t s are r e q u i r e d t o describe a s t r a i g h t l i n e :
Consider:
g r a d i e n t = m = d i f f . y y2 - y l d i f f . x x2 - x l
(2)
S u b s t i t u t i n g (2) i n t o (1) gives
( y2 - y l ) y = * x + c
( x2 - x l ) (3)
Appendix 5.1

- 247 -
At p o i n t x l , y l from ( 3 ) :
( y2 - y l ) y l = * x l + c
( x2 - x l )
To f i n d c:
( y2 - y l ) c = y l - * x l (4)
( x2 - x l )
S u b s t i t u t i n g (4) i n t o (3) g i v e s :
( y2 - y l ) ( y2 - y l ) y = * x + y l - * x l
( x2 - x l ) ( x2 - x l )
( y2 - y l ) * ( x - x l ) y - y l =
( x2 - x l )
Equation o f a s t r a i g h t l i n e knowing two p o i n t s on t h a t l i n e i s :
y - y l x - x l y2 - y l x2 - x l
Appendix 5.1

- 248 -
THE MANIPULATION OF RASTER DATA ON A PARALLEL COMPUTER
.1 INTRODUCTION
Since the e a r l y s e v e n t i e s , a new generation o f computing hardware i n v o l v i n g a r r a y (or p a r a l l e l ) techniques has been undergoing s t r i n g e n t t e s t s i n an attempt t o speed-up e x i s t i n g processing r a t e s f o r some algo r i t h m s (Parkinson 1976). Not s u r p r i s i n g l y , many o f these t e s t s have had t h e i r o r i g i n s i n the applied-sciences, where d i g i t a l a p p l i c a t i o n s r e q u i r e vast amounts o f c e n t r a l processor power: f i n i t e element a n a l y s i s and modelling and s i m u l a t i o n techniques i n f i e l d s such as meteorology are a l l examples. There i s l i t t l e evidence o f research o f a s i m i l a r nature f o r the h a n d l i n g o f geographic data. By f a r the m a j o r i t y o f known e x i s t i n g systems are based-around a s e r i a l - t y p e computing environment (e.g. Brassel et a l 1980, Calkins e t a l 1980, Cooke and Ma x f i e l d 1967, ESRI 1971, Harvard U n i v e r s i t y 1974, MSDOA 1971, Peuquet et a l 1980, Switzer 1975, Tomlinson et al. 1976): a se q u e n t i a l method o f d i g i t a l m anipulation has not r e s t r i c t e d these developments unduly since the amounts o f a r i t h m e t i c operations tend t o be l i m i t e d i n e x t e n t . The steady decrease i n costs for* computing hardware and the generation o f advanced serial-programming techniques and data s t r u c t u r e s
Chapter s i x

- 249 -
and the c o n c e n t r a t i o n o f vector data formats have been i n s t r u m e n t a l i n p r e s e r v i n g t h i s conservatism.
Section 5.1 p o i n t s - o u t how the increased data volumes and c e n t r a l processor dependance l i k e l y t o a r i s e w i t h r a s t e r systems may w e l l b e n e f i t from p a r a l l e l processing techniques. The nature o f the raster-based algorithms and the h i g h demand f o r increased throughput o f data i s p r o v i n g t o be s e v e r e l y constrained by s e r i a l processors. The c u r r e n t design o f these t r a d i t i o n a l machines appears t o be n e a r l y reaching the l i m i t s o f i t s performance c a p a b i l i t y (see 5.2). Speed-up f a c t o r s o f the order o f two t o f i v e may be achieveable w i t h the use o f ^ l a r g e scale i n t e g r a t i o n (VLSI) m i c r o - c i r c u i t s and heat e x t r a c t i o n technologies although, even w i t h these increases, t h e r e i s evidence (see t a b l e 5.10) t o suggest the need f o r serious i n v e s t i g a t i o n i n t o the a p p l i c a b i l i t y o f completely new approaches. The high-costs o f hardware and the s p e c i a l i s e d software associated w i t h these a l t e r n a t i v e s have not been conducive towards the development o f f a s t e r and c o s t - e f f e c t i v e r a s t e r systems. No commercially a v a i l a b l e raster-based systems (see chapter seven) have yet adopted a p a r a l l e l - s t r a t e g y o f d i g i t a l manipulation and, hence, any formal research i n t o methodologies are l i m i t e d i n e x t e n t .
This chapter r e p o r t s on the design and implementation o f a s e r i e s o f t e s t s c a r r i e d - o u t t o discover the f e a s i b i l i t y and
Chapter s i x

- 250 -
performance o f ha n d l i n g the Ordnance Survey l a r g e scales data i n raster-mode on a p a r a l l e l processor. There i s much evidence t o suggest t h a t d i s t i n c t b e n e f i t s can be achieved w i t h the adoption o f these new generation machines which lend themselves r e a d i l y t o c e r t a i n tasks f a r more f a v o u r a b l y . I t i s c r u c i a l t o develop them now as present i n d i c a t i o n s suggest the widespread a v a i l a b i l i t y o f these new hardware concepts w i t h i n the next decade (Parkinson 1978).
AN ARRAY-TYPE COMPUTING ENVIRONMENT
A d e s c r i p t i o n o f the a r c h i t e c t u r e o f conve n t i o n a l serial-computers has been given i n s e c t i o n 5.2; the i n t r o d u c t i o n o f s p e c i a l i s e d array-processors has been a l o g i c a l extension o f these basic p r i n c i p l e s . The essence o f an array-processor i s a considerable "number-crunching" c a p a c i t y ; attempts have been made t o increase the r a t e s o f c e n t r a l processor m a n i p u l a t i o n w h i l s t l i t t l e a t t e n t i o n has been given t o speeding-up the t r a n s f e r o f data t o and from the backing s t o r e . Some fundamentally new approaches have been necessary t o develop these computers which are orders o f magnitude f a s t e r than the f a s t e s t s e q u e n t i a l machines.
The separation o f the main-memory and the a r i t h m e t i c u n i t i n normal computers has lead t o a requirement f o r data t o be
Chapter s i x
- 251 -
t r a n s m i t t e d between the two; the speed o f t h i s data highway i s an obvious b o t t l e n e c k , p a r t i c u l a r l y w i t h voluminous r a s t e r data, and t r a n s f e r r a t e s many times those a v a i l a b l e from c u r r e n t technology are needed i f dramatic increases i n useable power are t o be achieved. Since the modern se q u e n t i a l machines are now reaching the p r a c t i c a b l e l i m i t s o f data t r a n s f e r and processing speeds, a t t e n t i o n has began to focus on the design o f these more s p e c i a l i s e d devices w i t h the a b i l i t y t o provide m u l t i p l e - p r o c e s s i n g streams, simultaneous data m a n i p u l a t i o n and so on. The term "array-processor" has come t o be a popular d e s c r i p t i o n o f t h i s new-type o f machine although i t encompasses two very d i f f e r e n t types o f a r c h i t e c t u r e : an a r r a y o f processors or an a l t e r n a t i v e design t h a t i s p a r t i c u l a r l y e f f i c i e n t a t processing arrays (the p i p e l i n e approach). Since confusion on the terminology o f these d i f f e r e n t types o f s p e c i a l i s e d hardware abounds, a d i s t i n c t i o n between the two w i l l now be made.
.2.1 The vec t o r or p i p e l i n e a r r a y processor
The v e c t o r - a r r a y processor e x p l o i t s the p i p e l i n e p r i n c i p l e already used i n many advanced s e q u e n t i a l machines. The basic p r i n c i p l e o f the p i p e l i n e i s t o a l l o w overlapping i n the various stages o f the decoding, data f e t c h i n g and execution
Chapter s i x

- 252 -
of i n s t r u c t i o n s . I n t h i s way, i t i s p o s s i b l e t o perform more q u i c k l y p r o v i d i n g t h a t the a l g o r i t h m i s s u i t e d t o the a r c h i t e c t u r e and there are s u f f i c i e n t data t o process. The devices emanating from F l o a t i n g Point Systems In c . have evolved around the p i p e l i n e p r i n c i p l e : these are designed t o connect as p e r i p h e r a l s t o e x i s t i n g computer systems t o provide a s p e c i a l i s e d form o f data processor f o r the r i g h t job. The AP120B can be connected t o most popular mini-computers and the AP190L has a s i m i l a r design s t r a t e g y w i t h i n t e r f a c e s a p p r o p r i a t e f o r mainframe computers ( F l o a t i n g Point Systems 1979).
A s i m p l i f e d d e s c r i p t i o n o f the elements i n a p i p e l i n e array-processor i s given i n f i g u r e 6.1, i n which the f l o a t i n g - p o i n t m u l t i p l i e r i s used as an example. I n b i n a r y form each f l o a t i n g - p o i n t m u l t i p l i c a t i o n comprises three o p e r a t i o n s : the exponents o f the two numbers are added, t h e i r mantissas are m u l t i p l i e d and the r e s u l t i s renormalised i n t o an a p p r o p r i a t e form. With conventional sequential-machines, each p a i r o f numbers must have completed a l l three stages before the next p a i r can enter the a r i t h m e t i c u n i t . The p i p e l i n e s t r a t e g y has been t o a l l o w the second p a i r o f numbers t o enter stage 1 as soon as the f i r s t p a i r have passed t o stage 2. Thus, p r o v i d i n g there are a s u f f i c i e n t number of numbers t o m u l t i p l y , the hardware w i l l perform three times as f a s t as a conventional processor.
Chapter s i x

- 253 -
CD O CD t CD
B a
cr m LU a
0) Q 55 Q 55
< Z CvJ O Q. 0. 0)
o 55 z <
LO
a 0) 55
>-a: O UJ
3 o
< 05
CC O co CO LU o o cr Q_ > < DC tr < L L T
L U
a.
O CO I -z UJ z o CL O o o CO < CD 111 I t t
cc O CO CO LU O O DC CL
< DC DC < LU
LU Q. CL <
CD U
cn •H fa

- 254 -
S i m i l a r design s t r a t e g i e s are p o s s i b l e f o r the f l o a t i n g - p o i n t a d d i t i o n o f numbers. C l e a r l y there i s an i n i t i a l s t a r t - u p time before the p i p e l i n e reaches i t s maximum speed o f op e r a t i o n . To m u l t i p l y one p a i r o f numbers on an AP120B, f o r example, w i l l take the same time as a s e r i a l machine -t y p i c a l l y 500 nanoseconds. For a s e r i e s o f m u l t i p l i c a t i o n s i t i s p o s s i b l e t o reduce these r a t e s by a f a c t o r o f t h r e e : once the p i p e l i n e i s f u l l , a new answer i s produced every 167 nanoseconds. The FPS brochure ( F l o a t i n g Point Systems 1979) quotes the p o s s i b i l i t y o f t w e l v e - m i l l i o n f l o a t i n g p o i n t computations per second; t h i s , however, i s dependant on the types o f a r i t h m e t i c t o be performed and the volume o f data i n v o l v e d .
C l e a r l y these s p e c i a l i s e d machines have much p o t e n t i a l f o r c e r t a i n , high-computational tasks; they have proved t o be h i g h l y u s e f u l f o r the Fo u r i e r t r a n s f o r m a t i o n s of l a r g e seismic data sets i n the o i l i n d u s t r y (Parkinson, pers comm 1979). Their s u i t a b i l i t y f o r the ha n d l i n g o f geographic r a s t e r data has r a t h e r less p o t e n t i a l , given the need t o perform operations which, f o r example, may ' r i p p l e outward* from one p o i n t i n the a r r a y and, furthermore, there are a number of fundamental problems i n the design s t r a t e g y making the devices l e s s - e f f i c i e n t than the t h e o r e t i c a l hardware s p e c i f i c a t i o n s lead us t o b e l i e v e . I n general, the p i p e l i n e processor has only l i m i t e d amounts of memory and must r e l y on
Chapter s i x

- 255 -
the main memory o f the host computer f o r data storage. This necessitates the r e p e t i t i v e t r a n s f e r o f data items between the host machine and the processor, which i s i n c l i n e d t o slow severely the computational r a t e s : the vector processor w i l l o f t e n spend most o f i t s time i d l e , a w a i t i n g the supply o f more numbers t o "crunch".
The development o f a p p r o p r i a t e software i s i n c l i n e d t o be arduous; the FPS array-processors are programmed i n a l o w - l e v e l assembly language (APAL) or v i a a s e r i e s o f subroutine c a l l s from standard h i g h - l e v e l FORTRAN. I n t h i s way the users are r e s t r i c t e d t o those f a c i l i t i e s o f f e r e d by the manufacturer; these are d i f f i c u l t t o change w i t h o u t d e t a i l e d knowledge o f l o w - l e v e l assembly programming and a thorough conception o f the machine's a r c h i t e c t u r e . Nevertheless, the s p e c i a l i s e d devices are pr o v i n g t o be favourable i n a number o f work environments: they are r e l a t i v e l y inexpensive (c. 60,000 US d o l l a r s f o r AP120B) and provide powerful resources f o r i n t e n s i v e computing t a s k s . For example, favourable r e p o r t s have emanated from the Royal A i r c r a f t Establishment, Farnborough, UK who are using a PRIME 400 mini-computer/API20B i n s t a l l a t i o n f o r e f f i c i e n t m anipulation o f remote-sensing data and image processing techniques (Hardy, Earwicker pers comm 1979). I n RAE remote sensing a p p l i c a t i o n s , the sheer volume o f the data i s a major problem: the d i g i t a l m anipulation o f each SEASAT (radar)
Chapter s i x

- 256 -
image has taken one f u l l day to process with the p i p e l i n e
p r o c e s s o r . I t i s expected t h a t t h i s would have taken
two-weeks by conventional methods.
Although F l o a t i n g Point Systems I n c . are market l e a d e r s i n
the f i e l d of p i p e l i n e a r r a y - p r o c e s s o r s , they do not have a
monopoly. Data General provides a r r a y - p r o c e s s i n g f a c i l i t i e s
by means of s p e c i a l i s e d options connected to t h e i r E c l i p s e
S130 and S250 mini-computers. The E c l i p s e S130 with AP130
a r r a y - p r o c e s s o r option c o s t s c.40,000 US d o l l a r s f o r the
64Kbyte machine and c.55,000 US d o l l a r s f o r a 256Kbyte
machine.
The IBM 3838 a r r a y - p r o c e s s o r has not found i t s way i n t o
many a p p l i c a t i o n s o u t s i d e s e i s m i c c a l c u l a t i o n s and
a l g o r i t h m s : the hardware i s expensive (3 70,000 pounds
s t e r l i n g f o r a one-megabyte machine) and runs on a l l IBM
mainframes supporting the V i r t u a l Storage (VS) or (MVS)
operating system w i t h the exception of the System 370/135.
Some more e x t e n s i v e l y used vector-based a r r a y p r o c e s s o r s
have been those of the Cray s e r i e s of computer systems (Cray
Research I n c . 1980). The f i r s t Cray machine was d e l i v e r e d i n
1976 and the design s t r a t e g y has s i n c e found i t s way i n t o the
f o l l o w i n g work a r e a s : weather f o r e c a s t i n g and climatology,
petroleum r e s e a r c h , s t r u c t u r a l a n a l y s i s , n u c l e a r r e s e a r c h ,
Chapter s i x

- 257 -
geophysics and s e i s m i c a n a l y s e s , f l u i d dynamics, defence and
medical r e s e a r c h . Current c o s t s of a Cray machine can range
between f i v e and ten m i l l i o n d o l l a r s , depending on the model
of machine and extent of memory s e l e c t e d .
.2.2 The D i s t r i b u t e d or c e l l u l a r Array P r o c e s sor
The p i p e l i n e approach d e s c r i b e d i n 6.2.1 can be co n s i d e r e d
a p r o c e s s o r o f a r r a y s ; i n c o n t r a s t , the c e l l u l a r s t r a t e g y i s
t r u e l y an a r r a y of p r o c e s s o r s . Although I C L c l a i m to be the
only manufacturer with a commercially a v a i l a b l e product i n
t h i s market - t h e i r D i s t r i b u t e d Array Processor - the b a s i c
notion of an a r r a y of m u l t i - o p e r a t i o n a l p r o c e s s o r s which can
execute the same i n s t r u c t i o n on many data items
s i m u l t a n e o u s l y has been known f o r many y e a r s . There have
been s e v e r a l d e v i c e s of t h i s type b u i l t , most notably the
Goodyear STARAN (Goodyear Aerospace 1974) and the Burrough's
I L L I A C - I V (Thurber and Wald 1975). The ICL D i s t r i b u t e d Array
Processor (DAP) i s s i m i l a r i n nature to these machines
although there a r e two important d i f f e r e n c e s :
1. there are 4096 p r o c e s s i n g elements i n the DAP as opposed
to 2 56 and 64 f o r the STARAN and I L L I A C - I V r e s p e c t i v e l y ;
2. the p r o c e s s i n g elements (PEs) are one-bit p r o c e s s o r s and
Chapter s i x

- 258 -
hence are l i m i t e d i n t h e i r a p p l i c a t i o n s - a l l data
manipulation, other than s i n g l e - b i t l o g i c a l i n s t r u c t i o n s ,
must be performed by software.
Furthermore, the STARAN, which has been b u i l t under
c o n t r a c t to NASA, i s more f l e x i b l e i n i t s host-computing
requirements. Whereas the DAP r e l i e s on the host machine
being a powerful ICL 2900 s e r i e s mainframe supporting the ICL
VME/B oper a t i n g system, the STARAN has been designed to
connect to a standard mini-computer, t y p i c a l l y the DEC PDP-11
s e r i e s .
A s i m p l i f i c a t i o n o f the DAP a r c h i t e c t u r e i s shown i n
fi g u r e 6.2. The b a s i c c o n f i g u r a t i o n comprises a 64 x 64
two-dimensional g r i d o f PEs each with 4096 b i t s of a s s o c i a t e d
l o c a l memory. The f a c t t h a t t h e r e a r e 4096 b i t s of l o c a l
memory and 4096 PEs i s c o i n c i d e n t a l ; f u t u r e v e r s i o n s of the
DAP w i l l u t i l i s e l a r g e s c a l e i n t e g r a t i o n technology and
i n c r e a s e the pre s e n t two-megabyte c a p a c i t i e s (64 x 64 x 4096
b i t s ) up to eight-megabytes (64 x 64 x 16K b i t s ) . Each
p r o c e s s i n g element i s , to a l l i n t e n t s and purposes, a c e n t r a l
processor i n i t s own r i g h t although the a c t u a l f u n c t i o n s t h a t
can be performed are l i m i t e d i n ex t e n t . These machines have
been c h r i s t e n e d as s i n g l e - i n s t r u c t i o n - m u l t i p l e - d a t a stream
(simd) computers; a s i n g l e i n s t r u c t i o n only can be obeyed
Chapter s i x

- 259 -
4K Bit planes
Master control unit
/ \ / \
/ \ / \
\ / \ / \ Array of processing
element
Planes of main store associated with P.E.'s
64 64
SIMPLIFIED ELEMENTS OF THE ICL DISTRIBUTED ARRAY PROCESSOR
Figure 6.2

- 260 -
simul t a n e o u s l y i n the m u l t i p l e p r o c e s s i n g elements. Thus,
two PEs cannot perform d i f f e r e n t t a s k s a t the same time
although they can be i n s t r u c t e d to s w i t c h o f f for a s p e c i f i e d
number of machine c y c l e s . The r e p e r t o i r e of the PEs i s two
f o l d : they can perform one-bit a d d i t i o n and a one - b i t
broadcast of data to one of t h e i r four neighbouring row and
column PEs,
For purposes of computation, the DAP can be d e s c r i b e d as
comprising:
1. 4096 s t o r e planes of 64 x 64 b i t s ?
2. the a c t i v i t y plane (A-plane) of 64 x 64 b i t s - t h i s i s
one of the t h r e e planes comprising the PEs (see f i g u r e
6.2). The s e t t i n g of a p a r t i c u a l r b i t to '.TRUE.1 i n the
A-plane i n s t r u c t s the a s s o c i a t e d PE to perform a given
i n s t r u c t i o n ; i f the A-plane b i t i s unset (.FALSE.) then
the PE remains i d l e and ignores any given i n s t r u c t i o n .
The use of the a c t i v i t y plane has much importance i n
a r r a y - p r o c e s s i n g and, i n p a r t i c u l a r , i n geographic data
p r o c e s s i n g ; i t a c t s as a 'mask' t o determine whether each
i n d i v i d u a l PE i n the g r i d a c t s on an i n s t r u c t i o n or l i e s
dormant;
3. the quo t i e n t and c a r r y p l a n e s (Q and C-planes) of 64 x 64
Chapter s i x

- 261 -
b i t s - these two planes complete the t h r e e planes i n each
p r o c e s s i n g element. There a r e two b a s i c o p e r a t i o n s t h a t
can be performed with t h e s e : the f i r s t i s to add the
contents of a s t o r e plane to the contents of the Q-plane
(element by element) with the r e s u l t i n g sum being p l a c e d
i n both the Q-plane and the s t o r e plane with the c a r r y
b i t s s e t i n the C-plane where n e c e s s a r y . The second
o p e r a t i o n i n v o l v e s s h i f t i n g a l l the b i t s i n the Q-plane
one g r i d i n t e r v a l i n the same d i r e c t i o n . For example,
the case shown below i s a c y c l i c - s h i f t n orth:
1 1 0 1 1 1
1 1 1 » 0 1 0
0 1 0 1 1 0
4. The master c o n t r o l u n i t (MCU) has the t a s k of c o n t r o l l i n g
the a r r a y of p r o c e s s o r s as a whole; i t i n s t r u c t s them as
to what they should be doing a t any p a r t i c u l a r time.
The a r c h i t e c t u r e of the DAP has been designed to f i t
n e a t l y i n t o an I C L 2900 s e r i e s mainframe computing
environment (a DAP w i l l run with an I C L 2960 or l a r g e r ) .
F i g u r e 6.3 shows t h i s r e l a t i o n s h i p .
Chapter s i x

- 262 -
3 Q >
cQ cQ cD 03 C
x ID
< Q
tive
[ no <
Q
0 o -o 0 0 °
< 00
0> <D 3 O "O CO m
o <
00
QJ O C O u CO Q) (/> — <D O (J >-U c J
° o <D U if
c o nj o o k
o ss
c $ 0) o E 0) o
E z o O
o E
in a> u o „ at OJ
;= a "5 ° ro «J m n 5
U < O 3
^ < o CO Q 2
a
0) a>
00 W5
DC O co CO UJ O O DC CL
< DC DC < a LU i -Z) go oc f -co a x
O < DC
o o o o o O) c\j _ i o < o CL > (-<
QJ
•H

- 263 -
To a l l i n t e n t s and purposes, the v i r t u a l memory of the
2900 comprises a s e r i e s of two-megabyte s t o r e modules, each
with t h e i r own a c c e s s c o n t r o l l e r to connect them to the order
code p r o c e s s o r ( I C L terminology for c e n t r a l p r o c e s s o r ) and
a l l other s t o r e modules. The DAP i s considered by the host
machine to be another two-megabyte s t o r e module except t h a t
i t has the a b i l i t y to perform i t s own s p e c i a l i s e d data
p r o c e s s i n g ; a DAP can be used as conventional 2900 s t o r e i f
a r r a y - p r o c e s s i n g c a p a b i l i t i e s are not r e q u i r e d . To load the
DAP with data i s an i d e n t i c a l o peration to loading the 2900
main memory; the host mainframe must provide a l l input and
output c a p a b i l i t i e s f o r the DAP, which i s unable t o perform
any i t s e l f . I n t h i s way, I C L have been a b l e t o reduce the
problems of the slow data loading a s s o c i a t e d with the
p i p e l i n e approach (see 6.2.1).
E a r l y r e l e a s e s of the VME/B operating system w i t h DAP
c a p a b i l i t i e s have n e c e s s i t a t e d a s i n g l e - u s e r batch-mode only
for a r r a y - p r o c e s s i n g j o b s . Recent m o d i f i c a t i o n s to the
software have permitted a s e r i e s of improvements:
1. the i n t r o d u c t i o n of asynchronous input and output - hence
I/O can be t a k i n g p l a c e w h i l s t the DAP i s s t i l l
p r o c e s s i n g . The f a c i l i t y i s achieved by c y c l e - s t e a l i n g
( i . e . the DAP w i l l stop f o r each s t o l e n c y c l e ) . At
worst, t h i s generates a twenty per cent degradation i n
Chapter s i x

- 264 -
performance but on average i s nearer to f i v e per cent.
C l e a r l y , the a b i l i t y to t r a n s f e r eight-megabytes per
second between the DAP module and other 2900 storage i s
advantageous t o enable more e f f i c i e n t use of the DAP on
t a s k s most s u i t e d to i t s c a p a b i l i t i e s .
2. The i n t r o d u c t i o n of a Multi-programming environment - has
given the a b i l i t y to have two or more programs running i n
the DAP si m u l t a n e o u s l y . T h i s f a c i l i t y operates by
c y c l e - s t e a l i n g as with (1) above.
3. The dynamic a l l o c a t i o n of the DAP i s a powerful r e c e n t
m o d i f i c a t i o n - i t i s now p o s s i b l e t o vary the amount of
DAP s t o r e being r e q u i r e d f o r a p a r t i c u l a r job as i t s
demand v a r i e s . T h i s i s the f i r s t stage towards the
m u l t i - u s e r i n t e r a c t i v e use of DAP f a c i l i t i e s i n r e a l
time.
6.2.2.1 Programming the DAP:
The DAP has been designed f o r e f f i c i e n t and easy
implementation o f u s e r - w r i t t e n programs. Two programming
languages a r e o f f e r e d : APAL and DAP-FORTRAN. APAL i s a
l o w - l e v e l assembly language ( I C L , 1979) p r o v i d i n g for
complete c o n t r o l of the hardware f u n c t i o n s i n a fa s h i o n
Chapter s i x

- 265 -
s i m i l a r to the FPS-APAL mentioned i n 6.2.1. DAP-FORTRAN i s
an e x t e n s i o n of h i g h - l e v e l standard ANSI FORTRAN. Almost a l l
data p r o c e s s i n g can be r e a d i l y programmed e f f e c t i v e l y i n
DAP-FORTRAN. The DAP hardware can execute a l l standard
FORTRAN statements with the exception of formatted READ and
WRITE o p e r a t i o n s ; t h i s must be l e f t to the host I C L 2900
(I C L , 1981). There are a number of a d d i t i o n a l f a c i l i t i e s i n
DAP-FORTRAN to provide e f f i c i e n t use of the a r r a y - p r o c e s s i n g
c a p a b i l i t i e s . They evolve around the i n t r o d u c t i o n o f two
e x t r a v a r i a b l e modes: v e c t o r and matrix v a r i a b l e s , together
with an a s s o c i a t e d g e n e r a l i s e d indexing syntax to f a c i l i t a t e
e f f i c i e n t use to be made of them. The d i s t i c t i o n between the
three modes can be d e c l a r e d as f o l l o w s :
INTEGER SCALAR-INTEGER, SCALAR-ARRAY(100), VECTOR()
INTEGER SET-OF-VECTORS(,10), MATRIX(,)
INTEGER SET-OF-MATRICES(,,15)
( S i m i l a r d e c l a r a t i o n s can be made f o r REAL, LOGICAL,
and CHARACTER v a r i a b l e s ) .
The dimensions of the a r r a y q u a n t i t i e s are determined by
the i m p l i c i t a r c h i t e c t u r e of the hardware. For the standard
64 x 64 DAP, each v e c t o r comprises s i x t y - f o u r elements and
each matrix comprises 4096 elements. Conventional a r i t h m e t i c
and l o g i c a l o p e r a t i o n s are performed by software element by
Chapter s i x

- 266 -
element s i m u l t a n e o u s l y . For example, i f A, B and C are REAL
m a t r i c e s , then the syntax i n DAP-FORTRAN to perform an
element by element a d d i t i o n of B and C to produce the r e s u l t
i n A w i l l be:
A = B + C
In standard s e r i a l - c o d e the above statement must i n v o l v e a
s e r i e s of nested loops with a s s o c i a t e d indexing, thus:
DO 10 1=1,64 DO 10 J=l,64
10 A ( J , I ) = B ( J , I ) + C ( J , I )
Mixed mode a r i t h m e t i c and l o g i c a l o p e r a t i o n s are qu i t e
l e g a l i n DAP-FORTRAN, p r o v i d i n g there i s no ambiguity i n the
r e s u l t . For example, i f A and B are REAL m a t r i c e s and C i s a
REAL s c a l a r , then:
A = B * C
means t h a t A i s the element-by-element product of matrix B by
the s c a l a r C.
The t h i r d s i g n i f i c a n t f e a t u r e of DAP-FORTRAN i s masked (or
l o g i c a l ) assignment; the assignment of one matrix to another
can be masked w i t h a LOGICAL matrix. For example, i f A and B
are CHARACTER m a t r i c e s and MASK i s a LOGICAL matrix, then the
statement s
Chapter s i x

- 267 -
A (MASK) = B
means t h a t the element by element assignment t a k e s p l a c e only
where the elements of MASK are s e t ; t h i s technique uses the
a c t i v i t y plane i n the hardware d e s c r i b e d e a r l i e r .
Though i t i s not d i f f i c u l t to w r i t e programs to run on the
DAP, a d i f f e r e n t approach t o algo r i t h m design i s c r u c i a l for
e f f i c i e n t use of the a r r a y p r o c e s s i n g c a p a b i l i t i e s (see
s e c t i o n 6.4). Any programs i n DAP-FORTRAN must f a l l i n t o two
p a r t s :
- a DAP s e c t i o n f o r f a s t a r r a y - p r o c e s s i n g c a p a b i l i t i e s ;
a h o s t s e c t i o n t o handle I/O and s e q u e n t i a l l y - b a s e d
t a s k s .
A modular s t r u c t u r e of software i s d e s i r a b l e with the use
of a s e r i e s of s u b r o u t i n e s : e n t r y i n t o the DAP-sections are
v i a ENTRY SUBROUTINES. Both h a l v e s of the program are
compiled s e p a r a t e l y and are l i n k e d together before e x e c u t i o n .
A block-summary of DAP software design i s given i n f i g u r e
6.4.
Chapter s i x

- 268 -
Figur e 6.4 Block diagram showing the modular nature and the s e p a r a t i o n between h o s t - and DAP-ralated
s e c t i o n s of t y p i c a l DAP software
Host machine s e c t i o n
Written i n ICL 2900 F o r t r a n
INTERFACE-
DAP s e c t i o n
Written i n DAP-Fortran
e n t r y subroutines
ICL 2900 compiled
The DAP knows nothing of t h i s s e c t i o n
•INTERFACE
DAP-Fortran compiled
The c o m p i l a t i o n o f the DAP s e c t i o n i s made i n th r e e
p a s s e s . The DAP-FORTRAN compiler converts the source code
i n t o APAL, the DAP assembler then assembles the APAL source
i n t o a semi-compiled format s u i t a b l e for the c o n s o l i d a t o r (or
l i n k e d i t o r ) t o l i n k the code t o app r o p r i a t e l i b r a r i e s
producing an o b j e c t module. T h i s can then be l i n k e d to the
host FORTRAN o b j e c t module a t run-time.
Chapter s i x

- 269 -
The system developed by I C L i s v e r s a t i l e although the
p r o c e s s i n g r a t e s a c h i e v e a b l e are c l o s e l y a l l i e d with data
c h a r a c t e r i s t i c s and task s p e c i f i c a t i o n s . P r o v i d i n g the
problem s u i t s the hardware a r c h i t e c t u r e then a c e l l u l a r
a r r a y - p r o c e s s o r can provide many-fold i n c r e a s e s i n
throughput. The author's experiences suggests t h a t a l g o r i t h m
design i s m a n i f e s t l y e a s i e r for c e r t a i n t a s k s than with any
s e q u e n t i a l - b a s e d procedures. Conversely, i f the problem
c h a r a c t e r i s t i c s and s i z e are u n s u i t a b l e , then performance
degrades r a p i d l y s i n c e any b e n e f i t s of the p a r a l l e l
a r c h i t e c t u r e are not being used to advantage. The amount of
l o g i c r e q u i r e d to implement a r r a y s of an i n a p p r o p r i a t e s i z e
makes f o r complex and c o s t l y software; i t i s d i f f i c u l t to
implement completely g e n e r a l i s e d code to s u i t a l l user needs.
N e v e r t h e l e s s , experiments c a r r i e d out during t h i s r e s e a r c h
have proved t h a t a DAP-like a r c h i t e c t u r e has much p o t e n t i a l
i n the image p r o c e s s i n g f i e l d . C e r t a i n l y the h a n d l i n g of
r a s t e r - b a s e d monochrome topographic data i s w e l l s u i t e d to a
c e l l u l a r a r r a y - p r o c e s s i n g environment. The a p p r a i s a l t e s t s
have been c a r r i e d - o u t on the f i r s t ICL D i s t r i b u t e d Array
Processor, i n s t a l l e d a t Queen Mary Coll e g e i n the U n i v e r s i t y
of London. T h i s DAP i s connected to a six-megabyte I C L 2980
mainframe which then supported the VME/B ( v e r s i o n 6.21)
operating system. The f o l l o w i n g s e c t i o n s r e p o r t on the
design of these t e s t s and an assessment of the s u i t a b i l i t y of
Chapter s i x

- 270 -
ar-T-ay-processing techniques towards Ordnance Survey d i g i t a l
a p p l i c a t i o n s .
.3 A RASTER-BASED DATA STRUCTURE APPROPRIATE TO THE ICL DAP
The t e s t s c a r r i e d - o u t on a co n v e n t i o n a l computer and
de s c r i b e d i n chapter f i v e have a l l been based on a r a s t e r
b u f f e r s i z e o f 5000 x 5000 elements. These dimensions do not
f i t n e a t l y i n t o the 64 x 64 a r c h i t e c t u r e o f the DAP. For
convenience, a b u f f e r of 4096 x 4096 p i x e l s i s more
app r o p r i a t e . I n g e n e r a l , i t i s not d e s i r a b l e t o amend data
to s u i t hardware c h a r a c t e r i s t i c s although a r r a y - s i z e s i n
m u l t i p l e s of DAP planes are e a s i e r to implement; each
complete image can be s t o r e d w i t h i n 4096 DAP plan e s (a DAP
plane i s a 64 x 64 ' s l i c e ' of the DAP s t o r e module - see
f i g u r e 6.2). However, i n t h i s i n s t a n c e , t o reduce the r a s t e r
dimensions t o 16 m i l l i o n p i x e l s does not a l t e r image
r e s o l u t i o n unduly; f o r a 1:1250 s c a l e map image, each p i x e l
w i l l r e p r e s e n t 0.12 metres a t ground s c a l e and 0.10 mm on the
map. A l l DAP-based r e s e a r c h has been c a r r i e d out with a 4096
x 4096 data s e t generated on the NUMAC IBM 370/168, using the
s e r i a l - c o d e d e s c r i b e d i n 5.3.4.
C l e a r l y , e x i s t i n g data storage n o t a t i o n s d e s c r i b e d i n
s e c t i o n s 5.3 and 5.4 are no longer a p p r o p r i a t e to t h i s
Chapter s i x

- 271 -
computing hardware: run-length encoding s t r a t e g i e s are
d i f f i c u l t to implement and e i g h t - b i t s per p i x e l i s too
voluminous f o r such b i n a r y data - t h i s would r e q u i r e
sixteen-megabytes when only two-megabytes of DAP s t o r e are
a v a i l a b l e . Because of t h i s , i t has been n e c e s s a r y to develop
a new method of data s t r u c t u r e t o s u i t the a r c h i t e c t u r e of
the DAP.
The a b i l i t y to s t o r e l o g i c a l data (.TRUE. or .FALSE.)
w i t h i n a s i n g l e b i n a r y d i g i t on the DAP has enabled an
e f f i c i e n t h i e r a r c h i c a l data s t r u c t u r e t o be developed for
Ordnance Survey r a s t e r - b a s e d map data. The i n d i v i d u a l r a s t e r
b u f f e r s comprising the f u l l DMB f e a t u r e codes (see s e c t i o n
5.3) have been d i v i d e d i n t o a s e r i e s of images - one f o r each
f e a t u r e - t y p e - p r i o r t o w r i t i n g these images onto tape. I n
t h i s way, i t i s p o s s i b l e t o s t o r e each image w i t h i n a one-bit
per p i x e l l o g i c a l a r r a y . Yet, to hold a maximum of 109
r a s t e r b u f f e r s of 4096 x 4096 x 1 b i t elements (one f o r each
c l a s s of f e a t u r e ) i s i n a p p r o p r i a t e with l i m i t e d amounts of
backing s t o r e . F o r t u i t o u s l y each map sheet comprises only
between twenty and t h i r t y f e a t u r e types (Adams 1979) and
hence i t i s unnecessary to hold the r a s t e r f i l e s f o r codes
which are not p r e s e n t . T h i s s t r a t e g y , when a s s o c i a t e d with
the h i e r a r c h i c a l p r o p e r t i e s to be d e s c r i b e d , has reduced data
volumes by f a c t o r s of t e n - f o l d or more.
Chapter s i x

- 272 -
Figure 6.5
A HIERARCHICAL DATA STRUCTURE FOR RASTER DATA
ON A CELLULAR ARRAY PROCESSOR
64
Level 6 64
Level 9 5 1 2
5 1 2
4096 Level 12
4096

- 273 -
The h i e r a r c h i c a l data s t r u c t u r e which has been developed
i s a l o g i c a l e x t e n s i o n of the quadtrees i d e a s of Samat (1980)
i n which a t o t a l image i s subdivided i n t o t i e r s of
information, where each lower t i e r i s a s u b d i v i s i o n of i t s
parent. Ichikawa (1981) has attempted s i m i l a r s t r a t e g i e s for
data compaction and r a p i d r e t r i e v a l of d i g i t a l images:
preceding work, however, has been r e s t r i c t e d to c o n v e n t i o n a l
computing hardware. I t i s appropriate to sub-divide the
complete 4096 x 4096 r a s t e r map sheet i n t o a s e r i e s of l e v e l s
( t i e r s ) i n which each comprises a c o l l e c t i o n o f DAP p l a n e s .
A d e s c r i p t i o n of the data s t r u c t u r e i s o u t l i n e d i n f i g u r e
6.5. At the most disaggregated l e v e l i s the 4096 x 4096
image; t h i s i s l e v e l 12 (2 = 4096). L e v e l 6 i s a 64 x 64
r e p r e s e n t a t i o n of the complete r a s t e r image (2 = 6 4 ) and
f i t s e x a c t l y i n t o one DAP plane. A l e v e l 6 r e p r e s e n t a t i o n of
a complete 1:1250 map p r o v i d e s an index to the more d e t a i l e d
l e v e l 12 d ata; f o r each s e t p i x e l i n the map-index, there
w i l l be an a s s o c i a t e d 64 x 64 DAP plane a t l e v e l 12. In t h i s
way, the data s t r u c t u r e developed i s compatible with the DAP
a r c h i t e c t u r e s i n c e a l l the t i e r s are c e n t r e d around an
a r r a y - s i z e of 64 x 64. Although t h i s s t r a t e g y has been
p r i m a r i l y designed to s u i t the DAP, i t has provided a minor
form of data compaction: t a b l e 6.6 shows a summary of the
r a t e s of compaction fo r two Ordnance Survey 1:1250 t e s t
sheets - f o r comparison purposes one of the sheets
(NZ 2642NE) was used i n the s e r i a l - c o m p a c t i o n t e s t s d e s c r i b e d
Chapter s i x
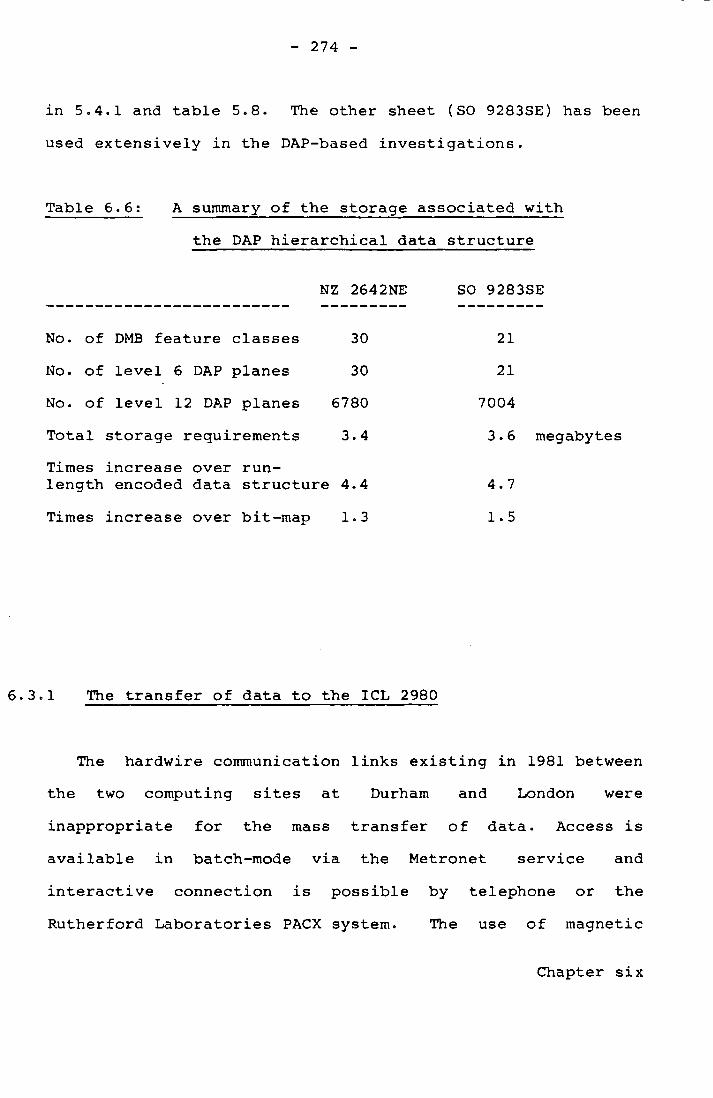
- 274 -
i n 5.4.1 and t a b l e 5.8. The other sheet (SO 9283SE) has been
used e x t e n s i v e l y i n the DAP-based i n v e s t i g a t i o n s .
Table 6.6: A summary of the storage a s s o c i a t e d with
the DAP h i e r a r c h i c a l data s t r u c t u r e
NZ 2642NE SO 9283SE
No. of DMB f e a t u r e c l a s s e s 30 21
No. of l e v e l 6 DAP planes 30 21
No. of l e v e l 12 DAP planes 6780 7004
T o t a l storage requirements 3.4 3.6 megabytes
Times i n c r e a s e over run-length encoded data s t r u c t u r e 4.4 4.7
Times i n c r e a s e over bit-map 1.3 1.5
6.3.1 The t r a n s f e r of data to the ICL 2980
The hardwire communication l i n k s e x i s t i n g i n 1981 between
the two computing s i t e s a t Durham and London were
i n a p p r o p r i a t e f o r the mass t r a n s f e r o f data. Access i s
a v a i l a b l e i n batch-mode v i a the Metronet s e r v i c e and
i n t e r a c t i v e connection i s p o s s i b l e by telephone or the
Rutherford L a b o r a t o r i e s PACX system. The use of magnetic
Chapter s i x

- 275 -
tape was adopted for the t r a n s f e r o f the r a s t e r data between
the two s i t e s . The problems a s s o c i a t e d with data interchange
on magnetic tapes have been pointed out by Visvalingam e t a_l
(1976). The t r a n s f e r o f the r a s t e r f i l e s as EBCDIC
c h a r a c t e r s , grouped i n t o a p p r o p r i a t e data b l o c k s , minimised
these problems: both machines handle EBCDIC by d e f a u l t and
both can read and w r i t e standard l a b e l l e d IBM ta p e s . The
h i e r a r c h i c a l data s t r u c t u r e d e s c r i b e d e a r l i e r was generated
on the IBM 370 at Durham and w r i t t e n d i r e c t l y on to magnetic
tape. With f i x e d length tape-blocks of 4096 c h a r a c t e r s
comprising l o g i c a l r e c ords of 64 c h a r a c t e r s , each DAP plane
f i t s n e a t l y i n t o a tape b l o c k . The r a s t e r p i x e l s are
repre s e n t e d by EBCDIC c h a r a c t e r s ('1' f o r .TRUE., '0' f o r
•FALSE.) and each of the f e a t u r e - t y p e s were grouped i n t o
f i l e s s eparated by tape-marks. Each f i l e comprised a l e v e l 6
(DAP plane) index f o r the whole map sheet , followed by the
r e l e v a n t l e v e l 12 data, which are a l s o grouped i n t o DAP plane
u n i t s . A d i a g r a m a t i c e x p l a n a t i o n o f the tape format i s shown
i n f i g u r e 6.7.
The s i z e of each f i l e i s thus dependant on the number of
s e t p i x e l s i n the index, s i n c e for every s e t p i x e l there w i l l
be an a s s o c i a t e d l e v e l 12 DAP plane. For example, i f f e a t u r e
code 52 has 33 s e t p i x e l s i n the l e v e l 6 index, then the
t o t a l f i l e w i l l comprise t h i r t y - f o u r blocks (2176 r e c o r d s ) ?
one block f o r the index and t h i r t y - t h r e e b l o c k s f o r each
Chapter s i x

- 276 -
Level 6 index 0001860 00 98169
64 Block 1
64 Level 1 2
Dap plane for first 'hit
in index
64 Block 2
Block 3 64
MAGNETIC TAPE FORMAT SUITABLE FOR DAP ENTRY
Figure 6.7

- 277 -
a s s o c i a t e d l e v e l 12 DAP plane. The ac c e s s and r e t r i e v a l of
each r e q u i r e d DAP plane i s t r i v i a l with t h i s method o f
tape-formatting.
A s e r i a l - b a s e d FORTRAN program "QMCFORMAT" was developed
to run a t Durham which c r e a t e d the Queen Mary Coll e g e
t r a n s f e r t a p e s . The source code for t h i s i s given i n Annex
6a. The software takes as input a l e v e l 6 r e p r e s e n t a t i o n (64
x 64 p i x e l s ) and a l e v e l 12 r e p r e s e n t a t i o n (4096 x 4096
p i x e l s ) of each 1:1250 map sh e e t . I t scans the l e v e l 6 index
of each f e a t u r e code and searches f o r s e t p i x e l s . For each
' h i t ' , an a s s o c i a t e d 64 x 64 p a r t i t i o n of the l e v e l 12 data
i s w r i t t e n to the output tape. I t was found n e c e s s a r y to
develop a p p r o p r i a t e mapping f u n c t i o n s t o determine which 64 x
64 l e v e l 12 p a r t i t i o n i s r e q u i r e d for each l e v e l 6 p i x e l . A
d e s c r i p t i o n o f these mapping f u n c t i o n s i s given i n Appendix
6.1. Standard l a b e l l e d IBM tape formats enable f i l e s to be
assigned names; each f e a t u r e code r e p r e s e n t e d on the map
sheets i s named 'FCn', where n i s the DMB f e a t u r e code
i n t e g e r v a l u e . I n t h i s way, i t i s simple t o d i s t i n g u i s h
f e a t u r e types on the ICL 2980 a t QMC.
Chapter s i x

- 278 -
.3.2 Data r e f o r m a t t i n g on the DAP
I t i s i n a p p r o p r i a t e t o s t o r e the r a s t e r - b a s e d data as
EBCDIC c h a r a c t e r s permanently; t h i s i s w a s t e f u l of storage
space and was only a temporary measure to f a c i l i t a t e easy
t r a n s f e r o f data to the DAP s i t e . However, s i n c e the
t r a n s f e r tape i s organised i n u n i t s of DAP planes on a
f e a t u r e - b y - f e a t u r e b a s i s , each DAP plane can be reformatted
from one-EBCDIC c h a r a c t e r per p i x e l to an e q u i v a l e n t s i n g l e
b i n a r y d i g i t . T h i s n o t a t i o n i s a f a c s i m i l e of a DAP-FORTRAN
LOGICAL matrix comprising a s i n g l e b i t plane o f 64 x 64
elements from the 4096 planes a v a i l a b l e i n the a c t i v e s t o r e
(see f i g u r e 6.2). The hexadecimal e q u i v a l e n t of the EBCDIC
c h a r a c t e r '1' i s ' F l ' , l i k e w i s e EBCDIC '0' i s hex. 'F0' and
hence data r e o r g a n i s a t i o n t o DAP form i s easy; a data
compaction and r e f o r m a t t i n g r o u t i n e merely i n v o l v e s
e x t r a c t i n g the l e a s t s i g n i f i c a n t b i t from the EBCDIC data.
Annex 6b l i s t s the DAP-FORTRAN source code developed to
perform t h i s r e f o r m a t t i n g operations program F I L E S i s the
host FORTRAN and subroutine PACK i s the DAP-FORTRAN s e c t i o n
to perform the b i t - s t r i p p i n g . The software can handle up to
300 DAP plane s a t one time ( i n v a r i a b l e ' F I L E ' ) and these are
compressed i n t o the v a r i a b l e 'PACKFILE*. The a c t u a l
b i t - s t r i p p i n g a lgorithm i s performed i n l i n e s 117 to 118 of
subroutine PACK. The p a r a l l e l nature o f the algorithm
ensures r a p i d c o n v e r s i o n . Since the code merely i n v o l v e s
Chapter s i x

- 279 -
l o g i c a l bit-comparisons with no complex a r i t h m e t i c , extremely
f a s t d a t a - r e f o r m a t t i n g i s p o s s i b l e . For example,
r e f o r m a t t i n g the EBCDIC f i l e 'FC002' (minor b u i l d i n g s ) has
taken 800 m i l l i s e c o n d s on the DAP. There are 252 l e v e l 12
DAP planes comprising the f i l e , which r e p r e s e n t s 252 c y c l e s
through the b i t - s t r i p p i n g loop; a conventional
s e r i a l - p r o c e s s o r would n e c e s s i t a t e i n excess of o n e - m i l l i o n
c y c l e s through a s i m i l a r loop - once for each p i x e l - and
re q u i r e d f o r t y - s i x seconds of cpu time on the IBM 370/168
with Assembler programming. The r e s u l t s from the software i n
annex 6b are a s e r i e s of DAP b i t - p l a n e s i n an appropriate
format f o r immediate e n t r y i n t o the a r r a y p r o c e s s o r f o r
f u r t h e r manipulation. These f i l e s , i n t h e i r much compressed
form, are h e l d on d i s k f o r convenience or o f f - l i n e f o r
a r c h i v a l purposes.
6.4 RASTER-BASED MANIPULATION APPROPRIATE TO AN ARRAY-PROCESSOR
The need f o r s e r i o u s development of post hoc manipulation
of r a s t e r - s c a n n e d data has been pointed out i n previous
chapters and elsewhere (Loodts 1981, Peuquet 1981, Weber
1980). Many of the l i m i t a t i o n s encountered i n e x i s t i n g known
r e s e a r c h have been brought about by the i n a p p r o p r i a t e
a r c h i t e c t u r e of conventional computers (see chapter f i v e ) .
F o r t u i t o u s l y a DAP-like machine i s p o t e n t i a l l y w e l l - s u i t e d to
Chapter s i x

- 280 -
the manipulation o f r a s t e r - d i g i t a l images and could provide a
more appropriate means of performing the post hoc p r o c e s s i n g
n e c e s s a r y . R e g r e t t a b l y , the design of the
p a r a l l e l - a l g o r i t h m s are g r o s s l y d i s s i m i l a r to any s e r i a l
e q u i v a l e n t s . Indeed, many of the techniques adopted w i l l be
extremely d i f f i c u l t to amend for a s e q u e n t i a l - p r o c e s s i n g
environment.
A number of f a c i l i t i e s are seen as r e q u i r i n g c r u c i a l
i n v e s t i g a t i o n t o develop a f l e x i b l e , v e r s a t i l e r a s t e r
p r o c e s s i n g system. These a r e : e f f i c i e n t g r aphic output, the
i n t r o d u c t i o n of ap p r o p r i a t e topology i n t o the r a s t e r
" s p a g h e t t i " and a r e l i a b l e conversion of the p i x e l data to
ve c t o r s t r i n g s . Though s e v e r a l systems a r e beginning to
o f f e r s o l u t i o n s to these problems (see chapter s e v e n ) , i t i s
b e l i e v e d t h a t the DAP can provide u s e f u l a s s i s t a n c e i n a l l of
these f a c i l i t i e s . I n p a r t i c u l a r , the DAP i s expected to
provide s o l u t i o n s t o the f o l l o w i n g r a s t e r - b a s e d data
manipulation:
1. Data reformating, s c a l e changes and r o t a t i o n .
2. The i d e n t i f i c a t i o n and r e t r i e v a l of a l l polygons.
3. The v e c t o r i s a t i o n o f the polygon boundaries.
Chapter s i x

- 281 -
4 . The determining of a s p a t i a l f e a t u r e code for each
polygon ( p o s s i b l y with human a s s i s t a n c e ) .
.4.1 DAP-assisted r a s t e r g r a p h i c s - an example of a p a r a l l e l
image p r o c e s s i n g a l g o r i t h m
The storage of the r a s t e r map-data i n s t r u c t u r e s
appropriate to DAP-processing i s a n e c e s s a r y p r e - r e q u i s i t e to
any f u r t h e r data manipulation. The h i e r a r c h i c a l nature of
the data s t r u c t u r e has provided two advantages: the
development of v e r s a t i l e g r a p h i c s f a c i l i t i e s and a c o n t r o l
over the volume of data used i n any f u r t h e r p r o c e s s i n g .
E f f i c i e n t r a s t e r programming r e q u i r e s an a b i l i t y to t r a n s f e r
between data l e v e l s ( r e s o l u t i o n s ) near i n s t a n t a n e o u s l y ; a
p a r a l l e l a l g o r i t h m f o r t h i s t a s k i s b e l i e v e d to o f f e r b e t t e r
response than any sequential-bound p r o c e s s . For example, the
a b i l i t y to t r a n s f o r m the l e v e l 12 data (4096 x 4096) to a
l e v e l 9 r e p r e s e n t a t i o n (512 x 512) f a c i l i t a t e s easy d i s p l a y
of complete r a s t e r 1:1250 images on a Sigma c o l o u r r a s t e r
d i s p l a y d e vice with an a d d r e s s a b l e s c r e e n a r e a of 768 x 512
p i x e l s .
I n essence a change of s c a l e of r a s t e r data i s obtained
through a change i n the r e s o l u t i o n of the p i x e l s . T his i s an
Chapter s i x

- 282 -
important d i f f e r e n c e to s c a l i n g i n ve c t o r p r o c e s s i n g .
Indeed, the a b i l i t y to change the s c a l e of r a s t e r data
q u i c k l y suggests a b a s i s f o r easy map g e n e r a l i s a t i o n of
c e r t a i n f e a t u r e s such as b u i l d i n g s and roads. However,
r a s t e r s c a l i n g i s d i f f i c u l t ; a s c a l e change from a l e v e l 12
image to a l e v e l 9 r e p r e s e n t a t i o n on a s e r i a l - m a c h i n e , for
example, i s a h i g h l y lengthy p r o c e s s . The algorithm i n v o l v e s
s u b - d i v i d i n g the 4096 x 4096 image i n t o a s e r i e s of 8 x 8
"chunks" (512 x 512 of them), c y c l i n g through a p a i r o f
l o c a l l y nested loops f o r each chunk t o t e s t the s t a t e o f each
p i x e l and a s s i g n i n g the e q u i v a l e n t elements i n the r e s u l t a n t
512 x 512 image where n e c e s s a r y . I n essence, the al g o r i t h m
i n v o l v e s 16,777,216 c y c l e s - once for each p i x e l ; t h i s has
taken 36.9 cpu seconds on the IBM 370/168 at Durham using
optimised F o r t r a n code. Far more favourable r e s u l t s have
been p o s s i b l e with p a r a l l e l a l g o r i t h m s . The DAP has achieved
the same end r e s u l t i n 75.4 m i l l i s e c o n d s (a five-hundred
times r e d u c t i o n ) f o r the ' p u b l i c - b u i l d i n g s ' data which a r e
l i m i t e d i n e x t e n t . Quoted DAP-times w i l l be dependant on the
number of DAP plane s comprising each c l a s s of f e a t u r e ; even
more e x t e n s i v e data (e.g. 'other b u i l d i n g s ' ) have taken l e s s
than f i v e seconds. A l t e r n a t i v e l y , the p r o c e s s i n g times on a
s e r i a l machine w i l l remain constant f o r both dense and sparse
r a s t e r images. Annex 6c shows the DAP-FORTRAN l i s t i n g s of a
s u i t e of programs developed to perform t h i s t r a n s f o r m a t i o n
between l e v e l s i n the h i e r a r c h i c a l data s t r u c t u r e . With the
Chapter s i x
- 283 -
a d d i t i o n of r e l e v a n t g r a p h i c s r o u t i n e s , i t i s p o s s i b l e t o
d i s p l a y near i n s t a n t a n e o u s l y complete map sheets h e l d as
l e v e l 12 r e p r e s e n t a t i o n s on a 512 x 512 colour d i s p l a y . The
contents of each r a s t e r DAP plane are d i s p l a y e d as p r o c e s s i n g
develops. H i t h e r t o , any g r a p h i c s d i s p l a y s of the r a s t e r data
i n t h i s work has been l i m i t e d to l i n e - p r i n t e r output ( s e c t i o n
5.3.5) and T e k t r o n i x s c r e e n p l o t s ( s e c t i o n 4.2.3).
The modular design of the g r a p h i c s software i n annex 6c
has f a c i l i t a t e d easy i n t e r f a c e s with subsequent al g o r i t h m s ;
much of the s c a l e - c h a n g i n g software has been used e x t e n s i v e l y
i n f u r t h e r i n v e s t i g a t i o n s . F i g u r e 6.8 shows a block diagram
of the modular g r a p h i c s - s u i t e with an i n d i c a t i o n o f the
a r r a y - p r o c e s s i n g s e c t i o n s .
Chapter s i x

- 284 -
Figure 6.8; A block summary of the gr a p h i c s r o u t i n e s
developed for the DAP and l i s t e d i n annex 6c
OSMAP
^ d a p e n t r y ^
^ ^ CONNECTFILE GETNFC SETMAP
d f IPACK DRAWPADS
ISIGMA
OSMAPPING
GRIDxxx DRAWxxx
I d 1 d COMPRESS MASKPLANE DRAW
dap e n t r y
OUTPUT
INSTRUCTION
Chapter s i x

- 285 -
In f i g u r e 6.8, the s u f f i c e s f = FORTRAN, d = DAP-FORTRAN
and s = VME/B system c o n t r o l language.
PROGRAM OSMAP i s the I C L 2980 host program which c o n t r o l s
the subsequent r o u t i n e s f o r the DAP and the g r a p h i c s output.
I t r e q u e s t s which f e a t u r e type i s r e q u i r e d and reads i n the
l e v e l 6 r a s t e r index f o r the complete map sh e e t . This i s
reor g a n i s e d w i t h i n the a r r a y - p r o c e s s o r i n t o a form more
appropriate f o r r a p i d data indexing. T h i s r e o r g a n i s a t i o n i s
de s c r i b e d below. Subroutine GETNFC ta k e s the index and
transposes each s e t - p i x e l i n t o an e q u i v a l e n t p o s i t i o n a l
address i n an i n t e g e r matrix ( t r e a t i n g i t as a long v e c t o r
1-4096). The p o s i t i o n a l data a r e then shunted (by f u n c t i o n
ISIGMA) to the upper-most p a r t of the matrix p r o v i d i n g a
s e q u e n t i a l index to the a s s o c i a t e d l e v e l 12 DAP p l a n e s .
These stages are shown i n f i g u r e 6.9.
Chapter s i x

- 286 -
Fig u r e 6.9: The generation of an appropriate index to
the l e v e l 12 data for an OS 1:1250 map sheet
l e v e l 6 index (64 x 64)
p o s i t i o n a l i n f o . (1 - 4096)
shunted to produce a s e q u e n t i a l index
Each ascending element i n the s e q u e n t i a l index provides
p o i n t e r s t o the l o c a t i o n of each l e v e l 12 DAP plane; these
can be r e a d - i n c o n s e c u t i v e l y and r e s t r u c t u r e d for the
gr a p h i c s d i s p l a y . Subroutine OSMAPPING i s the DAP e n t r y
subroutine which h o s t s the c o l l e c t i o n o f g r a p h i c s modules.
Three options have been i n c l u d e d to transfor m the data from
l e v e l 12 to l e v e l s 9, 10 and 11: GRID512, GRID1024 and
GRID2048 perform these t a s k s r e s p e c t i v e l y . The a c t u a l data
r e d u c t i o n o p e r a t i o n i s performed i n subroutines COMPRESS and
MASKPLANE. COMPRESS compresses each 64 x 64 DAP plane i n t o
an 8 x 8 c l u s t e r of p i x e l s (or 4 x 4 or 2 x 2 depending on
which data l e v e l i s r e q u i r e d ) . Conceptually t h i s i s achieved
i n a f o l d i n g o p e r a t i o n over the whole DAP plane
s i m u l t a n e o u s l y : a g r a p h i c a l r e p r e s e n t a t i o n b e s t e x p l a i n s t h i s
procedure - see f i g u r e 6.10.
Chapter s i x

- 287 -
Fi g u r e 6.10; A p a r a l l e l algorithm to compress a 64 x 64
image to an 8 x 8
64 8
-
DAP plane 1-8 x 8 f o l d i n g operation by r e p e t i t i v e sub-d.v.AcA i<vte chunk of s h i f t i n g and .OR. ope r a t i o n s 'cku«ks' " f i«sp«is. p i x e l s
For the whole DAP image, t h i s produces:
64 a
(b) 64
Each s i g n i f i c a n t b i t r e p r e s e n t i n g the 8 x 8 chunk can be
grouped together and p o s i t i o n e d i n the a p p r o p r i a t e area of
the (512 x 512) l e v e l 9 f i l e and d i s p l a y e d on the g r a p h i c s
s c r e e n . S i m i l a r l y , map sheet quadrants or o c t a n t s can be
d i s p l a y e d for the l e v e l 10 and l e v e l 11 data r e s p e c t i v e l y .
Chapter s i x

- 288 -
Since the a r r a y p r o c e s s i n g hardware has no f a c i l i t i e s t o
perform any data input and output, then c o n t r o l must be
t r a n s f e r r e d to the host mainframe f o r the grap h i c s d i s p l a y .
An apt method of t e m p o r a r i l y t r a n s f e r r i n g t h i s c o n t r o l , f o r
each DAP plane, i s t o manually cause an e r r o r (or i n t e r r u p t )
i n the DAP-FORTRAN a t the point where I/O i s r e q u i r e d . T h i s
i s achieved w i t h the ICL 2900 extension to F o r t r a n by using
the 'ERROR' statement. Under normal circumstances an
execution i n t e r r u p t w i l l cause the 2980 to i n t e r r u p t the DAP,
produce a d i a g n o s t i c post-mortem r e p o r t and h a l t the program.
However, the VME/B e x e c u t i v e provides f a c i l i t i e s t o t r a p
i n t e r r u p t s and run a l t e r n a t i v e code; c o n t r o l i s t r a n s f e r r e d
to subroutine OUTPUT f o r the d i s p l a y of each DAP image, then
returned to the DAP f o r the a d j a c e n t plane.
The d e t a i l e d d e s c r i p t i o n of t h i s a l g o r i t h m s e r v e s as an
example of the p e r t i n e n c e of DAP-based p r o c e s s i n g f o r
binary-images. Such orders of processing-speeds are achieved
by the e l i m i n a t i o n o f c o s t l y a r i t h m e t i c o p e r a t i o n s and o n l y
l i m i t e d amounts of software looping. These stages a r e
inh e r e n t i n any s e r i a l - b a s e d e q u i v a l e n t code. T e s t s on both
the DAP and the IBM 370/168 have shown a five-hundred times
i n c r e a s e i n performance with the p a r a l l e l s t r a t e g y ; t h i s
g i v e s a s h o r t d e l a y i n response to user re q u e s t s which i s
e s s e n t i a l for any i n t e r a c t i v e r a s t e r - s y s t e m . An example of
the r e s u l t s achieved on the SIGMA scree n are given for l e v e l s
Chapter s i x

- 289 -
Figure 6.11: Raster d i s p l a y of two
p u b l i c b u i l d i n g s at three data l e v e l s
i n order - ( a ) l e v e l 9 (512 x 512) (b) l e v e l 10 (1024 x 1024) (c ) l e v e l 11 (2048 x 2048)

- 290 -
9, 10 and 11 data i n f i g u r e s 6.11a, b and c r e s p e c t i v e l y .
.4.2 The automated a d d i t i o n of topology to a r a s t e r image
The l a c k of any appropriate topology i n scanned-images of
the l a r g e s c a l e s monochrome O.S. data has been pointed-out i n
s e c t i o n 3.7. The design of appropriate p a r a l l e l p r o c e s s i n g
algorithms i s expected to o f f e r some s o l u t i o n s to t h i s
problem; software l o g i c i s arduous on a con v e n t i o n a l computer
(Rhind 1979) but f a r more v i a b l e on the DAP by v i r t u e o f the
d i m e n s i o n a l - c o n n e c t i v i t y of the hardware. I n b i n a r y r a s t e r
r e p r e s e n t a t i o n s , each l a r g e s c a l e map sheet can be t r e a t e d as
a s e r i e s of a d j a c e n t r e g i o n s or s u b - p a r c e l s s p e c i f i e d by a
c l u s t e r of c o n t i g u o u s - p i x e l s . Each s u b - p a r c e l has a v a l i d
d e s c r i p t i o n : a house, a footpath, a f i e l d and so on. Th i s
conception i s d i f f i c u l t t o implement on a s e r i a l - p r o c e s s o r
but f i t s n e a t l y i n t o the g r i d - o f - p r o c e s s o r s of a DAP-like
a r c h i t e c t u r e . Furthermore, the a b i l i t y to change between
d a t a - l e v e l s , as o u t l i n e d i n the previous s e c t i o n , has
importance here i n c o n t r o l l i n g the s i z e of the image being
h e l d i n the DAP thereby v a r y i n g the s c a l e of the image being
processed. C l e a r l y , an image with a low r e s o l u t i o n l e v e l
w i l l have fewer DAP planes of 64 x 64 per map sheet than w i l l
a higher r e s o l u t i o n l e v e l . Thus, i t i s p o s s i b l e t o c o n t r o l
Chapter s i x

- 291 -
the number of sub- p a r c e l u n i t s h e l d i n a s i n g l e DAP plane a t
any one time by v i r t u e of the scale-changing concepts
d e s c r i b e d e a r l i e r .
T e s t s have been c a r r i e d - o u t with p a r a l l e l algorithms t o
d i g i t a l l y i d e n t i f y and i s o l a t e the s u b - p a r c e l s q u i c k l y and
hence to sub-divide the complex map images i n t o t h e i r atomic
r a s t e r - f r a g m e n t s . The boundaries of these fragments can be
d i s p l a y e d on a r a s t e r c o l o u r d i s p l a y , v e c t o r i s e d to produce a
f i l e of polygons f o r other t a s k s or c l a s s i f i e d by shape, s i z e
and perimeter lengths i n p i x e l form to f a c i l i t a t e a crude
form of automatic f e a t u r e coding. T h e o r e t i c a l l y , a t l e a s t ,
i t w i l l become p o s s i b l e for u s e r s to request s p e c i f i c types
of s u b - p a r c e l i n a r a s t e r or v e c t o r format or they can be
amalgamated to produce more app r o p r i a t e s p a t i a l u n i t s such as
property p a r c e l s as r e q u i r e d by H.M. Land R e g i s t r y . A
d e s c r i p t i o n of the a l g o r i r t h m s developed now f o l l o w s ;
l i s t i n g s of the a c t u a l DAP-FORTRAN source code can be found
i n annex 6d and 6e.
6.4.2.1 I s o l a t i o n of the s u b - p a r c e l s :
The method of i s o l a t i n g each s u b - p a r c e l i s be s t d e s c r i b e d
for a s i n g l e 64 x 64 s u b - s e c t i o n (DAP plane) of the whole
image; the theory can be expanded to the c o l l e c t i o n o f DAP
planes comprising a complete map by means of software
Chapter s i x

- 292 -
looping. T e s t s have been c a r r i e d - o u t using data i n l e v e l s 9,
10 and 11 f o r the su b - p a r c e l i d e n t i f i c a t i o n p r o c e s s ; a l e v e l
11 r e p r e s e n t a t i o n (2048 x 2048) has been found to be most
appropriate, g i v i n g an adequate number of su b - p a r c e l s
( c . f i f t y ) per DAP plane. f o r easy h a n d l i n g of b u f f e r
storage, frequency of program i n t e r r u p t s , e t c .
Each s u b - s e c t i o n (64 x 64) of the map image f i t s i n t o a
LOGICAL matrix v a r i a b l e e x a c t l y : the p i x e l s are unset f o r
areas i n s i d e the s u b - p a r c e l s and s e t where each boundary i s
l o c a t e d ( t h i s bit-map concept can be generated d i r e c t l y by
most scanning d e v i c e s ) . Each s u b - p a r c e l u n i t i s i d e n t i f i e d
i n d i v i d u a l l y by means of an expansion process w i t h i n the
sub-parcel u n t i l the complete boundary has been detected.
The DAP plane d i r e c t l y beneath the one ho l d i n g the b i n a r y map
image i s i n i t i a l l y s e t to .FALSE, throughout. The f i r s t s tep
i s to f i n d a p i x e l which l i e s i n s i d e the f i r s t s u b - p a r c e l
u n i t ; an i n - b u i l t f u n c t i o n i n DAP-FORTRAN 'FRST' takes a
l o g i c a l matrix and r e t u r n s a second l o g i c a l matrix which i s
wholly s e t to .FALSE, except f o r the p o s i t i o n of the f i r s t
•TRUE, detected i n the input matrix. Thus, i f l o g i c a l matrix
'MAP' s t o r e s the map image and the l o g i c a l matrix 'SEARCH' i s
the DAP plane d i r e c t l y beneath MAP t o be used when i s o l a t i n g
the s u b - p a r c e l s , then the f o l l o w i n g DAP-FORTRAN statement
w i l l i d e n t i f y the f i r s t p i x e l i n s i d e the f i r s t s u b - p a r c e l and
p l a c e t h i s i n SEARCH:
Chapter s i x

- 293 -
SEARCH = FRST (.NOT. MAP)
With a p a r a l l e l approach t h i s s i n g l e point i s then
r e p e a t e d l y expanded to f i l l the f i r s t s u b - p a r c e l , stopping
i t s propagation wherever i t meets a boundary. The f u n c t i o n
'NBH' i n annex 6d performs t h i s expansion; the process
i n v o l v e s a s h i f t north, south, e a s t and west of the s i n g l e
p o i n t i n SEARCH to s e t i t s n e a r e s t neighbours. This
procedure i s repeated i n - p a r a l l e l for the newly-formed
f i v e - p i x e l c l u s t e r to produce a t h i r t e e n - p i x e l c l u s t e r and so
on. The code shown below g i v e s a s i m p l i f i e d example of the
algorithm n e c e s s a r y :
LOGICAL MATRIX FUNCTION EXPAND (AREA) LOGICAL AREA(,) EXPAND = AREA .OR. SHNP(AREA) .OR. SHEP(AREA)
C .OR. SHSP(AREA) .OR. SHWP(AREA) RETURN END
The f u n c t i o n s SHNP, SHEP, SHSP and SHWP are i n - b u i l t
DAP-FORTRAN r o u t i n e s t o s h i f t a l o g i c a l b i t - p a t t e r n north,
e a s t , south and west r e s p e c t i v e l y . The boundary information
h e l d i n MAP provides a l o g i c a l mask (see 6.2.2) to stop the
propagation of the expanding p i x e l v e n t u r i n g o u t s i d e the
region of the s u b - p a r c e l . Thus, the complete code to f i n d
the f i r s t s u b - p a r c e l i n MAP might be:
Chapter s i x

- 294 -
SEARCH = FRST (.NOT. MAP) DO 10 1=1,64
10 SEARCH (.NOT. MAP) = EXPAND (SEARCH)
The mask '.NOT. MAP' i n l i n e 10 ensures t h a t p i x e l
expansion i n SEARCH only occurs w i t h i n the sub-parcel
boundaries; c l e a r l y the expansion process w i l l
" s p i l l - o u t s i d e " the region i f th e r e i s a on e - p i x e l gap i n any
of the sub- p a r c e l boundaries.
The same process i s repeated for each sub-parcel i n the
map sheet; each i s "painted-out" from the master f i l e and
moved to some ap p r o p r i a t e s u b - f i l e as i t i s i d e n t i f i e d . I n
t h i s way i t i s s u p e r f i c i a l l y simple t o introduce some minor
topology i n t o the r a s t e r " s p a g h e t t i " q u i c k l y . The above
process has been a p p l i e d to a 4096 x 4096 r a s t e r
r e p r e s e n t a t i o n c o n t a i n i n g 1677 s u b - p a r c e l s and took three
seconds of DAP time to i s o l a t e each i n t o a s e r i e s of
s u b - f i l e s . F i g u r e 6.12 shows a l i n e - p r i n t e r r e p r e s e n t a t i o n
of two DAP planes during the sub- p a r c e l e x t r a c t i o n p r o c e s s .
I n t h i s example, the l a r g e - o u t e r region of the map area
( r e p r e s e n t e d by '!' i n the e x t r a c t ) was being i d e n t i f i e d .
Chapter s i x

F i g u r e 6.12 L i n e p r i n t e r r e p r e s e n t a t i o n
o f two DAP planes w h i l s t e x t r a c t i n g
s u b - p a r c e l s from t he master
image o f map da t a . I I I I I I 1 I I I I i t t tu t t i t t t t t 1 1 1 11 I I I I I I I I 1 I I I I 1 I 1 I I I I T 1 1 i 11 1 ! U I I I I I I I I I I I I I I T 1 1 1 1 I I 1 1 1 I I I I I I I I I 11 I I I I 11 I I I I 1 I I 1 1 1 1 I t [ U I I I I I I I I 1 I 11 I I I I I I I I 1 1 1 I I t I 1 I
E f f i i f i f 1
11 u 111 n i i i i i i r
I I I I 1 I I I I 1 I I 1 I 1 1 1 1 1 1 1 1 1 : 1 1 1 1 1111 I 11 T 1 1 1: i ' .
1 1 1 ; 1 1 111
1 t l i f i f i i f i I I I I I I I I i t i l l ! 1 T I 1 I li t i t i 11 • 1111 i i 1 1 1 : 1 1 1 1 l i t t I T I
i i i m i i i [ i i i i u t i
1 1 1 T 1 1 I I I 11 I 11 1 1 1 1 1 1 1 1 1 1 ; T 11
111 1 1 1
I I i f i f i i i i i i t : I i u 1 1 1 1 1 1 111 I I i i I I 1 1 1 1 1 1 1 1 1 1 1 1 1 1 1 1 n i 111 ! i i i H i t f i f l i i i f t t t t i f i 1 t t
li iimiii i n i I I I I i t u i t 1 1 1 1 1 1 i i 1 1 1 1 1 1
111 H I
11 I I I I I U U 1 1 1 1 I I 1 1 1 1 1 1 1 1 I I I 11 I I I I U I I i i n n 1 1 1 1 i i 11 I I I I I i i i n i u i t t t t t i t i f t i i j I I I t l [ i i i i u i u 1 1 I I 1 1 I I i u i I I I
111 11 i t n u t i 1 1 1 1 1 1 1 1 ; 1 1 1 1 1 I I I 111
I I l l l i t l t i i i i i n u l l i i l l 1 1 1 I 1 i i i i i u i 1111 I I 1 1 1 1 1 1 u i " 11 m u m 1 1 1 1 1 1 1 1 1 1 1 1 1 1 1 1 1 i f i i i t i i u i n i i i 11 n 11 i t 111 1i t i i t it11 i t i i t t i i i t i t i t t t l 11 I I T I I t l l i t t i t t i i i i u i i I I I 11 f t t i f f t f i i i i i i i i i u t i t I t t 11 U I I I I I I 1111 i t 1 1 u 1 1 1 1 1 1 1 11 t l U I I I I i i i t i t t t i t i i i t 111 it I I I I I I I i i 1 1 u 1 1 1 1 1 1 i t I I I i i T l l I I I I I f t i i f i i t t i i f f i l i t 11 [ I l l l j l l t i t i u u i i n u I I I 11 I I I I I U I 1 1 1 1 i t i i 1 1 1 1 1 1 I I I i i I l l l t l l l i t i i i i i t i t t t i t l i t 11 I I I I I I I I 11 1 1 i t 1 1 i t 1 1 1 1 I I I i i I I I I 1 1 1 I I I I U U I I I I I I I l i t u u t t t t n t t t t t t t t t i i u t i 111 u u t t t t n t t t t t t t t t i i u t i
m 11 I I I I I I I I 11 1 1 I I 1 1 1 1 1 1 1 1 I I I 11 I l l l l t l l i t i i i i i i i i t u i 111 11 I I I I I I I I i t i t i i 1 1 i t 1 1 1 1 111 11 I I I I I I I I I I I I t l l T l I I I l I I t t 11 I I I I I I I I 111 I I t 1 1 1 1 I 1 I t 111 11 I I I U I I I 11 1 t U 1 1 1 1 1 1 1 1 I I I 11 ItItittl i i i i i f i i i i i i f I I I 11 ItItittl i t 1 1 1 1 1 1 1 1 1 1 1 1 I I I T I I I 11 I I I I i i t t i t 1 1 1 1 1 1 1 1 t i t I I I I I I l l I I I I 1 1 i t 11 i t 11 i t I I I I I I t l l l l l l 1 1 1 1 i t 1 1 1 1 1 1 1 1 I t l I I i i i t l i t I u i i m i i t i t 111 I I i i i i i u i i t I I i t i t t i t 1 1 1 I I i i i i u i i I I I I I I I I l i t i t n i i i i i i i n i I I i I I I I U l I I U l i t 1 1 i t i I I I i i i i i i u u 1 1 i t I I I i i i i i u t 1 1 1 1 1 11 I I i i i u t i i 1 1 1 1 1 111 I I i i i i t i n 1 1 1 1 1 1 1 I I i i i i i t u i n t 1 1 1 I I I I I I I I I I i n i t 1 1 1 I I i t u i i i i M O O O O O O O O O O U 1 1 1 GOCOGOuCCOCOOOO
r a s t e r
tit u u it n n 1 1 1 : 1 1 1 1 T 1 1 1 1
l i t i t t t 1 1 t l i t t t t t t t t t t t i t i i ' l I I I ] 1 I 1 ! I I 1 I I I I 1 I t I I I I 11 I I I l t l l t l l l t t i f f f f f t f t u t t i t t t t t u t 1 1 1 u 1 1 1 1 1 1 i it 1 1 1 1 1 1 1 1 t t t t T t t f t t t i t t t : i t 1 1 1 1 t i i t t i t t t i t t t i t t t i i t i i t i t i i u i i i i 1 1 1 1 i t t i i 1 1 1 1 1 1 1 i t 1 1 1 1 t u t i t t t t t t t i t t t i t t i t t 1 1 1 1 1 1 1 1 1 1 1 1 1 1 1 1 1 1 1 1 i t 1 1 1 1 1 1 1 i t i t m i l i u m i t t i t t t t t t t 1 1 1 i t 1 1 1 1 1 1 t t t i t i i i t i t i t t t i t i i t t i 1 1 1 1 1 1 1 t i 1 1 t i t t t i t t i t t u t i i i i i t i t i f t i i i i f f f i 1 1 1 1 1 1 1 1 1 1 1 1 1 1 1 1 1 1 i t 1 1 t i i i i i t u t t t i t i t t i t t t t t i t i i i t i t t i i t i 1 1 1 1 1 1 t t
H H H H H H t u n m tt t i n t 1 1 1 1 1 t u n t u n i ii n u t 1 1 1 I I t i n t 1 1 1 I I t u n 1 1 1 I I 1 1 1 1 1 t i n t 1 I t I I I t t l t t i n t 1 1 1 1 1 it I I I ttt I I I I t I I
t u t u I l l t t t utt t t m m u n i t t t t t t t
i i i m t u t u I I t u t I I I t I t t u t 1 1
iifiii n u l l t i l l t l i f l i l t u n i t I ! 11 I t I l I I U I l t l t t m m it t t 1 1
i t t tit t t l l j i l l l t l l u n i t n u n u n i t i t i i n i t t t i l t u t u i u i n u 1 1 1 ; m i : i u i ; t i f i i t i i i i t i t t t t t t tu i t t t i t t i u i i t t m i ; t 11 1 1 i t 11 u
I t M M M 11 I I I l U U I t I t M I t I I U I I M M t l I I U I 11 I I I 11 I I M I I 11 1 I I I I I M i t I t I t l f l i l t 11 I I I 1 1 I I M I M 1 I M I t 11 I I M M I I 11 M M M I I I 1 I t I 1 1 111 I I M I T M U I t M I I M t t I I I I M I 1 1 1 I T i i i i m i t t I I M 1 1 1 1 I I I t I I 111 111 U I 1 1 l l I I t f f f f f f t f f l m i n i m M M M M I I M 11 I I t M I l i l t M i t t I M i l i u m
liiiiiiiiii
i c a o o o o o i
i 1 1 1 I t t 1 T t i l t l i t 1 1 t I I I I t I t 1 1 u n i t 1 1 M 11 t t t t t t
iiiiii m m 1 1 1 1 1 1 m m 1 1 1 1 I T m m m i l t u m i m t t i m i i t t i t i t t I T M I I I t I t I T M M I t t l 1 1 11 m i l l u I t I T t u t u M l I 1 1
H I ! ! !
0 0 0 t
1 1 1 1 1 1 1 1
I T I T r u t I I I t
1 1 1 n i t m u
t t t t i m i I T U t i n u i t t u t t u t t u t I T U m i t u t t u t t u t t u t n i t m i t u t t u t i m nit u t i m i I T U m i
Hi, m m m m m i : : 1
I I I t 11 I i M t M I t 11 I t U U l t t l t l l t l l M I t l
iiiiiiiiimiiiiiii I I I M I l M t M l M i t U
\\\\ Iiiiii Hi i m i i u u i u u t i i i t u 1 1 1 m : m 1 1 t t i t i i i i i m u t i m i m i i t i u m i i i n i i i i i i f f f f i f f f f i f f f f f f i f t t i i t t t i i i i t i t f i f it t t t i t t t t t t t t f t t ittt t l l t l l l l l U I t l U I I I OOCiCCOOOOOOOOC a ir.
111 T I T T I * T I T I I T 111 T T T I I I T I T I I T I I T ! T I t t t I 1 I I I I l i t I I I t I 1
M i l t u t
n u t I i t i t M i l l T I t t I M 1 I t I I I I I t M T 1 I T I M T i l l ' M i l l I M M t M t I t M 11 M i l l T M I 1 T I I I t I I I M T M l I M t t t T M U I I I 1 1 T M M I I I I I 1 1 T
I M t I I I T t t I I I M I t I t l I I I t I n u t i t i i t t i n ; m i l u t i t I t T T I t i n n i t 1 1 1 1 1 1 u 11 i i n 1 1 i t t m i l M 11 I M i l l I I t I I t I I I I I I I I I I M t t t l l t t I t 111 I t I I t M 1 11 M i l l I I I M I t I t I M i t t I M M M i l l I I I I I I I I t I t t i t T 11 I I I I t I T t I I T t l I M T 1
n u o o c o c o o c c o o a o G 1 1
1 1 T I M M T U t u n t u n u m m 11 m i l t i l l ! t u n t i n : i i t u m t t m i t t i n t m t t I I i n m i l m i l m i t I I I i t t m t u r n n u t
, 1 1 1 1 1 1 1 1 1 1 1 1 1
T i t l t t l l t l l l l l t T I t I I I t I T I t i t M i t i f t f t t t t t f f i "
m i i i f f
i f f i t 11 t t t t t t t t t t t t f t
H i m i i i i i i i t n t n i i i n n i t t l u t u t t t t i t t i t u i i i i i m u i i i i i i i i i i i i i i i f i t i l i i i i i i i i i f i t t t t i t t t t t t t t t t tnt I t l U t I l M 11 t l 11 11 11 l U t l U I I I I U U T l I l l l i i i i i n i i i i m i i i i i 00OCC06CCOOCOC00CCO0
t i l l i n i 11 I T I I T I 111 1 1 ; I I I I I T : i : 111 -. T T : i i If] I T I 1 1 : M l I 1 1
ooo
llilllilflfffflltlflllfltlllftflfifflllf
i i
T I T I
I I T I I I
I I I I n i l T U T I I t l t u t n i t t u t I I u u t t m i m i u u t u t i t 1 1 m i m i t t t t I I M I I I I M M M M M M M l I M M t i l l I I I I M i l t t t t t t l I t u t U T T m i m i u u t u t t i t I
t u n m t i t u n t it u n u t n u t M T U I I T I I T 1 I T T H t H t i n t I 1 1 I I
n u t t M M t u n m i l I I tit i n n I I I I I t t t u m I I u r n u i t t t u n t t tu 1 1 1 i t t u n t t 1 1 1 I I u i i n n M i l t l l t t t m i l m i l m i t I I T 1 1 m u t u n I I I u ti 1 1 1 i tu t t u n i t 1 1 1
u u i u 11 i t i t i I I 1 1 T I T m m t i i n i n t m 1 1 ; m 1 1 1 1 i t 1 1 1 1 1 i t 1 1 1 1 1 m i n t t t t i t t : t i t 1 1 1 1 1 1 1 1 1 i t I t t t t T T m i n t 1 1 i t 1 1 : I I I m t i t i t i t i u n t i l 1 1 I I i t t I I I I U I i i i i u i tttf ft J t m u T 11 i t t i t t i i t t t t l I 1 1 l T I t l t l t t l I T U l t ! m u t t 1 1 I I t l I I I I 1 I I t l i m i t T U M M U t t t T T t i f f t t i 1 1 1 1 t t I ttttttt t t t t m f i i f t f i u 1 1 1 1 1 m 1 1 1 1 u i t 11 1 i t u u t
I f f i i f t t t f t t f t t i f 1
i t i 1 1 1 i t 1 1 1 m i t u i : i t m i l i u m t i i i i i i i i i i m i i i m u m m u m m i l i t u 1 1 u t u t m t i i n u 1 1 1 i t t i t t u t m u t u i t i t i t u i l i i i i n i n i f f i t f f j t f ] i t i t t n n n u u i t u I I t m i i m m COOOOGCOOGOOOOO
m u t t : u i I n t t i t t t i
i f f t t t i m u t t 11 i t n i U I M U i i t t m i t t t u i i t i t i t i H u m Iffx f fI I l t t U t I I t t 111 I t l t t t I ooooooc

- 296 -
6.4.2.2 Conversion of r a s t e r s u b - p a r c e l s to vector
polygons:
Once t h i s l i m i t e d amount of s t r u c t u r e has been introduced
i n t o the b i n a r y r a s t e r map images, post hoc v e c t o r i s i n g or
f e a t u r e coding i s s t r a i g h t - f o r w a r d . I t i s t r i v i a l to
v e c t o r i s e the boundaries of the r a s t e r s u b - p a r c e l s on the DAP
i n a simple, l o g i c a l and u s e f u l form. H a r r i s e t a l (1981)
d e s c r i b e a s e r i a l - b a s e d conversion system which produces a
segment and node format although most other commercial
s o l u t i o n s produce poorly s t r u c t u r e d , ad hoc line-work (see
r e s u l t s d e s c r i b e d i n s e c t i o n 7.4.2).
V e c t o r i s i n g developments by the author have taken on two
d i s t i n c t c o u r s e s : the s e l e c t i o n of the appropriate method i s
dependant on the types of use t o which the v e c t o r f i l e s w i l l
be put. Each method i n v o l v e s i n i t i a l l y d e f i n i n g the
s u b - p a r c e l boundaries i n r a s t e r - f o r m ; the s e r i e s of s u b - f i l e s
comprising the whole map image are r e p r e s e n t a t i o n s of the
i n t e r n a l a r e a s of each s u b - p a r c e l . The boundary l o c a t i o n can
be e s t a b l i s h e d be means of the point expansion i d e a d e s c r i b e d
fo r the s u b - p a r c e l i d e n t i f i c a t i o n p r o c e s s . The f u n c t i o n
EXPAND (see e a r l i e r ) i s a p p l i e d to each s u b - p a r c e l u n i t to
i d e n t i f y the boundary p i x e l s extremely q u i c k l y ( c . 600
nanoseconds per DAP-plane).
Chapter s i x

- 297 -
The s i m p l e s t method to convert the boundary p i x e l data
i n t o x,y coordinate p a i r s i s achieved when
l i n e a r - c o n n e c t i v i t y i s unimportant; the r e s u l t a n t v ector f i l e
comprises a c o l l e c t i o n of d i s o r d e r e d c o o r d i n a t e s h e l d
s c a n - l i n e by s c a n - l i n e . T h i s vector-format i s q u i t e
a c c e p t a b l e for e f f i c i e n t storage of the r a s t e r s u b - p a r c e l s
and i s , indeed, near i d e a l f o r r a p i d d i s p l a y on a r a s t e r
d i s p l a y d e v i c e ; the r e s u l t a n t image appears s c a n - l i n e by
s c a n - l i n e for the whole map sheet i n u n i t s of 64 x 64 DAP
pl a n e s . The DAP-FORTRAN to perform t h i s t a s k i s t r i v i a l .
Two i n t e g e r m a t r i c e s are d e c l a r e d to provide the
base-coordinate system, thus
. 63
. 63
X =
0 1 2 3
0 1 2 3
Y =
0 1 2 3 .
63 63 63 63 .
62 62 62 62 .
1 1 1 1
0 0 0 0
. 63
. 63
. 62
» o
. 1
. 0
Chapter s i x

- 298 -
The generation of the x,y boundary coordinates i s
s t r a i g h t f o r w a r d ; the boundary DAP planes are t r e a t e d as
l o g i c a l masks for the coordinate assignment, thus:
INTEGER X ( , ) , Y ( , ) , XCOORD(,), YCOORD(,) LOGICAL BOUNDARY(,) XCOORD=0 YCOORD=0 XCOORD (BOUNDARY) = X YCOORD (BOUNDARY) = Y
In t h i s way the r e s u l t a n t m a t r i c e s XCOORD and YCOORD w i l l
comprise the d i s o r d e r e d x,y boundary coordinates
r e s p e c t i v e l y .
C l e a r l y t h i s method of r a s t e r to v e c t o r conversion i s
u n s u i t a b l e f o r most post-manipulation. Many vector-systems
(e.g. see Baxter 1980, Waugh 1980) expect a s e r i e s of
polygons as input data; the use of vector-based p e n - p l o t t i n g
d e v i c e s r e q u i r e the l i n e a r c o n n e c t i v i t y i n h e r e n t i n vector
s t r i n g s to work e f f i c i e n t l y . T e s t s have been c a r r i e d out on
the DAP to generate a s e r i e s of l i n e a r l y connected polygon
f i l e s from the r a s t e r s u b - p a r c e l data. I t i s l e s s easy to
u t i l i s e p a r a l l e l - p r o c e s s i n g techniques f o r t h i s p r o c e s s ; the
task r e q u i r e s a l i n e - f o l l o w i n g algorithm which, i n essence,
i s s e q u e n t i a l i n nature. A l i s t i n g of the r e l e v a n t
DAP-FORTRAN code i s a t annex 6e; subroutine GINOV has been
w r i t t e n to chain the boundary p i x e l s i n t o a s e r i e s of v e c t o r
polygons. The algorithm works i n a s i m i l a r manner to the
Chapter s i x

- 299 -
poi n t expansion p r o c e s s . For each l o g i c a l DAP plane
comprising a sub - p a r c e l boundary, the f i r s t (FRST - see
e a r l i e r ) p o i n t i s detected and the a s s o c i a t e d x,y coordinates
are w r i t t e n i n t o a v e c t o r - b u f f e r f i l e . A c y c l i c s earch i n a
cl o c k w i s e r o t a t i o n i s performed to d e t e c t the next p i x e l i n
the v e c t o r c h a i n . As each new p i x e l i s detected, i t s x,y
coor d i n a t e s are t r a n s f e r r e d to the v e c t o r - b u f f e r and the
boundary p i x e l i n the r a s t e r image i s "painted-out". This
procedure continues u n t i l the s t a r t p o s i t i o n i s reached; t h i s
w i l l always occur s i n c e the r e s u l t a n t v e c t o r w i l l be a c l o s e d
polygon by d e f i n i t i o n of the sub-parcel u n i t s .
A number of s p e c i f i c f e a t u r e s i n the al g o r i t h m are
important; these are d e s c r i b e d below.
1. Each v e c t o r polygon i s not r e s t r i c t e d to one 64 x 64 DAP
plane; i t f r e q u e n t l y o v e r l a p s i n t o a d j a c e n t r e g i o n s . The
c y c l i c s e a r c h i n g o p e r a t i o n has been introduced i n s i d e a
moveable window. Each time the v e c t o r coordinates reach
the edge of the DAP plane, the sea r c h window moves i n t o
the next half-DAP plane f o r continued s e a r c h i n g . I n t h i s
way i t has become easy to c h a i n very long v e c t o r s (e.g.
roads) a c r o s s many DAP p l a n e s ; the work has been
c a r r i e d - o u t on l e v e l 11 r e p r e s e n t a t i o n s (2048 x 2048)
which comprise 32 x 32 l o g i c a l DAP planes f o r the
complete 1:1250 sheet. The windowing s t r a t e g y i s coded
Chapter s i x

- 300 -
in s ubroutines WINDOW, WINDOW-COORDS and STORE-WINDOW
(see annex 6 e ) .
2. I m p l i c i t i n normal, p r e - s k e l e t o n i s e d r a s t e r
r e p r e s e n t a t i o n s of boundary data are l i n e s which are
gr e a t e r than o n e - p i x e l i n width. As the l i n e - f o l l o w i n g
operation i s t a k i n g p l a c e , with i t s a s s o c i a t e d
" p a i n t i n g - o u t " f a c i l i t y , i t becomes n e c e s s a r y to check
t h a t a d j a c e n t p i x e l s are a l s o removed i f the need a r i s e s .
An example of the problem i s shown below:
p a i n t i n g - o u t i —
l e a v e s a .
secondary j
v e c t o r
A secondary l o g i c a l matrix 'ALLPTS' i s n e c e s s a r y to keep
a t a l l y on the route taken by the l i n e - f o l l o w i n g p r o c e s s ;
as soon as the polygon has c l o s e d , a l l the remaining
secondary v e c t o r s are de l e t e d to enable v e c t o r i s i n g of
the next s u b - p a r c e l to begin.
The r e s u l t a n t f i l e c o n t a i n s v e c t o r polygons of a higher
q u a l i t y by these methods than by more t r a d i t i o n a l
r a s t e r - t o - v e c t o r c o n v e r s i o n methods s i n c e , by f i r s t i s o l a t i n g
Chapter s i x
c y c l i c
c h a i n i n g
produces

- 301 -
the s u b - p a r c e l s i n r a s t e r form, ensures t h a t the conversion
software need not be concerned with l i n e - j u n c t i o n s (nodes) or
the h i n d e r i n g e f f e c t s of a d j a c e n t polygons. Once generated,
the l i n e a r f e a t u r e s can be i n t e r f a c e d to e x i s t i n g
s e r i a l - b a s e d software such as GIMMS (Waugh 1980) or p l o t t e d
d i r e c t l y on an ap p r o p r i a t e display/hard-copy d e v i c e by means
of v a l i d g r a p h i c s software: GINO, *GHOST and PLOTSYS a r e
examples. The r e s u l t i n g data s t r u c t u r e w i l l comprise
d u p l i c a t e d segments and ( e x c e p t i o n a l l y ) polygons which,
according to Arms (1970), can be broken down i n t o more
appropriate vector-segments e a s i l y .
A d d i t i o n a l l y , post hoc f i l t e r i n g i s d e s i r a b l e ? the vector
data emanating from the DAP r o u t i n e s c h a r a c t e r i s t i c a l l y
comprise too many x,y p o i n t s f o r e f f i c i e n t storage and
p l o t t i n g . There w i l l be a coordinate p a i r f o r each p i x e l i n
the r a s t e r image - the m a j o r i t y of these p o i n t s can be
f i l t e r e d to l e a v e only prominant f e a t u r e end-points, corner
p o i n t s or those n e c e s s a r y to a c c u r a t e l y d e f i n e c u r v e s . There
have been s e v e r a l s t u d i e s i n t o e f f i c i e n t p o i n t - f i l t e r i n g (see
Douglas and Peucker 1973, Opheim 1980); t e s t s have been
c a r r i e d - o u t by t h i s author using s e r i a l - s o f t w a r e w r i t t e n by
Douglas when i n the U n i v e r s i t y of Ottawa. The ve c t o r f i l e s
generated by the DAP were t r a n s f e r r e d to the IBM 370 at NUMAC
through the Metronet communication l i n k and f i l t e r e d to
produce data s u i t a b l e f o r a p e n - p l o t t e r . F i g u r e 6.13 shows
Chapter s i x

Figure 6.13 R a s t e r - t o - v e c t o r
conversion of sub-parcel boundaries.
In order (a) by DAP (before f i l t e r i n g )
(b) a f t e r f i l t e r i n g .

- 303 -
the r e s u l t s of the v e c t o r i s i n g process (a) from the DAP and
(b) the e q u i v a l e n t p o s t - f i l t e r e d v e r s i o n for two prominant
p u b l i c - b u i l d i n g s on an Ordnance Survey 1:1250 map s h e e t .
Such post hoc f i l t e r i n g i s a process common to a l l
r a s t e r - t o - v e c t o r c o n v e r s i o n software (see H a r r i s e t a_l 1981,
Peuquet 1981); i t seems l i k e l y t h a t the i n h e r e n t l i n e a r
natures of t h e s e f e a t u r e s w i l l r e s u l t i n such g e n e r a l i s a t i o n
being most s u i t e d to a s e r i a l - p r o c e s s . Research has examined
the p o t e n t i a l of DAP-based software t o speed-up t h i s process
with l i t t l e s u c c e s s a t p r e s e n t . I n any event, the e x i s t i n g
s e r i a l - c o d e i s not unduly lengthy, t a k i n g f i f t y cpu seconds
on the 370/168 f o r a complete Ordnance Survey 1:1250 p l a n .
6.4.2.3 DAP-assisted sub-parcel f e a t u r e coding:
The v e c t o r data emanating from the procedures d e s c r i b e d
above are a p p r o p r i a t e f o r immediate e n t r y i n t o a vector-based
i n t e r a c t i v e e d i t - s t a t i o n . C l e a r l y , any f e a t u r e - c o d i n g ( i . e .
the assignment of a t t r i b u t e codes to f e a t u r e s such as l i n e
segments) w i l l s t i l l r e q u i r e operator i n t e r v e n t i o n . E x i s t i n g
r e s u l t s achieved on the DAP suggest t h a t appropriate
p a r a l l e l - a l g o r i t h m s can a s s i s t i n t h i s arduous post hoc stage
with the r a s t e r s u b - p a r c e l s data. I t i s almost c e r t a i n l y
i m possible t o d e t e c t and i d e n t i f y a l l members of the complex
scheme of 109 f e a t u r e codes c u r r e n t l y adopted by the Ordnance
Survey, s i n c e some of these are only i d e n t i f i a b l e through
Chapter s i x

- 304 -
recourse to a d j a c e n t t e x t or to genera l c o n t e x t . There a r e ,
however, some advantages i n c a t e g o r i s i n g the s u b - p a r c e l s i n t o
simple groupings such as roads, b u i l d i n g s , r a i l w a y s ,
water-courses, f i e l d s and so on. T h i s , a t l e a s t , w i l l be a
s i g n i f i c a n t s t a r t towards the development of a computer-aided
f e a t u r e coding system f o r e a s i e r v a l i d a t i o n by an operator
a f t e r w a r d s : i t w i l l a l s o permit the computerised p a r t i t i o n i n g
of scanned map data i n t o s m a l l e r and more manageable f i l e s .
The automatic c a t e g o r i s a t i o n of the s u b - p a r c e l s i n v o l v e s
an a n a l y s i s of the s i z e , shape and perimeter lengths i n p i x e l
form. To obtain s i z e and perimeter lengths i n r a s t e r i s
t r i v i a l on the DAP; i t merely i n v o l v e s a count of the p i x e l s
i n v o l v e d and th e r e i s an appropriate f u n c t i o n i n DAP-FORTRAN
to achieve t h i s . The determination of parameters d e s c r i b i n g
the shapes i s not unduly d i f f i c u l t ; c o n s i d e r a t i o n i s given i n
most works on q u a n t i t a t i v e geography techniques - see i n
p a r t i c u l a r , Haggett e t a l (1977 pp 309-312) and Ta y l o r (1977
pp 41-44). I n the image a n a l y s i s area of remote-sensing data
(see Rosenfeld and Kak 1976 s e c t i o n 8.3), attempts are made
to match p i x e l - p a t t e r n s with s i m i l a r s t r u c t u r e s h e l d i n a
p a t t e r n l i b r a r y . S i m i l a r procedures were i n v e s t i g a t e d with
the s u b - p a r c e l data on the DAP. A s e r i e s of p i x e l p a t t e r n s
comprising two, t h r e e , four or more p i x e l s of many shapes and
o r i e n t a t i o n s were h e l d i n a p a t t e r n l i b r a r y . I n turn, a
count was determined of how many of each p a t t e r n - t y p e w i l l
Chapter s i x

- 305 -
f i t n e a t l y i n t o the s u b - p a r c e l areas thereby p r o v i d i n g a type
of spfttVcxl s i g n a t u r e for each one. I t i s p o s s i b l e to
match-up the a t t a i n e d s i g n a t u r e with a predetermined l i s t to
c l a s s i f y the sub-parcel type. The o r i e n t a t i o n of the
s u b - p a r c e l s can be expected to have prominant e f f e c t s on the
d e r i v e d shape parameters; d i f f e r e n t arrangements of p i x e l
boundaries w i l l g i v e very d i f f e r e n t shapes. However, the
success i s a l l i e d w i t h the number of p i x e l - p a t t e r n s adopted
i n the comparisons. A l l d e r i v e d parameters must be r a t i o
v a l u e s of the pattern-count and the area of the s u b - p a r c e l s .
Providing p i x e l - p a t t e r n s i n a l l o r i e n t a t i o n s are i n c l u d e d i n
the a l g o r i t h m then sub-parcel c l a s s i f i c a t i o n i s m a n i f e s t l y
apparent. C l e a r l y a road p a r c e l d i f f e r s c o n s i d e r a b l y from a
b u i l d i n g p a r c e l ; a s i x t y to e i g h t y per cent s u c c e s s r a t e i n
such c i r c u m s t a n c e s i s hoped f o r , although a t p r e s e n t any
development has been n e c e s s a r i l y r e s t r i c t e d to a r t i f i c i a l
data generated from e x i s t i n g v e c t o r f i l e s . The s t r a t e g y
adopted i n c o r p o r a t e s the Sigma c o l o u r r a s t e r d i s p l a y device
to show a l l s u b - p a r c e l s of a s p e c i f i c v a r i e t y . A
human-operator can then accept or r e j e c t the DAP's
c a t e g o r i s i n g i n t e r a c t i v e l y . The r e s u l t a n t ' s p e c t r a l
s i g n a t u r e s ' a r e d i s p l a y e d on the SIGMA g r a p h i c s s c r e e n f o r
each uniquely r e f e r e n c e d s u b - p a r c e l u n i t (see f i g u r e 6.14).
The p a r a l l e l algorithm to perform the auto-feature-coding
i n v o l v e s d i s a g g r e g a t i n g each s u b - p a r c e l i n t o i t s c o n s t i t u e n t
Chapter s i x

- 306 -W | . i u i U ( U i i ) n j t U i U < y ' U H I ^ < y t -» i f »At 1^- <*l > U IN. I U UJ V&f
ft $ $ R 8 8 8 8 •» •».' « • i 8 S I S r
i n p * I . ( C i» - © <» 0 ( 1 I
s 8 # 0 1 r-. ii i r CO CO r.| l f • V I
vy :>i n i t o 8 8 8 8 5**1! \D N SO '1J I T -f I 1 <30
ft
7̂ >
1
/ 7 C v> c r j Ci-7 C3»
If <
c
ft
V 0
1 ,
X L 7
U \ 7
u c s2 8 to
Figure 6.14 Example of i n t e r a c t i v e
d i s p l a y of Sigma r a s t e r screen
showing sub-parcel r e f e r e n c e s with
a s s o c i a t e d s p e c t r a l - t y p e s i g n a t u r e s .

- 307 -
p i x e l formations. Some of the p i x e l c l u s t e r s being examined
are given below i n f i g u r e 6.15.
Figure 6.15; Types of p i x e l p a t t e r n to measure shape
1 - p i x e l
• 2 - p i x e l s
B 3 - p i x e l s
m • • • •
A measure of the sub - p a r c e l shape i s determined by
counting how many of these b a s i c p i x e l - c l u s t e r s w i l l f i t
completely i n s i d e a sub - p a r c e l a r e a . C l e a r l y , elongated
p i x e l s (e.g. roads) w i l l have a h i g h e r frequency of the
3 - p i x e l elongated p a t t e r n s than b u i l d i n g p a r c e l s . S i m i l a r l y ,
the b u i l d i n g s comprise a much g r e a t e r proportion of
r i g h t - a n g l e s than do roads, f i e l d s , r i v e r s , e t c .
The implementation o f such a t a s k i s w e l l - s u i t e d to the
p i x e l - c o n n e c t i v i t y a s s o c i a t e d with the DAP's a r c h i t e c t u r e .
Each chosen p i x e l - p a t t e r n must i n t e r l o c k n e a t l y to ensure a
c o n s i s t e n t coverage over the whole DAP plane. Current t e s t s
have i n v o l v e d a s s i g n i n g a unique r e f e r e n c e to each p i x e l i n
the p a t t e r n - c l u s t e r . A simple example i s shown i n f i g u r e
6.16.
Chapter s i x

- 308 -
F i g u r e 6.16; The i n t e r c o n n e c t i o n of p i x e l - c l u s t e r s t o
determine the shape of s u b - p a r c e l u n i t s
r -> i
4 2 5
3
1
4 2 5
3 1
4 2 5
3
4 2 5
3 1
4 2 5
3 1
4 2 5
3
1
4 2 5
3
scan l i n e s
I t can be seen i n f i g u r e 6.16 t h a t f o r each r a s t e r
s c a n - l i n e , the s e r i e s of i n t e r c o n n e c t e d p a t t e r n - c l u s t e r s
generate a numeric s e r i e s : i n t h i s example i t i s - 1, 3, 4,
2, 5; 1, 3, 4, 2, 5;... Thus, the a l g o r i t h m n e c e s s a r y t o
d e s c r i b e each p a t t e r n r e q u i r e s two parameters:
1. number of p i x e l s i n the c l u s t e r - p a t t e r n (a s c a l a r
v a r i a b l e ) ;
2. the x - s h i f t s n e c e s s a r y to p l a c e them i n the c o r r e c t
p o s i t i o n s r e l a t i v e t o some l o c a l datum (a v e c t o r
v a r i a b l e ) .
Chapter s i x
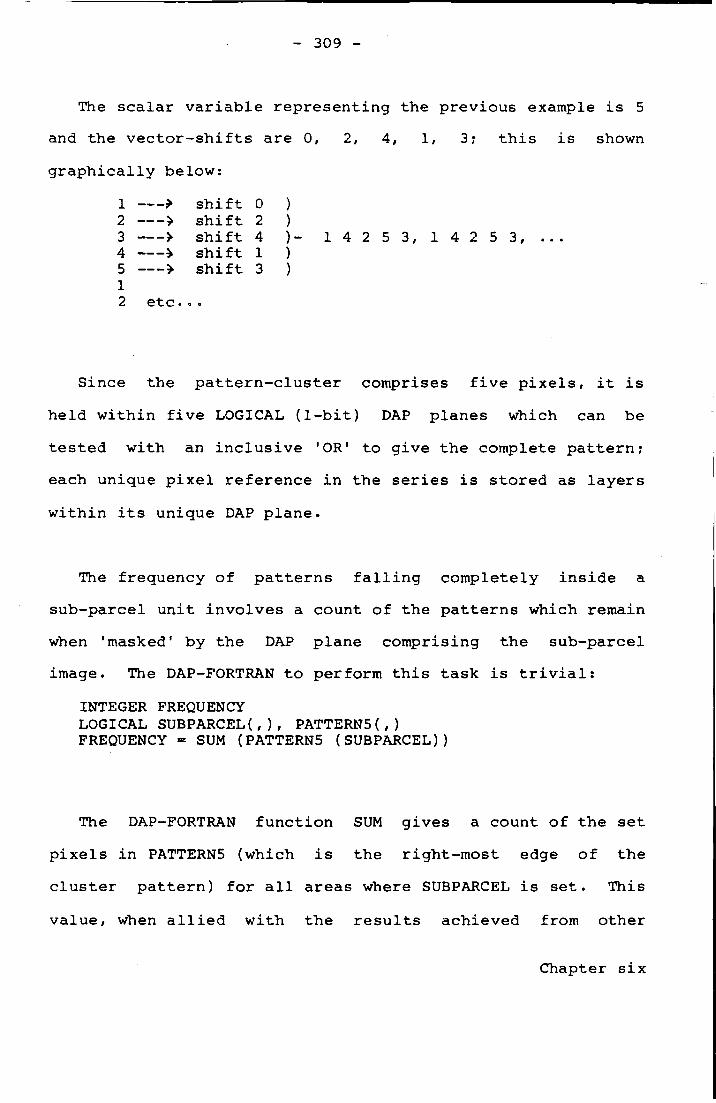
- 309 -
The s c a l a r v a r i a b l e r e p r e s e n t i n g the previous example i s 5
and the v e c t o r - s h i f t s are 0, 2, 4, 1, 3; t h i s i s shown
g r a p h i c a l l y below:
1 » s h i f t 0 2 > s h i f t 2 3 > s h i f t 4 4 > s h i f t 1 5 > s h i f t 3 1 2 e t c . . .
- 1 4 2 5 3, 1 4 2 5 3,
Since the p a t t e r n - c l u s t e r comprises f i v e p i x e l s , i t i s
h e l d w i t h i n f i v e LOGICAL ( 1 - b i t ) DAP planes which can be
t e s t e d with an i n c l u s i v e 'OR' to give the complete p a t t e r n ;
each unique p i x e l r e f e r e n c e i n the s e r i e s i s s t o r e d as l a y e r s
w i t h i n i t s unique DAP p l a n e .
The frequency of p a t t e r n s f a l l i n g completely i n s i d e a
s u b - p a r c e l u n i t i n v o l v e s a count of the p a t t e r n s which remain
when 'masked' by the DAP plane comprising the sub-parcel
image. The DAP-FORTRAN to perform t h i s t a s k i s t r i v i a l :
INTEGER FREQUENCY LOGICAL SUBPARCEL(,), PATTERN5(,) FREQUENCY = SUM (PATTERN5 (SUBPARCEL))
The DAP-FORTRAN f u n c t i o n SUM g i v e s a count of the s e t
p i x e l s i n PATTERN5 (which i s the right-most edge of the
c l u s t e r p a t t e r n ) f o r a l l areas where SUBPARCEL i s s e t . This
value, when a l l i e d w i t h the r e s u l t s achieved from other
Chapter s i x

- 310 -
c l u s t e r - s h a p e s , can c a t e g o r i s e the sub-parcel image t o some
( p r e s e n t l y unknown) e x t e n t . I n i t i a l i n v e s t i g a t i o n s have
in v o l v e d c a t e g o r i s i n g known sub-parcel u n i t s by means of the
OS DMB data converted to r a s t e r mode (see s e c t i o n 5.3). The
t h e o r i e s are e a s i l y t r a n s f e r a b l e to data which have come from
h i g h - q u a l i t y r a s t e r scanners provided that no gaps e x i s t i n
the r a s t e r line-work. For t h i s reason, an obvious next s t e p
i s to c l a s s i f y s u b - p a r c e l regions w i t h i n data which have
emanated from an expensive and s o p h i s t i c a t e d r a s t e r scanner.
6.5 CONCLUSIONS
The hardware a r c h i t e c t u r e d e s c r i b e d i n t h i s chapter i s
novel. The b e n e f i t s gained i n complex numerical a p p l i c a t i o n s
are not completely a s s e s s e d a t the p r e s e n t time; c e r t a i n l y
t h e re i s evidence ( K l e t t e 1979, Marks 1980, Reeves 1980) to
suggest much p o t e n t i a l i n image-processing work. These
techniques are i n t h e i r development stages though e a r l y
r e s u l t s i n t h i s r e s e a r c h have been very promising f o r
r a s t e r - c a r t o g r a p h y . Since the DAP i s performing the same
operat i o n s i m u l t a n e o u s l y , then extremely f a s t
throughput-rates have been p o s s i b l e . I t i s d i f f i c u l t to
provide comparisons with s e r i a l - b a s e d e q u i v a l e n t s (see
Parkinson 1978) s i n c e the m a j o r i t y of algorithms being used
are not amenable t o the a r c h i t e c t u r e of a conventional
Chapter s i x

- 311 -
computer but t e s t s c a r r i e d out on an IBM 370/168 have been
g e n e r a l l y o r d e r s of magnitude slower.
On the whole, any c o n c l u s i o n s reached on the
c h a r a c t e r i s t i c s of these new-generation machines must i n c l u d e
a mention o f t h e i r v e r s a t i l i t y and r e l a t i v e ease of use.
Extremely powerful o p e r a t i o n s can be coded i n a few l i n e s of
DAP-FORTRAN which are four or f i v e times s h o r t e r than any
s e r i a l - c o d e . The r e s u l t i s s h o r t , easy to understand
software. I t must be pointed-out t h a t g e n e r a l l y any
programming t a s k s r e q u i r e much d i f f e r e n t a l g o r i t h m l o g i c ; i t
i s e a s i e r to r e - d e s i g n the software from f i r s t p r i n c i p l e s
than to attempt to convert e x i s t i n g s e r i a l - c o d e for a
p a r a l l e l computer.
Most of the s e t e s t s were based on 'clean' data although
t h e i r c h a r a c t e r i s t i c s are d i r e c t l y t r a n s f e r r a b l e t o
eq u i v a l e n t data emanating from a r a s t e r - s c a n n e r . T e s t s
c a r r i e d - o u t on h i g h - q u a l i t y scanned data a r e c u r r e n t l y i n
progress with the view to s i m i l a r r e s u l t s being a t t a i n e d . On
the b a s i s of r e s u l t s to date, i t seems not unreasonable to
expect t h a t a p a r a l l e l - b a s e d r a s t e r system w i l l be the norm
by the l a t e e i g h t i e s .
Many of the s e e a r l y developments are h i g h l y
machine-dependant on a device which i s c u r r e n t l y expensive as
Chapter s i x

- 312 -
a r e s u l t of only a l i m i t e d number being sold a t the pre s e n t
time; a DAP c o s t s c.600,000 pounds s t e r l i n g + a s s o c i a t e d
c o s t s for an ICL 2900 host mainframe. As has been pointed
out i n s e c t i o n 6.2.2, the DAP i s the f i r s t of i t s kind,
though the Goodyear Staran used i n The US Engineer
Topographic L a b o r a t o r i e s has c e r t a i n f e a t u r e s i n common.
Others are bound to f o l l o w before too long; a l r e a d y
Braunleder and Kober (1981) d e s c r i b e a s i m i l a r machine based
on an a r r a y of mi c r o - p r o c e s s o r s . The design of p a r a l l e l
algorithms must be made now i n p r e p a r a t i o n for these
new-generation machines.
Chapter s i x

- 313 -
APPENDIX 6.1
Mapping f u n c t i o n s used i n u t i l i t y "QMCFORMAT"
See s e c t i o n 6.3.1 and annex 6a:
A d e s c r i p t i o n of the tape formats adopted f o r the t r a n s f e r
of OS r a s t e r data between Durham and Queen Mary Coll e g e ,
London i s given i n s e c t i o n 6.3.1. A l e v e l 6 (64 x 64) index
provides p o i n t e r s t o the a s s o c i a t e d 64 x 64 p i x e l DAP images
of the l e v e l 12 (4096 x 4096) data. I t has been n e c e s s a r y to
develop mapping f u n c t i o n s to provide these p o i n t e r s between
l e v e l 6 and l e v e l 12 r a s t e r r e p r e s e n t a t i o n s . The l e v e l 6
data are s t o r e d i n an a r r a y of 64 x 64 elements:
l e v e l 6
I
y
> x
64
64
The l e v e l 12 data (4096
p a r t i t i o n s of 4096 x 256;
x 4096) are st o r e d as s i x t e e n
Appendix 6.1

- 314 -
l e v e l 12 •> x 4096
I
y
I
I
2
3
256
256
256
16 256
(a) Mapping f u n c t i o n i n x:
Each p i x e l address i n the l e v e l 6 f i l e must be mapped i n t o
a s t a r t an end address i n the l e v e l 12 f i l e . Each l e v e l 6
p i x e l r e p r e s e n t s a 64 x 64 c l u s t e r i n the l e v e l 12 f i l e .
l e t l e v e l 6 h i t address of x = p
then l e v e l 12 s t a r t address i n x = [(p - 1 ) * 64] + 1
and l e v e l 12 end address i n x = 64 * p
(b) Mapping f u n c t i o n i n y:
The theory f o r the mapping f u n c t i o n i n y i s i d e n t i c a l to
t h a t i n x wi t h some minor m o d i f i c a t i o n s . The y-addresses f o r
Appendix 6.1

- 315 -
the l e v e l 12 f i l e comprise s i x t e e n p a r t i t i o n s of 256 p i x e l s
(or 4 x 64 p i x e l s ) and hence i t i s n e c e s s a r y to compute:
1. which p a r t i t i o n i s d e s i r e d and
2. the increment (1 - 4) of the c o l l e c t i o n of 64 s c a n - l i n e s
w i t h i n the p a r t i t i o n ,
before the y mapping f u n c t i o n can be determined.
l e t l e v e l 6 h i t address of y = q
p a r t i t i o n = Y = INT C(q - 1) / N] + 1
p a r t i t i o n increment = I = q - [ ( Y - l ) * N ]
where N = p a r t i t i o n s i z e i n y/64
= 4 i n t h i s case
then l e v e l 12 s t a r t address i n y = [ ( I - 1) * 64] + 1
and l e v e l 12 end address i n y = 64 * I
Appendix 6.1

- 316 -
7 AN APPRAISAL OF RASTER-DRIVEN HARDWARE
7.1 INTRODUCTION
The d i g i t a l manipulation of topographic data has taken on
three d i s t i n c t phases: capture (data i n p u t ) ,
manipulation/storage and p r e s e n t a t i o n (data o u t p u t ) .
I n v e s t i g a t i o n s i n t o the c h a r a c t e r i s t i c s and e f f i c i e n t
h andling of the manipulation/storage stage are reported i n
chapters f i v e and s i x . This chapter c o n c e n t r a t e s on
techniques f o r ap p r o p r i a t e mass data input and output by
r a s t e r - d r i v e n hardware dedicated to t h i s t a s k . I n
p a r t i c u l a r , c o n s i d e r a t i o n i s given t o the q u a l i t y and
s u i t a b i l i t y o f the data generated by commercially a v a i l a b l e
r a s t e r scanning systems. These s p e c i a l i s e d d e v i c e s a r e
expected t o have an i n c r e a s i n g importance i n automated
map-production w i t h i n the next decade. Although the
c a r t o g r a p h i c market i s somewhat l i m i t e d , t h e r e are s e v e r a l
commercial scanners a v a i l a b l e a t v a r y i n g c o s t s and with a
number of design s t r a t e g i e s . Much l i t e r a t u r e has been
produced d e s c r i b i n g each p a r t i c u l a r scanner ( H a r r i s et a l
1981, Lloyd 1981, Pferd and Stocker 1981, Robertson 1980,
Tafoya 1980, Rhind 1979), although l i t t l e attempt has been
made to provide any comparisons between each type of d e v i c e .
Chapter seven

- 317 -
C l e a r l y , t h i s i s a d e f i c i e n c y ; c o n s t r u c t i v e a p p r a i s a l s of
a v a i l a b l e hardware are c r u c i a l f o r e f f e c t i v e system design
and data base generation. The r e p o r t by Davey et aj. (1977)
i s the only l i t e r a t u r e known t o the author which has i t e m i s e d
and compared scanning systems; t h i s document - commisioned by
the Department of the Environment - gives a good summary of
the s t a t e - o f - t h e - a r t i n the mi d - s e v e n t i e s . Present
i n d i c a t i o n s suggest a r a p i d development i n the f i e l d of
r a s t e r data p r o c e s s i n g (Peuquet 1979a) and hence these
documents are q u i c k l y outdated. A c o n t i n u a l monitoring of
the progress on a four - f i v e year c y c l e i s considered
d e s i r a b l e . F u r t h e r , u n t i l h i t h e r t o , no attempts have been
made to encode d i g i t a l l y Ordnance Survey l a r g e s c a l e data
with scanning systems; p r o v i s i o n a l t r i a l s a re c r u c i a l for a
comprehensive assessment of the use of r a s t e r methods i n
handling topographic data i n the UK.
A s e r i e s of bench-marking t r i a l s have been c a r r i e d - o u t
with the kind cooperation o f both manufacturers and u s e r s of
r a s t e r - s c a n n i n g equipment; these have enabled an
i n v e s t i g a t i o n i n t o the procedures and problems i n v o l v e d with
t h i s form f o r d i g i t a l capture o f OS l a r g e s c a l e s data. Table
7.1 i t e m i s e s examples of scanning hardware known to the
author and e v a l u a t i o n s have been undertaken on those scanners
a s t e r i s k e d - these a r e rep o r t e d i n s e c t i o n 7.3.
Chapter seven

- 318 -
Table 7.1 Summary o f / e x i s t i n g r a s t e r - d r i v e n scanning systems
1. B e l l Telephone L a b o r a t o r i e s I n c .
Whippany, NJ, USA 07945
* EDAD - f i b r e - o p t i c scanner - r o l l e r t r a n s p o r t system
1016mm x u n l i m i t e d length maximum document s i z e 9.8 pixels/mm r e s o l u t i o n + 0.01mm r e p e a t a b i l i t y + 0.01mm accuracy G r e y - l e v e l d e t e c t i o n R a s t e r - t o - v e c t o r conversion software.
2. Broomall I n d u s t r i e s I n c .
Broomall, Pa, USA 19008
LAS-200 - f l a t b e d l a s e r scanning system
1117 x 1625mm maximum document s i z e 39.4 pixels/mm r e s o l u t i o n + 0.025mm r e p e a t a b i l i t y 0.05mm + 0.006mm accuracy G r e y - l e v e l d e t e c t i o n R a s t e r - t o - v e c t o r conversion software.
3. Kongsberg L t d .
Kongsberg, Norway
* KartoScan scanner subsystem
600 x 1010 mm maximum document s i z e 5-40 pixels/mm r e s o l u t i o n + 0.01mm r e p e a t a b i l i t y + 0.01mm accurac y G r e y - l e v e l d e t e c t i o n R a s t e r - t o - v e c t o r conversion software.
..... continued
Chapter seven

- 319 -
4. Oxford U n i v e r s i t y Nuclear P h y s i c s Laboratory
Oxford, UK
* PEPR - CRT f i l m scanner
Documents reduced to 16mm or 35mm m i c r o f i l m 1 i n 10000 r e s o l u t i o n 1 i n 100000 accuracy G r e y - l e v e l d e t e c t i o n R a s t e r - t o - v e c t o r conversion software.
5. S c i t e x Corporation L t d .
H e r z l i a B 46 103, I s r a e l
* Response 250 - drum-scanner subsystem
914 x 914mm maximum document s i z e 4-47 pixels/mm r e s o l u t i o n + 0.01mm r e p e a t a b i l i t y + 0.01mm accuracy Twelve colour d e t e c t i o n R a s t e r - t o - v e c t o r conversion software.
7.2 SCANNING TESTS OF ORDNANCE SURVEY LARGE SCALE DOCUMENTS
The q u a l i t y and formats of the source documents are
expected to a f f e c t s e r i o u s l y any scanning p r o c e s s e s ; most
scanners w i l l accept both t r a n s p a r e n t and opaque media
although image q u a l i t y and c o n t r a s t must be c l e a r . There
are, t h e r e f o r e , expected to be s e v e r a l problems a s s o c i a t e d
with the a c c u r a t e d e t e c t i o n of some o f the p o o r e r - q u a l i t y
Chapter seven

- 320 -
master survey documents (MSD) c u r r e n t l y i n use at the
Ordnance Survey, though s i m i l a r d i f f i c u l t i e s w i l l probably
occur with the use of the automatic l i n e - f o l l o w i n g equipment
c u r r e n t l y under-going t e s t s in-house a t Ordnance Survey
( s e c t i o n 2 .8). Unfortunately, i t has been i m p o s s i b l e t o
c l a s s i f y the extent of thes e problems without very
s u b s t a n t i a l a c c e s s to scanning equipment. I n order to ensure
the b e s t data p o s s i b l e , a t l e a s t for p r e l i m i n a r y assessments,
a s p e c i a l l y prepared source document of a 1:1250 sheet
(SO 9283SE) has been used i n a l l the scanning t r i a l s . I n the
l i g h t of experience gained from t h i s r e s e a r c h , i t i s l i k e l y
t h a t most scanners w i l l accept the h i g h e r - q u a l i t y MSD's with
l i t t l e or no graphic enhancement. The exte n t of the
m o d i f i c a t i o n s n e c e s s a r y to the poorer images i s unknown a t
pr e s e n t ; c e r t a i n l y some photographic enhancement w i l l be
ne c e s s a r y and p o s s i b l y complete redrawing i n (some)
e x c e p t i o n a l c a s e s .
The r a s t e r information generated a t the scanning stage
w i l l be a f i l e of d i g i t a l data r e p r e s e n t i n g the map image.
Most s u p p l i e r s of scanning hardware o f f e r software options to
transform t h i s r a s t e r output i n t o v e c t o r s t r i n g s f o r f u r t h e r
manipulation. General d i s c u s s i o n s with e x p e r t s ( B e l l
L a b o r a t o r i e s , Broomall I n d u s t r i e s , Kongsberg, S c i t e x , USGS
pers comm 1980) p r i o r t o the scanning t e s t s have suggested
t h a t the performance o f t h i s c onversion process w i l l be
Chapter seven
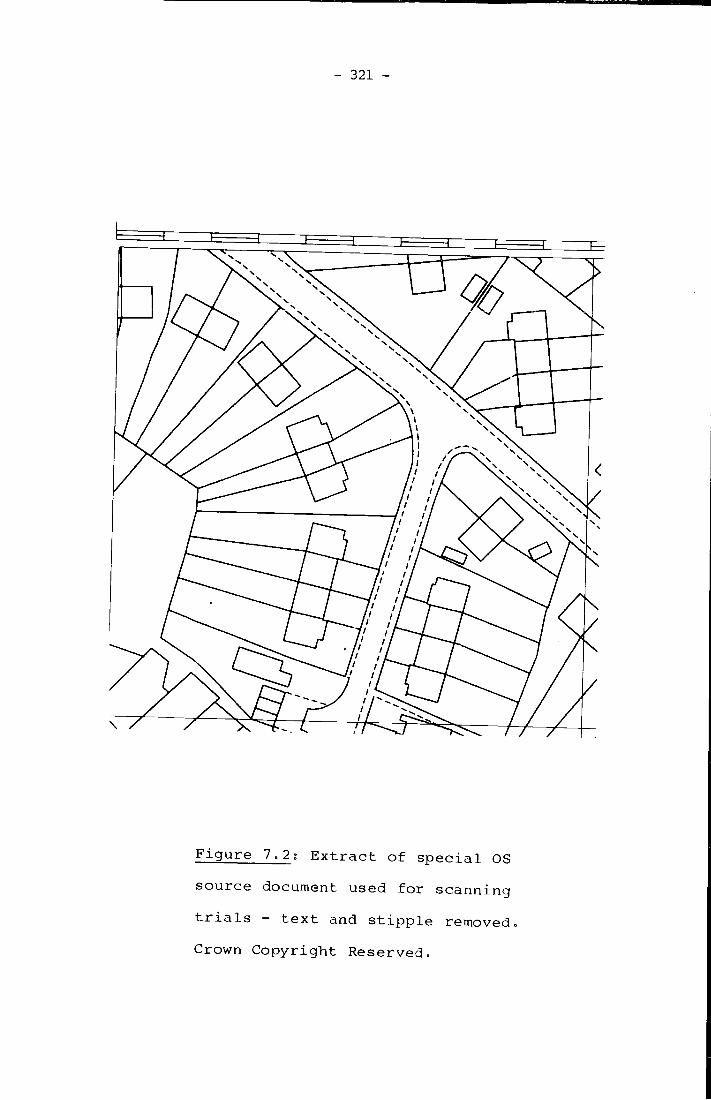
- 321 -
E
< /
N
/
\ 1
F i g u r e 7.2: E x t r a c t of s p e c i a l OS
s o u r c e document used f o r s c a n n i n g
t r i a l s - t e x t and s t i p p l e removed.
Crown C o p y r i g h t R e s e r v e d .
- 322 -
s e r i o u s l y degraded by the t e x t u a l information and the
b u i l d i n g i n f i l l ( s t i p p l e ) i n c l u d e d i n the OS l a r g e s c a l e maps
s p e c i f i c a t i o n . Text and f e a t u r e i n f i l l can be s t o r e d
s u c c e s s f u l l y i n the r a s t e r - f i l e s but cannot be v e c t o r i s e d and
d e s c r i b e d s u c c i n c t l y as v e c t o r s t r i n g s by e x i s t i n g software.
Thus, f u r t h e r development i n the r a s t e r - t o - v e c t o r conversion
methods i s n e c e s s a r y before an a l l r a s t e r - d r i v e n OS map
production system i s p o s s i b l e . For these reasons, the
s p e c i a l l y prepared source document i n the scanning t r i a l s had
both t e x t and s t i p p l e information removed. An e x t r a c t of
t h i s source document i s shown i n f i g u r e 7.2.
H i g h - q u a l i t y copies of t h i s graphic on s t a b l e base
photographic f i l m were sent to the f o l l o w i n g r a s t e r - s i t e s
with a request to scan the image a t a r e s o l u t i o n considered
most appropriate f o r a c c u r a t e d i g i t a l r e p r e s e n t a t i o n .
1. B e l l Telephone L a b o r a t o r i e s I n c .
2. Broomall I n d u s t r i e s I n c .
3. Kongsberg Ltd.
4. Oxford Image A n a l y s i s Group.
5. United S t a t e s G e o l o g i c a l Survey (USGS) - o p e r a t i n g a
Chapter seven

- 323 -
S c i t e x Response 250 system.
A l l systems o p e r a t i o n a l a t these s i t e s perform an
immediate conversion to v e c t o r format f o r most mapping
although r e q u e s t s were made for both the r a s t e r data and the
v e c t o r data to enable comprehensive assessments of the
degrees of s u c c e s s from both the systems' hardware and
software.
.2.1 The r o l e o f a r a s t e r - d r i v e n data e n t r y system
Scanning d e v i c e s provide an i n t e r f a c e between each source
graphic and the computer system. The r o l e o f t h i s
s p e c i a l i s e d hardware i s to accept the e x i s t i n g p l a n s (or some
p h o t o g r a p h i c a l l y reduced e q u i v a l e n t ) and r e s o l v e the
line-work i n t o i t s c o n s t i t u e n t p i x e l d a ta. There i s a
l i m i t e d number of design s t r a t e g i e s f o r t h i s t a s k - they
i n v o l v e e i t h e r a t t a c h i n g map sheets to moving or f i x e d
f l a t b e d frames, t o drums t h a t r o t a t e a t a c o n t r o l l e d speed or
use f r i c t i o n r o l l e r s t o t r a n s p o r t the document through a
f i x e d scanning system. Regardless of the mechanics of the
d e v i c e , however, the r o l e of each device i s e f f e c t i v e l y the
same. An increment i n the y - d i r e c t i o n c r e a t e s a new
s c a n - l i n e and a s e r i e s of contiguous x - s h i f t s e s t a b l i s h e s the
Chapter seven

- 324 -
p i x e l information along each s c a n - l i n e . With the exception
of the S c i t e x Response 250 Super-Scanner which can
d i s t i n g u i s h up to twelve c o l o u r s , most systems can c l a s s i f y
only monochrome inf o r m a t i o n . Each p i x e l comprises a measure
of the greyness of a very s m a l l element of the map image.
For example, assuming e i g h t - b i t s are a l l o c a t e d to each r a s t e r
p i x e l , then the g r e y - l e v e l s are h e l d i n the range 0 to 255.
Areas of no data (pure white) a r e represented by a zero and
b l a c k areas i n the c e n t r e of map line-work are coded as 255
or v a l u e s near to i t . P i x e l s which f a l l on the edge of l i n e s
w i l l comprise v a l u e s somewhere w i t h i n t h i s range; 'noise'
a r i s i n g from such d i v e r s e f a c t o r s as d i r t y source g r a p h i c s or
poor s i g n a l - t o - n o i s e r a t i o s of the scanning equipment w i l l
a l s o have i n t e r m e d i a t e v a l u e s .
The r e s u l t i n g d i g i t a l f i l e i s a l a r g e a r r a y of p i x e l data
r e p r e s e n t i n g the o r i g i n a l map. Those p i x e l s with high
g r e y - l e v e l s (darker r e g i o n s ) are a s s o c i a t e d with the map
line-work and p i x e l s with lower l e v e l s of greyness r e p r e s e n t
the l i g h t e r a r e a s which appear as empty spaces on the map
s h e e t s .
In l i n e mapping (as d i s t i n c t from encoding continuous tone
images) i t i s n e c e s s a r y to a s s i g n a t h r e s h o l d g r e y - l e v e l to
demarcate the boundary between b l a c k and white p i x e l s . T h i s
w i l l be a s s i g n e d e m p i r i c a l l y by a t r a i n e d operator and can
Chapter seven

- 325 -
h^x^m nl*
i H | i l ummim h # H W # > w ^ l l
"i r
F i g u r e 7.3: The e f f e c t s o f i n c o r r e c t
g r e y - l e v e l t h r e s h o l d i n g w i t h OS map
d a t a i n t he Oxford U n i v . PEPR system.
Crown C o p y r i g h t R e s e r v e d .

- 326 -
vary from document to document depending on image q u a l i t y and
data c h a r a c t e r i s t i c s . The t e s t s c a r r i e d - o u t i n t h i s r e s e a r c h
have, by n e c e s s i t y , been c o n s t r a i n e d by the t h r e s h o l d s chosen
at the scanning s i t e s . I t has had to be assumed t h a t these
c h o i c e s are adequate fo r s u i t a b l e d i g i t a l r e p r e s e n t a t i o n of
the OS data. C l e a r l y , the choice of g r e y - l e v e l t h r e s h o l d can
be more a c c u r a t e l y d e f i n e d by a t r a i n e d operator as a r e s u l t
of experience and experimentation than by the r e s e a r c h e r
u n f a m i l i a r w i t h the equipment. The e f f e c t of the t h r e s h o l d
l e v e l i s to tune the scanner to d e t e c t l i n e s of a d e s i r e d
l i n e - w e i g h t . Varying the t h r e s h o l d w i l l a f f e c t the
p i x e l - w i d t h of the v e c t o r s i n the r a s t e r image: a low
t h r e s h o l d w i l l provide l i n e - w i d t h s comprising many p i x e l s
s i n c e more low-order g r e y - l e v e l s are accepted. F i g u r e 7.3
shows the e f f e c t of an i n a p p r o p r i a t e t h r e s h o l d s e t t i n g at the
scanning stage. The c l o s e p r o x i m i t y of p a r a l l e l l i n e s are
seen to merge together, producing e r r o r s i n the r a s t e r f i l e
and i n any subsequent v e c t o r s .
T h i s has summarised the r o l e of any scanning subsystem i n
the t o t a l r a s t e r p r o c e s s ; f u r t h e r data manipulation i s not
dependent on the scanner and i s performed post hoc by
computer software. D e t a i l e d accounts of the nature of t h i s
software i s given i n chapters four, f i v e and s i x .
Chapter seven

- 327 -
3 DESCRIPTIONS OF COMMERCIAL RASTER-SCANNING SYSTEMS
There now f o l l o w s a b r i e f overview of r a s t e r scanners
known to the author which are considered appropriate for
handling c a r t o g r a p h i c data.
3.1 Broomall I n d u s t r i e s I n c .
Broomall I n d u s t r i e s I n c . ( B I I ) o f f e r a complete r a s t e r
system - 'SCAN-GRAPHICS'. Th i s i n c l u d e s scanning hardware,
c o n t r o l l i n g PDP 11/70 mini-computer, e d i t i n g f a c i l i t e s and
a l l a s s o c i a t e d software. E a r l y scanning subsystems used
w h i t e - l i g h t sources to d e t e c t the r a s t e r p i x e l s : t h i s was
found to be error-prone and d i f f i c u l t t o implement (Broomall
pers comm 1980). More advanced hardware using l a s e r - o p t i c s
has proved to be more a c c u r a t e and r e l i a b l e .
There are c u r r e n t l y two scanning systems commercially
a v a i l a b l e from B I I (Broomall I n d u s t r i e s I n c . 1980): the
LAS-200 i s a high r e s o l u t i o n f l a t b e d l a s e r scanner and the
D-400 i s a more mediocre, lower r e s o l u t i o n drum-type scanner.
The l a t t e r i s intended f o r small-format g r a p h i c s
engineering drawings, a r t i s t i c line-work and so on. I t does
not have p o t e n t i a l f o r Ordnance Survey production methods
without major m o d i f i c a t i o n s t o the scanning source documents.
Chapter seven

- 328 -
The maximum s i z e a c c e p t a b l e i s 12 x 18 inches which i s too s m a l l for any s e r i o u s c a r t o g r a p h i c work. N e v e r t h e l e s s , the D-400 i s a compact (38 x 25 x 11.5 i n c h e s ) , v e r s a t i l e scanner o f f e r i n g a scanning r e s o l u t i o n of ten p i x e l s per m i l l i m e t r e and a minimum l i n e - w e i g h t d e t e c t i o n of 0.1mm.
The Broomall LAS-200 f l a t b e d scanner f i t s more n e a t l y i n t o
a c a r t o g r a p h i c production environment; i t has a t e c h n i c a l
s p e c i f i c a t i o n (Table 7.1) q u i t e s a t i s f a c t o r y f o r Ordnance
Survey mapping. The large-format scanning area w i l l enable
up to four l a r g e s c a l e p l a n s to be scanned during each
machine set-up. The l a s e r scanning head has the a b i l i t y to
speed-up and slow-down as data complexity v a r i e s and hence
w i l l run p r o p o r t i o n a l l y q u i c k e r for the s p a r s e l y covered
1:2500 r u r a l data (Adams and Rhind 1981) than w i l l be the
case f o r the more d e t a i l e d 1:1250 p l a n s . A disadvantage f o r
production use i s the l a r g e dimensions n e c e s s a r y f o r the
f l a t b e d scanning e a s e l , producing a device which r e q u i r e s
much space. Each u n i t measures 115 x 86 x 32 inches making
i t comparable w i t h the l a r g e F e r r a n t i Master p l o t t e r s
p r e s e n t l y i n use a t the OS headquarters.
E a r l y systems emanating from B I I - where the r a s t e r data
are s t o r e d on d i s k t e m p o r a r i l y f o r post hoc v e c t o r i s i n g -
have been superceded by a more i m p r e s s i v e r e a l - t i m e
v e c t o r i s i n g s t r a t e g y . B I I c l a i m (Broomall pers comm 1980)
Chapter seven

- 329 -
t h a t data i n a r a s t e r form are d i f f i c u l t to s t o r e , manipulate
and e d i t ( c f . a l t e r n a t i v e to S c i t e x ideas - 7.3.5), and t h a t
the e l i m i n a t i o n of any r a s t e r storage provides f o r a more
e f f i c i e n t system. The d e t a i l e d workings of the a l g o r i t h m are
a commercial s e c r e t although some general f e a t u r e s can be
reviewed. The LAS-200 device scans the graphic document i n
two-inch swathes, g e n e r a t i n g r a s t e r data for each swathe. A
microprocessor b u f f e r s the data and t r a n s f e r s them to the
c o n t r o l l i n g mini-computer. Once the f i r s t swathe has been
completed, the v e c t o r i s i n g software begins the
r a s t e r - t o - v e c t o r c o n v e r s i o n w h i l s t the second swathe i s being
scanned. V e c t o r i s i n g speeds i n the range 5000 to 10,000
l i n e a l i n ches of a r c per hour are claimed (Broomall
I n d u s t r i e s I n c . 1980) although i n t u i t i v e l y i t i s expected
t h a t Ordnance Survey data w i l l be f a r slower than t h i s .
Although no f e a t u r e - t a g g i n g i s p o s s i b l e during the scanning
or v e c t o r i s i n g s t a g e s , the software has the a b i l i t y to d e t e c t
c l o s e d polygon data and f l a g each f e a t u r e by l i n e - w e i g h t .
Approximate c o s t s f o r a Broomall system (LAS-200,
mini-computer, software) are $300,000. A v e c t o r - d r i v e n
i n t e r a c t i v e e d i t i n g s t a t i o n (with software) f o r post hoc data
v a l i d a t i o n , f e a t u r e - t a g g i n g , e t c . c o s t s $80,000 (Broomall
pers comm 1980).
Chapter seven
- 330 -
•3.2 B e l l Telephone L a b o r a t o r i e s I n c .
The Whippany NJ base i s r e s p o n s i b l e for p r o v i d i n g and
maintaining a l l u t i l i t i e s connected to B e l l L a b o r a t o r i e s '
p l a n t s . In t h i s t a s k , i t i s predominently concerned with
t e c h n i c a l and engineering drawings. I n 1975 a study was
i n i t i a t e d to i n v e s t i g a t e the c o s t - e f f e c t i v e n e s s of using
d i g i t a l techniques f o r the storage and manipulation of these
drawings; t h i s has l e d to the i n i t i a t i o n of a development
p r o j e c t f o r a scanner to perform the g r a p h i c - t o - d i g i t a l
conversion process (Pferd and Ramachandran 1978). E f f e c t i v e
scanner design was c o n s t r a i n e d by the f o l l o w i n g f a c t o r s :
1. i t had to be i n e x p e n s i v e ;
2. i t must be able t o handle l a r g e g r a p h i c s - t y p i c a l l y
E - s i z e (30" x 40") and K - s i z e (36" x 6 0 " ) .
For these reasons, any form of l a s e r s , f l a t b e d scanners or
drums were r e j e c t e d . F u r t h e r , the nature of the engineering
drawing data has d i c t a t e d an immediate conversion to a v e c t o r
form to reduce data storage overheads and i n c r e a s e p r o c e s s i n g
r a t e s . A f t e r some four y e a r s of r e s e a r c h , a working system
has been developed which meets t h e i r scanning requirements
and can d i s t i n g u i s h between d i f f e r e n t l i n e - w e i g h t s - an
Chapter seven

- 331 -
important n e c e s s i t y f o r engineering drawings ( P f e r d and
Stocker 1980). The device operates with a l i n e a r - g r i d o f
o p t i c a l f i b r e s which t r a n s f e r a r e f l e c t e d i l l u m i n a t i n g l i g h t
source from the graphic to a video camera and on to a
v i d e o - t o - d i g i t a l c o n v e r t e r . A p a i r of f r i c t i o n r o l l e r s ,
c o n t r o l l e d by a servo-motor, provides the t r a n s p o r t system
for the graphic w h i l s t scanning i s t a k i n g p l a c e . At b e s t ,
the system can provide a scanning r e s o l u t i o n of 250 p i x e l s
per i n c h (9.8 p i x e l s per m i l l i m e t r e ) - t h i s i s a f u n c t i o n of
the diameter of each f i b r e - o p t i c and i s an a c c e p t a b l e
r e s o l u t i o n f o r e n g i n e e r i n g drawings.
The system o p e r a t i n g at B e l l L a b o r a t o r i e s i s coupled to a
t i m e - s h a r i n g PDP 11/70 p r o c e s s o r with 256k bytes of memory,
supporting the UNIX op e r a t i n g system w i t h up t o 100
simultaneous u s e r s - most other commercial scanners r e q u i r e a
dedicated mini-computer system to operate e f f i c i e n t l y . I t i s
the aim of the B e l l L a b o r a t o r i e s t o produce a computer
p e r i p h e r a l f o r about $25,000 which e v e n t u a l l y w i l l be as
commonplace as a T e k t r o n i x g r a p h i c s t e r m i n a l . T h i s w i l l
enable f a s t l o c a l d i g i t i s i n g f o r remote copy,
t e l e c o n f e r e n c i n g and e d i t i n g (Pferd et a l 1979). One scanner
for every T e k t r o n i x 4014 i s foreseen i n the f u t u r e .
In order to reduce data volumes, thereby i n c r e a s i n g
p r o c e s s i n g and data b r o a d c a s t i n g r a t e s , the r e a l - t i m e
Chapter seven

- 332 -
v e c t o r i s i n g software has been developed to run s i m u l t a n e o u s l y
with the scanner. Pferd and White (1981) d e s c r i b e the nature
of t h i s software and the coding s t r a t e g i e s adopted f o r the
B e l l L a b o r a t o r i e s ' requirements. G e n e r a l l y , the system i s
not intended as a c a r t o g r a p h i c t o o l ; r e s u l t a n t v e c t o r output
i s optimised f o r a t e l e c o n f e r e n c i n g system ( i . e . r a p i d
conversion t o v e c t o r s to g i v e an approximation of the image
being scanned). N e v e r t h e l e s s , the system provides a c l e a r
i n d i c a t i o n o f the nature and p o t e n t i a l of i n e x p e n s i v e
scanners f o r the medium-term f u t u r e . Although the
v e c t o r i s i n g software i s i n a p p r o p r i a t e f o r most c a r t o g r a p h i c
work, the scanner can provide an o p e r a t i o n a l data e n t r y
system f o r more app r o p r i a t e post hoc software - f o r example,
the ideas using p a r a l l e l - c o m p u t e r s d i s c u s s e d i n chapter s i x .
.3.3 Kongsberg L t d .
Kongsberg L t d . of Norway have t r a d i t i o n a l l y been much
respected f o r t h e i r h i g h - q u a l i t y v e c t o r p l o t t i n g d e v i c e s .
More r e c e n t l y , i n cooperation with Messerschmitt-Bolkow-Blohm
(MBB) of Munich, they have developed the SysScan automated
mapping system which i s aimed towards the l a r g e - s c a l e
u t i l i t y , topographic and hydrographic market (Ll o y d 1981).
In essence, the SysScan system comprises t h r e e components:
r a s t e r scanning data e n t r y , a p r o c e s s i n g / i n t e r a c t i v e e d i t i n g
Chapter seven

- 333 -
f a c i l i t y and data p r e s e n t a t i o n .
The KartoScan scanning subsystem provides the means of
automatic data e n t r y although a d d i t i o n a l l y the system can
accept data from other s o u r c e s : T o t a l - S t a t i o n surveying
equipment, photogrammetric d e v i c e s , manual d i g i t i s i n g and so
on (Kongsberg Ltd. 1980). The scanner operates o f f - l i n e and
i s connected to a magnetic tape d r i v e to provide an i n t e r f a c e
with the SysScan c o n t r o l l i n g mini-computer - a PDP VAX 11/780
supporting the DEC VMS o p e r a t i n g system. The source
documents (which can be t r a n s p a r e n t or opaque) are h e l d to a
f l a t b e d e a s e l by g l a s s p r e s s u r e and are scanned i n a s e r i e s
of swathes ( s t r i p by s t r i p ) by the o p t i c a l scanning head.
There are 507 p i x e l s per swathe; each swathe i s a l i g n e d to
i t s neighbours without l e a v i n g any gaps or o v e r l a p p i n g . The
width of t h e s e swathes and the time taken for a complete
t r a v e r s e of the source graphic i s dependent on the s e l e c t e d
scanning r e s o l u t i o n . Table 7.4 summarises the
c h a r a c t e r i s t i c s of each swathe f o r the four p o s s i b l e scanning
r e s o l u t i o n o p t i o n s .
Chapter seven

- 334 -
Table 7.4: The e f f e c t of scanning r e s o l u t i o n on p i x e l
swathes i n the Kongsberg KartoScan
Source: Kongsberg L t d . (1980)
P i x e l r e s o l u t i o n
(mm)
Width of swathe (mm)
T r a v e r s e r a t e T h e o r e t i c a l max i n mm/sec scan times for
(1600 bpi tape) 1:12 50 map (mins)
0.2 0.1 0.05
100 50 25
32 16 8 4
1 4
14 54 0.025 12. 5
The scanner provides a f i l e of g r e y - l e v e l p i x e l s i n the
range 0 t o 127 which are transformed i n t o an e q u i v a l e n t
bit-map r e p r e s e n t a t i o n ( b l a c k / w h i t e ) with an appropriate
t h r e s h o l d boundary ( s e c t i o n 7.2.1). Once i n a s u i t a b l e form,
the data enter the Kongsberg data base GINIS ( G r a p h i c a l
I n t e r a c t i v e Information System). This data s t r u c t u r e i s
h i e r a r c h i c a l i n concept and takes on a t r e e - l i k e
r e p r e s e n t a t i o n ( L l o y d 1981, Martin 1976). Each branch i n the
t r e e comprises r e f e r e n c e s to a s p e c i f i c c o l l e c t i o n o f
l i k e - a t t r i b u t e s i n the map image. The parent t o each branch
provides a summary of i t s c h i l d r e n . For example, a branch
comprising r e f e r e n c e s to a l l b u i l d i n g s i n a map image i s the
parent of sub-branches which comprise p o i n t e r s t o p r i v a t e
b u i l d i n g s , p u b l i c b u i l d i n g s and so on. GINIS i s a
Chapter seven

- 335 -
v e c t o r - d r i v e n system p r o v i d i n g a means of e d i t i n g and
manipulating topographic data e a s i l y . C l e a r l y , an
intermediate p r o c e s s i n g stage i s n e c e s s a r y to r e o r g a n i s e the
b i n a r y scanned data i n t o s p e c i f i c e n t i t i e s ; b u i l d i n g s , for
example, must be c o n s t r u c t e d from s p e c i f i c l i n e s and through
recourse to a d j a c e n t t e x t i n f o r m a t i o n . The Kongsberg system
provides two mechanisms f o r t h i s o p e r a t i o n : one operates
a u t o m a t i c a l l y and the other i n v o l v e s l a r g e amounts of human
i n t e r a c t i o n . During the c o n v e r s i o n stage between r a s t e r and
v e c t o r , each r e s u l t i n g l i n e i s 'tagged* with a d e s c r i p t i o n of
i t s l i n e - w i d t h on the o r i g i n a l document. In t h i s way,
s p e c i f i c l i n e s can be e x t r a c t e d from the bulk of the data
a u t o m a t i c a l l y and h e l d at some l e v e l i n the data base
h i e r a r c h y . Since l i n e - w i d t h s v a r y only s l i g h t l y i n OS l a r g e
s c a l e s mapping, then t h i s f a c i l i t y i s expected to o f f e r
l i t t l e a s s i s t a n c e f o r e n t i t y r e - b u i l d i n g i n production. I t
i s the second mechanism a v a i l a b l e which i s expected to o f f e r
most p o t e n t i a l f o r production a t p r e s e n t , although such an
approach may prove too c o s t l y to be c o s t - e f f e c t i v e . T his
second option i n v o l v e s the use of the Kongsberg Graphics-7
(Kongsberg L t d . 1980) i n t e r a c t i v e g r a p h i c s s c r e e n with
a s s o c i a t e d l i g h t - p e n c u r s o r . With such hardware and the
Kongsberg c o n t r o l l i n g software, i t i s t r i v i a l to point to
f e a t u r e s on the s c r e e n and c l a s s i f y them q u i c k l y i n t o
p a r t i c u l a r c a t a g o r i e s to take advantage of the f l e x i b l e
storage and r e t r i e v a l mechanisms o f f e r e d i n the GINIS data
Chapter seven

- 336 -
base. Lloyd (1981) summarised the f a c i l i t i e s o f f e r e d by the
complete Kongsberg system and provided an i n d i c a t i o n of the
design of the data s t r u c t u r e used i n GINIS.
The p r e s e n t a t i o n stage of the SysScan system i n c o r p o r a t e s
small e l e c t r o s t a t i c r a s t e r p l o t t e r s (see s e c t i o n 7.5.2) for
quick d i s p l a y or h i g h - q u a l i t y t r a d i t i o n a l Kongsberg
v e c t o r - p l o t t e r s f o r a c c u r a t e work.
Each component i n the SysScan system i s s o l d s e p a r a t e l y to
enable customised i n s t a l l a t i o n s to be purchased. I n
mid-1981, Kongsberg L t d . quoted the f o l l o w i n g p r i c e s f o r
t h e i r SysScan u n i t s . Data e n t r y subsystem (scanner, magnetic
tape d r i v e , v e c t o r i s i n g software) - £220,000. Data
e d i t i n g / a r c h i v e subsystem (VAX 11/780 computer, t e r m i n a l , 67M
byte d i s k d r i v e , magnetic tape d r i v e , GINIS software)
£ 200,000. Data p r e s e n t a t i o n subsystem ( h i g h - q u a l i t y f l a t b e d
p l o t t e r ) - £80-90,000 (Kongsberg L t d . pers comm 1981).
.3.4 Oxford U n i v e r s i t y Image A n a l y s i s Group
Since the e a r l y nineteen s e v e n t i e s , two p r e c i s i o n CRT f i l m
scanners have been i n use a t Oxford U n i v e r s i t y for s e v e r a l
image p r o c e s s i n g a p p l i c a t i o n s ; both were o r i g i n a l l y developed
for bubble chamber f i l m p r o c e s s i n g t a s k s (Davey et aJL 1979).
Chapter seven

- 337 -
The work of the Image A n a l y s i s Group has been reported widely
( H a r r i s et a l 1981, Black et al_ 1979, Davey et a l 1979, Davey
et a l 1976) and has i n v o l v e d much progress i n the automatic
i n t e r p r e t a t i o n of l i n e - s t r u c t u r e d d ata.
Source documents t o be scanned are f i r s t photo-reduced to
16mm or 35mm f i l m f o r e n t r y to the PEPR scanner. The
hardware w i l l execute autonomously a s i n g l e sweep of the
cathode-ray through a d i s t a n c e of 500 microns with a
parameterised t h r e s h o l d from a s o f t w a r e - c o n t r o l l e d o r i g i n .
The s i g n a l p r o c e s s i n g r e t u r n s p o i n t e r s t o p o s i t i o n s where the
detected t h r e s h o l d on the scanned image i s h i g h e r than the
given sweep t h r e s h o l d . U n l i k e the m a j o r i t y of scanners,
scanning on the PEPR as a s e r i e s of s u c c e s s i v e p a r a l l e l
sweeps i s generated under software c o n t r o l by r e p e a t e d l y
d e f i n i n g the sweep o r i g i n .
The PEPR scanner i s not completely s u i t a b l e for
c a r t o g r a p h i c work; there are two major d e f e c t s i n i t s
s p e c i f i c a t i o n s . One a r i s e s from the s e n s i t i v i t y o f t h r e s h o l d
v a r i a t i o n s i n the photographic image causing gaps i n the
r e s u l t a n t p i x e l data - such an occurence i s commonplace with
scanning d e v i c e s o p e r a t i n g to micron standards. The second
i s the l a r g e amount of noi s e introduced i n t o the p i x e l data
l a r g e l y a r e s u l t of the photographic p r e p a r a t i o n stage and
the s i g n a l - t o - n o i s e l i m i t a t i o n s i n the PEPR (Preston pers
Chapter seven

- 338 -
comm 1981). S i m i l a r e f f e c t s would be evident, f o r example,
from a p o o r - q u a l i t y source document being scanned on a
h i g h - q u a l i t y scanner. Current r e s e a r c h a t Oxford i s
attempting to develop p i x e l - p r e p r o c e s s i n g software to
'clean-up' poor q u a l i t y data p r i o r to the post hoc
v e c t o r i s i n g stage ( P r e s t o n pers comm 1981).
.3.5 S c i t e x Corporation
The f u n c t i o n a l r o l e of most of the r a s t e r scanning systems
examined thus f a r has been fo r r a p i d data e n t r y ( i n p i x e l
form) with immediate con v e r s i o n t o a vec t o r n o t a t i o n for
storage and other p r o c e s s i n g . The S c i t e x Corporation of
I s r a e l have adopted a l t e r n a t i v e s t r a t e g i e s ; they c o n s i d e r
r a s t e r data capture and subsequent r a s t e r storage and
manipulation t o be the most f l e x i b l e approach f o r handling
c a r t o g r a p h i c d a t a . The Response 250 system was r e l e a s e d i n
the l a t e - s e v e n t i e s p r i m a r i l y f o r the map-production i n d u s t r y ;
i t i s an ex t e n s i o n o f the Response 200 system introduced i n
1975 f o r t e x t i l e and d e c o r a t i v e p r i n t i n g a p p l i c a t i o n s
(Gronemann and Bar-Lev 1979). The Response 250 comprises
three components ( c f . Kongsberg L t d . ) : scanner, c ol our
e d i t i n g s t a t i o n and l a s e r p l o t t e r ( S c i t e x Corp. 1981). Each
subsystem r e q u i r e s a c e n t r a l - p r o c e s s o r to run independently;
the c o n t r o l l i n g computers are Hewlett Packard - the c e n t r a l
Chapter seven

- 339 -
proc e s s o r i s a HP 24MXE with 32k words of 16 b i t memory with
an attached tape d r i v e and a 120 megabyte d i s k d r i v e .
The b a s i s of data capture i s a l a r g e format (90 x 90 cm)
drum scanner on t o which i s pla c e d f u l l - s i z e opaque or
t r a n s p a r e n t o r i g i n a l s h e l d by vacuum and p i n - r e g i s t r a t i o n
marks. S i n g l e - p a s s scanning i s c a r r i e d - o u t i n monochrome or
i n up to twelve c o l o u r s or hues. P i x e l r e s o l u t i o n can range
between 4 and 47 p i x e l s per m i l l i m e t r e and i s s e t by the
operator; the data a r e run-length-encoded by the scanning
hardware and s t o r e d d i r e c t l y on magnetic d i s k .
The i n t e r a c t i v e e d i t s t a t i o n comprises a n i n e t e e n - i n c h
colour d i s p l a y w i t h r e f r e s h memory of 320 x 256 p i x e l s of
four b i t s , a d i g i t i s i n g t a b l e t and c u r s o r and a s e r i e s of
f u n c t i o n buttons f o r the most common manipulation t a s k s .
Functions i n c l u d e : l i n e / c u r v e drawing, area i n f i l l , zoomimg,
f e a t u r e movement, o r i e n t a t i o n changes, c o l o u r or f e a t u r e
recoding, f e a t u r e d e l e t i o n and so on. The i n t e r a c t i v e
c a p a b i l i t i e s are i m p r e s s i v e and f a s t , l a r g e l y a r e s u l t of the
e f f i c i e n t use of data compaction methods and the dedicated
computing f a c i l i t i e s . Text and name placement i s t r e a t e d i n
e x a c t l y the same manner as p o i n t symbols. Text c h a r a c t e r s
and u s e r - d e f i n e d p o i n t symbols are h e l d on d i s k i n a p a t t e r n
l i b r a r y for easy r e c a l l and i n t e r a c t i v e placement i n the
d i g i t a l image. The magnetic tape u n i t provides the means of
Chapter seven

- 340 -
t r a n s f e r r i n g data between the components of the Response 250.
I t i s a l s o p o s s i b l e t o input s a t e l l i t e imagery data i n t o the
system and perform i n t e r a c t i v e e d i t i n g and image enhancement
and d i s p l a y as though they had o r i g i n a t e d from the scanner.
Hardcopy data p r e s e n t a t i o n and d i s p l a y i s p o s s i b l e by a
number of means. The l a s e r c o l o u r p l o t t i n g subsystem
provides a h i g h - q u a l i t y r a s t e r d i s p l a y for l a r g e format
gra p h i c s (up to 185 x 100 cm). P l o t t i n g r e s o l u t i o n i s
v a r i a b l e up t o 72 p o i n t s per m i l l i m e t r e ; p l o t t i n g speeds are
dependent on t h i s and on the c h a r a c t e r i s t i c s and d e n s i t y of
the data and the p l o t dimensions. Vector p l o t t e r s can
d i s p l a y l i n e a r f e a t u r e s which have been converted from r a s t e r
form by software.
Costs of the S c i t e x hardware i n mid-1981 were c. $250,000
fo r each component i n c l u d i n g the c o n t r o l l i n g computers. I n
essence, a f u l l system can be purchased for approximately
$750,000.
.3.6 Other scanning d e v i c e s
S e c t i o n s 7.3.1 to 7.3.5 have summarised the commercially
a v a i l a b l e r a s t e r hardware known to the author. A number o f
other d e v i c e s have been examined which do not c u r r e n t l y match
Chapter seven

- 341 -
ca r t o g r a p h i c requirements although c l o s e monitoring of t h e i r
progress i s a d v i s e d s i n c e common problems and s o l u t i o n s a r e
bound to develop. Some of these systems are o u t l i n e d below.
GEC-Marconi L t d . of Chelmsford are using r a s t e r - d r i v e n
techniques i n a p r o j e c t to study the problems and
c h a r a c t e r i s t i c s of handli n g information o r i g i n a t i n g from a
s y n t h e t i c a p e r t u r e radar (SAR) d e v i c e . A ' o n e - o f f ,
s p e c i a l l y designed scanner/camera has been developed to
e f f e c t i v e l y r e p r e s e n t the SAR i n l a b o r a t o r y c o n d i t i o n s . The
camera i s capable of r e s o l u t i o n s of 13 microns and generates
1024 x 1024 p i x e l s per image; each p i x e l i s not square
measuring 13 x 12.5 microns i n dimension. The graphic to be
scanned must be no l a r g e r than A4 format and i s secured to a
f l a t b e d e a s e l above which i s p l a c e d the camera which scans i n
the x - d i r e c t i o n under servo-motor c o n t r o l • A quartz-halogen
l i g h t source i s r e f l e c t e d o f f the graphic and det e c t e d by the
camera which t r a n s m i t s i t s analogue s i g n a l through an
a n a l o g u e - t o - d i g i t a l c o n v e r t e r before being s t o r e d on floppy
d i s k s . The source g r a p h i c s must be of h i g h - q u a l i t y ;
p r o v i s i o n a l t r i a l s have i n c l u d e d TV t e s t - c a r d data and a e r i a l
photographs ( B l y t h e pers comm 1981).
L e v e l s of nois e a r e i n t o l e r a b l y high f o r most c a r t o g r a p h i c
work; t h i s i s l a r g e l y due t o such f i n e scanning r e s o l u t i o n s .
The system i n c o r p o r a t e s up to 1000 g r e y - l e v e l s and i s
Chapter seven
- 342 -
i n e f f i c i e n t i n storage - 24 b i t s are a l l o c a t e d to each p i x e l .
In essence, a 1024 x 1024 image r e q u i r e s i n excess of t h r e e
megabytes (8 b i t s per b y t e ) . P r i m a r i l y f o r reasons of speed,
there are no f a c i l i t i e s to f i l t e r or modify the incoming data
as scanning i s t a k i n g p l a c e ; each d i g i t a l image generated
exceeds the c a p a c i t y of the floppy d i s k s . The d u a l - d e n s i t y
volumes i n use ( c . 0.5 megabytes c a p a c i t y ) w i l l each s t o r e
only a one-centimetre p a r t i t i o n of the o r i g i n a l image.
V i s u a l i n s p e c t i o n i s p o s s i b l e as scanning i s i n progress by
sampling the four most s i g n i f i c a n t b i t s of each incoming
p i x e l and d i s p l a y i n g them on a TV monitor. The r e s e a r c h
p r o j e c t i s t e c h n o l o g i c a l l y i n t e n s i v e and w e l l i n advance
(they c l a i m ) of s i m i l a r work i n the world although,
g e n e r a l l y , the nature of developments are not considered
s u i t a b l e f o r any Ordnance Survey a p p l i c a t i o n s without much
m o d i f i c a t i o n and f u r t h e r r e s e a r c h .
R a s t e r - d r i v e n hardware, g e n e r a l l y , has become i n c r e a s i n g l y
popular i n a number of i n d u s t r i e s - some are p a r t i a l l y
r e l a t e d to map production. I n p a r t i c u l a r , i n t e r a c t i v e
plate-making i n the c o l o u r - p r i n t i n g i n d u s t r y has gained
importance as a p p r o p r i a t e systems have been developed. A
t y p i c a l d e v i c e i s the Magnascan 550 ( C r o s f i e l d E l e c t r o n i c s
1981) which has an a r c h i t e c t u r e s i m i l a r to the scanning
hardware marketed by the S c i t e x Corporation. Though
d i s c u s s e d by C r o s f i e l d and the ECU i n c i r c a . 1970 (Rhind pers
Chapter seven

- 343 -
comm 1982), there are no p r i n t i n g systems of t h i s nature
known to the author which o f f e r f a c i l i t i e s to e x t r a c t the
d i g i t a l information for other types of manipulation. T h e i r
a p p l i c a t i o n s a r e r e s t r i c t e d to g r a p h i c s e d i t i n g to produce
s c r e e n i n g , continuous tone, p o s i t i v e or negative s e p a r a t i o n s
and so on; any in t e r m e d i a r y d i g i t a l p r o c e s s i n g i s concealed
completely from the operator who has no c o n t r o l on the system
software. There i s much to be s a i d f o r developing s u i t a b l e
i n t e r f a c e s to these d e v i c e s f o r extended f a c i l i t i e s . Most
l a r g e map-producing companies are a l r e a d y c o n s i d e r i n g t h e i r
use i n reprographic o p e r a t i o n s (Fortesque pers comm 1981) and
hence they can provide a means of mass data e n t r y i n t o an
i n t e r r e l a t e d computer data base.
The l i s t of r a s t e r - d e d i c a t e d systems d e s c r i b e d i n the
previous s e c t i o n s i s not ex h a u s t i v e although these are the
major examples s t u d i e d by the author. Current i n d i c a t i o n s
have suggested t h a t the next f i v e - t o - t e n years w i l l see the
i n t r o d u c t i o n o f ot h e r s (probably based on s i m i l a r s t r a t e g i e s )
which are cheaper and more v e r s a t i l e .
.4 AN APPRAISAL OF EXISTING RASTER SYSTEMS
S e c t i o n 7.2 i t e m i s e s the s u p p l i e r s of scanning systems who
were i n v i t e d to p a r t i c i p a t e i n the bench-mark t r i a l s to scan
Chapter seven

- 344 -
a s p e c i a l l y prepared h i g h - q u a l i t y OS 1:1250 map sheet ( f i g u r e
7.2). The cooperation from these s u p p l i e r s was e x c e l l e n t ;
with the exception of Broomall I n d u s t r i e s , a l l agreed to
provide samples of data generated by t h e i r systems. S e c t i o n
7.4.1 d e s c r i b e s the r e s u l t s obtained from the scanning
hardware and s e c t i o n 7.4.2 c o n s i d e r s the nature and q u a l i t y
of the r e s u l t a n t v e c t o r data generated by software.
Bench-marking t e s t s on a S c i t e x Response 250 system were
undertaken w i t h the kind cooperation of the USGS who operate
a system i n t h e i r map-production f l o w l i n e . I n mid-1980, when
the p r o j e c t was i n i t i a t e d , S c i t e x Corp. had no bench-marking
f a c i l i t i e s .
The r e s u l t s :
The output tapes from each scanning system d i f f e r
markedly, r e f l e c t i n g the wide d i v e r s i t y of data formats i n
common usage w i t h systems e f f e c t i v e l y performing the same
t a s k . Much work was n e c e s s a r y to decipher the incoming
tapes; t h i s ranged from l o w - l e v e l assembler programming to
unpack bit-compacted p i x e l s from the USGS to t r a n s l a t i n g
German language format s p e c i f i c a t i o n s s u p p l i e d by Kongsberg
(an i n d i c a t i o n o f t h e i r c l o s e a s s o c i a t i o n with MBB i n Munich
- see s e c t i o n 7.3.3).
Chapter seven

- 345 -
Table 7.5 Summary of the c h a r a c t e r i s t i c s of the r a s t e r - f i l e s
generated by four t e s t e d scanning systems
B e l l Labs Kongsberg Oxford U USGS S c i t e x EDAD KartoScan PEPR Response
Scanning
r e s o l u t i o n (mm) 0.05 0.10 0.06 0.05
Raster
dimensions 8000 x 2000 4000 x 4000 6441 x 6385 8000 x 7979
B i t s per
p i x e l see t e x t 8 8 1
Sparseness
of f i l e (%) 94.66 94.12 - 94.45
T o t a l tape
length ( f e e t ) 99 1219 - 848
Recording
d e n s i t y ( b p i ) 800 1600 - 1600
Machine set-up
time (mins) c.15 10 - 15
Scanning times (mins) unknown 15 unknown 72
No d e t a i l e d information can be given on the
c h a r a c t e r i s t i c s of the r a s t e r f i l e generated by the Oxford
PEPR system as only the v e c t o r data were s u p p l i e d .
Chapter seven

- 346 -
.4.1 The c h a r a c t e r i s t i c s of the r a s t e r f i l e s
Comparisons between the d i g i t a l r a s t e r f i l e s generated by
each scanning system i s d i f f i c u l t because p i x e l r e s o l u t i o n s ,
storage n o t a t i o n s and formats d i f f e r markedly. I n future
t r i a l s of scanning systems by the OS, i t would be b e t t e r to
request a s p e c i f i c s i n g l e p i x e l r e s o l u t i o n - 0.05mm i s
d e s i r a b l e for a p p r o p r i a t e g r a p h i c s and other manipulation.
Nonetheless, on the b a s i s of the work c a r r i e d - o u t i n t h i s
r e s e a r c h , i t has been p o s s i b l e t o compile t a b l e 7.5 which
i t e m i s e s the important c h a r a c t e r i s t i c s of each r a s t e r f i l e
produced.
The r a s t e r - f i l e from B e l l L a b o r a t o r i e s i s not a complete
r e p r e s e n t a t i o n o f the whole map s h e e t . The f i x e d scanning
r e s o l u t i o n o f 250 p i x e l s per i n c h of the EDAD scanner was
considered too c o a r s e f o r a c c u r a t e r e p r e s e n t a t i o n of the map
image. A c e n t r a l s t r i p of the document was p h o t o g r a p h i c a l l y
enlarged by a f a c t o r o f two p r i o r to scanning i n order to
give an i n c r e a s e d r e s o l u t i o n of 500 p i x e l s per i n c h (0.05mm).
The r a s t e r f i l e - comprising 8000 x 2000 p i x e l s - r e p r e s e n t s
one-quarter of the t o t a l map-sheet. Each s c a n - l i n e i n the
f i l e i s run-length-encoded (see s e c t i o n 5.4); only the s t a r t
and end addresses of the s e t - p i x e l s a r e s t o r e d for each
s c a n - l i n e . A resume of the B e l l L a b o r a t o r i e s tape formats i s
given i n appendix 7.1 to provide an example of a commercial
Chapter seven

- 347 -
F i g u r e 7.6a; E x t r a c t o f r a s t e r image
gene r a t e d by B e l l L a b o r a t o r i e s I n c .
EDAD scanner. Crown C o p y r i g h t Reserved
liLILLffl m
ill 1 > CO
I t I »
LU § L O 8 r z t I
Z ii Q o
S

- 348 -
/ /
t
\
X
F i g u r e 7.6b; Enlarged s e c t i o n o f
r a s t e r image generated by B e l l Labs.
EDAD scanner.
Crown C o p y r i g h t Reserved.

- 349 -
run-length-encoding scheme. F i g u r e 7.6a,b shows a g r a p h i c a l
r e p r e s e n t a t i o n of the r a s t e r f i l e p r i o r t o the r e a l - t i m e
v e c t o r i s i n g stage i n the B e l l system. There i s an i n h e r e n t
s c a l e d i s t o r t i o n i n the images due t o each p i x e l being
r e c t a n g u l a r ; the v e r t i c a l s t e p - s i z e i s approximately 1.075
times the h o r i z o n t a l s t e p - s i z e . Most non-graphic p r o c e s s i n g
can compensate f o r t h i s d e f i c i e n c y although the m o d i f i c a t i o n s
of the data f o r g r a p h i c s i s more d i f f i c u l t .
The evidence of m i s s i n g line-work ( e s p e c i a l l y on the
narrower-gauge g r i d - l i n e s ) i s a f u n c t i o n of the choice of a
d e t e c t i o n t h r e s h o l d d e s c r i b e d i n 7.2.1. To lower t h i s
t h r e s h o l d would introduce the mi s s i n g line-work but a l s o
generate more e x t e n s i v e l e v e l s of 'noise', a f f e c t i n g image
q u a l i t y , and post hoc v e c t o r i s i n g . The extent of the n o i s e
i n the r a s t e r f i l e i s c l e a r i n f i g u r e 7.6; i n p a r t i c u l a r , two
'noisy s t r e a k s ' ( l i n e s ) are apparent a t approximate g r i d
l o c a t i o n s 927.3 and 927.7. I t was s t a t e d by B e l l Labs. t h a t
these were caused by broken f i b r e s i n the scanner. There are
other randomly d i s p e r s e d areas of noi s e i n the image, which
appear as c l u s t e r s of s e t - p i x e l s - u s u a l l y of the order of 8
x 8 p i x e l s wide. T h i s may be due to dust p a r t i c l e s / s c r a t c h e s
on the o r i g i n a l , or poor s i g n a l - t o - n o i s e l e v e l s i n the
scanner. I n g e n e r a l , the l e v e l s of noi s e are not e x c e s s i v e
given the low-cost of the device and the consequent
r e l a t i v e l y poor s i g n a l - t o - n o i s e r a t i o . Most software can
Chapter seven

- 350 -
e l i m i n a t e the e f f e c t s of n o i s e e a s i l y , although a r e a s where
i t i s a t t ached to v a l i d l i n e data may be problematic i n
f u r t h e r data p r o c e s s i n g . T h i s n o i s e appears as bulges i n the
weight of l i n e s i n the the map data (see f i g u r e 7.6c).
No scanning times have been given for these t r i a l s and
hence i t i s d i f f i c u l t to comment (with c e r t a i n t y ) on the
e f f i c i e n c y of the B e l l system from a production standpoint.
Nonetheless, i t was pointed-out by Pferd (Pferd pers corati
1980) t h a t the scanner performs q u i c k l y and i s not considered
a s e r i o u s t h r e a t t o the demise of a production system.
The format of the r a s t e r - f i l e generated by the Kongsberg
KartoScan system r e f l e c t s the scanning s t r a t e g y performed by
the hardware ( s e c t i o n 7.3.3). The r a s t e r data a r e h e l d as a
s e r i e s of g r e y - l e v e l s ( i n uncompacted form) s e q u e n t i a l l y
swathe by swathe ( t a b l e 7.4). Each l o g i c a l r e c o r d comprises
512 b y t e s ; t h e r e a r e f i v e bytes of header information for
each record, followed by a s i n g l e s c a n - l i n e o f 507 p i x e l s
(with one g r e y - l e v e l per b y t e ) . F i g u r e 7.7 shows the
Kongsberg r a s t e r - f i l e g r a p h i c a l l y . The apparent h i g h l e v e l
of n o i s e i s a f u n c t i o n of the d e t e c t i o n t h r e s h o l d d e s c r i b e d
i n s e c t i o n 7.2.1. I t has been n e c e s s a r y to a l l o c a t e a
t h r e s h o l d v a l u e to d i s t i n g u i s h the boundary s e p a r a t i n g b l a c k
from white i n the g r e y - l e v e l data. As o u t l i n e d i n s e c t i o n
7.2.1, t h e r e are no formal r u l e s d i c t a t i n g a t h r e s h o l d l e v e l
Chapter seven

9r Of
9en ft 9e oa y K fin or. 9SK Co
9ht
as
1 1
56? 1- la
1 2^

- 352 -
- t h i s i s d e r i v e d e m p i r i c a l l y and v a r i e s from graphic to
g r a p h i c .
The scanning r e s o l u t i o n adopted fo r the t e s t s by the
Kongsberg operator was 0.1 m i l l i m e t r e s although the hardware
i s capable of scanning to f i n e r r e s o l u t i o n s i f d e s i r e d
( t y p i c a l l y 0.05 and 0.025 m i l l i m e t r e s ) . No p r e p a r a t i o n
stages were n e c e s s a r y for the source g r a p h i c ; the KartoScan
can handle the f u l l - s i z e d o r i g i n a l drawing. Kongsberg
s u p p l i e d time e s t i m a t e s a s s o c i a t e d w i t h t h e s e t e s t s : the
t o t a l time was quoted to. be t w e n t y - f i v e minutes.
I n i t i a l i s i n g the scanner (magnetic tape loading, source
graphic loading, machine c a l i b r a t i o n ) took ten minutes and
a c t u a l scanning took a f u r t h e r f i f t e e n minutes. I t i s c l e a r
t h a t t h i s scanning time quoted does not agree with the
t h e o r e t i c a l f i g u r e s obtained from the KartoScan t e c h n i c a l
documents and shown i n t a b l e 7.4. F u r t h e r communication with
Kongsberg L t d . ( L l o y d pers comm 1982) suggested t h a t an
a d d i t i o n a l time p e r i o d must be i n c l u d e d for such f a c t o r s as
movement of the scan-head to the s t a r t of each swathe;
f u r t h e r , i t was claimed (by Lloyd) t h a t a d d i t i o n a l times are
always quoted s i n c e o p e r a t i o n a l scanning r a r e l y meets the
t h e o r e t i c a l maximum speeds suggested by the t e c h n i c a l
s p e c i f i c a t i o n s . I t i s c l e a r t h a t one should be wary of
commercial propaganda i n t e c h n i c a l s p e c i f i c a t i o n s and any
f u r t h e r scanning t r i a l s must se t - o u t c l e a r o b j e c t i v e s of
Chapter seven

- 353 -
r e q u i r e d q u a l i t y and p r o c e s s i n g times to be met.
The q u a l i t y of the r e s u l t s a t t a i n e d from the Kongsberg
KartoScan scanner were d i f f i c u l t to a s s e s s without adequate
a c c e s s to an a p p r o p r i a t e r a s t e r p l o t t e r . To hold the data as
a s e r i e s of g r e y - l e v e l s r e q u i r e s repeated p l o t t i n g with
v a r y i n g t h r e s h o l d s to determine the value most appropriate to
d i s t i n g u i s h b l a c k and white. Nonetheless, on the b a s i s of a
random s e l e c t i o n of areas i n the r a s t e r f i l e being d i s p l a y e d
with v a r y i n g t h r e s h o l d s on a T e k t r o n i x cathode-ray t e r m i n a l ,
i t i s e v i d e n t t h a t the KartoScan produces a reasonable
d i g i t a l r e p r e s e n t a t i o n of an OS l a r g e s c a l e source document.
There i s a l s o evidence of s u b s t a n t i a l amounts of 'noise' i n
the data which must be cleaned post hoc by software. C a r e f u l
t h r e s h o l d c a l i b r a t i o n a t the s e t t i n g - u p stage i s e s s e n t i a l
f o r a c c u r a t e d e p i c t i o n of the data i n d i g i t a l form; a p a r t
from the presence of n o i s e , t h e r e i s a l s o evidence of
omissions of t h i n l i n e s (e.g. g r i d - l i n e s ) or data b l o c k i n g of
dense l i n e work and r e g i o n s with v e r y c l o s e p a r a l l e l l i n e s .
I t i s c l e a r t h a t the post-scanning software being developed
by Kongsberg i s tuned p r e c i s e l y to the output of the
KartoScan; g r e a t d i f f i c u l t i e s were encountered i n p r o c e s s i n g
the Kongsberg r a s t e r data with home-written software by the
author.
Chapter seven

- 354 -
The r a s t e r - f i l e generated by the S c i t e x Response 250 at
the USGS comprises a b i t - s e r i a l r e p r e s e n t a t i o n of the
scanner's output and hence t h e r e have been no problems with
the s e l e c t i o n of an app r o p r i a t e t h r e s h o l d for d i s p l a y
purposes. The scanning r e s o l u t i o n i s twenty p o i n t s per
m i l l i m e t r e , g e n e r a t i n g ( t h e o r e t i c a l l y ) an a r r a y of 8000 x
8000 p i x e l s for the complete 1:1250 map. I n p r a c t i c e the
scanner was h a l t e d prematurely i n the x - d i r e c t i o n producing a
f i l e of 8000 x 7979 p i x e l s . Such a b i t - s e r i a l p i x e l
r e p r e s e n t a t i o n p r o v i d e s an e f f i c i e n t method o f t r a n s f e r r i n g
the Ordnance Survey monochrome r a s t e r images between computer
i n s t a l l a t i o n s . Each l o g i c a l record of 1000 bytes (8000 b i t s )
comprises a s i n g l e r a s t e r s c a n - l i n e . An IBM assembler
r o u t i n e has been w r i t t e n t o unpack the b i t - s e r i a l data i n t o
one-byte u n i t s f o r e a s i e r manipulation with FORTRAN.
The q u a l i t y of the r e s u l t s a t t a i n e d from the USGS S c i t e x
scanner are encouraging f o r Ordnance Survey a p p l i c a t i o n s .
Examples of these data a r e shown i n f i g u r e 7.8a,b,c. A
c l e a r , e r r o r - f r e e image has been generated w i t h no v i s u a l
evidence o f nois e or f e a t u r e o m issions. Since no
s k e l e t o n i s a t i o n had been c a r r i e d out a t t h i s stage, the width
of each l i n e (number o f p i x e l s ) i s a f u n c t i o n o f f e a t u r e
o r i e n t a t i o n although i n ge n e r a l they are approximately s i x
p i x e l s wide.
Chapter seven

- 355 -
/ i i
i i i i 9
/ /
•
> /
r
F i g u r e 7.8a; E x t r a c t o f r a s t e r image
g e n e r a t e d by S c i t e x Corp. scanner.
Crown C o p y r i g h t Reserved.

- 356 -
/ / /
\
F i g u r e 7.8b; Enlarged s e c t i o n o f
r a s t e r image generated by S c i t e x Corp
scanner.
Crown C o p y r i g h t Reserved.

- 357 -
F i g u r e 7.8c: G r o s s l y e n l a r g e d r a s t e r
image generated by S c i t e x scanner
showing p i x e l s d e s c r i b i n g OS l i n e w o r k .
Crown C o p y r i g h t Reserved.
- 358 -
The scanning process on the S c i t e x system was quoted as
being c. f i f t e e n minutes set-up time and a f u r t h e r
seventy-two minutes scanning time. For the same r e s o l u t i o n
as used by Kongsberg (0.1mm), set-up time would be unchanged
but scanning time would be of the order of t h i r t y minutes on
the S c i t e x d e v i c e . No m o d i f i c a t i o n s were n e c e s s a r y to the
source document, nor were t h e r e any post hoc e d i t i n g and data
v a l i d a t i o n s t ages performed. No use was made of the c o l o u r
c a p a b i l i t i e s of the scanner i n t h i s a p p l i c a t i o n although i t
i s expected to a i d i n t e r a c t i v e f e a ture-coding and v a l i d a t i o n
procedures on a S c i t e x e d i t - s t a t i o n : such c o l o u r d e t e c t i o n
would be u s e f u l i n scanning 1:10000 s c a l e OS sheets f o r areas
with no 1:1250 or 1:2500 cover, s i n c e these i n c l u d e b l a c k
l i n e d e t a i l and brown contours.
7.4.1.1 Comparisons:
There are s e v e r a l problems i n h e r e n t i n any attempts t o
compare q u a n t i t a t i v e l y the r a s t e r data s e t s . Complete map
coverage i n r a s t e r form i s only a v a i l a b l e with the Kongsberg
and S c i t e x data? those f u r n i s h e d by B e l l L a b o r a t o r i e s were
r e s t r i c t e d to a q u a r t e r of the map s h e e t .
S p e c i f i c a l l y , the obvious form of d i g i t a l comparison i s t o
o v e r l a y one data s e t with another and examine the r e s u l t i n g
d i f f e r e n c e s and s i m i l a r i t i e s . T h i s was attempted f o r the
Chapter seven

- 359 -
B e l l , Kongsberg and S c i t e x data although the e x e r c i s e proved
u n s u c c e s s f u l f o r a number of t e c h n i c a l and conceptual
reasons. The b a s i c problems and c o n s t r a i n t s of such an
approach t o comparison are i t e m i s e d below.
1. The sheer volume of data comprising m u l t i - r a s t e r images
d i c t a t e d t h a t only s e l e c t e d s e c t i o n s of the map images
could be h e l d i n the computer simul t a n e o u s l y . For t h i s
reason, any comparisons attempted were r e s t r i c t e d to
images of 500 x 500 p i x e l s ; t h i s generated a
half-megabyte storage requirement f o r two r a s t e r images
to be processed at-a-time.
2. Since the p i x e l s i n each r a s t e r data s e t were o f
d i f f e r i n g r e s o l u t i o n s , i t was ne c e s s a r y to perform
appropriate s c a l e changes to reduce them a l l to a common
s i z e for comparison. Since the work was c a r r i e d out on
the NUMAC IBM 370/168 s e r i a l p r o c e s s o r , t h i s was known to
be a lengthy o p e r a t i o n (see s e c t i o n 6.4.1).
3. The coding and compaction conventions adopted by each
r a s t e r data s e t were d i f f e r e n t and hence software was
nec e s s a r y to r e o r g a n i s e them a l l to a common s t r u c t u r e .
For ease o f programming and subsequent d i s p l a y of the
r e s u l t s , t h i s s t r u c t u r e comprised the complete
uncompressed p i x e l s h e l d s c a n - l i n e by s c a n - l i n e .
Chapter seven

- 360 -
4. F i n a l l y , s i n c e the coordinate conventions adopted by each
of the source scanners were d i f f e r e n t , i t was n e c e s s a r y
to perform t r a n s l a t i o n s of the r a s t e r a r r a y s i n the x and
y d i r e c t i o n s and r o t a t e them as n e c e s s a r y to determine a
common r e f e r e n c e system.
A number of attempts were made to perform data o v e r l a y i n g
d i g i t a l l y by these techniques although no u s e f u l r e s u l t s were
achieved. I t proved most d i f f i c u l t to perform the
t r a n s l a t i o n s and r o t a t i o n s s i n c e these had to be determined
e m p i r i c a l l y on a t r i a l - a n d - e r r o r b a s i s . The l a c k of
appropriate r a s t e r - b a s e d g r a p h i c s f a c i l i t i e s i n Durham at
t h a t time (see s e c t i o n 5.3.5) meant t h a t any a s s i s t a n c e o f
g r a p h i c s (which would have been i n v a l u a b l e ) were a l s o
l a c k i n g . A number of reasons were concluded from t h i s
i n a b i l i t y to perform a working d i g i t a l o v e r l a y system. For
i n s t a n c e , the e f f i c a c y of performing a s c a l e change f o r
comparison purposes under these circumstances i s not
considered completely l e g i t i m a t e ; a s c a l e i n c r e a s e suggests
attempts to e x t r a c t more information than i s a c t u a l l y h e l d i n
the o r i g i n a l d ata. More a p p r o p r i a t e l y , though, the o r d e r s of
t h i s s c a l e change should probably have minimal importance.
The r e s u l t s achieved are p a r t i a l l y a r e f l e c t i o n of the
q u a l i t y and the c h a r a c t e r i s t i c s of the t r a n s f o r m a t i o n
r o u t i n e s (which were modified from a n a l y t i c a l photogrammetry
Chapter seven

- 361 -
o p e r a t i o n s known by the author) and of the r e l i a b i l i t y of the
i d e n t i f i e d f i d u c i a l marks ( a l l of which were, by n e c e s s i t y ,
OS map f e a t u r e s with l i n e s of s e v e r a l p i x e l s w i d e ) . The
a l t e r a t i o n s of the coordinate systems used from those
d e s c r i b e d i n the t e c h n i c a l s p e c i f i c a t i o n s and ( i n some c a s e s )
the non-square p i x e l s i n the r a s t e r images were a l s o
suspected reasons f o r the f a i l u r e .
For s i m i l a r reasons, the use of photographic techniques
for data o v e r l a y - although considered - were a l s o r e j e c t e d
s i n c e the photographic process would have been a f f e c t e d by
s i m i l a r problems as those encountered by the d i g i t a l p r o c e s s .
The p i x e l data i n the B e l l L a b o r a t o r i e s ' data, f o r example,
were known not to be square and hence i t was considered
u n r e a l i s t i c to continue the development of e f f e c t i v e d i g i t a l
or photographic comparisons, given the drawbacks encountered
a f t e r about one month's work.
U l t i m a t e l y , then, any v a l i d comparisons must r e l y on a
v i s u a l i n s p e c t i o n of the r e s u l t a n t g r a p h i c s ( f i g u r e s
7.6a,b,c, 7.7, 7.8a,b,c). At the o u t s e t , the S c i t e x images
appear to have most p o t e n t i a l f o r p r e c i s e l a r g e s c a l e work;
the image i s c l e a r and a c c u r a t e , with no v i s u a l s i g n s of
noise or coding e r r o r s . The s e l e c t e d scanning r e s o l u t i o n i s
adequate f o r image r e p r e s e n t a t i o n with no v i s u a l e f f e c t s of
stepping at 1J1250 s c a l e . The Kongsberg data cannot be
Chapter seven

- 362 -
compared f a i r l y by g r a p h i c a l means with the example shown i n
f i g u r e 7.7 s i n c e t h i s image comprises i n a p p r o p r i a t e
t h r e s h o l d i n g . N e v e r t h e l e s s , from a s e r i e s of modified images
d i s p l a y e d on a g r a p h i c s d i s p l a y t e r m i n a l , i t i s c l e a r t h a t
s u b s t a n t i a l amounts of n o i s e i s present i n the image. The
r e s o l u t i o n ( t e n l i n e s per m i l l i m e t r e ) chosen by Kongsberg on
the b a s i s of t h e i r own experience i s h a l f t h a t chosen by USGS
and stepping i s v i s i b l e on 1:1250 s c a l e output. C l e a r l y , i t
i s a d v i s a b l e t o scan 1:1250 documents with a r e s o l u t i o n of
twenty l i n e s per m i l l i m e t r e ; s c a l e r e d u c t i o n s are then
p o s s i b l e post hoc ( i f r e q u i r e d ) f o r other p r o c e s s e s .
Scanning times f o r the KartoScan t o encode the data a t twenty
p o i n t s per m i l l i m e t r e a r e expected to i n c r e a s e by a f a c t o r o f
four. T h i s suggests a scanning time of c. 40-60 minutes ( c f .
the S c i t e x machine has taken 72 m i n u t e s ) .
In g e n e r a l , the B e l l L a b o r a t o r i e s ' scanner cannot be
compared f a i r l y w i t h the equipment from S c i t e x and Kongsberg;
the scanner c o s t s one s i x t e e n t h of i t s more s o p h i s t i c a t e d
competitors. However, the r a s t e r r e s u l t s from B e l l are
g e n e r a l l y good w i t h i n c e r t a i n lower t h r e s h o l d s - the system
p r e s e n t s v a l u e for money f o r a p p r o p r i a t e t a s k s .
In c o n c l u s i o n , i t should be pointed-out t h a t a l l the
scanners t e s t e d are s u f f i c i e n t l y advanced to handle Ordnance
Survey data. T h e i r design and t e c h n i c a l s p e c i f i c a t i o n s are
Chapter seven

- 363 -
capable of a c c e p t i n g e x i s t i n g documents and scanning them
with s u f f i c i e n t speed and p i x e l r e s o l u t i o n . The l e v e l s of
noise i n h e r e n t i n the r e s u l t a n t d i g i t a l data a r e t o l e r a b l e ,
p r o v i d i n g d e v i c e c a l i b r a t i o n and t h r e s h o l d v a l u e s are
a c c u r a t e l y e s t a b l i s h e d a t the set-up stage. However, the
c o s t - e f f e c t i v e n e s s of each system cannot be completely
a s s e s s e d without f u r t h e r , more d e t a i l e d , a p p r a i s a l s and a
s p e c i f i c a t i o n of Ordnance Survey work methods. I t may, for
example, be uneconomic to reduce or en l a r g e p h o t o g r a p h i c a l l y
the source documents i f some other scanners ( a t the same
p r i c e ) w i l l accept f u l l - s i z e d c o n v e n t i o n a l MSD's. I t has
proved i m p o s s i b l e t o i n v e s t i g a t e the e f f e c t of p o o r - q u a l i t y
source documents because o f the l i m i t e d a v a i l a b l e a c c e s s to
scanners during the r e s e a r c h p r o j e c t : i t has a l r e a d y been
pointed out t h a t these are expected to be a major c o n s t r a i n t
on automated data capture g e n e r a l l y and w i l l slow-down
progress to a p r e s e n t l y unknown e x t e n t .
The a b i l i t y to convert the r a s t e r - f i l e s d i r e c t l y i n t o
v e c t o r n o t a t i o n i s l i k e l y to be of primary importance, a t
l e a s t f o r the next t e n y e a r s . I t i s the performance of t h i s
c o n v e r s i o n process which w i l l have most importance for
Ordnance Survey a p p l i c a t i o n s i f vec t o r storage remains the
favoured mode. A l l the systems t e s t e d provide post hoc
software options t o generate v e c t o r data? these are d e s c r i b e d
and compared i n s e c t i o n 7.4.2. No d e t a i l e d account can be
Chapter seven
- 364 -
given of the design of the algorithms a s , i n most i n s t a n c e s ,
these are company s e c r e t s . For these reasons, comparisons
below are c a r r i e d out on an e m p i r i c a l b a s i s . However, t h e r e
i s no reason why scanning hardware and v e c t o r i s i n g software
from d i f f e r e n t s u p p l i e r s cannot be interchanged to provide
customised i n s t a l l a t i o n s although the wide d i v e r s i t y of data
formats and computing hardware suggests t h i s approach to be
arduous or, a t l e a s t , demand i n t e r f a c i n g problems.
.4.2 The c h a r a c t e r i s t i c s of the r a s t e r - t o - v e c t o r conversions
At the o u t s e t , i t i s worth p o i n t i n g out t h a t the
experiments c a r r i e d out i n t h i s r e s e a r c h have p r i m a r i l y
(almost e x c l u s i v e l y ) addressed the problems of encoding the
geometry of the l i n e work, not the f e a t u r e a t t r i b u t e s . The
l a t t e r t ask i s l i k e l y to i n v o l v e s u b s t a n t i a l a c c e s s t o
appropriate i n t e r a c t i v e systems which were not a v a i l a b l e to
the author. For these reasons, most emphasis i s p l a c e d on
the conversion of the p i x e l data to v e c t o r s and the l i k e l y
l o s s of q u a l i t y i n the v e c t o r f i l e s over the r a s t e r images
and (perhaps more i m p o r t a n t l y ) the o r i g i n a l scanned
documents. The problems a s s o c i a t e d with an e f f e c t i v e
r a s t e r - t o - v e c t o r c o n v e r s i o n system, g e n e r a l l y , have been
d i s c u s s e d w i d e l y elsewhere ( H a r r i s et a l 1981, Loodts 1981,
Peuquet 1981, Weber 1981). The c h a r a c t e r i s t i c s of the
Chapter seven

- 365 -
r e s u l t a n t v e c t o r s t r i n g s are not amenable to most d i g i t a l
manipulation other than data compression and somewhat
p o o r - q u a l i t y g r a p h i c s : there are no c o n v e r s i o n systems
a v a i l a b l e at p r e s e n t to s u i t the q u a l i t y and data s t r u c t u r e
requirements of the Ordnance Survey. S p e c i f i c a l l y , any
v e c t o r s generated a u t o m a t i c a l l y have s p e c i f i c l i m i t a t i o n s a t
p r e s e n t :
1. The data s t r u c t u r e s are i n a p p r o p r i a t e for most t a s k s
other than g r a p h i c s d i s p l a y s ; even systems generating
l i n k and node f i l e s do not match the l e v e l of information
and the c l e a n l i n e s s a c h i e v e a b l e with manual d i g i t i s i n g
systems (e.g. PMA 1978).
2. The o r g a n i s a t i o n and the o r d e r i n g of the v e c t o r segments
resembles the s c a n - l i n e by s c a n - l i n e p r o p e r t i e s of the
o r i g i n a l r a s t e r - f i l e ; l i n e a r f e a t u r e s are seen to be
terminated once they e x i t from the c u r r e n t s t r i p of c.
10-20 s c a n - l i n e s (see s e c t i o n 5.3.1).
3. I n p a r t i c u l a r , most v e c t o r i s i n g software has d i f f i c u l t y
i n d e f i n i n g node p o i n t s ( l i n e j u n c t i o n s ) a c c u r a t e l y . In
extreme c a s e s , they are r e p l a c e d by l i n e a r s t r u c t u r e s
comprising s e v e r a l s h o r t l i n k s i n the g e n e r a l p o s i t i o n of
the node. Some examples of t h i s problem are e v i d e n t i n
s e v e r a l i n s t a n c e s i n the f i g u r e s showing the r e s u l t s of
Chapter seven

- 366 -
the r a s t e r - t o - v e c t o r c o n v e r s i o n s . I n p a r t i c u l a r , see
f i g u r e s 7.9b, 7.11b,c 7.17 ad 7.18 where elongated nodes
abound.
4. Vector s p i k i n g i s a c h a r a c t e r i s t i c problem a s s o c i a t e d
with e x i s t i n g r a s t e r - t o - v e c t o r methods; i t occurs i n the
s k e l e t o n i s i n g process of l i n e s with v a r y i n g p i x e l - w i d t h s .
The r e s u l t i s a s e r i e s of very short ' s p i k e s ' ,
p e r p e n d i c u l a r to the gen e r a l d i r e c t i o n of the f e a t u r e . A
number of r e s e a r c h p r o j e c t s are attempting to r e s o l v e
t h i s problem - i n p a r t i c u l a r , the Oxford Image A n a l y s i s
team (Preston pers comm 1981) and that a t IGN, B r u s s e l s
(Loodts pers comm 1981).
5. The volumes of data i n v o l v e d and the n e c e s s a r i l y
s e r i a l - n a t u r e of the con v e r s i o n algorithm i s causing
severe timing d i f f i c u l t i e s on a l l types of computer
( s e r i a l and p a r a l l e l ) .
I n g e n e r a l , and d e s p i t e the above comments, the r e s u l t s
a t t a i n e d from the t e s t e d s e r i a l - s y s t e m s are encouraging
although none o f f e r complete s o l u t i o n s f o r Ordnance Survey
work methods. The t e s t s undertaken with the B e l l
L a b o r a t o r i e s ' system, although i n t e r e s t i n g , show r e s u l t s
which are unacceptable for most c a r t o g r a p h i c p r o c e s s e s .
Chapter seven

- 367 -
OKDKIANOI WUV\ Y
+ 1
H
7
ii
s
F i g u r e 7.9a: S t r i p o f OS data i n
v e c t o r form generated by B e l l Labs,
c o n v e r s i o n s o f t w a r e w i t h B e l l r a s t e r
d a t a . Crown C o p y r i g h t Reserved.

- 368 -
I? I < / n I
i /
\ / /
r~ N
i r /
L I
•
F i g u r e 7.9b; S i n g l e g r i d - s q u a r e of OS
d a t a i n v e c t o r form g e n e r a t e d by B e l l
L a b s , s o f t w a r e w i t h B e l l r a s t e r d a t a .
Crown C o p y r i g h t R e s e r v e d .

- 369 -
/ / / /
/ 1 / r / /
s / X \ \
/ \
/ \ / \ X
\ V \ \
\ \ \ \ \ \ \
\ X N
F i g u r e 7.9c; Two l a n d p a r c e l s i n
v e c t o r form g e n e r a t e d by B e l l Lab
s o f t w a r e w i t h B e l l r a s t e r d a t a .
Crown C o p y r i g h t R e s e r v e d .

- 370 -
Although the r e s u l t s from t h e i r EDAD scanner are s u f f i c i e n t l y
a c c u r a t e i f m a t e r i a l s are photo-enlarged to g i v e 0.05mm
r e s o l u t i o n , the c r i t e r i a for the production of v e c t o r data
are not - these have been pointed-out i n 7.3.2 and are
d e s c r i b e d i n d e t a i l by Pferd and White (1981). Figure 7.9a,b
shows the r e s u l t s obtained. The (somewhat) poor appearance
of the v e c t o r s i s t o be expected from a system which i s
p r i m a r i l y not designed for h i g h - q u a l i t y c a r t o g r a p h i c work.
Figu r e 7.15 shows the same data p l o t t e d on a h i g h - q u a l i t y
F e r r a n t i Master p l o t t e r a t the Ordnance Survey headquarters.
A software i n t e r f a c e was w r i t t e n to p l o t a l l the v e c t o r f i l e s
on t h i s p l o t t e r to ensure t h a t the q u a l i t y of the r e s u l t s are
not e f f e c t e d by poor v e c t o r p l o t t i n g f a c i l i t i e s .
I t can be seen how the B e l l software has an apparent
d e s i r e to r o t a t e a l l v e c t o r s through a s m a l l , constant angle;
t h i s i s e s p e c i a l l y c l e a r with the p e c k e d - l i n e data and
b u i l d i n g s which have l o s t t h e i r 'square' p r o p e r t i e s . The
p o o r - q u a l i t y of l i n e j u n c t i o n s (node p o i n t s ) are unacceptable
for even the c r u d e s t map d i s p l a y s ; i n most c a s e s , t h e r e are
i n t o l e r a b l e gaps a t each j u n c t i o n and the i n t r o d u c t i o n of
s e v e r a l s h o r t v e c t o r s a t each node has d i s t o r t e d the geometry
of the data. The e r r o r s a t each node point are not g e n e r a l l y
c o n s i s t e n t ; some l i n e s overshoot each other w h i l s t o t h e r s
terminate too soon c r e a t i n g gaps. The software has
p a r t i c u l a r problems i n ha n d l i n g the j u n c t i o n s of l i n e s
Chapter seven

- 371 -
converging at a s m a l l angle. I n these i n s t a n c e s , each node
point i s seen to be r e p l a c e d by a s h o r t - l e n g t h v e c t o r . I t i s
l i k e l y t h a t these d e f i c i e n c i e s are l a r g e l y a r e s u l t of
i n a p p r o p r i a t e tuning of p o i n t f i l t e r i n g t o l e r a n c e s at the
c h a i n i n g and smoothing stages s i n c e the B e l l system i s
designed to convert to v e c t o r s q u i c k l y (with low order
t o l e r a n c e s ) t o produce an approximation v e c t o r image for
r a p i d t r a n s m i s s i o n of the d i g i t a l image by telephone between
s i t e s .
The e f f e c t s of scanning and v e c t o r i s i n g t e x t u a l data are
shown c l e a r l y i n f i g u r e s 7.9a and 7.15. The map t i t l e and
g r i d - v a l u e s have appeared i n the r a s t e r f i l e (see f i g u r e
7.6a) s i n c e a s m a l l area o u t s i d e the n e a t - l i n e s was scanned
i n a d d i t i o n to the main map-detail. The r e s u l t a n t v e c t o r
r e p r e s e n t a t i o n s of t h i s t e x t i s i n d e c i p h e r a b l e , which i s
s u r p r i s i n g s i n c e most engineering drawings comprise t e x t
information which i s p r e s e r v e d i n the B e l l d i g i t a l system.
In g e n e r a l , the B e l l L a b o r a t o r i e s ' v e c t o r s are e f f i c i e n t
i n p l o t t i n g speed - l a r g e l y a r e s u l t of the requirements of a
t e l e c o n f e r e n c i n g system. The data a r e 48.8 per cent
e f f i c i e n t i n p l o t t i n g ( i . e . 48.8 per cent of the p l o t t e r
pen-movement i s i n the down p o s i t i o n ) . Table 7.10 shows a
summary of the v e c t o r c h a r a c t e r i s t i c s although the B e l l data
are (by n e c e s s i t y ) f o r one-quarter only of the t o t a l map
Chapter seven

- 372 -
Table 7.10; A summary of the c h a r a c t e r i s t i c s of the vec t o r
f i l e s produced by the t e s t e d commercial systems
(a) Data produced by conventional OS (source Adams 1979).
d i g i t a l f l o w l i n e
T o t a l l i n e length = 4369.6 cm Number of p o i n t s = 13687 Number of segments = 11857
Max. i n t e r - p o i n t d i s t a n c e Min. i n t e r - p o i n t d i s t a n c e
= 4.3 cm = 0.0 cm
(b) B e l l Labs EDAD
Kongsberg SysScan
Oxford PEPR
Oxford S c i t e x
USGS S c i t e x
No. of segments 3635 No. of p o i n t s 7267
12165 30056
15946 34899
9385 23380
4102 11669
Max pts/segment 2 Min pts/segment 2 Av. pts/segment 2.0
15 2
2.5
18 2
2.2
30 2
2.5
20 2
2.8
T o t a l pen-down l i n e length 1111.4 4386.2 3444.7 3946.6 4417.6
P l o t length as % of v e c t o r f i l e 101.7 100.4 78.8 90.3 101.1
Max i n t e r - p t d i s t 38.8 Min i n t e r - p t d i s t 0.0 Av. i n t e r - p t d i s t 15.3
5.2 0.0 0.4
4.8 0.0 0.2
7.8 0.0 0.4
14.1 0.0 1.1
T o t a l pen-up l i n e length 1167.2 14608.5 202376.5 108258.9 5249.9
P l o t e f f i c i e n c y 48.8 23.0 1.7 3.5 45. 7
P l o t time on F e r r a n t i Master Oh 40m 2h 30m 7h 00m 5h 25m l h 55m
A l l d i s t a n c e s are i n c e n t i m e t r e s ; p l o t e f f i c i e n c y i s perc e n t
Chapter seven
- 373 -
image ( s e c t i o n 7.4.1). Each v e c t o r segment comprises two
end-points - t h i s i s the convention adopted i n the B e l l
v e c t o r data s t r u c t u r e which i s summarised i n appendix 7.1.
The l a r g e average length of the v e c t o r segments (15.3 cms)
r e f l e c t s the c r i t e r i o n of the B e l l system - to give a g e n e r a l
impression only; most of the c a r t o g r a p h i c systems ( t a b l e
7.10) r e s t r i c t s v e c t o r segments to much s m a l l e r q u a n t i t i e s
( t y p i c a l l y 0.4 cms).
The v e c t o r data r e s u l t i n g from the Kongsberg SysScan are
are shown i n f i g u r e 7.11a,b,c with an example of the output
from the F e r r a n t i Master p l o t t e r i n f i g u r e 7.16. These
r e s u l t s show the extent of the l i m i t a t i o n s with most
s e r i a l - b a s e d v e c t o r conversion systems which were pointed-out
e a r l i e r . I t i s the p r e c i s e geometry of the l a r g e s c a l e s data
which demonstrates most c l e a r l y the e r r o r s i n the v e c t o r i s i n g
p r o c e s s ; such i n c o n s i s t e n c i e s a r e d i f f i c u l t to d e t e c t i n data
with l e s s geometric p r o p e r t i e s (e.g. c o n t o u r s ) . A
s i g n i f i c a n t problem i n the Kongsberg r e s u l t s has seemed to
a r i s e with the edge-matching of data a c r o s s each swathe i n
the f u l l r a s t e r image ( s e c t i o n 7.3.3); most f e a t u r e s c r o s s i n g
to a d j a c e n t swathes appear to d e v i a t e m a r g i n a l l y along the
swathe edge. T h i s causes a s e r i e s of l i n e a r d i s t o r t i o n s
appearing as p a r a l l e l l i n e s running north t o south along the
complete g r a p h i c . Other problems have a r i s e n with the square
nature of b u i l d i n g s which i s l o s t to a l a r g e e x t e n t i n the
Chapter seven

- 374 -
i n \ \
CD JT" e L_l
/
o
F i g u r e 7.11a; Complete OS map i n
v e c t o r form g e n e r a t e d by Kongsberg
c o n v e r s i o n s o f t w a r e w i t h Kongsberg
r a s t e r d a t a . Crown C o p y r i g h t R e s e r v e d

- 375 -
x V X X X
1 \
7/ X
X 7h-0 / N
-X X
V I A '
• / / 4 /
/ J
7 a a ch i i \
F i g u r e 7.11b; S i n g l e g r i d - s q u a r e of
OS d a t a i n v e c t o r form g e n e r a t e d by
Kongsberg s o f t w a r e w i t h Kongsberg
r a s t e r d a t a . Crown C o p y r i g h t R e s e r v e d

- 376 -
/ / / I /
/ /
/ / / /
\ / / \ \
\
V \ \
\
\ \ \
/
F i g u r e 7.11c: Two l a n d p a r c e l s i n
v e c t o r form g e n e r a t e d by Kongsberg
s o f t w a r e w i t h Kongsberg r a s t e r d a t a .
Crown C o p y r i g h t R e s e r v e d .

- 377 -
Kongsberg r e s u l t s ( c f . B e l l L a b o r a t o r i e s ) ; though t h e r e i s
l i t t l e evidence of rounded-corners, each supposedly 'square'
b u i l d i n g comprises more than four p o i n t s r e s u l t i n g i n a
d i s t o r t e d image. B u i l d i n g squareness i s l i k e l y to be
dependent on the p o i n t f i l t e r i n g / l i n e smoothing stage. The
graphic evidence suggests the need for a post hoc data
c l e a n i n g stage t o make-square the b u i l d i n g data though t h i s
can only be done e f f i c i e n t l y a f t e r the a s s i g n a t i o n of f e a t u r e
codes d e s c r i b i n g the polygon as a b u i l d i n g ; proven methods
for t h i s t a s k are a l r e a d y a v a i l a b l e i n the e x i s t i n g Ordnance
Survey d i g i t a l f l o w l i n e ( s e c t i o n 2.5). Fences and property
boundaries appear jaggered and o f t e n c o n t a i n s e v e r a l gaps
along t h e i r l e n g t h , probably f o r s i m i l a r r e a s o n s . T h i s
problem i s shown even more c l e a r l y i n the jaggered
g r i d - l i n e s .
I n g e n e r a l , the Kongsberg system handles the p e c k e d - l i n e
data very w e l l ; they have been r e c o n s t r u c t e d c o n s i s t e n t l y
with i n t e r - p e c k spacing and l i n e length agreeing w i t h the
data appearing on the o r i g i n a l g r a p h i c . T h i s i s s u r p r i s i n g
s i n c e the c l o s e p r o x i m i t y of line-work has g e n e r a l l y caused
s e r i o u s problems i n the a c c u r a t e r e c o n s t r u c t i o n of other
v e c t o r s by the Kongsberg softwares t h e r e i s evidence of
extremely s m a l l polygons being generated at some l i n e
j u n c t i o n s , i n o t h e r s , complete geometry i s l o s t ; t h ere are
s e v e r a l i n s t a n c e s of l i n e undercut a t node p o i n t s but no
Chapter seven

- 378 -
evidence of overshoot as was the case with the B e l l
L a b o r a t o r i e s ' v e c t o r i s a t i o n . I n some i n s t a n c e s , the nearness
of c l o s e p a r a l l e l l i n e s (see f i g u r e 7.16) has caused chaos i n
the v e c t o r r e c o n s t r u c t i o n ; up to f i f t e e n s mall l i n k s have
been i n s e r t e d between the r e l a t i v e l y s h o r t p a r a l l e l l i n e s ,
which has attempted to concatenate them i n t o a s i n g l e ,
t h i c k e r l i n e . The Kongsberg GINIS software may cope with
these e r r o r s although, g e n e r a l l y , most data s t r u c t u r e s w i l l
r e q u i r e software tuning or post hoc v a l i d a t i o n of data to
r e s o l v e them f i r s t . G e n e r a l l y , the r e s u l t s from the
Kongsberg system have provided good examples of the
l i m i t a t i o n s c i t e d e a r l i e r i n present r a s t e r - t o - v e c t o r
s t r a t e g i e s . I n s h o r t , on the b a s i s of the s e t e s t s the
geometry and s t r u c t u r e of the data produced i s unacceptable
i n i t s p r e s e n t s t a t e f o r most non-graphic manipulation and
has severe c o n s t r a i n t s even for graphic p r e s e n t a t i o n (though
the q u a l i t y of data scanned at 0.05mm r e s o l u t i o n may be much
b e t t e r ) .
The t o t a l l i n e - l e n g t h of the v e c t o r data i s very s i m i l a r
i n both the Kongsberg and S c i t e x r e s u l t s - these agree w i t h i n
t h i r t y c e n t i m e t r e s of each other ( t a b l e 7.10). Indeed, the
c h a r a c t e r i s t i c s of the the Kongsberg and S c i t e x data a r e
s i m i l a r to those d e s c r i b i n g the v e c t o r f i l e o r i g i n a t i n g from
the Ordnance Survey d i g i t a l f l o w l i n e ( t a b l e 7.10). The
Kongsberg r e s u l t s agree w i t h i n seventeen centimetres of the
Chapter seven

- 379 -
c u r r e n t l y d e f i n e d 'true' length although point-frequency i s
very much higher with the automated method. The l a r g e r
number of x,y p o i n t s i n the Kongsberg f i l e ( c . 2.2 times as
many as OS f l o w l i n e ) g i v e s f u r t h e r impetus towards the need
for more app r o p r i a t e software tuning and p o i n t - f i l t e r i n g .
The r a s t e r - t o - v e c t o r software o r i g i n a t i n g from Oxford
U n i v e r s i t y i s one of the few systems known to the author
which generates data i n a l i n k and node format, thus
p r o v i d i n g more topology and e a s i e r i n t e r f a c e s for other
software ( s e c t i o n 5.6.2, H a r r i s e t a l 1981). Thompson (1978)
pointed out t h a t l i n k and node n o t a t i o n i s expected to be the
norm i n f u t u r e Ordnance Survey a p p l i c a t i o n s . For these
reasons, two i n v e s t i g a t i o n s i n t o the q u a l i t y of the Oxford
alg o r i t h m have been undertaken: these used both the r a s t e r
data o r i g i n a t i n g from the Oxford PEPR scanner (7.3.4) and the
h i g h e r - q u a l i t y r a s t e r data generated on the more
s o p h i s t i c a t e d S c i t e x scanner a t the USGS ( 7 . 3 . 5 ) . Figure
7.12a,b,c shows the r e s u l t a n t v e c t o r s generated from the PEPR
r a s t e r data and, f o r comparisons, f i g u r e 7.13a,b,c shows the
r e s u l t s from the same software using the S c i t e x data. Marked
d i f f e r e n c e s s are v i s i b l e . These examples show c o n c l u s i v e l y
how the q u a l i t y of r e s u l t a n t v e c t o r s i s not only dependent on
the design of the conversion a l g o r i t h m but a l s o on the
q u a l i t y of the r a s t e r data used as i n p u t . Without a c c e s s to
the Oxford U n i v e r s i t y data base r e t r i e v a l software, i t has
Chapter seven

- 380 -
7 1 v ? >
1 Sly-
3 V. \
' XX/ \ \ \ \
\ \ V \ x. x
X \
X / /,
a
r V- x /
V7 \ \
X
xmnTTTTrJ \ X
N \ \ \ N-
/
CP mram X 8
o v V
\
F i g u r e 7.12a; Complete OS map i n
v e c t o r form g e n e r a t e d by Oxford Univ.
s o f t w a r e w i t h Oxford U n i v . PEPR
r a s t e r d a t a . Crown C o p y r i g h t R e s e r v e d

- 381 -
x / X /~X, X X X
/ X X /
x V X X / X
V / /
7 j r / / r
i J 1 1 T H r • n r u •
F i g u r e 7.12b; S i n g l e g r i d - s q u a r e of
OS d a t a i n v e c t o r form g e n e r a t e d by
Oxford Univ. s o f t w a r e w i t h PEPR
r a s t e r d a t a . Crown C o p y r i g h t R e s e r v e d

- 382 -
/ / /
J
r \
/ \ \ \ \ \ \ \ \
\ \ r \ \ \ 3 \
\ /
\ II \ \
I
F i g u r e 7.12c; Two l a n d p a r c e l s i n
v e c t o r form g e n e r a t e d by Oxford U n i v .
s o f t w a r e w i t h Oxford PEPR r a s t e r
d a t a . Crown C o p y r i g h t R e s e r v e d .

- 383 -
•r
x
m
: 6 18
cDICDimimii
O v
F i g u r e 7.13a; Complete OS map i n
v e c t o r form g e n e r a t e d by Oxford U n i v .
s o f t w a r e w i t h USGS S c i t e x r a s t e r d a t a
Crown C o p y r i g h t R e s e r v e d .

- 384 -
/
7 x
2 /
X x / /
' / /
J
f
X / / /
/ / D / / /
7
/
7 1 rrm
r • n O.LU D ftl I
F i g u r e 7.13b: S i n g l e g r i d - s q u a r e of
OS d a t a i n v e c t o r form g e n e r a t e d by
Ox f o r d Univ. s o f t w a r e w i t h S c i t e x
r a s t e r d a t a . Crown C o p y r i g h t R e s e r v e d
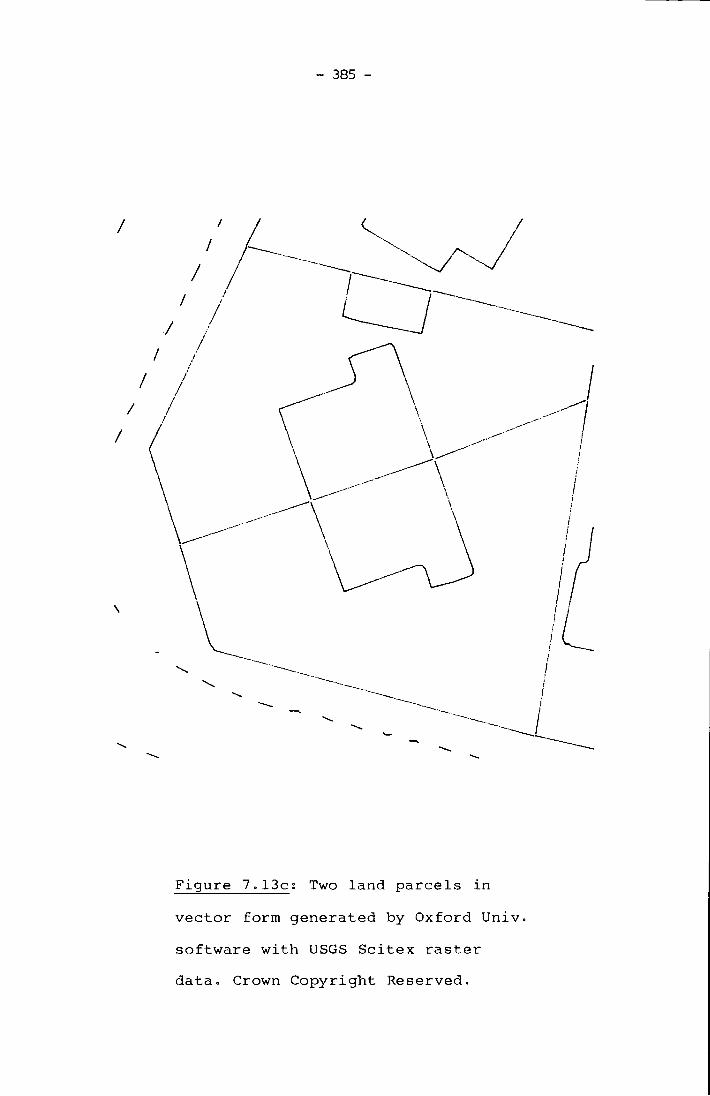
- 385 -
/ / / / /
/ / / / /
/ / / \
\ / \
\ \ \
\ \ /
1
•v.
F i g u r e 7.13c; Two l a n d p a r c e l s i n
v e c t o r form g e n e r a t e d by Oxford Univ.
s o f t w a r e w i t h USGS S c i t e x r a s t e r
d a t a . Crown C o p y r i g h t R e s e r v e d .

- 386 -
been d i f f i c u l t to c r o s s - r e f e r e n c e the l i n k and node f i l e s to
generate s p e c i f i c polygon data. For these reasons, only the
l i n k s f i l e s have been p l o t t e d i n f i g u r e s 7.12 and 7.13,
causing gaps to be i n s e r t e d at each node p o s i t i o n . These
same reasons account f o r the poor p l o t t i n g e f f i c i e n c i e s
d e s c r i b e d i n t a b l e 7.10 f o r the Oxford data; much improved
p l o t t i n g times are p o s s i b l e through r e c o u r s e to s e n s i b l e l i n k
and node connection by appropriate software. The r e s u l t s
shown i n f i g u r e s 7.17 and 7.18 give an i n d i c a t i o n of the
l e v e l of q u a l i t y p o s s i b l e on the more s o p h i s t i c a t e d Ordnance
Survey p l o t t i n g d e v i c e s ; these were drawn on f i l m by the
F e r r a n t i Master p l o t t e r for the PEPR and S c i t e x data
r e s p e c t i v e l y .
In g e n e r a l , the r e s u l t s obtained from the PEPR scanner are
s u r p r i s i n g l y good, e s p e c i a l l y s i n c e a ten-times photographic
r e d u c t i o n of the source document i s n e c e s s a r y p r i o r t o
scanning ( s e c t i o n 7.3.4). However, a c l o s e r examination of
the r e s u l t s with a l i n e n - t e s t e r or by i n c r e a s i n g the
p l o t t i n g - s c a l e ( f i g u r e 7.12c) shows some grave d e f i c i e n c i e s
more c l e a r l y i n the PEPR r e s u l t s . Reasons f o r these are
d i f f i c u l t to i d e n t i f y and a number of f a c t o r s are b e l i e v e d to
be r e s p o n s i b l e - a comparatively poor scanner, the e f f e c t s of
photo-reduction and the post hoc v e c t o r i s i n g and f i l t e r i n g .
The Oxford team have suggested most f a u l t s to l i e with the
PEPR scanner which has an a r c h i t e c t u r e and s i g n a l - t o - n o i s e
Chapter seven

- 387 -
r a t i o which i s i n a p p r o p r i a t e f o r c a r t o g r a p h i c work (Preston
pers comm 1981).
Although the O x f o r d - v e c t o r i s e d data r e f l e c t most c l o s e l y
the storage n o t a t i o n of the Ordnance Survey r e s t r u c t u r e d data
( s e c t i o n 2.7), they d i f f e r markedly from those a t t a i n e d by
manual d i g i t i s i n g ( t a b l e 7.10). There are c. 2.5 times as
many p o i n t s i n the Oxford f i l e s with a reduced o v e r a l l
l i n e - l e n g t h . To some (unknown) e x t e n t , the l a r g e number of
coordinate p o i n t s i s l a r g e l y a r e s u l t of the high-frequency
of p e c k e d - l i n e s on the source document. In e x i s t i n g OS
conventions, pecks are not h e l d e x p l i c i t l y i n the data
a r c h i v e and are generated post hoc by software. In g e n e r a l ,
the Oxford algorithm has extreme d i f f i c u l t y i n handling
pecked data; t h i s i s e v i d e n t i n both the r e s u l t s from the
PEPR and S c i t e x scanners ( f i g u r e s 7.12 and 7.13). T h i s i s a
major d e f i c i e n c y from an Ordnance Survey viewpoint s i n c e
about twenty per cent of line-work i s pecked with p r e s e n t map
s p e c i f i c a t i o n s . The removal of the node-points i n the
graphic d i s p l a y s ( f i g u r e s 7.12 and 7.17) has enabled
i n c o n s i s t e n c i e s i n the geometry of the PEPR data to be seen
more c l e a r l y . A l a r g e proportion of the gaps i n the f e a t u r e s
could be removed without s e r i o u s l o s s of d e t a i l . T h i s
i n c r e a s e i n l i n k and node r e f e r e n c e s has provided a measure
of the incompleteness of the data geometry from the PEPR?
more sound r e s u l t s are evident with the Oxford/Scitex r e s u l t s
Chapter seven

- 388 -
although t h e r e are s t i l l one or two e r r o r s p r e s e n t ( f i g u r e s
7.13 and 7.18). T h i s over-production of node-points has
caused many b u i l d i n g s to l o s e t h e i r squareness and other
f e a t u r e s to be d i s t o r t e d g e n e r a l l y .
On the whole, the Oxford r a s t e r - t o - v e c t o r system has been
more encouraging when presented with h i g h e r - q u a l i t y r a s t e r
data at the input stage. A much neater data s t r u c t u r e has
been generated w i t h the S c i t e x r a s t e r f i l e ( t a b l e 7.10):
t h e r e are fewer l i n k s than with the PEPR data producing a
much more c o n c i s e , l e s s - j a g g e r e d s e r i e s of l i n e s . However,
the r e remains a high-frequency of v e r y s h o r t l i n k s
e s p e c i a l l y a t node p o s i t i o n s . Point smoothing i s a l i t t l e
too c oarse f o r curved f e a t u r e s , making them loose t h e i r t r u e
c h a r a c t e r i s t i c s ; a roundabout symbol, for example, i s reduced
to a s i x t e e n - s i d e d polygon and most b u i l d i n g c o r n e r s are
rounded. These e r r o r s are l a r g e l y due to i n a p p r o p r i a t e
software tuning, which a l s o accounts f o r the i n a b i l i t y to
r e c o n s t i t u t e the p e c k e d - l i n e s . Even with the S c i t e x data,
however, pecks have not been r e c o n s t r u c t e d s u c c e s s f u l l y by
the then e x i s t i n g Oxford softwware ( c f . Kongsberg). Most
have c o r r e c t o r i e n t a t i o n s but have v a r i o u s lengths ranging
from dots t o m a r g i n a l l y longer pecks than on the o r i g i n a l
f o i l . As with the Kongsberg r e s u l t s , i t can be concluded
t h a t much data v a l i d a t i o n and c l e a n i n g i s n e c e s s a r y before
they can be presented to a data base system f o r a r c h i v i n g .
Chapter seven

- 389 -
7"T"T
F i g u r e 7.14a: S i n g l e g r i d - s q u a r e of
OS d a t a i n v e c t o r form g e n e r a t e d by
USGS s o f t w a r e w i t h S c i t e x r a s t e r
d a t a . Crown C o p y r i g h t R e s e r v e d .
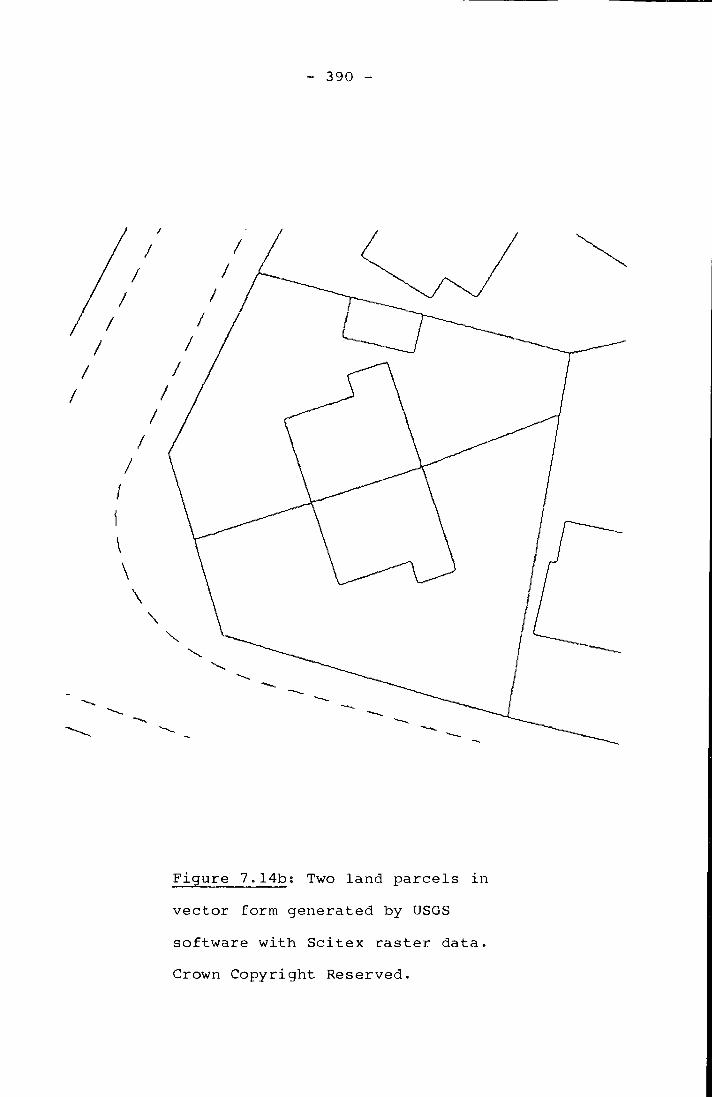
- 390 -
/ / / / /
/ / / / ' / / / /
/ / /
/ /
/
\
\ \
F i g u r e 7.14b: Two l a n d p a r c e l s i n
v e c t o r form g e n e r a t e d by USGS
s o f t w a r e w i t h S c i t e x r a s t e r d a t a .
Crown C o p y r i g h t R e s e r v e d .

- 391 -
F i g u r e 7•14c; Semi-detached p r o p e r t y
i n v e c t o r form g e n e r a t e d by USGS
s o f t w a r e w i t h S c i t e x r a s t e r d a t a .
Crown C o p y r i g h t R e s e r v e d .

- 392 -
The q u a l i t y and accurac y of the v e c t o r s emanating from the
USGS/Scitex system meet the standards r e q u i r e d by the
Ordnance Survey more c l o s e l y although t h e r e i s l i t t l e
topology i n h e r e n t i n t h e i r o r g a n i s a t i o n . Examples of these
r e s u l t s are shown i n f i g u r e 7.14a,b,c; the image produced on
the F e r r a n t i Master p l o t t e r i s a t f i g u r e 7.19. The software
i n s t a l l e d at the USGS was developed by the Computer Science
D i v i s i o n , NRIMS, CSIR, P r e t o r i a , South A f r i c a under the
d i r e c t i o n of Dr. Ray Boyle (Boyle pers comm 1981) and i s
de s c r i b e d by Boyle (1979). The data f u r n i s h e d by the USGS
have been s k e l e t o n i s e d and p i x e l - c h a i n e d only, without any
smoothing or i n t e r a c t i v e e d i t i n g . T h i s has enabled an
e s t i m a t i o n of the percentage success of the r a s t e r - t o - v e c t o r
conversion p r i o r to any p o i n t - f i l t e r i n g o p e r a t i o n s ; i t i s
l i k e l y t h a t many of the problems of the Kongsberg r e s u l t s ,
f o r example, are not a r e f l e c t i o n o f the conversion t o
v e c t o r s , r a t h e r the i n a p p r o p r i a t e tuning of the p o i n t - f i l t e r
a f t e r v e c t o r i s a t i o n (see e a r l i e r i n t h i s s e c t i o n ) . A p l o t of
the v e c t o r data converted from r a s t e r p r i o r to smoothing
produces line-work which i s somewhat jaggered; t h i s i s
v i r t u a l l y i n d i s t i n g u i s h a b l e a t 1:1250 s c a l e but i s v i s i b l e
through a l i n e n - t e s t e r or i n enlarged p l o t t i n g s c a l e s ( f i g u r e
7.14c). The jaggered appearance i s removed when the data a r e
passed through an a p p r o p r i a t e l y tuned p o i n t - f i l t e r ; t h i s
improves the appearance o f the g r a p h i c - d i s p l a y s , speeds-up
p l o t t i n g times and removes redundant data.
Chapter seven

- 393 -
/ I > I
\
/ / / — 7 /, /
>
7 7 7\ / \
F i g u r e 7.15; B e l l L a b s , v e c t o r d a t a
F i g u r e 7.16; Kongsberg v e c t o r d a t a
(both produced on F e r r a n t i Master
p l o t t e r ) . Crown C o p y r i g h t R e s e r v e d .
V / / / J -1 /
X \ \
X
X
r X X
/ / >
/ 7 / \
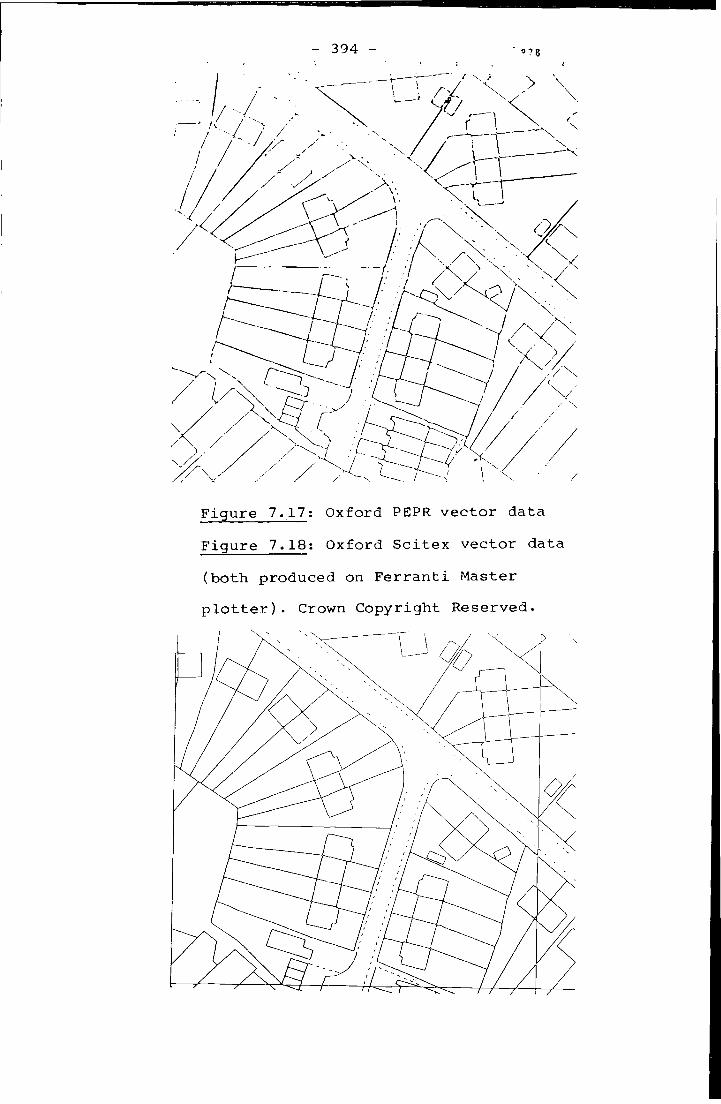
- 394 -/ \ > > \ \ / X V
/, / x̂ / / / / / -
V x' \ X
/
X X xX X
/
• X / \ / X X /
< ?
J / X
^7 X / X/ / /
x 1/
X / x
F i g u r e 7.17: Oxford PEPR v e c t o r d a t a
F i g u r e 7.18: Oxford S c i t e x v e c t o r d a t a
( b o t h produced on F e r r a n t i Master
p l o t t e r ) . Crown C o p y r i g h t R e s e r v e d .

- 395 -
F i g u r e 7.19: U n f i l t e r e d S c i t e x v e c t o r s
F i g u r e 7.20: F i l t e r e d S c i t e x v e c t o r s
(both p l o t t e d on F e r r a n t i Master
p l o t t e r ) . Crown C o p y r i g h t R e s e r v e d .
x: X? n X
r /
/ / / <
/
/
/

- 396 -
Approximately n i n e t y - e i g h t per cent of the p o i n t s are removed
by line-smoothing. The r e s u l t s are shown i n f i g u r e 7.20 f o r
the USGS v e c t o r s . P r i o r t o smoothing, the data r e q u i r e d c.
ten hours to p l o t on the F e r r a n t i Master p l o t t e r ? t h i s has
been reduced to one and a h a l f hours a f t e r w a r d s .
The q u a l i t y of the v e c t o r s i s g e n e r a l l y good; the network
of i n t e r c o n n e c t e d l i n e s i s neat and g e o m e t r i c a l l y c o n s i s t e n t .
From a g r a p h i c a l viewpoint, t h i s a l g o r i t h m i s most
appropriate f o r Ordnance Survey needs although the r e s u l t i n g
data s t r u c t u r e and p r o c e s s i n g times remain a major drawback.
Thus, the data produced a u t o m a t i c a l l y by each t e s t e d
system are s i m i l a r i n content although they d i f f e r w idely i n
q u a l i t y and format. Each system has generated a s e r i e s of
v e c t o r s d e s c r i b i n g the source document which was scanned.
There has been no data v a l i d a t i o n or attempts to a t t a c h any
f e a t u r e - c o d i n g t o the line-work; the problems and r e s o u r c e s
n e c e s s a r y to do t h i s are u n t e s t a b l e without lengthy a c c e s s t o
appropriate hardware and a thorough knowledge of t h e i r uses.
C l e a r l y , i t has been important to monitor the times taken by
each system t o r e a c h t h i s stage i n the data e n t r y p r o c e s s : an
idea of p r o c e s s i n g times has d i r e c t r e l e v a n c e to the expected
t i m e - s c a l e s n e c e s s a r y to r a s t e r encode the n a t i o n a l
topographic data a r c h i v e i n the UK (HMSO 1979). However, a
d e t a i l e d breakdown of the scanning times i s d i f f i c u l t s i n c e
Chapter seven

- 397 -
any information obtained has been r e s t r i c t e d to those f i g u r e s
quoted by the machine operators who performed the scanning
t r i a l s . A summary of the r a s t e r - t o - v e c t o r performance r a t e s
are given i n t a b l e 7.21 where i t can be seen t h a t each of the
systems compare favourably with each other - with the
exception of the USGS which was an order of magnitude slower.
Furthermore, these r a t e s of p r o c e s s i n g appear to match the
times quoted f o r the p a r a l l e l s t r a t e g i e s for r a s t e r - t o - v e c t o r
attempted on the ICL DAP which were d e s c r i b e d i n chapter s i x .
I t was pointed out i n s e c t i o n 6.4.2.1 t h a t a r a s t e r - t o - v e c t o r
conversion process i s , e s s e n t i a l l y , s e r i a l i n nature and
cannot use a p a r a l l e l a r c h i t e c t u r e of the DAP to f u l l
advantage. For these reasons, then, the DAP was programmed
to operate i n a s e q u e n t i a l - t y p e mode for t h i s p a r t i c u l a r
p rocess and hence t h i s accounts f o r the s i m i l a r r a t e s of
throughput per u n i t a c c e s s time of the cpu on both a p a r a l l e l
and s e r i a l computer. Nonetheless, the DAP method of
p r o c e s s i n g has had the advantage of generating the v e c t o r s i n
a s t r u c t u r e more ap p r o p r i a t e for f u r t h e r p r o c e s s i n g although
s i n c e only polygons are given (and not i n d i v i d u a l segments
between nodes), then f u r t h e r breakdowns may be n e c e s s a r y post
hoc.
Chapter seven

- 398 -
Table 7.21; Summary of the p r o c e s s i n g times n e c e s s a r y for
r a s t e r - t o - v e c t o r conversion
F i g u r e s quoted by s u p p l i e r s .
B e l l Labs Kongsberg Oxford Oxford USGS EDAD SysScan PEPR S c i t e x S c i t e x
Computer system M u l t i - u s e r Dedicated M u l t i - u s e r Dedic. PDP 11/70 VAX 11/780 DEC 10 11/60
V e c t o r i s i n g (cpu mins) unknown c. 20 44 46 235
Smoothing (cpu mins) unknown unknown 1.6 3.3 5.2
I n terms of run c o s t s , the Oxford system must be the
cheapest s i n c e t h i s software has performed the conversion
most r a p i d l y . Though the Kongsberg SysScan system has
performed the conversion i n h a l f t h a t time, t h i s i s p r i m a r i l y
due to the lower r e s o l u t i o n p i x e l s c r e a t e d : s e c t i o n 5.5 has
pointed-out t h a t i n c r e a s e d p i x e l r e s o l u t i o n has severe
e f f e c t s on p r o c e s s i n g r a t e s . The hi g h q u a l i t y of the v e c t o r s
generated by the USGS has r e f l e c t e d i n the l a r g e p r o c e s s i n g
times n e c e s s a r y f o r t h i s t a s k . I t has taken t h e i r d e d i c a t e d
PDP 11/60 n e a r l y f i v e hours; t h i s (they c l a i m ) i s l a r g e l y a
r e s u l t of the software being optimised for n o n - i n t e r s e c t i n g
l i n e (contour) p r o c e s s i n g (Smith pers comm 1981).
Chapter seven

- 399 -
In g e n e r a l , the r a s t e r - t o - v e c t o r c o n v e r s i o n processes have
been c e n t r a l p r o c e s s o r - i n t e n s i v e , l a r g e l y as a r e s u l t of the
high volume of data and complexity of the linework. This
confirms the notions d i s c u s s e d i n s e c t i o n 5.1 regarding
s l o w - r a t e s of p r o c e s s i n g using s e r i a l - o p e r a t i o n s (such as
r a s t e r - t o - v e c t o r ) with r a s t e r data. The problems of software
o p t i m i s a t i o n i s important when c l a s s i f y i n g performance r a t e s
g e n e r a l l y f o r the commercial systems. With the exception of
the Kongsberg system, a l l those t e s t e d were claimed not to be
tuned to handle the complexity of the OS i n t e r c o n n e c t e d
l i n e s . C l e a r l y , i t i s im p o s s i b l e t o a s s e s s the performance
of these systems without adequate tuning towards OS data.
F u r t h e r t e s t s - probably on a repayment b a s i s - are n e c e s s a r y
i n which more e x t e n s i v e tuning and m o d i f i c a t i o n s t o the
software are c a r r i e d out f i r s t . Thus i n the l i g h t of the
r e s u l t s gained from t h i s r e s e a r c h , i t i s concluded t h a t there
are no adequate commercial r a s t e r - d r i v e n systems s u i t a b l e for
the Ordnance Survey a t the pre s e n t time. The system
o p e r a t i o n a l a t the USGS i s adequate i n terms of v e c t o r
q u a l i t y but p r o v i d e s an i n a p p r o p r i a t e data s t r u c t u r e and i t s
co s t of r a s t e r - t o - v e c t o r c o n v e r s i o n may not be
c o s t - e f f e c t i v e . I t i s unreasonable t o take c. 6-7 hours
scanning and p r o c e s s i n g to generate a v e c t o r f i l e which s t i l l
r e q u i r e s data r e s t r u c t u r i n g and feat u r e - c o d i n g . Continual
r e s e a r c h i s c r u c i a l to develop an e f f e c t i v e system for
Ordnance Survey needs.
Chapter seven

- 400 -
.5 DESCRIPTIONS OF RASTER-DRIVEN OUTPUT DEVICES
Computer-graphics d i s p l a y systems producing temporary-copy (from d i s p l a y screens) and hard-copy (from p r i n t e r / p l o t t e r s ) are developing r a p i d l y . The increase i n technology and v e r s a t i l i t y o f the temporary-copy devices i s l a r g e l y a r e s u l t o f the c o n s t a n t l y decreasing p r i c e o f semiconductor memory and the i n c r e a s i n g s o p h i s t i c a t i o n o f cathode-ray d i s p l a y tubes ( P e t r i e 1981). I n general, d i g i t a l mapping systems are expected t o r e q u i r e both temporary d i s p l a y s f o r i n t e r a c t i v e data manipulation and hard-copy p l o t t e r s f o r the produc t i o n of permanent records. There i s some debate about whether vec t o r or r a s t e r - d r i v e n output devices should be used f o r data p r e s e n t a t i o n i n e x i s t i n g commercial systems. C e r t a i n l y a device capable o f d i s p l a y i n g r a s t e r i n f o r m a t i o n has the v e r s a t i l i t y t o handle both vectors and r a s t e r s ; the reverse does not n e c e s s a r i l y produce a workable s o l u t i o n (see s e c t i o n 4.2.3). Systems from Kongsberg and B e l l L a b o r a t o r i e s have opted f o r immediate conversion o f the scanned i n f o r m a t i o n t o vectors f o r d i s p l a y on conventional p l o t t e r s and Te k t r o n i x storage-tubes. Conversely, the approach by the Scitex Corporation has been t o preserve data i n r a s t e r n o t a t i o n and u t i l i s e r e f r e s h r a s t e r d i s p l a y s and l a s e r f i l m - w r i t e r s .
I t i s evident t h a t the nature o f the data e n t r y stage need not concern the methods o f data processing and output
Chapter seven

- 401 -
although the l e v e l o f the r e s u l t s described i n s e c t i o n 7.4 suggest t h a t o n l y l i m i t e d t r a n s f o r m a t i o n s between r a s t e r s and vectors i s p o s s i b l e a t present. Thus, t h e r e i s s t i l l a c l e a r d i s t i n c t i o n between the uses of v e c t o r - and r a s t e r - d r i v e n hardware a t present. Vector-based d i s p l a y s t r a t e g i e s have been discussed w i d e l y elsewhere (Rhind 1977) and need no f u r t h e r e x p l a n a t i o n here. The use o f raster-based techniques f o r data p r e s e n t a t i o n w i l l now be discussed since they have importance f o r the d i s p l a y and i n t e r a c t i v e manipulation o f ca r t o g r a p h i c data i n the medium-term f u t u r e . Chapter f i v e p o i n t e d out the i n c r e a s i n g need f o r e f f i c i e n c y i n handling these data due both t o the a n t i c i p a t e d data volumes and the need f o r f a s t and economical response r a t e s ; r a s t e r hardware has the p o t e n t i a l o f p r o v i d i n g these f a c i l i t i e s - e s p e c i a l l y when attached t o dedicated micro- and mini-computers.
.5.1 Raster-driven r e f r e s h graphics d i s p l a y s
The most important p o i n t i n favour o f these devices i s t h e i r low p r i c e . The development o f Cathode-Ray Tubes has received i t s main impetus from the t e l e v i s i o n i n d u s t r y ; indeed the lowest-cost r a s t e r graphics t e r m i n a l s contain standard t e l e v i s i o n tubes. I n general, a r a s t e r t e r m i n a l has a heavy demand f o r semiconductor memory because each p i x e l on i t s screen has t o be a l l o c a t e d a s p e c i f i c area o f memory i n
Chapter seven

- 402 -
i t s b u f f e r s t o r e . At present, the p r i n c i p a l d e f e c t i n most medium-priced devices f o r most ca r t o g r a p h i c work i s t h e i r low r e s o l u t i o n ; t y p i c a l d i s p l a y areas of 512 x 256 p i x e l s are o f f e r e d , which i s w e l l below the r e s o l u t i o n o f f e r e d by conventional vector-based storage tube d i s p l a y s . A T e k t r o n i x 4014 nineteen-inch storage tube, f o r example, o f f e r s up t o 4096 x 4096 addressing, although r e s o l u t i o n i s o n l y a v a i l a b l e t o 1024 x 1024 - producing overlapping p i x e l s . More s o p h i s t i c a t e d r a s t e r systems o f f e r d i s p l a y s o f up t o 1000 l i n e s although costs f o r these r i s e d r a m a t i c a l l y over t h e i r lower r e s o l u t i o n c o u n t e r p a r t s .
The advent o f colour has g r e a t l y increased the d e s c r i p t i v e power o f graphics and had most impact on the development o f v e r s a t i l e , i n t e r a c t i v e systems i n recent years ( P e t r i e 1981). Sloan and Brown (1979) described general techniques f o r i n c o r p o r a t i n g i n t e r a c t i v e , c o l o u r r a s t e r d i s p l a y s i n a map p r o d u c t i o n system. A h i g h l y adaptable i n t e r a c t i v e c a p a b i l i t y i s o f f e r e d on the S c i t e x Response 250 system using a nineteen-inch c o l o u r d i s p l a y screen o f 320 x 256 p o i n t s ( S c i t e x Corp. 1981). This r e s o l u t i o n (they claim) i s adequate f o r the ma n i p u l a t i o n o f graphics i n a l l types o f topographic and thematic mapping. A l l user i n t e r a c t i o n and data processing tasks are c a r r i e d out on the c o n t r o l l i n g mini-computer w i t h i n the S c i t e x system. An i n t e r e s t i n g development w i t h considerable p o s s i b i l i t i e s f o r d i g i t a l
Chapter seven

- 403 -
mapping i s the m u l t i - p l a n e c a p a b i l i t y now a v a i l a b l e on some of the more expensive stand-alone r a s t e r d i s p l a y s . Most o f the r e s u l t s d i s p l a y e d from the t e s t s c a r r i e d - o u t on the ICL DAP and reported i n chapter s i x were produced on such a device - a Sigma R5680 d i s p l a y . Microprocessor c o n t r o l provides a graphic generator and f o u r planes o f associated s t o r e comprising 768 x 512 b i t s f o r use w i t h the c o l o u r monitor (Sigma E l e c t r o n i c s No-date). The m u l t i - p l a n e f a c i l i t y thus a l l o w s the storage o f f o u r w h o l l y independant monochrome p l o t s which can be e i t h e r d i s p l a y e d s i n g l y or i n any combination. I n t h i s way, f o r example, i t i s p o s s i b l e t o assign d i f f e r e n t c o l ours t o s p e c i f i c classes o f f e a t u r e i n t e r a c t i v e l y . Areas (such as the Ordnance Survey sub-parcel data described i n 6.4.2) can be d i s p l a y e d as m u l t i - c o l o u r s using polygon i n f i l l methods. P a v l i d i s (1979) has described a number o f a l g o r i t h m s t o perform area i n f i l l i n raster-mode although the more s o p h i s t i c a t e d devices (such as the Sigma R5680) already have a p p r o p r i a t e software i n s i d e t h e i r c o n t r o l l i n g microprocessor. I t i s unnecessary, t h e r e f o r e , t o modify e x i s t i n g user-programs t o u t i l i s e these p o w e r f u l , i n t e r a c t i v e f a c i l i t i e s . Current costs o f these devices are i n the range £5000 t o £8000.
Chapter seven

- 404 -
.5.2 Raster-driven hard-copy p l o t t e r s
The development o f r a s t e r - d r i v e n hard-copy devices i s becoming i n c r e a s i n g l y popular because o f t h e i r speed and a b i l i t y t o produce graphics which are not r e s t r i c t e d p u r e l y t o l i n e - w o r k . D i g i t a l r e p r e s e n t a t i o n s o f photographic images and h a l f - t o n e p r i n t s can be dis p l a y e d q u i c k l y and e a s i l y . Current technology has adopted two d i s t i n c t s t r a t e g i e s : the o p t i c a l exposure o f l i g h t on t o f i l m and the e l e c t r o s t a t i c charging o f s p e c i a l paper. I n p a r t i c u l a r , the l a t t e r approach i s popular f o r the r a p i d p r o d u c t i o n o f e d i t - p l o t s . Versatec E l e c t r o n i c s L t d . manufacture (perhaps) the best known o f these devices which are becoming commonplace i n many areas o f computer-graphics work. The method o f o p e r a t i o n i s h i g h l y ingenious. A w r i t i n g - h e a d comprising many nibs ( t y p i c a l l y 100, 160 or 200 per inch) t r a v e r s e s a r o l l o f e l e c t r o g r a p h i c paper and t r a n s m i t s an e l e c t r o s t a t i c charge f o r s e t - p i x e l s i n each s c a n - l i n e . The paper then moves through a t o n i n g system i n which s p e c i a l toner s t i c k s t o areas o f the paper c a r r y i n g the e l e c t r o s t a t i c charge. The paper i s d r i e d and ready f o r immediate h a n d l i n g . Versatec p l o t t e r s can handle r o l l s o f paper between 8.5 and 72 inches wide; each r o l l i s a v a i l a b l e i n r o l l s o f 500 or 1500 f e e t i n l e n g t h . Since the e l e c t r o s t a t i c w r i t i n g process i s e n t i r e l y e l e c t r o n i c , the o n l y movements i n the p l o t t e r s are i n the paper t r a n s p o r t and the toner supply. For these reasons,
Chapter seven

- 405 -
p l o t t i n g i s f a s t and s i l e n t ; t y p i c a l p l o t t i n g speeds can range as h i g h as 1000 scan-lines per minute (c. two-inches per second). A s o l i d - s t a t e b u f f e r i n g system ensures maximum speed p l o t t i n g w i t h o u t loss o f data. Such p l o t t e r s are h i g h l y v e r s a t i l e f o r map-production, p a r t i c u l a r l y f o r e d i t i n g purposes; shading areas, h a l f - t o n i n g and the p r o d u c t i o n o f g r i d p a t t e r n s are a l l p o s s i b l e w i t h r e l a t i v e ease.
Figures 7.2 2 and 7.2 3 show e x t r a c t s o f Ordnance Survey r a s t e r data p l o t t e d on a Versatec p l o t t e r w i t h a r e s o l u t i o n o f 200 p i x e l s per i n c h . I n t e r f a c i n g software was developed to enable r a s t e r f i l e s described e a r l i e r t o be dumped d i r e c t l y on t o the p l o t t e r . The d i s p l a y s were produced on an eleven-inch Versatec p l o t t e r i n s t a l l e d i n the Department o f Geological Sciences a t Durham U n i v e r s i t y . The normal procedure used on the p l o t t e r a t t h i s s i t e i s t o pass any v e c t o r f i l e s through Versatec i n t e r f a c i n g software ( V e r s a p l o t ) , which converts them t o a r a s t e r form s u i t a b l e f o r e n t r y t o the p l o t t e r ; t h i s software i s addressed by e a s y - t o - c a l l subroutines which are attached t o user's programs i n a manner s i m i l a r t o the use o f other p l o t t i n g l i b r a r i e s such as Gino and *Ghost. A d i r e c t dump of a r a s t e r image, however, - as was c a r r i e d out i n t h i s instance - was discovered t o operate f a r f a s t e r than w i t h the use o f the Versaplot method (Stephenson pers comm 1981) since no v e c t o r - t o - r a s t e r conversion was necessary f i r s t .
Chapter seven

- 406 -
/ / LU u /
/ /
Q
0
Figure 7.22; Ex t r a c t of simulated 4096 x 4096 r a s t e r image of SO 9283SE produced on Versatec r a s t e r p l o t t e r . Crown Copyright Reserved.

- 407 -
v \
s
s
Figure 7.23; Ext r a c t of Scitex 8000 x 8000 r a s t e r image of SO 9283SE produced on Versatec r a s t e r p l o t t e r . Crown Copyright Reserved.

- 408 -
Figure 7.22 shows the r e s u l t s o f a 4096 x 4096 p i x e l r e p r e s e n t a t i o n o f 1:1250 sheet SO 9283SE a f t e r s k e l e t o n i s a t i o n - each l i n e has been reduced t o o n e - p i x e l wide. Figure 7.23 shows an example o f the 8000 x 8000 p i x e l r a s t e r data generated by the Scitex scanner a t USGS p r i o r t o any s k e l e t o n i s i n g - each l i n e i s c. s i x - p i x e l s wide. The r e s u l t s , although c l e a r , are not t o the standard a t t a i n a b l e by the Xynetics p l o t t e r s producing vectors (see s e c t i o n 2.5.3) which are c u r r e n t l y used f o r e d i t i n g purposes in-house at Ordnance Survey. Versatec p l o t t i n g speeds, however, are impressive: the 4096 x 4096 data took c. 40 seconds t o p l o t and the 8000 x 8000 data took c. 110 seconds t o p l o t , compared w i t h c. 20 minutes per OS 1:1250 map sheet on a Xynetics v e c t o r p l o t t e r .
Equally e l a b o r a t e and h i g h l y accurate r a s t e r - d r i v e n p l o t t e r s are a v a i l a b l e which operate on a p r i n c i p l e s i m i l a r t o t h a t o f drum-type scanning devices. The p l o t t e r s expose images on h i g h - c o n t r a s t , medium speed a r t s f i l m ( l i n e or l i t h ) which i s secured t o the r o t a t i n g drum. Scitex Corp. use a laser-based method o f exposure on t h e i r p r e c i s i o n p l o t t e r which forms the data p r e s e n t a t i o n component o f the Response 250 r a s t e r - c a r t o g r a p h i c system ( S c i t e x Corp. 1981). These p l o t t e r s are h i g h l y s u i t e d t o Landsat and s i m i l a r data (e.g. such a p l o t t e r was used t o p l o t w a l l - c h a r t s and grid-square census data i n B r i t a i n (Rhind, Evans and
Chapter seven

- 409 -
Visvalingam 1980). A con t i n u o u s l y v a r i a b l e scanning r e s o l u t i o n o f between four and seventy-two p i x e l s per m i l l i m e t r e s i s achieveable on the Scitex device. Gronemann and Bar-Lev (1979) described the i n t r i c a c i e s o f t h i s p l o t t e r and summarised i t s performance i n a p r o d u c t i o n environment. No a p p r a i s a l - t e s t s have been p o s s i b l e on t h i s type o f p l o t t e r although general discussions w i t h various experts i n the f i e l d ( S c i t e x pers comm 1981, Smith pers comm 1980) suggest i t t o be a p p r o p r i a t e f o r Ordnance Survey standards. However, more d e t a i l e d a p p r a i s a l s would be d e s i r a b l e .
.6 CONCLUSIONS
The a b i l i t y t o r a s t e r - s c a n e x i s t i n g OS map sheets i s c l e a r l y w i t h i n the bounds o f c u r r e n t technology; a number o f scanning devices are commercially a v a i l a b l e t o perform t h i s task q u i c k l y and e a s i l y . This judgement has confirmed the f i n d i n g s o f a number o f other research workers i n v o l v e d i n s i m i l a r f e a s i b i l i t y s t u d i e s (e.g. Robertson 1980, Boyle 1979, Davey e t a l 1977) who have drawn s i m i l a r conclusions. However, the work r e p o r t e d here i s the f i r s t attempt a t using scanning methods t o d i g i t i s e Ordnance Survey mapping; i n p a r t i c u l a r , the d e t a i l e d l a r g e scale map data o f the UK. These data comprise w h o l l y l i n e - w o r k i n c l u d i n g pecks and t e x t - c h a r a c t e r s . Most scanners - e s p e c i a l l y those designed
Chapter seven

- 410 -
f o r c a r t o g r a p h i c data - can provide adequate p i x e l r e p r e s e n t a t i o n s o f these data. Their r e s o l u t i o n c a p a b i l i t i e s and speed o f o p e r a t i o n are acceptable f o r mass-production purposes. Generally, scanning o f a s i n g l e 1:1250 plan has taken between t h i r t y and s e v e n t y - f i v e minutes; t h i s elapsed time i s dependent on the chosen r e s o l u t i o n o f the p i x e l s (twenty p i x e l s per m i l l i m e t r e i s advised f o r the l a r g e scale OS-type mapping). Conservative estimates from these r a t e s o f scanning suggest t h a t one device can convert between f i v e and e i g h t map-sheets t o p i x e l form i n each e i g h t hour working day. I t seems i n e v i t a b l e , however, t h a t such expensive equipment may w e l l operate on a t w o - s h i f t per day b a s i s , thereby g e n e r a t i n g between ten and s i x t e e n sheets i n r a s t e r form each day. Thus, assuming f i v e scanners are a v a i l a b l e w i t h c. 230 working days per year, then a l l 220,000 basic scale OS maps can be converted t o p i x e l form i n between te n and twelve years.
Of n e c e s s i t y , l i t t l e i n v e s t i g a t i o n was p o s s i b l e t o discover the e x t e n t o f problems associated w i t h poor q u a l i t y source documents. I t i s t o be expected t h a t much image enhancement w i l l be necessary t o an unknown e x t e n t ; complete redrawing w i l l be necessary i n e x c e p t i o n a l cases. C l e a r l y , f u r t h e r s c a n n i n g - t r i a l s (which have been impossible i n a research p r o j e c t o f t h i s s o r t ) are r e q u i r e d t o q u a l i f y the problems. The use o f photographic enhancement w i t h s p e c i a l
Chapter seven

- 411 -
purpose l i n e f i l m may o f f e r p o s s i b i l i t i e s here. S i m i l a r t e s t s are being undertaken by the Ordnance Survey which i s c o n s i d e r i n g a p p r o p r i a t e s t r a t e g i e s t o provide adequate source documents f o r i t s Laser-scan Fastrak d i g i t i s e r (Latham-Warde pers comm 1981).
The extent o f noise and c o d i n g - e r r o r i n the r a s t e r f i l e i s t o l e r a b l e f o r most software t o d e t e c t and c o r r e c t . E f f e c t i v e data v a l i d a t i o n i s c l o s e l y r e l a t e d t o program t u n i n g which s u i t s the c h a r a c t e r i s t i c s o f the scanned data. This, i n i t s e l f , i s worthy o f f u r t h e r research - r a s t e r images of dense co n t o u r i n g are markedly d i f f e r e n t t o an urban 1:1250 pl a n , f o r example.
In general, then, the c a p a b i l i t i e s o f e x i s t i n g scanning hardware are adequate f o r l a r g e - s c a l e s mapping. With the exception o f the S c i t e x equipment, a l l scanners can handle monochrome images o n l y . This does not hinder t h e i r s u i t a b i l i t y f o r these data since they are already h e l d on monochrome sheets. However, the v e r s a t i l i t y o f a scanner which can d e t e c t m u l t i - c o l o u r e d images i n a d d i t i o n t o b l a c k / w h i t e data should not be underestimated. I t i s p o s s i b l e t o use such hardware f o r o t h e r r o l e s i n the map making process as a f r o n t - e n d t o the production o f colour-separate i n f o r m a t i o n f o r p r i n t i n g p l a t e s or the single-pass scanning o f m u l t i - c o l o u r e d small scale mapping
Chapter seven
- 412 -
are examples. F u r t h e r , complete r a s t e r scanning ( i n c o l o u r ) o f the 204 sheets i n the Landranger (1:50,000) mapping has been quoted as being p o s s i b l e w i t h i n c. 750 hours (36 p i x e l s per m i l l i m e t r e r e s o l u t i o n ) by the Scitex Corp (King pers comm 1980). This would provide a n a t i o n a l topographic data base i n computer form, t o serve as an i n t e r i m measure f o r the UK u n t i l complete d i g i t a l l a r g e scale coverage i s a v a i l a b l e . C l e a r l y , the ex t e n t t o which t h i s i s commercial propaganda can only be assessed v a l i d l y w i t h some scanning t r i a l s f o r small scale maps.
The costs o f these s p e c i a l i s e d devices compare favourably w i t h s i m i l a r automated l i n e - f o l l o w i n g d i g i t i s e r s . Raster scanners which are s u i t a b l e f o r l a r g e scale topographic cartography cost c. $250,000; s i m i l a r f i g u r e s are quoted f o r a Fastrak device w i t h associated c o n t r o l l i n g computer.
There i s evidence t o suggest t h a t r a s t e r - d r i v e n output devices are e q u a l l y adaptable i n the mapping i n d u s t r y . T r a d i t i o n a l l y , the raster-based c a p a b i l i t i e s o f t h i s hardware have not been used t o f u l l advantage. Many o f the manufacturers p r o v i d e v e c t o r - t o - r a s t e r software t o f a c i l i t a t e the d i s p l a y o f vector-based data but o n l y those data-sets already s t r u c t u r e d i n p i x e l form (e.g. Landsat imagery) have been able t o u t i l i s e the r a s t e r - d r i v e n d i s p l a y c a p a b i l i t i e s t o f u l l advantage. This s i t u a t i o n seems c e r t a i n t o change as
Chapter seven

- 413 -
r a s t e r data i n the mapping i n d u s t r y gain more impetus - when t h i s time comes, r a s t e r - d r i v e n p l o t t e r s w i l l become more commonplace. I n p a r t i c u l a r , the e l e c t r o s t a t i c p r i n t e r s have much p o t e n t i a l f o r the p r o d u c t i o n o f e d i t - p l o t s f o r graphics v a l i d a t i o n i n a d i g i t a l p r o d u c t i o n f l o w l i n e . Although the q u a l i t y of t h e i r o u t p u t i s not t o as h i g h a standard as the s o p h i s t i c a t e d vector-based hardware c u r r e n t l y used by the Ordnance Survey, t h e i r speed o f o p e r a t i o n i s more impressive. Evidence has suggested t h a t the r a s t e r - d r i v e n p l o t t e r s can produce a 1:1250 map sheet t e n times f a s t e r than the Xynetics v e c t o r p l o t t e r s a t the Ordnance Survey. I n a d d i t i o n , the use of r a s t e r - d r i v e n d i s p l a y screens can o f f e r the advantages o f v e r s a t i l i t y and i n t e r a c t i v e graphics c a p a b i l i t i e s f o r map p r o d u c t i o n . Their low-cost and extensive f a c i l i t i e s (e.g. colour d i s p l a y and r e f r e s h image up-date) are expected t o be h i g h l y f u n c t i o n a l i n f u t u r e p r o d u c t i o n systems.
In general, i t i s concluded t h a t the e x t e n t o f hardware technology f o r a l l s p e c i a l i s e d r a s t e r i n p u t and output i s s u f f i c i e n t l y advanced f o r serious mapping a p p l i c a t i o n s . I t i s the s t a t u s o f the associated raster-based software and user-experience which i s i n s u f f i c i e n t l y developed at the present time. The problems o f e f f i c i e n t and working algorithms t o access and manipulate the d i g i t a l r a s t e r - f i l e s a u t o m a t i c a l l y are prominent i n a l l stages o f the post hoc processing. I n p a r t i c u l a r , the l i m i t a t i o n s o f v i a b l e
Chapter seven

- 414 -
r a s t e r - t o - v e c t o r conversion have become evident i n t h i s work. The l a r g e scales data used i n the t e s t s are m a n i f e s t l y more d i f f i c u l t t o convert t o vectors than i s the case w i t h n o n - i n t e r s e c t i n g (contour-type) data. The l a r g e scales l i n e work has a p r e c i s e geometry which has been d i f f i c u l t t o r e c o n s t r u c t s u c c e s s f u l l y by software. F u r t h e r , the s t r u c t u r e of the r e s u l t i n g v e c t o r s i s not a p p r o p r i a t e f o r immediate e n t r y i n t o most data bases f o r other manipulation and a r c h i v i n g . Large amounts o f data v a l i d a t i o n and c l e a n i n g are e s s e n t i a l t o generate a data o r g a n i s a t i o n which i s acceptable f o r the f u r t h e r stages o f a t t r i b u t e t a g g i n g and i n t e r f a c i n g w i t h other data s e t s . A d d i t i o n a l l y , the amounts of c e n t r a l - p r o c e s s o r time necessary f o r the raster-based procedures have proved t o be lengthy f o r the complex l a r g e scales data. The o n l y r a s t e r - t o - v e c t o r system which has provided r e s u l t s o f a d i s p l a y q u a l i t y t o the standard expected f o r Ordnance Survey work r e q u i r e d f i v e hours o f processing on a dedicated PDP 11/60 computer.
A l l v e c t o r i s i n g systems t e s t e d - w i t h the exception o f t h a t o p e r a t i o n a l at the USGS - have been unable t o chain pecked-lines t o produce s o l i d l i n e f e a t u r e s . This has serious i m p l i c a t i o n s f o r the f u t u r e o f such an approach f o r OS o p e r a t i o n s . There i s a d i f f e r e n c e between wishing t o manipulate graphics as graphics and wishing t o use graphics as topographic data. C l e a r l y , software needs development t o
Chapter seven

- 415 -
s t r i n g pecks togeth e r a u t o m a t i c a l l y ( i n a manner s i m i l a r t o the technique used by the Fastrak when d i g i t i s i n g pecked-lines a u t o m a t i c a l l y ) . Pecks can e a s i l y be generated from s o l i d l i n e s but the reverse seems not t o be t r i v i a l according t o the scanning concerns t a l k e d - t o . I t seems i n t u i t i v e t h a t the DAP-type o f a r c h i t e c t u r e may w e l l o f f e r c o n c e p t u a l l y easy s o l u t i o n s t o t h i s peck-chaining, although no work o f t h i s nature has been attempted i n t h i s research.
On the whole, the r e s u l t s from e x i s t i n g commercial systems have been (somewhat) discouraging f o r serious p r o d u c t i o n work. I n essence, the time taken t o generate a f i l e by these systems, w i t h a content and s t r u c t u r e comparable t o those emanating from a Fastrak d i g i t i s e r i s v i r t u a l l y the same (estimated at te n - t w e l v e h o u r s ) . A r a s t e r approach may s t i l l have serious i m p l i c a t i o n s i n the data e n t r y stages i f the post hoc processing i s made more e f f i c i e n t w i t h a r e d u c t i o n i n the c o s t l y and labour i n t e n s i v e r o l e s o f a human op e r a t o r . The need f o r much a p p l i e d e f f o r t i s c l e a r f o r r a s t e r systems t o progress t o a standard a p p r o p r i a t e f o r OS requirements. Some systems are already s u f f i c i e n t l y advanced t o be serious p r o p o s i t i o n s i n a few years from now.
Chapter seven

- 416 -
APPENDIX 7.1
Summary of the r a s t e r and v e c t o r data formats in-use by the
B e l l Telephone L a b o r a t o r i e s I n c .
(a) Run-length-encoded r a s t e r f i l e :
I n t r o d u c t i o n :
The output from the EDAD scanner i s i n e i g h t - b i t s p i x e l
form. The number of p i x e l s per l i n e can be s e t by the
operator a c c o r d i n g t o the width of the drawing. Each
s c a n - l i n e of data i s run-length-encoded and w r i t t e n on
magnetic d i s k . The length of each s c a n - l i n e ( r e c o r d ) v a r i e s ;
t h i s i s dependent on the drawing d e n s i t y of the source
g r a p h i c .
F i l e s t r u c t u r e :
The f i l e c o n s i s t s of 'n'+l r e c o r d s . This number
corresponds t o 'n' s c a n - l i n e s and one e n d - o f - f i l e (EOF)
record.
Appendix 7.1

- 417 -
Record s t r u c t u r e :
The information s t o r e d i n a r e c o r d c o n s i s t s of header,
data and t r a i l e r :
1. The header c o n t a i n s the length of the r e c o r d .
2. The data c o n t a i n the s t a r t and end addresses of the
run-length p i x e l data.
3. The t r a i l e r i s an end-of-record (EOR) marker.
Record Format
• • • • • • • • • • • • • • • I I I I I I I I NO I S I | E l | S2 I E2 | ! Sn | En | EOR
I I I I I I I I
where: NO = number of f i e l d s -to f o l l o w (n*2+l) (2 b y t e s ) S i = RUN i - s t a r t i n g address (2 b y t e s ) E i = RUN i - ending address (2 b y t e s )
EOR = End of r e c o r d ; (-1) (2 b y t e s )
E n d - o f - f i l e (EOF) i s a minus one (-1) w r i t t e n a f t e r the l a s t
data r e c o r d .
Appendix 7.1

- 418 -
(b) Vector data f i l e :
F i l e s t r u c t u r e :
In the v e c t o r f i l e t h e r e are 'n'+l r e c o r d s . This number
of records corresponds to 'n' v e c t o r s and one e n d - o f - f i l e
r e c o r d . A l l r e c o r d s have a f i x e d length of 14 b y t e s .
Record s t r u c t u r e :
Each v e c t o r i s d e s c r i b e d by seven f i e l d r e c o r d s :
I I I I I I I I I TB | XI | Y l I X2 I Y2 I WD | TB | I I I I I I I I
Where TB = t o t a l b y t e s i n the dat a - p o r t i o n of the r e c o r d ; XI = x coordinate o f ' u p p e r - l e f t ' corner of the v e c t o r Y l = y coordinate of ' u p p e r - l e f t ' corner o f the v e c t o r X2 = x coordinate of ' l o w e r - l e f t ' corner of the v e c t o r Y2 = y coordinate o f ' l o w e r - l e f t ' corner o f the v e c t o r WD = width of the v e c t o r
Note: a l l f i e l d s i n the r e c o r d are two-bytes long
The l a s t r e c o r d i n the f i l e has XI = -1.
Appendix 7.1
- 419 -
8 CONCLUSIONS AND IMPLICATIONS FOR A NATIONAL DIGITAL RASTER
TOPOGRAPHIC DATA BASE
8.1 SUMMARY OF THE WORK
This t h e s i s has d e s c r i b e d work c a r r i e d out by the author
to determine the f e a s i b i l i t y of ha n d l i n g topographic data
he l d on l a r g e s c a l e maps by computer with a r a s t e r or
grid-based format. Raster s t r a t e g i e s f o r computer-assisted
cartography o f f e r s e r i o u s a l t e r n a t i v e s t o the more widely
adopted vector-based techniques. I n p a r t i c u l a r , r a s t e r data
p r o c e s s i n g p r o v i d e s a second option for future Ordnance
Survey planning, and t h i s t h e s i s has been e s p e c i a l l y
concerned w i t h r a s t e r methods f o r OS data and with the r o l e
which t h i s a l t e r n a t i v e might p l a y i n future topographic
mapping programmes i n the UK.
The o r g a n i s a t i o n of the t h e s i s has been arranged i n such a
way as to int r o d u c e the concepts of a r a s t e r approach to
mapping and to show the d i s t i n c t d i f f e r e n c e s to vector-based
s t r a t e g i e s . T h i s i n t r o d u c t i o n i s then followed by a more
d e t a i l e d assessment of the l i k e l y c h a r a c t e r i s t i c s and
mechanisms n e c e s s a r y to manipulate e f f e c t i v e l y the l a r g e
r a s t e r map f i l e s w i th conventional computing hardware. Since
Chapter e i g h t

- 420 -
i t seems c e r t a i n t h a t new g e n e r a t i o n s of computers w i l l o f f e r
d i s t i n c t advantages fo r the handling of l a r g e a r r a y s of data,
then the r o l e t h a t such systems might p l a y i n production has
a l s o been c o n s i d e r e d . I n p a r t i c u l a r , the ICL D i s t r i b u t e d
Array Processor i s suggested as a l i k e l y forerunner of f u t u r e
designs of computing systems. E x t e n s i v e t r i a l s have been
attempted using somewhat novel approaches to r a s t e r
p r o c e s s i n g on the DAP and a s e c t i o n on t h i s work has been
i n c l u d e d .
I t i s evident t h a t most b e n e f i t s from a r a s t e r approach to
d i g i t a l mapping w i l l a r i s e a t the data e n t r y stage; the
conversion from paper- or film-based media to computer i s f a r
f a s t e r with a r a s t e r scanner than by any l i n e - f o l l o w i n g
mechanisms. For t h e s e reasons, a s e c t i o n of the t h e s i s has
been given over to d e s c r i p t i o n s and comparisons of commercial
r a s t e r scanning systems known to be a v a i l a b l e i n 1980/81.
The a b i l i t y to t r a n s f e r data from e x i s t i n g images to a
d i g i t a l form with s u f f i c i e n t speed and q u a l i t y of data with
these systems i s e s s e n t i a l i n any r a s t e r - b a s e d mapping
system. In p a r t i c u l a r , scanning t r i a l s have been c a r r i e d - o u t
with OS data on a l l systems whose manufacturer's were w i l l i n g
to p a r t i c i p a t e ; a good response was r e c e i v e d from most of the
commercial concerns - a l l but one who were approached agreed
to run the t r i a l s g r a t i s .
Chapter e i g h t

- 421 -
.2 IMPLICATIONS FROM RESULTS OF STUDIES INTO THE 'STATE OF THE
ART1 OF DIGITISING SYSTEMS
The Ordnance Survey was probably the f i r s t major mapping
o r g a n i s a t i o n to introduce d i g i t a l a p p l i c a t i o n s i n t o the
map-making process on a production b a s i s ; no other agency has
so much experience of the problems and b e n e f i t s of
compu t e r - a s s i s t e d cartography on a l a r g e production s c a l e .
From t h i s view-point, the work of the OS to-date has been
e x c e p t i o n a l : a t p r e s e n t , c. 18,000 of the b a s i c s c a l e maps of
Great B r i t a i n a r e h e l d i n computer form, generated by what
must now be considered an out-dated d i g i t a l mapping f l o w l i n e .
E a r l y assessments of the use of s p e c i a l - p u r p o s e
i n t e r a c t i v e graphic e d i t i n g systems f o r r e a l - t i m e data
v a l i d a t i o n and c o r r e c t i o n by the OS are suggesting
s u b s t a n t i a l improvements over the o r i g i n a l batch e d i t i n g
system. Following the f e a s i b i l i t y t e s t i n g of one such system
over a one-year period, the OS has now up-graded the
f a c i l i t i e s , e s s e n t i a l l y , t o run f i v e i n t e r a c t i v e e d i t i n g
s t a t i o n s (the L a s e r - s c a n IGES) i n r e a l - t i m e from a Vax 11/780
computer. The use of the s e new mapping t o o l s i s considered
s u c c e s s f u l f o r both i n t e r a c t i v e c o r r e c t i o n of e x i s t i n g
d i g i t a l f i l e s or for the c r e a t i o n of new f i l e s by a manual
d i g i t i s i n g p r o c e s s . I t has proved s t r a i g h t - f o r w a r d to t r a i n
s t a f f to operate these systems and the mechanisms are now
Chapter e i g h t

- 422 -
a v a i l a b l e to introduce the new f a c i l i t i e s i n t o the e x i s t i n g
production f l o w - l i n e .
R e s u l t s from the L a s e r - s c a n F a s t r a k automatic
l i n e - f o l l o w i n g d i g i t i s e r - the front-end to the OS
development p r o j e c t TODDS ( d e s c r i b e d i n s e c t i o n 2.8) - have
been r a t h e r l e s s encouraging. Although i t was envisaged t h a t
an automated l i n e - f o l l o w i n g approach to OS map d i g i t i s i n g
would i n c r e a s e throughput r a t e s d r a m a t i c a l l y ( c . 5 - f o l d ) ,
r e c e n t r e s u l t s have shown f a r l e s s favourable speed i n c r e a s e s
with t y p i c a l improvement f a c t o r s ranging between two and four
times, depending on the complexity of the data i n v o l v e d .
This d i s a p p o i n t i n g performance does not, of course, c a s t
doubts on F a s t r a k ' s s u i t a b i l i t y for d i g i t i s i n g other types of
data. I n t r i n s i c a l l y , the c h a r a c t e r i s t i c s of the GB b a s i c
s c a l e p l a n s are not s u i t e d to the d i g i t i s i n g r o l e o f f e r e d by
a F a s t r a k ; t h e r e a r e too many l i n e - j u n c t i o n s connected by
i n a p p r o p r i a t e l y s h o r t v e c t o r s f o r the device to operate
without i n t e r r u p t i o n f o r any length of time. The F a s t r a k i s
more s u i t e d towards expanses of u n i n t e r r u p t e d l i n e work, such
as contour data or c o a s t l i n e s ; f u r t h e r , r e c e n t work c a r r i e d
out by the author (not reported here) suggest i t s s u i t a b i l i t y
for the high-speed d i g i t i s i n g of some p u b l i c - u t i l i t y networks
such as gas-mains, telecommunication l i n e s , e t c .
Chapter e i g h t

- 423 -
The evidence gathered i n t h i s r e s e a r c h has suggested t h a t
a l l the r a s t e r scanning systems t e s t e d can generate
e f f i c i e n t l y a p i x e l - b a s e d d i g i t a l image of OS l a r g e s c a l e map
data. These images can then be d i s p l a y e d d i r e c t l y on
appropriate s c r e e n s / p l o t t e r s to provide f u r t h e r hard- or
s o f t - c o p i e s of the maps or to provide a d i g i t a l " b a c k - c l o t h "
on which to superimpose other data such as u t i l i t y networks,
census data, e l e c t o r a l and h e a l t h s t a t i s t i c s and so on.
C l e a r l y , though, the use of the data i n OS mapping
a p p l i c a t i o n s - and f o r s u i t a b l e i n t e r f a c e s to e x i s t i n g
vector-based GIS and m a n i p u l a t i o n / d i s p l a y systems such as the
GIMMS and MOSS packages - d i c t a t e the need to generate
e q u i v a l e n t data i n ve c t o r n o t a t i o n . F u r t h e r , i t seems l i k e l y
t h a t adequate s t r u c t u r e i s r e q u i r e d i n the data to enable the
i n c l u s i o n and r e t r i e v a l of s p e c i f i c f e a t u r e codes and
complete u s e r - d e f i n e d s p a t i a l e n t i t i e s , thus f a c i l i t a t i n g the
f l e x i b l e use o f the r e s u l t i n g map-data a r c h i v e f o r both
graphic and non-graphic u s e s . I t i s the post hoc pr o c e s s e s
which n e c e s s a r i l y must be a p p l i e d to the scanned data which
c u r r e n t l y undermines the s u i t a b i l i t y of r a s t e r p r o c e s s i n g of
map data f o r OS-type purposes.
The t e c h n i c a l f e a s i b i l i t y of i n t r o d u c i n g more s t r u c t u r e
i n t o scanned data - whether i t be by conversion t o v e c t o r s ,
or the p r e s e r v a t i o n of r a s t e r - c e l l s - i s s t i l l i n need of
much development. G l i b l y , most commercial agencies which
Chapter e i g h t

- 424 -
market r a s t e r d e v i c e s d e s c r i b e the v e r s a t i l i t y and speed o f
t h e i r systems; a l l those systems t e s t e d i n t h i s p r o j e c t
cannot be considered s u i t a b l e for OS needs a t p r e s e n t .
In p a r t i c u l a r , t h e r e i s need for much f u r t h e r r e s e a r c h and
development i n t o the e f f e c t i v e h a n d l i n g of the f o l l o w i n g
three map e n t i t i e s : l i n e work - e s p e c i a l l y pecks, symbols and
t e x t . T h i s r e s e a r c h has n e c e s s a r i l y r e s t r i c t e d i t s
i n v e s t i g a t i o n s to the handli n g of map line-work; these data
comprise the bulk of a l l information i n c l u d e d i n maps and are
considered most d i f f i c u l t t o process s i n c e even minor changes
i n a map's geometry of l i n e s can a l t e r completely the
appearance and r e l i a b l i t y of the working documents.
The handling of map symbols and t e x t data i n r a s t e r mode
i s not expected to be unduly d i f f i c u l t . C l e a r l y , symbols on
l a r g e s c a l e maps a r e l i m i t e d i n extent although they do
appear i n the s m a l l e r s c a l e s ; t e x t i s p r e s e n t i n a l l mapping
s c a l e s . The S c i t e x Corp. s t r a t e g y f o r the handli n g of p o i n t
symbols and t e x t has been t o produce t h e i r p i x e l formations
i n a r a s t e r p a t t e r n l i b r a r y f o r r a p i d r e c a l l at some l a t e r
date. The p o s i t i o n s i n the map image of these t e x t and
symbols data a r e r e f e r e n c e d uniquely and i n t e r a c t i v e l y by a
t r a i n e d operator on a s p e c i a l - p u r p o s e g r a p h i c s e d i t i n g
s t a t i o n . A l t e r n a t i v e l y , Kongsberg L t d . - which has opted for
immediate c o n v e r s i o n t o v e c t o r s - suggests i t to be most
Chapter e i g h t

- 425 -
c o s t - e f f e c t i v e to convert the t e x t and symbols to v e c t o r s
along with a l l accompanying line-work and then to r e p l a c e
i n t e r a c t i v e l y the r e l e v a n t v e c t o r s with an e q u i v a l e n t ASCII
c h a r a c t e r or symbol macro on a s p e c i a l - p u r p o s e e d i t i n g
s t a t i o n . The i n t r o d u c t i o n of s p e c i f i c t y p e - f a c e s can be
predefined i n a p a t t e r n l i b r a r y and r e c a l l e d for subsequent
p l o t t i n g a t a l a t e r date ( c . f . S c i t e x Corp.). They
(Kongsberg) suggest t h a t automatic c h a r a c t e r r e c o g n i t i o n i s
i n development w i t h i n t h e i r o r g a n i s a t i o n but not due to be
r e l e a s e d f o r some yea r s y e t . C l e a r l y , however, some
commercial systems are more advanced than others i n t h i s
r e s p e c t : r e c e n t m o d i f i c a t i o n s to those systems produced by
Broomall I n d u s t r i e s , f o r example, c l a i m to perform e f f e c t i v e
c h a r a c t e r r e c o g n i t i o n (Logan pers comm 1982). Indeed, some
completely new concepts i n hardware seem l i k e l y to appear i n
the near f u t u r e : hand-held c u r s o r s with l o c a l r a s t e r scanners
and d i g i t i s e r s which can both f o l l o w l i n e s or r a s t e r scan
complete images a r e j u s t two examples. I t i s evident t h a t
the r e s u l t s from a p r o j e c t of t h i s nature cannot ever be
completely up-to-date; the r a p i d developments i n computer
hardware designs and the a b i l i t y of end-users to d e f i n e more
c l e a r l y t h e i r e x a c t needs i s ena b l i n g the c r e a t i o n of newer,
more modern, more innovatory ideas and t h e i r i n t r o d u c t i o n
i n t o working systems.
Chapter e i g h t

- 426 -
.3 IMPLICATIONS FROM RESULTS OF STUDIES INTO POST HOC
MANIPULATION OF SCANNED DATA
A s u b s t a n t i a l p r o p o r t i o n of the r e s e a r c h content of t h i s
p r o j e c t has i n v o l v e d i n v e s t i g a t i o n s of the mechanisms
ne c e s s a r y and problems concerned with d i g i t a l manipulation
f o l l o w i n g the data e n t r y (or scanning) s t a g e s . C l e a r l y ,
t h e r e are a l r e a d y a number o f "turn-key" commercial systems
a v a i l a b l e for the han d l i n g of r a s t e r - t y p e data.
I t i s c l e a r , however, t h a t none of the commercial r a s t e r
systems t e s t e d o f f e r complete s o l u t i o n s f o r mass throughput
of the b a s i c s c a l e s OS map s e r i e s a t the pre s e n t time. A l l
are c o s t l y i n terms of computer p r o c e s s i n g time and storage
and a l l r e q u i r e l a r g e amounts of i n t e r a c t i v e data v a l i d a t i o n
and c l e a n s i n g . No systems have provided d i g i t a l v e c t o r data
to a q u a l i t y comparable with the e x i s t i n g Ordnance Survey
f l o w l i n e and no p l o t t e d r e s u l t s have been generated which
meet c u r r e n t OS s t a n d a r d s . F u r t h e r , a l l line-work generated
i s h e l d a t one l e v e l w ith no in c l u d e d 'feature coding'. I t
has proved i m p o s s i b l e t o q u a n t i f y the r e s o u r c e s n e c e s s a r y to
a t t a c h f e a t u r e codes t o t h i s ad hoc line-work generated by
the systems? t h i s d e f i c i e n c y i s l a r g e l y a consequence o f a
la c k of a c c e s s t o an appropriate data e d i t i n g s t a t i o n for
f e a s i b i l i t y t r i a l s .
Chapter e i g h t

- 427 -
In essence, the nature of the r e s u l t s achieved have
r e f l e c t e d the c h a r a c t e r i s t i c s of the source data presented to
the scanners. A s e r i e s of g r a p h i c s can only produce a
d i g i t a l r e p r e s e n t a t i o n of the same g r a p h i c s . Thus, for
example, most of the systems t e s t e d have preserved the pecked
l i n e s as pecks i n the r e s u l t i n g v e c t o r f i l e s . I n order t o
process t h e s e data f o r many other uses - as w e l l as f o r
p u r e l y g r a p h i c reproduction - i t i s n e c e s s a r y to s t r i n g pecks
together to generate the graphic l i n e work i n a more l o g i c a l
and u s e f u l form. I n attempting to a t t a c h f e a t u r e codes to
the s e r i e s of map l i n e s and by r e c o n s t r u c t i n g s o l i d l i n e s
from the pecked data, we a r e , thus, s t r i v i n g towards a
working information system and not merely an a r c h i v e f o r
graphic data.
The absence of any a p p r o p r i a t e f e a t u r e coding and, indeed,
the poor s t r u c t u r e of the line-work which i s generated by
most of the commercial systems i s a major drawback to the use
of a commercial r a s t e r system i n production a t p r e s e n t . Some
systems can d i s t i n g u i s h l i n e s by e i t h e r clours or by t h i c k n e s s
but n e i t h e r o f these f a c t o r s have much r e l e v a n c e for l a r g e
s c a l e maps which are monochrome ( a p a r t from the brown contour
l i n e s on the 1:10000 s c a l e s h e e t s ) and have a l i m i t e d
v a r i a t i o n of l i n e - w e i g h t s i n t h e i r s p e c i f i c a t i o n ? t h e r e are
c l e a r i n d i c a t i o n s t h a t the s m a l l e r s c a l e mapping s e r i e s o f f e r
data which are more s u i t a b l e for e x i s t i n g r a s t e r systems
Chapter e i g h t
- 428 -
although t h i s has not been t e s t e d i n p r a c t i c e .
The l a c k of s t r u c t u r e and the c l a s s i f i c a t i o n of f e a t u r e s
being generated by the commercial s o l u t i o n s posed the need
for r e s e a r c h i n t o other, more novel, s t r a t e g i e s f o r
post-scanning computer manipulation. To some ext e n t , the
r e s u l t s r e ported from the use of the I C L D i s t r i b u t e d Array
Processor - a new g eneration of computing hardware - has
o f f e r e d some f i r s t i n d i c a t i o n s of the l i k e l y l e v e l o f r e s u l t s
p o s s i b l e i n the f u t u r e . I t has been shown, for example, how
a u s e f u l and l o g i c a l s t r u c t u r e can be introduced to
r a s t e r - s c a n n e d data q u i c k l y and e a s i l y with a DAP method of
p r o c e s s i n g ; such u s e f u l s t r u c t u r e s and e n t i t y d i s s e m i n a t i o n
i s seemingly d i f f i c u l t to a c h i e v e on the r a s t e r systems which
were t e s t e d . The speeds of operation for c e r t a i n t a s k s have
been very encouraging on the DAP which operates most
e f f e c t i v e l y on p a r a l l e l o p e r a t i o n s . Thus, for example, the
a b i l i t y to s ub-divide a complete b i n a r y r a s t e r image of a
l a r g e s c a l e map i n t o a c o l l e c t i o n of s u b - f i l e s - each
comprising a s i n g l e s p a t i a l e n t i t y - and other simple image
manipulations such as s c a l e changing and g e n e r a l i s a t i o n have
been found to operate extremely q u i c k l y . Conversely, the
a b i l i t y to c o nvert the boundary of these s p a t i a l e n t i t i e s
i n t o v e c t o r s to generate a f i l e of polygons has been found to
operate r a t h e r more slowly, s i n c e r a s t e r - t o - v e c t o r conversion
i s , e s s e n t i a l l y , a s e q u e n t i a l , l i n e - f o l l o w i n g p r o c e s s .
Chapter e i g h t

- 429 -
However, speed of operation alone i s not the only b e n e f i t
to be concluded from a p a r a l l e l approach to r a s t e r
manipulation though, c l e a r l y , the l a r g e volumes of data
i n h e r e n t i n r a s t e r s t r u c t u r e s do d i c t a t e the need for high
speeds of o p e r a t i o n . The DAP a l s o has proved to be a
v e r s a t i l e image p r o c e s s i n g t o o l i n i t s own r i g h t . Many of
the algorithms attempted i n t h i s r e s e a r c h would be d i f f i c u l t
to implement on a c o n v e n t i o n a l s e r i a l p r o c e s s o r . The a b i l i t y
to operate on complete s u b - d i v i s i o n s of a t o t a l image makes
for e a s i e r and c o n c e p t u a l l y more s t r a i g h t f o r w a r d programming.
There are, of course, many c o n s t r a i n t s on the use of the
DAP i n work of t h i s nature; i t cannot be considered as
p r o v i d i n g a complete s o l u t i o n t o r a s t e r - b a s e d d i g i t a l mapping
at p r e s e n t . The two dimensional c o n n e c t i v i t y of the
p r o c e s s o r s i n the a r c h i t e c t u r e of the hardware means t h a t
algorithms perform most e f f e c t i v e l y on complete uncompressed
r a s t e r images. Thus, the volumes of data being processed on
the DAP i n t h i s work have been n e c e s s a r i l y l a r g e - up to f i v e
times l a r g e r than the most e f f e c t i v e l y compacted r a s t e r f i l e s
and up to 48 times l a r g e r than an e q u i v a l e n t v e c t o r method of
storage. These f i g u r e s are achieved even a f t e r the use of
the e f f i c i e n t h i e r a r c h i c a l data s t r u c t u r e developed, which
i n c l u d e s a s u b s t a n t i a l compaction over f u l l r a s t e r a r r a y s .
C l e a r l y , i t seems i n t u i t i v e to a r c h i v e the data i n some form
more ap p r o p r i a t e to a data bank and then expand them - or
Chapter e i g h t

- 430 -
even convert between ve c t o r and r a s t e r as r e q u i r e d - for
e a s i e r manipulation.
Secondly, the v e c t o r s t r u c t u r e generated by the DAP a f t e r
the conversion of the r a s t e r s p a t i a l e n t i t i e s i n t o v e c t o r
polygons i s not i d e a l f o r subsequent p r o c e s s i n g , which i s
more l i k e l y to r e q u i r e segments extending between j u n c t i o n s
or nodes. The v e c t o r s being generated i n t h i s work are
presented as complete polygon boundaries with d u p l i c a t e d
segments from polygons which are ad j a c e n t to each other. I t
i s n e c e s s a r y - and p o s s i b l e - to process t h e s e v e c t o r s
f u r t h e r to d e r i v e a l i n k and node s t r u c t u r e for more
conventional p r o c e s s i n g by removing c o i n c i d e n t l i n e s and
adding a p p r o p r i a t e l e f t and r i g h t f e a t u r e coding.
F i n a l l y , s i n c e the DAP can p r e s e n t l y operate only i n batch
mode, i t has no c a p a b i l i t i e s f o r r e a l - t i m e i n t e r a c t i o n
between the user and the machine; t h i s i s e s s e n t i a l i n any
v e r s a t i l e image p r o c e s s i n g . Since the DAP used i n these
t e s t s i s p a r t of a l a r g e mainframe computer which provides a
complete u n i v e r s i t y computing s e r v i c e , then the turn-around
of batch jobs and, i n p a r t i c u l a r , the speeds of grap h i c s
d i s p l a y s on r a s t e r t e r m i n a l s i s poor. I t i s envisaged t h a t
t h i s mode of operation f o r the DAP i s only a f i r s t s t e p ; i t
seems l i k e l y , f or example, t h a t I C L w i l l develop a
stand-alone minicomputer c o n f i g u r a t i o n based on the ICL Perq
Chapter e i g h t

- 431 -
which w i l l i n c l u d e a scaled-down v e r s i o n of the DAP i n the
near f u t u r e (Smallbone pers comm 1982). Such an i n s t a l l a t i o n
w i l l provide a much improved t o o l f o r image p r o c e s s i n g t a s k s
which r e q u i r e near instantaneous responses and f a s t ,
h i g h - r e s o l u t i o n graphic d i s p l a y c a p a b i l i t i e s .
.4 IMPLICATIONS FOR THE NATIONAL TOPOGRAPHIC DIGITAL DATA BASE
I t has been suggested t h a t r a s t e r - b a s e d r e p r e s e n t a t i o n s
for map data a r e more s u i t e d to c e r t a i n a r e a l manipulations
than are data i n a v e c t o r form. C e l l u l a r p i c t u r e p r o c e s s i n g ,
i n g e n e r a l , r e q u i r e s s h o r t e r programs and more
s t r a i g h t f o r w a r d r e t r i e v a l o p e r a t i o n s t o e x t r a c t s p e c i f i c
regions w i t h i n map images. Furthermore, i t seems l i k e l y t h a t
a r a s t e r data s t r u c t u r e for e i t h e r a s i n g l e map sheet or,
indeed, when p r o j e c t e d f o r the whole country w i l l be l e s s
complex c o n c e p t u a l l y than w i l l a segment and node vector
s t r u c t u r e . However, a r r a y s of v e r y small p i c t u r e elements
generate c a t a s t r o p h i c storage problems for computer d i s k or
tape media and are l i k e l y to overflow even the mass storage
mechanisms c u r r e n t l y being announced.
In p a r t i c u l a r , two s t r a t e g i e s for s t o r i n g r a s t e r data have
been suggested i n t h i s work. The f i r s t i s a
run-length-encoded form of compaction i n which superfluous
Chapter e i g h t

- 432 -
data are compressed on a s c a n - l i n e by s c a n - l i n e b a s i s . The
second storage s t r a t e g y suggested has formed a h i e r a r c h i c a l
s t r u c t u r e i n which the data are compressed i n t o
two-dimensional s e c t i o n s : a low r e s o l u t i o n indexing a r r a y
provides p o i n t e r s t o higher r e s o l u t i o n base data h e l d i n an
uncompacted r a s t e r form. On the b a s i s of the work c a r r i e d
out i n t h i s r e s e a r c h - i n which only a small number of 1:1250
s c a l e map s h e e t s have been considered f o r t e s t purposes - i t
i s e v ident from the r e s e a r c h t h a t a s c a n - l i n e
run-length-encoded compaction scheme provides g r e a t e r l e v e l s
of data compaction than does the two-dimensional h i e r a r c h i c a l
scheme. The l a t t e r , however, provides b e t t e r o r g a n i s a t i o n
and the a b i l i t y to r e t r i e v e s p e c i f i c r e g i o n s of data q u i c k l y
and e a s i l y by v i r t u e o f i t s comprehensive indexing
f a c i l i t i e s .
Although c a u t i o n must be e x e r c i s e d when i n t e r p r e t i n g
e x t r a p o l a t i o n s from such f i g u r e s owing to the small sample of
data c u r r e n t l y h e l d i n r a s t e r form, i t i s p o s s i b l e t o p r o j e c t
the l i k e l y s i z e of the complete topographic data base i f h e l d
i n r a s t e r form f o r the whole of Great B r i t a i n . Table 8.1
i t e m i s e s t h e s e estimated p r o j e c t i o n s on the b a s i s of
experience gained on the c h a r a c t e r i s t i c s of a r a s t e r
r e p r e s e n t a t i o n o f OS b a s i c s c a l e s data. I t was shown i n
chapter f i v e how even the s m a l l e s t of v a r i a t i o n s i n the
r e s o l u t i o n of each p i x e l w i l l a l t e r the s i z e of the r e s u l t a n t
Chapter e i g h t

- 433 -
r a s t e r f i l e s d r a m a t i c a l l y , and hence these f i g u r e s w i l l
change e x t e n s i v e l y as p i x e l r e s o l u t i o n i s v a r i e d .
Table 8.1 E s t i m a t i o n of the l i k e l y s i z e of the GB b a s i c s c a l e
topographic data base
No. of map sheets i n s e r i e s 217,777 3
Vector storage i n DMC c h a r a c t e r format 16 x 10 * (200) Uncompressed r a s t e r storage 3653 x 10 (38800)
a Run-length-encoded r a s t e r storage 140 x 10 (1500)
3 H i e r a r c h i c a l r a s t e r storage 562 x 10 (6000)
•Source: Adams and Rhind (1981) A l l storage quoted i n megabytes fo r a 0.1 m p i x e l r e s o l u t i o n . F i g u r e s i n b r a c k e t s r e p r e s e n t estimated number of standard 62 50 b p i , 2400 f e e t computer magnetic tapes.
Such l a r g e volumes of data as those envisaged i n t a b l e 8.1
suggest i t to be i n a p p r o p r i a t e to s t o r e the complete n a t i o n a l
data base i n a r a s t e r form. I t i s m a n i f e s t l y more convenient
to s t o r e the data as v e c t o r s f o r e f f i c i e n t use of computer
backing s t o r e and f o r f a s t e r r e t r i e v a l a c c e s s times. Yet, i n
order to take advantage of the b e n e f i t s of r a s t e r - b a s e d
p r o c e s s i n g and both v e c t o r - and r a s t e r - b a s e d methods of input
and output, i t i s e s s e n t i a l to have the a b i l i t y to
interchange f l u e n t l y between vector and r a s t e r as r e q u i r e d .
However, though i t has been shown t h a t v e c t o r - t o - r a s t e r
Chapter e i g h t

- 434 -
conversion i s r e a d i l y p o s s i b l e , the r e v e r s e i s not to a
standard adequate for OS data i n a production environment a t
the p r e s e n t time. Indeed, t h e r e are few systems a v a i l a b l e
c u r r e n t l y which perform r o u t i n e l y v e c t o r - t o - r a s t e r and
r a s t e r - t o - v e c t o r c o n v e r s i o n s with f l u e n c y such t h a t the t a s k
i s ignored as being no longer a problem. I n essence, a
"black-box" i n t e r f a c e i s r e q u i r e d i n the future - whether i t
be a hardware, or a software or a h y b r i d s o l u t i o n - which can
perform t h i s conversion r o u t i n e l y l e a v i n g programmers f r e e to
concentrate on more a p p l i c a t i o n s - b a s e d software.
In c o n c l u s i o n , i t seems l i k e l y t h a t the volumes of data
invol v e d with a v e c t o r r e p r e s e n t a t i o n f o r the whole country
are more manageable a t p r e s e n t than with a r a s t e r mode.
Nonetheless, i t i s not beyond the bounds of t e c h n i c a l
p o s s i b i l i t y t o manage a r a s t e r data s t r u c t u r e for the whole
country. The e x t e n t of data i n v o l v e d i s no l a r g e r than
remote-sensed data handled r o u t i n e l y by the NASA EROS c e n t r e
i n Sioux F a l l s , f o r example, and a r a s t e r s t r a t e g y to mapping
has d i s t i n c t advantages with the ease and speed o f any input
and d i s p l a y of the data.
Chapter e i g h t

- 435 -
.4.1 A r a s t e r - b a s e d data base
C l e a r l y , a r a s t e r data a r c h i v e for the whole of Great
B r i t a i n must a t a minimum posses s u f f i c i e n t s t r u c t u r e and
o r g a n i s a t i o n for r a p i d r e t r i e v a l and up-date. I t i s
suggested t h a t the h i e r a r c h i c a l data s t r u c t u r e developed for
DAP p r o c e s s i n g ( d e s c r i b e d i n d e t a i l i n s e c t i o n 6.3 and f i g u r e
6.5) i s eminently s u i t a b l e t o cover the whole country.
The notion of h o l d i n g two l e v e l s only i n t h i s h i e r a r c h i c a l
data s t r u c t u r e - an index and the base data - has been a
p r e l i m i n a r y experiment to i n v e s t i g a t e the p o t e n t i a l of such
an o r g a n i s a t i o n for the data. I t was pointed-out i n s e c t i o n
6.3 t h a t c o n c e p t u a l l y the h i e r a r c h y can be extended i n t o any
number of l e v e l s , depending on the range o f p i x e l r e s o l u t i o n s
needed for a p a r t i c u l a r t a s k - e.g. to d i s p l a y a complete map
image on a 512 x 512 p i x e l r a s t e r d i s p l a y s c r e e n . C l e a r l y ,
the volumes of data comprising a r a s t e r data base f o r the
whole of B r i t a i n w i l l need to take advantage of the
m u l t i - l e v e l c a p a b i l i t i e s i n h e r e n t i n t h i s s t r u c t u r e ; i t i s
c e r t a i n t h a t a m u l t i - l e v e l of indexing to the base data w i l l
be r e q u i r e d . I n essence, there w i l l be a s e r i e s of
h i e r a r c h i c a l indexes: a low r e s o l u t i o n index to the next
higher r e s o l u t i o n , which i s i t s e l f a low r e s o l u t i o n index to
the next h i g h e r r e s o l u t i o n l e v e l and so on. Such a data
Chapter e i g h t

- 436 -
s t r u c t u r e w i l l provide both adequate indexing to more
d e t a i l e d base data and a means of p a r t i t i o n i n g the base a r r a y
of p i x e l s f o r the whole country i n t o more manageable u n i t s .
F u r t h e r , the int e r m e d i a t e l e v e l s of data (between the base
l e v e l and the c o a r s e s t l e v e l index) w i l l provide base data a t
va r y i n g r e s o l u t i o n s f o r more g e n e r a l i s e d approximations of
the t o t a l data as w e l l as as s e r i e s of in t e r m e d i a t e index
f i l e s . I n theory, i t w i l l be p o s s i b l e for u s e r s to enter the
data s t r u c t u r e a t any d e s i r e d l e v e l and e x t r a c t j u s t the
r e s o l u t i o n of information which they r e q u i r e . F i g u r e 8.2
shows some suggestions f o r the p a r t i t i o n i n g of a r a s t e r data
base f o r the whole of Great B r i t a i n ; i n p a r t i c u l a r , f i g u r e
8.2a c o n c e n t r a t e s on the p a r t i t i o n i n g of the master f i l e s f o r
the whole country i n t o s m a l l e r u n i t s and f i g u r e 8.2b shows
s i m i l a r techniques f o r the s u b - d i v i s i o n o f i n d i v i d u a l map
sheets f o r manageable i n - c o r e p r o c e s s i n g . The Nat i o n a l G r i d
r e f e r e n c i n g system f o r B r i t a i n comprises an area of
0 - 700 Km i n e a s t i n g s and 0 - 1100 Km i n northings
( e x c l u d i n g the Shetland I s l a n d s ) . Thus, to hold a r a s t e r
image f o r t h i s a r e a with a p i x e l r e s o l u t i o n o f 0.1 mm at map
s c a l e (0.12 m ground s c a l e ) r e q u i r e s an a r r a y of p i x e l s of 6 £
dimensions (5.7 x 10 ) x (9.0 x 10 ) . C l e a r l y , i t would be
u n r e a l i s t i c to process such a l a r g e a r r a y without adequate
p a r t i t i o n i n g ; t h i s i s p o s s i b l e with the h i e r a r c h i c a l concepts
d e s c r i b e d i n s e c t i o n 6.3. Holding the complete country with
0.1 mm r e s o l u t i o n for the data h i e r a r c h y would e n t a i l r i s i n g
Chapter e i g h t

- 4 3 7 -
A) LEVEL 6 INDEX Each pixel corresponds to 16km square partit ion o level 23
LEVEL 11 INDEX
Each pixel corresponds 500m square part i t ion of level 23
LEVEL 23 BASE D A T A
g) LEVEL 23 SINGLE M A P SHEET
pixel resolution 0.12 m
LEVEL 17 M A P SHEET INDEX
pixel resolution 7.68 m
' 64 /pixels 1 0 \
2048 pixels
700 km 1024 km
8,388,608 pixels
4096 pixels
64 partitions of / /
Ability to transfer between other
levels as required
sub-file part i t ions of full map sheet
Suggested Data Structure For A UK Raster Topographic Data Base
Figure 8.2

- 438 -
to l e v e l s 23 or 24. L e v e l 24 provides a r a s t e r of 16,777216
p i x e l s square - an a r e a l extent of 2048 x 2048 Km on the
ground. L e v e l 23 provides a r a s t e r of 8,388,608 p i x e l s
square which r e p r e s e n t s 1024 x 1024 Km on the ground; the use
of t h i s l a t t e r l e v e l w i l l o f f e r dramatic storage r e d u c t i o n s
over l e v e l 24, although the Orkney I s l a n d s w i l l be cut i n
h a l f g e o g r a p h i c a l l y at northing 1024 Km N. I t i s reasonable
to suppose t h a t a l t e r n a t i v e mechanisms can be used for the
Orkneys and the Shetlands - perhaps as an i n s e r t i n the
d i g i t a l f i l e s as i s c a r r i e d - o u t r o u t i n e l y by conventional
c a r t o g r a p h i c means on small s c a l e maps.
Thus, f i g u r e 8.2a shows the h i e r a r c h y n e c e s s a r y for the
whole of GB and assumes t h a t complete coverage of the country
i s h e l d at l e v e l 23. The p o s i t i o n i n g of the country's NG
r e f e r e n c e frame w i t h i n the l e v e l 23 base f i l e i s such to
ensure t h a t 1:1250 and 1:2500 s c a l e sheet edges can - where
p o s s i b l e - be o v e r l a y e d with v a l i d northings and e a s t i n g s
l i n e s on the base a r r a y . I t i s e v i d e n t , from f i g u r e 8.2a
t h a t there a r e redundant p i x e l s i n the e a s t i n g s d i r e c t i o n i n
areas of s e a ; t h e s e unused p i x e l s could be w a s t e f u l of space
although need not be s t o r e d i n l e v e l 23 s i n c e r e f e r e n c e s i n
index f i l e s h e l d higher-up the h i e r a r c h y w i l l show them to be
empty p i x e l s . This i s one example of the b e n e f i t s o f f e r e d by
the use of a s e r i e s of h i e r a r c h i c a l index f i l e s . S i m i l a r
advantages w i l l e x i s t i f the data are o r g a n i s e d i n t o a s e r i e s
Chapter e i g h t

- 439 -
of b i n a r y f i l e s - one for each f e a t u r e type - s i n c e those
areas i n which none of a p a r t i c u l a r f e a t u r e e x i s t s need not
be s t o r e d at l e v e l 23; f o r example, the 1971 population
census of GB showed t h a t only t h r e e - f i f t h s of the country's
area i s populated (Rhind pers comm 1982) thus, i t i s
reasonable t o assume t h a t t h e r e are many regions of the
country i n which no b u i l d i n g s are p r e s e n t .
The p o s i t i o n i n g of the indexes w i t h i n the h i e r a r c h y should
r e f l e c t the uses to which they w i l l be put. For example,
each p i x e l i n a l e v e l 6 (64 x 64) index w i l l r e p r e s e n t 16 Km
at ground s c a l e (or a 131,072 p i x e l square i n the l e v e l 23
base d a t a ) ; t h i s , then, w i l l provide only a crude d e s c r i p t i v e
summary of the data h e l d i n the lower l e v e l s . A l e v e l 11
index (2048 x 2048) w i l l provide a more ap p r o p r i a t e
d e s c r i p t i v e summary s i n c e each p i x e l i n l e v e l 11 w i l l
r e p r e s e n t 4096 x 4096 p i x e l s i n the base data or a
500 x 500 m square a t ground s c a l e which corresponds to a
s i n g l e 1:1250 s c a l e map s h e e t .
For o p e r a t i o n a l convenience, i t i s l i k e l y t h a t the sheet
edges of the l a r g e s c a l e maps w i l l remain important f o r some
time y e t . I n p a r t i c u l a r , the scanning stages of the data
base c r e a t i o n w i l l be c a r r i e d out on a sheet-by-sheet b a s i s .
Thus, i t i s e s s e n t i a l to be able to p o s i t i o n the r e s u l t i n g
p i x e l f i l e s i n t o t h e i r e x a c t s p a t i a l l o c a t i o n s w i t h i n the
Chapter e i g h t

- 440 -
l e v e l 23 base data for the whole country. The l e v e l 11 index
w i l l provide a mechanism f o r a c h i e v e i n g t h i s and a l s o show -
near i n s t a n t a n e o u s l y - the progress of scanning of the map
sheets as more and more are converted to p i x e l form.
I t i s l i k e l y t h a t a data base ( a t l e v e l 23, say) w i l l be
handled (more a p p r o p r i a t e l y ) as a s e r i e s of s u b - f i l e s - one
for each map sheet u n i t . Thus, a c e r t a i n amount of
compaction i s p o s s i b l e by extending the h i e r a r c h i c a l concepts
to each r a s t e r map f i l e . F i g u r e 8.2b shows an example of the
manipulation of a s i n g l e map sheet i n h i e r a r c h i c a l terms
r e l a t i v e to the complete r a s t e r s t r u c t u r e f o r the whole of
Great B r i t a i n . I n essence, these concepts are an e x t e n s i o n
of the DAP-based data s t r u c t u r e f o r s i n g l e s heets developed
i n t h i s r e s e a r c h and d e s c r i b e d i n s e c t i o n 6.3. The b a s i c
p a r t i t i o n o f each 4096 x 4096 complete r a s t e r f i l e comprises
64 x 64 p i x e l s ; t h i s i s a dimension o f convenience which i s
s u f f i c i e n t l y s m a l l to be handled e f f e c t i v e l y on even the
s m a l l e s t of computers. An index to these p a r t i t i o n s w i l l
then be a 64 x 64 p i x e l r e p r e s e n t a t i o n f o r one complete map
sheet ( t h e r e a r e 64 x 64 p a r t i t i o n s of 64 x 64 p i x e l s i n a
f u l l 4096 x 4096 r a s t e r map s h e e t s ) . The index, t h e r e f o r e ,
w i l l be h e l d a t l e v e l 17 i n the complete data base s i n c e each
p i x e l w i l l correspond to 64 x 64 p i x e l s i n the complete map
image and w i l l have a r e s o l u t i o n o f 7.8 ground metres.
Chapter e i g h t

- 441 -
This mechanism f o r a r a s t e r data s t r u c t u r e has much
p o t e n t i a l f o r both the r a p i d storage and the f l e x i b l e
r e t r i e v a l o f i n d i v i d u a l map sheets - or indeed of s m a l l
s e c t i o n s of i n d i v i d u a l map sheets - i n the complete n a t i o n a l
data base; moreover, i t provides a means of s u b - d i v i d i n g the
complete data a r c h i v e of p i x e l s i n t o p a r t i t i o n s a p p r o p r i a t e
to the l i m i t e d amounts of main memory o f f e r e d by even the
s m a l l e s t of computers. Such a data s t r u c t u r e - although
i d e a l f o r the DAP - i s not r e s t r i c t e d to a p a r a l l e l
p r o c e s s o r . I n theory, i t i s p o s s i b l e t o handle t h i s form of
data o r g a n i s a t i o n on a l l s i z e s of s e r i a l p r o c e s s o r too,
though a s m a l l e r machine w i l l r e q u i r e the conversion of the
base data t o very s m a l l p a r t i t i o n s to enable any i n - c o r e
p r o c e s s i n g . I t f o l l o w s t h a t micro-computers with very
l i m i t e d amounts of main memory w i l l be a b l e to perform any
o p e r a t i o n s on a s i m i l a r b a s i s to a mainframe, a l b e i t more
slowly, s i n c e they w i l l have to repeat the manipulative
o p e r a t i o n s a g r e a t e r number of times on a l a r g e r c o l l e c t i o n
of very s m a l l r a s t e r p a r t i t i o n s .
8.4.2 The i n t e r r e l a t i o n between v e c t o r and r a s t e r data i n the
data base
I t i s c l e a r t h a t u s e r s of d i g i t a l topographic information
r e q u i r e t h e i r data i n both forms: v e c t o r s for l i n e a r
Chapter e i g h t

- 442 -
a p p l i c a t i o n s and p e n - p l o t t i n g and r a s t e r s f o r a r e a l
a p p l i c a t i o n s and f o r quick and easy methods of data e n t r y and
d i s p l a y - e s p e c i a l l y f o r background information on which to
a t t a c h other v a r i a b l e s . There are d i s p l a y t e r m i n a l s now
a v a i l a b l e such as those emanating from Sigma, Megatec and
GEC-Marconi, f o r example, which are capable of p r e s e n t i n g
both r a s t e r and v e c t o r data together and hence the
p o s s i b i l i t y of o v e r l a y i n g OS topographic r a s t e r data h e l d at
one l e v e l (no f e a t u r e codes) with network, s a t e l l i t e or other
more thematic v a r i a b l e s i s immense.
Figu r e 8.3 i s based on the work reported i n t h i s t h e s i s
and summarises the s t r u c t u r e and components of a complete
r a s t e r - b a s e d topographic data base system; i t i n c o r p o r a t e s
the DAP where n e c e s s a r y and attempts t o show the need for an
e f f i c i e n t c o n v e r s i o n between ve c t o r and r a s t e r and the
i n c l u s i o n of s u i t a b l e s t r u c t u r e s and f e a t u r e c a t e g o r i s i n g for
a l l known user end-needs. I n essence, attempts have been
made i n t h i s r e s e a r c h t o develop prototype s o l u t i o n s to many
of the stages suggested i n f i g u r e 8.3. In p a r t i c u l a r ,
encouraging r e s u l t s have been gained i n the data e n t r y stages
scanning, data c l e a n i n g and r e o r g a n i s a t i o n and sub-parcel
i d e n t i f i c a t i o n . I t i s l i k e l y t h a t f u r t h e r e f f o r t i s r e q u i r e d
to develop a r e l i a b l e method of automated/semi-automated
s p a t i a l f e a t u r e coding of the sub-parcel r e g i o n s , although
the i n i t i a l r e s u l t s gained have shown promise. I t i s
Chapter e i g h t

- 4 4 3 -
O UJ CO < CD
I
DC LLI I— CO ^
DC LU
O CO H Z LJJ Z o Q.
o O O CO < CD LU X
CO
< m
< Q O I D_ < QC O O Q. O
2 K £
co HI
g z X
o LU
CO O >- z CO 111 CO CO LU o o
DC D_ _l LU
< DC < CL CD
CO 3
2 § CO OS V (0 a £ -O «
Lii LU
111 < t— u .
AS
O
1 DA
tt in 1 DA
ARY
!MAG
LE
AN
z O m
to LU
UJ a: > < X a o z < u. 0 LX O m O z
CT
O CT
a
VE
> _i o Q_
T C O CO
LU CC
a LU CO < U
CTU
N
DIS
DO LX 1-O d. co Q
DA
TA
IEL
< X
Figure 8 . 3

- 444 -
expected t h a t a working prototype f e a t u r e coding system could
be tuned to s u i t OS data along the l i n e s d e s c r i b e d i n s e c t i o n
6.4.2. The a b i l i t y to amalgamate the sub - p a r c e l regions i n t o
more u s e f u l s p a t i a l u n i t s i s expected to r e q u i r e l a r g e
amounts of human a s s i s t a n c e a t p r e s e n t .
I t seems l i k e l y t h a t a mixed-mode data base combining the
b e n e f i t s of r a s t e r and v e c t o r n o t a t i o n s i s the most
appropriate long term o b j e c t i v e . With the exception o f data
capture a t speed, most vector-based manipulation and storage
i s s u f f i c i e n t l y well-advanced now to provide a mechanism
adequate f o r r o u t i n e storage and r e t r i e v a l . Although a
r a s t e r approach has advantages of neighbourhood s e a r c h i n g and
other a r e a l based a c t i v i t i e s , i t i s c o s t l y to s t o r e for any
s i z e a b l e geographic a r e a . The volumes generated w i t h
vector-based e q u i a v l e n t f i l e s a r e s u b s t a n t i a l l y s m a l l e r but
are more complex, w i t h the need f o r lengthy c r o s s - r e f e r e n c i n g
between nodes and l i n k s f i l e s , t e x t f i l e s and so on. I t i s
i n a p p r o p r i a t e to s t o r e both v e c t o r and r a s t e r v e r s i o n s of the
same geographic a r e a s ; t h i s w i l l be counter productive -
e s p e c i a l l y i n storage requirements and up-dates. I t i s more
convenient t o s t o r e one type o f data and convert between
v e c t o r and r a s t e r as r e q u i r e d .
The q u a l i t y of the source g r a p h i c s i s expected to have
much c o n t r o l over the mode of en t r y of the data i n t o d i g i t a l
Chapter e i g h t

- 445 -
form. For o p e r a t i o n a l reasons, i t i s l i k e l y t h a t some poorer
q u a l i t y images are u n s u i t a b l e for scanning and w i l l , thus, be
d i g i t i s e d manually by hand. I t w i l l be n e c e s s a r y , t h e r e f o r e ,
to develop appropriate i n t e r f a c e s between ve c t o r and r a s t e r
methods of input to generate a s i n g l e data base with a l l
sheets h e l d i n a common n o t a t i o n . C l e a r l y , i t i s p o s s i b l e t o
r a s t e r i s e the v e c t o r s once they have been d i g i t i s e d and i t i s
then p o s s i b l e to i n s e r t each d i g i t a l map i n t o a r a s t e r
s t r u c t u r e as though i t had o r i g i n a t e d from a scanner i n the
f i r s t p l a c e . Since v e c t o r i s i n g techniques are s t i l l
i n s u f f i c i e n t l y advanced, then the r e v e r s e approach
( v e c t o r i s i n g scanned data) i s l i k e l y to be r a t h e r more
troublesome a t p r e s e n t .
SUGGESTED AREAS OF FURTHER STUDY
I t i s e v i d e n t t h a t a r e s e a r c h p r o j e c t of the nature
reported i n t h i s t h e s i s i s l i m i t e d n e c e s s a r i l y i n the time
and the expense which can be i n c u r r e d during the work. For
these reasons, t h e r e are s e v e r a l s p e c i f i c work areas which
have been ignored although they are i n need o f f u r t h e r
i n v e s t i g a t i o n for a comprehensive assessment of r a s t e r
mapping. I t i s c l e a r t h a t a c o n t i n u a l monitoring of the
seemingly e n d l e s s new systems and a s s o c i a t e d conversion
software being developed by i n d u s t r i e s and by r e s e a r c h
Chapter e i g h t
- 446 -
est a b l i s h m e n t s f o r r a s t e r - b a s e d graphic data i s e s s e n t i a l .
The hardware and software s o l u t i o n s being developed by these
e s t a b l i s h m e n t s are becoming more r e l i a b l e , v e r s a t i l e and
advanced q u i c k l y .
I t i s suggested t h a t an a p p r a i s a l o f the new systems i s
only r e l i a b l e t o the degree r e u i r e d for investment d e c i s i o n s
i n v o l v i n g m i l l i o n s of pounds i f s p e c i f i c scanning and post
hoc p r o c e s s i n g t r i a l s a re made and monitored c a r e f u l l y by
both the p r o f e s s i o n a l s and the u s e r s . I n p a r t i c u l a r , a
h i g h - p r i o r i t y should be given t o t e s t s which a p p r a i s e the
ease of use and the v e r s a t i l i t y of the complementary r a s t e r
work s t a t i o n s . These have been mentioned s e v e r a l times i n
t h i s t h e s i s but were not i n v e s t i g a t e d i n d e t a i l because o f
the l a c k of a c c e s s by the author to r e l e v a n t systems. I t i s
important, f o r example, to d i s c o v e r the problems i n v o l v e d i n
a t t a c h i n g the Ordnance Survey scheme o f f e a t u r e codes to a
b i n a r y r a s t e r image (or a v e c t o r f i l e with no a t t r i b u t e s
i n c l u d e d ) : apart from the automated f e a t u r e coding experiment
( s e c t i o n 6.4.2), no c o n s i d e r a t i o n was made i n t h i s t h e s i s of
the b e s t procedures t o a t t a c h f e a t u r e codes. Such a study
can only operate e f f e c t i v e l y by i n c l u d i n g both experienced
personnel who are f a m i l i a r with the i n t r i c a s i e s of OS f e a t u r e
coding conventions and wi t h the op e r a t i o n of each p a r t i c u l a r
computer-controlled work s t a t i o n . For these reasons, i t was
not considered p r a c t i c a b l e t o attempt such a t a s k i n t h i s
Chapter e i g h t

- 447 -
r e s e a r c h although i t i s r e a l i s e d t h a t an idea of the c o s t i n g s
and mechanisms n e c e s s a r y f o r i n t e r a c t i v e e d i t i n g are
e s s e n t i a l for a production r a s t e r system. During such t e s t s ,
i t w i l l a l s o be n e c e s s a r y to monitor the l i k e l y advantages
and d i f f i c u l t i e s i n ha n d l i n g t e x t data on these systems.
T h i s too was not considered i n great depth i n t h i s work due
to s i m i l a r reasons of l a c k of a c c e s s to app r o p r i a t e hardware.
A l l scanning t r i a l s and r a s t e r data used i n t h i s work have
in v o l v e d the use of a h i g h - q u a l i t y o r i g i n a l document; t h i s
was considered a s u i t a b l e f i r s t - s t e p f o r hand l i n g OS data i n
r a s t e r mode. C l e a r l y , the q u a l i t y of a l l source documents i n
a production system are u n l i k e l y to r e f l e c t such a
h i g h - q u a l i t y with h i g h c o n t r a s t i n g l i n e s on a s t a b l e , robust,
c l e a n base. Moreover, the documents scanned i n t h i s study
had t e x t and s t i p p l e i n f i l l removed - t h i s i s l i k e l y to be
impo s s i b l e when scanning l a r g e numbers of s h e e t s . A d e t a i l e d
i n v e s t i g a t i o n i n t o the v a r i o u s c o n d i t i o n s of the master
survey documents being used i n the OS r e g i o n a l o f f i c e s i s
r e q u i r e d , together with some c o n s i d e r a t i o n s of the l i k e l y
mechanisms f o r c a r t o g r a p h i c enhancement where n e c e s s a r y . I n
p r i n c i p l e , i t w i l l be n e c e s s a r y to perform a s e r i e s of
scanning t r i a l s with a c o l l e c t i o n o f MSD's of v a r i o u s
q u a l i t i e s t o d i s c o v e r the l i k e l i h o o d of h a n d l i n g a l l images
d i r e c t l y on a r a s t e r scanner. I t seems c l e a r t h a t some
p o o r e r - q u a l i t y source documents w i l l be of l i t t l e use f o r
Chapter e i g h t

- 448 -
r a s t e r scanning and w i l l probably r e q u i r e complete redrawing
or manual d i g i t i s i n g by v e c t o r means and subsequent
r a s t e r i s i n g .
F i n a l l y , w h i l s t much experience has been gained on r a s t e r
methods for l a r g e s c a l e maps, i t seems l i k e l y t h a t e x i s t i n g
t e c h n o l o g i e s are more s u i t e d towards the s m a l l e r s c a l e s
mapping s e r i e s . I t would be b e n e f i c i a l to attempt a s i m i l a r
p r e l i m i n a r y study with OS sma l l s c a l e maps t o a s s e s s the
l i k e l y advantages and c h a r a c t e r i s t i c s of a small s c a l e s
r a s t e r data base.
Chapter e i g h t

- 449 -
BIBLIOGRAPHY
ADAMS T.A. (1979) C h a r a c t e r i s t i c s of a Nati o n a l Topographic D i g i t a l Data Base, Unpublished M.Sc d i s s e r t a t i o n , Univ. of Durham.
ADAMS T.A. , MOUNSEY H.M. and RHIND D.W. (1980) Topographic maps from computer output on m i c r o f i l m , C a r t . J l . , 17, 1, 33-39.
ADAMS T.A. and RHIND D.W. (1981) The p r o j e c t e d c h a r a c t e r i s t i c s of a N a t i o n a l Topographic D i g i t a l Data Bank, Geogr. J l . , 147, 1, 38-53.
ADLER R. (1978) The o r g a n i s a t i o n and s t r u c t u r e of d i g i t a l t e r r a i n models, Proc. symp. of FIG and Land Information Systems, Darmstadt, Oct. 1978.
ALDRED B.K. (1972) P o i n t s i n polygon algorithm, IBM S c i e n t i f i c Centre Report UKSC-0025, P e t e r l e e , UK.
ALLEN R.R. and MORRIS L.P. (1980) High performance i n t e r a c t i v e g r a p h i c s , Proc. Harvard Graphics Week, Cambridge, Mass., J u l y 1980.
AMIDON E.L. and AKIN G.S. (1970) A l g o r i t h m i c s e l e c t i o n of the b e s t method f o r compressing map data s t r i n g s , Comm ACM, 14, 769-774.
ARMS A. (1970) MAP/MODEL System: System d e s c r i p t i o n and u s e r ' s guide. Bureau of Governmental Research and S e r v i c e , U. o f Oregon
Lord AVEBURY (1978) The impact of computers on s o c i e t y seen from the western viewpoint. Paper read a t 8th Conf. o f the A u s t r a l i a n Computer Soc., Canberra.
BABCOCK H.C. (1978) Automated cartography data formats and g r a p h i c s ; the ETL e x p e r i e n c e , Amer. C a r t . , 5, 1, 21-29.
BARRETT E.C. and CURTIS L.F. (1976) I n t r o d u c t i o n to environmental remote s e n s i n g , Chapman and H a l l .
B i b l i o g r a p h y

- 450 -
BAXTER R.S. (1976) Computer and s t a t i s t i c a l techniques for p l a n n e r s , Methuen.
BAXTER R.S. (1980) A computer f i l e and data s t r u c t u r e for manipulating d i g i t a l o u t l i n e s of polygons, Geo-Processing, 1, 243-255.
BENNY A.H. (1979) C o a s t a l d e f i n i t i o n u sing Landsat and p o t e n t i a l bathymetric a p p l i c a t i o n s , Proc. Remote Sensing S o c i e t y Annual Conf., Dundee.
BICKMORE D.P. and BOYLE A.R. (1964) An automated system of cartography. Tech. Symp. I n t . Cartogr. Ass. Edinburgh
BICKMORE D.P. and MOLINEUX A. (1978) Land-use mapping by L o c a l A u t h o r i t i e s i n B r i t a i n , Experimental Cartography U n i t , NERC.
BLACK W., CLEMENT T., DAVEY P.G., HARRIS J. F . and PRESTON G. (1979) The use of an i n t e r a c t i v e h i g h - p r e c i s i o n scanner for
image p r o c e s s i n g , I n s t . P h y s i c s conf., s e r . no.4 ch. 8
BOMFORD A.G. (1979) The r o l e of a n a t i o n a l mapping o r g a n i s a t i o n . Proc. Conf. of Commonwealth Survey O f f i c e r s . Cambridge.
BOYLE A.R. (1979) Scan d i g i t i s a t i o n of c a r t o g r a p h i c data, Paper read a t NATO ASI on Map Data P r o c e s s i n g , Maratea" I t a l y .
BRASSEL K., WASILENKO M. and MARBLE D.F. (1980) Computer software f o r s p a t i a l data h a n d l i n g : cartography and g r a p h i c s . Volume 3 o f s e r i e s prepared by the IGU f o r the USGS. Contract no. 14-08-0001-16560.
BRAUNLEDER B. and KOBER R. (1981) P a r a l l e l p r o c e s s i n g w i t h an a r r a y of microcomputers, Microprocessors and microsystems, 5, 6, 241-245.
BROOMALL INDUSTRIES INC. (1980) H o l d a l l of t e c h n i c a l s p e c i f i c a t i o n s f o r Scan-Graphics and a s s o c i a t e d Broomall systems. Mimeo. 700 Abbott Dr. Broomall, Pa.
BURNSIDE C D . (1979) Mapping from a e r i a l photographs. Crosby, Lockwood and S t a p l e s .
B i b l i o g r a p h y

- 451 -
CALKINS H. and MARBLE D.F. (1980) Computer software f o r s p a t i a l d a ta: f u l l geographic i n f o r m a t i o n systems. Volume 1 of s e r i e s prepared by the IGU f o r the USGS. Co n t r a c t no. 14-08-0001-16560.
CEDERBERG R.L.T. (1979) C h a i n - l i n k coding and segmentation for r a s t e r - s c a n d e v i c e s , Computer Graphics and Image P r o c e s s i n g , 10, 224-235.
CHAMBERLIN D.D, (1976) R e l a t i o n a l data base management systems, ACM Computing Surveys, 8, 1, 43-66.
CODD E.F. (1970) A r e l a t i o n a l model fo r l a r g e shared data banks, ACM Computing Surveys, 13, 6, 377-397.
COLES D. (1974) Ordnance Survey d i g i t a l mapping, i n Dale P.F. (ed) Automated Cartography, BCS s p e c i a l pub. 1, London.
COOK D. and MAXFIELD W. (1967) The development of a geographic base f i l e and i t s uses f o r mapping, P r o c URISA, Long I s l a n d .
COPPOCK J.T. (1975) Maps by l i n e p r i n t e r , i n Davis J.C. and McCullagh M.J. ( e d ) , D i s p l a y and A n a l y s i s of S p a t i a l Data, Wiley.
COX N.J., ALDRED B.K. and RHIND D.W. (1981) A r e l a t i o n a l data base system and a proposal for a g e o g r a p h i c a l data type, Geo-Processing, 1, 217-229.
CRAY RESEARCH INC. (1980) The Cray-1 s e r i e s of computers, Tech. Pub. 2240008 D, 1440 Northland D r i v e , Mendota Heights, Mn 55120.
CROSFIELD ELECTRONICS (1981) System s p e c i f i c a t i o n for Magnascan 550/570. C r o s s f i e l d E l e c t r o n i c s , 776 Holloway Rd., London N19 3JG.
DALE P.F. (1977) The land surveyor and land information management, Proc. conf. of FIG, Sweden.
DALE P.F. and HOLLWEY J.R. (1978) Tasks f o r the surveyor i n land information management, Proc. symp. of FIG and Land I n f o . Systems, Darmstadt.
B i b l i o

- 452 -
DAVEY P.G., HARRIS J . F . , LOKEN J.G. and PRESTON G. (1976) O p e r a t i o n a l experience with microfilmed r a i n c h a r t s . Paper read a t I n t . Conf. on Computer a s s i s t e d scanning, A p r i l , Padua, I t a l y .
DAVEY P.G., HARRIS J . F . and PRESTON G. (1977) Automatic boundary d i g i t i s i n g f o r the Department of the Environment, Nuclear Phys. Lab., Oxford U n i v e r s i t y .
DAVEY P.G., HARRIS J . F . , HAWES B., STOREY C. and WEST N. (1979) A four-view automatic measuring system f o r
bubble chamber f i l m . I n s t . Phys. Conf., 44, 8.
DAVIS M.J.K., PROCTOR D.W., ASHKENAZI V. and CROSS P.A. (1972) The readjustment of the R e t r i a n g u l a t i o n of Great
B r i t a i n and i t s r e l a t i o n s h i p to the European T e r r e s t r i a l and S a t e l l i t e networks, OS Prof. Paper NS24
DAY A.C. (1972) London FORTRAN course, The Athorne P r e s s , London.
DIELLO J . , KIRK K. and CALLANDER J . (1969) The development of an automated c a r t o g r a p h i c system, C a r t J l , 6, 1, 9-17.
DoE (1976) Parsed data s e t of B r i t i s h L o c a l A u t h o r i t y Boundaries, B u i l d i n g Research Est a b l i s h m e n t Note N138/76, October.
DOUGLAS D. (No date) S e l e c t e d algorithms f o r the h a n d l i n g of vector-based geographic data. Unpublished Mimeo, Univ. of Ottawa.
DOUGLAS D. and PEUCKER T. (1973) Algorithms f o r the r e d u c t i o n o f the number of p o i n t s r e q u i r e d to r e p r e s e n t a d i g i t i s e d l i n e or i t s c a r c a t u r e Can. C a r t . , 10, 2, 112-122.
DOYLE F . J . (1978) The next decade o f s a t e l l i t e remote sensing, Photogr. Eng. and Remote Sensing, 44, 2, 155-164.
DREWITT B. (1973) The changing p r o f i l e of the map user i n Great B r i t a i n . C a r t . J l . , 10, 1, 42-8.
ENVIRONMENTAL SYSTEM RESEARCH INSTITUTE (ESRI) (1971) Polygon Information Overlay System. CPO, San Diego, Ca.
FERRANTI-CETEC GRAPHICS LTD. (1979) F u n c t i o n a l s p e c i f i c a t i o n of the C a d a s t r a l and Land-Use Mapping and Information System, Spec/FCG/79/6 I s s u e 1.
B i b l i o g r a p h y

- 453 -
FLOATING POINT SYSTEMS INC. (1979) The a r r a y p rocessor brochure, PO Box 23489, Portland Or
FRANKLIN W.R. (1979) E v a l u a t i o n of algorithms to d i s p l a y v e c t o r p l o t s on r a s t e r d e v i c e s , Computer Graphics and Image Pro c e s s i n g , 11, 337-397.
FRASER TAYLOR D.R. (1980) The computer i n contemporary cartography. Wiley.
FREEMAN H. (1961) On the encoding of a r b i t r a r y geometric c o n f i g u r a t i o n s , IRE Trans. E l e c t r o n i c Computers, EC-10, 260-268.
GARDINER-HILL R.C. (1972) The development of d i g i t a l maps, OS Prof. Paper NS23.
GOODYEAR AEROSPACE CORP. (1974) System d e s c r i p t i o n of STARAN, Akron, Ohio.
GRONEMANN U. and BAR-LEV A. (1979) L a s e r p r i n t i n g . Proc. Soc. P h o t o - o p t i c a l I n s t r u m e n t a t i o n E n g i n e e r s . Los Angeles.
HAGGETT P., CL I F F A.D. and FREY A. (1977) L o c a t i o n a l methods, 2nd ed. Arnold.
HARDY P.G. (1978) The L a s e r - s c a n F a s t r a k automatic d i g i t i s i n g system, Paper read at seminar on "Data banks and D i g i t a l Mapping""^ RICS/N.E. London Poly., Nov. 1978.
HARLEY J.B. (1975) Ordnance Survey maps - a d e s c r i p t i v e manual, HMSO.
HARRIS J . F . , KITTLER J . , LLEWLLYN B. and PRESTON G. (1981) A modular system for i n t e r p r e t i n g b i n a r y p i x e l r e p r e s e n t a t i o n s of l i n e - s t r u c t u r e d data, Paper read at NATO ASI on P a t t e r n Recognition; theory and a p p l i c a t i o n s Oxford, March 1981.
HARRIS L . J . (1980) The a p p l i c a t i o n o f computer technology to topog r a p h i c a l cartography, i n T a y l o r D.R.F. (ed) The computer i n contemporary cartography, 59-92, Wiley.
HARRIS R. (1979) Access to Landsat data, Area, 11, 1, 63-66.
Bi b l i o g r a p h y

- 454 -
HARRIS R. and BARRETT E.C. (1978) Towards an o b j e c t i v e n e p h a n a l y s i s , J l . Appl. Met., 17, 1258-1266.
HARRISON J.C. (1978) The LAMIS system, Paper read at seminar on "Data banks and D i g i t a l Mapping", RICS/N.E. London Poly. Nov 1978.
HARVARD UNIVERSITY LABORATORY FOR COMPUTER GRAPHICS AND SPATIAL ANALYSIS (1974)
POLYVRT Manual. Cambridge, Mass.
H. M.S.O. (1979) Report of the Ordnance Survey Review Committee, London.
HOWARD S. (1968) A c a r t o g r a p h i c data bank f o r Ordnance Survey maps, C a r t . J l . , 5, 48-52.
HOWMAN C. and WOODSFORD P.A. (1978) The L a s e r - s c a n F a s t r a k automatic d i g i t i s i n g system, Paper read at ICA 9th Conf. on cartography, Washington D.C., J u l y 1978.
ICHIKAWA T. (1981) A pyramidal r e p r e s e n t a t i o n of images and i t s f e a t u r e e x t r a c t i o n f a c i l i t y , I E E E Trans, on p a t t e r n a n a l y s i s and machine i n t e l l i g e n c e , 1-3, 3, 257-264.
I . C.L. (1979) DAP: APAL language, I C L Tech. Pub. 6919, 1st ed.
I.C.L. (1981) DAP: FORTRAN language, I C L Tech Pub. 6918, 3rd ed.
KEATES J.S. (1973) Cartography d e s i g n and production, Longmans.
KEIR K.M. (1976) A d i g i t a l mapping system designed f o r the commercial a i r survey market, Paper read at 13th congress of the ISP, H e l s i n k i .
KLETTE R. (1979) P a r a l l e l o p e r a t i o n s on b i n a r y images, Computer Graphics and Image P r o c e s s i n g , 14, 145-158.
KONGSBERG LTD. (1980) H o l d a l l of t e c h n i c a l s p e c i f i c a t i o n s of SysScan and a s s o c i a t e d Kongsberg systems. Mimeo. P r i o r s Way, Maidenhead, SL6 2HP.
B i b l i o g r a p h y

- 455 -
LASER-SCAN LABORATORIES LTD. (1981a) L a s e r - a i d : the L a s e r - s c a n F a s t r a k u s e r ' s guide, r e l 7. 11 June 1981.
LASER-SCAN LABORATORIES LTD. (1981b) IGES: c a r t o g r a p h i c e d i t i n g system u s e r ' s guide, r e l 2. 18 June 1981.
LLOYD C. (1981) The Kongsberg SysScan system f o r automated cartography. Proc. Ann. Symp. B r i t Cartogr. Soc., Southampton.
LOGAN I.T. (1981) Ordnance Survey d i g i t a l mapping, Paper given a t Conf. on Survey and Mapping, RICS, Reading, A p r i l 1981.
LOODTS J . (1981) V e c t o r i s a t i o n ou i n t e l l i g e n c e a r t i f i c i e l l e en car t o g r a p h i e automatique, B u l l , t r i m e s t r i a l de l a Soc. de Photogr., 141/142, March/July 1981.
LOOMIS R.C. (1965) Boundary networks, Comm. ACM, 8, 44-48.
MacDOUGALL E.B. (1976) Computer programming for s p a t i a l problems. Arnold.
MALLER V.A.J. (1979) The content a d d r e s s a b l e f i l e s t o r e - CAFS, I C L Tech. J l . , 265-279, November.
MARBLE D.F. and PEUQUET D.J. (1978) Problems i n the storage and manipulation o f l a r g e s p a t i a l data s e t s , Proc. UNESCO Conf. on computer mapping for r e s o u r c e a n a l y s i s .
MARBLE D.F. and PEUQUET D.J. (1980) The Domestic Information D i s p l a y System: some p o t e n t i a l developments, Mimeo•
MARKS P. (1980) Low-level v i s i o n using an a r r a y p r o c e s s o r , Computer Graphics and Image P r o c e s s i n g , 14, 281-292.
MARLES A.C. (1971) The p l a c e of map m i n i a t u r i s a t i o n i n map production, Proc. Conf. Commw. survey o f f r s . , Cambridge.
MARTIN J . (1976) P r i n c i p l e s of data base management, P r e n t i c e - H a l l , NJ.
B i b l i o g r a p h y

- 456 -
McEWEN R.B. (1980) The USGS d i g i t a l c a r t o g r a p h i c a p p l i c a t i o n s program, J l . o f Surveying and Mapping P i v . ASCE, May 1980.
McEWEN R.B. and WHITE J.C. (1979) Development of d i g i t a l techniques f o r mapping and c h a r t i n g , Proc• Conf. Commw. survey o f f r s . , Cambridge.
MINNESOTA STATE DEPARTMENT OF ADMINISTRATION (MSDOA) (1971) The Minnesota Land Information System, Information Systems, Minnesota N a t u r a l Resources, Newsletter 2 March 1971, S t . Paul, Minnesota.
MITCHELL W.B., GUPTILL S.C., ANDERSON E., FEGAS R.G. and HALLAM C.A. (1977) GIRAS: A Geographic Information
R e t r i e v a l and A n a l y s i s System f o r h a n d l i n g land-use and land-cover data, USGS Prof. Paper 1059.
MUELLER C.G. (1970) Some p s y c h o p h y s i c a l and n e u r o p h y s i o l o g i c a l data on c o n t r a s t and contour s e n s i t i v i t y , i n L i p k i n B.S. and Rosenfeld A. (ed) P i c t u r e p r o c e s s i n g and p s y c h o p i c t o r i c s , Academic P r e s s , London.
NELDER J.A. (1975) Computers i n biology, Wykeham P u b l i c a t i o n s , London.
OPHEIM H. (1980) A new method for data r e d u c t i o n of a d i g i t i s e d curve, Mimeo, Norwegian Computing Centre, Oslo.
ORDNANCE SURVEY (1981a) Annual Report 1980-81, Southampton.
ORDNANCE SURVEY (1981b) Summary r e p o r t of the study of r e v i s i o n , Aug. 1981, Southampton.
PAGE E.S. and WILSON L.B. (1978) Information and manipulation i n a computer, 2nd ed., Cambridge Univ. P r e s s .
PALMER A. (1980) Computer aided land s u r v e y s . Chartered Land Surveyor/ Mineral Surveyor Q u a r t e r l y , Winter 1980, RICS.
PARKINSON D. (1976) Computers by the thousand, New S c i e n t i s t , 17 June 1976.
PARKINSON D. (1977) An i n r o d u c t i o n to a r r a y p r o c e s s o r s . Systems I n t e r n a t i o n a l . November.
Bi b l i o g r a p h y

- 457 -
PARKINSON D. (1978) High-speed computing, Phys. B u l l . , 29, 464-465.
PAVLIDIS T. (1979) F i l l i n g a lgorithms f o r r a s t e r g r a p h i c s . Comp. Graphics and Image P r o c e s s i n g . , 10, 126-141.
PETRIE G. (1981) Hardware a s p e c t s of d i g i t a l mapping, Photogr. Eng.and Remote Sensing, 47, 3, 307-320.
PEUCKER T.K. and CHRISMAN N. (1975) C a r t o g r a p h i c data s t r u c t u r e s , Amer. C a r t . , 2, 2, 55-69.
PEUQUET D.J. (1979a) R a s t e r p r o c e s s i n g : an a l t e r n a t i v e approach to automated c a r t o g r a p h i c data handling, Amer. C a r t • , 6, 2, 129-131.
PEUQUET D.J. (1979b) A r a s t e r mode al g o r i t h m f o r i n t e r a c t i v e m o d i f i c a t i o n of l i n e drawing data. Comp. Graphics and Im Proc. 10, 142-58
PEUQUET D.J. (1981) An examination o f techniques f o r r e f o r m a t t i n g d i g i t a l c a r t o g r a p h i c data, Cartographica, 18, 1 and 2.
PEUQUET D.J. and MARBLE D.F. (1980) Computer software for s p a t i a l data h a n d l i n g : data manipulation programs. Volume 2 of s e r i e s prepared by IGU f o r the USGS. Con t r a c t no. 14-08-0001-16560.
PFALTZ J . L . and ROSENFELD A. (1967) Computer r e p r e s e n t a t i o n of p l a n a r r e g i o n s by t h e i r s k e l e t o n s , Comm ACM, 10, 2, 119-125.
PFERD W. and RAMACHANDRAN K. (1978) Computer aided automatic d i g i t i s i n g of engineering drawings, Proc. I E E E . Conf. on Computer Software A p p l i c a t i o n s , pp630-635, November 1978.
PFERD W. and STOCKER G.C. (1981) O p t i c a l f i b r e s f o r scanning d i g i t i s e r s , The B e l l Lab. Tech. J l . , 60, 4.
PFERD W. and WHITE J.P. (1978) Vector coding methods f o r compaction of s c a n - d i g i t i s e d l i n e drawing images, Mimeo.
PMA CONSULTANTS LTD. (1978) System s p e c i f i c a t i o n o f the conve r s i o n of Ordnance Survey d i g i t a l map data to a r e s t r u c t u r e d form, February 1978, Horley, Surrey.
B i b l i o g r a p h y

- 458 -
POOCH U.W. and NEIDER A. (1973) A summary of indexing techniques f o r sparse m a t r i c e s , ACM Computing Surveys, 5, 2.
REEVES A.P. (1980) On e f f i c i e n t g l o b a l information e x t r a c t i o n methods f o r p a r a l l e l p r o c e s s o r s , Computer Graphics and Image Pr o c e s s i n g , 14, 159-l"6^
RHIND D.W. (1974) An i n t r o d u c t i o n t o the d i g i t i s i n g and e d i t i n g of mapped data, i n Dale P.F. (ed) Automated Cartography, BCS S p e c i a l publ. 1, London.
RHIND D.W. (1976) Towards u n i v e r s a l , i n t e l l i g e n t and usable automated c a r t o g r a p h i c systems, ITC J l . , 3, 515-545.
RHIND D.W. (1977) Computer-aided cartography. I n s t . B r i t . Geogr. Trans. New s e r i e s , 2, 1.
RHIND D.W. (1979) " S t a t e of the a r t " d i g i t i s i n g of g r a p h i c s : F a s t r a k and Response 250, Paper read a t A u s t r a l i a n N a t i o n a l Univ. workshop on Geographical Information Systems, December 1979.
RHIND D.W. (1981) Computer p r o c e s s i n g and mapping requirements of the ' e c o l o g i c a l mapping' community p r o j e c t . F i n a l r e p o r t prepared f o r the Environment and Consumer P r o t e c t i o n S e r v i c e of the Commission o f the European Communities. Dept. of Geography, Univ. of Durham, U.K.
RHIND D.W. and ADAMS T.A. (1980) Recent developments i n survey and mapping, i n Brown E.H. (ed) Geography - y e s t e r d a y and tomorrow, Oxford U. P.
RHIND D.W. and ADAMS T.A. (1981) Coordinate data b a s e s : a v a i l a b i l i t y and c h a r a c t e r i s t i c s Harvard L i b r a r y of Computer Graphics, 13.
RHIND D.W. and EVANS I . S . (1980) The d i s p l a y of pop u l a t i o n census data, Harvard L i b r a r y of Computer Graphics, 16.
RHIND D.W., EVANS I . S . and DEWDNEY J.C. (1977) The d e r i v a t i o n of new v a r i a b l e s from population census data, CRU working paper 9, Univ. of Durham.
Bi b l i o g r a p h y

- 459 -
RHIND D.W., EVANS I . S . and VISVALINGAM M. (1980) Making a National A t l a s of Population by Computer. C a r t g r . J l . 17, 1, pp 3-11.
RHIND D.W. and HUDSON R. (1980) Land-use, Methuen.
ROBERTSON P.K. (1980) A r a s t e r - s c a n c a r t o g r a p h i c d i g i t i s i n g system, Unpublished M.Sc. d i s s e r t a t i o n , U. of Saskatchewan.
ROBINSON A.H. and PETCHENNIK B.B. (1976) The nature of maps. Chicago Univ. P r e s s .
ROGERS A. and DAWSON J.A. (1979) "Which d i g i t i s e r ?", Area, 11, 69-73.
ROSE D.J. and WILLOUGHBY R.A. (ed) (1972) Sparse m a t r i c e s and t h e i r a p p l i c a t i o n s , Plenum p r e s s .
ROSENFELD A. (1969) P i c t u r e p r o c e s s i n g by computer, Academic P r e s s , NY.
ROSENFELD A. and KAK A.C. (1976) D i g i t a l p i c t u r e p r o c e s s i n g , Academic P r e s s , NY.
SAMAT H. (1980) Region r e p r e s e n t a t i o n : quadtrees from b i n a r y images, Computer Graphics and Image P r o c e s s i n g , 13, 88-93.
SCHMIDT A.H. and ZAFFT W.A. (1975) Programs of the Harvard U n i v e r s i t y Laboratory f o r Computer Graphics and S p a t i a l A n a l y s i s , i n Davis C. and McCullagh M.J. (ed) D i s p l a y and A n a l y s i s of S p a t i a l Data, Wiley.
SCITEX CORP. (1981) Response-250: computer g r a p h i c s f o r cartography. Mimeo. 304 Ave. Lo u i s e , 1050 B r u s s e l s .
S.D.D. (1978) Ru r a l land-use information system p r o j e c t , S c o t t i s h Development Dept. of the F i f e r e g i o n .
SEARLE P.R. and WATERS R.S. (1979) The Ordnance Survey 1:10000 and 1:25000 d i g i t a l maps, Proc. Conf. Commw. survey o f f r s . , Cambridge.
SEYMOUR W.A. (ed) (1980) A h i s t o r y of the Ordnance Survey, Dawson.
Bi b l i o g r a p h y

- 460 -
SHAPIRO L.G. and HARALICK R.M. (1980) A s p a t i a l data s t r u c t u r e , Geo-Processing, 1, 313-317.
SIGMA ELECTRONIC SYSTEMS LTD. (No date) T e c h n i c a l d e s c r i p t i o n and user manual for R5680 colour d i s p l a y . Church S t r e e t , Horsham, Sussex. RH12 3QN.
SIMMONDS M.C. (1978) The p r e s e n t a t i o n of survey information on mic r o f i l m , Mimeo paper a t I n s t , of Reprographic Technology.
SLOAN K. R. and BROWN CM. (1979) Colour map tech n i q u e s . Comp. Graphics and Image P r o c e s s i n g . , 10, 297-317.
STEPHENS M.J. (1980) The USGS 1:2 m i l l i o n - s c a l e d i g i t a l data base, Mimeo.
SUMMAGRAPHICS CORP. (1979) User manual ID Data t a b l e t / d i g i t i s e r . F a i r f i e l d , Conn.
SWITZER W.A. (1975) The Canadian Geographic Information System, i n W i l f o r d Brickwood J.M., Bertrand R. and van Zuylen L. (ed) Automation i n cartography, 58-81, ICA, Netherlands.
TAFOYA B.R. (1980) R a s t e r r e v i s i t e d or r a s t e r - t o - v e c t o r and v e c t o r - t o - r a s t e r systems. SPIE, Vol 222, Laser scanning and re c o r d i n g f o r advanced image and data handling, pp 148-55.
TAYLOR P.J. (1977) Q u a n t i t a t i v e methods i n geography, Houghton-Mifflin.
TEKTRONIX CORP. (1974) 4014 computer d i s p l a y t e r m i n a l user manual, Beaverton, Or., J u l y 1974.
THOMPSON C.N. (1978) D i g i t a l mapping i n the Ordnance Survey: 1968 - 1978, Paper read a t ISP Commission IV, Ottawa, October.
THOMPSON C.N. and SHREEVE S.T. (1978) Ordnance Survey and Remote Sensing, Proc. Remote Sensing S o c i e t y Annual Conf., Durham.
THURBER K.J. and WALD L.D. (1975) A s s o c i a t i v e and p a r a l l e l p r o c e s s o r s , ACM Computing Surveys 7, 4, 215-255.
B i b l i o g r a p h y
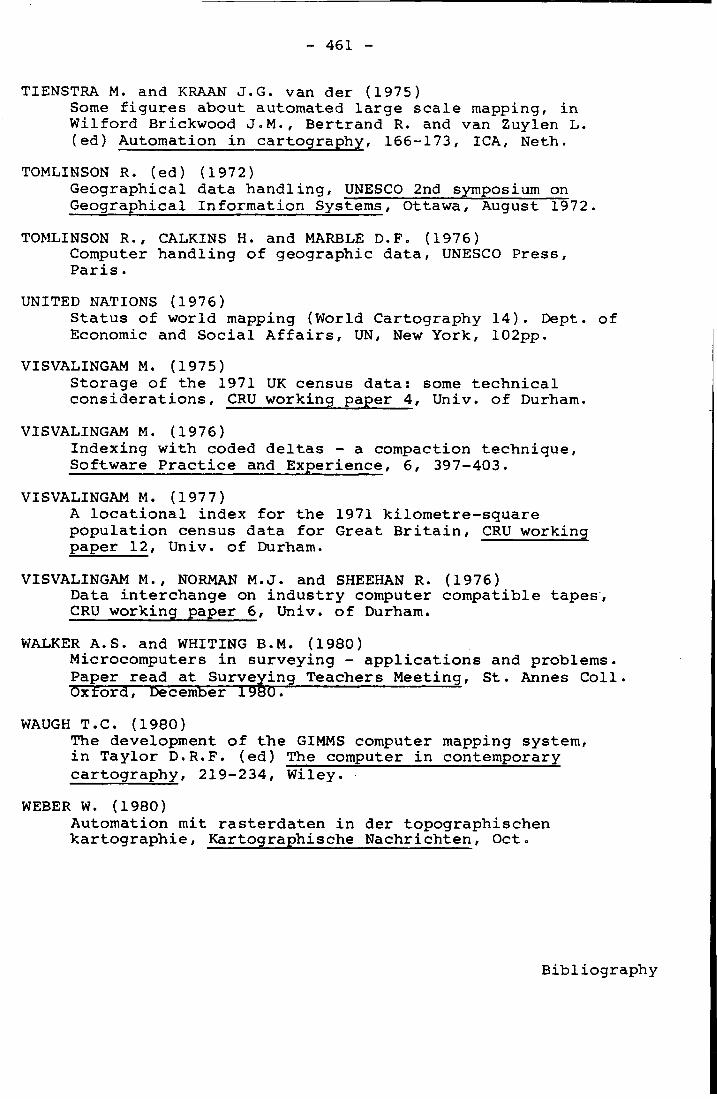
- 461 -
TIENSTRA M. and KRAAN J.G. van der (1975) Some f i g u r e s about automated l a r g e s c a l e mapping, i n Wi l f o r d Brickwood J.M., Bertrand R. and van Zuylen L. (ed) Automation i n cartography, 166-173, ICA, Neth.
TOMLINSON R. (ed) (1972) Geographical data h a n d l i n g , UNESCO 2nd symposium on Geographical Information Systems, Ottawa, August 1972.
TOMLINSON R., CALKINS H. and MARBLE D.F. (1976) Computer handling of geographic data, UNESCO Pre s s , P a r i s .
UNITED NATIONS (1976) S t a t u s of world mapping (World Cartography 1 4 ) . Dept. of Economic and S o c i a l A f f a i r s , UN, New York, 102pp.
VISVALINGAM M. (1975) Storage of the 1971 UK census data: some t e c h n i c a l c o n s i d e r a t i o n s , CRU working paper 4, Univ. of Durham.
VISVALINGAM M. (1976) Indexing with coded d e l t a s - a compaction technique, Software P r a c t i c e and Experience, 6, 397-403.
VISVALINGAM M. (1977) A l o c a t i o n a l index f o r the 1971 k i l o m e t r e - s q u a r e population census data f o r Great B r i t a i n , CRU working paper 12, Univ. of Durham.
VISVALINGAM M., NORMAN M.J. and SHEEHAN R. (1976) Data interchange on i n d u s t r y computer compatible tapes, CRU working paper 6, Univ. of Durham.
WALKER A.S. and WHITING B.M. (1980) Microcomputers i n sur v e y i n g - a p p l i c a t i o n s and problems. Paper read a t Surveying Teachers Meeting, S t . Annes C o l l . Oxford, December 1980.
WAUGH T.C. (1980) The development of the GIMMS computer mapping system, i n T a y l o r D.R.F. (ed) The computer i n contemporary cartography, 219-234, Wiley.
WEBER W. (1980) Automation mit r a s t e r d a t e n i n der topographischen k a r t o g r a p h i e , Kartographische Nachrichten, Oct.
B i b l i o g r a p h y
- 462 -
WOHLMUT P.G. (1976) The i / o M e t r i c s automatic d i g i t i s i n g system. Proc. of the ACSM I n t . Conf• on Automation i n Cartography "Auto-Carto 1", Reston, Va. Dec 1974.
YOELLI P. (1977) Computer executed i n t e r p o l a t i o n of contours i n t o a r r a y s of randomly d i s t r i b u t e d h e i g h t p o i n t s , C a r t . J l . , 103-108.
B i b l i o g r a p h y

- 463 -
LIS T OF PERSONAL COMMUNICATIONS
BBC (1980) V i s i t to Mr W. Gardner, Head of BBC Computer Graphics U n i t , BBC TV Centre, London W12 on 14th Nov. 1980.
BLYTHE J.H. (1981) V i s i t to GEC-Marconi E l e c t r o n i c s L t d . Communications Research Laboratory, Chelmsford on 20th Mar. 1981.
BOYLE A.R. (1981) D i s c u s s i o n s with Dr Boyle (Univ. of Saskatchewan) during the B r i t i s h C a rtographic Soc. Annual T e c h n i c a l Symposium Southampton on 12th-13th Sept. 1981.
Broomall I n d u s t r i e s I n c . (1981) V i s i t to Mr K. Pl a n t y and Mr M. Lemmon a t Broomall I n d u s t r i e s headquarters, Broomall, Pa. USA on 28th J u l y 1980
FORTESQUE F. (1981) D i s c u s s i o n s with Mr Fortesque, A s s t . D i r e c t o r Reprographics, Ordnance Survey during v i s i t to OS headquarters, Southampton i n Sept. 1981.
HAYWOOD P.E. (1980) D i s c u s s i o n s with Mr Haywood, Senior Survey O f f i c e r , Development Branch, Ordnance Survey during v i s i t to OS headquarters, Southampton i n Oct. 1980.
HOWMAN C. (1982) Telephone c o n v e r s a t i o n with Mr Howman, Cartography Manager, MCE RE, Feltham i n Mar. 1982.
HUNT D.J. (1980) D i s c u s s i o n s with Dr Hunt, ICL Research and Advanced Development Centre, Stevenage on 4th Nov. 1980.
KING S. (1980) V i s i t to Mr King, S a l e s D i r e c t o r , S c i t e x (North America) headquarters, Bedford, Mass, USA on 31st J u l . 1980.
Kongsberg L t d . (1981) D i s c u s s i o n s with Messers. Anderson, Kaasa, Lloyd and M i l l e r during Kongsberg seminar on "Advanced Technology i n Cartography" h e l d a t the C r e s t Hotel, Maidenhead on 7th J u l y 1981.
Kummerley and Frey AG (1981) D i s c u s s i o n s with M. Brunner and M. F i c k e r during S c i t e x seminar on "Cartography with r a s t e r - b a s e d computer g r a p h i c s " h e l d a t the H i l t o n Hotel, B r u s s e l s on 28th-29th Apr. 1981.
Pers o n a l communications

- 464 -
LATHAM-WARDE D.L. (1981) D i s c u s s i o n s with Mr Latham-Warde, Senior Survey O f f i c e r , Development Branch, Ordnance Survey during v i s i t to OS headquarters, Southampton i n Sept. 1981.
LINKLATER C. (1979) D i s c u s s i o n s with Mr L i n k l a t e r , Supt. C1D, Cartography D i v i s o n , Ordnance Survey during v i s i t to OS headquarters Southampton i n Nov. 1979.
LLOYD C. (1980) Telephone and l e t t e r communications with Mr Llo y d , Cartography T e c h n i c a l Support, Kongsberg L t d . , Maidenhead.
LOGAN I . T . (1982) D i s c u s s i o n s with Mr Logan, P r i n c i p a l Survey O f f i c e r , Development Branch, Ordnance Survey during v i s i t to Birkbeck C o l l e g e on 29th Apr. 1982.
LOODTS J . (1981.) D i s c u s s i o n s with Dr Loodts, IGN B r u s s e l s , during S c i t e x seminar on "Cartography with r a s t e r - b a s e d computer g r a p h i c s " h e l d a t the H i l t o n Hotel, B r u s s e l s on 28th-29th Apr. 1981.
Ordnance Survey D i s c u s s i o n s with v a r i o u s personnel during s e v e r a l v i s i t s to the OS headquarters, Southampton i n the p e r i o d Sep. 1979 - Jun. 1982. Ch i e f amongst them a r e : Messers Arnold, Arnott, B e l l , Boyle, F r a s e r , Fortesque, Haywood, Latham-Warde, L i n k l a t e r , Logan, N.S. Smith, W.P. Smith, Thompson, Wesley.
PARKINSON D. (1979) V i s i t to Prof. Parkinson, Head of DAP Support U n i t , Queen Mary C o l l e g e , London on 22nd Nov. 1979.
PFERD W. (1980) V i s i t to Dr Pferd, Head o f O f f i c e Planning Dept., B e l l Telephone L a b o r a t o r i e s headquarters, Whippany, NJ, USA on 29th J u l . 1980.
PRESTON G. (1981) V i s i t to Image A n a l y s i s Group, Nuclear P h y s i c s Laboratory a t Oxford U n i v e r s i t y on 22nd Apr. 1981.
RAGG J.M. (1981) L e t t e r of 31st Jan. 1981 and subsequent d i s c u s s i o n s with Mr Ragg, S o i l Survey of England and Wales, Derby during the B r i t i s h C a r t o g r a p h i c Soc. Annual T e c h n i c a l Symposium, Southampton on 12th-13th Sep. 1981.
Personal communications

- 465 -
RHIND D.W. (1982) D i s c u s s i o n s with Prof. Rhind, Head of Geography Dept., Birkbeck C o l l e g e (Ph.D. s u p e r v i s o r ) i n May 1982.
S c i t e x Corp. (1981) D i s c u s s i o n s with v a r i o u s personnel of the S c i t e x Corp. i n North America and Europe. I n p a r t i c u l a r , w ith Messers. Fono, Herzka and King during S c i t e x seminar on "Cartography with r a s t e r - b a s e d computer g r a p h i c s " h e l d at the H i l t o n Hotel, B r u s s e l s on 28th-29th Apr. 1981.
SMALLBONE J . (1982) V i s i t to Mr Smallbone, DAP Marketing, ICL London headquarters, ICL House, London on 3rd Mar. 1982.
SMITH D.G. (1980) V i s i t to Mr Smith, Computing Manager, USGS N a t i o n a l Centre, Reston, Va, USA on 2 3rd-25th J u l . 1980.
SMITH N.S. (1981) D i s c u s s i o n s with Mr Smith, Survey O f f i c e r , Development Branch, Ordnance Survey during v i s i t to OS headquarters, Southampton i n Sept. 1981.
STEPHENSON D.L. (1981) D i s c u s s i o n s with Mr Stephenson, Research O f f i c e r , Dept. of G e o l o g i c a l S c i e n c e s , Univ. of Durham i n Oct. 1981.
US Bureau of the Census (1980) V i s i t to Mr F. Broome and Mr M. White, Geography D i v i s i o n , US Census Bureau headquarters, Washington DC on 22nd J u l . 1980.
USGS (1980) D i s c u s s i o n s with v a r i o u s personnel from USGS, i n c l u d i n g : Drs Anderson, G u p t i l l and Messers Schmidt, Smith, Southard and Stephens during v i s i t t o USGS N a t i o n a l Centre, Reston, Va, USA on 23rd-25th J u l . 1981.
WESLEY P.W. (1981) D i s c u s s i o n s with Mr Wesley, Manager of Development Branch, Ordnance Survey during v i s i t to OS headquarters, Southampton i n Sept. 1981.
WOODSFORD P.A. (1981) D i s c u s s i o n s with Mr Woodsford, D i r e c t o r of L a s e r - s c a n L a b o r a t o r i e s , Cambridge during B r i t i s h C a r t o g r a p h i c Soc. Annual T e c h n i c a l Symposium, Southampton on 12th-13th Sep. 1981.
Personal communications

- 466 -
ANNEX 5a
FORTRAN source l i s t i n g of program FROMDMC see s e c t i o n 5.3.3 1 c******** T H I S I S F R O M D M C 2 C 3 c*************************************************** 4 C* * 5 C* PROGRAM TO CONVERT ORDNANCE SURVEY DIGITAL DATA * 6 C* IN CUSTOMER (DMC) FORMAT INTO PACKED BINARY NG * 7 C* COORDINATES STORED AS X(1000), Y(1000), 11(1000)* 8 C* WHERE X,Y ARE THE COORDS (DOUBLE PRECISION) AND * 9 C* I I I S THE DMB FEATURE CODE ARRAY (HALFWORDS) *
10 C* * 11 C* WRITTEN BY TIM ADAMS - UNIVERSITY OF DURHAM VI * 12 C* JUNE 1980 * 13 C* * 14 C* INPUT OF THE DMC CHARACTERS I S ON CHANNEL 5 * 15 C* OUTPUT OF THE BLOCKED BINARY ARRAYS I S CHANNEL 1* 16 C* * 17 c*************************************************** 18 C 19 REAL*8 X(1000),Y(1000),EAST,RNORTH 2 0 REAL*8SE,SN,BE,CE,BN,CN,BGS,SQE,SQN 21 INTEGER*2 11(1000) 22 COMMON X , Y , I I , I 23 CALL STARTR 24 IPEN=0 25 IN=5 26 IOUT=6 27 IKEY=1 28 C 29 c ****** INPUT OF THE DMC RECORDS 30 C 31 5 READ(IN,10,END=9999)IC1,IC2 32 10 FORMAT(2I4) 33 C 34 c ****** t e s t f o r end of f i l e , s t a r t of shee t , 35 c ****** s t a r t of f e a t u r e and e n t r y i n t o new 35 c ****** b a s i c g r i d square r e s p e c t i v e l y 37 C 38 IF(IC1.EQ.-3)G0T09999 39 IF(ICl.EQ.-l)GOTO1000 40 IF(ICl.EQ.-4)GOTO4000 41 IF(IC1.EQ.-9)GOT09000 42 IF(ICl.LT.0)GOTO5 43 C 44 c ****** compute f u l l ng coord v a l u e s from the 45 c ****** sheet o r i g i n 46 C 47 BE=SQE*BGS
Annex 5a

- 467 -
48 BN=SQN*BGS 49 CE=BGS*FLOAT( ICD/1000. 50 CN=BGS*FLOAT(IC2)/1000. 51 EAST=SE+BE+CE 52 RNORTH=SN+BN+CN 53 C 54 c ****** t e s t to see i f the b i n a r y b u f f e r of 55 c ****** output i s f u l l 56 C 57 CALL OVERFL(EAST,RNORTH,ICODE) 58 ICODE=ICODE2 59 GOTO 5 60 C 61 c *** read i n sheet o r i g i n , b a s i c g r i d 62 c *** u n i t and s c a l e r e s p e c t i v e l y 63 C 64 1000 READ(IN,1010)SE,SN,BGS,SCALE
FORMAT(F8.0/F8.0/F8.0/F8.0) 65 1010 READ(IN,1010)SE,SN,BGS,SCALE FORMAT(F8.0/F8.0/F8.0/F8.0)
66 GOT05 67 C 68 c ****** START OF NEW FEATURE 69 c 70 134 71 C 72 C ****** START OF NEW BASIC GRID SQUARE 73 C 74 4000 READ(IN,10)IDUMMY,ICODE 75 ICODE2=ICODE 76 ICODE=-ICODE 77 IKE Y=IKEY+1 78 IPEN=1 79 GOT05 80 9000 READ(IN,9010)SQE,SQN 81 9010 FORMAT(2F4.0) 82 GOTO 5 83 C 84 C ****** FLUSH THE BINARY BUFFER BEFORE STOPPING 85 C 86 9999 WRITE(1)X,Y,II 87 STOP 222 88 END 89 C 90 C 91 c 92 SUBROUTINE OVERFL(XNEXT,YNEXT,IPNEXT) 93 c 94 c ****** SUBROUTINE OVERFLOW (TAA) 95 c *** a subroutine t o t e s t i f the 1000 96 c *** element b u f f e r i s f u l l of ng 97 c *** coords, i f the b u f f e r s t i l l has 98 c *** space i n i t then r e t u r n , i f the 99 c *** b u f f e r i s f u l l then w r i t e the
Annex 5a

- 468 -
100 c *** contents to backing s t o r e and 101 c *** i n i t i a l i s e a l l p o i n t e r s 102 C 103 REAL*8 X(1000),Y(1000),EAST ,RNORTH 104 REAL*8 XNEXT,YNEXT 105 INTEGER*2 11(1000) 106 COMMON X , Y , I I , I 107 1=1 + 1 108 IF(I.EQ.1001)GOTO10 109 5 X(I)=XNEXT 110 Y(I)=YNEXT 111 I I ( I ) = I P N E X T 112 RETURN 113 10 1=1 114 WRITE(1)X,Y,II 115 D011K=1,1000 116 X(K)=0. 117 Y(K)=0. 118 11 I I ( K ) = 0 119 GOT05 120 END 121 C 122 C 123 c 124 SUBROUTINE STARTR 125 c 126 c ****** SUBROUTINE STARTER (TAA) 127 c *** a subroutine to c r e a t e the 1000 128 c *** element b u f f e r s e t a l l 129 c *** p o i n t e r s to zero and empty the 130 c *** b u f f e r 131 C 132 REAL*8X(1000),Y(1000),EAST, RNORTH 133 INTEGER*2 11(1000) 134 COMMON X , Y , I I , I 135 D01I=1,1000 136 X ( I ) = 0 . 137 Y ( I ) = 0 . 138 1 I I ( I ) = 0 139 1=0 140 RETURN 141 END
END OF F I L E
Annex 5a

- 469 -
ANNEX 5b
FORTRAN source l i s t i n g f or program TO.RASTER (see s e c t i o n 5.3.4)
1 c******* T H I S I S T O . R A S T E R ****** 2 C 3 C 4 Q******** ******************************************* 4.8 C* * 5.6 C* PROGRAM TO PERFORM A VECTOR TO RASTER * 6.4 C* CONVERSION ON ORDNANCE SURVEY DIGITAL DATA * 7.2 C* WRITTEN BY TIM ADAMS - UNIVERSITY OF DURHAM VIA * 8 C* JULY 1980 * 8.8 C* PROGRAM TAKES AS INPUT ON CHANNEL 1 UNFORMATTED * 9.6 C* BINARY STRINGS OF NG COORDINATES IN BLOCKS OF *
10.4 C* 1000 ELEMENTS. THESE BLOCKS MUST BE STORED AS * 11.2 C* REAL*8 ARRAYS IN THE FORM X(1000), Y(1000) AND * 12 C* AN INTEGER*2 11(1000) ARRAY WHICH REPRESENTS THE* 12.8 C* DMB F/CODES. THESE CODES ARE ALWAYS POSITIVE * 13.6 C* UNLESS THE POINT I S THE FIRST IN A NEW FEATURE * 14.4 C* TYPE, IN WHICH CASE I T I S NEGATED. * 15.2 C* * 16 C* OUTPUT I S TO CHANNEL 2 IN THE FORM: * 16.8 C* RASTER(5000,200) WHICH I S STORED IN UNFORMATTED * 17.6 C* BINARY FOR EFFICIENT DATA TRANSFER * 18.4 C* * 19.2 Q*************************************************** 21 C 22 C 23 C 24 C 25 LOGICAL*l RASTER(5000,200) 26 INTEGER*2 ICODE(IOOO) 27 INTEGER*2 INTEG 28 LOGICAL*l LOGIC(2) 29 LOGICAL*l FF/ZFF/ 30 REAL*8 SX(1000),SY(1000) 31 EQUIVALENCE(INTEG,LOGIC(l)) 32 COMMON/IO/SX,SY,ICODE,II,XORIG,YORIG 33 COMMON/BUFF/RASTER 34 C 35 C INITIALISATION 36 C 41 XORIG=426500. 42 YORIG=542500. 43 KK=0 44 PLTSCL=1250 45 PIXEL=0.1 4 6 TLRNCE=PIXEL/2. 47 ISTRIP=200 48 JSTRIP=5000
Annex 5b

- 470 -
49 WRITE(6,4) 50 4 FORMAT(1 GIVE THE STRIP NUMBER (12 ) ' ) 51 READ(5,3)NSTRIP 52 WRITE(6,71)NSTRIP 53 71 FORMAT(15) 54 3 FORMAT(12) 5 5 LOWY=NSTRIP*ISTRIP 56 IHIY=LOWY+ISTRIP 57 INTEG=0 58 DO 5 I=1,JSTRIP 59 DO 5 J=1,ISTRIP 60 5 RASTER(I,J)=LOGIC(2) 61 WRITE(6,1) 62 1 FORMAT(' INITIALISATION DONE') 63 CALL STARTR 64 C 65 C INPUT OF FIRST COORDINATES 66 C 67 CALL INPUT(X,Y,L) 68 10 KK=KK+1 69 XI=X 70 Y1=Y 71 L1=L 72 C 73 C INPUT OF NEXT COORDINATES 74 C 75 CALL INPUT(X,Y,L) 76 IF(L.LT.0)GOTOll 77 GOTO20 78 11 IF(Ll.GE.0)GOTO10 79 C 80 C HANDLING OF PT SYMBOL 81 C 82 IX=INT(X1/PIXEL)+1 83 IY=INT(Y1/PIXEL)+1 84 IF(IY.LE.LOWY.OR.IY.GT.IHIY)GOTO10 85 IY=IY-LOWY 86 INTEG=IABS(L1) 87 RASTER(IX,IY)=LOGIC(2) 88 GOTO10 89 C 90 C DETERMINATION OF ACTUAL MAX AND MIN X AND Y 90.2 C FOR TOLERANCE TESTS LATER 91 C 92 20 CALL MAXMIN(X1,Yl,X,Y,XMA,XMI,YMA,YMI) 93 C 94 C TO ORDER END PTS IN X FOR THE DO LOOP 95 C 96 IF(X-X1)50,55,60 97 50 XMAX=X1 98 XMIN=X 99 YMAX=Y1
Annex 5b

- 471 -
100 YMIN=Y 101 GOTO70 102 C 103 C TO HANDLE PERFECTLY VERTICAL LINES 104 C (N-S RUNNING) 105 C FIRST CHECK I F POINT I S COINCIDENT WITH 105.2 C LAST ONE (ZERO SEGMENT LENGTH) 106 C 107 55 IF(Y-Y1)56,10,57 108 56 ISTART=IFIX(Y/PIXEL) 109 IEND=IFIX(Y1/PIXEL) 110 GOT058 111 57 ISTART=IFIX(Y1/PIXEL) 112 IEND=IFIX(Y/PIXEL) 113 58 IX=INT(X/PIXEL)+1 114 DO 59 1=1START,IEND 115 IY=I+1 116 IF(IY.LE.LOWY.OR.IY.GT.IHIY)GOT059 117 IY=IY-LOWY 118 INTEG=IABS(L) 119 RASTER(IX,IY)=LOGIC(2) 120 59 CONTINUE 121 GOTO 10 122 60 XMAX=X 123 XMIN=X1 124 YMAX=Y 125 YMIN=Y1 126 C 127 C SOLUTION FOR Y'S GIVEN X 128 C 129 70 ISTART=IFIX(XMIN/PIXEL) 130 IEND=IFIX(XMAX/PIXEL) 131 DO 100 I=ISTART,IEND 132 XI=I*PIXEL 133 YGEN=((YMAX-YMIN)*((XI-XMIN)/(XMAX-XMIN)))+YMIN 134 C 135 C TOLERANCE TEST FOR PTS NEAR LINE ENDS 136 C 137 IF(YGEN.LT.YMI)GOTO80 138 IF(YGEN.GT.YMA)GOT085 139 GOTO90 140 80 RLIMIT=YMIN-YGEN 141 IF(RLIMIT.GT.TLRNCE)GOTO100 142 GOTO90 143 85 RLIMIT=YGEN-YMAX 144 IF(RLIMIT.GT.TLRNCE)GOTO100 145 90 CONTINUE 146 C 147 C ASSIGNMENT OF THE DESIRED PIXEL SQUARE 148 C 149 IX=I+1 150 IY=INT(YGEN/PIXEL)+1
Annex 5b

- 472 -
151 IF(IY.LE.LOWY.OR.IY.GT.IHIY)GOTO100 152 IY=IY-LOWY 153 INTEG=IABS(L) 154 RASTER(IX,IY)=LOGIC(2) 155 100 CONTINUE 156 C 157 C- --SOLUTION OF X'S GIVEN Y 158 c 159 c- —ORDERING OF END PTS IN Y FOR DO LOOP 160 c 161 103 IF(Y-Y1)105,10, 115 162 105 XMAX=X1 163 XMIN=X 164 YMAX=Y1 165 YMIN=Y 166 GOTO120 167 115 XMAX=X 168 XMIN=X1 169 YMAX=Y 170 YMIN=Y1 171 120 ISTART=IFIX(YMIN/PIXEL) 172 IEND=IFIX(YMAX/PIXEL) 173 DO 200 1=1START,IEND 174 Y I = I * P I X E L 175 XGEN=((XMAX-XMIN)*((YI-YMIN)/(YMAX-YMIN)))+XMIN 176 c 177 c- --TOLERANCE TESTS FOR PTS NEAR THE LINE ENDS 178 c 179 IF(XGEN.LT.XMI)GOTO130 180 IF(XGEN.GT.XMA)GOTO140 181 GOTO150 182 130 RLIMIT=XMIN-XGEN 183 IF(RLIMIT.GT.TLRNCE)GOTO200 184 GOTO150 185 140 RLIMIT=XGEN-XMAX 186 IF(RLIMIT.GT.TLRNCE)GOTO200 187 150 CONTINUE 188 c 189 c- —ASSIGNMENT OF THE DESIRED PIXEL SQUARE 190 c 191 IY=I+1 192 IX=INT(XGEN/PIXEL)+1 193 IF(IY.LE.LOWY.OR.IY.GT.IHIY)GOTO200 194 IY=IY-LOWY 195 INTEG=IABS(L) 196 RASTER(IX,IY)=LOGIC ( 2) 197 200 CONTINUE 198 GOTO10 199 END 200 c 201 c 202 c
Annex 5b

- 473 -
203 C 204 C 205 C 206 SUBROUTINE INPUT(CURRX,CURRY,LCURR) 206.02 C 206.05 C A SUBROUTINE TO INTERFACE THE INPUT VECTOR 206.1 C BUFFER OF 1000 ELEMENTS WITH THE MAIN CODE 206.15 C THE ROUTINE RETURNS THE CURRENT VALUES OF 206.2 C X,Y AND F/CODE (LCURR) FROM THE BUFFER 206.25 C I T HANDLES INSTANCES WHEN THE BUFFER I S 206.3 C EMPTY AND SO ON. THE NG COORDS PASSED TO 206.35 C THE MAIN CODE HAVE HAD THE MAP SHEET 206.4 C ORIGIN SUBTRACTED FROM THEM TO REMOVE 206.45 C THE NEED FOR REAL*8 PRECISION 206.5 C 207 REAL*8 SX(1000),SY(1000) 208 INTEGER*2 ICODE(1000) 209 COMMON/10/SX,SY,ICODE,II,XORIG,YORIG 210 IF ( I I . E Q . 1 0 0 1 ) C A L L STARTR 211 CURRX=SX(II)-XORIG 212 CURRY=SY(II)-YORIG 213 LCURR=ICODE(II) 214 11=11+1 215 IF(CURRX.LT.0.)CALL PEXIT 216 RETURN 217 END 218 C 219 C 220 C 221 C 222 C 223 C 224 SUBROUTINE STARTR 224.1 C 224.2 C A SUBROUTINE TO READ IN THE BUFFER OF 1000 224.3 C NG COORDS AND F/CODES WHEN NECESSARY. THE 224.4 C POINTERS ARE SET BACK TO 1 TOO. 224.5 C 225 REAL*8 SX(1000),SY(1000) 226 INTEGER*2 ICODE(1000) 227 COMMON/IO/SX,SY,ICODE,II,XORIG,YORIG 228 IN=1 229 READ(IN)SX,SY,ICODE 230 11=1 231 RETURN 232 END 233 C 234 C 235 C 236 C 237 C 238 C
Annex 5b

- 474 -
239 SUBROUTINE MAXMIN(XI,Yl,X2,Y2,XMAX,XMIN, 239.01 1YMAX,YMIN) 239.1 C 239.2 C A SUBROUTINE TO RETURN THE MAX AND MIN 239.3 C VALUES OF X AND Y FOR A PAIR OF COORDS 239.4 C DESCRIBED BY X I , Y l AND X2,Y2 239.5 C 240 XMAX=X1 241 XMIN=X1 242 YMAX=Y1 243 YMIN=Y1 244 IF(X1-X2)1, 2, 2 245 1 XMAX=X2 246 GOT03 247 2 XMIN=X2 248 3 IF(Y1-Y2)4,5, 5 249 4 YMAX=Y2 250 RETURN 251 5 YMIN=Y2 252 RETURN 253 END 254 C 255 C 256 C 257 C 258 C 259 C 260 SUBROUTINE PEXIT 260.1 C 260.2 C- A SUBROUTINE TO WRITE OUT THE CONTENTS OF 260.3 C THE RASTER PARTITION AND STOP THE PROG. 260.4 C 261 LOGICAL*l RASTER(5000,200) 262 COMMON/BUFF/RASTER 263 WRITE(6,1) 264 1 FORMAT(' BUFFER WRITE BEGINS') 265 WRITE(2)RASTER 267 WRITE(6,2) 268 2 FORMAT(' BUFFER WRITE ENDS') 269 STOP 999 2 70 END
END OF F I L E
Annex 5b

- 475 -
ANNEX 5c
FORTRAN source l i s t i n g of three u t i l i t i e s found to be
very u s e f u l i n developing r a s t e r r e s e a r c h on a s e r i a l
p r o c e s s o r . They are LPDRAW, RASTER. SCAN and RASTER?;
(see s e c t i o n 5.3.5)
1 c******* T H I S I S L P D R A W 2 C 3 Q************ *************************************** 4 C* * 5 C* A UTILITY PROGRAM TO TAKE A RASTER BUFFER AND * 6 C* GENERATE A CRUDE PLOT OF THE IMAGE ON A LINE * 7 C* PRINTER DEVICE WITH A CHARACTER LENGTH OF UP * 8 C* TO 133. * 9 C* *
10 C* WRITTEN BY TIM ADAMS - UNIVERSITY OF DURHAM * 11 C* JUNE 1980 * 12 C* * 13 C* UP TO 20 DMB FEATURE TYPES CAN BE PLOTTED * 14 C* WHICH ARE GIVEN AS INPUT PARAMETERS ON CHANNEL * 15 C* 5. FORTRAN UNIT 6 I S A GENERAL CHANNEL FOR * 16 C* PROGRAM GENERATED MESSAGES * 17 C* * 18 C* THE RASTER DATA ARE READ IN ON CHANNEL 1 AS * 19 C* ONE-BYTE PER ELEMENT OF PARTITIONS WHICH CAN * 20 C* BE SET BY THE USER * 21 C* * 22 C* THE RESULTANT PLOT I S OUTPUT ON CHANNEL 2 * 23 C* * 24 Q*************************************************** 25 C 26 INTEGER*2ITYPE(20),RAST 27 LOGICAL*1RASTER(5000,200) 28 INTEGER*2XLINE(100),BLANK,HASH 29 LOGICAL*lFF/ZFF/ 30 LOGICAL*lLOGIC(2) 31 INTEGER* 2INTEG 32 EQUIVALENCE(INTEG,LOGIC(1)) 33 C 34 C *** SET THE CHARACTER TYPE FOR BLANK OR DOT 35 C *** ON THE RESULTANT IMAGE 36 C 37 DATA BLANK/' 1/,HASH/1#'/ 38 C 39 C *** SET THE DIMENSIONS OF THE RASTER BUFFER 40 C *** PARTITION AND THE NUMBER OF CHARACTERS 41 C *** TO EACH LINE-PRINTER,SCAN LINE
Annex 5c

- 476 -
42 C 43 ISTRIP=200 44 JSTRIP=5000 45 LPCHAR=100 46 C 47 c *** COMPUTE SCALING FACTORS 48 c 49 JFACT=J STRIP/LPCHAR 50 FACT=FLOAT(J STRIP)/FLOAT(LPCHAR) 51 c 52 c ** * TEST I F THE SCALING FACTOR I S AN 53 c * ** WHOLE INTEGER...IF NOT REPORT 54 c * ** THE CHANCES OF PLOT CORRUPTION 55 c 56 FTEST=FACT-INT(FACT) 57 IF(FTEST.NE.0)WRITE(6,51) 58 51 FORMAT(' *** PLOT MAY BE IN ERROR') 59 KOUNT=0 60 IFACT=ISTRIP/JFACT 61 c 62 c *** READ IN THE USER DEFINED FEATURE TYPES 63 c 64 100 WRITE(6,101) 65 101 FORMAT(' HOW MANY FEATURE TYPES ? (12)') 66 READ(5,105)NTYPE 67 105 FORMAT(12) 68 IF(NTYPE.LE.0.OR•NTYPE.GT.2 0)GOTOl00 69 WRITE(6,110) 70 110 FORMAT(' GIVE EACH FEATURE TYPE ( 1 3 ) ' ) 71 DO 115 1=1,NTYPE 72 115 READ(5,120)ITYPE(I) 73 120 FORMAT(13) 74 WRITE(2,1) 75 1 FORMAT(1HI) 76 c 77 c *** READ IN THE RASTER PARTITION 78 c 79 5 READ(1,END=99)RASTER 80 WRITE(6,6)KOUNT 81 6 FORMAT(' IN STRIP * , I 3 ) 82 KOUNT=KOUNT+l 83 c 84 c *** SEARCH EACH PIXEL IN A LOCAL CLUSTER 85 c * ** SIZE OF WHICH I S GIVEN BY THE SCALING 86 c *** FACTOR TO SEE I F ANY ARE SET WITH A 87 c * ** F/CODE AS DECLARED BY THE USER (ITYPE) 88 c 89 c *** WHEN PIXELS ARE FOUND THE CORRESPONDING 90 c * ** ELEMENT IN THE LP IMAGE I S SET 91 c 92 ISTART=1-JFACT 93 IEND=0
Annex 5c

- 477 -
94 DO 50 K=1,IFACT 95 DO 10 1=1,100 96 10 XLINE(I)=BLANK 97 ISTART=ISTART+JFACT 98 IEND=IEND+JFACT 99 DO 20 I=1,JSTRIP
100 DO 20 J=ISTART,IEND 101 IX=((1-1)/JFACT)+l 102 DO 15 L=l,NTYPE 103 INTEG=0 104 LOGIC(2)=RASTER(I,J) 105 IF(INTEG.GT.127)LOGIC(l)=FF 106 RAST=INTEG 107 15 IF(RAST.EQ.ITYPE(L))XLINE(IX)=HASH 108 20 CONTINUE 109 C 110 C *** OUTPUT THE MUCH REDUCED RASTER IMAGE 111 C *** ON THE LP — A SCAN LINE AT A TIME 112 C 113 WRITE(2,30)(XLINE(I),1=1,LPCHAR) 114 30 FORMAT(IX,100A1) 115 50 CONTINUE 116 C 117 C***GO AND READ IN THE NEXT RASTER PARTITION 118 C 119 GOT05 120 99 WRITE(2,1) 121 STOP 122 END
END OF F I L E
Annex 5c

- 478 -
1 c******* T H I S I S R A S T E R . S C A N 2 C 3 £•**************************************************
END
3. 8 C* * 4. 6 C* PROGRAM TO PRINT-OUT THE ADDRESS LOCATION OF * 5. 4 C* EACH NON-ZERO ELEMENT IN A ONE-BYTE RASTER * 6'. 2 C* BUFFER PARTITIONED INTO 5000 X 200 STRIPS * 7 C* * 7. 8 C* WRITTEN BY TIM ADAMS - UNIVERSITY OF DURHAM * 8. 6 C* JUNE 1980 * 9. 4 C* •
10. 2 C* INPUT OF BINARY RASTER PARTITION I S ON CHAN.l * 11 c* OUTPUT OF RESULTS I S ON CHANNEL 6 * 11. 8 c* * 12. 6 c*************************************************** 16 c 17 c 18 LOGICAL*l RASTER(5000,200) 19 LOGICAL*l LOGIC(2),FF/ZFF/ 20 INTEGER*2 RAST,INTEG 21 EQUIVALENCE(INTEG,LOGIC(1)) 22 KOUNT=-l 23 c 24 c ****** READ IN RASTER PARTITION 25 c 26 1 READ(2,END=99) RASTER 27 KOUNT=KOUNT+l 28 WRITE(6,2)KOUNT 29 2 FORMAT(' ***** IN STRIP ',13,' *****•) 30 c 31 c ****** SEARCH EACH PIXEL FOR NON-ZERO VALUES 32 c 33 DO 10 1=1,5000 34 DO 10 J=l,200 35 INTEG=0 36 LOGIC(2)=RASTER(I,J) 37 IF(INTEG.GT.127)LOGIC(l)=FF 38 IF(INTEG.EQ.0)GOTO10 39 c 40 c ****** OUTPUT PIXEL ADDRESSES FOR VALUES >0 41 c 42 WRITE(6,5)1,J 43 5 FORMAT(1 ADDRESS ',15,',',15) 44 10 CONTINUE 45 c 46 c ****** G 0 AND READ NEXT PARTITION 47 c 48 GOTOl 49 99 STOP 111 50 END OF F I L E
Annex 5c

- 479 -
1 C******* T H I S I S R A S T E R ! r>
3 Q*************************************************** 4 C* * 5 . C* A PROGRAM TO PERFORM SOME ELEMENTARY ANALYSES * 6 C* ON A RASTER IMAGE FOR ORDNANCE SURVEY DIGITAL * 7 c* DATA * 8 c* * 9 c* WRITTEN BY TIM ADAMS - UNIVERSITY OF DURHAM *
10 c* SEPTEMBER 1980 * 11 c* * 12 c* PROGRAM READS IN ONE-BYTE PER ELEMENT RASTER * 13 c* PARTITION AND COUNTS SET PIXELS OF EACH DMB * 14 c* FEATURE TYPE. THESE COUNTS, TOGETHER WITH * 15 c* PERCENTAGES ARE PRESENTED IN TABULAR FORM * 16 c* * 17 c* INPUT OF THE RASTER PARTITIONS I S ON CHANNEL 1 * 18 c* OUTPUT OF THE TABULAR RESULTS I S ON CHANNEL 2 * 19 c* AN UPDATE OF THE JOB'S PROGRESS I S GIVEN ON * 20 c* CHANNEL 6 * 21 c* * 22 Q************************************* ************** 24 LOGICAL*l RASTER(5000,200),LOGIC(2),FF/ZFF/ 25 INTEGER*4 PERCNT(130)/l30*0/ 26 INTEGER*2 INTEG 27 EQUIVALENCE(INTEG,LOGIC(1)) 28 c 29 c *** SET THE DIMENSIONS OF THE PARTITION 30 c 31 IXAXIS=5000 32 ISTRIP=200 33 KOUNT=0 34 c 35 c *** INPUT THE RASTER PARTITION 36 c 37 1 READ(1,END=99)RASTER 38 WRITE(6,5)KOUNT 39 c 40 c *** GIVE THE PROGRESS OF THE JOB 41 c 42 5 FORMAT(' ****** IN STRIP ',12) 43 KOUNT=KOUNT+l 44 c 45 c *** FOR EACH PIXEL UNPACK IT INTO 2 BYTES 46 c *** LOOK AT THE FEATURE CODE OR OTHERWISE 48 c *** THE FOLLOWING VARIABLES STORE THESE 49 c *** ENTITIES: 50 c *** ITOTAL - COUNTS EACH PIXEL 51 c *** ISET - COUNTS SET PIXELS 52 c *** PSET - PERCENTAGE SET PIXELS 53 c *** PERCNT - AN ARRAY OF PERCENTAGE SET 54 c PIXELS — 1 FOR EACH CODE
Annex 5c

- 480 -
55 C *** PZERO - PERCENTAGE ZERO ELEMENTS 56 C 57 DO 50 J=1,ISTRIP 58 DO 50 1=1, IXAXIS 59 INTEG=0 60 LOGIC(2)=RASTER(I,J) 61 IF(INTEG.GT.127)LOGIC(l)=FF 62 L=INTEG+1 63 50 PERCNT(L)=PERCNT(L)+1 64 GOTOl 65 99 IACCUM=ISTRIP*IXAXIS*KOUNT 66 ISET=0 67 DO 100 1=2,110 68 100 ISET=ISET+PERCNT(I) 69 ITOTAL=ISET+PERCNT(l) 70 C 71 C *** WRITE OUT HEADINGS FOR EACH COLUMN IN TABLE 72 C 73 WRITE(2,110) 74 110 FORAM(///,' BREAKDOWN OF THE RASTER BUFFER*,/ 75 1//' F/CODE PIXEL COUNT PERCENTAGE OF ' 76 2' PERCENTAGE OF'/28X,'SET PIXELS TOTAL ' 77 3 1 BUFFER',/IX,5 5 ( 1 - ' ) / ) 78 PTOT=(FLOAT(PERCNT(1))/FLOAT(ITOTAL))*100. 79 WRITE(2,101)PERCNT(1)>PTOT 80 C 81 C *** WRITE OUT THE RESULTS FOR EACH F/CODE 82 C 83 101 FORMAT(' UNSET',5X,18,22X,F7.3) 84 DO 120 1=2,110 85 L=I-1 86 PSET=(FLOAT(PERCNT(I))/FLOAT(ISET))*100. 87 PTOT=(FLOAT(PERCNT(I))/FLOAT(ITOTAL))*100. 88 WRITE(2,115)L,PERCNT(I),PSET,PTOT 89 115 FORMAT(4X,I3 (5X,I8,7X,F7.3,8X,F7.3) 90 120 CONTINUE 91 C 92 C *** WORK OUT GLOBAL RESULTS FOR WHOLE BUFFER 93 C *** AND WRITE OUT RESULTS AT BOTTOM OF TABLE 94 C 95 PSET=(FLOAT(ISET)/FLOAT(ITOTAL))*100. 96 PZERO=(FLOAT(PERCNT(l))/FLOAT(ITOTAL))*100. 97 WRITE(2,150)ITOTAL,ISET,PSET,PERCNT(1),PZERO, 98 1IACCUM 99 150 FORMAT(//' BUFFER SUMMARY:'//' TOTAL PIXELS '
100 l ' I N BUFFER = ',110//' TOTAL SET PIXELS IN ', 101 2*BUFFER = ',110,' (',F8.4,')'//' TOTAL BLANK' 102 3'PIXELS IN BUFFER = ',110,' (',F8.4,')'// 103 4' TOTAL PIXELS IN BUFFER (CHECK) ',110//) 104 STOP 105 END
END OF F I L E
Annex 5c

- 481 -
ANNEX 5d
FORTRAN source l i s t i n g of two subroutines to handle
the compaction and uncompaction o f OS d i g i t a l data
i n a r a s t e r format: (see s e c t i o n 5.4.1)
CODER compacts a r a s t e r p a r t i t i o n i n t o coded-deltas
BUFF uncompacts the coded-delta data back i n t o r a s t e r
1 SUBROUTINE CODER(IOUT) 2 C 3 Q********** ******** ********************************* 4 C* * 5 C* THIS I S A SUBROUTINE TO RUN-LENGTH-ENCODE A * 6 C* RASTER PARTITION AND PRODUCE A 1-BYTE ELEMENT * 7 C* COMPACTED EQUIVALENT. THE LENGTHS OF ZERO-CODED * 8 C* ELEMENTS ARE STORED AS NEGATIVE STRINGS IN * 9 C* 1-BYTE ELEMENTS *
10 C* * 11 C* WRITTEN BY TIM ADAMS - UNIVERSITY OF DURHAM V3 * 12 C* NOVEMBER 1980 * 13 C* * 14 C* THE RASTER PARTITION I S STORED IN RASTER * 15 C* THE COMPRESSED SCAN-LINE I S STORED IN LINE * 16 C* EACH COMPRESSED SCAN LINE I S TRANSFERRED TO * 17 C* BACKING STORE ON CHANNEL SPECIFIED BY IOUT * 18 C* * 19 Q*************************************************** 20 C 21 LOGICAL*l RASTER(5000,200),LHOLD(2) 22 LOGICAL*l LOGIC(2J,LINE(5000),FLAG 23 LOGICAL*l FF/ZFF/ 24 INTEGER*2 INTEG,IHOLD,KOUNT 25 COMMON/BUFF/RASTER 26 EQUIVALENCE(INTEG,LOGIC(1)),(IHOLD,LHOLD(1)) 27 C 28 C *** DECLARE DIMENSION OF RASTER PARTITION 29 C 30 ISTRIP=200 31 JSTRIP=5000 32 NBYTE=0 33 DO 300 J=1,ISTRIP 34 NZERO=0 35 KOUNT=l 36 C 37 C *** FLAG I S FALSE WHEN NO RUN-LENGTH PRECEDES 38 C *** THIS ELEMENT AND TRUE WHILST A R-L IS
Annex 5d
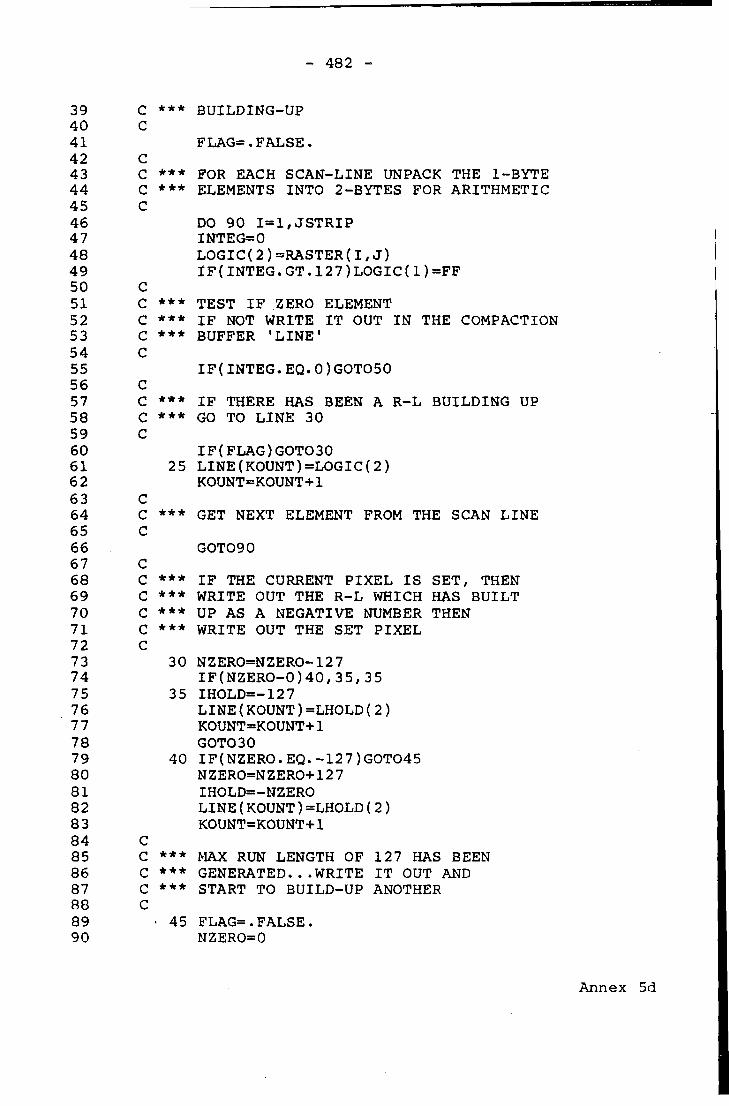
- 482 -
39 C *** BUILDING-UP 40 C 41 FLAG=.FALSE. 42 C 43 C *** FOR EACH SCAN-LINE UNPACK THE 1-BYTE 44 C * ** ELEMENTS INTO 2-BYTES FOR ARITHMETIC 45 C 46 DO 90 I=1,JSTRIP 47 INTEG=0 48 LOGIC(2)=RASTER(I/J) 49 IF(INTEG.GT.127)LOGIC(l)=FF 50 C 51 C *** TEST I F ZERO ELEMENT 52 C *** I F NOT WRITE IT OUT IN THE COMPACTION 53 c *** BUFFER 'LINE' 54 c 55 IF(INTEG.EQ.0)GOTO50 56 c 57 c *** I F THERE HAS BEEN A R-L BUILDING UP 58 c * ** GO TO LINE 30 59 c 60 IF(FLAG)GOTO30 61 25 LINE(KOUNT)=LOGIC(2) 62 KOUNT=KOUNT+l 63 c 64 c *** GET NEXT ELEMENT FROM THE SCAN LINE 65 c 66 GOTO90 67 c 68 c *** I F THE CURRENT PIXEL I S SET, THEN 69 c *** WRITE OUT THE R-L WHICH HAS BUILT 70 c *** UP AS A NEGATIVE NUMBER THEN 71 c *** WRITE OUT THE SET PIXEL 72 c 73 30 NZERO=NZERO-127 74 IF(NZERO-0)40,35,35 75 35 IHOLD=-127 76 LINE(KOUNT)=LHOLD(2) 77 KOUNT=KOUNT+l 78 GOTO30 79 40 IF(NZERO.EQ.-127)GOT045 80 NZERO=NZERO+127 81 IHOLD=-NZERO 82 LINE(KOUNT)=LHOLD(2) 83 KOUNT=KOUNT+l 84 c 85 c *** MAX RUN LENGTH OF 127 HAS BEEN 86 c *** GENERATED...WRITE I T OUT AND 87 c * ** START TO BUILD-UP ANOTHER 88 c 89 • 45 FLAG=.FALSE. 90 NZERO=0
Annex 5d

- 483 -
91 GOTO25 92 50 NZERO=NZERO+l 93 FLAG=.TRUE. 94 90 CONTINUE 96 C *** WE ARE AT THE END OF THIS SCAN LINE 97 C * ** THE R-L CODED DATA ARE IN 'LINE' 98 C * * * I F NO MORE R-L'S TO TAG ON TO THE END 99 C *** GO TO 110 AND OUTPUT LINE ON CHANN IOUT
100 C * ** I F S T I L L A R-L TO BE TAGGED THEN 101 C * ** COUNT THEM OUT AND THEN OUTPUT LINE 103 IF(.NOT.FLAG)GOTO110 104 95 NZERO=NZERO-12 7 105 IF(NZERO-0)105,100, 100 106 100 IHOLD=-127 107 LINE(KOUNT)=LHOLD(2) 108 KOUNT=KOUNT+l 109 GOT095 110 105 IF(NZERO.EQ.=127)GOTO110 111 NZERO=NZERO+127 112 IHOLD=-NZERO 113 LINE(KOUNT)=LHOLD(2) 114 KOUNT=KOUNT+l 115 110 FLAG=.FALSE. 116 NZERO=0 117 KOUNT=KOUNT-l 118 C 119 C *** OUTPUT 'KOUNT' NO. OF BYTES FROM 120 C *** ARRAY LINE TO CHANNEL IOUT 121 c 122 CALL WRITE(LINE,KOUNT,0,LNUM,IOUT,&9999) 123 c 124 c *** COUNT UP THE TOTAL NUMBER OF BYTES 125 c * ** IN THIS PARTITION 126 c 127 N BYTE=N BYTE+KOUNT 128 300 CONTINUE 129 c 130 c *** INFORM USER ON CHANN. 6 OF NO. 131 c *** OF BYTES TRANSFERRED 132 c 133 WRITE(6,1000)NBYTE 134 1000 FORMAT(' TRANSFERRED 1,110,' BYTES') 135 RETURN 136 c 137 c *** TROUBLES HAVE DEVELOPED ON OUTPUT 138 c *** INFORM USER AND STOP 139 c 140 9999 WRITE(6,10000) 141 10000 FORMAT(' ** ERROR DETECTED ON DATA TRANSFER 142 STOP 111 143 END
END OF F I L E
Annex 5d

- 484 -
1 SUBROUTINE BUFF(RASTER,*) 2 C 3 Q******************************************* ******* 4 c* 5 c* THIS I S A SUBROUTINE TO UNCOMPACT THE BACKING * 6 c* STORE VERSION OF A COMPRESSED OS DIGITAL RASTER* 7 c* F I L E BACK INTO ITS FULL REPRESENTATION * 8 c* 9 G* WRITTEN BY TIM ADAMS - UNIVERSITY OF DURHAM V2 *
10 C* NOVEMBER 1980 * 11 C* 12 C* THE COMPRESSED SCAN LINES ARE READ IN ON CHAN 1* 13 C* A 1-BYTE ELEMENT RASTER PARTITION 'RASTER' I S * 14 C* RETURNED TO THE CALLING PROGRAM * 15 C* * 16 Q***************************************** ********* 17 C 18 LOGICAL*l RASTER(5000,200),LINE(5000) 19 LOGICAL*l LOGIC(2),FF/ZFF/ 20 INTEGER*2NBYTE,INTEG 21 EQUIVALENCE(INTEG,LOGIC(l)) 22 ISTRIP=200 23 DO 80 J = l , I S T R I P 24 KOUNT=l 25 C 26 c *** READ IN THE SCAN LINE FROM CHAN 1 27 c *** NBYTE I S THE NUMBER OF BYTES READ 28 c 29 CALL READ(LINE,NBYTE,0,LNUM,1,&99) 30 C 31 C *** FOR EACH BYTE IN 'LINE' UNCOMPACT 32 C *** THE RUN-LENGTHS (R-L) INTO ZEROS 33 c 34 DO 70 K=l,NBYTE 35 INTEG=0 36 LOGIC(2)=LINE(K) 37 IF(INTEG.GT.127)GOTO50 38 RASTER(KOUNT,J)=LINE(K) 39 KOUNT=KOUNT+l 40 GOTO70 41 50 LOGIC(l)=FF 42 C 43 c *** CONVERT THE NEGATIVE R-L'S TO POSITIVE 44 C 45 L=-INTEG 46 L=L+KOUNT-l 47 C 48 C *** FLLL IN THE R-L'S WITH ZEROS 49 C 50 INTEG=0
Annex 5d
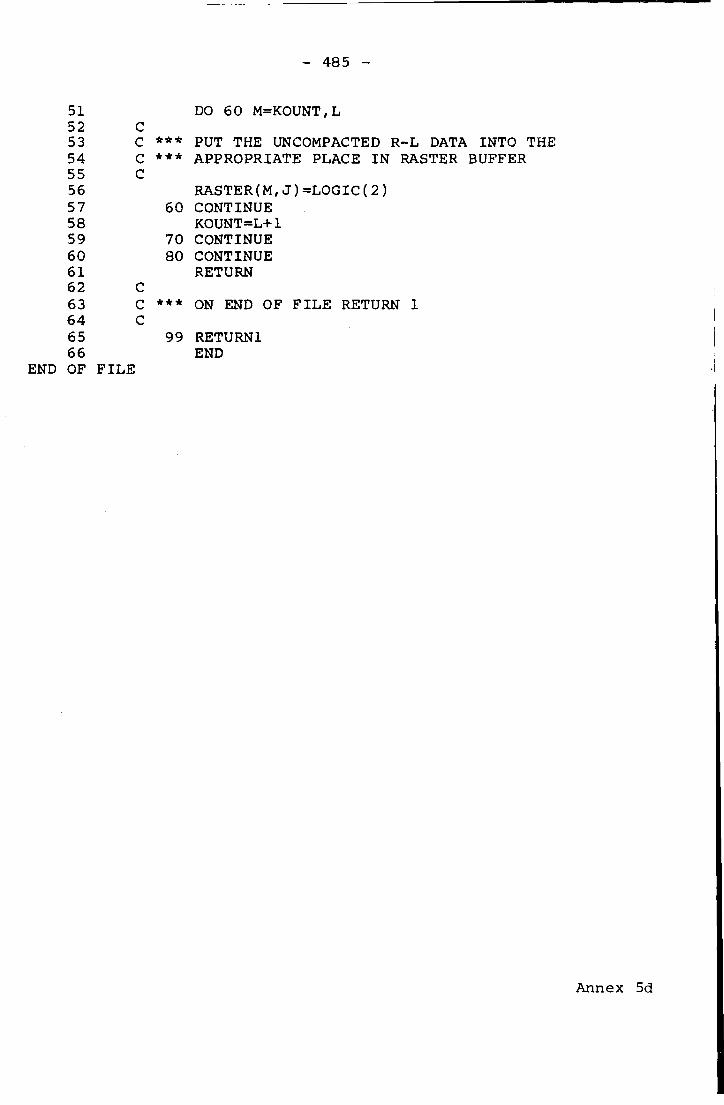
- 485 -
51 DO 60 M=KOUNT,L 52 C 53 C *** PUT THE UNCOMPACTED R-L DATA INTO THE 54 c *** APPROPRIATE PLACE IN RASTER BUFFER 55 c 56 RASTER(M,J)=LOGIC(2) 57 60 CONTINUE 58 KOUNT=L+l 59 70 CONTINUE 60 80 CONTINUE 61 RETURN 62 c 63 c *** ON END OF F I L E RETURN 1 64 c 65 99 RETURN1 66 END
END OF F I L E
Annex 5d

- 486 -
ANNEX 6a
FORTRAN l i s t i n g of a program to generate a magnetic tape
i n a DAP-based format f o r data t r a n s f e r between the
computing s i t e s of Durham and Queen Mary Col l e g e , London.
1 C 2 3
C C
********** T H I S I S Q M C F O R M A T
4 5
C C **• THIS I S A PROGRAM TO FORMAT A TAPE TO EBCDIC
6 7
C n
* ** CHARACTERS FOR TRANSPORTATION TO AN ICL 2980 1 8 c *** LOGICAL UNIT 1 HOLDS THE LEVEL 6 DATA STORED 9 c *** AT NUMAC AS UNFORMATTED FORTRAN (64,64)
10 c *** 1-BYTE ELEMENTS 11 c 12 c *** LOGICAL UNIT 2 I S THE GENERAL PURPOSE INPUT 13 c *** CHANNEL FOR COMMUNICATION BETWEEN USER AND 14 c *** PROGRAM 15 c 16 c *** LOGICAL UNIT 3 I S THE OUTPUT TAPE WHICH I S 17 c * ** STANDARD LABELLED FIXED BLOCK (4096,64) 18 c 19 c *** LOGICAL UNITS 4-19 ARE FOR THE INPUT OF 20 c *** THE 16 (4096,256) RASTER PARTITONS FOR 21 c *** THE LEVEL 12 DATA. CHANNEL 4 READS PART 0, 22 c * ** CHANNEL 5 READS PART 1...AND SO ON 23 c 24 c 4** VARIABLES: RASTER HOLDS LEVEL 12 DATA 25 c N.B. BECAUSE OF LIMITATIONS OF FORTRAN AT 26 c NUMAC, THE ARRAY RASTER HAS TO BE 27 c READ-IN IN TWO PASSES..A AND B 28 c THESE ARE EQUIVALENCED WITH RASTER 29 c 30 c L I HOLDS THE LEVEL 6 DATA 31 c LINE HOLDS THE EBCDIC DATA FOR O/PUT 32 c 33 c 34 LOGICAL*l A(4096,128),B(4096,128) 35 INTEGER*2 INTEG 36 INTEGER LINE(64) 37 EQUIVALENCE(INTEG,LOGIC(1)) 38 EQUIVALENCE(RASTER(1, 1) ,A(1, 1)) 39 EQUIVALENCE(RASTER(1, 129) , B( 1, 1) ) 40 COMMON RASTER 41 DATA IZERO/'O'/zIONE/'l'/ 42 c
Annex 6a

- 487 -
43 C IYCURR I S THE CURRENT LEVEL 12 SEGMENT 44 C (INITIALLY SET TO 0) 45 C 46 IYCURR=0 47 IHIT=0 48 C 49 C IFC I S THE FEATURE CODE UNDER SCRUTINY 50 C 51 READ(2, 10 ) I F C 52 10 FORMAT(15) 53 C 54 C INPUT OF THE APPROPRIATE LEVEL 6 DATA 55 C 56 READ(1'IFC)LI 57 C 58 C OUTPUT OF DATA AS CHARS IN BLOCK 1 59 C OF F I L E ON TAPE 60 C 61 DO 15 J=l,64 62 DO 12 N=l,64 63 12 LINE(N)=IZERO 64 DO 13 1=1,64 65 INTEG=0 66 L O G I C ( 2 ) = L 1 ( I , J ) 67 IF(INTEG.EQ.0)GOTO13 68 LINE(I)=IONE 69 13 CONTINUE 70 WRITE(3,35)(LINE(N),N=l,64) 71 15 CONTINUE 72 C 73 C RETRIEVAL OF APPROPRIATE LEVEL 12 74 C DATA IN SEQUENTIAL ORDER OF 75 C INCREASING X 76 C 77 DO 100 J=l,64 78 DO 100 1=1,64 79 C 80 C TEST LEVEL 6 DATA TO SEE I F A LEVEL 12 81 C SUB-DIVISION I S NEEDED 82 C 83 INTEG=0 84 LOGIC(2)=L1(I,J) 85 IF(INTEG.EQ.0)GOTO100 86 C 87 C YES 1 SUBDIVISION NEEDED 88 C 89 IHIT=IHIT+1 90 C SOLUTION OF MAPPING FUNCTION IN X — > 91 C IXS=START, IXF=FINISH RANGE 92 C 93 I X S = ( ( I - l ) * 6 4 ) + l 94 IXF=64*I
Annex 6a
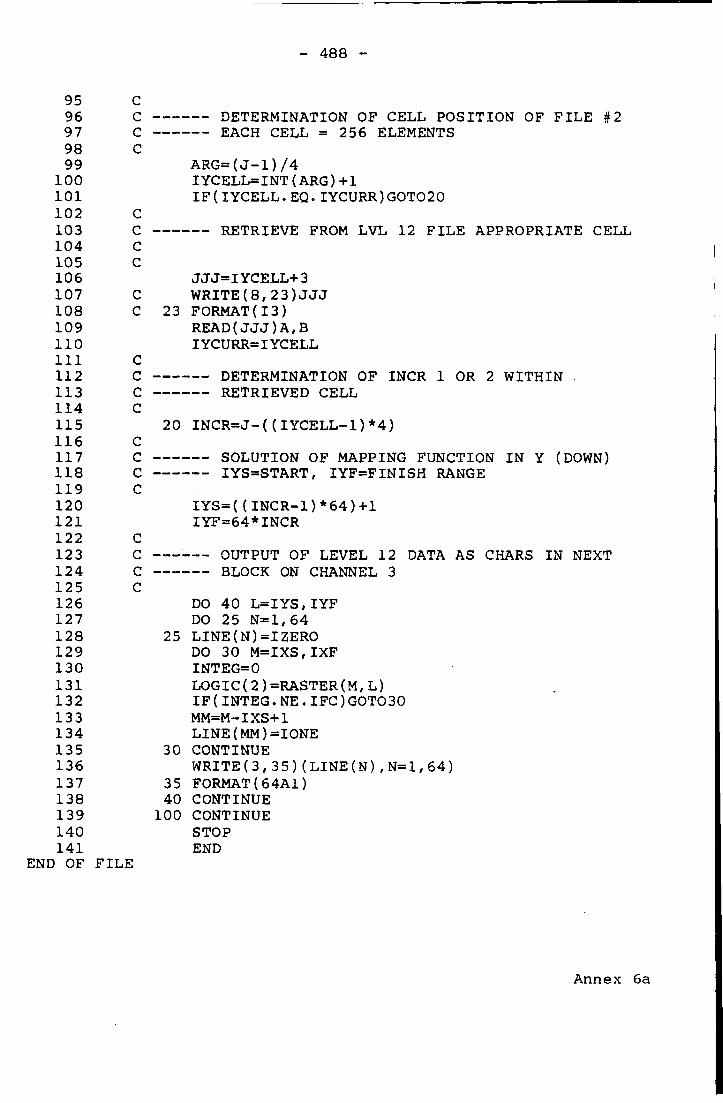
- 488 -
95 C 96 C DETERMINATION OF CELL POSITION OF F I L E #2 97 C EACH CELL = 256 ELEMENTS 98 C 99 ARG=(J-l)/4
100 IYCELL=INT(ARG)+1 101 IF(IYCELL.EQ.IYCURR)GOTO20 102 C 103 C RETRIEVE FROM LVL 12 F I L E APPROPRIATE CELL 104 C 105 C 106 JJJ=IYCELL+3 107 C WRITE(8,23)JJJ 108 C 23 FORMAT(13) 109 READ(JJJ)A,B 110 IYCURR=IYCELL 111 C 112 C DETERMINATION OF INCR 1 OR 2 WITHIN 113 C RETRIEVED CELL 114 C 115 20 INCR=J-((IYCELL-1)*4) 116 C 117 C SOLUTION OF MAPPING FUNCTION IN Y (DOWN) 118 C IYS=START, IYF=FINISH RANGE 119 C 120 IYS=((INCR-1)*64)+1 121 IYF=64*INCR 122 C 123 C OUTPUT OF LEVEL 12 DATA AS CHARS IN NEXT 124 C BLOCK ON CHANNEL 3 125 C 126 DO 40 L=IYS,IYF 127 DO 25 N=l,64 128 25 LINE(N)=IZERO 129 DO 30 M=IXS,IXF 130 INTEG=0 131 LOGIC(2)=RASTER(M,L) 132 IF(INTEG.NE.IFC)GOTO30 133 MM=M-IXS+1 134 LINE(MM)=IONE 135 30 CONTINUE 136 WRITE(3,35)(LINE(N),N=1,64) 137 35 FORMAT(64A1) 138 40 CONTINUE 139 100 CONTINUE 140 STOP 141 END
END OF F I L E
Annex 6a

- 489 -
ANNEX 6b
FORTRAN/DAP-FORTRAN l i s t i n g of a program to convert EBCDIC
c h a r a c t e r s on a magnetic tape to a compacted b i n a r y format
for immediate e n t r y i n t o the ICL DAP
1 C ********** T H I S I S F I L E S / P A C K 2 C 3 C 4 PROGRAM FILES 5 C 6 C THIS I S A PROGRAM TO READ THE F I L E S FROM 7 C NUMAC TAPE AND RESTRUCTURE IT INTO A DAP 8 C BASED FORMAT I E CONVERT I T FROM CHARACTERS 9 C (8 BIT) FORM TO 1 BIT FORM. ' F I L E ' CAN
10 C HANDLE 300 DAP PLANES AT ONCE. 11 C 'PACKFILE 1 I S 8 TIMES REDUCTION OF 'F I L E ' 12 C 13 CHARACTER*64 FILE(19200),PACKFILE(2400) 14 C 15 C NFC (INTEGER*8 TO AVOID DAP CONVERSION) 16 C I S THE FEATURE CODE NUMBER 17 C 18 INTEGER*8 NFC 19 LOGICAL FIRST 20 COMMON/DATA/FILE 21 COMMON/PARM/NPL 22 EQUIVALENCE (FILE,PACKFILE) 23 C 24 C N I S NO. OF F / C S TO BE DEALT WITH 25 C 26 READ(5,*)N 27 DO 10 1=1,N 28 FIRST=.TRUE. 29 Jl.=9 30 C 31 C NFC I S F/C, NPL I S NO. OF PLANES 32 C NEEDED AT LEVEL 12 33 C 34 READ(5,*)NFC,NPL 35 C 36 C NPACK SPLITS THE F I L E INTO 300 PLANE CHUNKS 37 C 38 NPACK=(NPL-l)/300 39 LNPL=NPL-NPACK*300 40 C 41 C OPEN THE DESIRED OUTPUT F I L E FCXXX 42 C WHERE XXX I S FEATURE CODE NUMBER
Annex 6b

- 490 -
43 C 44 CALL CONNECTFILES(NFC) 45 I F (NPACK.EQ.O) GOTO 100 46 C 47 C 48 C FOR F I L E S >=300 PLANES 49 C 50 C 51 DO 20 K=1,NPACK 52 NPL=300 53 NF=NPL*64 54 READ(10,1000)(FILE(J),J=1,NF) 55 1000 FORMAT(1A64) 56 CALL PACK 57 NP=NPL*8 58 I F (.NOT.FIRST)J1=1 59 WRITE(11,1000)(PACKFILE(J),J=J1,NP) 60 FIRST=.FALSE. 61 20 CONTINUE 62 C 63 C 64 C — FOR F I L E S <300 PLANES 65 C 66 C 67 100 I F (LNPL.EQ.O) GOTO 30 68 NPL=LNPL 69 NF=NPL*64 70 C 71 C INPUT CHARACTER DATA F I L E FROM TAPE 72 C 73 READ(10,1000)(FILE(J),J=l,NF) 74 C 75 C PACK IT 76 C 77 CALL PACK 78 NP=NPL*8 79 I F ( . N O T . F I R S T ) J l = l 80 C 81 C WRITE IT OUT IN DAP FORMAT 82 C 83 WRITE(11,1000)(PACKFILE(J),J=J1,NP) 84 30 CALL ICL9HFCLOSE(10) 85 CALL ICL9HFCLOSE(ll) 86 10 CONTINUE 87 STOP 88 END 89 C 90 C 91 C 92 C 93 C 94 C
Annex 6b

- 491 -
95 ENTRY SUBROUTINE PACK 96 C THIS I S A SUBROUTINE TO STRIP OFF THE TOP 97 C 7 BITS OF EACH CHARACTER. I E EACH TOP 7 98 C BIT PLANES 99 C
100 CHARACTER F I L E ( , , 3 0 0 ) , C ( , ) 101 COMMON/DATA/FILE 102 COMMON/PARM/NPL 103 LOGICAL LM(,,2400) 104 EQUIVALENCE (LM,FILE) 105 CALL CONVFSI(NPL, 1) 106 C 107 C PLANE BY PLANE CONVERT DATA TO DAP FORMAT 108 C 109 DO 10 1=1,NPL 110 C = F I L E ( , , I ) 111 CALL CONVFMl(C) 112 10 F I L E ( , , I ) = C 113 C 114 C COMPRESS ONLY THE 8TH SUCCESSSIVE BIT 115 C PLANES INTO THE TOP END OF ' LM' 116 C 117 DO 20 1=1,NPL 118 L M ( / / I ) = L M ( , , 8 * I ) 119 20 CONTINUE 120 CALL CONVSFI(NPL,1) 121 RETURN 122 END 123 C 124 C 125 C 126 C 127 C 128 VME/B JOB CONTROL LANGUAGE MACRO TO CONNECT GIVEN 129 FILE-NAME TO A FORTRAN CHANNEL NO. 130 131 MACRO NAME I S "CONNECTFILES" 132 133 134 MACRO CONNECTFILES I S ( 135 REF INT ?A ) 136 MACBEGIN 137 I F ?A GT 9 THEN 138 STRING INFILE= ':HLFA100.FCO'+NUMERIC(?A) 139 STRING OUTFILE= ':.TAPE.FCO'+NUMERIC(?A) 140 ELSE 141 STRING INFILE= ':HLFA100.FCOO'+NUMERIC(?A) 142 STRING OUTFILE= ':.TAPE.FCOO'+NUMERIC(?A) 143 F I 144 AF(VAL INFILE,ICL9LF10) 145 CF(VAL OUTFILE) 146 AF(VAL OUTFILE,ICL9LF11,ACC=W)
Annex 6b

- 492 -
147 RETURN 148 MACEND
END OF F I L E
Annex 6b

- 493 -
FORTRAN/DAP-FORTRAN l i s t i n g of a gr a p h i c s s u i t e w r i t t e n
to transpose r a s t e r images between l e v e l s i n the
h i e r a r c h i c a l data s t r u c t u r e and d i s p l a y them on a
Sigma c o l o u r r a s t e r d i s p l a y d e v i c e .
ANNEX 6c
! C ********** T H I S I S O S M A P 2 c ********** ( R A S T E R - G R A P H I C S ) 3 C 4 PROGRAM OSMAP 5 C 6 C THIS I S THE MAINLINE 2980 HOST PROGRAM 7 C FOR THE DAP RASTER GRAPHICS PACKAGE 8 C 9 C DECLARATION OF INTEGER*8 MEANS THAT
10 C NO CONVERSION TO DAP FORMAT I S NECESSARY 11 C 12 INTEGER*8 NFC,SUM6,NFIRST 13 INTEGER INDEX(4096) 14 COMMON/FC/NFC 15 C 16 C F I L E I S DECLARED SUITABLY LARGE AND 17 C I S , IN EFFECT, THE DAP TO THIS PROGRAM 18 C 19 CHARACTER*64 FILE(14000) 20 COMMON/DATA/FILE 21 COMMON/IND/INDEX,SUM6,NFIRST 22 EXTERNAL OUTPUT 23 C 24 C THE USE OF AN ERROR TRAP ENABLES A SNEAKY 25 C REVERT BACK FROM THE DAP TO THE 2980 26 C 27 C THE FOLLOWING THREE LINES ARE JUST 28 C VME/B MANDATORY FOR ERROR TRAP CATCHING 29 C 30 CALL ICL9HERRORTRAPDR(OUTPUT,IRES) 31 IF(IRES.NE.0)WRITE(6,1) 32 1 FORMAT(' SETMAP UNSUCCESSFUL') 33 C 34 C ASK THE USER TO REQUEST WHICH F/C HE WISHES 35 C 36 WRITE(6,100) 37 100 FORMAT(1 WHICH FEATURE CODE?') 38 READ(5,*)NFC
Annex 6c

- 494 -
39 C 40 c INPUT OF THE INDEX LEVEL 6 F I L E 41 C 42 NF=1417*8 43 READ(7,1000)(FILE(I),1=1,NF) 44 1000 FORMAT(1A64) 45 C 46 c OPEN AND LINK UP CHANNEL 10 TO APPROPRIATE 47 C NFC LEVEL 12 (DAP FORMAT) F I L E 48 c 49 CALL CONNECTFILE(NFC) 50 WRITE(6,500)NFC 51 500 FORMAT(I15) 52 C 53 c EXAMINE DESIRED LEVEL 6 F I L E 54 C AND SHUNT THE POSITIONAL 55 c INDEX TO TOP OF LONG VECTOR 56 c 57 CALL GETNFC 58 c 59 c TEMPORARY INSERTION 60 c 61 c SUM6=22 62 c 63 c SUM6 IS THE NO. OF SET LEVEL 6 PIXELS 64 c 65 NF=SUM6*8 66 WRITE(6,1001)NF 67 1001 FORMAT(' NF = ',110) 68 c 69 c READ IN THE DESIRED LEVEL 12 DATA 70 c 71 READ(10,1000)(FILE(I),1=1,NF) 72 c 73 c SET UP THE SIGMA GRAPHICS TERMINAL 74 c
SET UP THE SIGMA GRAPHICS TERMINAL
75 CALL SETMAP 76 c 77 c MOVE INTO THE DAP FOR GRAPHICS PRODUCTION 78 c 79 CALL OSMAPPING 80 STOP 81 END 82 c 83 c 84 c 85 c 86 c 87 c 88 VME/B job c o n t r o l language macro to connect a d i s k 89 f i l e t o a s p e c i f i e d FORTRAN channel number 90 c
Annex 6c

- 495 -
91 MACRO CONNECTFILE I S ( 92 REF INT ?A ) 93 MACBEGIN 94 I F ?A GT 9 THEN 95 STRING INFILE= ':.TAPE.FCO'+NUMERIC(?A) 96 ELSE 97 STRING INFILE= 's.TAPE.FCOO'+NUMERIC(?A) 98 F I 99 AF(VAL INFILE,ICL9LF10)
100 RETURN 101 MACEND 102 C 103 C 104 C 105 C 106 C 107 ENTRY SUBROUTINE GETNFC 108 C 109 C THIS I S A SUBROUTINE TO EXTRACT THE 110 C DESIRED LEVEL 6 DAP PLANE AND 111 C DEVELOP AN INTEGER MATRIX 'INDEX' WHICH 112 C I S THE POSITIONAL ELEMENT INFO. SHUNTED 113 C TO THE TOP OF THE LONG VECTOR 114 C 115 INTEGER SUM6,NFIRST,INDEX(,),TINDEX(,) 116 LOGICAL LEVEL6(,,109),LM( , ) 117 COMMON/DATA/LEVEL6 118 COMMON/IND/INDEX,SUM6,NFIRST 119 COMMON/FC/NFC 120 EXTERNAL INTEGER MATRIX FUNCTION IPACK 121 C 122 C PUT JUST OUR DESIRED F/C DAP PLANE INTO LM 123 C 124 LM=LEVEL6(,,NFC) 125 C 126 C DETERMINE HOW MANY PIXELS THERE ARE IN 1LM' 127 C 128 SUM6=SUM(LM) 129 C 130 C SET ALL OF INDEX=1 131 C 132 INDEX=1 133 IS=1 134 C 135 C USE RECURSIVE DOUBLING TO SET UP A LONG 136 C VECTOR OF 4096 ELEMENTS AS 1 , 2 , 3 , 4 4 0 9 6 137 C 138 DO 10 1=1,12 139 INDEX=INDEX+SHRP(INDEX,IS) 140 10 IS=IS*2 141 TINDEX=0 142 C
Annex 6c

- 496 -
143 C MASK THROUGH ONLY THOSE POSITIONS IN WHICH 144 C THERE ARE SET PIXELS ( I E WHERE LM = .TRUE.) 145 C RESULT GOES INTO TEMPORARY INDEX 'TINDEX' 146 C 147 TINDEX(LM)=INDEX 148 C 149 C SHUNT THE RELEVANT DATA TO THE TOP OF THE 150 C LONG VECTOR 151 C 152 INDEX=IPACK(TINDEX) 153 TRACE 1(INDEX) 154 RETURN 155 END 156 C 157 C 158 C 159 C 160 C 161 INTEGER MATRIX FUNCTION IPACK(IM) 162 C 163 C TREATING IM AS A LONG VECTOR, THE MAX. 164 C MATRIX POSITION WILL BE 4096 ( I . E . ONLY 165 C — • NEEDS 12-BITS FOR STORAGE). 166 C 167 C THIS I S A FUNCTION TO CHOP OFF BITS 13-32 168 C FROM THE INTEGER STACK FOR EFFICIENCY IN 169 C DAP STORAGE. FUNCTION ISIGMA I S USED TO 170 C SHUNT THE SET PIXELS TO THE TOP OF THE 171 C LONG VECTOR FOR EASY ACCESS. 172 C 173 INTEGER IM(,) 174 INTEGER COUNT(,) 175 LOGICAL L C ( 3 2 ) , M O V E ( , ) 176 EQUIVALENCE (COUNT,LC) 177 EXTERNAL INTEGER MATRIX FUNCTION ISIGMA 178 MOVE=IM.EQ.0 179 COUNT=0 180 COUNT(.NOT.MOVE)=ISIGMA(IFIX(MOVE)) 181 L=l 182 IPACK=IM 183 DO 20 1=1,12 184 MOVE=LC(,,33-1) 185 MOVE=SHLP(MOVE,L) 186 IPACK(MOVE)=SHLP(IPACK,L) 187 COUNT(MOVE)=SHLP(COUNT,L) 188 20 L=L*2 189 RETURN 190 END 191 C 192 C 193 C 194 C
Annex 6c

- 497 -
195 C 196 INTEGER MATRIX FUNCTION ISIGMA(X) 197 C 198 C THIS IS A FUNCTION TO SHUNT SET PIXELS IN 199 C — INTEGER MATRIX X TO THE TOP OF THE MATRIX. 200 C IT USES THE RECURSIVE DOUBLING THEORY OF 201 C — BINARY ARITHMETIC. 202 C 203 INTEGER X( , ) 204 ISIGMA=X 205 L=l 206 DO 10 1=1,12 207 ISIGMA=ISIGMA+SHRP(ISIGMA,L) 208 10 L=L*2 209 RETURN 210 END 211 C 212 C 213 C 214 C 215 C 216 SUBROUTINE SETMAP 217 C 218 C — THIS IS A SUBROUTINE TO INITIALISE THE SIGMA 219 C —- COLOUR GRAPHICS TERMINAL FOR DISPLAY OF THE 220 C — RASTER DATA FROM THE DAP 221 c 222 CALL START 223 CALL SETBUFFSIZE(1024,6) 224 CALL CSIZE(2) 225 CALL DRAWPADS 226 CALL INSTRUCTION 227 RETURN 228 END 229 c 230 c 231 c 232 c 233 c 234 SUBROUTINE DRAWPADS 235 c 236 c — THIS IS A SUBROUTINE TO DRAW THREE PADS 237 c — ON THE RIGHT HAND SIDE OF THE GRAPHICS 238 c SCREEN TO ACT AS MENU SQUARES FOR DESIRED 239 c — RESOLUTION OF PLOT 240 c 241 CALL MOVE(560,490,.FALSE.) 242 CALL CHAR(' GRID 512X512 *.') 243 JST=476 244 CALL CSIZE(l) 245 DO 10 J=l,64 246 JST=JST-1
Annex 6c

- 498 -
247 CALL MOVE(600,JST,.FALSE.) 248 10 CALL OUTLINE('88888888888888888888888888888888 249 188888888888888888888888888888888',64) 250 CALL CSIZE(2) 251 CALL MOVE(510,370,.FALSE.) 252 CALL CHAR(' GRID 1024X1024 *.') 253 JST=357 254 CALL CSIZE(l) 255 DO 20 J=l,64 256 JST=JST-1 257 CALL MOVE(600,JST,.FALSE.) 258 20 CALL OUTLINE('88888888888888888888888888888888 259 188888888888888888888888888888888',64) 260 CALL CSIZE(2) 261 CALL MOVE(515,250,.FALSE.) 262 CALL CHARC GRID 2048X2048 *.') 263 JST=238 264 CALL CSIZE(l) 265 DO 30 J=l,64 266 JST=JST-1 267 CALL MOVE(600,JST,.FALSE.) 268 30 CALL OUTLINE('88888888888888888888888888888888 269 188888888888888888888888888888888',64) 270 RETURN 271 END 272 C 273 C 274 C 275 C 276 C 277 ENTRY SUBROUTINE OSMAPPING 278 C 279 C — THIS IS THE ENTRY SUBROUTINE FOR THE 280 c — GRAPHICS SECTION OF THE PROGRAM 281 c 282 INTEGER INDEX(,),SUM6 283 c 284 c — 'INT' IS THE INSTRUCTION CODE, IX , IY ARE 285 c — POSITIONS IN WHICH A PLOT IS DESIRED 286 c 287 COMMON/INST/INT,IX,IY 288 COMMON/IND/INDEX,SUM6 289 c 290 c — CONVERT THE INSTRUCTION 'INT' TO DAP FORMAT 291 c 292 c CALL CONVFSI(INT,3) 293 c 294 c — SET UP THE 3 GRAPHIC (RESOLUTION) OPTIONS 295 c 296 CALL GRID512(INDEX,SUM6) 297 CALL GRID1024(INDEX,SUM6) 298 CALL GRID2048(INDEX,SUM6)
Annex 6c

- 499 -
299 C 300 C -— I F INSTRUCTION=999 THEN PREPARE TO STOP 301 C 302 999 IF(INT.EQ.999)RETURN 303 IY=511-IY 304 C 305 C CALL APPROPRIATE DRAW ROUTINES -306 C DEPENDING ON INSTRUCTION 307 C 308 IF(INT.NE.9)GOTO 10 309 CALL DRAW512 310 C CALL CONVFSKINT, 3) 311 GOTO 999 312 10 IF(INT.NE.10)GOTO 11 313 IX=IX/32+l 314 IY=IY/32+l 315 CALL DRAW1024(IX,IY) 316 C CALL CONVFSKINT, 3) 317 GOTO 999 318 11 IF(INT.NE.11)GOTO 999 319 IX=IX/16+1 320 IY=IY/16+1 321 CALL DRAW2048(IX,IY) 322 c CALL CONVFSKINT, 3) 323 GOTO 999 324 END 325 c 326 c 327 c 328 c 329 c 330 SUBROUTINE GRID512(INDEX,SUM6) 331 c 332 c THIS IS A SUBROUTINE TO SET UP COMMON BLOCK 333 c MAP9 AND SPLIT UP THE DAP PLANES INTO 8 X 8 334 c CHUNKS FOR 512 X 512 RESOLUTION LEVEL 9 335 c 336 LOGICAL LEVEL12(,,1750),MAP9(,,8,8),SECT12(,) 337 LOGICAL TEMP(,) 338 INTEGER INDEX(,),SUM6 339 EXTERNAL LOGICAL MATRIX FUNCTION MASKPLANE 340 COMMON/DATA/LEVEL12 341 COMMON/MAPS9/MAP9 342 c 343 c INITIALISE MAP9 344 c 345 DO 100 1=1,8 346 DO 100 J=l,8 347 100 MAP9(,,I,J)=.FALSE. 348 c 349 c DO FOR EACH BIT PLANE OF THE LEVEL 12 DATA 350 c
Annex 6c

- 500 -
351 DO 10 K=1,SUM6 352 C 353 C SET 1N 1 TO BE THE POSITIONAL LEVEL 6 POSN. 354 C IN THE MAP-SHEET INDEX 355 C 356 N=INDEX(K) 357 C 358 C COMPUTE CORRESPONDING POSITIONAL COORDS IN 359 C THE LEVEL 12 IMAGE: 360 C 164,J64 ARE THE x,y COORDS IN LEVEL 6 361 C 18,J8 ARE THE x,y COORDS OF THE 8 X 8 CHUNK 362 C IN THE 64 X 64 363 C 118,JJ8 ARE THE x,y COORDS WITHIN THE 8 X 8 364 C 365 IGRID=64/8 366 I64=(N/64)+l 367 IF(N.EQ.4096)164=64 368 I 8 = ( ( I 6 4 - 1 ) / I G R I D ) + 1 369 J64=N-((164-1)*64) 370 J8=((J64-1)/IGRID)+1 371 J J 8 = N - ( ( ( I 6 4 - 1 ) * 6 4 ) + ( J 8 - 1 ) * I G R I D ) 372 I I 8 = ( ( N - ( ( ( I 8 - 1 ) * 6 4 * I G R I D ) + J 6 4 ) ) / 6 4 ) + l 373 C 374 C SET SECT12 TO BE CURRENT LEVEL 12 DAP PLANE 375 C 376 SECT12=LEVEL12( , ,K) 377 TRACE 1(SECT12) 378 C 379 C REDUCE TO A LEVEL 9 REPRESENTATION 380 C 381 CALL COMPRESS(3,SECT12,118,JJ8) 382 TRACE 1(SECT12) 383 C 384 C PLACE REDUCED IMAGE IN CORRECT POSN. OF THE 385 C 512 X 512 IMAGE 386 C 387 MAP9(MASKPLANE(118,JJ8,3),18,J8)=SECT12 388 TEMP=MAP9(,,18,J8) 389 TRACE l(TEMP) 390 10 CONTINUE 391 RETURN 392 END 393 C 394 C 395 C 396 C 397 C 398 SUBROUTINE GRID1024(INDEX,SUM6) 399 C 400 C THIS I S A SUBROUTINE TO SET UP COMMON BLOCK 401 C MAP10 AND SPLIT THE DAP PLANES TO 4x4 CHNKS 402 C FOR A LEVEL 10 REPRESENTATION
Annex 6c

- 501 -
403 C 404 LOGICAL LEVEL6(,,109) 405 LOGICAL LEVEL12(,,1750),MAP10(,,16,16) 406 LOGICAL SECT12(,) 407 INTEGER INDEX(,),SUM6 408 EXTERNAL LOGICAL MATRIX FUNCTION MASKPLANE 409 COMMON/DATA/LEVEL6,LEVEL12
COMMON/MAPS10/MAP10 410 COMMON/DATA/LEVEL6,LEVEL12 COMMON/MAPS10/MAP10
411 C 412 C I N I T I A L I S E MAP10 413 C 414 DO 100 1=1,16 415 DO 100 J=l,16 416 100 MAP10(,,I,J)=.FALSE. 417 C 418 C DO FOR EACH BIT-PLANE OF THE LEVEL 12 DATA 419 C 420 DO 10 K=1,SUM6 421 C 422 C SET N TO BE THE POSITIONAL LEVEL 6 POSN. 423 C IN THE MAP-SHEET INDEX 424 c 425 N=INDEX(K) 426 c 427 c COMPUTE CORRESPONDING POSTN. COORDS IN 428 c THE LEVEL 12 DATA: 429 c 164,J64 I S x,y IN 64 X 64 DAP-PLANE 430 c 116,J16 I S x,y OF EACH 4x4 CHUNK 431 c 14,J4 I S x,y WITHIN EACH 4x4 CHUNK 432 c 433 c 434 IGRID=64/16 435 I64=(N/64)+l 436 IF(N.EQ.4096)164=64 437 I16=((I64-1)/IGRID)+1 438 J64=N-((164-1)*64) 439 J16=((J64-1)/IGRID)+1 440 J4=N-(((164-1)*64)+(J16-1)*IGRID) 441 c I 4 = ( ( N - ( ( ( I 1 6 - 1 ) * 6 4 * I G R I D ) + J 6 4 ) ) / 6 4 ) + l 442 L=(116-1)*64*IGRID+(J16-1)*IGRID 443 14=4 444 IF(N-L.GT.4) GOTO 20 445 14=1 446 GOTO 40 447 20 IF(N-L-64.GT.4) GOTO 30 448 14=2 449 GOTO 40 450 30 IF(N-L-128.GT.4) GOTO 40 451 14=3 452 40 CONTINUE 453 C 454 C SET SECT12 TO CURRENT L12 PLANE
Annex 6c
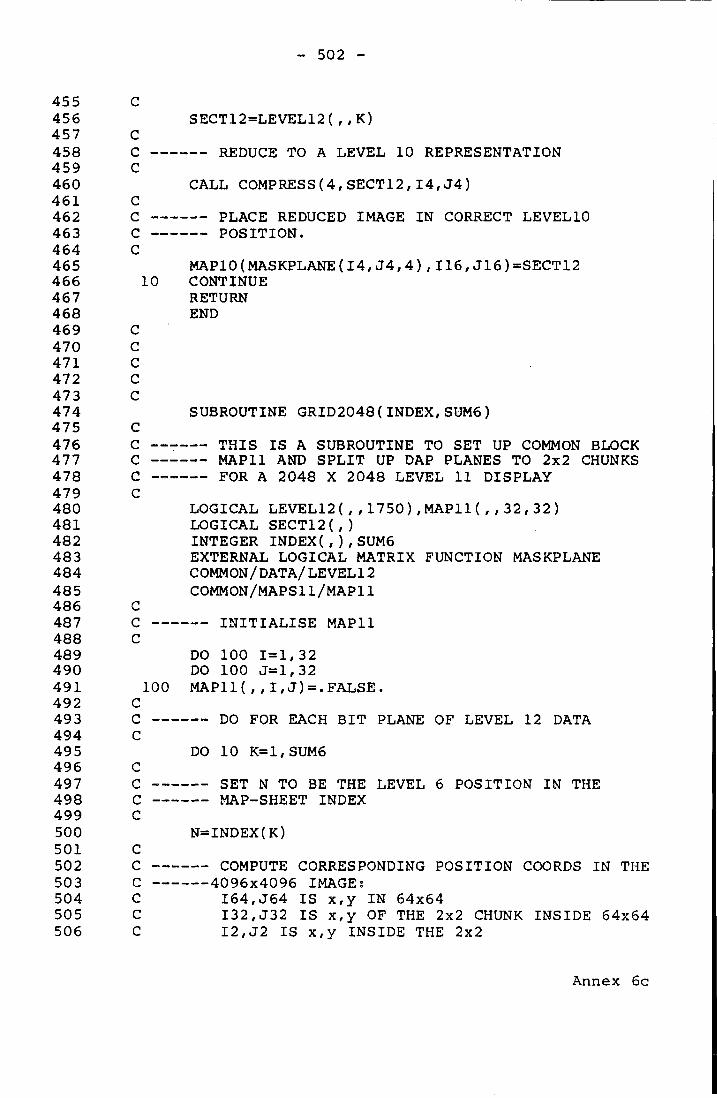
- 502 -
455 C 456 SECT12=LEVEL12( , , K) 457 C 458 C REDUCE TO A LEVEL 10 REPRESENTATION 459 C 460 CALL COMPRESS(4,SECT12,14,J4) 461 C 462 C PLACE REDUCED IMAGE IN CORRECT LEVEL10 463 C POSITION. 464 C 465 MAP10(MASKPLANE(I4,J4,4),116,J16)=SECT12 466 10 CONTINUE 467 RETURN 468 END 469 C 470 C 471 C 472 C 473 C 474 SUBROUTINE GRID2048(INDEX,SUM6) 475 C 476 C THIS I S A SUBROUTINE TO SET UP COMMON BLOCK 477 C MAP11 AND SPLIT UP DAP PLANES TO 2x2 CHUNKS 478 C FOR A 2048 X 2048 LEVEL 11 DISPLAY 479 C 480 LOGICAL LEVEL12(,,1750),MAP11(,,32,32) 481 LOGICAL SECT12(,) 482 INTEGER INDEX(,),SUM6 483 EXTERNAL LOGICAL MATRIX FUNCTION MASKPLANE 484 COMMON/DATA/LEVEL12 485 COMMON/MAPS11/MAP11 486 C 487 C I N I T I A L I S E MAP11 488 C 489 DO 100 1=1,32 490 DO 100 J=l,32 491 100 MAPI1(,,I,J)=.FALSE. 492 C 493 C DO FOR EACH BIT PLANE OF LEVEL 12 DATA 494 C 495 DO 10 K=1,SUM6 496 C 497 C SET N TO BE THE LEVEL 6 POSITION IN THE 498 C MAP-SHEET INDEX 499 C 500 N=INDEX(K) 501 C 502 C COMPUTE CORRESPONDING POSITION COORDS IN THE 503 C 4096x4096 IMAGE; 504 C 164,J64 I S x,y IN 64x64 505 C 132,J32 I S x,y OF THE 2x2 CHUNK INSIDE 64x64 506 C 12,J2 I S x,y INSIDE THE 2x2
Annex 6c

- 503 -
507 C 508 IGRID=64/32 509 I64=(N/64)+l 510 IP(N.EQ.4096)164=64 511 I32=((I64-1)/IGRID)+1 512 J64=N-((164-1)*64) 513 J32=((J64-1)/IGRID)+1 514 J2=N-(((164-1)*64)+(J32-l)*IGRID) 515 C I 2 = ( ( N - ( ( ( I 3 2 - l ) * 6 4 * I G R I D ) + J 6 4 ) ) / 6 4 ) + l 516 L=(I32-1)*64*IGRID+(J32-1)*IGRID 517 12=1 518 I F (N-L.GT.2) 12=2 519 C 520 C SET SECT12 TO BE CURRENT LEVEL 12 DAP PLANE 521 C 522 SECT12=LEVEL12(,,K) 523 C 524 C REDUCE TO A LEVEL 11 REPRESENTATION 525 C 526 CALL COMPRESS(5,SECT12,12,J2) 527 C 528 C PLACE REDUCED IMAGE IN CORRECT 529 C — POSITION OF LEVEL 11 530 C 531 MAP11(MASKPLANE(I2,J2,5),132,J32)=SECT12 532 10 CONTINUE 533 RETURN 534 END 535 C 536 C 537 C 538 C 539 C 540 SUBROUTINE COMPRESS(P,SECT12,X,Y) 541 C 542 C *** THIS I S A SUBROUTINE TO DIVIDE CONCEPTUALLY 543 C *** THE 64x64 DAP PLANE SECT12 (WHICH I S A 5 4 4 c *** LEVEL 12 DAP IMAGE) INTO CHUNKS OF 2**P 545 C *** THEN ON THE BASIS OF THESE CHUNKS IT PERFORMS 546 C *** A 'FOLDING' OPERATION TO REDUCE THE 2**Px2**P 547 C *** UNITS INTO 1 PIXEL (SCATTERED WITHIN THE 548 C *** 64x64 IMAGE. THESE SCATTERED DATA ARE SHUNTED 549 C *** TO THE TOP 2**Px2**P AREA OF THE MATRIX AND 550 C *** MOVED TO THEIR CORRECT POSITION SPECIFIED BY 551 C *** SUPPLIED PARAMETERS X AND Y 552 C 553 C 554 C 555 INTEGER X,Y,P,V(),XX(,),COUNT(,),TCOUNT(,) 556 LOGICAL SECT12(,),MASK(,),LC(,,32),LTC(,,32), 557 1M0VE(,) 5 58 EQUIVALENCE(COUNT,LC(,,1)),(TCOUNT,LTC(,, 1) )
Annex 6c

- 504 -
559 C 560 C SET N=NO OF PIXELS IN THE 2**P 561 C CHUNK THEN SUBTRACT 1 562 C 563 M=2**P 564 N=2**(6-P)-l 565 C 566 C SUCCESSIVELY SHIFT NTH AND WEST (FOLDING 567 C OPERATION) PRESERVING ANY SET PIXELS 568 C 569 DO 10 1=1,N 570 SECT12=SHNC(SECT12,1).OR.SECT12 571 10 SECT12=SHWC(SECT12, 1) .OR.SECT12 572 N=N+1 573 C 574 C SET V (A 64 ELEMENT INT VECTOR) = 1 575 C 576 V=l 577 L = l 578 C 579 C USE RECURSIVE DOUBLING ON THE VECTOR V TO 580 C CREATE A VECTOR OF THE FORM: 1,2,3,4,..64 581 C 582 DO 20 1=1,6 583 V=V+SHRP(V,L) 584 20 L=L*2 585 C 586 C SUBTRACT 1 FROM EVERY VALUE OF VECTOR V 587 C 588 V=V-1 589 C 590 C BUILD XX A MATRIX OF SUCCESSIVE ROWS OF V 591 C 592 XX=MATR(V) 593 C 594 C SET UP A MASK OF .TRUE. ONLY WHERE NO WILL 595 C DIVIDE BY N EXACTLY 596 C 597 MASK=XX-(XX/N)*N.EQ.0 598 C 599 C NOW XX = SUCCESSIVE COLUMNS OV VECTOR V 600 C 601 XX=MATC(V) 602 C 603 C NOW AMEND MASK SO THAT I T I S ONLY .TRUE. I F 604 C THE COLUMNS WILL DIVIDE BY N EXACTLY BUT 605 C PRESERVE THE PROPERTIES OF MASK 606 C 607 MASK=MASK.AND.XX-(XX/N)*N.EQ.0 608 C 609 C SET SECT12 ONLY EQUAL TO ELEMENTS WHERE 610 C MASK I S TRUE
Annex 6c

- 505 -
611 C 612 SECT12=MASK.AND.SECT12 613 TRACE 1(SECT12) 614 C 615 c SET COUNT = INTEGER EQUIV OF . NOT.MASK 616 c 617 COUNT=IFIX(.NOT.MASK) 618 L=l 619 c 620 c - — RECURSIVE DOUBLING ROUTINE TO SHUNT THE 621 c - — DISPERSED VALUES TO TOP N*N AREA OF THE 622 c - — MATRIX 623 c 624 c 625 DO 30 1=1,6 626 COUNT=COUNT+SHSP(COUNT,L) 627 30 L=L*2 628 L=l 629 DO 35 1=1,6 630 MOVE=LC(,,33-1) 631 SECT12(MOVE)=SHNP(SECT12,L) 632 MAS K(MOVE)=SHNP(MASK,L) 633 COUNT(MOVE)=SHNP(COUNT,L) 634 35 L=L*2 635 L=l 636 TRACE 1(SECT12) 637 TCOUNT=IFIX(.NOT.MASK) 638 DO 40 1=1,6 639 TCOUNT=TCOUNT+SHEP(TCOUNT,L) 640 40 L=L*2 641 L=l 642 DO 45 1=1,6 643 C 644 MOVE=LTC(, ,33-1) 645 SECT12(MOVE)=SHWP(SECT12,L) 646 TCOUNT(MOVE)=SHWP(TCOUNT,L) 647 C 648 45 L=L*2 649 c 650 IX=(X-1)*M 651 IY=(Y-1)*M 652 IY=(Y-1)*64/N 653 TRACE 1(SECT12) 654 SECT12=SHEP(SHSP(SECT12,IY),IX) 655 TRACE 1(SECT12) 656 RETURN 657 END 658 c 659 c 660 c 661 c 662 c
Annex 6c

- 506 -
663 LOGICAL MATRIX FUNCTION MASKPLANE(I,J,P) 664 C 665 C — THIS I S A FUNCTION TO SET UP A MASK SET TO 666 C — .FALSE. EXCEPT IN A 2**Px2**P AREA IN 667 C — - POSITION I , J WHICH I S SET TO .TRUE. 668 C 669 INTEGER P 670 LOGICAL X ( , ) , Y ( , ) 671 ISIZE=2**P 672 I S T A R T - ( ( I - 1 ) * I S I Z E ) + 1 673 IEND=ISTART+(ISIZE-1) 674 JSTART=((J-1)*ISIZE)+1 675 JEND=J START+(ISIZE-1) 676 MASKPLANE=.FALSE. 677 X=COLS(ISTART,IEND) 678 Y=COLS(JSTART,JEND) 679 Y=TRAN(Y) 680 MAS KP LANE=X.AND.Y 681 RETURN 682 END 683 C 684 C 685 c 686 c 687 < c 688 SUBROUTINE DRAW512 689 c 690 c — THIS I S A SUBROUTINE TO OUTPUT A LEVEL 9 691 c — 512 X 512 IMAGE TO THE SIGMA 692 c 693 LOGICAL MAP9(,,8,8)
COMMON/MAPS9/MAP9 694 LOGICAL MAP9(,,8,8) COMMON/MAPS9/MAP9
695 CALL DRAW(MAP9,0,511) 696 RETURN 697 END 698 c 699 c 700 c 701 c 702 c 703 SUBROUTINE DRAW1024(I,J) 704 c 705 c — THIS I S A SUBROUTINE TO OUTPUT A LEVEL 10 706 c — 1024 X 1024 IMAGE TO THE SIGMA 707 c 708 LOGICAL MAP10(,,16,16),OUT(,,8,8) 709 COMMON/MAPS10/MAP10 710 DO 10 K=l,8 711 DO 10 L=l, 8 712 10 OUT(,,K,L)=.FALSE. 713 18=1+7 714 J8=J+7
Annex 6c

- 507 -
715 11=0 716 JJ=0 717 I F ( I 8 . G T . 1 6 ) 18=16 718 IF(J8.GT.16) J8=16 719 DO 20 K=I,I8 720 11=1+11 721 JJ=0 722 DO 20 L=J,J8 72 3 JJ=1+JJ 724 OUT(,,II,JJ)=MAP10(,, K, L) 725 20 CONTINUE 726 CALL DRAW(OUT,0,511) 727 RETURN 728 END 729 C 730 C 731 C 732 C 733 C 734 SUBROUTINE DRAW2048(I,J) 735 C 736 C THIS I S A SUBROUTINE TO OUTPUT A LEVEL 11 737 C — 2048 X 2048 IMAGE TO THE SIGMA 738 C 739 LOGICAL MAP11(,,32,32),OUT(,,8,8) 740 COMMON/MAPS11/MAP11 741 DO 10 K=l,8 742 DO 10 L=l,8 743 10 OUT(,,K,L)=.FALSE. 744 18=1+7 745 J8=J+7 746 11=0 747 JJ=0 748 I F ( I 8 . G T . 3 2 ) 18=32 749 IF(J8.GT.32) J8=32 750 DO 20 K=I,I8 751 11=1+11 752 JJ=0 753 DO 20 L=J,J8 754 JJ=1+JJ 755 OUT(,,II,JJ)=MAP11(, ,K,L) 756 20 CONTINUE 757 CALL DRAW(OUT,0,511) 758 RETURN 759 END 760 C 761 C 762 C 763 C 764 C 765 SUBROUTINE DRAW(PICT,IST,JST) 766 C
Annex 6c

- 508 -
767 C THIS I S A SUBROUTINE TO TAKE A 512 X 512 768 C IMAGE CONVERT IT TO SIGMA FORMAT AND 769 C CAUSE AN ERROR TO FORCE THE HOST MACHINE 770 C TO INTERRUPT THE DAP FOR THE i/O 771 C 772 LOGICAL PICT(,,8,8) 773 INTEGER I G , J G , I S I Z E 774 C 775 C SET UP COLOUR OPTIONS 776 C 777 CHARACTER* 1 IA( , ) , CHARR( ) / ' l ,
/ ' 2 , , ' 3 \ , 4 , , , 5 \ 778 l , 6 , , , 7 , , , 8 ,
f, 9 , , , A , , , B ,
f, C ,
f, D ,
f, E ,
f, F , , , 0 ' /
779 COMMON/DISPLAY/IA 780 COMMON/DISSIZE/ISIZE,IG,JG 781 COMMON/COUNT/INSTR 782 DO 10 1=1,8 783 IG=IST+(I-1)*64 784 DO 10 J=l,8 785 INSTR=1 786 J G = J S T - ( J - l ) * 6 4 787 IA=CHARR(8) 788 C 789 C DISPLAY LINEWORK IN COLOUR OPTION 1 790 C 791 IA(PICT(,,J,I))=CHARR(1) 792 CALL CONVMFl(IA) 793 IF(I.EQ.8.AND.J.EQ.8)INSTR=0 794 ERROR 8999 795 10 CONTINUE 796 RETURN 797 END 798 C 799 C 800 C 801 C 802 C 803 SUBROUTINE OUTPUT(L,NUM) 804 C 805 C THIS I S A SUBROUTINE IN 2980 FORTRAN 806 C IT'S INVOKED EACH TIME ERROR CONDITION 8999 807 C OCCURS IN THE DAP AND DISPLAYS THE SIGMA 808 C FORMATTED IMAGE IA TO THE COLOUR DISPLAY 809 C 810 CHARACTER*1 L,IA(64,64) 811 INTEGER*8 ISIZE,IG,JG,INSTR 812 INTEGER NUM 813 COMMON/COUNT/INSTR 814 COMMON/DISSIZE/ISIZE,IG,JG 815 COMMON/DISPLAY/IA 816 C 817 C VME/B MANDATORY FOR ERRORTRAP 818 C
Annex 6c

- 509 -
819 I F (L.NE.'S') RETURN 820 I F (NUM.NE.8999) RETURN 821 CALL CONT 822 CALL ICL9HERRORTABLE(0,-1,-1,0,0,0,0, 823 1-1,0,-1,1,IRES) 824 C 825 C DISPLAY THE DATA IN THIS DAP PLANE 826 c 827 JG=JG+1 828 DO 10 J=l,64 829 JG=JG-1 830 IIG=IG 831 JJG=JG 832 CALL MOVE(IIG,JJG,.FALSE.) 833 CALL OUTLINE(IA(1,J),64) 834 10 CONTINUE 835 c 836 c — -— I F END OF PLOT CALL FOR NEXT USER COMMAND 837 c — •— OR RETURN TO THE DAP FOR THE NEXT PLANE 838 c 839 IF(INSTR.EQ.O)CALL INSTRUCTION 840 RETURN 841 END 842 c 843 c 844 c 845 c 846 c 847 SUBROUTINE INSTRUCTION 848 c 849 c — THIS SUBROUTINE I S CALLED EACH TIME A USER 850 c — - COMMAND I S REQUIRED. THE INFORMATION R'Q'D 851 c I S THE LEVEL OF DATA REQUIRED AND THE 852 c — COORD VALUE (IN RASTER) OF THE LOWER LEFT 853 c — HAND CORNER. 854 c 855 c — INSTRUCTION 999 MEANS STOP THE PROGRAM 856 c 857 INTEGER*8 INT,IX,IY 858 COMMON/INST/INT,IX,IY 859 CALL END 860 WRITE(6,100) 861 100 FORMAT(' TYPE IN : INSTRUCTION IX IY 1 ) 862 READ(5,*)INT,IX, I Y 863 IF(INT.EQ.999)RETURN 864 c 865 c — PREPARE THE DISPLAY 866 c 867 CALL CLEAR 868 RETURN 869 END
END OF F I L E
Annex 6c

- 510 -
ANNEX 6d
DAP-FORTRAN source l i s t i n g of software to i s o l a t e s u b - p a r c e l
data from OS l a r g e s c a l e map images i n r a s t e r form.
See s e c t i o n 6.4.2 o f t e x t f o r d e t a i l s
1 c ********** T H I S I S P A R C E L 5 1 2 2 c ********** A N D S U B P A R C . E L 5 1 2 3 C 4 PROGRAM PARCEL512 5 C 6 C *** THIS I S THE HOST FORTRAN SECTION OF THE 7 C *** SUB-PARCEL EXTRACTION SOFTWARE. ITS PURPOSE 8 C *** I S TO CONTROL THE DAP MODULES IN SUBDIVIDING 9 C *** A COMPLETE OS RASTER IMAGE INTO A SERIES OF
10 C *** SUB-PARCEL UNITS. THE RASTER INPUT DATA ARE 11 C *** READ ON CHANN. 10 AND THE LEVEL 6 INDEX I S 12 C *** READ ON CHANN. 7 13 C *** SEE SECTION 6.4.2 OF TEXT FOR DESCRIPTION 14 C 15 C 16 C DECLARATION OF INTEGER*8 MEANS THAT 17 C NO CONVERSION TO DAP FORMAT I S NECESSARY 18 C 19 INTEGER*8 NFC,SUM6,NFIRST 20 INTEGER INDEX(4096) 21 COMMON/FC/NFC 22 C 23 C F I L E I S DECLARED SUITABLY LARGE AND 24 C I S , IN EFFECT, THE DAP TO THIS PROGRAM 25 C 26 CHARACTER*64 FILE(14000) 27 COMMON/DATA/FILE 28 COMMON/IND/INDEX,SUM6,NFIRST 29 EXTERNAL VECTOUT 30 C 31 C THE USE OF AN ERROR TRAP ENABLES A SNEAKY 32 C REVERT BACK FROM THE DAP TO THE 2980 33 C 34 C THE FOLLOWING THREE LINES ARE JUST 35 C VME/B MANDATORY FOR ERROR TRAP CATCHING 36 C SUB "VECTOUT" WILL RUN ON EACH ERROR 37 C 38 CALL ICL9HERRORTRAPDR(VECTOUT,IRES) 39 IF(IRES.NE.0)WRITE(6,1) 40 1 FORMAT(' SET VECTOUT UNSUCCESSFUL') 41 C
Annex 6d

- 511 -
42 c ASK THE USER TO REQUEST WHICH F/C HE WISHES 43 C 44 WRITE(6,100) 45 100 FORMAT(' WHICH FEATURE CODE?') 46 READ(5,*)NFC 47 c 48 c INPUT OF THE INDEX LEVEL 6 F I L E 49 c 50 NF=1417*8 51 READ(7,1000)(FILE(I),1=1,NF) 52 1000 FORMAT(1A64) 53 c 54 c OPEN AND LINK UP CHANNEL 10 TO APPROPRIATE 55 c NFC LEVEL 12 (DAP FORMAT) F I L E 56 c 57 CALL CONNECTFILE(NFC) 58 c 59 c EXAMINE DESIRED LEVEL 6 F I L E , SHUNT 60 c POSITIONAL INDEX TO TOP OF LONG VECTOR 61 c 62 CALL GETNFC 63 c 64 c 65 c SUM6 IS THE NO. OF SET LEVEL 6 PIXELS 66 c 67 NF=SUM6*8 68 c 69 c READ IN THE DESIRED LEVEL 12 DATA 70 c 71 READ(10,1000)(FILE(I),1=1,NF) 72 c 73 c SET UP THE SIGMA GRAPHICS TERMINAL 74 c 75 CALL START 76 CALL SETBUFFSIZE(1024,6) 77 c 78 c PREPARE LEVEL 12 F I L E TO A LEVEL 9 REP, 79 c 80 CALL SETUP512 81 c 82 c START IDENTIFYING SUB-PARCELS ON DAP 83 c 84 CALL SUBPARCEL512 85 CALL END 86 STOP 87 END 88 c 89 c 90 c 91 c 92 c 93 ENTRY SUBROUTINE SETUP512
Annex 6d

- 512 -
94 C 95 C - THIS I S A SUBROUTINE TO CONVERT LEVEL 12 96 C - REP. OF RASTER IMAGE TO LEVEL 9 97 C 98 INTEGER INDEX(,),SUM6 99 COMMON/IND/INDEX,SUM6
100 C 101 C - SEE ANNEX 6C FOR THIS SUB 102 C 103 CALL GRID512(INDEX,SUM6) 104 RETURN 105 END 106 c 107 c 108 c 109 c 110 c 111 ENTRY SUBROUTINE SUBPARCEL512 112 c 113 c - THIS I S THE ENTRY SUBROUTINE FOR THE 114 c - SUB-PARCEL EXTRACTION FOR THE LEVEL 9 DATA 115 c - I T HANDLES ANY INITIALISING AND SUBR CALLS 116 c 117 LOGICAL NSIDE(,) 118 LOGICAL CORNERS(,) 119 LOGICAL PADDING(,,22) 120 INTEGER BBUFF(,,11) 121 EQUIVALENCE (BBUFF,BUFF) 122 LOGICAL EDGE(,,4),START(,),BOUND(,),NBOUND(,) 123 LOGICAL SIDE(,),MAP(,,8,8) 124 LOGICAL POINT(,) 125 INTEGER*2 V ( ) , X C ( , ) , Y C ( , ) 126 INTEGER*2 P( 256),L(256),PARCEL(62,2),NPP,NP,IB 127 INTEGER C(,),BUFF(,,10) 128 INTEGER*2 OLDP,NCOOORD 129 INTEGER*2 I I , J J 130 c 131 c - SET UP AN ARRAY 'CORNERS' SO THAT ONLY EACH 132 c - CORNER ELEMENT I S SET 133 c 134 DATA CORNERS/#8000000000000001,
1 62* #0000000000000000, 135 DATA CORNERS/#8000000000000001,
1 62* #0000000000000000, 136 1 #8000000000000001/ 137 COMMON/XY/XC,YC 138 COMMON/IMAGE/IX, IY 139 COMMON/XYBUFF/BUFF,P,L,PARCEL,NPP, NP, IB, 140 1PADDING 141 COMMON/MAPS9/MAP 142 EXTERNAL LOGICAL MATRIX FUNCTION NBH 143 c 144 c - SET-UP TO MATRICES XC AND YC TO AID 145 c - VECTORISING OF SUB-PARCELS. XC CONTAINS
Annex 6d

- 513 -
146 C SUCCESSIVE ROWS OF 1,2,3,....64 AND 147 C YC COLS OF 1,2,3,... 64 148 N=l 149 V=l 150 DO 100 1=1,6 151 V=V+SHRP(V,N) 152 100 N=N*2 153 V=V-1 154 XC=MATR(V) 155 YC=MATC(REV(V)) 156 C 157 C I N I T I A L I S E BUFF WHICH I S A COLLECTION OF 158 C TO STORE THE VECTOR DATA BEFORE MATRICES 159 C I/O TO A F I L E ON THE 2980 160 C 161 NP=0 162 DO 200 1=1,11 163 200 BBUFF(,,I)=0 164 IB=1 165 NPP=1 166 P ( D=1 167 L(1)=0 168 OLDP=l 169 C 170 DO 300 1=1,8 171 DO 300 J=l,8 172 C 173 C TRANSFORM MAP SO THAT ITS APPEARANCE I S THE 174 C CORRECT WAY ROUND 175 C 176 300 MAP(,,I,J)=TRAN(MAP(,,I,J)) 177 C 178 C PUT A BORDER RIGHT AROUND THE EDGE OF MAP 179 C 180 CALL BORDERMAPJ512 ( MAP) 181 C 182 C SET UP EDGE WHICH I S A COLLECTION OF 4 183 C LOGICAL MATRICES SUCH THAT EACH WILL 184 C HAVE 1 OF 4 POSSIBLE EDGES SET ONLY 185 C 186 CALL SETEDGE(EDGE) 187 C 188 C DAP IMAGE BY DAP IMAGE, START TO LOOK FOR 189 C SUB-PARCELS 190 C 191 DO 10 1=1,8 192 DO 10 J=l,8 193 DO 40 LL=1,100 194 C 195 C BOUND I S THE TEMP LOGICAL MATRIX WHICH 196 C STORES THE CURRENT DAP IMAGE UNDER SCRUTINY 197 C
Annex 6d

- 514 -
198 BOUND=MAP(,,I,J) 199 C 200 C START I S A LOGICAL MATRIX IN WHICH THE 201 C POINT EXPANSION WILL TAKE PLACE DURING 202 C THE PARCEL EXTRACTION PROCESS 203 C 204 C SET THE FIRST POINT IN THE FIRST NEXT 205 C AVAILABLE PARCEL TO TRUE IN READINESS FOR 206 C POINT EXPANSION. 207 C 208 START=FRST(.NOT.BOUND) 209 C 210 C I F THERE ARE NO AVAILABLE TRUES LEFT IN 211 C START THEN THIS DAP IMAGE HAS BEEN 212 C FINISHED SO GO TO THE NEXT 213 C 214 IF(ALL(.NOT.START))GOTO 10 215 NP=NP+1 216 C 217 C START THE POINT EXPANSION PROCESS UP TO THE 218 C PARCEL BDY. 130 I S AN EMPIRICAL NUMBER TO 219 C ENSURE THAT ALL DAP IMAGE I S SEARCHED. 220 C 221 POINT=START 222 DO 20 K=l,130 223 20 START(.NOT.BOUND)=NBH(START) 224 CALL VECTOR(START,BOUND,I,J,POINT) 225 C 226 C AMEND THIS VERSION OF MAP NOW BY 227 C 'PAINTING-OUT' THE SUB-PARCEL WHICH 228 C HAS CURRENTLY BEEN EXTRACTED. 229 C 230 MAP(,,I,J)=BOUND.OR.START 231 C 232 C NOW LOOK TO SEE I F THE CURRENT SUB-PARCEL 233 C OVERLAPS INTO ANY ADJACENT DAP IMAGE 234 C 235 DO 30 K=l,4 236 SIDE=START.AND.EDGE(,,K).AND..NOT.CORNERS 237 C 238 C I F THERE I S NO OVERLAP GO BACK AND LOOK FOR 239 C NEXT SUBPARCEL IN THIS DAP IMAGE 240 C 241 IF(.NOT.ANY(SIDE))GOTO 30 242 C 243 C SEARCH SIDE BY SIDE FOR THE PARCEL IN THE 244 C NEXT ADJACENT DAP IMAGE. I I AND J J ARE 245 C NEEDED TO KEEP THE RECURSIVE STACK AS SMALL 246 C AS POSSIBLE WHEN SUB NEXTPLANE512 247 C I S CALLED RECURSIVELY 248 C 249 11=1
Annex 6d

- 515 -
250 JJ=J 251 GOTO(l,2,3,4) ,K 252 1 11=1-1 253 SIDE=SHNC(SIDE) 254 GOTO 25 255 2 JJ=J+1 256 SIDE=SHEC(SIDE) 257 GOTO 25 258 3 11=1+1 259 SIDE=SHSC(SIDE) 260 GOTO 25 261 4 JJ=J-1 262 SIDE=SHWC(SIDE) 263 C 264 C 265 C GO SEARCH NEXT DAP IMAGE FOR OVERLAP PARCEL 266 c 267 25 CALL NEXTPLANE512(MAP,II,JJ,KK,SIDE,EDGE, 268 INBOUND,CORNERS,NSIDE) 269 30 CONTINUE 270 PARCEL(NP,1)=OLDP 271 OLDP=OLDP+PARCEL(NP,2) 272 CALL DISPLAYPARCEL512 273 40 CONTINUE 274 10 CONTINUE 275 RETURN 276 END 277 c 278 c 279 c 280 c 281 c 282 SUBROUTINE BORDERMAP_512 (MAP) 283 c 284 c THIS I S A SUBROUTINE WHICH TAKES A 285 c COLLECTION OF 8 X 8 DAP IMAGES AND SETS 286 c THE OUTER BORDER OF THE WHOLE" SET 287 c I . E . I T SETS AN 8 X 8 BORDER 288 c 289 LOGICAL MAP(,,8,8),EDGE( , ,4) 290 c 291 CALL SETEDGE(EDGE) 292 DO 10 K=l,8 293 MAP(,,1,K)=MAP(,,1,K).OR.EDGE(,,1) 294 MAP(,,8,K)=MAP(,,8,K).OR.EDGE(,,3) 295 MAP(,,K,1)=MAP(,,K,1).OR.EDGE( , ,4) 296 10 MAP(,,K,8)=MAP(,,K,8).OR.EDGE(,,2) 297 RETURN 298 END 299 c 300 c 301 c
Annex 6d
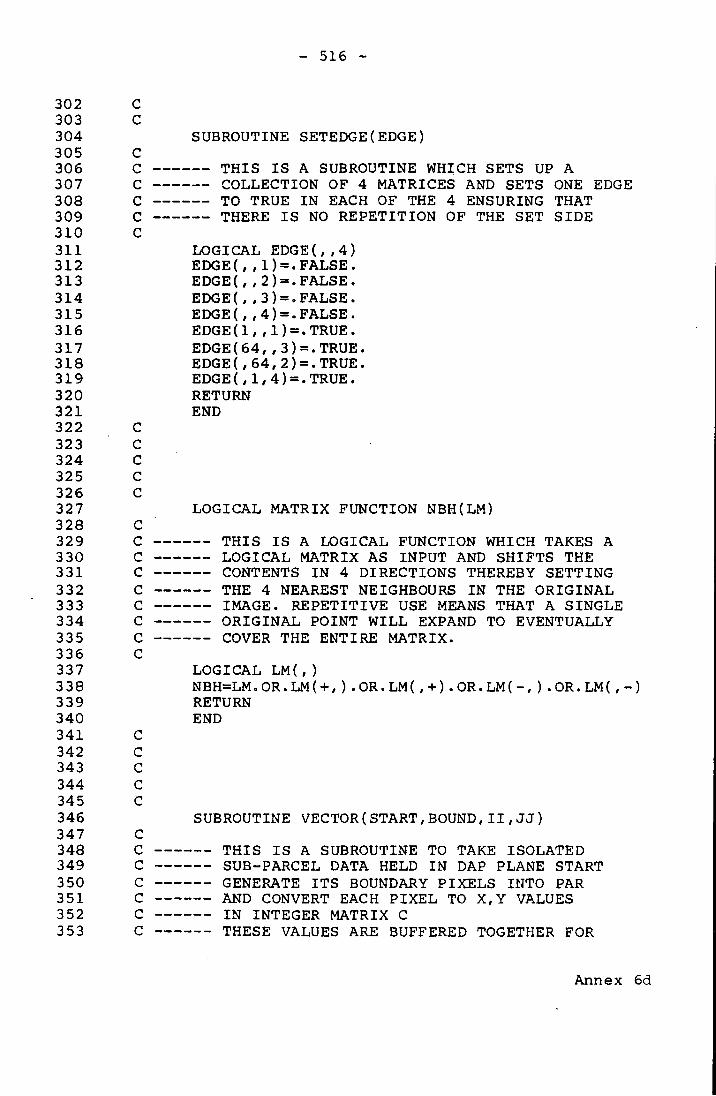
- 516 -
302 C 303 C 304 SUBROUTINE SETEDGE(EDGE) 305 C 306 C THIS I S A SUBROUTINE WHICH SETS UP A 307 C COLLECTION OF 4 MATRICES AND SETS ONE EDGE 308 C TO TRUE IN EACH OF THE 4 ENSURING THAT 309 C THERE I S NO REPETITION OF THE SET SIDE 310 C 311 LOGICAL EDGE(,,4) 312 E D G E ( 1 ) = . F A L S E . 313 EDGE(,, 2 ) =.FALSE. 314 EDGE(,, 3 ) =.FALSE. 315 EDGE( , , 4) =.FALSE. 316 EDGE(1,, 1) =.TRUE. 317 EDGE(64,,3)=.TRUE. 318 EDGE(,64,2)=.TRUE. 319 EDGE( , 1, 4) =.TRUE. 320 RETURN 321 END 322 C 323 C 324 C 325 C 326 C 327 LOGICAL MATRIX FUNCTION NBH(LM) 328 C 329 C THIS I S A LOGICAL FUNCTION WHICH TAKES A 330 C LOGICAL MATRIX AS INPUT AND SHIFTS THE 331 C CONTENTS IN 4 DIRECTIONS THEREBY SETTING 332 C THE 4 NEAREST NEIGHBOURS IN THE ORIGINAL 333 C IMAGE. REPETITIVE USE MEANS THAT A SINGLE 334 C ORIGINAL POINT WILL EXPAND TO EVENTUALLY 335 C COVER THE ENTIRE MATRIX. 336 C 337 LOGICAL LM(,) 338 NBH=LM.OR.LM(+,).OR.LM(,+).OR.LM(-,).OR.LM(,-) 339 RETURN 340 END 341 C 342 C 343 C 344 C 345 C 346 SUBROUTINE VECTOR(START,BOUND,II,JJ) 347 C 348 C THIS I S A SUBROUTINE TO TAKE ISOLATED 349 C SUB-PARCEL DATA HELD IN DAP PLANE START 3 50 C GENERATE ITS BOUNDARY PIXELS INTO PAR 351 C AND CONVERT EACH PIXEL TO X,Y VALUES 352 C IN INTEGER MATRIX C 353 C THESE VALUES ARE BUFFERED TOGETBIER FOR
Annex 6d

- 517 -
354 C STORAGE IN BUFF FOR ARCHIVE OR DISPLAY 355 C 356 LOGICAL LC(,,32) 357 LOGICAL START( , ) ,BOUND( , ) ,PAR(,) 358 INTEGER*2 X C ( , ) , Y C ( , ) , P ( 2 5 6 ) , L ( 2 5 6 ) , 359 1PARCEL(62,2),X(,),Y(,),NPP,NP 360 INTEGER BUFF(,,10),C(,) 361 INTEGER*2 I I , J J , I B 362 EXTERNAL INTEGER MATRIX FUNCTION IPACK 363 EXTERNAL LOGICAL MATRIX FUNCTION NBH 364 COMMON/XY/XC,YC 365 COMMON/XYBUFF/BUFF,P,L,PARCEL,NPP,NP,IB 366 EQUIVALENCE (LC,C,X),(LC(,,17),Y) 367 C 368 C GENERATE X AND Y MATRICES WITH 369 C ELEMENT COORDINATES IN THEM 370 C 371 Y=(JJ-1)*64+XC 372 X=(8-II)*64+YC 373 C 374 C I N I T I A L I S E PAR - A MATRIX TO HOLD 375 C THE SUB-PARCEL BOUNDARY 376 C 377 PAR=.FALSE. 378 C 379 C GENERATE THE SUB-PARCEL BDY. INTO PAR 380 C 381 PAR(BOUND)=NBH(START) 382 NCOORD=SUM(PAR) 383 C 384 C SET-UP POINTERS FOR THE START AND END 385 C OF VECTOR CHAINS IN THE SEQUENTIAL 386 C BUFFER STORE 387 C 388 IP=P(NPP)+L(NPP) 389 I S = I P - ( I P - l ) / 4 0 9 6 * 4 0 9 6 390 NPP=NPP+1 391 P(NPP)=IP 392 L(NPP)=NCOORD 393 PARCEL(NP,2)=PARCEL(NP,2)+NCOORD 394 C 395 C CONVERT PIXEL BOUNDARY TO COORDINATES 396 C 397 C(.NOT.PAR)=0 398 C 399 C SHUNT THESE COORDS TO TOP OF C 400 C 401 C=SHRC(IPACK(C) , IS-1) 402 C 403 C STORE THEM IN THE SEQUENTIAL BUFFER 404 C 405 BUFF(.NOT.ELSL(1,IS-1),IB)=C
Annex 6d

- 518 -
406 IF((IS+NCOORD-1).LE.4096)RETURN 407 IB=IB+1 408 BUFF(,,IB)=C 409 RETURN 410 END 411 C 412 C 413 C 414 C 415 C 416 SUBROUTINE NEXT PLANE 512(MAP,II,JJ,KK,START, 417 1EDGE,BOUND,CORNERS,SIDE) 418 C 419 C THIS I S A SUBROUTINE WHICH CAN BE CALLED 420 C RECURSIVELY AND I S DESIGNED TO SEARCH 421 c ADJACENT DAP PLANES WHEN SUBPARCEL OVERLAPS 422 c INTO THEM. IT WORKS EXACTLY THE SAME AS 423 c THE ENTRY SUB SUBPARCEL512 WHICH CONTROLS 424 c THE STARTING POINT OF THE RECURSION. 425 c 426 c 427 c 428 LOGICAL SIDE(,) 429 LOGICAL CORNERS(,) 430 INTEGER*2 I I I , J J J 431 INTEGER*2 I I , J J 432 LOGICAL MAP{,,8,8),START(,),BOUND(,),EDGE(,,4) 433 EXTERNAL LOGICAL MATRIX FUNCTION NBH 434 BOUND=MAP(,,II,JJ) 435 IF(.NOT.ANY(.NOT.CORNERS.AND.START.AND. 436 1.NOT.BOUND))RETURN 437 DO 20 KK=1,130 438 20 START(.NOT.BOUND)=NBH(START) 439 CALL VECTOR(START,BOUND,II,JJ) 440 MAP(,,II,JJ)=BOUND.OR.START 441 DO 30 KK=1,4 442 SIDE=START.AND.EDGE(,,KK).AND..NOT.CORNERS 443 IF(.NOT.ANY(SIDE))GOTO 30 444 I I I = I I 445 J J J = J J 446 GOTO (1,2,3,4),KK 447 1 111=111-1 448 SIDE=SHNC(SIDE) 449 GOTO 35 450 2 JJJ=JJJ+1 451 SIDE=SHEC(SIDE) 452 GOTO 35 453 3 111=111+1 454 SIDE=SHSC(SIDE) 455 GOTO 35 456 4 J J J = J J J - 1 457 SIDE=SHWC(SIDE)
Annex 6d

- 519 -
458 35 CALL NEXTPLANE512(MAP, III,JJJ,KK,SIDE,EDGE, 45 9 1B0UND,CORNERS,START) 460 30 CONTINUE 461 RETURN 462 END 463 C 464 C 465 C 466 C 467 C 468 SUBROUTINE DISPLAYPARCEL512 469 C ~ 470 C THIS I S A SUBROUTINE TO UNCOMPACT THE 471 C VECTOR BUFFER BUFF AND REORGANISE THE 472 C CONTENTS INTO 'OUT' IN A FORM SUITED 473 C FOR DISPLAY ON A SIGMA RASTER DISPLAY 474 C 475 INTEGER*2 P(256),L(256),PARCEL(62,2),NPP,NP, IB 476 INTEGER BUFF(,,10),OUT(,),NC 477 COMMON/XYBUFF/BUFF,P,L,PARCEL,NPP,NP 478 COMMON/XYOUT/OUT,NC,ID1,ID2,NNP 479 C 480 C — ESTABLISH THE BUFFER POINTERS 481 C 482 NNP=NP 483 IP=PARCEL(NP,1) 484 I S = I P - ( I P - l ) / 4 0 9 6 * 4 0 9 6 485 I B = ( I P - l ) / 4 0 9 6 + l 486 NC=PARCEL(NP,2) 487 C 488 C UNPACK THE BUFFER FOR THIS DAP PLANE 489 C 490 OUT=SHLP(BUFF(,,IB),IS-1) 491 I F (IS+NC-1.LE.4096) GOTO 10 492 OUT(.NOT.ELSL(1,4096-IS+l).AND..NOT.ELSL 493 1(NC+1,4096))=SHRP(BUFF(,,IB+1),4096-IS+l) 494 C 495 C CONVERT FROM DAP FORMAT TO 2980 FORMAT 496 C 497 10 CALL CONVMF4(OUT) 498 C 499 C CALL FOR I/O FROM 2980 FOR SIGMA 500 C 501 ERROR 8999 502 RETURN 503 END 504 C 505 C 506 C 507 C 508 C 509 SUBROUTINE VECTOUT(L,NUM)
Annex 6d

- 520 -
510 C 511 C THIS I S 2980 FORTRAN TO DUMP THE SCAN-LINE 512 C ORDERED SUB-PARCEL BOUNDARY COORDINATES ON 513 C THE SIGMA SCREEN 514 C 515 INTEGER*8 NPT 516 CHARACTER*1 L 517 INTEGER*2 OUT(2,4096) 518 INTEGER NUM 519 COMMON/XYOUT/OUT,NPT 520 C 521 C VME/B MANDATORY FOR ERROR TRAP CATCHING 522 C 523 I F (L.NE.'S') RETURN 524 I F (NUM.NE.8999) RETURN 525 CALL ICL9HERRORTABLE(0,-1,-1,0,0,0,0,-1,0, 526 1-1,1,IRES) 527 I F (NPT.GT.4096)NPT=4096 528 C 529 C NPT I S NUMBER OF COORDS IN BOUNDARY 530 C 531 DO 10 1=1,NPT 532 C 533 C GENERATE SIGMA COORD SYSTEM FOR 534 C DAP PLANE 'OUT' 535 C 536 IX=511-OUT(1,1) 537 IY=OUT(2,I) 538 C 539 C MOVE TO POSITION X,Y (PEN UP) 540 C 541 CALL MOVE(IY,IX,.FALSE.) 542 C 543 C DRAW A DOT WITH COLOUR OPTION 8 544 C 545 CALL OUTLINE('8',1) 546 10 CONTINUE 547 C 548 C BACK TO DAP FOR NEXT DAP PLANE 549 C 550 RETURN 551 END
END OF F I L E
Annex 6d

- 521 -
ANNEX 6e
DAP-FORTRAN source l i s t i n g of software to perform a
r a s t e r - t o - v e c t o r c o n v e r s i o n on the su b - p a r c e l data
f o r OS l a r g e s c a l e s data i n DAP format.
See s e c t i o n 6.4.2 o f t e x t f o r f u l l d e s c r i p t i o n
1 SUBROUTINE GINOV 2 C 3 C *** THIS I S A SUBROUTINE TO GENERATE VECTOR CHAINS 4 C *** SUITABLE FOR INPUT TO A PLOTTING PACKAGE SUCH 5 C *** AS GINO OR GHOST ETC.. 6 C 7 C *** I T TAKES AS INPUT A SUB-PARCEL BOUNDARY IN 8 C *** PIXEL FORM OVERLAPPING UP TO 8 X 8 DAP 9 C *** PLANES WHICH ARE HANDLED ONE AT A TIME IN
10 C *** THE LOGICAL MATRIX "POLY". THE PARCEL 11 C *** ENTERS THE SUBROUTINE THROUGH A LOGICAL 12 C *** MATRIX FUNCTION "WINDOW" WHICH GIVES THE 13 C *** APPROPRIATE DAP IMAGE IN POLY. THE VECTOR 14 C *** I S FOLLOWED AND AS IT APPROACHES THE EDGE 15 C *** OF THE DAP PLANE THE ADJACENT HALF DAP IMAGE 16 C *** I S BROUGHT INTO POLY. THUS, INSTEAD OF USING 17 C * * * I , J COORDS (1-8) TO REPRESENT THE CURRENT 18 C *** WINDOW POSITION, IW,JW ARE USED (1-17) WHICH 19 C *** ARE UNITS OF HALF DAP IMAGES. 20 C 21 INTEGER*2 XLINE(4096) 22 LOGICAL SUB(,,8,8) 23 LOGICAL POLY(,),START(,),ALLPTS(,),EDGE(,,4) 24 INTEGER*4 C(,),LINE(4096),POINTER(64) 2 5 EXTERNAL LOGICAL MATRIX FUNCTION NBH,WINDOW, 26 1SHIFT 27 EXTERNAL INTEGER*4 MATRIX FUNCTION 28 1WINDOWCOORDS 29 COMMON/SUBPARCEL/SUB 30 COMMON/VECTORS/LINE,POINTER 31 EQUIVALENCE (XLINE,LINE) 32 C 33 C I N I T I A L I S E LINE BUFFER POINTER AND COUNTER 34 C 35 LP=1 36 IL=1 37 IPTR=1 38 C 39 C SEE ANNEX 6D FOR THIS SUBROUTINE 40 C
Annex 6e

- 522 -
41 CALL SETEDGE(EDGE) 42 C 43 C START THE SEARCH CYCLE FOR PARCEL IN FIRST 44 C DAP IMAGE AND CYCLE UNTIL FOUND 45 C 46 DO 10 1=1,8 47 DO 10 J=l,8 48 C 49 C CONVERT DAP IMAGE COORDS TO WINDOW COORDS 50 C 51 IW=2*(I-l)+2 52 JW=2*(J-l)+2 53 C 54 C BRING APPROPRIATE WINDOW INTO POLY AND PUT 55 C ABSOLUTE COORDS FOR THAT WINDOW INTO C 56 C 57 POLY=WINDOW(IW,JW) 58 C=WINDOWCOORDS(IW,JW) 59 liP100=LP+100 60 DO 20 LL=LP,LP100 61 C 62 C — SET START TO HAVE ONE PIXEL SET ON POLY. BDY 63 C 64 START=FRST(POLY) 65 ALLPTS=START 66 TRACE 2(POLY,ALLPTS,IW,JW) 67 C 68 C I F THIS DAP PLANE I S EMPTY SKIP TO NEXT 69 C 70 IF(ALL(.NOT.START))GOTO 10 71 C 72 C PAINT OUT IN POLY THE CURRENT PIXEL SET IN 73 C START 74 C 75 POLY=POLY.AND..NOT.START 76 C 77 C TEST FOR 1 PIXEL POLYGON CASE 78 C 79 I F (.NOT.ANY(POLY))GOTO 10 80 C 81 C PUT THE COORDS OF CURRENT PT IN START INTO 82 C STORAGE BUFFER 'LINE 1 AND INCREMENT POINTER 83 C 84 LINE(IL)=C(START) 85 IL=IL+1 86 C 87 C ARBITRARILY LARGE NO. TO COUNT SUB-PARCELS 88 C 89 DO 30 LLL=1,14096 90 C 91 C ARE WE AT THE EDGE OF A DAP PLANE? 92 C IGNORE THIS LOOP I F WE AREN'T
Annex 6e

- 523 -
93 C 94 50 DO 60 IDIR=1,8 95 I F (ANY(POLY.AND.SHIFT(START,IDIR))) GOTO 70 96 60 CONTINUE 97 C 98 C ARE WE AT EDGE OF WINDOW ? I F NOT GOTO 40 99 C 100 DO 40 K=l,4 101 IF(.NOT.ANY(START.AND.EDGE(,,K)))GOTO 40 102 C 103 C PAINT OUT THE NEAREST NEIGHBOURS OF LINE 104 C DETECTED THUS FAR TO REMOVE PROBLEM OF 105 C DOUBLE THICKNESS PIXEL-WIDTHS 106 C SEE ANNEX 6D FOR NBH DESCRIPTION 107 C 108 POLY(NBH(ALLPTS).AND..NOT.ALLPTS)=.FALSE. 109 C 110 C PUT UPDATED VERSION OF POLY AFTER PAINT OUT 111 C BACK INTO STORAGE 112 C 113 CALL STOREWINDOW(POLY,IW,JW) 114 C 115 C MOVE CURRENT PT (START) BY HALF DAP IMAGE 116 C IN APPROPRIATE DIRECTION FOR NEXT WINDOW 117 C 118 GOTO (1,2,3,4),K 119 1 IW=IW-1 120 START=SHSP(START,32) 121 GOTO 5 122 2 JW=JW+1 123 START=SHWP(START,32) 124 GOTO 5 125 3 IW=IW+1 126 START=SHNP(START,32) 127 GOTO 5 128 4 JW=JW-1 129 START=SHEP(START,32) 130 C 131 C BRING IN NEW WINDOW AND UPDATE COORDS IN C 132 C 133 5 P0LY=WIND0W(IW,JW) 134 C=WINDOWCOORDS(IW,JW) 135 ALLPTS=START 136 TRACE 2(POLY,ALLPTS,IW,JW) 137 GOTO 50 138 40 CONTINUE 139 POINTER(IPTR)=IL 140 IPTR=IPTR+1 141 TRACE 1(POLY,START,IW,JW,ALLPTS) 142 GOTO 20 143 C 144 C SEARCH ALL THE 8 NEIGHBOURS FOR THE NEXT
Annex 6e

- 524 -
145 C PT IN THE CHAIN. CLOCKWISE SEARCH l=NORTH 146 C 147 C 148 C PAINT OUT CURRENT START PT FROM POLY 149 C 150 70 POLY=POLY.AND..NOT.START 151 C 152 C MOVE CURRENT START PT INTO THE APPROPRIATE 153 C NEW PIXEL POSITION IN DIRECTION IDIR 154 C 155 START=SHIFT(START,IDIR) 156 C 157 C UPDATE ALLPTS 158 C 159 ALLPTS=ALLPTS.OR.START 160 TRACE 2(POLY,START,ALLPTS,IW,JW) 161 C 162 C PUT ASSOC. ABSOLUTE COORDS IN STORAGE BUFFER 163 C LINE AND UPDATE COUNTER 164 C 165 LINE(IL)=C(START) 166 IL=IL+1 167 30 CONTINUE 168 POINTER(IPTR)=IL 169 IPTR=IPTR+1 170 20 CONTINUE 171 TRACE 1 ( I P T R , I L ) 172 10 CONTINUE 173 POINTER(IPTR)=-1 174 C 175 C INVOKE AN ERROR CONDITION TO FORCE 2980 TO 176 C TAKE OVER FOR I/O CONTROL 177 C 178 ERROR 8999 179 RETURN 180 END 181 C 182 C 183 C 184 C 185 C 186 LOGICAL MATRIX FUNCTION WINDOW(IW,JW) 187 C 188 C THIS FUNCTION RETURNS A WINDOW FROM AN 8x8 189 C COLLECTION OF DAP IMAGES WITH COORDS IW,JW, 190 C WHICH CAN BE INCREMENTED BY HALF A DAP 191 C PLANE AT A TIME. 192 C AT WORST, THE PARTITIONING COULD INVOLVE 193 C TAKING QUADRANTS FROM THE ADJACENT PLANES 194 C TO PUT INTO WINDOW 195 C 196 LOGICAL S U B ( , , 8 , 8 ) , I L , J L , A ( , ) , B ( , )
Annex 6e

- 525 -
197 COMMON/SUBPARCEL/SUB 198 EXTERNAL LOGICAL MATRIX FUNCTION W 199 C 200 C ASCERTAIN WHETHER IW,JW ARE ODD OR EVEN 201 C ODD SUGGESTS PARTITIONING WILL BE NECESSARY 202 C 203 IL=(IW-IW/2*2.EQ.0) 204 JL=(JW-JW/2*2.EQ.0) 205 A=.FALSE. 206 B=.FALSE. 207 C 208 C I F IWf JW ARE ODD GOTO 10 OTHERWISE BRING 209 C BACK A COMPLETE DAP IMAGE 210 C 211 IF(.NOT.(IL.AND.JL))GOTO 10 212 WINDOW=SUB(,,IW/2,JW/2) 213 RETURN 214 C 215 C DAP PARTITIONING I S REQUIRED. HERE ARE 216 C THE THREE CASES 217 C 218 10 IF(.NOT.(IL.AND..NOT.JL))GOTO 20 219 C 220 C VERTICAL PARTITION INTO HALVES 221 C 222 IF(JW.NE.1)A=SHWP(SUB(,,IW/2,JW/2),32) 223 IF(JW.NE.17)B=SHEP(SUB(,,IW/2,JW/2+1),32) 224 WINDOW=A.OR.B 225 RETURN 226 20 IF(.NOT.(.NOT.IL.AND.JL))GOTO 30 227 C 228 C HORIZONTAL PARTITION INTO HALVES 229 C 230 IF(IW.NE.1)A=SHNP(SUB(,,IW/2,JW/2),32) 231 IF(IW.NE.17)B=SHSP(SUB(,,IW/2+1,JW/2),32) 232 WINDOW=A.OR.B 233 RETURN 234 C 235 C RECURSIVE CALL OF THIS FUNCTION TO HANDLE 236 C THE 4 QUADRANT CASE WITH HORIZONTAL 237 C AND VERTICAL PARTITION 238 C 239 30 IWM1=IW-1 240 IWP1=IW+1 241 IF(IW.NE.1)A=W(IWM1,JW) 242 IF(IW.NE.17)B=W(IWP1,JW) 243 WINDOW=SHNP(A,32).OR.SHSP(B,32) 244 RETURN 245 END 246 C 247 C 248 C
Annex 6e

- 526 -
249 C 250 C 251 INTEGER*4 MATRIX FUNCTION WINDOWCOORDS(IW,JW) 252 C 253 C THIS I S A FUNCTION TO RETURN THE ABSOLUTE 254 C COORDS OF ALL PIXELS IN A PARTICULAR WINDOW 255 C WITH REFERENCE TO THE 8 X 8 ORIGINAL FRAME 256 C 257 LOGICAL LC(,,32) 258 INTEGER*4 C(,) 259 INTEGER*2 X C ( , ) , Y C ( , ) , X ( , ) , Y ( , ) 260 C 261 C XC AND YC ARE MATS. WITH X,Y COORDS IN THEM 262 C 263 COMMON/XY/XC,YC 264 EQUIVALENCE(LC,X,C),(LC(,,17),Y) 265 C 266 C ADD ON THE EXCESS COORD VALUES FROM 267 C THE SW CORNER OF THIS DAP PLANE 268 C 269 Y=(JW-2)*32+XC 270 X=(16-IW)*32+YC 271 WINDOWCOORDS=C 272 RETURN 273 END 274 C 275 C 276 C 277 C 278 C 279 SUBROUTINE STOREWINDOW(POLY,IW,JW) 280 C 281 C THIS I S A SUBROUTINE TO RESTORE A DAP 282 C WINDOW (POLY) INTO ITS APPROPRIATE 283 C POSITION IN SUB. IT MAY REQUIRE SPLITTING 284 C INTO CONSTITUENT HALVES (OR QUADS) AND 285 C PUTTING INTO APPROPRIATE DAP PLANES 286 C SINCE THE WINDOW MOVES IN UNITS OF HALF 287 C A DAP PLANE 288 C 289 LOGICAL POLY(,),SUB(,,8,8),IL,JL 290 LOGICAL A ( , ) , B ( , ) 291 EXTERNAL LOGICAL MATRIX FUNCTION WINDOW 292 COMMON/SUBPARCEL/SUB 293 C 294 C ASCERTAIN WHETHER IW,JW ARE ODD OR EVEN 295 C ODD SUGGESTS PARTITIONING WILL BE NECESSARY 296 C 297 IL=IW-IW/2*2.EQ.O 298 JL=JW-JW/2*2.EQ.O 299 IF(.NOT.(IL.AND.JL))GOTO 10 300 C
Annex 6e

- 527 -
301 C NO PARTITION NECESSARY - POLY FITS 302 C EXACTLY INTO A "SUB" POSITION 303 C 304 SUB(,,IW/2,JW/2)=POLY 30 5 RETURN 306 10 IF(.NOT.(IL.AND..NOT.JL))GOTO 20 307 C 308 C PARTITION NECESSARY - POLY REQUIRES 309 C SPLITTING UP INTO HALVES WITH A 310 C VERTICAL PARTITION LINE 311 C 312 A=SHEP(POLY,32) 313 B=SHWP(POLY,32) 314 IF(JW.NE.1)SUB(ALTC(32),IW/2,JW/2)=A 315 IF(JW.NE.17)SUB(.NOT.ALTC(32),IW/2,JW/2+1)=B 316 RETURN 317 20 IF(.NOT.(.NOT.IL.AND.JL))GOTO 30 318 C 319 C PARTITION NECESSARY - POLY REQUIRES 320 C SPLITTING UP INTO HALVES WITH A 321 C HORIZONTAL PARTITION LINE 322 C 323 A=SHSP(POLY,32) 324 B=SHNP(POLY,32) 325 IF(IW.NE.1)SUB(ALTR(32),IW/2,JW/2)=A 326 IF(IW.NE.17)SUB(.NOT.ALTR(32),IW/2+1,JW/2)=B 327 RETURN 328 C 329 C QUADRANT PARTITION CASE - THE CONTENTS 330 C OF POLY ARE 4 QUADRANTS OF A DAP PLANE 331 C TWO PARTITIONS ARE REQUIRED - VERTICAL 332 C AND HORIZONTAL 333 C 334 30 IWP1=IW+1 3 35 IWM1=IW-1 336 I F (IWM1.EQ.0) GOTO 40 337 A=WIND0W(IWM1, JW) 338 A(ALTR(32))=SHSP(POLY,32) 3 39 CALL STOREWINDOW(A,IWM1,JW) 340 40 I F (IWP1.EQ.18) RETURN 341 B=WINDOW(IWP1,JW) 342 B(.NOT.ALTR(32))=SHNP(POLY,32) 343 CALL STOREWINDOW(B,IWP1,JW) 344 RETURN 345 END 346 C 347 C 348 C 349 C 350 C 351 SUBROUTINE GINOLIST(L,NUM) 352 C
Annex 6e

- 528 -
353 C THIS I S GINOLIST WRITTEN IN HOST FORTRAN 354 C I T I S INVOKED EACH TIME ERROR 8999 OCCURS 355 C IN GINOV. IT TAKES THE BUFFERED VECTOR 356 C CHAINS FROM THE DAP IN "LINE" WITH ASSOC. 357 C POINTERS TO START AND END OF EACH VECTOR 358 C AND OUTPUT TO CHANN 6 X,Y COORDS IN FORMAT 359 C 2110. A -1 (INEG) I S PLACED BETWEEN EACH 360 C VECTOR FEATURE 361 C 362 CHARACTERS L 363 INTEGER*2 LINE(4,4096) 364 INTEGER*8 POINTER(64) 365 INTEGER NUM 366 COMMON/VECTORS/LINE,POINTER 367 IF(L.NE. 1S')RETURN 368 IF(NUM.NE.8999)RETURN 369 CALL ICL9HERRORTABLE(0,-1,-1,0,0,0,0, 370 1-1,0,-1,1,IRES) 371 INEG=-1 372 IEND=0 373 KOUNT=0 374 1 KOUNT=KOUNT+l 375 IPTR=POINTER(KOUNT) 376 IF(IPTR.LT.O)GOTO 999 3 77 ISTART=IEND+1 378 IEND=IPTR-1 379 WRITE(6,10)INEG 380 10 FORMAT(I10) 381 DO 20 I=ISTART,IEND 382 IX=LINE(3,I) 383 IY=LINE(4»D 384 WRITE(6,15)IX, I Y 385 15 FORMAT(2I10) 386 20 CONTINUE 387 GOTO.1 388 999 RETURN 389 END
END OF F I L E
Annex


