Embed Size (px)
Citation preview

RESEARCH Open Access
Reactive strategies for containing developingoutbreaks of pandemic influenzaSigrún Andradóttir1, Wenchi Chiu1, David Goldsman1*, Mi Lim Lee1, Kwok-Leung Tsui1, Beate Sander2,3,4,David N Fisman5, Azhar Nizam6
Abstract
Background: In 2009 and the early part of 2010, the northern hemisphere had to cope with the first waves of thenew influenza A (H1N1) pandemic. Despite high-profile vaccination campaigns in many countries, delays inadministration of vaccination programs were common, and high vaccination coverage levels were not achieved.This experience suggests the need to explore the epidemiological and economic effectiveness of additional,reactive strategies for combating pandemic influenza.
Methods: We use a stochastic model of pandemic influenza to investigate realistic strategies that can be used inreaction to developing outbreaks. The model is calibrated to documented illness attack rates and basicreproductive number (R0) estimates, and constructed to represent a typical mid-sized North American city.
Results: Our model predicts an average illness attack rate of 34.1% in the absence of intervention, with total costsassociated with morbidity and mortality of US$81 million for such a city. Attack rates and economic costs can bereduced to 5.4% and US$37 million, respectively, when low-coverage reactive vaccination and limited antiviral useare combined with practical, minimally disruptive social distancing strategies, including short-term, as-neededclosure of individual schools, even when vaccine supply-chain-related delays occur. Results improve with increasingvaccination coverage and higher vaccine efficacy.
Conclusions: Such combination strategies can be substantially more effective than vaccination alone fromepidemiological and economic standpoints, and warrant strong consideration by public health authorities whenreacting to future outbreaks of pandemic influenza.
BackgroundIn April, 2009, the World Health Organization (WHO)announced the emergence of a new influenza A (H1N1)virus, and on June 11, 2009, it declared that the worldwas at the start of a new influenza pandemic [1]. WHOreported more than 414,000 laboratory-confirmed cases ofH1N1 [2] — a gross underestimate, as many countriessimply stopped counting individual cases. The US Centersfor Disease Control and Prevention reported widespreadinfluenza activity in forty-six states, with influenza-like ill-ness (ILI) activity in October 2009 higher than what isseen during the peak of many regular flu seasons; andfurther, “Almost all of the influenza viruses identified …are 2009 H1N1 influenza A viruses” [3]. Countries found
themselves in the position of having to react to containalready developing Fall outbreaks of influenza due to thenew pandemic strain, a position they are likely to findthemselves in again if and when future waves of pandemicinfluenza occur.Research has suggested that mass vaccination of 60–
70% of the population prior to the start of the flu seasoncould effectively contain outbreaks due to pandemicstrains [4-7]; and the public health preparedness plans ofmost countries have, accordingly, emphasized vaccinationintervention strategies. However, the recent experiencewith H1N1 suggests that high vaccination coverage levelsare difficult to achieve. In the case of H1N1, vaccinationprograms in most northern hemisphere countries startedonly after the virus was widely circulating. Furthermore,in some countries, supplies of vaccine were limited [8],delivery and administration occurred over a period ofseveral months [9,10], and there were reports of public
* Correspondence: [email protected]. Milton Stewart School of Industrial and Systems Engineering, GeorgiaInstitute of Technology, Atlanta, Georgia, 30332, USAFull list of author information is available at the end of the article
Andradóttir et al. BMC Public Health 2011, 11(Suppl 1):S1http://www.biomedcentral.com/1471-2458/11/S1/S1
© 2011 Andradóttir et al; licensee BioMed Central Ltd. This is an open access article distributed under the terms of the CreativeCommons Attribution License (http://creativecommons.org/licenses/by/2.0), which permits unrestricted use, distribution, andreproduction in any medium, provided the original work is properly cited.
skepticism regarding the necessity and safety of vaccina-tion [11,12], all of which were strong indicators suggest-ing that high vaccination coverage would be difficult toachieve. While many institutions in the US and elsewherestrongly encouraged and, in some cases, required workersto be vaccinated against seasonal influenza in 2009,H1N1 vaccination guidelines were focused mostly onpeople in certain age and high-risk groups [13]. Delays,limited and untimely vaccination supplies, and publicreluctance to be vaccinated are likely to reduce the effec-tiveness of vaccination campaigns [4,5].The issues outlined above for the recent outbreak of
H1N1 are likely to occur again in future outbreaks ofpandemic influenza. In this paper, we explore the effec-tiveness of realistic reactive intervention strategies imple-mented after the beginning of outbreaks of pandemicinfluenza. We calibrate our model based on data for theH1N1 pandemic (see Tuite et al. [14]), and we investigatethe impacts of (i) the moderate vaccination coveragelevels which, based on past experience, are likely to berealized, as well as high levels which would be moreideal; (ii) very limited treatment of cases with antiviralsand prophylaxis of cases’ households with antivirals; and(iii) limited and practical social distancing measures suchas five-day closure of individual schools on an as-neededbasis, encouragement of liberal leave policies in the work-place, and encouragement of self-isolation. Interventionstrategies that combine these approaches are also studied(cf. Halloran et al. [15]). For all intervention strategies,we provide cost estimates associated with morbidity andmortality that take into account direct medical costs aswell as economic consequences resulting from schoolclosures and work loss.
MethodsThe simulation modelWe developed a portable and adaptable stochastic, indivi-dual-level simulation model of influenza spread within astructured population. The simulator is similar to modelsdeveloped by Longini et al. [7,16]. The simulation popu-lation of 649,565 people was generated stochasticallyto represent a typical North American city, namely,Hamilton (Ontario), Canada, which was chosen due toavailability of demographic and epidemiological datanecessary for constructing and calibrating the simulator.Our population is a collection of heterogeneous indivi-duals with various attributes that impact whom theyinteract with (and hence whom they may infect or getinfected by). More specifically, each individual has thefollowing stochastically generated attributes: age, house-hold, playgroup or daycare attended (for pre-school chil-dren), school attended (for school-age children),workgroup (for working adults), household census tractand workplace census subdivision, community, and
neighborhood. As in [16], a community consists ofapproximately 2000 people living within the same censustract, and a neighborhood consists of approximately 500people living within proximity to each other within thesame community; also see the recent papers [17] and[18], which incorporate more-detailed individual-levelbehavior involving larger populations. Age and house-hold-size distributions, shown in Figures 1 and 2, werematched to 2001 Canadian census data [19,20]. House-hold census tract assignments were made so that censustract population sizes were consistent with 2006 censusstatistics [21]. Workgroups were formed to match 2006employment statistics [22] as well as census statistics onthe geographical distribution of workers [23]. Ratherthan representing entire workplace institutions, weformed workgroups of size 20 to represent the typicalnumber of co-workers an individual is likely to haveclose contact with during the day. Average playgroup,daycare, and lower and upper secondary school (i.e., mid-dle and high school) contact group sizes were chosen forsimilar reasons; see the Appendix.Susceptible people are assumed to have daily contacts
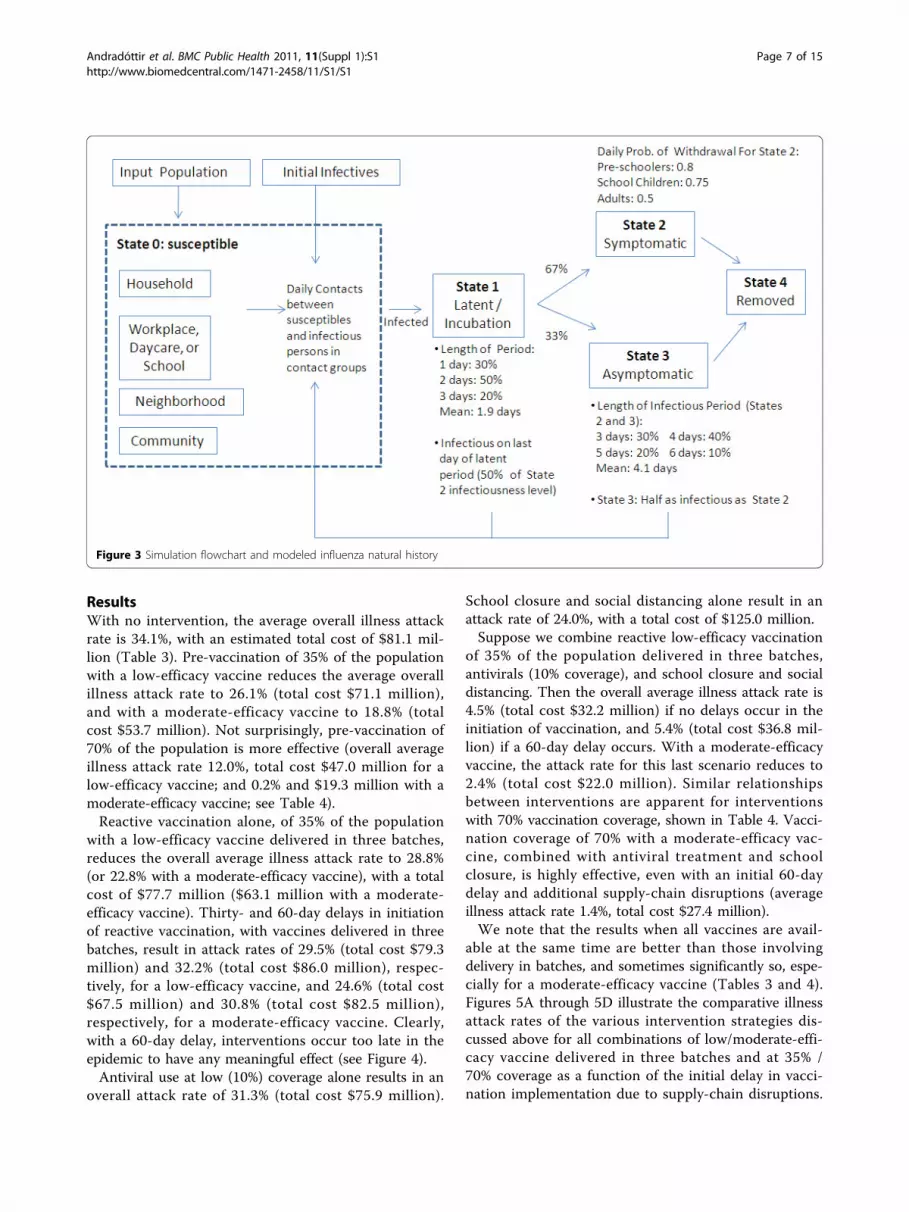
with other individuals in their contact groups, i.e., theirhousehold and school or workgroups, as well as withpeople in their neighborhood and community. Infectionof susceptibles depends on the number of infected per-sons in their contact groups, on the vaccine and anti-viral-use status of susceptibles and their infectiouscontacts, and on age- and contact-group-specific per-contact transmission probabilities (Table 1). This diseasetransmission model is based on previously describedmodels [7,16], and is detailed in the Appendix. Peopleinfected with influenza first pass through a latent / incu-bation period, during which they do not have influenzasymptoms. They are not infectious until the last day ofthe period; at that point, they become half as infectiousas if they were to develop symptoms in the subsequentperiod. During that subsequent infectious period, 67%will develop influenza symptoms and 33% will be asymp-tomatic (and will be half as infectious as those who aresymptomatic) [7]. The model allows for people to with-draw from all of their mixing groups, except the house-hold, if they become infected or have an infected child.The simulator is calibrated to match documented ill-
ness attack rates and basic reproductive numbers (R0).Baseline (no-intervention) scenario age-group-specificattack rates were derived using 2009 estimates for theH1N1 basic reproductive number in Ontario [14,24,25](see Table 2). These rates take into account reducedrisk in adults born prior to 1957 [24]. A compartmentalmodel parameterized in this way was well-calibrated toobserved attack rates during the Fall pandemic wave inOntario [25]. The simulator’s R0 value of 1.4 is also con-sistent with other published reports [4,26,27].
Andradóttir et al. BMC Public Health 2011, 11(Suppl 1):S1http://www.biomedcentral.com/1471-2458/11/S1/S1
Page 2 of 15

Intervention strategiesWe modeled a baseline case where no intervention takesplace, along with strategies representing various combi-nations of vaccination, antiviral treatment and house-hold prophylaxis, school closure, and general socialdistancing (see the results in Tables 3 and 4 and Supple-mentary Data Table S1 provided in “Additional File 1”).
Each component of the strategies is described in detailbelow. Interventions are triggered in a particular simula-tion run when the overall illness attack rate reaches0.01%. Twenty runs of the simulator were performed foreach intervention strategy, from which average illnessattack rates were calculated. We briefly describe theinterventions under consideration.
Figure 1 Age distribution for simulated population
Figure 2 Household size distribution for simulated population
Andradóttir et al. BMC Public Health 2011, 11(Suppl 1):S1http://www.biomedcentral.com/1471-2458/11/S1/S1
Page 3 of 15

VaccinationWe model both pre-vaccination as well as reactive strate-gies, with reactive vaccination programs beginning imme-diately, 30 days, or 60 days after the trigger. The delaysmodel disruptions in vaccine production and supplychains. We allow enough doses to cover either 35% or70% of the population. In reactive strategies, we considercases where (i) all vaccines become available at the sametime, and (ii) the doses become available in three equal-sized batches, two weeks apart, due to additional produc-tion and supply-chain disruptions. We study a low-
efficacy single-dose vaccine (efficacy against susceptibilityto infection, VEs = 0.3, and efficacy against infectious-ness, VEi = 0.2) as well as a moderate-efficacy vaccine(VEs = 0.4, VEi = 0.5) [28]. Vaccine efficacy refers to thereduction, after vaccination, in the probability of becom-ing infected due to contact with an infected person(VEs), or to the reduction, after vaccination, in the prob-ability of infecting a susceptible contact (VEi). Vaccineefficacy does not refer to the fraction of individuals hav-ing an immunogenic response to the vaccine (which istypically much larger than our measures).Each day, our model randomly vaccinates any remain-
ing unvaccinated individuals who are either uninfectedor in the latent or asymptomatic phases of infection, allwith equal probability based on the number of availabledoses. Moreover, protection from the vaccine buildsover time, with 50% of the vaccine’s efficacy realizedupon vaccination, and full protection after two weeks.Antiviral treatment and household prophylaxisWe investigate strategies involving treatment of infectedindividuals with a five-day course of antivirals, as well asstrategies that also allow for ten-day prophylaxis of theinfected individuals’ household members. We assumethat 1% of individuals do not complete their course. Weuse an antiviral efficacy against susceptibility (AVEs) of0.3 and against infectiousness (AVEi) of 0.7 [16]. Indivi-duals receive direct benefit from antivirals only whilethey are taking them. Antiviral use is considered aloneand in combination with other intervention strategies. Itis assumed that antiviral courses are available for 10% ofthe population and that they are distributed to infectedindividuals and their household members until the sup-ply is exhausted.School closure and social distancingWe implement a rolling school closure model, where adaycare or school closes for five days if five or morecases are identified in that group. Given that infectedindividuals are on average infectious for 4.1 days (seeFigure 3), closing schools for fewer than 5 days is
Table 1 Per-contact influenza infection transmissionprobabilities within contact groups
Contact Group Transmission Probability
Household1
Child-to-Child 0.8
Child-to-Adult 0.3
Adult-to-Child 0.3
Adult-to-Adult 0.4
Community2
Pre-schooler 0.000005
School child 0.000005
Adult (ages 19–52) 0.000075
Adult (ages 53+) 0.000055
Daycares/Playgroups2
Daycares 0.028
Playgroups 0.018
Schools2
Elementary schools 0.012
Middle schools 0.011
High schools 0.010
Workgroups 0.010
1. Within households, the probability that a symptomatic child (age 18 yearsor less) infects a susceptible child is 0.8; that a symptomatic child infects asusceptible adult (at least 19 years old), or that a symptomatic adult infects asusceptible child, is 0.3; that a symptomatic adult infects a susceptible adult is0.4 [16].
2. Probability that a susceptible person in the age or school group is infectedthrough contact with a symptomatic person in the group.
Table 2 Age-group-specific H1N1 influenza illness attack rates in Ontario, Canada, 2009, and calibrated attack rates
Simulated Ontario Illness Attack Rates by the Percentage of Adults 53+ Years Old with Pre-existing Immunity1
Calibrated Attack Rates(AR)
Age 30% 50% 70% Age AR
0–4 30.6% 31.0% 30.8% 0–4 29.5%
5–13 53.8% 55.0% 55.2% 5–18 55.9%
14–17 56.0% 57.1% 57.3%
18–22 48.9% 49.7% 49.7% 19–52 40.8%
23–52 39.6% 39.8% 39.3%
53–64 21.7% 15.3% 8.8% 53–59 14.3%
65+ 19.1% 13.2% 7.5% 60+ 11.0%
Overall 36.8% 35.4% 33.5% Overall 34.1%
1. See the discussion in [25].
Andradóttir et al. BMC Public Health 2011, 11(Suppl 1):S1http://www.biomedcentral.com/1471-2458/11/S1/S1
Page 4 of 15

unlikely to be very effective. It is possible for thesegroups to close more than once during the simulation.We also model a reduction in workplace and generalcommunity contacts of 20% (i.e., 20% of infected indivi-duals in each contact group will not infect other mem-bers of the group). This represents the exercise of ageneral level of caution, including a modest limitation ofcontacts within workgroups (e.g., by invoking occasional
telecommuting and other self-limiting behaviors, holdingfewer large meetings, etc.) and also within the generalcommunity (e.g., reduction in attendance in socialgroups and larger community events, etc.).
Economic cost estimationWe determine economic costs associated with the influ-enza outbreaks and modeled intervention strategies
Table 3 Average overall illness attack rates and total costs of interventions with 35% vaccination coverage
Intervention1 Delay in Initiation of Vaccination2 No Post-initiationVaccination Delays
Post-initiation VaccinationDelays3
Attack Rate (%) Cost (US$m) Attack Rate (%) Cost (US$m)
None 34.1 81.1
A 31.3 75.9
S 24.0 125.0
A+S 9.2 48.0
VL Pre-vaccination 26.1 71.1
VL Reactive, no delay 28.8 77.7 28.8 77.7
VL 30-day delay 29.0 78.1 29.5 79.3
VL 60-day delay 30.7 82.2 32.2 86.0
VM Pre-vaccination 18.8 53.7
VM Reactive, no delay 22.6 62.8 22.8 63.1
VM 30-day delay 23.0 63.7 24.6 67.5
VM 60-day delay 27.3 74.1 30.8 82.5
VL+A Pre-vaccination 19.3 56.4
VL+A Reactive, no delay 25.2 70.6 25.3 70.8
VL+A 30-day delay 25.4 71.1 25.7 71.8
VL+A 60-day delay 26.2 72.9 27.1 75.0
VM+A Pre-vaccination 2.1 16.1
VM+A Reactive, no delay 8.1 30.1 10.0 34.3
VM+A 30-day delay 12.4 40.2 15.8 48.2
VM+A 60-day delay 18.6 54.7 20.8 60.1
VL+S Pre-vaccination 12.7 69.9
VL+S Reactive, no delay 17.3 93.6 17.5 95.7
VL+S 30-day delay 17.8 96.5 18.3 99.0
VL+S 60-day delay 18.6 101.9 19.6 108.8
VM+S Pre-vaccination 2.3 19.6
VM+S Reactive, no delay 6.8 41.6 8.5 49.4
VM+S 30-day delay 9.9 56.3 15.4 87.3
VM+S 60-day delay 13.4 74.7 17.9 95.7
VL+A+S Pre-vaccination 1.0 15.9
VL+A+S Reactive, no delay 3.9 29.2 4.5 32.2
VL+A+S 30-day delay 4.6 32.6 4.9 34.2
VL+A+S 60-day delay 4.8 33.8 5.4 36.8
VM+A+S Pre-vaccination 0.2 11.9
VM+A+S Reactive, no delay 0.5 13.1 0.8 14.9
VM+A+S 30-day delay 1.2 16.6 1.6 18.6
VM+A+S 60-day delay 2.0 20.2 2.4 22.0
1. Abbreviations for modeled interventions: V (vaccination of up to 35% of the population), L (low efficacy), M (moderate efficacy), A (antiviral treatment andhousehold prophylaxis of up to 10% of the population), S (school closure and social distancing).
2. Initial supply-chain delays which prevent immediate initiation of vaccination programs after the intervention trigger occurs.
3. Additional supply-chain delays, after initiation of the vaccination program, as a result of which vaccines become available in three equal batches, spaced twoweeks apart.
Andradóttir et al. BMC Public Health 2011, 11(Suppl 1):S1http://www.biomedcentral.com/1471-2458/11/S1/S1
Page 5 of 15
using methods described by Meltzer et al. [29]. Weinclude medical spending due to illness, costs of antivir-als and vaccines, and costs associated with teachers andother working adults staying home due to their own ill-ness, illness of dependent children, or due to school clo-sure. Medical spending includes co-payments and netpayments for outpatient visits and hospitalization, aswell as prescription and over-the-counter medicationsfor influenza and complications or secondary infections.Costs are stratified by age-group and by low- or high-risk status of individuals with respect to complications
of influenza. We also include the present value of earn-ings lost due to premature mortality.Cost estimates and probabilities of risk status and of
complications and death were taken from Meltzer etal. [29], with costs inflated using 2008 consumer priceindex and medical price index estimates [30-33].These costs are combined with the data on age-speci-fic attack rates, utilized vaccination doses, and days ofschool closure obtained from our simulation model.Details of the cost calculations are given in theAppendix.
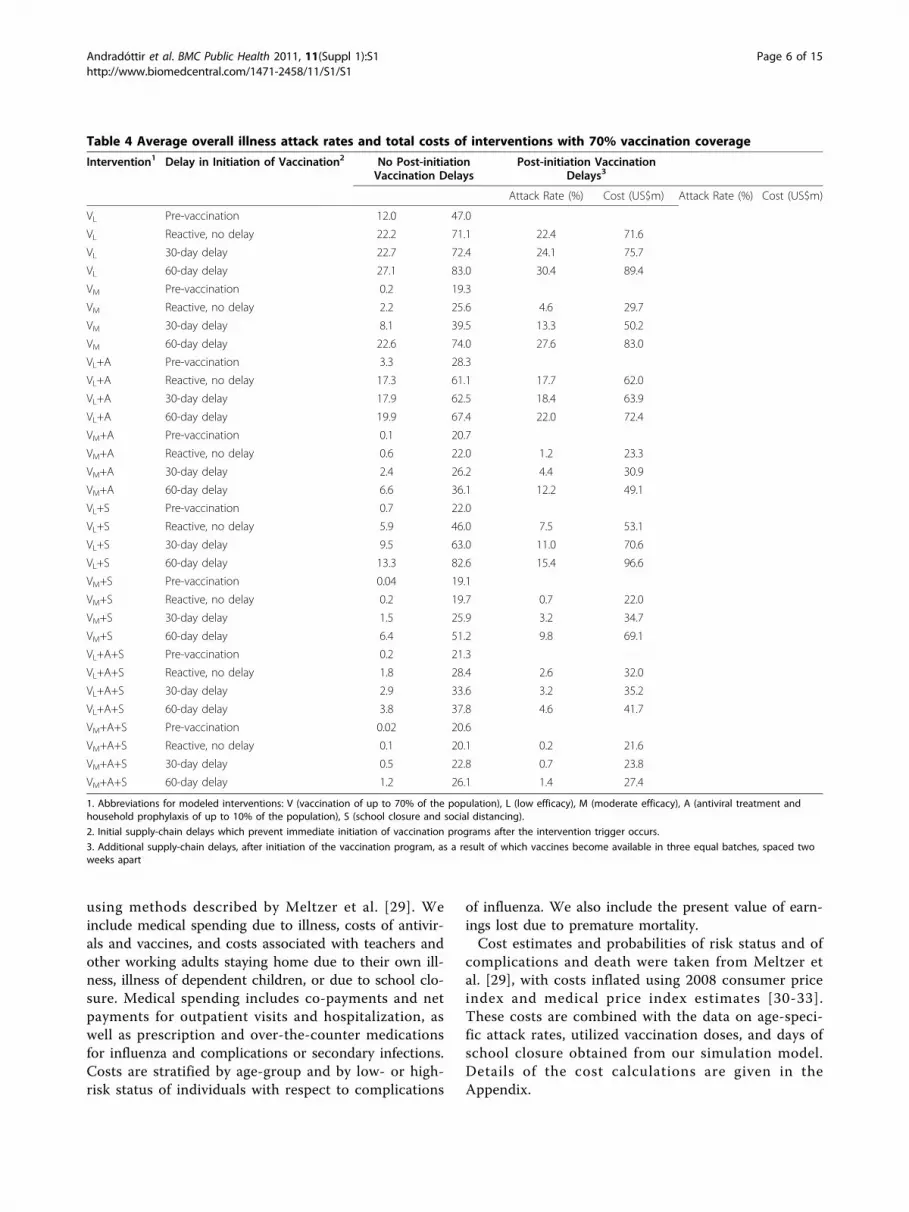
Table 4 Average overall illness attack rates and total costs of interventions with 70% vaccination coverage
Intervention1 Delay in Initiation of Vaccination2 No Post-initiationVaccination Delays
Post-initiation VaccinationDelays3
Attack Rate (%) Cost (US$m) Attack Rate (%) Cost (US$m)
VL Pre-vaccination 12.0 47.0
VL Reactive, no delay 22.2 71.1 22.4 71.6
VL 30-day delay 22.7 72.4 24.1 75.7
VL 60-day delay 27.1 83.0 30.4 89.4
VM Pre-vaccination 0.2 19.3
VM Reactive, no delay 2.2 25.6 4.6 29.7
VM 30-day delay 8.1 39.5 13.3 50.2
VM 60-day delay 22.6 74.0 27.6 83.0
VL+A Pre-vaccination 3.3 28.3
VL+A Reactive, no delay 17.3 61.1 17.7 62.0
VL+A 30-day delay 17.9 62.5 18.4 63.9
VL+A 60-day delay 19.9 67.4 22.0 72.4
VM+A Pre-vaccination 0.1 20.7
VM+A Reactive, no delay 0.6 22.0 1.2 23.3
VM+A 30-day delay 2.4 26.2 4.4 30.9
VM+A 60-day delay 6.6 36.1 12.2 49.1
VL+S Pre-vaccination 0.7 22.0
VL+S Reactive, no delay 5.9 46.0 7.5 53.1
VL+S 30-day delay 9.5 63.0 11.0 70.6
VL+S 60-day delay 13.3 82.6 15.4 96.6
VM+S Pre-vaccination 0.04 19.1
VM+S Reactive, no delay 0.2 19.7 0.7 22.0
VM+S 30-day delay 1.5 25.9 3.2 34.7
VM+S 60-day delay 6.4 51.2 9.8 69.1
VL+A+S Pre-vaccination 0.2 21.3
VL+A+S Reactive, no delay 1.8 28.4 2.6 32.0
VL+A+S 30-day delay 2.9 33.6 3.2 35.2
VL+A+S 60-day delay 3.8 37.8 4.6 41.7
VM+A+S Pre-vaccination 0.02 20.6
VM+A+S Reactive, no delay 0.1 20.1 0.2 21.6
VM+A+S 30-day delay 0.5 22.8 0.7 23.8
VM+A+S 60-day delay 1.2 26.1 1.4 27.4
1. Abbreviations for modeled interventions: V (vaccination of up to 70% of the population), L (low efficacy), M (moderate efficacy), A (antiviral treatment andhousehold prophylaxis of up to 10% of the population), S (school closure and social distancing).
2. Initial supply-chain delays which prevent immediate initiation of vaccination programs after the intervention trigger occurs.
3. Additional supply-chain delays, after initiation of the vaccination program, as a result of which vaccines become available in three equal batches, spaced twoweeks apart
Andradóttir et al. BMC Public Health 2011, 11(Suppl 1):S1http://www.biomedcentral.com/1471-2458/11/S1/S1
Page 6 of 15
ResultsWith no intervention, the average overall illness attackrate is 34.1%, with an estimated total cost of $81.1 mil-lion (Table 3). Pre-vaccination of 35% of the populationwith a low-efficacy vaccine reduces the average overallillness attack rate to 26.1% (total cost $71.1 million),and with a moderate-efficacy vaccine to 18.8% (totalcost $53.7 million). Not surprisingly, pre-vaccination of70% of the population is more effective (overall averageillness attack rate 12.0%, total cost $47.0 million for alow-efficacy vaccine; and 0.2% and $19.3 million with amoderate-efficacy vaccine; see Table 4).Reactive vaccination alone, of 35% of the population
with a low-efficacy vaccine delivered in three batches,reduces the overall average illness attack rate to 28.8%(or 22.8% with a moderate-efficacy vaccine), with a totalcost of $77.7 million ($63.1 million with a moderate-efficacy vaccine). Thirty- and 60-day delays in initiationof reactive vaccination, with vaccines delivered in threebatches, result in attack rates of 29.5% (total cost $79.3million) and 32.2% (total cost $86.0 million), respec-tively, for a low-efficacy vaccine, and 24.6% (total cost$67.5 million) and 30.8% (total cost $82.5 million),respectively, for a moderate-efficacy vaccine. Clearly,with a 60-day delay, interventions occur too late in theepidemic to have any meaningful effect (see Figure 4).Antiviral use at low (10%) coverage alone results in an
overall attack rate of 31.3% (total cost $75.9 million).
School closure and social distancing alone result in anattack rate of 24.0%, with a total cost of $125.0 million.Suppose we combine reactive low-efficacy vaccination
of 35% of the population delivered in three batches,antivirals (10% coverage), and school closure and socialdistancing. Then the overall average illness attack rate is4.5% (total cost $32.2 million) if no delays occur in theinitiation of vaccination, and 5.4% (total cost $36.8 mil-lion) if a 60-day delay occurs. With a moderate-efficacyvaccine, the attack rate for this last scenario reduces to2.4% (total cost $22.0 million). Similar relationshipsbetween interventions are apparent for interventionswith 70% vaccination coverage, shown in Table 4. Vacci-nation coverage of 70% with a moderate-efficacy vac-cine, combined with antiviral treatment and schoolclosure, is highly effective, even with an initial 60-daydelay and additional supply-chain disruptions (averageillness attack rate 1.4%, total cost $27.4 million).We note that the results when all vaccines are avail-
able at the same time are better than those involvingdelivery in batches, and sometimes significantly so, espe-cially for a moderate-efficacy vaccine (Tables 3 and 4).Figures 5A through 5D illustrate the comparative illnessattack rates of the various intervention strategies dis-cussed above for all combinations of low/moderate-effi-cacy vaccine delivered in three batches and at 35% /70% coverage as a function of the initial delay in vacci-nation implementation due to supply-chain disruptions.
Figure 3 Simulation flowchart and modeled influenza natural history
Andradóttir et al. BMC Public Health 2011, 11(Suppl 1):S1http://www.biomedcentral.com/1471-2458/11/S1/S1
Page 7 of 15

The impact of vaccinating 70% of the population, ratherthan 35%, ranges from moderate to substantial, with theincreased coverage being most beneficial when the vac-cine is delivered in a timely manner, and the vaccine iseither of moderate efficacy or of low efficacy applied incombination with other intervention strategies.Complete (age-stratified and overall) average illness
attack results for all modeled interventions are given inSupplementary Data Table S1. The comparative effec-tiveness of interventions is similar when age-group-spe-cific results are studied.Figure 6A illustrates attack rate and total cost combi-
nations for interventions that result in at least a 75%reduction in cost compared to no intervention. The clo-ser to the origin, the more desirable an intervention isin terms of total cost and average illness attack rate.Aside from pre-vaccination strategies, we see that 70%reactive vaccination with a moderate-efficacy vaccineand school closure and social distancing, or even 35%reactive vaccination with a moderate-efficacy vaccine,antiviral use, and school closure, also result in substan-tial reductions in cost and attack rates. Figure 6B illus-trates attack rate and cost results for interventions thatresult in more-modest 50%–75% reductions in costcompared to no intervention. Once again, several
strategies combining vaccination, antiviral use, andschool closure/social distancing are competitive withpre-vaccination.
DiscussionPreviously published research has shown that pre-vacci-nation of 60%–70% of the population can contain seaso-nal as well as pandemic influenza, but that delays invaccination can greatly reduce the effectiveness of thevaccination programs [4-7]. Our model confirms theseresults for moderate-efficacy vaccines (Tables 3, 4, andS1). However, vaccination efforts in countries such asthe US, Canada, and others began well after the firstwaves of H1N1 activity, and it is reasonable to believethat the same will be true in future outbreaks of pan-demic influenza. In particular, in the event of an out-break, it will likely take time to achieve high levels ofvaccination coverage, and, if past experience with seaso-nal influenza vaccination campaigns is an indication, itis plausible that only low or moderate coverage willeventually be achieved. The results of our simulationmodel show that delayed and low-coverage reactive vac-cination strategies (with a low-efficacy vaccine, plus lim-ited use of antivirals) will not be enough to mitigate thepandemic or to significantly reduce total costs associated
Figure 4 Daily attack rates for (i) the case of 70% coverage of low-efficacy vaccine with 60-day initial delay, and (ii) the baseline case.For case (i), the vaccine is given on the 60th day followed by receipt of vaccine after two additional two-week delays (see arrows). Note thatvaccine given on the 60th day decreases the attack rate compared to the baseline; but the two subsequent receipts of vaccine do not result inadditional benefits.
Andradóttir et al. BMC Public Health 2011, 11(Suppl 1):S1http://www.biomedcentral.com/1471-2458/11/S1/S1
Page 8 of 15

Figure 5 Average overall illness attack rates (%) for modeled interventions. Average overall illness attack rates for the following scenarios:no intervention; pre-vaccination; reactive vaccination with delays in initiation of 0, 30, and 60 days after the intervention trigger of a 0.01%overall illness attack rate; antiviral treatment or household prophylaxis with 10% population coverage (intervention “A”); rolling, as-needed five-day individual school closures and social distancing (20% reduction in workgroup and general community contacts—intervention “S”); antiviraluse plus vaccination; school closure, and social distancing plus vaccination; antiviral use, school closure and social distancing, plus vaccination (“A+S”). Vaccination coverage is 35% of the population in Figures 5A and 5B; it is 70% of the population in Figures 5C and 5D. In reactivevaccination scenarios, additional supply-chain disruptions are assumed, such that vaccines are available in three equal batches, spaced twoweeks apart, after initiation of vaccination programs. In Figures 5A and 5C, a low-efficacy vaccine is assumed (efficacy against susceptibility, VEs,0.3; efficacy against infectiousness, VEi, 0.2). In Figures 5B and 5D, a moderate-efficacy vaccine is assumed (VEs, 0.5; VEi, 0.5).
Andradóttir et al. BMC Public Health 2011, 11(Suppl 1):S1http://www.biomedcentral.com/1471-2458/11/S1/S1
Page 9 of 15
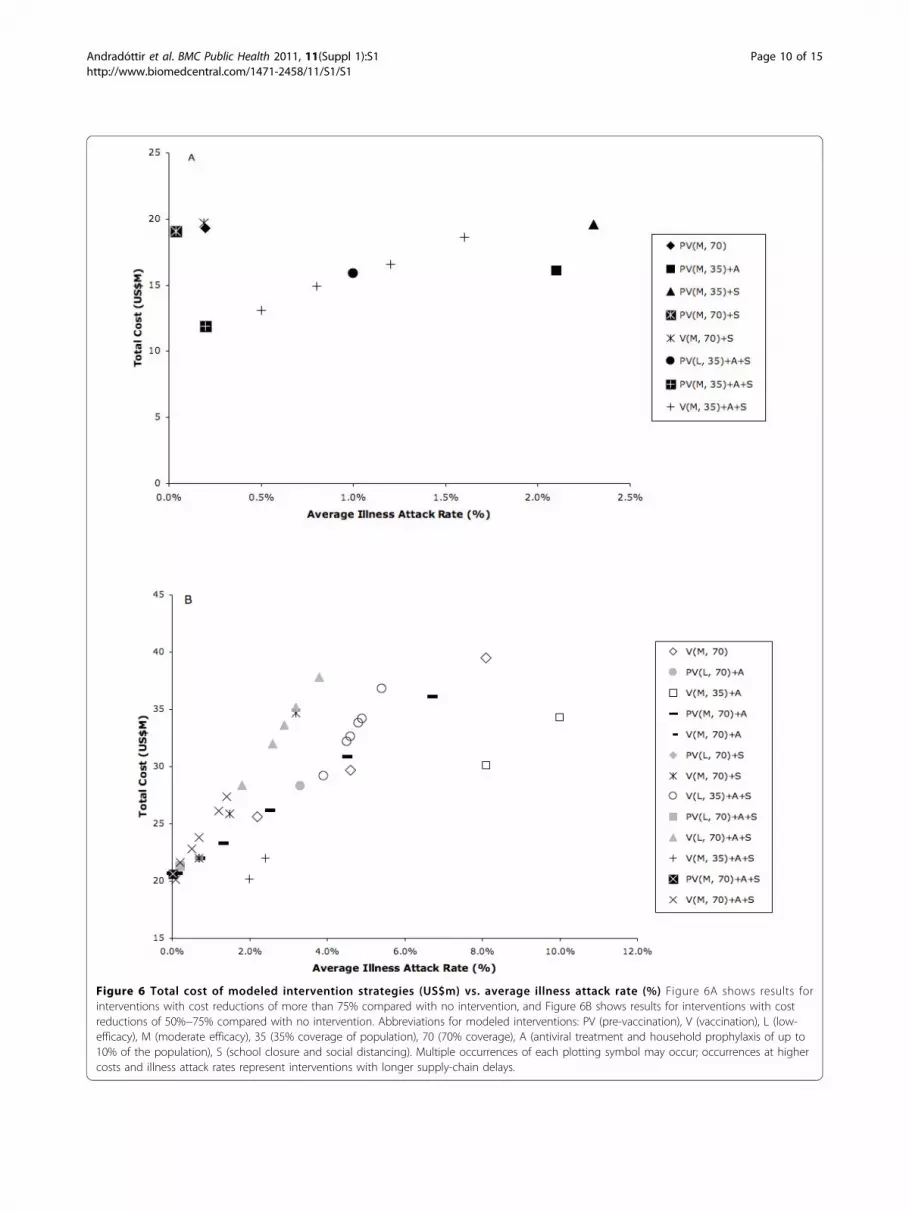
Figure 6 Total cost of modeled intervention strategies (US$m) vs. average illness attack rate (%) Figure 6A shows results forinterventions with cost reductions of more than 75% compared with no intervention, and Figure 6B shows results for interventions with costreductions of 50%−75% compared with no intervention. Abbreviations for modeled interventions: PV (pre-vaccination), V (vaccination), L (low-efficacy), M (moderate efficacy), 35 (35% coverage of population), 70 (70% coverage), A (antiviral treatment and household prophylaxis of up to10% of the population), S (school closure and social distancing). Multiple occurrences of each plotting symbol may occur; occurrences at highercosts and illness attack rates represent interventions with longer supply-chain delays.
Andradóttir et al. BMC Public Health 2011, 11(Suppl 1):S1http://www.biomedcentral.com/1471-2458/11/S1/S1
Page 10 of 15

with influenza morbidity and mortality (based on resultsfrom Table 3, average illness attack rates are onlyreduced by 26% and total costs by 13%, compared to nointervention).According to our model, combining rolling, limited-
duration, as-needed closures of individual schools and apractical social distancing policy with 35% reactive low-efficacy vaccination coverage and low-level (10%) anti-viral use can reduce illness attack rates by 89% com-pared to no intervention, as well as total costs by 64%.Similarly, combining interventions in this mannerreduces overall attack rates by 99% and costs by 84%when a moderate-efficacy vaccine is available. This strat-egy remains highly effective even when delays in imple-menting vaccination of up to 60 days occur. Previouslypublished results have left open the question of howcostly interventions involving school closure might be[5]. Our results show that reactive combination strate-gies that include practical school closure measures,when diligently implemented, can reduce total costsassociated with influenza morbidity and mortalitysubstantially.Our model has several limitations. We do not con-
sider vaccination strategies targeted to high-risk groups,which could reduce costs associated with complicationsfrom influenza. We have not modeled co-circulatingstrains of seasonal and pandemic influenza or possibleresistance to antiviral drugs (although, to mitigate thislimitation, our model assumes only low coverage withantivirals, as well as interventions without antivirals). Asis always the case with simulation models, continuingfollow-up analyses are needed, including: (i) sensitivityto model parameters; (ii) sensitivity to model interven-tion triggers (e.g., overall illness attack rate, numbers ofcases detected in schools, etc.); (iii) sensitivity to R0,which can be heterogeneous across cities and countries;and (iv) results for new H1N1 natural history and trans-mission parameters, and new cost estimates for compli-cations resulting from H1N1 illness, as they becomeknown.Our model has several strengths. We model a large,
realistic, heterogeneous population, base the simulationmodel on well-studied and documented stochastic simu-lators, calibrate to actual H1N1 attack rates and most-likely R0 values, and have the ability to model largenumbers of scenarios in a relatively short amount oftime on a desktop platform. The model also providescost estimates that are useful for making policy deci-sions about potentially expensive interventions. In parti-cular, we model and analyze a variety of interventionsand combinations of interventions in terms of costs andefficacy. We also take into consideration reactive strate-gies incorporating supply-chain delays, and we identifystrategies that effectively contain outbreaks and costs
even in the presence of supply-chain delays, low vaccineefficacy, and low vaccine coverage.
ConclusionsOur model illustrates the epidemiological effectivenessof a combination strategy involving short-term closuresof individual schools on an as-needed basis, other prac-tical social distancing activities, reactive vaccination of35% or more of the population, and limited use of anti-virals for treatment and prophylaxis. The model alsoquantifies the cost savings for this and alternative reac-tive strategies. Public health authorities should considerplacing renewed emphasis on such combination strate-gies when reacting to possible additional waves of thecurrent pandemic, or to new waves of future pandemics.
AppendixIn this Appendix, we provide details on the simulationmodel as well as economic cost considerations.
Simulation modelOur simulator is similar to those developed by Longiniet al. for high-end computing platforms [7,16]; oursimulator is programmed in C++ and runs on desktopplatforms. Population structure and influenza transmis-sion model details are given below.Population structureAs discussed in the main text, the stochastically gener-ated attributes for each person in our population of649,565 included: age, household, playgroup or daycareattended (for pre-school children), school attended (forchildren 5–18 years of age), workgroup (for workingadults and working 16–18 year old children), house-hold census tract and workplace census subdivision,community (approximately 2000 people), and neigh-borhood (approximately 500 people). Thus individualsbelong to three or four contact groups. In particular,each individual belongs to a household, neighborhood,and community. In addition, children younger than 16belong to either a playgroup, daycare, or school,depending on age; most children in age range 16–18belong to a school or workgroup; and most adults inage range 19–59 belong to a workgroup. Preschoolchildren were categorized as belonging to a playgroup/ daycare, each with 50% probability. We separatedsecondary schools into middle schools and highschools based on grade to allow different contactgroup sizes and to make our model more representa-tive of mid-sized US cities. The numbers ofplaygroups, daycares, elementary, middle, and highschools in each community were based on Longini etal. [16], and were combined with the number of indivi-duals in each category in our simulation population toobtain the contact group sizes. The number of working
Andradóttir et al. BMC Public Health 2011, 11(Suppl 1):S1http://www.biomedcentral.com/1471-2458/11/S1/S1
Page 11 of 15

adults (19–59 years old) was based on census data[23]; and the number of working children (16–18 yearsold) was based on Ontario data on drop-out rates [34]and the employment rate for ages 15–24 [23].Influenza transmission modelThe simulator models influenza transmission over a180-day period, within the contact groups previouslydefined. Figure 3 depicts a flowchart of the model. Themodeled natural history and simulator dynamics para-meters, described below and shown in Figure 3, werebased on Longini et al. [7,19].To initiate influenza outbreaks, simulations are seeded
with approximately 100 randomly selected initial infec-tives, with all other individuals considered susceptible(state 0). Susceptible people have the opportunity, eachday, to become infected in their contact groups. As dis-cussed in the main text, the daily probability of infectionfor each susceptible person is determined by the num-ber of infectious contacts in his contact groups, and onthe per-contact probability of transmission for each typeof contact. For example, the probability of a susceptiblechild who attends daycare being infected on a particularday is:1 – [Pr(child is not infected in the household)× Pr(child is not infected in the neighborhood)× Pr(child is not infected in the community)× Pr(child is not infected at the daycare center)].Within each contact group, the probability of infection
of a susceptible individual depends on the number ofinfectious individuals in the group. For example, sup-pose that k1 children and k2 adults in a household areinfectious on a particular day. Then the probability of asusceptible household member being infected in thathousehold on that day is:1 – [Pr(not infected by a particular infected child in
the household)k1
× Pr(not infected by a particular infected adult in thehousehold)k2].The number of infectious people in the contact groups
(e.g., k1 and k2), are random variables that are updatedat the beginning of each day.Age- and contact-group-specific per-contact probabil-
ities of transmission of infection are given in Table 1.The probability that infection is transmitted from aninfected person to a susceptible person also depends onwhether the infectious person is symptomatic or asymp-tomatic. Table 1 shows the rates for symptomatic indivi-duals. The transmission rates for asymptomaticindividuals are half of those shown in Table 1. Theseprobabilities are based on Longini et al. [7,16], withadjustments made to calibrate baseline (no intervention)results to age-group-specific illness attack rates and R0
estimates for novel A (H1N1) in Ontario [14,24,25]; seeTable 2.
Once infected, people enter a 1–3 day latent period(state 1; average length 1.9 days). They are assumed tobecome infectious on the last day of the latent period,and are half as infectious as they will be after the latentperiod ends. After the latent period, 67% of infectivesbecome symptomatic (state 2), and 33% are asympto-matic (state 3). These infectious states last between 3and 6 days. Symptomatic infectives are assumed to betwice as infectious as asymptomatics, and have a chanceof withdrawing home during each day of illness (see Fig-ure 3); upon withdrawal, they only make contacts withintheir household and neighborhood, with transmissionprobabilities doubled in the household contact group,until they recover. If a school child withdraws home dueto illness, one adult in the household also stays home.Each day in states 2 and 3, an infectious person has achance to exit the state and be removed from the simu-lation (i.e., to recover or die — state 4). Probabilities fortransition into and out of states are given in Figure 3and are based on Longini et al. [7,16].
Economic cost calculationsThe total cost of each intervention scenario includes thecost of vaccine doses and antiviral courses used, if any;costs associated with parents staying at home with sickchildren and school teachers, parents, and children stay-ing home due to school closure; costs due to illness-related absence from work; medical costs associatedwith illness, including outpatient visits, prescription andover-the-counter drugs, and hospitalization; and lostearnings due to death.
Table 5 Proportions of influenza cases at high risk forcomplications1
Age Group Proportion at High Risk
Children (0–18) 0.064
Adults (19–59) 0.144
Seniors (60+) 0.400
1. Proportions taken from Meltzer et al. [29], and adapted to our age groups
Table 6 Outpatient visit, hospitalization, and death rates,by age group and risk status for complications1
Rates per 1000 persons ill
Outpatient Visits Hospitalizations Deaths
Not at High Risk
Children 165 0.2 0.014
Adults 40 0.18 0.025
Seniors 45 1.5 0.28
High Risk
Children 289 2.1 0.126
Adults 70 0.83 0.1
Seniors 79 4.0 2.76
1. Rates taken from Meltzer et al. [29]
Andradóttir et al. BMC Public Health 2011, 11(Suppl 1):S1http://www.biomedcentral.com/1471-2458/11/S1/S1
Page 12 of 15

We use methods described by Meltzer et al. [29] toquantify most medical and work-loss costs (see also[33]). Table 5 shows the proportions of illnessesassumed to be at high risk for complications amongchildren (0–18 years old), younger adults (19–59 yearsold) and seniors (over 60). Table 6 shows estimatedrates of outpatient visits, hospitalizations, and deathused in our calculations for children, adults, and seniorsat high risk and not at high risk of complications. Wechose the ‘low’ rate estimates presented in Meltzer et al.[29], which we believe to be most consistent with therelatively low R0 (1.4) for our model. Outpatient visit,hospitalization, and death costs are shown in Table 7;cost figures from Meltzer et al. [29] have been inflatedusing 2008 consumer price and medical price indexes[30-32]. All the above costs were combined with age-specific attack rates obtained from our simulationmodel. In addition, we assume average costs of $25 pervaccine dose or antiviral course used, consistent withprevious reports [35]. Table 8 shows other costs asso-ciated with vaccination (i.e., the cost of lost time, travel,and side effects). These costs are based on [34], inflatedas described above. The vaccination costs are combinedwith the number of used vaccination doses obtainedfrom our simulation model. We assume that 1% of anti-viral users discontinue use due to side effects; medicaland other costs associated with these side effects are notincluded in our model.To estimate costs of ill individuals staying home and
work-loss associated with parents staying at home withsick children, we multiplied the number of days(obtained from our simulation model) with the infla-tion-adjusted average value of lost days from Table 7.Similarly, we estimated the average number of teachersat schools and daycares by dividing the total number ofsuch teachers in Hamilton [36] among the schools anddaycares in our model. To estimate the cost of lost tea-cher productivity due to school closures, we multipliedthe number of days schools and daycares are closed inour simulation model by the average number of teachers
Table 7 Frequency and costs (in US$) associated withinfluenza-related outpatient visits, hospitalizations, anddeaths1
Age Group
Outcome Category Item Children Adults Seniors
Outpatient Visits
Average no. visits per case 1.52 1.52 1.52
Net payment per visit $80.90 $62.74 $82.55
Average copayment for outpatientvisit
$8.26 $6.60 $6.60
Net payment per prescription $41.28 $59.44 $59.44
Average prescriptions per visit 0.9 1.8 1.4
Average copayment perprescription
$4.95 $4.95 $4.95
Days lost 3 2 5
Value of 1 day lost $91.85 $141.30 $91.85
Subtotal: Per-case Outpatient Costs $448.86 $496.50 $679.47
Hospitalization
Hospital cost $4,847.34 $9,932.42 $11,319.26
Net payment per outpatient visit $122.17 $155.19 $168.40
Average copayment for outpatientvisit
$8.26 $6.60 $6.60
Net payment for drug claims $42.93 $69.34 $67.69
Most likely days lost 5 8 10
Value of 1 day lost $91.85 $141.30 $91.85
Subtotal: Per-case HospitalizationCosts
$5,479.92 $11,293.96 $12,480.40
Deaths
Average age (years) 9 35 74
PV earnings lost $1,435,750 $1,466,231 $93,027
Most likely hospital costs $5,671 $12,555 $13,718
Subtotal $1,441,422 $1,478,788 $106,746
Ill but no medical care sought
Days lost 3 2 5
Value of 1 day lost $91.85 $141.30 $91.85
Over-the-counter drugs $3.30 $3.30 $3.30
Subtotal: Per-case ill (no caresought)
$278.84 $285.90 $462.53
1. Estimates based on figures from Meltzer et al. [29]. Cost estimates inflatedby 2008 consumer and medical price indices [30-32] as appropriate.
Table 8 Costs and impacts of vaccination1
Cost or Side Effect Item Probability of Side Effect Per-case Cost of Side Effect Cost Scenario (per patient)
Assumed cost of vaccination 25.00
Patient time 5.65
Patient travel costs 5.65
Side effects
Mild 0.0325 94 5.04
Guillain-Barré Syndrome (GBS) 0.000002 100,800 0.33
Anaphylaxis 0.000000157 2,490 0.0006
1. Estimates based on figures from Meltzer et al. [29]. Travel and side effect cost estimates inflated by 2008 consumer and medical price indices [30-32] asappropriate.
Andradóttir et al. BMC Public Health 2011, 11(Suppl 1):S1http://www.biomedcentral.com/1471-2458/11/S1/S1
Page 13 of 15

at Hamilton schools and daycares and by the averagevalue of a day of lost work obtained from Table 7.Table S1 shows age-stratified and overall illness attack
rates for all modeled scenarios, along with total costestimates. Figure 7 depicts the total cost (US$) plottedvs. average overall illness attack rate for eachintervention.
Additional material
Additional file 1: Supplementary Data for Reactive Strategies forContaining Developing Outbreaks of Pandemic Influenza
AcknowledgementWe thank the referees and Robert Smith? for their constructive comments.This article has been published as part of BMC Public Health Volume 11Supplement 1, 2011: Mathematical Modelling of Influenza. The full contentsof the supplement are available online at http://www.biomedcentral.com/1471-2458/11?issue=S1.
Author details1H. Milton Stewart School of Industrial and Systems Engineering, GeorgiaInstitute of Technology, Atlanta, Georgia, 30332, USA. 2Toronto HealthEconomics and Technology Assessment Collaborative, Toronto, Ontario, M5S3M2, Canada. 3Department of Health Policy, Management and Evaluation,University of Toronto, Toronto, Ontario, M5T 3M6, Canada. 4Division ofClinical Decision-Making and Health Care Research, University HealthNetwork, Toronto, Ontario, M5G 2C4, Canada. 5Department of Epidemiology,Dalla Lana School of Public Health, University of Toronto, Toronto, Ontario,
M5T 3M7, Canada. 6Department of Biostatistics and Bioinformatics, EmoryUniversity, Atlanta, Georgia, 30322, USA.
Authors’ contributionsStudy conception and design: AN, SA, DG, KLTSimulation model development: AN, WC, KLT, SA, MLL, DG, BS, DNFAnalysis and interpretation of simulation results: AN, SA, DG, WCDrafting of manuscript: SA, AN, DGAll authors read and approved the final manuscript.
Competing interestsDNF has received grant matching funds from Sanofi Pasteur, whichmanufactures a vaccine for use against influenza A (H1N1)-2009 outsideCanada.
Published: 25 February 2011
References1. World Health Organization: World now at the start of 2009 influenza
pandemic.[http://www.who.int/mediacentre/news/statements/2009/h1n1_pandemic_phase6_20090611/en/index.html], (Accessed October 26,2009.).
2. World Health Organization: Pandemic (H1N1) 2009 - update 71.[http://www.who.int/csr/don/2009_10_23/en/index.html], (Accessed October 26,2009.).
3. The Centers for Disease Control and Prevention: 2009 H1N1 Flu SituationUpdate.[http://www.cdc.gov/H1n1flu/update.htm], (Accessed October 26,2009.).
4. Yang Y, Sugimoto JD, Halloran ME, Basta NE, Chao DL, Matrajt L, Potter G,Kenah E, Longini IM: The transmissibility and control of pandemicinfluenza A (H1N1) virus. Science 2009, 326:729-733.
5. Gojovic MZ, Sander B, Fisman D, Krahn MD, Bauch CT: Modellingmitigation strategies for pandemic (H1N1) 2009. Canadian MedicalAssociation Journal 2009, 181(10):673-680.
Figure 7 Total cost of modeled intervention strategies versus the average illness attack rate
Andradóttir et al. BMC Public Health 2011, 11(Suppl 1):S1http://www.biomedcentral.com/1471-2458/11/S1/S1
Page 14 of 15

6. Ferguson NM, Cummings DAT, Cauchemez S, Fraser C, Riley S, Meeyai A,Iamsirithaworn S, Burke SD: Strategies for containing an emerginginfluenza pandemic in Southeast Asia. Nature 2005, 437:209-214.
7. Longini IM, Nizam A, Xu S, Ungchusak K, Hanshaoworakul W,Cummings DAT, Halloran ME: Containing pandemic influenza at thesource. Science 2005, 309:1083-1087.
8. The Centers for Disease Control and Prevention: 2009 H1N1 vaccine dosesallocated, ordered, and shipped by project area.[http://www.cdc.gov/h1n1flu/vaccination/updates/102309.htm], (Accessed October 26, 2009.).
9. The Public Health Agency of Canada: H1N1 flu virus in Canada.[http://www.phac-aspc.gc.ca/alert-alerte/h1n1/faq_rg_h1n1-eng.php], (AccessedOctober 26, 2009.).
10. The New York Times: A nation battling flu and short vaccine supplies.2009 [http://www.nytimes.com/2009/10/26/health/26flu.html?hpw],(Accessed October 26, 2009.).
11. The New York Times: City parents opting out of swine flu vaccine. 2009[http://www.nytimes.com/2009/10/29/nyregion/29vaccine.html?_r=1],(Accessed November 6, 2009.).
12. The New York Times: Swine flu shots revive a debate about vaccines.2009 [http://query.nytimes.com/gst/fullpage.html?res=9903EFDA1739F935A25753C1A96F9C8B63], (Accessed October 21,2010.).
13. The Centers for Disease Control and Prevention: 2009 H1N1 vaccinationrecommendations.[http://www.cdc.gov/h1n1flu/vaccination/acip.htm],(Accessed December 9, 2009.).
14. Tuite AR, Greer AL, Whelan M, Winter A, Lee B, Yan P, Wu J, Moghadas S,Buckeridge D, Pourbohloul B, Fisman DN: Estimated epidemiologicparameters and morbidity associated with pandemic H1N1 influenza.Canadian Medical Association Journal , DOI:10.1503/cmaj.091807. (Advanceaccess December 3, 2009.).
15. Halloran ME, Ferguson NM, Eubank S, Longini IM Jr, Cummings DAT,Lewis B, Xu S, Fraser C, Vullikanti A, Germann TC, Wagener D, Beckman R,Kadau K, Barrett C, Macken CA, Burke DS, Cooley P: Modeling targetedlayered containment of an influenza pandemic in the United States.Proceedings of the National Academy of Sciences of the USA 2008,105(12):4639-4644[http://www.pnas.org/cgi/doi/10.1073/pnas.0706849105],(Accessed October 22, 2010.).
16. Longini IM, Halloran ME, Nizam A, Yang Y: Containing pandemic influenzawith antiviral agents. American Journal of Epidemiology 2004, 159:623-633.
17. Aleman DM, Wibisono TG, Schwartz B: Accounting for individualbehaviors in a pandemic disease spread model. In Proceedings of the2009 Winter Simulation Conference. Piscataway, NJ: Institute for Electrical andElectronics Engineers;Rossetti MD, Hill RR, Johansson B, Dunkin A, Ingalls RG2009:1977-1985.
18. Stroud P, Del Valle S, Sydoriak S, Riese J, Mniszewski S: Spatial dynamics ofpandemic influenza in a massive artificial society. Journal of ArtificialSocieties and Social Simulation 2007, 10(4):9[http://jasss.soc.surrey.ac.uk/10/4/9.html].
19. Statistics Canada 2006 Census of Population, CANSIM using CHASS: Table510036 - Estimates of population, by sex and age group, censusdivisions and census metropolitan areas, 2006 Census boundaries,annually (Persons unless specified).[http://dc1.chass.utoronto.ca/cansimdim/English/], (Accessed May 6, 2009.).
20. Statistics Canada 2006 Census of Population, CANSIM using CHASS: ProfileTables/Marital status, families & household living arrangements, andhousing.[http://dc1.chass.utoronto.ca/census/index.html and http://www40.statcan.gc.ca/l01/cst01/famil54b-eng.htm], (Accessed May 6, 2009.).
21. Statistics Canada 2006 Census of Population, CANSIM using CHASS: 2006Profile of Census Tracts / Age and sex.[http://dc1.chass.utoronto.ca/cansimdim/English/], (Accessed May 6, 2009.).
22. Statistics Canada 2006 Census of Population, CANSIM using CHASS: Labourforce survey estimates (LFS), by census metropolitan area, sex and agegroup, annually (Persons unless specified).[http://dc1.chass.utoronto.ca/cansimdim/English/], (Accessed May 6, 2009.).
23. Statistics Canada 2006 Census of Population, CANSIM using CHASS: 2006Profile of Census Tracts/Labour market activity.[http://dc1.chass.utoronto.ca/cansimdim/English/], (Accessed May 6, 2009.).
24. Hancock K, Veguilla V, Lu X, Zhong W, Butler EN, Sun H, Liu F, Dong L,DeVos JR, Gargiullo PM, Brammer TL, Cox NJ, Tumpey TM, Katz M: Cross-reactive antibody responses to the 2009 pandemic H1N1 InfluenzaVirus. New England Journal of Medicine 2009, 361:1945-1952.
25. Tuite AR, Greer A, Kwong JC, Fisman DN: Optimal pandemic influenzavaccine allocation strategies for the Canadian population. PLoS ONE 5(5):e10520[http://www.ncbi.nlm.nih.gov/pmc/articles/PMC2865540/pdf/pone.0010520.pdf], (Accessed Sept. 12, 2010.).
26. Fraser C, Donnelly CA, Cauchemez S, Hanage WP, Van Kerkhove MD,Hollingsworth TD, Griffin J, Baggaley RF, Jenkins HE, Lyons EJ, Jombart T,Hinsley WR, Grassly NC, Balloux F, Ghani AC, Ferguson NM, Rambaut A,Pybus OG, Lopez-Gatell H, Alpuche-Aranda CM, Chapela IB, Zavala EP,Guevara DME, Checchi F, Garcia E, Hugonnet S, Roth C: The WHO RapidPandemic Assessment Collaboration: Pandemic potential of a strain ofinfluenza A (H1N1): Early findings. Science 2009, 324:1557-1561.
27. New Scientist: Warm weather may not halt swine flu. 2009 [http://www.newscientist.com/article/dn17100-warm-weather-may-not-halt-swine-flu.html], (Accessed November 13, 2009.).
28. Basta NE, Chao DL, Halloran ME, Matrajt L, Longini IM Jr: Strategies forpandemic and seasonal influenza vaccination of schoolchildren in theUnited States. American Journal of Epidemiology 2009, 170:679-686.
29. Meltzer MI, Cox NJ, Fukuda K: The economic impact of pandemicinfluenza in the United States: Priorities for intervention. EmergingInfectious Diseases 1999, 5:659-671.
30. InflationData.com: Historical CPI-U data from 1913 to the present. 2009[http://www.inflationdata.com/Inflation/Consumer_Price_Index/HistoricalCPI.aspx], (Accessed November 29, 2009.).
31. Bureau of Labor Statistics: Consumer Price Index.[http://www.bls.gov/cpi/cpi_dr.htm], (Accessed November 29, 2009.).
32. Swivel Preview: Consumer Price Index for Medical Care.[http://www.swivel.com/data_columns/spreadsheet/1875739], (Accessed November 29,2009.).
33. Medlock J, Galvani AP: Optimizing influenza vaccine distribution. Science2009, 325:1705-1708.
34. Bowlby G: Provincial drop-out rates – Trends and consequences. StatisticsCanada;[http://www.statcan.gc.ca/pub/81-004-x/2005004/8984-eng.htm#b],(Accessed May 6, 2009.).
35. Sander B, Nizam A, Garrison L, Postma MJ, Halloran ME, Longini IM:Economic evaluation of influenza pandemic mitigation strategies in theUS using a stochastic microsimulation transmission model. Value inHealth 2008, 12:226-233.
36. Statistics Canada: Industry – North American Industry ClassificationSystem 2002 (433), Class of Worker (6) and Sex (3) for the Labour Force15 Years and Over of Canada, Provinces, Territories, Census MetropolitanAreas and Census Agglomerations, 2006 Census – 20% Sample Data.[http://www.statcan.gc.ca/bsolc/olc-cel/olc-cel?lang=eng&catno=97-559-X2006009], (Accessed 11/29/2009.).
doi:10.1186/1471-2458-11-S1-S1Cite this article as: Andradóttir et al.: Reactive strategies for containingdeveloping outbreaks of pandemic influenza. BMC Public Health 2011 11(Suppl 1):S1.
Submit your next manuscript to BioMed Centraland take full advantage of:
• Convenient online submission
• Thorough peer review
• No space constraints or color figure charges
• Immediate publication on acceptance
• Inclusion in PubMed, CAS, Scopus and Google Scholar
• Research which is freely available for redistribution
Submit your manuscript at www.biomedcentral.com/submit
Andradóttir et al. BMC Public Health 2011, 11(Suppl 1):S1http://www.biomedcentral.com/1471-2458/11/S1/S1
Page 15 of 15


