Embed Size (px)
Citation preview
REAL ESTATE MARKET OVERVIEW
| C&W | 1
Industry Research Report Mumbai & Pune (Residential & Commercial Real Estate)
Final Report For Puranik Builders Ltd.
September 2021
REAL ESTATE MARKET OVERVIEW
| C&W | 2
Contents
1. ECONOMIC OVERVIEW............................................................................................................................. 4
1.1. India Economic Overview ........................................................................................................................ 4
2. ADVANTAGE INDIA .................................................................................................................................... 6
2.1. Recent Policy Announcements and Government Initiatives .................................................................... 6
2.1.1. Pradhan Mantri Awas Yojana (PMAY) ................................................................................................ 6
2.1.3. Smart Cities ......................................................................................................................................... 7
2.1.4. Atal Mission for Rejuvenation and Urban Transformation (AMRUT) .................................................. 7
2.1.5. Industrial Corridors & Logistic Parks driving growth ............................................................................ 8
2.3. Private Equity Investments in Real Estate............................................................................................... 9
2.4. RERA, GST and Demonetization ............................................................................................................ 9
2.5. Changes in tax liability on Joint Development (JDA) ............................................................................. 11
2.6. REIT Policy and way forward ................................................................................................................ 11
3. IMPACT OF UNIFIED DEVELOPMENT CONTROL AND PROMOTION REGULATIONS FOR
MAHARASHTRA STATE (UDCPR) .................................................................................................................. 12
4. INDIA RESIDENTIAL REAL ESTATE OVERVIEW .................................................................................. 13
4.1. Comparative Analysis of Residential Markets ....................................................................................... 14
4.2. Affordable and Mid-income housing ...................................................................................................... 15
4.3. Impact of COVID on Real Estate Sector ............................................................................................... 16
5. MUMBAI METROPOLITAN REGION (MMR) MARKET OVERVIEW ....................................................... 18
5.1. MMR Demographic and Economic Profile ............................................................................................. 18
5.1.1. MMR Infrastructure Initiatives ............................................................................................................ 19
5.1.2. MMR Commercial Real Estate Overview .......................................................................................... 21
5.1.3. MMR Retail Market Snippet ............................................................................................................... 23
5.1.4. MMR Residential Real Estate Overview ............................................................................................ 23
5.1.5. Slum Rehabilitation Authority (SRA) Policy ....................................................................................... 28
5.1.6. Private Society Redevelopment 30 & 32 ........................................................................................... 29
6. PUNE MARKET OVERVIEW .................................................................................................................... 30
6.1. Pune Demographic & Economic Overview ............................................................................................ 30
6.2. Pune Infrastructure Initiatives ................................................................................................................ 31
6.2.1. Pune Commercial Real Estate Overview .......................................................................................... 32
6.2.2. Pune Retail Market Snippet ............................................................................................................... 34
6.2.3. Pune Residential Overview ............................................................................................................... 35
ANNEXURE 1: MUMBAI METROPOLITAN REGION INFRASTRUCTURE MAP ........................................... 39
ANNEXURE 2: MUMBAI RETAIL AND COMMERCIAL MARKET SPREAD ................................................... 40
ANNEXURE 3: MMR RESIDENTIAL CAPITAL VALUE RANGES (INR PER SQ.FT. ON CARPET AREA) ... 41
ANNEXURE 4: PUNE INFRASTRUCTURE MAP (KEY EXISTING AND UPCOMING DEVELOPMENTS) .... 42
ANNEXURE 5: PUNE RETAIL AND COMMERCIAL MARKET SPREAD ........................................................ 43
ANNEXURE 6: PUNE RESIDENTIAL CAPITAL VALUE RANGES (INR PER SQ.FT. ON CARPET AREA) .. 44
ANNEXURE 7: DETAILS OF SLUM REHABILITATION SCHEME 33 (10) ...................................................... 45

REAL ESTATE MARKET OVERVIEW
| C&W | 3
ANNEXURE 8: DETAILS OF PRIVATE SOCIETY REDEVELOPMENT 30 & 32 ............................................ 46
ANNEXURE 9: DEFINITIONS ........................................................................................................................... 47
ANNEXURE 10: KEY DEVELOPER PROFILES .............................................................................................. 48
ANNEXURE 11: DEVELOPERS IN MUMBAI MMR & PUNE PMR .................................................................. 50
CAVEATS & LIMITATIONS ............................................................................................................................... 54
REAL ESTATE MARKET OVERVIEW
| C&W | 4
1. ECONOMIC OVERVIEW
1.1. India Economic Overview
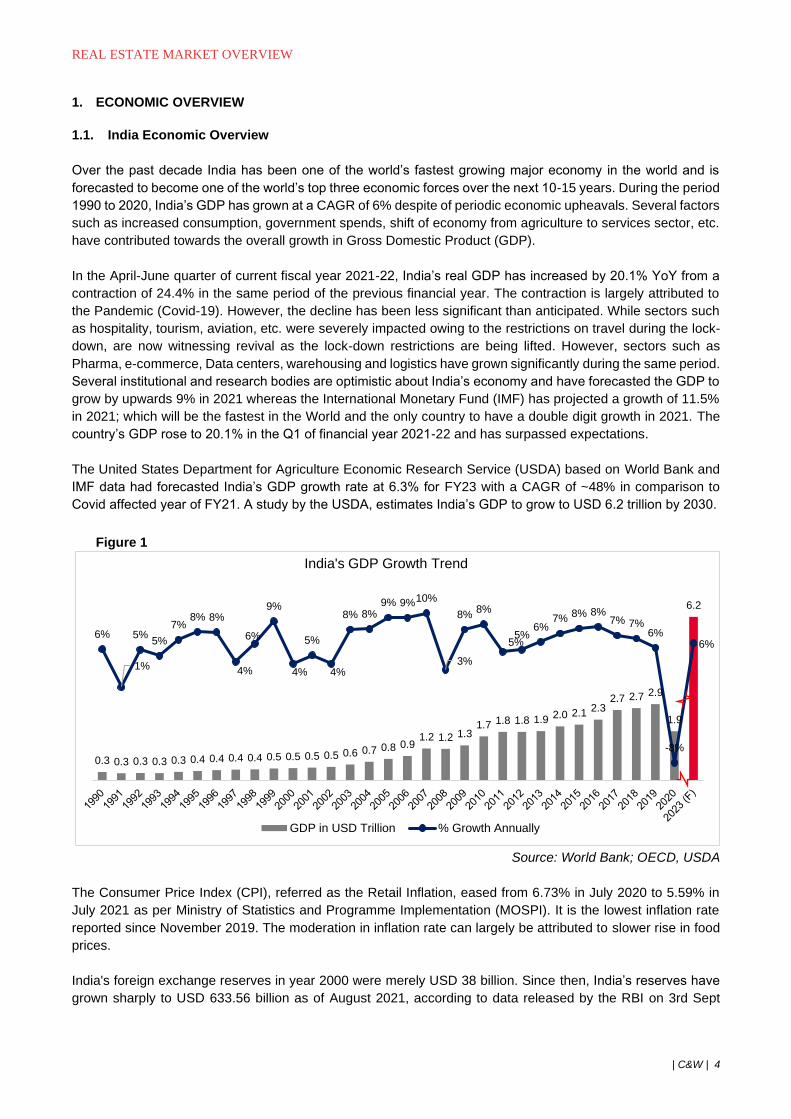
Over the past decade India has been one of the world’s fastest growing major economy in the world and is
forecasted to become one of the world’s top three economic forces over the next 10-15 years. During the period
1990 to 2020, India’s GDP has grown at a CAGR of 6% despite of periodic economic upheavals. Several factors
such as increased consumption, government spends, shift of economy from agriculture to services sector, etc.
have contributed towards the overall growth in Gross Domestic Product (GDP).
In the April-June quarter of current fiscal year 2021-22, India’s real GDP has increased by 20.1% YoY from a
contraction of 24.4% in the same period of the previous financial year. The contraction is largely attributed to
the Pandemic (Covid-19). However, the decline has been less significant than anticipated. While sectors such
as hospitality, tourism, aviation, etc. were severely impacted owing to the restrictions on travel during the lock-
down, are now witnessing revival as the lock-down restrictions are being lifted. However, sectors such as
Pharma, e-commerce, Data centers, warehousing and logistics have grown significantly during the same period.
Several institutional and research bodies are optimistic about India’s economy and have forecasted the GDP to
grow by upwards 9% in 2021 whereas the International Monetary Fund (IMF) has projected a growth of 11.5%
in 2021; which will be the fastest in the World and the only country to have a double digit growth in 2021. The
country’s GDP rose to 20.1% in the Q1 of financial year 2021-22 and has surpassed expectations.
The United States Department for Agriculture Economic Research Service (USDA) based on World Bank and
IMF data had forecasted India’s GDP growth rate at 6.3% for FY23 with a CAGR of ~48% in comparison to
Covid affected year of FY21. A study by the USDA, estimates India’s GDP to grow to USD 6.2 trillion by 2030.
Figure 1
Source: World Bank; OECD, USDA
The Consumer Price Index (CPI), referred as the Retail Inflation, eased from 6.73% in July 2020 to 5.59% in
July 2021 as per Ministry of Statistics and Programme Implementation (MOSPI). It is the lowest inflation rate
reported since November 2019. The moderation in inflation rate can largely be attributed to slower rise in food
prices.
India's foreign exchange reserves in year 2000 were merely USD 38 billion. Since then, India’s reserves have
grown sharply to USD 633.56 billion as of August 2021, according to data released by the RBI on 3rd Sept
0.3 0.3 0.3 0.3 0.3 0.4 0.4 0.4 0.4 0.5 0.5 0.5 0.5 0.6 0.7 0.8 0.91.2 1.2 1.3
1.7 1.8 1.8 1.9 2.0 2.1 2.32.7 2.7 2.9
1.9
6.2
6%
1%
5%5%
7%8% 8%
4%
6%
9%
4%
5%
4%
8% 8%9% 9%10%
3%
8%8%
5%5%
6%7% 8% 8%
7% 7%6%
-8%
6%
India's GDP Growth Trend
GDP in USD Trillion % Growth Annually
REAL ESTATE MARKET OVERVIEW
| C&W | 5
2021. This is amongst the highest amount of foreign exchange reserves that India has recorded, with foreign
exchange assets at USD 571.6 Bn and gold reserves at USD 37.4 Bn. Such high accumulation is being touted
as the best buffer amidst global, economic and geopolitical uncertainties.
Since 2015, India has jumped 79 places to rank 63rd in the 2020 Ease of Doing Business Ranking by The World
Bank, reflecting the government’s pro-business stance to create a conducive environment for businesses to
operate in the country. Investor confidence continues to remain strong, on the back of high cross border M&A
activity.
As per the NASSCOM report, India ranked third in the world in terms of number of startup companies with
11,000 to 12,500 tech startups, adding about 1,600 new startups in 2020. India continues to witness grow at
about 8%-10% in startups despite Covid-19 with 2020 recording 12 unicorns. The Indian startup ecosystem
continued to attract investor interest with almost $16.9 Bn of funding in 2021 (January to July). The phenomenal
growth in number of start-ups can be attributed to government’s push to support entrepreneurs via schemes
such as “Start-up India”, improvement in “ease of doing business”, access to funds (private equity), etc.
India is currently ranked the 6th largest economy in 2020 however, projected to become the 3rd largest economy
by 2030. The government’s pro-business reforms such as Make in India, Start-up India, relaxations in FDI, etc.
coupled with governments spends on infrastructure, RBI’s monetary policies, etc. are the key factors that have
contributed towards this economic growth of the country. Owing to such factors, India’s economy is expected
to maintain its growth trajectory over the next 10 – 15 years.
REAL ESTATE MARKET OVERVIEW
| C&W | 6
2. ADVANTAGE INDIA
Over the past few years, the government has significantly contributed in providing its support to develop India
and promote business opportunities within the country. Government initiatives and policies such as relaxation
in Foreign Direct Investments (FDI) limits, ease of doing business, Housing for All, Make in India, Smart City,
Start-up India, and infrastructure initiatives has transformed India into one of the largest economies in the world.
Some of these initiatives are as under.
2.1. Recent Policy Announcements and Government Initiatives
2.1.1. Pradhan Mantri Awas Yojana (PMAY)
Housing for All Scheme: A report published by the Report of Technical Group (TG-12) on Estimation of Urban
Housing Shortage 2012-17, Ministry of Housing & Urban Poverty Alleviation, reported a total urban housing
shortage of 18.8 million units. About 96% (~18 Mn units) of this shortage is within the Economically Weaker
Section (EWS) and Low-Income Group (LIG). The Mid-Income Group (MIG) and High-Income Group (HIG)
account for only 4% in housing shortage (0.8 Mn units).
With the vision to provide homes for the economically weaker sections, the Prime Minister announced, “Housing
for All Scheme” under the PMAY in June 2015. Under this scheme the government has planned to construct 20
Mn houses by the year 2022. The Ministry of Housing and Urban Affairs (MoHUA) has so far sanctioned 11.3
Mn houses under PMAY – Urban as published on its online portal. MoHUA also reported that 5 Mn houses have
been completed and over 8.6 Mn houses are under-construction. An amount of INR 80 Bn has been allocated
during FY21-22 for PMAY scheme by the central government. Thane and Pune are part of the cities selected
under the PMAY scheme that will receive assistance from the center. Additionally, the stamp duty payable in
case of PMAY projects in Maharashtra have been reduced to INR 1,000 per dwelling unit belonging to EWS &
LIG category further enhancing the affordability for the end users in the state.
Affordable Housing in Partnership (AHP): The Finance Minister in its Union Budget 2016-17 had announced
that real estate developers would be exempt from paying tax on profits in affordable housing segment for a
period of five years, conditionally to project size. The exemption would be for projects that have been approved
by the competent authority during the period starting 01st June 2016 and ending on 31st March 2020. In the
Union Budget 2020-21 the government extended the timeline to 31st March 2021, and the same is further
extended for one year until 31st March 2022 as announced in the Union Budget 2021-22. Section 80 IBA has
been inserted by the Government in the Income Tax Act, 1961 to declare 100% deduction of the profits and
gains arising from the construction sector to make house purchases affordable and provide tax benefits to the
Real Estate Developers. The government also increased the time limit to 5 years to construct such projects,
providing developers sufficient timelines to efficiently execute construction of affordable housing projects.
Further, under the AHP, the government aims to provide financial assistance to increase participation of private
developers in affordable housing projects. Through this initiative, the central government extends assistance of
INR 0.15 Mn per EWS house in private projects, where at least 35% of the houses are constructed for the EWS
category.
Credit Linked Subsidy Scheme (CLSS): The scheme provides interest subsidy of 6.5% on loans for first time
home buyers from the Economically Weaker sections (EWS) and Low-Income Group (LIG) having annual
household income of up to INR 0.6 Mn. The subsidy is provided on home loans of up to INR 0.6 Mn for a
maximum period of 20 years, to the beneficiaries under this scheme. First-time home buyers from Mid-Income
Groups (MIG) with annual household income between INR 0.6 Mn and INR 1.2 Mn for MIG 1 category and
household income of INR 1.2 Mn and INR 1.8 Mn for MIG 2 category can also avail this subsidy, amounting to
maximum of 4% for MIG I category and 3% for MIG II category, for a maximum loan amount of INR 0.9 Mn and
INR 1.2 Mn, respectively. The unit size permissible under this scheme is a maximum of 30 sq. mt. of carpet
area for EWS & 60 sq. mt. of carpet area for LIG category. In June 2018, the government increased the CLSS
REAL ESTATE MARKET OVERVIEW
| C&W | 7
subsidy unit size limits to 160 sq.mt and 200 sq.mt of carpet area for MIG 1 & MIG 2 applicants respectively,
subject to income eligibility. Earlier, the size limits were a maximum of 120 sq.mt. and 150 sq.mt. of carpet area
for MIG 1 & MIG 2 applicants respectively. During the FY21-22 Union Budget announcement, the Finance
Minister allocated INR 10 Bn towards the CLSS for the EWS and LIG whereas INR 0.1 Mn is allocated for the
MIG. Until 31st August 2021, around 1.63 Mn beneficiaries were reported to have availed the CLSS under the
PMAY (Urban).
In-situ slum redevelopment (ISSR): The scheme aims to provide houses to slum dwellers by redeveloping
the existing slums on public and private land. A grant of INR 0.1 Mn per house will be provided by the central
government to the planning and implementing authorities of the respective states. The Government further
awarded Infrastructure status to the affordable housing sector in February 2017. In line with government’s strong
focus on the affordable housing sector, the RBI had increased the permissible lending limits to 90% of loan to
value ratio for loans of up to INR 3 Mn.
In February 2018, the Union Cabinet approved the creation of National Urban Housing Fund (NUHF) with an
outlay of INR 600 Bn. The NUHF was planned to facilitate requisite fund raising for the different verticals of
PMAY, over the period of four years. The NUHF was created to provide a sustainable model for financing the
construction of houses under the PMAY- Urban scheme. On the back of focused government reforms for
affordable housing coupled with increased spending from the government, the affordable housing sector has
emerged as the one of the key growth drivers for real estate in India.
2.1.2. Budget 2022 for Real Estate Sector
In order to bolster demand in real estate industry, Government sees ‘Housing for All’ and affordable housing as
priority areas. The Budget 2022 provides multi-fold announcements that are likely to impact real estate and
includes Extension of Interest exemption up to INR 1.5 Lakhs for Affordable home loans up to March 2022,
Extension of tax holidays for developers for Affordable projects u/s 80IA up to March 2022, New tax exemptions
to developers on developing Affordable Rental Housing Complexes (a newly added fifth vertical in PMAY-U) for
Migrant Workers, Increase in safe harbour limit for primary sale of residential units from 10% to 20% by enabling
the developers to liquidate their unsold inventory at a rate substantially lower than the circle rate and giving
benefit to the home buyers and Debt Financing of InVITs and REITs by Foreign Portfolio Investors that can
ease access of finance and augmenting funds in infrastructure and real estate sectors.
2.1.3. Smart Cities
Smart Cities Mission is an urban re-development program by the Government of India with the mission to
improve and modernize 100 cities across the country. The improvements will be in the form of better utilities
(power, water, sewage, waste management, etc.), ease in transportation and commute, digitization and
governance making the cities people friendly and self-sustainable. The Union Ministry of Urban Development
in collaboration with respective state governments is responsible for the implementation. An amount of INR 64.5
Bn has been allocated during FY21-22 for the development of the Smart Cities under the Smart City Mission of
the central government. Within Maharashtra, eleven cities were selected for re-development under this initiative
including Mumbai, Thane, Kalyan-Dombivali, Navi Mumbai, Pune, Amravati, Solapur, Nagpur, Nashik and
Aurangabad and Pimpri-Chinchwad.
2.1.4. Atal Mission for Rejuvenation and Urban Transformation (AMRUT)
AMRUT was formed in June 2015 with a view of providing basic services such as water supply, sewerage,
urban transport, etc. to households as well as building amenities that contribute towards improving the quality
of life for all. A total of 500 cities will be considered for development under this scheme. The government had
increased the budget by 14% and allocated a budget of INR 500 Bn for a 5-year period from FY16 to FY20. The
government has extended this by another 2 years, till March 2022. An amount of INR 73 Bn was allocated
REAL ESTATE MARKET OVERVIEW
| C&W | 8
during FY21-22 for AMRUT by the central government. The Maharashtra state government has included a total
of 44 cities under this scheme that will be undertaken for development during the 5-year period. Mumbai, Thane,
Kalyan-Dombivali, Navi Mumbai, Pune, etc. are amongst the key cities selected under this initiative.
2.1.5. Industrial Corridors & Logistic Parks driving growth
Industrial growth is one of the most important agendas of the current government. The Make in India campaign
was launched in 2014 with an objective to promote India as an investment destination and global hub for
manufacturing. Under this initiative the government has managed to attract significant investment commitments
from several countries and companies. The 2018 Make in India event had recorded investment commitments
of INR 15.5 Trillion, with Maharashtra accounting for about INR 8 Trillion on investment commitments. Under
the Magnetic Maharashtra initiative, Shri. Uddhav Thakrey, the current Chief Minister of Maharashtra,
announced that the Maharashtra Government has signed MOU’s amounting to over INR 2 Tn in 2020. The
investment commitments are for diverse sectors including pharmaceuticals, healthcare, biotechnology, food
processing, FMCG, steel, automobiles, engineering and oil & gas. The further highlights the optimistic stance
of investors and the government in anticipation of a rapid turn-around of economic activities post Covid-19
impact.
To accommodate and drive this industrial growth in the country, several industrial corridors have also been
planned and are in various stages of implementation. Some of the key industrial corridors are
• Mumbai-Nagpur Samruddhi Corridor
• Delhi-Mumbai Industrial Corridor (DMIC)
• Bengaluru-Mumbai Economic Corridor (BMEC)
• Chennai-Bengaluru Industrial Corridor (CBIC)
• Visakhapatnam-Chennai Industrial Corridor (VCIC)
• Amritsar-Kolkata Industrial Corridor (AKIC)
While these industrial corridors will house industrial & logistics parks, the Ministry of Road Transport and
Highways is also planning to develop multimodal logistics parks under the Logistics Efficiency Enhancement
Programme (LEEP) across 35 locations in India with an estimated investment of INR 330 Bn. These industrial
parks are being built with an objective to reduce logistics costs incurred and will account for about 50% of the
road freight in India.
The World Bank ranked India at #42 out of the total 167 countries in its 2018 Logistics Performance Index (LPI).
India’s ranking for Quality of Overall Infrastructure was #46 in 2017. India’s overall ranking declined from #85
and to #90 in Quality of Overall Infrastructure ranking from 2014 to 2015. However, with several government
initiatives and policies, India’s ranking improved significantly to #74 in Quality of Overall Infrastructure in 2016.
The government continues to implement various initiatives towards improvement of the industrial &
infrastructure development within the country. The World bank has not released the LPI rankings after 2018.
These factors contribute substantially to drive real estate growth in India since these industrial corridors are
expected to create significant job opportunities, thereby attracting work force to these locations. Emergence of
these employment hubs is expected to create several new residential markets spreading along the stretch of
these industrial corridors. The DMIC alone cuts across 6 states and is expected to provide impetus to real estate
sector in 24 cities along its route. About 18% area of Maharashtra falls within the influence zone of DMIC. The
whole of Thane city falls within this influence zone and hence is likely to witness significant growth going forward.
The DMIC is India’s most progressive and largest infrastructure programme to build emerging industrial cities
as Smart Cities and enhancing the technologies across the infrastructural sector. The estimated investment for
DMIC is $100 Bn.
REAL ESTATE MARKET OVERVIEW
| C&W | 9
2.2. Foreign Direct Investments (FDI) in Construction Development in India
Foreign Direct Investment (FDI) received in Construction Development from April 2000 to March 2021 stood at
USD 26 Bn, according to the Department of Industrial Policy and Promotion (DIPP). The Cabinet in January
2018 had approved 100% FDI under automatic route in the construction development segment, which includes
townships, housing, built-up infrastructure and real estate broking services. The government has taken these
measures to liberalize and simplify the FDI policy to offer ease of doing business in the country. India witnessed
an FDI inflow of USD 81.97 Bn in the FY20-21. This was a 10% rise compared to the previous year’s inflows of
about USD 74.39 Bn. Despite Covid 19, the FDI inflows have remained resilient recording USD 22.53 Bn for
the period between April 2021 and June 2021. Apart from the Covid-19 led slowdown, the FDI in construction
development had seen a steady growth over the previous six years. This reflects the sustained confidence
amongst investors especially towards the construction development sector in India and Maharashtra, despite
Covid-19 causing a short-term hinderance.
2.3. Private Equity Investments in Real Estate
Over the years, the Private Equity (PE) Investment in Real Estate in India have evolved significantly. While the
2000’s witnessed investments being made at an entity level (equity stake), the markets have evolved in recent
years and investments are typically being made at the project/SPV level. During the years between 2013 and
2016, the residential sector in India attracted on an average about 56% of the annual PE investments made in
India’s Real Estate market. However, with demonetization in 2016 and subsequent introduction of RERA and
GST coupled with increased momentum in office space, the investments in residential sector declined, average
investments percentage share being 19% between 2017 and 2020. The office segment attracted higher share
(averaging around half of the total investments between 2017-19) in the overall pie with institutional investors
having a huge favor for the asset class. Robust office leasing in major cities attracted investors to this rent-
yielding asset class. Industrial segment also started seeing traction starting 2017 and played a key role in
altering the sectoral share of the overall investment pie. However, residential with respect to affordable and mid
income housing remains on the investors’ radar for the long term as they continue to scout for opportunities in
this segment, given the thrust by government for affordable housing in India as well as rising demand from end-
users especially in mid-income category.
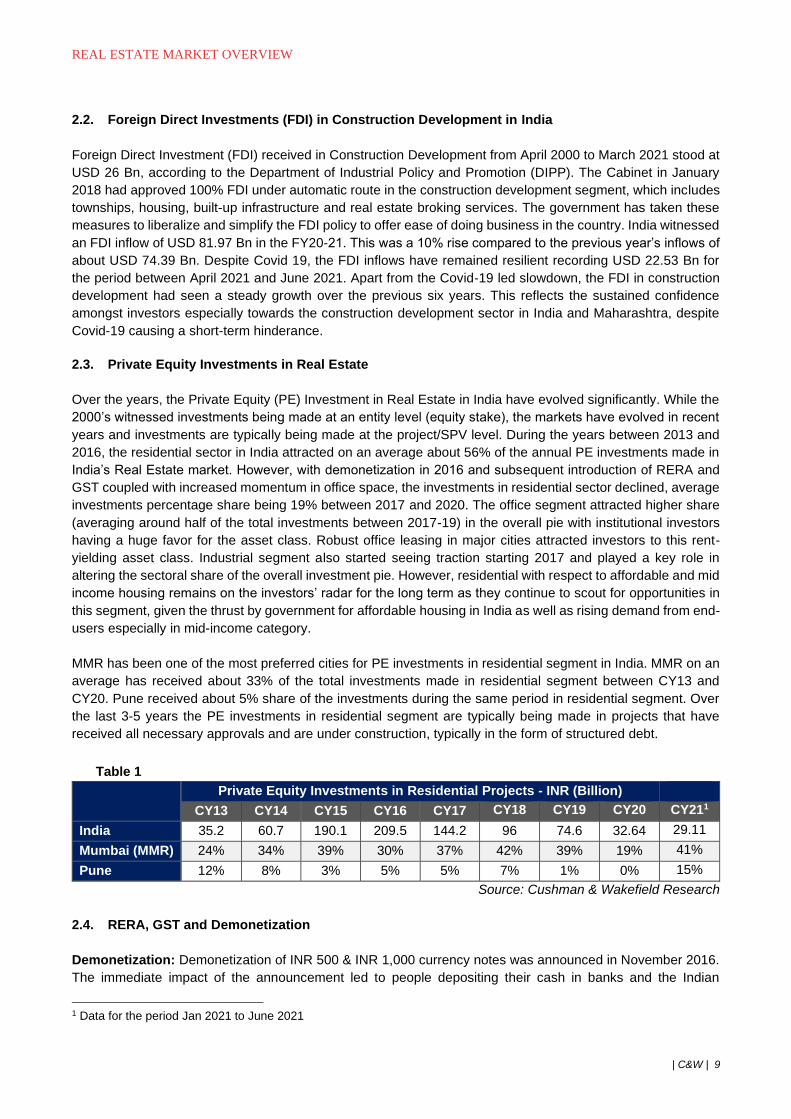
MMR has been one of the most preferred cities for PE investments in residential segment in India. MMR on an
average has received about 33% of the total investments made in residential segment between CY13 and
CY20. Pune received about 5% share of the investments during the same period in residential segment. Over
the last 3-5 years the PE investments in residential segment are typically being made in projects that have
received all necessary approvals and are under construction, typically in the form of structured debt.
Table 1
Private Equity Investments in Residential Projects - INR (Billion)
CY13 CY14 CY15 CY16 CY17 CY18 CY19 CY20 CY211
India 35.2 60.7 190.1 209.5 144.2 96 74.6 32.64 29.11
Mumbai (MMR) 24% 34% 39% 30% 37% 42% 39% 19% 41%
Pune 12% 8% 3% 5% 5% 7% 1% 0% 15%
Source: Cushman & Wakefield Research
2.4. RERA, GST and Demonetization
Demonetization: Demonetization of INR 500 & INR 1,000 currency notes was announced in November 2016.
The immediate impact of the announcement led to people depositing their cash in banks and the Indian
1 Data for the period Jan 2021 to June 2021
REAL ESTATE MARKET OVERVIEW
| C&W | 10
economy was drained out of liquid cash for a brief period. While majority of the low- and mid-income home
buyers make their purchases with home loans, they went into a wait and watch mode owing to uncertainties.
Developers also refrained from launching new projects during this period as there were no buyers. The High-
end to luxury housing segment was severely impacted by this announcement owing to higher proportion of cash
transactions involved in property purchases in this segment. The mid segment and the affordable housing
segment however, continued to grow cumulatively recording 13% increase in new unit launches in Q1 2017
compared to Q4 2016. Demonetization had led to increased liquidity in the banking system, allowing the interest
rates to be at the lower end and hence increasing affordability for a greater number of home buyers.
Demonetization has also helped in bringing transparency in property purchases with increase in transactions
undertaken through formal banking channels.
RERA: The Real Estate (Regulation and Development) Act (RERA) came into effect in May 2017. The RERA
policies are inclined towards safeguarding buyers’ interest, brining transparency and making the real estate
developers accountable for the development of their projects. The RERA has several stringent policies with
regards to completion timelines, revenue management, advertising, etc. Owing to such policies guidelines, real
estate developers not only require enough cash flows to fund their projects but also have project monitoring
systems in place to ensure adherence with RERA. These policies make real estate development challenging,
specifically for smaller/standalone developers. However, larger organized developers typically have structured
business operations and access to funds and hence could seamlessly adapt to the RERA guidelines. Over the
years, smaller developers have been partnering with larger developer to execute real estate projects, offering
significant partnership opportunities in terms of joint development and joint venture arrangements for organized
players. These factors are thus expected to increase the market share of the organized players in the real estate
sector. As a result, organized developers are likely to benefit owing to increase in business opportunities
coupled with reduced competition in the long term.
Due to the spread of Covid-19 the government has made suitable relaxations on certain regulations in order to
help the builders deliver their duties and obligations. As per RERA guidelines, project timelines have been
extended by one year. Maharashtra has been the first state to implement RERA. Maharashtra is considered as
the first state to initiate a conciliation forum. The forum will provide a quick and amicable resolution to complaints
filed by the buyers, saving time and cost. Such factors are expected to improve home buyer’s confidence in the
state.
GST: The Goods and Service Tax (GST) Act came into effect in July 2017 with an objective to simplify the
complex taxation structure. The implementation of GST on real estate has been structured in a manner that is
expected to reduce the tax burden on developers as well as buyers. The GST regime also enabled real estate
developers to pass on the savings in taxation to its buyers, by claiming input tax credit for the project’s under-
construction (completed projects are exempted from GST). Under the pre-GST regime the Value Added Tax
(VAT) + Service Tax cumulatively accounted for 5.5% to 8.5% of the property price across states in India. The
GST for under construction projects was initially pegged at 12%. The GST Council in January 2018 has
recommended extension of the concessional rate of 8% GST to construction of flats/ houses of less than 60
sqm in Affordable Housing projects. Affordable Housing project has been defined in the said notification as a
housing project using at least 50% of the FAR/FSI for dwelling units with carpet area of not more than 60 sqm
in metropolitan cities and 90 sqm in non-metropolitan cities. This recommendation has been accepted and has
helped in reducing the total cost of property acquisition, helping drive sales in the affordable housing segment.
However, as of 1st April 2019, the GST rates were reduced to 1% for affordable housing projects and 5% for all
other residential projects. Under the revised GST regime, the developers cannot claim input tax credits.
RBI’s “Deployment of Gross Bank Credit” shows that the outstanding debt for the housing sector (including
priority sector) grew by 3% between March 2020 and November 2020 (up from INR 13,390 billion to INR 13,834
billion) indicating that the number of homebuyers have continued to grow despite Covid-19, albeit at a slower
rate. The continued growth reflects that buyers are likely to continue to make home purchases and are no longer
impacted by the short-term disruptions, including Covid-19
REAL ESTATE MARKET OVERVIEW
| C&W | 11
2.5. Changes in tax liability on Joint Development (JDA)
In the 2017 union budget announcement, the government amended the capital gains tax liability policy for joint
development agreement (JDA) for real estate projects. Under the revised policy, the capital gains tax shall be
applicable in the year of completion of the project and not at the time of signing the agreement. Whereby, the
landowner would be taxed in the year the completion certificate (CC) for the project is awarded. These changes
have reduced upfront costs to initiate projects thereby making the JDA model significantly efficient for real estate
developers. Moreover, this move enables the developers to split their financial liabilities and risks with
landowners while launching new projects, especially in cities with high land rates such as Mumbai.
2.6. REIT Policy and way forward
While the Securities and Exchange Board of India (SEBI) had been trying to implement REITs in India since
2007, it amended its rules significantly in September 2014. SEBI further amended its policies in November 2016
to remove major taxation hurdles. The revised guidelines have now made it feasible for companies to list REITs.
In the latest amendment on 1st March 2019, Securities and Exchange Board of India (SEBI) reduced the
minimum investment limit in REIT to ₹50,000 from ₹2 lakh, making it easier to invest in a REIT. Following the
pandemic, the SEBI recently eased the due date for the REIT regulatory filings for FY21 that ended on 31st
March 2021.
The first REIT initial public offering (IPO) in India was made by Embassy Office Parks that opened its bids in
March 2019. The second REIT in India was introduced in July 2020, the K. Raheja Mindspace REIT followed
by Brookfield India REIT in February 2021. While REITs are expected to support growth of commercial real
estate in the country, permitting REITs to invest in the housing sector can further help developers get better
access to funds, provide an option for developers to exit their projects and help drive growth of housing sector
in India.
2.7. Urbanization
As per the 2001 census about 27.8% of India’s population lived in urban areas. This increased to 31.2% as per
the 2011 census. A report by United Nations (UN) has forecasted that India is likely to add 300 million new
urban residents by 2050. The concentration of employment opportunities, education centers, social
infrastructure, etc. in urban areas are some of the key factors attracting people to migrate to urban areas. The
government initiatives for city development such as smart cities, Atal Mission for Rejuvenation and Urban
Transformation, etc. are focused easing stress on city infrastructure and accommodating rapid urbanization;
thereby improving livability standards for those living in urban areas.
Maharashtra accounts for highest (13.5%) share in urban population, with Mumbai being the most populated
city in India and having the highest population density, 32,303 people per sq.km. (Mumbai City District) as per
the Census 2011. Pune is the 8th most populated city in India and has density of ~5,600 people per sq.km2. The
population density of Thane district is ~1,160 people per sq.km. Owing to such rapid urbanization, especially in
cities such as Mumbai and Pune, the central parts of such cities are nearly saturated in terms of real estate
development and availability of land. The real estate growth has therefore been shifting towards the peripheral
locations that have availability of land and property prices are more affordable, leading to expanding boundaries
of these cities.
With rapid expansion of city boundaries and increasing population, the infrastructure in most cities is grossly
inadequate. The local governments have increased their focus on improving public transport systems, road &
2 Source: World Population Review
REAL ESTATE MARKET OVERVIEW
| C&W | 12
rail connectivity, infrastructure, etc. to improve livability in cities, whereas the central government is focusing in
developing smaller towns under initiatives such as the Smart City mission, to de-stress the metro and Tier 1
cities.
3. IMPACT OF UNIFIED DEVELOPMENT CONTROL AND PROMOTION REGULATIONS FOR
MAHARASHTRA STATE (UDCPR)
In December 2020, Government of Maharashtra sanctioned the Unified DCPR which is applicable to all the
municipal corporations except MCGM, MIDC, NAINA, JNPT, Hill Station Municipal Council and Lonavala
Municipal Council. Apart from these municipal bodies the special planning areas under MCGM jurisdiction, other
special planning areas and authorities, eco-sensitive / eco-fragile zones are also exempted. However, the
UDCPR is applicable for town planning schemes.
The new UDCPR has increased the basic FSI to 1.50 from 1 in congested areas for plot with access road below
9m and the basic FSI to 2 from 1 for plot above 9m wide access road. Developers can buy additional FSI on
the payment of premium and load the TDR as per market rate on the basic FSI to exploit the maximum
development potential. This would give an advantage to the plots which has access road less than 9m. In earlier
DCR, the plots having access road less than 9m were entitled to utilized only basic FSI which was 1.
Thane Municipal Corporation DCR had the basic FSI of 1 for plot having access of 9m and above. The maximum
permissible additional FSI was 0.5 and maximum permissible TDR loading was 1.4. Thus, the total development
potential for the plots having access road of 30m and above becomes 2.70 which was the maximum permissible
FSI in TMC area. In case of the similar development by applying the UDCPR 2020, the total development
potential increases to 3.00 for plot having access of more than 9m. The ancillary area FSI up to the extent of
60% of the total proposed FSI which includes basic FSI, additional FSI on payment of premium and TDR is
allowed on the payment at 15% of the ready reckoner rate for Thane and Pune Municipal Corporation Areas.
This ancillary area FSI is applicable for all other schemes such as TOD, PMAY, URS, ITP, IT and MHADA
except SRA. As per TMC DCR, the FSI computation was done on the net plot area. However, as per UDCPR
2020 the computation of additional FSI and TDR to be calculated is on gross plot area. Thane Municipal
Corporation used to charge additional FSI at the 60% of ready reckoner rates for residential use but in UDCPR
2020, this rate has been reduced to 35% for residential. However, the state government may revise the
percentage and ready reckoner rate time to time.
In case of Pune Municipal Corporation, the FSI computation for all the components such as basic FSI, additional
FSI and TDR was calculated on the net plot area which excludes amenity spaces and recreational open spaces
as per PMC DCPR 2017. Whereas in the UDCPR 2020, the FSI computation of basic FSI is to be done on net
plot area and additional FSI & TDR to be calculated on gross plot area. This FSI computation increases the total
development potential considerably giving the developers an opportunity to construct larger developments.
Refer Annexure 12 for detailed break-up of the FSI norms under the UDCPR 2020.
As per the latest Govt. Resolution by the Govt. of Maharashtra, dated 14th January 2021, the developer can
avail the 50% rebate in the development premium. However, the developer has to submit a certificate to the
municipal corporation that the entire stamp duty on the units purchased is borne by him. The rebate will be
payable on such projects till 31st December 2021.
REAL ESTATE MARKET OVERVIEW
| C&W | 13
4. INDIA RESIDENTIAL REAL ESTATE OVERVIEW3
India’s current population is 1.3 billion and is expected to overtake that of China by 2030. This large population
provides a huge base for India’s real estate sector, especially in tier 1 cities such as Mumbai and Pune owing
to rapid urbanization. As per industry estimates, the housing sector is expected to account for ~13% share in
India’s Gross Domestic Product (GDP) by 2025 and the cumulative real estate sector is expected grow to USD
1 Trillion by 20304. The real estate sector is considered as the largest employer after agriculture in India.
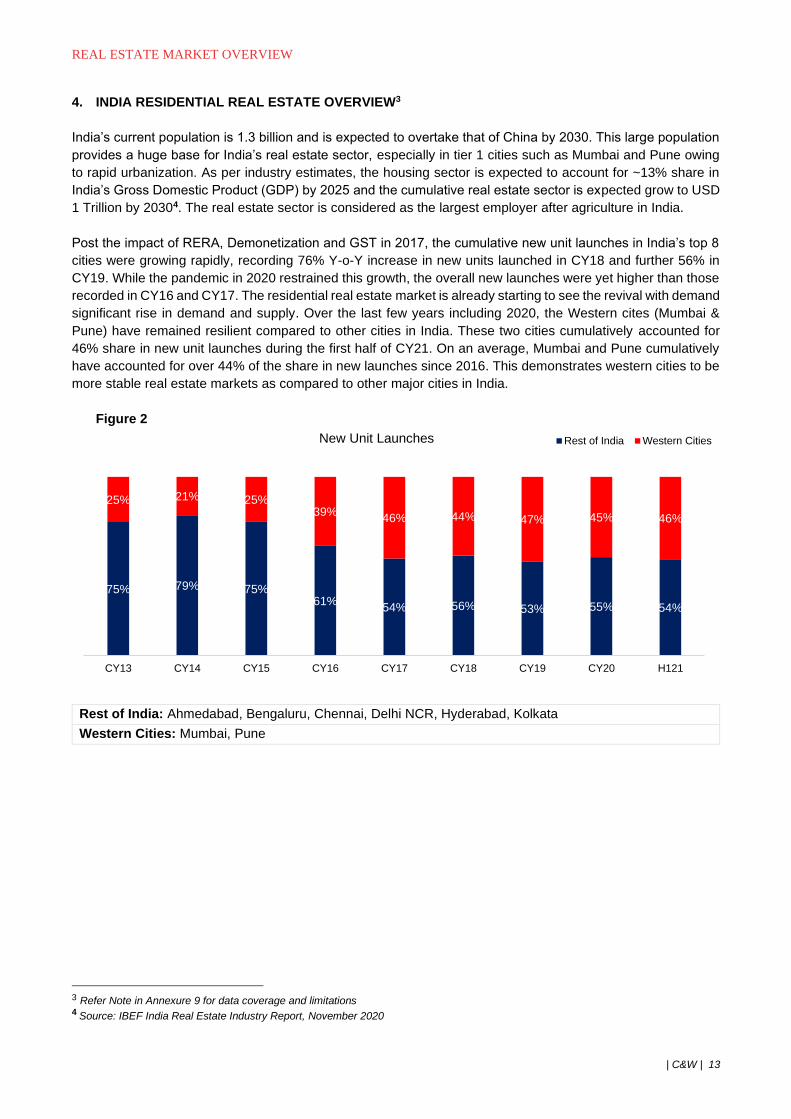
Post the impact of RERA, Demonetization and GST in 2017, the cumulative new unit launches in India’s top 8
cities were growing rapidly, recording 76% Y-o-Y increase in new units launched in CY18 and further 56% in
CY19. While the pandemic in 2020 restrained this growth, the overall new launches were yet higher than those
recorded in CY16 and CY17. The residential real estate market is already starting to see the revival with demand
significant rise in demand and supply. Over the last few years including 2020, the Western cites (Mumbai &
Pune) have remained resilient compared to other cities in India. These two cities cumulatively accounted for
46% share in new unit launches during the first half of CY21. On an average, Mumbai and Pune cumulatively
have accounted for over 44% of the share in new launches since 2016. This demonstrates western cities to be
more stable real estate markets as compared to other major cities in India.
Figure 2
Rest of India: Ahmedabad, Bengaluru, Chennai, Delhi NCR, Hyderabad, Kolkata
Western Cities: Mumbai, Pune
3 Refer Note in Annexure 9 for data coverage and limitations 4 Source: IBEF India Real Estate Industry Report, November 2020
75% 79% 75%61%
54% 56% 53% 55% 54%
25% 21% 25%39%
46% 44% 47% 45% 46%
CY13 CY14 CY15 CY16 CY17 CY18 CY19 CY20 H121
New Unit Launches Rest of India Western Cities
REAL ESTATE MARKET OVERVIEW
| C&W | 14
4.1. Comparative Analysis of Residential Markets
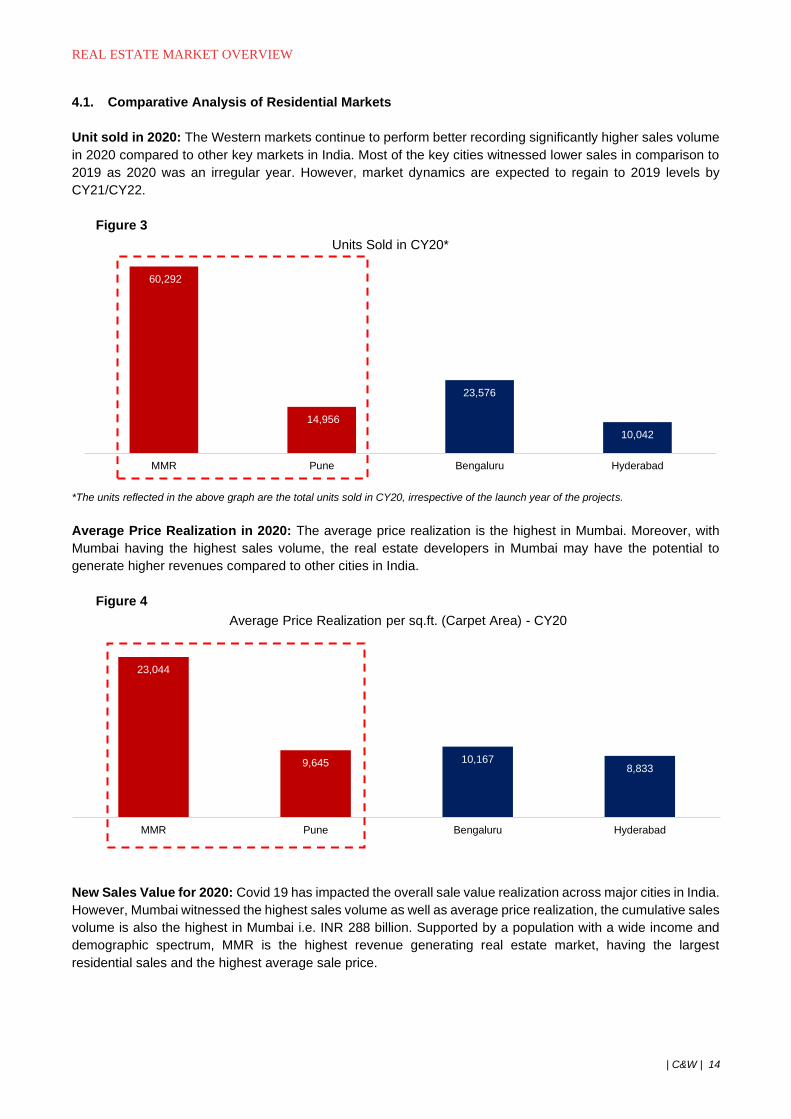
Unit sold in 2020: The Western markets continue to perform better recording significantly higher sales volume
in 2020 compared to other key markets in India. Most of the key cities witnessed lower sales in comparison to
2019 as 2020 was an irregular year. However, market dynamics are expected to regain to 2019 levels by
CY21/CY22.
Figure 3
*The units reflected in the above graph are the total units sold in CY20, irrespective of the launch year of the projects.
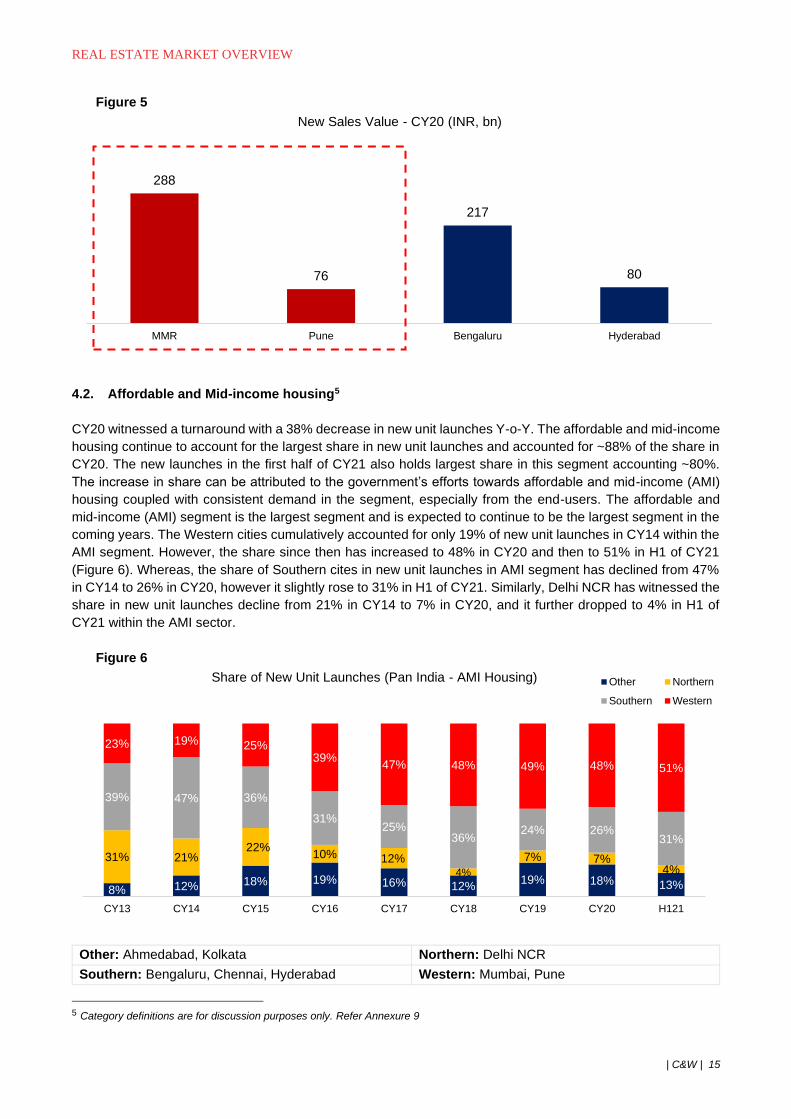
Average Price Realization in 2020: The average price realization is the highest in Mumbai. Moreover, with
Mumbai having the highest sales volume, the real estate developers in Mumbai may have the potential to
generate higher revenues compared to other cities in India.
Figure 4
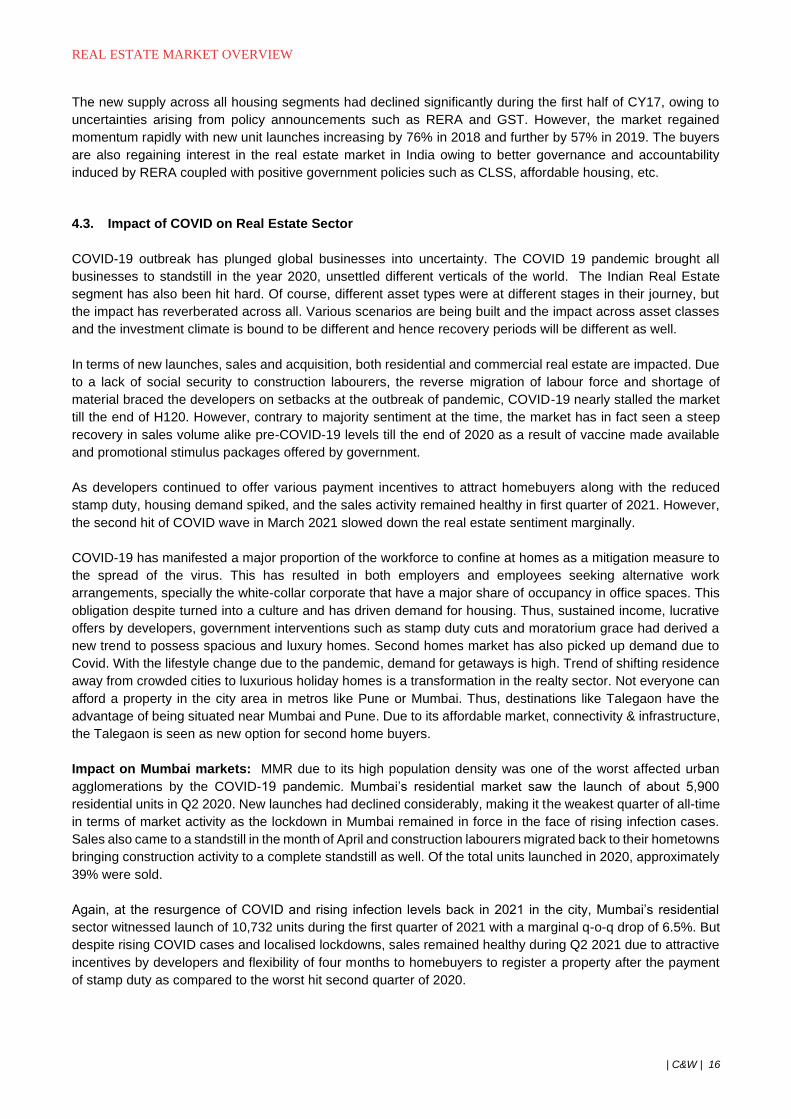
New Sales Value for 2020: Covid 19 has impacted the overall sale value realization across major cities in India.
However, Mumbai witnessed the highest sales volume as well as average price realization, the cumulative sales
volume is also the highest in Mumbai i.e. INR 288 billion. Supported by a population with a wide income and
demographic spectrum, MMR is the highest revenue generating real estate market, having the largest
residential sales and the highest average sale price.
60,292
14,956
23,576
10,042
MMR Pune Bengaluru Hyderabad
Units Sold in CY20*
23,044
9,645 10,1678,833
MMR Pune Bengaluru Hyderabad
Average Price Realization per sq.ft. (Carpet Area) - CY20
REAL ESTATE MARKET OVERVIEW
| C&W | 15
Figure 5
4.2. Affordable and Mid-income housing5
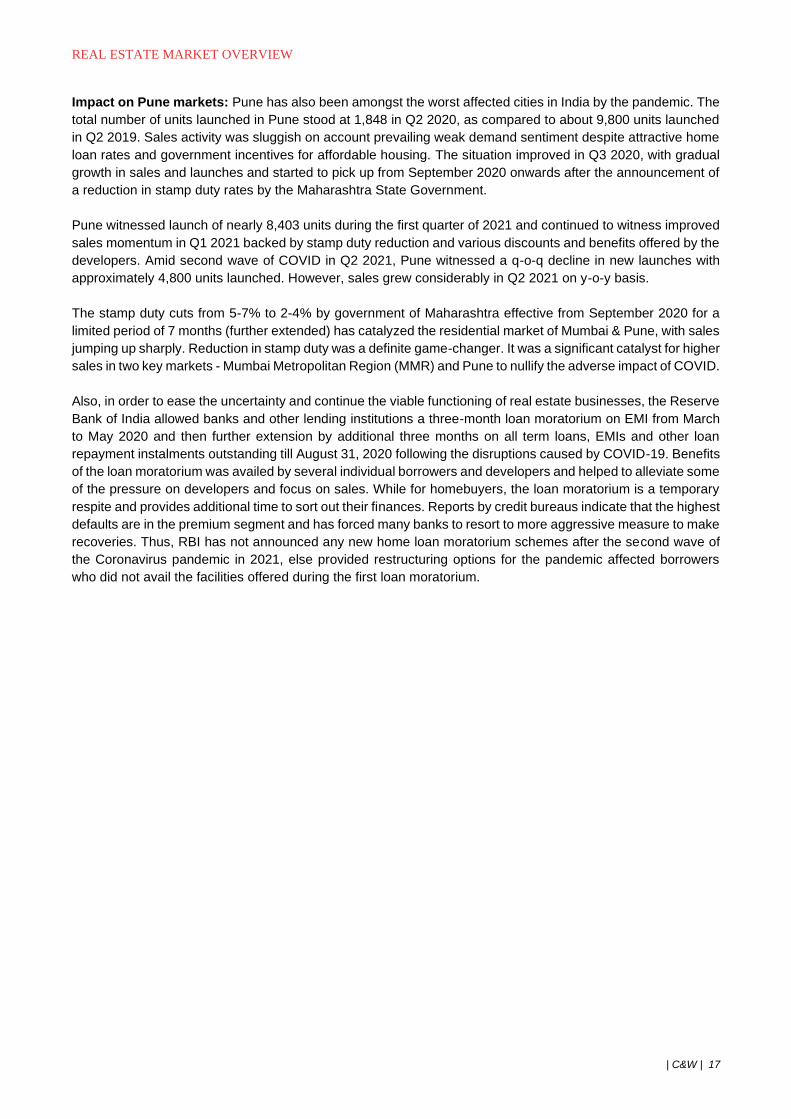
CY20 witnessed a turnaround with a 38% decrease in new unit launches Y-o-Y. The affordable and mid-income
housing continue to account for the largest share in new unit launches and accounted for ~88% of the share in
CY20. The new launches in the first half of CY21 also holds largest share in this segment accounting ~80%.
The increase in share can be attributed to the government’s efforts towards affordable and mid-income (AMI)
housing coupled with consistent demand in the segment, especially from the end-users. The affordable and
mid-income (AMI) segment is the largest segment and is expected to continue to be the largest segment in the
coming years. The Western cities cumulatively accounted for only 19% of new unit launches in CY14 within the
AMI segment. However, the share since then has increased to 48% in CY20 and then to 51% in H1 of CY21
(Figure 6). Whereas, the share of Southern cites in new unit launches in AMI segment has declined from 47%
in CY14 to 26% in CY20, however it slightly rose to 31% in H1 of CY21. Similarly, Delhi NCR has witnessed the
share in new unit launches decline from 21% in CY14 to 7% in CY20, and it further dropped to 4% in H1 of
CY21 within the AMI sector.
Figure 6
Other: Ahmedabad, Kolkata Northern: Delhi NCR
Southern: Bengaluru, Chennai, Hyderabad Western: Mumbai, Pune
5 Category definitions are for discussion purposes only. Refer Annexure 9
288
76
217
80
MMR Pune Bengaluru Hyderabad
New Sales Value - CY20 (INR, bn)
8% 12% 18% 19% 16% 12%19% 18% 13%
31% 21%22%
10% 12%4%
7% 7%4%
39% 47% 36%
31%25%
36%24% 26%
31%
23% 19% 25%39%
47% 48% 49% 48% 51%
CY13 CY14 CY15 CY16 CY17 CY18 CY19 CY20 H121
Share of New Unit Launches (Pan India - AMI Housing) Other Northern
Southern Western
REAL ESTATE MARKET OVERVIEW
| C&W | 16
The new supply across all housing segments had declined significantly during the first half of CY17, owing to
uncertainties arising from policy announcements such as RERA and GST. However, the market regained
momentum rapidly with new unit launches increasing by 76% in 2018 and further by 57% in 2019. The buyers
are also regaining interest in the real estate market in India owing to better governance and accountability
induced by RERA coupled with positive government policies such as CLSS, affordable housing, etc.
4.3. Impact of COVID on Real Estate Sector
COVID-19 outbreak has plunged global businesses into uncertainty. The COVID 19 pandemic brought all
businesses to standstill in the year 2020, unsettled different verticals of the world. The Indian Real Estate
segment has also been hit hard. Of course, different asset types were at different stages in their journey, but
the impact has reverberated across all. Various scenarios are being built and the impact across asset classes
and the investment climate is bound to be different and hence recovery periods will be different as well.
In terms of new launches, sales and acquisition, both residential and commercial real estate are impacted. Due
to a lack of social security to construction labourers, the reverse migration of labour force and shortage of
material braced the developers on setbacks at the outbreak of pandemic, COVID-19 nearly stalled the market
till the end of H120. However, contrary to majority sentiment at the time, the market has in fact seen a steep
recovery in sales volume alike pre-COVID-19 levels till the end of 2020 as a result of vaccine made available
and promotional stimulus packages offered by government.
As developers continued to offer various payment incentives to attract homebuyers along with the reduced
stamp duty, housing demand spiked, and the sales activity remained healthy in first quarter of 2021. However,
the second hit of COVID wave in March 2021 slowed down the real estate sentiment marginally.
COVID-19 has manifested a major proportion of the workforce to confine at homes as a mitigation measure to
the spread of the virus. This has resulted in both employers and employees seeking alternative work
arrangements, specially the white-collar corporate that have a major share of occupancy in office spaces. This
obligation despite turned into a culture and has driven demand for housing. Thus, sustained income, lucrative
offers by developers, government interventions such as stamp duty cuts and moratorium grace had derived a
new trend to possess spacious and luxury homes. Second homes market has also picked up demand due to
Covid. With the lifestyle change due to the pandemic, demand for getaways is high. Trend of shifting residence
away from crowded cities to luxurious holiday homes is a transformation in the realty sector. Not everyone can
afford a property in the city area in metros like Pune or Mumbai. Thus, destinations like Talegaon have the
advantage of being situated near Mumbai and Pune. Due to its affordable market, connectivity & infrastructure,
the Talegaon is seen as new option for second home buyers.
Impact on Mumbai markets: MMR due to its high population density was one of the worst affected urban
agglomerations by the COVID-19 pandemic. Mumbai’s residential market saw the launch of about 5,900
residential units in Q2 2020. New launches had declined considerably, making it the weakest quarter of all-time
in terms of market activity as the lockdown in Mumbai remained in force in the face of rising infection cases.
Sales also came to a standstill in the month of April and construction labourers migrated back to their hometowns
bringing construction activity to a complete standstill as well. Of the total units launched in 2020, approximately
39% were sold.
Again, at the resurgence of COVID and rising infection levels back in 2021 in the city, Mumbai’s residential
sector witnessed launch of 10,732 units during the first quarter of 2021 with a marginal q-o-q drop of 6.5%. But
despite rising COVID cases and localised lockdowns, sales remained healthy during Q2 2021 due to attractive
incentives by developers and flexibility of four months to homebuyers to register a property after the payment
of stamp duty as compared to the worst hit second quarter of 2020.
REAL ESTATE MARKET OVERVIEW
| C&W | 17
Impact on Pune markets: Pune has also been amongst the worst affected cities in India by the pandemic. The
total number of units launched in Pune stood at 1,848 in Q2 2020, as compared to about 9,800 units launched
in Q2 2019. Sales activity was sluggish on account prevailing weak demand sentiment despite attractive home
loan rates and government incentives for affordable housing. The situation improved in Q3 2020, with gradual
growth in sales and launches and started to pick up from September 2020 onwards after the announcement of
a reduction in stamp duty rates by the Maharashtra State Government.
Pune witnessed launch of nearly 8,403 units during the first quarter of 2021 and continued to witness improved
sales momentum in Q1 2021 backed by stamp duty reduction and various discounts and benefits offered by the
developers. Amid second wave of COVID in Q2 2021, Pune witnessed a q-o-q decline in new launches with
approximately 4,800 units launched. However, sales grew considerably in Q2 2021 on y-o-y basis.
The stamp duty cuts from 5-7% to 2-4% by government of Maharashtra effective from September 2020 for a
limited period of 7 months (further extended) has catalyzed the residential market of Mumbai & Pune, with sales
jumping up sharply. Reduction in stamp duty was a definite game-changer. It was a significant catalyst for higher
sales in two key markets - Mumbai Metropolitan Region (MMR) and Pune to nullify the adverse impact of COVID.
Also, in order to ease the uncertainty and continue the viable functioning of real estate businesses, the Reserve
Bank of India allowed banks and other lending institutions a three-month loan moratorium on EMI from March
to May 2020 and then further extension by additional three months on all term loans, EMIs and other loan
repayment instalments outstanding till August 31, 2020 following the disruptions caused by COVID-19. Benefits
of the loan moratorium was availed by several individual borrowers and developers and helped to alleviate some
of the pressure on developers and focus on sales. While for homebuyers, the loan moratorium is a temporary
respite and provides additional time to sort out their finances. Reports by credit bureaus indicate that the highest
defaults are in the premium segment and has forced many banks to resort to more aggressive measure to make
recoveries. Thus, RBI has not announced any new home loan moratorium schemes after the second wave of
the Coronavirus pandemic in 2021, else provided restructuring options for the pandemic affected borrowers
who did not avail the facilities offered during the first loan moratorium.
REAL ESTATE MARKET OVERVIEW
| C&W | 18
5. MUMBAI METROPOLITAN REGION (MMR) MARKET OVERVIEW
5.1. MMR Demographic and Economic Profile
Mumbai, with a population density of ~21,000 per sq.km. is one of the most populous cities in India as well as
the world. The MMR region recorded a population of 18.4 million in the 2011 census of which, Mumbai city itself
recorded a population of about 12.5 million. The rapid growth in population is largely attributed to large immigrant
population that comes to Mumbai in search of business and employment opportunities. Owing to limited
availability of land in Mumbai Island city, most of the development is shifting towards Thane and Navi Mumbai.
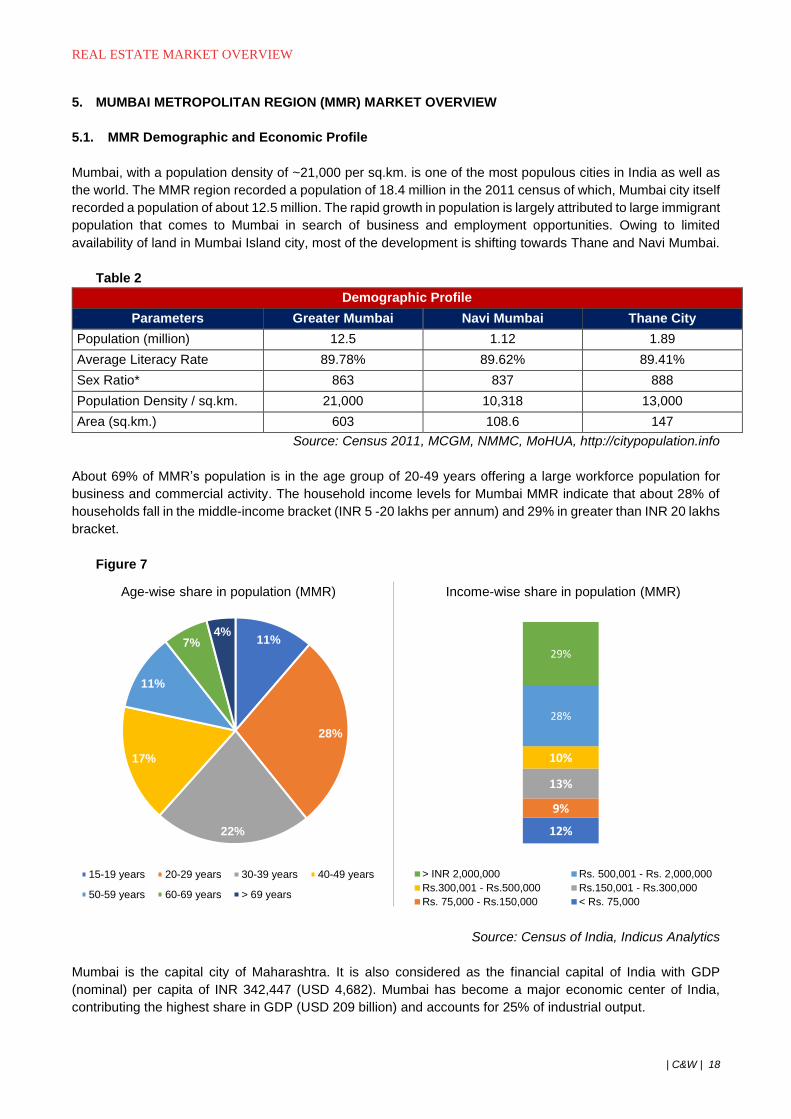
Table 2
Demographic Profile
Parameters Greater Mumbai Navi Mumbai Thane City
Population (million) 12.5 1.12 1.89
Average Literacy Rate 89.78% 89.62% 89.41%
Sex Ratio* 863 837 888
Population Density / sq.km. 21,000 10,318 13,000
Area (sq.km.) 603 108.6 147
Source: Census 2011, MCGM, NMMC, MoHUA, http://citypopulation.info
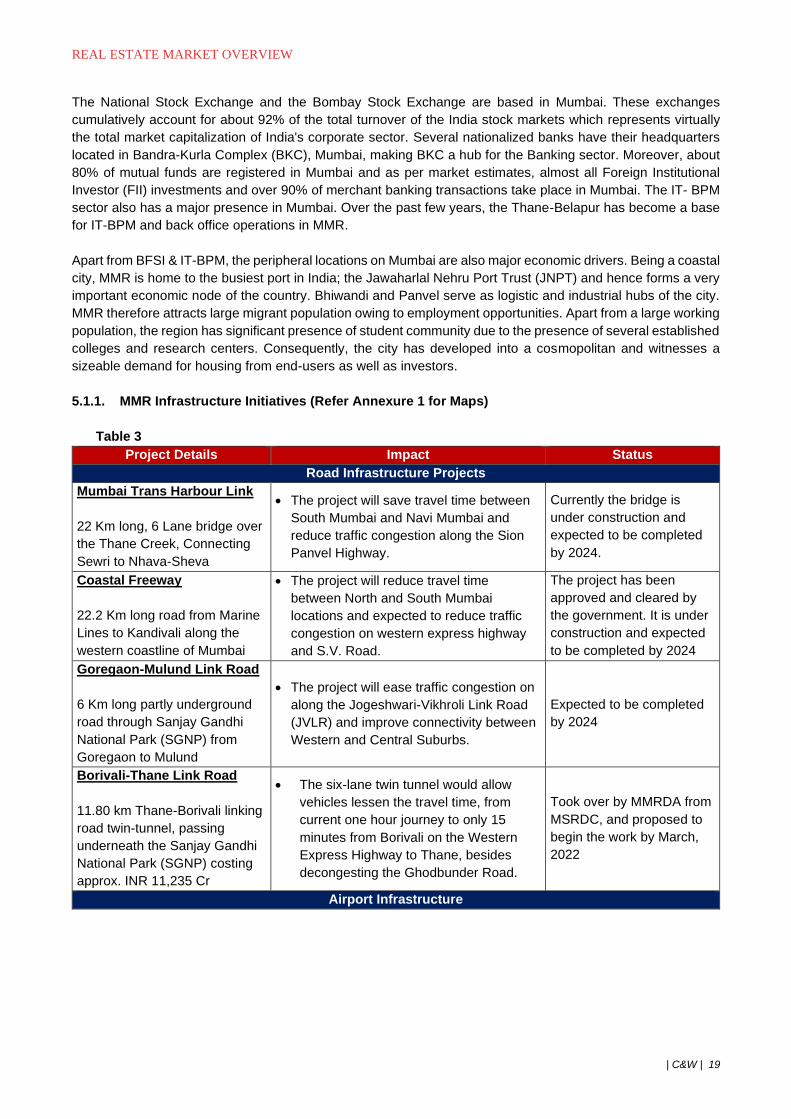
About 69% of MMR’s population is in the age group of 20-49 years offering a large workforce population for
business and commercial activity. The household income levels for Mumbai MMR indicate that about 28% of
households fall in the middle-income bracket (INR 5 -20 lakhs per annum) and 29% in greater than INR 20 lakhs
bracket.
Figure 7
Source: Census of India, Indicus Analytics
Mumbai is the capital city of Maharashtra. It is also considered as the financial capital of India with GDP
(nominal) per capita of INR 342,447 (USD 4,682). Mumbai has become a major economic center of India,
contributing the highest share in GDP (USD 209 billion) and accounts for 25% of industrial output.
11%
28%
22%
17%
11%
7%4%
Age-wise share in population (MMR)
15-19 years 20-29 years 30-39 years 40-49 years
50-59 years 60-69 years > 69 years
12%
9%
13%
10%
28%
29%
Series 1
Income-wise share in population (MMR)
> INR 2,000,000 Rs. 500,001 - Rs. 2,000,000
Rs.300,001 - Rs.500,000 Rs.150,001 - Rs.300,000
Rs. 75,000 - Rs.150,000 < Rs. 75,000
REAL ESTATE MARKET OVERVIEW
| C&W | 19
The National Stock Exchange and the Bombay Stock Exchange are based in Mumbai. These exchanges
cumulatively account for about 92% of the total turnover of the India stock markets which represents virtually
the total market capitalization of India's corporate sector. Several nationalized banks have their headquarters
located in Bandra-Kurla Complex (BKC), Mumbai, making BKC a hub for the Banking sector. Moreover, about
80% of mutual funds are registered in Mumbai and as per market estimates, almost all Foreign Institutional
Investor (FII) investments and over 90% of merchant banking transactions take place in Mumbai. The IT- BPM
sector also has a major presence in Mumbai. Over the past few years, the Thane-Belapur has become a base
for IT-BPM and back office operations in MMR.
Apart from BFSI & IT-BPM, the peripheral locations on Mumbai are also major economic drivers. Being a coastal
city, MMR is home to the busiest port in India; the Jawaharlal Nehru Port Trust (JNPT) and hence forms a very
important economic node of the country. Bhiwandi and Panvel serve as logistic and industrial hubs of the city.
MMR therefore attracts large migrant population owing to employment opportunities. Apart from a large working
population, the region has significant presence of student community due to the presence of several established
colleges and research centers. Consequently, the city has developed into a cosmopolitan and witnesses a
sizeable demand for housing from end-users as well as investors.
5.1.1. MMR Infrastructure Initiatives (Refer Annexure 1 for Maps)
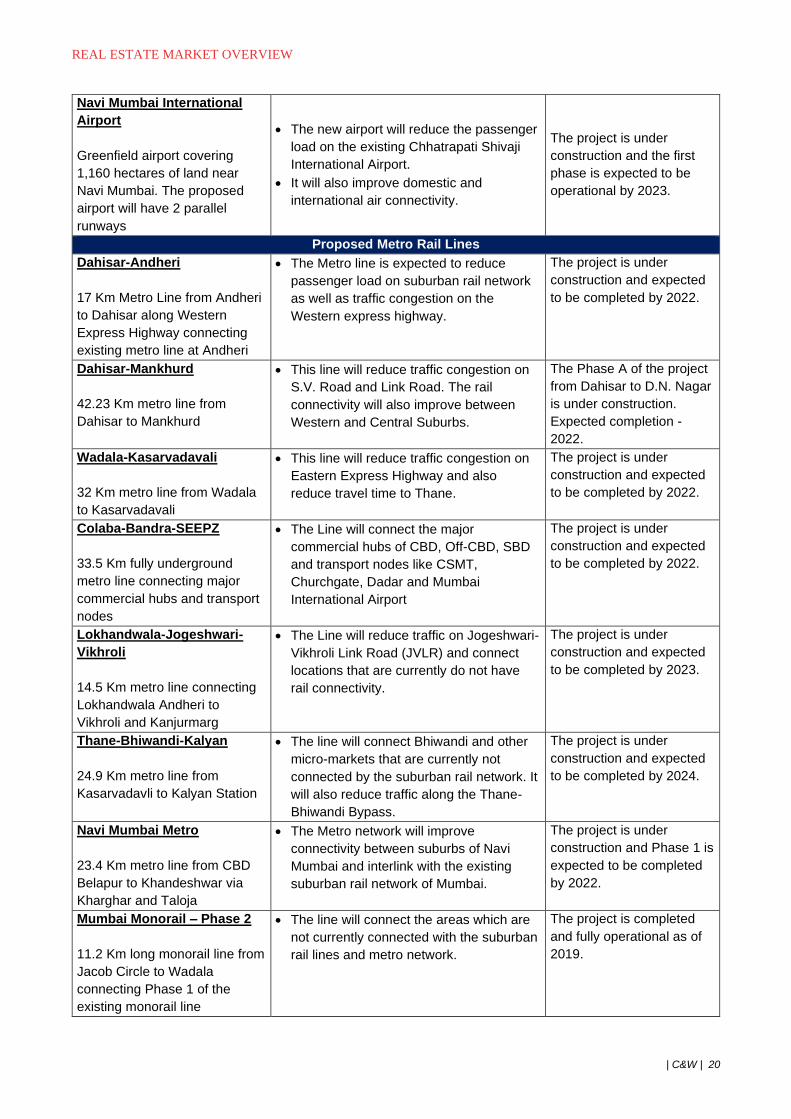
Table 3
Project Details Impact Status
Road Infrastructure Projects
Mumbai Trans Harbour Link
22 Km long, 6 Lane bridge over
the Thane Creek, Connecting
Sewri to Nhava-Sheva
• The project will save travel time between
South Mumbai and Navi Mumbai and
reduce traffic congestion along the Sion
Panvel Highway.
Currently the bridge is
under construction and
expected to be completed
by 2024.
Coastal Freeway
22.2 Km long road from Marine
Lines to Kandivali along the
western coastline of Mumbai
• The project will reduce travel time
between North and South Mumbai
locations and expected to reduce traffic
congestion on western express highway
and S.V. Road.
The project has been
approved and cleared by
the government. It is under
construction and expected
to be completed by 2024
Goregaon-Mulund Link Road
6 Km long partly underground
road through Sanjay Gandhi
National Park (SGNP) from
Goregaon to Mulund
• The project will ease traffic congestion on
along the Jogeshwari-Vikhroli Link Road
(JVLR) and improve connectivity between
Western and Central Suburbs.
Expected to be completed
by 2024
Borivali-Thane Link Road
11.80 km Thane-Borivali linking
road twin-tunnel, passing
underneath the Sanjay Gandhi
National Park (SGNP) costing
approx. INR 11,235 Cr
• The six-lane twin tunnel would allow
vehicles lessen the travel time, from
current one hour journey to only 15
minutes from Borivali on the Western
Express Highway to Thane, besides
decongesting the Ghodbunder Road.
Took over by MMRDA from
MSRDC, and proposed to
begin the work by March,
2022
Airport Infrastructure
REAL ESTATE MARKET OVERVIEW
| C&W | 20
Navi Mumbai International
Airport
Greenfield airport covering
1,160 hectares of land near
Navi Mumbai. The proposed
airport will have 2 parallel
runways
• The new airport will reduce the passenger
load on the existing Chhatrapati Shivaji
International Airport.
• It will also improve domestic and
international air connectivity.
The project is under
construction and the first
phase is expected to be
operational by 2023.
Proposed Metro Rail Lines
Dahisar-Andheri
17 Km Metro Line from Andheri
to Dahisar along Western
Express Highway connecting
existing metro line at Andheri
• The Metro line is expected to reduce
passenger load on suburban rail network
as well as traffic congestion on the
Western express highway.
The project is under
construction and expected
to be completed by 2022.
Dahisar-Mankhurd
42.23 Km metro line from
Dahisar to Mankhurd
• This line will reduce traffic congestion on
S.V. Road and Link Road. The rail
connectivity will also improve between
Western and Central Suburbs.
The Phase A of the project
from Dahisar to D.N. Nagar
is under construction.
Expected completion -
2022.
Wadala-Kasarvadavali
32 Km metro line from Wadala
to Kasarvadavali
• This line will reduce traffic congestion on
Eastern Express Highway and also
reduce travel time to Thane.
The project is under
construction and expected
to be completed by 2022.
Colaba-Bandra-SEEPZ
33.5 Km fully underground
metro line connecting major
commercial hubs and transport
nodes
• The Line will connect the major
commercial hubs of CBD, Off-CBD, SBD
and transport nodes like CSMT,
Churchgate, Dadar and Mumbai
International Airport
The project is under
construction and expected
to be completed by 2022.
Lokhandwala-Jogeshwari-
Vikhroli
14.5 Km metro line connecting
Lokhandwala Andheri to
Vikhroli and Kanjurmarg
• The Line will reduce traffic on Jogeshwari-
Vikhroli Link Road (JVLR) and connect
locations that are currently do not have
rail connectivity.
The project is under
construction and expected
to be completed by 2023.
Thane-Bhiwandi-Kalyan
24.9 Km metro line from
Kasarvadavli to Kalyan Station
• The line will connect Bhiwandi and other
micro-markets that are currently not
connected by the suburban rail network. It
will also reduce traffic along the Thane-
Bhiwandi Bypass.
The project is under
construction and expected
to be completed by 2024.
Navi Mumbai Metro
23.4 Km metro line from CBD
Belapur to Khandeshwar via
Kharghar and Taloja
• The Metro network will improve
connectivity between suburbs of Navi
Mumbai and interlink with the existing
suburban rail network of Mumbai.
The project is under
construction and Phase 1 is
expected to be completed
by 2022.
Mumbai Monorail – Phase 2
11.2 Km long monorail line from
Jacob Circle to Wadala
connecting Phase 1 of the
existing monorail line
• The line will connect the areas which are
not currently connected with the suburban
rail lines and metro network.
The project is completed
and fully operational as of
2019.
REAL ESTATE MARKET OVERVIEW
| C&W | 21
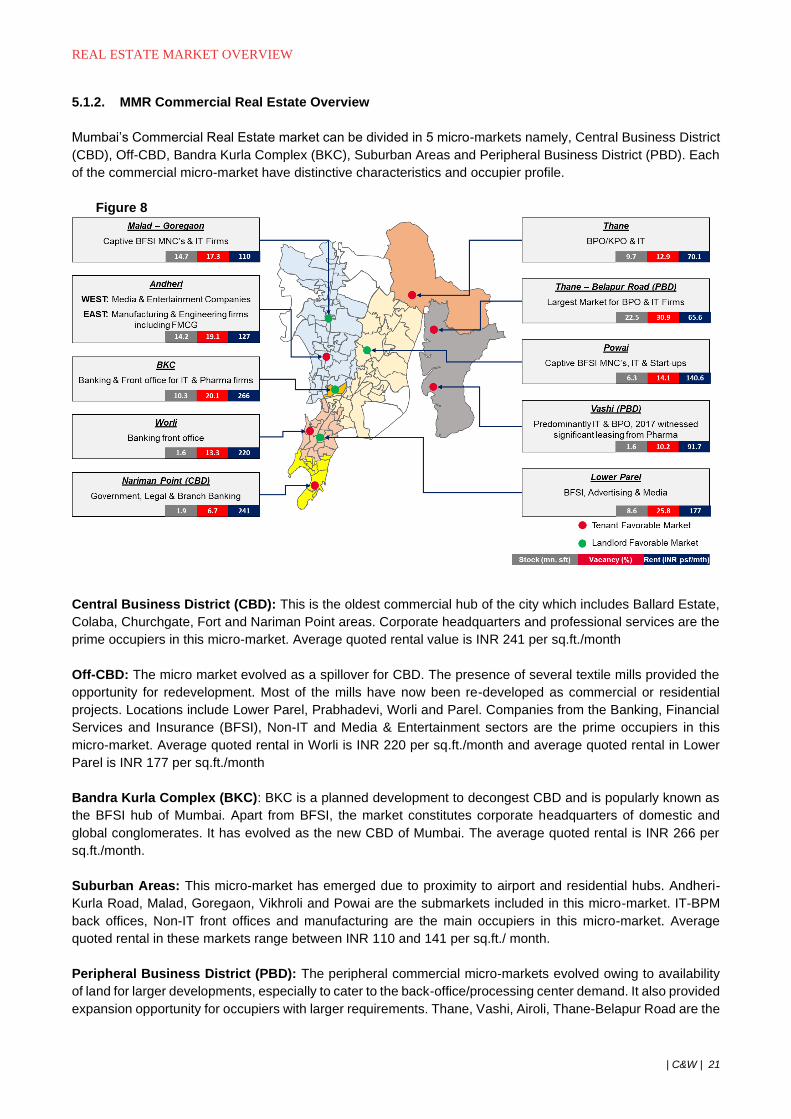
5.1.2. MMR Commercial Real Estate Overview
Mumbai’s Commercial Real Estate market can be divided in 5 micro-markets namely, Central Business District
(CBD), Off-CBD, Bandra Kurla Complex (BKC), Suburban Areas and Peripheral Business District (PBD). Each
of the commercial micro-market have distinctive characteristics and occupier profile.
Figure 8
Central Business District (CBD): This is the oldest commercial hub of the city which includes Ballard Estate,
Colaba, Churchgate, Fort and Nariman Point areas. Corporate headquarters and professional services are the
prime occupiers in this micro-market. Average quoted rental value is INR 241 per sq.ft./month
Off-CBD: The micro market evolved as a spillover for CBD. The presence of several textile mills provided the
opportunity for redevelopment. Most of the mills have now been re-developed as commercial or residential
projects. Locations include Lower Parel, Prabhadevi, Worli and Parel. Companies from the Banking, Financial
Services and Insurance (BFSI), Non-IT and Media & Entertainment sectors are the prime occupiers in this
micro-market. Average quoted rental in Worli is INR 220 per sq.ft./month and average quoted rental in Lower
Parel is INR 177 per sq.ft./month
Bandra Kurla Complex (BKC): BKC is a planned development to decongest CBD and is popularly known as
the BFSI hub of Mumbai. Apart from BFSI, the market constitutes corporate headquarters of domestic and
global conglomerates. It has evolved as the new CBD of Mumbai. The average quoted rental is INR 266 per
sq.ft./month.
Suburban Areas: This micro-market has emerged due to proximity to airport and residential hubs. Andheri-
Kurla Road, Malad, Goregaon, Vikhroli and Powai are the submarkets included in this micro-market. IT-BPM
back offices, Non-IT front offices and manufacturing are the main occupiers in this micro-market. Average
quoted rental in these markets range between INR 110 and 141 per sq.ft./ month.
Peripheral Business District (PBD): The peripheral commercial micro-markets evolved owing to availability
of land for larger developments, especially to cater to the back-office/processing center demand. It also provided
expansion opportunity for occupiers with larger requirements. Thane, Vashi, Airoli, Thane-Belapur Road are the
REAL ESTATE MARKET OVERVIEW
| C&W | 22
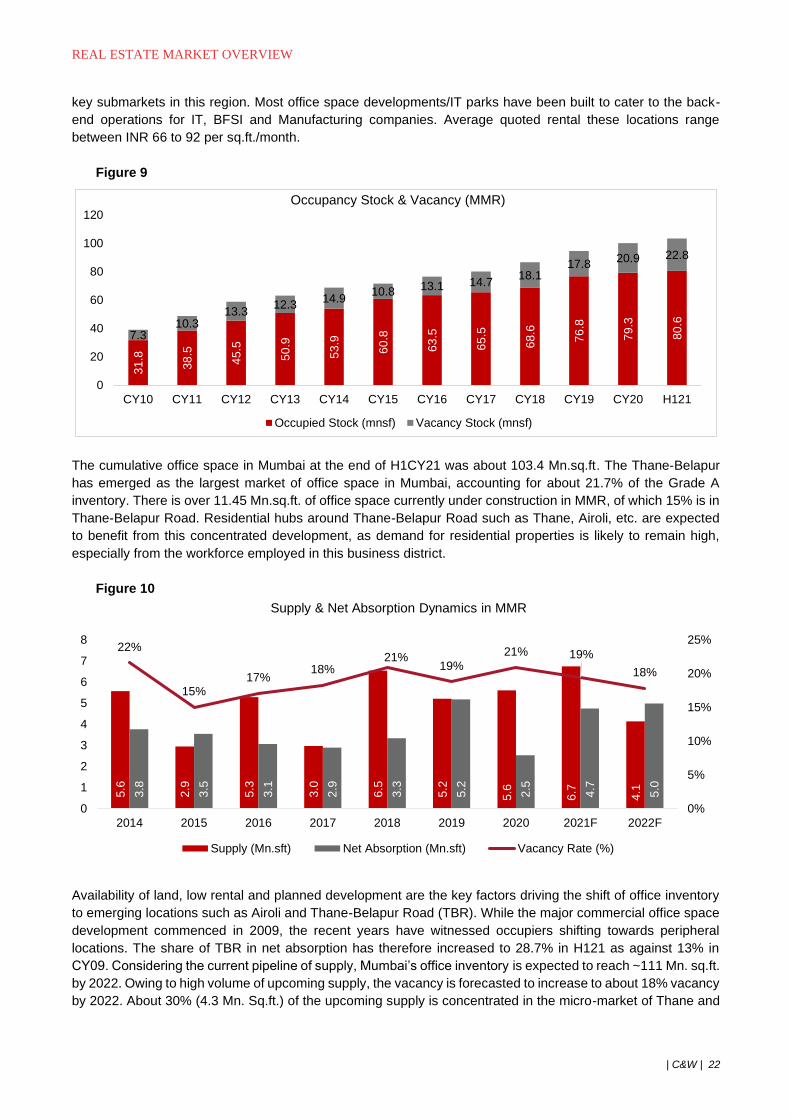
key submarkets in this region. Most office space developments/IT parks have been built to cater to the back-
end operations for IT, BFSI and Manufacturing companies. Average quoted rental these locations range
between INR 66 to 92 per sq.ft./month.
Figure 9
The cumulative office space in Mumbai at the end of H1CY21 was about 103.4 Mn.sq.ft. The Thane-Belapur
has emerged as the largest market of office space in Mumbai, accounting for about 21.7% of the Grade A
inventory. There is over 11.45 Mn.sq.ft. of office space currently under construction in MMR, of which 15% is in
Thane-Belapur Road. Residential hubs around Thane-Belapur Road such as Thane, Airoli, etc. are expected
to benefit from this concentrated development, as demand for residential properties is likely to remain high,
especially from the workforce employed in this business district.
Figure 10
Availability of land, low rental and planned development are the key factors driving the shift of office inventory
to emerging locations such as Airoli and Thane-Belapur Road (TBR). While the major commercial office space
development commenced in 2009, the recent years have witnessed occupiers shifting towards peripheral
locations. The share of TBR in net absorption has therefore increased to 28.7% in H121 as against 13% in
CY09. Considering the current pipeline of supply, Mumbai’s office inventory is expected to reach ~111 Mn. sq.ft.
by 2022. Owing to high volume of upcoming supply, the vacancy is forecasted to increase to about 18% vacancy
by 2022. About 30% (4.3 Mn. Sq.ft.) of the upcoming supply is concentrated in the micro-market of Thane and
31
.8
38
.5
45
.5
50
.9
53
.9
60
.8
63
.5
65
.5
68
.6
76
.8
79
.3
80
.6
7.310.3
13.312.3
14.910.8 13.1 14.7
18.117.8
20.9 22.8
0
20
40
60
80
100
120
CY10 CY11 CY12 CY13 CY14 CY15 CY16 CY17 CY18 CY19 CY20 H121
Occupancy Stock & Vacancy (MMR)
Occupied Stock (mnsf) Vacancy Stock (mnsf)
5.6
2.9
5.3
3.0
6.5
5.2
5.6
6.7
4.13.8
3.5
3.1
2.9
3.3
5.2
2.5
4.7
5.0
22%
15%17%
18%21%
19%
21% 19%
18%
0%
5%
10%
15%
20%
25%
0
1
2
3
4
5
6
7
8
2014 2015 2016 2017 2018 2019 2020 2021F 2022F
Supply & Net Absorption Dynamics in MMR
Supply (Mn.sft) Net Absorption (Mn.sft) Vacancy Rate (%)
REAL ESTATE MARKET OVERVIEW
| C&W | 23
Thane Belapur Road. Other suburban micro-markets including Andheri, Malad and Goregaon cumulatively
account for about 25% of the upcoming supply (3.7Mn. Sq.ft.).
5.1.3. MMR Retail Market Snippet
Mumbai’s retail market activity was traditionally ‘High Street’ format located largely in Colaba, Kemps Corner,
Linking Road. In year 2000, with the development of Crossroads Mall, Mumbai witnessed the organized retail
development. Since then Mumbai has observed rise in organized retail across major locations like Lower Parel,
Andheri, Goregaon, Malad, Kurla, Thane and Navi Mumbai. These malls are primarily concentrated in suburban
locations due to availability of land and proximity to high density residential development and commercial hubs.
High Street Phoenix and Palladium in Lower Parel, Phoenix Market City in Kurla, Infinity Mall in Andheri, Oberoi
Mall in Goregaon, Inorbit Mall in Malad, Korum and Viviana Mall in Thane and Seawoods Grand Central in Navi
Mumbai have the international brands and large format retail stores. Refer Annexure 2 for Retail Market Spread.
5.1.4. MMR Residential Real Estate Overview
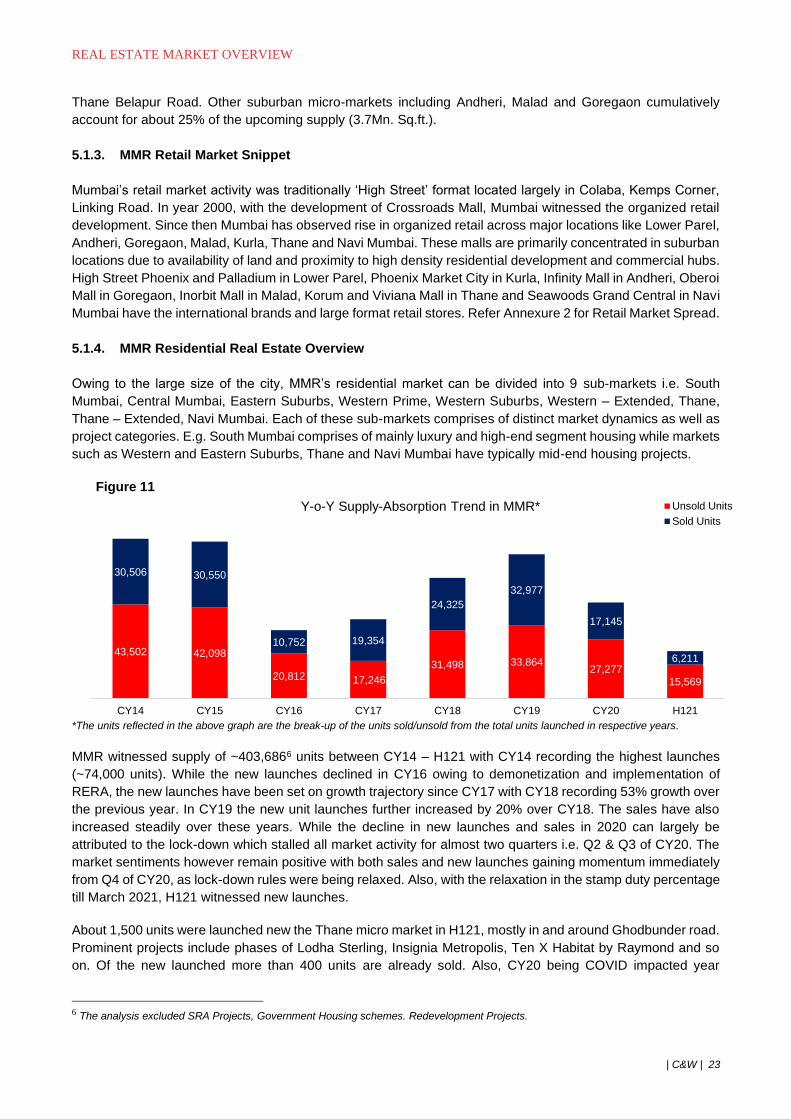
Owing to the large size of the city, MMR’s residential market can be divided into 9 sub-markets i.e. South
Mumbai, Central Mumbai, Eastern Suburbs, Western Prime, Western Suburbs, Western – Extended, Thane,
Thane – Extended, Navi Mumbai. Each of these sub-markets comprises of distinct market dynamics as well as
project categories. E.g. South Mumbai comprises of mainly luxury and high-end segment housing while markets
such as Western and Eastern Suburbs, Thane and Navi Mumbai have typically mid-end housing projects.
Figure 11
*The units reflected in the above graph are the break-up of the units sold/unsold from the total units launched in respective years.
MMR witnessed supply of ~403,6866 units between CY14 – H121 with CY14 recording the highest launches
(~74,000 units). While the new launches declined in CY16 owing to demonetization and implementation of
RERA, the new launches have been set on growth trajectory since CY17 with CY18 recording 53% growth over
the previous year. In CY19 the new unit launches further increased by 20% over CY18. The sales have also
increased steadily over these years. While the decline in new launches and sales in 2020 can largely be
attributed to the lock-down which stalled all market activity for almost two quarters i.e. Q2 & Q3 of CY20. The
market sentiments however remain positive with both sales and new launches gaining momentum immediately
from Q4 of CY20, as lock-down rules were being relaxed. Also, with the relaxation in the stamp duty percentage
till March 2021, H121 witnessed new launches.
About 1,500 units were launched new the Thane micro market in H121, mostly in and around Ghodbunder road.
Prominent projects include phases of Lodha Sterling, Insignia Metropolis, Ten X Habitat by Raymond and so
on. Of the new launched more than 400 units are already sold. Also, CY20 being COVID impacted year
6 The analysis excluded SRA Projects, Government Housing schemes. Redevelopment Projects.
43,502 42,098
20,812 17,246
31,498 33,86427,277
15,569
30,506 30,550
10,752 19,354
24,325
32,977
17,145
6,211
CY14 CY15 CY16 CY17 CY18 CY19 CY20 H121
Y-o-Y Supply-Absorption Trend in MMR* Unsold Units
Sold Units
REAL ESTATE MARKET OVERVIEW
| C&W | 24
witnessed launch of approx. 4,700 units in Thane micro market against more than 37,000 and 10,000 units in
2018 and 2019 respectively.
Figure 12
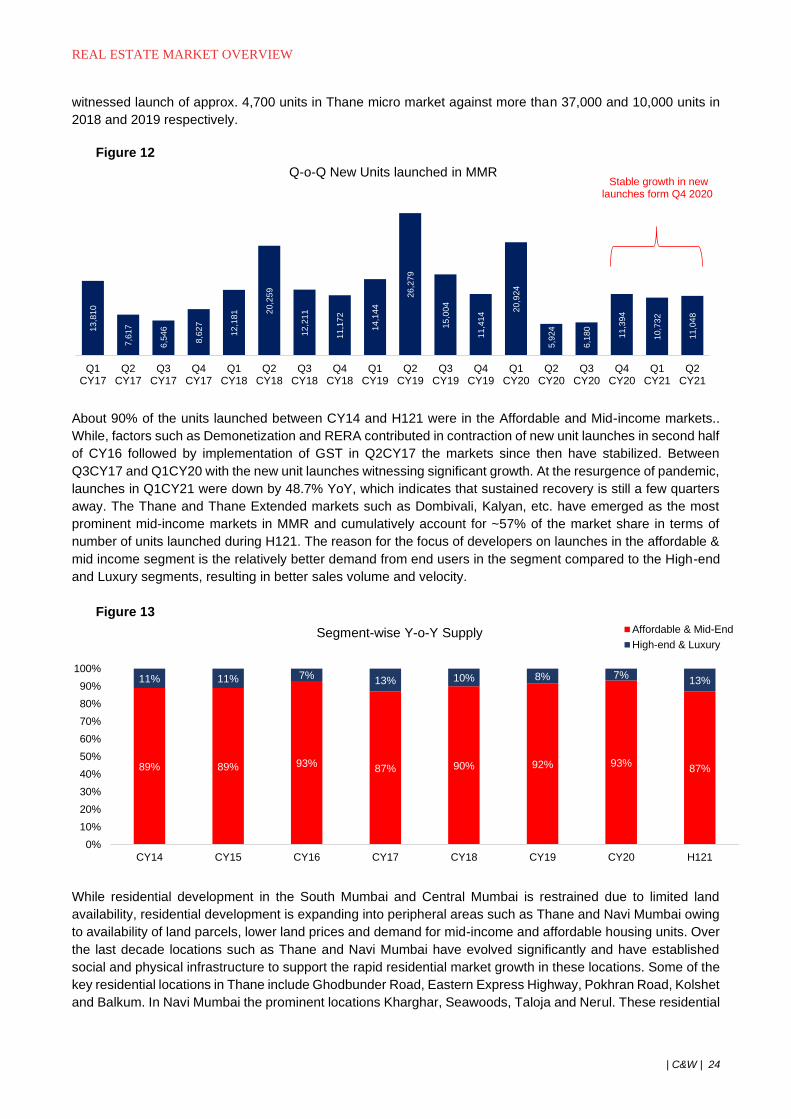
About 90% of the units launched between CY14 and H121 were in the Affordable and Mid-income markets..
While, factors such as Demonetization and RERA contributed in contraction of new unit launches in second half
of CY16 followed by implementation of GST in Q2CY17 the markets since then have stabilized. Between
Q3CY17 and Q1CY20 with the new unit launches witnessing significant growth. At the resurgence of pandemic,
launches in Q1CY21 were down by 48.7% YoY, which indicates that sustained recovery is still a few quarters
away. The Thane and Thane Extended markets such as Dombivali, Kalyan, etc. have emerged as the most
prominent mid-income markets in MMR and cumulatively account for ~57% of the market share in terms of
number of units launched during H121. The reason for the focus of developers on launches in the affordable &
mid income segment is the relatively better demand from end users in the segment compared to the High-end
and Luxury segments, resulting in better sales volume and velocity.
Figure 13
While residential development in the South Mumbai and Central Mumbai is restrained due to limited land
availability, residential development is expanding into peripheral areas such as Thane and Navi Mumbai owing
to availability of land parcels, lower land prices and demand for mid-income and affordable housing units. Over
the last decade locations such as Thane and Navi Mumbai have evolved significantly and have established
social and physical infrastructure to support the rapid residential market growth in these locations. Some of the
key residential locations in Thane include Ghodbunder Road, Eastern Express Highway, Pokhran Road, Kolshet
and Balkum. In Navi Mumbai the prominent locations Kharghar, Seawoods, Taloja and Nerul. These residential
13,8
10
7,6
17
6,5
46
8,6
27
12,1
81 2
0,2
59
12,2
11
11,1
72
14,1
44
26,2
79
15,0
04
11,4
14
20,9
24
5,9
24
6,1
80
11,3
94
10,7
32
11,0
48
Q1CY17
Q2CY17
Q3CY17
Q4CY17
Q1CY18
Q2CY18
Q3CY18
Q4CY18
Q1CY19
Q2CY19
Q3CY19
Q4CY19
Q1CY20
Q2CY20
Q3CY20
Q4CY20
Q1CY21
Q2CY21
Q-o-Q New Units launched in MMR
89% 89% 93%87% 90% 92% 93%
87%
11% 11% 7%13% 10% 8% 7%
13%
0%
10%
20%
30%
40%
50%
60%
70%
80%
90%
100%
CY14 CY15 CY16 CY17 CY18 CY19 CY20 H121
Segment-wise Y-o-Y Supply Affordable & Mid-End
High-end & Luxury
Stable growth in new launches form Q4 2020
REAL ESTATE MARKET OVERVIEW
| C&W | 25
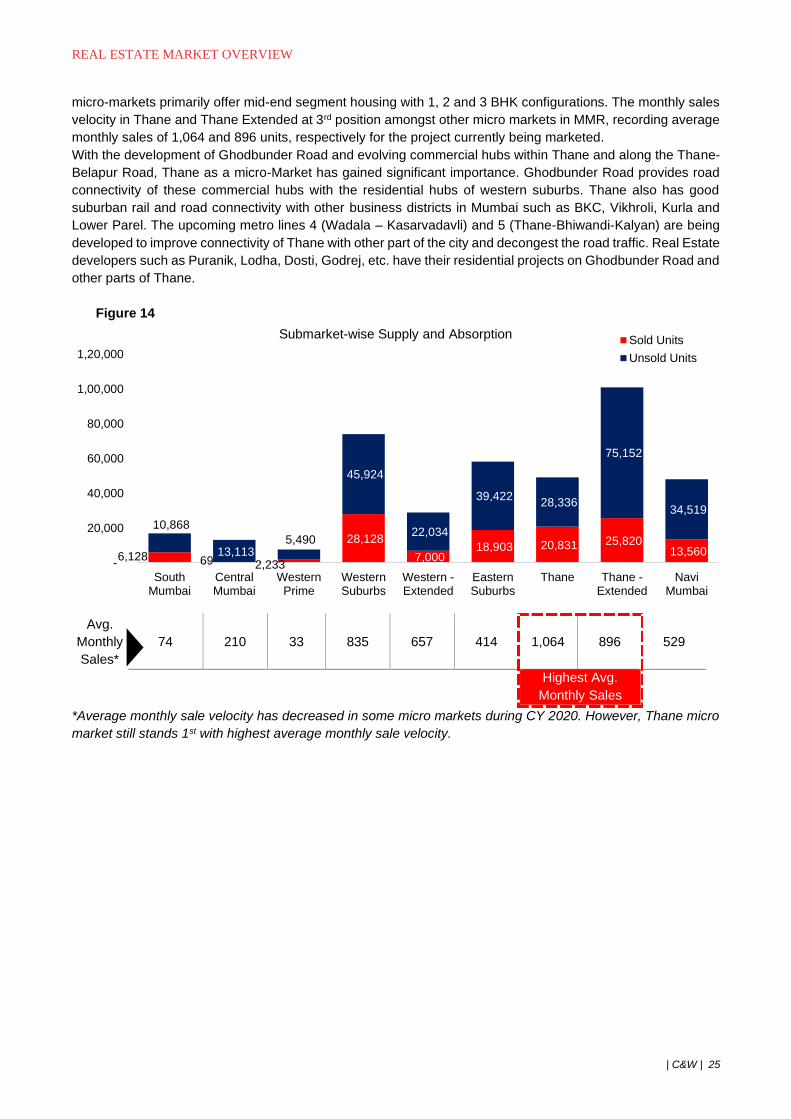
micro-markets primarily offer mid-end segment housing with 1, 2 and 3 BHK configurations. The monthly sales
velocity in Thane and Thane Extended at 3rd position amongst other micro markets in MMR, recording average
monthly sales of 1,064 and 896 units, respectively for the project currently being marketed.
With the development of Ghodbunder Road and evolving commercial hubs within Thane and along the Thane-
Belapur Road, Thane as a micro-Market has gained significant importance. Ghodbunder Road provides road
connectivity of these commercial hubs with the residential hubs of western suburbs. Thane also has good
suburban rail and road connectivity with other business districts in Mumbai such as BKC, Vikhroli, Kurla and
Lower Parel. The upcoming metro lines 4 (Wadala – Kasarvadavli) and 5 (Thane-Bhiwandi-Kalyan) are being
developed to improve connectivity of Thane with other part of the city and decongest the road traffic. Real Estate
developers such as Puranik, Lodha, Dosti, Godrej, etc. have their residential projects on Ghodbunder Road and
other parts of Thane.
Figure 14
Avg.
Monthly
Sales*
74 210 33 835 657 414 1,064 896 529
Highest Avg.
Monthly Sales
*Average monthly sale velocity has decreased in some micro markets during CY 2020. However, Thane micro
market still stands 1st with highest average monthly sale velocity.
6,128 69 2,233
28,128
7,000 18,903 20,831 25,820
13,560
10,868
13,113 5,490
45,924
22,034
39,422 28,336
75,152
34,519
-
20,000
40,000
60,000
80,000
1,00,000
1,20,000
SouthMumbai
CentralMumbai
WesternPrime
WesternSuburbs
Western -Extended
EasternSuburbs
Thane Thane -Extended
NaviMumbai
Submarket-wise Supply and AbsorptionSold Units
Unsold Units
REAL ESTATE MARKET OVERVIEW
| C&W | 26
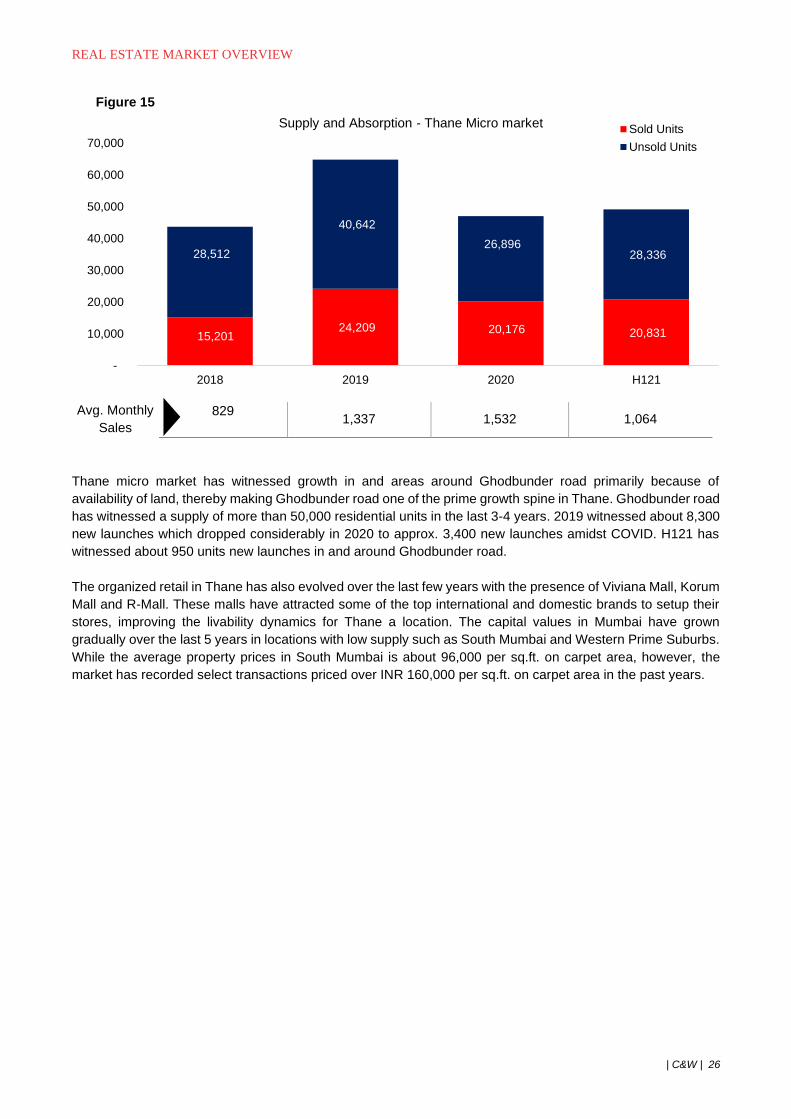
Figure 15
Avg. Monthly
Sales
829 1,337 1,532 1,064
Thane micro market has witnessed growth in and areas around Ghodbunder road primarily because of
availability of land, thereby making Ghodbunder road one of the prime growth spine in Thane. Ghodbunder road
has witnessed a supply of more than 50,000 residential units in the last 3-4 years. 2019 witnessed about 8,300
new launches which dropped considerably in 2020 to approx. 3,400 new launches amidst COVID. H121 has
witnessed about 950 units new launches in and around Ghodbunder road.
The organized retail in Thane has also evolved over the last few years with the presence of Viviana Mall, Korum
Mall and R-Mall. These malls have attracted some of the top international and domestic brands to setup their
stores, improving the livability dynamics for Thane a location. The capital values in Mumbai have grown
gradually over the last 5 years in locations with low supply such as South Mumbai and Western Prime Suburbs.
While the average property prices in South Mumbai is about 96,000 per sq.ft. on carpet area, however, the
market has recorded select transactions priced over INR 160,000 per sq.ft. on carpet area in the past years.
15,201 24,209 20,176 20,831
28,512
40,642
26,896 28,336
-
10,000
20,000
30,000
40,000
50,000
60,000
70,000
2018 2019 2020 H121
Supply and Absorption - Thane Micro marketSold Units
Unsold Units
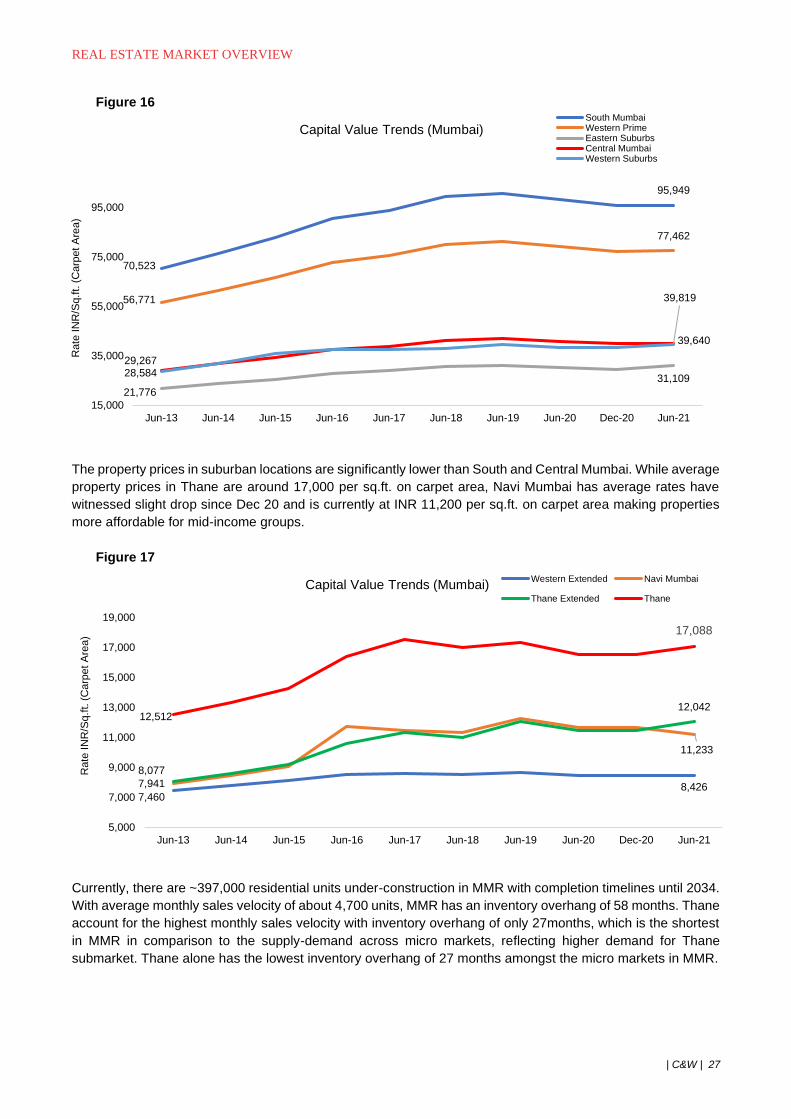
REAL ESTATE MARKET OVERVIEW
| C&W | 27
Figure 16
The property prices in suburban locations are significantly lower than South and Central Mumbai. While average
property prices in Thane are around 17,000 per sq.ft. on carpet area, Navi Mumbai has average rates have
witnessed slight drop since Dec 20 and is currently at INR 11,200 per sq.ft. on carpet area making properties
more affordable for mid-income groups.
Figure 17
Currently, there are ~397,000 residential units under-construction in MMR with completion timelines until 2034.
With average monthly sales velocity of about 4,700 units, MMR has an inventory overhang of 58 months. Thane
account for the highest monthly sales velocity with inventory overhang of only 27months, which is the shortest
in MMR in comparison to the supply-demand across micro markets, reflecting higher demand for Thane
submarket. Thane alone has the lowest inventory overhang of 27 months amongst the micro markets in MMR.
70,523
95,949
56,771
77,462
21,776
31,109
29,267
39,819
28,584
39,640
15,000
35,000
55,000
75,000
95,000
Jun-13 Jun-14 Jun-15 Jun-16 Jun-17 Jun-18 Jun-19 Jun-20 Dec-20 Jun-21
Rate
IN
R/S
q.f
t. (
Carp
et
Are
a)
Capital Value Trends (Mumbai)South MumbaiWestern PrimeEastern SuburbsCentral MumbaiWestern Suburbs
7,4608,4267,941
11,233
8,077
12,04212,512
17,088
5,000
7,000
9,000
11,000
13,000
15,000
17,000
19,000
Jun-13 Jun-14 Jun-15 Jun-16 Jun-17 Jun-18 Jun-19 Jun-20 Dec-20 Jun-21
Rate
IN
R/S
q.f
t. (
Carp
et
Are
a)
Capital Value Trends (Mumbai)Western Extended Navi Mumbai
Thane Extended Thane
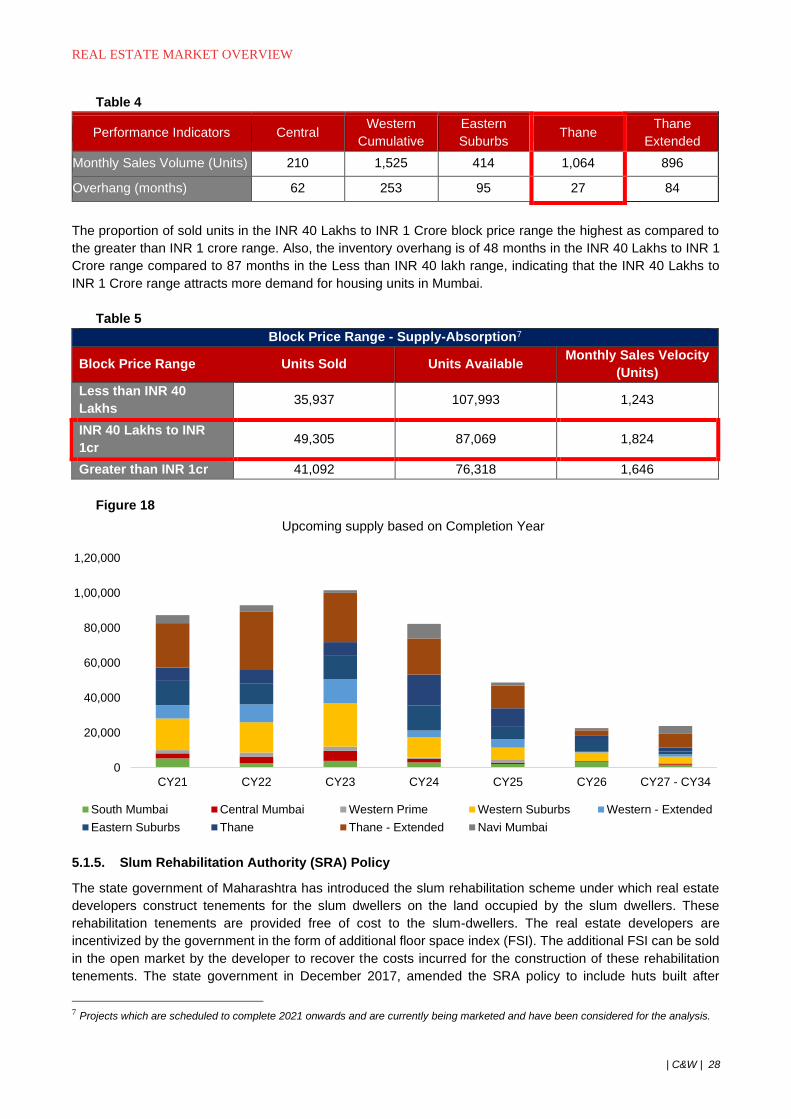
REAL ESTATE MARKET OVERVIEW
| C&W | 28
Table 4
Performance Indicators Central Western
Cumulative
Eastern
Suburbs Thane
Thane
Extended
Monthly Sales Volume (Units) 210 1,525 414 1,064 896
Overhang (months) 62 253 95 27 84
The proportion of sold units in the INR 40 Lakhs to INR 1 Crore block price range the highest as compared to
the greater than INR 1 crore range. Also, the inventory overhang is of 48 months in the INR 40 Lakhs to INR 1
Crore range compared to 87 months in the Less than INR 40 lakh range, indicating that the INR 40 Lakhs to
INR 1 Crore range attracts more demand for housing units in Mumbai.
Table 5
Block Price Range - Supply-Absorption7
Block Price Range Units Sold Units Available Monthly Sales Velocity
(Units)
Less than INR 40
Lakhs 35,937 107,993 1,243
INR 40 Lakhs to INR
1cr 49,305 87,069 1,824
Greater than INR 1cr 41,092 76,318 1,646
Figure 18
5.1.5. Slum Rehabilitation Authority (SRA) Policy
The state government of Maharashtra has introduced the slum rehabilitation scheme under which real estate
developers construct tenements for the slum dwellers on the land occupied by the slum dwellers. These
rehabilitation tenements are provided free of cost to the slum-dwellers. The real estate developers are
incentivized by the government in the form of additional floor space index (FSI). The additional FSI can be sold
in the open market by the developer to recover the costs incurred for the construction of these rehabilitation
tenements. The state government in December 2017, amended the SRA policy to include huts built after
7 Projects which are scheduled to complete 2021 onwards and are currently being marketed and have been considered for the analysis.
0
20,000
40,000
60,000
80,000
1,00,000
1,20,000
CY21 CY22 CY23 CY24 CY25 CY26 CY27 - CY34
Upcoming supply based on Completion Year
South Mumbai Central Mumbai Western Prime Western Suburbs Western - Extended
Eastern Suburbs Thane Thane - Extended Navi Mumbai
REAL ESTATE MARKET OVERVIEW
| C&W | 29
January 1, 2000 within the purview of Pradhan Mantri Awas Yojana and provide homes to slum dwellers at
subsidized rates. This change in policy is expected to provide significant development opportunities for real
estate developers, especially for those having focus on affordable and mid-income housing development.
Currently, there are about 1,500 projects recorded with the SRA. Refer Annexure 7 for detailed policy terms.
5.1.6. Private Society Redevelopment 30 & 32
To provide old housing societies an opportunity to demolish and reconstruct the old building structures, the
government has implemented the Private Society Redevelopment policy. Under this policy, private housing
societies that need significant repairs and upgrades can be demolished and reconstructed. While the unit
owners get new homes along with additional FSI, the real estate developers are permitted to sell the additional
FSI to existing owners or new buyers to recover their costs incurred for the redevelopment. However, the
societies can proceed with redevelopment only if 51% of the members agree and give their consent for the
redevelopment.
The government is currently planning to provide additional FSI amounting to 15% of built-up area per flat at no
extra charge. Currently there are over 40,000 housing societies in Mumbai awaiting redevelopment proposals.
Therefore, policy provides alternative development option, especially in areas with high land prices or lack of
availability of land for development. Refer Annexure 8 for detailed policy terms.
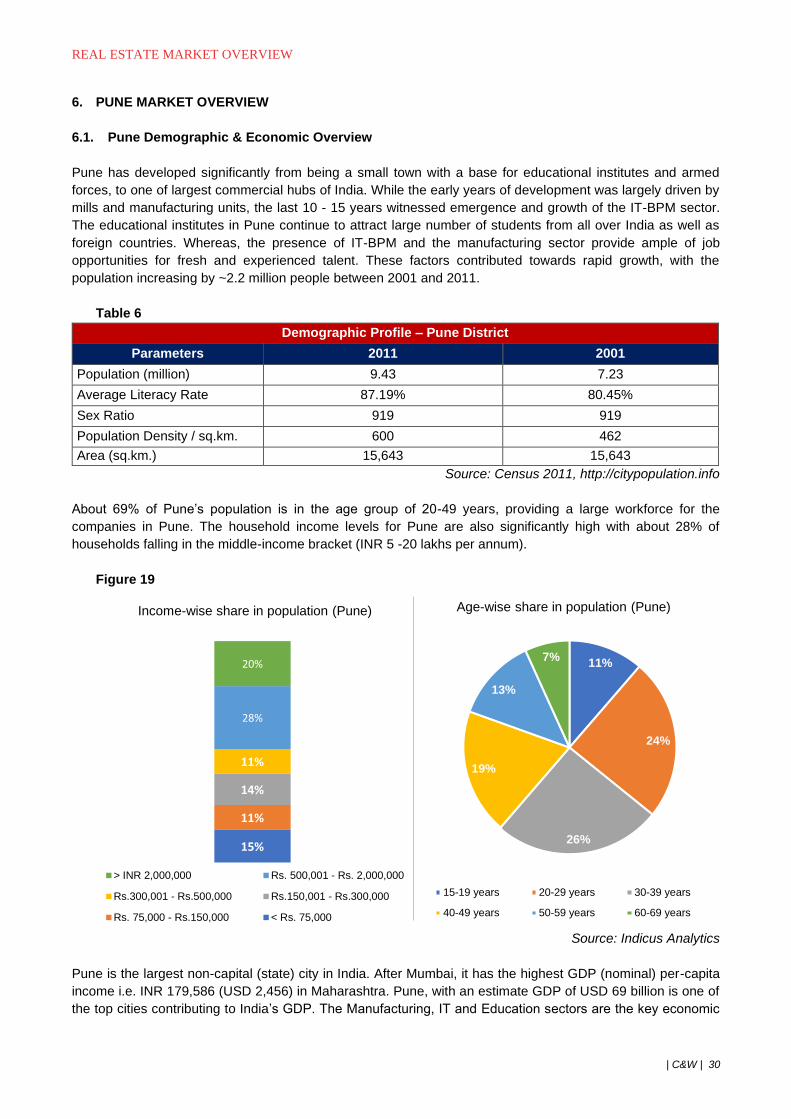
REAL ESTATE MARKET OVERVIEW
| C&W | 30
6. PUNE MARKET OVERVIEW
6.1. Pune Demographic & Economic Overview
Pune has developed significantly from being a small town with a base for educational institutes and armed
forces, to one of largest commercial hubs of India. While the early years of development was largely driven by
mills and manufacturing units, the last 10 - 15 years witnessed emergence and growth of the IT-BPM sector.
The educational institutes in Pune continue to attract large number of students from all over India as well as
foreign countries. Whereas, the presence of IT-BPM and the manufacturing sector provide ample of job
opportunities for fresh and experienced talent. These factors contributed towards rapid growth, with the
population increasing by ~2.2 million people between 2001 and 2011.
Table 6
Demographic Profile – Pune District
Parameters 2011 2001
Population (million) 9.43 7.23
Average Literacy Rate 87.19% 80.45%
Sex Ratio 919 919
Population Density / sq.km. 600 462
Area (sq.km.) 15,643 15,643
Source: Census 2011, http://citypopulation.info
About 69% of Pune’s population is in the age group of 20-49 years, providing a large workforce for the
companies in Pune. The household income levels for Pune are also significantly high with about 28% of
households falling in the middle-income bracket (INR 5 -20 lakhs per annum).
Figure 19
Source: Indicus Analytics
Pune is the largest non-capital (state) city in India. After Mumbai, it has the highest GDP (nominal) per-capita
income i.e. INR 179,586 (USD 2,456) in Maharashtra. Pune, with an estimate GDP of USD 69 billion is one of
the top cities contributing to India’s GDP. The Manufacturing, IT and Education sectors are the key economic
15%
11%
14%
11%
28%
20%
Series 1
Income-wise share in population (Pune)
> INR 2,000,000 Rs. 500,001 - Rs. 2,000,000
Rs.300,001 - Rs.500,000 Rs.150,001 - Rs.300,000
Rs. 75,000 - Rs.150,000 < Rs. 75,000
11%
24%
26%
19%
13%
7%
Age-wise share in population (Pune)
15-19 years 20-29 years 30-39 years
40-49 years 50-59 years 60-69 years
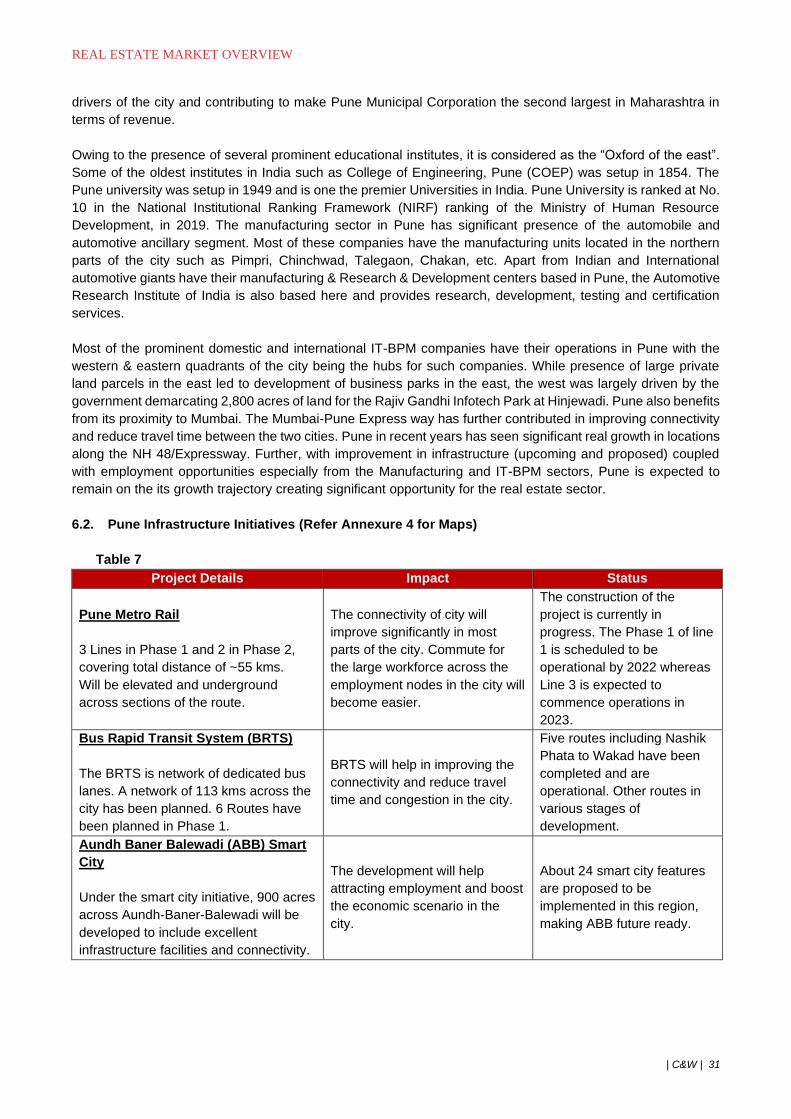
REAL ESTATE MARKET OVERVIEW
| C&W | 31
drivers of the city and contributing to make Pune Municipal Corporation the second largest in Maharashtra in
terms of revenue.
Owing to the presence of several prominent educational institutes, it is considered as the “Oxford of the east”.
Some of the oldest institutes in India such as College of Engineering, Pune (COEP) was setup in 1854. The
Pune university was setup in 1949 and is one the premier Universities in India. Pune University is ranked at No.
10 in the National Institutional Ranking Framework (NIRF) ranking of the Ministry of Human Resource
Development, in 2019. The manufacturing sector in Pune has significant presence of the automobile and
automotive ancillary segment. Most of these companies have the manufacturing units located in the northern
parts of the city such as Pimpri, Chinchwad, Talegaon, Chakan, etc. Apart from Indian and International
automotive giants have their manufacturing & Research & Development centers based in Pune, the Automotive
Research Institute of India is also based here and provides research, development, testing and certification
services.
Most of the prominent domestic and international IT-BPM companies have their operations in Pune with the
western & eastern quadrants of the city being the hubs for such companies. While presence of large private
land parcels in the east led to development of business parks in the east, the west was largely driven by the
government demarcating 2,800 acres of land for the Rajiv Gandhi Infotech Park at Hinjewadi. Pune also benefits
from its proximity to Mumbai. The Mumbai-Pune Express way has further contributed in improving connectivity
and reduce travel time between the two cities. Pune in recent years has seen significant real growth in locations
along the NH 48/Expressway. Further, with improvement in infrastructure (upcoming and proposed) coupled
with employment opportunities especially from the Manufacturing and IT-BPM sectors, Pune is expected to
remain on the its growth trajectory creating significant opportunity for the real estate sector.
6.2. Pune Infrastructure Initiatives (Refer Annexure 4 for Maps)
Table 7
Project Details Impact Status
Pune Metro Rail
3 Lines in Phase 1 and 2 in Phase 2,
covering total distance of ~55 kms.
Will be elevated and underground
across sections of the route.
The connectivity of city will
improve significantly in most
parts of the city. Commute for
the large workforce across the
employment nodes in the city will
become easier.
The construction of the
project is currently in
progress. The Phase 1 of line
1 is scheduled to be
operational by 2022 whereas
Line 3 is expected to
commence operations in
2023.
Bus Rapid Transit System (BRTS)
The BRTS is network of dedicated bus
lanes. A network of 113 kms across the
city has been planned. 6 Routes have
been planned in Phase 1.
BRTS will help in improving the
connectivity and reduce travel
time and congestion in the city.
Five routes including Nashik
Phata to Wakad have been
completed and are
operational. Other routes in
various stages of
development.
Aundh Baner Balewadi (ABB) Smart
City
Under the smart city initiative, 900 acres
across Aundh-Baner-Balewadi will be
developed to include excellent
infrastructure facilities and connectivity.
The development will help
attracting employment and boost
the economic scenario in the
city.
About 24 smart city features
are proposed to be
implemented in this region,
making ABB future ready.
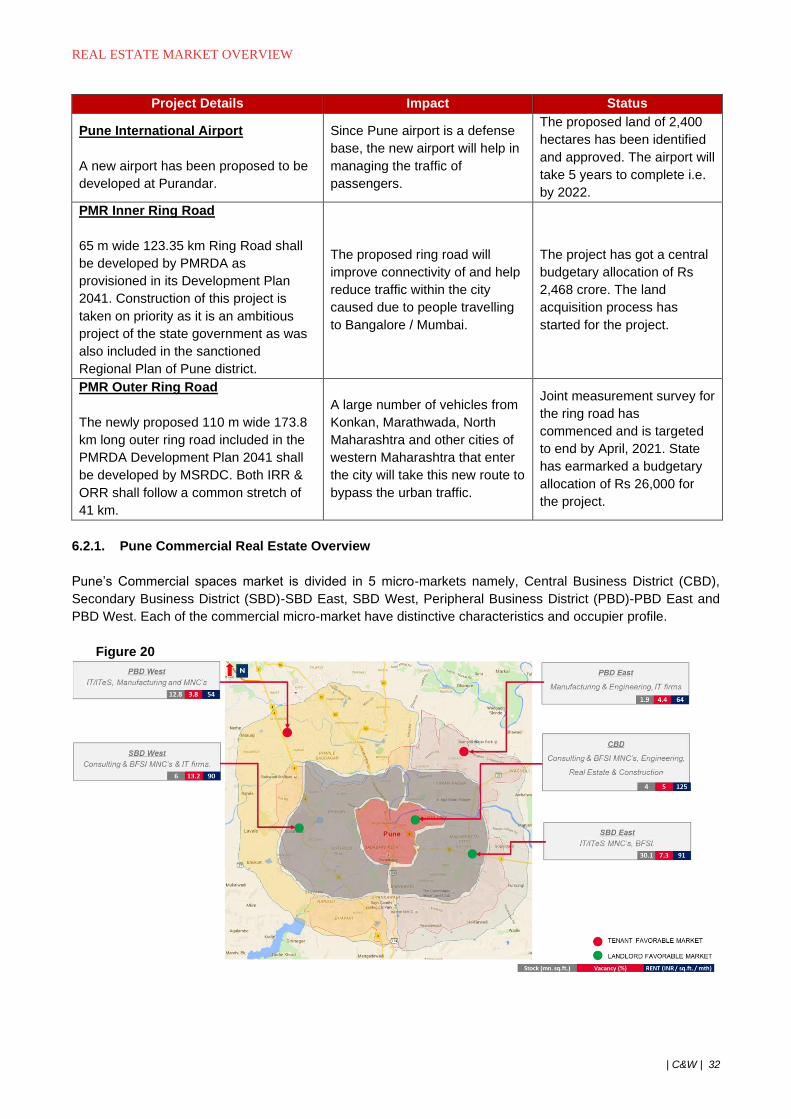
REAL ESTATE MARKET OVERVIEW
| C&W | 32
Project Details Impact Status
Pune International Airport
A new airport has been proposed to be
developed at Purandar.
Since Pune airport is a defense
base, the new airport will help in
managing the traffic of
passengers.
The proposed land of 2,400
hectares has been identified
and approved. The airport will
take 5 years to complete i.e.
by 2022.
PMR Inner Ring Road
65 m wide 123.35 km Ring Road shall
be developed by PMRDA as
provisioned in its Development Plan
2041. Construction of this project is
taken on priority as it is an ambitious
project of the state government as was
also included in the sanctioned
Regional Plan of Pune district.
The proposed ring road will
improve connectivity of and help
reduce traffic within the city
caused due to people travelling
to Bangalore / Mumbai.
The project has got a central
budgetary allocation of Rs
2,468 crore. The land
acquisition process has
started for the project.
PMR Outer Ring Road
The newly proposed 110 m wide 173.8
km long outer ring road included in the
PMRDA Development Plan 2041 shall
be developed by MSRDC. Both IRR &
ORR shall follow a common stretch of
41 km.
A large number of vehicles from
Konkan, Marathwada, North
Maharashtra and other cities of
western Maharashtra that enter
the city will take this new route to
bypass the urban traffic.
Joint measurement survey for
the ring road has
commenced and is targeted
to end by April, 2021. State
has earmarked a budgetary
allocation of Rs 26,000 for
the project.
6.2.1. Pune Commercial Real Estate Overview
Pune’s Commercial spaces market is divided in 5 micro-markets namely, Central Business District (CBD),
Secondary Business District (SBD)-SBD East, SBD West, Peripheral Business District (PBD)-PBD East and
PBD West. Each of the commercial micro-market have distinctive characteristics and occupier profile.
Figure 20
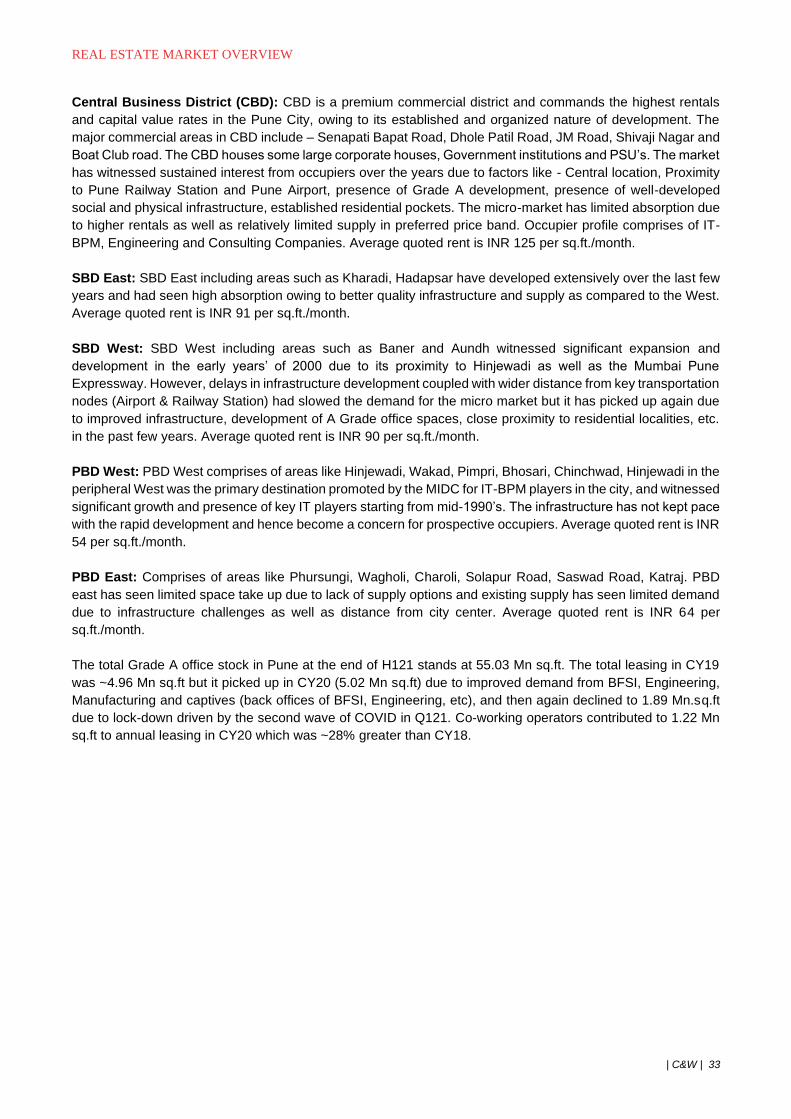
REAL ESTATE MARKET OVERVIEW
| C&W | 33
Central Business District (CBD): CBD is a premium commercial district and commands the highest rentals
and capital value rates in the Pune City, owing to its established and organized nature of development. The
major commercial areas in CBD include – Senapati Bapat Road, Dhole Patil Road, JM Road, Shivaji Nagar and
Boat Club road. The CBD houses some large corporate houses, Government institutions and PSU’s. The market
has witnessed sustained interest from occupiers over the years due to factors like - Central location, Proximity
to Pune Railway Station and Pune Airport, presence of Grade A development, presence of well-developed
social and physical infrastructure, established residential pockets. The micro-market has limited absorption due
to higher rentals as well as relatively limited supply in preferred price band. Occupier profile comprises of IT-
BPM, Engineering and Consulting Companies. Average quoted rent is INR 125 per sq.ft./month.
SBD East: SBD East including areas such as Kharadi, Hadapsar have developed extensively over the last few
years and had seen high absorption owing to better quality infrastructure and supply as compared to the West.
Average quoted rent is INR 91 per sq.ft./month.
SBD West: SBD West including areas such as Baner and Aundh witnessed significant expansion and
development in the early years’ of 2000 due to its proximity to Hinjewadi as well as the Mumbai Pune
Expressway. However, delays in infrastructure development coupled with wider distance from key transportation
nodes (Airport & Railway Station) had slowed the demand for the micro market but it has picked up again due
to improved infrastructure, development of A Grade office spaces, close proximity to residential localities, etc.
in the past few years. Average quoted rent is INR 90 per sq.ft./month.
PBD West: PBD West comprises of areas like Hinjewadi, Wakad, Pimpri, Bhosari, Chinchwad, Hinjewadi in the
peripheral West was the primary destination promoted by the MIDC for IT-BPM players in the city, and witnessed
significant growth and presence of key IT players starting from mid-1990’s. The infrastructure has not kept pace
with the rapid development and hence become a concern for prospective occupiers. Average quoted rent is INR
54 per sq.ft./month.
PBD East: Comprises of areas like Phursungi, Wagholi, Charoli, Solapur Road, Saswad Road, Katraj. PBD
east has seen limited space take up due to lack of supply options and existing supply has seen limited demand
due to infrastructure challenges as well as distance from city center. Average quoted rent is INR 64 per
sq.ft./month.
The total Grade A office stock in Pune at the end of H121 stands at 55.03 Mn sq.ft. The total leasing in CY19
was ~4.96 Mn sq.ft but it picked up in CY20 (5.02 Mn sq.ft) due to improved demand from BFSI, Engineering,
Manufacturing and captives (back offices of BFSI, Engineering, etc), and then again declined to 1.89 Mn.sq.ft
due to lock-down driven by the second wave of COVID in Q121. Co-working operators contributed to 1.22 Mn
sq.ft to annual leasing in CY20 which was ~28% greater than CY18.
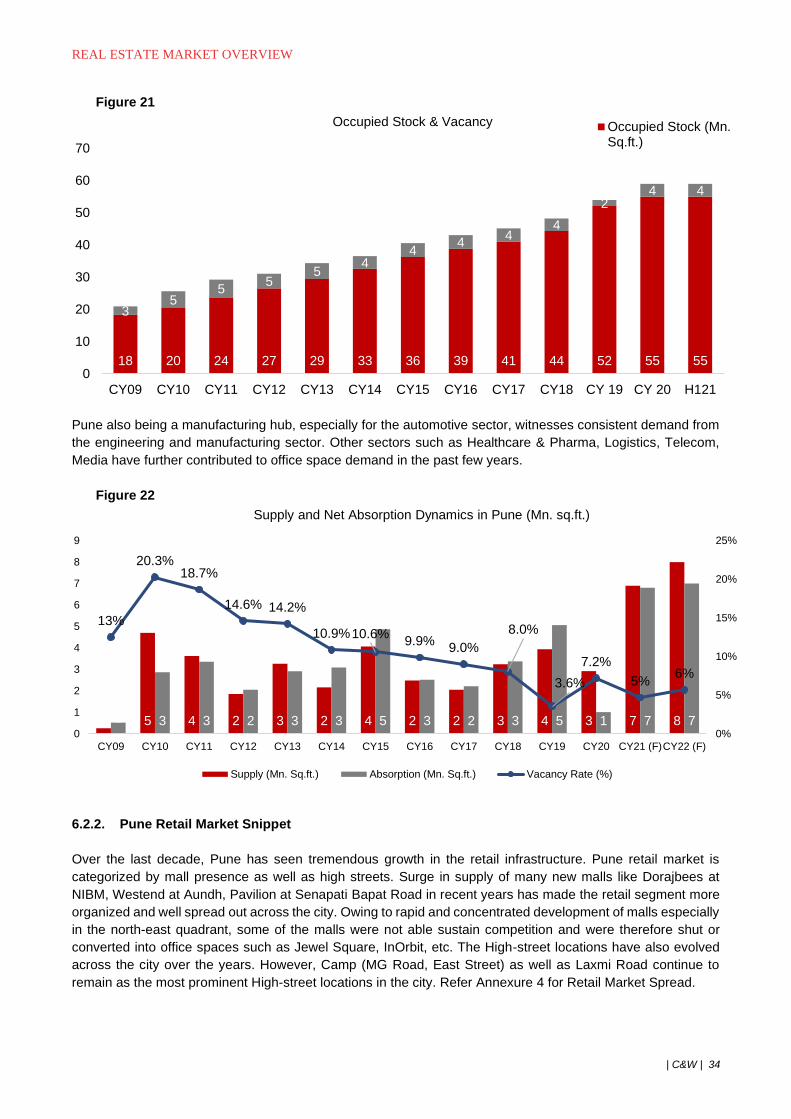
REAL ESTATE MARKET OVERVIEW
| C&W | 34
Figure 21
Pune also being a manufacturing hub, especially for the automotive sector, witnesses consistent demand from
the engineering and manufacturing sector. Other sectors such as Healthcare & Pharma, Logistics, Telecom,
Media have further contributed to office space demand in the past few years.
Figure 22
6.2.2. Pune Retail Market Snippet
Over the last decade, Pune has seen tremendous growth in the retail infrastructure. Pune retail market is
categorized by mall presence as well as high streets. Surge in supply of many new malls like Dorajbees at
NIBM, Westend at Aundh, Pavilion at Senapati Bapat Road in recent years has made the retail segment more
organized and well spread out across the city. Owing to rapid and concentrated development of malls especially
in the north-east quadrant, some of the malls were not able sustain competition and were therefore shut or
converted into office spaces such as Jewel Square, InOrbit, etc. The High-street locations have also evolved
across the city over the years. However, Camp (MG Road, East Street) as well as Laxmi Road continue to
remain as the most prominent High-street locations in the city. Refer Annexure 4 for Retail Market Spread.
18 20 24 27 29 33 36 39 41 44 52 55 55
35
55
54
44
44
24 4
0
10
20
30
40
50
60
70
CY09 CY10 CY11 CY12 CY13 CY14 CY15 CY16 CY17 CY18 CY 19 CY 20 H121
Occupied Stock & Vacancy Occupied Stock (Mn.Sq.ft.)
0 5 4 2 3 2 4 2 2 3 4 3 7 81 3 3 2 3 3 5 3 2 3 5 1 7 7
13%
20.3%18.7%
14.6% 14.2%
10.9%10.6%9.9%
9.0%
8.0%
3.6%
7.2%
5%6%
0%
5%
10%
15%
20%
25%
0
1
2
3
4
5
6
7
8
9
CY09 CY10 CY11 CY12 CY13 CY14 CY15 CY16 CY17 CY18 CY19 CY20 CY21 (F)CY22 (F)
Supply and Net Absorption Dynamics in Pune (Mn. sq.ft.)
Supply (Mn. Sq.ft.) Absorption (Mn. Sq.ft.) Vacancy Rate (%)
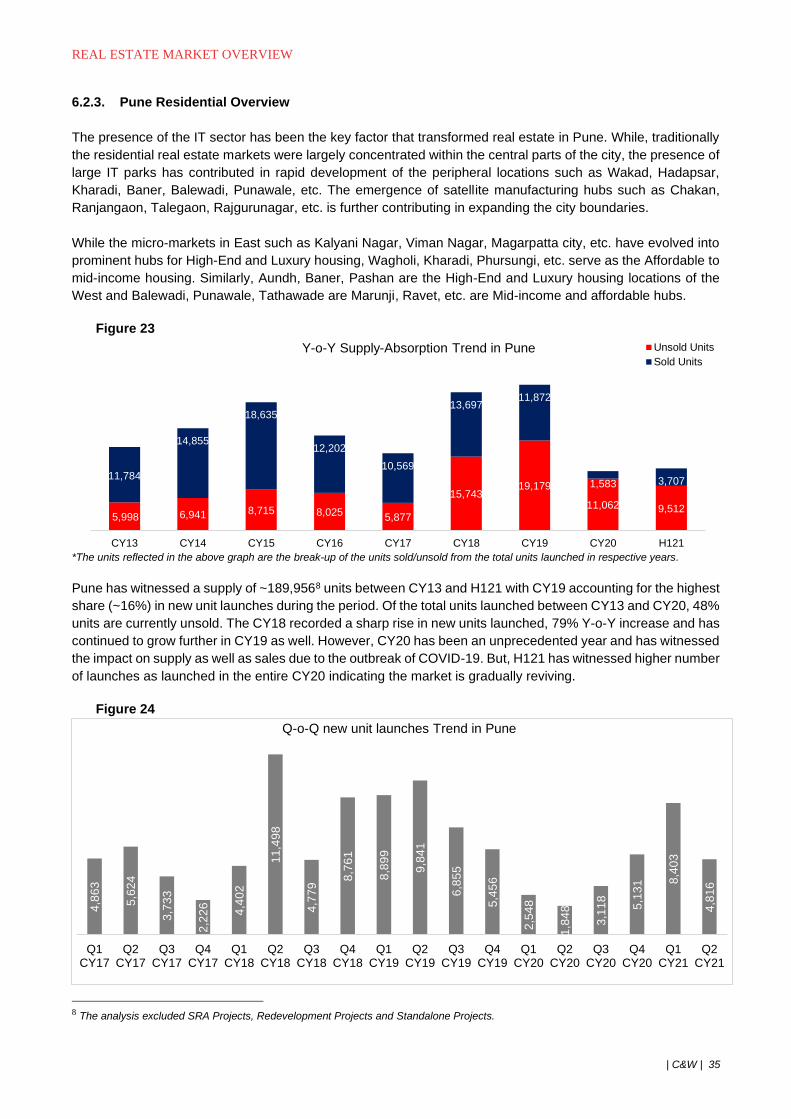
REAL ESTATE MARKET OVERVIEW
| C&W | 35
6.2.3. Pune Residential Overview
The presence of the IT sector has been the key factor that transformed real estate in Pune. While, traditionally
the residential real estate markets were largely concentrated within the central parts of the city, the presence of
large IT parks has contributed in rapid development of the peripheral locations such as Wakad, Hadapsar,
Kharadi, Baner, Balewadi, Punawale, etc. The emergence of satellite manufacturing hubs such as Chakan,
Ranjangaon, Talegaon, Rajgurunagar, etc. is further contributing in expanding the city boundaries.
While the micro-markets in East such as Kalyani Nagar, Viman Nagar, Magarpatta city, etc. have evolved into
prominent hubs for High-End and Luxury housing, Wagholi, Kharadi, Phursungi, etc. serve as the Affordable to
mid-income housing. Similarly, Aundh, Baner, Pashan are the High-End and Luxury housing locations of the
West and Balewadi, Punawale, Tathawade are Marunji, Ravet, etc. are Mid-income and affordable hubs.
Figure 23
*The units reflected in the above graph are the break-up of the units sold/unsold from the total units launched in respective years.
Pune has witnessed a supply of ~189,9568 units between CY13 and H121 with CY19 accounting for the highest
share (~16%) in new unit launches during the period. Of the total units launched between CY13 and CY20, 48%
units are currently unsold. The CY18 recorded a sharp rise in new units launched, 79% Y-o-Y increase and has
continued to grow further in CY19 as well. However, CY20 has been an unprecedented year and has witnessed
the impact on supply as well as sales due to the outbreak of COVID-19. But, H121 has witnessed higher number
of launches as launched in the entire CY20 indicating the market is gradually reviving.
Figure 24
8 The analysis excluded SRA Projects, Redevelopment Projects and Standalone Projects.
5,998 6,941 8,715 8,0255,877
15,74319,179
11,062 9,512
11,784
14,855
18,635
12,202
10,569
13,69711,872
1,583 3,707
CY13 CY14 CY15 CY16 CY17 CY18 CY19 CY20 H121
Y-o-Y Supply-Absorption Trend in Pune Unsold Units
Sold Units
4,8
63
5,6
24
3,7
33
2,2
26
4,4
02
11
,49
8
4,7
79
8,7
61
8,8
99
9,8
41
6,8
55
5,4
56
2,5
48
1,8
48
3,1
18
5,1
31 8
,40
3
4,8
16
Q1CY17
Q2CY17
Q3CY17
Q4CY17
Q1CY18
Q2CY18
Q3CY18
Q4CY18
Q1CY19
Q2CY19
Q3CY19
Q4CY19
Q1CY20
Q2CY20
Q3CY20
Q4CY20
Q1CY21
Q2CY21
Q-o-Q new unit launches Trend in Pune
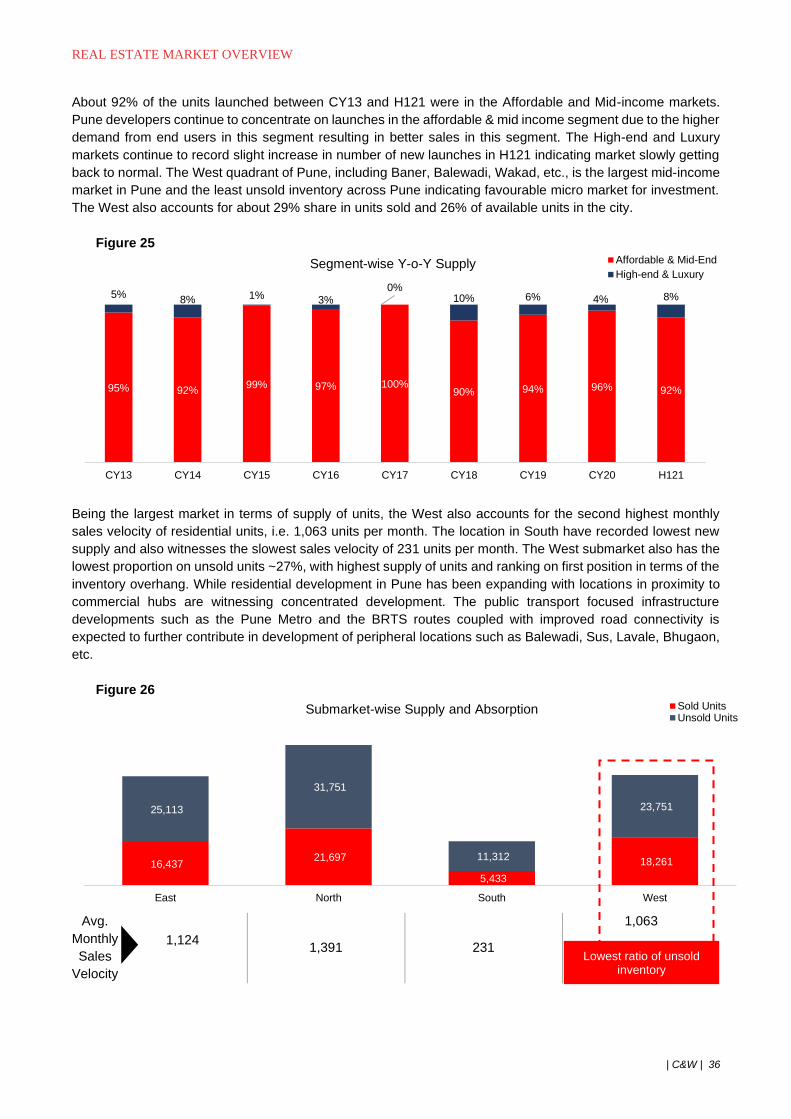
REAL ESTATE MARKET OVERVIEW
| C&W | 36
About 92% of the units launched between CY13 and H121 were in the Affordable and Mid-income markets.
Pune developers continue to concentrate on launches in the affordable & mid income segment due to the higher
demand from end users in this segment resulting in better sales in this segment. The High-end and Luxury
markets continue to record slight increase in number of new launches in H121 indicating market slowly getting
back to normal. The West quadrant of Pune, including Baner, Balewadi, Wakad, etc., is the largest mid-income
market in Pune and the least unsold inventory across Pune indicating favourable micro market for investment.
The West also accounts for about 29% share in units sold and 26% of available units in the city.
Figure 25
Being the largest market in terms of supply of units, the West also accounts for the second highest monthly
sales velocity of residential units, i.e. 1,063 units per month. The location in South have recorded lowest new
supply and also witnesses the slowest sales velocity of 231 units per month. The West submarket also has the
lowest proportion on unsold units ~27%, with highest supply of units and ranking on first position in terms of the
inventory overhang. While residential development in Pune has been expanding with locations in proximity to
commercial hubs are witnessing concentrated development. The public transport focused infrastructure
developments such as the Pune Metro and the BRTS routes coupled with improved road connectivity is
expected to further contribute in development of peripheral locations such as Balewadi, Sus, Lavale, Bhugaon,
etc.
Figure 26
Avg.
Monthly
Sales
Velocity
1,124 1,391 231
1,063
95% 92%99% 97% 100%
90% 94% 96% 92%
5%8% 1% 3%
0%10% 6% 4% 8%
CY13 CY14 CY15 CY16 CY17 CY18 CY19 CY20 H121
Segment-wise Y-o-Y Supply Affordable & Mid-End
High-end & Luxury
16,437 21,697
5,433
18,261
25,113
31,751
11,312
23,751
East North South West
Submarket-wise Supply and Absorption Sold UnitsUnsold Units
Lowest ratio of unsold inventory
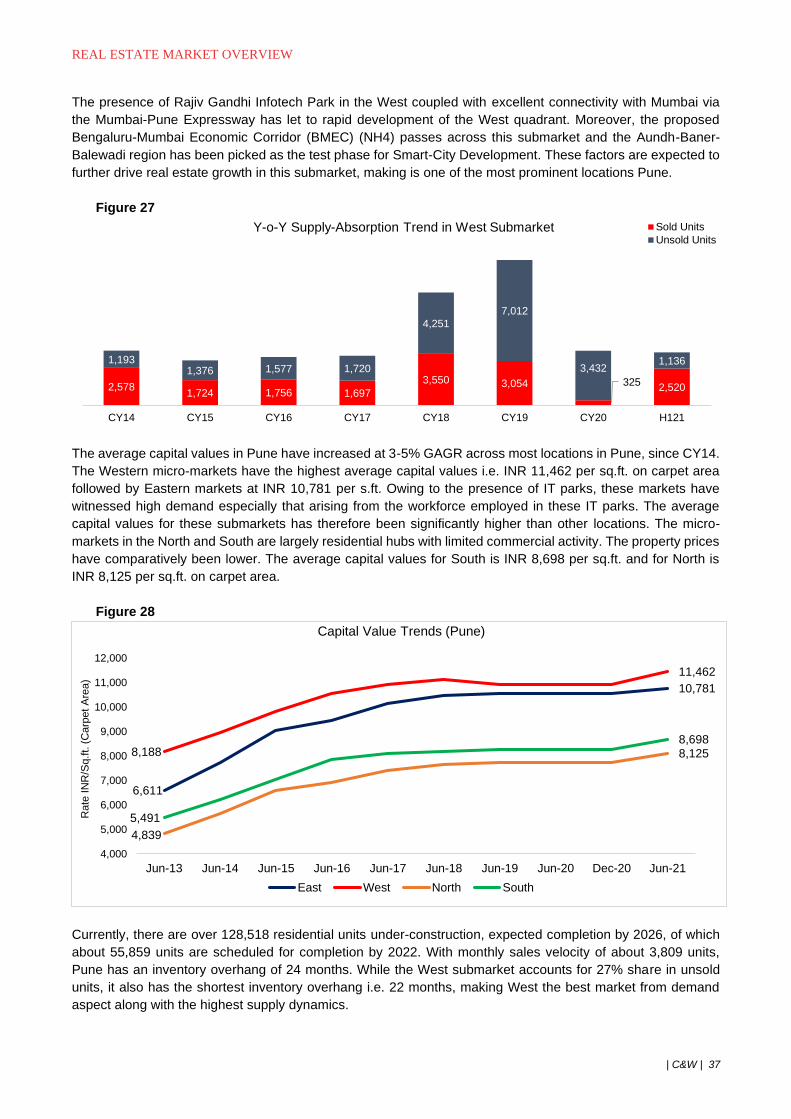
REAL ESTATE MARKET OVERVIEW
| C&W | 37
The presence of Rajiv Gandhi Infotech Park in the West coupled with excellent connectivity with Mumbai via
the Mumbai-Pune Expressway has let to rapid development of the West quadrant. Moreover, the proposed
Bengaluru-Mumbai Economic Corridor (BMEC) (NH4) passes across this submarket and the Aundh-Baner-
Balewadi region has been picked as the test phase for Smart-City Development. These factors are expected to
further drive real estate growth in this submarket, making is one of the most prominent locations Pune.
Figure 27
The average capital values in Pune have increased at 3-5% GAGR across most locations in Pune, since CY14.
The Western micro-markets have the highest average capital values i.e. INR 11,462 per sq.ft. on carpet area
followed by Eastern markets at INR 10,781 per s.ft. Owing to the presence of IT parks, these markets have
witnessed high demand especially that arising from the workforce employed in these IT parks. The average
capital values for these submarkets has therefore been significantly higher than other locations. The micro-
markets in the North and South are largely residential hubs with limited commercial activity. The property prices
have comparatively been lower. The average capital values for South is INR 8,698 per sq.ft. and for North is
INR 8,125 per sq.ft. on carpet area.
Figure 28
Currently, there are over 128,518 residential units under-construction, expected completion by 2026, of which
about 55,859 units are scheduled for completion by 2022. With monthly sales velocity of about 3,809 units,
Pune has an inventory overhang of 24 months. While the West submarket accounts for 27% share in unsold
units, it also has the shortest inventory overhang i.e. 22 months, making West the best market from demand
aspect along with the highest supply dynamics.
2,5781,724 1,756 1,697
3,550 3,054 3252,520
1,1931,376 1,577 1,720
4,251
7,012
3,4321,136
CY14 CY15 CY16 CY17 CY18 CY19 CY20 H121
Y-o-Y Supply-Absorption Trend in West Submarket Sold Units
Unsold Units
6,611
10,781
8,188
11,462
4,839
8,125
5,491
8,698
4,000
5,000
6,000
7,000
8,000
9,000
10,000
11,000
12,000
Jun-13 Jun-14 Jun-15 Jun-16 Jun-17 Jun-18 Jun-19 Jun-20 Dec-20 Jun-21
Rate
IN
R/S
q.f
t. (
Carp
et
Are
a)
Capital Value Trends (Pune)
East West North South
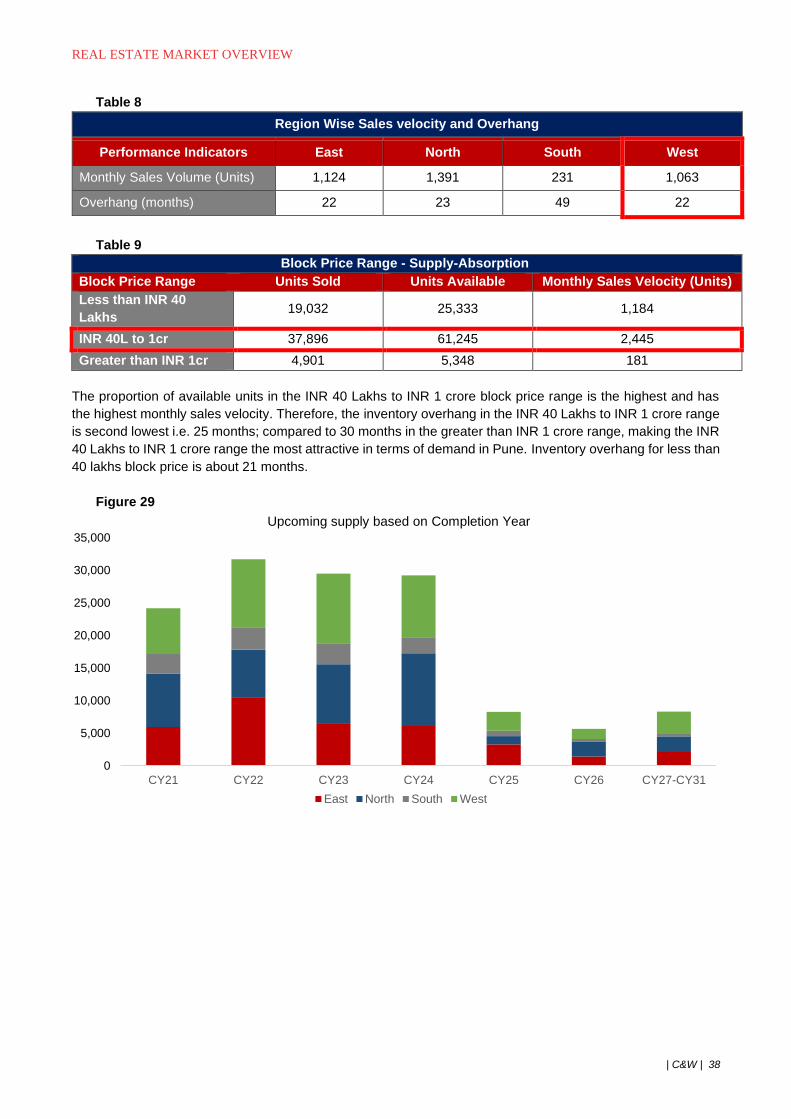
REAL ESTATE MARKET OVERVIEW
| C&W | 38
Table 8
Region Wise Sales velocity and Overhang
Performance Indicators East North South West
Monthly Sales Volume (Units) 1,124 1,391 231 1,063
Overhang (months) 22 23 49 22
Table 9
Block Price Range - Supply-Absorption
Block Price Range Units Sold Units Available Monthly Sales Velocity (Units)
Less than INR 40
Lakhs 19,032 25,333 1,184
INR 40L to 1cr 37,896 61,245 2,445
Greater than INR 1cr 4,901 5,348 181
The proportion of available units in the INR 40 Lakhs to INR 1 crore block price range is the highest and has
the highest monthly sales velocity. Therefore, the inventory overhang in the INR 40 Lakhs to INR 1 crore range
is second lowest i.e. 25 months; compared to 30 months in the greater than INR 1 crore range, making the INR
40 Lakhs to INR 1 crore range the most attractive in terms of demand in Pune. Inventory overhang for less than
40 lakhs block price is about 21 months.
Figure 29
0
5,000
10,000
15,000
20,000
25,000
30,000
35,000
CY21 CY22 CY23 CY24 CY25 CY26 CY27-CY31
Upcoming supply based on Completion Year
East North South West
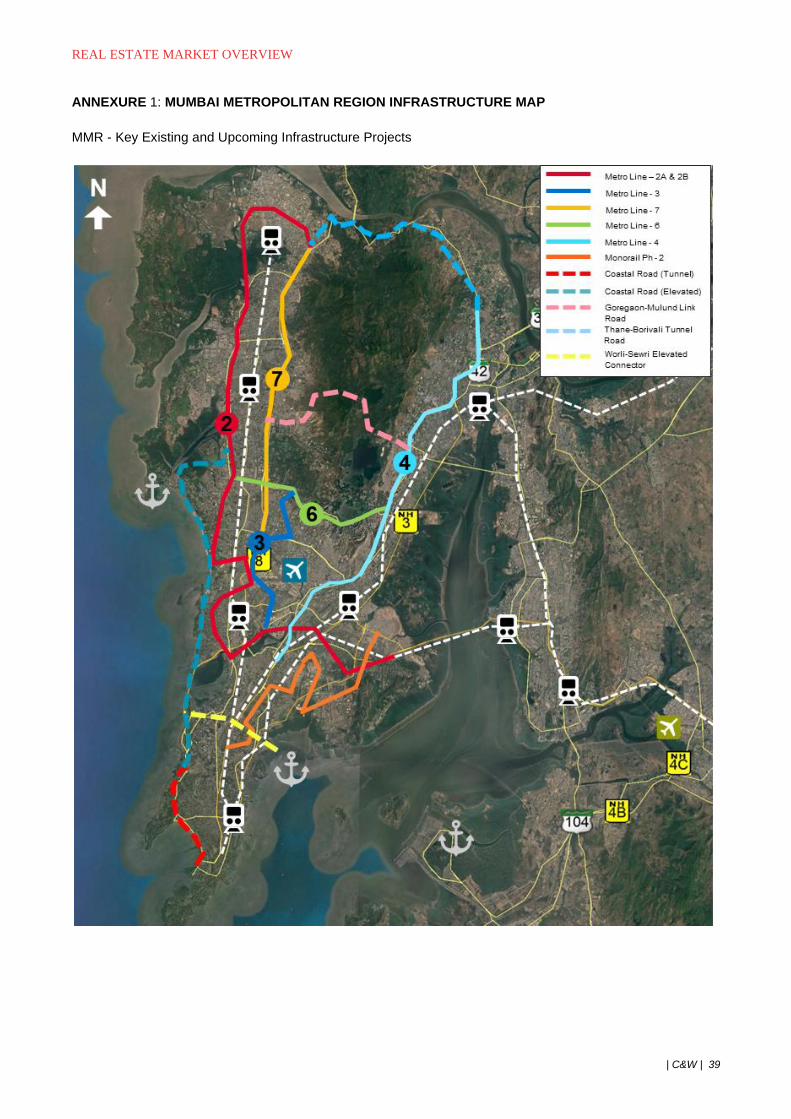
REAL ESTATE MARKET OVERVIEW
| C&W | 39
ANNEXURE 1: MUMBAI METROPOLITAN REGION INFRASTRUCTURE MAP
MMR - Key Existing and Upcoming Infrastructure Projects
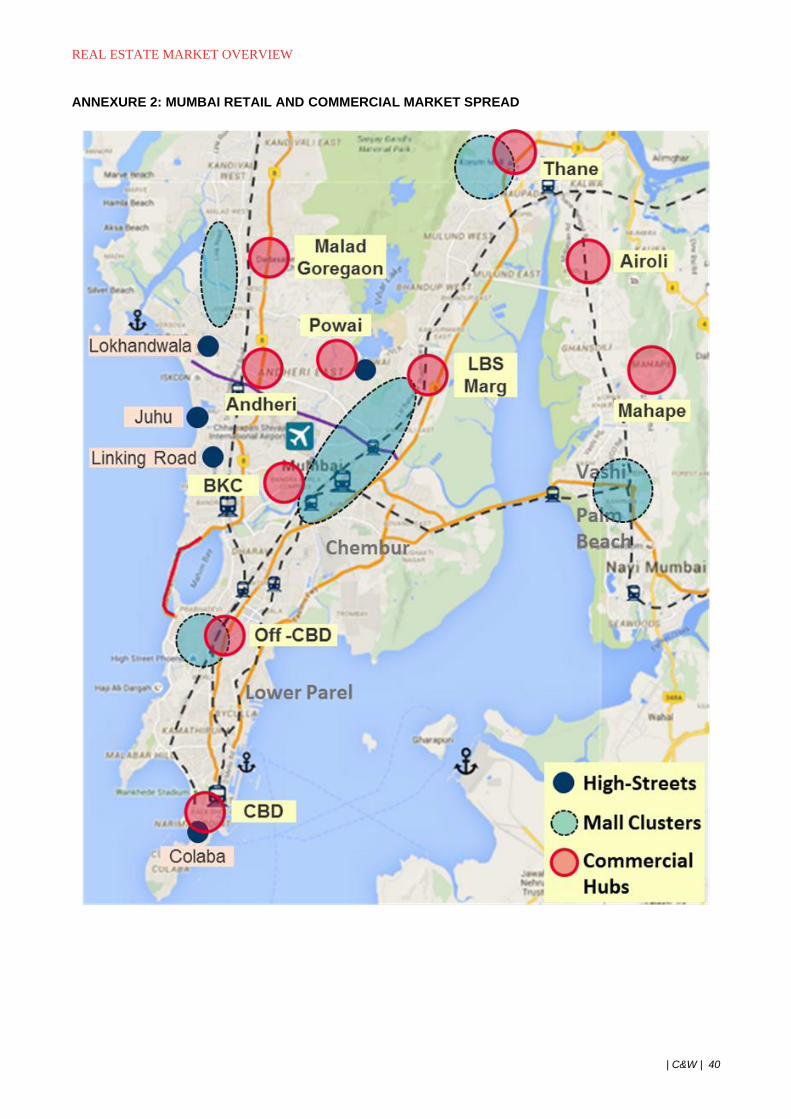
REAL ESTATE MARKET OVERVIEW
| C&W | 40
ANNEXURE 2: MUMBAI RETAIL AND COMMERCIAL MARKET SPREAD
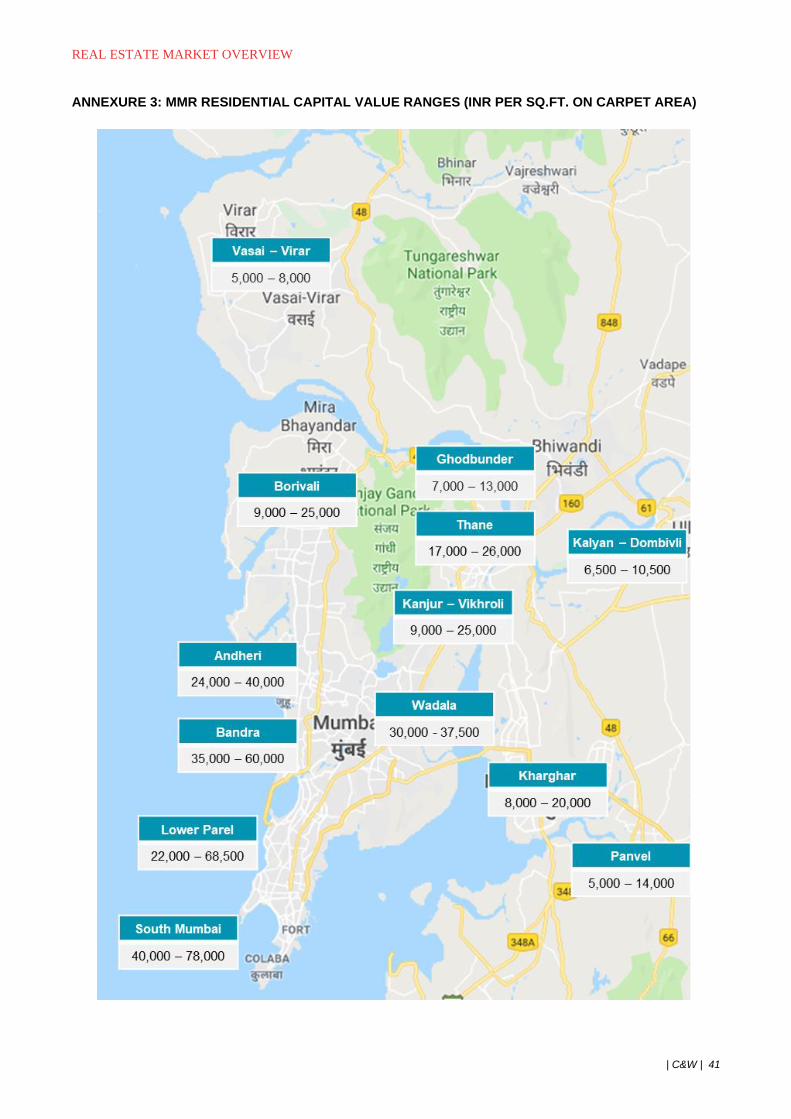
REAL ESTATE MARKET OVERVIEW
| C&W | 41
ANNEXURE 3: MMR RESIDENTIAL CAPITAL VALUE RANGES (INR PER SQ.FT. ON CARPET AREA)
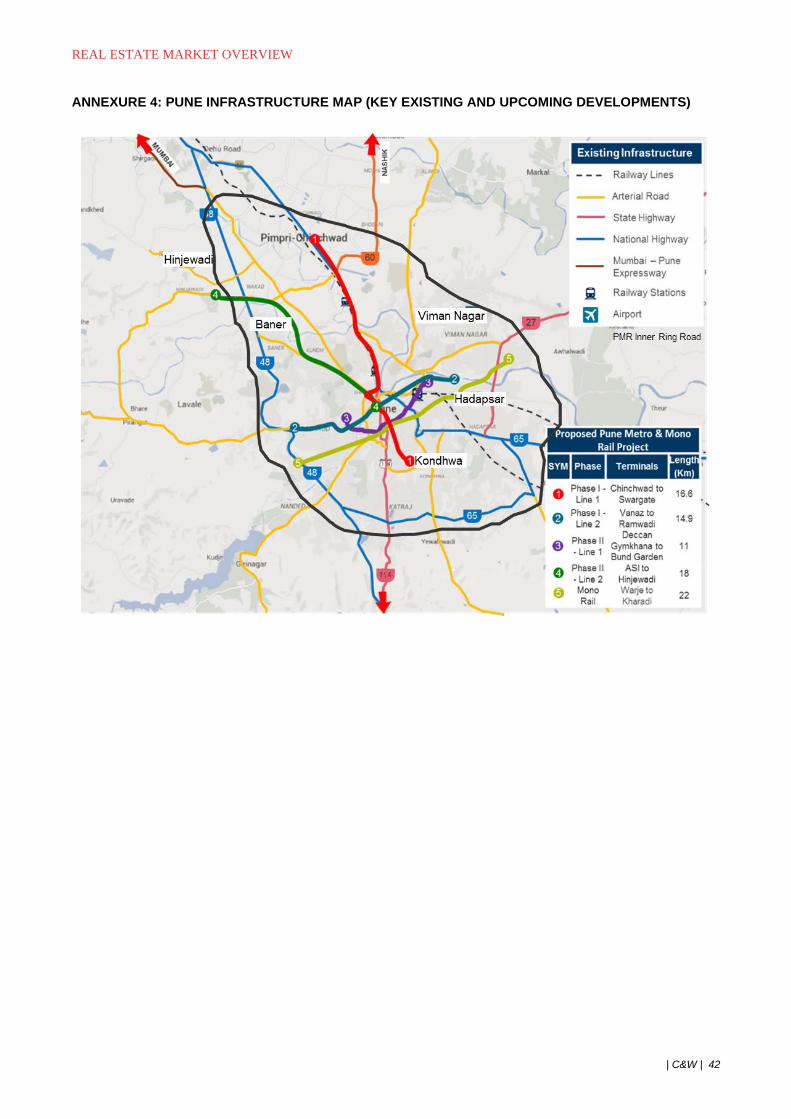
REAL ESTATE MARKET OVERVIEW
| C&W | 42
ANNEXURE 4: PUNE INFRASTRUCTURE MAP (KEY EXISTING AND UPCOMING DEVELOPMENTS)
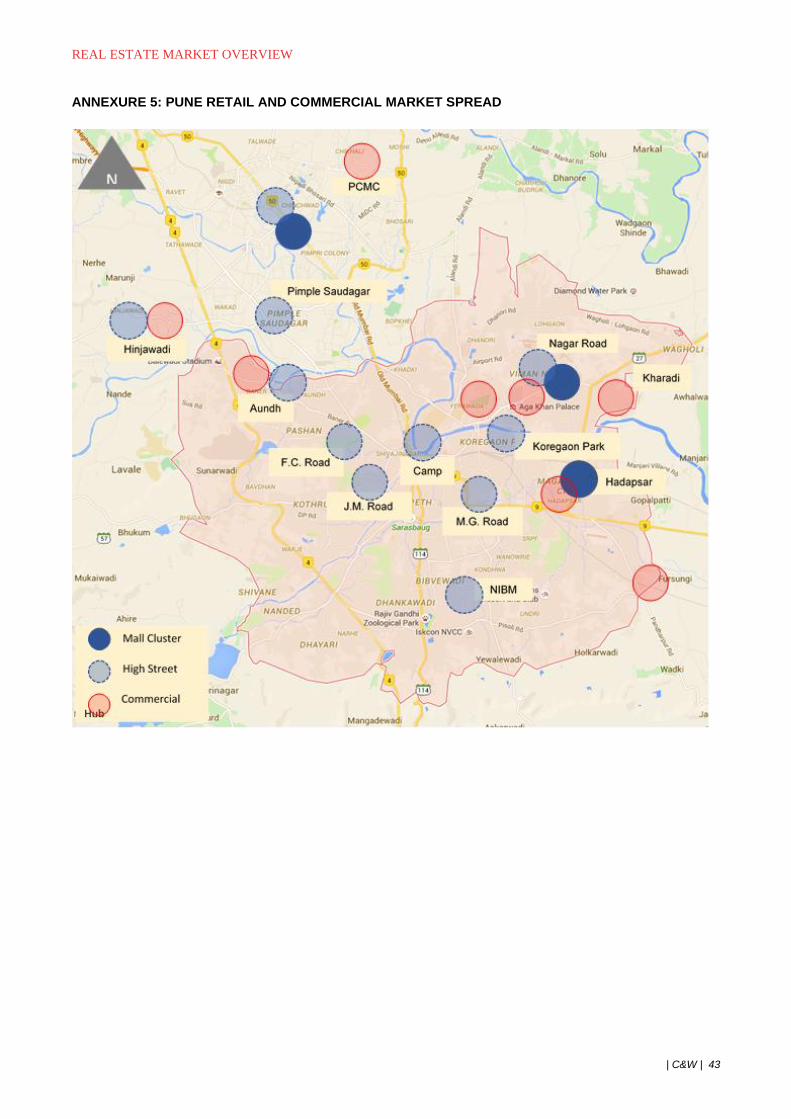
REAL ESTATE MARKET OVERVIEW
| C&W | 43
ANNEXURE 5: PUNE RETAIL AND COMMERCIAL MARKET SPREAD
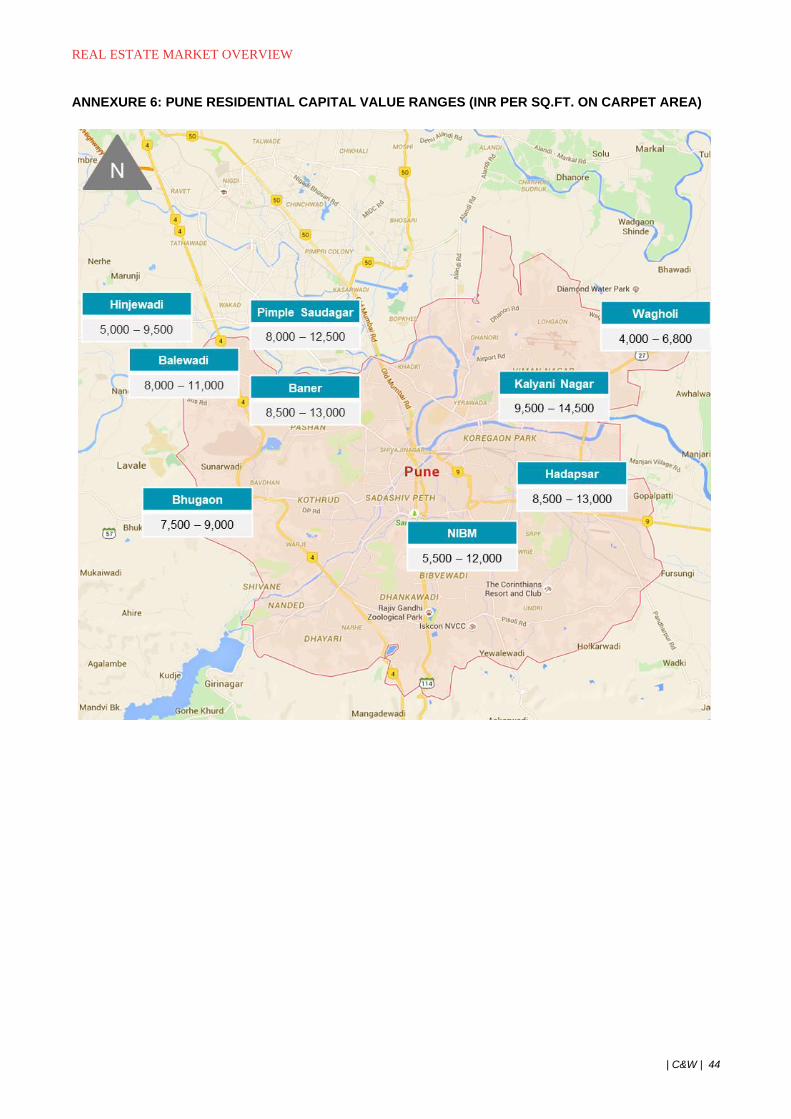
REAL ESTATE MARKET OVERVIEW
| C&W | 44
ANNEXURE 6: PUNE RESIDENTIAL CAPITAL VALUE RANGES (INR PER SQ.FT. ON CARPET AREA)
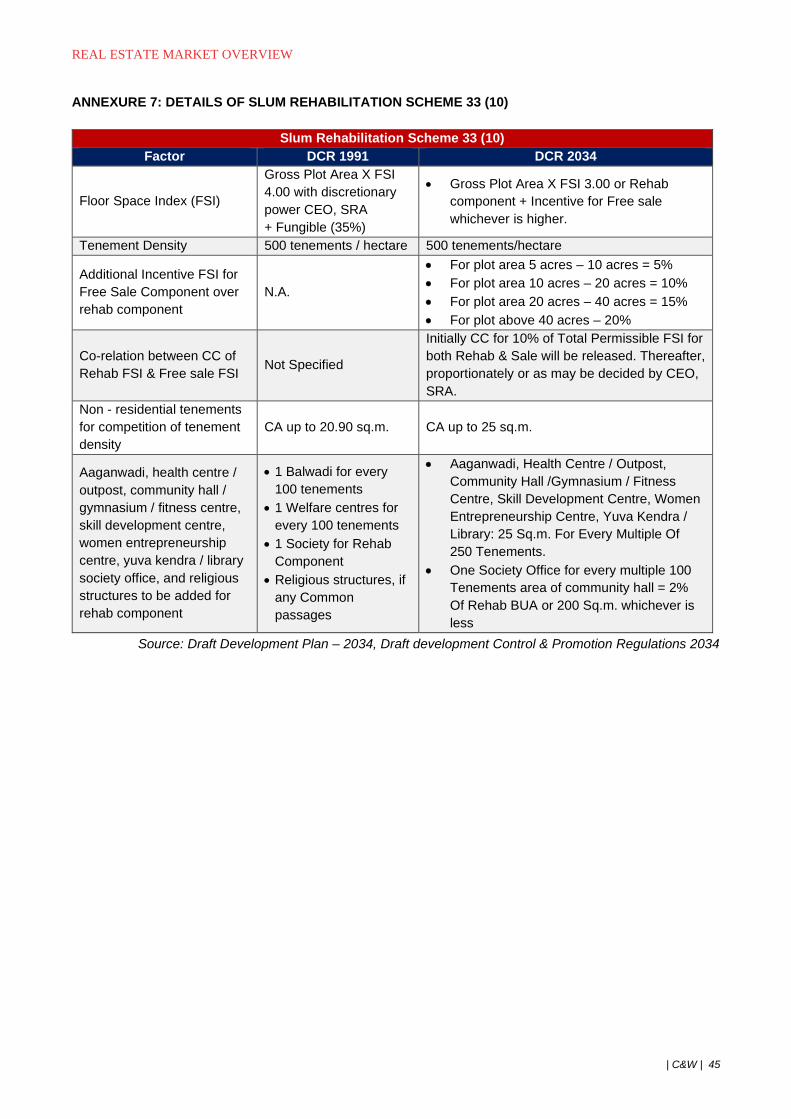
REAL ESTATE MARKET OVERVIEW
| C&W | 45
ANNEXURE 7: DETAILS OF SLUM REHABILITATION SCHEME 33 (10)
Slum Rehabilitation Scheme 33 (10)
Factor DCR 1991 DCR 2034
Floor Space Index (FSI)
Gross Plot Area X FSI
4.00 with discretionary
power CEO, SRA
+ Fungible (35%)
• Gross Plot Area X FSI 3.00 or Rehab
component + Incentive for Free sale
whichever is higher.
Tenement Density 500 tenements / hectare 500 tenements/hectare
Additional Incentive FSI for
Free Sale Component over
rehab component
N.A.
• For plot area 5 acres – 10 acres = 5%
• For plot area 10 acres – 20 acres = 10%
• For plot area 20 acres – 40 acres = 15%
• For plot above 40 acres – 20%
Co-relation between CC of
Rehab FSI & Free sale FSI Not Specified
Initially CC for 10% of Total Permissible FSI for
both Rehab & Sale will be released. Thereafter,
proportionately or as may be decided by CEO,
SRA.
Non - residential tenements
for competition of tenement
density
CA up to 20.90 sq.m. CA up to 25 sq.m.
Aaganwadi, health centre /
outpost, community hall /
gymnasium / fitness centre,
skill development centre,
women entrepreneurship
centre, yuva kendra / library
society office, and religious
structures to be added for
rehab component
• 1 Balwadi for every
100 tenements
• 1 Welfare centres for
every 100 tenements
• 1 Society for Rehab
Component
• Religious structures, if
any Common
passages
• Aaganwadi, Health Centre / Outpost,
Community Hall /Gymnasium / Fitness
Centre, Skill Development Centre, Women
Entrepreneurship Centre, Yuva Kendra /
Library: 25 Sq.m. For Every Multiple Of
250 Tenements.
• One Society Office for every multiple 100
Tenements area of community hall = 2%
Of Rehab BUA or 200 Sq.m. whichever is
less
Source: Draft Development Plan – 2034, Draft development Control & Promotion Regulations 2034
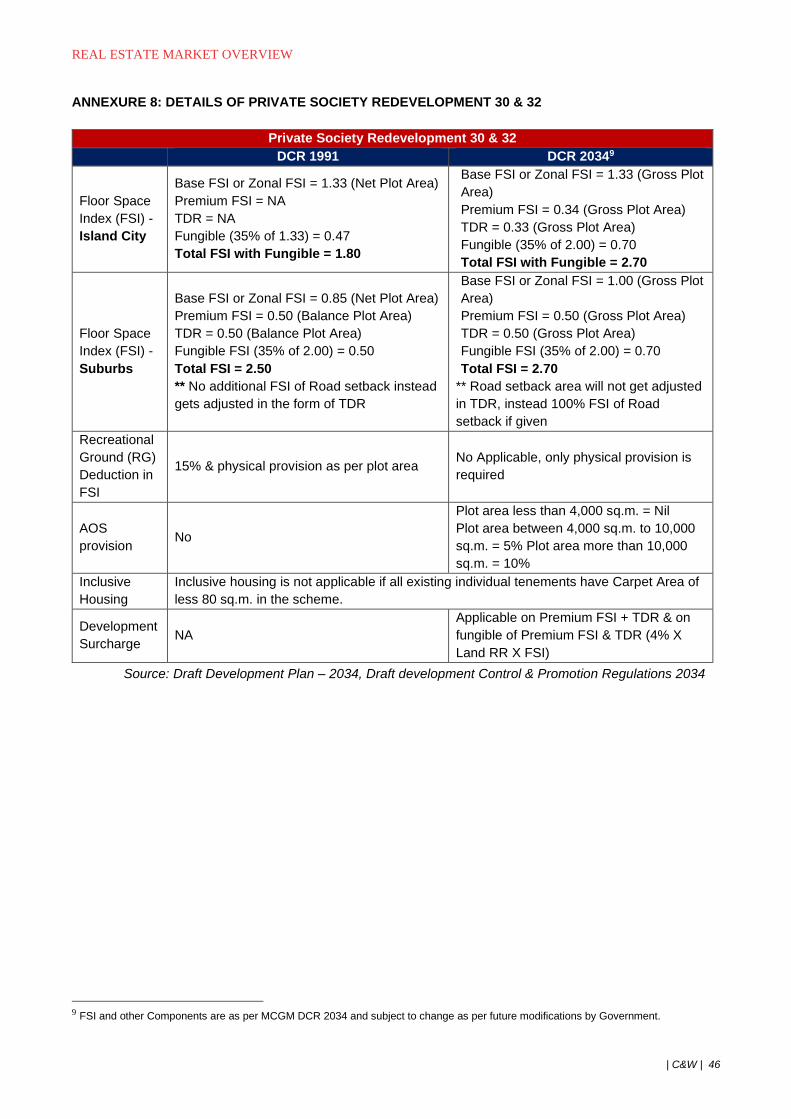
REAL ESTATE MARKET OVERVIEW
| C&W | 46
ANNEXURE 8: DETAILS OF PRIVATE SOCIETY REDEVELOPMENT 30 & 32
Private Society Redevelopment 30 & 32 DCR 1991 DCR 20349
Floor Space
Index (FSI) -
Island City
Base FSI or Zonal FSI = 1.33 (Net Plot Area)
Premium FSI = NA
TDR = NA
Fungible (35% of 1.33) = 0.47
Total FSI with Fungible = 1.80
Base FSI or Zonal FSI = 1.33 (Gross Plot
Area)
Premium FSI = 0.34 (Gross Plot Area)
TDR = 0.33 (Gross Plot Area)
Fungible (35% of 2.00) = 0.70
Total FSI with Fungible = 2.70
Floor Space
Index (FSI) -
Suburbs
Base FSI or Zonal FSI = 0.85 (Net Plot Area)
Premium FSI = 0.50 (Balance Plot Area)
TDR = 0.50 (Balance Plot Area)
Fungible FSI (35% of 2.00) = 0.50
Total FSI = 2.50
** No additional FSI of Road setback instead
gets adjusted in the form of TDR
Base FSI or Zonal FSI = 1.00 (Gross Plot
Area)
Premium FSI = 0.50 (Gross Plot Area)
TDR = 0.50 (Gross Plot Area)
Fungible FSI (35% of 2.00) = 0.70
Total FSI = 2.70
** Road setback area will not get adjusted
in TDR, instead 100% FSI of Road
setback if given
Recreational
Ground (RG)
Deduction in
FSI
15% & physical provision as per plot area No Applicable, only physical provision is
required
AOS
provision No
Plot area less than 4,000 sq.m. = Nil
Plot area between 4,000 sq.m. to 10,000
sq.m. = 5% Plot area more than 10,000
sq.m. = 10%
Inclusive
Housing
Inclusive housing is not applicable if all existing individual tenements have Carpet Area of
less 80 sq.m. in the scheme.
Development
Surcharge NA
Applicable on Premium FSI + TDR & on
fungible of Premium FSI & TDR (4% X
Land RR X FSI)
Source: Draft Development Plan – 2034, Draft development Control & Promotion Regulations 2034
9 FSI and other Components are as per MCGM DCR 2034 and subject to change as per future modifications by Government.
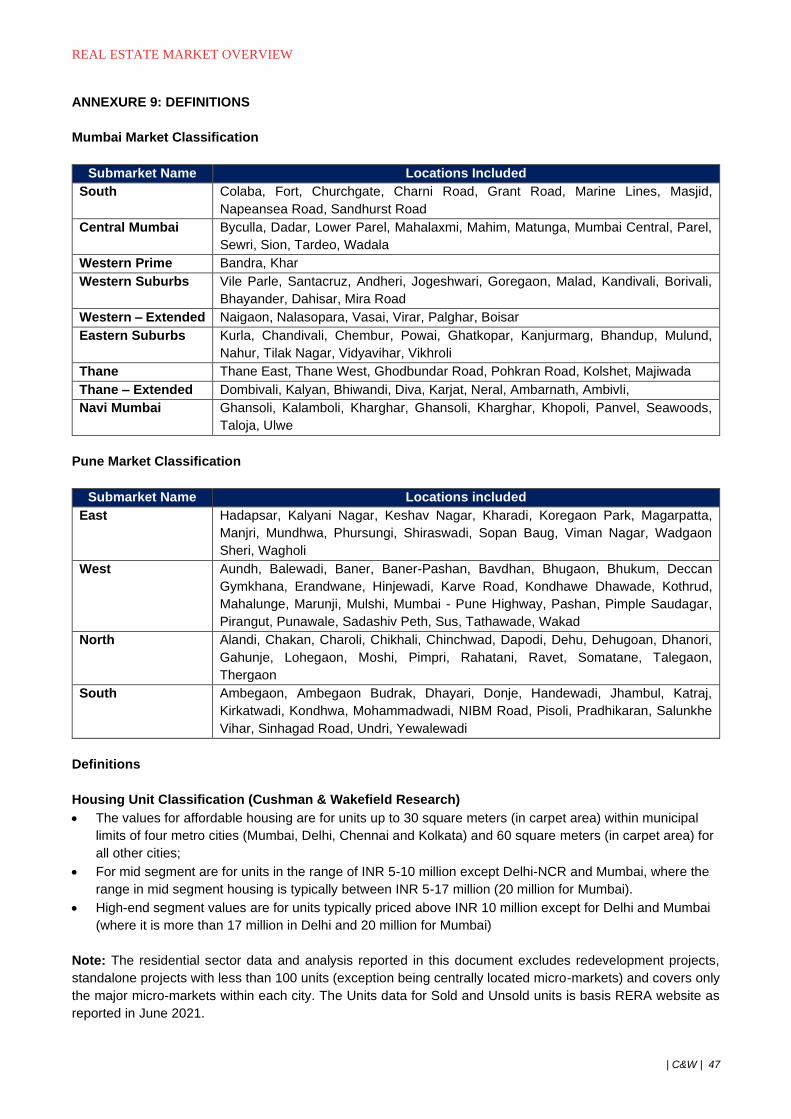
REAL ESTATE MARKET OVERVIEW
| C&W | 47
ANNEXURE 9: DEFINITIONS
Mumbai Market Classification
Submarket Name Locations Included
South Colaba, Fort, Churchgate, Charni Road, Grant Road, Marine Lines, Masjid,
Napeansea Road, Sandhurst Road
Central Mumbai Byculla, Dadar, Lower Parel, Mahalaxmi, Mahim, Matunga, Mumbai Central, Parel,
Sewri, Sion, Tardeo, Wadala
Western Prime Bandra, Khar
Western Suburbs Vile Parle, Santacruz, Andheri, Jogeshwari, Goregaon, Malad, Kandivali, Borivali,
Bhayander, Dahisar, Mira Road
Western – Extended Naigaon, Nalasopara, Vasai, Virar, Palghar, Boisar
Eastern Suburbs Kurla, Chandivali, Chembur, Powai, Ghatkopar, Kanjurmarg, Bhandup, Mulund,
Nahur, Tilak Nagar, Vidyavihar, Vikhroli
Thane Thane East, Thane West, Ghodbundar Road, Pohkran Road, Kolshet, Majiwada
Thane – Extended Dombivali, Kalyan, Bhiwandi, Diva, Karjat, Neral, Ambarnath, Ambivli,
Navi Mumbai Ghansoli, Kalamboli, Kharghar, Ghansoli, Kharghar, Khopoli, Panvel, Seawoods,
Taloja, Ulwe
Pune Market Classification
Submarket Name Locations included
East Hadapsar, Kalyani Nagar, Keshav Nagar, Kharadi, Koregaon Park, Magarpatta,
Manjri, Mundhwa, Phursungi, Shiraswadi, Sopan Baug, Viman Nagar, Wadgaon
Sheri, Wagholi
West Aundh, Balewadi, Baner, Baner-Pashan, Bavdhan, Bhugaon, Bhukum, Deccan
Gymkhana, Erandwane, Hinjewadi, Karve Road, Kondhawe Dhawade, Kothrud,
Mahalunge, Marunji, Mulshi, Mumbai - Pune Highway, Pashan, Pimple Saudagar,
Pirangut, Punawale, Sadashiv Peth, Sus, Tathawade, Wakad
North Alandi, Chakan, Charoli, Chikhali, Chinchwad, Dapodi, Dehu, Dehugoan, Dhanori,
Gahunje, Lohegaon, Moshi, Pimpri, Rahatani, Ravet, Somatane, Talegaon,
Thergaon
South Ambegaon, Ambegaon Budrak, Dhayari, Donje, Handewadi, Jhambul, Katraj,
Kirkatwadi, Kondhwa, Mohammadwadi, NIBM Road, Pisoli, Pradhikaran, Salunkhe
Vihar, Sinhagad Road, Undri, Yewalewadi
Definitions
Housing Unit Classification (Cushman & Wakefield Research)
• The values for affordable housing are for units up to 30 square meters (in carpet area) within municipal
limits of four metro cities (Mumbai, Delhi, Chennai and Kolkata) and 60 square meters (in carpet area) for
all other cities;
• For mid segment are for units in the range of INR 5-10 million except Delhi-NCR and Mumbai, where the
range in mid segment housing is typically between INR 5-17 million (20 million for Mumbai).
• High-end segment values are for units typically priced above INR 10 million except for Delhi and Mumbai
(where it is more than 17 million in Delhi and 20 million for Mumbai)
Note: The residential sector data and analysis reported in this document excludes redevelopment projects,
standalone projects with less than 100 units (exception being centrally located micro-markets) and covers only
the major micro-markets within each city. The Units data for Sold and Unsold units is basis RERA website as
reported in June 2021.
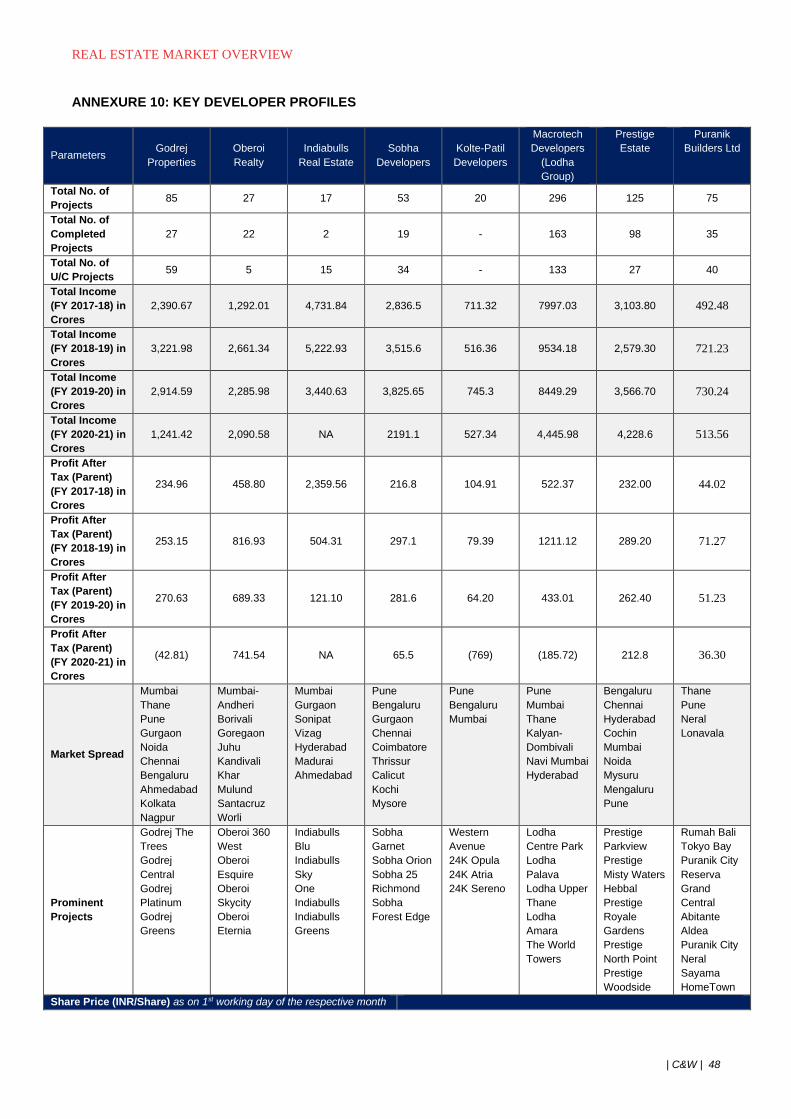
REAL ESTATE MARKET OVERVIEW
| C&W | 48
ANNEXURE 10: KEY DEVELOPER PROFILES
Parameters Godrej
Properties
Oberoi
Realty
Indiabulls
Real Estate
Sobha
Developers
Kolte-Patil
Developers
Macrotech
Developers
(Lodha
Group)
Prestige
Estate
Puranik
Builders Ltd
Total No. of
Projects 85 27 17 53 20 296 125 75
Total No. of
Completed
Projects
27 22 2 19 - 163 98 35
Total No. of
U/C Projects 59 5 15 34 - 133 27 40
Total Income
(FY 2017-18) in
Crores
2,390.67 1,292.01 4,731.84 2,836.5 711.32 7997.03 3,103.80 492.48
Total Income
(FY 2018-19) in
Crores
3,221.98 2,661.34 5,222.93 3,515.6 516.36 9534.18 2,579.30 721.23
Total Income
(FY 2019-20) in
Crores
2,914.59 2,285.98 3,440.63 3,825.65 745.3 8449.29 3,566.70 730.24
Total Income
(FY 2020-21) in
Crores
1,241.42 2,090.58 NA 2191.1 527.34 4,445.98 4,228.6 513.56
Profit After
Tax (Parent)
(FY 2017-18) in
Crores
234.96 458.80 2,359.56 216.8 104.91 522.37 232.00 44.02
Profit After
Tax (Parent)
(FY 2018-19) in
Crores
253.15 816.93 504.31 297.1 79.39 1211.12 289.20 71.27
Profit After
Tax (Parent)
(FY 2019-20) in
Crores
270.63 689.33 121.10 281.6 64.20 433.01 262.40 51.23
Profit After
Tax (Parent)
(FY 2020-21) in
Crores
(42.81) 741.54 NA 65.5 (769) (185.72) 212.8 36.30
Market Spread
Mumbai
Thane
Pune
Gurgaon
Noida
Chennai
Bengaluru
Ahmedabad
Kolkata
Nagpur
Mumbai-
Andheri
Borivali
Goregaon
Juhu
Kandivali
Khar
Mulund
Santacruz
Worli
Mumbai
Gurgaon
Sonipat
Vizag
Hyderabad
Madurai
Ahmedabad
Pune
Bengaluru
Gurgaon
Chennai
Coimbatore
Thrissur
Calicut
Kochi
Mysore
Pune
Bengaluru
Mumbai
Pune
Mumbai
Thane
Kalyan-
Dombivali
Navi Mumbai
Hyderabad
Bengaluru
Chennai
Hyderabad
Cochin
Mumbai
Noida
Mysuru
Mengaluru
Pune
Thane
Pune
Neral
Lonavala
Prominent
Projects
Godrej The
Trees
Godrej
Central
Godrej
Platinum
Godrej
Greens
Oberoi 360
West
Oberoi
Esquire
Oberoi
Skycity
Oberoi
Eternia
Indiabulls
Blu
Indiabulls
Sky
One
Indiabulls
Indiabulls
Greens
Sobha
Garnet
Sobha Orion
Sobha 25
Richmond
Sobha
Forest Edge
Western
Avenue
24K Opula
24K Atria
24K Sereno
Lodha
Centre Park
Lodha
Palava
Lodha Upper
Thane
Lodha
Amara
The World
Towers
Prestige
Parkview
Prestige
Misty Waters
Hebbal
Prestige
Royale
Gardens
Prestige
North Point
Prestige
Woodside
Rumah Bali
Tokyo Bay
Puranik City
Reserva
Grand
Central
Abitante
Aldea
Puranik City
Neral
Sayama
HomeTown
Share Price (INR/Share) as on 1st working day of the respective month

REAL ESTATE MARKET OVERVIEW
| C&W | 49
April-21 1,380 565 82 449.5 234.6 439 303.35 -
May-21 1,360 545.25 77.1 485.95 213.15 585 271.7 -
June-21 1,375 615 102.9 498 227.8 635.9 271.65 -
July-21 1,410 630 119 472.25 219 685.05 286 -
Aug.-21 1,605 673.15 153.65 605 235.3 853 356.15 -
Sept.-21 1,500 715 137.85 630 244.7 969.9 344.05 -
Source: Revenue and PBT from respective Annual reports, stock prices from BSE.com, Project Data from
public domains
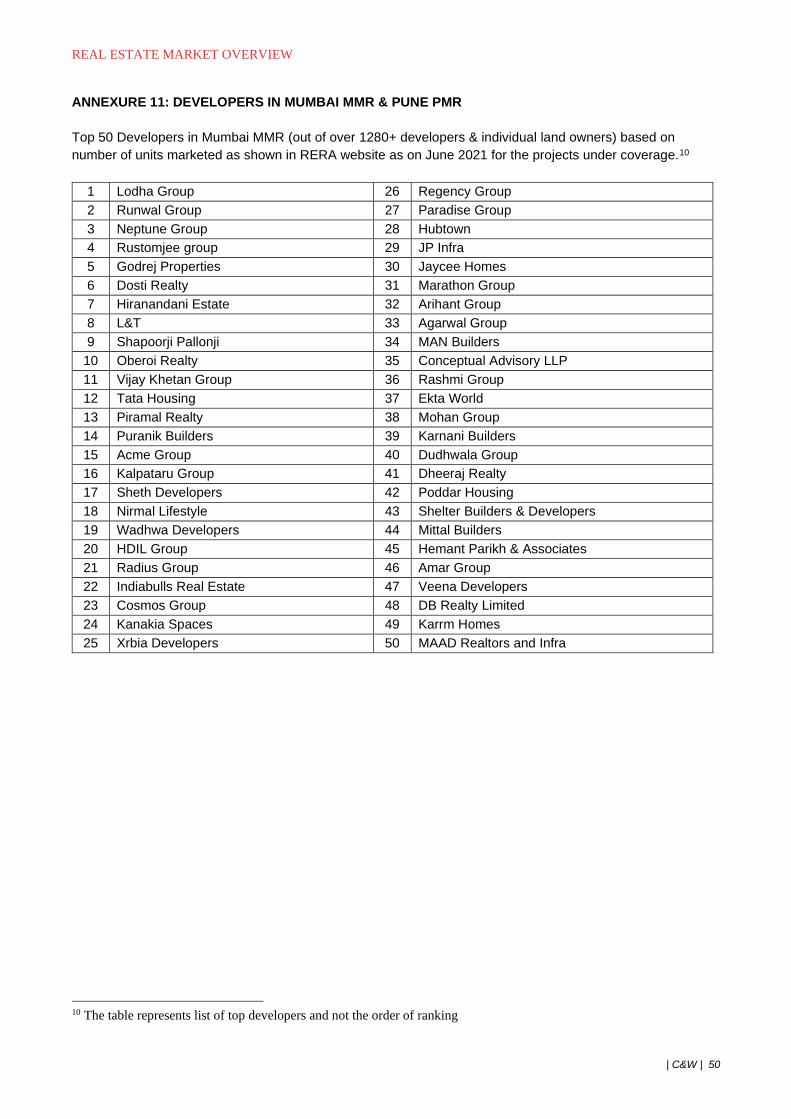
REAL ESTATE MARKET OVERVIEW
| C&W | 50
ANNEXURE 11: DEVELOPERS IN MUMBAI MMR & PUNE PMR
Top 50 Developers in Mumbai MMR (out of over 1280+ developers & individual land owners) based on
number of units marketed as shown in RERA website as on June 2021 for the projects under coverage.10
1 Lodha Group 26 Regency Group
2 Runwal Group 27 Paradise Group
3 Neptune Group 28 Hubtown
4 Rustomjee group 29 JP Infra
5 Godrej Properties 30 Jaycee Homes
6 Dosti Realty 31 Marathon Group
7 Hiranandani Estate 32 Arihant Group
8 L&T 33 Agarwal Group
9 Shapoorji Pallonji 34 MAN Builders
10 Oberoi Realty 35 Conceptual Advisory LLP
11 Vijay Khetan Group 36 Rashmi Group
12 Tata Housing 37 Ekta World
13 Piramal Realty 38 Mohan Group
14 Puranik Builders 39 Karnani Builders
15 Acme Group 40 Dudhwala Group
16 Kalpataru Group 41 Dheeraj Realty
17 Sheth Developers 42 Poddar Housing
18 Nirmal Lifestyle 43 Shelter Builders & Developers
19 Wadhwa Developers 44 Mittal Builders
20 HDIL Group 45 Hemant Parikh & Associates
21 Radius Group 46 Amar Group
22 Indiabulls Real Estate 47 Veena Developers
23 Cosmos Group 48 DB Realty Limited
24 Kanakia Spaces 49 Karrm Homes
25 Xrbia Developers 50 MAAD Realtors and Infra
10 The table represents list of top developers and not the order of ranking
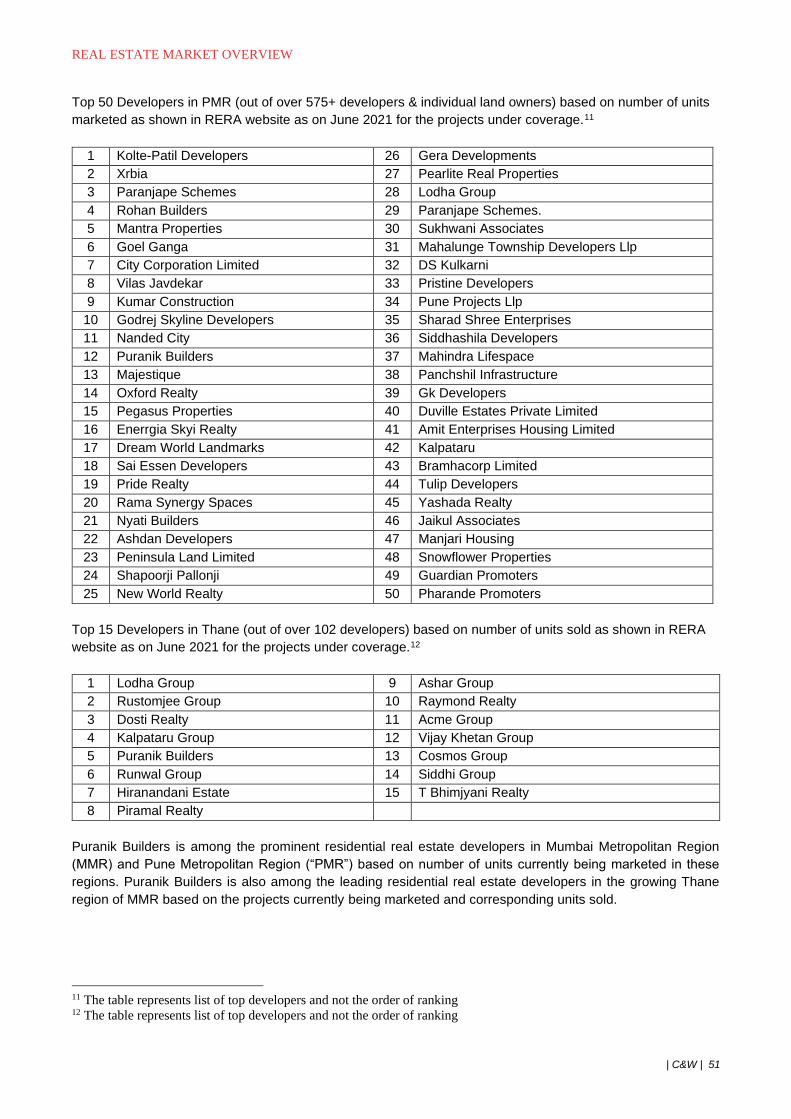
REAL ESTATE MARKET OVERVIEW
| C&W | 51
Top 50 Developers in PMR (out of over 575+ developers & individual land owners) based on number of units
marketed as shown in RERA website as on June 2021 for the projects under coverage.11
1 Kolte-Patil Developers 26 Gera Developments
2 Xrbia 27 Pearlite Real Properties
3 Paranjape Schemes 28 Lodha Group
4 Rohan Builders 29 Paranjape Schemes.
5 Mantra Properties 30 Sukhwani Associates
6 Goel Ganga 31 Mahalunge Township Developers Llp
7 City Corporation Limited 32 DS Kulkarni
8 Vilas Javdekar 33 Pristine Developers
9 Kumar Construction 34 Pune Projects Llp
10 Godrej Skyline Developers 35 Sharad Shree Enterprises
11 Nanded City 36 Siddhashila Developers
12 Puranik Builders 37 Mahindra Lifespace
13 Majestique 38 Panchshil Infrastructure
14 Oxford Realty 39 Gk Developers
15 Pegasus Properties 40 Duville Estates Private Limited
16 Enerrgia Skyi Realty 41 Amit Enterprises Housing Limited
17 Dream World Landmarks 42 Kalpataru
18 Sai Essen Developers 43 Bramhacorp Limited
19 Pride Realty 44 Tulip Developers
20 Rama Synergy Spaces 45 Yashada Realty
21 Nyati Builders 46 Jaikul Associates
22 Ashdan Developers 47 Manjari Housing
23 Peninsula Land Limited 48 Snowflower Properties
24 Shapoorji Pallonji 49 Guardian Promoters
25 New World Realty 50 Pharande Promoters
Top 15 Developers in Thane (out of over 102 developers) based on number of units sold as shown in RERA
website as on June 2021 for the projects under coverage.12
1 Lodha Group 9 Ashar Group
2 Rustomjee Group 10 Raymond Realty
3 Dosti Realty 11 Acme Group
4 Kalpataru Group 12 Vijay Khetan Group
5 Puranik Builders 13 Cosmos Group
6 Runwal Group 14 Siddhi Group
7 Hiranandani Estate 15 T Bhimjyani Realty
8 Piramal Realty
Puranik Builders is among the prominent residential real estate developers in Mumbai Metropolitan Region
(MMR) and Pune Metropolitan Region (“PMR”) based on number of units currently being marketed in these
regions. Puranik Builders is also among the leading residential real estate developers in the growing Thane
region of MMR based on the projects currently being marketed and corresponding units sold.
11 The table represents list of top developers and not the order of ranking 12 The table represents list of top developers and not the order of ranking
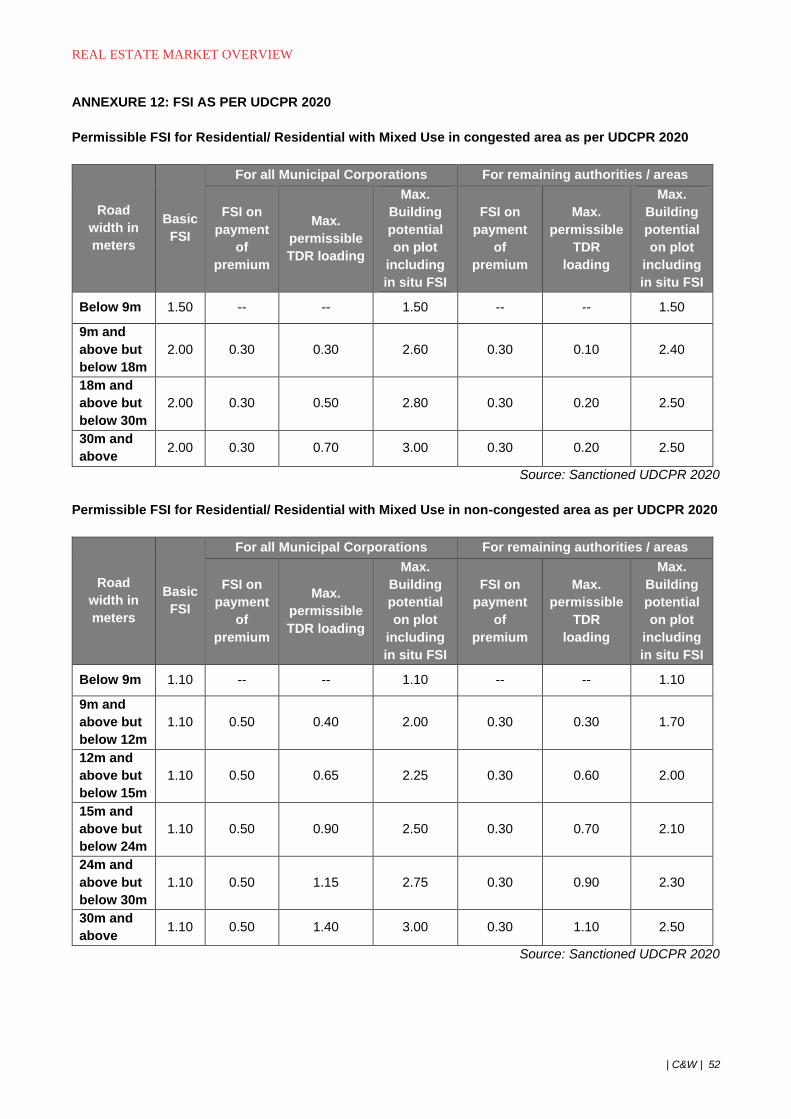
REAL ESTATE MARKET OVERVIEW
| C&W | 52
ANNEXURE 12: FSI AS PER UDCPR 2020
Permissible FSI for Residential/ Residential with Mixed Use in congested area as per UDCPR 2020
Road
width in
meters
Basic
FSI
For all Municipal Corporations For remaining authorities / areas
FSI on
payment
of
premium
Max.
permissible
TDR loading
Max.
Building
potential
on plot
including
in situ FSI
FSI on
payment
of
premium
Max.
permissible
TDR
loading
Max.
Building
potential
on plot
including
in situ FSI
Below 9m 1.50 -- -- 1.50 -- -- 1.50
9m and
above but
below 18m
2.00 0.30 0.30 2.60 0.30 0.10 2.40
18m and
above but
below 30m
2.00 0.30 0.50 2.80 0.30 0.20 2.50
30m and
above 2.00 0.30 0.70 3.00 0.30 0.20 2.50
Source: Sanctioned UDCPR 2020
Permissible FSI for Residential/ Residential with Mixed Use in non-congested area as per UDCPR 2020
Road
width in
meters
Basic
FSI
For all Municipal Corporations For remaining authorities / areas
FSI on
payment
of
premium
Max.
permissible
TDR loading
Max.
Building
potential
on plot
including
in situ FSI
FSI on
payment
of
premium
Max.
permissible
TDR
loading
Max.
Building
potential
on plot
including
in situ FSI
Below 9m 1.10 -- -- 1.10 -- -- 1.10
9m and
above but
below 12m
1.10 0.50 0.40 2.00 0.30 0.30 1.70
12m and
above but
below 15m
1.10 0.50 0.65 2.25 0.30 0.60 2.00
15m and
above but
below 24m
1.10 0.50 0.90 2.50 0.30 0.70 2.10
24m and
above but
below 30m
1.10 0.50 1.15 2.75 0.30 0.90 2.30
30m and
above 1.10 0.50 1.40 3.00 0.30 1.10 2.50
Source: Sanctioned UDCPR 2020
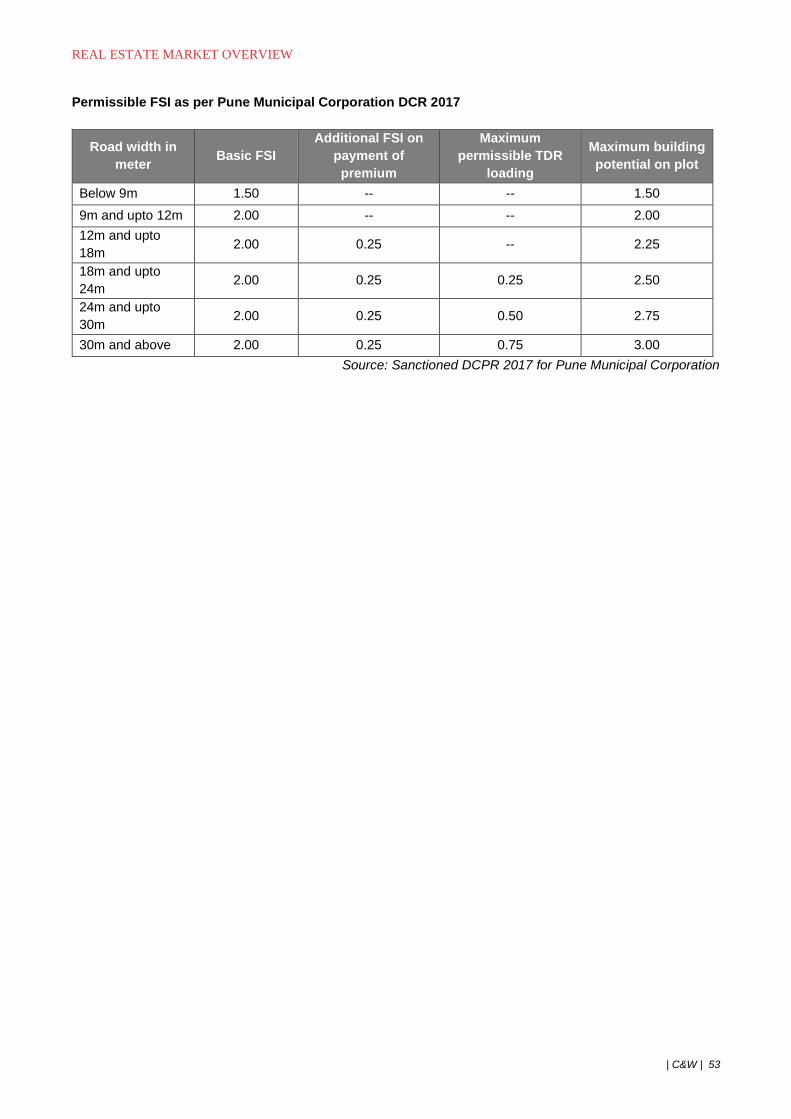
REAL ESTATE MARKET OVERVIEW
| C&W | 53
Permissible FSI as per Pune Municipal Corporation DCR 2017
Road width in
meter Basic FSI
Additional FSI on
payment of
premium
Maximum
permissible TDR
loading
Maximum building
potential on plot
Below 9m 1.50 -- -- 1.50
9m and upto 12m 2.00 -- -- 2.00
12m and upto
18m 2.00 0.25 -- 2.25
18m and upto
24m 2.00 0.25 0.25 2.50
24m and upto
30m 2.00 0.25 0.50 2.75
30m and above 2.00 0.25 0.75 3.00
Source: Sanctioned DCPR 2017 for Pune Municipal Corporation
REAL ESTATE MARKET OVERVIEW
| C&W | 54
CAVEATS & LIMITATIONS
• The ‘Industry Report’ referred to as the “Report”) will not be based on comprehensive market research of
the overall market for all possible situations. Cushman & Wakefield India (hereafter referred to as “C&WI”)
will cover specific markets and situations, which will be highlighted in the Report. C&WI will not be carrying
out comprehensive field research based analysis of the market and the industry given the limited nature of
the scope of the assignment. In this connection, C&WI will rely solely on the information supplied to C&WI
and update it by reworking the crucial assumptions underlying such information as well as incorporating
published or otherwise available information.
• In conducting this assignment, C&WI will carry out analysis and assessments of the level of interest
envisaged for the property(ies) under consideration and the demand-supply for the residential sector in
general. C&WI will also obtain other available information and documents that are additionally considered
relevant for carrying out the exercise. The opinions expressed in the Report will be subject to the limitations
expressed below.
• C&WI endeavors to develop forecasts on demand, supply and pricing on assumptions that would
be considered relevant and reasonable at that point of time. All of these forecasts will be in the
nature of likely or possible events/occurrences and the Report will not constitute a recommendation
to Puranik Builders Limited (hereafter referred to as the “Client”) or its affiliates and subsidiaries
or its customers or any other party to adopt a particular course of action. The use of the Report at
a later date may invalidate the assumptions and bases on which forecasts have been generated
and is not recommended as an input to a financial decision.
• Changes in socio-economic and political conditions could result in a substantially different situation
than those presented at the stated effective date. C&WI assumes no responsibility for changes in
such external conditions.
• In the absence of a detailed field survey of the market and industry (as and where applicable),
C&WI will rely upon secondary sources of information for a macro-level analysis. Hence, no direct
link is sought to be established between the macro-level understandings on the market with the
assumptions estimated for the analysis.
• The services provided will be limited to Industry Report and will not constitute an audit, a due
diligence, tax related services or an independent validation of the projections. Accordingly, C&WI
will not express any opinion on the financial information of the business of any party, including the
Client and its affiliates and subsidiaries. The Report will be prepared solely for the purpose stated,
and should not be used for any other purpose.
• While the information included in the Report will be believed to be accurate and reliable, no
representations or warranties, expressed or implied, as to the accuracy or completeness of such
information is being made. C&WI will not undertake any obligation to update, correct or
supplement any information contained in the Report.
• In the preparation of the Report, C&WI will rely on the following information:
• Information provided to us by the Client and its affiliates and subsidiaries and third parties;
• Recent data on the industry segments and market projections;
• Other relevant information provided to us by the Client and its affiliates and subsidiaries at
C&WI's request;
• Other relevant information available to C&WI; and
• Other publicly available information and reports.
• The Report will reflect matters as they currently exist. Changes may materially affect the information
contained in the Report.
• All assumptions made in the Industry Report will be based on information or opinions as current. In the
course of the analysis, C&WI would be relying on information or opinions, both written and verbal, as
current obtained from the Clients as well as from third parties provided with, including limited information on
the market, financial and operating data, which would be accepted as accurate in bona-fide belief. No
responsibility is assumed for technical information furnished by the third party organizations and this is
bona-fidely believed to be reliable.

REAL ESTATE MARKET OVERVIEW
| C&W | 55
• No investigation of the title of the assets will be been made and owners' claims to the assets will be assumed
to be valid. No consideration will be given to liens or encumbrances, which may be against the assets.
Therefore, no responsibility is assumed for matters of a legal nature.
• The Client including its agents, affiliates and employees, must not use, reproduce or divulge to any third
party any information it receives from C&WI for any purpose without prior consent from C&WI and should
take all reasonable precautions to protect such information from any sort of disclosure. The information or
data, whether oral or in written form (including any negotiations, discussion, information or data) forwarded
by C&WI to the Client may comprise confidential information and the Client undertakes to keep such
information strictly confidential at all times.