Embed Size (px)
Citation preview
Real-Time Corrosion Monitoring of Steel Influenced by Microbial Activity (SRB) under Controlled Seawater Injection Conditions
Russell D. Kane
InterCorr International, Inc. 14503 Bammel N. Houston Road, Suite 300
Houston, TX 77019 USA [email protected]
Scott Campbell
Commercial Microbiology Inc. 10400 Westoffice Drive Suite 107,
Houston, TX 77042 USA [email protected]
ABSTRACT
An experimental study of microbiologically influenced corrosion (MIC) was conducted involving online, real-time monitoring of a biofilm loop under controlled conditions simulating oilfield water handling and injection. Biofilm growth, MIC and biocide efficacy were monitored using an automated, multi-technique monitoring system including linear polarization resistance, electrochemical noise and harmonic distortion analysis. This data was correlated with conventional off-line methods to differentiate conditions of varying MIC activity in real-time to facilitate quick assessment and operator intervention. Keywords: microbiologically influenced corrosion, MIC, monitoring, electrochemical noise, sulfate reducing bacteria
INTRODUCTION In a previous investigation, an evaluation of electrochemical techniques were conducted involving the use of linear polarization resistance (LPR), harmonic distortion analysis (HDA) and electrochemical noise (EN) for evaluation of microbiologically influenced corrosion (MIC). The effects of SRB activity on the electrochemistry of the corroding interface and the effects of biocide treatments were examined. [1] While electrochemical monitoring provided certain advantages for detecting corrosion due to SRB activity and the effectiveness of biocide treatments, the capability to deliver a field-ready solution for online, real-time monitoring was not complete at the time of this previous investigation. However, in these experiments, it was shown that SRB activity resulted in the corrosion of carbon steel, primarily due to the formation of hydrogen sulfide. Currently, in sea-water injection systems, bacterial activity is usually monitored by biological sampling involving everything from a variety of quick checks to culturing techniques to define the presence and activity of SRB populations. Furthermore, these methods do provide critical information such as biofilm community composition and specific populations numbers. The biological activity of SRB’s can usually be controlled using several methods. The application of biocides is the most widely accepted method used to control bacterial activity. Another method that is gaining acceptance is the application of nitrate which stimulates the growth of nitrate reducing bacteria which reduces the activity of SRBs. However, if the improper biocide is used or inadequate concentrations of either biocides or nitrate are applied, SRB activity may persist resulting in catastrophic corrosion of water injection system piping and facilities. Thus to respond to bacterial activity in a manner that
would prevent or reduce MIC, there exists a need for immediate monitoring of bacterial activity so an appropriate response can be implemented. Electrochemical corrosion monitoring techniques have the ability to provide real-time monitoring to address the needs of operators of field facilities to control bacterial activity. Although quick checks and culturing techniques are critical to fully understand that the microbiological component of corrosion, they are generally time consuming manual processes that are not easily amenable to the online, real-time needs of operators. Electrochemical corrosion monitoring techniques provide the distinct advantage of a quick response time, providing a real-time analysis that may be used to assess uniform corrosion, the onset of sulfide production, in addition to the onset of localized corrosion activity. In combination with culturing techniques, a comprehensive analysis can be prepared that would address real-time events with the understanding of the effects of the microbial community has on corrosion.
EXPERIMENTAL INVESTIGATION The present investigation involved the characterization of MIC due to SRBs in oilfield water injection environments using a new generation of field-ready, multi-technique electro-chemical monitoring instrumentation (SmartCET®)1 incorporating automated, on-line measurements and on-board data processing for Linear Polarization Resistance (LPR) for general corrosion measurements, Harmonic Distortion Analysis (HDA) for measurement of B value (Stearn-Geary Constant) and correction of LPR corrosion rates, and Electrochemical Noise (ECN) for evaluation of pitting tendencies with nine additional statistical parameters.
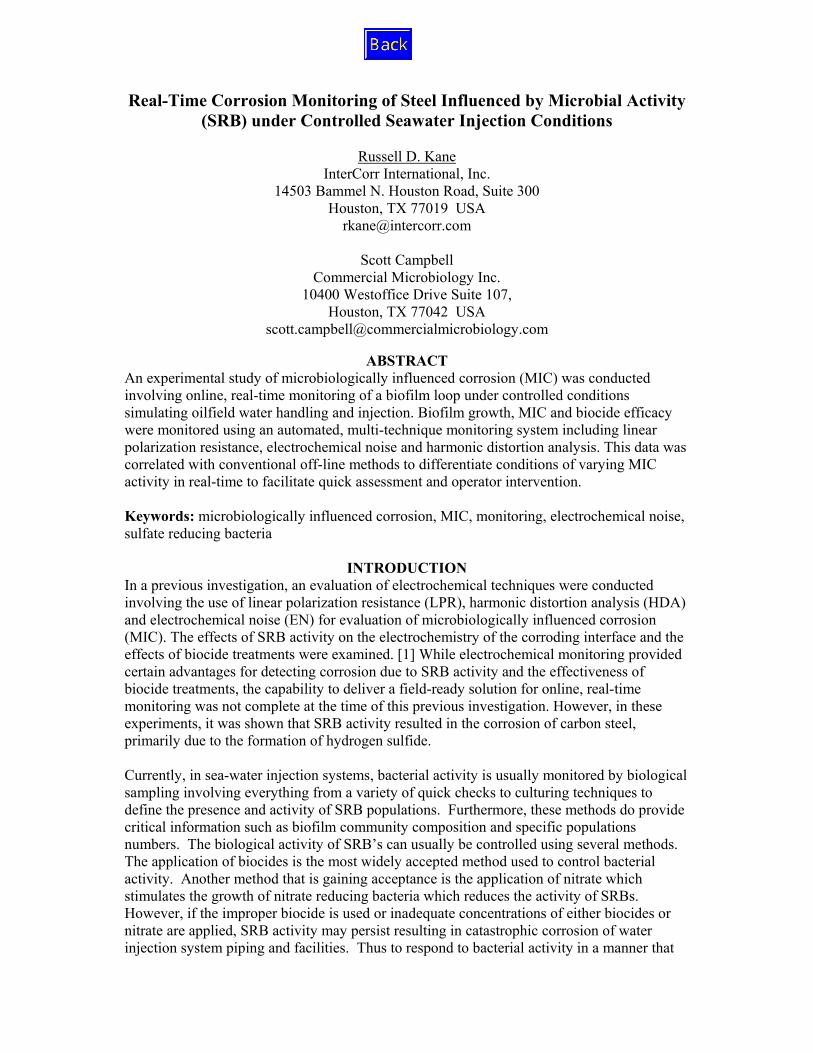
Further background and descriptions of these techniques have been published previously [2-20]. A summary of the three primary field techniques utilized (LPR, HDA and EN) in this current study are provided in Appendix I. The principal concept of this system is shown schematically in Figure 1. The instrumentation provides operators a simple data stream (two variables: general corrosion rate and pitting factor) that can be integrated with other system process data to make real-time decisions to identify system upsets before substantial damage has occurred. It can also integrate operators and specialists (with a more robust data stream) to make real-time operational decisions more easily than with conventional means.
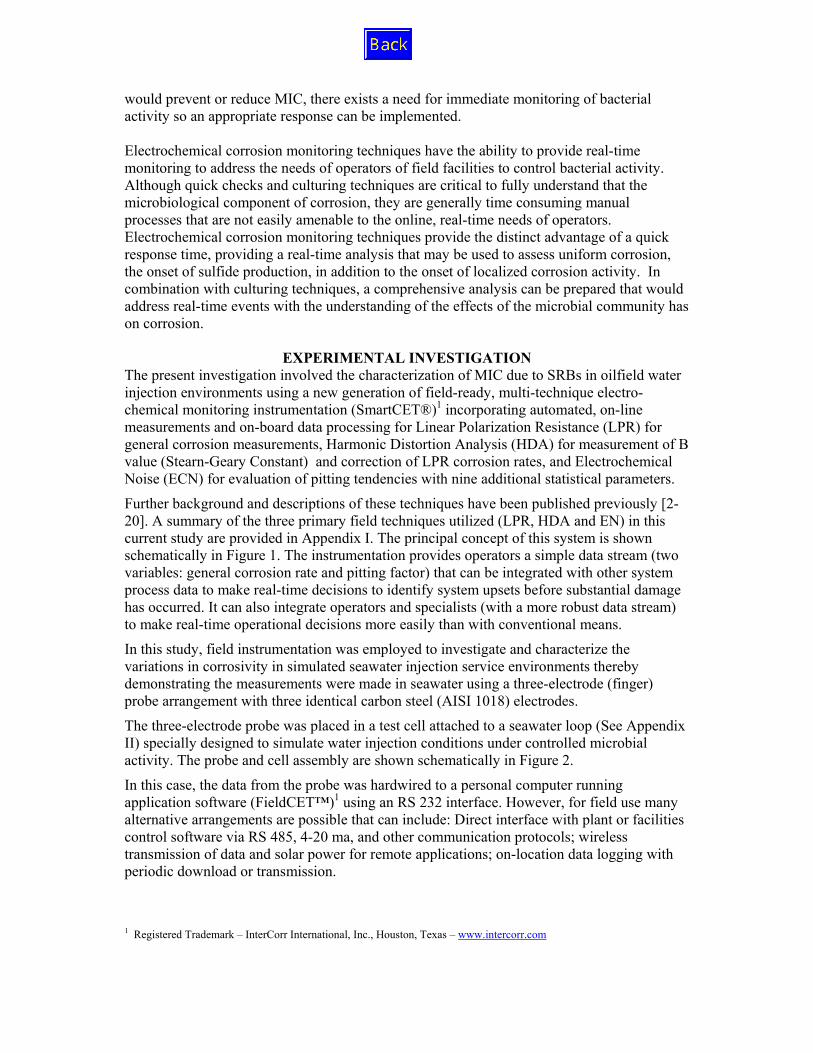
In this study, field instrumentation was employed to investigate and characterize the variations in corrosivity in simulated seawater injection service environments thereby demonstrating the measurements were made in seawater using a three-electrode (finger) probe arrangement with three identical carbon steel (AISI 1018) electrodes.
The three-electrode probe was placed in a test cell attached to a seawater loop (See Appendix II) specially designed to simulate water injection conditions under controlled microbial activity. The probe and cell assembly are shown schematically in Figure 2.
In this case, the data from the probe was hardwired to a personal computer running application software (FieldCET™)1 using an RS 232 interface. However, for field use many alternative arrangements are possible that can include: Direct interface with plant or facilities control software via RS 485, 4-20 ma, and other communication protocols; wireless transmission of data and solar power for remote applications; on-location data logging with periodic download or transmission.
1 Registered Trademark – InterCorr International, Inc., Houston, Texas – www.intercorr.com
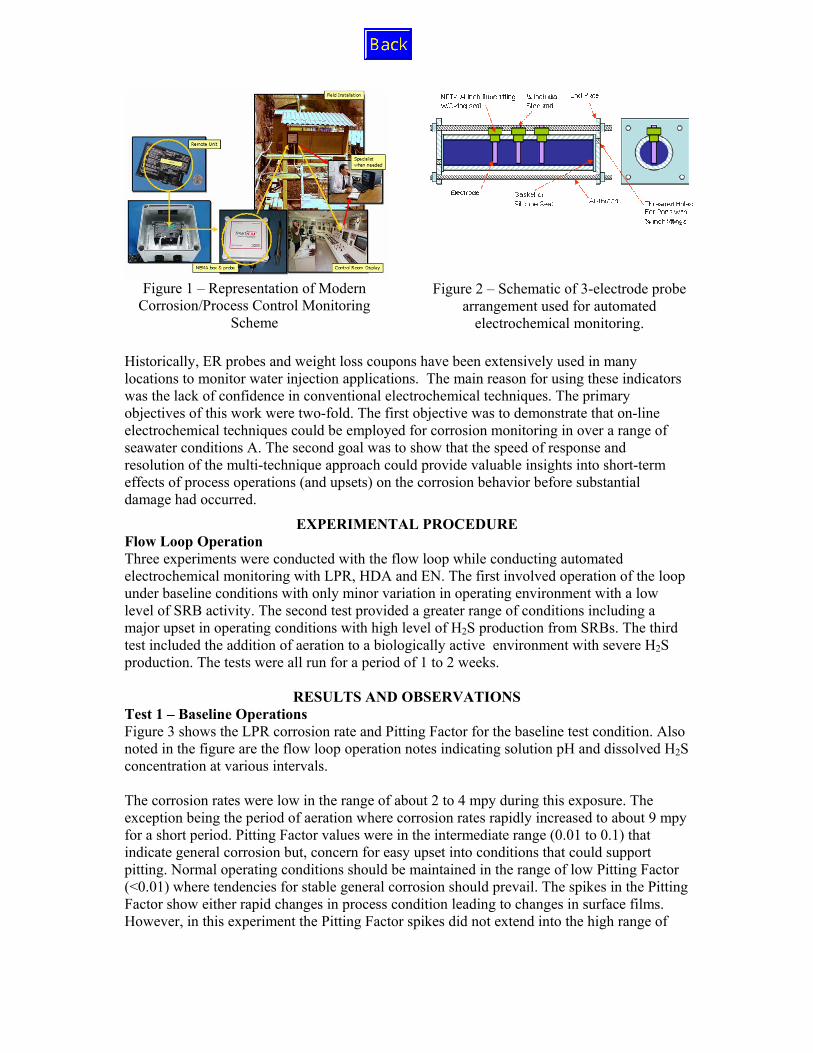
Figure 1 – Representation of Modern Corrosion/Process Control Monitoring
Scheme
Figure 2 – Schematic of 3-electrode probe arrangement used for automated
electrochemical monitoring. Historically, ER probes and weight loss coupons have been extensively used in many locations to monitor water injection applications. The main reason for using these indicators was the lack of confidence in conventional electrochemical techniques. The primary objectives of this work were two-fold. The first objective was to demonstrate that on-line electrochemical techniques could be employed for corrosion monitoring in over a range of seawater conditions A. The second goal was to show that the speed of response and resolution of the multi-technique approach could provide valuable insights into short-term effects of process operations (and upsets) on the corrosion behavior before substantial damage had occurred.
EXPERIMENTAL PROCEDURE Flow Loop Operation Three experiments were conducted with the flow loop while conducting automated electrochemical monitoring with LPR, HDA and EN. The first involved operation of the loop under baseline conditions with only minor variation in operating environment with a low level of SRB activity. The second test provided a greater range of conditions including a major upset in operating conditions with high level of H2S production from SRBs. The third test included the addition of aeration to a biologically active environment with severe H2S production. The tests were all run for a period of 1 to 2 weeks.
RESULTS AND OBSERVATIONS Test 1 – Baseline Operations Figure 3 shows the LPR corrosion rate and Pitting Factor for the baseline test condition. Also noted in the figure are the flow loop operation notes indicating solution pH and dissolved H2S concentration at various intervals. The corrosion rates were low in the range of about 2 to 4 mpy during this exposure. The exception being the period of aeration where corrosion rates rapidly increased to about 9 mpy for a short period. Pitting Factor values were in the intermediate range (0.01 to 0.1) that indicate general corrosion but, concern for easy upset into conditions that could support pitting. Normal operating conditions should be maintained in the range of low Pitting Factor (<0.01) where tendencies for stable general corrosion should prevail. The spikes in the Pitting Factor show either rapid changes in process condition leading to changes in surface films. However, in this experiment the Pitting Factor spikes did not extend into the high range of
Pitting Factors (>0.1) where pitting would be expected, and did not stay in the high range for an extended period.
LPR Corrosion Rate with B = 0.012 mV from HDA& Pitting Factor (Trial 10-19)
0.0
10.0
20.0
30.0
2-Sep-03
3-Sep-03
4-Sep-03
5-Sep-03
6-Sep-03
7-Sep-03
8-Sep-03
9-Sep-03
10-Sep-03
11-Sep-03
12-Sep-03
13-Sep-03
14-Sep-03
15-Sep-03
16-Sep-03
17-Sep-03
18-Sep-03
19-Sep-03
20-Sep-03
21-Sep-03
22-Sep-03
23-Sep-03
24-Sep-03
Time (Date / Time)
Cor
rosi
on R
ate
(mpy
)
0.001
0.010
0.100
1.000
Pitti
ng F
acto
r
LPR Corrosion RatePitting Factor
0.5 ppmH2S
0.5 ppmH2S
0.3 ppmH2S; lactate
added
0.3 ppmH2S
2.3 ppmH2S; air
injected andremoved;
0.1 ppm H2S
0.4 ppmH2S; lactate
added
0.6 ppmH2S
Figure 3 – LPR corrosion rate (with HDA adjusted B value) and Pitting Factor
versus time for baseline (low level) SRB condition in Experiment 1.
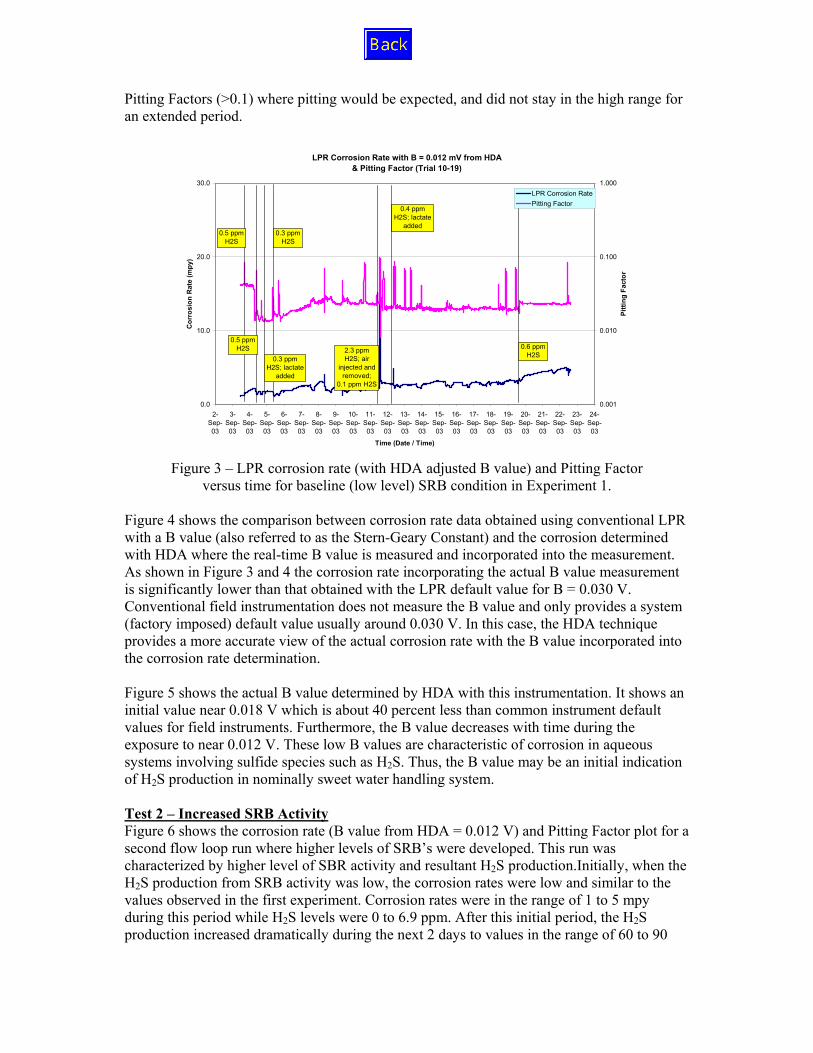
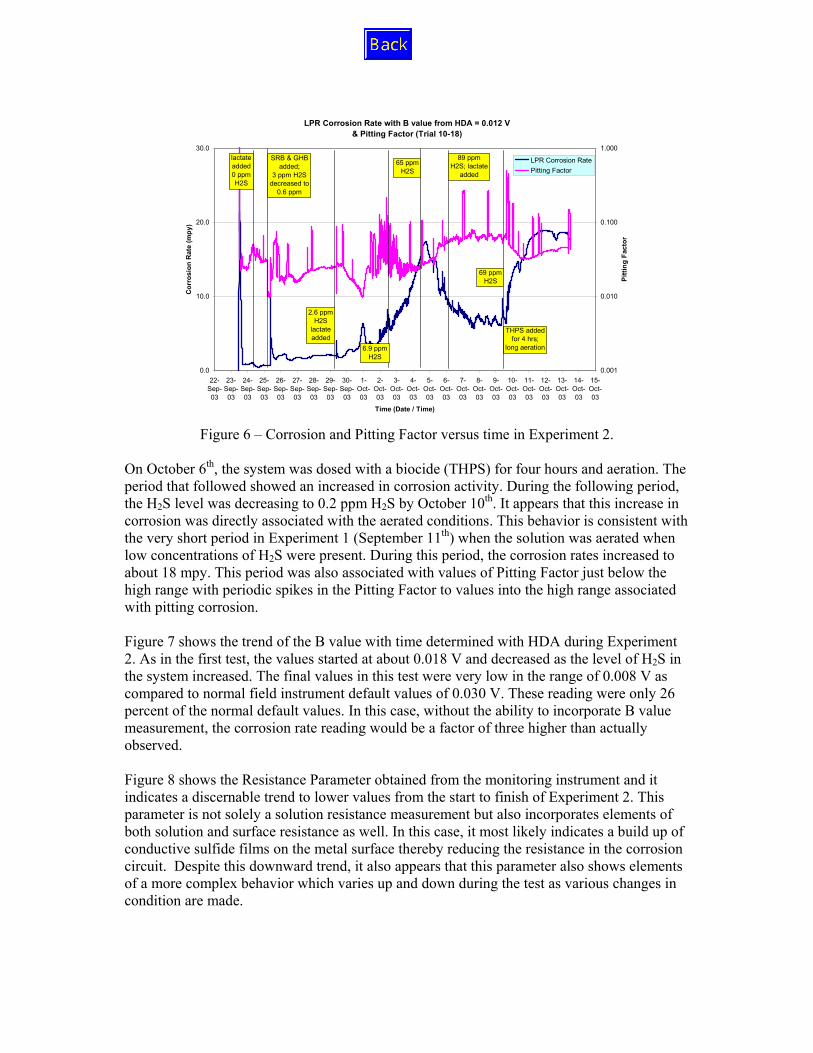
Figure 4 shows the comparison between corrosion rate data obtained using conventional LPR with a B value (also referred to as the Stern-Geary Constant) and the corrosion determined with HDA where the real-time B value is measured and incorporated into the measurement. As shown in Figure 3 and 4 the corrosion rate incorporating the actual B value measurement is significantly lower than that obtained with the LPR default value for B = 0.030 V. Conventional field instrumentation does not measure the B value and only provides a system (factory imposed) default value usually around 0.030 V. In this case, the HDA technique provides a more accurate view of the actual corrosion rate with the B value incorporated into the corrosion rate determination. Figure 5 shows the actual B value determined by HDA with this instrumentation. It shows an initial value near 0.018 V which is about 40 percent less than common instrument default values for field instruments. Furthermore, the B value decreases with time during the exposure to near 0.012 V. These low B values are characteristic of corrosion in aqueous systems involving sulfide species such as H2S. Thus, the B value may be an initial indication of H2S production in nominally sweet water handling system. Test 2 – Increased SRB Activity Figure 6 shows the corrosion rate (B value from HDA = 0.012 V) and Pitting Factor plot for a second flow loop run where higher levels of SRB’s were developed. This run was characterized by higher level of SBR activity and resultant H2S production.Initially, when the H2S production from SRB activity was low, the corrosion rates were low and similar to the values observed in the first experiment. Corrosion rates were in the range of 1 to 5 mpy during this period while H2S levels were 0 to 6.9 ppm. After this initial period, the H2S production increased dramatically during the next 2 days to values in the range of 60 to 90
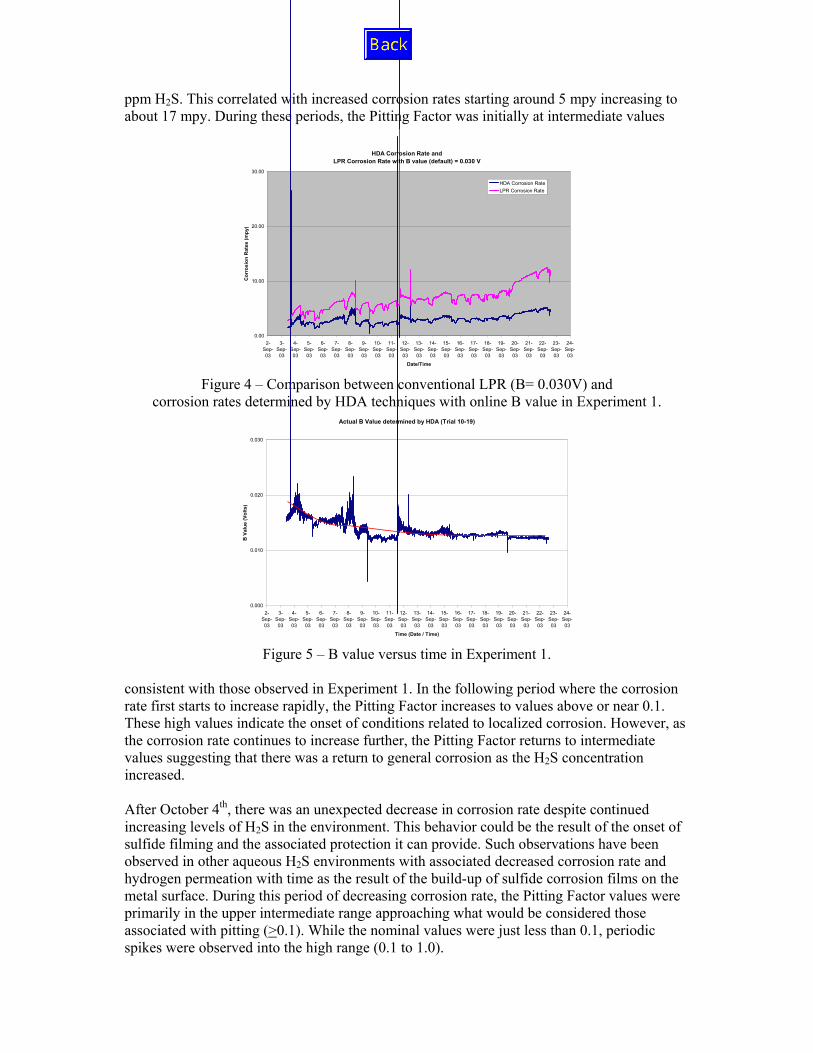
ppm H2S. This correlated with increased corrosion rates starting around 5 mpy increasing to about 17 mpy. During these periods, the Pitting Factor was initially at intermediate values
HDA Corrosion Rate and LPR Corrosion Rate with B value (default) = 0.030 V
0.00
10.00
20.00
30.00
2-Sep-03
3-Sep-03
4-Sep-03
5-Sep-03
6-Sep-03
7-Sep-03
8-Sep-03
9-Sep-03
10-Sep-03
11-Sep-03
12-Sep-03
13-Sep-03
14-Sep-03
15-Sep-03
16-Sep-03
17-Sep-03
18-Sep-03
19-Sep-03
20-Sep-03
21-Sep-03
22-Sep-03
23-Sep-03
24-Sep-03
Date/Time
Cor
rosi
on R
ates
(mpy
)
HDA Corrosion RateLPR Corrosion Rate
Figure 4 – Comparison between conventional LPR (B= 0.030V) and
corrosion rates determined by HDA techniques with online B value in Experiment 1. Actual B Value determined by HDA (Trial 10-19)
0.000
0.010
0.020
0.030
2-Sep-03
3-Sep-03
4-Sep-03
5-Sep-03
6-Sep-03
7-Sep-03
8-Sep-03
9-Sep-03
10-Sep-03
11-Sep-03
12-Sep-03
13-Sep-03
14-Sep-03
15-Sep-03
16-Sep-03
17-Sep-03
18-Sep-03
19-Sep-03
20-Sep-03
21-Sep-03
22-Sep-03
23-Sep-03
24-Sep-03
Time (Date / Time)
B V
alue
(Vol
ts)
Figure 5 – B value versus time in Experiment 1.
consistent with those observed in Experiment 1. In the following period where the corrosion rate first starts to increase rapidly, the Pitting Factor increases to values above or near 0.1. These high values indicate the onset of conditions related to localized corrosion. However, as the corrosion rate continues to increase further, the Pitting Factor returns to intermediate values suggesting that there was a return to general corrosion as the H2S concentration increased. After October 4th, there was an unexpected decrease in corrosion rate despite continued increasing levels of H2S in the environment. This behavior could be the result of the onset of sulfide filming and the associated protection it can provide. Such observations have been observed in other aqueous H2S environments with associated decreased corrosion rate and hydrogen permeation with time as the result of the build-up of sulfide corrosion films on the metal surface. During this period of decreasing corrosion rate, the Pitting Factor values were primarily in the upper intermediate range approaching what would be considered those associated with pitting (>0.1). While the nominal values were just less than 0.1, periodic spikes were observed into the high range (0.1 to 1.0).
LPR Corrosion Rate with B value from HDA = 0.012 V
& Pitting Factor (Trial 10-18)
0.0
10.0
20.0
30.0
22-Sep-03
23-Sep-03
24-Sep-03
25-Sep-03
26-Sep-03
27-Sep-03
28-Sep-03
29-Sep-03
30-Sep-03
1-Oct-03
2-Oct-03
3-Oct-03
4-Oct-03
5-Oct-03
6-Oct-03
7-Oct-03
8-Oct-03
9-Oct-03
10-Oct-03
11-Oct-03
12-Oct-03
13-Oct-03
14-Oct-03
15-Oct-03
Time (Date / Time)
Cor
rosi
on R
ate
(mpy
)
0.001
0.010
0.100
1.000
Pitti
ng F
acto
r
LPR Corrosion RatePitting Factor
lactateadded0 ppmH2S
SRB & GHBadded;
3 ppm H2Sdecreased to
0.6 ppm
89 ppmH2S; lactate
added
2.6 ppmH2S
lactateadded
THPS added for 4 hrs;
long aeration
65 ppmH2S
6.9 ppmH2S
69 ppmH2S
Figure 6 – Corrosion and Pitting Factor versus time in Experiment 2.
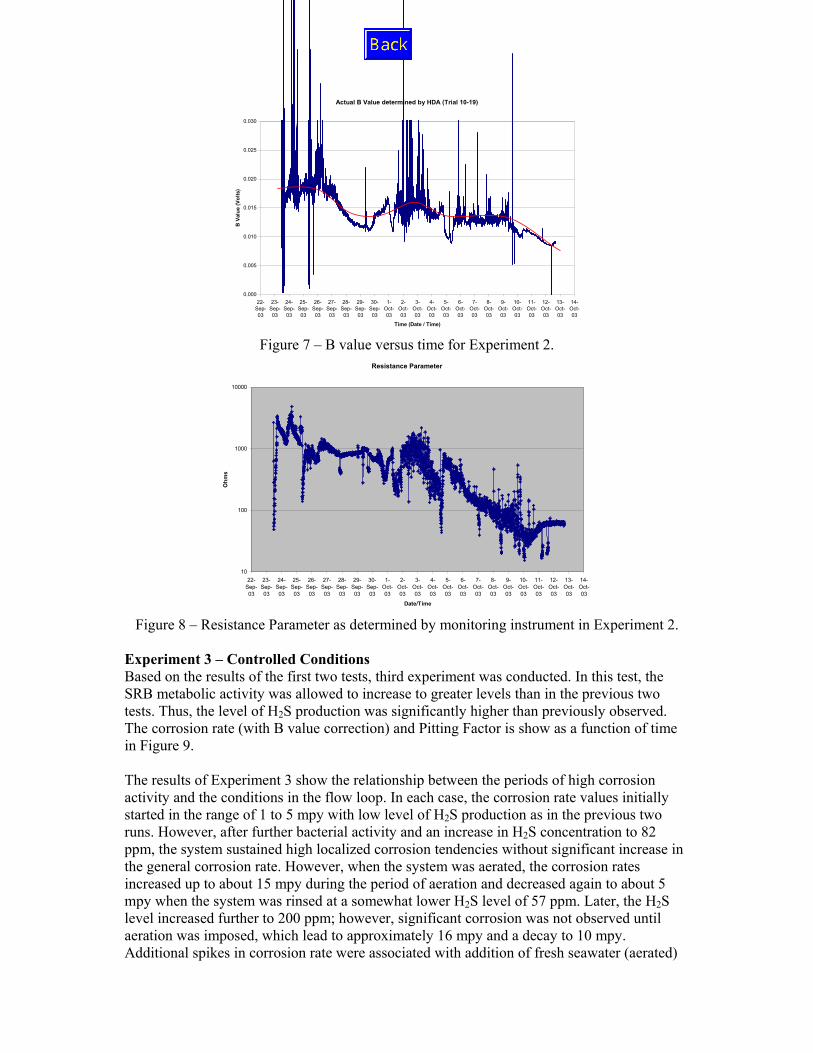
On October 6th, the system was dosed with a biocide (THPS) for four hours and aeration. The period that followed showed an increased in corrosion activity. During the following period, the H2S level was decreasing to 0.2 ppm H2S by October 10th. It appears that this increase in corrosion was directly associated with the aerated conditions. This behavior is consistent with the very short period in Experiment 1 (September 11th) when the solution was aerated when low concentrations of H2S were present. During this period, the corrosion rates increased to about 18 mpy. This period was also associated with values of Pitting Factor just below the high range with periodic spikes in the Pitting Factor to values into the high range associated with pitting corrosion. Figure 7 shows the trend of the B value with time determined with HDA during Experiment 2. As in the first test, the values started at about 0.018 V and decreased as the level of H2S in the system increased. The final values in this test were very low in the range of 0.008 V as compared to normal field instrument default values of 0.030 V. These reading were only 26 percent of the normal default values. In this case, without the ability to incorporate B value measurement, the corrosion rate reading would be a factor of three higher than actually observed. Figure 8 shows the Resistance Parameter obtained from the monitoring instrument and it indicates a discernable trend to lower values from the start to finish of Experiment 2. This parameter is not solely a solution resistance measurement but also incorporates elements of both solution and surface resistance as well. In this case, it most likely indicates a build up of conductive sulfide films on the metal surface thereby reducing the resistance in the corrosion circuit. Despite this downward trend, it also appears that this parameter also shows elements of a more complex behavior which varies up and down during the test as various changes in condition are made.
Actual B Value determined by HDA (Trial 10-19)
0.000
0.005
0.010
0.015
0.020
0.025
0.030
22-Sep-03
23-Sep-03
24-Sep-03
25-Sep-03
26-Sep-03
27-Sep-03
28-Sep-03
29-Sep-03
30-Sep-03
1-Oct-03
2-Oct-03
3-Oct-03
4-Oct-03
5-Oct-03
6-Oct-03
7-Oct-03
8-Oct-03
9-Oct-03
10-Oct-03
11-Oct-03
12-Oct-03
13-Oct-03
14-Oct-03
Time (Date / Time)
B V
alue
(Vol
ts)
Figure 7 – B value versus time for Experiment 2.
Resistance Parameter
10
100
1000
10000
22-Sep-03
23-Sep-03
24-Sep-03
25-Sep-03
26-Sep-03
27-Sep-03
28-Sep-03
29-Sep-03
30-Sep-03
1-Oct-03
2-Oct-03
3-Oct-03
4-Oct-03
5-Oct-03
6-Oct-03
7-Oct-03
8-Oct-03
9-Oct-03
10-Oct-03
11-Oct-03
12-Oct-03
13-Oct-03
14-Oct-03
Date/Time
Ohm
s
Figure 8 – Resistance Parameter as determined by monitoring instrument in Experiment 2.
Experiment 3 – Controlled Conditions Based on the results of the first two tests, third experiment was conducted. In this test, the SRB metabolic activity was allowed to increase to greater levels than in the previous two tests. Thus, the level of H2S production was significantly higher than previously observed. The corrosion rate (with B value correction) and Pitting Factor is show as a function of time in Figure 9. The results of Experiment 3 show the relationship between the periods of high corrosion activity and the conditions in the flow loop. In each case, the corrosion rate values initially started in the range of 1 to 5 mpy with low level of H2S production as in the previous two runs. However, after further bacterial activity and an increase in H2S concentration to 82 ppm, the system sustained high localized corrosion tendencies without significant increase in the general corrosion rate. However, when the system was aerated, the corrosion rates increased up to about 15 mpy during the period of aeration and decreased again to about 5 mpy when the system was rinsed at a somewhat lower H2S level of 57 ppm. Later, the H2S level increased further to 200 ppm; however, significant corrosion was not observed until aeration was imposed, which lead to approximately 16 mpy and a decay to 10 mpy. Additional spikes in corrosion rate were associated with addition of fresh seawater (aerated)
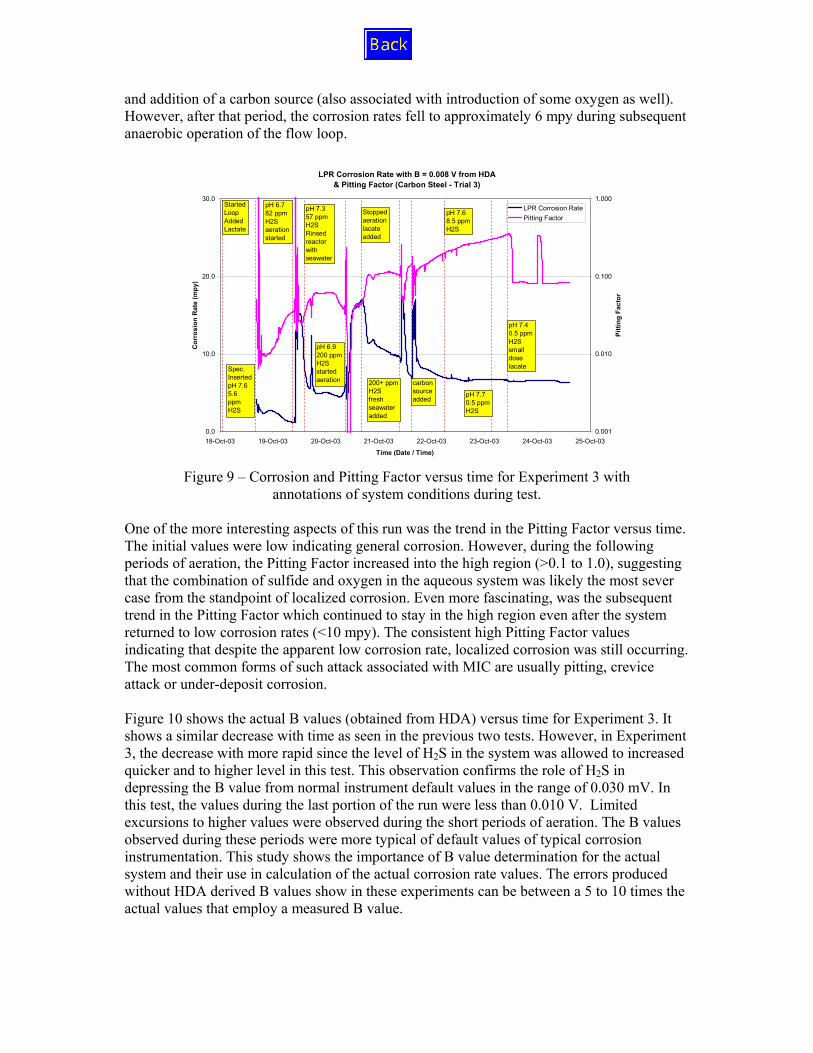
and addition of a carbon source (also associated with introduction of some oxygen as well). However, after that period, the corrosion rates fell to approximately 6 mpy during subsequent anaerobic operation of the flow loop.
LPR Corrosion Rate with B = 0.008 V from HDA& Pitting Factor (Carbon Steel - Trial 3)
0.0
10.0
20.0
30.0
18-Oct-03 19-Oct-03 20-Oct-03 21-Oct-03 22-Oct-03 23-Oct-03 24-Oct-03 25-Oct-03
Time (Date / Time)
Cor
rosi
on R
ate
(mpy
)
0.001
0.010
0.100
1.000
Pitti
ng F
acto
r
LPR Corrosion RatePitting Factor
Started Loop AddedLactate
Spec. InsertedpH 7.65.6 ppm H2S
pH 6.782 ppmH2Saerationstarted
pH 7.357 ppm H2SRinsed reactorwith seawater
pH 6.9200 ppmH2S startedaeration
Stoppedaerationlacateadded
200+ ppmH2Sfreshseawateradded
pH 7.68.5 ppmH2S
pH 7.40.5 ppmH2Ssmalldoselacate
carbonsourceadded
pH 7.70.5 ppmH2S
Figure 9 – Corrosion and Pitting Factor versus time for Experiment 3 with
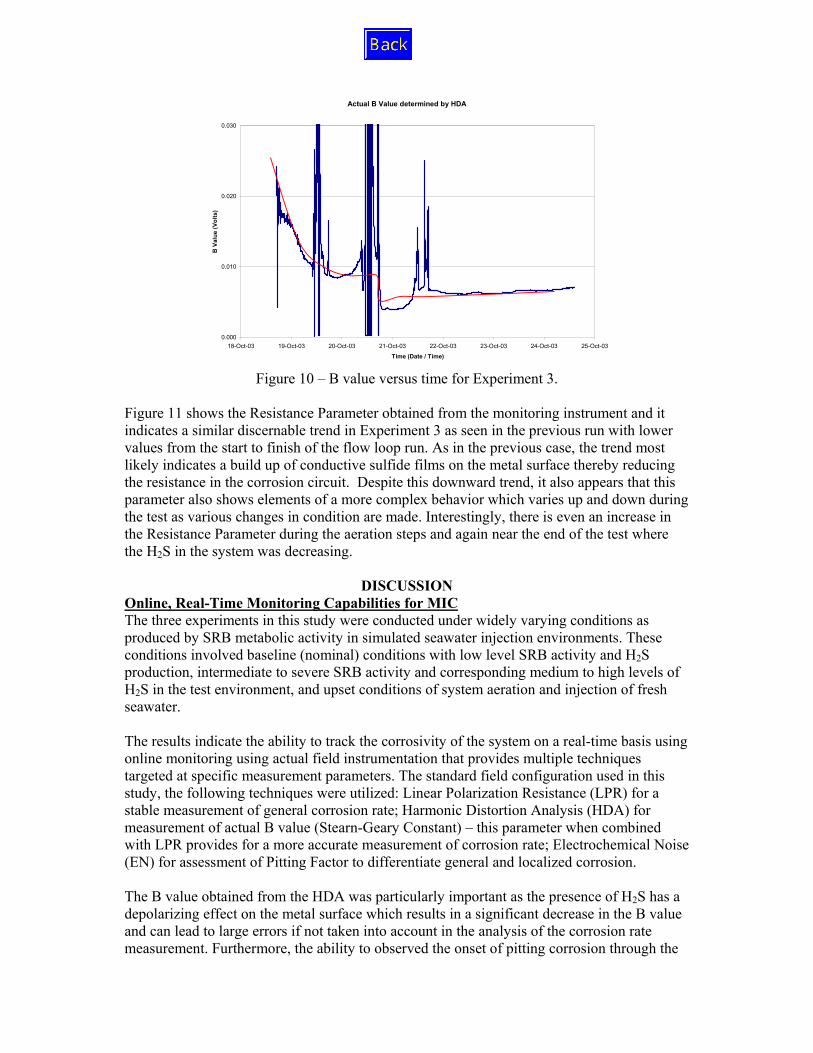
annotations of system conditions during test. One of the more interesting aspects of this run was the trend in the Pitting Factor versus time. The initial values were low indicating general corrosion. However, during the following periods of aeration, the Pitting Factor increased into the high region (>0.1 to 1.0), suggesting that the combination of sulfide and oxygen in the aqueous system was likely the most sever case from the standpoint of localized corrosion. Even more fascinating, was the subsequent trend in the Pitting Factor which continued to stay in the high region even after the system returned to low corrosion rates (<10 mpy). The consistent high Pitting Factor values indicating that despite the apparent low corrosion rate, localized corrosion was still occurring. The most common forms of such attack associated with MIC are usually pitting, crevice attack or under-deposit corrosion. Figure 10 shows the actual B values (obtained from HDA) versus time for Experiment 3. It shows a similar decrease with time as seen in the previous two tests. However, in Experiment 3, the decrease with more rapid since the level of H2S in the system was allowed to increased quicker and to higher level in this test. This observation confirms the role of H2S in depressing the B value from normal instrument default values in the range of 0.030 mV. In this test, the values during the last portion of the run were less than 0.010 V. Limited excursions to higher values were observed during the short periods of aeration. The B values observed during these periods were more typical of default values of typical corrosion instrumentation. This study shows the importance of B value determination for the actual system and their use in calculation of the actual corrosion rate values. The errors produced without HDA derived B values show in these experiments can be between a 5 to 10 times the actual values that employ a measured B value.
Actual B Value determined by HDA
0.000
0.010
0.020
0.030
18-Oct-03 19-Oct-03 20-Oct-03 21-Oct-03 22-Oct-03 23-Oct-03 24-Oct-03 25-Oct-03
Time (Date / Time)
B V
alue
(Vol
ts)
Figure 10 – B value versus time for Experiment 3.
Figure 11 shows the Resistance Parameter obtained from the monitoring instrument and it indicates a similar discernable trend in Experiment 3 as seen in the previous run with lower values from the start to finish of the flow loop run. As in the previous case, the trend most likely indicates a build up of conductive sulfide films on the metal surface thereby reducing the resistance in the corrosion circuit. Despite this downward trend, it also appears that this parameter also shows elements of a more complex behavior which varies up and down during the test as various changes in condition are made. Interestingly, there is even an increase in the Resistance Parameter during the aeration steps and again near the end of the test where the H2S in the system was decreasing.
DISCUSSION
Online, Real-Time Monitoring Capabilities for MIC The three experiments in this study were conducted under widely varying conditions as produced by SRB metabolic activity in simulated seawater injection environments. These conditions involved baseline (nominal) conditions with low level SRB activity and H2S production, intermediate to severe SRB activity and corresponding medium to high levels of H2S in the test environment, and upset conditions of system aeration and injection of fresh seawater. The results indicate the ability to track the corrosivity of the system on a real-time basis using online monitoring using actual field instrumentation that provides multiple techniques targeted at specific measurement parameters. The standard field configuration used in this study, the following techniques were utilized: Linear Polarization Resistance (LPR) for a stable measurement of general corrosion rate; Harmonic Distortion Analysis (HDA) for measurement of actual B value (Stearn-Geary Constant) – this parameter when combined with LPR provides for a more accurate measurement of corrosion rate; Electrochemical Noise (EN) for assessment of Pitting Factor to differentiate general and localized corrosion. The B value obtained from the HDA was particularly important as the presence of H2S has a depolarizing effect on the metal surface which results in a significant decrease in the B value and can lead to large errors if not taken into account in the analysis of the corrosion rate measurement. Furthermore, the ability to observed the onset of pitting corrosion through the
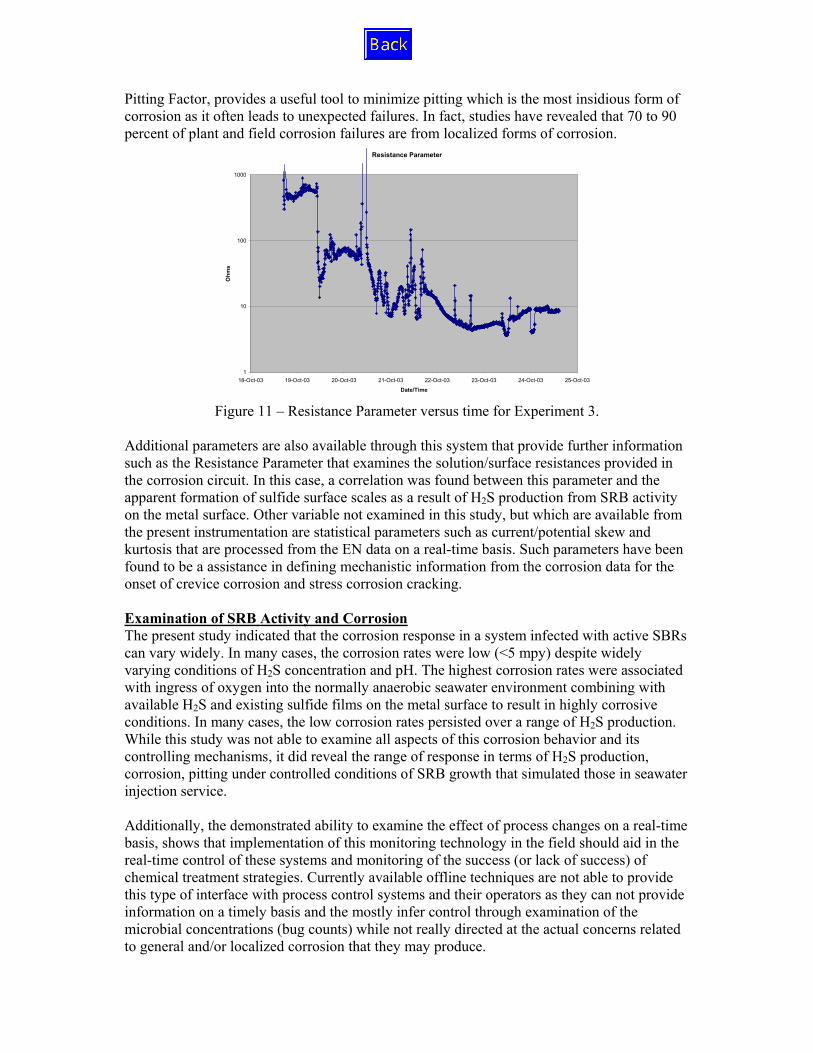
Pitting Factor, provides a useful tool to minimize pitting which is the most insidious form of corrosion as it often leads to unexpected failures. In fact, studies have revealed that 70 to 90 percent of plant and field corrosion failures are from localized forms of corrosion.
Resistance Parameter
1
10
100
1000
18-Oct-03 19-Oct-03 20-Oct-03 21-Oct-03 22-Oct-03 23-Oct-03 24-Oct-03 25-Oct-03
Date/Time
Ohm
s
Figure 11 – Resistance Parameter versus time for Experiment 3.
Additional parameters are also available through this system that provide further information such as the Resistance Parameter that examines the solution/surface resistances provided in the corrosion circuit. In this case, a correlation was found between this parameter and the apparent formation of sulfide surface scales as a result of H2S production from SRB activity on the metal surface. Other variable not examined in this study, but which are available from the present instrumentation are statistical parameters such as current/potential skew and kurtosis that are processed from the EN data on a real-time basis. Such parameters have been found to be a assistance in defining mechanistic information from the corrosion data for the onset of crevice corrosion and stress corrosion cracking. Examination of SRB Activity and Corrosion The present study indicated that the corrosion response in a system infected with active SBRs can vary widely. In many cases, the corrosion rates were low (<5 mpy) despite widely varying conditions of H2S concentration and pH. The highest corrosion rates were associated with ingress of oxygen into the normally anaerobic seawater environment combining with available H2S and existing sulfide films on the metal surface to result in highly corrosive conditions. In many cases, the low corrosion rates persisted over a range of H2S production. While this study was not able to examine all aspects of this corrosion behavior and its controlling mechanisms, it did reveal the range of response in terms of H2S production, corrosion, pitting under controlled conditions of SRB growth that simulated those in seawater injection service. Additionally, the demonstrated ability to examine the effect of process changes on a real-time basis, shows that implementation of this monitoring technology in the field should aid in the real-time control of these systems and monitoring of the success (or lack of success) of chemical treatment strategies. Currently available offline techniques are not able to provide this type of interface with process control systems and their operators as they can not provide information on a timely basis and the mostly infer control through examination of the microbial concentrations (bug counts) while not really directed at the actual concerns related to general and/or localized corrosion that they may produce.
CONCLUSIONS
Based on the results of this study presented herein the following conclusions were made: 1. Online, real-time monitoring of corrosion and pitting in seawater system populated
with SRB’s is possible. 2. Real-time data was found to be able to identify changes in system corrosivity during
both short (days) and long term (weeks) changes in the environment and SRB activity. 3. The most severe corrosion observed in these tests was associated with conditions of
oxygen ingress into a normally anaerobic environment containing H2S produced by SRBs. These conditions included high general corrosion rate and high pitting tendencies as defined by the Pitting Factor.
4. The ability to measure the actual B value in the environment resulted in the determination of more accurate corrosion rates versus conventional corrosion monitoring instrumentation which use a defaulted B value which does not related to actual values in the service environment. In sulfide environments, B values measured in this study were in the range 0.008 to 0.018 V versus instrument default values which are typically around 0.030 V. Such errors in systems with active SRB population were shown to produce corrosion rate that could be off by 5 to 10 times actual corrosion rate values.
REFERENCES
1. D.A. Eden and S.S. Moody, Control of Microbially Induced Corrosion in Seawater Injection Systems using Electrochemical Noise Technology, Corrosion/2002, Paper No. 02338, NACE International, Houston, Texas, April, 2002
2. K. Hladky, US Patent # 4,575,678 3. D.A.Eden, D.G.John, J.L.Dawson, US Patent # 5,139,627 4. D.A.Eden, R.N.Carr, J.L.Dawson, US Patent # 5,425,867
5. D.Halford, “A General Model for αf Spectral Density Random Noise with Special
Reference to Flicker Noise 1/|f|," PROCEEDINGS OF THE IEEE. VOL. 56. NO 3. MARCH 1968
6. K,Hladky, J.L.Dawson, “The Measurement of Localised Corrosion Using Electrochemical Noise,” 1981, CORROS. SCI. 21 (4), 317-322
7. K,Hladky, J.L.Dawson, “The Measurement of Corrosion Using Electrochemical 1/f Noise,” 1982, CORROS. SCI. 22, (3), 231-237
8. R.C.Newman, K.Sieradzki, “Correlation of Acoustic and Electrochemical Noise in the Stress Corrosion Cracking of Alpha-Brass,”May 1983, SCR.METALL. 17, (5), 621-624
9. J.L.Dawson, K.Hladky, D.A.Eden, “Electrochemical Noise – Some New Developments in Corrosion Monitoring,” 16-17 Nov. 1983, UK Corrosion ’83 – Proceedings of the Conference, 99-108, (The Institution of Corrosion Science and Technology, Exeter House, 48 Holloway Head, Birmingham B1 1NQ, U.K.)
10. J.L.Dawson, D.Gearey, W.M.Cox, “Recent Experience of Monitoring Condensed Acid Corrosion in Boiler Flue Gas Ducts,” 16-18 Nov. 1982, 193-198, UK National Corrosion Conference, (The Institution of Corrosion Science and Technology, Exeter House, 48 Holloway Head, Birmingham B1 1NQ, UK"
11. K.Hladky, J.P.Lomas, D.G.John, D.A.Eden, J.L.Dawson, “Corrosion Monitoring Using Electrochemical Noise: Theory and Practice,” 16-17 Feb. Corrosion Monitoring and Inspection in the Oil, Petrochemical and Process Industries 1984,
London, UK, 211-231, (Oyez Scientific and Technical Services, Bath House, 56 Holborn Viaduct, London EC1A 2EX, U.K.)
12. W.M.Cox, D.M.Farrell, J.L.Dawson, “Corrosion Monitoring for Process Control,” 1985, Dewpoint Corrosion, 191-217, (Ellis Horwood, Market Cross House, Cooper Street, Chichester, West Sussex PO19 1EB, U.K.)
13. W.P.Iverson, L.F.Heverly, “Electrochemical Noise as an Indicator of Anaerobic Corrosion,” 22-24 May 1984, Corrosion Monitoring in Industrial Plants Using Non-destructive Testing and Electrochemical methods, Montreal, Canada, 459-471, (ASTM, 1916 Race St., Philadelphia, Pennsylvania 19103, USA)
14. J.Gollner, I.Garz, K.Meyer, “Electrochemical Noise and Its Use for Corrosion Experiments,” 1986, KORROSION 17, (5), 244-249
15. D.A.Eden, M. Hoffman, B.S.Skerry, “Application of Electrochemical Noise Measurements to Coated Systems,” 1985, Polymeric Materials for Corrosion Control, 36-47, (American Chemical Society, 1155 16th St., N.W., Washington, D.C. 20036, USA)
16. C.Gabrielli, F.Huet, M.Keddam, H.Takenouti, “Application of Electrochemical Noise Measurement to the Study of Localised and Uniform Corrosion,” Nov. 1985, 8th European Congress of Corrosion, Vol 2, P37.1-937.7, (Centre Francais de al Corrosion, Societe de Chimie Industrielle, 28 rue Saint-Dominique, F75007 Paris, France)
17. G.L.Edgemon, P.C.Ohl, G.E.C.Bell, D.F.Wilson, CORROSION/96, Paper No. 094, NACE International, 1996.
18. G.L.Edgemon and G.E.C.Bell, Technical Basis for Electrochemical Noise Based Corrosion Monitoring of Underground Nuclear Waste Storage Tanks, Westinghouse Hanford Company Report, WHC-SD-WM-TI-772, November, 1996.
19. G.L. Edgemon and G.E.C. Bell, CORROSION/98, Paper No. 383, NACE International, Houston, TX, 1998.
20. R.D. Kane, D.A. Eden, D.C. Eden, “Online, Real-Time Corrosion Monitoring for Improving Pipeline Integrity – Technology and Experience”, Paper No. 03175, Corrosion/2003, NACE International, Houston, Texas, April 2003.
APPENDIX I - AUTOMATED ELECTROCHEMICAL
MONITORING TECHNIQUES There are three main techniques that were used to facilitate real-time, online monitoring. These are discussed below. Other techniques are possible but require offline data analysis or have a cycle time that exceeds what can be reasonably handled in the context of process monitoring and control. Linear Polarization Resistance (LPR) / Harmonic Distortion Analysis (HDA) LPR measurements rely on the Stern-Geary relationship to correlate potential perturbations with a current response close to the corrosion potential. This behavior is used to produce a measurement of polarization resistance (Rp) from which corrosion rate can be determined. It provides a good estimate of uniform corrosion rate particularly if the correct Stern-Geary constant (B value) is utilized. An automated variation of the LPR technique and its analysis is Harmonic Distortion Analysis (HDA). In this application, a continuous low-frequency (15mHz) symmetrical square-wave polarization signal is employed to measure both the overall polarization resistance, Rp, and the solution resistance, Rs. The leading edge of the square wave acts as a high frequency perturbation and effectively short-circuits the double-layer capacitance, thereby allowing Rs to be measured. The DC component of the current response is used to measure Rp, and by subtraction the charge transfer resistance can be
obtained. Another distinct benefit of HDA is the determination of the B value (Stern Geary constant) for use in correcting LPR corrosion rates and the anodic and cathodic Tafel slopes used in mechanistic and inhibition studies. Electrochemical Noise (EN) EN is the measurement of spontaneous fluctuations in the current and potential generated by corrosion occurring at the metal-electrolyte interface of a three-electrode system. Ideally, the corrosion sensors comprise two identical working electrodes plus a reference electrode. Whereas in the laboratory, the reference electrode is usually a conventional solute electrode (such as Ag/AgCl), for practical field monitoring applications, a metal pseudo reference electrode of the same material as the working electrodes is typically used. This leads to the use of three nominally identical electrodes made from the material of interest in the evaluation. Automated statistical analysis of the current and potential time records are used to derive a Pitting Factor (defined simply as the standard deviation of the corrosion current divided by the average corrosion current during the measurement period) to infer tendencies for general or localized corrosion. Whereas EN can also used to derive corrosion rates, these values are not normally used in process control.
APPENDIX II – BIOFILM LOOP CONFIGURATION AND SAMPLING TECHNIQUE
A anaerobic fouling reactor was used to culture SRB-containing biofilms on carbon steel electrodes. The reactor was attached to a low pressure biofouling chamber (SideStream® - Trademark Commercial Microbiology, Inc., Houston, Texas) to monitor biofilm accumulation on carbon steel within the reactor system. The anaerobic fouling reactor and the low pressure biofouling chamber were connected in series as a flow-loop using a centrifugal pump. The rate of flow was approximately 3 liters per minute and the complete reactor set-up had a working volume of approximately 1 liter. The reactor was operated anaerobically (except when specifically indicated) and precautions were taken to minimize oxygen entering the system during sampling. Sea water was pumped into the system through a separate inlet port separate from the flow loop. A pressure release valve was inserted to allow the sample to be collected as the sea water was pumped, thus eliminating the addition of air into the system. Approximately 30 ml of sample was collected in a test tube that contained 0.3ml of Zinc Acetate to preserve the sulfide in the sample for further analysis.
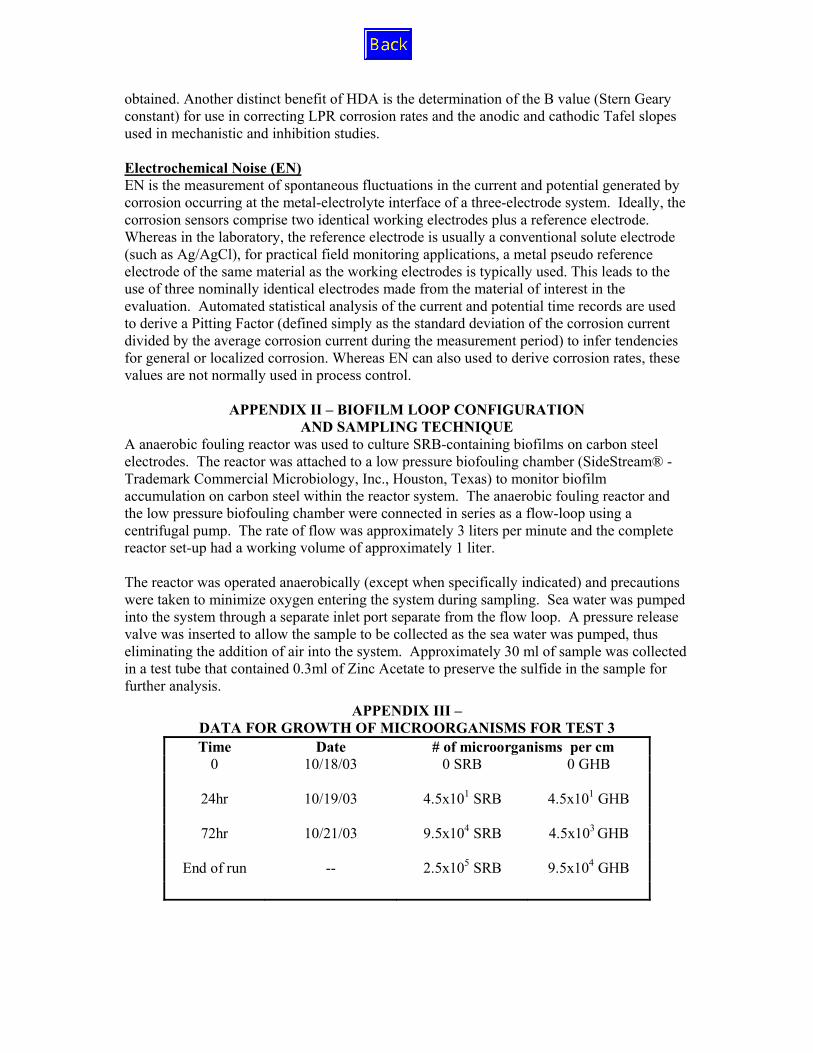
APPENDIX III – DATA FOR GROWTH OF MICROORGANISMS FOR TEST 3 Time Date # of microorganisms per cm
0 10/18/03 0 SRB 0 GHB
24hr 10/19/03 4.5x101 SRB 4.5x101 GHB
72hr 10/21/03 9.5x10⁴ SRB 4.5x10³ GHB
End of run -- 2.5x10⁵ SRB 9.5x10⁴ GHB


