Embed Size (px)
Citation preview
Realization of the low backgroundneutrino detector Double Chooz: Fromthe development of a high-purity liquid& gas handling concept to first neutrino
data
Dissertationof
Patrick Pfahler
TECHNISCHE UNIVERSITAT MUNCHEN
Physik DepartmentLehrstuhl fur experimentelle Astroteilchenphysik / E15
Univ.-Prof. Dr. Lothar Oberauer
Realization of the low background neutrino detector Double Chooz: From thedevelopment of high-purity liquid- & gas handling concept to first neutrino data
Dipl. Phys. (Univ.) Patrick Pfahler
Vollstandiger Abdruck der von der Fakultat fur Physik der Technischen Universitat Munchenzur Erlangung des akademischen Grades eines
Doktors des Naturwissenschaften (Dr. rer. nat)
genehmigten Dissertation.
Vorsitzender: Univ.-Prof. Dr. Alejandro IbarraPrufer der Dissertation: 1. Univ.-Prof. Dr. Lothar Oberauer
2. Priv.-Doz. Dr. Andreas Ulrich
Die Dissertation wurde am 3.12.2012 bei der Technischen Universitat Munchen eingereicht unddurch die Fakultat fur Physik am 17.12.2012 angenommen.
2

Contents
Contents i
Introduction 1
I The Neutrino Disappearance Experiment Double Chooz 5
1 Neutrino Oscillation and Flavor Mixing 61.1 PMNS Matrix . . . . . . . . . . . . . . . . . . . . . . . . . . . . . . . . . . . . . . . . . 61.2 Flavor Mixing and Neutrino Oscillations . . . . . . . . . . . . . . . . . . . . . . . . . 7
1.2.1 Survival Probability of Reactor Neutrinos . . . . . . . . . . . . . . . . . . . . 91.2.2 Neutrino Masses and Mass Hierarchy . . . . . . . . . . . . . . . . . . . . . . 12
2 Reactor Neutrinos 142.1 Neutrino Production in Nuclear Power Cores . . . . . . . . . . . . . . . . . . . . . . 142.2 Energy Spectrum of Reactor neutrinos . . . . . . . . . . . . . . . . . . . . . . . . . . 152.3 Neutrino Flux Approximation . . . . . . . . . . . . . . . . . . . . . . . . . . . . . . . 16
3 The Double Chooz Experiment 193.1 The Double Chooz Collaboration . . . . . . . . . . . . . . . . . . . . . . . . . . . . . 193.2 Experimental Site: Commercial Nuclear Power Plant in Chooz . . . . . . . . . . . 203.3 Physics Program and Experimental Concept . . . . . . . . . . . . . . . . . . . . . . 213.4 Signal . . . . . . . . . . . . . . . . . . . . . . . . . . . . . . . . . . . . . . . . . . . . . . 23
3.4.1 The Inverse Beta Decay (IBD) . . . . . . . . . . . . . . . . . . . . . . . . . . 233.4.2 Signature of the IBD . . . . . . . . . . . . . . . . . . . . . . . . . . . . . . . . 243.4.3 Expected Signal . . . . . . . . . . . . . . . . . . . . . . . . . . . . . . . . . . . 27
3.5 Detector Design . . . . . . . . . . . . . . . . . . . . . . . . . . . . . . . . . . . . . . . 293.5.1 Neutrino Target (NT) . . . . . . . . . . . . . . . . . . . . . . . . . . . . . . . 293.5.2 Gamma Catcher (GC) . . . . . . . . . . . . . . . . . . . . . . . . . . . . . . . 303.5.3 Buffer (BF) . . . . . . . . . . . . . . . . . . . . . . . . . . . . . . . . . . . . . . 313.5.4 Inner Muon Veto (IV) . . . . . . . . . . . . . . . . . . . . . . . . . . . . . . . 313.5.5 Passive Steel Shielding . . . . . . . . . . . . . . . . . . . . . . . . . . . . . . . 313.5.6 Outer Muon Veto (OV) . . . . . . . . . . . . . . . . . . . . . . . . . . . . . . 313.5.7 Detector Liquids . . . . . . . . . . . . . . . . . . . . . . . . . . . . . . . . . . . 323.5.8 Detector Readout System . . . . . . . . . . . . . . . . . . . . . . . . . . . . . 323.5.9 Detector Calibration System . . . . . . . . . . . . . . . . . . . . . . . . . . . 33
3.6 Background . . . . . . . . . . . . . . . . . . . . . . . . . . . . . . . . . . . . . . . . . . 353.6.1 Accidental Background . . . . . . . . . . . . . . . . . . . . . . . . . . . . . . . 353.6.2 Correlated Background . . . . . . . . . . . . . . . . . . . . . . . . . . . . . . . 363.6.3 Artificial Background . . . . . . . . . . . . . . . . . . . . . . . . . . . . . . . . 36
3.7 Neutrino Selection . . . . . . . . . . . . . . . . . . . . . . . . . . . . . . . . . . . . . . 37
i
CONTENTS
3.7.1 Pre-Selection Cuts for the Neutrino Search . . . . . . . . . . . . . . . . . . . 373.7.2 Neutrino Selection Cuts . . . . . . . . . . . . . . . . . . . . . . . . . . . . . . 37
II Development and Production of two Detector Liquids 39
4 Hardware Installations for Detector Liquid Production 414.1 Liquid Storage Area (LSA) . . . . . . . . . . . . . . . . . . . . . . . . . . . . . . . . . 424.2 Liquid Handling System . . . . . . . . . . . . . . . . . . . . . . . . . . . . . . . . . . . 43
4.2.1 Pumping Stations . . . . . . . . . . . . . . . . . . . . . . . . . . . . . . . . . . 464.2.2 Storage Tanks for Buffer and Muon Veto . . . . . . . . . . . . . . . . . . . . 504.2.3 Monitoring- and Safety-Systems . . . . . . . . . . . . . . . . . . . . . . . . . 53
4.3 Gas Handling System . . . . . . . . . . . . . . . . . . . . . . . . . . . . . . . . . . . . 564.3.1 Liquid Nitrogen Plant and Gas Filter Station . . . . . . . . . . . . . . . . . 584.3.2 High Pressure Nitrogen . . . . . . . . . . . . . . . . . . . . . . . . . . . . . . . 594.3.3 Low Pressure Nitrogen . . . . . . . . . . . . . . . . . . . . . . . . . . . . . . . 604.3.4 Low Pressure Ventilation . . . . . . . . . . . . . . . . . . . . . . . . . . . . . . 60
4.4 Trunk Line System (TLS) . . . . . . . . . . . . . . . . . . . . . . . . . . . . . . . . . 61
5 Material Selection for the Detector Liquid Production 645.1 Organic Liquid Scintillators and Requirements for Double Chooz . . . . . . . . . . 64
5.1.1 Scintillating Mechanism and Stokes Shift . . . . . . . . . . . . . . . . . . . . 645.1.2 Requirements for Double Chooz . . . . . . . . . . . . . . . . . . . . . . . . . 68
5.2 Component Selection for the Muon Veto Scintillator . . . . . . . . . . . . . . . . . . 695.2.1 Scintillating Solvent . . . . . . . . . . . . . . . . . . . . . . . . . . . . . . . . . 695.2.2 Non-scintillating Dilution . . . . . . . . . . . . . . . . . . . . . . . . . . . . . 715.2.3 Wavelength Shifter . . . . . . . . . . . . . . . . . . . . . . . . . . . . . . . . . 73
5.3 Component Selection for the Buffer Liquid . . . . . . . . . . . . . . . . . . . . . . . 755.3.1 Non-scintillating Mineral Oils . . . . . . . . . . . . . . . . . . . . . . . . . . . 75
5.4 Selected Components for Muon Veto Scintillator and Buffer Liquid . . . . . . . . . 77
6 Detector Liquid Production 786.1 Composition of Muon Veto and Buffer . . . . . . . . . . . . . . . . . . . . . . . . . . 786.2 Preparation of the LSA . . . . . . . . . . . . . . . . . . . . . . . . . . . . . . . . . . . 786.3 Parallel Production of the Muon Veto Scintillator and Buffer Liquid . . . . . . . . 79
6.3.1 Master Solution . . . . . . . . . . . . . . . . . . . . . . . . . . . . . . . . . . . 796.3.2 Mixing Process . . . . . . . . . . . . . . . . . . . . . . . . . . . . . . . . . . . . 80
III Filling and Handling of the Double Chooz Far Detector 83
7 Hardware Installations for the Filling and Handling of the DC far Detector 847.1 Liquid Handling System . . . . . . . . . . . . . . . . . . . . . . . . . . . . . . . . . . . 85
7.1.1 Detector Fluid Operating System (DFOS) . . . . . . . . . . . . . . . . . . . 857.1.2 DFOS Main Operation Modes . . . . . . . . . . . . . . . . . . . . . . . . . . 937.1.3 Expansion Tank Operating System (XTOS) . . . . . . . . . . . . . . . . . . 94
7.2 Gas Handling System . . . . . . . . . . . . . . . . . . . . . . . . . . . . . . . . . . . . 987.2.1 Nitrogen Supply System . . . . . . . . . . . . . . . . . . . . . . . . . . . . . . 997.2.2 Consumers . . . . . . . . . . . . . . . . . . . . . . . . . . . . . . . . . . . . . . 1047.2.3 Ventilation System . . . . . . . . . . . . . . . . . . . . . . . . . . . . . . . . . 106
7.3 Detector Monitoring System (DMS) . . . . . . . . . . . . . . . . . . . . . . . . . . . 1127.3.1 Liquid Level Monitoring Systems . . . . . . . . . . . . . . . . . . . . . . . . . 1127.3.2 Gas Pressure Monitoring System (GPM) . . . . . . . . . . . . . . . . . . . . 124
ii
CONTENTS
8 Detector Filling 1278.1 Preparations for Filling . . . . . . . . . . . . . . . . . . . . . . . . . . . . . . . . . . . 128
8.1.1 Filling Team . . . . . . . . . . . . . . . . . . . . . . . . . . . . . . . . . . . . . 1288.1.2 Detector Flushing . . . . . . . . . . . . . . . . . . . . . . . . . . . . . . . . . . 1288.1.3 DFOS Cleaning . . . . . . . . . . . . . . . . . . . . . . . . . . . . . . . . . . . 129
8.2 Detector Filling . . . . . . . . . . . . . . . . . . . . . . . . . . . . . . . . . . . . . . . . 1298.2.1 Filling Sequence . . . . . . . . . . . . . . . . . . . . . . . . . . . . . . . . . . . 132
IV Performance and Results 147
9 Quality of the Produced Detector Liquids 1489.1 Muon Veto Scintillator . . . . . . . . . . . . . . . . . . . . . . . . . . . . . . . . . . . 149
9.1.1 Transparency, Light Yield and Density . . . . . . . . . . . . . . . . . . . . . 1499.1.2 Radio Purity . . . . . . . . . . . . . . . . . . . . . . . . . . . . . . . . . . . . . 151
9.2 Buffer Liquid . . . . . . . . . . . . . . . . . . . . . . . . . . . . . . . . . . . . . . . . . 1519.2.1 Transparency, Light Yield and Density . . . . . . . . . . . . . . . . . . . . . 1519.2.2 Radio Purity . . . . . . . . . . . . . . . . . . . . . . . . . . . . . . . . . . . . . 153
9.3 Performance of the Liquid- and Gas Handling Systems in the LSA . . . . . . . . . 153
10 Accuracy and Performance of Detector Filling and Handling 15610.1 Detector Filling Process . . . . . . . . . . . . . . . . . . . . . . . . . . . . . . . . . . . 156
10.1.1 Performance of the Filling Systems . . . . . . . . . . . . . . . . . . . . . . . . 15710.2 Detector Handling . . . . . . . . . . . . . . . . . . . . . . . . . . . . . . . . . . . . . . 162
10.2.1 Performance of XTOS . . . . . . . . . . . . . . . . . . . . . . . . . . . . . . . 16210.2.2 Performance of the Gas Handling System . . . . . . . . . . . . . . . . . . . . 165
11 Detector Performance & Results from 2012 16811.1 Cosmogenic Muons in the Inner Muon Veto . . . . . . . . . . . . . . . . . . . . . . . 16911.2 Cosmogenic Muons in the Inner Detector . . . . . . . . . . . . . . . . . . . . . . . . 17011.3 First Neutrino Data . . . . . . . . . . . . . . . . . . . . . . . . . . . . . . . . . . . . . 17711.4 First Result for Θ13 . . . . . . . . . . . . . . . . . . . . . . . . . . . . . . . . . . . . . 180
Summary & Outlook 18311.5 Detector Liquid Production . . . . . . . . . . . . . . . . . . . . . . . . . . . . . . . . 18611.6 Liquid Transfer from the Surface to the Underground Laboratory . . . . . . . . . . 18711.7 Filling of the Double Chooz Far Detector . . . . . . . . . . . . . . . . . . . . . . . . 18811.8 Detector Handling During Data Taking . . . . . . . . . . . . . . . . . . . . . . . . . 19011.9 Conclusion and Outlook . . . . . . . . . . . . . . . . . . . . . . . . . . . . . . . . . . . 191
V Appendix 193
A Double Chooz Experiment 194A.1 Detector Design . . . . . . . . . . . . . . . . . . . . . . . . . . . . . . . . . . . . . . . 194
B Surface Installations 197B.1 Liquid Storage Area . . . . . . . . . . . . . . . . . . . . . . . . . . . . . . . . . . . . . 197
B.1.1 Pumping Station . . . . . . . . . . . . . . . . . . . . . . . . . . . . . . . . . . 197B.1.2 Storage Tank Instrumentation . . . . . . . . . . . . . . . . . . . . . . . . . . 198B.1.3 Gas Handling System . . . . . . . . . . . . . . . . . . . . . . . . . . . . . . . . 200
B.2 Trunk Line System . . . . . . . . . . . . . . . . . . . . . . . . . . . . . . . . . . . . . . 201
iii
CONTENTS
C Scintillator Production 204C.1 Liquid Composition . . . . . . . . . . . . . . . . . . . . . . . . . . . . . . . . . . . . . 204
D Underground Installations 206D.1 Liquid Handling System . . . . . . . . . . . . . . . . . . . . . . . . . . . . . . . . . . . 206
D.1.1 DFOS Instrumentation of MU, BF, and GC . . . . . . . . . . . . . . . . . . 208D.1.2 DFOS Valve Identification . . . . . . . . . . . . . . . . . . . . . . . . . . . . . 213D.1.3 DFOS P&ID’s . . . . . . . . . . . . . . . . . . . . . . . . . . . . . . . . . . . . 213D.1.4 DFOS Instrumentation of Target Module . . . . . . . . . . . . . . . . . . . . 217D.1.5 Programmable Logic Controller, DFOS-PLC . . . . . . . . . . . . . . . . . . 219D.1.6 DFOS Connections . . . . . . . . . . . . . . . . . . . . . . . . . . . . . . . . . 222D.1.7 Expansion Tank Operating System (XTOS) . . . . . . . . . . . . . . . . . . 224
D.2 Gas Handling System . . . . . . . . . . . . . . . . . . . . . . . . . . . . . . . . . . . . 228D.3 Monitoring System . . . . . . . . . . . . . . . . . . . . . . . . . . . . . . . . . . . . . . 232
D.3.1 Liquid Level Monitoring System . . . . . . . . . . . . . . . . . . . . . . . . . 232D.3.2 Gas Pressure Monitoring . . . . . . . . . . . . . . . . . . . . . . . . . . . . . . 232
E Detector Filling 234E.1 Filling Modes . . . . . . . . . . . . . . . . . . . . . . . . . . . . . . . . . . . . . . . . . 235
F Results 240
List of Figures 241
List of Tables 245
Glossary 246
Bibliography 250
Acknowledgement 256
iv
Abstract
Neutrino physics is one of the most vivid fields in particle physics. Within this field, neutrino os-cillations are of special interest as they allow to determine driving oscillation parameters, whichare collected as mixing angles in the leptonic mixing matrix. The exact knowledge of theseparameters is the main key for the investigation of new physics beyond the currently knownStandard Model of particle physics. The Double Chooz experiment is one of three reactor dis-appearance experiments currently taking data, which recently succeeded to discover a non-zerovalue for the last neutrino mixing angle Θ13. As successor of the CHOOZ experiment, DoubleChooz will use two detectors with improved design, each of them now composed of four con-centrically nested detector vessels each filled with different detector liquid. The integrity of thismulti-layered structure and the quality of the used detector liquids are essential for the successof the experiment. Within this frame, the here presented work describes the production of twodetector liquids, the filling and handling of the Double Chooz far detector and the installationof all necessary hardware components therefore. In order to meet the strict requirements exist-ing for the detector liquids, all components were individually selected in an extensive materialselection process at TUM, which compared samples from different companies for their key prop-erties: density, transparency, light yield and radio purity. Based on these measurements, thecomposition of muon veto scintillator and buffer liquid were determined. For the productionof the detector liquids, a simple surface building close to the far detector site was upgradedinto a large-scale storage and mixing facility, which allowed to separately, mix, handle and store90 m3 of muon veto scintillator and 110 m3 of buffer liquid. For the muon veto scintillator,a master-solution composed of 4800 l LAB, 180 kg PPO and 1.8 kg of bis/MSB was producedand, together with all other ingredients of muon veto and buffer, delivered to the experiment,where they were mixed and tuned in due consideration of the individual requirements of thedifferent liquids. For the filling and handling of the DC-far detector, the underground labora-tory was equipped with a comprehensive liquid-handling, gas-handling and monitoring-system,which provides all necessary functions to flush, fill, operate and empty the detector safely. Us-ing these systems, the DC-far detector was flushed and filled in accordance with an especiallydeveloped sequence, which considered critical filling points and avoided unnecessary stress onthe different detector vessels. By the means of this, the far detector of Double Chooz could befilled without damaging the detector vessels. In addition, it could be demonstrated that thequality and cleanliness of the detector liquids were maintained during filling. As a result of this,Double Chooz was able to acquire first neutrino data and to publish its first result of Θ13 withsin2(2Θ13)= 0.109± 0.030(stat.)± 0.025(syst.).
Zusammenfassung
Die Neutrinophysik ist fur die Teilchenphysik von besonderer Bedeutung, nicht nur weil dieNeutrinophysik in den letzten Dekaden die meisten Erfolge verzeichnen konnte, sondern weiles die Untersuchung von Neutrinooszillationen erlaubt, auch neue und unbekannte Physik jen-seits des Standardmodels zu untersuchen. Vorraussetzung hierfur ist jedoch die exakte Bestim-mung der verschiedenen Oszillationsparameter, die als drei Mischungswinkel in der leptonischenMischungsmatrix zusammengefasst sind. Das Double-Chooz-Experiment ist eines von drei der-zeit laufenden Neutrino-Oszillationsexperimenten, die mit Hilfe von Reaktorneutrinos erfolgreicheinen ersten Wert fur den letzten und bis dato unbekannten Neutrino-Mischungs-Winkel Θ13 be-stimmen konnten. Als Nachfolger des CHOOZ-Experimentes benutzt Double Chooz zwei identi-sche Detektoren, jeweils bestehend aus vier konzentrisch ineinandander liegenden Behaltern, diemit unterschiedlichen Detektorflussigkeiten gefullt sind. Die Integritat dieser mehrschichtigenStruktur und die Qualitat der benutzten Detektorflussigkeiten sind grundlegend fur den Er-folg des Double-Chooz-Experiments. In diesem Zusammenhang beschreibt die hier prasentierteArbeit die Produktion zweier Detektorflussigkeiten, das Fullen und Betreiben des ersten De-tektors sowie die Entwicklung und Installation aller hierfur benotigten Systeme. Um die stren-gen Qualitatsanforderungen an die Detektorflussigkeiten zu erfullen, wurden alle Bestandteilein einem umfassenden Materialselektionsprozess einzeln ausgewahlt und Proben verschiedenerAnbieter auf ihre Schlusseleigenschaften wie Dichte, Transparenz, Lichtausbeute und radioche-mische Reinheit hin untersucht. Basierend auf diesen Messungen wurden die Zusammensetzun-gen von Myon-Veto-Szintillator und Bufferflussigkeit bestimmt. Fur die Produktion der De-tektorflussigkeiten wurde ein einfaches Gebaude in der Nahe des Experimentstandorts in einehochreine, großvolumige Lager- und Mischanlage umgewandelt, die es ermoglichte, 90 m3 Myon-Veto-Szintillator und 110 m3 Bufferflussigkeit getrennt voneinander herzustellen. Fur den Myon-Veto-Szintillator wurde eine Master Solution, bestehend aus 4800 l LAB, 180 kg PPO und 1,8 kgbis/MSB hergestellt und, zusammen mit allen anderen Flussigkeiten fur Myon Veto und Buffer,zum Standort des Experiments transportiert. Dort wurden alle Bestandteile unter Einbeziehungder individuellen Anforderungen an die verschiedenen Detektorflussigkeiten in eigens dafur ent-wickelten Systemen gemischt und feinabgestimmt. Fur das Fullen und den Betrieb des erstenDetektors von Double Chooz wurde das Untergrundlabor mit einem umfassenden Flussigkeits-,Gas-handling und Monitoring system ausgestattet, welche zusammen alle erforderlichen Funktio-nen fur das sichere Fullen, Leeren und den storungsfreien Betrieb des Detektors gewahrleisteten.Mit Hilfe dieser Systeme folgte das Fullen, im Anschluss an das Spulen mit Stickstoff, einemspeziell hierfur entwickelten sequenziellen Ablauf, der kritische Fullabschnitte berucksichtigteund unnotigen Stress auf die verschiedenen Behalter vermied. Also Folge der erfolgreichen Um-setzung aller Systeme und Ablaufe konnte der ersten Detektor ende 2010 erfolgreich befllt undohne Schaden in Betrieb genommen werden. Zusatzlich konnte gezeigt werden, dass die Qualitatund Reinheit der Detekorflussigkeiten durch den Fullprozess nicht beeintrachtigt wurde. Basie-rend auf dieser Arbeit war es der Double Chooz Kollaboration moglich, erste Daten zu erhebenund den ersten reaktorbasierten Wert fur Θ13 mit sin2(2Θ13)= 0.109± 0.030(stat.)± 0.025(syst.)zu veroffentlichen.
Introduction
[1] First proposed by Wolfgang Pauli [2] in 1930, who required a third particle in order toexplain the continuous energy spectrum of the electrons emitted by the beta-decay, neutrinosare nowadays well established and part of the standard model of particle physics. Belongingto the group of leptons, neutrinos exist in three different flavors (νe, νµ, ντ ), named after theircharged family partners e, µ, τ . Of all elementary particles, neutrinos are the ones most difficultto detect, as they have (almost) no mass, no electrical charge and interact only weakly withmatter. Therefore neutrinos travel nearly with the speed of light and are neither deflectedby magnetic fields nor influenced by matter due to the extremely small cross section for weakinteractions (σ ∼10−43cm2)[3]. Although difficult to detect, these properties make neutrinos toideal messengers for elementary- and astro-particle physics. Produced in our sun, neutrinos allowfor the first time to “look” directly into the center of a star and to observe fusion processes asthey happen. Hence, the observation of solar neutrinos provides important information aboutthe structure, evolution or energy production in our sun and allows to test the theoreticalpredictions provided by the standard solar model (SSM) [4].
The first successful solar neutrino experiment was realized in the late 1960’s by R. Davis, whoinstalled 615 tons of perchloroethylene (C2Cl4) in a large tank deep underground in the Home-stake gold mine in South Dakota. The Homestake-Chlorine experiment [5] (1969-1989) ob-served the absorption of νe on 37Cl, which lead to the formation of the instable isotope 37Ar(τ1/2 = 34.8 days) and the emission of an electron.
νe +37 Cl → 37Ar + e− (threshold 814 keV)
Extracting the argon atoms from the detector and analyzing their decay in a proportional counterallowed to measure the solar neutrino flux and to compare it with the predictions of the SSM.The result, however, was surprising, as the observed neutrino flux was a factor of three below theprediction [6]. This deficit, also known as the solar neutrino problem, motivated the proposalof other experiments with a higher sensitivity, as SAGE [7] (1989-2012), GALLEX [8] (1992-1997) and its successor GNO [9] (1998-2003), which used a similar detection method. Theseradiochemical experiments were based on the neutrino absorption on 71Ga and its transforma-tion into 71Ge, what provides a significantly lower detection threshold of 233 keV and madethese experiments sensitive to the most abundant solar neutrino type produced by the pp-chain[4].
νe +71 Ga→71 Ge + e− (threshold 233 keV)
Although these experiments were able to measure a higher neutrino flux and therefore to confirmthe leading energy production process (pp-cycle) predicted by SSM, the solar neutrino problemremained, as all of these experiments measured the same deficit between the expectation and theobservation. A possible solution for the solar neutrino problem was presented by Pontecorvo,who suggested that the observed neutrino deficit might be the result of undetected, rather thanmissing neutrinos [10]. He reported the possibility that solar neutrinos were able to change
1
Introduction
their flavor from νe → νµ,τ , which he described as neutrino oscillations. As the experimentaltechniques were only sensitive to νe, this flavor change could have been one of the possibleexplanations for the solar neutrino problem.
As will be shown in chapter 1 neutrino oscillation can be mathematically expressed as transitionprobability between two flavor eigenstates α and β, which is described by
Pα→β(U,L,E,∆m2ij) =
3
∑i,j=1
UαiU∗
βiU∗
αjUβje−i(∆m2
ijL2E), (1)
where the amplitude is given by the elements of the leptonic mixing matrix (U), which containsthree different mixing angles and an additional CP violating δ-phase (Θ12,Θ23,Θ13, δCP ). Thesecond and oscillating term is driven by the squared mass difference of the oscillating neutrinos(∆m2
ij), the traveled distance (L) and the neutrino energy (E).
After 20 years of uncertainty, whether neutrino oscillation caused the observed deficit or not,a great advance could be realized by new experiments and the first employment of a real timedetection channel as the elastic scattering (ES), as well as neutral -(NC) or charged-current-interactions (CC), which lead to the dissociation or transformation of nuclei:
1. νx + e− = νx + e− (ES, sensitive to νx)
2. νx + d = p + n + νx (NC, Qth = 1.44 MeV, sensitive to νx)
3. νe + d = p + p + e− (CC, Qth = 2.22 MeV, sensitive to νe).
The first real time measuring experiment, which exploited one of these new detection channels,was the Kamiokande-experiment [11] in Japan, which succeeded in 1987 to measure the direc-tion of neutrinos by using the directional correlation between incoming neutrino and recoiledlepton (e−, µ−). Kamiokande employed a 3000 t water-Cherenkov detector equipped with 1000photomultiplier tubes (PMTs) and its successor, the Super-Kamiokande (SK) [12] (1998), even50.000 tons of water and 30.000 PMTs. The recoiled leptons produced characteristic Cherenkov-rings, whose shape allow to distinguish between solar-νe’s and the higher energetic νµ’s producedin the atmosphere. This allowed to study solar as well atmospheric neutrinos independently.The comparison of atmospheric neutrinos provided strong evidence for atmospheric oscillation(νµ → ντ ) [13], which allowed to narrow down Θ23 and ∆m2
32. The solar neutrino data allowedto exclude a small solar mixing angle, which indicated a fundamental difference between themixing of quarks and leptons. Although these observations were in accordance with neutrinooscillations, alternative explanations as the neutrino decay [14] could yet not be excluded.
In 2001, the solar neutrino problem could finally be resolved by the SNO experiment [15, 16],which used a 1000 t heavy water (D2O) Cherenkov detector equipped with 9700 PMTs, sur-rounded by several kilotons of normal water in a copper mine in Sudbury, Canada. The ideawas to measure the solar neutrinos independently of their respective flavor. Using heavy water,SNO was sensitive to all three detection channels (ES, NC and CC), which could be used tocompare the interaction rate of νe (CC-channel) with the interaction rate of all neutrino flavors,observed by the NC-channel. The outcome was definite and showed a CC/CN-ratio of 0.301 [16]in accordance with predictions of the solar standard model. Thus, SNO solved the solar neutrinoproblem and provided compelling evidence for neutrino oscillations, as well as the influence ofmatter on the oscillation probability described by the MSW-effect [17, 18]. Based on these data,2/3 of the produced νe’s undergo a flavor change still within the sun (ν1 → ν2) and are later(on their way to earth) subdued to vacuum-oscillations. Combining the oscillation data from
2
Introduction
the different experiments allowed to further precise the other solar- and atmospheric-oscillationparameters as well as to determine the sign of ∆m2
12 to be positive (see table 1.1).
Although neutrino oscillation solved the solar neutrino problem, the confirmation of its cause hadtwo major implications: firstly, neutrino oscillations require massive neutrinos and, moreover,three different mass eigenstates. Secondly, flavor change violates the lepton family number.Both facts contradict the standard model of particle physics and prove evidently the existenceof yet unknown physics, resulting in the need to refine the standard model. This gives rise to awhole set of new questions regarding:
� the absolute mass scale of neutrinos (mν),
� the hierarchy of the different mass eigenstates (ν1 < ν2 < ν3) or (ν3 < ν1 < ν2) for ∆m212 > 0,
� the existence of CP-violation in the leptonic sector (δCP -phase) and
� the nature of the neutrino itself (Majorana-(ν = ν) or Dirac-(ν ≠ ν) particles).
The investigation of this new physics requires a precise knowledge of Θ13 as well as of all otheroscillation parameters, as only a complete mixing matrix will allow to disentangle the smallinfluence of mass hierarchy or CP-violation on the oscillation-pattern. Within this frame, reactorneutrinos play a major role as they provide ideal conditions to investigate the mixing angle Θ13.Nuclear power plants produce exclusively νe’s with low energies between 0-8 MeV [19], which areemitted from a well defined position. Providing CPT-invariance1, this pure and low energeticanti-neutrino sample can be used to observe the disappearance of νe’s in (νe → νµ, τ )-oscillations,which is dominated by Θ13 on short baselines (<10 km).
The first attempt to measure the last mixing angle Θ13 was realized in 1997 by the CHOOZ-experiment (1993-1998) [20], which measured the disappearance of anti-neutrinos (νe → νµ, τ )emitted by a nuclear power plant in Chooz, France. The experiment used a 112 ton liquidscintillator detector installed in a shallow depth underground laboratory about 1050 m from thetwo power cores. The detector itself had a multi layered design and was composed of threedifferent detector vessels, filled with 5 tons of gadolinium doped target scintillator, 17 tons ofgamma catcher scintillator as well as a 90 ton water Cherenkov muon veto. Measuring νe’s,CHOOZ could use the inverse beta decay (IBD) as real time detection channel and exploit thedirect correlation between the neutrino energy and the kinetic energy of the positron
IBD: νe + p→ n + e+ (Qth = 1.8 MeV, sensitive to νe),
which allowed to carry out neutrino spectroscopy. As reactor neutrinos have only low energies(Eν < 8 MeV [19]), the IBD can only produce e− but not the heavier µ− or τ−, because ofwhich CHOOZ is only sensitive to νe’s but not to the appearing νµ, τ ’s. This electronic-channelof the IBD leads to a delayed coincidence, composed of the prompt positron signal and thedelayed capture of the neutron on gadolinium, which can be used to identify the IBD andreduce background events efficiently. Located close to the oscillation maximum (for 2 MeV ν’s),CHOOZ compared the measured flux to a calculated expectation based on a neutrino spectrum,which was measured at the former Bugey4-experiment [21]. After a data taking phase of oneyear, the detector of CHOOZ suffered from a degradation of the target scintillator, which led to apremature end of the experiment. The analysis of the available data showed that the experimentwas dominated by background events and systematics, no sign of oscillations could be found,providing only an upper limit for Θ13 of sin2(2Θ13) < 0.18 at ∆m2 = 2.43 ⋅ 10−3 eV2 [20].
Still motivated by the search for Θ13, the here presented thesis is related to the successor-experiment of CHOOZ, named Double Chooz, which anticipates to increase the sensitivity for
1CPT-invariance implies, that the survival probability of νe’s is the same as for νe’s, what allows to use bothfor the investigation of the driving oscillation parameters.
3
Introduction
Θ13 in a two staged approach. In the first phase, Double Chooz repeats the measurement ofCHOOZ using a new detector with improved design, now including: a bigger target volume,a newly added buffer vessel, newly developed detector liquids and highly increased radiopurityrequirements. This new design provides a higher neutrino statistics and, at the same time, asignificantly reduced number of background events. In the second phase, Double Chooz will elim-inate the reactor based uncertainties (2 - 3 %) with the installation of an identical detector only400 m from the two power cores. The relative comparison between near and far detector will thenallow a clean measurement of Θ13. The Double Chooz experiment is currently in phase one andtakes data since April of 2011. An analysis of the first 220 days of data (see chapter 11) alreadyindicates a non-zero value for Θ13, corresponding to sin2(2Θ13)=0.109±0.030(stat.)±0.025(syst.),excluding the non-oscillation hypothesis now with 2.9σ [22].
Apart from Double Chooz, also two other experiments aim for a precise measurement of Θ13,the Daya Bay experiment in China [23] and the RENO experiment in South Korea [24]. Bothexperiments recently published similar values for Θ13 (see [25, 26] or section 11.4) in accordancewith Double Chooz.
As part of the Double Chooz collaboration, the author of this thesis had, in cooperation withother colleagues, the responsibility for the production of two detector liquids, the filling of thefar detector and the development and realization of all necessary systems needed therefor. Thiswork will provide an insight into the mentioned tasks and all related information.
The here presented thesis is divided into four parts:
The first part is dedicated to the Double Chooz experiment and will shortly revise the theoreticalframework of neutrino oscillations and the production process of νe in nuclear power plants inchapters 1 and 2. Chapter 3 will then be dedicated to the presentation of the Double Chooz-experiment and the design of the far detector.
The second part describes the development and on-site production of the muon veto scintillatorand the buffer liquid for the two outer detector layers of the Double Chooz far detector. Inchapter 4, the instrumentation of a large scale on-site mixing facility is presented, whereasthe material selection process for the different detector liquids is described in chapter 5. Theproduction process of the two detector liquids is finally presented in chapter 6.
The third part presents the development and realization of a complete liquid- and gas-handling-concept for the Double Chooz far detector and its use during the filling and handling of thedetector. In detail, this part presents the instrumentation of the far underground laboratorycomposed of comprehensive liquid-handling, gas-handling and monitoring systems in chapter 7and in chapter 8 the realization of the developed filling procedure.
The last part of this thesis will be used to summarize the achieved results, presenting the qualityof the detector liquids in chapter 9, the accuracy of the filling process in chapter 10 and the firstresults obtained by the Double Chooz experiment in chapter 11.
4
Part I
The Neutrino Disappearance ExperimentDouble Chooz
5
Chapter 1
Neutrino Oscillation and Flavor Mixing
1.1 PMNS Matrix
In the current view, the three neutrino flavors (α = e, µ, τ) can be described as three orthogonaleigenstates of the weak interaction, called flavor-eigenstates. Each of them is a superpositionof three orthogonal mass-eigenstates (i = 1, 2, 3) [27, 28] and can be mathematically expressedby:
∣να⟩ =∑i
Uαi ∣νi⟩ respectively ∣να⟩ =∑i
U∗
αi ∣νi⟩ . (1.1)
The entanglement between mass and flavor eigenstates is described by Uαi, an unitary 3 × 3-matrix called PMNS1-matrix:
Uαi =⎛⎜⎝
Ue1 Ue2 Ue3Uµ1 Uµ2 Uµ3
Uτ1 Uτ2 Uτ3
⎞⎟⎠. (1.2)
The flavor-mixing can be described by a rotation about three axes, represented by a rotation-matrix with (3+1) parameters, which consist of three rotation angles (Θ12,Θ13,Θ23 < π
2 ) and aδ-phase, describing possible CP-violations. The phase would be zero, or ±π, for CP-conservationand between −π < δ < 0 and 0 < δ < +π for a violation of CP [27, 3]. Apart from that, twoadditional Majorana-phases (α1, α2) exist, which are zero for Dirac-particles and non-zero forthe Majorana case [27, 3]. The full matrix including all mentioned parameters is presentedbelow.
Uαi =⎛⎜⎜⎝
c12c13ei2α1 s12c13e
i2α2 s13e
−iδ
−(s12c23 + c12s23s13e−iδ)e i2α1 (c12c23 − s12s23s13e
−iδ)e i2α2 s23c13
(s12s23 − c12c23s13e−iδ)e i2α1 −(c12s23 + s12c23s13e
−iδ)e i2α2 c23c13
⎞⎟⎟⎠
cij = cos(Θij)sij = sin(Θij)
(1.3)
Uαi can be parametrized in the following chain of matrices, disentangling the oscillation para-
1Acronym for Pontecorvo-Maki-Nakagawa-Sakata, the group of physicists, who developed the concept of neu-trino oscillation [29] and formulated a neutrino-mixing matrix.
6
Neutrino Oscillation and Flavor Mixing
meters:
Uαi =⎛⎜⎝
1 0 00 c23 −s23
0 s23 c23
⎞⎟⎠
´¹¹¹¹¹¹¹¹¹¹¹¹¹¹¹¹¹¹¹¹¹¹¹¹¹¹¹¹¹¹¹¹¹¹¹¹¹¹¹¹¹¹¹¹¹¹¹¹¹¸¹¹¹¹¹¹¹¹¹¹¹¹¹¹¹¹¹¹¹¹¹¹¹¹¹¹¹¹¹¹¹¹¹¹¹¹¹¹¹¹¹¹¹¹¹¹¹¹¹¶atmospheric
⎛⎜⎝
c13 0 −s13eiδ
0 1 0
s13eiδ 0 c13
⎞⎟⎠
´¹¹¹¹¹¹¹¹¹¹¹¹¹¹¹¹¹¹¹¹¹¹¹¹¹¹¹¹¹¹¹¹¹¹¹¹¹¹¹¹¹¹¹¹¹¹¹¹¹¹¹¹¹¹¹¹¹¹¹¹¹¹¹¹¹¹¹¹¹¹¸¹¹¹¹¹¹¹¹¹¹¹¹¹¹¹¹¹¹¹¹¹¹¹¹¹¹¹¹¹¹¹¹¹¹¹¹¹¹¹¹¹¹¹¹¹¹¹¹¹¹¹¹¹¹¹¹¹¹¹¹¹¹¹¹¹¹¹¹¹¹¶interference
⎛⎜⎝
c12 −s12 0s12 c12 00 0 1
⎞⎟⎠
´¹¹¹¹¹¹¹¹¹¹¹¹¹¹¹¹¹¹¹¹¹¹¹¹¹¹¹¹¹¹¹¹¹¹¹¹¹¹¹¹¹¹¹¹¹¹¹¹¹¸¹¹¹¹¹¹¹¹¹¹¹¹¹¹¹¹¹¹¹¹¹¹¹¹¹¹¹¹¹¹¹¹¹¹¹¹¹¹¹¹¹¹¹¹¹¹¹¹¹¶solar
⎛⎜⎜⎝
ei2α1 0 0
0 ei2α2 0
0 0 1
⎞⎟⎟⎠
´¹¹¹¹¹¹¹¹¹¹¹¹¹¹¹¹¹¹¹¹¹¹¹¹¹¹¹¹¹¹¹¹¹¹¹¹¹¹¹¹¹¹¹¹¹¹¹¹¹¹¹¹¹¹¹¸¹¹¹¹¹¹¹¹¹¹¹¹¹¹¹¹¹¹¹¹¹¹¹¹¹¹¹¹¹¹¹¹¹¹¹¹¹¹¹¹¹¹¹¹¹¹¹¹¹¹¹¹¹¹¹¹¶Majorana−phases
. (1.4)
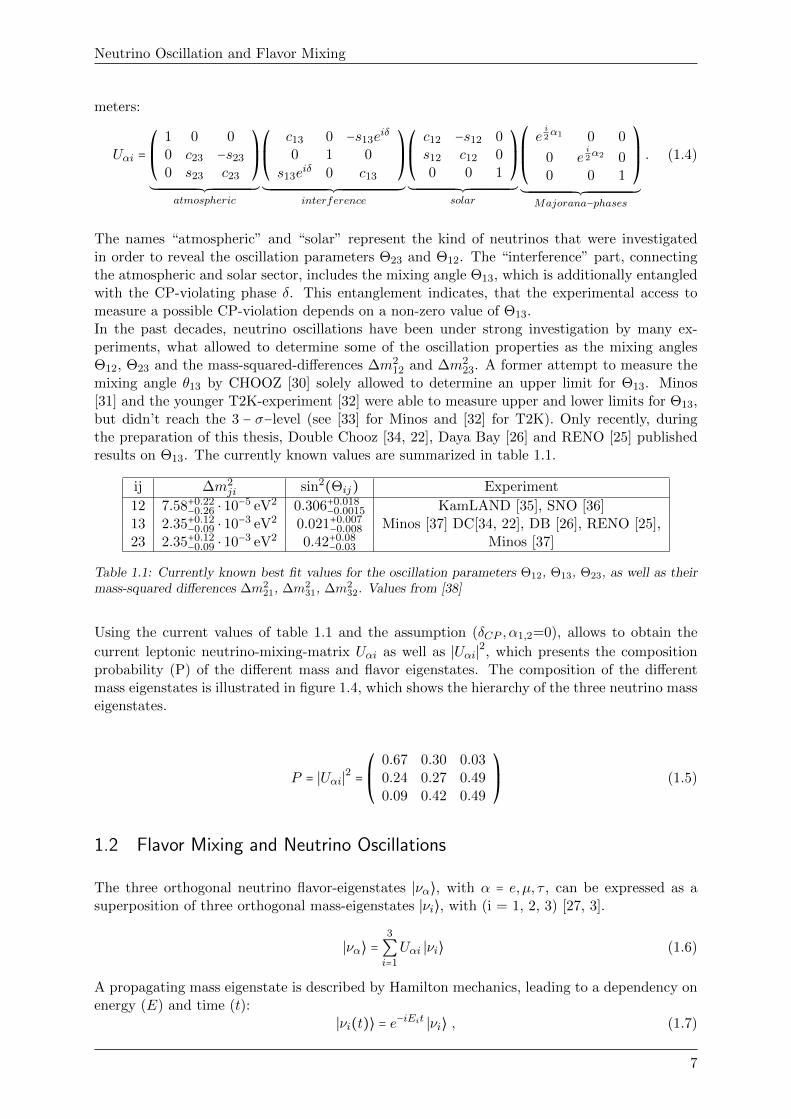
The names “atmospheric” and “solar” represent the kind of neutrinos that were investigatedin order to reveal the oscillation parameters Θ23 and Θ12. The “interference” part, connectingthe atmospheric and solar sector, includes the mixing angle Θ13, which is additionally entangledwith the CP-violating phase δ. This entanglement indicates, that the experimental access tomeasure a possible CP-violation depends on a non-zero value of Θ13.In the past decades, neutrino oscillations have been under strong investigation by many ex-periments, what allowed to determine some of the oscillation properties as the mixing anglesΘ12, Θ23 and the mass-squared-differences ∆m2
12 and ∆m223. A former attempt to measure the
mixing angle θ13 by CHOOZ [30] solely allowed to determine an upper limit for Θ13. Minos[31] and the younger T2K-experiment [32] were able to measure upper and lower limits for Θ13,but didn’t reach the 3 − σ−level (see [33] for Minos and [32] for T2K). Only recently, duringthe preparation of this thesis, Double Chooz [34, 22], Daya Bay [26] and RENO [25] publishedresults on Θ13. The currently known values are summarized in table 1.1.
ij ∆m2ji sin2(Θij) Experiment
12 7.58+0.22−0.26 ⋅ 10−5 eV2 0.306+0.018
−0.0015 KamLAND [35], SNO [36]13 2.35+0.12
−0.09 ⋅ 10−3 eV2 0.021+0.007−0.008 Minos [37] DC[34, 22], DB [26], RENO [25],
23 2.35+0.12−0.09 ⋅ 10−3 eV2 0.42+0.08
−0.03 Minos [37]
Table 1.1: Currently known best fit values for the oscillation parameters Θ12, Θ13, Θ23, as well as theirmass-squared differences ∆m2
21, ∆m231, ∆m2
32. Values from [38]
Using the current values of table 1.1 and the assumption (δCP , α1,2=0), allows to obtain the
current leptonic neutrino-mixing-matrix Uαi as well as ∣Uαi∣2, which presents the compositionprobability (P) of the different mass and flavor eigenstates. The composition of the differentmass eigenstates is illustrated in figure 1.4, which shows the hierarchy of the three neutrino masseigenstates.
P = ∣Uαi∣2 =⎛⎜⎝
0.67 0.30 0.030.24 0.27 0.490.09 0.42 0.49
⎞⎟⎠
(1.5)
1.2 Flavor Mixing and Neutrino Oscillations
The three orthogonal neutrino flavor-eigenstates ∣να⟩, with α = e, µ, τ , can be expressed as asuperposition of three orthogonal mass-eigenstates ∣νi⟩, with (i = 1, 2, 3) [27, 3].
∣να⟩ =3
∑i=1
Uαi ∣νi⟩ (1.6)
A propagating mass eigenstate is described by Hamilton mechanics, leading to a dependency onenergy (E) and time (t):
∣νi(t)⟩ = e−iEit ∣νi⟩ , (1.7)
7
Neutrino Oscillation and Flavor Mixing
where Ei is the energy of the i-th mass eigenstate. The propagation of a neutrino flavor-eigenstateα in time can thus be expressed by combining eq. 1.6 and eq. 1.7:
∣να(t)⟩ =3
∑i=1
Uαie−iEit ∣νi⟩ . (1.8)
The transition amplitude (A) for a flavor change να→νβ, at a time t, can be found by projectingνβ onto να(t) and using ⟨νi∣νj⟩ = δij what leads to:
A(α → β; (E, t)) ≡ ⟨νβ ∣να(t)⟩ =3
∑i,j=1
UαiU∗
βjδije−iEit =
3
∑i=1
UαiU∗
βie−iEit . (1.9)
The transition probability (P ) for an oscillation να→νβ is given by P = ∣A∣2:
P (α → β) = ∣A(α → β; t)∣2 = ∣3
∑i=1
UαiU∗
βie−iEit∣
2
=3
∑i,j=1
UαiU∗
βiU∗
αjUβje−i(Ei−Ej)t . (1.10)
The first part of eq. 1.10 describes the influence of the PMNS-matrix-elements (Uαi,Uβi) onthe oscillation probability. This part is invariant and only defined by the oscillation parametersΘ13,Θ12,Θ23 (and a possible δ-phase for CP-violation). The second argument e(Ei−Ej)t dependson the neutrino energy and the traveled time and can be interpreted as oscillation frequency,also referred to as phase difference. For the next steps, it is helpful to rewrite the phase dif-ference by assuming, that neutrinos have higher momentum than mass, and that all neutrinomass-eigenstates have the same momentum (more information regarding light ray and equalmomentum assumption can be found in [3], page 253).
Ei =√p2i +m2
i
mi<<∣pi∣≈ ∣pi∣ +m2i
2 ∣pi∣∣pi∣≈Eνi≈ Eνi +
m2i
2Eνi, (1.11)
where mi, Eνiand pi are mass, energy and momentum of the i-th mass-eigenstate. Replacingthe time (t) via (L = ct, c ≡ 1) and Eν1,2,3 with E, allows to rephrase the phase difference.
(Ei −Ej)t ≈m2i −m2
j
2EtL=t→ ∆m2
ij
L
2E. (1.12)
This allows to formulate a general form of the oscillation probability P(α → β):
Pα→β(L,E) =3
∑i,j=1
UαiU∗
βiU∗
αjUβje−i(∆m2
ijL2E) . (1.13)
The matrix elements Uαi are composed of real and imaginary arguments [27, 3], which allowsto re-write eq. 1.13 into a sum of real- and imaginary parts of Uαi of which the latter includethe CP-violating phase δ. This leads to a general the transition probability for a flavor changePα→β, which is shown in eq. 1.14.
Pα→β(L,E) = δαβ − 4∑k>j
Re(UαkU∗
βkU∗
αjUβj) sin2(∆m2ij
L
4E)
+2∑k>j
Im(UαkU∗
βkU∗
αjUβj) sin(∆m2ij
L
2E) .
(1.14)
8
Neutrino Oscillation and Flavor Mixing
1.2.1 Survival Probability of Reactor Neutrinos
For the special case of P(α → α), and thus the survival probability for a given flavor, the matrixelements of the mixing matrix Uαi are only real arguments, simplifying eq.1.14 to
Pα→α(L,E) = 1 − 4∑k>j
Re(UαkU∗
αkU∗
αjUαj) sin2(∆m2ij
L
4E) (1.15)
= 1 − 4∑k>j
∣Uαk∣2 ∣Uαj ∣2 sin2(∆m2ij
L
4E) . (1.16)
Without the imaginary arguments in Uαi and therefore without the CP-violating phase δ, thesurvival probability is not affected by a possible CP-violation. In consequence, all experiments,which measure the survival probability (as Double Chooz, Daya Bay and RENO) are not effectedby CP-violation and can therefore measure Θ13 independent from the influence of a δ-phase.Here, reactor experiments have an inherent advantage compared to accelerator experiments,which measure an appearance of neutrinos and are therefore subdued to CP-violating effects[27, 3]. However, once Θ13 is precisely known, accelerator experiments will be able to mea-sure the influence of CP-violation in the leptonic sector. Such a CP-violating δ-phase in theleptonic mixing matrix would lead to a different oscillation probability for neutrinos than foranti-neutrinos (P (να → νβ) ≠ P (να → νβ)) [3, 27]. Future accelerator experiments will be ableto produce both neutrino- as well as anti-neutrino-beams and have therefore a good chance tofind a CP-violation in the leptonic sector. The survival probability for reactor neutrinos canexplicitly be written as [3]:
Pνe−νe = 1st + 2nd + 3rd (1.17)
1st = 1 − sin2(2Θ13) sin2 (∆m231L
4E) (1.18)
2nd = − cos4(Θ13) sin2(2Θ12) sin2 (∆m221L
4E) (1.19)
3rd = + 1
2sin2(2Θ13) sin2(Θ12) [cos(∆m2
31L
2E− ∆m2
21L
2E) − cos(∆m2
31L
2E)] . (1.20)
The survival probability is composed of three different parts, each composed of an amplitude(defined by the mixing angles) and a sin2-oscillation, which depends on (∆m2L/E). The 1st-part of eq. 1.17 is dominated by Θ13 and ∆m2
13, the 2nd-part is dominated by Θ12 and ∆m212
(the Θ13-contribution is only minor due to cos(Θ13) ≈ 1) and the 3rd-part is an interferenceterm, which has only minor effect on base lines below 5 km. Figure 1.1 compares the threeindividual contributions of 1st-, 2nd- and 3rd-part on the survival probability. For a bettercomparison, each contribution starts at 1.00. The comparison uses 3 MeV-neutrinos and theoscillation parameters summarized in table 1.1. The important part for Double Chooz is thefirst one (dominated by Θ13 and ∆m2
13) and is shown in blue. The curve indicates the firstminimum between 1.5 km from the cores (a short baseline) and an amplitude that correspondsto sin2(2Θ13). The 2nd part is shown in red, indicating long baseline oscillations (≥ 50 km)and an amplitude that corresponds to sin2(2Θ12). The interference part is shown in green andshows a larger influence on longer base lines than on short base lines, because of which thisinterference can be neglected in Double Chooz. As can be seen dominates Θ13 the oscillationpattern at short baselines because of which the survival probability for reactor neutrinos on shortbaselines can be approximated by only the first part of eq. 1.17. Figure 1.2 presents the sumof all three contributions and therefore the full survival probability as given in equation 1.17.Obvious are the two oscillation maxima defined by the first and second part. The small value of
9
Neutrino Oscillation and Flavor Mixing
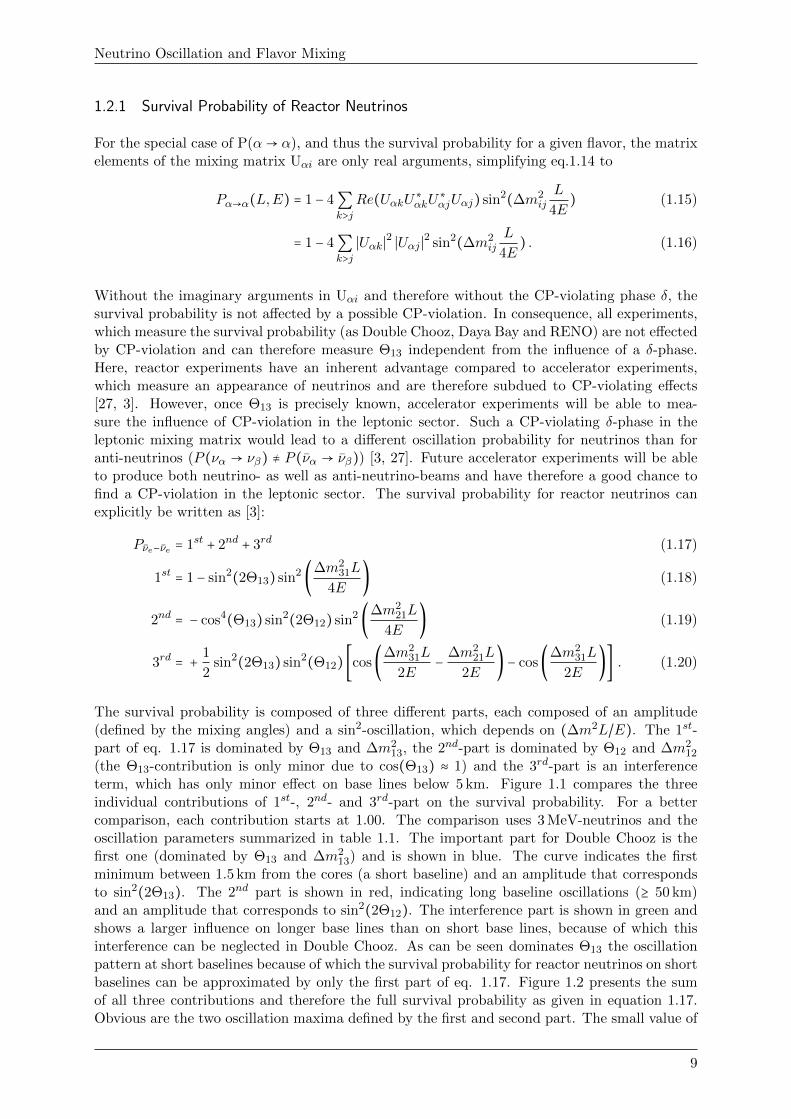
Figure 1.1: Comparison of the 1st, 2nd and 3rd part of eq.1.17 and their individual influence on thesurvival probability for 3 MeV-neutrinos. For a better comparison all parts start at 1.00. The blue curveshows the first oscillation minimum already at about 1.5 km from the source, indicating oscillations onshort base lines which are produced by the large value of ∆m2
13. The amplitude of the blue curve isdefined by Θ13. The red curve indicates the same behavior, however dominated by a smaller ∆m2
12 anda bigger Θ12, which leads to long baseline oscillations and a larger amplitude, and finally almost a fullconversion of νe into νµ,τ at the first oscillation maximum (L0 = Eν/∆m2
12). The third part, depictedin green, describes an interference between the oscillation parameters and has only influence at longerbaselines.
∆m221 ∝ 10−5eV 2 leads to long baseline oscillations, whereas the bigger ∆m2
31 ∝ 10−3eV 2 leadsto short baseline oscillations for νe → νµ,τ . Also prominent to see are the two different oscillationamplitudes depending on sin2(2Θ13) and sin2(2Θ12). The big mixing angle of the atmosphericsector Θ12 = 33.5○ leads to a large conversion of νe into νµ,τ , while the smaller Θ13 = 8.3○ leadsonly to a significantly smaller conversion (∼10%). Due to the small effect Θ13 is more difficultto detect and requires sensitive experiments, which allow resolve such a small variation with thenecessary accuracy. In the case of Double Chooz the design goal was to limit the systematicaland the statistical errors below one percent, what could successfully be realized (compare withsection 11.4)Comparing the two blue graphs of figures 1.1 and 1.2 visualizes, that the survival probability(on small baselines ≤10 km) can be well approximated by only the 1st-part of equation 1.17.The survival probability for reactor neutrinos in the vicinity of the power plant can therefore besimplified to:
Pνe−νe = 1 − sin2(2Θ13)´¹¹¹¹¹¹¹¹¹¹¹¹¹¹¹¹¹¹¹¹¹¹¸¹¹¹¹¹¹¹¹¹¹¹¹¹¹¹¹¹¹¹¹¹¹¹¶amplitude
sin2 (∆m231L
4E) ≈
´¹¹¹¹¹¹¹¹¹¹¹¹¹¹¹¹¹¹¹¹¹¹¹¹¹¹¹¹¹¹¹¹¹¹¹¹¹¹¹¹¹¹¹¹¹¸¹¹¹¹¹¹¹¹¹¹¹¹¹¹¹¹¹¹¹¹¹¹¹¹¹¹¹¹¹¹¹¹¹¹¹¹¹¹¹¹¹¹¹¹¹¶frequency
(1.21)
≈ 1 − sin2(2Θ13) sin2 (1.27∆m2
31[eV 2]L[m]4E[MeV ] ) (1.22)
An important consequence of this formula is, that neutrino oscillation needs not only massiveneutrinos, but also at least two different mass eigenstates in order to produce the ∆m2
ij ≠ 0,which is necessary for the oscillation. This simple form allows to determine the position of thesurvival probability minimum, in dependence of L/E and given ∆m2. The survival probability is
10
Neutrino Oscillation and Flavor Mixing
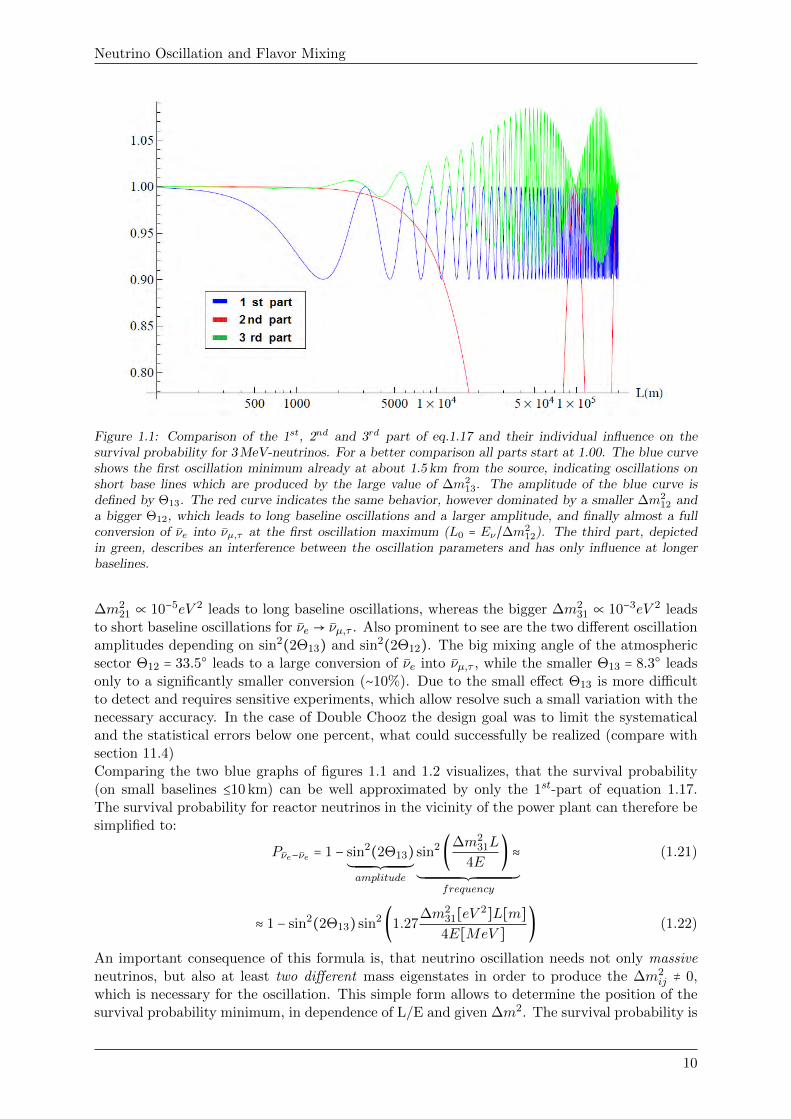
Figure 1.2: Survival probability of νe’s for 3 MeV neutrinos and the current oscillation parameters givenin table tab:CurrentValuesForTheOscillationParameters. The curve represents the sum of all three partsof the oscillation formula presented in equation 1.17. The amplitude of short baseline oscillations isdefined by sin2(2Θ13), while the first oscillation minimum is defined by L0. Comparing the blue curves offigures 1.2 and 1.1 at short baselines (1-5 km) indicates, that the survival probability of reactor neutrinoscan be approximated by the first part only.
minimal, if the oscillating-term (sin2(∆m2L/E)) is maximal. Given that sin2(x) = 1 (maximal)for nπ2 , the minimum of the survival probability is described by:
sin2 (π2n) != sin2 ( πL
2L0) != sin2 ⎛
⎝1.27∆m2
ijL
Eν
⎞⎠Ô⇒ πL
2L0
!=1.27∆m2
ijL
Eν.
This allows to define the oscillation length L0, which represents the first minimum of the sur-vival probability, depending only on the neutrino energy (Eν) and the squared mass difference(∆m2
ij).
L0 [m] = πEν2.54∆m2
= 1.23Eν[MeV ]∆m2[eV 2] (1.23)
Using a ∆m213=2.4⋅10−3eV 2 and neutrino energies between 2 and 10 MeV, different values for L0
are summarized in table 1.2. In addition presented are the individual survival probabilities forthe near and far detector at 400 m and 1050 m and their difference, which indicates the maximalmeasurable disappearance effect for the detector setup in Double Chooz. The individual survivalprobability curves for 2, 3, 4 and 5 MeV neutrinos are presented in figure 1.3 together with thepositions of the near and far detector. As can be seen varies the survival probability for afixed position with the neutrino energy. Due to this dependance and the defined position of thefar detector, Double Chooz is most sensitive for 2-MeV-neutrino oscillation and less for higherenergies. Based on the observable energy spectrum of reactor neutrinos, which is also shown infigure 1.3 and which peaks around 3 MeV, the Double Chooz far detector is almost in an idealposition. This energy dependent behavior of neutrino oscillations, will lead to a distortion ofthe observable energy spectrum at the lower energy region. Searching for neutrino oscillations,this distortion is an unmistakable evidence of oscillation and far more convincingly than just
11
Neutrino Oscillation and Flavor Mixing
the observation of a reduced counting rate (rate-analysis). Consequently, neutrino oscillationexperiments benefit from a good energy resolution, as this will allow to resolve the distortion inthe energy spectrum providing the possibility of an additional shape analysis. This, however,requires a well understood experimental setup and a sufficient energy resolution.
Survival probability for νe’s between 2 and 10 MeV
Neutrino Energy Eν MeV 2 3 4 5 6 7 8 9 10
First Minimum (L0) m 1025 1537 2050 2563 3075 3588 4100 4613 5125Surv. Prob.@400 m % 96.6 98.4 99.1 99.4 99.5 99.7 99.7 99.8 99.8Surv. Prob.@1050 m % 90.0 92.3 94.8 96.4 97.4 98.0 98.4 98.7 99.0Disappearance Effect % 6.6 6.0 4.2 2.9 2.1 1.6 1.2 1.0 0.8
Table 1.2: Oscillation length (L0), the survival probabilities for the position of the near (400 m) andfar (1050 m) detector of Double Chooz. Additionally indicated are the differences between near and fardetector indicating the maximal measurable disappearance effect for neutrino energies between 2 and10 MeV.
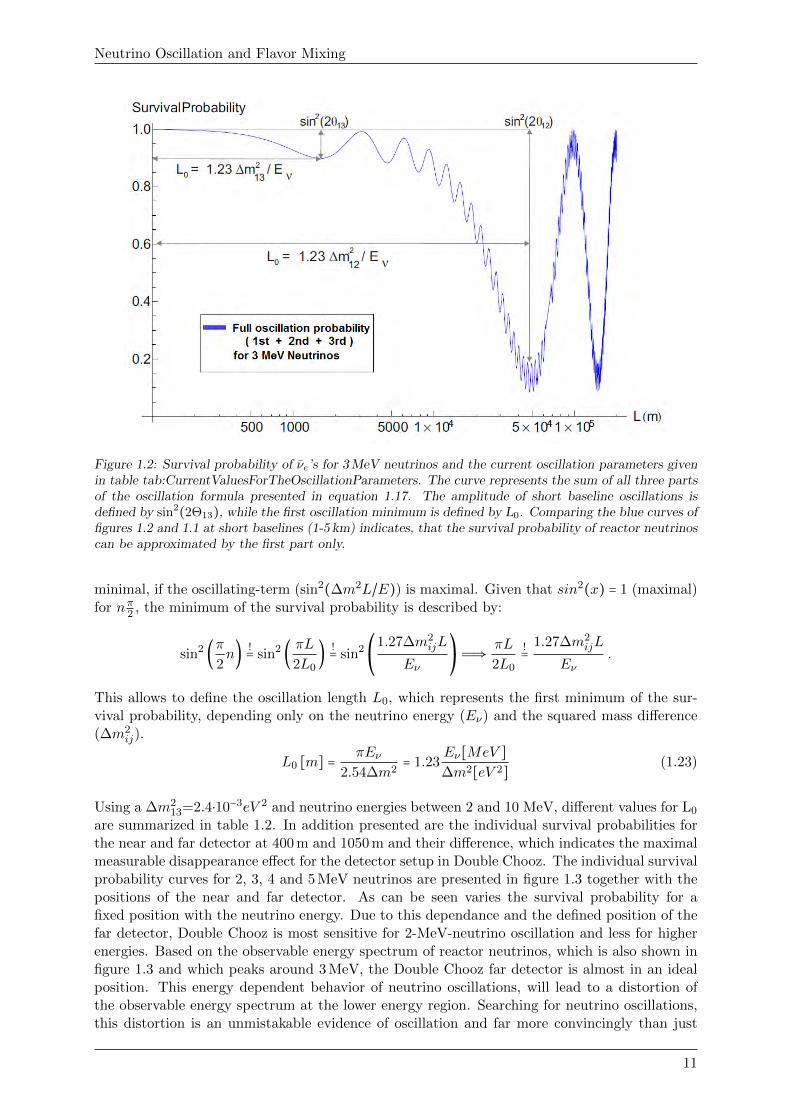
Figure 1.3: (left): Different survival probability curves for reactor neutrinos with 2, 3, 4 and 5 MeV.As can be seen depends the survival probability for a fixed position on the neutrino energy. The twovertical lines indicated the positions of the near and the far detector of Double Chooz. Based on thesepositions, the Double Chooz is most sensitive to oscillations of 2 MeV-neutrinos and less sensitive forhigher energies as indicated in table 1.2. This energy dependance will lead to a spectra distortion of theobserved neutrino spectrum in the lower energy region. (right): a) Observable energy spectrum of theIBD in a liquid scintillator detector (without spectral distortion) b) energy spectrum for reactor neutrinosc) energy dependent cross-section (σ(E)∼ 10−43cm2) for the IBD. Plot taken from [3]
1.2.2 Neutrino Masses and Mass Hierarchy
Although the observation of oscillations implies the existence of mass-differences between thedifferent neutrinos, their absolute mass scale could not be determined so far. The determinationof the absolute mass scale is fundamental and subject of various different experiments, whichinvestigate the β-spectrum of tritium decays or the neutrino less double beta decay. In addition,provides the observation and analysis of cosmological data to limit the total mass of all neutrinosmass eigenstates (∑imi). Currently the strongest limit on the absolute neutrino mass is providedby the tritium decay experiments Troitsk and Mainz, which provide mβ ≤ 2.1 eV [39] and mβ ≤2.3 eV [40] respectively. Furthermore allowed the observation and analysis ob cosmological datato limit sum of all neutrino masses down to ∑imi ≤ 0.5 eV [41]. The future tritium decay
12
Neutrino Oscillation and Flavor Mixing
experiments KATRIN [42] plans to improve this measurement by a factor of ten aiming foran sensitivity of mβ ≤ 0.2 eV [43], future cosmological observations might be even sensitive to
∑imi ≤ (6 ⋅ 10−3 − 0.1) eV [44]. The oscillation of solar neutrinos in combination with theMSW-effect [18], however, allowed to determine the sign of ∆m2
21 to be positive, and thus thatm1 < m2 . The sign of the other squared mass-difference ∆m2
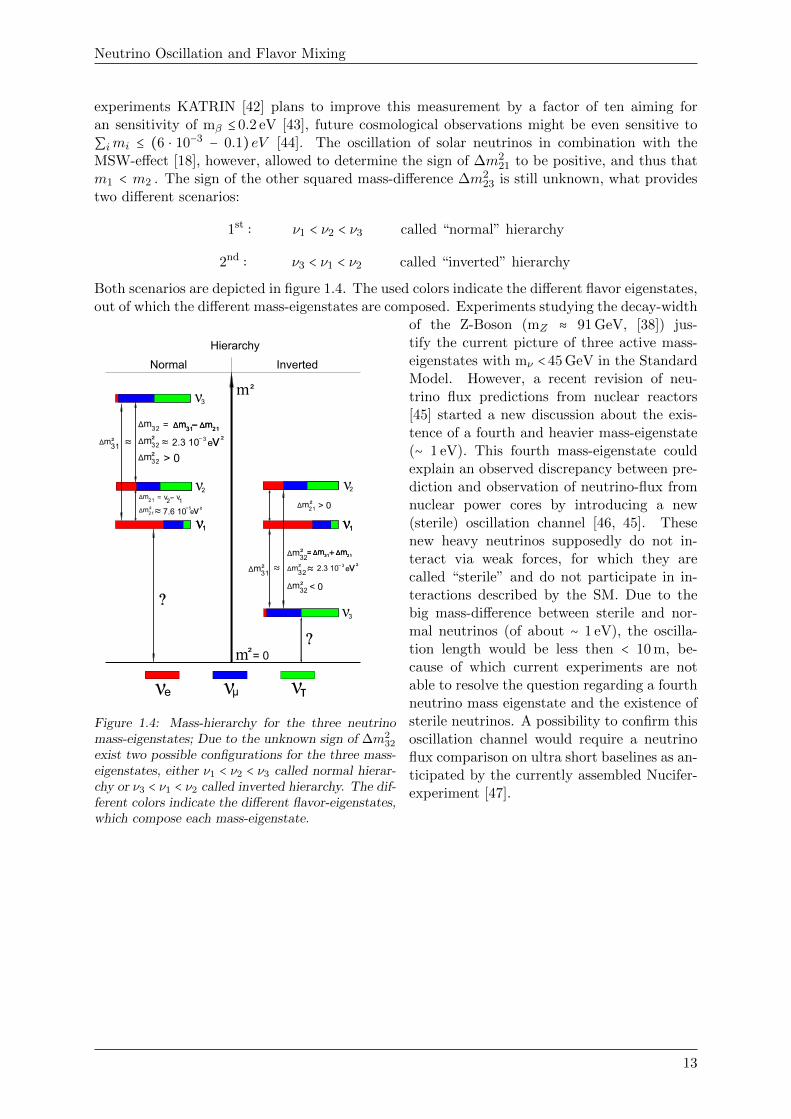
23 is still unknown, what providestwo different scenarios:
1st ∶ ν1 < ν2 < ν3 called “normal” hierarchy
2nd ∶ ν3 < ν1 < ν2 called “inverted” hierarchy
Both scenarios are depicted in figure 1.4. The used colors indicate the different flavor eigenstates,out of which the different mass-eigenstates are composed. Experiments studying the decay-width
2.3 10
7.6 10
Normal Inverted
2.3 10
Hierarchy
> 0
= 0
> 0
< 0
11
3
3
11
Figure 1.4: Mass-hierarchy for the three neutrinomass-eigenstates; Due to the unknown sign of ∆m2
32
exist two possible configurations for the three mass-eigenstates, either ν1 < ν2 < ν3 called normal hierar-chy or ν3 < ν1 < ν2 called inverted hierarchy. The dif-ferent colors indicate the different flavor-eigenstates,which compose each mass-eigenstate.
of the Z-Boson (mZ ≈ 91 GeV, [38]) jus-tify the current picture of three active mass-eigenstates with mν < 45 GeV in the StandardModel. However, a recent revision of neu-trino flux predictions from nuclear reactors[45] started a new discussion about the exis-tence of a fourth and heavier mass-eigenstate(∼ 1 eV). This fourth mass-eigenstate couldexplain an observed discrepancy between pre-diction and observation of neutrino-flux fromnuclear power cores by introducing a new(sterile) oscillation channel [46, 45]. Thesenew heavy neutrinos supposedly do not in-teract via weak forces, for which they arecalled “sterile” and do not participate in in-teractions described by the SM. Due to thebig mass-difference between sterile and nor-mal neutrinos (of about ∼ 1 eV), the oscilla-tion length would be less then < 10 m, be-cause of which current experiments are notable to resolve the question regarding a fourthneutrino mass eigenstate and the existence ofsterile neutrinos. A possibility to confirm thisoscillation channel would require a neutrinoflux comparison on ultra short baselines as an-ticipated by the currently assembled Nucifer-experiment [47].
13
Chapter 2
Reactor Neutrinos
2.1 Neutrino Production in Nuclear Power Cores
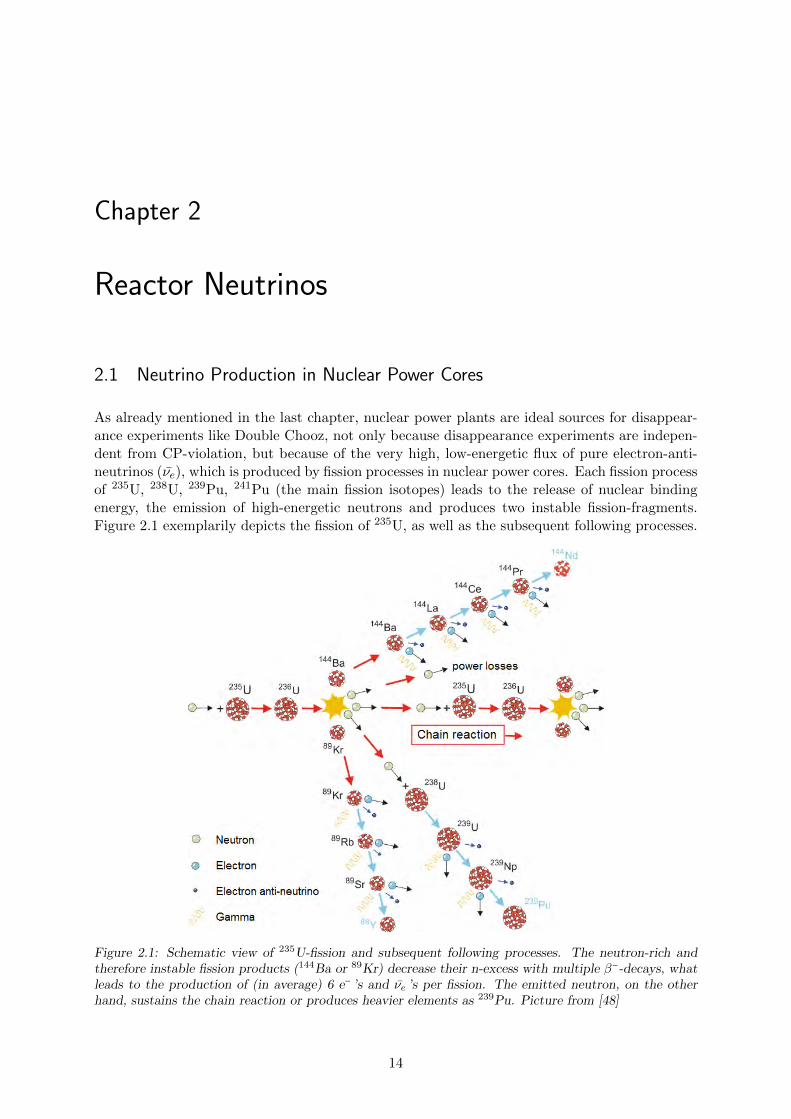
As already mentioned in the last chapter, nuclear power plants are ideal sources for disappear-ance experiments like Double Chooz, not only because disappearance experiments are indepen-dent from CP-violation, but because of the very high, low-energetic flux of pure electron-anti-neutrinos (νe), which is produced by fission processes in nuclear power cores. Each fission processof 235U, 238U, 239Pu, 241Pu (the main fission isotopes) leads to the release of nuclear bindingenergy, the emission of high-energetic neutrons and produces two instable fission-fragments.Figure 2.1 exemplarily depicts the fission of 235U, as well as the subsequent following processes.
Figure 2.1: Schematic view of 235U-fission and subsequent following processes. The neutron-rich andtherefore instable fission products (144Ba or 89Kr) decrease their n-excess with multiple β−-decays, whatleads to the production of (in average) 6 e− ’s and νe ’s per fission. The emitted neutron, on the otherhand, sustains the chain reaction or produces heavier elements as 239Pu. Picture from [48]
14
Reactor Neutrinos
The high-energetic neutrons are moderated and interact in different ways. Some produce heavierelements, like 239Pu, some lose their energy in collisions and some produce a new fission process(on average one, in order to maintain a controlled chain-reaction). In general, the fission leavestwo fragments, a lighter one with an atomic mass of around 90, and a heavier one with a massof about 140 (in figure 2.1, 89Kr and 144Ba). Both of these fragments are neutron-rich and thusunstable. Consequently, they undergo multiple β−-decays to reduce their n-excess
n→ p + e− + νe.
This chain of β−-decays leads in average to production and emission of about 6 electrons and6 νe ’s per fission. The total energy released by each fission process depends on the fissionedisotope. Table 2.1 summarizes the averaged energy release per fission for the four main fissionisotopes 235U, 238U, 239Pu and 241Pu.
Isotope ⟨Efiss⟩ (MeV)235U 201.92±0.46238U 205.52±0.96239Pu 209.99±0.60241Pu 213.60±0.65
Table 2.1: Mean values for the energy release per fission of the four main fission isotopes [22].
Investigating the fission of Uranium and measuring the kinetic energy of the different constituentparts (fission fragments, neutrons, electrons, neutrinos and gamma emissions), allowed to findan energy distribution of [49, 50, 51]:
� Kinetic Energy of the neutrinos ≈ 12MeV ,
� Kinetic Energy of the fission fragments ≈ 167MeV ,
� Kinetic Energy of the neutrons ≈ 5MeV ,
� Kinetic Energy of the electrons ≈ 8MeV ,
� Gamma Ray emissions ≈ 10MeV .
2.2 Energy Spectrum of Reactor neutrinos
Considering the production process of reactor neutrinos, their possible energy is limited. Then-rich fission products reduce their n-excess via multiple β-decays, what finally leads to theproduction of electron anti-neutrinos νe. As this is a three-body-decay, the available energy isunequally shared between the electron, the neutrino and the respective fission product. Neglect-ing the recoil energy of the fission product, the energy relation between neutrino and electronis Eν = E(β−decay) - Ee.
The 235U-fission, depicted in Figure 2.1, presents one possible pair of fission fragments. Each ofthese fragments has its individual decay-chain leading to an individual beta-spectrum. Combin-ing this spectrum with all other spectra that can follow the fission of 235U, allows to determinethe β-spectrum for 235U. This combined spectrum can be defined theoretically (if all possiblefission products and their beta-branches are known) or measured experimentally, what allowsto verify the prediction. The good agreement between predicted and measured electron spec-trum (few percent level) shows the fundamental understanding of the processes and justifiesthe second step to convert the electron spectrum into a neutrino spectrum [19]. This approach
15
Reactor Neutrinos
considers, that the total energy of each β-decay has to be shared between electron and anti-neutrino. Knowing the total energy of the β-decay, as well as the energy of the emitted electron,allows to deduce the residual energy for the neutrino. On reactor level, this means to have avery detailed (theoretical & experimental) knowledge about the β-spectra of 235U, 238U, 239Puand 241Pu and to combine them weighted by their abundance in the reactor fuel. Knowing thetheoretical β-spectrum of a reactor, as well as the actual measured β-spectrum, allows then todetermine the resulting neutrino spectrum
Stotal(Eν) = ∫ αkSk(Eν)d(Eν) =∑αkSk(Eν),
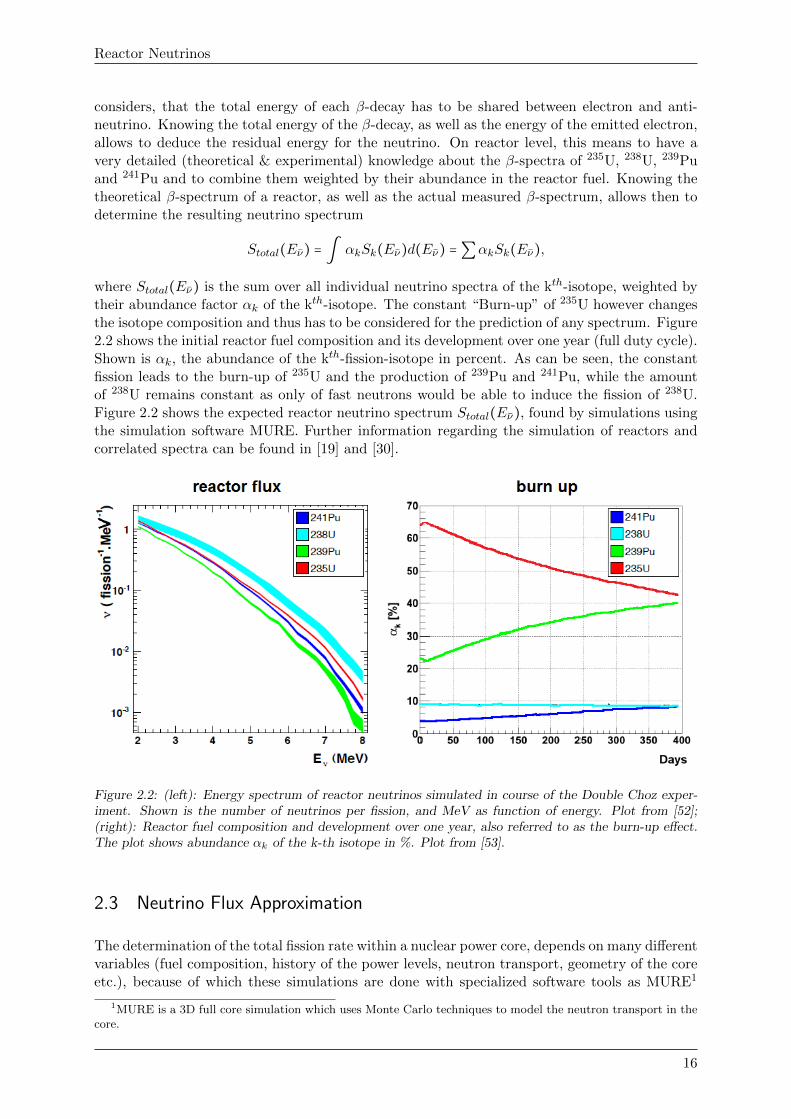
where Stotal(Eν) is the sum over all individual neutrino spectra of the kth-isotope, weighted bytheir abundance factor αk of the kth-isotope. The constant “Burn-up” of 235U however changesthe isotope composition and thus has to be considered for the prediction of any spectrum. Figure2.2 shows the initial reactor fuel composition and its development over one year (full duty cycle).Shown is αk, the abundance of the kth-fission-isotope in percent. As can be seen, the constantfission leads to the burn-up of 235U and the production of 239Pu and 241Pu, while the amountof 238U remains constant as only of fast neutrons would be able to induce the fission of 238U.Figure 2.2 shows the expected reactor neutrino spectrum Stotal(Eν), found by simulations usingthe simulation software MURE. Further information regarding the simulation of reactors andcorrelated spectra can be found in [19] and [30].
Figure 2.2: (left): Energy spectrum of reactor neutrinos simulated in course of the Double Choz exper-iment. Shown is the number of neutrinos per fission, and MeV as function of energy. Plot from [52];(right): Reactor fuel composition and development over one year, also referred to as the burn-up effect.The plot shows abundance αk of the k-th isotope in %. Plot from [53].
2.3 Neutrino Flux Approximation
The determination of the total fission rate within a nuclear power core, depends on many differentvariables (fuel composition, history of the power levels, neutron transport, geometry of the coreetc.), because of which these simulations are done with specialized software tools as MURE1
1MURE is a 3D full core simulation which uses Monte Carlo techniques to model the neutron transport in thecore.
16
Reactor Neutrinos
or DRAGON2. A detailed description about reactor simulations and the its conversion into aneutrino spectrum can be found in [19], shall however not be discussed here. In order to providean idea about the immense neutrino flux emitted by nuclear power plants, the neutrino flux canbe roughly approximate, which will be briefly presented in the following.
Assuming that the entire energy of nuclear fission is heating up the reactor core, the emitted fluxcan be approximated by comparing the thermal power output of nuclear power plants Pth withthe heating-increment, that is released per fission ⟨Efiss⟩. In order to do this approximation,
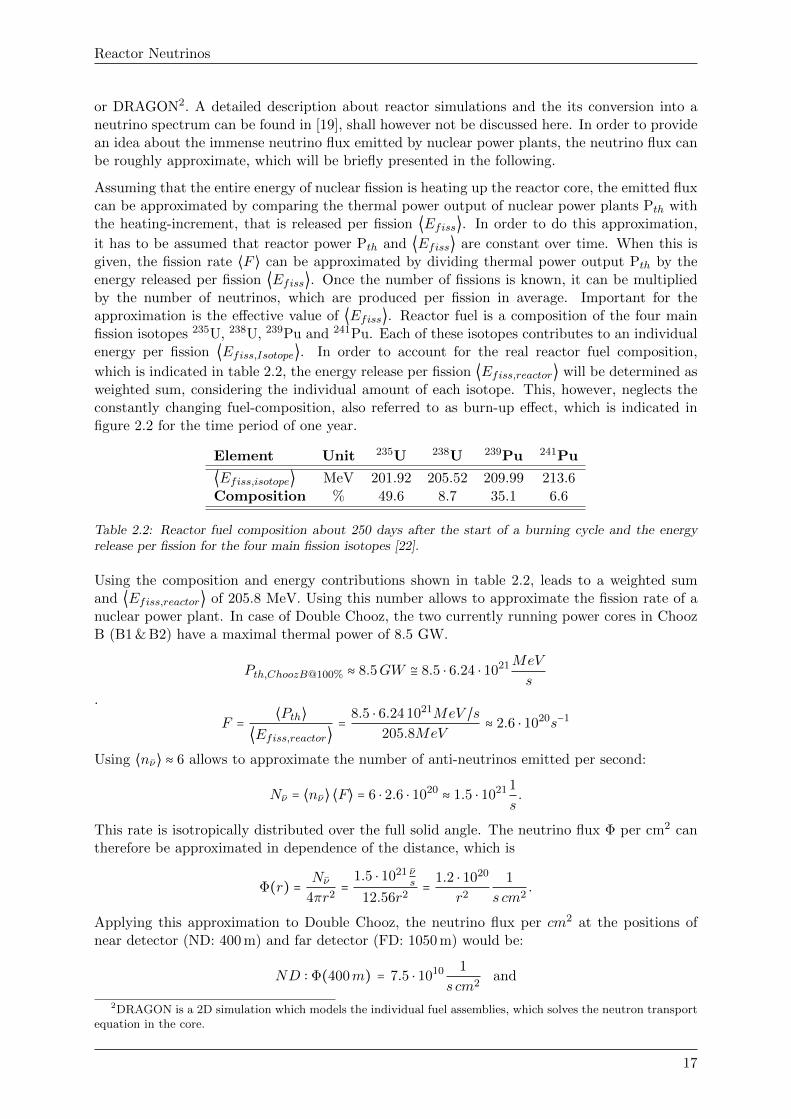
it has to be assumed that reactor power Pth and ⟨Efiss⟩ are constant over time. When this isgiven, the fission rate ⟨F ⟩ can be approximated by dividing thermal power output Pth by theenergy released per fission ⟨Efiss⟩. Once the number of fissions is known, it can be multipliedby the number of neutrinos, which are produced per fission in average. Important for theapproximation is the effective value of ⟨Efiss⟩. Reactor fuel is a composition of the four mainfission isotopes 235U, 238U, 239Pu and 241Pu. Each of these isotopes contributes to an individualenergy per fission ⟨Efiss,Isotope⟩. In order to account for the real reactor fuel composition,
which is indicated in table 2.2, the energy release per fission ⟨Efiss,reactor⟩ will be determined asweighted sum, considering the individual amount of each isotope. This, however, neglects theconstantly changing fuel-composition, also referred to as burn-up effect, which is indicated infigure 2.2 for the time period of one year.
Element Unit 235U 238U 239Pu 241Pu
⟨Efiss,isotope⟩ MeV 201.92 205.52 209.99 213.6
Composition % 49.6 8.7 35.1 6.6
Table 2.2: Reactor fuel composition about 250 days after the start of a burning cycle and the energyrelease per fission for the four main fission isotopes [22].
Using the composition and energy contributions shown in table 2.2, leads to a weighted sumand ⟨Efiss,reactor⟩ of 205.8 MeV. Using this number allows to approximate the fission rate of anuclear power plant. In case of Double Chooz, the two currently running power cores in ChoozB (B1 & B2) have a maximal thermal power of 8.5 GW.
Pth,ChoozB@100% ≈ 8.5GW ≅ 8.5 ⋅ 6.24 ⋅ 1021MeV
s
.
F = ⟨Pth⟩⟨Efiss,reactor⟩
= 8.5 ⋅ 6.24 1021MeV /s205.8MeV
≈ 2.6 ⋅ 1020s−1
Using ⟨nν⟩ ≈ 6 allows to approximate the number of anti-neutrinos emitted per second:
Nν = ⟨nν⟩ ⟨F⟩ = 6 ⋅ 2.6 ⋅ 1020 ≈ 1.5 ⋅ 1021 1
s.
This rate is isotropically distributed over the full solid angle. The neutrino flux Φ per cm2 cantherefore be approximated in dependence of the distance, which is
Φ(r) = Nν
4πr2=
1.5 ⋅ 1021 νs
12.56r2= 1.2 ⋅ 1020
r2
1
s cm2.
Applying this approximation to Double Chooz, the neutrino flux per cm2 at the positions ofnear detector (ND: 400 m) and far detector (FD: 1050 m) would be:
ND ∶ Φ(400m) = 7.5 ⋅ 1010 1
s cm2and
2DRAGON is a 2D simulation which models the individual fuel assemblies, which solves the neutron transportequation in the core.
17
Reactor Neutrinos
FD ∶ Φ(1050m) = 1.1 ⋅ 1010 1
s cm2.
Only 25% of this flux has enough energy to induce an inverse beta decay in the detector [3].Based on this neutrino flux values the measurable event rate in the near and far detector canbe approximated by:
Nν(r) = Φ(r) ⋅ σIBD ⋅Nprotons ⋅ εDetwhere Φ(r) is the neutrino flux at a certain distance, σIBD the cross section for the inversebeta decay, Nprotons the number of target protons and εDet an overall detection efficiency. Usingthe approximated neutrino flux, σIBD=5.25⋅10−43cm2 [22] and Nprotons=6.74⋅1029 [54] allows toapproximate the neutrino rate to:
Nν(ND) = 588 × εDet d−1
Nν(FD) = 84 × εDet d−1
Using a data taking efficiency of 71% (see figure 11.1) as well as a neutron detection efficiencyof 91.85% as presented in [22] leads to an εDet of about 65% which results in an expected rateof
Nν(ND) = 383d−1
Nν(FD) = 57d−1
Comparing this rough approximation with the actual measured neutrino rate in the DC-far de-tector (42 d−1, compare with fig. 11.12) shows that the used simplifications are reasonable.
18
Chapter 3
The Double Chooz Experiment
3.1 The Double Chooz Collaboration
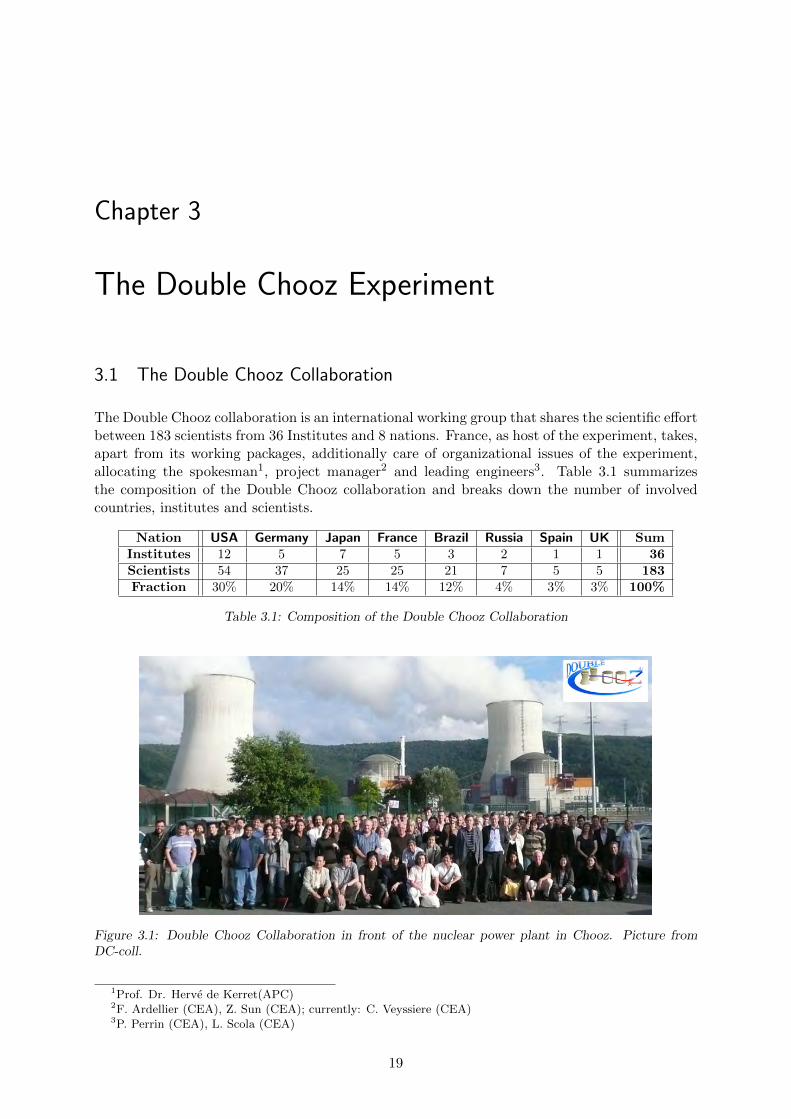
The Double Chooz collaboration is an international working group that shares the scientific effortbetween 183 scientists from 36 Institutes and 8 nations. France, as host of the experiment, takes,apart from its working packages, additionally care of organizational issues of the experiment,allocating the spokesman1, project manager2 and leading engineers3. Table 3.1 summarizesthe composition of the Double Chooz collaboration and breaks down the number of involvedcountries, institutes and scientists.
Nation USA Germany Japan France Brazil Russia Spain UK SumInstitutes 12 5 7 5 3 2 1 1 36Scientists 54 37 25 25 21 7 5 5 183Fraction 30% 20% 14% 14% 12% 4% 3% 3% 100%
Table 3.1: Composition of the Double Chooz Collaboration
Figure 3.1: Double Chooz Collaboration in front of the nuclear power plant in Chooz. Picture fromDC-coll.
1Prof. Dr. Herve de Kerret(APC)2F. Ardellier (CEA), Z. Sun (CEA); currently: C. Veyssiere (CEA)3P. Perrin (CEA), L. Scola (CEA)
19
The Double Chooz Experiment
3.2 Experimental Site: Commercial Nuclear Power Plant in Chooz
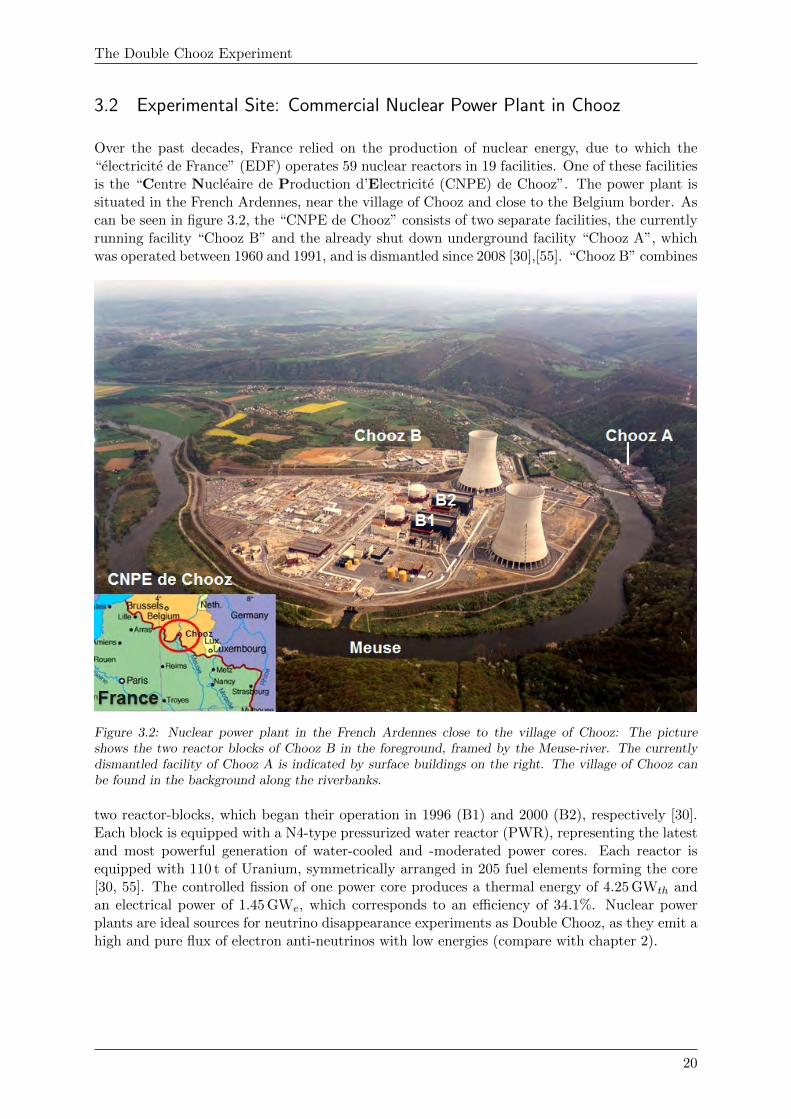
Over the past decades, France relied on the production of nuclear energy, due to which the“electricite de France” (EDF) operates 59 nuclear reactors in 19 facilities. One of these facilitiesis the “Centre Nucleaire de Production d’Electricite (CNPE) de Chooz”. The power plant issituated in the French Ardennes, near the village of Chooz and close to the Belgium border. Ascan be seen in figure 3.2, the “CNPE de Chooz” consists of two separate facilities, the currentlyrunning facility “Chooz B” and the already shut down underground facility “Chooz A”, whichwas operated between 1960 and 1991, and is dismantled since 2008 [30],[55]. “Chooz B” combines
Figure 3.2: Nuclear power plant in the French Ardennes close to the village of Chooz: The pictureshows the two reactor blocks of Chooz B in the foreground, framed by the Meuse-river. The currentlydismantled facility of Chooz A is indicated by surface buildings on the right. The village of Chooz canbe found in the background along the riverbanks.
two reactor-blocks, which began their operation in 1996 (B1) and 2000 (B2), respectively [30].Each block is equipped with a N4-type pressurized water reactor (PWR), representing the latestand most powerful generation of water-cooled and -moderated power cores. Each reactor isequipped with 110 t of Uranium, symmetrically arranged in 205 fuel elements forming the core[30, 55]. The controlled fission of one power core produces a thermal energy of 4.25 GWth andan electrical power of 1.45 GWe, which corresponds to an efficiency of 34.1%. Nuclear powerplants are ideal sources for neutrino disappearance experiments as Double Chooz, as they emit ahigh and pure flux of electron anti-neutrinos with low energies (compare with chapter 2).
20
The Double Chooz Experiment
3.3 Physics Program and Experimental Concept
Physics Program
The Double Chooz experiment aims for a high precision measurement of the recently foundmixing angle Θ13 as part of the neutrino mixing matrix [34, 23, 24]. The completion of theleptonic mixing matrix clears the way for future precision experiments, searching for CP-violationin the leptonic sector or the neutrino mass hierarchy. In addition, Double Chooz supports theInternational Atomic Energy Agency (IAEA) in investigating the possibility to monitor nuclearpower cores with neutrino detectors as part of their non-proliferation efforts. As neutrinoscannot be shielded, but carry information about the fissile materials, as well as the fission rate,neutrino detectors could be used to monitor the power-level and the amount and composition offissile materials within nuclear power plants. The implementation of such an independent toolwould be a significant improvement to the international efforts of non-proliferation and help tokeep track of fissile materials.
Experimental Concept
In order to measure the disappearance effect of reactor neutrinos one has to know the number ofactually emitted neutrinos and the number of neutrinos at a certain distance form the power core.The truly emitted neutrino flux can either be calculated (simulated) or it can be measured usinga second detector. The Double Chooz experiment is realizing both scenarios in two differentexperimental phases.
During the first phase, Double Chooz repeats the CHOOZ-experiment using only one detectorwith a distance of 1050 m from the reactors. For the first phase of Double Chooz, the expectedν-signal for the far detector has to be obtained by calculation, which is based on a actuallymeasured neutrino spectrum from the former Bugey-4-experiment [21]. Using reactor evolutionsimulations, this spectrum is adapted to the present situation in Chooz B and finally used forthe prediction of a no-oscillation-signal. The far detector is then used to measure the oscillatedand therefore reduced neutrino flux, which can then be compared to the expectation. Thisapproach, was already used by the CHOOZ-experiment, suffered however from the necessaryassumptions regarding the neutrino production process in nuclear power cores, which lead tosystematic errors in the range of 2 - 3 %.In the second phase Double Chooz will improve this situation by employing a second, neardetector with only an averaged distance of 400 m from the cores. This near detector is supposedto measure the actual emitted neutrino flux before oscillation-effects have to be considered (seefigure 3.4). Using this unoscillated ν-flux, the expected neutrino signal for the position of thefar detector can be predicted completely independent from simulations or any reactor basedassumptions. Hence, the employment of a second detector is a significant improvement and willallow a relative measurement, which will reduce the systematic uncertainties of the experimentsignificantly. In order to facilitate the later analysis of the two different oscillation base lines,both detectors will be installed on the iso-flux-line. The line on which the neutrino-flux-ratioof both reactors is equal for both detectors. Figure 3.3 provides an overview of the facilityin Chooz and the relative positions two underground lab, which are used to host near- andfar-detector.
In addition Double Chooz improved the experimental situation by employing a new detectordesign. Both detectors are equally designed and are composed of four concentrically nestedvessels, each filled with different newly developed detector liquids. The detector is optimized toreduce the disturbing influence of background events using several layers of as passive shielding
21
The Double Chooz Experiment
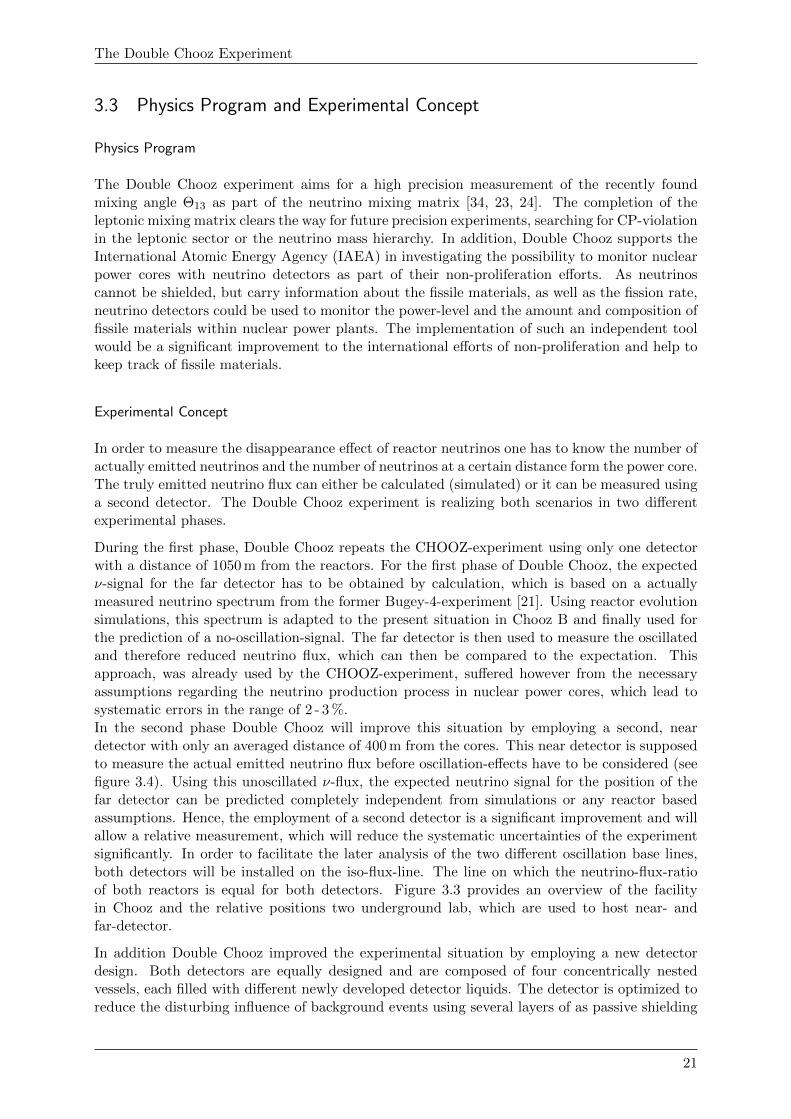
Figure 3.3: Overview scheme of CNPE de Chooz: Indicated are the two power cores B1 (purple) and B2(yellow), as well as the location of the near and far detector (red circles). The individual base lines areshown in black. The Double Chooz detector setup comprises two underground laboratories, a far one,which has already been used for the Chooz experiment, and a near one, which is currently excavated.The “far lab” is affiliated to Chooz A and lays on the far side of the river, providing an average distanceof 1050 m from the two cores. It is 17 m below ground and was additionally driven into a hill, whatprovides an additional rock overburden leading to a passive shielding of 300 m.w.e. The new “near lab”will be excavated below a smaller geological elevation just outside of Chooz B, which leads to an averageddistance of 400 m and a rock overburden corresponding to 120 m of water. Both underground labs areequipped with a drivable entrance tunnel, connecting the labs with necessary surface installations.
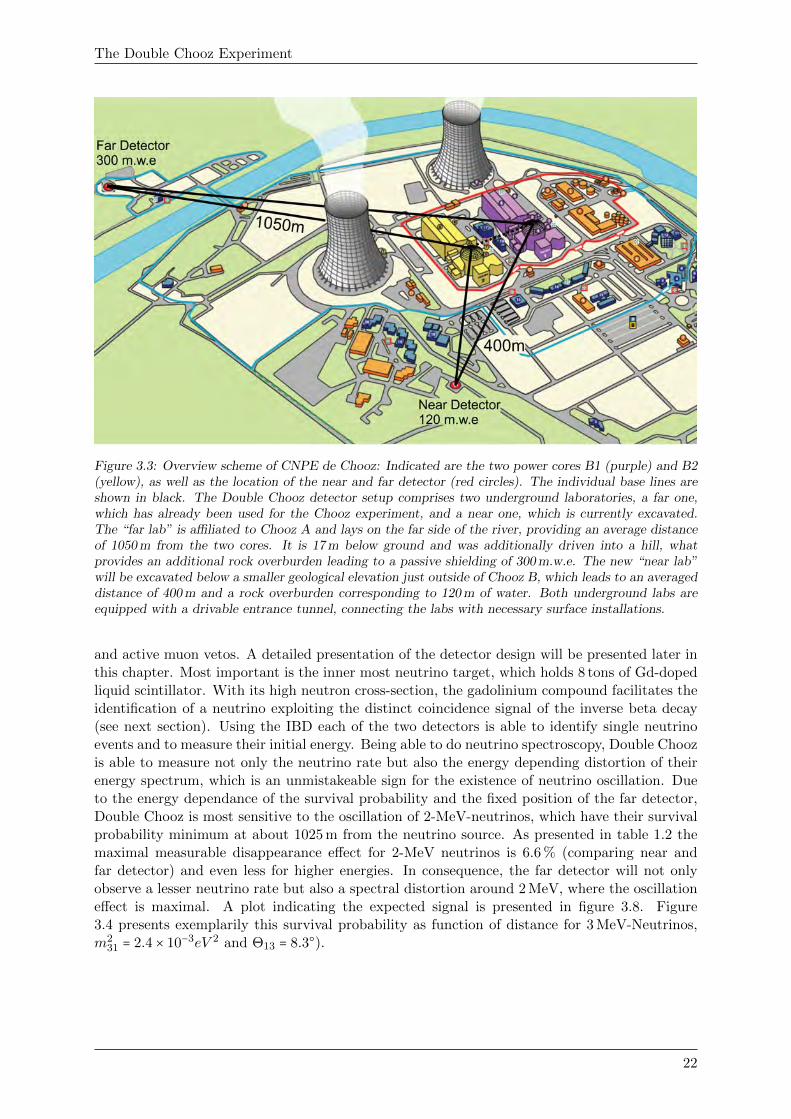
and active muon vetos. A detailed presentation of the detector design will be presented later inthis chapter. Most important is the inner most neutrino target, which holds 8 tons of Gd-dopedliquid scintillator. With its high neutron cross-section, the gadolinium compound facilitates theidentification of a neutrino exploiting the distinct coincidence signal of the inverse beta decay(see next section). Using the IBD each of the two detectors is able to identify single neutrinoevents and to measure their initial energy. Being able to do neutrino spectroscopy, Double Choozis able to measure not only the neutrino rate but also the energy depending distortion of theirenergy spectrum, which is an unmistakeable sign for the existence of neutrino oscillation. Dueto the energy dependance of the survival probability and the fixed position of the far detector,Double Chooz is most sensitive to the oscillation of 2-MeV-neutrinos, which have their survivalprobability minimum at about 1025 m from the neutrino source. As presented in table 1.2 themaximal measurable disappearance effect for 2-MeV neutrinos is 6.6 % (comparing near andfar detector) and even less for higher energies. In consequence, the far detector will not onlyobserve a lesser neutrino rate but also a spectral distortion around 2 MeV, where the oscillationeffect is maximal. A plot indicating the expected signal is presented in figure 3.8. Figure3.4 presents exemplarily this survival probability as function of distance for 3 MeV-Neutrinos,m2
31 = 2.4 × 10⁻³eV 2 and Θ13 = 8.3○).
22
The Double Chooz Experiment
1000500200 2000300150 1500700LHmL
0.92
0.94
0.96
0.98
1.00
SurvivalProbabilityH%L
E = 3 MeV
sin
(2
θ )
21
3
ν0 13L = 1.23 Δm / E
ND FD
Figure 3.4: Survival probability of νe’s, assuming (E = 3 MeV, ∆m231 = 2.4× 10⁻³eV 2 and Θ13 = 8.3○). At
L0, the oscillation amplitude is maximal and sin2(2Θ13) converts about 10 % of the emitted νes into νµτto which the detector is insensitive4 The vertical lines represent the positions, the horizontal lines theindividual survival probability of near- (ND) and far-detector (FD). The difference between the latterindicates the maximal measurable disappearance effect of 6 %.
3.4 Signal
3.4.1 The Inverse Beta Decay (IBD)
The inverse beta decay describes the neutrino induced conversion of a proton into a neutron[27, 3]. As the neutron is heavier than the proton the incoming anti neutrino has to provide atleast the energy Qth to initialize the conversion, which is given by:
Qth =mnc2 −mpc
2 +me+c2
= (939.56 − 938.27 + 0.51)MeV .
= 1.80MeV
The inverse beta decay is the main detection channel for reactor neutrinos. Table 3.2 summarizesthe Qth-values for IBDs, which can be induced by the different neutrino flavors.
Channel IBD with ν Energy Threshold
Electronic νe + p→ e+ + n Qth,e = 1.80MeV
Muonic νµ + p→ µ+ + n Qth,µ = 106.94MeV
Tauonic ντ + p→ τ+ + n Qth,τ = 1778.28MeV
Table 3.2: Inverse beta decay channels, including their necessary energy threshold Qth [27, 3].
Comparing the different channels and the corresponding energy thresholds Qth of table 3.2 withthe energy spectrum of reactor neutrinos (0 < Eνe < 12MeV ), illustrates that reactor neutrinoscan only induce the electronic IBD-channel. This characteristic makes them ideal for reactor
23
The Double Chooz Experiment
disappearance experiments, as all detected IBDs are the result of νe, but not νµ,τ , which allowsa clean measurement of the oscillation effect.
3.4.2 Signature of the IBD
Figure 3.5: An IBD-event produces a de-layed coincidence composed of prompt anddelayed event.
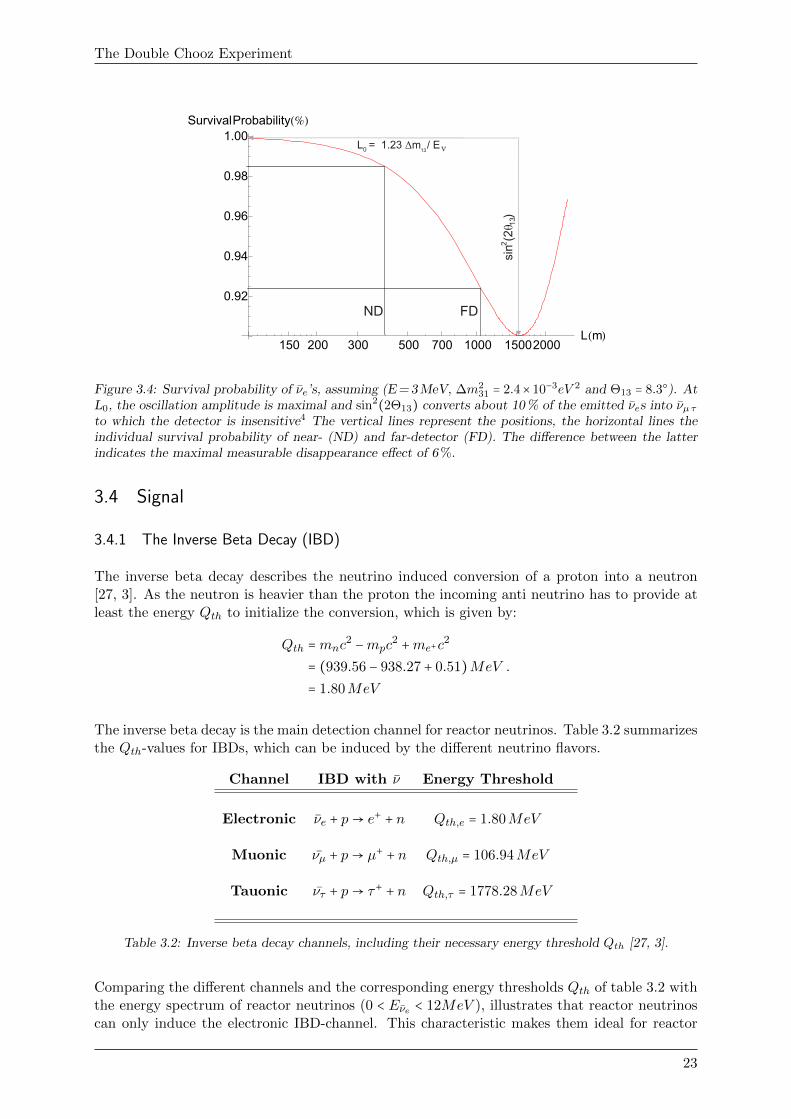
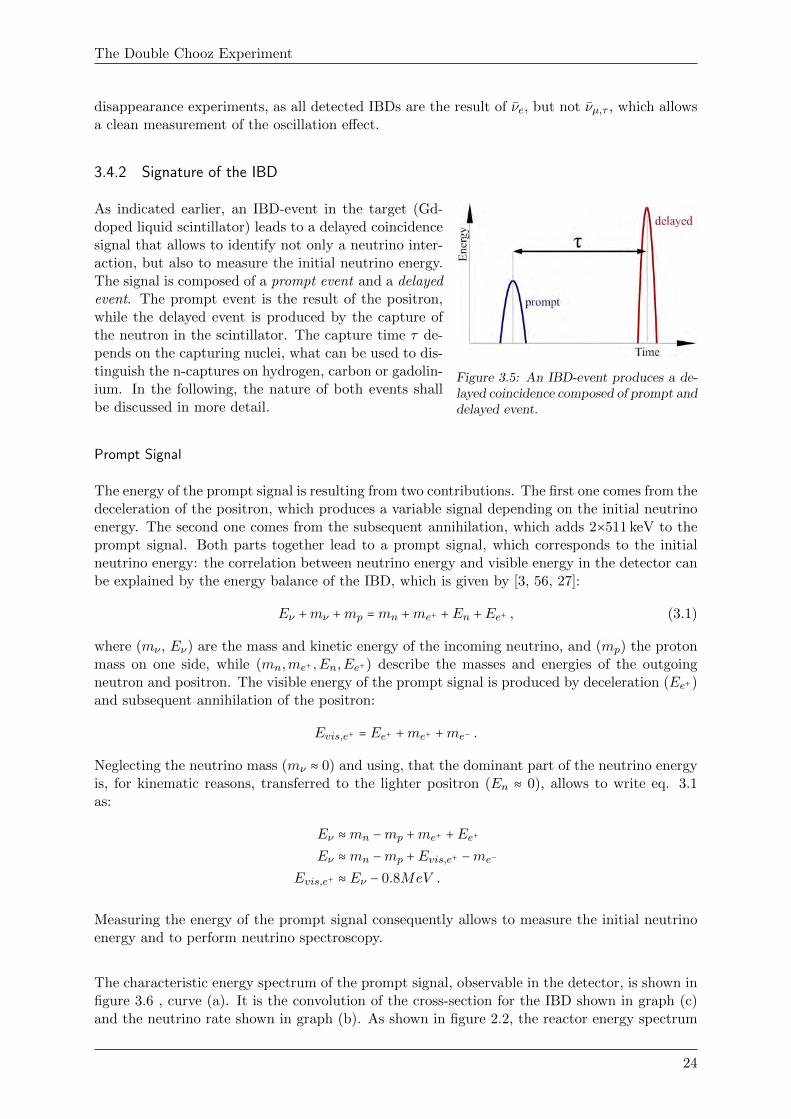
As indicated earlier, an IBD-event in the target (Gd-doped liquid scintillator) leads to a delayed coincidencesignal that allows to identify not only a neutrino inter-action, but also to measure the initial neutrino energy.The signal is composed of a prompt event and a delayedevent. The prompt event is the result of the positron,while the delayed event is produced by the capture ofthe neutron in the scintillator. The capture time τ de-pends on the capturing nuclei, what can be used to dis-tinguish the n-captures on hydrogen, carbon or gadolin-ium. In the following, the nature of both events shallbe discussed in more detail.
Prompt Signal
The energy of the prompt signal is resulting from two contributions. The first one comes from thedeceleration of the positron, which produces a variable signal depending on the initial neutrinoenergy. The second one comes from the subsequent annihilation, which adds 2×511 keV to theprompt signal. Both parts together lead to a prompt signal, which corresponds to the initialneutrino energy: the correlation between neutrino energy and visible energy in the detector canbe explained by the energy balance of the IBD, which is given by [3, 56, 27]:
Eν +mν +mp =mn +me+ +En +Ee+ , (3.1)
where (mν , Eν) are the mass and kinetic energy of the incoming neutrino, and (mp) the protonmass on one side, while (mn,me+ ,En,Ee+) describe the masses and energies of the outgoingneutron and positron. The visible energy of the prompt signal is produced by deceleration (Ee+)and subsequent annihilation of the positron:
Evis,e+ = Ee+ +me+ +me− .
Neglecting the neutrino mass (mν ≈ 0) and using, that the dominant part of the neutrino energyis, for kinematic reasons, transferred to the lighter positron (En ≈ 0), allows to write eq. 3.1as:
Eν ≈mn −mp +me+ +Ee+Eν ≈mn −mp +Evis,e+ −me−
Evis,e+ ≈ Eν − 0.8MeV .
Measuring the energy of the prompt signal consequently allows to measure the initial neutrinoenergy and to perform neutrino spectroscopy.
The characteristic energy spectrum of the prompt signal, observable in the detector, is shown infigure 3.6 , curve (a). It is the convolution of the cross-section for the IBD shown in graph (c)and the neutrino rate shown in graph (b). As shown in figure 2.2, the reactor energy spectrum
24
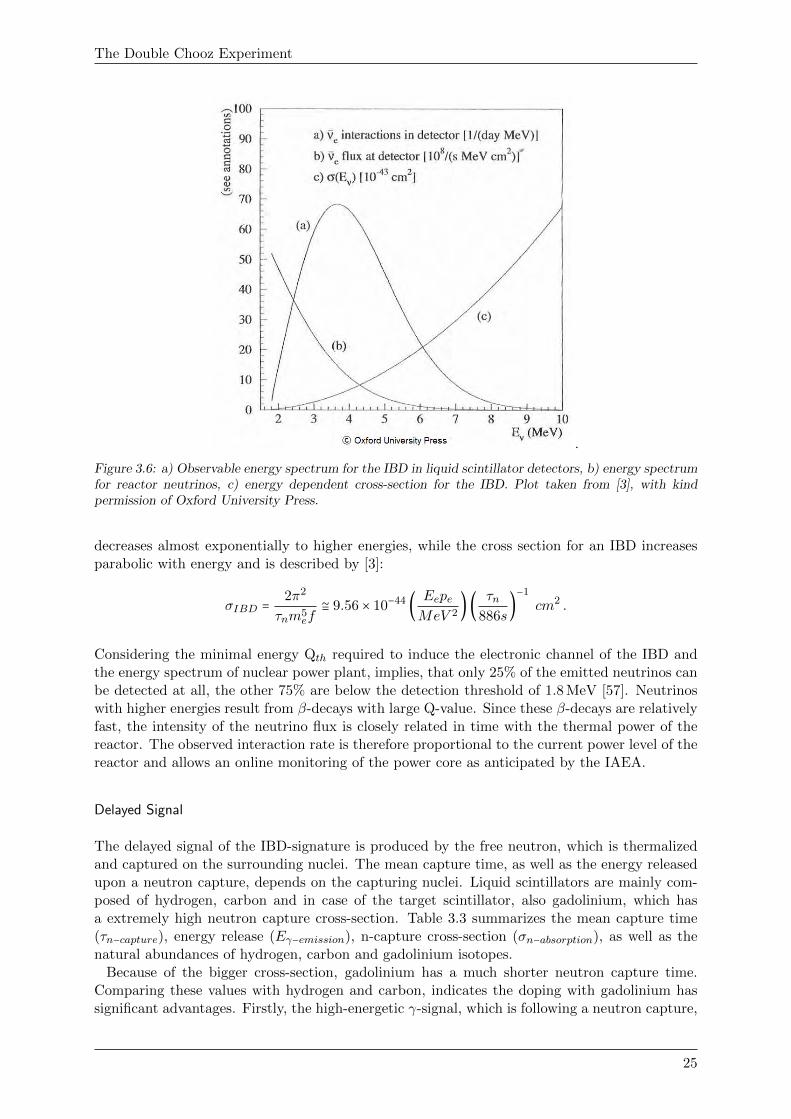
The Double Chooz Experiment
.
Figure 3.6: a) Observable energy spectrum for the IBD in liquid scintillator detectors, b) energy spectrumfor reactor neutrinos, c) energy dependent cross-section for the IBD. Plot taken from [3], with kindpermission of Oxford University Press.
decreases almost exponentially to higher energies, while the cross section for an IBD increasesparabolic with energy and is described by [3]:
σIBD = 2π2
τnm5ef
≅ 9.56 × 10−44 ( EepeMeV 2
)( τn886s
)−1
cm2 .
Considering the minimal energy Qth required to induce the electronic channel of the IBD andthe energy spectrum of nuclear power plant, implies, that only 25% of the emitted neutrinos canbe detected at all, the other 75% are below the detection threshold of 1.8 MeV [57]. Neutrinoswith higher energies result from β-decays with large Q-value. Since these β-decays are relativelyfast, the intensity of the neutrino flux is closely related in time with the thermal power of thereactor. The observed interaction rate is therefore proportional to the current power level of thereactor and allows an online monitoring of the power core as anticipated by the IAEA.
Delayed Signal
The delayed signal of the IBD-signature is produced by the free neutron, which is thermalizedand captured on the surrounding nuclei. The mean capture time, as well as the energy releasedupon a neutron capture, depends on the capturing nuclei. Liquid scintillators are mainly com-posed of hydrogen, carbon and in case of the target scintillator, also gadolinium, which hasa extremely high neutron capture cross-section. Table 3.3 summarizes the mean capture time(τn−capture), energy release (Eγ−emission), n-capture cross-section (σn−absorption), as well as thenatural abundances of hydrogen, carbon and gadolinium isotopes.
Because of the bigger cross-section, gadolinium has a much shorter neutron capture time.Comparing these values with hydrogen and carbon, indicates the doping with gadolinium hassignificant advantages. Firstly, the high-energetic γ-signal, which is following a neutron capture,
25
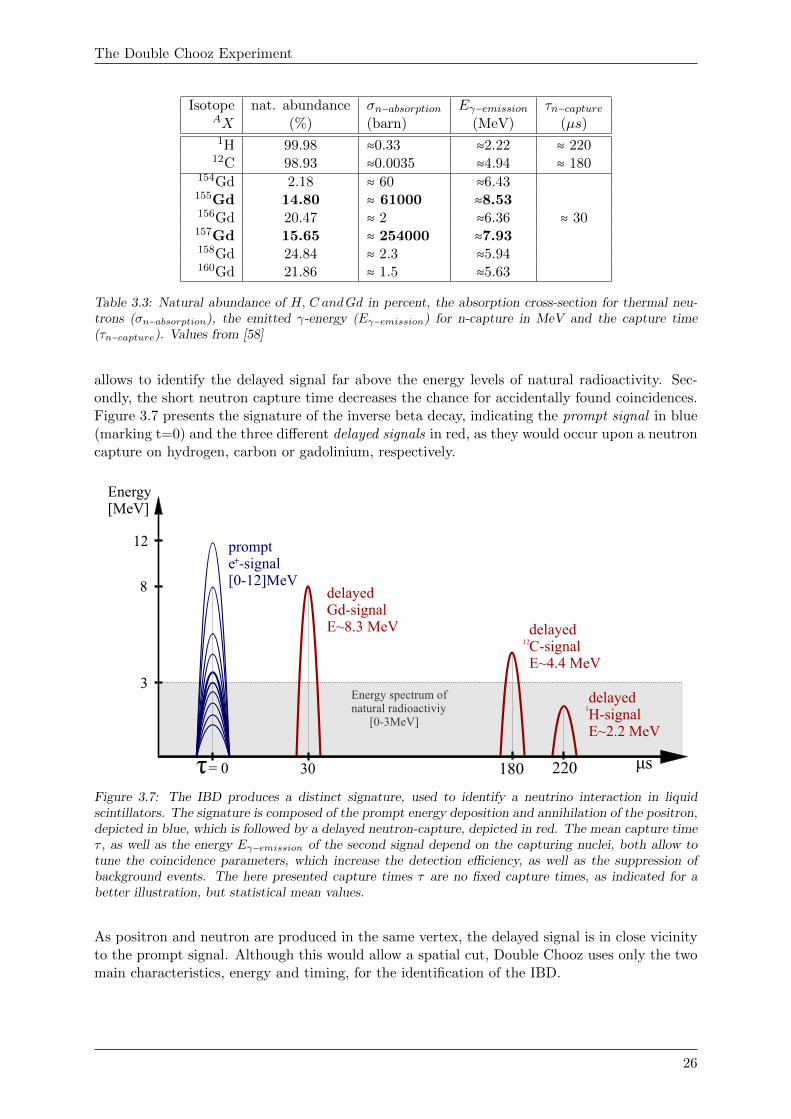
The Double Chooz Experiment
Isotope nat. abundance σn−absorption Eγ−emission τn−captureAX (%) (barn) (MeV) (µs)1H 99.98 ≈0.33 ≈2.22 ≈ 220
12C 98.93 ≈0.0035 ≈4.94 ≈ 180154Gd 2.18 ≈ 60 ≈6.43155Gd 14.80 ≈ 61000 ≈8.53156Gd 20.47 ≈ 2 ≈6.36 ≈ 30157Gd 15.65 ≈ 254000 ≈7.93158Gd 24.84 ≈ 2.3 ≈5.94160Gd 21.86 ≈ 1.5 ≈5.63
Table 3.3: Natural abundance of H, C andGd in percent, the absorption cross-section for thermal neu-trons (σn−absorption), the emitted γ-energy (Eγ−emission) for n-capture in MeV and the capture time(τn−capture). Values from [58]
allows to identify the delayed signal far above the energy levels of natural radioactivity. Sec-ondly, the short neutron capture time decreases the chance for accidentally found coincidences.Figure 3.7 presents the signature of the inverse beta decay, indicating the prompt signal in blue(marking t=0) and the three different delayed signals in red, as they would occur upon a neutroncapture on hydrogen, carbon or gadolinium, respectively.
μs
Energy[MeV]
prompte -signal[0-12]MeV
delayedH-signalE~2.2 MeV
τ 30 180 220 = 0
delayedGd-signalE~8.3 MeV delayed
C-signalE~4.4 MeV
12
1
3
8
Energy spectrum of natural radioactiviy [0-3MeV]
+
12
Figure 3.7: The IBD produces a distinct signature, used to identify a neutrino interaction in liquidscintillators. The signature is composed of the prompt energy deposition and annihilation of the positron,depicted in blue, which is followed by a delayed neutron-capture, depicted in red. The mean capture timeτ , as well as the energy Eγ−emission of the second signal depend on the capturing nuclei, both allow totune the coincidence parameters, which increase the detection efficiency, as well as the suppression ofbackground events. The here presented capture times τ are no fixed capture times, as indicated for abetter illustration, but statistical mean values.
As positron and neutron are produced in the same vertex, the delayed signal is in close vicinityto the prompt signal. Although this would allow a spatial cut, Double Chooz uses only the twomain characteristics, energy and timing, for the identification of the IBD.
26
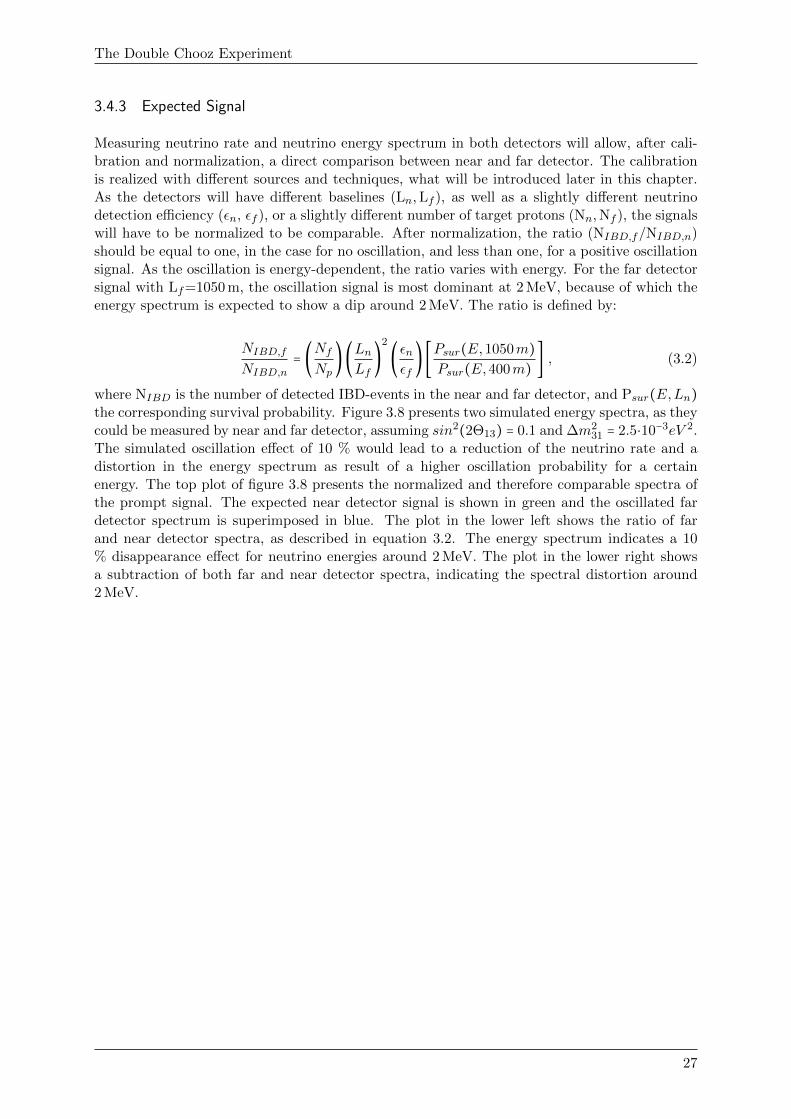
The Double Chooz Experiment
3.4.3 Expected Signal
Measuring neutrino rate and neutrino energy spectrum in both detectors will allow, after cali-bration and normalization, a direct comparison between near and far detector. The calibrationis realized with different sources and techniques, what will be introduced later in this chapter.As the detectors will have different baselines (Ln, Lf ), as well as a slightly different neutrinodetection efficiency (εn, εf ), or a slightly different number of target protons (Nn, Nf ), the signalswill have to be normalized to be comparable. After normalization, the ratio (NIBD,f/NIBD,n)should be equal to one, in the case for no oscillation, and less than one, for a positive oscillationsignal. As the oscillation is energy-dependent, the ratio varies with energy. For the far detectorsignal with Lf=1050 m, the oscillation signal is most dominant at 2 MeV, because of which theenergy spectrum is expected to show a dip around 2 MeV. The ratio is defined by:
NIBD,f
NIBD,n= (Nf
Np)(Ln
Lf)
2
(εnεf
)[Psur(E,1050m)Psur(E,400m) ] , (3.2)
where NIBD is the number of detected IBD-events in the near and far detector, and Psur(E,Ln)the corresponding survival probability. Figure 3.8 presents two simulated energy spectra, as theycould be measured by near and far detector, assuming sin2(2Θ13) = 0.1 and ∆m2
31 = 2.5⋅10−3eV 2.The simulated oscillation effect of 10 % would lead to a reduction of the neutrino rate and adistortion in the energy spectrum as result of a higher oscillation probability for a certainenergy. The top plot of figure 3.8 presents the normalized and therefore comparable spectra ofthe prompt signal. The expected near detector signal is shown in green and the oscillated fardetector spectrum is superimposed in blue. The plot in the lower left shows the ratio of farand near detector spectra, as described in equation 3.2. The energy spectrum indicates a 10% disappearance effect for neutrino energies around 2 MeV. The plot in the lower right showsa subtraction of both far and near detector spectra, indicating the spectral distortion around2 MeV.
27
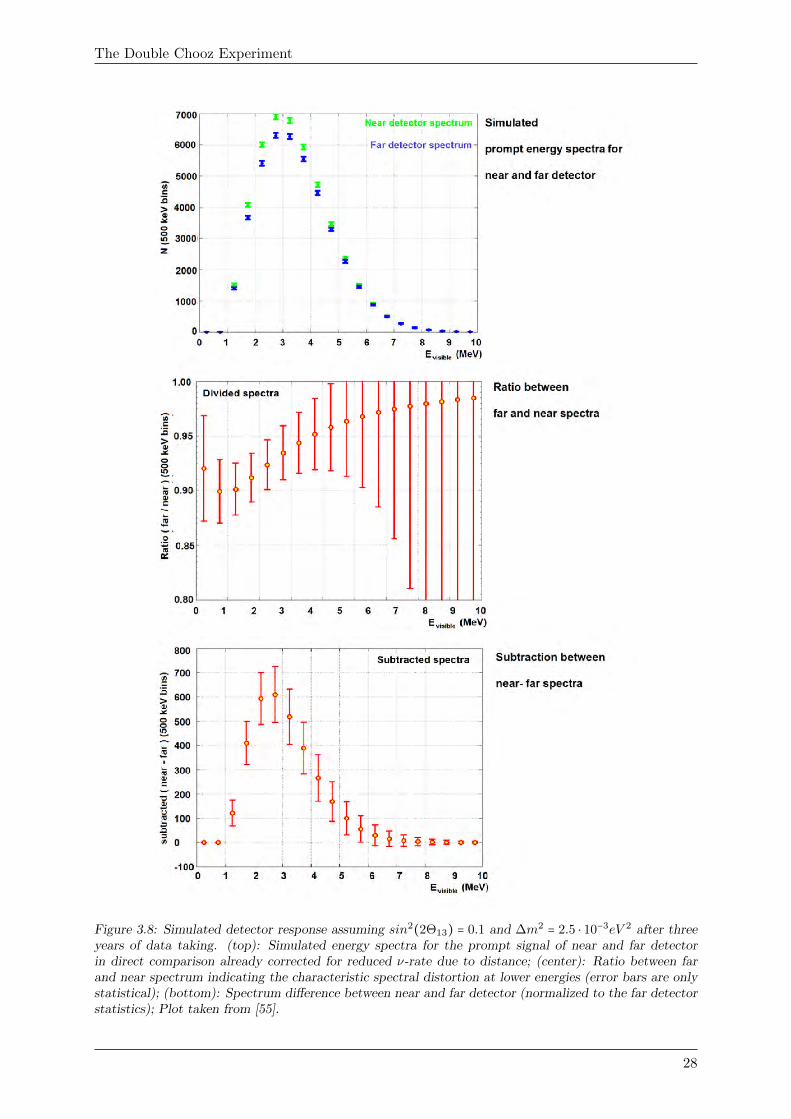
The Double Chooz Experiment
Figure 3.8: Simulated detector response assuming sin2(2Θ13) = 0.1 and ∆m2 = 2.5 ⋅ 10−3eV 2 after threeyears of data taking. (top): Simulated energy spectra for the prompt signal of near and far detectorin direct comparison already corrected for reduced ν-rate due to distance; (center): Ratio between farand near spectrum indicating the characteristic spectral distortion at lower energies (error bars are onlystatistical); (bottom): Spectrum difference between near and far detector (normalized to the far detectorstatistics); Plot taken from [55].
28
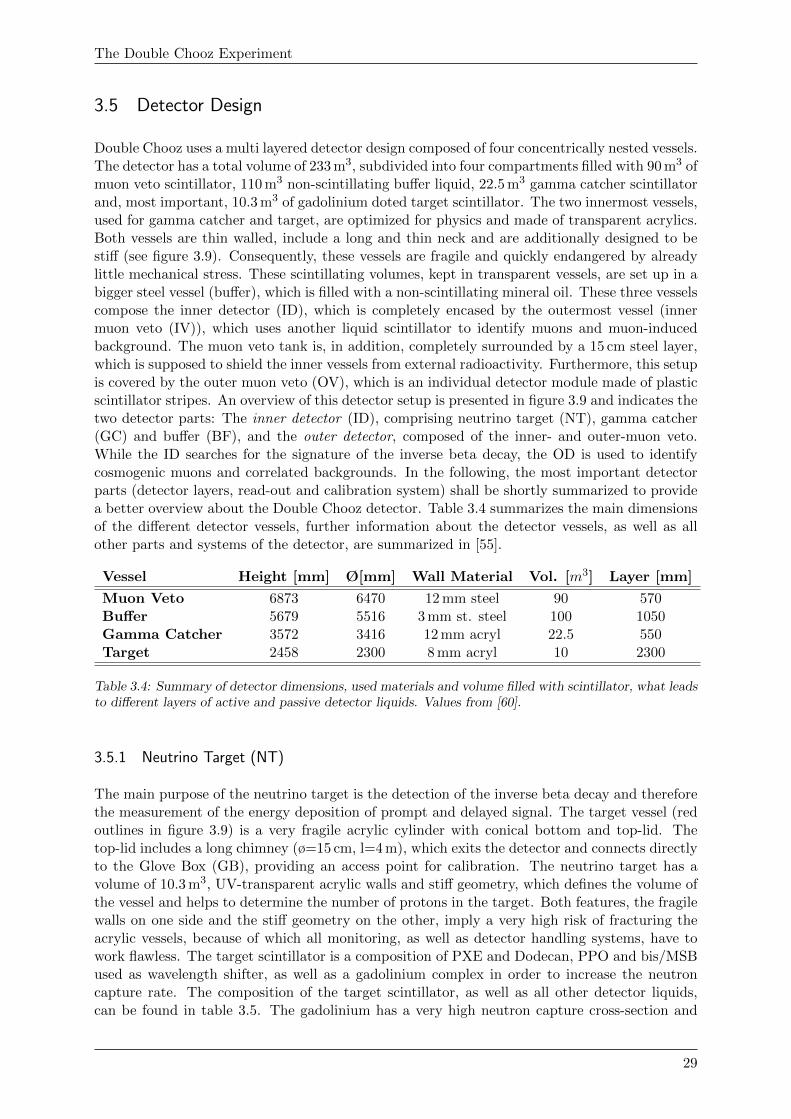
The Double Chooz Experiment
3.5 Detector Design
Double Chooz uses a multi layered detector design composed of four concentrically nested vessels.The detector has a total volume of 233 m3, subdivided into four compartments filled with 90 m3 ofmuon veto scintillator, 110 m3 non-scintillating buffer liquid, 22.5 m3 gamma catcher scintillatorand, most important, 10.3 m3 of gadolinium doted target scintillator. The two innermost vessels,used for gamma catcher and target, are optimized for physics and made of transparent acrylics.Both vessels are thin walled, include a long and thin neck and are additionally designed to bestiff (see figure 3.9). Consequently, these vessels are fragile and quickly endangered by alreadylittle mechanical stress. These scintillating volumes, kept in transparent vessels, are set up in abigger steel vessel (buffer), which is filled with a non-scintillating mineral oil. These three vesselscompose the inner detector (ID), which is completely encased by the outermost vessel (innermuon veto (IV)), which uses another liquid scintillator to identify muons and muon-inducedbackground. The muon veto tank is, in addition, completely surrounded by a 15 cm steel layer,which is supposed to shield the inner vessels from external radioactivity. Furthermore, this setupis covered by the outer muon veto (OV), which is an individual detector module made of plasticscintillator stripes. An overview of this detector setup is presented in figure 3.9 and indicates thetwo detector parts: The inner detector (ID), comprising neutrino target (NT), gamma catcher(GC) and buffer (BF), and the outer detector, composed of the inner- and outer-muon veto.While the ID searches for the signature of the inverse beta decay, the OD is used to identifycosmogenic muons and correlated backgrounds. In the following, the most important detectorparts (detector layers, read-out and calibration system) shall be shortly summarized to providea better overview about the Double Chooz detector. Table 3.4 summarizes the main dimensionsof the different detector vessels, further information about the detector vessels, as well as allother parts and systems of the detector, are summarized in [55].
Vessel Height [mm] Ø[mm] Wall Material Vol. [m3] Layer [mm]
Muon Veto 6873 6470 12 mm steel 90 570Buffer 5679 5516 3 mm st. steel 100 1050Gamma Catcher 3572 3416 12 mm acryl 22.5 550Target 2458 2300 8 mm acryl 10 2300
Table 3.4: Summary of detector dimensions, used materials and volume filled with scintillator, what leadsto different layers of active and passive detector liquids. Values from [60].
3.5.1 Neutrino Target (NT)
The main purpose of the neutrino target is the detection of the inverse beta decay and thereforethe measurement of the energy deposition of prompt and delayed signal. The target vessel (redoutlines in figure 3.9) is a very fragile acrylic cylinder with conical bottom and top-lid. Thetop-lid includes a long chimney (ø=15 cm, l=4 m), which exits the detector and connects directlyto the Glove Box (GB), providing an access point for calibration. The neutrino target has avolume of 10.3 m3, UV-transparent acrylic walls and stiff geometry, which defines the volume ofthe vessel and helps to determine the number of protons in the target. Both features, the fragilewalls on one side and the stiff geometry on the other, imply a very high risk of fracturing theacrylic vessels, because of which all monitoring, as well as detector handling systems, have towork flawless. The target scintillator is a composition of PXE and Dodecan, PPO and bis/MSBused as wavelength shifter, as well as a gadolinium complex in order to increase the neutroncapture rate. The composition of the target scintillator, as well as all other detector liquids,can be found in table 3.5. The gadolinium has a very high neutron capture cross-section and
29
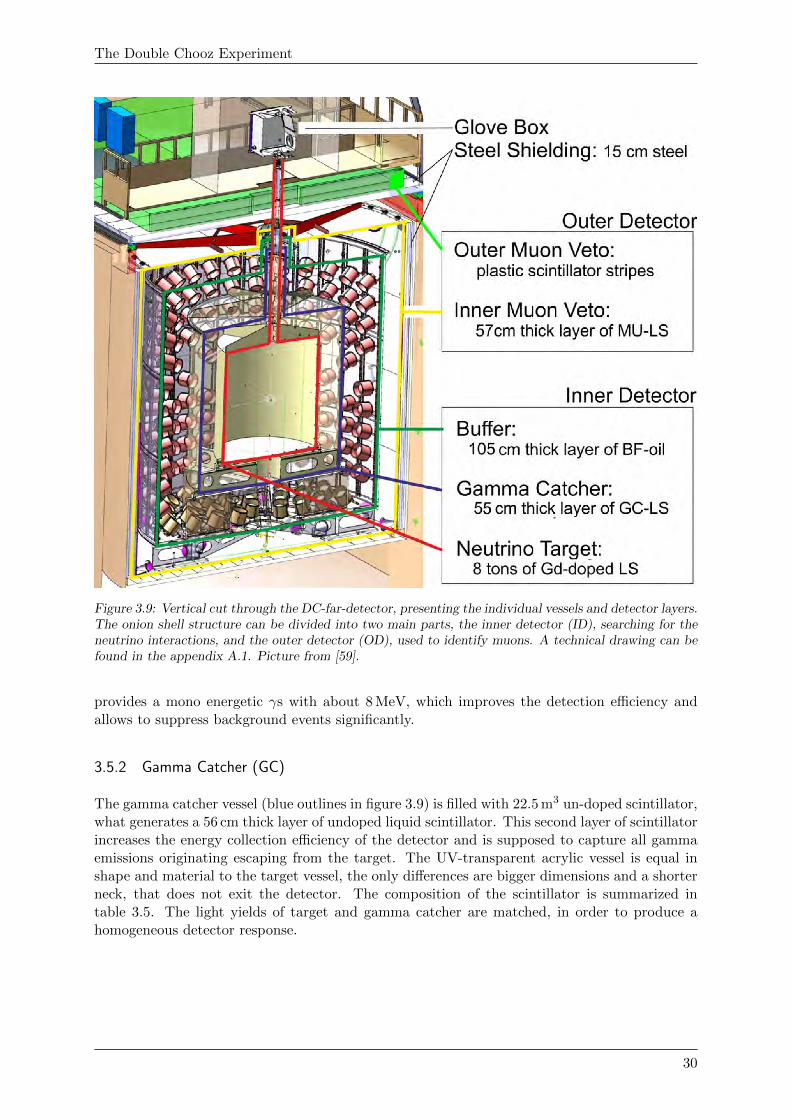
The Double Chooz Experiment
Figure 3.9: Vertical cut through the DC-far-detector, presenting the individual vessels and detector layers.The onion shell structure can be divided into two main parts, the inner detector (ID), searching for theneutrino interactions, and the outer detector (OD), used to identify muons. A technical drawing can befound in the appendix A.1. Picture from [59].
provides a mono energetic γs with about 8 MeV, which improves the detection efficiency andallows to suppress background events significantly.
3.5.2 Gamma Catcher (GC)
The gamma catcher vessel (blue outlines in figure 3.9) is filled with 22.5 m3 un-doped scintillator,what generates a 56 cm thick layer of undoped liquid scintillator. This second layer of scintillatorincreases the energy collection efficiency of the detector and is supposed to capture all gammaemissions originating escaping from the target. The UV-transparent acrylic vessel is equal inshape and material to the target vessel, the only differences are bigger dimensions and a shorterneck, that does not exit the detector. The composition of the scintillator is summarized intable 3.5. The light yields of target and gamma catcher are matched, in order to produce ahomogeneous detector response.
30
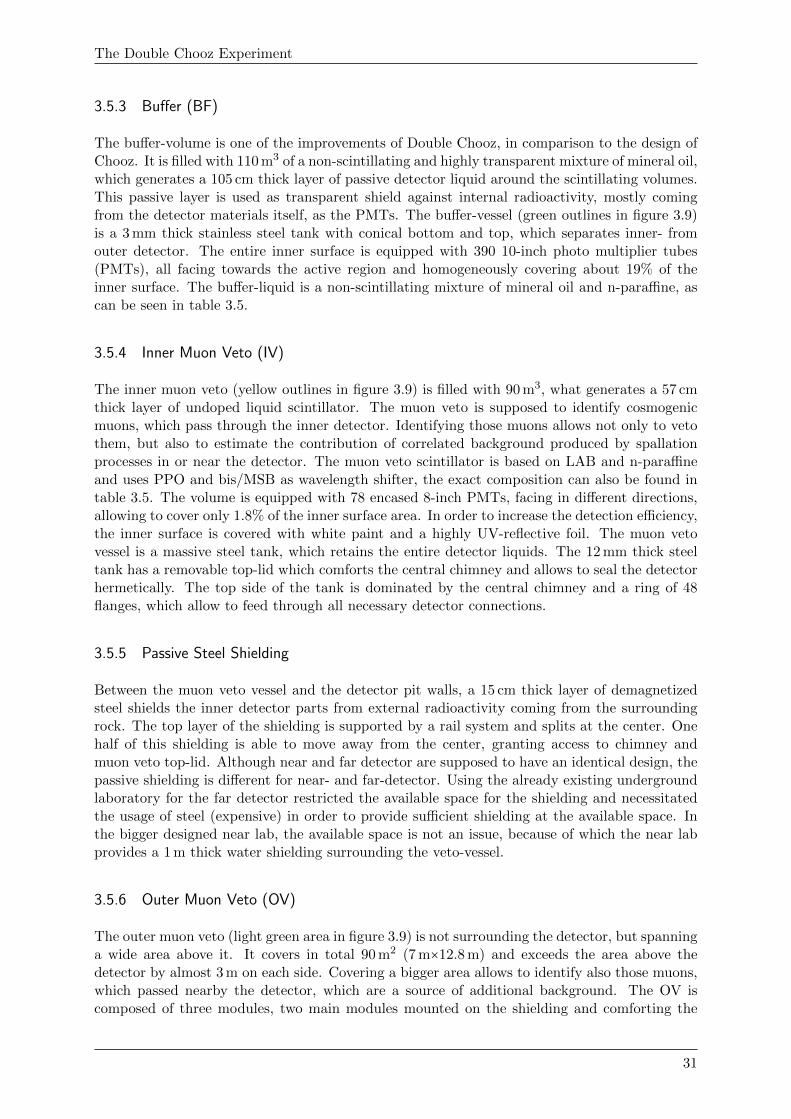
The Double Chooz Experiment
3.5.3 Buffer (BF)
The buffer-volume is one of the improvements of Double Chooz, in comparison to the design ofChooz. It is filled with 110 m3 of a non-scintillating and highly transparent mixture of mineral oil,which generates a 105 cm thick layer of passive detector liquid around the scintillating volumes.This passive layer is used as transparent shield against internal radioactivity, mostly comingfrom the detector materials itself, as the PMTs. The buffer-vessel (green outlines in figure 3.9)is a 3 mm thick stainless steel tank with conical bottom and top, which separates inner- fromouter detector. The entire inner surface is equipped with 390 10-inch photo multiplier tubes(PMTs), all facing towards the active region and homogeneously covering about 19% of theinner surface. The buffer-liquid is a non-scintillating mixture of mineral oil and n-paraffine, ascan be seen in table 3.5.
3.5.4 Inner Muon Veto (IV)
The inner muon veto (yellow outlines in figure 3.9) is filled with 90 m3, what generates a 57 cmthick layer of undoped liquid scintillator. The muon veto is supposed to identify cosmogenicmuons, which pass through the inner detector. Identifying those muons allows not only to vetothem, but also to estimate the contribution of correlated background produced by spallationprocesses in or near the detector. The muon veto scintillator is based on LAB and n-paraffineand uses PPO and bis/MSB as wavelength shifter, the exact composition can also be found intable 3.5. The volume is equipped with 78 encased 8-inch PMTs, facing in different directions,allowing to cover only 1.8% of the inner surface area. In order to increase the detection efficiency,the inner surface is covered with white paint and a highly UV-reflective foil. The muon vetovessel is a massive steel tank, which retains the entire detector liquids. The 12 mm thick steeltank has a removable top-lid which comforts the central chimney and allows to seal the detectorhermetically. The top side of the tank is dominated by the central chimney and a ring of 48flanges, which allow to feed through all necessary detector connections.
3.5.5 Passive Steel Shielding
Between the muon veto vessel and the detector pit walls, a 15 cm thick layer of demagnetizedsteel shields the inner detector parts from external radioactivity coming from the surroundingrock. The top layer of the shielding is supported by a rail system and splits at the center. Onehalf of this shielding is able to move away from the center, granting access to chimney andmuon veto top-lid. Although near and far detector are supposed to have an identical design, thepassive shielding is different for near- and far-detector. Using the already existing undergroundlaboratory for the far detector restricted the available space for the shielding and necessitatedthe usage of steel (expensive) in order to provide sufficient shielding at the available space. Inthe bigger designed near lab, the available space is not an issue, because of which the near labprovides a 1 m thick water shielding surrounding the veto-vessel.
3.5.6 Outer Muon Veto (OV)
The outer muon veto (light green area in figure 3.9) is not surrounding the detector, but spanninga wide area above it. It covers in total 90 m2 (7 m×12.8 m) and exceeds the area above thedetector by almost 3 m on each side. Covering a bigger area allows to identify also those muons,which passed nearby the detector, which are a source of additional background. The OV iscomposed of three modules, two main modules mounted on the shielding and comforting the
31
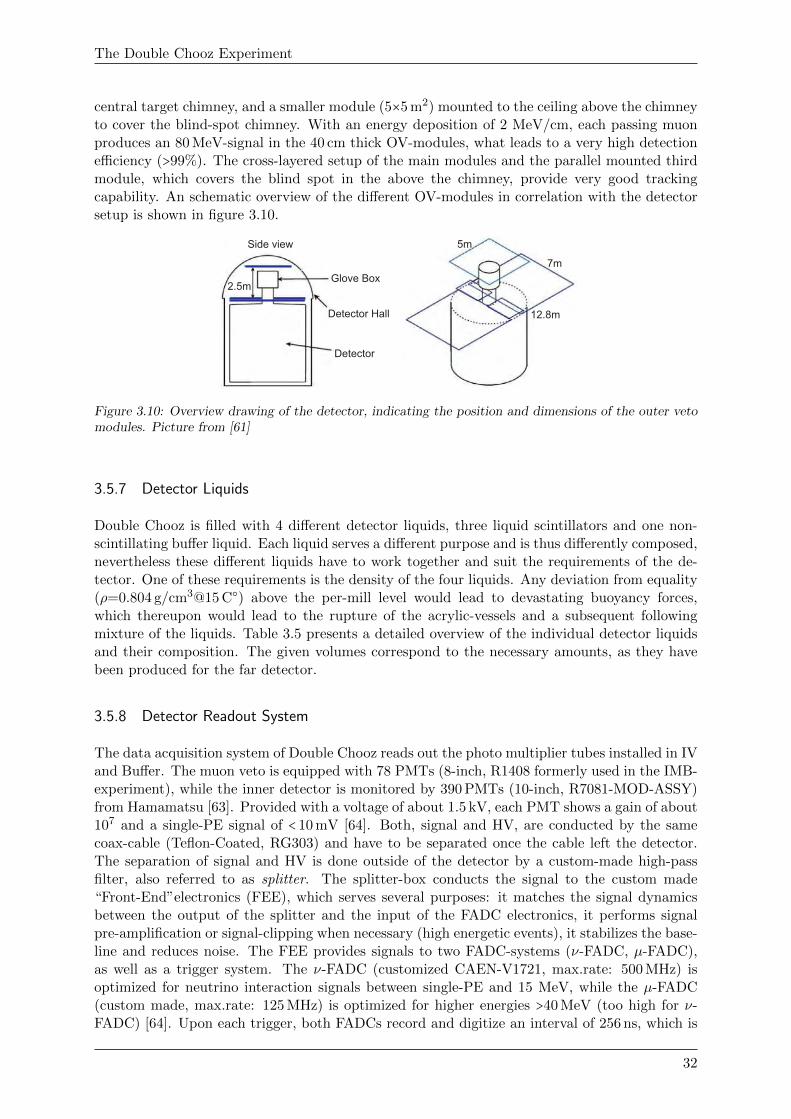
The Double Chooz Experiment
central target chimney, and a smaller module (5×5 m2) mounted to the ceiling above the chimneyto cover the blind-spot chimney. With an energy deposition of 2 MeV/cm, each passing muonproduces an 80 MeV-signal in the 40 cm thick OV-modules, what leads to a very high detectionefficiency (>99%). The cross-layered setup of the main modules and the parallel mounted thirdmodule, which covers the blind spot in the above the chimney, provide very good trackingcapability. An schematic overview of the different OV-modules in correlation with the detectorsetup is shown in figure 3.10.
Side view
Detector Hall
Detector
Glove Box
12.8m
7m
5m
2.5m
Figure 3.10: Overview drawing of the detector, indicating the position and dimensions of the outer vetomodules. Picture from [61]
3.5.7 Detector Liquids
Double Chooz is filled with 4 different detector liquids, three liquid scintillators and one non-scintillating buffer liquid. Each liquid serves a different purpose and is thus differently composed,nevertheless these different liquids have to work together and suit the requirements of the de-tector. One of these requirements is the density of the four liquids. Any deviation from equality(ρ=0.804 g/cm3@15 C○) above the per-mill level would lead to devastating buoyancy forces,which thereupon would lead to the rupture of the acrylic-vessels and a subsequent followingmixture of the liquids. Table 3.5 presents a detailed overview of the individual detector liquidsand their composition. The given volumes correspond to the necessary amounts, as they havebeen produced for the far detector.
3.5.8 Detector Readout System
The data acquisition system of Double Chooz reads out the photo multiplier tubes installed in IVand Buffer. The muon veto is equipped with 78 PMTs (8-inch, R1408 formerly used in the IMB-experiment), while the inner detector is monitored by 390 PMTs (10-inch, R7081-MOD-ASSY)from Hamamatsu [63]. Provided with a voltage of about 1.5 kV, each PMT shows a gain of about107 and a single-PE signal of < 10 mV [64]. Both, signal and HV, are conducted by the samecoax-cable (Teflon-Coated, RG303) and have to be separated once the cable left the detector.The separation of signal and HV is done outside of the detector by a custom-made high-passfilter, also referred to as splitter. The splitter-box conducts the signal to the custom made“Front-End”electronics (FEE), which serves several purposes: it matches the signal dynamicsbetween the output of the splitter and the input of the FADC electronics, it performs signalpre-amplification or signal-clipping when necessary (high energetic events), it stabilizes the base-line and reduces noise. The FEE provides signals to two FADC-systems (ν-FADC, µ-FADC),as well as a trigger system. The ν-FADC (customized CAEN-V1721, max.rate: 500 MHz) isoptimized for neutrino interaction signals between single-PE and 15 MeV, while the µ-FADC(custom made, max.rate: 125 MHz) is optimized for higher energies >40 MeV (too high for ν-FADC) [64]. Upon each trigger, both FADCs record and digitize an interval of 256 ns, which is
32
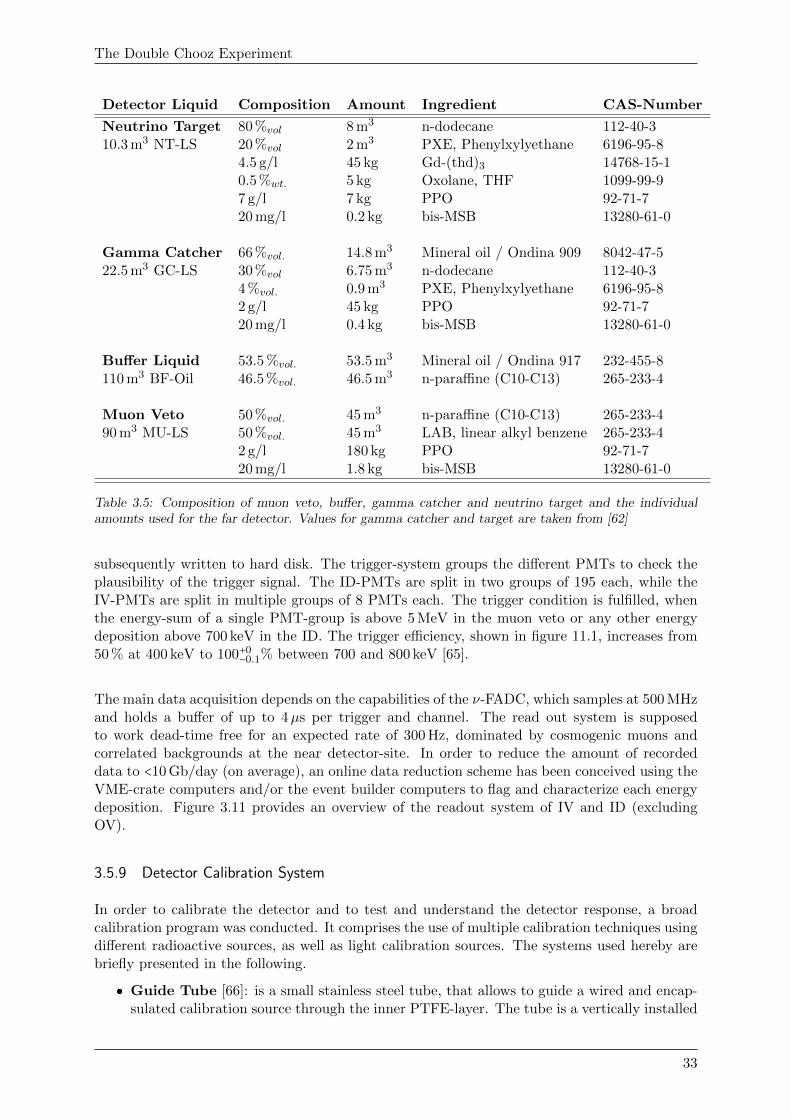
The Double Chooz Experiment
Detector Liquid Composition Amount Ingredient CAS-Number
Neutrino Target 80 %vol 8 m3 n-dodecane 112-40-310.3 m3 NT-LS 20 %vol 2 m3 PXE, Phenylxylyethane 6196-95-8
4.5 g/l 45 kg Gd-(thd)3 14768-15-10.5 %wt. 5 kg Oxolane, THF 1099-99-97 g/l 7 kg PPO 92-71-720 mg/l 0.2 kg bis-MSB 13280-61-0
Gamma Catcher 66 %vol. 14.8 m3 Mineral oil / Ondina 909 8042-47-522.5 m3 GC-LS 30 %vol 6.75 m3 n-dodecane 112-40-3
4 %vol. 0.9 m3 PXE, Phenylxylyethane 6196-95-82 g/l 45 kg PPO 92-71-720 mg/l 0.4 kg bis-MSB 13280-61-0
Buffer Liquid 53.5 %vol. 53.5 m3 Mineral oil / Ondina 917 232-455-8110 m3 BF-Oil 46.5 %vol. 46.5 m3 n-paraffine (C10-C13) 265-233-4
Muon Veto 50 %vol. 45 m3 n-paraffine (C10-C13) 265-233-490 m3 MU-LS 50 %vol. 45 m3 LAB, linear alkyl benzene 265-233-4
2 g/l 180 kg PPO 92-71-720 mg/l 1.8 kg bis-MSB 13280-61-0
Table 3.5: Composition of muon veto, buffer, gamma catcher and neutrino target and the individualamounts used for the far detector. Values for gamma catcher and target are taken from [62]
subsequently written to hard disk. The trigger-system groups the different PMTs to check theplausibility of the trigger signal. The ID-PMTs are split in two groups of 195 each, while theIV-PMTs are split in multiple groups of 8 PMTs each. The trigger condition is fulfilled, whenthe energy-sum of a single PMT-group is above 5 MeV in the muon veto or any other energydeposition above 700 keV in the ID. The trigger efficiency, shown in figure 11.1, increases from50 % at 400 keV to 100+0
−0.1% between 700 and 800 keV [65].
The main data acquisition depends on the capabilities of the ν-FADC, which samples at 500 MHzand holds a buffer of up to 4µs per trigger and channel. The read out system is supposedto work dead-time free for an expected rate of 300 Hz, dominated by cosmogenic muons andcorrelated backgrounds at the near detector-site. In order to reduce the amount of recordeddata to <10 Gb/day (on average), an online data reduction scheme has been conceived using theVME-crate computers and/or the event builder computers to flag and characterize each energydeposition. Figure 3.11 provides an overview of the readout system of IV and ID (excludingOV).
3.5.9 Detector Calibration System
In order to calibrate the detector and to test and understand the detector response, a broadcalibration program was conducted. It comprises the use of multiple calibration techniques usingdifferent radioactive sources, as well as light calibration sources. The systems used hereby arebriefly presented in the following.
� Guide Tube [66]: is a small stainless steel tube, that allows to guide a wired and encap-sulated calibration source through the inner PTFE-layer. The tube is a vertically installed
33
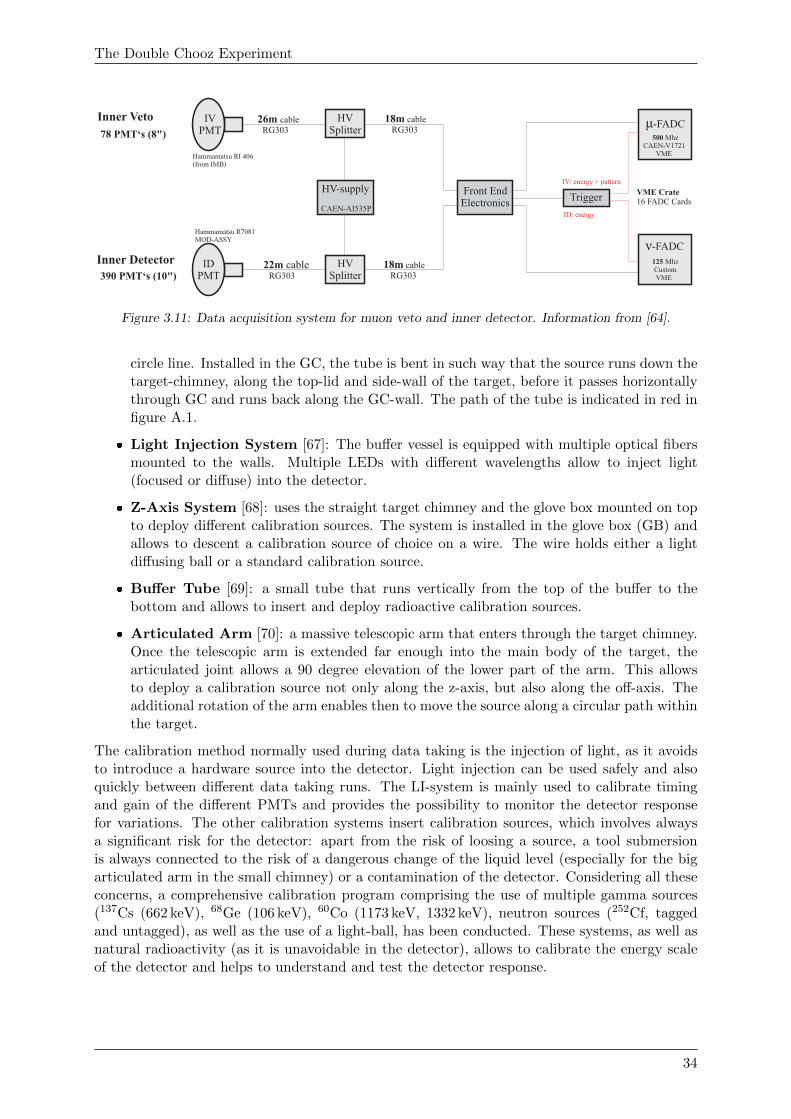
The Double Chooz Experiment
HVSplitter
IV PMT
26m cable RG303
HVSplitter
ID PMT
22m cable RG303
HV-supply Trigger
μ-FADC
ν-FADC
18m cable RG303
18m cable RG303
MOD-ASSYHammamatsu R7081
Hammamatsu RI 406 (from IMB)
CAEN-AI535P
500 MhzCAEN-V1721 VME
125 Mhz Custom VME
IV: energy + pattern
Inner Veto
Inner Detector
78 PMT‘s (8")
390 PMT‘s (10")
Front End Electronics
VME Crate16 FADC Cards
ID: energy
Figure 3.11: Data acquisition system for muon veto and inner detector. Information from [64].
circle line. Installed in the GC, the tube is bent in such way that the source runs down thetarget-chimney, along the top-lid and side-wall of the target, before it passes horizontallythrough GC and runs back along the GC-wall. The path of the tube is indicated in red infigure A.1.
� Light Injection System [67]: The buffer vessel is equipped with multiple optical fibersmounted to the walls. Multiple LEDs with different wavelengths allow to inject light(focused or diffuse) into the detector.
� Z-Axis System [68]: uses the straight target chimney and the glove box mounted on topto deploy different calibration sources. The system is installed in the glove box (GB) andallows to descent a calibration source of choice on a wire. The wire holds either a lightdiffusing ball or a standard calibration source.
� Buffer Tube [69]: a small tube that runs vertically from the top of the buffer to thebottom and allows to insert and deploy radioactive calibration sources.
� Articulated Arm [70]: a massive telescopic arm that enters through the target chimney.Once the telescopic arm is extended far enough into the main body of the target, thearticulated joint allows a 90 degree elevation of the lower part of the arm. This allowsto deploy a calibration source not only along the z-axis, but also along the off-axis. Theadditional rotation of the arm enables then to move the source along a circular path withinthe target.
The calibration method normally used during data taking is the injection of light, as it avoidsto introduce a hardware source into the detector. Light injection can be used safely and alsoquickly between different data taking runs. The LI-system is mainly used to calibrate timingand gain of the different PMTs and provides the possibility to monitor the detector responsefor variations. The other calibration systems insert calibration sources, which involves alwaysa significant risk for the detector: apart from the risk of loosing a source, a tool submersionis always connected to the risk of a dangerous change of the liquid level (especially for the bigarticulated arm in the small chimney) or a contamination of the detector. Considering all theseconcerns, a comprehensive calibration program comprising the use of multiple gamma sources(137Cs (662 keV), 68Ge (106 keV), 60Co (1173 keV, 1332 keV), neutron sources (252Cf, taggedand untagged), as well as the use of a light-ball, has been conducted. These systems, as well asnatural radioactivity (as it is unavoidable in the detector), allows to calibrate the energy scaleof the detector and helps to understand and test the detector response.
34
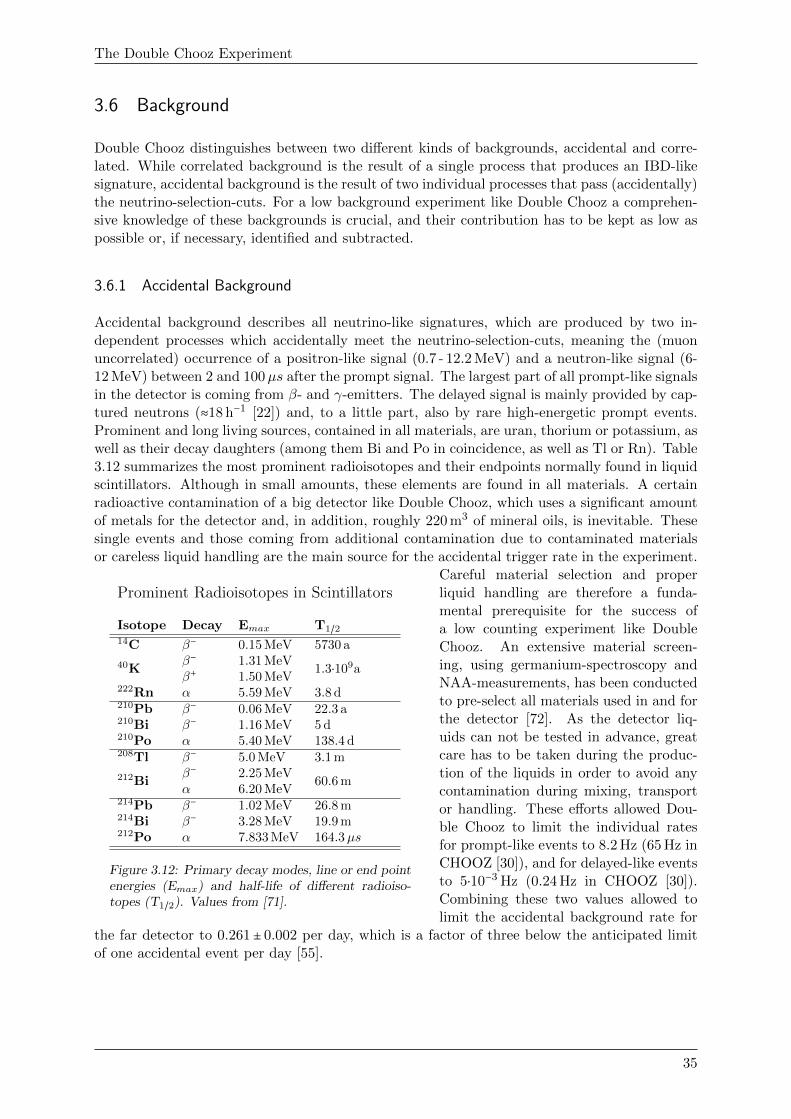
The Double Chooz Experiment
3.6 Background
Double Chooz distinguishes between two different kinds of backgrounds, accidental and corre-lated. While correlated background is the result of a single process that produces an IBD-likesignature, accidental background is the result of two individual processes that pass (accidentally)the neutrino-selection-cuts. For a low background experiment like Double Chooz a comprehen-sive knowledge of these backgrounds is crucial, and their contribution has to be kept as low aspossible or, if necessary, identified and subtracted.
3.6.1 Accidental Background
Accidental background describes all neutrino-like signatures, which are produced by two in-dependent processes which accidentally meet the neutrino-selection-cuts, meaning the (muonuncorrelated) occurrence of a positron-like signal (0.7 - 12.2 MeV) and a neutron-like signal (6-12 MeV) between 2 and 100µs after the prompt signal. The largest part of all prompt-like signalsin the detector is coming from β- and γ-emitters. The delayed signal is mainly provided by cap-tured neutrons (≈18 h−1 [22]) and, to a little part, also by rare high-energetic prompt events.Prominent and long living sources, contained in all materials, are uran, thorium or potassium, aswell as their decay daughters (among them Bi and Po in coincidence, as well as Tl or Rn). Table3.12 summarizes the most prominent radioisotopes and their endpoints normally found in liquidscintillators. Although in small amounts, these elements are found in all materials. A certainradioactive contamination of a big detector like Double Chooz, which uses a significant amountof metals for the detector and, in addition, roughly 220 m3 of mineral oils, is inevitable. Thesesingle events and those coming from additional contamination due to contaminated materialsor careless liquid handling are the main source for the accidental trigger rate in the experiment.
Prominent Radioisotopes in Scintillators
Isotope Decay Emax T1/214C β− 0.15 MeV 5730 a
40Kβ− 1.31 MeV
1.3⋅109aβ+ 1.50 MeV
222Rn α 5.59 MeV 3.8 d210Pb β− 0.06 MeV 22.3 a210Bi β− 1.16 MeV 5 d210Po α 5.40 MeV 138.4 d208Tl β− 5.0 MeV 3.1 m
212Biβ− 2.25 MeV
60.6 mα 6.20 MeV
214Pb β− 1.02 MeV 26.8 m214Bi β− 3.28 MeV 19.9 m212Po α 7.833 MeV 164.3µs
Figure 3.12: Primary decay modes, line or end pointenergies (Emax) and half-life of different radioiso-topes (T1/2). Values from [71].
Careful material selection and properliquid handling are therefore a funda-mental prerequisite for the success ofa low counting experiment like DoubleChooz. An extensive material screen-ing, using germanium-spectroscopy andNAA-measurements, has been conductedto pre-select all materials used in and forthe detector [72]. As the detector liq-uids can not be tested in advance, greatcare has to be taken during the produc-tion of the liquids in order to avoid anycontamination during mixing, transportor handling. These efforts allowed Dou-ble Chooz to limit the individual ratesfor prompt-like events to 8.2 Hz (65 Hz inCHOOZ [30]), and for delayed-like eventsto 5⋅10−3 Hz (0.24 Hz in CHOOZ [30]).Combining these two values allowed tolimit the accidental background rate for
the far detector to 0.261± 0.002 per day, which is a factor of three below the anticipated limitof one accidental event per day [55].
35
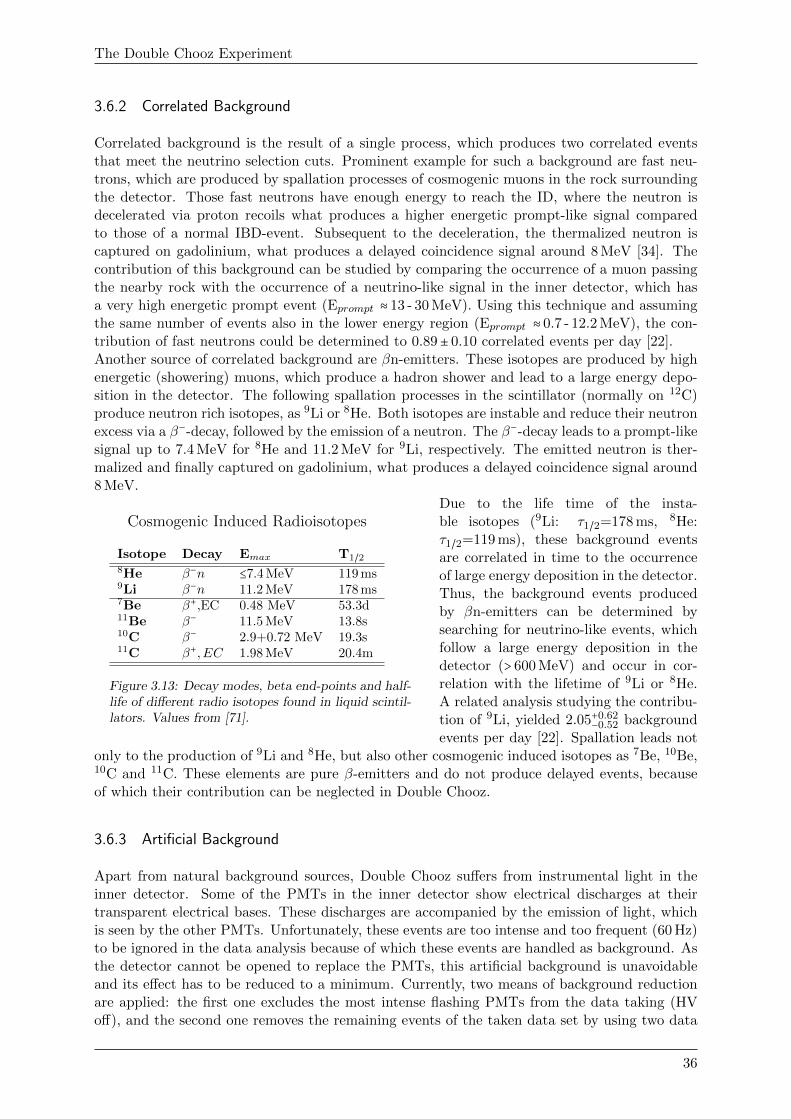
The Double Chooz Experiment
3.6.2 Correlated Background
Correlated background is the result of a single process, which produces two correlated eventsthat meet the neutrino selection cuts. Prominent example for such a background are fast neu-trons, which are produced by spallation processes of cosmogenic muons in the rock surroundingthe detector. Those fast neutrons have enough energy to reach the ID, where the neutron isdecelerated via proton recoils what produces a higher energetic prompt-like signal comparedto those of a normal IBD-event. Subsequent to the deceleration, the thermalized neutron iscaptured on gadolinium, what produces a delayed coincidence signal around 8 MeV [34]. Thecontribution of this background can be studied by comparing the occurrence of a muon passingthe nearby rock with the occurrence of a neutrino-like signal in the inner detector, which hasa very high energetic prompt event (Eprompt ≈ 13 - 30 MeV). Using this technique and assumingthe same number of events also in the lower energy region (Eprompt ≈ 0.7 - 12.2 MeV), the con-tribution of fast neutrons could be determined to 0.89± 0.10 correlated events per day [22].Another source of correlated background are βn-emitters. These isotopes are produced by highenergetic (showering) muons, which produce a hadron shower and lead to a large energy depo-sition in the detector. The following spallation processes in the scintillator (normally on 12C)produce neutron rich isotopes, as 9Li or 8He. Both isotopes are instable and reduce their neutronexcess via a β−-decay, followed by the emission of a neutron. The β−-decay leads to a prompt-likesignal up to 7.4 MeV for 8He and 11.2 MeV for 9Li, respectively. The emitted neutron is ther-malized and finally captured on gadolinium, what produces a delayed coincidence signal around8 MeV.
Cosmogenic Induced Radioisotopes
Isotope Decay Emax T1/28He β−n ≤7.4 MeV 119 ms9Li β−n 11.2 MeV 178 ms7Be β+,EC 0.48 MeV 53.3d11Be β− 11.5 MeV 13.8s10C β− 2.9+0.72 MeV 19.3s11C β+,EC 1.98 MeV 20.4m
Figure 3.13: Decay modes, beta end-points and half-life of different radio isotopes found in liquid scintil-lators. Values from [71].
Due to the life time of the insta-ble isotopes (9Li: τ1/2=178 ms, 8He:τ1/2=119 ms), these background eventsare correlated in time to the occurrenceof large energy deposition in the detector.Thus, the background events producedby βn-emitters can be determined bysearching for neutrino-like events, whichfollow a large energy deposition in thedetector (> 600 MeV) and occur in cor-relation with the lifetime of 9Li or 8He.A related analysis studying the contribu-tion of 9Li, yielded 2.05+0.62
−0.52 backgroundevents per day [22]. Spallation leads not
only to the production of 9Li and 8He, but also other cosmogenic induced isotopes as 7Be, 10Be,10C and 11C. These elements are pure β-emitters and do not produce delayed events, becauseof which their contribution can be neglected in Double Chooz.
3.6.3 Artificial Background
Apart from natural background sources, Double Chooz suffers from instrumental light in theinner detector. Some of the PMTs in the inner detector show electrical discharges at theirtransparent electrical bases. These discharges are accompanied by the emission of light, whichis seen by the other PMTs. Unfortunately, these events are too intense and too frequent (60 Hz)to be ignored in the data analysis because of which these events are handled as background. Asthe detector cannot be opened to replace the PMTs, this artificial background is unavoidableand its effect has to be reduced to a minimum. Currently, two means of background reductionare applied: the first one excludes the most intense flashing PMTs from the data taking (HVoff), and the second one removes the remaining events of the taken data set by using two data
36
The Double Chooz Experiment
selection cuts (light noise cuts) in order to identify and veto these events. Unlike the wantedIBD-events, which are exclusively produced in the target, light noise events are produced directlyat the PMTs and thus near the buffer wall. While a real IBD-event (near the center ) producesa homogeneous signal in the detector, an event near the wall produces an inhomogeneous signal(regarding energy deposition as well as onset-timing of the PMTs). This difference can be usedto identify light noise events. The first selection possibility, also referred to as max Q/total Q-cut, takes the ratio between the maximum observed charge by one PMT (max Q) and the totalcharge seen by all PMTs (total Q). This ratio is close to one, if one PMT observed most ofthe charge (light noise event), and close to zero, when all PMTs observe more or less the samecharge. The second selection cut considers the light propagation time from the source to thePMTs. A central event will show only small variation between the trigger times of all PMTs, adecentral event, however, will result in a wider spread of trigger times, which can be used foridentification. This second selection cut, also referred to as RMS-cut, takes the squared meansof all trigger times and rejects events with a wider spread than 40 ns, what requests a certainhomogeneity of the observed events.
3.7 Neutrino Selection
3.7.1 Pre-Selection Cuts for the Neutrino Search
The neutrino search starts with a pre-selection of the acquired data. The pre-selection appliesthree pre-selection cuts, which are supposed to remove all events originating from light-noise,muons or muon correlated events. This is done by rejecting all events which fall into a 1000-µs-window upon each muon-trigger or which fall into a 0.5 s-window upon each muon with an energyabove > 600 MeV to account for production of βn-emitters (1-Muon Veto cut, 1a-cosmogentic-isotope-cut). In addition, the outer veto cut rejects all prompt events, which follow within 224 nsupon an outer veto trigger (1b-Outer veto cut). Artificial background, respectively light noise,is rejected by a Qmax/Qtotal-cut (2), as well as a RMS-cut (3), as they have been described inthe previous section. For the pre-selection, a Qmax/Qtotal of ≤ 0.09 for the prompt event and≤ 0.055 for the delayed event has been chosen. Additionally, both events had to meet a RMS (τs)of ≤ 40 ns. The pre-selected data, also referred to as “single-spectrum”, for prompt and delayedenergy window are presented in figure 11.6. The cuts 1,2,3 were used for the first analysis ofDouble Chooz presented in [34]. For the later data analysis as presented in the second publicationall of the here presented cuts were applied now including also 1a, 1b, which allowed to reducethe correlated background events caused by cosmogenic isotopes, however, at the expense of aincreased veto time from 4.4% at the first and 9.2% [22] at the second publication [22].
3.7.2 Neutrino Selection Cuts
Out of these pre-selected data, Double Chooz applies four additional selection cuts to searchfor neutrino candidates. The neutrino selection is based on the search of a delayed coincidence,a prompt-signal with an energy between 0.7 - 12.2 MeV (4: prompt energy-cut) and a delayedsignal between 6 - 12 MeV (5: delayed energy cut). A neutrino candidate is flagged when thesecond event occurs between 2µs5 and 100µs after a prompt event (6: coincidence time) andno other prompt-like signal was found 100µs before and 400µs after the primary prompt event(7: multiplicity cut). Some background events (correlated as well as uncorrelated) survivethe neutrino selection cuts (4-7), their contributions have to be determined and subtracted asdescribed in the previous section.
5The time 0 - 2µs is excluded to eliminate after-pulses and correlated events.
37

38
Part II
Development and Production of two DetectorLiquids
39
Joint Venture
The Technische Universitat Munchen (TUM) and the Max Planck Institut fur Kernphysik(MPIK) in Heidelberg were responsible for the production of the four detector liquids used in theDouble Chooz experiment. This task included the development and installation of the necessaryinfrastructure, as well as its subsequent usage during the production of the detector liquids.TUM and MPIK shared this responsibility and cooperated closely in planning and productionin order to realize this comprehensive working package in a common effort. In this cooperation,TUM was responsible for production and storage of the muon veto- and the buffer-liquid, whileMPIK overtook the responsibility for gamma catcher- and target-liquid. Furthermore, TUMand MPIK cooperated closely during the instrumentation of the underground laboratory andshared the responsibility for the filling and handling of the DC-far detector. When helpful for abetter understanding of the global system the contributions from MPIK will be mentioned andare explicitly marked in related drawings. The following two parts are dedicated to summarizethe contributions of TUM, which were realized by the author in course of the here presentedthesis.
Part II concentrates on the production of two detector liquids and presents the instrumentationof the liquid storage area (LSA) in chapter 4, the requirements and selection process of theused components in chapter 5 and in chapter 6 finally the on-site production of the muon vetoscintillator and the buffer liquid.
Part III is then dedicated to the filling and handling of the Double Chooz far detector andpresents in chapter 7 all necessary systems to fill, handle and monitor all detector liquids in theunderground laboratory. Chapter 8 then presents the usage of these systems and describes thepreparation and filling of the DC far detector.
40
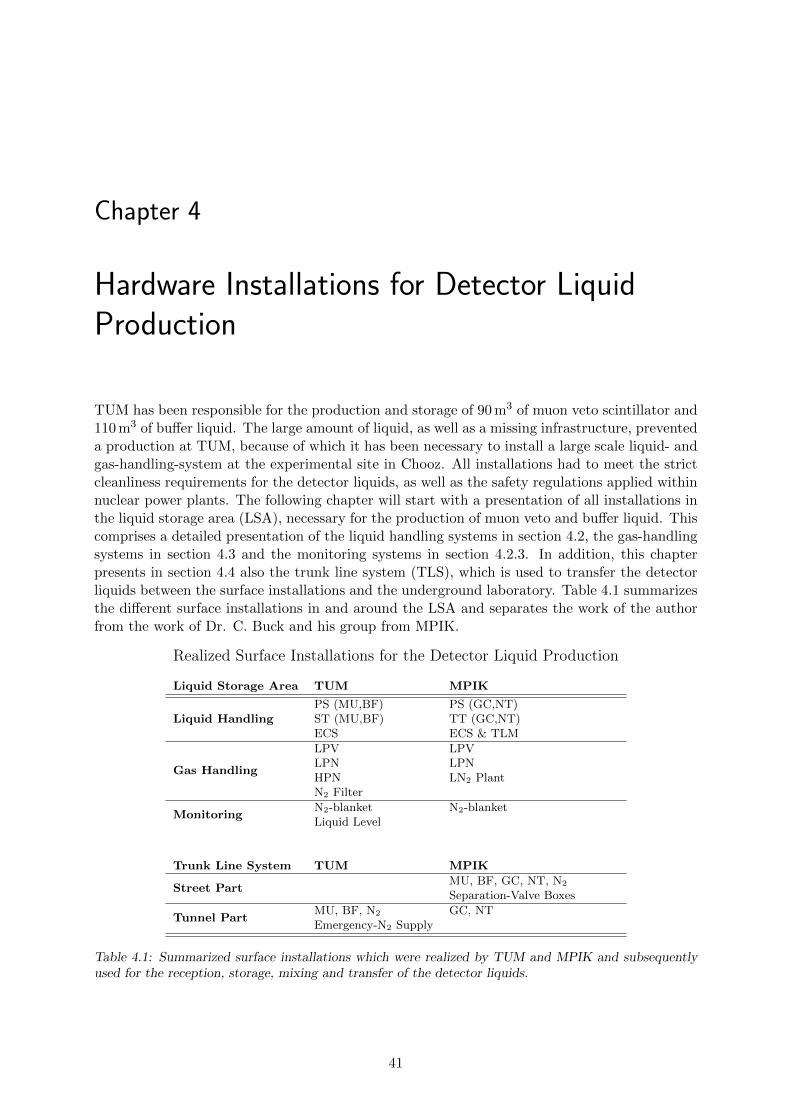
Chapter 4
Hardware Installations for Detector LiquidProduction
TUM has been responsible for the production and storage of 90 m3 of muon veto scintillator and110 m3 of buffer liquid. The large amount of liquid, as well as a missing infrastructure, preventeda production at TUM, because of which it has been necessary to install a large scale liquid- andgas-handling-system at the experimental site in Chooz. All installations had to meet the strictcleanliness requirements for the detector liquids, as well as the safety regulations applied withinnuclear power plants. The following chapter will start with a presentation of all installations inthe liquid storage area (LSA), necessary for the production of muon veto and buffer liquid. Thiscomprises a detailed presentation of the liquid handling systems in section 4.2, the gas-handlingsystems in section 4.3 and the monitoring systems in section 4.2.3. In addition, this chapterpresents in section 4.4 also the trunk line system (TLS), which is used to transfer the detectorliquids between the surface installations and the underground laboratory. Table 4.1 summarizesthe different surface installations in and around the LSA and separates the work of the authorfrom the work of Dr. C. Buck and his group from MPIK.
Realized Surface Installations for the Detector Liquid Production
Liquid Storage Area TUM MPIK
Liquid HandlingPS (MU,BF) PS (GC,NT)ST (MU,BF) TT (GC,NT)ECS ECS & TLM
Gas Handling
LPV LPVLPN LPNHPN LN2 PlantN2 Filter
MonitoringN2-blanket N2-blanketLiquid Level
Trunk Line System TUM MPIK
Street PartMU, BF, GC, NT, N2
Separation-Valve Boxes
Tunnel PartMU, BF, N2 GC, NTEmergency-N2 Supply
Table 4.1: Summarized surface installations which were realized by TUM and MPIK and subsequentlyused for the reception, storage, mixing and transfer of the detector liquids.
41
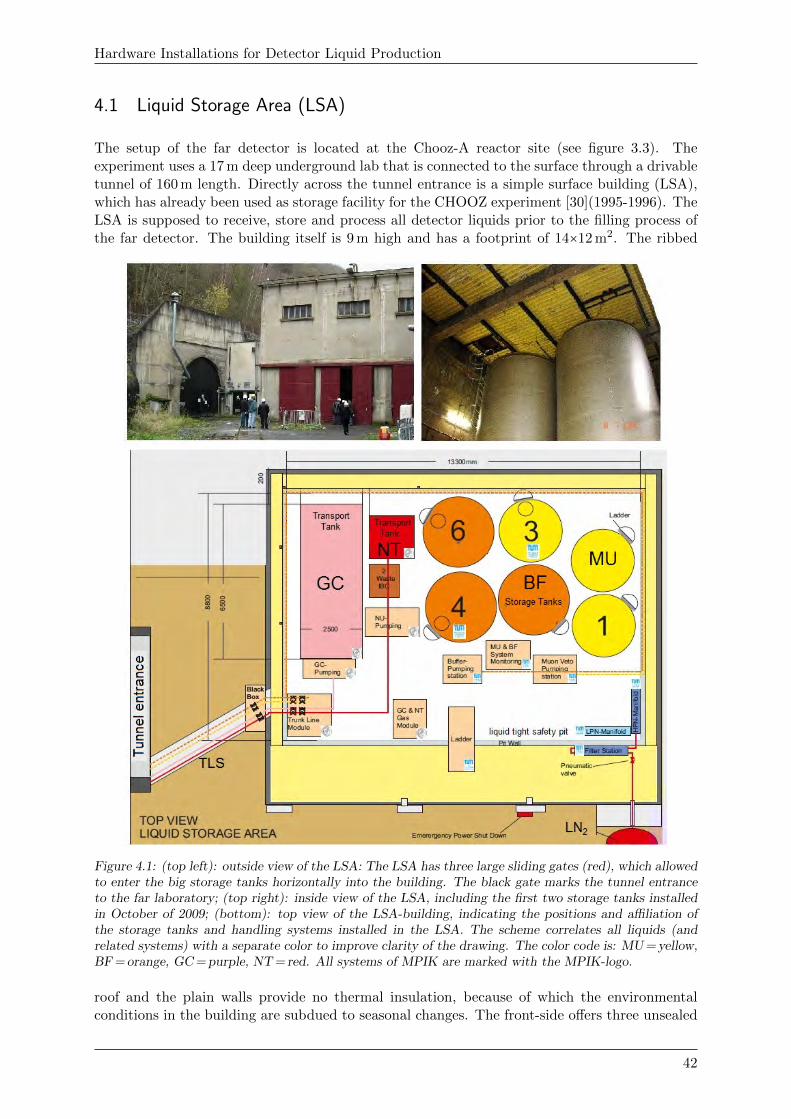
Hardware Installations for Detector Liquid Production
4.1 Liquid Storage Area (LSA)
The setup of the far detector is located at the Chooz-A reactor site (see figure 3.3). Theexperiment uses a 17 m deep underground lab that is connected to the surface through a drivabletunnel of 160 m length. Directly across the tunnel entrance is a simple surface building (LSA),which has already been used as storage facility for the CHOOZ experiment [30](1995-1996). TheLSA is supposed to receive, store and process all detector liquids prior to the filling process ofthe far detector. The building itself is 9 m high and has a footprint of 14×12 m2. The ribbed
Figure 4.1: (top left): outside view of the LSA: The LSA has three large sliding gates (red), which allowedto enter the big storage tanks horizontally into the building. The black gate marks the tunnel entranceto the far laboratory; (top right): inside view of the LSA, including the first two storage tanks installedin October of 2009; (bottom): top view of the LSA-building, indicating the positions and affiliation ofthe storage tanks and handling systems installed in the LSA. The scheme correlates all liquids (andrelated systems) with a separate color to improve clarity of the drawing. The color code is: MU = yellow,BF = orange, GC = purple, NT = red. All systems of MPIK are marked with the MPIK-logo.
roof and the plain walls provide no thermal insulation, because of which the environmentalconditions in the building are subdued to seasonal changes. The front-side offers three unsealed
42
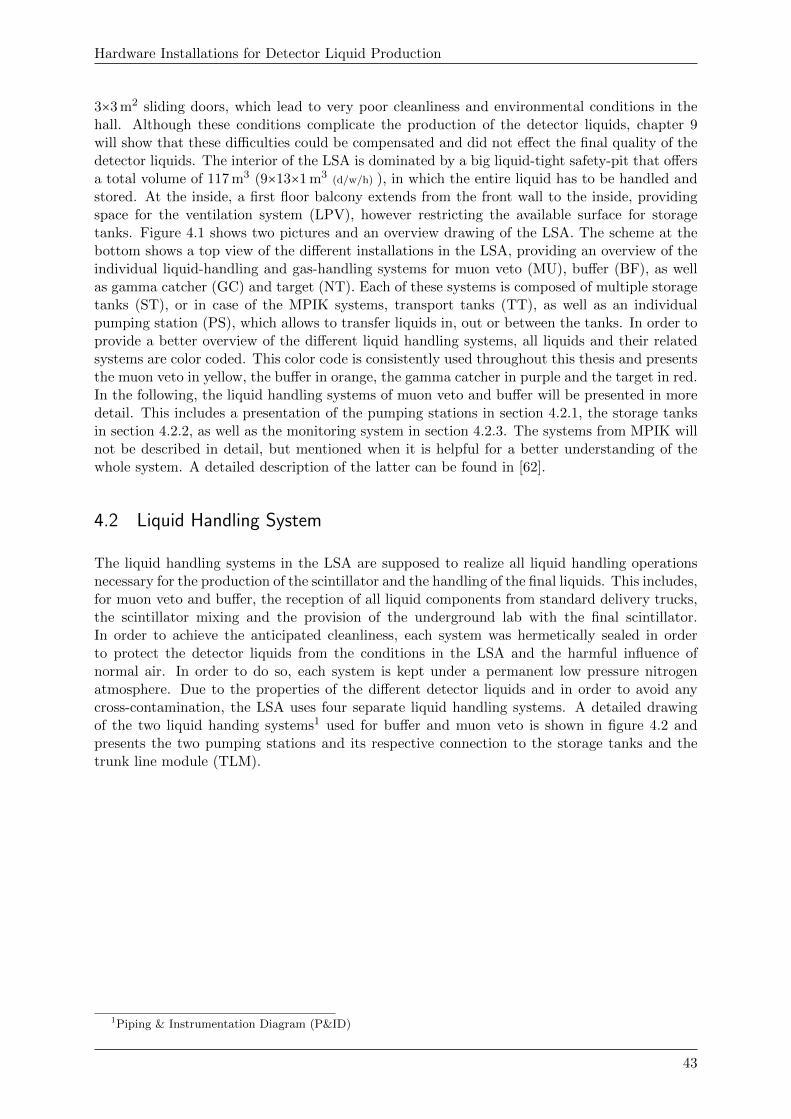
Hardware Installations for Detector Liquid Production
3×3 m2 sliding doors, which lead to very poor cleanliness and environmental conditions in thehall. Although these conditions complicate the production of the detector liquids, chapter 9will show that these difficulties could be compensated and did not effect the final quality of thedetector liquids. The interior of the LSA is dominated by a big liquid-tight safety-pit that offersa total volume of 117 m3 (9×13×1 m3
(d/w/h) ), in which the entire liquid has to be handled andstored. At the inside, a first floor balcony extends from the front wall to the inside, providingspace for the ventilation system (LPV), however restricting the available surface for storagetanks. Figure 4.1 shows two pictures and an overview drawing of the LSA. The scheme at thebottom shows a top view of the different installations in the LSA, providing an overview of theindividual liquid-handling and gas-handling systems for muon veto (MU), buffer (BF), as wellas gamma catcher (GC) and target (NT). Each of these systems is composed of multiple storagetanks (ST), or in case of the MPIK systems, transport tanks (TT), as well as an individualpumping station (PS), which allows to transfer liquids in, out or between the tanks. In order toprovide a better overview of the different liquid handling systems, all liquids and their relatedsystems are color coded. This color code is consistently used throughout this thesis and presentsthe muon veto in yellow, the buffer in orange, the gamma catcher in purple and the target in red.In the following, the liquid handling systems of muon veto and buffer will be presented in moredetail. This includes a presentation of the pumping stations in section 4.2.1, the storage tanksin section 4.2.2, as well as the monitoring system in section 4.2.3. The systems from MPIK willnot be described in detail, but mentioned when it is helpful for a better understanding of thewhole system. A detailed description of the latter can be found in [62].
4.2 Liquid Handling System
The liquid handling systems in the LSA are supposed to realize all liquid handling operationsnecessary for the production of the scintillator and the handling of the final liquids. This includes,for muon veto and buffer, the reception of all liquid components from standard delivery trucks,the scintillator mixing and the provision of the underground lab with the final scintillator.In order to achieve the anticipated cleanliness, each system was hermetically sealed in orderto protect the detector liquids from the conditions in the LSA and the harmful influence ofnormal air. In order to do so, each system is kept under a permanent low pressure nitrogenatmosphere. Due to the properties of the different detector liquids and in order to avoid anycross-contamination, the LSA uses four separate liquid handling systems. A detailed drawingof the two liquid handing systems1 used for buffer and muon veto is shown in figure 4.2 andpresents the two pumping stations and its respective connection to the storage tanks and thetrunk line module (TLM).
1Piping & Instrumentation Diagram (P&ID)
43
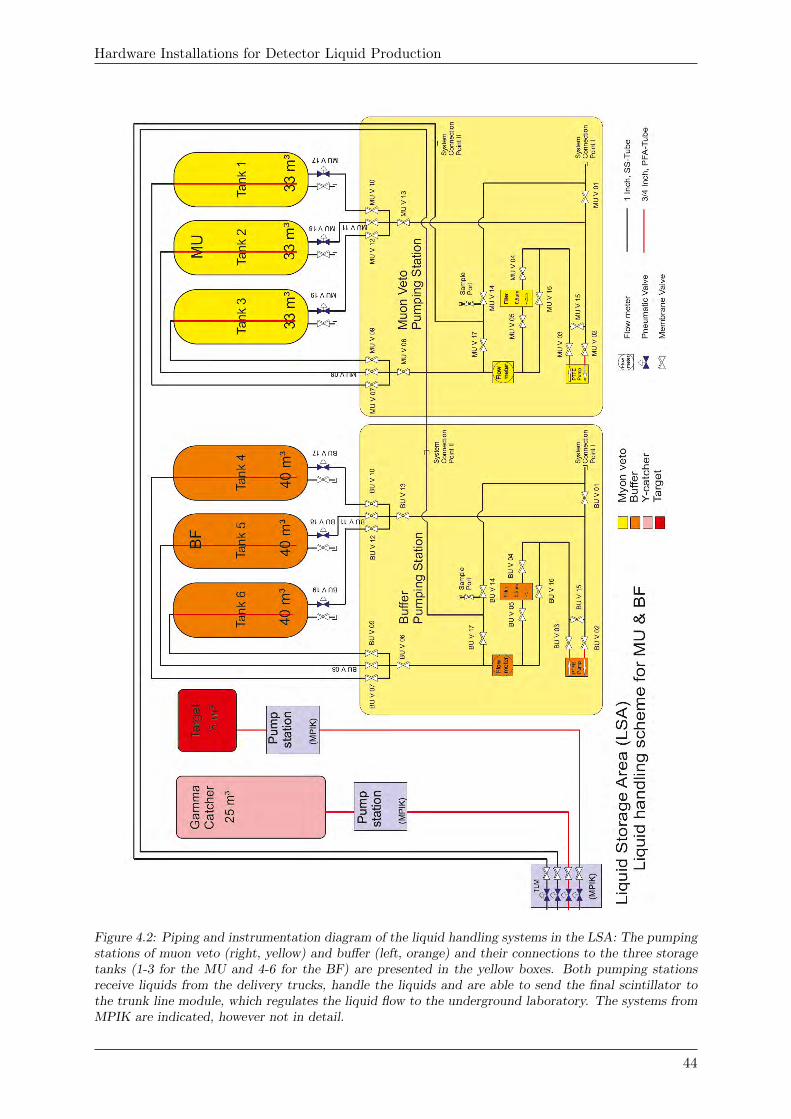
Hardware Installations for Detector Liquid Production
Figure 4.2: Piping and instrumentation diagram of the liquid handling systems in the LSA: The pumpingstations of muon veto (right, yellow) and buffer (left, orange) and their connections to the three storagetanks (1-3 for the MU and 4-6 for the BF) are presented in the yellow boxes. Both pumping stationsreceive liquids from the delivery trucks, handle the liquids and are able to send the final scintillator tothe trunk line module, which regulates the liquid flow to the underground laboratory. The systems fromMPIK are indicated, however not in detail.
44
Hardware Installations for Detector Liquid Production
The systems for MU and BF are made of stainless steel, each comprising a pumping station (PS)and three interconnected storage tanks (ST) (3×33 m3 for MU and 3×40 m3 for BF respectively;see figure 4.11). Apart from the liquid circuit, each pumping station includes two gas supplymanifolds (see figure 4.15). The combinations of gas- and liquid-handling valves in one moduleallows to operate the entire system (of MU and BF) from one position. In order to receivefeedback from the system and to monitor the progress of different handling steps, all storagetanks are equipped with sensors. These sensors monitor the different liquid- and gas-pressurelevels as well as the temperature in all tanks and trigger alarm if critical values are reached.All sensors are connected to a central PC, situated between the two pumping stations, whichallows to monitor the different operations. A picture of these installations is presented in figure4.3, which shows the two pumping stations, connected tubing, and the white tent in between,which hosts the monitoring system and protects the electrical set-up from dust, humidity orthe fire sprinkling systems installed in the LSA. The safety regulations on a nuclear powerplant furthermore requested the installation of an emergency closure system (ECS), which isindependent from electricity and allows to isolate all tanks in case of fire or any other emergency(see figure 4.14). In the following, the individual parts of the liquid handling system (pumpingstation, storage tanks and monitoring system) will be presented in more detail.
Figure 4.3: Picture of the liquid handling system in the LSA. Showing parts of the muon veto pumpingstation (MU-PS) on the left, the monitoring tent with LM-PC in the middle and the BF-PS on the right.In the background, the MU-storage tank 1, as well as the buffer tanks 4 and 5 can be seen. Mountedto the BF-PS, the emergency closure system (ECS) and the necessary air compressor are additionallyindicated.
45
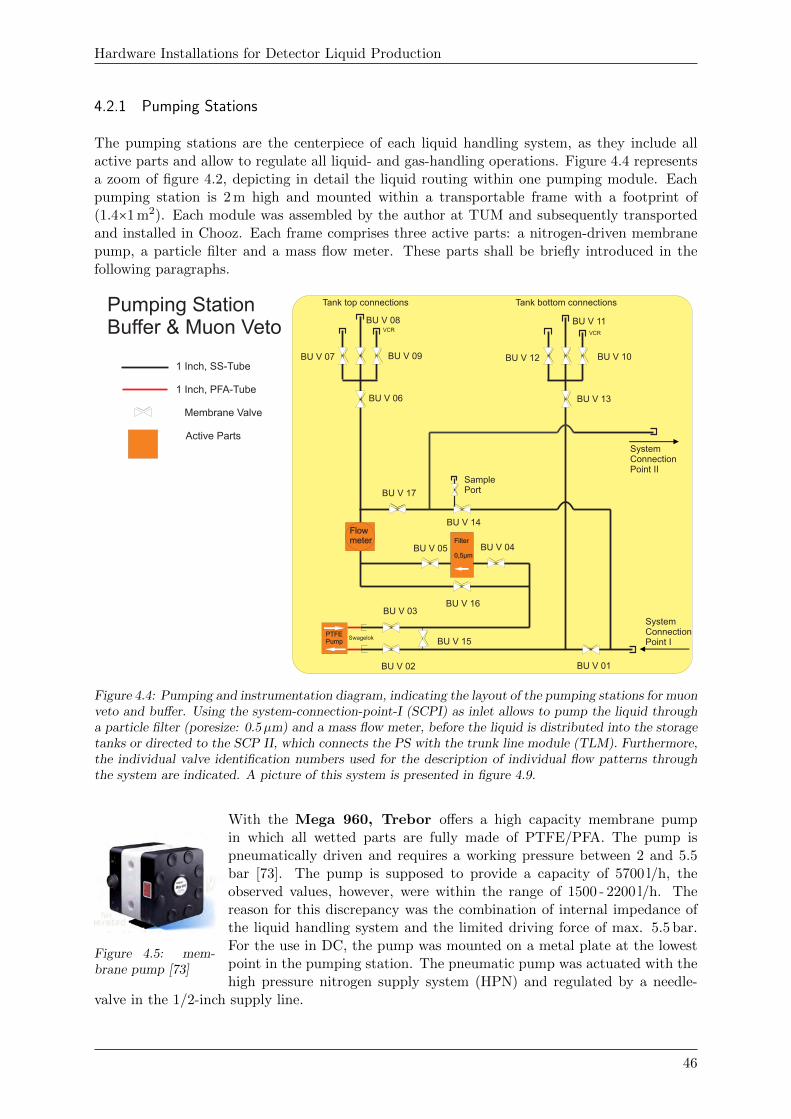
Hardware Installations for Detector Liquid Production
4.2.1 Pumping Stations
The pumping stations are the centerpiece of each liquid handling system, as they include allactive parts and allow to regulate all liquid- and gas-handling operations. Figure 4.4 representsa zoom of figure 4.2, depicting in detail the liquid routing within one pumping module. Eachpumping station is 2 m high and mounted within a transportable frame with a footprint of(1.4×1 m2). Each module was assembled by the author at TUM and subsequently transportedand installed in Chooz. Each frame comprises three active parts: a nitrogen-driven membranepump, a particle filter and a mass flow meter. These parts shall be briefly introduced in thefollowing paragraphs.
PTFEPump
Filter
0,5µm
Flowmeter
Pumping StationBuffer & Muon Veto
BU V 02
BU V 03
BU V 15
BU V 16
BU V 04BU V 05
BU V 17
BU V 14
BU V 01
BU V 13
BU V 09 BU V 12 BU V 10
BU V 11
BU V 06
BU V 07
SystemConnection Point I
Sample Port
SystemConnectionPoint II
BU V 08
Swagelok
VCR VCR
1 Inch, SS-Tube
1 Inch, PFA-Tube
Membrane Valve
Active Parts
Tank top connections Tank bottom connections
Figure 4.4: Pumping and instrumentation diagram, indicating the layout of the pumping stations for muonveto and buffer. Using the system-connection-point-I (SCPI) as inlet allows to pump the liquid througha particle filter (poresize: 0.5µm) and a mass flow meter, before the liquid is distributed into the storagetanks or directed to the SCP II, which connects the PS with the trunk line module (TLM). Furthermore,the individual valve identification numbers used for the description of individual flow patterns throughthe system are indicated. A picture of this system is presented in figure 4.9.
Figure 4.5: mem-brane pump [73]
With the Mega 960, Trebor offers a high capacity membrane pumpin which all wetted parts are fully made of PTFE/PFA. The pump ispneumatically driven and requires a working pressure between 2 and 5.5bar [73]. The pump is supposed to provide a capacity of 5700 l/h, theobserved values, however, were within the range of 1500 - 2200 l/h. Thereason for this discrepancy was the combination of internal impedance ofthe liquid handling system and the limited driving force of max. 5.5 bar.For the use in DC, the pump was mounted on a metal plate at the lowestpoint in the pumping station. The pneumatic pump was actuated with thehigh pressure nitrogen supply system (HPN) and regulated by a needle-
valve in the 1/2-inch supply line.
46
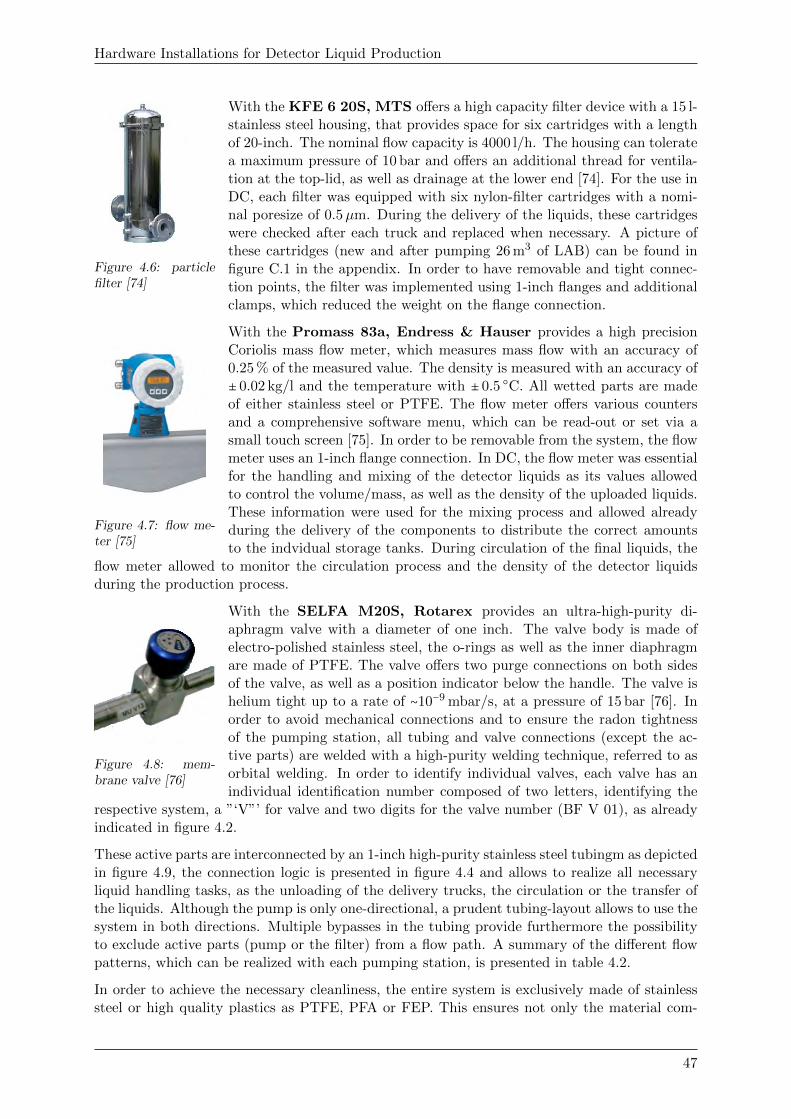
Hardware Installations for Detector Liquid Production
Figure 4.6: particlefilter [74]
With the KFE 6 20S, MTS offers a high capacity filter device with a 15 l-stainless steel housing, that provides space for six cartridges with a lengthof 20-inch. The nominal flow capacity is 4000 l/h. The housing can toleratea maximum pressure of 10 bar and offers an additional thread for ventila-tion at the top-lid, as well as drainage at the lower end [74]. For the use inDC, each filter was equipped with six nylon-filter cartridges with a nomi-nal poresize of 0.5µm. During the delivery of the liquids, these cartridgeswere checked after each truck and replaced when necessary. A picture ofthese cartridges (new and after pumping 26 m3 of LAB) can be found infigure C.1 in the appendix. In order to have removable and tight connec-tion points, the filter was implemented using 1-inch flanges and additionalclamps, which reduced the weight on the flange connection.
Figure 4.7: flow me-ter [75]
With the Promass 83a, Endress & Hauser provides a high precisionCoriolis mass flow meter, which measures mass flow with an accuracy of0.25 % of the measured value. The density is measured with an accuracy of± 0.02 kg/l and the temperature with ± 0.5 ○C. All wetted parts are madeof either stainless steel or PTFE. The flow meter offers various countersand a comprehensive software menu, which can be read-out or set via asmall touch screen [75]. In order to be removable from the system, the flowmeter uses an 1-inch flange connection. In DC, the flow meter was essentialfor the handling and mixing of the detector liquids as its values allowedto control the volume/mass, as well as the density of the uploaded liquids.These information were used for the mixing process and allowed alreadyduring the delivery of the components to distribute the correct amountsto the indvidual storage tanks. During circulation of the final liquids, the
flow meter allowed to monitor the circulation process and the density of the detector liquidsduring the production process.
Figure 4.8: mem-brane valve [76]
With the SELFA M20S, Rotarex provides an ultra-high-purity di-aphragm valve with a diameter of one inch. The valve body is made ofelectro-polished stainless steel, the o-rings as well as the inner diaphragmare made of PTFE. The valve offers two purge connections on both sidesof the valve, as well as a position indicator below the handle. The valve ishelium tight up to a rate of ∼10−9 mbar/s, at a pressure of 15 bar [76]. Inorder to avoid mechanical connections and to ensure the radon tightnessof the pumping station, all tubing and valve connections (except the ac-tive parts) are welded with a high-purity welding technique, referred to asorbital welding. In order to identify individual valves, each valve has anindividual identification number composed of two letters, identifying the
respective system, a ”‘V”’ for valve and two digits for the valve number (BF V 01), as alreadyindicated in figure 4.2.
These active parts are interconnected by an 1-inch high-purity stainless steel tubingm as depictedin figure 4.9, the connection logic is presented in figure 4.4 and allows to realize all necessaryliquid handling tasks, as the unloading of the delivery trucks, the circulation or the transfer ofthe liquids. Although the pump is only one-directional, a prudent tubing-layout allows to use thesystem in both directions. Multiple bypasses in the tubing provide furthermore the possibilityto exclude active parts (pump or the filter) from a flow path. A summary of the different flowpatterns, which can be realized with each pumping station, is presented in table 4.2.
In order to achieve the necessary cleanliness, the entire system is exclusively made of stainlesssteel or high quality plastics as PTFE, PFA or FEP. This ensures not only the material com-
47
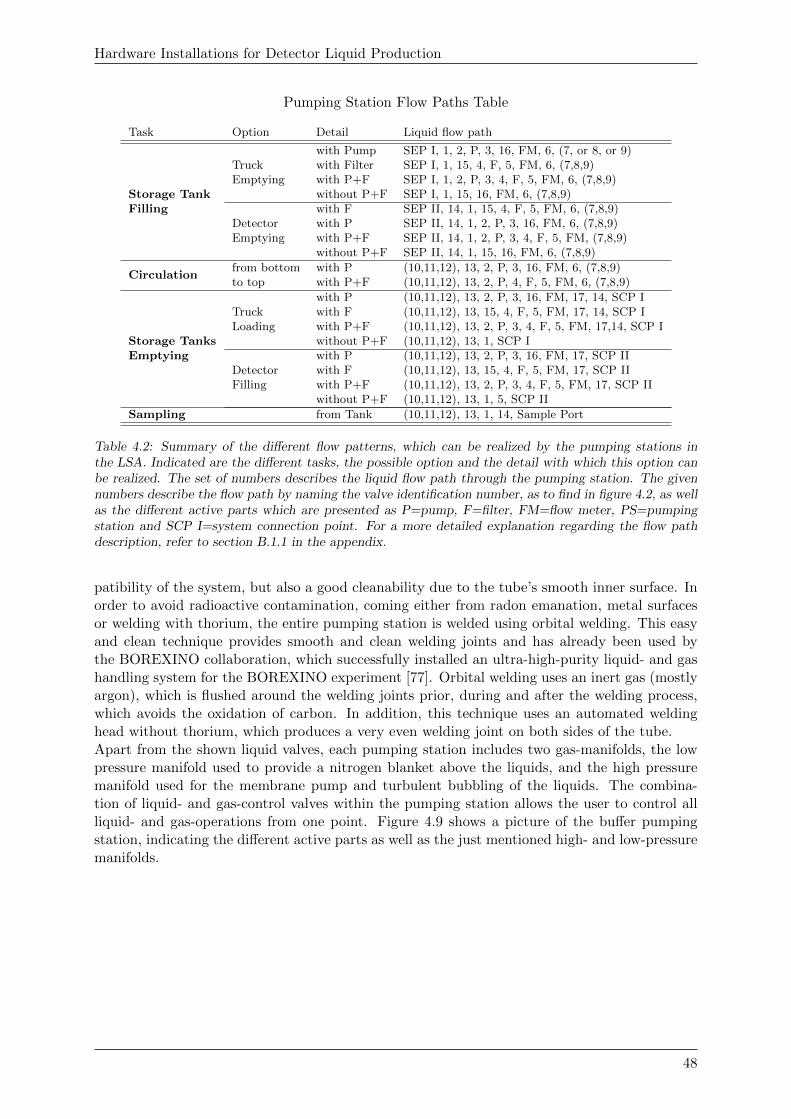
Hardware Installations for Detector Liquid Production
Pumping Station Flow Paths Table
Task Option Detail Liquid flow path
with Pump SEP I, 1, 2, P, 3, 16, FM, 6, (7, or 8, or 9)Truck with Filter SEP I, 1, 15, 4, F, 5, FM, 6, (7,8,9)Emptying with P+F SEP I, 1, 2, P, 3, 4, F, 5, FM, 6, (7,8,9)
Storage Tank without P+F SEP I, 1, 15, 16, FM, 6, (7,8,9)Filling with F SEP II, 14, 1, 15, 4, F, 5, FM, 6, (7,8,9)
Detector with P SEP II, 14, 1, 2, P, 3, 16, FM, 6, (7,8,9)Emptying with P+F SEP II, 14, 1, 2, P, 3, 4, F, 5, FM, (7,8,9)
without P+F SEP II, 14, 1, 15, 16, FM, 6, (7,8,9)
Circulationfrom bottom with P (10,11,12), 13, 2, P, 3, 16, FM, 6, (7,8,9)to top with P+F (10,11,12), 13, 2, P, 4, F, 5, FM, 6, (7,8,9)
with P (10,11,12), 13, 2, P, 3, 16, FM, 17, 14, SCP ITruck with F (10,11,12), 13, 15, 4, F, 5, FM, 17, 14, SCP ILoading with P+F (10,11,12), 13, 2, P, 3, 4, F, 5, FM, 17,14, SCP I
Storage Tanks without P+F (10,11,12), 13, 1, SCP IEmptying with P (10,11,12), 13, 2, P, 3, 16, FM, 17, SCP II
Detector with F (10,11,12), 13, 15, 4, F, 5, FM, 17, SCP IIFilling with P+F (10,11,12), 13, 2, P, 3, 4, F, 5, FM, 17, SCP II
without P+F (10,11,12), 13, 1, 5, SCP II
Sampling from Tank (10,11,12), 13, 1, 14, Sample Port
Table 4.2: Summary of the different flow patterns, which can be realized by the pumping stations inthe LSA. Indicated are the different tasks, the possible option and the detail with which this option canbe realized. The set of numbers describes the liquid flow path through the pumping station. The givennumbers describe the flow path by naming the valve identification number, as to find in figure 4.2, as wellas the different active parts which are presented as P=pump, F=filter, FM=flow meter, PS=pumpingstation and SCP I=system connection point. For a more detailed explanation regarding the flow pathdescription, refer to section B.1.1 in the appendix.
patibility of the system, but also a good cleanability due to the tube’s smooth inner surface. Inorder to avoid radioactive contamination, coming either from radon emanation, metal surfacesor welding with thorium, the entire pumping station is welded using orbital welding. This easyand clean technique provides smooth and clean welding joints and has already been used bythe BOREXINO collaboration, which successfully installed an ultra-high-purity liquid- and gashandling system for the BOREXINO experiment [77]. Orbital welding uses an inert gas (mostlyargon), which is flushed around the welding joints prior, during and after the welding process,which avoids the oxidation of carbon. In addition, this technique uses an automated weldinghead without thorium, which produces a very even welding joint on both sides of the tube.Apart from the shown liquid valves, each pumping station includes two gas-manifolds, the lowpressure manifold used to provide a nitrogen blanket above the liquids, and the high pressuremanifold used for the membrane pump and turbulent bubbling of the liquids. The combina-tion of liquid- and gas-control valves within the pumping station allows the user to control allliquid- and gas-operations from one point. Figure 4.9 shows a picture of the buffer pumpingstation, indicating the different active parts as well as the just mentioned high- and low-pressuremanifolds.
48
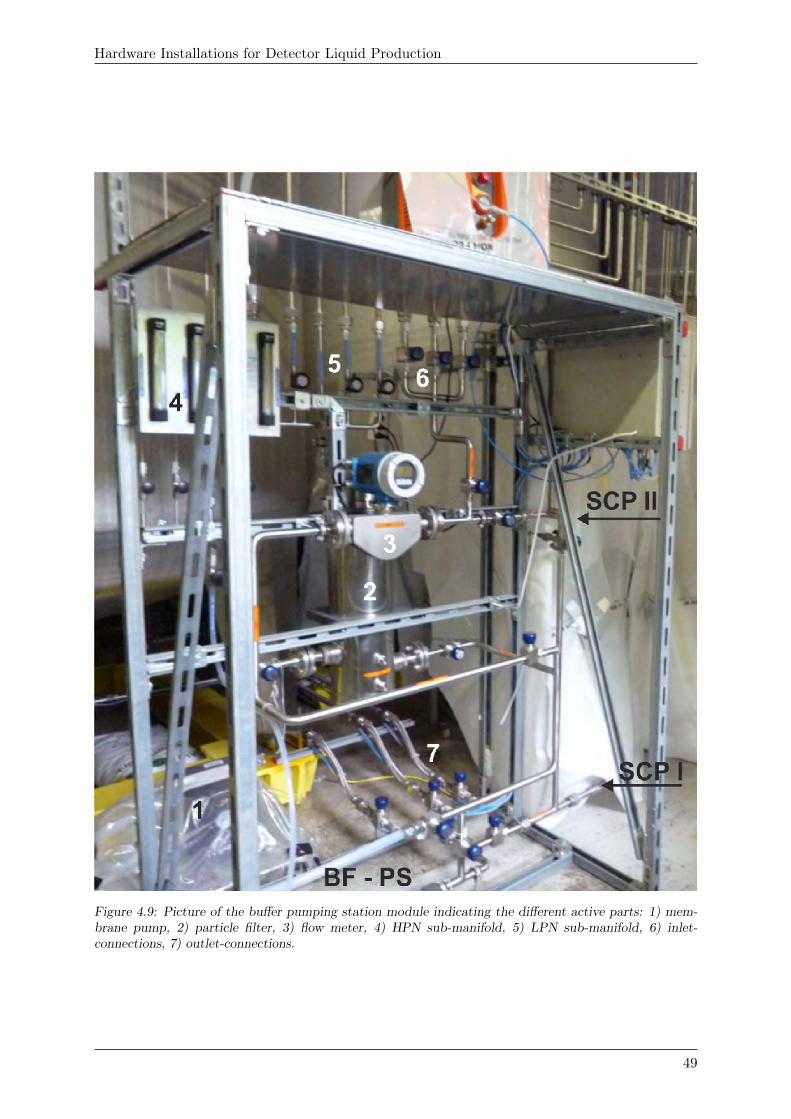
Hardware Installations for Detector Liquid Production
Figure 4.9: Picture of the buffer pumping station module indicating the different active parts: 1) mem-brane pump, 2) particle filter, 3) flow meter, 4) HPN sub-manifold, 5) LPN sub-manifold, 6) inlet-connections, 7) outlet-connections.
49
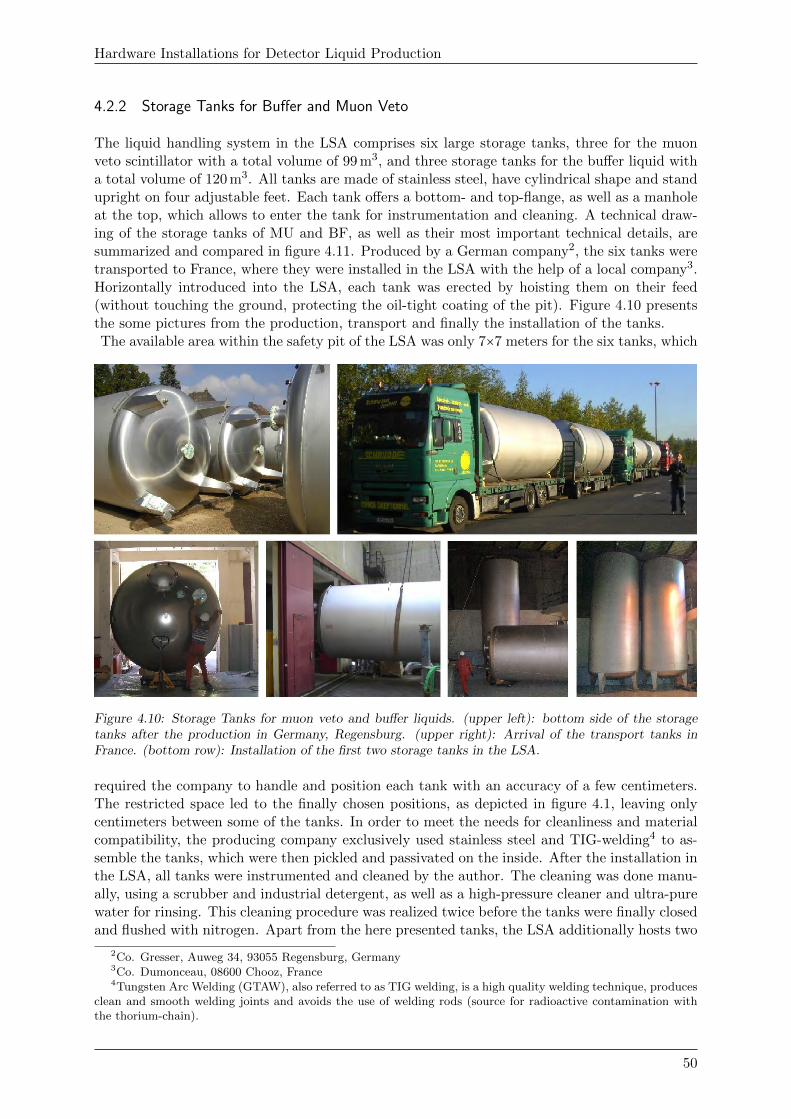
Hardware Installations for Detector Liquid Production
4.2.2 Storage Tanks for Buffer and Muon Veto
The liquid handling system in the LSA comprises six large storage tanks, three for the muonveto scintillator with a total volume of 99 m3, and three storage tanks for the buffer liquid witha total volume of 120 m3. All tanks are made of stainless steel, have cylindrical shape and standupright on four adjustable feet. Each tank offers a bottom- and top-flange, as well as a manholeat the top, which allows to enter the tank for instrumentation and cleaning. A technical draw-ing of the storage tanks of MU and BF, as well as their most important technical details, aresummarized and compared in figure 4.11. Produced by a German company2, the six tanks weretransported to France, where they were installed in the LSA with the help of a local company3.Horizontally introduced into the LSA, each tank was erected by hoisting them on their feed(without touching the ground, protecting the oil-tight coating of the pit). Figure 4.10 presentsthe some pictures from the production, transport and finally the installation of the tanks.The available area within the safety pit of the LSA was only 7×7 meters for the six tanks, which
Figure 4.10: Storage Tanks for muon veto and buffer liquids. (upper left): bottom side of the storagetanks after the production in Germany, Regensburg. (upper right): Arrival of the transport tanks inFrance. (bottom row): Installation of the first two storage tanks in the LSA.
required the company to handle and position each tank with an accuracy of a few centimeters.The restricted space led to the finally chosen positions, as depicted in figure 4.1, leaving onlycentimeters between some of the tanks. In order to meet the needs for cleanliness and materialcompatibility, the producing company exclusively used stainless steel and TIG-welding4 to as-semble the tanks, which were then pickled and passivated on the inside. After the installation inthe LSA, all tanks were instrumented and cleaned by the author. The cleaning was done manu-ally, using a scrubber and industrial detergent, as well as a high-pressure cleaner and ultra-purewater for rinsing. This cleaning procedure was realized twice before the tanks were finally closedand flushed with nitrogen. Apart from the here presented tanks, the LSA additionally hosts two
2Co. Gresser, Auweg 34, 93055 Regensburg, Germany3Co. Dumonceau, 08600 Chooz, France4Tungsten Arc Welding (GTAW), also referred to as TIG welding, is a high quality welding technique, produces
clean and smooth welding joints and avoids the use of welding rods (source for radioactive contamination withthe thorium-chain).
50
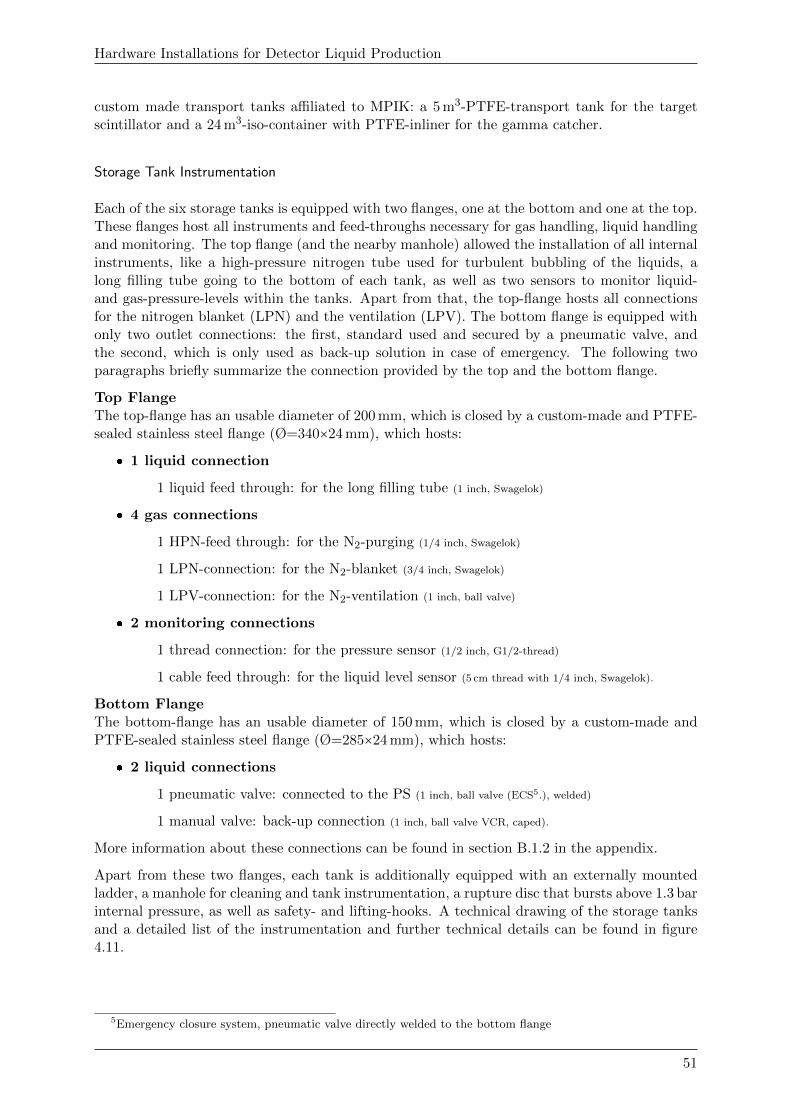
Hardware Installations for Detector Liquid Production
custom made transport tanks affiliated to MPIK: a 5 m3-PTFE-transport tank for the targetscintillator and a 24 m3-iso-container with PTFE-inliner for the gamma catcher.
Storage Tank Instrumentation
Each of the six storage tanks is equipped with two flanges, one at the bottom and one at the top.These flanges host all instruments and feed-throughs necessary for gas handling, liquid handlingand monitoring. The top flange (and the nearby manhole) allowed the installation of all internalinstruments, like a high-pressure nitrogen tube used for turbulent bubbling of the liquids, along filling tube going to the bottom of each tank, as well as two sensors to monitor liquid-and gas-pressure-levels within the tanks. Apart from that, the top-flange hosts all connectionsfor the nitrogen blanket (LPN) and the ventilation (LPV). The bottom flange is equipped withonly two outlet connections: the first, standard used and secured by a pneumatic valve, andthe second, which is only used as back-up solution in case of emergency. The following twoparagraphs briefly summarize the connection provided by the top and the bottom flange.
Top FlangeThe top-flange has an usable diameter of 200 mm, which is closed by a custom-made and PTFE-sealed stainless steel flange (Ø=340×24 mm), which hosts:
� 1 liquid connection
1 liquid feed through: for the long filling tube (1 inch, Swagelok)
� 4 gas connections
1 HPN-feed through: for the N2-purging (1/4 inch, Swagelok)
1 LPN-connection: for the N2-blanket (3/4 inch, Swagelok)
1 LPV-connection: for the N2-ventilation (1 inch, ball valve)
� 2 monitoring connections
1 thread connection: for the pressure sensor (1/2 inch, G1/2-thread)
1 cable feed through: for the liquid level sensor (5 cm thread with 1/4 inch, Swagelok).
Bottom FlangeThe bottom-flange has an usable diameter of 150 mm, which is closed by a custom-made andPTFE-sealed stainless steel flange (Ø=285×24 mm), which hosts:
� 2 liquid connections
1 pneumatic valve: connected to the PS (1 inch, ball valve (ECS5.), welded)
1 manual valve: back-up connection (1 inch, ball valve VCR, caped).
More information about these connections can be found in section B.1.2 in the appendix.
Apart from these two flanges, each tank is additionally equipped with an externally mountedladder, a manhole for cleaning and tank instrumentation, a rupture disc that bursts above 1.3 barinternal pressure, as well as safety- and lifting-hooks. A technical drawing of the storage tanksand a detailed list of the instrumentation and further technical details can be found in figure4.11.
5Emergency closure system, pneumatic valve directly welded to the bottom flange
51

Hardware Installations for Detector Liquid Production
Technical Details for MU & BF Storage Tanks
Dimension Buffer Muon Veto
Height 7890 mm 7560 mmDiameter 2800 mm 2600 mmWall thickness 3 mm 3 mmBottom/Top thickness 4 mm 4 mmWeight empty 2.150 kg 1.910 kgWeight full 32.160 kg 26.532 kgNom. Volume 40 m3 33 m3
Max. Volume 43 m3 35 m3
Pressure Buffer Muon Veto
Certified Pressure 1300 mbar 1300 mbarRupture disk Pressure 1100 bar 1100 barMaximum pressure 900 mbar 900 mbarBlanket Pressure 0-100 mbar 0-100 mbar
Material Buffer Muon Veto
Walls SS 1.403 SS 1.403Bottom/Top SS 1.403 SS 1.403Joints PTFE PTFE
Instrumentation Buffer Muon Veto
1-Manhole 600 mm 600 mm2-Top Flange 200 mm 200 mm3-Rupture disk 80 mm 80 mm4-Lifting hooks 2 25-Bottom Flange 150 mm 150 mm6-Feet (adjustable) 4 47-Type plate 1 18-Safety hooks 1 19-Ladder+Back protection yes yes
Figure 4.11: Technical drawing and technical details of the storage tanks of muon veto and buffer: top-and side-view of the tanks, as well as the details A and B. Detail A shows the design of the tank-feet, whiledetail B shows the upper side of the tanks, indicating the number and position of the tank instrumentation.The table summarizes and compares the most important technical details of the different tanks. Biggerfull-scale version of the drawing can be found in the appendix, see figure B.1.
52
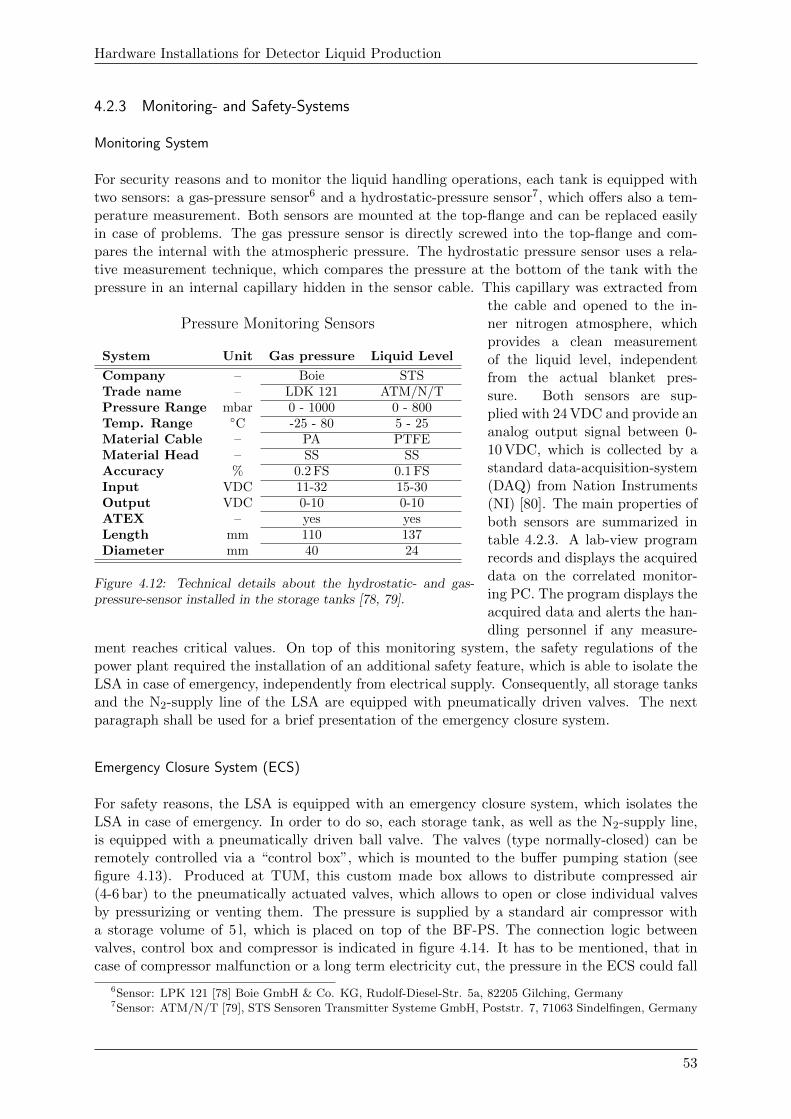
Hardware Installations for Detector Liquid Production
4.2.3 Monitoring- and Safety-Systems
Monitoring System
For security reasons and to monitor the liquid handling operations, each tank is equipped withtwo sensors: a gas-pressure sensor6 and a hydrostatic-pressure sensor7, which offers also a tem-perature measurement. Both sensors are mounted at the top-flange and can be replaced easilyin case of problems. The gas pressure sensor is directly screwed into the top-flange and com-pares the internal with the atmospheric pressure. The hydrostatic pressure sensor uses a rela-tive measurement technique, which compares the pressure at the bottom of the tank with thepressure in an internal capillary hidden in the sensor cable. This capillary was extracted from
Pressure Monitoring Sensors
System Unit Gas pressure Liquid Level
Company – Boie STSTrade name – LDK 121 ATM/N/TPressure Range mbar 0 - 1000 0 - 800Temp. Range ○C -25 - 80 5 - 25Material Cable – PA PTFEMaterial Head – SS SSAccuracy % 0.2 FS 0.1 FSInput VDC 11-32 15-30Output VDC 0-10 0-10ATEX – yes yesLength mm 110 137Diameter mm 40 24
Figure 4.12: Technical details about the hydrostatic- and gas-pressure-sensor installed in the storage tanks [78, 79].
the cable and opened to the in-ner nitrogen atmosphere, whichprovides a clean measurementof the liquid level, independentfrom the actual blanket pres-sure. Both sensors are sup-plied with 24 VDC and provide ananalog output signal between 0-10 VDC, which is collected by astandard data-acquisition-system(DAQ) from Nation Instruments(NI) [80]. The main properties ofboth sensors are summarized intable 4.2.3. A lab-view programrecords and displays the acquireddata on the correlated monitor-ing PC. The program displays theacquired data and alerts the han-dling personnel if any measure-
ment reaches critical values. On top of this monitoring system, the safety regulations of thepower plant required the installation of an additional safety feature, which is able to isolate theLSA in case of emergency, independently from electrical supply. Consequently, all storage tanksand the N2-supply line of the LSA are equipped with pneumatically driven valves. The nextparagraph shall be used for a brief presentation of the emergency closure system.
Emergency Closure System (ECS)
For safety reasons, the LSA is equipped with an emergency closure system, which isolates theLSA in case of emergency. In order to do so, each storage tank, as well as the N2-supply line,is equipped with a pneumatically driven ball valve. The valves (type normally-closed) can beremotely controlled via a “control box”, which is mounted to the buffer pumping station (seefigure 4.13). Produced at TUM, this custom made box allows to distribute compressed air(4-6 bar) to the pneumatically actuated valves, which allows to open or close individual valvesby pressurizing or venting them. The pressure is supplied by a standard air compressor witha storage volume of 5 l, which is placed on top of the BF-PS. The connection logic betweenvalves, control box and compressor is indicated in figure 4.14. It has to be mentioned, that incase of compressor malfunction or a long term electricity cut, the pressure in the ECS could fall
6Sensor: LPK 121 [78] Boie GmbH & Co. KG, Rudolf-Diesel-Str. 5a, 82205 Gilching, Germany7Sensor: ATM/N/T [79], STS Sensoren Transmitter Systeme GmbH, Poststr. 7, 71063 Sindelfingen, Germany
53
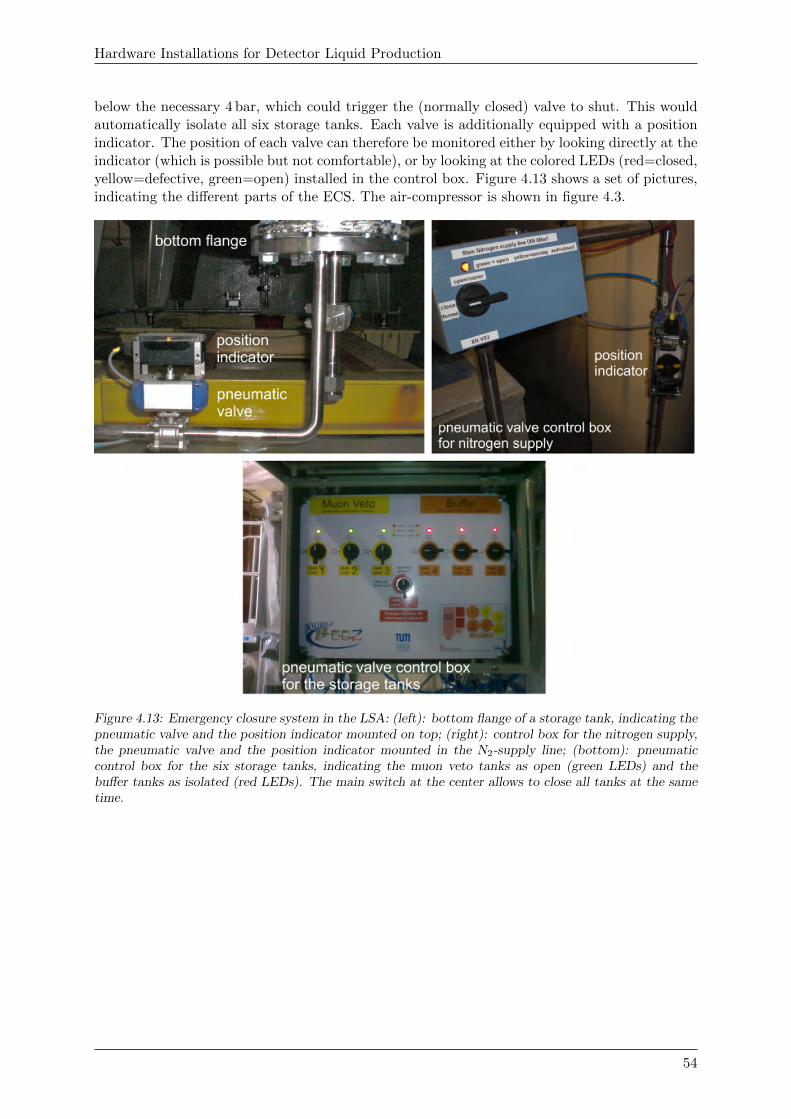
Hardware Installations for Detector Liquid Production
below the necessary 4 bar, which could trigger the (normally closed) valve to shut. This wouldautomatically isolate all six storage tanks. Each valve is additionally equipped with a positionindicator. The position of each valve can therefore be monitored either by looking directly at theindicator (which is possible but not comfortable), or by looking at the colored LEDs (red=closed,yellow=defective, green=open) installed in the control box. Figure 4.13 shows a set of pictures,indicating the different parts of the ECS. The air-compressor is shown in figure 4.3.
Figure 4.13: Emergency closure system in the LSA: (left): bottom flange of a storage tank, indicating thepneumatic valve and the position indicator mounted on top; (right): control box for the nitrogen supply,the pneumatic valve and the position indicator mounted in the N2-supply line; (bottom): pneumaticcontrol box for the six storage tanks, indicating the muon veto tanks as open (green LEDs) and thebuffer tanks as isolated (red LEDs). The main switch at the center allows to close all tanks at the sametime.
54
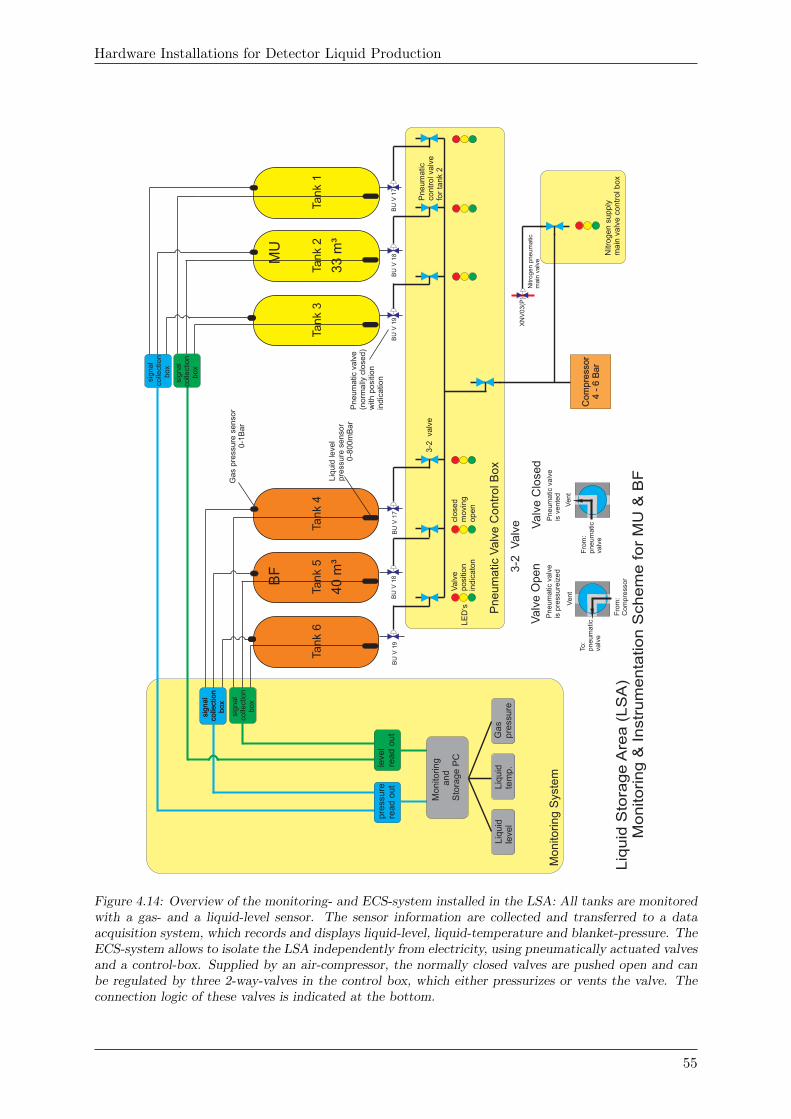
Hardware Installations for Detector Liquid Production
Tank
4
Tank 5
Ta
nk 6
BF
40
m³
Liq
uid
Sto
rage A
rea (
LS
A)
M
onitoring &
Instr
um
enta
tion S
chem
e for
MU
& B
F
BU
V 1
7B
U V
18
BU
V 1
9
Valv
e O
pen
Valv
e C
losed
Pneum
atic
valv
eis
pre
ssure
ized
Pn
eu
ma
tic v
alv
e
is v
en
ted
3-2
V
alv
e
Fro
m:
Co
mp
ress
or
To:
pn
eu
ma
ticva
lve
Ve
nt
Tank
1
Tank 2
Tank
3
MU
33
m³
BU
V 1
7B
U V
18
BU
V 1
9
pre
ssu
re
rea
d o
ut
leve
l re
ad
ou
t
Mo
nito
rin
g
an
d
Sto
rag
e P
C
Co
mp
ress
or
4
- 6
Ba
r
3-2
va
lve
Pneum
atic
Valv
e C
ontr
ol B
ox
si
gnal
colle
ctio
n box
si
gnal
colle
ctio
n box
Va
lve
ind
ica
ton
p
osi
tion
Ga
s p
ress
ure
se
nso
r
0
-1B
ar
Liq
uid
le
vel
pre
ssu
re s
en
so
r
0
-80
0m
Bar
Monito
ring S
yste
m
Liq
uid
le
vel
Liq
uid
te
mp
.
Ga
sp
ress
ure
Pn
eu
ma
tic
valv
e
(no
rma
lly c
lose
d)
with p
ositi
on
in
dic
atio
n
Nitro
ge
n s
up
ply
ma
in v
alv
e c
on
tro
l bo
x
Pn
eu
ma
tic
con
tro
l va
lve
fo
r ta
nk
2
XN
V0
3(P
)N
itro
gen p
neum
atic
main
valv
e
Ve
nt
Fro
m:
pn
eu
ma
ticva
lve
LE
D‘s
clo
sed
mo
vin
go
pe
n
si
gnal
colle
ctio
n box
si
gnal
colle
ctio
n box
si
gnal
colle
ctio
n box
Figure 4.14: Overview of the monitoring- and ECS-system installed in the LSA: All tanks are monitoredwith a gas- and a liquid-level sensor. The sensor information are collected and transferred to a dataacquisition system, which records and displays liquid-level, liquid-temperature and blanket-pressure. TheECS-system allows to isolate the LSA independently from electricity, using pneumatically actuated valvesand a control-box. Supplied by an air-compressor, the normally closed valves are pushed open and canbe regulated by three 2-way-valves in the control box, which either pressurizes or vents the valve. Theconnection logic of these valves is indicated at the bottom.
55
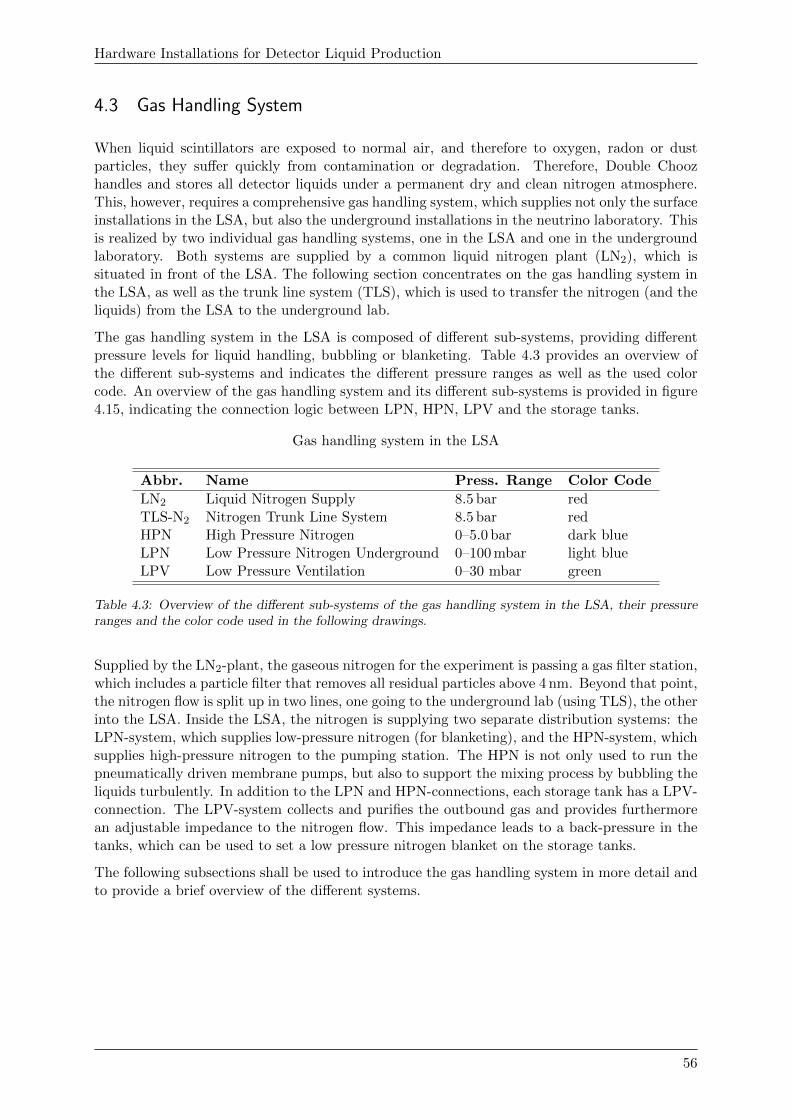
Hardware Installations for Detector Liquid Production
4.3 Gas Handling System
When liquid scintillators are exposed to normal air, and therefore to oxygen, radon or dustparticles, they suffer quickly from contamination or degradation. Therefore, Double Choozhandles and stores all detector liquids under a permanent dry and clean nitrogen atmosphere.This, however, requires a comprehensive gas handling system, which supplies not only the surfaceinstallations in the LSA, but also the underground installations in the neutrino laboratory. Thisis realized by two individual gas handling systems, one in the LSA and one in the undergroundlaboratory. Both systems are supplied by a common liquid nitrogen plant (LN2), which issituated in front of the LSA. The following section concentrates on the gas handling system inthe LSA, as well as the trunk line system (TLS), which is used to transfer the nitrogen (and theliquids) from the LSA to the underground lab.
The gas handling system in the LSA is composed of different sub-systems, providing differentpressure levels for liquid handling, bubbling or blanketing. Table 4.3 provides an overview ofthe different sub-systems and indicates the different pressure ranges as well as the used colorcode. An overview of the gas handling system and its different sub-systems is provided in figure4.15, indicating the connection logic between LPN, HPN, LPV and the storage tanks.
Gas handling system in the LSA
Abbr. Name Press. Range Color Code
LN2 Liquid Nitrogen Supply 8.5 bar redTLS-N2 Nitrogen Trunk Line System 8.5 bar redHPN High Pressure Nitrogen 0–5.0 bar dark blueLPN Low Pressure Nitrogen Underground 0–100 mbar light blueLPV Low Pressure Ventilation 0–30 mbar green
Table 4.3: Overview of the different sub-systems of the gas handling system in the LSA, their pressureranges and the color code used in the following drawings.
Supplied by the LN2-plant, the gaseous nitrogen for the experiment is passing a gas filter station,which includes a particle filter that removes all residual particles above 4 nm. Beyond that point,the nitrogen flow is split up in two lines, one going to the underground lab (using TLS), the otherinto the LSA. Inside the LSA, the nitrogen is supplying two separate distribution systems: theLPN-system, which supplies low-pressure nitrogen (for blanketing), and the HPN-system, whichsupplies high-pressure nitrogen to the pumping station. The HPN is not only used to run thepneumatically driven membrane pumps, but also to support the mixing process by bubbling theliquids turbulently. In addition to the LPN and HPN-connections, each storage tank has a LPV-connection. The LPV-system collects and purifies the outbound gas and provides furthermorean adjustable impedance to the nitrogen flow. This impedance leads to a back-pressure in thetanks, which can be used to set a low pressure nitrogen blanket on the storage tanks.
The following subsections shall be used to introduce the gas handling system in more detail andto provide a brief overview of the different systems.
56
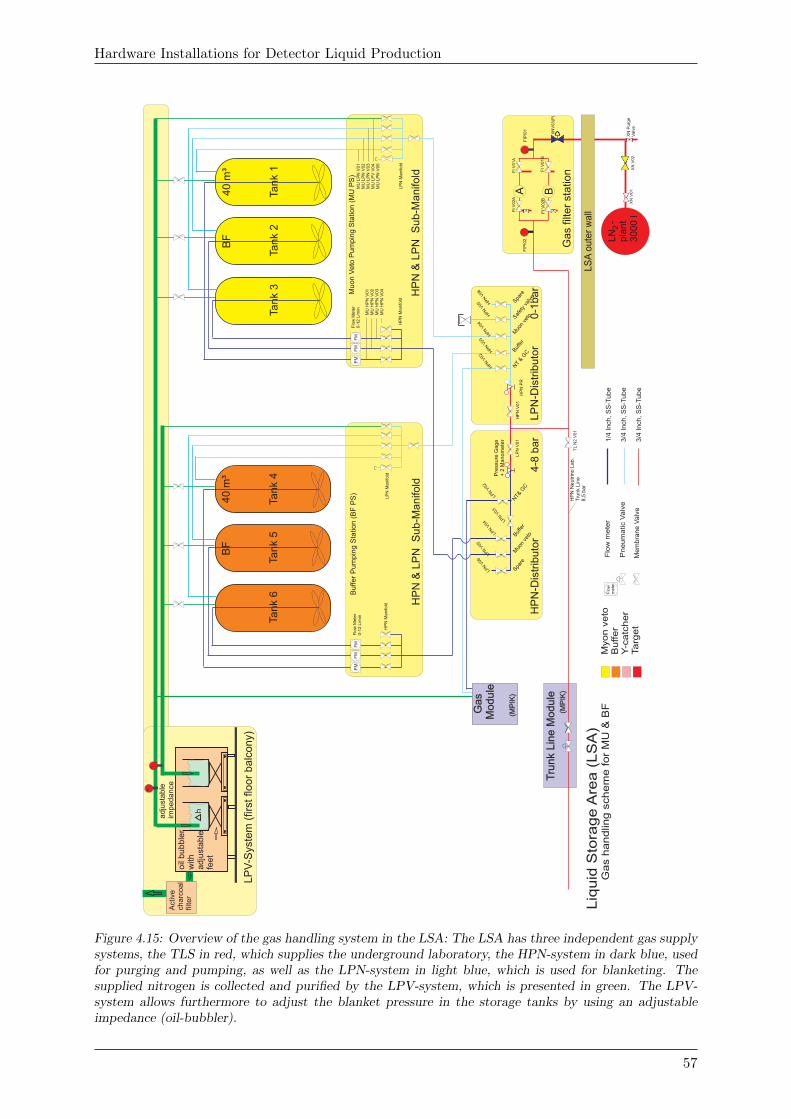
Hardware Installations for Detector Liquid Production
Tank 4
Tank
5
Tank
6
BF
40 m
³
Myon v
eto
Buffer
Y-c
atc
her
Targ
et
Liq
uid
Sto
rag
e A
rea
(L
SA
)
Gas h
andlin
g s
chem
e for
MU
& B
F
Targ
et
Gam
ma
Catc
her
5 m
³25 m
³
Pum
pst
atio
n (M
PIK
)
Flo
wm
ete
rF
low
me
ter
Pn
eu
ma
tic V
alv
e
Pum
pst
atio
n (M
PIK
)
Tank
1
Tank 2
Tank
3
BF
40 m
³
NT
& G
C
HP
N N
eu
trin
o L
ab
.T
run
k L
ine
8
,5 b
ar
HP
N-D
istr
ibuto
r 4
-8 b
ar
A B
LS
A o
ute
r w
all
XN
V0
1
FI
V0
1B
FI
V0
2B
FIP
I01
FIP
I02 LN
-
pla
nt
30
00
l
HP
N P
R
HP
N V
01
XN
Pu
rge
Va
lve
XN
V02
XN
V03(P
)
FI V
01A
FI V
02A
Pre
ssu
re G
ag
e+
2 M
an
om
ete
r
LP
N-D
istr
ibuto
r 0-1
bar
LP
N V
01
LPN V
02
LPN V
03
HPN V
02 H
PN V
03
HPN V
04
HPN V
05 HPN V
06
FM
FM
FM
Spa
re
Saf
ety
valve
Muo
n ve
to
Buf
fer
Spa
re
LPN V
06
LPN V
05
LPN V
04
NT&
GC
Muo
n ve
toBuf
fer
TL N
2 V
01
Act
ive
cha
rco
al
filte
r
LP
V-S
yste
m (
first
flo
or
balc
ony)
Gas filt
er
sta
tion
HP
N M
an
ifold
MU
HP
N V
01
MU
HP
N V
02
MU
HP
N V
03
MU
HP
N V
04
Flo
w M
ete
r0
-12
L/m
in
FM
FM
FM
Flo
w M
ete
r0
-12
L/m
in
HP
N &
LP
N S
ub-M
anifold
MU
LP
N V
01
MU
LP
N V
02
MU
LP
N V
03
MU
LP
V V
04
MU
LP
N V
05
LP
N M
an
ifold
HP
N M
an
ifold
L
PN
Ma
nifo
ld
Buffer
Pum
pin
g S
tatio
n (
BF
PS
)
Muon V
eto
Pum
pin
g S
tatio
n (
MU
PS
)
HP
N &
LP
N S
ub-M
anifold
h
oil
bu
bb
ler
with
a
dju
sta
ble
fe
et
adju
stable
im
pedance
1/4
Inch
, S
S-T
ube
3/4
Inch
, S
S-T
ube
3/4
Inch
, S
S-T
ube
G
as
Module
(MP
IK)
Tru
nk
Lin
e M
odule
(MP
IK)
2
Mem
bra
ne V
alv
e
Figure 4.15: Overview of the gas handling system in the LSA: The LSA has three independent gas supplysystems, the TLS in red, which supplies the underground laboratory, the HPN-system in dark blue, usedfor purging and pumping, as well as the LPN-system in light blue, which is used for blanketing. Thesupplied nitrogen is collected and purified by the LPV-system, which is presented in green. The LPV-system allows furthermore to adjust the blanket pressure in the storage tanks by using an adjustableimpedance (oil-bubbler).
57
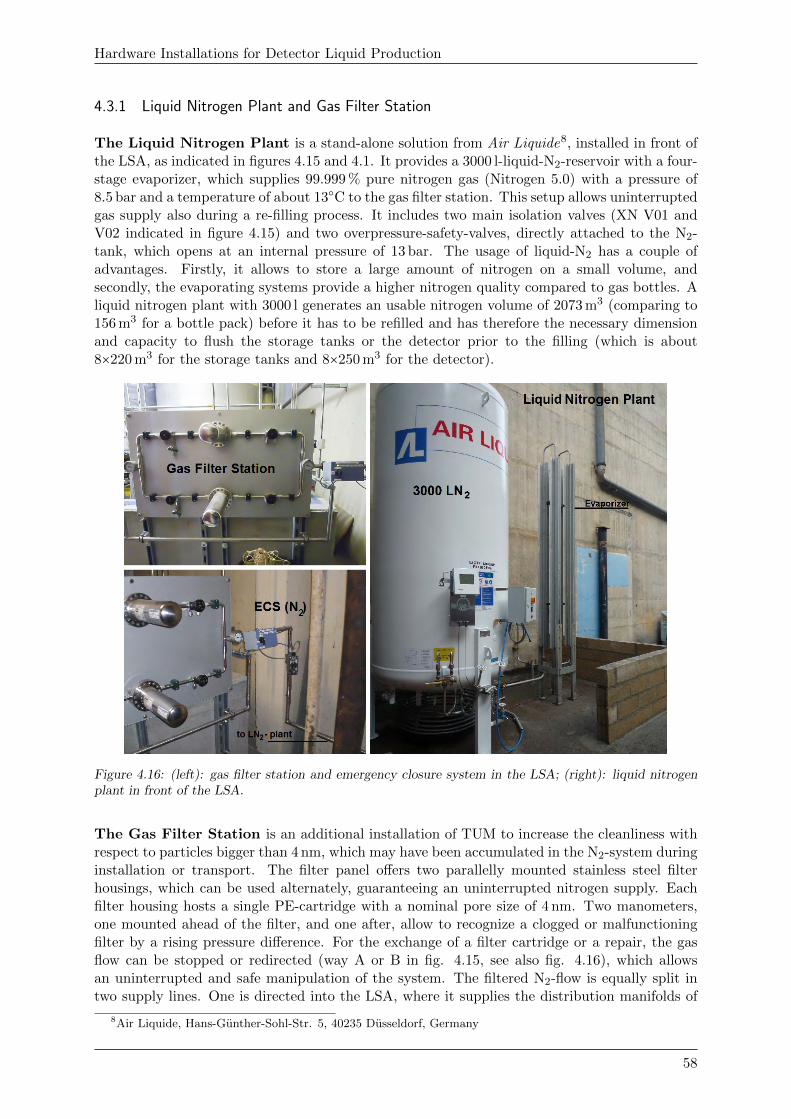
Hardware Installations for Detector Liquid Production
4.3.1 Liquid Nitrogen Plant and Gas Filter Station
The Liquid Nitrogen Plant is a stand-alone solution from Air Liquide8, installed in front ofthe LSA, as indicated in figures 4.15 and 4.1. It provides a 3000 l-liquid-N2-reservoir with a four-stage evaporizer, which supplies 99.999 % pure nitrogen gas (Nitrogen 5.0) with a pressure of8.5 bar and a temperature of about 13○C to the gas filter station. This setup allows uninterruptedgas supply also during a re-filling process. It includes two main isolation valves (XN V01 andV02 indicated in figure 4.15) and two overpressure-safety-valves, directly attached to the N2-tank, which opens at an internal pressure of 13 bar. The usage of liquid-N2 has a couple ofadvantages. Firstly, it allows to store a large amount of nitrogen on a small volume, andsecondly, the evaporating systems provide a higher nitrogen quality compared to gas bottles. Aliquid nitrogen plant with 3000 l generates an usable nitrogen volume of 2073 m3 (comparing to156 m3 for a bottle pack) before it has to be refilled and has therefore the necessary dimensionand capacity to flush the storage tanks or the detector prior to the filling (which is about8×220 m3 for the storage tanks and 8×250 m3 for the detector).
Figure 4.16: (left): gas filter station and emergency closure system in the LSA; (right): liquid nitrogenplant in front of the LSA.
The Gas Filter Station is an additional installation of TUM to increase the cleanliness withrespect to particles bigger than 4 nm, which may have been accumulated in the N2-system duringinstallation or transport. The filter panel offers two parallelly mounted stainless steel filterhousings, which can be used alternately, guaranteeing an uninterrupted nitrogen supply. Eachfilter housing hosts a single PE-cartridge with a nominal pore size of 4 nm. Two manometers,one mounted ahead of the filter, and one after, allow to recognize a clogged or malfunctioningfilter by a rising pressure difference. For the exchange of a filter cartridge or a repair, the gasflow can be stopped or redirected (way A or B in fig. 4.15, see also fig. 4.16), which allowsan uninterrupted and safe manipulation of the system. The filtered N2-flow is equally split intwo supply lines. One is directed into the LSA, where it supplies the distribution manifolds of
8Air Liquide, Hans-Gunther-Sohl-Str. 5, 40235 Dusseldorf, Germany
58
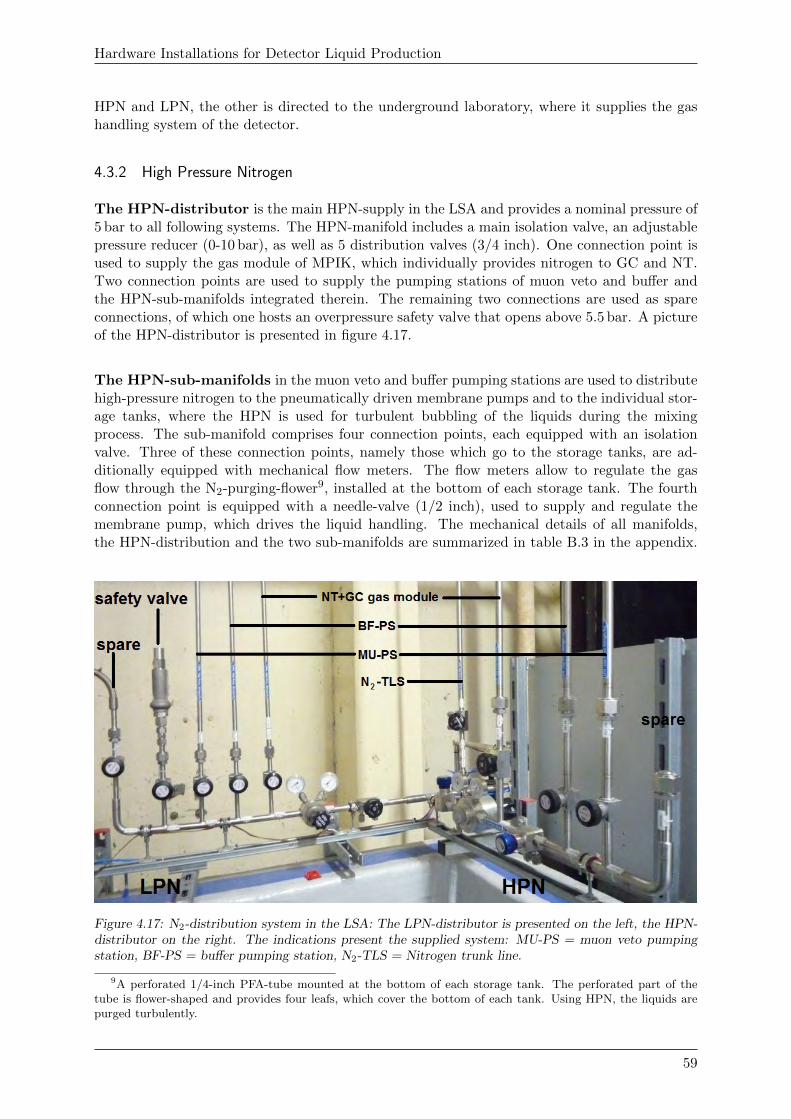
Hardware Installations for Detector Liquid Production
HPN and LPN, the other is directed to the underground laboratory, where it supplies the gashandling system of the detector.
4.3.2 High Pressure Nitrogen
The HPN-distributor is the main HPN-supply in the LSA and provides a nominal pressure of5 bar to all following systems. The HPN-manifold includes a main isolation valve, an adjustablepressure reducer (0-10 bar), as well as 5 distribution valves (3/4 inch). One connection point isused to supply the gas module of MPIK, which individually provides nitrogen to GC and NT.Two connection points are used to supply the pumping stations of muon veto and buffer andthe HPN-sub-manifolds integrated therein. The remaining two connections are used as spareconnections, of which one hosts an overpressure safety valve that opens above 5.5 bar. A pictureof the HPN-distributor is presented in figure 4.17.
The HPN-sub-manifolds in the muon veto and buffer pumping stations are used to distributehigh-pressure nitrogen to the pneumatically driven membrane pumps and to the individual stor-age tanks, where the HPN is used for turbulent bubbling of the liquids during the mixingprocess. The sub-manifold comprises four connection points, each equipped with an isolationvalve. Three of these connection points, namely those which go to the storage tanks, are ad-ditionally equipped with mechanical flow meters. The flow meters allow to regulate the gasflow through the N2-purging-flower9, installed at the bottom of each storage tank. The fourthconnection point is equipped with a needle-valve (1/2 inch), used to supply and regulate themembrane pump, which drives the liquid handling. The mechanical details of all manifolds,the HPN-distribution and the two sub-manifolds are summarized in table B.3 in the appendix.
Figure 4.17: N2-distribution system in the LSA: The LPN-distributor is presented on the left, the HPN-distributor on the right. The indications present the supplied system: MU-PS = muon veto pumpingstation, BF-PS = buffer pumping station, N2-TLS = Nitrogen trunk line.
9A perforated 1/4-inch PFA-tube mounted at the bottom of each storage tank. The perforated part of thetube is flower-shaped and provides four leafs, which cover the bottom of each tank. Using HPN, the liquids arepurged turbulently.
59
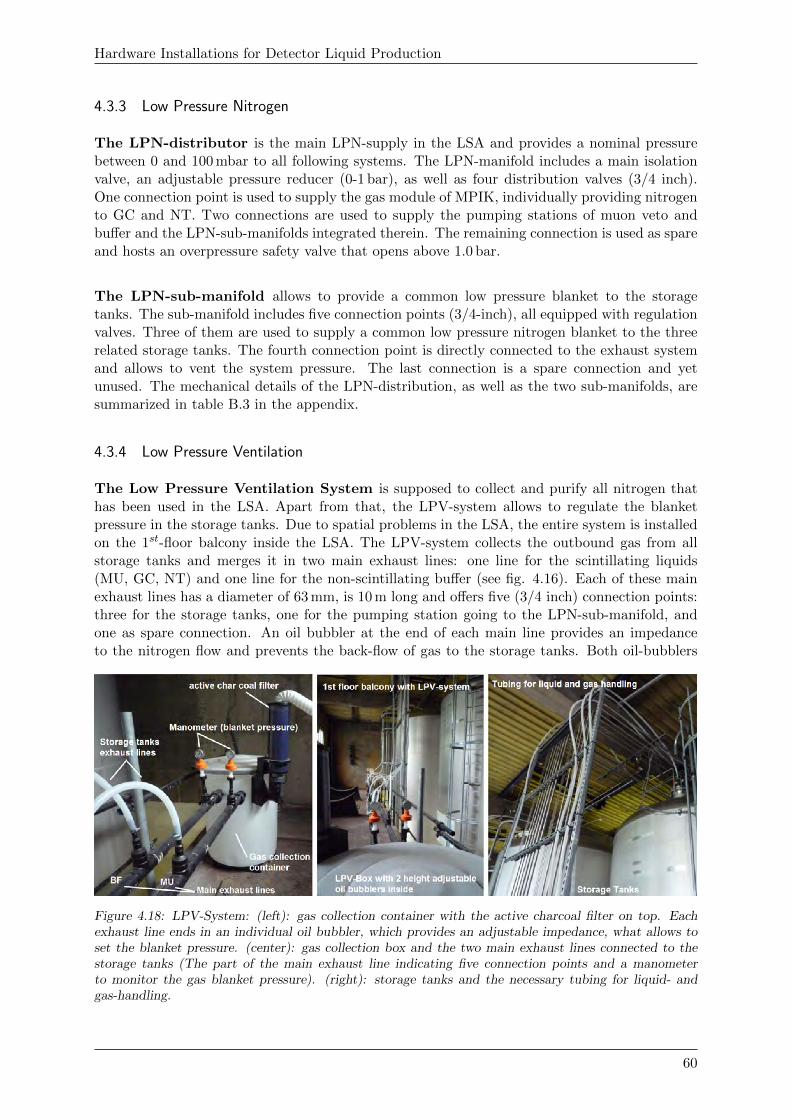
Hardware Installations for Detector Liquid Production
4.3.3 Low Pressure Nitrogen
The LPN-distributor is the main LPN-supply in the LSA and provides a nominal pressurebetween 0 and 100 mbar to all following systems. The LPN-manifold includes a main isolationvalve, an adjustable pressure reducer (0-1 bar), as well as four distribution valves (3/4 inch).One connection point is used to supply the gas module of MPIK, individually providing nitrogento GC and NT. Two connections are used to supply the pumping stations of muon veto andbuffer and the LPN-sub-manifolds integrated therein. The remaining connection is used as spareand hosts an overpressure safety valve that opens above 1.0 bar.
The LPN-sub-manifold allows to provide a common low pressure blanket to the storagetanks. The sub-manifold includes five connection points (3/4-inch), all equipped with regulationvalves. Three of them are used to supply a common low pressure nitrogen blanket to the threerelated storage tanks. The fourth connection point is directly connected to the exhaust systemand allows to vent the system pressure. The last connection is a spare connection and yetunused. The mechanical details of the LPN-distribution, as well as the two sub-manifolds, aresummarized in table B.3 in the appendix.
4.3.4 Low Pressure Ventilation
The Low Pressure Ventilation System is supposed to collect and purify all nitrogen thathas been used in the LSA. Apart from that, the LPV-system allows to regulate the blanketpressure in the storage tanks. Due to spatial problems in the LSA, the entire system is installedon the 1st-floor balcony inside the LSA. The LPV-system collects the outbound gas from allstorage tanks and merges it in two main exhaust lines: one line for the scintillating liquids(MU, GC, NT) and one line for the non-scintillating buffer (see fig. 4.16). Each of these mainexhaust lines has a diameter of 63 mm, is 10 m long and offers five (3/4 inch) connection points:three for the storage tanks, one for the pumping station going to the LPN-sub-manifold, andone as spare connection. An oil bubbler at the end of each main line provides an impedanceto the nitrogen flow and prevents the back-flow of gas to the storage tanks. Both oil-bubblers
Figure 4.18: LPV-System: (left): gas collection container with the active charcoal filter on top. Eachexhaust line ends in an individual oil bubbler, which provides an adjustable impedance, what allows toset the blanket pressure. (center): gas collection box and the two main exhaust lines connected to thestorage tanks (The part of the main exhaust line indicating five connection points and a manometerto monitor the gas blanket pressure). (right): storage tanks and the necessary tubing for liquid- andgas-handling.
60
Hardware Installations for Detector Liquid Production
are contained in a gas-tight collection-container and can be adjusted in height, what allowsto regulate the impedance and therefore the blanket pressure in the storage tanks. Both oilbubblers use transparent mineral oil (Ondina-909). After the bubbler, the mixed gas-phase iscollected in the container and has to pass an active charcoal filter, which removes any vaporizedaromatics, before it is finally released to the environment. Figure 4.18 presents three picturesof the LPV-system installed in the LSA, indicating the main exhaust lines, the gas-collectioncontainer and the storage tanks including the necessary tubing.
4.4 Trunk Line System (TLS)
The trunk line system connects the surface installations with the underground laboratory. It isa joint effort of MPIK and TUM, which made it necessary to divide it into three parts.
� TLS-Street part,
� TLS-Tunnel part and
� TLS-DFOS part.
The TLS is composed of five individual 3/4-inch trunk-lines: A stainless steel line for the N2-supply and four liquid lines for muon veto, buffer, gamma catcher and target. Although thetrunk line system is technically not very difficult, its cleanliness is of great importance for theexperiment. The contact of the scintillator with the 160 m of tubing is not negligible. TheTLS is therefore a potential source for re-contamination of the detector liquids stored in theLSA. Improper installation, as well as inadequate welding or incompatible materials, could haveled to a degradation or contamination of the detector liquids and delimit the sensitivity of theexperiment. In order to avoid such a scenario, all tubes were installed and subsequently purgedwith nitrogen. In case of gamma catcher and target the tubes were additionally cleaned byflushing with an industrial detergent and a weak acid-solution. Finally, all tubes were flushedwith a batch of final detector liquids, before they were used for the liquid transfer to the filingsystem in the underground laboratory. The next paragraphs will provide a brief overview of thedifferent trunk line parts, while table 4.4 summarizes the most important technical details.
The street part : The first part spans 15 m from the trunk line module (TLM, see figure4.1) in the LSA to the tunnel entrance of the laboratory. The TLM is part of the emergencyclosure system installed by MPIK and allows to isolate the LSA in case of emergency. The TLMincludes the five trunk lines and secures each line with a manually- and a pneumatically-drivenvalve. After the TLM, the tubes exit the LSA through the wall. Mounted on the outside ofLSA, a waterproof PE-box contains additional isolation valves (manual), which allow to isolatethe LSA from the outside (see fig. 4.19). The tubes are leaving the isolation valve box verticallyto reach below the street level, where the tubes run across the street. At the other side of theroad, the tubes run vertically into the tunnel entrance, where they are connected to a secondisolation-valve box, which marks the end of the street part. Except for the nitrogen line, whichis stainless steel, all tubes are made of flexible PFA. The PFA tubes are furthermore doublecontained, as required by reactor safety regulations, within a bigger, stiff and transparent PVC-tube in order to secure the PFA-tube from mechanical forces. In order to secure the tubes fromstatic discharge (non-conducting liquid passes through non-conducting PFA-tube), the PVC-tube is additionally mantled by a metal mesh. A detailed technical description of the usedvalves (in the TLM as well as in the valve boxes) can be found in table B.5 in the appendix.
TLS-Tunnel Part : The tunnel part spans a length of 145 m and a vertical height of 17 m fromthe entrance of the tunnel to the entrance of the underground lab. As already in the street part,
61
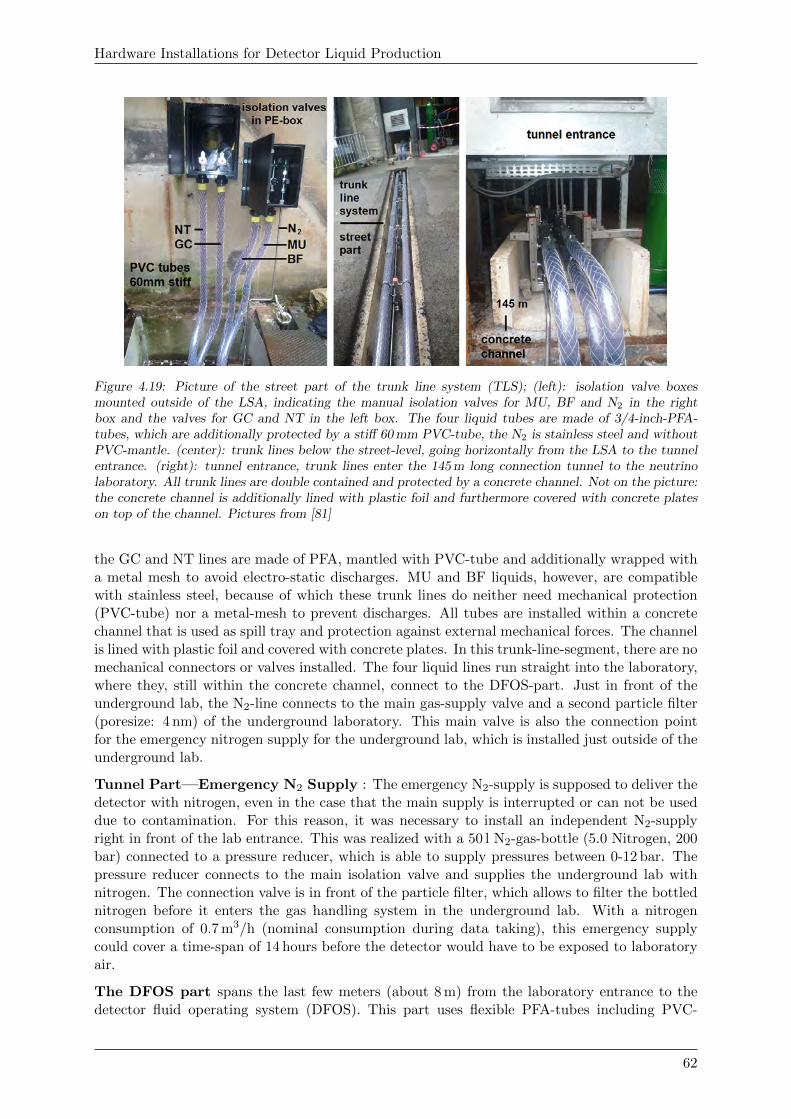
Hardware Installations for Detector Liquid Production
Figure 4.19: Picture of the street part of the trunk line system (TLS); (left): isolation valve boxesmounted outside of the LSA, indicating the manual isolation valves for MU, BF and N2 in the rightbox and the valves for GC and NT in the left box. The four liquid tubes are made of 3/4-inch-PFA-tubes, which are additionally protected by a stiff 60 mm PVC-tube, the N2 is stainless steel and withoutPVC-mantle. (center): trunk lines below the street-level, going horizontally from the LSA to the tunnelentrance. (right): tunnel entrance, trunk lines enter the 145 m long connection tunnel to the neutrinolaboratory. All trunk lines are double contained and protected by a concrete channel. Not on the picture:the concrete channel is additionally lined with plastic foil and furthermore covered with concrete plateson top of the channel. Pictures from [81]
the GC and NT lines are made of PFA, mantled with PVC-tube and additionally wrapped witha metal mesh to avoid electro-static discharges. MU and BF liquids, however, are compatiblewith stainless steel, because of which these trunk lines do neither need mechanical protection(PVC-tube) nor a metal-mesh to prevent discharges. All tubes are installed within a concretechannel that is used as spill tray and protection against external mechanical forces. The channelis lined with plastic foil and covered with concrete plates. In this trunk-line-segment, there are nomechanical connectors or valves installed. The four liquid lines run straight into the laboratory,where they, still within the concrete channel, connect to the DFOS-part. Just in front of theunderground lab, the N2-line connects to the main gas-supply valve and a second particle filter(poresize: 4 nm) of the underground laboratory. This main valve is also the connection pointfor the emergency nitrogen supply for the underground lab, which is installed just outside of theunderground lab.
Tunnel Part—Emergency N2 Supply : The emergency N2-supply is supposed to deliver thedetector with nitrogen, even in the case that the main supply is interrupted or can not be useddue to contamination. For this reason, it was necessary to install an independent N2-supplyright in front of the lab entrance. This was realized with a 50 l N2-gas-bottle (5.0 Nitrogen, 200bar) connected to a pressure reducer, which is able to supply pressures between 0-12 bar. Thepressure reducer connects to the main isolation valve and supplies the underground lab withnitrogen. The connection valve is in front of the particle filter, which allows to filter the bottlednitrogen before it enters the gas handling system in the underground lab. With a nitrogenconsumption of 0.7 m3/h (nominal consumption during data taking), this emergency supplycould cover a time-span of 14 hours before the detector would have to be exposed to laboratoryair.
The DFOS part spans the last few meters (about 8 m) from the laboratory entrance to thedetector fluid operating system (DFOS). This part uses flexible PFA-tubes including PVC-
62
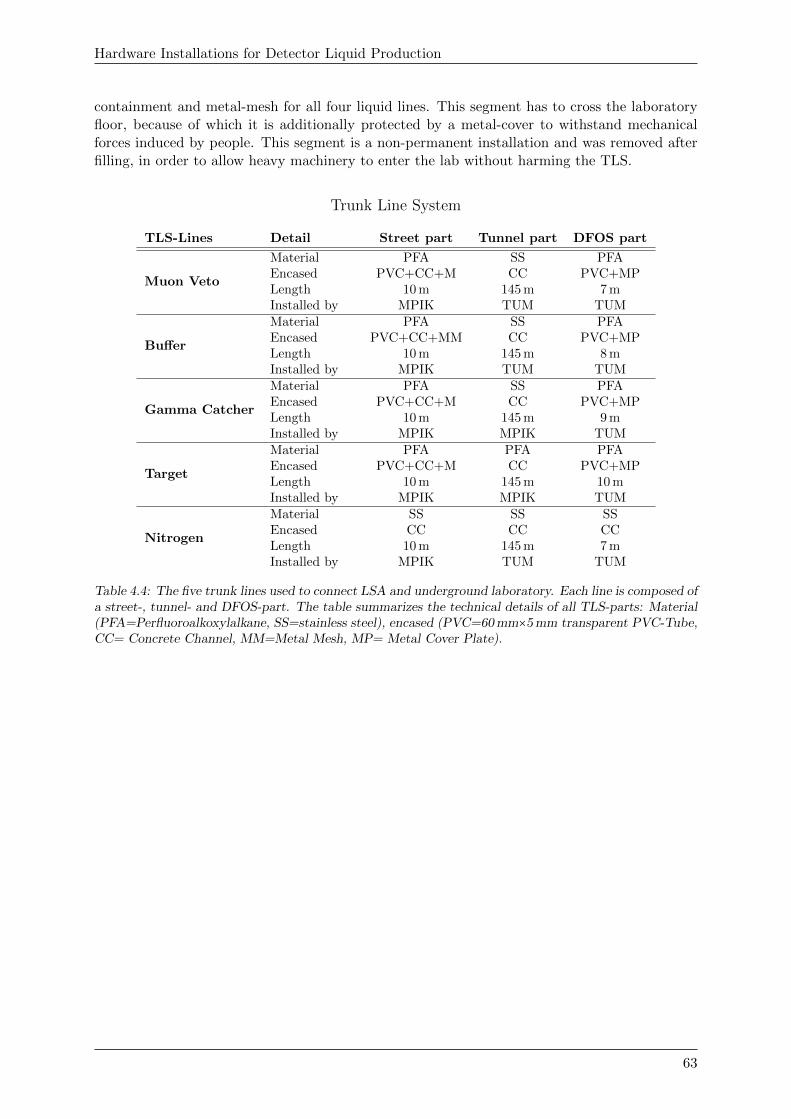
Hardware Installations for Detector Liquid Production
containment and metal-mesh for all four liquid lines. This segment has to cross the laboratoryfloor, because of which it is additionally protected by a metal-cover to withstand mechanicalforces induced by people. This segment is a non-permanent installation and was removed afterfilling, in order to allow heavy machinery to enter the lab without harming the TLS.
Trunk Line System
TLS-Lines Detail Street part Tunnel part DFOS part
Muon Veto
Material PFA SS PFAEncased PVC+CC+M CC PVC+MPLength 10 m 145 m 7 mInstalled by MPIK TUM TUM
Buffer
Material PFA SS PFAEncased PVC+CC+MM CC PVC+MPLength 10 m 145 m 8 mInstalled by MPIK TUM TUM
Gamma Catcher
Material PFA SS PFAEncased PVC+CC+M CC PVC+MPLength 10 m 145 m 9 mInstalled by MPIK MPIK TUM
Target
Material PFA PFA PFAEncased PVC+CC+M CC PVC+MPLength 10 m 145 m 10 mInstalled by MPIK MPIK TUM
Nitrogen
Material SS SS SSEncased CC CC CCLength 10 m 145 m 7 mInstalled by MPIK TUM TUM
Table 4.4: The five trunk lines used to connect LSA and underground laboratory. Each line is composed ofa street-, tunnel- and DFOS-part. The table summarizes the technical details of all TLS-parts: Material(PFA=Perfluoroalkoxylalkane, SS=stainless steel), encased (PVC=60 mm×5 mm transparent PVC-Tube,CC= Concrete Channel, MM=Metal Mesh, MP= Metal Cover Plate).
63
Chapter 5
Material Selection for the Detector LiquidProduction
5.1 Organic Liquid Scintillators and Requirements for Double Chooz
As particles pass through matter, they deposit energy. A possibility to measure this energydeposition is provided by certain organic, as well as inorganic materials, which have the char-acteristic to re-emit a proportional part of this energy as scintillation light. Consequently, thisscintillation light can be used to determine the amount of energy, which has been deposited bythe particle [82]. However, an inherent problem of all scintillation materials is the re-absorptionof the initially emitted scintillation light on the neighboring molecule of the same species, be-cause of which all scintillating materials are opaque for its own scintillation light. A possibility tosuppress this re-absorption is provided by the stokes shift, which allows to shift the wavelengthof the initial scintillation light above the absorption bands of the emitting material. In organicliquid scintillators, this wavelength shift requires a certain chemical compound, also referred toas wavelength shifter, which absorbs the initial fluorescence light (Eabs.=hν1) and re-emits theabsorbed energy at a significant higher wavelength (Eem.=hν2), which is defined as stokes shift.
5.1.1 Scintillating Mechanism and Stokes Shift
Organic scintillation bases on the use of a solvent that includes benzene, which has a chemicalring-structure composed of six carbon atoms. The individual carbon atoms are bound by strongσ- and π-bonds, resulting from overlapping s- and p-orbitals [83]. The overlap of the p-orbitalsleads to a delocalization of the p-electrons and therefore a multi-electron-system. The excitationand subsequently following relaxation of these electrons leads to the emission of scintillationlight, normally in the UV region, which is composed of fluorescence and phosphorescence light,of which the latter is emitted on longer time scales. This can be understood by considering theelectron configurations of benzene, its energy levels and the different transitions between them.The delocalized electrons can be described as multi-electron-system with a total spin quantumnumber (S). The coupling between spin and orbit leads to a multiplicity term (defined by 2S+1)and an energetic splitting of the electronic states. Important for the multiplicity is the relativeorientation of the electron-spin in the ground state, compared with the orientation in the excitedstate. For an even number of electrons, (2S+1) produces two distinguishable states:
64
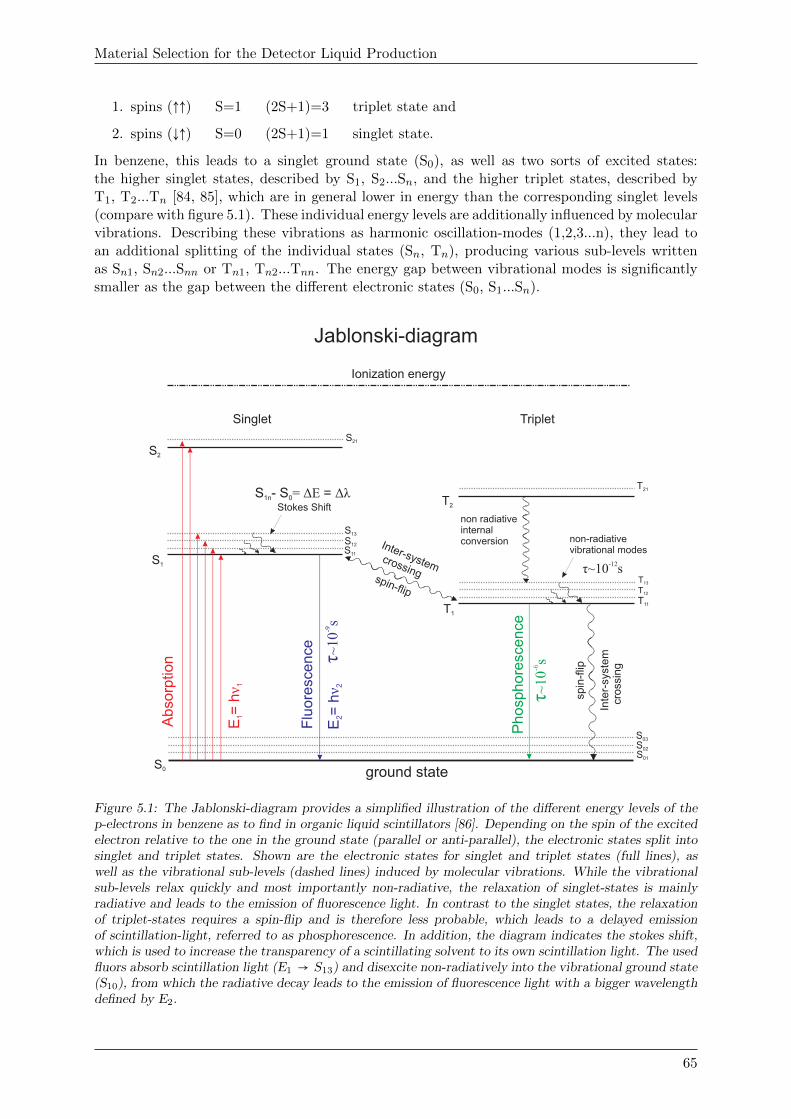
Material Selection for the Detector Liquid Production
1. spins (↑↑) S=1 (2S+1)=3 triplet state and
2. spins (↓↑) S=0 (2S+1)=1 singlet state.
In benzene, this leads to a singlet ground state (S0), as well as two sorts of excited states:the higher singlet states, described by S1, S2...Sn, and the higher triplet states, described byT1, T2...Tn [84, 85], which are in general lower in energy than the corresponding singlet levels(compare with figure 5.1). These individual energy levels are additionally influenced by molecularvibrations. Describing these vibrations as harmonic oscillation-modes (1,2,3...n), they lead toan additional splitting of the individual states (Sn, Tn), producing various sub-levels writtenas Sn1, Sn2...Snn or Tn1, Tn2...Tnn. The energy gap between vibrational modes is significantlysmaller as the gap between the different electronic states (S0, S1...Sn).
S0
S2
S1
S21
S11
S12
S13
Ionization energy
T2
T1
T21
T11
T12
T13
S01
S02
S03
Ab
sorp
tion
Flu
ore
sce
nce
Ph
osp
ho
resc
en
ce
Inter-system crossing spin-flip
-12τ~10 s
-9τ~
10s
non-radiative vibrational modes
non radiative internal conversion
Singlet Triplet
E=
hν
11
E=
hν
22
ground state
S - S = ΔE Δλ 1n 0 = Stokes Shift
Jablonski-diagram
-6τ~
10
s
Inte
r-sy
ste
m
cro
ssin
g
spin
-flip
Figure 5.1: The Jablonski-diagram provides a simplified illustration of the different energy levels of thep-electrons in benzene as to find in organic liquid scintillators [86]. Depending on the spin of the excitedelectron relative to the one in the ground state (parallel or anti-parallel), the electronic states split intosinglet and triplet states. Shown are the electronic states for singlet and triplet states (full lines), aswell as the vibrational sub-levels (dashed lines) induced by molecular vibrations. While the vibrationalsub-levels relax quickly and most importantly non-radiative, the relaxation of singlet-states is mainlyradiative and leads to the emission of fluorescence light. In contrast to the singlet states, the relaxationof triplet-states requires a spin-flip and is therefore less probable, which leads to a delayed emissionof scintillation-light, referred to as phosphorescence. In addition, the diagram indicates the stokes shift,which is used to increase the transparency of a scintillating solvent to its own scintillation light. The usedfluors absorb scintillation light (E1 → S13) and disexcite non-radiatively into the vibrational ground state(S10), from which the radiative decay leads to the emission of fluorescence light with a bigger wavelengthdefined by E2.
65
Material Selection for the Detector Liquid Production
Starting with an excitation from the ground state S0, the absorption of electro-magnetic energy(E1=hν1) leads exclusively to the excitation of higher singlet states, but not to the population oftriplet states, as this would require a spin flip and is forbidden by the rules of selection [84, 85].Hence, triplet states can not be populated by em-radiation, but have to be populated by otherprocesses like inter-system-crossing, which describes the excitation of T1 by decay of the higherS1 state (S1 →T1) or the recombination of electrons and an ionized molecule, which leads for75% to the population of triplet states [84].
The disexcitation of these higher states has two different possibilities: non-radiative transitions,which dissipate the absorbed energy mechanically via collisions with other molecules [86], aswell as radiative transitions, which use luminescence to disexcite the higher energy levels. Bothof these scenarios are presented in figure 5.1, showing the Jablonski-diagram1, which indicatesa simplified scheme of the different energy levels and possible transitions. Indicated are:
� Radiative transitions between:
– states of the same multiplicity (S1 → S0, S2 → S1, T2 →T1).These transitions do not require a spin flip because of which these transition happenon time scales of few nano-seconds [88, 85]. The energy gap between S1 and S0 isnormally between 2-4.5 eV [84, 85], which results in a fluorescence light emission in theUV region around 270 nm. Due to the fast and non radiative relaxation of vibrationalmodes, the fluorescence emission originate only from the vibrational ground state(Sn0), as indicated in figure 5.1 by the blue emission arrow.
– states of different multiplicity (T1 → S0)These transitions require a spin flip and are therefore highly forbidden by the rulesof selection. These processes are less probable, because of which the direct emissionof phosphorescence light has a time scale of microseconds or longer. More probable,however, is the indirect and delayed relaxation (T1 ↝ S1 → S0), which necessitates therepopulation of the higher S1 state. This can be done by the absorption of thermalenergy or by the interaction of two molecules. Once the higher S1-state is repopulatedby these processes, radiative transitions can disexcite the molecule into the groundstate. The delay accounts for the time, which has been necessary to repopulatethe higher S1-state. Furthermore the interaction between two molecules with thesame level of excitation allows to relax two triplet states into the ground state via:T1+T1 →S∗+S0 → S0+S0 + photon [84, 85].
� Non-radiative transitions between:
– states of the same multiplicity (S1 ↝ S0, S2 ↝ S1, T2 ↝T1)The non radiative relaxation of excited levels has to be divided into internal conver-sion, describing the relaxation between electronic states (S2 ↝ S1), and vibrationalrelaxation, describing the decay of vibrational modes of individual electronic states(S11, S12, S13 ↝ S0). Especially the latter happens very fast (τ ∼ 10−12s)[84, 85] andtherefore long before radiative emission can occur. This has two consequences: firstly,radiative transitions happen only from the vibrational ground states S10, S20...Sn0,and secondly, the quick vibrational relaxation reduces the available energy for a radia-tive emission. In consequence, the emission spectrum (E2 =hν2) is shifted to higherwavelength. The difference between absorbed and emitted energy ∆E =h(ν2-ν1) isknown as stokes shift with ∆E ≈ 0.1 eV.
1Aleksander Jablonski, Ukraine, 1898-1980. According to A. Jabolnski, it is possible to approximate thespectroscopic properties of many organic molecules by a simplified energy level diagram, considering only theground state and the deepest excited states S1 and T1. In 1935, he developed the first energy-level-diagram toexplain the energy transfer in molecules, today known as Jablonski-diagram [87].
66
Material Selection for the Detector Liquid Production
– states of different multiplicity (S1 ↝T1, T1 ↝ S0)These transitions require a spin flip and are the result of a direct interaction betweenelectrons. These transitions are referred to as inter-system-crossing and are shown aswavy lines in figure 5.1.
Non Radiative Energy Transfer
The non radiative energy transfer is dominated by two different processes:
The Dexter -process [89, 84], also referred to as collisional energy transfer, depends on spatialoverlap of interacting molecular orbitals and describes the exchange of electrons between theinteracting orbitals. The energy transfer rate (k) is strongly depending on the distance (∼ e−r),because of which this transfer is mainly responsible for interactions below 50 A. The directinteraction and the exchange of electrons provide the possibility for a spin-flip, because of whichthis process is the dominant energy transfer for the above mentioned inter system crossing.
The Forster -process [90, 84] describes a dipol-dipol interaction between the transition dipoles oftwo interacting molecules [91]. This energy transfer depends on the orientation of the interactingdipoles as well as on their distance (k∼1/r6). Typically, this process describes interactions up to100 A and is used to describe the non-radiative energy transfer between charged particles andthe scintillating-solvent, as well as the energy transfer between solvent and wavelengths shiftingmolecules.
Loss of Scintillation Light
In order to use scintillation for the detection, it is important to maximize the emission offluorescence light. This, however, can be reduced by different effects, as for instance:
1. a higher rate of internal conversion, which is correlated to the temperature of the solvent,
2. a contamination of the solvent with a (quenching) molecule-species or
3. the formation of molecule-complexes.
A prominent example for a quenching molecule, which additionally can lead to a degradation, isoxygen. When liquid scintillators are stored or handled under normal atmosphere, they saturatewith oxygen. Depending on the duration of the exposure, this leads to two different quenchingeffects:
1. a reversible one, which is caused by the presence of quenching-molecules. Oxygen, forexample, absorbs energy from the solvent and dissipates it in non-radiative relaxationchannels. This effect can be reversed by removing the oxygen form the solvent, which isnormally done by purging the solvent with nitrogen.
2. an irreversible one (caused by a longer exposure), which leads to a chemical reaction ofthe solvent with oxygen. The oxidation of organic molecules can lead to the formation ofmolecule-complexes (dye), which alter the absorption- and emission-bands from UV intothe visible spectra. This reduces the fluorescence emissions in the UV-region and leads toa visible and yellowish discoloring of the solvent. As this chemical-quenching can not bereversed, it reduces the optical properties of the solvent permanently. This is an inherentproblem of all liquid scintillators because of which these materials have to be handled andstored in an oxygen-free environment.
67
Material Selection for the Detector Liquid Production
5.1.2 Requirements for Double Chooz
Double Chooz uses three different liquid scintillators to measure the energy depositions in thedetector vessels by observing the produced scintillation light, because of which the experimentdepends on the stability and cleanliness of the detector liquids. Produced in the target, thescintillation light has to pass through the different liquid layers of the detector before the photonscan be detected by the photo multipliers. All processes which change either the production offluorescence light (quenching) or its subsequent detection at the PMTs (optical degradation ofthe liquids) are critical for the experiment and must be prevented. In order to be usable forDouble Chooz, all liquids have to provide certain minimum requirements, regarding:
Optical purity: In order to minimize the loss of scintillation light, the final detector liquids haveto be highly transparent. Attenuating effects, as absorption and scattering, have to be avoided,because of which all detector liquids have to demonstrate an attenuation length above 5 m at awavelength of 430 nm. In addition, all liquids have to be free from impurities. This is especiallytrue for suspended particles which are similar in size compared to the emitted scintillationwavelength, as those particles would lead to additional Mie-scattering effects [92].
Density: Double Chooz uses four different detector liquids separated only by thin and fragilewalls. Any density difference between these liquids leads to buoyancy forces and therefore tostress on the different vessels. In order to avoid dangerous stress levels, the density of thedifferent liquids should not vary more than one percent. Based on this, all liquids should beadjusted to 0.804 g/cm3 at 15○C [55] with a maximal variation of 0.008 g/cm3.
Radio purity: Double Chooz is a low background experiment, which aims to limit the acci-dental background rate below 1 event per day [55]. The accidental background is driven byradio-chemical contamination, which is either induced by the detector materials (PMTs, metals,acrylics etc.) or by the detector liquids. Based on detector simulations, the activity of thedetector materials (mainly caused by the PMTs) accounts for 0.4 accidental-background-eventsper day. Using additional 0.4 events per day as upper limit caused by the detector liquids, themaximal contamination with 40K, 238U and 232Th for each detector liquid can be calculated.For the inner detector vessels, these limits are in the range of 10−13 g/g for 238U and 232Thand of 10−10 g/g for 40K. The individual limits for the different liquids are summarized in table5.1.
Light yield: In order to recognize also small energy depositions, all liquid scintillators have toprovide a certain minimum light yield. The muon veto, as optically separated detector module,is independent from the other detector liquids and should provide a minimum light yield of5000 photons per MeV [55]. The light yield of the inner detector liquids has to be equal in orderto provide homogeneous response and should provide a light emission of minimum 6000 photonsper MeV [55]. The buffer liquid, used as transparent and inactive shielding, however must notscintillate at all, because any scintillation in the buffer would lead to a significant limitation ofthe anticipated detector performance.
Chemical stability: In order to provide a stable detector response, all detector liquids have toprovide constant properties, especially regarding light yield and transparency. Any degradationof one or the other detector liquid would immediately limit the performance of the entire detectoror, in the worst case, could lead to the premature end of the experiment as experienced by theparent experiment CHOOZ [93] or the Paloverde-experiment [94]. The stability of the detectorliquids is therefore a major concern for Double Chooz. In order to ensure the chemical stability,each liquid is handled and stored under a permanent nitrogen atmosphere, protected from UV-light and only in contact with compatible materials as stainless steel or fluorinated plastics.
68
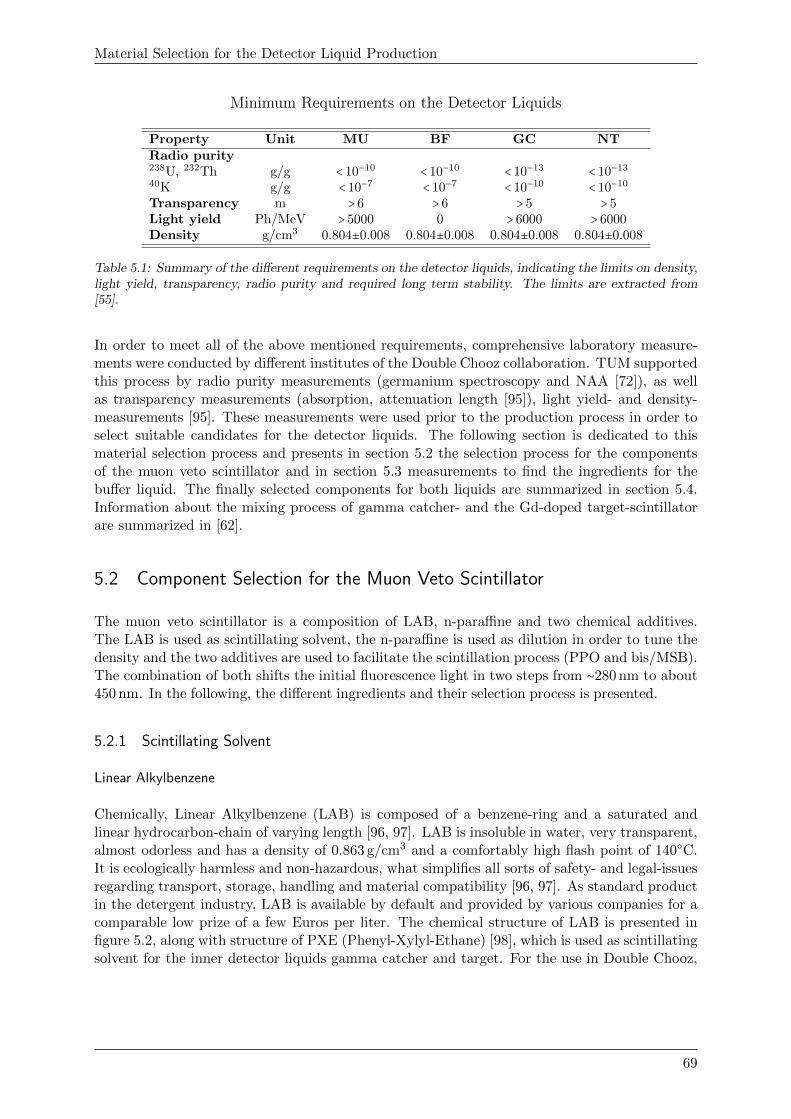
Material Selection for the Detector Liquid Production
Minimum Requirements on the Detector Liquids
Property Unit MU BF GC NTRadio purity238U, 232Th g/g < 10−10 < 10−10 < 10−13 < 10−1340K g/g < 10−7 < 10−7 < 10−10 < 10−10
Transparency m > 6 > 6 > 5 > 5Light yield Ph/MeV > 5000 0 > 6000 > 6000Density g/cm3 0.804±0.008 0.804±0.008 0.804±0.008 0.804±0.008
Table 5.1: Summary of the different requirements on the detector liquids, indicating the limits on density,light yield, transparency, radio purity and required long term stability. The limits are extracted from[55].
In order to meet all of the above mentioned requirements, comprehensive laboratory measure-ments were conducted by different institutes of the Double Chooz collaboration. TUM supportedthis process by radio purity measurements (germanium spectroscopy and NAA [72]), as wellas transparency measurements (absorption, attenuation length [95]), light yield- and density-measurements [95]. These measurements were used prior to the production process in order toselect suitable candidates for the detector liquids. The following section is dedicated to thismaterial selection process and presents in section 5.2 the selection process for the componentsof the muon veto scintillator and in section 5.3 measurements to find the ingredients for thebuffer liquid. The finally selected components for both liquids are summarized in section 5.4.Information about the mixing process of gamma catcher- and the Gd-doped target-scintillatorare summarized in [62].
5.2 Component Selection for the Muon Veto Scintillator
The muon veto scintillator is a composition of LAB, n-paraffine and two chemical additives.The LAB is used as scintillating solvent, the n-paraffine is used as dilution in order to tune thedensity and the two additives are used to facilitate the scintillation process (PPO and bis/MSB).The combination of both shifts the initial fluorescence light in two steps from ∼280 nm to about450 nm. In the following, the different ingredients and their selection process is presented.
5.2.1 Scintillating Solvent
Linear Alkylbenzene
Chemically, Linear Alkylbenzene (LAB) is composed of a benzene-ring and a saturated andlinear hydrocarbon-chain of varying length [96, 97]. LAB is insoluble in water, very transparent,almost odorless and has a density of 0.863 g/cm3 and a comfortably high flash point of 140○C.It is ecologically harmless and non-hazardous, what simplifies all sorts of safety- and legal-issuesregarding transport, storage, handling and material compatibility [96, 97]. As standard productin the detergent industry, LAB is available by default and provided by various companies for acomparable low prize of a few Euros per liter. The chemical structure of LAB is presented infigure 5.2, along with structure of PXE (Phenyl-Xylyl-Ethane) [98], which is used as scintillatingsolvent for the inner detector liquids gamma catcher and target. For the use in Double Chooz,
69
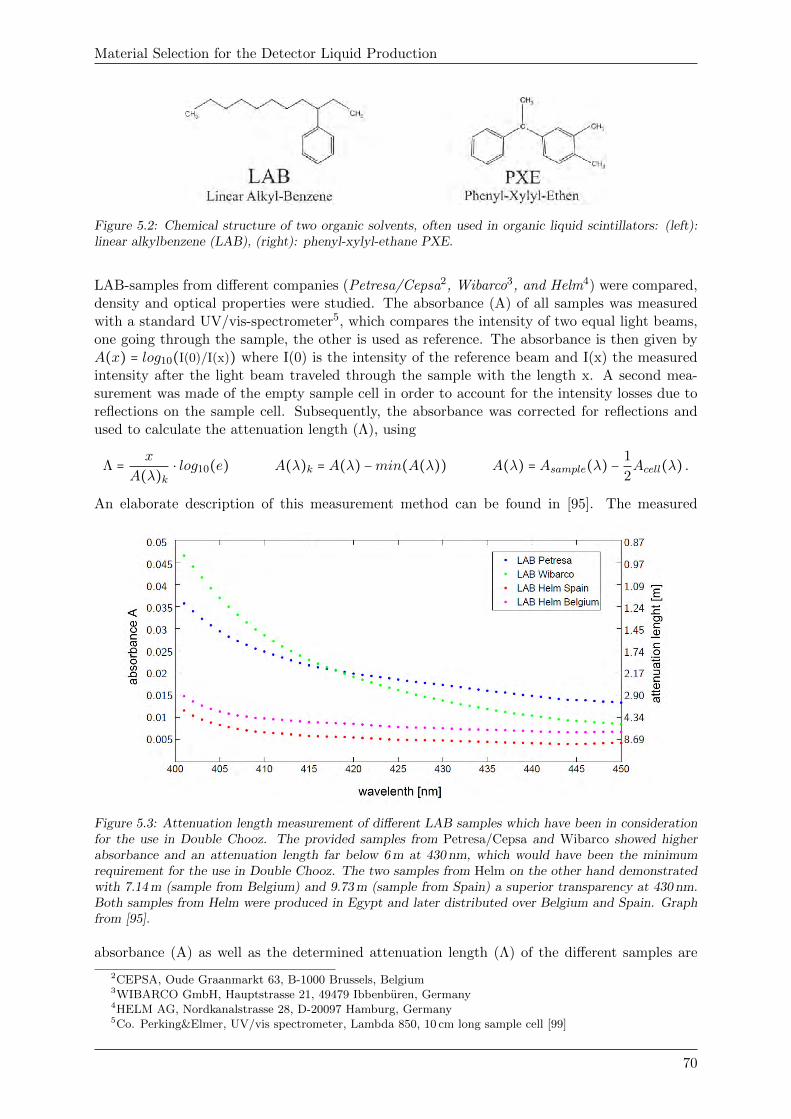
Material Selection for the Detector Liquid Production
Figure 5.2: Chemical structure of two organic solvents, often used in organic liquid scintillators: (left):linear alkylbenzene (LAB), (right): phenyl-xylyl-ethane PXE.
LAB-samples from different companies (Petresa/Cepsa2, Wibarco3, and Helm4) were compared,density and optical properties were studied. The absorbance (A) of all samples was measuredwith a standard UV/vis-spectrometer5, which compares the intensity of two equal light beams,one going through the sample, the other is used as reference. The absorbance is then given byA(x) = log10(I(0)/I(x)) where I(0) is the intensity of the reference beam and I(x) the measuredintensity after the light beam traveled through the sample with the length x. A second mea-surement was made of the empty sample cell in order to account for the intensity losses due toreflections on the sample cell. Subsequently, the absorbance was corrected for reflections andused to calculate the attenuation length (Λ), using
Λ = x
A(λ)k⋅ log10(e) A(λ)k = A(λ) −min(A(λ)) A(λ) = Asample(λ) −
1
2Acell(λ) .
An elaborate description of this measurement method can be found in [95]. The measured
Figure 5.3: Attenuation length measurement of different LAB samples which have been in considerationfor the use in Double Chooz. The provided samples from Petresa/Cepsa and Wibarco showed higherabsorbance and an attenuation length far below 6 m at 430 nm, which would have been the minimumrequirement for the use in Double Chooz. The two samples from Helm on the other hand demonstratedwith 7.14 m (sample from Belgium) and 9.73 m (sample from Spain) a superior transparency at 430 nm.Both samples from Helm were produced in Egypt and later distributed over Belgium and Spain. Graphfrom [95].
absorbance (A) as well as the determined attenuation length (Λ) of the different samples are
2CEPSA, Oude Graanmarkt 63, B-1000 Brussels, Belgium3WIBARCO GmbH, Hauptstrasse 21, 49479 Ibbenburen, Germany4HELM AG, Nordkanalstrasse 28, D-20097 Hamburg, Germany5Co. Perking&Elmer, UV/vis spectrometer, Lambda 850, 10 cm long sample cell [99]
70
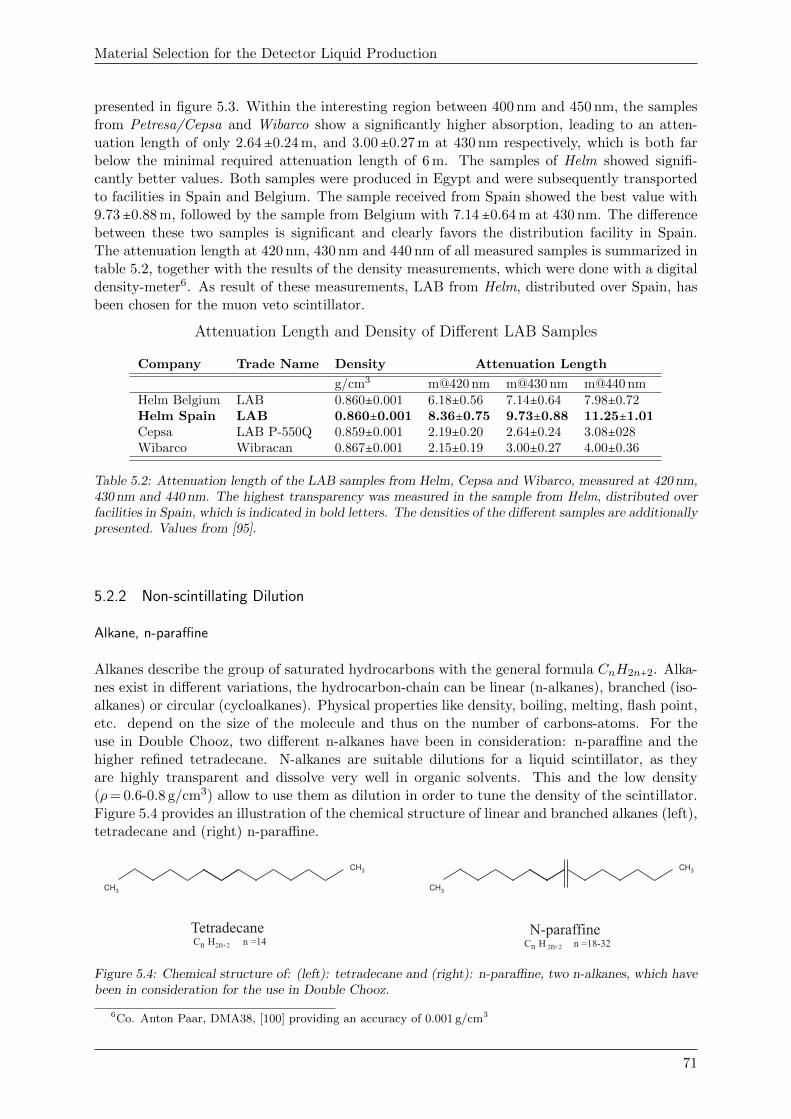
Material Selection for the Detector Liquid Production
presented in figure 5.3. Within the interesting region between 400 nm and 450 nm, the samplesfrom Petresa/Cepsa and Wibarco show a significantly higher absorption, leading to an atten-uation length of only 2.64±0.24 m, and 3.00±0.27 m at 430 nm respectively, which is both farbelow the minimal required attenuation length of 6 m. The samples of Helm showed signifi-cantly better values. Both samples were produced in Egypt and were subsequently transportedto facilities in Spain and Belgium. The sample received from Spain showed the best value with9.73±0.88 m, followed by the sample from Belgium with 7.14±0.64 m at 430 nm. The differencebetween these two samples is significant and clearly favors the distribution facility in Spain.The attenuation length at 420 nm, 430 nm and 440 nm of all measured samples is summarized intable 5.2, together with the results of the density measurements, which were done with a digitaldensity-meter6. As result of these measurements, LAB from Helm, distributed over Spain, hasbeen chosen for the muon veto scintillator.
Attenuation Length and Density of Different LAB Samples
Company Trade Name Density Attenuation Length
g/cm3 m@420 nm m@430 nm m@440 nmHelm Belgium LAB 0.860±0.001 6.18±0.56 7.14±0.64 7.98±0.72Helm Spain LAB 0.860±0.001 8.36±0.75 9.73±0.88 11.25±1.01Cepsa LAB P-550Q 0.859±0.001 2.19±0.20 2.64±0.24 3.08±028Wibarco Wibracan 0.867±0.001 2.15±0.19 3.00±0.27 4.00±0.36
Table 5.2: Attenuation length of the LAB samples from Helm, Cepsa and Wibarco, measured at 420 nm,430 nm and 440 nm. The highest transparency was measured in the sample from Helm, distributed overfacilities in Spain, which is indicated in bold letters. The densities of the different samples are additionallypresented. Values from [95].
5.2.2 Non-scintillating Dilution
Alkane, n-paraffine
Alkanes describe the group of saturated hydrocarbons with the general formula CnH2n+2. Alka-nes exist in different variations, the hydrocarbon-chain can be linear (n-alkanes), branched (iso-alkanes) or circular (cycloalkanes). Physical properties like density, boiling, melting, flash point,etc. depend on the size of the molecule and thus on the number of carbons-atoms. For theuse in Double Chooz, two different n-alkanes have been in consideration: n-paraffine and thehigher refined tetradecane. N-alkanes are suitable dilutions for a liquid scintillator, as theyare highly transparent and dissolve very well in organic solvents. This and the low density(ρ= 0.6-0.8 g/cm3) allow to use them as dilution in order to tune the density of the scintillator.Figure 5.4 provides an illustration of the chemical structure of linear and branched alkanes (left),tetradecane and (right) n-paraffine.
CH3
CH3
CH3
CH3
Tetradecane C H n =14 n 2n+2
N-paraffine C H =18-32 nn 2n+2
Figure 5.4: Chemical structure of: (left): tetradecane and (right): n-paraffine, two n-alkanes, which havebeen in consideration for the use in Double Chooz.
6Co. Anton Paar, DMA38, [100] providing an accuracy of 0.001 g/cm3
71
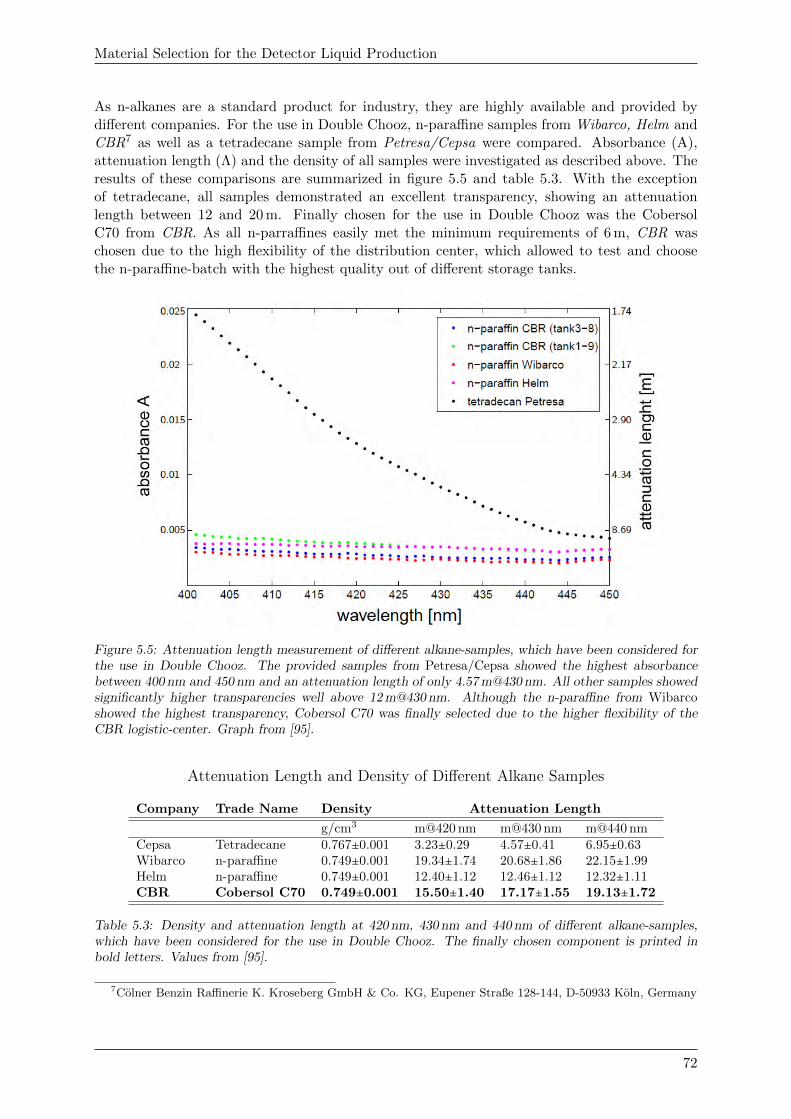
Material Selection for the Detector Liquid Production
As n-alkanes are a standard product for industry, they are highly available and provided bydifferent companies. For the use in Double Chooz, n-paraffine samples from Wibarco, Helm andCBR7 as well as a tetradecane sample from Petresa/Cepsa were compared. Absorbance (A),attenuation length (Λ) and the density of all samples were investigated as described above. Theresults of these comparisons are summarized in figure 5.5 and table 5.3. With the exceptionof tetradecane, all samples demonstrated an excellent transparency, showing an attenuationlength between 12 and 20 m. Finally chosen for the use in Double Chooz was the CobersolC70 from CBR. As all n-parraffines easily met the minimum requirements of 6 m, CBR waschosen due to the high flexibility of the distribution center, which allowed to test and choosethe n-paraffine-batch with the highest quality out of different storage tanks.
Figure 5.5: Attenuation length measurement of different alkane-samples, which have been considered forthe use in Double Chooz. The provided samples from Petresa/Cepsa showed the highest absorbancebetween 400 nm and 450 nm and an attenuation length of only 4.57 m@430 nm. All other samples showedsignificantly higher transparencies well above 12 m@430 nm. Although the n-paraffine from Wibarcoshowed the highest transparency, Cobersol C70 was finally selected due to the higher flexibility of theCBR logistic-center. Graph from [95].
Attenuation Length and Density of Different Alkane Samples
Company Trade Name Density Attenuation Length
g/cm3 m@420 nm m@430 nm m@440 nmCepsa Tetradecane 0.767±0.001 3.23±0.29 4.57±0.41 6.95±0.63Wibarco n-paraffine 0.749±0.001 19.34±1.74 20.68±1.86 22.15±1.99Helm n-paraffine 0.749±0.001 12.40±1.12 12.46±1.12 12.32±1.11CBR Cobersol C70 0.749±0.001 15.50±1.40 17.17±1.55 19.13±1.72
Table 5.3: Density and attenuation length at 420 nm, 430 nm and 440 nm of different alkane-samples,which have been considered for the use in Double Chooz. The finally chosen component is printed inbold letters. Values from [95].
7Colner Benzin Raffinerie K. Kroseberg GmbH & Co. KG, Eupener Straße 128-144, D-50933 Koln, Germany
72
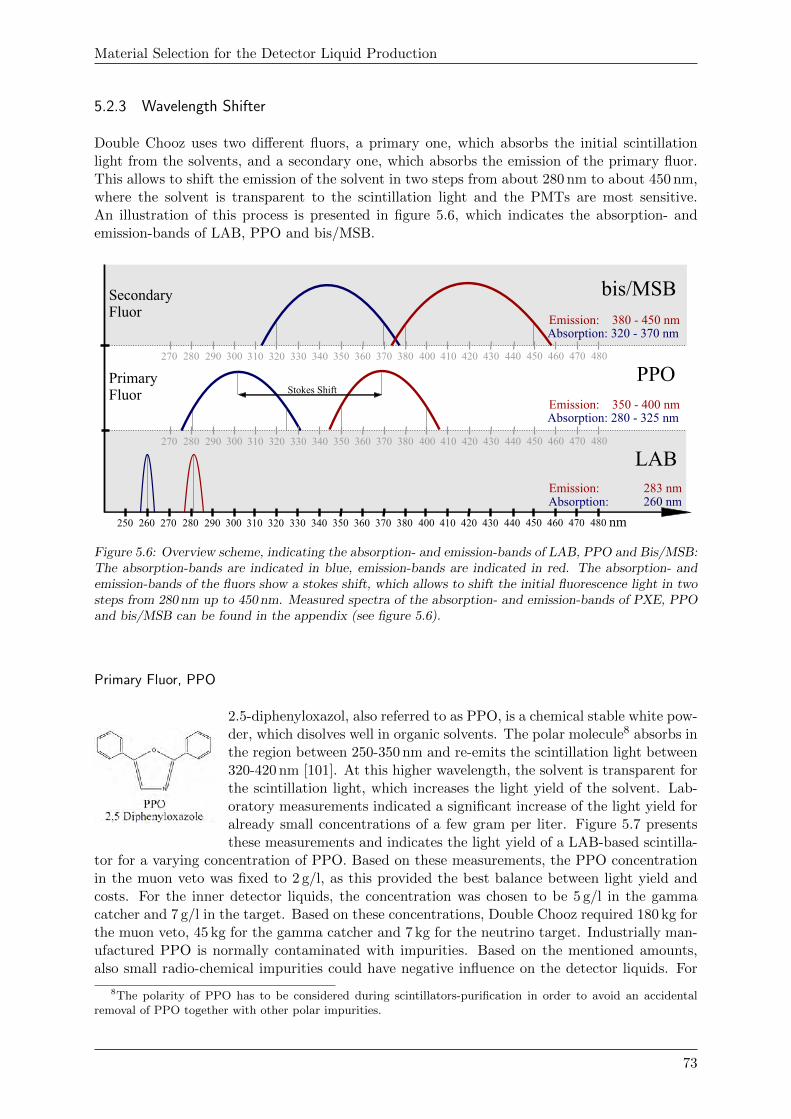
Material Selection for the Detector Liquid Production
5.2.3 Wavelength Shifter
Double Chooz uses two different fluors, a primary one, which absorbs the initial scintillationlight from the solvents, and a secondary one, which absorbs the emission of the primary fluor.This allows to shift the emission of the solvent in two steps from about 280 nm to about 450 nm,where the solvent is transparent to the scintillation light and the PMTs are most sensitive.An illustration of this process is presented in figure 5.6, which indicates the absorption- andemission-bands of LAB, PPO and bis/MSB.
nm 270 280 290 300 310 320 330 340 350 360 370 380 400 410 420 430 440 450 460 470 480250 260
PPO
270 280 290 300 310 320 330 340 350 360 370 380 400 410 420 430 440 450 460 470 480
270 280 290 300 310 320 330 340 350 360 370 380 400 410 420 430 440 450 460 470 480
Secondary Fluor
Primary Fluor
Emission: 350 - 400 nm Absorption: 280 - 325 nm
LAB
Emission: 283 nm Absorption: 260 nm
bis/MSB
Emission: 380 - 450 nm Absorption: 320 - 370 nm
Stokes Shift
Figure 5.6: Overview scheme, indicating the absorption- and emission-bands of LAB, PPO and Bis/MSB:The absorption-bands are indicated in blue, emission-bands are indicated in red. The absorption- andemission-bands of the fluors show a stokes shift, which allows to shift the initial fluorescence light in twosteps from 280 nm up to 450 nm. Measured spectra of the absorption- and emission-bands of PXE, PPOand bis/MSB can be found in the appendix (see figure 5.6).
Primary Fluor, PPO
2.5-diphenyloxazol, also referred to as PPO, is a chemical stable white pow-der, which disolves well in organic solvents. The polar molecule8 absorbs inthe region between 250-350 nm and re-emits the scintillation light between320-420 nm [101]. At this higher wavelength, the solvent is transparent forthe scintillation light, which increases the light yield of the solvent. Lab-oratory measurements indicated a significant increase of the light yield foralready small concentrations of a few gram per liter. Figure 5.7 presentsthese measurements and indicates the light yield of a LAB-based scintilla-
tor for a varying concentration of PPO. Based on these measurements, the PPO concentrationin the muon veto was fixed to 2 g/l, as this provided the best balance between light yield andcosts. For the inner detector liquids, the concentration was chosen to be 5 g/l in the gammacatcher and 7 g/l in the target. Based on these concentrations, Double Chooz required 180 kg forthe muon veto, 45 kg for the gamma catcher and 7 kg for the neutrino target. Industrially man-ufactured PPO is normally contaminated with impurities. Based on the mentioned amounts,also small radio-chemical impurities could have negative influence on the detector liquids. For
8The polarity of PPO has to be considered during scintillators-purification in order to avoid an accidentalremoval of PPO together with other polar impurities.
73
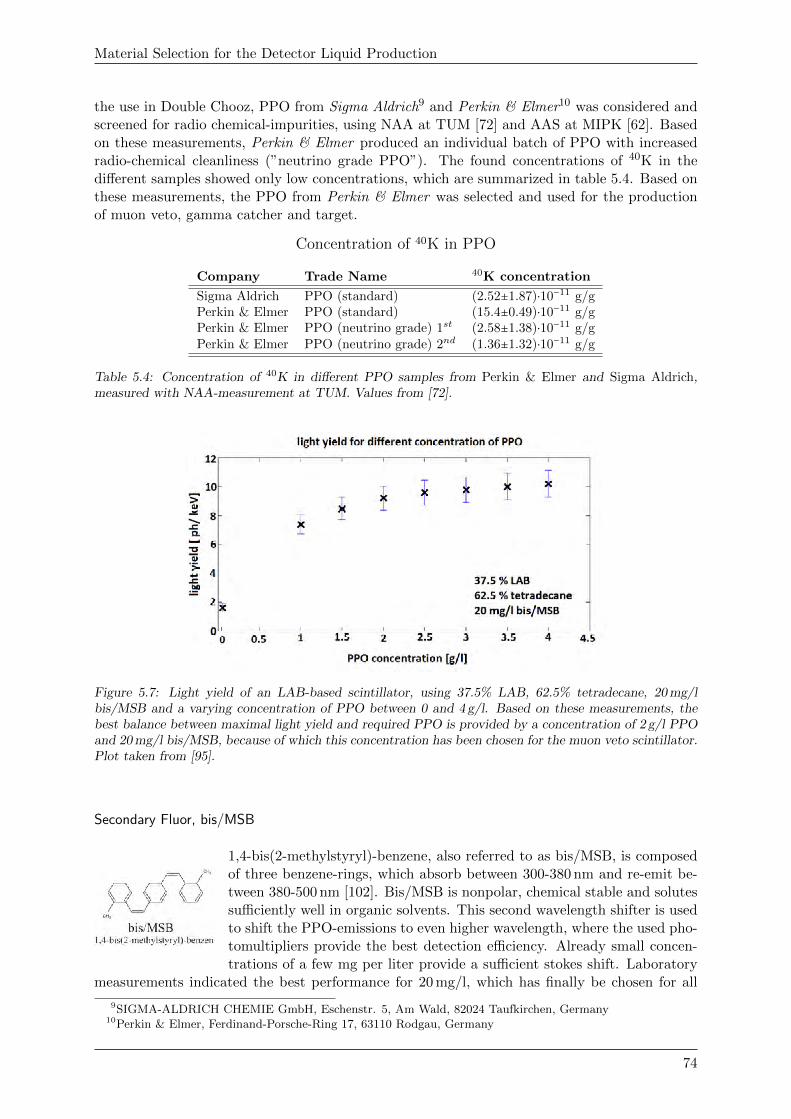
Material Selection for the Detector Liquid Production
the use in Double Chooz, PPO from Sigma Aldrich9 and Perkin & Elmer10 was considered andscreened for radio chemical-impurities, using NAA at TUM [72] and AAS at MIPK [62]. Basedon these measurements, Perkin & Elmer produced an individual batch of PPO with increasedradio-chemical cleanliness (”neutrino grade PPO”). The found concentrations of 40K in thedifferent samples showed only low concentrations, which are summarized in table 5.4. Based onthese measurements, the PPO from Perkin & Elmer was selected and used for the productionof muon veto, gamma catcher and target.
Concentration of 40K in PPO
Company Trade Name 40K concentration
Sigma Aldrich PPO (standard) (2.52±1.87)⋅10−11 g/gPerkin & Elmer PPO (standard) (15.4±0.49)⋅10−11 g/gPerkin & Elmer PPO (neutrino grade) 1st (2.58±1.38)⋅10−11 g/gPerkin & Elmer PPO (neutrino grade) 2nd (1.36±1.32)⋅10−11 g/g
Table 5.4: Concentration of 40K in different PPO samples from Perkin & Elmer and Sigma Aldrich,measured with NAA-measurement at TUM. Values from [72].
Figure 5.7: Light yield of an LAB-based scintillator, using 37.5% LAB, 62.5% tetradecane, 20 mg/lbis/MSB and a varying concentration of PPO between 0 and 4 g/l. Based on these measurements, thebest balance between maximal light yield and required PPO is provided by a concentration of 2 g/l PPOand 20 mg/l bis/MSB, because of which this concentration has been chosen for the muon veto scintillator.Plot taken from [95].
Secondary Fluor, bis/MSB
1,4-bis(2-methylstyryl)-benzene, also referred to as bis/MSB, is composedof three benzene-rings, which absorb between 300-380 nm and re-emit be-tween 380-500 nm [102]. Bis/MSB is nonpolar, chemical stable and solutessufficiently well in organic solvents. This second wavelength shifter is usedto shift the PPO-emissions to even higher wavelength, where the used pho-tomultipliers provide the best detection efficiency. Already small concen-trations of a few mg per liter provide a sufficient stokes shift. Laboratory
measurements indicated the best performance for 20 mg/l, which has finally be chosen for all
9SIGMA-ALDRICH CHEMIE GmbH, Eschenstr. 5, Am Wald, 82024 Taufkirchen, Germany10Perkin & Elmer, Ferdinand-Porsche-Ring 17, 63110 Rodgau, Germany
74
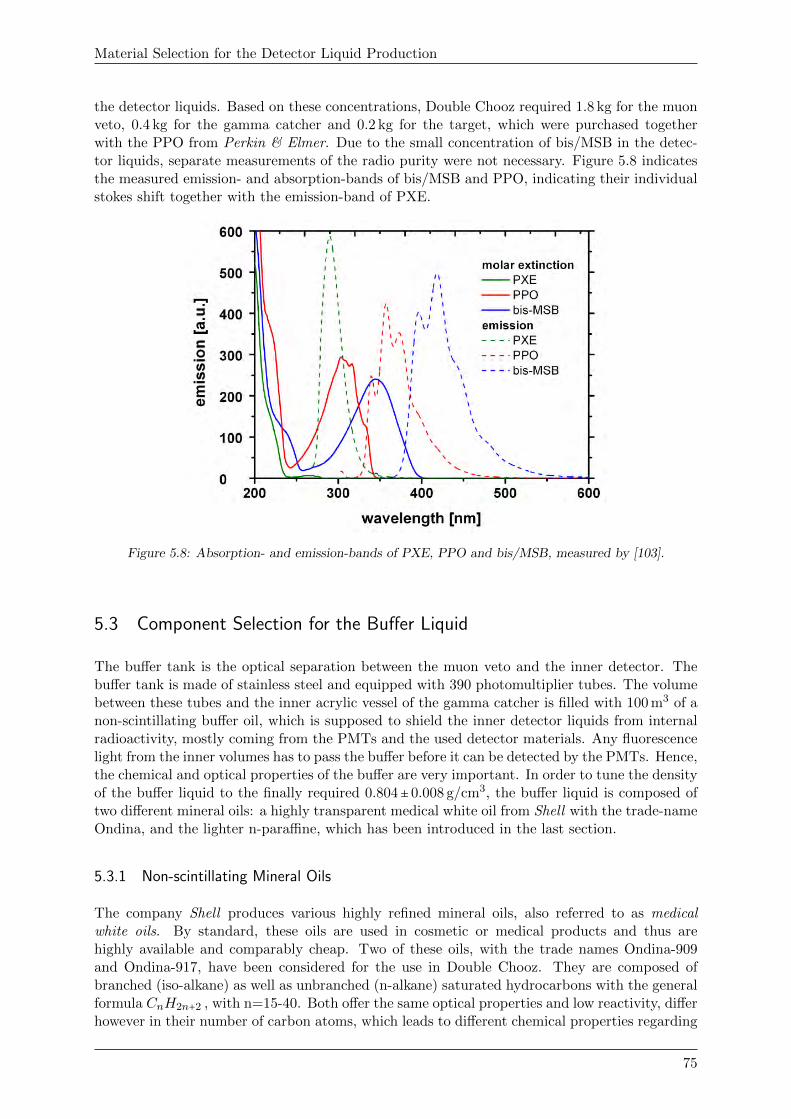
Material Selection for the Detector Liquid Production
the detector liquids. Based on these concentrations, Double Chooz required 1.8 kg for the muonveto, 0.4 kg for the gamma catcher and 0.2 kg for the target, which were purchased togetherwith the PPO from Perkin & Elmer. Due to the small concentration of bis/MSB in the detec-tor liquids, separate measurements of the radio purity were not necessary. Figure 5.8 indicatesthe measured emission- and absorption-bands of bis/MSB and PPO, indicating their individualstokes shift together with the emission-band of PXE.
Figure 5.8: Absorption- and emission-bands of PXE, PPO and bis/MSB, measured by [103].
5.3 Component Selection for the Buffer Liquid
The buffer tank is the optical separation between the muon veto and the inner detector. Thebuffer tank is made of stainless steel and equipped with 390 photomultiplier tubes. The volumebetween these tubes and the inner acrylic vessel of the gamma catcher is filled with 100 m3 of anon-scintillating buffer oil, which is supposed to shield the inner detector liquids from internalradioactivity, mostly coming from the PMTs and the used detector materials. Any fluorescencelight from the inner volumes has to pass the buffer before it can be detected by the PMTs. Hence,the chemical and optical properties of the buffer are very important. In order to tune the densityof the buffer liquid to the finally required 0.804±0.008 g/cm3, the buffer liquid is composed oftwo different mineral oils: a highly transparent medical white oil from Shell with the trade-nameOndina, and the lighter n-paraffine, which has been introduced in the last section.
5.3.1 Non-scintillating Mineral Oils
The company Shell produces various highly refined mineral oils, also referred to as medicalwhite oils. By standard, these oils are used in cosmetic or medical products and thus arehighly available and comparably cheap. Two of these oils, with the trade names Ondina-909and Ondina-917, have been considered for the use in Double Chooz. They are composed ofbranched (iso-alkane) as well as unbranched (n-alkane) saturated hydrocarbons with the generalformula CnH2n+2 , with n=15-40. Both offer the same optical properties and low reactivity, differhowever in their number of carbon atoms, which leads to different chemical properties regarding
75
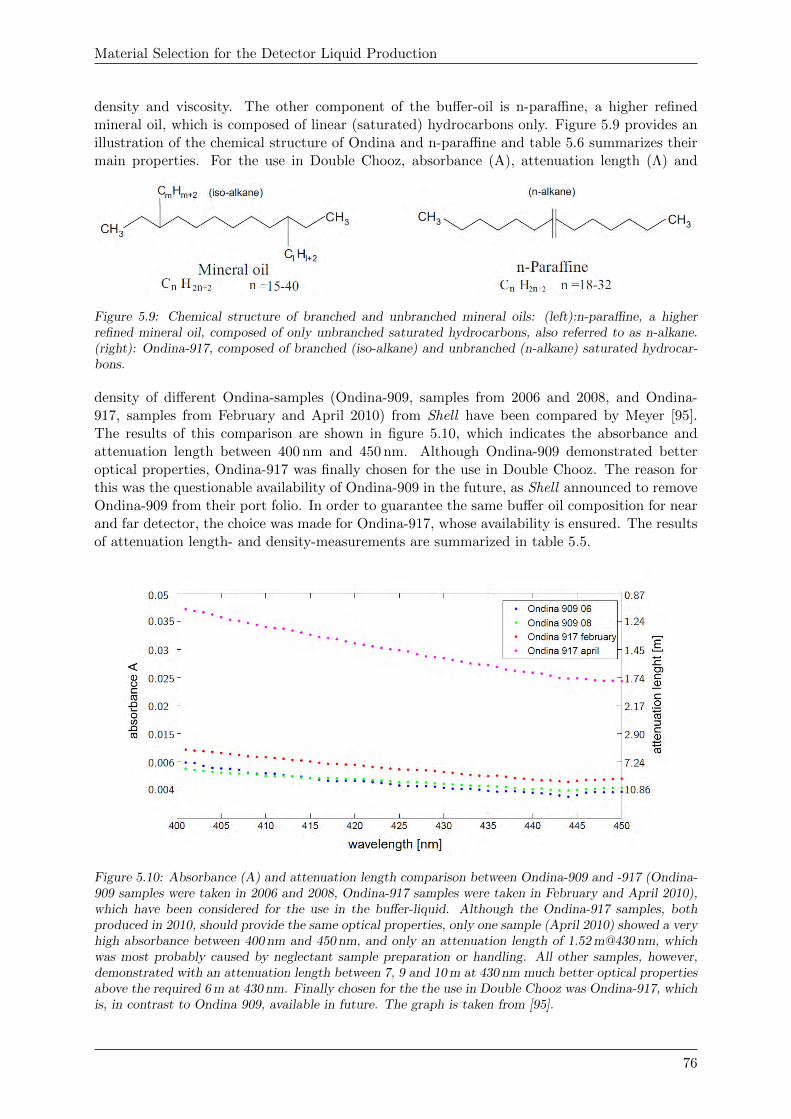
Material Selection for the Detector Liquid Production
density and viscosity. The other component of the buffer-oil is n-paraffine, a higher refinedmineral oil, which is composed of linear (saturated) hydrocarbons only. Figure 5.9 provides anillustration of the chemical structure of Ondina and n-paraffine and table 5.6 summarizes theirmain properties. For the use in Double Chooz, absorbance (A), attenuation length (Λ) and
Figure 5.9: Chemical structure of branched and unbranched mineral oils: (left):n-paraffine, a higherrefined mineral oil, composed of only unbranched saturated hydrocarbons, also referred to as n-alkane.(right): Ondina-917, composed of branched (iso-alkane) and unbranched (n-alkane) saturated hydrocar-bons.
density of different Ondina-samples (Ondina-909, samples from 2006 and 2008, and Ondina-917, samples from February and April 2010) from Shell have been compared by Meyer [95].The results of this comparison are shown in figure 5.10, which indicates the absorbance andattenuation length between 400 nm and 450 nm. Although Ondina-909 demonstrated betteroptical properties, Ondina-917 was finally chosen for the use in Double Chooz. The reason forthis was the questionable availability of Ondina-909 in the future, as Shell announced to removeOndina-909 from their port folio. In order to guarantee the same buffer oil composition for nearand far detector, the choice was made for Ondina-917, whose availability is ensured. The resultsof attenuation length- and density-measurements are summarized in table 5.5.
Figure 5.10: Absorbance (A) and attenuation length comparison between Ondina-909 and -917 (Ondina-909 samples were taken in 2006 and 2008, Ondina-917 samples were taken in February and April 2010),which have been considered for the use in the buffer-liquid. Although the Ondina-917 samples, bothproduced in 2010, should provide the same optical properties, only one sample (April 2010) showed a veryhigh absorbance between 400 nm and 450 nm, and only an attenuation length of 1.52 m@430 nm, whichwas most probably caused by neglectant sample preparation or handling. All other samples, however,demonstrated with an attenuation length between 7, 9 and 10 m at 430 nm much better optical propertiesabove the required 6 m at 430 nm. Finally chosen for the the use in Double Chooz was Ondina-917, whichis, in contrast to Ondina 909, available in future. The graph is taken from [95].
76
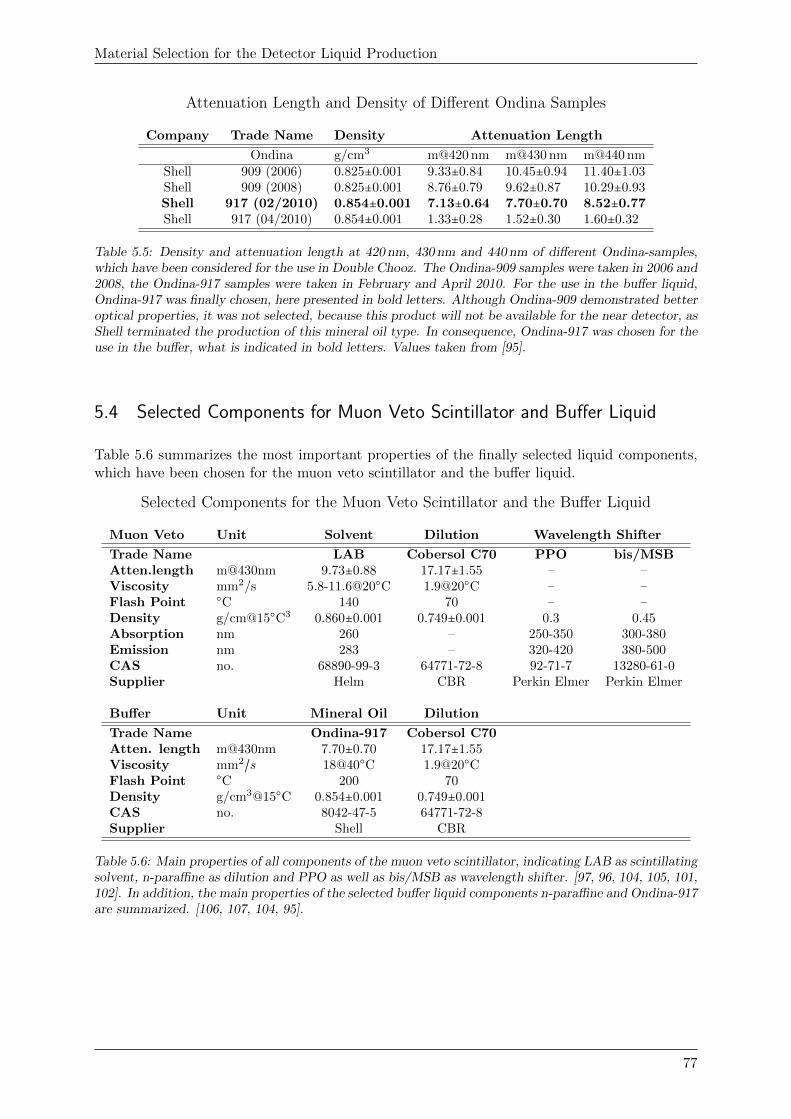
Material Selection for the Detector Liquid Production
Attenuation Length and Density of Different Ondina Samples
Company Trade Name Density Attenuation Length
Ondina g/cm3 m@420 nm m@430 nm m@440 nmShell 909 (2006) 0.825±0.001 9.33±0.84 10.45±0.94 11.40±1.03Shell 909 (2008) 0.825±0.001 8.76±0.79 9.62±0.87 10.29±0.93Shell 917 (02/2010) 0.854±0.001 7.13±0.64 7.70±0.70 8.52±0.77Shell 917 (04/2010) 0.854±0.001 1.33±0.28 1.52±0.30 1.60±0.32
Table 5.5: Density and attenuation length at 420 nm, 430 nm and 440 nm of different Ondina-samples,which have been considered for the use in Double Chooz. The Ondina-909 samples were taken in 2006 and2008, the Ondina-917 samples were taken in February and April 2010. For the use in the buffer liquid,Ondina-917 was finally chosen, here presented in bold letters. Although Ondina-909 demonstrated betteroptical properties, it was not selected, because this product will not be available for the near detector, asShell terminated the production of this mineral oil type. In consequence, Ondina-917 was chosen for theuse in the buffer, what is indicated in bold letters. Values taken from [95].
5.4 Selected Components for Muon Veto Scintillator and Buffer Liquid
Table 5.6 summarizes the most important properties of the finally selected liquid components,which have been chosen for the muon veto scintillator and the buffer liquid.
Selected Components for the Muon Veto Scintillator and the Buffer Liquid
Muon Veto Unit Solvent Dilution Wavelength Shifter
Trade Name LAB Cobersol C70 PPO bis/MSBAtten.length m@430nm 9.73±0.88 17.17±1.55 – –Viscosity mm2/s 5.8-11.6@20○C 1.9@20○C – –Flash Point ○C 140 70 – –Density g/cm@15○C3 0.860±0.001 0.749±0.001 0.3 0.45Absorption nm 260 – 250-350 300-380Emission nm 283 – 320-420 380-500CAS no. 68890-99-3 64771-72-8 92-71-7 13280-61-0Supplier Helm CBR Perkin Elmer Perkin Elmer
Buffer Unit Mineral Oil Dilution
Trade Name Ondina-917 Cobersol C70Atten. length m@430nm 7.70±0.70 17.17±1.55Viscosity mm2/s 18@40○C 1.9@20○CFlash Point ○C 200 70Density g/cm3@15○C 0.854±0.001 0.749±0.001CAS no. 8042-47-5 64771-72-8Supplier Shell CBR
Table 5.6: Main properties of all components of the muon veto scintillator, indicating LAB as scintillatingsolvent, n-paraffine as dilution and PPO as well as bis/MSB as wavelength shifter. [97, 96, 104, 105, 101,102]. In addition, the main properties of the selected buffer liquid components n-paraffine and Ondina-917are summarized. [106, 107, 104, 95].
77
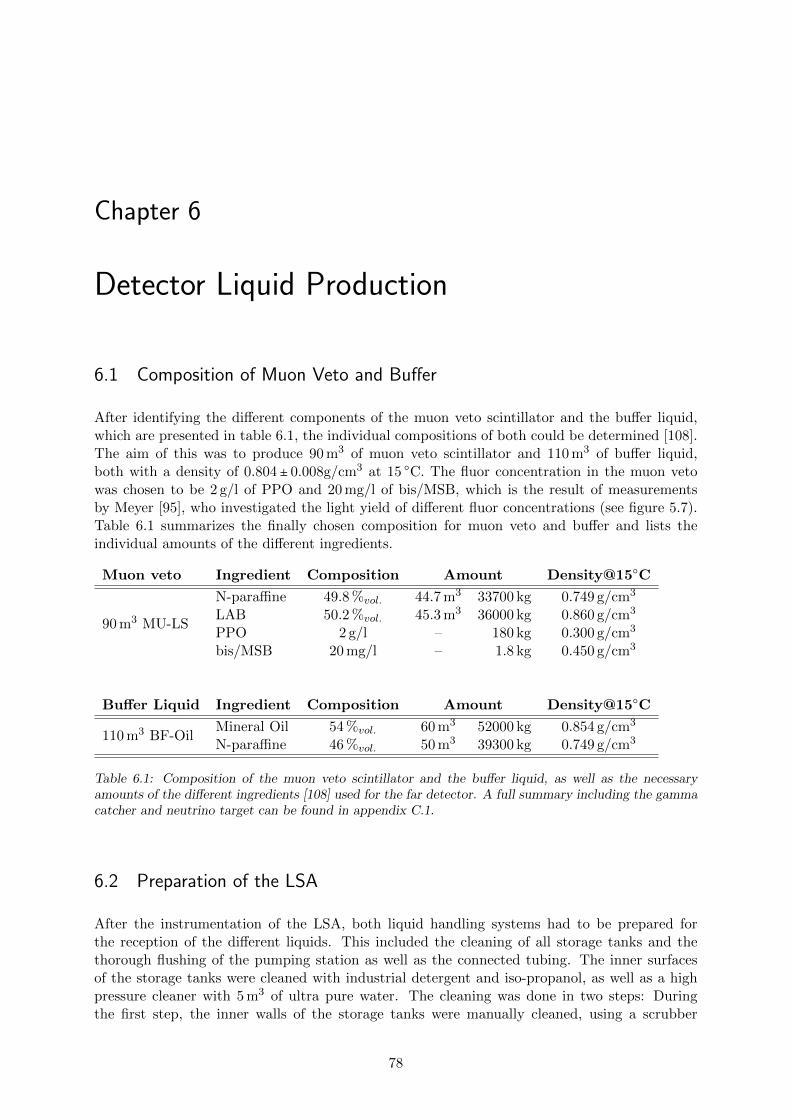
Chapter 6
Detector Liquid Production
6.1 Composition of Muon Veto and Buffer
After identifying the different components of the muon veto scintillator and the buffer liquid,which are presented in table 6.1, the individual compositions of both could be determined [108].The aim of this was to produce 90 m3 of muon veto scintillator and 110 m3 of buffer liquid,both with a density of 0.804± 0.008g/cm3 at 15 ○C. The fluor concentration in the muon vetowas chosen to be 2 g/l of PPO and 20 mg/l of bis/MSB, which is the result of measurementsby Meyer [95], who investigated the light yield of different fluor concentrations (see figure 5.7).Table 6.1 summarizes the finally chosen composition for muon veto and buffer and lists theindividual amounts of the different ingredients.
Muon veto Ingredient Composition Amount Density@15○C
90 m3 MU-LS
N-paraffine 49.8 %vol. 44.7 m3 33700 kg 0.749 g/cm3
LAB 50.2 %vol. 45.3 m3 36000 kg 0.860 g/cm3
PPO 2 g/l – 180 kg 0.300 g/cm3
bis/MSB 20 mg/l – 1.8 kg 0.450 g/cm3
Buffer Liquid Ingredient Composition Amount Density@15○C
110 m3 BF-OilMineral Oil 54 %vol. 60 m3 52000 kg 0.854 g/cm3
N-paraffine 46 %vol. 50 m3 39300 kg 0.749 g/cm3
Table 6.1: Composition of the muon veto scintillator and the buffer liquid, as well as the necessaryamounts of the different ingredients [108] used for the far detector. A full summary including the gammacatcher and neutrino target can be found in appendix C.1.
6.2 Preparation of the LSA
After the instrumentation of the LSA, both liquid handling systems had to be prepared forthe reception of the different liquids. This included the cleaning of all storage tanks and thethorough flushing of the pumping station as well as the connected tubing. The inner surfacesof the storage tanks were cleaned with industrial detergent and iso-propanol, as well as a highpressure cleaner with 5 m3 of ultra pure water. The cleaning was done in two steps: Duringthe first step, the inner walls of the storage tanks were manually cleaned, using a scrubber
78
Detector Liquid Production
and a water-detergent-mixture. The second step was done by using a scrubber with a water-propanol-mixture. After each cleaning step, the inner walls were flushed with ultra pure water,using the high pressure cleaner. In order to clean also the interior of the pumping station andall related tubing, the accumulated water-mixture (of about 1 m3 per tank) was circulated andsubsequently disposed. After this cleaning process, all tanks were dried with a flow of warm airin order to remove the residual water-propanol-mixture. After drying, the entire liquid handlingsystem was isolated and flushed with dry nitrogen in order to remove oxygen and still remainingwater-propanol-mixture from the system. By using the gas-flow-meters in the pumping station,the nitrogen purging was maintained until 1800 m3 of nitrogen was pushed through the system,corresponding to eight times the storage volume. After the initial inertization of the liquidhandling system, the small nitrogen flow was maintained in order to produce a low pressurenitrogen blanket in the storage tanks.
6.3 Parallel Production of the Muon Veto Scintillator and Buffer Liquid
The liquid handling system in the LSA was designed to receive and mix large amounts ofliquids, but not to dissolve and blend large amounts of crystalline compounds, as PPO andbis/MSB. Such a functionality would have risen the costs for the liquid handling system inthe LSA tremendously. In order to avoid these costs and due to the possibility to cooperatewith Wacker-Chemie, the chemicals PPO and bis/MSB were dissolved in a small batch of LABat Wacker-Chemie in Munich. This highly concentrated solution, also referred to as MasterSolution1, contained all the chemicals in liquefied form. In a second step, the MS was transportedto Chooz, where the liquid handling system was used to dilute the MS until the desired densityand concentration of the scintillator was reached. Subsequently, the mixture was blended, finetuned and tested in order to verify the final density, transparency, as well as the light yield.
6.3.1 Master Solution
The master solution for the far detector was made in cooperation with Wacker-Chemie inMunich, which operates a chemical research and provides the necessary infrastructure to processand mix liquids and chemicals under controlled, clean and adjustable conditions. This industrialsetup, also referred to as “Technikum”, includes a 1000 l stainless steel mixing tank, whichprovides a stirring- and purging-unit along with the possibility to heat the medium inside.The production of the master solution started with the delivery of 5000 l of LAB, 180 kg ofPPO and 1.8 kg of bis/MSB to the “Technikum” in Munich. The process tank was cleanedand evacuated before a batch of 960 l LAB was transferred to the tank. In order to removeoxygen from the LAB and to facilitate the dissolving of the crystalline PPO and bis/MSB,the LAB was heated to +50○C and continuously purged with nitrogen. After weighing, bothchemicals were added to the tank and the mixture was blended under constant stirring andpurging. In order to guarantee a homogeneous mixture, purging and stirring was maintainedfor three additional hours. Subsequently, the master solution was filtered using a 3µm particlefilter, in order to remove all residual particles, which did not dissolve during the mixing process.After the production, each batch was transferred to a nitrogen-filled 1000 l transport tank (IBC-international bulk container), which was used to deliver the LAB. The four remaining batches
1A master solution is a highly concentrated solution, which includes the entire amount of chemical additivesof an anticipated scintillator batch. The production of a master solution eases the production process, as onlya small amount of liquid has to be handled to dissolve the chemical additives. In addition, the production of amaster solution simplifies the requirements on the on-site mixing facility, as only liquids have to be handled.
79
Detector Liquid Production
were produced correspondingly, what allowed to prepare 4800 l of master solution with a fluorconcentration of 40 g/l PPO and 0.4 g/l bis/MSB.
6.3.2 Mixing Process
The on-site mixing process of the muon veto started with the delivery of five IBCs filled withmaster solution (MS). For the unloading of the MS, the containers were placed in front of thestorage area and connected to the pumping station, using an 1-inch PTFE-tube, mantled withmetal mesh. Using the pumping station, the master solution was equally distributed, loadingeach of the three muon veto storage tanks with 1600 l of MS. In order to avoid a possible oxygencontamination during the uploading process, the IBC containers and the storage tanks wereconstantly purged with nitrogen.
All other liquids for the muon veto (i.e. 40.5 m3 of LAB as well as the 44.7 m3 of n-paraffine)and the buffer liquid (i.e. 60 m3 of Ondina-917 as well as the 50 m3 of n-paraffine) were supplieddirectly by the different companies and delivered by standard delivery trucks.
In order facilitate the mixing process and the restricted space in front of the liquid storage area,the delivery trucks were coordinated. At first, the liquids with higher density (LAB, Ondina)were delivered, followed by the lighter n-paraffine. The arriving trucks were parked in front ofthe LSA, supplied with nitrogen and connected to the corresponding pumping station. Beforethe unloading of an individual truck started, the transport compartment of each truck waspressurized (up to 1 bar) with nitrogen. This allowed to check the tightness of all connectionsand provided a higher liquid flow to the membrane pump in the pumping station. The deliveredcomponents were equally uploaded (max. 2 m3/h) into the respective storage tanks, strictlyseparating the scintillating LAB from the other liquids. Figure 6.1 provides a set of pictures,showing the liquid delivery of LAB/n-paraffine/mineral oil with standard delivery trucks anddelivery and unloading of the master solution using five IBC-containers.
For the purpose of avoiding a possible pollution of the storage tanks with sediments (whichmight have accumulated in the delivery trucks), the first 50 l of each new truck were disposed.In order to blend the new arriving liquid with the already stored mixture, the uploading processwas accompanied by turbulent nitrogen purging. The equal uploading of MS, LAB, n-paraffineand Ondina-917 into the three storage tanks provided similar, but not identical batches in thethree storage tanks. In order to blend these three batches to one final batch, the pumpingstation was used to circulate the scintillator between the three tanks. This circulation was donefor the muon veto and for the buffer liquid.
After mixing and thorough blending, the density of the muon veto was fine-tuned by addingeither the heavier LAB (0.860 g/cm3) or Ondina-917 (0.854 g/cm3) and the lighter n-paraffine(0.749 g/cm3). For this process, 1 m3 of LAB, 1 m3 of n-paraffine, as well as 1 m3 of Ondina-917were available, which were set aside in separate IBC-container during the uploading process.This fine tuning process finally led to 90 m3 MU-scintillator with a fluor concentration of 2 g/lPPO and 20 mg/l bis/MSB, with a density of ρ=0.804± 0.001 g/cm3, as well as 110 m3 bufferliquid with a density of ρ=0.805± 0.001 g/cm3.
In order to monitor the quality of the detector liquids, different liquid samples were taken, oneafter the mixing process from the different storage tanks in the LSA, and a second one from theintermediate tanks of DFOS in the underground laboratory, after the liquid passed the 160 mtrunk line. The results of these measurements showed a successful and clean production ofthe different detector liquids and a clean transfer to the underground laboratory, what will bepresented in chapter 9.
80
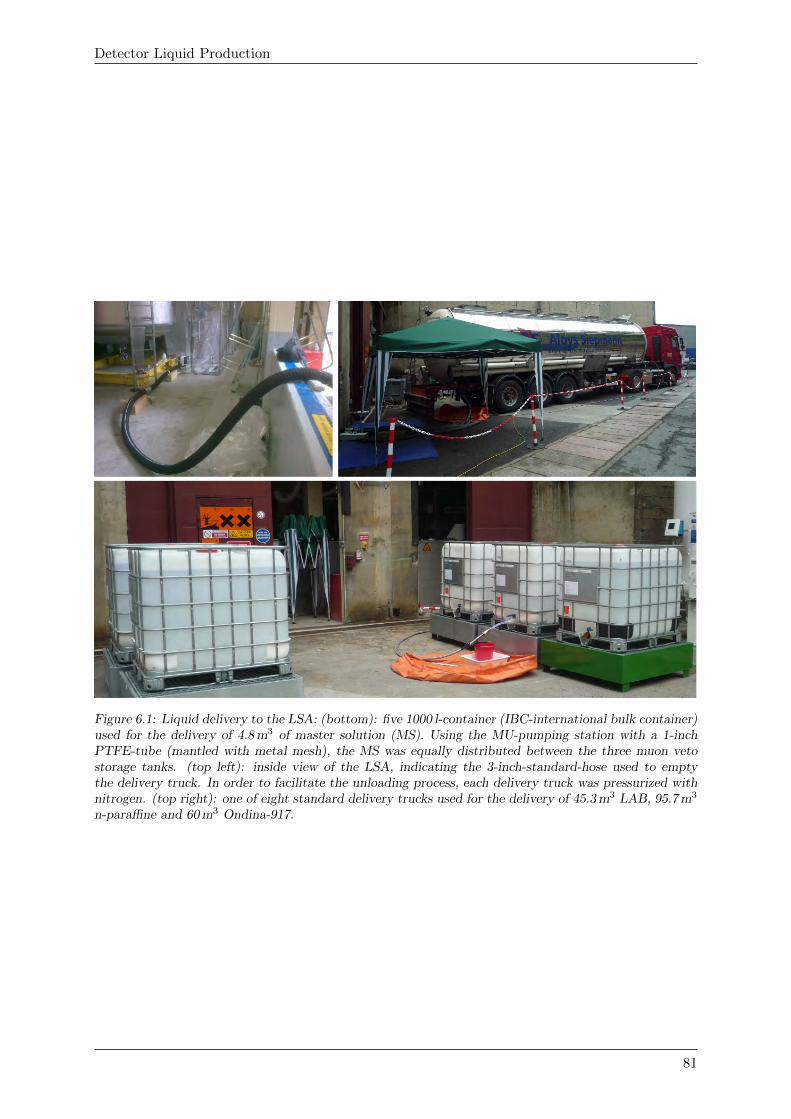
Detector Liquid Production
Figure 6.1: Liquid delivery to the LSA: (bottom): five 1000 l-container (IBC-international bulk container)used for the delivery of 4.8 m3 of master solution (MS). Using the MU-pumping station with a 1-inchPTFE-tube (mantled with metal mesh), the MS was equally distributed between the three muon vetostorage tanks. (top left): inside view of the LSA, indicating the 3-inch-standard-hose used to emptythe delivery truck. In order to facilitate the unloading process, each delivery truck was pressurized withnitrogen. (top right): one of eight standard delivery trucks used for the delivery of 45.3 m3 LAB, 95.7 m3
n-paraffine and 60 m3 Ondina-917.
81

82
Part III
Filling and Handling of the Double Chooz FarDetector
83
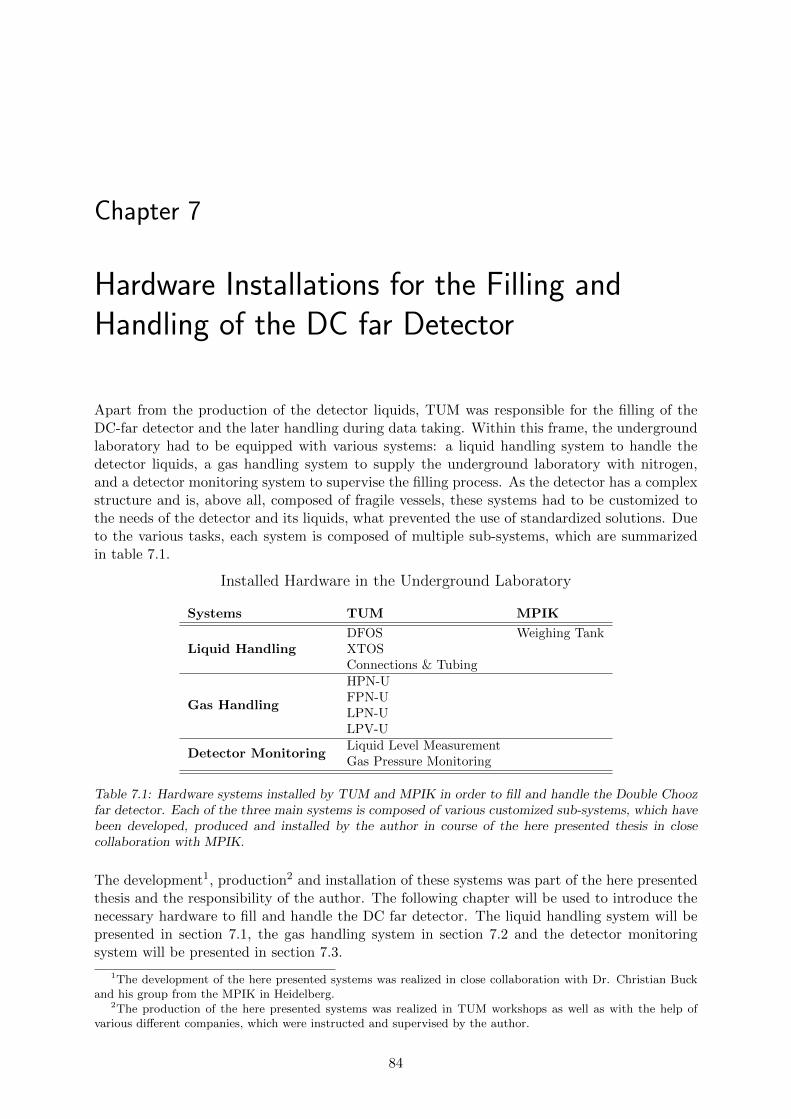
Chapter 7
Hardware Installations for the Filling andHandling of the DC far Detector
Apart from the production of the detector liquids, TUM was responsible for the filling of theDC-far detector and the later handling during data taking. Within this frame, the undergroundlaboratory had to be equipped with various systems: a liquid handling system to handle thedetector liquids, a gas handling system to supply the underground laboratory with nitrogen,and a detector monitoring system to supervise the filling process. As the detector has a complexstructure and is, above all, composed of fragile vessels, these systems had to be customized tothe needs of the detector and its liquids, what prevented the use of standardized solutions. Dueto the various tasks, each system is composed of multiple sub-systems, which are summarizedin table 7.1.
Installed Hardware in the Underground Laboratory
Systems TUM MPIK
Liquid HandlingDFOS Weighing TankXTOSConnections & Tubing
Gas Handling
HPN-UFPN-ULPN-ULPV-U
Detector MonitoringLiquid Level MeasurementGas Pressure Monitoring
Table 7.1: Hardware systems installed by TUM and MPIK in order to fill and handle the Double Choozfar detector. Each of the three main systems is composed of various customized sub-systems, which havebeen developed, produced and installed by the author in course of the here presented thesis in closecollaboration with MPIK.
The development1, production2 and installation of these systems was part of the here presentedthesis and the responsibility of the author. The following chapter will be used to introduce thenecessary hardware to fill and handle the DC far detector. The liquid handling system will bepresented in section 7.1, the gas handling system in section 7.2 and the detector monitoringsystem will be presented in section 7.3.
1The development of the here presented systems was realized in close collaboration with Dr. Christian Buckand his group from the MPIK in Heidelberg.
2The production of the here presented systems was realized in TUM workshops as well as with the help ofvarious different companies, which were instructed and supervised by the author.
84
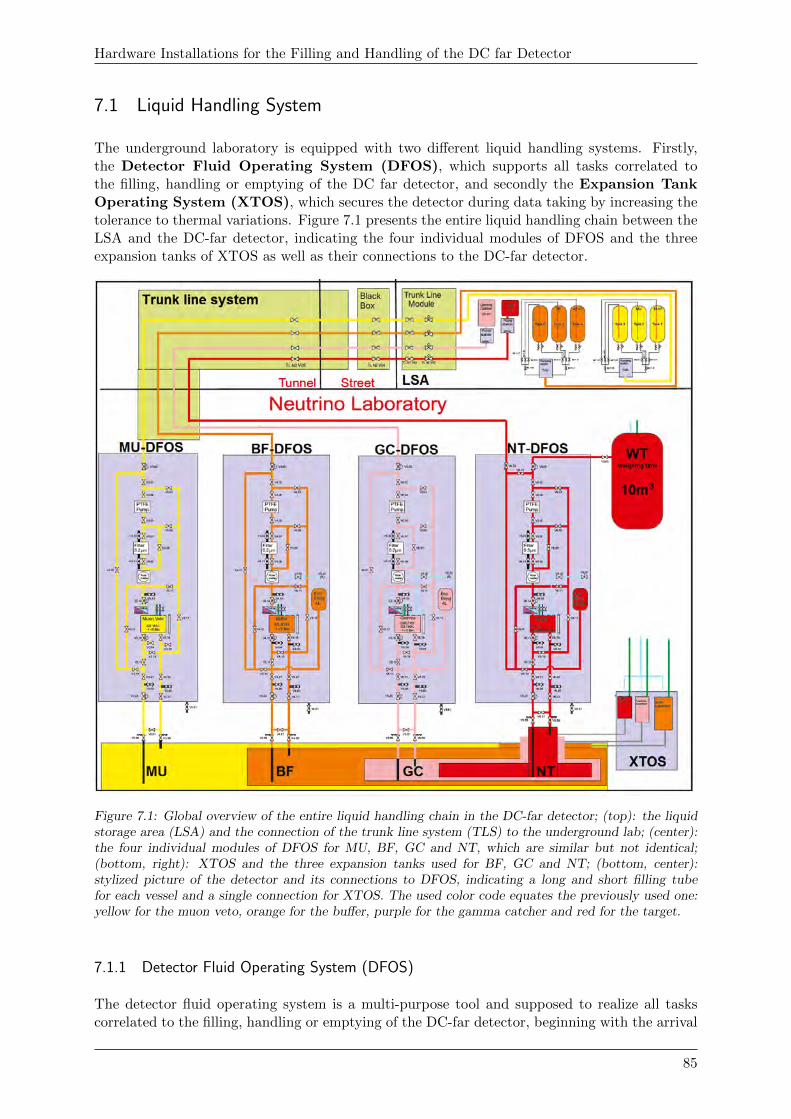
Hardware Installations for the Filling and Handling of the DC far Detector
7.1 Liquid Handling System
The underground laboratory is equipped with two different liquid handling systems. Firstly,the Detector Fluid Operating System (DFOS), which supports all tasks correlated tothe filling, handling or emptying of the DC far detector, and secondly the Expansion TankOperating System (XTOS), which secures the detector during data taking by increasing thetolerance to thermal variations. Figure 7.1 presents the entire liquid handling chain between theLSA and the DC-far detector, indicating the four individual modules of DFOS and the threeexpansion tanks of XTOS as well as their connections to the DC-far detector.
Figure 7.1: Global overview of the entire liquid handling chain in the DC-far detector; (top): the liquidstorage area (LSA) and the connection of the trunk line system (TLS) to the underground lab; (center):the four individual modules of DFOS for MU, BF, GC and NT, which are similar but not identical;(bottom, right): XTOS and the three expansion tanks used for BF, GC and NT; (bottom, center):stylized picture of the detector and its connections to DFOS, indicating a long and short filling tubefor each vessel and a single connection for XTOS. The used color code equates the previously used one:yellow for the muon veto, orange for the buffer, purple for the gamma catcher and red for the target.
7.1.1 Detector Fluid Operating System (DFOS)
The detector fluid operating system is a multi-purpose tool and supposed to realize all taskscorrelated to the filling, handling or emptying of the DC-far detector, beginning with the arrival
85
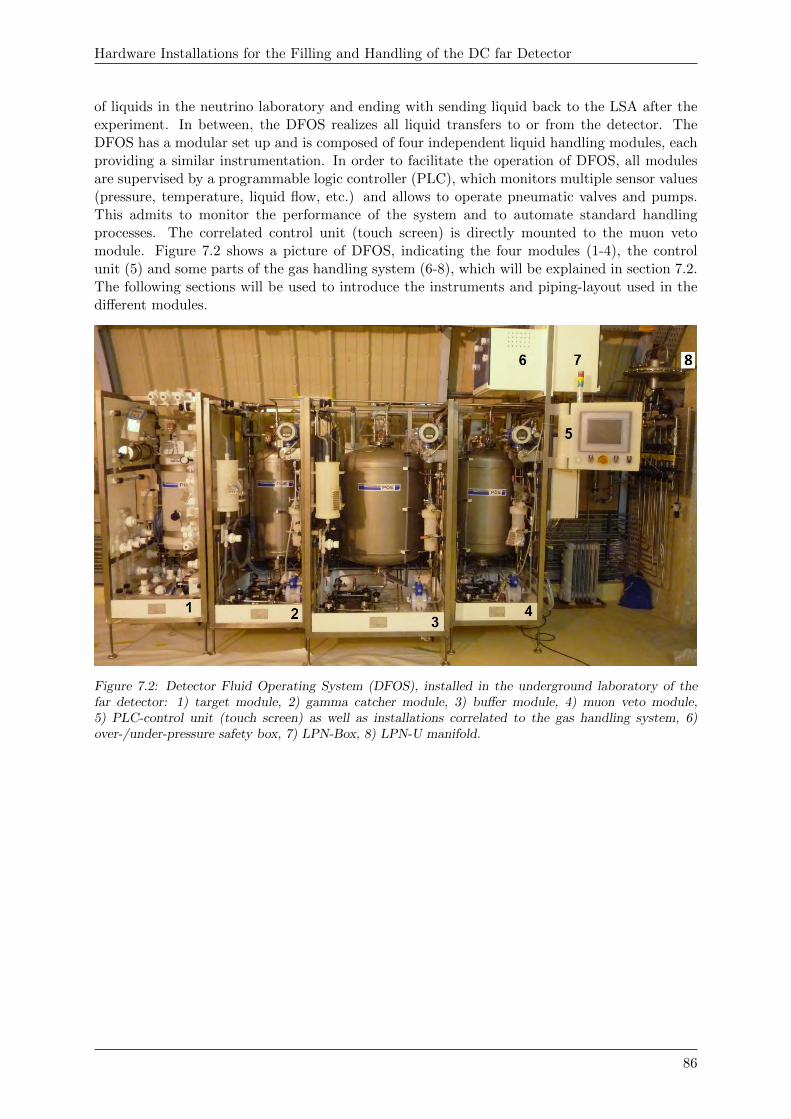
Hardware Installations for the Filling and Handling of the DC far Detector
of liquids in the neutrino laboratory and ending with sending liquid back to the LSA after theexperiment. In between, the DFOS realizes all liquid transfers to or from the detector. TheDFOS has a modular set up and is composed of four independent liquid handling modules, eachproviding a similar instrumentation. In order to facilitate the operation of DFOS, all modulesare supervised by a programmable logic controller (PLC), which monitors multiple sensor values(pressure, temperature, liquid flow, etc.) and allows to operate pneumatic valves and pumps.This admits to monitor the performance of the system and to automate standard handlingprocesses. The correlated control unit (touch screen) is directly mounted to the muon vetomodule. Figure 7.2 shows a picture of DFOS, indicating the four modules (1-4), the controlunit (5) and some parts of the gas handling system (6-8), which will be explained in section 7.2.The following sections will be used to introduce the instruments and piping-layout used in thedifferent modules.
Figure 7.2: Detector Fluid Operating System (DFOS), installed in the underground laboratory of thefar detector: 1) target module, 2) gamma catcher module, 3) buffer module, 4) muon veto module,5) PLC-control unit (touch screen) as well as installations correlated to the gas handling system, 6)over-/under-pressure safety box, 7) LPN-Box, 8) LPN-U manifold.
86
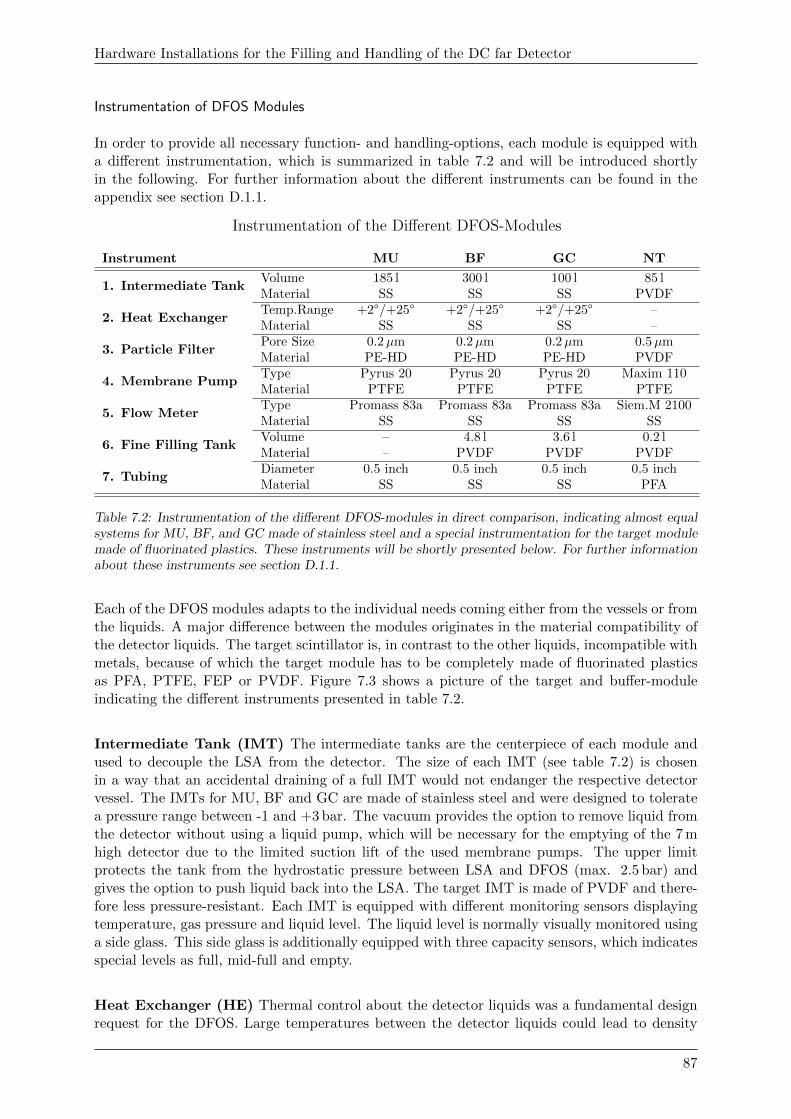
Hardware Installations for the Filling and Handling of the DC far Detector
Instrumentation of DFOS Modules
In order to provide all necessary function- and handling-options, each module is equipped witha different instrumentation, which is summarized in table 7.2 and will be introduced shortlyin the following. For further information about the different instruments can be found in theappendix see section D.1.1.
Instrumentation of the Different DFOS-Modules
Instrument MU BF GC NT
1. Intermediate TankVolume 185 l 300 l 100 l 85 lMaterial SS SS SS PVDF
2. Heat ExchangerTemp.Range +2○/+25○ +2○/+25○ +2○/+25○ –Material SS SS SS –
3. Particle FilterPore Size 0.2µm 0.2µm 0.2µm 0.5µmMaterial PE-HD PE-HD PE-HD PVDF
4. Membrane PumpType Pyrus 20 Pyrus 20 Pyrus 20 Maxim 110Material PTFE PTFE PTFE PTFE
5. Flow MeterType Promass 83a Promass 83a Promass 83a Siem.M 2100Material SS SS SS SS
6. Fine Filling TankVolume – 4.8 l 3.6 l 0.2 lMaterial – PVDF PVDF PVDF
7. TubingDiameter 0.5 inch 0.5 inch 0.5 inch 0.5 inchMaterial SS SS SS PFA
Table 7.2: Instrumentation of the different DFOS-modules in direct comparison, indicating almost equalsystems for MU, BF, and GC made of stainless steel and a special instrumentation for the target modulemade of fluorinated plastics. These instruments will be shortly presented below. For further informationabout these instruments see section D.1.1.
Each of the DFOS modules adapts to the individual needs coming either from the vessels or fromthe liquids. A major difference between the modules originates in the material compatibility ofthe detector liquids. The target scintillator is, in contrast to the other liquids, incompatible withmetals, because of which the target module has to be completely made of fluorinated plasticsas PFA, PTFE, FEP or PVDF. Figure 7.3 shows a picture of the target and buffer-moduleindicating the different instruments presented in table 7.2.
Intermediate Tank (IMT) The intermediate tanks are the centerpiece of each module andused to decouple the LSA from the detector. The size of each IMT (see table 7.2) is chosenin a way that an accidental draining of a full IMT would not endanger the respective detectorvessel. The IMTs for MU, BF and GC are made of stainless steel and were designed to toleratea pressure range between -1 and +3 bar. The vacuum provides the option to remove liquid fromthe detector without using a liquid pump, which will be necessary for the emptying of the 7 mhigh detector due to the limited suction lift of the used membrane pumps. The upper limitprotects the tank from the hydrostatic pressure between LSA and DFOS (max. 2.5 bar) andgives the option to push liquid back into the LSA. The target IMT is made of PVDF and there-fore less pressure-resistant. Each IMT is equipped with different monitoring sensors displayingtemperature, gas pressure and liquid level. The liquid level is normally visually monitored usinga side glass. This side glass is additionally equipped with three capacity sensors, which indicatesspecial levels as full, mid-full and empty.
Heat Exchanger (HE) Thermal control about the detector liquids was a fundamental designrequest for the DFOS. Large temperatures between the detector liquids could lead to density
87
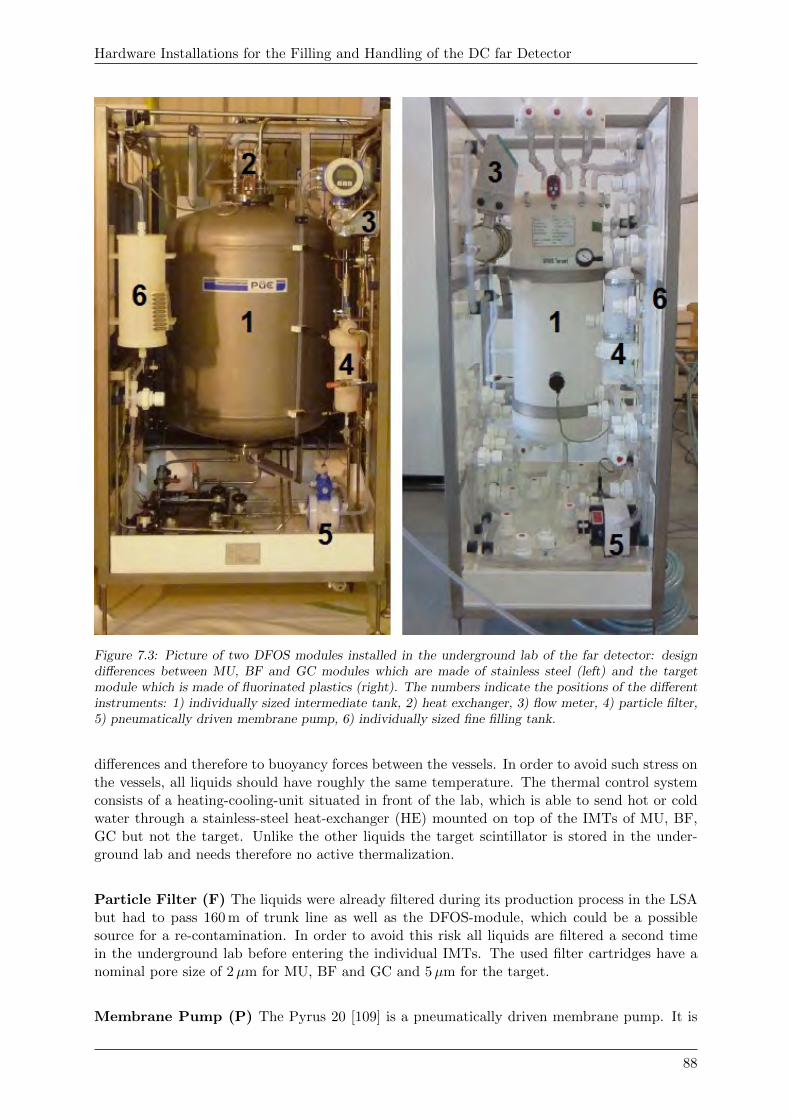
Hardware Installations for the Filling and Handling of the DC far Detector
Figure 7.3: Picture of two DFOS modules installed in the underground lab of the far detector: designdifferences between MU, BF and GC modules which are made of stainless steel (left) and the targetmodule which is made of fluorinated plastics (right). The numbers indicate the positions of the differentinstruments: 1) individually sized intermediate tank, 2) heat exchanger, 3) flow meter, 4) particle filter,5) pneumatically driven membrane pump, 6) individually sized fine filling tank.
differences and therefore to buoyancy forces between the vessels. In order to avoid such stress onthe vessels, all liquids should have roughly the same temperature. The thermal control systemconsists of a heating-cooling-unit situated in front of the lab, which is able to send hot or coldwater through a stainless-steel heat-exchanger (HE) mounted on top of the IMTs of MU, BF,GC but not the target. Unlike the other liquids the target scintillator is stored in the under-ground lab and needs therefore no active thermalization.
Particle Filter (F) The liquids were already filtered during its production process in the LSAbut had to pass 160 m of trunk line as well as the DFOS-module, which could be a possiblesource for a re-contamination. In order to avoid this risk all liquids are filtered a second timein the underground lab before entering the individual IMTs. The used filter cartridges have anominal pore size of 2µm for MU, BF and GC and 5µm for the target.
Membrane Pump (P) The Pyrus 20 [109] is a pneumatically driven membrane pump. It is
88
Hardware Installations for the Filling and Handling of the DC far Detector
fully made of PFA and offers a theoretical capacity of 20 l/min but demonstrated not more than10 l/min when implemented in DFOS. The pump is the anticipated driving mechanism to allliquid transfers as IMT-filling, circulation, detector filling or emptying processes. The pump isconnected to the PLC what allows to start the pump automatically or manually by the user.As the direction of membrane pumps can not be reversed, the liquid tubing had to be set up insuch way to allow also bi-directional pumping.
Flow Meter (FM) The promass 83a is a coriolis flow meter, which measures the mass flowwith an accuracy of 0.25 % of the measured value (0.1 % in case of the target flow meter), thedensity with an accuracy of ± 0.02 kg/l and the temperature with ± 0.5 ○C. Together with thePLC, which is opening pneumatic valves and starting the pump, the flow meter allows to dosea preset amount of liquid either into or out of the IMT.
Fine Filling Tanks (FFT) The fine filling tanks are a smaller version of the intermediatetanks and are used to fill the chimney. The size of each FFT (see table 7.2) is chosen in a waythat an accidental draining of a full FFT would not lead to a dangerous liquid level increase inthe respective chimney. All tanks are made of PVDF and withstand also vacuum, which allowsto suck liquid out of the IMT (to fill the FFT) or out of the detector to actively control theliquid level in the chimney.
Programmable Logic Controller (PLC) The programmable logic controller is supposed tosupport the handling-personnel. The PLC acquires sensor data (temperature, pressure, flowrate, etc.) and a custom-made software displays these values on a touch screen. The touchscreen is the main interface and allows to monitor and control the four modules as well as thegas handling system, to set the alarm and critical limits, to monitor filling and to indicate thestatus of pumps and valve-positions (see figure D.8). If one of the monitored values reaches thealarm limit, the PLC notifies the user by acoustic and visual alarms. If values further exceedand reach critical values, the PLC stops any operation, isolates the detector and secures thesystem. The PLC supports the IMT-filling mode and assists by automating the three includedfilling steps (IMT-filling, thermalization, and IMT-emptying), which will be explained in section7.1.2. In order to avoid an accidental filling in the automated mode, each automated processrequires also the setting of manual valves. Apart from these “semi”-automated steps, the PLCoffers the possibility to operate every pneumatic valve and pump also manually. This allows touse also non-standard flow-paths if necessary.
More details about the instrumentation of the different modules are collected in two separate sec-tions in the appendix. For information on MU, BF and GC see section D.1.1 and for informationon the target module, see section D.1.4.
Piping of DFOS Modules
The tube routing and the instruments in each module provide various possibilities to transferliquid. The four main transfers are:
1. LSA ↔ IMT: allows to receive3 liquid from the LSA, to store and process detector liquidsin the underground lab as well as to send4 the liquids in all directions, also back to thestorage tanks in the LSA when the detector has to be emptied.
3via pump or by using gravitational pull4via pump or by pressurizing the IMTs
89
Hardware Installations for the Filling and Handling of the DC far Detector
2. IMT → IMT: allows to circulate liquid within DFOS what provides the possibility tothermalize or re-filter the liquids before they are filled into the detector.
3. IMT ↔ Detector: allows to send liquid from the IMTs into the detector. The twofilling lines enable to transmit the liquid either to the bottom (long filling tube) or to thetop (short filling tube) of the detector. Furthermore DFOS provides three different fillingmodes5, in order to fill the detector safely and homogeneously. Due to the flexible tuberouting, these filling modes can be reversed, what allows to regulate the liquid levels andto empty the detector.
4. Detector → Filter → Detector: in combination with the two detector connections ofDFOS (long and short-filling tube), it allows to circulate detector liquids from top tobottom out of the detector and vice versa. This enables to re-filter the detector liquids orto relocate warmer liquids.
In order to provide these different functions, the tube-routing within each module has to beflexible and is therefore comprehensive. As all modules have to provide the same functions,the tube routing is roughly the same in all modules with slight exceptions for muon veto andtarget module. The muon veto module provides no fine filling tank and the target module hasno heat exchanger. Furthermore, the target module connects to the 10 m3-weighing tank, whichalso changes the tube routing. Figure 7.4 presents exemplarily the piping- and instrumentation-diagram (P&ID) of the buffer module, which allows to see the tube routing and the implemen-tation of the different instruments. The piping diagram can be divided in two parts: the mainline, which includes the different instruments and the side lines, which are bypasses and allow toreverse processes or to exclude instruments from a flow path. The main line starts at the systemconnection point (SCP) and aligns the instruments in the following order: membrane pump6
(P), particle filter (F), flow meter6 (FM), heat exchanger6 (HE) and intermediate tank6 (IMT).In figure 7.4 the main line is indicated in red, the bypasses are presented in black and the differ-ent instruments are indicated with letters. The main-line and side-lines include various valves,what allows to set the individual flow path through the module. The mixture of pneumatic-6
and manual-valves avoids an accidental filling, as all liquid handling processes require the settingof manual valves. Those flow paths that are required for the different liquid handling tasks aresummarized in table 7.3. For an explanation how to read the flow patterns in table 7.3, seesection D.1.2.Apart from main- and side-lines, which connect to the intermediate tank, each module providestwo connections to the detector. A long filling tube, which runs straight to the bottom of thedetector, and a short filling tube, which enters 20 cm below the final liquid level. Shortly beforethe filling lines enter the detector, a valve station provides the last isolation valves ahead ofthe detector. This valve station enables to cross-connect both filling lines, what allows to cleanthe tubes prior to filling. A more detailed description about the valve station, filling tubes andlaboratory connections can be found in the appendix, see section D.1.6.
5IMT-filling mode, continuous mode and fine filling mode, see section 7.1.26can be monitored and/or regulated by the PLC
90
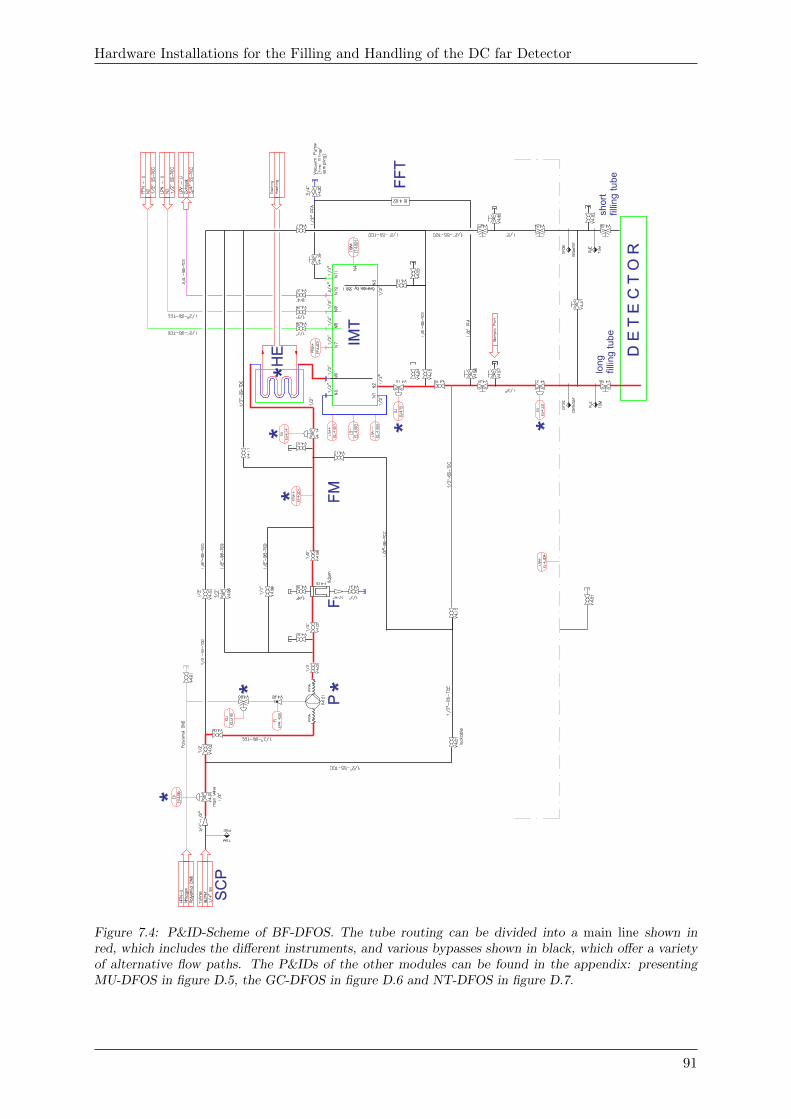
Hardware Installations for the Filling and Handling of the DC far Detector
HE
P F
FM
HE
IMT
D E
T E
C T
O R
lon
g
fillin
g t
ub
esh
ort
fillin
g t
ub
e
SC
P
FF
T
Figure 7.4: P&ID-Scheme of BF-DFOS. The tube routing can be divided into a main line shown inred, which includes the different instruments, and various bypasses shown in black, which offer a varietyof alternative flow paths. The P&IDs of the other modules can be found in the appendix: presentingMU-DFOS in figure D.5, the GC-DFOS in figure D.6 and NT-DFOS in figure D.7.
91
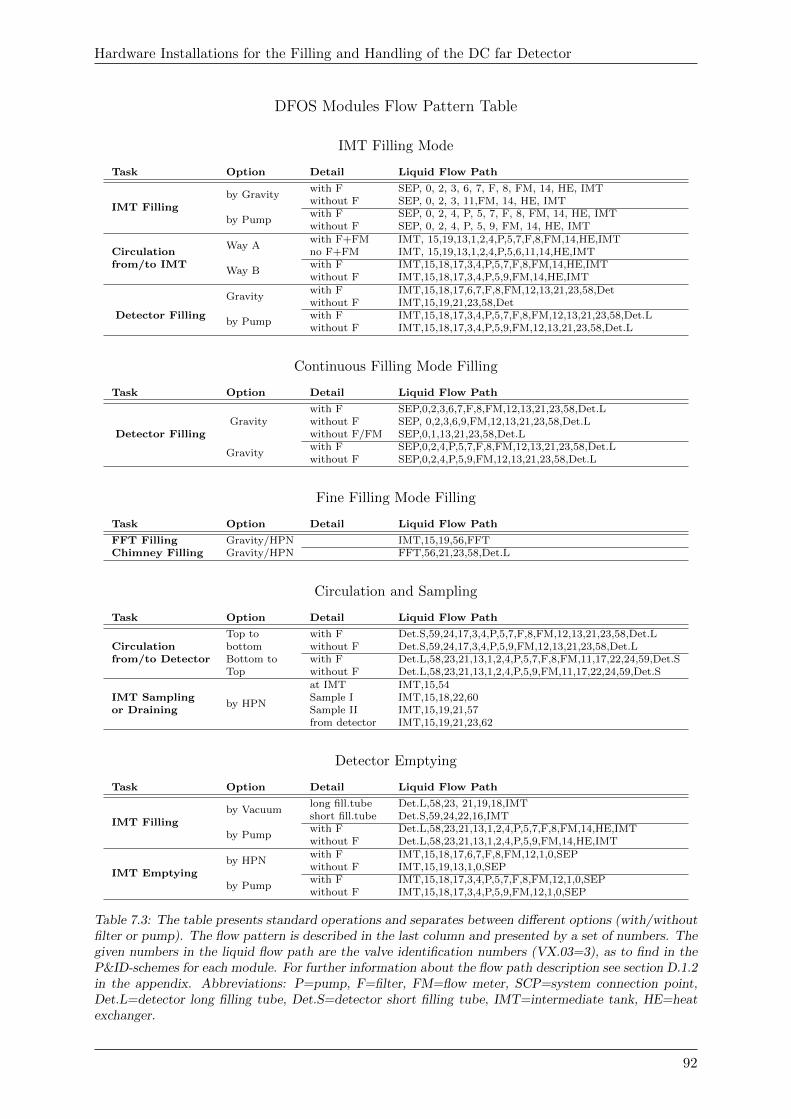
Hardware Installations for the Filling and Handling of the DC far Detector
DFOS Modules Flow Pattern Table
IMT Filling Mode
Task Option Detail Liquid Flow Path
IMT Fillingby Gravity
with F SEP, 0, 2, 3, 6, 7, F, 8, FM, 14, HE, IMTwithout F SEP, 0, 2, 3, 11,FM, 14, HE, IMT
by Pumpwith F SEP, 0, 2, 4, P, 5, 7, F, 8, FM, 14, HE, IMTwithout F SEP, 0, 2, 4, P, 5, 9, FM, 14, HE, IMT
Way Awith F+FM IMT, 15,19,13,1,2,4,P,5,7,F,8,FM,14,HE,IMT
Circulation no F+FM IMT, 15,19,13,1,2,4,P,5,6,11,14,HE,IMTfrom/to IMT
Way Bwith F IMT,15,18,17,3,4,P,5,7,F,8,FM,14,HE,IMTwithout F IMT,15,18,17,3,4,P,5,9,FM,14,HE,IMT
Detector Filling
Gravitywith F IMT,15,18,17,6,7,F,8,FM,12,13,21,23,58,Detwithout F IMT,15,19,21,23,58,Det
by Pumpwith F IMT,15,18,17,3,4,P,5,7,F,8,FM,12,13,21,23,58,Det.Lwithout F IMT,15,18,17,3,4,P,5,9,FM,12,13,21,23,58,Det.L
Continuous Filling Mode Filling
Task Option Detail Liquid Flow Path
Detector FillingGravity
with F SEP,0,2,3,6,7,F,8,FM,12,13,21,23,58,Det.Lwithout F SEP, 0,2,3,6,9,FM,12,13,21,23,58,Det.Lwithout F/FM SEP,0,1,13,21,23,58,Det.L
Gravitywith F SEP,0,2,4,P,5,7,F,8,FM,12,13,21,23,58,Det.Lwithout F SEP,0,2,4,P,5,9,FM,12,13,21,23,58,Det.L
Fine Filling Mode Filling
Task Option Detail Liquid Flow Path
FFT Filling Gravity/HPN IMT,15,19,56,FFTChimney Filling Gravity/HPN FFT,56,21,23,58,Det.L
Circulation and Sampling
Task Option Detail Liquid Flow Path
Top to with F Det.S,59,24,17,3,4,P,5,7,F,8,FM,12,13,21,23,58,Det.LCirculation bottom without F Det.S,59,24,17,3,4,P,5,9,FM,12,13,21,23,58,Det.Lfrom/to Detector Bottom to with F Det.L,58,23,21,13,1,2,4,P,5,7,F,8,FM,11,17,22,24,59,Det.S
Top without F Det.L,58,23,21,13,1,2,4,P,5,9,FM,11,17,22,24,59,Det.S
by HPN
at IMT IMT,15,54IMT Sampling Sample I IMT,15,18,22,60or Draining Sample II IMT,15,19,21,57
from detector IMT,15,19,21,23,62
Detector Emptying
Task Option Detail Liquid Flow Path
IMT Fillingby Vacuum
long fill.tube Det.L,58,23, 21,19,18,IMTshort fill.tube Det.S,59,24,22,16,IMT
by Pumpwith F Det.L,58,23,21,13,1,2,4,P,5,7,F,8,FM,14,HE,IMTwithout F Det.L,58,23,21,13,1,2,4,P,5,9,FM,14,HE,IMT
IMT Emptyingby HPN
with F IMT,15,18,17,6,7,F,8,FM,12,1,0,SEPwithout F IMT,15,19,13,1,0,SEP
by Pumpwith F IMT,15,18,17,3,4,P,5,7,F,8,FM,12,1,0,SEPwithout F IMT,15,18,17,3,4,P,5,9,FM,12,1,0,SEP
Table 7.3: The table presents standard operations and separates between different options (with/withoutfilter or pump). The flow pattern is described in the last column and presented by a set of numbers. Thegiven numbers in the liquid flow path are the valve identification numbers (VX.03=3), as to find in theP&ID-schemes for each module. For further information about the flow path description see section D.1.2in the appendix. Abbreviations: P=pump, F=filter, FM=flow meter, SCP=system connection point,Det.L=detector long filling tube, Det.S=detector short filling tube, IMT=intermediate tank, HE=heatexchanger.
92
Hardware Installations for the Filling and Handling of the DC far Detector
7.1.2 DFOS Main Operation Modes
Detector Filling
An equal and homogeneous increase of all liquid levels necessitates the adjustment of the liquidflow over a wide dynamic range, from large flows in the main body of the detector and verysmall flows in the different chimneys. Each DFOS-module therefore provides three differentfilling modes with different dynamic ranges and sensitivities. From high to low flows, thesemodes are
� Continuous Filling
� IMT-Filling
� Fine Filling.
While Continuous- and IMT-filling mode are only used in the main-bodies of the detector, finefilling is exclusively used to regulate the liquid levels in the different chimneys. These threemodes and their working principle are shortly summarized in the following paragraphs and canbe found in more detail in chapter E in the appendix.
1. Continuous Filling Mode (CM): Continuous filling is the quickest way to fill thedetector. The flow path excludes the IMT and provides a continuous flow directly into thedifferent detector vessels. In this mode, DFOS is predominantly passive as it only filtersthe liquid (0.5µm) and measures the flow rate. The only active roll is the regulation ofthe different liquid flows in order to realize a homogeneous increase in all four vessels. Theliquid flows can be regulated by a manual membrane valve (Vx.23) and are monitored bythe flow meter. This mode provides a flow rate of 8 - 9 l/min (only driven by gravity) andallows to increase the liquid level in the detector by about 3.3 cm per hour. Although it isthe most efficient way of filling, it is only used during non-critical filling phases where thesurface area of the detector vessels is not changing. A disadvantage of this mode is theinability to thermalize the arriving liquid before it enters the detector. Figure E.3 in theappendix presents a technical drawing of DFOS with different liquid paths superimposed.
2. IMT-Filling Mode (IMT): IMT filling is the anticipated standard filling mode. It usesthe IMTs to decouple the liquid flow from the LSA to the detector. The liquid enters theIMTs over the main-line. Once the IMT is full, the liquid can be probed, thermalized,re-filtered, or event sent back to the LSA if necessary. When the liquids in the IMTare thermalized, the IMT is emptied into the detector (by pump, gravity or pressure).The volume of each IMT has been individually chosen to increase the liquid level by notmore than 2 cm in the corresponding volume. Using this mode, the detector is filled ina batch-mode with an IMT as filling increment. The simultaneous filling of all detectorvolumes requires therefore the constant iteration of IMT-filling, thermalization and IMT-emptying parallel in all modules. These three steps are automated by the PLC. Includingthe thermalization-step, this filling mode allows to fill about 2 cm/h. This mode has beenused only during the beginning of the filling and at critical points, where CM-filling wouldhave been too dangerous. An illustration of the different liquid flow patterns of IMT-filling,thermalization and detector filling can be found in figure E.2 in the appendix.
3. Fine Filling Mode (FF): This mode is exclusively used in the chimney, where alreadythe addition of a small volume increases the liquid level significantly and thus the pressureon the whole vessel. This mode uses the IMTs as liquid storage that supplies the smallerfine-filling-tanks. These small PVDF-tanks can be pressurized or evacuated, what allowsto insert or extract liquid from the chimney. Figure E.4 presents the flow pattern usedduring the fine filling mode.
93
Hardware Installations for the Filling and Handling of the DC far Detector
Detector Circulation
Apart from the filling, DFOS provides the possibility to recirculate the different detector liquids.Each module is therefore equipped with two filling lines. A long filling tube that runs straightto the bottom of the detector and a short filling tube that enters at a different point and endsalready 20 cm below the final liquid level. These lines allow to circulate the detector liquidsfrom bottom-to-top or vice versa. This circulation can in- or exclude certain instruments likethe particle filter or heat exchanger. Furthermore the system allows to in- or exclude the IMTand to circulate liquid directly out of the detector.
Detector Emptying
After data taking, DFOS is supposed to remove liquids from the detector. All modules aretherefore able to reverse the three filling scenarios. Normally, this is done by pumping using adifferent flow path. Due to the depth of the detector and the limited suction lift of the usedmembrane pump, it is also possible to empty the detector without pump. In this scenario,the IMT-mode is reversed using under-pressure to fill the IMT and over pressure to empty it.The pressure resistance of each7 IMT has been chosen from vacuum to +3 bar, which allows toretrieve liquid from the detector and push this liquid back into the LSA.
7.1.3 Expansion Tank Operating System (XTOS)
The design of the detector vessels, a small and long chimney attached to a big main body, isoptimized for physics, however, at the expense of technical aspects. Once the liquid is insidethe chimney, such a design is very vulnerable to thermal expansion, as the volume in the vesselscan only expand into the chimney. The small cross-section of the chimney, however, leads toa significant increase of the liquid level in the respective chimney and therefore to a significantincrease of the hydrostatic pressure in this vessels. In the case of Double Chooz, thermalexpansion could lead to large liquid level differences between the different vessels and causetherefore significant pressure differences which can quickly lead to a fracturing of the acrylicvessels. The thermal expansion ∆Vt and the related liquid level increase ∆L in the chimneyscan be calculated via
∆Vt = V0γ ⋅∆T and ∆L = ∆VtA
where V0 is the total expanding volume, γ the thermal expansion coefficient, ∆T the thermalvariation and A the respective chimney surface. Using the expansion coefficient of mineral oil,γoil = 7.6 ⋅10−4K−1 [110], and a thermal variation of 1 K, the expansion leads to a volume increasein the different detector vessels as summarized in table 7.4. The target vessel for instance has avolume of 10 m3, offers, however, only a cross-section of 176 cm2 in the chimney. The expansion,correlated to a thermal change of 1 K, would push 7.8 l into the target chimney and induce a levelincrease of 45 cm where only 3 cm are considered to be safe. Due to this extreme sensitivity ofthe target to volumetric changes is the submersion of calibration tools highly critic and can posea threat to the detector. Table 7.4 summarizes the situation for all detector vessels and presentsthe total volume (V0) stored in the detector vessels, the expansion volumes (∆Vt) for a thermalincrease of 1 K, the available surface area (A) in the chimneys, the expected level change forthermal variation of 1 K, as well as the thermal variation (∆t) necessary to increase the liquidlevel up to the critical level of 3 cm. As can be seen in the mentioned table, the liquid levelsin the chimneys react very sensitive to thermal variations. The target, for example, reaches the
7This is only true for MU, BF and GC, the target IMT is with 0-400 mbar less pressure resistant.
94
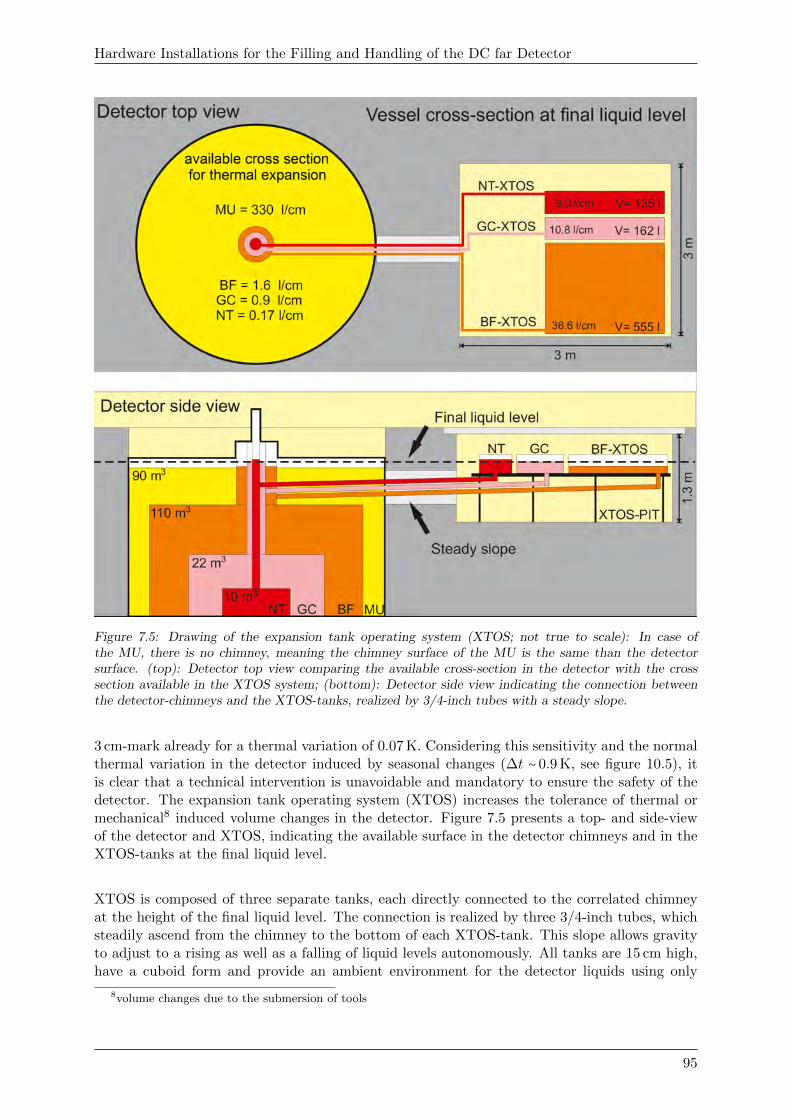
Hardware Installations for the Filling and Handling of the DC far Detector
Figure 7.5: Drawing of the expansion tank operating system (XTOS; not true to scale): In case ofthe MU, there is no chimney, meaning the chimney surface of the MU is the same than the detectorsurface. (top): Detector top view comparing the available cross-section in the detector with the crosssection available in the XTOS system; (bottom): Detector side view indicating the connection betweenthe detector-chimneys and the XTOS-tanks, realized by 3/4-inch tubes with a steady slope.
3 cm-mark already for a thermal variation of 0.07 K. Considering this sensitivity and the normalthermal variation in the detector induced by seasonal changes (∆t ∼ 0.9 K, see figure 10.5), itis clear that a technical intervention is unavoidable and mandatory to ensure the safety of thedetector. The expansion tank operating system (XTOS) increases the tolerance of thermal ormechanical8 induced volume changes in the detector. Figure 7.5 presents a top- and side-viewof the detector and XTOS, indicating the available surface in the detector chimneys and in theXTOS-tanks at the final liquid level.
XTOS is composed of three separate tanks, each directly connected to the correlated chimneyat the height of the final liquid level. The connection is realized by three 3/4-inch tubes, whichsteadily ascend from the chimney to the bottom of each XTOS-tank. This slope allows gravityto adjust to a rising as well as a falling of liquid levels autonomously. All tanks are 15 cm high,have a cuboid form and provide an ambient environment for the detector liquids using only
8volume changes due to the submersion of tools
95
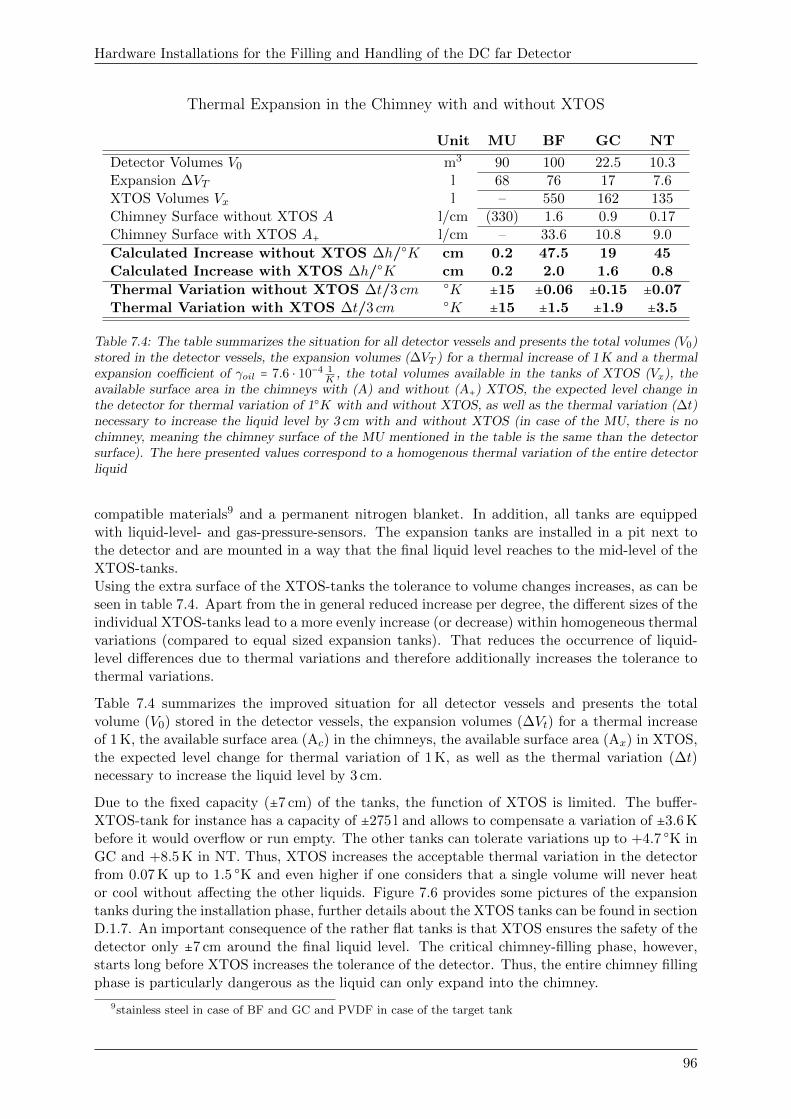
Hardware Installations for the Filling and Handling of the DC far Detector
Thermal Expansion in the Chimney with and without XTOS
Unit MU BF GC NT
Detector Volumes V0 m3 90 100 22.5 10.3Expansion ∆VT l 68 76 17 7.6XTOS Volumes Vx l – 550 162 135Chimney Surface without XTOS A l/cm (330) 1.6 0.9 0.17Chimney Surface with XTOS A+ l/cm – 33.6 10.8 9.0
Calculated Increase without XTOS ∆h/○K cm 0.2 47.5 19 45Calculated Increase with XTOS ∆h/○K cm 0.2 2.0 1.6 0.8
Thermal Variation without XTOS ∆t/3 cm ○K ±15 ±0.06 ±0.15 ±0.07Thermal Variation with XTOS ∆t/3 cm ○K ±15 ±1.5 ±1.9 ±3.5
Table 7.4: The table summarizes the situation for all detector vessels and presents the total volumes (V0)stored in the detector vessels, the expansion volumes (∆VT ) for a thermal increase of 1 K and a thermalexpansion coefficient of γoil = 7.6 ⋅ 10−4 1
K, the total volumes available in the tanks of XTOS (Vx), the
available surface area in the chimneys with (A) and without (A+) XTOS, the expected level change inthe detector for thermal variation of 1○K with and without XTOS, as well as the thermal variation (∆t)necessary to increase the liquid level by 3 cm with and without XTOS (in case of the MU, there is nochimney, meaning the chimney surface of the MU mentioned in the table is the same than the detectorsurface). The here presented values correspond to a homogenous thermal variation of the entire detectorliquid
compatible materials9 and a permanent nitrogen blanket. In addition, all tanks are equippedwith liquid-level- and gas-pressure-sensors. The expansion tanks are installed in a pit next tothe detector and are mounted in a way that the final liquid level reaches to the mid-level of theXTOS-tanks.Using the extra surface of the XTOS-tanks the tolerance to volume changes increases, as can beseen in table 7.4. Apart from the in general reduced increase per degree, the different sizes of theindividual XTOS-tanks lead to a more evenly increase (or decrease) within homogeneous thermalvariations (compared to equal sized expansion tanks). That reduces the occurrence of liquid-level differences due to thermal variations and therefore additionally increases the tolerance tothermal variations.
Table 7.4 summarizes the improved situation for all detector vessels and presents the totalvolume (V0) stored in the detector vessels, the expansion volumes (∆Vt) for a thermal increaseof 1 K, the available surface area (Ac) in the chimneys, the available surface area (Ax) in XTOS,the expected level change for thermal variation of 1 K, as well as the thermal variation (∆t)necessary to increase the liquid level by 3 cm.
Due to the fixed capacity (±7 cm) of the tanks, the function of XTOS is limited. The buffer-XTOS-tank for instance has a capacity of ±275 l and allows to compensate a variation of ±3.6 Kbefore it would overflow or run empty. The other tanks can tolerate variations up to +4.7 ○K inGC and +8.5 K in NT. Thus, XTOS increases the acceptable thermal variation in the detectorfrom 0.07 K up to 1.5 ○K and even higher if one considers that a single volume will never heator cool without affecting the other liquids. Figure 7.6 provides some pictures of the expansiontanks during the installation phase, further details about the XTOS tanks can be found in sectionD.1.7. An important consequence of the rather flat tanks is that XTOS ensures the safety of thedetector only ±7 cm around the final liquid level. The critical chimney-filling phase, however,starts long before XTOS increases the tolerance of the detector. Thus, the entire chimney fillingphase is particularly dangerous as the liquid can only expand into the chimney.
9stainless steel in case of BF and GC and PVDF in case of the target tank
96
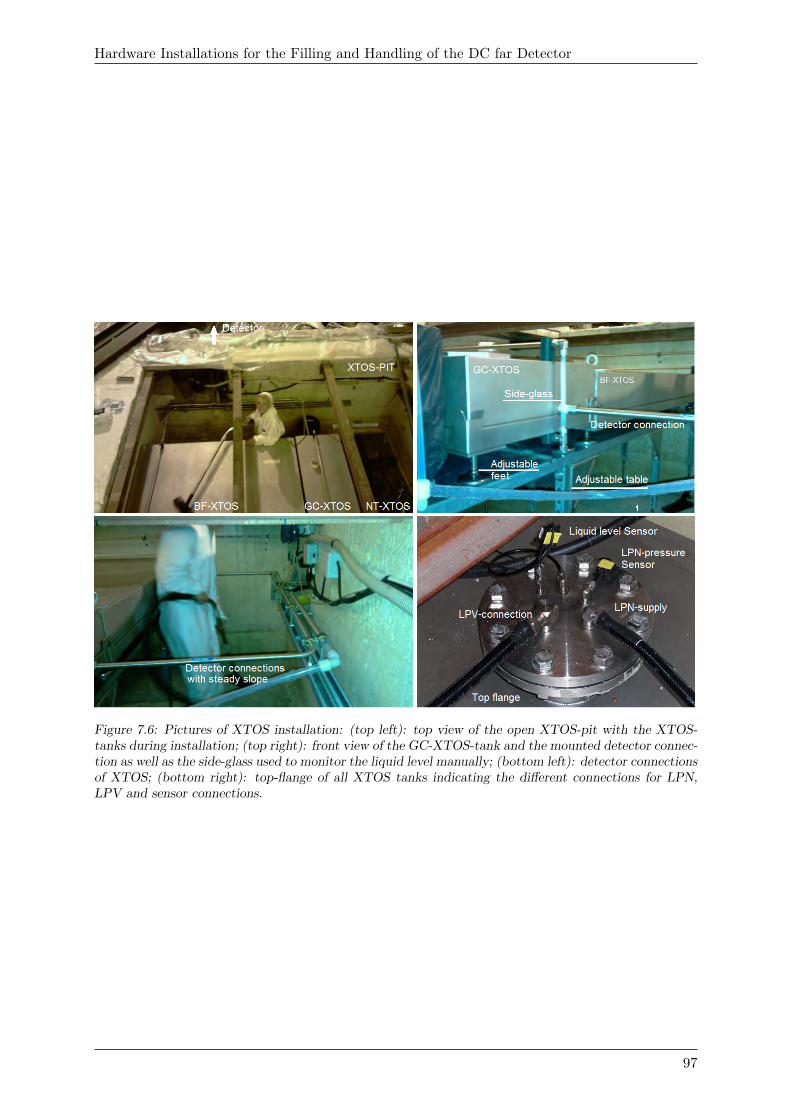
Hardware Installations for the Filling and Handling of the DC far Detector
Figure 7.6: Pictures of XTOS installation: (top left): top view of the open XTOS-pit with the XTOS-tanks during installation; (top right): front view of the GC-XTOS-tank and the mounted detector connec-tion as well as the side-glass used to monitor the liquid level manually; (bottom left): detector connectionsof XTOS; (bottom right): top-flange of all XTOS tanks indicating the different connections for LPN,LPV and sensor connections.
97
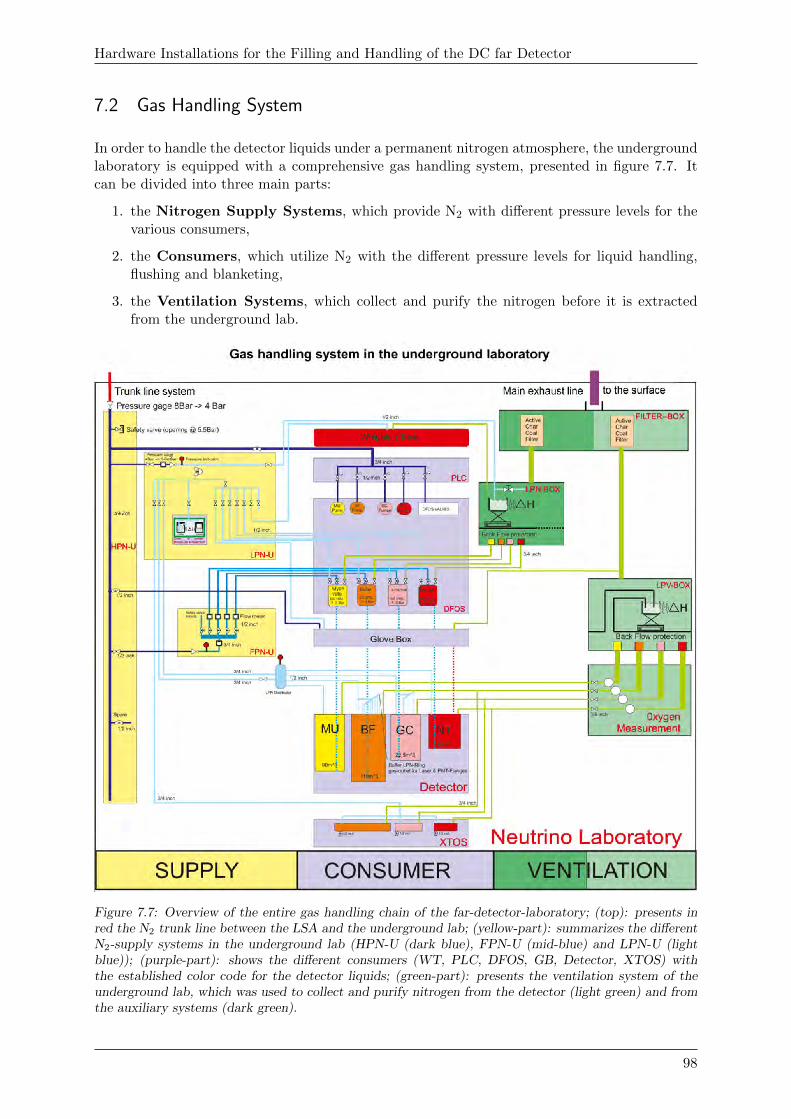
Hardware Installations for the Filling and Handling of the DC far Detector
7.2 Gas Handling System
In order to handle the detector liquids under a permanent nitrogen atmosphere, the undergroundlaboratory is equipped with a comprehensive gas handling system, presented in figure 7.7. Itcan be divided into three main parts:
1. the Nitrogen Supply Systems, which provide N2 with different pressure levels for thevarious consumers,
2. the Consumers, which utilize N2 with the different pressure levels for liquid handling,flushing and blanketing,
3. the Ventilation Systems, which collect and purify the nitrogen before it is extractedfrom the underground lab.
Figure 7.7: Overview of the entire gas handling chain of the far-detector-laboratory; (top): presents inred the N2 trunk line between the LSA and the underground lab; (yellow-part): summarizes the differentN2-supply systems in the underground lab (HPN-U (dark blue), FPN-U (mid-blue) and LPN-U (lightblue)); (purple-part): shows the different consumers (WT, PLC, DFOS, GB, Detector, XTOS) withthe established color code for the detector liquids; (green-part): presents the ventilation system of theunderground lab, which was used to collect and purify nitrogen from the detector (light green) and fromthe auxiliary systems (dark green).
98
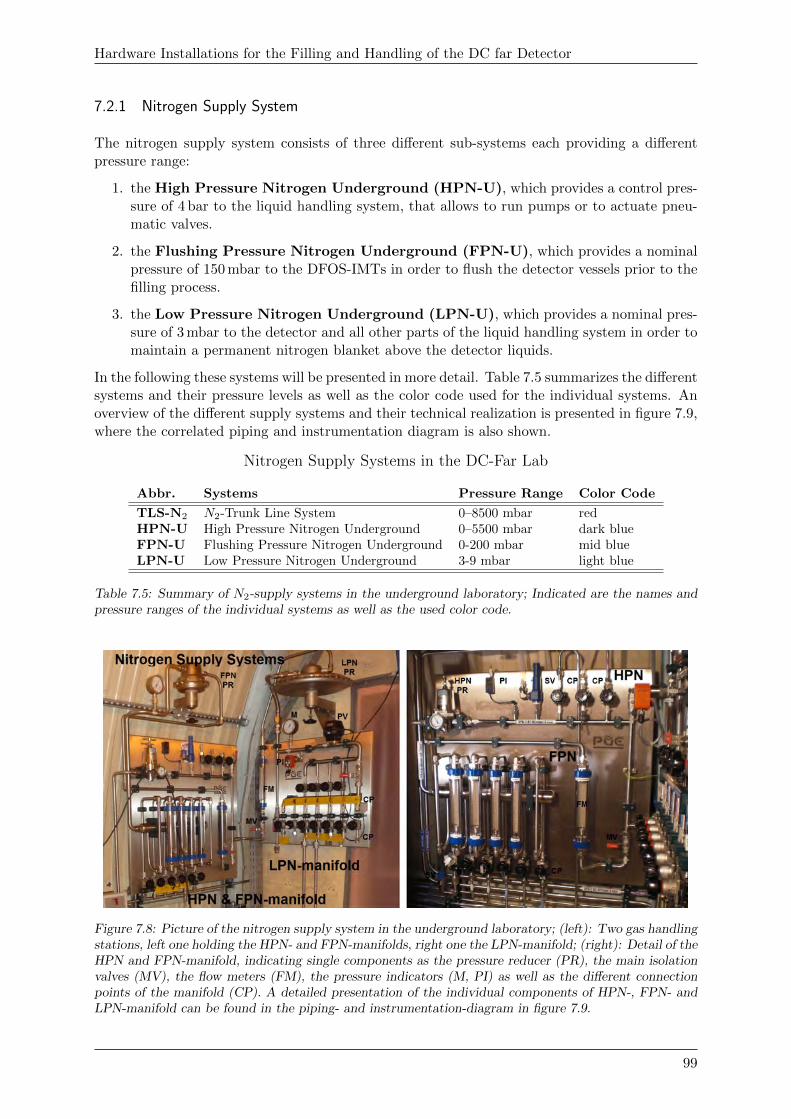
Hardware Installations for the Filling and Handling of the DC far Detector
7.2.1 Nitrogen Supply System
The nitrogen supply system consists of three different sub-systems each providing a differentpressure range:
1. the High Pressure Nitrogen Underground (HPN-U), which provides a control pres-sure of 4 bar to the liquid handling system, that allows to run pumps or to actuate pneu-matic valves.
2. the Flushing Pressure Nitrogen Underground (FPN-U), which provides a nominalpressure of 150 mbar to the DFOS-IMTs in order to flush the detector vessels prior to thefilling process.
3. the Low Pressure Nitrogen Underground (LPN-U), which provides a nominal pres-sure of 3 mbar to the detector and all other parts of the liquid handling system in order tomaintain a permanent nitrogen blanket above the detector liquids.
In the following these systems will be presented in more detail. Table 7.5 summarizes the differentsystems and their pressure levels as well as the color code used for the individual systems. Anoverview of the different supply systems and their technical realization is presented in figure 7.9,where the correlated piping and instrumentation diagram is also shown.
Nitrogen Supply Systems in the DC-Far Lab
Abbr. Systems Pressure Range Color Code
TLS-N2 N2-Trunk Line System 0–8500 mbar redHPN-U High Pressure Nitrogen Underground 0–5500 mbar dark blueFPN-U Flushing Pressure Nitrogen Underground 0-200 mbar mid blueLPN-U Low Pressure Nitrogen Underground 3-9 mbar light blue
Table 7.5: Summary of N2-supply systems in the underground laboratory; Indicated are the names andpressure ranges of the individual systems as well as the used color code.
Figure 7.8: Picture of the nitrogen supply system in the underground laboratory; (left): Two gas handlingstations, left one holding the HPN- and FPN-manifolds, right one the LPN-manifold; (right): Detail of theHPN and FPN-manifold, indicating single components as the pressure reducer (PR), the main isolationvalves (MV), the flow meters (FM), the pressure indicators (M, PI) as well as the different connectionpoints of the manifold (CP). A detailed presentation of the individual components of HPN-, FPN- andLPN-manifold can be found in the piping- and instrumentation-diagram in figure 7.9.
99
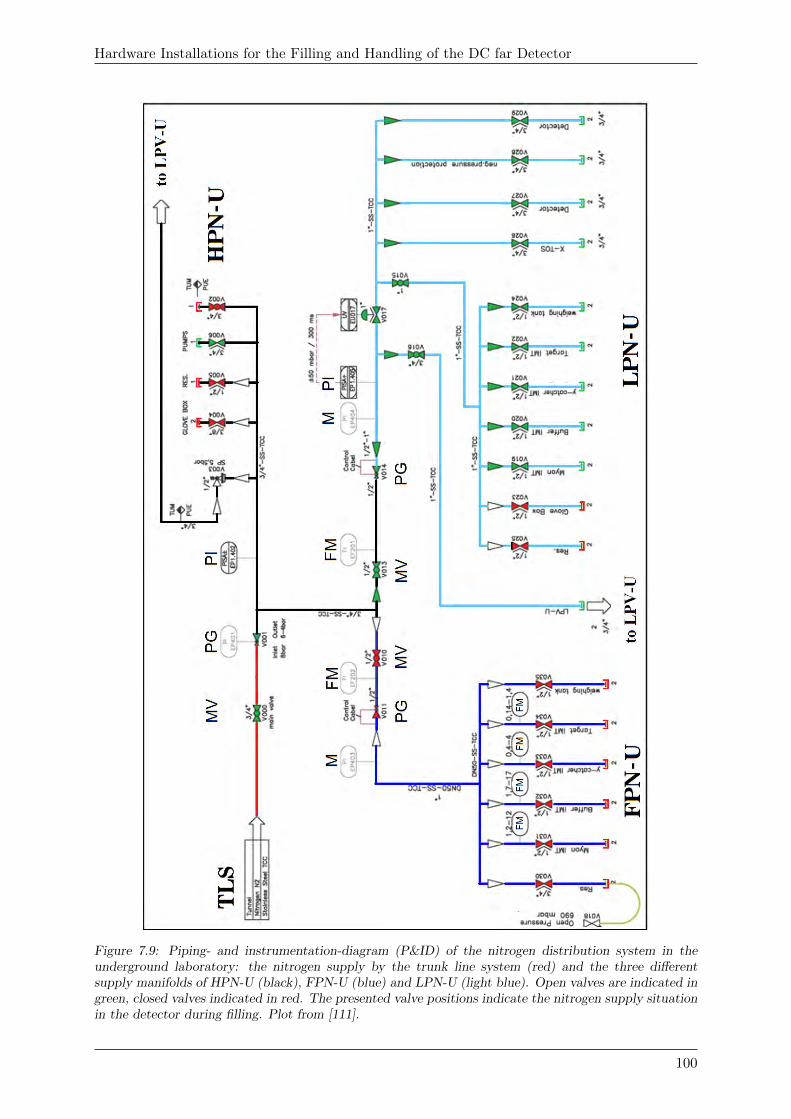
Hardware Installations for the Filling and Handling of the DC far Detector
Figure 7.9: Piping- and instrumentation-diagram (P&ID) of the nitrogen distribution system in theunderground laboratory: the nitrogen supply by the trunk line system (red) and the three differentsupply manifolds of HPN-U (black), FPN-U (blue) and LPN-U (light blue). Open valves are indicated ingreen, closed valves indicated in red. The presented valve positions indicate the nitrogen supply situationin the detector during filling. Plot from [111].
100
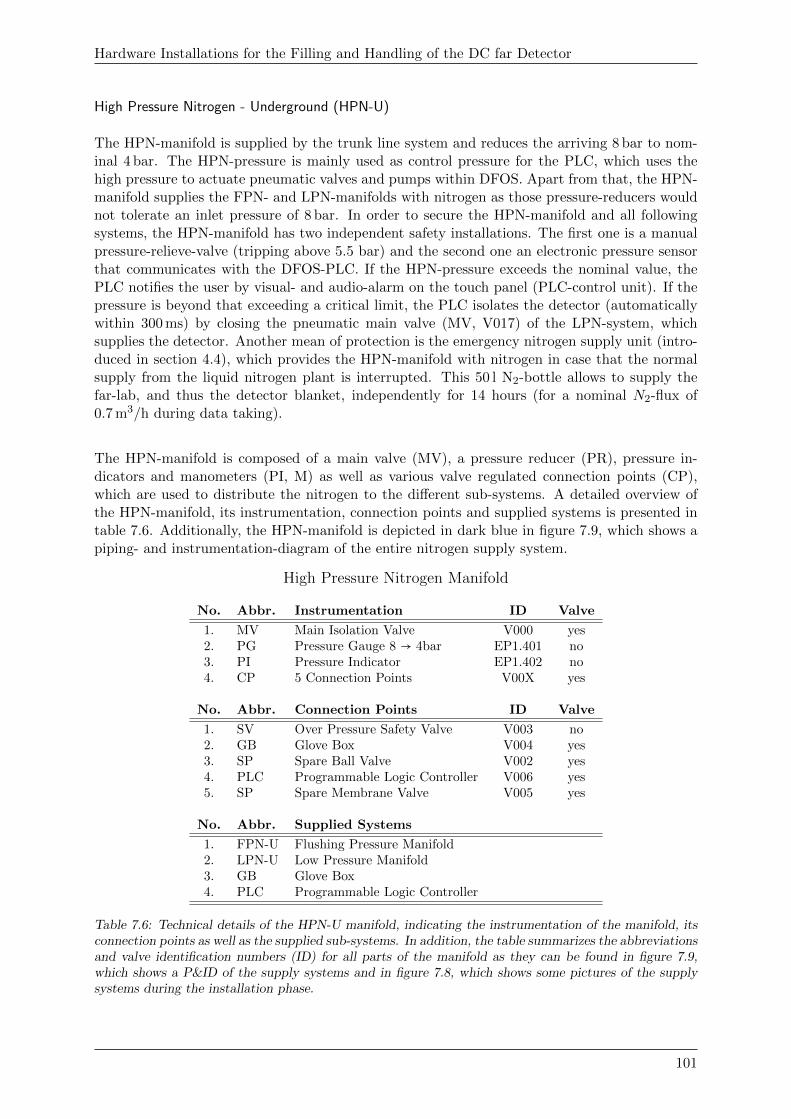
Hardware Installations for the Filling and Handling of the DC far Detector
High Pressure Nitrogen - Underground (HPN-U)
The HPN-manifold is supplied by the trunk line system and reduces the arriving 8 bar to nom-inal 4 bar. The HPN-pressure is mainly used as control pressure for the PLC, which uses thehigh pressure to actuate pneumatic valves and pumps within DFOS. Apart from that, the HPN-manifold supplies the FPN- and LPN-manifolds with nitrogen as those pressure-reducers wouldnot tolerate an inlet pressure of 8 bar. In order to secure the HPN-manifold and all followingsystems, the HPN-manifold has two independent safety installations. The first one is a manualpressure-relieve-valve (tripping above 5.5 bar) and the second one an electronic pressure sensorthat communicates with the DFOS-PLC. If the HPN-pressure exceeds the nominal value, thePLC notifies the user by visual- and audio-alarm on the touch panel (PLC-control unit). If thepressure is beyond that exceeding a critical limit, the PLC isolates the detector (automaticallywithin 300 ms) by closing the pneumatic main valve (MV, V017) of the LPN-system, whichsupplies the detector. Another mean of protection is the emergency nitrogen supply unit (intro-duced in section 4.4), which provides the HPN-manifold with nitrogen in case that the normalsupply from the liquid nitrogen plant is interrupted. This 50 l N2-bottle allows to supply thefar-lab, and thus the detector blanket, independently for 14 hours (for a nominal N2-flux of0.7 m3/h during data taking).
The HPN-manifold is composed of a main valve (MV), a pressure reducer (PR), pressure in-dicators and manometers (PI, M) as well as various valve regulated connection points (CP),which are used to distribute the nitrogen to the different sub-systems. A detailed overview ofthe HPN-manifold, its instrumentation, connection points and supplied systems is presented intable 7.6. Additionally, the HPN-manifold is depicted in dark blue in figure 7.9, which shows apiping- and instrumentation-diagram of the entire nitrogen supply system.
High Pressure Nitrogen Manifold
No. Abbr. Instrumentation ID Valve
1. MV Main Isolation Valve V000 yes2. PG Pressure Gauge 8 → 4bar EP1.401 no3. PI Pressure Indicator EP1.402 no4. CP 5 Connection Points V00X yes
No. Abbr. Connection Points ID Valve
1. SV Over Pressure Safety Valve V003 no2. GB Glove Box V004 yes3. SP Spare Ball Valve V002 yes4. PLC Programmable Logic Controller V006 yes5. SP Spare Membrane Valve V005 yes
No. Abbr. Supplied Systems
1. FPN-U Flushing Pressure Manifold2. LPN-U Low Pressure Manifold3. GB Glove Box4. PLC Programmable Logic Controller
Table 7.6: Technical details of the HPN-U manifold, indicating the instrumentation of the manifold, itsconnection points as well as the supplied sub-systems. In addition, the table summarizes the abbreviationsand valve identification numbers (ID) for all parts of the manifold as they can be found in figure 7.9,which shows a P&ID of the supply systems and in figure 7.8, which shows some pictures of the supplysystems during the installation phase.
101
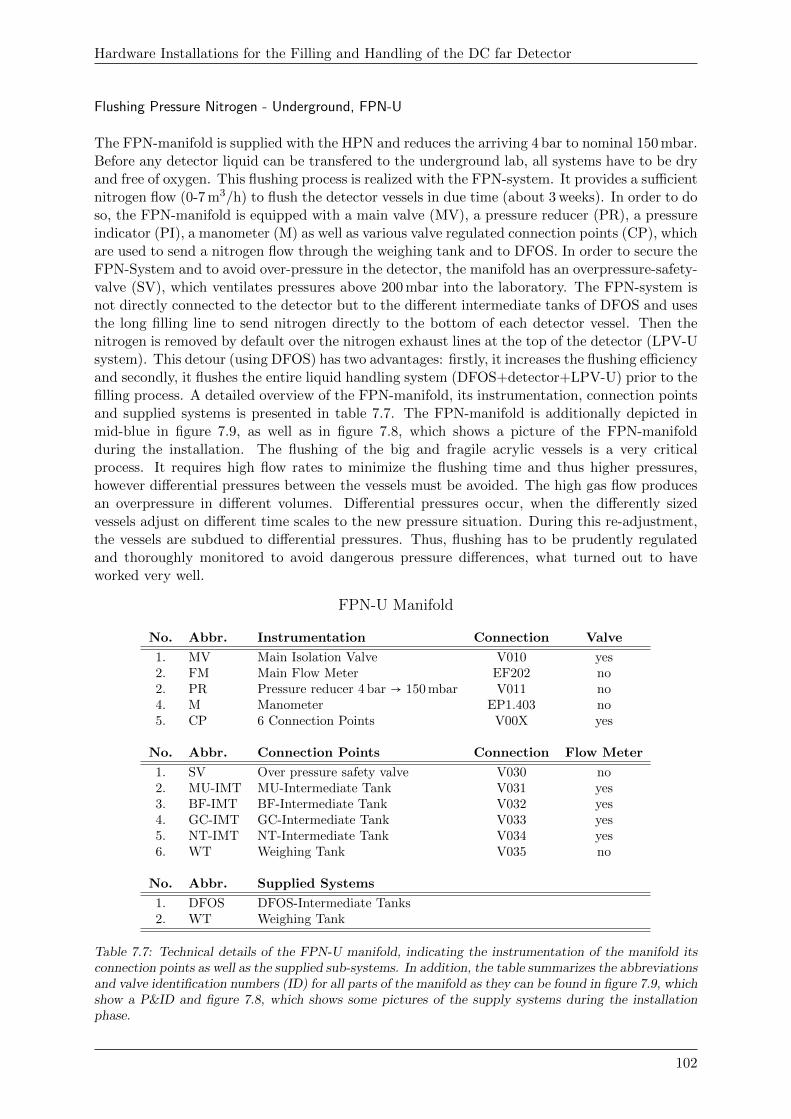
Hardware Installations for the Filling and Handling of the DC far Detector
Flushing Pressure Nitrogen - Underground, FPN-U
The FPN-manifold is supplied with the HPN and reduces the arriving 4 bar to nominal 150 mbar.Before any detector liquid can be transfered to the underground lab, all systems have to be dryand free of oxygen. This flushing process is realized with the FPN-system. It provides a sufficientnitrogen flow (0-7 m3/h) to flush the detector vessels in due time (about 3 weeks). In order to doso, the FPN-manifold is equipped with a main valve (MV), a pressure reducer (PR), a pressureindicator (PI), a manometer (M) as well as various valve regulated connection points (CP), whichare used to send a nitrogen flow through the weighing tank and to DFOS. In order to secure theFPN-System and to avoid over-pressure in the detector, the manifold has an overpressure-safety-valve (SV), which ventilates pressures above 200 mbar into the laboratory. The FPN-system isnot directly connected to the detector but to the different intermediate tanks of DFOS and usesthe long filling line to send nitrogen directly to the bottom of each detector vessel. Then thenitrogen is removed by default over the nitrogen exhaust lines at the top of the detector (LPV-Usystem). This detour (using DFOS) has two advantages: firstly, it increases the flushing efficiencyand secondly, it flushes the entire liquid handling system (DFOS+detector+LPV-U) prior to thefilling process. A detailed overview of the FPN-manifold, its instrumentation, connection pointsand supplied systems is presented in table 7.7. The FPN-manifold is additionally depicted inmid-blue in figure 7.9, as well as in figure 7.8, which shows a picture of the FPN-manifoldduring the installation. The flushing of the big and fragile acrylic vessels is a very criticalprocess. It requires high flow rates to minimize the flushing time and thus higher pressures,however differential pressures between the vessels must be avoided. The high gas flow producesan overpressure in different volumes. Differential pressures occur, when the differently sizedvessels adjust on different time scales to the new pressure situation. During this re-adjustment,the vessels are subdued to differential pressures. Thus, flushing has to be prudently regulatedand thoroughly monitored to avoid dangerous pressure differences, what turned out to haveworked very well.
FPN-U Manifold
No. Abbr. Instrumentation Connection Valve
1. MV Main Isolation Valve V010 yes2. FM Main Flow Meter EF202 no2. PR Pressure reducer 4 bar → 150 mbar V011 no4. M Manometer EP1.403 no5. CP 6 Connection Points V00X yes
No. Abbr. Connection Points Connection Flow Meter
1. SV Over pressure safety valve V030 no2. MU-IMT MU-Intermediate Tank V031 yes3. BF-IMT BF-Intermediate Tank V032 yes4. GC-IMT GC-Intermediate Tank V033 yes5. NT-IMT NT-Intermediate Tank V034 yes6. WT Weighing Tank V035 no
No. Abbr. Supplied Systems
1. DFOS DFOS-Intermediate Tanks2. WT Weighing Tank
Table 7.7: Technical details of the FPN-U manifold, indicating the instrumentation of the manifold itsconnection points as well as the supplied sub-systems. In addition, the table summarizes the abbreviationsand valve identification numbers (ID) for all parts of the manifold as they can be found in figure 7.9, whichshow a P&ID and figure 7.8, which shows some pictures of the supply systems during the installationphase.
102
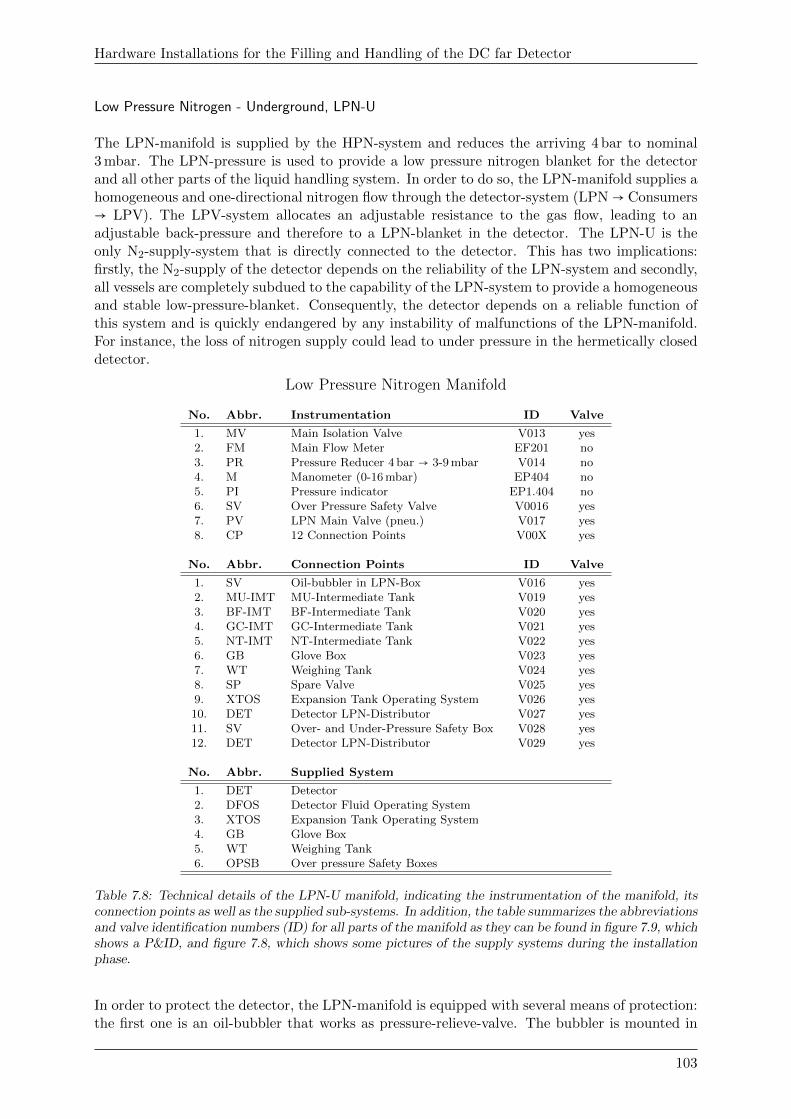
Hardware Installations for the Filling and Handling of the DC far Detector
Low Pressure Nitrogen - Underground, LPN-U
The LPN-manifold is supplied by the HPN-system and reduces the arriving 4 bar to nominal3 mbar. The LPN-pressure is used to provide a low pressure nitrogen blanket for the detectorand all other parts of the liquid handling system. In order to do so, the LPN-manifold supplies ahomogeneous and one-directional nitrogen flow through the detector-system (LPN → Consumers→ LPV). The LPV-system allocates an adjustable resistance to the gas flow, leading to anadjustable back-pressure and therefore to a LPN-blanket in the detector. The LPN-U is theonly N2-supply-system that is directly connected to the detector. This has two implications:firstly, the N2-supply of the detector depends on the reliability of the LPN-system and secondly,all vessels are completely subdued to the capability of the LPN-system to provide a homogeneousand stable low-pressure-blanket. Consequently, the detector depends on a reliable function ofthis system and is quickly endangered by any instability of malfunctions of the LPN-manifold.For instance, the loss of nitrogen supply could lead to under pressure in the hermetically closeddetector.
Low Pressure Nitrogen Manifold
No. Abbr. Instrumentation ID Valve
1. MV Main Isolation Valve V013 yes2. FM Main Flow Meter EF201 no3. PR Pressure Reducer 4 bar → 3-9 mbar V014 no4. M Manometer (0-16 mbar) EP404 no5. PI Pressure indicator EP1.404 no6. SV Over Pressure Safety Valve V0016 yes7. PV LPN Main Valve (pneu.) V017 yes8. CP 12 Connection Points V00X yes
No. Abbr. Connection Points ID Valve
1. SV Oil-bubbler in LPN-Box V016 yes2. MU-IMT MU-Intermediate Tank V019 yes3. BF-IMT BF-Intermediate Tank V020 yes4. GC-IMT GC-Intermediate Tank V021 yes5. NT-IMT NT-Intermediate Tank V022 yes6. GB Glove Box V023 yes7. WT Weighing Tank V024 yes8. SP Spare Valve V025 yes9. XTOS Expansion Tank Operating System V026 yes10. DET Detector LPN-Distributor V027 yes11. SV Over- and Under-Pressure Safety Box V028 yes12. DET Detector LPN-Distributor V029 yes
No. Abbr. Supplied System
1. DET Detector2. DFOS Detector Fluid Operating System3. XTOS Expansion Tank Operating System4. GB Glove Box5. WT Weighing Tank6. OPSB Over pressure Safety Boxes
Table 7.8: Technical details of the LPN-U manifold, indicating the instrumentation of the manifold, itsconnection points as well as the supplied sub-systems. In addition, the table summarizes the abbreviationsand valve identification numbers (ID) for all parts of the manifold as they can be found in figure 7.9, whichshows a P&ID, and figure 7.8, which shows some pictures of the supply systems during the installationphase.
In order to protect the detector, the LPN-manifold is equipped with several means of protection:the first one is an oil-bubbler that works as pressure-relieve-valve. The bubbler is mounted in
103
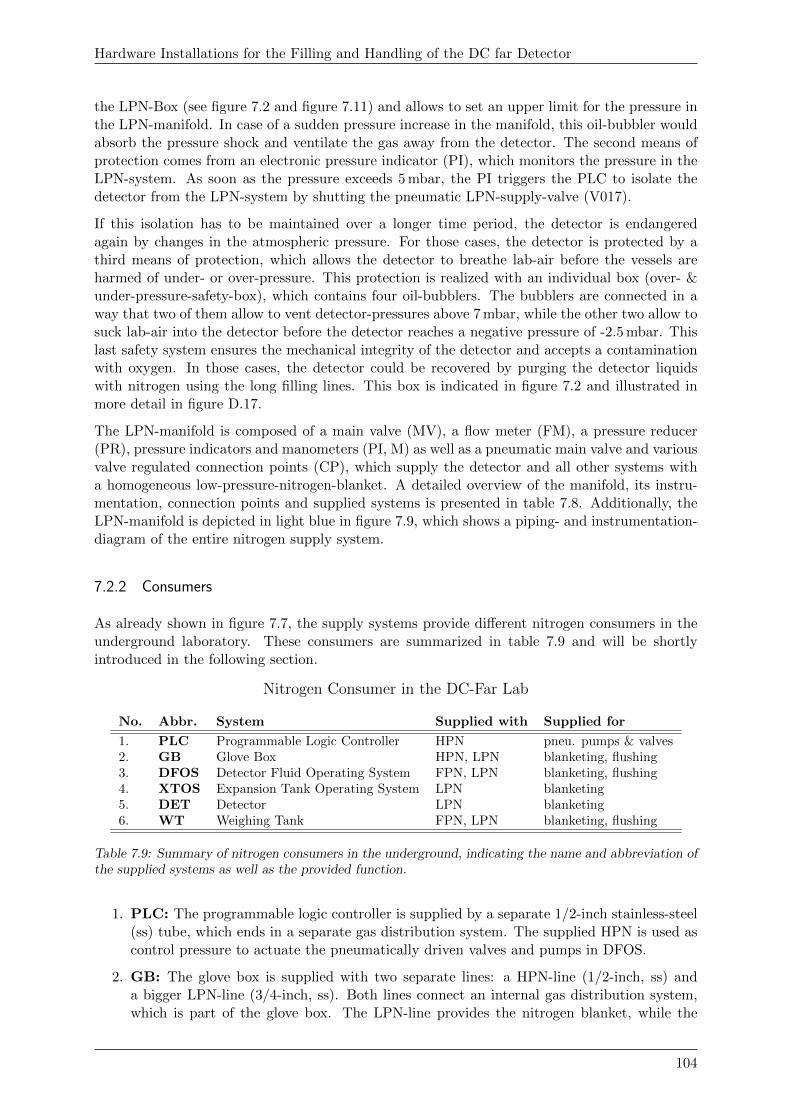
Hardware Installations for the Filling and Handling of the DC far Detector
the LPN-Box (see figure 7.2 and figure 7.11) and allows to set an upper limit for the pressure inthe LPN-manifold. In case of a sudden pressure increase in the manifold, this oil-bubbler wouldabsorb the pressure shock and ventilate the gas away from the detector. The second means ofprotection comes from an electronic pressure indicator (PI), which monitors the pressure in theLPN-system. As soon as the pressure exceeds 5 mbar, the PI triggers the PLC to isolate thedetector from the LPN-system by shutting the pneumatic LPN-supply-valve (V017).
If this isolation has to be maintained over a longer time period, the detector is endangeredagain by changes in the atmospheric pressure. For those cases, the detector is protected by athird means of protection, which allows the detector to breathe lab-air before the vessels areharmed of under- or over-pressure. This protection is realized with an individual box (over- &under-pressure-safety-box), which contains four oil-bubblers. The bubblers are connected in away that two of them allow to vent detector-pressures above 7 mbar, while the other two allow tosuck lab-air into the detector before the detector reaches a negative pressure of -2.5 mbar. Thislast safety system ensures the mechanical integrity of the detector and accepts a contaminationwith oxygen. In those cases, the detector could be recovered by purging the detector liquidswith nitrogen using the long filling lines. This box is indicated in figure 7.2 and illustrated inmore detail in figure D.17.
The LPN-manifold is composed of a main valve (MV), a flow meter (FM), a pressure reducer(PR), pressure indicators and manometers (PI, M) as well as a pneumatic main valve and variousvalve regulated connection points (CP), which supply the detector and all other systems witha homogeneous low-pressure-nitrogen-blanket. A detailed overview of the manifold, its instru-mentation, connection points and supplied systems is presented in table 7.8. Additionally, theLPN-manifold is depicted in light blue in figure 7.9, which shows a piping- and instrumentation-diagram of the entire nitrogen supply system.
7.2.2 Consumers
As already shown in figure 7.7, the supply systems provide different nitrogen consumers in theunderground laboratory. These consumers are summarized in table 7.9 and will be shortlyintroduced in the following section.
Nitrogen Consumer in the DC-Far Lab
No. Abbr. System Supplied with Supplied for
1. PLC Programmable Logic Controller HPN pneu. pumps & valves2. GB Glove Box HPN, LPN blanketing, flushing3. DFOS Detector Fluid Operating System FPN, LPN blanketing, flushing4. XTOS Expansion Tank Operating System LPN blanketing5. DET Detector LPN blanketing6. WT Weighing Tank FPN, LPN blanketing, flushing
Table 7.9: Summary of nitrogen consumers in the underground, indicating the name and abbreviation ofthe supplied systems as well as the provided function.
1. PLC: The programmable logic controller is supplied by a separate 1/2-inch stainless-steel(ss) tube, which ends in a separate gas distribution system. The supplied HPN is used ascontrol pressure to actuate the pneumatically driven valves and pumps in DFOS.
2. GB: The glove box is supplied with two separate lines: a HPN-line (1/2-inch, ss) anda bigger LPN-line (3/4-inch, ss). Both lines connect an internal gas distribution system,which is part of the glove box. The LPN-line provides the nitrogen blanket, while the
104
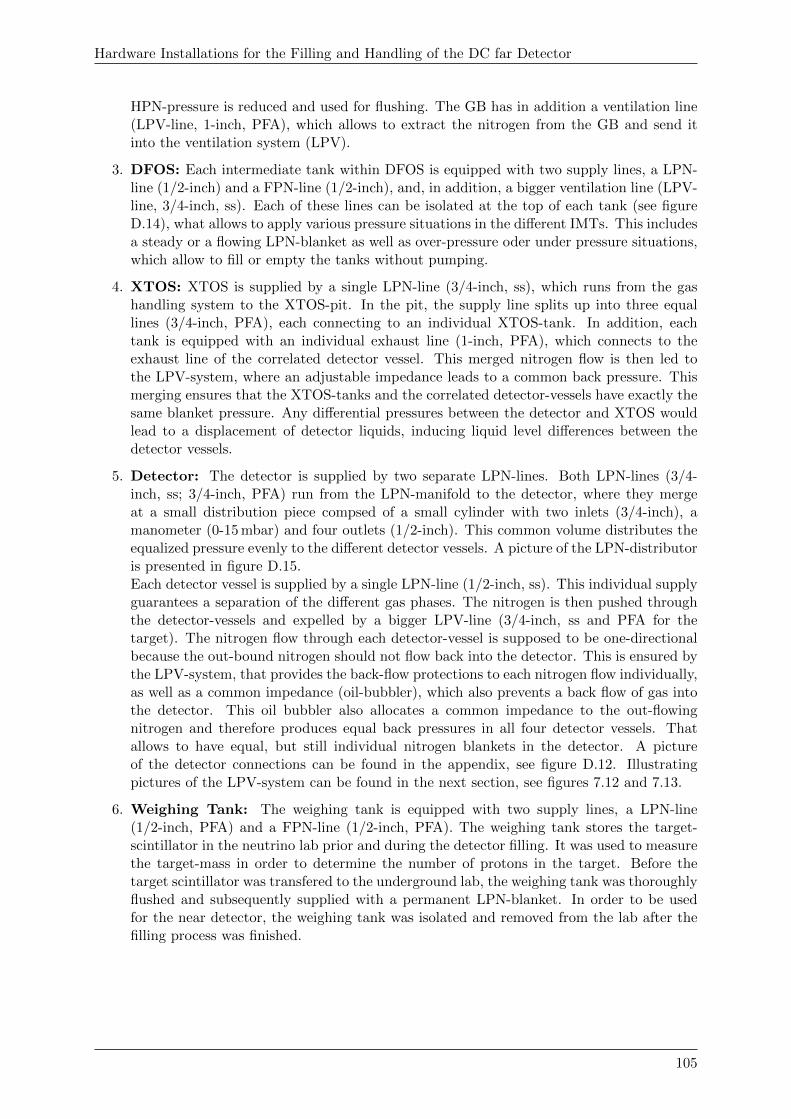
Hardware Installations for the Filling and Handling of the DC far Detector
HPN-pressure is reduced and used for flushing. The GB has in addition a ventilation line(LPV-line, 1-inch, PFA), which allows to extract the nitrogen from the GB and send itinto the ventilation system (LPV).
3. DFOS: Each intermediate tank within DFOS is equipped with two supply lines, a LPN-line (1/2-inch) and a FPN-line (1/2-inch), and, in addition, a bigger ventilation line (LPV-line, 3/4-inch, ss). Each of these lines can be isolated at the top of each tank (see figureD.14), what allows to apply various pressure situations in the different IMTs. This includesa steady or a flowing LPN-blanket as well as over-pressure oder under pressure situations,which allow to fill or empty the tanks without pumping.
4. XTOS: XTOS is supplied by a single LPN-line (3/4-inch, ss), which runs from the gashandling system to the XTOS-pit. In the pit, the supply line splits up into three equallines (3/4-inch, PFA), each connecting to an individual XTOS-tank. In addition, eachtank is equipped with an individual exhaust line (1-inch, PFA), which connects to theexhaust line of the correlated detector vessel. This merged nitrogen flow is then led tothe LPV-system, where an adjustable impedance leads to a common back pressure. Thismerging ensures that the XTOS-tanks and the correlated detector-vessels have exactly thesame blanket pressure. Any differential pressures between the detector and XTOS wouldlead to a displacement of detector liquids, inducing liquid level differences between thedetector vessels.
5. Detector: The detector is supplied by two separate LPN-lines. Both LPN-lines (3/4-inch, ss; 3/4-inch, PFA) run from the LPN-manifold to the detector, where they mergeat a small distribution piece compsed of a small cylinder with two inlets (3/4-inch), amanometer (0-15 mbar) and four outlets (1/2-inch). This common volume distributes theequalized pressure evenly to the different detector vessels. A picture of the LPN-distributoris presented in figure D.15.Each detector vessel is supplied by a single LPN-line (1/2-inch, ss). This individual supplyguarantees a separation of the different gas phases. The nitrogen is then pushed throughthe detector-vessels and expelled by a bigger LPV-line (3/4-inch, ss and PFA for thetarget). The nitrogen flow through each detector-vessel is supposed to be one-directionalbecause the out-bound nitrogen should not flow back into the detector. This is ensured bythe LPV-system, that provides the back-flow protections to each nitrogen flow individually,as well as a common impedance (oil-bubbler), which also prevents a back flow of gas intothe detector. This oil bubbler also allocates a common impedance to the out-flowingnitrogen and therefore produces equal back pressures in all four detector vessels. Thatallows to have equal, but still individual nitrogen blankets in the detector. A pictureof the detector connections can be found in the appendix, see figure D.12. Illustratingpictures of the LPV-system can be found in the next section, see figures 7.12 and 7.13.
6. Weighing Tank: The weighing tank is equipped with two supply lines, a LPN-line(1/2-inch, PFA) and a FPN-line (1/2-inch, PFA). The weighing tank stores the target-scintillator in the neutrino lab prior and during the detector filling. It was used to measurethe target-mass in order to determine the number of protons in the target. Before thetarget scintillator was transfered to the underground lab, the weighing tank was thoroughlyflushed and subsequently supplied with a permanent LPN-blanket. In order to be usedfor the near detector, the weighing tank was isolated and removed from the lab after thefilling process was finished.
105
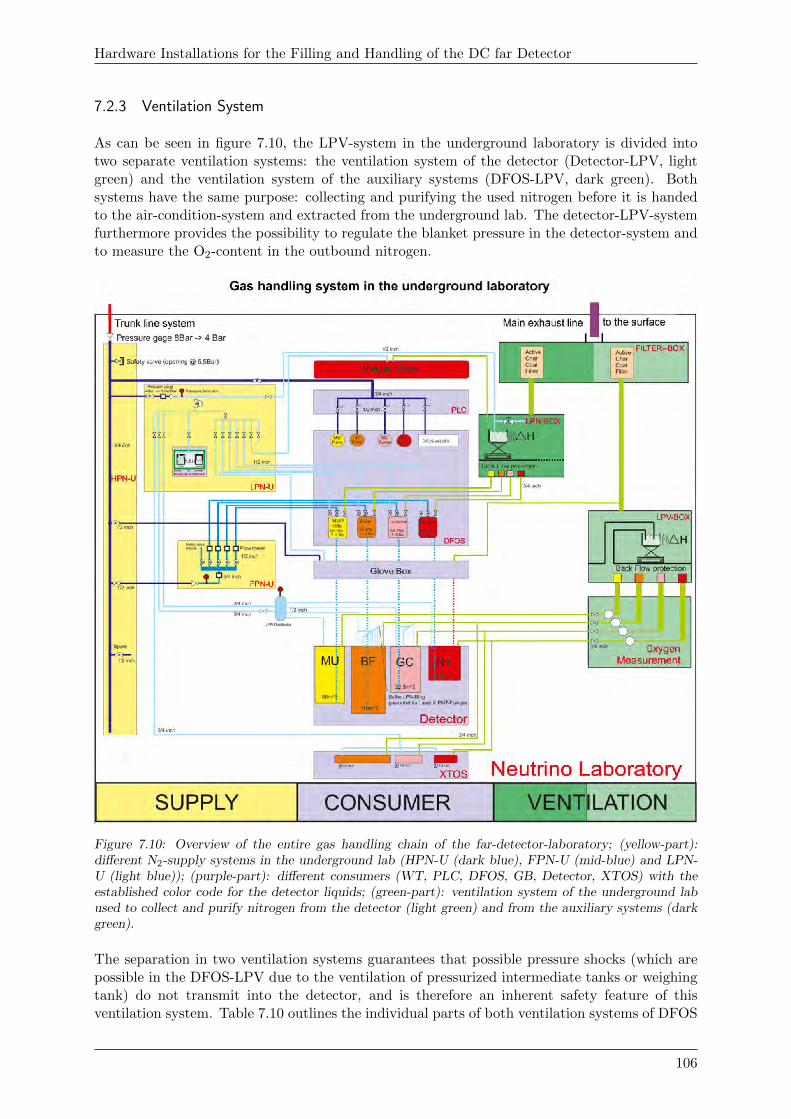
Hardware Installations for the Filling and Handling of the DC far Detector
7.2.3 Ventilation System
As can be seen in figure 7.10, the LPV-system in the underground laboratory is divided intotwo separate ventilation systems: the ventilation system of the detector (Detector-LPV, lightgreen) and the ventilation system of the auxiliary systems (DFOS-LPV, dark green). Bothsystems have the same purpose: collecting and purifying the used nitrogen before it is handedto the air-condition-system and extracted from the underground lab. The detector-LPV-systemfurthermore provides the possibility to regulate the blanket pressure in the detector-system andto measure the O2-content in the outbound nitrogen.
Figure 7.10: Overview of the entire gas handling chain of the far-detector-laboratory; (yellow-part):different N2-supply systems in the underground lab (HPN-U (dark blue), FPN-U (mid-blue) and LPN-U (light blue)); (purple-part): different consumers (WT, PLC, DFOS, GB, Detector, XTOS) with theestablished color code for the detector liquids; (green-part): ventilation system of the underground labused to collect and purify nitrogen from the detector (light green) and from the auxiliary systems (darkgreen).
The separation in two ventilation systems guarantees that possible pressure shocks (which arepossible in the DFOS-LPV due to the ventilation of pressurized intermediate tanks or weighingtank) do not transmit into the detector, and is therefore an inherent safety feature of thisventilation system. Table 7.10 outlines the individual parts of both ventilation systems of DFOS
106
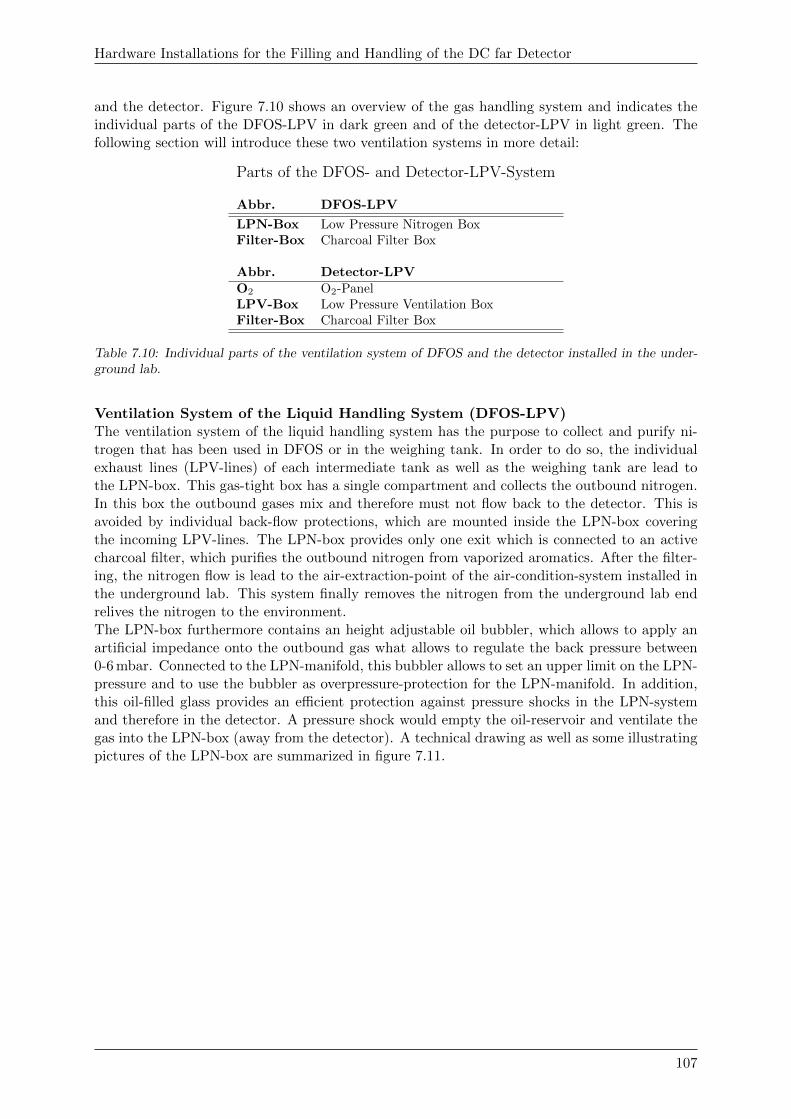
Hardware Installations for the Filling and Handling of the DC far Detector
and the detector. Figure 7.10 shows an overview of the gas handling system and indicates theindividual parts of the DFOS-LPV in dark green and of the detector-LPV in light green. Thefollowing section will introduce these two ventilation systems in more detail:
Parts of the DFOS- and Detector-LPV-System
Abbr. DFOS-LPV
LPN-Box Low Pressure Nitrogen BoxFilter-Box Charcoal Filter Box
Abbr. Detector-LPVO2 O2-PanelLPV-Box Low Pressure Ventilation BoxFilter-Box Charcoal Filter Box
Table 7.10: Individual parts of the ventilation system of DFOS and the detector installed in the under-ground lab.
Ventilation System of the Liquid Handling System (DFOS-LPV)The ventilation system of the liquid handling system has the purpose to collect and purify ni-trogen that has been used in DFOS or in the weighing tank. In order to do so, the individualexhaust lines (LPV-lines) of each intermediate tank as well as the weighing tank are lead tothe LPN-box. This gas-tight box has a single compartment and collects the outbound nitrogen.In this box the outbound gases mix and therefore must not flow back to the detector. This isavoided by individual back-flow protections, which are mounted inside the LPN-box coveringthe incoming LPV-lines. The LPN-box provides only one exit which is connected to an activecharcoal filter, which purifies the outbound nitrogen from vaporized aromatics. After the filter-ing, the nitrogen flow is lead to the air-extraction-point of the air-condition-system installed inthe underground lab. This system finally removes the nitrogen from the underground lab endrelives the nitrogen to the environment.The LPN-box furthermore contains an height adjustable oil bubbler, which allows to apply anartificial impedance onto the outbound gas what allows to regulate the back pressure between0-6 mbar. Connected to the LPN-manifold, this bubbler allows to set an upper limit on the LPN-pressure and to use the bubbler as overpressure-protection for the LPN-manifold. In addition,this oil-filled glass provides an efficient protection against pressure shocks in the LPN-systemand therefore in the detector. A pressure shock would empty the oil-reservoir and ventilate thegas into the LPN-box (away from the detector). A technical drawing as well as some illustratingpictures of the LPN-box are summarized in figure 7.11.
107
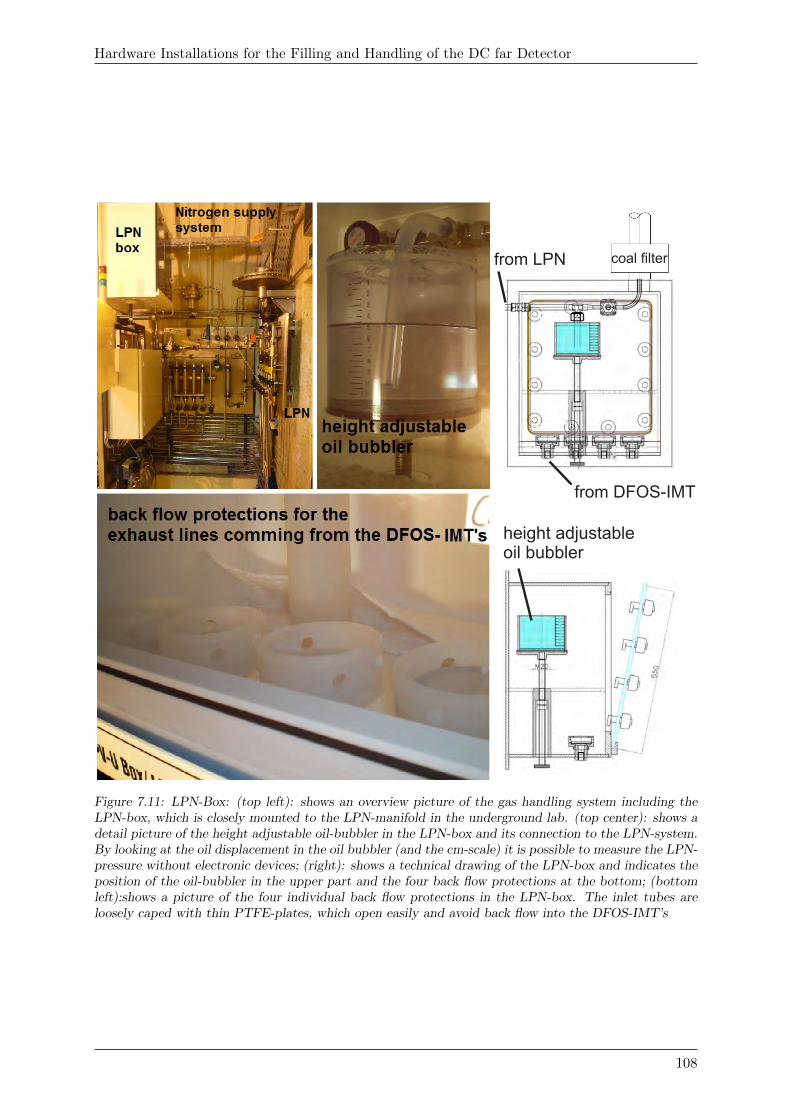
Hardware Installations for the Filling and Handling of the DC far Detector
from LPN
from DFOS-IMT
height adjustable oil bubbler
coal filter
Figure 7.11: LPN-Box: (top left): shows an overview picture of the gas handling system including theLPN-box, which is closely mounted to the LPN-manifold in the underground lab. (top center): shows adetail picture of the height adjustable oil-bubbler in the LPN-box and its connection to the LPN-system.By looking at the oil displacement in the oil bubbler (and the cm-scale) it is possible to measure the LPN-pressure without electronic devices; (right): shows a technical drawing of the LPN-box and indicates theposition of the oil-bubbler in the upper part and the four back flow protections at the bottom; (bottomleft):shows a picture of the four individual back flow protections in the LPN-box. The inlet tubes areloosely caped with thin PTFE-plates, which open easily and avoid back flow into the DFOS-IMT’s
108
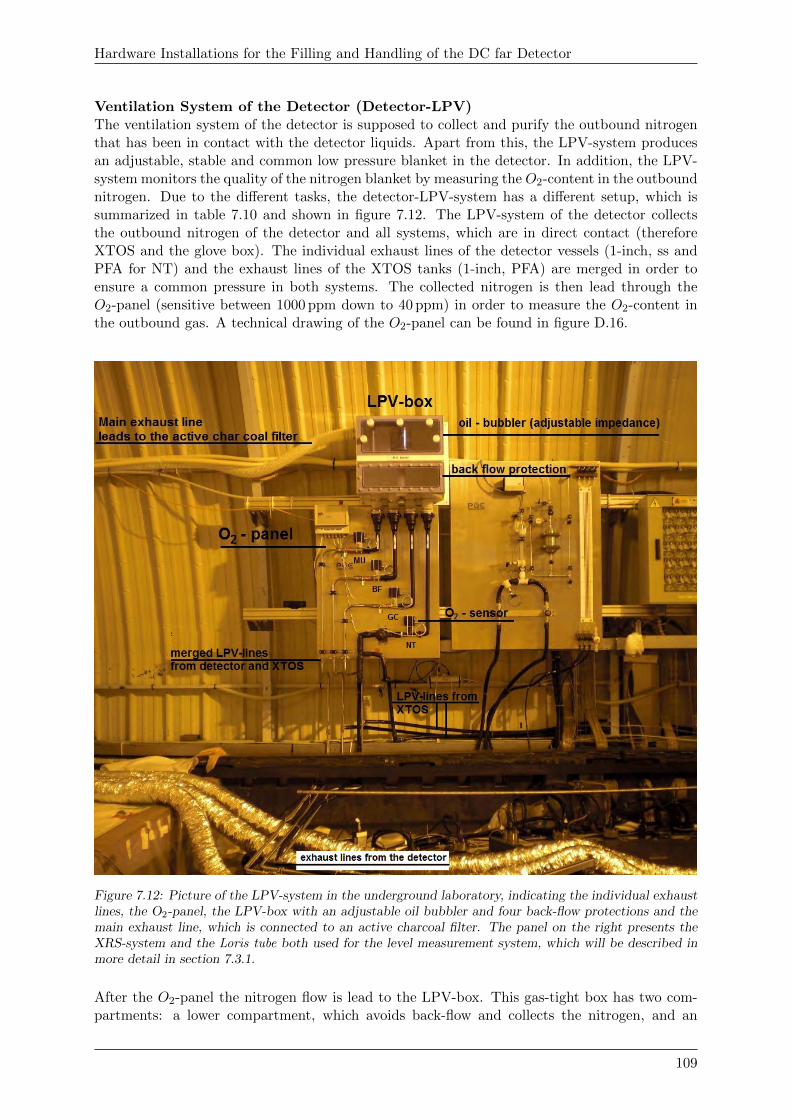
Hardware Installations for the Filling and Handling of the DC far Detector
Ventilation System of the Detector (Detector-LPV)The ventilation system of the detector is supposed to collect and purify the outbound nitrogenthat has been in contact with the detector liquids. Apart from this, the LPV-system producesan adjustable, stable and common low pressure blanket in the detector. In addition, the LPV-system monitors the quality of the nitrogen blanket by measuring the O2-content in the outboundnitrogen. Due to the different tasks, the detector-LPV-system has a different setup, which issummarized in table 7.10 and shown in figure 7.12. The LPV-system of the detector collectsthe outbound nitrogen of the detector and all systems, which are in direct contact (thereforeXTOS and the glove box). The individual exhaust lines of the detector vessels (1-inch, ss andPFA for NT) and the exhaust lines of the XTOS tanks (1-inch, PFA) are merged in order toensure a common pressure in both systems. The collected nitrogen is then lead through theO2-panel (sensitive between 1000 ppm down to 40 ppm) in order to measure the O2-content inthe outbound gas. A technical drawing of the O2-panel can be found in figure D.16.
Figure 7.12: Picture of the LPV-system in the underground laboratory, indicating the individual exhaustlines, the O2-panel, the LPV-box with an adjustable oil bubbler and four back-flow protections and themain exhaust line, which is connected to an active charcoal filter. The panel on the right presents theXRS-system and the Loris tube both used for the level measurement system, which will be described inmore detail in section 7.3.1.
After the O2-panel the nitrogen flow is lead to the LPV-box. This gas-tight box has two com-partments: a lower compartment, which avoids back-flow and collects the nitrogen, and an
109
Hardware Installations for the Filling and Handling of the DC far Detector
upper compartment, which provides an adjustable impedance for the gas coming from the lowercompartment. In order to avoid back-flow, the lower compartment is equipped with four plasticcovers which cover the four nitrogen inlets. The lower compartment has only one exit, whichleads the total nitrogen flow directly into an oil-bubbler in the upper compartment. This oil-bubbler is adjustable in height, what allows to regulate the impedance of the bubbler between0-5 mbar. The impedance in the gas flow leads to a common back pressure in all detector vesselsand at the same time avoids differential pressures between the different detector vessels. Afterthe oil bubbler the gas is lead through big exhaust lines (3-inch, PVC) to an active charcoalfilter, which removes a possible organic contamination of the nitrogen. Finally, the gas is trans-fered to the air extraction point of the air-conditioning-system in the underground laboratory,which ventilates the nitrogen to the surface. Figure 7.12 provides an overview of the detector-LPV-system, indicating the LPV-lines of the detector, the LPV-lines of XTOS, the O2-panel,the LPV-box and the main exhaust lines leading to the active charcoal filters. A detailed illus-tration of the LPV-box can be found in figure 7.11 and figure 7.13 in the appendix.Using the bubbler in the LPN-box (LPN-inlet-pressure, Pi) and the bubbler in the LPV-box(LPV-outlet-impedance, Po) allows to operate the gas handling system in two different modes:The first mode (Pi <Po) provides a steady blanket (no gas flow through the detector) and thesecond mode (Pi >Po) provides a flowing blanket through the detector. Furthermore the trans-parent oil bubblers allow to measure and regulate the inlet as well as the outlet pressure withoutthe usage of electronic devices just by looking at the oil-displacement in the transparent bubblers(compare with figure 7.11).
110
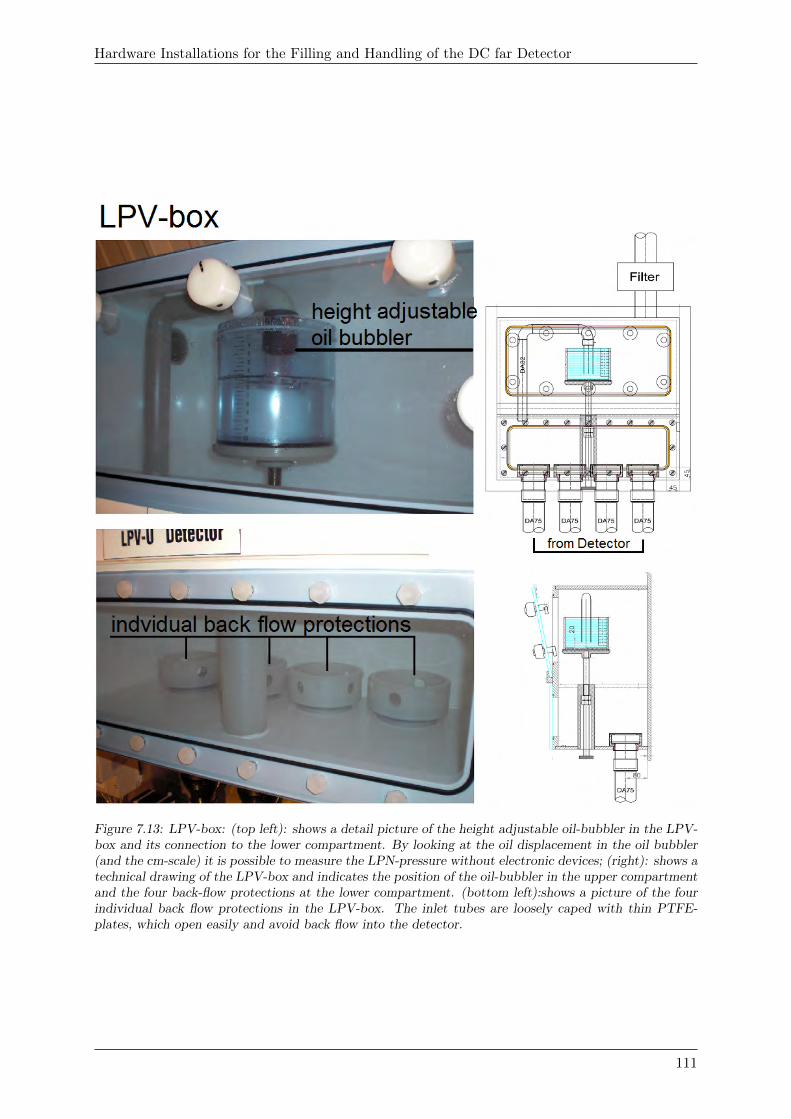
Hardware Installations for the Filling and Handling of the DC far Detector
Figure 7.13: LPV-box: (top left): shows a detail picture of the height adjustable oil-bubbler in the LPV-box and its connection to the lower compartment. By looking at the oil displacement in the oil bubbler(and the cm-scale) it is possible to measure the LPN-pressure without electronic devices; (right): shows atechnical drawing of the LPV-box and indicates the position of the oil-bubbler in the upper compartmentand the four back-flow protections at the lower compartment. (bottom left):shows a picture of the fourindividual back flow protections in the LPV-box. The inlet tubes are loosely caped with thin PTFE-plates, which open easily and avoid back flow into the detector.
111
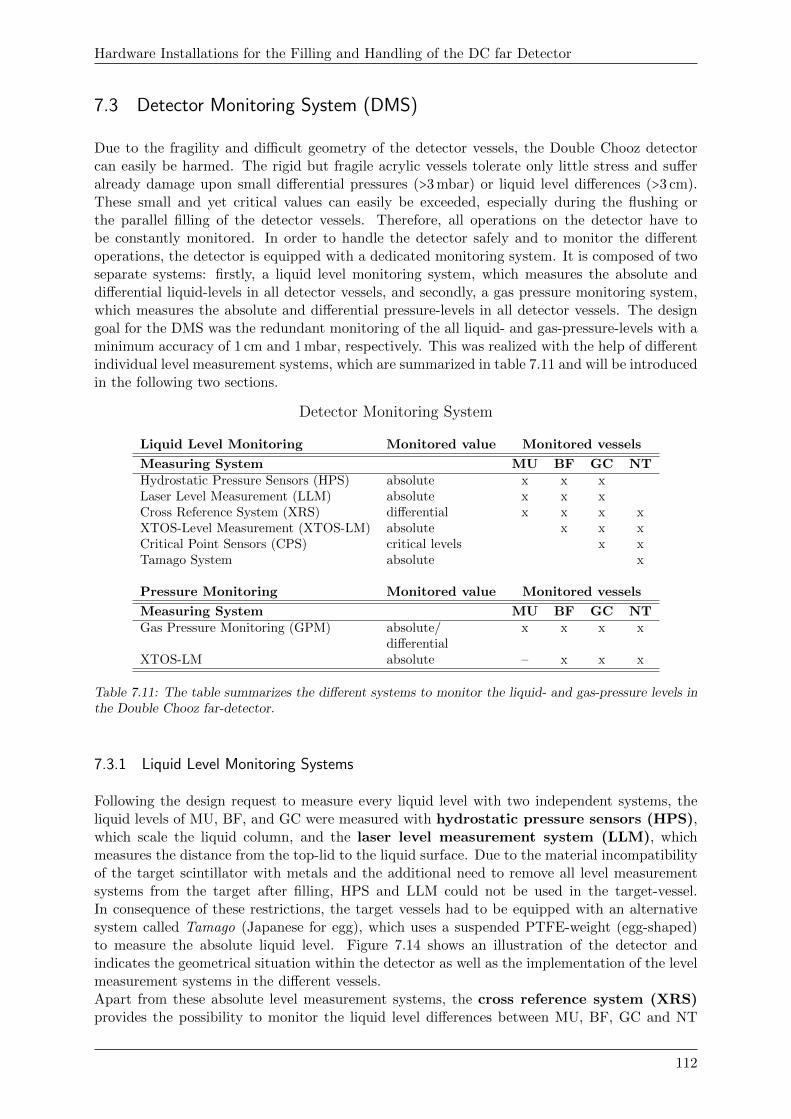
Hardware Installations for the Filling and Handling of the DC far Detector
7.3 Detector Monitoring System (DMS)
Due to the fragility and difficult geometry of the detector vessels, the Double Chooz detectorcan easily be harmed. The rigid but fragile acrylic vessels tolerate only little stress and sufferalready damage upon small differential pressures (>3 mbar) or liquid level differences (>3 cm).These small and yet critical values can easily be exceeded, especially during the flushing orthe parallel filling of the detector vessels. Therefore, all operations on the detector have tobe constantly monitored. In order to handle the detector safely and to monitor the differentoperations, the detector is equipped with a dedicated monitoring system. It is composed of twoseparate systems: firstly, a liquid level monitoring system, which measures the absolute anddifferential liquid-levels in all detector vessels, and secondly, a gas pressure monitoring system,which measures the absolute and differential pressure-levels in all detector vessels. The designgoal for the DMS was the redundant monitoring of the all liquid- and gas-pressure-levels with aminimum accuracy of 1 cm and 1 mbar, respectively. This was realized with the help of differentindividual level measurement systems, which are summarized in table 7.11 and will be introducedin the following two sections.
Detector Monitoring System
Liquid Level Monitoring Monitored value Monitored vessels
Measuring System MU BF GC NTHydrostatic Pressure Sensors (HPS) absolute x x xLaser Level Measurement (LLM) absolute x x xCross Reference System (XRS) differential x x x xXTOS-Level Measurement (XTOS-LM) absolute x x xCritical Point Sensors (CPS) critical levels x xTamago System absolute x
Pressure Monitoring Monitored value Monitored vessels
Measuring System MU BF GC NTGas Pressure Monitoring (GPM) absolute/ x x x x
differentialXTOS-LM absolute – x x x
Table 7.11: The table summarizes the different systems to monitor the liquid- and gas-pressure levels inthe Double Chooz far-detector.
7.3.1 Liquid Level Monitoring Systems
Following the design request to measure every liquid level with two independent systems, theliquid levels of MU, BF, and GC were measured with hydrostatic pressure sensors (HPS),which scale the liquid column, and the laser level measurement system (LLM), whichmeasures the distance from the top-lid to the liquid surface. Due to the material incompatibilityof the target scintillator with metals and the additional need to remove all level measurementsystems from the target after filling, HPS and LLM could not be used in the target-vessel.In consequence of these restrictions, the target vessels had to be equipped with an alternativesystem called Tamago (Japanese for egg), which uses a suspended PTFE-weight (egg-shaped)to measure the absolute liquid level. Figure 7.14 shows an illustration of the detector andindicates the geometrical situation within the detector as well as the implementation of the levelmeasurement systems in the different vessels.Apart from these absolute level measurement systems, the cross reference system (XRS)provides the possibility to monitor the liquid level differences between MU, BF, GC and NT
112
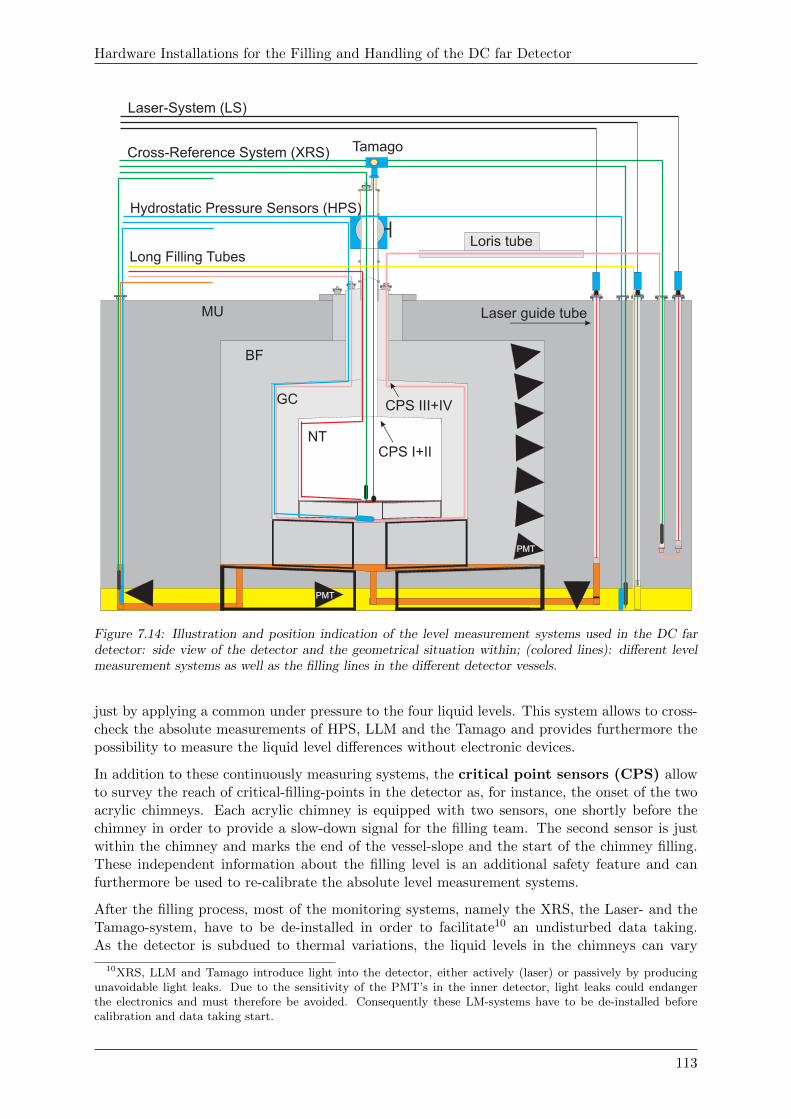
Hardware Installations for the Filling and Handling of the DC far Detector
Loris tubeLong Filling Tubes
Hydrostatic Pressure Sensors (HPS)
Cross-Reference System (XRS)
GC
BF
MU
NT
PMT
Laser-System (LS)
Tamago
Laser guide tube
PMT
CPS I+II
CPS III+IV
Figure 7.14: Illustration and position indication of the level measurement systems used in the DC fardetector: side view of the detector and the geometrical situation within; (colored lines): different levelmeasurement systems as well as the filling lines in the different detector vessels.
just by applying a common under pressure to the four liquid levels. This system allows to cross-check the absolute measurements of HPS, LLM and the Tamago and provides furthermore thepossibility to measure the liquid level differences without electronic devices.
In addition to these continuously measuring systems, the critical point sensors (CPS) allowto survey the reach of critical-filling-points in the detector as, for instance, the onset of the twoacrylic chimneys. Each acrylic chimney is equipped with two sensors, one shortly before thechimney in order to provide a slow-down signal for the filling team. The second sensor is justwithin the chimney and marks the end of the vessel-slope and the start of the chimney filling.These independent information about the filling level is an additional safety feature and canfurthermore be used to re-calibrate the absolute level measurement systems.
After the filling process, most of the monitoring systems, namely the XRS, the Laser- and theTamago-system, have to be de-installed in order to facilitate10 an undisturbed data taking.As the detector is subdued to thermal variations, the liquid levels in the chimneys can vary
10XRS, LLM and Tamago introduce light into the detector, either actively (laser) or passively by producingunavoidable light leaks. Due to the sensitivity of the PMT’s in the inner detector, light leaks could endangerthe electronics and must therefore be avoided. Consequently these LM-systems have to be de-installed beforecalibration and data taking start.
113
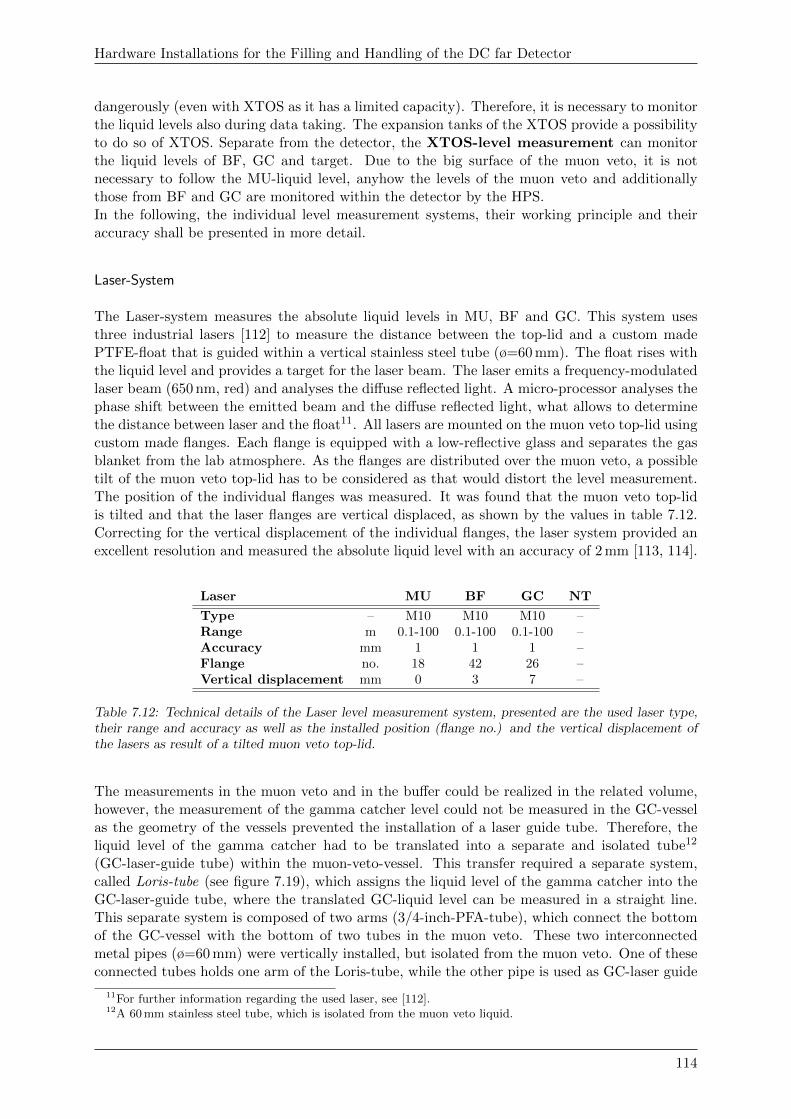
Hardware Installations for the Filling and Handling of the DC far Detector
dangerously (even with XTOS as it has a limited capacity). Therefore, it is necessary to monitorthe liquid levels also during data taking. The expansion tanks of the XTOS provide a possibilityto do so of XTOS. Separate from the detector, the XTOS-level measurement can monitorthe liquid levels of BF, GC and target. Due to the big surface of the muon veto, it is notnecessary to follow the MU-liquid level, anyhow the levels of the muon veto and additionallythose from BF and GC are monitored within the detector by the HPS.In the following, the individual level measurement systems, their working principle and theiraccuracy shall be presented in more detail.
Laser-System
The Laser-system measures the absolute liquid levels in MU, BF and GC. This system usesthree industrial lasers [112] to measure the distance between the top-lid and a custom madePTFE-float that is guided within a vertical stainless steel tube (ø=60 mm). The float rises withthe liquid level and provides a target for the laser beam. The laser emits a frequency-modulatedlaser beam (650 nm, red) and analyses the diffuse reflected light. A micro-processor analyses thephase shift between the emitted beam and the diffuse reflected light, what allows to determinethe distance between laser and the float11. All lasers are mounted on the muon veto top-lid usingcustom made flanges. Each flange is equipped with a low-reflective glass and separates the gasblanket from the lab atmosphere. As the flanges are distributed over the muon veto, a possibletilt of the muon veto top-lid has to be considered as that would distort the level measurement.The position of the individual flanges was measured. It was found that the muon veto top-lidis tilted and that the laser flanges are vertical displaced, as shown by the values in table 7.12.Correcting for the vertical displacement of the individual flanges, the laser system provided anexcellent resolution and measured the absolute liquid level with an accuracy of 2 mm [113, 114].
Laser MU BF GC NT
Type – M10 M10 M10 –Range m 0.1-100 0.1-100 0.1-100 –Accuracy mm 1 1 1 –Flange no. 18 42 26 –Vertical displacement mm 0 3 7 –
Table 7.12: Technical details of the Laser level measurement system, presented are the used laser type,their range and accuracy as well as the installed position (flange no.) and the vertical displacement ofthe lasers as result of a tilted muon veto top-lid.
The measurements in the muon veto and in the buffer could be realized in the related volume,however, the measurement of the gamma catcher level could not be measured in the GC-vesselas the geometry of the vessels prevented the installation of a laser guide tube. Therefore, theliquid level of the gamma catcher had to be translated into a separate and isolated tube12
(GC-laser-guide tube) within the muon-veto-vessel. This transfer required a separate system,called Loris-tube (see figure 7.19), which assigns the liquid level of the gamma catcher into theGC-laser-guide tube, where the translated GC-liquid level can be measured in a straight line.This separate system is composed of two arms (3/4-inch-PFA-tube), which connect the bottomof the GC-vessel with the bottom of two tubes in the muon veto. These two interconnectedmetal pipes (ø=60 mm) were vertically installed, but isolated from the muon veto. One of theseconnected tubes holds one arm of the Loris-tube, while the other pipe is used as GC-laser guide
11For further information regarding the used laser, see [112].12A 60 mm stainless steel tube, which is isolated from the muon veto liquid.
114
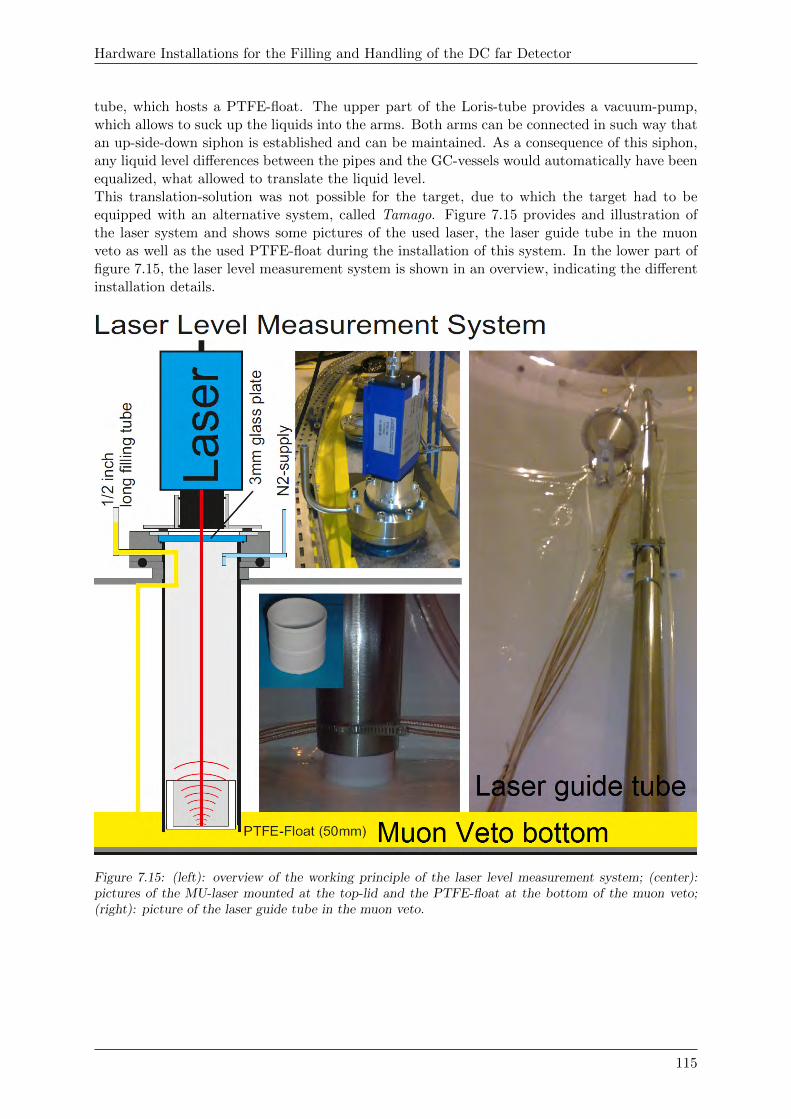
Hardware Installations for the Filling and Handling of the DC far Detector
tube, which hosts a PTFE-float. The upper part of the Loris-tube provides a vacuum-pump,which allows to suck up the liquids into the arms. Both arms can be connected in such way thatan up-side-down siphon is established and can be maintained. As a consequence of this siphon,any liquid level differences between the pipes and the GC-vessels would automatically have beenequalized, what allowed to translate the liquid level.This translation-solution was not possible for the target, due to which the target had to beequipped with an alternative system, called Tamago. Figure 7.15 provides and illustration ofthe laser system and shows some pictures of the used laser, the laser guide tube in the muonveto as well as the used PTFE-float during the installation of this system. In the lower part offigure 7.15, the laser level measurement system is shown in an overview, indicating the differentinstallation details.
Figure 7.15: (left): overview of the working principle of the laser level measurement system; (center):pictures of the MU-laser mounted at the top-lid and the PTFE-float at the bottom of the muon veto;(right): picture of the laser guide tube in the muon veto.
115
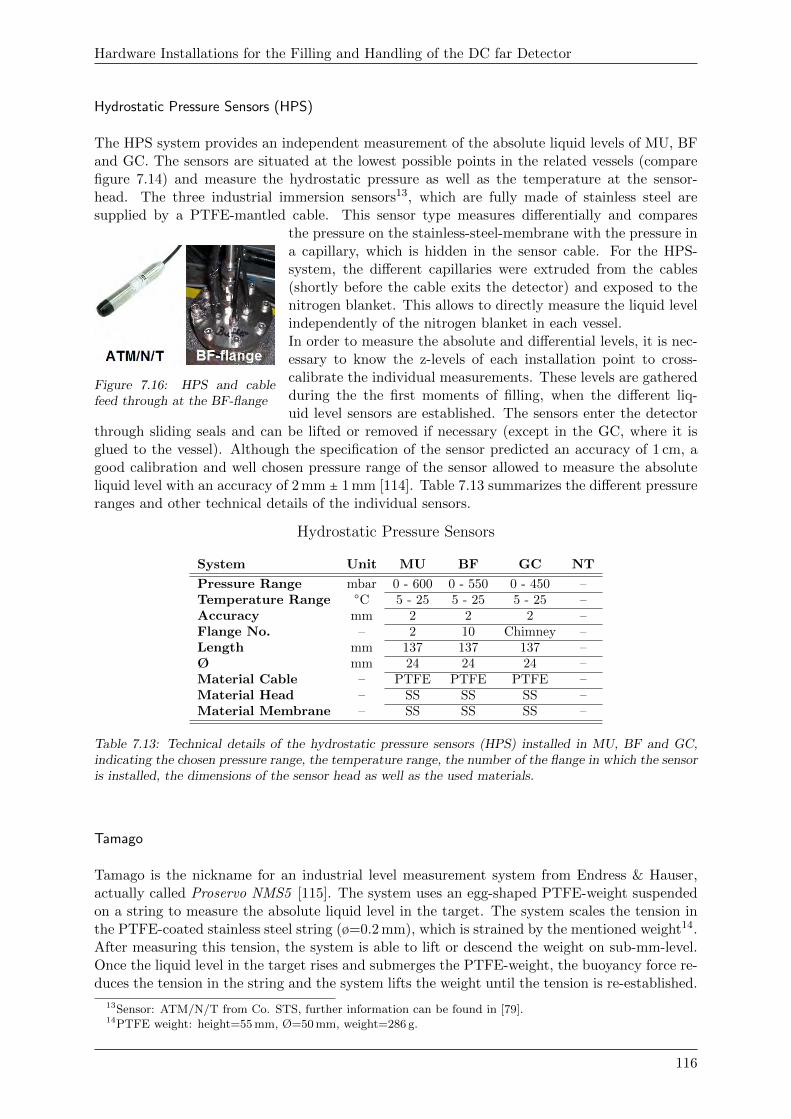
Hardware Installations for the Filling and Handling of the DC far Detector
Hydrostatic Pressure Sensors (HPS)
The HPS system provides an independent measurement of the absolute liquid levels of MU, BFand GC. The sensors are situated at the lowest possible points in the related vessels (comparefigure 7.14) and measure the hydrostatic pressure as well as the temperature at the sensor-head. The three industrial immersion sensors13, which are fully made of stainless steel aresupplied by a PTFE-mantled cable. This sensor type measures differentially and compares
Figure 7.16: HPS and cablefeed through at the BF-flange
the pressure on the stainless-steel-membrane with the pressure ina capillary, which is hidden in the sensor cable. For the HPS-system, the different capillaries were extruded from the cables(shortly before the cable exits the detector) and exposed to thenitrogen blanket. This allows to directly measure the liquid levelindependently of the nitrogen blanket in each vessel.In order to measure the absolute and differential levels, it is nec-essary to know the z-levels of each installation point to cross-calibrate the individual measurements. These levels are gatheredduring the the first moments of filling, when the different liq-uid level sensors are established. The sensors enter the detector
through sliding seals and can be lifted or removed if necessary (except in the GC, where it isglued to the vessel). Although the specification of the sensor predicted an accuracy of 1 cm, agood calibration and well chosen pressure range of the sensor allowed to measure the absoluteliquid level with an accuracy of 2 mm ± 1 mm [114]. Table 7.13 summarizes the different pressureranges and other technical details of the individual sensors.
Hydrostatic Pressure Sensors
System Unit MU BF GC NT
Pressure Range mbar 0 - 600 0 - 550 0 - 450 –Temperature Range ○C 5 - 25 5 - 25 5 - 25 –Accuracy mm 2 2 2 –Flange No. – 2 10 Chimney –Length mm 137 137 137 –Ø mm 24 24 24 –Material Cable – PTFE PTFE PTFE –Material Head – SS SS SS –Material Membrane – SS SS SS –
Table 7.13: Technical details of the hydrostatic pressure sensors (HPS) installed in MU, BF and GC,indicating the chosen pressure range, the temperature range, the number of the flange in which the sensoris installed, the dimensions of the sensor head as well as the used materials.
Tamago
Tamago is the nickname for an industrial level measurement system from Endress & Hauser,actually called Proservo NMS5 [115]. The system uses an egg-shaped PTFE-weight suspendedon a string to measure the absolute liquid level in the target. The system scales the tension inthe PTFE-coated stainless steel string (ø=0.2 mm), which is strained by the mentioned weight14.After measuring this tension, the system is able to lift or descend the weight on sub-mm-level.Once the liquid level in the target rises and submerges the PTFE-weight, the buoyancy force re-duces the tension in the string and the system lifts the weight until the tension is re-established.
13Sensor: ATM/N/T from Co. STS, further information can be found in [79].14PTFE weight: height=55 mm, Ø=50 mm, weight=286 g.
116
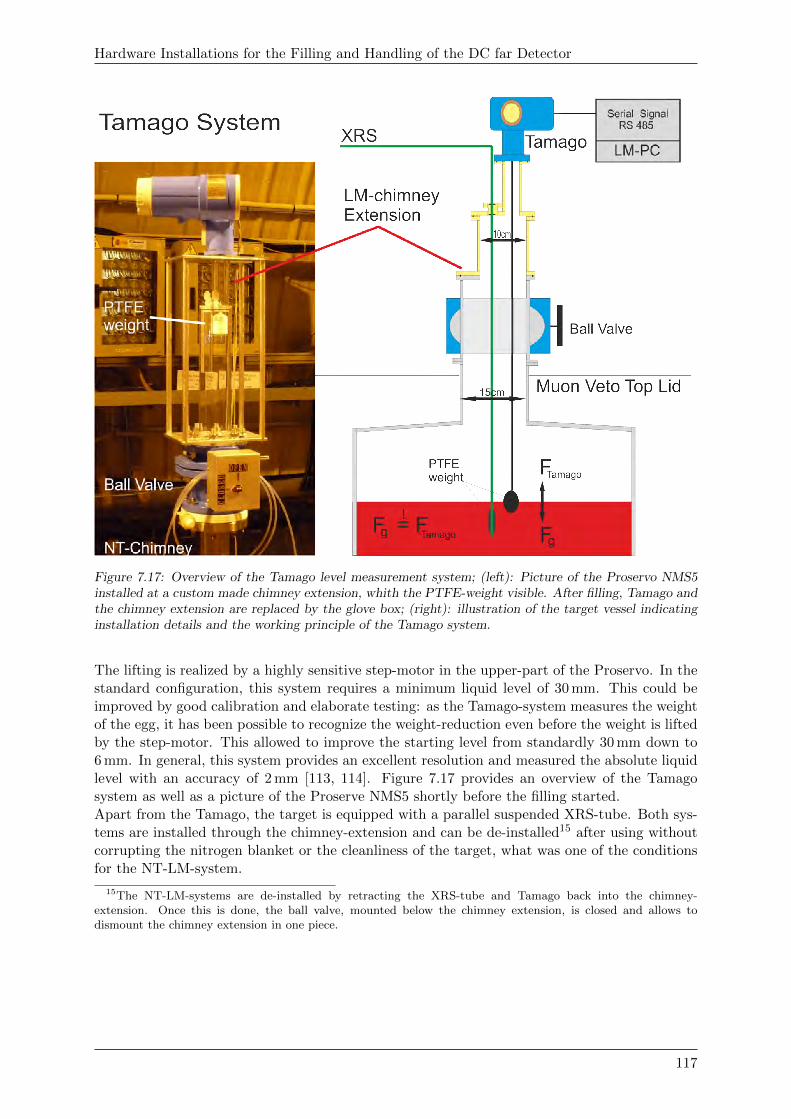
Hardware Installations for the Filling and Handling of the DC far Detector
Figure 7.17: Overview of the Tamago level measurement system; (left): Picture of the Proservo NMS5installed at a custom made chimney extension, whith the PTFE-weight visible. After filling, Tamago andthe chimney extension are replaced by the glove box; (right): illustration of the target vessel indicatinginstallation details and the working principle of the Tamago system.
The lifting is realized by a highly sensitive step-motor in the upper-part of the Proservo. In thestandard configuration, this system requires a minimum liquid level of 30 mm. This could beimproved by good calibration and elaborate testing: as the Tamago-system measures the weightof the egg, it has been possible to recognize the weight-reduction even before the weight is liftedby the step-motor. This allowed to improve the starting level from standardly 30 mm down to6 mm. In general, this system provides an excellent resolution and measured the absolute liquidlevel with an accuracy of 2 mm [113, 114]. Figure 7.17 provides an overview of the Tamagosystem as well as a picture of the Proserve NMS5 shortly before the filling started.Apart from the Tamago, the target is equipped with a parallel suspended XRS-tube. Both sys-tems are installed through the chimney-extension and can be de-installed15 after using withoutcorrupting the nitrogen blanket or the cleanliness of the target, what was one of the conditionsfor the NT-LM-system.
15The NT-LM-systems are de-installed by retracting the XRS-tube and Tamago back into the chimney-extension. Once this is done, the ball valve, mounted below the chimney extension, is closed and allows todismount the chimney extension in one piece.
117
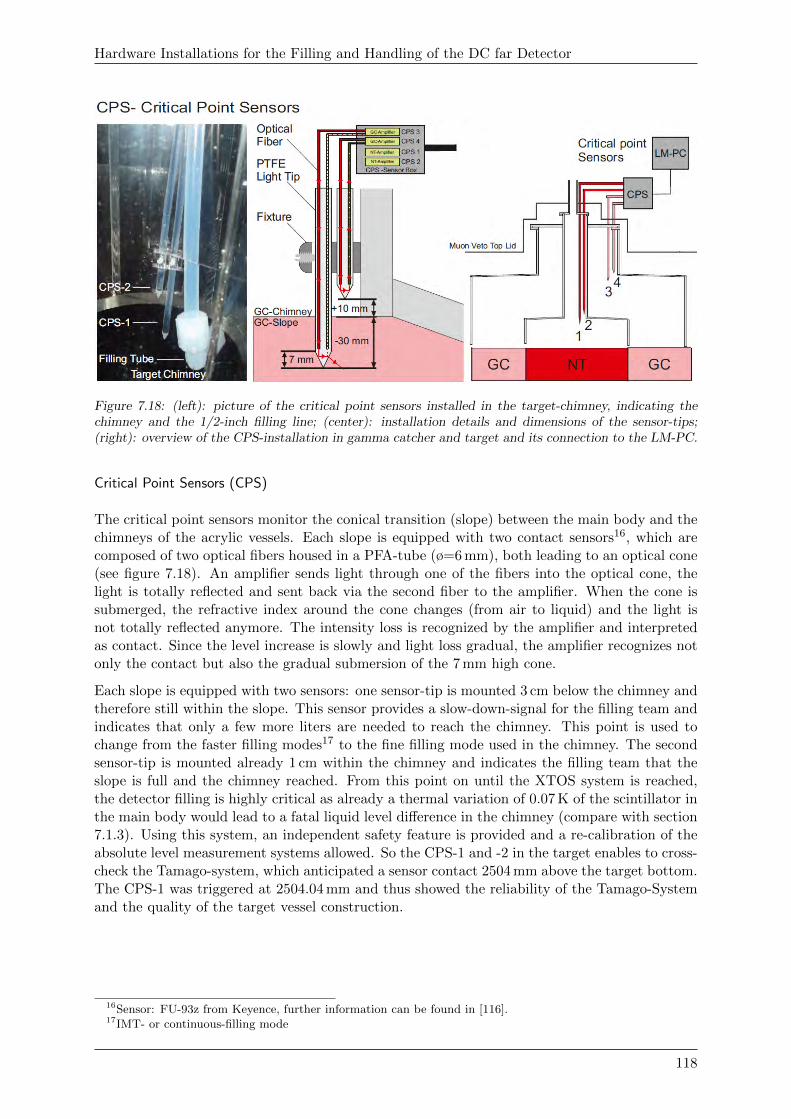
Hardware Installations for the Filling and Handling of the DC far Detector
Figure 7.18: (left): picture of the critical point sensors installed in the target-chimney, indicating thechimney and the 1/2-inch filling line; (center): installation details and dimensions of the sensor-tips;(right): overview of the CPS-installation in gamma catcher and target and its connection to the LM-PC.
Critical Point Sensors (CPS)
The critical point sensors monitor the conical transition (slope) between the main body and thechimneys of the acrylic vessels. Each slope is equipped with two contact sensors16, which arecomposed of two optical fibers housed in a PFA-tube (ø=6 mm), both leading to an optical cone(see figure 7.18). An amplifier sends light through one of the fibers into the optical cone, thelight is totally reflected and sent back via the second fiber to the amplifier. When the cone issubmerged, the refractive index around the cone changes (from air to liquid) and the light isnot totally reflected anymore. The intensity loss is recognized by the amplifier and interpretedas contact. Since the level increase is slowly and light loss gradual, the amplifier recognizes notonly the contact but also the gradual submersion of the 7 mm high cone.
Each slope is equipped with two sensors: one sensor-tip is mounted 3 cm below the chimney andtherefore still within the slope. This sensor provides a slow-down-signal for the filling team andindicates that only a few more liters are needed to reach the chimney. This point is used tochange from the faster filling modes17 to the fine filling mode used in the chimney. The secondsensor-tip is mounted already 1 cm within the chimney and indicates the filling team that theslope is full and the chimney reached. From this point on until the XTOS system is reached,the detector filling is highly critical as already a thermal variation of 0.07 K of the scintillator inthe main body would lead to a fatal liquid level difference in the chimney (compare with section7.1.3). Using this system, an independent safety feature is provided and a re-calibration of theabsolute level measurement systems allowed. So the CPS-1 and -2 in the target enables to cross-check the Tamago-system, which anticipated a sensor contact 2504 mm above the target bottom.The CPS-1 was triggered at 2504.04 mm and thus showed the reliability of the Tamago-Systemand the quality of the target vessel construction.
16Sensor: FU-93z from Keyence, further information can be found in [116].17IMT- or continuous-filling mode
118
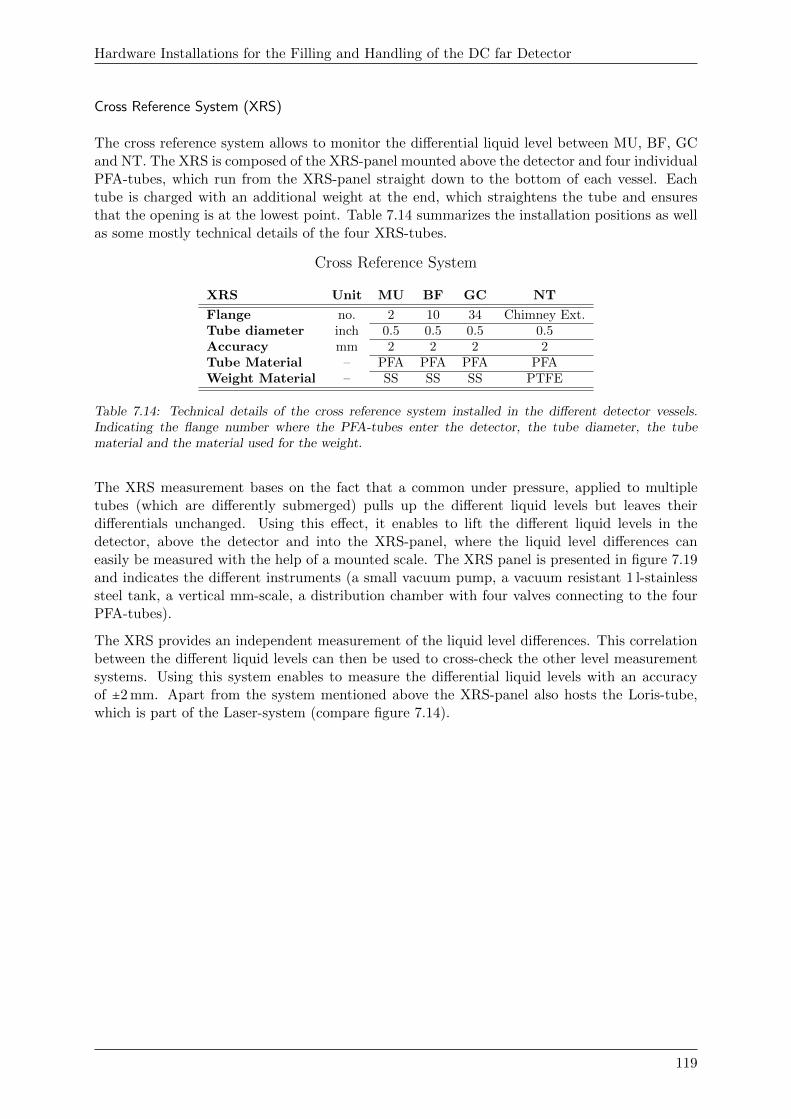
Hardware Installations for the Filling and Handling of the DC far Detector
Cross Reference System (XRS)
The cross reference system allows to monitor the differential liquid level between MU, BF, GCand NT. The XRS is composed of the XRS-panel mounted above the detector and four individualPFA-tubes, which run from the XRS-panel straight down to the bottom of each vessel. Eachtube is charged with an additional weight at the end, which straightens the tube and ensuresthat the opening is at the lowest point. Table 7.14 summarizes the installation positions as wellas some mostly technical details of the four XRS-tubes.
Cross Reference System
XRS Unit MU BF GC NT
Flange no. 2 10 34 Chimney Ext.Tube diameter inch 0.5 0.5 0.5 0.5Accuracy mm 2 2 2 2Tube Material – PFA PFA PFA PFAWeight Material – SS SS SS PTFE
Table 7.14: Technical details of the cross reference system installed in the different detector vessels.Indicating the flange number where the PFA-tubes enter the detector, the tube diameter, the tubematerial and the material used for the weight.
The XRS measurement bases on the fact that a common under pressure, applied to multipletubes (which are differently submerged) pulls up the different liquid levels but leaves theirdifferentials unchanged. Using this effect, it enables to lift the different liquid levels in thedetector, above the detector and into the XRS-panel, where the liquid level differences caneasily be measured with the help of a mounted scale. The XRS panel is presented in figure 7.19and indicates the different instruments (a small vacuum pump, a vacuum resistant 1 l-stainlesssteel tank, a vertical mm-scale, a distribution chamber with four valves connecting to the fourPFA-tubes).
The XRS provides an independent measurement of the liquid level differences. This correlationbetween the different liquid levels can then be used to cross-check the other level measurementsystems. Using this system enables to measure the differential liquid levels with an accuracyof ±2 mm. Apart from the system mentioned above the XRS-panel also hosts the Loris-tube,which is part of the Laser-system (compare figure 7.14).
119
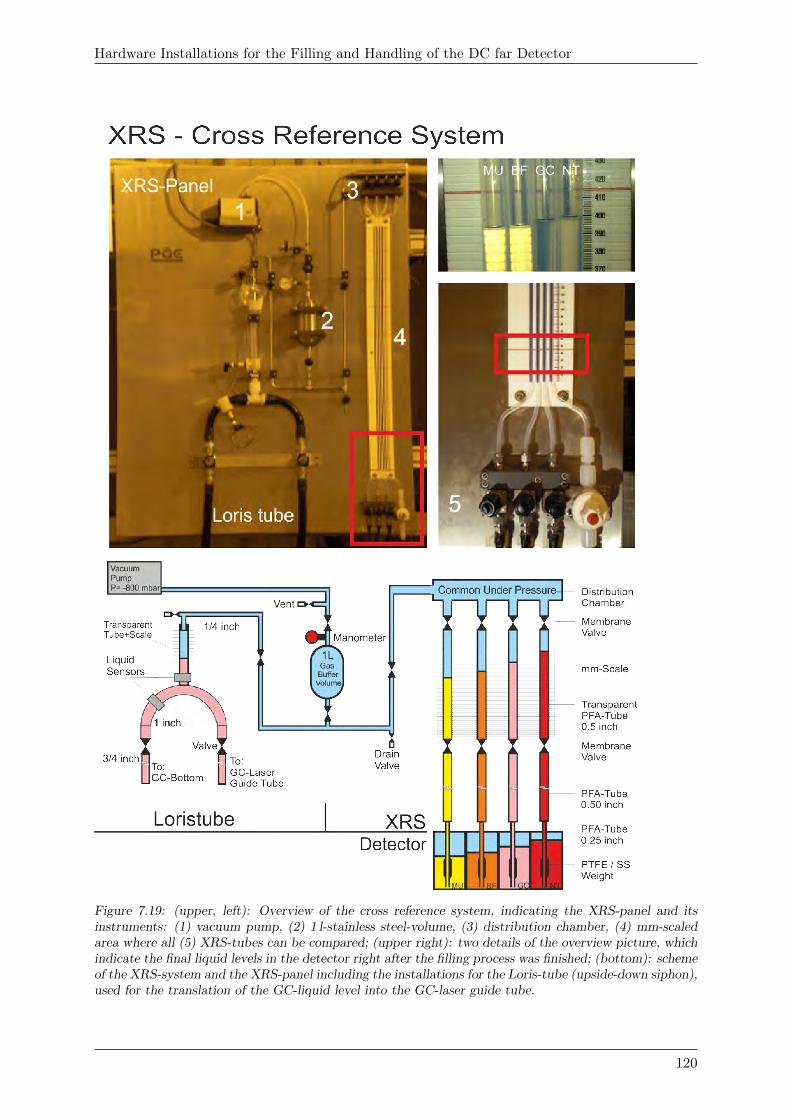
Hardware Installations for the Filling and Handling of the DC far Detector
Figure 7.19: (upper, left): Overview of the cross reference system, indicating the XRS-panel and itsinstruments: (1) vacuum pump, (2) 1 l-stainless steel-volume, (3) distribution chamber, (4) mm-scaledarea where all (5) XRS-tubes can be compared; (upper right): two details of the overview picture, whichindicate the final liquid levels in the detector right after the filling process was finished; (bottom): schemeof the XRS-system and the XRS-panel including the installations for the Loris-tube (upside-down siphon),used for the translation of the GC-liquid level into the GC-laser guide tube.
120
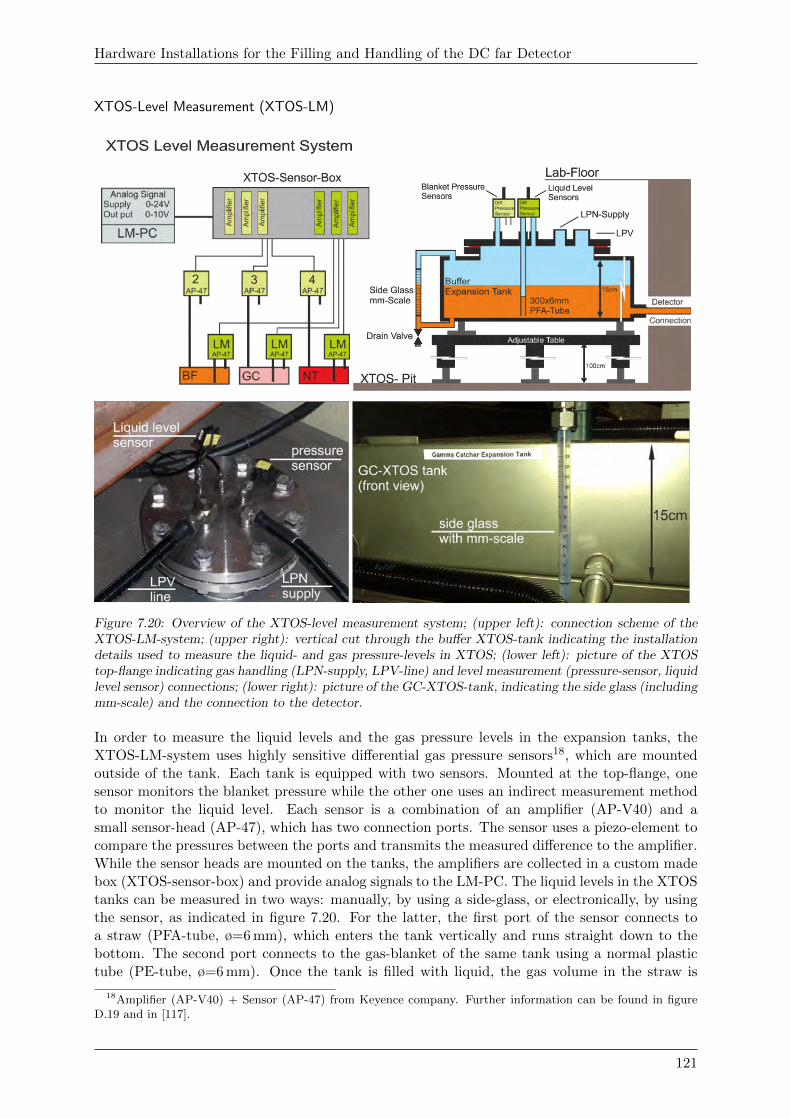
Hardware Installations for the Filling and Handling of the DC far Detector
XTOS-Level Measurement (XTOS-LM)
Figure 7.20: Overview of the XTOS-level measurement system; (upper left): connection scheme of theXTOS-LM-system; (upper right): vertical cut through the buffer XTOS-tank indicating the installationdetails used to measure the liquid- and gas pressure-levels in XTOS; (lower left): picture of the XTOStop-flange indicating gas handling (LPN-supply, LPV-line) and level measurement (pressure-sensor, liquidlevel sensor) connections; (lower right): picture of the GC-XTOS-tank, indicating the side glass (includingmm-scale) and the connection to the detector.
In order to measure the liquid levels and the gas pressure levels in the expansion tanks, theXTOS-LM-system uses highly sensitive differential gas pressure sensors18, which are mountedoutside of the tank. Each tank is equipped with two sensors. Mounted at the top-flange, onesensor monitors the blanket pressure while the other one uses an indirect measurement methodto monitor the liquid level. Each sensor is a combination of an amplifier (AP-V40) and asmall sensor-head (AP-47), which has two connection ports. The sensor uses a piezo-element tocompare the pressures between the ports and transmits the measured difference to the amplifier.While the sensor heads are mounted on the tanks, the amplifiers are collected in a custom madebox (XTOS-sensor-box) and provide analog signals to the LM-PC. The liquid levels in the XTOStanks can be measured in two ways: manually, by using a side-glass, or electronically, by usingthe sensor, as indicated in figure 7.20. For the latter, the first port of the sensor connects toa straw (PFA-tube, ø=6 mm), which enters the tank vertically and runs straight down to thebottom. The second port connects to the gas-blanket of the same tank using a normal plastictube (PE-tube, ø=6 mm). Once the tank is filled with liquid, the gas volume in the straw is
18Amplifier (AP-V40) + Sensor (AP-47) from Keyence company. Further information can be found in figureD.19 and in [117].
121
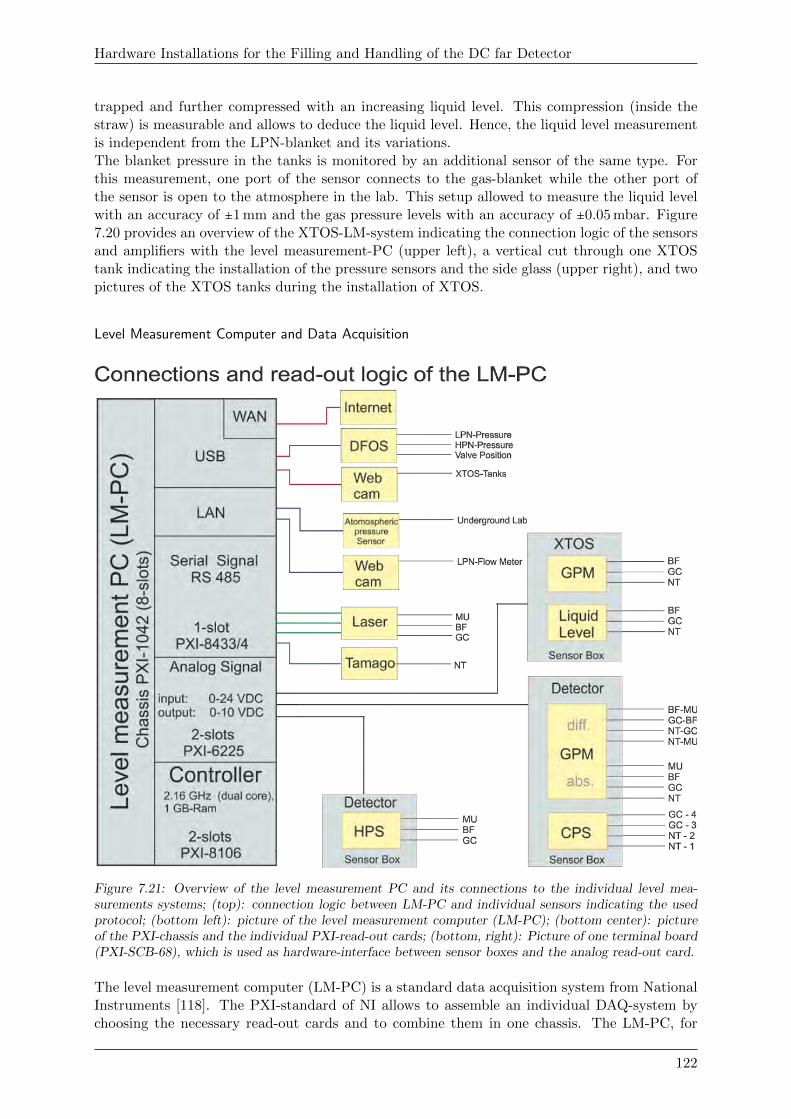
Hardware Installations for the Filling and Handling of the DC far Detector
trapped and further compressed with an increasing liquid level. This compression (inside thestraw) is measurable and allows to deduce the liquid level. Hence, the liquid level measurementis independent from the LPN-blanket and its variations.The blanket pressure in the tanks is monitored by an additional sensor of the same type. Forthis measurement, one port of the sensor connects to the gas-blanket while the other port ofthe sensor is open to the atmosphere in the lab. This setup allowed to measure the liquid levelwith an accuracy of ±1 mm and the gas pressure levels with an accuracy of ±0.05 mbar. Figure7.20 provides an overview of the XTOS-LM-system indicating the connection logic of the sensorsand amplifiers with the level measurement-PC (upper left), a vertical cut through one XTOStank indicating the installation of the pressure sensors and the side glass (upper right), and twopictures of the XTOS tanks during the installation of XTOS.
Level Measurement Computer and Data Acquisition
Figure 7.21: Overview of the level measurement PC and its connections to the individual level mea-surements systems; (top): connection logic between LM-PC and individual sensors indicating the usedprotocol; (bottom left): picture of the level measurement computer (LM-PC); (bottom center): pictureof the PXI-chassis and the individual PXI-read-out cards; (bottom, right): Picture of one terminal board(PXI-SCB-68), which is used as hardware-interface between sensor boxes and the analog read-out card.
The level measurement computer (LM-PC) is a standard data acquisition system from NationalInstruments [118]. The PXI-standard of NI allows to assemble an individual DAQ-system bychoosing the necessary read-out cards and to combine them in one chassis. The LM-PC, for
122
Hardware Installations for the Filling and Handling of the DC far Detector
instance, is composed of a standard PXI-chassis (PXI-1042), which offers space for 8 differentPXI-cards. Two of these slots are equipped with a controller (PXI-8106), which offers a windowsplatform and the standard PC connection ports. The controller uses the software package Lab-view [119] and a custom made level-measurement-program19 to visualize and record the acquireddata. Apart from that, the chassis holds two analog read-out cards (PXI-6225, 1-slot) and aserial read-out card (PXI-8433/4, 1-slot). Most of the sensors (HPS, CPS and the gas pressuresensors) provide analog signals, the other sensors, namely the lasers and the Tamago-system,use a serial protocol. In order to provide a clear arrangement, all analog signals were collected incustom made sensor-boxes [113, 114] and sent collected to the read-out cards. This allowed to or-ganize the LM-system and to reduce the amount of cables and the number of power-supply units.
Apart from the analog and serial read-out cards, the PC provides standard connections as USBand LAN. These connections are also used to read out information from other systems as indi-cated in figure 7.21. For instance, the LM-PC is connected to the programmable logic controller(PLC) of DFOS. By using a LAN-connection, the LM-PC is able to read-out the different pres-sure levels in the gas handling system of the detector. Furthermore this connection allows tomonitor the condition20 of the LPN main valve (V017) of the detector.
The connections of the controller are used to read out an additional pressure sensor, whichmonitors the atmospheric pressure in the laboratory. Furthermore the LM-PC connects to theInternet as well as two web cams, which monitor the side glasses of the XTOS-tanks and thegas-flow-meter in the LPN-supply of the detector. These last connections allow to monitor themost important detector values (liquid level and current gas flow) also remotely and independentfrom the running monitoring program. The LM-PC reads-out 32 different sensors, the acquireddata are recorded and visualized at the LM-PC. In addition, the entire data volume is transferedto a MySQL-database, which provides an online access of the stored data.
19Details related to the level measurement program as well as a screen shot of the program are presented in[114].
20open/malfunction/close
123
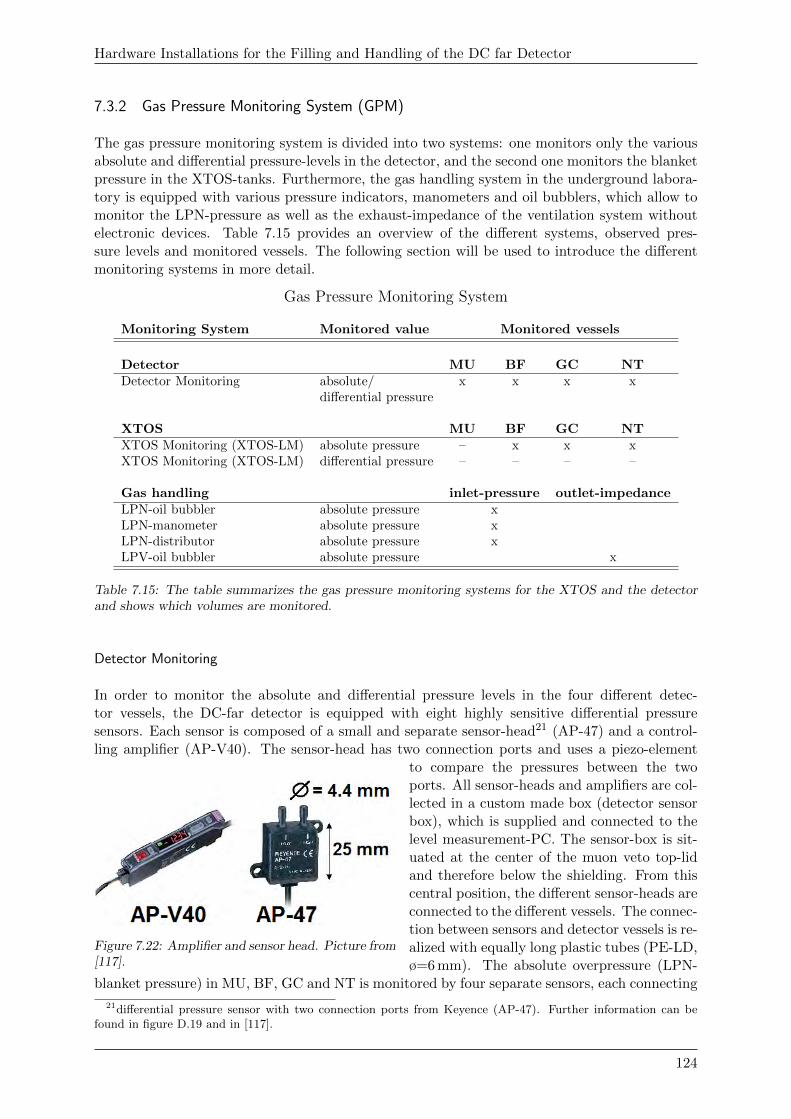
Hardware Installations for the Filling and Handling of the DC far Detector
7.3.2 Gas Pressure Monitoring System (GPM)
The gas pressure monitoring system is divided into two systems: one monitors only the variousabsolute and differential pressure-levels in the detector, and the second one monitors the blanketpressure in the XTOS-tanks. Furthermore, the gas handling system in the underground labora-tory is equipped with various pressure indicators, manometers and oil bubblers, which allow tomonitor the LPN-pressure as well as the exhaust-impedance of the ventilation system withoutelectronic devices. Table 7.15 provides an overview of the different systems, observed pres-sure levels and monitored vessels. The following section will be used to introduce the differentmonitoring systems in more detail.
Gas Pressure Monitoring System
Monitoring System Monitored value Monitored vessels
Detector MU BF GC NTDetector Monitoring absolute/ x x x x
differential pressure
XTOS MU BF GC NTXTOS Monitoring (XTOS-LM) absolute pressure – x x xXTOS Monitoring (XTOS-LM) differential pressure – – – –
Gas handling inlet-pressure outlet-impedanceLPN-oil bubbler absolute pressure xLPN-manometer absolute pressure xLPN-distributor absolute pressure xLPV-oil bubbler absolute pressure x
Table 7.15: The table summarizes the gas pressure monitoring systems for the XTOS and the detectorand shows which volumes are monitored.
Detector Monitoring
In order to monitor the absolute and differential pressure levels in the four different detec-tor vessels, the DC-far detector is equipped with eight highly sensitive differential pressuresensors. Each sensor is composed of a small and separate sensor-head21 (AP-47) and a control-ling amplifier (AP-V40). The sensor-head has two connection ports and uses a piezo-element
Figure 7.22: Amplifier and sensor head. Picture from[117].
to compare the pressures between the twoports. All sensor-heads and amplifiers are col-lected in a custom made box (detector sensorbox), which is supplied and connected to thelevel measurement-PC. The sensor-box is sit-uated at the center of the muon veto top-lidand therefore below the shielding. From thiscentral position, the different sensor-heads areconnected to the different vessels. The connec-tion between sensors and detector vessels is re-alized with equally long plastic tubes (PE-LD,ø=6 mm). The absolute overpressure (LPN-
blanket pressure) in MU, BF, GC and NT is monitored by four separate sensors, each connecting
21differential pressure sensor with two connection ports from Keyence (AP-47). Further information can befound in figure D.19 and in [117].
124
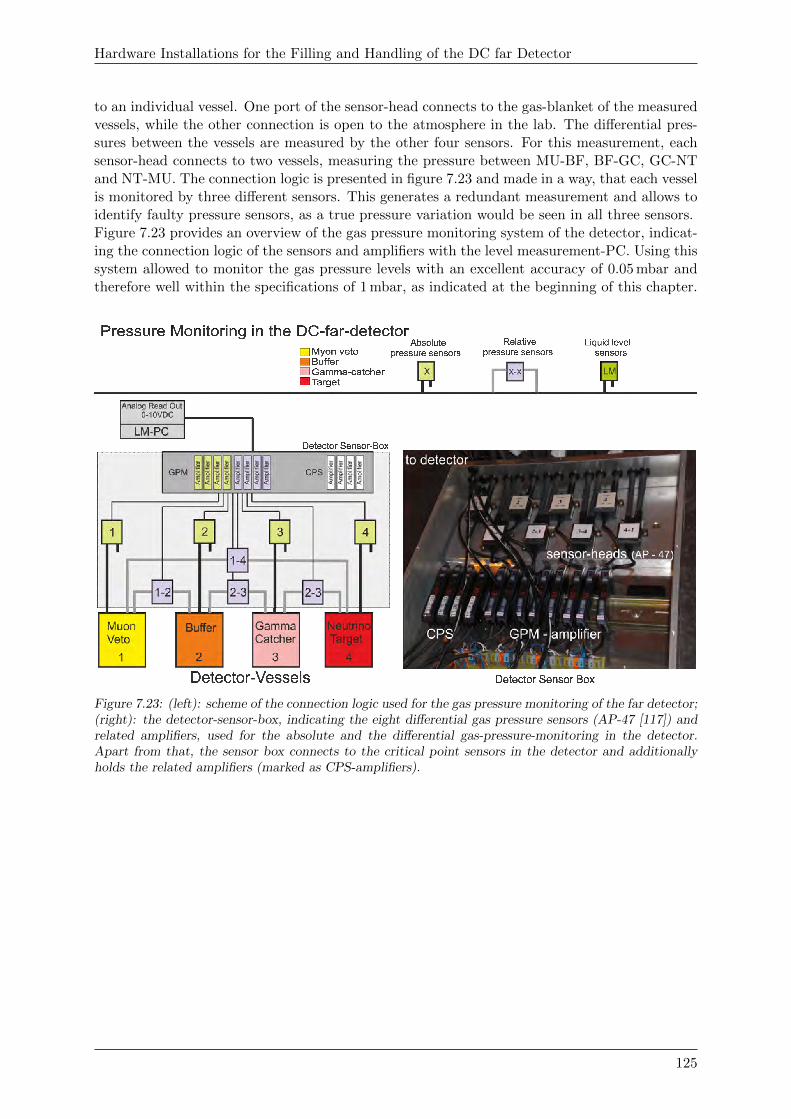
Hardware Installations for the Filling and Handling of the DC far Detector
to an individual vessel. One port of the sensor-head connects to the gas-blanket of the measuredvessels, while the other connection is open to the atmosphere in the lab. The differential pres-sures between the vessels are measured by the other four sensors. For this measurement, eachsensor-head connects to two vessels, measuring the pressure between MU-BF, BF-GC, GC-NTand NT-MU. The connection logic is presented in figure 7.23 and made in a way, that each vesselis monitored by three different sensors. This generates a redundant measurement and allows toidentify faulty pressure sensors, as a true pressure variation would be seen in all three sensors.Figure 7.23 provides an overview of the gas pressure monitoring system of the detector, indicat-ing the connection logic of the sensors and amplifiers with the level measurement-PC. Using thissystem allowed to monitor the gas pressure levels with an excellent accuracy of 0.05 mbar andtherefore well within the specifications of 1 mbar, as indicated at the beginning of this chapter.
Figure 7.23: (left): scheme of the connection logic used for the gas pressure monitoring of the far detector;(right): the detector-sensor-box, indicating the eight differential gas pressure sensors (AP-47 [117]) andrelated amplifiers, used for the absolute and the differential gas-pressure-monitoring in the detector.Apart from that, the sensor box connects to the critical point sensors in the detector and additionallyholds the related amplifiers (marked as CPS-amplifiers).
125
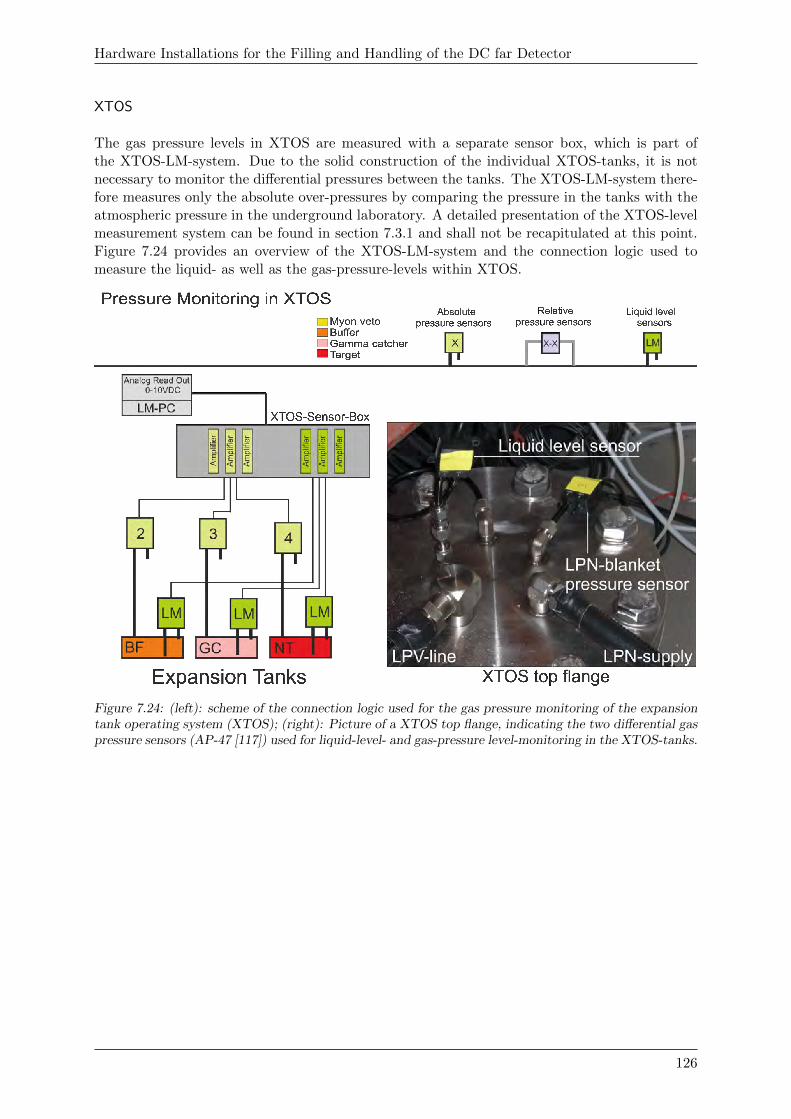
Hardware Installations for the Filling and Handling of the DC far Detector
XTOS
The gas pressure levels in XTOS are measured with a separate sensor box, which is part ofthe XTOS-LM-system. Due to the solid construction of the individual XTOS-tanks, it is notnecessary to monitor the differential pressures between the tanks. The XTOS-LM-system there-fore measures only the absolute over-pressures by comparing the pressure in the tanks with theatmospheric pressure in the underground laboratory. A detailed presentation of the XTOS-levelmeasurement system can be found in section 7.3.1 and shall not be recapitulated at this point.Figure 7.24 provides an overview of the XTOS-LM-system and the connection logic used tomeasure the liquid- as well as the gas-pressure-levels within XTOS.
Figure 7.24: (left): scheme of the connection logic used for the gas pressure monitoring of the expansiontank operating system (XTOS); (right): Picture of a XTOS top flange, indicating the two differential gaspressure sensors (AP-47 [117]) used for liquid-level- and gas-pressure level-monitoring in the XTOS-tanks.
126
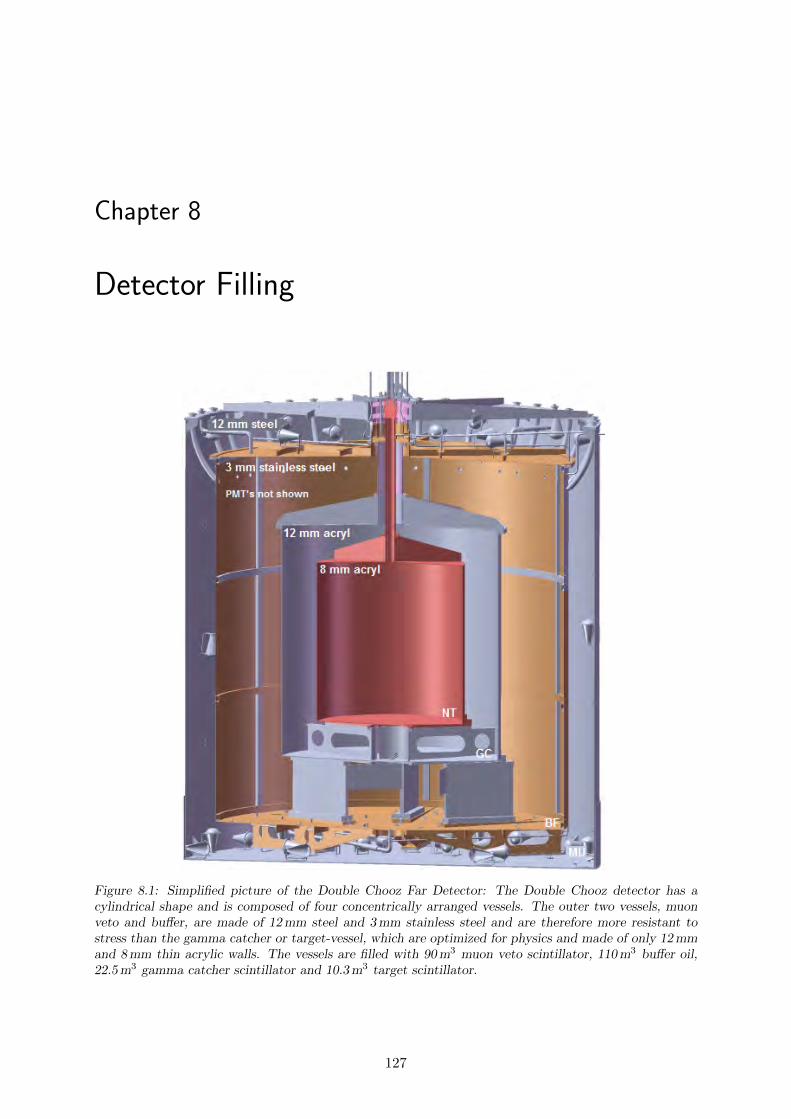
Chapter 8
Detector Filling
Figure 8.1: Simplified picture of the Double Chooz Far Detector: The Double Chooz detector has acylindrical shape and is composed of four concentrically arranged vessels. The outer two vessels, muonveto and buffer, are made of 12 mm steel and 3 mm stainless steel and are therefore more resistant tostress than the gamma catcher or target-vessel, which are optimized for physics and made of only 12 mmand 8 mm thin acrylic walls. The vessels are filled with 90 m3 muon veto scintillator, 110 m3 buffer oil,22.5 m3 gamma catcher scintillator and 10.3 m3 target scintillator.
127
Detector Filling
After the production of the detector liquids and the realization of all liquid-, gas- and monitoring-systems in the underground laboratory, the Double Chooz far detector could be filled. Thisrequired not only absolutely reliable hardware but also a prudently planned filling process, whichanticipated imminent dangers and avoided unnecessary stress on the vessels. The developmentof this filling procedure, the preparation of the detector and finally, the realization of the fillingprocess had been the responsibility of the author and Dr. C. Buck from MPIK in Heidelbergand were realized together with a dedicated filling team between October and December of2010. The following chapter is dedicated to the filling of the Double Chooz far detector and willstart with a presentation of the necessary preparations, followed by a detailed description of theindividual filling steps.
8.1 Preparations for Filling
8.1.1 Filling Team
The filling of the detector required the parallel use of all systems, which have already beenintroduced in this thesis. This included the surface installations in the LSA (chapter 4), whichprovided the detector liquids to the underground lab, as well as all liquid-, gas-handling, andmonitoring systems in the underground lab (chapter 7), which were used to fill the detector.The parallel use of all these systems, scattered over different locations, clearly necessitatedseveral people. In order to handle the different systems and to meet the safety requirements ofthe nuclear power plant, a filling-team was composed of minimum 5 people: two shifters, whomonitored all surface systems and supplied the underground laboratory with different liquids,two trained experts, who handled the underground systems and were responsible for the correctrealization of the filling procedure, and a filling coordinator, who was responsible for the safetyof the detector, the filling process and the coordination of the filling team.
8.1.2 Detector Flushing
After the assembly of the detector, the lab-atmosphere (ambient air with suspended particlesand significant humidity) had to be removed from the different detector vessels. While air anddust particles can lead to radioactive contamination and/or a degradation of the scintillatorproperties, water harms1 the target scintillator in concentrations of more than 100 ppm. Auseful means to avoid such negative effects is therefore a thorough flushing process with dry andclean nitrogen.
The standard system for supplying the detector with nitrogen was the low pressure nitrogensystem (LPN-U). The low pressure provided only a small nitrogen flow, which was, additionally,supplied to the top of the detector. Both of these features were a disadvantage for flushing.Because of this, the gas handling system in the underground lab provided an individual systemexclusively used for the flushing of the detector, the FPN-U-system (see section 7.2). Thisoffered elevated pressure-levels and allowed to send a controlled nitrogen flow directly to thebottom of the detector. In order to do that, FPN-U was not connected to the detector, butto the intermediate tanks of the filling system. Using this system, the nitrogen ran from thegas handling system to the intermediate tanks and then over the filling lines to the bottom ofthe detector. The nitrogen was vented at the top over the standard ventilation system (LPV-U).
1The polarity of water is able to disintegrate the soluted gadolinium-complex in the target scintillator, whatcauses the gadolinium to precipitate from the solution. Furthermore, the target vessel is made of acrylic, whichis a hygroscopic material and therefore saturates with the humidity of the surrounding air.
128
Detector Filling
The flushing of fragile structures, what the acrylic detector vessels in the Double Chooz are,is highly critical. The big volumes and the need to keep the flushing time short, requiredlarge nitrogen flows through the different detector vessels. High flow rates, however, have to behandled carefully, because any sudden change induces2 differential pressures between the detectorvessels. In addition, the big detector volume (∼240 m3) was hermetically closed and subjectedto atmospheric pressure changes, what again could have lead to high gas flows in or out of thedetector. In order to ensure the safety of the detector and to monitor the flushing progress, thedetector was monitored with pressure and oxygen-sensors. While the pressure sensors allowed tomonitor stress on the vessels, the oxygen-sensors (installed within the individual exhaust linesat the O2-panel) provided information about the oxygen content in the outbound nitrogen flow.Aiming for an oxygen concentration of less than 100 ppm, the sensors indicated between 1000and 40 ppm. Once the oxygen levels were constantly below 40 ppm, the FPN-U-system could bestopped and the LPN-U-system could overtake the nitrogen-supply of the detector. By usingthis procedure, the detector was flushed for about three weeks, with a nitrogen flow between 1and 4 m3/h, adapted to the size of the individual detector vessels.
8.1.3 DFOS Cleaning
Before the individual liquid handling modules in DFOS could start to fill their correspondingdetector volume, it had to be ensured that all systems were clean and not source of a possiblere-contamination of the liquids. Each system therefore was thoroughly rinsed at two differentoccasions. Once with ultra pure water in the manufacturing hall of the constructing company,and a second time in the underground lab after DFOS was installed and connected to thedetector. The second rinsing was done with the final detector liquids. Supplied by the LSA,each IMT was filled and the liquid was circulated: in a first step through DFOS, and in a secondstep also through the two filling lines3, which connected DFOS with the detector. After rinsing,the liquids used for cleaning were removed and replaced by new liquids from the LSA. These newliquids were the first to enter the detector and were therefore also used to monitor the quality ofthe final detector liquids. The results of these measurements are summarized in chapter 9.
8.2 Detector Filling
The parallel filling of the four nested vessels was dangerous, especially for the fragile acrylicvessels. In order to determine the stability of the acrylic vessels, the vessel-constructing-group(CEA) conducted a related FEM-analysis4, which indicated that liquid level differences of ≤ 3 cm,density differences of ≤ 0.01 g/cm3 or gas pressure differences of ≤ 3 mbar could be tolerated bythe vessels. During the filling process, when the vessels were held under a permanent nitrogenatmosphere and were additionally filled with different liquids, all vessels were exposed to a com-bination of gas-pressure-differences, liquid-level-differences and density-differences. The totalstress on the vessels therefore was the sum of these influences. Consequently, the filling processhad to be carefully executed and well monitored in order to limit the total-stress on the detec-tor vessels below the mentioned values. Considering this, it is clear that a safe detector fillingrequired equal densities (within the percent level), a reliable and stable working gas handling
2The reason for this are the different detector volumes, which adjust to sudden pressure changes on differenttime scales. During this adjustment, the detector is subjected to pressure differences.
3The circulation sent liquid through the long filling line to the valve-station shortly ahead of the detector. Atthe valve station, the liquid used the bypass valve and was sent back to DFOS via the short filling tube.
4The finite element analysis (FEM) was conducted by CEA. They considered the geometry of the vessels andthe strength of acrylic materials. Although they neglected the gluing-joints of the vessels, which are mechanicalweak points, this study provided stress limits which could be used as a guideline for a safe detector handling.
129
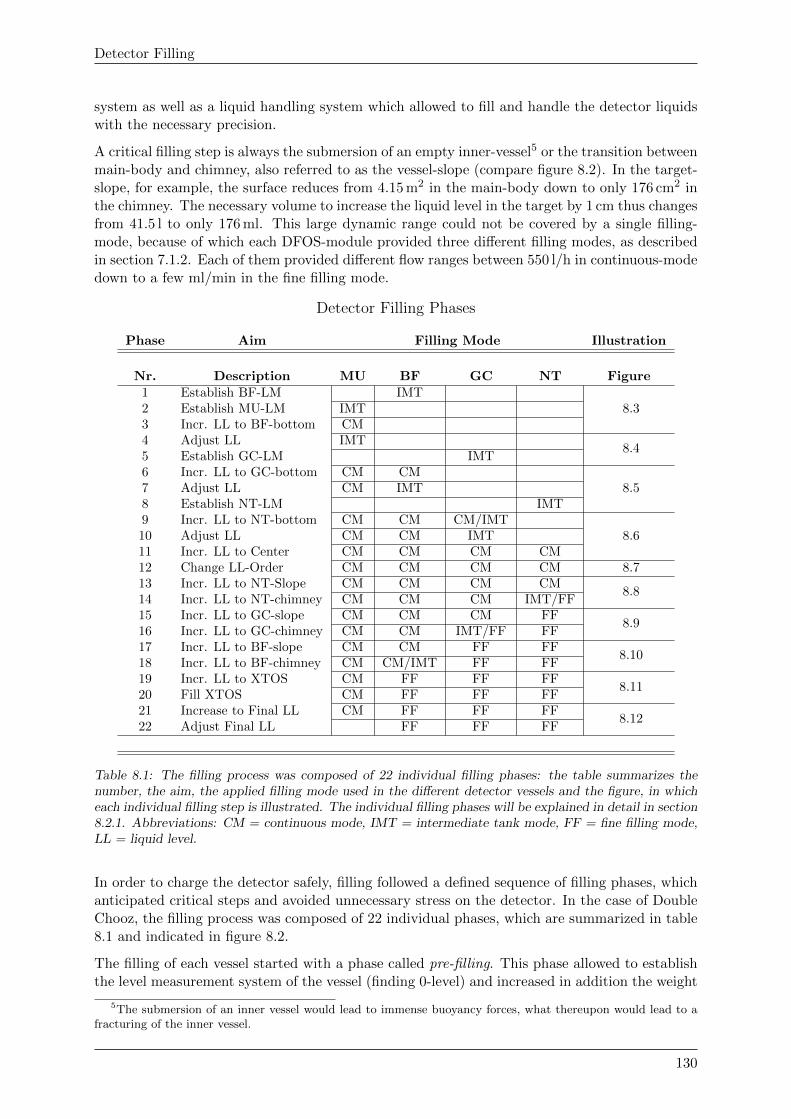
Detector Filling
system as well as a liquid handling system which allowed to fill and handle the detector liquidswith the necessary precision.
A critical filling step is always the submersion of an empty inner-vessel5 or the transition betweenmain-body and chimney, also referred to as the vessel-slope (compare figure 8.2). In the target-slope, for example, the surface reduces from 4.15 m2 in the main-body down to only 176 cm2 inthe chimney. The necessary volume to increase the liquid level in the target by 1 cm thus changesfrom 41.5 l to only 176 ml. This large dynamic range could not be covered by a single filling-mode, because of which each DFOS-module provided three different filling modes, as describedin section 7.1.2. Each of them provided different flow ranges between 550 l/h in continuous-modedown to a few ml/min in the fine filling mode.
Detector Filling Phases
Phase Aim Filling Mode Illustration
Nr. Description MU BF GC NT Figure1 Establish BF-LM IMT
8.32 Establish MU-LM IMT3 Incr. LL to BF-bottom CM4 Adjust LL IMT
8.45 Establish GC-LM IMT6 Incr. LL to GC-bottom CM CM
8.57 Adjust LL CM IMT8 Establish NT-LM IMT9 Incr. LL to NT-bottom CM CM CM/IMT
8.610 Adjust LL CM CM IMT11 Incr. LL to Center CM CM CM CM12 Change LL-Order CM CM CM CM 8.713 Incr. LL to NT-Slope CM CM CM CM
8.814 Incr. LL to NT-chimney CM CM CM IMT/FF15 Incr. LL to GC-slope CM CM CM FF
8.916 Incr. LL to GC-chimney CM CM IMT/FF FF17 Incr. LL to BF-slope CM CM FF FF
8.1018 Incr. LL to BF-chimney CM CM/IMT FF FF19 Incr. LL to XTOS CM FF FF FF
8.1120 Fill XTOS CM FF FF FF21 Increase to Final LL CM FF FF FF
8.1222 Adjust Final LL FF FF FF
Table 8.1: The filling process was composed of 22 individual filling phases: the table summarizes thenumber, the aim, the applied filling mode used in the different detector vessels and the figure, in whicheach individual filling step is illustrated. The individual filling phases will be explained in detail in section8.2.1. Abbreviations: CM = continuous mode, IMT = intermediate tank mode, FF = fine filling mode,LL = liquid level.
In order to charge the detector safely, filling followed a defined sequence of filling phases, whichanticipated critical steps and avoided unnecessary stress on the detector. In the case of DoubleChooz, the filling process was composed of 22 individual phases, which are summarized in table8.1 and indicated in figure 8.2.
The filling of each vessel started with a phase called pre-filling. This phase allowed to establishthe level measurement system of the vessel (finding 0-level) and increased in addition the weight
5The submersion of an inner vessel would lead to immense buoyancy forces, what thereupon would lead to afracturing of the inner vessel.
130
Detector Filling
of the vessel. For example, the first filling phase in DC was the pre-filling of the buffer. The0-level in the buffer provided a reference mark, to which the upcoming MU-liquid level couldbe adjusted. In addition, the extra weight in the buffer helped to reduce the buoyancy forces,which emerged during the adjustment of the MU-liquid level to the 0-level of the buffer (Phase4). After this adjustment, the gamma catcher vessel was pre-filled (Phase 5) and the liquidlevels in MU and BF were homogeneously increased until they matched the 0-level of the GC-vessel (Phase 6). The implementation of the target vessel was done accordingly (Phases 8-11).This procedure was maintained until the center of the detector was reached. At the centerthe remaining level differences were re-arranged in anticipation of the upcoming chimney fillingphase (Phase 12).
The chimney filling phase was the most critical part of the filling, because already small volume-or thermal changes could endanger the detector. Important for the safety of the detector there-fore was the identification of the vessel-slopes and the controlled transition into the chimney.Once the transition was done, the liquid level in the chimney was adjusted stepwise (with FFM)to the continuously increasing liquid level of other vessels, which were filled by the standardfilling modes IMT or CM. In these filling modes, the detector was filled until the gamma catcherslope was reached (Phase 15). From this point on, the next chimneys were implemented accord-ingly (Phases 16-19). This procedure was maintained until the XTOS-tanks and the final liquidlevels were reached (Phases 20-22).
The filling of the Double Chooz far detector started on 12.10.2010, 10:30 am (MEZ) and lasted,including all interruptions, two month until 13.12.2010, 1.46 am (MEZ). A detailed descriptionof the individual filling phases will be presented in the next section.
131
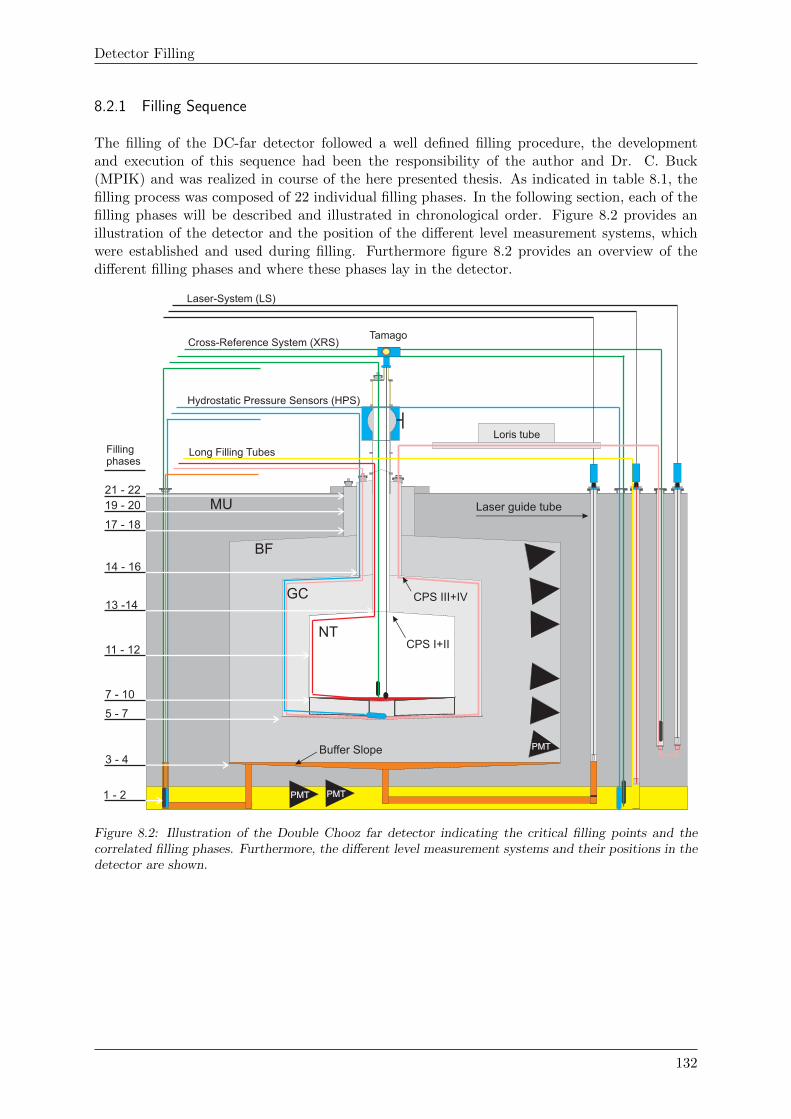
Detector Filling
8.2.1 Filling Sequence
The filling of the DC-far detector followed a well defined filling procedure, the developmentand execution of this sequence had been the responsibility of the author and Dr. C. Buck(MPIK) and was realized in course of the here presented thesis. As indicated in table 8.1, thefilling process was composed of 22 individual filling phases. In the following section, each of thefilling phases will be described and illustrated in chronological order. Figure 8.2 provides anillustration of the detector and the position of the different level measurement systems, whichwere established and used during filling. Furthermore figure 8.2 provides an overview of thedifferent filling phases and where these phases lay in the detector.
Loris tube
Long Filling Tubes
Hydrostatic Pressure Sensors (HPS)
Cross-Reference System (XRS)
GC
BF
MU
NT
PMT
Laser-System (LS)
Tamago
Laser guide tube
PMT
CPS I+II
CPS III+IV
Filling phases
1 - 2
3 - 4
5 - 7
7 - 10
11 - 12
13 -14
14 - 16
17 - 18
19 - 20
21 - 22
PMT
Buffer Slope
Figure 8.2: Illustration of the Double Chooz far detector indicating the critical filling points and thecorrelated filling phases. Furthermore, the different level measurement systems and their positions in thedetector are shown.
132
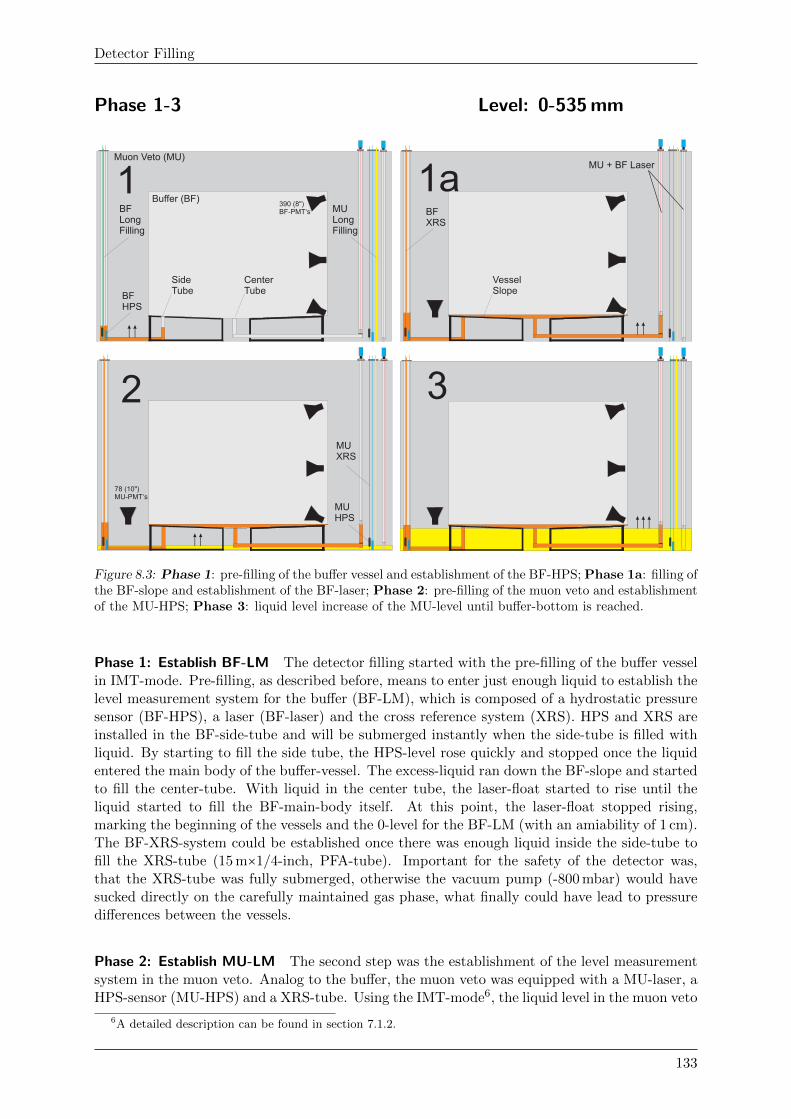
Detector Filling
Phase 1-3 Level: 0-535 mm
1 1a
2 3
Muon Veto (MU)
Buffer (BF)
SideTube
CenterTube
BFLongFilling
MU + BF Laser
MULongFilling
BFXRS
BFHPS
MUHPS
VesselSlope
390 (8")BF-PMT‘s
MUXRS
78 (10")MU-PMT‘s
Figure 8.3: Phase 1: pre-filling of the buffer vessel and establishment of the BF-HPS; Phase 1a: filling ofthe BF-slope and establishment of the BF-laser; Phase 2: pre-filling of the muon veto and establishmentof the MU-HPS; Phase 3: liquid level increase of the MU-level until buffer-bottom is reached.
Phase 1: Establish BF-LM The detector filling started with the pre-filling of the buffer vesselin IMT-mode. Pre-filling, as described before, means to enter just enough liquid to establish thelevel measurement system for the buffer (BF-LM), which is composed of a hydrostatic pressuresensor (BF-HPS), a laser (BF-laser) and the cross reference system (XRS). HPS and XRS areinstalled in the BF-side-tube and will be submerged instantly when the side-tube is filled withliquid. By starting to fill the side tube, the HPS-level rose quickly and stopped once the liquidentered the main body of the buffer-vessel. The excess-liquid ran down the BF-slope and startedto fill the center-tube. With liquid in the center tube, the laser-float started to rise until theliquid started to fill the BF-main-body itself. At this point, the laser-float stopped rising,marking the beginning of the vessels and the 0-level for the BF-LM (with an amiability of 1 cm).The BF-XRS-system could be established once there was enough liquid inside the side-tube tofill the XRS-tube (15 m×1/4-inch, PFA-tube). Important for the safety of the detector was,that the XRS-tube was fully submerged, otherwise the vacuum pump (-800 mbar) would havesucked directly on the carefully maintained gas phase, what finally could have lead to pressuredifferences between the vessels.
Phase 2: Establish MU-LM The second step was the establishment of the level measurementsystem in the muon veto. Analog to the buffer, the muon veto was equipped with a MU-laser, aHPS-sensor (MU-HPS) and a XRS-tube. Using the IMT-mode6, the liquid level in the muon veto
6A detailed description can be found in section 7.1.2.
133
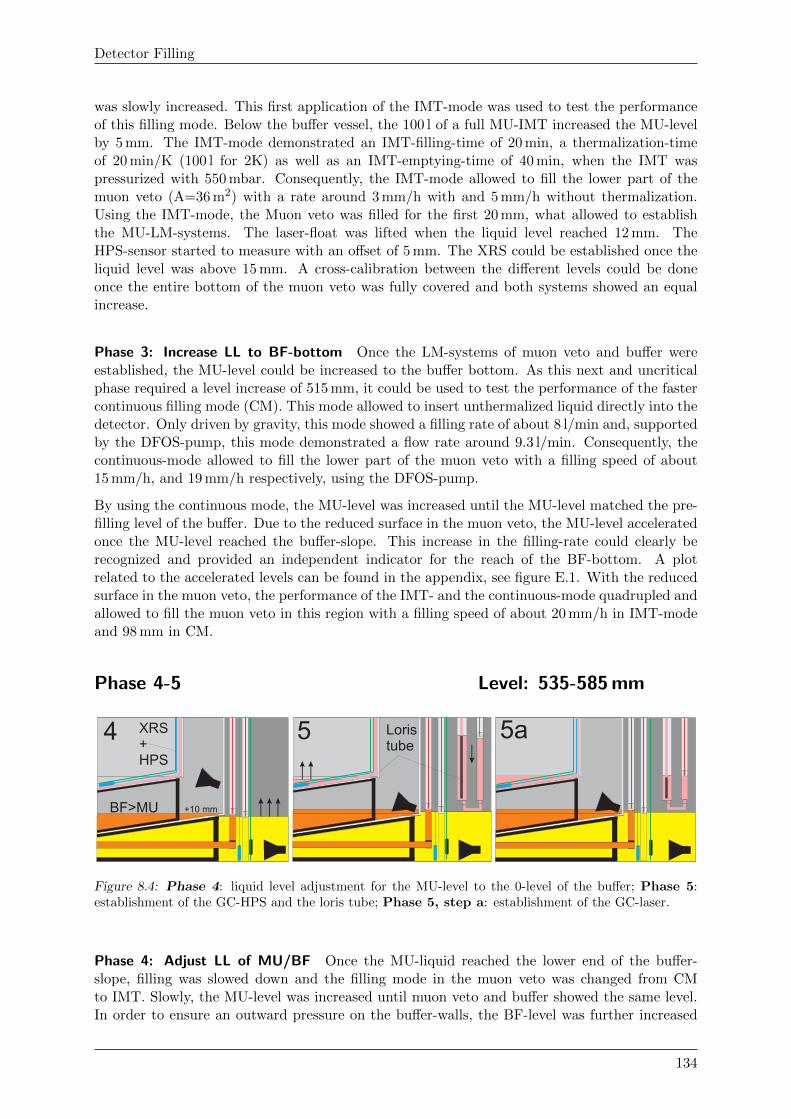
Detector Filling
was slowly increased. This first application of the IMT-mode was used to test the performanceof this filling mode. Below the buffer vessel, the 100 l of a full MU-IMT increased the MU-levelby 5 mm. The IMT-mode demonstrated an IMT-filling-time of 20 min, a thermalization-timeof 20 min/K (100 l for 2K) as well as an IMT-emptying-time of 40 min, when the IMT waspressurized with 550 mbar. Consequently, the IMT-mode allowed to fill the lower part of themuon veto (A=36 m2) with a rate around 3 mm/h with and 5 mm/h without thermalization.Using the IMT-mode, the Muon veto was filled for the first 20 mm, what allowed to establishthe MU-LM-systems. The laser-float was lifted when the liquid level reached 12 mm. TheHPS-sensor started to measure with an offset of 5 mm. The XRS could be established once theliquid level was above 15 mm. A cross-calibration between the different levels could be doneonce the entire bottom of the muon veto was fully covered and both systems showed an equalincrease.
Phase 3: Increase LL to BF-bottom Once the LM-systems of muon veto and buffer wereestablished, the MU-level could be increased to the buffer bottom. As this next and uncriticalphase required a level increase of 515 mm, it could be used to test the performance of the fastercontinuous filling mode (CM). This mode allowed to insert unthermalized liquid directly into thedetector. Only driven by gravity, this mode showed a filling rate of about 8 l/min and, supportedby the DFOS-pump, this mode demonstrated a flow rate around 9.3 l/min. Consequently, thecontinuous-mode allowed to fill the lower part of the muon veto with a filling speed of about15 mm/h, and 19 mm/h respectively, using the DFOS-pump.
By using the continuous mode, the MU-level was increased until the MU-level matched the pre-filling level of the buffer. Due to the reduced surface in the muon veto, the MU-level acceleratedonce the MU-level reached the buffer-slope. This increase in the filling-rate could clearly berecognized and provided an independent indicator for the reach of the BF-bottom. A plotrelated to the accelerated levels can be found in the appendix, see figure E.1. With the reducedsurface in the muon veto, the performance of the IMT- and the continuous-mode quadrupled andallowed to fill the muon veto in this region with a filling speed of about 20 mm/h in IMT-modeand 98 mm in CM.
Phase 4-5 Level: 535-585 mm
4 5 5aLoristube
XRS+HPS
BF>MU +10 mm
Figure 8.4: Phase 4: liquid level adjustment for the MU-level to the 0-level of the buffer; Phase 5:establishment of the GC-HPS and the loris tube; Phase 5, step a: establishment of the GC-laser.
Phase 4: Adjust LL of MU/BF Once the MU-liquid reached the lower end of the buffer-slope, filling was slowed down and the filling mode in the muon veto was changed from CMto IMT. Slowly, the MU-level was increased until muon veto and buffer showed the same level.In order to ensure an outward pressure on the buffer-walls, the BF-level was further increased
134
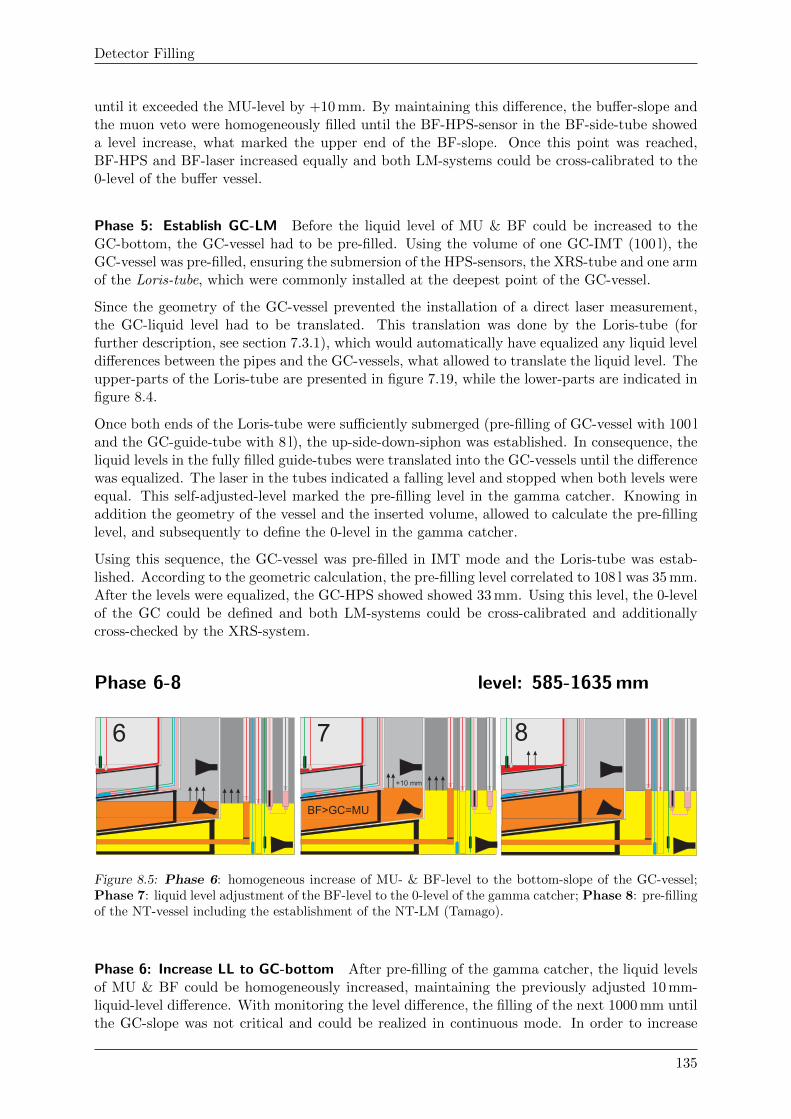
Detector Filling
until it exceeded the MU-level by +10 mm. By maintaining this difference, the buffer-slope andthe muon veto were homogeneously filled until the BF-HPS-sensor in the BF-side-tube showeda level increase, what marked the upper end of the BF-slope. Once this point was reached,BF-HPS and BF-laser increased equally and both LM-systems could be cross-calibrated to the0-level of the buffer vessel.
Phase 5: Establish GC-LM Before the liquid level of MU & BF could be increased to theGC-bottom, the GC-vessel had to be pre-filled. Using the volume of one GC-IMT (100 l), theGC-vessel was pre-filled, ensuring the submersion of the HPS-sensors, the XRS-tube and one armof the Loris-tube, which were commonly installed at the deepest point of the GC-vessel.
Since the geometry of the GC-vessel prevented the installation of a direct laser measurement,the GC-liquid level had to be translated. This translation was done by the Loris-tube (forfurther description, see section 7.3.1), which would automatically have equalized any liquid leveldifferences between the pipes and the GC-vessels, what allowed to translate the liquid level. Theupper-parts of the Loris-tube are presented in figure 7.19, while the lower-parts are indicated infigure 8.4.
Once both ends of the Loris-tube were sufficiently submerged (pre-filling of GC-vessel with 100 land the GC-guide-tube with 8 l), the up-side-down-siphon was established. In consequence, theliquid levels in the fully filled guide-tubes were translated into the GC-vessels until the differencewas equalized. The laser in the tubes indicated a falling level and stopped when both levels wereequal. This self-adjusted-level marked the pre-filling level in the gamma catcher. Knowing inaddition the geometry of the vessel and the inserted volume, allowed to calculate the pre-fillinglevel, and subsequently to define the 0-level in the gamma catcher.
Using this sequence, the GC-vessel was pre-filled in IMT mode and the Loris-tube was estab-lished. According to the geometric calculation, the pre-filling level correlated to 108 l was 35 mm.After the levels were equalized, the GC-HPS showed showed 33 mm. Using this level, the 0-levelof the GC could be defined and both LM-systems could be cross-calibrated and additionallycross-checked by the XRS-system.
Phase 6-8 level: 585-1635 mm
876
BF>GC=MU
+10 mm
Figure 8.5: Phase 6: homogeneous increase of MU- & BF-level to the bottom-slope of the GC-vessel;Phase 7: liquid level adjustment of the BF-level to the 0-level of the gamma catcher; Phase 8: pre-fillingof the NT-vessel including the establishment of the NT-LM (Tamago).
Phase 6: Increase LL to GC-bottom After pre-filling of the gamma catcher, the liquid levelsof MU & BF could be homogeneously increased, maintaining the previously adjusted 10 mm-liquid-level difference. With monitoring the level difference, the filling of the next 1000 mm untilthe GC-slope was not critical and could be realized in continuous mode. In order to increase
135
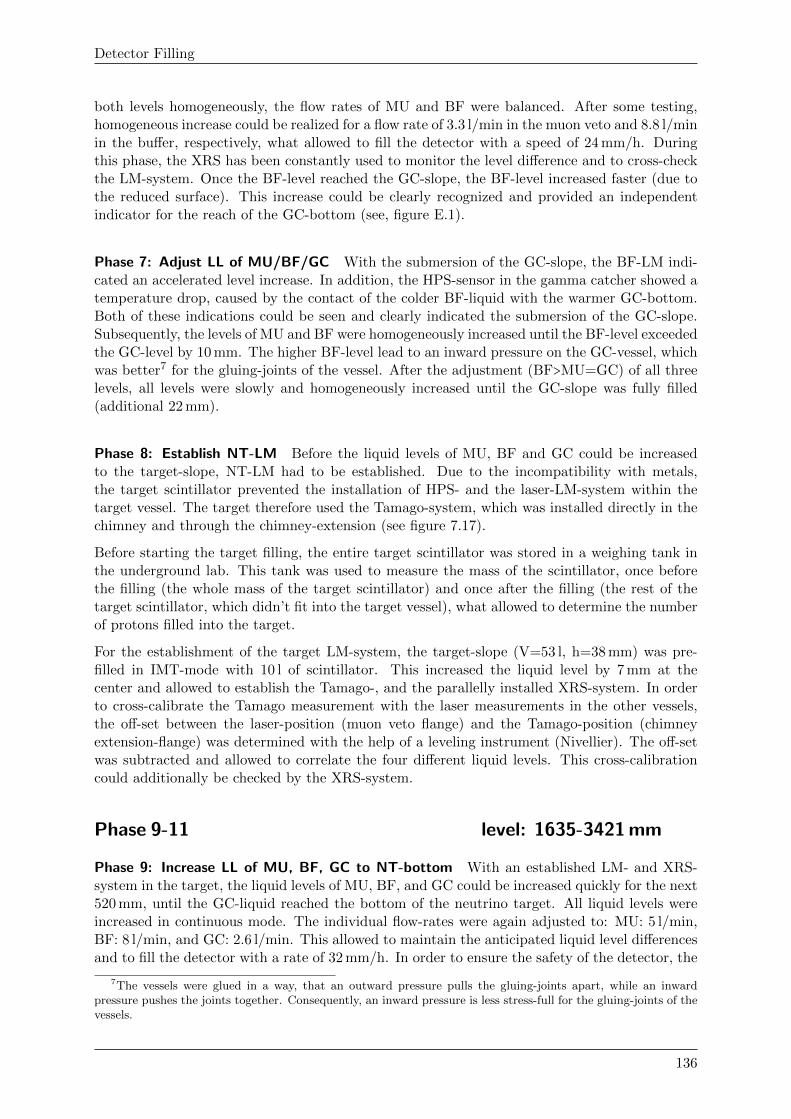
Detector Filling
both levels homogeneously, the flow rates of MU and BF were balanced. After some testing,homogeneous increase could be realized for a flow rate of 3.3 l/min in the muon veto and 8.8 l/minin the buffer, respectively, what allowed to fill the detector with a speed of 24 mm/h. Duringthis phase, the XRS has been constantly used to monitor the level difference and to cross-checkthe LM-system. Once the BF-level reached the GC-slope, the BF-level increased faster (due tothe reduced surface). This increase could be clearly recognized and provided an independentindicator for the reach of the GC-bottom (see, figure E.1).
Phase 7: Adjust LL of MU/BF/GC With the submersion of the GC-slope, the BF-LM indi-cated an accelerated level increase. In addition, the HPS-sensor in the gamma catcher showed atemperature drop, caused by the contact of the colder BF-liquid with the warmer GC-bottom.Both of these indications could be seen and clearly indicated the submersion of the GC-slope.Subsequently, the levels of MU and BF were homogeneously increased until the BF-level exceededthe GC-level by 10 mm. The higher BF-level lead to an inward pressure on the GC-vessel, whichwas better7 for the gluing-joints of the vessel. After the adjustment (BF>MU=GC) of all threelevels, all levels were slowly and homogeneously increased until the GC-slope was fully filled(additional 22 mm).
Phase 8: Establish NT-LM Before the liquid levels of MU, BF and GC could be increasedto the target-slope, NT-LM had to be established. Due to the incompatibility with metals,the target scintillator prevented the installation of HPS- and the laser-LM-system within thetarget vessel. The target therefore used the Tamago-system, which was installed directly in thechimney and through the chimney-extension (see figure 7.17).
Before starting the target filling, the entire target scintillator was stored in a weighing tank inthe underground lab. This tank was used to measure the mass of the scintillator, once beforethe filling (the whole mass of the target scintillator) and once after the filling (the rest of thetarget scintillator, which didn’t fit into the target vessel), what allowed to determine the numberof protons filled into the target.
For the establishment of the target LM-system, the target-slope (V=53 l, h=38 mm) was pre-filled in IMT-mode with 10 l of scintillator. This increased the liquid level by 7 mm at thecenter and allowed to establish the Tamago-, and the parallelly installed XRS-system. In orderto cross-calibrate the Tamago measurement with the laser measurements in the other vessels,the off-set between the laser-position (muon veto flange) and the Tamago-position (chimneyextension-flange) was determined with the help of a leveling instrument (Nivellier). The off-setwas subtracted and allowed to correlate the four different liquid levels. This cross-calibrationcould additionally be checked by the XRS-system.
Phase 9-11 level: 1635-3421 mm
Phase 9: Increase LL of MU, BF, GC to NT-bottom With an established LM- and XRS-system in the target, the liquid levels of MU, BF, and GC could be increased quickly for the next520 mm, until the GC-liquid reached the bottom of the neutrino target. All liquid levels wereincreased in continuous mode. The individual flow-rates were again adjusted to: MU: 5 l/min,BF: 8 l/min, and GC: 2.6 l/min. This allowed to maintain the anticipated liquid level differencesand to fill the detector with a rate of 32 mm/h. In order to ensure the safety of the detector, the
7The vessels were glued in a way, that an outward pressure pulls the gluing-joints apart, while an inwardpressure pushes the joints together. Consequently, an inward pressure is less stress-full for the gluing-joints of thevessels.
136
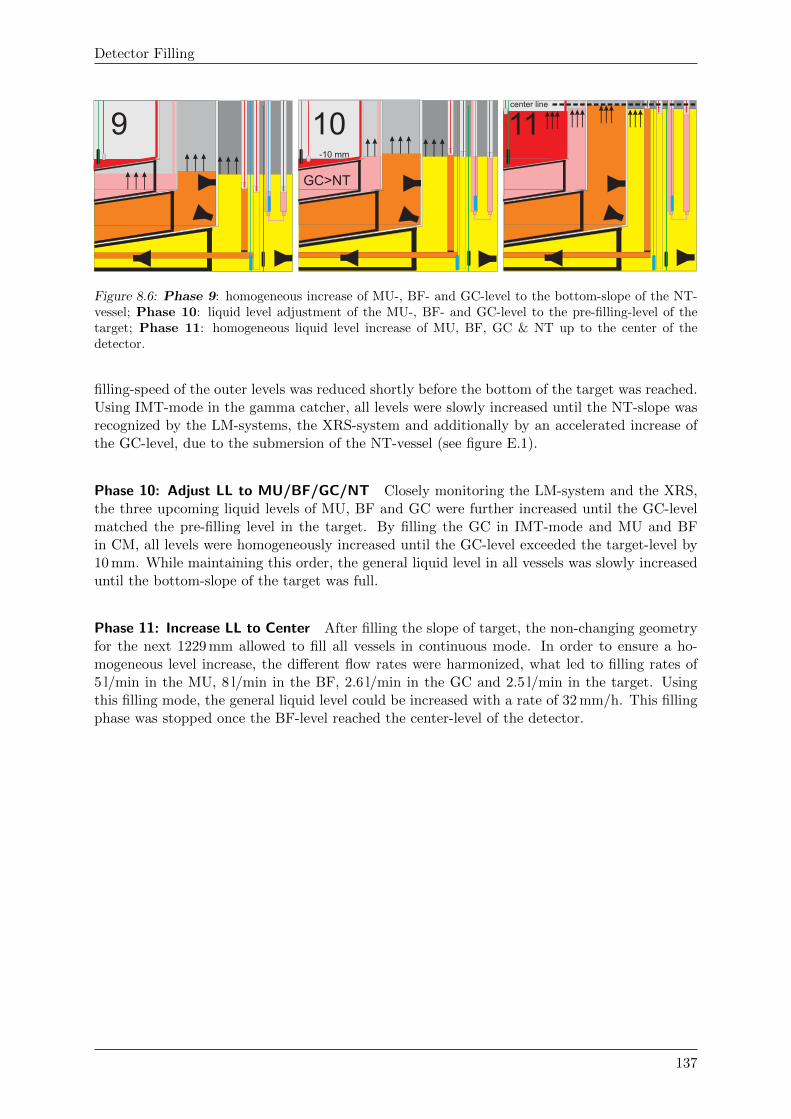
Detector Filling
9 10 11
10
-10 mm
GC>NT
center line
Figure 8.6: Phase 9: homogeneous increase of MU-, BF- and GC-level to the bottom-slope of the NT-vessel; Phase 10: liquid level adjustment of the MU-, BF- and GC-level to the pre-filling-level of thetarget; Phase 11: homogeneous liquid level increase of MU, BF, GC & NT up to the center of thedetector.
filling-speed of the outer levels was reduced shortly before the bottom of the target was reached.Using IMT-mode in the gamma catcher, all levels were slowly increased until the NT-slope wasrecognized by the LM-systems, the XRS-system and additionally by an accelerated increase ofthe GC-level, due to the submersion of the NT-vessel (see figure E.1).
Phase 10: Adjust LL to MU/BF/GC/NT Closely monitoring the LM-system and the XRS,the three upcoming liquid levels of MU, BF and GC were further increased until the GC-levelmatched the pre-filling level in the target. By filling the GC in IMT-mode and MU and BFin CM, all levels were homogeneously increased until the GC-level exceeded the target-level by10 mm. While maintaining this order, the general liquid level in all vessels was slowly increaseduntil the bottom-slope of the target was full.
Phase 11: Increase LL to Center After filling the slope of target, the non-changing geometryfor the next 1229 mm allowed to fill all vessels in continuous mode. In order to ensure a ho-mogeneous level increase, the different flow rates were harmonized, what led to filling rates of5 l/min in the MU, 8 l/min in the BF, 2.6 l/min in the GC and 2.5 l/min in the target. Usingthis filling mode, the general liquid level could be increased with a rate of 32 mm/h. This fillingphase was stopped once the BF-level reached the center-level of the detector.
137
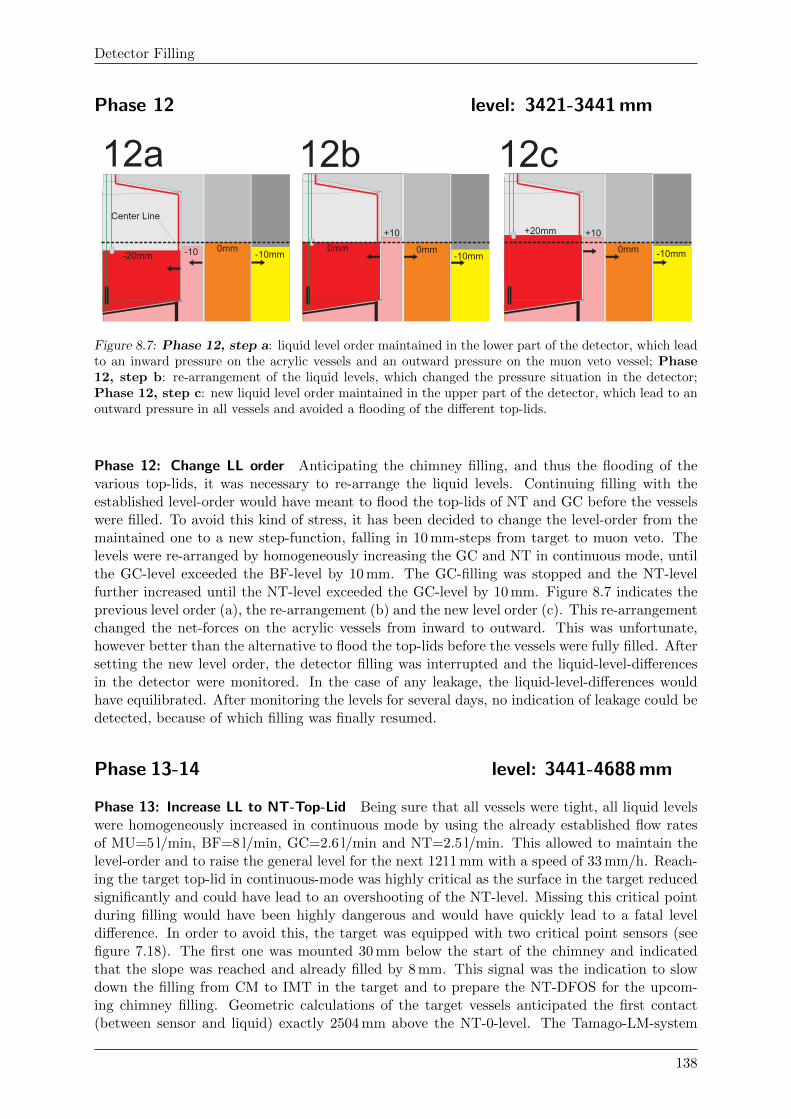
Detector Filling
Phase 12 level: 3421-3441 mm
12a 12b 12c
Center Line
-20mm -10 0mm-10mm -10mm
0mm
+10
0mm-10mm0mm
+10+20mm
Figure 8.7: Phase 12, step a: liquid level order maintained in the lower part of the detector, which leadto an inward pressure on the acrylic vessels and an outward pressure on the muon veto vessel; Phase12, step b: re-arrangement of the liquid levels, which changed the pressure situation in the detector;Phase 12, step c: new liquid level order maintained in the upper part of the detector, which lead to anoutward pressure in all vessels and avoided a flooding of the different top-lids.
Phase 12: Change LL order Anticipating the chimney filling, and thus the flooding of thevarious top-lids, it was necessary to re-arrange the liquid levels. Continuing filling with theestablished level-order would have meant to flood the top-lids of NT and GC before the vesselswere filled. To avoid this kind of stress, it has been decided to change the level-order from themaintained one to a new step-function, falling in 10 mm-steps from target to muon veto. Thelevels were re-arranged by homogeneously increasing the GC and NT in continuous mode, untilthe GC-level exceeded the BF-level by 10 mm. The GC-filling was stopped and the NT-levelfurther increased until the NT-level exceeded the GC-level by 10 mm. Figure 8.7 indicates theprevious level order (a), the re-arrangement (b) and the new level order (c). This re-arrangementchanged the net-forces on the acrylic vessels from inward to outward. This was unfortunate,however better than the alternative to flood the top-lids before the vessels were fully filled. Aftersetting the new level order, the detector filling was interrupted and the liquid-level-differencesin the detector were monitored. In the case of any leakage, the liquid-level-differences wouldhave equilibrated. After monitoring the levels for several days, no indication of leakage could bedetected, because of which filling was finally resumed.
Phase 13-14 level: 3441-4688 mm
Phase 13: Increase LL to NT-Top-Lid Being sure that all vessels were tight, all liquid levelswere homogeneously increased in continuous mode by using the already established flow ratesof MU=5 l/min, BF=8 l/min, GC=2.6 l/min and NT=2.5 l/min. This allowed to maintain thelevel-order and to raise the general level for the next 1211 mm with a speed of 33 mm/h. Reach-ing the target top-lid in continuous-mode was highly critical as the surface in the target reducedsignificantly and could have lead to an overshooting of the NT-level. Missing this critical pointduring filling would have been highly dangerous and would have quickly lead to a fatal leveldifference. In order to avoid this, the target was equipped with two critical point sensors (seefigure 7.18). The first one was mounted 30 mm below the start of the chimney and indicatedthat the slope was reached and already filled by 8 mm. This signal was the indication to slowdown the filling from CM to IMT in the target and to prepare the NT-DFOS for the upcom-ing chimney filling. Geometric calculations of the target vessels anticipated the first contact(between sensor and liquid) exactly 2504 mm above the NT-0-level. The Tamago-LM-system
138
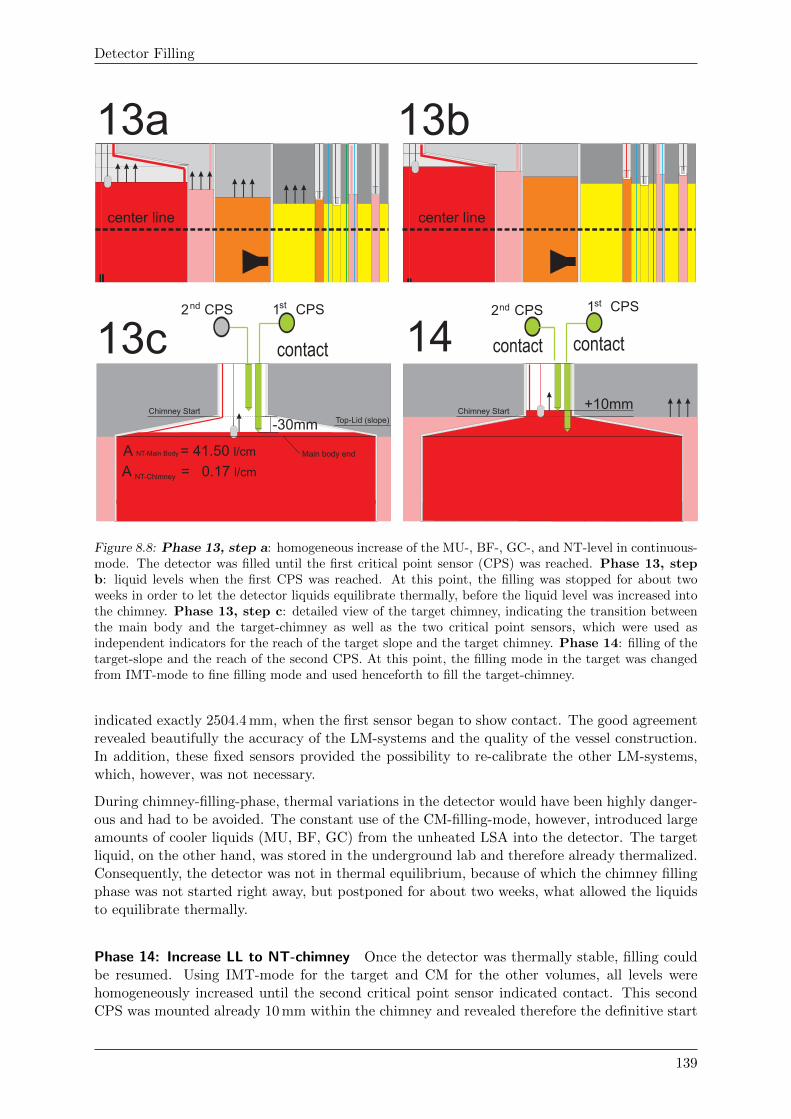
Detector Filling
13a 13b
center linecenter line
contact14 contact contact
1 CPSst2 CPSnd nd 1 CPSst2 CPS
Chimney Start
-30mmChimney Start
+10mm
13c
A NT-Main Body = 41.50 l/cm
A = 0.17 l/cmNT-Chimney
Main body end
Top-Lid (slope)
Figure 8.8: Phase 13, step a: homogeneous increase of the MU-, BF-, GC-, and NT-level in continuous-mode. The detector was filled until the first critical point sensor (CPS) was reached. Phase 13, stepb: liquid levels when the first CPS was reached. At this point, the filling was stopped for about twoweeks in order to let the detector liquids equilibrate thermally, before the liquid level was increased intothe chimney. Phase 13, step c: detailed view of the target chimney, indicating the transition betweenthe main body and the target-chimney as well as the two critical point sensors, which were used asindependent indicators for the reach of the target slope and the target chimney. Phase 14: filling of thetarget-slope and the reach of the second CPS. At this point, the filling mode in the target was changedfrom IMT-mode to fine filling mode and used henceforth to fill the target-chimney.
indicated exactly 2504.4 mm, when the first sensor began to show contact. The good agreementrevealed beautifully the accuracy of the LM-systems and the quality of the vessel construction.In addition, these fixed sensors provided the possibility to re-calibrate the other LM-systems,which, however, was not necessary.
During chimney-filling-phase, thermal variations in the detector would have been highly danger-ous and had to be avoided. The constant use of the CM-filling-mode, however, introduced largeamounts of cooler liquids (MU, BF, GC) from the unheated LSA into the detector. The targetliquid, on the other hand, was stored in the underground lab and therefore already thermalized.Consequently, the detector was not in thermal equilibrium, because of which the chimney fillingphase was not started right away, but postponed for about two weeks, what allowed the liquidsto equilibrate thermally.
Phase 14: Increase LL to NT-chimney Once the detector was thermally stable, filling couldbe resumed. Using IMT-mode for the target and CM for the other volumes, all levels werehomogeneously increased until the second critical point sensor indicated contact. This secondCPS was mounted already 10 mm within the chimney and revealed therefore the definitive start
139
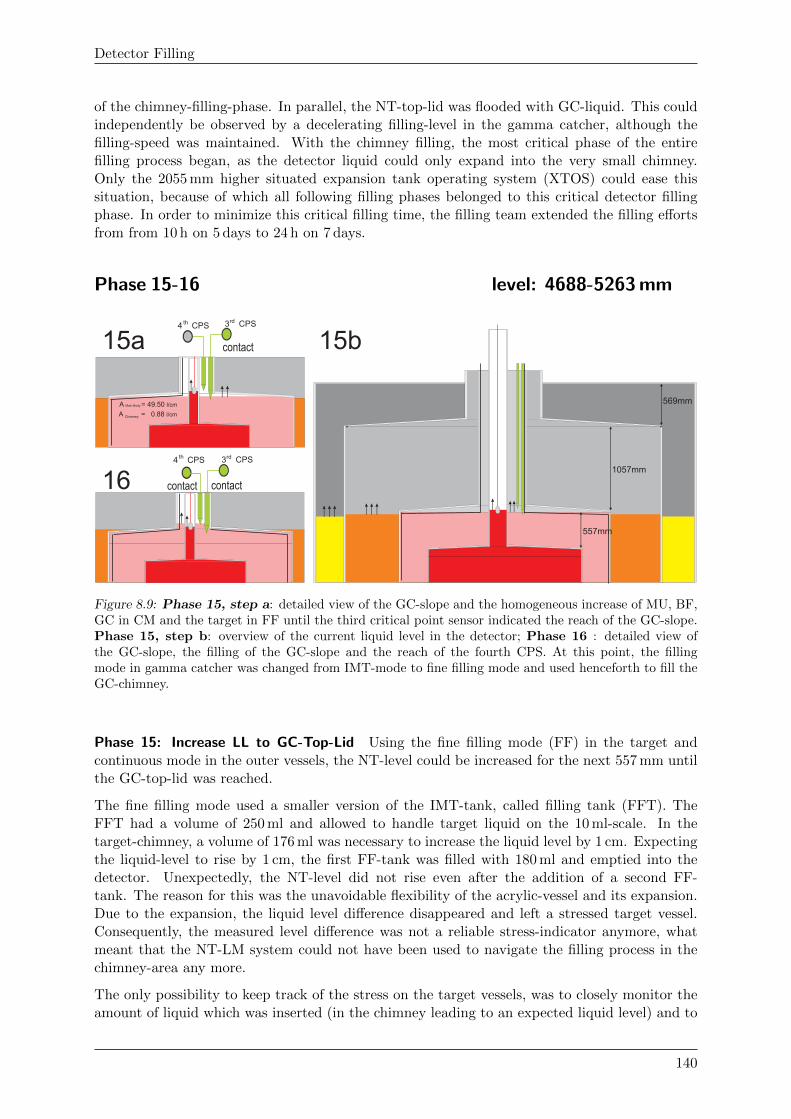
Detector Filling
of the chimney-filling-phase. In parallel, the NT-top-lid was flooded with GC-liquid. This couldindependently be observed by a decelerating filling-level in the gamma catcher, although thefilling-speed was maintained. With the chimney filling, the most critical phase of the entirefilling process began, as the detector liquid could only expand into the very small chimney.Only the 2055 mm higher situated expansion tank operating system (XTOS) could ease thissituation, because of which all following filling phases belonged to this critical detector fillingphase. In order to minimize this critical filling time, the filling team extended the filling effortsfrom from 10 h on 5 days to 24 h on 7 days.
Phase 15-16 level: 4688-5263 mm
contact contact
15a
16
contact
th 3 CPSrd4 CPS
th 3 CPSrd4 CPS
15b
569mm
1057mm
557mm
A Main Body = 49.50 l/cm
A = 0.88 l/cmChimney
Figure 8.9: Phase 15, step a: detailed view of the GC-slope and the homogeneous increase of MU, BF,GC in CM and the target in FF until the third critical point sensor indicated the reach of the GC-slope.Phase 15, step b: overview of the current liquid level in the detector; Phase 16 : detailed view ofthe GC-slope, the filling of the GC-slope and the reach of the fourth CPS. At this point, the fillingmode in gamma catcher was changed from IMT-mode to fine filling mode and used henceforth to fill theGC-chimney.
Phase 15: Increase LL to GC-Top-Lid Using the fine filling mode (FF) in the target andcontinuous mode in the outer vessels, the NT-level could be increased for the next 557 mm untilthe GC-top-lid was reached.
The fine filling mode used a smaller version of the IMT-tank, called filling tank (FFT). TheFFT had a volume of 250 ml and allowed to handle target liquid on the 10 ml-scale. In thetarget-chimney, a volume of 176 ml was necessary to increase the liquid level by 1 cm. Expectingthe liquid-level to rise by 1 cm, the first FF-tank was filled with 180 ml and emptied into thedetector. Unexpectedly, the NT-level did not rise even after the addition of a second FF-tank. The reason for this was the unavoidable flexibility of the acrylic-vessel and its expansion.Due to the expansion, the liquid level difference disappeared and left a stressed target vessel.Consequently, the measured level difference was not a reliable stress-indicator anymore, whatmeant that the NT-LM system could not have been used to navigate the filling process in thechimney-area any more.
The only possibility to keep track of the stress on the target vessels, was to closely monitor theamount of liquid which was inserted (in the chimney leading to an expected liquid level) and to
140
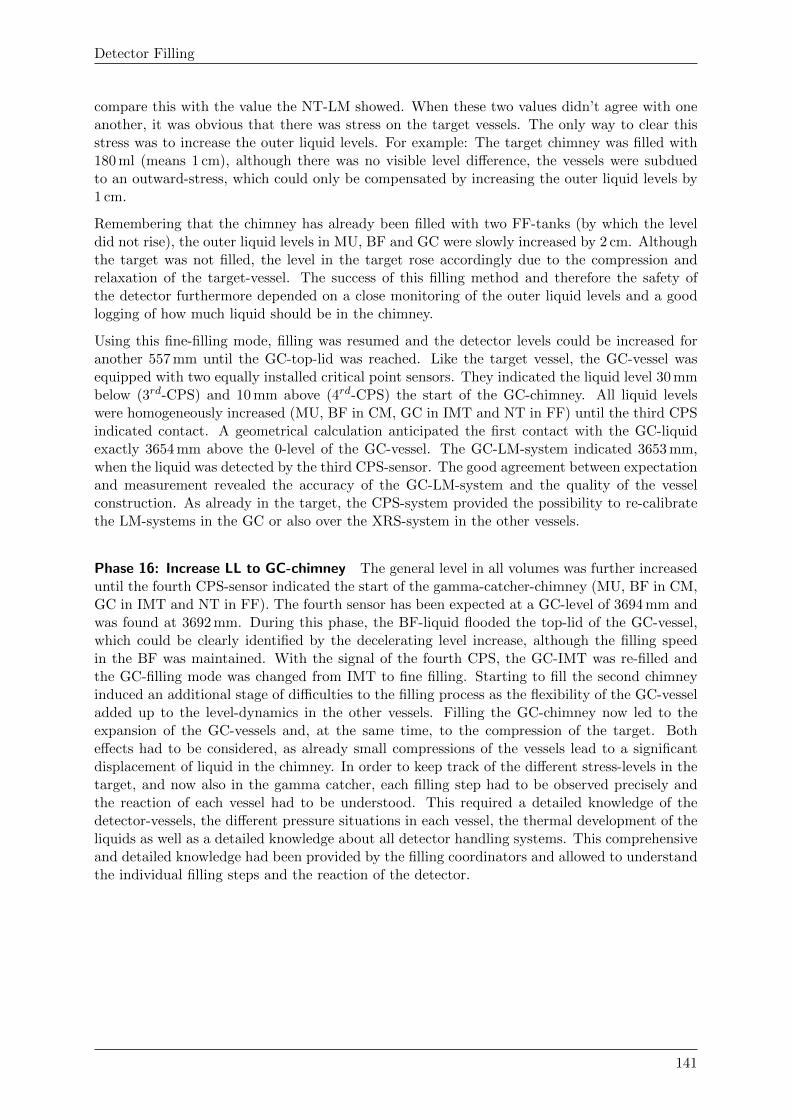
Detector Filling
compare this with the value the NT-LM showed. When these two values didn’t agree with oneanother, it was obvious that there was stress on the target vessels. The only way to clear thisstress was to increase the outer liquid levels. For example: The target chimney was filled with180 ml (means 1 cm), although there was no visible level difference, the vessels were subduedto an outward-stress, which could only be compensated by increasing the outer liquid levels by1 cm.
Remembering that the chimney has already been filled with two FF-tanks (by which the leveldid not rise), the outer liquid levels in MU, BF and GC were slowly increased by 2 cm. Althoughthe target was not filled, the level in the target rose accordingly due to the compression andrelaxation of the target-vessel. The success of this filling method and therefore the safety ofthe detector furthermore depended on a close monitoring of the outer liquid levels and a goodlogging of how much liquid should be in the chimney.
Using this fine-filling mode, filling was resumed and the detector levels could be increased foranother 557 mm until the GC-top-lid was reached. Like the target vessel, the GC-vessel wasequipped with two equally installed critical point sensors. They indicated the liquid level 30 mmbelow (3rd-CPS) and 10 mm above (4rd-CPS) the start of the GC-chimney. All liquid levelswere homogeneously increased (MU, BF in CM, GC in IMT and NT in FF) until the third CPSindicated contact. A geometrical calculation anticipated the first contact with the GC-liquidexactly 3654 mm above the 0-level of the GC-vessel. The GC-LM-system indicated 3653 mm,when the liquid was detected by the third CPS-sensor. The good agreement between expectationand measurement revealed the accuracy of the GC-LM-system and the quality of the vesselconstruction. As already in the target, the CPS-system provided the possibility to re-calibratethe LM-systems in the GC or also over the XRS-system in the other vessels.
Phase 16: Increase LL to GC-chimney The general level in all volumes was further increaseduntil the fourth CPS-sensor indicated the start of the gamma-catcher-chimney (MU, BF in CM,GC in IMT and NT in FF). The fourth sensor has been expected at a GC-level of 3694 mm andwas found at 3692 mm. During this phase, the BF-liquid flooded the top-lid of the GC-vessel,which could be clearly identified by the decelerating level increase, although the filling speedin the BF was maintained. With the signal of the fourth CPS, the GC-IMT was re-filled andthe GC-filling mode was changed from IMT to fine filling. Starting to fill the second chimneyinduced an additional stage of difficulties to the filling process as the flexibility of the GC-vesseladded up to the level-dynamics in the other vessels. Filling the GC-chimney now led to theexpansion of the GC-vessels and, at the same time, to the compression of the target. Botheffects had to be considered, as already small compressions of the vessels lead to a significantdisplacement of liquid in the chimney. In order to keep track of the different stress-levels in thetarget, and now also in the gamma catcher, each filling step had to be observed precisely andthe reaction of each vessel had to be understood. This required a detailed knowledge of thedetector-vessels, the different pressure situations in each vessel, the thermal development of theliquids as well as a detailed knowledge about all detector handling systems. This comprehensiveand detailed knowledge had been provided by the filling coordinators and allowed to understandthe individual filling steps and the reaction of the detector.
141
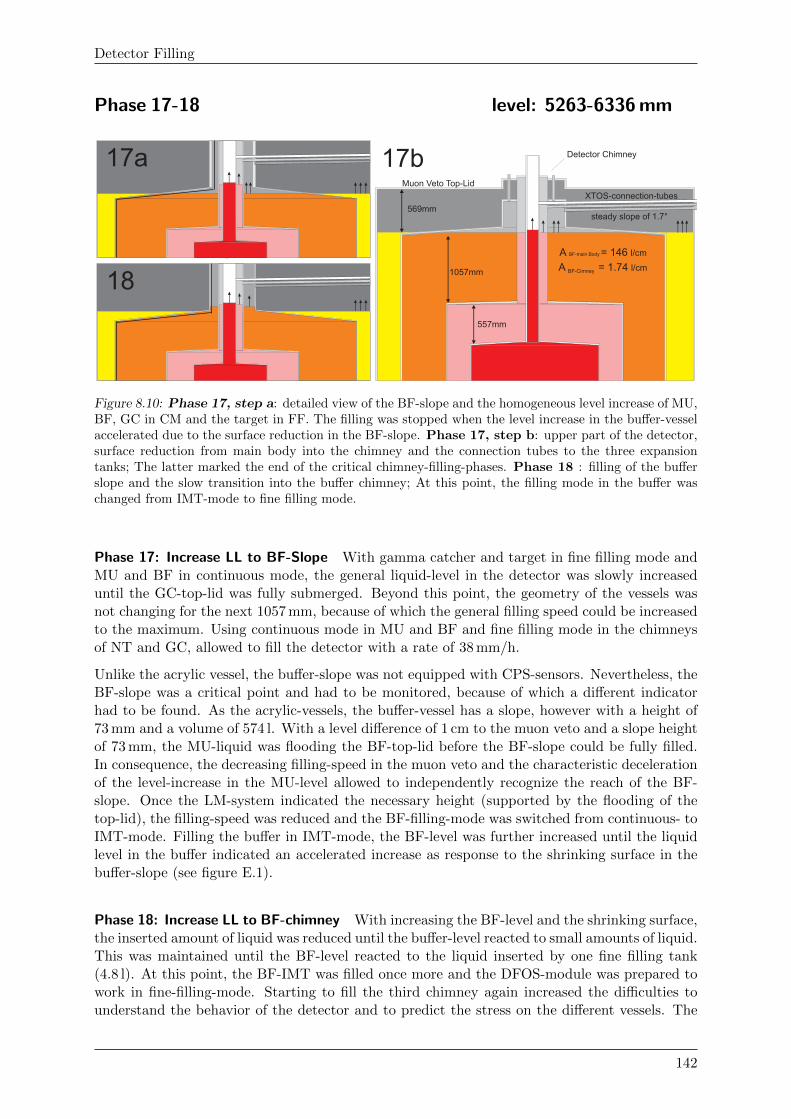
Detector Filling
Phase 17-18 level: 5263-6336 mm
17a 17b
18
XTOS-connection-tubes
A BF-main Body = 146 l/cm
A = 1.74 l/cmBF-Cimney
steady slope of 1.7°569mm
1057mm
557mm
Detector Chimney
Muon Veto Top-Lid
Figure 8.10: Phase 17, step a: detailed view of the BF-slope and the homogeneous level increase of MU,BF, GC in CM and the target in FF. The filling was stopped when the level increase in the buffer-vesselaccelerated due to the surface reduction in the BF-slope. Phase 17, step b: upper part of the detector,surface reduction from main body into the chimney and the connection tubes to the three expansiontanks; The latter marked the end of the critical chimney-filling-phases. Phase 18 : filling of the bufferslope and the slow transition into the buffer chimney; At this point, the filling mode in the buffer waschanged from IMT-mode to fine filling mode.
Phase 17: Increase LL to BF-Slope With gamma catcher and target in fine filling mode andMU and BF in continuous mode, the general liquid-level in the detector was slowly increaseduntil the GC-top-lid was fully submerged. Beyond this point, the geometry of the vessels wasnot changing for the next 1057 mm, because of which the general filling speed could be increasedto the maximum. Using continuous mode in MU and BF and fine filling mode in the chimneysof NT and GC, allowed to fill the detector with a rate of 38 mm/h.
Unlike the acrylic vessel, the buffer-slope was not equipped with CPS-sensors. Nevertheless, theBF-slope was a critical point and had to be monitored, because of which a different indicatorhad to be found. As the acrylic-vessels, the buffer-vessel has a slope, however with a height of73 mm and a volume of 574 l. With a level difference of 1 cm to the muon veto and a slope heightof 73 mm, the MU-liquid was flooding the BF-top-lid before the BF-slope could be fully filled.In consequence, the decreasing filling-speed in the muon veto and the characteristic decelerationof the level-increase in the MU-level allowed to independently recognize the reach of the BF-slope. Once the LM-system indicated the necessary height (supported by the flooding of thetop-lid), the filling-speed was reduced and the BF-filling-mode was switched from continuous- toIMT-mode. Filling the buffer in IMT-mode, the BF-level was further increased until the liquidlevel in the buffer indicated an accelerated increase as response to the shrinking surface in thebuffer-slope (see figure E.1).
Phase 18: Increase LL to BF-chimney With increasing the BF-level and the shrinking surface,the inserted amount of liquid was reduced until the buffer-level reacted to small amounts of liquid.This was maintained until the BF-level reacted to the liquid inserted by one fine filling tank(4.8 l). At this point, the BF-IMT was filled once more and the DFOS-module was prepared towork in fine-filling-mode. Starting to fill the third chimney again increased the difficulties tounderstand the behavior of the detector and to predict the stress on the different vessels. The
142
Detector Filling
filling of one vessel now had measurable impact on three other vessels, which were deformed andaccordingly displaced liquid in all detector vessels.
Phase 19-20 level: 6336-6522 mm
20
19
Final Liquid Level
NTGC
BFMU
XTOS-Tubes
Bottle Neck
XTOS -Tubes
Expansion tank operating system (XTOS)
Final Liquid Level
2cm below MU-TopLid
GC-Bellow
Figure 8.11: Phase 19: 3D-CAD drawing of the upper detector, indicating the different chimneys indetail. The homogeneous level increase to the XTOS-tanks and the bottle-neck in the BF-Chimney isshown. The liquid levels are indicated in their related colors. The buffer chimney can be seen in brown,the GC-chimney in purple and the muon veto is presented in gray, the bottle neck is additionally markedby the black circle. Furthermore, the different XTOS-connection tubes are shown. They have a steadyupward slope of 1.7○ and connect the individual chimneys with the correlated XTOS-tanks; Phase 20:overview of the connection between detector and XTOS, indicating the XTOS-filling phase, realized infine filling mode.
Phase 19: Increase LL to XTOS Filling the three chimneys in fine filling mode and the muonveto in continuous mode allowed to increase the general liquid level towards the expansion tanks,which marked the end of this highly critical chimney-filling-phase. However, the BF-chimneyhas a bottle neck, which had to be passed before the XTOS-tanks could be reached. Figure8.11 indicates a three dimensional CAD-drawing of the upper chimney-area [59]. The liquids ofbuffer and gamma catcher are separated by the GC-chimney and therefore by the flexible GC-bellows. This bellows protected the acrylic vessels from mechanical stress, however, extended
143
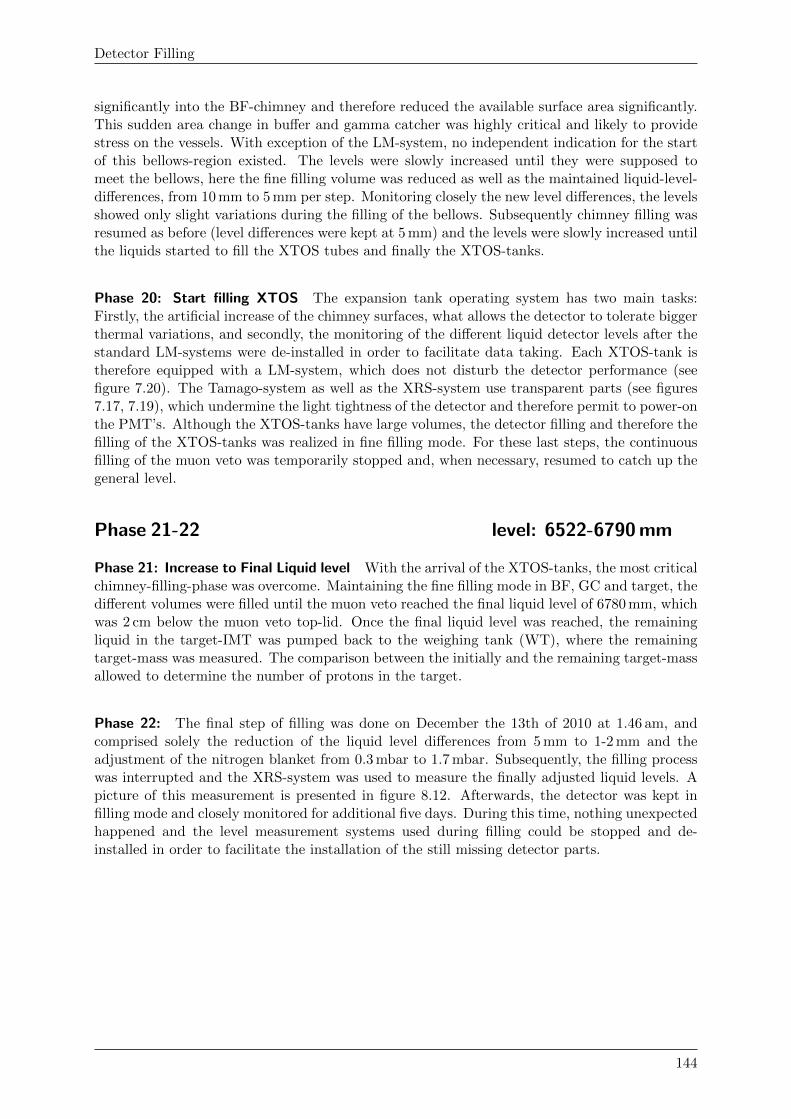
Detector Filling
significantly into the BF-chimney and therefore reduced the available surface area significantly.This sudden area change in buffer and gamma catcher was highly critical and likely to providestress on the vessels. With exception of the LM-system, no independent indication for the startof this bellows-region existed. The levels were slowly increased until they were supposed tomeet the bellows, here the fine filling volume was reduced as well as the maintained liquid-level-differences, from 10 mm to 5 mm per step. Monitoring closely the new level differences, the levelsshowed only slight variations during the filling of the bellows. Subsequently chimney filling wasresumed as before (level differences were kept at 5 mm) and the levels were slowly increased untilthe liquids started to fill the XTOS tubes and finally the XTOS-tanks.
Phase 20: Start filling XTOS The expansion tank operating system has two main tasks:Firstly, the artificial increase of the chimney surfaces, what allows the detector to tolerate biggerthermal variations, and secondly, the monitoring of the different liquid detector levels after thestandard LM-systems were de-installed in order to facilitate data taking. Each XTOS-tank istherefore equipped with a LM-system, which does not disturb the detector performance (seefigure 7.20). The Tamago-system as well as the XRS-system use transparent parts (see figures7.17, 7.19), which undermine the light tightness of the detector and therefore permit to power-onthe PMT’s. Although the XTOS-tanks have large volumes, the detector filling and therefore thefilling of the XTOS-tanks was realized in fine filling mode. For these last steps, the continuousfilling of the muon veto was temporarily stopped and, when necessary, resumed to catch up thegeneral level.
Phase 21-22 level: 6522-6790 mm
Phase 21: Increase to Final Liquid level With the arrival of the XTOS-tanks, the most criticalchimney-filling-phase was overcome. Maintaining the fine filling mode in BF, GC and target, thedifferent volumes were filled until the muon veto reached the final liquid level of 6780 mm, whichwas 2 cm below the muon veto top-lid. Once the final liquid level was reached, the remainingliquid in the target-IMT was pumped back to the weighing tank (WT), where the remainingtarget-mass was measured. The comparison between the initially and the remaining target-massallowed to determine the number of protons in the target.
Phase 22: The final step of filling was done on December the 13th of 2010 at 1.46 am, andcomprised solely the reduction of the liquid level differences from 5 mm to 1-2 mm and theadjustment of the nitrogen blanket from 0.3 mbar to 1.7 mbar. Subsequently, the filling processwas interrupted and the XRS-system was used to measure the finally adjusted liquid levels. Apicture of this measurement is presented in figure 8.12. Afterwards, the detector was kept infilling mode and closely monitored for additional five days. During this time, nothing unexpectedhappened and the level measurement systems used during filling could be stopped and de-installed in order to facilitate the installation of the still missing detector parts.
144
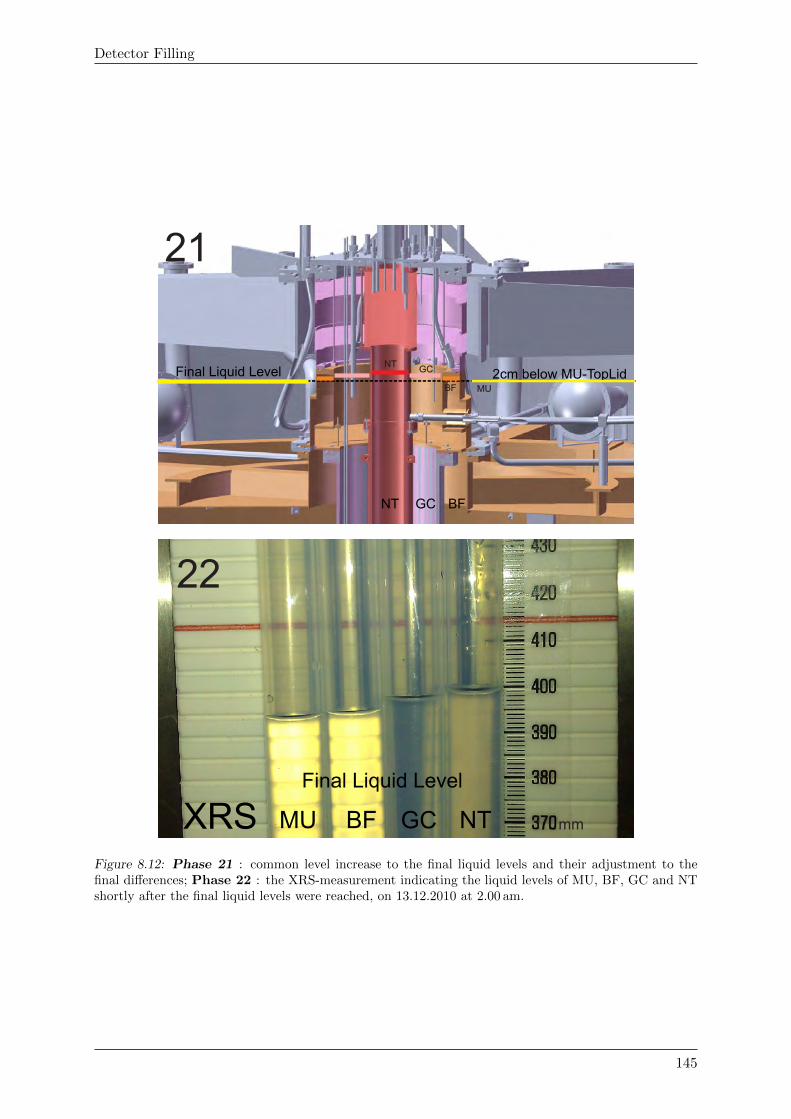
Detector Filling
NTGCBFMUXRS
Final Liquid Level
NT GC BF
2cm below MU-TopLidNT
GC
BF MU
21
22
Final Liquid Level
mm
Figure 8.12: Phase 21 : common level increase to the final liquid levels and their adjustment to thefinal differences; Phase 22 : the XRS-measurement indicating the liquid levels of MU, BF, GC and NTshortly after the final liquid levels were reached, on 13.12.2010 at 2.00 am.
145
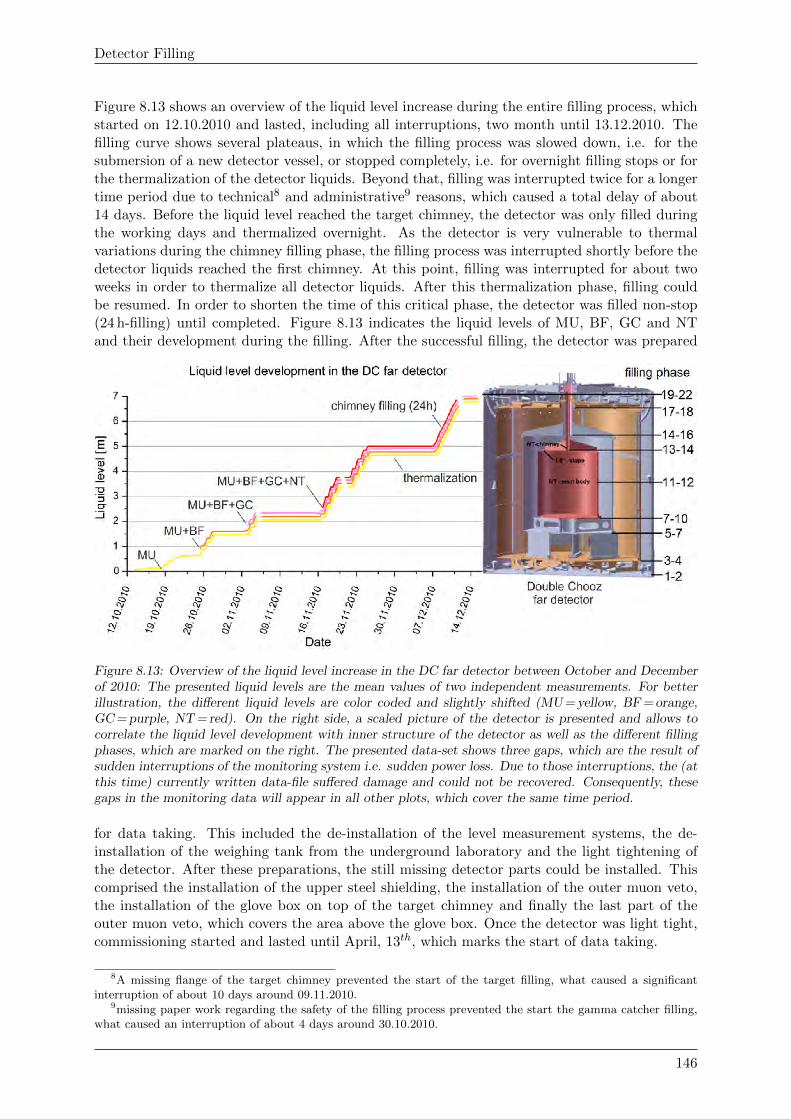
Detector Filling
Figure 8.13 shows an overview of the liquid level increase during the entire filling process, whichstarted on 12.10.2010 and lasted, including all interruptions, two month until 13.12.2010. Thefilling curve shows several plateaus, in which the filling process was slowed down, i.e. for thesubmersion of a new detector vessel, or stopped completely, i.e. for overnight filling stops or forthe thermalization of the detector liquids. Beyond that, filling was interrupted twice for a longertime period due to technical8 and administrative9 reasons, which caused a total delay of about14 days. Before the liquid level reached the target chimney, the detector was only filled duringthe working days and thermalized overnight. As the detector is very vulnerable to thermalvariations during the chimney filling phase, the filling process was interrupted shortly before thedetector liquids reached the first chimney. At this point, filling was interrupted for about twoweeks in order to thermalize all detector liquids. After this thermalization phase, filling couldbe resumed. In order to shorten the time of this critical phase, the detector was filled non-stop(24 h-filling) until completed. Figure 8.13 indicates the liquid levels of MU, BF, GC and NTand their development during the filling. After the successful filling, the detector was prepared
Figure 8.13: Overview of the liquid level increase in the DC far detector between October and Decemberof 2010: The presented liquid levels are the mean values of two independent measurements. For betterillustration, the different liquid levels are color coded and slightly shifted (MU = yellow, BF = orange,GC = purple, NT = red). On the right side, a scaled picture of the detector is presented and allows tocorrelate the liquid level development with inner structure of the detector as well as the different fillingphases, which are marked on the right. The presented data-set shows three gaps, which are the result ofsudden interruptions of the monitoring system i.e. sudden power loss. Due to those interruptions, the (atthis time) currently written data-file suffered damage and could not be recovered. Consequently, thesegaps in the monitoring data will appear in all other plots, which cover the same time period.
for data taking. This included the de-installation of the level measurement systems, the de-installation of the weighing tank from the underground laboratory and the light tightening ofthe detector. After these preparations, the still missing detector parts could be installed. Thiscomprised the installation of the upper steel shielding, the installation of the outer muon veto,the installation of the glove box on top of the target chimney and finally the last part of theouter muon veto, which covers the area above the glove box. Once the detector was light tight,commissioning started and lasted until April, 13th, which marks the start of data taking.
8A missing flange of the target chimney prevented the start of the target filling, what caused a significantinterruption of about 10 days around 09.11.2010.
9missing paper work regarding the safety of the filling process prevented the start the gamma catcher filling,what caused an interruption of about 4 days around 30.10.2010.
146

Part IV
Performance and Results
147
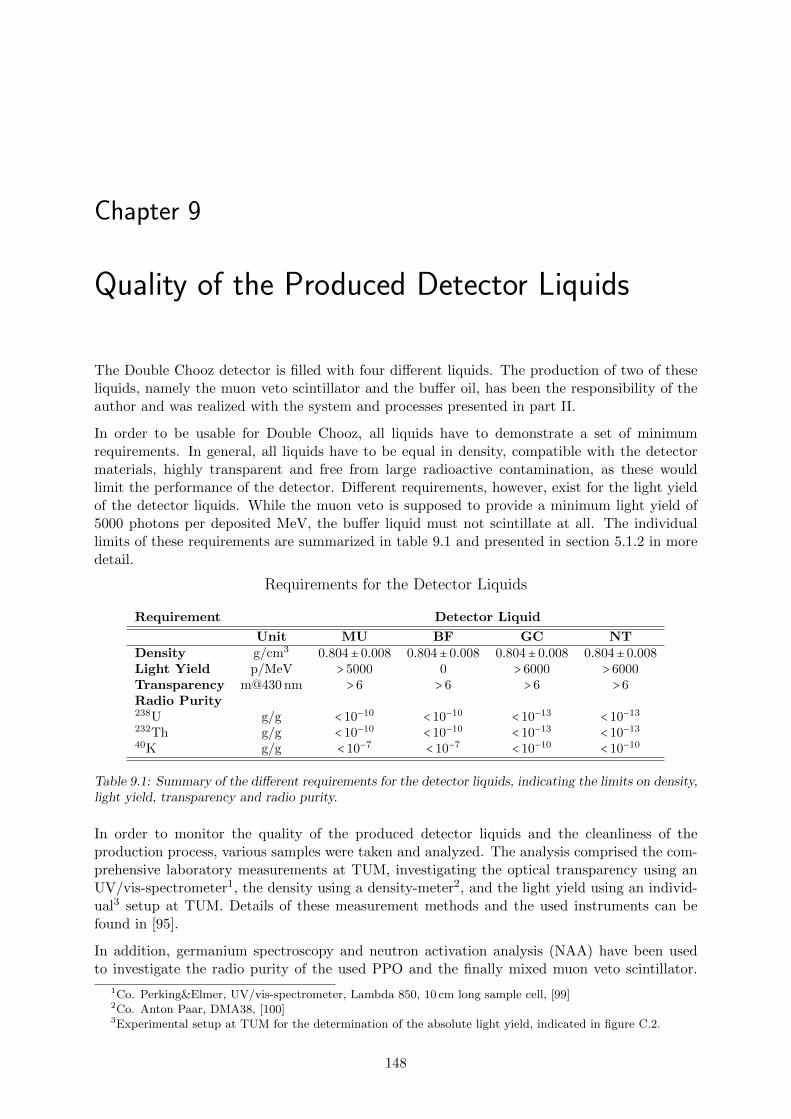
Chapter 9
Quality of the Produced Detector Liquids
The Double Chooz detector is filled with four different liquids. The production of two of theseliquids, namely the muon veto scintillator and the buffer oil, has been the responsibility of theauthor and was realized with the system and processes presented in part II.
In order to be usable for Double Chooz, all liquids have to demonstrate a set of minimumrequirements. In general, all liquids have to be equal in density, compatible with the detectormaterials, highly transparent and free from large radioactive contamination, as these wouldlimit the performance of the detector. Different requirements, however, exist for the light yieldof the detector liquids. While the muon veto is supposed to provide a minimum light yield of5000 photons per deposited MeV, the buffer liquid must not scintillate at all. The individuallimits of these requirements are summarized in table 9.1 and presented in section 5.1.2 in moredetail.
Requirements for the Detector Liquids
Requirement Detector Liquid
Unit MU BF GC NTDensity g/cm3 0.804± 0.008 0.804± 0.008 0.804± 0.008 0.804± 0.008Light Yield p/MeV > 5000 0 > 6000 > 6000Transparency m@430 nm > 6 > 6 > 6 > 6Radio Purity238U g/g < 10−10 < 10−10 < 10−13 < 10−13232Th g/g < 10−10 < 10−10 < 10−13 < 10−1340K g/g < 10−7 < 10−7 < 10−10 < 10−10
Table 9.1: Summary of the different requirements for the detector liquids, indicating the limits on density,light yield, transparency and radio purity.
In order to monitor the quality of the produced detector liquids and the cleanliness of theproduction process, various samples were taken and analyzed. The analysis comprised the com-prehensive laboratory measurements at TUM, investigating the optical transparency using anUV/vis-spectrometer1, the density using a density-meter2, and the light yield using an individ-ual3 setup at TUM. Details of these measurement methods and the used instruments can befound in [95].
In addition, germanium spectroscopy and neutron activation analysis (NAA) have been usedto investigate the radio purity of the used PPO and the finally mixed muon veto scintillator.
1Co. Perking&Elmer, UV/vis-spectrometer, Lambda 850, 10 cm long sample cell, [99]2Co. Anton Paar, DMA38, [100]3Experimental setup at TUM for the determination of the absolute light yield, indicated in figure C.2.
148
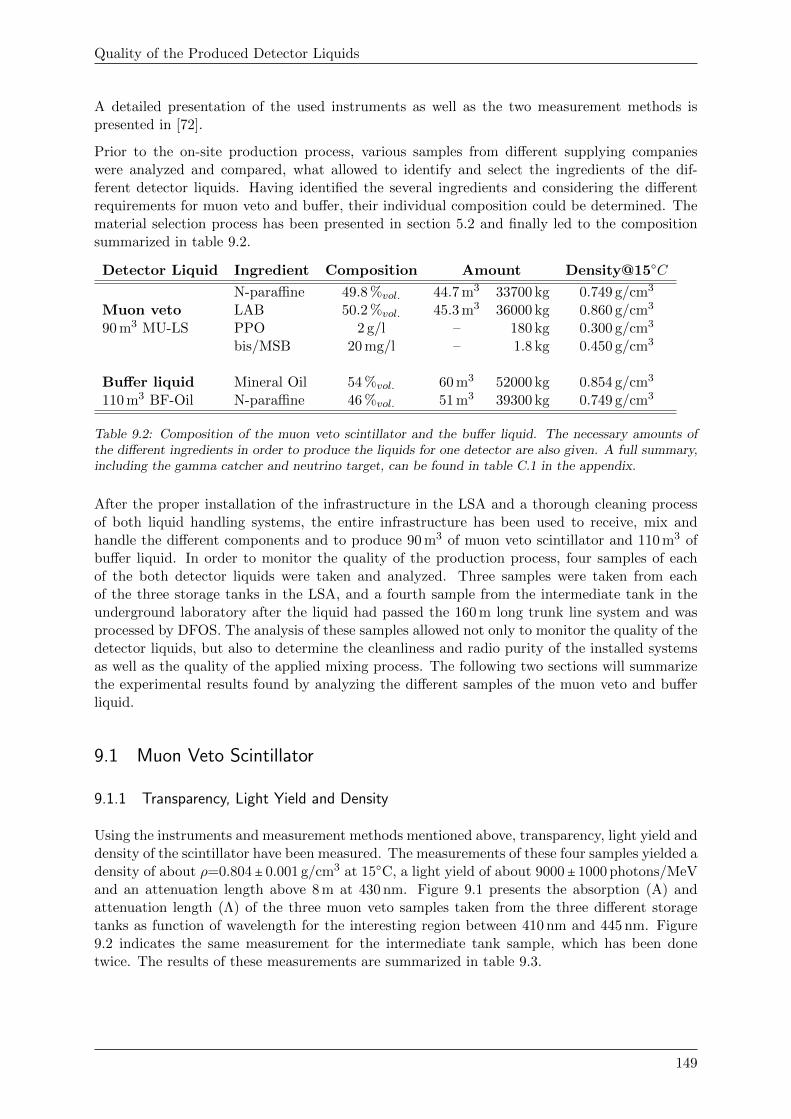
Quality of the Produced Detector Liquids
A detailed presentation of the used instruments as well as the two measurement methods ispresented in [72].
Prior to the on-site production process, various samples from different supplying companieswere analyzed and compared, what allowed to identify and select the ingredients of the dif-ferent detector liquids. Having identified the several ingredients and considering the differentrequirements for muon veto and buffer, their individual composition could be determined. Thematerial selection process has been presented in section 5.2 and finally led to the compositionsummarized in table 9.2.
Detector Liquid Ingredient Composition Amount Density@15○C
N-paraffine 49.8 %vol. 44.7 m3 33700 kg 0.749 g/cm3
Muon veto LAB 50.2 %vol. 45.3 m3 36000 kg 0.860 g/cm3
90 m3 MU-LS PPO 2 g/l – 180 kg 0.300 g/cm3
bis/MSB 20 mg/l – 1.8 kg 0.450 g/cm3
Buffer liquid Mineral Oil 54 %vol. 60 m3 52000 kg 0.854 g/cm3
110 m3 BF-Oil N-paraffine 46 %vol. 51 m3 39300 kg 0.749 g/cm3
Table 9.2: Composition of the muon veto scintillator and the buffer liquid. The necessary amounts ofthe different ingredients in order to produce the liquids for one detector are also given. A full summary,including the gamma catcher and neutrino target, can be found in table C.1 in the appendix.
After the proper installation of the infrastructure in the LSA and a thorough cleaning processof both liquid handling systems, the entire infrastructure has been used to receive, mix andhandle the different components and to produce 90 m3 of muon veto scintillator and 110 m3 ofbuffer liquid. In order to monitor the quality of the production process, four samples of eachof the both detector liquids were taken and analyzed. Three samples were taken from eachof the three storage tanks in the LSA, and a fourth sample from the intermediate tank in theunderground laboratory after the liquid had passed the 160 m long trunk line system and wasprocessed by DFOS. The analysis of these samples allowed not only to monitor the quality of thedetector liquids, but also to determine the cleanliness and radio purity of the installed systemsas well as the quality of the applied mixing process. The following two sections will summarizethe experimental results found by analyzing the different samples of the muon veto and bufferliquid.
9.1 Muon Veto Scintillator
9.1.1 Transparency, Light Yield and Density
Using the instruments and measurement methods mentioned above, transparency, light yield anddensity of the scintillator have been measured. The measurements of these four samples yielded adensity of about ρ=0.804± 0.001 g/cm3 at 15○C, a light yield of about 9000± 1000 photons/MeVand an attenuation length above 8 m at 430 nm. Figure 9.1 presents the absorption (A) andattenuation length (Λ) of the three muon veto samples taken from the three different storagetanks as function of wavelength for the interesting region between 410 nm and 445 nm. Figure9.2 indicates the same measurement for the intermediate tank sample, which has been donetwice. The results of these measurements are summarized in table 9.3.
149
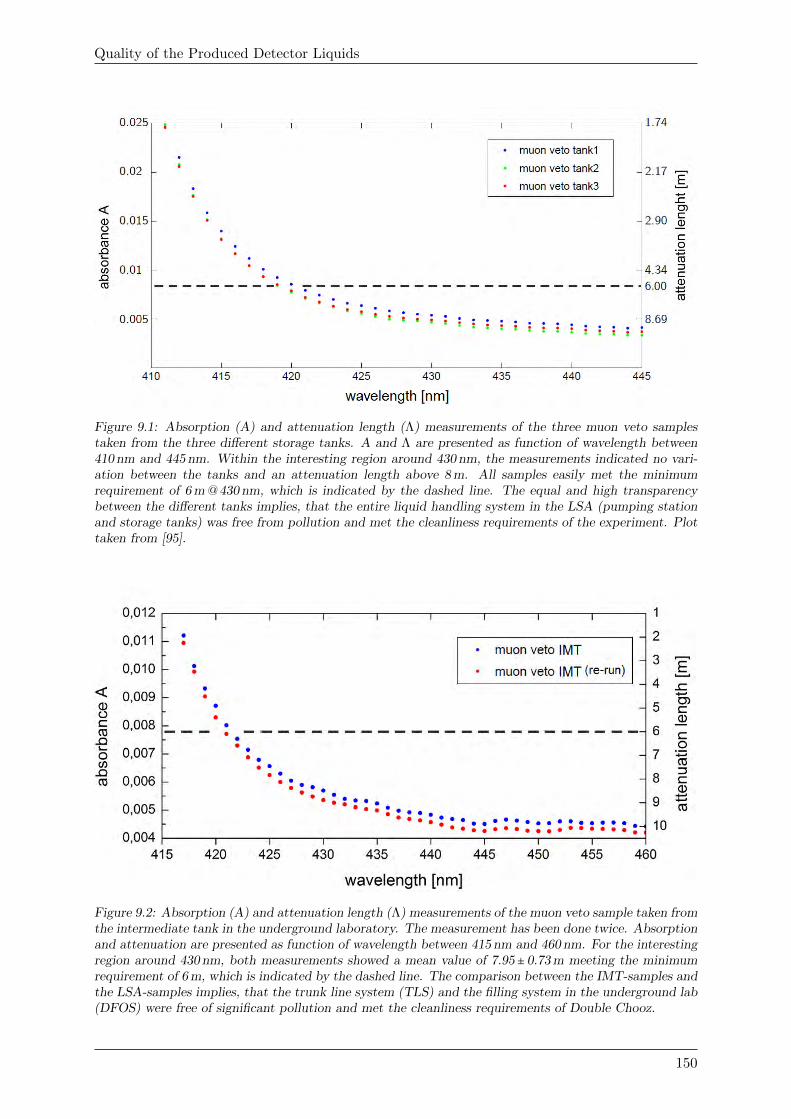
Quality of the Produced Detector Liquids
Figure 9.1: Absorption (A) and attenuation length (Λ) measurements of the three muon veto samplestaken from the three different storage tanks. A and Λ are presented as function of wavelength between410 nm and 445 nm. Within the interesting region around 430 nm, the measurements indicated no vari-ation between the tanks and an attenuation length above 8 m. All samples easily met the minimumrequirement of 6 m @ 430 nm, which is indicated by the dashed line. The equal and high transparencybetween the different tanks implies, that the entire liquid handling system in the LSA (pumping stationand storage tanks) was free from pollution and met the cleanliness requirements of the experiment. Plottaken from [95].
Figure 9.2: Absorption (A) and attenuation length (Λ) measurements of the muon veto sample taken fromthe intermediate tank in the underground laboratory. The measurement has been done twice. Absorptionand attenuation are presented as function of wavelength between 415 nm and 460 nm. For the interestingregion around 430 nm, both measurements showed a mean value of 7.95± 0.73 m meeting the minimumrequirement of 6 m, which is indicated by the dashed line. The comparison between the IMT-samples andthe LSA-samples implies, that the trunk line system (TLS) and the filling system in the underground lab(DFOS) were free of significant pollution and met the cleanliness requirements of Double Chooz.
150
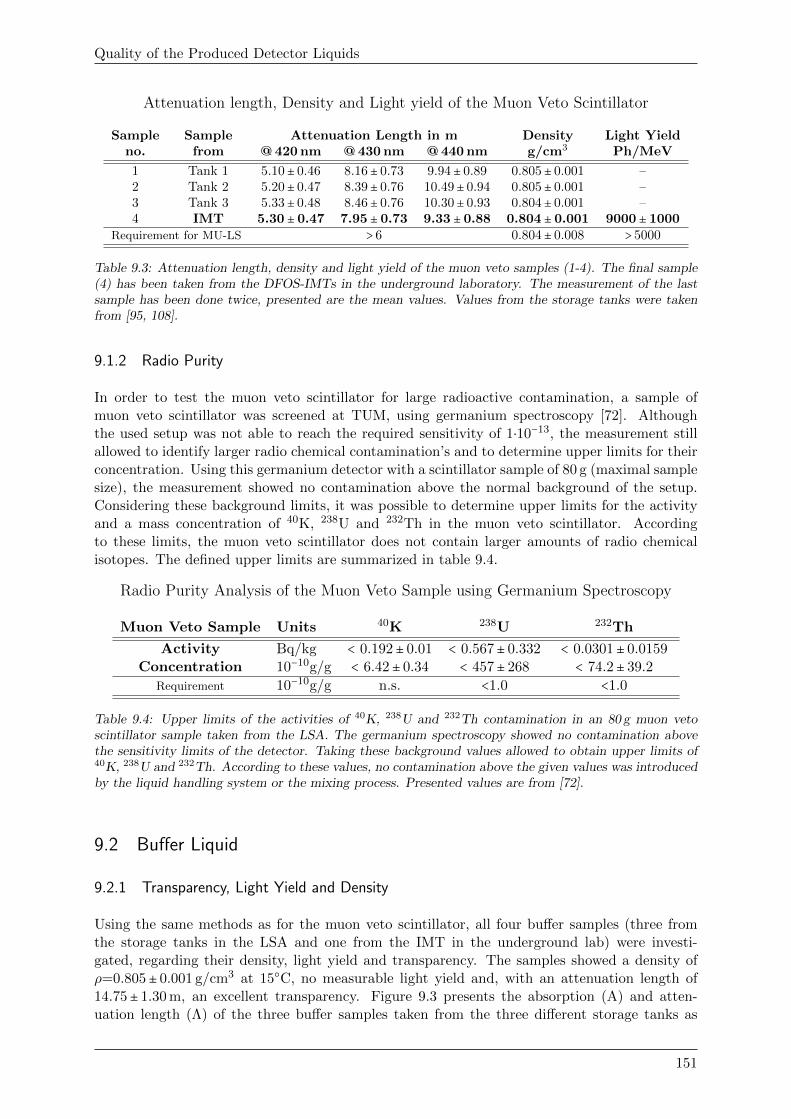
Quality of the Produced Detector Liquids
Attenuation length, Density and Light yield of the Muon Veto Scintillator
Sample Sample Attenuation Length in m Density Light Yieldno. from @ 420 nm @ 430 nm @ 440 nm g/cm3 Ph/MeV
1 Tank 1 5.10± 0.46 8.16± 0.73 9.94± 0.89 0.805± 0.001 –2 Tank 2 5.20± 0.47 8.39± 0.76 10.49± 0.94 0.805± 0.001 –3 Tank 3 5.33± 0.48 8.46± 0.76 10.30± 0.93 0.804± 0.001 –4 IMT 5.30 ± 0.47 7.95 ± 0.73 9.33 ± 0.88 0.804 ± 0.001 9000 ± 1000
Requirement for MU-LS > 6 0.804± 0.008 > 5000
Table 9.3: Attenuation length, density and light yield of the muon veto samples (1-4). The final sample(4) has been taken from the DFOS-IMTs in the underground laboratory. The measurement of the lastsample has been done twice, presented are the mean values. Values from the storage tanks were takenfrom [95, 108].
9.1.2 Radio Purity
In order to test the muon veto scintillator for large radioactive contamination, a sample ofmuon veto scintillator was screened at TUM, using germanium spectroscopy [72]. Althoughthe used setup was not able to reach the required sensitivity of 1⋅10−13, the measurement stillallowed to identify larger radio chemical contamination’s and to determine upper limits for theirconcentration. Using this germanium detector with a scintillator sample of 80 g (maximal samplesize), the measurement showed no contamination above the normal background of the setup.Considering these background limits, it was possible to determine upper limits for the activityand a mass concentration of 40K, 238U and 232Th in the muon veto scintillator. Accordingto these limits, the muon veto scintillator does not contain larger amounts of radio chemicalisotopes. The defined upper limits are summarized in table 9.4.
Radio Purity Analysis of the Muon Veto Sample using Germanium Spectroscopy
Muon Veto Sample Units 40K 238U 232Th
Activity Bq/kg < 0.192± 0.01 < 0.567± 0.332 < 0.0301± 0.0159Concentration 10−10g/g < 6.42± 0.34 < 457± 268 < 74.2± 39.2
Requirement 10−10g/g n.s. <1.0 <1.0
Table 9.4: Upper limits of the activities of 40K, 238U and 232Th contamination in an 80 g muon vetoscintillator sample taken from the LSA. The germanium spectroscopy showed no contamination abovethe sensitivity limits of the detector. Taking these background values allowed to obtain upper limits of40K, 238U and 232Th. According to these values, no contamination above the given values was introducedby the liquid handling system or the mixing process. Presented values are from [72].
9.2 Buffer Liquid
9.2.1 Transparency, Light Yield and Density
Using the same methods as for the muon veto scintillator, all four buffer samples (three fromthe storage tanks in the LSA and one from the IMT in the underground lab) were investi-gated, regarding their density, light yield and transparency. The samples showed a density ofρ=0.805± 0.001 g/cm3 at 15○C, no measurable light yield and, with an attenuation length of14.75± 1.30 m, an excellent transparency. Figure 9.3 presents the absorption (A) and atten-uation length (Λ) of the three buffer samples taken from the three different storage tanks as
151
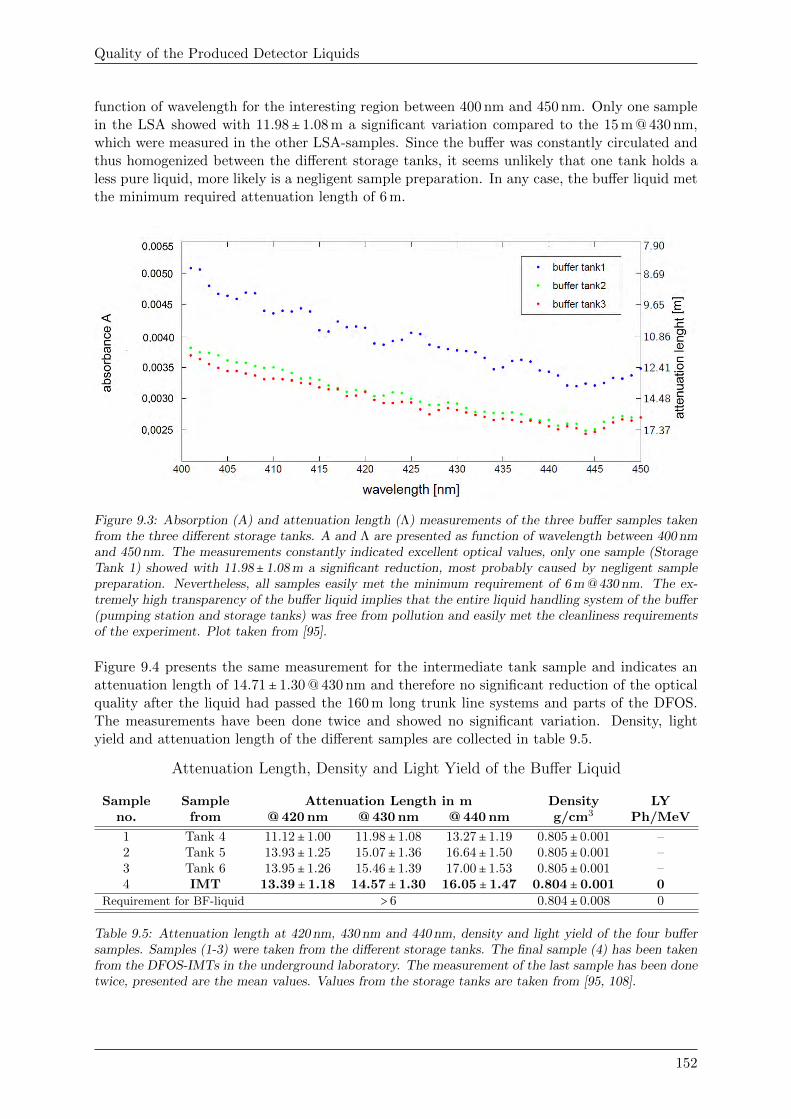
Quality of the Produced Detector Liquids
function of wavelength for the interesting region between 400 nm and 450 nm. Only one samplein the LSA showed with 11.98± 1.08 m a significant variation compared to the 15 m @ 430 nm,which were measured in the other LSA-samples. Since the buffer was constantly circulated andthus homogenized between the different storage tanks, it seems unlikely that one tank holds aless pure liquid, more likely is a negligent sample preparation. In any case, the buffer liquid metthe minimum required attenuation length of 6 m.
Figure 9.3: Absorption (A) and attenuation length (Λ) measurements of the three buffer samples takenfrom the three different storage tanks. A and Λ are presented as function of wavelength between 400 nmand 450 nm. The measurements constantly indicated excellent optical values, only one sample (StorageTank 1) showed with 11.98± 1.08 m a significant reduction, most probably caused by negligent samplepreparation. Nevertheless, all samples easily met the minimum requirement of 6 m @ 430 nm. The ex-tremely high transparency of the buffer liquid implies that the entire liquid handling system of the buffer(pumping station and storage tanks) was free from pollution and easily met the cleanliness requirementsof the experiment. Plot taken from [95].
Figure 9.4 presents the same measurement for the intermediate tank sample and indicates anattenuation length of 14.71± 1.30 @ 430 nm and therefore no significant reduction of the opticalquality after the liquid had passed the 160 m long trunk line systems and parts of the DFOS.The measurements have been done twice and showed no significant variation. Density, lightyield and attenuation length of the different samples are collected in table 9.5.
Attenuation Length, Density and Light Yield of the Buffer Liquid
Sample Sample Attenuation Length in m Density LYno. from @ 420 nm @ 430 nm @ 440 nm g/cm3 Ph/MeV
1 Tank 4 11.12± 1.00 11.98± 1.08 13.27± 1.19 0.805± 0.001 –2 Tank 5 13.93± 1.25 15.07± 1.36 16.64± 1.50 0.805± 0.001 –3 Tank 6 13.95± 1.26 15.46± 1.39 17.00± 1.53 0.805± 0.001 –4 IMT 13.39 ± 1.18 14.57 ± 1.30 16.05 ± 1.47 0.804 ± 0.001 0
Requirement for BF-liquid > 6 0.804± 0.008 0
Table 9.5: Attenuation length at 420 nm, 430 nm and 440 nm, density and light yield of the four buffersamples. Samples (1-3) were taken from the different storage tanks. The final sample (4) has been takenfrom the DFOS-IMTs in the underground laboratory. The measurement of the last sample has been donetwice, presented are the mean values. Values from the storage tanks are taken from [95, 108].
152
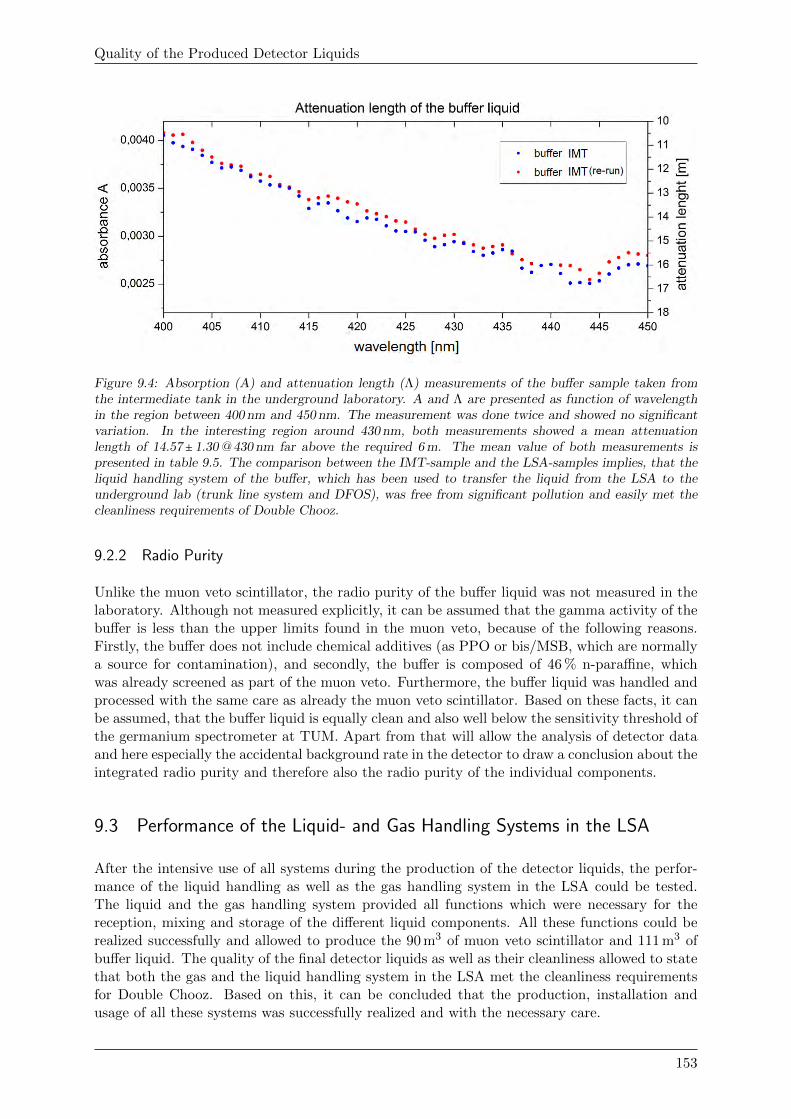
Quality of the Produced Detector Liquids
Figure 9.4: Absorption (A) and attenuation length (Λ) measurements of the buffer sample taken fromthe intermediate tank in the underground laboratory. A and Λ are presented as function of wavelengthin the region between 400 nm and 450 nm. The measurement was done twice and showed no significantvariation. In the interesting region around 430 nm, both measurements showed a mean attenuationlength of 14.57± 1.30 @ 430 nm far above the required 6 m. The mean value of both measurements ispresented in table 9.5. The comparison between the IMT-sample and the LSA-samples implies, that theliquid handling system of the buffer, which has been used to transfer the liquid from the LSA to theunderground lab (trunk line system and DFOS), was free from significant pollution and easily met thecleanliness requirements of Double Chooz.
9.2.2 Radio Purity
Unlike the muon veto scintillator, the radio purity of the buffer liquid was not measured in thelaboratory. Although not measured explicitly, it can be assumed that the gamma activity of thebuffer is less than the upper limits found in the muon veto, because of the following reasons.Firstly, the buffer does not include chemical additives (as PPO or bis/MSB, which are normallya source for contamination), and secondly, the buffer is composed of 46 % n-paraffine, whichwas already screened as part of the muon veto. Furthermore, the buffer liquid was handled andprocessed with the same care as already the muon veto scintillator. Based on these facts, it canbe assumed, that the buffer liquid is equally clean and also well below the sensitivity threshold ofthe germanium spectrometer at TUM. Apart from that will allow the analysis of detector dataand here especially the accidental background rate in the detector to draw a conclusion about theintegrated radio purity and therefore also the radio purity of the individual components.
9.3 Performance of the Liquid- and Gas Handling Systems in the LSA
After the intensive use of all systems during the production of the detector liquids, the perfor-mance of the liquid handling as well as the gas handling system in the LSA could be tested.The liquid and the gas handling system provided all functions which were necessary for thereception, mixing and storage of the different liquid components. All these functions could berealized successfully and allowed to produce the 90 m3 of muon veto scintillator and 111 m3 ofbuffer liquid. The quality of the final detector liquids as well as their cleanliness allowed to statethat both the gas and the liquid handling system in the LSA met the cleanliness requirementsfor Double Chooz. Based on this, it can be concluded that the production, installation andusage of all these systems was successfully realized and with the necessary care.
153
Quality of the Produced Detector Liquids
The only limitation of the liquid handling system is related to the flow rates provided by thepumping stations. Although designed to provide a flow rate of 5000 l/h, the liquid handlingsystem demonstrated a maximal flow rate of only 2200 l/h during uploading, and even less(1600 l/h) during the circulation of the detector liquids. The reason for this limitation was theused membrane pump4 in combination with the used tube size. Although the pump was sup-posed to provide a capacity of 5000 l/h [73], the pump was overburdened by the impedance ofthe 1-inch-tubing, which led to 70 % decrease of capacity. Due to the large discrepancy betweenpromised and observed flow rate, consequently the usage of an alternative pump with higherdriving force as well as a continuous liquid flow (which was a general drawback of all membranepumps) would be advisable. A rotary pump could be a suiting alternative, as this pump type isavailable in the required materials (fluorinated plastics), offers a continous liquid flow and addi-tionally, significantly larger driving forces. Using the maximal driving force of 10 bar (maximalallowed pressure in the liquid handling system in the LSA), such a pump could increase the flowrate significantly. This would not only allow to safe time during the production process, butalso during the transport of the liquids to the near-detector, for which the detector liquids haveto be transfered to nine ISO-containers (each 26 m3). An increased flow capacity would alsoreduce the holding time of the delivery trucks during uploading and therefore reduce some ofthe delivery and rental costs. These costs, however, have to be balanced with the costs for newpumps, which are also significant.
4Co. Trebor, Mega 960, biggest pneumatically driven (max. 5.5 bar) PTFE-membrane pump on the market,which offers 1-inch in- and outlet connections, [73].
154
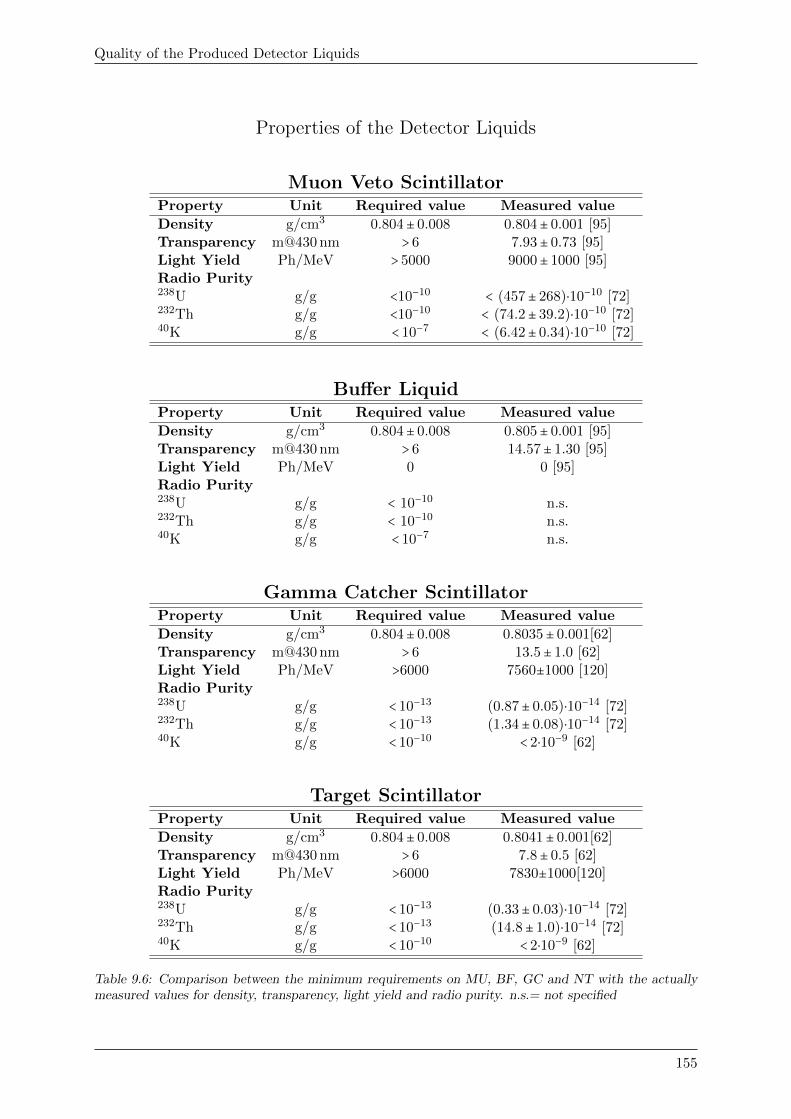
Quality of the Produced Detector Liquids
Properties of the Detector Liquids
Muon Veto ScintillatorProperty Unit Required value Measured value
Density g/cm3 0.804± 0.008 0.804± 0.001 [95]Transparency m@430 nm > 6 7.93± 0.73 [95]Light Yield Ph/MeV > 5000 9000± 1000 [95]Radio Purity238U g/g <10−10 < (457± 268)⋅10−10 [72]232Th g/g <10−10 < (74.2± 39.2)⋅10−10 [72]40K g/g < 10−7 < (6.42± 0.34)⋅10−10 [72]
Buffer LiquidProperty Unit Required value Measured value
Density g/cm3 0.804± 0.008 0.805± 0.001 [95]Transparency m@430 nm > 6 14.57± 1.30 [95]Light Yield Ph/MeV 0 0 [95]Radio Purity238U g/g < 10−10 n.s.232Th g/g < 10−10 n.s.40K g/g < 10−7 n.s.
Gamma Catcher ScintillatorProperty Unit Required value Measured value
Density g/cm3 0.804± 0.008 0.8035± 0.001[62]Transparency m@430 nm > 6 13.5± 1.0 [62]Light Yield Ph/MeV >6000 7560±1000 [120]Radio Purity238U g/g < 10−13 (0.87± 0.05)⋅10−14 [72]232Th g/g < 10−13 (1.34± 0.08)⋅10−14 [72]40K g/g < 10−10 < 2⋅10−9 [62]
Target ScintillatorProperty Unit Required value Measured value
Density g/cm3 0.804± 0.008 0.8041± 0.001[62]Transparency m@430 nm > 6 7.8± 0.5 [62]Light Yield Ph/MeV >6000 7830±1000[120]Radio Purity238U g/g < 10−13 (0.33± 0.03)⋅10−14 [72]232Th g/g < 10−13 (14.8± 1.0)⋅10−14 [72]40K g/g < 10−10 < 2⋅10−9 [62]
Table 9.6: Comparison between the minimum requirements on MU, BF, GC and NT with the actuallymeasured values for density, transparency, light yield and radio purity. n.s.= not specified
155
Chapter 10
Accuracy and Performance of Detector Fillingand Handling
As described in part III of this thesis, the author was responsible for the development andrealization of all detector systems in the underground laboratory, which were necessary to filland handle the Double Chooz far detector. This required the development of a comprehensiveliquid- and gas handling concept and the realization of all necessary systems, which have beenpresented in chapter 7. This mainly included the development and realization of:
� A liquid handling system (DFOS, see section 7.1), that allowed to fill and handle eachdetector liquid individually and with the necessary precision as well as a system, whichincreased the tolerance of the detector to thermal variations and therefore allowed tohandle the detector safely during data taking (XTOS, see section 7.1.3).
� A gas handling system (HPN, FPN, LPN, see section 7.2), that provisioned the under-ground lab and cared for a homogeneous and permanent nitrogen blanket in the fourdifferent detector vessels during all stages of detector life.
� A detector monitoring system (DMS, see section 7.3), which measured all absolute anddifferential liquid-levels as well as gas-pressure-levels in the detector.
Subsequently to the proper installation in the underground laboratory, these systems were usedto flush, fill and handle the Double Chooz far detector. Using the gas handling system to providea common and permanent nitrogen blanket, the liquid handling system was used to fill the DoubleChooz far detector according to the sequence presented in chapter 8. In order to supervisethe filling process and to monitor actual stress on the detector vessels, the DMS measured allabsolute and differential liquid-levels as well as gas-pressure-levels in the detector. The followingchapter will be used to present the performance of these systems and the accuracy, with whichthe Double Chooz far detector could be filled and handled. Section 10.1 will concentrate on theaccuracy of the filling process and present the development of all liquid- and gas pressure levelsin the detector and demonstrate, that the detector was not harmed during the filling process.Section 10.2, on the other hand, will concentrate on the performance of the XTOS and the gashandling system, which were used to maintain the detector safety also during data taking.
10.1 Detector Filling Process
The gas handling system in the underground laboratory is supposed to supply the four differentdetector vessels with a homogeneous and stable low pressure nitrogen blanket. The blanket
156
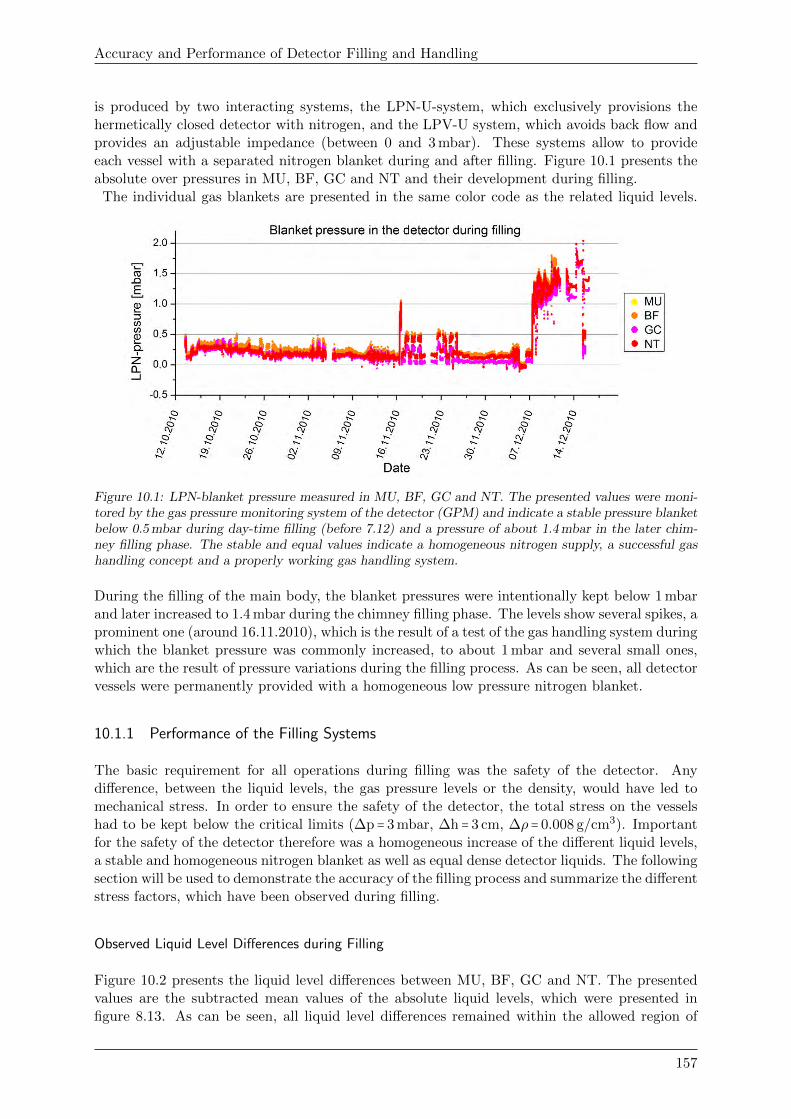
Accuracy and Performance of Detector Filling and Handling
is produced by two interacting systems, the LPN-U-system, which exclusively provisions thehermetically closed detector with nitrogen, and the LPV-U system, which avoids back flow andprovides an adjustable impedance (between 0 and 3 mbar). These systems allow to provideeach vessel with a separated nitrogen blanket during and after filling. Figure 10.1 presents theabsolute over pressures in MU, BF, GC and NT and their development during filling.
The individual gas blankets are presented in the same color code as the related liquid levels.
Figure 10.1: LPN-blanket pressure measured in MU, BF, GC and NT. The presented values were moni-tored by the gas pressure monitoring system of the detector (GPM) and indicate a stable pressure blanketbelow 0.5 mbar during day-time filling (before 7.12) and a pressure of about 1.4 mbar in the later chim-ney filling phase. The stable and equal values indicate a homogeneous nitrogen supply, a successful gashandling concept and a properly working gas handling system.
During the filling of the main body, the blanket pressures were intentionally kept below 1 mbarand later increased to 1.4 mbar during the chimney filling phase. The levels show several spikes, aprominent one (around 16.11.2010), which is the result of a test of the gas handling system duringwhich the blanket pressure was commonly increased, to about 1 mbar and several small ones,which are the result of pressure variations during the filling process. As can be seen, all detectorvessels were permanently provided with a homogeneous low pressure nitrogen blanket.
10.1.1 Performance of the Filling Systems
The basic requirement for all operations during filling was the safety of the detector. Anydifference, between the liquid levels, the gas pressure levels or the density, would have led tomechanical stress. In order to ensure the safety of the detector, the total stress on the vesselshad to be kept below the critical limits (∆p = 3 mbar, ∆h = 3 cm, ∆ρ = 0.008 g/cm3). Importantfor the safety of the detector therefore was a homogeneous increase of the different liquid levels,a stable and homogeneous nitrogen blanket as well as equal dense detector liquids. The followingsection will be used to demonstrate the accuracy of the filling process and summarize the differentstress factors, which have been observed during filling.
Observed Liquid Level Differences during Filling
Figure 10.2 presents the liquid level differences between MU, BF, GC and NT. The presentedvalues are the subtracted mean values of the absolute liquid levels, which were presented infigure 8.13. As can be seen, all liquid level differences remained within the allowed region of
157
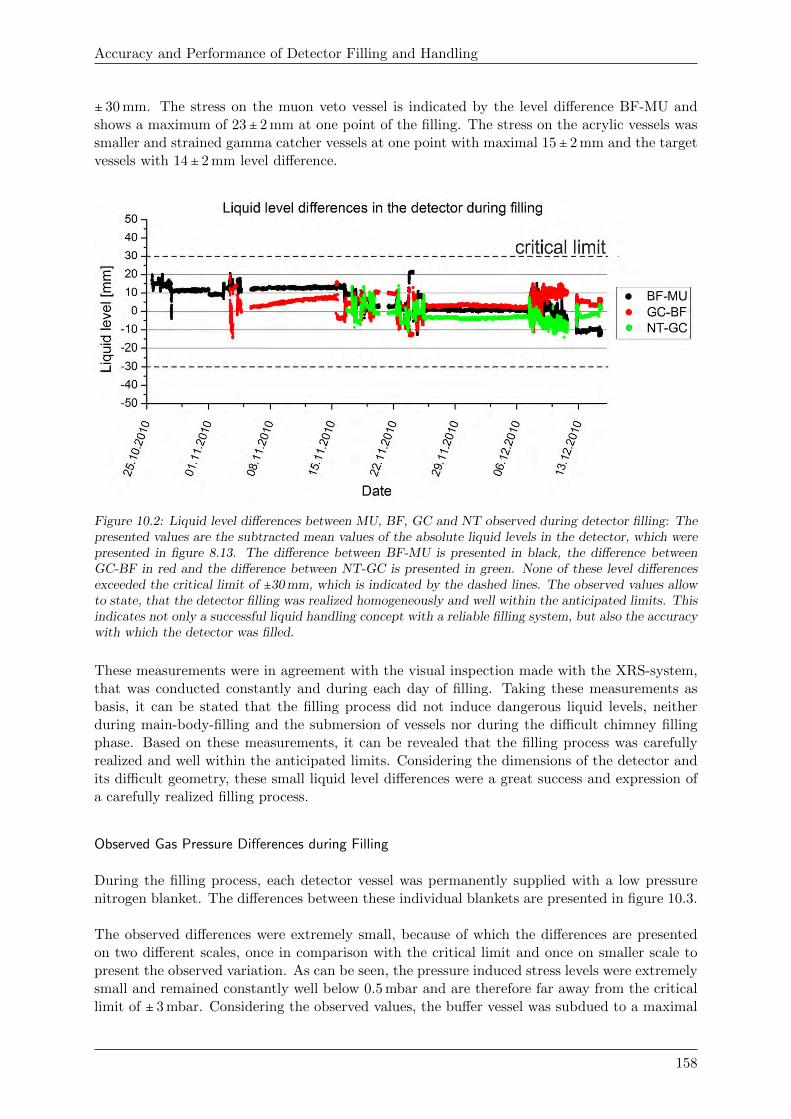
Accuracy and Performance of Detector Filling and Handling
± 30 mm. The stress on the muon veto vessel is indicated by the level difference BF-MU andshows a maximum of 23± 2 mm at one point of the filling. The stress on the acrylic vessels wassmaller and strained gamma catcher vessels at one point with maximal 15± 2 mm and the targetvessels with 14± 2 mm level difference.
Figure 10.2: Liquid level differences between MU, BF, GC and NT observed during detector filling: Thepresented values are the subtracted mean values of the absolute liquid levels in the detector, which werepresented in figure 8.13. The difference between BF-MU is presented in black, the difference betweenGC-BF in red and the difference between NT-GC is presented in green. None of these level differencesexceeded the critical limit of ±30 mm, which is indicated by the dashed lines. The observed values allowto state, that the detector filling was realized homogeneously and well within the anticipated limits. Thisindicates not only a successful liquid handling concept with a reliable filling system, but also the accuracywith which the detector was filled.
These measurements were in agreement with the visual inspection made with the XRS-system,that was conducted constantly and during each day of filling. Taking these measurements asbasis, it can be stated that the filling process did not induce dangerous liquid levels, neitherduring main-body-filling and the submersion of vessels nor during the difficult chimney fillingphase. Based on these measurements, it can be revealed that the filling process was carefullyrealized and well within the anticipated limits. Considering the dimensions of the detector andits difficult geometry, these small liquid level differences were a great success and expression ofa carefully realized filling process.
Observed Gas Pressure Differences during Filling
During the filling process, each detector vessel was permanently supplied with a low pressurenitrogen blanket. The differences between these individual blankets are presented in figure 10.3.
The observed differences were extremely small, because of which the differences are presentedon two different scales, once in comparison with the critical limit and once on smaller scale topresent the observed variation. As can be seen, the pressure induced stress levels were extremelysmall and remained constantly well below 0.5 mbar and are therefore far away from the criticallimit of ± 3 mbar. Considering the observed values, the buffer vessel was subdued to a maximal
158
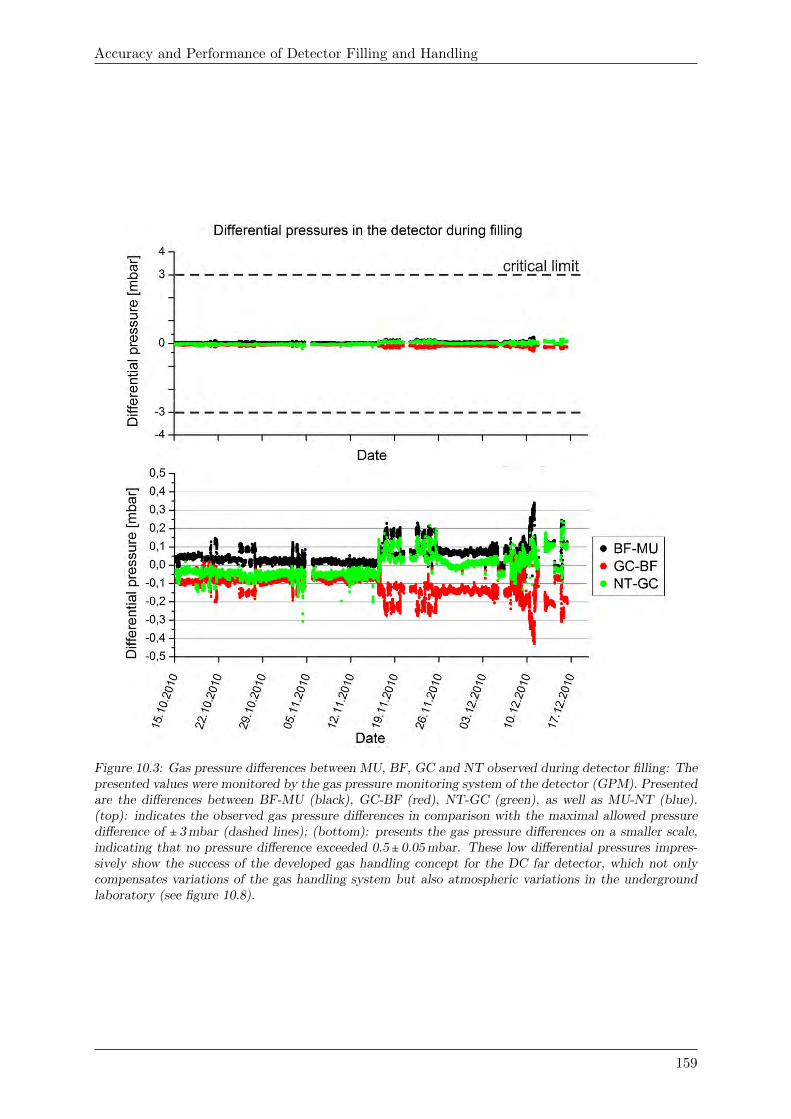
Accuracy and Performance of Detector Filling and Handling
Figure 10.3: Gas pressure differences between MU, BF, GC and NT observed during detector filling: Thepresented values were monitored by the gas pressure monitoring system of the detector (GPM). Presentedare the differences between BF-MU (black), GC-BF (red), NT-GC (green), as well as MU-NT (blue).(top): indicates the observed gas pressure differences in comparison with the maximal allowed pressuredifference of ± 3 mbar (dashed lines); (bottom): presents the gas pressure differences on a smaller scale,indicating that no pressure difference exceeded 0.5± 0.05 mbar. These low differential pressures impres-sively show the success of the developed gas handling concept for the DC far detector, which not onlycompensates variations of the gas handling system but also atmospheric variations in the undergroundlaboratory (see figure 10.8).
159
Accuracy and Performance of Detector Filling and Handling
stress of 0.35± 0.05 mbar, the gamma catcher vessel to maximal 0.43± 0.05 mbar and the targetvesselto maximal 0.31± 0.05 mbar.
Based on these measurements, it can be stated that the detector was successfully supplied withfour individual and yet very equal low pressure nitrogen blankets. The stability of the blanketand the low stress levels furthermore allow to conclude that the gas handling concept of the fardetector was successful.
Thermally Induced Density Differences During Filling
Providing equal liquid levels in the detector, density variations between the detector liquidscan lead to buoyancy forces and therefore also to mechanical stress on the detector vessels.Large density variations between the liquids could already be avoided during the productionduring which all densities were matched to 0.804± 0.001 g/cm3 and therefore already a factorof eight better than the critical variation of 1 %. In order to keep track of also small densityvariations induced by thermal variations, the temperature in the detector liquids was monitored.Figure 10.4 shows the thermal development in MU, BF and GC measured by the hydrostaticpressure sensors during filling. The sensor-heads were installed near the filling lines, becauseof which the sensors measured the temperature of the arriving liquid during filling, and thetemperature of in the detector only during filling-stops. As can be seen, the repeated usageof the continuous filling mode led to a repeated decrease of the averaged temperature in thedetector. The largest thermal variation was measured during the chimney filling phase, where thecontinuous filling mode decreased the average temperature by about two degrees. Consideringthe thermal expansion coefficient of mineral oil (γmin.oil= 7.6⋅10−4K−1), the density variationper degree can be calculated by:
∆ρ(∆T ) = ρ( γ∆T
1 − γ∆T) ,
where ρ is the density, ∆T the averaged thermal variation of the liquid and γmin.oil the thermalexpansion coefficient. Based on this calculation, the density in the liquids varied only by 1.5 ⋅10−3g/cm3, the critical limit of one percent (∆ρ = ±0.008 g/cm3) would be reached if one ofthe detector liquids would show a thermal variation of ± 13 K. As all detector liquids decreasedhomogeneously and only by two degrees, the detector was not subdued to buoyancy forces.
Summary
During the filling process, neither the individual stress factors nor their sum exceeded criticalvalues. The largest mechanical stress during the filling process was induced by liquid leveldifferences: the buffer vessel (stainless steel) was subdued to a maximal level difference of 23 mm,the acrylic vessels, meaning the vessels of gamma catcher and target, were subdued to a maximallevel difference of 15 mm and 14 mm. The mechanical stress induced by pressure differences wassignificantly lower and reached a maximum of 0.35 mbar on the buffer vessel, 0.43 mbar on thegamma catcher vessel and 0.31 mbar on the target vessel. The mechanical stress induced bydensity differences was only of minor order as the detector liquids were already matched indensity (to the per-mil-level) during the production process. Thermal variations in the detectorcould be observed, however, these variations were homogeneous in all vessels and, in addition,relatively small compared to the critical limits. Consequently, density differences between thedetector liquids did not lead to any significant mechanical stress during the filling process.
As the different detector vessels have no real indicator for stress, the integrity of each vesselcan therefore only be tested with two things. Firstly by monitoring the liquid level differences,
160
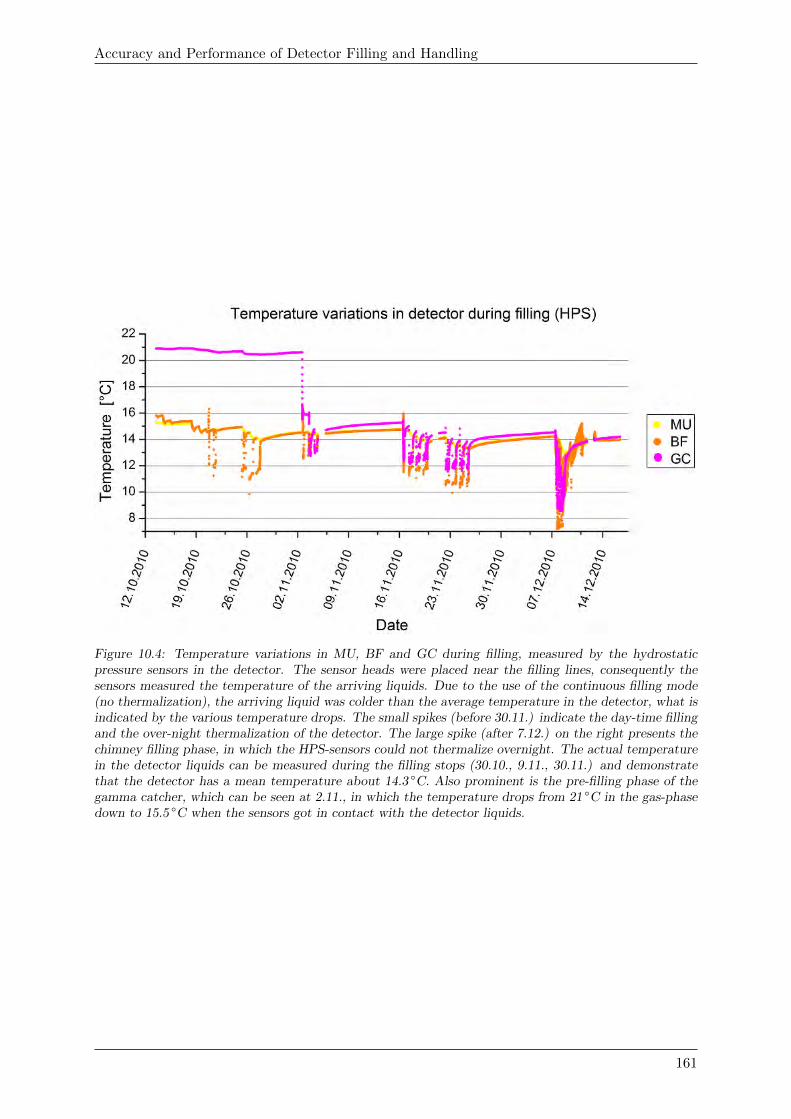
Accuracy and Performance of Detector Filling and Handling
Figure 10.4: Temperature variations in MU, BF and GC during filling, measured by the hydrostaticpressure sensors in the detector. The sensor heads were placed near the filling lines, consequently thesensors measured the temperature of the arriving liquids. Due to the use of the continuous filling mode(no thermalization), the arriving liquid was colder than the average temperature in the detector, what isindicated by the various temperature drops. The small spikes (before 30.11.) indicate the day-time fillingand the over-night thermalization of the detector. The large spike (after 7.12.) on the right presents thechimney filling phase, in which the HPS-sensors could not thermalize overnight. The actual temperaturein the detector liquids can be measured during the filling stops (30.10., 9.11., 30.11.) and demonstratethat the detector has a mean temperature about 14.3 ○C. Also prominent is the pre-filling phase of thegamma catcher, which can be seen at 2.11., in which the temperature drops from 21 ○C in the gas-phasedown to 15.5 ○C when the sensors got in contact with the detector liquids.
161
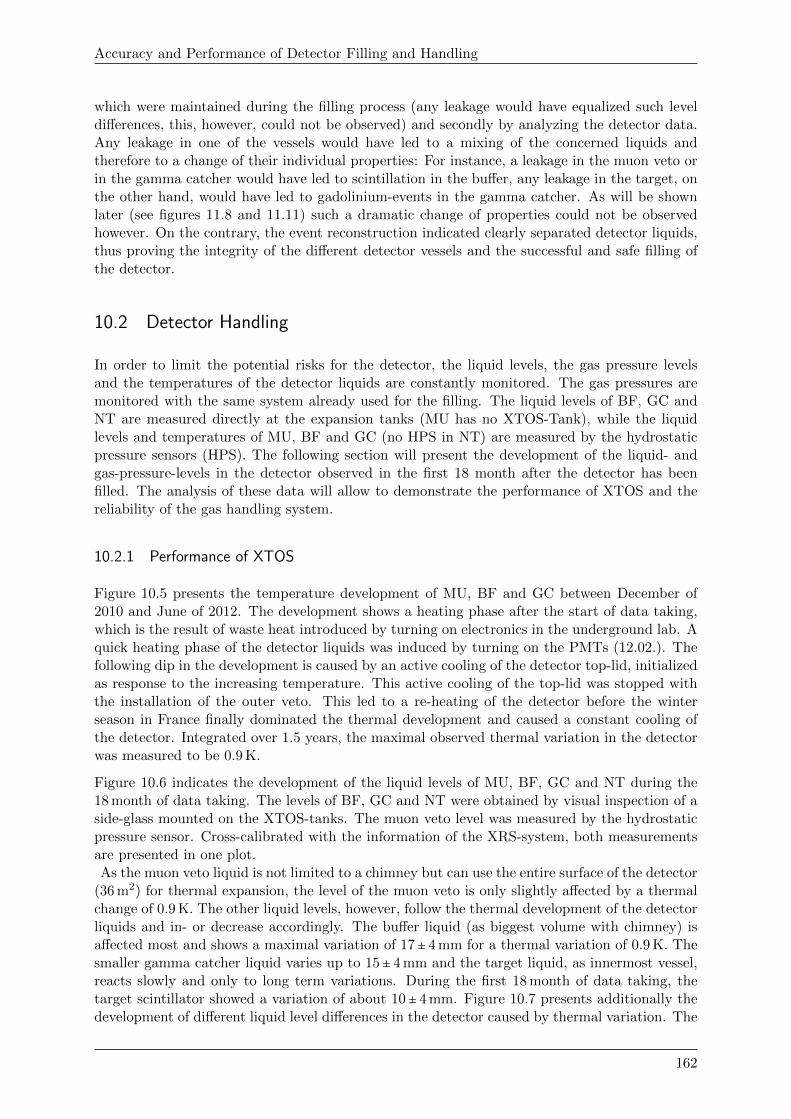
Accuracy and Performance of Detector Filling and Handling
which were maintained during the filling process (any leakage would have equalized such leveldifferences, this, however, could not be observed) and secondly by analyzing the detector data.Any leakage in one of the vessels would have led to a mixing of the concerned liquids andtherefore to a change of their individual properties: For instance, a leakage in the muon veto orin the gamma catcher would have led to scintillation in the buffer, any leakage in the target, onthe other hand, would have led to gadolinium-events in the gamma catcher. As will be shownlater (see figures 11.8 and 11.11) such a dramatic change of properties could not be observedhowever. On the contrary, the event reconstruction indicated clearly separated detector liquids,thus proving the integrity of the different detector vessels and the successful and safe filling ofthe detector.
10.2 Detector Handling
In order to limit the potential risks for the detector, the liquid levels, the gas pressure levelsand the temperatures of the detector liquids are constantly monitored. The gas pressures aremonitored with the same system already used for the filling. The liquid levels of BF, GC andNT are measured directly at the expansion tanks (MU has no XTOS-Tank), while the liquidlevels and temperatures of MU, BF and GC (no HPS in NT) are measured by the hydrostaticpressure sensors (HPS). The following section will present the development of the liquid- andgas-pressure-levels in the detector observed in the first 18 month after the detector has beenfilled. The analysis of these data will allow to demonstrate the performance of XTOS and thereliability of the gas handling system.
10.2.1 Performance of XTOS
Figure 10.5 presents the temperature development of MU, BF and GC between December of2010 and June of 2012. The development shows a heating phase after the start of data taking,which is the result of waste heat introduced by turning on electronics in the underground lab. Aquick heating phase of the detector liquids was induced by turning on the PMTs (12.02.). Thefollowing dip in the development is caused by an active cooling of the detector top-lid, initializedas response to the increasing temperature. This active cooling of the top-lid was stopped withthe installation of the outer veto. This led to a re-heating of the detector before the winterseason in France finally dominated the thermal development and caused a constant cooling ofthe detector. Integrated over 1.5 years, the maximal observed thermal variation in the detectorwas measured to be 0.9 K.
Figure 10.6 indicates the development of the liquid levels of MU, BF, GC and NT during the18 month of data taking. The levels of BF, GC and NT were obtained by visual inspection of aside-glass mounted on the XTOS-tanks. The muon veto level was measured by the hydrostaticpressure sensor. Cross-calibrated with the information of the XRS-system, both measurementsare presented in one plot.As the muon veto liquid is not limited to a chimney but can use the entire surface of the detector
(36 m2) for thermal expansion, the level of the muon veto is only slightly affected by a thermalchange of 0.9 K. The other liquid levels, however, follow the thermal development of the detectorliquids and in- or decrease accordingly. The buffer liquid (as biggest volume with chimney) isaffected most and shows a maximal variation of 17± 4 mm for a thermal variation of 0.9 K. Thesmaller gamma catcher liquid varies up to 15± 4 mm and the target liquid, as innermost vessel,reacts slowly and only to long term variations. During the first 18 month of data taking, thetarget scintillator showed a variation of about 10± 4 mm. Figure 10.7 presents additionally thedevelopment of different liquid level differences in the detector caused by thermal variation. The
162
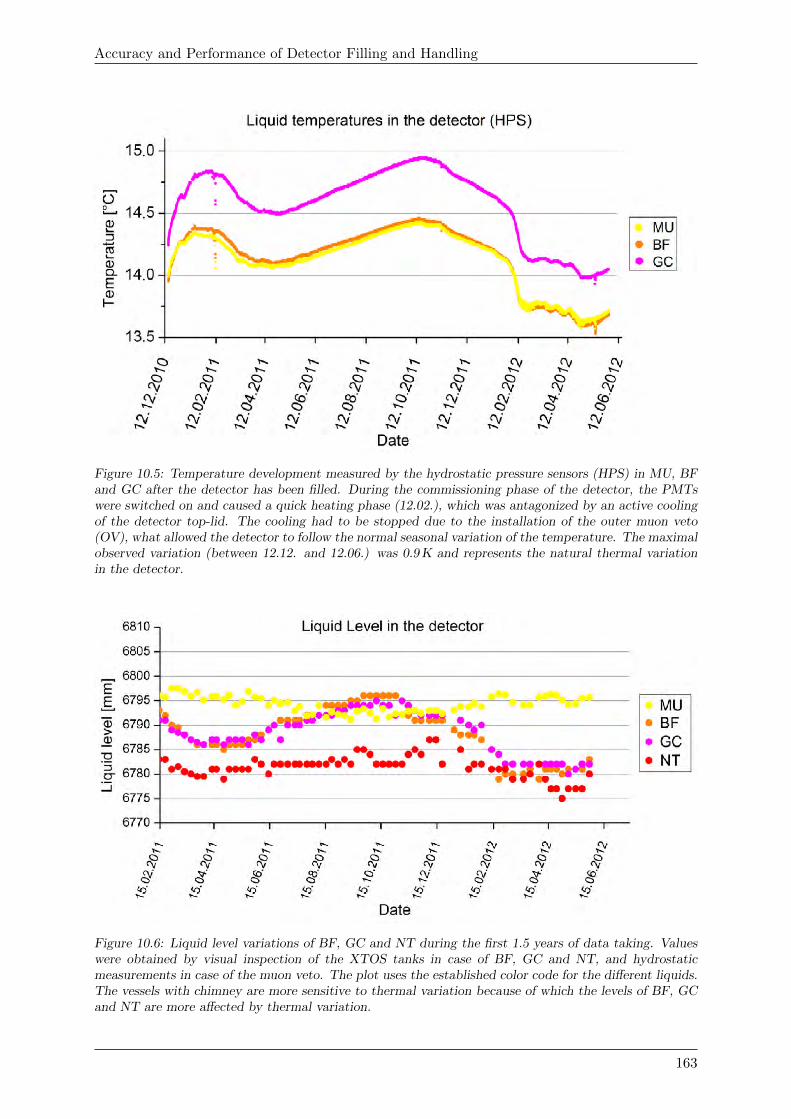
Accuracy and Performance of Detector Filling and Handling
Figure 10.5: Temperature development measured by the hydrostatic pressure sensors (HPS) in MU, BFand GC after the detector has been filled. During the commissioning phase of the detector, the PMTswere switched on and caused a quick heating phase (12.02.), which was antagonized by an active coolingof the detector top-lid. The cooling had to be stopped due to the installation of the outer muon veto(OV), what allowed the detector to follow the normal seasonal variation of the temperature. The maximalobserved variation (between 12.12. and 12.06.) was 0.9 K and represents the natural thermal variationin the detector.
Figure 10.6: Liquid level variations of BF, GC and NT during the first 1.5 years of data taking. Valueswere obtained by visual inspection of the XTOS tanks in case of BF, GC and NT, and hydrostaticmeasurements in case of the muon veto. The plot uses the established color code for the different liquids.The vessels with chimney are more sensitive to thermal variation because of which the levels of BF, GCand NT are more affected by thermal variation.
163
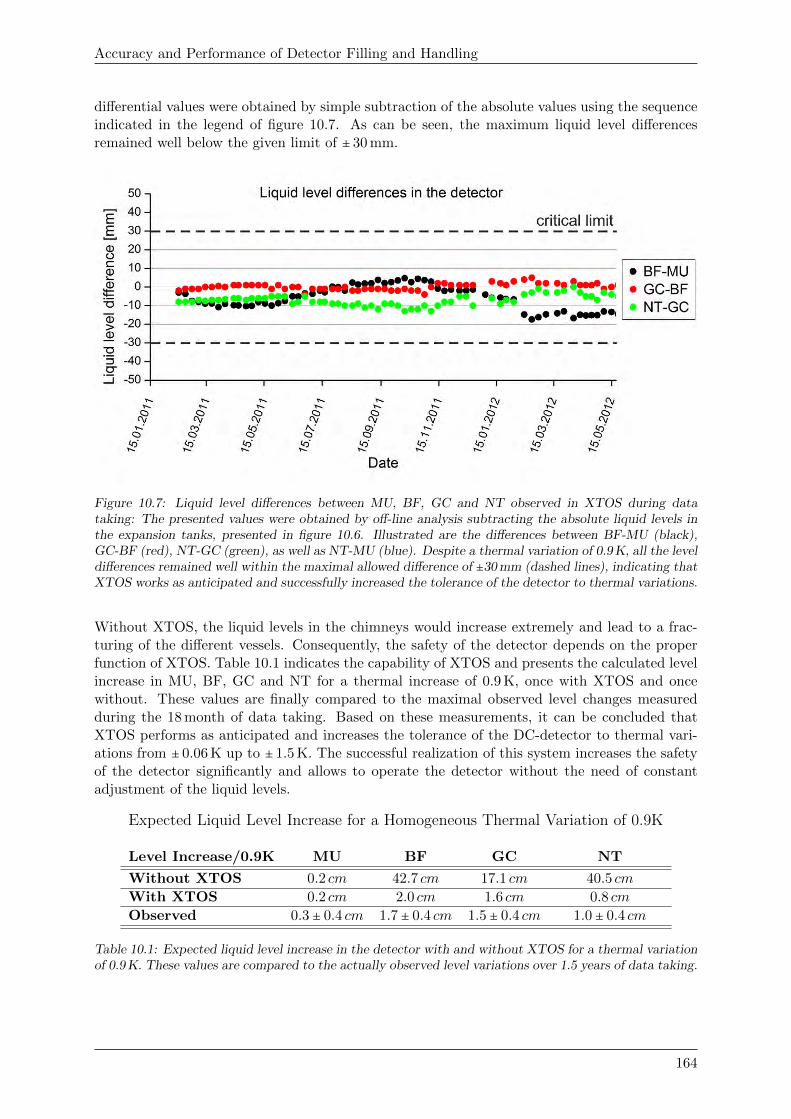
Accuracy and Performance of Detector Filling and Handling
differential values were obtained by simple subtraction of the absolute values using the sequenceindicated in the legend of figure 10.7. As can be seen, the maximum liquid level differencesremained well below the given limit of ± 30 mm.
Figure 10.7: Liquid level differences between MU, BF, GC and NT observed in XTOS during datataking: The presented values were obtained by off-line analysis subtracting the absolute liquid levels inthe expansion tanks, presented in figure 10.6. Illustrated are the differences between BF-MU (black),GC-BF (red), NT-GC (green), as well as NT-MU (blue). Despite a thermal variation of 0.9 K, all the leveldifferences remained well within the maximal allowed difference of ±30 mm (dashed lines), indicating thatXTOS works as anticipated and successfully increased the tolerance of the detector to thermal variations.
Without XTOS, the liquid levels in the chimneys would increase extremely and lead to a frac-turing of the different vessels. Consequently, the safety of the detector depends on the properfunction of XTOS. Table 10.1 indicates the capability of XTOS and presents the calculated levelincrease in MU, BF, GC and NT for a thermal increase of 0.9 K, once with XTOS and oncewithout. These values are finally compared to the maximal observed level changes measuredduring the 18 month of data taking. Based on these measurements, it can be concluded thatXTOS performs as anticipated and increases the tolerance of the DC-detector to thermal vari-ations from ± 0.06 K up to ± 1.5 K. The successful realization of this system increases the safetyof the detector significantly and allows to operate the detector without the need of constantadjustment of the liquid levels.
Expected Liquid Level Increase for a Homogeneous Thermal Variation of 0.9K
Level Increase/0.9K MU BF GC NT
Without XTOS 0.2 cm 42.7 cm 17.1 cm 40.5 cm
With XTOS 0.2 cm 2.0 cm 1.6 cm 0.8 cm
Observed 0.3 ± 0.4 cm 1.7 ± 0.4 cm 1.5 ± 0.4 cm 1.0 ± 0.4 cm
Table 10.1: Expected liquid level increase in the detector with and without XTOS for a thermal variationof 0.9 K. These values are compared to the actually observed level variations over 1.5 years of data taking.
164
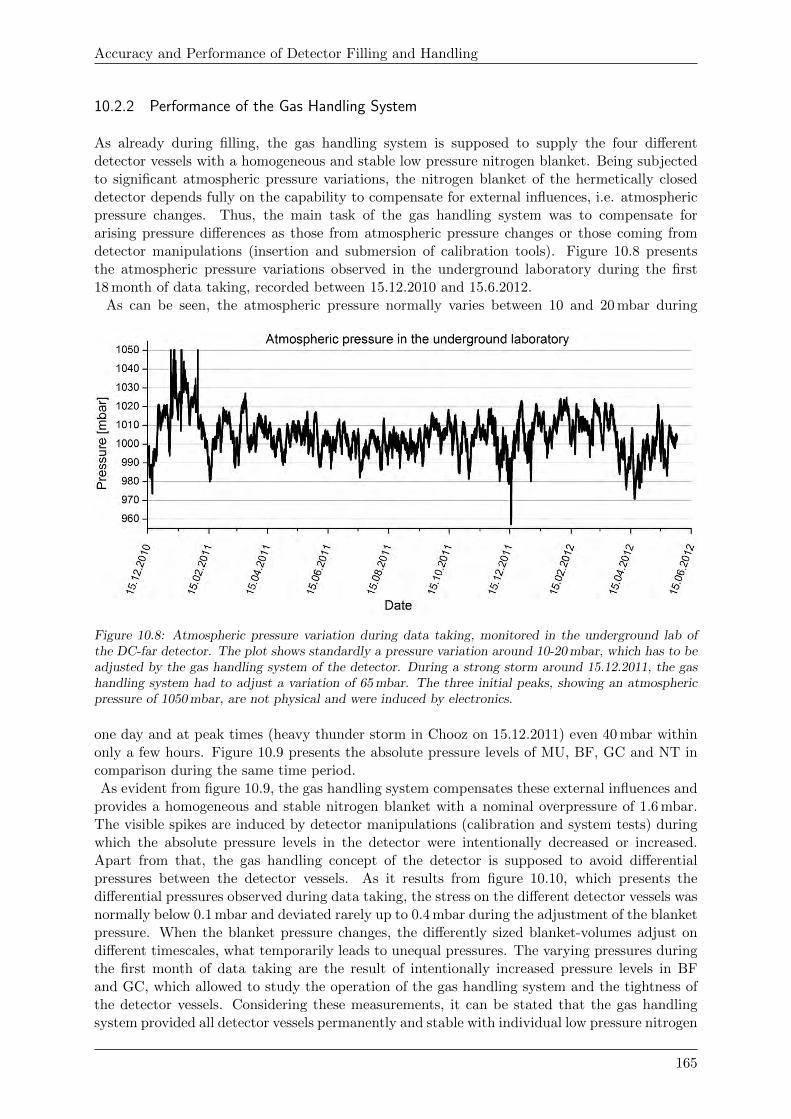
Accuracy and Performance of Detector Filling and Handling
10.2.2 Performance of the Gas Handling System
As already during filling, the gas handling system is supposed to supply the four differentdetector vessels with a homogeneous and stable low pressure nitrogen blanket. Being subjectedto significant atmospheric pressure variations, the nitrogen blanket of the hermetically closeddetector depends fully on the capability to compensate for external influences, i.e. atmosphericpressure changes. Thus, the main task of the gas handling system was to compensate forarising pressure differences as those from atmospheric pressure changes or those coming fromdetector manipulations (insertion and submersion of calibration tools). Figure 10.8 presentsthe atmospheric pressure variations observed in the underground laboratory during the first18 month of data taking, recorded between 15.12.2010 and 15.6.2012.
As can be seen, the atmospheric pressure normally varies between 10 and 20 mbar during
Figure 10.8: Atmospheric pressure variation during data taking, monitored in the underground lab ofthe DC-far detector. The plot shows standardly a pressure variation around 10-20 mbar, which has to beadjusted by the gas handling system of the detector. During a strong storm around 15.12.2011, the gashandling system had to adjust a variation of 65 mbar. The three initial peaks, showing an atmosphericpressure of 1050 mbar, are not physical and were induced by electronics.
one day and at peak times (heavy thunder storm in Chooz on 15.12.2011) even 40 mbar withinonly a few hours. Figure 10.9 presents the absolute pressure levels of MU, BF, GC and NT incomparison during the same time period.As evident from figure 10.9, the gas handling system compensates these external influences and
provides a homogeneous and stable nitrogen blanket with a nominal overpressure of 1.6 mbar.The visible spikes are induced by detector manipulations (calibration and system tests) duringwhich the absolute pressure levels in the detector were intentionally decreased or increased.Apart from that, the gas handling concept of the detector is supposed to avoid differentialpressures between the detector vessels. As it results from figure 10.10, which presents thedifferential pressures observed during data taking, the stress on the different detector vessels wasnormally below 0.1 mbar and deviated rarely up to 0.4 mbar during the adjustment of the blanketpressure. When the blanket pressure changes, the differently sized blanket-volumes adjust ondifferent timescales, what temporarily leads to unequal pressures. The varying pressures duringthe first month of data taking are the result of intentionally increased pressure levels in BFand GC, which allowed to study the operation of the gas handling system and the tightness ofthe detector vessels. Considering these measurements, it can be stated that the gas handlingsystem provided all detector vessels permanently and stable with individual low pressure nitrogen
165
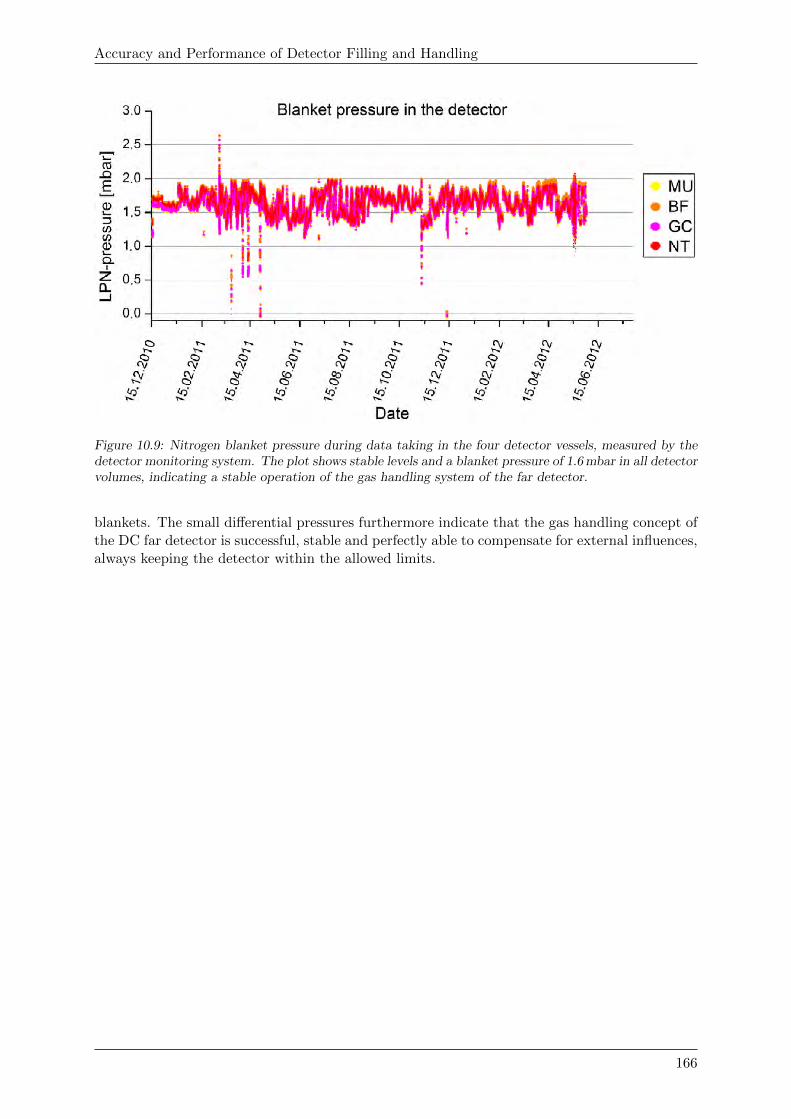
Accuracy and Performance of Detector Filling and Handling
Figure 10.9: Nitrogen blanket pressure during data taking in the four detector vessels, measured by thedetector monitoring system. The plot shows stable levels and a blanket pressure of 1.6 mbar in all detectorvolumes, indicating a stable operation of the gas handling system of the far detector.
blankets. The small differential pressures furthermore indicate that the gas handling concept ofthe DC far detector is successful, stable and perfectly able to compensate for external influences,always keeping the detector within the allowed limits.
166
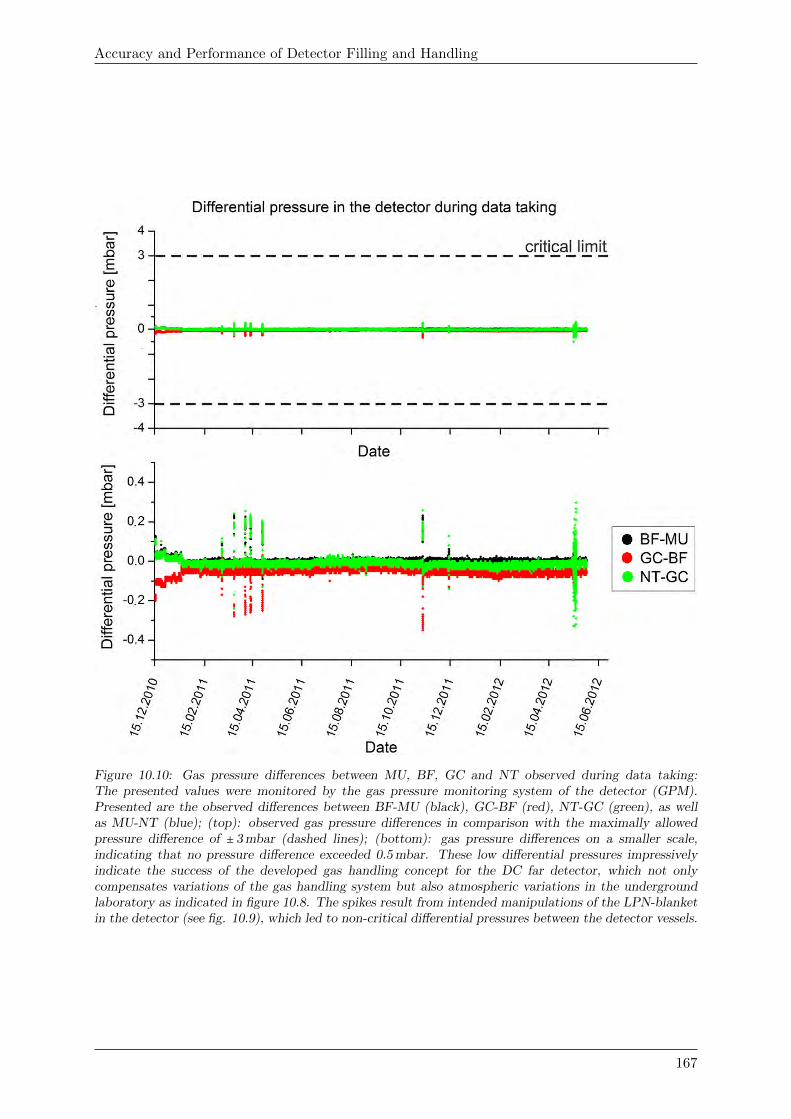
Accuracy and Performance of Detector Filling and Handling
Figure 10.10: Gas pressure differences between MU, BF, GC and NT observed during data taking:The presented values were monitored by the gas pressure monitoring system of the detector (GPM).Presented are the observed differences between BF-MU (black), GC-BF (red), NT-GC (green), as wellas MU-NT (blue); (top): observed gas pressure differences in comparison with the maximally allowedpressure difference of ± 3 mbar (dashed lines); (bottom): gas pressure differences on a smaller scale,indicating that no pressure difference exceeded 0.5 mbar. These low differential pressures impressivelyindicate the success of the developed gas handling concept for the DC far detector, which not onlycompensates variations of the gas handling system but also atmospheric variations in the undergroundlaboratory as indicated in figure 10.8. The spikes result from intended manipulations of the LPN-blanketin the detector (see fig. 10.9), which led to non-critical differential pressures between the detector vessels.
167
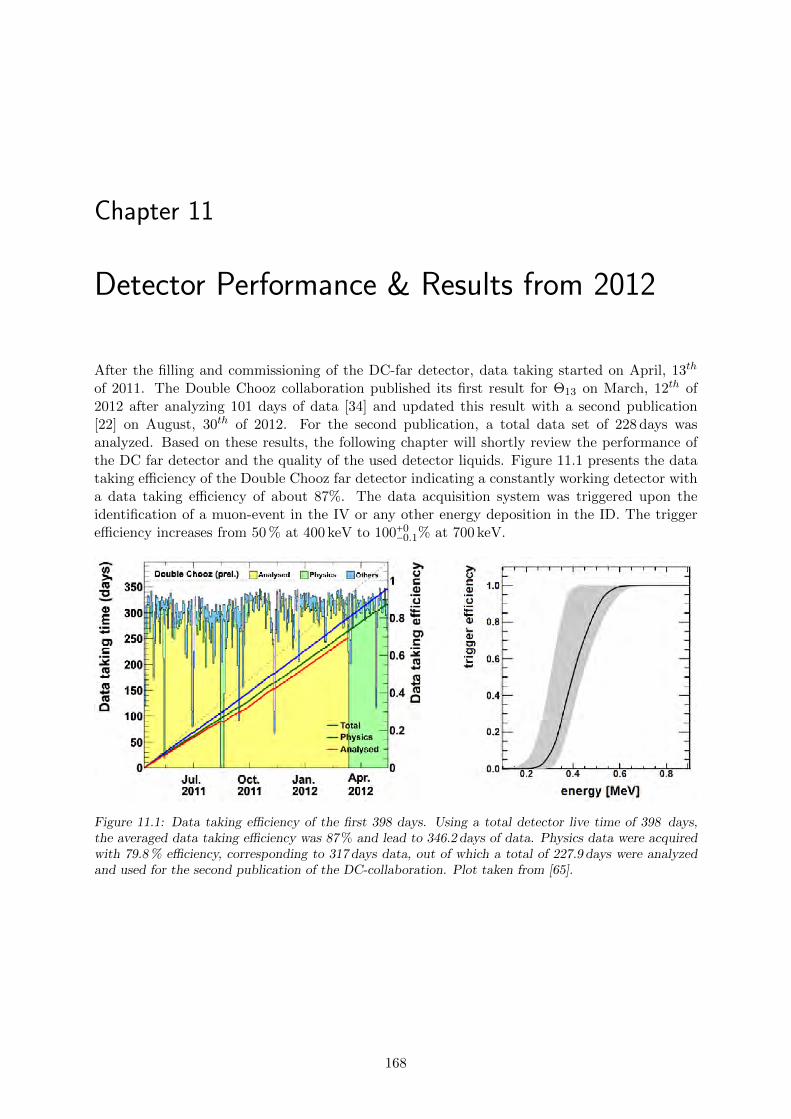
Chapter 11
Detector Performance & Results from 2012
After the filling and commissioning of the DC-far detector, data taking started on April, 13th
of 2011. The Double Chooz collaboration published its first result for Θ13 on March, 12th of2012 after analyzing 101 days of data [34] and updated this result with a second publication[22] on August, 30th of 2012. For the second publication, a total data set of 228 days wasanalyzed. Based on these results, the following chapter will shortly review the performance ofthe DC far detector and the quality of the used detector liquids. Figure 11.1 presents the datataking efficiency of the Double Chooz far detector indicating a constantly working detector witha data taking efficiency of about 87%. The data acquisition system was triggered upon theidentification of a muon-event in the IV or any other energy deposition in the ID. The triggerefficiency increases from 50 % at 400 keV to 100+0
−0.1% at 700 keV.
Figure 11.1: Data taking efficiency of the first 398 days. Using a total detector live time of 398 days,the averaged data taking efficiency was 87 % and lead to 346.2 days of data. Physics data were acquiredwith 79.8 % efficiency, corresponding to 317 days data, out of which a total of 227.9 days were analyzedand used for the second publication of the DC-collaboration. Plot taken from [65].
168
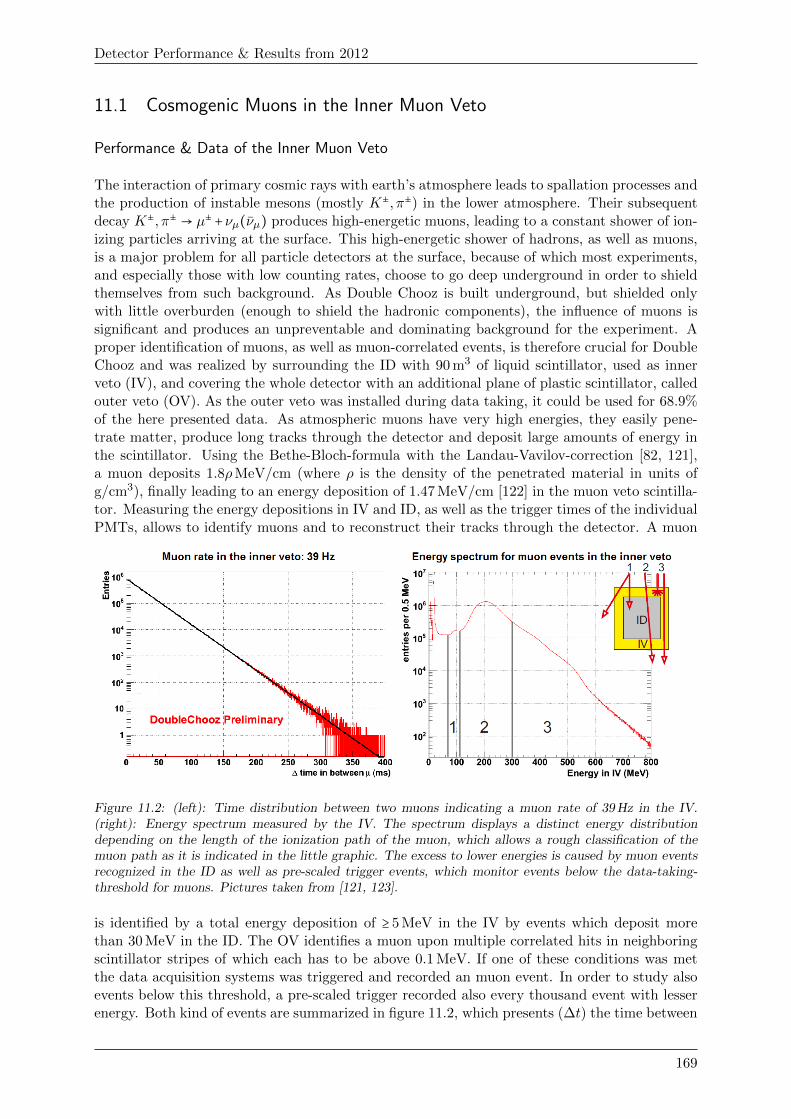
Detector Performance & Results from 2012
11.1 Cosmogenic Muons in the Inner Muon Veto
Performance & Data of the Inner Muon Veto
The interaction of primary cosmic rays with earth’s atmosphere leads to spallation processes andthe production of instable mesons (mostly K±, π±) in the lower atmosphere. Their subsequentdecay K±, π± → µ±+νµ(νµ) produces high-energetic muons, leading to a constant shower of ion-izing particles arriving at the surface. This high-energetic shower of hadrons, as well as muons,is a major problem for all particle detectors at the surface, because of which most experiments,and especially those with low counting rates, choose to go deep underground in order to shieldthemselves from such background. As Double Chooz is built underground, but shielded onlywith little overburden (enough to shield the hadronic components), the influence of muons issignificant and produces an unpreventable and dominating background for the experiment. Aproper identification of muons, as well as muon-correlated events, is therefore crucial for DoubleChooz and was realized by surrounding the ID with 90 m3 of liquid scintillator, used as innerveto (IV), and covering the whole detector with an additional plane of plastic scintillator, calledouter veto (OV). As the outer veto was installed during data taking, it could be used for 68.9%of the here presented data. As atmospheric muons have very high energies, they easily pene-trate matter, produce long tracks through the detector and deposit large amounts of energy inthe scintillator. Using the Bethe-Bloch-formula with the Landau-Vavilov-correction [82, 121],a muon deposits 1.8ρMeV/cm (where ρ is the density of the penetrated material in units ofg/cm3), finally leading to an energy deposition of 1.47 MeV/cm [122] in the muon veto scintilla-tor. Measuring the energy depositions in IV and ID, as well as the trigger times of the individualPMTs, allows to identify muons and to reconstruct their tracks through the detector. A muon
Figure 11.2: (left): Time distribution between two muons indicating a muon rate of 39 Hz in the IV.(right): Energy spectrum measured by the IV. The spectrum displays a distinct energy distributiondepending on the length of the ionization path of the muon, which allows a rough classification of themuon path as it is indicated in the little graphic. The excess to lower energies is caused by muon eventsrecognized in the ID as well as pre-scaled trigger events, which monitor events below the data-taking-threshold for muons. Pictures taken from [121, 123].
is identified by a total energy deposition of ≥ 5 MeV in the IV by events which deposit morethan 30 MeV in the ID. The OV identifies a muon upon multiple correlated hits in neighboringscintillator stripes of which each has to be above 0.1 MeV. If one of these conditions was metthe data acquisition systems was triggered and recorded an muon event. In order to study alsoevents below this threshold, a pre-scaled trigger recorded also every thousand event with lesserenergy. Both kind of events are summarized in figure 11.2, which presents (∆t) the time between
169
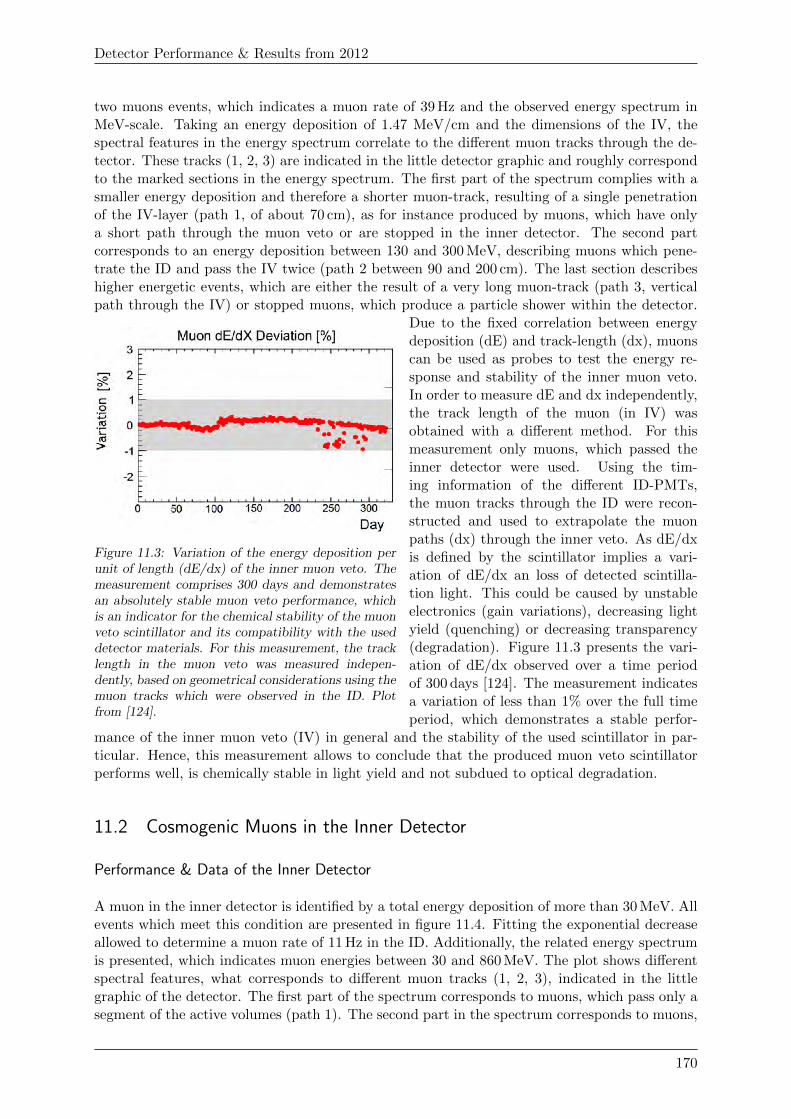
Detector Performance & Results from 2012
two muons events, which indicates a muon rate of 39 Hz and the observed energy spectrum inMeV-scale. Taking an energy deposition of 1.47 MeV/cm and the dimensions of the IV, thespectral features in the energy spectrum correlate to the different muon tracks through the de-tector. These tracks (1, 2, 3) are indicated in the little detector graphic and roughly correspondto the marked sections in the energy spectrum. The first part of the spectrum complies with asmaller energy deposition and therefore a shorter muon-track, resulting of a single penetrationof the IV-layer (path 1, of about 70 cm), as for instance produced by muons, which have onlya short path through the muon veto or are stopped in the inner detector. The second partcorresponds to an energy deposition between 130 and 300 MeV, describing muons which pene-trate the ID and pass the IV twice (path 2 between 90 and 200 cm). The last section describeshigher energetic events, which are either the result of a very long muon-track (path 3, verticalpath through the IV) or stopped muons, which produce a particle shower within the detector.
Figure 11.3: Variation of the energy deposition perunit of length (dE/dx) of the inner muon veto. Themeasurement comprises 300 days and demonstratesan absolutely stable muon veto performance, whichis an indicator for the chemical stability of the muonveto scintillator and its compatibility with the useddetector materials. For this measurement, the tracklength in the muon veto was measured indepen-dently, based on geometrical considerations using themuon tracks which were observed in the ID. Plotfrom [124].
Due to the fixed correlation between energydeposition (dE) and track-length (dx), muonscan be used as probes to test the energy re-sponse and stability of the inner muon veto.In order to measure dE and dx independently,the track length of the muon (in IV) wasobtained with a different method. For thismeasurement only muons, which passed theinner detector were used. Using the tim-ing information of the different ID-PMTs,the muon tracks through the ID were recon-structed and used to extrapolate the muonpaths (dx) through the inner veto. As dE/dxis defined by the scintillator implies a vari-ation of dE/dx an loss of detected scintilla-tion light. This could be caused by unstableelectronics (gain variations), decreasing lightyield (quenching) or decreasing transparency(degradation). Figure 11.3 presents the vari-ation of dE/dx observed over a time periodof 300 days [124]. The measurement indicatesa variation of less than 1% over the full timeperiod, which demonstrates a stable perfor-
mance of the inner muon veto (IV) in general and the stability of the used scintillator in par-ticular. Hence, this measurement allows to conclude that the produced muon veto scintillatorperforms well, is chemically stable in light yield and not subdued to optical degradation.
11.2 Cosmogenic Muons in the Inner Detector
Performance & Data of the Inner Detector
A muon in the inner detector is identified by a total energy deposition of more than 30 MeV. Allevents which meet this condition are presented in figure 11.4. Fitting the exponential decreaseallowed to determine a muon rate of 11 Hz in the ID. Additionally, the related energy spectrumis presented, which indicates muon energies between 30 and 860 MeV. The plot shows differentspectral features, what corresponds to different muon tracks (1, 2, 3), indicated in the littlegraphic of the detector. The first part of the spectrum corresponds to muons, which pass only asegment of the active volumes (path 1). The second part in the spectrum corresponds to muons,
170
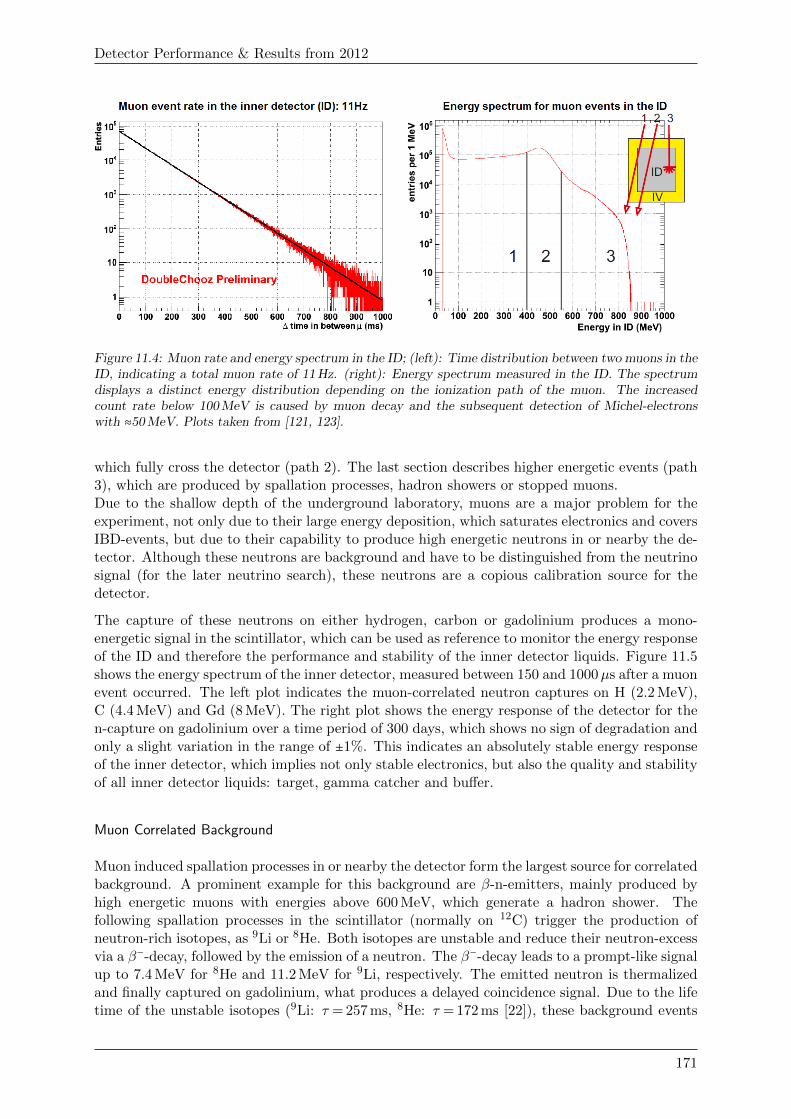
Detector Performance & Results from 2012
Figure 11.4: Muon rate and energy spectrum in the ID; (left): Time distribution between two muons in theID, indicating a total muon rate of 11 Hz. (right): Energy spectrum measured in the ID. The spectrumdisplays a distinct energy distribution depending on the ionization path of the muon. The increasedcount rate below 100 MeV is caused by muon decay and the subsequent detection of Michel-electronswith ≈50 MeV. Plots taken from [121, 123].
which fully cross the detector (path 2). The last section describes higher energetic events (path3), which are produced by spallation processes, hadron showers or stopped muons.Due to the shallow depth of the underground laboratory, muons are a major problem for theexperiment, not only due to their large energy deposition, which saturates electronics and coversIBD-events, but due to their capability to produce high energetic neutrons in or nearby the de-tector. Although these neutrons are background and have to be distinguished from the neutrinosignal (for the later neutrino search), these neutrons are a copious calibration source for thedetector.
The capture of these neutrons on either hydrogen, carbon or gadolinium produces a mono-energetic signal in the scintillator, which can be used as reference to monitor the energy responseof the ID and therefore the performance and stability of the inner detector liquids. Figure 11.5shows the energy spectrum of the inner detector, measured between 150 and 1000µs after a muonevent occurred. The left plot indicates the muon-correlated neutron captures on H (2.2 MeV),C (4.4 MeV) and Gd (8 MeV). The right plot shows the energy response of the detector for then-capture on gadolinium over a time period of 300 days, which shows no sign of degradation andonly a slight variation in the range of ±1%. This indicates an absolutely stable energy responseof the inner detector, which implies not only stable electronics, but also the quality and stabilityof all inner detector liquids: target, gamma catcher and buffer.
Muon Correlated Background
Muon induced spallation processes in or nearby the detector form the largest source for correlatedbackground. A prominent example for this background are β-n-emitters, mainly produced byhigh energetic muons with energies above 600 MeV, which generate a hadron shower. Thefollowing spallation processes in the scintillator (normally on 12C) trigger the production ofneutron-rich isotopes, as 9Li or 8He. Both isotopes are unstable and reduce their neutron-excessvia a β−-decay, followed by the emission of a neutron. The β−-decay leads to a prompt-like signalup to 7.4 MeV for 8He and 11.2 MeV for 9Li, respectively. The emitted neutron is thermalizedand finally captured on gadolinium, what produces a delayed coincidence signal. Due to the lifetime of the unstable isotopes (9Li: τ = 257 ms, 8He: τ = 172 ms [22]), these background events
171
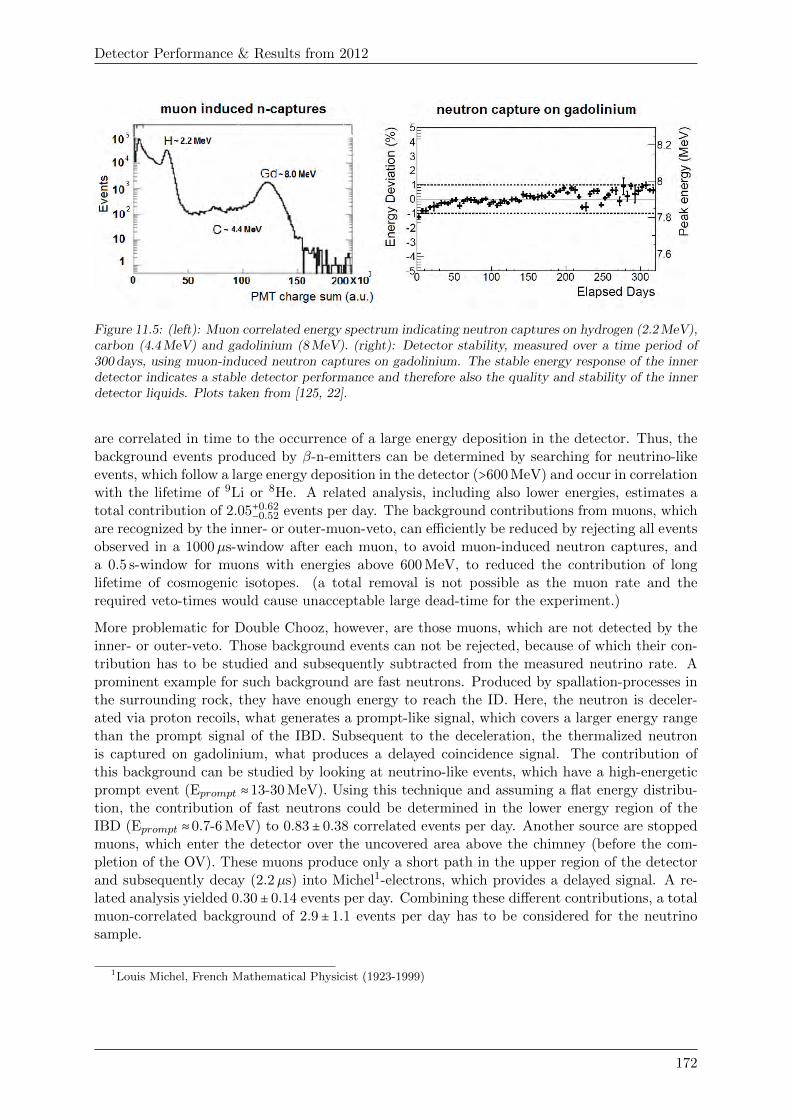
Detector Performance & Results from 2012
Figure 11.5: (left): Muon correlated energy spectrum indicating neutron captures on hydrogen (2.2 MeV),carbon (4.4 MeV) and gadolinium (8 MeV). (right): Detector stability, measured over a time period of300 days, using muon-induced neutron captures on gadolinium. The stable energy response of the innerdetector indicates a stable detector performance and therefore also the quality and stability of the innerdetector liquids. Plots taken from [125, 22].
are correlated in time to the occurrence of a large energy deposition in the detector. Thus, thebackground events produced by β-n-emitters can be determined by searching for neutrino-likeevents, which follow a large energy deposition in the detector (>600 MeV) and occur in correlationwith the lifetime of 9Li or 8He. A related analysis, including also lower energies, estimates atotal contribution of 2.05+0.62
−0.52 events per day. The background contributions from muons, whichare recognized by the inner- or outer-muon-veto, can efficiently be reduced by rejecting all eventsobserved in a 1000µs-window after each muon, to avoid muon-induced neutron captures, anda 0.5 s-window for muons with energies above 600 MeV, to reduced the contribution of longlifetime of cosmogenic isotopes. (a total removal is not possible as the muon rate and therequired veto-times would cause unacceptable large dead-time for the experiment.)
More problematic for Double Chooz, however, are those muons, which are not detected by theinner- or outer-veto. Those background events can not be rejected, because of which their con-tribution has to be studied and subsequently subtracted from the measured neutrino rate. Aprominent example for such background are fast neutrons. Produced by spallation-processes inthe surrounding rock, they have enough energy to reach the ID. Here, the neutron is deceler-ated via proton recoils, what generates a prompt-like signal, which covers a larger energy rangethan the prompt signal of the IBD. Subsequent to the deceleration, the thermalized neutronis captured on gadolinium, what produces a delayed coincidence signal. The contribution ofthis background can be studied by looking at neutrino-like events, which have a high-energeticprompt event (Eprompt ≈13-30 MeV). Using this technique and assuming a flat energy distribu-tion, the contribution of fast neutrons could be determined in the lower energy region of theIBD (Eprompt ≈0.7-6 MeV) to 0.83± 0.38 correlated events per day. Another source are stoppedmuons, which enter the detector over the uncovered area above the chimney (before the com-pletion of the OV). These muons produce only a short path in the upper region of the detectorand subsequently decay (2.2µs) into Michel1-electrons, which provides a delayed signal. A re-lated analysis yielded 0.30± 0.14 events per day. Combining these different contributions, a totalmuon-correlated background of 2.9± 1.1 events per day has to be considered for the neutrinosample.
1Louis Michel, French Mathematical Physicist (1923-1999)
172
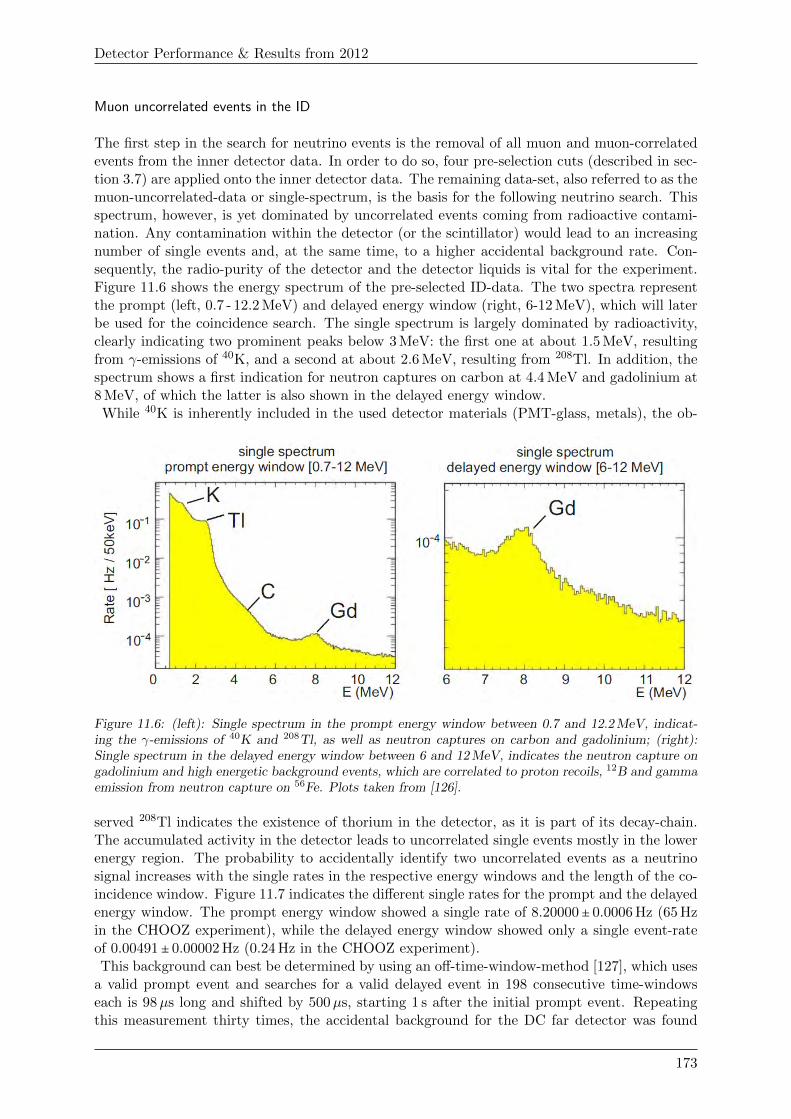
Detector Performance & Results from 2012
Muon uncorrelated events in the ID
The first step in the search for neutrino events is the removal of all muon and muon-correlatedevents from the inner detector data. In order to do so, four pre-selection cuts (described in sec-tion 3.7) are applied onto the inner detector data. The remaining data-set, also referred to as themuon-uncorrelated-data or single-spectrum, is the basis for the following neutrino search. Thisspectrum, however, is yet dominated by uncorrelated events coming from radioactive contami-nation. Any contamination within the detector (or the scintillator) would lead to an increasingnumber of single events and, at the same time, to a higher accidental background rate. Con-sequently, the radio-purity of the detector and the detector liquids is vital for the experiment.Figure 11.6 shows the energy spectrum of the pre-selected ID-data. The two spectra representthe prompt (left, 0.7 - 12.2 MeV) and delayed energy window (right, 6-12 MeV), which will laterbe used for the coincidence search. The single spectrum is largely dominated by radioactivity,clearly indicating two prominent peaks below 3 MeV: the first one at about 1.5 MeV, resultingfrom γ-emissions of 40K, and a second at about 2.6 MeV, resulting from 208Tl. In addition, thespectrum shows a first indication for neutron captures on carbon at 4.4 MeV and gadolinium at8 MeV, of which the latter is also shown in the delayed energy window.While 40K is inherently included in the used detector materials (PMT-glass, metals), the ob-
Figure 11.6: (left): Single spectrum in the prompt energy window between 0.7 and 12.2 MeV, indicat-ing the γ-emissions of 40K and 208Tl, as well as neutron captures on carbon and gadolinium; (right):Single spectrum in the delayed energy window between 6 and 12 MeV, indicates the neutron capture ongadolinium and high energetic background events, which are correlated to proton recoils, 12B and gammaemission from neutron capture on 56Fe. Plots taken from [126].
served 208Tl indicates the existence of thorium in the detector, as it is part of its decay-chain.The accumulated activity in the detector leads to uncorrelated single events mostly in the lowerenergy region. The probability to accidentally identify two uncorrelated events as a neutrinosignal increases with the single rates in the respective energy windows and the length of the co-incidence window. Figure 11.7 indicates the different single rates for the prompt and the delayedenergy window. The prompt energy window showed a single rate of 8.20000± 0.0006 Hz (65 Hzin the CHOOZ experiment), while the delayed energy window showed only a single event-rateof 0.00491± 0.00002 Hz (0.24 Hz in the CHOOZ experiment).This background can best be determined by using an off-time-window-method [127], which uses
a valid prompt event and searches for a valid delayed event in 198 consecutive time-windowseach is 98µs long and shifted by 500µs, starting 1 s after the initial prompt event. Repeatingthis measurement thirty times, the accidental background for the DC far detector was found
173
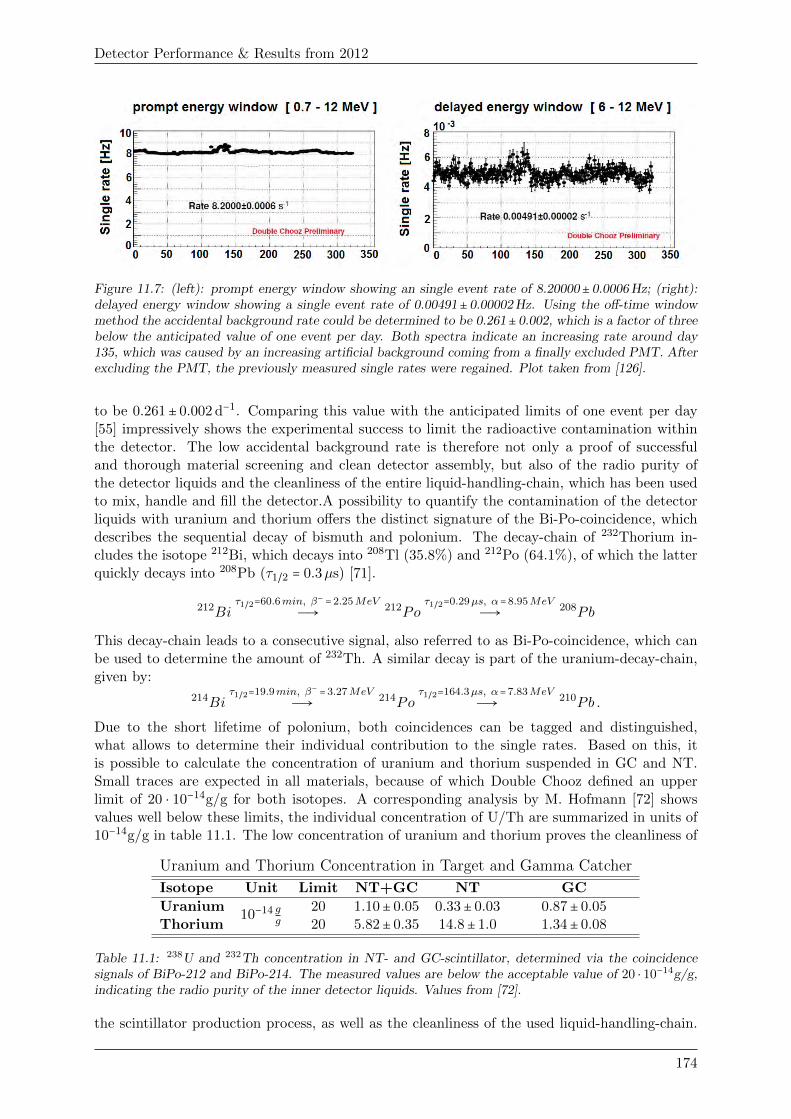
Detector Performance & Results from 2012
Figure 11.7: (left): prompt energy window showing an single event rate of 8.20000± 0.0006 Hz; (right):delayed energy window showing a single event rate of 0.00491± 0.00002 Hz. Using the off-time windowmethod the accidental background rate could be determined to be 0.261± 0.002, which is a factor of threebelow the anticipated value of one event per day. Both spectra indicate an increasing rate around day135, which was caused by an increasing artificial background coming from a finally excluded PMT. Afterexcluding the PMT, the previously measured single rates were regained. Plot taken from [126].
to be 0.261± 0.002 d−1. Comparing this value with the anticipated limits of one event per day[55] impressively shows the experimental success to limit the radioactive contamination withinthe detector. The low accidental background rate is therefore not only a proof of successfuland thorough material screening and clean detector assembly, but also of the radio purity ofthe detector liquids and the cleanliness of the entire liquid-handling-chain, which has been usedto mix, handle and fill the detector.A possibility to quantify the contamination of the detectorliquids with uranium and thorium offers the distinct signature of the Bi-Po-coincidence, whichdescribes the sequential decay of bismuth and polonium. The decay-chain of 232Thorium in-cludes the isotope 212Bi, which decays into 208Tl (35.8%) and 212Po (64.1%), of which the latterquickly decays into 208Pb (τ1/2 = 0.3µs) [71].
212Biτ1/2=60.6min, β− =2.25MeV
Ð→ 212Poτ1/2=0.29µs, α=8.95MeV
Ð→ 208Pb
This decay-chain leads to a consecutive signal, also referred to as Bi-Po-coincidence, which canbe used to determine the amount of 232Th. A similar decay is part of the uranium-decay-chain,given by:
214Biτ1/2=19.9min, β− =3.27MeV
Ð→ 214Poτ1/2=164.3µs, α=7.83MeV
Ð→ 210Pb .
Due to the short lifetime of polonium, both coincidences can be tagged and distinguished,what allows to determine their individual contribution to the single rates. Based on this, itis possible to calculate the concentration of uranium and thorium suspended in GC and NT.Small traces are expected in all materials, because of which Double Chooz defined an upperlimit of 20 ⋅ 10−14g/g for both isotopes. A corresponding analysis by M. Hofmann [72] showsvalues well below these limits, the individual concentration of U/Th are summarized in units of10−14g/g in table 11.1. The low concentration of uranium and thorium proves the cleanliness of
Uranium and Thorium Concentration in Target and Gamma Catcher
Isotope Unit Limit NT+GC NT GC
Uranium10−14 g
g
20 1.10± 0.05 0.33± 0.03 0.87± 0.05Thorium 20 5.82± 0.35 14.8± 1.0 1.34± 0.08
Table 11.1: 238U and 232Th concentration in NT- and GC-scintillator, determined via the coincidencesignals of BiPo-212 and BiPo-214. The measured values are below the acceptable value of 20 ⋅ 10−14g/g,indicating the radio purity of the inner detector liquids. Values from [72].
the scintillator production process, as well as the cleanliness of the used liquid-handling-chain.
174
Detector Performance & Results from 2012
This implies permanent cleanliness (on the level of 10−14g/g for U/Th) during the production-process at MPIK, the liquid transport to Chooz, the liquid handling in the LSA, the liquidtransfer to the underground lab (TLS) and finally also during the filling process (DFOS). Asthe cleanliness efforts in Chooz were equal for all the detector liquids, it can be assumed thatthe liquid handling of muon veto scintillator and buffer liquid were of similar quality.
In order to identify individual sources of contamination, which could be induced by installationsor detector materials, it is possible to reconstruct the position of the single events and thereforethe possible position of the contaminating source. The accuracy of this reconstruction dependson the energy deposition and is about 20 cm for lower energies and improves to 10 cm for energiesabove 5 MeV. Figure 11.8 presents a 2D-reconstruction of single events in the prompt (top row)and delayed energy window (bottom row). The reconstruction of single events in the promptenergy window shows a higher event rate in the gamma catcher, as well as point like sourcesat the center of the detector. The gamma-catcher-ring is the first scintillating barrier for theincoming gammas, thus, a homogeneously elevated event rate can be expected. The hot spot inthe center, however, is caused by two point-like sources within the detector. The correlated sideview of the detector indicates two sources, one near the target-chimney the other near gammacatcher bottom. The upper one is partially caused by incoming radiation (γ, µ, etc. whichenter through the uncovered target chimney) and partially caused by a small metal box, whichis installed just outside the target chimney as part of the calibration system guide-tube. Thelower source is caused by the hydrostatic pressure sensor (GC-HPS, see figure 7.3.1), which hadto be installed at this position as part of the detector monitoring system. In order to limit thecontamination in the detector, the HPS-sensor was screened at TUM and MPIK. The depictedevents corresponds mainly to 40K and other less active isotopes found in the sensor. A fullradio assay of this sensor and the mentioned guide-tube-box, is summarized in the appendix seefigure D.18. Analyzing the accidental background events accumulated around the HPS-sensor,allowed to determine the impact of the HPS sensor on the accidental background. Based on thisselection, the HPS-sensor is responsible for 0.0023 events per day or ∼1 % of the total accidentalbackground rate [128]. The bottom row of figure 11.8 shows reconstructed events in the delayedenergy window. Due to the higher energy deposition, the accuracy of reconstruction is higherand indicates a clear separation between GC and BF vessel as well as the absence of events inthe buffer. While a higher event rate can be expected from the n-captures on gadolinium, theequal high event rate in the gamma catcher is unexpected. Excluding correlated events thishomogenous distributed events are caused by proton-recoil, 12B and an additional contributioncoming from n-capture on 56Fe, which emits two high energetic gammas with 6 and 7.6 MeV.Based on the in general very low accidental background rate and the absence of unexpectedradioactive sources, this reconstruction shows a very an effective cleanliness concept, a cleandetector assembly and clean detector liquids.
Summary
In summary, it can be stated, that all parts of the detector and the detector liquids exceededthe cleanliness requirements of Double Chooz. In addition, the radio purity of the detectorliquids demonstrates the cleanliness of the entire liquid-handling-chain, which was used for theproduction and handling of the liquids. Apart from that, the stable performance of the detectorimplies that all liquids are chemically stable and compatible with the used detector materials.The clear separation between the different detector vessels furthermore allows to state that allinner detector vessels are intact and free from leakage. Consequently, it can be reasoned thatthe detector was not harmed before, during or after the detector filling process.
175
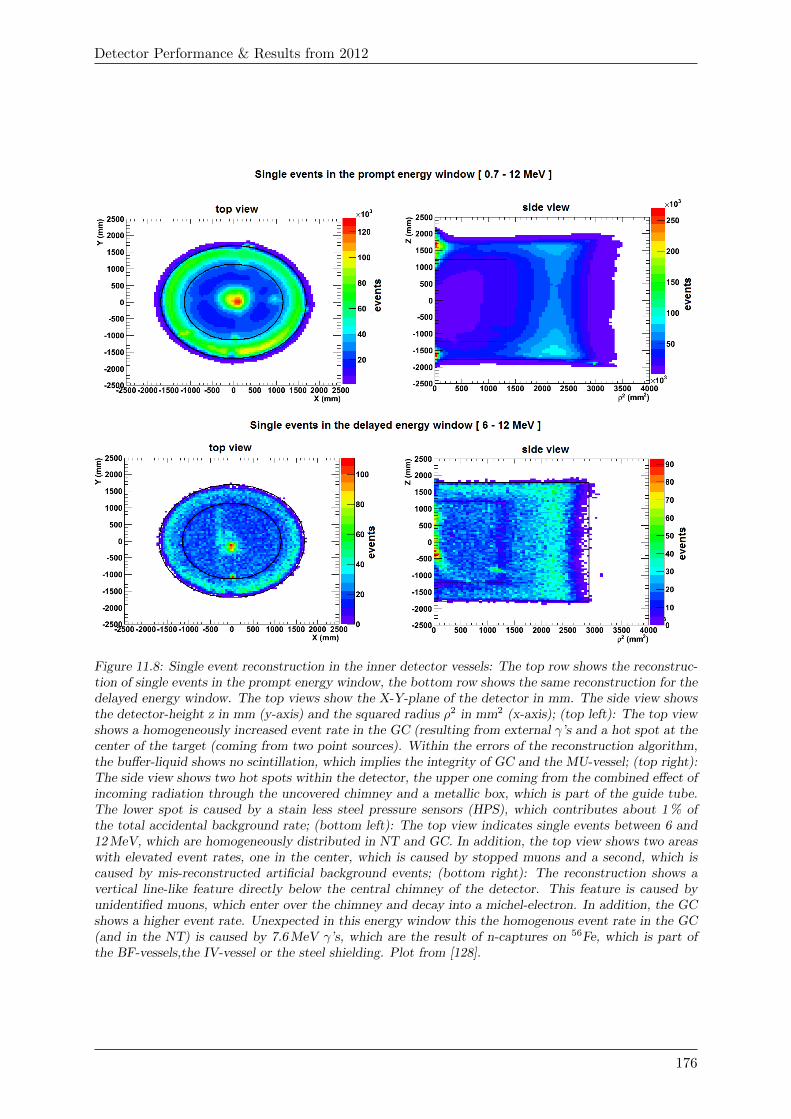
Detector Performance & Results from 2012
Figure 11.8: Single event reconstruction in the inner detector vessels: The top row shows the reconstruc-tion of single events in the prompt energy window, the bottom row shows the same reconstruction for thedelayed energy window. The top views show the X-Y-plane of the detector in mm. The side view showsthe detector-height z in mm (y-axis) and the squared radius ρ2 in mm2 (x-axis); (top left): The top viewshows a homogeneously increased event rate in the GC (resulting from external γ’s and a hot spot at thecenter of the target (coming from two point sources). Within the errors of the reconstruction algorithm,the buffer-liquid shows no scintillation, which implies the integrity of GC and the MU-vessel; (top right):The side view shows two hot spots within the detector, the upper one coming from the combined effect ofincoming radiation through the uncovered chimney and a metallic box, which is part of the guide tube.The lower spot is caused by a stain less steel pressure sensors (HPS), which contributes about 1 % ofthe total accidental background rate; (bottom left): The top view indicates single events between 6 and12 MeV, which are homogeneously distributed in NT and GC. In addition, the top view shows two areaswith elevated event rates, one in the center, which is caused by stopped muons and a second, which iscaused by mis-reconstructed artificial background events; (bottom right): The reconstruction shows avertical line-like feature directly below the central chimney of the detector. This feature is caused byunidentified muons, which enter over the chimney and decay into a michel-electron. In addition, the GCshows a higher event rate. Unexpected in this energy window this the homogenous event rate in the GC(and in the NT) is caused by 7.6 MeV γ’s, which are the result of n-captures on 56Fe, which is part ofthe BF-vessels,the IV-vessel or the steel shielding. Plot from [128].
176
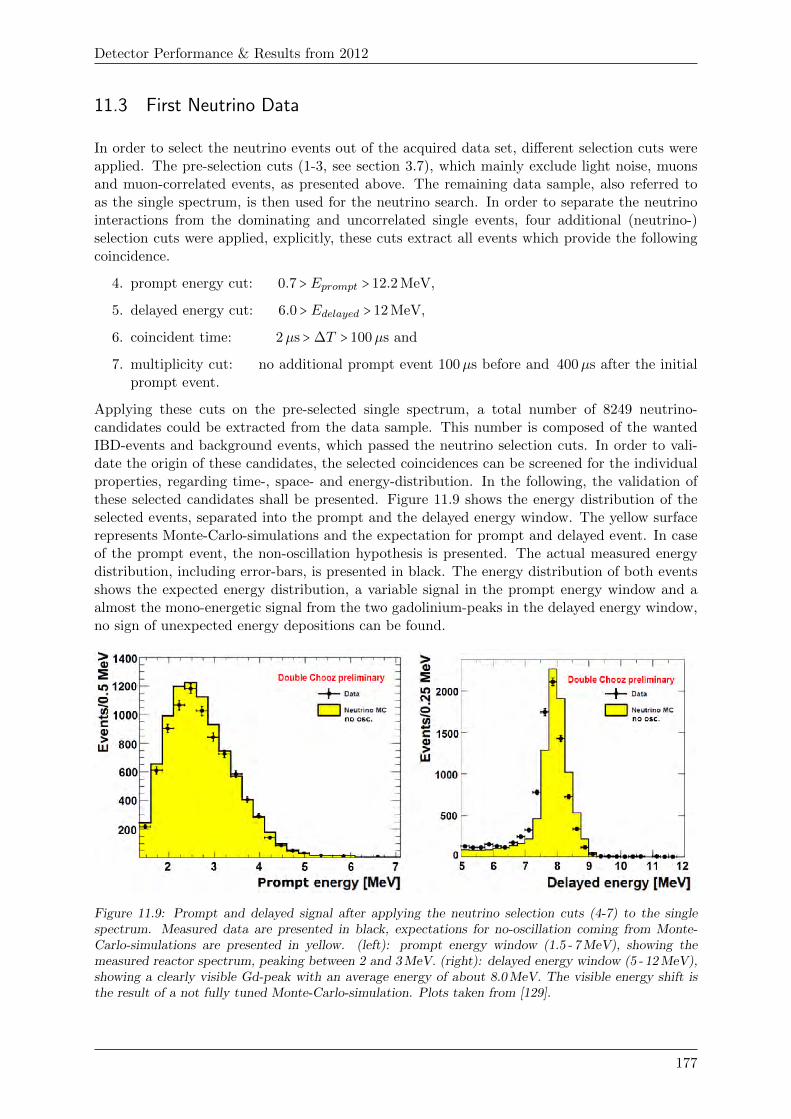
Detector Performance & Results from 2012
11.3 First Neutrino Data
In order to select the neutrino events out of the acquired data set, different selection cuts wereapplied. The pre-selection cuts (1-3, see section 3.7), which mainly exclude light noise, muonsand muon-correlated events, as presented above. The remaining data sample, also referred toas the single spectrum, is then used for the neutrino search. In order to separate the neutrinointeractions from the dominating and uncorrelated single events, four additional (neutrino-)selection cuts were applied, explicitly, these cuts extract all events which provide the followingcoincidence.
4. prompt energy cut: 0.7 > Eprompt > 12.2 MeV,
5. delayed energy cut: 6.0 > Edelayed > 12 MeV,
6. coincident time: 2µs > ∆T > 100µs and
7. multiplicity cut: no additional prompt event 100µs before and 400µs after the initialprompt event.
Applying these cuts on the pre-selected single spectrum, a total number of 8249 neutrino-candidates could be extracted from the data sample. This number is composed of the wantedIBD-events and background events, which passed the neutrino selection cuts. In order to vali-date the origin of these candidates, the selected coincidences can be screened for the individualproperties, regarding time-, space- and energy-distribution. In the following, the validation ofthese selected candidates shall be presented. Figure 11.9 shows the energy distribution of theselected events, separated into the prompt and the delayed energy window. The yellow surfacerepresents Monte-Carlo-simulations and the expectation for prompt and delayed event. In caseof the prompt event, the non-oscillation hypothesis is presented. The actual measured energydistribution, including error-bars, is presented in black. The energy distribution of both eventsshows the expected energy distribution, a variable signal in the prompt energy window and aalmost the mono-energetic signal from the two gadolinium-peaks in the delayed energy window,no sign of unexpected energy depositions can be found.
Figure 11.9: Prompt and delayed signal after applying the neutrino selection cuts (4-7) to the singlespectrum. Measured data are presented in black, expectations for no-oscillation coming from Monte-Carlo-simulations are presented in yellow. (left): prompt energy window (1.5 - 7 MeV), showing themeasured reactor spectrum, peaking between 2 and 3 MeV. (right): delayed energy window (5 - 12 MeV),showing a clearly visible Gd-peak with an average energy of about 8.0 MeV. The visible energy shift isthe result of a not fully tuned Monte-Carlo-simulation. Plots taken from [129].
177
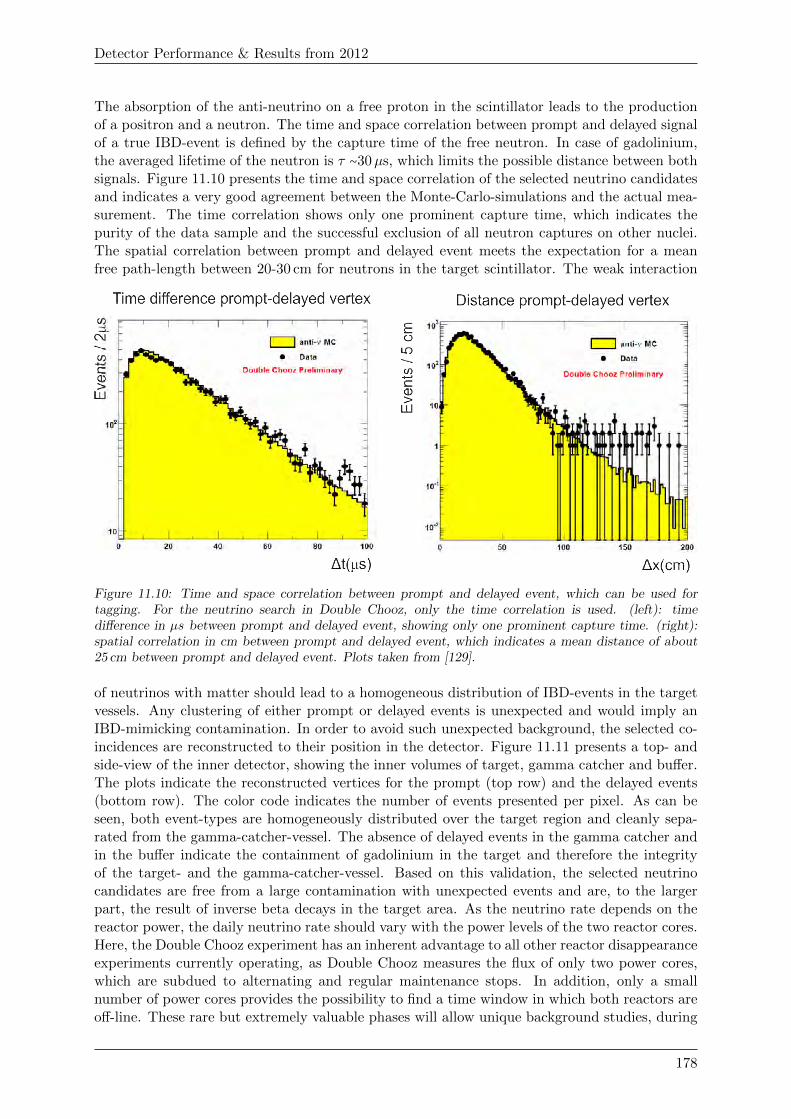
Detector Performance & Results from 2012
The absorption of the anti-neutrino on a free proton in the scintillator leads to the productionof a positron and a neutron. The time and space correlation between prompt and delayed signalof a true IBD-event is defined by the capture time of the free neutron. In case of gadolinium,the averaged lifetime of the neutron is τ ∼30µs, which limits the possible distance between bothsignals. Figure 11.10 presents the time and space correlation of the selected neutrino candidatesand indicates a very good agreement between the Monte-Carlo-simulations and the actual mea-surement. The time correlation shows only one prominent capture time, which indicates thepurity of the data sample and the successful exclusion of all neutron captures on other nuclei.The spatial correlation between prompt and delayed event meets the expectation for a meanfree path-length between 20-30 cm for neutrons in the target scintillator. The weak interaction
Figure 11.10: Time and space correlation between prompt and delayed event, which can be used fortagging. For the neutrino search in Double Chooz, only the time correlation is used. (left): timedifference in µs between prompt and delayed event, showing only one prominent capture time. (right):spatial correlation in cm between prompt and delayed event, which indicates a mean distance of about25 cm between prompt and delayed event. Plots taken from [129].
of neutrinos with matter should lead to a homogeneous distribution of IBD-events in the targetvessels. Any clustering of either prompt or delayed events is unexpected and would imply anIBD-mimicking contamination. In order to avoid such unexpected background, the selected co-incidences are reconstructed to their position in the detector. Figure 11.11 presents a top- andside-view of the inner detector, showing the inner volumes of target, gamma catcher and buffer.The plots indicate the reconstructed vertices for the prompt (top row) and the delayed events(bottom row). The color code indicates the number of events presented per pixel. As can beseen, both event-types are homogeneously distributed over the target region and cleanly sepa-rated from the gamma-catcher-vessel. The absence of delayed events in the gamma catcher andin the buffer indicate the containment of gadolinium in the target and therefore the integrityof the target- and the gamma-catcher-vessel. Based on this validation, the selected neutrinocandidates are free from a large contamination with unexpected events and are, to the largerpart, the result of inverse beta decays in the target area. As the neutrino rate depends on thereactor power, the daily neutrino rate should vary with the power levels of the two reactor cores.Here, the Double Chooz experiment has an inherent advantage to all other reactor disappearanceexperiments currently operating, as Double Chooz measures the flux of only two power cores,which are subdued to alternating and regular maintenance stops. In addition, only a smallnumber of power cores provides the possibility to find a time window in which both reactors areoff-line. These rare but extremely valuable phases will allow unique background studies, during
178
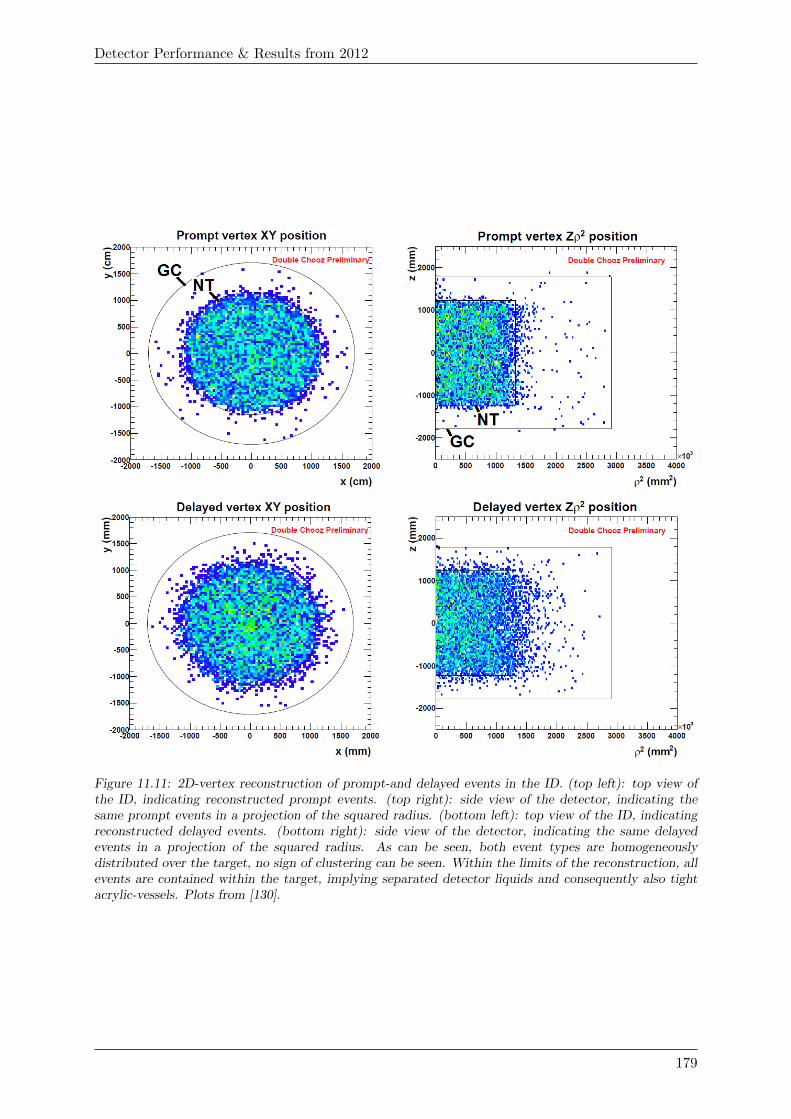
Detector Performance & Results from 2012
Figure 11.11: 2D-vertex reconstruction of prompt-and delayed events in the ID. (top left): top view ofthe ID, indicating reconstructed prompt events. (top right): side view of the detector, indicating thesame prompt events in a projection of the squared radius. (bottom left): top view of the ID, indicatingreconstructed delayed events. (bottom right): side view of the detector, indicating the same delayedevents in a projection of the squared radius. As can be seen, both event types are homogeneouslydistributed over the target, no sign of clustering can be seen. Within the limits of the reconstruction, allevents are contained within the target, implying separated detector liquids and consequently also tightacrylic-vessels. Plots from [130].
179
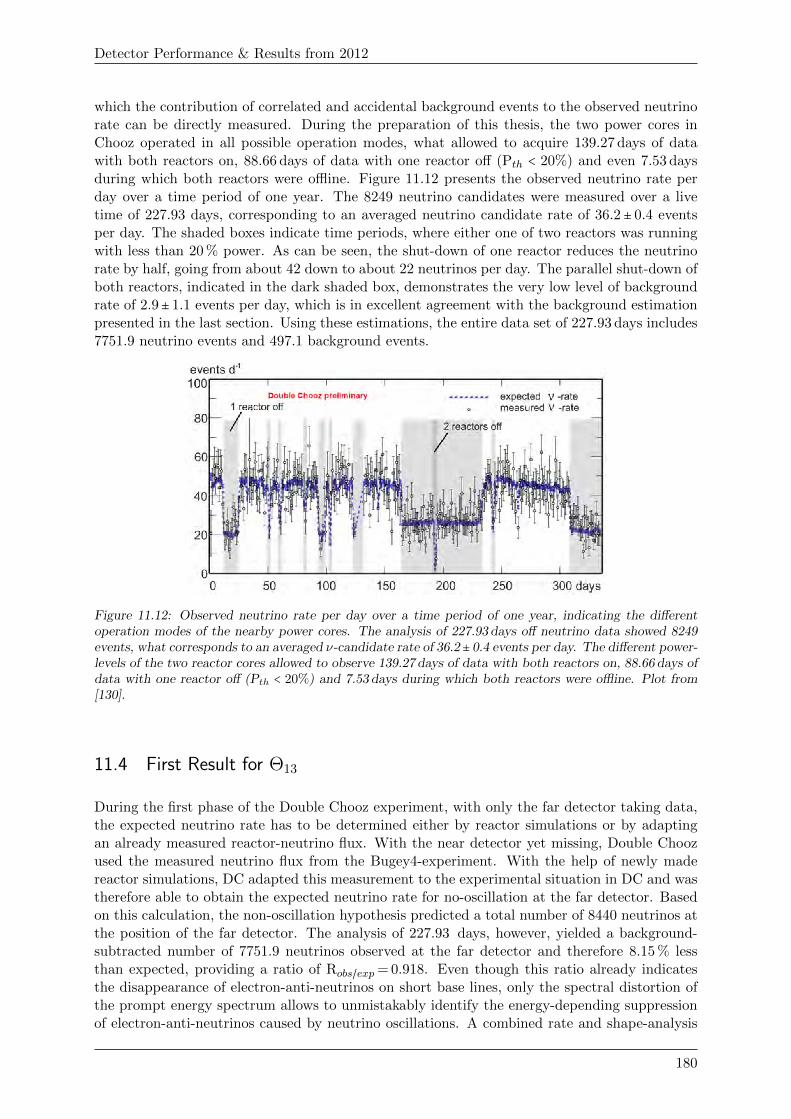
Detector Performance & Results from 2012
which the contribution of correlated and accidental background events to the observed neutrinorate can be directly measured. During the preparation of this thesis, the two power cores inChooz operated in all possible operation modes, what allowed to acquire 139.27 days of datawith both reactors on, 88.66 days of data with one reactor off (Pth < 20%) and even 7.53 daysduring which both reactors were offline. Figure 11.12 presents the observed neutrino rate perday over a time period of one year. The 8249 neutrino candidates were measured over a livetime of 227.93 days, corresponding to an averaged neutrino candidate rate of 36.2± 0.4 eventsper day. The shaded boxes indicate time periods, where either one of two reactors was runningwith less than 20 % power. As can be seen, the shut-down of one reactor reduces the neutrinorate by half, going from about 42 down to about 22 neutrinos per day. The parallel shut-down ofboth reactors, indicated in the dark shaded box, demonstrates the very low level of backgroundrate of 2.9± 1.1 events per day, which is in excellent agreement with the background estimationpresented in the last section. Using these estimations, the entire data set of 227.93 days includes7751.9 neutrino events and 497.1 background events.
Figure 11.12: Observed neutrino rate per day over a time period of one year, indicating the differentoperation modes of the nearby power cores. The analysis of 227.93 days off neutrino data showed 8249events, what corresponds to an averaged ν-candidate rate of 36.2± 0.4 events per day. The different power-levels of the two reactor cores allowed to observe 139.27 days of data with both reactors on, 88.66 days ofdata with one reactor off (Pth < 20%) and 7.53 days during which both reactors were offline. Plot from[130].
11.4 First Result for Θ13
During the first phase of the Double Chooz experiment, with only the far detector taking data,the expected neutrino rate has to be determined either by reactor simulations or by adaptingan already measured reactor-neutrino flux. With the near detector yet missing, Double Choozused the measured neutrino flux from the Bugey4-experiment. With the help of newly madereactor simulations, DC adapted this measurement to the experimental situation in DC and wastherefore able to obtain the expected neutrino rate for no-oscillation at the far detector. Basedon this calculation, the non-oscillation hypothesis predicted a total number of 8440 neutrinos atthe position of the far detector. The analysis of 227.93 days, however, yielded a background-subtracted number of 7751.9 neutrinos observed at the far detector and therefore 8.15 % lessthan expected, providing a ratio of Robs/exp = 0.918. Even though this ratio already indicatesthe disappearance of electron-anti-neutrinos on short base lines, only the spectral distortion ofthe prompt energy spectrum allows to unmistakably identify the energy-depending suppressionof electron-anti-neutrinos caused by neutrino oscillations. A combined rate and shape-analysis
180
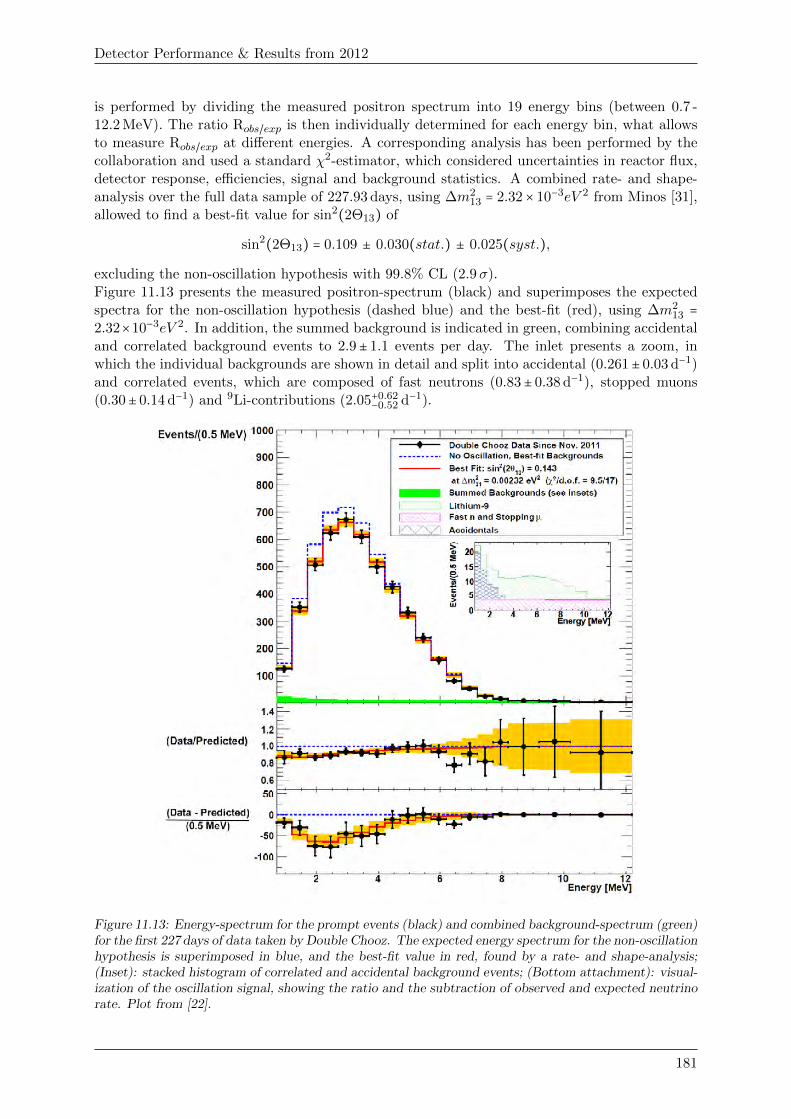
Detector Performance & Results from 2012
is performed by dividing the measured positron spectrum into 19 energy bins (between 0.7 -12.2 MeV). The ratio Robs/exp is then individually determined for each energy bin, what allowsto measure Robs/exp at different energies. A corresponding analysis has been performed by thecollaboration and used a standard χ2-estimator, which considered uncertainties in reactor flux,detector response, efficiencies, signal and background statistics. A combined rate- and shape-analysis over the full data sample of 227.93 days, using ∆m2
13 = 2.32 × 10⁻³eV 2 from Minos [31],allowed to find a best-fit value for sin2(2Θ13) of
sin2(2Θ13) = 0.109 ± 0.030(stat.) ± 0.025(syst.),
excluding the non-oscillation hypothesis with 99.8% CL (2.9σ).Figure 11.13 presents the measured positron-spectrum (black) and superimposes the expectedspectra for the non-oscillation hypothesis (dashed blue) and the best-fit (red), using ∆m2
13 =2.32×10⁻³eV 2. In addition, the summed background is indicated in green, combining accidentaland correlated background events to 2.9± 1.1 events per day. The inlet presents a zoom, inwhich the individual backgrounds are shown in detail and split into accidental (0.261± 0.03 d−1)and correlated events, which are composed of fast neutrons (0.83± 0.38 d−1), stopped muons(0.30± 0.14 d−1) and 9Li-contributions (2.05+0.62
−0.52 d−1).
Figure 11.13: Energy-spectrum for the prompt events (black) and combined background-spectrum (green)for the first 227 days of data taken by Double Chooz. The expected energy spectrum for the non-oscillationhypothesis is superimposed in blue, and the best-fit value in red, found by a rate- and shape-analysis;(Inset): stacked histogram of correlated and accidental background events; (Bottom attachment): visual-ization of the oscillation signal, showing the ratio and the subtraction of observed and expected neutrinorate. Plot from [22].
181
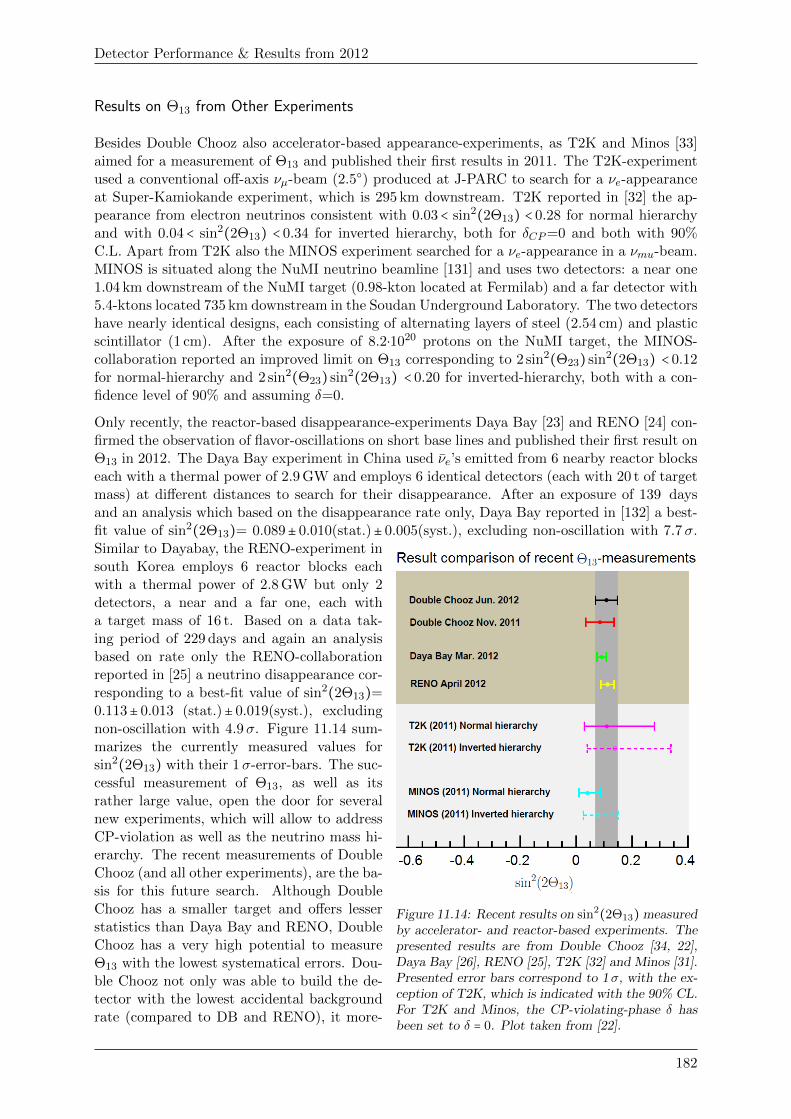
Detector Performance & Results from 2012
Results on Θ13 from Other Experiments
Besides Double Chooz also accelerator-based appearance-experiments, as T2K and Minos [33]aimed for a measurement of Θ13 and published their first results in 2011. The T2K-experimentused a conventional off-axis νµ-beam (2.5○) produced at J-PARC to search for a νe-appearanceat Super-Kamiokande experiment, which is 295 km downstream. T2K reported in [32] the ap-pearance from electron neutrinos consistent with 0.03 < sin2(2Θ13) < 0.28 for normal hierarchyand with 0.04 < sin2(2Θ13) < 0.34 for inverted hierarchy, both for δCP=0 and both with 90%C.L. Apart from T2K also the MINOS experiment searched for a νe-appearance in a νmu-beam.MINOS is situated along the NuMI neutrino beamline [131] and uses two detectors: a near one1.04 km downstream of the NuMI target (0.98-kton located at Fermilab) and a far detector with5.4-ktons located 735 km downstream in the Soudan Underground Laboratory. The two detectorshave nearly identical designs, each consisting of alternating layers of steel (2.54 cm) and plasticscintillator (1 cm). After the exposure of 8.2⋅1020 protons on the NuMI target, the MINOS-collaboration reported an improved limit on Θ13 corresponding to 2 sin2(Θ23) sin2(2Θ13) < 0.12for normal-hierarchy and 2 sin2(Θ23) sin2(2Θ13) < 0.20 for inverted-hierarchy, both with a con-fidence level of 90% and assuming δ=0.
Only recently, the reactor-based disappearance-experiments Daya Bay [23] and RENO [24] con-firmed the observation of flavor-oscillations on short base lines and published their first result onΘ13 in 2012. The Daya Bay experiment in China used νe’s emitted from 6 nearby reactor blockseach with a thermal power of 2.9 GW and employs 6 identical detectors (each with 20 t of targetmass) at different distances to search for their disappearance. After an exposure of 139 daysand an analysis which based on the disappearance rate only, Daya Bay reported in [132] a best-fit value of sin2(2Θ13)= 0.089± 0.010(stat.)± 0.005(syst.), excluding non-oscillation with 7.7σ.
Figure 11.14: Recent results on sin2(2Θ13) measuredby accelerator- and reactor-based experiments. Thepresented results are from Double Chooz [34, 22],Daya Bay [26], RENO [25], T2K [32] and Minos [31].Presented error bars correspond to 1σ, with the ex-ception of T2K, which is indicated with the 90% CL.For T2K and Minos, the CP-violating-phase δ hasbeen set to δ = 0. Plot taken from [22].
Similar to Dayabay, the RENO-experiment insouth Korea employs 6 reactor blocks eachwith a thermal power of 2.8 GW but only 2detectors, a near and a far one, each witha target mass of 16 t. Based on a data tak-ing period of 229 days and again an analysisbased on rate only the RENO-collaborationreported in [25] a neutrino disappearance cor-responding to a best-fit value of sin2(2Θ13)=0.113± 0.013 (stat.)± 0.019(syst.), excludingnon-oscillation with 4.9σ. Figure 11.14 sum-marizes the currently measured values forsin2(2Θ13) with their 1σ-error-bars. The suc-cessful measurement of Θ13, as well as itsrather large value, open the door for severalnew experiments, which will allow to addressCP-violation as well as the neutrino mass hi-erarchy. The recent measurements of DoubleChooz (and all other experiments), are the ba-sis for this future search. Although DoubleChooz has a smaller target and offers lesserstatistics than Daya Bay and RENO, DoubleChooz has a very high potential to measureΘ13 with the lowest systematical errors. Dou-ble Chooz not only was able to build the de-tector with the lowest accidental backgroundrate (compared to DB and RENO), it more-
182
Detector Performance & Results from 2012
over compares the neutrino signal from only two instead of six power cores. This alone providestwo advantages: firstly, with only two power cores the probability to find them both off lineis high, and secondly the disappearance signal from two power cores is significantly easier todisentangle than the one provided by six power cores. Since the start of data taking, DoubleChooz was already able to acquire 7.53 days of data during which both reactors were off line.This allowed to measure a the accidental and the correlated backgrounds of the DC-far detec-tor with unprecedented accuracy, what further reduced the systematic error of the experiment.Within the next two years, Double Chooz will begin the second phase of the experiment andstart measuring with near and far detector in parallel. With both detectors online, DoubleChooz will be able to increase its sensitivity and further reduce systematic as well as statisticalerrors. The combined analysis of near and far detector data will finally allow to measure Θ13
with highest precision.
Update on the Double Chooz Analysis
During the preparation of this thesis, Double Chooz was able to continue its analysis effortsand published three additional papers. In [133] the collaboration reports about a first test forLorentz-violation by searching for an annual (sidereal) variation in the neutrino signal. Using thesame data set as in [22] (227.93 days of detector live time), no variation could be found, whichallowed for the first time to set limits on fourteen different Lorentz-violation coefficients.
In [134] the collaboration presents an correlated and accidental background measurement of theDC-far detector based on the analysis of 7.53 days during which both reactors were off line.Using the same selection process as in [22], the measurement provided a combined backgroundrate of 1.0±0.4 events per day, which is less than predicted by the background model used in[22], however, correct within the uncertainties. Most recently, the Double Chooz collaborationcould profit from the very high cleanliness of the far detector setup and could exploit the verylow accidental background rate. In [1] DC presents the first results on Θ13 obtained by theanalysis of neutron capture on hydrogen (Eγ−delayed,H ≈ 2.2 MeV) instead of Gd (Eγ−delayed,Gd ≈8 MeV) which were analyzed and presented in [22]. While the higher γ-emissions of Gd allowedto separate the IBD-signal efficiently from the background events, the ν-search with hydrogenis more challenging as the delayed event can not be distinguished from natural background(compare with figure 3.7). Using this hydrogen-analysis, Double Chooz was able to increasethe total target volume from 10.3 m3 in the target to 32.8 m3 in target and gamma catcher.This allowed to increase the effective number of target protons from (6.747±0.02) ⋅ 1029 [22]in the target by (1.582±0.016)⋅1030 protons provided by the gamma catcher. Analyzing thesame the data-set as in [22], however, with adapted selection cuts regarding the coincidencewindows and for the first time also the spatial relation between prompt and delayed events,allowed to identify 36284 neutrino candidates (ν-events and background). This corresponds todaily candidate rate of 77.69± 0.81 d−1, which is due to the different selection cuts in the samedimension as the accidental background rate of 73.45± 0.16 d−1. A combined rate and shapeanalysis of the mostly in the GC-found events, equal to the one presented in [22], yielded apreliminary best-fit value of sin2(2Θ13)= 0.097± 0.034 [1] in very good agreement with previousvalues for Θ13 reported in [22]. Taking only this hydrogen analysis as basis Double Chooz is ableto exclude the non-oscillation hypothesis with 2.0σ. An overview plot presenting a comparisonbetween the observed and simulated energy spectra of the prompt events of the hydrogen analysisare summarized in figure 11.15. A combined analysis using gadolinium- and hydrogen-events iscurrently under preparation and will be presented soon.
183
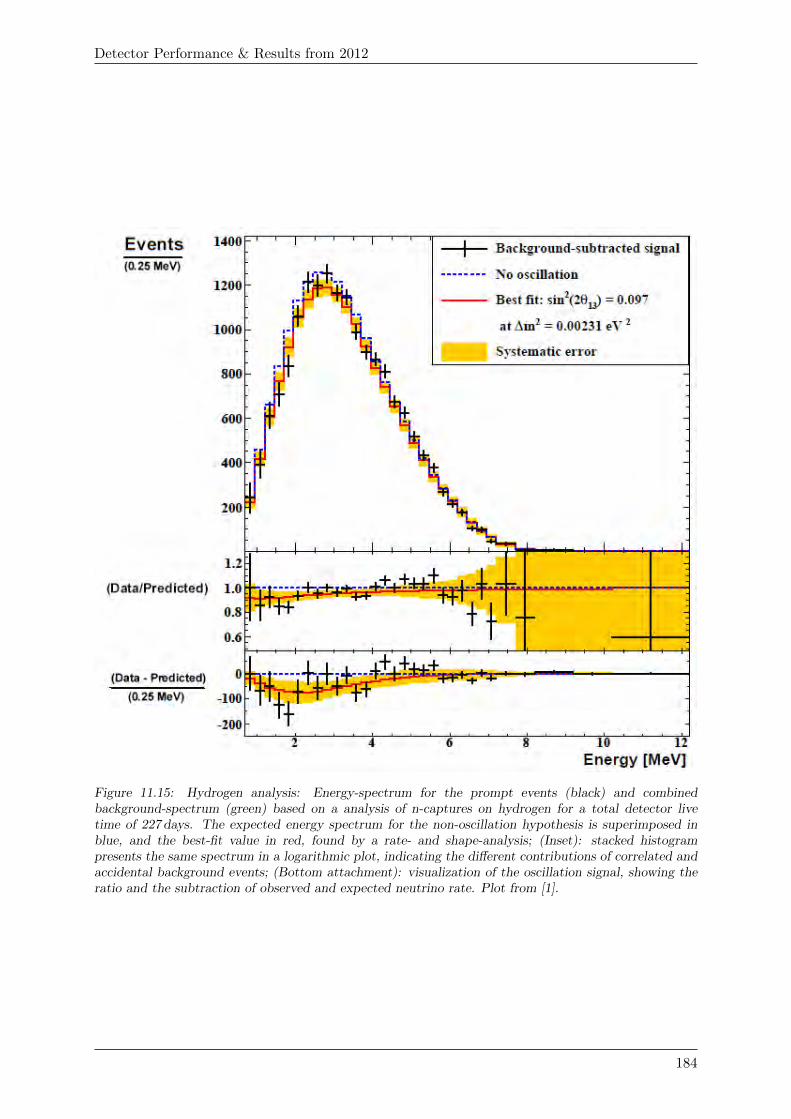
Detector Performance & Results from 2012
Figure 11.15: Hydrogen analysis: Energy-spectrum for the prompt events (black) and combinedbackground-spectrum (green) based on a analysis of n-captures on hydrogen for a total detector livetime of 227 days. The expected energy spectrum for the non-oscillation hypothesis is superimposed inblue, and the best-fit value in red, found by a rate- and shape-analysis; (Inset): stacked histogrampresents the same spectrum in a logarithmic plot, indicating the different contributions of correlated andaccidental background events; (Bottom attachment): visualization of the oscillation signal, showing theratio and the subtraction of observed and expected neutrino rate. Plot from [1].
184
Summary & Outlook
The Double Chooz experiment is, besides to Daya Bay [26] and RENO [25], one of three currentlydata taking reactor disappearance experiments, which recently succeeded to discover a non-zerovalue for the last neutrino mixing angle Θ13. This result improves the current knowledge of thestandard model of particle physics and will have a considerable impact on the current field ofneutrino, as well as astro particle physics. A non zero value for Θ13 provides the opportunityto investigate a possible CP-violation in the leptonic sector, which would be measurable asadditional phase (δ) in the leptonic mixing matrix. Providing the respective δ-phase has ameasurable influence (δ ≠ 0, ±π), future accelerator experiments will have the chance to observethe influence of a CP-violation by comparing the oscillation probabilities of neutrinos and anti-neutrinos P (να → νβ) ≠ P (να → νβ) [27, 3].
Regarding the search for Θ13, Double Chooz will use two identical liquid scintillator detectors,installed at two different baselines (400 m & 1050 m) from the two power cores, which provide atotal thermal power of 8.5 GW [55]. While the near detector measures the unoscillated neutrinoflux, the far detector observes an oscillated flux, as it is located near to the first Θ13-oscillationmaximum for 2 MeV ν’s. A comparison between emitted and observed neutrino rate, as wellas its spectral distribution, then allows to observe a disappearance effect and thus to determineΘ13. Double Chooz is realized in two phases: the currently running phase I, which uses onlythe far detector, and phase II (starting in 2014), in which the near detector joins data taking.For the time being, Double Chooz compares the far detector data to an adapted version of theneutrino spectrum originating from the former Bugey4-experiment [21].
As successor of the CHOOZ experiment, Double Chooz uses a new and optimized detectordesign composed of four concentrically nested detector vessels, each filled with a newly developeddetector liquid. The neutrino target is filled with 10.3 m3 of gadolinium doped scintillator andexploits the distinct signature of the inverse beta decay produced by the positron and thedelayed capture of the neutron on Gd. In order to increase the detection efficiency, the target issurrounded by 22.5 m3 of undoped scintillator, which is supposed to detect all gamma-emissionsescaping the target. These scintillating volumes are surrounded by 110 m3 of non-scintillatingbuffer liquid, which is used as transparent shielding against external radiation mainly from thePMTs. The last layer surrounding these inner detector parts is composed of 90 m3 of muonveto scintillator, which is used to identify cosmogenic muons and muon correlated events. Inaddition, the entire setup is covered by an individual detection module composed of multiplelayers of plastic scintillator stripes, which are used as outer muon veto.
Liquid scintillators are sensitive detector materials, whose main properties as light yield, trans-parency or radio purity quickly suffer from wrong handling, improper storage or contact withincompatible materials. Thus, the employment of liquid scintillators in large scale experimentsis challenging and requires, besides ideal storage- and handling-conditions, an ultra pure en-vironment. Previous experiments2 suffered from a degradation of their detector liquids. The
2CHOOZ [93] and the Palo Verde experiment [94]
185
Summary & Outlook
performance and stability of the detector liquids is therefore a major concern for all currentliquid scintillator experiments and the main key for a high precision measurement of Θ13.
Within this frame, the here presented work described the development and realization of allprocesses and hardware systems, which have been necessary for:
1. the clean production and storage of two detector liquids,
2. the clean transfer of these liquids to the underground laboratory,
3. the safe filling of the detector and
4. the stable handling of the detector during data taking.
11.5 Detector Liquid Production
Development and Installation of the Required Hardware
For the production of the detector liquids, a simple surface building close to the experiment wasupgraded into a high-purity large scale mixing facility (LSA), which allowed to separately mix,handle and store 90 m3 of muon veto scintillator and 110 m3 of buffer liquid. In order to realizethis task, the LSA was instrumented with:
� Two independent liquid handling systems, each composed of three large storagetanks, which are interconnected by a correlated pumping station. Each of these systemprovides all functions to receive, mix and handle the different components and to store thefinal mixtures for the later filling. In order to protect the detector liquids, all systems areexclusively made of compatible materials as stainless steel or fluorinated plastics. Duringthe filling process, these systems were used to supply the underground laboratory with thedifferent detector liquids.
� A gas handling system, which regulates the nitrogen flow through the LSA. This sys-tem is composed of two supply systems (HPN, LPN), different consumers (storage tanks,pumps) and a ventilation system (LPV). The high pressure system (HPN) was used ascontrol-pressure to run the pneumatically driven membrane pumps and to purge the differ-ent liquids during the mixing process. The low pressure system (LPN) was used to supplyall storage and transport tanks in the LSA with a constant low pressure nitrogen flow. Theventilation system, finally, collected and purified the “used”-nitrogen-flow and provided anartificial impedance to the outbound nitrogen-flow. This impedance was adjustable andcould be used to set and maintain a constant low pressure nitrogen blanket on all storage-and transport-tanks in the LSA.
� A level monitoring system, which allows to observe all liquid-, gas- and temperature-levels in the different storage tanks of muon veto and buffer. The liquid levels and thetemperature were measured by hydrostatic submersion sensors, the gas pressure levelswere measured by an independent set of sensors. Using this system, all liquid handlingprocesses (uploading or mixing), as well as gas handling processes (flushing or blanketing),could be monitored and consequently allowed a safe operation of these systems.
After the installation of these systems, the entire liquid handling system in the LSA was manuallycleaned, isolated and thoroughly flushed with nitrogen. Subsequently, the system could be usedfor the detector liquid production.
186
Summary & Outlook
Material Selection Process for the Detector Liquids
Prior to the on-site production of the detector liquids, a extensive material selection processwas conducted at TUM. Considering the requirements on the final detector liquids, possibleingredients from different companies were compared and individually tested for their key prop-erties: density, transparency, light yield and radio purity. Based on these measurements, theindividual components of muon veto and buffer were selected and their composition determined.The results of this selection process are summarized in the following:
� Components and composition of the muon veto scintillator: For the muon vetoscintillator finally selected was: LAB from Helm and n-paraffine from CBR, as well as PPOand bis/MSB from Perkin Elmer. The selected LAB had a density of 0.806± 0.001 g/cm3
and showed an attenuation length of 9.73± 0.88 m at 430 nm. The lighter n-paraffine had adensity of 0.749± 0.001 g/cm3 and showed an excellent transparency with an attenuationlength of 17.17± 1.55 m at 430 nm. In order to meet the required density and light yield,the muon veto scintillator is composed of 49.8 %vol. of LAB and 50.2 %vol. of n-paraffine,with an admixture of 2 g/l PPO and 20 mg/l bis/MSB. Due to the large amounts of PPO,a sample of PPO and a sample of the final muon veto scintillator was tested for radiopurity, indicating only upper limits for Uranium, Thorium and Potassium (see [62, 72] orcompare with table 5.4 and 11.2).
� Components and composition of the buffer liquid : The analog study for the bufferliquid selected two non-scintillating mineral oils: the already mentioned n-paraffine fromCBR and a medical white oil with the trade name Ondina-917 from Shell. Ondina-917 hada density of 0.854± 0.001 g/cm3 and demonstrated an attenuation length of 7.70± 0.70 mat 430 nm. In order to meet the required density of 0.804± 0.008 g/cm3, the buffer liquidis composed of 54 %vol of Ondina-917 and 46 %vol of n-paraffine.
Detector Liquid Production
For the production of the muon veto scintillator, a master solution composed of 4800 l LAB,180 kg PPO and 1.8 kg of bis/MSB was produced in cooperation with Wacker Chemie. For theon-site production of the detector liquids, this master solution, as well as all other componentsof muon veto and buffer, were delivered to the LSA following a pre-defined delivery sequence. Inorder to promote the mixing process, each detector liquid was thoroughly blended by constantcirculation and turbulent nitrogen purging in the respective storage tanks. After blending, thedensity of the liquids was fine-tuned and all liquids were stored in the LSA. In order to monitorthe quality of the detector liquids and the cleanliness of the liquid handling system, both detectorliquids were sampled. The analysis of these samples as well as the analysis of the first detectordata indicated the successful and very clean production of 90 m3 of muon veto scintillator and of110 m3 of non-scintillating buffer-liquid. The main properties of the produced detector liquidsare summarized in table 11.2.
11.6 Liquid Transfer from the Surface to the Underground Laboratory
Development and Installation of a Trunk Line System
In order to transfer all detector liquids from their storage tanks to the filling system in theunderground laboratory, TUM and MPIK installed a dedicated trunk line system (TLS). Dueto the large surface being in contact with the liquids and the very low cleanliness conditions in
187
Summary & Outlook
Properties of the Produced Detector Liquids
Property Unit Requirement Muon Veto Buffer
Density g/cm3 0.804± 0.008 0.804± 0.001 [95] 0.805± 0.001 [95]Transparency m@430 nm > 6 7.93± 0.73 [95] 14.57± 1.30 [95]Light Yield Ph/MeV > 6000 / 0 9000± 1000 [95] 0[95]Radio Purity238U g/g <10−10 < (457± 268)⋅10−10 [72] n.a.232Th g/g <10−10 < (74.2± 39.2)⋅10−10 [72] n.a.40K g/g <10−7 < (6.42± 0.34)⋅10−10 [72] n.a.
Table 11.2: Summary and comparison of the initially made requirements on the detector liquids andthe actually measured values, using the results from liquid samples analysis and the first detector dataanalysis. The combined analysis shows that both detector liquids easily meet the requirements for DoubleChooz and were consequently produced, handled and stored under high purity conditions. Due to thelimited sensitivity of the measurement, only upper limits for the radio-purity of the muon veto can begiven.
the tunnel during the installation, the TLS was a possible source for re-contamination. In orderto ensure the cleanliness of the TLS, all tubes were thoroughly flushed, using gaseous nitrogenand a batch of the final detector liquid. In addition, the tubes of gamma catcher and targetwere cleaned with an industrial detergent and a light acidic solution. Subsequently, this systemhas been used during filling to transfer all liquids from their storage tanks to the four differentliquid handling systems in the underground laboratory. In order to monitor the cleanliness ofthis system, the transparency of all liquids was tested before and after the liquids passed thesystem. All samples showed stable optical properties, what allows to conclude that the TLS wascleanly installed and no source of contamination.
11.7 Filling of the Double Chooz Far Detector
During the filling process, the different detector vessels were subdued to liquid level as well asgas pressure differences. Due to the geometry and fragility of the detector vessels, such leveldifferences can quickly lead to dangerous stress on the detector. The safety of the detectortherefore depends on the capability of the filling and monitoring system to avoid or recognizedangerous level differences. In order to provide these capabilities, the Double Chooz far detectorwas equipped with two systems: The expansion tank operating system, which compensatesthermal variations and volumetric changes of the detector liquids, and a gas handling system,which provides a homogeneous and stable nitrogen blanket for the detector and compensates foratmospheric pressure variations.
Development and Installation of all liquid- and gas-handling-systems in the underground lab-oratory
For the filling of the Double Chooz far detector, the underground laboratory was equipped withthree main systems:
� A filling system (DFOS), composed of four separate liquid handling systems, all madeof compatible materials as stainless steel, or in the case of the target system, exclusivelyfluorinated plastics. Each system provides three different filling modes, which allow to fill,
188
Summary & Outlook
handle and empty the individual detector vessels homogeneously and with the necessaryprecision to avoid critical liquid level differences above 30 mm.
� A gas handling system, composed of four sub-systems: three different supply systems(HPN, FPN, LPN), which provide different pressure levels as well as a ventilation system(LPV), which collects, purifies and regulates the outbound nitrogen flow. The HPN wasused as supply or control pressure in order to actuate pneumatically driven pumps andvalves. The FPN system allowed to flush the detector prior to the detector filling, theLPN system then was used to supply all four detector vessels with an individual nitrogenblanket. Together, these systems supplied the detector during all stages of detector life andallowed to flush the detector before the filling process and to fill and handle all detectorliquids under the required nitrogen atmosphere.
� A detector monitoring system (DMS), which allows to monitor all liquid-levels andgas-pressure-levels in the detector. It is composed of two separate systems: Firstly, aliquid level monitoring system, which measures the absolute- and differential-liquid-levelsin all detector vessels, and secondly, a gas pressure monitoring system, which measures theabsolute and differential gas pressure-levels in and between the different detector vessels.Design goal for the DMS was the redundant monitoring of all levels with a minimumaccuracy of 1 cm and 1 mbar, respectively. Using four independent systems (Laser, HPS,Tamago, XRS) for the liquid level measurement and two separate sets of pressure sensors tomeasure the gas pressure levels, the DMS demonstrated an accuracy for the absolute liquidlevel of ± 4 mm and the absolute gas pressure levels of ± 0.1 mbar. The relative differencescould be measured with an accuracy of ± 2 mm and ± 0.05 mbar, respectively. Combiningthe different sensor information in a central level measurement-PC, this system was usedto monitor the arising level differences and to supervise the filling process accordingly.
After the installation of these systems in the underground laboratory, they were used to flushthe detector with a constant nitrogen flow. Applied over several weeks, the oxygen content inthe detector was reduced to less than 40 ppm, which was monitored by corresponding sensorsmounted in the ventilation system.
Detector filling
For the detector filling, a dedicated filling process has been developed, composed of 22 indi-vidual filling steps, which considered critical filling points and avoided unnecessary stress onthe different detector vessels. In order to protect the detector liquids from oxygen and a cross-contamination with the other detector vapors, each vessel was provided with an individual nitro-gen blanket. The detector filling was finally realized with the Detector Fluid Operating System(DFOS), which allowed to increase all liquid levels homogeneously and with the necessary pre-cision to avoid large liquid level differences. The filling process was supervised by the DetectorMonitoring System (DMS), which allowed to monitor all liquid- and gas-pressure levels in thedetector. The analysis of the corresponding level-data showed a homogeneous filling process,during which neither the sum nor the individual level differences exceeded the critical limits.The maximal observed liquid level differences were: 23± 2 mm in the buffer vessel, 15± 2 mmin the gamma catcher vessel and 14± 2 mm in the target vessel. The maximal observed gaspressure differences were significantly lower and reached a maximum at 0.35± 0.05 mbar on thebuffer vessel, 0.43± 0.05 mbar on the gamma catcher vessel and 0.31± 0.05 mbar on the targetvessel. The stress induced by density differences was only of minor order, as the detector liquidswere already matched in density to the per-mil-level during the production process. Thermalvariations in the detector could be observed but did not lead to any significant density varia-tions during the filling process. Based on these measurements, it can be stated that none of the
189
Summary & Outlook
detector vessels was subdued to any critical level difference and was consequently not harmedduring the filling process. The integrity of the different detector vessels could additionally beconfirmed by an analysis of the first detector data, where the event reconstruction demonstrateda clean separation between the different detector liquids.
11.8 Detector Handling During Data Taking
During the data taking phase, the Double Chooz detector is subdued to thermal variations,atmospheric pressure changes as well as manual operations as the submersion of calibration tools.Due to the fragility of the detector, these unavoidable influences can quickly lead to dangerousstress levels and, in the worst case, to a fracturing of the detector vessels. The safety of thedetector therefore depends on the capability of the detector handling system to compensate thesefluctuations. In order to provide this capability, the Double Chooz far detector was equippedwith two systems: The expansion tank operating system, which compensates thermal variationsand volumetric changes of the detector liquids, and a gas handling system, which provides ahomogeneous and stable nitrogen blanket for the detector and compensates for atmosphericpressure variations.
Development and Installation of an Expansion Tank Operating System (XTOS)
XTOS is composed of three individually sized expansion tanks (with maximized surface), allmounted at the final liquid level in a pit next to the detector. The XTOS-tanks for buffer andgamma catcher are made of stainless steel, the tank of the target is made of PVDF. Each ofthese tanks is equipped with a side-glass and an additional low pressure nitrogen supply. Eachvessel chimney is connected to XTOS by a steady upward going tube that enters at the bottomof the respective expansion tank. Once the liquid level in the detector reaches the XTOS-tanks,the expanding liquid can use the larger surface of the tank, which significantly reduces the levelincrease per degree. In addition, all tanks are individually sized in order to compensate for thedifferent expansion volumes, which are produced by differently large liquid volumes. Using thecritical liquid level of ± 3 cm as baseline, XTOS increases the thermal tolerance of the detectorfrom ± 0.06 K to ± 1.5 K.
The performance of XTOS could be demonstrated by monitoring the temperature developmentin the detector and the related development of liquid levels. The maximal observed thermalvariation during 18 month of data taking was 0.9 K. The level variation in the same time framewas monitored and showed the expected variation for a properly working expansion tank system(e.g. 17± 4 mm in the buffer, where 2.0 cm were expected, for the other values see table 10.1).The maximal observed liquid level difference was measured to be 18± 4 mm between muonveto and buffer. Hence, it can be stated, that the expansion tank operating system works asanticipated and successfully increases the tolerance of the Double Chooz far detector to thermalvariations.
Performance of the Gas Handling System during Data Taking
Apart from liquid level differences, the detector is also exposed to pressure variations, mostlycoming from atmospheric pressure changes or variations in the gas blanket system. The safetyof the detector therefore depends also on the reliability of the gas handling system and itscapability to compensate internal or external pressure variations.
190
Summary & Outlook
The LPN-system supplies the hermetically closed detector with a permanent nitrogen flow.The LPV-system receives the nitrogen and provides an adjustable impedance to the outboundgas flow. As the impedance can be adjusted, it is also possible to regulate the back pressureand to apply a constant low pressure nitrogen blanket in the detector. In order to maintainthis blanket pressure, the gas handling system has to compensate for atmospheric pressurechanges and react flexible to the arising change. Monitoring the absolute and the differentialpressures in the detector during the first 18 month of data taking showed an reliable working gashandling system. Although the gas handling system adjusted to atmospheric pressure changesup to 40 mbar, the gas handling provided a stable nitrogen blanket of 1.6± 0.18 mbar, limitingthe differential pressures between the vessels normally below 0.1± 0.05 mbar and at peak timesbelow 0.4± 0.05 mbar. Based on these results, it can be stated, that the gas handling system inthe underground worked successfully and provided the necessary flexibility to compensate foratmospheric pressure changes.
11.9 Conclusion and Outlook
The here presented work described the successful production of two detector liquids, their cleantransfer to the underground lab, as well as the successful filling and handling of the detec-tor. Based on this work, the Double Chooz could successfully initialize the first phase of theexperiment and start data taking on April 13th of 2011. The analysis of the first detectordata showed a stably and well performing detector with cleanly separated detector liquids.An analysis of the accidental background rate indicated only 0.261± 0.002 d−1 [22], which isa factor three below the anticipated value, and a compelling evidence for a radio-chemicallyclean detector assembly and most important, clean detector liquids. The subsequent anal-ysis, including 227 days of data as part of the second publication [22], indicated a best-fitvalue of sin2(2Θ13) =0.109± 0.030(stat.)± 0.025(syst.), excluding the non-oscillation hypothesiswith 2.9σ [22]. A combined analysis including the results of Daya Bay and RENO excludessin2(2Θ13) = 0 even with 7.7σ [38]. Considering that Double Chooz currently measures withonly one detector (Phase I), which takes data since about one and a half years, the already clearmeasurement of the oscillation effect is a great success and expression of an ideally performingand clean detector. At present, arrangements for the building of the second (near) detector arein progress and will allow a start of phase II early in 2014. With the implementation of a seconddetector, Double Chooz will be able to further reduce the reactor based uncertainties, what willallow to minimize the systematic errors of the experiment. Assuming equally good performancealso for the near detector, Double Chooz will be able to measure Θ13 with unique accuracy.This accuracy, combined with the unexpectedly large value of Θ13, cleared the way for futureexperiments to investigate the CP-violation in the leptonic sector as well as the yet unknownmass hierarchy.
Due to the good functionality of the liquid-handling, gas-handling and monitoring systems andthe good results, which could be achieved by using these systems, equally designed systemsshall be installed and utilized in the near detector also. In addition, the same productionprocess for the detector liquids will be used for the near detector liquids. The gas handlingsystem also does not have to be changed, whereas there is the need of only small modificationswithin the liquid handling and the monitoring system. For example, the author of this worksuggests to exchange the membrane-pumps within the liquid handling systems because of theirlimited efficiency and noncontinuous flow-pattern. Within the Detector Monitoring System, it issuggested to investigate, if the hydrostatic pressure sensor used in the gamma catcher could bereplaced by one with less radioactivity, to further improve the purity of the detector. In additionthe level measurement system of the expansion tank demonstrated not the necessary stability,
191

Summary & Outlook
because of which it is suggested to exchange this measurement technique by weight-sensors.Furthermore, the monitoring system should be secured against electrical power outage to avoiddata loss. With the exception of these changes, there is no further need for improvements of thementioned systems. This is a great success, regarding the required planning of the near detector,and states again the excellent performance of the realized processes and systems as well as theoutstanding quality of the muon veto scintillator and the buffer oil, developed and executed bythe author of this thesis.
192

Part V
Appendix
193

Appendix A
Double Chooz Experiment
A.1 Detector Design
194
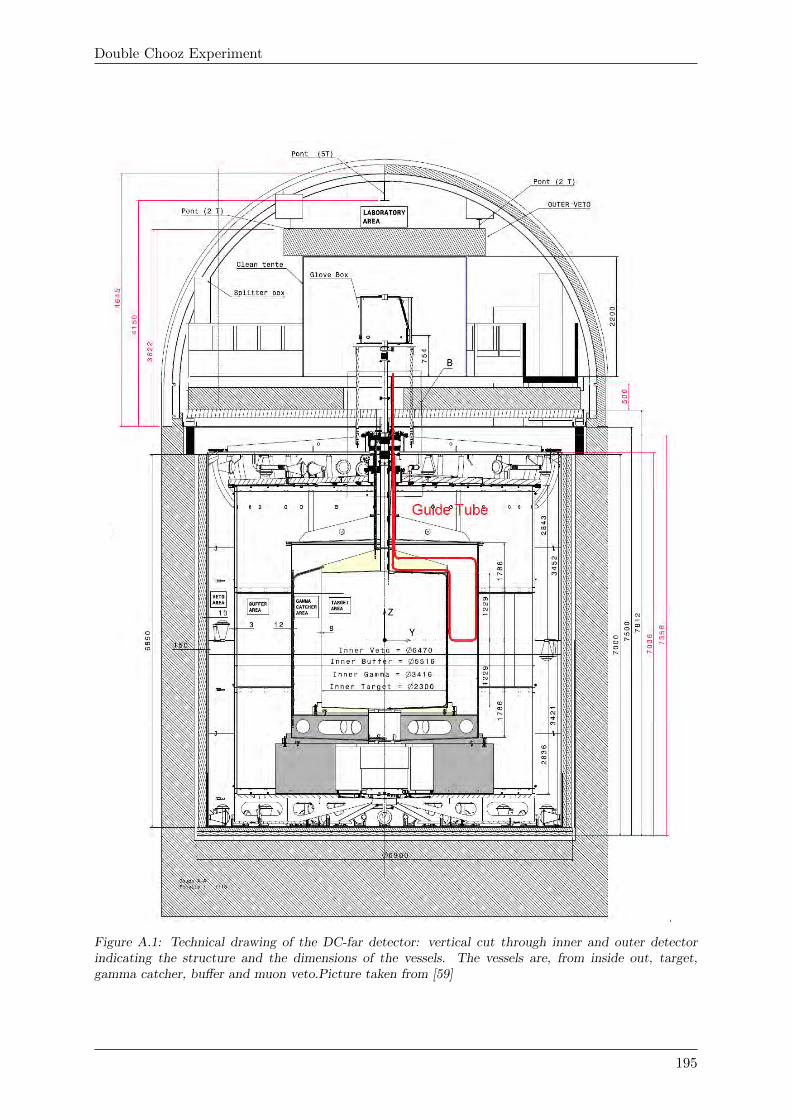
Double Chooz Experiment
Figure A.1: Technical drawing of the DC-far detector: vertical cut through inner and outer detectorindicating the structure and the dimensions of the vessels. The vessels are, from inside out, target,gamma catcher, buffer and muon veto.Picture taken from [59]
195
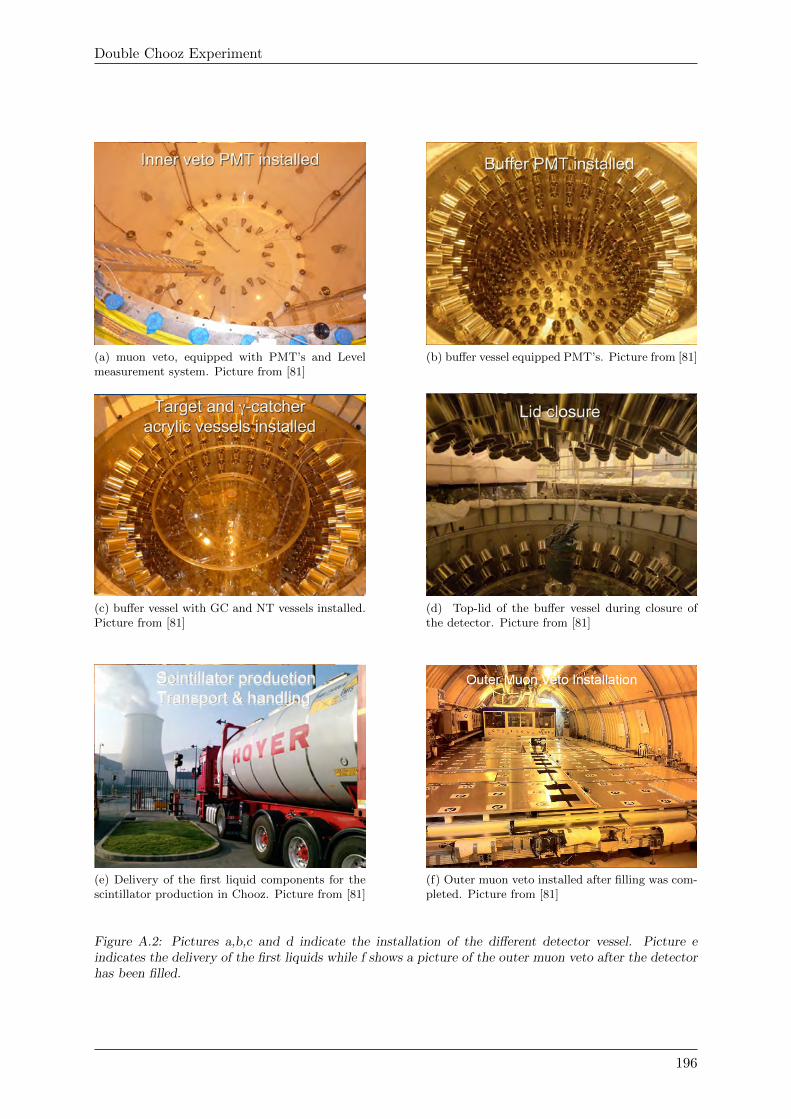
Double Chooz Experiment
(a) muon veto, equipped with PMT’s and Levelmeasurement system. Picture from [81]
(b) buffer vessel equipped PMT’s. Picture from [81]
(c) buffer vessel with GC and NT vessels installed.Picture from [81]
(d) Top-lid of the buffer vessel during closure ofthe detector. Picture from [81]
(e) Delivery of the first liquid components for thescintillator production in Chooz. Picture from [81]
(f) Outer muon veto installed after filling was com-pleted. Picture from [81]
Figure A.2: Pictures a,b,c and d indicate the installation of the different detector vessel. Picture eindicates the delivery of the first liquids while f shows a picture of the outer muon veto after the detectorhas been filled.
196
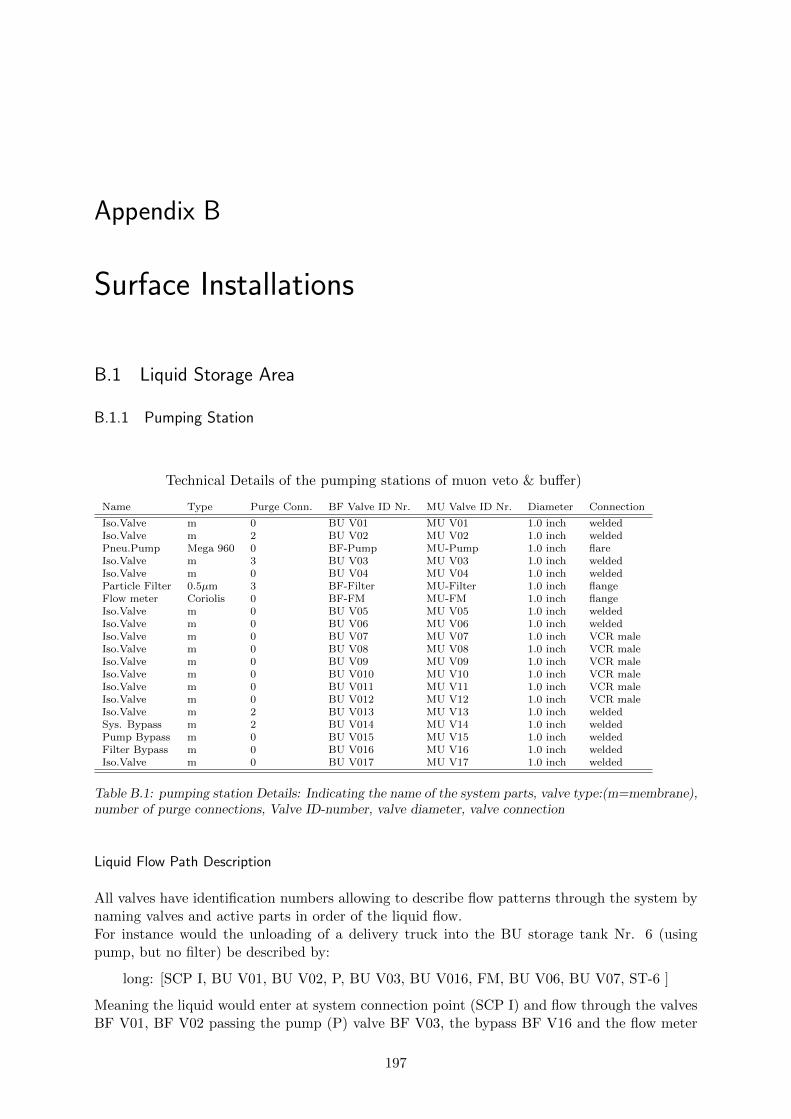
Appendix B
Surface Installations
B.1 Liquid Storage Area
B.1.1 Pumping Station
Technical Details of the pumping stations of muon veto & buffer)
Name Type Purge Conn. BF Valve ID Nr. MU Valve ID Nr. Diameter Connection
Iso.Valve m 0 BU V01 MU V01 1.0 inch weldedIso.Valve m 2 BU V02 MU V02 1.0 inch weldedPneu.Pump Mega 960 0 BF-Pump MU-Pump 1.0 inch flareIso.Valve m 3 BU V03 MU V03 1.0 inch weldedIso.Valve m 0 BU V04 MU V04 1.0 inch weldedParticle Filter 0.5µm 3 BF-Filter MU-Filter 1.0 inch flangeFlow meter Coriolis 0 BF-FM MU-FM 1.0 inch flangeIso.Valve m 0 BU V05 MU V05 1.0 inch weldedIso.Valve m 0 BU V06 MU V06 1.0 inch weldedIso.Valve m 0 BU V07 MU V07 1.0 inch VCR maleIso.Valve m 0 BU V08 MU V08 1.0 inch VCR maleIso.Valve m 0 BU V09 MU V09 1.0 inch VCR maleIso.Valve m 0 BU V010 MU V10 1.0 inch VCR maleIso.Valve m 0 BU V011 MU V11 1.0 inch VCR maleIso.Valve m 0 BU V012 MU V12 1.0 inch VCR maleIso.Valve m 2 BU V013 MU V13 1.0 inch weldedSys. Bypass m 2 BU V014 MU V14 1.0 inch weldedPump Bypass m 0 BU V015 MU V15 1.0 inch weldedFilter Bypass m 0 BU V016 MU V16 1.0 inch weldedIso.Valve m 0 BU V017 MU V17 1.0 inch welded
Table B.1: pumping station Details: Indicating the name of the system parts, valve type:(m=membrane),number of purge connections, Valve ID-number, valve diameter, valve connection
Liquid Flow Path Description
All valves have identification numbers allowing to describe flow patterns through the system bynaming valves and active parts in order of the liquid flow.For instance would the unloading of a delivery truck into the BU storage tank Nr. 6 (usingpump, but no filter) be described by:
long: [SCP I, BU V01, BU V02, P, BU V03, BU V016, FM, BU V06, BU V07, ST-6 ]
Meaning the liquid would enter at system connection point (SCP I) and flow through the valvesBF V01, BF V02 passing the pump (P) valve BF V03, the bypass BF V16 and the flow meter
197
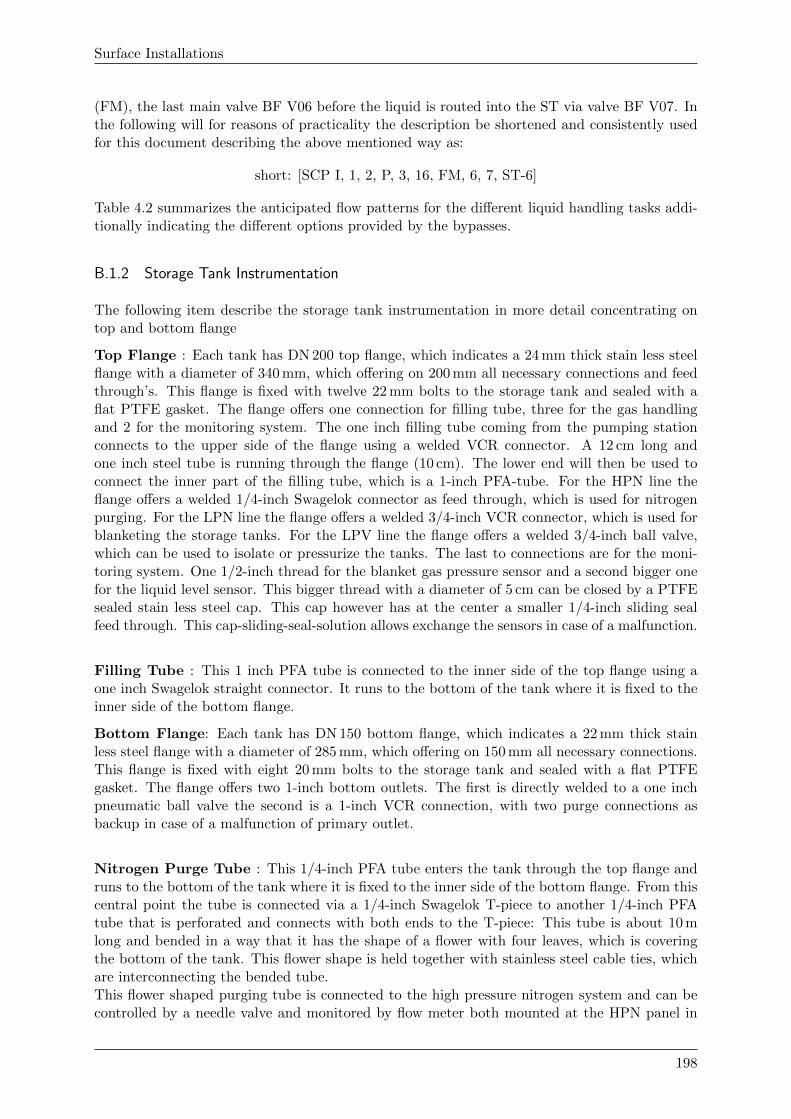
Surface Installations
(FM), the last main valve BF V06 before the liquid is routed into the ST via valve BF V07. Inthe following will for reasons of practicality the description be shortened and consistently usedfor this document describing the above mentioned way as:
short: [SCP I, 1, 2, P, 3, 16, FM, 6, 7, ST-6]
Table 4.2 summarizes the anticipated flow patterns for the different liquid handling tasks addi-tionally indicating the different options provided by the bypasses.
B.1.2 Storage Tank Instrumentation
The following item describe the storage tank instrumentation in more detail concentrating ontop and bottom flange
Top Flange : Each tank has DN 200 top flange, which indicates a 24 mm thick stain less steelflange with a diameter of 340 mm, which offering on 200 mm all necessary connections and feedthrough’s. This flange is fixed with twelve 22 mm bolts to the storage tank and sealed with aflat PTFE gasket. The flange offers one connection for filling tube, three for the gas handlingand 2 for the monitoring system. The one inch filling tube coming from the pumping stationconnects to the upper side of the flange using a welded VCR connector. A 12 cm long andone inch steel tube is running through the flange (10 cm). The lower end will then be used toconnect the inner part of the filling tube, which is a 1-inch PFA-tube. For the HPN line theflange offers a welded 1/4-inch Swagelok connector as feed through, which is used for nitrogenpurging. For the LPN line the flange offers a welded 3/4-inch VCR connector, which is used forblanketing the storage tanks. For the LPV line the flange offers a welded 3/4-inch ball valve,which can be used to isolate or pressurize the tanks. The last to connections are for the moni-toring system. One 1/2-inch thread for the blanket gas pressure sensor and a second bigger onefor the liquid level sensor. This bigger thread with a diameter of 5 cm can be closed by a PTFEsealed stain less steel cap. This cap however has at the center a smaller 1/4-inch sliding sealfeed through. This cap-sliding-seal-solution allows exchange the sensors in case of a malfunction.
Filling Tube : This 1 inch PFA tube is connected to the inner side of the top flange using aone inch Swagelok straight connector. It runs to the bottom of the tank where it is fixed to theinner side of the bottom flange.
Bottom Flange: Each tank has DN 150 bottom flange, which indicates a 22 mm thick stainless steel flange with a diameter of 285 mm, which offering on 150 mm all necessary connections.This flange is fixed with eight 20 mm bolts to the storage tank and sealed with a flat PTFEgasket. The flange offers two 1-inch bottom outlets. The first is directly welded to a one inchpneumatic ball valve the second is a 1-inch VCR connection, with two purge connections asbackup in case of a malfunction of primary outlet.
Nitrogen Purge Tube : This 1/4-inch PFA tube enters the tank through the top flange andruns to the bottom of the tank where it is fixed to the inner side of the bottom flange. From thiscentral point the tube is connected via a 1/4-inch Swagelok T-piece to another 1/4-inch PFAtube that is perforated and connects with both ends to the T-piece: This tube is about 10 mlong and bended in a way that it has the shape of a flower with four leaves, which is coveringthe bottom of the tank. This flower shape is held together with stainless steel cable ties, whichare interconnecting the bended tube.This flower shaped purging tube is connected to the high pressure nitrogen system and can becontrolled by a needle valve and monitored by flow meter both mounted at the HPN panel in
198
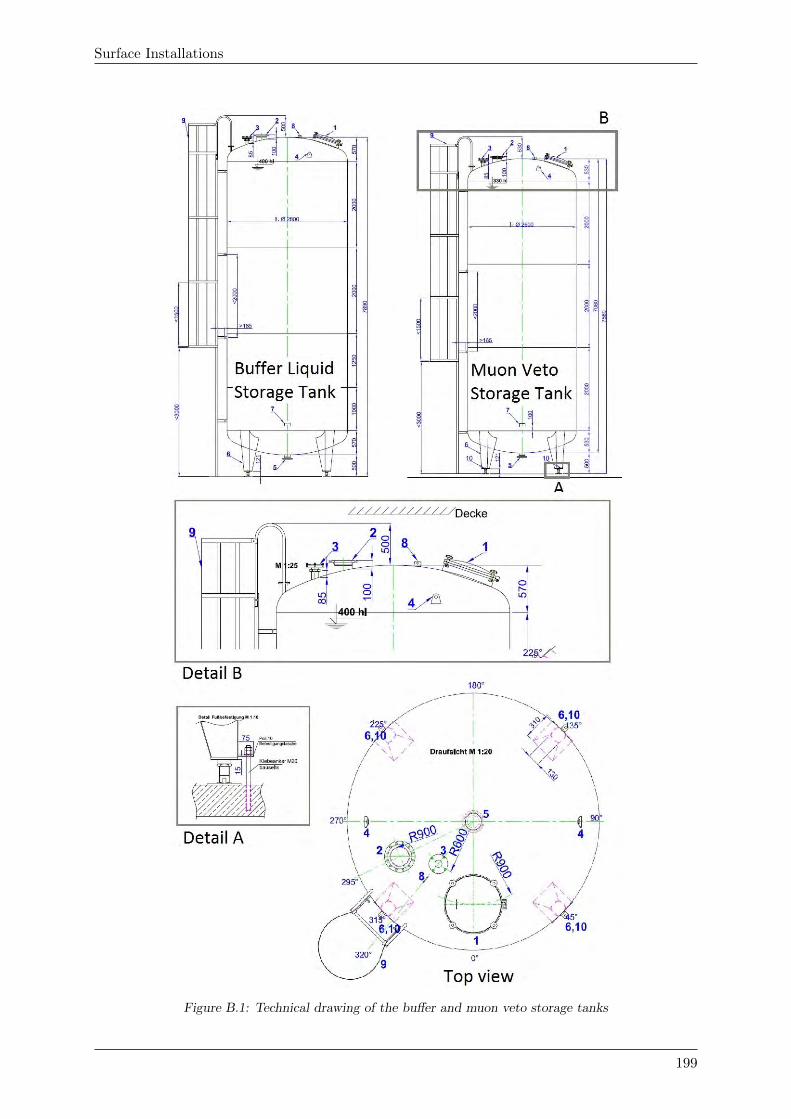
Surface Installations
Figure B.1: Technical drawing of the buffer and muon veto storage tanks
199
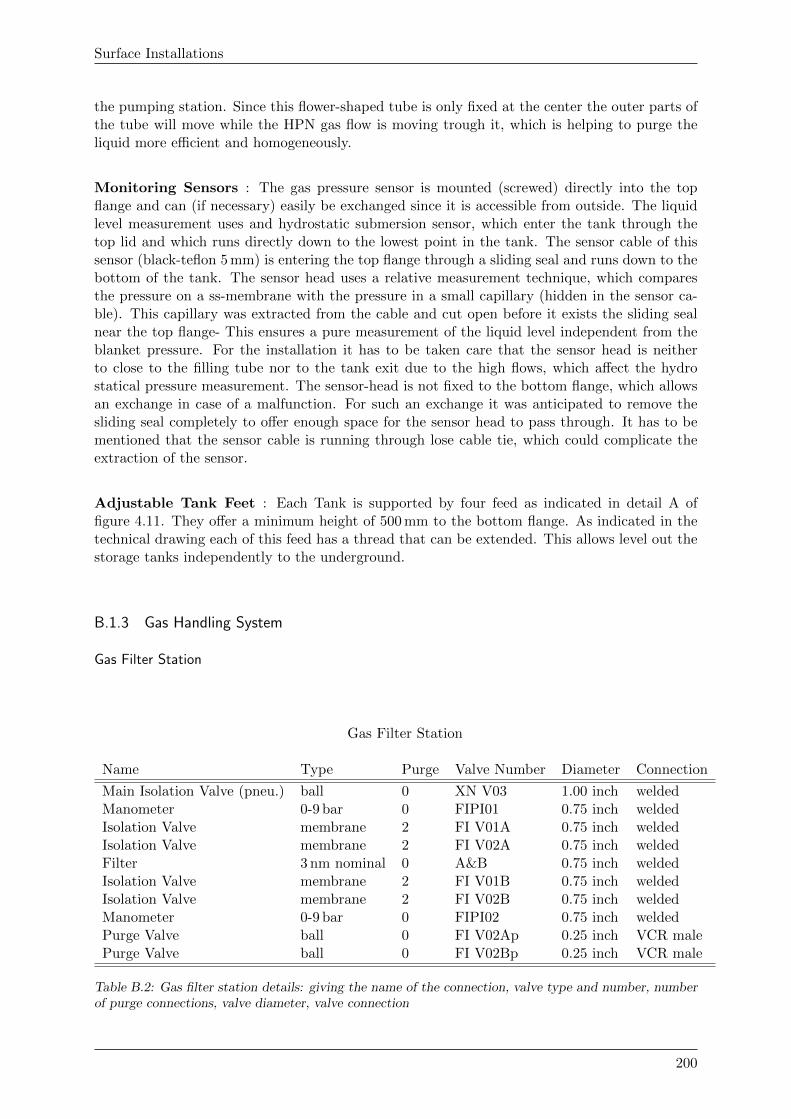
Surface Installations
the pumping station. Since this flower-shaped tube is only fixed at the center the outer parts ofthe tube will move while the HPN gas flow is moving trough it, which is helping to purge theliquid more efficient and homogeneously.
Monitoring Sensors : The gas pressure sensor is mounted (screwed) directly into the topflange and can (if necessary) easily be exchanged since it is accessible from outside. The liquidlevel measurement uses and hydrostatic submersion sensor, which enter the tank through thetop lid and which runs directly down to the lowest point in the tank. The sensor cable of thissensor (black-teflon 5 mm) is entering the top flange through a sliding seal and runs down to thebottom of the tank. The sensor head uses a relative measurement technique, which comparesthe pressure on a ss-membrane with the pressure in a small capillary (hidden in the sensor ca-ble). This capillary was extracted from the cable and cut open before it exists the sliding sealnear the top flange- This ensures a pure measurement of the liquid level independent from theblanket pressure. For the installation it has to be taken care that the sensor head is neitherto close to the filling tube nor to the tank exit due to the high flows, which affect the hydrostatical pressure measurement. The sensor-head is not fixed to the bottom flange, which allowsan exchange in case of a malfunction. For such an exchange it was anticipated to remove thesliding seal completely to offer enough space for the sensor head to pass through. It has to bementioned that the sensor cable is running through lose cable tie, which could complicate theextraction of the sensor.
Adjustable Tank Feet : Each Tank is supported by four feed as indicated in detail A offigure 4.11. They offer a minimum height of 500 mm to the bottom flange. As indicated in thetechnical drawing each of this feed has a thread that can be extended. This allows level out thestorage tanks independently to the underground.
B.1.3 Gas Handling System
Gas Filter Station
Gas Filter Station
Name Type Purge Valve Number Diameter Connection
Main Isolation Valve (pneu.) ball 0 XN V03 1.00 inch weldedManometer 0-9 bar 0 FIPI01 0.75 inch weldedIsolation Valve membrane 2 FI V01A 0.75 inch weldedIsolation Valve membrane 2 FI V02A 0.75 inch weldedFilter 3 nm nominal 0 A&B 0.75 inch weldedIsolation Valve membrane 2 FI V01B 0.75 inch weldedIsolation Valve membrane 2 FI V02B 0.75 inch weldedManometer 0-9 bar 0 FIPI02 0.75 inch weldedPurge Valve ball 0 FI V02Ap 0.25 inch VCR malePurge Valve ball 0 FI V02Bp 0.25 inch VCR male
Table B.2: Gas filter station details: giving the name of the connection, valve type and number, numberof purge connections, valve diameter, valve connection
200
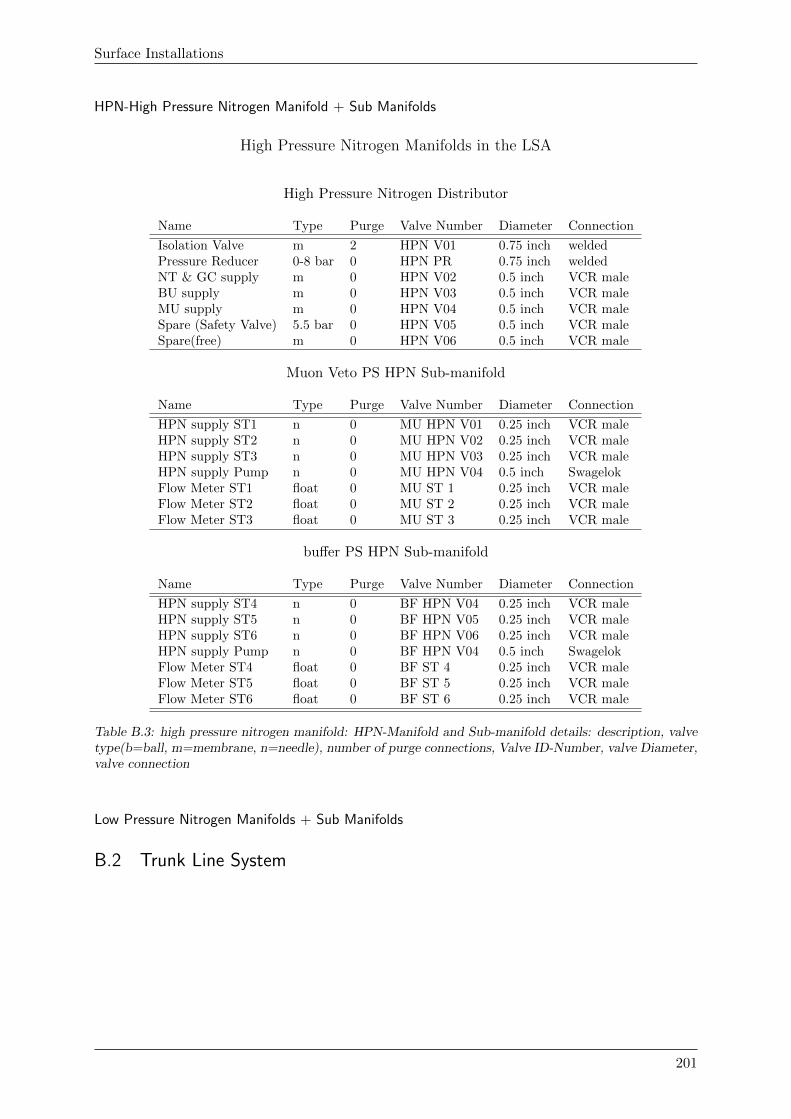
Surface Installations
HPN-High Pressure Nitrogen Manifold + Sub Manifolds
High Pressure Nitrogen Manifolds in the LSA
High Pressure Nitrogen Distributor
Name Type Purge Valve Number Diameter Connection
Isolation Valve m 2 HPN V01 0.75 inch weldedPressure Reducer 0-8 bar 0 HPN PR 0.75 inch weldedNT & GC supply m 0 HPN V02 0.5 inch VCR maleBU supply m 0 HPN V03 0.5 inch VCR maleMU supply m 0 HPN V04 0.5 inch VCR maleSpare (Safety Valve) 5.5 bar 0 HPN V05 0.5 inch VCR maleSpare(free) m 0 HPN V06 0.5 inch VCR male
Muon Veto PS HPN Sub-manifold
Name Type Purge Valve Number Diameter Connection
HPN supply ST1 n 0 MU HPN V01 0.25 inch VCR maleHPN supply ST2 n 0 MU HPN V02 0.25 inch VCR maleHPN supply ST3 n 0 MU HPN V03 0.25 inch VCR maleHPN supply Pump n 0 MU HPN V04 0.5 inch SwagelokFlow Meter ST1 float 0 MU ST 1 0.25 inch VCR maleFlow Meter ST2 float 0 MU ST 2 0.25 inch VCR maleFlow Meter ST3 float 0 MU ST 3 0.25 inch VCR male
buffer PS HPN Sub-manifold
Name Type Purge Valve Number Diameter Connection
HPN supply ST4 n 0 BF HPN V04 0.25 inch VCR maleHPN supply ST5 n 0 BF HPN V05 0.25 inch VCR maleHPN supply ST6 n 0 BF HPN V06 0.25 inch VCR maleHPN supply Pump n 0 BF HPN V04 0.5 inch SwagelokFlow Meter ST4 float 0 BF ST 4 0.25 inch VCR maleFlow Meter ST5 float 0 BF ST 5 0.25 inch VCR maleFlow Meter ST6 float 0 BF ST 6 0.25 inch VCR male
Table B.3: high pressure nitrogen manifold: HPN-Manifold and Sub-manifold details: description, valvetype(b=ball, m=membrane, n=needle), number of purge connections, Valve ID-Number, valve Diameter,valve connection
Low Pressure Nitrogen Manifolds + Sub Manifolds
B.2 Trunk Line System
201
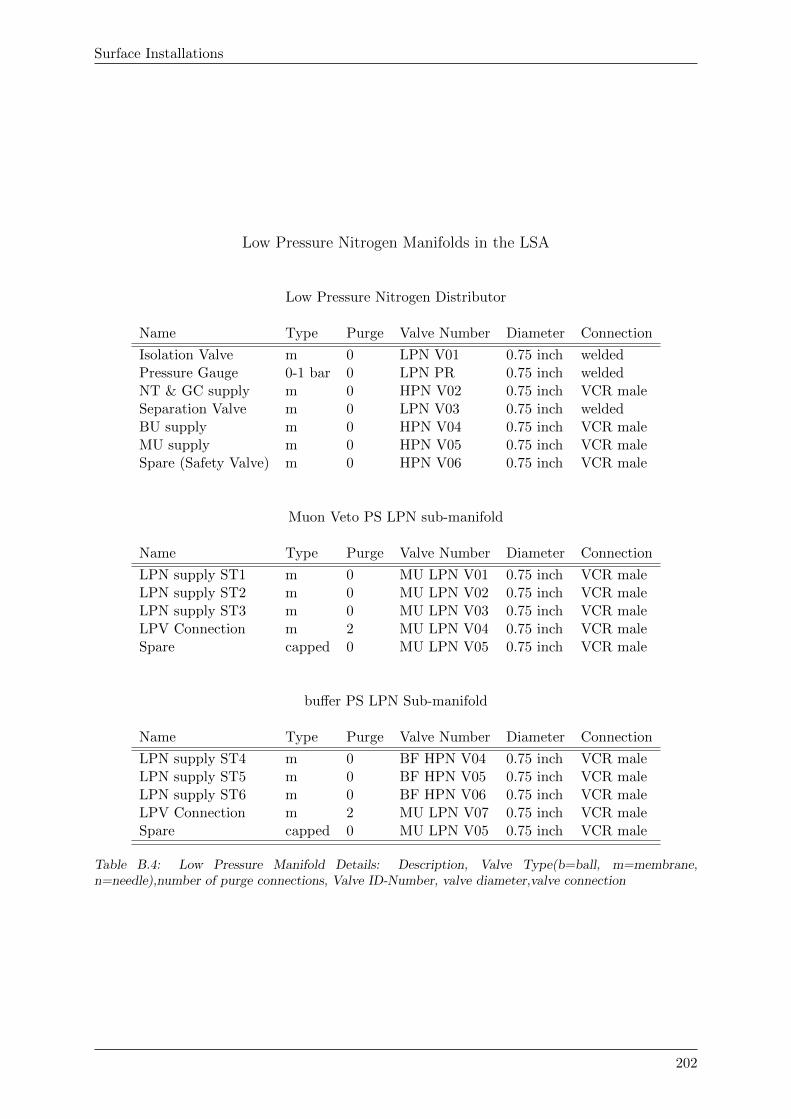
Surface Installations
Low Pressure Nitrogen Manifolds in the LSA
Low Pressure Nitrogen Distributor
Name Type Purge Valve Number Diameter Connection
Isolation Valve m 0 LPN V01 0.75 inch weldedPressure Gauge 0-1 bar 0 LPN PR 0.75 inch weldedNT & GC supply m 0 HPN V02 0.75 inch VCR maleSeparation Valve m 0 LPN V03 0.75 inch weldedBU supply m 0 HPN V04 0.75 inch VCR maleMU supply m 0 HPN V05 0.75 inch VCR maleSpare (Safety Valve) m 0 HPN V06 0.75 inch VCR male
Muon Veto PS LPN sub-manifold
Name Type Purge Valve Number Diameter Connection
LPN supply ST1 m 0 MU LPN V01 0.75 inch VCR maleLPN supply ST2 m 0 MU LPN V02 0.75 inch VCR maleLPN supply ST3 m 0 MU LPN V03 0.75 inch VCR maleLPV Connection m 2 MU LPN V04 0.75 inch VCR maleSpare capped 0 MU LPN V05 0.75 inch VCR male
buffer PS LPN Sub-manifold
Name Type Purge Valve Number Diameter Connection
LPN supply ST4 m 0 BF HPN V04 0.75 inch VCR maleLPN supply ST5 m 0 BF HPN V05 0.75 inch VCR maleLPN supply ST6 m 0 BF HPN V06 0.75 inch VCR maleLPV Connection m 2 MU LPN V07 0.75 inch VCR maleSpare capped 0 MU LPN V05 0.75 inch VCR male
Table B.4: Low Pressure Manifold Details: Description, Valve Type(b=ball, m=membrane,n=needle),number of purge connections, Valve ID-Number, valve diameter,valve connection
202
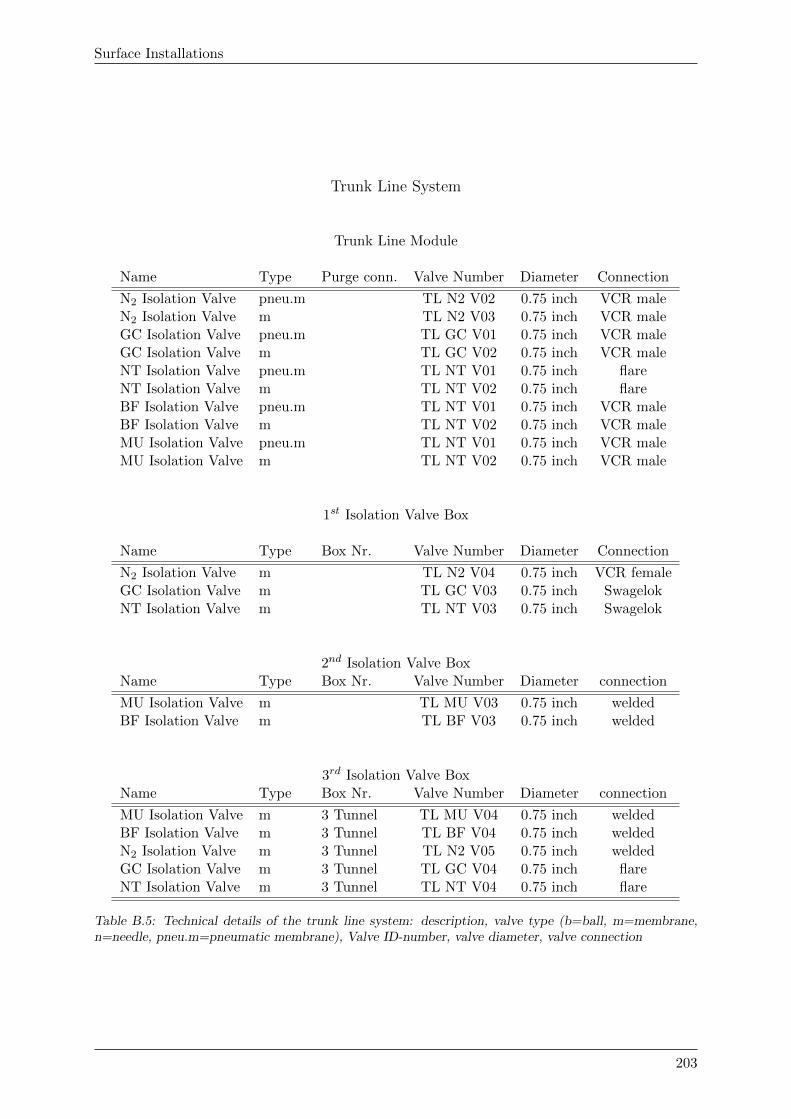
Surface Installations
Trunk Line System
Trunk Line Module
Name Type Purge conn. Valve Number Diameter Connection
N2 Isolation Valve pneu.m TL N2 V02 0.75 inch VCR maleN2 Isolation Valve m TL N2 V03 0.75 inch VCR maleGC Isolation Valve pneu.m TL GC V01 0.75 inch VCR maleGC Isolation Valve m TL GC V02 0.75 inch VCR maleNT Isolation Valve pneu.m TL NT V01 0.75 inch flareNT Isolation Valve m TL NT V02 0.75 inch flareBF Isolation Valve pneu.m TL NT V01 0.75 inch VCR maleBF Isolation Valve m TL NT V02 0.75 inch VCR maleMU Isolation Valve pneu.m TL NT V01 0.75 inch VCR maleMU Isolation Valve m TL NT V02 0.75 inch VCR male
1st Isolation Valve Box
Name Type Box Nr. Valve Number Diameter Connection
N2 Isolation Valve m TL N2 V04 0.75 inch VCR femaleGC Isolation Valve m TL GC V03 0.75 inch SwagelokNT Isolation Valve m TL NT V03 0.75 inch Swagelok
2nd Isolation Valve BoxName Type Box Nr. Valve Number Diameter connection
MU Isolation Valve m TL MU V03 0.75 inch weldedBF Isolation Valve m TL BF V03 0.75 inch welded
3rd Isolation Valve BoxName Type Box Nr. Valve Number Diameter connection
MU Isolation Valve m 3 Tunnel TL MU V04 0.75 inch weldedBF Isolation Valve m 3 Tunnel TL BF V04 0.75 inch weldedN2 Isolation Valve m 3 Tunnel TL N2 V05 0.75 inch weldedGC Isolation Valve m 3 Tunnel TL GC V04 0.75 inch flareNT Isolation Valve m 3 Tunnel TL NT V04 0.75 inch flare
Table B.5: Technical details of the trunk line system: description, valve type (b=ball, m=membrane,n=needle, pneu.m=pneumatic membrane), Valve ID-number, valve diameter, valve connection
203
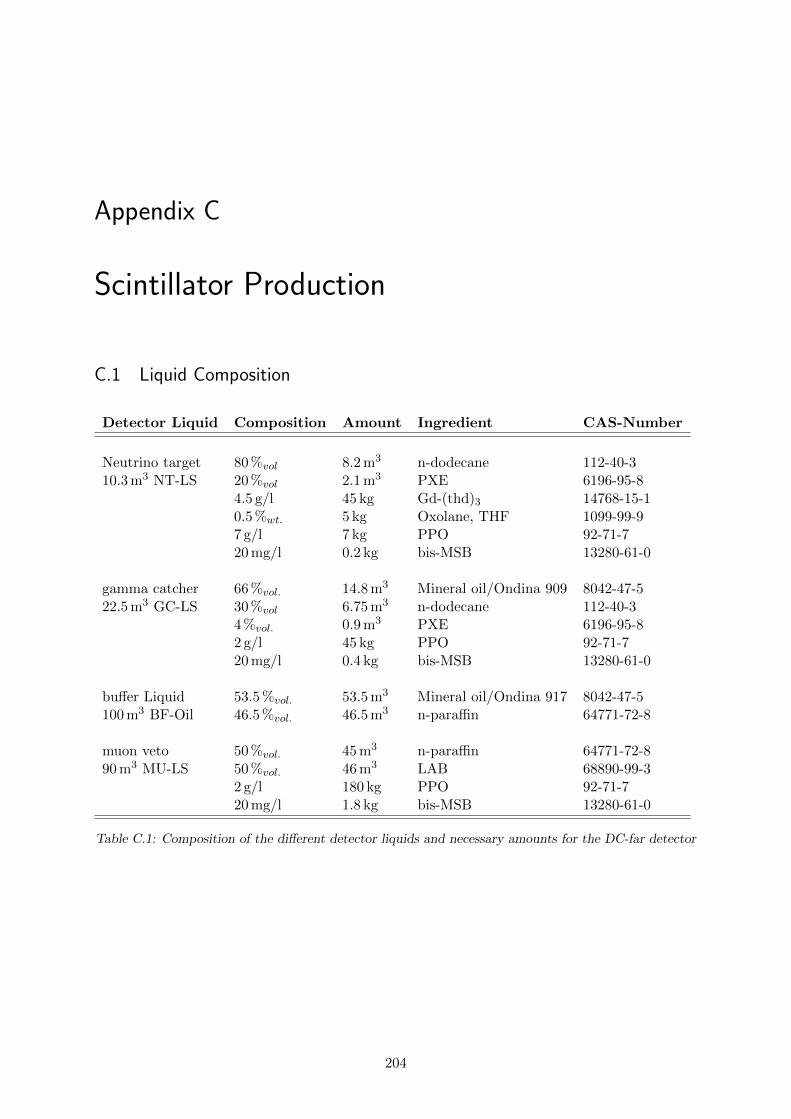
Appendix C
Scintillator Production
C.1 Liquid Composition
Detector Liquid Composition Amount Ingredient CAS-Number
Neutrino target 80 %vol 8.2 m3 n-dodecane 112-40-310.3 m3 NT-LS 20 %vol 2.1 m3 PXE 6196-95-8
4.5 g/l 45 kg Gd-(thd)3 14768-15-10.5 %wt. 5 kg Oxolane, THF 1099-99-97 g/l 7 kg PPO 92-71-720 mg/l 0.2 kg bis-MSB 13280-61-0
gamma catcher 66 %vol. 14.8 m3 Mineral oil/Ondina 909 8042-47-522.5 m3 GC-LS 30 %vol 6.75 m3 n-dodecane 112-40-3
4 %vol. 0.9 m3 PXE 6196-95-82 g/l 45 kg PPO 92-71-720 mg/l 0.4 kg bis-MSB 13280-61-0
buffer Liquid 53.5 %vol. 53.5 m3 Mineral oil/Ondina 917 8042-47-5100 m3 BF-Oil 46.5 %vol. 46.5 m3 n-paraffin 64771-72-8
muon veto 50 %vol. 45 m3 n-paraffin 64771-72-890 m3 MU-LS 50 %vol. 46 m3 LAB 68890-99-3
2 g/l 180 kg PPO 92-71-720 mg/l 1.8 kg bis-MSB 13280-61-0
Table C.1: Composition of the different detector liquids and necessary amounts for the DC-far detector
204
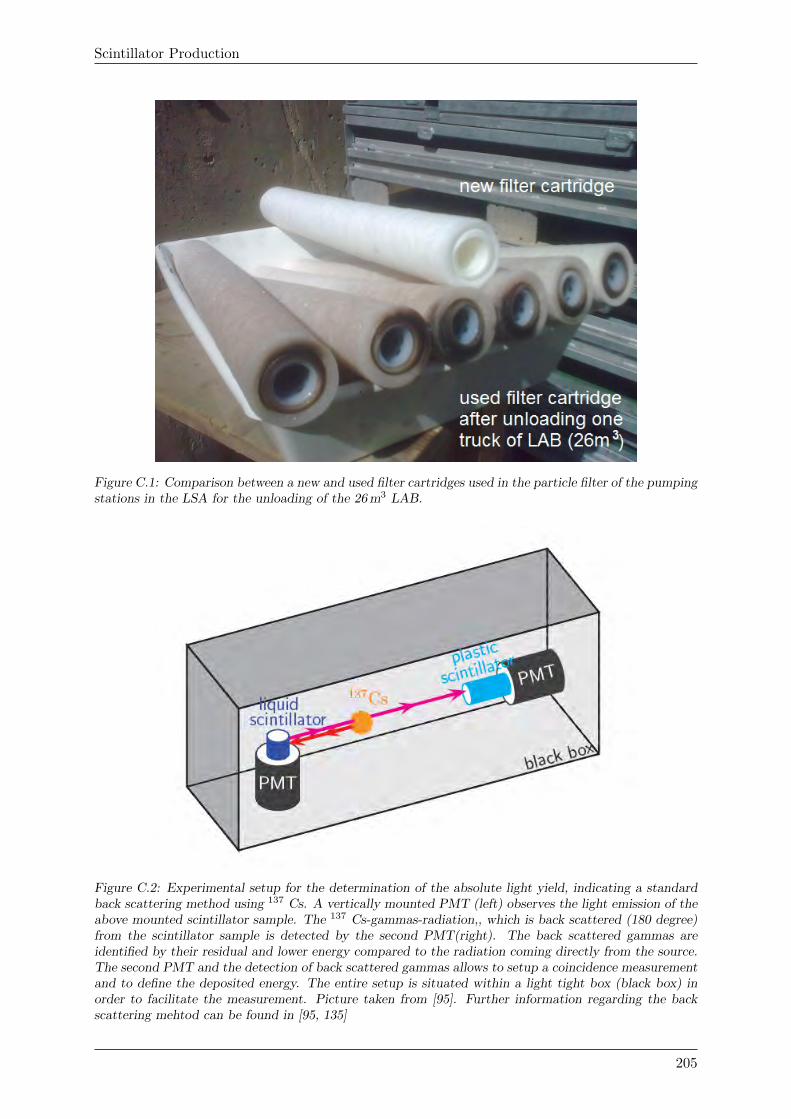
Scintillator Production
Figure C.1: Comparison between a new and used filter cartridges used in the particle filter of the pumpingstations in the LSA for the unloading of the 26 m3 LAB.
Figure C.2: Experimental setup for the determination of the absolute light yield, indicating a standardback scattering method using 137 Cs. A vertically mounted PMT (left) observes the light emission of theabove mounted scintillator sample. The 137 Cs-gammas-radiation,, which is back scattered (180 degree)from the scintillator sample is detected by the second PMT(right). The back scattered gammas areidentified by their residual and lower energy compared to the radiation coming directly from the source.The second PMT and the detection of back scattered gammas allows to setup a coincidence measurementand to define the deposited energy. The entire setup is situated within a light tight box (black box) inorder to facilitate the measurement. Picture taken from [95]. Further information regarding the backscattering mehtod can be found in [95, 135]
205

Appendix D
Underground Installations
D.1 Liquid Handling System
206
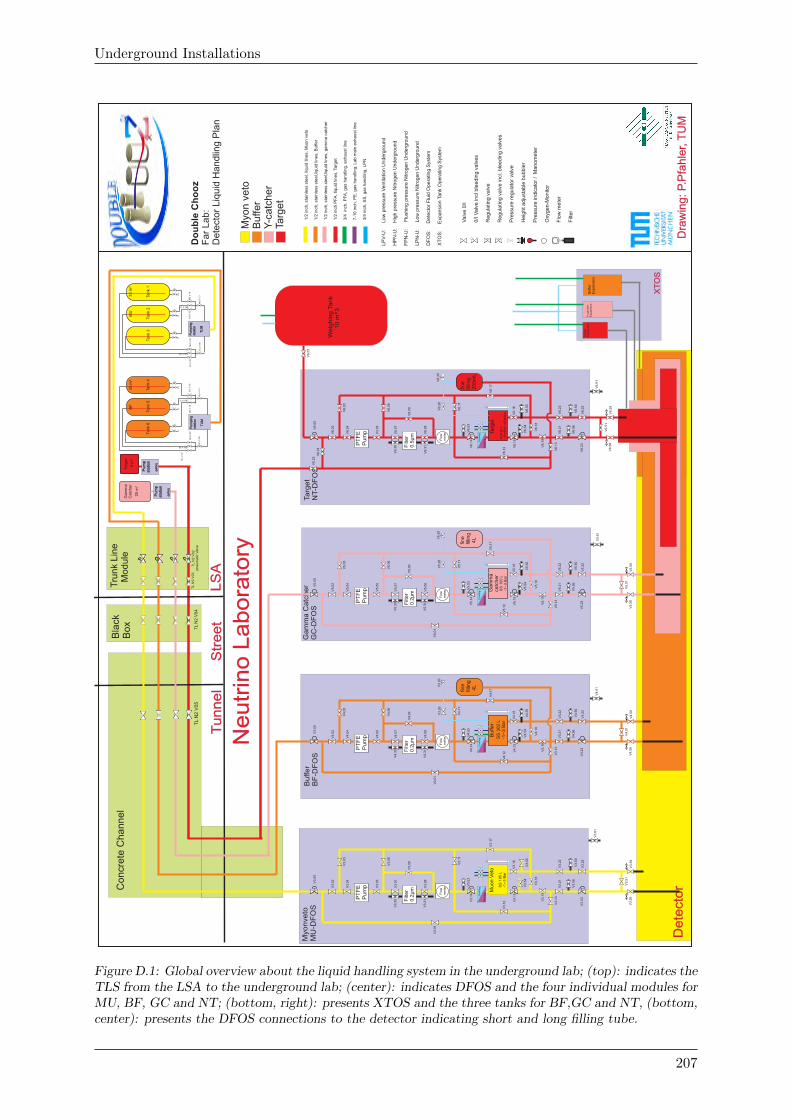
Underground Installations
Myonveto
MU
-DF
OS
V6
.61
Targ
et
NT-D
FO
S
V5.6
1
Gam
ma C
atc
her
GC
-DF
OS
V4
.61
Buffer
BF
-DF
OS
Do
ub
le C
ho
oz
Fa
r L
ab
:
De
tect
or
Liq
uid
Ha
nd
ling
Pla
n
1/2
P
FA
, Ta
rge
t
3/4
,
PFA
, g
as
ha
nd
ling
, e
xha
ust
lin
e
7-1
0 i
1/2
inch
, st
ain
less
ste
el, li
qu
id lin
es,
Mu
on
ve
to
1/2
inch
, st
ain
less
ste
el,liq
uid
lin
es,
Bu
ffe
r
1/2
inch
, st
ain
less
ste
el,liq
uid
lin
es,
ga
mm
a c
atc
he
r
inch
liqu
id lin
es,
inch nch
, P
E,
ga
s h
an
dlin
g,
La
b m
ain
exh
au
st lin
e
3/4
inch
, S
S,
ga
s h
an
dlin
g,
LP
N
Myo
n v
eto
Bu
ffe
r Y
-ca
tch
er
Targ
et
Va
lve
0/I
0/I
Va
lve
in
cl b
lee
din
g v
alv
es
Re
gu
latin
g v
alv
e
Re
gu
latin
g v
alv
e in
cl.
ble
ed
ing
va
lve
s
Pre
ssu
re r
eg
ula
tor
va
lve
He
igh
t a
dju
sta
ble
bu
bb
ler
Pre
ssu
re in
dic
ato
r /
Ma
no
me
ter
Oxy
ge
n-M
on
ito
r
Flo
w m
ete
r
Filt
er
LP
V-U
: Low
pre
ssure
Ventil
atio
n U
nderg
round
HP
N-U
: H
igh p
ress
ure
Nitr
ogen U
nderg
round
F DF
OS
: D
ete
ctor
Flu
id O
pera
ting S
yste
m
XT
OS
: E
xpansi
on T
ank O
pera
ting S
yste
m
PN
-U: F
lushin
g p
ress
ure
Nitro
gen U
nderg
round
LP
N-U
: Low
pre
ssure
Nitr
ogen U
nderg
round
Neutr
ino L
abora
tory
T
un
ne
l
TL N
2 V
05
Str
ee
t
LS
A
Tru
nk
Lin
e
Mo
du
leB
lack
B
ox
T
L N
2 V
02
pneum
atic
Valv
eT
L N
2 V
03
TL N
2 V
04
Concr
ete
Channel
Dra
win
g: P.P
fahle
r, T
UM
Buffer
Expansio
n
Ta
rge
tE
xp
an
sio
nY
-ca
tch
er
Exp
an
sio
n
XT
OS
Dete
cto
r
Hea
ting
Coolin
g
1/4
”
SS
185 L
-1
--3 B
ar
Muon V
eto
Tank
1
Tank
2
Tank
3
Tank
4
Tank
5
Tank
6
BF
MU
33 m
³40 m
³Ta
rget
Gam
ma
Catc
her
5 m
³25 m
³
Pum
pst
atio
n (M
PIK
) P
um
pst
atio
n (M
PIK
)
MU
V 1
3
MU
V 1
2
MU V 11
MU
V 1
0M
U V
07
MU V 08
MU
V 0
9
MU
V 0
6B
U V
13
BU
V 0
9
BU V 08
BU
V 1
2B
U V
10
BU V 11
BU
V 0
6
BU
V 0
7
Pum
pin
g
statio
n
T
UM
Pum
pin
g
sta
tion
T
UM
½”
V3
.15
V3
.16
1/4”
V3
.18
1/4” V3
.54
1/4” V3
.55
1/4
”
V3
.19
1/4
” V3
.21
V3
.22
V3
.13
1/4” V3
.56
1/4” V3
.60
V3
.23
V3
.22
V3
.51
V3
.59
V3
.56
1/4
” V3
.17
1/4”
V3
.11
V3
.12
V3
.01
V3
.08
V3
.07
Flo
w
me
ter
V3
.31
V3
.30
V3
.09
V3
.06
V3
.05
V3
.04
V3
.03
V3
.02
V3
.00
1/4” V3
.53
Filt
er
0.2
µm
PT
FE
Pu
mp
V3
.14
Hea
ting
Coolin
g
1/4
”
SS
300 L
-1
--3 B
ar
Bu
ffer
½
”
V4
.15
V4
.16
1/4”
V4
.18
1/4” V4
.54
1/4” V4
.55
1/4
”
V3
.19
1/4
” V3
.21
V3
.22
V3
.13
1/4” V4
.56
1/4” V4
.60
V4
.23
V4
.22
V4
.51
V4
.59
V4
.56
1/4
” V4
.17
1/4”
V4
.11
V4
.12
V4
.01
V4
.08
V4
.07
Flo
w
me
ter
V4
.31
V4
.30
V4
.09
V4
.06
V4
.05
V4
.04
V4
.03
V4
.02
V3
.00
1/4” V4
.53
Filt
er
0.2
µm
PT
FE
Pu
mp
V4
.14
Hea
ting
Coolin
g
1/4
”
SS
100 L
-1
--3 B
ar
Gam
ma
catc
her
½”
V5
.15
V5
.16
1/4”
V5
.18
1/4” V5
.54
1/4” V5
.55
1/4
”
V5
.19
1/4
” V5
.21
V5
.22
V5
.13
1/4” V5
.56
1/4” V5
.60
V5
.23
V5
.22
V5
.51
V5
.59
V5
.56
1/4
” V5
.17
1/4”
V5
.11
V5
.12
V5
.01
V5
.08
V5
.07
Flo
w
me
ter
V5
.31
V5
.30
V5
.09
V5
.06
V5
.05
V5
.04
V5
.03
V5
.02
V5
.00
1/4” V5
.53
Filt
er
0.2
µm
PT
FE
Pu
mp
V5
.14
Hea
ting
Coolin
g
1/4
”
PF
A 8
5 L
-4
0m
Ba
r--4
00
mB
ar
Targ
et
½”
V6
.15
V6
.16
1/4”
V6
.18
1/4” V6
.54
1/4” V6
.55
1/4
”
V6
.19
1/4
” V6
.21
V6
.22
V6
.13
1/4” V6
.56
1/4” V6
.60
V6
.23
V6
.22
V6
.51
V6
.59
V6
.56
1/4
” V6
.17
1/4”
V6
.11
V6
.12
V6
.01
V6
.08
V6
.07
Flo
w
me
ter
V6
.31
V6
.30
V6
.09
V6
.06
V3
.05
V6
.04
V6
.03
V6
.02
V6
.00
1/4” V6
.53
Filt
er
0.5
µm
PT
FE
Pu
mp
V6
.14
V6
.03
V6
.32
V3
.61
We
igh
ing
Ta
nk
10
m^3
1/4”
V6
.26
V5
.26
V3
.26
fine
fillin
g
4L
fine
fillin
g
4L
fine
fil
ling
2
50m
L
V3
.20
V5
.20
V6
.20
Figure D.1: Global overview about the liquid handling system in the underground lab; (top): indicates theTLS from the LSA to the underground lab; (center): indicates DFOS and the four individual modules forMU, BF, GC and NT; (bottom, right): presents XTOS and the three tanks for BF,GC and NT, (bottom,center): presents the DFOS connections to the detector indicating short and long filling tube.
207
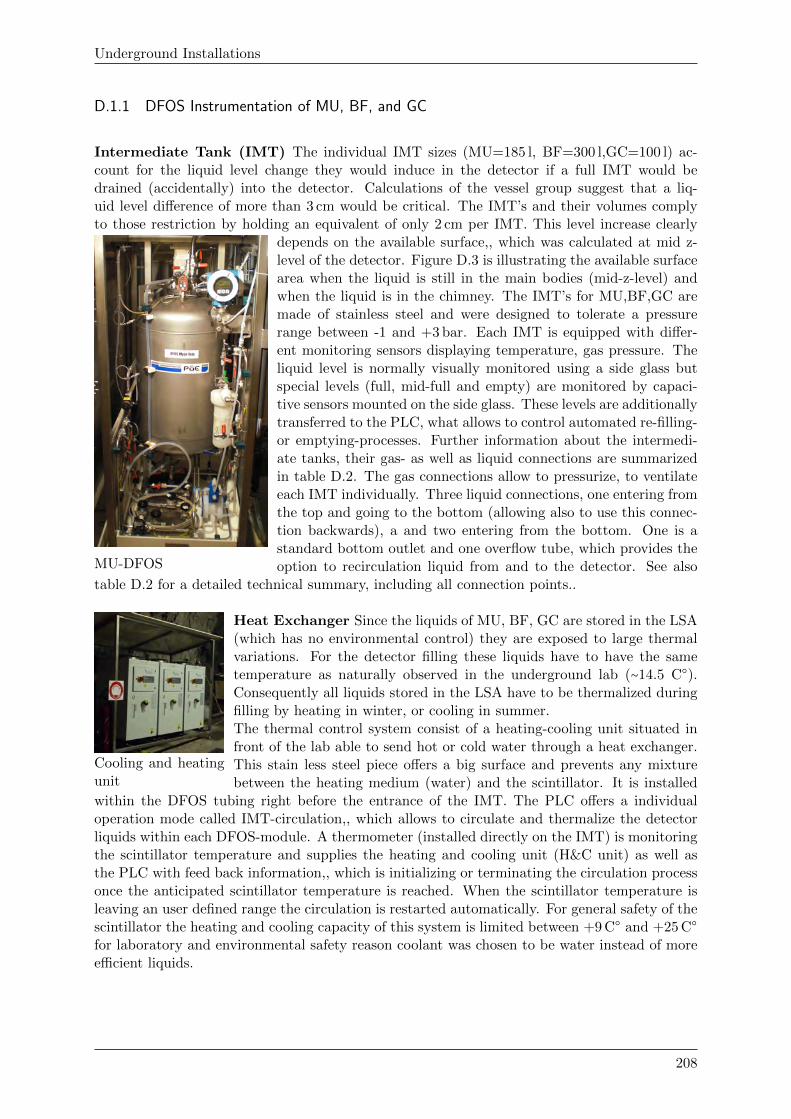
Underground Installations
D.1.1 DFOS Instrumentation of MU, BF, and GC
Intermediate Tank (IMT) The individual IMT sizes (MU=185 l, BF=300 l,GC=100 l) ac-count for the liquid level change they would induce in the detector if a full IMT would bedrained (accidentally) into the detector. Calculations of the vessel group suggest that a liq-uid level difference of more than 3 cm would be critical. The IMT’s and their volumes complyto those restriction by holding an equivalent of only 2 cm per IMT. This level increase clearly
MU-DFOS
depends on the available surface,, which was calculated at mid z-level of the detector. Figure D.3 is illustrating the available surfacearea when the liquid is still in the main bodies (mid-z-level) andwhen the liquid is in the chimney. The IMT’s for MU,BF,GC aremade of stainless steel and were designed to tolerate a pressurerange between -1 and +3 bar. Each IMT is equipped with differ-ent monitoring sensors displaying temperature, gas pressure. Theliquid level is normally visually monitored using a side glass butspecial levels (full, mid-full and empty) are monitored by capaci-tive sensors mounted on the side glass. These levels are additionallytransferred to the PLC, what allows to control automated re-filling-or emptying-processes. Further information about the intermedi-ate tanks, their gas- as well as liquid connections are summarizedin table D.2. The gas connections allow to pressurize, to ventilateeach IMT individually. Three liquid connections, one entering fromthe top and going to the bottom (allowing also to use this connec-tion backwards), a and two entering from the bottom. One is astandard bottom outlet and one overflow tube, which provides theoption to recirculation liquid from and to the detector. See also
table D.2 for a detailed technical summary, including all connection points..
Cooling and heatingunit
Heat Exchanger Since the liquids of MU, BF, GC are stored in the LSA(which has no environmental control) they are exposed to large thermalvariations. For the detector filling these liquids have to have the sametemperature as naturally observed in the underground lab (∼14.5 C○).Consequently all liquids stored in the LSA have to be thermalized duringfilling by heating in winter, or cooling in summer.The thermal control system consist of a heating-cooling unit situated infront of the lab able to send hot or cold water through a heat exchanger.This stain less steel piece offers a big surface and prevents any mixturebetween the heating medium (water) and the scintillator. It is installed
within the DFOS tubing right before the entrance of the IMT. The PLC offers a individualoperation mode called IMT-circulation,, which allows to circulate and thermalize the detectorliquids within each DFOS-module. A thermometer (installed directly on the IMT) is monitoringthe scintillator temperature and supplies the heating and cooling unit (H&C unit) as well asthe PLC with feed back information,, which is initializing or terminating the circulation processonce the anticipated scintillator temperature is reached. When the scintillator temperature isleaving an user defined range the circulation is restarted automatically. For general safety of thescintillator the heating and cooling capacity of this system is limited between +9 C○ and +25 C○
for laboratory and environmental safety reason coolant was chosen to be water instead of moreefficient liquids.
208
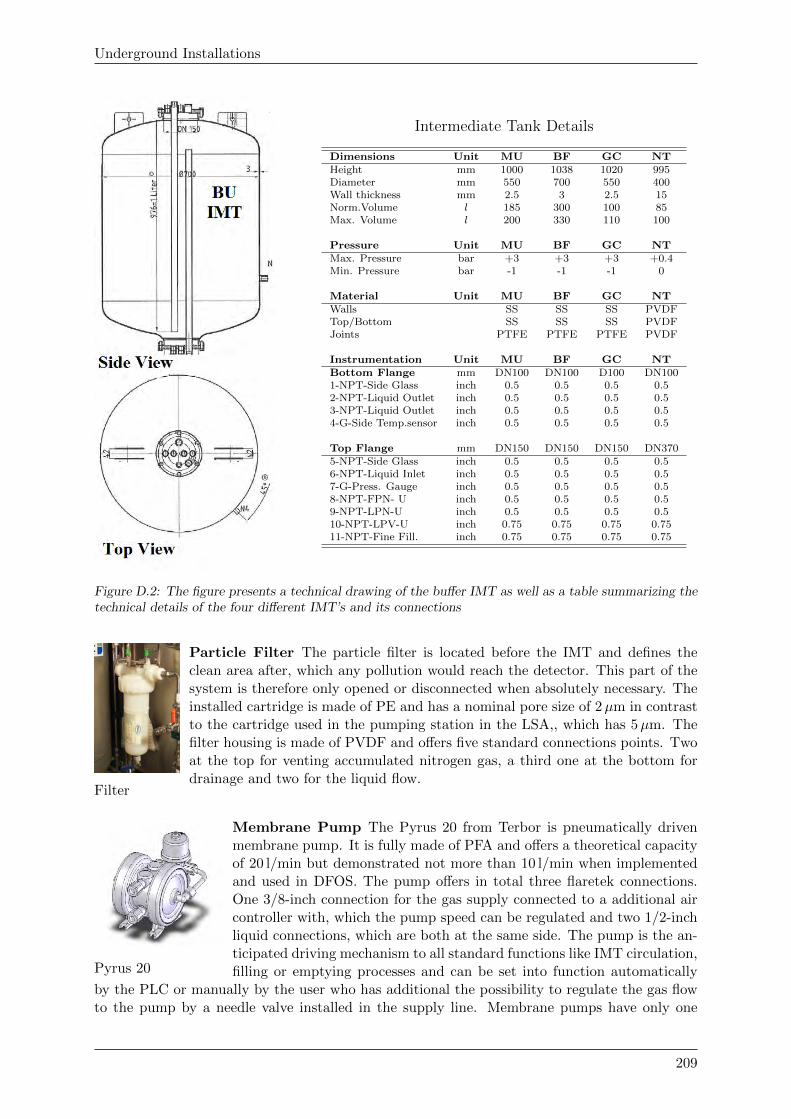
Underground Installations
Intermediate Tank Details
Dimensions Unit MU BF GC NTHeight mm 1000 1038 1020 995Diameter mm 550 700 550 400Wall thickness mm 2.5 3 2.5 15Norm.Volume l 185 300 100 85Max. Volume l 200 330 110 100
Pressure Unit MU BF GC NTMax. Pressure bar +3 +3 +3 +0.4Min. Pressure bar -1 -1 -1 0
Material Unit MU BF GC NTWalls SS SS SS PVDFTop/Bottom SS SS SS PVDFJoints PTFE PTFE PTFE PVDF
Instrumentation Unit MU BF GC NTBottom Flange mm DN100 DN100 D100 DN1001-NPT-Side Glass inch 0.5 0.5 0.5 0.52-NPT-Liquid Outlet inch 0.5 0.5 0.5 0.53-NPT-Liquid Outlet inch 0.5 0.5 0.5 0.54-G-Side Temp.sensor inch 0.5 0.5 0.5 0.5
Top Flange mm DN150 DN150 DN150 DN3705-NPT-Side Glass inch 0.5 0.5 0.5 0.56-NPT-Liquid Inlet inch 0.5 0.5 0.5 0.57-G-Press. Gauge inch 0.5 0.5 0.5 0.58-NPT-FPN- U inch 0.5 0.5 0.5 0.59-NPT-LPN-U inch 0.5 0.5 0.5 0.510-NPT-LPV-U inch 0.75 0.75 0.75 0.7511-NPT-Fine Fill. inch 0.75 0.75 0.75 0.75
Figure D.2: The figure presents a technical drawing of the buffer IMT as well as a table summarizing thetechnical details of the four different IMT’s and its connections
Filter
Particle Filter The particle filter is located before the IMT and defines theclean area after, which any pollution would reach the detector. This part of thesystem is therefore only opened or disconnected when absolutely necessary. Theinstalled cartridge is made of PE and has a nominal pore size of 2µm in contrastto the cartridge used in the pumping station in the LSA,, which has 5µm. Thefilter housing is made of PVDF and offers five standard connections points. Twoat the top for venting accumulated nitrogen gas, a third one at the bottom fordrainage and two for the liquid flow.
Pyrus 20
Membrane Pump The Pyrus 20 from Terbor is pneumatically drivenmembrane pump. It is fully made of PFA and offers a theoretical capacityof 20 l/min but demonstrated not more than 10 l/min when implementedand used in DFOS. The pump offers in total three flaretek connections.One 3/8-inch connection for the gas supply connected to a additional aircontroller with, which the pump speed can be regulated and two 1/2-inchliquid connections, which are both at the same side. The pump is the an-ticipated driving mechanism to all standard functions like IMT circulation,filling or emptying processes and can be set into function automatically
by the PLC or manually by the user who has additional the possibility to regulate the gas flowto the pump by a needle valve installed in the supply line. Membrane pumps have only one
209
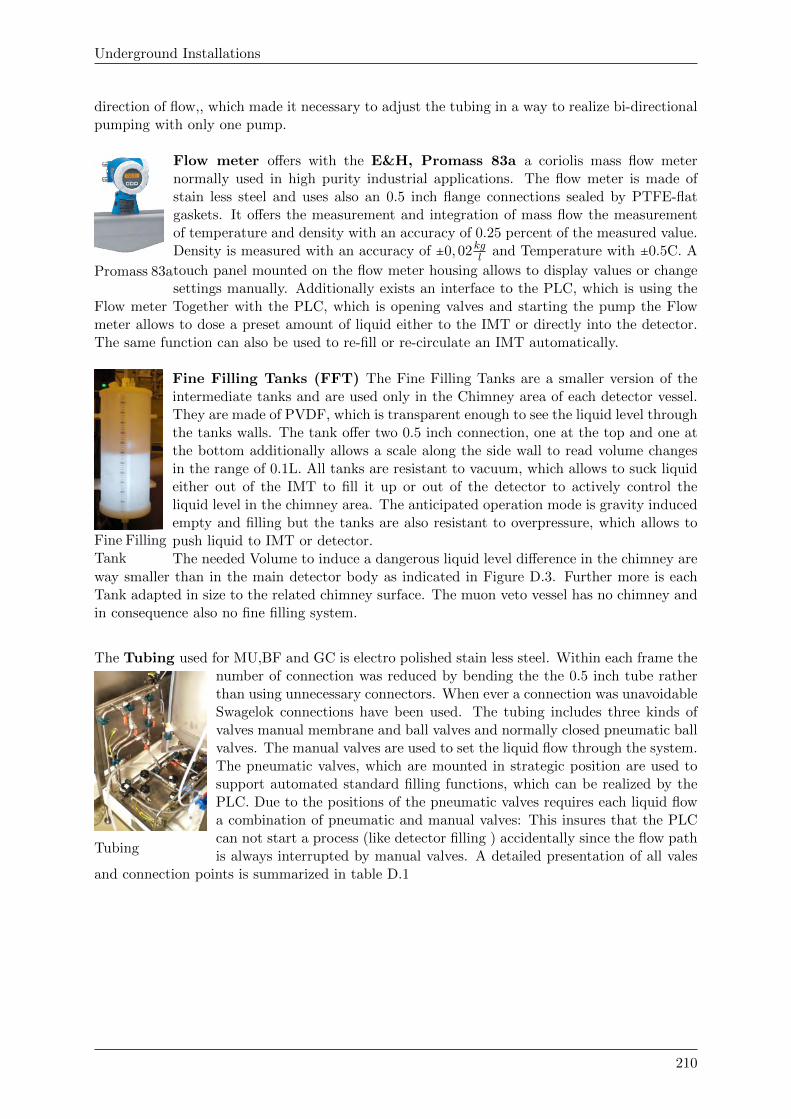
Underground Installations
direction of flow,, which made it necessary to adjust the tubing in a way to realize bi-directionalpumping with only one pump.
Promass 83a
Flow meter offers with the E&H, Promass 83a a coriolis mass flow meternormally used in high purity industrial applications. The flow meter is made ofstain less steel and uses also an 0.5 inch flange connections sealed by PTFE-flatgaskets. It offers the measurement and integration of mass flow the measurementof temperature and density with an accuracy of 0.25 percent of the measured value.Density is measured with an accuracy of ±0,02kgl and Temperature with ±0.5C. A
touch panel mounted on the flow meter housing allows to display values or changesettings manually. Additionally exists an interface to the PLC, which is using the
Flow meter Together with the PLC, which is opening valves and starting the pump the Flowmeter allows to dose a preset amount of liquid either to the IMT or directly into the detector.The same function can also be used to re-fill or re-circulate an IMT automatically.
Fine FillingTank
Fine Filling Tanks (FFT) The Fine Filling Tanks are a smaller version of theintermediate tanks and are used only in the Chimney area of each detector vessel.They are made of PVDF, which is transparent enough to see the liquid level throughthe tanks walls. The tank offer two 0.5 inch connection, one at the top and one atthe bottom additionally allows a scale along the side wall to read volume changesin the range of 0.1L. All tanks are resistant to vacuum, which allows to suck liquideither out of the IMT to fill it up or out of the detector to actively control theliquid level in the chimney area. The anticipated operation mode is gravity inducedempty and filling but the tanks are also resistant to overpressure, which allows topush liquid to IMT or detector.The needed Volume to induce a dangerous liquid level difference in the chimney are
way smaller than in the main detector body as indicated in Figure D.3. Further more is eachTank adapted in size to the related chimney surface. The muon veto vessel has no chimney andin consequence also no fine filling system.
The Tubing used for MU,BF and GC is electro polished stain less steel. Within each frame the
Tubing
number of connection was reduced by bending the the 0.5 inch tube ratherthan using unnecessary connectors. When ever a connection was unavoidableSwagelok connections have been used. The tubing includes three kinds ofvalves manual membrane and ball valves and normally closed pneumatic ballvalves. The manual valves are used to set the liquid flow through the system.The pneumatic valves, which are mounted in strategic position are used tosupport automated standard filling functions, which can be realized by thePLC. Due to the positions of the pneumatic valves requires each liquid flowa combination of pneumatic and manual valves: This insures that the PLCcan not start a process (like detector filling ) accidentally since the flow pathis always interrupted by manual valves. A detailed presentation of all vales
and connection points is summarized in table D.1
210
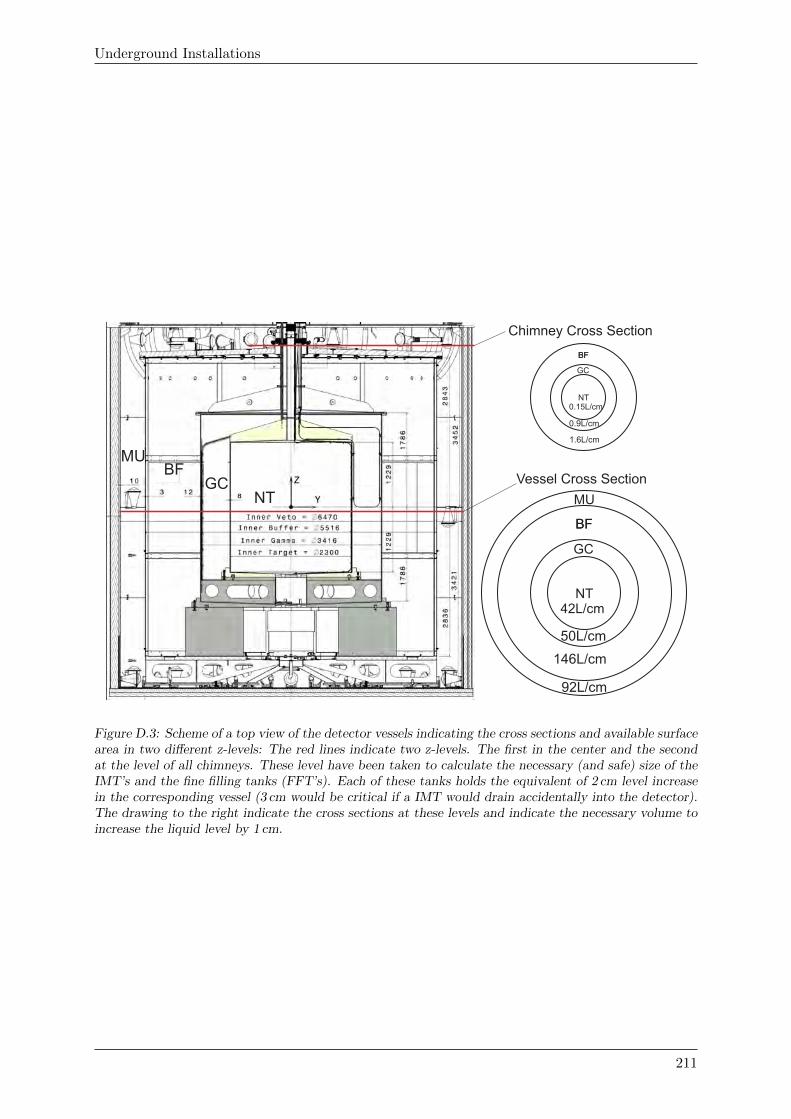
Underground Installations
NT42L/cm
GC
BFBF
MU
50L/cm
146L/cm
92L/cm
NT0.15L/cm
GC
BFBF
0.9L/cm
1.6L/cm
MUBF
GCNT
Chimney Cross Section
Vessel Cross Section
Figure D.3: Scheme of a top view of the detector vessels indicating the cross sections and available surfacearea in two different z-levels: The red lines indicate two z-levels. The first in the center and the secondat the level of all chimneys. These level have been taken to calculate the necessary (and safe) size of theIMT’s and the fine filling tanks (FFT’s). Each of these tanks holds the equivalent of 2 cm level increasein the corresponding vessel (3 cm would be critical if a IMT would drain accidentally into the detector).The drawing to the right indicate the cross sections at these levels and indicate the necessary volume toincrease the liquid level by 1 cm.
211
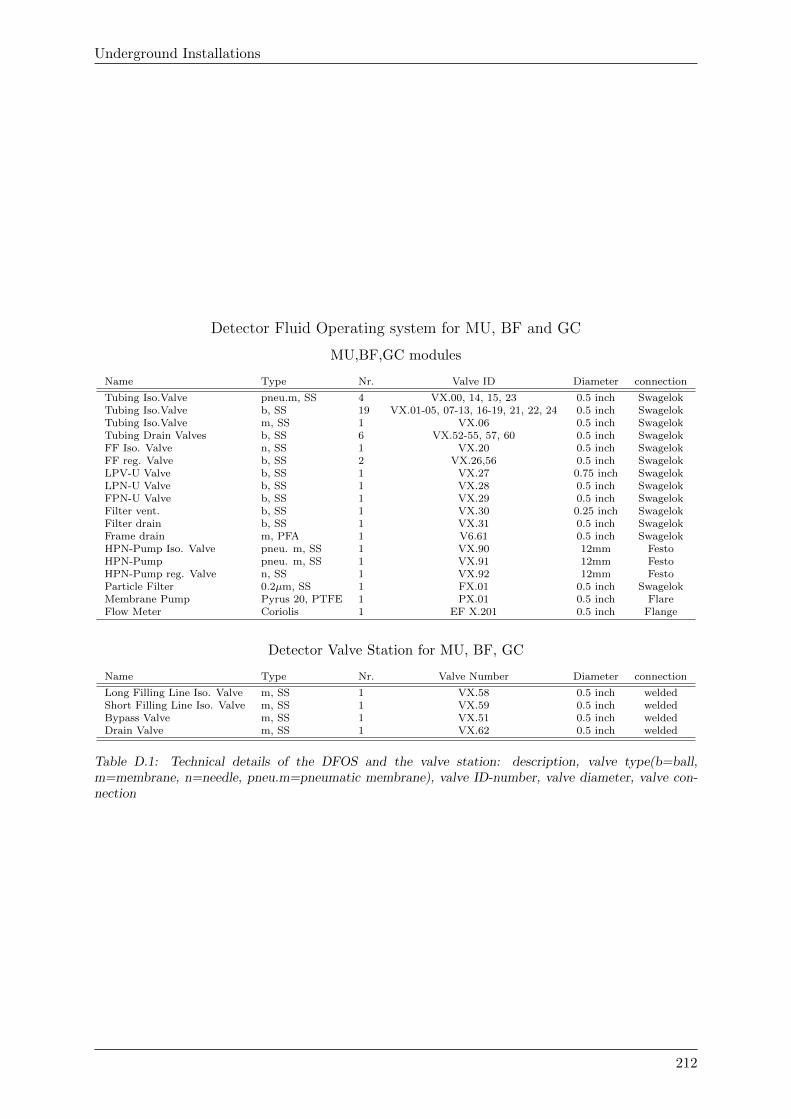
Underground Installations
Detector Fluid Operating system for MU, BF and GC
MU,BF,GC modules
Name Type Nr. Valve ID Diameter connection
Tubing Iso.Valve pneu.m, SS 4 VX.00, 14, 15, 23 0.5 inch SwagelokTubing Iso.Valve b, SS 19 VX.01-05, 07-13, 16-19, 21, 22, 24 0.5 inch SwagelokTubing Iso.Valve m, SS 1 VX.06 0.5 inch SwagelokTubing Drain Valves b, SS 6 VX.52-55, 57, 60 0.5 inch SwagelokFF Iso. Valve n, SS 1 VX.20 0.5 inch SwagelokFF reg. Valve b, SS 2 VX.26,56 0.5 inch SwagelokLPV-U Valve b, SS 1 VX.27 0.75 inch SwagelokLPN-U Valve b, SS 1 VX.28 0.5 inch SwagelokFPN-U Valve b, SS 1 VX.29 0.5 inch SwagelokFilter vent. b, SS 1 VX.30 0.25 inch SwagelokFilter drain b, SS 1 VX.31 0.5 inch SwagelokFrame drain m, PFA 1 V6.61 0.5 inch SwagelokHPN-Pump Iso. Valve pneu. m, SS 1 VX.90 12mm FestoHPN-Pump pneu. m, SS 1 VX.91 12mm FestoHPN-Pump reg. Valve n, SS 1 VX.92 12mm FestoParticle Filter 0.2µm, SS 1 FX.01 0.5 inch SwagelokMembrane Pump Pyrus 20, PTFE 1 PX.01 0.5 inch FlareFlow Meter Coriolis 1 EF X.201 0.5 inch Flange
Detector Valve Station for MU, BF, GC
Name Type Nr. Valve Number Diameter connection
Long Filling Line Iso. Valve m, SS 1 VX.58 0.5 inch weldedShort Filling Line Iso. Valve m, SS 1 VX.59 0.5 inch weldedBypass Valve m, SS 1 VX.51 0.5 inch weldedDrain Valve m, SS 1 VX.62 0.5 inch welded
Table D.1: Technical details of the DFOS and the valve station: description, valve type(b=ball,m=membrane, n=needle, pneu.m=pneumatic membrane), valve ID-number, valve diameter, valve con-nection
212
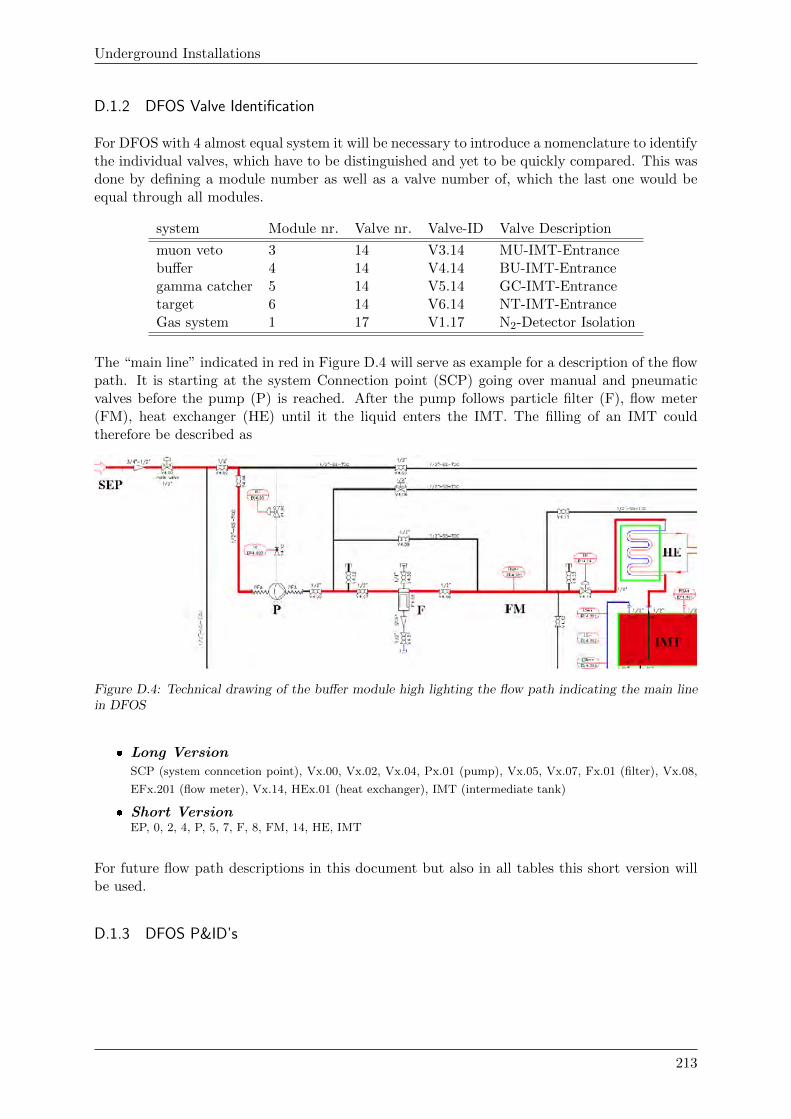
Underground Installations
D.1.2 DFOS Valve Identification
For DFOS with 4 almost equal system it will be necessary to introduce a nomenclature to identifythe individual valves, which have to be distinguished and yet to be quickly compared. This wasdone by defining a module number as well as a valve number of, which the last one would beequal through all modules.
system Module nr. Valve nr. Valve-ID Valve Description
muon veto 3 14 V3.14 MU-IMT-Entrancebuffer 4 14 V4.14 BU-IMT-Entrancegamma catcher 5 14 V5.14 GC-IMT-Entrancetarget 6 14 V6.14 NT-IMT-EntranceGas system 1 17 V1.17 N2-Detector Isolation
The “main line” indicated in red in Figure D.4 will serve as example for a description of the flowpath. It is starting at the system Connection point (SCP) going over manual and pneumaticvalves before the pump (P) is reached. After the pump follows particle filter (F), flow meter(FM), heat exchanger (HE) until it the liquid enters the IMT. The filling of an IMT couldtherefore be described as
Figure D.4: Technical drawing of the buffer module high lighting the flow path indicating the main linein DFOS
� Long VersionSCP (system conncetion point), Vx.00, Vx.02, Vx.04, Px.01 (pump), Vx.05, Vx.07, Fx.01 (filter), Vx.08,
EFx.201 (flow meter), Vx.14, HEx.01 (heat exchanger), IMT (intermediate tank)
� Short VersionEP, 0, 2, 4, P, 5, 7, F, 8, FM, 14, HE, IMT
For future flow path descriptions in this document but also in all tables this short version willbe used.
D.1.3 DFOS P&ID’s
213
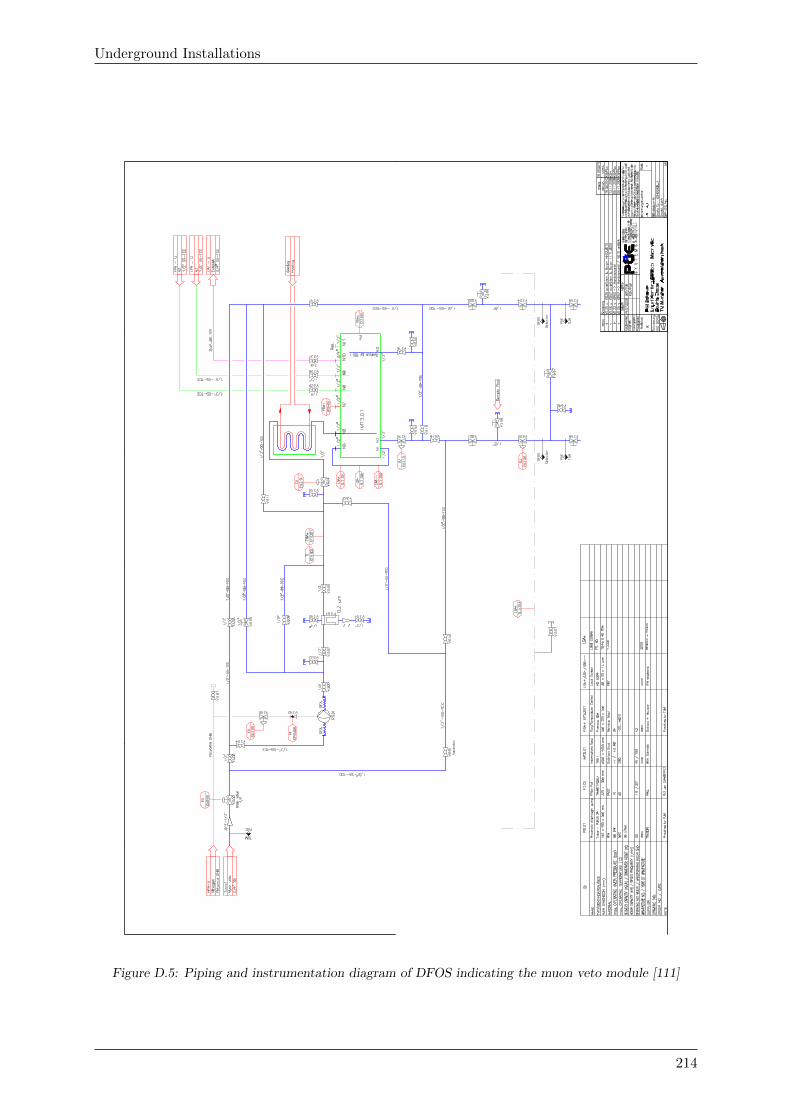
Underground Installations
Figure D.5: Piping and instrumentation diagram of DFOS indicating the muon veto module [111]
214
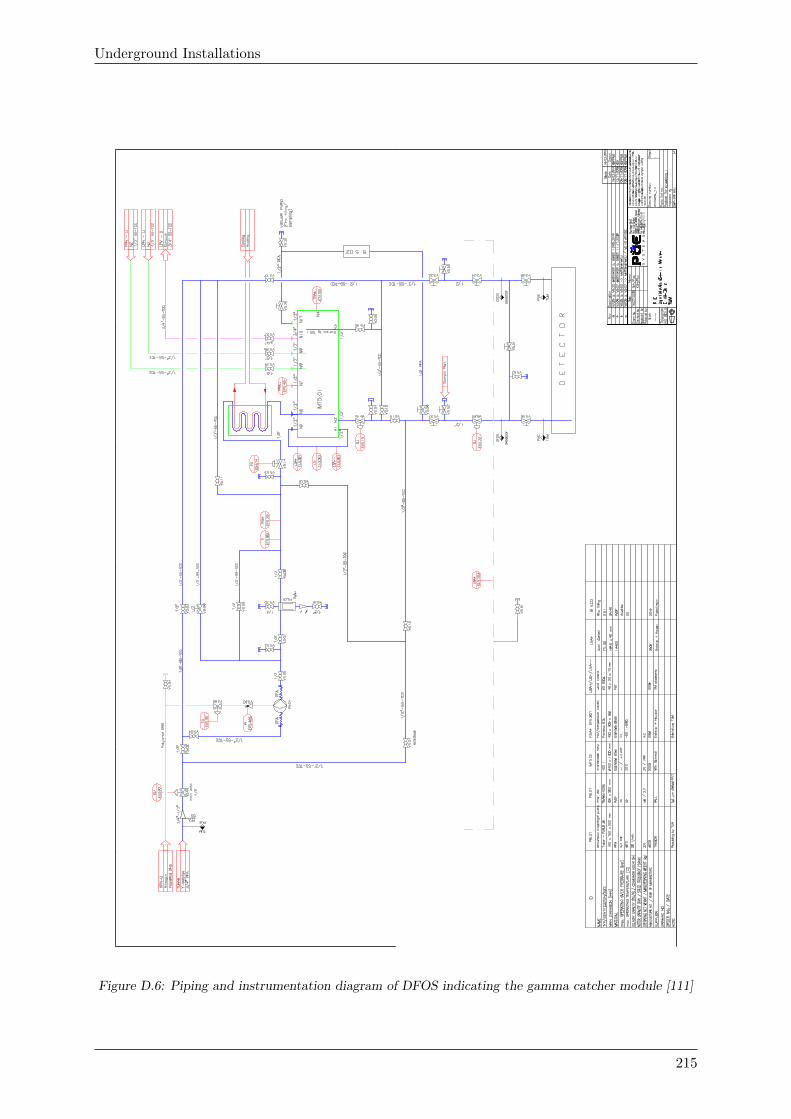
Underground Installations
Figure D.6: Piping and instrumentation diagram of DFOS indicating the gamma catcher module [111]
215
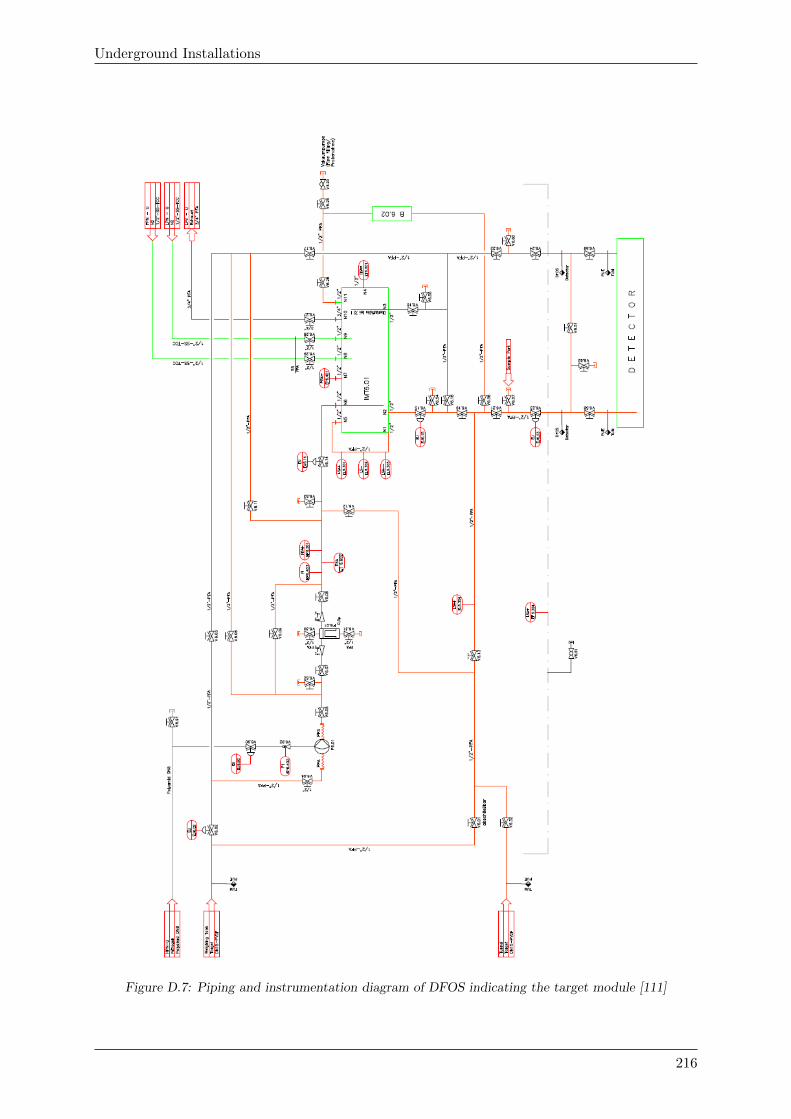
Underground Installations
Figure D.7: Piping and instrumentation diagram of DFOS indicating the target module [111]
216
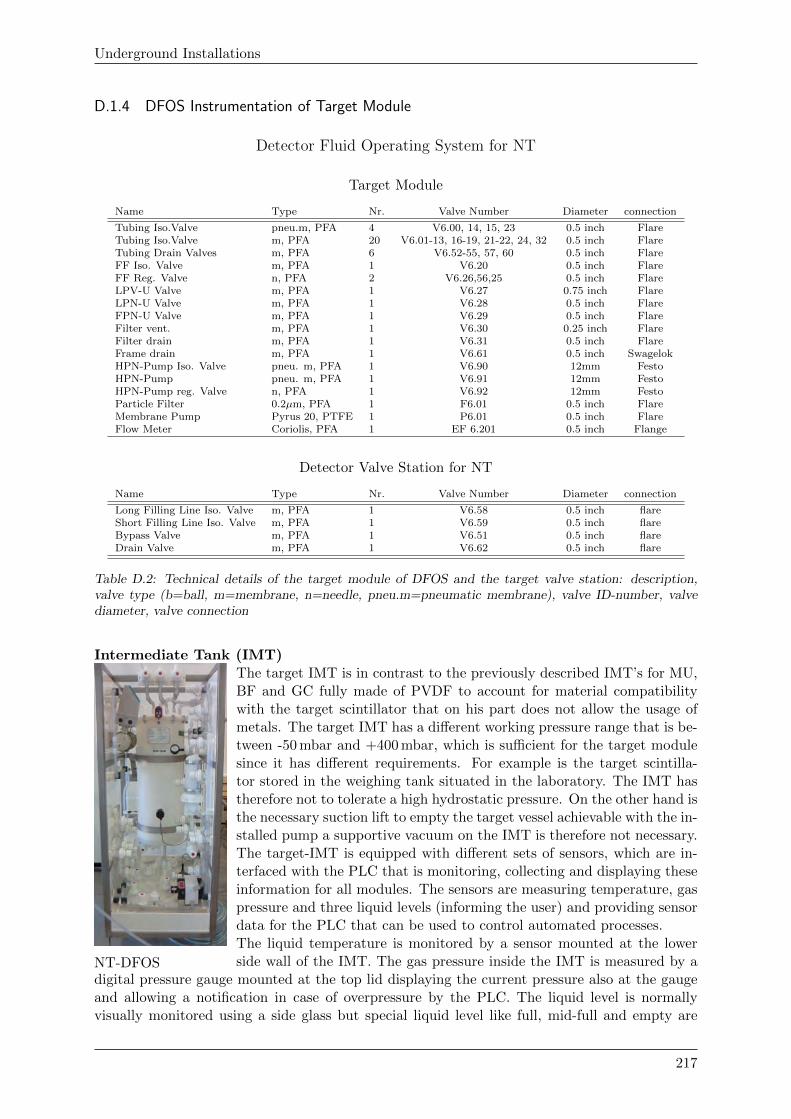
Underground Installations
D.1.4 DFOS Instrumentation of Target Module
Detector Fluid Operating System for NT
Target Module
Name Type Nr. Valve Number Diameter connection
Tubing Iso.Valve pneu.m, PFA 4 V6.00, 14, 15, 23 0.5 inch FlareTubing Iso.Valve m, PFA 20 V6.01-13, 16-19, 21-22, 24, 32 0.5 inch FlareTubing Drain Valves m, PFA 6 V6.52-55, 57, 60 0.5 inch FlareFF Iso. Valve m, PFA 1 V6.20 0.5 inch FlareFF Reg. Valve n, PFA 2 V6.26,56,25 0.5 inch FlareLPV-U Valve m, PFA 1 V6.27 0.75 inch FlareLPN-U Valve m, PFA 1 V6.28 0.5 inch FlareFPN-U Valve m, PFA 1 V6.29 0.5 inch FlareFilter vent. m, PFA 1 V6.30 0.25 inch FlareFilter drain m, PFA 1 V6.31 0.5 inch FlareFrame drain m, PFA 1 V6.61 0.5 inch SwagelokHPN-Pump Iso. Valve pneu. m, PFA 1 V6.90 12mm FestoHPN-Pump pneu. m, PFA 1 V6.91 12mm FestoHPN-Pump reg. Valve n, PFA 1 V6.92 12mm FestoParticle Filter 0.2µm, PFA 1 F6.01 0.5 inch FlareMembrane Pump Pyrus 20, PTFE 1 P6.01 0.5 inch FlareFlow Meter Coriolis, PFA 1 EF 6.201 0.5 inch Flange
Detector Valve Station for NT
Name Type Nr. Valve Number Diameter connection
Long Filling Line Iso. Valve m, PFA 1 V6.58 0.5 inch flareShort Filling Line Iso. Valve m, PFA 1 V6.59 0.5 inch flareBypass Valve m, PFA 1 V6.51 0.5 inch flareDrain Valve m, PFA 1 V6.62 0.5 inch flare
Table D.2: Technical details of the target module of DFOS and the target valve station: description,valve type (b=ball, m=membrane, n=needle, pneu.m=pneumatic membrane), valve ID-number, valvediameter, valve connection
Intermediate Tank (IMT)
NT-DFOS
The target IMT is in contrast to the previously described IMT’s for MU,BF and GC fully made of PVDF to account for material compatibilitywith the target scintillator that on his part does not allow the usage ofmetals. The target IMT has a different working pressure range that is be-tween -50 mbar and +400 mbar, which is sufficient for the target modulesince it has different requirements. For example is the target scintilla-tor stored in the weighing tank situated in the laboratory. The IMT hastherefore not to tolerate a high hydrostatic pressure. On the other hand isthe necessary suction lift to empty the target vessel achievable with the in-stalled pump a supportive vacuum on the IMT is therefore not necessary.The target-IMT is equipped with different sets of sensors, which are in-terfaced with the PLC that is monitoring, collecting and displaying theseinformation for all modules. The sensors are measuring temperature, gaspressure and three liquid levels (informing the user) and providing sensordata for the PLC that can be used to control automated processes.The liquid temperature is monitored by a sensor mounted at the lowerside wall of the IMT. The gas pressure inside the IMT is measured by a
digital pressure gauge mounted at the top lid displaying the current pressure also at the gaugeand allowing a notification in case of overpressure by the PLC. The liquid level is normallyvisually monitored using a side glass but special liquid level like full, mid-full and empty are
217
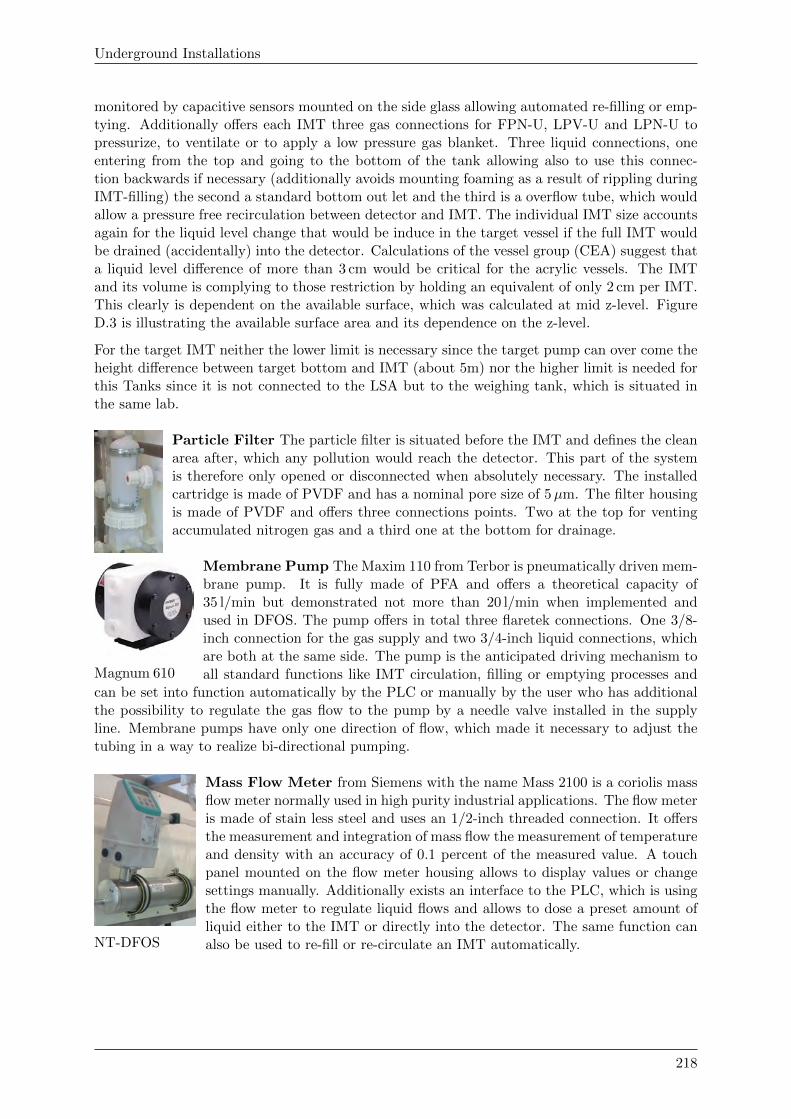
Underground Installations
monitored by capacitive sensors mounted on the side glass allowing automated re-filling or emp-tying. Additionally offers each IMT three gas connections for FPN-U, LPV-U and LPN-U topressurize, to ventilate or to apply a low pressure gas blanket. Three liquid connections, oneentering from the top and going to the bottom of the tank allowing also to use this connec-tion backwards if necessary (additionally avoids mounting foaming as a result of rippling duringIMT-filling) the second a standard bottom out let and the third is a overflow tube, which wouldallow a pressure free recirculation between detector and IMT. The individual IMT size accountsagain for the liquid level change that would be induce in the target vessel if the full IMT wouldbe drained (accidentally) into the detector. Calculations of the vessel group (CEA) suggest thata liquid level difference of more than 3 cm would be critical for the acrylic vessels. The IMTand its volume is complying to those restriction by holding an equivalent of only 2 cm per IMT.This clearly is dependent on the available surface, which was calculated at mid z-level. FigureD.3 is illustrating the available surface area and its dependence on the z-level.
For the target IMT neither the lower limit is necessary since the target pump can over come theheight difference between target bottom and IMT (about 5m) nor the higher limit is needed forthis Tanks since it is not connected to the LSA but to the weighing tank, which is situated inthe same lab.
filter
Particle Filter The particle filter is situated before the IMT and defines the cleanarea after, which any pollution would reach the detector. This part of the systemis therefore only opened or disconnected when absolutely necessary. The installedcartridge is made of PVDF and has a nominal pore size of 5µm. The filter housingis made of PVDF and offers three connections points. Two at the top for ventingaccumulated nitrogen gas and a third one at the bottom for drainage.
Magnum 610
Membrane Pump The Maxim 110 from Terbor is pneumatically driven mem-brane pump. It is fully made of PFA and offers a theoretical capacity of35 l/min but demonstrated not more than 20 l/min when implemented andused in DFOS. The pump offers in total three flaretek connections. One 3/8-inch connection for the gas supply and two 3/4-inch liquid connections, whichare both at the same side. The pump is the anticipated driving mechanism toall standard functions like IMT circulation, filling or emptying processes and
can be set into function automatically by the PLC or manually by the user who has additionalthe possibility to regulate the gas flow to the pump by a needle valve installed in the supplyline. Membrane pumps have only one direction of flow, which made it necessary to adjust thetubing in a way to realize bi-directional pumping.
NT-DFOS
Mass Flow Meter from Siemens with the name Mass 2100 is a coriolis massflow meter normally used in high purity industrial applications. The flow meteris made of stain less steel and uses an 1/2-inch threaded connection. It offersthe measurement and integration of mass flow the measurement of temperatureand density with an accuracy of 0.1 percent of the measured value. A touchpanel mounted on the flow meter housing allows to display values or changesettings manually. Additionally exists an interface to the PLC, which is usingthe flow meter to regulate liquid flows and allows to dose a preset amount ofliquid either to the IMT or directly into the detector. The same function canalso be used to re-fill or re-circulate an IMT automatically.
218
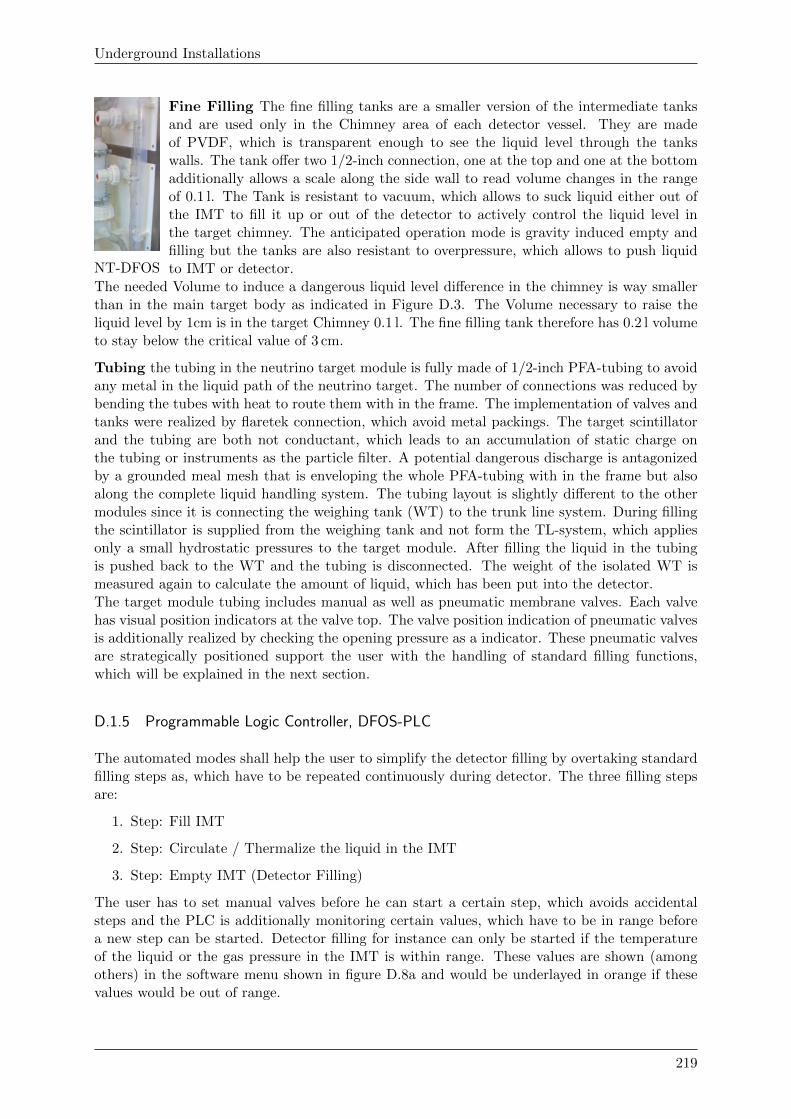
Underground Installations
NT-DFOS
Fine Filling The fine filling tanks are a smaller version of the intermediate tanksand are used only in the Chimney area of each detector vessel. They are madeof PVDF, which is transparent enough to see the liquid level through the tankswalls. The tank offer two 1/2-inch connection, one at the top and one at the bottomadditionally allows a scale along the side wall to read volume changes in the rangeof 0.1 l. The Tank is resistant to vacuum, which allows to suck liquid either out ofthe IMT to fill it up or out of the detector to actively control the liquid level inthe target chimney. The anticipated operation mode is gravity induced empty andfilling but the tanks are also resistant to overpressure, which allows to push liquidto IMT or detector.
The needed Volume to induce a dangerous liquid level difference in the chimney is way smallerthan in the main target body as indicated in Figure D.3. The Volume necessary to raise theliquid level by 1cm is in the target Chimney 0.1 l. The fine filling tank therefore has 0.2 l volumeto stay below the critical value of 3 cm.
Tubing the tubing in the neutrino target module is fully made of 1/2-inch PFA-tubing to avoidany metal in the liquid path of the neutrino target. The number of connections was reduced bybending the tubes with heat to route them with in the frame. The implementation of valves andtanks were realized by flaretek connection, which avoid metal packings. The target scintillatorand the tubing are both not conductant, which leads to an accumulation of static charge onthe tubing or instruments as the particle filter. A potential dangerous discharge is antagonizedby a grounded meal mesh that is enveloping the whole PFA-tubing with in the frame but alsoalong the complete liquid handling system. The tubing layout is slightly different to the othermodules since it is connecting the weighing tank (WT) to the trunk line system. During fillingthe scintillator is supplied from the weighing tank and not form the TL-system, which appliesonly a small hydrostatic pressures to the target module. After filling the liquid in the tubingis pushed back to the WT and the tubing is disconnected. The weight of the isolated WT ismeasured again to calculate the amount of liquid, which has been put into the detector.The target module tubing includes manual as well as pneumatic membrane valves. Each valvehas visual position indicators at the valve top. The valve position indication of pneumatic valvesis additionally realized by checking the opening pressure as a indicator. These pneumatic valvesare strategically positioned support the user with the handling of standard filling functions,which will be explained in the next section.
D.1.5 Programmable Logic Controller, DFOS-PLC
The automated modes shall help the user to simplify the detector filling by overtaking standardfilling steps as, which have to be repeated continuously during detector. The three filling stepsare:
1. Step: Fill IMT
2. Step: Circulate / Thermalize the liquid in the IMT
3. Step: Empty IMT (Detector Filling)
The user has to set manual valves before he can start a certain step, which avoids accidentalsteps and the PLC is additionally monitoring certain values, which have to be in range beforea new step can be started. Detector filling for instance can only be started if the temperatureof the liquid or the gas pressure in the IMT is within range. These values are shown (amongothers) in the software menu shown in figure D.8a and would be underlayed in orange if thesevalues would be out of range.
219
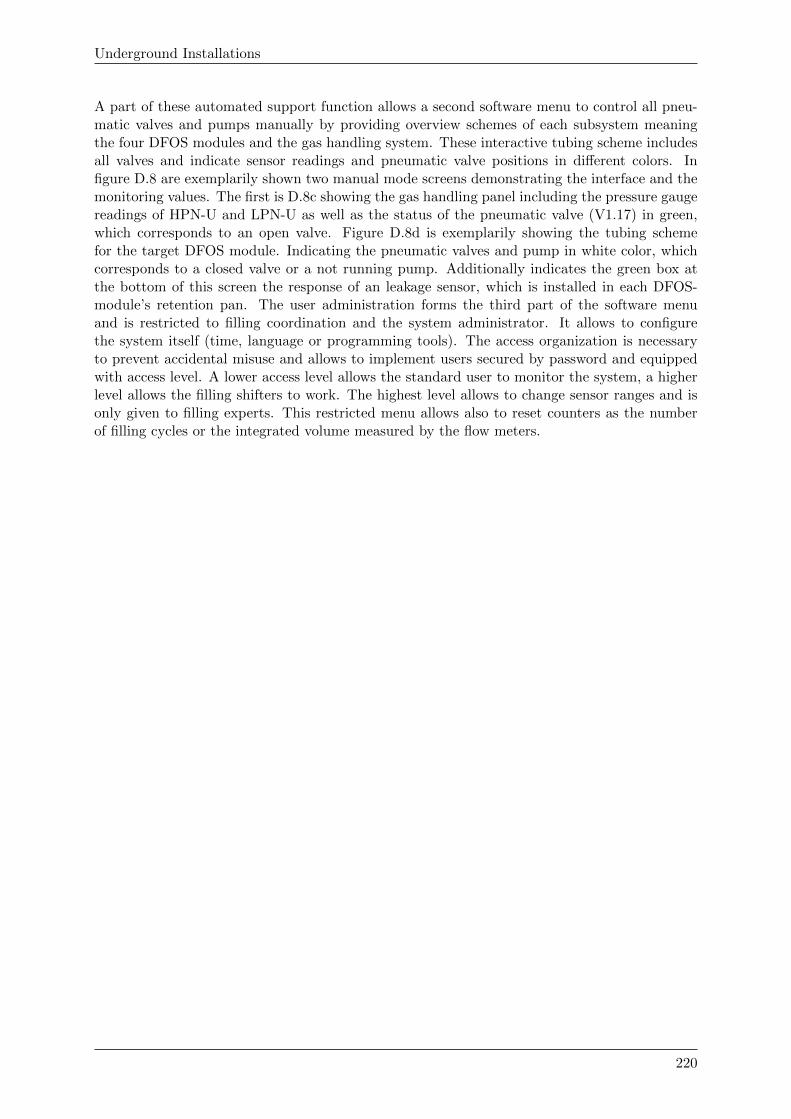
Underground Installations
A part of these automated support function allows a second software menu to control all pneu-matic valves and pumps manually by providing overview schemes of each subsystem meaningthe four DFOS modules and the gas handling system. These interactive tubing scheme includesall valves and indicate sensor readings and pneumatic valve positions in different colors. Infigure D.8 are exemplarily shown two manual mode screens demonstrating the interface and themonitoring values. The first is D.8c showing the gas handling panel including the pressure gaugereadings of HPN-U and LPN-U as well as the status of the pneumatic valve (V1.17) in green,which corresponds to an open valve. Figure D.8d is exemplarily showing the tubing schemefor the target DFOS module. Indicating the pneumatic valves and pump in white color, whichcorresponds to a closed valve or a not running pump. Additionally indicates the green box atthe bottom of this screen the response of an leakage sensor, which is installed in each DFOS-module’s retention pan. The user administration forms the third part of the software menuand is restricted to filling coordination and the system administrator. It allows to configurethe system itself (time, language or programming tools). The access organization is necessaryto prevent accidental misuse and allows to implement users secured by password and equippedwith access level. A lower access level allows the standard user to monitor the system, a higherlevel allows the filling shifters to work. The highest level allows to change sensor ranges and isonly given to filling experts. This restricted menu allows also to reset counters as the numberof filling cycles or the integrated volume measured by the flow meters.
220
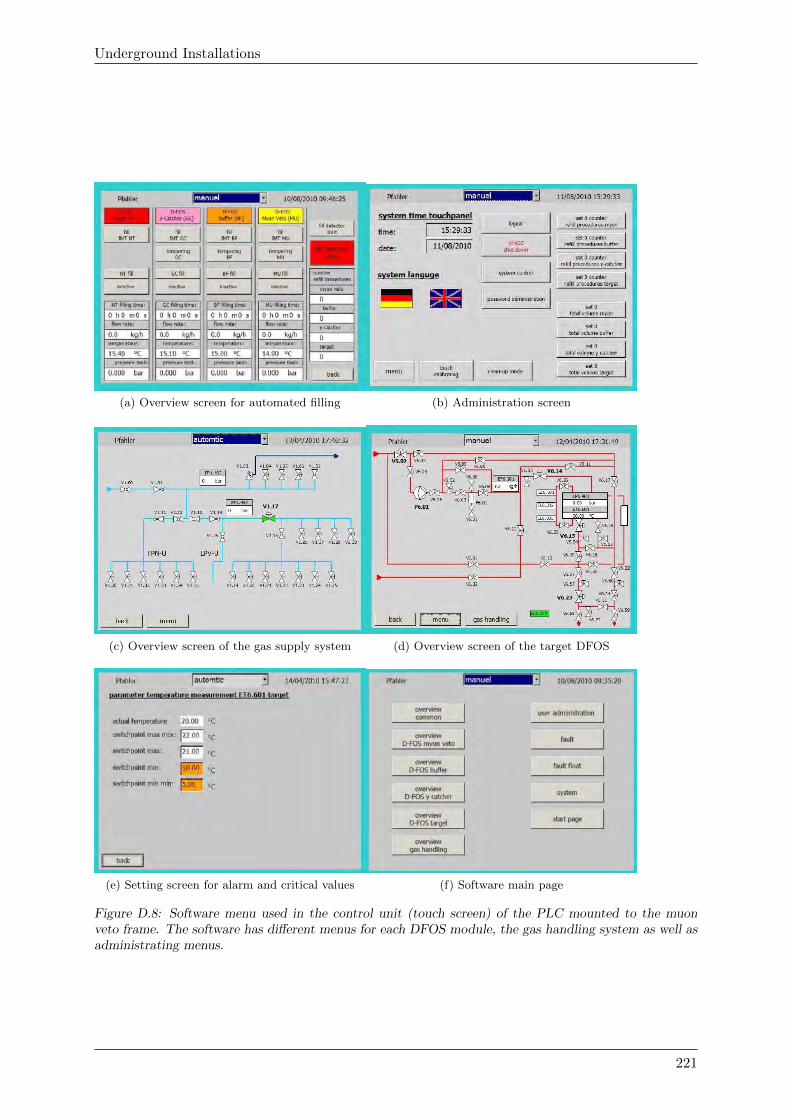
Underground Installations
(a) Overview screen for automated filling (b) Administration screen
(c) Overview screen of the gas supply system (d) Overview screen of the target DFOS
(e) Setting screen for alarm and critical values (f) Software main page
Figure D.8: Software menu used in the control unit (touch screen) of the PLC mounted to the muonveto frame. The software has different menus for each DFOS module, the gas handling system as well asadministrating menus.
221
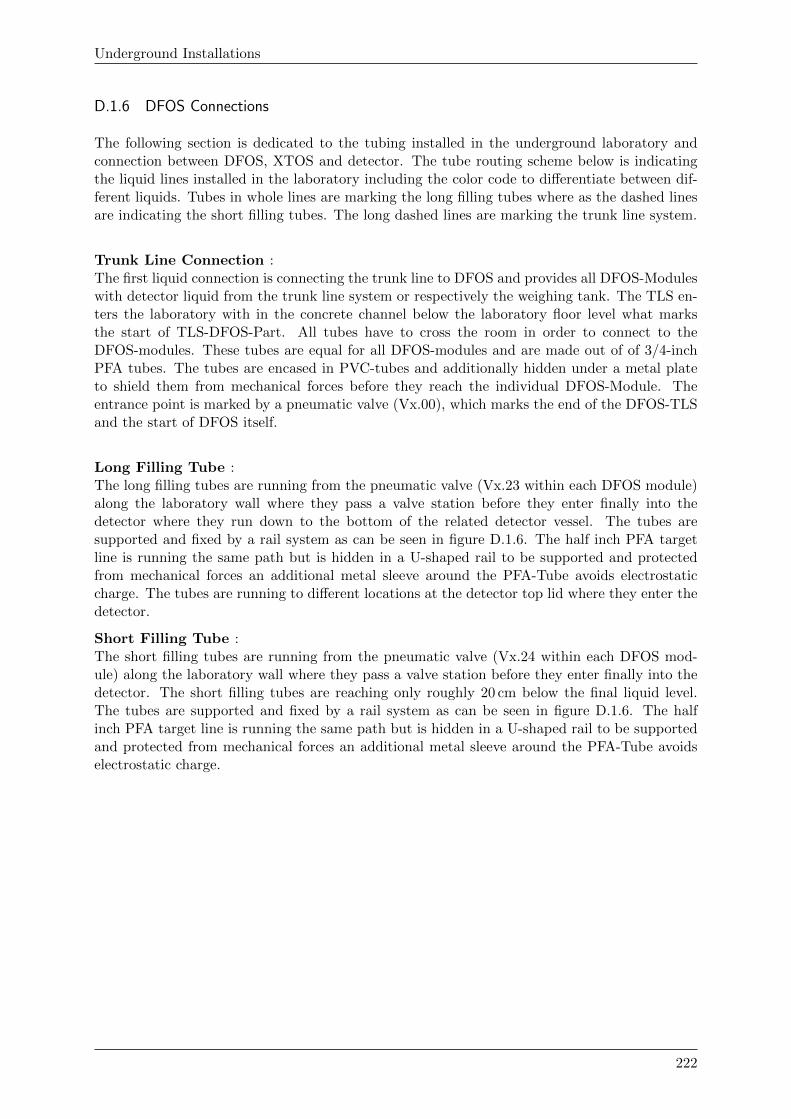
Underground Installations
D.1.6 DFOS Connections
The following section is dedicated to the tubing installed in the underground laboratory andconnection between DFOS, XTOS and detector. The tube routing scheme below is indicatingthe liquid lines installed in the laboratory including the color code to differentiate between dif-ferent liquids. Tubes in whole lines are marking the long filling tubes where as the dashed linesare indicating the short filling tubes. The long dashed lines are marking the trunk line system.
Trunk Line Connection :The first liquid connection is connecting the trunk line to DFOS and provides all DFOS-Moduleswith detector liquid from the trunk line system or respectively the weighing tank. The TLS en-ters the laboratory with in the concrete channel below the laboratory floor level what marksthe start of TLS-DFOS-Part. All tubes have to cross the room in order to connect to theDFOS-modules. These tubes are equal for all DFOS-modules and are made out of of 3/4-inchPFA tubes. The tubes are encased in PVC-tubes and additionally hidden under a metal plateto shield them from mechanical forces before they reach the individual DFOS-Module. Theentrance point is marked by a pneumatic valve (Vx.00), which marks the end of the DFOS-TLSand the start of DFOS itself.
Long Filling Tube :The long filling tubes are running from the pneumatic valve (Vx.23 within each DFOS module)along the laboratory wall where they pass a valve station before they enter finally into thedetector where they run down to the bottom of the related detector vessel. The tubes aresupported and fixed by a rail system as can be seen in figure D.1.6. The half inch PFA targetline is running the same path but is hidden in a U-shaped rail to be supported and protectedfrom mechanical forces an additional metal sleeve around the PFA-Tube avoids electrostaticcharge. The tubes are running to different locations at the detector top lid where they enter thedetector.
Short Filling Tube :The short filling tubes are running from the pneumatic valve (Vx.24 within each DFOS mod-ule) along the laboratory wall where they pass a valve station before they enter finally into thedetector. The short filling tubes are reaching only roughly 20 cm below the final liquid level.The tubes are supported and fixed by a rail system as can be seen in figure D.1.6. The halfinch PFA target line is running the same path but is hidden in a U-shaped rail to be supportedand protected from mechanical forces an additional metal sleeve around the PFA-Tube avoidselectrostatic charge.
222
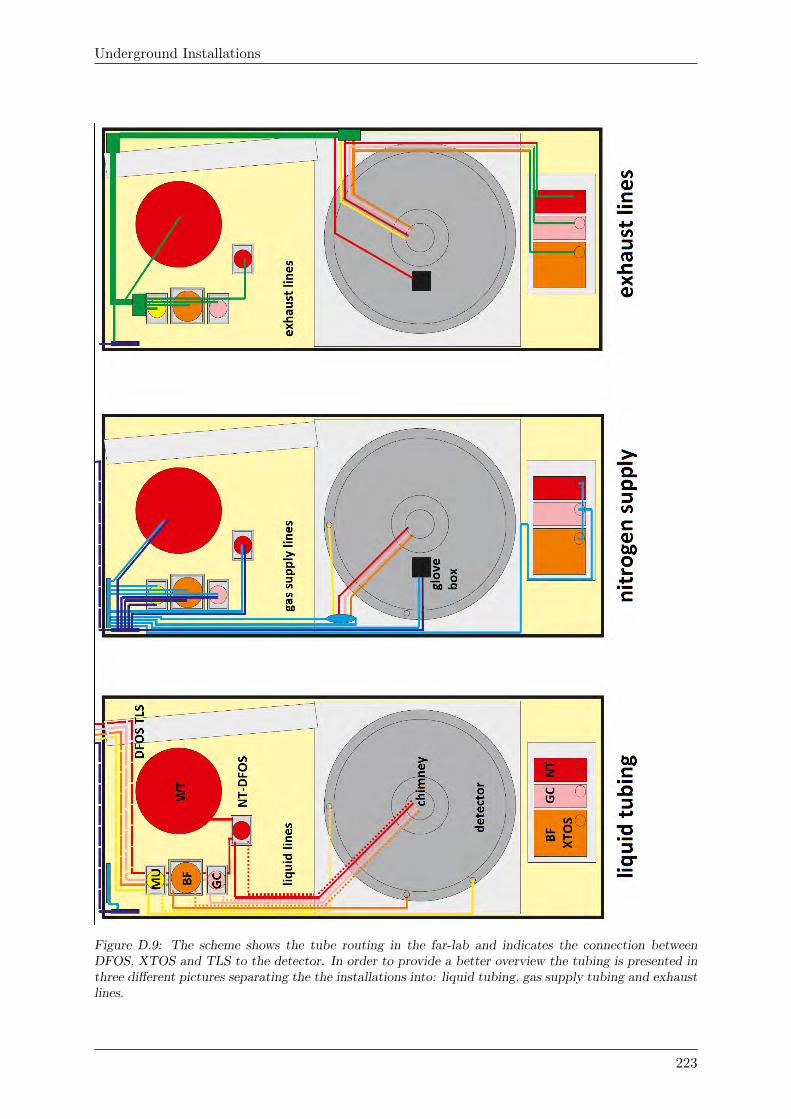
Underground Installations
Figure D.9: The scheme shows the tube routing in the far-lab and indicates the connection betweenDFOS, XTOS and TLS to the detector. In order to provide a better overview the tubing is presented inthree different pictures separating the the installations into: liquid tubing, gas supply tubing and exhaustlines.
223
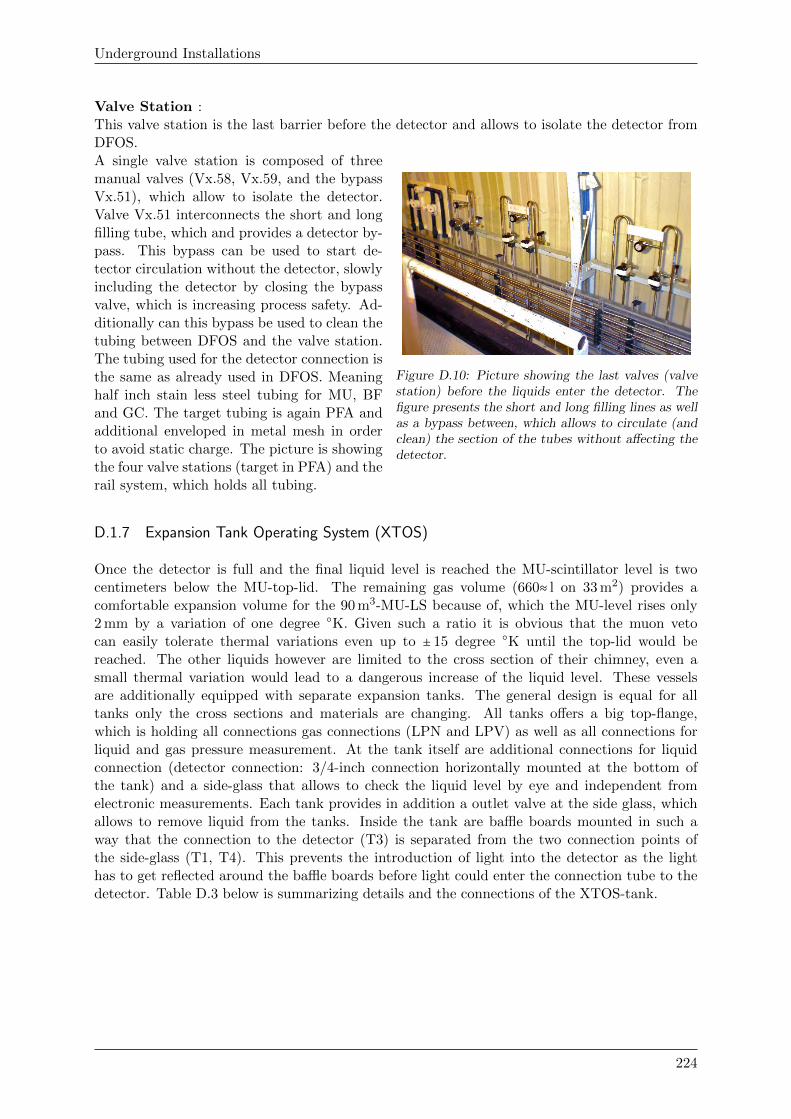
Underground Installations
Valve Station :This valve station is the last barrier before the detector and allows to isolate the detector fromDFOS.
Figure D.10: Picture showing the last valves (valvestation) before the liquids enter the detector. Thefigure presents the short and long filling lines as wellas a bypass between, which allows to circulate (andclean) the section of the tubes without affecting thedetector.
A single valve station is composed of threemanual valves (Vx.58, Vx.59, and the bypassVx.51), which allow to isolate the detector.Valve Vx.51 interconnects the short and longfilling tube, which and provides a detector by-pass. This bypass can be used to start de-tector circulation without the detector, slowlyincluding the detector by closing the bypassvalve, which is increasing process safety. Ad-ditionally can this bypass be used to clean thetubing between DFOS and the valve station.The tubing used for the detector connection isthe same as already used in DFOS. Meaninghalf inch stain less steel tubing for MU, BFand GC. The target tubing is again PFA andadditional enveloped in metal mesh in orderto avoid static charge. The picture is showingthe four valve stations (target in PFA) and therail system, which holds all tubing.
D.1.7 Expansion Tank Operating System (XTOS)
Once the detector is full and the final liquid level is reached the MU-scintillator level is twocentimeters below the MU-top-lid. The remaining gas volume (660≈ l on 33 m2) provides acomfortable expansion volume for the 90 m3-MU-LS because of, which the MU-level rises only2 mm by a variation of one degree ○K. Given such a ratio it is obvious that the muon vetocan easily tolerate thermal variations even up to ± 15 degree ○K until the top-lid would bereached. The other liquids however are limited to the cross section of their chimney, even asmall thermal variation would lead to a dangerous increase of the liquid level. These vesselsare additionally equipped with separate expansion tanks. The general design is equal for alltanks only the cross sections and materials are changing. All tanks offers a big top-flange,which is holding all connections gas connections (LPN and LPV) as well as all connections forliquid and gas pressure measurement. At the tank itself are additional connections for liquidconnection (detector connection: 3/4-inch connection horizontally mounted at the bottom ofthe tank) and a side-glass that allows to check the liquid level by eye and independent fromelectronic measurements. Each tank provides in addition a outlet valve at the side glass, whichallows to remove liquid from the tanks. Inside the tank are baffle boards mounted in such away that the connection to the detector (T3) is separated from the two connection points ofthe side-glass (T1, T4). This prevents the introduction of light into the detector as the lighthas to get reflected around the baffle boards before light could enter the connection tube to thedetector. Table D.3 below is summarizing details and the connections of the XTOS-tank.
224
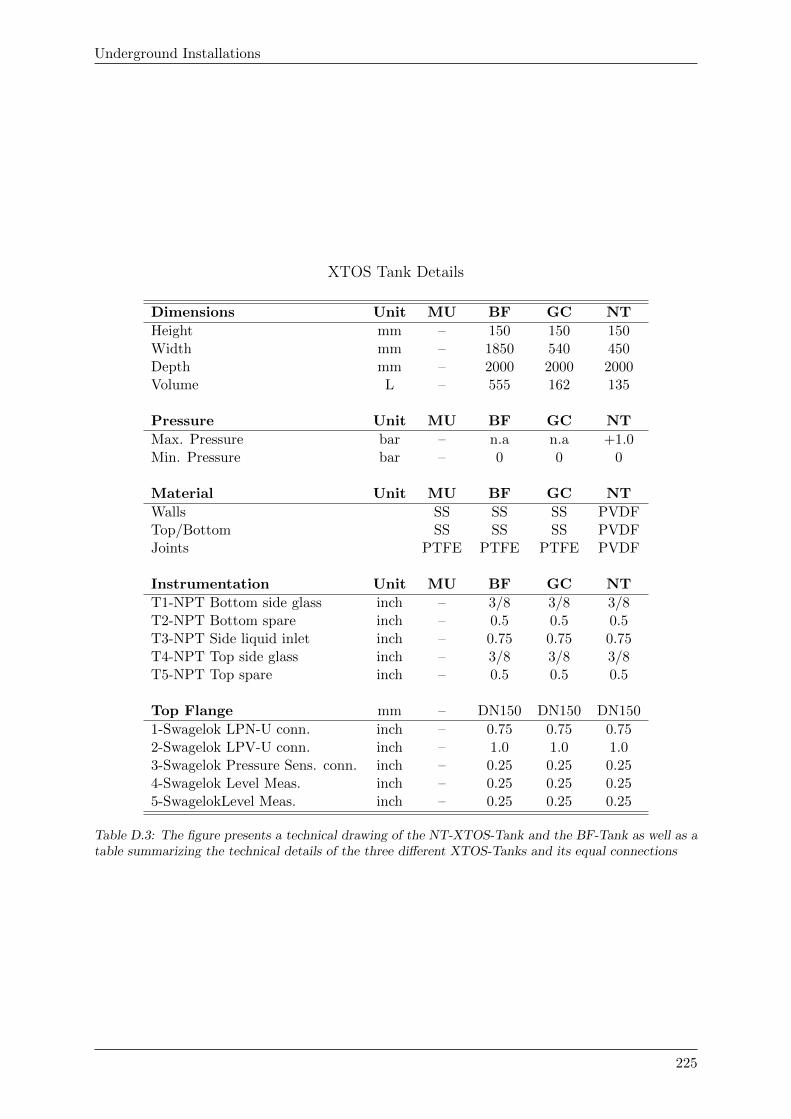
Underground Installations
XTOS Tank Details
Dimensions Unit MU BF GC NT
Height mm – 150 150 150Width mm – 1850 540 450Depth mm – 2000 2000 2000Volume L – 555 162 135
Pressure Unit MU BF GC NT
Max. Pressure bar – n.a n.a +1.0Min. Pressure bar – 0 0 0
Material Unit MU BF GC NT
Walls SS SS SS PVDFTop/Bottom SS SS SS PVDFJoints PTFE PTFE PTFE PVDF
Instrumentation Unit MU BF GC NT
T1-NPT Bottom side glass inch – 3/8 3/8 3/8T2-NPT Bottom spare inch – 0.5 0.5 0.5T3-NPT Side liquid inlet inch – 0.75 0.75 0.75T4-NPT Top side glass inch – 3/8 3/8 3/8T5-NPT Top spare inch – 0.5 0.5 0.5
Top Flange mm – DN150 DN150 DN150
1-Swagelok LPN-U conn. inch – 0.75 0.75 0.752-Swagelok LPV-U conn. inch – 1.0 1.0 1.03-Swagelok Pressure Sens. conn. inch – 0.25 0.25 0.254-Swagelok Level Meas. inch – 0.25 0.25 0.255-SwagelokLevel Meas. inch – 0.25 0.25 0.25
Table D.3: The figure presents a technical drawing of the NT-XTOS-Tank and the BF-Tank as well as atable summarizing the technical details of the three different XTOS-Tanks and its equal connections
225
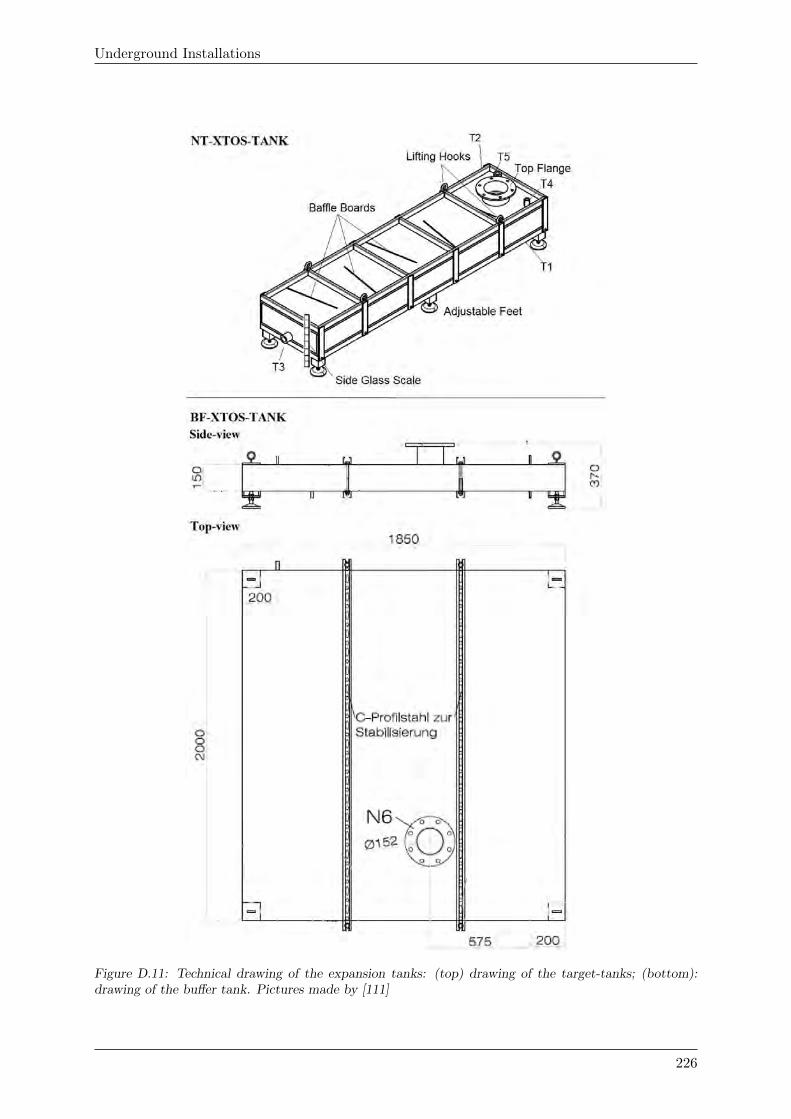
Underground Installations
Figure D.11: Technical drawing of the expansion tanks: (top) drawing of the target-tanks; (bottom):drawing of the buffer tank. Pictures made by [111]
226
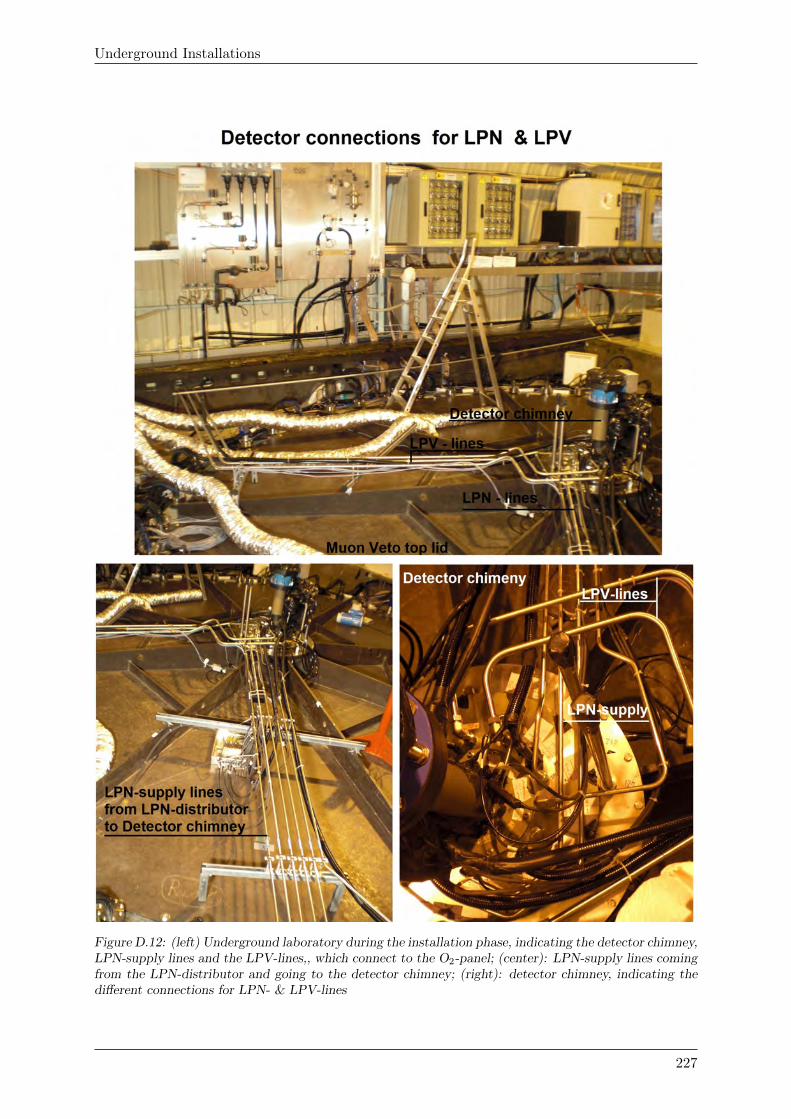
Underground Installations
Figure D.12: (left) Underground laboratory during the installation phase, indicating the detector chimney,LPN-supply lines and the LPV-lines,, which connect to the O2-panel; (center): LPN-supply lines comingfrom the LPN-distributor and going to the detector chimney; (right): detector chimney, indicating thedifferent connections for LPN- & LPV-lines
227
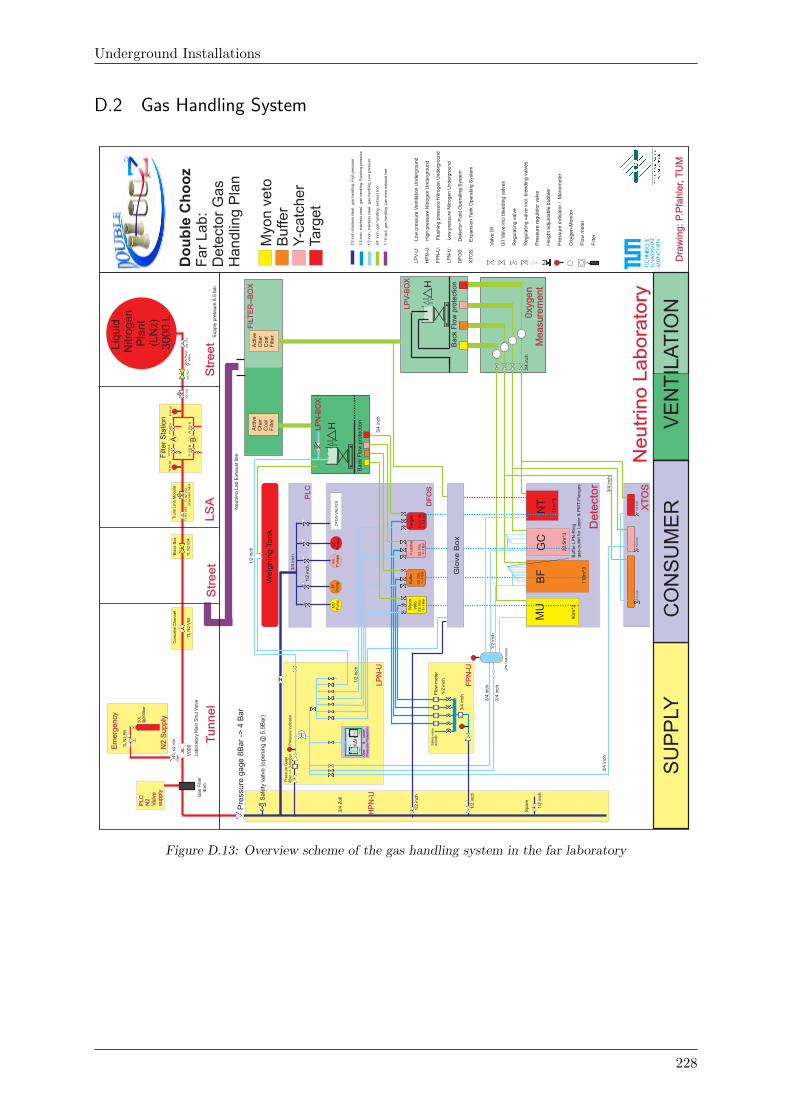
Underground Installations
D.2 Gas Handling System
MU
NT
GC
BF
110
m^3
22
,5m
^3
10
m^3
Pre
ssu
re g
ag
e 8
Ba
r ->
4 B
ar
Labora
tory
Main
Shut V
alv
e
3/4
Zoll
1/2
inch
3/4
inch
3/4
inch
3/4
inch
M
UP
um
p N
TP
um
pe
G
CP
um
pe
B
FP
um
p
SS
185L
-1--
3 B
ar
SS
300L
-1--
3 B
ar
SS
100L
-1--
3 B
ar
PV
DF
85L
0--
0.4
Bar
Act
ive
Char
Coal
Filt
er
HP
N-U
LP
N-U
1/2
inch
Buffer
LP
N-R
ing
gas-o
utle
t fo
r Laser
& P
MT-F
langes
Ne
utr
ino
La
b E
xha
ust
line
1/2
inch
Ba
ck F
low
pro
tect
ion
Targ
et
Y-c
atc
he
rB
uffer
Myo
nveto
DF
OS
H
Do
ub
le C
ho
oz
Fa
r L
ab
:
De
tecto
r G
as
Ha
nd
ling
Pla
n
1/2
s
tain
less
ste
el,
gas
handlin
g, H
igh p
ress
ure
1/2
, st
ain
less
ste
el,
gas
handlin
g, F
lush
ing p
ress
ure
3/4
, gas
handlin
g, exhaust
lin
e
7-1
0 iinch
inch
1/2
inch
, st
ain
less
ste
el,
gas
handlin
g, Low
pre
ssure
inch nch
, gas
handlin
g, Lab m
ain
exh
aust
line
Myo
n v
eto
Bu
ffe
r Y
-ca
tch
er
Ta
rge
t
Va
lve
0/I
0/I
Va
lve
incl
ble
ed
ing
va
lve
s R
eg
ula
ting
va
lve
Re
gu
latin
g v
alv
e in
cl.
ble
ed
ing
va
lve
s
Pre
ssu
re r
eg
ula
tor
va
lve
He
igh
t a
dju
sta
ble
bu
bb
ler
Pre
ssu
re in
dic
ato
r /
Ma
no
me
ter
Oxy
ge
n-M
on
itor
Flo
w m
ete
r
Filt
er
LP
V-U
: Low
pre
ssure
Ventila
tion U
nderg
round
HP
N-U
: H
igh p
ress
ure
Nitr
ogen U
nderg
round
F DF
OS
: D
ete
ctor
Flu
id O
pera
ting S
yste
m
XT
OS
: E
xpansi
on T
ank
Opera
ting S
yste
m
PN
-U: F
lush
ing p
ress
ure
Nitr
ogen U
nderg
round
LP
N-U
: Low
pre
ssure
Nitr
ogen U
nderg
round
Weig
hin
g T
an
k D
ete
cto
r
Pre
ssu
re G
ag
e
4B
ar
-->
3-9
mB
ar
Flo
w m
ete
r
3/4
inch
FP
N-U
Sa
fety
va
lve
6
00
mB
PL
C
Pre
ssu
re I
nd
ica
tor
Over
&
under
Pre
ssure
Pro
tection
H+
7m
Bar
-2,4
mB
ar
Spare
1/2
inch
1/2
inch
1/2
inch
0xy
gen
Measure
ment
1/2
inch
Sa
fety
va
lve
(o
pe
nin
g @
5.5
Ba
r)
Neutr
ino L
abora
tory
Tu
nn
el
LP
N-D
istr
ibuto
r
50
L
@2
00
ba
r
TL N
2 V
06
TL N
2 P
R
V0
00Em
erg
en
cy
N2
Su
pp
ly
PL
CN
2V
alv
esu
pp
ly
Gas
Filt
er
4nm
TL N
2 V
05
Str
ee
t
LS
A
Tru
nk
Lin
e M
od
ule
Bla
ck B
ox
T
L N
2 V
02
pn
eu
ma
tic V
alv
eT
L N
2 V
03
TL N
2 V
04
Filt
er
Sta
tion
A BF
I V
01
BF
I V
02
B
FI
PI
01
FI
PI
02
XN
V0
3
FI
V0
1 A
FI
V0
2 A
XN
V01
Liq
uid
N
itrogen
P
lant
(L
N2)
3000 L
XN
Pu
rge
V
alv
eX
N V
02 Str
ee
t Su
pp
ly p
ressu
re 8
.5 b
ar
Co
ncr
ete
Ch
an
ne
l
Dra
win
g: P.P
fahle
r, T
UM
DF
OS
-VA
LVE
S
1/2
inch
3/4
inch
1/2
inch
1/2
inch
Glo
ve B
ox
90
m^3
H
Back
Flo
w p
rote
ctio
n
LP
N-B
OX
LP
V-B
OX
FIL
TE
R--
BO
X
3/4
inch
XT
OS
SU
PP
LY
CO
NS
UM
ER
V
EN
TIL
AT
ION
Act
ive
Char
Coal
Filt
er
3/4
inch
3/4
inch
1/2
inch
Figure D.13: Overview scheme of the gas handling system in the far laboratory
228
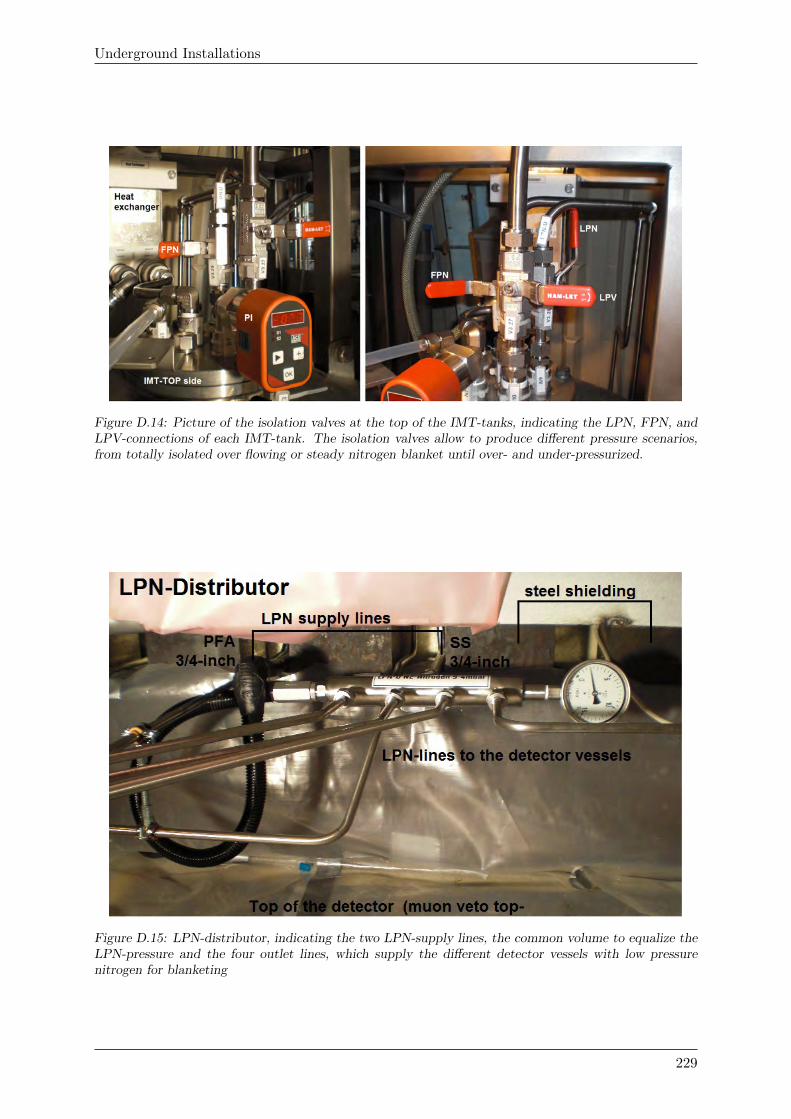
Underground Installations
Figure D.14: Picture of the isolation valves at the top of the IMT-tanks, indicating the LPN, FPN, andLPV-connections of each IMT-tank. The isolation valves allow to produce different pressure scenarios,from totally isolated over flowing or steady nitrogen blanket until over- and under-pressurized.
Figure D.15: LPN-distributor, indicating the two LPN-supply lines, the common volume to equalize theLPN-pressure and the four outlet lines, which supply the different detector vessels with low pressurenitrogen for blanketing
229
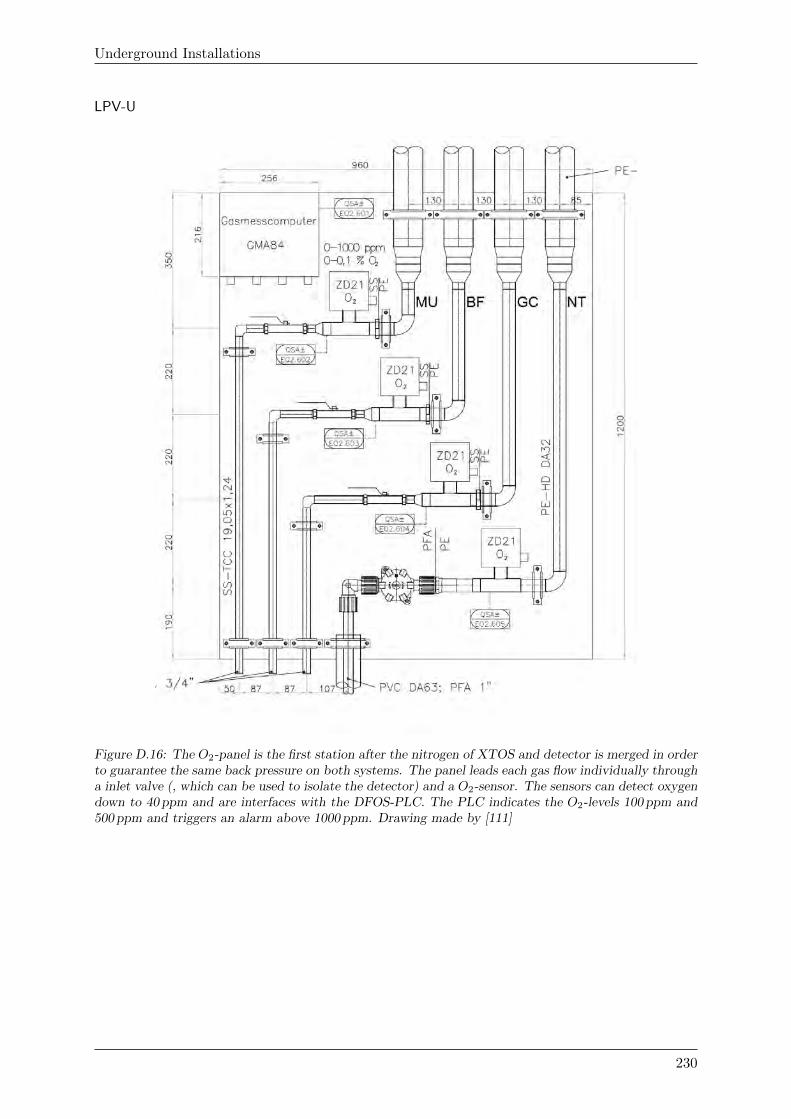
Underground Installations
LPV-U
Figure D.16: The O2-panel is the first station after the nitrogen of XTOS and detector is merged in orderto guarantee the same back pressure on both systems. The panel leads each gas flow individually througha inlet valve (, which can be used to isolate the detector) and a O2-sensor. The sensors can detect oxygendown to 40 ppm and are interfaces with the DFOS-PLC. The PLC indicates the O2-levels 100 ppm and500 ppm and triggers an alarm above 1000 ppm. Drawing made by [111]
230
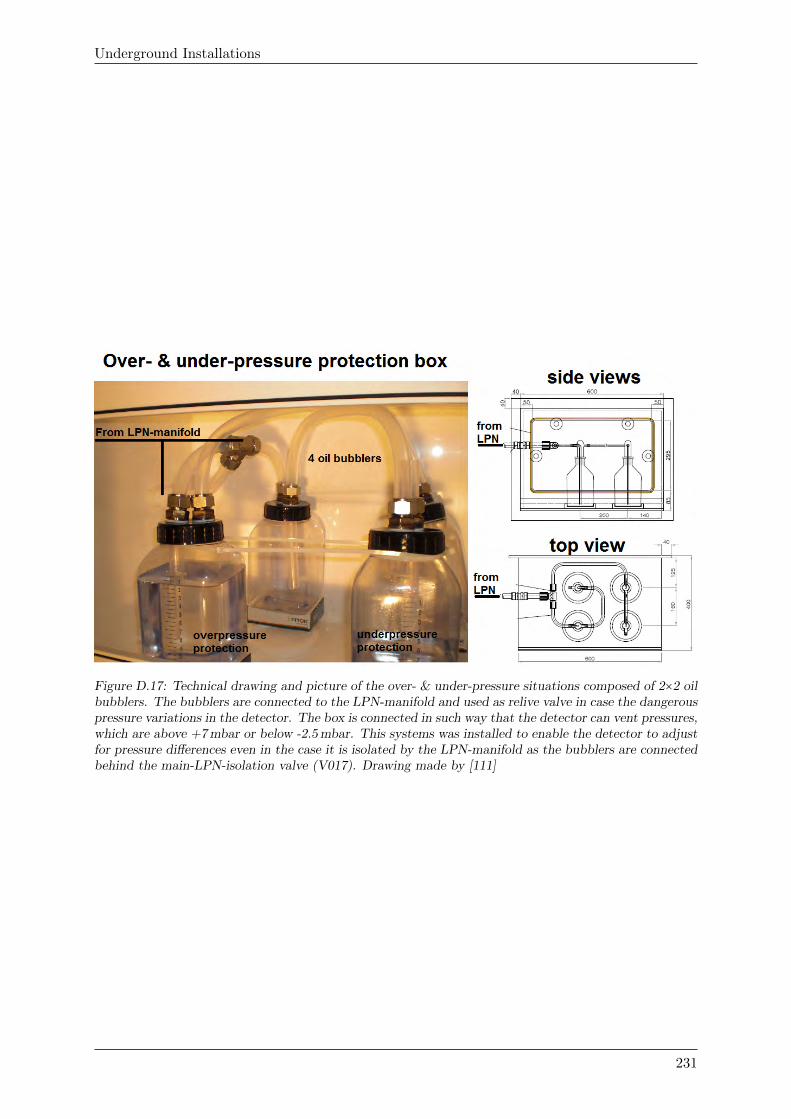
Underground Installations
Figure D.17: Technical drawing and picture of the over- & under-pressure situations composed of 2×2 oilbubblers. The bubblers are connected to the LPN-manifold and used as relive valve in case the dangerouspressure variations in the detector. The box is connected in such way that the detector can vent pressures,which are above +7 mbar or below -2.5 mbar. This systems was installed to enable the detector to adjustfor pressure differences even in the case it is isolated by the LPN-manifold as the bubblers are connectedbehind the main-LPN-isolation valve (V017). Drawing made by [111]
231
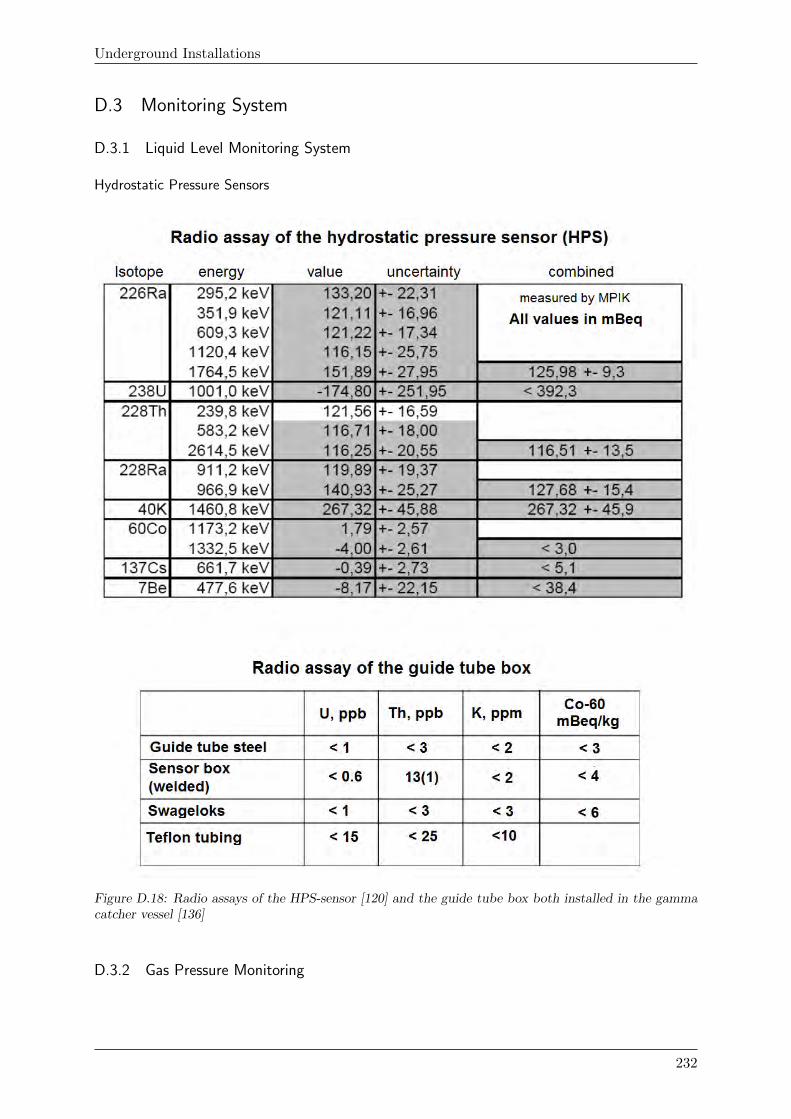
Underground Installations
D.3 Monitoring System
D.3.1 Liquid Level Monitoring System
Hydrostatic Pressure Sensors
Figure D.18: Radio assays of the HPS-sensor [120] and the guide tube box both installed in the gammacatcher vessel [136]
D.3.2 Gas Pressure Monitoring
232
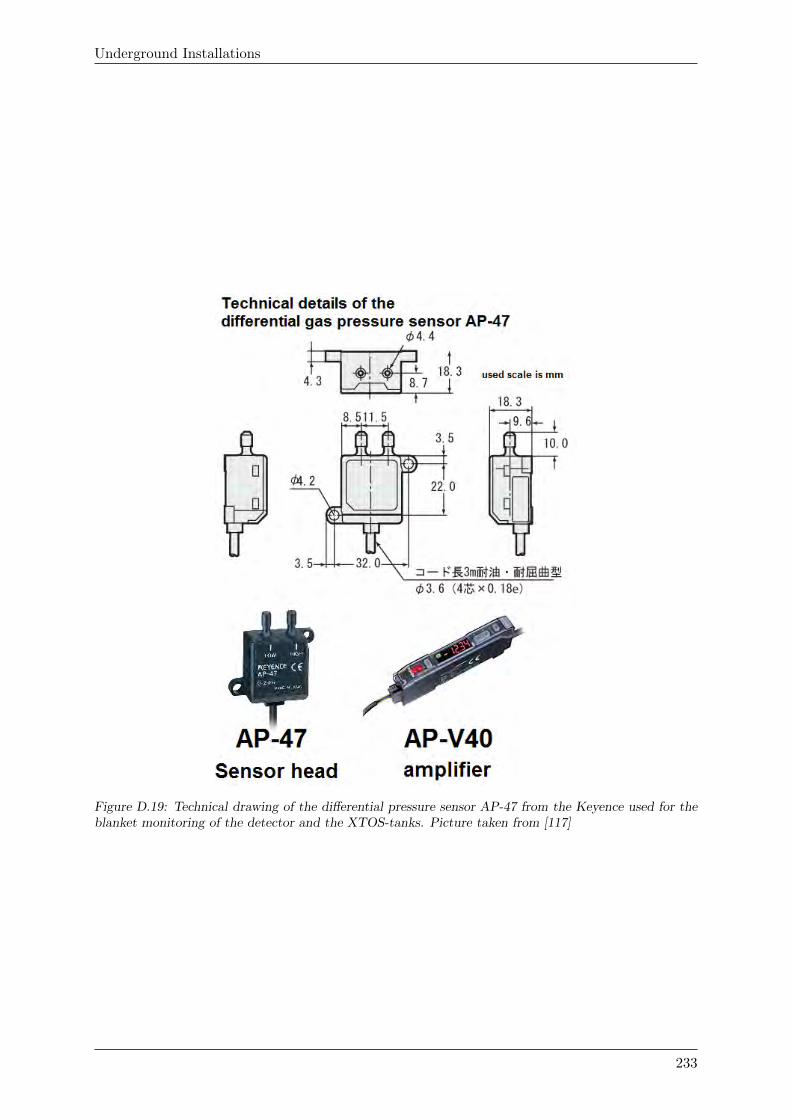
Underground Installations
Figure D.19: Technical drawing of the differential pressure sensor AP-47 from the Keyence used for theblanket monitoring of the detector and the XTOS-tanks. Picture taken from [117]
233
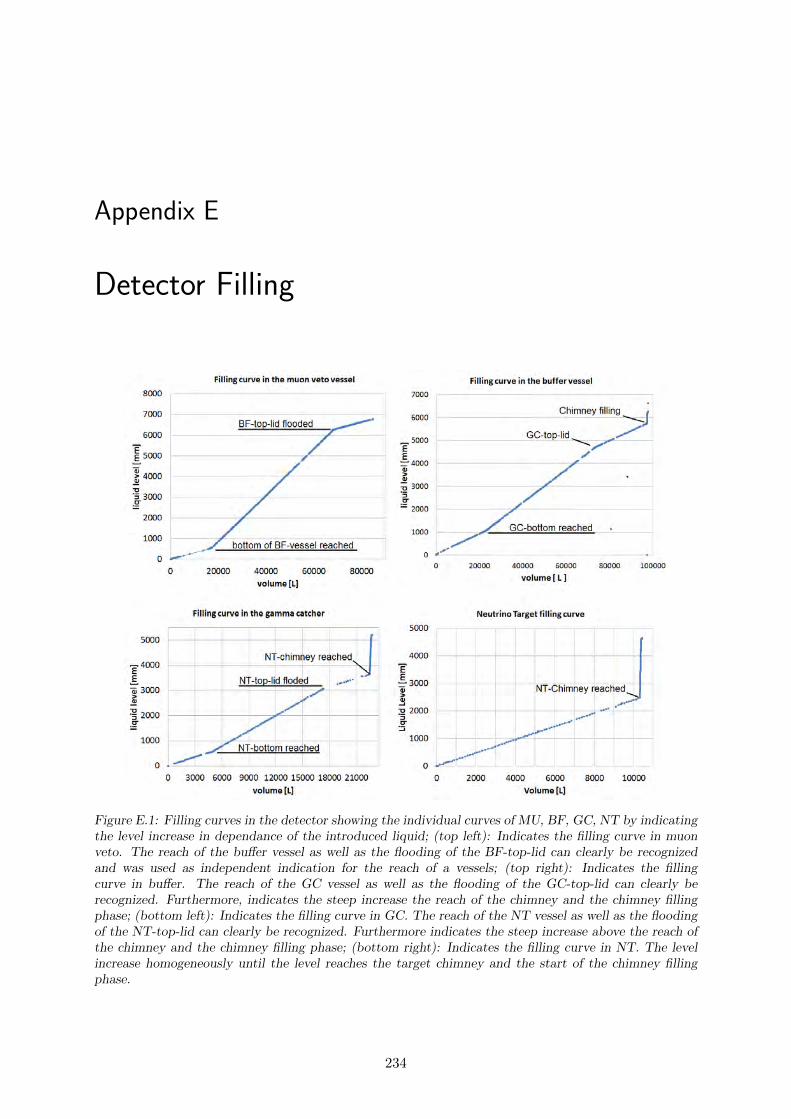
Appendix E
Detector Filling
Figure E.1: Filling curves in the detector showing the individual curves of MU, BF, GC, NT by indicatingthe level increase in dependance of the introduced liquid; (top left): Indicates the filling curve in muonveto. The reach of the buffer vessel as well as the flooding of the BF-top-lid can clearly be recognizedand was used as independent indication for the reach of a vessels; (top right): Indicates the fillingcurve in buffer. The reach of the GC vessel as well as the flooding of the GC-top-lid can clearly berecognized. Furthermore, indicates the steep increase the reach of the chimney and the chimney fillingphase; (bottom left): Indicates the filling curve in GC. The reach of the NT vessel as well as the floodingof the NT-top-lid can clearly be recognized. Furthermore indicates the steep increase above the reach ofthe chimney and the chimney filling phase; (bottom right): Indicates the filling curve in NT. The levelincrease homogeneously until the level reaches the target chimney and the start of the chimney fillingphase.
234
Detector Filling
E.1 Filling Modes
� Automated Filling Mode
IMT-Filling Mode (Standard)
� Manual Filling Mode
Continuous Filling Mode
Fine Filling Mode
Automated Filling Mode (standard running mode)Using the DFOS to fill the detector means to fill up an IMT from the LSA, to thermalize theliquid within the IMT and to empty it safely into the detector. These steps have to be repeateda couple of hundred times not only for one but for all of the four DFOS frames at the sametime. These three running modes are the standard running modes. To ease the handling of thefull system and to disburden the filling team these standard running modes are supported by aPLC, which opens or closes valves and starts or stops pumps. These standard (or automatic)modes can be started by pushing a button on the touch screen of the PLC, which automaticallywill open all needed valves and start the pump in order to start the wanted process.
1. Step: Filling the IMT (using gravity or via Pump)The liquid will be supplied by the TLS and enters the DFOS when the PLC opens apneumatic valve (VX.00) and starts the pump. The liquid will enter and flow through ateflon pump, a filter, a flow meter and a heat exchanger before it enters the IMT itself(only when all manual valves have been opened). The flow meter has to be set in advancemanually to the requested Volume and will supply a stop signal to the PLC to stop thefill up process once the requested volume has passed. The PLC will also stop the fillingprocess when the sensors detect an overfilled IMT. The path for the liquid is dependingon the emptying path since the liquid volume should only be counted once in the flowmeter. Therefore it is necessary to coordinate filling and emptying process in order toavoid double counting.
2. Step: Circulating the IMT-Volume for heating or coolingThe liquid will be circulated from IMT to the same IMT using the pump and passing theheat exchanger shortly before the liquid enters the IMT again. The temperature of theliquid is monitored by temperature sensors mounted on the side wall of the IMT. The PLCwill continue circulating liquid through the heat exchanger as long as the temperature inthe IMT is not within the manual set value and its range of tolerance (i.e. 15±1○K). Oncethe liquid has the correct temperature the system will maintain it as long as the circulationrunning mode is kept.
3. Step: Emptying the IMT (Detector Filling) (via Pump or FPN-U)The PLC will open up the pneumatic valves (VX.15, VX.23) to allow the flow out of theDFOS and into the filling lines, which include also manual valves to avoid accidental filling.The PLC will only open up these valves when the system is:
� Fully thermalized and within temperature range
� No errors or alarms are noted on the PLC
When the IMT is emptying, the PLC is monitoring the time needed to decrease the liquid levelin the IMT between full and mid full. If the time is longer than a certain value (manually set;experience values can be set) an alarm will be given. This will help to recognize an unequalfilling of one of the IMTS or a clogged filter within one DFOS-frame. The lower liquid sensor of
235
Detector Filling
each IMT is giving a stop signal to the PLC once the level has decreased to it in order to stopthe emptying process. The sensor is installed at a level that the IMT will not run empty butwill remain with a volume of roughly 10 - 20 l to avoid pushing gas through the liquid lines.For each process it is necessary to set manual and pneumatic valves in order to successfully startthe process meaning the system cannot accidentally jump into a different automatic mode orstart a process alone.
Manual Filling Mode:In addition to this automatic mode we can run each DFOS-frame individually in a manualmode. In manual mode all pneumatic valves and pumps can be closed or opened individually.The manual mode shall cover all processes that are not used during standard running modesexplained above. Those processes could be cleaning runs, test runs, alternative circulation runsor -continuous filling mode
� Continuous Filling Mode:In this mode it is possible to bypass the IMT and to fill the liquid coming from the LSAdirectly into the detector. This mode does not allow a thermalization of the liquid butallows to save filling time where thermalization is not needed. This direct filling modesaves a factor of 3 to 4 in time, since the IMT has neither to be filled nor to be emptied byFPN-pressure. In this mode the liquid will be pumped or pressed through DFOS, filteredand its volume measured before it finally enters the detector. However, it is not possibleto thermalize the liquid since the heat exchanger is directly in front of the bypassed IMT.This mode will only be used where a thermalization is not necessary and the geometry ofthe detector does not indicate otherwise.
� Fine Filling ModeThe fine filling mode is specially designed to be used in the chimney area of the detector.The related system uses smaller intermediate tanks (B 4.02 in the drawing below, pictureto the left), which are in volume adapted to the needs of the individual chimneys. Chimneyfilling follows the same idea as it is discussed above with the use of IMT during normaldetector filling. A safe amount (for the chimney this time) of liquid is given from theIMT to the significant smaller fine-filling-tank (ff-tank) this can be done by gravity or bya little vacuum pump that is connected to the upper side of the ff-tank. Each fine-fillingtank is slightly transparent and has a scale, which allows reading the volume that has beenentered into it or drained from it.
In order to fill the chimney the fine ff-tank will be filled from an IMT via gravity (or asmall under pressure). The bottom connection between IMT and ff-tank will be closed andthe ff-tank will be opened to the detector. The volume corresponding to a wanted liquidlevel raise will be added by gravity (optional: with the help of FPN; FPN-connection isavailable on the IMT) As mentioned above it is possible to use a little vacuum pump tounder pressurize a fine-filling tank, which will allow drawing liquid out of the IMT or ifrouted differently out of the detector. It is the same type of vacuum pump as we use it forthe Loris-tube. Due to the small volume of these tanks this can be done fairly accurateand in small amounts. This might be needed if we see unwanted liquid level due to liquidheating or overfilling. In this case this liquid drawing could help to secure the detector. Incase it would be necessary to draw a bigger amount out of the detector it is also possibleto start the DFOS pumps to pump liquid out.
236
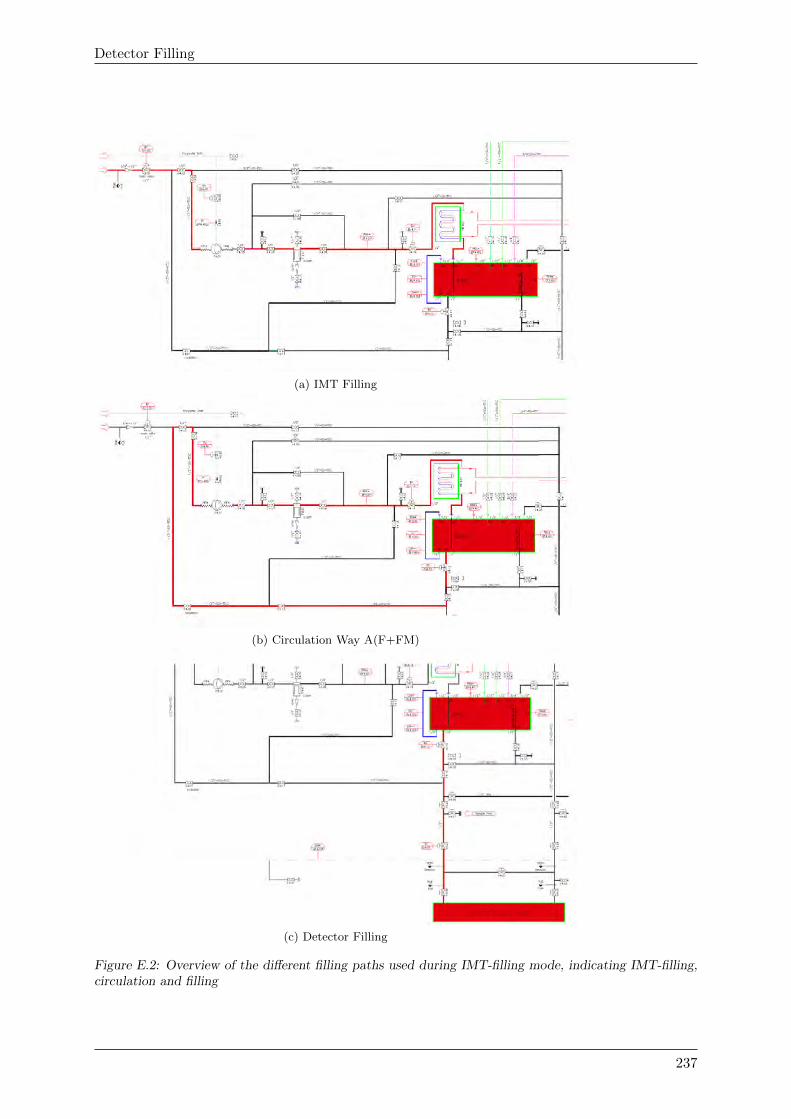
Detector Filling
(a) IMT Filling
(b) Circulation Way A(F+FM)
(c) Detector Filling
Figure E.2: Overview of the different filling paths used during IMT-filling mode, indicating IMT-filling,circulation and filling
237
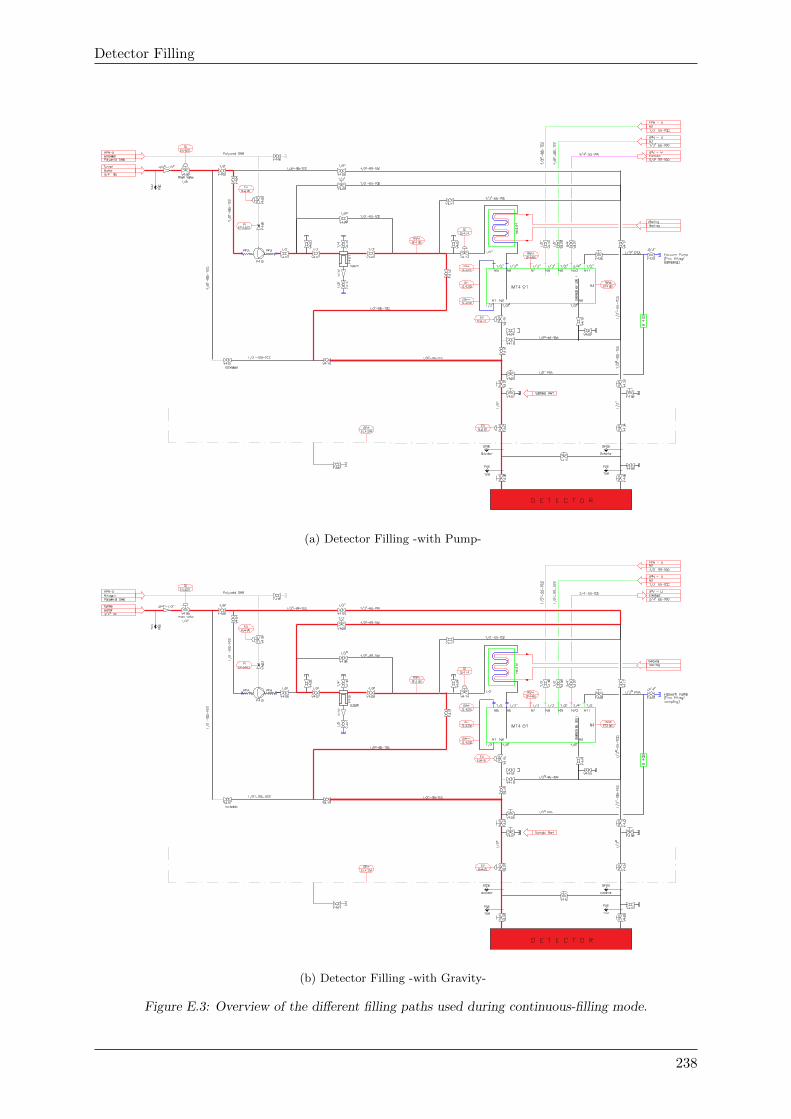
Detector Filling
HE
(a) Detector Filling -with Pump-
HE
(b) Detector Filling -with Gravity-
Figure E.3: Overview of the different filling paths used during continuous-filling mode.
238
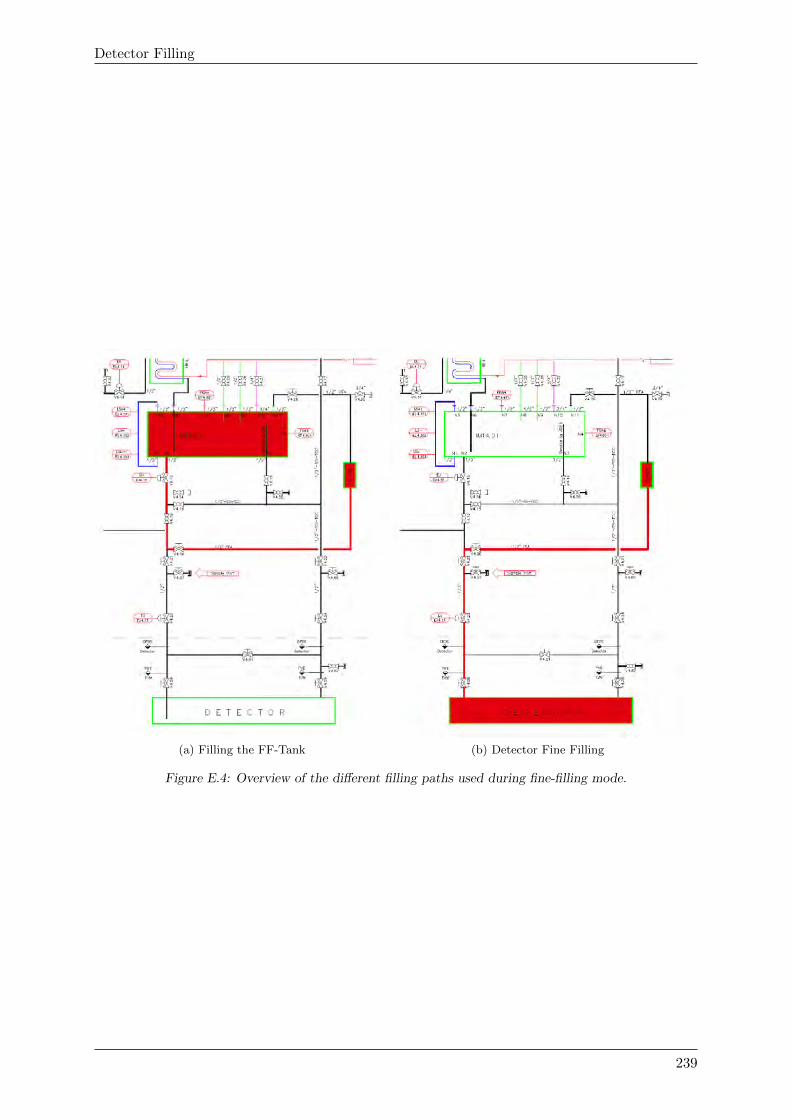
Detector Filling
(a) Filling the FF-Tank (b) Detector Fine Filling
Figure E.4: Overview of the different filling paths used during fine-filling mode.
239
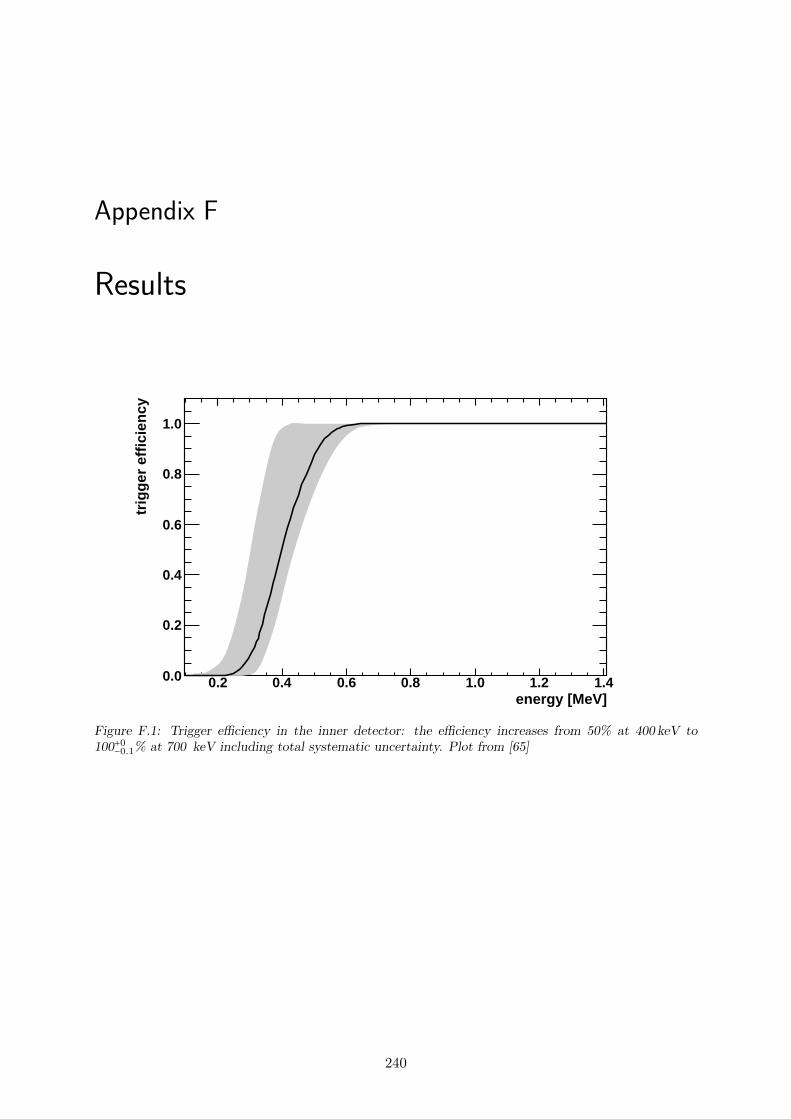
Appendix F
Results
energy [MeV]0.2 0.4 0.6 0.8 1.0 1.2 1.4
trig
ger
eff
icie
ncy
0.0
0.2
0.4
0.6
0.8
1.0
Figure F.1: Trigger efficiency in the inner detector: the efficiency increases from 50% at 400 keV to100+0−0.1% at 700 keV including total systematic uncertainty. Plot from [65]
240
List of Figures
1.1 Influence of the three individual parts in the survival probabilities for 3 MeV-neutrinos . . . . . . . . . . . . . . . . . . . . . . . . . . . . . . . . . . . . . . . . . . . . 10
1.2 Survival probability of νe’s for 3 MeV . . . . . . . . . . . . . . . . . . . . . . . . . . . 111.3 Survival probability for reactor neutrinos for different neutrino energies . . . . . . 121.4 Mass-hierarchy for the three neutrino mass-eigenstates . . . . . . . . . . . . . . . . 13
2.1 Schematic view of 235U-fission and subsequent following processes . . . . . . . . . 142.2 Energy spectrum of reactor neutrinos and reactor fuel composition and develop-
ment over one year . . . . . . . . . . . . . . . . . . . . . . . . . . . . . . . . . . . . . . 16
3.1 Picture of the Double Chooz Collaboration . . . . . . . . . . . . . . . . . . . . . . . 193.2 Picture of nuclear power plant (CNPE) in Chooz . . . . . . . . . . . . . . . . . . . 203.3 Overview scheme of CNPE de Chooz . . . . . . . . . . . . . . . . . . . . . . . . . . . 223.4 Disappearance effect for νe’s at 3 MeV . . . . . . . . . . . . . . . . . . . . . . . . . . 233.5 Signature of the IBD in liquid scintillators . . . . . . . . . . . . . . . . . . . . . . . . 243.6 Observable energy spectrum for the IBD in liquid scintillator detectors . . . . . . 253.7 Comparison of the varying coincidence signature, following an IBD-signal on hy-
drogen, carbon and gadolinium . . . . . . . . . . . . . . . . . . . . . . . . . . . . . . 263.8 Expected disappearance signal for Double Chooz, simulated with sin2(2Θ13) = 0.1
and ∆m2 = 2.5 ⋅ 10−3eV 2 . . . . . . . . . . . . . . . . . . . . . . . . . . . . . . . . . . . 283.9 Vertical cut through the DC-far-detector, showing the inner detector structure . . 303.10 Position of the three outer muon veto modules in correlation to the detector . . . 323.11 Data acquisition system for muon veto and inner detector . . . . . . . . . . . . . . 343.12 Primary decay modes, line or end point energies (Emax) and half-life of different
radioisotopes (T1/2) . . . . . . . . . . . . . . . . . . . . . . . . . . . . . . . . . . . . . 353.13 Cosmogenic Induced Radioisotopes . . . . . . . . . . . . . . . . . . . . . . . . . . . . 36
4.1 Pictures and drawing indicating the LSA and the installations therein . . . . . . . 424.2 Piping and instrumentation diagram of the liquid handling systems in the LSA . 444.3 Picture of the liquid handling system in the LSA . . . . . . . . . . . . . . . . . . . . 454.4 Pumping and instrumentation diagram of the pumping stations for MU and BF. 464.5 membrane pump [73] . . . . . . . . . . . . . . . . . . . . . . . . . . . . . . . . . . . . 464.6 particle filter [74] . . . . . . . . . . . . . . . . . . . . . . . . . . . . . . . . . . . . . . . 474.7 flow meter [75] . . . . . . . . . . . . . . . . . . . . . . . . . . . . . . . . . . . . . . . . 474.8 membrane valve [76] . . . . . . . . . . . . . . . . . . . . . . . . . . . . . . . . . . . . . 474.9 Picture of the buffer pumping station module . . . . . . . . . . . . . . . . . . . . . . 494.10 Pictures of the storage tanks for muon veto and buffer . . . . . . . . . . . . . . . . 504.11 Technical drawing and details of the storage tanks of muon veto and buffer . . . . 524.12 Technical details about the hydrostatic- and gas-pressure-sensor installed in the
storage tanks . . . . . . . . . . . . . . . . . . . . . . . . . . . . . . . . . . . . . . . . . 534.13 Pictures of the emergency closure system in the LSA . . . . . . . . . . . . . . . . . 54
241
LIST OF FIGURES
4.14 Overview drawing of the monitoring- and ECS-system installed in the LSA . . . . 554.15 Overview drawing of the gas handling system in the LSA . . . . . . . . . . . . . . . 574.16 The gas filter station and the liquid nitrogen plant . . . . . . . . . . . . . . . . . . . 584.17 N2-distribution system in the LSA . . . . . . . . . . . . . . . . . . . . . . . . . . . . 594.18 Pictures of the ventilation system in the LSA . . . . . . . . . . . . . . . . . . . . . . 604.19 Picture of the street part of the trunk line system . . . . . . . . . . . . . . . . . . . 62
5.1 Jablonski-diagram provides a simplified illustration of the different energy levelsof the p-electrons in benzene as to find in organic liquid scintillators . . . . . . . . 65
5.2 Chemical structure of LAB and PXE . . . . . . . . . . . . . . . . . . . . . . . . . . . 705.3 Attenuation length measurement of different LAB samples . . . . . . . . . . . . . . 705.4 Chemical structure of tetradecane and n-paraffine . . . . . . . . . . . . . . . . . . . 715.5 Attenuation length measurement of different alkane-samples . . . . . . . . . . . . . 725.6 Overview scheme, indicating the stokes shift of LAB, PPO and bis/MSB . . . . . 735.7 Light yield of LAB-based scintillators for varying PPO concentrations . . . . . . . 745.8 Absorption- and emission-bands of PXE, PPO and bis/MSB . . . . . . . . . . . . 755.9 Chemical structure of mineral oil and n-paraffine . . . . . . . . . . . . . . . . . . . . 765.10 Absorbance and attenuation length comparison between Ondina-909 and -917 . . 76
6.1 Pictures of the liquid delivery to the LSA . . . . . . . . . . . . . . . . . . . . . . . . 81
7.1 Global overview of the liquid handling chain in the DC-far detector . . . . . . . . 857.2 Picture of Detector Fluid Operating System of the DC-far detector . . . . . . . . . 867.3 Picture of the DFOS modules of buffer and target . . . . . . . . . . . . . . . . . . . 887.4 Piping and instrumentation diagram of the buffer module . . . . . . . . . . . . . . 917.5 Drawing of the expansion tank operating system (XTOS) . . . . . . . . . . . . . . 957.6 Pictures of XTOS during the installation in the far laboratory . . . . . . . . . . . 977.7 Overview of the gas handling system in the far laboratory . . . . . . . . . . . . . . 987.8 Picture of the nitrogen supply system in the underground laboratory . . . . . . . 997.9 Piping- and instrumentation-diagram of the nitrogen distribution system in the
far lab . . . . . . . . . . . . . . . . . . . . . . . . . . . . . . . . . . . . . . . . . . . . . 1007.10 Overview of the gas handling system in the far laboratory . . . . . . . . . . . . . . 1067.11 Technical drawing of the LPN-Box . . . . . . . . . . . . . . . . . . . . . . . . . . . . 1087.12 Picture of the LPV-system in the underground laboratory . . . . . . . . . . . . . . 1097.13 Technical drawing of the LPV-Box . . . . . . . . . . . . . . . . . . . . . . . . . . . . 1117.14 Illustration and position indication of the level measurement systems used in the
DC far detector . . . . . . . . . . . . . . . . . . . . . . . . . . . . . . . . . . . . . . . . 1137.15 Overview of the laser level measurement system . . . . . . . . . . . . . . . . . . . . 1157.16 Picture of the HPS-Sensor . . . . . . . . . . . . . . . . . . . . . . . . . . . . . . . . . 1167.17 Overview of the Tamago level measurement system . . . . . . . . . . . . . . . . . . 1177.18 Overview of the critical point sensor system . . . . . . . . . . . . . . . . . . . . . . . 1187.19 Overview of the XRS-System . . . . . . . . . . . . . . . . . . . . . . . . . . . . . . . . 1207.20 Overview of the XTOS-level measurement system . . . . . . . . . . . . . . . . . . . 1217.21 Overview of the level measurement PC and its connections . . . . . . . . . . . . . . 1227.22 Picture of the differential gas pressure sensor AP-47 and the related amplifier
AP-V40 . . . . . . . . . . . . . . . . . . . . . . . . . . . . . . . . . . . . . . . . . . . . 1247.23 Connection Scheme for the gas pressure monitoring system of the far detector . . 1257.24 Connection scheme for the gas pressure monitoring system of the expansion tank
operating system (XTOS) . . . . . . . . . . . . . . . . . . . . . . . . . . . . . . . . . 126
8.1 Vertical cut through the center of Double Chooz Detector . . . . . . . . . . . . . . 127
242
LIST OF FIGURES
8.2 Illustration of the detector indicating the different filling phases and the LM-systems in the detector . . . . . . . . . . . . . . . . . . . . . . . . . . . . . . . . . . . 132
8.3 Illustration of filling phases 1-3 . . . . . . . . . . . . . . . . . . . . . . . . . . . . . . 1338.4 Illustration of filling phases 4-5 . . . . . . . . . . . . . . . . . . . . . . . . . . . . . . 1348.5 Illustration of filling phases 6-8 . . . . . . . . . . . . . . . . . . . . . . . . . . . . . . 1358.6 Illustration of filling phases 9-11 . . . . . . . . . . . . . . . . . . . . . . . . . . . . . . 1378.7 Illustration of filling phase 12 . . . . . . . . . . . . . . . . . . . . . . . . . . . . . . . 1388.8 Illustration of filling phases 13-14 . . . . . . . . . . . . . . . . . . . . . . . . . . . . . 1398.9 Illustration of filling phases 15-16 . . . . . . . . . . . . . . . . . . . . . . . . . . . . . 1408.10 Illustration of filling phases 17-18 . . . . . . . . . . . . . . . . . . . . . . . . . . . . . 1428.11 Illustration of filling phases 19-20 . . . . . . . . . . . . . . . . . . . . . . . . . . . . . 1438.12 Illustration of filling phases 21-22 . . . . . . . . . . . . . . . . . . . . . . . . . . . . . 1458.13 Detector filling: Overview of the general liquid level increase in the DC far detector146
9.1 Absorption (A) and attenuation length (Λ) measurements of the three muon vetosamples taken from the three different storage tanks. . . . . . . . . . . . . . . . . . 150
9.2 Absorption (A) and attenuation length (Λ) measurements of the muon veto sam-ple taken from the intermediate tank in the underground laboratory . . . . . . . . 150
9.3 Absorption (A) and attenuation length (Λ) measurements of the three buffersamples taken from the three different storage tanks. . . . . . . . . . . . . . . . . . 152
9.4 Absorption (A) and attenuation length (Λ) of the buffer sample taken from theintermediate tank in the underground laboratory . . . . . . . . . . . . . . . . . . . . 153
10.1 Detector filling: Observed LPN-blanket pressures in MU, BF, GC, NT . . . . . . 15710.2 Detector filling: Observed liquid level differences between MU, BF, GC and NT . 15810.3 Detector filling: differential pressures between MU, BF, GC and NT . . . . . . . . 15910.4 Detector filling: Observed temperature variations in MU, BF and GC . . . . . . . 16110.5 Detector monitoring: Temperature development in MU, BF and GC after the
detector has been filled . . . . . . . . . . . . . . . . . . . . . . . . . . . . . . . . . . . 16310.6 Detector monitoring: Liquid level variations of BF, GC and NT during the first
1.5 years of data taking . . . . . . . . . . . . . . . . . . . . . . . . . . . . . . . . . . . 16310.7 Detector Monitoring: Observed liquid level differences between MU, BF, GC and
NT . . . . . . . . . . . . . . . . . . . . . . . . . . . . . . . . . . . . . . . . . . . . . . . 16410.8 Atmospheric pressure in the underground lab during data taking . . . . . . . . . . 16510.9 Nitrogen blanket pressure during data taking . . . . . . . . . . . . . . . . . . . . . . 16610.10Detector monitoring: differential pressures between MU, BF, GC and NT . . . . . 167
11.1 Data taking statistics of the first 398 days of data taking . . . . . . . . . . . . . . . 16811.2 Muon rate and energy spectrum in the inner veto . . . . . . . . . . . . . . . . . . . 16911.3 Variation of the energy deposition per unit of length of the inner muon veto . . . 17011.4 Muon rate and energy spectrum in the inner detector . . . . . . . . . . . . . . . . . 17111.5 Muon-correlated energy spectrum indicating neutron captures on H, C and Gd
and the stability of these energy peaks over a time period of 300 days . . . . . . . 17211.6 Single spectrum in the prompt energy window between 0.7 and 12.2 MeV . . . . . 17311.7 Single event rate in the prompt and delayed energy window . . . . . . . . . . . . . 17411.8 Single event reconstruction in the inner detector vessels . . . . . . . . . . . . . . . . 17611.9 Prompt and delayed signal after applying the neutrino selection cuts (4-7) . . . . 17711.10Time and space correlation between prompt and delayed event . . . . . . . . . . . 17811.11Vertex reconstruction of prompt (top row) and delayed (bottom row) IBD-events
in the inner detector . . . . . . . . . . . . . . . . . . . . . . . . . . . . . . . . . . . . . 17911.12Observed neutrino rate per day over a time period of one year . . . . . . . . . . . 180
243
LIST OF FIGURES
11.13Prompt energy-spectrum and combined background-spectrum for the first 227 daysof data taken by the Double Chooz experiment . . . . . . . . . . . . . . . . . . . . . 181
11.14Recent results on sin2(2Θ13) measured by accelerator- and reactor-based experi-ments, . . . . . . . . . . . . . . . . . . . . . . . . . . . . . . . . . . . . . . . . . . . . . 182
11.15Prompt energy-spectrum and combined background-spectrum for the first 227 daysof data taken by the Double Chooz experiment using hydrogen analysis . . . . . . 184
A.1 Technical drawing of the DC-far detector . . . . . . . . . . . . . . . . . . . . . . . . 195A.2 Pictures of the DC far laboratory during the installation of the different detector
vessels . . . . . . . . . . . . . . . . . . . . . . . . . . . . . . . . . . . . . . . . . . . . . 196
B.1 Technical drawing of the buffer and muon veto storage tanks . . . . . . . . . . . . 199
C.1 Picture of the new and used filter cartridges used in the particle filter of the muonveto pumping station in the LSA for the unloading of LAB . . . . . . . . . . . . . 205
C.2 Experimental setup for the determination of the absolute light yield, indicating astandard back scattering method using 137 Cs. . . . . . . . . . . . . . . . . . . . . . 205
D.1 Global overview about the liquid handling system in the underground lab . . . . . 207D.2 Technical details of the intermediate tanks in the DFOS system . . . . . . . . . . . 209D.3 Scheme of a top view of the detector vessels indicating the cross sections and
available surface area in two different z-levels . . . . . . . . . . . . . . . . . . . . . . 211D.4 Technical drawing of the buffer module high lighting the flow path indicating the
main line in DFOS . . . . . . . . . . . . . . . . . . . . . . . . . . . . . . . . . . . . . . 213D.5 Piping and instrumentation diagram of DFOS indicating the muon veto module . 214D.6 Piping and instrumentation diagram of DFOS indicating the gamma catcher module215D.7 Piping and instrumentation diagram of DFOS indicating the target module . . . 216D.8 Picture of the software menu used in the control unit (touch screen) of the PLC
mounted to the muon veto frame . . . . . . . . . . . . . . . . . . . . . . . . . . . . . 221D.9 Overview scheme of the tubing in the DC-far laboratory . . . . . . . . . . . . . . . 223D.10 Pictures of the valve station in the DF-far laboratory . . . . . . . . . . . . . . . . . 224D.11 Technical drawing of the expansion tank used for the target . . . . . . . . . . . . . 226D.12 Picture of the underground laboratory during the installation phase . . . . . . . . 227D.13 Overview scheme of the gas handling system in the far laboratory . . . . . . . . . 228D.14 Picture of the isolation valves at the top of the IMT-tanks . . . . . . . . . . . . . . 229D.15 LPN-distributor . . . . . . . . . . . . . . . . . . . . . . . . . . . . . . . . . . . . . . . 229D.16 Technical overview drawing of the O2-panel . . . . . . . . . . . . . . . . . . . . . . . 230D.17 Technical drawing and picture of the over- and under-pressure protection box . . 231D.18 Radio assays of the HPS-sensor and the guide tube box both installed in the
gamma catcher vessel . . . . . . . . . . . . . . . . . . . . . . . . . . . . . . . . . . . . 232D.19 Technical drawing of the differential pressure sensor AP-47 from the Keyence . . 233
E.1 Filling curves in the detector showing the individual curves of MU, BF, GC, NT 234E.2 Overview of the different filling paths used during IMT-filling mode . . . . . . . . 237E.3 Overview of the different filling paths used during Continuous-filling mode . . . . 238E.4 Overview of the different filling paths used during fine-filling mode . . . . . . . . . 239
F.1 Plot of the trigger efficiency in the inner detector . . . . . . . . . . . . . . . . . . . 240
244
List of Tables
1.1 Currently known best fit values for the oscillation parameters . . . . . . . . . . . . 71.2 Oscillation length (L0), the survival probabilities for near and far detector, as well
as their difference for neutrino energies between 2 and 10 MeV . . . . . . . . . . . 12
2.1 Mean values for the energy release per fission of the four main fission isotopes . . 152.2 Reactor fuel composition at the beginning of a burning cycle and the energy
release per fission for the four main fission isotopes . . . . . . . . . . . . . . . . . . 17
3.1 Composition of the Double Chooz Collaboration . . . . . . . . . . . . . . . . . . . . 193.2 Inverse beta decay channels, including their necessary energy threshold Qth . . . 233.3 Natural abundance of H, C and Gd in percent, the absorption cross-section for
thermal neutrons, gamma emission and capture time for n-captures on H, C, Gd 263.4 Summary of detector dimensions . . . . . . . . . . . . . . . . . . . . . . . . . . . . . 293.5 Composition and amounts of muon veto, buffer, gamma catcher and neutrino
target used for the far detector . . . . . . . . . . . . . . . . . . . . . . . . . . . . . . 33
4.1 Surface installations, realized by TUM and MPIK . . . . . . . . . . . . . . . . . . . 414.2 Flow path table for the muon veto and buffer pumping stations . . . . . . . . . . . 484.3 Individual sub-systems and their pressure range of the gas handling system in the
LSA . . . . . . . . . . . . . . . . . . . . . . . . . . . . . . . . . . . . . . . . . . . . . . . 564.4 Trunk line system . . . . . . . . . . . . . . . . . . . . . . . . . . . . . . . . . . . . . . 63
5.1 Summary of all requirements on the detector liquids . . . . . . . . . . . . . . . . . . 695.2 Attenuation length of the LAB samples from Helm, Cepsa and Wibarco . . . . . . 715.3 Attenuation length and density of different alkane samples . . . . . . . . . . . . . . 725.4 Radio chemical impurities of PPO . . . . . . . . . . . . . . . . . . . . . . . . . . . . 745.5 Attenuation length and density of different Ondina samples . . . . . . . . . . . . . 775.6 Main properties of all components of the muon veto scintillator and the buffer
liquid . . . . . . . . . . . . . . . . . . . . . . . . . . . . . . . . . . . . . . . . . . . . . . 77
6.1 Composition of the muon veto scintillator and the buffer liquid . . . . . . . . . . . 78
7.1 Hardware systems installed in the underground laboratory realized by TUM andMPIK . . . . . . . . . . . . . . . . . . . . . . . . . . . . . . . . . . . . . . . . . . . . . 84
7.2 Instrumentation details of the different DFOS-modules . . . . . . . . . . . . . . . . 877.3 Flow paths summary of the DFOS-modules . . . . . . . . . . . . . . . . . . . . . . . 927.4 Thermal Expansion in the chimney with and without XTOS . . . . . . . . . . . . . 967.5 Summary of the nitrogen supply systems in the underground Laboratory . . . . . 997.6 Technical details of the HPN-U manifold . . . . . . . . . . . . . . . . . . . . . . . . 1017.7 Technical details of the FPN-U manifold . . . . . . . . . . . . . . . . . . . . . . . . . 1027.8 Technical details of the LPN-U manifold . . . . . . . . . . . . . . . . . . . . . . . . . 1037.9 Summary of nitrogen consumers in the underground laboratory . . . . . . . . . . . 104
245
LIST OF TABLES
7.10 LPV-U systems of DFOS and detector and sub-systems . . . . . . . . . . . . . . . 1077.11 Summary of the detector monitoring system . . . . . . . . . . . . . . . . . . . . . . 1127.12 Technical details of the Laser level measurement system . . . . . . . . . . . . . . . 1147.13 Technical details of the HPS-Sensors . . . . . . . . . . . . . . . . . . . . . . . . . . . 1167.14 Technical details of the cross reference system (XRS) . . . . . . . . . . . . . . . . . 1197.15 Overview of the pressure monitoring system . . . . . . . . . . . . . . . . . . . . . . 124
8.1 Summary of the filling process of the DC-far detector . . . . . . . . . . . . . . . . 130
9.1 Summary of all requirements for the detector liquids. . . . . . . . . . . . . . . . . . 1489.2 Composition of the muon veto scintillator and buffer liquid . . . . . . . . . . . . . 1499.3 Transparency, density and light yield of the muon veto scintillator . . . . . . . . . 1519.4 Radio purity analysis of the muon veto sample . . . . . . . . . . . . . . . . . . . . . 1519.5 Transparency, density and light yield of the buffer liquid . . . . . . . . . . . . . . . 1529.6 Density, light yield, transparency and radio purity of the MU, BF, GC and NT . 155
10.1 Expected liquid level increase in the detector with and without XTOS for a ther-mal variation of 0.9 K . . . . . . . . . . . . . . . . . . . . . . . . . . . . . . . . . . . . 164
11.1 Uranium and thorium concentration in target and gamma catcher . . . . . . . . . 17411.2 Comparison between the minimum requirements on MU and BF with the actually
measured values for density, light yield, transparency and radio purity. . . . . . . 188
B.1 pumping station Details . . . . . . . . . . . . . . . . . . . . . . . . . . . . . . . . . . . 197B.2 Technical details of the gas filter station . . . . . . . . . . . . . . . . . . . . . . . . . 200B.3 Technical details of the high pressure nitrogen manifold in the LSA . . . . . . . . 201B.4 Technical details of the low pressure nitrogen manifold in the LSA . . . . . . . . . 202B.5 Technical details of the trunk line system . . . . . . . . . . . . . . . . . . . . . . . . 203
C.1 Composition of the different detector liquids and necessary amounts for the DC-far detector . . . . . . . . . . . . . . . . . . . . . . . . . . . . . . . . . . . . . . . . . . 204
D.1 Technical details of the detector fluid operating system and the valve station . . . 212D.2 Technical details of the target module of DFOS and the target valve station . . . 217D.3 Technical details of the expansion tank operating system (XTOS) . . . . . . . . . 225
246
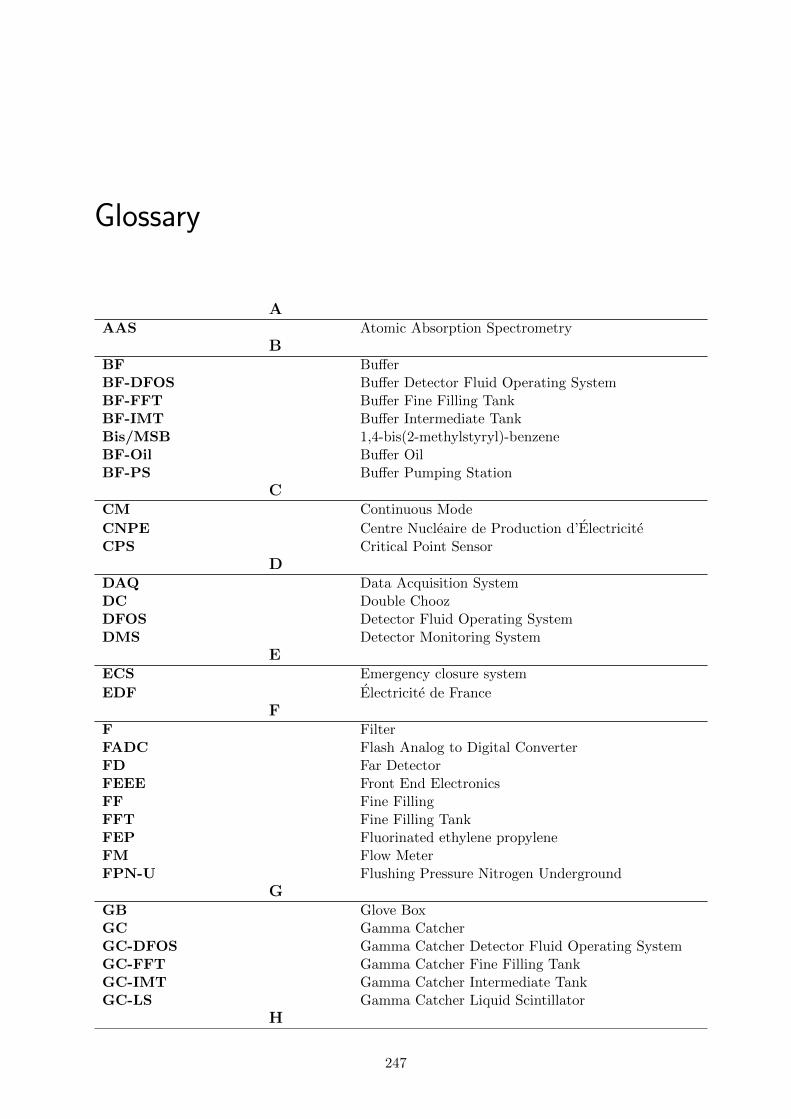
Glossary
AAAS Atomic Absorption Spectrometry
BBF BufferBF-DFOS Buffer Detector Fluid Operating SystemBF-FFT Buffer Fine Filling TankBF-IMT Buffer Intermediate TankBis/MSB 1,4-bis(2-methylstyryl)-benzeneBF-Oil Buffer OilBF-PS Buffer Pumping Station
CCM Continuous Mode
CNPE Centre Nucleaire de Production d’ElectriciteCPS Critical Point Sensor
DDAQ Data Acquisition SystemDC Double ChoozDFOS Detector Fluid Operating SystemDMS Detector Monitoring System
EECS Emergency closure system
EDF Electricite de FranceF
F FilterFADC Flash Analog to Digital ConverterFD Far DetectorFEEE Front End ElectronicsFF Fine FillingFFT Fine Filling TankFEP Fluorinated ethylene propyleneFM Flow MeterFPN-U Flushing Pressure Nitrogen Underground
GGB Glove BoxGC Gamma CatcherGC-DFOS Gamma Catcher Detector Fluid Operating SystemGC-FFT Gamma Catcher Fine Filling TankGC-IMT Gamma Catcher Intermediate TankGC-LS Gamma Catcher Liquid Scintillator
H
247
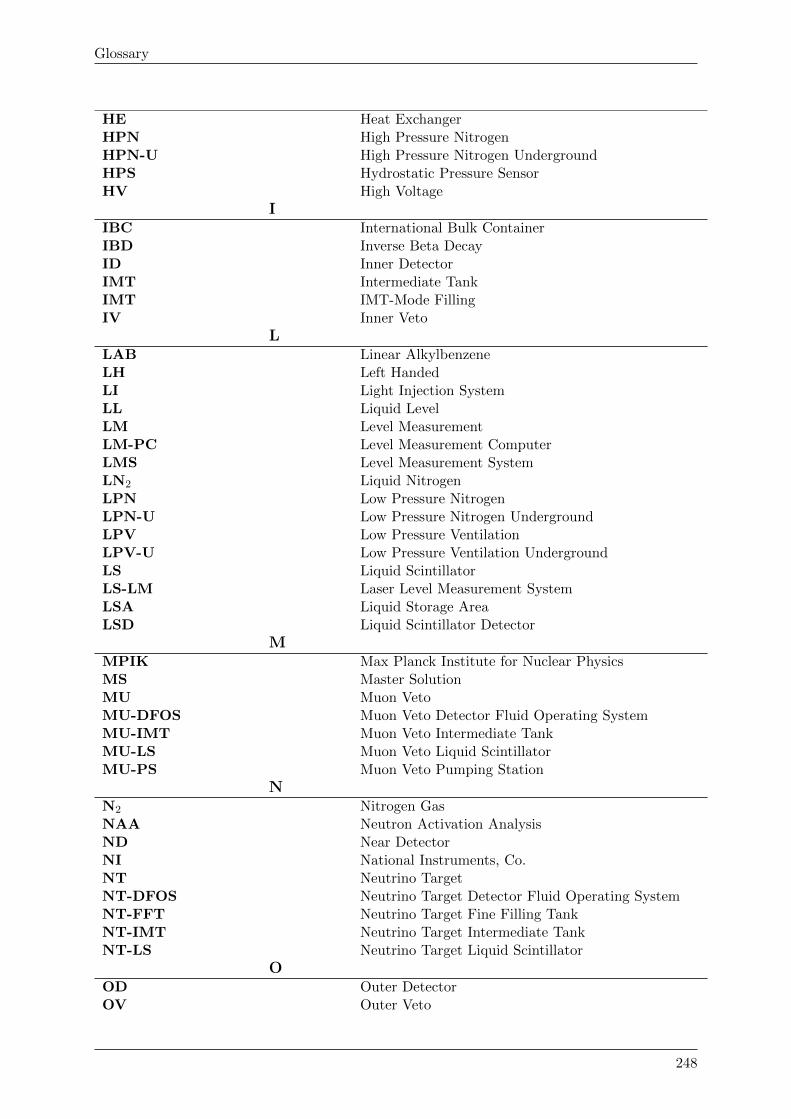
Glossary
HE Heat ExchangerHPN High Pressure NitrogenHPN-U High Pressure Nitrogen UndergroundHPS Hydrostatic Pressure SensorHV High Voltage
IIBC International Bulk ContainerIBD Inverse Beta DecayID Inner DetectorIMT Intermediate TankIMT IMT-Mode FillingIV Inner Veto
LLAB Linear AlkylbenzeneLH Left HandedLI Light Injection SystemLL Liquid LevelLM Level MeasurementLM-PC Level Measurement ComputerLMS Level Measurement SystemLN2 Liquid NitrogenLPN Low Pressure NitrogenLPN-U Low Pressure Nitrogen UndergroundLPV Low Pressure VentilationLPV-U Low Pressure Ventilation UndergroundLS Liquid ScintillatorLS-LM Laser Level Measurement SystemLSA Liquid Storage AreaLSD Liquid Scintillator Detector
MMPIK Max Planck Institute for Nuclear PhysicsMS Master SolutionMU Muon VetoMU-DFOS Muon Veto Detector Fluid Operating SystemMU-IMT Muon Veto Intermediate TankMU-LS Muon Veto Liquid ScintillatorMU-PS Muon Veto Pumping Station
NN2 Nitrogen GasNAA Neutron Activation AnalysisND Near DetectorNI National Instruments, Co.NT Neutrino TargetNT-DFOS Neutrino Target Detector Fluid Operating SystemNT-FFT Neutrino Target Fine Filling TankNT-IMT Neutrino Target Intermediate TankNT-LS Neutrino Target Liquid Scintillator
OOD Outer DetectorOV Outer Veto
248
Glossary
PP PumpP&ID Piping and Instrumentation Diagram/DrawingPE PolyethylenePE-HD Polyethylene High DensityPE-LD Polyethylene Low DensityPFA PerfluoroalkoxyPLC Programmable Logic ControllerPMNS Pontecorvo, Maki, Nakagawa, SakataPMT Photo Multiplier TubePPO 2,5 diphenyloxazolPS Pumping StationPTFE PolytetrafluoroethylenePVC Polyvinyl chloridePVDF Polyvinylidene fluoridePWR Pressurized Water ReactorPXE PhenylxylylethanePXI PCI eXtensions for Instrumentation
SS SteelSEP System Entry PointSS Stainless Steel
TTIG-welding Tungsten Inert Gas WeldingTLS Trunk Line SystemTLM Trunk Line ModuleTT Transport Tank
VVME Versa Module Eurocard
WWT Weighing Tank
XXRS Cross Reference SystemXTOS Expansion Tank Operating System
249
Bibliography
[1] Y. Abe et al. First Measurement of Θ13 from Delayed Neutron Capture on Hydrogen inthe Double Chooz Experiment. 2013, arXiv: hep-ex/1301.2948.
[2] W. Pauli. Interscience, New York, 2:1313, 1964.
[3] C. Giunti and C.W. Kim. Fundamentals of Neutrino Physics and Astrophysics. Universitypress, Oxford, 2007.
[4] J.N. Bahcall et al. Solar neutrino flux simulation. Astrophys. J. 621, L85, 2005.
[5] Raymond et al. Davis. Search for neutrinos from the sun. Phys. Rev. Lett., 20:1205–1209,May 1968.
[6] B.T. Cleveland et al. Measurement of the solar electron neutrino flux with the homestakechlorine detector. Astrophys.J., 496:505–526, 1998.
[7] J.N. Abdurashitov et al. Measurement of the solar neutrino capture rate by sage andimplications for neutrino oscillations in vacuum. Phys. Rev. Lett., 83:4686–4689, Dec1999.
[8] W. Hampel et al. Gallex solar neutrino observations: results for gallex iv. Phys. Lett.,B447:127, 1999.
[9] M. Altmann et al. Complete results for five years of gno solar neutrino observations.Phys.Lett., B616:174–190, 2005, arXiv: hep-ex/0504037.
[10] B. Pontecorvo. J. Exptl. Theoret. Phys., 53,1717, 1967.
[11] K.S. Hirata et al. Observation of 8B solar neutrinos in the kamiokande-ii detector. Phys.Rev. Lett., 63:16–19, Jul 1989.
[12] Y. Fukuda et al. Evidence for oscillation of atmospheric neutrinos. Phys.Rev.Lett.,81:1562–1567, 1998, arXiv: hep-ex/9807003.
[13] K. Abe et al. Measurement of atmospheric neutrino flux consistent with tau neutrinoappearance. Phys. Rev. Lett., 97:171801, Oct 2006.
[14] V. Barger et al. Neutrino decay as an explanation of atmospheric neutrino observations.Phys. Rev. Lett., 82:2640–2643, Mar 1999.
[15] K.M. Heeger. Resolving the solar neutrino problem: Evidence for massive neutrinos in theSudbury Neutrino Observatory. Europhys.News, 32:180–183, 2001.
[16] B. Aharmim et al. Independent measurement of the total active 8B solar neutrino fluxusing an array of 3He proportional counters at the sudbury neutrino observatory. Phys.Rev. Lett., 101:111301, Sep 2008.
[17] H. A. Bethe. Possible explanation of the solar-neutrino puzzle. Phys. Rev. Lett., 56:1305–1308, Mar 1986.
250
BIBLIOGRAPHY
[18] S.P Mikheev et al. Resonance Amplification of Oscillations in Matter and Spectroscopyof Solar Neutrinos. Sov.J.Nucl.Phys., 42:913–917, 1985.
[19] Th. A Mueller et al. Improved predictions of reactor antineutrino spectra. Phys. Rev. C,83:054615, May 2011.
[20] M. Apollonio et al. Initial results from the CHOOZ long baseline reactor neutrino oscilla-tion experiment. Phys.Lett., B420:397–404, 1998, arXiv: hep-ex/9711002.
[21] Y. Declais et al. Study of reactor anti-neutrino interaction with proton at Bugey nuclearpower plant. Phys.Lett., B338:383–389, 1994.
[22] Y. Abe et al. Reactor electron antineutrino disappearance in the Double Chooz experiment.Phys.Rev., D86:052008, 2012, arXiv: hep-ex/1207.6632.
[23] Xinheng et al. Guo. A Precision measurement of the neutrino mixing angle theta(13) usingreactor antineutrinos at Daya-Bay. 2007, arXiv: hep-ex/0701029.
[24] Ahn et al. J.K. RENO: An Experiment for Neutrino Oscillation Parameter θ13 UsingReactor Neutrinos at Yonggwang. 2010, arXiv: hep-ex/1003.1391.
[25] J.K. Ahn et al. Observation of reactor electron antineutrinos disappearance in the renoexperiment. Phys. Rev. Lett., 108:191802, May 2012.
[26] F.P. An et al. Observation of electron-antineutrino disappearance at daya bay. Phys. Rev.Lett., 108:171803, Apr 2012.
[27] N. Schmitz. Neutrinophysik. Teubener Verlag, Stuttgart, 1997.
[28] P. Schmuser. Feynman-Graphen und Eichtheorien fur Experimentalphysiker. 2. AuflageSpringer Verlag, Heidelberg, 1995.
[29] Shoichi Sakata. On a Composite Model for the New Particles. Prog.Theor.Phys., 16:686–688, 1956.
[30] M. Apollonio et al. Search for neutrino oscillations on a long baseline at the CHOOZnuclear power station. Eur.Phys.J., C27:331–374, 2003, arXiv: hep-ex/0301017.
[31] P. Adamson et al. Search for the disappearance of muon antineutrinos in the NuMIneutrino beam. Phys.Rev., D84:071103, 2011, arXiv: hep-ex/1108.1509.
[32] K. Abe et al. Indication of Electron Neutrino Appearance from an Accelerator-produced Off-axis Muon Neutrino Beam. Phys.Rev.Lett., 107:041801, 2011, arXiv: hep-ex/1106.2822.
[33] P. Adamson et al. Improved search for muon-neutrino to electron-neutrino oscillations inMINOS. Phys.Rev.Lett., 107:181802, 2011, arXiv: hep-ex/1108.0015.
[34] Y. Abe et al. Indication of reactor νe disappearance in the double chooz experiment. Phys.Rev. Lett., 108:131801, Mar 2012.
[35] S. Abe et al. Precision Measurement of Neutrino Oscillation Parameters with KamLAND.Phys.Rev.Lett., 100:221803, 2008, arXiv: hep-ex/0801.4589.
[36] B. Aharmim et al. Low-energy-threshold analysis of the phase i and phase ii data sets ofthe sudbury neutrino observatory. Phys. Rev. C, 81:055504, May 2010.
[37] P. Adamson et al. Measurement of the neutrino mass splitting and flavor mixing by minos.Phys. Rev. Lett., 106:181801, May 2011.
251
BIBLIOGRAPHY
[38] J. Beringer et al. Review of particle physics, 2012-2013. review of particle properties. Phys.Rev. D, 86(1):010001, 2012.
[39] V.N. Aseev et al. An upper limit on electron antineutrino mass from Troitsk experiment.Phys.Rev., D84:112003, 2011, arXiv: hep-ex/1108.5034.
[40] Ch. Kraus et al. Final results from phase II of the Mainz neutrino mass search in tritiumbeta decay. Eur.Phys.J., C40:447–468, 2005, arXiv: hep-ex/0412056.
[41] Steen Hannestad. Neutrino physics from precision cosmology. Prog.Part.Nucl.Phys.,65:185–208, 2010, arXiv: hep-ph/1007.0658.
[42] A. Osipowicz et al. KATRIN: A Next generation tritium beta decay experiment withsub-eV sensitivity for the electron neutrino mass. Letter of intent. 2001, arXiv: hep-ex/0109033.
[43] J.A. Formaggio. Probing the absolute mass scale of neutrinos. AIP Conf.Proc., 1441:426–428, 2012.
[44] K.N. Abazajian et al. Cosmological and Astrophysical Neutrino Mass Measurements.Astropart.Phys., 35:177–184, 2011, arXiv: astro-ph.CO/1103.5083.
[45] Th. Lasserre. The reactor antineutrino anomaly. J.Phys.Conf.Ser., 375:042042, 2012.
[46] A.J Anderson et al. Measuring Active-to-Sterile Neutrino Oscillations with Neutral Cur-rent Coherent Neutrino-Nucleus Scattering. Phys.Rev., D86:013004, 2012, arXiv: hep-ex/1201.3805.
[47] A. Cucoanes. Status of the Nucifer experiment. J.Phys.Conf.Ser., 375:042063, 2012.
[48] M. Franke. private communication, TUM/E15, Munchen, 2010.
[49] F.v.F. Feilitzsch et al. Experimental Beta spectra from PU-239 and U-235 thermal neutronfission products and their correlated anti-neutrino spectra . Phys.Lett., B118:162–166,1982.
[50] Schreckenbach et al. Determination of the antineutrino spectrum from 235U thermal neu-tron fission products up to 9.5 MeV. Phys.Lett., B160:325–330, 1985.
[51] K.H. Lieser. Nuclear and Radiochemistry. VCH, Weinheim, p.201, 1997.
[52] D. Lhuillier et al. Double Chooz Collaboration. available online. www.dchooz.org/DocDB/cgi-bin/private/DocumentDatabase, DOC Db3373 v4. (restricted access).
[53] M. Fallot et al. Double Chooz Collaboration. available online. www.dchooz.org/DocDB/cgi-bin/private/DocumentDatabase. (restricted access).
[54] T. Lassere et al. Double Chooz Collaboration. available online. www.dchooz.org/DocDB/cgi-bin/private/DocumentDatabase, DC-Doc-3281. (restricted access).
[55] F. Ardellier et al. Letter of intent for Double-CHOOZ: A Search for the mixing angletheta(13). 2004, arXiv: hep-ex/0405032.
[56] B. Povh et. al. Teilchen und Kerne. 8.edition, Springer Verlag Heidelberg, 2008.
[57] K. Zuber. Neutrino Physics. CRC-Press, University press,, 2012.
[58] G. Pfennig et al. Karlsruher Nuklidarte. Edition Haberbeck, 1995.
[59] L. Scola. Picture, 2010. http://doublechooz.in2p3.fr/Scientific/Photos/photos.php.
[60] L. Scola. Technical drawing dc-far detector, 2007. private communication.
252
BIBLIOGRAPHY
[61] Y.Abe et al. Double Chooz Collaboration. available online. www.dchooz.org/ DocDB/cgi-bin/private/DocumentDatabase, DC-doc-1400-v3. (restricted access).
[62] C. Aberle et al. Large scale Gd-beta-diketonate based organic liquid scintillator productionfor antineutrino detection. JINST, 7:P06008, 2012, arXiv: physics.ins-det/1112.5941.
[63] Hamamatsu Photonics Corporation. web page: www.hamamatsu.com, 2012.
[64] A. Cabrera. The Double Chooz detector. Nucl.Instrum.Meth., A617:473–477, 2010.
[65] Y.Abe et al. Double Chooz Collaboration. available online. http://doublechooz.in2p3.fr/Private/WorkingGroups/ Analysis/AnalysisBlessPlots/ DC2ndPub.php. (restricted ac-cess).
[66] I. Ostrovskiy Double Chooz Collaboration. available online. www.dchooz. org/DocDB/cgi-bin/private/DocumentDatabase, DC-doc-729-v2. (restricted access).
[67] M. Ishitsuka et al. Double Chooz Collaboration. available online. www.dchooz.org/DocDB/cgi-bin/private/DocumentDatabase, DC-doc-1873-v1. (restricted access).
[68] Z. Djurcic et al. Double Chooz Collaboration. available online. www.dchooz.org/DocDB/cgi-bin/private/DocumentDatabase, DC-doc-2419-v2. (restricted access).
[69] G. Mention et al. Double Chooz Collaboration. available online. www.dchooz.org/DocDB/cgi-bin/private/DocumentDatabase, DC-doc-2428-v2. (restricted access).
[70] V. Guarino et al. Double Chooz Collaboration. available online. www.dchooz.org/DocDB/cgi-bin/private/DocumentDatabase, DC-doc-1426-v1. (restricted access).
[71] Richard B. Firestone, C.M. Baglin, and V.S. Shirley. Table of isotopes. Number Bd. 1-2in Table of Isotopes. Wiley, 1998.
[72] M. Hofmann Double Chooz Collaboration. Liquefied rare gases and liquid scintillators asparticle detectors. PhD thesis, TUM/E15, Munich, 2012.
[73] Idex Corporation. web page: www.treborintl.com/support-documents/ds-Mega-960.pdf,2012.
[74] MTS Corporation. web page: www.mts-filtertechnik.de/Filter-Edelstahl.html, 2012.
[75] Endress & Hauser Corporation. web page: www.accessinstrumentation.com /PDFs/ En-dress Promass 80A-83ADataSheet.pdf, 2012.
[76] Rotarex Corporation. web page: www.rotarex-gmbh.de, 2012.
[77] L. S. Niedermeier. High efficiency Purification of Liquid Scintillators for the Solar Neu-trino Experiment Borexino. PhD thesis, TUM/E15, Munich, 2004.
[78] Boie Corporation. web page: www.boie-systemtechnik.de/ ?pagefunc=showArticle&article-id =54145, 2012.
[79] STS Corporation. web page: www.stssensoren.de/produkte/drucktransmitter.html, 2012.
[80] National Instruments Corporation. web page: http://sine.ni.com/nips/cds/ view/p/lang/en/nid/ 13909, 2012.
[81] P Perrin. Picture, 2011. private communication.
[82] W.R.Leo. Techniques for Nuclear and Particle Physics Experiments. Springer Verlag,1994.
253
BIBLIOGRAPHY
[83] C.E. Mortimer et al. Das Basiswissen der Chemie. Georg Thieme-Verlag, 8th-edition,2003.
[84] J.B. Birks. Scintillation counters. Pergamon press, London, 1953.
[85] W.Tausch et al. Photochemie - Konzepte, Methoden, Experimente. Wiley-VCH Verlag,Weinheim, 1998.
[86] G.F. Knoll. Radiation Detection and Measurement. Wiley-Verlag, 1989.
[87] A. Jablonski. uber den Mechanismus der Photolumineszenz von Farbstoffphosphoren.Zeitschrift fur Physik, 94:38–46, 1935.
[88] A. Jablonski. Solar neutrino flux simulation. Z.Phys.94, 38, 1935.
[89] D. L. Dexter. A theory of sensitized luminescence in solids. J. Chem. Phys. 21, 1953.
[90] Th Forster. Zwischenmolekulare energiewanderung und fluoreszenz. Annalen der Physik,437(1-2):55–75, 1948.
[91] V.Helms. Computational cell biology. Wiley-VCH Verlag, Weinheim, 2007.
[92] G. Mie. Beitrage zur Optik truber Medien, speziell kolloidaler Metallosungen. Annalender Physik, 4.te Folge, 25:377–455, 1908.
[93] M. Apollonio et al. Limits on neutrino oscillations from the CHOOZ experiment.Phys.Lett., B466:415–430, 1999, arXiv: hep-ex/9907037.
[94] A.G.Piepke et al. Development of a Gd loaded liquid scintillator for electron anti-neutrinospectroscopy. Nucl.Instrum.Meth., A432:392–398, 1999, arXiv: nucl-ex/9904002.
[95] J. Meyer. Realization and characterization of the muon veto scintillator and buffer liquidof the dc-experiment. Master’s thesis, TUM/E15/Munich, 2010.
[96] Helm Corporation. Material safety data sheet (msds) lab. Technical report.www.helmag.com.
[97] Cepsa Corporation. Material safety data sheet (msds) lab. Technical report.www.cepsa.com.
[98] Dixi Chemical Company. Material safety data sheet (msds) pxe. Technical report.www.dixiechemical.com/ products-listed-alphabetically.html.
[99] Perkin & Elmer Corporation. Technical data sheet: Uv-vis spectrometer lambda 850.Technical report. www.perkinelmer.com/Catalog/Product/ID/L850.
[100] Anton Paar Corporation. Technical data sheet: Dma 38. Technical report.www.rofa.at/Leaflet/Apaar/DMA38 L. pdf.
[101] Science Lab Corporation. Material safety data sheet (msds) ppo. Technical report.www.sciencelab.com/ page/S/PVAR/10423/ SLP1039.
[102] Perkin&Elmer Corporation. Material safety data sheet (msds) bis/msb. Technical report.www.perkinelmer.com.
[103] C. Aberle. Optimization,Simulation and analysis of the scintillator signals in the DoubleChooz Experiment. PhD thesis, MPIK/Heidelberg, 2011.
[104] Wibarco Corporation. Material safety data sheet (msds) wibracan. Technical report. www.wibarco.com.
254
BIBLIOGRAPHY
[105] CBR Corporation. Material safety data sheet (msds) cobersol c70. Technical report.www.cbr-online.de/produkte/details.php?id=12.
[106] Shell Corporation. Material safety data sheet (msds) ondina-917. Technical report.www.shell.com.
[107] Shell Corporation. Material safety data sheet (msds) ondina 909. Technical report.www.shell.com.
[108] Dr. Hanh Trinh Thi. private communication, TUM/E15, Munich, 2012.
[109] Idex Corporation. web page: www.treborintl.com/product-purus20.asp, 2012.
[110] Thermal expansion coefficients of n paraffine. web page: www.chemie.de /lexikon/ Aus-dehnungskoeffizient.html, 2012.
[111] Purstinger High Purity Systems GmbH. engineering devision. Technical report, Gewer-bepark Lindach B3-B4, D-84489 Burghausen.
[112] MEL Mikroelectronik GmbH. Technical data sheet: Distance laser m10. Technical re-port. www.melsensor.de/component/content/article/105-ensensoren/508-m10-bis-150-m-en2011.html.
[113] M. Franke. Das neutrino experiment double chooz und erste datenanalyse mit dem fernendetector. Master’s thesis, TUM/E15/Munich, 2011.
[114] A. Rockl. Level measurement system for the double chooz far detector. Master’s thesis,TUM/E15/Munich, 2011.
[115] Endress & Hauser Corporation. Technical data sheet: Proservo nm5. Technical report.https://portal.endress.com/wa001/dla/50004041107/000/00/TI00452G08EN02.11.pdf.
[116] Keyence Corporation. Technical data sheet: fiber optic contact sensor fu-93z. Technicalreport. www.keyence.com /products/sensors/ fiberoptic/fu/ fu features 9.php.
[117] Keyence Corporation. Technical data sheet: gas pressure sensor ap-47. Technical report.www.keyence.co.jp/atsuryoku/atsuryoku/ap 40/ap 47.
[118] National Instruments Corporation. web page. Technical report. www.ni.com.
[119] National Instruments Corporation. Technical data sheet: Daq-system pxi-1043. Technicalreport. Labview Software Package 8.6.
[120] Dr. C.Buck. private communication, MPIK, Heidelberg, 2010.
[121] D. Dietrich Double Chooz Collaboration. available online. www.dchooz.org/DocDB/cgi-bin/private/DocumentDatabase, DC-doc-3367-v2. (restricted access).
[122] A. Franke et al. Double Chooz Collaboration. available online. www.dchooz.org/ DocDB/cgi-bin/private/ DocumentDatabase, DC-doc-3519-v16. (restricted access).
[123] D. Dietrich Double Chooz Collaboration. available online. www.dchooz.org/DocDB/cgi-bin/private/DocumentDatabase, DC-doc-2813-v2. (restricted access).
[124] D. Dietrich, 2011. private communication.
[125] T. Kawasaki Double Chooz Collaboration. available online. www.dchooz.org/ DocDB/cgi-bin/private/DocumentDatabase, DC-doc-2818-v1. (restricted access).
[126] C. Palomares et al. Double Chooz Collaboration. available online. www.dchooz.org/DocDB/cgi-bin/private/DocumentDatabase, DC-doc-3339-v7 and DC-doc-3339-v7. (re-stricted access).
255
BIBLIOGRAPHY
[127] K. Crum Double Chooz Collaboration. available online. www.dchooz.org/ DocDB/cgi-bin/private/DocumentDatabase, DOC Db3279 v2. (restricted access).
[128] C. Palomares, 2012. private communication.
[129] P. Novella et. al Double Chooz Collaboration. available online. www.dchooz.org/DocDB/cgi-bin/private/DocumentDatabase, DC-doc-3386-v4. (restricted access).
[130] P. Novella et. al Double Chooz Collaboration. available online. www.dchooz.org/DocDB/cgi-bin/private/DocumentDatabase, DC-doc-4036-v3. (restricted access).
[131] K. Anderson, B. Bernstein, D. Boehnlein, Kenneth R. Bourkland, S. Childress, et al. TheNuMI Facility Technical Design Report. 1998.
[132] F.P. An et al. Improved Measurement of Electron Antineutrino Disappearance at DayaBay. 2012, arXiv: hep-ex/1210.6327.
[133] Y. Abe et al. First Test of Lorentz Violation with a Reactor-based Antineutrino Experi-ment. 2012, arXiv: hep-ex/1209.5810.
[134] Y. Abe et al. Direct Measurement of Backgrounds using Reactor-Off Data in DoubleChooz. 2012, arXiv: hep-ex/1210.3748.
[135] National Instruments Corporation. Bestimmung der absoluten lichtausbeute des flussigsz-intillators fur die außeren detektorkomponenten des neutrinoexperiments double chooz.Master’s thesis, TUM/E15, Munich, 2007.
[136] I. Ostrovskiy et al. Double Chooz Collaboration. available online. www.dchooz.org/DocDB/cgi-bin/private/DocumentDatabase, DC-doc-887-v1. (restricted access).
256
Acknowledgement
Zum Abschluss meiner Arbeit mochte ich mich bei allen bedanken, die mir in den letzten Jahrenzur Seite standen.Prof. Franz von Feilitzsch und Prof. Stefan Schonert sage ich zuerst vielen Dank fur dieMoglichkeit am E 15 zu promovieren und fur Ihre damit verbundene stetige Unterstutzung inallen Belangen. Daruber hinaus danke ich Ihnen fur die vielen Vorschusslorbeeren, Geschichtenaus der Jagd- & Forstwirtschaft und ein sehr motivierendes Arbeitsumfeld.Prof. Lothar Oberauer, meinem Doktorvater, danke ich fur seine Betreuung dieser Arbeit,sehr viel Vertrauen, und die Bereitstellung von politischem Gewicht, vor allem wenn man selbstnicht genug davon hat. Zudem mochte ich mich fur viel Menschlichkeit, Zeit sowie seine stetsoffene Burotur bedanken.Dr. Marianne Goger-Neff gilt der Dank fur Ihre große Hilfsbereitschaft, der Beantwortungvieler Fragen, ihre Offenheit, die gute Zusammenarbeit und fur das Korrekturlesen dieser Arbeit.Dr. Frank Hartmann for good ideas and a critical mind, which made me reconsider morethan once.Dr. Christian Buck und allen anderen Mitgliedern des MPIK danke ich fur die tolleZusammenarbeit, viel Hilfe und Unterstutzung im Laufe der letzten Jahre, sowie fur die gemein-schaftliche Losung von Problemen und viele lustige Abende in Chooz.Dr. Hong Hanh Trinh Thi hat meinen Dank furs Vorbild sein - nicht nur was gewis-senhaftes und strukturiertes Arbeiten angeht, sondern vor allem, wenn es um Verhandlungenmit Verkaufern geht. Hanh, ohne Deine wertvolle Arbeit ware vieles nicht so gut wie es jetztist. Danke !Dr. Jean Come Lanfranchi danke ich fur seinen entspannenden Humor, seine immer gutenRatschlage, Spaziergange, Bootsfahrten, gegrillten Mitternachtsfisch und die Moglichkeit, Pa-pageien tanzen zu lassen.Patrick Perrin for wordless understanding, French lessons, very good meals, insides, transla-tions, constant help, and a coffee break at the right time.Michael Franke, Judith Meyer und Anton Rockl verdienen großen Dank fur Ihre Diplo-marbeiten, welche die hier vorliegende Arbeit unterstutzen. Vielen Dank fur all eure die Arbeit,unermudliche und sehr kompetente Hilfe, fur Marmorkuchen, Kerzen und die durchgestandenenKalibrationsnachtschichten im Beschleuniger.Allen Borexinesen, Lenisten sowie Cryonisten: habt Dank fur viele Geschichten undEinsichten in eure Experimente und stets die richtige Ablenkung, wenn man gerade ein Pausebraucht. Im Detail sind das: 5 l Rotwein, Latte Macchiato, Klettern, Mittagsplanschen, Helsinki,sowie, nicht zu vergessen, stetige Updates bezuglich der neuen Lieder von David Hasselhoff.Allen Double Chooz’lern gilt mein Dank fur ihre stetige Unterstutzung und tolles Ar-beitsklima, fur sehr viel Hilfe beim Planen, Bestellen, Abholen, Transportieren, Installieren,Analysieren und Simulieren. Vielen Dank fur alles !Nils Haag und Martin Hofmann danke ich fur die ausfuhrliche und geduldige Korrekturdieser Arbeit, ihre vielen Verbesserungsvorschlage, das Privatseminar zur Losung der Dirac-Gleichung, viele Antworten auf noch mehr Fragen... und... Nilspferde.Dem alten Sekretariat und damit Beatrice van Bellen und Alexandra Fuldner, die mir
257
Acknowledgement
zu Beginn dieser Arbeit bei all meinen verwaltungstechnischen Problemen zu Seite standen unddie nicht mude wurden mir zu erklaren, dass das Original bei mir bleibt, der gelbe Durchschlagzu Wahrenannahme gehort, der rote zur Verwaltung muss und das man den dunkelweißen nieraus reißen darf! danke ich ganz herzlich.Dem neuen Sekretariat und damit Maria Bremberger, die mir in den letzten Jahren immeraus der Patsche half, auch wenn ich schon wieder vergessen hatte den Reiseantrag rechtzeitigabzugeben, gilt mein besonderer Dank. Daruber hinaus mochte ich mich noch fur gute Stim-mung, lustige Geschichten und die Erkenntnis bedanken, daß man besser druckt als zieht.Der Werkstatt und damit Harald Hess, Erich Seitz und Thomas Richter mochte ich furdie an Kunst grenzende Verwirklichung meiner Ideen danken. Fur gute Vor- wie Ratschlage,immer freundlichen Empfang, selbst wenn man schon wieder kommt, um doch noch etwas zuandern.Mein Dank gilt weiterhin der Firma Purstinger und damit den Herren Kehrberg, Brauner,Deinbock, Gahn und, nicht zu vergessen, Tim-Bob, die Double Chooz auch zu ihrem Projektgemacht haben.Ebenso bedanke ich mich bei Wacker-Chemie und damit Herrn Dr. Stohrer, der mit viel En-gagement, professionellem Rat und der Bereitstellung von idealer Infrastruktur einen entschei-denden Beitrag zur Produktion des Muon-Veto-Szintillators leisten konnte und damit auchwesentlich zum Erfolg dieser Arbeit beigetragen hat.All meinen Freunden , und damit (glucklicherweise) sehr vielen lieben Menschen, die mich inden letzten Jahren begleitet haben. Ich freu mich schon sehr darauf wieder mehr Zeit mit Euchzu verbringen, und zwar genau ab jetzt!Der Band Waaazzzzuuup ! What can you say ...? You, me, them, everybody, everybody !Meiner lieben Familie, ohne Eure Unterstutzung hatte ich es nie soweit geschafft. VielenDank, furs Dasein und Begleiten, furs an mich Glauben und Aufbauen, furs Ablenken und in-teressiert sein. Einfach fur alles !...ab jetzt hab ich auch wieder Zeit was an die Wand zu dubeln !
Dem besondersten aller Menschen, namlich meiner Liebsten, Angelika Giglberger, danke ichvon ganzem Herzen fur all das was Du in den letzten Jahren fur mich getan hast und damit furso viel mehr als man hier aufzahlen kann. Vielen Dank fur Deine unermudliche Unterstutzung,Dein Durchhaltevermogen, Deinen unerschutterlichen Glauben an mich und daran, daß dieseArbeit doch irgendwann fertig wird. Fur die Korrektur dieser Arbeit und Deine Fahigkeit Kom-mas zu setzen, furs Aufbauen, furs Ablenken, fur Brotzeitbretter, fur unendeckte Saftschorlen,fur Kerschgeist... und fur so viel Geduld. Ich liebe Dich!
...and thanks for all the fish !
258


