Embed Size (px)
Citation preview

Recent Progress in the Operational Forecastingof Summer Severe Weather
Paul Joe1, Cliff Crozier1, Norman Donaldson1, Dave Etkin1, Erik Brun1,Steve Clodman1, Jim Abraham2, Stan Siok3, Henri-Paul Biron3, Mike Leduc4,
Phil Chadwick4, Steve Knott5, Jamie Archibald6, Glenn Vickers6,Steve Blackwell6, Rick Drouillard7, Alan Whitman8, Harold Brooks9,
Nick Kouwen10, Richard Verret11, Gilles Fournier12, Bob Kochtubajda13
Atmospheric Environment Service,4905 Dufferin St., Downsview, Ontario M3H 5T41 Climate and Atmospheric Research Directorate,
2Maritimes Weather Centre,- Quebec Weather Centre,^Regional Centre Toronto,
5Saskatchewan Environmental Services Office,6Alberta Weather Centre,
1 Mountain Weather Office - Kelowna,^Prince George Weather Office,
^National Severe Storms Laboratory, ERL/NOAA, Norman, OK,10 University of Waterloo,
1 ' Canadian Meteorological Centre,nTransport Canada,
nAlberta Research Council/University of Alberta.
[Original manuscript received 30 August 1994; in revised form 9 December 1994]
ABSTRACT Summer severe weather (SSW) can strike suddenly and unexpectedly with dis-astrous consequences for human activity. Considerable progress has been made in the pastten years in the operational forecasting of SSW. Traditionally, SSW was defined to consistof tornadoes, strong winds, hail, lightning and heavy rain. Hazardous types of strong windshave recently been expanded to include microbursts, macrobursts and surfacing rear inflowjet damage behind mesoscale convective systems. Doppler radar was used to relate surfacedamage to the appropriate atmospheric phenomena, first diagnostically and then prognosti-cally. This improvement in classification has fedback to and improved the forecast process.Concurrent progress has been made in the use of synoptic observations. The concept ofhelical wind profiles and improved knowledge of the role of dry mid-level air has improvedthe forecasting of tornadoes and strong gusty winds. Moisture flux convergence, derivedfrom surface measurements, shows great promise in identifying areas of storm initiation.Satellite imagery has been used to identify dynamical atmospheric boundaries. Numerical
ATMOSPHERIC-OCEAN 33 (1) 1995, 249-302 07O5-59O0/94/0OO0-0249$01.25/0© Canadian Meteorological and Oceanographic Society

250 / Paul Joe et al.
modelling of the interaction of environmental wind profiles and individual thunderstorms hasgreatly contributed to the understanding of SSW. Studies of spatial and temporal patternsof lightning, both specific cases and climatology, contribute to the forecasting of severestorms. Polarization radar results have shown progress in separating the signals of hailfrom those of rain and in the improved measurement of heavy rainfalls. Radar observationof clear air boundaries and their interactions show potential for the forecasting of thunder-storm initiation. Though not traditionally considered part of SSW, hurricanes that evolveinto extra-tropical storms share many of the same hazardous features. The progress in com-puting, communications and display technologies has also made substantial contributions tooperational forecasting and to the dissemination of weather warnings.
RESUME Le temps violent d'ete peut frapper soudainement et sans avertissement entratnantdes consequences desastreuses pour les activites humaines. La prevision du temps violentd'ete a fait des progres considerables au cours des dix dernieres annees. Traditionnelle-ment, on le definissait en termes de tornades, vents fonts, grele, eclairs et pluie abondante.Dernierement, on a ajoute des vents dangereux tels que les micro et macro rafales descen-dantes et la descente vers la surface du courant-jet entrant arriere qui suit immediatement lessysteme convectifs a I'echelle moyenne. L'utilisation du radar doppler a permis d'associerles dommages en surface aux phenomenes atmospheriques pertinents, premierement pardiagnostic et par la suite par pronostic. Cet amelioration de la classification permet unmeilleur processus de prevision en fournissant des informations necessaires. L'utilisationdes observations synoptiques a, en meme temps, fait des progres. Le concept de profits devents helicoldaux et une meilleure connaissance du role de I'air sec aux moyens niveauxa ameliore la prevision des tornades et des forts vents en rafales. La convergence des fluxd'humidite, derivee de mesures en surface, promet de faciliter Videntification des regionsou se forment les tempetes. L'imagerie satellitaire est utilisee pour identifier les limites at-mospheriques dynamiques. Des itudes numeriques de Vinteraction entre les profits environ-nementaux des vents et un orage particulier ont grandement contribue a mieux comprendrele temps violent d'ete. Les etudes des patrons spatiaux et temporels des eclairs, tant dansdes cas specifiques que climatologiques, a contribue a la prevision du temps violent. Lesresultats du radar de polarisation ont demontre des progres dans la classification de lagrele et de la pluie, et dans de meilleures mesures des pluies abondantes. Les observa-tions radar des limites d'air clair et leurs interactions laissent voir un potentiel pour laprevision du declenchement d'orages. Bien que traditionnellement Von ne considere pas lesouragans comme faisant partie du temps violent, ceux qui deviennent des temp&tes extratrop-icales partagent un bon nombres de memes elements dangereux. Les progres en ordinatique,communications et technologies d'afichage ont aussi grandement contribue a la previsionoperationnelle et a la diffusion des avertissements de temps violent.
1 Introduction
Summer severe weather (SSW) can strike suddenly and unexpectedly with dis-astrous consequences. It is intimately linked with thunderstorm and convectiveactivity although recent observations show that strong winds can also originate instratiform rain areas. There have been many studies on the climatology, the char-acteristics, the impact, the modification and mitigation of thunderstorms from allparts of the world (Atlas et al., 1963; Klemp, 1987; Church et al., 1990; Kessler,1982; Fujita, 1981; Grazulis, 1993; Cotton and Anthes, 1989; Rotunno, 1990; toname a few). The thunderstorm is ephemeral and small, often escaping detectionby surface and upper atmosphere observation systems. The environmental condi-

Forecasting of Summer Severe Weather / 251
TABLE 1. Warning description
Type Description
Wind Strong winds that cause mobility problems and possible damage to vegetation andstructures.
Heavy rainfall Heavy or prolonged rainfall accumulating on a scale sufficient to cause local/orwidespread flooding.
Thunderstorm One or more of the following: strong winds causing mobility difficulty, damage tostructures due to wind and hail, heavy rain that may cause local flooding andlightning.
Severe weather Presence of tornado(es), damaging hail, heavy rain, strong winds, life andproperty exposed to real threat, lightning.
Tornado Public has real potential to be exposed to tornado(es).
TABLE 2. Severe Thunderstorm Warning Criteria
Weather Centre Wind Rain Hail Remarks
Newfoundland gusts of90km/h
Mari times
Quebec
Ontario
Prairie
Alberta
gusts of90km/h
gusts of90km/h
gusts of90km/h
90km/h
gust of90km/h
25 mm/h
25 mm in 1 hror 50 mmin 3 hrs25 mm in 1 hror 50 mmin 12 hrs
50 mm/hrfor 1 hr; 75mm for 3 hrs
50 mm in1 hr; 75 nunin 3 hr
30 mm/h
20 mm
15 mm
20 mm
20 mm
20 mm
20 mm
Arctic
Yukon
Pacific
90km/h
gust to90 km/hgusts of90 km/h
25 mm/hr
25 mm in2hr25 mm in1 hr
12 mm
significanthail15 mm
No tornado criteria; no tornado warning;may mention hurricanes in marine warningTornado or tornadic waterspout; no tornadowarning; will issue hurricane prognosticmessage and information statementsTornado, waterspout, funnel cloud,windfall; no tornado warning
No tornado criteria in severe thunderstormwarning; tornado watch issued whenconfirmed tornadoes threaten to move intoregion or issued up to 6 hours in advancebased on analysis or immediately forsevere thunderstorms that indicatepotential for becoming tornadic; tornadowarning on forecast or observationTornado or waterspout probable; tornadowarning issued when expected or observed
Tornado, waterspout; tornado warningwhen observed or expected or waterspoutexists; cold air funnel cloud warningwhen cold air funnels expected but nottornadoesTornado, waterspout, funnel cloud; tornadooccurrence warning on a confirmed reportPotential of tornado; warning is forthunderstorms; no tornado warningLightning intensity of 500 strikes in 1 hrover an area of 1° by 1° latitude/longitude;no watches for severe thunderstormsor tornadoes; no tornado warnings;thunderstorm warning issued on a less thansevere thunderstorm; will issue hurricaneprognostic messages and informationstatements

252 / Paul Joe et al.
TABLE 3. Heavy rainfall warning criteria
Weather centre Warning criteria
Newfoundland 50 mm in 24 hrs
Maritimes 50 mm in 24 hrs
Quebec 50 mm in 24 hrs or 30 mm in 12 hrs during a spring thaw
Ontario 50 mm in 12 hrs; sodden ground/bare frozen ground: 25 mm in 24 hrs; spring:25 mm in 24 hrs; slow moving thunderstorms: 50 mm/3 hrs or 25 mm/3 hrs ifground is sodden
Prairie 80 mm in 24 hrs or 50 mm in 12 hrs
Alberta 50 mm in 24 hrs
Arctic 50 mm in 24 hr
Yukon 40 mm in 24 hr
Pacific 50 mm in 24 hr except in west Vancouver Island and northern coastal regions100 mm in 24 hr and interior of B.C. 25 mm in 24 hr
Weather centre
TABLE 4. Strong wind warning criteria
Warning criteria
Newfoundland 75 km/h and/or gusts of 100 km/h
Maritimes 65 km/h and/or gusts to 90 km/h
Quebec 50 km/h with gusts to 90 km/h or with only gust to 90 km/h
Ontario 60 km/h for 3 hours, or gusts of 90 km/h for 3 hrs
Prairie 60 km/h and/or gusts to 90 km/h for 1 hr
Alberta 60 km/h or gusts to 100 km/h except in Lethbridge Region: 70 km/h or gusts to
120 km/h
Arctic 60 km/h or gusts of 90 km/h
Yukon 60 km/h for 3 hr or gusts to 90 km/hPacific mandatory if 90 km/h expected over adjacent marine areas; discretionary if gale
force winds (63 to 89 km/h) expected over marine areas; discretionary for interiorB.C. 65 km/h or gusts of 90 km/h
tions under which thunderstorms form can be localized in space and time and areoften poorly represented by the data sources. For example, they can form on aconvergence line (Wilson and Schreiber, 1986), possibly created by lake breezesthat are most strongly developed in the mid-afternoon at the time of maximumcontrast between land and lake temperatures (Moroz, 1967). They can also origi-nate on seemingly randomly located thermals. These factors make the thunderstormdifficult to predict.
SSW is defined to consist of tornadoes, strong winds, hail, lightning and heavyrain (see Tables 1 through 4 for definitions and criteria for SSW; MANPUB, 1988).These are all sub-elements of the thunderstorm and are therefore even more difficult

Forecasting of Summer Severe Weather / 253
to detect and predict. Not all thunderstorms have these elements but if they do occur,they may occur more than once. Radar is the only sensor that can see into the core ofthunderstorms to remotely sense their structure and hazardous potential. However,at long range, even a radar may be unable to detect the damaging element. It may beclose to the ground so the radar beam overshoots the hazard due to the curvature ofthe earth, or the size of the hazard may be smaller than the radar volume. Lightningdetection systems provide direct observations of one of the SSW elements. Satelliteobservations reveal only some details of the cloud structure.
Considerable progress has been made in the past few years in the operationalforecasting of SSW. This is a result of new and better technology, better numericalprediction models, better understanding of storm structure and better understandingof the causes of surface wind damage. In this paper, we summarize the progress inthe prediction of severe weather in forecast offices in Canada. Much of the materialis unpublished in the formal literature but an attempt is made to provide a briefdescription of the ongoing activities. We describe the basic forecast processes andproblems, the development and use of conceptual models, recent climatologicalresults of SSW, some signficant observations, the role of new technology and thebetter use of synoptic observations.
2 Forecasting summer severe weathera The Major DifficultyThe essential problem for SSW forecasters is to forecast the severe weather. Themajor problem is the lack of appropriate observations. The observing systems ofthe basic meteorological parameters of temperature, humidity, pressure and windwere established to forecast the daily weather. SSW phenomena can be smaller than1 km and last less than 5 minutes for tornadoes and microbursts or can be severalhundreds of kilometers in size for mesoscale convective systems and hurricanesand last for several days. However, the basic surface meteorological observationsare separated by several hundred kilometers and are taken routinely every sixtyminutes (Fig. 1). Special observations are made when a significant change is noted.The upper air data are spaced about 1000 km apart and collected every 12 hours.While satellite and radar data have higher spatial and temporal resolution, upper airand surface data provide the basic state parameter measurements needed for initial-ization of numerical weather prediction models and diagnosis of the atmosphere.
Conditions local to the formation of individual thunderstorms govern their sever-ity. On a given day and in a given area, thunderstorms evolve in different ways. Thesame comments could be applied to individual updrafts in a multistorm complex.Therefore, these environmental conditions are severely undersampled in space andtime. In addition, many atmospheric features responsible for SSW are not surfacebased, can have time scales of several hours and can be totally undetected by theupper air network (Bonner, 1968). However, the basic premise of the SSW fore-caster is that with sufficient scientific training, experience and local knowledge, thesmall scale (10 km) behaviour of the atmosphere is predictable. Needless to say,this is a very difficult task.

Fig. 1 Upper air (left) and surface observation (right) network. The dots mark the location of observing stations. The U.S. upper air stations are also plottedsince many are used in the preparation of weather watches in Canada.

Forecasting of Summer Severe Weather / 255
b The WatchForecasting of SSW is broken into two categories - the watch and the warning. Thewatch is a statement of the potential development of severe weather and is based onthe large-scale observations. It is broad in spatial scale (100 km) and in time (3-12hour). The essential analysis technique was established by Fawbush and Miller(1953). The analyst looks for adequate thermodynamic, moisture and dynamicconditions and a mechanism to lift a parcel to its level of free convection (Doswell,1982; 1985). When and where these factors come into juxtaposition, thunderstormsare likely and a watch is issued for the potential of severe weather. No attempt ismade to characterize the type of expected severe weather.
An analysis of upper air data to identify areas of instability is made - essentiallyan analysis of cold over warm air (an unstable condition) taking into considerationpressure and moisture effects (Iribarne and Godson, 1973). Fig. 2 shows a soundingfrom Flint, Michigan on Aug. 28, 1990 - a day that produced a very strong tornadoin southwestern Ontario. The sounding is valid for the observation time of 12Z but ismodified on the basis of surface observations, diurnal effect, boundary-layer mixingand perhaps mid or upper level differential advection effects that may occur thatday in southern Ontario. From this, the forecaster estimates the weather potentialat later times. The instability of an upper air sounding is assessed by the lifting ofa surface parcel. If the parcel does not mix with its environment, the changes tothe thermodynamic characteristics of the parcel are adiabatic. Before condensation,the process is dry adiabatic (corresponds to the leftmost-leaning curved line onFig. 2). Once condensation occurs, the parcel follows the moist adiabatic curve(the rightmost left-leaning curved line on Fig. 2). Latent heat of condensation isreleased which enhances the lifting process generating the thunderstorm updraft.The resulting line is known as a process curve for a surface parcel. The greaterthe difference from the environmental sounding, the greater the updraft speedsand the more severe the resulting thunderstorm. Many variables or indices havebeen developed to describe the severe weather potential of this process curve. Forexample, the potential buoyant energy (PBE) is the area between the process curveand the temperature sounding and the lifted index is the difference between thetemperature and process curve at 500 hPa. Both are estimates of the energy releasedto the updraft.
A general assessment is made of the synoptic weather pattern. Fig. 3 shows anexample of this part of the analysis - the composite chart. On this chart, dy-namical features are analyzed for the observation time of 12Z. These include thelocation of fronts, high and low level jets, areas of moisture, to name a few. Anyrelevant features may be added. Again, the forecaster estimates the progression ofthese upper-level thermodynamic and dynamic conditions and assesses their im-pact, in conjunction with the diurnal variation in the surface weather, to arrive ata spatial and temporal window for severe weather development. The differencebetween the upper air observations upon which the analysis is made and the oc-currence of severe weather is often eight to twelve hours, so constant monitoring of

256 / Paul Joe et al.
FNT AUG28 1990 1200Z
Fig. 2 A 12Z upper air sounding from Flint, MI, Aug. 28, 1990. A typical sounding of a tornadicstorm environment with a moist low-level and a dry mid-level layer.
the atmosphere is needed to ensure that the assessment is correct. Differences be-tween the assessment/forecast and available observations - such as the unexpecteddevelopment of thunderstorms - initiates a feedback process in which the forecastmay be reassessed.
c The WarningThe warning is a specific nowcast of SSW. When an individual thunderstormexists or is about to form, a warning message is issued to inform the public ofits occurrence and perhaps its character. This is based on the actual detection ofa hazard by human observers and/or radar. Depending on locale, the warning isfor an area of about 104 km2 - typically the size of several counties. A warningmay not be issued if a thunderstorm is not expected to produce SSW. The oper-

Forecasting of Summer Severe Weather / 257
990 1200ZCompositeA
High Level Jet.90 knots"
Fig. 3 An example of a composite chart for 28 August 1990 12Z used to produce the severe weatherwatch. The chart depicts key SSW elements such as the area of high moisture (light shading),the upper level jet, the jet max (dark shading) and the cold and warm fronts.
ational techniques, in the early eighties, relied solely on the reflectivity structureof the thunderstorm. Many of these radar warning techniques are well documented(Burgess and Lemon, 1990; Donaldson, 1961; Donaldson, 1965; Doswell, 1985;Forbes, 1981). The warning process is complex; it is described more fully in thenext section.
3 Conceptual modelsa Role in Forecast ProcessThe production of a useful SSW weather warning requires years of experience,an ability to assimilate volumes of data, a talent to interpolate between sparselyspaced observations, an ability to extrapolate in time the movement of air massesin three dimensions and most importantly an ability to scientifically interpret theinformation. These processes all occur in the SSW forecaster's mind where the dataare transformed into information. Conceptual models are used to make sense of thevarious pieces of information to form a coherent picture of the puzzle. They are theheart of SSW forecasting (Johns and Doswell, 1992; Joe and Leduc, 1990). Patternsof the large-scale observations form clues and the framework. Necessary dynamicaland thermodynamical (including moisture) factors and a lifting mechanism arerequired for SSW to initiate. Sometimes, these factors are large scale in nature
258 / Paul Joe et al.
and are captured by the observations. Yet, in many other instances, these factorsare localized and difficult to identify. In between, mesoscale convective systems(MCS) with spatial scales of the order of 100 km are longer lived and are morepredictable once they form.
Recent model refinements have greatly explained the occurrence of SSW wherenone was expected. Several models come to mind:
• Strong downbursts (Fujita, 1985) can produce localized diverging damage pat-terns similar in some respects to weak tornado damage patterns. Downburstsoccur with most thunderstorms; but, damaging downbursts are intense, smalland less frequent. Upon hitting the ground, the downdraft air diverges horizon-tally causing the wind damage. Microbursts are defined to be less than 4 km indiameter with a velocity differential of at least 10 m/s (Campbell et al., 1989).It is the most hazardous form of low level wind shear to aviation. This is anoperational definition in that these are the critical thresholds beyond which anaircraft will experience great difficulty. Between 1975 and 1985, the microburstis known to have been responsible for the loss of 500 lives in aircraft accidents(Fujita, 1985).
• The refinement of the pulse thunderstorm models for weaker but still potentstorms has helped fill the gap (Wilk and Dooley, 1980). They grow and die veryquickly, are randomly located and little prediction of individual storms is possi-ble. They form in environments with high potential buoyant energy (>3000 J/Kg)but with little wind shear (<5 m/s in the lowest 3 km). The precipitation es-sentially falls back into the updraft cutting off the supply of moisture. Outflowboundaries may be formed that can initiate subsequent redevelopment - conse-quently, generating a pulse-like cyclical behaviour.
• The development of tornadoes along a thunderstorm gust front boundary hashelped to explain the presence of tornadoes where none was expected (Wilsonand Schreiber, 1986; Wilson et al., 1992). Precipitation associated with thesetornadoes may be weak, appear close to the ground, and occur away from themain core of the thunderstorm, therefore remaining almost undetectable by radar.These tornadoes originate from surface-based processes and can induce rotationwithin the cloud aloft. For now, they are unpredictable because they have beenso difficult to detect and their precursors are poorly understood or non-existent.Storm-scale models (Lee and Wilhelmson, 1993) have simulated their devel-opment and it appears that the temperature contrast across the gust front andevaporation are needed to create vorticity through a baroclinic spin-up process(Brooks et al., 1994b).
• Low precipitation (LP) and low topped supercells have explained the develop-ment of tornadoes and other SSW phenomena when the weak radar echo structurehas eluded deciphering (Moller et al., 1994; Davies, 1993; Kennedy et al., 1993).These develop in dynamically unstable environments, low in moisture, but highin available potential energy.

Forecasting of Summer Severe Weather / 259
• The understanding of the mesoscale convective complex (MCC) and the role ofthe rear inflow jet has explained the widespread wind damage behind the leadingconvective squall line (Smull and Houze, 1985; Joe et al., 1990; Nichols, 1990)There appear to be several mechanisms for the initiation of the rear inflow jet:precipitation loading, a dynamically induced low pressure zone behind the squallline and downward deflection of mid-level air. Only a few systems have beenobserved in detail in research projects but those that have been observed havebeen well documented.
b Forecasting with Conceptual ModelsTo an increasing degree, the forecaster's role has evolved into one of finding agood correspondance between real time data and the initial conditions of one ofthe storm models such as described above. This is not an easy job. There are subtledifferences between the storm types; the sparse data are often insufficient to differ-entiate amongst the research modelling results. However, there are many situationswhere synoptic weather patterns, combined with smaller scale vertical profiles oftemperature and wind, do closely match the inputs used in numerical models togenerate a particular storm type. Here, based on such "objective" indices as PBE,vertical wind shear and helicity, the forecaster can have some confidence that aparticular type of storm will develop (Johns and Doswell, 1992). Numerical mod-elling suggests that these numbers can differentiate among supercells, bow echosand pulse storms (Weisman and Klemp, 1984). This has led to more specificity andprecision in the forecast.
In the model identification process, the forecaster will initially divide the geo-graphical area of responsibility into several subareas. A different conceptual modelmay fit the data in different sections. As well, the data in some forecast regionsmay equally support more than one possible storm model due to inaccuracies inthe extrapolation and interpolation of upper air soundings from the 12Z data. Asthe situation evolves, new data, particularly radar data, will confirm the validity ofthe conceptual model or allow a choice to be made from equally likely models.The data will feed back into the learning curve about these models. This results inan improved forecast process (Joe and Leduc, 1990; Joe et al., 1993).
This technique of convective weather forecasting is a big change from the earlyeighties. The early techniques were analogue or statistical in nature and lookedfor a best fit between mandatory level wind, temperature and humidity values ofthe given storm and known major "classic" events. It is not surprising that thesestatistical methods do not work for the non-classic events since, in recent years,there has been a recognition that there are many different storm types that canproduce damage. The new objective techniques provide a far more encompassingview of the severe storm environment.
4 Climatologya Damage Classification and SurveysClimatological studies of SSW are of great benefit to the forecaster. However,

260 / Paul Joe et al.
TORNADO INCIDENCE(per 10.000 km2)
4.0
Fig. 4 Tornado incidence map for North America (after Newark, 1984). The highest incidence occursin mid-western U.S. with an extension to the northeast up the Ohio valley towards southwesternOntario.
climatological studies are very difficult because of the ephemeral nature, poordetectability and blurred classification of SSW. Anecdotal evidence in newspaperarticles forms the primary database for many of these studies (Newark, 1984, 1988).
Proper deduction and classification of the cause of wind damage is critical to theuse of these climatological studies. For example, damage due to microbursts wasnot (and may still not be) properly classified with the result that there was an over-abundance of tornadoes reported (Fujita, 1981, 1987). This artificially introducesan error that recursively leads to a poor foundation for the conceptual model and

Forecasting of Summer Severe Weather / 261
to poor correlations. Damage due to thunderstorms is rare and these classificationerrors can therefore have a large effect on small sample events. This often resultsin contradictory opinions about the required environmental conditions for the for-mation of tornadoes and microbursts. While there are still many problems, betterand more accurate damage classification has reduced the scatter. Mis-classificationis real. There is some pressure by assessors or reporters to attribute wind damageto tornadoes because of insurance considerations or for media hype. Damage dueto tornadoes is covered under an "act of God" clause of insurance policies andclaimants may qualify for disaster aid funds whereas straight-line wind damage isgoverned by adherence to building code standards.
b TornadoesPrior to the late 1970's, tornado occurrences in Canada were considered to berare events. Newark (1984) published the most complete climatological study ofCanadian tornadoes to date, using data up to 1979, demonstrating that tornadicevents should be deemed more than simply rare occurrences. Results show that thehighest risk of tornado damage exists in southwestern Ontario which is an extensionof the Ohio maximum in the United States (Fig. 4). An analysis using post-1980data shows that tornadoes have been reported in greater numbers across Canadathan reported in Newark (1984), particularly in the southern Prairie provinces andespecially, in anomalously warm summer months (Etkin, 1994). Southwestern On-tario is more prone to high intensity tornadoes; of the eight F4 events recordedin Canada, seven have occurred in southwestern Ontario and only one in westernCanada.
There are also many biases in the available climatological data. Large events areprobably better represented, but marginal events may be misclassified. The strongestevents have the most classic damage patterns (Fujita and Smith, 1990; Grazulis,1993). Weaker events and weaker parts of the damage paths may exhibit ambiguousdamage. Weak events frequently fail to exhibit either divergence or convergence inthe patterns of debris deposition. Recent work (Etkin and Leduc, 1994; Paruk andBlackwell, 1994) that takes into account population biases in reporting ephemeralevents has shown a difference by up to an order of magnitude for very low populatedareas from Newark's study. Fig. 5 should be interpreted in this light; areas withlow population density (which is more common in western Canada than in southernOntario and Quebec) under-report tornadoes to a much larger extent. Fig. 6 showsthe 74-year trend in tornado reports with a large increase in reports beginning about1980 corresponding to the development of SSW forecast operations, widespreaduse of radar, watcher networks and most importantly, increased awareness by thepublic.
c MicroburstsA climatological study was initiated by Transport Canada (Low, 1993) to help esti-mate the occurrence, frequency and location of microbursts in Canada (Fujita,1985). The objective was to account for both wet and dry microbursts. The latter

262 / Paul Joe et al.
Frequency of Observation*: 19 1
140W 130W 80W 70W 60W 50W
Fig. 5 A population bias-compensated tornado incidence map. This map differs from Fig. 4 in thatreports in low population density areas are statistically boosted to adjust for under-reporting.Note the general increase in western Canada where the population density is low.
100
0)
o
oCO 60
o
ez
1918 1926 1934 1942 1950 1958 1966 1974 1982 19901922 1930 1938 1946 1954 1962 1970 1978 1986
YearFig. 6 Number of tornado reports as a function of time. Note the increase in trend in 1980 which
corresponds to the creation of severe weather programs in the forecast centres and other factors,not related to the occurrence of weather.

Forecasting of Summer Severe Weather / 263
2025
Fig. 7 Microburst occurrence map based on synoptic observations. The isopleths are lines of equalrelative frequency (%) of potential microburst days in Canada. The map takes into account drymicrobursts which may occur in the absence of thunderstorm reports. Occurrences in coastalregions are overestimated (see text).
type could occur in the absence of a thunderstorm report. The technique was toidentify a "microburst day" from the available climatological database of hourlysurface observations and twice daily radiosonde soundings. Surface weather pa-rameters and upper air indices were developed and tested as microburst indicators.Detailed research data from U.S. microburst experiments (McCarthy and Wilson,1985; McCarthy et al., 1982; Dodge et al., 1986; Fujita, 1979; DiStefano, 1987;Rinehart et al., 1986) were initially used to find the most significant predictors.Then, the operational National Weather Service climatological database was usedfor independent test and verification. Not too surprisingly, using the climatologi-cal database, it was difficult to statistically determine the conditions under whichmicrobursts occur. However, the testing concluded that microbursts did not occuron days with the ceilings always greater than 5000 m, with the low cloud typenever being reported convective, with the wind direction never deviating by morethan 60° and never exceeding 60 km/h or with the wind being reported less than20 km/h. Fig. 7 shows the resulting incidence map for Canada. With the statedcriteria, non-convective maritime conditions with strong winds and low ceilingscan produce false indications. In absolute terms, the numbers may have very littlemeaning and may overestimate occurrences by 50%. However, in relative terms,the analysis shows a maximum in southern Alberta, and a secondary maximum

264 / Paul Joe et al.
Fig. 8 Total recorded cloud-to-ground flash density map for the warm season averaged over the threeyears 1989-1991 (km^/yr"1). Note the maximum over southwestern Ontario and the decreaseto the north and east (after Clodman and Chisholm, 1994b). Contour levels are selectivelylabelled in the figure and apply for the entire figure. The relative maximum in southwesternOntario is due to preferred thunderstorm development which is clearly indicated by this figure.
along the north shore of Lake Ontario, which is not unreasonable. To "calibrate"the results of this microburst climatology study for Canada, a feasibility study toestimate the absolute frequency of microburst occurrences using radar was initiated(Bellon and Zawadzki, 1994). Since there are few Doppler radars across the countryat this time, this study attempted to verify a three-dimensional reflectivity algorithmfor the occurrence of downbursts (Stewart, 1991) with Doppler observations.
d LightningLightning is a complex electrical phenomenon and is very difficult to forecast, partlybecause it is not fully understood (Uman, 1987; Williams et al., 1989). Forecastsfor the Canadian forestry program have focussed on the expected fire damage inrelation to ground lightning counts. At the Mountain Weather Service Office inKelowna, B.C., the public warning program relies heavily on the monitoring oflightning strikes as indicators of severe weather. Another major user of lightningdata is the hydro utilities, where lightning strikes can cause havoc with the distri-bution of electrical power. Recent case studies have shown that lightning is relatedto other severe weather hazards - downbursts, tornadoes, heavy rains (Williams

Forecasting of Summer Severe Weather / 265
et al., 1989; Kane, 1991; Keighton et al., 1991). The lightning flash density forslow-moving high-rainfall storms has been related to heavy rain events (Clodmanand Chisholm, 1994a).
Lightning climatology, as a measure of convective storms, has the advantagesof objectivity, and temporal and spatial precision and can be expressed as total flashdensity, lightning-day frequency or frequency of high flash density cases(Clodman and Chisholm, 1994b; Orville, 1994). Results from lightning detectionsystems show differences from conventional thunder-event observations (Reap,1993). The mesoscale variations of lightning flash density in Fig. 8 can be ex-plained in terms of lake effects, orographic lift and possibly terrain cover (Lopezand Holle, 1986).
5 Phenomena
a IntroductionConceptual models and observations go hand in hand. Routine observations oftenare at variance with the models and understanding of these observations leads tomodification and development of better conceptual models. Occasionally, certainobservations lead to significant changes in the way the problem of SSW forecastingis approached.
b MesocyclonesThe prime motivation for the operational implementation of Doppler radar is thedetection of tornado precursors. Fig. 9 shows a radial velocity image of a meso-cyclone and the results of an automated detection algorithm. Without the aid ofan automated algorithm, it is difficult and excessively time consuming to pick outthe areas showing mesocyclonic rotation (Leduc and Joe, 1987; Joe and Crozier,1988; Desrochers et al., 1986; Zrnic et al., 1985). In order to provide adequatelead time, the pattern recognition algorithms are tuned for a high probability ofdetection. Vertical and time continuity of the feature are used to reduce the highfalse alarm rate that results from a sensitive algorithm. Fig. 10 shows the verti-cal histories of mesocyclone parameters which may be useful in the prediction oftornado development (Burgess et al., 1988; Joe and Crozier, 1988). The develop-ment of the average shear across the mesocyclone is consistent with the touchdownof the tornado. However, there is little predictive capability. The evolution of themomentum parameter shows a much earlier development and potentially could beused in a predictive manner. More studies of tornadic mesocyclones need to bedone to establish the statistical significance.
This case and others (Joe and Crozier, 1988; Leduc and Joe, 1987) have ledto significant conclusions regarding the operational use of Doppler radar. First,conceptual models of mesocyclones that were developed in a different climaticregime have some validity in southwestern Ontario; however, the structures of thestorms are vastly different. The mesocyclonic storm models have been developedfor isolated supercellular storms whereas the Ontario storms are much more multi-

PPI00.7
H/S <UNFOLDED)
MESO 3A2 S
67 222 643 2061952189 18
JKR2200 Z
24 JUL 872200 Z I
24 JUL 87 1 20 KX1 RINGS
MADHT 0KM1.8 270 131.4 270 80.9280 120.6 260 8[0.3 290 1310.1 290 12120 Kfi RFig. 9 A radial velocity image of a mesocyclone embedded in a multi-cell storm complex (left) and the results of an automated detection algorithm (right).
The data are from 24 July 1987 2200 and 2210Z. Circles highlight significant areas of azimuthal shear (3= 2 m/s/km) from multiple elevation scans.The base image is a reflectivity map used to provide contextual information.

Forecasting of Summer Severe Weather / 267
September 17 1988
<S> m/s/km
2010 2020 2030 2040 2050 2100 2110 2120 2130 2140Time
213C
I Elev - 0.5 Elev • 1.4 tttM Elev - 3.5
September 17 1988
PMAX m/s km
600
500
2010 2020 2030 2040 2050 2100 2110 2120 2130 2140
I Elev • 0.5
TIME
Elev • 1.4 Elev • 3.5
Fig. 10 Temporal history of a tornadic mesocyclone showing the early development of "momentum"(PMAX) that decreases to touchdown (indicated by the arrow). Contrast this with the latedevelopment of the average "shear" ((S)). This behaviour has been consistently observed inthe few confirmed cases of tornadoes. The three plots in each graph are for the mesocyclonecharacteristics at three elevation angles (0.5°, 1.5° and 3.5°). The arrow indicates when theFO tornado touched down. The units of time are in hours (first two digits) and minutes (lasttwo digits). The data are from 17 September 1988.

268 / Paul Joe et al.
cellular with embedded convection. Alberta storms have characteristics similar toOklahoma storms (Holt et al., 1994). The tuning of the detection algorithm mustbe modified to detect weaker mesocyclones and to extend the lead times.
On 28 August 1992, a Fl tornado was reported in Newcastle, Ontario near theshores of Lake Ontario with a storm that had a different mesocyclone structure(not shown) than that just described. The mesocyclone and the tornado lasted lessthan ten minutes. In the previous case, the mesocyclone appeared at mid-levels ofthe storm and progressed downwards. In this case, the mesocyclone could only beidentified on the lowest elevation angle (0.5°). It was surmised that this tornadowas surface based. This was the first observation of a boundary-layer tornado anddemonstrated that conditions sufficient for its spin-up existed in southern Ontario.This case also demonstrated that not all tornadoes can be detected with sufficientlead time for the provision of warnings.
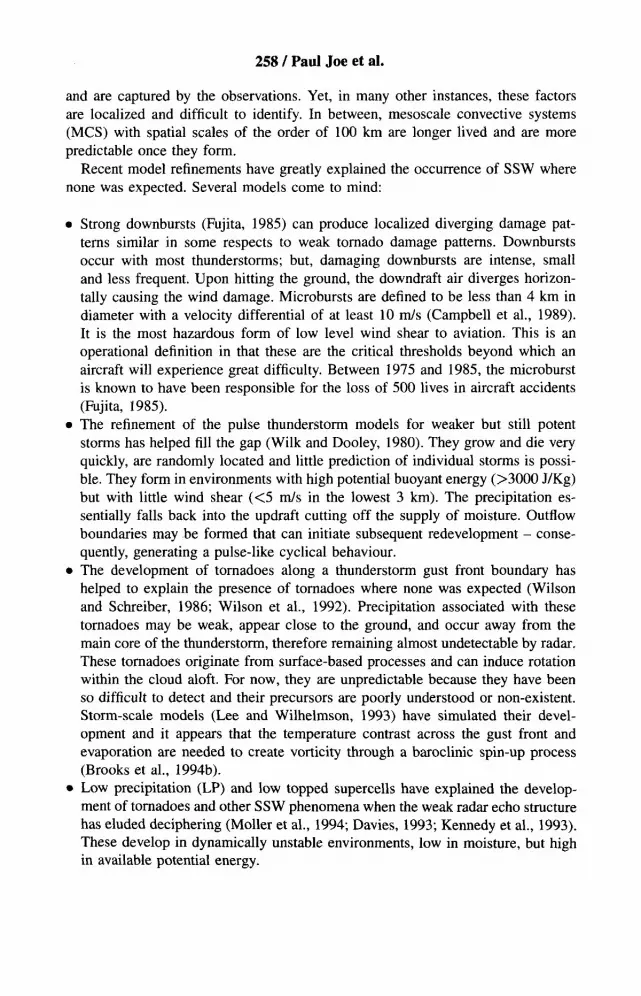
c Rear Inflow JetsRoutine operational observations of mesoscale convective systems (Joe and Leduc,1990; Knott and Van de Velde, 1992) exhibit many more features than re-ported in the formal literature. These features include multiple inflow jets, descend-ing and rising jets and various initiation locations (implying various developmentmechanisms). Fig. 11 shows an example of a mesoscale convective system withdual rear inflow jets. Fig. 12 shows an example of a rear inflow jet from 28 March1992 that produced surface wind damage. The rear inflow jet descended much morerapidly than cases reported in the literature (Smull and Houze, 1985) implying adifferent formation mechanism. Straight-line wind damage was reported with a re-peated spacing of about 190 km, suggesting a periodicity to the surfacing jet. Thesignificance of this observation (and others) was that the strong winds found in theseemingly benign light stratiform rain area, sometimes several hundred kilometersbehind the initial convective squall line, can cause severe wind damage.
d DownburstsDownbursts are a common feature of thunderstorms (Fujita, 1985) and are related tothe formation of the descent of the precipitation core. Critical factors in the devel-opment of the most intense downbursts are precipitation loading, evaporation andentrainment of mid-level dry air. Wet microbursts (strong convective downdraftscoincident with a significant shower) are not necessarily associated with supercellsor multicells (that is, strong convective updrafts), but can also occur under condi-tions of moderate potential buoyant energy and weak shear. Recent studies (Aitkinsand Wakimoto, 1991) show that an environment favouring wet microbursts is char-acterized by the presence of very dry air at mid-levels. It is possible to identify suchenvironments with the equivalent potential temperature profile. Recent cases veri-fied at the Quebec Weather Centre (Siok and Biron, 1992) show that this approachshows some promise.
Fig. 13 shows a Doppler radial velocity image of a macroburst from 13 June

Fig. 11 Reflectivity (left) and radial velocity (right) maps showing a leading squall line (approximately aligned with azimuth 230° (left figure)) with a trailingstratiform region to the northwest. The radial velocity image shows two areas of toward radial velocities in the stratiform rain area indicative of tworear inflow jets at azimuths 275° and 315°. The data are for July 17 1987 13Z (after Joe et al., 1988).
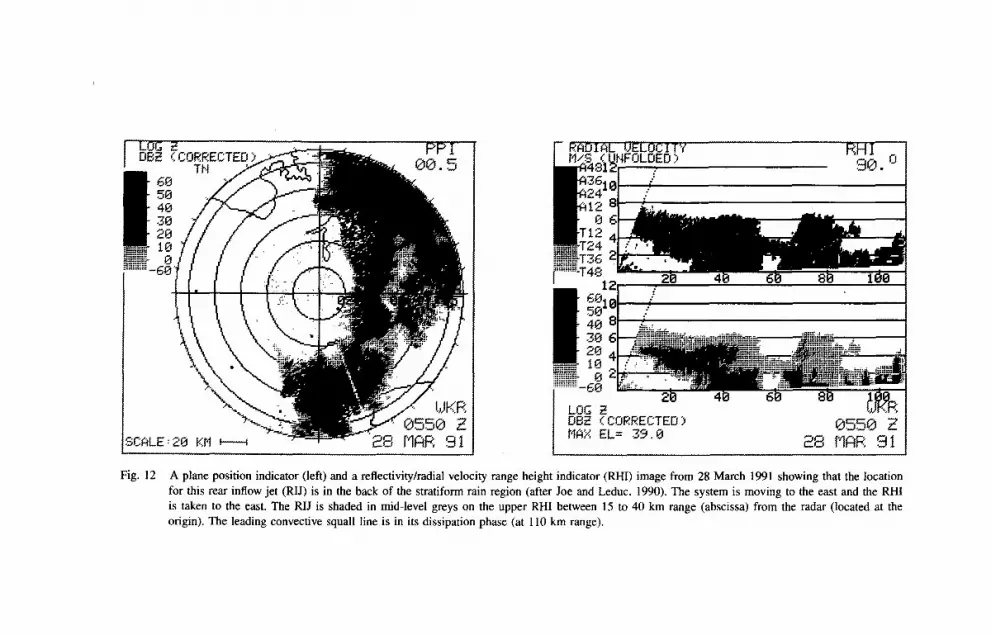
Fig. 12 A plane position indicator (left) and a reflectivity/radial velocity range height indicator (RHI) image from 28 March 1991 showing that the locationfor this rear inflow jet (RIJ) is in the back of the stratiform rain region (after Joe and Leduc, 1990). The system is moving to the east and the RHIis taken to the east. The RIJ is shaded in mid-level greys on the upper RHI between 15 to 40 km range (abscissa) from the radar (located at theorigin). The leading convective squall line is in its dissipation phase (at 110 km range).

Fig. 13 A radial velocity image showing the rapid development of a downburst. The circle highlights the divergence signature approximately 20 km indiameter. The image is from June 13, 1987.

272 / Paul Joe et al.
1987. Stewart (1991) developed a volume scan reflectivity-only technique that pre-dicted the strength of thunderstorm downdraft. It was based on Emanuel's (1981)theory of penetrative downdrafts. Bellon and Zawadzki (1994) validated this tech-nique with Doppler data and demonstrated the commonness of these downdrafts.As discussed earlier, it remains to determine the frequency, characteristics and pre-dictability of the microburst in Canada. The microburst is a special case of thedownburst that is characterized by its short duration, small size, intense horizontalvelocities and an intensification process (Caracena, 1982; Fujita, 1985). Its detec-tion and therefore prediction is very difficult because of the short duration (about10 minutes) of its entire life cycle. Specialized radar scanning is required to provideadequate detection capability. The microburst is a particular hazard to the aviationindustry, where aircraft have great difficulty in recovering from encounters whenthey are close to the ground during takeoff and landing. The issuance of warningsfor microbursts has little value for the general public because of the lack of ad-equate lead and reaction time. However, the common occurrence, short duration,small size and diverging wind have explained many of the surface damage patternsthat were in the past incorrectly attributed to small tornadoes.
e Gust FrontsDoppler radar observations have permitted the forecasting of very precise featuresin precise locations. Fig. 14 shows the analyzed results for 14 Oct 1989 of theautomated detection and display of three gust fronts passing through the PearsonInternational Airport. Contiguous areas of radial shear in the radial velocity fieldwere analyzed to locate the gust fronts. This example shows the precision in timing,location and hazard identification that is possible with Doppler technology andnot possible with reflectivity only systems. The three gust fronts passed throughthe airport within 20 minutes of each other. With this level of sophistication, theuser must be sufficiently knowledgeable about the weather to properly utilize theinformation.
f Convergence LinesDetection of "clear air" returns has not been a traditional use of weather radar. Inthe past, radar reflectivities have been thresholded to remove non-precipitation tar-gets. However, with the implementation of Doppler radar technology and the desireto detect the lowest possible echo intensity to examine wind fields, the thresholdinghas been removed and line echoes less than 15 dBZ are often observed in radardata. These line echoes have been identified with atmospheric boundaries includinglake breezes, thunderstorm outflows, drainage flows from mountain valleys, to namea few (Wilson and Schreiber, 1986). The intersection of these lines or their inter-action with pre-existing thunderstorms enhances upward motion. Thunderstormshave been forecast up to 30 minutes before the first precipitation echo and strongthunderstorms have developed from weaker ones (Wilson and Mueller, 1991). Itremains to determine how to extend observations of the line echoes and their evo-

Forecasting of Summer Severe Weather / 273
40 kmscale
Fig. 14 The location and timing of three gust fronts, determined from the King Doppler radar, passingthrough the Pearson International Airport (Toronto) illustrating the precision possible in SSWforecasting. The data are from 14 October 1989.
lution to produce weather warnings. One of the many questions that remains is thenature and climatology of the "clear air" target(s), to determine the effectiveness ofthis forecasting technique. They have been readily observed in radar imagery fromthe C-band Carvel (Vickers, 1992a), near Edmonton, and S-band Alberta ResearchCouncil radars but only rarely in Southern Ontario (Fig. 15).
g Flooding1 INTRODUCTION
Forecasting for flood situations is different from forecasting the other SSW ele-ments. Like many hazards, flooding is not very frequent but the results can bedevastating. Depending on the precipitation rates and the ground condition (seeTable 3), a flooding event occurs over hours or days while at the same time in-formation on precipitation rates over the time scale of minutes is needed for fore-casting. Time of year and the underlying ground condition play a significant roleand must be taken into account. For example, moderate to heavy precipitation eventscombined with melting of accumulated winter snowfalls, which independently maynot pose a problem, are often the cause of flooding in the spring time. Ice jamsthat block the flow of the resulting water compound the problem.

Fig. 15 An example of long-lived clear air line echoes from the Carvel radar (Alberta). The line precedes the storm complex to the west. Reflectivities aregenerally less than 10 dBZ. The data are from 19 August 1991.
Forecasting of Summer Severe Weather / 275
Hooding situations also often occur with quasi-stationary storms. If a stormremains at a convergence location, such as a lake breeze/convergence line, it canbe sustained despite the lack of shear (Chandik and Lyons, 1971) and the stormsare to some extent predictable (Clodman and Chisholm, 1994a). Extreme pointrainfalls and lightning flash densities are possible; one storm in southern Ontariogave over 400 mm of rain (Leduc and Conway, 1990) over a 36-hour period.
2 DECAYING HURRICANES/TROPICAL CYCLONES
Eastern Canada, in particular the Atlantic coastal waters, is affected by tropicalcyclones (or the remnants of them) two to three times per year on average. Thesesystems are normally decaying as they move over colder waters, and accelerateunder the influence of the mid-latitude westerlies. However, on occasion, thesetropical disturbances interact with baroclinic systems, resulting in an increase insurface winds and even more threatening, a significant increase in precipitation. In1954, the remnants of hurricane Hazel (Knox, 1955; Palmen, 1958; Anthes, 1990)interacted with a mid-latitude low pressure system, and was transformed into anextra-tropical storm. The result was 80 deaths and 24 million dollars in damage inSouthern Ontario, largely due to flooding. The forecaster continues to be influencedby this event and is watchful for similar weather conditions. While these types ofevents are rare, several other examples have been studied. In September, 1938(Pierce, 1939), a hurricane interacted with a frontal system over New Englandand was transformed into an extra-tropical storm of hurricane intensity; with 680deaths and 400 million dollars in damage. Similarly, in 1972, Agnes interactedwith a mid-latitude trough aloft (DiMego and Bozart, 1982) resulting in 3.5 billiondollars damage. Inland and coastal flooding was responsible for most of the deathsand damage.
More recently, Hurricane Hugo followed a similar track to that of Hazel, passingthrough the King City Doppler radar coverage in Southern Ontario (Abraham etal., 1991; Joe et al., 1991). The surface conditions were similar as well - withmoderate to heavy rains preceding the storm that soaked the ground. The rem-nants of Hurricane Hugo also interacted with a strong baroclinic zone associatedwith a cold front (Fig. 16). As well, surprisingly, "Hugo" continued to possessconsiderable tropical characteristics well inland. Fig. 17a shows that the Buffaloand Pittsburgh upper-air soundings through Hugo were essentially those of a meantropical profile (Anthes, 1982). The Doppler radial velocity winds (Fig. 17b) showhurricane force winds still existing 1000 m above the surface, suggesting that thishurricane cum extra-tropical storm was detached from the boundary layer. UnlikeHazel, the remnants of Hugo accelerated rapidly in a strong southwesterly flowaloft, keeping the bulk of the tropical moisture and circulation well ahead of thebaroclinic zone. Severe interactions like Hazel, Agnes and the storm of 1938 arerare. In addition, relatively little study has been done on these type of complextransformations. Consequently, meteorologists in middle latitudes world-wide be-come very concerned when tropical and "post" tropical cyclones pass into theirareas of interest.

Fig. 16 Two CAPPI images of extra-tropical storm Hugo interacting with the cold front to the northwest. At 2330Z, Hugo is the rain band stretching fromazimuth 220° to azimuth 110°. The cold front is the narrower rain band to the northwest. At O33OZ, the entire system has rotated counter-clockwisewith the cold front lying from azimuths 190° to 20°. At this time, Hugo is the band to the east of the cold front and is accelarating away at thispoint. The image is from 22 September 1989 (after Joe et al., 1991; Abraham et al., 1991).
20 330 340 350 330 370
lhetae (K)
(a)
RADINL UELOCITYM/S ' UNFOLDED >
IN >t
23 SEP 89
(b)
Fig. 17 (a) Soundings from the synoptic upper air network that passed through extra-tropical Hugo showing the remarkable similarity with the tropical phase(Anthes, 1982) and (b) a 0.5° radial velocity map showing winds of at least 24 m/s, 1 km above the surface (from 140° to 175° azimuths). A cycloniccirculation can be deduced from the strong inbound velocities (just described) and the outbound velocities at azimuth 205°, forming a mesoscalerotation couplet of about 80-100 km in diameter centred about 160 km south of the King radar. Adjusting for the viewing angle, the 24 m/s towardvelocities are deduced to be in excess of 36 m/s, strong enough to be classified hurricane force (after Joe et al., 1991; Abraham et al., 1991).

278 / Paul Joe et al.
3 FLOOD FORECASTING BY RADAR
The capability of radar to delineate rainfall accumulation patterns has not been fullyexploited in North America (Collinge and Kirby, 1987). The intercomparisons ofrain rates estimated by a radar volume measurement to raingauge point measure-ments have large scatter. To a large extent, the scatter is a result of the difference inmeasurement technique. This has hindered the acceptance of radar rainfall patternsby hydrologists (Zawadzki, 1975; Wilson and Brandes, 1979; Brandes and Wilson,1982). Also, the radar maps cannot be directly translated into flooding estimateswithout a hydrological model and a mapping of the underlying terrain (Kouwenet al., 1993; Kouwen and Garland, 1989) and assumptions or measurement of pre-existing ground moisture conditions.
The real-time delivery of area maps of radar-derived rainfall estimates in a nu-merical format combined with an objectively derived hydrological model has shownexcellent comparisons (Fig. 18) and is now being operationally evaluated by theGrand River Conservation Authority of southern Ontario. The flood forecast system(WATFLOOD) uses the previous seven days of radar data to initialize the soil mois-ture content. The radar-derived stream flux can be adjusted by the measured streamflux, if available, and the radar rain rate estimates are accumulated to produce thestream flow estimates.
The Montreal Urban Community is receiving radar rainfall estimates for evalu-ation. The urban hydrology problem is different from the river flooding problem.Higher spatial and temporal resolution is required since the lag time from rainfallto sewer flow is typically 5 to 15 minutes and catchment areas range from a fewhectares up to several kilometers square (Kouwen and Soulis, 1992).
6 Technologya IntroductionThe enormous progess in computing power has allowed great and rapid advancesin the manner in which SSW forecasting can be approached. The advances havecome mainly in the development of SSW forecasting tools. The actual forecastprocess (described above) is still necessarily dependent on the human. Availabilityof computing power has allowed developments to be made in a broad range ofareas. Developments in communication systems have allowed greater access tothe data for more people which in turn fosters the development of more weather-related applications. In this section, we discuss some of the tools that have beendeveloped as a result of the increased computer power and data access. As discussedearlier, radar systems play a crucial role in SSW forecasting; and Doppler radarsin particular have played a prominent role.
b RadarRadar has played a key role in the progress of SSW detection and prediction,because of its extensive range coverage (typically 250 km) and resolution (1 km).This has been extensively documented (Joint Doppler Operations Project, 1979;

Forecasting of Summer Severe Weather / 279
Fig. 18 Eight hydrographs from the WATFLOOD forecasting system that uses radar-derived precip-itation rates and a detailed hydrological model of a river catchment basin. The data are for3 Jan 93 and begin at 6Z and the precipitation is assumed to be snow. The abscissa is timein hours and covers a period of 7 days and the ordinate is stream flow in cm/s. The GrandRiver/Cambridge-Gait hydrograph is located in a major damage area. The radar data (com-puted; thick line) are initially scaled to the stream flow measurements (thin line) to accountfor soil conditions.
Burgess and Lemon, 1990). Estimates of the contributions of Doppler radar to theSSW program are illustrated in Fig. 19 in the statistics for the accuracy of thewarning program. The figure shows the probability of detection (POD) and theconsistency (1 - False Alarm Rate) for the watches and warnings. Without radar,the success rate (Probability of Detection) is about 20%. With Doppler radar and anadequately trained forecaster, the success rate rises to about 70%. There are quicklyevolving marginal SSW situations that cannot yet be fully diagnosed. These occurabout 10% to 30% of the time (Joe and Leduc, 1990; Leduc and Joe, 1987).
The ability to observe thunderstorms by radar is the key factor in their short-termprediction. The introduction of Doppler technology has provided direct measure-

280 / Paul Joe et al.
Watches / Warnings4 year averages
0.8-
Watches POD FAR
I 1983-1986
Warnings POD
yA 1987-1990
FAR
Fig. 19 Improvement of the weather warning program in Ontario after the introduction of Dopplerradar technology (1987-1990). There is little difference in the watch statistics as radar hasvery little influence there. There is a general 20 to 30% increase in probability of detection(POD) and decrease in false alarm rate (FAR) (Joe and Leduc, 1990).
ments of the wind elements that produce surface damage such as downbursts,gustfronts and surfacing low level jets (Crozier et al., 1991). In general, tornadoesare not directly detectable due to their small size. Their presence must be indirectlyinferred by observation of the parent mesocyclone - if it exists. Previous radar tech-niques for SSW forecasting depended on the related but indirect observation of theprecipitation intensities and three-dimensional patterns (Crozier and Scott, 1981).In addition, the Doppler radar supplements and provides detailed observations ofthe environmental and mesoscale winds that are fundamental to understanding thestate of the atmosphere and of the evolution of mesoscale precipitation systems.This knowledge feeds back into and enhances the process of producing weatherforecasts, watches and warnings (Joe and Leduc, 1990).
Developments in affordable animated colour display systems and telecommuni-cations, have taken the radar imagery out of the hands of specialists, co-locatedwith the radar, onto the desk of every forecaster in the weather offices (Crozierand Scott, 1981; Crozier et al., 1991). Colour displays, while commonplace today,were revolutionary when they first appeared in the early 80's. They caught theattention of the forecaster in a very dramatic way in contrast to the poor quality ofthe limited black and white shaded facsimile recorders of the day.

Forecasting of Summer Severe Weather / 281
The increase in the computing and communication power has allowed the three-dimensional radar data and Doppler data to be processed in real-time. ConstantAltitude Plan Position Indicator maps (CAPPI) (Marshall, 1957) were developed atMcGill University to overcome ground clutter problems. In the past, the significantcorrelation between strong radar echoes and severe weather were used to issuewarnings (Marois, 1977; Lemon, 1977; Donaldson, 1961, 1965). Now, mid and lowlevel CAPPI's are used at the Quebec Weather Centre, to facilitate the identificationof the thunderstorm overhang. This developed into a simple automated algorithm;significant difference between the reflectivity at 3 and 7 km are highlighted ona map. At the Ontario Weather Centre, the development of the MAXR chart -the maximum reflectivity in a column above 2 km (Crozier and Scott, 1981) -reduced the problem of finding the "correct" mid-level CAPPI for low-toppedsupercells. In both cases, the forecaster monitored the radar for the appearanceof echo overhang - large areas of strong reflectivity above smaller areas of strongreflectivity - indicative of strong updrafts. At the end of the 1980's, the Radar DataProcessing prototype, that processed volume scan reflectivity data, at the QuebecWeather Centre, allowed the display of the vertical structure of a thunderstorm.The forecaster can interact with the data to examine the details of particular stormsbefore the issuance of the warning (Austin et al., 1989; Biron et al., 1989).
Many radar advances were prototyped and first developed at the WoodbridgeRadar site in the 70's and early 80's before inclusion in the operational radarnetwork requirements. This included the application of digital computers for controlof volume scanning, data recording, product production, display and transmission.Advances in the use of radar included the development of various volume-scan-derived charts such as MAXR (mentioned above), echo top and severe storm. Thelatter chart integrates lightning strike locations with an automated analysis of radardata for severe storms (Crozier et al., 1991). Communication of the displays wasgreatly enhanced by soft and hard colour copies. Most importantly, animation ofdisplays allowed viewing of the time evolution of the radar echoes. These advancesallowed the forecaster to make better use of the radar data. The better productsencouraged their use and eliminated unnecessary intermediate steps in the analyses.
The great progress in computing technology has been exploited to produce pat-tern recognition products that are generated in real-time. The small spatial scales ofthe SSW features and the broad area of coverage dictate that automated algorithmsbe used to help the forecaster identify those storms that have the greatest potentialfor SSW, especially when multiple radars must be surveyed. At the King WeatherRadar, automated detection algorithms for Doppler radar were developed,largely driven by the complexity of the interpretation of Doppler radial velocityand the need to detect the presence of very small coherent radial velocity patternsin noisy data as early as possible (Zrnic et al., 1985; Desrochers et al. 1986; Joeand Crozier, 1988). The difference in the radial velocity and reflectivity imageryfor a storm required that the imagery be displayed simultaneously and led to the

282 / Paul Joe et al.
King Automated Radar Display System (KARDS) designed specifically for severeweather applications. The key features were quick access to many products, side byside display of different types of imagery and display and overlay of automaticallyrecognized thunderstorm features such as mesocyclones and microbursts. At theQuebec Weather Centre, GUST, a product combining VIZ (Vertically IntegratedReflectivity) and echo tops (Stewart, 1991), provides an estimate of the peak gustsassociated with the downdrafts. Preliminary studies show that these algorithms aregood indicators of the presence of severe weather and that GUST is a better dis-criminator of cells that can generate strong gusts than radar reflectivities observedfrom multiple CAPPI levels alone. These are just a few examples of the tools thathave been and continue to be developed.
c Satellite DataSatellite monitoring of the earth-atmosphere system allows diagnosis of all scalesof meteorological processes ranging from the hemispheric to the mesoscale. At-mospheric clouds and water vapour can be used as tracers for circulation patterns(Weldon and Holmes, 1991). The temperature, size, shape, texture, tone and evenshadow of satellite features reveal additional information. Analysis and diagnosisof satellite data in terms of theoretical and conceptual models of severe thunder-storms and atmospheric circulations, allows better prediction of areas where theconvection is likely than can be provided from observations by present surfaceplatforms (Scofield and Purdom, 1986; Cherna et al., 1985). The observation ofunusally sharp and well-organized cumulonimbus anvils can often be broadly linkedto severe weather and form particularly useful observations in areas devoid ofradar coverage. For example, the rate of expansion of the thunderstorm anvil -indicative of cloud top divergence - can provide evidence of strong updrafts butthen this has to be related to the production of strong winds, hail or tornadoes.In addition, anvils from older storms can hide new development. The 30 minutecycle of GOES satellite data limits its use for warnings, except in cases where thelarge-scale features dominate or long-lived storms can be tracked.
Some interesting satellite applications include the following: identification ofdeformation zones separating atmospheric circulation partition areas with differentair mass characteristics; retrieval of satellite-derived winds revealing the ener-getics of the atmosphere; clear skies in the imagery locate areas where daytimeheating will be maximized, fueling afternoon convection that might result fromother satellite-diagnosed processes; information with respect to lifting mechanismsthat are not easily observed in any other way may be deduced - including jetstreaks, arc cloud boundaries, intersecting convergence zones and lake breezes. Asatellite dynamics feature analysis can define threat or watch areas where convec-tion is expected to be initiated and where the thunderstorms are most likely to reachsevere limits (Fig. 20). Satellite data can then be used to monitor the large-scaleevolution and interaction of the thunderstorm circulations.

Forecasting of Summer Severe Weather / 283
Sep. 13, 1989 2300Z GOES
Deformation Boundary II
Jet
Actiwty discontinuityLine
Fig. 20 Dynamic features analysis of a satellite image for 13 September 1989 23Z. The visible imageryon the right panel is repeated in background on the left panel for reference. This exampleshows how satellite imagery can be interpreted in terms of meteorological features that canbe used in conjunction with conceptual models to produce watches and warnings.
d Better Use of Upper Air DataThe pressure/height, temperature and humidity soundings form the basis of thethree-dimensional observations of the atmosphere. For many severe weather appli-cations, the main deficiencies are the large spatial and temporal scales of the obser-vations. The upper air network has changed very little in the past ten years. Windprofilers have been proposed as a partial replacement; but the lack of complemen-tary humidity and temperature profiles restricts the replacement of the radiosonde.Historically, radiosonde data have been used to assess the potential for developmentof severe weather, by evaluating the strength of the convective updraught currentthat the atmosphere can generate on a particular day and in a particular area. Thisis done by considering the vertical profile of both temperature and dew-point, andinitially, in practice, was assessed with the aid of various stability indices whichconsidered only a few levels in the troposphere. The basic assumption behind suchindices is that the degree of severity of the weather phenomena depends uniquelyon the strength of the updraught current - which is not always the case.
Computer programs in the Weather Centres made it possible to evaluate, moreprecisely, the instability of the atmosphere, by considering the entire temperature-

284 / Paul Joe et al.
1- •
o
_ o
1
Tornadic
Severe
Non-severe
D
O
1
~ o p c
8 ° ci i
fqbrf
3 O
1
fcp, % t
]
i ^
-5.6 -5.4 -5.2 -5.0 -4.8 -4.6 -4.4 -4.2
LOG(0-12000 ft shear)
Fig. 21 Potential Buoyant Energy as a function of shear in the lowest 3 km of the atmosphere. Thethick line separates the severe versus the non-severe thunderstorm. However, tornadic stormscannot be discriminated from non-tornadic severe storms (after Turcotte and Vigneux, 1987).In contrast to the previous figure which is a pattern recognition approach, this figure is thebasis for a parametric approach to SSW forecasting.
humidity profile. In the eighties, research showed that the wind shear in the lower4 km plays as important a role as the PBE in the generation of a strong updraughtas well as its maintenance (Rasmussen and Wilhelmson, 1983). PBE and windshear were combined in the development of the Storm Severity Index (Turcotteet al., 1985). This index demonstrated skill in discriminating between severe andnon-severe thunderstorms but not between tornadic and non-tornadic thunderstorms(Fig. 21) (Turcotte and Vigneux, 1987). These predictors also form the link withsensitivity studies of storm-scale numerical models for the prediction of differentstorm types (Brooks et al., 1990).
The search continues for parameters that provide insight into the environ-mental factors governing storm behaviour and that provide aid to the forecaster.Weisman and Klemp (1984) performed simulations of severe storm behaviour withhodographs that changed substantially in direction in the lowest levels. In a lim-ited statistical study, using one year of data, Patrick and Keck (1987) found thatthe most significant predictor to distinguish tornadic from non-tornadic storms wasa medium-to-large veering arc in the windshear profile below 3 km. Theoreticalstudies (Davies-Jones, 1984; Lilly, 1986; Davies-Jones and Brooks, 1990) led tothe development of the storm relative helicity parameter (H(c)). It is a measure ofthe horizontal streamwise vorticity that can be converted into vertical vorticity by

Forecasting of Summer Severe Weather / 285
Fig. 22 A hodograph with significant helicity ( 3= 150 m2 s~2). The shaded area shows contributionsdue to the wind profile (light) alone and that due to the storm motion (dark). The data arefrom Flint MI 28 August 1990 12Z. The dots indicate data points below 3 km and the squareis the storm motion.
the updraft and is given by:
- LH(c) = - I k • (V - c) x ^- (1)
where k is the unit vertical vector, V is the environmental wind profile, h is thedepth of the inflow normally taken to be 3 km, c is the storm motion, z is the heightand H(c) is the storm relative helicity. Pictorially and in magnitude (Fig. 22), it isan enclosed area on a hodograph and has two contributions - a contribution due tothe turning of the wind and a contribution due to the storm motion.
In general, the value of H(c) has been found to be well correlated with supercel-lular storms, the greater the value the more severe the storm (Davies-Jones et al.,1990; Brooks et al., 1990; Brooks et al., 1994a). Fig. 22 shows the hodograph fora tornadic day, 28 Aug. 1990. Some excellent successes have been noted; however,there are still some puzzles to be solved. The Barrie tornado case of May 31, 1985

286 / Paul Joe et al.
Fig. 23 A hodograph for a storm without significant helicity (120 m2 s 2) but which produced verystrong tornadoes. The symbols are as in the previous graph. The storm motion componentactually contributes negatively to the helicity. The component of helicity due to the windprofile alone is 311 m2 s"2. The data are from Dayton OH 31 May 1985 12Z.
exhibited very little storm relative helicity (Fig. 23) yet produced many very strongtornadoes. In this latter case, the helicity component due to the storm motion ac-tually decreased the value. Fig. 24 shows an example of a time history of helicityfrom the demonstration wind profiler network in the U.S. (van de Kamp, 1993).Helicity develops very quickly just minutes before the occurrence of a strong tor-nado and is unlikely to be picked up by current upper air observations. Studies atthe Ontario Weather Centre showed that the storm motion was important. An incor-rect motion could significantly change the forecast of a tornadic to a non-tornadicsituation and vice versa. The motion of the storms can only be accurately derivedfrom radar. Estimates of storm motion using the wind information from the upperair sounding information were inconsistent (Doswell et al., 1992).
e Better Use of Surface ObservationsThe availability of computer power at the forecasters' fingertips has allowed them
Forecasting of Summer Severe Weather / 287
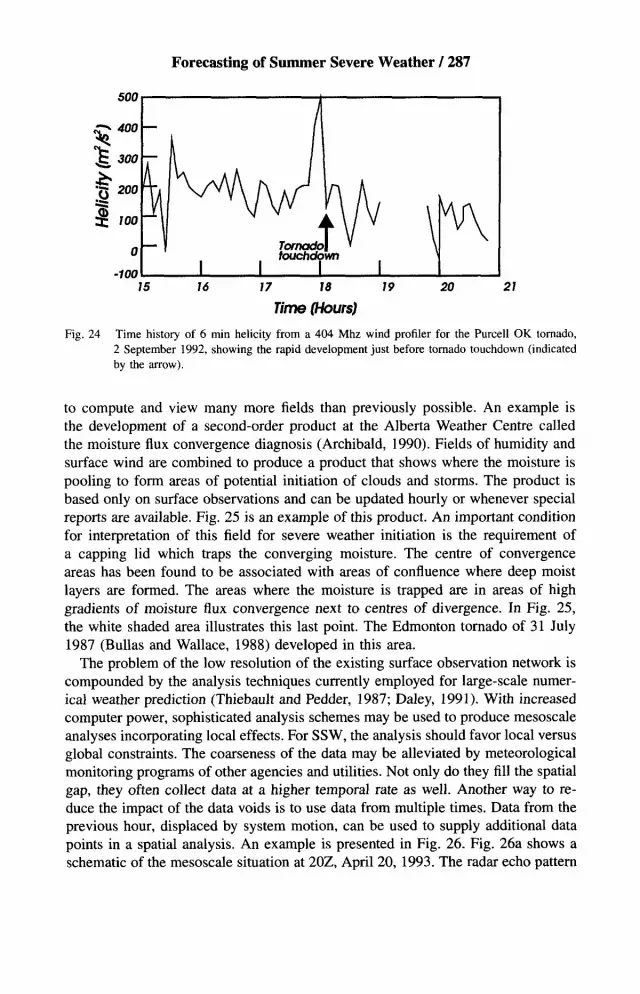
Fig. 24 Time history of 6 min helicity from a 404 Mhz wind profiler for the Purcell OK tornado,2 September 1992, showing the rapid development just before tornado touchdown (indicatedby the arrow).
to compute and view many more fields than previously possible. An example isthe development of a second-order product at the Alberta Weather Centre calledthe moisture flux convergence diagnosis (Archibald, 1990). Fields of humidity andsurface wind are combined to produce a product that shows where the moisture ispooling to form areas of potential initiation of clouds and storms. The product isbased only on surface observations and can be updated hourly or whenever specialreports are available. Fig. 25 is an example of this product. An important conditionfor interpretation of this field for severe weather initiation is the requirement ofa capping lid which traps the converging moisture. The centre of convergenceareas has been found to be associated with areas of confluence where deep moistlayers are formed. The areas where the moisture is trapped are in areas of highgradients of moisture flux convergence next to centres of divergence. In Fig. 25,the white shaded area illustrates this last point. The Edmonton tornado of 31 July1987 (Bullas and Wallace, 1988) developed in this area.
The problem of the low resolution of the existing surface observation network iscompounded by the analysis techniques currently employed for large-scale numer-ical weather prediction (Thiebault and Pedder, 1987; Daley, 1991). With increasedcomputer power, sophisticated analysis schemes may be used to produce mesoscaleanalyses incorporating local effects. For SSW, the analysis should favor local versusglobal constraints. The coarseness of the data may be alleviated by meteorologicalmonitoring programs of other agencies and utilities. Not only do they fill the spatialgap, they often collect data at a higher temporal rate as well. Another way to re-duce the impact of the data voids is to use data from multiple times. Data from theprevious hour, displaced by system motion, can be used to supply additional datapoints in a spatial analysis. An example is presented in Fig. 26. Fig. 26a shows aschematic of the mesoscale situation at 20Z, April 20, 1993. The radar echo pattern

288 / Paul Joe et al.
Fig. 25 An example of moisture flux convergence for 19Z 31 July 1987. The contouring intervalis 0.5 g kg"1 hr~'. The dashed dark line is zero, the thin lines and light shading indicatedivergence areas and the thick solid lines with dark shading indicate divergence. The whiteshaded area approximately mid-way between Calgary and Edmonton shows a favored areafor severe thunderstorm development - high gradient areas between centres of convergenceand divergence; at this time, the storm that produced the Edmonton tornado developed in thislocation.
(Fig. 26b) suggests that waves may be propagating along the front. A Cressmananalysis with resolution similar to that used for large-scale NWP (Fig. 26c) showsa smooth frontal pattern. Using the previous hour's data and adjusting the locationof the data points with the system speed, the subsequent analysis (Fig. 26d) revealsa mesoscale structure consistent with the radar observations.
f Combined Use of Upper-Air and Surface DataAttempts have been made to use surface data to diagnose the state of the atmo-

Forecasting of Summer Severe Weather / 289
sphere above. In this analysis, initially radiosonde data, and then surface data areused to identify areas where vertical motion generated by forcing terms is maxi-mized. Therefore, features such as low/high-level jets, positive vorticity advectionzones, areas of warm/cold-air advection etc. are identified. Surface data are used toidentify areas of low-level convergence, and the ascent associated with topographiceffects. Stability changes related to differential advection and to diurnal humidityor temperature variations also must be considered. These processes are essentialto eliminate any inversion-inhibiting convection, and to maintain strong convectiononce it has been initiated. When no synoptic-scale forcing is present, a pre-existingcloud boundary can favour the development of a sea breeze type of circulation,and the resulting convergence can, sometimes, favour the development of severethunderstorms (Vigneux and Siok, 1985).
A major problem in the use of upper-air data for evaluation of forcing termsis resolution. Because of the sparse nature of the upper-air network, it is likelythat the position of analyzed features, such as low-level and high-level jets, isnot sufficiently accurate to define SSW areas with the desired accuracy. The samecomment could be made about numerical model output features, which, to a largedegree, are still dependent on this type of data. Therefore, to get past this problem,ever increasing use of surface data is made to decide where the forced ascent ismaximized. The vertical motion can be computed by the Laplacians of the surfacepressure and pressure tendencies (not shown); this technique shows promise as atool for optimizing the surface data network for severe weather purposes.
g Artificial IntelligenceExpert systems using artificial intelligence techniques are under development for theprediction of severe weather. In Alberta, a knowledge-based expert system calledMETEOR (Elio et al., 1987) combines the Synoptic Index of Convection (Strong,1979; Strong and Wilson, 1983) and current surface weather reports to forecastthe initiation region, intensity and motion of severe hailstorms. In the KASSPrsystem (Knowledge Augmented Severe Storms Predictor; Bullas et al., 1990), ther-modynamic and dynamic fields from numerical weather prediction models andconvective index information form the input data to predict the potential for se-vere weather. The latter system attempts to emulate the Fawbush-Miller (1953)technique. An interactive capability allows the meteorologist to modify any of thefields, and add analyzed features such as the location of the jet stream, vorticitytroughs and ridges. KASSPr has been in operation since the 1989 convective seasonat the Alberta Weather Centre (ALWC) in Edmonton. A severe-weather verificationof KASSPr and ALWC forecasts (Vickers, 1992b) shows that improvements havebeen realized using KASSPr over the past four years (see Table 5).
h Numerical Weather Prediction GuidanceThe Canadian Meteorological Centre issues on a twice daily basis, a SSW packagethat has four charts based on fine mesh outputs from the Canadian Regional


Fig. 26 An example of a mesoscale surface analysis for 20Z 20 April 1993, based on the use of time-adjusted synoptic data sets, showing the possibility ofresolving mesoscale features, (a) shows the resulting schematic of the analysis, (b) shows the radar data, (c) shows the result of a Cressman analysisusing global constraints and (d) shows the result of using data from multiple times advected with a system speed of 10 m/s from 250° and usinglocal constraints. The result is a mesoscale analysis consistent with the radar and satellite observations (not shown).

292 / Paul Joe et al.
TABLE 5.
Year
1989199019911992
SSW forecasting performance -Critical Success Index
KASSPr
0.200.100.130.00
ALWC
0.150.100.180.13
Finite Element model (Benoit et al., 1989). This model is currently (summer 1994)running at a 50 km horizontal resolution with 25 sigma levels in the vertical. Theprojection times of the SSW prognostic charts extend out to 24 hours at 00 UTCand out to 18 hours at 12 UTC.
The package includes the following fields: 250 hPa heights, isotachs and isoplethsof absolute vorticity; surface temperature and dew point; maximum wind (betweensigma levels 0.85 and 1.00); high level maximum wind (between sigma levels0.10 and 0.50); stability indices including the Showalter index (Showalter, 1953),the Severe Weather Threat index (Miller, 1972) and the Lifted index (Galway,1956); temperature and pressure at the tropopause level; buoyant energy, isoplethsof mean vertical windshear between sigma levels 0.65 and 1.00 and the SevereStorm index (Turcotte and Vigneux, 1987), precipitable water and isopleths of700 hPa vertical motion; relative helicity (Morris and Kessler, 1993) and stormmotion streamlines. The relative helicity is calculated according to equation (1).The storm translation velocity is set to 75% and 30° to the right of the averagedmodel wind vector between 850 and 300 hPa. Also plotted on the buoyant energychart are the calculated maximum heights of the tops of convective clouds and theequilibrium level.
7 Dissemination of weather warningsA good product (warning) is only useful and effective if it can be communicatedto the end user (for example, the public) in a simple understandable form and in atimely manner. Weather Radio has been a cost-effective solution for disseminatingwatches and warnings. However, improvements were needed to reach a broaderand perhaps non-listening audience in a more effective manner. The national dig-ital weather radio project, called WEATHERCOPY, was initiated to improve thedissemination of weather warnings. This was a key recommendation of a federalinquiry (Hage, 1987) into the events surrounding the Edmonton tornado of July 311987 (Bullas and Wallace, 1988). While warnings for that storm were issued withmore than 50 minutes lead time, the inquiry called for a review of the disseminationsystem. The idea of this project was to develop a system that could directly andeasily reach the public. A WEATHERCOPY receiver can be commercially pur-chased that receives both digital and voice transmissions. The digital transmissioncan be displayed on a printer, computer screen or on television. The system is left
Forecasting of Summer Severe Weather / 293
on all the time and messages are delivered within a minute of issue and can betargeted to specific users. An audible tone alarm can be generated as well as voicemessages. A typical message contains about 5000 characters and requires only 3to 4 seconds for simultaneous transmission to all users. By the end of 1997, theCanadian Weatheradio network will consist of 180 transmitters that can providedigital weather warnings to 90% of the population. Future technology being con-sidered for distribution of weather warnings includes the use of pagers that canprovide warnings to users within one minute of transmission.
8 Public educationThe need for public education has been identified as one key component of a SSWmitigation program. The public needs to be educated with respect to the meaningof the warning messages and to their consequence. This was a clear messagefrom the Hage (1987) report on the Edmonton tornado which examined, amongother things the response of the public to the warning messages. Across Canada,public education efforts have been stepped up in the years since the Edmontonevent (Bullas and Wallace, 1988) and the Barrie tornado of 1985 (Leduc, 1985).Annual Severe Weather Awareness weeks were organized to take advantage ofmedia exposure and to rekindle public interest in severe weather warning programs.Despite these efforts, there is a sense that public awareness is on the decline. Inthe future, efforts must be directed towards the education system, to attain a longerterm solution for increased awareness of severe weather safety (Blackwell, 1993).Communications is an area where improvements could be made. Close ties withthe broadcast media were established. Direct access to commercial broadcasts ispossible with tornadoes of F2 strength or more. There has also been a focus onimproving the response capability of municipalities. In Ontario, Project Tornadowas established with the Office of the Solicitor General of Ontario. Mock scenarioswere developed and acted out by emergency response teams. The effect of a tornadodisaster was based on the Barrie tornado.
9 DiscussionOne major missing piece to the SSW forecasting process is the lack of operationalstorm-scale models (Brooks, 1992). With the development of fast computers andcommunications, models running on supercomputers can be accessed on worksta-tions right next to the forecaster. Experiments where the 12Z sounding, adjustedto expected mid-afternoon conditions, was used to initialize storm scale models,have performed with mixed results. At this time, it is not clear whether the prob-lem is in forecasting the afternoon sounding, initialization of the model or themodel physics (Stauffer and Seaman, 1994) or a combination of all three factors.
Operational models continue to resolve smaller and smaller scales (Mailhot et al.,1992; Zhang and Fritsch, 1986). There are three major problems: lack of mesoscaledata to initialize the models, effective cloud and precipitation parameterizations andspin-up times of the models. The major errors in forecast models are the timing

294 / Paul Joe et al.
and exact location of the precipitation, the amount of precipitation and the durationof precipitation. Still, progress is being made in these areas and it is expected thatthese models will be available in the next ten years. Twenty-four hour simulationsare expected to run in 1-2 minutes in the near future (Tremblay, 1994). Increasedresolution in the models does not necessarily improve forecasting without an ap-propriate ability to assimilate all the available data and improved parameterizationof physical processes (Stauffer and Seaman, 1994). Another approach is to usean ensemble approach to 0-48 hour forecasting problems (Brooks and Doswell,1993). In this method, rather than using a single very-high resolution numericalforecast, several lower-resolution forecasts are used. Preliminary work (Mullen andBaumhefner, 1994) shows that the use of many low-resolution model runs providesmore information than a single high-resolution run.
A source of additional upper air data is the commercial air carrier. Many modernaircraft measure basic meteorological parameters on descent from 12 to 3 km and enroute. Access to these data will supplement the current sparse upper air soundings.
Doppler radars are now available in three major centres in Canada. It is ex-pected that there will be at least three more by 1997. On the horizon, polarizationcapability for radars has not yet been operationally demonstrated due to the ambi-guity of the signatures. Research from the Alberta Research Council S-band radaron propagation effects has just begun to unravel the interpretation of polarizationradar signatures (Holt, 1988; Holt and Tan, 1992; Holt et al., 1988; Torlaschi,1991; Torlaschi and Holt, 1993; Torlaschi et al., 1989) and recent research resultsshow their usefulness in heavy rain (English et al., 1991) and hail-prone areas ofthe country (Holt et al., 1993a; Holt et al., 1994; Al-Jumily et al., 1991). Theremay be some application of polarization radar to identify storm structure (Holtet al., 1993b). The degree-of-polarization parameter (Bebbington, 1992), which isa propagation-independent measure of the polarizing character of the target, candelineate the updraft region even if a weak echo region does not develop. So far,observations have been limited to Alberta storms.
The Alberta Research Council studied hailstorms for many years (ARC, 1986;Chisholm and Renick, 1972; Chisholm and English, 1973; Summers et al., 1972).During the Alberta Hail Project, the hail forecaster relied primarily upon predictingthe strength of convection. Forecasts of storm depth, type, motion, duration, andmaximum hail size were made. A simple, one-dimensional, loaded moist-adiabatic(LMA) cloud model (Chisholm, 1973) was used as a forecasting aid for assessingthe degree of hydrostatic instability, and a nomogram was developed empiricallyfor forecasting maximum hail size based upon the computed vertical velocity inthe model and the temperature at the height of that velocity maximum (Renickand Maxwell, 1978). A statistical model, called the Synoptic Index of Convection(Sc4) was developed (Strong, 1979; Strong and Wilson, 1983) as a point index forpredicting hail size. The Sc4 is computed from 2 synoptic-scale upper air predic-tors - 24 hr forecasts of 700 mb temperature change and of 1000-500 mb thick-

Forecasting of Summer Severe Weather / 295
ness change - and 2 subsynoptic-scale surface instability predictors - Lifted Indexand EGDEX (Checkwitch, 1971). EGDEX is the difference between the wet bulbpotential temperature at the surface and at 500 hPa. The model generates a singleconvective rating (—3 to +5) representative of maximum storm severity. A highernumber corresponds to an increase in convective activity and severity. For example,— 1 represents "scattered showers with no hail or thundershowers", while +5 repre-sents "hail larger than golfballs". Zero delineates hail from no-hail. Accuracies of85% have been reported but the techniques have not been adopted operationally.Strong (1986) later modified and extended the Sc4 as an areal predictor for con-vective complex initiation, movement and maximum intensity.
The SSW forecast process relies heavily on the human and must still use concep-tual models to fill data gaps and to assimilate the data. Tools need to be developedthat can analyze all the data sets in an integrated fashion - not just an overlayingof individual fields. For example, in the future, the use of wind fields derived fromDoppler radar data may be used to initiate storm-scale models.
The applicability of operational/research results from elsewhere cannot be di-rectly transferred to different climatic regimes. This is particularly true for SSW.The addition of the Carvel radar in central Alberta showed dramatic differences inthe climatology of severe weather type and local influences compared to southernOntario. For example, the climatology of dew points and the characteristics andmotion of the storms are quite different.
10 ConclusionSubstantial progress has been made in the forecasting of severe weather in Canada.This paper briefly described the activity to mitigate the effects of the summersevere hazard within the operational forecast offices. Research results that havenot made their way into operational tools have not been discussed. The progresshas been a result of new and changing technology, the transfer of research studiesin Canada and elsewhere and the development of new methods and techniqueswithin the various weather centres. In the past ten years, the summer severe weatherhazard has been better defined in its understanding, detection and forecasting ofsummer severe weather. This is highlighted by better classification of hazardouswind phenomena, understanding of severe weather processes, technology such asDoppler radar, data processing, numerical weather prediction models, conceptualmodels, use of existing datasets, public education, and dissemination of weatherwarnings.
The most significant improvement is that forecasts have become more specificwith respect to the meteorological hazard (different damaging wind phenomena,hail and heavy rains) rather than broad statements about the occurrence of thunder-storms. However, as forecasts have become more accurate and more precise, theremust be corresponding developments in communications, in public education andin public awareness to utilize the information.

296 / Paul Joe et al.
ReferencesABRAHAM, I ; K. MACDONALD a n d P. JOE. 1 9 9 1 . T h e
interaction of hurricane Hugo with the Mid-Latitude Westerlies, 19th Conf. on Hurricanesand Tropical Meteorology, May 6-10, Miami,FL, Amer. Met. Soc, 124-129.
AITKINS, N.T. and R.M. WAKIMOTO. 1991. Wet mi-
croburst activity over the southeastern UnitedStates: implications for forecasting. Weatherand Forecasting, 6: 470-482.
AL-JUMILY K.; R.B. CHARLTON a n d R.G. HUMPHRIES.
1991. Identification of Rain and Hail with Cir-cular polarization Radar, J. Appl. Meteorol. 30:1075-1087.
ALBERTA RESEARCH COUNCIL. 1986. Weather mod-
ification in Alberta - Research and Operations1980-1985, Summary report and recommenda-tions, Natural Resources Division, AtmosphericSciences Department Report, 18 pp.
ANTHES, R.A. 1982. Tropical Cylones - Their Evo-lution, Structure and Effects, Amer. Met. Soc.Meteorol. Mono., 19: No. 41, 208 pp.
ANTHES, R.A. 1990. Advances in the understand-ing and prediction of cyclone development withlimited-area fine-mesh models. In: Extratropi-cal Cyclones: The Erik Palmen Memorial Vol-ume, C.W. Newton and E.O. Holopainen, (Eds),Amer. Meteorol. Soc, 262 pp.
ARCHIBALD, JR. 1990. The diagnosis of moistureflux convergence as a convective forecastingtool, Alberta Weather Centre Tech. Note, 90-N-97, 11 pp.
ATLAS, D.; D.R. BOOKER, H.R. BYERS, R.H. DOUGLAS,
T. FUJITA, D.C. HOUSE, F.H. LUDLAM, J.S. MALKUS,
C.W. NEWTON, Y. OGURA, R.A. SCHLEUSENER, B. VON-
NEGUT and R.T. WILLIAMS. 1963. Sev. Local
Storms. Meteorol. Mono., 5: No. 27, Amer. Me-teorol. Soc., 247 pp.
AUSTIN, G.L.; A. KILAMBI a n d H.P. BIRON. 1989 . T h e
operational use of a high speed interactive radardata processing system (RDPS): Part 1 - Tech-nical Description. In: Weather Radar Network-ing, COST 73 project, WMO, 229-236.
BEBBINGTON, D.H.O. 1992. Degree of polarizationas a radar parameter and its susceptibility tocoherent propagation effects. URSI CommissionF Symposium on Wave Propagation and RemoteSensing, Ravenscar, UK, 431^136.
BELLON, A. and i. ZAWADZKI. 1994. Microburst
climatology for the Montreal area using the
McGill Radar Observatory, Transport CanadaAviation Report, TP 12170, 64 pp.
BENOIT, R.; J. COTE and J. MAILHOT. 1989. Inclu-
sion of a TKE boundary layer parameterizationin the Canadian regional finite-element model,Mon. Weather Rev. 117: 1726-1750.
BIRON, H.P.; G.L. AUSTIN a n d A. KILAMBI. 1989 . T h e
operational use of a high speed interactive radardata processing system (RDPS): Part 2 - Ap-plication in real-time severe thunderstorm de-tection and forecasting. In: Weather Radar Net-working, COST 73 project, WMO, 415^22.
BLACKWELL, s.R. 1993. Severe weather safety andeducation. 3rd Intern. Conf. on Met. and Ocean.Education, Amer. Meteorol. Soc, Toronto,Canada, 148-149.
BONNER, w.D. 1968. Climatology of the low-leveljet. Mon. Weather Rev. 96: 833-850.
BRANDES, E.A. and J.w. WILSON. 1982. Measuring
storm rainfall by radar and rain gauge. In: Thun-derstorms: A social, scientific and technologi-cal documentary, Vol. 3, Instruments and tech-niques for thunderstorm observation and anal-ysis, E. Kessler (Ed), U.S. Dept. of Commerce,NOAA, ERL, 313 pp, 241-278.
BROOKS, H.E. 1992. Operational implications ofthe sensitivity of modelled thunderstorms tothermal perturbations, Preprints, 4th Workshopon Operational Meteorology, Whistler, B.C.,AES/CMOS, 398-407.
and C.A. DOSWELL in. 1993. New tech-nology and numerical weather prediction - awasted opportunity? Weather 48: 173-177.
; C.A. DOSWELL in and J.B. COOPER.
1994a. On the environments of tornadic andnon-tornadic mesocyclones, Weather and Fore-casting 9: in press.
; C.A. DOSWELL in and R.B. WILHELMSON.
1994b. The role of midtropospheric winds in theevolution and maintenance of low-level meso-cyclones, Mon. Weather Rev. 122: 126-136.
; C.A. DOSWELL in and R. DAVIES-JONES. 1990.
Environmental Helicity and the maintence andevolution of low-level mesocyclones. In: TheTornado: Its Structure, Dynamics, Predictionand Hazards. Church, C , D. Burgess, C.Doswell and R. Davies-Jones, (Eds), Amer.Geoph. Union, Geophysical Mono. 79: 97-104.
BULLAS, J.M. and A.F. WALLACE. 1988. The Ed-

Forecasting of Summer Severe Weather / 297
ton tornado, July 31, 1987. 15th Conf. on Sev.Local Storms, Amer. Meteorol. Soc, Baltimore,MD, 437^43 .
; J.c. MCLEOD and B. DELORENZIS. 1990.
Lakes region, National Weather Digest, in press.and . 1994b. Lightning flash cli-
Knowledge Augmented Severe Storms Predictor(KASSPr) - An operational test. In: 16th Conf.on Sev. Local Storms, Kananaskis Park, Alberta,Amer. Meteorol. Soc, 106-111.
BURGESS D.W.; V.T. WOOD a n d R.A. BROWN. 1 9 8 8 .
Mesocyclone evolution statistics. In: 12th Conf.Sev. Local Storms, San Antonio, TX, Amer.Met. Soc, 422-434
and L. LEMON. 1990. Severe thunderstormdetection by radar. In: Radar in Meteorology:Battan Memorial and 4ffh Anniversary RadarMeteorology Conference, D. Atlas, (Ed), Amer.Meteorol. Soc, 806 pp, 619-647.
CAMPBELL. S.D.; MERRIT, M.W. a n d IT. DISTEFANO.
1989. Microburst recognition performance ofTDWR operational testbed, 3rd Int. Conf. Avi-ation Weather Systems, Amer. Meteorol. Soc,Anaheim, CA, 25-30.
CARACENA, F. 1982. Is the microburst a large vor-tex ring imbedded in a thunderstorm downdraft?EOS Trans., Amer. Geophys. Union, 63: 89.
CHANDIK, J.F. and w.A. LYONS. 1971. Thunderstormsand the lake breeze front, 7th Conf. on Sev. Lo-cal Storms, Amer. Meteorol. Soc, 218-225.
CHECKWITCH, s.M. 1971. A short-range forecasttechnique for summer precipitation forecast-ing in the Edmonton area, Unpublished internalAES manuscript, Alberta Weather Centre, AES,Edmonton, Alberta. 32 pp.
CHERNA, E.; A. BELLON, G.L. AUSTIN a n d A. KILAMBI.
1985. An objective technique for the delineationand extrapolation of thunderstorms from GOESsatellite data, J. Geophy. Res. 90, D4: 6203-6210.
CHISHOLM, A.J. and M. ENGLISH. 1973. Alberta hail-storms, Part 1: Radar case studies and airflowmodels, Meteorol. Mono. 36: Amer. Meteorol.Soc, 1-36.
and I.H. RENICK. 1972. Supercell andmulticell Alberta Hailstorms, Intern. Conf. onCloud Physics, London, ICCP/IAMAP/IUGG/WMO, Geneva, 67-68.
CHURCH, C ; D. BURGESS, C. DOSWELL a n d R. DAVIES-
IONES, (Ed.). 1990. The Tornado: Its Structure,Dynamics, Prediction and Hazards, Amer.Geoph. Union, Geophysical Mono. 79: 637 pp.
CLODMAN, s. and w. CHISHOLM. 1994a. High light-ning flash density storms in the southern Great
matology in the southern Great Lakes region,accepted by ATMOSPHERE-OCEAN,
COLLINGE, v. and c. KIRBY. 1987. Weather Radarand Flood Forecasting, John Wiley and Sons,Inc., 296 pp.
COTTON, w.R. and R.A. ANTHES. 1989. Cloud and
Storm Dynamics, Academic Press, Inc., 880 pp.CROZIER, C.L. and i.w. s c o n . 1981. A C-band
weather radar system with spherics to servemultiple diverse users in the Canadian climate,20th Conf. on Radar Met, Boston, MA, Amer.Meteorol. Soc, 749-756.
; C.L.; P. IOE, J.W. SCOTT, H.N. HERSCOVITCH
and T.R. NICHOLS. 1991. The King City oper-ational Doppler radar: development, all sea-son applications and forecasting, ATMOSPHERE-OCEAN, 29: 479-516.
DALEY, R. 1991. Atmospheric Data Analysis, Cam-bridge Univ. Press., Atmospheric and SpaceScience Series No. 2, Cambridge, U.K., 457 pp.
DAVIES, J.M. 1993. Small tornadic supercells in thecentral plains. / 7th Conf. on Sev. Local Storms,St. Louis, MO, Amer. Meteorol. Soc, 305-309.
DAVIES-JONES, R. 1984. Streamwise vorticity: Theorigin of updraft rotation in supercell storms. J.Atmos. Sci. 41: 2991-3006.
; D.w. BURGESS and D. FOSTER. 1990. Test
of helicity as a tornado forecasting parameter.16th Conf. on Sev. Local Storms, Kananaskis,Alberta, Amer. Meteorol. Soc, 588-592.
- and H.E. BROOKS. 1990. Mesocyclogenesis
from a theoretical perspective. In: The Tornado:Its Structure, Dynamics, Prediction and Haz-ards, Church, C , D. Burgess, C. Doswell andR. Davies-Jones, (Eds). Amer. Geoph. Union,Geophysical Mono. 79: 105-114.
DESROCHERS, PR.; R.I. DONALDSON JR. and D.W. BUR-GESS. 1986. Mesocyclone rotational kinetic en-ergy as a discriminator for tornadic and non-tornadic types. 23rd Conf. on Radar Meteorol.Snowmass, CO, Amer. Meteorol. Soc, 1 ^ .
DIMEGO, G. and L. BOSART. 1982. The transforma-
tion of tropical storm Agnes into an extratropi-cal cyclone, Part 1: The observed fields and ver-tical motion computations. Mon. Weather Rev.110: 385^11 .
DISTEFANO, J.T. 1987. Study of microburst detec-tion performance during 1985 in Huntsville, Al-abama, MIT. Lincoln Laboratory Report ATC-142.

298 / Paul Joe et al.
DODGE, J.; J. ARNOLD, G. WILSON, J. EVANS a n d T.T.
FUJITA. 1986. The cooperative Huntsville mete-orological experiment (COHMEX). Bull. Amer.Meteorol. Soc. 67: 417-419.
DONALDSON, R.J. 1961. Radar reflectivity profiles inthunderstorms. / Meteorol. 18: 292-305.
. 1965. Methods for identifying severethunderstorms by radar: A guide and bibliog-raphy. Bull. Amer. Meteorol. Soc. 46: 174-193.
DOSWELL in, C.A. 1982. The Operational Meteo-rology of Convective Weather, Vol. 1: Opera-tional Mesoanalysis, NOAA Tech. Mem., NWSNSSFC-5, 158 pp.
. 1985. The Operational Meteorology ofConvective Weather, Vol. 2: Storm Scale Anal-ysis, NOAA Tech. Mem., ERL ESG-15, 240 pp.
; M.E. SPLITT and M. KAY. 1992. On storm
motion and operational assessment of supercellstorm potential using hodographs. 4th AES/CMOS Workshop on Operational Meteorology,AES/CMOS, Whistler, BC, 245-252.
EMANUEL, K.A. 1981. A similarity theory for unsat-urated downdrafts within clouds, J. Atmos. Sci.38: 1541-1580.
ELIO, R.; j . DE HAAN and G.S. STRONG. 1987. ME-
TEOR: An artificial Intelligence system forconvective storm forecasting. J. Atmos. andOceanic Tech. 4: 19-28.
ENGLISH M.; B. KOCHTUBAJDA, F.D. BARLOW, A.R. HOLT
and R. MCGUINNESS. 1991. Radar measurementof rainfall by differential propagation phase: apilot experiment, ATMOSPHERE-OCEAN, 29: 357-380.
ETKIN, D. 1994. Beyond the Year 2000, More Tor-nadoes in Western Canada? Implications fromthe historical record. J. Natural Hazards, inpress.
ETKIN, D. and M. LEDUC. 1994. A non-tornadic
severe storm climatology for southern Ontarioadjusted for population bias: some surprisingresults, CMOS Bulletin 22: 4-8.
FAWBUSH, E.J. and R.c. MILLER. 1953. Forecasting
tornadoes. Air University Quart. Rev., MaxwellAFB, Alabama, 108-117.
FORBES, G. 1981. On the reliability of hook echoesas tornado indicators. Mon. Weather Rev. 109:1457-1466.
FUJITA, T.T. 1979. Objective, operation and resultsof project NIMROD. 11th Conf. on Sev. Lo-cal Storms, Amer. Meteorol. Soc, Kansas City,KA, 259-266.
. 1981. Tornadoes and downbursts in thecontext of generalized planetary scales. J. Atmos.Sci. 38: 1511-1534.
. 1985. The downburst. SMRP ResearchPaper, 210, Dept. of Geoph. Sci., U. of Chicago,122 pp.
. 1987. U.S. Tornadoes Part 1, SMRP Re-search Paper no. 218, Dept. of Geoph. Sci., U.of Chicago, 122 pp.
— and BE. SMITH. 1990. Aerial survey andphotography of tornado and microburst damage.In: The Tornado: Its Structure, Dynamics, Pre-diction and Hazards, Church, C , D. Burgess,C. Doswell and R. Davies-Jones (Eds), Amer.Geoph. Union, Geophysical Mono. 79: 479-494.
GALWAY j G. 1956. The lifted index as a predictorof latent instability. Bull. Amer. Meteorol. Soc.37: 528-529.
GRAZULIS, T.P. 1993. Significant Tornadoes 1680-1991, Environmental Films, St. Johnsbury, Ver-mont, 1326 pp.
HAGE, K.D. 1987. Review of the weather warningsystem associated with the Edmonton tornadoof July 31 1987, Internal AES report.
HOLT, A.R. 1988. Extraction of differential propa-gation phase from data from S-Band circularlypolarised radars. Electron. Lett. 24: 1241-1242.
; R.G. HUMPHRIES and R. MCGUINNESS. 1988.
Some advantages of using polarisation diver-sity illustrated through the analysis of radar datafrom a storm in Central Alberta, IGARSS 88,ESA SP-284, 237-40.
and J. TAN. 1992. Separation of differentialpropagation phase and differential back scatterphase in polarisation-diversity radar.Electron. Lett. 28: 943-944.
; E. TORLASCHI, R. MCGUINNESS, D.A. HOL-
LAND, F. BERGWALL, T. NICHOLS a n d P. JOE. 1993a .
Polarisation and Doppler observations of a tor-nadic storm in central Alberta. 11th Intern.Conf. on Cloud Physics, Montreal, Quebec,650-653.
; P.I. JOE, R. MCGUINNESS a n d E. TORLASCHI.
1993b. Some examples of the use of degree ofpolarization in interpreting weather radar data.26th Intern. Conf. on Radar Meteorol. 748-750.
; P. JOE, R. MCGUINNESS, E. TORLASCHI, T.
NICHOLS, F. BERGWALL a n d D.A. HOLLAND. 1 9 9 4 .
Simultaneous polarization and Doppler obser-vations of severe convective storms in CentralAlberta, Atmos. Res. 33: 37-56.

Forecasting of Summer Severe Weather / 299
IRIBARNE, J.v. and w.L. GODSON. 1973. Atmospheric
Thermodynamics, Reidel, 222 pp.IDOP STAFF. 1979. Final Report on the Joint Doppler
Operational Project (JDOP) 1976-1978, NOAATech. Memo., ERL NSSL-86, 84 pp.
JOE, p. and C.L. CROZIER. 1988. Evolution of meso-cyclonic circulation in severe storms. 10th In-tern. Cloud Physics Conf., Bad Homborg, FRG,687-689.
and M. LEDUC. 1990. Radar signatures andsevere weather forecasting. In: The Tornado:Its Structure, Dynamics, Prediction and Haz-ards, Church, C, D. Burgess, C. Doswell andR. Davies-Jones, (Eds), 1990: Amer. Geoph.Union, Geophysical Mono. 79: 233-240.
; J. ABRAHAM and K. MACDONALD. 1991.
Doppler radar study of post-tropical HUGO in-teracting with a cold front. 25th Intern. Conf. onRadar Meteorol. Paris, France, Amer. Meteorol.Soc, 678-682.
; M.J. LEDUC and T.R. NICHOLS. 1993. The
impact of Doppler radar in two operational fore-cast offices. 26th Intern. Conf. on Radar Mete-orol. Norman, OK, Amer. Meteorol. Soc, 21-23.
; T.R. NICHOLS and C.L. CROZIER. 1990. Air-
flow patterns in two mesoscale convective sys-tems. Atmos. Res. 25: 167-194.
JOHNS, R.H. and c.A. DOSWELL, HI. 1992. Severe Lo-
cal Storms Forecasting, Weather and Forecast-ing 7: 588-609.
KANE, R.J. 1991. Correlating lightning to severe lo-cal storms in the Northeastern United States.Weather and Forecasting 6: 3-12.
KEIGHTON, S.J.; H.B. BLUESTEIN a n d D.R. MACGOR-
MAN. 1991. The evolution of a severe mesoscaleconvective system: cloud-to-ground lightninglocation and storm structure, Mon. WeatherRev., 119: 1533-1556.
KENNEDY, P.C.; N.E. WESTCOTT a n d R.W. SCOTT. 1 9 9 3 .
Single-Doppler radar observations of a mini-supercell tornadic thunderstorm, Mon. WeatherRev., 121: 1860-1870.
KESSLER, E. 1982. Thunderstorms: A social, sci-entific and technological documentary, Vol. 2,Thunderstorm morphology and dynamics, U.S.Dept. of Commerce, NOAA, ERL, 603 pp.
KLEMP, J. 1987. Dynamics of tornadic thunder-storms, Ann. Rev. Fluid Mechanics, 19: 369-402.
KNOTT, s. and c. DENIS VAN DE VELDE. 1992. The
March 28, 1991 MCS squall line structure and
evolution of the decaying phase, AES TrainingBranch Document, 41 pp.
KNOX, J.L. 1955. The storm "Hazel", synoptic re-sume of its development as it approached South-ern Ontario. Bull. Amer. Met. Soc. 36: 239-246.
KOUWEN, N. and G. GARLAND. 1989. Resolution con-
siderations in using radar rainfall data for floodforecasting. Can. J. Civil Engineering 16: 279-289.
; E.D. SOULIS, A. PIETRONIRO, J.D. DONALD a n d
R.A. HARRINGTON. 1993. Group response unitsfor distributed hydrologic modeling. J. WaterResources Planning and Management, ASCE,119(3).
and E.D. SOULIS. 1992. Remote sensing in-puts for flash flood forecasting in urban areas.In: New Techniques for Modelling the Manage-ment of Stormwater Quality Impacts, W. James,(Ed.), Lewis Pubishers, Boca Raton, U.S.A.,Ch. 8: 177-200.
LEDUC, M.J. 1985. The May 31, 1985 F4 Barrie Tor-nado, Ontario Region Tech. Note, 85-3, 16 pp.
and F.J. CONWAY. 1990. The Harrow eventJuly 19-20, 1989. 16th Conf. on Sev. LocalStorms, Amer. Meteorol. Soc, 648-651.
and P. JOE. 1987. Use of 5 cm Dopplerradar to detect and forecast severe thunder-storms in a realtime forecast operation, Proc.Mesoscale Analysis and Forecasting Symp., 17-19 August 1987, Vancouver, B.C., IAMAP/ESA, 49-54.
LEE, B.D. and R.B. WILHELMSON. 1993. A numeri-cal study of vortex development associated withconvergence boundaries. / 7th Conf. on Sev. Lo-cal Storms, Amer. Meteorol. Soc, St. Louis,MO, Amer. Meteorol. Soc, 366-370.
LEMON, L.R. 1977. Severe thunderstorm evolution:its use in a new technique for radar warnings,lffh Conf. on Sev. Local Storms, Omaha, NB,Amer. Met. Soc, 77-80.
LILLY. D.K. 1986. The structure, energetics andpropagation of rotating convective storms, II:Helicity and storm stabilization, /. Atmos. Sci.43: 126-140.
LOPEZ, RE. and R.L. HOLLE. 1986. Diurnal and spa-
tial variability of lightning activity in north-eastern Colorado and central Florida during thesummer. Mon. Weather Rev., 114: 1288-1312.
LOW, T.B. 1993. Climatology study to determinemicroburst occurrence, frequency of occurrenceand location in Canada, Transport Canada Avi-ation, TP 11785E.

300 / Paul Joe et al.
MAILHOT, I.; A. TREMBLAY, S. BELAIR, D.L. ZHANG a n d
L. GARAND. 1992. The Montreal flash flood of14 July 1987: Numerical simulation with ameso-(3-scale model. 5th Conf. on MesoscaleProcesses, Atlanta, GA, Amer. Meteorol. Soc,288-292.
MANPUB. 1988. Manual of standard procedures forpublic weather service, 5th edition, AES.
MAROIS, B.P. 1977. Evaluation du programmeSHARP dans l'exploitation d'un Bureau de pro-visions metorologique, rapport interne, CMQ.
MARSHALL, J.w. 1957. The constant-altitude presen-tation of radar weather patterns. 6th WeatherRadar Conf. 321-324.
MCCARTHY, j . and J.W. WILSON. 1985. The Clas-
sify, Locate and Avoid Wind Shear (CLAWS)project at Denver's Stapleton International Air-port: Operational testing of terminal weatherhazard warnings with an emphasis on micro-burst wind shear. 21"1 Intern. Conf. on Avia-tion Weather Systems, Montreal, Quebec, Amer.Meteorol. Soc, 247-256.
MCCARTHY, J.; j.w. WILSON and T. FUJITA. 1982. The
Joint Airport Weather Studies Project, Bull.Amer. Meteorol. Soc, 63: 15-22.
MILLER, R.C. 1972. Notes on analysis and severe-storm forecasting techniques of the Air ForceGlobal Weather Central, Technical Report, 200(rev).
MOLLER, A.R.; C.A. DOSWELL III, M.P. FOSTER a n d G.R.
WOODALL. 1994. The operational recognition ofsupercell thunderstorm environments and stormstructures. Weather and Forecasting, 9: in press.
MOROZ, W.J. 1967. A lake breeze on the easternshore of Lake Michigan: observation and model./ Atmos. Sci. 24: 337-355.
MORRIS K.R. and R.W. KESSLER. 1993. Helicity char-acteristics in tornadic storm environments fromhourly wind profiler data, NOAA/NWS, TDLOffice Note, 93-3, 33 pp.
MULLEN, S.L. and D.P. BAUMHEFNER. 1994. Monte
Carlo simulations of explosive cyclogenesis,Mon. Weather Rev. 122: 1548-1567.
NEWARK, M.J. 1988. The tornado hazard in Canada.In: Natural and Man-Made Hazards. M.I. El-Sabh and T.S. Murty (Eds.), 743-748.
. 1984. Canadian tornadoes, 1953-1979,ATMOSPHERE-OCEAN 22: 343-353.
NICHOLS.TR. 1990. A mesoscale convective systemcase study, M.Sc. thesis, York University, 86 pp.
ORVILLE, R.E. 1994. Cloud-to-ground lightning flashcharacteristics in the contiguous United States:
1989-1991. J. Geophys. Res. 99, D5, 10, 833-841.
PALMEN, E. 1958. Vertical circulation and release ofkinetic energy during the development of hurri-cane Hazel into an extratropical cyclone. Tellus10: 1-23.
PATRICK. D. and A.J. KECK. 1987. The importance of
the lower level windshear profile in tornado/non-tornado discrimination. Proc. Symposium onMesoscale Analysis and Forecasting, ESA SP-282, 393-397.
PARUK, B.J. and S.R. BLACKWELL. 1994. A severe
weather climatology for Alberta. NationalWeather Association Digest 19: 27-33.
PIERCE, c. 1939. The meteorological history of theNew England hurricane of Sept 21, 1938. Mon.Weather Rev. 67: 237-288.
RASMUSSEN, E. and R.B. WILHELMSON. 1983. Re-
lationships between storm characteristics and1200 GMT hodographs, low-level shear and sta-bility. 13lh Conf. on Sev. Local Storms, Tulsa,OK, Amer. Meteorol. Soc, 55-58.
REAP, R.M. 1993. The use of lightning network datato detect thunderstorms near surface reportingstations. Mon. Weather Rev. 121: 464-469.
RENICK, J.H. and J.B. MAXWELL. 1978. Forecasting
hailfall in Alberta, Meteorol. Mono. No. 38,Amer. Meteorol. Soc, 145-151.
RHINEHART, R.E.; J.T. DISTEFANO a n d M.M. WOLFSON.
1986. Preliminary Memphis FAA Lincoln Lab-oratory Operational Weather Studies Results,MIT, Lincoln Laboratory Project Report, ATC-141.
ROTUNNO, R. 1990. Modeling and theory of super-cell storms. In: The Tornado: Its Structure, Dy-namics, Prediction and Hazards, Church, C,D. Burgess, C. Doswell and R. Davies-Jones,(Eds), 1990: Amer. Geoph. Union, GeophysicalMono. 79: 57-74.
SCOFIELD, R.A. and J.F.w. PURDOM. 1986. The use of
satellite data for mesoscale analyses and fore-casting applications. In: Mesoscale Meteorologyand Forecasting, P.S. Ray, (Ed), Amer. Meteo-rol. Soc, 793 pp, 118-150.
SHOWALTER, A.K. 1953. A stability index for thun-derstorm forecasting, Bull. Am. Meteorol. Soc.34: 250-252.
SIOK, s. and H.P. BIRON. 1992. Wet microbursts, 4th
CMOS Workshop on Operational Meteorology,Whistler, B.C.
SMULL, B.F. and HOUZE. R.A., JR. 1985. A midlati-
tude squall line with a trailing region of strati-

Forecasting of Summer Severe Weather / 301
form rain: radar and satellite observation. Mon.Weather Rev. 113: 117-133.
STAUFFER, D.R. and N.L. SEAMAN. 1994. Multiscale
four-dimensional data assimilation, J. Appl. Me-teorol. 33: 416^*34.
STEWART, s.R. 1991. The prediction of pulse-typethunderstorm gusts using vertically integratedliquid water content and cloud top penetrativedowndraft mechanism, NOAA Tech. Memo.NWS SR-136.
STRONG, G.s. 1979. Convective weather predictionbased on synoptic parameters. 11th Conf. onSev. Local Storms, Kansas City, MO, Amer.Meteorol. Soc, 608-615.
and W.D. WILSON. 1983. The synoptic indexof convection: Application to the Fort Collinshailstorm of 30 July 1979. 13th Sev. LocalStorms Conf., Tulsa, OK, Amer. Meteorol. Soc,300-303.
. 1986. Synoptic to mesoscale dynamicsof severe thunderstorm environments: A diag-nostic study with forecasting applications, Ph.D.Thesis, University of Alberta, 346 pp.
SUMMERS, P.W.; G.K. MATHER a n d D.S. TREDDENICK.
1972. The development and testing of an air-borne droppable pyrotechnic flare system forseeding Alberta hailstorms. J. Appl. Meteorol.11: 695-703.
THIEBAUX, J. and PEDDER. 1987. Spatial ObjectiveAnalysis with Applications in Atmospheric Sci-ence, Academic Press, London, 299 pp.
TORLASCHI, E. 1991. S-band circular polarizationdiversity radars: a method for correcting the po-larization effects. 25lh Intern. Conf. on RadarMeteorol. Paris, France, Amer. Meteorol. Soc,599-601.
; B. PETTIGREW and J. ST-PIERRE. 1989. Cir-cular Polarization: Correction of propagation ef-fects and comparison between radar fields andground precipitation pattern. 24th Intern. Conf.on Radar Meteorol. Tallahasse, FL, Amer. Me-teorol. Soc, 599-601.
and A.R. HOLT. 1993. Separation of propa-gation and backscattering effects in circular po-larisation diversity S-band radars. J. Atmos. andOceanic Tech. 465^77.
TREMBLAY, A. 1994. Simulations of the 14 July1987 squall line using a compressible model.Accepted by ATMOSPHERE-OCEAN.
TURCOTTE, v.; s. SIOK and G. DEAUDELIN. 1985. Re-
lationship between between wind shear andhydrostatic energy in summer severe weather.
Note technique 85N-002, QWC.and D. VIGNEUX. 1987. Severe thunder-
storms and hail forecasting using derived pa-rameters from standard RAOBS data. 2nd CMOSWorkshop on Operational Meteorology 142-153.
UMAN, M.A. 1987. The Lightning Discharge. Aca-demic Press, Int. Geoph. Series, 39: 377 pp.
VAN DE KAMP, D.w. 1993. Current status and recentimprovements to the wind profiler demonstra-tion network. 26th Intern. Conf. on Radar Mete-orol. Norman, OK, Amer. Meteorol. Soc, 552-554.
VICKERS. G. 1992a. Gust fronts in the Edmontonarea during 1991. Internal AES Report, Al-berta Weather Centre, AES, Edmonton, Alberta,10 pp.
. 1992b. 1992 ALWC Summer SevereWeather Program, Internal AES report, Al-berta Weather Centre, AES, Edmonton, Alberta,41 pp.
VIGNEUX, D. et s. SIOK. 1985. Effets d'une circula-tion directe sur le declenchement d'orages vio-lents. Note technique Region de Quebec, 85N-001.
WEISMAN, M.L. and J.B. KLEMP. 1984. The struc-
ture and classification of numerically simulatedconvective storms in directionally varying windshears. Mon. Weather Rev. 112: 2479-2498.
WELDON, R.B. and S.J. HOLMES. 1991. Water Va-
por Imagery, Interpretation and Applications toWeather Analysis and Forecasting, NOAATech. Rep. NESDIS 57, 213 pp.
WILK, K.E. and J.T. DOOLEY. 1980. FAA radars and
their display of severe weather (thunderstorms),Report no. FAA-RD-80-65.
WILLIAMS, E.R.; ME. WEBER a n d R.E. ORVILLE. 1989 .
The relationship between lightning type andconvective state of thunderclouds, J. Geophys.Res. 94: 13213-13220.
WILSON, J.w. and E.A. BRANDES. 1979. Radar mea-
surement of rainfall - a summary. Bull. Amer.Meteorol. Soc. 60: 1048-1058.
; G.B. FOOTE, N.A. CROOK, J.C. FANKHAUSER,
C.G. WADE, I.D. TUTTLE, C.Y. MUELLER a n d
s.K. KRUEGER. 1992. The role of boundary-layerconvergence zones and horizontal rolls in theinitiation of thunderstorms: a case study. Mon.Weather Rev. 120: 1785-1815.
- and c.K. MUELLER. 1991. Topics related toboundary layer variability and an operationalexperiment for 30 min forecasts of thunder-

302 / Paul Joe et al.
storms, 25th Intern. Conf. on Radar Meteorol.,Paris, France, Amer. Meteorol. Soc. 55-62.
and w.E. SCHREIBER. 1986. Initiation of
convective storms at radar-observed boundary-layer convergence lines. Mon. Weather Rev.114: 2516-2536.
ZAWADSKI, I.I. 1975. On radar-raingauge compar-ison, J. Appl. Meteorol, 14: 1430-1436.
ZHANG, D.L. and J.M. FRITSCH. 1986. Numerical sim-
ulation of the meso-P-scale structure and evolu-tion of the 1977 Johnston flood, Part I: Modeldescription and verification. J. Atmos. Sci. 43:1913-1943.
ZRNIC, D.; D.W. BURGESS a n d L. HENNINGTON. 1 9 8 5 .
Automatic detection of mesocyclonic shear withDoppler radar. J. Atmos. Oceanic Tech. 24:425-438.


