Embed Size (px)
Citation preview
2
RECOMMENDATIONS FOR IMPROVED WELDING PROCEDURES FOR
THICK STEEL PLATES THROUGH THERMO-MECHANICAL ANALYSIS
Omar A. Ibrahim 1, Dimitrios G. Lignos 2 and Colin A. Rogers 3
1Assistant Professor. Dept. of Structural Engineering, Alexandria University.
Lotfy El-Sied st. off Gamal Abd El-Naser - Alexandria, Alexandria Governorate 11432, Egypt
Tel: +20 3 5910052
email: [email protected]
2Corresponding author
Associate Professor. Dept. of Civil and Environmental Engineering, Ecole Polytechnique Fédérale
de Lausanne (EPFL)
EPFL ENAC IIC RESSLab, GC B3 485, Station 18, CH-1015 Lausanne, Switzerland
email: [email protected]
Tel. +41 21 693 2427
Fax. +41 21 693 2868
3Associate Professor. Dept. of Civil Engineering and Applied Mechanics McGill University
Macdonald Engineering Building 817 Sherbrooke Street West Montreal, QC, Canada, H3A 0C3
email: [email protected]
3
Abstract
Welding of steel plates is accompanied by residual stresses that increase as the constraint provided
by the welded components becomes greater. Consequently, crack initiation has been reported after
welding thick plates due to the high residual stresses developed by the welding procedure. This is
further exacerbated by the higher likelihood of imperfections present in thick steel plates due to
the rolling and cooling process. The research described herein aims to develop improved
submerged arc welding (SAW) procedures to reduce the residual stresses for steel plates of
thickness greater than 50mm. Acceptance criteria are developed for discontinuities present in the
steel plates prior to welding, to limit the probability of crack initiation. A parametric study of SAW
procedure parameters was conducted utilizing a validated finite element model. Two welding
procedures were recommended for thick steel plates. Discontinuity acceptance limits were also
recommended for each welding procedure using a fracture toughness database and an expression
developed to calculate the probability of a crack to initiate.
Keywords: Thick steel plates – Welding procedure – Welding simulation – Discontinuities
acceptance criteria
4
1 Introduction
In recent years, more stringent requirements have been employed for the design of steel
infrastructure due to seismic and blast loading as well as the design complexity. For this reason,
steel plates with thickness 50mm and higher are becoming common in the steel construction
industry to form heavy built-up sections. Connecting such components through welding is an
essential part of construction; for example, the welding of built-up members composed of thick
steel plates and splice connections. Welding thick plates employs higher heat input than that
required for commonly used 25mm plates. Additionally, the plate thickness provides substantial
constraint to the contraction of the heated steel resulting in high post-welding tensile residual
stresses that can lead to crack initiation (Blodgett & Miller, 1993; Fisher & Pense, 1987). Miller
(2010) proposed a set of recommendations to reduce shrinkage stresses and restraints in welded
thick plates, in addition to ensuring that minimum levels of fracture toughness be met. Although
these recommendations are informative and provide fabricators with the knowledge to weld thick
steel plates, they are of a qualitative nature. Furthermore, welding specifications (AWS D1.1,
2010; CAN/CSA-W59, 2013) have no special requirements for the welding of thick steel plates.
According to AWS D1.1 (2010) “Table 3.2”; the required prequalified minimum preheat and inter-
pass temperatures for the welding of steel plates increase according to the plate thickness.
However, AWS D1.1 (2010) also states in “Tables 4.2 and 4.3” that in order to qualify a welding
procedure for unlimited thickness, it is permissible to use test plates of 25mm in thickness.
Consequently, steel fabricators are using welding procedures qualified for thick plates that were
tested on common 25mm plates. With the increasing demand to use thick plates welding
procedures (AWS D1.1, 2010; CAN/CSA-W59, 2013) should be revisited with the aim to develop
quantitative welding recommendations for various design applications. To the best of our
5
knowledge, there has not been a study to provide quantitative recommendations for the welding of
thick steel plates.
Very few studies have been carried out to address the effect of different parameters of the welding
procedure on the resulting residual stresses. Pilipenko (2001) utilized finite element modeling of
the welding procedure to study two different mitigation techniques to reduce the resulting residual
stresses in thick-walled ship hull structures; mechanical straightening and thermal tensioning. Both
techniques showed a 35 - 45% decrease in peak tensile residual stresses. However, new residual
stresses were generated in previously stress free regions. The ASTM A131 (2014) Gr. 50 steel
plates (i.e., nominal fy = 345 MPa) used in Pilipenko’s study were of maximum thickness of 45mm.
Yang (2008) conducted experiments to study the effect of submerged arc welding current and
speed on the mechanical and physical properties of ASTM A516 Gr.70 (2015) (i.e., nominal fy =
480MPa) and ASTM A709 Gr.50 (2015) (i.e., nominal fy = 345MPa) steel. The dimensions of the
welded sample plates were 915x122x17mm (36x4.8x0.66in.). Yang concluded that high travel
speed and welding current result in severe undercuts, and the toughness of both steel materials
increased with higher welding current and speed. In addition, the percent elongation at the heat
affected zone increased with travel speed but decreased with welding current.
This paper contains a proposal for an improved submerged arc welding (SAW) procedure for thick
plates using a partial penetration butt joint. This was achieved based on a rigorous parametric study
that investigated the main parameters affecting the resulting post-welding residual stresses in thick
steel plates. The parametric study was conducted based on detailed thermo-mechanical finite
element (FE) analysis. The FE simulations utilize a modeling approach for welding procedures of
welded thick plates that was recently proposed by the authors (Ibrahim et al., 2016). The parametric
study is divided into two phases; the first phase involves parameters directly related to the heat
6
input and cooling rate. These parameters are; the welding temperature, the welding speed, and the
preheat and inter-pass temperatures. The second phase involves a set of general parameters; the
steel material quality, the welded plate thickness, the number of passes, as well as the welding
sequence. The assessment of each parameter is based on two criteria; first the stress profile during
and after the welding procedure. Second, the minimum computed crack size according to the
resulting residual stresses; based on fracture toughness tests for the steel material (Ibrahim et al.,
2017). The results of the parametric study are utilized to provide quantitative recommendations
for the welding of thick steel plates that are currently used in steel construction practice in North
America.
2 Main Features of the Employed Thermo-Mechanical Finite Element Model for
Welding Simulation
Establishing a detailed parametric study for SAW procedures through experiments is time
consuming and costly. Therefore, such parametric study can be conducted through detailed FE
analysis. A simulation of the welding procedure for thick steel plates is developed using an
uncoupled thermo-mechanical finite element model proposed by Ibrahim et al. (2016). The
simulation is divided into two models; a heat-transfer model that produces temperature
distributions at all stages of the welding procedure. The temperature distributions are then exported
to a stress analysis model that calculates the corresponding strains and stresses, which have
resulted from the temperature changes. The results of the numerical model are validated with full-
scale welding experiments, involving thick plates, described in detail in Ibrahim et al. (2016). The
validation is achieved by comparing temperature distribution results from the model with
measured temperatures from the welding experiment at the same time and location for each
welding pass. Additionally the stress distribution results from the model are validated with
7
experimental results achieved from previous research (Chen & Chang, 1993). In brief, the main
parameters of the welding simulation are the heat input, preheat and inter-pass temperatures, steel
material properties, thickness of the welded plate, number of passes and welding sequence. The
heat input is simulated through the welding temperature, welding pass size and the welding travel
speed. Preheat and inter-pass temperatures are modeled by applying heat boundary conditions at
the required area on the surface of the base metal until the required temperature is achieved.
In order to validate the employed thermo-mechanical finite element approach, a heavy built-up
box column, that experienced cracks after welding, is used. The box column is composed of two
660x75mm (26x3in.) plates and two 324x75mm (123/4x3in.) plates of ASTM A572 Gr.50 (2013)
steel (fy = 345 MPa, fu = 450 MPa), where fy is the yield stress and fu is the ultimate stress of the
steel material. The material properties of the numerical model are calibrated through tensile tests
conducted for standard coupons obtained from different locations of the heavy built-up box
column. Additional Charpy-V-Notch (CVN) tests are conducted to estimate the base metal and
heat affected zone (HAZ) fracture toughness (Ibrahim et al., 2016). The welding procedure is
conducted on two corners of the built-up column simultaneously using an automated SAW process
with average heat input of 2.4 KJ/mm, average current of 700 A and average voltage of 30 V.
These parameters reflect standard welding practice in North America. Each corner is a partial joint
penetration (PJP) weld, with groove depth of 37.5mm and groove angle of 60°, consisting of 13
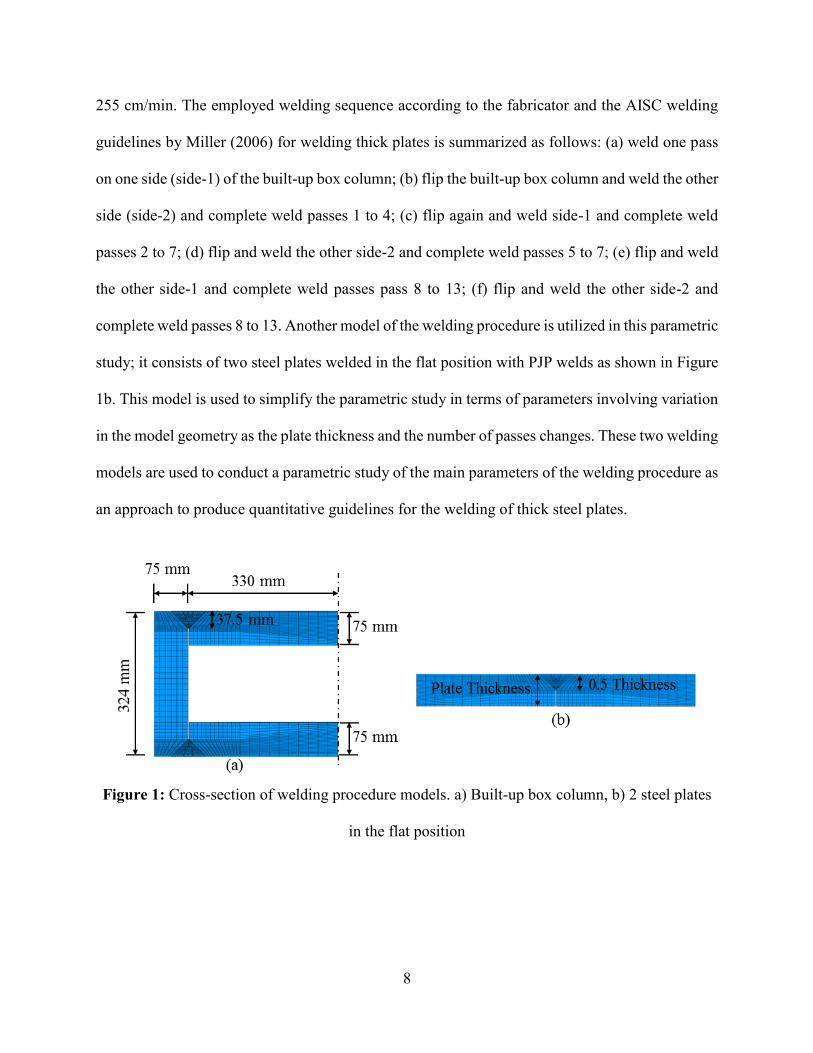
passes according to specifications suggested in AWS D1.1 (2010). Due to symmetry, only half
the built-up box is modeled, as shown in Figure 1a. The electrodes used for this procedure are
F7A4-EM12K according to AWS D1.1 A5.17 (AWS D1.1, 2010) with suitable granular flux type
(OK FLUX 10.71). Two electrodes are used at each corner with diameter 2.4mm and an 8mm gap.
The average travel speed of the electrodes is 525 mm/min and the average wire feeding speed is
8
255 cm/min. The employed welding sequence according to the fabricator and the AISC welding
guidelines by Miller (2006) for welding thick plates is summarized as follows: (a) weld one pass
on one side (side-1) of the built-up box column; (b) flip the built-up box column and weld the other
side (side-2) and complete weld passes 1 to 4; (c) flip again and weld side-1 and complete weld
passes 2 to 7; (d) flip and weld the other side-2 and complete weld passes 5 to 7; (e) flip and weld
the other side-1 and complete weld passes pass 8 to 13; (f) flip and weld the other side-2 and
complete weld passes 8 to 13. Another model of the welding procedure is utilized in this parametric
study; it consists of two steel plates welded in the flat position with PJP welds as shown in Figure
1b. This model is used to simplify the parametric study in terms of parameters involving variation
in the model geometry as the plate thickness and the number of passes changes. These two welding
models are used to conduct a parametric study of the main parameters of the welding procedure as
an approach to produce quantitative guidelines for the welding of thick steel plates.
Figure 1: Cross-section of welding procedure models. a) Built-up box column, b) 2 steel plates
in the flat position
9
3 Description of the Methodology Employed for the Welding Procedure Parametric
study
The parametric study of the welding procedure for thick steel plates was divided into two phases.
The first phase (noted as Phase A) involves parameter variations that directly affect the heat input
and the cooling rate. These parameters do not require variations of the weld geometry or sequence.
The outcome of this phase is the assessment of the main parameters of the welding process and
the recommendations regarding the heat input including preheat and inter-pass temperatures. In
the second phase (noted as Phase B) of the parametric study additional parameters are introduced,
including the steel material properties and the plate thickness variation. Additionally, in this phase
the influence of the number of passes and the welding direction are included. Tables 1 and 3
summarize the main values of different parameters and the analysis models employed in this study
for Phases A and B. Each phase of the parametric study is discussed in detail in Sections 3.1 and
3.2, respectively. It should be stated that the parameter variation summarized in Tables 1 and 3
was established and refined based on feedback from steel fabricators in North America. The
assessment criteria for each parameter are summarized in Section 3.3.
3.1 Phase A: parameters affecting the heat input and cooling rate
The first phase of the parametric study was conducted using the case study model of the built-up
box column shown in Figure 1a, and briefly discussed in Section 2. The two main parameters in
the heat-transfer modeling are the amount of heat introduced in the welded plates (the heat input)
and the rate of cooling of the plate from the welding temperature to the ambient temperature (the
cooling rate). These parameters are represented in the thermo-mechanical FE model by the welding
temperature, the speed of welding (electrode), as well as the preheat and the inter-pass
10
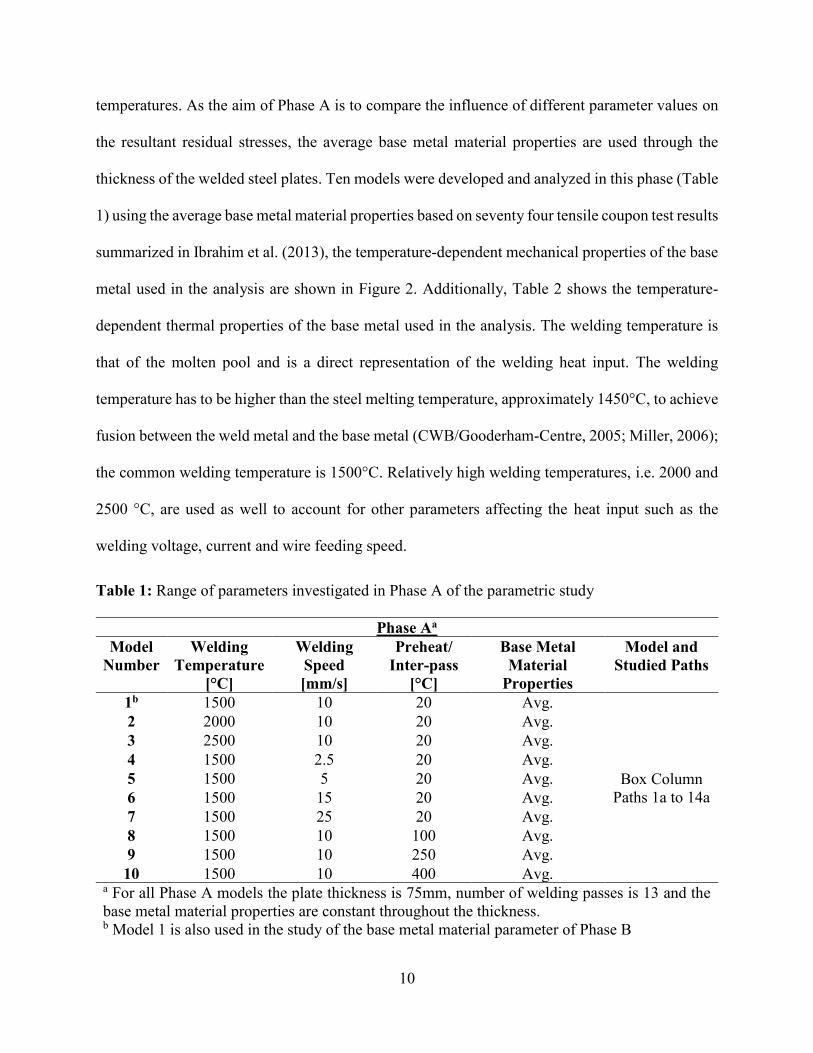
temperatures. As the aim of Phase A is to compare the influence of different parameter values on
the resultant residual stresses, the average base metal material properties are used through the
thickness of the welded steel plates. Ten models were developed and analyzed in this phase (Table
1) using the average base metal material properties based on seventy four tensile coupon test results
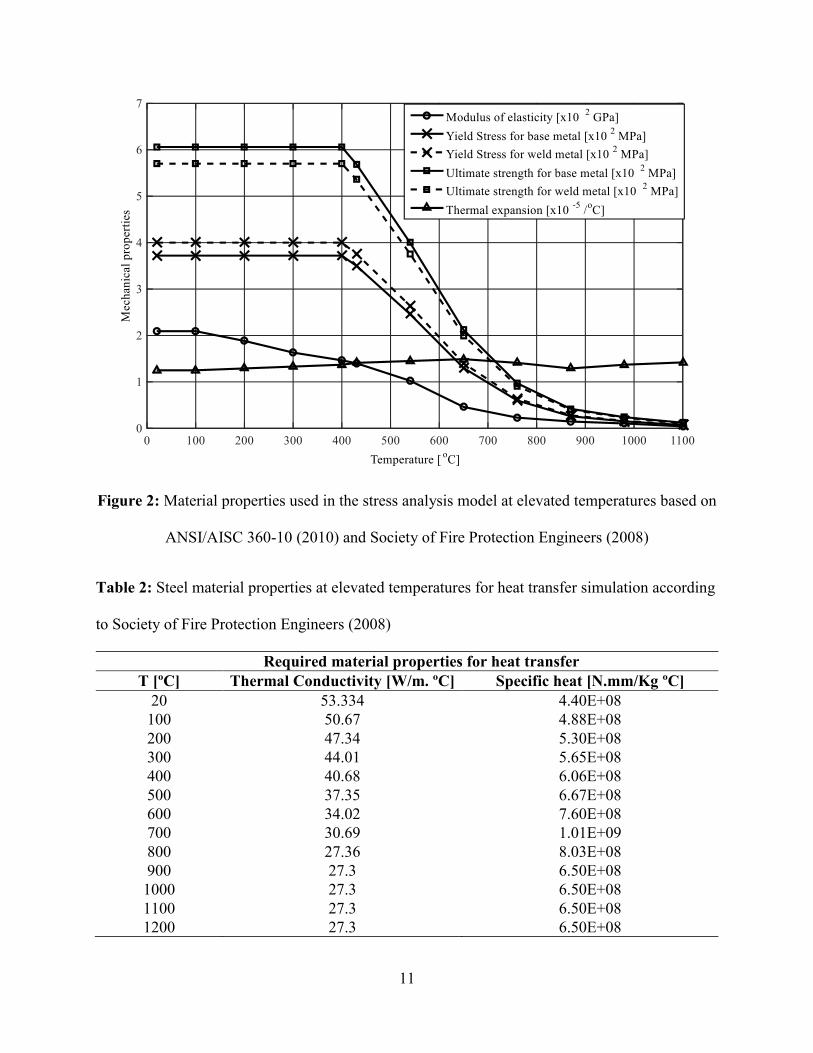
summarized in Ibrahim et al. (2013), the temperature-dependent mechanical properties of the base
metal used in the analysis are shown in Figure 2. Additionally, Table 2 shows the temperature-
dependent thermal properties of the base metal used in the analysis. The welding temperature is
that of the molten pool and is a direct representation of the welding heat input. The welding
temperature has to be higher than the steel melting temperature, approximately 1450°C, to achieve
fusion between the weld metal and the base metal (CWB/Gooderham-Centre, 2005; Miller, 2006);
the common welding temperature is 1500°C. Relatively high welding temperatures, i.e. 2000 and
2500 °C, are used as well to account for other parameters affecting the heat input such as the
welding voltage, current and wire feeding speed.
Table 1: Range of parameters investigated in Phase A of the parametric study
Phase Aa
Model
Number
Welding
Temperature
[°C]
Welding
Speed
[mm/s]
Preheat/
Inter-pass
[°C]
Base Metal
Material
Properties
Model and
Studied Paths
1b 1500 10 20 Avg.
Box Column
Paths 1a to 14a
2 2000 10 20 Avg.
3 2500 10 20 Avg.
4 1500 2.5 20 Avg.
5 1500 5 20 Avg.
6 1500 15 20 Avg.
7 1500 25 20 Avg.
8 1500 10 100 Avg.
9 1500 10 250 Avg.
10 1500 10 400 Avg. a For all Phase A models the plate thickness is 75mm, number of welding passes is 13 and the
base metal material properties are constant throughout the thickness. b Model 1 is also used in the study of the base metal material parameter of Phase B
11
Figure 2: Material properties used in the stress analysis model at elevated temperatures based on
ANSI/AISC 360-10 (2010) and Society of Fire Protection Engineers (2008)
Table 2: Steel material properties at elevated temperatures for heat transfer simulation according
to Society of Fire Protection Engineers (2008)
Required material properties for heat transfer
T [ºC] Thermal Conductivity [W/m. ºC] Specific heat [N.mm/Kg ºC]
20 53.334 4.40E+08
100 50.67 4.88E+08
200 47.34 5.30E+08
300 44.01 5.65E+08
400 40.68 6.06E+08
500 37.35 6.67E+08
600 34.02 7.60E+08
700 30.69 1.01E+09
800 27.36 8.03E+08
900 27.3 6.50E+08
1000 27.3 6.50E+08
1100 27.3 6.50E+08
1200 27.3 6.50E+08
12
In summary, the welding temperature parameter is studied through Models 1 to 3 (Table 1). The
heat input also depends on the travel speed of the electrode (Miller, 2006). In turn, this welding
travel speed has a great effect on the weld penetration and the bead size. With slow welding speed
the heat input increases, as does the penetration and the bead size. The disadvantages of slow
welding travel speed are that it diminishes the control of the molten pool and increases the slag
inclusion (Jefferson & Woods, 1962). The average welding travel speed of the SAW procedure is
approximately 10 mm/s (AWS D1.1, 2010; Miller, 2006). From Table 1, lower and higher values
are used to illustrate the effect of the welding travel speed on the heat input and on the residual
stresses. The welding travel speeds of 2.5 and 25 mm/s were studied based on Model 1, and Models
4 to 7 (Table 1) in order to emphasize the effect of travel speed on the welding residual stress.
However, these welding travel speeds are not practical because the slow welding travel speed
decreases the control of the molten weld metal and the fast welding travel speed leads to low heat
input, which in turn affects the fusion between the weld metal and base metal.
The cooling rate is the primary parameter that affects the shrinkage cracks developed in welded
plates. A slow cooling rate will decrease the shrinkage stress that results in shrinkage cracks.
According to Graville (1975) the cooling rate can be calculated from the heat input, the plate
thickness and the preheat temperature. Preheat and inter-pass temperatures are the parameters that
have the highest influence on the cooling rate. According to AWS D1.1 (2010), for ASTM A572
Gr.50 (2013) steel plates with thickness greater than 65mm, the preheat temperature is 110°C and
the inter-pass temperature should not be lower than 110°C. Moreover, the preheated area should
be at a distance from the weld equal to the thickness of the thicker plate and not less than 75mm.
The preheat and inter-pass temperatures were studied through Model 1 and Models 8 to 10. From
Table 1, these parameters vary from room temperature (20⁰C) to 400°C.
13
3.2 Phase B: Additional parameters
This phase focuses on other general parameters, including those which affect indirectly the
resulting residual stresses after completion of the welding procedure. Twelve models are included
in this phase, in addition to Model 1 of Phase A (Tables 1 and 3). The variability of the steel’s
mechanical properties through the thickness of thick steel plates may have an impact on the
distribution of the residual stress induced by welding. To take this into account, the mechanical
properties of the steel material through the plate thickness were measured based on tensile coupon
specimens from different locations in the steel plate. In the parametric study the impact of the steel
mechanical properties is assessed based on the mean and standard deviation values of the elastic
modulus (E), the yield stress (fy) and the ultimate strength (fu). Three material profiles were based
on 74 tensile coupon tests (46 through-thickness specimens and 28 specimens from the plate
surface) conducted by Ibrahim et al. (2016) for different locations in the case study heavy box-
column. The average material properties of all the results, the lower bound (LB) (located at
material near the surface of the plate) and the upper bound (UB) (located at material through the
thickness of the plate) are shown in
Table 4. The base metal material properties parameter is studied through Models 1, 11 and 12
(Tables 1 and 3).
The impact of the plate thickness is also included in this modelling phase. The thicknesses used
are those commonly found in current practice 25, 12, 19, 38mm, as well as thicker plates 50, 75
and 100mm. The thickness variation is studied through Models 13 to 19 (Table 3). Another
important parameter is the number of welding passes. Four welding procedures were studied
through Model 18 and Models 20 to 22 (Table 3); the first three are composed of 5, 13 and 20
14
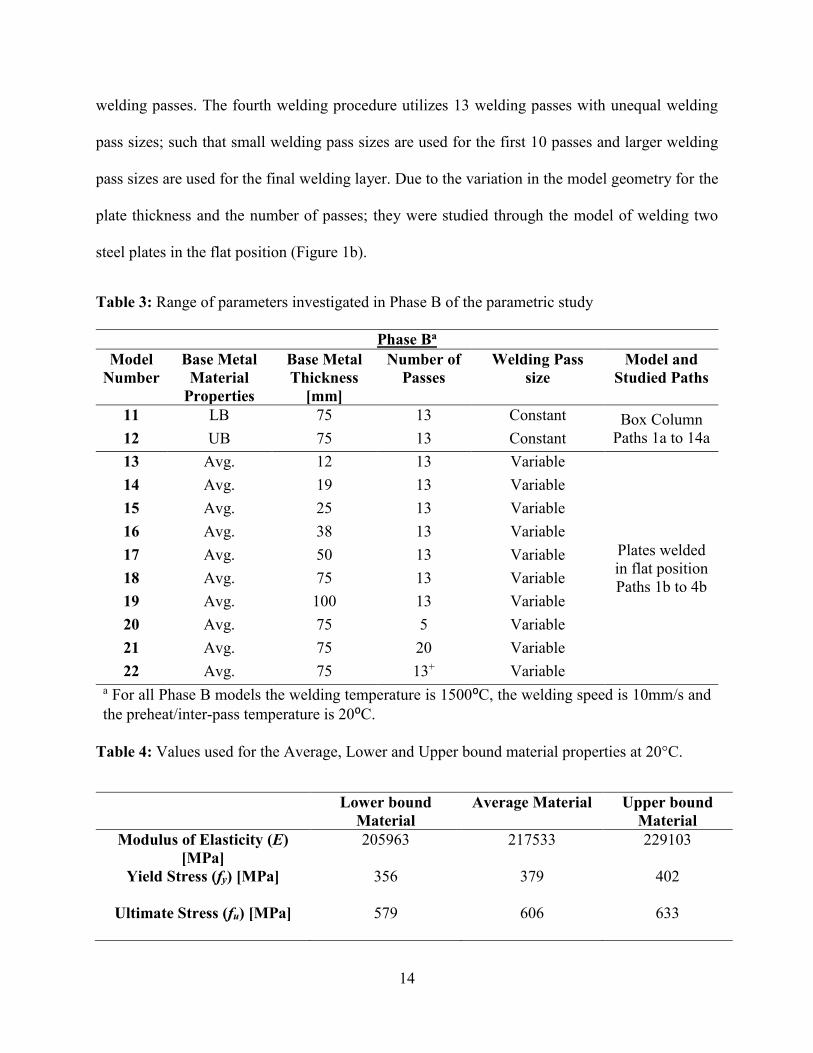
welding passes. The fourth welding procedure utilizes 13 welding passes with unequal welding
pass sizes; such that small welding pass sizes are used for the first 10 passes and larger welding
pass sizes are used for the final welding layer. Due to the variation in the model geometry for the
plate thickness and the number of passes; they were studied through the model of welding two
steel plates in the flat position (Figure 1b).
Table 3: Range of parameters investigated in Phase B of the parametric study
Phase Ba
Model
Number
Base Metal
Material
Properties
Base Metal
Thickness
[mm]
Number of
Passes
Welding Pass
size
Model and
Studied Paths
11 LB 75 13 Constant Box Column
Paths 1a to 14a 12 UB 75 13 Constant
13 Avg. 12 13 Variable
Plates welded
in flat position
Paths 1b to 4b
14 Avg. 19 13 Variable
15 Avg. 25 13 Variable
16 Avg. 38 13 Variable
17 Avg. 50 13 Variable
18 Avg. 75 13 Variable
19 Avg. 100 13 Variable
20 Avg. 75 5 Variable
21 Avg. 75 20 Variable
22 Avg. 75 13+ Variable a For all Phase B models the welding temperature is 1500⁰C, the welding speed is 10mm/s and
the preheat/inter-pass temperature is 20⁰C.
Table 4: Values used for the Average, Lower and Upper bound material properties at 20°C.
Lower bound
Material
Average Material Upper bound
Material
Modulus of Elasticity (E)
[MPa]
205963 217533 229103
Yield Stress (fy) [MPa] 356 379 402
Ultimate Stress (fu) [MPa] 579 606 633
15
3.3 Parameter assessment criteria
According to the preliminary results of the numerical simulation technique utilized in this study,
which conform to the findings of previous research programs that involved numerical and
experimental investigations (Bjorhovde et al., 1972; Pilipenko, 2001; Yang, 2008), the maximum
residual tensile stresses from the welding procedure are located at the surface of the welded plates,
and gradually decrease through the thickness until reaching the center of the steel plate.
Consequently, the temperature and residual stress results of each of the 22 models discussed in
Sections 3.1 and 3.2 (Tables 1 and 3) were obtained at the plate surface after each welding pass at
all the locations shown in Figures 3 and 4 in the transverse and longitudinal directions,
respectively. These paths represent possible regions for the peak tensile residual stresses according
to the stress distribution results. The assessment of the results from each parameter is based on two
criteria; the first is the effect of the parameter on the stress distribution and peak tensile stresses at
the plate surface for all the paths mentioned in Figures 3 and 4, as well as through the plate
thickness. The second criterion is related to the critical crack sizes at the plate surface, after each
welding pass, for a probability of crack initiation of 5% based on the statistical assessment of the
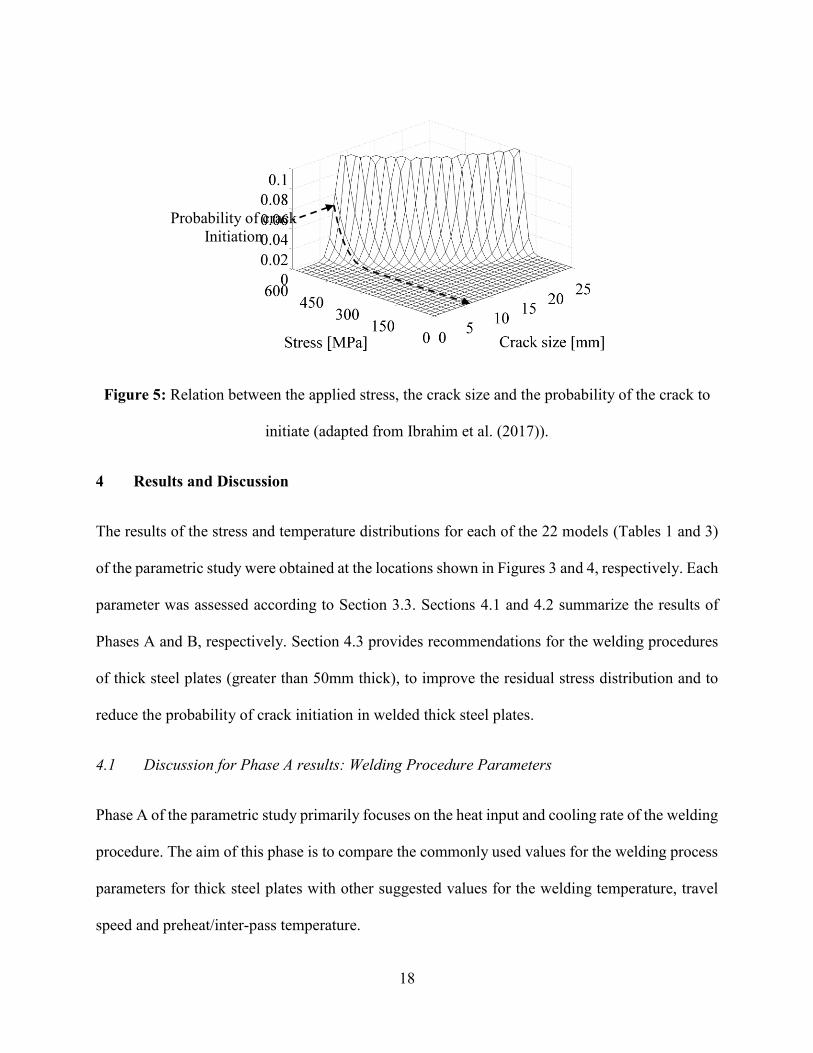
fracture toughness as discussed in Ibrahim et al. (2017). Figure 5 shows the relation between the
applied stress, the crack size and the probability of this crack to initiate at 21°C. In this example,
if the probability limit of crack initiation is set to 5% and the applied stress is assumed as 600 MPa
then the critical crack size will be 7mm. Through this assessment process, the impact of each
parameter on the output stress distribution and on the temperature distribution throughout the
welding procedure has been taken into account.
16
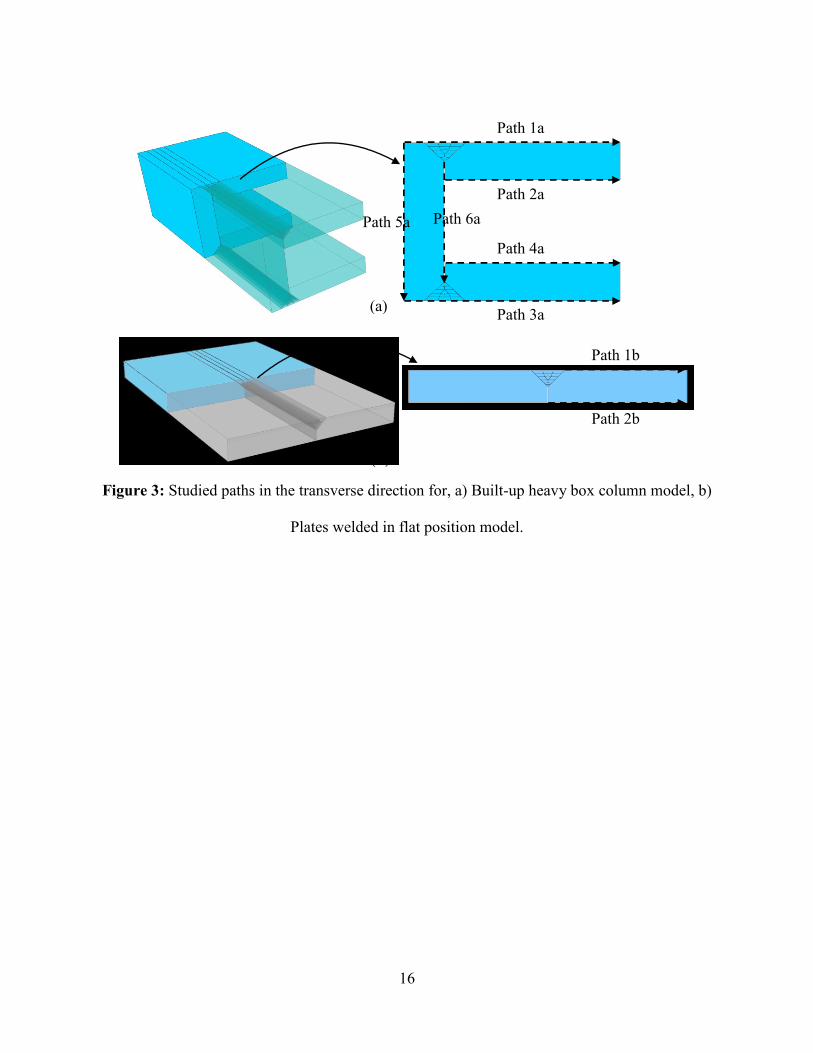
Figure 3: Studied paths in the transverse direction for, a) Built-up heavy box column model, b)
Plates welded in flat position model.
(a)
Path 1a
Path 2a
Path 4a
Path 3a
Path 5a Path 6a
(b)
Path 1b
Path 2b
17
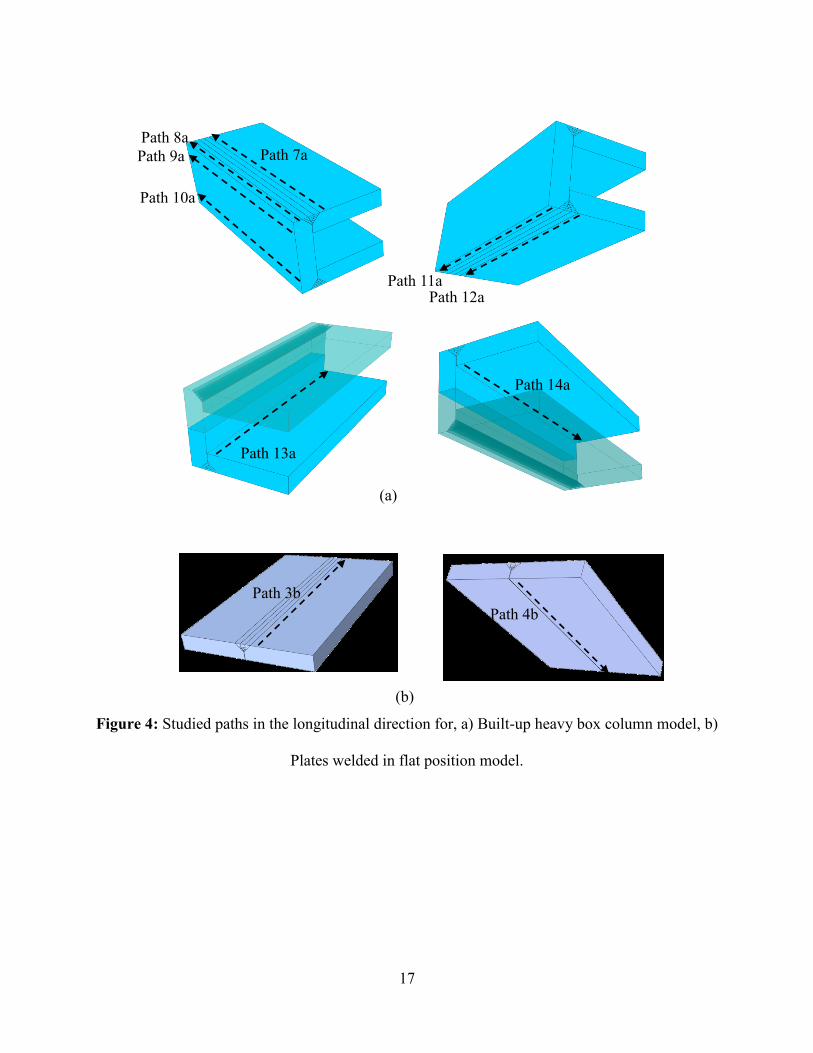
Figure 4: Studied paths in the longitudinal direction for, a) Built-up heavy box column model, b)
Plates welded in flat position model.
Path 7a Path 8a
Path 9a
Path 10a
Path 11a Path 12a
Path 13a
Path 14a
Path 3b
Path 4b
(a)
(b)
18
Figure 5: Relation between the applied stress, the crack size and the probability of the crack to
initiate (adapted from Ibrahim et al. (2017)).
4 Results and Discussion
The results of the stress and temperature distributions for each of the 22 models (Tables 1 and 3)
of the parametric study were obtained at the locations shown in Figures 3 and 4, respectively. Each
parameter was assessed according to Section 3.3. Sections 4.1 and 4.2 summarize the results of
Phases A and B, respectively. Section 4.3 provides recommendations for the welding procedures
of thick steel plates (greater than 50mm thick), to improve the residual stress distribution and to
reduce the probability of crack initiation in welded thick steel plates.
4.1 Discussion for Phase A results: Welding Procedure Parameters
Phase A of the parametric study primarily focuses on the heat input and cooling rate of the welding
procedure. The aim of this phase is to compare the commonly used values for the welding process
parameters for thick steel plates with other suggested values for the welding temperature, travel
speed and preheat/inter-pass temperature.
Probability of crack
Initiation
19
4.1.1 Welding temperature
The welding temperature is a direct representation of the heat input in the numerical model;
temperatures of 1500, 2000 and 2500⁰C were considered. It is worth mentioning that the 2500⁰C
welding temperature was only used as an academic value to demonstrate the effect of high heat
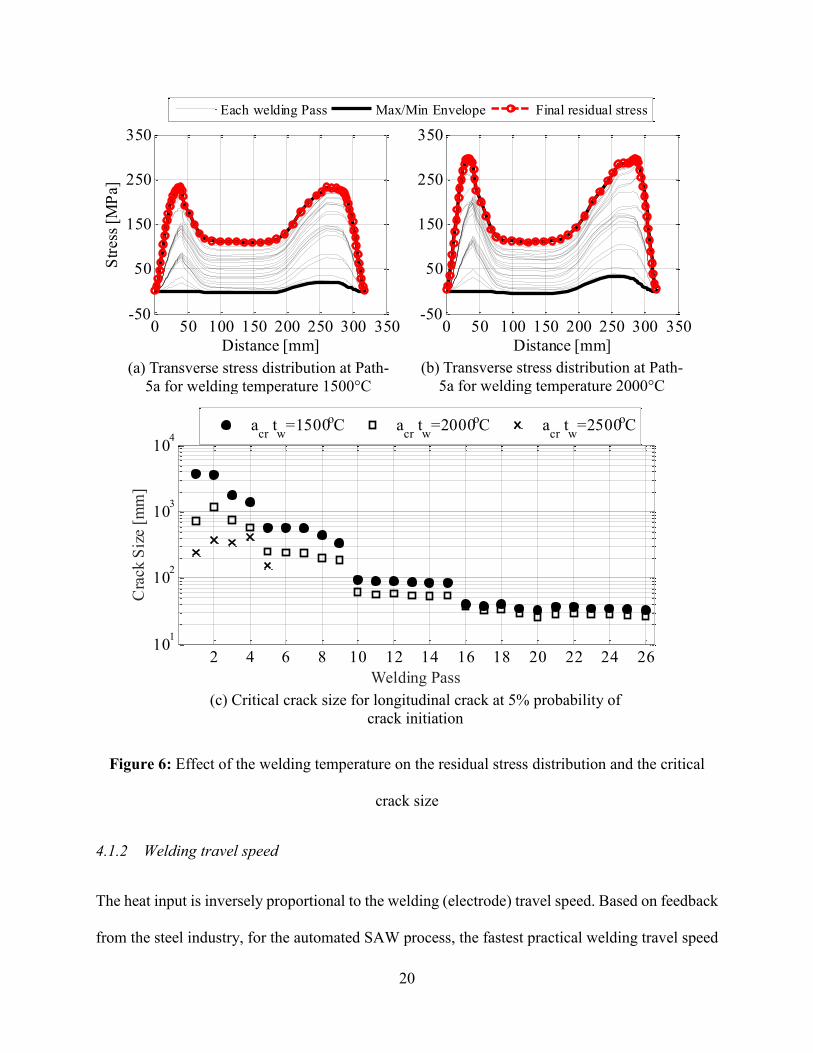
input on the resulting residual stresses. Figures 6a and 6b show the transverse residual stresses
through the Path-5a (Figure 3a) (in the direction perpendicular to the welding line) for the welding
temperatures 1500⁰C and 2000⁰C, respectively. The graphs illustrate that the residual stress
increases with each welding pass such that the maximum residual stress is that after the last
welding pass. It can be concluded from the graphs that with a 500⁰C increase in welding
temperature the residual transverse stress at the plate surface near the welding area increases by
20%. For a welding temperature of 2500⁰C the analysis stopped after the fifth welding pass due to
numerical limitations given the high heat input, and as such a full set of results could not be
presented. Figure 6c shows the critical longitudinal surface discontinuity size at the welded plate
surface after each welding pass for a probability of crack initiation of 5% according to the resulting
stress levels at all the studied paths (Figures 3a and 4a). It is worth mentioning that the critical
crack size of 1000mm reflects that it is unlikely for an actual crack to be critical according to the
resulting stresses, i.e. a high critical crack size means low residual stresses resulting from the
corresponding welding procedure. For the early welding stages there is a significant difference in
the allowed discontinuity size for the commonly used welding temperature (tw=1500⁰C) and for a
higher welding temperature (i.e., tw=2000⁰C). For the final welding stages, there is no significant
difference in the critical discontinuity sizes (30mm) between the welding temperatures that were
investigated. In conclusion, the residual tensile stress developed at the end of the welding
procedure produce the smallest critical discontinuity size.
20
Figure 6: Effect of the welding temperature on the residual stress distribution and the critical
crack size
4.1.2 Welding travel speed
The heat input is inversely proportional to the welding (electrode) travel speed. Based on feedback
from the steel industry, for the automated SAW process, the fastest practical welding travel speed
0 50 100 150 200 250 300 350-50
50
150
250
350A12-S22-5
Distance [mm]
Str
ess
[MP
a]
0 50 100 150 200 250 300 350-50
50
150
250
350A11-S22-5
Distance [mm]
Str
ess
[MP
a]
0 100 200 300 400-300
-100
100
300
500
700
900
Distance [mm]
Str
ess
[MP
a]
Each welding Pass Max/Min Envelope Final residual stress
2 4 6 8 10 12 14 16 18 20 22 24 2610
1
102
103
104
Welding Pass
Cra
ck S
ize
[mm
]
acr
tw
=1500oC acr
tw
=2000oC acr
tw
=2500oC
(a) Transverse stress distribution at Path-
5a for welding temperature 1500°C
(b) Transverse stress distribution at Path-
5a for welding temperature 2000°C
(c) Critical crack size for longitudinal crack at 5% probability of
crack initiation
21
is 15mm/s and the slowest is 5mm/s. In the present paper, the models were run with welding speeds
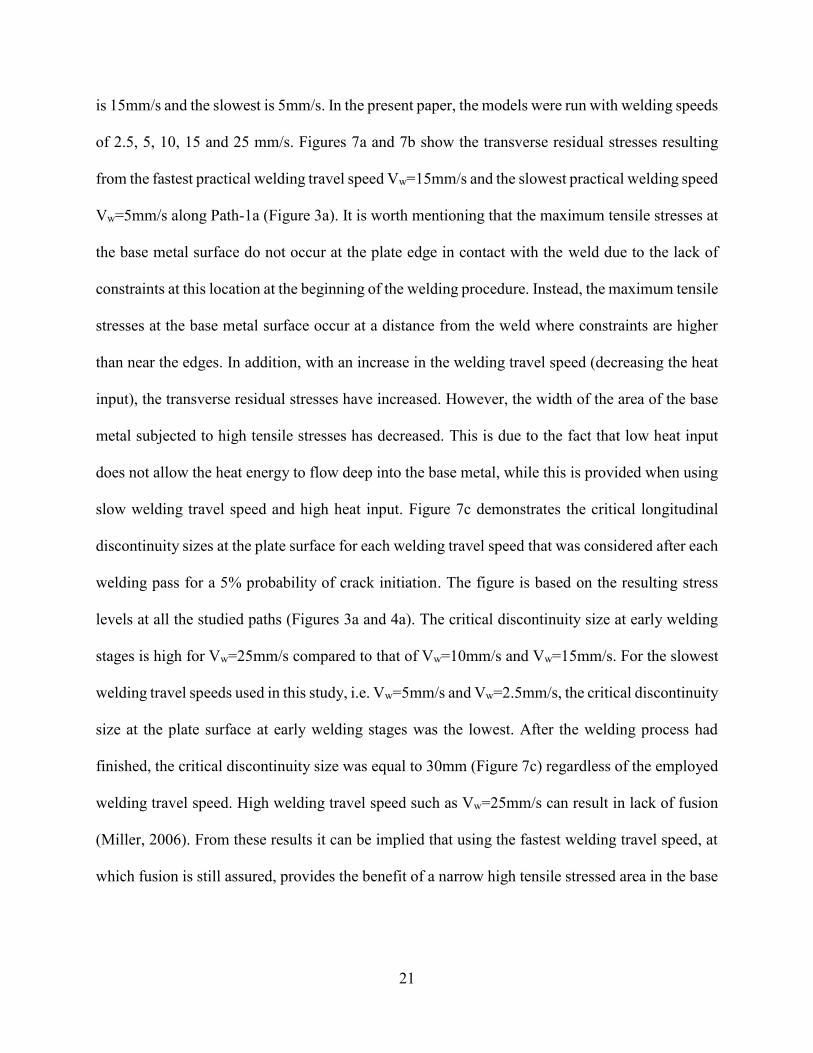
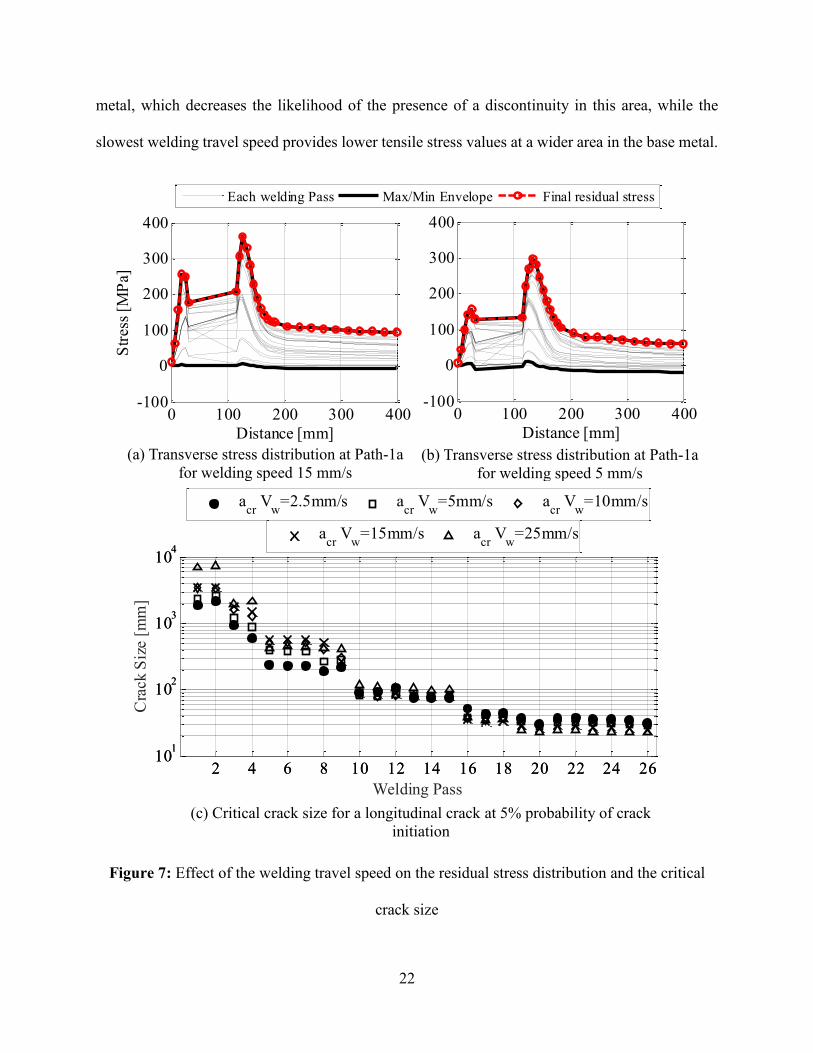
of 2.5, 5, 10, 15 and 25 mm/s. Figures 7a and 7b show the transverse residual stresses resulting
from the fastest practical welding travel speed Vw=15mm/s and the slowest practical welding speed
Vw=5mm/s along Path-1a (Figure 3a). It is worth mentioning that the maximum tensile stresses at
the base metal surface do not occur at the plate edge in contact with the weld due to the lack of
constraints at this location at the beginning of the welding procedure. Instead, the maximum tensile
stresses at the base metal surface occur at a distance from the weld where constraints are higher
than near the edges. In addition, with an increase in the welding travel speed (decreasing the heat
input), the transverse residual stresses have increased. However, the width of the area of the base
metal subjected to high tensile stresses has decreased. This is due to the fact that low heat input
does not allow the heat energy to flow deep into the base metal, while this is provided when using
slow welding travel speed and high heat input. Figure 7c demonstrates the critical longitudinal
discontinuity sizes at the plate surface for each welding travel speed that was considered after each
welding pass for a 5% probability of crack initiation. The figure is based on the resulting stress
levels at all the studied paths (Figures 3a and 4a). The critical discontinuity size at early welding
stages is high for Vw=25mm/s compared to that of Vw=10mm/s and Vw=15mm/s. For the slowest
welding travel speeds used in this study, i.e. Vw=5mm/s and Vw=2.5mm/s, the critical discontinuity
size at the plate surface at early welding stages was the lowest. After the welding process had
finished, the critical discontinuity size was equal to 30mm (Figure 7c) regardless of the employed
welding travel speed. High welding travel speed such as Vw=25mm/s can result in lack of fusion
(Miller, 2006). From these results it can be implied that using the fastest welding travel speed, at
which fusion is still assured, provides the benefit of a narrow high tensile stressed area in the base
22
metal, which decreases the likelihood of the presence of a discontinuity in this area, while the
slowest welding travel speed provides lower tensile stress values at a wider area in the base metal.
Figure 7: Effect of the welding travel speed on the residual stress distribution and the critical
crack size
0 100 200 300 400-100
0
100
200
300
400A23-S11-1
Distance [mm]
Str
ess
[MP
a]0 100 200 300 400
-100
0
100
200
300
400A25-S11-1
Distance [mm]
Str
ess
[MP
a]
0 100 200 300 400-300
-100
100
300
500
700
900
Distance [mm]
Str
ess
[MP
a]
Each welding Pass Max/Min Envelope Final residual stress
2 4 6 8 10 12 14 16 18 20 22 24 2610
1
102
103
104
acr
Vw
=2.5mm/s acr
Vw
=5mm/s acr
Vw
=10mm/s
2 4 6 8 10 12 14 16 18 20 22 24 2610
1
102
103
104
Welding Pass
Cra
ck S
ize
[mm
]
acr
Vw
=15mm/s acr
Vw
=25mm/s
(c) Critical crack size for a longitudinal crack at 5% probability of crack
initiation
(a) Transverse stress distribution at Path-1a
for welding speed 15 mm/s (b) Transverse stress distribution at Path-1a
for welding speed 5 mm/s
23
4.1.3 Preheat/inter-pass temperatures
The last parameter, which was investigated as part of Phase A, is the preheat/inter-pass
temperature. The base metal is preheated to a specified temperature in the vicinity of the welding
area before the welding procedure starts. This temperature is maintained at these regions
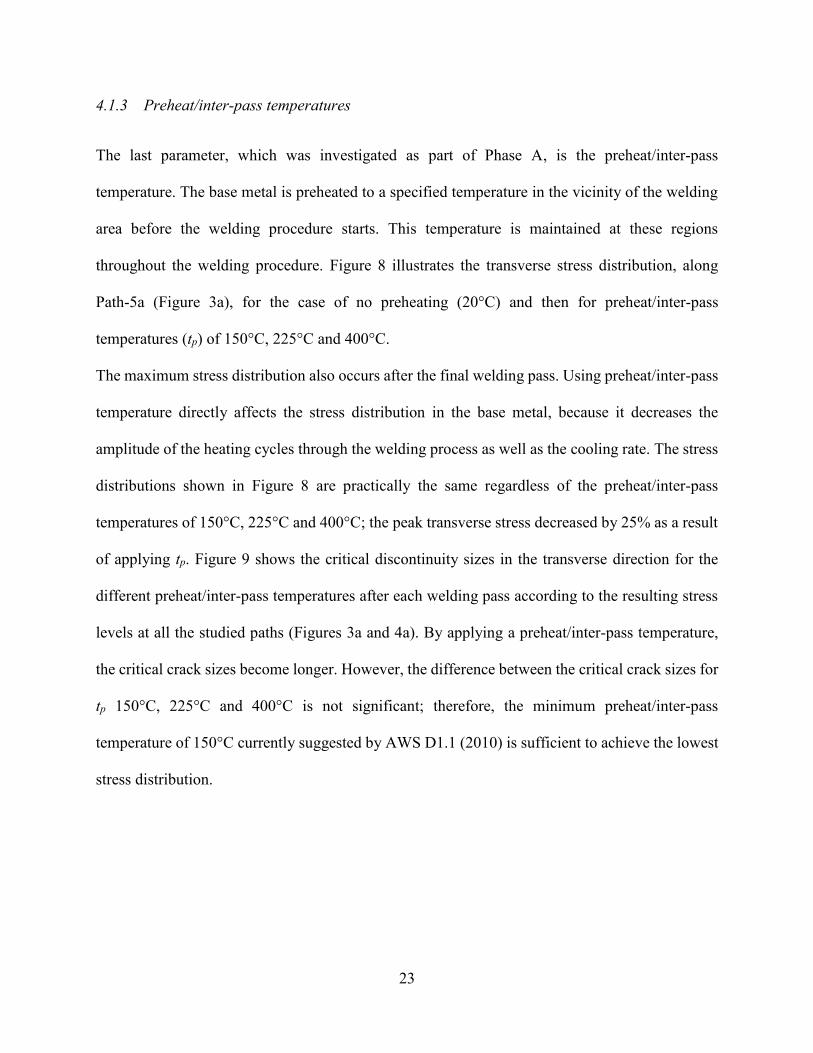
throughout the welding procedure. Figure 8 illustrates the transverse stress distribution, along
Path-5a (Figure 3a), for the case of no preheating (20°C) and then for preheat/inter-pass
temperatures (tp) of 150°C, 225°C and 400°C.
The maximum stress distribution also occurs after the final welding pass. Using preheat/inter-pass
temperature directly affects the stress distribution in the base metal, because it decreases the
amplitude of the heating cycles through the welding process as well as the cooling rate. The stress
distributions shown in Figure 8 are practically the same regardless of the preheat/inter-pass
temperatures of 150°C, 225°C and 400°C; the peak transverse stress decreased by 25% as a result
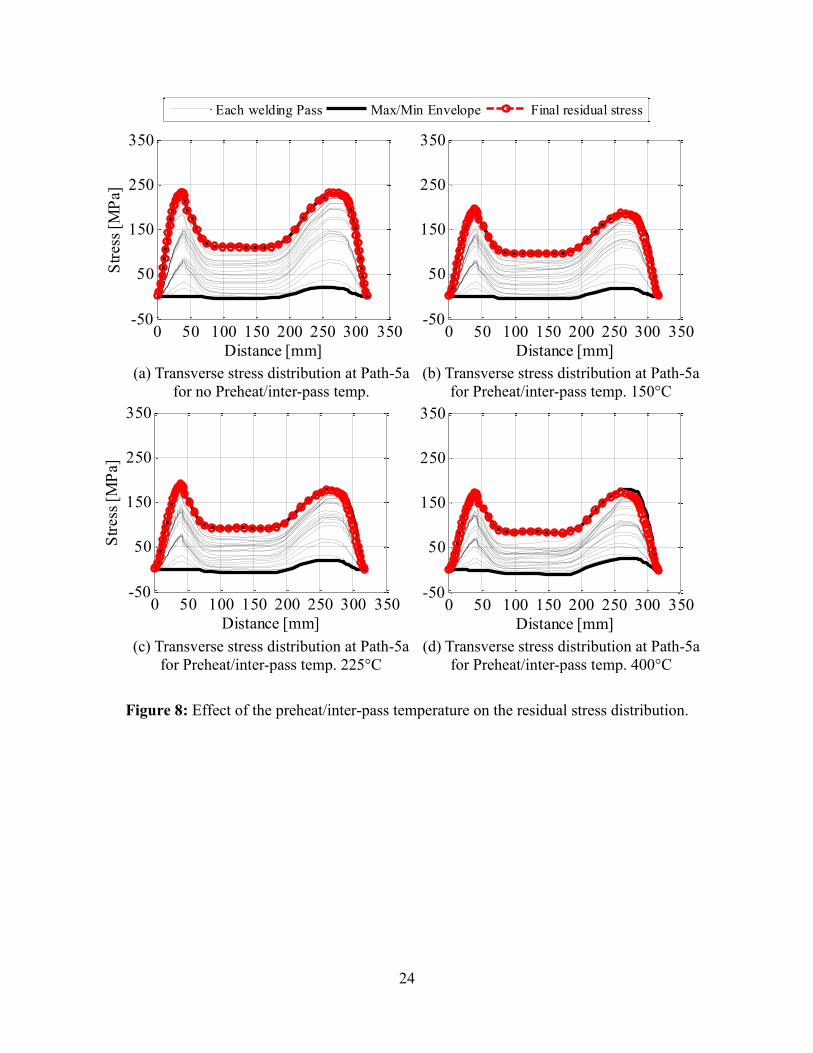
of applying tp. Figure 9 shows the critical discontinuity sizes in the transverse direction for the
different preheat/inter-pass temperatures after each welding pass according to the resulting stress
levels at all the studied paths (Figures 3a and 4a). By applying a preheat/inter-pass temperature,
the critical crack sizes become longer. However, the difference between the critical crack sizes for
tp 150°C, 225°C and 400°C is not significant; therefore, the minimum preheat/inter-pass
temperature of 150°C currently suggested by AWS D1.1 (2010) is sufficient to achieve the lowest
stress distribution.
24
Figure 8: Effect of the preheat/inter-pass temperature on the residual stress distribution.
0 50 100 150 200 250 300 350-50
50
150
250
350A32-S22-5
Distance [mm]
Str
ess
[MP
a]
0 50 100 150 200 250 300 350-50
50
150
250
350A31-S22-5
Distance [mm]
Str
ess
[MP
a]
0 50 100 150 200 250 300 350-50
50
150
250
350A34-S22-5
Distance [mm]
Str
ess
[MP
a]
0 50 100 150 200 250 300 350-50
50
150
250
350A33-S22-5
Distance [mm]
Str
ess
[MP
a]
0 100 200 300 400-300
-100
100
300
500
700
900
Distance [mm]
Str
ess
[MP
a]
Each welding Pass Max/Min Envelope Final residual stress
(d) Transverse stress distribution at Path-5a
for Preheat/inter-pass temp. 400°C
(a) Transverse stress distribution at Path-5a
for no Preheat/inter-pass temp.
(b) Transverse stress distribution at Path-5a
for Preheat/inter-pass temp. 150°C
(c) Transverse stress distribution at Path-5a
for Preheat/inter-pass temp. 225°C
25
Figure 9: Effect of the preheat/inter-pass temperature on the critical transverse crack size at 5%
probability of initiation.
4.2 Discussion for Phase B results: Geometry and Material Parameters
In Phase B of the study the general properties in terms of geometry and material of the welded
assembly are studied with the aim to detect the properties that have the most influential
contribution to the residual stress distributions and the probability of crack initiation.
4.2.1 Mechanical properties of the base metal
Due to the variability of the mechanical properties of thick steel plates (see Ibrahim et al. (2016)),
the material model was defined as having the average mechanical properties of the test results, the
lower bound (LB) properties and the upper bound (UB) properties as shown in
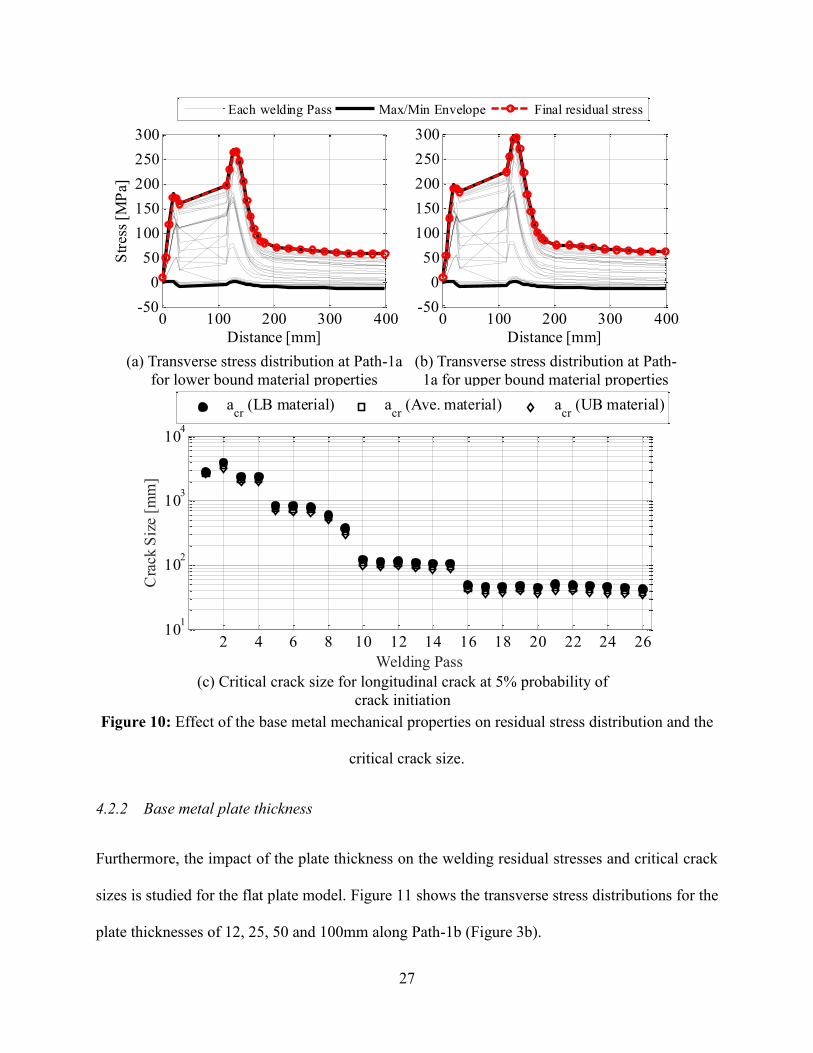
Table 4, throughout the plate thickness. Figures 10a and 10b show the transverse stress distribution
of the LB and the UB material models along Path-1a (Figure 3a). From these figures, the difference
26
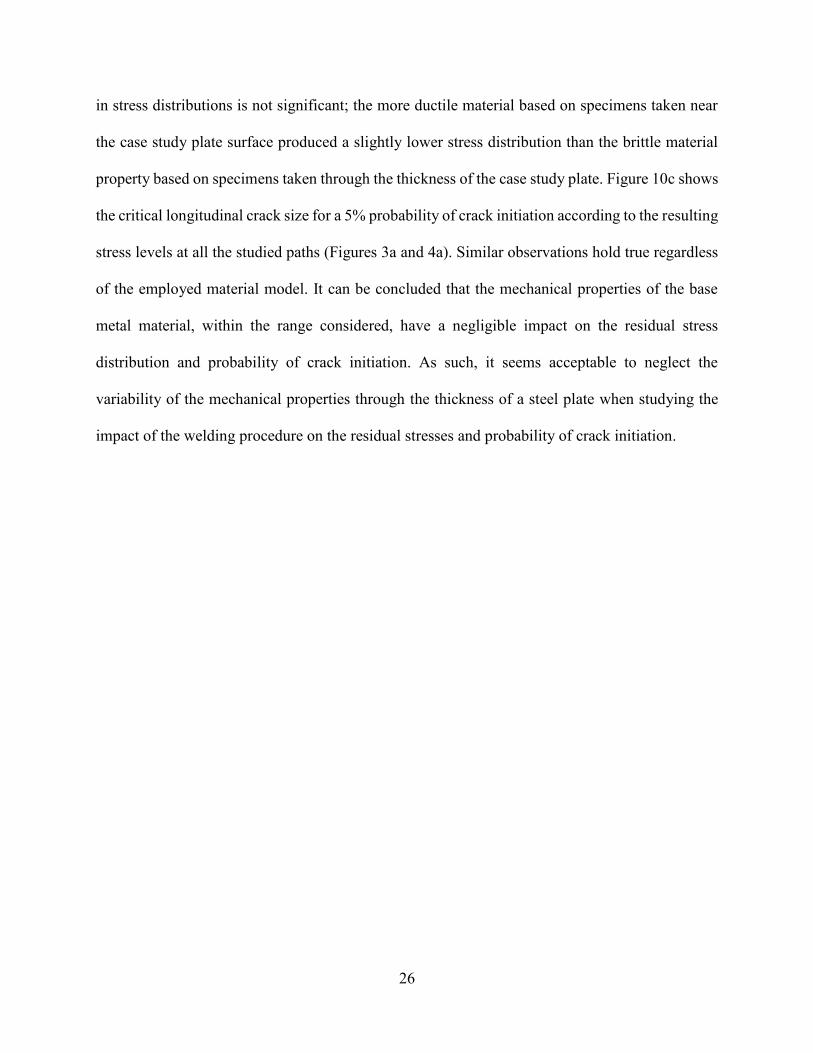
in stress distributions is not significant; the more ductile material based on specimens taken near
the case study plate surface produced a slightly lower stress distribution than the brittle material
property based on specimens taken through the thickness of the case study plate. Figure 10c shows
the critical longitudinal crack size for a 5% probability of crack initiation according to the resulting
stress levels at all the studied paths (Figures 3a and 4a). Similar observations hold true regardless
of the employed material model. It can be concluded that the mechanical properties of the base
metal material, within the range considered, have a negligible impact on the residual stress
distribution and probability of crack initiation. As such, it seems acceptable to neglect the
variability of the mechanical properties through the thickness of a steel plate when studying the
impact of the welding procedure on the residual stresses and probability of crack initiation.
27
Figure 10: Effect of the base metal mechanical properties on residual stress distribution and the
critical crack size.
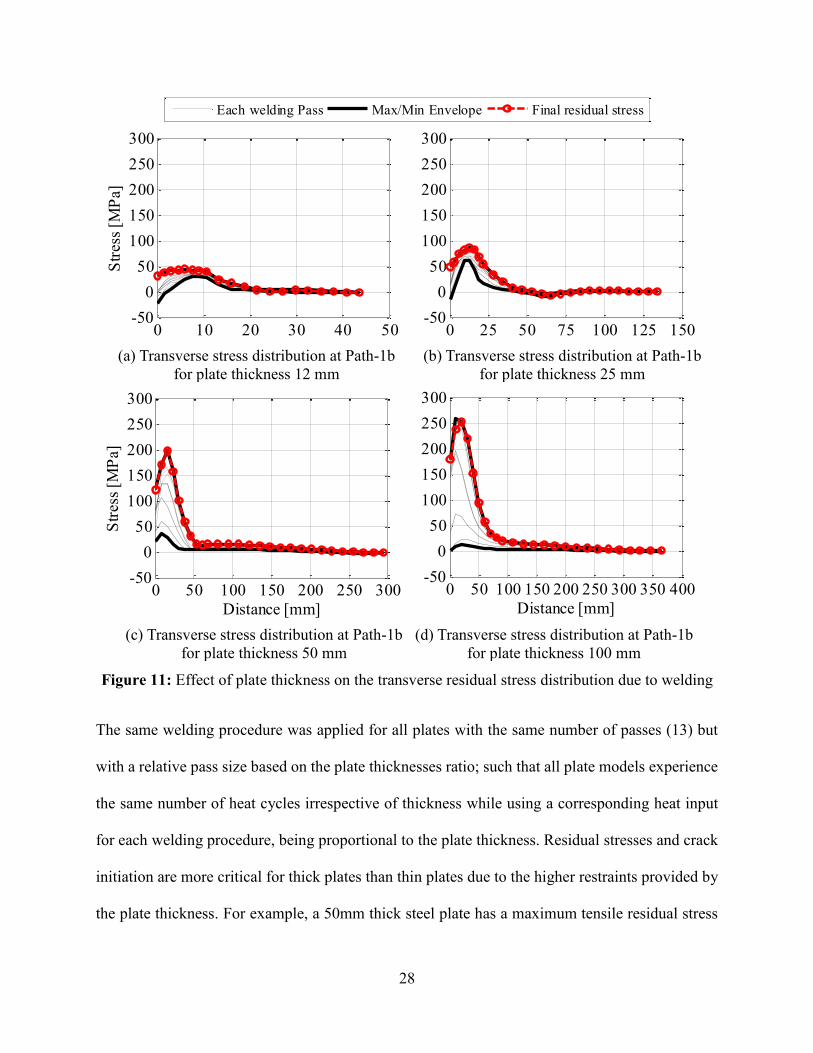
4.2.2 Base metal plate thickness
Furthermore, the impact of the plate thickness on the welding residual stresses and critical crack
sizes is studied for the flat plate model. Figure 11 shows the transverse stress distributions for the
plate thicknesses of 12, 25, 50 and 100mm along Path-1b (Figure 3b).
0 100 200 300 400-50
0
50
100
150
200
250
300B13-S11-1
Distance [mm]
Str
ess
[MP
a]
0 100 200 300 400-50
0
50
100
150
200
250
300B11-S11-1
Distance [mm]
Str
ess
[MP
a]
0 100 200 300 400-300
-100
100
300
500
700
900
Distance [mm]
Str
ess
[MP
a]
Each welding Pass Max/Min Envelope Final residual stress
2 4 6 8 10 12 14 16 18 20 22 24 2610
1
102
103
104
Welding Pass
Cra
ck S
ize
[mm
]
acr
(LB material) acr
(Ave. material) acr
(UB material)
(a) Transverse stress distribution at Path-1a
for lower bound material properties
(b) Transverse stress distribution at Path-
1a for upper bound material properties
(c) Critical crack size for longitudinal crack at 5% probability of
crack initiation
28
Figure 11: Effect of plate thickness on the transverse residual stress distribution due to welding
The same welding procedure was applied for all plates with the same number of passes (13) but
with a relative pass size based on the plate thicknesses ratio; such that all plate models experience
the same number of heat cycles irrespective of thickness while using a corresponding heat input
for each welding procedure, being proportional to the plate thickness. Residual stresses and crack
initiation are more critical for thick plates than thin plates due to the higher restraints provided by
the plate thickness. For example, a 50mm thick steel plate has a maximum tensile residual stress
0 25 50 75 100 125 150-50
0
50
100
150
200
250
300B22-S11-1
Distance [mm]
Str
ess
[MP
a]
0 50 100 150 200 250 300 350 400-50
0
50
100
150
200
250
300B24-S11-1
Distance [mm]
Str
ess
[MP
a]
0 10 20 30 40 50-50
0
50
100
150
200
250
300B25-S11-1
Distance [mm]
Str
ess
[MP
a]
0 50 100 150 200 250 300-50
0
50
100
150
200
250
300B23-S11-1
Distance [mm]
Str
ess
[MP
a]
0 100 200 300 400-300
-100
100
300
500
700
900
Distance [mm]
Str
ess
[MP
a]
Each welding Pass Max/Min Envelope Final residual stress
(b) Transverse stress distribution at Path-1b
for plate thickness 25 mm
(c) Transverse stress distribution at Path-1b
for plate thickness 50 mm
(d) Transverse stress distribution at Path-1b
for plate thickness 100 mm
(a) Transverse stress distribution at Path-1b
for plate thickness 12 mm
29
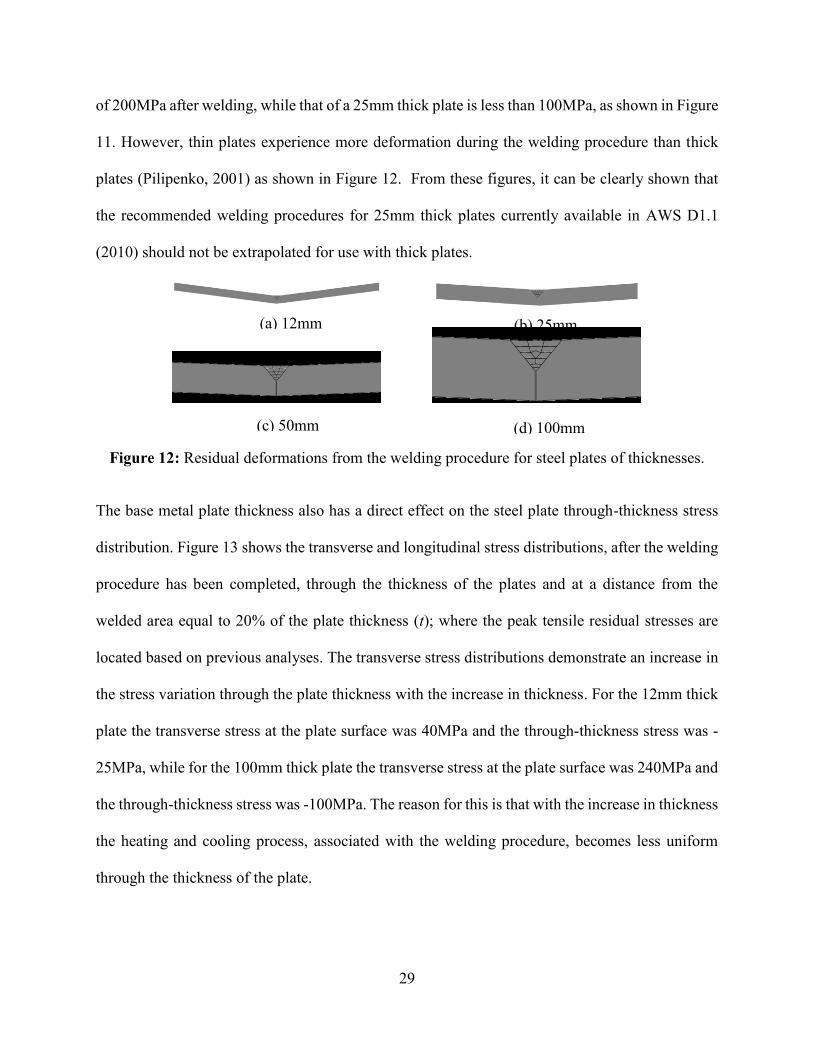
of 200MPa after welding, while that of a 25mm thick plate is less than 100MPa, as shown in Figure
11. However, thin plates experience more deformation during the welding procedure than thick
plates (Pilipenko, 2001) as shown in Figure 12. From these figures, it can be clearly shown that
the recommended welding procedures for 25mm thick plates currently available in AWS D1.1
(2010) should not be extrapolated for use with thick plates.
Figure 12: Residual deformations from the welding procedure for steel plates of thicknesses.
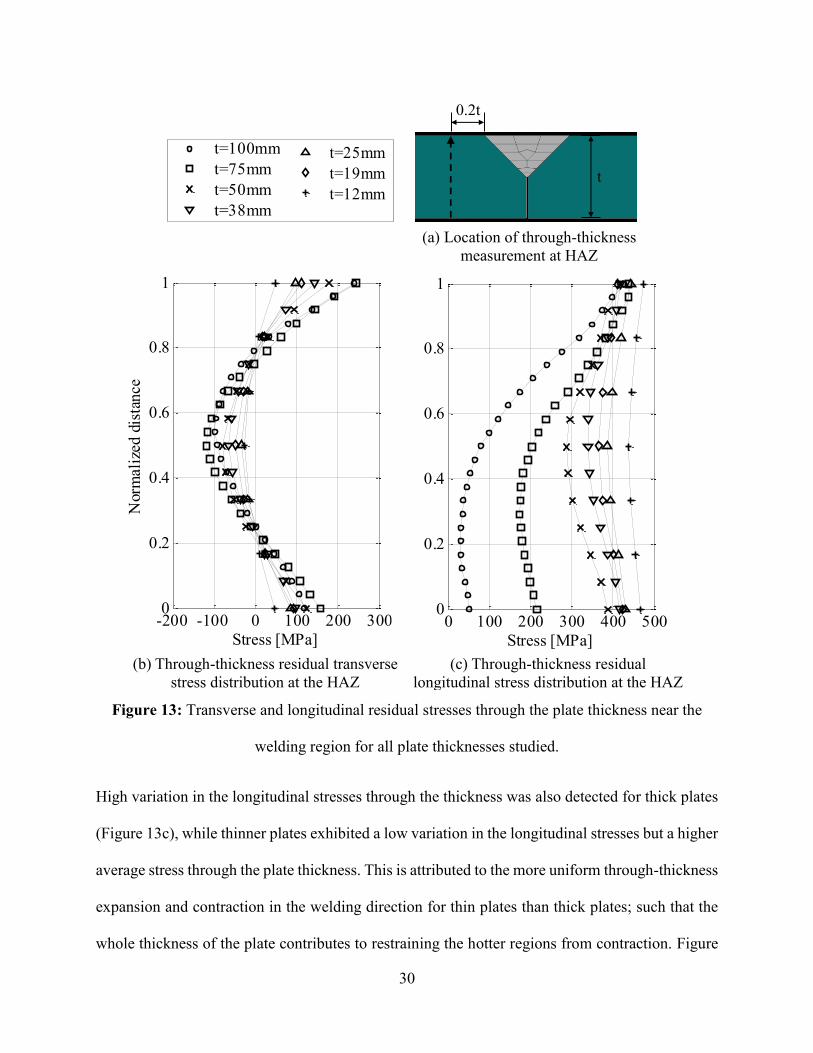
The base metal plate thickness also has a direct effect on the steel plate through-thickness stress
distribution. Figure 13 shows the transverse and longitudinal stress distributions, after the welding
procedure has been completed, through the thickness of the plates and at a distance from the
welded area equal to 20% of the plate thickness (t); where the peak tensile residual stresses are
located based on previous analyses. The transverse stress distributions demonstrate an increase in
the stress variation through the plate thickness with the increase in thickness. For the 12mm thick
plate the transverse stress at the plate surface was 40MPa and the through-thickness stress was -
25MPa, while for the 100mm thick plate the transverse stress at the plate surface was 240MPa and
the through-thickness stress was -100MPa. The reason for this is that with the increase in thickness
the heating and cooling process, associated with the welding procedure, becomes less uniform
through the thickness of the plate.
(a) 12mm (b) 25mm
(c) 50mm (d) 100mm
30
Figure 13: Transverse and longitudinal residual stresses through the plate thickness near the
welding region for all plate thicknesses studied.
High variation in the longitudinal stresses through the thickness was also detected for thick plates
(Figure 13c), while thinner plates exhibited a low variation in the longitudinal stresses but a higher
average stress through the plate thickness. This is attributed to the more uniform through-thickness
expansion and contraction in the welding direction for thin plates than thick plates; such that the
whole thickness of the plate contributes to restraining the hotter regions from contraction. Figure
-200 -100 0 100 200 3000
0.2
0.4
0.6
0.8
1
Stress [MPa]
Nor
mal
ized
dis
tan
ce
t=100mm
t=75mm
t=50mm
t=38mm
t=25mm
t=19mm
t=12mm
0 100 200 300 400 5000
0.2
0.4
0.6
0.8
1
Stress [MPa]
Nor
mal
ized
dis
tan
ce
t=100mm
t=75mm
t=50mm
t=38mm
t=25mm
t=19mm
t=12mm
0 100 200 300 400 5000
20
40
60
80
100
Stress [MPa]
Dis
tance [
mm
]
t=100mm
t=75mm
t=50mm
t=38mm
t=25mm
t=19mm
t=12mm
0 100 200 300 400 5000
20
40
60
80
100
Stress [MPa]
Dis
tanc
e [m
m]
t=100mm
t=75mm
t=50mm
t=38mm
t=25mm
t=19mm
t=12mm
(b) Through-thickness residual transverse
stress distribution at the HAZ
(c) Through-thickness residual
longitudinal stress distribution at the HAZ
(a) Location of through-thickness
measurement at HAZ
0.2t
t
31
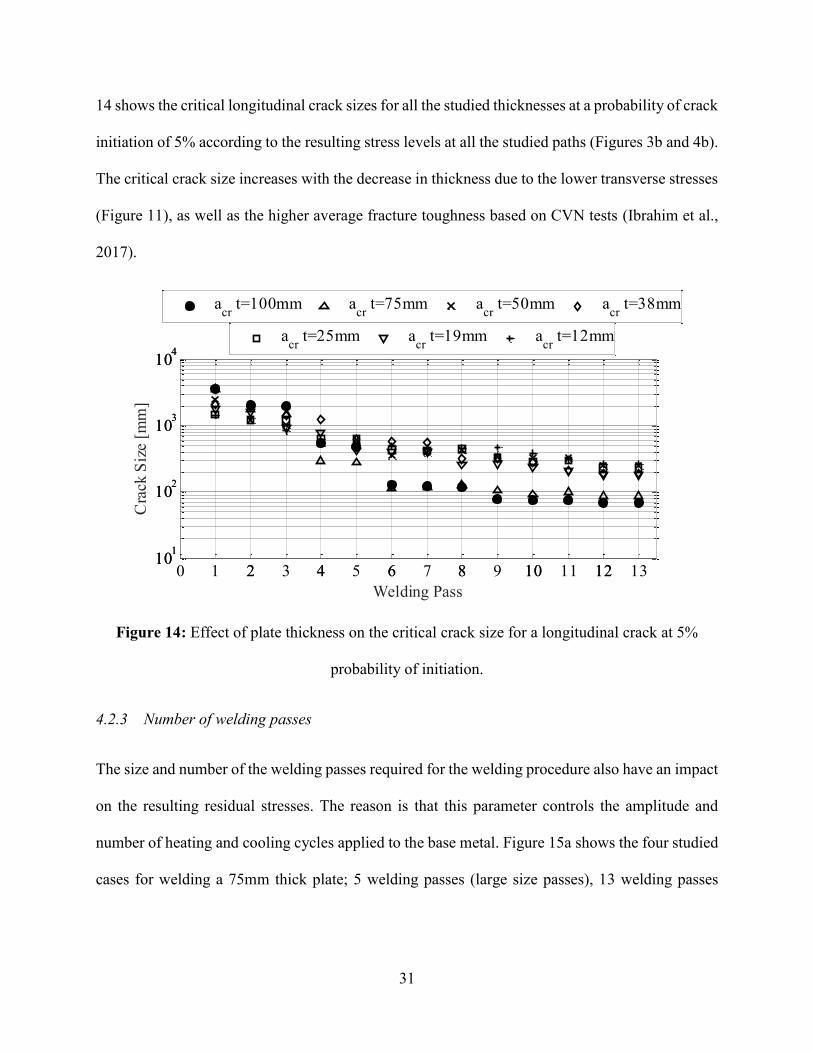
14 shows the critical longitudinal crack sizes for all the studied thicknesses at a probability of crack
initiation of 5% according to the resulting stress levels at all the studied paths (Figures 3b and 4b).
The critical crack size increases with the decrease in thickness due to the lower transverse stresses
(Figure 11), as well as the higher average fracture toughness based on CVN tests (Ibrahim et al.,
2017).
Figure 14: Effect of plate thickness on the critical crack size for a longitudinal crack at 5%
probability of initiation.
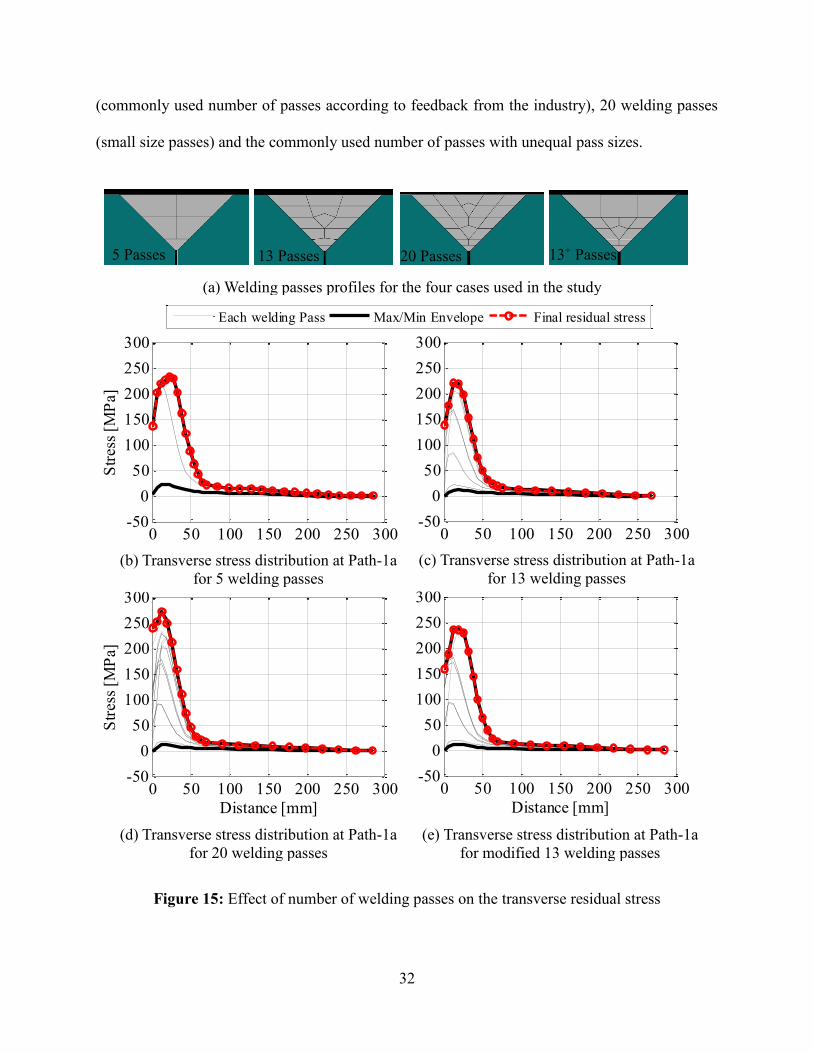
4.2.3 Number of welding passes
The size and number of the welding passes required for the welding procedure also have an impact
on the resulting residual stresses. The reason is that this parameter controls the amplitude and
number of heating and cooling cycles applied to the base metal. Figure 15a shows the four studied
cases for welding a 75mm thick plate; 5 welding passes (large size passes), 13 welding passes
1 2 3 4 5 6 7 8 9 10 11 12 1310
1
102
103
104
acr
t=100mm acr
t=75mm acr
t=50mm acr
t=38mm
0 2 4 6 8 10 1210
1
102
103
104
Welding Pass
Cra
ck S
ize
[mm
]
acr
t=25mm acr
t=19mm acr
t=12mm
32
(commonly used number of passes according to feedback from the industry), 20 welding passes
(small size passes) and the commonly used number of passes with unequal pass sizes.
Figure 15: Effect of number of welding passes on the transverse residual stress
0 50 100 150 200 250 300-50
0
50
100
150
200
250
300B31-S11-1
Distance [mm]
Str
ess
[MP
a]
0 50 100 150 200 250 300-50
0
50
100
150
200
250
300B34-S11-1
Distance [mm]
Str
ess
[MP
a]
0 50 100 150 200 250 300-50
0
50
100
150
200
250
300B32-S11-1
Distance [mm]
Str
ess
[MP
a]
0 50 100 150 200 250 300-50
0
50
100
150
200
250
300B33-S11-1
Distance [mm]
Str
ess
[MP
a]
0 100 200 300 400-300
-100
100
300
500
700
900
Distance [mm]
Str
ess
[MP
a]
Each welding Pass Max/Min Envelope Final residual stress
(a) Welding passes profiles for the four cases used in the study
5 Passes 13 Passes 20 Passes 13+ Passes
(d) Transverse stress distribution at Path-1a
for 20 welding passes
(c) Transverse stress distribution at Path-1a
for 13 welding passes
(e) Transverse stress distribution at Path-1a
for modified 13 welding passes
(b) Transverse stress distribution at Path-1a
for 5 welding passes
33
The weld assembly and overall size of the weld is the same for each case. The weld pass size can
be made larger by increasing the number of electrodes, the heat input, the wire feeding speed or
decreasing the welding travel speed or any combination of the above-mentioned parameters. The
welding travel speed is considered constant for each of the studied cases (Tables 1 and 3). Figures
15b to 15e show the transverse stress distribution along Path-1b of the flat plate model (Figure 3b)
for the four studied cases. The graphs suggest that while the number of welding passes increases,
the peak value of the transverse residual tensile stress near the welding area also increases. This is
in agreement with experimental results reported by Bjorhovde et al. (1972) on 50mm thick plates.
Furthermore, using a small number of welding passes results in a wider area of tensile stress near
the welding region (Figure 15b) compared with the case where a larger number of welding passes
are used (Figure 15d); thus a wider heat affected zone (HAZ). This is due to the higher heat input
required to complete the large size welding passes. Also, there is no significant difference between
the final residual stress distribution for the modified 13 welding pass procedure (Figure 15e) and
the 5 welding pass procedure (Figure 15b). As such, it has been demonstrated that the size of the
final welding passes has a greater impact on the residual stress distribution than the size of the
welding passes at the early stages of the welding procedure, regardless of the number of passes.
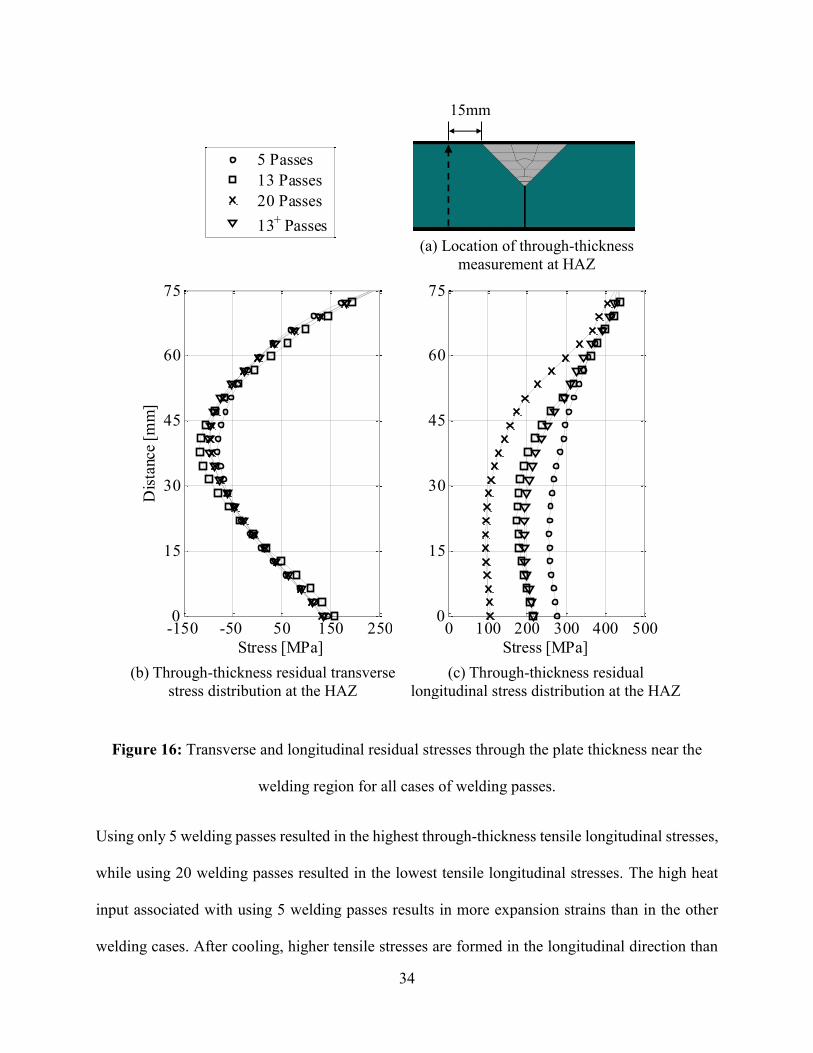
The through-thickness stress distribution for each of the studied welding procedures was also
obtained. Figure 16a shows the location of the through-thickness studied path at the mid-span of
the welded plates and at 15mm from the edge of the welding. Figures 16b and 16c show the
transverse and longitudinal stress distributions, respectively. For the through-thickness transverse
stresses there is no significant difference between the results of the different welding procedures.
34
Figure 16: Transverse and longitudinal residual stresses through the plate thickness near the
welding region for all cases of welding passes.
Using only 5 welding passes resulted in the highest through-thickness tensile longitudinal stresses,
while using 20 welding passes resulted in the lowest tensile longitudinal stresses. The high heat
input associated with using 5 welding passes results in more expansion strains than in the other
welding cases. After cooling, higher tensile stresses are formed in the longitudinal direction than
0 100 200 300 400 5000
15
30
45
60
75
Stress [MPa]
Dis
tanc
e [m
m]
5 Passes
13 Passes
20 Passes
13+ Passes
-150 -50 50 150 2500
15
30
45
60
75
Stress [MPa]
Dis
tanc
e [m
m]
5 Passes
13 Passes
20 Passes
13+ Passes
0 100 200 300 400 5000
15
30
45
60
75
Stress [MPa]
Dis
tanc
e [m
m]
5 Passes
13 Passes
20 Passes
13+ Passes
(a) Location of through-thickness
measurement at HAZ
15mm
(b) Through-thickness residual transverse
stress distribution at the HAZ
(c) Through-thickness residual
longitudinal stress distribution at the HAZ
35
for the other welding cases constrained by the length of the welded plates. While in the transverse
direction, the high heat input causes high expansion strains as well as a wide area of expansion.
As a result, the constraint levels in this direction are low in comparison to the other welding cases;
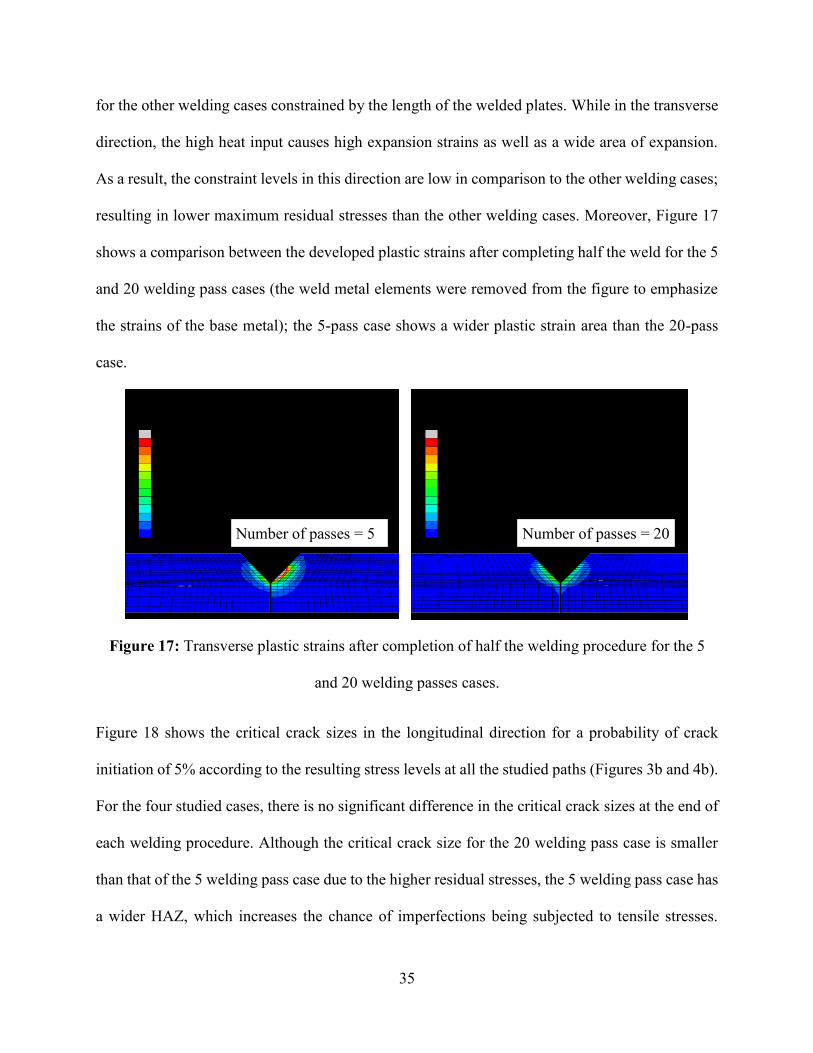
resulting in lower maximum residual stresses than the other welding cases. Moreover, Figure 17
shows a comparison between the developed plastic strains after completing half the weld for the 5
and 20 welding pass cases (the weld metal elements were removed from the figure to emphasize
the strains of the base metal); the 5-pass case shows a wider plastic strain area than the 20-pass
case.
Figure 17: Transverse plastic strains after completion of half the welding procedure for the 5
and 20 welding passes cases.
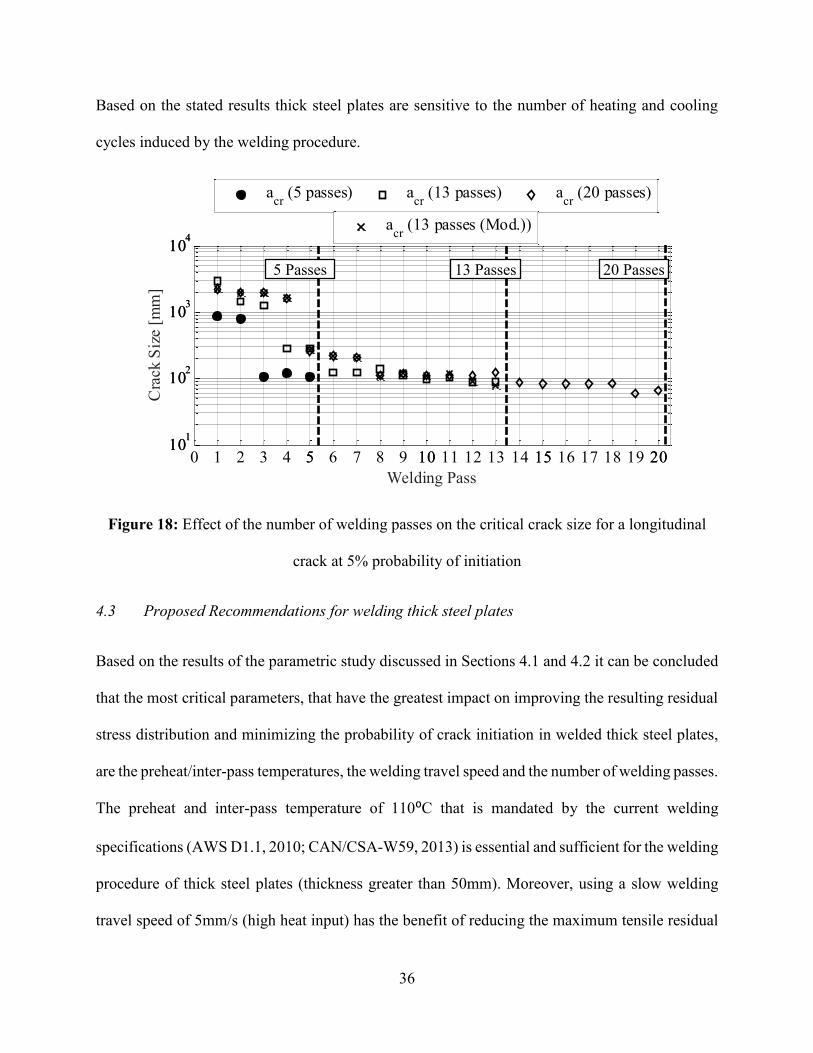
Figure 18 shows the critical crack sizes in the longitudinal direction for a probability of crack
initiation of 5% according to the resulting stress levels at all the studied paths (Figures 3b and 4b).
For the four studied cases, there is no significant difference in the critical crack sizes at the end of
each welding procedure. Although the critical crack size for the 20 welding pass case is smaller
than that of the 5 welding pass case due to the higher residual stresses, the 5 welding pass case has
a wider HAZ, which increases the chance of imperfections being subjected to tensile stresses.
Number of passes = 5 Number of passes = 20
36
Based on the stated results thick steel plates are sensitive to the number of heating and cooling
cycles induced by the welding procedure.
Figure 18: Effect of the number of welding passes on the critical crack size for a longitudinal
crack at 5% probability of initiation
4.3 Proposed Recommendations for welding thick steel plates
Based on the results of the parametric study discussed in Sections 4.1 and 4.2 it can be concluded
that the most critical parameters, that have the greatest impact on improving the resulting residual
stress distribution and minimizing the probability of crack initiation in welded thick steel plates,
are the preheat/inter-pass temperatures, the welding travel speed and the number of welding passes.
The preheat and inter-pass temperature of 110⁰C that is mandated by the current welding
specifications (AWS D1.1, 2010; CAN/CSA-W59, 2013) is essential and sufficient for the welding
procedure of thick steel plates (thickness greater than 50mm). Moreover, using a slow welding
travel speed of 5mm/s (high heat input) has the benefit of reducing the maximum tensile residual
1 2 3 4 5 6 7 8 9 10 11 12 13 14 15 16 17 18 19 2010
1
102
103
104
acr
(5 passes) acr
(13 passes) acr
(20 passes)
0 5 10 15 2010
1
102
103
104
Welding Pass
Cra
ck S
ize
[mm
]
acr
(13 passes (Mod.))
5 Passes 13 Passes 20 Passes
37
stress, however the HAZ size increases. If the resulting wide area in the base metal subjected to
tensile stress leads to the initiation of discontinuities present in the base metal, the fabricator may
instead select a faster welding travel speed of 15mm/s (low heat input) to provide a narrower tensile
stressed area, however the maximum tensile stress is higher than that obtained with a fast welding
travel speed. Another benefit of using a fast welding travel speed is increasing the production rate,
which is an important factor in steel fabrication. The number of welding passes has the same effect
as welding travel speed on the tensile stress values and distribution. Using a small number of
welding passes (high heat input) results in a wide area under tensile stress with low maximum
tension stress value, while using a large number of welding passes (low heat input) leads to a
narrow area of tensile stress with high maximum tensile stress value. The application of fast and
slow welding travel speed as well as small and large number of passes can be achieved by change
the welding voltage, current and wire feeding speed accordingly.
Accordingly, four welding procedures are recommended for PJP groove welding of thick steel
plates. All four procedures utilize a preheat/inter-pass temperature of 110⁰C. The first welding
procedure provides the lowest tensile stress value and widest tensile stressed area and is a
combination of a welding travel speed of 5mm/s and 5 welding passes. The second welding
procedure provides the narrowest area subjected to high tensile stresses and utilizes a welding
travel speed of 15mm/s and 20 welding passes. The third welding procedure provides the highest
fabrication rate using welding travel speed of 15mm/s and 5 welding passes. The fourth welding
procedure provides the slowest production rate using a welding travel speed of 5mm/s and 20
welding passes, where, the other parameters such as the welding voltage, current and the wire
feeding speed are adjusted accordingly. Figure 19 shows the residual stress distribution as well as
the residual deformation (with a scale factor of 5) for the four recommended welding procedures
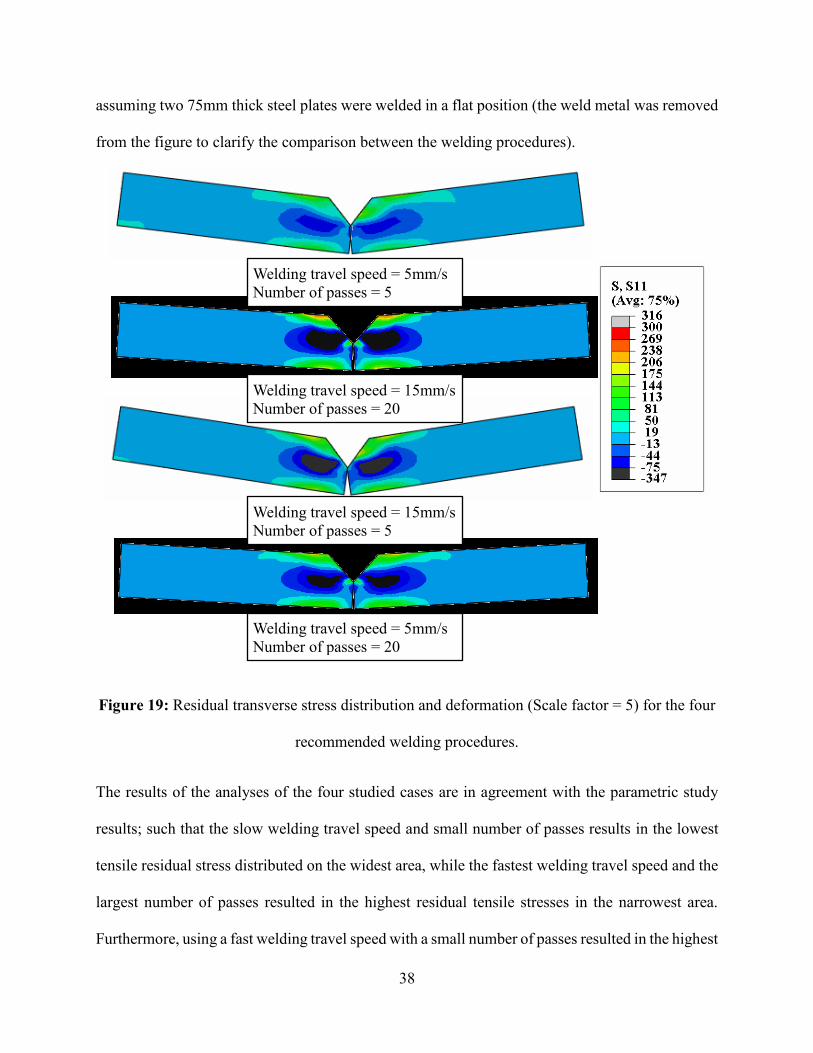
38
assuming two 75mm thick steel plates were welded in a flat position (the weld metal was removed
from the figure to clarify the comparison between the welding procedures).
Figure 19: Residual transverse stress distribution and deformation (Scale factor = 5) for the four
recommended welding procedures.
The results of the analyses of the four studied cases are in agreement with the parametric study
results; such that the slow welding travel speed and small number of passes results in the lowest
tensile residual stress distributed on the widest area, while the fastest welding travel speed and the
largest number of passes resulted in the highest residual tensile stresses in the narrowest area.
Furthermore, using a fast welding travel speed with a small number of passes resulted in the highest
Welding travel speed = 5mm/s
Number of passes = 5
Welding travel speed = 15mm/s
Number of passes = 20
Welding travel speed = 15mm/s
Number of passes = 5
Welding travel speed = 5mm/s
Number of passes = 20
39
residual deformation due to high shrinkage strains, while using a slow welding travel speed with
a large number of passes results in the smallest residual deformation (Figure 19).
A detailed analysis of the recommended welding procedures in combination with the crack
assessment method based on fracture toughness tests developed by Ibrahim et al. (2017) was
performed. In this analysis thick plates are divided into two categories according to the thickness
ranges; 25 to 50mm and 50 to 100mm. The analysis was developed for minimally and highly
restrained welding conditions. Consequently, for welding thick steel plates, the base metal has to
be inspected before welding for discontinuities and the following recommendation shall apply for
the four welding procedures;
• The corresponding critical probability of crack initiation, with respect to the specifications’
(AWS D1.1, 2010; CAN/CSA-W59, 2013) limit of 27J at 0⁰C CVN value for ASTM A572
Gr.50 (2013) steel, is 2% according to Ibrahim et al. (2017).
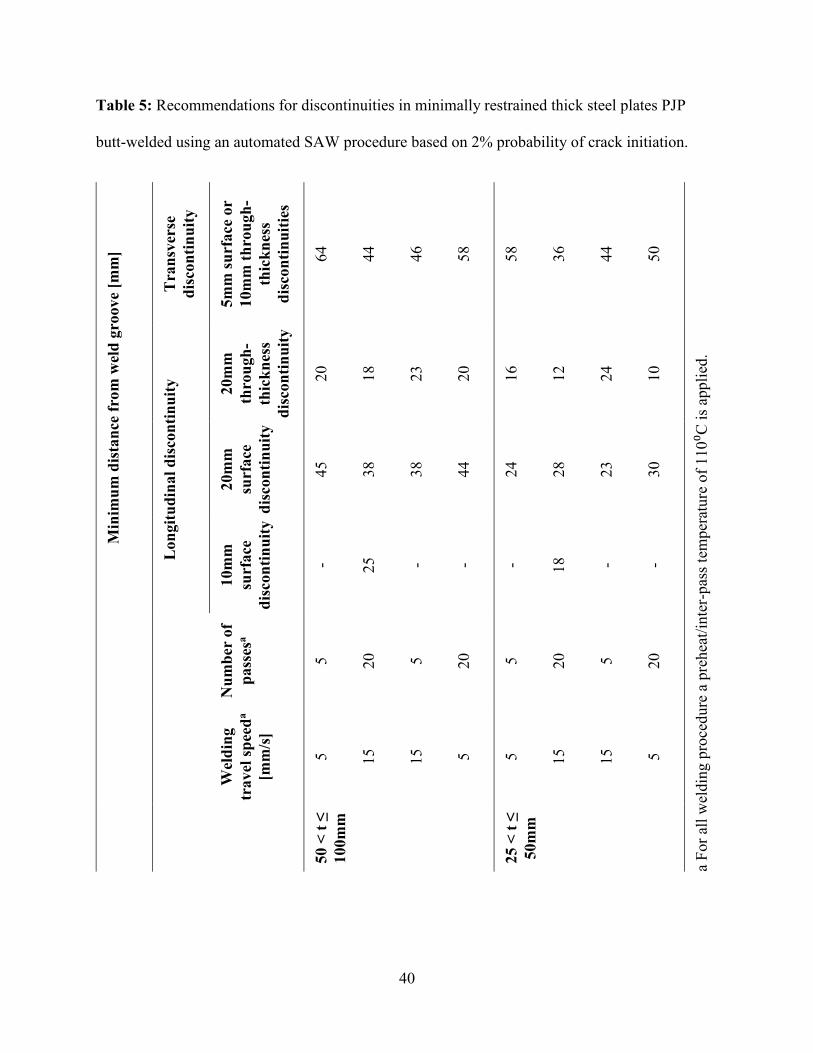
• Provided in Table 5: the minimum distance from the edge of the plate to be welded, for
surface and through-thickness discontinuities in the direction of the weld as well as in the
transverse direction for each welding procedure. Such that the restraint to the deformation
of the plates in the welding procedure is minimal for a probability of crack initiation of 2%.
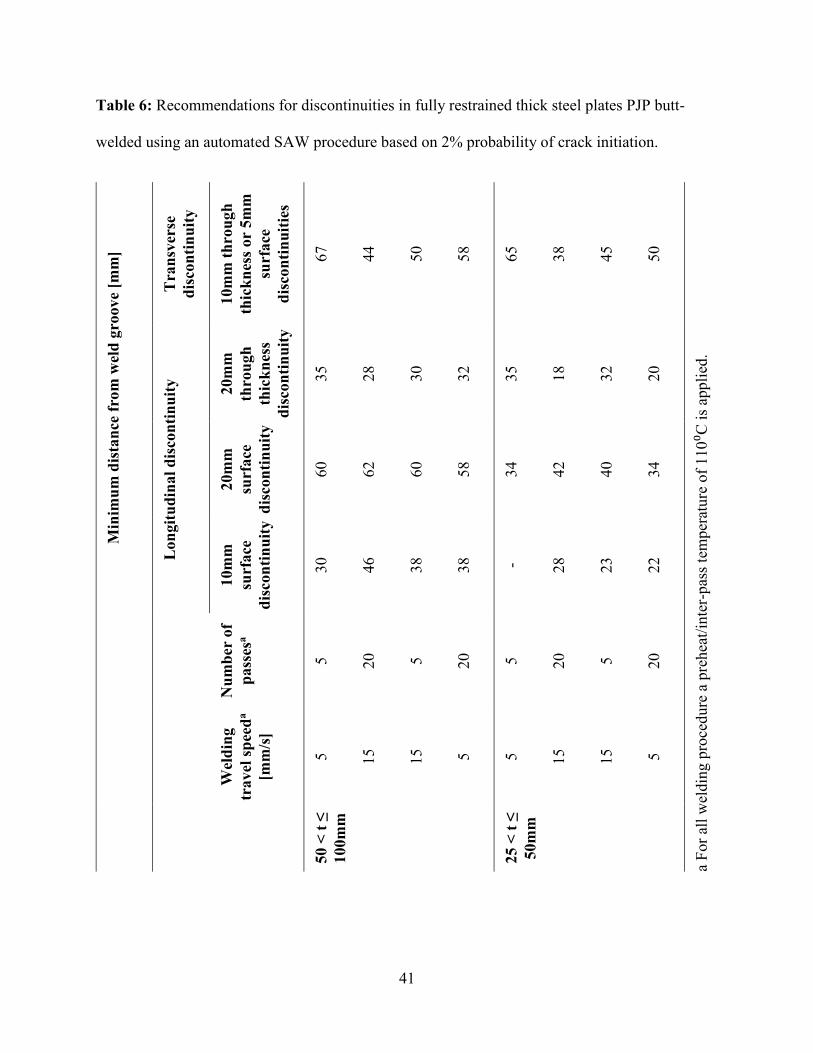
• Provided in Table 6: the minimum distance from the edge of the plate to be welded for
surface and through-thickness discontinuities in the direction of the weld as well as in the
transverse direction for each welding procedure. Such that the plates used in the welding
procedure are fully restrained, for a probability of crack initiation of 2%.
40
Table 5: Recommendations for discontinuities in minimally restrained thick steel plates PJP
butt-welded using an automated SAW procedure based on 2% probability of crack initiation.
Min
imu
m d
ista
nce
fro
m w
eld
gro
ove
[mm
]
Tra
nsv
erse
dis
con
tin
uit
y
5m
m s
urf
ace
or
10m
m t
hro
ugh
-
thic
kn
ess
dis
con
tin
uit
ies
64
44
46
58
58
36
44
50
a F
or
all
wel
din
g p
roce
dure
a p
rehea
t/in
ter-
pas
s te
mper
ature
of
110⁰C
is
appli
ed.
Lon
git
ud
inal
dis
con
tin
uit
y
20m
m
thro
ugh
-
thic
kn
ess
dis
con
tin
uit
y
20
18
23
20
16
12
24
10
20m
m
surf
ace
dis
con
tin
uit
y
45
38
38
44
24
28
23
30
10m
m
surf
ace
dis
con
tin
uit
y
- 25
- - - 18
- -
Nu
mb
er o
f
pass
esa
5
20
5
20
5
20
5
20
Wel
din
g
travel
sp
eed
a
[mm
/s]
5
15
15
5
5
15
15
5
50 <
t ≤
100m
m
25 <
t ≤
50m
m
41
Table 6: Recommendations for discontinuities in fully restrained thick steel plates PJP butt-
welded using an automated SAW procedure based on 2% probability of crack initiation.
Min
imu
m d
ista
nce
fro
m w
eld
gro
ove
[mm
]
Tra
nsv
erse
dis
con
tin
uit
y
10m
m t
hro
ugh
thic
kn
ess
or
5m
m
surf
ace
dis
con
tin
uit
ies
67
44
50
58
65
38
45
50
a F
or
all
wel
din
g p
roce
dure
a p
rehea
t/in
ter-
pas
s te
mper
ature
of
110⁰C
is
appli
ed.
Lon
git
ud
inal
dis
con
tin
uit
y
20m
m
thro
ugh
thic
kn
ess
dis
con
tin
uit
y
35
28
30
32
35
18
32
20
20m
m
surf
ace
dis
con
tin
uit
y
60
62
60
58
34
42
40
34
10m
m
surf
ace
dis
con
tin
uit
y
30
46
38
38
- 28
23
22
Nu
mb
er o
f
pass
esa
5
20
5
20
5
20
5
20
Wel
din
g
travel
sp
eed
a
[mm
/s]
5
15
15
5
5
15
15
5
50 <
t ≤
100m
m
25 <
t ≤
50m
m
42
It is worth mentioning that the AWS D1.1 (2010) acceptability limits for laminar discontinuities
in cut surfaces is 25mm. According to the results of this paper this limit should not be applied for
thick steel plates undergoing a welding procedure; instead, Tables 5 and 6 should be employed. In
addition, according to the residual stress results in the weld metal, the limitations of porosity and
fusion discontinuities in the weld metal for welded steel plates with thickness greater than 50mm
should follow Clause 6.12.2.1 of AWS D1.1 (2010), which normally is for cyclically loaded non-
tubular connections in tension, because of the maximum discontinuity length of 12mm.
5 Limitations of the Present Study
The parametric study and recommendations for the welding procedures of welding thick steel
plates were established for plates with thickness greater than 25mm that are welded using the
automated SAW process. This study is also limited to steel plates that are butt-welded using either
complete joint penetration (CJP) or partial joint penetration (PJP). The crack assessment approach
is based on fracture toughness data from ASTM A572 Gr.50 (2013) steel plates. The fracture
toughness variability can be different for high strength steel grades as well as other steel materials
(Kanno, 2016), therefore, further investigation is required for these cases.
6 Summary and Conclusions
In order to develop quantitative recommendations for the welding procedure of butt-welded thick
steel plates using a SAW process, a parametric study was conducted for the welding procedure
parameters. The study utilized a validated numerical simulation approach of the welding procedure
for thick steel plates. The simulation was established for two welded assemblies; for a case study
heavy built-up box column that are commonly used in high-rise steel frame building construction
and two thick steel plates welded in a flat position. The parametric study was divided into two
43
phases; the first phase focused on the heat input and cooling rate parameters of the welding
procedure, the second phase focused on general parameters regarding the welding assembly. The
study for each parameter was carried out such that the other parameters such as the welding
voltage, current and the wire feeding speed were adjusted accordingly. The assessment of each
parameter was based on its impact on the residual stress distribution and the critical crack sizes
after each welding pass for a probability of crack initiation of 5%. The main conclusions achieved
from Phase A of the parametric study are summarized as follows:
• A low heat input that ensures full fusion of the weld and base metal is recommended. This
is in agreement with the current code recommendations.
• Fast welding travel speeds result in a narrower high tensile stress area in the base metal
than slow welding travel speeds; however, the maximum tensile stress values are higher.
• As the welding travel speed increase the area subjected maximum tensile residual stresses
decrease.
• Applying preheat/inter-pass temperature is essential for welding thick steel plates;
however, the improvement in the stress distribution achieved by applying temperatures
greater than 110°C is not significant.
The main conclusions of Phase B of the parametric study are summarized as follows:
• The variation of material mechanical properties through the thickness of thick plates has a
negligible effect on the welding residual stress distribution. An assumption of uniform
material mechanical properties in the simulation is adequate within the range of
applicability of the present study.
44
• The welding tensile transverse residual stresses increase as the thickness of the welded
plates increases. Longitudinal tensile residual stresses increase as the thickness of the
welded plate decreases. Thin steel plates are more susceptible to deformation from the
welding procedure than thicker plates.
• The variation in the through-thickness residual stresses increases as the thickness of the
welded plate increases.
• Large number of welding passes results in a narrower tensile stressed area in the base metal
and higher maximum tensile stresses than using a small number of welding passes.
• As the number of welding passes decreases the maximum transverse tensile residual
stresses decreases.
• The number of welding passes has no significant effect on the transverse through-thickness
residual stresses.
The welding travel speed, the preheat/inter-pass temperature and the number of welding passes
were identified as the welding parameters with the highest impact on the developed residual
stresses and the probability of crack initiation for the welding procedure of thick steel plates. Four
welding procedures are recommended for butt-welding thick steel plates using an automated SAW
process such that different combinations of fast and slow welding travel speed and a small and
large number of welding passes were utilized. Numerical analysis of the four welding procedures
was performed and acceptable limits for cracks and discontinuities in the base metal before
welding were provided.
45
Acknowledgments
The authors sincerely thank the ADF Group Inc. and DPHV Structural Consultants for their
financial and technical support. The authors also acknowledge the financial support from the
Natural Sciences and Engineering Research Council of Canada.
References
ANSI/AISC 360-10. (2010). "AISC 360-10, Specification for structural steel buildings." American
Institute of Steel Construction, Chicago, IL, USA.,
ASTM A131. (2014). "A131/A131M-14, Standard Specification for Structural Steel for Ships,
ASTM International, West Conshohocken, PA,
ASTM A516 Gr.70. (2015). "ASTM A516/516M-10(2015) Standard Specification for Pressure
Vessel Plates, Carbon Steel, for Moderate- and Lower-Temperature Service,
ASTM A572 Gr.50. (2013). "A572/A572M-13a Standard Specification for High-Strength Low-
Alloy Columbium-Vanadium Structural Steel,
ASTM A709 Gr.50. (2015). "ASTM A709/A709M-15 Standard Specification for Structural Steel
for Bridges,
AWS D1.1. (2010). "AWS D1.1 2010, Structural welding code—steel." American Welding
Society, Miami, FL, USA.,
Bjorhovde, R., Brozzetti, J., Alpsten, G. A. and Tall, L. (1972). "Residual Stresses in Thick Welded
Plates." Welding Journal, 51(8), S392,
Blodgett, O. W. and Miller, D. K. (1993). "The Challenge of Welding Jumbo Shapes." Welding
Innovation, James F. Lincoln Arc Welding Foundation, X, 3-16,
CAN/CSA-W59 (2013). "CAN/CSA W59-13 Welded steel construction." Canadian Standards
Association, Mississauga, Ont.
Chen, S. and Chang, S. C. (1993). "Residual Stresses in Welded Jumbo Box Columns." Journal
of Constructional Steel Research, 25, pp. 201-209,
CWB/Gooderham-Centre (2005). "Welding for Design Engineers." Canadian Welding Bureau,
7250 West Credit Ave., Mississauga, ON, Canada L5N 5N1.
Fisher, J. W. and Pense, A. W. (1987, April 29–May 2). "Procedures for Thermal Cutting and
Welding Heavy Structural Shapes." Proc. Proceedings of the National Engineering
Conference and Conference of Operating Personnel, New Orleans.
Graville, B. A. (1975). "The principles of cold cracking control in welds." Dominion Bridge Co.,
Montreal.
Ibrahim, O. A., Lignos, D. G. and Rogers, C. A. (2013). "Estimation of residual stresses in thick
steel plates due to welding through finite element simulation." Canadian Society of Civil
Engineering, 3rd Specialty Conference on Material Engineering and Applied Mechanics,
Montreal, Quebec,
Ibrahim, O. A., Lignos, D. G. and Rogers, C. A. (2016). "Proposed modeling approach of welding
procedures for heavy steel plates." Engineering Structures, 127, 18-30,
doi:http://dx.doi.org/10.1016/j.engstruct.2016.08.022
46
Ibrahim, O. A., Lignos, D. G. and Rogers, C. A. (2017). "Probabilistic approach for assessing
discontinuities in steel components based on Charpy-V-Notch tests." Engineering
Structures, 147, 1-11, doi:https://doi.org/10.1016/j.engstruct.2017.05.016
Jefferson, T. B. and Woods, G. (1962). "Metals and how to weld them." (2d ed) James F. Lincoln
Arc Welding Foundation, Cleveland,.
Kanno, R. (2016). "Advances in Steel Materials for Innovative and Elegant Steel Structures in
Japan—A Review." Structural Engineering International, 26(3), 242-253,
Miller, D. K. (2006). "AISC Steel Design Guide 21 Welded Connections – A Primer for
Engineers." American Institute of Steel Construction, Chicago, IL.
Miller, D. K. (2010). "Welding heavy Structural Steel -- Successfully." 2010 NASCC: The Steel
Conference, Orlando, FL, USA,
Pilipenko, A. (2001). Computer simulation of residual stress and distortion of thick plates in multi-
electrode submerged arc welding. Their mitigation techniques. (Ph.D. dissertation),
Norwegian University of Science and Technology, N-7491 Trondheim, Norway.
Society of Fire Protection Engineers (2008). "SFPE handbook of fire protection engineering." (4th
ed) National Fire Protection Association, Quincy, Mass. Bethesda, Md.
Yang, Y. (2008). The effect of submerged arc welding parameters on the properties of pressure
vessel and wind turbine tower steels. (Master of Science), University of Saskatchewan,
Saskatoon.


