Embed Size (px)
Citation preview
ISIJ International, Vol, 39 (1999), No. 9, pp. 913-922
Recrystallization-Preci pitation
Carbon Niobium Microalloyed
Interaction
Steels
Study of TwoMedium
S. F. MEDINA.A. OUISPE.P. VALLES1)and J. L. BA~OS2)
Centro Nacional de Investigaciones Metal~rgicas (CENIM-CSIC),Av. Gregorio del Amo,8; 28040,
1) Instituto Nacional de T6cnica Aeroespacial (lNTA), Torrej6n de Ardoz. Madrid, Spain.2) Facultad de Odontologfa, Dpto. Estomatologfa ll, UCM,Madrid, Spain.
(Received on January 21. 1999, accepted in final form on June 18, l999)
Madrid, Spaln
Recrystallization-precipitation-time-temperature (RPTT)diagrams for strains of 0.20 and O.35 have beendetermined for two microalloyed steels with niobium percentages of 0.024 and 0,058, respectively, andequal percentages of carbon and nitrogen. The methodknownas "back extrapolation" has been used for
the determination of static recrystallization kinetics and also for the plotting of the diagrams, While a single
plateau wasobserved on the recrystallized fraction against time curves for the first steel, as a consequenceof sttain induced precipitation, these curves for the second steel showedthe formation of a double plateau.
whoseinterpretation, confirmed by calorimetric analysis, supposesthe formation of two types of preci pitates,
The work uses transmission microscopy to showthe precipitates which are formed in both steels, as well
as the size most probably capable of inhibiting recrystallization. Final]y, an analysis is madeof the RPTTdiagrams and of the large amountof information which they offer for designing a moreappropriate rolling
schedule in order to obtain finer precipitates andabetter austenitic microstructure before the austenite+ferrite
transformation.
KEYWORDS:static recrystallization; precipitation; RPTTdiagrams; electron transmission microscopy.
1. Introduction
Most hot rolled microalloyed steels are steels whichcontain niobium, as these have the advantageof adequatesolubility at normal rolling temperatures. Vanadiumpresents greater solubility in austenite than niobium andits precipitation as VN, and above all as VC, occurs at
very low temperatures, making it difficult to obtainsufficiently deformedaustenites before the y~c( transfor-
mation. To this end, a good part of the research workon microalloyed steels has been focused on low ormediumcarbon niobium steels, obtaining highly de-
formed austenites at the end of rolling which give rise,
after the transformation, to very fine ferrite/pearlite mi-
crostructures and consequently good mechanical prop-erties.
However, Nbmicroalloyed steels should not be con-sidered to be the ideal steels, as they present somedisadvantages which makeit difficult to finally obtainfine precipitates in hot rolling. Onthe one hand, in steels
with a Ccontent of approximately 0.2 o/o, around 60ppmof N, the difference between the solubility temperaturesof niobium carbides and carbonitrides are not verydifferent. I ~4) Oneof the consequencesderiving from the
above is the formation of complex carbonitrides which
can be formed not as a precipitate as such but by the
heterogeneous nucleation of one type of precipitates onanother, forming relatively complex and coarse pre-
91 3
cipitates. On the other hand, the precipitation start
temperature is relatively high and diffusion is still im-
portant for favouring both heterogeneous precipitation
and coalescence betweenprecipitates.
With regard to the static recrystallization of thesesteels, Nb is known to be the alloying element whichmost delays kinetics, even whenit is in solution,s - Io) Its
greater atomic volume, comparedwith other typical al-
loying elements of low alloy steels, contributes to con-siderably increasing the activation energy even whenit is present only in thousandths.ll) Physically, the ac-tlvation energy for static recrystallization practically
coincides with the self-diffusion energy of iron at the
grain boundaries, clearly affected by the presence ofsolutes and above all by precipitates.1 1~ 13)
Whenstrain induced precipitation starts, static recrys-tallization is inhibited during a certain time, normallyuntil the end of precipitation, before again advancinguntil recrystallization is complete. This momentaryin-
hibition of recrystallization appears as a plateau on the
recrystallized fraction against the logarithm of timecurves.14'15) The good definition of the plateau permitsthe plotting of the recrystallization-precipitationtime
temperature (RPTT)curves and consequently a greater
knowledge of the conditions (temperature, strain, etc.)
which permit the obtainment or improvementof the mi-
crostructure of these steels,16)
Very few experimentally determined RPTTdiagrams
C 1999 ISIJ
ISIJ International, Vol.
Table l. Chemical compositions (masso/o) of the steels
studied.
39 (1999), No. 9
Steel
N3
N4
S
0.014
0.0 15
have been published, though PTT diagrams can befound in the literature determined by theoretical equa-tions, 17~ 21) transmission microscopy,22) stress relaxationmethods,23.24) and final]y by app]ying the "back ex-trapolatlon" method.16)
The temperature at which the inhibitlon of recrys-tallization starts has been termed the Static Recrystal-lization Critical Temperature (SRCT)and its differencefrom the No-Recrystallization Temperature (T~.) hasbeen discussed elsewhere.25)
In this paper the static recrystallization-precipitationinteraction is studied in two niobium microalloyed steels
through the determination of RPTTdiagrams. Ananalysis is madeof the influence of the strain on this
interaction and transmission electron microscopy (TEM)Is used to assess the size, distribution, nature and coa-lescence of the precipitates.
2. Experimental Procedure
The steels used, and referred to as N3and N4, weremanufactured by Electroslag Remeltlng (ESR) in alaboratory unit capable of producing 30 kg ingots. Theircompositions are shownin Table I .
This technique avoidsmacrosegregation, both in a]loying elements and im-purities, and there is considerably less microsegrega-tion; these defects being present in conventional ingots
and continuous castlng billets. The compositions of the
two steels differ only in their Nbcontents, the contentsof other elements being similar.
The torsion specimens, with a useful length of 50mmand 6mmin diameter, were austenitized at 1250'C for
10min and then the ternperature was rapidly reduced tothe testing temperature and maintained at that tem-perature for a time of no morethan 90 s. During the test
the specimenswere protected by an argon atmospherein
order to prevent their oxidation.
Themagnitudes of torsion (torque, no. of revolutions)
and the equivalent magnitudes (stress, strain) have beenrelated in accordance with Von Mises criterion.16) Therecrystallized fractlon was determined at different tem-peratures, at the equivalent stralns of 0.20 and O.35,
at a constant straln rate of 3.63 s~1 (= I OOOrev/mln).Thestrains applied wereprogrammedso as to be reachedat the surface of the torsion specimen and the micro-structures were observed on a lengthways portion nearthe cylindrical surface.
The recrystallized fraction has been measuredusingthe method knownas "back extrapolation".26) It hasbeen found that using this method the softened frac-
tion and the recrystaliized fraction are approximatelyequal.27)
Thecharacterlstics of the precipitates were determined
Table 2. Solubility temperature (T*) of the precipitates, ac-cording to Turkdogan's solubility products,2) forsteels used.
C 1999 ISIJ
Steel Solubility temperature T*, K(~C)
[Nb][C]~*~ [Nbl[N] [Nb][C]~'[N]~=
N3 1399
(I 126)
1327
(I054)
1419
(I146)
N4 1514
(1241)1402
(i 129)
l506
(1233)
Table 3. Transformationtemperatures Acl.Ac3 and Ar3 at
heating rate and cooling rate of 0.25'C/s and grainslze D,, (,am) at 1250'Cx 10min of the steels
studied.
Acl' K('C) Ac3
, K('C) Ar3, K('C)
l006 (733) I103 (830) 1041 (768)
l007 (734) I104 (83 l) 1042 (769)
91 4
by transmission electron microscopy (TEM), using thecarbon extraction replica technique.
The phase transformation ternperatures were de-termined by the dilatometry technique. Thestudy of thedissolution of precipitates wascarried out by differential
thermal analysis, where the heating rate of the samples
was 15'C/min and they were protected frorn oxidationby an argon flow of 3(1/min).
3. Results and Discussion
The austenitization temperature was chosen takinginto account that in this type of steels preliminary re-heating to the deformation ternperatures must guaran-tee total dissolution of the precipitates. In this sense, thesolubility temperature for carbides, nitrides or carbo-nitrides (Table 2), hypothetically present in both steels,is below the selected austenitization temperature ofl 250'C.
Quenchingthe specimen in water and carrying out thesubsequent meta]10graphic study, the austenite grain size
was determined for each steel, corresponding to theaustenitization conditions (1 250'C x 10min). Applyingthe linear intersection technique, twenty fields wereanalysed in eachspecimenand the average austenite grainsizes were determined, which were 210~mand 190~mfor steels N3and N4, respectively (Table 3). Similarly,the dilatometry technique wasused to determine the A3phasetransformation temperatures, both in heating (Ac3)and in cooling (Ar3), with the hysteresis phenomenonnaturally appearing. The values obtained for rates of0.25'Cs~1 were as indicated also in Table 3, it being
seen that these are similar, or in fact practically equal,for both steels. The different Nbcontent and the slight
difference in grain slze has not influenced the trans-formation ternperatures. Having determined the trans-formation temperatures, it is assured that the testing tem-peratures correspond to the austenite phase, taking into
ISIJ Internationa[, Vol. 39 (1999), No. 9
1
cu> 0.5
Steel N38 = 0.20
~= 3.63s~1
D=210um
e
I
1150 'ce
1050 'c[]
1ooo 'c
950 'c
~
O0.1 100 1000 10000 100000101
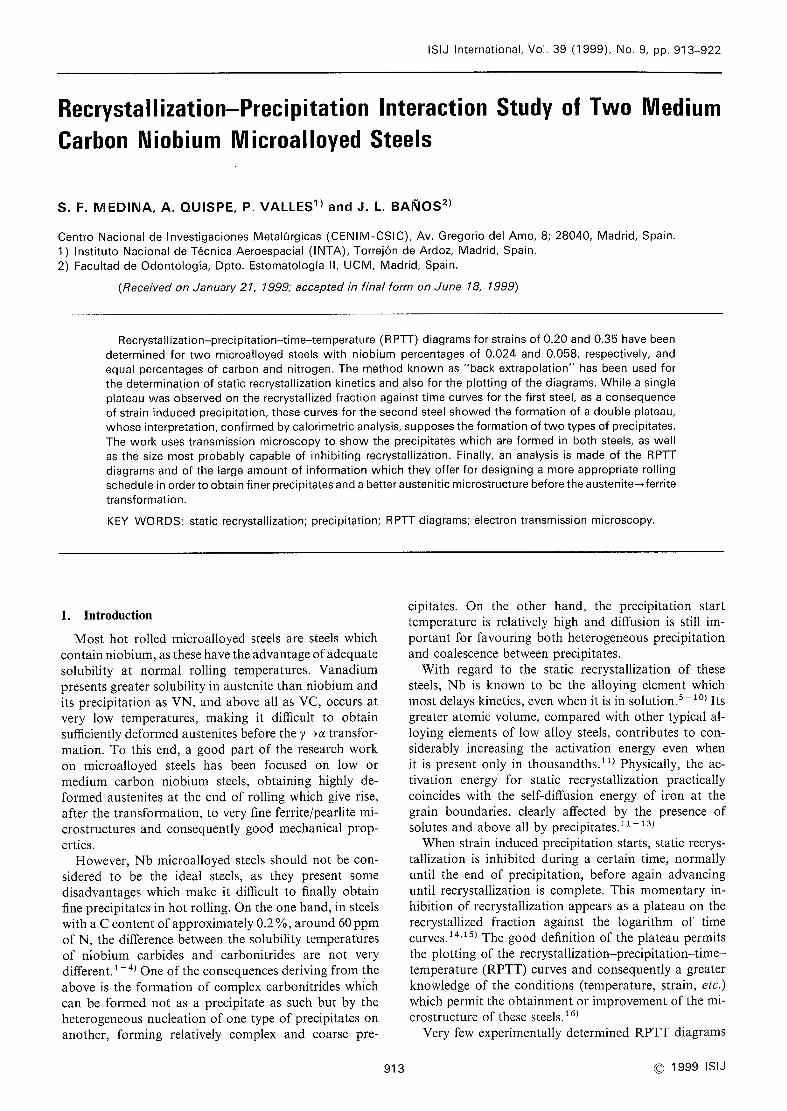
t, sFig. l. Variation of the recrystallized fraction (X*) with tlme
(t) for steel N3and t;=0.20; i=3,63 s~ l.
1
cU> 0.5
o
Steel N4s = 0.20
~=3 63 s~i
D= 190 um
e
'I--~i
1200'ce
1Ioo 'co
1050'c[]
1025'cI~
looo 'c
0.1
Fig. 3.
1 10 100 1000 10000 100000t, s
Variation of the recrystallized fraction (X*) with time(!) for steel N4and 8=0.20; ~=3,63 s~ I
.
1
'T:
> 0.5
Steel N3D=210um8 =0.35
~= 3.63 s'1
o
I
1200 'ce
1150 'c
I11oo 'c
o1050 'c
[]1ooo 'c
950 'c
O0.1 100 1000 10000 100000101
t, s
Fig. 2. Variation ofthe recrystauized fraction (x with time(1) for steel N3and t=0.35; i= 3,63 s~ *.
account furthermore that the Ar3 transformation tem-perature is a more appropriate reference than Ac3, asboth in the torsion tests and in rolling the steel follows
a cooling process.
3.1. Static Recrystallization
Ashas beenmentioned, the recrystallized fraction wasdetermined for different temperatures and strains of 0.20and 0.35, respectively. Figures I and 2showthe recrys-tallized fraction against time curves, obtained for steel
N3 and strains of O.20 and 0.35, respectively, with the
formatlon being seen of a single plateau on the curvescorresponding to 1000'C and 950'C. The shape of the
plateau is similar to that which appears in all the
microalloyed steels studied to date, both in vanadium,niobium or titanium steels.12,1 5) Thecurves correspond-ing to higher temperatures than those mentioned havethe sigrnoidal shape of Avrami's law. Furthermore, the
plateau is not undefined, i.e. precipitation does notpermanently inhibit recrystallization, and recrystalliza-
tion again progresses until it is cornplete, following agraphic plot siml]ar to that recorded before the formationof the plateau. This meansthat before and after theplateau, i.e. before and after precipitation, the recrys-tallization kinetics obey Avrami's law, whose expres-
1
CD> 0.5
Steel N4D= 190ume =0.35
i =3 63 sl
llt
[]
'~i'
1200 'c
O1150 'c
I1Ioo 'cO
1050 'c[]
1025 'cI~
1ooo 'c
91 5
O 100 1000 10000 1000001 10O.1t, s
Fig. 4. Variation ofthe recrystallized rraction (X*) with time(t) for steel N4and t:=0,35; ~=3,63 s~ 1.
sion is as foIIOWS:
a:E - -X I exp o'693 t n
t0'5.(1)
where t0.5 is the time corresponding to 500/0 of therecrystallized volume and depends on the temperature(T), strain (e), strain rate (i), grain size (D) and chemicalcomposition of the steel, according to the equation:
to 5 A8PeqD*expQ ..........(2)
RT """
whereQis the activation energy, R= 8.3 144Jmol - I K~ l
P, c/, s, Aare constants.
Whenthe strain was O.35, the recrystallized fractionagainst time curves for different temperatures weresimilar to the above, except that recrystallization is nowfaster, as the strain is greater (Fig. 2).
However, steel N4, unlike the above, presented adouble plateau for both strains of 0.20 and 0.35 (Figs. 3and 4). Whenthe deformation temperature wasequal to
or less than I050'C, the double plateau was formed. Inprinciple, the only possible interpretation of this
phenomenon,never before observed, seems to be the
formation of two types of precipitates whlch start to
form practically at the same temperature. Once the
C 1999 ISIJ
ISIJ International, Vol. 39 (1999), No. 9
1200
1150
11OO
1050
o 1000
950H gOO
850
800
750
700
~l~ 'I Xa
0.95
o+~. [~i~ 0.9
1020'c []0.5
I~,~0.3~~o. 1
Steel N3 +8 =0~20
(~P
s =3.63 S-l
D=210um
Pf
0.1 100 1000 10000 1000001 10t, s
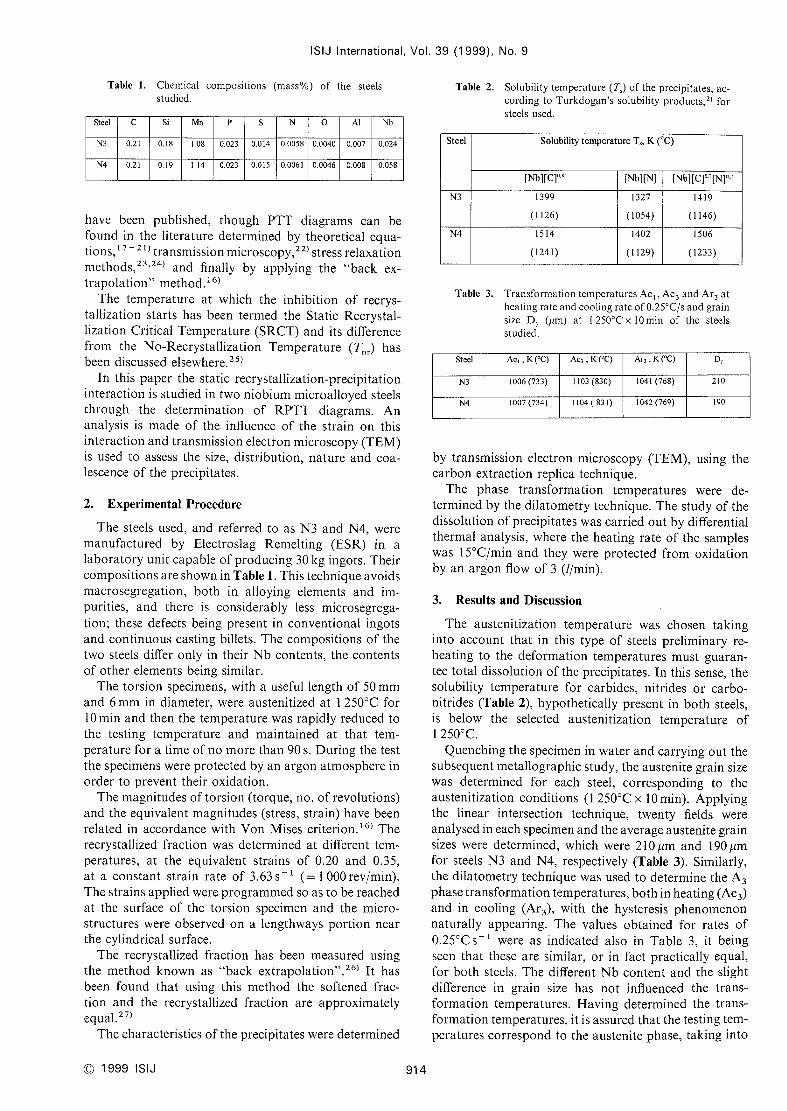
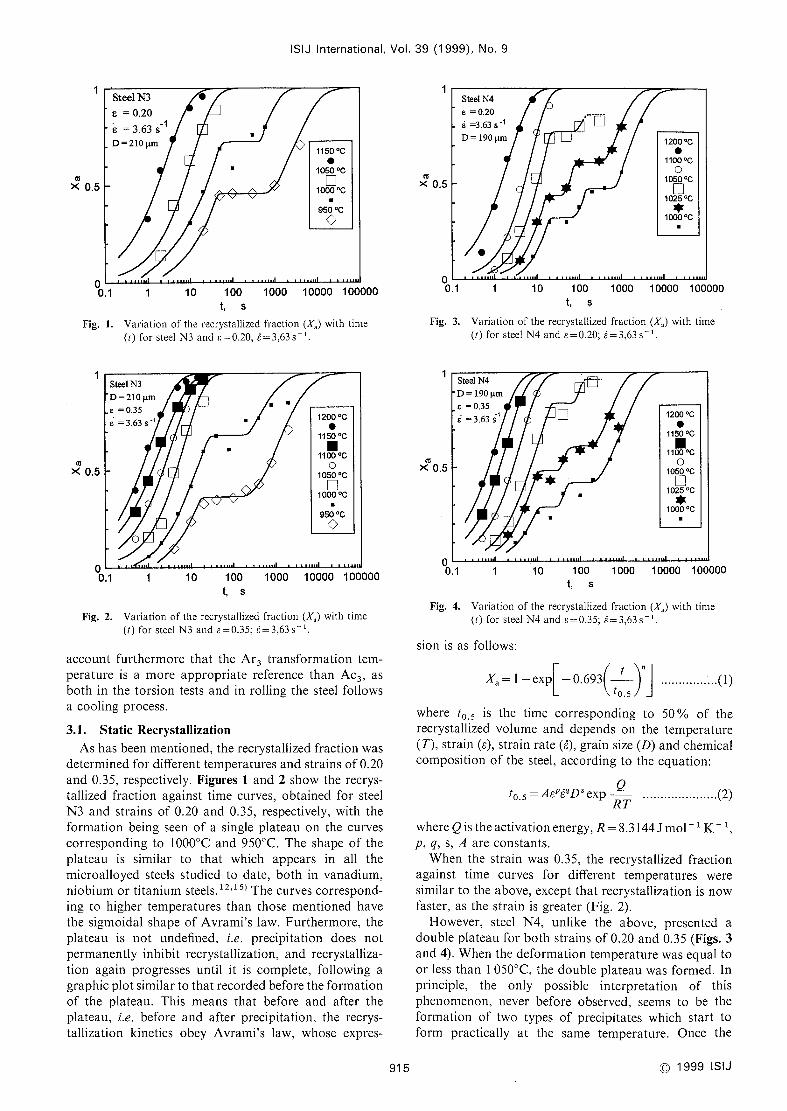
Fig. 5. RPTTdiagram for steel N3and 8=0.20.
1250
1200
1150
11OO
1050O. 1000
F 950
900
850
800
750
700100 1000 10000 1000000.1 1 10
t, s
Fig. 6. RPTTdiagram for steel N3and g=0.35.
[~~,~
.*. ~~~l~,.. h~'
+11'
Xa
0.95
o0.9
+~. '\;
[]
\+1 1002oc0.5
0.3
l~~~~o.1
+Ps
Steel N3 (F
8 =0.3S Pf
s =3 63 s~>
D=210um
1250
1200
1150
o 1100
F I050
1ooo
950
900
x0.95
o0.9[]0.5
1oe5•c 0.3~~0.1
+P~s =0.20
s =3.63 S1
Pf~>
D= 190um
0.1 1 100 1000 10000 10000010t, s
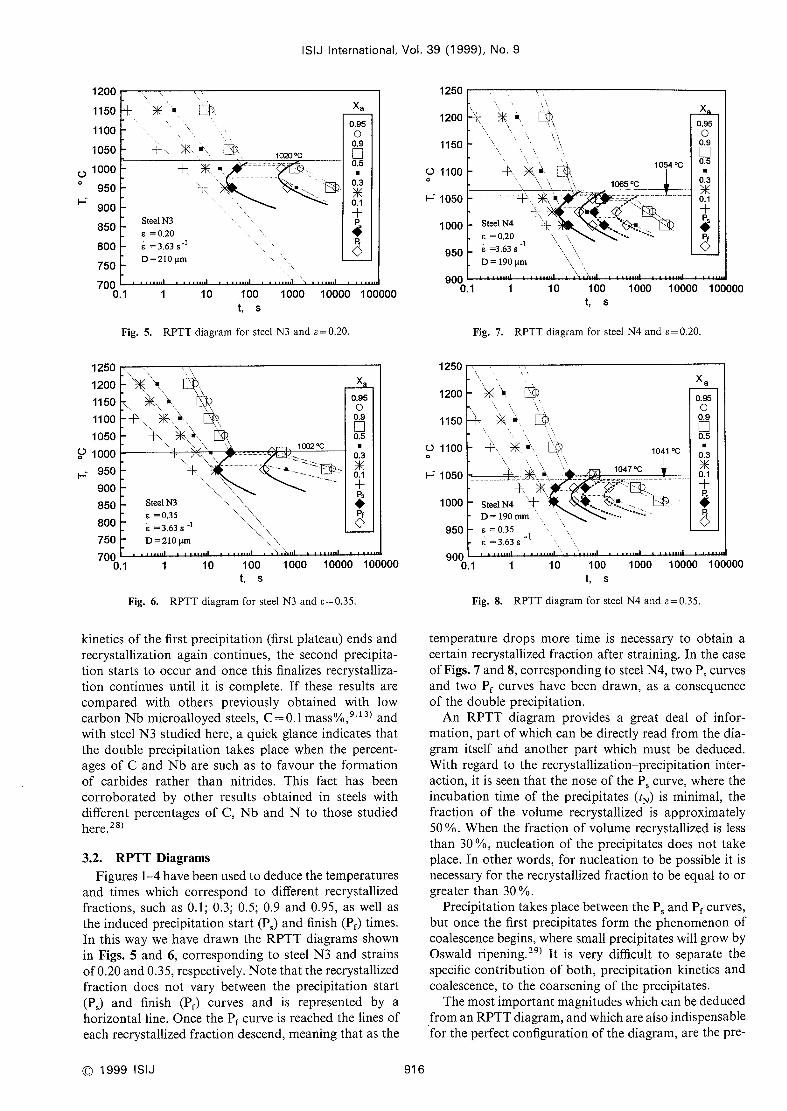
Fig. 7. RPTTdiagram for steel N4and 8=0.20
1250
1200
1150
o 1100
F I050
1oOo
50Xa
oo ~i~'~o. 95o
150 ~}~ : L~), 0.9[]o. 5
1oo +- I1041 •C 0.3
1047'c~1
050 o. 1+, ~.',
~
Steel N4 '+ "
D=190mmL,
+oOo ~:L,'
.
~P
950 E = 0.35 ~~=363S
~l
900ooO 1oooo 1Oooo(0.1 1 10 100 1000 10000 100000
t, s
Fig. 8. RPTTdiagram for steel N4and 8 O35
kinetics of the first precipitation (first plateau) ends andrecrystallization again continues, the second precipita-
tion starts to occur and once this finalizes recrystalliza-
tion continues until it is complete. If these results arecompared with others previously obtained with lowcarbon Nbmicroalloyed steels, C=0,1 mass"/o 9'13) andwith steel N3studied here, a quick glance indicates that
the double precipitation takes place whenthe percent-
ages of Cand Nbare such as to favour the formationof carbides rather than nitrides. This fact has beencorroborated by other results obtained in steels withdifferent percentages of C, Nband N to those studiedhere.28)
3.2. RPTTDiagramsFigures 1~havebeenused to deducethe temperatures
and times which correspond to different recrystallized
fractions, such as O.1; O.3; O.5; 0.9 and 0.95, as well asthe induced precipitation start (P~) and finish (Pf) times.
In this waywehave drawn the RPTTdiagrams shownin Figs. 5and 6, corresponding to steel N3and strains
of O.20 and0.35, respectively. Note that the recrystallized
fraction does not vary between the precipitation start
(P~) and finish (Pf) curves and is represented by ahorizontal line. Oncethe Pf curve is reached the lines ofeach recrystallized fraction descend, meaningthat as the
C 1999 ISIJ 91 6
temperature drops more time is necessary to obtain acertain recrystallized fraction after straining. In the caseof Figs. 7and 8, corresponding to steel N4, two P~curvesand two Pf curves have been drawn, as a consequenceof the double precipitation.
An RPTTdiagram provides a great deal of infor-
mation, part of which can be directly read from the dia-
gram itself afid another part which must be deduced.With regard to the recrystallization-precipitation inter-
action, it is seen that the nose of the P~ curve, where the
incubation time of the precipitates (tN) is minimal, thefraction of the volume recrystallized is approximately50~/.. Whenthe fraction of volume recrystallized is less
than 30 o/o, nucleation of the precipitates does not takeplace. In other words, for nucleation to be possible it is
necessary for the recrystallized fraction to be equal to orgreater than 30 ol..
Precipitation takes place betweenthe P* and Pf curves,but once the first precipitates form the phenomenonofcoalescence begins, wheresmall precipitates will growbyOswald ripening.29) It is very difficult to separate the
specific contribution of both, precipitation kinetics andcoalescence, to the coarsening of the precipitates.
Themost important magnitudeswhich can be deducedfrom anRPTTdiagram, andwhich are also indispensable
for the perfect configuration of the diagram, are the pre-
ISIJ International, Vol.
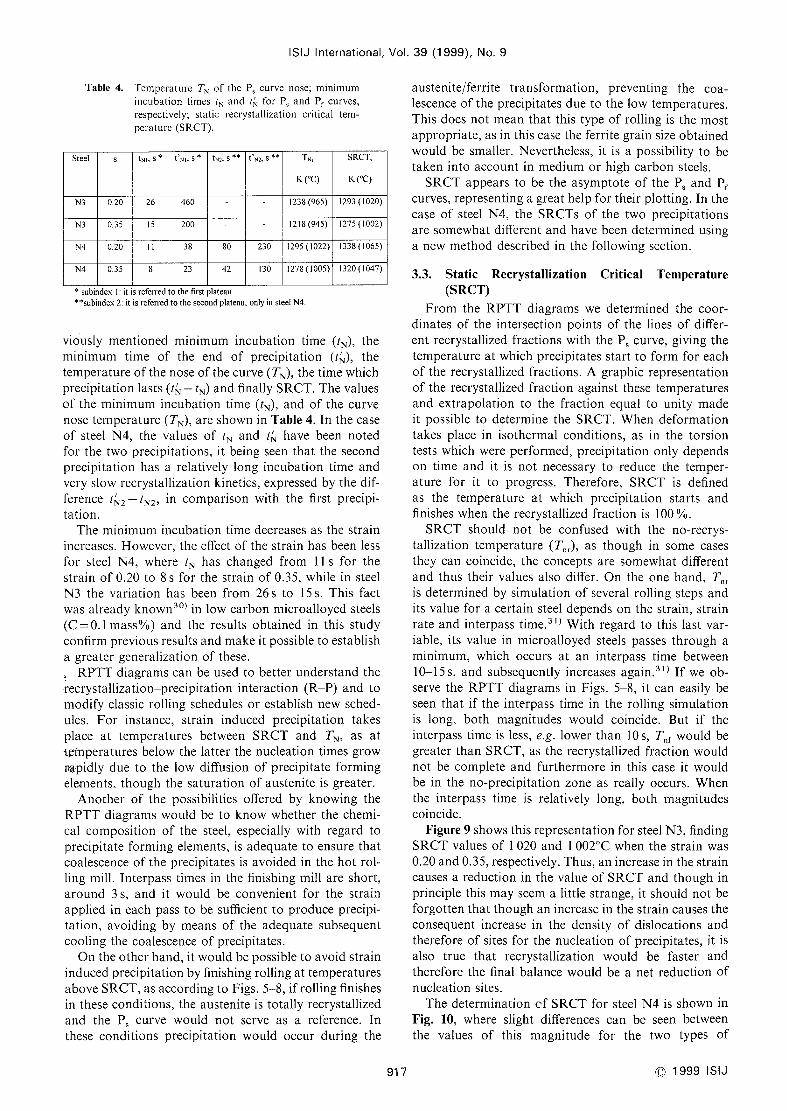
Table 4. Temperature TN of the P* curve nose; minimumincubation timcs IN 'and !~ for P* and Pf curves,respectively: static recrystallization critical tem-perature (SRCT).
Steel ; tN], s * t'N]• S'l, tN2. S** t*N2, S** TN,
K('C)
SRCT.
K('C)
N3 0.20 26 460 l238 (965) 1293(1020)
N3 0.35 15 200 1218(945) 1275(1002)
N4 0.20 ll 38 80 230 I295 (I022) I333(I065)
N4 0.35 8 23 42 l30 l278(I005) i320(I047)
* subindex I: it is referred to the first plateau
39 (1999), No. 9
it is referred to the first plateau
**subindex 2: it is referred to the secondp]ateau, curly in steel N4.
viously mentioned minimumincubation time (tN), the
minimumtime of the end of precipitation (t~), the
temperature of the nose of the curve (TN), the time whichprecipitation lasts (t~ - tN) and finally SRCT.Thevaluesof the minimumincubation time (tN), and of the curvenose temperature (TN), are shownin Table 4. In the caseof steel N4, the values of !N and l~ have been notedfor the two precipitations, it being seen that the secondprecipitation has a relatively long incubation time andvery slow recrystallization kinetics, expressed by the dif-
ference t~2-tN2, In comparison with the first precipi-
tatlon.
Theminimumincubation time decreases as the strain
increases. However, the effect of the strain has been less
for steel N4, where tN has changed from II s for the
strain of 0.20 to 8s for the strain of 0.35, while in steel
N3 the variation has been from 26s to 15s. This fact
wasalready known30)in low carbon microalloyed steels
(C=0.1 masso/o) and the results obtained in this studyconfirm previous results andmakeit possible to establish
a greater generalization of these.
. RPTTdlagrams can be used to better understand the
,recrystallization-precipitatlon interaction (R-P) and to
modify classic roliing schedules or establish newsched-ules. For instance, strain induced precipitation takes
place at temperatures between SRCTand TN, as at
t~inperatures below the latter the nucleation times growr,~rpidly due to the low diffusion of precipitate formingeiements, though the saturation of austenite is greater.
Another of the possibilities offered by knowing the
RPTTdiagrams would be to knowwhether the cheml-cal composition of the steel, especially with regard toprecipitate forming elements, Is adequate to ensure that
coalescence of the precipitates is avoided in the hot roi-
ling mill. Interpass times in the finishlng mill are short,
around 3s, and it would be convenient for the strain
applied in each pass to be sufficient to produce precipi-
tation, avoiding by meansof the adequate subsequentcooling the coalescence of precipitates.
Onthe other hand, it would be possib]e to avoid strain
induced precipitation by finishing rolling at temperaturesaboveSRCT,as according to Figs. 58, if rolling finishes
in these conditlons, the austenite is totally recrystallized
and the P curve would not serve as a reference. Inthese conditions precipitation would occur during the
91 7
austenite/ferrite transformation, preventlng the coa-lescence of the preclpltates due to the low temperatures.This does not meanthat this type of rolling is the mostappropriate, as in this case the ferrite grain size obtainedwould be smaller. Nevertheless, it Is a possibi]ity to betaken into account in mediumor high carbon steels.
SRCTappears to be the asymptote of the P* and Pf
curves, representing a great help for their plotting. In the
case of steel N4, the SRCTSof the two precipitations
are somewhatdifferent and have been determined using
a newmethoddescribed in the following section.
3.3. Static Recrystallization Critical Temperature(SRCT)
From the RPTTdiagrams we determined the coor-dinates of the intersection points of the lines of differ-
ent recrystallized fractions with the P* curve, giving the
temperature at which precipitates start to form for eachof the recrystallized fractions. A graphic representationof the recrystallized fraction against these temperaturesand extrapolation to the fraction equal to unity madeit possible to determine the SRCT.Whendeformationtakes place in isothermal conditions, as in the torsion
tests which were performed, precipitation only dependson time and it is not necessary to reduce the temper-atLure for it to progress. Therefore, SRCTis defined
as the temperature at which precipitation starts andfinishes whenthe recrystallized fraction is 100olo.
SRCTshould not be confused with the no-recrys-tallization temperature (T~*), as though in somecasesthey can coincide, the concepts are somewhatdifferent
and thus their values a]so differ. On the one hand, T~*is determlned by simulation of several rolling steps andits value for a certain steel dependson the strain, strain
rate and interpass time.31) With regard to thls last var-iable, its va]ue in microalloyed steels passes through amlnimum, which occurs at an interpass time betweenl0-15 s, and subsequently increases again.31) If we ob-
serve the RPTTdiagrams in Figs. 5-8, it can easily be
seen that if the interpass time in the rolling simulationis long, both magnitudes would coincide. But if theinterpass time Is less, e.g. Iower than lOs. T~f would begreater than SRCT,as the recrystallized fraction wouldnot be complete and furthermore in this case it wouldbe in the no-precipitation zone as really occurs. Whenthe interpass time is relatively long, both magnitudescoincide.
Figure 9showsthis representation for steel N3, finding
SRCTvalues of I 020 and I002'C whenthe strain was0.20 andO.35, respectively. Thus, an increase in the strain
causes a reduction in the value of SRCTand though in
principle this mayseema little strange, it should not beforgotten that though an increase in the strain causes the
consequent increase in the density of dislocations andtherefore of sites for the nucleation of precipitates, it is
also true that recrystaliization would be faster andtherefore the final balance would be a net reduction ofnucleation sites.
The determination cf SRCTfor steel N4 is shownin
Fig. lO, where slight differences can be seen betweenthe values of this magnitude for the two types of
@1999 ISIJ
ISIJ International, Vol, 39 (1 999), No. 9
1
o.8
co> 0.6
0.4
0.2
lOO~c l020 ~;1oooo
Steel N3
8 = O35
8 = 0.20
850 900 950 1OOO I050 11OOT, ac
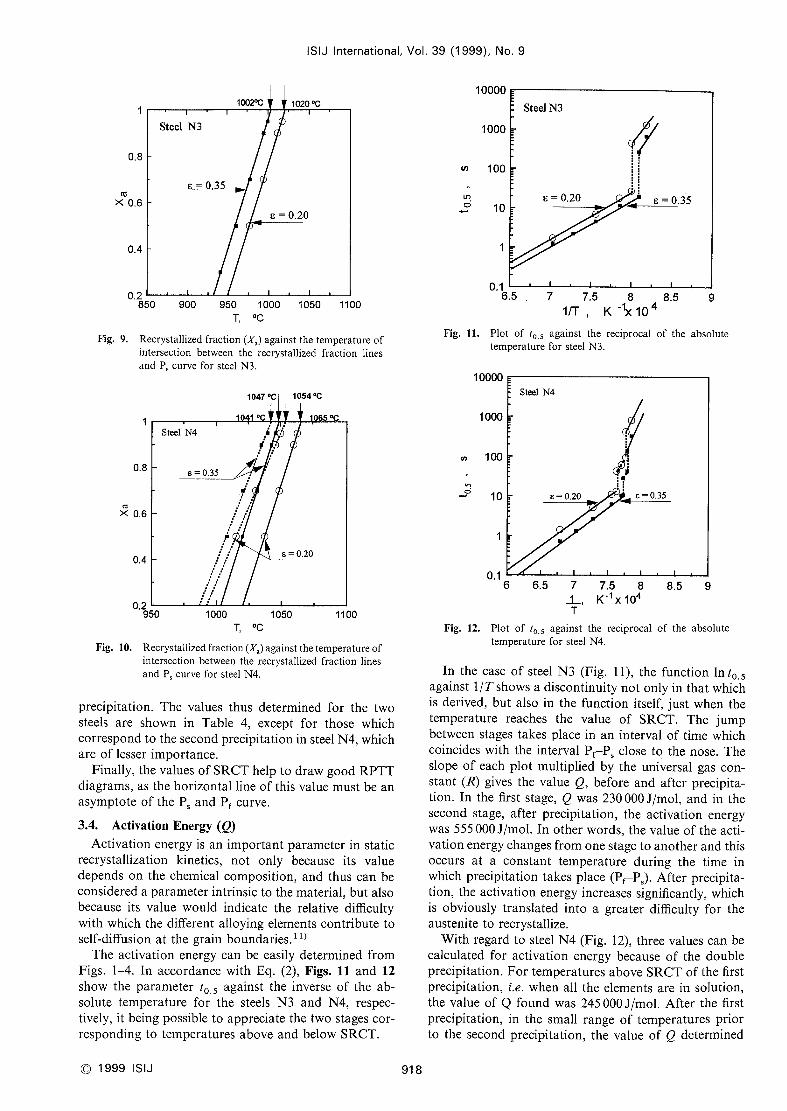
Recrystallized fraction (X*) against the temperature ofintersection between the recrystallized fraction lines
and P* curve for steel N3.
1OOO
u' IOO
Lo
o 10~
1
0.1
Fig. 9.
Steel N3
8 = 0.20
ll
8= 0.35
Fig. Il.
6.5 7 7.5 8 8.5 91/T
, K~~ 104
Plot of to 5against the reciprocal of the absolute
temperature for steel N3.
1OOOO
1
0.8
c!$
> 0.6
0.4
0.2
1047 •C IQ54•C
10 1•C 065 •C
Steel N4, .
s = 0.35
i
,,8 =O20
Fig. lO.
1ooo
,,) IOO
_o 10
Steel N4
s = 0.20
.=,//.
950 1OOO I050 11OOT, 'C
Recrystallized fraction (X*) against the temperature ofintersection between the recrystallized fraction lines
and P curve for steel N4.
precipitation. The values thus determined for the twosteels are shown in Table 4, except for those whichcorrespond to the secondprecipitation in steel N4, whichare of lesser importance.
Finally, the values of SRCThelp to drawgoodRPTTdiagrams, as the horizontal line of this value must be anasymptote of the P~ and Pf curve.
3.4. Activation Energy (Q)
Activation energy is an important parameter in static
recrystallization kinetics, not only because its valuedependson the chemical composition, and thus can beconsidered a parameter intrinsic to the material, but alsobecause its value would indicate the relative difficulty
with which the different alloying elements contribute toself-diffusion at the grain boundaries.1 1)
The activation energy can be easily determined fromFigs. I~L In accordance with Eq. (2), Figs. 11 and 12show the parameter t0.5 against the inverse of the ab-solute temperature for the steels N3 and N4, respec-tively, it being possible to appreciate the two stages cor-responding to temperatures above and below SRCT.
C 1999 ISIJ 91 8
1
e= 0.35
0.1
6 6.5 7 7.5 8 8.5 9~L, K~1xl04T
Fig. n. Plot of t. =against the reciprocal of the absolute
temperature for steel N4.
In the case of steel N3 (Fig. 11), the function In t0.5
against 1/T showsa discontinuity not only in that whichis derived, but also in the function itself, just whenthetemperature reaches the value of SRCT. The jumpbetween stages takes place in an interval of time whichcoincides with the interval Pf~P~ close to the nose. Theslope of each plot multiplied by the universal gas con-stant (R) gives the value Q, before and after precipita-tion. In the first stage, Qwas230OOOJ/mol, and in thesecond stage, after precipitation, the activation energywas555OOOJ/mol. In other words, the value of the acti-
vation energy changesfrom onestage to another and this
occurs at a constant temperature during the time in
which precipitation takes place (Pf~P*). After precipita-tion, the activation energy increases significantly, whichis obviously translated into a greater difficulty for theaustenite to recrystallize.
With regard to steel N4(Fig. 12), three values can becalculated for activation energy because of the doubleprecipitation. For temperatures aboveSRCTof the first
precipitation, i.e. whenall the elements are in solution,the value of Qfound was245000J/mol. After the first
precipitation, in the small range of temperatures prior
to the second precipitation, the value of Qdetermined
ISIJ lnternational, Vol. 39 (1999), NO. 9
15
E Steel N3Jc:
Io
uJ
5
>5to
Ha
-5
E~: ~lo
1~
uJ
Onset 920 QcPeak 968 'CEn(iset 1004 'C
-15400 600 800 Iooo
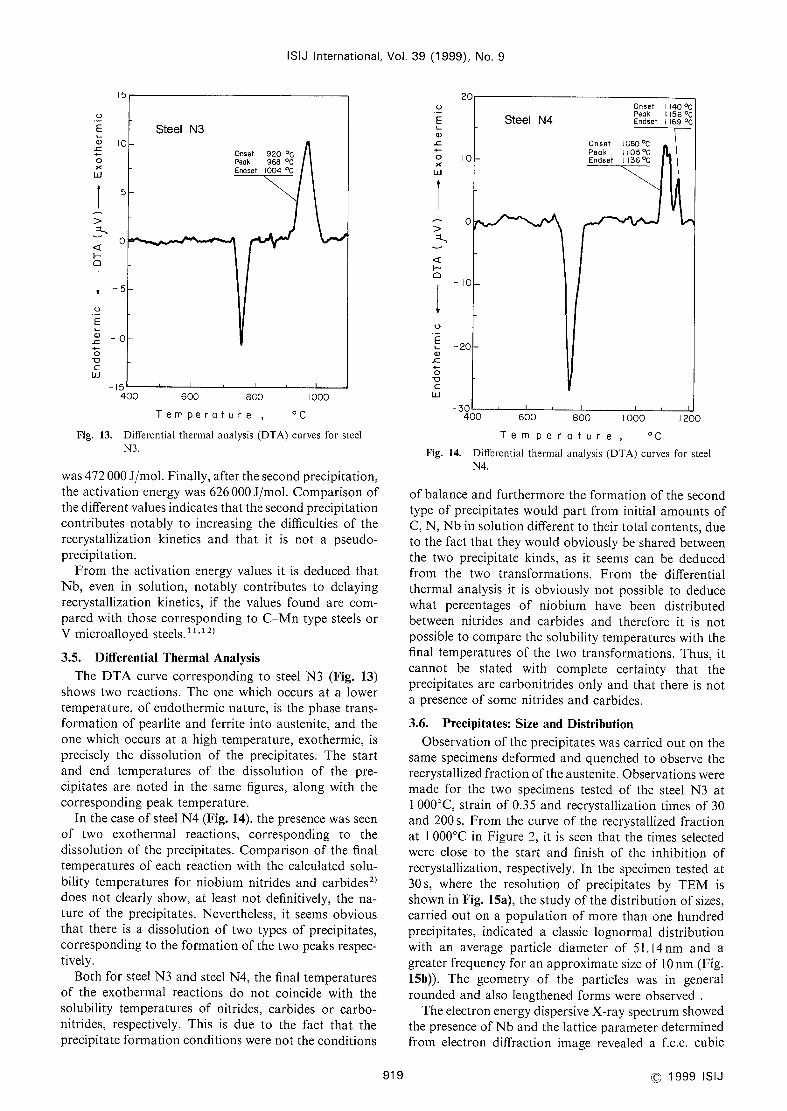
TemperGture , 'CFig. 13. Diffcrential thermal analysis (DTA) curves for steel
N3.
was472OOOJ/mol. Flnally, after the secondprecipitation,the activation energy was626OOOJ/mol. Comparisonofthe different values indicates that the secondprecipitationcontributes notably to increasing the difficulties of therecrystallization kinetics and that it is not a pseudo-precipitation.
From the activation energy values it is deduced that
Nb, even in solution, notably contributes to delayingrecrystallization kinetics, if the values found are com-pared wlth those corresponding to C-Mntype steeis orVmicroalloyed steels.1 1'12)
3.5. Differential Thermal Analysis
The DTAcurve corresponding to steel N3 (Fig. 13)
shows two reactions. The one which occurs at a lowertemperature, of endothermic nature, is the phase trans-formation of pearlite and ferrite into austenite, and the
one which occurs at a high temperature, exothermic, is
precisely the dissolution of the precipitates. The start
and end temperatures of the dissolution of the pre-cipitates are noted in the samefigures, along with thecorresponding peak temperature.
In the case of steel N4(Fig. 14), the presence wasseenof two exothermal reactions, corresponding to thedissolution of the precipitates. Comparisonof the final
temperatures of each reaction with the calculated solu-bility temperatures for niobium nitrides and carbides2)
does not clearly show, at least not definitively, the na-ture of the precipitates. Nevertheless, it seemsobviousthat there is a dissolution of two types of precipitates,
corresponding to the formation of the two peaks respec-tively.
Both for steel N3and steel N4, the final temperaturesof the exothermal reactions do not coincide with thesolubllity temperatures of nitrides, carbides or carbo-nitrides, respectively. This is due to the fact that theprecipitate formation conditions were not the conditions
91 9
20oE'l)
~o lO
UJ
O>~.
h~lo
oEL - 20,1)
J:
o1:,
cUJ
Steel N4O.nset I 140 acPeak I 156 ocEndset i 169 oc
~;;!'1\\;:~~~g":65_~c~~ooo;
flpeak 11050cEndset ll360c
- 30400 600 800 iooo 1200
TemperGture, 'CFig. 14. Differential thermal analysis (DTA) curves for steel
N4.
of balance and furthermore the formation of the secondtype of precipitates would part from initial amountsofC, N, Nbin solution different to their total contents, dueto the fact that they would obviously be shared betweenthe two precipitate kinds, as it seemscan be deducedfrom the two transformations. From the differential
thermal analysis it is obviously not possible to deducewhat percentages of nioblum have been distrlbutedbetween nitrides and carbldes and therefore it is notpossible to comparethe solubility temperatures with thefinal temperatures of the two transformations. Thus, it
cannot be stated with complete certainty that theprecipitates are carbonitrides only and that there is nota presence of somenitrides and carbides.
3.6. Precipitates: Size and Distribution
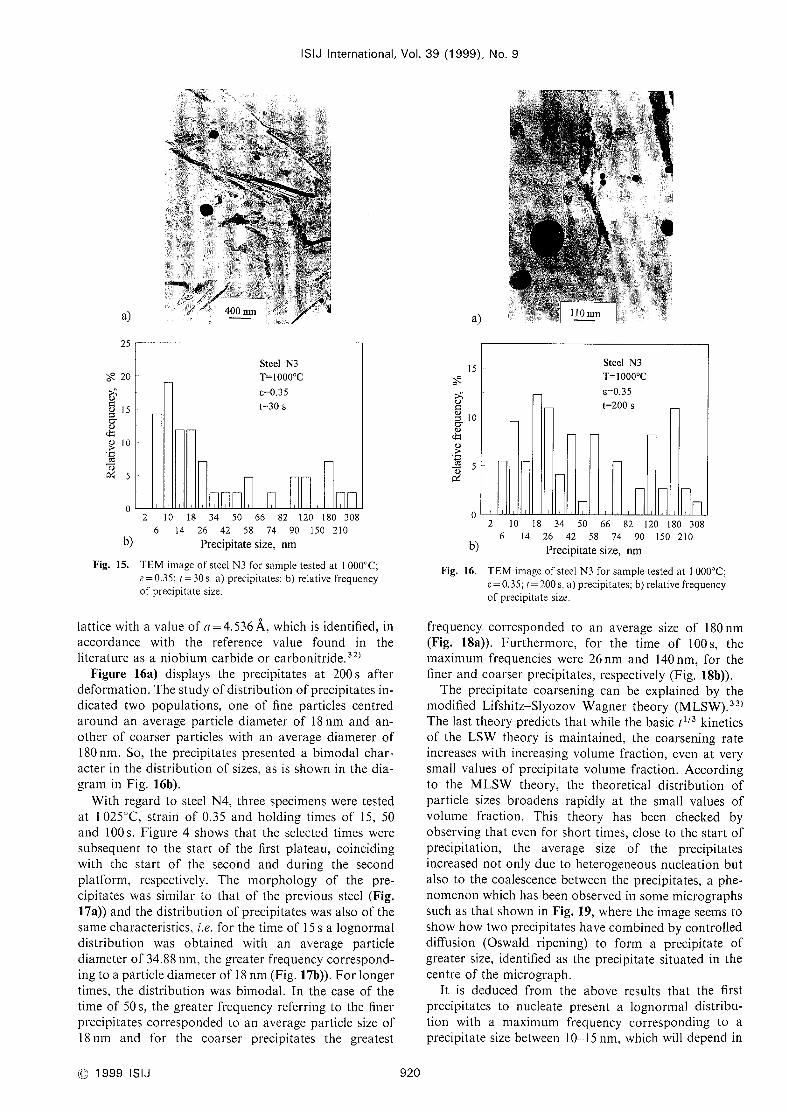
Observation of the precipitates wascarried out on the
samespecimens deformed and quenchedto observe therecrystallized fraction of the austenite. Observations weremadefor the two specimens tested of the steel N3 at
1OOO'C,strain of 0.35 and recrystallization times of 30and 200 s. Fromthe curve of the recrystallized fractionat IOOO'Cin Figure 2, it is seen that the times selected
were close to the start and finish of the inhibition ofrecrystallization, respectively. In the specimen tested at30s, where the resolution of precipitates by TEMis
shownin Fig. 15a), the study of the distribution of sizes,
carried out on a population of more than one hundredprecipitates, indicated a classic lognormal distributionwith an average particle diameter of 51.14nm and agreater frequency for an approximate size of IOnm(Fig.
15b)). The geometry of the particles was in general
rounded and also lengthened forms were observed.
Theelectron energy dispersive X-ray spectrum showedthe presence of Nband the lattice parameter determinedfrorn electron diffraction image revealed a f.c,c, cubic
C 1999 ISIJ
ISIJ International. Vol. 39 (1999), No. 9
a)
25
~
Steel N3T=1000'C8=0.35
t=30 s
a)
~:~ 20>:;
oe;::1
15
~e)~:i
(L)> lO
~~5e~5
o2 10 18 34 50 66 82 120 180 30g
6 14 26 42 58 74 90 150 210b) precipitate size, nm
Fig. 15. TEMimage ofsteel N3 for sample tested at IOOO'C;8=0,35; ! =30 s, a) precipitates; b) relative frequencyof precipitate size.
lattice with a value of a=4.536A, which is identified, in
accordance with the reference value found in theliterature as a niobium carbide or carbonitride.32)
Figure 16a) displays the precipitates at 200s after
deformation. Thestudy of distributlon of precipitates in-
dicated two populations, one of fine particles centredaround an average particle diameter of 18nmand an-other of coarser particles with an average diameter of180nm. So, the precipitates presented a bimodal char-
acter in the distribution of sizes, as is shownin the dia-
gram in Fig. 16b).
With regard to stee] N4, three specimens were tested
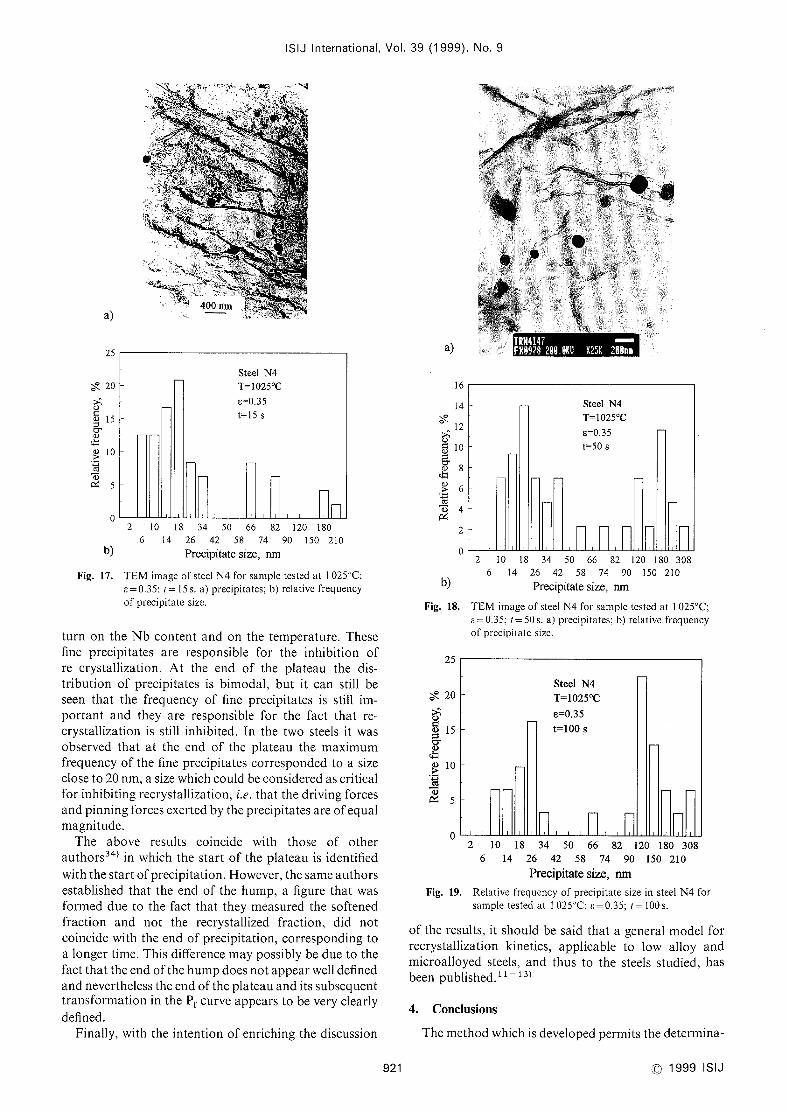
at I025'C, strain of 0.35 and holding times of 15, 50and 100 s. Figure 4 shows that the selected times weresubsequent to the start of the first plateau, coincidingwith the start of the second and during the secondplatform, respectively. The morphology of the pre-clpitates was simllar to that of the previous steel (Fig.
17a)) and the distribution of precipitates wasalso of the
samecharacteristics, i.e. for the tlme of 15 s a lognormaldistribution was obtalned with an average particle
diameter of 34.88 nm, the greater frequency correspond-ing to a particle diameter of 18nm(Fig. 17b)). For longertimes, the distribution was bimodal. In the case of thetime of 50 s, the greater frequency referring to the finer
precipitates corresponded to an average particle size of18nm and for the coarser precipitates the greatest
C 1999 ISIJ 920
~K.'
~{:;
e)!;~~a'
~:1
e'>
~5p~
15
lO
5
Steel N3T=IOOO'C
8=0.35
t=200 s
o2 Io 18 34 50 66 82 120 180 308
6 14 26 42 58 74 90 150 210b) precipitate size, nm
Fig. 16. TEMimage ofsteel N3 for sample tested at Iooo'C;
8=o.35; t= '_oo s, a) precipitates; b) relative rrequencyof precipitate size.
frequency corresponded to an average size of 180nm(Fig. 18a)). Furthermore, for the time of 100s, the
maximumfrequencies were 26nmand 140nm, for thefiner and coarser precipitates, respectively (Fig. 18b)).
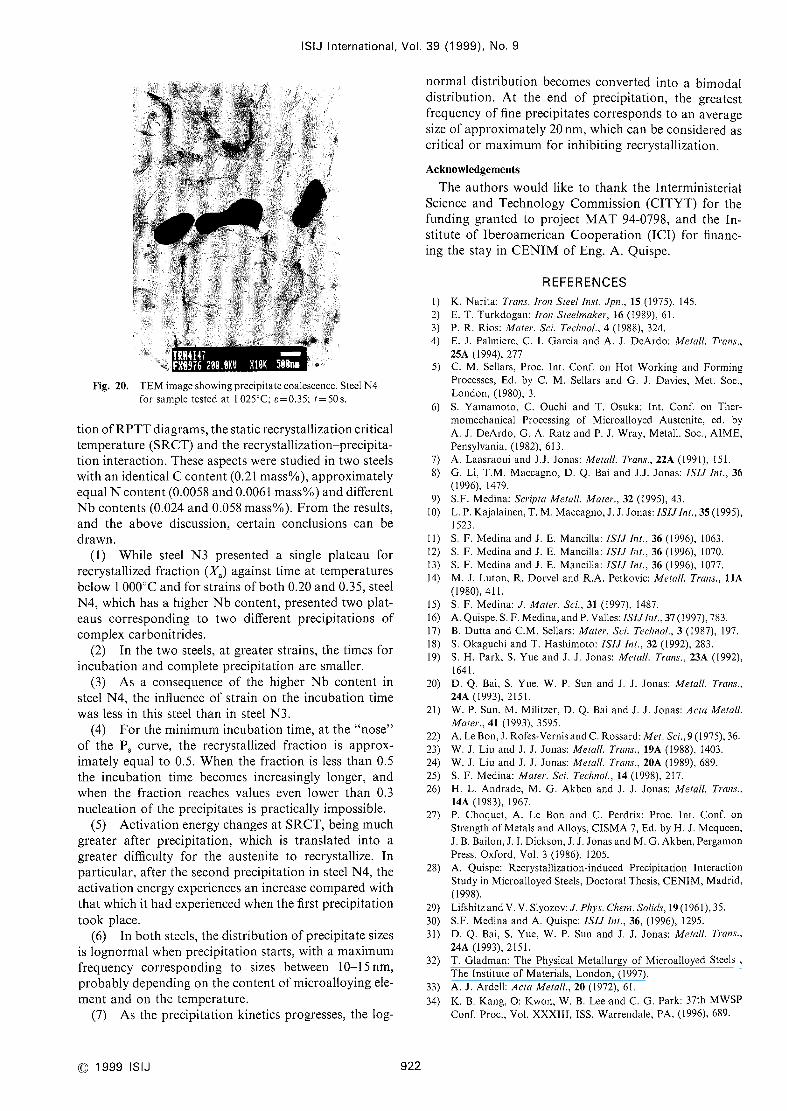
The precipitate coarsening can be explained by themodified Lifshltz-Slyozov-Wagner theory (MLSW).33)The last theory predicts that while the basic tl/3 kineticsof the LSWtheory is maintained, the coarsening rateincreases with increasing volume fraction, even at verysma]1 values of precipitate volume fraction. Accordingto the MLSWtheory, the theoretical distribution ofparticle sizes broadens rapidly at the small values ofvolume fraction. This theory has been checked byobserving that even for short times, close to the start ofprecipitation, the average size of the precipitatesincreased not only due to heterogeneous nucleation butalso to the coalescence between the precipitates, a phe-
nomenonwhich has been observed in somemicrographssuch as that shownin Fig. 19, where the image seemsto
showhowtwo precipitates have combinedby controlleddiffusion (Oswald ripening) to form a precipitate ofgreater size, identified as the precipitate situated in the
centre of the micrograph.It is deduced from the above results that the first
precipitates to nucleate present a lognormal distribu-
tion with a maximumfrequency corresponding to aprecipitate slze between iOl5 nm, which will depend in
ISIJ International. Vol. 39 (1999), No. 9
a)
25
~:.e 20
~c!)
F~e)::;
~a)ej:~
>e:l
~5~e:
:~~ ,I~
400mn
~~~
Steel N420 T=I025'C
80.35
15 t=15 S
lO
5
o
b)
Fig. 17.
2 10 18 34 50 66 82 120 180
6 14 26 42 58 74 90 150 210Precipitate size, nm
TEMimage of steel N4for sample tested at I025'C;f;=0.35; I= 15s. a) precipitates; b) relative frequencyof precipitate size.
turn on the Nbcontent and on the temperature. Thesefine precipitates are responsible for the inhibition of
re crystallizatlon. At the end of the plateau the dis-
tribution of precipltates is bimodal, but It can still be
seen that the frequency of fine precipitates is still im-portant and they are responsible for the fact that re-crystallization is still inhibited. In the two steels it wasobserved that at the end of the plateau the maximumfrequency of the fine precipitates corresponded to a size
close to 20 nm,a size which could be consldered as critical
for inhibiting recrystallization, i.e. that the driving forces
andpinning forces exerted by the precipitates are of equalmagnitude.
The above results coincide with those of otherauthors34) in which the start of the plateau is identified
with the start of precipltation. However,the sameauthorsestablished that the end of the hump, a figure that wasformed due to the fact that they measuredthe softenedfraction and not the recrystallized fraction, did notcoincide with the end of preclpitation, corresponding to
a longer time. This difference maypossibly be due to thefact that the endof the humpdoesnot appear well defined
andnevertheless the endof the plateau and its subsequenttransformation in the Pf curve appears to be very clearly
defined.
Finally, with the intention of enriching the discussion
a)
~(ee
~~~)$~e):$C~a)
aj:~
~)~
~Sp~
16
14
12
lO
8
6
4
2
o
Steel N4T=I025'C
8=0.35
t=50 s
b)
Fig. 18.
25
2 10 18 34 50 66 82 120 180 308
6 14 26 42 58 74 90 150 210Precipitate size, nm
TEMimage of steel N4for salnple tested at I025'C;f.=0,35; !=50 s. a) precipitates; b) relative frequencyof precipitate size,
~~:.' 20>:;
os{4)F$
15c-a)
~a)> lO
~,Dp~5
O2 Io 18 34 50 66 82 120 180 308
6 14 26 42 58 74 90 150 210Precipitate size, nm
Fig. 19. Relative frequency of precipit•,rte size in steel N4 for
sample tested rt I0'5 C 8 O35; i=100s.
of the results, it should be said that a general model forrecrystallization kinetics, applicable to low alloy andmicroalloyed steels, and thus to the steels studied, hasbeen published. 11~ 13)
4. Conclusions
Themethodwhich is developed permits the determina-
Steel N4T=1025'C
8=0.35
t=100 s
921 O1999 ISIJ
ISIJ International, Vol. 39 (1999), No, 9
Fig. 20. TEMlmageshowingprecipitate coalescence.Steel N4for sample tested at I025*C; 8=0.35; t= 50s.
tlon of RPTTdiagrams, the static recrystallization critical
temperature (SRCT)and the recrystallization-precipita-
tion interaction. Theseaspects were studied in two steels
with an identical Ccontent (O.21 masso/*), approximatelyequal Ncontent (O.0058 andO.0061masso/*) anddifferent
Nbcontents (0.024 and O.058mass~/*). Fromthe results,
and the above discussion, certain conclusions can bedrawn.
(1) While steel N3 presented a single plateau for
recrystallized fraction (X*) against time at temperaturesbelow I OOO'Cand for strains of both O.20 and 0.35, steel
N4, which has a higher Nbcontent, presented two plat-
eaus corresponding to two different precipitations of
complex carbonitrides.(2) In the two steels, at greater strains, the times for
incubation and complete precipitation are smaller.
(3) As a consequenceof the higher Nb content in
steel N4, the influence of strain on the incubation time
was less in this steel than in stee] N3.(4) For the minimumincubation time, at the "nose"
of the P* curve, the recrystallized fraction is approx-imately equal to 0.5. Whenthe fraction is less than 0.5
the incubation time becomesincreasingly longer, andwhen the fraction reaches values even lower than 0.3
nucleation of the precipltates Is practically impossible.(5) Activation energy changesat SRCT,being much
greater after precipitation, which is translated into agreater difficulty for the austenite to recrystallize. Inparticular, after the second precipitation in steel N4, the
activation energy experiences an increase comparedwiththat which it had experienced whenthe first precipitation
took place.
(6) In both steels, the distribution ofprecipitate sizes
is lognormal whenprecipitation starts, with a maximumfrequency correspondlng to sizes between 10-15nm,probably depending on the content of microalloying ele-
ment and on the temperature.(7) As the precipitation kinetics progresses, the log-
normal distribution becomesconverted into a bimodaldistribution. At the end of precipitation, the greatestfrequency of fine precipitates corresponds to an averagesize of approximately 20 nm, which can be considered ascritical or maximumfor inhibiting recrystallization.
Acknowledgements
The authors would like to thank the Interministerial
Science and Technology Commission(CITYT) for thefunding granted to project MAT94-0798, and the In-stitute of lberoamerican Cooperation (ICI) for financ-ing the stay in CENlMof Eng. A. Quispe.
1)
2)
3)
4)
5)
6)
7)
8)
9)
10)
11)
12)
l3)
l4)
l5)
l6)
l7)
l8)
19)
20)
21)
22)
23)
24)
25)
26)
27)
28)
29)
30)
31)
32)
33)
34)
REFERENCESK. Narita: T,'ans lr0,7 Stee! Inst. Jpn., 15 (1975), 145.
E. T. Turkdogan: Iron Steehllake,', 16 (1989), 61.
P. R. Rios: Mcue,'. Sci. Tc'ch,10!., 4(1988). 324,
E. J. Palmiere. C. I. Garcia and A. J. DeArdo: Metal!. Trans.,
25A (1994), 277.C. M. Sellars, Proc. Int. Conf, on Hot Working and FormingProcesses. Ed, by C. M. Sellars and G. J. Davies. Met. Soc.,
London, (1980), 3S. Yamamoto.C. Ouchi and T. Osuka: Int. Conf. on Ther*momechanical Processing of Microalloyed Austenite, ed. byA. J. DeArdo. G. A. Ratz and P. J. Wray. Metall. Soc., AIME,Pensylvania, (1982), 61 3.
A. Laasraoui and J.J. Jonas: Metall. T,'ans., 22A (1991), 151.
G. Li, T.M. Maccagno.D. Q. Bai and J.J. Jonas: ISIJ Int., 36(1996), 1479.
S,F. Medina: Sc,'1j)ta Metall. Mate,'., 32 (1995), 43.
L. P. Kajalainen, T, M. Maccagno,J. J. Jonas: ISIJlnt., 35 (1995),
l523.S. F. Medinaand J. E. Mancilla: ISIJ 1,7r, 36 (1996), 1063.S. F. Medinaand J. E. Mancilla: ISIJ 1,7t., 36 (1996), 1070.S. F. Medina and J. E. Mancilla: ISIJ Inl., 36 (1996), 1077.
M. J. Luton, R. Dorvel and R.A. Petkovic: Meta!!. Trans., IIA
(1980), 41 1.
S. F. Medina: J. Mate,'. Sci., 31 (1997), 1487.
A. Quispe. S. F. Medina, andP. Valles: ISIJlnt,. 37 (1997), 783.
B. Dutta and C.M. Sellars: Mclter. Sci. Techno!., 3(1987), 197.
S. Okaguchi and T. Hashimoto: ISIJ Inl., 32 (1992), 283.S. H. Park. S. Yueand J. J. Jonas: Meta[/. T,'ans., 23A (1992),
1641.
D. Q. Bai. S. Yue, W. P. Sun and J. J. Jonas: Me!a!!. T,'ans.,
24A (1993), 2151.
W. P. Sun. M. Militzer. D. Q. Bai and J. J. Jonas: Acta Meta!l.
Ma!e,'., 41 (1993), 3595.
A. Le Bon. J. Rofes-Vernis andCRossard: Mel. Sci., 9(1 975), 36.
W. J. Liu and J. J. Jonas: Meta!!. T,'a,7s., 19A (1988), 1403.
W. J, Liu and J. J. Jonas: Mela!l. T,'ans., 20A (1989), 689.S. F. Medina: Mater. Sci. Techno!., 14 (1998), 217.
H. L. Andrade, M. G, Akbenand J. J. Jonas: Meta!!. Trans,,
14A (1983), 1967.P. Choquet. A. Le Bon and C. Perdrix: Proc. Int. Conf, onStrength of Metals and A110ys. CISMA7. Ed by H. J. Mcqueen,J. B. Bailon, J. I. Dickson. J. J. JonasandM. G. Akben, PergamonPress. Oxford, Vol. 3(1986), 1205.
A. Quispe: Recrystallization-induced Precipitatlon Interaction
Study in Microalloyed Steels, Doctoral Thesis. CENlM.Madrid,
(1998).
Lifshitz andV. V. Slyozov: J. Pllys. Chem.So!icl.s, 19(1961), 35.
S.F. Medinaand A. Quispe: ISIJ hll., 36, (1996). 1295.
D. Q. Bai. S. Yue, W. P. Sun and J. J. Jonas: Meta!!. T,'ans.,
24A (1993). 2151.
T. Gladman: The Physical Metallurgy of Microalloyed Steels,
The Institute of Materials, London, (1997).
A. J. Ardell: Acta Meta!!., 20 (1972), 61.
K. B. Kang. O: Kwon.W. B Lee ~~nd C. G. Park: 37th MWSPConf. Proc., Vol. XXXIII, ISS, Warrendale. PA, (1996), 689.
C 1999 ISIJ 922


