Embed Size (px)
Citation preview
Redefining Requirements of Ancillary Services for TechnologyAgnostic Sources
J. S. MacDonald E. C. Kara, D. P. Chassin, S. KiliccoteLawrence Berkeley National Lab SLAC National Accelerator Lab
D. E. M. Bondy, O. Gehrke,K. Heussen, H. W. Bindner
Technical University of Denmarkbondy,kh,olge,[email protected]
[email protected] ekara,dchassin,[email protected]
Abstract
New sources for ancillary services are needed, yetthe requirements for service provision in most countriesare explicitly formulated for traditional generators. Thisleads to waste of the potential for new technologies to de-liver ancillary services. In order to harness this potential,we propose to parameterize the requirements of ancillaryservices so that reserves can be built by combining theadvantageous properties of different technologies. Theproposal is exemplified through a laboratory test whereit shown that the system needs can be covered throughcheaper and smaller reserves.
1. Introduction
Ancillary services (AS) are essential for the reliable op-eration of power systems. In some countries, the highpenetration of renewable energy sources is leading to thedecommissioning of traditional generators, thus reduc-ing the available resources for AS provision [1]. Withthe increase in adoption of distributed energy resources(DERs) and controllable smart loads, as well as the emer-gence of schemes for utilizing consumption flexibility,such as demand response (DR), new sources for AS fromthe demand-side are potentially available.
Demand-side resources (DSRs) possess qualities thatin many cases match the performance needs of the sys-tem better than traditional generators [2], yet the require-ments for AS in many countries are defined on the im-plicit assumption that only generators provide ancillaryservices. Therefore, these requirements can be a bar-rier for the participation of DSRs in the AS markets [3].There are both economic and technical benefits in ex-ploiting the qualities of flexible demand.
This work parametrizes the requirements for re-sources providing AS such that the reserve can be sizedoptimally to the overall system requirements. The over-all system requirements are also redefined in termsof a desired shape instead of a capacity. The newparametrized requirements are focused on service per-formance and are source/technology independent. Bychanging the AS requirements to focus on performancerather than unit capabilities and utilizing new technolo-gies as AS sources, system operators may increase sys-
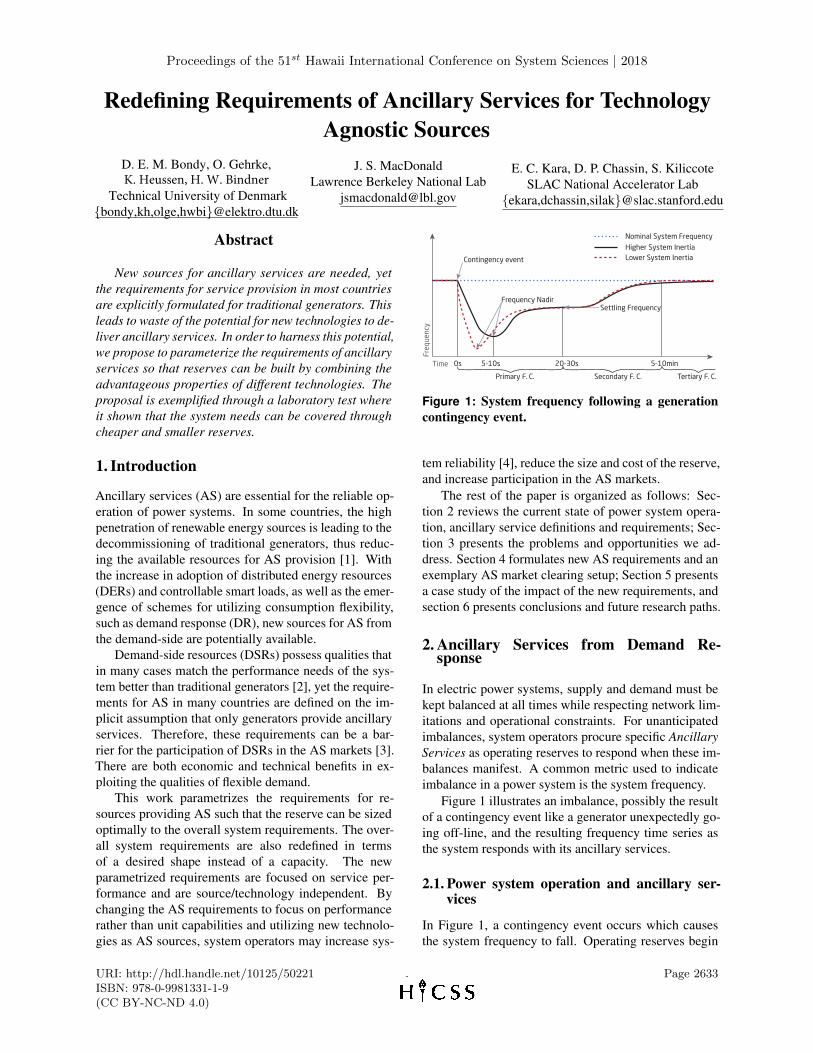
Figure 1: System frequency following a generationcontingency event.
tem reliability [4], reduce the size and cost of the reserve,and increase participation in the AS markets.
The rest of the paper is organized as follows: Sec-tion 2 reviews the current state of power system opera-tion, ancillary service definitions and requirements; Sec-tion 3 presents the problems and opportunities we ad-dress. Section 4 formulates new AS requirements and anexemplary AS market clearing setup; Section 5 presentsa case study of the impact of the new requirements, andsection 6 presents conclusions and future research paths.
2. Ancillary Services from Demand Re-sponse
In electric power systems, supply and demand must bekept balanced at all times while respecting network lim-itations and operational constraints. For unanticipatedimbalances, system operators procure specific AncillaryServices as operating reserves to respond when these im-balances manifest. A common metric used to indicateimbalance in a power system is the system frequency.
Figure 1 illustrates an imbalance, possibly the resultof a contingency event like a generator unexpectedly go-ing off-line, and the resulting frequency time series asthe system responds with its ancillary services.
2.1. Power system operation and ancillary ser-vices
In Figure 1, a contingency event occurs which causesthe system frequency to fall. Operating reserves begin
1
Proceedings of the 51st Hawaii International Conference on System Sciences | 2018
URI: http://hdl.handle.net/10125/50221ISBN: 978-0-9981331-1-9(CC BY-NC-ND 4.0)
Page 2633
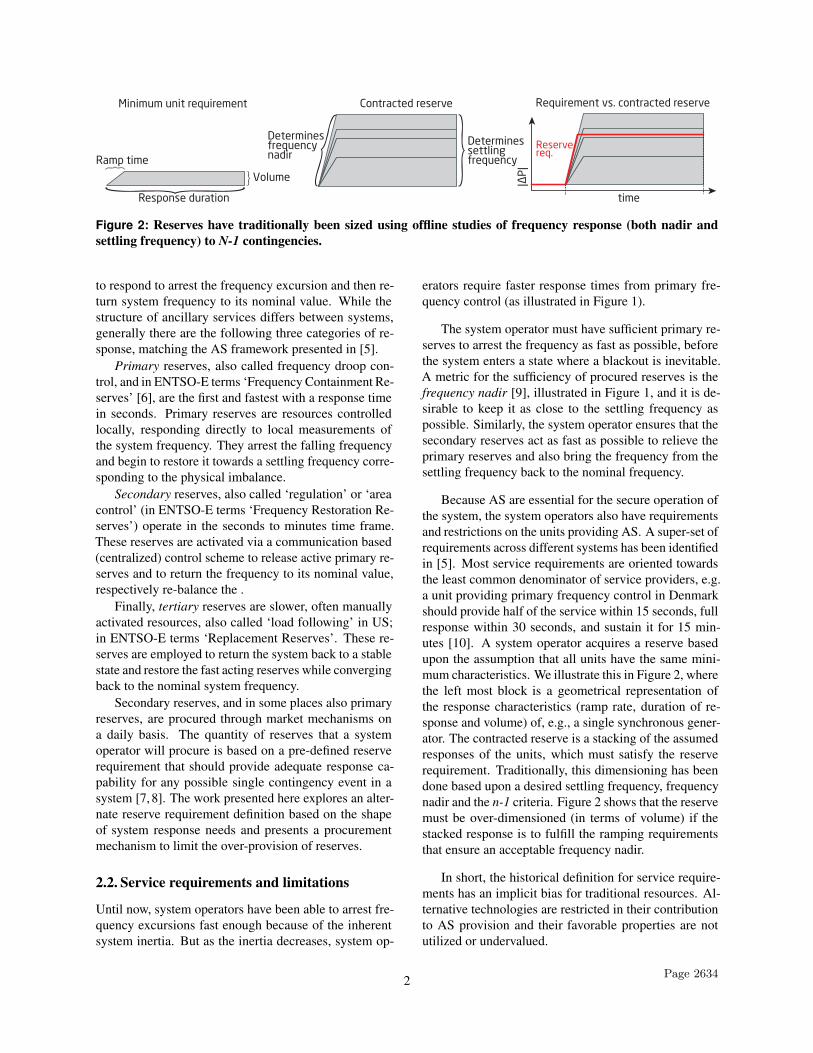
Figure 2: Reserves have traditionally been sized using offline studies of frequency response (both nadir andsettling frequency) to N-1 contingencies.
to respond to arrest the frequency excursion and then re-turn system frequency to its nominal value. While thestructure of ancillary services differs between systems,generally there are the following three categories of re-sponse, matching the AS framework presented in [5].
Primary reserves, also called frequency droop con-trol, and in ENTSO-E terms ‘Frequency Containment Re-serves’ [6], are the first and fastest with a response timein seconds. Primary reserves are resources controlledlocally, responding directly to local measurements ofthe system frequency. They arrest the falling frequencyand begin to restore it towards a settling frequency corre-sponding to the physical imbalance.
Secondary reserves, also called ‘regulation’ or ‘areacontrol’ (in ENTSO-E terms ‘Frequency Restoration Re-serves’) operate in the seconds to minutes time frame.These reserves are activated via a communication based(centralized) control scheme to release active primary re-serves and to return the frequency to its nominal value,respectively re-balance the .
Finally, tertiary reserves are slower, often manuallyactivated resources, also called ‘load following’ in US;in ENTSO-E terms ‘Replacement Reserves’. These re-serves are employed to return the system back to a stablestate and restore the fast acting reserves while convergingback to the nominal system frequency.
Secondary reserves, and in some places also primaryreserves, are procured through market mechanisms ona daily basis. The quantity of reserves that a systemoperator will procure is based on a pre-defined reserverequirement that should provide adequate response ca-pability for any possible single contingency event in asystem [7, 8]. The work presented here explores an alter-nate reserve requirement definition based on the shapeof system response needs and presents a procurementmechanism to limit the over-provision of reserves.
2.2. Service requirements and limitations
Until now, system operators have been able to arrest fre-quency excursions fast enough because of the inherentsystem inertia. But as the inertia decreases, system op-
erators require faster response times from primary fre-quency control (as illustrated in Figure 1).
The system operator must have sufficient primary re-serves to arrest the frequency as fast as possible, beforethe system enters a state where a blackout is inevitable.A metric for the sufficiency of procured reserves is thefrequency nadir [9], illustrated in Figure 1, and it is de-sirable to keep it as close to the settling frequency aspossible. Similarly, the system operator ensures that thesecondary reserves act as fast as possible to relieve theprimary reserves and also bring the frequency from thesettling frequency back to the nominal frequency.
Because AS are essential for the secure operation ofthe system, the system operators also have requirementsand restrictions on the units providing AS. A super-set ofrequirements across different systems has been identifiedin [5]. Most service requirements are oriented towardsthe least common denominator of service providers, e.g.a unit providing primary frequency control in Denmarkshould provide half of the service within 15 seconds, fullresponse within 30 seconds, and sustain it for 15 min-utes [10]. A system operator acquires a reserve basedupon the assumption that all units have the same mini-mum characteristics. We illustrate this in Figure 2, wherethe left most block is a geometrical representation ofthe response characteristics (ramp rate, duration of re-sponse and volume) of, e.g., a single synchronous gener-ator. The contracted reserve is a stacking of the assumedresponses of the units, which must satisfy the reserverequirement. Traditionally, this dimensioning has beendone based upon a desired settling frequency, frequencynadir and the n-1 criteria. Figure 2 shows that the reservemust be over-dimensioned (in terms of volume) if thestacked response is to fulfill the ramping requirementsthat ensure an acceptable frequency nadir.
In short, the historical definition for service require-ments has an implicit bias for traditional resources. Al-ternative technologies are restricted in their contributionto AS provision and their favorable properties are notutilized or undervalued.
2 Page 2634
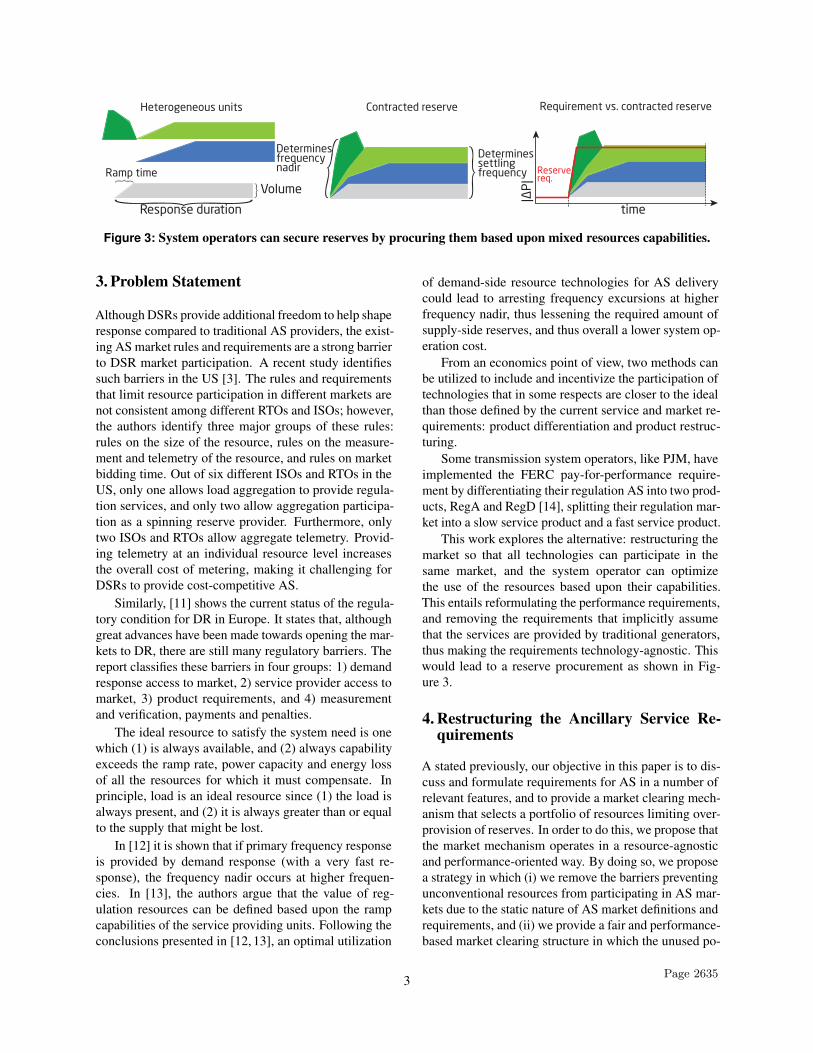
Figure 3: System operators can secure reserves by procuring them based upon mixed resources capabilities.
3. Problem Statement
Although DSRs provide additional freedom to help shaperesponse compared to traditional AS providers, the exist-ing AS market rules and requirements are a strong barrierto DSR market participation. A recent study identifiessuch barriers in the US [3]. The rules and requirementsthat limit resource participation in different markets arenot consistent among different RTOs and ISOs; however,the authors identify three major groups of these rules:rules on the size of the resource, rules on the measure-ment and telemetry of the resource, and rules on marketbidding time. Out of six different ISOs and RTOs in theUS, only one allows load aggregation to provide regula-tion services, and only two allow aggregation participa-tion as a spinning reserve provider. Furthermore, onlytwo ISOs and RTOs allow aggregate telemetry. Provid-ing telemetry at an individual resource level increasesthe overall cost of metering, making it challenging forDSRs to provide cost-competitive AS.
Similarly, [11] shows the current status of the regula-tory condition for DR in Europe. It states that, althoughgreat advances have been made towards opening the mar-kets to DR, there are still many regulatory barriers. Thereport classifies these barriers in four groups: 1) demandresponse access to market, 2) service provider access tomarket, 3) product requirements, and 4) measurementand verification, payments and penalties.
The ideal resource to satisfy the system need is onewhich (1) is always available, and (2) always capabilityexceeds the ramp rate, power capacity and energy lossof all the resources for which it must compensate. Inprinciple, load is an ideal resource since (1) the load isalways present, and (2) it is always greater than or equalto the supply that might be lost.
In [12] it is shown that if primary frequency responseis provided by demand response (with a very fast re-sponse), the frequency nadir occurs at higher frequen-cies. In [13], the authors argue that the value of reg-ulation resources can be defined based upon the rampcapabilities of the service providing units. Following theconclusions presented in [12, 13], an optimal utilization
of demand-side resource technologies for AS deliverycould lead to arresting frequency excursions at higherfrequency nadir, thus lessening the required amount ofsupply-side reserves, and thus overall a lower system op-eration cost.
From an economics point of view, two methods canbe utilized to include and incentivize the participation oftechnologies that in some respects are closer to the idealthan those defined by the current service and market re-quirements: product differentiation and product restruc-turing.
Some transmission system operators, like PJM, haveimplemented the FERC pay-for-performance require-ment by differentiating their regulation AS into two prod-ucts, RegA and RegD [14], splitting their regulation mar-ket into a slow service product and a fast service product.
This work explores the alternative: restructuring themarket so that all technologies can participate in thesame market, and the system operator can optimizethe use of the resources based upon their capabilities.This entails reformulating the performance requirements,and removing the requirements that implicitly assumethat the services are provided by traditional generators,thus making the requirements technology-agnostic. Thiswould lead to a reserve procurement as shown in Fig-ure 3.
4. Restructuring the Ancillary Service Re-quirements
A stated previously, our objective in this paper is to dis-cuss and formulate requirements for AS in a number ofrelevant features, and to provide a market clearing mech-anism that selects a portfolio of resources limiting over-provision of reserves. In order to do this, we propose thatthe market mechanism operates in a resource-agnosticand performance-oriented way. By doing so, we proposea strategy in which (i) we remove the barriers preventingunconventional resources from participating in AS mar-kets due to the static nature of AS market definitions andrequirements, and (ii) we provide a fair and performance-based market clearing structure in which the unused po-
3 Page 2635
tential of DSRs (and other technologies) is utilized.
4.1. Overall approach
The proposed restructuring assumes that system opera-tors acquire AS reserves through a market, and that po-tential AS providers bid their reserve capacity in thatmarket. The restructuring is based on the following fourkey concepts (which are further developed in this sec-tion):
• The formulation of an ideal ancillary service re-serve that the system operator desires for the sys-tem will depend strongly on system needs, e.g. areserve with very fast response in case of low sys-tem inertia, and will be submitted as a tender offerto the market.
• The parameterization of the AS bids, where the pa-rameters reflect the service providers’ ability to per-form as an ideal reserve, removes the minimum-requirements-barriers on new technologies, thus en-abling any potential useful unit to participate in theAS provision, which facilitates market liquidity andreduces overall costs of acquiring and calling onneeded resources.
• Clearing all units under a generalized singleclearing-price auction provides incentives to bidactual marginal cost. In this auction, the capabilityvalue of each service provider, their availability andtheir historical performance is taken into account.
• Performance-based remuneration creates an incen-tive to provide better AS resources and enablestransparent performance-based clearing of the mar-ket.
Based on an assessment of the complete decision pro-cess, we merge the four key concepts outlined before intoa novel approach to AS valuation that accounts both forresource performance and the actual spectrum of systemneeds. The holistic assessment includes:
• Planning: Parameterization of resource perfor-mance and specification of tender conditions basedon the assessment of system needs;
• Scheduling: Quantification of AS tender volume,AS bid submission, and market clearing;
• Operation: Monitoring the performances of reservedispatch/activation based on the traditional defini-tions related to frequency excursions; and
• Settlement: Verification of service delivery and re-muneration.
0s 5-10s 20-30s 5-10min
Nominal system frequencyFrequency excursionOptimal system response
Freq
uenc
y|∆P|
Time
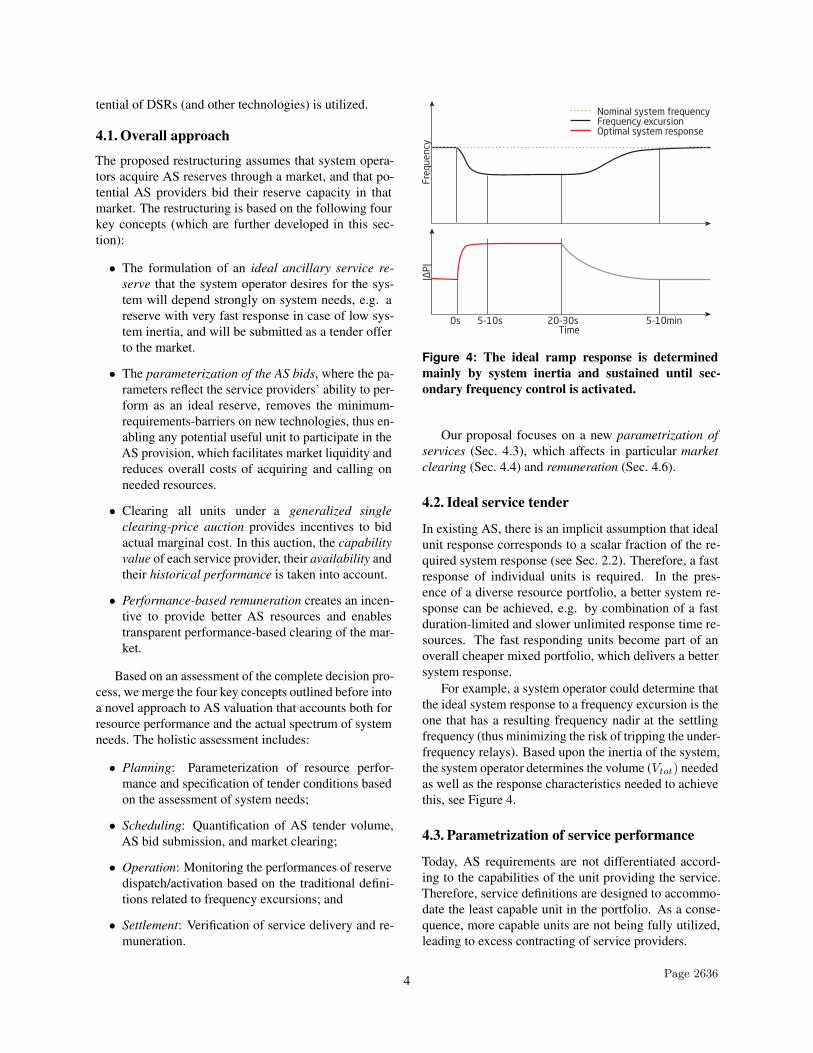
Figure 4: The ideal ramp response is determinedmainly by system inertia and sustained until sec-ondary frequency control is activated.
Our proposal focuses on a new parametrization ofservices (Sec. 4.3), which affects in particular marketclearing (Sec. 4.4) and remuneration (Sec. 4.6).
4.2. Ideal service tender
In existing AS, there is an implicit assumption that idealunit response corresponds to a scalar fraction of the re-quired system response (see Sec. 2.2). Therefore, a fastresponse of individual units is required. In the pres-ence of a diverse resource portfolio, a better system re-sponse can be achieved, e.g. by combination of a fastduration-limited and slower unlimited response time re-sources. The fast responding units become part of anoverall cheaper mixed portfolio, which delivers a bettersystem response.
For example, a system operator could determine thatthe ideal system response to a frequency excursion is theone that has a resulting frequency nadir at the settlingfrequency (thus minimizing the risk of tripping the under-frequency relays). Based upon the inertia of the system,the system operator determines the volume (Vtot) neededas well as the response characteristics needed to achievethis, see Figure 4.
4.3. Parametrization of service performance
Today, AS requirements are not differentiated accord-ing to the capabilities of the unit providing the service.Therefore, service definitions are designed to accommo-date the least capable unit in the portfolio. As a conse-quence, more capable units are not being fully utilized,leading to excess contracting of service providers.
4 Page 2636
This sub-optimal allocation of resources could be ad-dressed by introducing a performance dependent defini-tion of AS, i.e., a service definition that allows compli-ance to be measured on a linear rather than a binary scale:In addition to compliance and noncompliance, differentlevels of partial compliance are possible. In this context,services will be defined such that the best possible per-formance of the most capable unit corresponds to fullcompliance.
One of the challenges with such an approach is toachieve a useful definition of partial compliance. De-pending on the complexity of the service, many parame-ters of DR resources may have to be included in a perfor-mance comparison to determine their relative value. Forexample, resources with identical response magnitudes,ramp rates and duration may represent a significantlydifferent value to the buyer of a cyclic service if one re-source requires a longer recovery time between cyclesthan the other. A performance model is therefore neededto provide a mapping between the multidimensional pa-rameter space of a DR resource and the degree to whichit fully satisfies the needs of the TSO, expressed on alinear scale.
We introduce the following definition of a capabilityvalue:
κi = g(x) ∈ [0, 1] (1)
where g is a functional mapping the parameter spacex to a scalar value according to resource utility. Thismapping function is highly specific to a particular serviceand must therefore be developed with care by the servicerequester; e.g., a TSO, in order to avoid units with certaincapabilities gaining too much market power.
The functional g is communicated to the resources aspart of the service definition included in a tender. Thescalar value κ for a particular resource can then be calcu-lated by its operator prior to bidding.
4.4. Market mechanism
The market mechanism progresses as follows: the TSOidentifies a tender request Ttot = f(x), where f mapsthe parameter space x to the desires reserve require-ments, and the mapping g of the individual bid to κiis announced for market participants. The tender requestcan be mapped to a piecewise linear response functionVTSO that is depicted by the red line in Figure 3.
The TSO transforms the market participants’ bidsinto a similar piecewise linear response function:
Vi(t) = h(x), (2)
where h is a function that maps the parameter space tothe piecewise linear response. The stacking of all Vi(t)
must fulfill the reserve requirement VTSO:∑i∈Ωacc
Vi ≥ VTSO, (3)
where Ωacc is the pool of accepted bids.In order to leverage the proposed AS restructuring,
the market clearing mechanism needs to be adapted.One option is to take the capability value of the serviceproviders, κi, a historical service performance index, γi,and a unit reliability index, εi, into account. There aremany different ways of formulating such a market clear-ing mechanism. We present an example of a market thatutilizes the service parameterization to form an ideal ser-vice response at the end of this section.
4.5. Reserve activation and operation
The specification of tender and bid parameterizationneeds to be aligned with the activation mechanism ap-plied during real-time operation of the resource dispatchand activation. For example, fast activation upon detec-tion of frequency excursion is important for primary fre-quency response, so the units or aggregators coordinatingthe DSRs should have instrumentation capable of quicklydetecting these excursions and actuating the required re-sponse.
The use of frequency responsive load was demon-strated in the Olympic Peninsula project [15]. Theproject showed that very fast load response to under-frequency events was consistent and effective both at theunit level and in the aggregate. However, the demon-stration did not address the question of how many orwhich loads should be sensitive to frequency. Usingthe proposed mechanism would permit a TSO to usea market to identify, select and dispatch the requirednumber of frequency-sensitive loads to satisfy the sys-tem needs at the lowest cost, without risking a potentialover-response from too many loads curtailing during anunder-frequency event and settling to a frequency toohigh to activate the needed secondary reserve response.
4.6. Performance-based remuneration
Performance-based remuneration has already been in-troduced in United States through the FERC Order 755.Similarly, in this work we propose that service providersare paid according to how close they follow the capa-bility parameters they bid to the market when cleared.The estimation of the service provision performance canbe done in different ways, depending on which param-eters the system operator deems to be the most critical.A service performance index is proposed in [16], whereservice performance is defined as the root mean square
5 Page 2637
error of the actual service delivery compared to an idealservice model:
η =
√∑Nt=0
(QoSt
2)
N, (4)
η ∈ [0, 1], (5)
where N is the time horizon over which the service is de-livered and QoS ∈ [0, 1] is the Quality of Service of theancillary service. The QoS is the error in service deliv-ery scaled to the tolerance limits defined by the systemoperator. When η = 0 the service has been deliveredperfectly, and when η = 1, the service delivery is barelyacceptable.
Similarly, the reliability parameter defined in the mar-ket mechanism can be derived from an average of histor-ical values of the performance metric:
γ = 1−∑Hh=1 ηhH
, (6)
where H is a historical horizon.
4.7. Example of requirements restructuring
In this section we present a concrete example of the pro-posed restructuring. It must be noted that it is a simpleexample, and a parameterization with complex polytopesand corresponding market clearing is envisioned as fu-ture work. This example is also used for the case studyin Section 5.
4.7.1 Parameterization of service performance
The capability value of a unit is defined through the fol-lowing parametrization:
κi = g(τ ri , τdi , Ci) ∈ [0, 1] (7)
In the remainder of the paper we define τ ri as the ramptime, τdi as the total duration the unit can sustain theservice provision and Ci as the power capacity the unit ibids.
4.7.2 Market mechanism
The reserve requirement is defined as Ttot =f(τ rtot, τ
dtot, Ctot). More specifically, for any set of
(τ ri ,τdi ,Ci) values the response function Vi(t) is a piece-wise linear function and has the following form:
Vi(t) =
Ci
τrit if 0 ≤ t ≤ τ ri
Ci if τ ri ≤ t ≤ τdi0 elsewhere
(8)
where t is duration.Using the above equation, a convex 2-D polyhedra Pi
that is bounded by V (i), unit duration τdi , and Vi(t) ≥ 0could be constructed as follows:
Pi = x ∈ R2|Aix ≤ bi (9)
where x is defined as the vector [t, V ] and, Ai and bi hasthe following forms:
Ai =
0 1−Ci
τri
1
1 00 −1
bi =
Ci0τdi0
(10)
Market participants respond to the tender requestwith a bid that consists of: capacity Ci [kW], bid priceP bidi [$/MW], ramp time τ ri [s], duration τdi [s] and ca-
pability value κi; where i denotes the individual bid ofeach market participant.
The TSO constructs the individual volume Vi bid byeach market participant and the Vis get adjusted by areliability parameter γi. γi depends on historical per-formance of the participating unit. If a unit’s error inavailability (εi) is less than a limit, the unit is eligiblefor participation. The exemplary market is designed asa single clearing price auction, in which each resources’volume get adjusted by a reliability parameter γi, andthe clearing price P cleari gets adjusted by the capabilityvalue κi. This ensures that the expectation from individ-ual resources is adjusted by its historical average perfor-mance, and the total market clearing cost includes thecapability value of each resource.
The clearing mechanism identifies a common clear-ing price based on the most expensive accepted bid, sim-ilar to a merit order clearing. Based on the clearing price,the mechanism selects the subset of bids which offerthe cheapest overall clearing cost and meet the tenderrequirements:
Ωacc = arg minΩ∈Ωrec
∑i∈Ω
κiPclear (11)
s.t.Vadjusted =∑i∈Ωacc
γiVi (12)
Ptot ⊆ Padjusted (13)
P clear = maxP bidi ,∀i ∈ Ωacc (14)
εi ≤ εmax (15)
where Ωacc and Ωrec is the set of accepted and receivedbids, respectively. Ptot refers to the polyhedra that iscreated by the TSO’s tender request, and Padjusted refersto the polyhedra created by the sum of all units i that arein Ω.
6 Page 2638
4.7.3 Remuneration
As previously mentioned, remuneration could take per-formance and capability values into account. An exam-ple of a final settlement price can be defined as:
P remi = (1− ηi)κiP clearCi, ∀i ∈ Ωacc, (16)
which means that each accepted bid gets remuneratedthe clearing price times the delivered capacity, scaled bythe capability value and how close they perform to thepromised capability.
5. Case Study: Primary Frequency Control
In the case study we show the proposed restructuringof the requirements through an example of primary fre-quency control. The case uses the example parameteri-zation and market definition presented in Section 4.
Also, in this case the capability value κ the TSO as-signs to the units is:
κ = α1τr,0
max(τr,0, τr,a)+ α2
min(τd,0, τd,a)
τd,0(17)
∑i
αi = 1 (18)
where τr,0 is the ideal ramp time the TSO desires of theunit and τr,a is what the unit can actually deliver. Simi-larly, τd,0 is the ideal delivery duration the TSO desiresand τd,a is what the unit can deliver. The minimum andmaximum functions ensure that units are not overvaluedin case they parameters are better than the ideal. In thisstudy case, τd and τr are valued equally, which meansthat α1 = α2 = 0.5.
5.1. System setup
The viability of the proposed market clearing mechanismhas been tested through a proof-of-concept study basedon an experimental implementation.
The experiment assumes the existence of a marketfor primary frequency response in which the TSO actsindirectly as a single buyer of services. Based on a calcu-lation of the system need for primary frequency response,the TSO provides a minimum capacity envelope to themarket for which the clearing algorithm computes thecost-optimal stacking of resources as described above.The market result is a list of resources to activate, wherethe most expensive unit sets the clearing price. Each ac-tivated resource then continuously provides the serviceby counteracting frequency excursions until the end ofthe contracted operating period.
A number of simplifying assumptions have beenmade for the experiment, without loss of generality. All
resources, load as well as generation, are assumed to in-teract with the market through a single aggregator. Thegrid is assumed to consist of a single control area over-seen by one TSO. No strategic bidding is implementedby the individual resources; base prices remain static.Nevertheless, market results change between operationalperiods due to the influence of performance evaluationsfor the individual units.
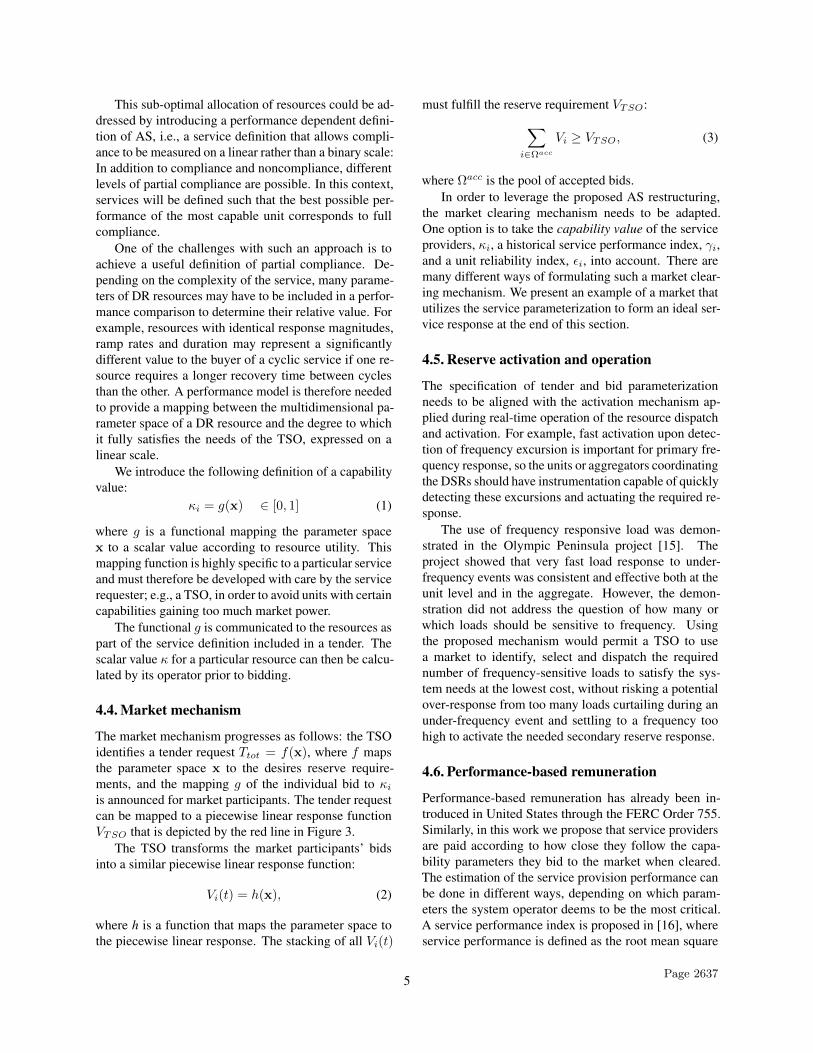
The operational timeline can be seen in Figure 5.Shortly before the end of each operational period, themarket clears for the upcoming period, and the resultis distributed to the aggregator which in turn activatesthe resources with winning bids. During the operationalperiod, each activated resource provides the service au-tonomously, based on a local frequency measurement.The power consumption of each resource is continuouslymeasured and the data forwarded to a performance evalu-ation module. Shortly before the end of each operationalperiod, the performance evaluation result is provided tothe market algorithm which clears for the next period,completing the cycle.
The experiment was conducted at the SYSLAB labo-ratory at DTU Risø Campus [17] which features a largevariety of DER units coupled to a 16-busbar 400V grid.The laboratory has a high degree of automation and facil-itates the deployment of distributed control software forcyber-physical experiments in the smart grid domain.
For the experiment, the power system was configuredas an island grid, with a 125 kVA Static Frequency Con-verter (SFC) serving as the grid forming unit. The droopsetting of the converter was adjusted to simulate a prede-termined frequency response to changes in generation orload.
In order to simplify the experiment, only two physi-cal DER resources were connected to the grid: An 80 kWload bank to represent all consumption and a 15 kW re-dox flow battery to represent all generation. Because thebehaviour of the market cannot be studied with such alow number of participants, virtual resources were imple-mented as real-time simulation processes, each of whichwould provide an independent frequency response ser-vice, responding to measurements of the physical gridfrequency conducted every 100 ms. The load bank andthe battery were then used to imprint the aggregate powerflow of all virtual units onto the physical grid.
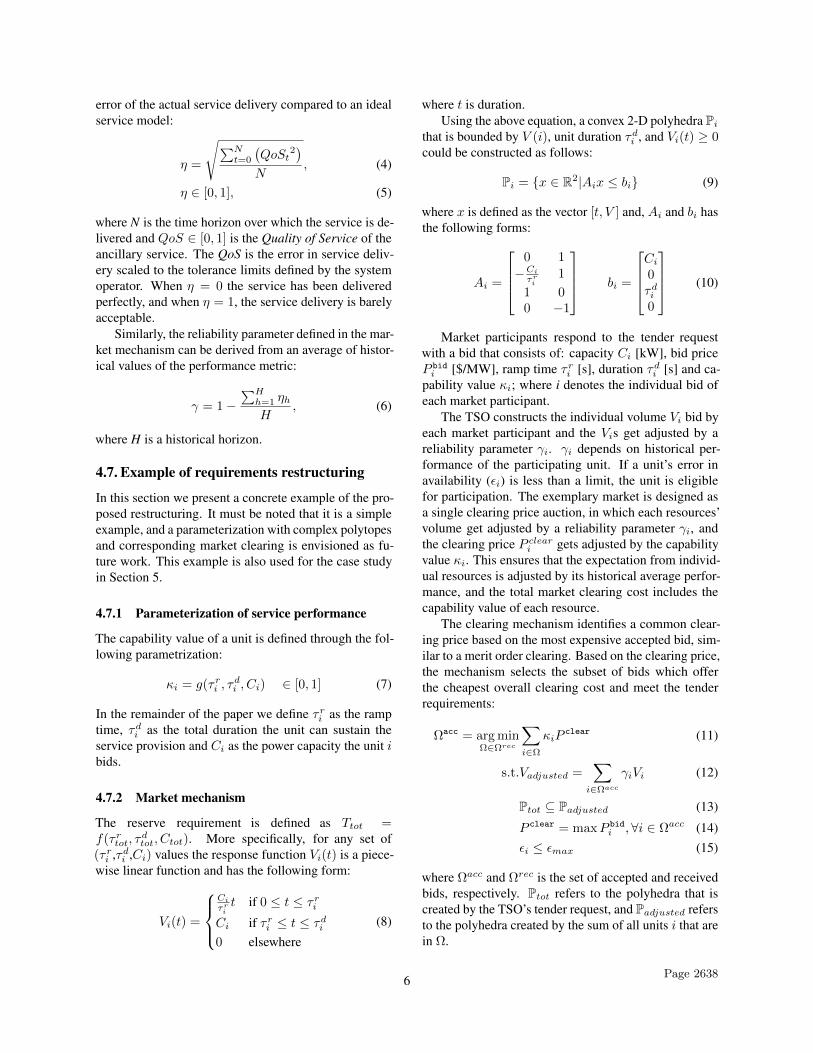
Figure 6 shows the entire setup and information flowof the experiment, divided into five layers. The two bot-tom layers represent the physical setup of the laboratorygrid and the DER units used by the experiment. At thethird layer, DER component simulators operate based onmarket input and real-time grid data. The simulation out-put is then mapped to the physical DER units (i.e. theload bank and the battery). The layer above performs
7 Page 2639
Cont inuous metering Droop cont rol loop (cont inuous)
Frequencymeasurement
DERdevices
DevicesimulatorsAggregatorMarketPerformance
evaluatorMetering
Result forperiod 3
Performance forPeriod 2
Act ivat ion forperiod 2
Result forperiod 2
Performance forPeriod 1
Psetpoint
fAct ivat ion forperiod 1
Result forperiod 1
Service execut ion (physical lab)Service allocat ion (market software)Phys.feedback
Figure 5: Interactions between system components (time advances down the vertical axis).
Figure 6: Overview of the experiment setup.
aggregation and evaluation of performance data and dis-tribution of market results, interacting directly with themarket layer at the top.
5.2. Experiment description
A set of eight fictitious market participants—three gener-ators and five loads—was generated as given in Table 1.At the start of the experiment, a net load of 17 kW hadbeen established as the steady-state baseline, resultingfrom the superposition of 27 kW of consumption and10 kW of generation. The droop characteristics of theback-to-back converter had been adjusted to provide anoutput frequency of 50 Hz at this load point. Additionalgeneration and consumption capacity is used to obtaina symmetrical reserve assignment of ±27 kW such that44 kW of consumption causes the converter output todrop to 48 Hz, while 10 kW of generation raises it to52 Hz. Additional loads in the physical grid are used to
introduce step disturbances during the experiment.The system need Vtot was characterized by τ rtot = 6
seconds, τdtot = 60 seconds, and Ctot = 12 kW. Dur-ing the experiment, the market cleared every 60 secondswith the same eight participants. The clearing is donethrough an exhaustive search that tests all possible ser-vice provider combinations to form the cheapest reserve.
In the period between clearings, step disturbanceswere applied to the physical grid, in order to determinethe reaction of individual market participants. η and γwere continuously calculated for each participant in orderto see the impact of performance based adjustments in(12) on market clearing results.
5.3. Results
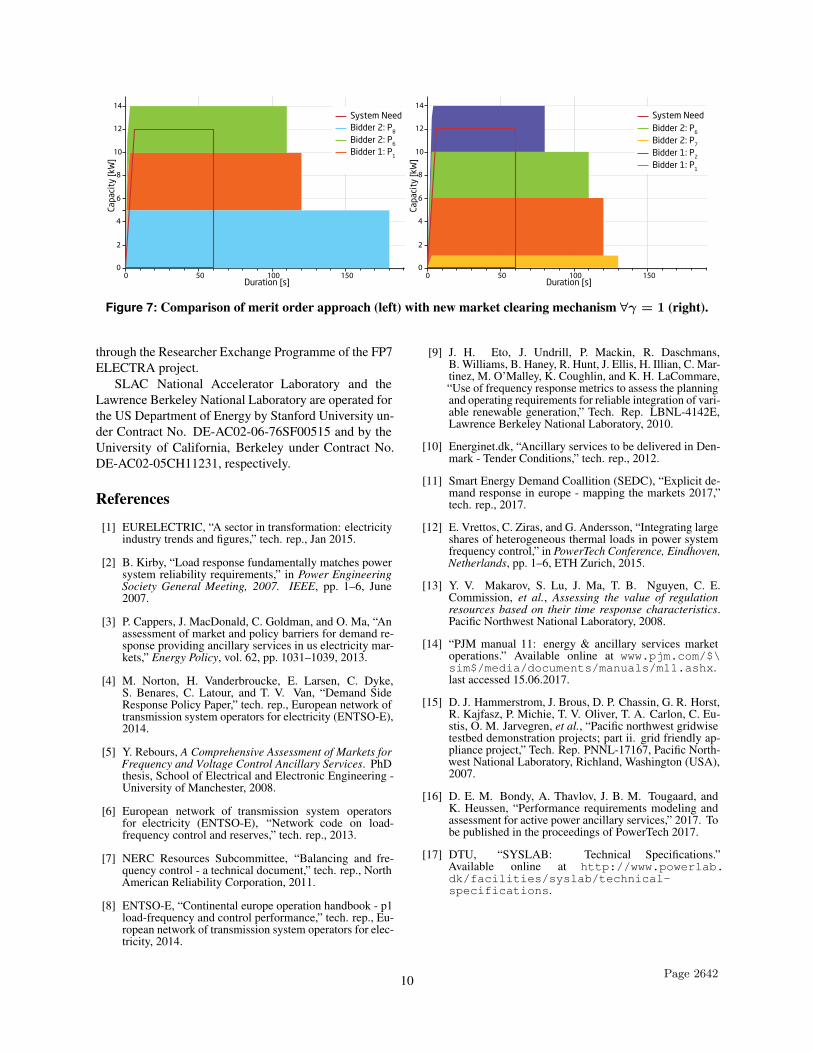
In Figure 7, we present the results of an example run ofthe new market clearing mechanism and compare it witha traditional merit order approach as used in the Nordic
8 Page 2640
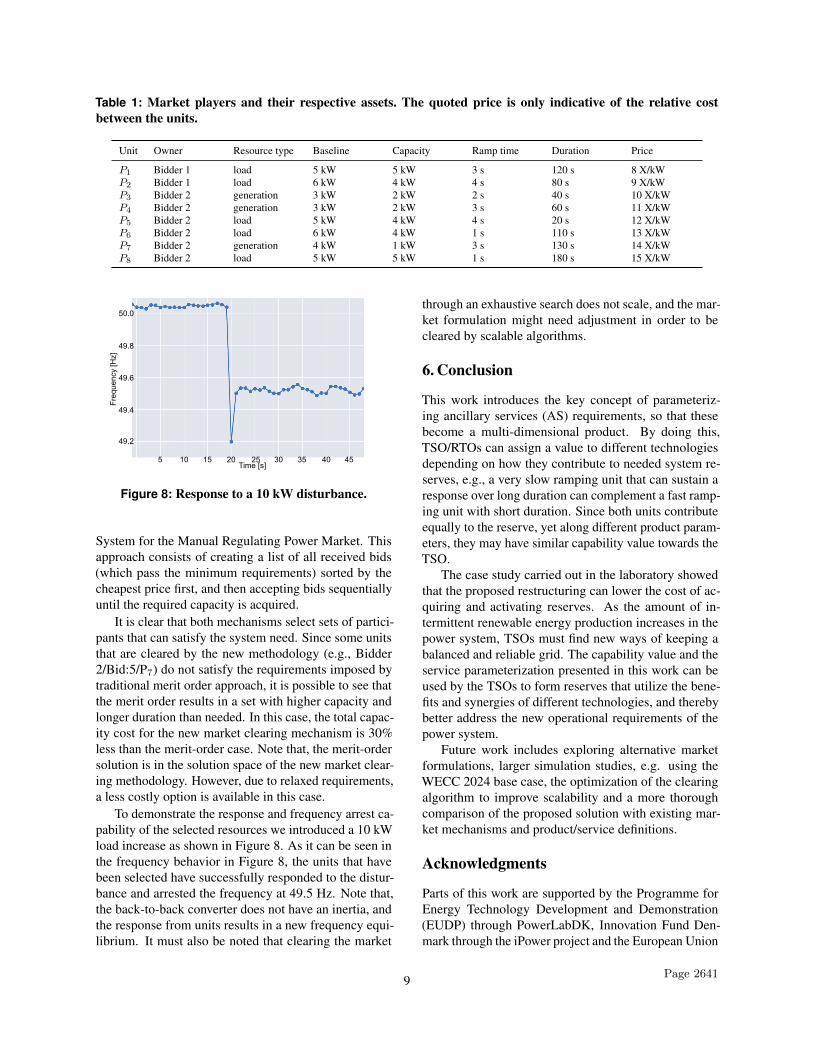
Table 1: Market players and their respective assets. The quoted price is only indicative of the relative costbetween the units.
Unit Owner Resource type Baseline Capacity Ramp time Duration Price
P1 Bidder 1 load 5 kW 5 kW 3 s 120 s 8 X/kWP2 Bidder 1 load 6 kW 4 kW 4 s 80 s 9 X/kWP3 Bidder 2 generation 3 kW 2 kW 2 s 40 s 10 X/kWP4 Bidder 2 generation 3 kW 2 kW 3 s 60 s 11 X/kWP5 Bidder 2 load 5 kW 4 kW 4 s 20 s 12 X/kWP6 Bidder 2 load 6 kW 4 kW 1 s 110 s 13 X/kWP7 Bidder 2 generation 4 kW 1 kW 3 s 130 s 14 X/kWP8 Bidder 2 load 5 kW 5 kW 1 s 180 s 15 X/kW
50.0
49.8
49.6
49.4
49.2
5 10 15 20 25 30 35 40 45
Fre
qu
en
cy [H
z]
Time [s]
Figure 8: Response to a 10 kW disturbance.
System for the Manual Regulating Power Market. Thisapproach consists of creating a list of all received bids(which pass the minimum requirements) sorted by thecheapest price first, and then accepting bids sequentiallyuntil the required capacity is acquired.
It is clear that both mechanisms select sets of partici-pants that can satisfy the system need. Since some unitsthat are cleared by the new methodology (e.g., Bidder2/Bid:5/P7) do not satisfy the requirements imposed bytraditional merit order approach, it is possible to see thatthe merit order results in a set with higher capacity andlonger duration than needed. In this case, the total capac-ity cost for the new market clearing mechanism is 30%less than the merit-order case. Note that, the merit-ordersolution is in the solution space of the new market clear-ing methodology. However, due to relaxed requirements,a less costly option is available in this case.
To demonstrate the response and frequency arrest ca-pability of the selected resources we introduced a 10 kWload increase as shown in Figure 8. As it can be seen inthe frequency behavior in Figure 8, the units that havebeen selected have successfully responded to the distur-bance and arrested the frequency at 49.5 Hz. Note that,the back-to-back converter does not have an inertia, andthe response from units results in a new frequency equi-librium. It must also be noted that clearing the market
through an exhaustive search does not scale, and the mar-ket formulation might need adjustment in order to becleared by scalable algorithms.
6. Conclusion
This work introduces the key concept of parameteriz-ing ancillary services (AS) requirements, so that thesebecome a multi-dimensional product. By doing this,TSO/RTOs can assign a value to different technologiesdepending on how they contribute to needed system re-serves, e.g., a very slow ramping unit that can sustain aresponse over long duration can complement a fast ramp-ing unit with short duration. Since both units contributeequally to the reserve, yet along different product param-eters, they may have similar capability value towards theTSO.
The case study carried out in the laboratory showedthat the proposed restructuring can lower the cost of ac-quiring and activating reserves. As the amount of in-termittent renewable energy production increases in thepower system, TSOs must find new ways of keeping abalanced and reliable grid. The capability value and theservice parameterization presented in this work can beused by the TSOs to form reserves that utilize the bene-fits and synergies of different technologies, and therebybetter address the new operational requirements of thepower system.
Future work includes exploring alternative marketformulations, larger simulation studies, e.g. using theWECC 2024 base case, the optimization of the clearingalgorithm to improve scalability and a more thoroughcomparison of the proposed solution with existing mar-ket mechanisms and product/service definitions.
Acknowledgments
Parts of this work are supported by the Programme forEnergy Technology Development and Demonstration(EUDP) through PowerLabDK, Innovation Fund Den-mark through the iPower project and the European Union
9 Page 2641
0 50 100 150
0
2
4
6
8
10
12
14
Duration [s]
Ca
pa
city
[k
W]
System Need
Bidder 2: P6
Bidder 2: P8
Bidder 1: P1
0 50 100 150
0
2
4
6
8
10
12
14
Duration [s]
Ca
pa
city
[k
W]
System Need
Bidder 2: P6
Bidder 2: P7
Bidder 1: P2
Bidder 1: P1
Figure 7: Comparison of merit order approach (left) with new market clearing mechanism ∀γ = 1 (right).
through the Researcher Exchange Programme of the FP7ELECTRA project.
SLAC National Accelerator Laboratory and theLawrence Berkeley National Laboratory are operated forthe US Department of Energy by Stanford University un-der Contract No. DE-AC02-06-76SF00515 and by theUniversity of California, Berkeley under Contract No.DE-AC02-05CH11231, respectively.
References
[1] EURELECTRIC, “A sector in transformation: electricityindustry trends and figures,” tech. rep., Jan 2015.
[2] B. Kirby, “Load response fundamentally matches powersystem reliability requirements,” in Power EngineeringSociety General Meeting, 2007. IEEE, pp. 1–6, June2007.
[3] P. Cappers, J. MacDonald, C. Goldman, and O. Ma, “Anassessment of market and policy barriers for demand re-sponse providing ancillary services in us electricity mar-kets,” Energy Policy, vol. 62, pp. 1031–1039, 2013.
[4] M. Norton, H. Vanderbroucke, E. Larsen, C. Dyke,S. Benares, C. Latour, and T. V. Van, “Demand SideResponse Policy Paper,” tech. rep., European network oftransmission system operators for electricity (ENTSO-E),2014.
[5] Y. Rebours, A Comprehensive Assessment of Markets forFrequency and Voltage Control Ancillary Services. PhDthesis, School of Electrical and Electronic Engineering -University of Manchester, 2008.
[6] European network of transmission system operatorsfor electricity (ENTSO-E), “Network code on load-frequency control and reserves,” tech. rep., 2013.
[7] NERC Resources Subcommittee, “Balancing and fre-quency control - a technical document,” tech. rep., NorthAmerican Reliability Corporation, 2011.
[8] ENTSO-E, “Continental europe operation handbook - p1load-frequency and control performance,” tech. rep., Eu-ropean network of transmission system operators for elec-tricity, 2014.
[9] J. H. Eto, J. Undrill, P. Mackin, R. Daschmans,B. Williams, B. Haney, R. Hunt, J. Ellis, H. Illian, C. Mar-tinez, M. O’Malley, K. Coughlin, and K. H. LaCommare,“Use of frequency response metrics to assess the planningand operating requirements for reliable integration of vari-able renewable generation,” Tech. Rep. LBNL-4142E,Lawrence Berkeley National Laboratory, 2010.
[10] Energinet.dk, “Ancillary services to be delivered in Den-mark - Tender Conditions,” tech. rep., 2012.
[11] Smart Energy Demand Coallition (SEDC), “Explicit de-mand response in europe - mapping the markets 2017,”tech. rep., 2017.
[12] E. Vrettos, C. Ziras, and G. Andersson, “Integrating largeshares of heterogeneous thermal loads in power systemfrequency control,” in PowerTech Conference, Eindhoven,Netherlands, pp. 1–6, ETH Zurich, 2015.
[13] Y. V. Makarov, S. Lu, J. Ma, T. B. Nguyen, C. E.Commission, et al., Assessing the value of regulationresources based on their time response characteristics.Pacific Northwest National Laboratory, 2008.
[14] “PJM manual 11: energy & ancillary services marketoperations.” Available online at www.pjm.com/$\sim$/media/documents/manuals/m11.ashx.last accessed 15.06.2017.
[15] D. J. Hammerstrom, J. Brous, D. P. Chassin, G. R. Horst,R. Kajfasz, P. Michie, T. V. Oliver, T. A. Carlon, C. Eu-stis, O. M. Jarvegren, et al., “Pacific northwest gridwisetestbed demonstration projects; part ii. grid friendly ap-pliance project,” Tech. Rep. PNNL-17167, Pacific North-west National Laboratory, Richland, Washington (USA),2007.
[16] D. E. M. Bondy, A. Thavlov, J. B. M. Tougaard, andK. Heussen, “Performance requirements modeling andassessment for active power ancillary services,” 2017. Tobe published in the proceedings of PowerTech 2017.
[17] DTU, “SYSLAB: Technical Specifications.”Available online at http://www.powerlab.dk/facilities/syslab/technical-specifications.
10 Page 2642