Embed Size (px)
Citation preview
Europeaii Jourrinl of' Neuroscience. Vol. 6, pp. 1645-1655. 1994 0 European Neuroscience Association
Reduced Synchronization in the Visual Cortex of Cats with Strabismic Amblyopia
Pieter R. Roelfsema, Peter Konig, Andreas K. Engel, Ruxandra Sireteanu and Wolf Singer Max-Planck-lnstitut fur Hirnforschung, DeutschordenstraOe 46, 60528 Frankfurt, Germany
Key words: esotropia, acuity, striate cortex, cross-correlation analysis, temporal coding, oscillation
Abstract Synchronous firing of spatially separate neurons was studied with multi-electrode recordings in area 17 of the visual cortex of strabismic cats which had developed behaviourally verified amblyopia of the deviated eye. Responses of neurons were evoked with moving light bars or gratings of different spatial frequency. Neurons driven by the normal eye displayed stronger synchronization of their responses than neurons dominated by the amblyopic eye. These interocular differences were highly significant and particularly pronounced for grating stimuli of high spatial frequency. No interocular differences were noted with respect to the amplitudes of responses to the light bars and gratings. These results suggest reduced synchronization of population responses as a neurophysiological correlate of strabismic amblyopia and underline the importance of correlated firing of spatially separate cortical neurons for normal processing of visual information.
Introduction Misalignment of the eyes during early development leads to a breakdown of binocular fusion and stereopsis. Double vision is avoided by using only one eye at a time for fixation and excluding signals conveyed by the other eye from conscious experience. Frequently fixation occurs in an alternating mode, with both eyes participating at different moments in time. However, in many cases only one eye takes part in fixation and the non-fixating eye acquires a syndrome of perceptual deficits that is referred to as strabismic amblyopia (Duke-Elder, 1973; von Noorden, 1990). When viewing with both eyes open patients usually have no access to information conveyed by the amblyopic eye, suggesting that the saliency of the activity provided by this eye is reduced. It is only upon closure of the normal eye that patients can see with the amblyopic eye and then several perceptual deficits become apparent. These include reduced visual acuity, temporal instability of the visual image (Altmann and Singer, 1986) and spatial distortions which are reflected by the inaccurate localization of visual targets (Lagrkze and Sireteanu, I99 1 ; Hess and Holliday, 1992; Sireteanu ef a/., 1993). Hess et al. (1978) presented gratings to the amblyopic eye of human observers and then asked them to sketch the nature of the distortions with the normal eye open. This revealed that neighbouring but non-connected contours presented to the amblyopic eye may be perceived as being connected while continuous contours could appear disrupted. Possibly related to such false conjunctions is the crowding phenomenon, another frequently occurring deficit in strabismic amblyopia: the ability to discriminate details in the visual image deteriorates further if contours are added in the vicinity (Levi and Klein, 1985).
So far single cell recordings i n squinting cats and monkeys have failed to disclose a clear relationship between the amblyopic deficits and modifications of neuronal response properties in the visual cortex
(von Noorden, 1988). Neurons dominated by the amblyopic eye are as numerous as neurons dominated by the normal eye and exhibit similar receptive field properties (Singer et al., 1980; Mower et al., 1982; Chino et ul., 1983, 1988; Freeman and Tsumoto, 1983; Crewther and Crewther, 1990; Blakemore and Vital-Durand, 1992). Surprisingly, even the spatial frequency tuning of neurons activated through the amblyopic eye is comparable to that of neurons activated through the normal eye, in spite of the reduced visual acuity of the amblyopic eye (Chino e f ul., 1983, 1988; Crewther and Crewther. 1990; Blakemore and Vital-Durand, 1992). The only consistent abnormalities that have been described are prolonged latencies of responses evoked through the deviating eye (Chino et a/., 1983; Eschweiler and Rauschecker, 1993). In contrast to the results obtained with single cell recordings, studies based on pattern evoked potentials have not only demonstrated increased latencies but also reduced amplitudes of potentials evoked through the affected eye in cats (Singer et ul., 1980; von Griinau and Singer, 1980; Freeman e f al., 1983) and humans (Lombroso et al., 1969; Manny and Levi, 1982; von Noorden, 1990; Holopigian rf al., 1991).
Recent theories have proposed that the temporal coordination of distributed neuronal responses may be important for cortical pro- cessing (Milner, 1974; von der Malsburg, 1981; Abeles, 1991; for review see Singer, 1993). In particular, it has been suggested that the synchronization of neuronal discharges in the visual cortex could serve to label responses evoked by segments of the same contour, and to distinguish these from responses to other, nearby contours (von der Malsburg, 1981; Gray et ul., 1989; Engel et al., 1991a. 1992: Singer, 1993). This could provide a mechanism to prevent false conjunctions between population responses evoked by different but spatially contiguous contours. Two observations support this
Corresporiderice to: Pieter Roelfsema, as above
Receirvd 16 Deceniber 1993, revised I 1 Mcirch 1994. uccepted 20 Mti! 1994
1646 Neuronal synchronization in cats with strabismic amblyopia
possibility. First, neurons in the visual cortex engage in synchronous discharges if activated with a coherent stimulus (Eckhorn et d.. 1988: Gray et a/. , 1989: Engel et al.. 1992). Second, if activated simultaneously by different, closely spaced or overlapping contours. neurons segregate into subpopulations that are distinguished by the temporal coherence of their responses. and synchronization now occurs selectively between neurons that respond to segments of the same contour (Gray et a/. , 1989; Engel et d., I99 1 a, 1992).
Because several of the amblyopic deficits can be interpreted as an inability to segregate nearby contours and to avoid false conjunctions. we hypothesized that abnormalities might exist in the interactions between neurons in the visual cortex that are activated by the amblyopic eye. In this study we examine synchronization of responses to visual stimuli in area 17 of cats with strabismic amblyopia. Part of this work has been presented previously in abstract form (Roelfsema et d., 1993).
Materials and methods Induction of squint In 13 kittens of 3 weeks of age, convergent strabismus was induced by transection of the tendon of the lateral rectus muscle of one eye. The animals were anaesthetized with an i.m. injection of a mixture of ketamine (10 mg/kg) and xylazine (2 mg/kg). After incision of the conjunctiva, the tendon of the lateral rectus muscle was located and cut. In all animals the angle of the resulting convergent squint was determined repeatedly during development using the corneal reflex method (Sherman, 1972; Olson and Freeman, 1978: von Grunau, 1979). The animals were manually restrained, several flashlight snapshots of the cat’s head were taken and the ratio of the distance between the corneal reflexes over the distance between pupils was determined on the photoprints. This ratio is a reliable measure of eye alignment (von Grunau, 1979).
Behavioural testing At the age of 4-5 months the animals were mildly food deprived (<lo% weight loss) and trained to discriminate between a square wave grating and equiluminant grey (Teller Acuity Cards, with a contrast of 82-84% and a luminance of 25 cdm’) on a modified jumping stand (Mitchell et a/., 1976; Katz and Sireteanu, 1992). Jumps to the grating were rewarded (correct response). When the animals jumped correctly to the gratings with the lowest spatial frequencies, the test phase was started. The cats were tested through the normal and squinting eye on alternate days, the respective other eye being occluded with an opaque contact lens during testing. Each eye was tested on at least 3 different days, and a test session was continued until the cat stopped jumping spontaneously. One animal (cat 1058) was tested with the method of constant stimuli, using five spatial frequencies with intervals of I octave in the range of 0.21- 3.2 C/O. The cards were presented in random order, in blocks of five trials. In the other cats the spatial frequency of the cards was continuously adjusted to the performance of the animal. The spatial frequencies of the gratings ranged from 0.21 to 14.2 c/” and were separated by 0.5 octave steps. After an incorrect response the spatial frequency was reduced by one step. After a correct response it was increased by one step with a probability of 33%. For each eye a minimum of 180 jumps were obtained.
The resulting psychometric functions were fitted with a logistic function
where P denotes performance (50% is chance level). x the spatial P(x) = 0.5 + 0 . 3 I + ( . V / U ) ’ Y
frequency. n the spatial frequency at which the animal performed at the 75% level (this was taken as the discrimination threshold) and b the slope. For the discrimination thresholds of the two eyes 95% confidence intervals were calculated using a Monte Carlo simulation (Press et d., 1986). Animals were considered to be amblyopic if the discrimination thresholds of the two eyes differed by at least one octave and if the 95% confidence intervals for the respective discrimination thresholds were non-overlapping.
Animal preparation Electrophysiological recording was performed when the animals were at least 7 months of age. Preparation and maintenance of the animals has been described in detail elsewhere (Engel et a/., 1990). Briefly. anaesthesia was induced with ketamine and xylazine ( 10 and 2 mg/ kg i.m. respectively). After tracheotomy. the head of the animal was placed i n the headholder of a stereotactic instrument. At the end of the preparation, the eye and ear bars were removed after the skull had been cemented to a metal rod. To eliminate painful stimuli, local anesthetics were applied to the wound edges. Throughout surgery and during subsequent recording general anaesthesia was maintained by ventilating the cat with a mixture of 70% NzO and 30% 0 2
supplemented by halothane ( 0 . 5 2 % halothane during surgery. and 0.4-0.8% during recording). After completion of all surgical proced- ures. animals were paralysed with pancuronium bromide (0.15 mg/ kg.h). Glucose and electrolytes were supplemented i.v. and through a gastric catheter. Throughout the experiment the electrocardiogram and the electroencephalogram were monitored, and the end-tidal CO? and the rectal temperature were kept in the range of 3 4 % and 37- 38°C respectively. Corneal contact lenses with an artificial pupil of 3 mm were titted in both eyes to prevent corneal drying. The eyes were refracted with a retinoscope for a viewing distance of 1.10 m. where a tangent screen was positioned. Using a reversible ophthalmo- scope, the optic discs and areae centrales were plotted onto the screen for reference during the recording session.
Recording Multi-unit activity was recorded in area 17 of the visual cortex with arrays of five Teflon-coated platinum-iridium electrodes. As the spacing between tips was 0.5 mm, the maximal inter-electrode distance was 2 mm. For detection of multi-unit activity the electrode signals were amplified and band-pass filtered in the range 1-3 kHz. The signal was fed through a Schmitt trigger with a threshold that exceeded the noise level at least by a factor of two.
The receptive fields for the multi-unit activity were mapped with a hand-held projector onto the tangent screen. In addition, the orientation preference and the direction selectivity of the neurons were assessed. To obtain a measure for sharpness of orientation tuning we estimated the orientation at which the response level decreased to 50% of the response to a light bar of optimal orientation. The relatively small interelectrode distances resulted in almost all cases in overlapping receptive fields for recording sites that could be activated through the same eye. For recording sites activated through different eyes the respective receptive fields were widely separated on the projection screen because of the esotropia. If a recording site could be activated through both eyes. the ocular dominance of this site was assessed quantitatively. A light bar with the cells’ preferred orientation was projected from a computer-controlled optical bench onto the tangent screen and the amplitudes of responses to stimulation of either eye were compared. The sites were classified into one o f five ocular dominance categories. Sites that could only be activated through the eye that was ipsilateral or contralateral to the recorded
Neuronal synchronization in cats with strabismic amblyopia I647
hemisphere were grouped into ocular dominance category 1 or 5 respectively. When the neurons responded to one eye at least twice as strongly as to the other, the site was assigned to category 2 or 4. The sites where neurons responded more evenly were grouped in class 3.
The interactions between sites that were dominated by the same eye were investigated with monocularly presented light bars and gratings. The orientation and movement direction of the stimuli were chosen to allow for activation of both recording sites with a single light bar or grating. The movement direction of gratings and light bars was always perpendicular to their orientation. Pairs of recording sites whose orientation or directional tuning precluded their activation with a single stimulus were excluded from further analysis. Pairs of recording sites that were dominated by different eyes were studied only with light bars which were binocularly presented and not with grating stimuli. When binocularly driven sites were present to allow for precise superposition of receptive fields, eyes were aligned with prisms and activation of the recording sites could be achieved with a single light bar. Otherwise, two light bars of identical size, speed and orientation were moved synchronously across the respective receptive fields. For stimulation with gratings, only recording sites were included whose receptive fields were in the central 5" of the visual field. The grating moved in both directions for 3 s with a speed that was adjusted to yield a temporal frequency of I Hz, irrespective of the selected spatial frequency. The contrast of the gratings was 85%, the luminance 3.5 cd/m'. For each stimulus condition a minimum of 10 responses were recorded.
Data analysis Peristimulus time histograms were compiled of responses to 10 presentations of the same stimulus. The response strength was quantified by averaging the increase in firing frequency in a window that was centred on the response with a duration of 2 and 3 s for stimulation with light bars and gratings respectively. Auto- and cross- correlation functions with a binwidth of 1 ms and phase shifts up to 2 127 ms were calculated for response epochs of 2 (bar stimuli) and 3 s (gratings) duration, and correlograms were then averaged over 10 successive stimulus presentations. Damped sine wave functions were fitted to the correlograms using the Marquardt-Levenberg algorithm (Press et al., 1986; Engel ef al., 1990; P. Konig, submitted for publication). The parameters of the best fitting function were used for the quantification of correlation strength. A centre peak in the cross-correlation was considered to be indicative of significant synchronization if the fitted function fulfilled the following criteria: ( I ) the offset had to be >I0 spikeshin; ( 2 ) the function had to account for at least 15% of the variance of the data points; (3) the amplitude of the centre peak had to exceed the offset by 10%; (4) the standard error of the estimate for the centre peak amplitude, which was calculated using propagation of errors, had to be signific- antly different from zero (P < 0.05). Similarly, an auto-correlation function was taken to be indicative of oscillatory firing when criteria I and 2 were fulfilled and a side peak was present in the auto- correlogram which met criteria 3 and 4.
As a measure of the strength of cross-correlation we used the relative modulation amplitude, which is defined as the ratio of the centre peak amplitude over the offset of the correlogram. As it has been argued (Aertsen et a/., 1989) that according to this measure correlations decrease when firing rates increase. we also computed another measure of synchronization strength, the detectability index (Melssen and Epping. 1987), which is defined as the amplitude of the central peak normalized to the geometric mean of the firing rates.
However, the two measures were highly correlated and yielded the same results in all experimental conditions (see Discussion). Shift predictors, which were computed as a control for stimulus-locked correlations, did not exhibit modulation on the investigated time scale.
Results The corneal reflex method indicated that induction of convergent
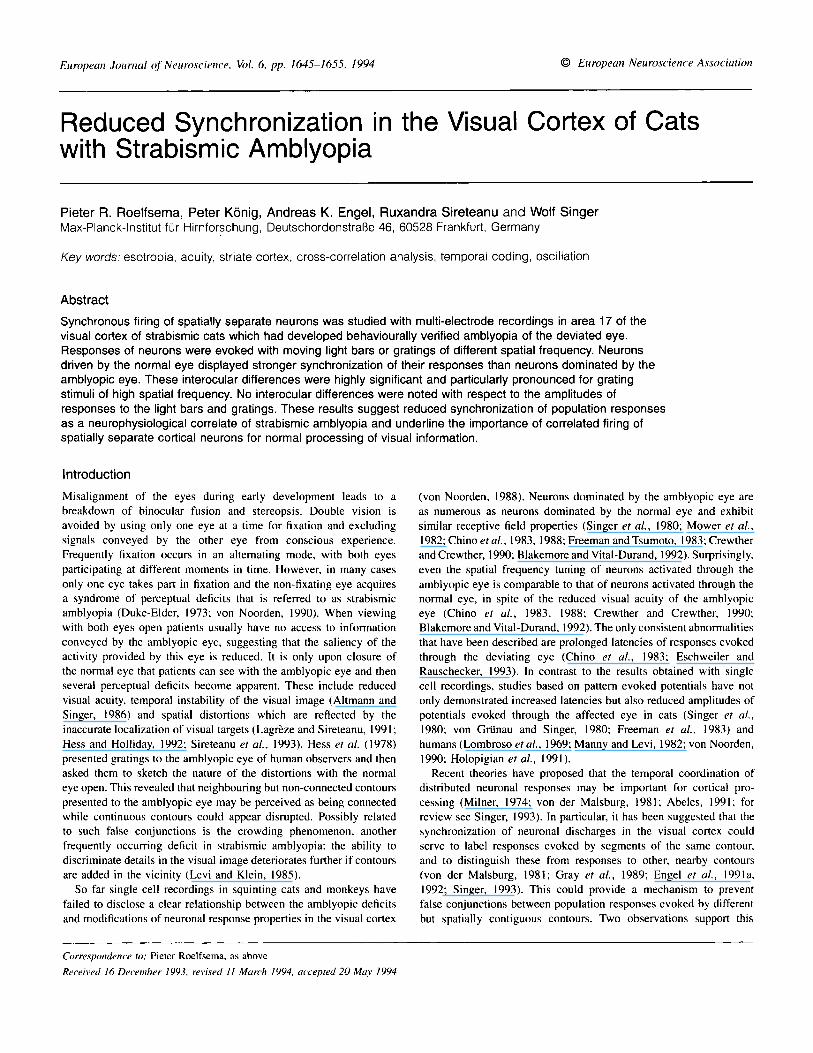
strabismus had been effective in all of our animals. The ratio of the distance between the reflexes over the distance between pupils ranged from 0.97 to 1.03. This ratio is 0.954 ? 0.007 (SD) for normal animals >2 months old (von Griinau, 1979). The effects of the misalignment of the optical axes on visual acuity were assessed psychophysically in 13 cats. The performance of one of the cats (1069) is shown in Figure 1 . With the non-deviating eye the animal could discriminate higher spatial frequencies than with the deviating eye. The discrimination thresholds differed by 1.4 octave and their 95% confidence intervals were non-overlapping. In addition to this cat. three further animals exhibited interocular acuity differences satisfying our criteria of significance (Table 1 ; for criteria see Materials and methods). In the other animals the psychophysical thresholds did not differ significantly (eight cats) or were separated by <I octave (one cat). Thus, our behavioural procedures allowed us to quantify the depth of amblyopia and to select the four most severely affected animals for further analysis.
Ocular dominance Recordings were obtained from area I7 of the visual cortex. Altogether 163 recording sites were analysed in the four cats. The ocular dominance distribution of these sites is U-shaped, as expected in strabismic animals (Hubel and Wiesel, 1965). and shows a slight prevalence of the eye contralateral to the recorded hemisphere (Fig. 2A). The ocular dominance distributions of individual animals were similar. In Figure 2 8 the recording sites are regrouped according to
0 0.24 0.48 0.96 1.8 3.6
Spatial frequency (c / O )
FIG. I . Behaviourally determined visual acuity of the normal and the amblyopic eye of one of the cats (1069) used in this study. Performance with the non- operated (U) and operated (A) eye. Error bars indicate the SEM. The dashed line refers to the 75% level of performance. which was taken as the criterion for the discrimination threshold. Open and tilled rectangles on the abscissa denote the 95% confidence intervals of discrimination thresholds for the non- operated and the operated eye respectively. Arrows show the spatial frequencies of gratings used in the subsequent recording session.
1648 Neuronal synchronization in cats with strabismic amblyopia
TABLE I. Discrimination thresholds for both eyes of the amblyopic cats and spatial frequencies of the gratings that were used in the recording session
Cat Threshold of Threshold of Low spatial High spatial the normal eye the deviated eye frequency frequency (C/O) (do) (C/O) (C/O)
~~
1058 1.9 (1.8-2.0) 0.78 (0.56-1.2) 0.46 I .3 1064 2.4 (1.8-3.7) 1.0 (0.77-1.3) 0.53 1.4 1069 2.2 (2.C-2.4) 0.76 (0.6641.92) 0.46 1.2 2006 3. I (2.63.9) I .2 ( I .O-I .6) 0.69 2.0
Numbers in brackets denote the 95% confidence intervals. The data of cat 1069 are shown in Figure 1.
A B 60 60
r
1 2 3 4 5 ipsi contra normal arnblyopic
(N=163) (N=163)
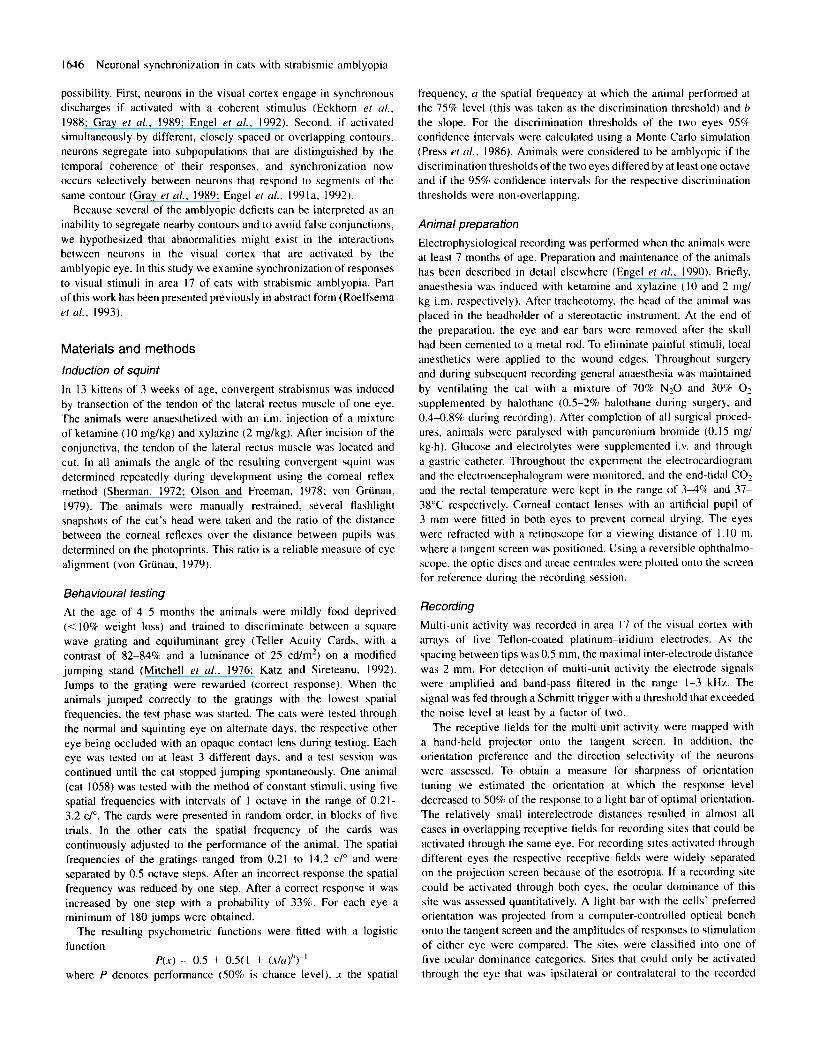
FIG. 2. Pooled ocular dominance distributions of all recording sites analysed in the four cats used in this study. In (A) sites are grouped with respect to the laterality of the dominant eye, in (B) according to dominance of the normal and amblyopic eye. The error bars indicate the SEM of the four individual distributions. Note that for computation of this measure of variation individual distributions are averaged with equal weighting. In contrast. the contributions of individual animals to the pooled distributions are weighted according to the number of sites recorded per animal.
dominance of the normal or amblyopic eye. At 81 of 162 recording sites the neurons were dominated by the normal eye (N-sites) and 88% of these sites were purely monocular. At 70 sites the neurons were dominated by the amblyopic eye (A-sites), 87% of these sites exhibiting purely monocular responses. Thus there is no indication of a significant shift of ocular dominance towards the normal eye, which is in accordance with earlier studies in animals with convergent strabismus (Mower et a/.. 1982; Chino et d.. 1983; Freeman and Tsumoto, 1983; Crewther and Crewther, 1990; Blakemore and Vital- Durand, 1992). At I2 sites cells responded equally well to either eye, and these sites were excluded from further analysis.
Bar stimuli
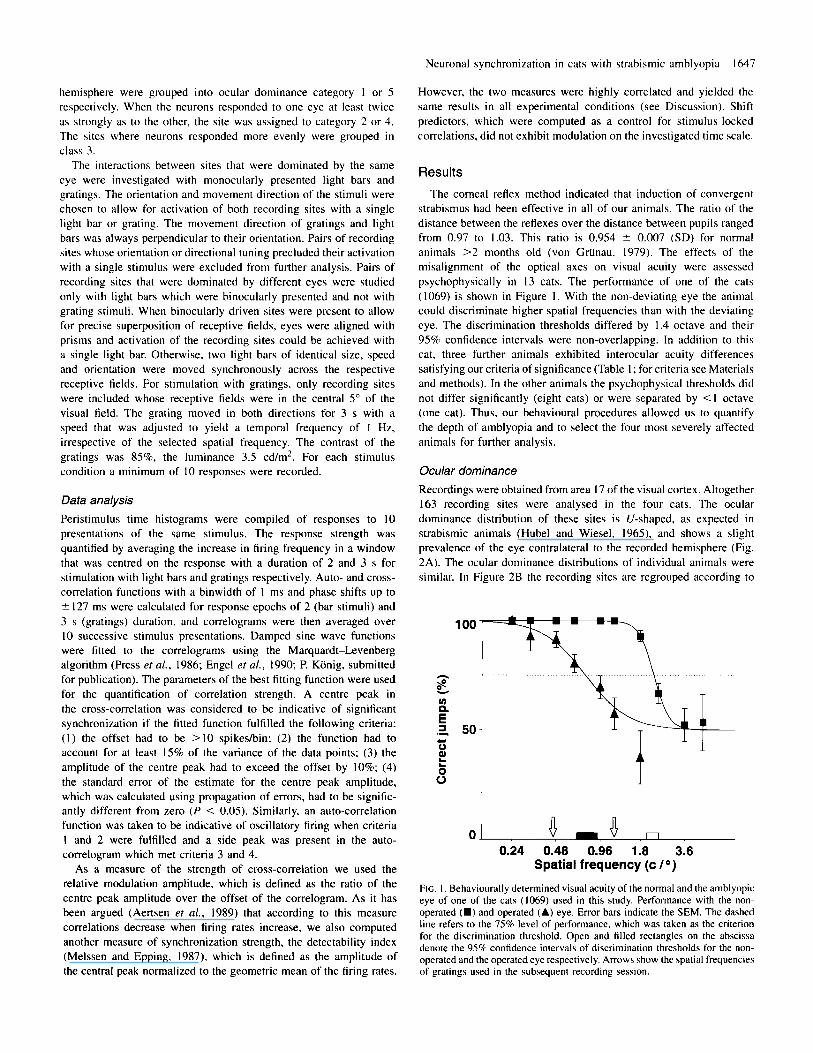
Apart from a slightly broader orientation tuning of cells dominated by the amblyopic eye. we noted no differences between the qualitatively determined response properties of neurons recorded at A- and N- sites. The strength of responses to a light bar of optimal orientation was assessed quantitatively for almost all recording sites. Comparison of the distributions of response amplitudes at N- and A-sites (Fig. 3) did not reveal a statistically significant difference ( P > 0.3; U-test). The use of multi-unit recordings does not allow us to exclude the possibility that a loss of visual drive at A-sites had been unintentionally compensated for by lowering the threshold for spike detection at A- sites which would have recruited more neurons into the sample. But the close correspondence between the levels of spontaneous activity ( P > 0.1: U-test) (Fig. 3) suggests that on average the same number
/ - *--a
6 6 O/O
lUU1 x:"- A 0 N-spont.
a A-spont. A A-bar
0 50 100 150 200 Firing rate (Spike&)
FIG. 3. Cumulative amplitude distributions of neuronal response\ to optimally oriented bar stimuli. The continuous lines indicate the relative frequency of responses with a particular strength (evoked minus spontaneous activity) at both N- ( W : ti = 80) and A-sites (A: 17 = 65). Ordinate. percentage of recording sites that had a lower response amplitude than the value indicated on the abscissa. For clarity of presentation only points close to every 10th percentile are shown. but the omitted points are well approximated by the interpolating line segments. The dashed lines connecting the open symbol\ show the cumulative distributions of spontaneous tiring rates at the same N- (0) and A-sites (A).
of units contributed to activity at N- and A-sites and that the similarity of response strength is genuine.
To gain insight in the temporal structure of responses at N- and A-sites, auto-correlograms were computed. Typically, these contained a centre peak with a half width of several bins, indicating that the units contributing to the recording had a tendency to discharge in synchrony. I n many auto-correlograms this centre peak was flanked by troughs and additional side peaks, indicative of oscillatory tiring patterns of the neurons involved (Eckhorn et d., 1988: Gray et a/.. 1989: Engel et d., 1990). The incidence of oscillatory episodes reaching our criteria of significance (see Materials and methods) was similar at N- (46%) and A-sites (48%).
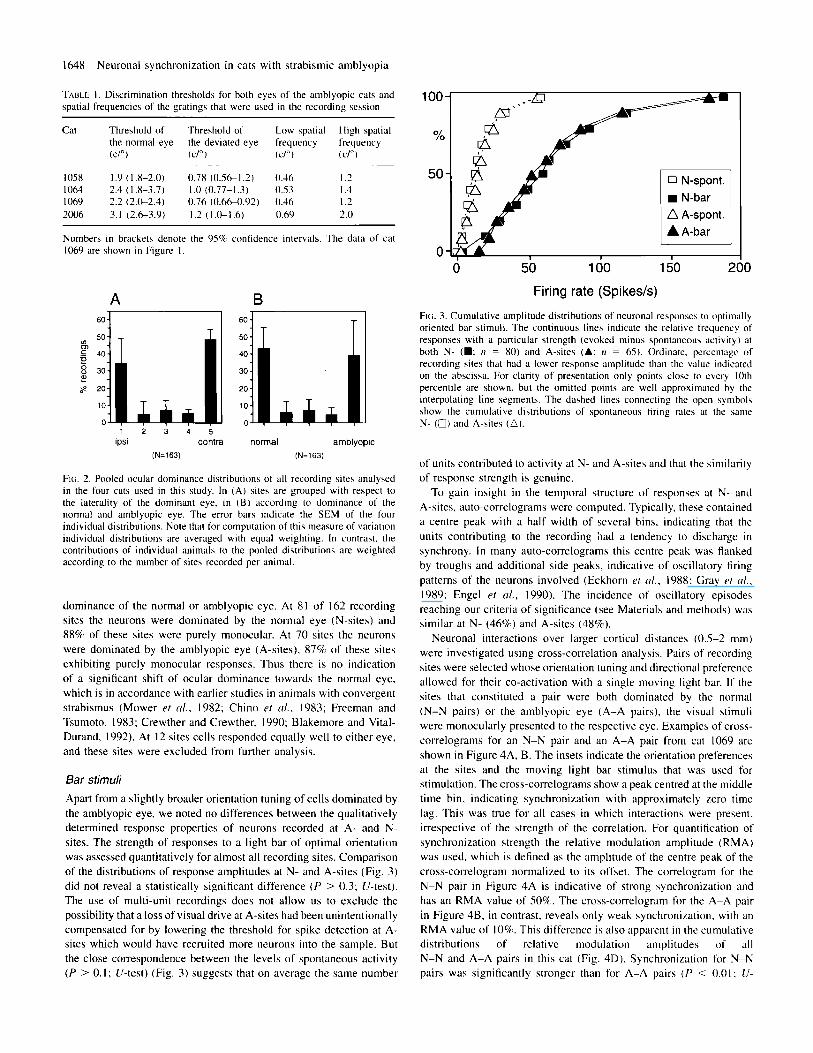
Neuronal interactions over larger cortical distances (0.5-2 mm) were investigated using cross-correlation analysis. Pairs of recording sites were selected whose orientation tuning and directional preference allowed for their co-activation with a single moving light bar. If the sites that constituted a pair were both dominated by the normal (N-N pairs) or the amblyopic eye (A-A pairs). the visual stimuli were monocularly presented to the respective eye. Exaniples of cross- correlograms for an N-N pair and an A-A pair from cat 1069 are shown in Figure 4A, B. The insets indicate the orientation preferences at the sites and the moving light bar stimulus that was used for stimulation. The cross-correlograms show a peak centred at the middle time bin. indicating synchronization with approximately zero time lag. This was true for all cases in which interactions were present. irrespective of the strength of the correlation. For quantitication of synchronization strength the relative modulation amplitude (RMA) was used, which is defined as the amplitude of the centre peak of the cross-correlogram normalized to its offset. The correlogram for the N-N pair in Figure 4A is indicative of strong synchronization and has an RMA value of 50%. The cross-correlogram for the A-A pair in Figure 48 . in contrast. reveals only weak synchronimtion, with an RMA value of 10%. This difference is also apparent in the cumulative distributions of relative modulation amplitudes of all N-N and A-A pairs i n this cat (Fig. 4D). Synchronization for N-N pairs was significantly stronger than for A-A pairs ( P < 0.01; U-
Neuronal synchronization in cats with strabismic amblyopia 1649
A N-N B A-A c N-A
-60 0 +60 -60 0 +60 -60 0 +60 Time (ms)
D CAT 1069
RMA (%)
Time (ms)
E CAT1058
7 0 40 80 120 '
0 40 80 120 RMA (Yo)
Time (ms)
F GROUPDATA
v ' 0 40 80 120 160
RMA (%)
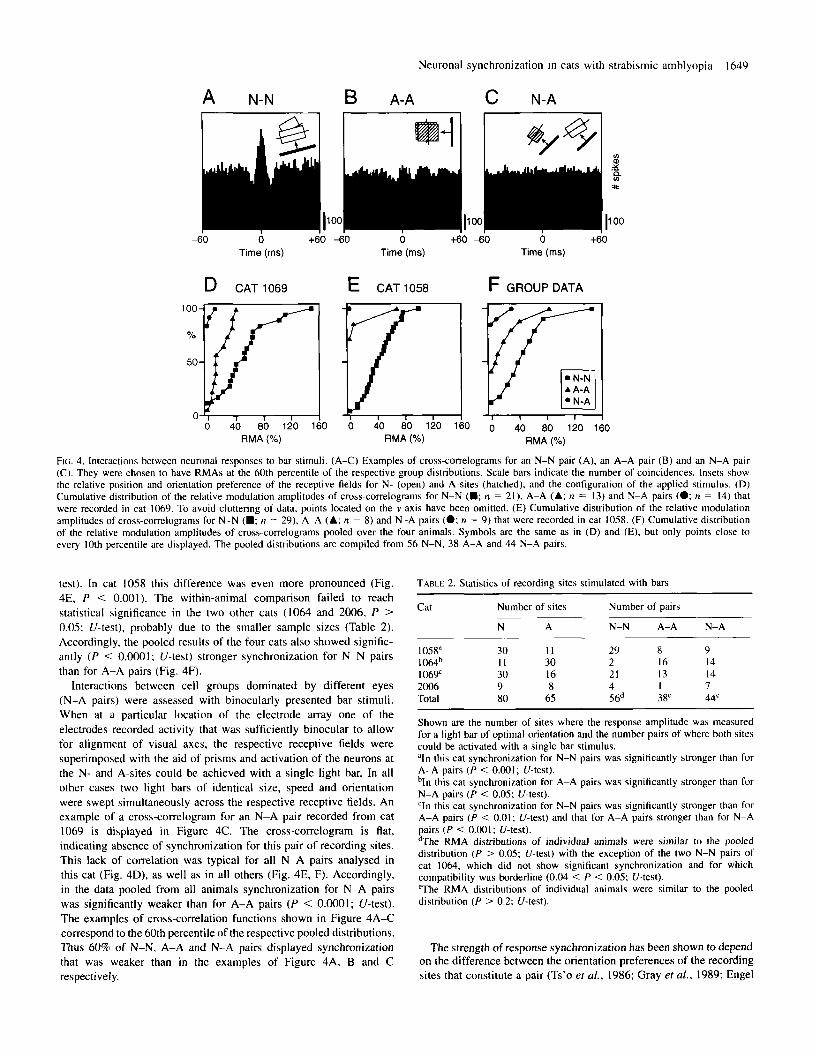
Fic. 4. Interactions between neuronal responses to bar stimuli. ( A X ) Examples of cross-correlograms for an N-N pair (A), an A-A pair (B) and an N-A pair (C). They were chosen to have RMAs at the 60th percentile of the respective group distributions, Scale bars indicate the number of coincidences. Insets show the relative position and orientation preference of the receptive fields for N- (open) and A-sites (hatched), and the configuration of the applied stimulus. (D) Cumulative distribution of the relative modulation amplitudes of cross-correlograms for N-N (D; n = 21). A-A (A; n = 13) and N-A pairs (0; n = 14) that were recorded in cat 1069. To avoid cluttering of data, points located on the v axis have been omitted. (E) Cumulative distribution of the relative modulation amplitudes of cross-correlograms for N-N (D; n = 29). A-A (A; n = 8) and N-A pairs (0; n = 9) that were recorded in cat 1058. (F) Cumulative distribution of the relative modulation amplitudes of cross-correlograms pooled over the four animals. Symbols are the same as in (D) and (E), but only points close to every 10th percentile are displayed. The pooled distributions are compiled from 56 N-N, 38 A-A and 44 N-A pairs.
test). In cat 1058 this difference was even more pronounced (Fig. 4E, P < 0.001). The within-animal comparison failed to reach statistical significance in the two other cats (1064 and 2006, P > 0.05: U-test), probably due to the smaller sample sizes (Table 2 ) . Accordingly, the pooled results of the four cats also showed signific- antly ( P < 0.0001; U-test) stronger synchronization for N-N pairs than for A-A pairs (Fig. 4F).
Interactions between cell groups dominated by different eyes (N-A pairs) were assessed with binocularly presented bar stimuli. When at a particular location of the electrode array one of the electrodes recorded activity that was sufficiently binocular to allow for alignment of visual axes, the respective receptive fields were superimposed with the aid of prisms and activation of the neurons at the N- and A-sites could be achieved with a single light bar. In all other cases two light bars of identical size, speed and orientation were swept simultaneously across the respective receptive fields. An example of a cross-correlogram for an N-A pair recorded from cat 1069 is displayed in Figure 4C. The cross-correlogram is flat, indicating absence of synchronization for this pair of recording sites. This lack of correlation was typical for all N-A pairs analysed in this cat (Fig. 4D). as well as in all others (Fig. 4E, F). Accordingly, in the data pooled from all animals synchronization for N-A pairs was significantly weaker than for A-A pairs ( P < 0.0001; U-test). The examples of cross-correlation functions shown in Figure 4A-C correspond to the 60th percentile of the respective pooled distributions. Thus 60% of N-N, A-A and N-A pairs displayed synchronization that was weaker than in the examples of Figure 4A, B and C respectively.
TABLE 2. Statistics of recording sites stimulated with bars
Cat Number of sites Number of pairs
N A N-N A-A N-A
1058a 30 I I 29 8 9 1 064b I I 30 2 16 14 1069' 30 16 21 13 14 2006 9 8 4 1 1 Total 80 65 56d 38' 44e
Shown are the number of sites where the response amplitude was measured for a light bar of optimal orientation and the number pairs of where both sites could be activated with a single bar stimulus. aln this cat synchronization for N-N pairs was significantly stronger than for A-A pairs ( P < 0.001; I/-test). hln this cat synchronization for A-A pairs was significantly stronger than for N-A pairs ( P < 0.05; U-test). 'In this cat synchronization for N-N pairs was significantly stronger than for A-A pairs ( P < 0.01; U-test) and that for A-A pairs stronger than for N-A pairs ( P < 0.001; West). dThe RMA distributions of individual animals were similar to the pooled distribution ( P > 0.05; U-test) with the exception of the two N-N pairs of cat 1064, which did not show significant synchronization and for which compatibility was borderline (0.04 < P < 0.05; I/-test). eThe RMA distributions of individual animals were similar to the pooled distribution ( P > 0.2; I/-test).
The strength of response synchronization has been shown to depend on the difference between the orientation preferences of the recording sites that constitute a pair (Ts'o er ul., 1986; Gray et ul., 1989; Engel
1650 Neuronal synchronization in cats with strabismic amblyopia
A B
difference in orientation preference (degree)
electrode distance (mm)
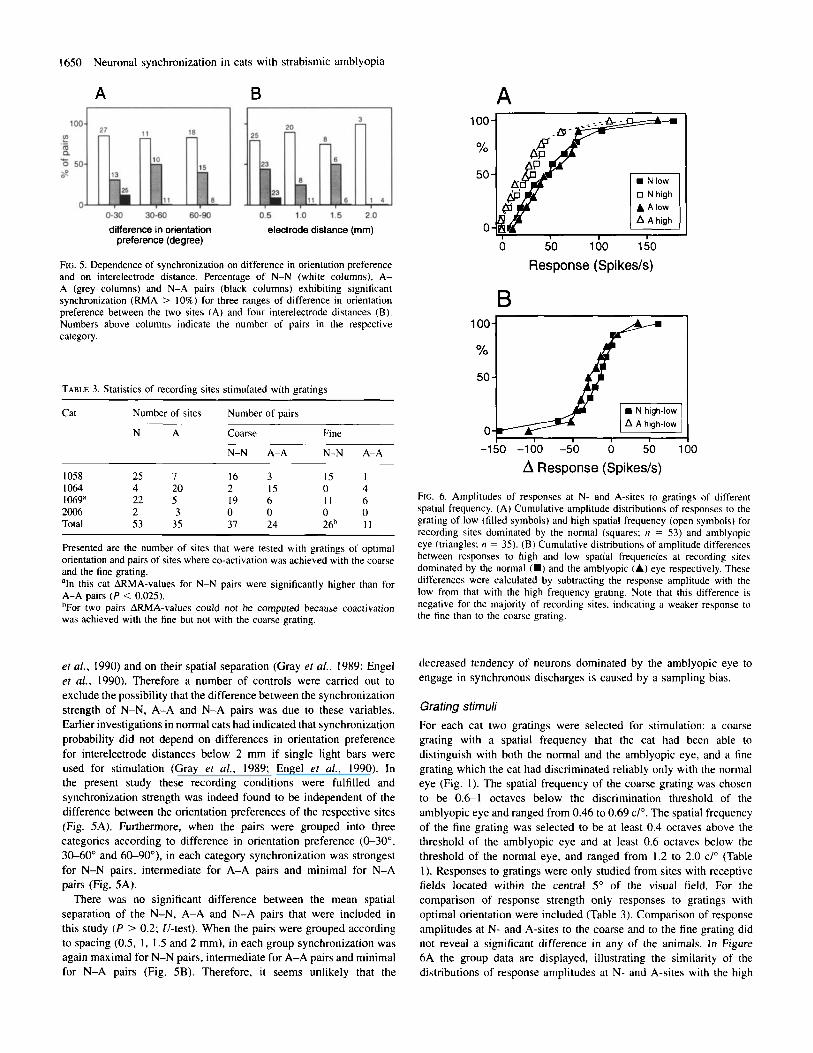
FIG. 5. Dependence of synchronization on difference in orientation preference and on interelectrode distance. Percentage of N-N (white columns), A- A (grey columns) and N-A pairs (black columns) exhibiting significant synchronization (RMA > 10%) for three ranges of difference in orientation preference between the two sites (A) and four interelectrode distances (B). Numbers above columns indicate the number of pairs in the respective category.
TABLE 3. Statistics of recording sites stimulated with gratings
Cat Number of sites Number of pairs
N A Coarse Fine
N-N A-A N-N A-A
1058 25 I 16 3 15 I 1064 4 20 2 15 0 4 i 0 6 9 a 22 5 19 6 I I 6 2006 2 3 0 0 0 0 Total 53 35 31 24 26b I I
Presented are the number of sites that were tested with gratings of optimal orientation and pairs of sites where co-activation was achieved with the coarse and the fine grating. "In this cat ARMA-values for N-N pairs were significantly higher than for A-A pairs (P < 0.025). bFor two pairs ARMA-values could not be computed because coactivation was achieved with the fine but not with the coarse grating.
et af., 1990) and on their spatial separation (Gray ef al., 1989; Engel ef al., 1990). Therefore a number of controls were carried out to exclude the possibility that the difference between the synchronization strength of N-N, A-A and N-A pairs was due to these variables. Earlier investigations in normal cats had indicated that synchronization probability did not depend on differences in orientation preference for interelectrode distances below 2 mm if single light bars were used for stimulation (Gray et al., 1989; Engel et al., 1990). In the present study these recording conditions were fulfilled and synchronization strength was indeed found to be independent of the difference between the orientation preferences of the respective sites (Fig. 5A). Furthermore, when the pairs were grouped into three categories according to difference in orientation preference (0-30", 30-60" and 6CL90°), in each category synchronization was strongest for N-N pairs, intermediate for A-A pairs and minimal for N-A pairs (Fig. 5A).
There was no significant difference between the mean spatial separation of the N-N, A-A and N-A pairs that were included in this study (P > 0.2; U-test). When the pairs were grouped according to spacing (0.5, I , I .5 and 2 mm), in each group synchronization was again maximal for N-N pairs, intermediate for A-A pairs and minimal for N-A pairs (Fig. SB). Therefore, it seems unlikely that the
100
Y O
50
0
A -_ --A- -
.LY- * -
0 N high A A Jaw A A high
I - I I I I
0 50 100 150
Response (Spikeds)
B
YO
50 -
0- -150 -100 -50 0 50 1
A Response (Spikeds) 0
FIG. 6. Amplitudes of responses at N- and A-sites to gratings of different spatial frequency. (A) Cumulative amplitude distributions of responses to the grating of low (filled symbols) and high spatial frequency (open symbols) for recording sites dominated by the normal (squares; 17 = 53) and amblyopic eye (triangles; n = 35). (B) Cumulative distributions of amplitude differences between responses to high and low spatial frequencies at recording sites dominated by the normal (W) and the amblyopic (A) eye respectively. These differences were calculated by subtracting the response amplitude with the low from that with the high frequency grating. Note that this difference is negative for the majority of recording sites. indicating a weaker response to the fine than to the coarse grating.
decreased tendency of neurons dominated by the amblyopic eye to engage in synchronous discharges is caused by a sampling bias.
Grating stimuli For each cat two gratings were selected for stimulation: a coarse grating with a spatial frequency that the cat had been able to distinguish with both the normal and the amblyopic eye, and a fine grating which the cat had discriminated reliably only with the normal eye (Fig. I ) . The spatial frequency of the coarse grating was chosen to be 0.61 octaves below the discrimination threshold of the amblyopic eye and ranged from 0.46 to 0.69 C/O. The spatial frequency of the fine grating was selected to be at least 0.4 octaves above the threshold of the amblyopic eye and at least 0.6 octaves below the threshold of the normal eye, and ranged from 1.2 to 2.0 C/O (Table I ) . Responses to gratings were only studied from sites with receptive fields located within the central 5" of the visual field. For the comparison of response strength only responses to gratings with optimal orientation were included (Table 3). Comparison of response amplitudes at N- and A-sites to the coarse and to the fine grating did not reveal a significant difference in any of the animals. In Figure 6A the group data are displayed, illustrating the similarity of the distributions of response amplitudes at N- and A-sites with the high
Neuronal synchronization in cats with strabismic amblyopia I65 1
A D N1
B N-N
A2
E A-A
Time (ms) Time (ms)
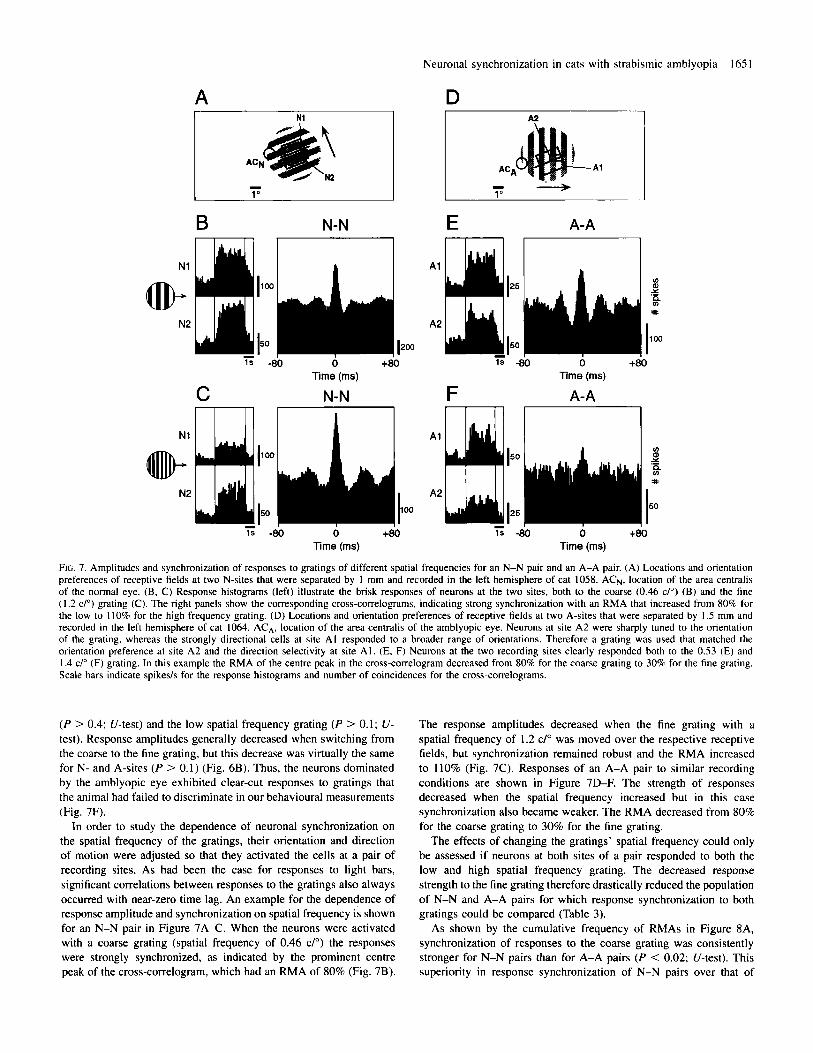
FIG. 7. Amplitudes and synchronization of responses to gratings of different spatial frequencies for an N-N pair and an A-A pair. (A) Locations and orientation preferences of receptive fields at two N-sites that were separated by 1 mm and recorded in the left hemisphere of cat 1058. ACN. location of the area centralis of the normal eye. (B, C) Response histograms (left) illustrate the brisk responses of neurons at the two sites, both to the coarse (0.46 C/O) (B) and the fine (1.2 C/O) grating (C). The right panels show the corresponding cross-correlograms, indicating strong synchronization with an RMA that increased from 80% for the low to 110% for the high frequency grating. (D) Locations and orientation preferences of receptive fields at two A-sites that were separated by 1.5 mm and recorded in the left hemisphere of cat 1064. ACA, location of the area centralis of the amblyopic eye. Neurons at site A2 were sharply tuned to the orientation of the grating, whereas the strongly directional cells at site A1 responded to a broader range of orientations. Therefore a grating was used that matched the orientation preference at site A2 and the direction selectivity at site A l . (E, F) Neurons at the two recording sites clearly responded both to the 0.53 (E) and I .4 c/" (F) grating. In this example the RMA of the centre peak in the cross-correlogram decreased from 80% for the coarse grating to 30% for the fine grating. Scale bars indicate spikes/s for the response histograms and number of coincidences for the cross-comelograms.
(P > 0.4; U-test) and the low spatial frequency grating (P > 0.1; U- test). Response amplitudes generally decreased when switching from the coarse to the fine grating, but this decrease was virtually the same for N- and A-sites (P > 0.1) (Fig. 6B). Thus, the neurons dominated by the amblyopic eye exhibited clear-cut responses to gratings that the animal had failed to discriminate in our behavioural measurements (Fig. 7F).
In order to study the dependence of neuronal synchronization on the spatial frequency of the gratings, their orientation and direction of motion were adjusted so that they activated the cells at a pair of recording sites. As had been the case for responses to light bars, significant correlations between responses to the gratings also always occurred with near-zero time lag. An example for the dependence of response amplitude and synchronization on spatial frequency is shown for an N-N pair in Figure 7A-C. When the neurons were activated with a coarse grating (spatial frequency of 0.46 C/O) the responses were strongly synchronized, as indicated by the prominent centre peak of the cross-correlogram, which had an RMA of 80% (Fig. 7B).
The response amplitudes decreased when the fine grating with a spatial frequency of I .2 C/O was moved over the respective receptive fields, but synchronization remained robust and the RMA increased to 110% (Fig. 7C). Responses of an A-A pair to similar recording conditions are shown in Figure 7D-F. The strength of responses decreased when the spatial frequency increased but in this case synchronization also became weaker. The RMA decreased from 80%, for the coarse grating to 30% for the fine grating.
The effects of changing the gratings' spatial frequency could only be assessed if neurons at both sites of a pair responded to both the low and high spatial frequency grating. The decreased response strength to the fine grating therefore drastically reduced the population of N-N and A-A pairs for which response synchronization to both gratings could be compared (Table 3).
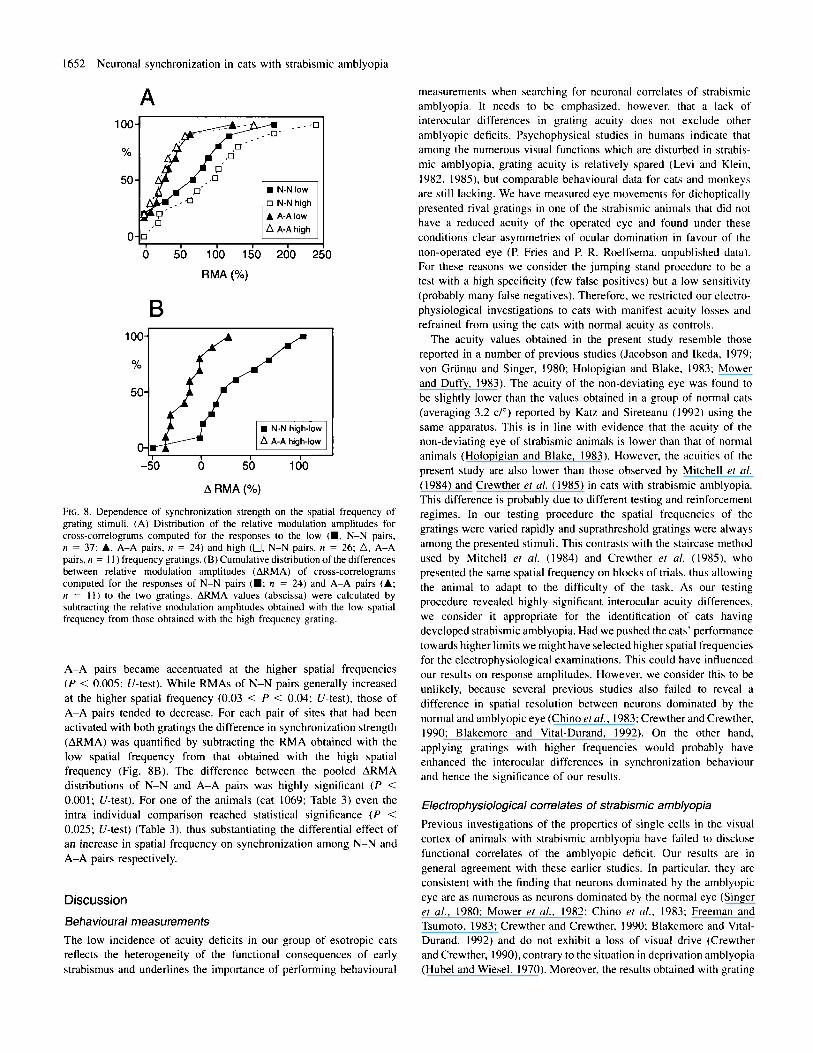
As shown by the cumulative frequency of RMAs in Figure 8A, synchronization of responses to the coarse grating was consistently stronger for N-N pairs than for A-A pairs (P < 0.02; U-test). This superiority in response synchronization of N-N pairs over that of
1652 Neuronal synchronization in cats with strabismic amblyopia
100-
YO
50-
0-
A
m
100-
%
0 N-N high A A-A low
0- 0' 0 50 100 150 200 250
RMA (Yo)
B
8 I I
-50 0 50 1 00
A RMA(%)
FIG. 8. DeDendence of svnchronization strength on the sDatial freouencv of .. . - grating stimuli. (A ) Distribution of the relative modulation amplitudes for cross-correlograms computed for the responses to the low (W. N-N pairs, n = 37; A, A-A pairs, n = 24) and high (0, N-N pairs, n = 26; A, A-A pairs, n = 11) frequency gratings. (B) Cumulative distribution of the differences between relative modulation amplitudes (ARMA) of cross-correlograms computed for the responses of N-N pairs (W; ri = 24) and A-A pairs (A; n = 1 1 ) to the two gratings. ARMA values (abscissa) were calculated by subtracting the relative modulation amplitudes obtained with the low spatial frequency from those obtained with the high frequency grating.
A-A pairs became accentuated at the higher spatial frequencies ( P < 0.005: U-test). While RMAs of N-N pairs generally increased at the higher spatial frequency (0.03 < P < 0.04; U-test), those of A-A pairs tended to decrease. For each pair of sites that had been activated with both gratings the difference in synchronization strength (ARMA) was quantified by subtracting the RMA obtained with the low spatial frequency from that obtained with the high spatial frequency (Fig. 8B). The difference between the pooled ARMA distributions of N-N and A-A pairs was highly significant ( P < 0.001: U-test). For one of the animals (cat 1069; Table 3) even the intra individual comparison reached statistical significance ( P < 0.025: U-test) (Table 3). thus substantiating the differential effect of an increase in spatial frequency on synchronization among N-N and A-A pairs respectively.
Discussion Behavioural measurements The low incidence of acuity deficits in our group of esotropic cats reflects the heterogeneity of the functional consequences of early strabismus and underlines the importance of performing behavioural
measurements when searching for neuronal correlates of strabismic amblyopia. It needs to be emphasized. however. that a lack of interocular differences in grating acuity does not exclude other amblyopic deficits. Psychophysical studies i n humans indicate that among the numerous visual functions which are disturbed in strabis- mic amblyopia, grating acuity is relatively spared (Levi and Klein, 1982, 1985). but comparable behavioural data for cats and monkeys are still lacking. We have measured eye movements for dichoptically presented rival gratings i n one of the strabismic animals that did not have a reduced acuity of the operated eye and found under these conditions clear asymmetries of ocular domination in favour of the non-operated eye (P. Fries and P. R. Roelfsema. unpublished data). For these reasons we consider the jumping stand procedure to be a test with a high specificity (few false positives) but a low sensitivity (probably many false negatives). Therefore, we restricted our electro- physiological investigations to cats with manifest acuity losses and refrained from using the cats with normal acuity as controls.
The acuity values obtained in the present study resemble those reported in a number of previous studies (Jacobson and Ikeda. 1979: von Griinau and Singer, 1980; Holopigian and Blake, 1983: Mower and Duffy, 1983). The acuity of the non-deviating eye was found to be slightly lower than the values obtained in a group of normal cats (averaging 3.2 C/O) reported by Katz and Sireteanu (1992) using the same apparatus. This is in line with evidence that the acuity of the non-deviating eye of strabismic animals is lower than that of normal animals (Holopigian and Blake, 1983). However, the acuities of the present study are also lower than those observed by Mitchell et al. (1984) and Crewther et al. (1985) in cats with strabismic amblyopia. This difference is probably due to different testing and reinforcement regimes. In our testing procedure the spatial frequencies of the gratings were varied rapidly and suprathreshold gratings were always among the presented stimuli. This contrasts with the staircase method used by Mitchell et al. ( I 984) and Crewther er al. (1985). who presented the same spatial frequency on blocks of trials, thus allowing the animal to adapt to the difficulty of the task. As our testing procedure revealed highly significant interocular acuity differences, we consider it appropriate for the identification of cats having developed strabismic amblyopia. Had we pushed the cats' performance towards higher limits we might have selected higher spatial frequencies for the electrophysiological examinations. This could have influenced our results on response amplitudes. However, we consider this to be unlikely, because several previous studies also failed to reveal a difference in spatial resolution between neurons dominated by the normal and amblyopic eye (Chino et al., 1983: Crewther and Crewther, 1990: Blakemore and Vital-Durand, 1992). On the other hand, applying gratings with higher frequencies would probably have enhanced the interocular differences in synchronization behaviour and hence the significance of our results.
Electrophysiological correlates of strabismic amblyopia Previous investigations of the properties of single cells in the visual cortex of animals with strabismic amblyopia have failed to disclose functional correlates of the amblyopic deficit. Our results are in general agreement with these earlier studies. In particular, they are consistent with the finding that neurons dominated by the amblyopic eye are as numerous as neurons dominated by the normal eye (Singer et al., 1980: Mower et d., 1982; Chino et d.. 1983; Freeman and Tsumoto. 1983; Crewther and Crewther, 1990; Blakemore and Vital- Durand, 1992) and do not exhibit a loss of visual drive (Crewther and Crewther, 1990), contrary to the situation in deprivation amblyopia (Hubel and Wiesel, 1970). Moreover, the results obtained with grating
Neuronal synchronization i n cats with strabismic amblyopia I653
stimuli corroborate earlier evidence (Chino ef a/.. 1983: Crewther and Crewther, 1900; Blakemore and Vital-Durand, 1992) that cells dominated by the amblyopic eye have a similar spatial frequency tuning as cells activated through the normal eye. Although we did not attempt to measure spatial frequency tuning, it is quite clear from our data that there was no preferential attenuation of responses from the amblyopic eye at high spatial frequencies. However, Crewther and Crewther ( 1990) found that binocular neurons in the visual cortex of amblyopic cats respond to higher spatial frequencies through the normal eye than through the amblyopic eye. Due to the multi-unit recording technique employed in the present study, genuine binocular neurons were indistinguishable from a combined response of mon- ocular neurons dominated by different eyes. Hence our data are neutral with respect to this issue. However, in our sample the sites that could be activated through both eyes constituted a true minority (Fig. 2).
The present study has revealed that synchronization of responses evoked through the eye which had developed an impaired grating acuity was reduced compared with that of responses evoked from the normal eye. This suggests disturbance of synchrony as a new correlate of strabismic amblyopia. As discussed above, uncertainties about the visual performance of animals with an intact grating acuity of the operated eye remain and prompted us to restrict electrophysiological examination to those animals we were confident had developed amblyopia. Future studies that combine electrophysiology with more sophisticated behavioural measurements of, for example, interocular suppression, hyperacuity or spatial interference in cats with an intact grating acuity might provide more detail with respect to the impaired visual functions that correlate most closely with the reduction in synchronization strength.
The results that were obtained with gratings of different spatial frequency show that the reduction of response synchronization is accentuated when responses are evoked with stimuli that emphasize the amblyopic deficits, which supports a relationship between reduced visual acuity and weaker neuronal interactions. Whenever interactions were detectable among A-A pairs, they indicated synchronization with near-zero time lag, as was the case for N-N pairs and also for interactions between multiple unit recordings in normal animals (Engel et a / . . 1990). Synchronization between neurons dominated by different eyes was virtually absent, corroborating a similar finding by Konig et a/ . ( 1993) in the visual cortex of animals with a divergent squint. This indicates that in squinting animals area 17 is partitioned in two compartments, with interactions on a millisecond time scale taking place only between neurons dominated by the same eye. Interestingly, Konig et a/. (1993) noted no difference between the strength of response synchronization between neurons dominated by the normal and the deviated eye respectively. The incidence of amblyopia is far lower with exotropia than with esotropia (Duke- Elder, 1973; von Noorden, 1990). As the exotropic animals in the study of Konig et a/ . ( 1993) had not been selected for the occurrence of amblyopia, it is reasonable to assume that the majority of the cats in this study had developed alternating fixation and were not ambly- opic. Thus the unimpaired synchronization in the exotropic cats is further support for the hypothesis that the reduced response synchronization in the esotropic cats of the present study is a correlate of amblyopia.
Measures of synchronization strength As a measure for synchronization strength, we used the relative modulation amplitude of the cross-correlogram, which is defined as the ratio of the central peak amplitude over the offset. Because the
offset of a cross-correlogram is proportional to the product of the tiring rates at the two recording sites, an increased response strength at both sites will typically result in a decreased modulation amplitude (Aertsen et al., 1989). Unfortunately, there is no measure of synchron- ization strength that is independent of response amplitudes (Melssen and Epping, 1987) and therefore caution is required when cross- correlograms are compared for responses of different amplitude. However, we are contident that the observed differences in relative modulation amplitudes reflect actual differences in synchronization behaviour. When moving light bars were used as stimuli, response amplitudes at N- and A-sites were of the same magnitude and hence this factor cannot have influenced our measure of synchrony. Indeed, synchronization was also found to be significantly weaker for A-A than for N-N pairs ( P < 0.001; U-test) when another measure, the detectability index (Melssen and Epping, 1987), was used for quantification of synchronization strength.
The evaluation of the results obtained with grating stimuli is complicated by the fact that response amplitudes generally decreased at higher spatial frequencies. This has certainly contributed to the higher modulation amplitudes that were obtained for the N-N pairs with the high spatial frequency grating. However, it does not invalidate our finding of increased interocular differences in synchronization strength with higher spatial frequencies because firing rates were similar at both N- and A-sites in response to both the low and high spatial frequency.
Substrate of reduced synchronization Previous investigations have suggested that response synchronization is mediated to a substantial extent by intracortical connections and hence that synchronization probability depends on the functional architecture of these connections. Sectioning the corpus callosurn abolished the synchronization between neurons in area 17 of the two hemispheres (Engel et al., 1991b). Similarly, the reduction of intracortical connections between columns of different ocular dominance in strabismic cats (Lowel and Singer, 1992) goes along with a drastic reduction in synchronization probability between neurons dominated by different eyes (this study; Konig et a/., 1993). This rearrangement of horizontal intracortical connections in early onset strabismus illustrates the susceptibility of their architecture to experience dependent modifications (Katz and Callaway, 1992). Therefore, it is tempting to speculate that the reduced synchronization between cells dominated by the amblyopic eye is due to abnormalities in the pattern of connections linking neurons driven from this eye.
Consequences of reduced synchronization in strabismic amblyopia A consistent finding in animals with strabismic amblyopia is that the latencies of responses evoked through the amblyopic eye are prolonged (Singer et al., 1980; Chino et a / . , 1983; Eschweiler and Rauschecker, 1993). We would like to stress that this cannot account for the reduction of synchronization between neurons dominated by the amblyopic eye. First, response latency is poorly defined for moving light bars and most of the spikes that contribute to the cross- correlograms do not originate from the onset of the responses. Second, in the primary visual cortex the distribution of neuronal response latencies is relatively broad (Chino et al., 1983; Raiguel er a/ . , 1989; Maunsell and Gibson, 1992; Eschweiler and Rauschecker, 1993) and therefore it is unlikely that synchronization with a millisecond precision could be produced by phase locking of neurons to the onset of a visual stimulus. Third, the synchronization described in this and our previous studies is the result of neuronal interactions and not due
1654 Neuronal synchronization in cats with strabismic amblyopia
to phase locking of response components to particular temporal features of the stimulus. This follows from the fact that cross- correlograms between responses to successive stimuli (shift predictors) do not exhibit modulation on the investigated time scale.
Interestingly, evoked potential studies in strabismic cats (Singer et al., 1980; von Griinau and Singer, 1980; Freeman et al., 1983) and humans (Lombroso et al., 1969; Manny and Levi, 1982; von Noorden. 1990; Holopigian et al., 1991) have not only revealed increased latencies but also reduced amplitudes of potentials evoked by patterned stimulation of the amblyopic eye. Since the amplitudes of macropoten- tials are enhanced if the synchronicity of the underlying neuronal responses increases (Mitzdorf, 1985). it is tempting to assume that the amplitude reduction of field responses mediated by the amblyopic eye is caused by the reduced synchronization between neurons dominated by this eye.
The probability of activating a postsynaptic cortical neuron increases when presynaptic neurons synchronize their action poten- tials, because this results in more effective summation of synaptic potentials (Abeles, 1991: Softky and Koch, 1993). Accordingly, the reduced synchronization of responses evoked through the amblyopic eye is likely to reduce the saliency of these responses which would lead to a competitive disadvantage relative to those evoked through the normal eye. This might explain why vision through the amblyopic eye is readily suppressed when both eyes are open (von Noorden, 1990). Moreover, if precise synchronization is a prerequisite for the effective propagation and processing of neuronal activity, a further reduction of synchrony among responses evoked by the high frequency grating can account for the inability to perceive such gratings with the amblyopic eye. If so, the reduced synchronization in area 17 of the visual cortex might result in a loss of visual drive of neurons in other areas of the visual cortex and in reduced synchronization among the cells that remain responsive. Chino et al. (1988) studied response properties of neurons in area 18 of the visual cortex of esotropic cats and reported that response properties of neurons dominated by the normal and deviating eye are similar at this stage of visual processing. A study of the lateral suprasylvian area of strabismic cats which exhibited a pronounced restriction in the visual field of the deviated eye revealed a reduction in the number of neurons that could be driven from this eye (Sireteanu, 1991: Sireteanu and Best, 1992). This decreased responsiveness might be related to reduced synchrony among neurons projecting to the suprasylvian cortex. Unfortunately. at present little is known about response properties, let alone synchron- ization behaviour, of cells in other visual areas of amblyopic animals.
Neuronal synchronization in the visual cortex has been demon- strated to occur selectively between neurons that respond to segments that belong to the same contour (Gray et a/., 1989; Engel et al., 1991a). It has been argued that this mechanism enhances the distinction between responses evoked by different, spatially contiguous contours (Milner, 1974; von der Malsburg, 1981; Engel et al.. 1992; Singer, 1993). If synchronization actually fulfils this role, its disruption should impair segregation of contiguous contours, which would explain disturbances of amblyopic vision such as the crowding phenomenon (Levi and Klein. 1985) and illusions of connectedness of closely spaced but non-contiguous contours (Hess et al., 1978).
In conclusion, the evaluation of temporal relations between simul- taneously recorded, spatially distributed neurons has revealed reduced response synchronization as a new correlate of strabismic amblyopia. This parameter shows closer relations with the perceptual deficits than the response amplitude and spatial resolution of individual neurons, suggesting that precise temporal relations between distributed neuronal responses are important for cortical processing
Acknowledgements We thank S. Wiemerslage. B. Loschner. and H. Duckstein for technical assistance. R. Ruhl for help in preparation of the figures and M. P. Stryker and S. Lowel for helpful comments on the manuscript.
Abbreviations A-site A-A pair
N-site N-N pair RMA relative modulation amplitude
recording site dominated by the amblyopic eye pair of recorded cell groups, both dominated hy the amblyopic eye recording site dominated by the normal eye pair of recorded cell groups, both dominated by the normal eye
References Abeles. M. ( I991 ) Corticonics. Cambridge University Press. Cambridge. Aertsen, A. M. H. J.. Gerstein, G. L.. Habib, M. K. and Palm. G. (1989)
Dynamics of neuronal firing correlation: modulation of "effective connectivity". J. Neurr,physiol., 61, 900-9 17.
Altmann, L. and Singer, W. (1986) Temporal integration in ainblyopic vision. Vision Res., 26, 1959-1968.
Blakemore. C. and Vital-Durand, F. (1992) Different neural origins for 'blur' amblyopia and strabismic amblyopia. Ophthul. fliysiol. Opt.. 12. 83.
Chino. Y. M., Shansky, M. S., Jankowski. W. L. and Banser. F. A. (1983) Effects of rearing kittens with convergent strabismus o n development of receptive-field properties in striate cortex neurons. J . Neurophy.sio/.. 50. 265-286.
Chino. Y. M.. Ridder. W. H., 111 and Czora. E. P. (1988) Effects of convergent strabismus on spatio-temporal response properties of neurons in cat area 18. Exp. Bruin Rex , 72. 2 6 2 7 8 .
Crewther. D. P. and Crewther. S. G. ( I 990) Neural site of strabismic amblyopia in cats: spatial frequency deficit in primary cortical neurons. Exp. Bruin R e x , 79. 6 15-622.
Crewther, S. G., Crewther. D. P. and Cleland, B. G. (1985) Convergent strabismic amblyopia in cats. Exp. Bruin Rex . 60, 1-9.
Duke-Elder. S. ( 1973) System of Ophthulndogy. Vol. VI. Oculor Mof i l i f y trnd Strubisnrus. Kimpton. London. pp. 290-3 17.
Eckhorn R.. Bauer. R., Jordan, W.. Brosch. M.. Kruse, W., Munk. M. and Reitboeck, H. J . (1988) Coherent oscillations: a mechanism of feature linking in the visual cortex? B i d . Cvhernet.. 60, 121-130.
Engel. A. K., Konig, P.. Gray. C. M. and Singer. W. (1990) Stimulus dependent neuronal oscillations in cat visual cortex: intercolumnar interaction as determined by cross-correlation analysis. Eu,: J . Neurosci., 2, 588-606.
Engel. A. K.. Konig. P. and Singer, W. (1991a) Direct physiological evidence for scene segmentation by temporal coding. Proc. Not/ Accrd. Sci. USA. 88. 9 I 36-9 I 40.
Engel. A. K., Konig, P., Kreiter, A. K. and Singer, W. (199 Ib) Interhemispheric synchronization of oscillatory neuronal responses in cat visual cortex. Scientv. 252. I 177-1 179.
Engel, A. K.. Konig, P.. Kreiter, A. K., Schillen. T. B. and Singer. W. (1992) Temporal coding i n the visual cortex: new vistas on integration in the nervous system. Trends Neurosci.. 15. 2 18-226.
Freeman. R. D. and Tsumoto, T. ( 1983) An electrophysiological comparison of convergent and divergent strabismus in the cat: electrical and visual activation of single cortical cells. J . Neurophv.sio/., 49. 238-253.
Eschweiler, G. W. and Rauschecker, J . P. (1993) Temporal integration in visual cortex of cats with surgically induced strabismus. Eur: J . Neurosci.. 5, 1501-1509.
Freeman, R. D.. Sclar. G. and Ohmwa. I . (1983) An electrophysiological comparison of convergent and divergent strabismus in the cat: visual evoked potentials. J . Neurophysiol., 49. 227-237.
Gray. C. M.. Konig, P., Engel. A. K. and Singer W. (1989) Oscillatory responses in cat visual cortex exhibit inter-columnar Synchronization which reflects global stimulus properties. Nature. 338, 334-337.
Hess, R. F. and Holliday. 1. E. (1992) The spatial localization deficit in amblyopia. Vision Res.. 32. 1319-1 339.
Hess, R. F., Campbell, F. W. and Greenhalgh, T. ( 1978) On the nature of the neural abnormality in human amblyopia; neural aberration and neural sensitivity loss. Sflu8er.s Arch.. 377. 201-207.
Holopigian, K. and Blake, R. (1983) Spatial vision in strabismic cats. J . Neurophysiol., 50. 287-296.
Holopigian, K.. Seiple. W. and Kupersmith.M. (1991) VEP threshold and
Neuronal synchronization in cats with strabismic amblyopia 1655
suprathreshold deficits in amblyopia. Clin. Vision Sci.. 6, 109-1 17. Hubel, D. H. and Wiesel. T. N. (1965) Binocular interaction in striate cortex
of kittens reared with artificial squint. J. Neuruphysiul., 28, 1041-1059. Hubel. D. H. and Wiesel, T. N . (1970) The period of susceptibility to the
physiological effects of unilateral eye closure in kittens. J. Physiol., 206, 4 19436.
Jacobson, S. G. and Ikeda, H. (1979) Behavioural studies of spatial vision in cats reared with convergent squint: is amblyopia due to arrest of development’? E X ~ J . Bruin Res., 34. 11-26.
Katz. B. and Sireteanu, R. (1992) Development of visual acuity in kittens: a comparison between jumping stand and Teller acuity card test. Clin. Vision Sci.. 7, 219-224.
Katz. L. C. and Callaway, E. M. (1992) Development of local circuits in mammalian visual cortex. Annu. Rei: Neurosci., 15, 3 1-56.
Konig, P.. Engel, A. K., Lowel, S. and Singer W. (1993) Squint affects synchronization of oscillatory responses in cat visual cortex. Eur: J. Nrurosci.. 5. 501-508.
Lagreze, W. D. and Sireteanu, R. (1991) Two-dimensional spatial distortions in human strabismic amblyopia. V i ~ i o n Res.. 31, 1271-1288.
Levi, D. M. and Klein, S. (1982) Hyperacuity and amblyopia. Nature, 298, 268-270.
Levi, D. M. and Klein, S. A. (1985) Vernier acuity, crowding and amblyopia. Vision Res., 25. 979-99 I .
Lowel, S. and Singer, W. (1992) Selection of intrinsic horizontal connections in the visual cortex by correlated neuronal activity. Science, 255, 209-2 12.
Lombroso, C. T.. Duffy, F. H. and Robb, R. M. (1969) Selective suppression of cerebral evoked potentials to patterned light in amblyopia ex anopsia. Electroeiiceph. Cliii. Neurophysiol., 27, 238-247.
Manny, R. E. and Levi, D. M. (1982) The visually evoked potential in humans with amblyopia: pseudorandom modulation of uniform field and sine-wave gratings. Exp. Brain Res., 47, 15-27.
Maunsell, J. H. R. and Gibson, J. R. (1992) Visual response latencies in striate cortex of the macaque monkey. J. Neurophysiol., 68, 1332-1 344.
Melssen, W. J. and Epping, W. J. M. (1987) Detection and estimation of neural connectivity based on cross-correlation analysis. B i d . Cybeni. , 57, 4 0 3 4 14.
Milner, M. P. (1974) A model for visual shape recognition. Psychol. Rei:. 81, 52 1-535.
Mitchell, D. E., Giffin. F., Wilkinson, F., Anderson. P. and Smith. M. L. (1976) Visual resolution in young kittens. Vision Rex . 16, 363-366.
Mitchell, D. E., Ruck, M., Kaye, M. G. and Kirby, S. (1984) Immediate and long-term effects on visual acuity of surgically induced strabismus in kittens. Exp. Brain Res., 55, 420430.
Mitzdorf, U. ( I 985) Current source4ensity method and application in cat cerebral cortex: investigations of evoked potentials and EEG phenomena. Physiol. Rei:, 65. 37-100.
Mower, G. D. and Duffy, F. H. (1983) Animal studies of strabismic amblyopia:
comparative behavioural studies. Behav. Bruin Rex . 7, 239-25 I . Mower, G. D., Burchfiel, J . L. and Duffy, F. H. (1982) Animal studies of
strabismic amblyopia: physiological studies of visual cortex and the lateral geniculate nucleus. Devl Brain Res., 5, 31 1-327.
Olson, C. R. and Freeman, R. D. (1978) Eye alignment in kittens. J . Neumphvsiol.. 41, 848-859.
Press, W. H., Flannery, B. P., Teukolsky, S. A. and Vetterling, W. T. ( 1986) Numericul Recipes. Cambridge University Press, Cambridge.
Raiguel, S. E., Lagae, L., Gulyis, B. and Orban, G. A. (1989) Response latencies of visual cells in macaque areas VI, V2 and V5. Brain Res.. 493. 155-159.
Roelfsema, P. R., Engel, A. K., Konig, P., Sireteanu, R. and Singer, W. ( 1993) Squint induced amblyopia is associated with reduced synchronization of cortical responses. SOC. Neurosci. Abstr.. 19, 867.
Sherman, S. ( 1972) Development of interocular alignment in cats. Bruin Rex . 37, 187-203.
Singer, W. (1993) Synchronization of cortical activity and its putative role in information processing and learning. Annu. Rei: Physiol., 55, 349-374.
Singer, W., von Grunau, M. and Rauschecker, J . (1980) Functional amblyopia in kittens with unilateral exotropia. Exp. Bruin Rex , 40, 294-304.
Sireteanu, R. (1991) Restricted visual fields in both eyes of kittens raised with unilateral, surgically induced strabismus: relationship to extrastriate cortical binocularity. Clin. Vision Sci., 6, 277-287.
Sireteanu. R. and Best, J. ( 1992) Squint-induced modification of visual receptive fields in the lateral suprasylvian cortex of the cat: binocular interaction, vertical effect and anomalous correspondence. Eur. J. Neurosci.,
Sireteanu, R.. Lagreze. W. D. and Constantinescu, D. H. (1993) Distortions in two-dimensional visual space perception in strabismic observers. Vision Rex, 33, 677490.
Softky. W. R. and Koch, C. (1993) The highly irregular firing of cortical cells is inconsistent with temporal integration of random EPSPs. J. Neurosci.. 13, 334-350.
Ts’o. D. Y., Gilbert, C. D. and Wiesel. T. N. (1986) Relationships between horizontal interactions and functional architecture in cat striate cortex as revealed by cross-correlation analysis. J. Neurosci., 6. I16&1 170.
von der Malsburg, C. ( I98 I ) The Currelution T h e o n ($Brain Function lnteriiul Report 8 / - 2 . Max-Planck-Institute for Biophysical Chemistry, Gottingen.
von Grunau, M. W. (1979) The role of maturation and visual experience in the development of eye alignment in cats. Exp. Brain Res., 37, 4 1 4 7 .
von Griinau, M. W. and Singer, W. (1980) Functional amblyopia in kittens with unilateral exotropia. Exp. Bruin Rex, 40, 305-3 10.
von Noorden, G. K. (1988) Amblyopia in humans and clinical relevance of animal models. In Lennerstrand, G., von Noorden, G. K. and Campos. E. C. (eds), Strabismus and Amblyopia. Plenum Press, New York, pp. 169-17 I .
von Noorden, G. K. ( 1990) Binoculur Vision and Ocular Moiility. T h e o p and Management of strabismus. C. V. Mosby, St Louis, MO.
4, 235-242.


