Embed Size (px)
Citation preview

Age and sex specific reference intervals across life-span for insulin-like growth factor binding protein 3(IGFBP-3) and the IGF-I/IGFBP-3 ratio measured by newautomated chemiluminescence assays
Nele Friedrich1*, Ole D. Wolthers2*, Ayman M. Arafat3,4,5*, Rebecca T. Emeny6,Joachim Spranger3,5,7, Josefine Roswall8, Jürgen Kratzsch9, Hans J. Grabe10,Christoph Hübener11, Andreas F. H. Pfeiffer3,4, Angela Doering6,Maximilian Bielohuby12, Jovanna Dahlgren8, Jan Frystyk13,14, Henri Wallaschofski1,Martin Bidlingmaier12
1Metabolic Center, Institute of Clinical Chemistry and Laboratory Medicine, University MedicineGreifswald, Germany; 2Children´s Clinic Randers, Randers, Denmark; 3Department of Endocrinology,Diabetes and Nutrition, Charité-University Medicine Berlin, Berlin, Germany; 4Department of ClinicalNutrition, German Institute of Human Nutrition Potsdam-Rehbruecke, Nuthetal, Germany; 5Center forCardiovascular Research (CCR), Charité-University Medicine Berlin, Berlin, Germany; 6Helmholtz ZentrumMuenchen - German Research Center for Environmental Health (GmbH), Institute of Epidemiology II,Neuherberg, Germany; 7Experimental and Clinical Research Center (ECRC), Charité-University MedicineBerlin and Max-Delbrück Centre Berlin-Buch, Berlin, Germany; 8Göteborg Pediatric Growth ResearchCenter (GP-GRC), The Sahlgrenska Academy at University of Gothenburg, Gothenburg, Sweden;9Institut für Laboratoriumsmedizin, Klinische Chemie, Molekulare Diagnostik, University of Leipzig,Leipzig, Germany; 10Department of Psychiatry and Psychotherapy, University Medicine Greifswald,Germany; 11Klinik und Poliklinik für Frauenheilkunde und Geburtshilfe - Großhadern, Klinikum derUniversität München, Munich, Germany; 12Endocrine Research Laboratories, Medizinische Klinik undPoliklinik IV, Klinikum der Universität München, Munich, Germany; 13Medical Research Laboratory,Department of Clinical Medicine, Faculty of Health, Aarhus University, Aarhus, Denmark; 14Departmentof Endocrinology and Internal Medicine, Aarhus University Hospital, Aarhus, Denmark
Context: Measurement of IGFBP-3 can aid the diagnosis of growth hormone related diseases.Furthermore, epidemiological studies suggest that IGFBP-3 and the molar IGF-I/IGFBP-3 ratio areassociated with clinical endpoints like cancer or cardiovascular disease. However, their clinicaluse is limited by the lack of validated reference intervals.
Objectives: Establishment of age- and sex-specific reference intervals for IGFBP-3 and the molarIGF-I/IGFBP-3 ratio by newly developed automated immunoassays.
Setting: Multicentre study with samples from 11 cohorts from the USA, Canada and Europe
Participants: 14,970 subjects healthy subjects covering all ages from birth to senescence.
Main outcome measures: Concentrations of IGFBP-3 and the IGF-I/IGFBP-3 ratio as determined bythe IDS iSYS IGF-I and IGFBP-3 assays.
Results: Both the concentration of IGFBP-3 and the IGF-I/IGFBP-3 ratio are mainly determined byage. IGFBP-3 concentrations increase until the age of 22 years, with a plateau being visiblebetween 15 and 25 years. Determined by the high peripubertal peak in IGF-I, the peak in theIGF-I/IGFBP-3 ratio occurs already around the age of 15, with a slightly earlier and higher peak
ISSN Print 0021-972X ISSN Online 1945-7197Printed in U.S.A.Copyright © 2014 by the Endocrine SocietyReceived August 5, 2013. Accepted January 24, 2014.
Abbreviations:
doi: 10.1210/jc.2013-3060 J Clin Endocrinol Metab jcem.endojournals.org 1
The Endocrine Society. Downloaded from press.endocrine.org by [${individualUser.displayName}] on 03 February 2014. at 03:39 For personal use only. No other uses without permission. . All rights reserved.
in females. Beyond the age of 60, IGFBP-3 concentrations remain higher in females, whereas IGF-Ias well as the IGF-I/IGFBP-3 ratio remain significantly higher in males.
Conclusions: We present an extensive set of assay specific, age and sex-adjusted normative datafor concentrations of IGFBP-3 and the molar IGF-I/IGFBP-3 ratio and demonstrate distinct sexspecific differences across lifespan.
The insulin-like growth factors (IGFs) represent a familyof proteo-hormones with high sequence homology to
proinsulin. The IGFs are involved in a wide spectrum ofphysiological processes including cell proliferation, apo-ptosis and protein synthesis, carbohydrate homeostasis,lipid metabolism and bone metabolism (1). Their biolog-ical effects are mediated and modified through a complexsystem consisting of three IGF receptors (IGF receptor Iand II; insulin receptor) and a superfamily of six high-affinity IGF-binding proteins (1, 2). It is widely acceptedthat binding proteins like the IGFBPs regulate their spe-cific ligands by prolonging IGF half-life in circulation. Fur-thermore, locally produced IGFBP is likely to act as au-tocrine/paracrine regulators of IGF action in varioustissues. In vivo as well as in vitro studies suggest that theIGFBPs also have IGF independent effects (3). For exam-ple, in contrast to IGF-I but similar to growth hormone(GH), IGFBP-3 increases circulating glucose and insulinlevels (4, 5).
IGF-I is predominantly synthesized in the liver in re-sponse to pituitary GH and is the main mediator of theperipheral GH effects. In the circulation, most IGF-I isbound to IGFBP-3 and ALS (acid labile subunit). In theresulting 150 kDa ternary complex IGF-I is unable to crossthe vascular endothelium (1). Therefore, the molar ratiobetween IGF-I and IGFBP-3 has been suggested to reflectan estimate of tissue-available IGF-I (6). In accordancewith this view, the molar ratio of IGF-I/IGFBP-3 appearsto correlate with free as well as with bioactive IGF-I (7).Whereas GH secretion follows a pulsatile pattern, the con-centrations of circulating IGF-I and IGFBP-3 are largelystable during the course of a day as well as during longerperiods, and are therefore considered to reflect the long-term status of GH secretion.
A recent meta-analysis (8) of twelve studies including atotal of 14,906 subjects demonstrated a U-shaped associ-ation between IGF-I concentrations and all-cause mortal-ity as well as cancer- and cardiovascular-related mortality.That study, however, contained no information onIGFBP-3 or the IGF-I/IGFBP-3 ratio. On the other hand,we recently, analyzed 1988 men and 2069 women in theStudy of Health in Pomerania (SHIP), and demonstratedthat low levels of IGFBP-3 were associated with higherall-cause mortality (9). Findings from other large epide-miological studies also support the notion that IGFBP-3 as
well as the IGF-I/IGFBP-3 ratio are associated with im-portant clinical endpoints like cancer (10) or cardiovas-cular disease (11).
While epidemiological data suggest an important rolefor IGFBP-3 as an additional biomarker of GH secretionand as a modulator of IGF effects, in clinical routine thediagnosis of GH related diseases as well as monitoring oftherapy is mainly based on measurements of IGF-I (12,13). One reason for the less frequent use of IGFBP-3 mea-surements and the neglect of the IGF-I/IGFBP-3 ratio in theclinical context may relate to the fact that solid data onreference intervals for IGFBP-3 and the IGF-I/IGFBP-3ratio obtained from large cohorts of well characterizedhealthy subjects are scarce. To our knowledge, all largerstudies are restricted to children and adolescents only (14–16). The availability of such data, however, represents aprerequisite for using a biomarker as a diagnostic tool. Inthe context of IGF-I this has been enforced by the recentconsensus statement (17). Based on these facts we aimedto establish reference intervals for IGFBP-3 and the IGF-I/IGFBP-3 ratio from birth to senescence for a newly de-veloped set of automated assays (IGF-I, IGFBP-3). We val-idated the assays and conducted a large multicenter studyinvolving well characterized subjects of all ages from sev-eral cohorts in different countries to provide robust ref-erence intervals for IGF-I, IGFBP-3 and the IGF-I/IGFBP-3ratio. The IGF-I assay and the construction of the respec-tive reference intervals are presented in the accompanyingmanuscript by Bidlingmaier et al; here, we present therespective studies for IGFBP-3 and the IGF-I/IGFBP-3ratio.
Methods and subjects
Development of the iSYS IGFBP-3 assayThe new iSYS IGFBP-3 assay involves two mouse
monoclonal antibodies and follows a one-step protocolwith a predilution step (6 �L of sample). Diluted samplesand antibodies are incubated at 37°C followed by the ad-dition of streptavidin-coated magnetic particles. The re-sultant signal is generated by flash chemiluminescence ini-tiated by the addition of trigger solutions. Initially, weused the reference material code 93/560 from NIBSC (Na-tional Institute for Biological Standards, Hertfordshire,United Kingdom) for calibration, but the final version ofthe assay utilizes recombinant glycosylated human
2 Reference intervals for IGFBP-3 and IGF-I/IGFBP-3 ratio J Clin Endocrinol Metab
The Endocrine Society. Downloaded from press.endocrine.org by [${individualUser.displayName}] on 03 February 2014. at 03:39 For personal use only. No other uses without permission. . All rights reserved.
IGFBP-3 as the working standard. Methodological detailsas well as the results of the development, validation andcharacterization of the assay are given in the Supplementaltext and Supplemental tables and figures.
Assay Validation and CharacterizationAccording to Clinical and Laboratory Standards Insti-
tute (CLSI) recommendations (18, 19) limits of detection(LOD) and quantification (LOQ), imprecision, linearityand recovery were determined. Comparability of resultsobtained on different instruments was also investigated.
Cross-reactivity and InterferenceSpecificity was tested by analyzing assay buffer and
pooled serum samples spiked with increasing amounts ofinsulin up to 18,000 mU/L (66/304, NIBSC, Hertford-shire, United Kingdom), IGF-I to 2,000 ng/mL, IGF-II to6,000 ng/mL and IGFBP-1, –2, –4, –5, and –6 to 4,000ng/mL (GroPep, Adelaide, Australia). The potential im-pact of high amounts of hemoglobin (Lampire, Pipersville,PA, USA), bilirubin (Merck Millipore, Middlesex, UK)and triglycerides (Sigma-Aldrich, Cambridge, UK) wasalso tested.
Sample type and stabilityTo investigate the potential impact of different collec-
tion tube types blood for IGFBP-3, parallel measurementswere performed in plain serum, serum in separator tubesand in different types of plasma (Na Citrate-, Li Heparin-,Na Heparin- and K-EDTA). Stability of IGFBP-3 levelswas tested by measuring five human serum and plasmasamples after storage at 4°C and 25°C for approximately4days (96hours) andafter4 freeze-thawcycles in6humanserum samples.
Comparison to existing methodThe new IDS-iSYS IGFBP-3 assay was compared to the
Immulite 2500 (Siemens, Los Angeles, CA) by parallel as-sessment of serum samples from the SHIP cohort (n �4121). Historical data from the same samples measured bythe Nichols Advantage (Nichols Institute Diagnostics)IGFBP-3 assay were additionally compared to the iSYSIGFBP-3 assay. All assays were performed according tothe respective manufacturers’ instructions.
Subjects included in the reference interval studyTo establish method specific reference intervals for
IGFBP-3 and the IGF-I/IGFBP-3 ratio, both parameterswere measured using the newly developed, automatedIDS-iSYS assays in samples obtained from 11 differentcohorts: one newborn study (cord blood), 5 pediatric co-horts (Canada, Denmark, Germany, Sweden, USA) andfour adult cohorts (Germany). Detailed informationabout the different cohorts is provided in the accompa-nying manuscript by Bidlingmaier et al and also summa-rized in Table 1. All studies were approved by the respec-tive local Institutional Review Board and informedconsent was obtained from participants or parents whenappropriate. Collection procedures, sample type and de-tails of the respective cohorts are given elsewhere (20–23).All samples were stored at –20°C or –80°C beforeanalysis.
MeasurementsSamples were analyzed on IDS-iSYS instruments in 7
laboratories in 5 countries (Table 1) according to a stan-dardized protocol. Due to limitations in sample volume,IGF-I was measured in 15014 samples, whereas IGFBP-3was only measured in 14970 samples. All analyses tookplace between 2010 and 2011. The same batch of reagents
Table 1. Details of the cohorts and laboratories taking part in the reference interval study. Detailed informationabout the exact number of subjects of each sex falling into each age group is given in the Supplemental tables S12-S15.
Studygroup
Labmeasured
No. of samples for
Samplematrix
Age range[years]
IGFBP-3 IGF-I/IGFBP-3 ratio
Munich, Germany Munich 144 144 cord blood 0CALIPER, Canada San
Clemente1359 1357 serum 0–19
CALIPER new Liege 602 588 serum 0–20Randers, Denmark Aarhus 854 854 serum 5–20Gothenburg,
SwedenGothenburg 319 319 serum 0.9–1.1
Leipzig, Germany Munich 190 190 serum 7–18Athens, Georgia,
USASan
Clemente716 682 serum 3–19
MESY-BEPO Berlin 2619 2616 serum 18–87SHIP Greifswald 4109 4109 serum 20–81KORA F4 Munich 3018 2988 plasma 32–81KORA Age Munich 1040 1040 serum 65–94Total 14970 14887
doi: 10.1210/jc.2013-3060 jcem.endojournals.org 3
The Endocrine Society. Downloaded from press.endocrine.org by [${individualUser.displayName}] on 03 February 2014. at 03:39 For personal use only. No other uses without permission. . All rights reserved.

was used in all laboratories, with the exception of themeasurement of the samples from KORA F4, where an-other batch was intentionally used to investigate indepen-dence of the results from the reagent batch. Variabilitybetween laboratories was assessed using the same set of 3QC samples in all assay runs, and between instrumentagreement was formally assessed in a separate study (seeSupplemental Tables S2, S3).
Detailed information about the IGF-I assay used in thisstudy is provided in the accompanying manuscript byBidlingmaier et al
Statistical analysisEP Evaluator Software (version 8.0.0114, Data Inno-
vations Europe, Brussels, Belgium) has been used for anal-ysis of the data obtained during assay validation. For cor-relation of results obtained by the new IGFBP-3 IDS-iSYSassay to those obtained by widely used existing or previousIGFBP-3 assays (Siemens Immulite 2500 and Nichols Ad-vantage), Passing-Bablok analysis was used to obtain theslope and intercept and Bland-Altman-Plots were dis-played. Statistical analyses were performed with SAS 9.1(SAS Institute Inc., Cary, NC, USA).
Acquired results from the multicentric reference inter-val study were explored by several statistical models. Amodification of the LMS method (24, 25) allowed the bestfit and therefore was used to construct reference rangesaccording to age and sex. In a subset of samples fromchildren and adolescents, information about Tannerstages was available. In this subset, reference intervals forboth sexes according to Tanner stage were developed us-ing the Harrell-Davis Estimate of Quantiles.
To further investigate the robustness of the referenceintervals obtained, three adult cohorts (KORA F4, KORAAge and SHIP) were used to analyze the influence of dif-ferent exclusion criteria (renal function, diabetes etc.,) bycalculating references intervals based on quantile regres-sion (26) with restricted cubic splines with three pre-defined knots (27).
Further statistical analysis was done with Statview 5.0(1998, SAS institute Inc., Cary, NC, USA). NonparametricMann Whitney U test or Kruskal-Wallis one-way analysisof variance (ANOVA) was used for between-group com-parisons as appropriate.
Concentrations of IGFBP-3 are given in ng/mLthroughout the manuscript, but the calculation of the IGF-I/IGFBP-3 ratio was performed after conversion intonmol/L (IGF-I: ng/mL x 0.1307 � nmol/L; IGFBP-3:ng/mL x 0.03478 � nmol/L). To better illustrate the rel-ative abundance of IGF-I and IGFBP-3 molecules in blood,the resulting molar ratio was expressed as a percentage(Ratio � IGF-I[nmol/l]/IGFBP-3[nmol/l]*100).
Results
Assay characteristicsValidation of the assay in different laboratories con-
firmed a broad measurement range up to supraphysiologi-cal concentrations (10,000 ng/mL; Table S4). The limit ofquantification was below 50 ng/mL (Supplemental figureS1). Excellent reproducibility of the measurements couldbe demonstrated between instruments, laboratories andreagent batches (Tables S2, S3). No cross-reactivity or in-terference was seen for any of the tested compounds, in-cluding the other IGFBPs (Table S6a, S6b). We show lineardilution of the glycosylated recombinant human (rh)IGFBP-3 used for calibration and parallel dilution withsamples containing high IGFBP-3 concentrations (TableS4a, S4b). Furthermore, measured IGFBP-3 concentra-tions in normal samples did not change after overnightincubation with third trimester samples at 37°C expectedto exhibit high proteolytic activity (Table S16). We alsoextensively tested the impact of preanalytical conditionsand repeated freezing and thawing but IGFBP-3 concen-trations remained stable under all conditions tested (Ta-bles S8-S10). Measured concentrations were comparablein most matrices, but 10%–20% lower when citrate oroxalate plasma was used (Table S11).
Comparison to other IGFBP-3 assaysSamples from the baseline examination in SHIP had
originally been measured using the Nichols AdvantageIGFBP-3 assay. We now reassayed these samples using theIDS-iSYS assay. The results from both assay correlated(R � 0.78 (95% CI 0.77–0.79)), but IGFBP-3 levels mea-sured by the Nichols Advantage assay were significantlylower than those reported by the new IDS-iSYS assay(iSYS � 92.8�2.14 x Nichols; Figure 1). In contrast, insamples recently collected during the first 5-year fol-low-up examination in SHIP, which were analyzed in par-allel using the Siemens Immulite 2500 and the IDS-iSYSassay a strong correlation with a much closer agreementwas observed (slope 0.86; 95%CI 0.85–0.87). The meandifference between the methods was only about 1% (52.7ng/ml).
Generation of reference intervals for IGFBP-3 andthe IGF-I/IGFBP-3 ratio
In the present study, data from 14,970 and 14,887 sub-jects were available for the calculation of reference inter-vals for IGFBP-3 and the IGF-I/IGFBP-3 ratio, respectively(Table 1). Summarized sex-specific L, M and S values andthe fitted percentiles for IGFBP-3 and the IGF-I/IGFBP-3ratio are given for males (Table 2a) and females (Table 2b),and individual data points are displayed in Figures 2a and2b. An extended version of the tables showing percentiles
4 Reference intervals for IGFBP-3 and IGF-I/IGFBP-3 ratio J Clin Endocrinol Metab
The Endocrine Society. Downloaded from press.endocrine.org by [${individualUser.displayName}] on 03 February 2014. at 03:39 For personal use only. No other uses without permission. . All rights reserved.

and variables for smaller increments (�1 year up to age 30,1 year thereafter) is given in the supplemental tables (S12- S15). These tables also show the number of subjects fromthe reference population falling into each age group.
As expected, concentrations of IGFBP-3 showed astrongly age-related pattern in both sexes (Figure 2a). Theincrease during childhood continues until the age of 22years and thus peak concentrations are reached later thanpeak IGF-I concentrations. Peak values for the percentilesfor IGFBP-3 were higher in females (50th percentile 4649ng/mL) than in males (4454 ng/mL). In contrast to the verypronounced peripubertal peak in IGF-I concentrations,which is followed by a rapid decline, IGFBP-3 concentra-tions exhibit a plateau in concentrations between the agesof 15 and 25. At age 30, IGFBP-3 concentrations are verysimilar in both sexes (50th percentile 4241 ng/mL (M) and4265 ng/mL (F)) followed by a more pronounced declinein males than in females, with lower concentrations at age60 (50th percentile M vs. F: 3751 vs. 3904 ng/mL) and 80(M vs. F: 3190 vs. 3634 ng/mL). Thus, during 50 years oflife, the 50th percentile of IGFBP-3 concentrations de-clines by about 25% in males as opposed to only 15% infemales.
The corresponding reference intervals for the IGF-I/IGFBP-3 ratio also exhibit a strong increase during child-hood. Peak concentrations for the ratio are mainly deter-mined by the high peak in IGF-I-concentrations andtherefore, the ratio reached peak values before IGFBP-3concentrations at around 15 years in both sexes (Figure
2b). The highest values for the IGF-I/IGFBP-3 ratio occur slightly earlier(F: 14.5–15.0 years, M: 15.0–15.5years) and the 50th percentile isslightly lower in females as com-pared to males (23.9 vs. 24.6%; sup-plemental Tables S14, S15). Beyondpuberty, ratios decline rapidly andare around 13% at age 30 in bothsexes. Females maintain higherIGFBP-3 concentrations at older age,whereas IGF-I concentrations re-main higher in males beyond the ageof 50, and accordingly, the corre-sponding IGF-I/IGFBP-3 ratio is alsohigher in older males (50th percen-tile at 80 years: M vs. F: 11.4 vs.9.3%).
To better reflect pubertalchanges, we also constructed refer-ence ranges for IGFBP-3 concentra-tions according to Tanner stagesfrom a pediatric cohort (n � 854(393 boys, 461 girls); Tables 3a and
3b), with the highest concentrations seen in Tanner stageIV/V. In both sexes, peak values for the 2.fifth percentilefor IGFBP-3 concentrations were significantly lower whencalculated based on chronological age (Tables 2a, 2b) ascompared to the calculation based on Tanner stages (Ta-ble 3; M: 2753 vs. 3867 ng/mL; F: 2855 vs. 3934 ng/mL).This difference between calculation based on chronolog-ical age and Tanner stage was much less pronounced at the50th percentile, and almost absent at the upper end of thereference interval (97.fifth percentile; M: 6361 vs. 6651ng/mL; F: 6570 vs. 6559 ng/mL).
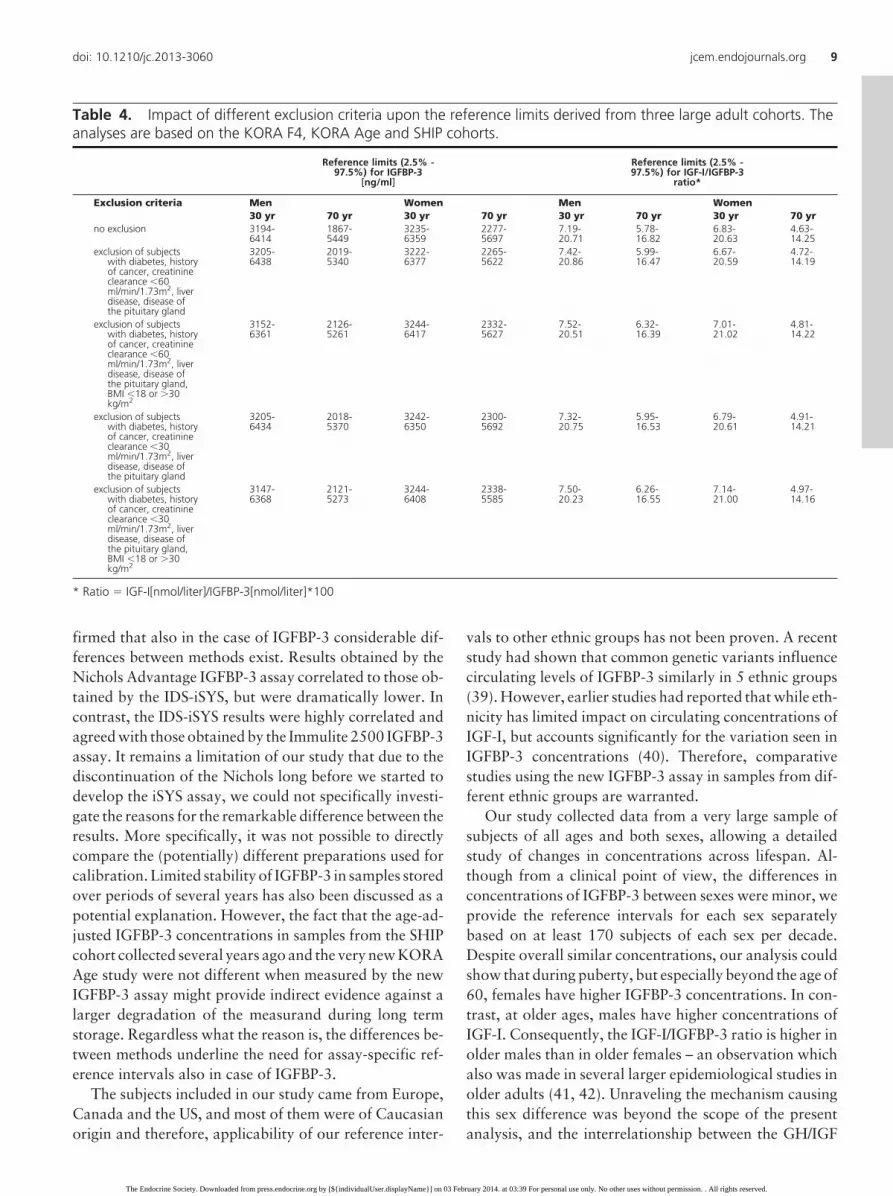
Based on three population-based adult studies (KORAF4, KORA Age and SHIP), where detailed information oncomorbidities and anthropometric measures were avail-able, we investigate the impact of the application of dif-ferent exclusion criteria to define the “reference popula-tion” on the resulting reference intervals (Table 4). Theoverall impact of applying stricter exclusion criteria on thereference intervals constructed was small. It is very obvi-ous that the minor differences between the resulting ref-erence ranges are clinically irrelevant.
Discussion
Here we report the development and validation of a new,automated chemiluminescence immunoassay for the mea-surement of IGFBP-3. We also report extensive method-
Figure 1. Comparison of the IGFBP-3 levels measured by Nichols Advantage and IDS-iSYS(based on the SHIP-0 cohort) on the left side and Immulite 2500 and IDS-iSYS (based on theSHIP-1 cohort) on the right side. Passing-Bablok regression plots are displayed in the top: thethick solid red line represents the regression line, the dashed red lines represents the 95%confidence interval (CI) for the fit. Bland-Altman plots are displayed in the bottom.
doi: 10.1210/jc.2013-3060 jcem.endojournals.org 5
The Endocrine Society. Downloaded from press.endocrine.org by [${individualUser.displayName}] on 03 February 2014. at 03:39 For personal use only. No other uses without permission. . All rights reserved.

Table 2. a. LMS charts for males for each age group. The variables � and sigma as well as the estimatedpercentiles (2.5, 50 and 97.5%) are provided. Note that an extended version of this table providing the data split bysmaller increments in age and also providing the exact number of subjects of each sex falling into each age group isgiven in the Supplemental tables S12-S15.
IGFBP-3 [ng/ml] IGF-I/IGFBP-3 ratio*
LMS parameter(lambda �0.7190)
Percentiles LMSparameter(lambda �0.4072)
Percentiles
age � sigma 2.5% 50% 97.5% � sigma 2.5% 50% 97.5%0 2072.6077 0.2558 1113 2073 3180 9.7254 0.4194 3.57 9.73 19.761 2378.7990 0.2528 1289 2379 3634 10.2974 0.4115 3.87 10.30 20.682 2678.0241 0.2498 1465 2678 4074 10.9794 0.4037 4.22 10.98 21.803 2965.7883 0.2468 1637 2966 4492 11.7516 0.3959 4.62 11.75 23.074 3234.9229 0.2438 1801 3235 4878 12.5967 0.3882 5.07 12.60 24.445 3458.4976 0.2409 1942 3458 5193 13.5140 0.3806 5.55 13.51 25.926 3600.7249 0.2381 2039 3601 5384 14.5105 0.3732 6.09 14.51 27.537 3670.4182 0.2353 2096 3670 5466 15.6094 0.3660 6.68 15.61 29.298 3741.0823 0.2326 2153 3741 5550 16.8557 0.3589 7.36 16.86 31.299 3830.0772 0.2301 2221 3830 5660 18.2445 0.3520 8.12 18.24 33.5110 3939.5526 0.2277 2300 3940 5801 19.7240 0.3451 8.94 19.72 35.8511 4058.3802 0.2254 2385 4058 5956 21.2109 0.3382 9.80 21.21 38.1412 4165.1026 0.2232 2463 4165 6093 22.5791 0.3312 10.62 22.58 40.1713 4249.6017 0.2212 2528 4250 6198 23.6721 0.3242 11.35 23.67 41.6514 4312.7807 0.2192 2580 4313 6272 24.3608 0.3171 11.90 24.36 42.3915 4348.5313 0.2174 2614 4349 6306 24.5955 0.3101 12.23 24.60 42.3416 4366.2753 0.2157 2638 4366 6316 24.4011 0.3033 12.35 24.40 41.5517 4378.8828 0.2141 2657 4379 6319 23.8399 0.2968 12.27 23.84 40.1818 4394.2924 0.2126 2678 4394 6327 22.9879 0.2907 12.02 22.99 38.3719 4413.4744 0.2113 2700 4413 6341 21.9323 0.2850 11.64 21.93 36.2820 4435.5676 0.2100 2723 4436 6361 20.7612 0.2799 11.16 20.76 34.0621–25 4453.2249 0.2074 2753 4453 6361 17.8642 0.2692 9.86 17.86 28.8126–30 4306.8442 0.2047 2683 4307 6127 14.2328 0.2572 8.09 14.23 22.5131–35 4197.6191 0.2053 2610 4198 5977 12.7923 0.2544 7.33 12.79 20.1436–40 4177.3891 0.2090 2571 4177 5982 12.2280 0.2566 6.96 12.23 19.3241–45 4161.0794 0.2155 2515 4161 6018 11.2808 0.2620 6.34 11.28 17.9846–50 4022.4845 0.2239 2374 4022 5891 11.1402 0.2701 6.14 11.14 17.9951–55 3913.7597 0.2328 2251 3914 5808 10.9564 0.2781 5.92 10.96 17.9256–60 3801.3203 0.2413 2133 3801 5711 10.9734 0.2815 5.87 10.97 18.0561–65 3693.6761 0.2487 2027 3694 5610 10.8437 0.2791 5.84 10.84 17.7766–70 3579.3183 0.2552 1926 3579 5487 11.1745 0.2752 6.08 11.17 18.2071–75 3364.5920 0.2609 1779 3365 5201 11.1568 0.2712 6.13 11.16 18.0576–80 3219.0924 0.2663 1673 3219 5015 11.2884 0.2651 6.30 11.29 18.0981–85 3194.2581 0.2717 1632 3194 5014 11.5752 0.2560 6.60 11.58 18.2786–90 3312.7544 0.2770 1665 3313 5239 11.6855 0.2449 6.85 11.69 18.12
* Ratio � IGF-I[nmol/liter]/IGFBP-3[nmol/liter]*100. Table 2b. LMS charts for females for each age group. Thevariables � and sigma as well as the estimated percentiles (2.5, 50 and 97.5%) are provided. Note that an extendedversion of this table providing the data split by smaller increments in age and also providing the exact number ofsubjects of each sex falling into each age group is given in the Supplemental tables S12-S15.
IGFBP-3 [ng/ml] IGF-I/IGFBP-3 ratio*
LMS parameter (lambda� 0. 8399)
Percentiles LMSparameter(lambda �0.3208)
Percentiles
age � sigma 2.5% 50% 97.5% � sigma 2.5% 50% 97.5%0 2113.7322 0.2692 1053 2114 3271 10.4133 0.3789 4.46 10.41 20.271 2417.1846 0.2652 1221 2417 3721 10.5573 0.3718 4.60 10.56 20.322 2711.3549 0.2613 1388 2711 4151 10.8268 0.3649 4.80 10.83 20.613 2992.6286 0.2573 1553 2993 4557 11.2273 0.3581 5.07 11.23 21.144 3257.3873 0.2534 1713 3257 4933 11.7641 0.3515 5.40 11.76 21.925 3479.9041 0.2496 1854 3480 5242 12.4383 0.3451 5.80 12.44 22.946 3605.4271 0.2458 1945 3605 5403 13.2495 0.3391 6.27 13.25 24.207 3699.0712 0.2421 2019 3699 5515 14.2414 0.3334 6.84 14.24 25.788 3794.7955 0.2385 2096 3795 5629 15.4551 0.3281 7.52 15.46 27.739 3903.2395 0.2350 2180 3903 5762 16.9106 0.3231 8.33 16.91 30.1010 4021.3541 0.2317 2270 4021 5908 18.5648 0.3184 9.25 18.56 32.7911 4140.0713 0.2285 2360 4140 6055 20.2738 0.3138 10.22 20.27 35.5412 4246.4293 0.2255 2444 4246 6184 21.8330 0.3094 11.12 21.83 38.0013 4334.6486 0.2226 2517 4335 6286 23.0439 0.3052 11.86 23.04 39.8314 4406.2559 0.2199 2580 4406 6365 23.7757 0.3011 12.36 23.78 40.8215 4466.1923 0.2173 2636 4466 6428 23.9725 0.2974 12.57 23.97 40.9016 4510.8040 0.2150 2682 4511 6470 23.6591 0.2941 12.51 23.66 40.15
(Continued )
6 Reference intervals for IGFBP-3 and IGF-I/IGFBP-3 ratio J Clin Endocrinol Metab
The Endocrine Society. Downloaded from press.endocrine.org by [${individualUser.displayName}] on 03 February 2014. at 03:39 For personal use only. No other uses without permission. . All rights reserved.

specific age- and sex-adjusted reference intervals forIGFBP-3 derived from a large multicenter study includingsamples from about 15,000 newborns, children, adoles-cents and adults of all ages from different geographic re-gions. Finally, because the same automated assay systemalso allows for the measurement of IGF-I, we are for thefirst time able to present reference intervals for the IGF-I/IGFBP-3 ratio in such a large population.
The strong influence of age on circulating IGFBP-3 con-centrations seen in our study confirms observations fromprevious studies reporting reference intervals in smallercohorts. Some of these studies focused on the generationof normative data in children and adolescents and in-cluded between 468 and 1692 individuals (15, 16, 28–33).Reference intervals for IGFBP-3 concentrations have alsobeen reported from studies in adults (30, 34, 35) whichincluded from 1584 to 2499 individuals. There are onlythree studies in children (15, 16, 32) and one study inadults (30) describing reference intervals for the IGF-I/IGFBP-3 ratio. Some of these studies reported ratios ofmass concentrations (15, 30), whereas others (16, 32) re-ported the ratio of the molar concentrations. We followedthe latter approach to accurately reflect the considerabledifference in size of the two molecules. Although the study
by Albertini et al (16, 32) only in-cluded children and adolescents be-tween ages 6 and 20, and was con-ducted using different assay (manualRIAs), the values reported for the ra-tio during early childhood are in asimilar range: the 50th percentilewas about 15% in both studies andat the peripubertal peak, the ratiowas about 30% at age 15 in (16, 32)and during Tanner IV in our study.Based on our data, at the pubertalpeak the molar IGF-I concentrationsconstituted on average about onethird of the molar IGFBP-3 concen-tration. In contrast, after birth and atold age, the molar IGF-I concentra-tions are only about 10% of the cor-responding molar IGFBP-3concentrations.
Many different manual or auto-mated assays involving polyclonalantisera or monoclonal antibodies ofdifferent specificity have been usedto establish reference intervals forIGFBP-3 concentrations. The co-horts used differed in size, age rangesand geographical origin. Further-more, various statistical methods
have been used for calculation of reference intervals. Thesefactors might contribute to the considerable differences inthe reported absolute concentrations of IGFBP-3 betweenstudies: E.g., the upper limit of normal at the pubertal peakvaries from 4,800 (28) to 13,800 ng/ml (29), althoughmost studies (15, 16, 30, 31, 33) report peak values around7,000 ng/ml. These dramatic variations cannot be ex-plained by biological variation alone. Analytical hetero-geneity between immunoassays has been studied and dis-cussed for several years, albeit mainly for GH and IGF-Iassays, for which a recent consensus statement demandedthe use of uniform standards to minimize between-methoddifferences (17). In this respect, until today much less at-tention was given to IGFBP-3 assays, although potentialfactors leading to heterogeneity in IGFBP-3 assay havebeen described: It is important to keep in mind thatIGFBP-3 circulates in different forms resulting from gly-cosylation (36). The assay presented here is calibratedagainst human glycosylated IGFBP-3 expressed in mam-malian cells, and our validation experiments have shownfull recovery of the glycosylated standard in human sam-ples as well as parallel dilution of the calibrator and sam-ples containing high endogenous IGFBP-3 concentrations.
Figure 2. Serum IGFBP-3 (a) and IGF-I/IGFBP-3-ratio (b) values in approximately 15,000 subjectsfor males (left side) and females (right side). The lines represent the 2.5%, 25%, 50%, 75% and97.5% percentiles calculated by quantile regression via vector generalized additive models.Ratio � IGF-I[nmol/l] / IGFBP-3[nmol/l] * 100.
doi: 10.1210/jc.2013-3060 jcem.endojournals.org 7
The Endocrine Society. Downloaded from press.endocrine.org by [${individualUser.displayName}] on 03 February 2014. at 03:39 For personal use only. No other uses without permission. . All rights reserved.

Furthermore, IGFBP-3 can be proteolysed (37), particu-larly under specific clinical conditions like pregnancy (38).We could demonstrate that in the new IGFBP-3 assay mea-sured concentrations in normal samples are not changedafter incubation with third trimester samples at 37°C in-
dicating the assay is not significantly affected byproteolysis.
Comparison of the IGFBP-3 concentrations obtainedby the new IDS-iSYS assay to those obtained by two otherautomated assays which were or are widely used con-
Table 2. Continued
IGFBP-3 [ng/ml] IGF-I/IGFBP-3 ratio*
17 4542.3031 0.2128 2718 4542 6495 22.9153 0.2913 12.20 22.92 38.7118 4566.3094 0.2108 2749 4566 6510 21.8598 0.2890 11.70 21.86 36.7919 4590.5104 0.2090 2779 4591 6527 20.6236 0.2873 11.08 20.62 34.6020 4617.5735 0.2073 2809 4618 6550 19.3455 0.2860 10.43 19.35 32.3921–25
4646.5472 0.2040 2855 4647 6559 16.4255 0.2846 8.88 16.43 27.44
26–30
4430.4156 0.2002 2752 4430 6219 13.4803 0.2868 7.25 13.48 22.60
31–35
4137.1585 0.1998 2573 4137 5804 12.8042 0.2905 6.83 12.80 21.60
36–40
4055.1332 0.2022 2504 4055 5709 12.4502 0.2920 6.62 12.45 21.05
41–45
3956.5718 0.2070 2409 3957 5610 11.6841 0.2928 6.20 11.68 19.79
46–50
3921.5147 0.2134 2343 3922 5612 11.1640 0.2954 5.88 11.16 18.99
51–55
3944.5084 0.2205 2306 3945 5703 10.4867 0.3006 5.46 10.49 17.99
56–60
3914.0402 0.2276 2238 3914 5717 9.6143 0.3063 4.93 9.61 16.65
61–65
3859.9509 0.2342 2161 3860 5691 9.1422 0.3082 4.67 9.14 15.88
66–70
3747.4925 0.2401 2059 3747 5572 9.1030 0.3053 4.68 9.10 15.74
71–75
3707.0794 0.2449 2005 3707 5549 9.0263 0.2976 4.73 9.03 15.41
76–80
3648.8049 0.2486 1950 3649 5490 9.0088 0.2880 4.83 9.01 15.13
81–85
3639.4316 0.2516 1925 3639 5498 9.5279 0.2788 5.22 9.53 15.76
86–90
3740.5262 0.2543 1961 3741 5672 9.6706 0.2701 5.41 9.67 15.77
* Ratio � IGF-I[nmol/liter]/IGFBP-3[nmol/liter]*100.
Table 3. Percentiles for IGFBP-3 (a) and IGF-I/IGFBP-3-ratio (b) according to Tanner stages based on the Danishcohort (n � 854). Estimated percentiles (2.5, 25, 50, 75 and 97.5%) derived by Harrell-Davis Estimate of Quartilesare provided. Ratio � IGF-I[nmol/liter]/IGFBP-3[nmol/liter]*100. (a)
IGFBP-3 (ng/mL)
sex Tanner age range 2.5% 25% 50% 75% 97.5%male I 6.1 – 12.9 2709 3511 4003 4331 5260
II 8.1 – 14.8 3528 4279 4606 4883 5748III 10.9 – 16.0 3731 4598 5000 5463 6387IV 12.4 – 17.1 3365 4914 5184 5585 6198V 13.5 – 20.0 3867 4571 5054 5515 6651
female I 5.8 – 12.1 2804 3699 4099 4521 5242II 9.3 – 14.1 3053 3927 4540 4891 5597III 9.3 – 15.1 3934 4489 4874 5341 6012IV 11.8 – 16.6 3800 4606 5024 5530 6358V 12.5 – 19.9 3880 4763 5086 5508 6486
(b)IGF-I/IGFBP-3 ratio (%)
sex Tanner age range 2.5% 25% 50% 75% 97.5%male I 6.1 – 12.9 9.36 13.02 15.03 17.05 23.12
II 8.1 – 14.8 10.55 18.34 22.39 26.42 33.00III 10.9 – 16.0 20.96 27.40 28.99 32.40 39.58IV 12.4 – 17.1 19.33 27.05 31.07 35.15 41.82V 13.5 – 20.0 18.43 23.47 26.98 29.74 35.21
female I 5.8 – 12.1 10.30 14.55 17.27 20.39 26.32II 9.3 – 14.1 12.93 17.21 20.92 25.84 32.44III 9.3 – 15.1 20.41 26.13 29.51 32.14 38.95IV 11.8 – 16.6 15.25 24.88 29.18 33.55 41.62V 12.5 – 19.9 14.25 20.00 25.69 29.02 36.14
8 Reference intervals for IGFBP-3 and IGF-I/IGFBP-3 ratio J Clin Endocrinol Metab
The Endocrine Society. Downloaded from press.endocrine.org by [${individualUser.displayName}] on 03 February 2014. at 03:39 For personal use only. No other uses without permission. . All rights reserved.
firmed that also in the case of IGFBP-3 considerable dif-ferences between methods exist. Results obtained by theNichols Advantage IGFBP-3 assay correlated to those ob-tained by the IDS-iSYS, but were dramatically lower. Incontrast, the IDS-iSYS results were highly correlated andagreed with those obtained by the Immulite 2500 IGFBP-3assay. It remains a limitation of our study that due to thediscontinuation of the Nichols long before we started todevelop the iSYS assay, we could not specifically investi-gate the reasons for the remarkable difference between theresults. More specifically, it was not possible to directlycompare the (potentially) different preparations used forcalibration. Limited stability of IGFBP-3 in samples storedover periods of several years has also been discussed as apotential explanation. However, the fact that the age-ad-justed IGFBP-3 concentrations in samples from the SHIPcohort collected several years ago and the very new KORAAge study were not different when measured by the newIGFBP-3 assay might provide indirect evidence against alarger degradation of the measurand during long termstorage. Regardless what the reason is, the differences be-tween methods underline the need for assay-specific ref-erence intervals also in case of IGFBP-3.
The subjects included in our study came from Europe,Canada and the US, and most of them were of Caucasianorigin and therefore, applicability of our reference inter-
vals to other ethnic groups has not been proven. A recentstudy had shown that common genetic variants influencecirculating levels of IGFBP-3 similarly in 5 ethnic groups(39). However, earlier studies had reported that while eth-nicity has limited impact on circulating concentrations ofIGF-I, but accounts significantly for the variation seen inIGFBP-3 concentrations (40). Therefore, comparativestudies using the new IGFBP-3 assay in samples from dif-ferent ethnic groups are warranted.
Our study collected data from a very large sample ofsubjects of all ages and both sexes, allowing a detailedstudy of changes in concentrations across lifespan. Al-though from a clinical point of view, the differences inconcentrations of IGFBP-3 between sexes were minor, weprovide the reference intervals for each sex separatelybased on at least 170 subjects of each sex per decade.Despite overall similar concentrations, our analysis couldshow that during puberty, but especially beyond the age of60, females have higher IGFBP-3 concentrations. In con-trast, at older ages, males have higher concentrations ofIGF-I. Consequently, the IGF-I/IGFBP-3 ratio is higher inolder males than in older females – an observation whichalso was made in several larger epidemiological studies inolder adults (41, 42). Unraveling the mechanism causingthis sex difference was beyond the scope of the presentanalysis, and the interrelationship between the GH/IGF
Table 4. Impact of different exclusion criteria upon the reference limits derived from three large adult cohorts. Theanalyses are based on the KORA F4, KORA Age and SHIP cohorts.
Reference limits (2.5% -97.5%) for IGFBP-3
[ng/ml]
Reference limits (2.5% -97.5%) for IGF-I/IGFBP-3
ratio*
Exclusion criteria Men Women Men Women30 yr 70 yr 30 yr 70 yr 30 yr 70 yr 30 yr 70 yr
no exclusion 3194-6414
1867-5449
3235-6359
2277-5697
7.19-20.71
5.78-16.82
6.83-20.63
4.63-14.25
exclusion of subjectswith diabetes, historyof cancer, creatinineclearance �60ml/min/1.73m2, liverdisease, disease ofthe pituitary gland
3205-6438
2019-5340
3222-6377
2265-5622
7.42-20.86
5.99-16.47
6.67-20.59
4.72-14.19
exclusion of subjectswith diabetes, historyof cancer, creatinineclearance �60ml/min/1.73m2, liverdisease, disease ofthe pituitary gland,BMI �18 or �30kg/m2
3152-6361
2126-5261
3244-6417
2332-5627
7.52-20.51
6.32-16.39
7.01-21.02
4.81-14.22
exclusion of subjectswith diabetes, historyof cancer, creatinineclearance �30ml/min/1.73m2, liverdisease, disease ofthe pituitary gland
3205-6434
2018-5370
3242-6350
2300-5692
7.32-20.75
5.95-16.53
6.79-20.61
4.91-14.21
exclusion of subjectswith diabetes, historyof cancer, creatinineclearance �30ml/min/1.73m2, liverdisease, disease ofthe pituitary gland,BMI �18 or �30kg/m2
3147-6368
2121-5273
3244-6408
2338-5585
7.50-20.23
6.26-16.55
7.14-21.00
4.97-14.16
* Ratio � IGF-I[nmol/liter]/IGFBP-3[nmol/liter]*100
doi: 10.1210/jc.2013-3060 jcem.endojournals.org 9
The Endocrine Society. Downloaded from press.endocrine.org by [${individualUser.displayName}] on 03 February 2014. at 03:39 For personal use only. No other uses without permission. . All rights reserved.
axis and sex hormones are complex (43, 44). However, theoccurrence of the dimorphism after menopause suggests arole of sex steroids (45).
Potential clinical implications of the analysis of changesin concentrations of IGFBP-3 and also the IGF-I/IGFBP-3ratio are also suggested by epidemiological data showingsignificant associations between IGFBP-3 or the IGF-I/IGFBP-3 ratio and various diseases ranging from cancer,coronary events, hepatic steatosis and lung function tomortality (9, 46–52). Also studies on the molecular levelsuggest a role of IGFBP-3 in the development of the dis-eases: IGFBP-3 possesses IGF-independent actions whichmainly are related to apoptosis and cell growth, andIGFBP-3 concentrations seem to modify glucose uptake(53). In vitro, IGFBP-3 inhibits the insulin-stimulated glu-cose uptake in adipocytes (54, 55), and in vivo overex-pression of IGFBP-3 leads to hyperglycemia, impaired glu-cose tolerance, and insulin resistance independent of IGF-I(56). In patient with non insulin-dependent diabetes ahigher IGFBP-3 proteolytic activity was found comparedto healthy controls suggesting a role for IGFBP-3 in met-abolic diseases (57). In this context, it is interesting that aninvestigation of the Third National Health and NutritionExaminationSurvey reported three-foldhigheroddsof themetabolic syndrome in subjects with a low IGF-I/IGFBP-ratio (58).
With our present study, we are able to provide methodspecific age- and sex-adjusted reference intervals across allage-groups from birth to senescence for serum concentra-tions of IGFBP-3 and for the molar IGF-I/IGFBP-3 ratio.We identified differences between sexes in the age-relatedchanges in the IGF-I/IGFBP-3 ratio, which is significantlyhigher in aged males. The huge data set obtained from theanalysis of samples from well characterized cohorts andanalyzed by the new combination of automated assays forIGF-I and IGFBP-3 might facilitate the application of theseparameters in clinical studies, research and potentiallyalso in clinical practice.
Acknowledgments
This work is part of the research project Greifswald Approach toIndividualized Medicine (GANI MED). The GANI MEDconsortium is funded by the Federal Ministry of Education andResearch and the Ministry of Cultural Affairs of the Federal Stateof Mecklenburg – West Pomerania (03IS2061A). Data collectionwas supported by the Community Medicine Research network(CMR) of the University of Greifswald, Germany, and is fundedby the Federal Ministry of Education and Research, the Ministryof Cultural Affairs, as well as the Social Ministry of the FederalState of Mecklenburg-West Pomerania. The CMR encompassesseveral research projects that share data from the population-
based Study of Health in Pomerania (SHIP;http://www.community-medicine.de).
The MONICA/KORA Augsburg studies were initiated andfinanced by the GSF-National Research Center for Environmentand Health, Neuherberg, Germany (now Helmholtz ZentrumMünchen, German Research Center for Environmental Health)and the German Federal Ministry of Education, Science, Re-search, and Technology and by the State of Bavaria.
This study was in part supported by a grant from the GermanFederal Ministry of Education and Research (BMBF) to MB(FKZ 01ET1003D).
The MeSy-BePo study is supported by a grant from the Ger-man Federal Ministry of Education and Research to AFHP(BMBF 0313042). AMA is supported by graduate school(GK1208) of the German Research Foundation (DFG).
The support from Dr Carsten Heuck, Mrs Anne Karina Kjaer,study nurse, and Mrs Charlotte Gradman, study nurse, for tak-ing the blood samples as well as from headmasters, teachers andstudents at Randers Realskole, Hadsundvejens Skole, Hobrove-jens Skole and Randers Statsskole, Randers, for providing fineworking conditions is gratefully acknowledged. The Randersstudy was supported by grants from Clinical Institute, Health,Aarhus University, Johannes M. Klein og Hustrus Mindelegat,Forskningsfonden Laegekredsforeningen for Aarhus Amt, KongChristian den Tiendes Fond, Overlaege Johan Boserup og LiseBoserups Legat, Koventualinde Emilie De Lancy´s Fond.
The Research and Development Board, Halland Contry Con-cil and the Halland Regional Development Council have sup-ported the study in Sweden.
Address all correspondence and requests for reprints to: Mar-tin Bidlingmaier, MD, Endocrine Research Laboratories, Me-dizinische Klinik und Poliklinik IV, Klinikum der UniversitätMünchen, Ziemssenstr. 1, 80336 Munich, Germany, Tel.: �49–89–5160–2277, Fax: �49–89–5160–4457, E-mail:[email protected].
*NF, ODW and AMA contributed equally to this workThis work was supported by .Disclosure summary: NF, ODW, RTE, JS, JR, JK, HJG, CH,
AFHP, AD and MBie have nothing to declare. AMA, JD, JF, andHW received research support from IDS. MB received researchsupport and/or lecture fees from IDS, Siemens, Novartis, Pfizer,Chiasma and Prolor and consults for IDS, Chiasma and Prolor.
References
1. Jones JI, Clemmons DR. Insulin-like growth factors and their bind-ing proteins: biological actions. Endocr Rev. 1995;16:3–34.
2. Juul A. Serum levels of insulin-like growth factor I and its bindingproteins in health and disease. Growth Horm IGF Res. 2003;13:113–170.
3. Mohan S, Baylink DJ. IGF-binding proteins are multifunctional andact via IGF-dependent and -independent mechanisms. J Endocrinol.2002;175:19–31.
4. Hussain MA, Schmitz O, Mengel A, Glatz Y, Christiansen JS, ZapfJ, Froesch ER. Comparison of the effects of growth hormone andinsulin-like growth factor I on substrate oxidation and on insulinsensitivity in growth hormone-deficient humans. J Clin Invest. 1994;94:1126–1133.
10 Reference intervals for IGFBP-3 and IGF-I/IGFBP-3 ratio J Clin Endocrinol Metab
The Endocrine Society. Downloaded from press.endocrine.org by [${individualUser.displayName}] on 03 February 2014. at 03:39 For personal use only. No other uses without permission. . All rights reserved.
5. Muzumdar RH, Ma X, Fishman S, Yang X, Atzmon G, Vuguin P,Einstein FH, Hwang D, Cohen P, Barzilai N. Central and opposingeffects of IGF-I and IGF-binding protein-3 on systemic insulin ac-tion. Diabetes. 2006;55:2788–2796.
6. Juul A, Main K, Blum WF, Lindholm J, Ranke MB, Skakkebaek NE.The ratio between serum levels of insulin-like growth factor (IGF)-Iand the IGF binding proteins (IGFBP-1, 2 and 3) decreases with agein healthy adults and is increased in acromegalic patients. Clin En-docrinol (Oxf). 1994;41:85–93.
7. Frystyk J. Free insulin-like growth factors – measurements and re-lationships to growth hormone secretion and glucose homeostasis.Growth Horm IGF Res. 2004;14:337–375.
8. Burgers AM, Biermasz NR, Schoones JW, Pereira AM, RenehanAG, Zwahlen M, Egger M, Dekkers OM. Meta-analysis and dose-response metaregression: circulating insulin-like growth factor I(IGF-I) and mortality. J Clin Endocrinol Metab. 2011;96:2912–2920.
9. Friedrich N, Haring R, Nauck M, Ludemann J, Rosskopf D, Spilcke-Liss E, Felix SB, Dorr M, Brabant G, Volzke H, Wallaschofski H.Mortality and serum insulin-like growth factor (IGF)-I and IGFbinding protein 3 concentrations. J Clin Endocrinol Metab. 2009;94:1732–1739.
10. Hernandez W, Grenade C, Santos ER, Bonilla C, Ahaghotu C,Kittles RA. IGF-1 and IGFBP-3 gene variants influence on serumlevels and prostate cancer risk in African-Americans. Carcinogen-esis. 2007;28:2154–2159.
11. Jogie-Brahim S, Feldman D, OH Y. Unraveling insulin-like growthfactor binding protein-3 actions in human disease. Endocr Rev2009;30:417–437.
12. Molitch ME, Clemmons DR, Malozowski S, Merriam GR, VanceML. Evaluation and treatment of adult growth hormone deficiency:an Endocrine Society clinical practice guideline. J Clin EndocrinolMetab. 2011;96:1587–1609.
13. Katznelson L, Atkinson JL, Cook DM, Ezzat SZ, Hamrahian AH,Miller KK. American Association of Clinical Endocrinologists med-ical guidelines for clinical practice for the diagnosis and treatment ofacromegaly–2011 update. Endocr Pract 17 Suppl. 2011;4:1–44.
14. Juul A, Dalgaard P, Blum WF, Bang P, Hall K, Michaelsen KF,Muller J, Skakkebaek NE. Serum levels of insulin-like growth factor(IGF)-binding protein-3 (IGFBP-3) in healthy infants, children, andadolescents: the relation to IGF-I, IGF-II, IGFBP-1, IGFBP-2, age,sex, body mass index, and pubertal maturation. J Clin EndocrinolMetab. 1995;80:2534–2542.
15. Lofqvist C, Andersson E, Gelander L, Rosberg S, Hulthen L, BlumWF, Wikland KA. Reference values for insulin-like growth factor-binding protein-3 (IGFBP-3) and the ratio of insulin-like growthfactor-I to IGFBP-3 throughout childhood and adolescence. J ClinEndocrinol Metab 2005;90:1420–1427. Epub 2004 Dec 1414.
16. Alberti C, Chevenne D, Mercat I, Josserand E, Armoogum-BoizeauP, Tichet J, Leger J. Serum concentrations of insulin-like growthfactor (IGF)-1 and IGF binding protein-3 (IGFBP-3), IGF-1/IGFBP-3 ratio, and markers of bone turnover: reference values forFrench children and adolescents and z-score comparability withother references. Clin Chem. 2011;57:1424–1435.
17. Clemmons DR. Consensus statement on the standardization andevaluation of growth hormone and insulin-like growth factor as-says. Clin Chem. 2011;57:555–559.
18. NCCLS Evaluation of precision performance of quantitative mea-surement methods; approved guideline—second edition 2004. NC-CLS document EP5–A2 (ISBN 1–56238–542–9)
19. NCCLS. Protocols for determination of limits of detection and limitsof quantitation; approved guideline 2004. NCCLS documentEP17-A (ISBN 1–56238–551–8)
20. Friedrich N, Schneider H, Dorr M, Nauck M, Volzke H, Klotsche J,Sievers C, Pittrow D, Bohler S, Lehnert H, Pieper L, Wittchen HU,Wallaschofski H, Stalla GK. All-cause mortality and serum insulin-like growth factor I in primary care patients. Growth Horm IGF Res.2011;21:102–106.
21. Adeli K. Closing the gaps in pediatric reference intervals: the CAL-IPER initiative. Clin Biochem. 2011;44:480–482.
22. Lowel H, Doring A, Schneider A, Heier M, Thorand B, MeisingerC. The MONICA Augsburg surveys–basis for prospective cohortstudies. Gesundheitswesen 67 Suppl. 2005;1:S13–18.
23. Wichmann HE, Gieger C, Illig T. KORA-gen–resource for popula-tion genetics, controls and a broad spectrum of disease phenotypes.Gesundheitswesen 67 Suppl. 2005;1:S26–30.
24. Cole TJ, Green PJ. Smoothing reference centile curves: the LMSmethod and penalized likelihood. Stat Med. 1992;11:1305–1319.
25. Yee TW. Quantile regression via vector generalized additive models.Stat Med. 2004;23:2295–2315.
26. Koenker R 2005 Quantile regression. New York: Cambridge Uni-versity Press
27. Stone C, Koo CY 1985 Additive splines in statistics. Washington,DC: American Statistical Association
28. Hyun SE, Lee BC, Suh BK, Chung SC, Ko CW, Kim HS, Lee KH,Yang SW, Shin CH, Hwang JS, Kim DH, Lim BK, Kim JD, Yoo HW,Chung WY, Park MJ, Woo YJ, Kim CJ, Lee DY, Kim EY, Choi JH,Han HS, Hwang IT. Reference values for serum levels of insulin-likegrowth factor-I and insulin-like growth factor binding protein-3 inKorean children and adolescents. Clin Biochem. 2012;45:16–21.
29. Xu S, Gu X, Pan H, Zhu H, Gong F, Li Y, Xing Y. Reference rangesfor serum IGF-1 and IGFBP-3 levels in Chinese children duringchildhood and adolescence. Endocr J. 2010;57:221–228.
30. Elmlinger MW, Kuhnel W, Weber MM, Ranke MB. Referenceranges for two automated chemiluminescent assays for serum insu-lin-like growth factor I (IGF-I) and IGF-binding protein 3 (IGFBP-3).Clin Chem Lab Med. 2004;42:654–664.
31. Soldin OP, Dahlin JR, Gresham EG, King J, Soldin SJ. IMMULITE2000 age and sex-specific reference intervals for alpha fetoprotein,homocysteine, insulin, insulin-like growth factor-1, insulin-likegrowth factor binding protein-3, C-peptide, immunoglobulin E andintact parathyroid hormone. Clin Biochem. 2008;41:937–942.
32. Kong AP, Wong GW, Choi KC, Ho CS, Chan MH, Lam CW, TongPC, Ozaki R, So WY, Ma RC, Lau JT, Chan JC. Reference values forserum levels of insulin-like growth factor (IGF-1) and IGF-bindingprotein 3 (IGFBP-3) and their ratio in Chinese adolescents. ClinBiochem. 2007;40:1093–1099.
33. Bereket A, Turan S, Omar A, Berber M, Ozen A, Akbenlioglu C,Haklar G. Serum IGF-I and IGFBP-3 levels of Turkish children dur-ing childhood and adolescence: establishment of reference rangeswith emphasis on puberty. Horm Res. 2006;65:96–105.
34. Friedrich N, Alte D, Volzke H, Spilcke-Liss E, Ludemann J, LerchMM, Kohlmann T, Nauck M, Wallaschofski H. Reference ranges ofserum IGF-1 and IGFBP-3 levels in a general adult population: re-sults of the Study of Health in Pomerania (SHIP). Growth Horm IGFRes. 2008;18:228–237.
35. Friedrich N, Krebs A, Nauck M, Wallaschofski H. Age- and gender-specific reference ranges for serum insulin-like growth factor I(IGF-I) and IGF-binding protein-3 concentrations on the Immulite2500: results of the Study of Health in Pomerania (SHIP). Clin ChemLab Med. 2010;48:115–120.
36. Greenall SA, Bentley JD, Pearce LA, Scoble JA, Sparrow LG, Bar-tone NA, Xiao X, Baxter RC, Cosgrove LJ, Adams TE. Biochemicalcharacterization of individual human glycosylated pro-insulin-likegrowth factor (IGF)-II and big-IGF-II isoforms associated with can-cer. J Biol Chem. 2013;288:59–68.
37. Conover CA. Insulin-like growth factor-binding proteins and bonemetabolism. Am J Physiol Endocrinol Metab. 2008;294:E10–14.
38. Yan X, Payet LD, Baxter RC, Firth SM. Activity of human preg-nancy insulin-like growth factor binding protein-3: determinationby reconstituting recombinant complexes. Endocrinology. 2009;150:4968–4976.
39. Cheng I, DeLellis Henderson K, Haiman CA, Kolonel LN, Hender-son BE, Freedman ML, Le Marchand L. Genetic determinants ofcirculating insulin-like growth factor (IGF)-I, IGF binding protein
doi: 10.1210/jc.2013-3060 jcem.endojournals.org 11
The Endocrine Society. Downloaded from press.endocrine.org by [${individualUser.displayName}] on 03 February 2014. at 03:39 For personal use only. No other uses without permission. . All rights reserved.

(BP)-1, and IGFBP-3 levels in a multiethnic population. J Clin En-docrinol Metab. 2007;92:3660–3666.
40. Nelson AE, Howe CJ, Nguyen TV, Leung KC, Trout GJ, Seibel MJ,Baxter RC, Handelsman DJ, Kazlauskas R, Ho KK. Influence ofdemographic factors and sport type on growth hormone-responsivemarkers in elite athletes. J Clin Endocrinol Metab. 2006;91:4424–4432.
41. Berrigan D, Potischman N, Dodd KW, Hursting SD, Lavigne J,Barrett JC, Ballard-Barbash R. Race/ethnic variation in serum levelsof IGF-I and IGFBP-3 in US adults. Growth Horm IGF Res. 2009;19:146–155.
42. DeLellis K, Rinaldi S, Kaaks RJ, Kolonel LN, Henderson B, LeMarchand L. Dietary and lifestyle correlates of plasma insulin-likegrowth factor-I (IGF-I) and IGF binding protein-3 (IGFBP-3): themultiethnic cohort. Cancer Epidemiol Biomarkers Prev. 2004;13:1444–1451.
43. Pfeilschifter J, Scheidt-Nave C, Leidig-Bruckner G, Woitge HW,Blum WF, Wuster C, Haack D, Ziegler R. Relationship betweencirculating insulin-like growth factor components and sex hormonesin a population-based sample of 50- to 80-year-old men and women.J Clin Endocrinol Metab. 1996;81:2534–2540.
44. Birzniece V, Meinhardt U, Gibney J, Johannsson G, Baxter RC,Seibel MJ, Ho KK. Modulatory effect of raloxifene and estrogen onthe metabolic action of growth hormone in hypopituitary women.J Clin Endocrinol Metab. 2010;95:2099–2106.
45. Veldhuis JD, Erickson D, Iranmanesh A, Miles JM, Bowers CYSex-steroid control of the aging somatotropic axis. EndocrinolMetab Clin North Am. 2005:34:877–893, viii
46. Empen K, Lorbeer R, Völzke H, Robinson DM, Friedrich N, KrebsA, Nauck M, Reffelmann T, Ewert R, Felix SB, Wallaschofski H,Dörr M. Association of serum insulin-like growth factor I with en-dothelial function: Results from the population-based Study ofHealth in Pomerania (SHIP). Eur J Endocrinol. 2010;163:617–623.
47. Glaser S, Friedrich N, Ewert R, Schaper C, Nauck M, Dorr M,Volzke H, Felix SB, Krebs A, Wallaschofski H, Koch B. 2009 As-sociation between serum IGF-I and IGFBP-3 and lung function.J Clin Endocrinol Metab
48. Douglas JB, Silverman DT, Pollak MN, Tao Y, Soliman AS, Stol-zenberg-Solomon RZ. Serum IGF-I, IGF-II, IGFBP-3, and IGF-I/IGFBP-3 molar ratio and risk of pancreatic cancer in the prostate,lung, colorectal, and ovarian cancer screening trial. Cancer Epide-miol Biomarkers Prev. 2010;19:2298–2306.
49. Aleem E, Elshayeb A, Elhabachi N, Mansour AR, Gowily A, HelaA. Serum IGFBP-3 is a more effective predictor than IGF-1 andIGF-2 for the development of hepatocellular carcinoma in patientswith chronic HCV infection. Oncol Lett. 2012;3:704–712.
50. Kaplan RC, McGinn AP, Pollak MN, Kuller LH, Strickler HD, Ro-han TE, Cappola AR, Xue X, Psaty BM. Association of total insulin-like growth factor-I, insulin-like growth factor binding protein-1(IGFBP-1), and IGFBP-3 levels with incident coronary events andischemic stroke. J Clin Endocrinol Metab. 2007;92:1319–1325.
51. Martin RM, Gunnell D, Whitley E, Nicolaides A, Griffin M, Geor-giou N, Davey Smith G, Ebrahim S, Holly JM. Associations of in-sulin-like growth factor (IGF)-I, IGF-II, IGF binding protein(IGFBP)-2 and IGFBP-3 with ultrasound measures of atherosclerosisand plaque stability in an older adult population. J Clin EndocrinolMetab. 2008;93:1331–1338.
52. Volzke H, Nauck M, Rettig R, Dorr M, Higham C, Brabant G,Wallaschofski H. Association between hepatic steatosis and serumIGF1 and IGFBP-3 levels in a population-based sample. Eur J En-docrinol. 2009;161:705–713.
53. Yamada PM, Lee KW. Perspectives in mammalian IGFBP-3 biology:local vs. systemic action. Am J Physiol Cell Physiol. 2009;296:C954–976.
54. Chan SS, Twigg SM, Firth SM, Baxter RC. Insulin-like growth fac-tor binding protein-3 leads to insulin resistance in adipocytes. J ClinEndocrinol Metab. 2005;90:6588–6595.
55. Kim HS, Ali O, Shim M, Lee KW, Vuguin P, Muzumdar R, BarzilaiN, Cohen P. Insulin-like growth factor binding protein-3 inducesinsulin resistance in adipocytes in vitro and in rats in vivo. PediatrRes. 2007;61:159–164.
56. Silha JV, Gui Y, Murphy LJ. Impaired glucose homeostasis in in-sulin-like growth factor-binding protein-3-transgenic mice. Am JPhysiol Endocrinol Metab. 2002;283:E937–945.
57. Bang P, Brismar K, Rosenfeld RG. Increased proteolysis of insulin-like growth factor-binding protein-3 (IGFBP-3) in noninsulin-de-pendent diabetes mellitus serum, with elevation of a 29-kilodalton(kDa) glycosylated IGFBP-3 fragment contained in the approxi-mately 130- to 150-kDa ternary complex. J Clin Endocrinol Metab.1994;78:1119–1127.
58. Sierra-Johnson J, Romero-Corral A, Somers VK, Lopez-Jimenez F,Malarstig A, Brismar K, Hamsten A, Fisher RM, Hellenius ML.IGF-I/IGFBP-3 ratio: a mechanistic insight into the metabolic syn-drome. Clin Sci (Lond). 2009;116:507–512.
12 Reference intervals for IGFBP-3 and IGF-I/IGFBP-3 ratio J Clin Endocrinol Metab
The Endocrine Society. Downloaded from press.endocrine.org by [${individualUser.displayName}] on 03 February 2014. at 03:39 For personal use only. No other uses without permission. . All rights reserved.