Embed Size (px)
Citation preview
http://cad.sagepub.com/Crime & Delinquency
http://cad.sagepub.com/content/early/2012/07/01/0011128712443179The online version of this article can be found at:
DOI: 10.1177/0011128712443179
published online 20 July 2012Crime & DelinquencyAndrew J. Harris, Jill S. Levenson and Alissa R. Ackerman
Registered Sex Offenders in the United States: Behind the Numbers
Published by:
http://www.sagepublications.com
can be found at:Crime & DelinquencyAdditional services and information for
http://cad.sagepub.com/cgi/alertsEmail Alerts:
http://cad.sagepub.com/subscriptionsSubscriptions:
http://www.sagepub.com/journalsReprints.navReprints:
http://www.sagepub.com/journalsPermissions.navPermissions:
What is This?
- Jul 20, 2012OnlineFirst Version of Record >>
at UNIV WASHINGTON LIBRARIES on September 29, 2013cad.sagepub.comDownloaded from at UNIV WASHINGTON LIBRARIES on September 29, 2013cad.sagepub.comDownloaded from at UNIV WASHINGTON LIBRARIES on September 29, 2013cad.sagepub.comDownloaded from at UNIV WASHINGTON LIBRARIES on September 29, 2013cad.sagepub.comDownloaded from at UNIV WASHINGTON LIBRARIES on September 29, 2013cad.sagepub.comDownloaded from at UNIV WASHINGTON LIBRARIES on September 29, 2013cad.sagepub.comDownloaded from at UNIV WASHINGTON LIBRARIES on September 29, 2013cad.sagepub.comDownloaded from at UNIV WASHINGTON LIBRARIES on September 29, 2013cad.sagepub.comDownloaded from at UNIV WASHINGTON LIBRARIES on September 29, 2013cad.sagepub.comDownloaded from at UNIV WASHINGTON LIBRARIES on September 29, 2013cad.sagepub.comDownloaded from at UNIV WASHINGTON LIBRARIES on September 29, 2013cad.sagepub.comDownloaded from at UNIV WASHINGTON LIBRARIES on September 29, 2013cad.sagepub.comDownloaded from at UNIV WASHINGTON LIBRARIES on September 29, 2013cad.sagepub.comDownloaded from at UNIV WASHINGTON LIBRARIES on September 29, 2013cad.sagepub.comDownloaded from at UNIV WASHINGTON LIBRARIES on September 29, 2013cad.sagepub.comDownloaded from at UNIV WASHINGTON LIBRARIES on September 29, 2013cad.sagepub.comDownloaded from at UNIV WASHINGTON LIBRARIES on September 29, 2013cad.sagepub.comDownloaded from at UNIV WASHINGTON LIBRARIES on September 29, 2013cad.sagepub.comDownloaded from at UNIV WASHINGTON LIBRARIES on September 29, 2013cad.sagepub.comDownloaded from at UNIV WASHINGTON LIBRARIES on September 29, 2013cad.sagepub.comDownloaded from at UNIV WASHINGTON LIBRARIES on September 29, 2013cad.sagepub.comDownloaded from at UNIV WASHINGTON LIBRARIES on September 29, 2013cad.sagepub.comDownloaded from at UNIV WASHINGTON LIBRARIES on September 29, 2013cad.sagepub.comDownloaded from at UNIV WASHINGTON LIBRARIES on September 29, 2013cad.sagepub.comDownloaded from at UNIV WASHINGTON LIBRARIES on September 29, 2013cad.sagepub.comDownloaded from at UNIV WASHINGTON LIBRARIES on September 29, 2013cad.sagepub.comDownloaded from at UNIV WASHINGTON LIBRARIES on September 29, 2013cad.sagepub.comDownloaded from at UNIV WASHINGTON LIBRARIES on September 29, 2013cad.sagepub.comDownloaded from at UNIV WASHINGTON LIBRARIES on September 29, 2013cad.sagepub.comDownloaded from at UNIV WASHINGTON LIBRARIES on September 29, 2013cad.sagepub.comDownloaded from at UNIV WASHINGTON LIBRARIES on September 29, 2013cad.sagepub.comDownloaded from at UNIV WASHINGTON LIBRARIES on September 29, 2013cad.sagepub.comDownloaded from
Crime & DelinquencyXX(X) 1 –31
© The Author(s) 2012Reprints and permission:
sagepub.com/journalsPermissions.navDOI: 10.1177/0011128712443179
http://cad.sagepub.com
443179 CADXXX10.1177/0011128712443179Harris et al.Crime & Delinquency© The Author(s) 2012
1University of Massachusetts Lowell, USA2Lynn University, Boca Raton, FL, USA3University of Washington Tacoma, USA
Corresponding Author:Andrew J. Harris, Department of Criminal Justice & Criminology, University of Massachusetts Lowell, 870 Broadway Street, No. 225, Lowell, MA 01854, USA Email: [email protected]
Registered Sex Offenders in the United States: Behind the Numbers
Andrew J. Harris1, Jill S. Levenson2, and Alissa R. Ackerman3
Abstract
Although sex offender registration and notification policies have occupied an increasingly prominent place on state and federal crime control agendas, much policy discourse has occurred amid a dearth of reliable and relevant national data. This article presents the results of a study designed to broaden knowledge about the registered sex offender (RSO) population and the content of the nation’s sex offender registries. The authors analyze state-level RSO populations across several dimensions, including levels of public Inter-net disclosure, RSO residential status, supervision status, and assigned risk levels. Findings suggest significant interstate variation across these dimen-sions, and indicate that the nation’s RSO population is considerably more diverse and complex than commonly portrayed in the media and in policy debates. Implications for federal and state policies aimed at reforming the nation’s sex offender registries are discussed.
Keywords
sex offenders in United States, sex offender registration, Adam Walsh Act, sex offender policy
2 Crime & Delinquency XX(X)
Since the early 1990s, policies governing the registration of convicted sex offenders and the public dissemination of this information have emerged as prominent elements in the nation’s public safety landscape. Independent sys-tems of sex offender registration and notification (SORN) now operate in all U.S. states and territories, and in many tribal nations. Since the 1994 passage of the Jacob Wetterling Crimes Against Children Act, systems have been sub-ject to increasing levels of federal oversight and involvement amid Congres-sional concerns that perceived “cracks in the system” are being exploited by dangerous sex offenders seeking to evade monitoring and detection. With the 2006 Adam Walsh Child Protection and Safety Act (AWA), Congress charged the U.S. Department of Justice with developing and enforcing national guide-lines designed to instill greater uniformity in SORN systems across states, territories, and tribal jurisdictions.
While SORN’s general objectives are to improve the monitoring and tracking of sex offenders by law enforcement and to provide the public with information about registered sex offenders (RSOs) living in their communi-ties, data contained within sex offender registries can also play a central role in the broader arena of sex offender management policy. At the offender level, assigned status on a sex offender registry may be utilized to determine restrictions on residence and employment, or may trigger electronic moni-toring or other supervision requirements. In the public policy domain, statis-tics associated with the registries are routinely used for purposes of framing problems, allocating resources, and making operational decisions. Considering these factors, data reflecting the scope and composition of the nation’s RSO population play an important role in policy debates concerning sex offender management.
To date, there has been little systematic analysis of the structure and con-tent of the registries and the diversity of individuals contained within them. Although some studies have produced data on the demographic and risk profiles of RSOs in individual states including New York (Freeman & Sandler, 2010), Iowa (Adkins, Huff, & Stageberg, 2000), Oklahoma and Ohio (Harris, Lobanov-Rostovsky, & Levenson, 2010), and South Carolina (Levenson, Letourneau, Armstrong, & Zgoba, 2010), there has been limited uniformity in the characteristics that have been described. This knowledge gap may be attributed in part to the fact that the registries are independently main-tained by the states and use a wide range of data standards (Ackerman, Harris, Levenson, & Zgoba, 2011).
The publicly available national registry data that do exist, drawn from a twice-per-year phone survey conducted by the National Center for Missing and Exploited Children (NCMEC), provide a comprehensive state-by-state
Harris et al. 3
RSO count but little in the way of population details. As of June 2011, NCMEC reported a total of 739,853 RSOs throughout the United States (NCMEC, 2011). While this information, along with the jurisdictional distribution of the total figure, provides a useful overall snapshot, it also prompts many ques-tions. What is the demographic (e.g., race, age, gender) composition of this population? What proportion is living in the community, and what propor-tions are incarcerated, residing out of state, deported, or otherwise inactive? How many are under active parole or probation supervision? What types of offenses have they committed, and how many are repeat offenders? How is this population distributed across offense types, risk levels, and other salient variables? These and many other policy-relevant questions concerning the scope and composition of the nation’s RSO population are just beginning to be explored in the research literature.
Beyond these questions regarding the RSO population, another set of unanswered questions concerns the scope and operations of the registries themselves. Concerns that jurisdictional inconsistencies in registry require-ments could be easily exploited by sex offenders attempting to evade authori-ties were a driving force behind the passage of Title I of the AWA of 2006, also known as the Sex Offender Registration and Notification Act (SORNA). Although such variation does indeed exist, most policy discussions have been driven more by a vague sense of these problems rather than by systematic analyses of specific inconsistencies and, perhaps more critically, why they exist and their implications for sex offender management practice.
RSO Statistics: What Do We Know About the U.S. Sex Offender Population?Since the mid-2000s, an emerging body of research has begun to analyze the impacts of state-level SORN systems. These studies have primarily evaluated factors such as the policies’ effects on recidivism (Duwe & Donnay, 2008; Letourneau, Levenson, Bandyopadhyay, Sinha, & Armstrong, 2010; Sandler, Freeman, & Socia, 2008; Vasquez, Maddan, & Walker, 2008; Zgoba, Witt, Dalessandro, & Veysey, 2009), offender reintegration (Levenson & Cotter, 2005; Levenson, D’Amora, & Hern, 2007; Mercado, Alvarez, & Levenson, 2008; Tewksbury, 2005; Tewksbury & Lees, 2006; Zevitz, 2006), and com-munity protection behaviors (Anderson & Sample, 2008; Bandy, 2011; Kernsmith, Comartin, Craun, & Kernsmith, 2009).
Few studies have produced comprehensive national data describing the characteristics of the RSO population. Ackerman and colleagues (2011) ana-lyzed case-level data on 445,127 RSOs obtained in 2010 from the public
4 Crime & Delinquency XX(X)
registries of 49 states, Washington, DC, Puerto Rico, and Guam. Demographically, the sample was found to be overwhelmingly male (98%), White (66%), and on average, about 45 years old (SD = 13.32; range = 12-99). Approximately 12% of the sample (n = 52,250) were listed as not living in the community, including those who were institutionalized (n = 47,971), deported (n = 3,251), or deceased (n = 1,028). Approximately 18,000 RSOs (4% of the sample) were designated as transient, homeless, absconded, noncompliant, or their addresses or whereabouts were otherwise unknown. Given that states use a variety of methods to classify absconders, registration violators, and others whose locations are uncertain, it was difficult to ascertain the specific number of fugitive sex offenders (Ackerman et al., 2011).
The authors noted that analyses were limited by significant variability in the scope, content, and format of information contained within state registries—variability that complicates interjurisdictional comparisons and challenges efforts to develop a comprehensive descriptive portrait of the nation’s sex offenders. Although certain aggregated demographic characteristics were reported with a reasonable degree of confidence, analyzing critical factors such as offense histories and RSO risk profiles was confounded by substan-tial variation in states’ definitions and procedures (Ackerman et al., 2011).
NCMEC Estimates: Scope, Roles, and LimitationsIn the absence of published studies investigating the characteristics of sex offenders listed on registries, national sex offender registration statistics—particularly those cited in the media and used by policy makers—have gener-ally emanated from a single source, the NCMEC. An independent nonprofit entity, NCMEC received approximately US$38 million in federal funds in fiscal year 2010, most of which is provided through grants and contracts with the U.S. Department of Justice (U.S. House of Representatives Committee on the Judiciary, 2011). Among its many functions, NCMEC manages the National Sex Offender Targeting Center, a federally funded initiative that works in coordination with the U.S. Marshals service to track and apprehend fugitive sex offenders. The organization and its leaders have played a promi-nent role in promoting expanded federal responsibility in the nation’s sex offender management policies, including the development and implementa-tion of the AWA.
NCMEC produces and publicly disseminates a state-by-state map of RSOs two times per year. The data contained in these maps, gathered via phone surveys of state registry officials, include an aggregate count of RSOs in each
Harris et al. 5
state and territory, along with U.S. census-adjusted figures denoting the rate of RSOs per 100,000 citizens. As of June 2011, the NCMEC figures reported a total of 739,853 RSOs across the 50 states, the District of Columbia, and 6 U.S. territories (a total of 57 jurisdictions), for an average rate of 236 RSOs per 100,000 (NCMEC, 2011). Of this total, approximately 42% (n = 308,298) came from 5 states—California (n = 106,216), Texas (n = 66,587), Florida (n = 55,999), Michigan (n = 47,329), and New York (n = 32,257). Of the 57 jurisdic-tions reporting, NCMEC reported that 38 of these included in their totals those RSOs who were incarcerated, deported, or had moved to another state.
Limitations of NCMEC DataAs the primary source of national data regarding the nation’s registries, the NCMEC figures carry significant influence in shaping both public opinion and policy deliberations regarding the nation’s responses to sexual violence. These data, however, are limited in some important ways.
The first set of limitations concerns the data’s aggregate nature. Presenting individual state counts of RSOs feeds into a tendency among the media and general public to adopt a homogenized view of the sex offender population, generally coupled with the belief that the typical RSO is a dangerous and repet-itive sexual predator (Fortney, Levenson, Brannon, & Baker, 2007; Levenson, Brannon, Fortney, & Baker, 2007; Lieb & Nunlist, 2008; Mears, Mancini, Gertz, & Bratton, 2008). In contrast with this perception, data suggest that sex offenders represent a diverse population and that most convicted sex offenders in the United States are not repeat offenders (Bureau of Justice Statistics, 2003; Sandler et al., 2008). Meta-analyses indicated that between 14% and 27% of sex offenders reoffend and that identifiable subgroups of sex offenders are at higher than average risk to repeat their sexual crimes by virtue of factors such as general criminality, victim preference, and sexual deviance (Hanson & Bussiere, 1998; Hanson & Morton-Bourgon, 2005; Harris & Hanson, 2004). Considering these factors, an aggregate count by state has limited practical utility for practitioners, policy makers, and the public, whereas a more com-plete picture of RSOs across risk and management levels would provide a far more revelatory picture.
A second set of limitations concerns the indications that 38 of 57 reporting jurisdictions included in their counts some combination of registrants who are incarcerated, deported, or living in another state. This creates certain con-founding problems with direct implications for policy, planning, and resource allocation. Since jurisdictions vary in their data collection and reporting pro-cedures, the overall numbers and population-adjusted rates are not directly
6 Crime & Delinquency XX(X)
comparable across jurisdictions, and in some cases may be highly inflated. This is relevant, for example, in decisions regarding allocation of federal resources aimed at registry improvements or expanded enforcement efforts. Perhaps more critically, SORN is ostensibly intended to facilitate tracking and monitoring of sex offenders within the community. As such, it is vital to distinguish between RSOs who are living in the community within a given jurisdiction and those who are not. Not only are such distinctions essential for planning, management, and resource allocation decisions, but the inclusion of these groups has the net effect of inflating the number of RSOs reported as living among us. The inclusion of out-of-state registrants in the official NCMEC statistics is particularly problematic, in that it raises a fundamental question of whether and to what extent individual RSOs are being counted more than once, thus inflating the overall national estimate.
Missing, Absconded, and Noncompliant Sex OffendersAnother key fixture in the SORN policy dialogue, and one particularly prone to obfuscation, involves the issue of RSOs who are missing, absconded, or noncompliant with registration requirements. Since 2003, the statistic that more than 100,000 sex offenders are missing and unaccounted for has appeared in dozens of media accounts, official testimony, and government reports, and has been routinely cited as a rationale for new federal guidelines and enforcement of registration laws. Despite its significant shelf-life and its influence in the policy discourse, the “100,000 missing” figure was based on flawed survey results that have never been fully released or substantiated. Moreover, many state-based SORN systems were in relative infancy at the time of that survey, and it remains unclear how much of the “missing sex offender” problem was due to actual RSO noncompliance and how much could be attributed to administrative and data management problems with the registries themselves (Levenson & Harris, 2011).
Goals of the Current StudyIn the context of these issues, the current study was designed to build upon the nascent research literature regarding the scope of U.S. sex offender reg-istries and the individuals contained within them. The study was designed with particular emphasis on adding detail and context to the aggregate state figures produced and disseminated by NCMEC.
Harris et al. 7
Based on a survey of state registries conducted between July and November 2010, the study sought to obtain accurate estimates of (a) rates of public dis-closure (i.e., the proportion of each state’s RSOs whose information is pub-licly available on the Internet); (b) residential status (i.e., the proportion actively residing within the community, incarcerated, relocated to another state, deported, deceased, or otherwise inactive); (c) supervision status (the proportion of RSOs under active community supervision through parole or probation); (d) special status (the number and proportion of RSOs officially listed as missing, absconded, homeless, or transient); and (e) RSO distribu-tion across assigned risk or management levels.
MethodIn July 2010, the authors developed a list of contacts at agencies that were statutorily charged with administration of state sex offender registries. Officials on this list were then contacted via email and provided with a link to an online survey, developed and administered using Survey Gizmo, a commercial tool designed for online data collection.
The study’s main areas of inquiry, along with the corresponding data ele-ments contained within the survey, are summarized in Table 1. In addition to the questionnaire items, respondents were given space to provide narrative comments or clarification in addition to the information submitted.
Following the first wave of responses, the research team conducted a series of follow-up emails and phone calls to encourage survey comple-tion, clarify submitted responses, and gather missing data elements. In some cases, registry officials responded to survey items directly via email, and the data from these responses were manually entered into the online survey tool by researchers. In other instances, registry officials provided official reports containing data that responded to survey items, and these data were also manually entered into the online tool. Because some respon-dents did not answer all questions, the sample size for each question or domain varied.
By the conclusion of data collection in November 2010, survey or email responses had been received from 42 of the 50 states and from 2 U.S. territo-ries. Of the 8 remaining states, 2 (Delaware and South Carolina) explicitly declined to participate and the remainder did not provide direct survey responses. In some of these instances, however, registry agencies provided links to official public reports that provided data responsive to some of the data elements. An evaluation of the nonresponding states and consideration
8 Crime & Delinquency XX(X)
Table 1. Focus Areas and Data Elements
Focus area Corresponding data elements
Numbers and proportions of RSOs whose information is contained on public Internet registries
1. As of today, how many individuals in total are currently in your state registry system?
2. As of today, how many registrants have their information available on the public Internet registry?
Distribution of RSOs living in the community and those with other living status (e.g., incarcerated, deported, inactive, out of state, deceased)
Numbers and proportions of RSOs designated as missing or absconded
3. Of the total number of RSOs in your state, please indicate how many fall into each of these categories (total number should approximate the figure given in response to question No. 1)
__ Active RSOs residing in your state in a community setting (excluding those officially listed as missing or absconded)
__ Incarcerated in jail, prison, or other institution
__ Officially missing or absconded (defined as unsuccessful attempts to locate)
__ Inactive due to completion of registration period
__ Officially designated as “out of state” (excluding deported)
__ Officially designated as deported__Deceased__Other status (please specify)
RSO supervision status (parole and probation)
4. Among those noted as active cases residing within the community, how many are:
__ Under active probation or parole supervision
__Not under official supervision__Unknown supervision status
RSOs officially designated as homeless or transient
5. Does your state track or count homeless or transient sex offenders?
6. If you responded “yes” to the question above, approximately how many RSOs are designated as homeless and/or transient today?
(continued)
Harris et al. 9
Focus area Corresponding data elements
RSO classification methods and, where applicable, the distribution of RSOs across classification categories
7. Which of the following best describes your state’s system for classifying registrants? (check one)
__ Single-tier system in which all registrants are subject to similar requirements
__ Single-tier system with separate designation for particularly high-risk individuals (e.g., “sexual predator” designation)
__ Multitier system with two or more categories of registrants
8. Which of the following does your state use in establishing registrant tiers (check all that apply):
__Offense of conviction__Number of offenses__Standardized actuarial risk assessment__Other risk assessment processes __Other criteria (please specify)9. If your state has more than one
registration category, please provide a breakdown of the number within each category (Example: Tier I = 3,400; Tier II = 2,500; Tier III = 7,600)
Note: RSOs = registered sex offenders.
Table 1. (continued)
of any potential sources of response bias is presented in the “Discussion” section later in this article.
ResultsPrior to presenting our results, it should be noted that many states reported inactive, deceased, and deported cases in their total RSO figures in response to our first question asking for the total number of RSOs contained within their registry systems. A review of the data, however, suggested that such cases were not typically included in the NCMEC-reported figures and there-fore were only marginally germane to our analysis. Accordingly, our categories
10 Crime & Delinquency XX(X)
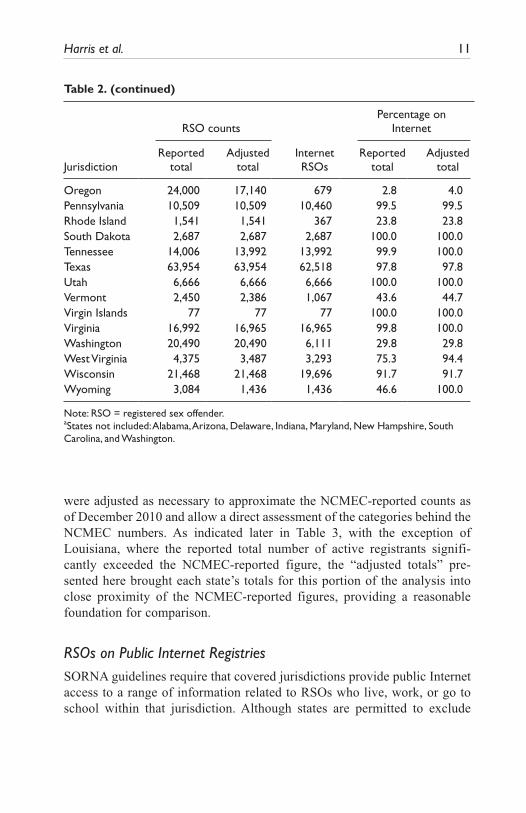
Table 2. RSOs on Public Internet Registries (n = 44 Jurisdictionsa)
RSO countsPercentage on
Internet
JurisdictionReported
totalAdjusted
totalInternet RSOs
Reported total
Adjusted total
Total 718,823 651,329 514,756 71.6 79.0
Alaska 2,709 1,829 1,829 67.5 100.0Arkansas 10,128 9,660 4,540 44.8 47.0California 121,779 121,389 90,704 74.5 74.7Colorado 13,719 13,719 7,299 53.2 53.2Connecticut 10,982 5,304 5,157 47.0 97.2District of Columbia
948 948 891 94.0 94.0
Florida 54,808 54,558 54,408 99.3 99.7Georgia 18,920 18,920 18,920 100.0 100.0Guam 625 625 530 84.8 84.8Hawaii 3,266 3,118 2,883 88.3 92.5Idaho 3,455 3,455 3,455 100.0 100.0Illinois 26,662 26,662 24,420 91.6 91.6Iowa 9,683 5,010 5,010 51.7 100.0Kansas 9,042 5,673 5,673 62.7 100.0Kentucky 8,130 8,060 8,060 99.1 100.0Louisiana 9,630 9,630 9,630 100.0 100.0Maine 6,006 3,000 3,000 50.0 100.0Massachusetts 10,901 10,901 2,735 25.1 25.1Michigan 50,194 46,533 44,017 87.7 94.6Minnesota 23,881 15,494 741 3.1 4.8Mississippi 6,328 6,328 6,328 100.0 100.0Missouri 11,224 11,224 11,179 99.6 99.6Montana 1,971 1,971 1,971 100.0 100.0Nebraska 3,192 3,192 3,192 100.0 100.0Nevada 14,943 6,473 2,419 16.2 37.4New Jersey 15,476 13,617 3,261 21.1 23.9New Mexico 2,654 2,654 2,532 95.4 95.4New York 31,133 31,133 18,738 60.2 60.2North Dakota 2,291 1,161 398 17.4 34.3Ohio 29,627 19,572 18,104 61.1 92.5Oklahoma 12,217 6,718 6,718 55.0 100.0
(continued)
Harris et al. 11
RSO countsPercentage on
Internet
JurisdictionReported
totalAdjusted
totalInternet RSOs
Reported total
Adjusted total
Oregon 24,000 17,140 679 2.8 4.0Pennsylvania 10,509 10,509 10,460 99.5 99.5Rhode Island 1,541 1,541 367 23.8 23.8South Dakota 2,687 2,687 2,687 100.0 100.0Tennessee 14,006 13,992 13,992 99.9 100.0Texas 63,954 63,954 62,518 97.8 97.8Utah 6,666 6,666 6,666 100.0 100.0Vermont 2,450 2,386 1,067 43.6 44.7Virgin Islands 77 77 77 100.0 100.0Virginia 16,992 16,965 16,965 99.8 100.0Washington 20,490 20,490 6,111 29.8 29.8West Virginia 4,375 3,487 3,293 75.3 94.4Wisconsin 21,468 21,468 19,696 91.7 91.7Wyoming 3,084 1,436 1,436 46.6 100.0
Note: RSO = registered sex offender.aStates not included: Alabama, Arizona, Delaware, Indiana, Maryland, New Hampshire, South Carolina, and Washington.
Table 2. (continued)
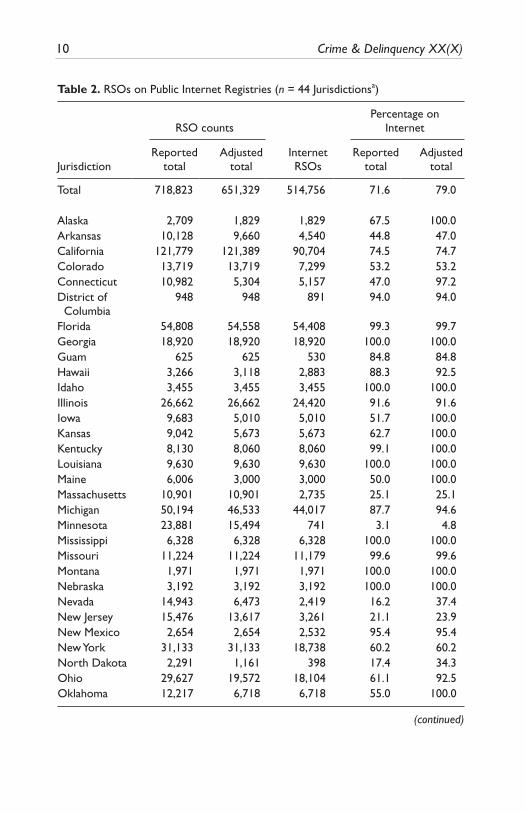
were adjusted as necessary to approximate the NCMEC-reported counts as of December 2010 and allow a direct assessment of the categories behind the NCMEC numbers. As indicated later in Table 3, with the exception of Louisiana, where the reported total number of active registrants signifi-cantly exceeded the NCMEC-reported figure, the “adjusted totals” pre-sented here brought each state’s totals for this portion of the analysis into close proximity of the NCMEC-reported figures, providing a reasonable foundation for comparison.
RSOs on Public Internet RegistriesSORNA guidelines require that covered jurisdictions provide public Internet access to a range of information related to RSOs who live, work, or go to school within that jurisdiction. Although states are permitted to exclude
12
Tabl
e 3.
RSO
s D
istr
ibut
ion
of A
ctiv
e, M
issi
ng, a
nd N
onco
mm
unity
Sta
tus
Act
ive
Mis
sing
Inca
rcer
ated
Out
of
stat
eD
epor
ted
Dec
ease
dO
ther
Adj
uste
d to
tal
NC
MEC
to
tala
Tota
l (re
port
ing
stat
es)
403,
124
28,5
4911
4,97
555
,204
18,5
701,
091
933
622,
446
630,
141
Perc
enta
ge o
f tot
al64
.84.
618
.58.
93.
00.
20.
1
Ala
ska
1,82
9—
——
——
—1,
829
1,83
8A
rkan
sas
6,19
735
01,
368
1,67
5 7
0—
—9,
660
10,3
85C
alifo
rnia
50,6
0515
,496
25,8
8220
,124
9,28
2—
—12
1,38
912
2,52
1C
olor
ado
13,7
19—
——
——
—13
,719
13,8
99C
onne
ctic
ut3,
910
554
840
——
——
5,30
45,
219
Dis
tric
t O
f Col
umbi
a94
8—
——
——
—94
894
1Fl
orid
a22
,680
796
16,8
0812
,306
1,96
8—
—54
,558
55,3
17G
eorg
ia15
,465
333
3,34
6—
——
—19
,144
19,1
12H
awai
i1,
672
398
639
409
——
—3,
118
3,26
6Id
aho
3,29
615
9—
——
——
3,45
53,
547
Illin
ois
13,4
751,
496
6,03
6—
——
—21
,007
21,1
35Io
wa
3,80
561
691
—14
2—
234
4,93
35,
159
Kan
sas
4,56
429
981
0—
——
—5,
673
5,77
2K
entu
cky
5,00
921
980
71,
894
50
81
8,06
08,
232
Loui
sian
a9,
630
——
——
——
9,63
07,
955
Mai
ne2,
937
63—
——
——
3,00
02,
948
Mic
higa
n27
,748
998
12,4
775,
262
——
48
46,5
3346
,635
Min
neso
ta11
,180
544,
260
——
——
15,4
9415
,883
Mis
siss
ippi
4,03
116
096
21,
175
——
—6,
328
6,30
6M
isso
uri
4,57
686
2,00
33,
468
—1,
091
—11
,224
12,1
69M
onta
na1,
971
——
——
——
1,97
12,
027
(con
tinue
d)
13
Act
ive
Mis
sing
Inca
rcer
ated
Out
of
stat
eD
epor
ted
Dec
ease
dO
ther
Adj
uste
d to
tal
NC
MEC
to
tala
Neb
rask
a3,
192
——
——
——
3,19
23,
285
Nev
ada
6,47
3—
——
——
—6,
473
6,51
2N
ew Je
rsey
12,1
2044
31,
054
——
——
13,6
1713
,561
New
Mex
ico
2,65
4—
——
——
—2,
654
2,65
5N
ew Y
ork
21,0
27—
3,40
73,
671
2,45
857
031
,133
31,4
29N
orth
Car
olin
a11
,169
—1,
350
——
——
12,5
1913
,327
Nor
th D
akot
a1,
146
15—
——
——
1,16
11,
163
Ohi
o18
,643
929
——
——
—19
,572
19,1
24O
klah
oma
5,81
890
0—
——
——
6,71
86,
713
Ore
gon
17,1
40—
——
——
—17
,140
17,1
91Pe
nnsy
lvan
ia8,
598
259
1,91
1—
——
—10
,768
10,5
09So
uth
Dak
ota
1,88
2—
805
——
——
2,68
72,
712
Tenn
esse
e9,
752
469
1,82
21,
876
73
——
13,9
9214
,284
Texa
s40
,609
1,41
711
,487
2,83
84,
439
——
60,7
9063
,694
Uta
h4,
342
—2,
324
——
——
6,66
66,
703
Verm
ont
1,45
020
560
352
4
——
2,38
62,
448
Vir
gini
a9,
669
—7,
296
——
——
16,9
6517
,300
Wes
t Vir
gini
a3,
373
18—
96
——
—3,
487
3,49
6W
isco
nsin
13,0
892,
437
5,94
2—
——
—21
,468
21,6
36W
yom
ing
1,34
690
——
——
—1,
436
1,46
2G
uam
317
22 8
7 5
8 8
4—
—56
859
5V
irgi
n Is
land
s 6
88
1
0
0
——
77
76
Not
e: R
SO =
reg
iste
red
sex
offe
nder
; NC
MEC
= N
atio
nal C
ente
r fo
r M
issi
ng a
nd E
xplo
ited
Chi
ldre
n.a N
CM
EC c
ount
of R
SOs
repo
rted
in D
ecem
ber
2010
.
Tabl
e 3.
(co
nitn
ued)
14 Crime & Delinquency XX(X)
certain categories of RSOs from such disclosure (e.g., adjudicated juveniles, RSOs classified with AWA “Tier I” designations), SORNA requires that information on most RSOs be made publicly available in this fashion.
Data regarding the proportion of registrants on public Internet registries were provided by 41 states, the District of Columbia, and 2 U.S. territories. These jurisdictions reported a total of 514,756 RSOs whose information was publicly available. Table 2 presents the numbers and percentages of RSOs subject to Internet disclosure in each state on the basis of two denominators: (a) the total number of RSOs reported in response to the survey’s first item (71.6%) and (b) the previously described “adjusted total” that excludes cases reported as inactive or otherwise not included in the NCMEC counts (79%). Notably, rates of Internet disclosure varied across jurisdictions, with 19 states (43% of those reporting) including more than 90% of their registrants on the public Internet registries, 31 (70%) including more than half, and 6 (14%) including fewer than 25% of their registrants on the public registries.
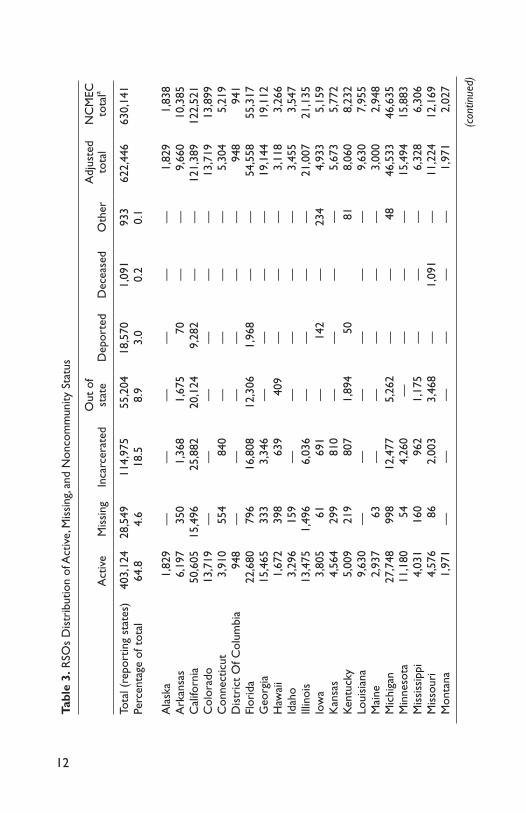
Community-Active, Incarcerated, and Out-of-StateAs referenced in the literature review, aggregate RSO counts reported by NCMEC may include registrants who are incarcerated, deported, or residing in another state. The December 2010 NCMEC survey indicated that 39 of 57 jurisdictions included RSOs in one or more of these categories within their counts. As a means of disaggregating these categories, we asked states to provide breakdowns of the numbers of RSOs who were (a) actively residing in the community (excluding those officially listed as missing or absconded); (b) incarcerated in jail, prison, or other institution; (c) officially missing or absconded (defined as unsuccessful attempts to locate); (d) inactive due to completion of registration period; (e) officially designated as living out of state (excluding deported); (f) officially designated as deported; (g) deceased; and (h) other status (which included an open-ended box for specification).
Table 3 presents data describing the distribution of 622,446 RSOs within 43 jurisdictions. The December 2010 NCMEC-reported totals for these juris-dictions are included in the table for comparison purposes, indicating that our presented results cover approximately 87% (630,141 of 728,435 RSOs) counted by NCMEC for that period.
In the aggregate, the data in Table 3 suggest that approximately 64.8% of RSOs in the included states are listed as actively residing in the community, and an additional 4.6% were reported as active cases that are missing or absconded—a total of approximately 69.4% between these two categories. The
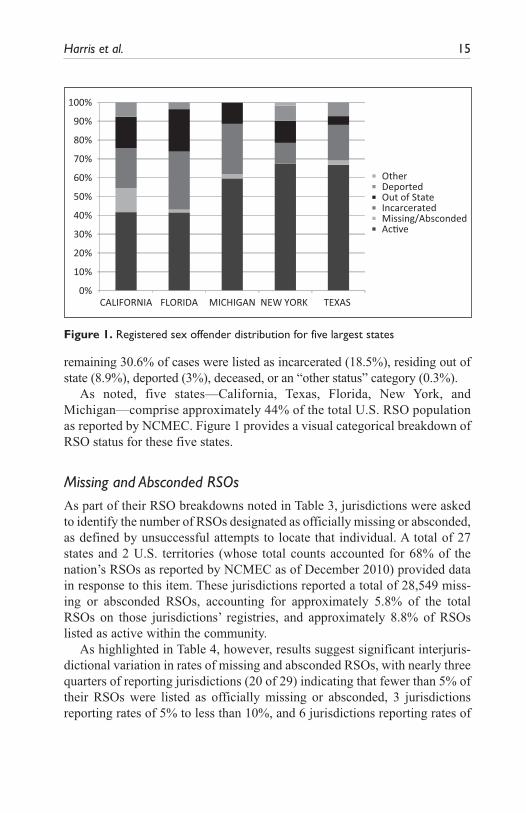
Harris et al. 15
remaining 30.6% of cases were listed as incarcerated (18.5%), residing out of state (8.9%), deported (3%), deceased, or an “other status” category (0.3%).
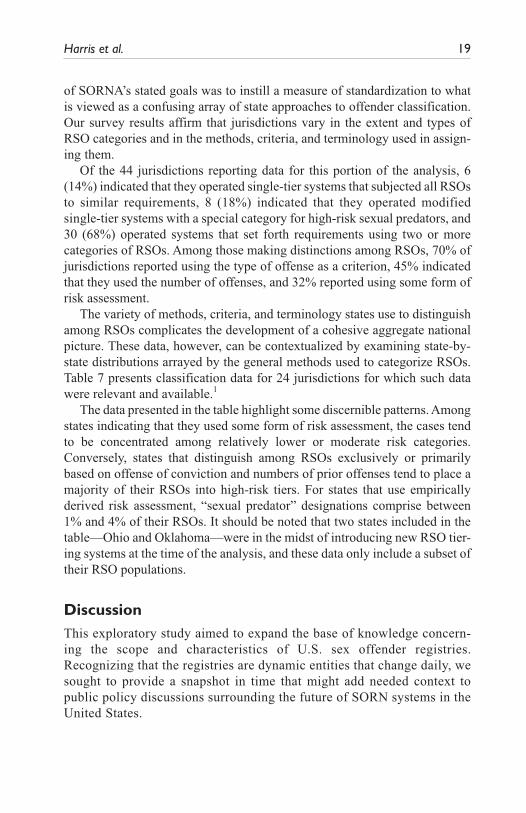
As noted, five states—California, Texas, Florida, New York, and Michigan—comprise approximately 44% of the total U.S. RSO population as reported by NCMEC. Figure 1 provides a visual categorical breakdown of RSO status for these five states.
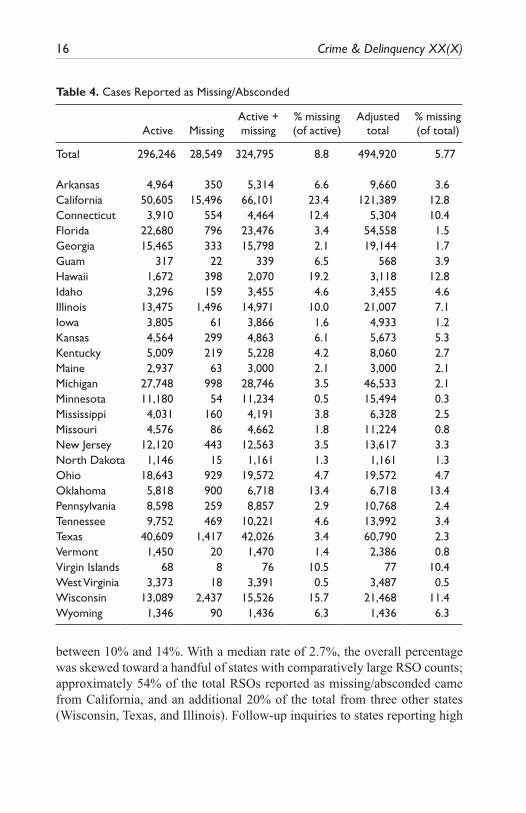
Missing and Absconded RSOsAs part of their RSO breakdowns noted in Table 3, jurisdictions were asked to identify the number of RSOs designated as officially missing or absconded, as defined by unsuccessful attempts to locate that individual. A total of 27 states and 2 U.S. territories (whose total counts accounted for 68% of the nation’s RSOs as reported by NCMEC as of December 2010) provided data in response to this item. These jurisdictions reported a total of 28,549 miss-ing or absconded RSOs, accounting for approximately 5.8% of the total RSOs on those jurisdictions’ registries, and approximately 8.8% of RSOs listed as active within the community.
As highlighted in Table 4, however, results suggest significant interjuris-dictional variation in rates of missing and absconded RSOs, with nearly three quarters of reporting jurisdictions (20 of 29) indicating that fewer than 5% of their RSOs were listed as officially missing or absconded, 3 jurisdictions reporting rates of 5% to less than 10%, and 6 jurisdictions reporting rates of
0%
10%
20%
30%
40%
50%
60%
70%
80%
90%
100%
CALIFORNIA FLORIDA MICHIGAN NEW YORK TEXAS
OtherDeportedOut of StateIncarceratedMissing/AbscondedAc�ve
Figure 1. Registered sex offender distribution for five largest states
16 Crime & Delinquency XX(X)
Table 4. Cases Reported as Missing/Absconded
Active MissingActive + missing
% missing (of active)
Adjusted total
% missing (of total)
Total 296,246 28,549 324,795 8.8 494,920 5.77
Arkansas 4,964 350 5,314 6.6 9,660 3.6California 50,605 15,496 66,101 23.4 121,389 12.8Connecticut 3,910 554 4,464 12.4 5,304 10.4Florida 22,680 796 23,476 3.4 54,558 1.5Georgia 15,465 333 15,798 2.1 19,144 1.7Guam 317 22 339 6.5 568 3.9Hawaii 1,672 398 2,070 19.2 3,118 12.8Idaho 3,296 159 3,455 4.6 3,455 4.6Illinois 13,475 1,496 14,971 10.0 21,007 7.1Iowa 3,805 61 3,866 1.6 4,933 1.2Kansas 4,564 299 4,863 6.1 5,673 5.3Kentucky 5,009 219 5,228 4.2 8,060 2.7Maine 2,937 63 3,000 2.1 3,000 2.1Michigan 27,748 998 28,746 3.5 46,533 2.1Minnesota 11,180 54 11,234 0.5 15,494 0.3Mississippi 4,031 160 4,191 3.8 6,328 2.5Missouri 4,576 86 4,662 1.8 11,224 0.8New Jersey 12,120 443 12,563 3.5 13,617 3.3North Dakota 1,146 15 1,161 1.3 1,161 1.3Ohio 18,643 929 19,572 4.7 19,572 4.7Oklahoma 5,818 900 6,718 13.4 6,718 13.4Pennsylvania 8,598 259 8,857 2.9 10,768 2.4Tennessee 9,752 469 10,221 4.6 13,992 3.4Texas 40,609 1,417 42,026 3.4 60,790 2.3Vermont 1,450 20 1,470 1.4 2,386 0.8Virgin Islands 68 8 76 10.5 77 10.4West Virginia 3,373 18 3,391 0.5 3,487 0.5Wisconsin 13,089 2,437 15,526 15.7 21,468 11.4Wyoming 1,346 90 1,436 6.3 1,436 6.3
between 10% and 14%. With a median rate of 2.7%, the overall percentage was skewed toward a handful of states with comparatively large RSO counts; approximately 54% of the total RSOs reported as missing/absconded came from California, and an additional 20% of the total from three other states (Wisconsin, Texas, and Illinois). Follow-up inquiries to states reporting high
Harris et al. 17
Table 5. RSO Supervision Status
Percentage distribution
State naUnder
supervisionNot under supervision
Unknown status
Total 92,927 34.8 64.7 0.5
Florida 22,680 27.4 71.6 1.0Hawaii 1,672 56.7 43.3 0.0Maine 3,000 33.2 59.8 7.0Minnesota 11,180 40.9 59.1 0.0Missouri 4,576 53.1 46.9 0.0Oregon 17,140 31.7 68.3 0.0Utah 4,342 38.2 61.8 0.0Vermont 1,725 45.2 54.8 0.0Virginia 9,696 34.0 66.0 0.0West Virginia 996 73.5 26.5 0.0Wisconsin 15,526 33.3 66.7 0.0Guam 317 25.9 74.1 0.0Virgin Islands 77 13.0 87.0 0.0
Note: RSO = registered sex offender.aActive registrants living in the community.
rates of missing or absconded RSOs revealed that the cited figures for these states typically included all RSOs flagged as delinquent or technically non-compliant with registration reporting requirements, and did not distinguish those confirmed to have truly absconded (as requested in the survey). The implications of this and related definitional issues are explored in the “Discussion” section.
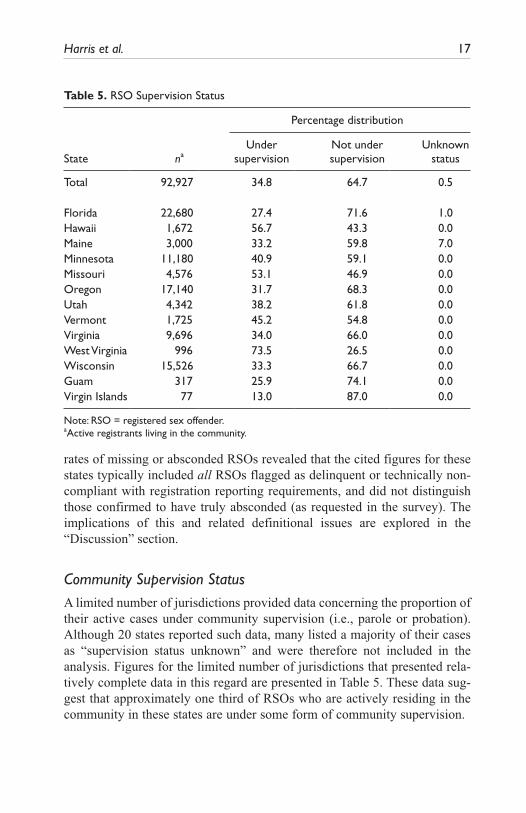
Community Supervision StatusA limited number of jurisdictions provided data concerning the proportion of their active cases under community supervision (i.e., parole or probation). Although 20 states reported such data, many listed a majority of their cases as “supervision status unknown” and were therefore not included in the analysis. Figures for the limited number of jurisdictions that presented rela-tively complete data in this regard are presented in Table 5. These data sug-gest that approximately one third of RSOs who are actively residing in the community in these states are under some form of community supervision.
18 Crime & Delinquency XX(X)
Homelessness and Transience
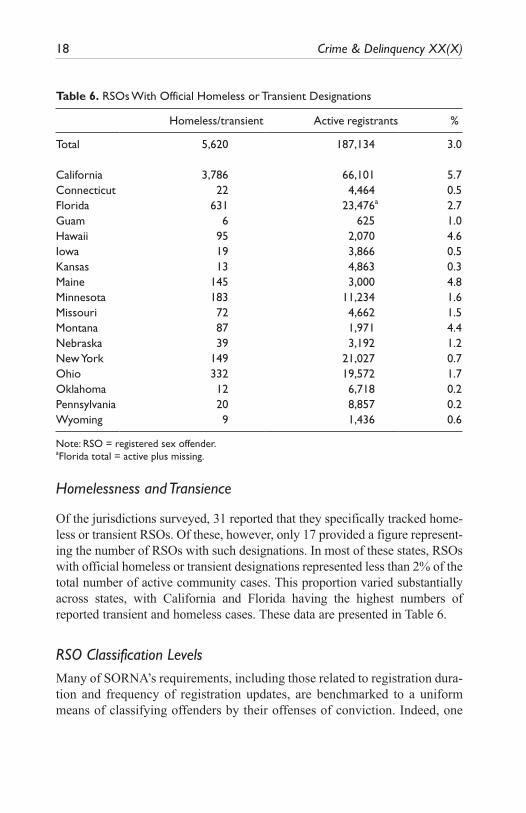
Of the jurisdictions surveyed, 31 reported that they specifically tracked home-less or transient RSOs. Of these, however, only 17 provided a figure represent-ing the number of RSOs with such designations. In most of these states, RSOs with official homeless or transient designations represented less than 2% of the total number of active community cases. This proportion varied substantially across states, with California and Florida having the highest numbers of reported transient and homeless cases. These data are presented in Table 6.
RSO Classification LevelsMany of SORNA’s requirements, including those related to registration dura-tion and frequency of registration updates, are benchmarked to a uniform means of classifying offenders by their offenses of conviction. Indeed, one
Table 6. RSOs With Official Homeless or Transient Designations
Homeless/transient Active registrants %
Total 5,620 187,134 3.0
California 3,786 66,101 5.7Connecticut 22 4,464 0.5Florida 631 23,476a 2.7Guam 6 625 1.0Hawaii 95 2,070 4.6Iowa 19 3,866 0.5Kansas 13 4,863 0.3Maine 145 3,000 4.8Minnesota 183 11,234 1.6Missouri 72 4,662 1.5Montana 87 1,971 4.4Nebraska 39 3,192 1.2New York 149 21,027 0.7Ohio 332 19,572 1.7Oklahoma 12 6,718 0.2Pennsylvania 20 8,857 0.2Wyoming 9 1,436 0.6
Note: RSO = registered sex offender.aFlorida total = active plus missing.
Harris et al. 19
of SORNA’s stated goals was to instill a measure of standardization to what is viewed as a confusing array of state approaches to offender classification. Our survey results affirm that jurisdictions vary in the extent and types of RSO categories and in the methods, criteria, and terminology used in assign-ing them.
Of the 44 jurisdictions reporting data for this portion of the analysis, 6 (14%) indicated that they operated single-tier systems that subjected all RSOs to similar requirements, 8 (18%) indicated that they operated modified single-tier systems with a special category for high-risk sexual predators, and 30 (68%) operated systems that set forth requirements using two or more categories of RSOs. Among those making distinctions among RSOs, 70% of jurisdictions reported using the type of offense as a criterion, 45% indicated that they used the number of offenses, and 32% reported using some form of risk assessment.
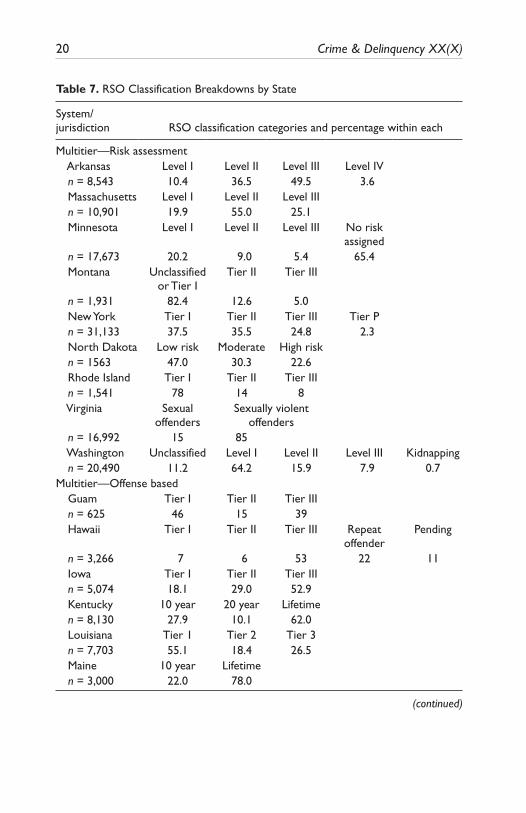
The variety of methods, criteria, and terminology states use to distinguish among RSOs complicates the development of a cohesive aggregate national picture. These data, however, can be contextualized by examining state-by-state distributions arrayed by the general methods used to categorize RSOs. Table 7 presents classification data for 24 jurisdictions for which such data were relevant and available.1
The data presented in the table highlight some discernible patterns. Among states indicating that they used some form of risk assessment, the cases tend to be concentrated among relatively lower or moderate risk categories. Conversely, states that distinguish among RSOs exclusively or primarily based on offense of conviction and numbers of prior offenses tend to place a majority of their RSOs into high-risk tiers. For states that use empirically derived risk assessment, “sexual predator” designations comprise between 1% and 4% of their RSOs. It should be noted that two states included in the table—Ohio and Oklahoma—were in the midst of introducing new RSO tier-ing systems at the time of the analysis, and these data only include a subset of their RSO populations.
DiscussionThis exploratory study aimed to expand the base of knowledge concern-ing the scope and characteristics of U.S. sex offender registries. Recognizing that the registries are dynamic entities that change daily, we sought to provide a snapshot in time that might add needed context to public policy discussions surrounding the future of SORN systems in the United States.
20 Crime & Delinquency XX(X)
Table 7. RSO Classification Breakdowns by State
System/jurisdiction RSO classification categories and percentage within each
Multitier—Risk assessment Arkansas Level I Level II Level III Level IV n = 8,543 10.4 36.5 49.5 3.6 Massachusetts Level I Level II Level III n = 10,901 19.9 55.0 25.1 Minnesota Level I Level II Level III No risk
assigned
n = 17,673 20.2 9.0 5.4 65.4 Montana Unclassified
or Tier ITier II Tier III
n = 1,931 82.4 12.6 5.0 New York Tier I Tier II Tier III Tier P n = 31,133 37.5 35.5 24.8 2.3 North Dakota Low risk Moderate High risk n = 1563 47.0 30.3 22.6 Rhode Island Tier I Tier II Tier III n = 1,541 78 14 8 Virginia Sexual
offendersSexually violent
offenders
n = 16,992 15 85 Washington Unclassified Level I Level II Level III Kidnapping n = 20,490 11.2 64.2 15.9 7.9 0.7Multitier—Offense based Guam Tier I Tier II Tier III n = 625 46 15 39 Hawaii Tier I Tier II Tier III Repeat
offenderPending
n = 3,266 7 6 53 22 11 Iowa Tier I Tier II Tier III n = 5,074 18.1 29.0 52.9 Kentucky 10 year 20 year Lifetime n = 8,130 27.9 10.1 62.0 Louisiana Tier 1 Tier 2 Tier 3 n = 7,703 55.1 18.4 26.5 Maine 10 year Lifetime n = 3,000 22.0 78.0
(continued)
Harris et al. 21
Consistent with this study’s exploratory nature, the results presented here should be interpreted with certain caveats. First, although significant efforts were made to present a representative national portrait of SORN systems, the presented data are limited by exclusion of some states from certain portions of our results. The findings included data from a subset of jurisdictions that accounted for approximately 87% of the NCMEC-reported RSO counts, and nonincluded jurisdictions were fairly evenly distributed geographically. It
Table 7. (continued)
System/jurisdiction RSO classification categories and percentage within each
Nebraska 15 year 25 year Lifetime Pending n = 3,192 20.7 25.1 51.8 2.4 Tennessee Sexual
offendersViolent sexual
offenders
n = 13,811 41.0 59.0 Texas Low risk Medium
riskHigh risk SVP Unclassified
n = 63,538 20.8 37.2 11.8 0.2 29.9 West Virginia 10 year Lifetime n = 3,373 2 98 Wyoming Tier I Tier II
and IIIUnder review
n = 1,436 25 73 2 States with predator designations Colorado Predator status n = 13,719 1.2 Georgia Predator status n = 19,095 0.9 Idaho Predator status n = 3,455 1.4 Pennsylvania Predator status n = 10,509 3.9 Transitional jurisdictions Ohio Tier I Tier II Tier III n = 14,746 17 33 50 Oklahoma Level I Level II Level III Aggravated Habitual n = 6,718 12.5 4.5 40.1 39.9 3.1
Note: RSO = registered sex offender, Sexually Violent Predator = SVP.
22 Crime & Delinquency XX(X)
should be noted, however, that many of the aggregate national measures pre-sented here were driven by a small number of states with particularly high RSO counts, such as California, Texas, Florida, Michigan, and New York. Conversely, those states that are missing from our results tended to be those operating smaller SORN systems that may differ from larger systems in cer-tain operational and population-based dimensions. Considering these factors, caution should be exercised in extrapolating these findings to derive defini-tive national estimates.
Second, it remains apparent that the study of sex offender registries and individuals contained within them must account for definitional ambiguity. As previously described, this problem emerged as particularly confounding in our assessment of the numbers of missing or absconded sex offenders, which in some states included all of those who were in technical noncompli-ance, whereas others used a more precise definition. The issue was also apparent in the range of designations used to classify RSOs and in the varying definitions of commonly applied terms. Beyond their implications for research endeavors, definitional discrepancies should also be of concern to policy makers, who need accurate data with common measures to understand social problems and craft relevant solutions.
What Have We Learned About RSOs on Public Internet Registries?Our findings suggest considerable variation regarding the proportion of RSOs contained on public registries. The majority of states included in the study allow public accessibility to information regarding more than 90% of their registrants—a level of disclosure that is generally consistent with emerging federal mandates. On the other side of the coin, many states have chosen a more selective approach, opting to release information on only a limited subset of their registrants who are believed to present an ongoing threat to the community.
In the realm of public policy, these findings prompt consideration of the respective roles and functions of sex offender registration and community notification. Although often conflated, these two sets of requirements actu-ally represent discrete functions with distinct operational and public safety implications. Certainly, law enforcement access to information on RSOs across the risk spectrum may serve as a viable tool for investigation, moni-toring, and crime prevention efforts. The rationale for citizen access to such information, however, remains a matter of debate. There has been little
Harris et al. 23
empirical support for the notion that citizen access to sex offender information leads to direct public safety benefits. Notably, research detecting positive effects has been limited to states like Minnesota that use empirically derived risk assessment to target high-risk offenders (Duwe & Donnay, 2008; Letourneau et al., 2010; Sandler et al., 2008; Vasquez et al., 2008; Zgoba, Witt, et al., 2009). In fact, an overly inclusive public registry may produce an overload of information that makes it difficult for concerned members of the public to distinguish truly dangerous RSOs from those who present less public safety risk (Harris et al., 2010; Levenson & D’Amora, 2007). Moreover, some research has suggested that public notification may even exacerbate risk factors for many RSOs through its collateral effects on the individual’s capacity for community integration, employment, housing, and development of requisite social supports (Levenson & Cotter, 2005; Levenson, D’Amora, et al., 2007; Mercado et al., 2008; Sample & Streveler, 2003; Tewksbury, 2004, 2005; Tewksbury & Lees, 2006; Zevitz & Farkas, 2000). Research also suggests that classifying sex offenders by their statute of conviction is less effective than empirically derived risk assessments in identifying potential recidivists (Freeman & Sandler, 2010).
What Have We Learned About RSO Community Residential Status?Our second notable set of findings relates to the residential status of RSOs, particularly in the context of the commonly cited nationwide figures pro-duced by NCMEC. Our analysis suggests that approximately two thirds of the RSOs reported by NCMEC are actually “active” registrants living among us, with the remainder either incarcerated, otherwise confined, deported, deceased, or living in another state. These latter categories comprise the largest proportions in those states with the highest overall RSO counts—states such as California, Texas, Florida, Michigan, and New York.
The presence of out-of-state registrants in official NCMEC data is par-ticularly confounding, because it suggests that they are counted more than once (i.e., listed on multiple state registries), inflating the total count both nationally and for individual states. Overall, our data indicate that more than 55,000 registrants are designated as living out of state, suggesting that as many as 8% of the nation’s RSOs could be counted on multiple registries. These factors appear to call for caution in the interpretation of the NCMEC figures for purposes of policy decisions, particularly those involving the allocation of resources.
24 Crime & Delinquency XX(X)
What Have We Learned About Missing and Absconded RSOs?
A third important finding of this study concerns the number of RSOs officially designated by states as missing or absconded. States reported 28,678 cases with such designations, with over half of this figure derived from one state (California) and nearly three quarters from just four states (California, Wisconsin, Texas, and Illinois). Rates of officially missing and absconded RSOs varied considerably across states, ranging from less than 1% to just over 13%, with a median rate of 2.7%.
These findings carry several noteworthy implications. First, they suggest that the ubiquitous statistic that more than 100,000 sex offenders are missing across the United States may overstate the problem and obscure important interjurisdictional differences of importance to policy makers (Levenson & Harris, 2011). Clearly, a more complete understanding of the geographic dis-tribution of noncompliance and missing or absconded sex offenders emerges as a critical need for informing national SORN policy.
Next, our investigation into this matter also illuminates the definitional challenges inherent in evaluating and discussing the problem of “missing” sex offenders. Follow-up inquiries with California and Wisconsin—the states with the two highest reported figures—revealed that the data from these states equated any form of registry noncompliance with missing/absconder status. In contrast, data from other states suggest that using a more refined definition of missing/absconded (defined as unsuccessful attempts to locate the offender) produced more moderate estimates. These are important matters, given that noncompliance may encompass a spectrum of circumstances, ranging from RSO carelessness to deliberate evasion of authorities, and considering that there is little support for the notion that noncompliance with registration requirements is associated with increased risk of sexual reoffending (Duwe & Donnay, 2010; Levenson et al., 2010). Moreover, definitional disparities, along with the skewed distribution of those designated in our sample as officially missing or absconded, caution against extrapolating figures based on a limited sample of states to derive a national estimate—a methodological fallacy that is at the root of the com-monly cited “100,000 missing” statistic (Levenson & Harris, 2011).
For purposes of national SORN policy, the varied responses to survey items reinforce the need for greater uniformity in how certain terms and desig-nations are communicated and interpreted. Particularly given AWA’s ostensible purpose to achieve greater standardization across the nation’s sex offender reg-istries, federal policy should aim to clarify these designations rather than
Harris et al. 25
obscure them. It should also be clear that additional critical and methodologi-cally sound examination of the extent and distribution of the noncompliant, missing, and absconded sex offenders is warranted.
What Have We Learned About Homeless and Transient RSOs?Although nearly three quarters of jurisdictions responding to our survey indicated that they had some method for keeping track of homeless or tran-sient sex offenders, barely half of those were able to provide numbers in this regard. This finding suggests that although the issue appears to be on the general radar of practitioners and policy makers, systems for tracking and reporting on the phenomenon remain in a nascent state of development. In those states for which data were provided, a total of 3% of community-active registrants are designated as homeless or transient, with wide variation between states. Although California emerges as the state with the highest proportion in this category (5.7%), homelessness and transience is not limited to states with high levels of urban density—States with highly disbursed populations such as Maine and Montana were among those with the highest reported proportions of homeless/transient RSOs.
In recent years, concerns over homeless and transient sex offenders have increasingly attracted the attention of both practitioners and policy makers. At the practitioner level, law enforcement and community corrections agencies must address a range of operational challenges associated with tracking and monitoring RSOs with no stable address. In the policy domain, the problems of homelessness and transience intersect with a wide range of prevailing sex offender management strategies, including SORN, residence restrictions, and Global Positioning System (GPS) monitoring. For instance, legislative concern that RSOs are using declarations of homelessness as a means of avoiding registration has led many states to pass legislation expand-ing reporting requirements for RSOs with no stable address (Scibelli & Levy, 2011). Meanwhile, residential restrictions on where RSOs are permitted to live diminish the range of available housing options (Bruell, Swatt, & Sample, 2008; Chajewski & Mercado, 2009; Red Bird, 2009; Zandbergen & Hart, 2006; Zgoba, Levenson, & McKee, 2009), potentially increasing the num-bers of homeless RSOs. In fact, data suggest that the dramatic increase in homeless RSOs in California may be attributed to statewide and local resi-dence restrictions banning RSOs from living within 2,000 feet of a school or park, rendering a vast majority of housing in urban areas off-limits to them (California Sex Offender Management Board, 2010).
26 Crime & Delinquency XX(X)
Despite its growing relevance for policy and practice, reliable data describ-ing the nature and magnitude of homeless and transient RSOs has remained limited, with policy decisions often driven by anecdotal case examples. Considering this, the matter beckons for expanded research attention to better understand the characteristics of homeless/transient RSOs and the dynamics between transience and sex offender management policy and practice.
What Have We Learned About RSO Classification Levels?One of the principal aims of the Adam Walsh Act was to introduce nation-wide standardization to the taxonomy for categorizing sex offenders. This classification scheme, in turn, has been linked in the AWA guidelines to a set of minimum standards governing duration of registration, frequency of required registration updates, and mandated public Internet notification. Our data suggest that, at least as of late 2010, such standardization has remained elusive. States use a range of classification methods, with some using multiple tier (or risk) levels, some classifying predators or habitual offenders, some identifying kidnappers or abductors, and some even includ-ing nonsexual offenses involving children. Moreover, as noted earlier, many states classify a significant portion of their RSOs as lower or moderate risk and do not include their information on public registries.
Furthermore, our data illustrate a wide distribution of RSOs across levels. Clearly, some jurisdictions have calibrated their registration and notification systems to selectively identify those presenting the greatest threat to public safety, while others have opted for a less refined approach. Although such variation appears to be generally linked to classification methods and criteria (i.e., “risk-based” vs. “offense-based” systems), differing distributions across tiers or levels were also observed between jurisdictions using similar classifi-cation schema. These findings suggest that RSO classification is an inherently idiosyncratic process, influenced by a range of organizational, operational, legal, intergovernmental, and political considerations within each jurisdiction. This complexity, in turn, presents particular challenges to the implementation of federal AWA guidelines and may suggest a need for federal lawmakers to reevaluate their expectations in this regard.
An effective RSO classification system is one that provides law enforce-ment and the general public with requisite levels of information to promote public safety and efficiently inform allocation of public resources. Given the observed variation across jurisdictions, it is likely that some states are achiev-ing these goals more effectively than others. It is, however, far from a fore-gone conclusion that the most effective RSO tiering systems are those that
Harris et al. 27
comport with the AWA requirements. In fact, AWA tiers have shown poor ability to predict recidivism (Freeman & Sandler, 2010). Some scholars have cautioned that offense-based categorization will overestimate risk for many offenders while underestimating risk for those who plea-bargain to lesser charges (Levenson, 2009). Other research has confirmed a “net widening” effect of the AWA-mandated classification criteria, which places a majority of registrants into the highest tier, contravening evidence suggesting that the highest risk of sexual reoffense is concentrated among a much smaller group of offenders (Harris et al., 2010).
Clearly, the rationale for standardized classification procedures is compel-ling: better communication across law enforcement agencies, more consis-tency in the information provided to the general public, and better articulated expectations for minimum requirements. Yet one may ask whether the pursuit of standardization and convenience has occurred at the expense of effective policy. Future federal policy should consider the sources of interstate varia-tion and encourage systematic evaluation of the relative efficiency and public safety impacts of varying approaches.
General Implications for Research and PolicyThe preceding discussion delineates a range of specific considerations for pol-icy makers concerning public disclosure, RSO residential status, missing or absconded RSOs, homelessness and transience, and risk classification. On a broader level, however, the current study raises some important general ques-tions for the consideration of researchers and policy makers. In particular, the significant interjurisdictional variability observed across the study’s domains suggests a strong need for further systematic analysis. For example, the wide variation in the counts and proportions of RSOs with designations of homeless, transient, missing, or absconded raises questions of whether this variation may be attributable to policy choices, endemic differences in the RSO population, enforcement mechanisms, or to structural or administrative characteristics of the registries themselves. Disentangling the relative effects of these factors should be an important focus for future research and a critical concern for policy makers.
Concluding CommentsIn a sense, the definitional issues and methodological barriers encoun-tered in this study reflect some of the fallacies that have permeated discourse surrounding contemporary sex offender management policies. While our study affirms the need for improvements and standardization across the
28 Crime & Delinquency XX(X)
nation’s registry systems, it also suggests that our pursuit of standardization has occurred amid a significant information vacuum in which many questions regarding both the RSO population and the reliability of registry data remain unanswered.
Policy scholar Deborah Stone states that “numbers can create the illusion that a very complex and ambiguous phenomenon is simple, countable, and precisely defined” (Stone, 2002, p.176). Along these lines, policy dialogue over SORN reform has often been framed by “sound-bite” statistics—more than 700,000 RSOs living in our communities and more than 100,000 missing—with little critical attention paid to the source of these numbers or the complexities behind them. In such an environment, imprecision in our understanding may too easily translate into misguided problem definitions and, in turn, ineffective public policies.
Declaration of Conflicting Interests
The authors declared no potential conflicts of interest with respect to the research, authorship, and/or publication of this article.
Funding
The authors received some in kind research assistant support from the University.
Note
1. This table is limited to those jurisdictions that were able to provide relevant and complete data. Beyond these jurisdictions, several states responding to the sur-vey indicated that similar requirements were applied to all registered sex offend-ers and therefore did not provide categorical breakdowns.
References
Ackerman, A. A., Harris, A. J., Levenson, J. S., & Zgoba, K. (2011). Who are the people in your neighborhood? A descriptive analysis of individuals on public sex offender registries. International Journal of Psychiatry and Law, 34, 149-159.
Adkins, G. Huff, D., & Stageberg, P. (2000). The Iowa Sex Offender Registry and Recidivism. Des Moines, Iowa: Iowa Department of Human Rights.
Anderson, A. L., & Sample, L. (2008). Public awareness and action resulting from sex offender community notification laws. Criminal Justice Policy Review, 19, 371-396.
Bandy, R. (2011). Measuring the impact of sex offender notification on community adoption of protective behaviors. Criminology & Public Policy, 10, 237-263.
Harris et al. 29
Bruell, C., Swatt, M., & Sample, L. (November, 2008). Potential consequences of sex offender residency restriction laws: Housing availability and offender displace-ment. Paper presented at the American Society of Criminology, St. Louis, MO.
Bureau of Justice Statistics. (2003). Recidivism of sex offenders released from prison in 1994. (Report No. NCJ 198281). Washington, DC: U.S. Department of Justice.
California Sex Offender Management Board. (2010). CASOMB recommendations report, January 2010. Retrieved from http://www.casomb.org/reports.htm
Chajewski, M., & Mercado, C. C. (2009). An evaluation of sex offender residency restriction functioning in town, county, and city-wide jurisdictions. Criminal Jus-tice Policy Review, 20, 44-61.
Duwe, G., & Donnay, W. (2008). The impact of Megan’s Law on sex offender recidi-vism: The Minnesota experience. Criminology, 46, 411-446.
Duwe, G., & Donnay, W. (2010). The effects of failure to register on sex offender recidivism. Criminal Justice and Behavior, 37, 520-536.
Fortney, T., Levenson, J. S., Brannon, Y., & Baker, J. (2007). Myths and facts about sex offenders: Implications for practice and public policy. Sex Offender Treat-ment, 2(1), 1-17.
Freeman, N., & Sandler, J. (2010). The Adam Walsh act: A false sense of security or an effective public policy initiative? Criminal Justice Policy Review, 21, 31-49.
Hanson, R. K., & Bussiere, M. T. (1998). Predicting relapse: A meta-analysis of sex-ual offender recidivism studies. Journal of Consulting and Clinical Psychology, 66, 348-362.
Hanson, R. K., & Morton-Bourgon, K. (2005). The characteristics of persistent sexual offenders: A meta-analysis of recidivism studies. Journal of Consulting and Clini-cal Psychology, 73, 1154-1163.
Harris, A. J., Lobanov-Rostovsky, C., & Levenson, J. S. (2010). Widening the net: The effects of transitioning to the Adam Walsh Act classification system. Crimi-nal Justice and Behavior, 37, 503-519.
Harris, A. J. R., & Hanson, R. K. (2004). Sex offender recidivism: A simple question. (Report No. 2004-03). Ottawa, Ontario: Public Safety and Emergency Prepared-ness Canada.
Kernsmith, P. D., Comartin, E., Craun, S. W., & Kernsmith, R. M. (2009). The rela-tionship between sex offender registry utilization and awareness. Sexual Abuse: A Journal of Research and Treatment, 21, 181-193.
Letourneau, E., Levenson, J. S., Bandyopadhyay, D., Sinha, D., & Armstrong, K. (2010). Effects of South Carolina’s sex offender registration and notification pol-icy on adult recidivism. Criminal Justice Policy Review, 21, 435-458.
Levenson, J. S. (2009). Sex offense recidivism, risk assessment, and the Adam Walsh Act. Sex Offender Law Report, 10(1), 1-6.
30 Crime & Delinquency XX(X)
Levenson, J. S., Brannon, Y., Fortney, T., & Baker, J. (2007). Public perceptions about sex offenders and community protection policies. Analyses of Social Issues and Public Policy, 7(1), 1-25.
Levenson, J. S., & Cotter, L. P. (2005). The effect of Megan’s Law on sex offender reintegration. Journal of Contemporary Criminal Justice, 21, 49-66.
Levenson, J. S., & D’Amora, D. A. (2007). Social policies designed to prevent sexual violence: The Emperor’s New Clothes? Criminal Justice Policy Review, 18(2), 168-199.
Levenson, J. S., D’Amora, D. A., & Hern, A. (2007). Megan’s Law and its impact on community re-entry for sex offenders. Behavioral Sciences & the Law, 25, 587-602.
Levenson, J. S., & Harris, A. (2011). 100,000 sex offenders missing . . . or are they? Deconstruction of an urban legend. Criminal Justice Policy Review. Advance online publication. doi:10.1177/0887403411415398
Levenson, J. S., Letourneau, E., Armstrong, K., & Zgoba, K. (2010). Failure to register as a sex offender: Is it associated with recidivism? Justice Quarterly, 27, 305-331.
Lieb, R., & Nunlist, C. (2008). Community notification as viewed by Washington’s citi-zens: A ten-year follow-up. Olympia: Washington State Institute for Public Policy.
Mears, D. P., Mancini, C., Gertz, M., & Bratton, J. (2008). Sex crimes, children, and pornography: Public views and public policy. Crime & Delinquency, 54, 532-650.
Mercado, C. C., Alvarez, S., & Levenson, J. S. (2008). The impact of specialized sex offender legislation on community re-entry. Sexual Abuse: A Journal of Research and Treatment, 20, 188-205.
National Center for Missing and Exploited Children. (2011). Registered sex offend-ers in the United States. Retrieved from http://www.missingkids.com/en_US/ documents/sex-offender-map.pdf
Red Bird, B. (2009). Assessing housing availability under Ohio’s sex offender resi-dency restrictions. Columbus: Ohio State University.
Sample, L. L., & Streveler, A. J. (2003). Latent consequences of community notifica-tion laws. In S. H. Decker, L. F. Alaird, & C. M. Katz (Eds.), Controversies in criminal justice (pp. 353-362). Los Angeles, CA: Roxbury.
Sandler, J. C., Freeman, N. J., & Socia, K. M. (2008). Does a watched pot boil? A time-series analysis of New York State’s sex offender registration and notification law. Psychology, Public Policy and Law, 14, 284-302.
Scibelli, P., & Levy, L. (2011). Sex offender registration and homelessness: Should homeless registrants be held to a different standard? Sex Offender Law Report, 12, 51-53.
Stone, D. (2002). Policy paradox: The art of political decision making. New York, NY: W. W. Norton.
Tewksbury, R. (2004). Experiences and attitudes of registered female sex offenders. Federal Probation, 68(3), 30-34.
Harris et al. 31
Tewksbury, R. (2005). Collateral consequences of sex offender registration. Journal of Contemporary Criminal Justice, 21, 67-82.
Tewksbury, R., & Lees, M. (2006). Consequences of sex offender registration: Collateral consequences and community experiences. Sociological Spectrum, 26, 309-334.
U.S. House of Representatives Committee on the Judiciary. (2011). Truth in Tes-timony Disclosure Form Submitted for Ernie Allen. National Center for Miss-ing and Exploited Children, submitted February 15, 2011. Retrieved on June 7, 2012 from http://judiciary.house.gov/hearings/pdf/AllenTruth.pdf
Vasquez, B. E., Maddan, S., & Walker, J. T. (2008). The influence of sex offender registration and notification laws in the United States. Crime & Delinquency, 54, 175-192.
Zandbergen, P., & Hart, T. C. (2006). Reducing housing options for convicted sex offenders: Investigating the impact of residency restriction laws using GIS. Jus-tice Research and Policy, 8(2), 1-24.
Zevitz, R. G. (2006). Sex offender community notification: Its role in recidivism and offender reintegration. Criminal Justice Studies, 19, 193-208.
Zevitz, R. G., & Farkas, M. A. (2000). Sex offender community notification: Assess-ing the impact in Wisconsin. Washington, DC: U.S. Department of Justice.
Zgoba, K., Levenson, J. S., & McKee, T. (2009). Examining the impact of sex offender residence restrictions on housing availability. Criminal Justice Policy Review, 20, 91-110.
Zgoba, K., Witt, P., Dalessandro, M., & Veysey, B. (2009). Megan’s Law: Assessing the practical and monetary efficacy [Electronic version]. Retrieved from http://www.ncjrs.gov/pdffiles1/nij/grants/225370.pdf
Bios
Andrew J. Harris is assistant professor in the Department of Criminal Justice and Criminology at the University of Massachusetts Lowell. His research focuses on issues concerning mental illness and the criminal justice system and on the develop-ment and implementation of state and federal sex offender policy.
Jill S. Levenson is associate professor of psychology and human services at Lynn University in Boca Raton, FL. Her research analyzes the impact and effectiveness of social policies designed to reduce sexual violence. She also studies the treatment of sex offenders and their families.
Alissa R. Ackerman is assistant professor in the Social Work Program at the University of Washington, Tacoma. Her research focuses on sex offender management and policy issues.