Embed Size (px)
Citation preview

APPLIED AND ENVIRONMENTAL MICROBIOLOGY, July 2010, p. 4169–4178 Vol. 76, No. 130099-2240/10/$12.00 doi:10.1128/AEM.03147-09Copyright © 2010, American Society for Microbiology. All Rights Reserved.
Regrowth of Potential Opportunistic Pathogens and Algae inReclaimed-Water Distribution Systems�
Patrick K. Jjemba,1* Lauren A. Weinrich,1 Wei Cheng,1†Eugenio Giraldo,2 and Mark W. LeChevallier2
American Water Research Laboratory, Delran, New Jersey 08075,1 and American Water Works Service Company,Inc., Voorhees, New Jersey 080432
Received 30 December 2009/Accepted 25 April 2010
A study of the quality of reclaimed water in treated effluent, after storage, and at three points in thedistribution system of four plants in California, Florida, Massachusetts, and New York was conducted for 1year. The plants had different treatment processes (conventional versus membrane bioreactor), productioncapacities, and methods for storage of the water, and the intended end uses of the water were different. Theanalysis focused on the occurrence of indicator bacteria (heterotrophic bacteria, coliforms, Escherichia coli, andenterococci) and opportunistic pathogens (Aeromonas spp., enteropathogenic E. coli O157:H7, Legionella spp.,Mycobacterium spp., and Pseudomonas spp.), as well as algae. Using immunological methods, E. coli O157:H7was detected in the effluent of only one system, but it was not detected at the sampling points, suggesting thatits survival in the system was poor. Although all of the treatment systems effectively reduced the levels ofbacteria in the effluent, bacteria regrew in the reservoir and distribution systems because of the loss of residualdisinfectant and high assimilable organic carbon levels. In the systems with open reservoirs, algal growthreduced the water quality by increasing the turbidity and accumulating at the end of the distribution system.Opportunistic pathogens, notably Aeromonas, Legionella, Mycobacterium, and Pseudomonas, occurred morefrequently than indicator bacteria (enterococci, coliforms, and E. coli). The Mycobacterium spp. were verydiverse and occurred most frequently in membrane bioreactor systems, and Mycobacterium cookii was identifiedmore often than the other species. The public health risk associated with these opportunistic pathogens inreclaimed water is unknown. Collectively, our results show the need to develop best management practices forreclaimed water to control bacterial regrowth and degradation of water before it is utilized at the point of use.
Freshwater is becoming increasingly scarce because of in-creasing populations, changing precipitation patterns, and/ordegradation of existing sources of water. Reclaimed water canbe used to alleviate some of the shortages. Indeed, reclaimingwater for reuse has become increasingly common (39, 42). Bydefinition, the term reclaimed water refers to effluents thathave undergone a combination of physical, chemical, and bio-logical treatments in engineered systems that utilize wastewa-ter treatment technologies to remove suspended solids, dis-solved solids, organic matter, nutrients, metals, and pathogens.When ideally practiced, the technologies used result in aneffluent whose quality is commensurate with the intended use.Typically, reclaimed water contains a high level of organicmatter, which potentially can react with the disinfectant (L. AWeinrich, P. K. Jjemba, E. Giraldo and M. W. LeChevallier,submitted for publication) but also provides nutrition in theform of organic carbon (40, 41). Depending on the mode ofstorage, some carbon may also be fixed through photosynthesisby algae, further impacting water quality.
Evaluation of the microbial quality of reclaimed water cur-rently focuses mainly on the abundance of indicator bacteria(namely, coliforms, Escherichia coli, and enterococci) in the
treated effluent (4, 13, 39, 42). However, there is increasingconcern about the quality of the water at the point of use(17, 27, 31, 35; http://www.americascarcare.com/database/dms/acc1006w50.pdf; http://www.tucsonaz.gov/water/reclaimed.htm). Studies have focused on the regrowth of indicator bac-teria, notably coliforms and E. coli (27). However, most ofthese indicator organisms are nonpathogenic, and their pres-ence does not clearly correlate with the presence of actualopportunistic pathogens, such as Aeromonas, Legionella, andMycobacterium, in reclaimed water (7, 16, 20, 22, 24, 27, 29). Toaddress concerns about the quality of reclaimed water, re-growth of these pathogens in such water, in addition to re-growth of the indicator bacteria, has to be examined.
In this study the biostability of reclaimed water in the dis-tribution systems at four plants that use different treatmentprocesses was examined (Table 1). The treatment practices atthe plants in California and Florida examined are conventionalpractices, whereas the plants in Massachusetts and New Yorkexamined use membrane bioreactor (MBR) technology. MBRtreatment is a form of activated sludge treatment with a muchsmaller footprint; it combines membrane-based separationtechnology with a high level of biological treatment. The plantsstudied differ in size, geographic location, disinfection prac-tices, and the way in which the reclaimed water is stored. Theabundance of indicator bacteria in relation to the abundance ofbacteria of public health concern (i.e., Aeromonas, Legionella,Mycobacterium, and Pseudomonas) was specifically determinedfor each distribution system. Because of its contribution to
* Corresponding author. Mailing address: American Water Re-search Laboratory, 213 Carriage Lane, Delran, NJ 08075. Phone: (856)764-4919. Fax: (856) 764-3246. E-mail: [email protected].
† Present address: Integrated Analytical Laboratories, Inc., Ran-dolph, NJ 07869.
� Published ahead of print on 7 May 2010.
4169

TA
BL
E1.
Cha
ract
eris
tics
ofth
efo
urre
clai
med
wat
ersy
stem
sst
udie
d
Cha
ract
eris
ticC
alifo
rnia
Flo
rida
Mas
sach
uset
tsN
ewY
ork
Tre
atm
ent
proc
ess
Scre
enin
g,flo
weq
ualiz
atio
n,tr
ickl
ing
filte
rs,
prim
ary
and
seco
ndar
ycl
arifi
catio
n,flo
ccul
atio
n,de
nitr
ifica
tion,
filtr
atio
n,di
sinf
ectio
nsy
stem
,and
two
recl
amat
ion
stor
age
rese
rvoi
rs;t
rick
ling
filte
rsw
ithte
rtia
rysa
ndfil
trat
ion
Act
ivat
edsl
udge
with
Bar
denp
hoan
dse
cond
ary
filtr
atio
n;ap
prox
150
colle
ctio
nsy
stem
pum
pst
atio
ns
Sing
lean
oxic
;MB
R(Z
enon
but
switc
hed
toT
orre
yfla
tpl
ate
prio
rto
the
fall
sam
plin
g)w
ithni
trifi
catio
nan
dde
nitr
ifica
tion
syst
em;2
.57
�10
7 -lite
req
ualiz
atio
nta
nkw
itha
13,2
00-li
ter/
min
subm
ersi
ble
lift
stat
ion
Ano
xic
and
aero
bic;
MB
R(Z
enon
)in
the
base
men
tof
a29
3-un
ithi
gh-r
ise
build
ing
Plan
tca
paci
ty88
,960
liter
s/da
yA
vera
ge,2
.9�
107
liter
s/da
y;fu
llca
paci
ty,3
.4�
107
liter
s/da
y95
0,00
0lit
ers/
day
but
ifne
eded
can
expa
ndto
4.2
�10
7lit
ers/
day,
aca
paci
tyth
atis
atta
inab
ledu
ring
high
-flo
wse
ason
s(i
.e.,
full-
scal
eac
tivity
and
use
ofth
esp
orts
stad
ium
that
itse
rves
)
Gen
erat
es95
,000
liter
s/da
yre
clai
med
wat
er,
34,0
00lit
ers/
day
ofw
hich
isfo
rto
ilet
flush
ing
and
43,5
00lit
ers/
day
ofw
hich
isfo
rth
eco
olin
gto
wer
Dis
infe
ctio
nC
hlor
ine
Chl
orin
eC
hlor
ine
UV
and
ozon
eSt
orag
eO
pen
rese
rvoi
rO
pen
rese
rvoi
r(6
.84
mde
epw
itha
usea
ble
stor
age
volo
fap
prox
2.11
�10
8lit
ers)
3.79
�10
6 -lite
rta
nk75
,700
-lite
rta
nk
Reu
sety
peIr
riga
tion
(lan
dsca
ping
)Ir
riga
tion
(res
iden
tial,
golf,
scho
ols,
etc.
)T
oile
tflu
shin
gan
dur
inal
sat
stad
ium
Irri
gatio
n,to
ilet
flush
ing,
cool
ing
tow
erpH
rang
e7.
07–9
.60
7.12
–8.1
97.
32–8
.94
6.12
–7.6
2C
ondu
ctiv
ity(�
S/cm
)1,
360–
2,02
951
8–1,
601
735–
1,46
117
5–91
4T
urbi
dity
(NT
U)
0.67
–12.
70.
58–1
6.2
0.23
–25.
20.
06–2
.20
Wat
erte
mp
(oC
)14
.1–2
5.1
21.1
–30.
12.
4–29
.720
.8–3
3.2
TO
Cco
ncn
(mg/
liter
)12
.8�
1.9
7.2
�0.
83.
8�
1.2
2.7
�0.
5B
DO
Cco
ncn
(mg/
liter
)6.
2�
1.4
1.4
�0.
80.
6�
0.4
0.4
�0.
2A
OC
conc
n(�
g/lit
er)
1,40
7�
983
1,14
1�
503
459
�46
714
9�
109
Alk
alin
ity(m
gof
CaC
O3/
liter
)23
6�
2820
5�
914
5�
1633
�10
NH
3-N
conc
n(m
g/lit
er)
7.8
�10
0.1
�0.
20.
04�
0.2
0.01
�0
NO
3-N
conc
n(m
g/lit
er)
6.2
�10
0.7
�1
2.5
�1
24.5
�10
Pco
ncn
(mg/
liter
)11
�3
4�
222
�12
2�
0.4
4170 JJEMBA ET AL. APPL. ENVIRON. MICROBIOL.

organic carbon, algal growth in reclaimed water was also de-termined.
MATERIALS AND METHODS
Sampling and physicochemical analyses. Samples of reclaimed water wereobtained from the four plants in winter 2006 and in spring, summer, and fall2007. In each season samples were collected on four consecutive days. Sampleswere obtained from the plant effluent, reservoir, and three points in the distri-bution system (designated DS1, DS2, and DS3). DS1 was always closest to thereservoir, and DS3 was always farthest from the reservoir. Because the lengths ofthe distribution systems are different, the distances between DS1, DS2, and DS3were different for the systems. For example, the shortest distance was approxi-mately 5 m from the effluent to the storage tank in the New York high-risebuilding, and the longest distance was 19.3 km between the effluent and DS3 inthe Florida system. The samples used for bacterial analysis were collected insterile, 1-liter, polypropylene, wide-mouth Nalgene bottles (Nalge Nunc Corpo-ration, Rochester, NY) which contained 0.1 ml of 2% sodium thiosulfate toquench the disinfectant (12). The samples were shipped on ice via overnightdelivery to the laboratory. The water temperature, conductivity, and pH weredetermined onsite using a SympHony SP80PC and a portable Hach meter(HQ40d), respectively. The residual disinfectant at each sampling point wasmeasured by measuring the free and total chlorine using standard method4500-Cl G (12). Nitrate N (NO3-N), ammonia N (NH3-N), and phosphorus (P)contents were determined using Hach methods 8039, 8155, and 8114, respec-tively (18). Alkalinity was determined by using the titration method (12). Tur-bidity was measured with a nephelometer (Hach 2100N turbidimeter; Hach,Loveland, CO) as specified by the manufacturer using a set of standards. Thesulfide concentrations in the water samples were measured by the methyleneblue method (Hach method 8131) using 25-ml aliquots, 1.0 ml of sulfide 1reagent, and 1.0 ml of sulfide 2 reagent (18). Hydrogen sulfide and acid-solublemetal sulfides reacted with N,N-dimethyl-p-phenylenediamine sulfate to formmethylene blue, whose absorbance at 665 nm was measured after 5 min.
Total organic carbon (TOC) and biodegradable dissolved organic carbon(BDOC) contents were determined as described elsewhere (41). The assimilableorganic carbon (AOC) content was determined as described elsewhere by Wein-rich et al. (L. A Weinrich et al., submitted) using bioluminescence. Because in arecent survey of 21 reclaimed water plant effluents resulting from differenttreatment processes the median AOC content was 450 �g/liter (range, 45 to3,200 �g/liter) (41), this concentration, twice this concentration, and three ormore times this concentration were considered low (450 �g/liter), medium (451to 1,350 �g/liter), and high (�1,350 �g/liter) AOC concentrations, respectively,in the present study.
Bacterial analyses. Heterotrophic bacteria (HPCs) were enumerated by thespread plate method using R2A medium (pH 7.2) and 100-�l aliquots (12).Concentrations of coliforms, E. coli, enterococci, and Pseudomonas spp. weredetermined using the membrane filtration method (with a 0.45-�m-pore-sizecellulose nitrate filter) and 0.1-, 10-, and/or 100-�l aliquots, whereas analyses ofAeromonas spp. also included 0.01-�l aliquots. Coliform contents were deter-mined using m-Endo LES agar incubated at 35°C for 24 h, and presumptivepositive results were confirmed based on the ability of the organisms to fermentlactose (brilliant green broth) at 35°C within 48 h (12). Fecal coliform contentswere determined similarly using m-FC agar containing 1% rosolic acid per literincubated at 44.5 � 0.2°C for 24 h, and the presence of presumptive fecalcoliforms was verified by fermentation of lactose at 44.5 � 0.2°C for 24 � 2 h. E.coli in the reclaimed water was enumerated on m-TEC agar using plates thatwere initially incubated for 2 h at 35 � 0.5°C and then incubated at 44.5 � 0.2°Cfor 22 h (12). The E. coli content was confirmed with a urea substrate (2 g ureawith 10 mg phenol red/100 ml water) after incubation for 15 min and subsequentenumeration of the yellow or yellowish brown colonies under a UV lamp. E. coliATCC 13706 was used as a positive control for analyses of coliforms and non-pathogenic E. coli. E. coli O157:H7 was detected using a nonquantitative immu-nomagnetic separation (IMS)-Reveal method as described by Bukhari et al. (8)by filtering 100 ml reclaimed water through a 0.45-�m-pore-size membrane filter.E. coli O157:H7 strain ATCC 35150 and E. coli ATCC 13706 were used aspositive and negative controls, respectively.
The concentration of Aeromonas spp. was determined using m-Aeromonasselective agar (ASA) modified with ampicillin sodium salt and vancomycin hy-drochloride (12). The ASA plates were incubated overnight at 35°C. Distinctbright yellow colonies that were 1 to 1.5 mm in diameter were consideredAeromonas colonies. Aeromonas hydrophila ATCC 7966 was used as a positivecontrol. Enterococci were enumerated on mE agar amended with cycloheximide(Acti-Dione) and nalidixic acid, as well as 2,3,5-triphenyltetrazolium chloride
after autoclaving (12). The mE agar plates were incubated at 41 � 0.5°C for 48 h,and then filters with suspect enterococci were placed on EIA substrate platescontaining 1 g esculin per liter, 0.5 g ferric citrate per liter, and 15 g agar per liter(pH 7.1 � 0.2). The EIA plates were incubated at 41 � 0.5°C for 20 min, and allpink or red colonies that produced a black or reddish brown precipitate on theunderside of the plate were counted. Pseudomonas aeruginosa was enumeratedon modified M-PA agar incubated at 41.5 � 0.5°C for 72 h by counting allcolonies that were �2.2 mm in diameter, were flat, and had light outer rims andbrown to greenish black centers.
The concentration of Legionella spp. was determined by filtering (pore size,0.45 �m) 100 ml of reclaimed water and submerging the filter aseptically in 10 mlphosphate buffer. The buffer was vortexed for 30 s, and a 0.1-ml aliquot wasmixed with an equal volume of acid (HCl-KCl, pH 2.2) (12). The mixture wasincubated at room temperature for 15 min and then neutralized with 0.1 ml ofKOH-KCl base. A 0.1-ml aliquot and dilutions were then spread onto bufferedcharcoal yeast extract (BCYE) plates supplemented with Legionella agar enrich-ment (BD Difco, MD), which contains primarily cysteine, an essential amino acidfor Legionella spp. A PAV supplement (Remel, KS) comprised of polymyxin B,anisomycin, and vancomycin was also added to the autoclaved medium. Legio-nella pneumophila ATCC 33152 was used as a positive control. The BCYE plateswere incubated in a moisturized tub at 35°C, and growth was monitored for 1week. Randomly selected presumptive Legionella spp. (a maximum of five colo-nies from each plate) were streaked on BCYE without cysteine (28). Failure togrow in the absence of cysteine was considered confirmation that Legionella spp.were present.
Mycobacterium spp. were enumerated by initially decontaminating an aliquotof a sample with a 0.005% cetylpyridinium chloride (CPC) solution (12). TheCPC-treated sample was then filtered (pore size, 0.45 �m), and the filter wasplaced on a Middlebrook 7H10 agar plate and incubated for 21 days at 35°C.Randomly selected colonies (a maximum of five colonies from each plate) weresubjected to acid-fast staining with carbol-fuchsin and Zeihl-Neelsen stain (RiccaChemical Company, Arlington, TX) and counterstained with a 1% methyleneblue solution (33). Cells that had a characteristic red color when they wereexamined with a microscope were considered cells of Mycobacterium spp.
Amplification and further identification of Mycobacterium spp. Because My-cobacterium spp. were encountered so frequently in reclaimed water, DNA wasextracted from a few isolates obtained from samples obtained in the winter andsummer to identify the predominant species. Cells from individual colonies weregrown in M7H9 broth (Hardy Diagnostics) at 35°C until the cultures were fullyturbid (4 to 7 days). DNA was extracted from the broth as described by Black-wood et al. (5) using 5-mm glass beads. The DNA was amplified, and the heatshock protein 65 (hsp65) gene was targeted using primers Tb11 (ACCAACGATGGTGTGTCCAT) and Tb12 (CTTGTCGAACCGCATACCCT) (14, 30, 38).Amplification was done with PerfCTa SYBR green FastMix (Quanta Bio-sciences, Gaithersburg, MD) as specified by the manufacturer using 25-�l reac-tion mixtures. The PCR protocol of Devallois et al. (14) was modified as follows:45 cycles of amplification (1 min at 94°C, 1 min at 60°C, and 1 min at 72°C),followed by a final extension at 72°C for 10 min using a Roche LightCycler 480System II device (Roche, Indianapolis, IN). The products were subjected tomelting curve analysis using the same PCR device after a 2-�l aliquot forrestriction enzyme analysis was obtained. A melting temperature analysis wasconducted using one cycle by heating the PCR products to 95°C for 5 s andcooling them to 65°C. Fluorescence was then detected continuously by increasingthe temperature to 97°C in 7 min. Restriction enzyme digestion was performedwith HaeIII (at 37°C) and BstEII (at 60°C) for 2 h. Both enzymes were obtainedfrom Promega (Madison, WI) and were used as described by the manufacturer.The digested products were electrophoresed on a 2% 3:1 NuSieve agarose(Cambrex BioScience, Rockland, MD) gel containing 1.5 �g of ethidium bro-mide/ml. All gels also contained a 100-bp DNA marker (Lonza Rockland Inc.,Rockland, ME). The gels were run at 100 V for 1.5 h and visualized under UVlight to determine the sizes of the fragments. The patterns were analyzed withPRASITE (http://app.chuv.ch/prasite/index.html) for identification. Bands forfragments shorter than 60 bp were not taken into account as they were suspectedof being primer or primer dimer bands (14, 38). Algorithms were also developedbased on the presence and absence of specific restriction fragments (100, 110,120, 140, 180, 190, and 200 bp for HaeI; 60, 100, 110, 120, 140, 180, 200, 210, and300 bp for BstI) and DNA melting temperatures. PCR products with meltingtemperatures differing by 0.5°C were placed in different categories. Thealgorithms were analyzed by the unweighted-pair group method with arith-metic mean (UPGMA) (http://genomes.urv.cat/UPGMA) algorithm using theJaccard coefficient with 100 bootstrap replicates. A dendrogram was con-structed to evaluate the relatedness of the strains identified by the objectivemethod as described by Sokal and Rohlf (34).
VOL. 76, 2010 REGROWTH IN RECLAIMED-WATER DISTRIBUTION SYSTEMS 4171
Chlorophyll content. The chlorophyll content was determined as an indicatorof the alga and cyanobacterium content in the two systems that have openreservoirs by filtering 500-ml aliquots of reclaimed water through 0.45-�m-pore-size membranes (Whatman). In some instances, more than one filter was nec-essary for this large volume. The filter(s) for each aliquot was ground in a glasstissue grinder (Kontes, Vineland, NJ) and dissolved in a mixture of acetone andMgCO3 (12). The acetone-MgCO3 mixture was made by adding 1 g of MgCO3
to 100 ml of distilled water and combining 90 parts of acetone with 10 parts ofthe saturated MgCO3 solution. The dissolved mixture was stored at 4°C in thedark for 4 h and then centrifuged at 500 � g for 20 min. The absorbance at 664nm of the supernatant was determined after optimization by acidification (0.1 NHCl) and incubation at room temperature for 90 s. The optical densities at 664nm (OD664) were converted to concentrations using a set of chlorophyll stan-dards (Tokyo Chemical Industries, Tokyo, Japan) whose concentrations were 0,0.0185, 0.034, 0.05, 0.1, and 0.32 mg/ml.
Statistical analyses. The significance of differences between residual chlorineconcentrations was analyzed using analysis of variance (ANOVA) with Excel,and the means were separated using the least significance difference (LSD) test(P � 0.05). The statistical significance of differences between the densities ofbacteria at sampling points at each site was evaluated by adding 1 to each densityand log10 transforming the densities. The transformed data for each samplinglocation (effluent, storage, and the three points in each distribution system) werecompared using the nonparametric Wilcoxon rank sum test.
RESULTS
Physicochemical characteristics of the water. The reclaimedwater was generally neutral to slightly alkaline, except for a fewinstances when the water in the New York MBR was slightlyacidic (pH 6.12) (Table 1). The water temperatures were�20°C, except for extreme cases when the temperatures in thereservoir in the Massachusetts system were close to freezingduring the winter. The temperatures were highest and leastvariable in the New York facility, where the plant and distri-bution system are entirely inside an air-conditioned high-riseapartment building that is adequately heated in the winter. Theturbidity was highest in the two systems with open reservoirsand typically exceeded 5 nephelometric turbidity units (NTU)(the permissible limit in many states) in the reclaimed waterdistribution systems; the maximum values approached fivetimes this limit. The increases in the distribution system tur-bidity levels were most prominent in the facilities with open
reservoirs. The conductivity, alkalinity, TOC content, andBDOC content were higher in the conventional systems (Table1). The AOC concentrations in the systems ranged from 149 �109 to 1,407 � 982 �g/liter (averages � standard deviations),and these concentrations were consistently lower in the MBRsystems than in the conventional treatment systems with openreservoirs. The concentration of ammonia nitrogen (NH4-N)was higher in the conventional systems, whereas the concen-tration of NO3-N was significantly high in the New York MBRsystem. The concentration of phosphorus was highest in theMassachusetts MBR system.
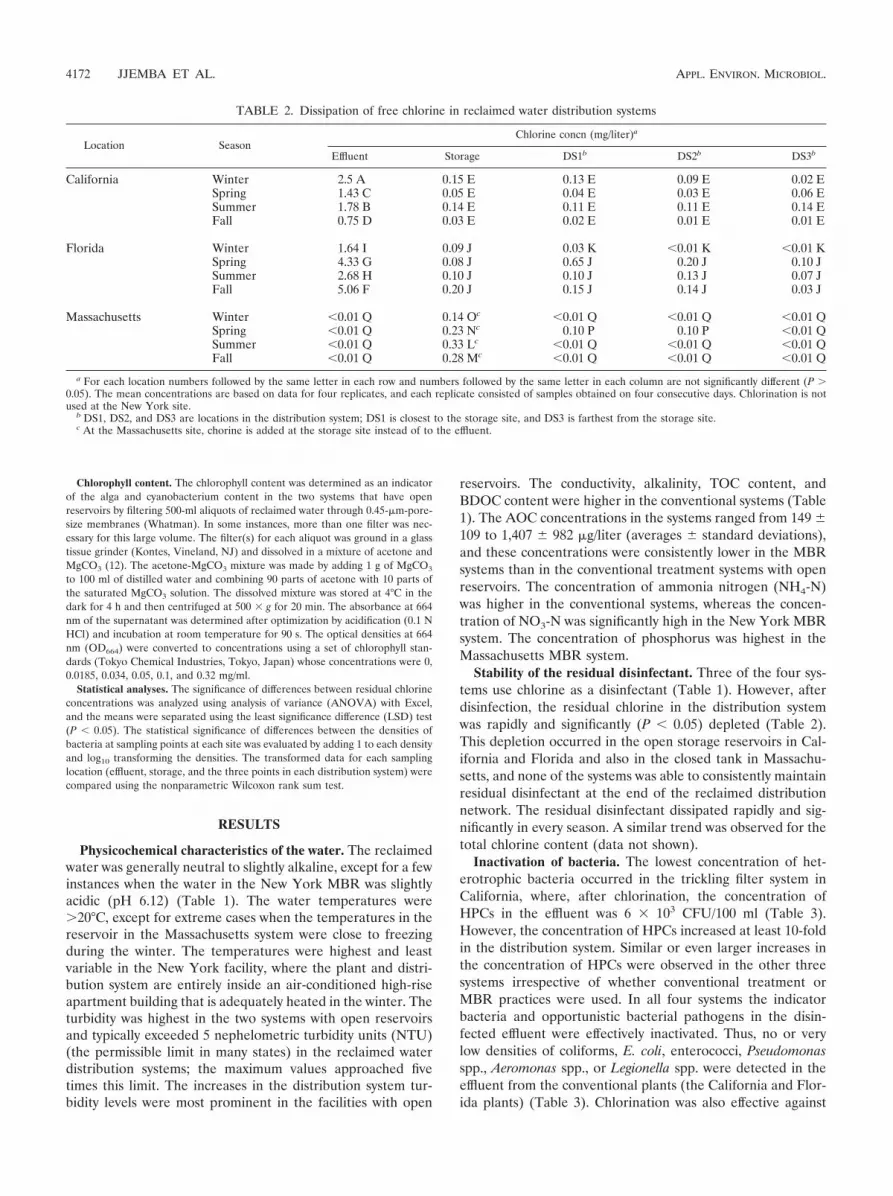
Stability of the residual disinfectant. Three of the four sys-tems use chlorine as a disinfectant (Table 1). However, afterdisinfection, the residual chlorine in the distribution systemwas rapidly and significantly (P � 0.05) depleted (Table 2).This depletion occurred in the open storage reservoirs in Cal-ifornia and Florida and also in the closed tank in Massachu-setts, and none of the systems was able to consistently maintainresidual disinfectant at the end of the reclaimed distributionnetwork. The residual disinfectant dissipated rapidly and sig-nificantly in every season. A similar trend was observed for thetotal chlorine content (data not shown).
Inactivation of bacteria. The lowest concentration of het-erotrophic bacteria occurred in the trickling filter system inCalifornia, where, after chlorination, the concentration ofHPCs in the effluent was 6 � 103 CFU/100 ml (Table 3).However, the concentration of HPCs increased at least 10-foldin the distribution system. Similar or even larger increases inthe concentration of HPCs were observed in the other threesystems irrespective of whether conventional treatment orMBR practices were used. In all four systems the indicatorbacteria and opportunistic bacterial pathogens in the disin-fected effluent were effectively inactivated. Thus, no or verylow densities of coliforms, E. coli, enterococci, Pseudomonasspp., Aeromonas spp., or Legionella spp. were detected in theeffluent from the conventional plants (the California and Flor-ida plants) (Table 3). Chlorination was also effective against
TABLE 2. Dissipation of free chlorine in reclaimed water distribution systems
Location SeasonChlorine concn (mg/liter)a
Effluent Storage DS1b DS2b DS3b
California Winter 2.5 A 0.15 E 0.13 E 0.09 E 0.02 ESpring 1.43 C 0.05 E 0.04 E 0.03 E 0.06 ESummer 1.78 B 0.14 E 0.11 E 0.11 E 0.14 EFall 0.75 D 0.03 E 0.02 E 0.01 E 0.01 E
Florida Winter 1.64 I 0.09 J 0.03 K �0.01 K �0.01 KSpring 4.33 G 0.08 J 0.65 J 0.20 J 0.10 JSummer 2.68 H 0.10 J 0.10 J 0.13 J 0.07 JFall 5.06 F 0.20 J 0.15 J 0.14 J 0.03 J
Massachusetts Winter �0.01 Q 0.14 Oc �0.01 Q �0.01 Q �0.01 QSpring �0.01 Q 0.23 Nc 0.10 P 0.10 P �0.01 QSummer �0.01 Q 0.33 Lc �0.01 Q �0.01 Q �0.01 QFall �0.01 Q 0.28 Mc �0.01 Q �0.01 Q �0.01 Q
a For each location numbers followed by the same letter in each row and numbers followed by the same letter in each column are not significantly different (P �0.05). The mean concentrations are based on data for four replicates, and each replicate consisted of samples obtained on four consecutive days. Chlorination is notused at the New York site.
b DS1, DS2, and DS3 are locations in the distribution system; DS1 is closest to the storage site, and DS3 is farthest from the storage site.c At the Massachusetts site, chorine is added at the storage site instead of to the effluent.
4172 JJEMBA ET AL. APPL. ENVIRON. MICROBIOL.

TA
BL
E3.
Concentrations
ofm
icroorganisms
intreated
effluentsand
theirregrow
thin
thedistribution
systems
Organism
sL
ocationC
oncn(C
FU
/100m
l)(geom
etricm
ean�
standarderror) a
Effluent
Storageb
DS1
DS2
DS3
HPC
sC
alifornia0.006
�10
6�
0.04�
106
B1.2
�10
6�
72�
106
AB
17.8�
106
�54.5
�10
6A
27�
106
�48
�10
6A
103�
106
�50.4
�10
6A
Florida
28�
106
�52
�10
6B
126�
106
�30
�10
6A
38.7�
106
�19
�10
6A
86.3�
106
�28.8
�10
6A
70.1�
106
�15.6
�10
6A
Massachusetts
1.6�
106
�1.1
�10
6A
B1.01
�10
6�
0.6�
106
B41.7
�10
6�
6.6�
106
A29.8
�10
6�
3.2�
106
A14.2
�10
6�
32.0�
106
AN
ewY
ork1.8
�10
6�
4.9�
106
B23.1
�10
6�
150�
106
AB
105.5�
106
�32.5
�10
6A
50.6�
106
�18.3
�10
6A
1.9�
106
�39
�10
6A
B
Totalcoliform
sC
alifornia�
11
�1
1�
11
�1
1�
6F
lorida1
�1
B11
�7
A3
�6
AB
9�
46A
B7
�17
AB
Massachusetts
2�
1�
11
�1
1�
11
�1
New
York
3�
23�
1�
11
�1
�1
Fecalcoliform
sC
alifornia1
�1
�1
�1
�1
�1
Florida
1�
1B
12�
9A
1�
3B
4�
4B
4�
5B
Massachusetts
�1
�1
�1
�1
�1
New
York
2�
6�
1�
11
�1
�1
E.coli
California
1�
11
�1
1�
1�
11
�1
Florida
1�
17
�8
2�
22
�3
4�
2M
assachusetts�
1�
1�
11
�1
1�
1N
ewY
ork3
�10
1�
1�
11
�1
1�
1
Enterococci
California
�1
�1
�1
1�
1�
1F
lorida1
�0
9�
263
�9
27�
3610
�18
Massachusetts
�1
�1
�1
�1
�1
New
York
3�
34�
1�
1�
1�
1
Pseudom
onasspp.
California
�1
2�
22
�5
3�
46
�12
Florida
1�
1C
8�
4A
B2
�2
BC
9�
10A
4�
2A
BM
assachusetts1
�1
�1
2�
52
�3
2�
5N
ewY
ork1
�1
2�
11
�1
1�
36
�130
Aerom
onasspp.
California
1�
102
�1
�10
22
�10
2�
7�
102
6�
102
�3
�10
220
�10
2�
200�
102
66�
102
�900
�10
2
Florida
1�
102
�1
�10
2210
�10
2�
480�
102
91�
102
�170
�10
2120
�10
2�
700�
102
300�
102
�410
�10
2
Massachusetts
1�
102
�1
�10
2�
1�
102
6�
102
�46
�10
25
�10
2�
57�
102
1�
102
�33
�10
2
New
York
1�
102
�2
�10
21
�10
2�
1�
102
10�
102
�18
�10
232
�10
2�
42�
102
1�
102
�1
�10
2
Mycobacterium
spp.C
alifornia1
�1
B5
�17
AB
22�
15A
35�
46A
30�
125A
Florida
11�
2065
�220
59�
29073
�610
107�
800M
assachusetts170
�190
AB
2�
1B
57�
25A
320�
130A
120�
80A
New
York
6�
15050
�80
42�
11016
�14
31�
29
Legionella
spp.C
alifornia�
0.3�
103
B2.2
�10
3�
4.1�
103
A2.3
�10
3�
2.0�
103
AB
0.9�
103
�1.5
�10
3A
B1.9
�10
3�
1.6�
103
AB
Florida
�0.3
�10
3B
3.0�
103
�70
�10
3A
2.7�
103
�13
�10
3A
3.5�
103
�16
�10
3A
8�
103
�52
�10
3A
Massachusetts
0.4�
103
�0.2
�10
3A
�0.3
�10
3B
1.3�
103
�2.8
�10
3A
0.7�
103
�2.0
�10
3A
0.4�
103
�0.7
�10
3A
New
York
0.6�
103
�2.1
�10
30.7
�10
3�
0.6�
103
0.5�
103
�0.6
�10
30.5
�10
3�
0.6�
103
0.5�
103
�0.4
�10
3
aT
hedata
areaverages
forthe
fourseasons.N
umbers
followed
bydifferentletters
ineach
roware
significantlydifferent(P
�0.05).In
rows
with
noletters
therew
asno
differencebetw
eenthe
values.Ateach
location,one
sample
was
collectedfrom
theeffluent
andthe
reservoironce
duringeach
season(4
samples
persite
peryear),w
hereasone
sample
was
collectedfrom
eachdistribution
systemsite
onfour
consecutivedays
duringeach
season(16
samples
persite
peryear).
bPoint
ofdisinfection
forthe
Massachusetts
site.For
allothersites,disinfection
occurredat
theeffluent
stage.
VOL. 76, 2010 REGROWTH IN RECLAIMED-WATER DISTRIBUTION SYSTEMS 4173

these organisms in the Massachusetts MBR reservoir, wherethe disinfectant is applied. Some coliforms, E. coli, and entero-cocci were detected in the UV- and ozone-disinfected NewYork effluent, but very rarely (i.e., once in summer 2007).Irrespective of the treatment technology used, higher densitiesof bacteria were frequently detected in the water after disin-fection, suggesting that there was regrowth in the distributionsystem. The increases were more pronounced for Aeromonasspp., Legionella spp., and Mycobacterium spp., whose concen-trations were at least 10-fold higher than the concentrations ofthe indicators (i.e., coliforms and E. coli) that are typicallymonitored for regulatory purposes. This set of organisms wasalso more prevalent in water, as reflected by the abundance ofthem expressed as a fraction of the heterotrophic bacteriacompared to indicator bacteria (Table 3). The increases werestatistically significant (P � 0.05) for heterotrophic bacteria atall sites and for a range of organisms in the two systems whichuse conventional treatment technologies. In the MBR system
in Massachusetts Mycobacterium and Legionella also regrewsignificantly after disinfection.
Organic carbon and occurrence of bacteria. The frequencywith which coliforms and Pseudomonas spp. occurred in re-claimed water systems increased with increasing AOC concen-tration (Fig. 1). The occurrence of Aeromonas, Mycobacterium,and Legionella was high (�55% of the samples) irrespective ofwhether the AOC concentration in the reclaimed water was450 �g/liter or more.
Of the three types of indicator bacteria, enterococci weredetected least frequently in the reclaimed water (Fig. 2). Incomparison, opportunistic pathogens, notably Aeromonas, Le-gionella, Mycobacterium, and Pseudomonas, occurred more fre-quently in the reclaimed water systems. Thus, there were nu-merous instances in which potentially opportunistic pathogenswere present in the reclaimed water distribution system in theabsence of indicator organisms. For example, in the New YorkMBR system, the routinely monitored coliforms were detected
FIG. 1. Frequency of occurrence of various organisms with different AOC concentrations. The low, medium, and high AOC concentrations areequivalent to 450 �g/liter, 451 to 1,350 �g/liter, and �1,350 �g/liter, respectively.
FIG. 2. Frequency of occurrence of opportunistic pathogens and indicator bacteria in reclaimed water.
4174 JJEMBA ET AL. APPL. ENVIRON. MICROBIOL.

in only 10% of the samples throughout the year, whereasMycobacterium spp. were detected in 97% of the samples.Likewise, in the conventional Florida system, coliforms andMycobacterium spp. were detected in 66% and 95% of the
samples, respectively. The presence of Legionella spp. and thepresence of Mycobacterium spp. in reclaimed distribution sys-tems were significantly (R2 � 0.2; P � 0.01) correlated.
Because of the high frequency of occurrence of Mycobacte-
FIG. 3. Diversity of Mycobacterium spp. in distribution systems for samples obtained in winter 2006 and summer 2007. FLWiResMcookii, M.cookii in Florida reservoir in winter; NYSuDS2Mcookii, M. cookii in New York DS2 in summer; CASuDS3Mcookii and CAWi DS3Mcookii, M.cookii in California DS3 in summer and winter, respectively; MAWiDS11Mcookii and MAWiDS12Mcookii, M. cookii in Massachusetts DS1colonies 1 and 2 in winter, respectively; CAWiDS1Mcookii, M. cookii in California DS1 in winter; MASuDS12Mcookii and MASuDS13, M. cookiiin Massachusetts DS1 colonies 2 and 3 in summer; MAWiDS1Mcookii and MAWiDS3Mcookii, M. cookii in Massachusetts DS1 and DS3 in winter,respectively; MASuDS11Mcookii, M. cookii in Massachusetts DS1 colony 1 in summer; MAWiDS15Maurum and MAWiDS16Mcookii, M. aurumand M. cookii, respectively, in Massachusetts DS1 colonies 5 and 6 in winter; MASuEff1Maustroafric and MASuEff2Maustroafric, M. austro-africanum in Massachusetts effluent colonies 1 and 2, respectively, in summer; MAWiDS13Maustroafric and MAWiDS14Maurum, M. austro-africanum and M. aurum, respectively, in Massachusetts DS1 colonies 3 and 4 in winter; MAWiEffMlentiflavum, M. lentiflavum in Massachusettseffluent in winter; FLSuResMgordonae, M. gordonae in Florida reservoir in summer; NYWiResMcookii, M. cookii in New York storage tank inwinter. The numbers on the dendrogram are similarity matrix distances. The dendrogram has a cophenetic correlation coefficient of 0.79. Oneasterisk indicates that the value is identical to the value for CAWiDS3Mcookii with a melting temperature of 90.28°C. Two asterisks indicate thatthe value is identical to the values for MAWiDS12Mcookii with a melting temperature of 89.16 � 0.40°C and CAWiDS1Mcookii with a meltingtemperature of 89.13 � 0.40°C.
VOL. 76, 2010 REGROWTH IN RECLAIMED-WATER DISTRIBUTION SYSTEMS 4175

rium in the distribution systems (range, 84% to 98% of thesamples), a few randomly selected isolates were subjected tofurther characterization using restriction enzyme fragmentlength polymorphism (RFLP) and DNA melting temperatureanalyses. This subsample was quite diverse; the isolates be-longed to 12 clusters (Fig. 3). The species identified mostfrequently was Mycobacterium cookii. The other taxa identifiedincluded Mycobacterium gordonae, Mycobacterium lentiflavumtype 4, Mycobacterium astroafricanum type 1, and Mycobacte-rium aurum type 1. Mycobacterium spp. do not appear to bedistribution system specific as M. cookii was detected in all foursystems.
Occurrence of E. coli O157:H7. The presence of E. coliO157:H7 was determined using the Reveal test system. Thisorganism was found in reclaimed water only twice in the Flor-ida effluent obtained during the spring and fall. It was notdetected in the open reservoir or the distribution system, sug-gesting that this pathogen may not survive or grow in thisenvironment. E. coli O157:H7 was not detected in any sectionof the other three systems.
Algal growth and hydrogen sulfide in reclaimed water. Thestandard curve for the chlorophyll content analysis had a cor-relation coefficient (R2) of 0.9947. In the open reservoirs, thelevels of algae and cyanobacteria were greater during thewarmer months; the concentrations increased in the summerand reached the maximum values in the fall (Fig. 4). Algal cellspersisted throughout the distribution system and were notconfined to the open reservoir. The chlorophyll level in the dis-tribution system was significantly correlated with the AOCcontent (R2 � 0.2112; P � 0.01) and the BDOC content (R2 �0.4033; P � 0.01), suggesting that algal growth from the res-ervoir contributed to increases in the level of biodegradablecarbon in the distribution system. The levels of hydrogen sul-fide in the reclaimed water were several times higher in the twoconventional plants than in the MBR systems (Fig. 5).
DISCUSSION
The loss of residual disinfectant in the systems was accom-panied by an increase in the level of bacteria, indicating that itis necessary to maintain a sufficient and stable residual level ofdisinfectant. The rapid dissipation of free chlorine may havebeen a result of its ability to react with organic matter, asreflected by the high organic carbon concentration comparedto the concentrations typically encountered in potable water.AOC is readily available for consumption by microorganisms,which in turn can enhance the regrowth of bacteria in thereclaimed water. Falkinham et al. (15) reported that there wasa strong positive correlation between Mycobacterium and AOClevels (17 to 234 �g/liter) in potable water systems that hadonly a fraction of the AOC levels encountered in the reclaimedwater systems. In the present study, high levels of AOC(�1,350 �g/liter) were associated with increased occurrence ofcoliforms and Pseudomonas spp. in the reclaimed water. Bothcoliforms and Pseudomonas spp. grow extremely fast. Even atthe lowest levels of AOC in reclaimed water, Mycobacteriumand Legionella, both of which have slightly lower growth ratesthan coliforms, Aeromonas spp., and Pseudomonas spp., oc-curred very frequently. Mycobacterium and Legionella survivequite well in biofilms (25). Unlike most indicator bacteria,some species of Pseudomonas, Aeromonas, Legionella, and My-cobacterium are opportunistic pathogens, and these organismsregrew to a greater concentration in the distribution systemthan the indicator bacteria. Regrowth is undesirable as it maycause odor and esthetic problems in reclaimed water, degrad-ing the water quality in the distribution system. The presentstudy shows that the treatment systems investigated (con-ventional and MBR) are typically capable of generating ahigh-quality effluent with very low densities of indicatormicroorganisms. Coliforms were rare in these systems, butopportunistic pathogens (Aeromonas, Legionella, Mycobacte-
FIG. 4. Chlorophyll content as an indicator of algal growth in the two systems with open reservoirs. DS1, DS2, and DS3 are locations in thedistribution system.
4176 JJEMBA ET AL. APPL. ENVIRON. MICROBIOL.

rium, and Pseudomonas) were detected quite frequently. Thus,while indicator organisms are effective for assessing the efficacyof treatment processes, they may not be representative of thepossible risk from regrowth of opportunistic pathogens in thedistribution system.
The occurrence of Mycobacterium spp. and the occurrenceof Legionella spp. in the distribution system were significantlycorrelated. Members of both of these genera are known toassociate with ciliated protozoa and amoebae (2, 21, 23), and ithas been hypothesized that their intracellular survival providesa training ground for enhancing their pathogenicity to humans(10, 11, 26). The Legionella-protozoan and Mycobacterium-protozoan symbiotic relationships can effectively protect theintracellular bacteria against disinfectants (24, 37). The pres-ence of L. pneumophila and Mycobacterium spp. can pose ahazard, particularly when the water is used for irrigation oflawns with sprinklers as the aerosols generated can expose thegeneral public to these pathogens (1, 9, 36). Inhalation ofairborne droplets or drop nuclei that contain Legionella spp. isbelieved to be the most common mode of transmission (3).Such droplets can also be generated by cooling towers or dec-orative water fountains where reclaimed water is used.
The accumulation of algal cells in a distribution system cansignificantly impact water quality. Furthermore, decaying algalcells release organic carbon, which in turn increases the de-mand for disinfectant and increases turbidity. Algal cellularfractions can be a significant source of biodegradable carbon,especially in the presence of an oxidant such as chlorine (6, 19,32). All of these factors stimulate bacterial growth, resulting ina loss of oxygen and creating anoxic conditions, which in turnfavor anaerobes, such as sulfur-reducing bacteria, as docu-mented for the systems with open reservoirs in which therewere also high hydrogen sulfide concentrations. Hydrogen sul-fide is an indicator of foul odors, a common complaint ofreclaimed water end users (http://www.americascarcare.com/database/dms/acc1006w50.pdf). The accumulation of algalcells can be controlled by regular flushing of the reclaimedwater systems, use of algaecides, or removal of the algae usingfine-mesh screens.
In summary, trickling filters with tertiary sand filtration, ac-tivated sludge with secondary filtration, and membrane biore-
actor processes effectively removed the indicator bacteria.However, the bacteria regrew in reclaimed water after disin-fection because of the rapid dissipation of the disinfectant inthe system and the high levels of organic carbon, which createda high demand for disinfectant. The regrowth and frequency ofoccurrence were even greater for opportunistic pathogens,such as Aeromonas, Mycobacterium, and Legionella, than forroutine indicator bacteria. The use of indicator bacteria tomonitor water quality may not reflect all of the subsequentrisks that can occur downstream of the treatment process,particularly in reclaimed water distribution systems where nu-trient and temperature profiles are more favorable for micro-bial survival and regrowth. A full assessment of the publichealth risks associated with opportunistic pathogens in re-claimed water needs to be conducted.
ACKNOWLEDGMENTS
We are very grateful to the four utilities for their participation andcooperation. In addition, the advice and help provided by the ProjectAdvisory Committee (Katie Benko, Bureau of Reclamation; UziDaniel, West Basin Water District; Sharon C. Long, University ofWisconsin—Madison; Craig Riley, Washington State Department ofHealth; Terri Slifko, County Sanitation Districts of Los Angeles; An-thony Andrade, Southwest Florida Water Management District; RichMills, California State Water Resources Control Board) and BurnettKing (WateReuse Foundation) are greatly appreciated.
This study was funded by the WateReuse Foundation (grant WRF-05-002), the Bureau of Reclamation, the Southwest Florida WaterManagement District, the California State Water Resources ControlBoard, and the utility subsidiaries of American Water, Voorhees, NJ.
REFERENCES
1. Addiss, D. G., J. P. Davis, M. LaVentura, P. J. Wand, M. A. Hutchinson, andR. M. McKinney. 1989. Community-acquired Legionnaires’ disease associ-ated with a cooling tower: evidence for longer-distance transport of Legio-nella pneumophila. Am. J. Epidemiol. 130:557–568.
2. Adekambi, T., S. B. Salah, M. Khlif, D. Raoult, and M. Drancourt. 2006.Survival of environmental mycobacteria in Acanthamoeba polyphaga. Appl.Environ. Microbiol. 72:5974–5981.
3. Armstrong, T. W., and C. N. Haas. 2007. Quantitative microbial risk assess-ment model for Legionnaires’ disease: assessment of human exposure forselected spa outbreaks. J. Occup. Environ. Hyg. 4:634–646.
4. Asano, T., F. L. Burton, H. L. Leverenz, R. Tsuchihashi, and G. Tchobano-glous. 2007. Water reuse: issues, technologies, and applications. McGrawHill, New York, NY.
5. Blackwood, K. S., C. He, J. Gunton, C. Y. Turenne, J. Wolfe, and A. M.Kabani. 2000. Evaluation of recA sequences for identification of Mycobac-terium species. J. Clin. Microbiol. 38:2846–2852.
FIG. 5. Hydrogen sulfide content in reclaimed water as an indicator of the intensity of odor. DS1, DS2, and DS3 are locations in the distributionsystem.
VOL. 76, 2010 REGROWTH IN RECLAIMED-WATER DISTRIBUTION SYSTEMS 4177

6. Bouteleux, C., S. Saby, D. Tozza, J. Cazzard, V. Lahoussine, P. Hartemann,and L. Mathieu. 2005. Escherichia coli behavior in the presence of organicmatter released by algae exposed to water treatment chemicals. Appl. En-viron. Microbiol. 71:734–740.
7. Brandi, G., M. Sisti, F. Giardini, G. F. Schiavano, and A. Albano. 1999.Survival ability of cytotoxic strains of motile Aeromonas spp. in differenttypes of water. Lett. Appl. Microbiol. 29:211–215.
8. Bukhari, Z., J. R. Weihe, and M. W. LeChevallier. 2007. Rapid detection ofEscherichia coli O157:H7 in water. J. Am. Water Works Assoc. 99:157–167.
9. Castellani Pastoris, M., L. Ciceroni, R. Lo Monaco, P. Goldoni, B. Mentore,G. Flego, L. Cattani, S. Ciarrocchi, A. Pinto, and P. Visca. 1997. Molecularepidemiology of an outbreak of Legionnaires’ disease associated with acooling tower in Genova-Sestri Ponente, Italy. Eur. J. Clin. Microbiol. Infect.Dis. 16:883–892.
10. Cirillo, J. D., S. Falkow, and L. S. Tompkins. 1994. Growth of Legionellapneumophila in Acanthamoeba castellanii enhances invasion. Appl. Environ.Microbiol. 62:3254–3261.
11. Cirillo, J. D., S. L. Cirillo, L. Yan, L. E. Bermudez, S. Falkow, and L. S.Tompkins. 1999. Intracellular growth in Acanthamoeba castellanii affectsmonocyte entry mechanisms and enhances virulence of Legionella pneumo-phila. Infect. Immun. 67:4427–4434.
12. Clesceri, L. S., A. E. Greenberg, and A. D. Eaton (ed.). 2005. Standardmethods for the examination of water and wastewater, 20th ed. APHA,AWWA, and WEF Publishing, Washington, DC.
13. Costan-Longares, A., M. Montemayor, A. Payan, J. Mendez, J. Jofre, R.Mujeriego, and F. Lucena. 2008. Microbial indicators and pathogens: re-moval, relationships and predictive capabilities in water reclamation facili-ties. Water Res. 42:4439–4448.
14. Devallois, A., K. Goh, and N. Rastogi. 1997. Rapid identification of myco-bacteria to species level by PCR-restriction fragment length polymorphismanalysis of the hsp65 gene and proposition of an algorithm to differentiate 34mycobacterial species. J. Clin. Microbiol. 35:2969–2973.
15. Falkinham, J. O., C. D. Norton, and M. W. LeChevallier. 2001. Factorsinfluencing numbers of Mycobacterium avium, Mycobacterium intracellulare,and other mycobacteria in drinking water distribution systems. Appl. Envi-ron. Microbiol. 67:1225–1231.
16. Gavriel, A. A., J. P. Landre, and A. J. Lamb. 1998. Incidence of mesophilicAeromonas within a public drinking water supply in north-east Scotland.J. Appl. Microbiol. 84:383–392.
17. Geldreich, E. E. 1996. Microbial quality of water supply in distributionsystems. CRC Press, Boca Raton, FL.
18. Hach Company. 1997. DR/4000 spectrophotometer handbook. Hach Com-pany, Loveland, CO.
19. Hammes, F. A., and T. Egli. 2005. New method for assimilable organiccarbon determination using flow-cytometric enumeration and a natural mi-crobial consortium as inoculum. Environ. Sci. Technol. 39:3289–3294.
20. Harwood, V. J., A. D. Levine, T. M. Scott, V. Chivukula, J. Lukasik, S. R.Farrah, and J. B. Rose. 2005. Validity of the indicator organism paradigm forpathogen reduction in reclaimed water and public health protection. Appl.Environ. Microbiol. 71:3163–3170.
21. Kilvington, S., and J. Price. 1990. Survival of Legionella pneumophila withincysts of Acanthamoeba polyphaga following chlorine exposure. J. Appl. Bac-teriol. 68:519–525.
22. Landre, J. P. B., A. A. Gavriel, and A. J. Lamb. 1998. False-positive coliformreaction mediated by Aeromonas in the Colilert defined substrate technologysystem. Lett. Appl. Microbiol. 26:352–354.
23. La Scola, B., R. J. Birtles, G. Greub, T. J. Harrison, R. M. Ratcliff, and D.Raoult. 2004. Legionella drancourtii sp. nov., a strictly intracellular amoebalpathogen. Int. J. Syst. Evol. Microbiol. 54:699–703.
24. Le Dantec, C., J.-P. Duguet, A. Montiel, N. Dumountier, S. Dubron, and V.Vincent. 2002. Chlorine disinfection of atypical mycobacteria isolated from awater distribution system. Appl. Environ. Microbiol. 68:1025–1032.
25. Lehtola, M. J., E. Torvinen, J. Kusnetsov, T. Pitkanen, L. Maunula, C.-H.von Bonsdorff, P. J. Martikainen, S. A. Wilks, C. W. Keevil, and I. T.Miettinen. 2007. Survival of Mycobacterium avium, Legionella pneumophila,Escherichia coli, and caliciviruses in drinking water-associated biofilms grownunder high-shear turbulent flow. Appl. Environ. Microbiol. 73:2854–2859.
26. Molmeret, M., M. Horn, M. Wagner, M. Santic, and Y. Abu Kwaik. 2005.Amoebae as training grounds for intracellular bacterial pathogens. Appl.Environ. Microbiol. 71:20–28.
27. Narasimhan, R., J. Brereton, M. Abbaszadegan, H. Ryu, P. Butterfield, K.Thompson, and H. Werth. 2005. Characterizing microbial water quality inreclaimed water distribution systems. AwwaRF report 91072F. AWWA Re-search Foundation, Denver, CO.
28. National Health Service. 2007. Identification of Legionella species. Na-tional standard method BSOP ID 18. Standards Unit, Evaluation andStandards Laboratory Centre for Infections, United Kingdom. http://www.hpa-standardmethods.org.uk/documents/bsopid/pdf/bsopid18.pdf.
29. New Hampshire Department of Environmental Services. 2003. Fecal coli-form as an indicator organism. Environmental fact sheet WD-WEB-18. NewHampshire Department of Environmental Services, Concord, NH. http://des.nh.gov/organization/commissioner/pip/factsheets/wwt/documents/web-18.pdf.
30. Pourahmad, F., K. D. Thompson, A. Adams, R. H. Richards. 2009. Com-parative evaluation of polymerase chain reaction-restriction enzyme analysis(PRA) and sequencing of heat shock protein 65 (hsp65) gene for identifi-cation of aquatic mycobacteria. J. Microbiol. Methods 76:28–135.
31. Ryu, H., A. Alum, and M. Abbaszadegan. 2005. Microbial characterizationand population changes in nonpotable reclaimed water distribution systems.Environ. Sci. Technol. 39:8600–8605.
32. Schmidt, W., B. Hambsch, and H. Petzoldt. 1998. Classification of algogenicorganic matter concerning its contribution to the bacterial regrowth poten-tial and by-products formation. Water Sci. Technol. 37:91–96.
33. Seeley, H. W., P. J. Vandemark, and J. J. Lee. 1991. Microbes in action—alaboratory manual of microbiology. W. H. Freeman and Company, NewYork, NY.
34. Sokal, R. R., and F. J. Rohlf. 1962. The comparison of dendrograms byobjective methods. Taxon 11:33–40.
35. Speight, V. 2008. Water-distribution systems: the next frontier. Bridge38:31–37. http://www.nae.edu/Publications/TheBridge/Archives/V38N2/Water-DistributionSystemsTheNextFrontier.aspx.
36. Steele, T. W., J. Lanser, and N. Sangster. 1990. Isolation of Legionellalongbeachae serogroup 1 from potting mixes. Appl. Environ. Microbiol. 56:49–53.
37. Taylor, R. H., J. O. Falkinham, C. D. Norton, and M. W. LeChevallier. 2000.Chlorine, chloramine, chlorine dioxide, and ozone susceptibility of Mycobac-terium avium. Appl. Environ. Microbiol. 66:1702–1705.
38. Telenti, A., F. Marchesi, M. Balz, F. Bally, E. C. Bottger, and T. Bodmer.1993. Rapid identification of mycobacteria to the species level by polymerasechain reaction and restriction enzyme analysis. J. Clin. Microbiol. 31:175–178.
39. U.S. Environmental Protection Agency. 2004. Guidelines for water reuse.Publication EPA625/R-04/108. U.S. Environmental Protection Agency,Washington, DC. http://www.epa.gov/NRMRL/pubs/625r04108/625r04108.pdf.
40. van der Kooij, D., A. Visser, and W. A. M. Hijnen. 1982. Determining theconcentration of easily assimilable organic carbon in drinking water. J. Am.Water Works Assoc. 74:540–545.
41. Weinrich, L. A., E. Giraldo, and M. W. LeChevallier. 2009. Development andapplication of a bioluminescence AOC test in reclaimed waters. Appl. En-viron. Microbiol. 75:7385–7390.
42. World Health Organization. 2006. Guidelines for the safe use of wastewater,excreta and greywater, vol. 2. Wastewater use in agriculture. World HealthOrganization, Geneva, Switzerland.
4178 JJEMBA ET AL. APPL. ENVIRON. MICROBIOL.


