Embed Size (px)
Citation preview
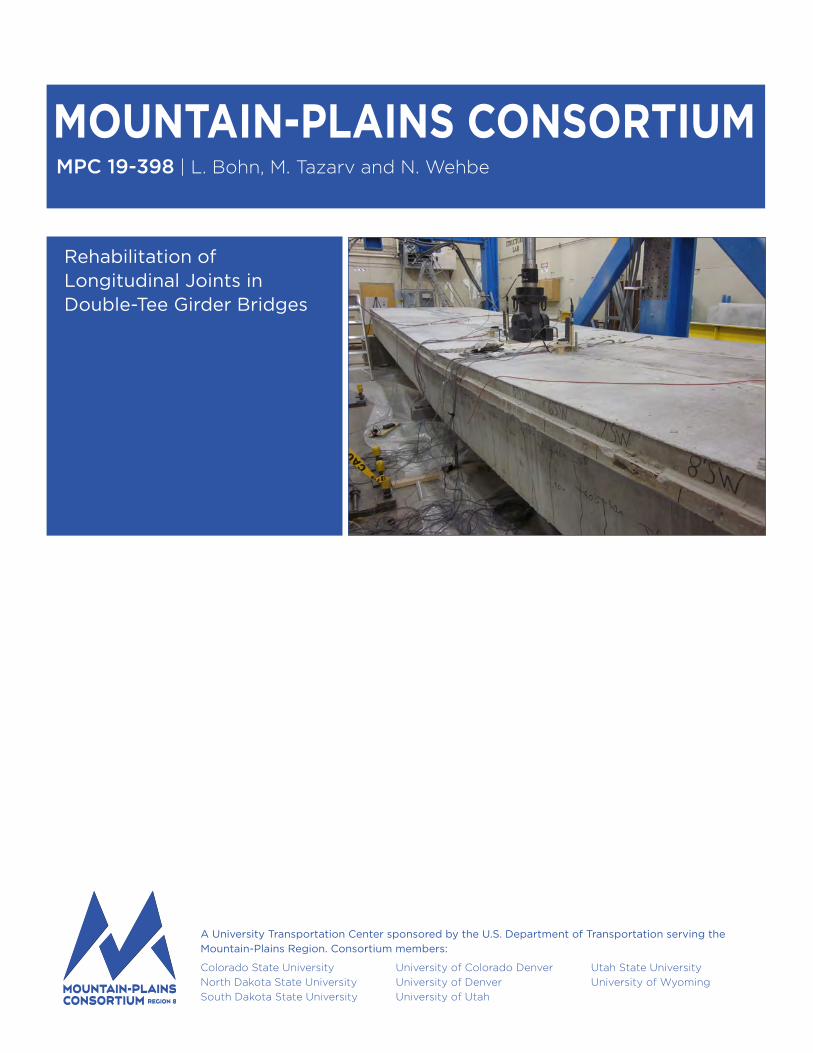
Rehabilitation of Longitudinal Joints in Double-Tee Girder Bridges
MPC 19-398 | L. Bohn, M. Tazarv and N. Wehbe
Colorado State University North Dakota State University South Dakota State University
University of Colorado Denver University of Denver University of Utah
Utah State UniversityUniversity of Wyoming
A University Transportation Center sponsored by the U.S. Department of Transportation serving theMountain-Plains Region. Consortium members:
Rehabilitation of Longitudinal Joints in Double-Tee Girder Bridges
Lucas Bohn Mostafa Tazarv Nadim Wehbe
Department of Civil and Environmental Engineering
South Dakota State University Brookings, South Dakota
August 2019
Acknowledgements This work was performed under the direction of the SD2014-20 Technical Panel. Aaron Breyfogle ................................ Research Cody Axlund ..... Local Government Assistance Dave Madden ......................................... Bridge Harvey Fitzgerald .............................. Research Jason Smith ........................................ Concrete Josh Olson ............................. Aberdeen Region
Justin Cook ......................................... Research Mark Hoelscher ..................................... FHWA Mark Wiley ......................................... SDDOT Ron Bren ...........Local Government Assistance Tom Kallemeyn...................................... Bridge Toby Crow ..... Associated General Contractors
This study was jointly funded by the South Dakota Department of Transportation (SDDOT) and the US Department of Transportation (USDOT) through the Mountain-Plains Consortium (MPC) - University Transportation Center (UTC). Their support and guidance are appreciated. The authors are thankful to Dominique Corvez, Gaston Doiron, and Paul White of Lafarge North America, Inc., Christian Dahl of Headed Reinforcement Corp., In-Steel Wire Products, and Forterra Pipe & Precast for their collaboration and support. The assistance and valuable feedback are greatly appreciated from the following persons: Aaron Breyfogle of the Research Office at the SDDOT, Jared Gusso of Journey Construction, and Zachary Gutzmer of South Dakota State University. Disclaimer
The contents of this report reflect the views of the authors, who are responsible for the facts and the accuracy of the information presented herein. This document is disseminated in the interest of information exchange. The report is funded, partially or entirely, by a grant from the U.S. Department of Transportation’s University Transportation Centers Program. However, the U.S. Government assumes no liability for the contents or use thereof. The contents of this report, which was jointly funded by the South Dakota State University and Mountain Plains Consortium (MPC) – University Transportation Center, reflect the views of the authors who are responsible for the facts and accuracy of the data presented herein. The contents do not necessarily reflect the official views or policies of the South Dakota Department of Transportation, the State Transportation Commission, or the Federal Highway Administration. This report does not constitute a standard, specification, or regulation.
The South Dakota Department of Transportation provides services without regard to race, color, gender, religion, national origin, age or disability, according to the provisions contained in SDCL 20-13, Title VI of the Civil Rights Act of 1964, the Rehabilitation Act of 1973, as amended, the Americans with Disabilities Act of 1990 and Executive Order 12898, Federal Actions to Address Environmental Justice in Minority Populations and Low-Income Populations, 1994. Any person who has questions concerning this policy or who believes he or she has been discriminated against should contact the Department’s Civil Rights Office at 605.773.3540. NDSU does not discriminate in its programs and activities on the basis of age, color, gender expression/identity, genetic information, marital status, national origin, participation in lawful off-campus activity, physical or mental disability, pregnancy, public assistance status, race, religion, sex, sexual orientation, spousal relationship to current employee, or veteran status, as applicable. Direct inquiries to: Vice Provost, Title IX/ADA Coordinator, Old Main 201, 701-231-7708, [email protected].
iii
ABSTRACT Precast prestressed double-tee girders are common on county bridges in South Dakota because of the ease of construction, short construction time, and low cost. However, the longitudinal joints of these bridges are rapidly deteriorating, imposing girder replacement after only 45 years of service. Currently, there are more than 700 double-tee bridges in South Dakota incorporating this joint detailing. The present study was conducted to develop, construct, and evaluate rehabilitation methods for this type of bridge. Current detailing between adjacent double-tee girders consists of discrete welded steel plate connections. A previous study showed that this detailing is insufficient for fatigue, service, and strength loads. Twenty joint rehabilitation detailing alternatives were proposed in the present study. Thirteen large-scale beams were tested to investigate the performance of the rehabilitation methods. Ultra-high performance concrete (UHPC) and latex modified concrete (LMC) were selected as the filler materials. Subsequently, two joint concepts, “pocket” and “continuous,” were developed based on the experimental and analytical studies. A full-scale 40-ft-long double-tee bridge was constructed using conventional longitudinal joint detailing and then initially tested under fatigue loads. Subsequently, the bridge was rehabilitated using the two proposed details, pocket joint with UHPC and continuous joint with LMC, each incorporated on one-half of the bridge length. The rehabilitated specimen was tested under 600,000 cycles of AASHTO (American Association of State Highway and Transportation Officials) fatigue loads. Stiffness tests were performed to monitor the degradation of the bridge. Finally, the specimen was monotonically loaded to failure. No significant damage, beyond initial shrinkage cracks in LMC, was observed throughout the fatigue testing. Furthermore, the stiffness of the bridge did not degrade. No damage or yielding of the reinforcement in the joint was observed throughout the strength testing. The rehabilitated bridge met all AASHTO limit state requirements indicating sufficient performance. Overall, both proposed rehabilitation methods are structurally viable alternatives for double-tee bridge girders; however, only UHPC should be used as filler material at this time. The rehabilitation cost of a double-tee bridge with pocket detailing is expected to be only 30% of the bridge’s superstructure replacement cost.
iv
TABLE OF CONTENTS
1. EXECUTIVE SUMMARY ............................................................................................................. 1
1.1 Introduction ............................................................................................................................... 1 1.2 Problem Description ................................................................................................................. 1 1.3 Research Work .......................................................................................................................... 1 1.4 Research Findings ..................................................................................................................... 2 1.5 Recommendations ..................................................................................................................... 3
1.5.1 Recommendation 1: General ......................................................................................... 3 1.5.2 Recommendation 2: Rehabilitation Methods ................................................................ 3 1.5.3 Recommendation 3: Joint Preparation for Rehabilitation .............................................. 3 1.5.4 Recommendation 4: Pocket Rehabilitation Method ...................................................... 4 1.5.5 Recommendation 5: Continuous Rehabilitation Method ............................................... 4
2. INTRODUCTION ........................................................................................................................... 5 2.1 Problem Description ................................................................................................................. 5 2.2 RESEARCH OBJECTIVES ..................................................................................................... 7
2.2.1 Review and Evaluate Longitudinal Joint Rehabilitation Methods ................................ 7 2.2.2 Test Longitudinal Joint Rehabilitation Detailing........................................................... 7 2.2.3 Recommend Longitudinal Joint Rehabilitation Detailing ............................................. 8
3. LITERATURE REVIEW ............................................................................................................... 9 3.1 Conventional Double-Tee Longitudinal Joints ......................................................................... 9 3.2 South Dakota Double-Tee Bridges ........................................................................................... 9
3.2.1 Identification of Double-Tee Bridges for Joint Rehabilitation .................................... 10 3.3 Continuous Longitudinal Joints .............................................................................................. 11 3.4 Dowel Bar Retrofit .................................................................................................................. 15 3.5 Joint Filler Materials ............................................................................................................... 16
3.5.1 Ultra-High Performance Concrete (UHPC) ................................................................. 16 3.5.2 Latex Modified Concrete (LMC) ................................................................................. 17 3.5.3 Other Filler Materials .................................................................................................. 18
3.6 Joint Reinforcement ................................................................................................................ 19 3.7 Demolition methods ................................................................................................................ 19
3.7.1 Hydro-Demolishing ..................................................................................................... 19 4. LONGITUDINAL JOINT REHABILITATION ALTERNATIVES ....................................... 20
4.1 Double-Tee Longitudinal Joint Rehabilitation Alternatives ................................................... 20 4.2 Rating System, Beam Tests, and Analytical Study ................................................................. 21
4.2.1 Rating System .............................................................................................................. 21 4.2.2 Beam Tests .................................................................................................................. 22 4.2.3 Analytical Study .......................................................................................................... 31
4.3 Proposed Rehabilitation Detailing .......................................................................................... 35 5. FULL-SCALE BRIDGE TEST SPECIMEN.............................................................................. 39
5.1 Design of Bridge Test Specimens ........................................................................................... 39 5.1.1 Conventional Bridge Test Specimen ........................................................................... 40 5.1.2 Rehabilitated Bridge Test Specimen ........................................................................... 40
5.2 Fabrication and Assembly ....................................................................................................... 42
v
5.2.1 Conventional Bridge Joint Completion ....................................................................... 43 5.2.2 Rehabilitated Bridge Joint Completion ....................................................................... 43
5.3 Instrumentation, Test Setup, and Loading Protocols .............................................................. 47 5.3.1 Instrumentation ............................................................................................................ 47 5.3.2 Test Setup .................................................................................................................... 48 5.3.3 Loading Protocol ......................................................................................................... 49
6. EXPERIMENTAL FINDINGS .................................................................................................... 51 6.1 Materials Properties ................................................................................................................ 51
6.1.1 Properties of Cementitious Materials .......................................................................... 51 6.1.2 Properties of Prestressing Strands ............................................................................... 53 6.1.3 Properties of Steel Reinforcement ............................................................................... 53 6.1.4 Properties of Elastomeric Neoprene Bearing Pads ...................................................... 54
6.2 Bridge Test Results ................................................................................................................. 54 6.2.1 Conventional Double-Tee Bridge Test Specimen ....................................................... 54 6.2.2 Rehabilitated Double-Tee Bridge Test Specimen ....................................................... 60
6.3 Performance of Double-Tee Bridges under Different Limit States ........................................ 73 6.3.1 Double-Tee Bridge Test Specimens ............................................................................ 73 6.3.2 Observed Damage ........................................................................................................ 74 6.3.3 Fatigue Performance .................................................................................................... 74 6.3.4 Force-Deflection Relationships ................................................................................... 76
6.4 Constructability of Proposed Joint Rehabilitation Methods ................................................... 77 6.4.1 Method of Demolishing ............................................................................................... 77 6.4.2 Construction of Rehabilitated Continuous Joint .......................................................... 78 6.4.3 Construction of Rehabilitated Pocket Joint ................................................................. 78
6.5 Cost of Double-Tee Bridge Longitudinal Joint Rehabilitation ............................................... 78 7. PROPOSED CONSTRUCTION SPECIFICATIONS ............................................................... 80
7.1 Preparation for Double-Tee Longitudinal Joint Rehabilitation ............................................... 80 7.2 Rehabilitation Methods for Double-Tee Longitudinal Joints ................................................. 80
7.2.1 Pocket Detailing for Rehabilitation of Double-Tee Bridge Longitudinal Joints ......... 81 7.2.2 Continuous Detailing for Rehabilitation of Double-Tee Bridge Longitudinal Joints .. 84
8. RECOMMENDATIONS .............................................................................................................. 87 8.1 Recommendation 1: General ................................................................................................... 87 8.2 Recommendation 2: Rehabilitation Methods .......................................................................... 87 8.3 Recommendation 3: Joint Preparation for Rehabilitation ....................................................... 87 8.4 Recommendation 4: Pocket Rehabilitation Method................................................................ 87 8.5 Recommendation 5: Continuous Rehabilitation Method ........................................................ 88
9. CONCLUSIONS ........................................................................................................................... 89 10. REFERENCES .............................................................................................................................. 91 APPENDIX A. Double-Tee Joint Rehabilitation Brochure ............................................................. 94
vi
LIST OF TABLES Table 3.1. UHPC Typical Mix Design (Graybeal, 2010) ..................................................................... 16 Table 3.2. UHPC Typical Mechanical Properties (Graybeal, 2010) .................................................... 16 Table 3.3. LMC Typical Mix Design (Baer, 2013) .............................................................................. 18 Table 4.1. Double-Tee Bridge Longitudinal Joint Rehabilitation Alternatives .................................... 21 Table 4.2. Rating of Double-Tee Bridge Longitudinal Joint Rehabilitation Alternatives .................... 22 Table 4.3. Large-Scale Beam Test Matrix ............................................................................................ 23 Table 4.4. Mode of Failure and Load Capacity for Beam Test Specimens .......................................... 27 Table 4.5. Input for Pocket Springs in Finite Element Analysis .......................................................... 33 Table 5.1. Full-Scale Bridge Loading Matrix ....................................................................................... 49 Table 6.1. Properties of Precast Girder Fresh Concrete ........................................................................ 51 Table 6.2. Compressive Strength of Girder Concrete ........................................................................... 51 Table 6.3. Compressive Strength of Non-Shrink Grout ....................................................................... 52 Table 6.4. Compressive Strength of UHPC .......................................................................................... 52 Table 6.5. Compressive Strength of LMC ............................................................................................ 53 Table 6.6. Tensile Properties of Prestressing Strands ........................................................................... 53 Table 6.7. Tensile Properties of Steel Wires Used in Joints and Girders ............................................. 53 Table 6.8. Tensile Properties of Reinforcing Steel Bars Used in UHPC Pockets ................................ 54 Table 6.9. Rehabilitation vs. Replacement Costs for 40-ft-long Double-Tee Bridges ......................... 79
vii
LIST OF FIGURES Figure 2.1 Conventional Double-tee Girder Longitudinal Joint Detail (Konrad, 2014) ...................... 5 Figure 2.2 Reflective Cracking and Deterioration of Double-Tee Girder Bridges (Konrad, 2014) .... 5 Figure 2.3 Full-Scale Conventional Double-Tee Girder Test Specimen (Konrad, 2014) .................... 6 Figure 3.1 Conventional Double-tee Girder Longitudinal Joint Detail (Konrad, 2014) ...................... 9 Figure 3.2 South Dakota Double-Tee Bridge Age Distribution ........................................................ 10 Figure 3.3 Recommended Longitudinal Joint Detailing (Jones, 2001) ............................................. 11 Figure 3.4 UHPC-Filled Deck Panel-to-Panel Longitudinal Joint Detailing (Graybeal, 2010) ........ 12 Figure 3.5 Failure of Longitudinal Deck Panel-to-Panel Joint with Straight Bars under Fatigue
Loading (Graybeal, 2010) ................................................................................................ 13 Figure 3.6 Continuous Joint Detailing for Double-Tee Bridges (Konrad, 2014) .............................. 13 Figure 3.7 Measured Load-Displacement Relationship for Double-Tee Bridges under Strength
Testing (Konrad, 2014) .................................................................................................... 14 Figure 3.8 Test Variables Used for Precast Deck Panel Connections (Haber and Graybeal, 2014) .. 14 Figure 3.9 Survey Results for Various Longitudinal Joint Detailing (Jones et al., 2016). ................ 15 Figure 4.1 Geometry of Beam Test Specimens ................................................................................. 24 Figure 4.2 Splice Detailing of Beam Test Specimens ....................................................................... 25 Figure 4.3 Construction of Beam Test Specimens ............................................................................. 26 Figure 4.4 Load-Displacement Relationships for Beam Test Specimens .......................................... 28 Figure 4.5 Beam Test Specimens at First Cracking ........................................................................... 29 Figure 4.6 Beam Test Specimens at Failure ...................................................................................... 30 Figure 4.8 Finite Element Analysis of Double-Tee Bridge Rehabilitation Concepts ........................ 32 Figure 4.9 Effect of Pocket Spacing on Double-Tee Girder Load Distribution ................................ 34 Figure 4.10 Calculated and Measured Double-Tee Girder Load Distribution ..................................... 34 Figure 4.11 Rehabilitated Double-Tee Girder Load Distribution vs. Span Length ............................. 35 Figure 4.12 Proposed Rehabilitation for Double-Tee Bridge Test Specimen—Plan View ................. 36 Figure 4.13 Proposed UHPC Pocket Detailing .................................................................................... 37 Figure 4.14 Proposed UHPC Intermediate Pocket Detailing ............................................................... 37 Figure 4.15 Proposed LMC Continuous Joint Detailing ...................................................................... 37 Figure 4.16 Proposed Continuous Joint Splice Detailing .................................................................... 38 Figure 5.1 Cross-Section of Typical Double-Tee Girder Bridges ..................................................... 39 Figure 5.2 Detailing of 23-in. Deep Double-Tee Girders .................................................................. 39 Figure 5.3 Plan View of Conventional Test Specimen ...................................................................... 40 Figure 5.4 Conventional Test Specimen Details ................................................................................ 40 Figure 5.5 Plan View of Rehabilitated Test Specimen ...................................................................... 41 Figure 5.6 UHPC Pocket Rehabilitation Detailing ............................................................................ 41 Figure 5.7 UHPC Intermediate Pocket Rehabilitation Detailing ....................................................... 41 Figure 5.8 LMC Continuous Rehabilitation Detailing ....................................................................... 41 Figure 5.9 Fabrication of Double-Tee Girders ................................................................................... 42 Figure 5.12 Demolition of Longitudinal Joint of Double-Tee Bridge Test Specimen ........................ 44 Figure 5.13 Rehabilitated Joint Surface Preparation in Double-Tee Bridge Test Specimen ............... 45 Figure 5.14 Formwork and Reinforcement of Rehabilitated Joints in Double-Tee Bridge Test
Specimen .......................................................................................................................... 46
viii
Figure 5.15 Casting UHPC and LMC in Rehabilitated Joints of Double-Tee Bridge Test Specimen 47 Figure 5.16 Full-Scale Double-Tee Bridge Test Setup ........................................................................ 48 Figure 5.17 Water Dams on Rehabilitated Joint of Double-Tee Bridge Test Specimen ..................... 49 Figure 5.18 Applied Load Configuration and Location ....................................................................... 50 Figure 6.1 Measured Force-Displacement Relationship of Elastomeric Bearing Pad
(Mingo, 2016) ................................................................................................................... 54 Figure 6.2 Stiffness Degradation during Fatigue II Testing of Conventional Double-Tee
Bridge Specimen .............................................................................................................. 55 Figure 6.3 Longitudinal Joint Relative Displacement for Conventional Double-Tee Bridge
Specimen during Fatigue II Testing ................................................................................. 55 Figure 6.4 Girder-to-Girder Joint Rotation for Conventional Double-Tee Bridge Specimen
during Fatigue II Testing .................................................................................................. 56 Figure 6.5 Girder-to-Girder Joint Cracking of Conventional Double-Tee Bridge Specimen ............ 56 Figure 6.6 Force-Displacement Relationship for Conventional Double-Tee Bridge Specimen
during Joint Crack Strength Testing ................................................................................. 57 Figure 6.7 Girder Load Distribution for Conventional Double-Tee Bridge Specimen ..................... 57 Figure 6.8 Measured Strains of Loaded Girder in Conventional Double-Tee Bridge Specimen
during Joint Crack Strength Testing ................................................................................. 58 Figure 6.9 Measured Strains of Girder B in Conventional Double-Tee Bridge Specimen during
Joint Crack Strength Testing ............................................................................................ 58 Figure 6.10 Longitudinal Joint Relative Displacement for Conventional Double-Tee Bridge
Specimen during Joint Crack Strength Testing ................................................................ 59 Figure 6.11 Girder-to-Girder Joint Rotation for Conventional Double-Tee Bridge Specimen
during Joint Crack Strength Testing ................................................................................. 59 Figure 6.12 Transverse Cracks in Continuous Joint of Rehabilitated Double-Tee Bridge
Specimen Prior to Testing ................................................................................................ 60 Figure 6.13 Damage of Continuous Joint of Rehabilitated Double-Tee Bridge Specimen during
Fatigue II Testing ............................................................................................................. 61 Figure 6.14 Damage of UHPC Pocket Joints of Rehabilitated Double-Tee Bridge Specimen
during Fatigue II Testing .................................................................................................. 61 Figure 6.15 Stiffness Degradation during Fatigue II Testing of Rehabilitated Double-Tee
Bridge Specimen .............................................................................................................. 62 Figure 6.16 Longitudinal Joint Relative Displacements for Rehabilitated Double-Tee Bridge
Specimen during Fatigue II Testing ................................................................................. 62 Figure 6.17 Girder-to-Girder Joint Rotation for Rehabilitated Double-Tee Bridge Specimen
during Fatigue II Testing .................................................................................................. 63 Figure 6.18 Damage of Rehabilitated Double-Tee Bridge Specimen after Fatigue I Testing ............. 64 Figure 6.21 Girder-to-Girder Joint Rotation for Rehabilitated Double-Tee Bridge Specimen
during Fatigue I Testing ................................................................................................... 66 Figure 6.22 Damage of Rehabilitated Double-Tee Bridge Specimen during Strength Testing ........... 67 Figure 6.23 Force-Deflection Relationships for Rehabilitated Double-Tee Bridge Specimen
during Strength Testing .................................................................................................... 68 Figure 6.24 Girder Load Distribution for Rehabilitated Double-Tee Bridge Specimen ...................... 68
ix
Figure 6.25 Measured Strains of Loaded Girder in Rehabilitated Double-Tee Bridge Specimen during Strength Testing .................................................................................................... 69
Figure 6.26 Measured Strains of Girder B in Rehabilitated Double-Tee Bridge Specimen during Strength Testing .................................................................................................... 70
Figure 6.27 Measured Strains of Transverse Reinforcement in UHPC Pockets of Rehabilitated Double-Tee Bridge Specimen during Strength Testing .................................................... 71
Figure 6.28 Measured Strains of Transverse Reinforcement in LMC Continuous Joint of Rehabilitated Double-Tee Bridge Specimen during Strength Testing ............................. 71
Figure 6.29 Measured Strains of Joint Longitudinal Reinforcement in Rehabilitated Double-Tee Bridge Specimen during Strength Testing ........................................................................ 72
Figure 6.30 Girder-to-Girder Joint Relative Displacement for Rehabilitated Double-Tee Bridge Specimen during Strength Testing ................................................................................... 72
Figure 6.31 Girder-to-Girder Joint Rotation for Rehabilitated Double-Tee Bridge Specimen during Strength Testing .................................................................................................... 73
Figure 6.32 Transverse Cracks of Continuous Joint in Rehabilitated Double-Tee Bridge .................. 74 Figure 6.33 Stiffness Degradation for Different Double-Tee Bridges under AASHTO
Fatigue II Loading ............................................................................................................ 75 Figure 6.34 Stiffness Degradation for Different Double-Tee Bridges under AASHTO
Fatigue I Loading ............................................................................................................. 76 Figure 6.35 Force-Deflection Relationships for Loaded Girders of Different Double-Tee Bridges ... 77 Figure 6.36 Joint Preparation for Rehabilitation .................................................................................. 78 Figure 7.1 Geometry Requirements for Proposed UHPC Pocket Joint Rehabilitation Method ........ 82 Figure 7.2 Detailing for Proposed UHPC Pocket Joint Rehabilitation Method................................. 83 Figure 7.3 Geometry Requirements for Proposed Continuous Joint Rehabilitation Method ............ 85 Figure 7.4 Detailing for Proposed Continuous Joint Rehabilitation Method ..................................... 86

x
TABLE OF ACRONYMS
Acronym Definition AASHTO American Association of State Highway and Transportation Officials
ABC Accelerated Bridge Construction ADTT Average Daily Truck Traffic ASTM American Society for Testing and Materials BrM Bridge Management Software DOT Department of Transportation FEA Finite Element Analysis
FHWA Federal Highway Administration ft Foot/Feet
HPC High Performance Concrete hr Hour/Hours in. Inch/Inches kip 1000 Pounds klf kip per Linear Foot ksi kip per Square Inch lb Pound/Pounds
LRFD Load and Resistance Factor Design LMC Latex Modified Concrete
LMC-VE Very Early High Strength Latex Modified Concrete MAP Magnesium Ammonium Phosphate Grout min Minute/Minutes
MoDOT Missouri Department of Transportation MPC Mountain Plains Consortium SD State of South Dakota, USA
SDDOT South Dakota Department of Transportation sec Second
SDSU South Dakota State University TxDOT Texas Department of Transportation UHPC Ultra-High Performance Concrete
WSDOT Washington State Department of Transportation yd Yards
1
1. EXECUTIVE SUMMARY
1.1 Introduction
Prefabricated bridge elements have become an essential part of Accelerated Bridge Construction (ABC), which is an emerging technology to expedite bridge construction. Among several prefabricated bridge girder types, precast prestressed double-tee girders are common on county bridges in South Dakota because of the ease of construction, relatively short construction time, and low overall cost.
The main goal of the present study was to explore different rehabilitation methods for existing double-tee girder bridges, since the long-term performance of the conventional double-tee longitudinal girder-to-girder joint detailing is not adequate. There are more than 700 double-tee bridges in South Dakota that incorporate this type of joint detailing. A cost-effective longitudinal joint rehabilitation method for double-tee bridges is needed for implementation in the state. The proposed rehabilitation method should be simple in construction and improve the structural performance and durability of these joints.
1.2 Problem Description
Double-tee bridges are common on South Dakota local roads. Conventional double-tee girder-to-girder joint detailing consists of discrete welded steel plate connections in a keyway filled with non-shrink grout. Based on the findings of a previous study at South Dakota State University (SDSU), bridges incorporating this detailing (which included almost all existing double-tee bridges at the time of this writing) may need rehabilitation or replacement. The problem is that longitudinal girder-to-girder joints are deteriorating rapidly and are insufficient, even for service loads (Wehbe et al., 2016). Several double-tee girders with only 40 years of service have been replaced because of this issue. A cost-effective, feasible, and structurally viable longitudinal joint rehabilitation method is needed to upgrade the existing double-tee bridges and to avoid girder or bridge replacement.
1.3 Research Work
Twenty joint rehabilitation detailing methods were proposed in the present study. Using a rating system adopted from the literature, four joint rehabilitation methods were found as viable candidates for further investigation. Thirteen large-scale beams were tested to investigate the performance of these top four rehabilitation methods. Ultra-high performance concrete (UHPC) and latex modified concrete (LMC) were selected as the joint filler materials. Two joint rehabilitation methods, “pocket” and “continuous,” were developed based on the findings of the beam tests and an analytical study. Subsequently, a full-scale 40-ft-long double-tee bridge consisting of two interior girders was constructed using conventional longitudinal joint detailing; it was then tested under 250,000 cycles of the AASHTO Fatigue II loading (equivalent to approximately 46 years of service) using a point load applied at the bridge mid-span. The point load was offset in the transverse direction to maximize the joint shear demands. Furthermore, the conventional specimen was monotonically loaded to crack the longitudinal girder-to-girder joint.
Subsequently, the bridge was rehabilitated using two proposed details, pocket and continuous, each incorporated on one-half of the bridge length. The pocket joint consisted of discrete pockets reinforced with steel bars and filled with UHPC. A UHPC keyway was used to connect the pockets. The continuous joint was reinforced with a wire mesh and filled with LMC. The rehabilitated specimen was tested under fatigue and strength loading to evaluate the performance of the bridge and to obtain data to comment on the suitability of the proposed joint rehabilitation alternatives. The
2
specimen was first tested under 500,000 cycles of AASHTO Fatigue II loading, which was equivalent to 91 years of service. Next, the joint was tested under an additional 100,000 cycles of AASHTO Fatigue I loading to investigate the joint performance under higher demands. Stiffness tests with a load amplitude equal to the AASHTO Fatigue I loading were performed during fatigue testing to monitor the degradation of the bridge. Finally, the specimen was monotonically loaded to failure.
1.4 Research Findings
Based on these analytical and experimental studies, the following conclusions were drawn:
• Of 20 rehabilitation alternatives, those with continuous detailing are more durable.
• Thirteen large-scale beam tests showed that at least a 3-in. lap-splice is needed for joints with UHPC, and a 5-in. lap-splice is need for joints with LMC. These minimum splice lengths ensure bar fracture.
• Finite element analyses showed that the use of pocket detailing for the rehabilitation of double-tee bridge girder-to-girder joints was feasible. The joint geometry was optimized through the analytical study.
• The full-scale bridge test confirmed that the non-shrink grout used in conventional longitudinal joint detailing cracks under the AASHTO Service I limit state loading. Therefore, current double-tee joint detailing is inadequate.
• Hammer-chipping was found to be a viable demolition method.
• Findings from the literature indicated that UHPC and LMC were durable materials. Therefore, these materials were included in the present experimental study. However, transverse shrinkage cracks and water leaks were observed in LMC of the continuous joint of the full-scale bridge before testing. The LMC shrinkage cracks were mainly due to a restrained boundary condition. The shrinkage cracks had no effect on bridge performance, but it might cause durability issues if this material is incorporated in the field. More durable filler materials such as UHPC may be used for the continuous detailing. No shrinkage cracks were observed for UHPC.
• Both rehabilitation longitudinal joint detailing methods, pocket and continuous, did not deteriorate through 500,000 cycles of the AASHTO Fatigue II loading and 100,000 cycles of the AASHTO Fatigue I loading. The rehabilitated bridge test specimen was subjected to 110 years of service loads. The stiffness of the bridge remained constant throughout the fatigue testing.
• The first flexural crack in the stem of the loaded girder of the rehabilitated bridge was observed at 53.8 kips, which was higher than the Service I limit state of 51 kips.
• The rehabilitated bridge load carrying capacity of 113.9 kips was higher than the AASHTO Strength I limit state of 89 kips, indicating sufficient performance for the rehabilitated joints. The strength capacity of the rehabilitated specimen was 1.5 times higher than a conventional reference double-tee bridge test specimen.
• The force-displacement relationship of both girders of the rehabilitated bridge was essentially the same throughout strength testing, indicating monolithic behavior.
• No structural damage or yielding of the reinforcement was observed in either joint rehabilitation details during the strength testing.
3
• The failure mode of the rehabilitated bridge was the flange concrete crushing in both girders at 9.55 in. of displacement in a ductile manner. No damage of rehabilitated joints was observed at the girder failure.
• The rehabilitation cost of the pocket and continuous joint detailing for a 40-ft-long, 30.6-ft-wide double-tee bridge is, respectively, only 26% and 53% of the superstructure replacement cost of the same bridge.
Overall, both proposed rehabilitation methods are structurally viable. However, the UHPC pocket alternative is the cheapest and most durable solution to extend the service life of double-tee bridge longitudinal joints for another 75 years.
1.5 Recommendations
Based on the findings of this study, the research team offers the following recommendations.
1.5.1 Recommendation 1: General
Longitudinal joints of prestressed double-tee girder bridges with a 23-in. girder depth may be rehabilitated using the preparation and construction detailing specified in the following sections.
Experimental and analytical studies were performed only on 23-in.-deep double-tee girder bridges because they are more common than 30-in.-deep double-tee girder bridges in South Dakota.
1.5.2 Recommendation 2: Rehabilitation Methods
Both pocket and continuous detailing should be allowed for the rehabilitation of longitudinal joints of double-tee girder bridges.
Two methods for the rehabilitation of double-tee bridge longitudinal joints can be used in the field: (1) pocket detailing in which discrete pockets reinforced with steel bars are formed and then connected through a longitudinally reinforced shear key, and (b) continuous detailing in which a continuous longitudinal joint is reinforced with wire mesh. The use of the pocket detailing method is more economical than the continuous detailing method. The pocket rehabilitation detailing cost is expected to be approximately 30% of double-tee bridge superstructure replacement cost.
1.5.3 Recommendation 3: Joint Preparation for Rehabilitation
The guidelines detailed in Sec. 7.1 should be adopted for preparing longitudinal joints of double-tee girder bridges to be rehabilitated using either pocket or continuous detailing.
The joint preparation method described in Sec. 7.1 of the present report was exercised during the rehabilitation of a full-scale 40-ft-long double-tee bridge test specimen. A contractor was hired to rehabilitate the bridge longitudinal joint. The proposed method of joint preparation was found simple and practical. The preparation for the pocket joints was faster and less involved compared with the continuous joint preparation.
4
1.5.4 Recommendation 4: Pocket Rehabilitation Method
The guidelines detailed in Sec. 7.2.1 should be adopted for rehabilitating longitudinal joints of double-tee girder bridges using pocket detailing. Only ultra-high performance concrete (UHPC) should be used as the joint filler material.
The rehabilitation of longitudinal joints of double-tee girder bridges incorporating pocket detailing should be performed in accordance with the requirements proposed in Sec. 7.2.1. The full-scale testing of a 40-ft-long double-tee bridge in which its longitudinal joint was rehabilitated using UHPC filled pocket detailing showed that this rehabilitation method is viable and can meet all AASHTO LRFD (2013) requirements. Other cementitious materials such as non-shrink grout, fiber reinforced grout, or latex modified concrete (LMC) should not be used as the joint filler material due to durability issues.
1.5.5 Recommendation 5: Continuous Rehabilitation Method
The guidelines as detailed in Sec. 7.2.2 should be adopted for the rehabilitation of longitudinal joints of double-tee girder bridges using continuous detailing. Only UHPC should be used as the joint filler material.
The rehabilitation of longitudinal joints of double-tee girder bridges incorporating continuous detailing should be performed in accordance with the requirements proposed in Sec. 7.2.2. The full-scale testing of a 40-ft-long double-tee bridge, in which its longitudinal joint was rehabilitated using LMC-filled continuous detailing, showed that this rehabilitation method is structurally viable meeting all AASHTO LRFD (2013) requirements, but LMC exhibited deep shrinkage cracks with water seepage. Except for UHPC, any other cementitious materials, such as non-shrink grout, fiber reinforced grout, or LMC, should not be used as the joint filler material due to durability issues.
5
2. INTRODUCTION
2.1 Problem Description
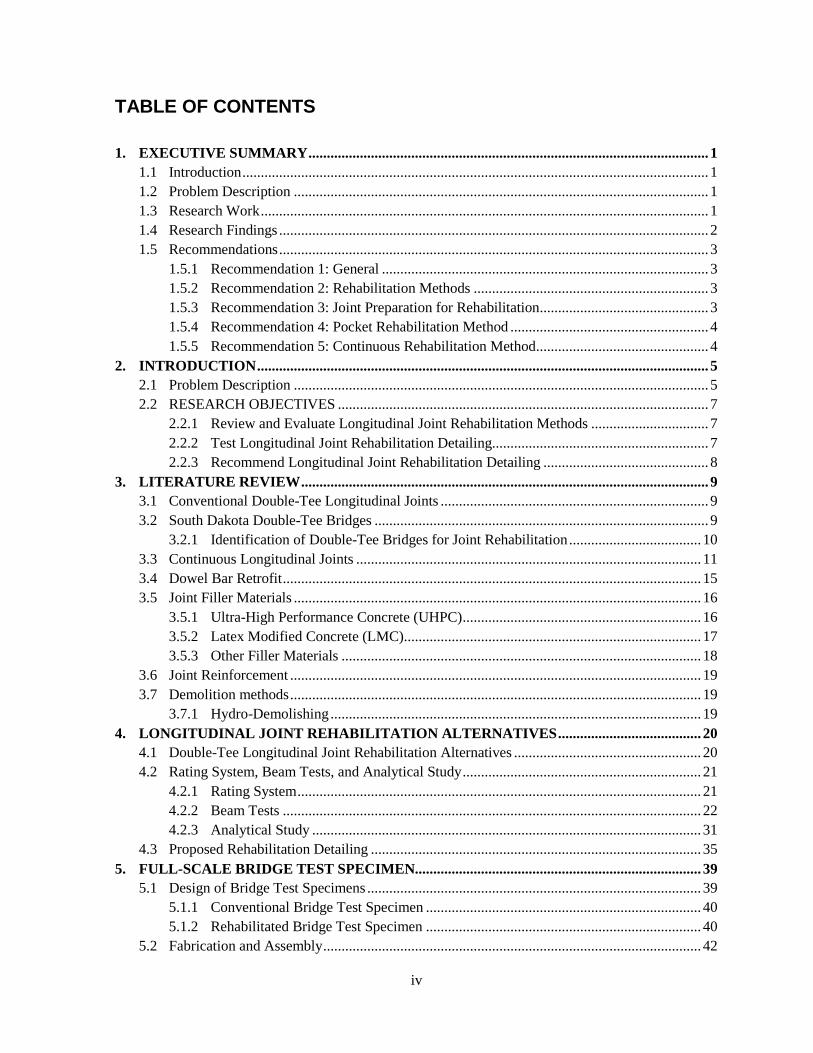
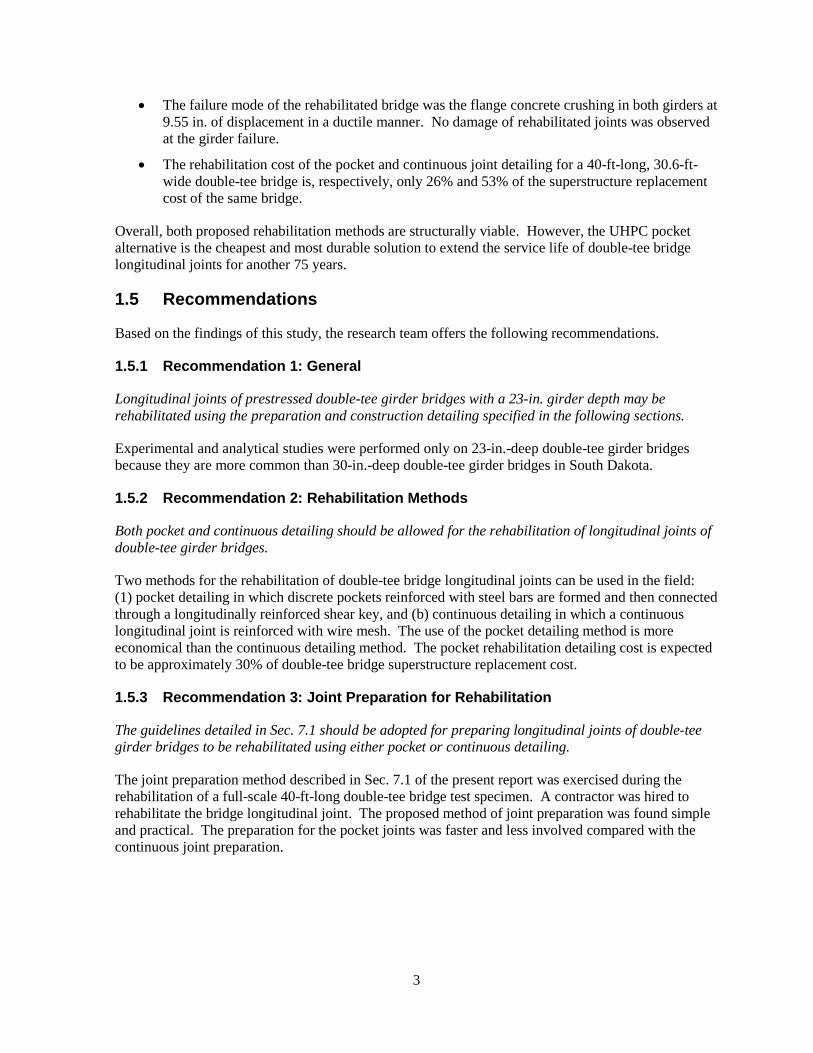
The conventional joint detailing currently used for double-tee girders in South Dakota utilizes discrete welded connections spaced every 5 ft. along the length of the bridge and embedded in a shear key filled with non-shrink grout (Fig2.1).
a. Plan View of Conventional Double-Tee Bridge Girder
b. Section Detail of Welded Connection c. Section Detail of Grouted Keyway
Figure 2.1 Conventional Double-tee Girder Longitudinal Joint Detail (Konrad, 2014)
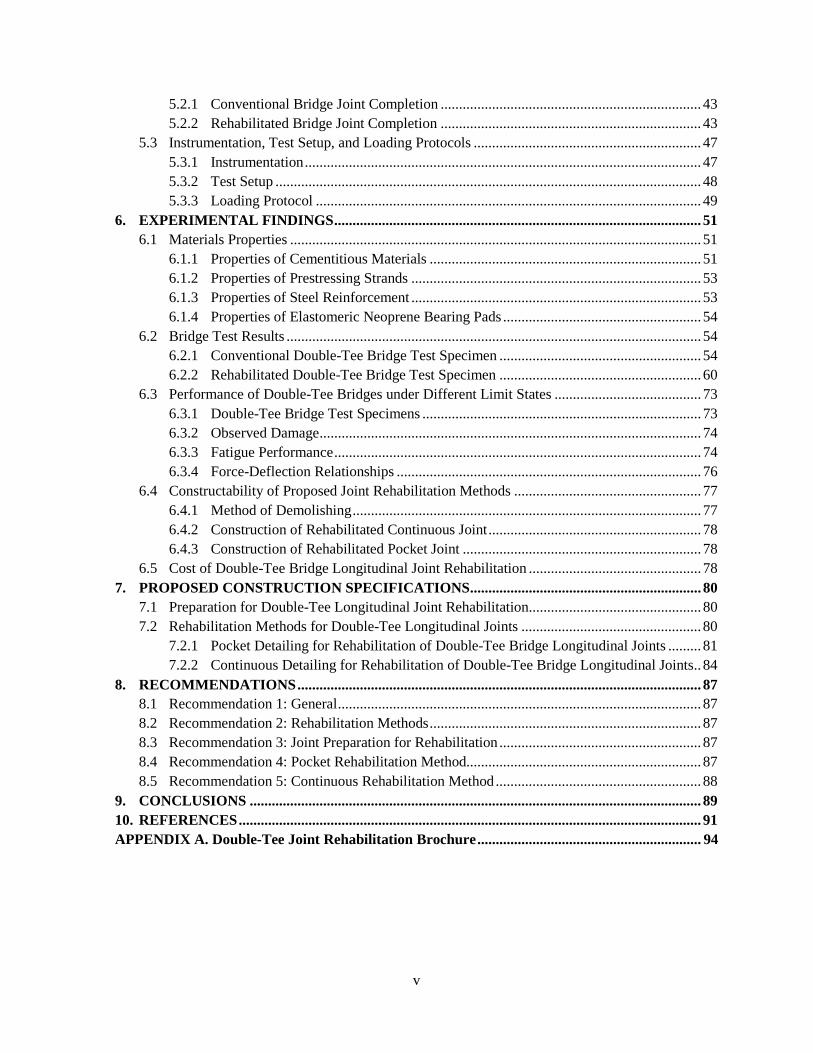
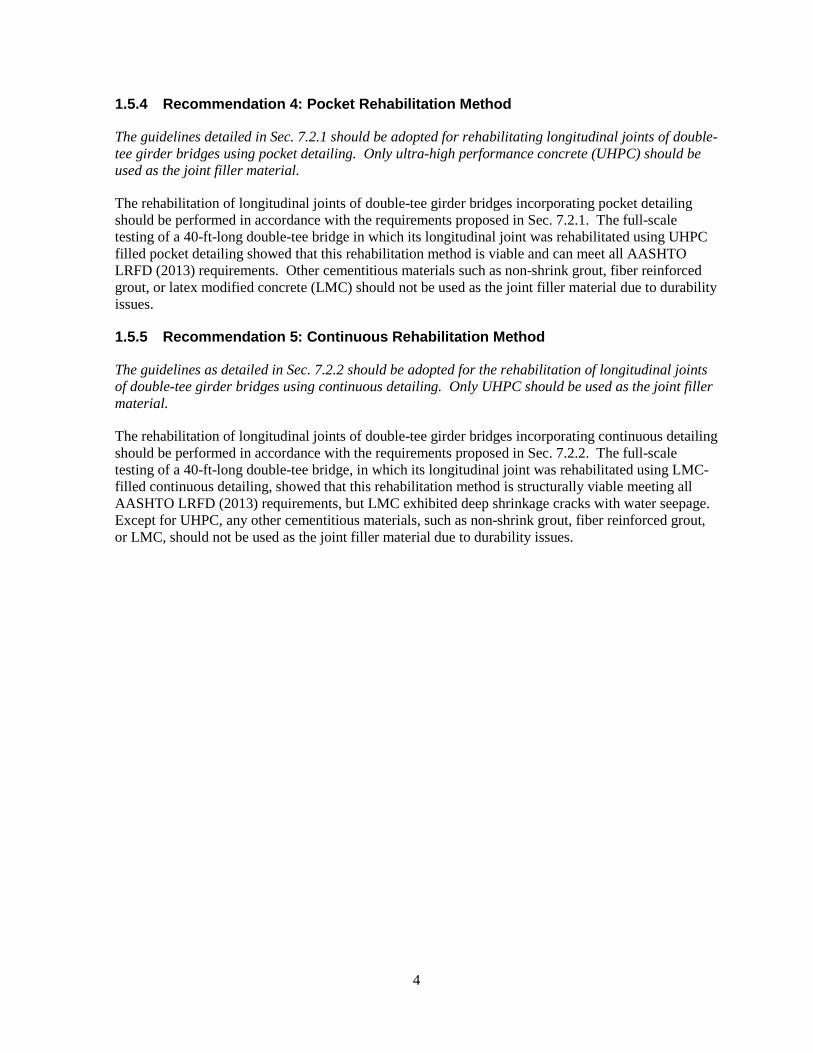
A common problem with existing double-tee bridges is the deterioration of the girder longitudinal joints. The inspection of bridges built less than 40 years ago revealed there are large reflective cracks along these joints causing corrosion of the reinforcement and the welded connections. The corrosion usually expedites the double-tee girder’s rate of deterioration (Fig. 2.2).
a. Reflective Cracking of Asphalt Overlay b. Spalling and Corrosion from Underside of a Girder
Figure 2.2 Reflective Cracking and Deterioration of Double-Tee Girder Bridges (Konrad, 2014)
6
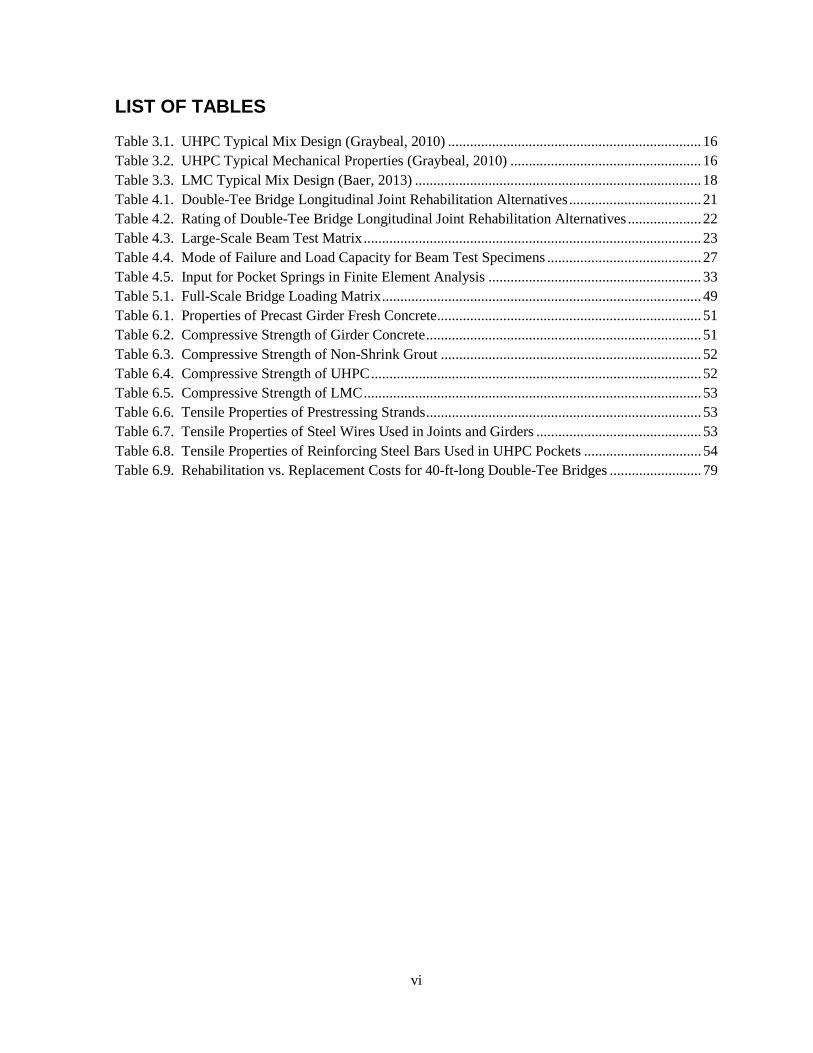
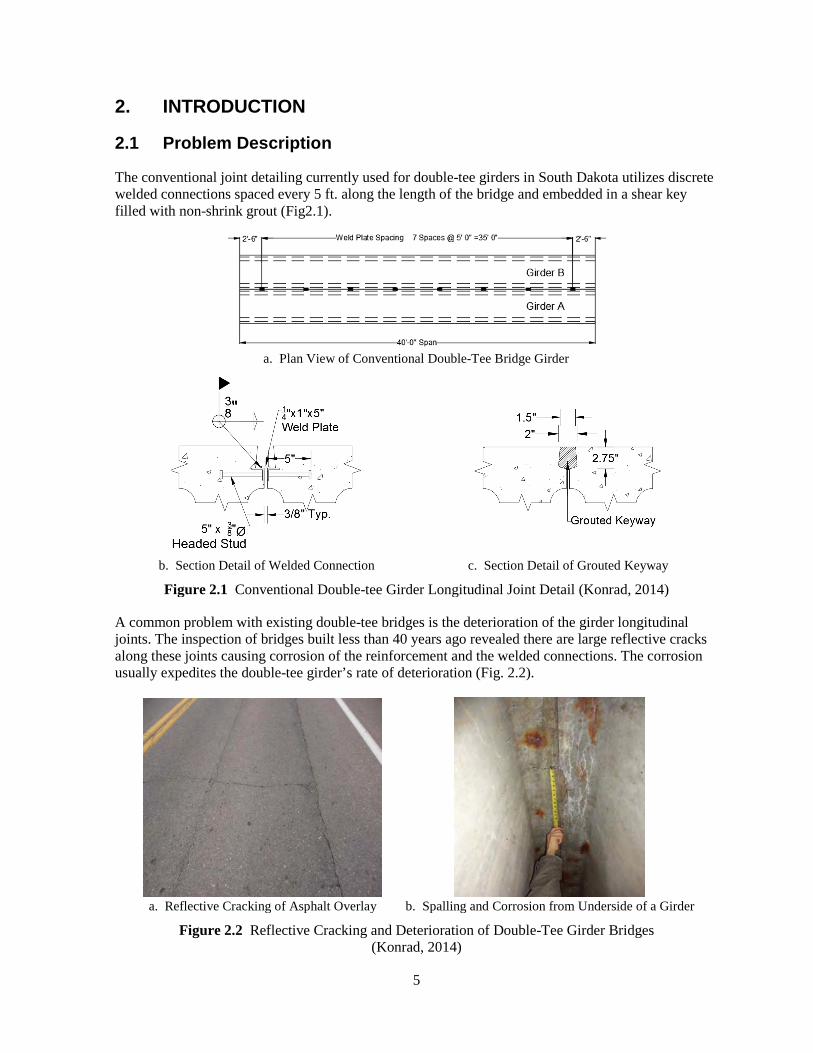
Wehbe et al. (2016) experimentally investigated the behavior of a full-scale conventional double-tee bridge under fatigue and strength loading (Fig. 2.3). The bridge test specimen consisted of two, 40-ft-long interior double-tee girders connected longitudinally using the conventional joint detailing discussed above. The fatigue test was carried out by applying a 21-kip half-cycle loading at a frequency of one cycle per second at the mid-span with a slight offset to maximize the shear force demand on the joint. The strength testing was done by applying an increasing monotonic loading to the girders to failure. Water leaked through the girder-to-girder joint at a load cycle of 19,500 during the fatigue testing (equivalent to 3.5 years of service). The welded connections failed near the mid-span at 62,000 cycles of the fatigue loading (equivalent to 11 years of service). Furthermore, the two girders acted as individual members under the strength testing, indicating the girder-to-girder joint is the weak link in the system. The study concluded that the current double-tee joint detailing is insufficient and does not meet current AASHTO service, fatigue, and strength limit state requirements.
Figure 2.3 Full-Scale Conventional Double-Tee Girder Test Specimen (Konrad, 2014)
Currently, there are hundreds of double-tee bridges in South Dakota utilizing conventional girder-to-girder joint detailing. A robust and cost-effective rehabilitation technique for double-tee longitudinal joints may extend the life of those bridges and provide long-term economic benefit to local governments. The present study was performed to identify potential rehabilitation methods and to assess their constructability, structural performance, and durability for implementation in the state.
7
2.2 Research Objectives
The main research objectives and activities carried out to achieve these goals are briefly discussed in this section.
2.2.1 Review and Evaluate Longitudinal Joint Rehabilitation Methods
Twenty joint detailing alternatives for the rehabilitation of the longitudinal joint of double-tee girder bridges were proposed in the present study based on an extensive literature review. Of the 20 alternatives, continuous joint details were selected for further study since they are more durable than rebar dowel connections by minimizing the number of cold joints.
A rating system was adopted from the literature and modified to identify the best rehabilitation alternatives (refer to Chapter 4 for more discussion on the rating system). The results from the rating showed that four of the 20 alternatives were favorable for further testing. Thirteen large-scale beam tests were carried out to investigate the performance of the selected joint rehabilitation details and to select the best for full-scale bridge testing. Subsequently, two joint rehabilitation concepts, pocket and continuous, were developed and analytically investigated using linear-elastic finite element analyses to optimize the selected joint detailing (refer to Chapter 4).
The proposed continuous and pocket joint rehabilitation details generally consist of exposing the transverse reinforcement of the deck (flange of double-tee girders), lap-slicing the double-tee flange wire mesh with new reinforcement, and using a filler material to complete the joint. Ultra-high performance concrete (UHPC) and latex modified concrete (LMC) were selected as the filler materials because of their higher strength and durability.
2.2.2 Test Longitudinal Joint Rehabilitation Detailing
A full-scale 40-ft-long double-tee bridge consisting of two interior girders was constructed using conventional longitudinal joint detailing. The bridge was then tested under 250,000 cycles of AASHTO Fatigue II (AASHTO LRFD, 2013) loading using a point load applied at the mid-span (equivalent to 46 years of service). The point load was offset in the transverse direction to maximize the joint shear demand. Furthermore, the conventional specimen was monotonically loaded to crack the longitudinal girder-to-girder joint. Subsequently, the bridge was rehabilitated using the two proposed details, pocket and continuous, each incorporated on one-half of the bridge length. The pocket joint consisted of discrete pockets reinforced with steel bars and filled with UHPC. A UHPC keyway was used to connect the pockets. The continuous joint was reinforced with wire mesh and filled with LMC.
The rehabilitated specimen was tested under fatigue and strength loading to evaluate the performance of the bridge and to obtain data in order to judge the suitability of the proposed joint rehabilitation alternatives. The specimen was first tested under 500,000 cycles of AASHTO Fatigue II loading (equivalent to 91 years of service). Next, the bridge was tested under an additional 100,000 cycles of AASHTO Fatigue I loading (equivalent to 18 years of service). Stiffness tests were performed to monitor the degradation of the bridge during both types of fatigue testing. Finally, the specimen was monotonically loaded to failure.

8
2.2.3 Recommend Longitudinal Joint Rehabilitation Detailing
The feasibility and performance of two rehabilitation methods were investigated in the present study: (1) discrete pockets filled with UHPC and reinforced with steel bars, and (2) continuous joints filled with LMC and reinforced with wire mesh. Of the two methods, only the UHPC pocket joint was found to be both structurally viable and durable. Even though the LMC continuous joint was structurally viable, it showed shrinkage cracks prior to testing, which may lead to serious durability issues in the field. Therefore, only the UHPC filled pocket joint detailing was recommended for the rehabilitation of double-tee bridge longitudinal joints. Continuous joint detailing may be accepted for field applications if the joint is filled with UHPC. Nevertheless, cost of the pocket detailing is minimal compared with continuous joint detailing and girder replacement.
9
3. LITERATURE REVIEW The literature was reviewed to identify rehabilitation methods for girder-to-girder joints of precast members. In this chapter, a review of conventional double-tee bridge joint detailing is presented first. Second, the number of South Dakota double-tee bridges is presented with respect to their age. Third, a simple equation to identify bridge candidates for joint rehabilitation is introduced based on full-scale test data. Fourth, a summary of the findings of the literature review on precast member joint detailing and joint filler materials is presented.
3.1 Conventional Double-Tee Longitudinal Joints
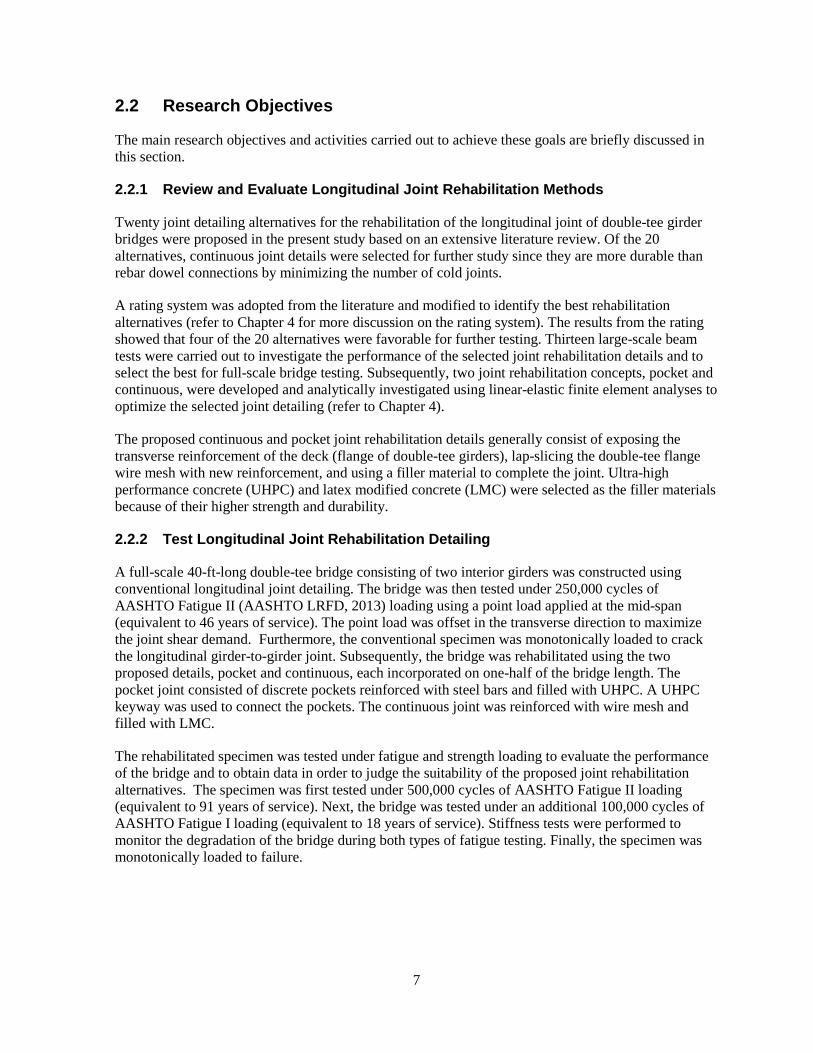
Conventional double-tee girder longitudinal joint detailing (Fig. 3.1), which is common in South Dakota, utilizes discrete welded steel plate connections spaced every 5 ft (Fig. 3.1b) and grouted longitudinal keyways (Fig. 3.1c) to complete the girder-to-girder connections.
a. Plan View of Conventional Double-Tee Bridge
b. Section Detail of Welded Connection c. Section Detail of Grouted Keyway
Figure 3.1 Conventional Double-tee Girder Longitudinal Joint Detail (Konrad, 2014)
A common problem with existing double-tee bridges is the deterioration of the girder longitudinal joints. The inspection of bridges built less than 40 years ago has revealed there are large cracks along these joints causing corrosion of reinforcement and welded connections, thus expediting the rate of deterioration of double-tee girders (e.g., Fig. 2.2). Previous experimental studies by Wehbe et al. (2016) showed that the current joint detailing is insufficient to meet AASHTO limit state requirements.
3.2 South Dakota Double-Tee Bridges
A database of South Dakota bridges is available through Bridge Management software (BrM), which generally includes bridge location, geometry, age, and condition. This software was used to collect information on double-tee bridges. More than 750 in-service double-tee bridges were identified.
10
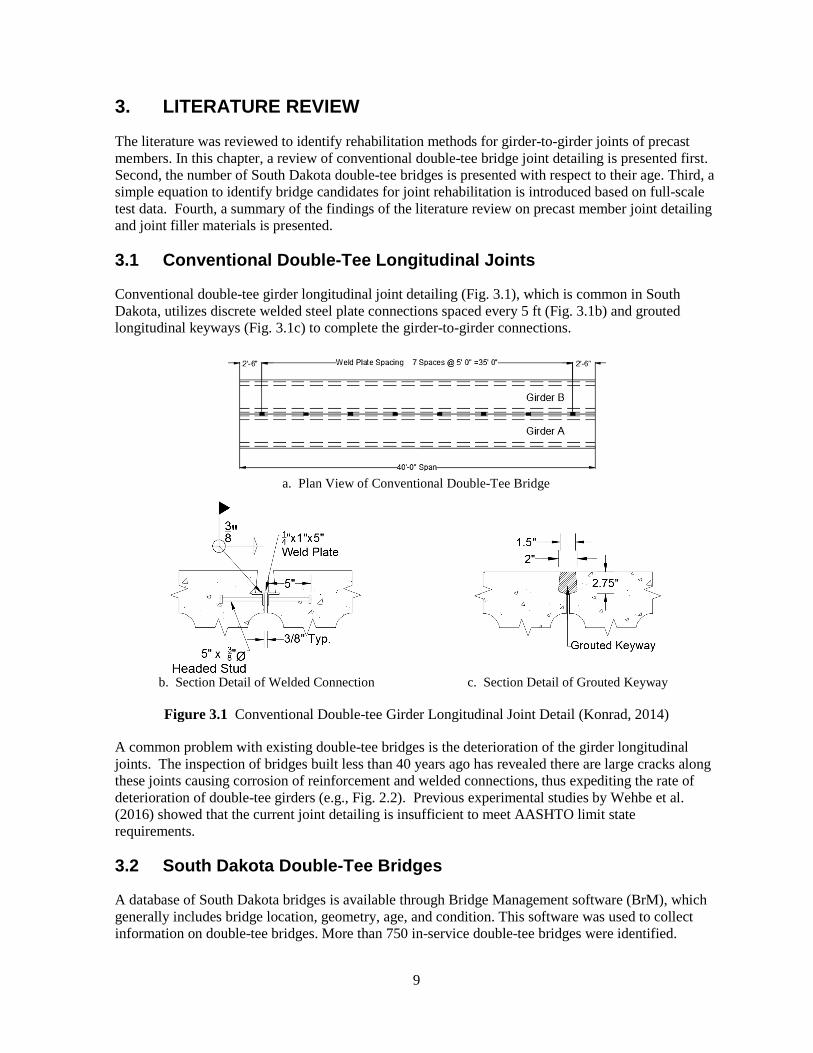
Figure 3.2 shows the age distribution of these bridges, the majority of which are from 20- to 45-years old at the time of this writing in 2017.
Figure 3.2 South Dakota Double-Tee Bridge Age Distribution
3.2.1 Identification of Double-Tee Bridges for Joint Rehabilitation
At the time of this writing, the BrM database for double-tee bridges is limited to general information that cannot help to identify the level of damage of girder-to-girder joints. It is not feasible, therefore, to comment on which double-tee bridge is in immediate need of joint rehabilitation using the BrM database. Extensive research is needed to review all inspection reports to identify double-tee bridges in need of rehabilitation, which is beyond the scope of this project. Nevertheless, a simple equation was developed to further help bridge engineers and owners identify potential double-tee bridges in which the girder-to-girder joint is most likely damaged and needs rehabilitation.
Based on the full-scale double-tee bridge test data, the number of cycles to fail a girder-to-girder welded connection in the conventional joint detailing under fatigue loading was 62,000 (Wehbe and Konrad, 2016). Therefore, it is feasible to estimate the year in which welded connections of double-
3321
22
17
13
51
124
3130
1922
24 3328
231717
2523
2818
192525
2618
1714
203
107
11666
1315
1017
1515
46
911
577
20
0 5 10 15 20 25 30 35>55
5452504846444240383634323028262422201816141210
86420
Number of Bridges
Age
(yea
r)
11
tee girders fail. Equation 3.1 shows the estimated year of rehabilitation need for longitudinal joints of double-tee bridges in South Dakota:
Year to Rehabilitate Double-Tee Bridge Longitudinal Joints = 170 / ADTT (Eq. 3.1)
where ADTT is the average daily truck traffic. Beckemeyer and McPeak (1995) provided ADTT values for three road types in South Dakota with different traffic volumes: low (15), medium (50), and high (200). For example, a double-tee bridge with an ADTT of 15 probably needs joint rehabilitation after approximately 11 years of service. Note Wehbe and Konrad (2016) assumed ADTT=15 for double-tee bridges on South Dakota local roads.
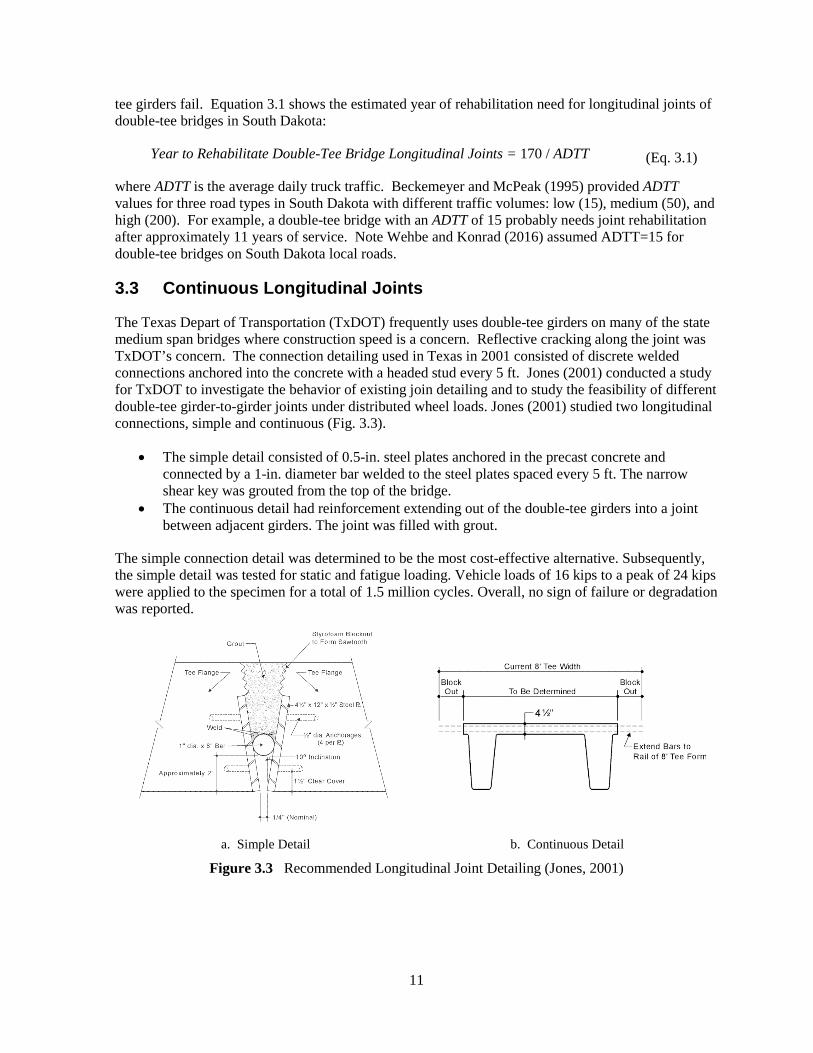
3.3 Continuous Longitudinal Joints
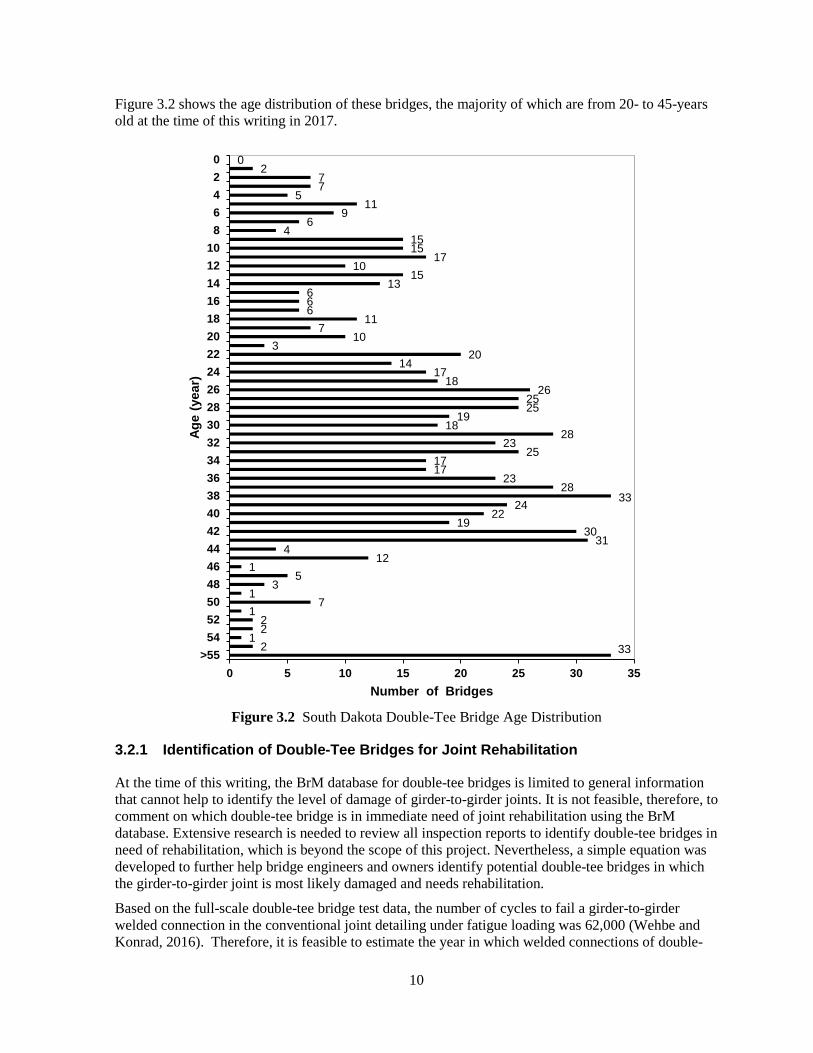
The Texas Depart of Transportation (TxDOT) frequently uses double-tee girders on many of the state medium span bridges where construction speed is a concern. Reflective cracking along the joint was TxDOT’s concern. The connection detailing used in Texas in 2001 consisted of discrete welded connections anchored into the concrete with a headed stud every 5 ft. Jones (2001) conducted a study for TxDOT to investigate the behavior of existing join detailing and to study the feasibility of different double-tee girder-to-girder joints under distributed wheel loads. Jones (2001) studied two longitudinal connections, simple and continuous (Fig. 3.3).
• The simple detail consisted of 0.5-in. steel plates anchored in the precast concrete and connected by a 1-in. diameter bar welded to the steel plates spaced every 5 ft. The narrow shear key was grouted from the top of the bridge.
• The continuous detail had reinforcement extending out of the double-tee girders into a joint between adjacent girders. The joint was filled with grout.
The simple connection detail was determined to be the most cost-effective alternative. Subsequently, the simple detail was tested for static and fatigue loading. Vehicle loads of 16 kips to a peak of 24 kips were applied to the specimen for a total of 1.5 million cycles. Overall, no sign of failure or degradation was reported.
a. Simple Detail b. Continuous Detail
Figure 3.3 Recommended Longitudinal Joint Detailing (Jones, 2001)
12
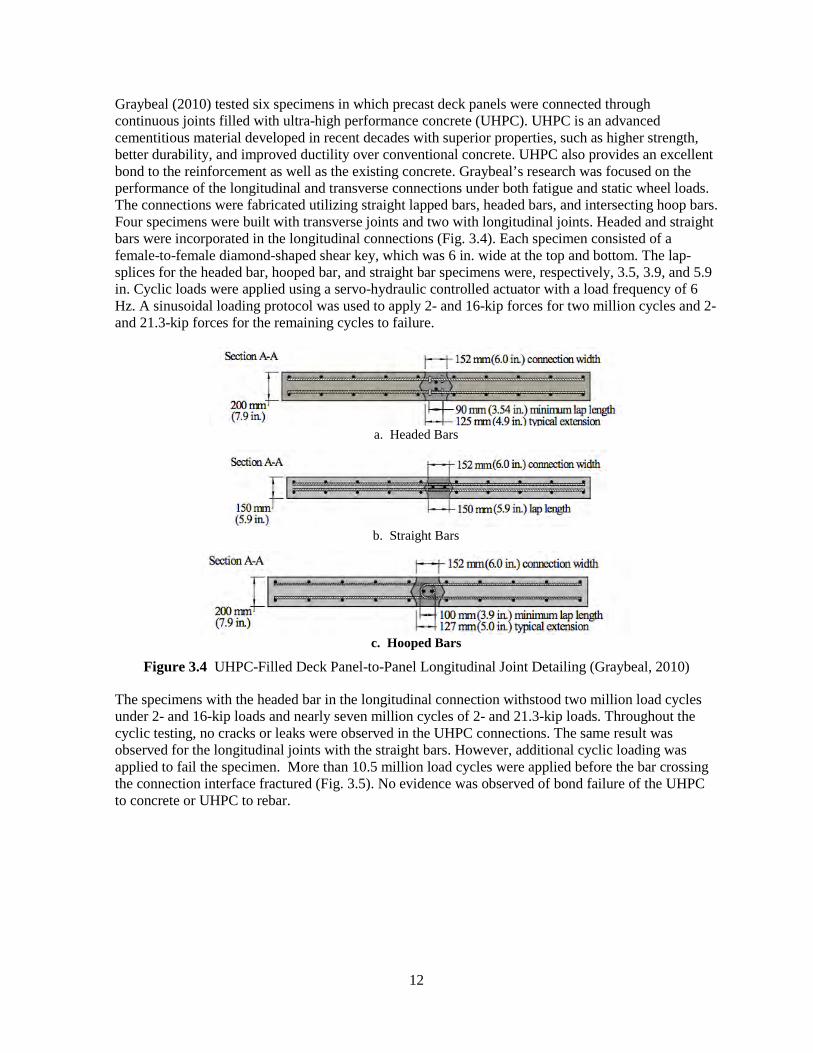
Graybeal (2010) tested six specimens in which precast deck panels were connected through continuous joints filled with ultra-high performance concrete (UHPC). UHPC is an advanced cementitious material developed in recent decades with superior properties, such as higher strength, better durability, and improved ductility over conventional concrete. UHPC also provides an excellent bond to the reinforcement as well as the existing concrete. Graybeal’s research was focused on the performance of the longitudinal and transverse connections under both fatigue and static wheel loads. The connections were fabricated utilizing straight lapped bars, headed bars, and intersecting hoop bars. Four specimens were built with transverse joints and two with longitudinal joints. Headed and straight bars were incorporated in the longitudinal connections (Fig. 3.4). Each specimen consisted of a female-to-female diamond-shaped shear key, which was 6 in. wide at the top and bottom. The lap-splices for the headed bar, hooped bar, and straight bar specimens were, respectively, 3.5, 3.9, and 5.9 in. Cyclic loads were applied using a servo-hydraulic controlled actuator with a load frequency of 6 Hz. A sinusoidal loading protocol was used to apply 2- and 16-kip forces for two million cycles and 2- and 21.3-kip forces for the remaining cycles to failure.
a. Headed Bars
b. Straight Bars
c. Hooped Bars
Figure 3.4 UHPC-Filled Deck Panel-to-Panel Longitudinal Joint Detailing (Graybeal, 2010)
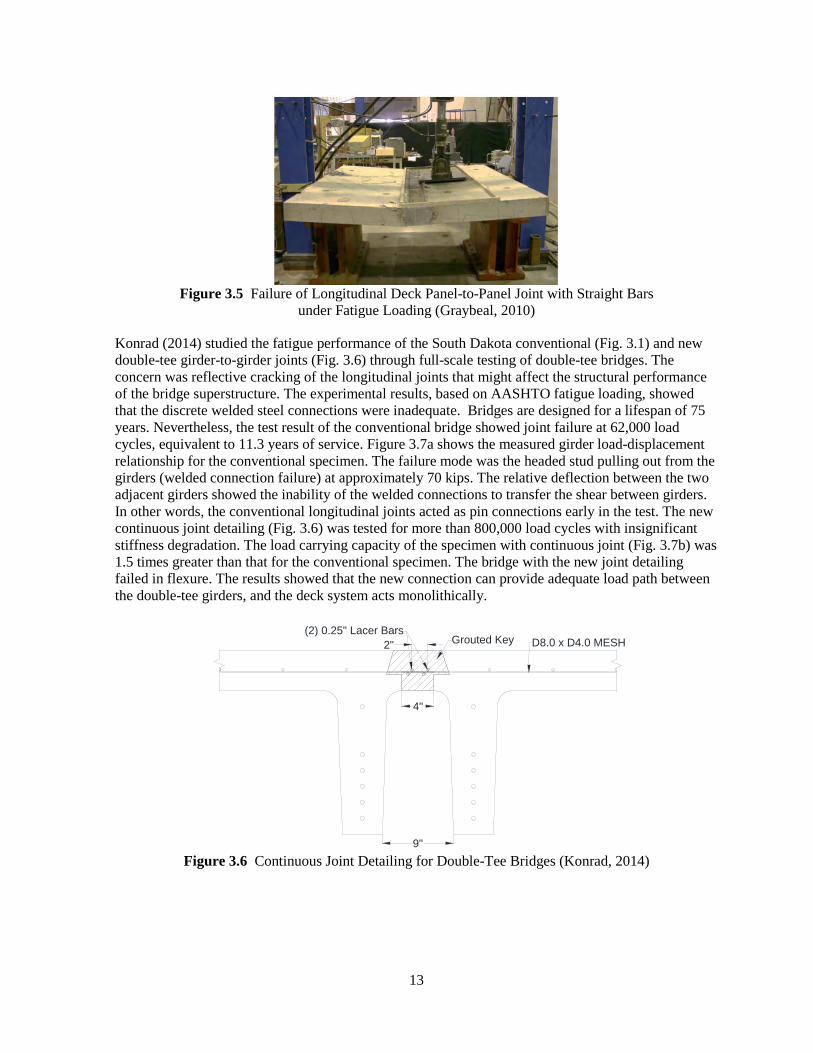
The specimens with the headed bar in the longitudinal connection withstood two million load cycles under 2- and 16-kip loads and nearly seven million cycles of 2- and 21.3-kip loads. Throughout the cyclic testing, no cracks or leaks were observed in the UHPC connections. The same result was observed for the longitudinal joints with the straight bars. However, additional cyclic loading was applied to fail the specimen. More than 10.5 million load cycles were applied before the bar crossing the connection interface fractured (Fig. 3.5). No evidence was observed of bond failure of the UHPC to concrete or UHPC to rebar.
13
Figure 3.5 Failure of Longitudinal Deck Panel-to-Panel Joint with Straight Bars
under Fatigue Loading (Graybeal, 2010)
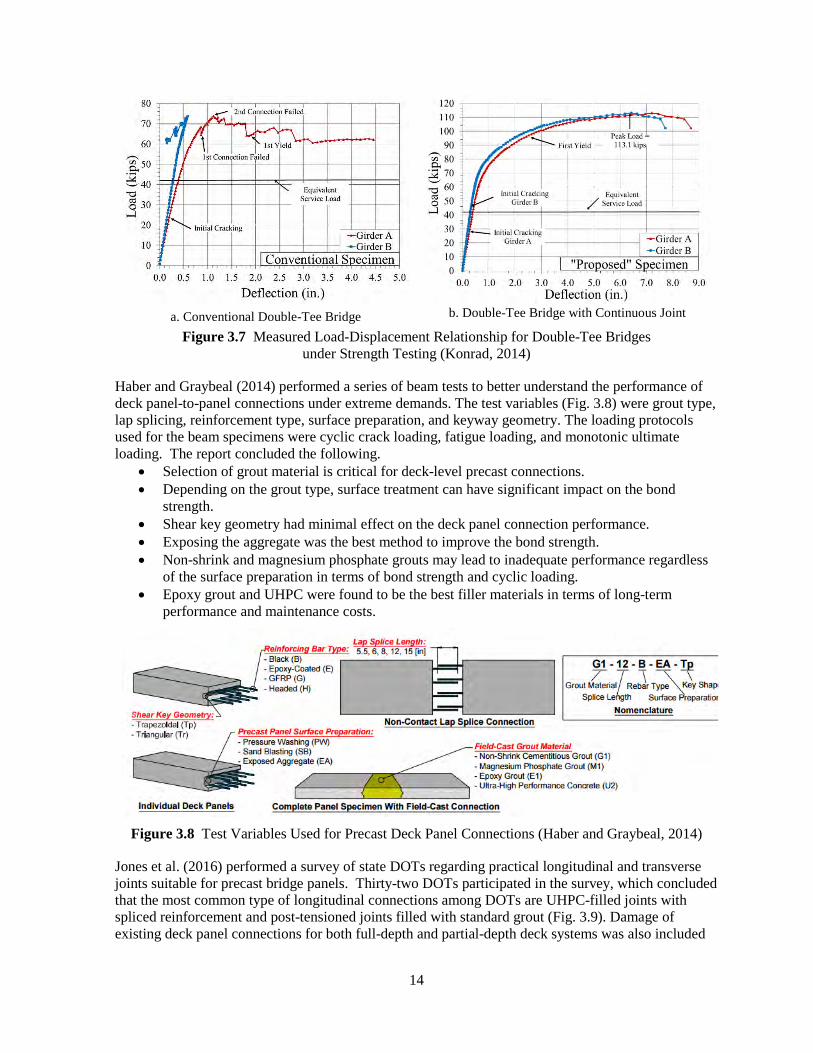
Konrad (2014) studied the fatigue performance of the South Dakota conventional (Fig. 3.1) and new double-tee girder-to-girder joints (Fig. 3.6) through full-scale testing of double-tee bridges. The concern was reflective cracking of the longitudinal joints that might affect the structural performance of the bridge superstructure. The experimental results, based on AASHTO fatigue loading, showed that the discrete welded steel connections were inadequate. Bridges are designed for a lifespan of 75 years. Nevertheless, the test result of the conventional bridge showed joint failure at 62,000 load cycles, equivalent to 11.3 years of service. Figure 3.7a shows the measured girder load-displacement relationship for the conventional specimen. The failure mode was the headed stud pulling out from the girders (welded connection failure) at approximately 70 kips. The relative deflection between the two adjacent girders showed the inability of the welded connections to transfer the shear between girders. In other words, the conventional longitudinal joints acted as pin connections early in the test. The new continuous joint detailing (Fig. 3.6) was tested for more than 800,000 load cycles with insignificant stiffness degradation. The load carrying capacity of the specimen with continuous joint (Fig. 3.7b) was 1.5 times greater than that for the conventional specimen. The bridge with the new joint detailing failed in flexure. The results showed that the new connection can provide adequate load path between the double-tee girders, and the deck system acts monolithically.
Figure 3.6 Continuous Joint Detailing for Double-Tee Bridges (Konrad, 2014)
(2) 0.25" Lacer BarsD8.0 x D4.0 MESH
9"
4"
Grouted Key2"
14
a. Conventional Double-Tee Bridge b. Double-Tee Bridge with Continuous Joint
Figure 3.7 Measured Load-Displacement Relationship for Double-Tee Bridges under Strength Testing (Konrad, 2014)
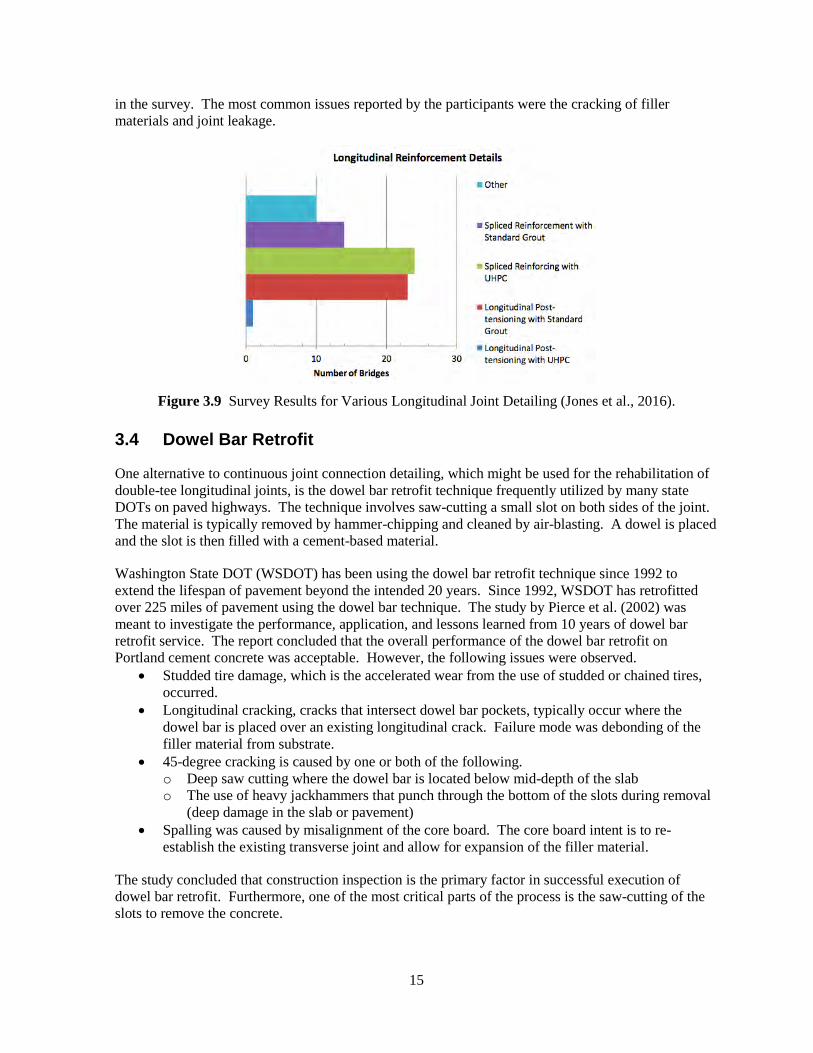
Haber and Graybeal (2014) performed a series of beam tests to better understand the performance of deck panel-to-panel connections under extreme demands. The test variables (Fig. 3.8) were grout type, lap splicing, reinforcement type, surface preparation, and keyway geometry. The loading protocols used for the beam specimens were cyclic crack loading, fatigue loading, and monotonic ultimate loading. The report concluded the following.
• Selection of grout material is critical for deck-level precast connections. • Depending on the grout type, surface treatment can have significant impact on the bond
strength. • Shear key geometry had minimal effect on the deck panel connection performance. • Exposing the aggregate was the best method to improve the bond strength. • Non-shrink and magnesium phosphate grouts may lead to inadequate performance regardless
of the surface preparation in terms of bond strength and cyclic loading. • Epoxy grout and UHPC were found to be the best filler materials in terms of long-term
performance and maintenance costs.
Figure 3.8 Test Variables Used for Precast Deck Panel Connections (Haber and Graybeal, 2014)
Jones et al. (2016) performed a survey of state DOTs regarding practical longitudinal and transverse joints suitable for precast bridge panels. Thirty-two DOTs participated in the survey, which concluded that the most common type of longitudinal connections among DOTs are UHPC-filled joints with spliced reinforcement and post-tensioned joints filled with standard grout (Fig. 3.9). Damage of existing deck panel connections for both full-depth and partial-depth deck systems was also included
15
in the survey. The most common issues reported by the participants were the cracking of filler materials and joint leakage.
Figure 3.9 Survey Results for Various Longitudinal Joint Detailing (Jones et al., 2016).
3.4 Dowel Bar Retrofit
One alternative to continuous joint connection detailing, which might be used for the rehabilitation of double-tee longitudinal joints, is the dowel bar retrofit technique frequently utilized by many state DOTs on paved highways. The technique involves saw-cutting a small slot on both sides of the joint. The material is typically removed by hammer-chipping and cleaned by air-blasting. A dowel is placed and the slot is then filled with a cement-based material.
Washington State DOT (WSDOT) has been using the dowel bar retrofit technique since 1992 to extend the lifespan of pavement beyond the intended 20 years. Since 1992, WSDOT has retrofitted over 225 miles of pavement using the dowel bar technique. The study by Pierce et al. (2002) was meant to investigate the performance, application, and lessons learned from 10 years of dowel bar retrofit service. The report concluded that the overall performance of the dowel bar retrofit on Portland cement concrete was acceptable. However, the following issues were observed.
• Studded tire damage, which is the accelerated wear from the use of studded or chained tires, occurred.
• Longitudinal cracking, cracks that intersect dowel bar pockets, typically occur where the dowel bar is placed over an existing longitudinal crack. Failure mode was debonding of the filler material from substrate.
• 45-degree cracking is caused by one or both of the following. o Deep saw cutting where the dowel bar is located below mid-depth of the slab o The use of heavy jackhammers that punch through the bottom of the slots during removal
(deep damage in the slab or pavement) • Spalling was caused by misalignment of the core board. The core board intent is to re-
establish the existing transverse joint and allow for expansion of the filler material.
The study concluded that construction inspection is the primary factor in successful execution of dowel bar retrofit. Furthermore, one of the most critical parts of the process is the saw-cutting of the slots to remove the concrete.
16
The dowel bar retrofit was suggested to be a viable option in rehabilitating concrete pavement. The use of the dowel bar retrofit technique on the rehabilitation of deck longitudinal joints, however, will need special care since the deck main reinforcement may be cut.
3.5 Joint Filler Materials
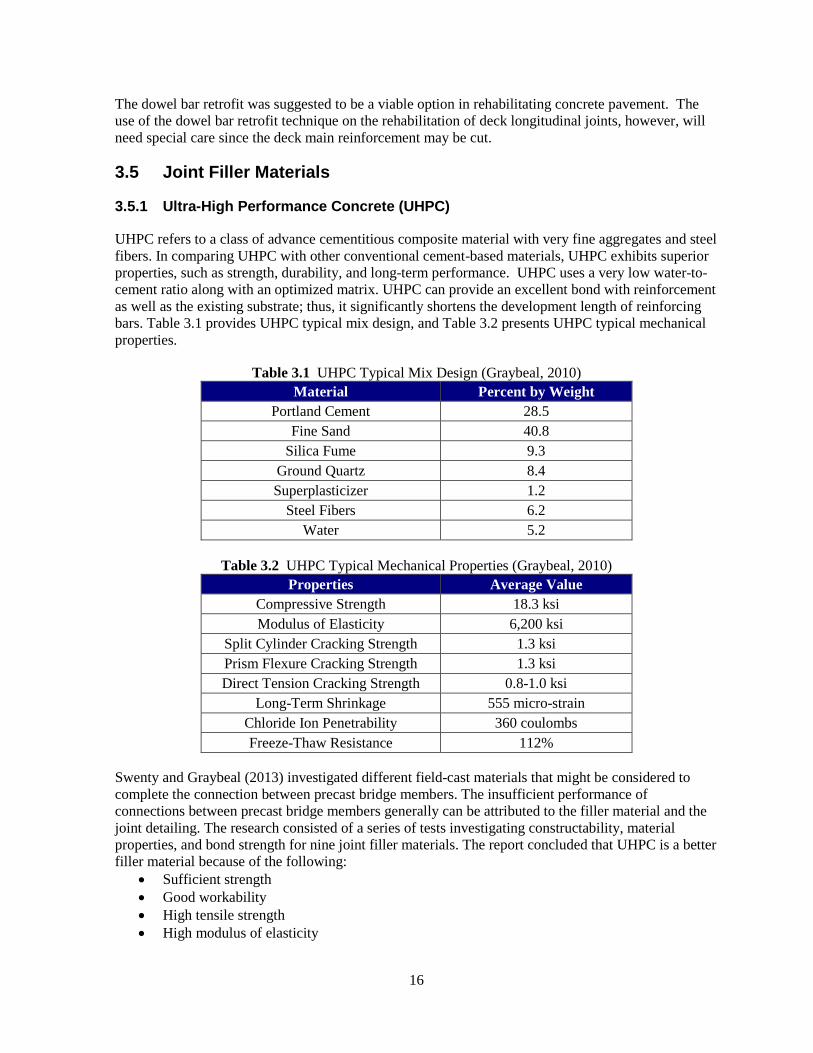
3.5.1 Ultra-High Performance Concrete (UHPC)
UHPC refers to a class of advance cementitious composite material with very fine aggregates and steel fibers. In comparing UHPC with other conventional cement-based materials, UHPC exhibits superior properties, such as strength, durability, and long-term performance. UHPC uses a very low water-to-cement ratio along with an optimized matrix. UHPC can provide an excellent bond with reinforcement as well as the existing substrate; thus, it significantly shortens the development length of reinforcing bars. Table 3.1 provides UHPC typical mix design, and Table 3.2 presents UHPC typical mechanical properties.
Table 3.1 UHPC Typical Mix Design (Graybeal, 2010) Material Percent by Weight
Portland Cement 28.5 Fine Sand 40.8
Silica Fume 9.3 Ground Quartz 8.4 Superplasticizer 1.2
Steel Fibers 6.2 Water 5.2
Table 3.2 UHPC Typical Mechanical Properties (Graybeal, 2010)
Properties Average Value Compressive Strength 18.3 ksi Modulus of Elasticity 6,200 ksi
Split Cylinder Cracking Strength 1.3 ksi Prism Flexure Cracking Strength 1.3 ksi Direct Tension Cracking Strength 0.8-1.0 ksi
Long-Term Shrinkage 555 micro-strain Chloride Ion Penetrability 360 coulombs Freeze-Thaw Resistance 112%
Swenty and Graybeal (2013) investigated different field-cast materials that might be considered to complete the connection between precast bridge members. The insufficient performance of connections between precast bridge members generally can be attributed to the filler material and the joint detailing. The research consisted of a series of tests investigating constructability, material properties, and bond strength for nine joint filler materials. The report concluded that UHPC is a better filler material because of the following:
• Sufficient strength • Good workability • High tensile strength • High modulus of elasticity
17
• Excellent durability • Lower cost compared with epoxy grouts.
Graybeal (2014) discussed 30 projects in which UHPC was incorporated in precast bridge deck connections. Currently, AASHTO requires a minimum development length of 24 times the bar diameter (db) for the joint lap splicing. UHPC, however, substantially reduces the development length (e.g., 8db is sufficient to fracture the bar) compared with that of conventional concrete or grout, resulting in smaller joints. This reduces the cost for reinforcement, fabrication, and field assembly.
Examples of UHPC proprietary products include BCV, BSI, Cor-Tuf, CRC, Densit, and Ductal. The performance and workability of UHPC decreases when the UHPC mix temperature is high. The UHPC can be mixed and placed using conventional methods. Finishing of UHPC is usually done in a closed form to avoid losing moisture.
3.5.2 Latex Modified Concrete (LMC)
Bridge deck deterioration is a problem when salts are used to de-ice roads. De-icing agents contribute to corrosion of the reinforcement in bridge decks. The use of latex in concrete resists the penetration of water and salts, and improves the bar bond with the existing concrete. Latex is an additive to concrete mixes to reduce the amount of water required to achieve adequate workability for placement. The lower water content increases the compressive strength of concrete. The latex forms an elastic membrane within the concrete matrix, reducing the number of voids and micro-cracks. Also, the flexural strength and abrasion resistance are improved using latex (BASF, 2011).
Wenzlick (2006) examined the suitability of very high-early strength latex modified concrete (LMC-VE) for the repair of bridge decks in Missouri. A trial repair was conducted on I-70 near downtown St. Louis to verify how well the process of quick repair would work. Compressive tests performed on LMC-VE cylinders showed that the strength was 3,000 psi in three hours and 6,000 psi in three days. Chlorine penetration was 100 coulombs, which is negligible. The study reported that two other projects in St. Louis County and St. Charles County, Missouri, utilized LMC-VE. Based on the cost difference of 25% to 53% between regular LMC and LMC-VE, respectively, the Missouri Department of Transportation (MoDOT) recommends using LMC-VE on bridge deck repairs in the area of extreme traffic congestion.
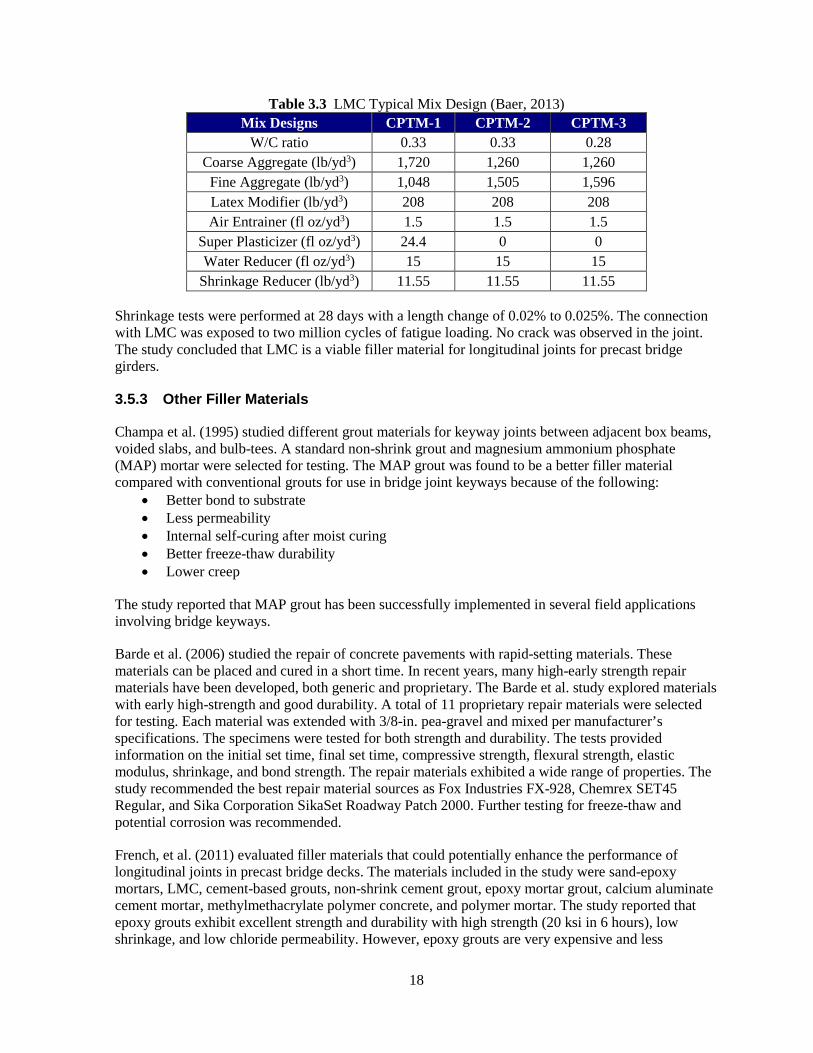
The durability of longitudinal joints is a concern for connections between precast bridge girders. The longitudinal joints may exhibit reflective cracking, which leads to moisture and chlorine corrosion of the reinforcement. Baer (2013) proposed LMC as a closure material with a better durability. LMC was selected because of the high bond to the existing concrete and its familiarity to contractors and designers. The objective of the study was to determine the performance of LMC as closure material for a new longitudinal joint connection that features a continuous detailing with spliced reinforcement. The latex modifier used in this project was Styron Mod A/NA, which was a preapproved modifier for the South Carolina Department of Transportation (SCDOT). Eclipse 4500 shrinkage reducing admixture was used to reduce the drying shrinkage. The test mixture was designed for 6,000 psi compressive strength and exhibited adequate workability (slump of 5 in.). Table 3.3 presents three different mix designs for LMC utilized by Baer (2013).
18
Table 3.3 LMC Typical Mix Design (Baer, 2013) Mix Designs CPTM-1 CPTM-2 CPTM-3
W/C ratio 0.33 0.33 0.28 Coarse Aggregate (lb/yd3) 1,720 1,260 1,260
Fine Aggregate (lb/yd3) 1,048 1,505 1,596 Latex Modifier (lb/yd3) 208 208 208 Air Entrainer (fl oz/yd3) 1.5 1.5 1.5
Super Plasticizer (fl oz/yd3) 24.4 0 0 Water Reducer (fl oz/yd3) 15 15 15
Shrinkage Reducer (lb/yd3) 11.55 11.55 11.55
Shrinkage tests were performed at 28 days with a length change of 0.02% to 0.025%. The connection with LMC was exposed to two million cycles of fatigue loading. No crack was observed in the joint. The study concluded that LMC is a viable filler material for longitudinal joints for precast bridge girders.
3.5.3 Other Filler Materials
Champa et al. (1995) studied different grout materials for keyway joints between adjacent box beams, voided slabs, and bulb-tees. A standard non-shrink grout and magnesium ammonium phosphate (MAP) mortar were selected for testing. The MAP grout was found to be a better filler material compared with conventional grouts for use in bridge joint keyways because of the following:
• Better bond to substrate • Less permeability • Internal self-curing after moist curing • Better freeze-thaw durability • Lower creep
The study reported that MAP grout has been successfully implemented in several field applications involving bridge keyways.
Barde et al. (2006) studied the repair of concrete pavements with rapid-setting materials. These materials can be placed and cured in a short time. In recent years, many high-early strength repair materials have been developed, both generic and proprietary. The Barde et al. study explored materials with early high-strength and good durability. A total of 11 proprietary repair materials were selected for testing. Each material was extended with 3/8-in. pea-gravel and mixed per manufacturer’s specifications. The specimens were tested for both strength and durability. The tests provided information on the initial set time, final set time, compressive strength, flexural strength, elastic modulus, shrinkage, and bond strength. The repair materials exhibited a wide range of properties. The study recommended the best repair material sources as Fox Industries FX-928, Chemrex SET45 Regular, and Sika Corporation SikaSet Roadway Patch 2000. Further testing for freeze-thaw and potential corrosion was recommended.
French, et al. (2011) evaluated filler materials that could potentially enhance the performance of longitudinal joints in precast bridge decks. The materials included in the study were sand-epoxy mortars, LMC, cement-based grouts, non-shrink cement grout, epoxy mortar grout, calcium aluminate cement mortar, methylmethacrylate polymer concrete, and polymer mortar. The study reported that epoxy grouts exhibit excellent strength and durability with high strength (20 ksi in 6 hours), low shrinkage, and low chloride permeability. However, epoxy grouts are very expensive and less
19
compatible with the surrounding concrete. The main disadvantage of cement-based grouts was the low durability that could lead to reflective cracking in the joints. The MAP grout extended with pea-gravel performed better than non-shrink grout. The test results showed that MAP as the overnight cure material (Set 45HW) and HPC mix1 as the seven-day cure material were the best among all grout types in terms of strength and durability.
3.6 Joint Reinforcement
Three reinforcing bar types that might be suitable for double-tee bridge longitudinal joint rehabilitation are conventional steel bars, headed bars, and wire meshes. Reinforcement to be used in any rehabilitated longitudinal joint must be able to resist and transfer shear force and bending moment demands, which mainly depend on the splice length. The AASHTO LRFD (2013) provides equations for development length of straight and hooked steel bars, and wire meshes. However, AASHTO requires lab testing for mechanical anchorages. International Code Council Report No. ES ESR-2935 (2016) provides development length for headed bars.
Of the three reinforcement types, headed bars and wire-meshes are expected to be better for the rehabilitation of double-tee bridge joints due to short development length or compatibility with double-tee existing reinforcement.
3.7 Demolition Methods
Saw cutting, jack-hammering, and hydro-demolishing might be used for the rehabilitation of double-tee bridge longitudinal joints to remove concrete.
3.7.1 Hydro-Demolishing
Wenzlick (2002) performed a study of bridge deck rehabilitation using hydro-demolishing. The study concluded that hydro-demolition is a better alternative for concrete removal from bridge decks than the conventional methods using jackhammers, since debonding and cracking of the rehabilitated bridge decks using conventional demolishing methods was observed. The study highlighted the major advantages of hydro-demolition versus jack-hammering as follows.
• Hydro-demolition does not damage the concrete that is to stay in place. Jack-hammering causes micro-fractures in the concrete surface that leads to poor bond.
• Bond strength of repaired concrete with hydro-demolition is, on average, two times higher than that repaired with jack-hammering.
• Hydro-demolition exposes the reinforcement with no additional damage, and no additional operation is needed before casting; whereas, jack-hammering requires sand-blasting after material is chipped away.
• The cost for hydro-demolishing in Missouri in 2002 was $12/yd2 to $75/yd2 compared with $260/yd2 to $300/yd2 for conventional removal.
The only disadvantage reported for hydro-demolition was the limited mobilization and availability of hydro-jets in 2002.
20
4. LONGITUDINAL JOINT REHABILITATION ALTERNATIVES In the previous chapter, two joint details (continuous and dowel), various filler materials (e.g., ultra-high performance concrete), and reinforcement types (e.g., wire mesh) were introduced. Twenty feasible alternatives for the rehabilitation of double-tee bridge longitudinal joints were developed using the combination of the above-mentioned joint detailing, materials, and reinforcement. In an attempt to identify the best joint rehabilitation methods, a rating system was adopted from NCHRP Report No. 698 (Marsh et al., 2011) and modified in the present study. Furthermore, 13 large-scale beams were tested to verify and optimize the best rehabilitation alternatives prior to full-scale bridge system testing. The joint rehabilitation alternatives, the rating system and results, and the beam test results are briefly discussed here. For an in-depth discussion refer to Bohn (2017).
4.1 Double-Tee Longitudinal Joint Rehabilitation Alternatives
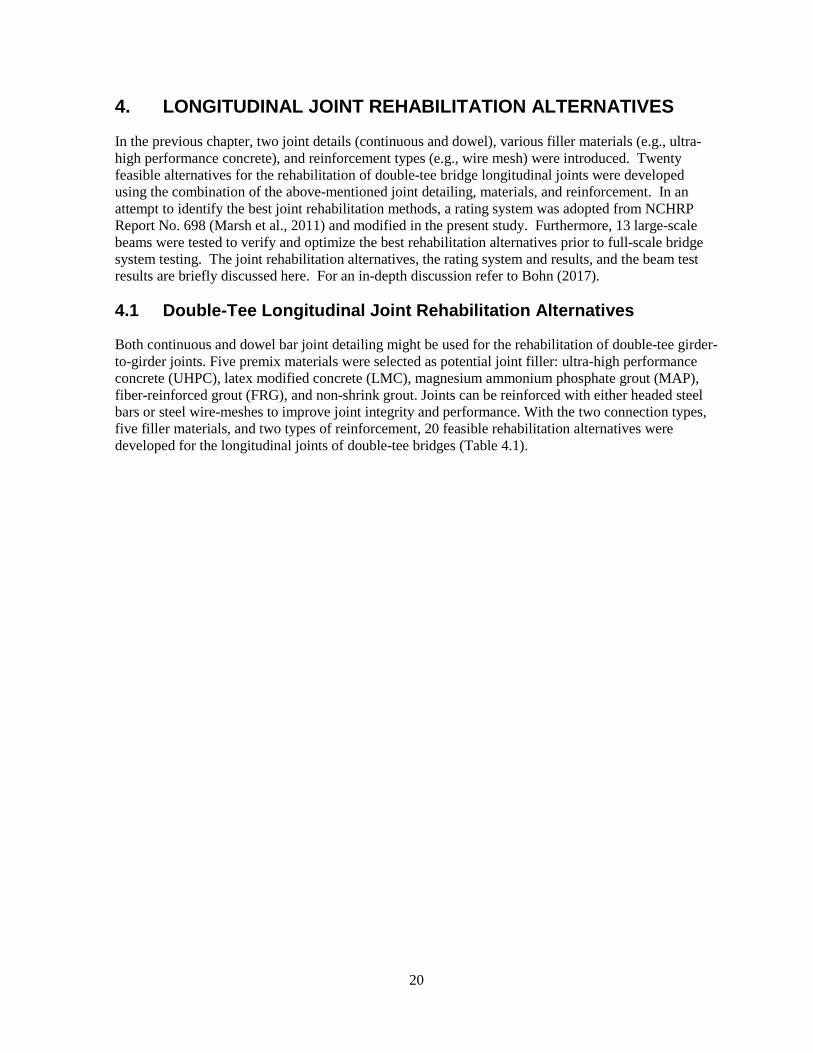
Both continuous and dowel bar joint detailing might be used for the rehabilitation of double-tee girder-to-girder joints. Five premix materials were selected as potential joint filler: ultra-high performance concrete (UHPC), latex modified concrete (LMC), magnesium ammonium phosphate grout (MAP), fiber-reinforced grout (FRG), and non-shrink grout. Joints can be reinforced with either headed steel bars or steel wire-meshes to improve joint integrity and performance. With the two connection types, five filler materials, and two types of reinforcement, 20 feasible rehabilitation alternatives were developed for the longitudinal joints of double-tee bridges (Table 4.1).
21
Table 4.1 Double-Tee Bridge Longitudinal Joint Rehabilitation Alternatives Alternative
Alternative
Joint Filler
Joint
1 CUH UHPC Headed-Bar 2 CUW UHPC Wire-Mesh 3 CNH NSG Headed-Bar 4 CNW NSG Wire-Mesh 5 CMH MAP Headed-Bar 6 CMW MAP Wire-Mesh 7 CLH LMC Headed-Bar 8 CLW LMC Wire-Mesh 9 CFH FRG Headed-Bar
10 CFW FRG Wire-mesh 11 DUH UHPC Headed-Bar 12 DUR UHPC Rebar 13 DNH NSG Headed-Bar 14 DNR NSG Rebar 15 DMH MAP Headed-Bar 16 DMR MAP Rebar 17 DLH LMC Headed-Bar 18 DLR LMC Rebar 19 DFH FRG Headed-Bar 20 DFW FRG Rebar
Notes: The rehabilitation alternative names consist of letters referring to: C – Continuous Joint Rehabilitation, D – Dowel Bar Retrofit, U – Ultra-High Performance Concrete, L – Latex Modified Concrete, F – Fiber Reinforced Grout, N – Non-Shrink Grout, M – Magnesium Ammonium Phosphate Grout, H – Headed Bar, W – Wire Mesh, R-Rebar.
4.2 Rating System, Beam Tests, and Analytical Study
4.2.1 Rating System
A double-tee longitudinal joint rehabilitation alternative consists of three constituents: connection detailing, filler material, and reinforcement type. A rating system to select the best accelerated bridge construction (ABC) methods was developed in NCHRP Report 698, which consists of five performance (-2, -1, 0, 1, 2) and five criteria (construction risk, performance, durability, inspectability, and cost). This rating system was adopted and modified in the present study to evaluate each constituent of a double-tee bridge’s longitudinal joint rehabilitation detailing.
Table 4.2 presents the results of the rating. The three numbers under the construction risk, durability, performance, and inspectability (columns 5 through 8, respectively) are the ratings for the three constituents of an alternative. The overall rating (column 10) is the summation of all sub-ratings for an alternative. The results indicated that alternatives with the dowel bar retrofit method are not adequate for the rehabilitation of the longitudinal joints. Overall, the alternatives with continuous joints filled with UHPC or LMC were identified as the best methods of joint rehabilitation. The rating favored the headed bars, but the wire mesh was still a potential option. The top four candidates (highlighted in the table) for the rehabilitation of double-tee longitudinal joints were: continuous joint with UHPC and headed bars (CUH), continuous joint with LMC and headed bars (CLH), continuous joint with UHPC and wire mesh (CUW), and continuous joint with LMC and wire mesh (CLW).
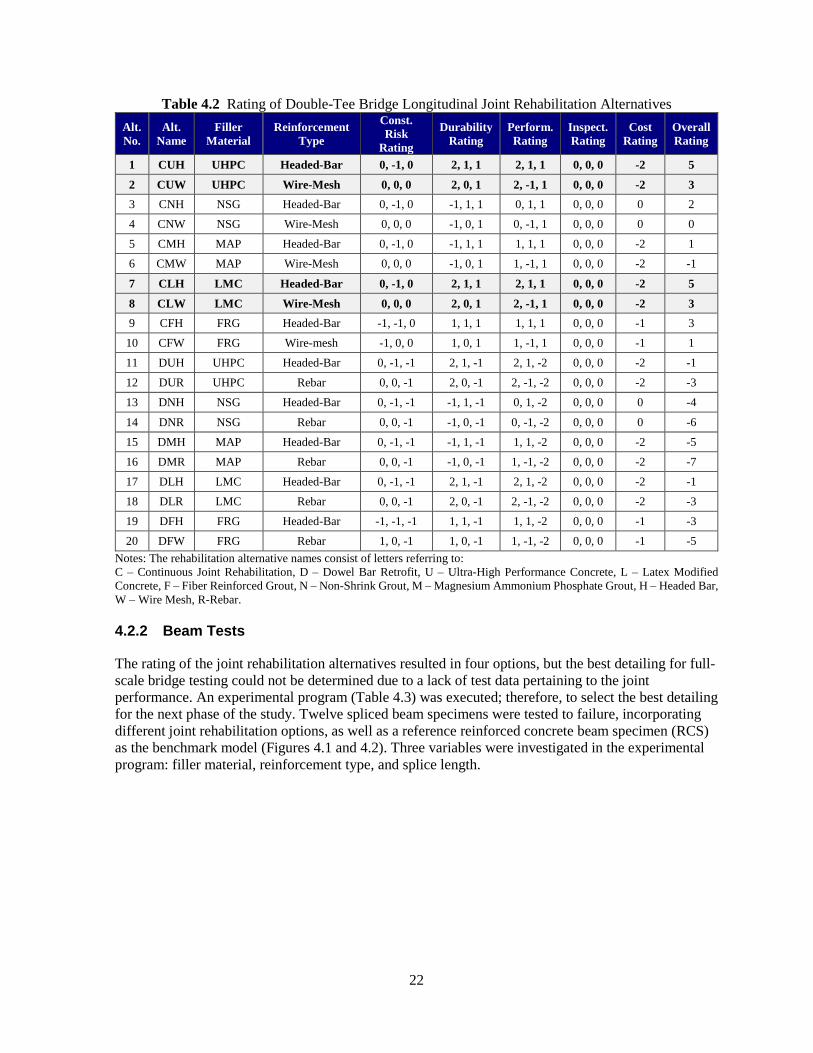
22
Table 4.2 Rating of Double-Tee Bridge Longitudinal Joint Rehabilitation Alternatives Alt. No.
Alt. Name
Filler Material
Reinforcement Type
Const. Risk
Rating
Durability Rating
Perform. Rating
Inspect. Rating
Cost Rating
Overall Rating
1 CUH UHPC Headed-Bar 0, -1, 0 2, 1, 1 2, 1, 1 0, 0, 0 -2 5
2 CUW UHPC Wire-Mesh 0, 0, 0 2, 0, 1 2, -1, 1 0, 0, 0 -2 3 3 CNH NSG Headed-Bar 0, -1, 0 -1, 1, 1 0, 1, 1 0, 0, 0 0 2 4 CNW NSG Wire-Mesh 0, 0, 0 -1, 0, 1 0, -1, 1 0, 0, 0 0 0 5 CMH MAP Headed-Bar 0, -1, 0 -1, 1, 1 1, 1, 1 0, 0, 0 -2 1 6 CMW MAP Wire-Mesh 0, 0, 0 -1, 0, 1 1, -1, 1 0, 0, 0 -2 -1
7 CLH LMC Headed-Bar 0, -1, 0 2, 1, 1 2, 1, 1 0, 0, 0 -2 5
8 CLW LMC Wire-Mesh 0, 0, 0 2, 0, 1 2, -1, 1 0, 0, 0 -2 3 9 CFH FRG Headed-Bar -1, -1, 0 1, 1, 1 1, 1, 1 0, 0, 0 -1 3
10 CFW FRG Wire-mesh -1, 0, 0 1, 0, 1 1, -1, 1 0, 0, 0 -1 1 11 DUH UHPC Headed-Bar 0, -1, -1 2, 1, -1 2, 1, -2 0, 0, 0 -2 -1 12 DUR UHPC Rebar 0, 0, -1 2, 0, -1 2, -1, -2 0, 0, 0 -2 -3 13 DNH NSG Headed-Bar 0, -1, -1 -1, 1, -1 0, 1, -2 0, 0, 0 0 -4
14 DNR NSG Rebar 0, 0, -1 -1, 0, -1 0, -1, -2 0, 0, 0 0 -6 15 DMH MAP Headed-Bar 0, -1, -1 -1, 1, -1 1, 1, -2 0, 0, 0 -2 -5 16 DMR MAP Rebar 0, 0, -1 -1, 0, -1 1, -1, -2 0, 0, 0 -2 -7 17 DLH LMC Headed-Bar 0, -1, -1 2, 1, -1 2, 1, -2 0, 0, 0 -2 -1 18 DLR LMC Rebar 0, 0, -1 2, 0, -1 2, -1, -2 0, 0, 0 -2 -3 19 DFH FRG Headed-Bar -1, -1, -1 1, 1, -1 1, 1, -2 0, 0, 0 -1 -3 20 DFW FRG Rebar 1, 0, -1 1, 0, -1 1, -1, -2 0, 0, 0 -1 -5
Notes: The rehabilitation alternative names consist of letters referring to: C – Continuous Joint Rehabilitation, D – Dowel Bar Retrofit, U – Ultra-High Performance Concrete, L – Latex Modified Concrete, F – Fiber Reinforced Grout, N – Non-Shrink Grout, M – Magnesium Ammonium Phosphate Grout, H – Headed Bar, W – Wire Mesh, R-Rebar.
4.2.2 Beam Tests
The rating of the joint rehabilitation alternatives resulted in four options, but the best detailing for full-scale bridge testing could not be determined due to a lack of test data pertaining to the joint performance. An experimental program (Table 4.3) was executed; therefore, to select the best detailing for the next phase of the study. Twelve spliced beam specimens were tested to failure, incorporating different joint rehabilitation options, as well as a reference reinforced concrete beam specimen (RCS) as the benchmark model (Figures 4.1 and 4.2). Three variables were investigated in the experimental program: filler material, reinforcement type, and splice length.
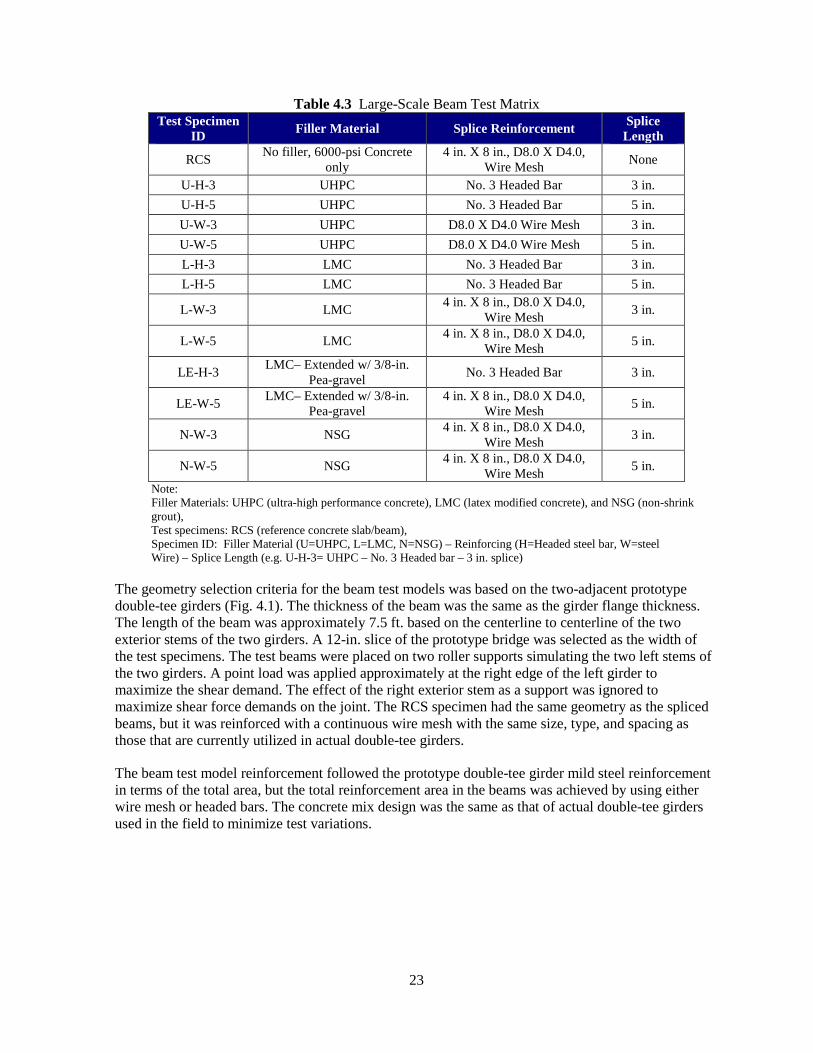
23
Table 4.3 Large-Scale Beam Test Matrix Test Specimen
ID Filler Material Splice Reinforcement Splice Length
RCS No filler, 6000-psi Concrete only
4 in. X 8 in., D8.0 X D4.0, Wire Mesh None
U-H-3 UHPC No. 3 Headed Bar 3 in. U-H-5 UHPC No. 3 Headed Bar 5 in. U-W-3 UHPC D8.0 X D4.0 Wire Mesh 3 in. U-W-5 UHPC D8.0 X D4.0 Wire Mesh 5 in. L-H-3 LMC No. 3 Headed Bar 3 in. L-H-5 LMC No. 3 Headed Bar 5 in.
L-W-3 LMC 4 in. X 8 in., D8.0 X D4.0, Wire Mesh 3 in.
L-W-5 LMC 4 in. X 8 in., D8.0 X D4.0, Wire Mesh 5 in.
LE-H-3 LMC– Extended w/ 3/8-in. Pea-gravel No. 3 Headed Bar 3 in.
LE-W-5 LMC– Extended w/ 3/8-in. Pea-gravel
4 in. X 8 in., D8.0 X D4.0, Wire Mesh 5 in.
N-W-3 NSG 4 in. X 8 in., D8.0 X D4.0, Wire Mesh 3 in.
N-W-5 NSG 4 in. X 8 in., D8.0 X D4.0, Wire Mesh 5 in.
Note: Filler Materials: UHPC (ultra-high performance concrete), LMC (latex modified concrete), and NSG (non-shrink grout), Test specimens: RCS (reference concrete slab/beam), Specimen ID: Filler Material (U=UHPC, L=LMC, N=NSG) – Reinforcing (H=Headed steel bar, W=steel Wire) – Splice Length (e.g. U-H-3= UHPC – No. 3 Headed bar – 3 in. splice)
The geometry selection criteria for the beam test models was based on the two-adjacent prototype double-tee girders (Fig. 4.1). The thickness of the beam was the same as the girder flange thickness. The length of the beam was approximately 7.5 ft. based on the centerline to centerline of the two exterior stems of the two girders. A 12-in. slice of the prototype bridge was selected as the width of the test specimens. The test beams were placed on two roller supports simulating the two left stems of the two girders. A point load was applied approximately at the right edge of the left girder to maximize the shear demand. The effect of the right exterior stem as a support was ignored to maximize shear force demands on the joint. The RCS specimen had the same geometry as the spliced beams, but it was reinforced with a continuous wire mesh with the same size, type, and spacing as those that are currently utilized in actual double-tee girders.
The beam test model reinforcement followed the prototype double-tee girder mild steel reinforcement in terms of the total area, but the total reinforcement area in the beams was achieved by using either wire mesh or headed bars. The concrete mix design was the same as that of actual double-tee girders used in the field to minimize test variations.
24
a. Profile View of Beam Test Extracted from a Double-tee Girder
b. Reference Concrete Slab (RCS) Test Specimen
c. Test Specimen with 3-in. Lap-Splice
d. Test Specimen with 5-in. Lap-Splice
Figure 4.1 Geometry of Beam Test Specimens
Concrete to be Removed,Backfilled w/ Filler Material
Double-Tee Girder
Beam Test Specimen
3'-10"
5"
3'-10"
5"
Point Load (P)
RCS
3'-4"
5"
7'-6"
4'2"
5"
4'2" 3'-4"
5" Filler Material
7'-6"
Point Load (P)
Keyway w/ 3" Lap Splice
5"
Point Load (P)
Filler Material5"Keyway w/ 5" Lap Splice
7'-6"
4'2" 3'-4"
25
a. Test Specimen with 3-in. Splice Lengths Utilizing No. 3 Headed Bars
b. Test Specimen with 5-in. Splice Lengths Utilizing No. 3 Headed Bars
c. Test Specimen with 3-in. Splice Lengths Utilizing D8/D4 Wire Mesh
d. Test Specimen with 5-in. Splice Lengths Utilizing D8/D4 Wire Mesh
Figure 4.2 Splice Detailing of Beam Test Specimens
CS
1'
No. 3 Headed Bar1'-1"
8"
7'-6"
10"
4"
3" D8.0 Deformed Wire
D4.0 Deformed Wire
10"
No. 3 Headed Bar
D4.0 Deformed Wire
D8.0 Deformed Wire
CS
1'
7'-6"
4" 8"
5"1'-5"
D4.0 Deformed Wire
D8.0 Deformed Wire
CS
1'10"
7'-6"
D4.0 Deformed Wire
1'-012"
D8.0 Deformed Wire
4"
3"
8"
10"
CS
D8.0 Deformed Wire
D4.0 Deformed Wire D4.0 Deformed Wire
D8.0 Deformed Wire
1'
7'-6"
4" 8"
5"1'-41
2"
26
The beams were fabricated (Fig. 4.3) in the Lohr Structures Laboratory at South Dakota State University (SDSU). Ready mix concrete was utilized for construction. The fresh concrete temperature was 64°F with a slump of 6.0 in. The mix design was based on the current double-tee mix design provided by the manufacturer, targeting 6,000-psi compressive strength at 28 days. After seven days of curing, the inner formwork was stripped in order to place the joint reinforcement. A previous study showed that roughening and pre-wetting the surface for 24 hours increase the bond between two cementitious materials (Graybeal, 2014). Since concrete is usually demolished by hammer chipping in South Dakota, a hammer drill was used to roughen the splice surface (Fig. 4.3c and 4.3d) to best resemble demolishing conditions.
After surface preparation, cleaning, and placing the reinforcement in the spliced region, the joints were poured with one of the following: a premix LMC, a premix UHPC (with 2% volumetric steel fibers), LMC extended with 3/8-in. diameter pea-gravel, or conventional non-shrink grout.
a. Formwork b. Pouring Concrete
c. Original Joint Surface d. Roughened Joint Surface
Figure 4.3 Construction of Beam Test Specimens
27
The test day compressive strength of the concrete, non-shrink grout, LMC, extended LMC, and UHPC was approximately 6,100, 6,100, 8,000, 4,500, and 20,500 psi, respectively. The wire mesh was made of ASTM A497 deformed wires with a yield strength of 108 ksi. ASTM A706 headed bars with a yield strength of 80 ksi were incorporated in the specimens.
A displacement-based half-cyclic loading protocol with a slow rate of 0.003 in./sec was used for the testing of the beam specimens. Cyclic, as opposed to monotonic, loading was chosen to maximize damage and to investigate the joint performance under large cyclic displacement demands.
RSC failed by the bar fracture. The failure mode of the spliced test specimens was either the bar pullout or the bar fracture. Table 4.4 presents a summary of the beam test results, including the initial cracking load, the ultimate load, and the failure mode. The load corresponding to the initial cracking was based on visual inspection of the test beams. All test specimens with a 5-in. lap-splice (Fig. 4.4a) exhibited bar fracture, except NW5 (a joint reinforced with wire mesh and filled with conventional non-shrink grout) and LH5 (a joint with headed bars and latex modified concrete). UW3 (a joint with wire mesh and UHPC) and UH3 (a joint with headed bars and UHPC) were the only test specimens with a 3-in. lap-splice exhibiting bar fracture (Fig. 4.4b).
Table 4.4 Mode of Failure and Load Capacity for Beam Test Specimens Specimen ID Measured Pcrack
(kips) Measured Pu
(kips) Mode of Failure
RCS 8.8 22.3 Bar rupture in joint LW5 9.9 20.1 Bar rupture in joint
UW5 13.3 29.4 Bar rupture in precast concrete segment
LEW5 7.2 16.8 Bar rupture in joint NW5 3 13.6 Bar pullout LH5 14.3 16.4 LMC compressive failure UH5 14.7 29.6 Bar rupture at interface LW3 12 13.8 Bar pullout UW3 16.4 32.9 Bar rupture at interface NW3 9.1 10.4 Bar pullout LH3 11.7 14.9 Bar pullout UH3 13.5 28.5 Bar rupture at interface
LEH3 10.5 12.9 Bar pullout
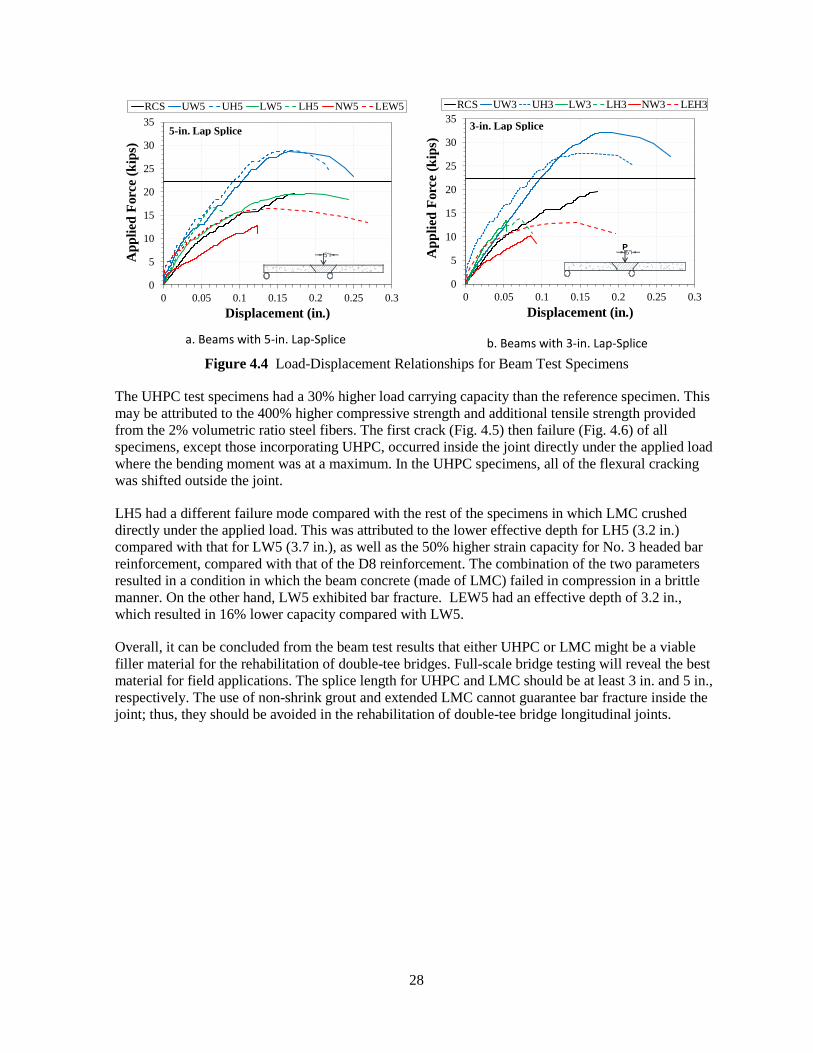
28
a. Beams with 5-in. Lap-Splice b. Beams with 3-in. Lap-Splice
Figure 4.4 Load-Displacement Relationships for Beam Test Specimens
The UHPC test specimens had a 30% higher load carrying capacity than the reference specimen. This may be attributed to the 400% higher compressive strength and additional tensile strength provided from the 2% volumetric ratio steel fibers. The first crack (Fig. 4.5) then failure (Fig. 4.6) of all specimens, except those incorporating UHPC, occurred inside the joint directly under the applied load where the bending moment was at a maximum. In the UHPC specimens, all of the flexural cracking was shifted outside the joint.
LH5 had a different failure mode compared with the rest of the specimens in which LMC crushed directly under the applied load. This was attributed to the lower effective depth for LH5 (3.2 in.) compared with that for LW5 (3.7 in.), as well as the 50% higher strain capacity for No. 3 headed bar reinforcement, compared with that of the D8 reinforcement. The combination of the two parameters resulted in a condition in which the beam concrete (made of LMC) failed in compression in a brittle manner. On the other hand, LW5 exhibited bar fracture. LEW5 had an effective depth of 3.2 in., which resulted in 16% lower capacity compared with LW5.
Overall, it can be concluded from the beam test results that either UHPC or LMC might be a viable filler material for the rehabilitation of double-tee bridges. Full-scale bridge testing will reveal the best material for field applications. The splice length for UHPC and LMC should be at least 3 in. and 5 in., respectively. The use of non-shrink grout and extended LMC cannot guarantee bar fracture inside the joint; thus, they should be avoided in the rehabilitation of double-tee bridge longitudinal joints.
0
5
10
15
20
25
30
35
0 0.05 0.1 0.15 0.2 0.25 0.3
App
lied
Forc
e (k
ips)
Displacement (in.)
RCS UW5 UH5 LW5 LH5 NW5 LEW5
5-in. Lap Splice
5"
0
5
10
15
20
25
30
35
0 0.05 0.1 0.15 0.2 0.25 0.3
App
lied
Forc
e (k
ips)
Displacement (in.)
RCS UW3 UH3 LW3 LH3 NW3 LEH3
3-in. Lap Splice
5"
P
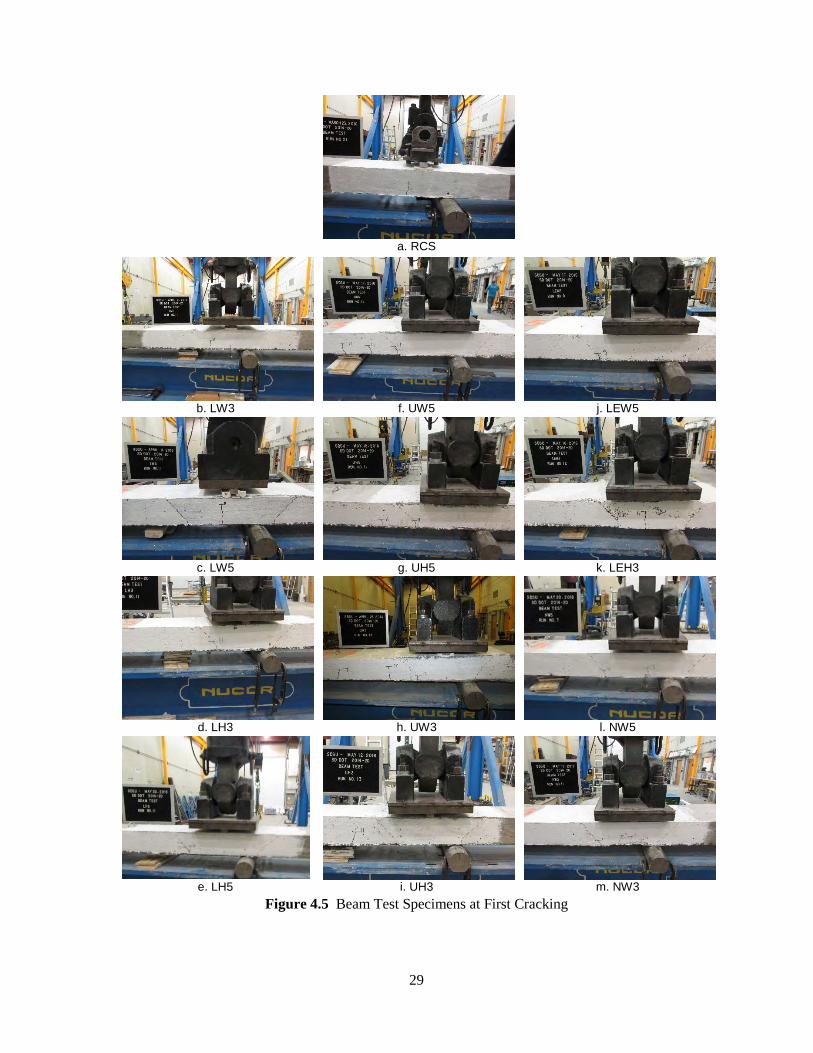
29
a. RCS
b. LW3 f. UW5 j. LEW5
c. LW5 g. UH5 k. LEH3
d. LH3 h. UW3 l. NW5
e. LH5 i. UH3 m. NW3
Figure 4.5 Beam Test Specimens at First Cracking
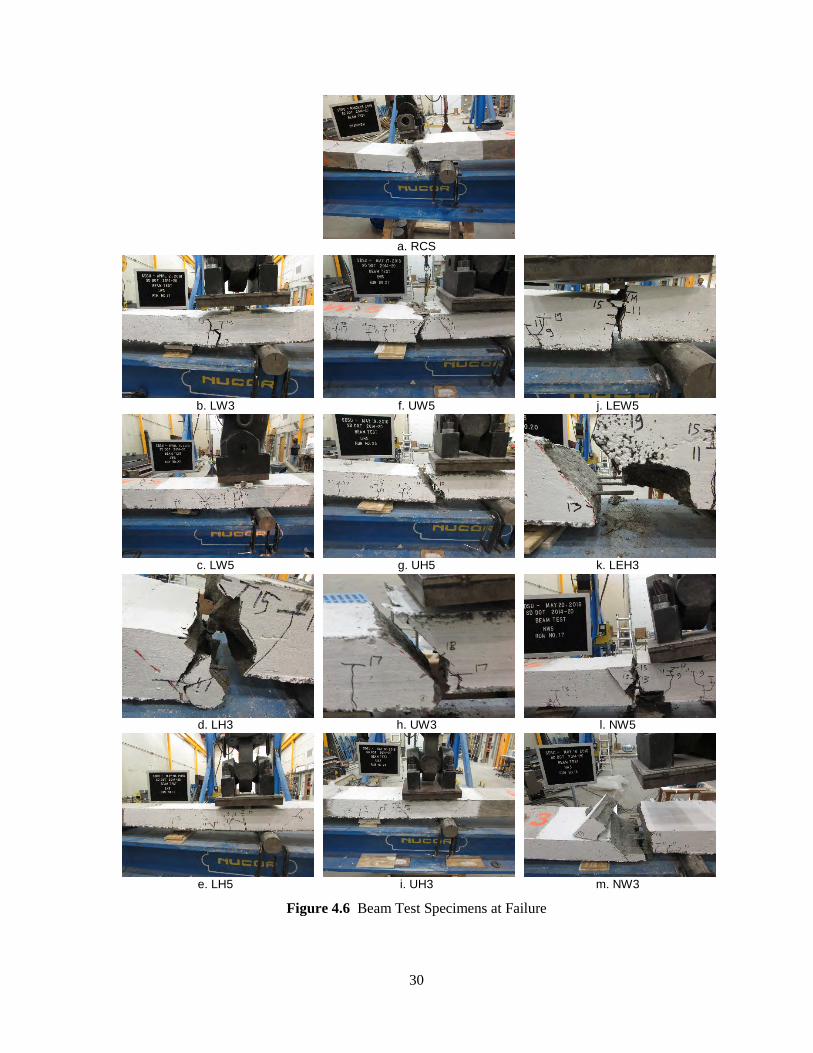
30
a. RCS
b. LW3 f. UW5 j. LEW5
c. LW5 g. UH5 k. LEH3
d. LH3 h. UW3 l. NW5
e. LH5 i. UH3 m. NW3
Figure 4.6 Beam Test Specimens at Failure
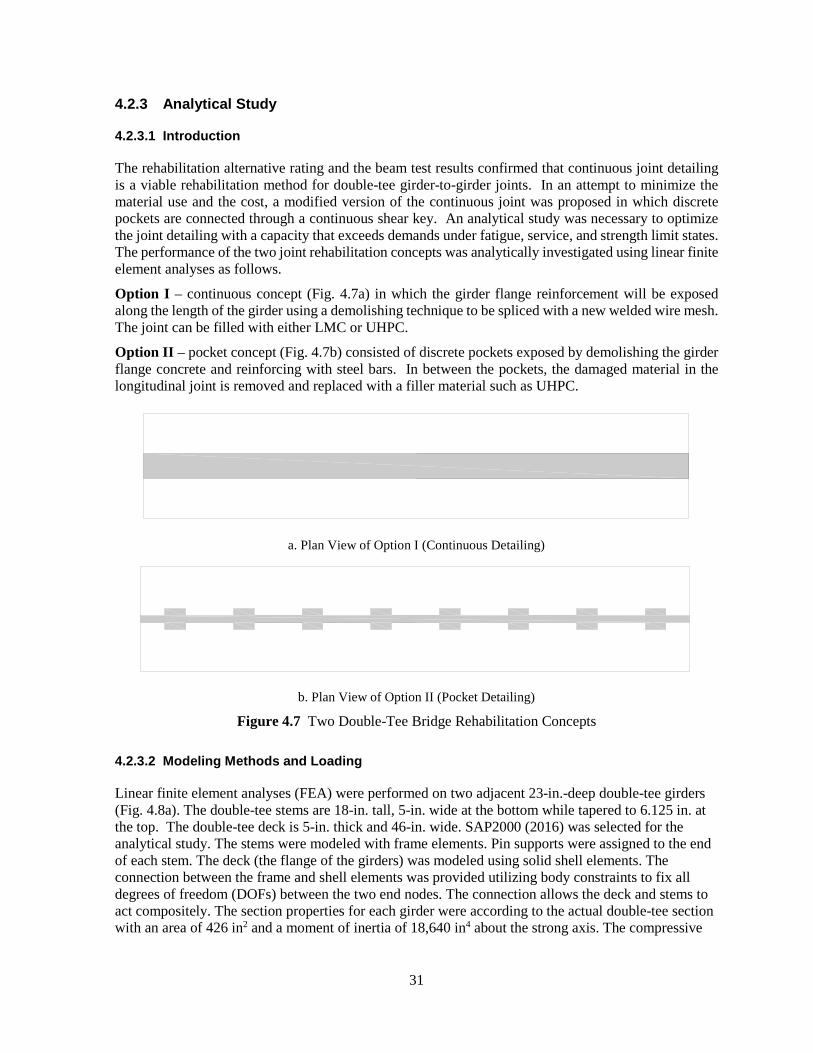
31
4.2.3 Analytical Study
4.2.3.1 Introduction
The rehabilitation alternative rating and the beam test results confirmed that continuous joint detailing is a viable rehabilitation method for double-tee girder-to-girder joints. In an attempt to minimize the material use and the cost, a modified version of the continuous joint was proposed in which discrete pockets are connected through a continuous shear key. An analytical study was necessary to optimize the joint detailing with a capacity that exceeds demands under fatigue, service, and strength limit states. The performance of the two joint rehabilitation concepts was analytically investigated using linear finite element analyses as follows.
Option I – continuous concept (Fig. 4.7a) in which the girder flange reinforcement will be exposed along the length of the girder using a demolishing technique to be spliced with a new welded wire mesh. The joint can be filled with either LMC or UHPC.
Option II – pocket concept (Fig. 4.7b) consisted of discrete pockets exposed by demolishing the girder flange concrete and reinforcing with steel bars. In between the pockets, the damaged material in the longitudinal joint is removed and replaced with a filler material such as UHPC.
a. Plan View of Option I (Continuous Detailing)
b. Plan View of Option II (Pocket Detailing)
Figure 4.7 Two Double-Tee Bridge Rehabilitation Concepts
4.2.3.2 Modeling Methods and Loading
Linear finite element analyses (FEA) were performed on two adjacent 23-in.-deep double-tee girders (Fig. 4.8a). The double-tee stems are 18-in. tall, 5-in. wide at the bottom while tapered to 6.125 in. at the top. The double-tee deck is 5-in. thick and 46-in. wide. SAP2000 (2016) was selected for the analytical study. The stems were modeled with frame elements. Pin supports were assigned to the end of each stem. The deck (the flange of the girders) was modeled using solid shell elements. The connection between the frame and shell elements was provided utilizing body constraints to fix all degrees of freedom (DOFs) between the two end nodes. The connection allows the deck and stems to act compositely. The section properties for each girder were according to the actual double-tee section with an area of 426 in2 and a moment of inertia of 18,640 in4 about the strong axis. The compressive
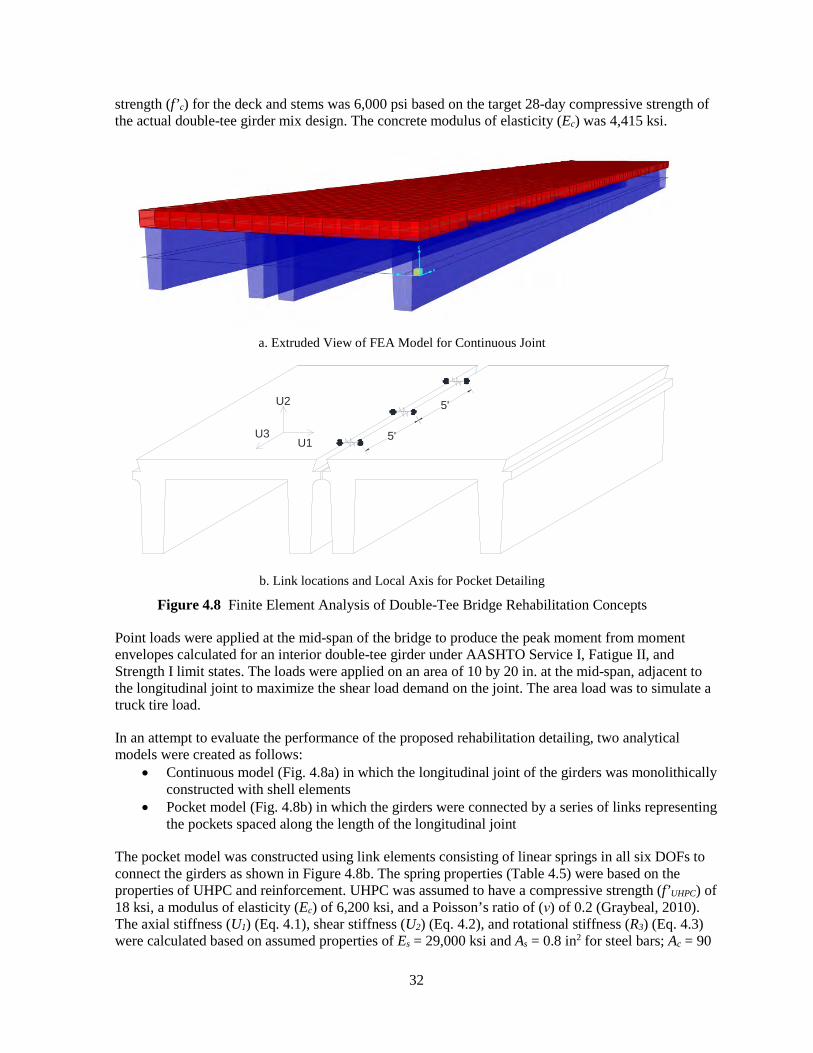
32
strength (f’c) for the deck and stems was 6,000 psi based on the target 28-day compressive strength of the actual double-tee girder mix design. The concrete modulus of elasticity (Ec) was 4,415 ksi.
a. Extruded View of FEA Model for Continuous Joint
b. Link locations and Local Axis for Pocket Detailing
Figure 4.8 Finite Element Analysis of Double-Tee Bridge Rehabilitation Concepts
Point loads were applied at the mid-span of the bridge to produce the peak moment from moment envelopes calculated for an interior double-tee girder under AASHTO Service I, Fatigue II, and Strength I limit states. The loads were applied on an area of 10 by 20 in. at the mid-span, adjacent to the longitudinal joint to maximize the shear load demand on the joint. The area load was to simulate a truck tire load.
In an attempt to evaluate the performance of the proposed rehabilitation detailing, two analytical models were created as follows:
• Continuous model (Fig. 4.8a) in which the longitudinal joint of the girders was monolithically constructed with shell elements
• Pocket model (Fig. 4.8b) in which the girders were connected by a series of links representing the pockets spaced along the length of the longitudinal joint
The pocket model was constructed using link elements consisting of linear springs in all six DOFs to connect the girders as shown in Figure 4.8b. The spring properties (Table 4.5) were based on the properties of UHPC and reinforcement. UHPC was assumed to have a compressive strength (f’UHPC) of 18 ksi, a modulus of elasticity (Ec) of 6,200 ksi, and a Poisson’s ratio of (ν) of 0.2 (Graybeal, 2010). The axial stiffness (U1) (Eq. 4.1), shear stiffness (U2) (Eq. 4.2), and rotational stiffness (R3) (Eq. 4.3) were calculated based on assumed properties of Es = 29,000 ksi and As = 0.8 in2 for steel bars; Ac = 90
U1
5'
U3
U2
5'
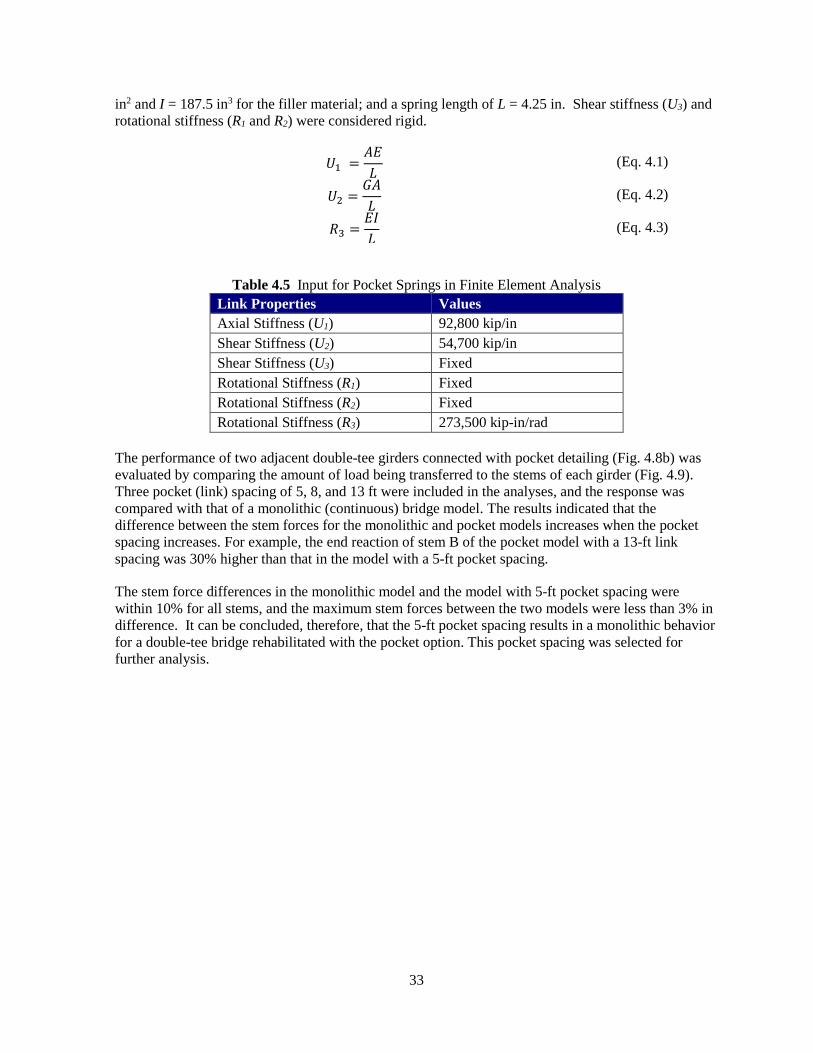
33
in2 and I = 187.5 in3 for the filler material; and a spring length of L = 4.25 in. Shear stiffness (U3) and rotational stiffness (R1 and R2) were considered rigid.
𝑈𝑈1 =𝐴𝐴𝐴𝐴𝐿𝐿
(Eq. 4.1)
𝑈𝑈2 =𝐺𝐺𝐴𝐴𝐿𝐿
(Eq. 4.2)
𝑅𝑅3 =𝐴𝐴𝐸𝐸𝐿𝐿
(Eq. 4.3)
Table 4.5 Input for Pocket Springs in Finite Element Analysis Link Properties Values Axial Stiffness (U1) 92,800 kip/in Shear Stiffness (U2) 54,700 kip/in Shear Stiffness (U3) Fixed Rotational Stiffness (R1) Fixed Rotational Stiffness (R2) Fixed Rotational Stiffness (R3) 273,500 kip-in/rad
The performance of two adjacent double-tee girders connected with pocket detailing (Fig. 4.8b) was evaluated by comparing the amount of load being transferred to the stems of each girder (Fig. 4.9). Three pocket (link) spacing of 5, 8, and 13 ft were included in the analyses, and the response was compared with that of a monolithic (continuous) bridge model. The results indicated that the difference between the stem forces for the monolithic and pocket models increases when the pocket spacing increases. For example, the end reaction of stem B of the pocket model with a 13-ft link spacing was 30% higher than that in the model with a 5-ft pocket spacing.
The stem force differences in the monolithic model and the model with 5-ft pocket spacing were within 10% for all stems, and the maximum stem forces between the two models were less than 3% in difference. It can be concluded, therefore, that the 5-ft pocket spacing results in a monolithic behavior for a double-tee bridge rehabilitated with the pocket option. This pocket spacing was selected for further analysis.
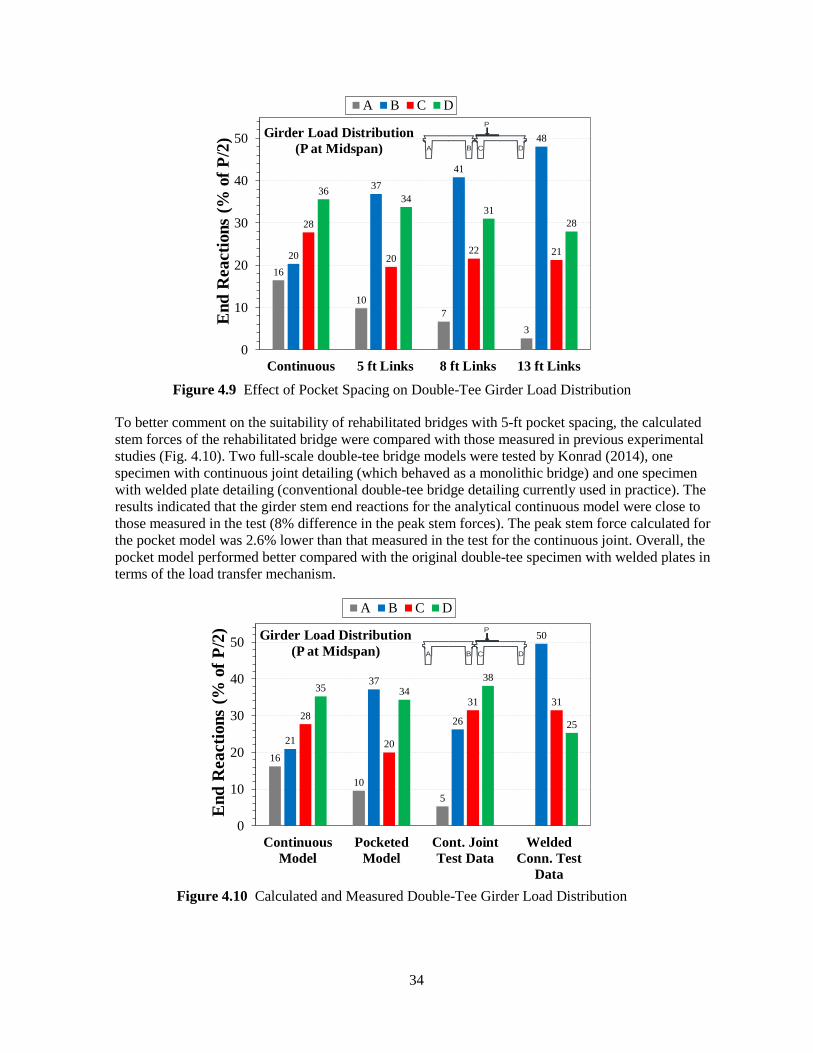
34
Figure 4.9 Effect of Pocket Spacing on Double-Tee Girder Load Distribution
To better comment on the suitability of rehabilitated bridges with 5-ft pocket spacing, the calculated stem forces of the rehabilitated bridge were compared with those measured in previous experimental studies (Fig. 4.10). Two full-scale double-tee bridge models were tested by Konrad (2014), one specimen with continuous joint detailing (which behaved as a monolithic bridge) and one specimen with welded plate detailing (conventional double-tee bridge detailing currently used in practice). The results indicated that the girder stem end reactions for the analytical continuous model were close to those measured in the test (8% difference in the peak stem forces). The peak stem force calculated for the pocket model was 2.6% lower than that measured in the test for the continuous joint. Overall, the pocket model performed better compared with the original double-tee specimen with welded plates in terms of the load transfer mechanism.
Figure 4.10 Calculated and Measured Double-Tee Girder Load Distribution
16
107
3
20
3741
48
28
2022 21
3634
3128
0
10
20
30
40
50
Continuous 5 ft Links 8 ft Links 13 ft Links
End
Rea
ctio
ns (%
of P
/2)
A B C D
Girder Load Distribution(P at Midspan) A B C
P
D
16
105
21
37
26
50
28
20
31 3135 34
38
25
0
10
20
30
40
50
ContinuousModel
PocketedModel
Cont. JointTest Data
WeldedConn. Test
Data
End
Rea
ctio
ns (%
of P
/2)
A B C D
Girder Load Distribution (P at Midspan) A B C
P
D
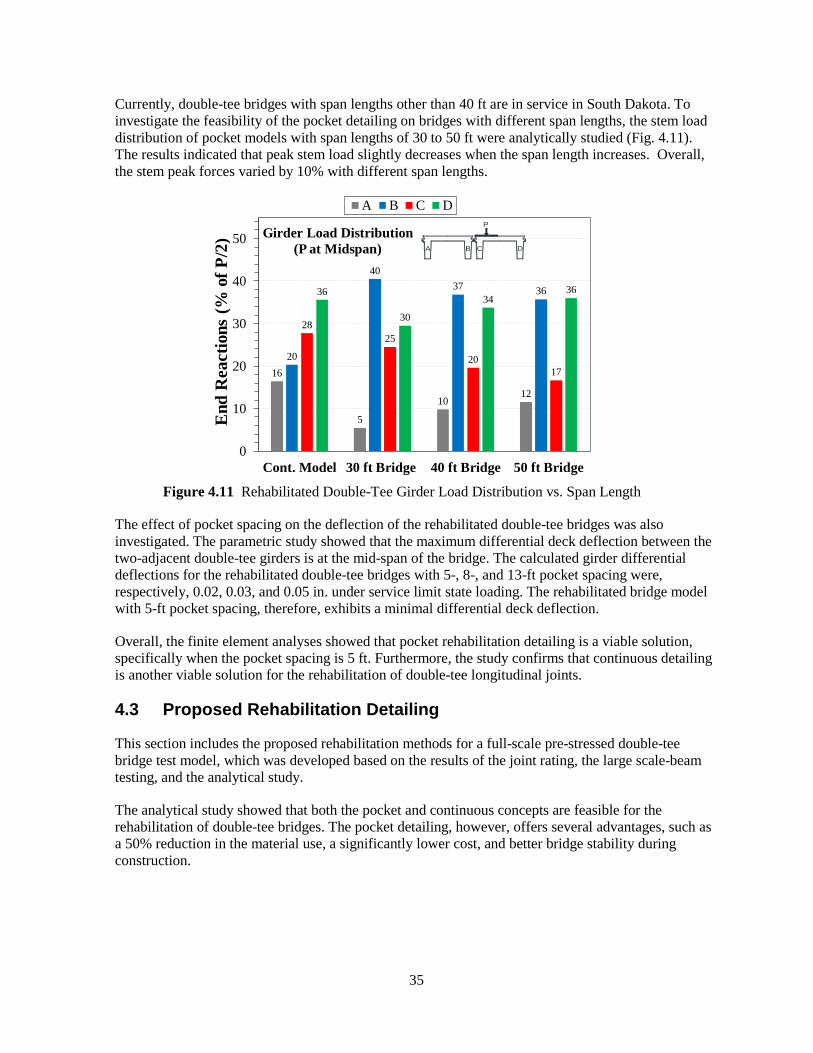
35
Currently, double-tee bridges with span lengths other than 40 ft are in service in South Dakota. To investigate the feasibility of the pocket detailing on bridges with different span lengths, the stem load distribution of pocket models with span lengths of 30 to 50 ft were analytically studied (Fig. 4.11). The results indicated that peak stem load slightly decreases when the span length increases. Overall, the stem peak forces varied by 10% with different span lengths.
Figure 4.11 Rehabilitated Double-Tee Girder Load Distribution vs. Span Length
The effect of pocket spacing on the deflection of the rehabilitated double-tee bridges was also investigated. The parametric study showed that the maximum differential deck deflection between the two-adjacent double-tee girders is at the mid-span of the bridge. The calculated girder differential deflections for the rehabilitated double-tee bridges with 5-, 8-, and 13-ft pocket spacing were, respectively, 0.02, 0.03, and 0.05 in. under service limit state loading. The rehabilitated bridge model with 5-ft pocket spacing, therefore, exhibits a minimal differential deck deflection.
Overall, the finite element analyses showed that pocket rehabilitation detailing is a viable solution, specifically when the pocket spacing is 5 ft. Furthermore, the study confirms that continuous detailing is another viable solution for the rehabilitation of double-tee longitudinal joints.
4.3 Proposed Rehabilitation Detailing
This section includes the proposed rehabilitation methods for a full-scale pre-stressed double-tee bridge test model, which was developed based on the results of the joint rating, the large scale-beam testing, and the analytical study.
The analytical study showed that both the pocket and continuous concepts are feasible for the rehabilitation of double-tee bridges. The pocket detailing, however, offers several advantages, such as a 50% reduction in the material use, a significantly lower cost, and better bridge stability during construction.
16
5
1012
20
4037 36
2825
2017
36
30
3436
0
10
20
30
40
50
Cont. Model 30 ft Bridge 40 ft Bridge 50 ft Bridge
End
Rea
ctio
ns (%
of P
/2)
A B C D
Girder Load Distribution(P at Midspan) A B C
P
D
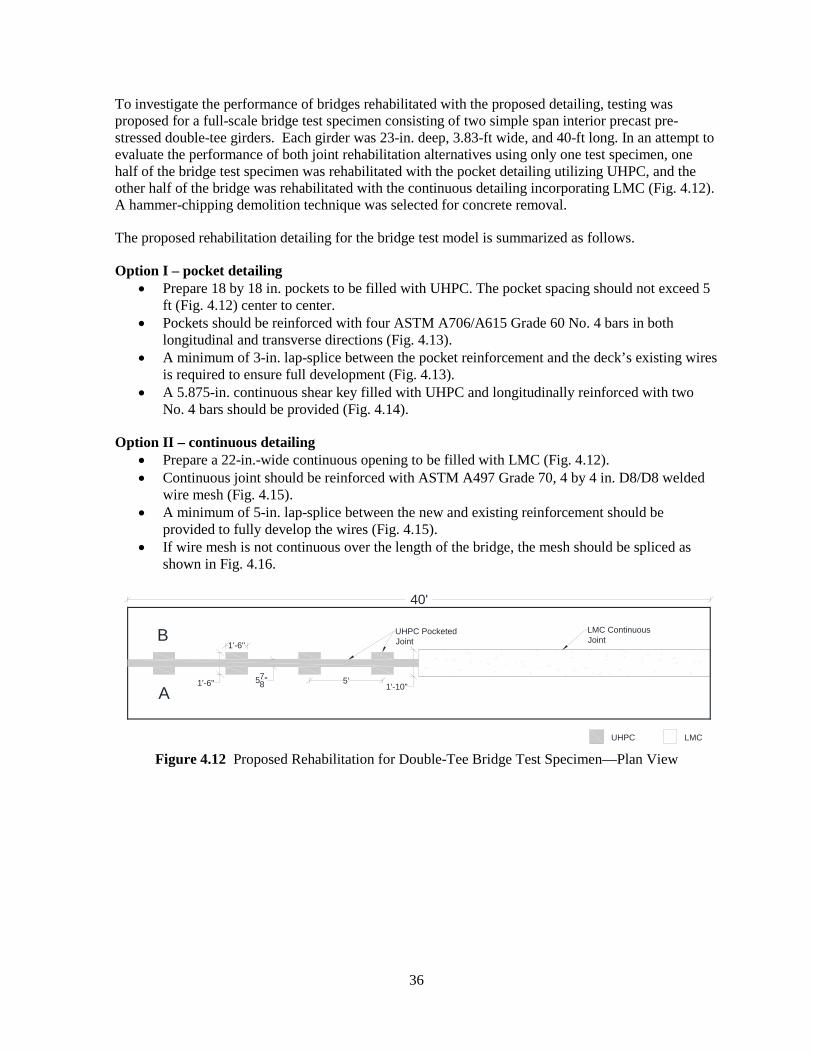
36
To investigate the performance of bridges rehabilitated with the proposed detailing, testing was proposed for a full-scale bridge test specimen consisting of two simple span interior precast pre-stressed double-tee girders. Each girder was 23-in. deep, 3.83-ft wide, and 40-ft long. In an attempt to evaluate the performance of both joint rehabilitation alternatives using only one test specimen, one half of the bridge test specimen was rehabilitated with the pocket detailing utilizing UHPC, and the other half of the bridge was rehabilitated with the continuous detailing incorporating LMC (Fig. 4.12). A hammer-chipping demolition technique was selected for concrete removal.
The proposed rehabilitation detailing for the bridge test model is summarized as follows.
Option I – pocket detailing • Prepare 18 by 18 in. pockets to be filled with UHPC. The pocket spacing should not exceed 5
ft (Fig. 4.12) center to center. • Pockets should be reinforced with four ASTM A706/A615 Grade 60 No. 4 bars in both
longitudinal and transverse directions (Fig. 4.13). • A minimum of 3-in. lap-splice between the pocket reinforcement and the deck’s existing wires
is required to ensure full development (Fig. 4.13). • A 5.875-in. continuous shear key filled with UHPC and longitudinally reinforced with two
No. 4 bars should be provided (Fig. 4.14).
Option II – continuous detailing • Prepare a 22-in.-wide continuous opening to be filled with LMC (Fig. 4.12). • Continuous joint should be reinforced with ASTM A497 Grade 70, 4 by 4 in. D8/D8 welded
wire mesh (Fig. 4.15). • A minimum of 5-in. lap-splice between the new and existing reinforcement should be
provided to fully develop the wires (Fig. 4.15). • If wire mesh is not continuous over the length of the bridge, the mesh should be spliced as
shown in Fig. 4.16.
Figure 4.12 Proposed Rehabilitation for Double-Tee Bridge Test Specimen—Plan View
A
B1'-6"
1'-6"
40'
LMC
LMC ContinuousJoint
5'
UHPC PocketedJoint
UHPC
578"
1'-10"
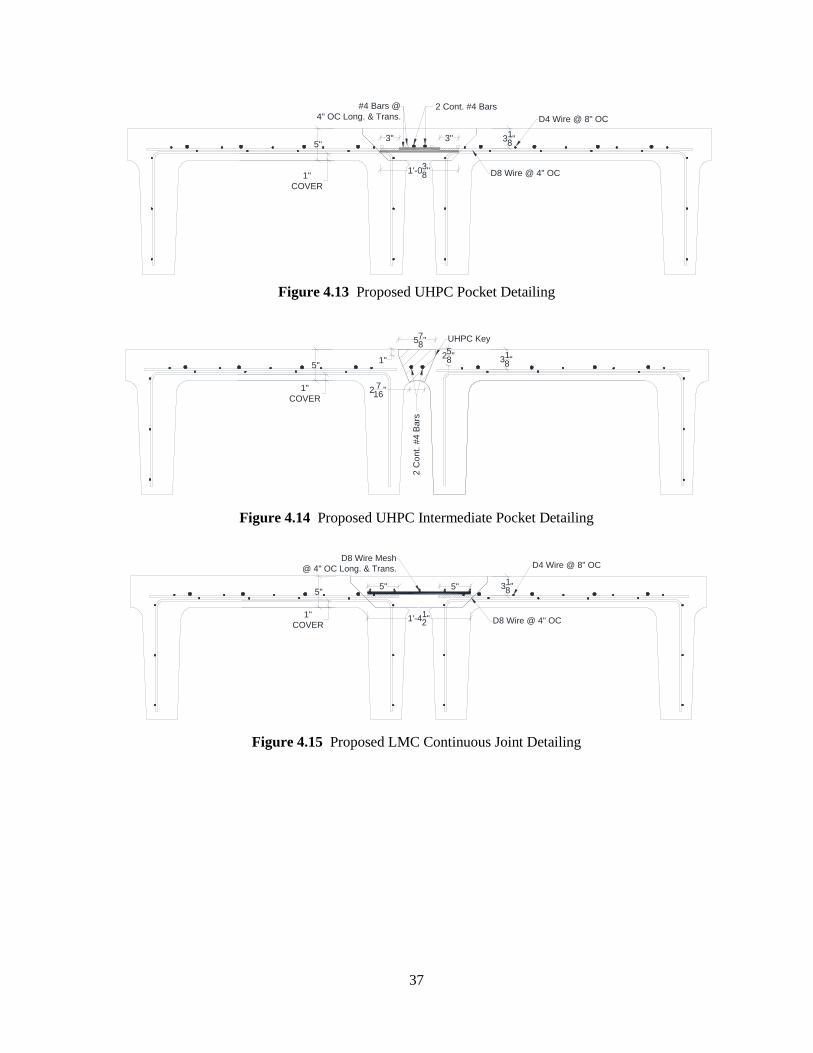
37
Figure 4.13 Proposed UHPC Pocket Detailing
Figure 4.14 Proposed UHPC Intermediate Pocket Detailing
Figure 4.15 Proposed LMC Continuous Joint Detailing
2 Cont. #4 Bars
1'-038"1"
COVER
5" 318"
#4 Bars @4" OC Long. & Trans.
3"
D8 Wire @ 4" OC
D4 Wire @ 8" OC
3"
2 C
ont.
#4 B
ars
258"1"
578"
1"COVER
UHPC Key
318"5"
2 716"
1"COVER
5"
D8 Wire Mesh@ 4" OC Long. & Trans.
318"5" 5"
D4 Wire @ 8" OC
1'-412" D8 Wire @ 4" OC
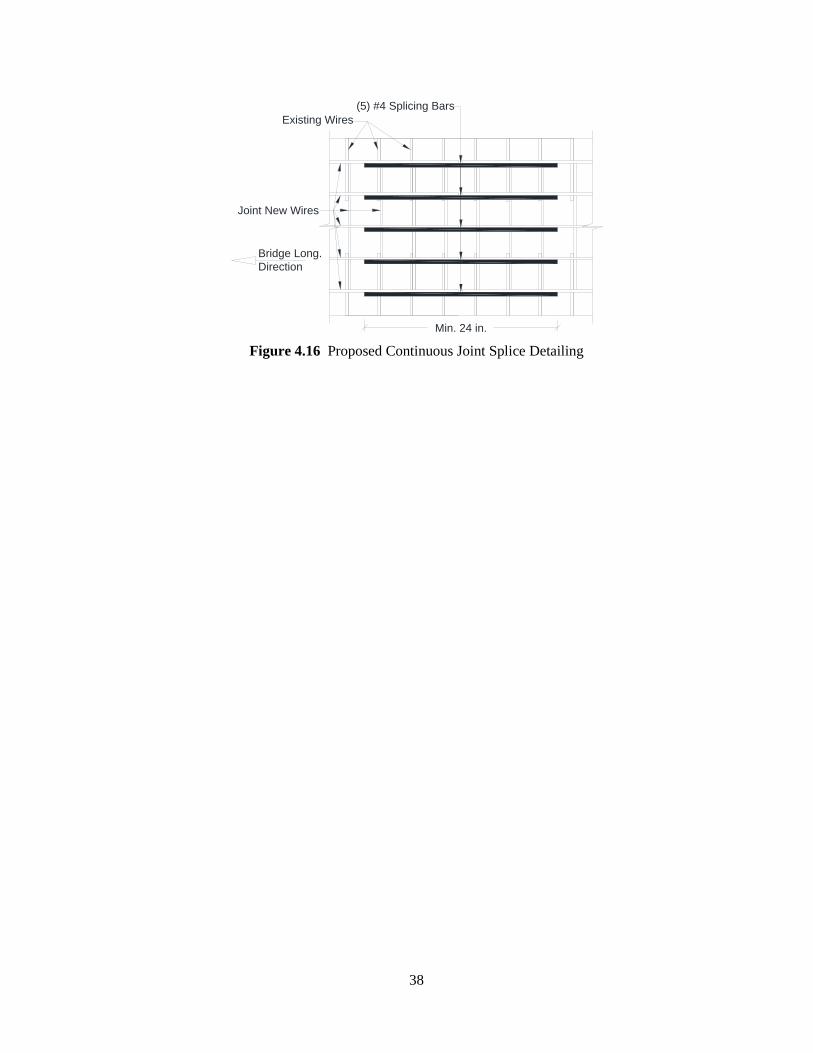
38
Figure 4.16 Proposed Continuous Joint Splice Detailing
Bridge Long.Direction
Existing Wires
Joint New Wires
(5) #4 Splicing Bars
Min. 24 in.
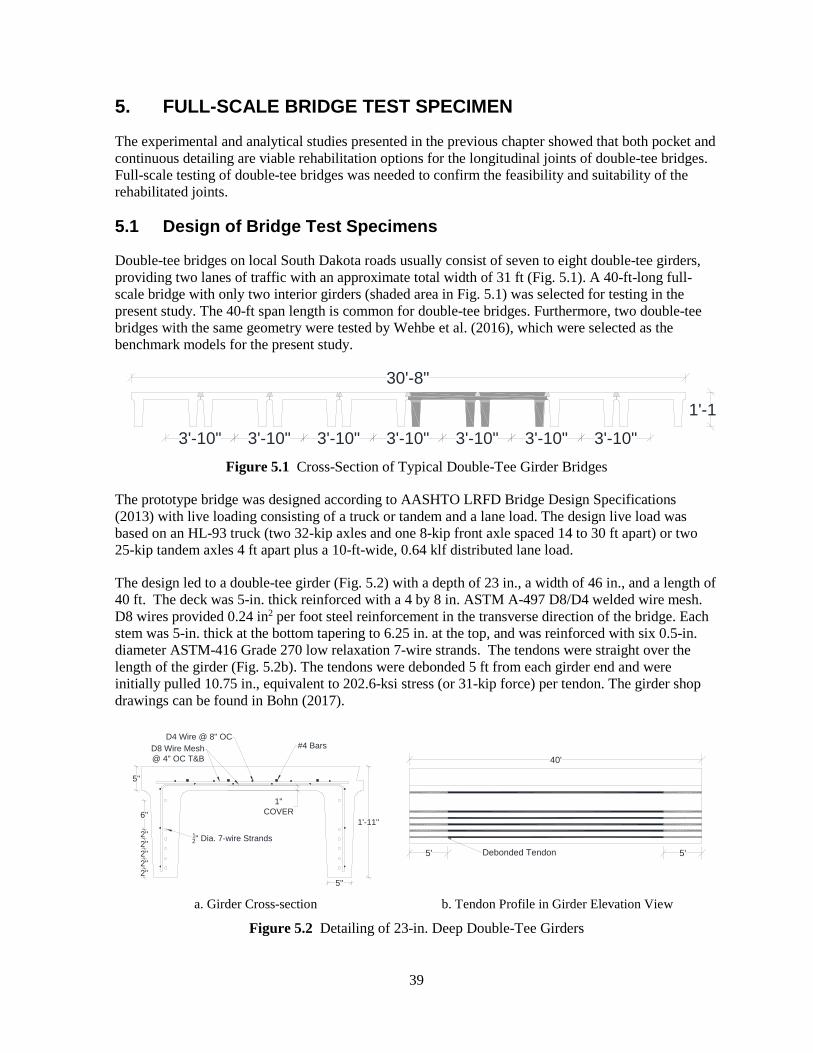
39
5. FULL-SCALE BRIDGE TEST SPECIMEN The experimental and analytical studies presented in the previous chapter showed that both pocket and continuous detailing are viable rehabilitation options for the longitudinal joints of double-tee bridges. Full-scale testing of double-tee bridges was needed to confirm the feasibility and suitability of the rehabilitated joints.
5.1 Design of Bridge Test Specimens
Double-tee bridges on local South Dakota roads usually consist of seven to eight double-tee girders, providing two lanes of traffic with an approximate total width of 31 ft (Fig. 5.1). A 40-ft-long full-scale bridge with only two interior girders (shaded area in Fig. 5.1) was selected for testing in the present study. The 40-ft span length is common for double-tee bridges. Furthermore, two double-tee bridges with the same geometry were tested by Wehbe et al. (2016), which were selected as the benchmark models for the present study.
Figure 5.1 Cross-Section of Typical Double-Tee Girder Bridges
The prototype bridge was designed according to AASHTO LRFD Bridge Design Specifications (2013) with live loading consisting of a truck or tandem and a lane load. The design live load was based on an HL-93 truck (two 32-kip axles and one 8-kip front axle spaced 14 to 30 ft apart) or two 25-kip tandem axles 4 ft apart plus a 10-ft-wide, 0.64 klf distributed lane load.
The design led to a double-tee girder (Fig. 5.2) with a depth of 23 in., a width of 46 in., and a length of 40 ft. The deck was 5-in. thick reinforced with a 4 by 8 in. ASTM A-497 D8/D4 welded wire mesh. D8 wires provided 0.24 in2 per foot steel reinforcement in the transverse direction of the bridge. Each stem was 5-in. thick at the bottom tapering to 6.25 in. at the top, and was reinforced with six 0.5-in. diameter ASTM-416 Grade 270 low relaxation 7-wire strands. The tendons were straight over the length of the girder (Fig. 5.2b). The tendons were debonded 5 ft from each girder end and were initially pulled 10.75 in., equivalent to 202.6-ksi stress (or 31-kip force) per tendon. The girder shop drawings can be found in Bohn (2017).
a. Girder Cross-section b. Tendon Profile in Girder Elevation View
Figure 5.2 Detailing of 23-in. Deep Double-Tee Girders
3'-10"3'-10"1'-1
30'-8"
3'-10" 3'-10"3'-10" 3'-10"3'-10"
1'-11"
2"2"
2"
2"2"
#4 Bars D8 Wire Mesh@ 4" OC T&B
12" Dia. 7-wire Strands
1"COVER6"
5"
5"
D4 Wire @ 8" OC
5'
40'
5'Debonded Tendon
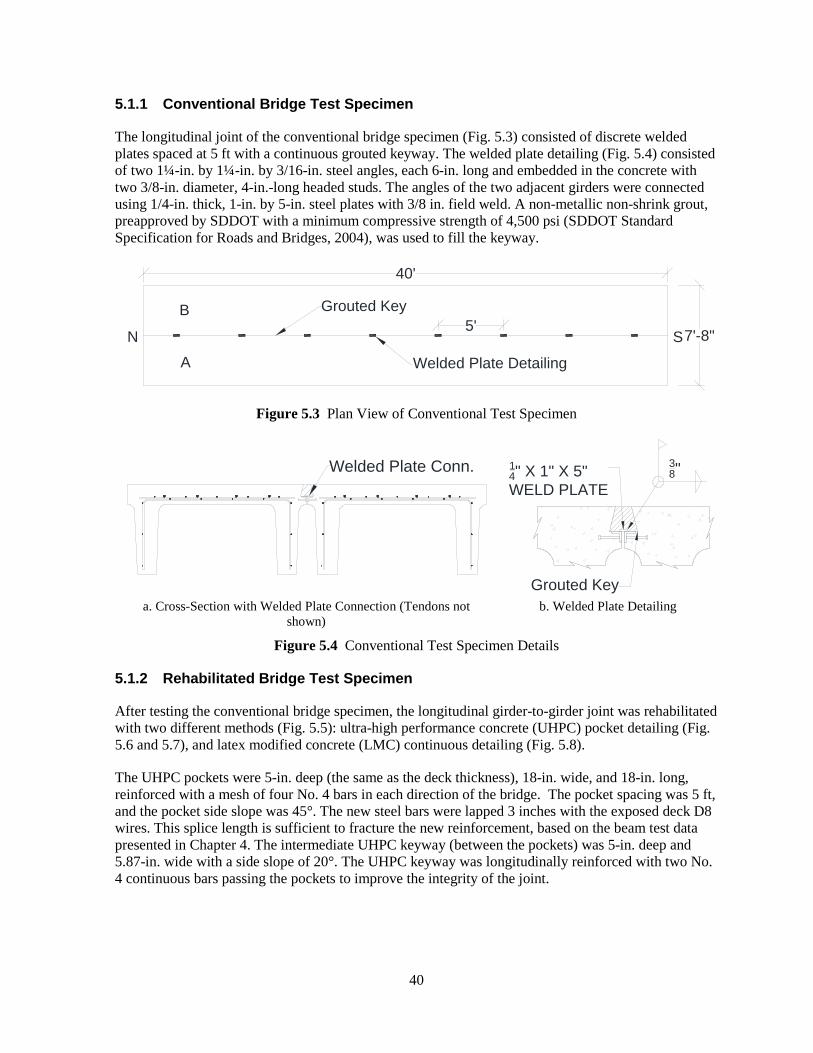
40
5.1.1 Conventional Bridge Test Specimen
The longitudinal joint of the conventional bridge specimen (Fig. 5.3) consisted of discrete welded plates spaced at 5 ft with a continuous grouted keyway. The welded plate detailing (Fig. 5.4) consisted of two 1¼-in. by 1¼-in. by 3/16-in. steel angles, each 6-in. long and embedded in the concrete with two 3/8-in. diameter, 4-in.-long headed studs. The angles of the two adjacent girders were connected using 1/4-in. thick, 1-in. by 5-in. steel plates with 3/8 in. field weld. A non-metallic non-shrink grout, preapproved by SDDOT with a minimum compressive strength of 4,500 psi (SDDOT Standard Specification for Roads and Bridges, 2004), was used to fill the keyway.
Figure 5.3 Plan View of Conventional Test Specimen
a. Cross-Section with Welded Plate Connection (Tendons not shown)
b. Welded Plate Detailing
Figure 5.4 Conventional Test Specimen Details
5.1.2 Rehabilitated Bridge Test Specimen
After testing the conventional bridge specimen, the longitudinal girder-to-girder joint was rehabilitated with two different methods (Fig. 5.5): ultra-high performance concrete (UHPC) pocket detailing (Fig. 5.6 and 5.7), and latex modified concrete (LMC) continuous detailing (Fig. 5.8).
The UHPC pockets were 5-in. deep (the same as the deck thickness), 18-in. wide, and 18-in. long, reinforced with a mesh of four No. 4 bars in each direction of the bridge. The pocket spacing was 5 ft, and the pocket side slope was 45°. The new steel bars were lapped 3 inches with the exposed deck D8 wires. This splice length is sufficient to fracture the new reinforcement, based on the beam test data presented in Chapter 4. The intermediate UHPC keyway (between the pockets) was 5-in. deep and 5.87-in. wide with a side slope of 20°. The UHPC keyway was longitudinally reinforced with two No. 4 continuous bars passing the pockets to improve the integrity of the joint.
N S5' 7'-8"
40'
A
B
Welded Plate Detailing
Grouted Key
Welded Plate Conn.
Grouted Key
38"1
4" X 1" X 5"WELD PLATE
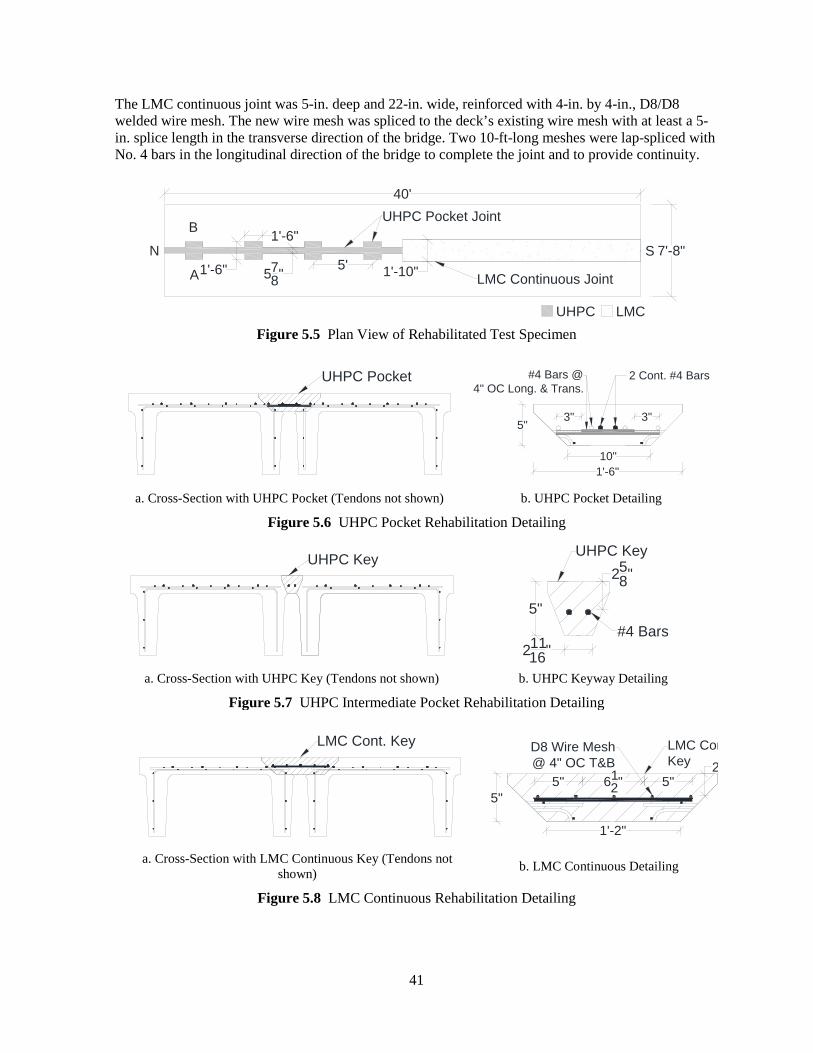
41
The LMC continuous joint was 5-in. deep and 22-in. wide, reinforced with 4-in. by 4-in., D8/D8 welded wire mesh. The new wire mesh was spliced to the deck’s existing wire mesh with at least a 5-in. splice length in the transverse direction of the bridge. Two 10-ft-long meshes were lap-spliced with No. 4 bars in the longitudinal direction of the bridge to complete the joint and to provide continuity.
Figure 5.5 Plan View of Rehabilitated Test Specimen
a. Cross-Section with UHPC Pocket (Tendons not shown) b. UHPC Pocket Detailing
Figure 5.6 UHPC Pocket Rehabilitation Detailing
a. Cross-Section with UHPC Key (Tendons not shown) b. UHPC Keyway Detailing
Figure 5.7 UHPC Intermediate Pocket Rehabilitation Detailing
a. Cross-Section with LMC Continuous Key (Tendons not shown) b. LMC Continuous Detailing
Figure 5.8 LMC Continuous Rehabilitation Detailing
N S
A
B
40'
7'-8"
LMC
LMC Continuous Joint
UHPC Pocket Joint
UHPC
578" 1'-10"
1'-6"
5'1'-6"
UHPC Pocket
10"
5"
1'-6"
3" 3"
2 Cont. #4 Bars#4 Bars @4" OC Long. & Trans.
UHPC Key
5"
21116"
UHPC Key258"
#4 Bars
LMC Cont. Key
5"5"
LMC ConKey
5" 612"
1'-2"
2 D8 Wire Mesh@ 4" OC T&B
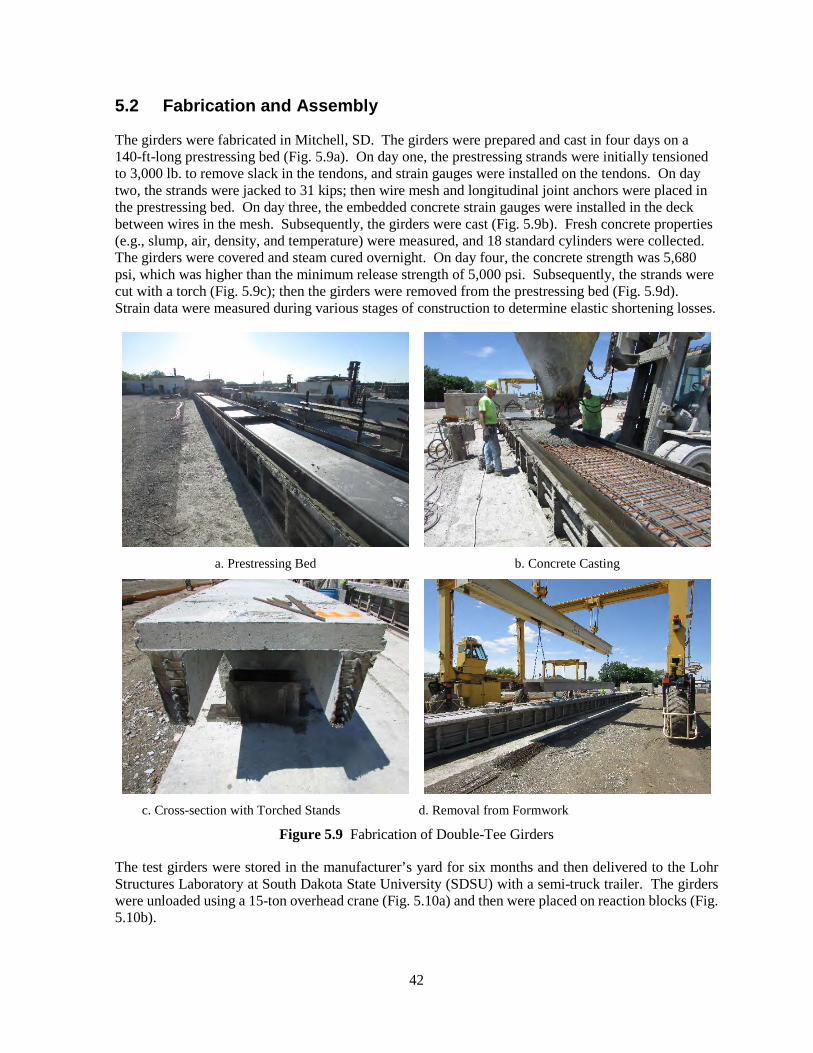
42
5.2 Fabrication and Assembly
The girders were fabricated in Mitchell, SD. The girders were prepared and cast in four days on a 140-ft-long prestressing bed (Fig. 5.9a). On day one, the prestressing strands were initially tensioned to 3,000 lb. to remove slack in the tendons, and strain gauges were installed on the tendons. On day two, the strands were jacked to 31 kips; then wire mesh and longitudinal joint anchors were placed in the prestressing bed. On day three, the embedded concrete strain gauges were installed in the deck between wires in the mesh. Subsequently, the girders were cast (Fig. 5.9b). Fresh concrete properties (e.g., slump, air, density, and temperature) were measured, and 18 standard cylinders were collected. The girders were covered and steam cured overnight. On day four, the concrete strength was 5,680 psi, which was higher than the minimum release strength of 5,000 psi. Subsequently, the strands were cut with a torch (Fig. 5.9c); then the girders were removed from the prestressing bed (Fig. 5.9d). Strain data were measured during various stages of construction to determine elastic shortening losses.
a. Prestressing Bed b. Concrete Casting
c. Cross-section with Torched Stands d. Removal from Formwork
Figure 5.9 Fabrication of Double-Tee Girders
The test girders were stored in the manufacturer’s yard for six months and then delivered to the Lohr Structures Laboratory at South Dakota State University (SDSU) with a semi-truck trailer. The girders were unloaded using a 15-ton overhead crane (Fig. 5.10a) and then were placed on reaction blocks (Fig. 5.10b).
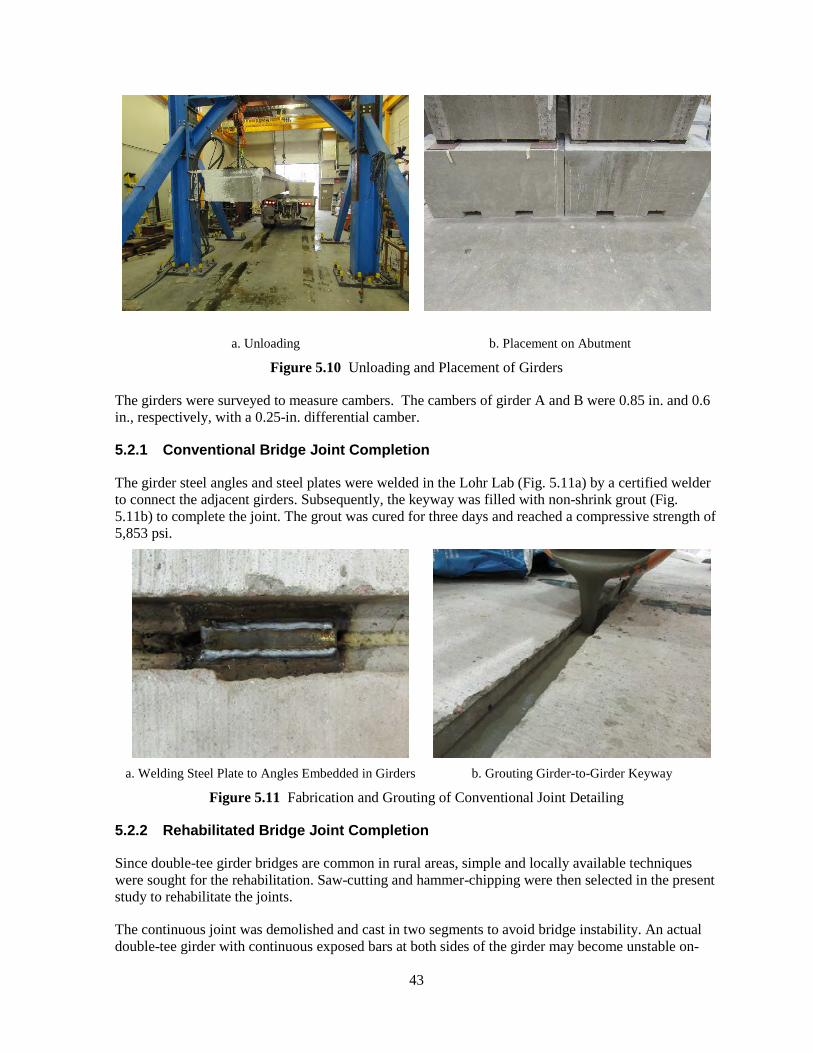
43
a. Unloading b. Placement on Abutment
Figure 5.10 Unloading and Placement of Girders
The girders were surveyed to measure cambers. The cambers of girder A and B were 0.85 in. and 0.6 in., respectively, with a 0.25-in. differential camber.
5.2.1 Conventional Bridge Joint Completion
The girder steel angles and steel plates were welded in the Lohr Lab (Fig. 5.11a) by a certified welder to connect the adjacent girders. Subsequently, the keyway was filled with non-shrink grout (Fig. 5.11b) to complete the joint. The grout was cured for three days and reached a compressive strength of 5,853 psi.
a. Welding Steel Plate to Angles Embedded in Girders b. Grouting Girder-to-Girder Keyway
Figure 5.11 Fabrication and Grouting of Conventional Joint Detailing
5.2.2 Rehabilitated Bridge Joint Completion
Since double-tee girder bridges are common in rural areas, simple and locally available techniques were sought for the rehabilitation. Saw-cutting and hammer-chipping were then selected in the present study to rehabilitate the joints.
The continuous joint was demolished and cast in two segments to avoid bridge instability. An actual double-tee girder with continuous exposed bars at both sides of the girder may become unstable on-
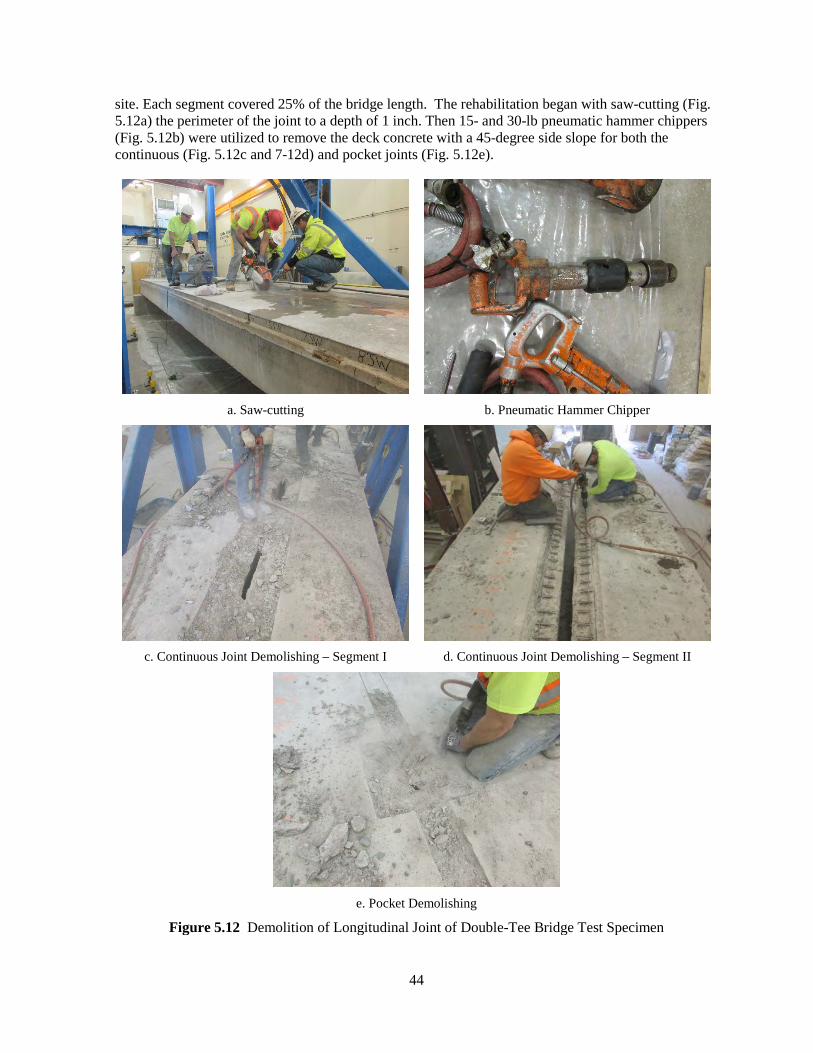
44
site. Each segment covered 25% of the bridge length. The rehabilitation began with saw-cutting (Fig. 5.12a) the perimeter of the joint to a depth of 1 inch. Then 15- and 30-lb pneumatic hammer chippers (Fig. 5.12b) were utilized to remove the deck concrete with a 45-degree side slope for both the continuous (Fig. 5.12c and 7-12d) and pocket joints (Fig. 5.12e).
a. Saw-cutting b. Pneumatic Hammer Chipper
c. Continuous Joint Demolishing – Segment I d. Continuous Joint Demolishing – Segment II
e. Pocket Demolishing
Figure 5.12 Demolition of Longitudinal Joint of Double-Tee Bridge Test Specimen
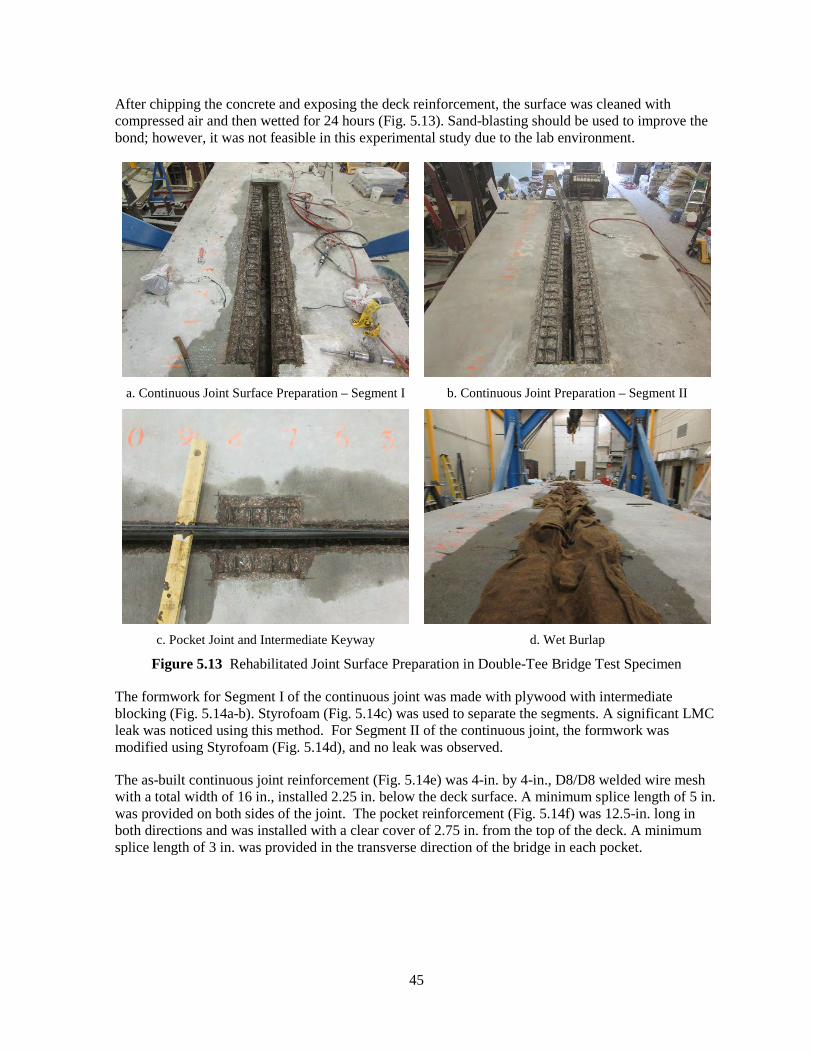
45
After chipping the concrete and exposing the deck reinforcement, the surface was cleaned with compressed air and then wetted for 24 hours (Fig. 5.13). Sand-blasting should be used to improve the bond; however, it was not feasible in this experimental study due to the lab environment.
a. Continuous Joint Surface Preparation – Segment I b. Continuous Joint Preparation – Segment II
c. Pocket Joint and Intermediate Keyway d. Wet Burlap
Figure 5.13 Rehabilitated Joint Surface Preparation in Double-Tee Bridge Test Specimen
The formwork for Segment I of the continuous joint was made with plywood with intermediate blocking (Fig. 5.14a-b). Styrofoam (Fig. 5.14c) was used to separate the segments. A significant LMC leak was noticed using this method. For Segment II of the continuous joint, the formwork was modified using Styrofoam (Fig. 5.14d), and no leak was observed.
The as-built continuous joint reinforcement (Fig. 5.14e) was 4-in. by 4-in., D8/D8 welded wire mesh with a total width of 16 in., installed 2.25 in. below the deck surface. A minimum splice length of 5 in. was provided on both sides of the joint. The pocket reinforcement (Fig. 5.14f) was 12.5-in. long in both directions and was installed with a clear cover of 2.75 in. from the top of the deck. A minimum splice length of 3 in. was provided in the transverse direction of the bridge in each pocket.
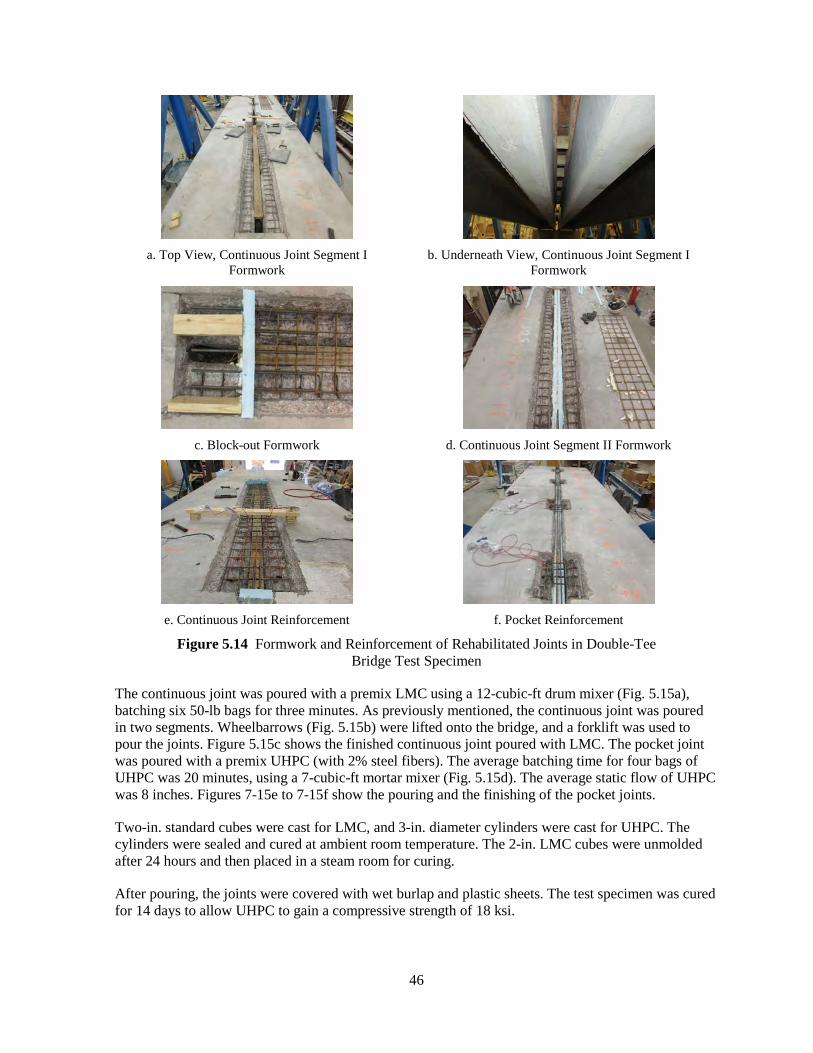
46
a. Top View, Continuous Joint Segment I
Formwork b. Underneath View, Continuous Joint Segment I
Formwork
c. Block-out Formwork d. Continuous Joint Segment II Formwork
e. Continuous Joint Reinforcement f. Pocket Reinforcement
Figure 5.14 Formwork and Reinforcement of Rehabilitated Joints in Double-Tee Bridge Test Specimen
The continuous joint was poured with a premix LMC using a 12-cubic-ft drum mixer (Fig. 5.15a), batching six 50-lb bags for three minutes. As previously mentioned, the continuous joint was poured in two segments. Wheelbarrows (Fig. 5.15b) were lifted onto the bridge, and a forklift was used to pour the joints. Figure 5.15c shows the finished continuous joint poured with LMC. The pocket joint was poured with a premix UHPC (with 2% steel fibers). The average batching time for four bags of UHPC was 20 minutes, using a 7-cubic-ft mortar mixer (Fig. 5.15d). The average static flow of UHPC was 8 inches. Figures 7-15e to 7-15f show the pouring and the finishing of the pocket joints.
Two-in. standard cubes were cast for LMC, and 3-in. diameter cylinders were cast for UHPC. The cylinders were sealed and cured at ambient room temperature. The 2-in. LMC cubes were unmolded after 24 hours and then placed in a steam room for curing.
After pouring, the joints were covered with wet burlap and plastic sheets. The test specimen was cured for 14 days to allow UHPC to gain a compressive strength of 18 ksi.
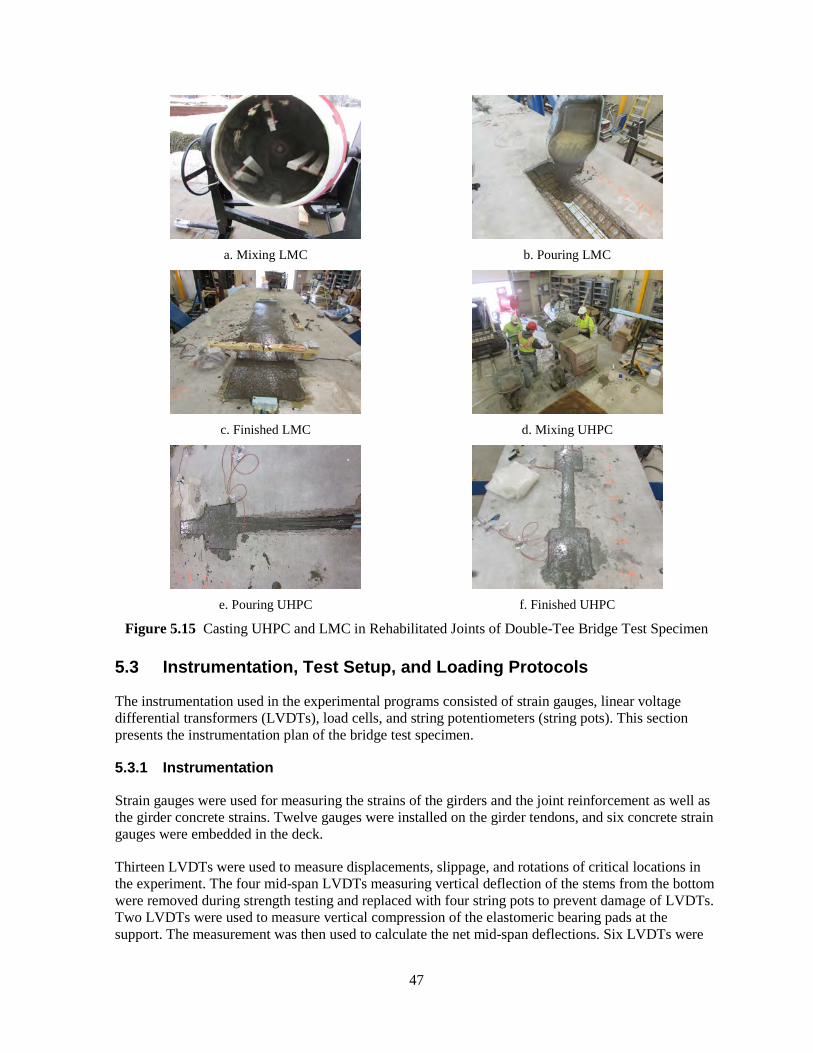
47
a. Mixing LMC b. Pouring LMC
c. Finished LMC d. Mixing UHPC
e. Pouring UHPC f. Finished UHPC
Figure 5.15 Casting UHPC and LMC in Rehabilitated Joints of Double-Tee Bridge Test Specimen 5.3 Instrumentation, Test Setup, and Loading Protocols
The instrumentation used in the experimental programs consisted of strain gauges, linear voltage differential transformers (LVDTs), load cells, and string potentiometers (string pots). This section presents the instrumentation plan of the bridge test specimen.
5.3.1 Instrumentation
Strain gauges were used for measuring the strains of the girders and the joint reinforcement as well as the girder concrete strains. Twelve gauges were installed on the girder tendons, and six concrete strain gauges were embedded in the deck.
Thirteen LVDTs were used to measure displacements, slippage, and rotations of critical locations in the experiment. The four mid-span LVDTs measuring vertical deflection of the stems from the bottom were removed during strength testing and replaced with four string pots to prevent damage of LVDTs. Two LVDTs were used to measure vertical compression of the elastomeric bearing pads at the support. The measurement was then used to calculate the net mid-span deflections. Six LVDTs were
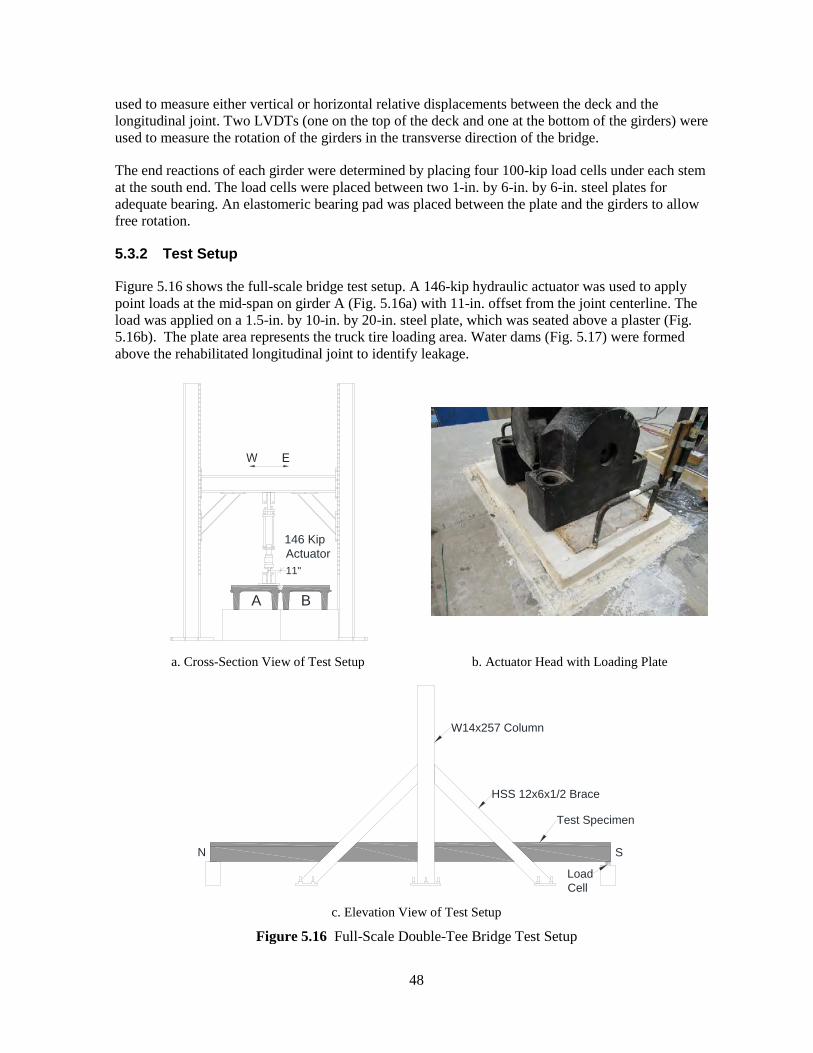
48
used to measure either vertical or horizontal relative displacements between the deck and the longitudinal joint. Two LVDTs (one on the top of the deck and one at the bottom of the girders) were used to measure the rotation of the girders in the transverse direction of the bridge.
The end reactions of each girder were determined by placing four 100-kip load cells under each stem at the south end. The load cells were placed between two 1-in. by 6-in. by 6-in. steel plates for adequate bearing. An elastomeric bearing pad was placed between the plate and the girders to allow free rotation.
5.3.2 Test Setup
Figure 5.16 shows the full-scale bridge test setup. A 146-kip hydraulic actuator was used to apply point loads at the mid-span on girder A (Fig. 5.16a) with 11-in. offset from the joint centerline. The load was applied on a 1.5-in. by 10-in. by 20-in. steel plate, which was seated above a plaster (Fig. 5.16b). The plate area represents the truck tire loading area. Water dams (Fig. 5.17) were formed above the rehabilitated longitudinal joint to identify leakage.
a. Cross-Section View of Test Setup b. Actuator Head with Loading Plate
c. Elevation View of Test Setup
Figure 5.16 Full-Scale Double-Tee Bridge Test Setup
11"
BA
146 KipActuator
LoadCell
N
W14x257 Column
S
HSS 12x6x1/2 Brace
Test Specimen
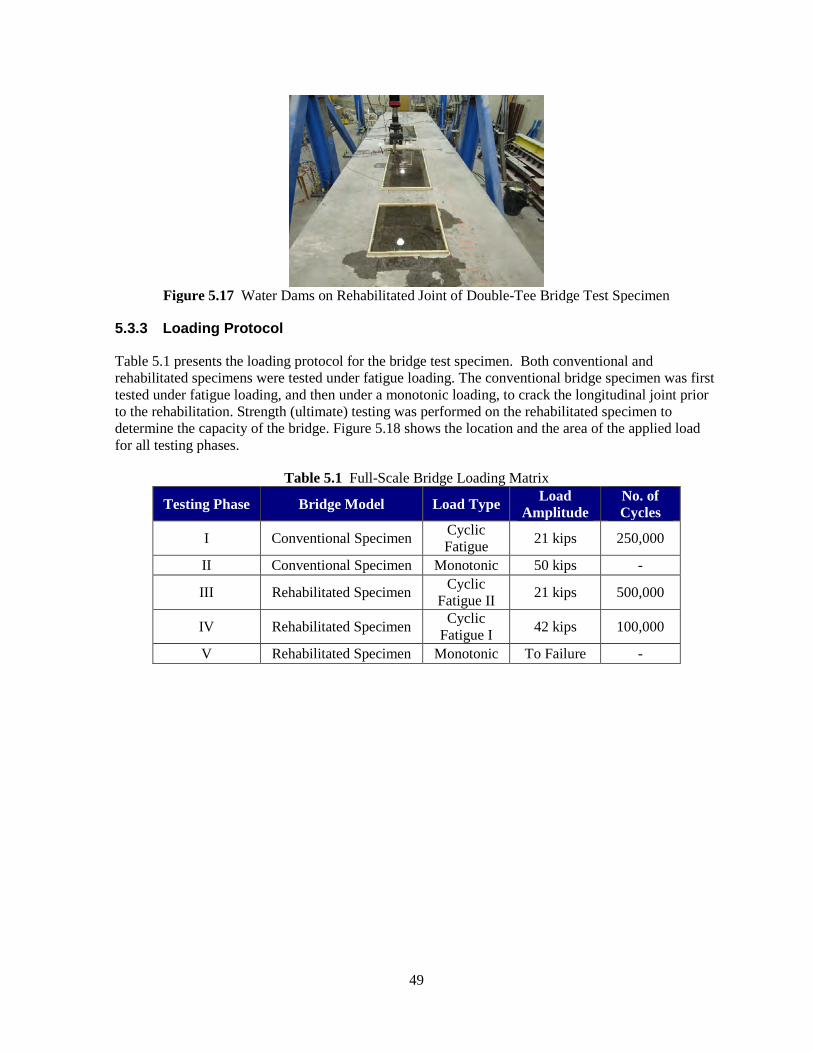
49
Figure 5.17 Water Dams on Rehabilitated Joint of Double-Tee Bridge Test Specimen
5.3.3 Loading Protocol
Table 5.1 presents the loading protocol for the bridge test specimen. Both conventional and rehabilitated specimens were tested under fatigue loading. The conventional bridge specimen was first tested under fatigue loading, and then under a monotonic loading, to crack the longitudinal joint prior to the rehabilitation. Strength (ultimate) testing was performed on the rehabilitated specimen to determine the capacity of the bridge. Figure 5.18 shows the location and the area of the applied load for all testing phases.
Table 5.1 Full-Scale Bridge Loading Matrix
Testing Phase Bridge Model Load Type Load Amplitude
No. of Cycles
I Conventional Specimen Cyclic Fatigue 21 kips 250,000
II Conventional Specimen Monotonic 50 kips -
III Rehabilitated Specimen Cyclic Fatigue II 21 kips 500,000
IV Rehabilitated Specimen Cyclic Fatigue I 42 kips 100,000
V Rehabilitated Specimen Monotonic To Failure -
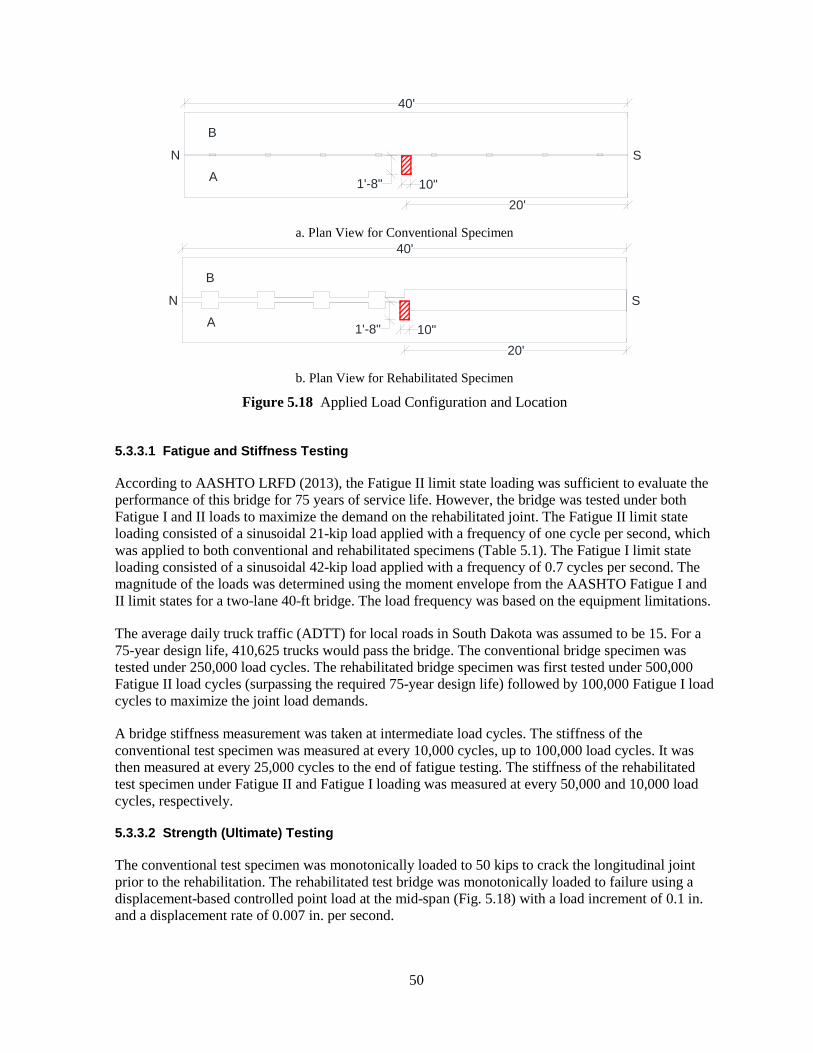
50
a. Plan View for Conventional Specimen
b. Plan View for Rehabilitated Specimen
Figure 5.18 Applied Load Configuration and Location
5.3.3.1 Fatigue and Stiffness Testing
According to AASHTO LRFD (2013), the Fatigue II limit state loading was sufficient to evaluate the performance of this bridge for 75 years of service life. However, the bridge was tested under both Fatigue I and II loads to maximize the demand on the rehabilitated joint. The Fatigue II limit state loading consisted of a sinusoidal 21-kip load applied with a frequency of one cycle per second, which was applied to both conventional and rehabilitated specimens (Table 5.1). The Fatigue I limit state loading consisted of a sinusoidal 42-kip load applied with a frequency of 0.7 cycles per second. The magnitude of the loads was determined using the moment envelope from the AASHTO Fatigue I and II limit states for a two-lane 40-ft bridge. The load frequency was based on the equipment limitations.
The average daily truck traffic (ADTT) for local roads in South Dakota was assumed to be 15. For a 75-year design life, 410,625 trucks would pass the bridge. The conventional bridge specimen was tested under 250,000 load cycles. The rehabilitated bridge specimen was first tested under 500,000 Fatigue II load cycles (surpassing the required 75-year design life) followed by 100,000 Fatigue I load cycles to maximize the joint load demands.
A bridge stiffness measurement was taken at intermediate load cycles. The stiffness of the conventional test specimen was measured at every 10,000 cycles, up to 100,000 load cycles. It was then measured at every 25,000 cycles to the end of fatigue testing. The stiffness of the rehabilitated test specimen under Fatigue II and Fatigue I loading was measured at every 50,000 and 10,000 load cycles, respectively.
5.3.3.2 Strength (Ultimate) Testing
The conventional test specimen was monotonically loaded to 50 kips to crack the longitudinal joint prior to the rehabilitation. The rehabilitated test bridge was monotonically loaded to failure using a displacement-based controlled point load at the mid-span (Fig. 5.18) with a load increment of 0.1 in. and a displacement rate of 0.007 in. per second.
AN
B
S
1'-8"20'
10"
40'
20'
A
40'
B
N
1'-8"
S
10"
51
6. EXPERIMENTAL FINDINGS This chapter includes the results of experimental studies on both conventional and rehabilitated full-scale double-tee bridge test specimens discussed in the previous chapter. The measured material properties and performance of both bridge test specimens under fatigue and strength loading are discussed.
6.1 Materials Properties
Many different cementitious and steel materials were incorporated in different components of the bridge test specimens. Presented in this section are the material properties for concrete used in the precast bridge girders, non-shrink grout used in the conventional longitudinal girder-to-girder joint, ultra-high performance concrete (UHPC) used in the rehabilitated longitudinal joint pockets, latex modified concrete (LMC) used in the rehabilitated continuous longitudinal joint, and the steel reinforcement utilized in the precast bridge girders and the rehabilitated longitudinal joints.
6.1.1 Properties of Cementitious Materials
The properties of fresh concrete and the compressive strength of precast concrete, non-shrink grout, UHPC, and LMC are presented herein.
6.1.1.1 Precast Concrete
The properties of fresh concrete incorporated in the precast double-tee bridge girders measured in accordance with ASTM C143 (2015) and C231 (2016) are presented in Table 6.1. The requirements based on the manufacturer’s mix design (Appendix C in Bohn, 2017) for fresh concrete were 6% (+1.5%, -1.0%) air content and a slump between 4 in. and 6 in. The girder concrete met the requirements.
Table 6.1 Properties of Precast Girder Fresh Concrete
Temperature (⁰F) Air Content (%) Unit Weight (lb/ft3) Slump (in.)
70 5.5 143.6 5
Standard 6-in. diameter cylinders were used for concrete sampling. The cylinders were steam cured for 12 hours on site with the girders; then the cylinders were sealed and stored in the structures lab. The concrete compressive strength was measured in accordance to the ASTM C39 (2016) procedure. Tests were performed after 1 day, 7 days, 28 days of casting, and the day of fatigue and strength testing. Table 6.2 presents the compressive strength for concrete used in the girders. The manufacturer’s 28-day compressive strength requirement of 6,000 psi was met.
Table 6.2 Compressive Strength of Girder Concrete Time (Day) f'c (psi)
1 5,698 7 7,192
28 7,636 Fatigue Test (Phase I) 8,783
Fatigue Test (Phase III) 9,230 Strength Test (Phase V) 9,512
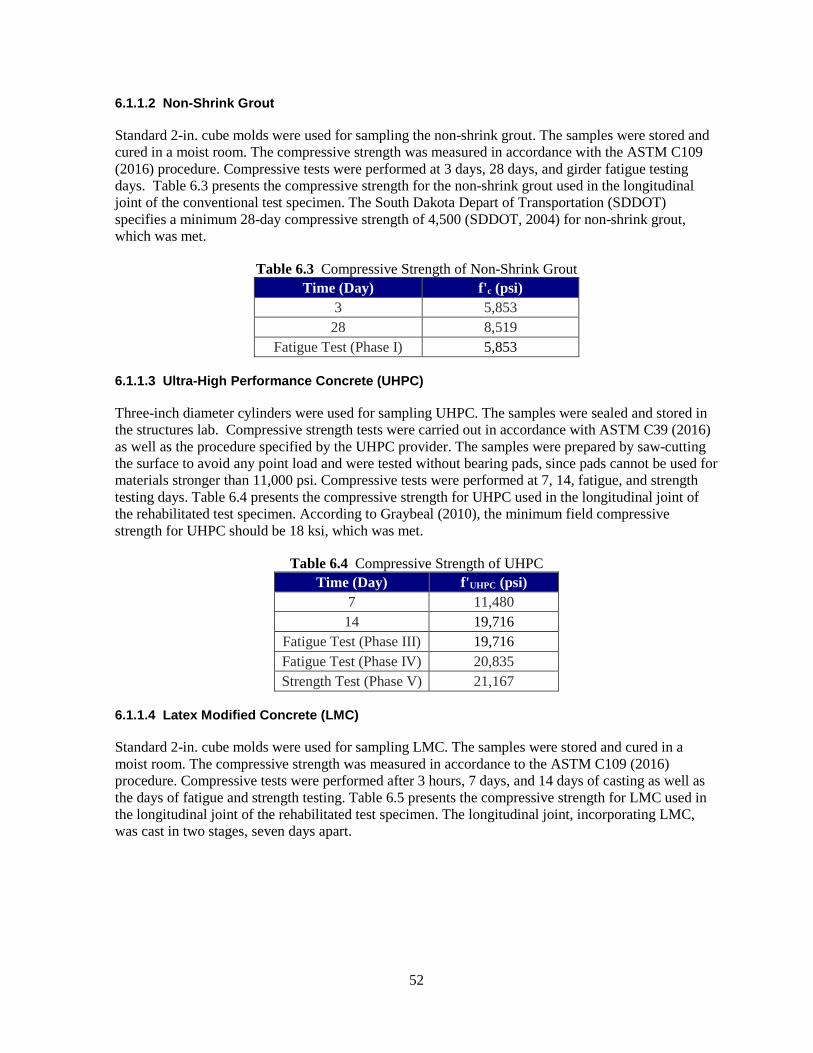
52
6.1.1.2 Non-Shrink Grout
Standard 2-in. cube molds were used for sampling the non-shrink grout. The samples were stored and cured in a moist room. The compressive strength was measured in accordance with the ASTM C109 (2016) procedure. Compressive tests were performed at 3 days, 28 days, and girder fatigue testing days. Table 6.3 presents the compressive strength for the non-shrink grout used in the longitudinal joint of the conventional test specimen. The South Dakota Depart of Transportation (SDDOT) specifies a minimum 28-day compressive strength of 4,500 (SDDOT, 2004) for non-shrink grout, which was met.
Table 6.3 Compressive Strength of Non-Shrink Grout Time (Day) f'c (psi)
3 5,853 28 8,519
Fatigue Test (Phase I) 5,853
6.1.1.3 Ultra-High Performance Concrete (UHPC)
Three-inch diameter cylinders were used for sampling UHPC. The samples were sealed and stored in the structures lab. Compressive strength tests were carried out in accordance with ASTM C39 (2016) as well as the procedure specified by the UHPC provider. The samples were prepared by saw-cutting the surface to avoid any point load and were tested without bearing pads, since pads cannot be used for materials stronger than 11,000 psi. Compressive tests were performed at 7, 14, fatigue, and strength testing days. Table 6.4 presents the compressive strength for UHPC used in the longitudinal joint of the rehabilitated test specimen. According to Graybeal (2010), the minimum field compressive strength for UHPC should be 18 ksi, which was met.
Table 6.4 Compressive Strength of UHPC Time (Day) f'UHPC (psi)
7 11,480 14 19,716
Fatigue Test (Phase III) 19,716 Fatigue Test (Phase IV) 20,835 Strength Test (Phase V) 21,167
6.1.1.4 Latex Modified Concrete (LMC)
Standard 2-in. cube molds were used for sampling LMC. The samples were stored and cured in a moist room. The compressive strength was measured in accordance to the ASTM C109 (2016) procedure. Compressive tests were performed after 3 hours, 7 days, and 14 days of casting as well as the days of fatigue and strength testing. Table 6.5 presents the compressive strength for LMC used in the longitudinal joint of the rehabilitated test specimen. The longitudinal joint, incorporating LMC, was cast in two stages, seven days apart.
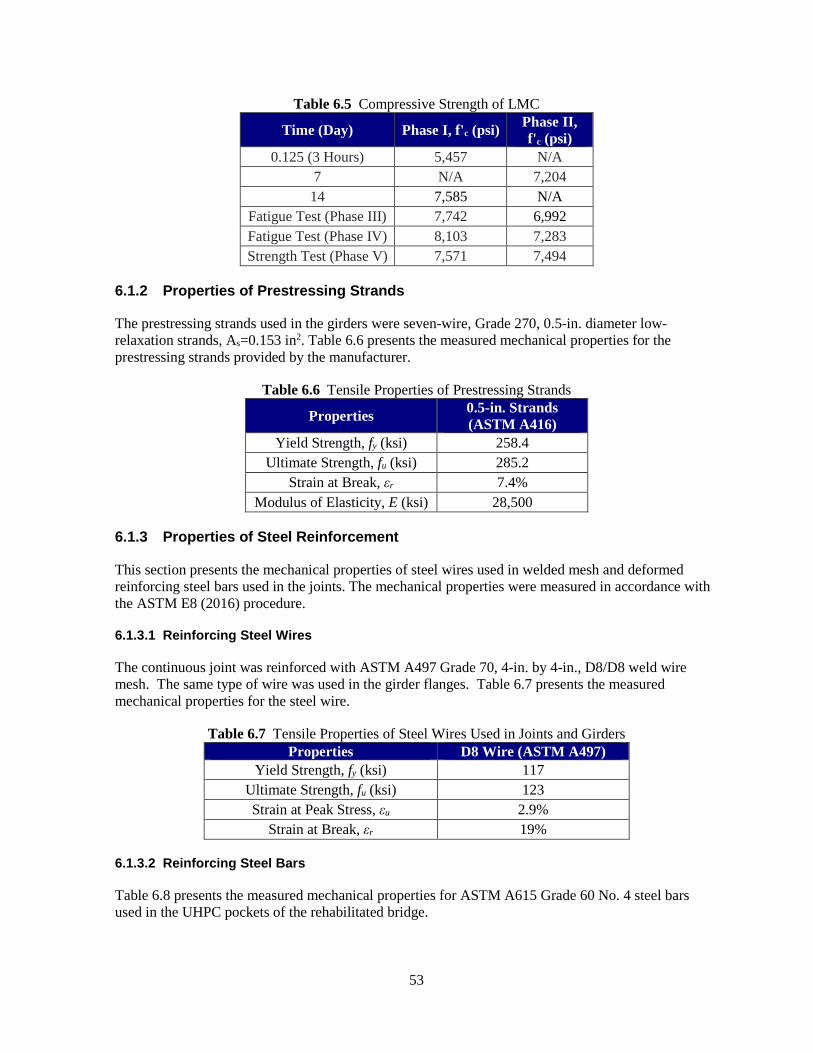
53
Table 6.5 Compressive Strength of LMC
Time (Day) Phase I, f'c (psi) Phase II, f'c (psi)
0.125 (3 Hours) 5,457 N/A 7 N/A 7,204 14 7,585 N/A
Fatigue Test (Phase III) 7,742 6,992 Fatigue Test (Phase IV) 8,103 7,283 Strength Test (Phase V) 7,571 7,494
6.1.2 Properties of Prestressing Strands
The prestressing strands used in the girders were seven-wire, Grade 270, 0.5-in. diameter low-relaxation strands, As=0.153 in2. Table 6.6 presents the measured mechanical properties for the prestressing strands provided by the manufacturer.
Table 6.6 Tensile Properties of Prestressing Strands
Properties 0.5-in. Strands (ASTM A416)
Yield Strength, fy (ksi) 258.4 Ultimate Strength, fu (ksi) 285.2
Strain at Break, εr 7.4% Modulus of Elasticity, E (ksi) 28,500
6.1.3 Properties of Steel Reinforcement
This section presents the mechanical properties of steel wires used in welded mesh and deformed reinforcing steel bars used in the joints. The mechanical properties were measured in accordance with the ASTM E8 (2016) procedure.
6.1.3.1 Reinforcing Steel Wires
The continuous joint was reinforced with ASTM A497 Grade 70, 4-in. by 4-in., D8/D8 weld wire mesh. The same type of wire was used in the girder flanges. Table 6.7 presents the measured mechanical properties for the steel wire.
Table 6.7 Tensile Properties of Steel Wires Used in Joints and Girders Properties D8 Wire (ASTM A497)
Yield Strength, fy (ksi) 117 Ultimate Strength, fu (ksi) 123 Strain at Peak Stress, εu 2.9%
Strain at Break, εr 19%
6.1.3.2 Reinforcing Steel Bars
Table 6.8 presents the measured mechanical properties for ASTM A615 Grade 60 No. 4 steel bars used in the UHPC pockets of the rehabilitated bridge.
54
Table 6.8 Tensile Properties of Reinforcing Steel Bars Used in UHPC Pockets Properties No. 4 Bars (ASTM A615)
Yield Strength, fy (ksi) 74 Ultimate Strength, fu (ksi) 107 Strain at Peak Stress, εu 10%
Strain at Break, εr 16%
6.1.4 Properties of Elastomeric Neoprene Bearing Pads
Mingo (2016) tested a 6-in. by 6-in. by 3/8-in. elastomeric neoprene bearing pad in compression to determine the force-displacement relationship of the bearing pads used at the supports (Fig. 6.1). The same neoprene pads were used in this study. The stiffness of the linear region of the force-displacement relationship was 1,128 kip/in.
Figure 6.1 Measured Force-Displacement Relationship of Elastomeric Bearing Pad
(Mingo, 2016) 6.2 Bridge Test Results
This section presents the results of the conventional and rehabilitated bridge specimens tested under fatigue and strength loading.
6.2.1 Conventional Double-Tee Bridge Test Specimen
The conventional double-tee bridge specimen (in which the girder-to-girder connection detailing was the same as that currently used in practice) was first tested under 250,000 cycles of the Fatigue II loading (Phase I) applied at the mid-span. The point load was offset from the longitudinal centerline of the bridge to apply the force on only one girder and to maximize the shear load demand transferred between the girders. After the fatigue loading, the conventional bridge specimen was monotonically loaded as Phase II of the testing to crack the longitudinal girder-to-girder joint prior to the rehabilitation. The results of experimental testing of the conventional double-tee bridge specimen is discussed.
0
10
20
30
40
50
60
70
0 0.02 0.04 0.06 0.08 0.1 0.12
Forc
e (k
ips)
Displacement (in.)
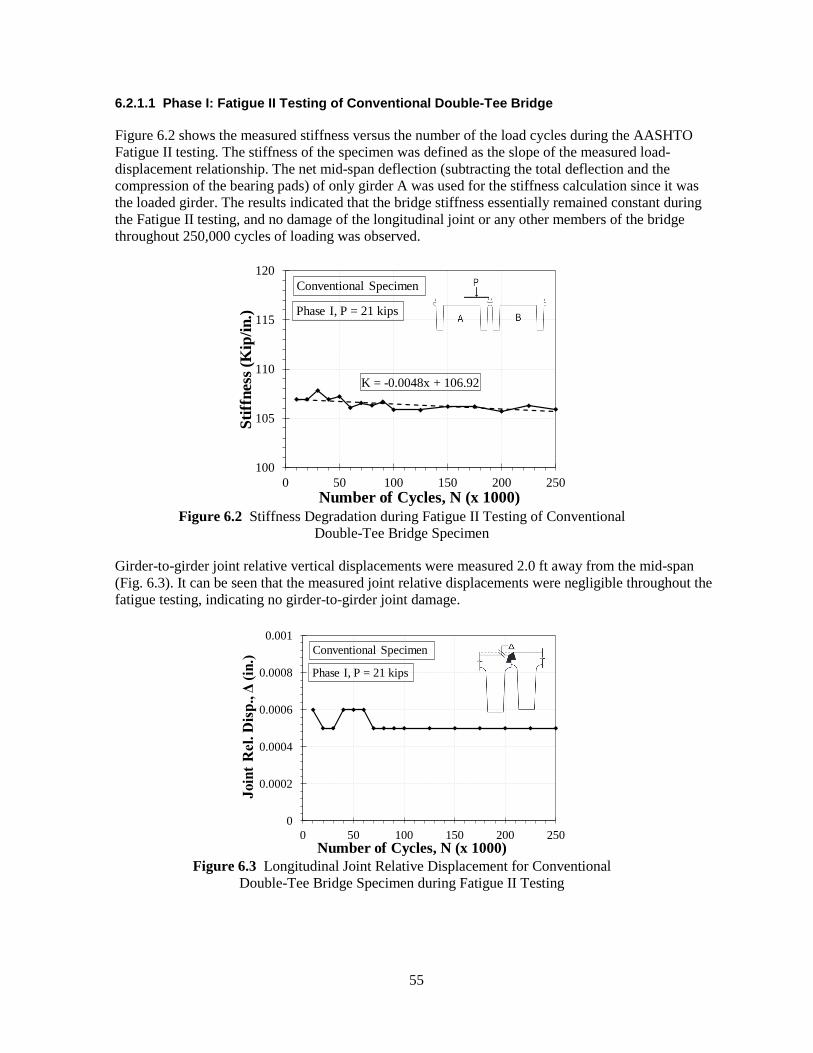
55
6.2.1.1 Phase I: Fatigue II Testing of Conventional Double-Tee Bridge
Figure 6.2 shows the measured stiffness versus the number of the load cycles during the AASHTO Fatigue II testing. The stiffness of the specimen was defined as the slope of the measured load-displacement relationship. The net mid-span deflection (subtracting the total deflection and the compression of the bearing pads) of only girder A was used for the stiffness calculation since it was the loaded girder. The results indicated that the bridge stiffness essentially remained constant during the Fatigue II testing, and no damage of the longitudinal joint or any other members of the bridge throughout 250,000 cycles of loading was observed.
Figure 6.2 Stiffness Degradation during Fatigue II Testing of Conventional
Double-Tee Bridge Specimen
Girder-to-girder joint relative vertical displacements were measured 2.0 ft away from the mid-span (Fig. 6.3). It can be seen that the measured joint relative displacements were negligible throughout the fatigue testing, indicating no girder-to-girder joint damage.
Figure 6.3 Longitudinal Joint Relative Displacement for Conventional
Double-Tee Bridge Specimen during Fatigue II Testing
K = -0.0048x + 106.92
100
105
110
115
120
0 50 100 150 200 250
Stiff
ness
(Kip
/in.)
Number of Cycles, N (x 1000)
Conventional Specimen
Phase I, P = 21 kips
0
0.0002
0.0004
0.0006
0.0008
0.001
0 50 100 150 200 250
Join
t Rel
. Dis
p., Δ
(in.
)
Number of Cycles, N (x 1000)
Phase I, P = 21 kips
Conventional Specimen
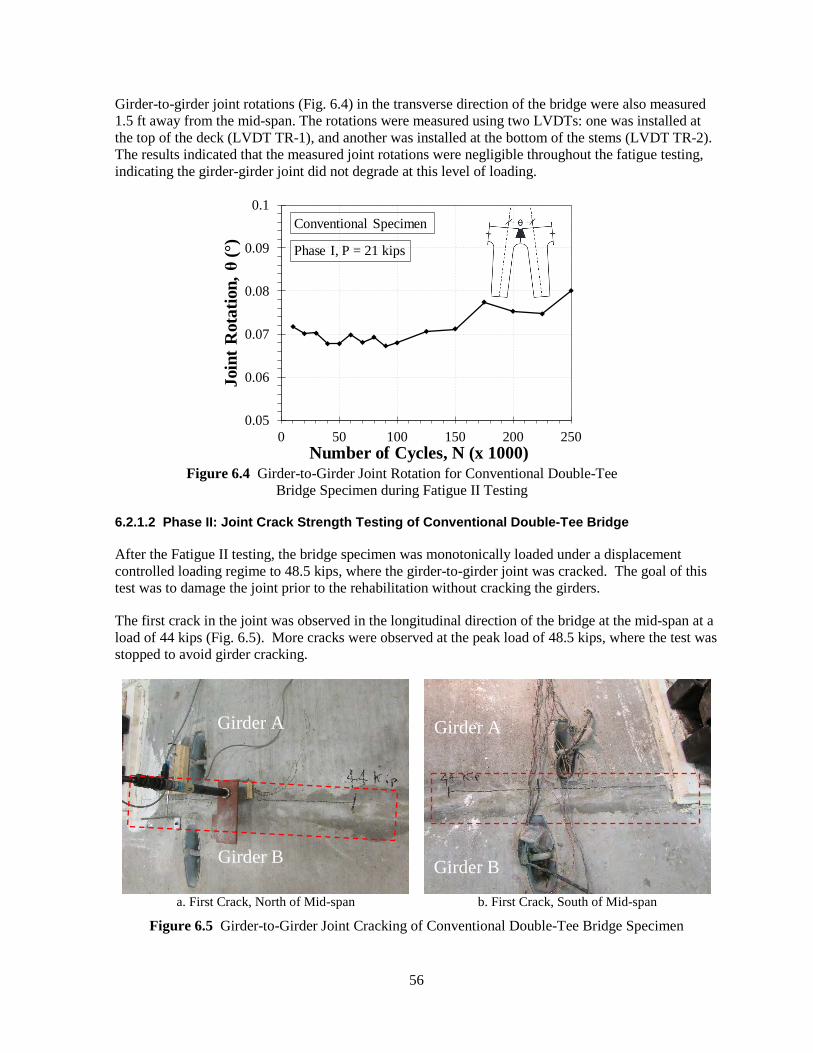
56
Girder-to-girder joint rotations (Fig. 6.4) in the transverse direction of the bridge were also measured 1.5 ft away from the mid-span. The rotations were measured using two LVDTs: one was installed at the top of the deck (LVDT TR-1), and another was installed at the bottom of the stems (LVDT TR-2). The results indicated that the measured joint rotations were negligible throughout the fatigue testing, indicating the girder-girder joint did not degrade at this level of loading.
Figure 6.4 Girder-to-Girder Joint Rotation for Conventional Double-Tee
Bridge Specimen during Fatigue II Testing
6.2.1.2 Phase II: Joint Crack Strength Testing of Conventional Double-Tee Bridge
After the Fatigue II testing, the bridge specimen was monotonically loaded under a displacement controlled loading regime to 48.5 kips, where the girder-to-girder joint was cracked. The goal of this test was to damage the joint prior to the rehabilitation without cracking the girders.
The first crack in the joint was observed in the longitudinal direction of the bridge at the mid-span at a load of 44 kips (Fig. 6.5). More cracks were observed at the peak load of 48.5 kips, where the test was stopped to avoid girder cracking.
a. First Crack, North of Mid-span b. First Crack, South of Mid-span
Figure 6.5 Girder-to-Girder Joint Cracking of Conventional Double-Tee Bridge Specimen
0.05
0.06
0.07
0.08
0.09
0.1
0 50 100 150 200 250
Join
t Rot
atio
n, θ
(°)
Number of Cycles, N (x 1000)
Conventional Specimen
Phase I, P = 21 kips
Girder A
Girder B
Girder A
Girder B
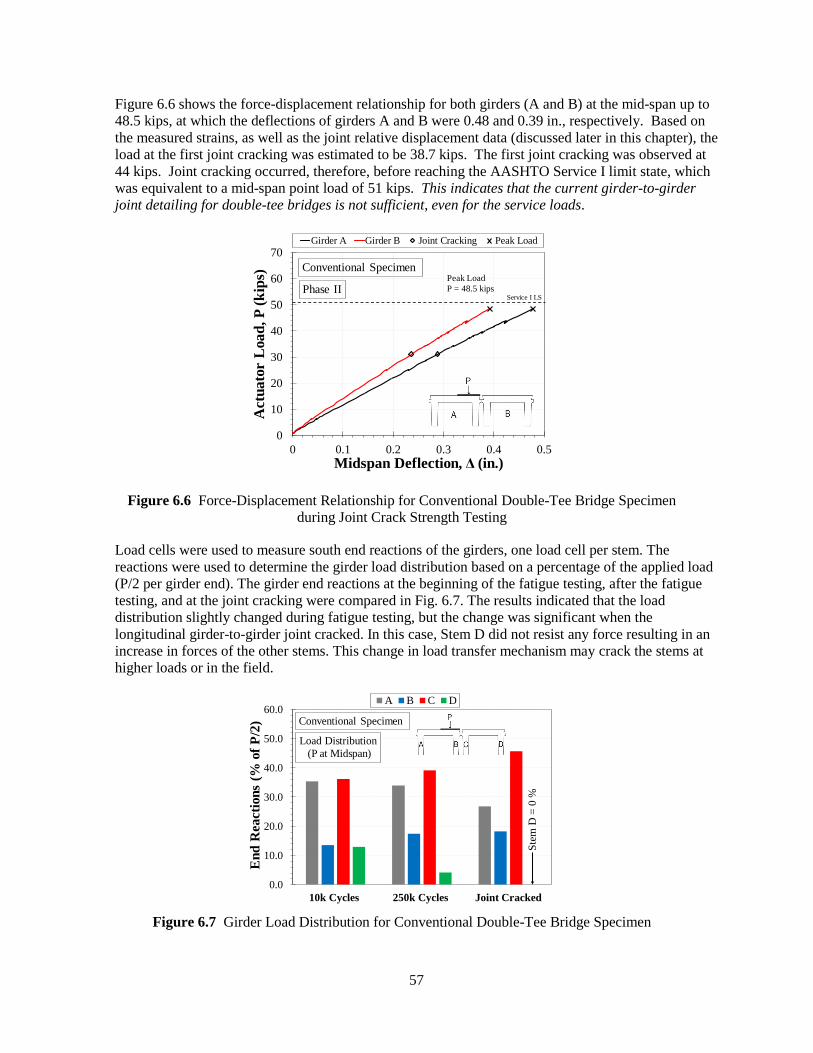
57
Figure 6.6 shows the force-displacement relationship for both girders (A and B) at the mid-span up to 48.5 kips, at which the deflections of girders A and B were 0.48 and 0.39 in., respectively. Based on the measured strains, as well as the joint relative displacement data (discussed later in this chapter), the load at the first joint cracking was estimated to be 38.7 kips. The first joint cracking was observed at 44 kips. Joint cracking occurred, therefore, before reaching the AASHTO Service I limit state, which was equivalent to a mid-span point load of 51 kips. This indicates that the current girder-to-girder joint detailing for double-tee bridges is not sufficient, even for the service loads.
Figure 6.6 Force-Displacement Relationship for Conventional Double-Tee Bridge Specimen during Joint Crack Strength Testing
Load cells were used to measure south end reactions of the girders, one load cell per stem. The reactions were used to determine the girder load distribution based on a percentage of the applied load (P/2 per girder end). The girder end reactions at the beginning of the fatigue testing, after the fatigue testing, and at the joint cracking were compared in Fig. 6.7. The results indicated that the load distribution slightly changed during fatigue testing, but the change was significant when the longitudinal girder-to-girder joint cracked. In this case, Stem D did not resist any force resulting in an increase in forces of the other stems. This change in load transfer mechanism may crack the stems at higher loads or in the field.
Figure 6.7 Girder Load Distribution for Conventional Double-Tee Bridge Specimen
0
10
20
30
40
50
60
70
0 0.1 0.2 0.3 0.4 0.5
Act
uato
r L
oad,
P (k
ips)
Midspan Deflection, Δ (in.)
Girder A Girder B Joint Cracking Peak Load
Conventional Specimen
Phase IIService I LS
Peak LoadP = 48.5 kips
0.0
10.0
20.0
30.0
40.0
50.0
60.0
10k Cycles 250k Cycles Joint Cracked
End
Rea
ctio
ns (%
of P
/2)
A B C D
Load Distribution(P at Midspan)
Conventional Specimen
Stem
D=
0 %

58
Figure 6.8 shows the strains of the prestressing strands and concrete in the flange of the loaded girder (A) during the phase II testing. The maximum tensile strain at the extreme strand of the interior stem at the peak load of 48.5 kips was 462 micro-strain (prestressing strains were not included in Fig. 6.8). The estimated initial strain without any losses from 31-kip pre-tensioning is 7,109 micro-strain from structural mechanics. The yield strain of Grade 270 strands is 8,772 micro-strain. The summation of the strain demand and the prestressing strains suggested that the strands did not yield. The maximum compressive strain in the girder flange concrete was 92.1 micro-strain at the peak load of 48.5 kips. The embedded concrete strain gauges were located 3.5 in. below the girder surface.
Figure 6.8 Measured Strains of Loaded Girder in Conventional Double-Tee Bridge
Specimen during Joint Crack Strength Testing
Figure 6.9 shows the strain of Girder B during Phase II testing. It can be seen that the maximum tendon tensile strain in Girder B is 29% less than that in Girder A, which was the loaded girder. The maximum strain in the extreme strand of Girder B at the peak load of 48.5 kips was 329 micro-strain, which was less than the yield strain, even after adding the initial prestressing strains. The maximum compressive strain in the girder flange concrete was 80.4 micro-strain at the peak load of 48.5 kips. Similar to Girder A, the embedded concrete strain gauges were located 3.5 in. below the girder surface.
Figure 6.9 Measured Strains of Girder B in Conventional Double-Tee Bridge
Specimen during Joint Crack Strength Testing
0
10
20
30
40
50
60
-100 0 100 200 300 400 500
Act
uato
r L
oad,
P (k
ips)
Strain, με (microstrain)
GA-L-17 GA-L-18 GA-L-19 GA-L-23 GA-L-24GA-L-27 GA-L-28 GA-L-31 GA-L-32
Conventional Specimen Phase II
Midspan
0
10
20
30
40
50
60
-100 0 100 200 300 400 500
Act
uato
r L
oad,
P (k
ips)
Strain, με (microstrain)
GB-L-20 GB-L-21 GB-L-22 GB-L-25 GB-L-26GB-L-29 GB-L-30 GB-L-33 GB-L-34
Conventional Specimen Phase II
Midspan
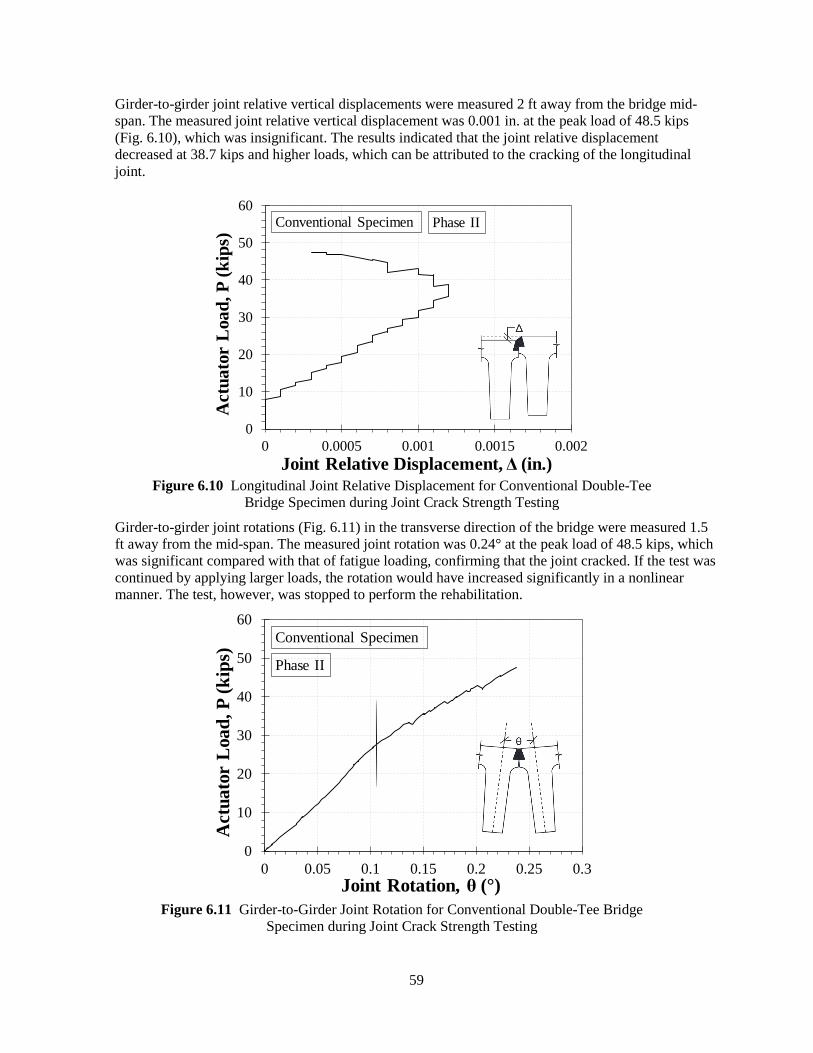
59
Girder-to-girder joint relative vertical displacements were measured 2 ft away from the bridge mid-span. The measured joint relative vertical displacement was 0.001 in. at the peak load of 48.5 kips (Fig. 6.10), which was insignificant. The results indicated that the joint relative displacement decreased at 38.7 kips and higher loads, which can be attributed to the cracking of the longitudinal joint.
Figure 6.10 Longitudinal Joint Relative Displacement for Conventional Double-Tee
Bridge Specimen during Joint Crack Strength Testing
Girder-to-girder joint rotations (Fig. 6.11) in the transverse direction of the bridge were measured 1.5 ft away from the mid-span. The measured joint rotation was 0.24° at the peak load of 48.5 kips, which was significant compared with that of fatigue loading, confirming that the joint cracked. If the test was continued by applying larger loads, the rotation would have increased significantly in a nonlinear manner. The test, however, was stopped to perform the rehabilitation.
Figure 6.11 Girder-to-Girder Joint Rotation for Conventional Double-Tee Bridge
Specimen during Joint Crack Strength Testing
0
10
20
30
40
50
60
0 0.0005 0.001 0.0015 0.002
Act
uato
r L
oad,
P (k
ips)
Joint Relative Displacement, Δ (in.)
Conventional Specimen Phase II
0
10
20
30
40
50
60
0 0.05 0.1 0.15 0.2 0.25 0.3
Act
uato
r L
oad,
P (k
ips)
Joint Rotation, θ (°)
Conventional Specimen
Phase II
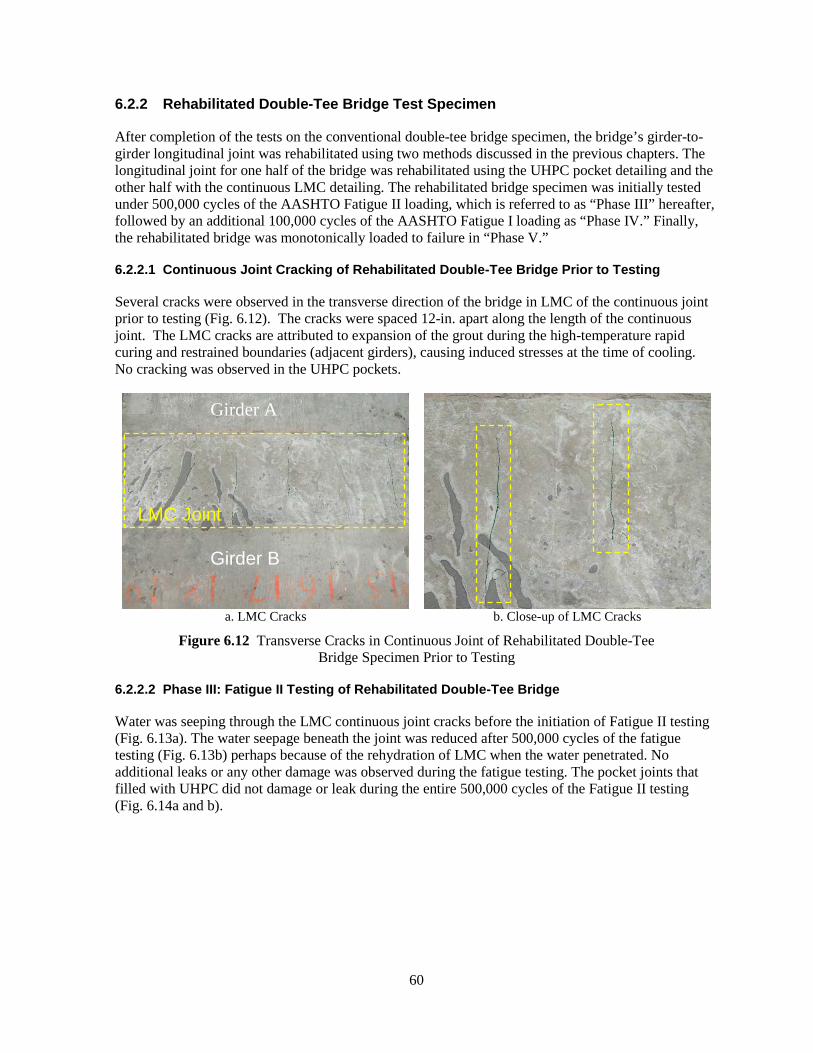
60
6.2.2 Rehabilitated Double-Tee Bridge Test Specimen
After completion of the tests on the conventional double-tee bridge specimen, the bridge’s girder-to-girder longitudinal joint was rehabilitated using two methods discussed in the previous chapters. The longitudinal joint for one half of the bridge was rehabilitated using the UHPC pocket detailing and the other half with the continuous LMC detailing. The rehabilitated bridge specimen was initially tested under 500,000 cycles of the AASHTO Fatigue II loading, which is referred to as “Phase III” hereafter, followed by an additional 100,000 cycles of the AASHTO Fatigue I loading as “Phase IV.” Finally, the rehabilitated bridge was monotonically loaded to failure in “Phase V.”
6.2.2.1 Continuous Joint Cracking of Rehabilitated Double-Tee Bridge Prior to Testing
Several cracks were observed in the transverse direction of the bridge in LMC of the continuous joint prior to testing (Fig. 6.12). The cracks were spaced 12-in. apart along the length of the continuous joint. The LMC cracks are attributed to expansion of the grout during the high-temperature rapid curing and restrained boundaries (adjacent girders), causing induced stresses at the time of cooling. No cracking was observed in the UHPC pockets.
a. LMC Cracks b. Close-up of LMC Cracks
Figure 6.12 Transverse Cracks in Continuous Joint of Rehabilitated Double-Tee Bridge Specimen Prior to Testing
6.2.2.2 Phase III: Fatigue II Testing of Rehabilitated Double-Tee Bridge
Water was seeping through the LMC continuous joint cracks before the initiation of Fatigue II testing (Fig. 6.13a). The water seepage beneath the joint was reduced after 500,000 cycles of the fatigue testing (Fig. 6.13b) perhaps because of the rehydration of LMC when the water penetrated. No additional leaks or any other damage was observed during the fatigue testing. The pocket joints that filled with UHPC did not damage or leak during the entire 500,000 cycles of the Fatigue II testing (Fig. 6.14a and b).
Girder A
Girder B
LMC Joint
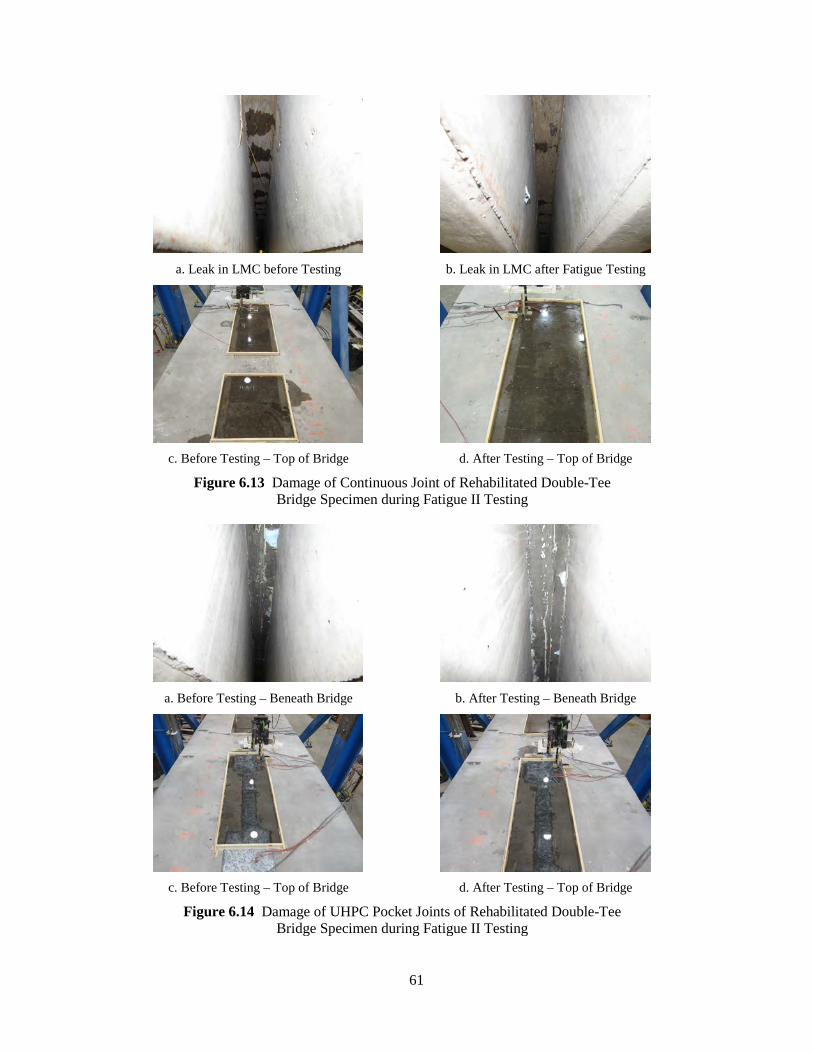
61
a. Leak in LMC before Testing b. Leak in LMC after Fatigue Testing
c. Before Testing – Top of Bridge d. After Testing – Top of Bridge
Figure 6.13 Damage of Continuous Joint of Rehabilitated Double-Tee Bridge Specimen during Fatigue II Testing
a. Before Testing – Beneath Bridge b. After Testing – Beneath Bridge
c. Before Testing – Top of Bridge d. After Testing – Top of Bridge
Figure 6.14 Damage of UHPC Pocket Joints of Rehabilitated Double-Tee Bridge Specimen during Fatigue II Testing
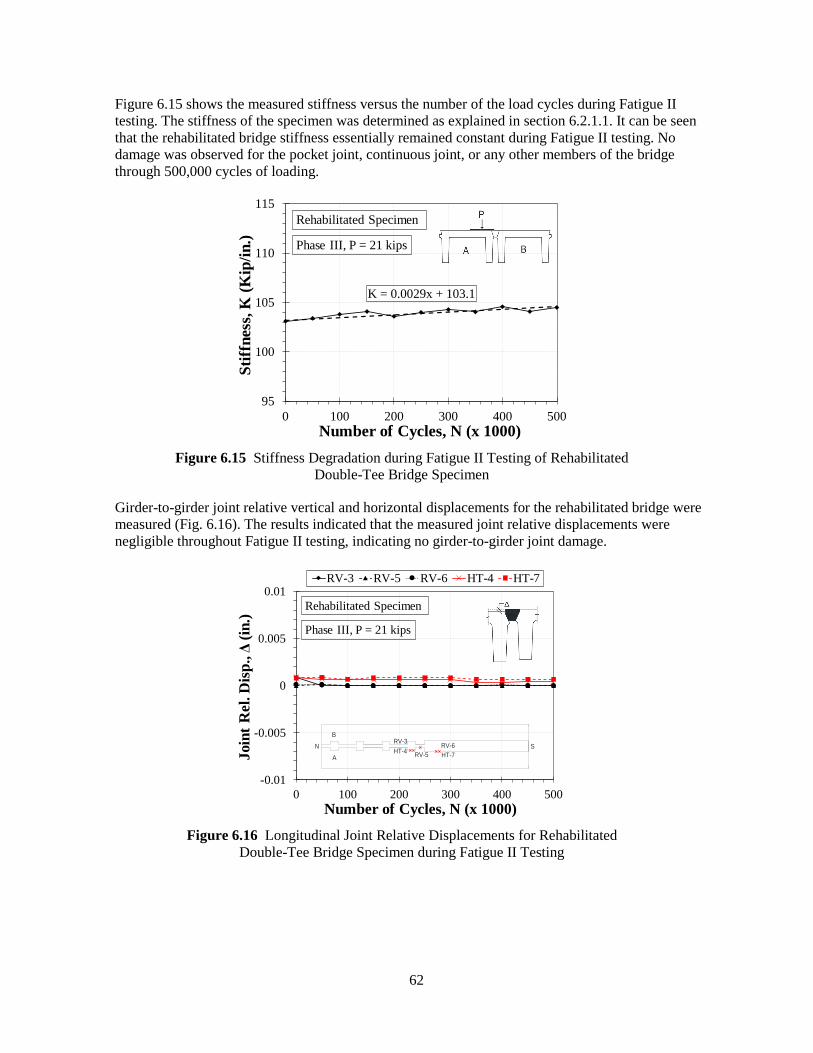
62
Figure 6.15 shows the measured stiffness versus the number of the load cycles during Fatigue II testing. The stiffness of the specimen was determined as explained in section 6.2.1.1. It can be seen that the rehabilitated bridge stiffness essentially remained constant during Fatigue II testing. No damage was observed for the pocket joint, continuous joint, or any other members of the bridge through 500,000 cycles of loading.
Figure 6.15 Stiffness Degradation during Fatigue II Testing of Rehabilitated
Double-Tee Bridge Specimen
Girder-to-girder joint relative vertical and horizontal displacements for the rehabilitated bridge were measured (Fig. 6.16). The results indicated that the measured joint relative displacements were negligible throughout Fatigue II testing, indicating no girder-to-girder joint damage.
Figure 6.16 Longitudinal Joint Relative Displacements for Rehabilitated
Double-Tee Bridge Specimen during Fatigue II Testing
K = 0.0029x + 103.1
95
100
105
110
115
0 100 200 300 400 500
Stiff
ness
, K (K
ip/in
.)
Number of Cycles, N (x 1000)
Rehabilitated Specimen
Phase III, P = 21 kips
-0.01
-0.005
0
0.005
0.01
0 100 200 300 400 500
Join
t Rel
. Dis
p., Δ
(in.)
Number of Cycles, N (x 1000)
RV-3 RV-5 RV-6 HT-4 HT-7
Rehabilitated Specimen
Phase III, P = 21 kips
BRV-3HT-4 RV-5
N RV-6
AS
HT-7
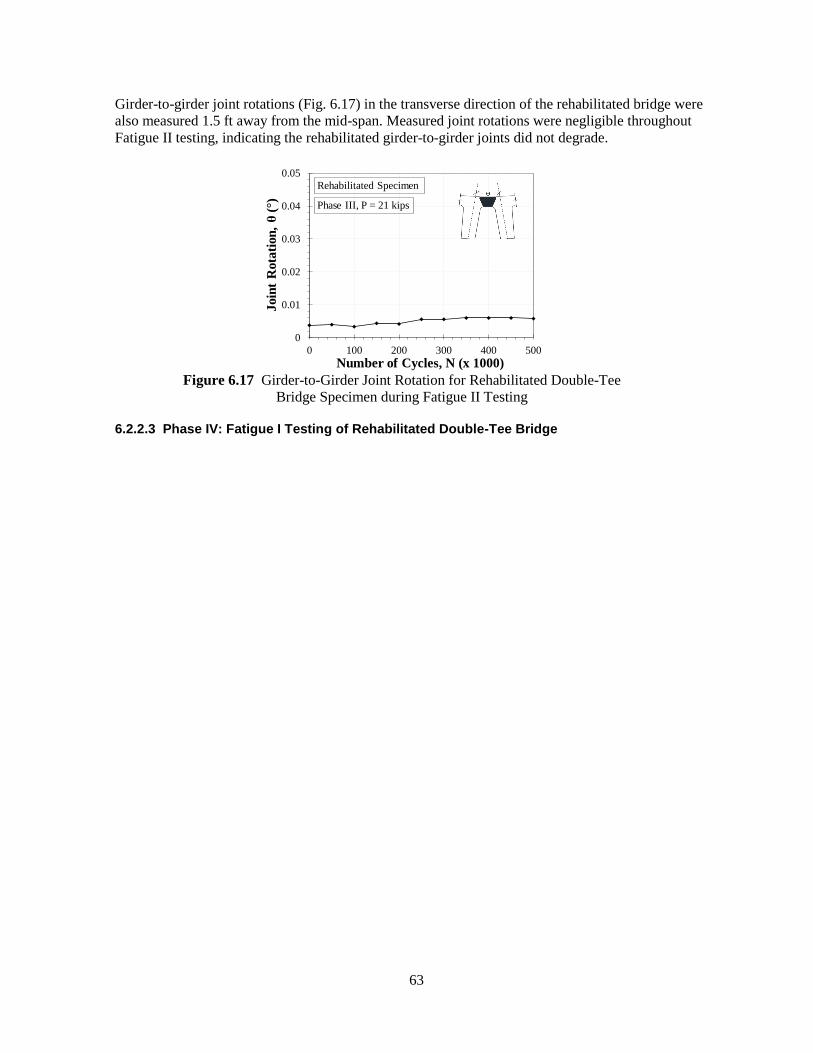
63
Girder-to-girder joint rotations (Fig. 6.17) in the transverse direction of the rehabilitated bridge were also measured 1.5 ft away from the mid-span. Measured joint rotations were negligible throughout Fatigue II testing, indicating the rehabilitated girder-to-girder joints did not degrade.
Figure 6.17 Girder-to-Girder Joint Rotation for Rehabilitated Double-Tee
Bridge Specimen during Fatigue II Testing
6.2.2.3 Phase IV: Fatigue I Testing of Rehabilitated Double-Tee Bridge
0
0.01
0.02
0.03
0.04
0.05
0 100 200 300 400 500
Join
t Rot
atio
n, θ
(°)
Number of Cycles, N (x 1000)
Rehabilitated Specimen
Phase III, P = 21 kips
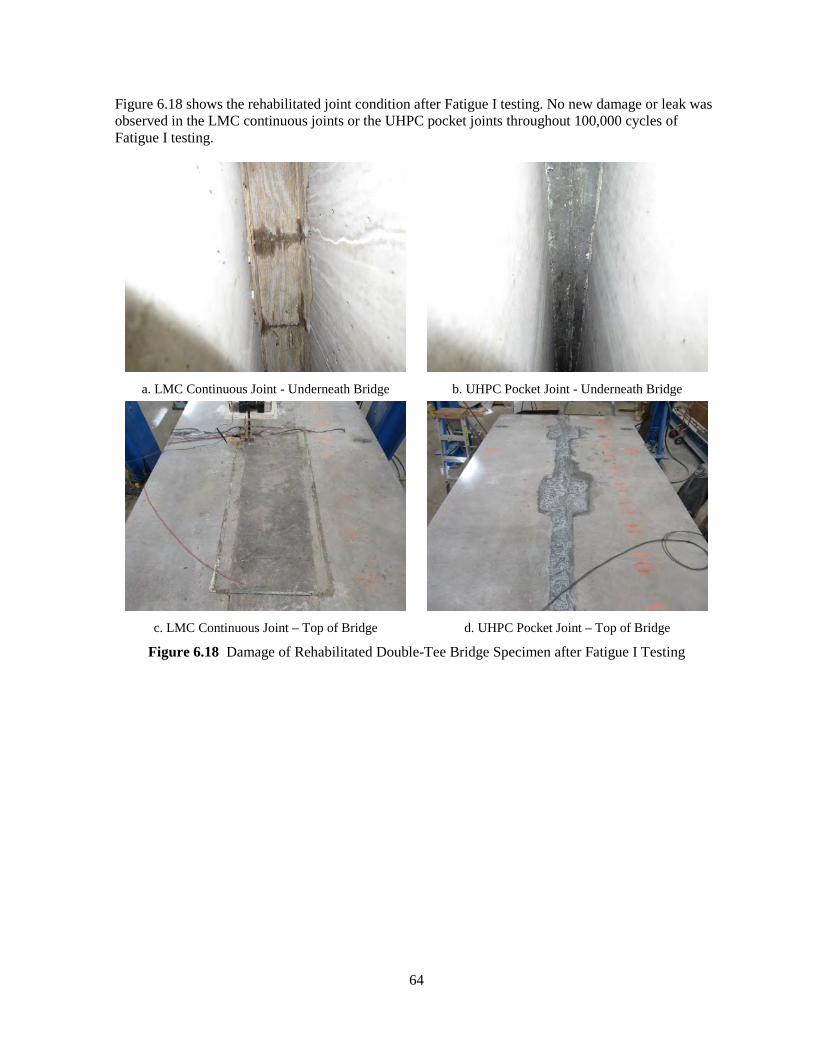
64
Figure 6.18 shows the rehabilitated joint condition after Fatigue I testing. No new damage or leak was observed in the LMC continuous joints or the UHPC pocket joints throughout 100,000 cycles of Fatigue I testing.
a. LMC Continuous Joint - Underneath Bridge b. UHPC Pocket Joint - Underneath Bridge
c. LMC Continuous Joint – Top of Bridge d. UHPC Pocket Joint – Top of Bridge
Figure 6.18 Damage of Rehabilitated Double-Tee Bridge Specimen after Fatigue I Testing
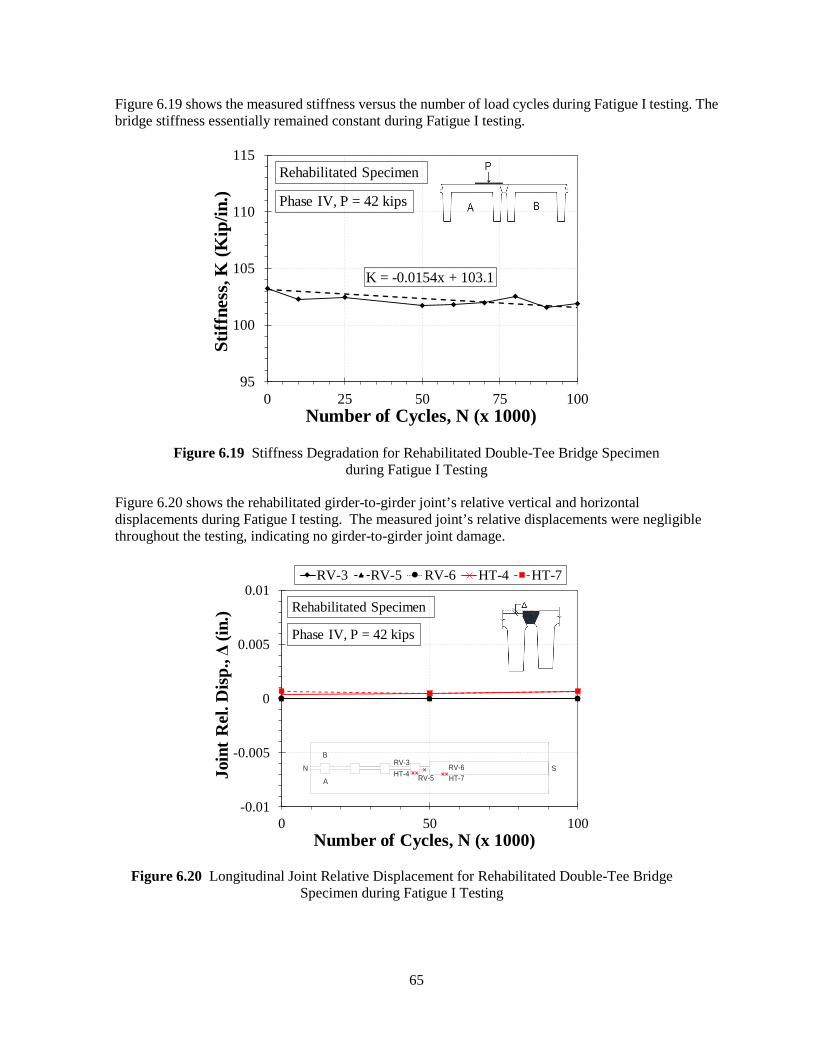
65
Figure 6.19 shows the measured stiffness versus the number of load cycles during Fatigue I testing. The bridge stiffness essentially remained constant during Fatigue I testing.
Figure 6.19 Stiffness Degradation for Rehabilitated Double-Tee Bridge Specimen during Fatigue I Testing
Figure 6.20 shows the rehabilitated girder-to-girder joint’s relative vertical and horizontal displacements during Fatigue I testing. The measured joint’s relative displacements were negligible throughout the testing, indicating no girder-to-girder joint damage.
Figure 6.20 Longitudinal Joint Relative Displacement for Rehabilitated Double-Tee Bridge Specimen during Fatigue I Testing
K = -0.0154x + 103.1
95
100
105
110
115
0 25 50 75 100
Stiff
ness
, K (K
ip/in
.)
Number of Cycles, N (x 1000)
Phase IV, P = 42 kips
Rehabilitated Specimen
-0.01
-0.005
0
0.005
0.01
0 50 100
Join
t Rel
. Dis
p., Δ
(in.)
Number of Cycles, N (x 1000)
RV-3 RV-5 RV-6 HT-4 HT-7
Rehabilitated Specimen
Phase IV, P = 42 kips
BRV-3HT-4 RV-5
N RV-6
AS
HT-7
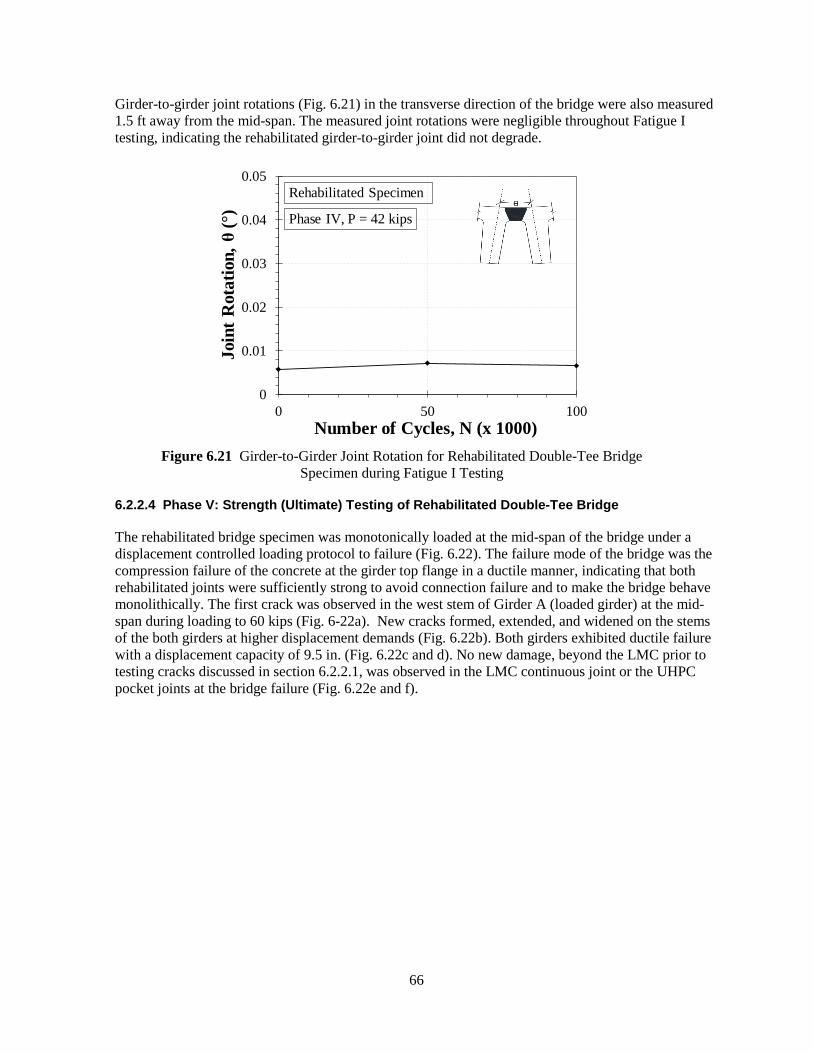
66
Girder-to-girder joint rotations (Fig. 6.21) in the transverse direction of the bridge were also measured 1.5 ft away from the mid-span. The measured joint rotations were negligible throughout Fatigue I testing, indicating the rehabilitated girder-to-girder joint did not degrade.
Figure 6.21 Girder-to-Girder Joint Rotation for Rehabilitated Double-Tee Bridge
Specimen during Fatigue I Testing
6.2.2.4 Phase V: Strength (Ultimate) Testing of Rehabilitated Double-Tee Bridge
The rehabilitated bridge specimen was monotonically loaded at the mid-span of the bridge under a displacement controlled loading protocol to failure (Fig. 6.22). The failure mode of the bridge was the compression failure of the concrete at the girder top flange in a ductile manner, indicating that both rehabilitated joints were sufficiently strong to avoid connection failure and to make the bridge behave monolithically. The first crack was observed in the west stem of Girder A (loaded girder) at the mid-span during loading to 60 kips (Fig. 6-22a). New cracks formed, extended, and widened on the stems of the both girders at higher displacement demands (Fig. 6.22b). Both girders exhibited ductile failure with a displacement capacity of 9.5 in. (Fig. 6.22c and d). No new damage, beyond the LMC prior to testing cracks discussed in section 6.2.2.1, was observed in the LMC continuous joint or the UHPC pocket joints at the bridge failure (Fig. 6.22e and f).
0
0.01
0.02
0.03
0.04
0.05
0 50 100
Join
t Rot
atio
n, θ
(°)
Number of Cycles, N (x 1000)
Rehabilitated Specimen
Phase IV, P = 42 kips
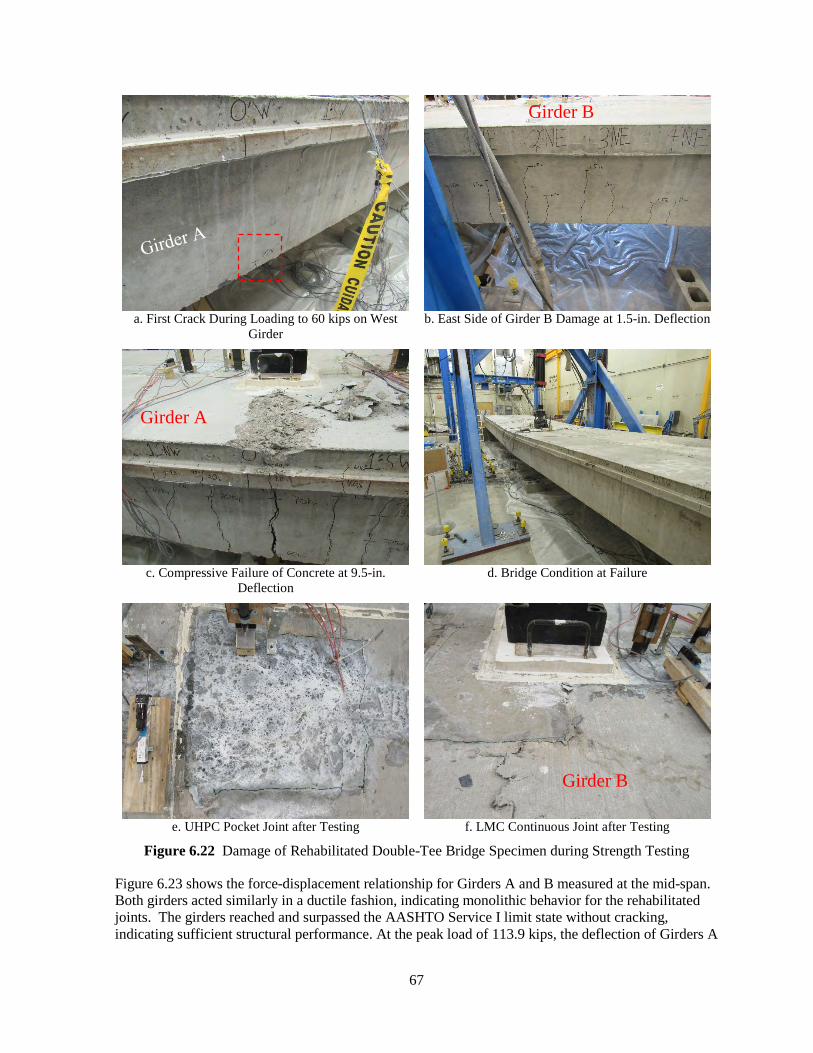
67
a. First Crack During Loading to 60 kips on West
Girder b. East Side of Girder B Damage at 1.5-in. Deflection
c. Compressive Failure of Concrete at 9.5-in.
Deflection d. Bridge Condition at Failure
e. UHPC Pocket Joint after Testing f. LMC Continuous Joint after Testing
Figure 6.22 Damage of Rehabilitated Double-Tee Bridge Specimen during Strength Testing
Figure 6.23 shows the force-displacement relationship for Girders A and B measured at the mid-span. Both girders acted similarly in a ductile fashion, indicating monolithic behavior for the rehabilitated joints. The girders reached and surpassed the AASHTO Service I limit state without cracking, indicating sufficient structural performance. At the peak load of 113.9 kips, the deflection of Girders A
Girder A
Girder B
Girder B
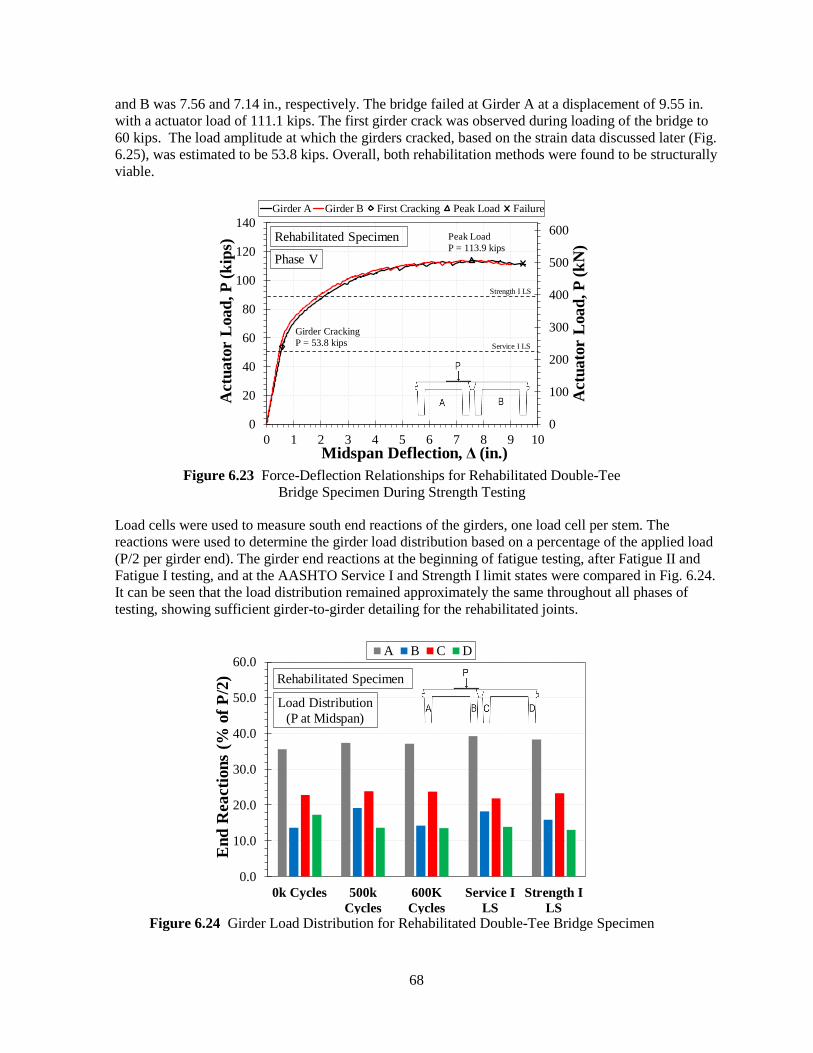
68
and B was 7.56 and 7.14 in., respectively. The bridge failed at Girder A at a displacement of 9.55 in. with a actuator load of 111.1 kips. The first girder crack was observed during loading of the bridge to 60 kips. The load amplitude at which the girders cracked, based on the strain data discussed later (Fig. 6.25), was estimated to be 53.8 kips. Overall, both rehabilitation methods were found to be structurally viable.
Figure 6.23 Force-Deflection Relationships for Rehabilitated Double-Tee
Bridge Specimen During Strength Testing
Load cells were used to measure south end reactions of the girders, one load cell per stem. The reactions were used to determine the girder load distribution based on a percentage of the applied load (P/2 per girder end). The girder end reactions at the beginning of fatigue testing, after Fatigue II and Fatigue I testing, and at the AASHTO Service I and Strength I limit states were compared in Fig. 6.24. It can be seen that the load distribution remained approximately the same throughout all phases of testing, showing sufficient girder-to-girder detailing for the rehabilitated joints.
Figure 6.24 Girder Load Distribution for Rehabilitated Double-Tee Bridge Specimen
0
100
200
300
400
500
600
0
20
40
60
80
100
120
140
0 1 2 3 4 5 6 7 8 9 10
Act
uato
r L
oad,
P (k
N)
Act
uato
r L
oad,
P (k
ips)
Midspan Deflection, Δ (in.)
Girder A Girder B First Cracking Peak Load Failure
Rehabilitated Specimen
Phase V
Strength I LS
Service I LS
Peak Load P = 113.9 kips
Girder CrackingP = 53.8 kips
0.0
10.0
20.0
30.0
40.0
50.0
60.0
0k Cycles 500kCycles
600KCycles
Service ILS
Strength ILS
End
Rea
ctio
ns (%
of P
/2)
A B C D
Load Distribution(P at Midspan)
Rehabilitated Specimen
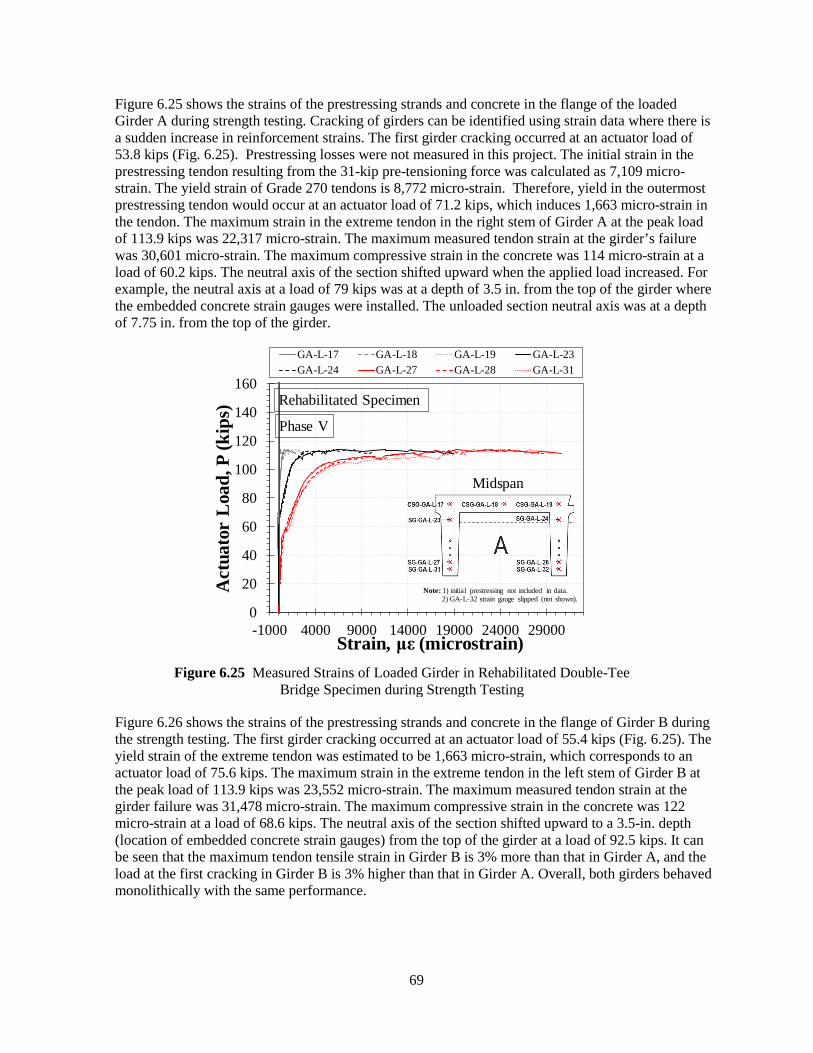
69
Figure 6.25 shows the strains of the prestressing strands and concrete in the flange of the loaded Girder A during strength testing. Cracking of girders can be identified using strain data where there is a sudden increase in reinforcement strains. The first girder cracking occurred at an actuator load of 53.8 kips (Fig. 6.25). Prestressing losses were not measured in this project. The initial strain in the prestressing tendon resulting from the 31-kip pre-tensioning force was calculated as 7,109 micro-strain. The yield strain of Grade 270 tendons is 8,772 micro-strain. Therefore, yield in the outermost prestressing tendon would occur at an actuator load of 71.2 kips, which induces 1,663 micro-strain in the tendon. The maximum strain in the extreme tendon in the right stem of Girder A at the peak load of 113.9 kips was 22,317 micro-strain. The maximum measured tendon strain at the girder’s failure was 30,601 micro-strain. The maximum compressive strain in the concrete was 114 micro-strain at a load of 60.2 kips. The neutral axis of the section shifted upward when the applied load increased. For example, the neutral axis at a load of 79 kips was at a depth of 3.5 in. from the top of the girder where the embedded concrete strain gauges were installed. The unloaded section neutral axis was at a depth of 7.75 in. from the top of the girder.
Figure 6.25 Measured Strains of Loaded Girder in Rehabilitated Double-Tee
Bridge Specimen during Strength Testing
Figure 6.26 shows the strains of the prestressing strands and concrete in the flange of Girder B during the strength testing. The first girder cracking occurred at an actuator load of 55.4 kips (Fig. 6.25). The yield strain of the extreme tendon was estimated to be 1,663 micro-strain, which corresponds to an actuator load of 75.6 kips. The maximum strain in the extreme tendon in the left stem of Girder B at the peak load of 113.9 kips was 23,552 micro-strain. The maximum measured tendon strain at the girder failure was 31,478 micro-strain. The maximum compressive strain in the concrete was 122 micro-strain at a load of 68.6 kips. The neutral axis of the section shifted upward to a 3.5-in. depth (location of embedded concrete strain gauges) from the top of the girder at a load of 92.5 kips. It can be seen that the maximum tendon tensile strain in Girder B is 3% more than that in Girder A, and the load at the first cracking in Girder B is 3% higher than that in Girder A. Overall, both girders behaved monolithically with the same performance.
0
20
40
60
80
100
120
140
160
-1000 4000 9000 14000 19000 24000 29000
Act
uato
r L
oad,
P (k
ips)
Strain, με (microstrain)
GA-L-17 GA-L-18 GA-L-19 GA-L-23GA-L-24 GA-L-27 GA-L-28 GA-L-31
Rehabilitated Specimen
Phase V
Note: 1) initial prestressing not included in data.2) GA-L-32 strain gauge slipped (not shown).
Midspan
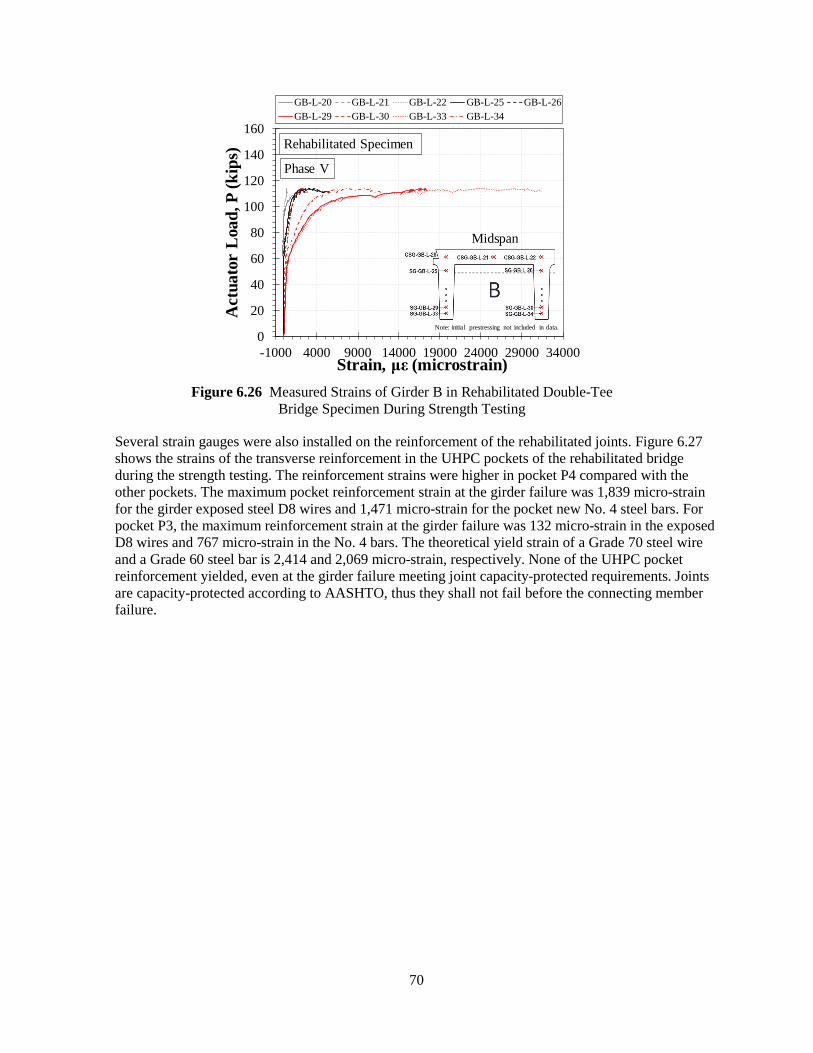
70
Figure 6.26 Measured Strains of Girder B in Rehabilitated Double-Tee
Bridge Specimen During Strength Testing
Several strain gauges were also installed on the reinforcement of the rehabilitated joints. Figure 6.27 shows the strains of the transverse reinforcement in the UHPC pockets of the rehabilitated bridge during the strength testing. The reinforcement strains were higher in pocket P4 compared with the other pockets. The maximum pocket reinforcement strain at the girder failure was 1,839 micro-strain for the girder exposed steel D8 wires and 1,471 micro-strain for the pocket new No. 4 steel bars. For pocket P3, the maximum reinforcement strain at the girder failure was 132 micro-strain in the exposed D8 wires and 767 micro-strain in the No. 4 bars. The theoretical yield strain of a Grade 70 steel wire and a Grade 60 steel bar is 2,414 and 2,069 micro-strain, respectively. None of the UHPC pocket reinforcement yielded, even at the girder failure meeting joint capacity-protected requirements. Joints are capacity-protected according to AASHTO, thus they shall not fail before the connecting member failure.
0
20
40
60
80
100
120
140
160
-1000 4000 9000 14000 19000 24000 29000 34000
Act
uato
r L
oad,
P (k
ips)
Strain, με (microstrain)
GB-L-20 GB-L-21 GB-L-22 GB-L-25 GB-L-26GB-L-29 GB-L-30 GB-L-33 GB-L-34
Rehabilitated Specimen
Phase V
Note: initial prestressing not included in data.
Midspan
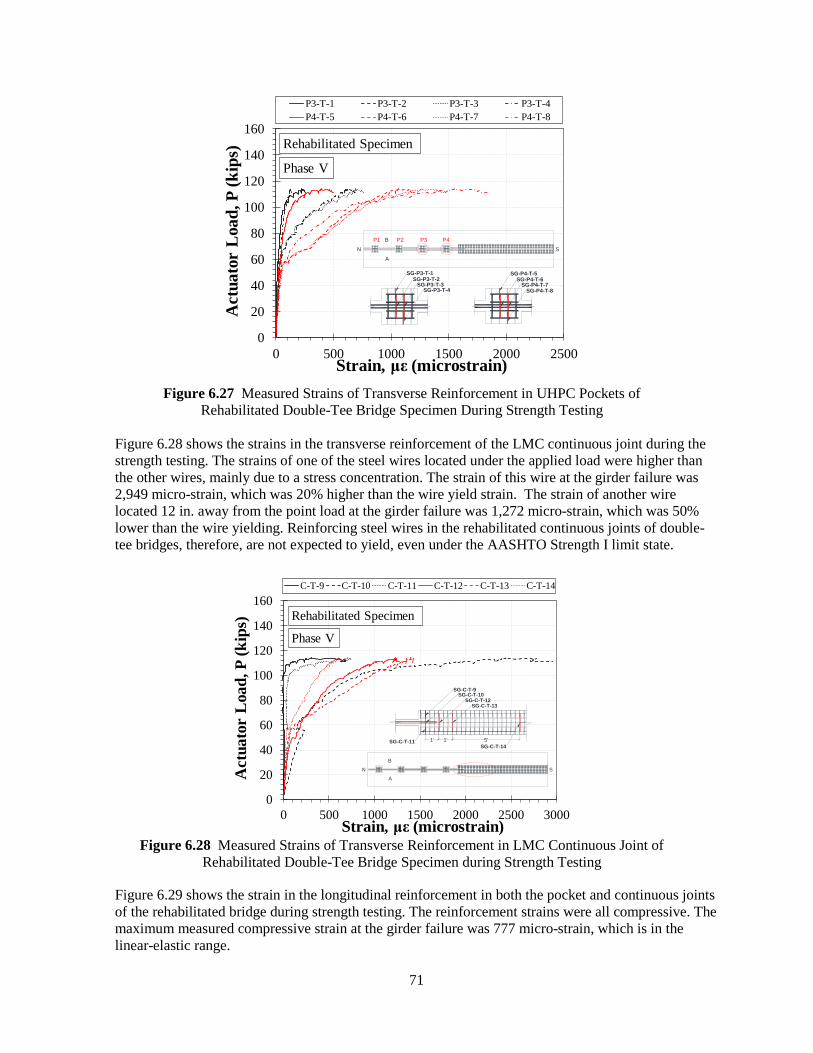
71
Figure 6.27 Measured Strains of Transverse Reinforcement in UHPC Pockets of
Rehabilitated Double-Tee Bridge Specimen During Strength Testing Figure 6.28 shows the strains in the transverse reinforcement of the LMC continuous joint during the strength testing. The strains of one of the steel wires located under the applied load were higher than the other wires, mainly due to a stress concentration. The strain of this wire at the girder failure was 2,949 micro-strain, which was 20% higher than the wire yield strain. The strain of another wire located 12 in. away from the point load at the girder failure was 1,272 micro-strain, which was 50% lower than the wire yielding. Reinforcing steel wires in the rehabilitated continuous joints of double-tee bridges, therefore, are not expected to yield, even under the AASHTO Strength I limit state.
Figure 6.28 Measured Strains of Transverse Reinforcement in LMC Continuous Joint of
Rehabilitated Double-Tee Bridge Specimen during Strength Testing
Figure 6.29 shows the strain in the longitudinal reinforcement in both the pocket and continuous joints of the rehabilitated bridge during strength testing. The reinforcement strains were all compressive. The maximum measured compressive strain at the girder failure was 777 micro-strain, which is in the linear-elastic range.
0
20
40
60
80
100
120
140
160
0 500 1000 1500 2000 2500
Act
uato
r L
oad,
P (k
ips)
Strain, με (microstrain)
P3-T-1 P3-T-2 P3-T-3 P3-T-4P4-T-5 P4-T-6 P4-T-7 P4-T-8
Rehabilitated Specimen
Phase V
A
P3B P4
SG-P4-T-6SG-P4-T-5
NP1
SG-P4-T-7SG-P4-T-8
S
SG-P3-T-2SG-P3-T-1
P2
SG-P3-T-3SG-P3-T-4
0
20
40
60
80
100
120
140
160
0 500 1000 1500 2000 2500 3000
Act
uato
r L
oad,
P (k
ips)
Strain, με (microstrain)
C-T-9 C-T-10 C-T-11 C-T-12 C-T-13 C-T-14
Rehabilitated Specimen
Phase V
NB
SG-C-T-13
1'
S
SG-C-T-141'
SG-C-T-9SG-C-T-10
A
5'SG-C-T-11
SG-C-T-12
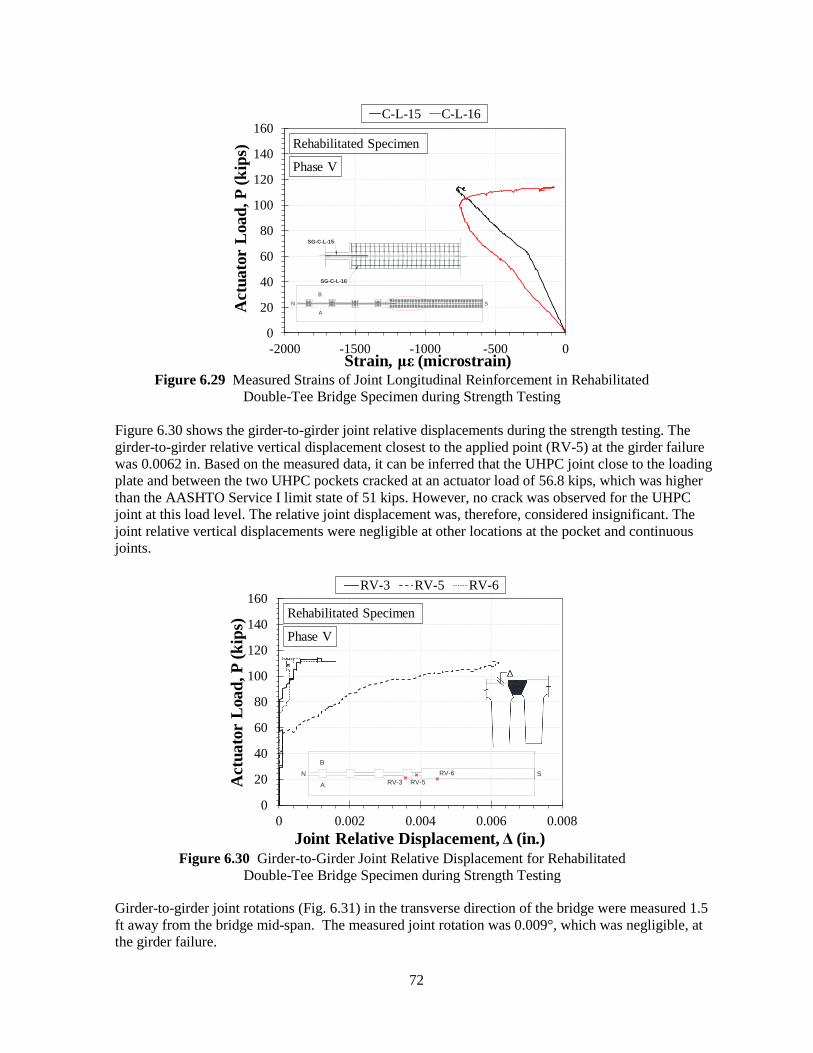
72
Figure 6.29 Measured Strains of Joint Longitudinal Reinforcement in Rehabilitated
Double-Tee Bridge Specimen during Strength Testing
Figure 6.30 shows the girder-to-girder joint relative displacements during the strength testing. The girder-to-girder relative vertical displacement closest to the applied point (RV-5) at the girder failure was 0.0062 in. Based on the measured data, it can be inferred that the UHPC joint close to the loading plate and between the two UHPC pockets cracked at an actuator load of 56.8 kips, which was higher than the AASHTO Service I limit state of 51 kips. However, no crack was observed for the UHPC joint at this load level. The relative joint displacement was, therefore, considered insignificant. The joint relative vertical displacements were negligible at other locations at the pocket and continuous joints.
Figure 6.30 Girder-to-Girder Joint Relative Displacement for Rehabilitated
Double-Tee Bridge Specimen during Strength Testing
Girder-to-girder joint rotations (Fig. 6.31) in the transverse direction of the bridge were measured 1.5 ft away from the bridge mid-span. The measured joint rotation was 0.009°, which was negligible, at the girder failure.
0
20
40
60
80
100
120
140
160
-2000 -1500 -1000 -500 0
Act
uato
r L
oad,
P (k
ips)
Strain, με (microstrain)
C-L-15 C-L-16
Rehabilitated Specimen
Phase V
A
B
SG-C-L-15
N S
SG-C-L-16
0
20
40
60
80
100
120
140
160
0 0.002 0.004 0.006 0.008
Act
uato
r L
oad,
P (k
ips)
Joint Relative Displacement, Δ (in.)
RV-3 RV-5 RV-6
Rehabilitated Specimen
Phase V
N RV-6RV-5RV-3
B
SA
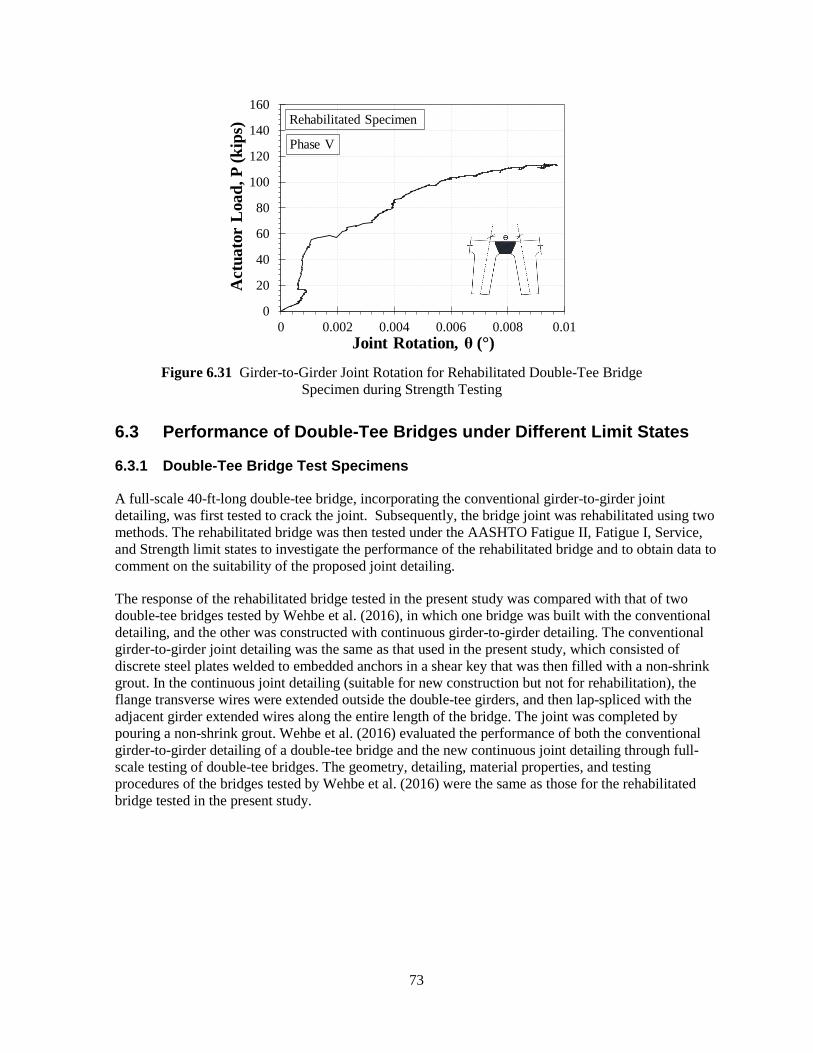
73
Figure 6.31 Girder-to-Girder Joint Rotation for Rehabilitated Double-Tee Bridge
Specimen during Strength Testing
6.3 Performance of Double-Tee Bridges under Different Limit States
6.3.1 Double-Tee Bridge Test Specimens
A full-scale 40-ft-long double-tee bridge, incorporating the conventional girder-to-girder joint detailing, was first tested to crack the joint. Subsequently, the bridge joint was rehabilitated using two methods. The rehabilitated bridge was then tested under the AASHTO Fatigue II, Fatigue I, Service, and Strength limit states to investigate the performance of the rehabilitated bridge and to obtain data to comment on the suitability of the proposed joint detailing.
The response of the rehabilitated bridge tested in the present study was compared with that of two double-tee bridges tested by Wehbe et al. (2016), in which one bridge was built with the conventional detailing, and the other was constructed with continuous girder-to-girder detailing. The conventional girder-to-girder joint detailing was the same as that used in the present study, which consisted of discrete steel plates welded to embedded anchors in a shear key that was then filled with a non-shrink grout. In the continuous joint detailing (suitable for new construction but not for rehabilitation), the flange transverse wires were extended outside the double-tee girders, and then lap-spliced with the adjacent girder extended wires along the entire length of the bridge. The joint was completed by pouring a non-shrink grout. Wehbe et al. (2016) evaluated the performance of both the conventional girder-to-girder detailing of a double-tee bridge and the new continuous joint detailing through full-scale testing of double-tee bridges. The geometry, detailing, material properties, and testing procedures of the bridges tested by Wehbe et al. (2016) were the same as those for the rehabilitated bridge tested in the present study.
0
20
40
60
80
100
120
140
160
0 0.002 0.004 0.006 0.008 0.01
Act
uato
r L
oad,
P (k
ips)
Joint Rotation, θ (°)
Rehabilitated Specimen
Phase V
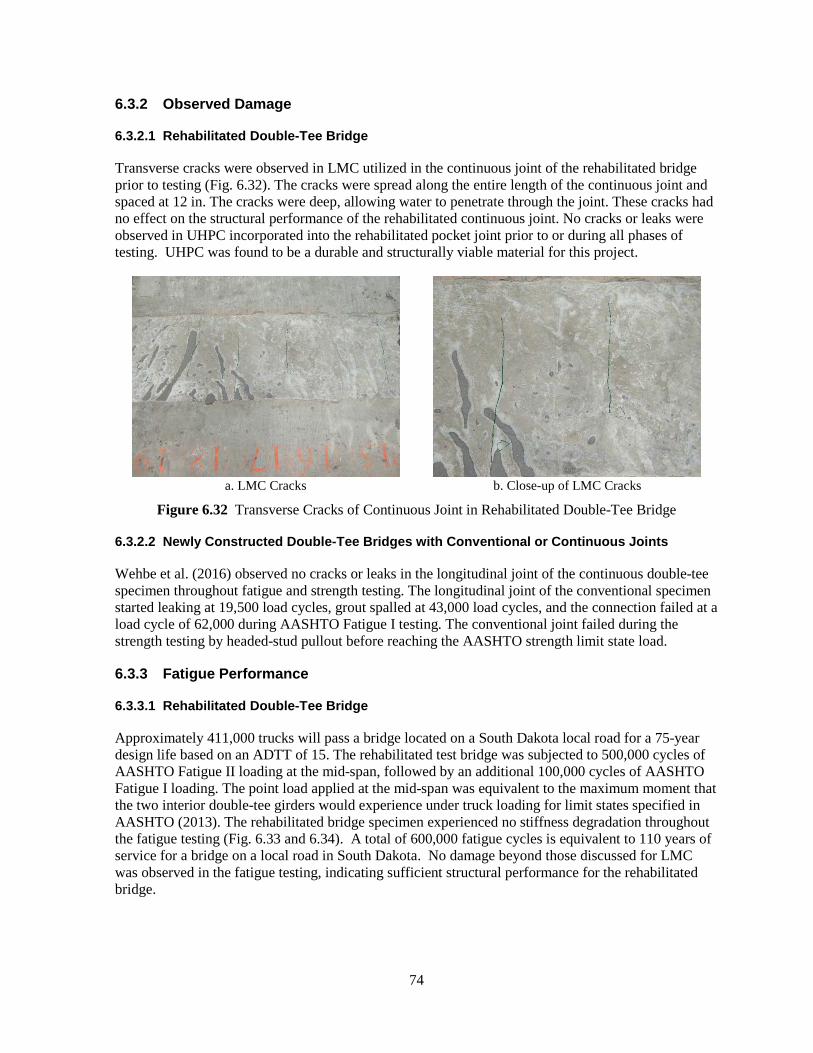
74
6.3.2 Observed Damage
6.3.2.1 Rehabilitated Double-Tee Bridge
Transverse cracks were observed in LMC utilized in the continuous joint of the rehabilitated bridge prior to testing (Fig. 6.32). The cracks were spread along the entire length of the continuous joint and spaced at 12 in. The cracks were deep, allowing water to penetrate through the joint. These cracks had no effect on the structural performance of the rehabilitated continuous joint. No cracks or leaks were observed in UHPC incorporated into the rehabilitated pocket joint prior to or during all phases of testing. UHPC was found to be a durable and structurally viable material for this project.
a. LMC Cracks b. Close-up of LMC Cracks
Figure 6.32 Transverse Cracks of Continuous Joint in Rehabilitated Double-Tee Bridge
6.3.2.2 Newly Constructed Double-Tee Bridges with Conventional or Continuous Joints
Wehbe et al. (2016) observed no cracks or leaks in the longitudinal joint of the continuous double-tee specimen throughout fatigue and strength testing. The longitudinal joint of the conventional specimen started leaking at 19,500 load cycles, grout spalled at 43,000 load cycles, and the connection failed at a load cycle of 62,000 during AASHTO Fatigue I testing. The conventional joint failed during the strength testing by headed-stud pullout before reaching the AASHTO strength limit state load.
6.3.3 Fatigue Performance
6.3.3.1 Rehabilitated Double-Tee Bridge
Approximately 411,000 trucks will pass a bridge located on a South Dakota local road for a 75-year design life based on an ADTT of 15. The rehabilitated test bridge was subjected to 500,000 cycles of AASHTO Fatigue II loading at the mid-span, followed by an additional 100,000 cycles of AASHTO Fatigue I loading. The point load applied at the mid-span was equivalent to the maximum moment that the two interior double-tee girders would experience under truck loading for limit states specified in AASHTO (2013). The rehabilitated bridge specimen experienced no stiffness degradation throughout the fatigue testing (Fig. 6.33 and 6.34). A total of 600,000 fatigue cycles is equivalent to 110 years of service for a bridge on a local road in South Dakota. No damage beyond those discussed for LMC was observed in the fatigue testing, indicating sufficient structural performance for the rehabilitated bridge.
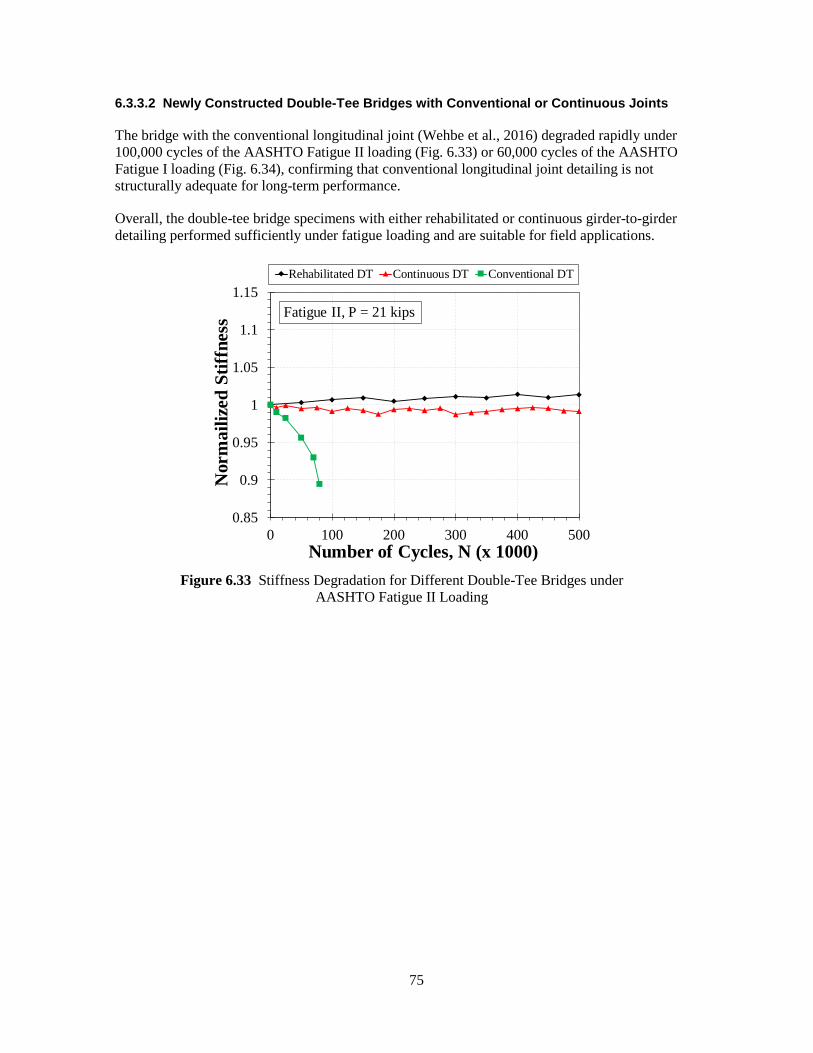
75
6.3.3.2 Newly Constructed Double-Tee Bridges with Conventional or Continuous Joints
The bridge with the conventional longitudinal joint (Wehbe et al., 2016) degraded rapidly under 100,000 cycles of the AASHTO Fatigue II loading (Fig. 6.33) or 60,000 cycles of the AASHTO Fatigue I loading (Fig. 6.34), confirming that conventional longitudinal joint detailing is not structurally adequate for long-term performance.
Overall, the double-tee bridge specimens with either rehabilitated or continuous girder-to-girder detailing performed sufficiently under fatigue loading and are suitable for field applications.
Figure 6.33 Stiffness Degradation for Different Double-Tee Bridges under
AASHTO Fatigue II Loading
0.85
0.9
0.95
1
1.05
1.1
1.15
0 100 200 300 400 500
Nor
mai
lized
Stif
fnes
s
Number of Cycles, N (x 1000)
Rehabilitated DT Continuous DT Conventional DT
Fatigue II, P = 21 kips
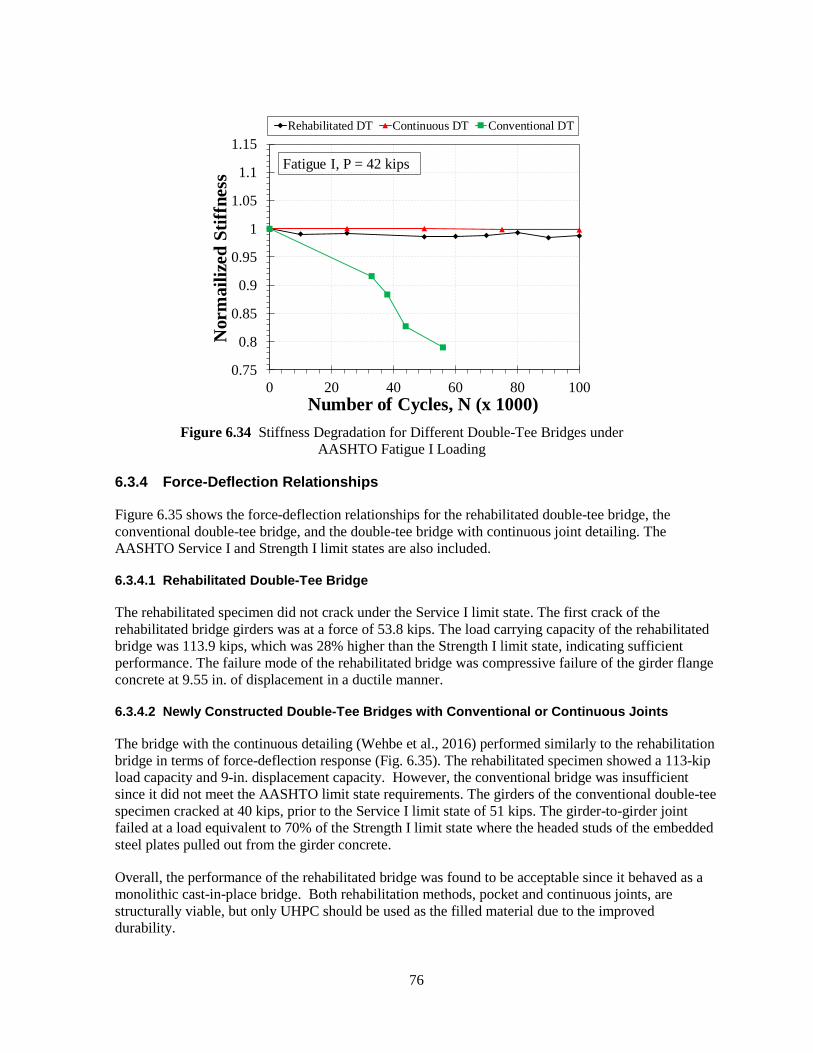
76
Figure 6.34 Stiffness Degradation for Different Double-Tee Bridges under
AASHTO Fatigue I Loading
6.3.4 Force-Deflection Relationships
Figure 6.35 shows the force-deflection relationships for the rehabilitated double-tee bridge, the conventional double-tee bridge, and the double-tee bridge with continuous joint detailing. The AASHTO Service I and Strength I limit states are also included.
6.3.4.1 Rehabilitated Double-Tee Bridge
The rehabilitated specimen did not crack under the Service I limit state. The first crack of the rehabilitated bridge girders was at a force of 53.8 kips. The load carrying capacity of the rehabilitated bridge was 113.9 kips, which was 28% higher than the Strength I limit state, indicating sufficient performance. The failure mode of the rehabilitated bridge was compressive failure of the girder flange concrete at 9.55 in. of displacement in a ductile manner.
6.3.4.2 Newly Constructed Double-Tee Bridges with Conventional or Continuous Joints
The bridge with the continuous detailing (Wehbe et al., 2016) performed similarly to the rehabilitation bridge in terms of force-deflection response (Fig. 6.35). The rehabilitated specimen showed a 113-kip load capacity and 9-in. displacement capacity. However, the conventional bridge was insufficient since it did not meet the AASHTO limit state requirements. The girders of the conventional double-tee specimen cracked at 40 kips, prior to the Service I limit state of 51 kips. The girder-to-girder joint failed at a load equivalent to 70% of the Strength I limit state where the headed studs of the embedded steel plates pulled out from the girder concrete.
Overall, the performance of the rehabilitated bridge was found to be acceptable since it behaved as a monolithic cast-in-place bridge. Both rehabilitation methods, pocket and continuous joints, are structurally viable, but only UHPC should be used as the filled material due to the improved durability.
0.75
0.8
0.85
0.9
0.95
1
1.05
1.1
1.15
0 20 40 60 80 100
Nor
mai
lized
Stif
fnes
s
Number of Cycles, N (x 1000)
Rehabilitated DT Continuous DT Conventional DT
Fatigue I, P = 42 kips
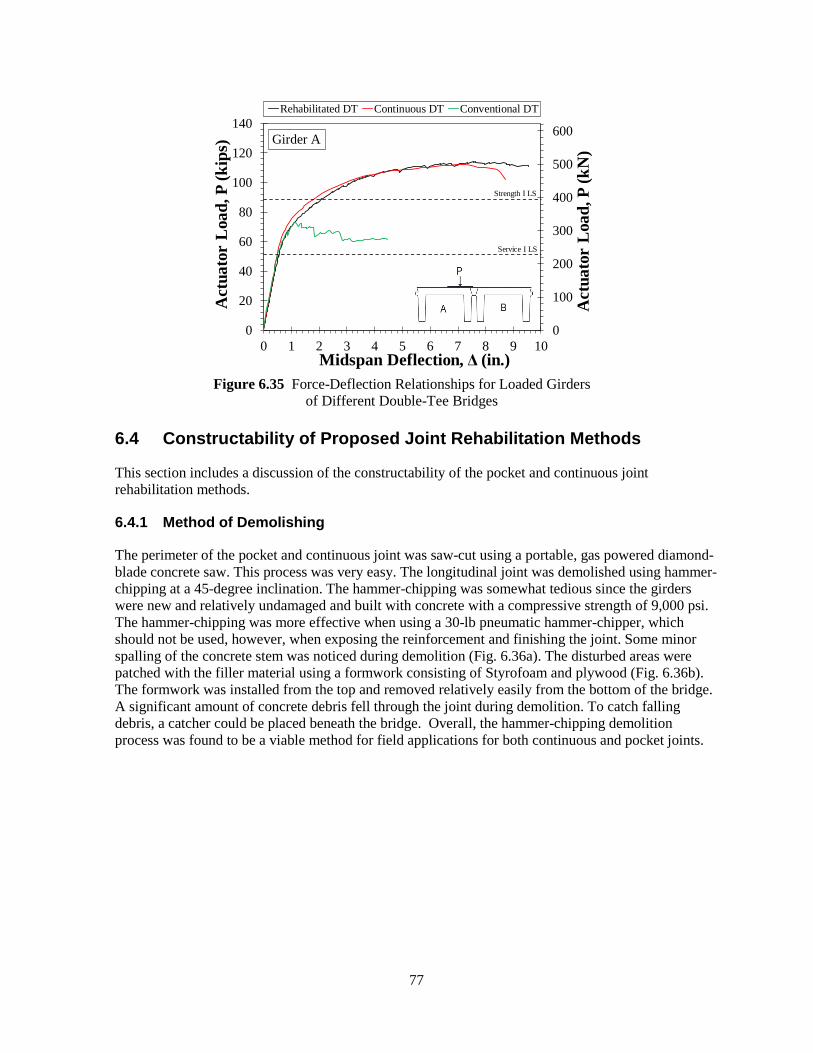
77
Figure 6.35 Force-Deflection Relationships for Loaded Girders
of Different Double-Tee Bridges
6.4 Constructability of Proposed Joint Rehabilitation Methods
This section includes a discussion of the constructability of the pocket and continuous joint rehabilitation methods.
6.4.1 Method of Demolishing
The perimeter of the pocket and continuous joint was saw-cut using a portable, gas powered diamond-blade concrete saw. This process was very easy. The longitudinal joint was demolished using hammer-chipping at a 45-degree inclination. The hammer-chipping was somewhat tedious since the girders were new and relatively undamaged and built with concrete with a compressive strength of 9,000 psi. The hammer-chipping was more effective when using a 30-lb pneumatic hammer-chipper, which should not be used, however, when exposing the reinforcement and finishing the joint. Some minor spalling of the concrete stem was noticed during demolition (Fig. 6.36a). The disturbed areas were patched with the filler material using a formwork consisting of Styrofoam and plywood (Fig. 6.36b). The formwork was installed from the top and removed relatively easily from the bottom of the bridge. A significant amount of concrete debris fell through the joint during demolition. To catch falling debris, a catcher could be placed beneath the bridge. Overall, the hammer-chipping demolition process was found to be a viable method for field applications for both continuous and pocket joints.
0
100
200
300
400
500
600
0
20
40
60
80
100
120
140
0 1 2 3 4 5 6 7 8 9 10
Act
uato
r L
oad,
P (k
N)
Act
uato
r L
oad,
P (k
ips)
Midspan Deflection, Δ (in.)
Rehabilitated DT Continuous DT Conventional DT
Strength I LS
Service I LS
Girder A
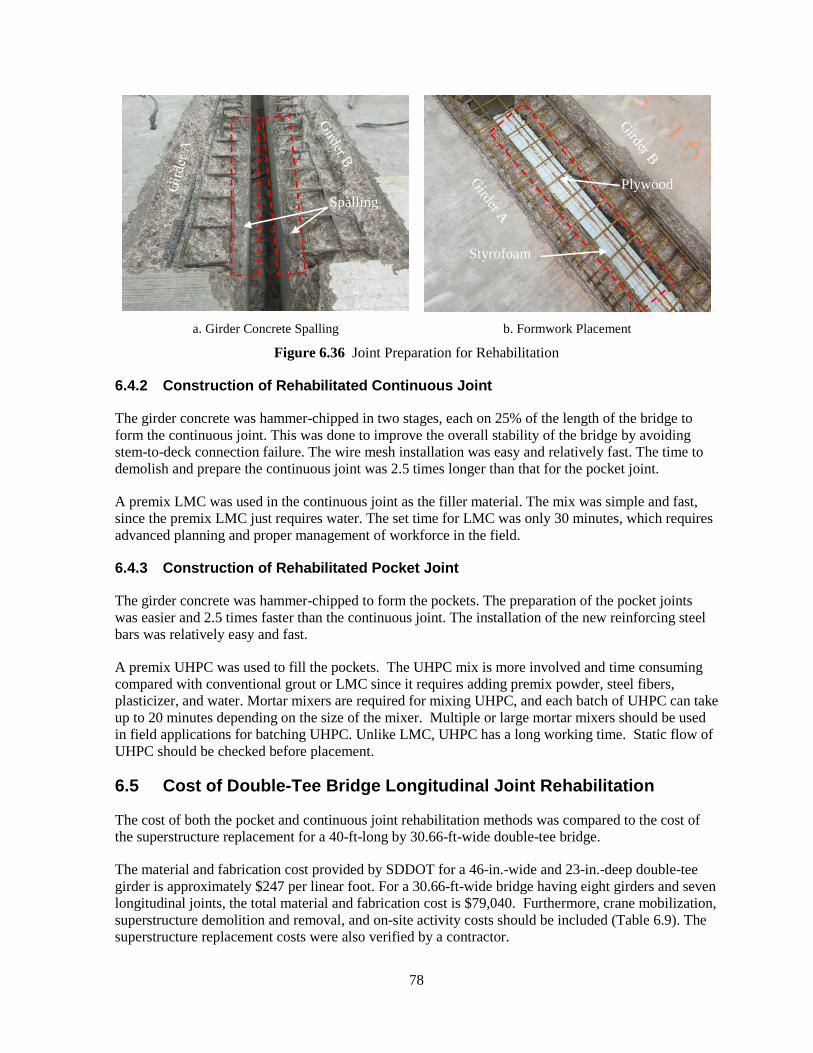
78
a. Girder Concrete Spalling b. Formwork Placement
Figure 6.36 Joint Preparation for Rehabilitation
6.4.2 Construction of Rehabilitated Continuous Joint
The girder concrete was hammer-chipped in two stages, each on 25% of the length of the bridge to form the continuous joint. This was done to improve the overall stability of the bridge by avoiding stem-to-deck connection failure. The wire mesh installation was easy and relatively fast. The time to demolish and prepare the continuous joint was 2.5 times longer than that for the pocket joint.
A premix LMC was used in the continuous joint as the filler material. The mix was simple and fast, since the premix LMC just requires water. The set time for LMC was only 30 minutes, which requires advanced planning and proper management of workforce in the field.
6.4.3 Construction of Rehabilitated Pocket Joint
The girder concrete was hammer-chipped to form the pockets. The preparation of the pocket joints was easier and 2.5 times faster than the continuous joint. The installation of the new reinforcing steel bars was relatively easy and fast.
A premix UHPC was used to fill the pockets. The UHPC mix is more involved and time consuming compared with conventional grout or LMC since it requires adding premix powder, steel fibers, plasticizer, and water. Mortar mixers are required for mixing UHPC, and each batch of UHPC can take up to 20 minutes depending on the size of the mixer. Multiple or large mortar mixers should be used in field applications for batching UHPC. Unlike LMC, UHPC has a long working time. Static flow of UHPC should be checked before placement.
6.5 Cost of Double-Tee Bridge Longitudinal Joint Rehabilitation
The cost of both the pocket and continuous joint rehabilitation methods was compared to the cost of the superstructure replacement for a 40-ft-long by 30.66-ft-wide double-tee bridge.
The material and fabrication cost provided by SDDOT for a 46-in.-wide and 23-in.-deep double-tee girder is approximately $247 per linear foot. For a 30.66-ft-wide bridge having eight girders and seven longitudinal joints, the total material and fabrication cost is $79,040. Furthermore, crane mobilization, superstructure demolition and removal, and on-site activity costs should be included (Table 6.9). The superstructure replacement costs were also verified by a contractor.
Spalling
Styrofoam
Plywood

79
Costs of double-tee bridge girder-to-girder joint rehabilitation were estimated by a contractor, who performed the rehabilitation of the double-tee test specimen in the Lohr Structures laboratory. The cost of the filler material was assumed to be $88/ft3. The approximate cost of the pocket and continuous joint rehabilitation detailing for a 40-ft-long and 30.7-ft-wide bridge with eight double-tee girders was $31,685 and $64,856, respectively, which are 26% and 53%, respectively, of the cost of the bridge superstructure replacement.
Note the aforementioned costs are raw and do not include mobilization, markup, taxes, fees, and insurance costs. A catch system is also needed underneath the bridge to collect debris during construction. The cost of a metal deck catcher is from $30,000 to $40,000 for a 40-ft-long, 31-ft-wide bridge. The cost of a heavy-duty debris safety net for a 40-ft-long, 31-ft-wide bridge is less than $5,000. The catcher cost was not included in the “neither replacement nor rehabilitation” option.
Both rehabilitation methods are structurally viable and are feasible in the field. In conclusion, the pocket rehabilitation method is the cheapest solution to preserve in-service double-tee bridges. The pocket rehabilitation method offers approximately 70% cost savings compared with the superstructure replacement option.
Table 6.9 Rehabilitation vs. Replacement Costs for 40-ft-long Double-Tee Bridges Type Item Cost
Superstructure Replacement
Girder Material and Fabrication $79, 040 Girder Demolition, Removal, and
Construction $25,000
Crane Mobilization $20,000 Total $124,040
Superstructure Rehabilitation
Pocket Joint $31,685 (or 26% of Superstructure Replacement)
Continuous Joint $64,856 (or 53% of Superstructure Replacement)
80
7. PROPOSED CONSTRUCTION SPECIFICATIONS This chapter includes proposed construction specifications for the rehabilitation of double-tee bridge girder-to-girder longitudinal joints. The proposed rehabilitation details are valid for 23-in.-deep double-tee girder bridges reinforced with welded wire fabrics in the flange (deck). Most double-tee bridges constructed after 2005 meet this requirement.
7.1 Preparation for Double-Tee Longitudinal Joint Rehabilitation
The general requirements for the demolition and preparation of double-tee bridge girder-to-girder longitudinal joints for field applications are the following:
1. A maximum 1-in.-deep saw-cut shall be allowed around the perimeter of the joints for the ease in demolition.
2. Hammer-chipping should be allowed for existing concrete demolition if meeting all of the following requirements:
a. For pocket joint rehabilitation, concrete shall be chipped with a slope of 45°. Concrete of the intermediate shear keys between the pockets shall be chipped with a minimum of 20° with respect to a vertical line.
b. For continuous joint rehabilitation, concrete shall be chipped with a slope of 45°. c. The use of either 15-lb or 30-lb pneumatic hammer chippers shall be allowed.
However, the 30-lb hammer chippers shall not be used for demolition of double-tee flange existing concrete deeper than 2.5 in. from the surface of the girder. In this case or in the vicinity of the girder reinforcement, only 15-lb hammer chippers shall be used.
3. The use of hydro-demolition shall be allowed to remove existing concrete from the double-tee girder flange and to form the joint.
4. After forming the joint and exposing the existing reinforcement, the joint surface shall be sand-blasted and pre-wetted with burlap for at least 12 hours prior to pouring.
5. Formwork shall be watertight and may be installed from the top of the bridge. Nets shall be installed beneath the bridge to catch falling debris.
7.2 Rehabilitation Methods for Double-Tee Longitudinal Joints
Feasibility and performance of two rehabilitation methods were investigated in the present study: (1) discrete pockets filled with ultra-high performance concrete (UHPC) and reinforced with steel bars, and (2) continuous joints filled with latex modified concrete (LMC) and reinforced with wire mesh. Of the two methods, only the UHPC pocket joint was found to be both structurally viable and durable. Even though the LMC continuous joint was structurally viable, it showed shrinkage cracks, which may cause serious durability issues in field applications. Therefore, only the UHPC filled pocket joint detailing should be used for the rehabilitation of double-tee bridge longitudinal joints. Continuous joint detailing may be an acceptable option for field applications if the joint is filled with UHPC or other material that does not shrink when used to fill relatively large gaps.
81
7.2.1 Pocket Detailing for Rehabilitation of Double-Tee Bridge Longitudinal Joints
Rehabilitation of girder-to-girder joints of double-tee bridges using the pocket detailing method shall be performed according to the following requirements:
1. Square pockets, each with a minimum side dimension of 18 in., shall be formed while meeting the preparation requirements. For each girder-to-girder joint, one pocket shall be placed at the mid-span of the bridge, and two pockets shall be placed no more than 24 in. away from the ends of the bridge (Fig. 7.1). The spacing of pockets between the mid-span and the end-span pockets shall not exceed 5 ft center-to-center. The pocket shall be filled with UHPC with a minimum 28-day compressive strength of 18 ksi.
2. The square pockets shall be reinforced with at least four ASTM A706 (or A615) Grade 60 No. 4 reinforcing steel bars in both the longitudinal and transverse directions of the bridge (Fig. 7.2b).
3. A continuous shear key with a minimum width of 5.5 in. shall be formed while meeting the preparation requirements and then be filled with UHPC. The UHPC intermediate keyways shall be longitudinally reinforced with at least two ASTM A706 (or A615) Grade 60 No. 4 bars (Fig. 7.2c) for the entire length of the bridge. A minimum of 2.5 in. clear cover shall be provided for the longitudinal reinforcement.
4. A minimum of 3-in. lap-splice between the pocket reinforcement and the deck exposed wires shall be provided in the transverse direction of the bridge. This length ensures full bar development to fracture (Fig. 7.2b and c).
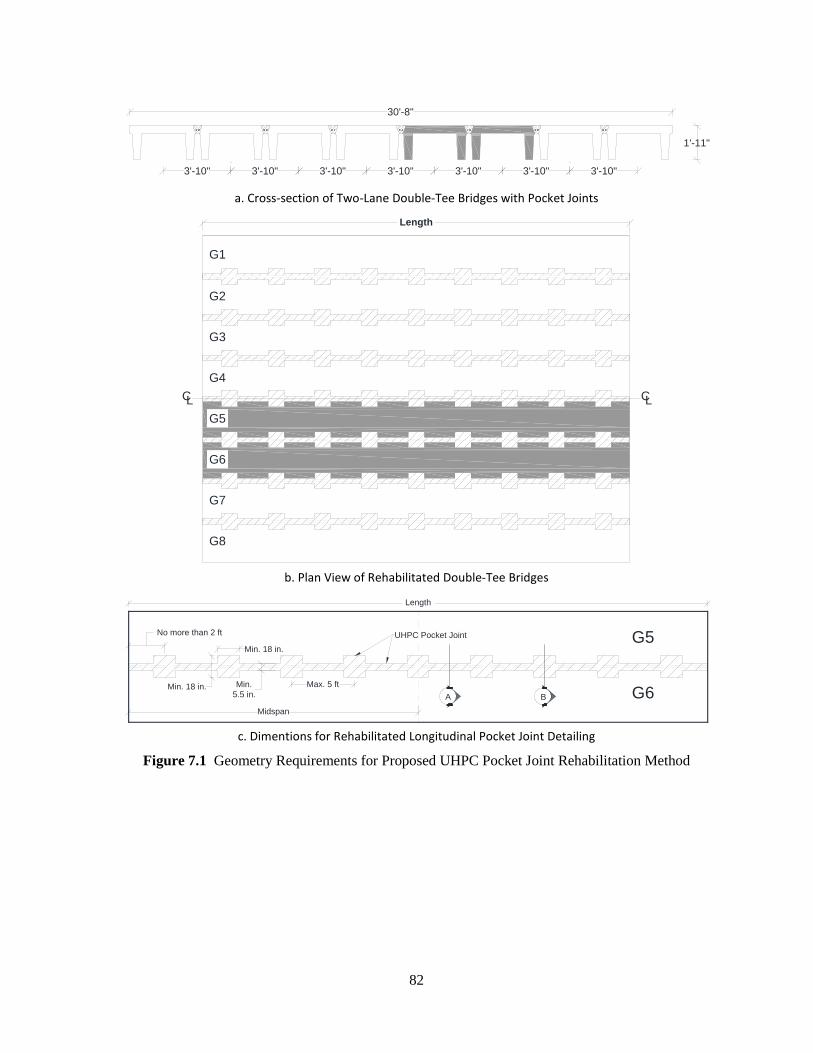
82
a. Cross-section of Two-Lane Double-Tee Bridges with Pocket Joints
b. Plan View of Rehabilitated Double-Tee Bridges
c. Dimentions for Rehabilitated Longitudinal Pocket Joint Detailing
Figure 7.1 Geometry Requirements for Proposed UHPC Pocket Joint Rehabilitation Method
1'-11"
3'-10" 3'-10" 3'-10" 3'-10" 3'-10" 3'-10" 3'-10"
30'-8"
G1
G5L
G2
G6
G3
C
G7
L
G4
G8
C
Length
G5
G6Max. 5 ft
Min. 18 in.
No more than 2 ft
Length
Min. 18 in.B
UHPC Pocket Joint
Midspan
Min.5.5 in. A
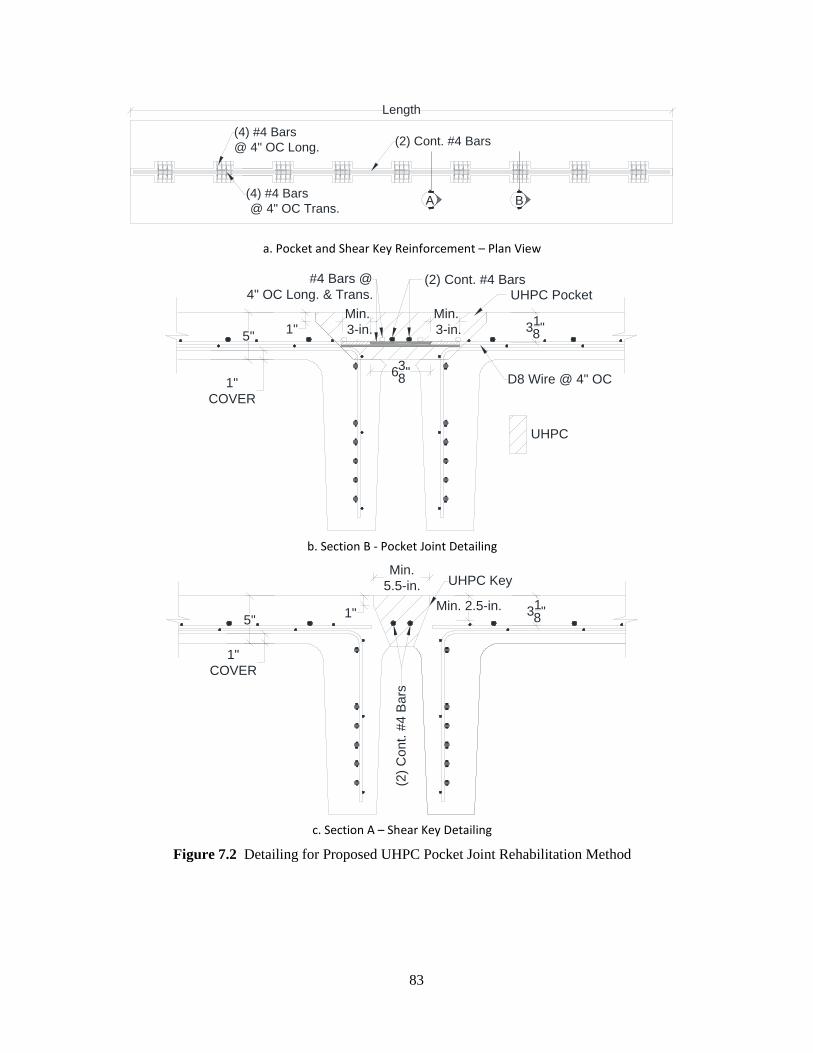
83
a. Pocket and Shear Key Reinforcement – Plan View
b. Section B - Pocket Joint Detailing
c. Section A – Shear Key Detailing
Figure 7.2 Detailing for Proposed UHPC Pocket Joint Rehabilitation Method
(2) Cont. #4 Bars
A
Length
(4) #4 Bars @ 4" OC Trans.
(4) #4 Bars@ 4" OC Long.
B
UHPC
(2) Cont. #4 Bars#4 Bars @4" OC Long. & Trans.
638"
1"Min. 3-in.
UHPC PocketMin. 3-in.
D8 Wire @ 4" OC
5" 318"
1"COVER
(2) C
ont.
#4 B
ars
318"
Min.5.5-in.
1"5"Min. 2.5-in.
UHPC Key
1"COVER

84
7.2.2 Continuous Detailing for Rehabilitation of Double-Tee Bridge Longitudinal Joints
Rehabilitation of girder-to-girder joints of double-tee bridges using the continuous detailing method shall be performed according to the following requirements:
1. Demolition and construction for each longitudinal joint of the bridge using the continuous detailing method shall be performed using segmental construction with quarter-span increments per joint. Joints shall not be rehabilitated along the length of the bridge all at once. Two adjacent joints shall not be demolished and rehabilitated at the same time.
2. A continuous opening with a minimum width of 22 in. shall be formed (Fig. 7.3) while meeting the preparation requirements. The joint shall be filled with UHPC with a minimum 28-day compressive strength of 18 ksi.
3. Other filler materials, such as non-shrink grout, LMC, and fiber reinforcement concrete, shall not be used for the continuous joints due to shrinkage cracking. New materials with improved durability suitable for filling large gaps may be used with bridge owner approval.
4. The continuous joints shall be reinforced with ASTM A497 Grade 70, 4-in. by 4-in. D8/D8 welded wire mesh (Fig. 7.4).
5. A minimum of a 5-in. lap-splice between the new and existing reinforcement shall be provided in the transverse direction of the bridge to ensure full development of the wires to fracture (Fig. 7.4b).
6. If wire meshes must be spliced over the length of the bridge, at least five No. 4 ASTM A706 (or A615) Grade 60 reinforcing steel bars shall be used to splice the wires in the longitudinal direction of the bridge with a minimum splice length of 12 in. per wire (Fig. 7.4c).
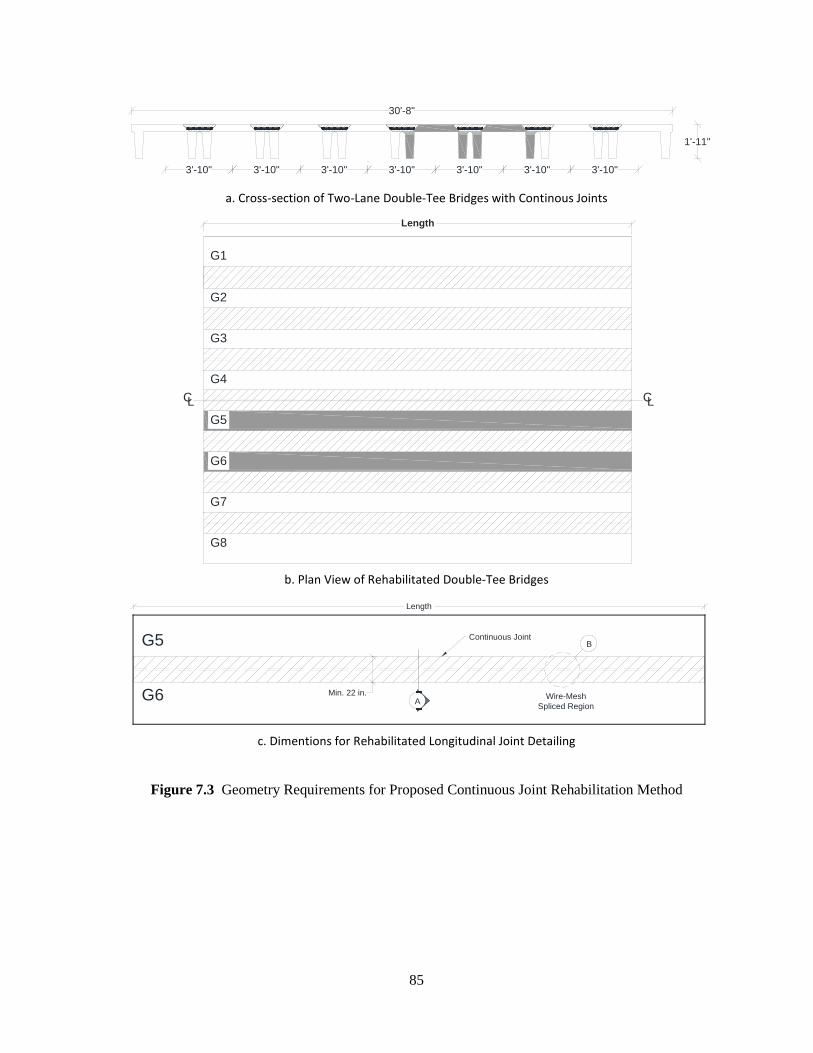
85
a. Cross-section of Two-Lane Double-Tee Bridges with Continous Joints
b. Plan View of Rehabilitated Double-Tee Bridges
c. Dimentions for Rehabilitated Longitudinal Joint Detailing
Figure 7.3 Geometry Requirements for Proposed Continuous Joint Rehabilitation Method
3'-10"3'-10" 3'-10"
30'-8"
1'-11"
3'-10"3'-10" 3'-10"3'-10"
G1
G5
C
G2
G6
L
G3
G7
CG4
G8
L
Length
Wire-MeshSpliced Region
G5
G6
B Continuous Joint
Min. 22 in.A
Length
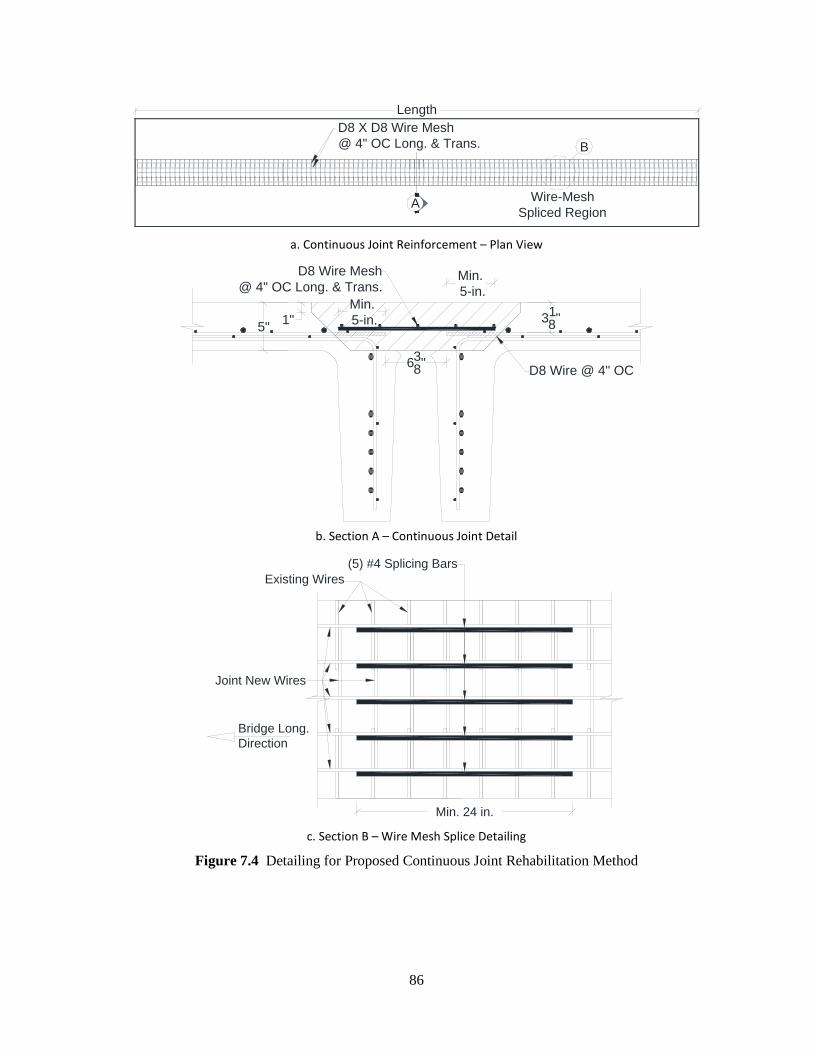
86
a. Continuous Joint Reinforcement – Plan View
b. Section A – Continuous Joint Detail
c. Section B – Wire Mesh Splice Detailing
Figure 7.4 Detailing for Proposed Continuous Joint Rehabilitation Method
Wire-MeshSpliced Region
D8 X D8 Wire Mesh@ 4" OC Long. & Trans. B
A
Length
5" 1"
Min. 5-in.
638"
318"
D8 Wire Mesh@ 4" OC Long. & Trans.
D8 Wire @ 4" OC
Min. 5-in.
Bridge Long.Direction
Existing Wires
Joint New Wires
(5) #4 Splicing Bars
Min. 24 in.
87
8. RECOMMENDATIONS Based on the findings of this study, the research team offers the following recommendations.
8.1 Recommendation 1: General
Longitudinal joints of prestressed double-tee girder bridges with a girder depth of 23 in. may be rehabilitated using the preparation and construction detailing specified in the following sections.
Experimental and analytical studies were performed only on 23-in.-deep double-tee girder bridges because they are more common than 30-in.-deep double-tee girder bridges in South Dakota.
8.2 Recommendation 2: Rehabilitation Methods
Both pocket and continuous detailing should be allowed for the rehabilitation of longitudinal joints of double-tee girder bridges.
Two methods for the rehabilitation of double-tee bridge longitudinal joints can be used in field: (1) pocket detailing, in which discrete pockets reinforced with steel bars are formed and then are connected through a longitudinally reinforced shear key, and (b) continuous detailing, in which a continuous longitudinal joint is reinforced with wire mesh. The use of the pocket detailing method is more economical than the continuous detailing method. The pocket rehabilitation detailing cost is expected to be approximately 30% of double-tee bridge superstructure replacement cost.
8.3 Recommendation 3: Joint Preparation for Rehabilitation
The guidelines as detailed in Sec. 7.1 should be adopted for the preparation of longitudinal joints of double-tee girder bridges to be rehabilitated using either pocket or continuous detailing.
The joint preparation method described in Sec. 7.1 of the present report was exercised during the rehabilitation of a full-scale 40-ft-long double-tee bridge test specimen. A contractor was hired to rehabilitate the bridge longitudinal joint. The proposed method of joint preparation was found simple and practical. The preparation for the pocket joints was faster and less involved compared with the continuous joint preparation.
8.4 Recommendation 4: Pocket Rehabilitation Method
The guidelines as detailed in Sec. 7.2.1 should be adopted for the rehabilitation of longitudinal joints of double-tee girder bridges using pocket detailing. Only ultra-high performance concrete (UHPC) should be used as the joint filler material.
The rehabilitation of longitudinal joints of double-tee girder bridges incorporating pocket detailing should be performed in accordance to the requirements proposed in Sec. 7.2.1. The full-scale testing of a 40-ft-long double-tee bridge, in which its longitudinal joint was rehabilitated using UHPC filled pocket detailing, showed that this rehabilitation method is viable and can meet all current AASHTO LRFD (2013) requirements. Other cementitious materials, such as non-shrink grout, fiber reinforced grout, or latex modified concrete (LMC) should not be used as the joint filler material due to durability issues.
88
8.5 Recommendation 5: Continuous Rehabilitation Method
The guidelines as detailed in Sec. 7.2.2 should be adopted for the rehabilitation of longitudinal joints of double-tee girder bridges using continuous detailing. Only UHPC should be used as the joint filler material.
The rehabilitation of longitudinal joints of double-tee girder bridges incorporating continuous detailing should be performed in accordance to the requirements proposed in Sec. 7.2.2. The full-scale testing of a 40-ft-long double-tee bridge, in which its longitudinal joint was rehabilitated using LMC filled continuous detailing, showed that this rehabilitation method is structurally viable meeting all current AASHTO LRFD (2013) requirements, but LMC exhibited deep shrinkage cracks with water seepage. Except UHPC, any other cementitious materials, such as non-shrink grout, fiber reinforced grout, or LMC, should not be used as the joint filler material due to durability issues.
89
9. CONCLUSIONS The girder-to-girder joints of double-tee bridges, the most common type of bridge on South Dakota local roads, are deteriorating due to improper detailing. Experimental and analytical programs were executed in the present study to investigate the feasibility and performance of two rehabilitation methods for the longitudinal joints in double-tee bridges. Based on this study, the following conclusions can be drawn.
• Of 20 rehabilitation alternatives, those with continuous detailing are more durable.
• Thirteen large-scale beam tests showed that at least a 3-in. lap-splice is needed for joints with UHPC, and a 5-in. lap-splice is need for joints with LMC. These minimum splice lengths ensure bar fracture.
• Finite element analyses showed that the use of pocket detailing for the rehabilitation of double-tee bridge girder-to-girder joints was feasible. The joint geometry was optimized through the analytical study.
• The full-scale bridge test confirmed that the non-shrink grout used in the conventional longitudinal joint detailing cracks under the AASHTO Service I limit state loading. Therefore, current double-tee joint detailing is inadequate.
• Hammer-chipping was found to be a viable demolition method.
• Findings from the literature indicated that UHPC and LMC were durable materials. Therefore, these materials were included in the present experimental study. However, transverse shrinkage cracks and water leaks were observed in LMC of the continuous joint of the full-scale bridge before testing. The LMC shrinkage cracks were mainly due to a restrained boundary condition. The shrinkage cracks had no effect on the bridge performance, but it might cause durability issues if this material is incorporated in the field. More durable filler materials such as UHPC may be used for the continuous detailing. No shrinkage cracks were observed for UHPC.
• Both rehabilitation longitudinal joint detailing, pocket and continuous, did not deteriorate through 500,000 cycles of the AASHTO Fatigue II loading and 100,000 cycles of the AASHTO Fatigue I loading. The rehabilitated bridge test specimen was subjected to a total of 110 years of service loads. The stiffness of the bridge remained constant throughout the fatigue testing.
• The first flexural crack in the stem of the loaded girder of the rehabilitated bridge was observed at 53.8 kips, which was higher than the Service I limit state of 51 kips.
• The rehabilitated bridge load carrying capacity of 113.9 kips was higher than the AASHTO Strength I limit state of 89 kips, indicating sufficient performance for the rehabilitated joints. The strength capacity of the rehabilitated specimen was 1.5 times higher than a conventional reference double-tee bridge test specimen.
• The force-deflection relationship of both girders of the rehabilitated bridge was essentially the same throughout strength testing, indicating monolithic behavior.
• No structural damage or yielding of the reinforcement was observed in both joint rehabilitation details during strength testing.
• The failure mode of the rehabilitated bridge was the flange concrete crushing in both girders at 9.55 in. of displacement in a ductile manner. No damage of rehabilitated joints was observed at the girder failure.

90
• The rehabilitation cost of the pocket and continuous joint detailing for a 40-ft-long, 30.6 ft-wide double-tee bridge is, respectively, only 26% and 53% of the superstructure replacement cost of the same bridge.
Overall, both proposed rehabilitation methods are structurally viable. However, the UHPC pocket alternative is the cheapest and the most durable solution to extend the service life of double-tee bridge longitudinal joints for another 75 years.
91
REFERENCES American Association of State Highway and Transportation Officials (AASHTO) (2013). “AASHTO
LRFD Bridge Design Specifications.” Washington, DC.
ASTM A416 / A416M-16 (2016). “Standard Specification for Low-Relaxation, Seven-Wire Steel Strand for Prestressed Concrete.” ASTM International, West Conshohocken, PA.
ASTM A497 / A497M-07 (2007). “Standard Specification for Steel Welded Wire Reinforcement, Deformed, for Concrete.” ASTM International, West Conshohocken, PA.
ASTM A615 / A615M-16 (2016). “Standard Specification for Deformed and Plain Carbon-Steel Bars for Concrete Reinforcement.” ASTM International, West Conshohocken, PA.
ASTM A706 / A706M-16 (2016). “Standard Specification for Deformed and Plain Low-Alloy Steel Bars for Concrete Reinforcement.” ASTM International, West Conshohocken, PA.
ASTM C39 / C39M-16 (2016). “Standard Test Method for Compressive Strength of Cylindrical Concrete Specimens.” ASTM International, West Conshohocken, PA.
ASTM C109 / C109M-16a (2016). “Standard Test Method for Compressive Strength of Hydraulic Cement Mortars (Using 2-in. or [50-mm] Cube Specimens).” ASTM International, West Conshohocken, PA.
ASTM C143 / C143M-15a (2015). “Standard Test Method for Slump of Hydraulic-Cement Concrete.” ASTM International, West Conshohocken, PA.
ASTM C231 / C231M-16 (2016) “Standard Test Method for Air Content of Freshly Mixed Concrete by the Pressure Method.” ASTM International, West Conshohocken, PA.
ASTM E8 / E8M-16a (2016). “Standard Test Methods for Tension Testing of Metallic Materials.” ASTM International, West Conshohocken, PA.
Baer, C. (2013). “Investigation of Longitudinal Joints Between Precast Prestressed Deck Bulb Tee Girders Using Latex Modified Concrete.” University of South Carolina - Columbia, Department of Civil Engineering, Columbia, SC.
Barde, A., Parameswaran, S., Chariton, T., Weiss, J., Cohen, M., and Newbolds, S. (2006). “Evaluation of Rapid Setting Cement-Based Materials for Patching and Repair.” Report No. FHWA/IN/JTRP/2006-11, Purdue University, School of Civil Engineering, West Lafayette, IN.
BASF Corporation (2011). “Placement of Latex Modified Concrete.” Charlotte, NC.
Beckemeyer, C., and McPeak, T. (1995). “Rural Road Design, Maintenance, and Rehabilitation Guide.” Report No. SD95-16-G2, South Dakota Department of Transportation, Office of Research, Pierre, SD.
Bohn, L. (2017), “Rehabilitation of Longitudinal Joints in Double-Tee Girder Bridge,” MS Thesis, South Dakota State University, 232 pp., available at: https://openprairie.sdstate.edu/etd/1216/.
92
Champa, J., Gulyas, R., and Wirthlin, G. (1995). “Evaluation of Keyway Grout Test Methods for Precast Concrete Bridges.” PCI Journal, Cleveland, OH.
Dayton Superior Corporation (2015). “Technical Data Sheet: HD-50.” Miamisburg, OH.
Five Star Products, Inc (2015). “Technical Data Sheet: Highway Patch FR.” Fairfield, CT.
French, C., Shield, C., Klaseus, D., Smith, M., Ericksson, W., and Ma, Z. (2011). “Cast-in-Place Concrete Connection for Precast Deck Systems.” National Cooperative Highway Research Program (NCHRP), Project No. 173, DOI: 10.17226/14556.
Graybeal, B. (2010). “Behavior of Field-Cast Ultra-High Performance Concrete Bridge Deck Connections Under Cyclic and Static Structural Loading.” FHWA Publication No. FHWA-HRT-11-023, Office of Infrastructure Research & Development, Federal Highway Administration, Mclean, VA.
Graybeal, B. (2014). “Design and Construction of Field-Cast UHPC Connections.” FHWA Publication No. FHWA-HRT-14-084, Office of Infrastructure Research & Development, Federal Highway Administration, Mclean, VA.
Haber, Z., and Graybeal, B. (2014). “Experimental Evaluation of Prefabricated Deck Panel Connections.” Office of Infrastructure Research & Development, Federal Highway Administration, Mclean, VA.
Headed Reinforcement Corporation (2014). “HRC 555 Headed Reinforcing Bars.” International Code Council – Evaluation Service Report No. ESR-2935, Fountain Valley, CA.
Jones, H. (2001). “Lateral Connections for Double Tee Bridges.” Report No. FHWA/TX-01/1856-2, Texas Transportation Institute, Texas A&M University, Austin, TX.
Jones, J., Ryan, K., and Saiidi, M. (2016). “Toward Successful Implementation of Prefabricated Deck Panels to Accelerate the Bridge Construction Process.” Center for Civil Engineering Earthquake Research, Report No. CCEER-16-05, Department of Civil and Environmental Engineering, University of Nevada, Reno, NV
Konrad, M. (2014). “Precast Bridge Girder for Improved Performance.” M.S. Thesis, South Dakota State University, Department of Civil and Environmental Engineering, Brookings, SD.
Marsh, M., Wernli, M., Garrett, B., Stanton, J., Eberhard, M., and Weinert, M. (2011). “Application of Accelerated Bridge Construction Connection in Moderate-to-High Seismic Regions.” NCHRP Report No. 698, Bergerabam; University of Washington, Seattle, WA.
Mingo, M. (2016). “Precast Full-Depth Panels on Inverted Bulb-tee Bridge Girders.” M.S. Thesis, South Dakota State University, Department of Civil Engineering, Brookings, SD.
Pierce, L., Uhlmeyer, J., Weston, J., Lovejoy, J., and Mahoney, J. (2002). “Ten-Year Performance of Dowel Bar Retrofit - Application, Performance, and Lessons Learned.” Washington State Department of Transportation, Olympia, WA.
SAP2000. (2016). Computers and Structures, Inc., Version 18, Berkeley, CA.
93
South Dakota Department of Transportation (SDDOT) (2004). “Standard Specifications for Roads and Bridges.” SDDOT, Pierre, SD.
Swenty, M., and Graybeal, B. (2013). “Material Characterization of Field-Cast Connection Grouts.” Report No. FHWA-HRT-13-041, Office of Infrastructure Research & Development, Federal Highway Administration, Mclean, VA.
Wehbe, N., and Konrad, M. (2016). “Precast Bridge Girder Detail for Improved Performance.” Report No. SD2013-01-F, South Dakota Department of Transportation, Office of Research, Pierre, SD.
Wehbe, N., Konrad, M., and Breyfogle, A. (2016). “Joint Detailing Between Double Tee Bridge Girders for Improved Serviceability and Strength.” Transportation Journal of the Transportation Research Board, No. 2592, Transportation Research Board, Washington, D.C, pp. 108-106.
Wenzlick, J. (2002). “Hydrodemolition and Repair of Bridge Decks.” Report No. RDT02-002, Missouri Department of Transportation, Jefferson City, MO.
Wenzlick, J. (2006). “Evaluation of Very High Strength Latex Modified Concrete Overlays.” Report No. OR06-004, Missouri Department of Transportation, Jefferson City, MO.
94
APPENDIX A. Double-Tee Joint Rehabilitation Brochure
95


