Embed Size (px)
Citation preview
A
eaTu(bdvi©
K
1
1
ht2
f
0
Landscape and Urban Planning 77 (2006) 393–407
Relationship between landscape visual attributes and spatialpattern indices: A test study in Mediterranean-climate landscapes
Gonzalo de la Fuente de Val, Jose A. Atauri, Jose V. de Lucio ∗
Department of Ecology, Facultad de Ciencias, Universidad de Alcala, 28871-Alcala de Henares, Madrid, Spain
Received 6 May 2004; received in revised form 29 April 2005; accepted 1 May 2005Available online 1 August 2005
bstract
The analysis of the relationships between landscape visual quality and landscape structural properties is an active area ofnvironmental perception research. The aim of this study was to determine the relationship between landscape spatial patternnd the rating of visual aesthetic quality. Eight landscape photographs were evaluated for 11 visual attributes by 98 respondents.he scores obtained for these 11 attributes were subjected to principal components analysis in order to summarize the qualitiessed by the respondents and thus determine their visual preferences. For each photograph, three window sizes were definedwith respect to a landcover map) to cover the different areas corresponding to the visual field (foreground, mid-ground andackground). The landscape spatial structure for each window was analyzed using spatial metrics. The correlation between each
imension and the spatial pattern indices of the landscape were then calculated. Positive correlations were obtained betweenisual aesthetic quality and a number of landscape pattern indices. The results suggest that landscape heterogeneity might be anmportant factor in determining visual aesthetic quality.2005 Elsevier B.V. All rights reserved.
lity; Lan
ttbts
eywords: Visual aesthetic quality; Spatial metrics; Landscape qua
. Introduction
.1. Landscape visual quality assessment
In recent years, the scenic beauty of the landscape
as become an important component of planning prac-ices and management strategies (Daniel, 2001; Scott,002). Historically, scenic beauty has played an impor-∗ Corresponding author. Tel.: +34 91 8855092;ax: +34 91 8854929.
E-mail address: [email protected] (J.V. de Lucio).
a
r2(ct
169-2046/$ – see front matter © 2005 Elsevier B.V. All rights reserved.doi:10.1016/j.landurbplan.2005.05.003
dscape structure
ant role in the way landscape has been protected and inhe conservation of places considered to be of singulareauty (Preece, 1991). Social concern for the degrada-ion of the landscape has renewed the importance ofcenic value as a key aspect of landscape managementnd planning.
Landscape visual quality can be defined as “theelative aesthetic excellence of a landscape” (Daniel,
001) and examined in terms of observer appreciationLothian, 1999). Knowledge of the elements and pro-esses that organize landscapes is indispensable, but sooo are the perceptions, opinions and valuations of the
3 pe and
phsw
trobpps1
mItptSito1fPtsrc(o
lpahsTiaKeatino
becmrilctplson
tctwopctt
scltrat(acp
1
ti((
94 G. de la Fuente de Val et al. / Landsca
ublic (Kline and Wechelns, 1998). Little is known,owever, about the relationships between landscapetructure and perception; better knowledge of themould be clearly advantageous (Litton, 1979).The assessment of the visual aesthetic quality of
he landscape has seen important developments inecent years. There are two main paradigms of the the-ry of landscape aesthetics, both of which are on theasis of landscape assessment methods: the “objective”aradigm (where visual quality is inherent to landscaperoperties) and the “subjective” paradigm (where land-cape quality is “in the eye of the beholder”) (Lothian,999).
With respect to these two paradigms, two approxi-ations to landscape assessment can be differentiated.
n the “expert-based” approach, the biophysical fea-ures of the landscape are transformed into formalarameters (form, line and variety), which are assumedo be indicators of landscape quality (Daniel, 2001).ome studies have emphasized the role of vegetation
n landscape preferences (Bishop, 1996), as well as spa-ial diversity or complexity (understood as the varietyf the landscape’s constitutive elements) (Crawford,994), waterform (Bishop and Hulse, 1994), land-orm, topography and viewshed (Hammitt et al., 1994;urcell and Lamb, 1998). Naturalness has been shown
o have a positive effect on the aesthetic quality ofcenery (Schroeder, 1987). Human influence, such asesidential backgrounds (urban, suburban and rural),ity streets (Baldwin et al., 1996) or industrial areasPurcell et al., 1994), etc., can have a negative impactn preference (Strumse, 1994).
In the “perception-based” approach (Daniel, 2001),andscape visual aesthetic quality is considered to be aroduct of the visible features of the landscape inter-cting with psychological processes taking place in theuman observer. This approach can be assessed throughensory–perceptual parameters or cognitive constructs.his relies on the idea that environments are sources of
nformation and that humans are information-seekingnimals actively pursuing knowledge. Kaplan andaplan (1982) proposed a model for landscape pref-
rences in which landscape organization is understoods a source of information that satisfies the motiva-
ion to comprehend and explore and indicated themportance of the following factors in the determi-ation of preference: coherence (logical placement,rder), legibility (permeability of the scene, accessi-mi
t
Urban Planning 77 (2006) 393–407
ility and ease of orientation), complexity (diversity oflements and visual richness) and mystery (the con-ealment of parts of the scene and the promise ofore information that encourages exploration) (see
eview by Stamps, 2004). In this model, understand-ng is favored in environments that are coherent andegible and exploration is enhanced in those that areomplex and mysterious. Appleton (1975) identifieswo components of landscape aesthetic preference: theossibility of accessing the information harbored by theandscape, termed “prospect” and safety or the pos-ibility of refuge termed as “refuge”. Prospect is thepportunity to gain a clear view, refuge is the opportu-ity to hide from the view of others.
According to Bernaldez and Gallardo (1989), affec-ive responses to landscape depend as much on visualharacteristics as on the characteristics of the specta-or; certain spectator attitudes appear to be correlatedith landscape preferences. Formal configurations (therganization of components), such as shape, colors,attern, etc., stand out as positive influences. Semanticharacteristics (the process of recognition of the objectshat compose the scene), such as diversity, viewshed,ransparency, etc., are also important.
These models relate quantifiable aspects of land-capes with subjective landscape preferences, but theyannot be easily used to evaluate the scenic quality ofarge regions (Hunziker and Kienast, 1999). Further,hey are not directly usable by planners and naturalesource managers, who work primarily with mapsnd other aerial representations of the landscape ratherhan individual perspectives, thoughts and perceptionsForman, 1995; Palmer, 2004). A synthesis of bothpproximations, i.e., of the “expert-based” and “per-eption-based” methods, would provide a more com-rehensive approach to the study of landscape quality.
.2. Landscape visual quality and spatial pattern
The possibility of relating landscape spatial metricso quantitative measurements of landscape preferences an area of great theoretical and practical interestGiles and Trani, 1999). Crawford (1994) and Palmer1997) have suggested that the spatial metrics com-
only used in landscape ecology could be used asndicators of visual aesthetic quality.Several studies have recently been performed in
his area. For example, in Salamanca (Spain), Saldana
pe and
eppstot
isasasMme
sthdtKtlt
rltn
1
rledaas
d
2
2
((Cgsa
2
scpsuFwwptsim1
dna
G. de la Fuente de Val et al. / Landsca
t al. (1986) demonstrated a relationship between theerceived diversity of the landscape and landscapereferences. Hunziker and Kienast (1999) used severalpatial metrics to analyze the structure and composi-ion of a group of photographs with different degreesf afforestation. The results showed significant correla-ions between diversity and contagion and scenic value.
Franco et al. (2003) related scenic beauty rat-ngs of photographs to the landscape metrics of thecenes represented (variables measured on the localnd landscape scales) and found significant relation-hips between landscape metrics (such as diversitynd circuitry) and preference. In a study to predictcenic perception in a changing landscape in Dennis,
assachusetts (USA), Palmer (2004) found approxi-ately half of the variation in scenic perceptions to be
xplained by spatial landscape metrics.Of all the spatial metrics of the landscape, diver-
ity and heterogeneity are perhaps the easiest to relateo human perception of the environment. Greateromogeneity increases coherence, while fragmentationecreases it. Greater coherence is generally thoughto be positively related to scenic value (Kaplan andaplan, 1982; Palmer, 2004). Subsequently, the frac-
al dimension should provide an indication of visibleandscape complexity, which is thought to contributeo scenic value (Purcell et al., 2001).
In summary, landcover structure plays a significantole in the visual quality of the landscape. Linkingandscape structure to landscape preferences should,herefore, be of the greatest interest in landscape plan-ing and management.
.3. Aim of the study
The aim of the present study was to explore theelationships between landscape visual quality andandscape spatial pattern. The first working hypothesisxplored was that landscape visual quality can beecomposed into a limited number of independentttributes. The second was that some of these visualttributes may be correlated with landscape spatialtructure.
To test these hypotheses, a two-phase experimentalesign was used:
Phase 1: Scores for eight landscape photographs wereobtained with respect to the visual landscape attributes
2
q
Urban Planning 77 (2006) 393–407 395
found in the existing literature. These were thenreduced into a few independent attributes by principalcomponents analysis (PCA).Phase 2: The statistical relationships between theseattributes and the spatial structure of the landscapemosaic, derived from landcover maps of the same areacaptured in the images, were examined by correlationtechniques.
. Methods
.1. Study area
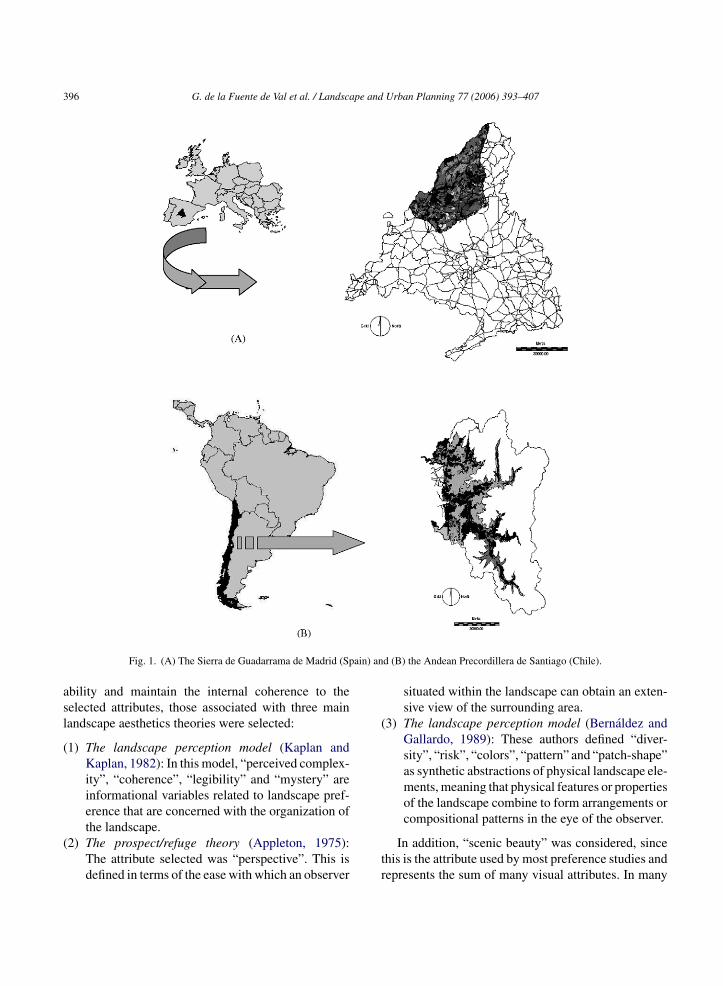
Two Mediterranean landscapes were examinedFig. 1): the central sector of the Sierra de GuadarramaMadrid, Spain) and the Andean foothills (Santiago,hile). These two areas were selected since they areood representatives of Mediterranean mountain land-capes subject to high leisure activity demands (bothre close to large urban areas).
.2. Selection of landscape images
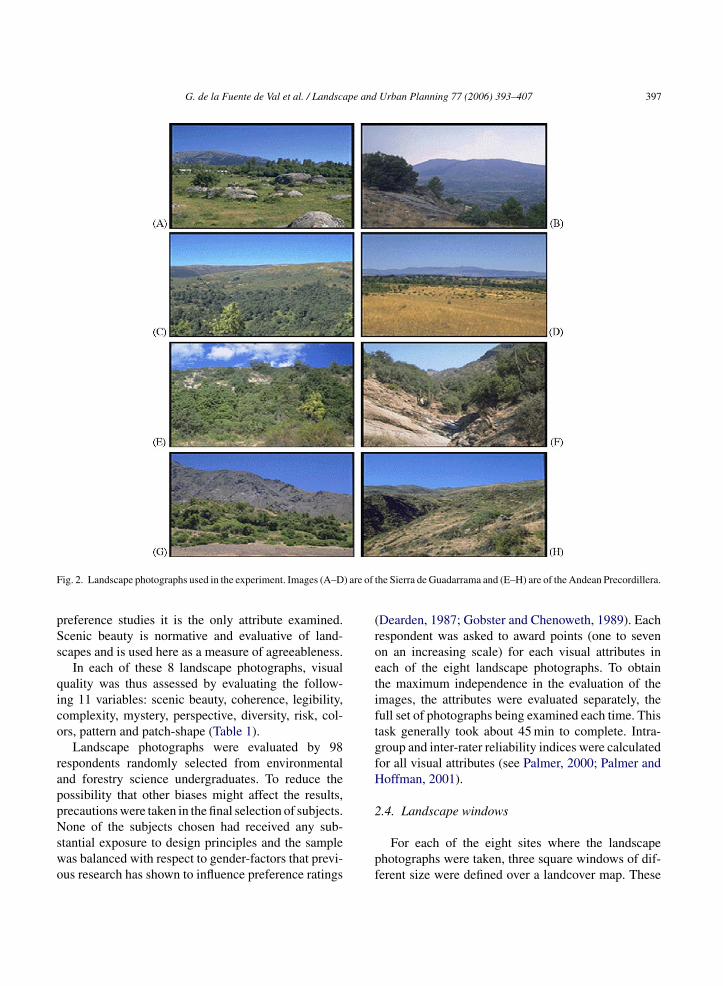
The study areas were overlain with a regular grid ofampling points to facilitate a series of landscape per-eption experiments. The distance between samplingoints (50 for the Madrid site and 60 for the Santiagoite) was 5 km. This grid was actually designed to besed in several different experiments—hence, its size.our photographs of the landscape (facing north, east,est and south) were taken at each point. Points thatere inaccessible were not covered. For the specificurposes of this experiment, four photographs werehen randomly selected from the total pool for eachtudy site (Fig. 2). The use of photographs for evaluat-ng landscape aesthetics has been established as a valid
ethod for most experiments (Steinitz, 1990; Strumse,994; Stamps, 1997).
To reduce the time of evaluation and prevent respon-ent fatigue (which could influence the results), theumber of photographs to be examined was intention-lly kept small (Hunziker and Kienast, 1999).
.3. Assessment of landscape visual attributes
Many different attributes for assessing landscapeuality can be found in the literature. To reduce vari-
396 G. de la Fuente de Val et al. / Landscape and Urban Planning 77 (2006) 393–407
ain) an
asl
(
(
(
Fig. 1. (A) The Sierra de Guadarrama de Madrid (Sp
bility and maintain the internal coherence to theelected attributes, those associated with three mainandscape aesthetics theories were selected:
1) The landscape perception model (Kaplan andKaplan, 1982): In this model, “perceived complex-ity”, “coherence”, “legibility” and “mystery” areinformational variables related to landscape pref-erence that are concerned with the organization of
the landscape.2) The prospect/refuge theory (Appleton, 1975):The attribute selected was “perspective”. This isdefined in terms of the ease with which an observer
tr
d (B) the Andean Precordillera de Santiago (Chile).
situated within the landscape can obtain an exten-sive view of the surrounding area.
3) The landscape perception model (Bernaldez andGallardo, 1989): These authors defined “diver-sity”, “risk”, “colors”, “pattern” and “patch-shape”as synthetic abstractions of physical landscape ele-ments, meaning that physical features or propertiesof the landscape combine to form arrangements or
compositional patterns in the eye of the observer.In addition, “scenic beauty” was considered, sincehis is the attribute used by most preference studies andepresents the sum of many visual attributes. In many
G. de la Fuente de Val et al. / Landscape and Urban Planning 77 (2006) 393–407 397
F ) are of t
pSs
qico
rappNswo
(roetiftgfH
2
ig. 2. Landscape photographs used in the experiment. Images (A–D
reference studies it is the only attribute examined.cenic beauty is normative and evaluative of land-capes and is used here as a measure of agreeableness.
In each of these 8 landscape photographs, visualuality was thus assessed by evaluating the follow-ng 11 variables: scenic beauty, coherence, legibility,omplexity, mystery, perspective, diversity, risk, col-rs, pattern and patch-shape (Table 1).
Landscape photographs were evaluated by 98espondents randomly selected from environmentalnd forestry science undergraduates. To reduce theossibility that other biases might affect the results,recautions were taken in the final selection of subjects.
one of the subjects chosen had received any sub-tantial exposure to design principles and the sampleas balanced with respect to gender-factors that previ-us research has shown to influence preference ratings
pf
he Sierra de Guadarrama and (E–H) are of the Andean Precordillera.
Dearden, 1987; Gobster and Chenoweth, 1989). Eachespondent was asked to award points (one to sevenn an increasing scale) for each visual attributes inach of the eight landscape photographs. To obtainhe maximum independence in the evaluation of themages, the attributes were evaluated separately, theull set of photographs being examined each time. Thisask generally took about 45 min to complete. Intra-roup and inter-rater reliability indices were calculatedor all visual attributes (see Palmer, 2000; Palmer andoffman, 2001).
.4. Landscape windows
For each of the eight sites where the landscapehotographs were taken, three square windows of dif-erent size were defined over a landcover map. These
398 G. de la Fuente de Val et al. / Landscape and Urban Planning 77 (2006) 393–407
Table 1Overview of the visual attributes examined and the corresponding questions and measurement scales (all visual attributes were measured onseven-point scales) [adapted from Appleton, 1975; Kaplan and Kaplan, 1982; Bernaldez and Gallardo, 1989; Gobster and Chenoweth, 1989;Strumse, 1994]
Visual attributes Question and scale
Scenic beauty Assign a value to the scene in the picture according to its scenic beauty
Coherence Indicate to what degree the picture is coherent. Assign a low value if there are strange elements that do not integratewith the rest of the landscape elements
Legibility Assign a low value if you consider that the image is confused or difficult to interpret
Complexity Indicate whether the spatial structure is simple or complex
Mystery Assign a high value if you perceive the picture is hiding information, that there are elements hidden to the observer
Perspective Assign a high value if you perceive the place in the picture has a wide or panoramic perspective
Diversity Assign a high value if you perceive the image to have a lot of different elements and a low value if the picture has fewdifferent elements
Risk Assign a high score if you perceive the components of the image to evoke hazards or dangers or a lower score if theypresent a hospitable, safe and sure appearance
Colors Assign a high value if you perceive the image to have many different colors
P age to h
P e eleme
wtdca
(
F(
attern Assign a high value if you perceive the im
atch-shape Assign a high value if you perceive that th
indows covered three distance-zones: the area close
o the observer or foreground (a 500 m × 500 m win-ow, 0.25 km2), the mid-ground (an intermediate areaomprising the former and the mid-ground (1 km2)nd the background (5 km × 5 km window, 25 km2)B
ta
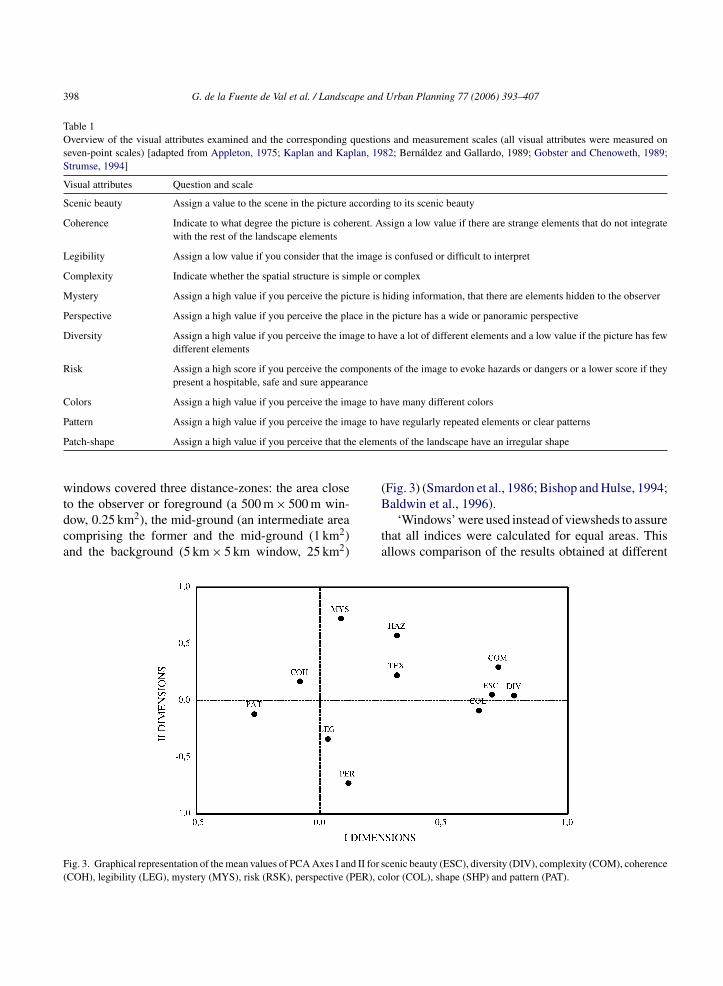
ig. 3. Graphical representation of the mean values of PCA Axes I and II for sCOH), legibility (LEG), mystery (MYS), risk (RSK), perspective (PER), c
ave regularly repeated elements or clear patterns
nts of the landscape have an irregular shape
Fig. 3) (Smardon et al., 1986; Bishop and Hulse, 1994;
aldwin et al., 1996).‘Windows’ were used instead of viewsheds to assurehat all indices were calculated for equal areas. Thisllows comparison of the results obtained at different
cenic beauty (ESC), diversity (DIV), complexity (COM), coherenceolor (COL), shape (SHP) and pattern (PAT).
pe and
stic
2
sstaetae
cttnan(gt(
c
TI
I
N
P
P
E
I
C
F
V
R
F
G. de la Fuente de Val et al. / Landsca
ampling points with different sized viewsheds (dueo variations in topography) and allows calculationsnvolving different window sizes to be performed in aomparable fashion.
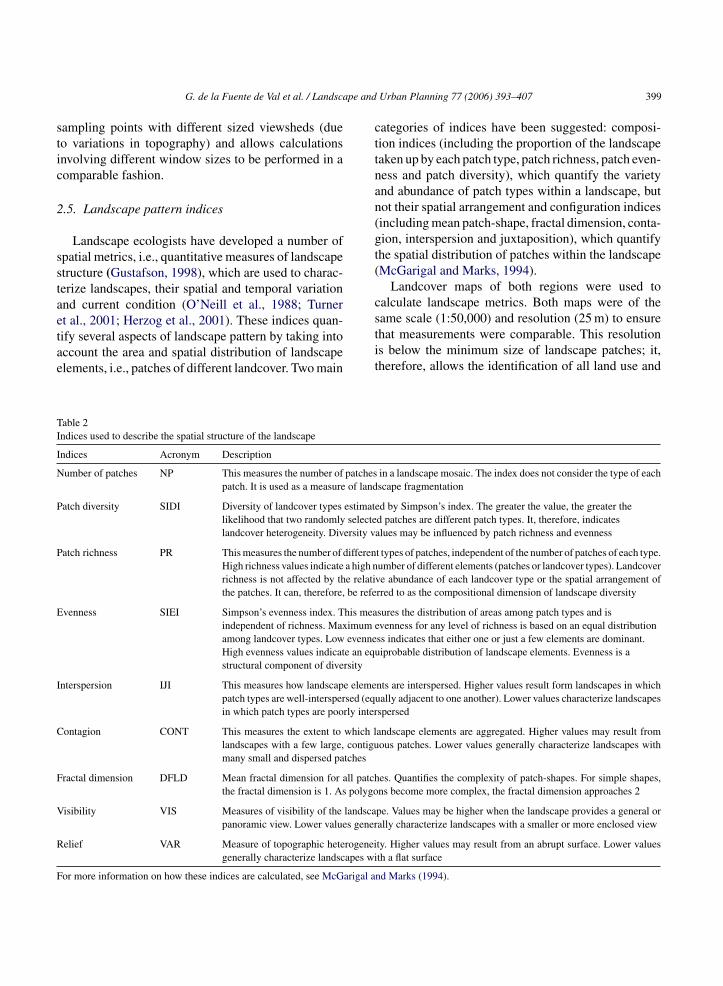
.5. Landscape pattern indices
Landscape ecologists have developed a number ofpatial metrics, i.e., quantitative measures of landscapetructure (Gustafson, 1998), which are used to charac-erize landscapes, their spatial and temporal variationnd current condition (O’Neill et al., 1988; Turner
t al., 2001; Herzog et al., 2001). These indices quan-ify several aspects of landscape pattern by taking intoccount the area and spatial distribution of landscapelements, i.e., patches of different landcover. Two mainstit
able 2ndices used to describe the spatial structure of the landscape
ndices Acronym Description
umber of patches NP This measures the number of patchespatch. It is used as a measure of land
atch diversity SIDI Diversity of landcover types estimatelikelihood that two randomly selectelandcover heterogeneity. Diversity v
atch richness PR This measures the number of differenHigh richness values indicate a high nrichness is not affected by the relatithe patches. It can, therefore, be refe
venness SIEI Simpson’s evenness index. This meaindependent of richness. Maximum eamong landcover types. Low evenneHigh evenness values indicate an equstructural component of diversity
nterspersion IJI This measures how landscape elemepatch types are well-interspersed (eqin which patch types are poorly inter
ontagion CONT This measures the extent to which llandscapes with a few large, contigumany small and dispersed patches
ractal dimension DFLD Mean fractal dimension for all patchthe fractal dimension is 1. As polygo
isibility VIS Measures of visibility of the landscapanoramic view. Lower values gener
elief VAR Measure of topographic heterogeneigenerally characterize landscapes wi
or more information on how these indices are calculated, see McGarigal a
Urban Planning 77 (2006) 393–407 399
ategories of indices have been suggested: composi-ion indices (including the proportion of the landscapeaken up by each patch type, patch richness, patch even-ess and patch diversity), which quantify the varietynd abundance of patch types within a landscape, butot their spatial arrangement and configuration indicesincluding mean patch-shape, fractal dimension, conta-ion, interspersion and juxtaposition), which quantifyhe spatial distribution of patches within the landscapeMcGarigal and Marks, 1994).
Landcover maps of both regions were used toalculate landscape metrics. Both maps were of the
ame scale (1:50,000) and resolution (25 m) to ensurehat measurements were comparable. This resolutions below the minimum size of landscape patches; it,herefore, allows the identification of all land use andin a landscape mosaic. The index does not consider the type of eachscape fragmentation
d by Simpson’s index. The greater the value, the greater thed patches are different patch types. It, therefore, indicatesalues may be influenced by patch richness and evenness
t types of patches, independent of the number of patches of each type.umber of different elements (patches or landcover types). Landcoverve abundance of each landcover type or the spatial arrangement ofrred to as the compositional dimension of landscape diversity
sures the distribution of areas among patch types and isvenness for any level of richness is based on an equal distributionss indicates that either one or just a few elements are dominant.iprobable distribution of landscape elements. Evenness is a
nts are interspersed. Higher values result form landscapes in whichually adjacent to one another). Lower values characterize landscapesspersed
andscape elements are aggregated. Higher values may result fromous patches. Lower values generally characterize landscapes with
es. Quantifies the complexity of patch-shapes. For simple shapes,ns become more complex, the fractal dimension approaches 2
pe. Values may be higher when the landscape provides a general orally characterize landscapes with a smaller or more enclosed view
ty. Higher values may result from an abrupt surface. Lower valuesth a flat surface
nd Marks (1994).
4 pe and Urban Planning 77 (2006) 393–407
vtl
o(ptwpsa
wTcv
2
wpm1o(Tvwah
italpo(s
3
3
b
Table 3Internal consistency reliability coefficients (intra-group and inter-rater) for the visual attributes variables
Visual attributes Reliability
Intra-group Inter-rater
Scenic beauty 0.94 0.34Coherence 0.92 0.27Legibility 0.93 0.29Complexity 0.95 0.37Mystery 0.89 0.20Perspective 0.98 0.65Diversity 0.97 0.49Risk 0.96 0.42Colors 0.96 0.40
00 G. de la Fuente de Val et al. / Landsca
egetation types. Landcover classifications reflectinghose types distinguishable by human perception at theandscape scale were used in both maps (Palmer, 1997).
A set of landscape indices was calculated for eachf the three window sizes, using Fragstats softwareMcGarigal and Marks, 1994). The landscape com-osition indices used included number of landcoverypes, diversity and evenness. Landscape configurationas measured according to the number of landcoveratches, contagion, patch interspersion and patch-hape. Table 2 provides definitions of the indices (forll formulae, see McGarigal and Marks, 1994).
The indices of visibility and relief for the two regionsere obtained from a digital elevation model (DEM).he visibility at each of the sampling points was cal-ulated taking into account the mean height of theegetation and urban elements (see Table 2 for details).
.6. Statistical analyses
To detect relationships among visual attributes, PCAas performed using the rotation varimax normalizedrocedure. The initial data matrix was formed by asany variables as there were visual attributes (i.e.,
1). The usefulness of this approach in the analysisf scenic quality has been reported in previous studiesStrumse, 1994; Hanyu, 1997; Todorova et al., 2004).his method allows redundancies to be detected amongariables (in this case, visual attributes) and showshich are the most important in explaining the vari-
bility of the data, i.e., which visual attributes have theighest loading factors.
The visual attributes with highest loading factorsn each axis of the PCA were then selected. Correla-ions between the mean scores for these visual attributesnd each of the landscape pattern indices were calcu-ated. All correlations were performed using the non-arametric Spearman rank test. Since a high degreef redundancy has been reported in landscape indicesTurner and Ruscher, 1988), correlations among all thepatial pattern indices were also calculated.
. Results
.1. Reliability
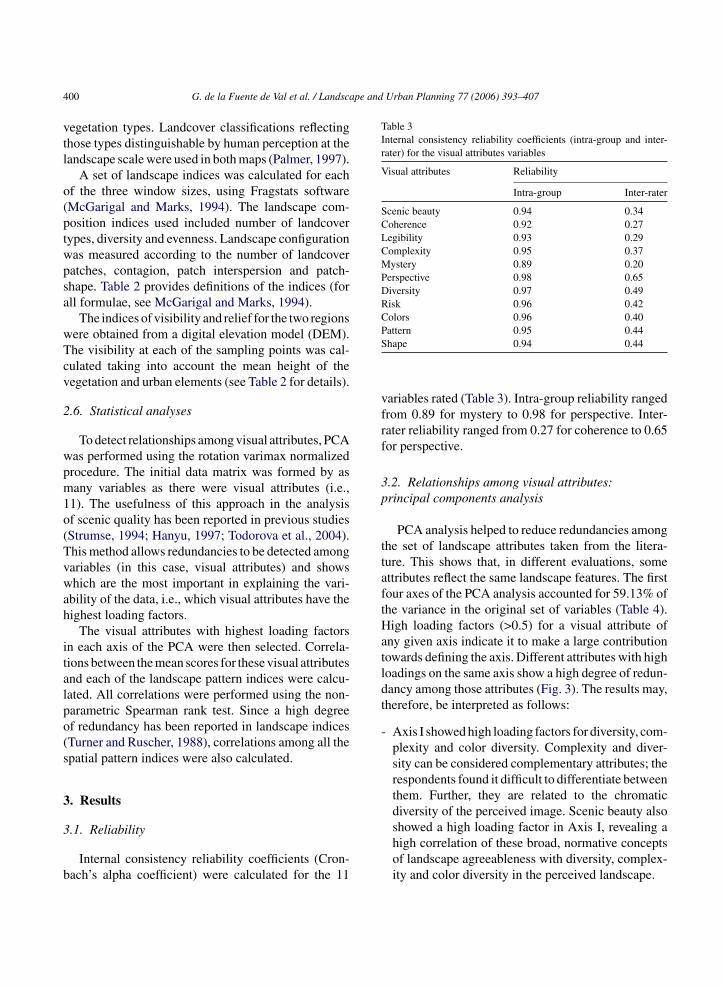
Internal consistency reliability coefficients (Cron-ach’s alpha coefficient) were calculated for the 11
Pattern 0.95 0.44Shape 0.94 0.44
variables rated (Table 3). Intra-group reliability rangedfrom 0.89 for mystery to 0.98 for perspective. Inter-rater reliability ranged from 0.27 for coherence to 0.65for perspective.
3.2. Relationships among visual attributes:principal components analysis
PCA analysis helped to reduce redundancies amongthe set of landscape attributes taken from the litera-ture. This shows that, in different evaluations, someattributes reflect the same landscape features. The firstfour axes of the PCA analysis accounted for 59.13% ofthe variance in the original set of variables (Table 4).High loading factors (>0.5) for a visual attribute ofany given axis indicate it to make a large contributiontowards defining the axis. Different attributes with highloadings on the same axis show a high degree of redun-dancy among those attributes (Fig. 3). The results may,therefore, be interpreted as follows:
- Axis I showed high loading factors for diversity, com-plexity and color diversity. Complexity and diver-sity can be considered complementary attributes; therespondents found it difficult to differentiate betweenthem. Further, they are related to the chromaticdiversity of the perceived image. Scenic beauty also
showed a high loading factor in Axis I, revealing ahigh correlation of these broad, normative conceptsof landscape agreeableness with diversity, complex-ity and color diversity in the perceived landscape.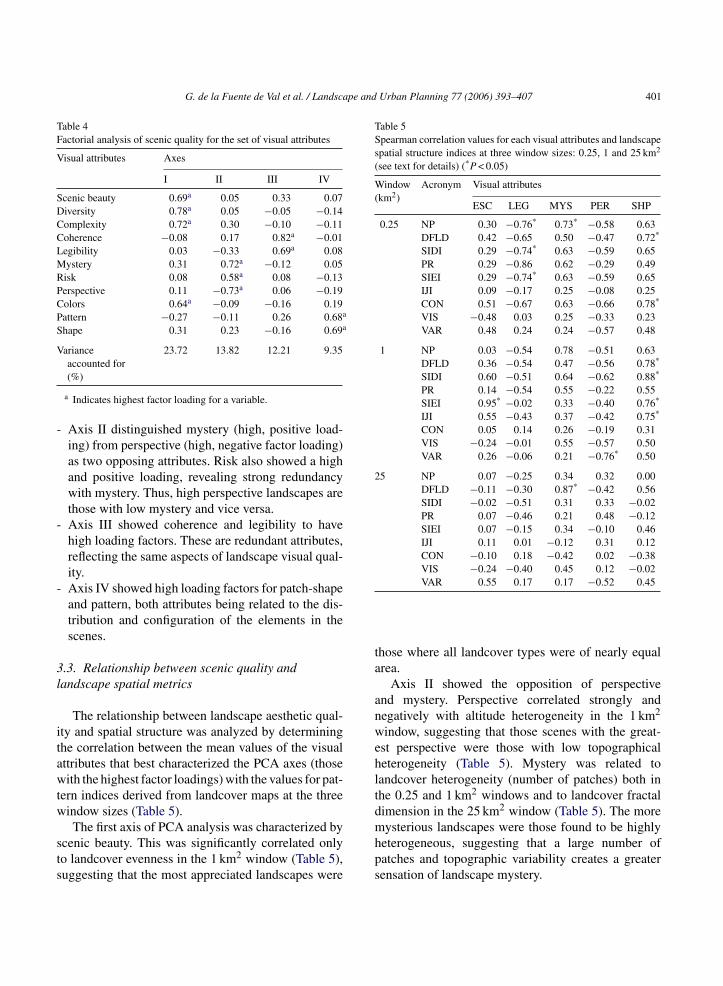
G. de la Fuente de Val et al. / Landscape and Urban Planning 77 (2006) 393–407 401
Table 4Factorial analysis of scenic quality for the set of visual attributes
Visual attributes Axes
I II III IV
Scenic beauty 0.69a 0.05 0.33 0.07Diversity 0.78a 0.05 −0.05 −0.14Complexity 0.72a 0.30 −0.10 −0.11Coherence −0.08 0.17 0.82a −0.01Legibility 0.03 −0.33 0.69a 0.08Mystery 0.31 0.72a −0.12 0.05Risk 0.08 0.58a 0.08 −0.13Perspective 0.11 −0.73a 0.06 −0.19Colors 0.64a −0.09 −0.16 0.19Pattern −0.27 −0.11 0.26 0.68a
Shape 0.31 0.23 −0.16 0.69a
Variance 23.72 13.82 12.21 9.35
-
-
-
3l
itawtw
sts
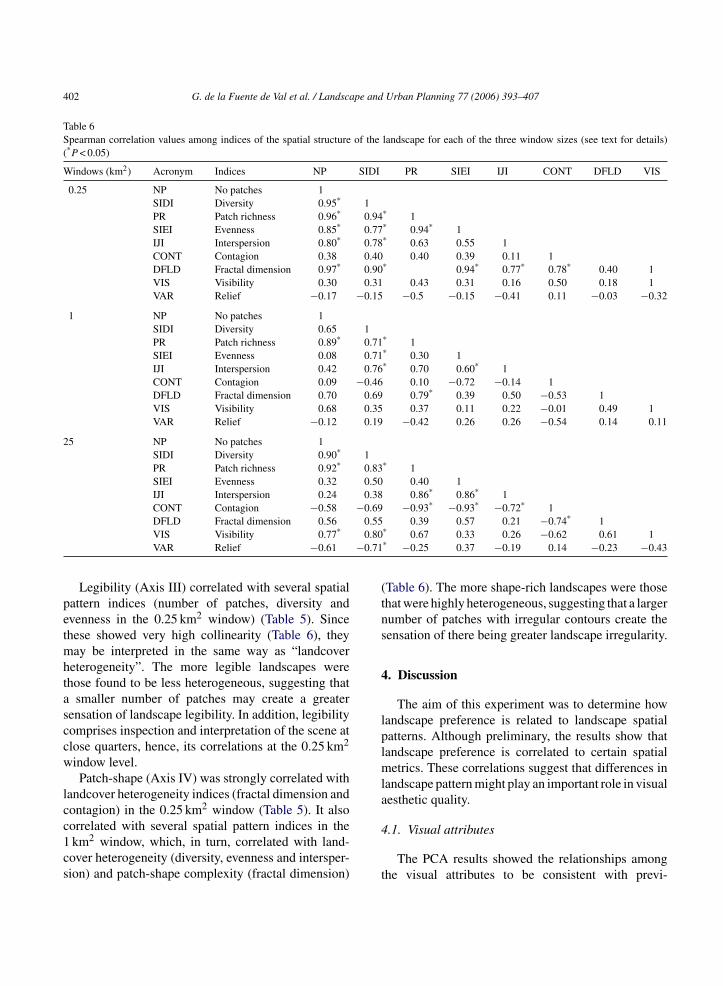
Table 5Spearman correlation values for each visual attributes and landscapespatial structure indices at three window sizes: 0.25, 1 and 25 km2
(see text for details) (*P < 0.05)
Window(km2)
Acronym Visual attributes
ESC LEG MYS PER SHP
0.25 NP 0.30 −0.76* 0.73* −0.58 0.63DFLD 0.42 −0.65 0.50 −0.47 0.72*
SIDI 0.29 −0.74* 0.63 −0.59 0.65PR 0.29 −0.86 0.62 −0.29 0.49SIEI 0.29 −0.74* 0.63 −0.59 0.65IJI 0.09 −0.17 0.25 −0.08 0.25CON 0.51 −0.67 0.63 −0.66 0.78*
VIS −0.48 0.03 0.25 −0.33 0.23VAR 0.48 0.24 0.24 −0.57 0.48
1 NP 0.03 −0.54 0.78 −0.51 0.63DFLD 0.36 −0.54 0.47 −0.56 0.78*
SIDI 0.60 −0.51 0.64 −0.62 0.88*
PR 0.14 −0.54 0.55 −0.22 0.55SIEI 0.95* −0.02 0.33 −0.40 0.76*
IJI 0.55 −0.43 0.37 −0.42 0.75*
CON 0.05 0.14 0.26 −0.19 0.31VIS −0.24 −0.01 0.55 −0.57 0.50VAR 0.26 −0.06 0.21 −0.76* 0.50
25 NP 0.07 −0.25 0.34 0.32 0.00DFLD −0.11 −0.30 0.87* −0.42 0.56SIDI −0.02 −0.51 0.31 0.33 −0.02PR 0.07 −0.46 0.21 0.48 −0.12SIEI 0.07 −0.15 0.34 −0.10 0.46IJI 0.11 0.01 −0.12 0.31 0.12CON −0.10 0.18 −0.42 0.02 −0.38VIS −0.24 −0.40 0.45 0.12 −0.02
ta
anwehltd
accounted for(%)
a Indicates highest factor loading for a variable.
Axis II distinguished mystery (high, positive load-ing) from perspective (high, negative factor loading)as two opposing attributes. Risk also showed a highand positive loading, revealing strong redundancywith mystery. Thus, high perspective landscapes arethose with low mystery and vice versa.Axis III showed coherence and legibility to havehigh loading factors. These are redundant attributes,reflecting the same aspects of landscape visual qual-ity.Axis IV showed high loading factors for patch-shapeand pattern, both attributes being related to the dis-tribution and configuration of the elements in thescenes.
.3. Relationship between scenic quality andandscape spatial metrics
The relationship between landscape aesthetic qual-ty and spatial structure was analyzed by determininghe correlation between the mean values of the visualttributes that best characterized the PCA axes (thoseith the highest factor loadings) with the values for pat-
ern indices derived from landcover maps at the threeindow sizes (Table 5).
The first axis of PCA analysis was characterized bycenic beauty. This was significantly correlated onlyo landcover evenness in the 1 km2 window (Table 5),uggesting that the most appreciated landscapes were
mhps
VAR 0.55 0.17 0.17 −0.52 0.45
hose where all landcover types were of nearly equalrea.
Axis II showed the opposition of perspectivend mystery. Perspective correlated strongly andegatively with altitude heterogeneity in the 1 km2
indow, suggesting that those scenes with the great-st perspective were those with low topographicaleterogeneity (Table 5). Mystery was related toandcover heterogeneity (number of patches) both inhe 0.25 and 1 km2 windows and to landcover fractalimension in the 25 km2 window (Table 5). The moreysterious landscapes were those found to be highly
eterogeneous, suggesting that a large number ofatches and topographic variability creates a greaterensation of landscape mystery.
402 G. de la Fuente de Val et al. / Landscape and Urban Planning 77 (2006) 393–407
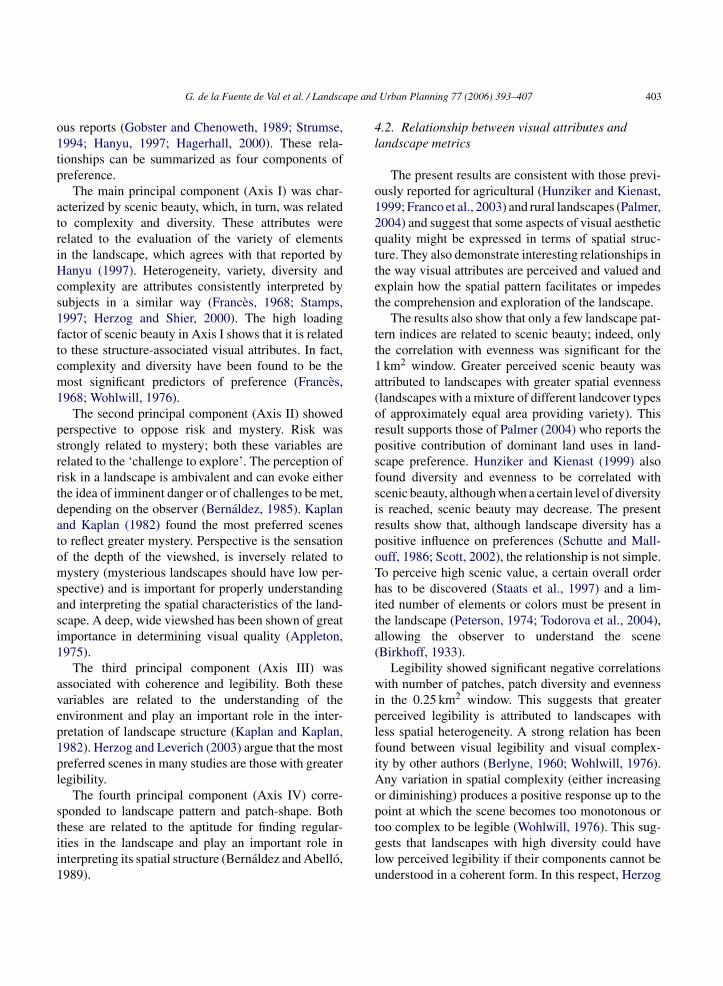
Table 6Spearman correlation values among indices of the spatial structure of the landscape for each of the three window sizes (see text for details)(*P < 0.05)
Windows (km2) Acronym Indices NP SIDI PR SIEI IJI CONT DFLD VIS
0.25 NP No patches 1SIDI Diversity 0.95* 1PR Patch richness 0.96* 0.94* 1SIEI Evenness 0.85* 0.77* 0.94* 1IJI Interspersion 0.80* 0.78* 0.63 0.55 1CONT Contagion 0.38 0.40 0.40 0.39 0.11 1DFLD Fractal dimension 0.97* 0.90* 0.94* 0.77* 0.78* 0.40 1VIS Visibility 0.30 0.31 0.43 0.31 0.16 0.50 0.18 1VAR Relief −0.17 −0.15 −0.5 −0.15 −0.41 0.11 −0.03 −0.32
1 NP No patches 1SIDI Diversity 0.65 1PR Patch richness 0.89* 0.71* 1SIEI Evenness 0.08 0.71* 0.30 1IJI Interspersion 0.42 0.76* 0.70 0.60* 1CONT Contagion 0.09 −0.46 0.10 −0.72 −0.14 1DFLD Fractal dimension 0.70 0.69 0.79* 0.39 0.50 −0.53 1VIS Visibility 0.68 0.35 0.37 0.11 0.22 −0.01 0.49 1VAR Relief −0.12 0.19 −0.42 0.26 0.26 −0.54 0.14 0.11
25 NP No patches 1SIDI Diversity 0.90* 1PR Patch richness 0.92* 0.83* 1SIEI Evenness 0.32 0.50 0.40 1IJI Interspersion 0.24 0.38 0.86* 0.86* 1CONT Contagion −0.58 −0.69 −0.93* −0.93* −0.72* 1
0.550.80
−0.71
petmhtasccw
lcc1cs
(tns
4
lplmla
DFLD Fractal dimension 0.56VIS Visibility 0.77*
VAR Relief −0.61
Legibility (Axis III) correlated with several spatialattern indices (number of patches, diversity andvenness in the 0.25 km2 window) (Table 5). Sincehese showed very high collinearity (Table 6), they
ay be interpreted in the same way as “landcovereterogeneity”. The more legible landscapes werehose found to be less heterogeneous, suggesting that
smaller number of patches may create a greaterensation of landscape legibility. In addition, legibilityomprises inspection and interpretation of the scene atlose quarters, hence, its correlations at the 0.25 km2
indow level.Patch-shape (Axis IV) was strongly correlated with
andcover heterogeneity indices (fractal dimension andontagion) in the 0.25 km2 window (Table 5). It also
orrelated with several spatial pattern indices in thekm2 window, which, in turn, correlated with land-over heterogeneity (diversity, evenness and intersper-ion) and patch-shape complexity (fractal dimension)4
t
0.39 0.57 0.21 −0.74* 1* 0.67 0.33 0.26 −0.62 0.61 1* −0.25 0.37 −0.19 0.14 −0.23 −0.43
Table 6). The more shape-rich landscapes were thosehat were highly heterogeneous, suggesting that a largerumber of patches with irregular contours create theensation of there being greater landscape irregularity.
. Discussion
The aim of this experiment was to determine howandscape preference is related to landscape spatialatterns. Although preliminary, the results show thatandscape preference is correlated to certain spatial
etrics. These correlations suggest that differences inandscape pattern might play an important role in visualesthetic quality.
.1. Visual attributes
The PCA results showed the relationships amonghe visual attributes to be consistent with previ-
pe and
o1tp
atriHcs1ftcm1
psrrtdatomsasi1
avep1pl
stii1
4l
o12qttet
tt1a(orpsfsirpoThita(
wiplfiAop
G. de la Fuente de Val et al. / Landsca
us reports (Gobster and Chenoweth, 1989; Strumse,994; Hanyu, 1997; Hagerhall, 2000). These rela-ionships can be summarized as four components ofreference.
The main principal component (Axis I) was char-cterized by scenic beauty, which, in turn, was relatedo complexity and diversity. These attributes wereelated to the evaluation of the variety of elementsn the landscape, which agrees with that reported byanyu (1997). Heterogeneity, variety, diversity and
omplexity are attributes consistently interpreted byubjects in a similar way (Frances, 1968; Stamps,997; Herzog and Shier, 2000). The high loadingactor of scenic beauty in Axis I shows that it is relatedo these structure-associated visual attributes. In fact,omplexity and diversity have been found to be theost significant predictors of preference (Frances,
968; Wohlwill, 1976).The second principal component (Axis II) showed
erspective to oppose risk and mystery. Risk wastrongly related to mystery; both these variables areelated to the ‘challenge to explore’. The perception ofisk in a landscape is ambivalent and can evoke eitherhe idea of imminent danger or of challenges to be met,epending on the observer (Bernaldez, 1985). Kaplannd Kaplan (1982) found the most preferred sceneso reflect greater mystery. Perspective is the sensationf the depth of the viewshed, is inversely related toystery (mysterious landscapes should have low per-
pective) and is important for properly understandingnd interpreting the spatial characteristics of the land-cape. A deep, wide viewshed has been shown of greatmportance in determining visual quality (Appleton,975).
The third principal component (Axis III) wasssociated with coherence and legibility. Both theseariables are related to the understanding of thenvironment and play an important role in the inter-retation of landscape structure (Kaplan and Kaplan,982). Herzog and Leverich (2003) argue that the mostreferred scenes in many studies are those with greateregibility.
The fourth principal component (Axis IV) corre-ponded to landscape pattern and patch-shape. Both
hese are related to the aptitude for finding regular-ties in the landscape and play an important role innterpreting its spatial structure (Bernaldez and Abello,989).tglu
Urban Planning 77 (2006) 393–407 403
.2. Relationship between visual attributes andandscape metrics
The present results are consistent with those previ-usly reported for agricultural (Hunziker and Kienast,999; Franco et al., 2003) and rural landscapes (Palmer,004) and suggest that some aspects of visual aestheticuality might be expressed in terms of spatial struc-ure. They also demonstrate interesting relationships inhe way visual attributes are perceived and valued andxplain how the spatial pattern facilitates or impedeshe comprehension and exploration of the landscape.
The results also show that only a few landscape pat-ern indices are related to scenic beauty; indeed, onlyhe correlation with evenness was significant for thekm2 window. Greater perceived scenic beauty wasttributed to landscapes with greater spatial evennesslandscapes with a mixture of different landcover typesf approximately equal area providing variety). Thisesult supports those of Palmer (2004) who reports theositive contribution of dominant land uses in land-cape preference. Hunziker and Kienast (1999) alsoound diversity and evenness to be correlated withcenic beauty, although when a certain level of diversitys reached, scenic beauty may decrease. The presentesults show that, although landscape diversity has aositive influence on preferences (Schutte and Mall-uff, 1986; Scott, 2002), the relationship is not simple.o perceive high scenic value, a certain overall orderas to be discovered (Staats et al., 1997) and a lim-ted number of elements or colors must be present inhe landscape (Peterson, 1974; Todorova et al., 2004),llowing the observer to understand the sceneBirkhoff, 1933).
Legibility showed significant negative correlationsith number of patches, patch diversity and evenness
n the 0.25 km2 window. This suggests that greatererceived legibility is attributed to landscapes withess spatial heterogeneity. A strong relation has beenound between visual legibility and visual complex-ty by other authors (Berlyne, 1960; Wohlwill, 1976).ny variation in spatial complexity (either increasingr diminishing) produces a positive response up to theoint at which the scene becomes too monotonous or
oo complex to be legible (Wohlwill, 1976). This sug-ests that landscapes with high diversity could haveow perceived legibility if their components cannot benderstood in a coherent form. In this respect, Herzog
4 pe and
actfii
amipLwastpttdadGAiTo
iaosnPtaafprotc
ttai
teastaKthfafct
lpotatt11bttte
4
fslu
(
04 G. de la Fuente de Val et al. / Landsca
nd Leverich (2003) found visual access to be a majoromponent of legibility in a forest setting. The correla-ion of legibility with landscape pattern indices in theoreground and mid-ground also suggests that legibilitys arrived at via the observer’s interpretation of his/hermmediate surroundings (Smardon et al., 1986).
Perspective and mystery were found to be opposingttributes. The results show that landscapes valued asysterious are those with high topographic variabil-
ty and a large number of irregular-shaped differentatches producing a sense great spatial heterogeneity.andscapes with high perspective values are those withide, open spaces providing a full view. Perspective
nd mystery are related to the exploration of the land-cape. In making preference decisions, there appearso be a conflict between a clear view and easy inter-retation of the landscape (perspective) and the needo be stimulated by the promise of additional informa-ion (mystery). A high spatial heterogeneity, landcoveriversity and the sensation of being inside the scenere properties that have been found to confer a highegree of mystery (Gimblett et al., 1987; Lynch andimblett, 1992). In the “prospect/refuge” theory ofppleton (1975), topography plays an important role
n interpreting the spatial structure of the landscape.his is closely linked to the feeling of having a generalr panoramic view of the landscape (Hagerhall, 2000).
Perceived patch-shape was correlated with severalndices in the foreground and mid-ground windows,ll related to landscape heterogeneity. High valuesf perceived shape correlated with landscape diver-ity and fractal dimension (landscapes with a largeumber of landcover classes and irregular shapes).urcell et al. (2001) noted empirically how the frac-
al geometry of different types of natural scene wasssociated with preference (greater preference beingssociated with higher fractal values). Bovill (1996)ound that judgments concerning ruggedness wereositively associated with fractal dimension. Theesults suggest that landscapes with irregular shapesffer a sensation of high visual complexity, whilehose with homogeneous shapes have appear lessomplex.
In summary, landscape structure seems to be related
o perceived visual aesthetic quality. From the perspec-ive of the analysis adopted here, spatial structure isn informative dimension of the landscape with strongmplications in the perceived quality of the scene.(
Urban Planning 77 (2006) 393–407
Apparently, this condition implies that the percep-ual qualities of landscapes of a certain structural het-rogeneity, have a profound effect on well-being andesthetic satisfaction (Lynch, 1960). Some researchersuggest relationships exist between heterogeneity andhe perception of the landscape and that this may haven evolutionary basis (Appleton, 1975; Kaplan andaplan, 1982; Bernaldez, 1985). These authors argue
hat humans have an innate standard of beauty whichas had (and still has) enormous adaptive and/or wel-are implications. Thus, humans prefer and/or assess beautiful those landscapes that include a series ofeatures (in terms of spatial configuration and specificontent) which would have provided survival benefitso our ancestors (Orians, 1986).
It makes sense that environments with intermediateevels of complexity should be preferred over both sim-ler and more complex environments since the rangef resources present in an environment (and the abilityo find and use them) probably peaks at intermedi-te levels of complexity. Simple environments haveoo few resources, while complex ones have so manyhat choosing among them becomes difficult (Orians,986). The influence of unity and variety (Berlyne,960) and order and complexity (Birkhoff, 1933) maye similar. The findings reported here suggest that inhe free and voluntary framework that characterizeshe observation and contemplation of the landscape,here is a more or less conscious search for theselements.
.3. Some remarks about the methodology
Although the proposed methodology shows promiseor helping determine the relationships between land-cape preference and landscape structure, it neverthe-ess has certain limitations (which might be improvedpon in subsequent work):
1) The small sample-size reduces the reliability andextrapolability of the results. A larger number ofphotographs would be advisable, especially if theresults are to be extrapolated to entire territories.Reducing the number of attributes to avoid respon-
dent fatigue might be advisable.2) The low inter-rater reliability observed might bedue to reduced variability among the images(Palmer, 1997). A sample of photographs with
pe and
(
5
vtltuamtmcsTrpbmcvaooptll
deftqo(
uulssiia(aotef
A
0ddpmf
R
A
A
B
G. de la Fuente de Val et al. / Landsca
greater landscape variability should make theresults more reliable.
3) The square windows used for the landscape patternindices might not coincide exactly with viewshedsand areas not visible from the sample point mightbe included within a window. However, this prob-lem would mainly affect the 5 km × 5 km windowalthough its effect should be small since the fore-ground and mid-ground play the most significantroles in judging spatial relationships and under-standing the perceived landscape (Smardon et al.,1986); landscape elements in the background areof little or no importance in terms of landscape per-ception (De Veer and Burrough, 1978; Palmer andRoos-Klein, 1998). The use of viewsheds couldbe helpful, although precautions need to be takenwhen comparing the viewsheds of different areas(Turner et al., 2001).
. Conclusions
This work shows how the rating of landscapeisual attributes might be related to landscape struc-ure. Scenic beauty shows a limited correlation withandscape pattern indices, revealing inherent difficul-ies in predicting such a broad and normative conceptsing spatial metrics. However, a number of visualttributes, notably legibility, shape, perspective andystery, show clearer correlations with landscape spa-
ial pattern indices. These correlations are in agree-ent with those in related theories concerning the
ontent of available information in the perceived land-cape and the pleasure or scenic attraction produced.his reinforces the importance of incorporating theo-
ies of landscape perception into the development ofrograms for the protection of ecological quality andiodiversity and in conventional landscape manage-ent strategies and planning. Landscape heterogeneity,
onsidered as a scenic resource, has an important role inisual aesthetic quality and the psychological benefit oflandscape. Landscape homogenization may not onlybstruct satisfaction being drawn from the perceptionf a landscape but also have a negative influence on
sychological well-being. Some authors suggest thathe greater the homogeneity of agrarian landscapes, theower their perceived visual beauty mainly due to theack of color contrast caused by the reduction of cropB
B
Urban Planning 77 (2006) 393–407 405
iversity (Weinstoerffer and Girardin, 2000; Arriazat al., 2004). These observations indicate the need forurther investigations that replicate and improve uponhis line of research and which address the followinguestion: can visual aesthetic quality change dependingn the composition and configuration of the landscapesee Nohl, 2001)?
The results also suggest that spatial metrics might beseful for explaining visual quality in landscape eval-ation and assessment. In the management of manyandscapes, great difficulty exists in reaching a con-ensus that guarantees results to be environmentallyustainable, appropriate and socially acceptable, eas-ly comprehended and economically feasible. Severalnvestigations have demonstrated that visual factorsre important in the adoption of conservation practicesNassauer, 1992; Sullivan et al., 2004) and that conflictsppear when the visual appearance of the landscapepposes public preferences. The use of landscape spa-ial metrics offers the advantage of availability and theirasy comprehension might have a positive effect onuture work on landscape preference.
cknowledgements
This study was financed by Project REN2001-972/GLO of the Direccion General de Investigacione Espana (Ministerio de Ciencia y Tecnologıa), a post-octoral grant form the Comunidad de Madrid and aost-doctoral grant from the AECI. We thank Dr. Her-ann Muhlhauser of the Universidad Central de Chile
or his collaboration.
eferences
ppleton, J., 1975. The Experience of Landscape. John Wiley andSons, London.
rriaza, M., Canas-Ortega, J., Canas-Madueno, J., Ruiz-Aviles, P.,2004. Assessing the visual quality of rural landscapes. Landsc.Urban Plann. 69, 115–125.
aldwin, J., Fisher, P., Wood, J., Langford, M., 1996. Modelling envi-ronmental cognition of the view with GIS. In: Third InternationalConference/Workshop on Integrating GIS and EnvironmentalModelling. Santa Fe, Nuevo Mexico.
erlyne, D., 1960. Conflict, Arousal and Curiosity. McGraw-Hill,NY.
ernaldez, F., Gallardo, D., 1989. Determinacion de los factoresque intervienen en las preferencias paisajısticas. Arbor 518–519,15–44.
4 pe and
B
B
B
B
B
C
D
D
D
F
F
F
G
G
G
G
H
H
H
H
H
H
H
K
K
L
L
L
L
M
N
N
O
O
P
P
P
P
P
P
P
P
06 G. de la Fuente de Val et al. / Landsca
ernaldez, F., 1985. Invitacion a La Ecologıa Humana: LaAdaptacion Afectiva al Entorno. Tecnos, S.A., Madrid.
irkhoff, G., 1933. Aesthetic Measure. Harvard University Press,Cambridge, MA.
ishop, I., 1996. Comparing regression and neural net basedapproaches to modelling of scenic beauty. Landsc. Urban Plann.34, 125–134.
ishop, I., Hulse, D., 1994. Prediction of scenic using mapped dataand geographic information systems. Landsc. Urban Plann. 30,59–70.
ovill, C., 1996. Fractal Geometry in Architecture and Design.Birkhauser, Boston.
rawford, D., 1994. Using remotely sensed data in landscape visualquality assessment. Landsc. Urban Plann. 30, 71–81.
aniel, T., 2001. Whither scenic beauty? Visual landscape qual-ity assessment in the 21st century. Landsc. Urban Plann. 56,267–281.
e Veer, A., Burrough, P., 1978. Physiognomic landscape mappingin the Netherlands. Landsc. Plann. 5, 45–62.
earden, P., 1987. Consensus and a theoretical framework for land-scape evaluation. J. Environ. Manage. 34, 267–278.
orman, R., 1995. Land Mosaics: The Ecology of Landscape andRegions. Cambridge University Press, NY.
rances, R., 1968. Psychologie de L’art et de L’esthetique. PressesUniversitaires de France, Paris, France.
ranco, D., Mannino, I., Zanetto, G., 2003. The impact of agro-forestry networks on scenic beauty estimation: the role of a lans-dcape ecological network on a socio-cultural process. Landsc.Urban Plann. 62, 119–138.
iles, J., Trani, M., 1999. Key elements of landscape pattern mea-sures. Environ. Manage. 23 (4), 477–481.
imblett, H., Fitzgibson, J., Bechard, K., Wightman, J., Itami, R.,1987. Procedure for assessing visual quality for landscape plan-ning and management. Environ. Manage. 11 (3), 359–367.
obster, P., Chenoweth, R., 1989. The dimensions of aesthetic pref-erence: a quantitative analysis. J. Environ. Manage. 29, 47–72.
ustafson, E., 1998. Quantifying landscape spatial pattern: what isthe state of the art? Ecosystems 1, 143–156.
agerhall, C., 2000. Clustering predictors of landscapes preferencein the traditional Swedish cultural landscapes: prospect–refuge,mystery, age and management. J. Environ. Psychol. 20, 83–90.
ammitt, W., Patterson, M., Noe, F., 1994. Identifying and predict-ing visual preference of southern Appalachian forest recreationvistas. Landsc. Urban Plann. 29, 171–183.
anyu, K., 1997. Visual properties and affective appraisals in resi-dential areas after dark. J. Environ. Psychol. 17, 301–315.
erzog, F., Lausch, A., Muller, E., Thulke, H., Steinhardt, U.,Lehmann, S., 2001. Landscape metrics for assessment of land-scape destruction and rehabilitation. Environ. Manage. 27 (1),91–107.
erzog, F., Shier, R., 2000. Complexity, age and building preference.Environ. Behav. 32 (4), 557–575.
erzog, T., Leverich, O., 2003. Search for legibility. Environ. Behav.35 (4), 459–477.
unziker, M., Kienast, F., 1999. Potential impacts of changing agri-cultural activities on scenic beauty—a prototypical technique forautomated rapid assessment. Landsc. Ecol. 14, 161–176.
P
P
Urban Planning 77 (2006) 393–407
aplan, S., Kaplan, R., 1982. Cognition and Environment: Function-ing in An Uncertain World. Preager, NY.
line, J., Wechelns, D., 1998. Measuring heterogeneous prefer-ences for preserving farmland and open spaces. Ecol. Econ. 26,211–224.
itton, R.B., 1979. Descriptive approaches to landscape analysis. In:Elsner, G.H., Smardon, R.C. (Technical Coordinators), Proceed-ings or Our National Landscape: A Conference on Applied Tech-niques for Analysis and Management of the Visual Resource.Incline Village, Nevada, April 23–25, 1979, pp. 77–87.
othian, A., 1999. Landscape and the philosophy of aesthetics: islandscape quality inherent in the landscape or in the eye of thebeholder? Landsc. Urban Plann. 44, 177–198.
ynch, J., Gimblett, R., 1992. Perceptual values in the cultural land-scape: a computer model for assessing and mapping perceivedmystery in rural environments. Comput. Environ. Urban Syst.16, 453–471.
ynch, K., 1960. The Image of the City. The Technology Press andthe Harvard University Press, Cambridge.
cGarigal, K., Marks, B.J., 1994. FRAGSTATS—Spatial AnalysisProgram for Quantifying Landscape Structure. USDA Forest Ser-vice, General Technical Report PNW-GTR-351, Corvallis, OR.
assauer, J., 1992. The appearance of ecological systems as a matterof policy. Landsc. Ecol. 6 (4), 239–250.
ohl, W., 2001. Sustainable landscape use and aestheticperception–preliminary reflections on future landscape aesthetic.Landsc. Urban Plann. 54, 223–237.
’Neill, R., Krummel, J., Gardner, R., Sugihara, G., Jackson, D.,Milne, B., Turner, M., Zygmunt, B., Christensen, S., Dale, V.,Graham, R., 1988. Indices of landscape pattern. Landsc. Ecol. 1(3), 153–162.
rians, G.H., 1986. An ecological and evolutionary approach to land-scape aesthetics. In: Penning-Rowsell, E.C., Lowethal, D. (Eds.),Landscape Meanings and Values. Allen and Unwin, London, pp.3–5.
almer, J.F., 2004. Predicting scenic perceptions in a changinglandscape: Dennis, Massachusetts. Landsc. Urban Plann. 69,201–218.
almer, J., Hoffman, R., 2001. Rating reliability and representationvalidity in scenic landscape assessments. Landsc. Urban Plann.54, 149–161.
almer, J., Roos-Klein, Lankhorst J., 1998. Evaluating visible spatialdiversity in the landscape. Landsc. Urban Plann. 43, 65–78.
almer, J.F., 1997. Stability of landscape perceptions in the face oflandscape change. Landsc. Urban Plann. 37, 109–113.
almer, J., 2000. Reliability of rating visible qualities. Landsc. J. 19(1/2), 166–178.
eterson, G., 1974. Evaluating the quality of the wilderness environ-ment. Environ. Behav. 6, 169–193.
reece, R., 1991. Designs on the Landscape: Everyday Landscapes,Values and Practice. Belhaven Press, London.
urcell, T., Lamb, R., Mainardi, E., Falchero, S., 1994. Preference
or preferences for landscape. J. Environ. Psychol. 14, 195–209.urcell, T., Lamb, R., 1998. Preference and naturalness: an ecologicalapproach. Landsc. Urban Plann. 42, 57–66.
urcell, T., Peron, E., Berto, R., 2001. Why do preference differbetween scene types? Environ. Behav. 33 (1), 93–106.
pe and
S
S
S
S
S
S
S
S
S
S
S
T
T
T
W
landscape indicator. Ecol. Modell. 130, 95–109.
G. de la Fuente de Val et al. / Landsca
aldana, J., Puerto, A., Gracıa, J., 1986. El Paisaje: Un EstudioEcologico de Su Diversidad en Ecosistemas Salmantinos. SerieCiencias, No. 1, Diputacion de Salamanca, Salamanca.
chroeder, H., 1987. Dimensions of variation in urban park design:a psychophysical analysis. J. Environ. Psychol. 7, 123–141.
chutte, N., Mallouff, J., 1986. Preference for complexity in naturallandscape scenes. Percept. Motor Skills 63, 109–110.
cott, A., 2002. Assessing public perception of landscape: theLANDMAP experience. Landsc. Res. 7 (3), 271–295.
mardon, R., Palmer, J., Felleman, J., 1986. Foundations for VisualProject Analysis. John Wiley & Sons, NY, Chirchester, Brisbane,Toronto, Singapore.
taats, H., Gatersleben, B., Hartig, T., 1997. Change in mood asa function of environmental design: arousal and pleasure on asimulated forest hike. J. Environ. Psychol. 17, 283–300.
tamps, A., 1997. A paradigm for distinguishing significant fromnon-significant visual impacts: theory, implementation, case his-tories. Environ. Impact Assess. Rev. 17, 249–293.
tamps, A.E., 2004. Mystery, complexity, legibility and coherence:a meta-analysis. J. Environ. Psychol. 24 (1), 1–16.
teinitz, C., 1990. Toward a sustainable landscape with high visualpreference ands high ecological integrity: the Loop road in Aca-dia National Park, USA. Landsc. Urban Plann. 19, 213–250.
W
Urban Planning 77 (2006) 393–407 407
trumse, E., 1994. Environmental attributes and the prediction ofvisual preferences for agrarian landscapes in western Norway. J.Environ. Psychol. 14, 293–303.
ullivan, W., Anderson, O., Taylor, S., 2004. Agricultural buffersat the rural–urban fringe: an examination of approval by farm-ers, residents, and academics in the Midwestern United States.Landsc. Urban Plann. 69, 299–313.
odorova, A., Asakawa, S., Aikoh, T., 2004. Preferences for and atti-tudes towards street flowers and trees in Sapporo, Japan. Landsc.Urban Plann. 69, 403–416.
urner, M., Ruscher, C., 1988. Changes in landscape patterns inGeorgia, USA. Landsc. Ecol. 1 (4), 241–251.
urner, M., Gardner, R.H., O’Neill, R.V., 2001. Landscape Ecologyin Theory and Practice. Pattern and Process. Springer-Verlag,NY, Berlin, Heidelberg.
einstoerffer, J., Girardin, P., 2000. Assessment of the contributionof land use pattern and intensity to landscape quality: use of a
ohlwill, J., 1976. Environmental aesthetics: the environment as asource of affect. In: Altman, I., Wohlwill, J.F. (Eds.), HumanBehavior and Environment, vol. 1. Plenum Press, NY, pp. 37–86.


