Embed Size (px)
Citation preview
1
Remote Sensing of Trichodesmium spp. mats in the Western Tropical
South Pacific
Guillaume Rousset1, Florian De Boissieu2, Christophe E. Menkes3, Jérôme Lefèvre4, Robert
Frouin5, Martine Rodier6, Vincent Ridoux7, Sophie Laran7, Sophie Bonnet8, and Cécile Dupouy8
1IRD (Institut de Recherche pour le Développement), UMR ESPACE DEV, Nouméa, New-Caledonia 5
2IRSTEA, UMR TETIS, Montpellier, France
3IRD-Sorbonne Universités (UPMC, Université Paris 06)-CNRS-MNHN, Laboratoire d'Océanographie et du Climat:
Expérimentations et Approches Numériques (LOCEAN), IRD Nouméa BP A5, 98848 Nouméa Cedex, New Caledonia
4LEGOS/MIO, 98800 Nouméa, New Caledonia
5Scripps Institution of Oceanography, University of California San Diego, La Jolla, CA 92093-0224, USA 10
6EIO (Ecosystèmes Insulaires Océaniens), Institut de Recherche pour le Développement-Université de la Polynésie Française-
Institut Malarmé-Ifremer, Papeete, French Polynesia
7PELAGIS, UMS 3462, Université de la Rochelle/CNRS, La Rochelle, France
8Aix Marseille Université-CNRS-INSU, IRD, Mediterranean Institute of Oceanography (MIO), UM 110, IRD Nouméa, BP
A5, 98848 Noumea Cedex, New Caledonia 15
Correspondence to: Guillaume Rousset ([email protected])
Abstract. Trichodesmium is the main nitrogen-fixing species in the South Pacific region, a hotspot for diazotrophy. Due to the
paucity of in situ observations, methods for detecting Trichodesmium presence on a large scale have been investigated to assess
the regional-to-global impact of these species on primary production and carbon cycling. A number of satellite-derived
algorithms have been developed to identify Trichodesmium surface blooms, but determining with confidence their accuracy 20
has been difficult, chiefly because of the scarcity of sea-truth information at time of satellite overpass. Here, we use a series of
new cruises as well as airborne observational surveys in the South Pacific to quantify statistically the ability of these algorithms
to discern correctly Trichodesmium surface blooms in the satellite imagery. The evaluation, performed on MODIS data at
250m and 1km resolution acquired over the South West Pacific, shows limitations due to spatial resolution, clouds, and
atmospheric correction. A new satellite-based algorithm is designed to alleviate some of these limitations, by exploiting 25
optimally spectral features in the atmospherically corrected reflectance at 531, 645, 678, 748, and 869 nm. This algorithm
outperforms former ones near clouds, limiting false positive detection, and allowing regional scale automation. Compared with
observations, 80% of the detected mats are within a 2 km range, demonstrating the good statistical skill of the new algorithm.
Application to MODIS imagery acquired during the February-March 2015 OUTPACE campaign reveals the presence of
surface blooms Northwest and East of New Caledonia and near 20oS-172oW in qualitative agreement with measured nitrogen 30
fixation rates. The new algorithm, however, fails to detect sub-surface booms evidenced in trichome counts. Improving
Trichodesmium detection requires measuring ocean color at higher spectral and spatial (< 250 m) resolution than MODIS,
Biogeosciences Discuss., https://doi.org/10.5194/bg-2017-571Manuscript under review for journal BiogeosciencesDiscussion started: 9 January 2018c© Author(s) 2018. CC BY 4.0 License.
2
taking into account environment properties (wind, sea surface temperature, …), fluorescence, and spatial structure of filaments,
and a better understanding of Trichodesmium dynamics, including aggregation processes to generate surface mats. Such sub-
mesoscales aggregation processes for Trichodesmium are yet to be understood.
1 Introduction
The Western Tropical South Pacific (WTSP) is a Low Nutrient Low Chlorophyll (LNLC) region, harboring surface nitrate 5
concentrations close to detection limits of standard analytical methods, and limiting for the growth of the majority of
phytoplankton species (Le Borgne et al., 2011). This lack of inorganic nitrogen favors the growth of dinitrogen (N2)-fixing
organisms (or diazotrophs), which have the ability to use the inexhaustible pool of N2 dissolved in seawater and convert it into
bioavailable ammonia. Several studies have reported high N2 fixation rates in the WTSP (Berthelot et al., 2017; Bonnet et al.,
2009, 2015; Garcia et al., 2007), that has recently been identified as a hot spot of N2 fixation (Bonnet et al., 2017). During 10
austral summer conditions, N2 fixation supports nearly all new primary production and organic matter export (Caffin et al.,
This issue; Knapp et al., This issue) as nitrate diffusion across the thermocline and atmospheric sources of N are < 10 % of
new N inputs. The cyanobacterium Trichodesmium is one of the most abundant diazotrophs in our oceans (Capone, 1997; Luo
et al., 2012) and in the WTSP in particular (Tenorio et al., accepted; Stenegren et al., 2017), where it has recently been
identified, based on cell-specific N2 fixation measurement, as the major N2-fixing organism, accounting for > 60 % of total N2 15
fixation (Bonnet et al., This issue). One of the characteristics of Trichodesmium is the presence of gas vesicles, which provide
buoyancy (van Baalen and Brown, 1969; Villareal and Carpenter, 2003) and help maintain this cyanobacterium in the upper
ocean surface. Trichodesmium cells are aggregated and form long chains called trichomes. Trichomes then can gather into
colonies called “puffs” or “tuffs,” and these colonies can aggregate at the surface of the water and form large mats that can
extend for miles and were detected since James Cook and Charles Darwin’s expeditions. During the southern austral summer, 20
Trichodesmium blooms have long been detected by satellite in the region, mostly around New Caledonia and Vanuatu (Dupouy
et al., 2000, 2011), and later confirmed by microscopic enumerations (Shiozaki et al., 2014).
Identifying the occurrence and the spatial distribution of Trichodesmium blooms and mats is of primary importance to assess
their contribution to primary production and biogeochemical cycles regionally. However because of their paucity, scientific
cruises alone are not sufficient to achieve such goal and remote sensing completed by sea observations of mats, appears as the 25
best alternate solution for assessing its global impact. By using specific optical properties of Trichodesmium, among which
pigment absorption (mainly phycoerythrin, PE) and particle backscattering (Subramaniam et al., 1999a, 1999b), several bio-
optical algorithms have been developed to detect Trichodesmium blooms in real time from various satellite sensors , i.e. the
ones of Hood et al. (2002); Westberry et al. (2005); Dupouy et al. (2011) for SeaWiFS, the ones of Gower et al. (2014) for
MERIS, and the ones of Hu et al. (2010) and McKinna et al. (2011) for MODIS-Aqua (review in Mckinna (2015)). 30
The application of these algorithms to MODIS imagery revealed several issues, some of which had already been raised and
discussed in the aforementioned articles. Atmospheric correction of satellite imagery above Trichodesmium mats is one of
Biogeosciences Discuss., https://doi.org/10.5194/bg-2017-571Manuscript under review for journal BiogeosciencesDiscussion started: 9 January 2018c© Author(s) 2018. CC BY 4.0 License.
3
these issues as reflectance from the floating algae can be wrongly interpreted as aerosols or clouds. It is a main concern in this
region as the blooming period of Trichodesmium (mainly November to March (Dupouy et al., 2011)) coincides with the South
Pacific Convergence Zone, i.e. heavy cloudiness making difficult the identification of coincident in-situ mats in satellite
imagery. The local aggregation and small width of Trichodesmium mats (~ 50 m typically) also calls into question the influence
of ocean color sensors resolution on the detection quality of these mats. 5
The aim of this study is to manage a systematic detection of Trichodesmium blooms in the vast WTSP Ocean between latitudes
26° and 10°S and longitudes between 155° and 190° E, building on previously published algorithm and, in particular, provide
an updated in situ database on which these algorithms can be evaluated with newly acquired datasets and particularly during
the “Oligotrophy from Ultra-oligoTrophy PACific Experiment”(OUTPACE) cruise (DOI:
http://dx.doi.org/10.17600/15000900) in March-April 2015 (Moutin et al., 2017). To achieve this objective, a large database 10
of mat observations in this region was created in order to evaluate retrievals from MODIS reflectance. Because of the
specificities of the MODIS latest release and the presence of numerous clouds in the WTSP, the existing algorithms had to be
adapted whenever possible. From this experience, a new algorithm was then created for the detection of Trichodesmium in the
WTSP, more robust to cloud cover and tested on high resolution MODIS imagery, building on the algorithms of (McKinna et
al., 2011) and (Hu et al., 2010). The paper is organized as follows: Section 2 presents in-situ data and satellite image used in 15
this study. Section 3 covers the methods used in order to extract Trichodesmium spectral signature and their limitations, as
well as the three detection algorithms evaluated in this study. Section 4 presents the detection performances of two former
compared to the newly developed algorithm and the detection results this last algorithm on the OUTPACE cruise path. Section
5 discusses the new algorithm performances. Section 6 draws the conclusions and perspectives of this study.
2 Material 20
2.1 In situ observations
The in-situ database used to train and test the Trichodesmium detection model is a combination of three datasets intersecting
with the MODIS acquisition period (2000-present). It includes the Trichodesmium mat observations published in Dupouy et
al. (2011). These observations were done between 1998 and 2010, from aircraft, French Navy ships, research vessels (e.g. R/V
Alis) and ships of opportunity. Some of these visual observations were confirmed by water samples analyzed with 25
photomicrographs confirming the presence of abundant Trichodesmium (Dupouy et al., 2011). Airborne visual observations
were also gathered in December 2014 in the vicinity of New Caledonia during the REMMOA program (Laran et al., 2016).
This second dataset provides a large number of Trichodesmium mat observations along numerous and repetitive transects,
which is most favorable for satellite data validation. During the same period, several in-situ observations of mats were made
during the SPOT 4 scientific cruise (Biegala et al., 2014), coincident with MODIS imagery and thus constituting a third dataset. 30
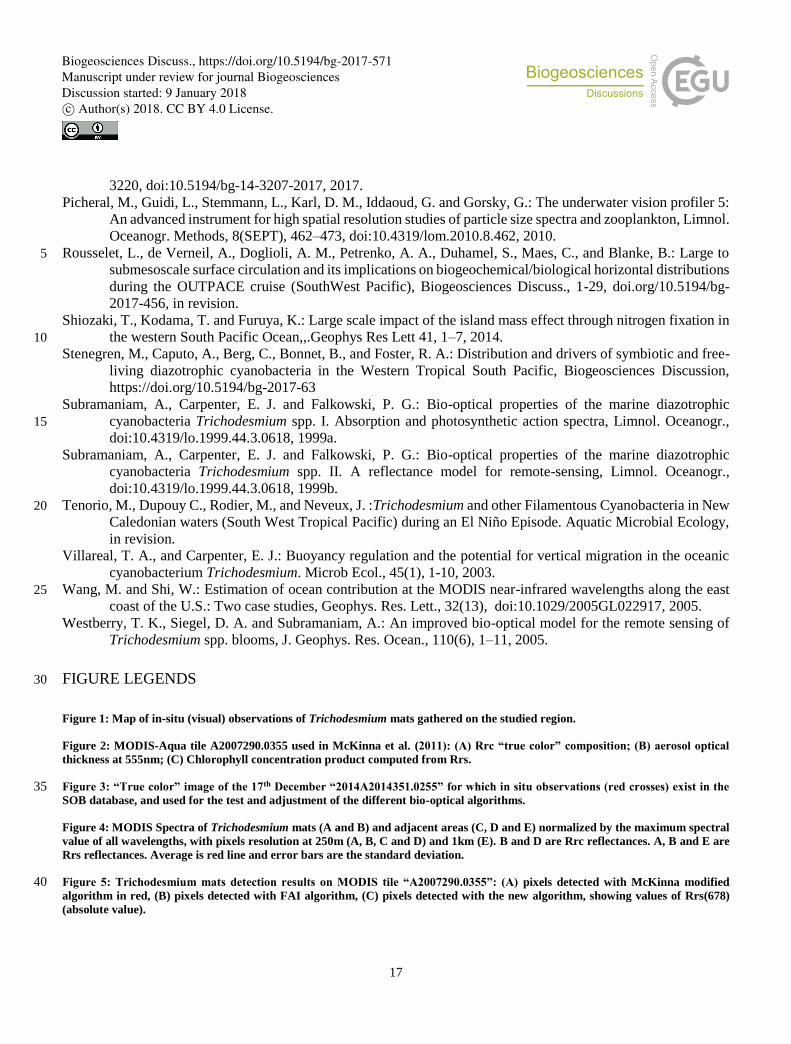
In total, the database created from the compilation of these open ocean observations contains 507 observations (Figure 1) in
the region 15°S-25°S, 155°E-180°E. It is referred to as the Simple Observation Base (SOB) in the following.
Biogeosciences Discuss., https://doi.org/10.5194/bg-2017-571Manuscript under review for journal BiogeosciencesDiscussion started: 9 January 2018c© Author(s) 2018. CC BY 4.0 License.
4
In addition to SOB, a latitudinal transect around 20°S was carried out during the OUTPACE scientific cruise (Moutin et al.,
2017) covering the region 160°E-160°W from February 23th to April 1st in 2015. Seawater samples were collected for
Trichodesmium quantification by quantitative PCR as described in Stenegren et al. (2017), microscopic counts at selected
stations (Caffin, Comm. Pers.), as well as N2 fixation rates as described in Bonnet et al. (This issue). Moreover, Trichodesmium
abundance from the Underwater Vision Profiler 5 (UVP5; (Picheral et al., 2010)), calibrated on trichome concentration from 5
pigment algorithms and on visual counts of surface samples at all stations allowed to describe the distribution of
Trichodesmium along the transect (Dupouy et al., This issue).
2.2 Satellite imagery
The satellite data used in this study was all MODIS-Aqua and MODIS-Terra data corresponding in time and space to the SOB
database and the OUTPACE campaign. Image were downloaded at level L1A (oceandata.sci.gsfc.nasa.gov) and processed 10
with SeaDAS v7.0.2 to produce a L2 MODIS Data basis at 250 m and 1 km resolution. Standard SeaDAS masks were applied
during this processing: atmospheric correction failure, land, sunglint, very high or saturated radiance, sensor view zenith angle
exceeding threshold, stray light contamination and cloud contamination. In order to reduce the influence of these phenomena,
only the observations with less than 60 % of mask coverage over a 0.5° radius area around point location were kept.
We used MODIS radiance in visible, near-infrared (NIR) and short wavelength infrared (SWIR) at different resolutions: 250 15
m resolution for bands 1 (645 nm) and 2 (859 nm), 500 m resolution (bands 3-7, visible and SWIR land/clouds dedicated
bands) and 1 km resolution (bands 8-16, VNIR ocean color dedicated bands).To evaluate the influence of resolution on
detection performances, L2 remote sensing data was produced at both 250 m and 1 km resolutions, with interpolation of 500
m and 1 km channels and aggregation of 250 m resolution channel respectively. The consequences of these processing are
discussed in Section 5. The images were processed with the SeaDAS standard atmospheric correction which is a correction 20
using bands 15 (748 nm) and 16 (869 nm). The method NIRSWIR (Wang and Shi, 2005) for aerosols correction was used
specifically for detection algorithm of (McKinna et al., 2011) as specified in the same publication.The aerosol correction has
consequences on floating algae reflectance retrieval, as it is shown in the following section. In order to avoid this kind of
issues, the reflectances were also computed without the aerosol correction, which avoids the wrong aerosol correction and the
eventuality of negative reflectance values as suggested by Hu et al. (2010). The remote sensing reflectances after Rayleigh and 25
standard aerosol correction (Rrs), and the reflectance corrected only by the Rayleigh effect (Rrc), are the MODIS L2 products
used for this study. Downloading and processing of MODIS images was based on a ProsgreSQL satellite database and a python
software developed for this study and ready for real-time Trichodesmium reporting during the OUTPACE cruise.
Biogeosciences Discuss., https://doi.org/10.5194/bg-2017-571Manuscript under review for journal BiogeosciencesDiscussion started: 9 January 2018c© Author(s) 2018. CC BY 4.0 License.
5
3 Methods
3.1 Atmospheric correction: sensitivity and adjustment
Atmospheric overcorrection is a general problem for strong floating algae concentrations and have been noticed repeatedly
(Hu et al., 2010). A major hypothesis of atmospheric correction and cloud detection algorithms is to consider seawater as a
black body in the NIR and SWIR. However, Trichodesmium mats floating at the surface present a strong reflectance in these 5
wavelengths due to chlorophyll pigment (red-edge). Thus it is wrongly interpreted as aerosol by the atmospheric correction
algorithms. It results in reflectance values excessively reduced, even leading to negative values in some cases, and has
consequences on all further computed L2 products.
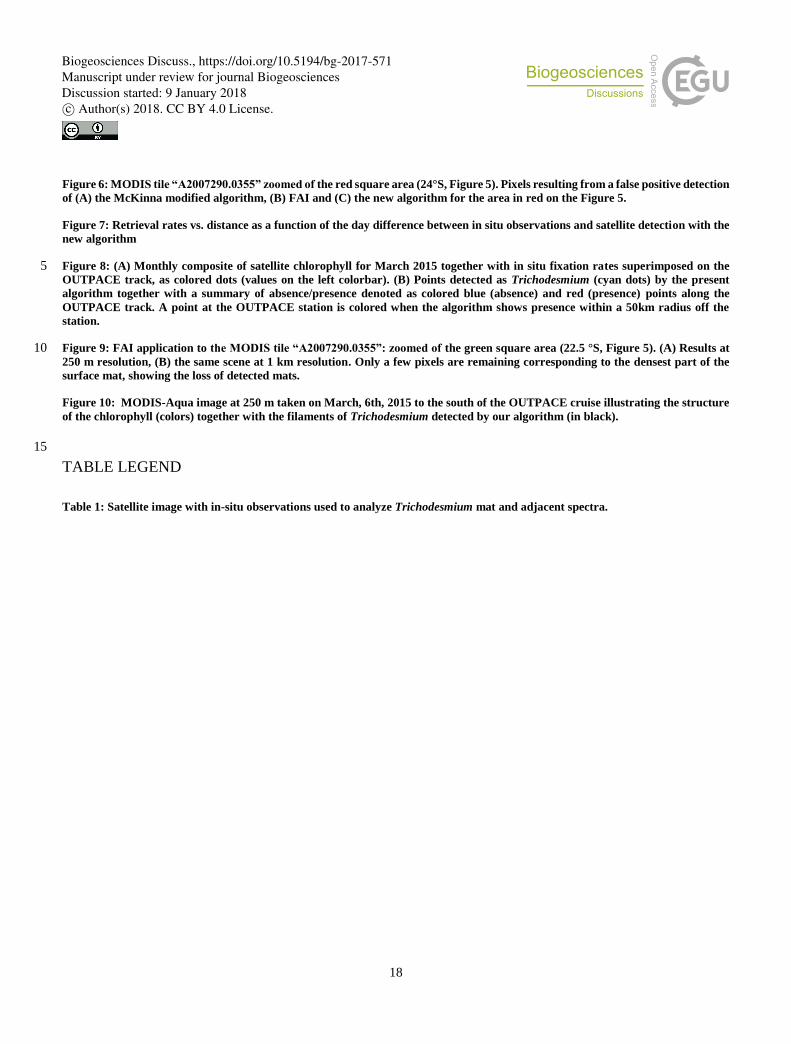
This phenomenon is illustrated in Figure 2 presenting a MODIS-Aqua image of the Australian coast acquired just after a period
of heavy rain that led to a massive Trichodesmium bloom. Fortunately, this bloom could also be observed in-situ (McKinna et 10
al., 2011). Figure 2A shows the “true-color” image obtained by combination of Rrc’s. On this image, large visible
Trichodesmium mats distributed over a vast area can be seen. Figure 2B displays the aerosol optical thickness (AOT) at 555
nm, an indicator of the aerosol load in the atmosphere. The high values of AOT match the filament spatial structure noticed in
the “true color” image. However, this spatial organization is quite unlikely to be due to aerosol structures, as they are very thin
and do not seem to be driven by wind. Moreover, the center of the blooming regions is masked (grey patches on figure 2B), 15
although the “true color” image does not indicate the presence of clouds in this particular area. These pixels were wrongly
identified as cloud by the cloud detection algorithm because of SWIR Rrs values higher than 3% (Wang and Shi, 2005). Figure
2C shows the chlorophyll concentration estimated according to the OC3 algorithm (Hu et al., 2012). Chlorophyll concentration
decreases systematically, even falling to zero, in the vicinity of the Trichodesmium distribution patterns, although the real
concentration is certainly large and higher at the core of the mats than at its periphery. The spectral signature of the mats are 20
studied in more details in next section, to show the consequences of the miscorrection on further used detection algorithms
and the interest of replacing Rrs by Rrc for floating algae detection.
3.2 Extraction of the spectral signature of mats
With the regular cloud cover of the region, the number of strict coincidences of in-situ observations and cloud free MODIS
images where Trichodesmium mats are visible is small. Therefore, the search for coincidences has been extended in space and 25
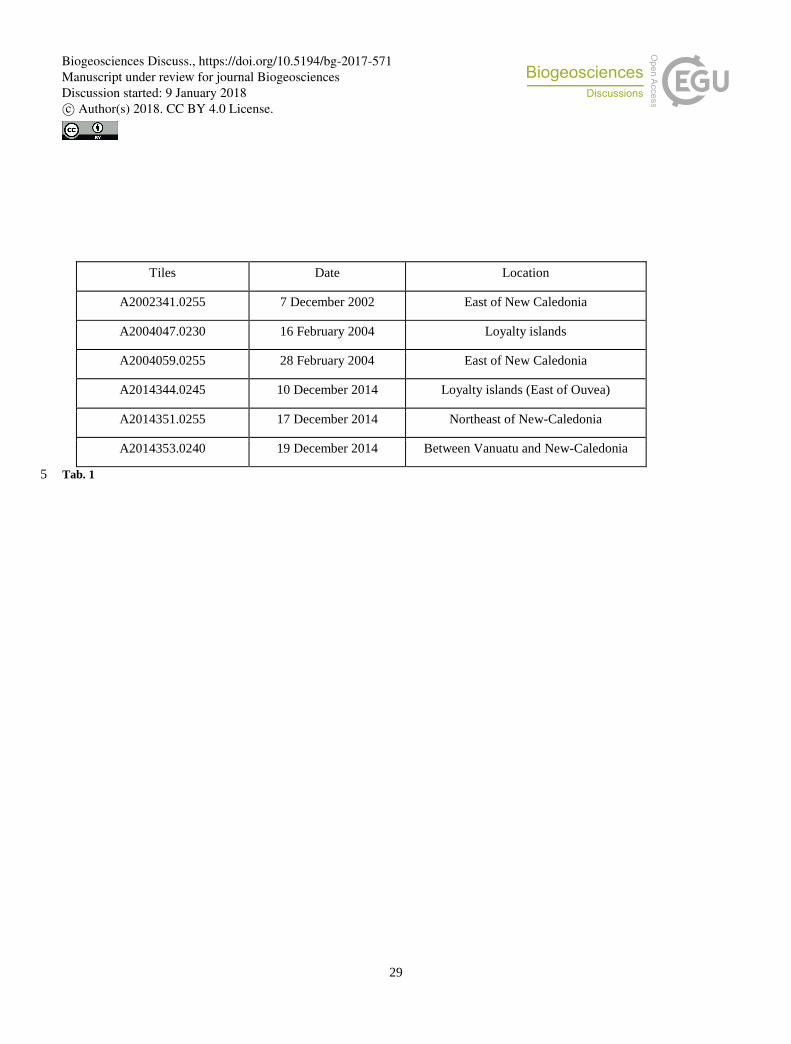
time. To extract Trichodesmium spectral signature, 6 tiles have been specifically selected (Table 1) and are used in order to
test the different bio-optical algorithms designed to detect the Trichodesmium presence. These images have been chosen
because they are mostly clear (i.e., contain few clouds), Trichodesmium mats are visible in the "true color" images, and
numerous in situ observations exist in the entire area (Figure 3).
The NASA method which allows one to select match-ups, i.e., average or nearest pixel, has been used to find coincidences 30
between in situ observations and clear MODIS satellite pixels (Bailey and Werdell, 2006). A total of 468 satellite pixels were
found coincident to the SOB database. Only 50 remain after the mask application. Thus, approximately 90 % of in-situ
Biogeosciences Discuss., https://doi.org/10.5194/bg-2017-571Manuscript under review for journal BiogeosciencesDiscussion started: 9 January 2018c© Author(s) 2018. CC BY 4.0 License.
6
observations are not usable, mainly because of cloud cover. Once inspected manually and sorted out, 19 spectra out of the 50
pixels selected exhibit fluctuations similar to the Trichodesmium signal presented in Hu et al. (2010) and McKinna et al. (2011).
In order to increase the number of useful observations, the coincidence detection was extended to a temporal window of +/- 4
days and the search area up to +/- 50 km (200 pixels at 250 m resolution) considering that the drifting speed of the algae mat
could be up to 0.5 m/s when the weather condition is favorable, i.e. wind speed sufficiently low to keep Trichodesmium 5
aggregates at surface. Also, some in-situ observations close spatially and temporarily (in the same tile and at intervals of +/- 4
days) increased our degree of confidence in identifying the filamentous patterns as Trichodesmium.
From the 6 MODIS tiles, two types of spectral signatures have been identified and extracted. The first type is the signature of
high algae concentration. With the hypothesis that only the algae Trichodesmium can make floating algae bloom in WTSP
region, pixels have been selected when there was a high Floating Algae Index (FAI) (Hu, 2009), visible mats on “true color” 10
image and remote sensing chlorophyll concentration anomaly. The second type of spectral signature is from areas selected
immediately next to the Trichodesmium mats, i.e., a pixel next to a FAI-selected pixel and without visible algae. These were
selected for each resolution of the satellite sensor. Indeed, a high probability of high concentration of mixed or deeper
Trichodesmium colonies in the water column is expected in these areas. In the end 1200 spectra were extracted, with 600
examples for each case. 15
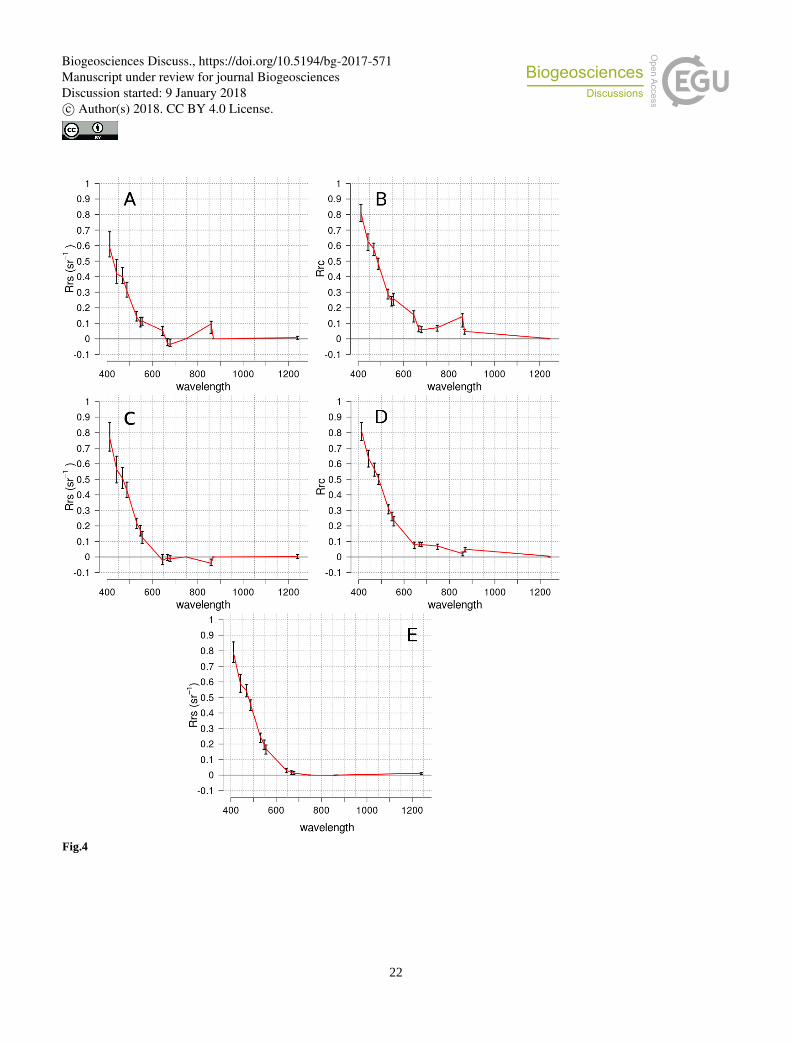
Figure 4 presents the average and standard deviation of the Rrs and Rrc spectra of mats and adjacent to mats pixels. The
standard atmospheric correction of SeaDAS (two-bands correction) has been applied for the Rrs spectra, which leads to
systematic zero value at the wavelengths used to calibrate correction, i.e. band 15-16 (748 and 869 nm). One can notice that
Rrs and Rrc average spectra have similar shapes, with an offset, keeping Rrc positive at all wavelengths. In comparison with
Trichodesmium spectrum of the literature, i.e. the ones in Hu et al. (2010) or in McKinna et al. (2011), Figure 4 shows that 20
several similarities appear. Spectra are showing a strong negative slope in the visible channels (from 400 to 600 nm) and a
"red-edge" more pronounced for mat pixels than for adjacent pixels. Negative values of Rrs are occurring at 678 nm (maximum
of chlorophyll absorption) and at 859 nm. Comparison between Rrc and Rrs shows interestingly that standard deviation error
bars are much smaller for Rrc reflectances while the range of magnitudes between wavelengths is larger. This is a significant
argument for using Rrc instead of Rrs, as it would lead to a better discrimination of Trichodesmium mat spectra against other 25
spectra.
If the negative slope at 678 nm can still be seen at 1 km resolution (Figure 4E), the negative spectral gradient at 859 nm
observed on pixels adjacent to mats on 250 m resolution data was not noticed. This issue has already been noticed by Hu et al.
(2010), the negative slope seems to be generated by the interpolation process while upscaling from 1 km to 250 m.
3.3 Two published algorithms 30
In order to detect mats (Gower et al., 2014) used the remote sensing chlorophyll concentration the 700 nm channel, which is a
key factor of his algorithm. Unfortunately, this band present on SeaWiFS is missing on MODIS. Thus, from all the
Biogeosciences Discuss., https://doi.org/10.5194/bg-2017-571Manuscript under review for journal BiogeosciencesDiscussion started: 9 January 2018c© Author(s) 2018. CC BY 4.0 License.
7
Trichodesmium bloom detection algorithms with MODIS, only the algorithms of McKinna et al. (2011) and Hu et al. (2010),
designed for the MODIS sensor, have been implemented and tested.
The Trichodesmium detection algorithm of McKinna et al. (2011) is based on 4 criteria relative to the shape of Rrs (see
definition in Appendix). When we applied it on the same MODIS image as the one used by McKinna et al. (2011), the detection
results of this algorithm showed more disregarded pixels because of the 4th criterion (eliminating pixels which have a negative 5
magnitude of nLw at wavelength 555, 645, 678 or 859 nm). Indeed, the test of a negative Rrs value at 678 nm due to aerosol
overcorrection excludes many pixels. Skipping the 4th criterion of the algorithm allowed to match the results of McKinna et
al. (2011). Therefore, this modification was adopted for this study and the algorithm is called “McKinna modified” in the
following.
The Trichodesmium detection algorithm presented in Hu et al. (2010) is based on a two steps analysis of Rrc spectra, 1) identify 10
of strong floating algae concentrations with FAI, 2) resolve ambiguity between algae species analyzing the spectral shape, i.e.
Trichodesmium and Sargassum. To avoid spectral influence of eventual aerosols, Hu et al. (2010) propose a correction method
simply based on the difference of Rrc spectra between bloom and nearby algae free region. After several try on the data
presented above, this correction method was found to be sensitive to the choice of the algae free region (not shown in this
article). Thus, we kept only the first step of his algorithm (FAI) and apply a threshold between 0 and 0.04 to detect the algal 15
signal in the following.
3.4 New algorithm criteria
Our criteria for detecting Trichodesmium mats were defined based on spectral characteristics of Rrs and Rrc (Figure 4). Indeed,
the systematic negative Rrs values at 678 nm over strong Trichodesmium mat concentrations is taken as an advantage here.
All pixels with negative Rrs value at this wavelength have a high probability to be floating algae and thus Trichodesmium in 20
this region. The absolute value of Rrs(678) is actually used as an index of mats concentration, and can also be used to detect
some artifact, e.g., sun glint (Eq. 1).
Similarly to the algorithms of Hu et al. (2010) and McKinna et al. (2011) (appendix A), three criteria were defined to extract
the typical spectrum shape of Trichodesmium: 1) Rrs(678), as the spectrum shape may be affected by the aerosol miscorrection
of SeaDAS standard atmospheric correction algorithm in the presence of mats (Eq. 1); 2) Rrc(748) and and Rrc(8679) are used 25
to detect the presence of the red-edge associated with the surface Trichodesmium mats, which is one of the main criteria (Eq.
2); and 3) Rrc(645) and Rrc(531) are used to resolve ambiguities between Trichodesmium mats and incorrectly detected pixels
after processing with previous criteria, the misdetections occurring mostly in cloud neighborhood (Eq. 3).
𝑅𝑟𝑠(678) < 0 , (1) 30
𝑅𝑟𝑐(748) < 𝑅𝑟𝑐(859) , (2)
𝑅𝑟𝑐(645) < 𝑅𝑟𝑐(531) , (3)
Biogeosciences Discuss., https://doi.org/10.5194/bg-2017-571Manuscript under review for journal BiogeosciencesDiscussion started: 9 January 2018c© Author(s) 2018. CC BY 4.0 License.
8
4. Results
4.1 Algorithm application
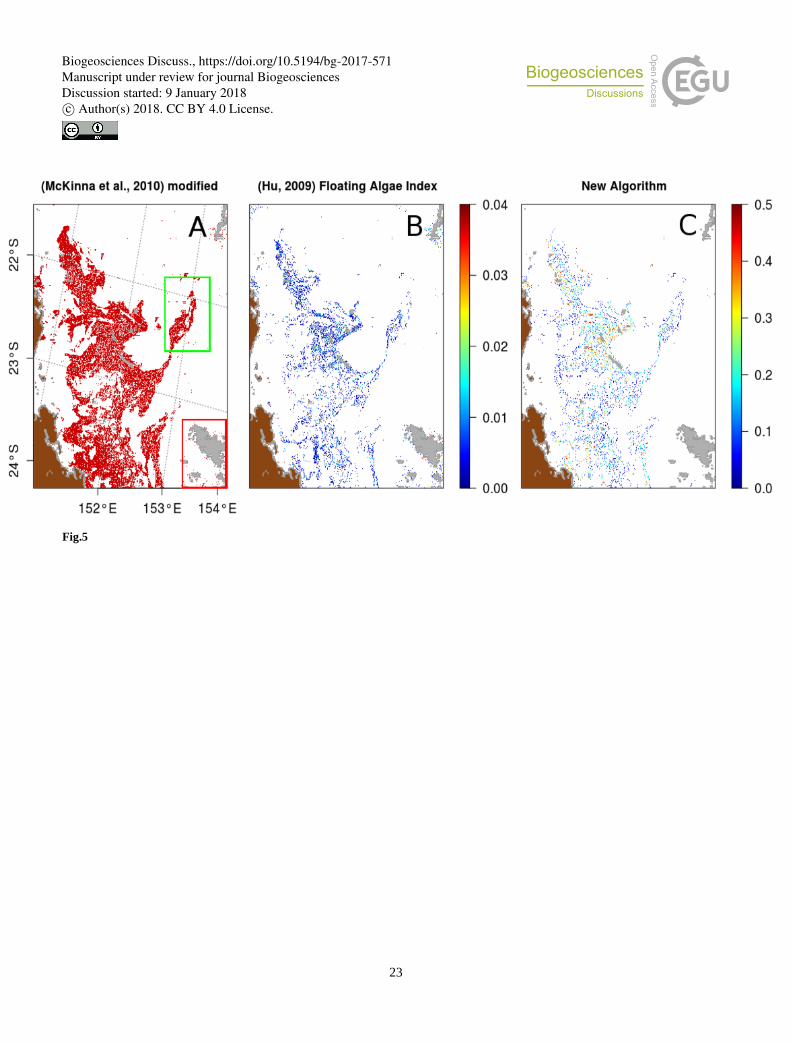
An attempt to compare efficiency of the three Trichodesmium detection algorithms is illustrated in Figure 5 on the MODIS tile
A2007290.0355, used in McKinna et al. (2011). The McKinna modified algorithm shows the same detection patterns as the
ones found in McKinna et al. (2011). It is a vast area of Trichodesmium within which the filamentous structures cannot be 5
distinguished. The new algorithm and the FAI (with a threshold between 0 and 0.04) show thin filamentous structures more
similar to Trichodesmium mat structures observed on airborne photographs. The new algorithm provides values which are the
amplitudes of the negative correction (at 678 nm).
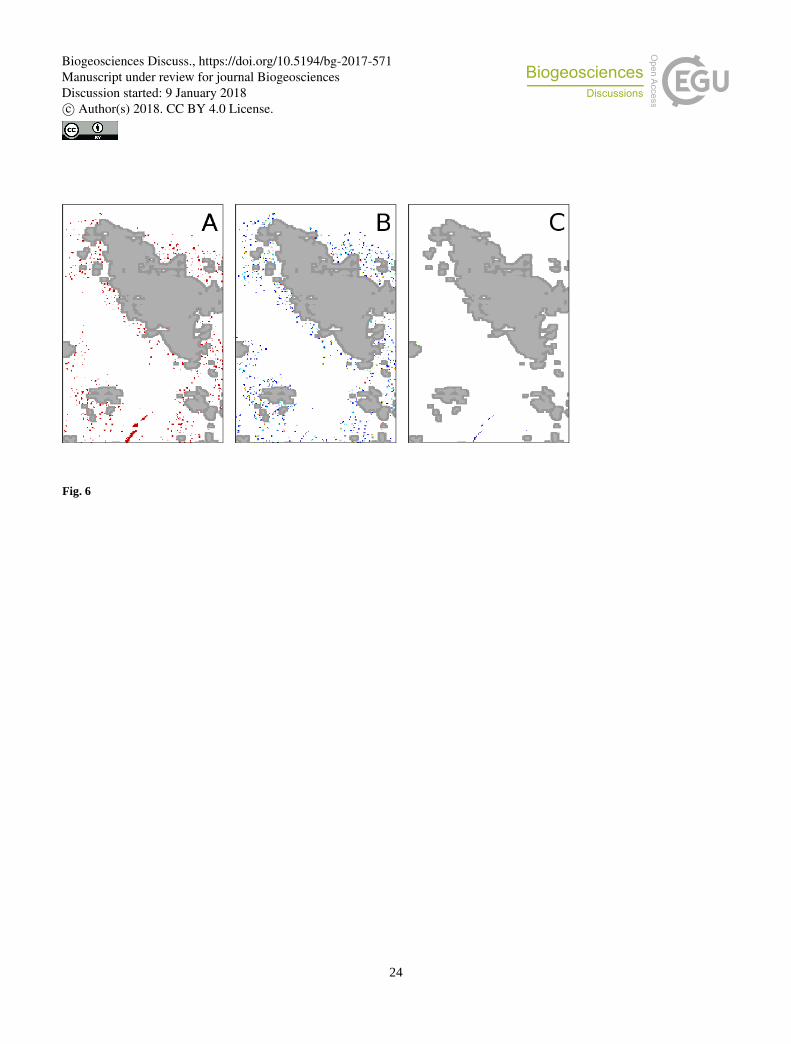
Compared with both former algorithms, the new algorithm performs much better near clouds. Figure 6 is a zoom of the red
rectangle of Figure 5. This area presents a cloud path where McKinna modified algorithm and Hu modified algorithm detect 10
Trichodesmium pixels. These pixels were identified as false positives as their spatial distribution is sparse and only in the
vicinity of clouds. This conclusion is also supported by the “true color” composition (Figure 2) where the only Trichodesmium
mats seem to be the ones at the bottom of the image. In that area the new algorithm does not make any false positive detection
while keeping the Trichodesmium mats at the bottom of the image. The robustness of the new detection algorithm to clouds
while keeping accurate Trichodesmium mat detection is an important improvement for regions with high cloud covering, such 15
as the WTSP.
4.2 Algorithm performance and comparison with in-situ mat observations
The exact coincidence in time and space between in-situ Trichodesmium mats observations and satellite mat detection is quite
difficult to reach in general. One of the main reasons is by far the cloud cover, which eliminates a large quantity of the possible
comparisons (90 %). A second reason is the elapsed time between in-situ observations and the corresponding satellite pass 20
during which the floating algae could have drifted at sea surface and/or migrated vertically depending on sea conditions
(temperature, wind, etc.). For example, the abundance of Trichodesmium at the sea surface may vary with the time of day, as
a daily cycle of rising and sinking of colonies in the water column is often observed as a result of cell ballasting (Villareal et
al., 2003). Moreover, as Trichodesmium acts as buoyant particle, it can be advected by surface currents. Given the highest
surface current speeds, such as ~ 0.5 m/s at most in eddies, a mat would have drifted by ~ 50km in a day and is unlikely to 25
escape the satellite acquisition area. However, that is a worst case scenario as eddies in that regions generally have speed lower
that 0.3 m/s, (Rousselet et al., This issue)(Cravatte et al., 2015).
To circumvent that problem and present a more statistically robust comparison of our algorithm with in situ data, we used the
following strategy. With the hypothesis that a bloom can last for ~one week (e.g Kumar et al., 2015), an analysis of the spatio-30
temporal distance between the closet in-situ observation and the nearest detected mat was conducted. For each day in a range
Biogeosciences Discuss., https://doi.org/10.5194/bg-2017-571Manuscript under review for journal BiogeosciencesDiscussion started: 9 January 2018c© Author(s) 2018. CC BY 4.0 License.
9
of +/- 4 days around the date of observations, the spatial distance between the position of the observation and the nearest
detected mat was computed.
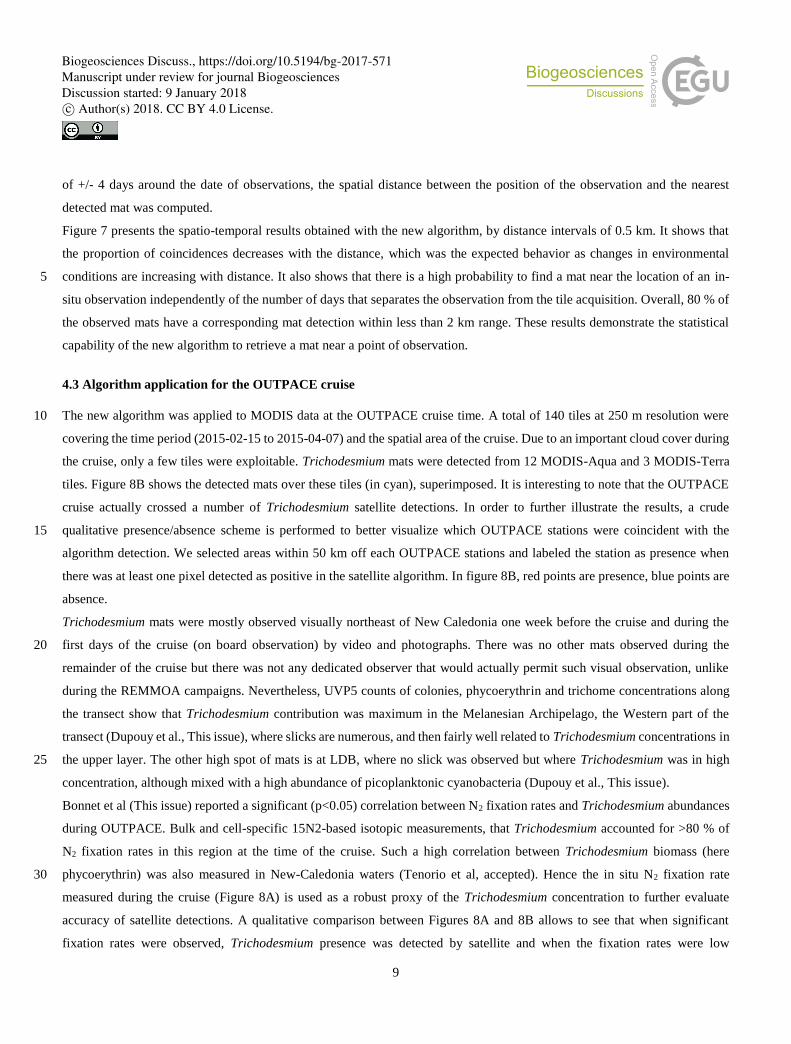
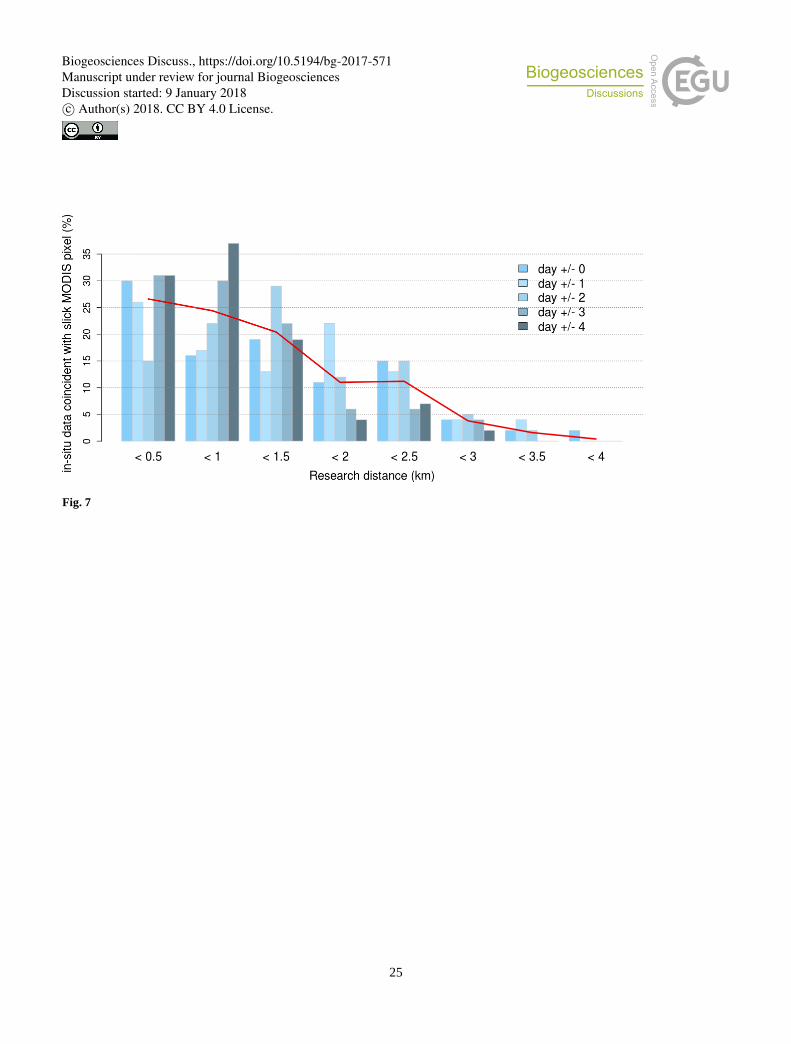
Figure 7 presents the spatio-temporal results obtained with the new algorithm, by distance intervals of 0.5 km. It shows that
the proportion of coincidences decreases with the distance, which was the expected behavior as changes in environmental
conditions are increasing with distance. It also shows that there is a high probability to find a mat near the location of an in-5
situ observation independently of the number of days that separates the observation from the tile acquisition. Overall, 80 % of
the observed mats have a corresponding mat detection within less than 2 km range. These results demonstrate the statistical
capability of the new algorithm to retrieve a mat near a point of observation.
4.3 Algorithm application for the OUTPACE cruise
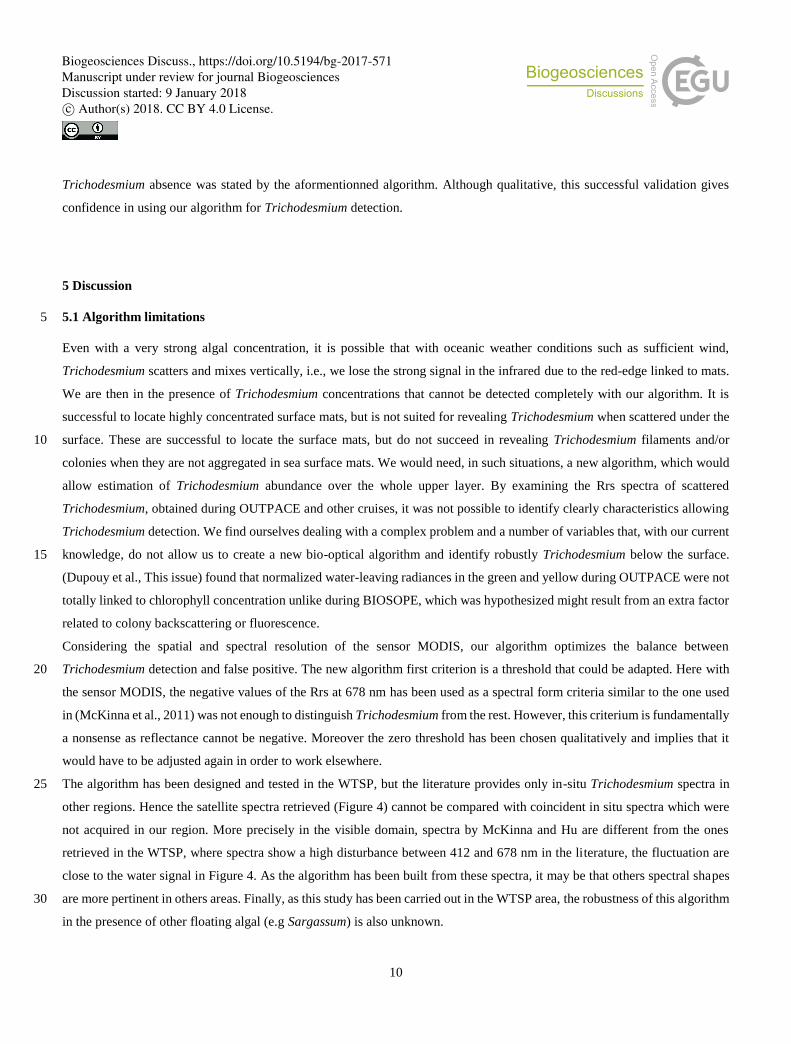
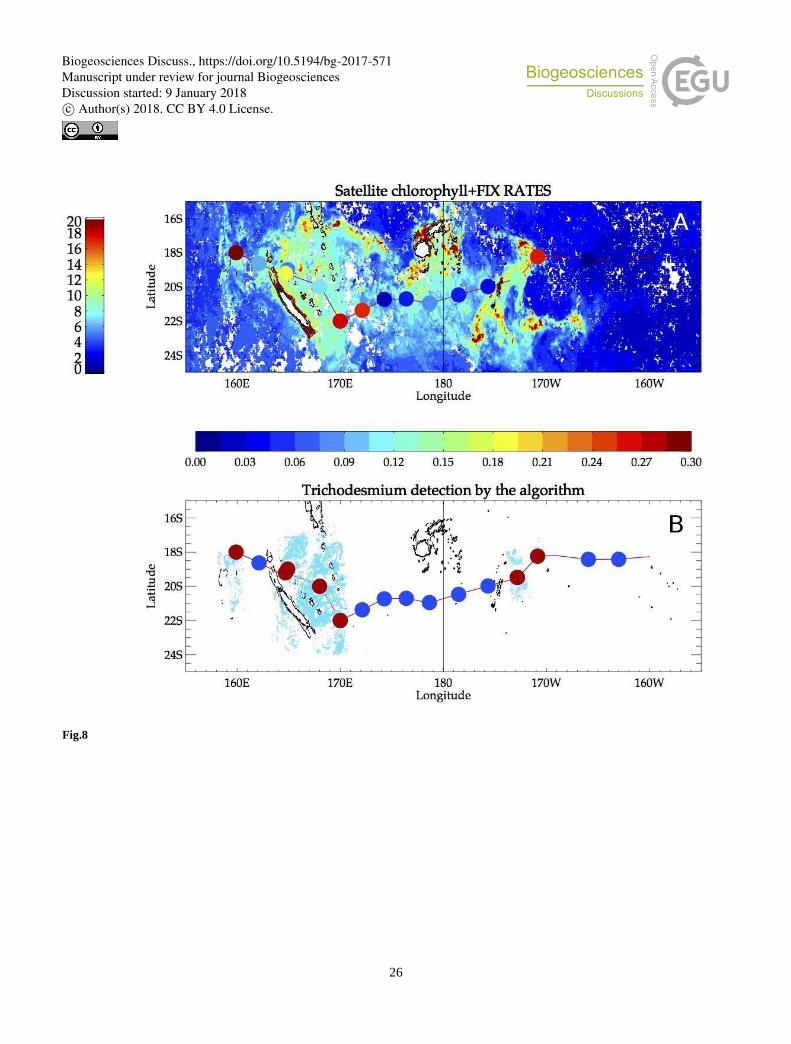
The new algorithm was applied to MODIS data at the OUTPACE cruise time. A total of 140 tiles at 250 m resolution were 10
covering the time period (2015-02-15 to 2015-04-07) and the spatial area of the cruise. Due to an important cloud cover during
the cruise, only a few tiles were exploitable. Trichodesmium mats were detected from 12 MODIS-Aqua and 3 MODIS-Terra
tiles. Figure 8B shows the detected mats over these tiles (in cyan), superimposed. It is interesting to note that the OUTPACE
cruise actually crossed a number of Trichodesmium satellite detections. In order to further illustrate the results, a crude
qualitative presence/absence scheme is performed to better visualize which OUTPACE stations were coincident with the 15
algorithm detection. We selected areas within 50 km off each OUTPACE stations and labeled the station as presence when
there was at least one pixel detected as positive in the satellite algorithm. In figure 8B, red points are presence, blue points are
absence.
Trichodesmium mats were mostly observed visually northeast of New Caledonia one week before the cruise and during the
first days of the cruise (on board observation) by video and photographs. There was no other mats observed during the 20
remainder of the cruise but there was not any dedicated observer that would actually permit such visual observation, unlike
during the REMMOA campaigns. Nevertheless, UVP5 counts of colonies, phycoerythrin and trichome concentrations along
the transect show that Trichodesmium contribution was maximum in the Melanesian Archipelago, the Western part of the
transect (Dupouy et al., This issue), where slicks are numerous, and then fairly well related to Trichodesmium concentrations in
the upper layer. The other high spot of mats is at LDB, where no slick was observed but where Trichodesmium was in high 25
concentration, although mixed with a high abundance of picoplanktonic cyanobacteria (Dupouy et al., This issue).
Bonnet et al (This issue) reported a significant (p<0.05) correlation between N2 fixation rates and Trichodesmium abundances
during OUTPACE. Bulk and cell-specific 15N2-based isotopic measurements, that Trichodesmium accounted for >80 % of
N2 fixation rates in this region at the time of the cruise. Such a high correlation between Trichodesmium biomass (here
phycoerythrin) was also measured in New-Caledonia waters (Tenorio et al, accepted). Hence the in situ N2 fixation rate 30
measured during the cruise (Figure 8A) is used as a robust proxy of the Trichodesmium concentration to further evaluate
accuracy of satellite detections. A qualitative comparison between Figures 8A and 8B allows to see that when significant
fixation rates were observed, Trichodesmium presence was detected by satellite and when the fixation rates were low
Biogeosciences Discuss., https://doi.org/10.5194/bg-2017-571Manuscript under review for journal BiogeosciencesDiscussion started: 9 January 2018c© Author(s) 2018. CC BY 4.0 License.
10
Trichodesmium absence was stated by the aformentionned algorithm. Although qualitative, this successful validation gives
confidence in using our algorithm for Trichodesmium detection.
5 Discussion
5.1 Algorithm limitations 5
Even with a very strong algal concentration, it is possible that with oceanic weather conditions such as sufficient wind,
Trichodesmium scatters and mixes vertically, i.e., we lose the strong signal in the infrared due to the red-edge linked to mats.
We are then in the presence of Trichodesmium concentrations that cannot be detected completely with our algorithm. It is
successful to locate highly concentrated surface mats, but is not suited for revealing Trichodesmium when scattered under the
surface. These are successful to locate the surface mats, but do not succeed in revealing Trichodesmium filaments and/or 10
colonies when they are not aggregated in sea surface mats. We would need, in such situations, a new algorithm, which would
allow estimation of Trichodesmium abundance over the whole upper layer. By examining the Rrs spectra of scattered
Trichodesmium, obtained during OUTPACE and other cruises, it was not possible to identify clearly characteristics allowing
Trichodesmium detection. We find ourselves dealing with a complex problem and a number of variables that, with our current
knowledge, do not allow us to create a new bio-optical algorithm and identify robustly Trichodesmium below the surface. 15
(Dupouy et al., This issue) found that normalized water-leaving radiances in the green and yellow during OUTPACE were not
totally linked to chlorophyll concentration unlike during BIOSOPE, which was hypothesized might result from an extra factor
related to colony backscattering or fluorescence.
Considering the spatial and spectral resolution of the sensor MODIS, our algorithm optimizes the balance between
Trichodesmium detection and false positive. The new algorithm first criterion is a threshold that could be adapted. Here with 20
the sensor MODIS, the negative values of the Rrs at 678 nm has been used as a spectral form criteria similar to the one used
in (McKinna et al., 2011) was not enough to distinguish Trichodesmium from the rest. However, this criterium is fundamentally
a nonsense as reflectance cannot be negative. Moreover the zero threshold has been chosen qualitatively and implies that it
would have to be adjusted again in order to work elsewhere.
The algorithm has been designed and tested in the WTSP, but the literature provides only in-situ Trichodesmium spectra in 25
other regions. Hence the satellite spectra retrieved (Figure 4) cannot be compared with coincident in situ spectra which were
not acquired in our region. More precisely in the visible domain, spectra by McKinna and Hu are different from the ones
retrieved in the WTSP, where spectra show a high disturbance between 412 and 678 nm in the literature, the fluctuation are
close to the water signal in Figure 4. As the algorithm has been built from these spectra, it may be that others spectral shapes
are more pertinent in others areas. Finally, as this study has been carried out in the WTSP area, the robustness of this algorithm 30
in the presence of other floating algal (e.g Sargassum) is also unknown.
Biogeosciences Discuss., https://doi.org/10.5194/bg-2017-571Manuscript under review for journal BiogeosciencesDiscussion started: 9 January 2018c© Author(s) 2018. CC BY 4.0 License.
11
As seen previously from the spectral view MODIS lacks several interesting band (Gower et al., 2014) that could be used in
identifying Trichodesmium. From the available bands, we constructed our detection criteria leading to our second and third
criteria. However the physical understanding of the phenomena behind our criteria are still unknown. Understanding the
significance of our choices from the inherent optical properties of Trichodesmium should be undertaken for these criteria.
One should notice that only the densest mats of Trichodesmium are detected with this algorithm. The goal was to provide an 5
algorithm that could detect automatically Trichodesmium in a global scale, and thus limiting the false positive detection as best
as possible. Finally, the new algorithm is unable to determine the existence of thin superficial slicks and diffuse Trichodesmium
in the water column. Trichodesmium quantification carried out during the OUTPACE campaign (Stenegren et al., 2017)
revealed high Trichodesmium abundances near the Fiji island, while our algorithm did not detect them (Figure 8).
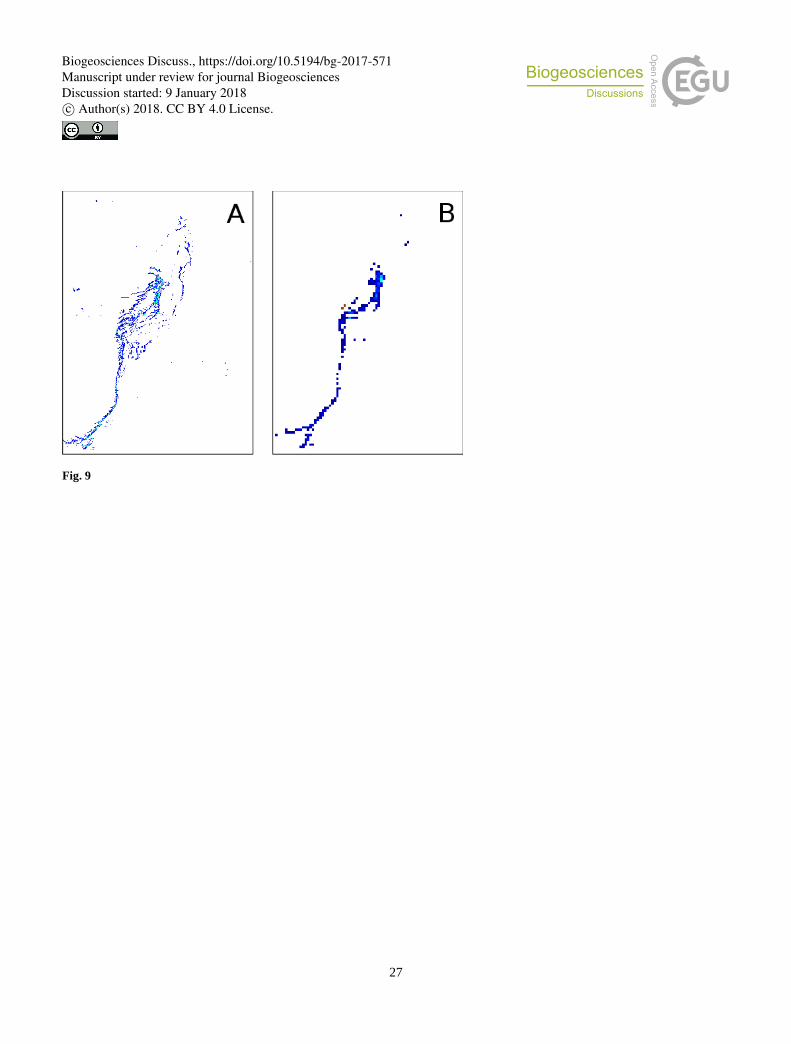
5.2 Spatial resolution impact 10
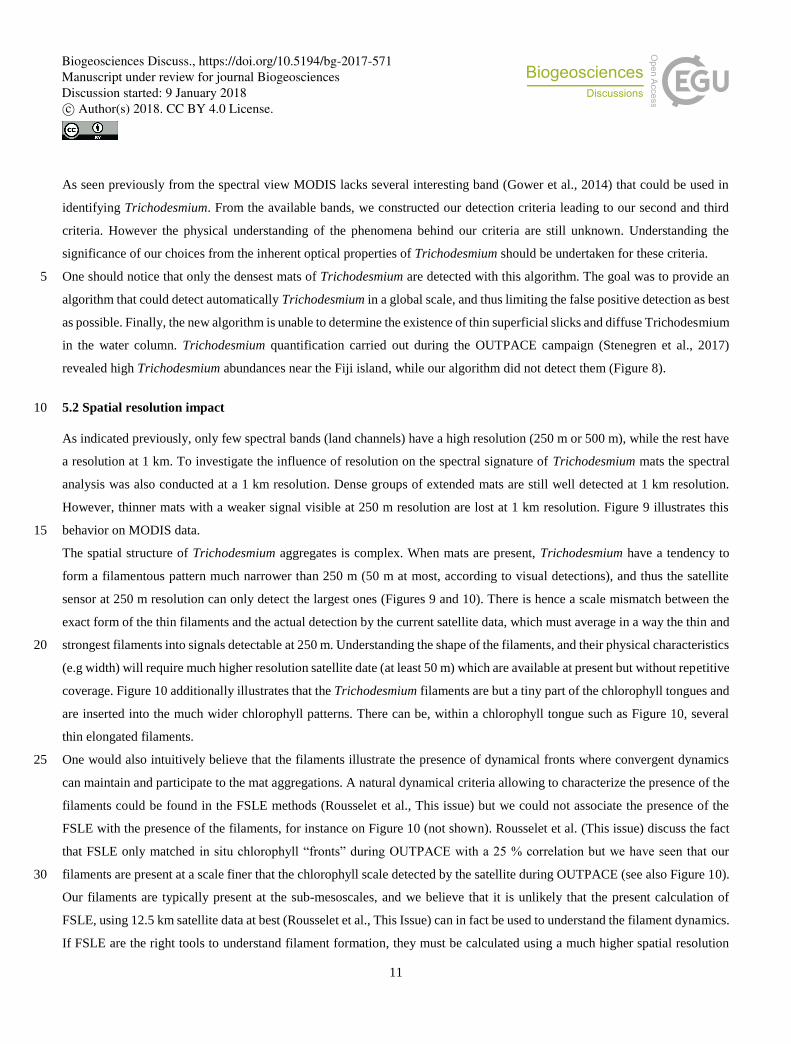
As indicated previously, only few spectral bands (land channels) have a high resolution (250 m or 500 m), while the rest have
a resolution at 1 km. To investigate the influence of resolution on the spectral signature of Trichodesmium mats the spectral
analysis was also conducted at a 1 km resolution. Dense groups of extended mats are still well detected at 1 km resolution.
However, thinner mats with a weaker signal visible at 250 m resolution are lost at 1 km resolution. Figure 9 illustrates this
behavior on MODIS data. 15
The spatial structure of Trichodesmium aggregates is complex. When mats are present, Trichodesmium have a tendency to
form a filamentous pattern much narrower than 250 m (50 m at most, according to visual detections), and thus the satellite
sensor at 250 m resolution can only detect the largest ones (Figures 9 and 10). There is hence a scale mismatch between the
exact form of the thin filaments and the actual detection by the current satellite data, which must average in a way the thin and
strongest filaments into signals detectable at 250 m. Understanding the shape of the filaments, and their physical characteristics 20
(e.g width) will require much higher resolution satellite date (at least 50 m) which are available at present but without repetitive
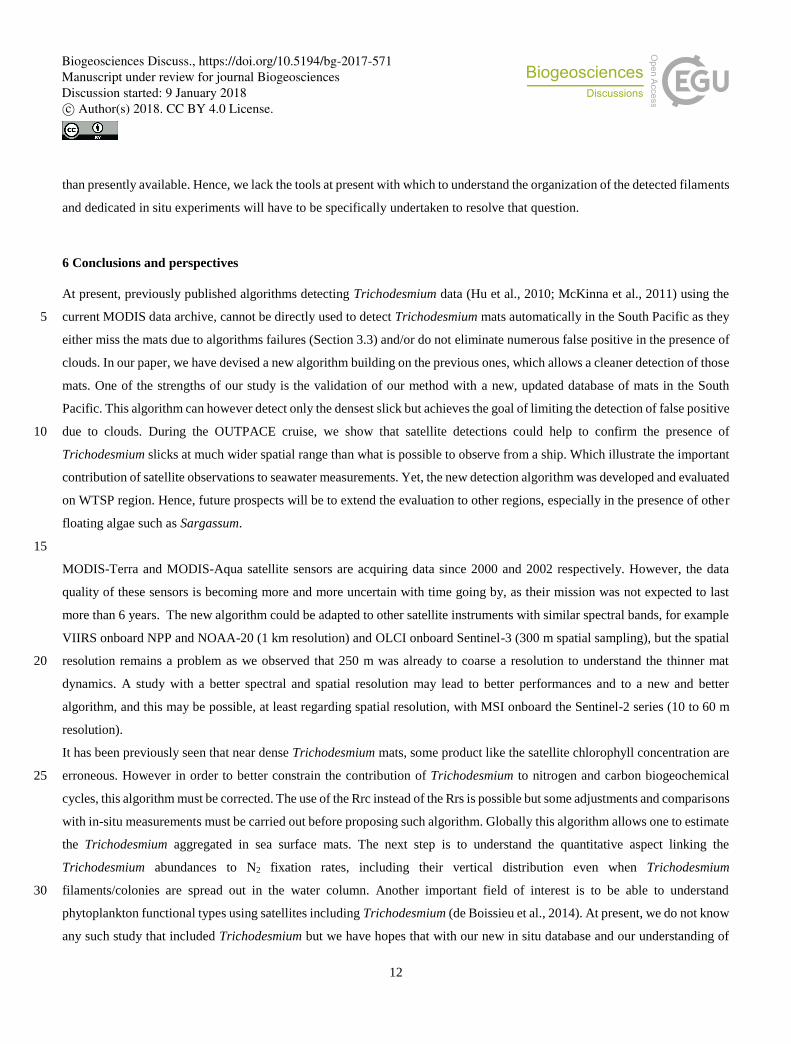
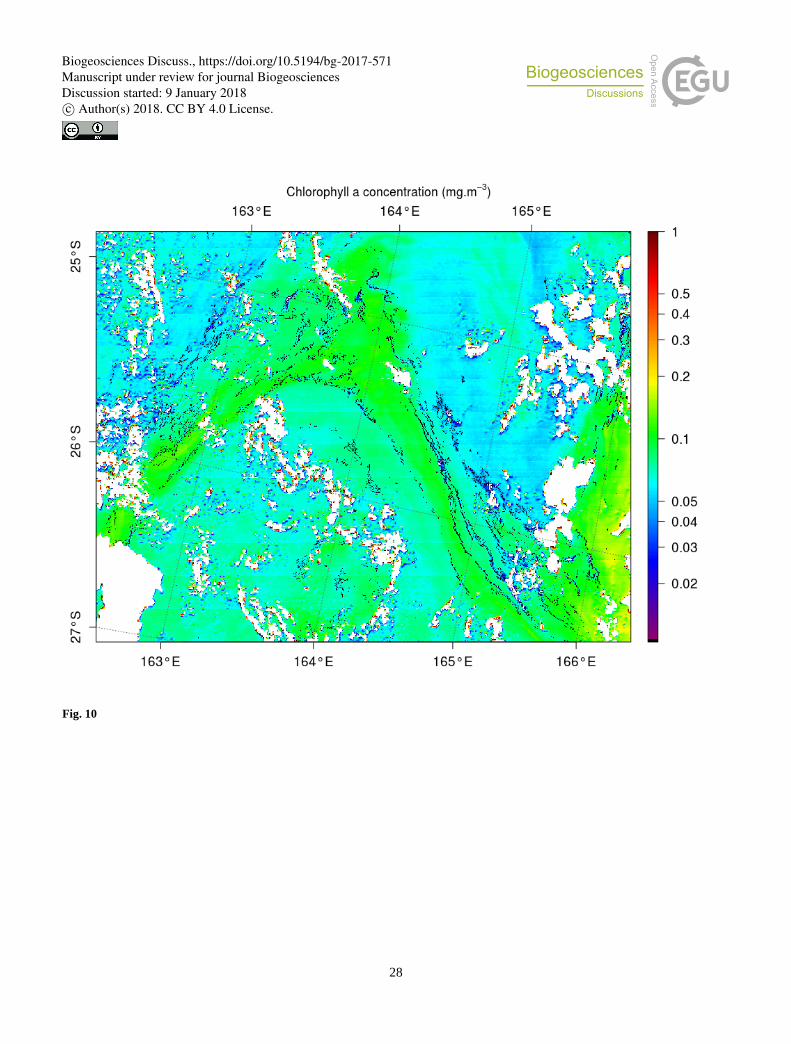
coverage. Figure 10 additionally illustrates that the Trichodesmium filaments are but a tiny part of the chlorophyll tongues and
are inserted into the much wider chlorophyll patterns. There can be, within a chlorophyll tongue such as Figure 10, several
thin elongated filaments.
One would also intuitively believe that the filaments illustrate the presence of dynamical fronts where convergent dynamics 25
can maintain and participate to the mat aggregations. A natural dynamical criteria allowing to characterize the presence of the
filaments could be found in the FSLE methods (Rousselet et al., This issue) but we could not associate the presence of the
FSLE with the presence of the filaments, for instance on Figure 10 (not shown). Rousselet et al. (This issue) discuss the fact
that FSLE only matched in situ chlorophyll “fronts” during OUTPACE with a 25 % correlation but we have seen that our
filaments are present at a scale finer that the chlorophyll scale detected by the satellite during OUTPACE (see also Figure 10). 30
Our filaments are typically present at the sub-mesoscales, and we believe that it is unlikely that the present calculation of
FSLE, using 12.5 km satellite data at best (Rousselet et al., This Issue) can in fact be used to understand the filament dynamics.
If FSLE are the right tools to understand filament formation, they must be calculated using a much higher spatial resolution
Biogeosciences Discuss., https://doi.org/10.5194/bg-2017-571Manuscript under review for journal BiogeosciencesDiscussion started: 9 January 2018c© Author(s) 2018. CC BY 4.0 License.
12
than presently available. Hence, we lack the tools at present with which to understand the organization of the detected filaments
and dedicated in situ experiments will have to be specifically undertaken to resolve that question.
6 Conclusions and perspectives
At present, previously published algorithms detecting Trichodesmium data (Hu et al., 2010; McKinna et al., 2011) using the
current MODIS data archive, cannot be directly used to detect Trichodesmium mats automatically in the South Pacific as they 5
either miss the mats due to algorithms failures (Section 3.3) and/or do not eliminate numerous false positive in the presence of
clouds. In our paper, we have devised a new algorithm building on the previous ones, which allows a cleaner detection of those
mats. One of the strengths of our study is the validation of our method with a new, updated database of mats in the South
Pacific. This algorithm can however detect only the densest slick but achieves the goal of limiting the detection of false positive
due to clouds. During the OUTPACE cruise, we show that satellite detections could help to confirm the presence of 10
Trichodesmium slicks at much wider spatial range than what is possible to observe from a ship. Which illustrate the important
contribution of satellite observations to seawater measurements. Yet, the new detection algorithm was developed and evaluated
on WTSP region. Hence, future prospects will be to extend the evaluation to other regions, especially in the presence of other
floating algae such as Sargassum.
15
MODIS-Terra and MODIS-Aqua satellite sensors are acquiring data since 2000 and 2002 respectively. However, the data
quality of these sensors is becoming more and more uncertain with time going by, as their mission was not expected to last
more than 6 years. The new algorithm could be adapted to other satellite instruments with similar spectral bands, for example
VIIRS onboard NPP and NOAA-20 (1 km resolution) and OLCI onboard Sentinel-3 (300 m spatial sampling), but the spatial
resolution remains a problem as we observed that 250 m was already to coarse a resolution to understand the thinner mat 20
dynamics. A study with a better spectral and spatial resolution may lead to better performances and to a new and better
algorithm, and this may be possible, at least regarding spatial resolution, with MSI onboard the Sentinel-2 series (10 to 60 m
resolution).
It has been previously seen that near dense Trichodesmium mats, some product like the satellite chlorophyll concentration are
erroneous. However in order to better constrain the contribution of Trichodesmium to nitrogen and carbon biogeochemical 25
cycles, this algorithm must be corrected. The use of the Rrc instead of the Rrs is possible but some adjustments and comparisons
with in-situ measurements must be carried out before proposing such algorithm. Globally this algorithm allows one to estimate
the Trichodesmium aggregated in sea surface mats. The next step is to understand the quantitative aspect linking the
Trichodesmium abundances to N2 fixation rates, including their vertical distribution even when Trichodesmium
filaments/colonies are spread out in the water column. Another important field of interest is to be able to understand 30
phytoplankton functional types using satellites including Trichodesmium (de Boissieu et al., 2014). At present, we do not know
any such study that included Trichodesmium but we have hopes that with our new in situ database and our understanding of
Biogeosciences Discuss., https://doi.org/10.5194/bg-2017-571Manuscript under review for journal BiogeosciencesDiscussion started: 9 January 2018c© Author(s) 2018. CC BY 4.0 License.
13
the mat shapes detected in the present study, and the development of performing statistical methods such as machine learning,
advances can be made in that that regard. This will be undertaken in the future.
Finally (Dutheil et al., This issue) explore the regional and seasonal budget of the N2 fixation due to Trichodesmium in a
numerical model based on physical and biogeochemical properties that does not take into consideration the part of
Trichodesmium that aggregates in mats. One interesting aspect will be to find a way to integrate our results in such model to 5
better estimate the regional effects of that species.
Appendix
(McKinna et al., 2011) algorithm
The McKinna et al. (2011) algorithm is based on the analysis of the reflectance spectrum of a moderate Trichodesmium mat
taken above the water, similar to the one measured on colonies in a small dish with an Ocean Optics spectroradiometer (Dupouy 10
et al., 2008). It uses typical spectral characteristics of the normalized water-leaving radiance (nLw) after atmospheric correction
to define 4 Trichodesmium detection criteria. The first three criteria relate to the shape of the spectrum and are given by the
last criteria discards any pixel with negative nLw. When these 4 criteria are respected the pixel is identified as Trichodesmium:
𝑛𝐿𝑤(859) > 𝑐1𝑛𝐿𝑤(678) (4) 15
𝑛𝐿𝑤(645) > 𝑛𝐿𝑤(678) (5)
𝑛𝐿𝑤(555) > 𝑛𝐿𝑤(678) (6)
𝑛𝐿𝑤(555) , 𝑛𝐿𝑤(645) , 𝑛𝐿𝑤(678) , 𝑛𝐿𝑤(859) < 0 (7)
(Hu et al., 2010) algorithm
Another detection algorithm, originally developed by (Hu, 2009) for floating algae, can be applied to Trichodesmium mats, as 20
demonstrated by Hu et al. (2010) on MODIS-Aqua images of the west coast of Florida and the Gulf of Mexico, even though
the Trichodesmium mats occurred in Case 2 waters. This algorithm can be decomposed into two steps: 1) detection of floating
algae (FAI, Floating Algal Index), and 2) test of the form criteria of the radiance spectrum.
The FAI aims at detecting the strong reflectance in the infrared (red-edge) characteristics of the algal agglomerate at the ocean
surface. To avoid the atmospheric overcorrection linked to the red-edge effect of the floating algae organized in a heap (Hu, 25
2009), the calculation of this index is applied to reflectance corrected only for the effects of Rayleigh scattering (Rrc). This
correction accounts for the major part of the color of the atmosphere if aerosols are not too abundant (i.e., small optical
thickness). The FAI is then defined as the difference between Rrc of the infrared domain (859 nm for MODIS) and a reference
reflectance (Rrc0) calculated by linear interpolation between the red and shortwave infrared domains, respectively 667 nm and
1240 nm for MODIS: 30
Biogeosciences Discuss., https://doi.org/10.5194/bg-2017-571Manuscript under review for journal BiogeosciencesDiscussion started: 9 January 2018c© Author(s) 2018. CC BY 4.0 License.
14
𝐹𝐴𝐼 = 𝑅𝑟𝑐,𝑁𝐼𝑅 + (𝑅𝑟𝑐,𝑆𝑊𝐼𝑅 − 𝑅𝑟𝑐,𝑅𝐸𝐷) ×(𝜆𝑁𝐼𝑅−𝜆𝑅𝐸𝐷)
(𝜆𝑆𝑊𝐼𝑅−𝜆𝑅𝐸𝐷) (8)
𝜆𝑅𝐸𝐷 = 645 𝑛𝑚 , 𝜆𝑁𝐼𝑅 = 859 𝑛𝑚 , 𝜆𝑆𝑊𝐼𝑅 = 1240 𝑛𝑚 (9)
where RED = 645 nm, NIR = 859 nm, and SWIR = 1240 nm. According to Hu et al. (2010), the difference between Rrc and Rrc0
(the second term of Equation 8) allows one to deal with the majority of the atmospheric effect which has a quasi-linear spectral 5
shape between 667nm and 1240nm.
The second step of the algorithm consists in identifying the mats emphasized by the FAI thanks to the shape of the spectrum
in the visible domain. So as to correct the bias inferred in the visible part of the spectrum by the possible presence of mats, Hu
et al. (2010) suggests applying to the pixels presenting a strong value of FAI, the correction of an area situated immediately
next to this pixel and without bloom. This approach being very expensive in times of calculation, it is substituted by a simple 10
difference between the spectrum Rrc of the pixels suspected and that of a nearby zone without mat. The spectrum of difference
of Rrc of Trichodesmium presents a pattern (spectral signature) that seems to be specific to it, i.e., a succession of high type
low - top - low - top for the wavelengths 469-488-531-551-555 nm.
Biogeosciences Discuss., https://doi.org/10.5194/bg-2017-571Manuscript under review for journal BiogeosciencesDiscussion started: 9 January 2018c© Author(s) 2018. CC BY 4.0 License.
15
References
van Baalen, C. and Brown, R. M.: The ultrastructure of the marine blue green alga, Trichodesmium erythraeum,
with special reference to the cell wall, gas vacuoles, and cylindrical bodies, Arch. für Mikrobiol., 69(1), 5
79–91, doi:10.1007/BF00408566, 1969.
Bailey, S. W. and Werdell, P. J.: A multi-sensor approach for the on-orbit validation of ocean color satellite data
products, Remote Sens. Environ., 102(1–2), 12–23, doi:10.1016/j.rse.2006.01.015, 2006.
Berthelot, H., Benavides, M., Moisander, P. H., Grosso, O. and Bonnet, S.: High-nitrogen fixation rates in the
particulate and dissolved pools in the Western Tropical Pacific (Solomon and Bismarck Seas), Geophys. 10
Res. Lett., 44(16), 8414–8423, doi:10.1002/2017GL073856, 2017.
Biegala I. C., Aucan J., Desnues A., Rodier M., Dupouy C., Raimbault P., Douillet P., Hunt B., Pagano M., Clavere-
Graciette A., Bonnefous A., Roumagnac M., Gasol J., Periot M., Schenkels O., Sharma P., Harlay J., Eldin
G., Cravatte S., Marin F., Varillon D., Roubaud F., Jamet L., Gérard P., Goyaud A., Legrand H., Gouriou
Y., and Ganachaud A.: The South Pacific Ocean Time Series (SPOT) station : a first focus on diazotrophs 15
community, http://www.eposters.net/poster/the-south-pacific-ocean-time-series-spot-station-a-first-focus-
on-diazotrophs-community, 2014
de Boissieu, F., Menkes, C., Dupouy, C., Rodier, M., Bonnet, S., Mangeas, M. and Frouin, R. J.: Phytoplankton
global mapping from space with a support vector machine algorithm, , 9261, 92611R,
doi:10.1117/12.2083730, 2014. 20
Bonnet, S., Biegala, I. C., Dutrieux, P., Slemons, L. O. and Capone, D. G.: Nitrogen fixation in the western
equatorial Pacific: Rates, diazotrophic cyanobacterial size class distribution, and biogeochemical
significance, Global Biogeochem. Cycles, 23(3), 1–13, doi:10.1029/2008GB003439, 2009.
Bonnet, S., Rodier, M., Turk-Kubo, K., Germineaud, C., Menkes, C., Ganachaud, A., Cravatte, S., Raimbault, P.,
Campbell, E., Quéroué, F., Sarthou, G., Desnues, A., Maes, C. and Eldin, G.: Contrasted geographical 25
distribution of N2 fixation rates and nifH phylotypes in the Coral and Solomon Seas (South-Western
Pacific) during austral winter conditions, Global Biogeochem. Cycles, 2015.
Bonnet, S., Caffin, M., Berthelot, H. and Moutin, T.: Hot spot of N2 fixation in the western tropical South Pacific
pleads for a spatial decoupling between N2 fixation and denitrification, Proc. Natl. Acad. Sci., 114(14),
E2800–E2801, doi:10.1073/pnas.1619514114, 2017. 30
Bonnet, S., Caffin, M., Berthelot, H., Grosso, O., Benavides, M., Helias-Nunige, S., Guieu, C., Stenegren, M., and
Foster R.: In depth characterization of diazotroph activity across the Western Tropical South Pacific hot
spot of N2 fixation, Biogeosciences Discussion, Submitted, This issue.
Le Borgne, R., Allain, V., Griffithos, S. P., Matear, R. J., McKinnon, D. A., Richardson, A. J. and Young, J. W.:
Vulnerability of open ocean food webs in the tropical Pacific to climate change, in Vulnerability of tropical 35
Pacific fisheries and aquaculture to climate change, pp. 189–249, South Pacific Commission, 2011
Caffin, M., Moutin, T., Foster, R. A., Bouruet-Aubertot, P. , Doglioli, A. M., Berthelot, H., Grosso, O. , Helias-
Nunige, S., Leblond, N., Gimenez, A., Petrenko, A. A. , de Verneil, A., and Bonnet, S.: Nitrogen budgets
following a Lagrangian strategy in the Western Tropical South Pacific Ocean: the prominent role of N2
fixation (OUTPACE cruise), Biogeosciences Discuss., 1–34, doi.org/10.5194/bg-2017-468, 2017. 40
Capone, D. G., Capone, D.G., Zehr, J. P., Paerl, H. W., Bergman, B., and Carpenter, E. J: Trichodesmium, a
Globally Significant Marine Cyanobacterium, Science (80), 276(5316), 1221–1229, 1997.
Cravatte, S., Kestenare, E., Eldin, G., Ganachaud, A., Lefèvre, J., Marin, F., Menkes, C. and Aucan, J.: Regional
Biogeosciences Discuss., https://doi.org/10.5194/bg-2017-571Manuscript under review for journal BiogeosciencesDiscussion started: 9 January 2018c© Author(s) 2018. CC BY 4.0 License.
16
circulation around New Caledonia from two decades of observations, J. Mar. Syst., 148, 249–271,
doi:10.1016/j.jmarsys.2015.03.004, 2015.
Dupouy, C., Neveux, J., Subramaniam, A., Mulholland, M. R., Montoya, J. P., Campbell, L., Carpenter, E. J. and
Capone, D. G.: Satellite captures Trichodesmium blooms in the southwestern tropical pacific, Eos
(Washington. DC), 81(2), doi:10.1029/00EO00008, 2000. 5
Dupouy, C., Neveux, J., Dirberg, G., Röttgers, R., Tenório, M. M. B., S. Ouillon, 2008. Bio-optical properties of
the marine cyanobacteria Trichodesmium spp., Journal of Applied Remote Sensing, 2, 1-17.
doi:10.1117/1.2839036
Dupouy, C., Benielli-Gary, D., Neveux, J., Dandonneau, Y. and Westberry, T. K.: An algorithm for detecting
Trichodesmium surface blooms in the South Western Tropical Pacific, Biogeosciences, 8(12), 3631–3647, 10
2011.
Dupouy, C, Frouin, R, Tedetti, M., Maillard, M., Rodier, M., Duhamel, S., Guidi, L., Lombard, F., R., Picheral,
M., Charriere B., Sempere, R.: Diazotrophic Trichodesmium influence on ocean color and pigment
composition in the South West Tropical Pacific, Biogeosciences Discussion, Submitted, this issue
Dutheil, C., Aumont, O., Gorgues, T., Lorrain, A., Bonnet, S., Rodier, M., Dupouy, C., and Shiozaki T.: Modelling 15
the processes driving Trichodesmium sp. spatial distribution and biogeochemical impact in the tropical
Pacific Ocean Southwest tropical Pacific, Biogeosciences Discussion, Submitted, this issue
Garcia, N., Raimbault, P. and Sandroni, V.: Seasonal nitrogen fixation and primary production in the Southwest
Pacific: Nanoplankton diazotrophy and transfer of nitrogen to picoplankton organisms, Mar. Ecol. Prog.
Ser., 343, 25–33, doi:10.3354/meps06882, 2007. 20
Gower, J., King, S. and Young, E.: Global remote sensing of Trichodesmium, Int. J. Remote Sens., 35(14), 5459–
5466, doi:10.1080/01431161.2014.926422, 2014.
Hood, R. R., Subramaniam, A., May, L. R., Carpenter, E. J. and Capone, D. G.: Remote estimation of nitrogen
fixation by Trichodesmium, Deep. Res. Part II Top. Stud. Oceanogr., 49(1–3), 123–147, 2002.
Hu, C.: A novel ocean color index to detect floating algae in the global oceans, Remote Sens. Environ., 113(10), 25
2118–2129, doi:10.1016/j.rse.2009.05.012, 2009.
Hu, C., Cannizzaro, J., Carder, K. L., Muller-Karger, F. E. and Hardy, R.: Remote detection of Trichodesmium
blooms in optically complex coastal waters: Examples with MODIS full-spectral data, Remote Sens.
Environ., 114(9), 2048–2058, 2010.
Hu, C., Lee, Z. and Franz, B.: Chlorophyll a algorithms for oligotrophic oceans: A novel approach based on three-30
band reflectance difference, J. Geophys. Res. Ocean., 117(1), 1–25, doi:10.1029/2011JC007395, 2012.
Knapp A., McCabe, K., Grosso, O., Leblond, N., Moutin, T., and Bonnet, S.: Distribution and rates of nitrogen
fixation in the western tropical South Pacific Ocean constrained by nitrogen isotope budgets,
Biogeosciences Discussion, submitted, this issue
McKinna, L., Furnas, M. and Ridd, P.: A simple, binary classification algorithm for the detection of Trichodesmium 35
spp. within the Great Barrier Reef using MODIS imagery, Limnol. Oceanogr. Methods, 9, 50–66,
doi:10.4319/lom.2011.9.50, 2011.
Mckinna, L. I. W.: Three decades of ocean-color remote-sensing Trichodesmium spp . in the World’s oceans : A
review, Prog. Oceanogr., 131, 177–199, doi:10.1016/j.pocean.2014.12.013, 2015.
Laran S., Hamani V., Authier M., Dorémus G., Van Canneyt O., Ridoux V. et Watremez P. : Distribution et 40
abondance de la mégafaune marine dans le sud-ouest du Pacifique. Campagne REMMOA - Nouvelle-
Calédonie et Wallis et Futuna. Rapport final pour l’Agence des aires marines protégées,105pp, 2016.
Luo Y-W, Doney SC, Anderson LA, Benavides M and others: Database of diazotrophs in global ocean: abundance
biomass and nitrogen fixation rates. ESSD 4:47-73, 2010.
Moutin, T., Doglioli, M. A., De Verneil, A. and Bonnet, S.: Preface: The Oligotrophy to the UlTra-oligotrophy 45
PACific Experiment (OUTPACE cruise, 18 February to 3 April 2015), Biogeosciences, 14(13), 3207–
Biogeosciences Discuss., https://doi.org/10.5194/bg-2017-571Manuscript under review for journal BiogeosciencesDiscussion started: 9 January 2018c© Author(s) 2018. CC BY 4.0 License.
17
3220, doi:10.5194/bg-14-3207-2017, 2017.
Picheral, M., Guidi, L., Stemmann, L., Karl, D. M., Iddaoud, G. and Gorsky, G.: The underwater vision profiler 5:
An advanced instrument for high spatial resolution studies of particle size spectra and zooplankton, Limnol.
Oceanogr. Methods, 8(SEPT), 462–473, doi:10.4319/lom.2010.8.462, 2010.
Rousselet, L., de Verneil, A., Doglioli, A. M., Petrenko, A. A., Duhamel, S., Maes, C., and Blanke, B.: Large to 5
submesoscale surface circulation and its implications on biogeochemical/biological horizontal distributions
during the OUTPACE cruise (SouthWest Pacific), Biogeosciences Discuss., 1-29, doi.org/10.5194/bg-
2017-456, in revision.
Shiozaki, T., Kodama, T. and Furuya, K.: Large scale impact of the island mass effect through nitrogen fixation in
the western South Pacific Ocean,,.Geophys Res Lett 41, 1–7, 2014. 10
Stenegren, M., Caputo, A., Berg, C., Bonnet, B., and Foster, R. A.: Distribution and drivers of symbiotic and free-
living diazotrophic cyanobacteria in the Western Tropical South Pacific, Biogeosciences Discussion,
https://doi.org/10.5194/bg-2017-63
Subramaniam, A., Carpenter, E. J. and Falkowski, P. G.: Bio-optical properties of the marine diazotrophic
cyanobacteria Trichodesmium spp. I. Absorption and photosynthetic action spectra, Limnol. Oceanogr., 15
doi:10.4319/lo.1999.44.3.0618, 1999a.
Subramaniam, A., Carpenter, E. J. and Falkowski, P. G.: Bio-optical properties of the marine diazotrophic
cyanobacteria Trichodesmium spp. II. A reflectance model for remote-sensing, Limnol. Oceanogr.,
doi:10.4319/lo.1999.44.3.0618, 1999b.
Tenorio, M., Dupouy C., Rodier, M., and Neveux, J. :Trichodesmium and other Filamentous Cyanobacteria in New 20
Caledonian waters (South West Tropical Pacific) during an El Niño Episode. Aquatic Microbial Ecology,
in revision.
Villareal, T. A., and Carpenter, E. J.: Buoyancy regulation and the potential for vertical migration in the oceanic
cyanobacterium Trichodesmium. Microb Ecol., 45(1), 1-10, 2003.
Wang, M. and Shi, W.: Estimation of ocean contribution at the MODIS near-infrared wavelengths along the east 25
coast of the U.S.: Two case studies, Geophys. Res. Lett., 32(13), doi:10.1029/2005GL022917, 2005.
Westberry, T. K., Siegel, D. A. and Subramaniam, A.: An improved bio-optical model for the remote sensing of
Trichodesmium spp. blooms, J. Geophys. Res. Ocean., 110(6), 1–11, 2005.
FIGURE LEGENDS 30
Figure 1: Map of in-situ (visual) observations of Trichodesmium mats gathered on the studied region.
Figure 2: MODIS-Aqua tile A2007290.0355 used in McKinna et al. (2011): (A) Rrc “true color” composition; (B) aerosol optical
thickness at 555nm; (C) Chlorophyll concentration product computed from Rrs.
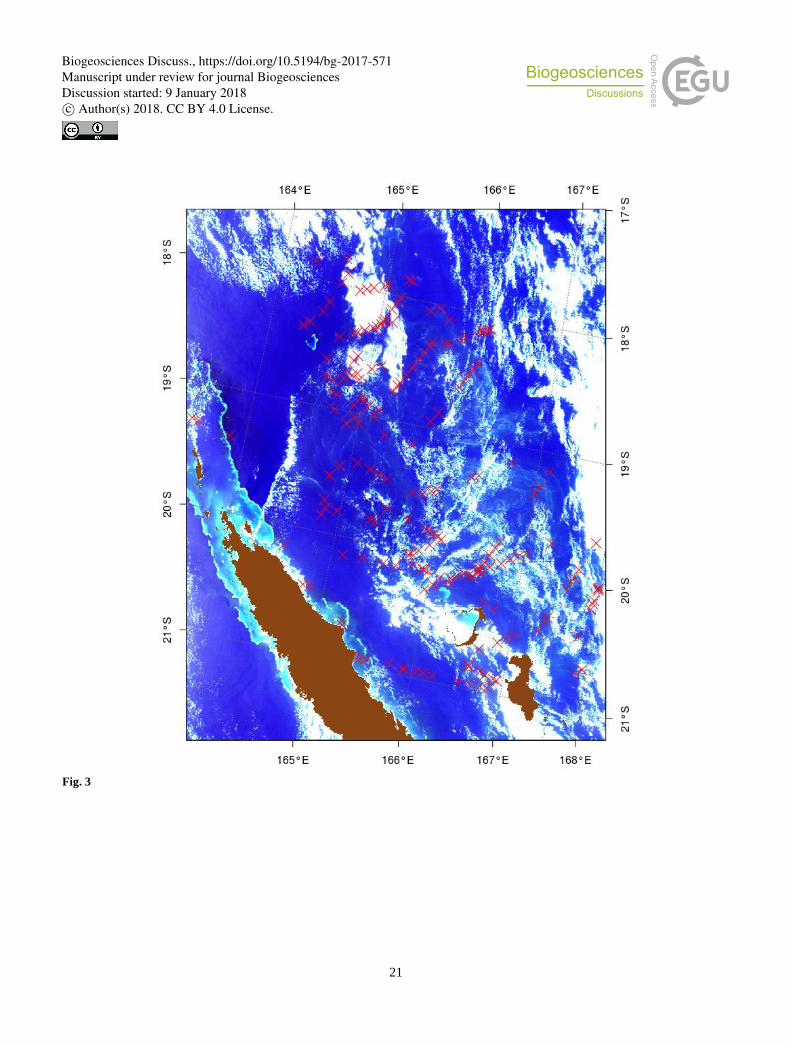
Figure 3: “True color” image of the 17th December “2014A2014351.0255” for which in situ observations (red crosses) exist in the 35 SOB database, and used for the test and adjustment of the different bio-optical algorithms.
Figure 4: MODIS Spectra of Trichodesmium mats (A and B) and adjacent areas (C, D and E) normalized by the maximum spectral
value of all wavelengths, with pixels resolution at 250m (A, B, C and D) and 1km (E). B and D are Rrc reflectances. A, B and E are
Rrs reflectances. Average is red line and error bars are the standard deviation.
Figure 5: Trichodesmium mats detection results on MODIS tile “A2007290.0355”: (A) pixels detected with McKinna modified 40 algorithm in red, (B) pixels detected with FAI algorithm, (C) pixels detected with the new algorithm, showing values of Rrs(678)
(absolute value).
Biogeosciences Discuss., https://doi.org/10.5194/bg-2017-571Manuscript under review for journal BiogeosciencesDiscussion started: 9 January 2018c© Author(s) 2018. CC BY 4.0 License.
18
Figure 6: MODIS tile “A2007290.0355” zoomed of the red square area (24°S, Figure 5). Pixels resulting from a false positive detection
of (A) the McKinna modified algorithm, (B) FAI and (C) the new algorithm for the area in red on the Figure 5.
Figure 7: Retrieval rates vs. distance as a function of the day difference between in situ observations and satellite detection with the
new algorithm
Figure 8: (A) Monthly composite of satellite chlorophyll for March 2015 together with in situ fixation rates superimposed on the 5 OUTPACE track, as colored dots (values on the left colorbar). (B) Points detected as Trichodesmium (cyan dots) by the present
algorithm together with a summary of absence/presence denoted as colored blue (absence) and red (presence) points along the
OUTPACE track. A point at the OUTPACE station is colored when the algorithm shows presence within a 50km radius off the
station.
Figure 9: FAI application to the MODIS tile “A2007290.0355”: zoomed of the green square area (22.5 °S, Figure 5). (A) Results at 10 250 m resolution, (B) the same scene at 1 km resolution. Only a few pixels are remaining corresponding to the densest part of the
surface mat, showing the loss of detected mats.
Figure 10: MODIS-Aqua image at 250 m taken on March, 6th, 2015 to the south of the OUTPACE cruise illustrating the structure
of the chlorophyll (colors) together with the filaments of Trichodesmium detected by our algorithm (in black).
15
TABLE LEGEND
Table 1: Satellite image with in-situ observations used to analyze Trichodesmium mat and adjacent spectra.
Biogeosciences Discuss., https://doi.org/10.5194/bg-2017-571Manuscript under review for journal BiogeosciencesDiscussion started: 9 January 2018c© Author(s) 2018. CC BY 4.0 License.
19
Fig. 1
5
Biogeosciences Discuss., https://doi.org/10.5194/bg-2017-571Manuscript under review for journal BiogeosciencesDiscussion started: 9 January 2018c© Author(s) 2018. CC BY 4.0 License.
20
Fig. 2
Biogeosciences Discuss., https://doi.org/10.5194/bg-2017-571Manuscript under review for journal BiogeosciencesDiscussion started: 9 January 2018c© Author(s) 2018. CC BY 4.0 License.
21
Fig. 3
Biogeosciences Discuss., https://doi.org/10.5194/bg-2017-571Manuscript under review for journal BiogeosciencesDiscussion started: 9 January 2018c© Author(s) 2018. CC BY 4.0 License.
22
Fig.4
Biogeosciences Discuss., https://doi.org/10.5194/bg-2017-571Manuscript under review for journal BiogeosciencesDiscussion started: 9 January 2018c© Author(s) 2018. CC BY 4.0 License.
23
Fig.5
Biogeosciences Discuss., https://doi.org/10.5194/bg-2017-571Manuscript under review for journal BiogeosciencesDiscussion started: 9 January 2018c© Author(s) 2018. CC BY 4.0 License.
24
Fig. 6
Biogeosciences Discuss., https://doi.org/10.5194/bg-2017-571Manuscript under review for journal BiogeosciencesDiscussion started: 9 January 2018c© Author(s) 2018. CC BY 4.0 License.
25
Fig. 7
Biogeosciences Discuss., https://doi.org/10.5194/bg-2017-571Manuscript under review for journal BiogeosciencesDiscussion started: 9 January 2018c© Author(s) 2018. CC BY 4.0 License.
26
Fig.8
Biogeosciences Discuss., https://doi.org/10.5194/bg-2017-571Manuscript under review for journal BiogeosciencesDiscussion started: 9 January 2018c© Author(s) 2018. CC BY 4.0 License.
27
Fig. 9
Biogeosciences Discuss., https://doi.org/10.5194/bg-2017-571Manuscript under review for journal BiogeosciencesDiscussion started: 9 January 2018c© Author(s) 2018. CC BY 4.0 License.
28
Fig. 10
Biogeosciences Discuss., https://doi.org/10.5194/bg-2017-571Manuscript under review for journal BiogeosciencesDiscussion started: 9 January 2018c© Author(s) 2018. CC BY 4.0 License.
29
Tiles Date Location
A2002341.0255 7 December 2002 East of New Caledonia
A2004047.0230 16 February 2004 Loyalty islands
A2004059.0255 28 February 2004 East of New Caledonia
A2014344.0245 10 December 2014 Loyalty islands (East of Ouvea)
A2014351.0255 17 December 2014 Northeast of New-Caledonia
A2014353.0240 19 December 2014 Between Vanuatu and New-Caledonia
Tab. 1 5
Biogeosciences Discuss., https://doi.org/10.5194/bg-2017-571Manuscript under review for journal BiogeosciencesDiscussion started: 9 January 2018c© Author(s) 2018. CC BY 4.0 License.


