Embed Size (px)
Citation preview

Energy Policy 38 (2010) 7021–7030
Contents lists available at ScienceDirect
Energy Policy
0301-42
doi:10.1
$This
at Mich
Brownfi
funding
by the J
State Unn Corr
E-m
jashaw@
mckeow1 Te2 Te
journal homepage: www.elsevier.com/locate/enpol
Renewable energy potential on brownfield sites: A case study of Michigan$
Soji Adelaja a,1, Judy Shaw b,2, Wayne Beyea a,1, J.D. Charles McKeown a,n
a Land Policy Institute (LPI), Michigan State University, 1405 S. Harrision Road, Ste 305, East Lansing, Michigan 48823 United Statesb National Center for Neighborhood and Brownfield Redevelopment, Cook College, Rutgers University, New Jersey, United States
a r t i c l e i n f o
Article history:
Received 11 December 2009
Accepted 15 July 2010Available online 5 August 2010
Keywords:
Brownfields
Renewable energy
Adaptive reuse
15/$ - see front matter & 2010 Elsevier Ltd. A
016/j.enpol.2010.07.021
report is the outcome of a joint project betw
igan State University and the National Ce
elds Redevelopment at Rutgers University. T
from the W.K. Kellogg Foundation under the P
ohn A. Hannah Distinguished Professor Resea
iversity.
esponding author. Tel.: +1 517 432 8800; fax
ail addresses: [email protected] (S.
rci.rutgers.edu (J. Shaw), [email protected]
[email protected] (Charles McKeown).
l.: +1 571 432 8800.
l.: +732 932 5475.
a b s t r a c t
Federal priorities are increasingly favoring the replacement of conventional sources of energy with
renewable energy. With the potential for a federal Renewable Electricity Standard (RES) legislation,
many states are seeking to intensify their renewable energy generation. The demand for wind, solar,
geothermal and bio-fuels-based energy is likely to be rapidly expressed on the landscape. However,
local zoning and NIMBYism constraints slow down the placement of renewable energy projects. One
area where land constraints may be lower is brownfields; whose development is currently constrained
by diminished housing, commercial, and industrial property demand. Brownfield sites have the
potential for rapid renewable energy deployment if state and national interests in this area materialize.
This study investigates the application of renewable energy production on brownfield sites
using Michigan as a case study. Wind and solar resource maps of Michigan were overlaid with the
brownfield locations based on estimates of brownfield land capacity. The total estimated energy
potential available on Michigan’s brownfield sites is 4320 megawatts (MW) of plate capacity for wind
and 1535for solar, equating to 43% of Michigan’s residential electricity consumption (using 30% capacity
factor). Estimated economic impacts include over $15 billion in investments and 17,500 in construction
and long-term jobs.
& 2010 Elsevier Ltd. All rights reserved.
1. Background
The term brownfield site means ‘‘real property for which theexpansion, redevelopment or reuse may be complicated by thepresence or potential presence of a hazardous substance,pollutant or contaminant’’ (U.S. Congress, 1980). Brownfield sitesare generally abandoned or under-utilized old industrial and/orcommercial facilities, and can be major eyesores and/or healthhazards for residents of the communities in which they arelocated. Brownfield sites are typically contaminated by lowconcentrations of hazardous waste or pollution, and have thepotential to be redeveloped only after clean-up.
Typical contaminants found on brownfields include heavymetals, such as lead (paints), arsenic, polychlorinated bi-phenols
ll rights reserved.
een the Land Policy Institute
nter for Neighborhood and
he project was supported by
eople and Land Program and
rch Endowment at Michigan
: +1 517 432 8769.
Adelaja),
su.edu (W. Beyea).
(PCBs), pesticides, asbestos, and hydrocarbons from fuel leaks.Brownfields are seen not only as compromising the environmentand threatening public health and safety, but as contributors toblight and barriers to economic development. The concentrationof such sites in urban areas or old industrial towns makeseconomic development more challenging for urban policy makers.By discouraging productive reuse of potential infill areas, brown-fields also serve to promote urban sprawl and the erosion of urbanvitality (Dorsey, 2003).
Brownfields are seen by local, state, and federal policy makersas a special problem area warranting policy intervention. Thenegative externalities3 associated with these sites led to thedevelopment of a number of federal, state, and local policies; andcomponent tools and incentives aimed at encouraging brownfieldredevelopment. Examples of incentives currently in place inMichigan include brownfield tax credits (BTCs), tax incrementfinancing (TIFs), brownfield redevelopment grants and loans, andbrownfield site assessment services (MDEQ, 2008). The assump-tion behind the creation of these incentives is that there is, atleast, some demand for real estate development in areas wherebrownfields exist. These incentives were designed to influence
3 Negative externalities are the negative effects that are not limited to the
property owner or user on the community and individuals who live or work near
the property.

S. Adelaja et al. / Energy Policy 38 (2010) 7021–70307022
developers toward choosing to redevelop brownfield sites ratherthan choosing greenfields or other sites for their developmentprojects. The slow pace of brownfield redevelopment in the U.S.,even in periods of rapid economic growth and sprawl, suggeststhat the barriers (real or perceived) to brownfield redevelopmentmay well outweigh the policies, tools and incentives in place toencourage their redevelopment in many areas of the country.
A primary barrier to brownfield redevelopment is that, evenwith incentives, the mitigation cost necessary to bring these sitesup to safe standards may be more than the land would be worthafter redevelopment. This cost gap makes it difficulty fordevelopers to embark on brownfield redevelopment projects,even in cases where the costs of clean-up and redevelopment areknown with certainty. Complicating the redevelopment process iscost uncertainty. Although, the methods of assessing and cleaningup environmentally distressed properties have become moresophisticated, surprises are often encountered in the process ofcleaning contaminated brownfield sites.
To better understand the risks associated with brownfield siteredevelopment, it is important to understand the redevelopmentprocess. The process starts with an Environmental Site Assess-ment (ESA), which may involve two phases. Phase 1 assessmentsare most often performed as the initial overview of a site’spotential contaminants. It is typically done in conjunction with aproposed transfer of property ownership or a change in the use ofthe property. Much of the context of a phase 1 ESA is recordsearches, title histories and an information review intended toprovide an overview of a site’s problems. While a phase 1 ESA is auseful tool, it does not generally involve a thorough siteevaluation and can often be accomplished without a site visit.For certain sites, a phase 1 ESA will not expose previouslyunreported or unknown problems.
To avoid such surprises and the associated risk, manydevelopers require that a brownfield site be fully investigatedvia a Phase 2 Site Investigation. Phase 2 assessments involvesextensive site examination, including soil sampling, water testing,building material testing, etc. (Witkin, 2002) prior to thecommencement of clean-up activities. Phase 2 assessment candecrease the risk associated with clean-up and development andreduce the chances of a project being slowed down or totallyhalted due to contamination surprises.
In addition to risk-related barriers to brownfield redevelop-ment, the lack of local brownfield expertise and capacity alsopresents challenges to redevelopment (Dewar, 2008; NALGEP,2004). Brownfield redevelopment is a complex process, whichrequires knowledge of both state and federal environmentalagency regulations, in-depth knowledge of remediation techni-ques, the ability to assess and limit liability, the ability to navigatecomplex financial vehicles, and the ability to assess and manageprojects to achieve the desired level of remediation within agiven budget (Meyer and Lyons, 2000). Limited local budgetsfor brownfield redevelopment authorities and the limited poolof experts have been limiting factors. Many states and theU.S. Environmental Protection Agency have helped to seeda variety of capacity-building programs through grants andtraining opportunities.
To further complicate brownfield redevelopment, a newconstraint has emerged in recent years—the decline in commer-cial, industrial, and consumer demand for redeveloped property.Such demand has waned, while supply has continued to increase.Many of these locations represent places where industrial activityhas fled (NALGEP, 2004) and where growth is slow or non-existent. In the aftermath of the sub-prime lending boom, someurban areas became flush with foreclosed homes as the rate ofmortgage default spiked, abandoned properties abound, propertyvalues plummeted, job opportunities waned and communities
became fiscally strapped, essentially wiping out the demand fornew development (Mian and Sufi, 2008).
The weak demand for commercial, industrial, and residentialdevelopment creates a major constraint to brownfield redevelop-ment nationwide, despite existing incentive programs. This hasaffected brownfield remediation programs, especially in theNortheast and other industrial states. The problem is particularlysignificant in Michigan, where housing foreclosure, urban disin-vestment, and industrial job losses are among the highest in thenation. So, despite the good intentions of policy tools, many of thesites will likely remain under-utilized for some time.
Parallel to this trend is the continued increase in the costs offuel used in the generation of electricity. This includes natural gas,coal, uranium, and liquid petroleum products (EIA, 2008). Thisand other factors, including climate change and economicdevelopment, have increased federal and state level interest inrenewable energy. With more competitor nations, such as China,increasing their demand for energy rapidly, fuel prices havebecome increasingly volatile. United States energy consumptionhas grown dramatically over the last 50 years, BP (BritishPetroleum) Renewable Energy forecasts an average annual growthrate that continues this trend, even in the face of dwindlingavailability of non-renewable energy sources (Hayward, 2008).Increased energy consumption, coupled with the projectedgrowth in the economies and the middle-class of such countriesas China and India, may challenge U.S. access to fossil-basedsources of energy abroad (Morse and Richard, 2002).
Potential relief for the myriad of current energy issues may bein the advent of U.S.-based renewable energy production (e.g.,solar, wind, biomass, geothermal, etc.). Each of these technologieshas significant land demand implications. Biomass will directlycompete for land devoted to the production of food, unless idleland is used, and may invariably increase the cost of food.Industrial solar farms will probably do likewise, perhaps with aslightly lower degree of competition for arable land. Geothermaltechnology promises to be less exhaustive of land, but itsefficiency is highly spatially variable. Wind energy, which canco-exist with existing land uses on farms, is a reasonable solution,but it also would compete, although fractionally, with agriculturaland other productive uses.
2. Using brownfield sites to produce renewable energy
These circumstances in the brownfield redevelopment andrenewable energy industries create the potential opportunity toachieve some of the brownfield redevelopment goals of commu-nities, while addressing the need for renewable energy in post-industrial regions of the country (Staba, 2007). Most of the currentthinking about the location of renewable energy development isfocused on agricultural and forested lands where substantivetransmission and other infrastructure does not exist (McDaniel,2008). This approach invariably competes with land uses fromenvironmental, food production, housing, tourism, and othersocially accepted priorities for land use. Brownfields offer acompelling alternative to siting renewable energy production ongreenfields. This combination could address some if the currentconstraints to brownfield redevelopment (markets and remedia-tion costs), while providing an immediate opportunity to produceclean new renewable energy. Since many of our brownfield sitesare in cities and other industrial locations, which have beenhardest hit by job loss, a brownfield application of renewableenergy could benefit those communities too through job creationand investment.
There are, however, impediments in creating the connectionbetween the renewable energy industry’s demand for land and

S. Adelaja et al. / Energy Policy 38 (2010) 7021–7030 7023
the land available in brownfield sites. Similar to brownfieldredevelopment, the renewable energy development requires itsown unique expertise including project design, a thoroughknowledge of state and federal renewable energy incentives, thegrid connection process, resource assessment, site design, andregulatory approval from multiple federal and state agencies. Forexample, wind energy can be a controversial issue and the siting4
of wind energy generation facilities has generated public opposi-tion related to noise concerns, aesthetics, and safety. This canpresent a significant barrier to wind energy projects and theprocess is smoothest when it includes significant communityinvolvement, which can be informed through public education(Klepinger, 2007). Community involvement and consensus-build-ing have been identified as two of the most important issues thatcould present barriers to brownfield redevelopment, especiallythose involving renewable energy projects (Smedley and VanDaale, 2007). Creating an environment where communities,brownfield redevelopers and renewable energy developers canuse existing federal and state incentives from their respectivearenas to develop renewable energy on brownfield sites firstrequires assessing the potential for renewable energy projects onbrownfield sites, and an assessment of the potential impacts ofthese projects as a means of raising awareness and creatingconnections.
3. Study objectives and rationale
The prime objective of this study is to evaluate the potentialfor renewable energy development on brownfield sites and toassess the potential economic impact of this development. Due tothe diversity and geographic dispersion of brownfield sitesnationally, and the absence of consistent national state-by-statedata on renewable energy potential, one state was selected as acase study—Michigan. With the heavy manufacturing heritage ofthe state and the rapidly changing focus of the economy, manyindustrial sites were put out of production and market relevance.Michigan now has one of the largest inventories of brownfieldsites in the nation (NALGEP, 2004). An estimated 44,000 acres ofbrownfield lands are currently undeveloped in the state ofMichigan (MEDC, 2008). In comparison, there are approximately480,000 potentially contaminated sites (15 million acres) acrossthe Unites States that are tracked by the U.S. EnvironmentalProtection Agency (EPA) (McDaniel, 2008). National figuresindicate that the EPA Brownfields Program has leveraged 48,238jobs and $11.3 billion in new investment as of March 2008. Inaddition, the 2007 U.S. Conference of Mayors survey indicates that150 cities have redeveloped 1578 sites (Paull, 2008).
With the newly constituted Michigan Land Bank Fast TrackAuthority and other initiatives, Michigan’s aggressive brownfieldincentive programs may well put it at the forefront of brownfieldredevelopment innovation nationally (MEDC, 2008). As of De-cember 2006, there were 266 local Brownfield RedevelopmentAuthorities comprised of 1335 members in Michigan (Smedleyand Van Daale, 2007). These were established under Michigan’sBrownfield Redevelopment Financing Act (Act 381 of 1996). Theseauthorities are charged with developing Brownfield Redevelop-ment Plans for their communities and establishing redevelopmentactivities and priorities. During the 10-year period between 1998and 2007, the Michigan Department of Environmental Quality(MDEQ) received 369 Act 381 work plans associated with 180individual projects, with approved Brownfield Redevelopment
4 The process of designing wind energy generation, arraying turbines on the
landscape and getting regulatory approval is generally referred to as the siting
process.
Plans from 79 different Brownfield Redevelopment Authorities.According to MDEQ, for these traditional redevelopment projectseither receiving approval or conditional approval, the localBrownfield Redevelopment Authorities estimate more than $2.6billion in private investment will be made as part of theseredevelopment efforts is, in turn, creating more than 15,600 newjobs and resulting in the redevelopment of more than 3400 acres(Smedley and Van Daale, 2007).
4. Methods: a preliminary case study of Michigan
On June 5, 1995, Governor John Engler of Michigan signed intolaw major amendments to Part 201 of the Michigan NaturalResources and Environmental Protection Act. Part 201 is theState’s primary environmental clean-up statute, which definesbrownfields in Michigan. The full list of Part 201 brownfield sitesin the state of Michigan was obtained from MDEQ.5 This dataset isgenerally regarded as current, and we assumed that our down-loaded version represents the full inventory of Part 201 brown-field sites. This database was geo-coded based on the propertyaddress and the latitude and longitude of each brownfield inMichigan. This spatially explicit brownfield data was then layeredinto a Geographical Information System (GIS) and intersectedwith wind and solar resource data. For the purposed of thisanalysis, the cost of connection to the grid is not estimated as it isassumed to be equal for greenfield development and brownfielddevelopment of renewable energy.
To determine wind resource availability on brownfield sites inthe state, the brownfield point locations were overlaid onto theMichigan 70 meter (m) mean annual wind speed data that wasproduced by a collaborative that included the National RenewableEnergy Laboratory (NREL), AWS Truewind and the MichiganDepartment of Energy, Labor & Economic Growth’s State EnergyOffice.6 The data was provided to the MSU Land Policy Institute’sLand Policy Research unit. To filter the sites down to only thosethat have the wind resource necessary for viable development,the NREL wind resource map was overlaid with the brownfieldlocations and only those that met the minimum standard wereretained for further analysis. This process yielded 2946 brown-field sites with wind speed greater than 6 meters-per-second(m/s) at 70 m elevation, which is approximately the lower limitfor commercially viable wind power projects (Calvert et al., 2002).As will be reported later, we had questions as to the validity of thetotal acreage in brownfields and the average acreage of 10 acres-per-site reported by the MEDC. The methodology used to estimatebrownfield acreages are presented below.
In the absence of parcel size information per site, we had toobtain such information. The MEDC estimate of an average of10 acres-per-site would have forced us to assume that contaminatedsites are distributed equally around the state and that an averagesize is sufficient for a statewide analysis. However, given thatwind resources are unevenly distributed throughout the state, theabove assumption needed to be verified. Parcel size informationon all brownfield sites was impossible to get because not alljurisdictions maintain such information in a readily accessibleform. Since, however, the addresses of the sites are generallyknown, but the acreages are not, the sizes of brownfield sites wereestimated by taking a random, stratified sample of the part 201contaminated sites list and verifying the acreages. This, at least,provided estimates that are probably closer to the actual numbersthan the MEDC estimated 10 acres. Fig. 1 shows the distribution of
5 MDEQ brownfield data from: http://www.deq.state.mi.us/part201ss/.6 Please see http://www.michigan.grov/dleg/0,1607,7-154-25676_25774-101765–
00.html.

S. Adelaja et al. / Energy Policy 38 (2010) 7021–70307024
brownfield sites overlaid onto the wind speed data, and Fig. 2shows the distribution of brownfield sites overlaid onto solarpotential.
The following methods were used in our sampling of brown-field sites. First, the state was classified into urban and ruralcounties using U.S. Census Bureau Urban Influence Codes. We thenclassified the data to obtain information on the brownfields inurban counties and all rural counties. Urban areas are representedby Urban Influence Codes 1 and 2 that are defined as
1.
Fig.et al
In a large metro area of more than one million residents.
2. In a small metro area of less than one million residents.Rural areas are represented by Urban Influence Codes 3–12,which are defined as
3.
A micropolitan area adjacent to a large metro area. 4. A noncore adjacent to a large metro area. 5. A micropolitan area adjacent to a small metro area. 6. A noncore adjacent to a small metro area and contains a townof at least 2500 residents.
1. Brownfield distribution and wind velocity in Michigan, 6 m/s and above is cons
., 2002).
7.
idere
A noncore adjacent to a small metro area and does not containa town of at least 2500 residents.
8.
A micropolitan area that is not adjacent to a metro area. 9. A noncore that is adjacent to micro area and contains a townof at least 2500 residents.
10. A noncore that is adjacent to micro area and does not containa town of at least 2500 residents.
11. A noncore that is not adjacent to a metro or micro area andcontains a town of at least 2500 residents.
12. A noncore that is not adjacent to a metro or micro area anddoes not contain a town of at least 2500 residents.
The brownfield point locations were then classified as eitherurban or rural, by location. We then calculated the sample sizesnecessary for a 95% confidence interval and a 95% confidence levelfor both categories, urban and rural, using the following formula:
ss¼Z2*ðpÞ*ð1�pÞ
c2ð1Þ
where Z¼Z value, p is the percentage of the total number of sitesrequired to be a representative sample, and c the confidence
d potentially viable for commercial wind energy generation projects (Calvert
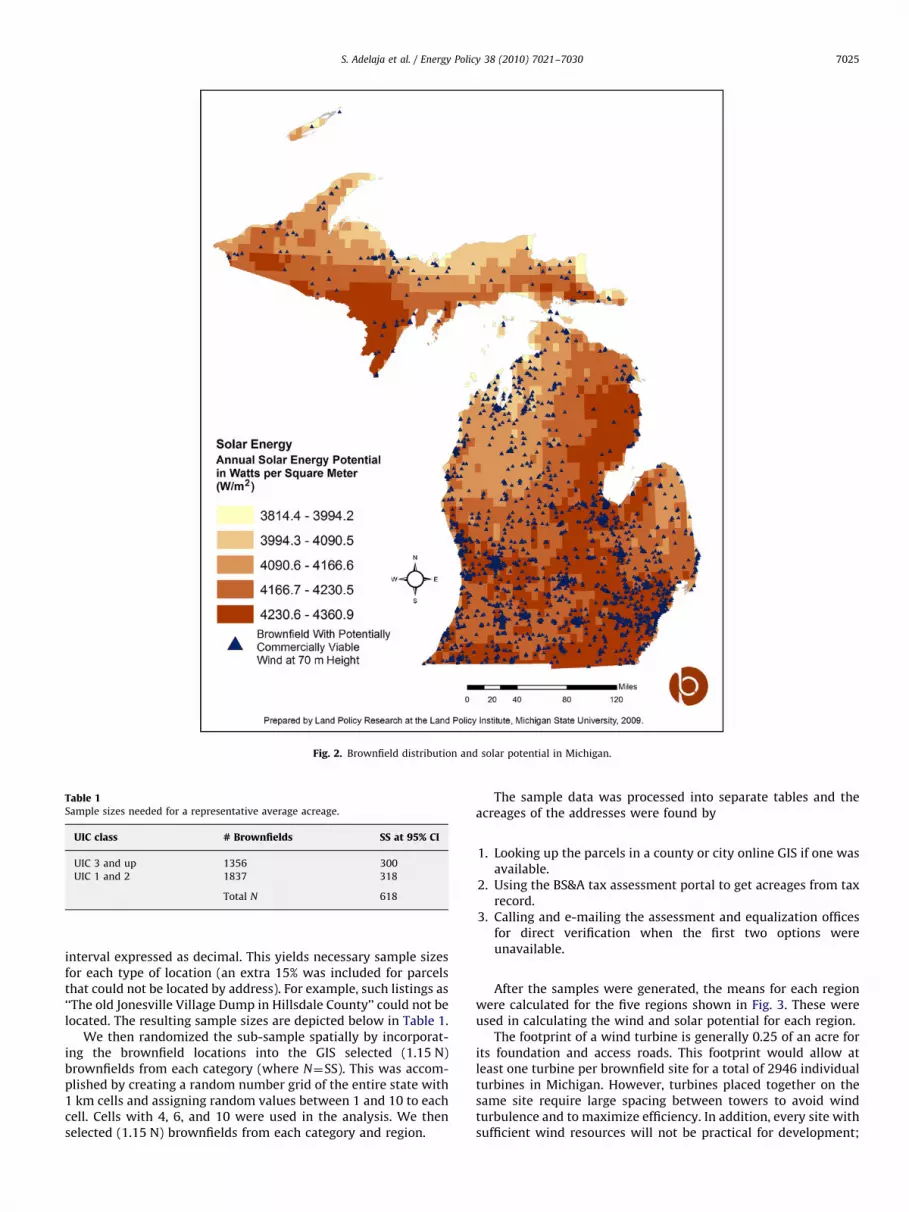
Fig. 2. Brownfield distribution and solar potential in Michigan.
Table 1Sample sizes needed for a representative average acreage.
UIC class # Brownfields SS at 95% CI
UIC 3 and up 1356 300
UIC 1 and 2 1837 318
Total N 618
S. Adelaja et al. / Energy Policy 38 (2010) 7021–7030 7025
interval expressed as decimal. This yields necessary sample sizesfor each type of location (an extra 15% was included for parcelsthat could not be located by address). For example, such listings as‘‘The old Jonesville Village Dump in Hillsdale County’’ could not belocated. The resulting sample sizes are depicted below in Table 1.
We then randomized the sub-sample spatially by incorporat-ing the brownfield locations into the GIS selected (1.15 N)brownfields from each category (where N¼SS). This was accom-plished by creating a random number grid of the entire state with1 km cells and assigning random values between 1 and 10 to eachcell. Cells with 4, 6, and 10 were used in the analysis. We thenselected (1.15 N) brownfields from each category and region.
The sample data was processed into separate tables and theacreages of the addresses were found by
1.
Looking up the parcels in a county or city online GIS if one wasavailable.2.
Using the BS&A tax assessment portal to get acreages from taxrecord.3.
Calling and e-mailing the assessment and equalization officesfor direct verification when the first two options wereunavailable.After the samples were generated, the means for each regionwere calculated for the five regions shown in Fig. 3. These wereused in calculating the wind and solar potential for each region.
The footprint of a wind turbine is generally 0.25 of an acre forits foundation and access roads. This footprint would allow atleast one turbine per brownfield site for a total of 2946 individualturbines in Michigan. However, turbines placed together on thesame site require large spacing between towers to avoid windturbulence and to maximize efficiency. In addition, every site withsufficient wind resources will not be practical for development;

Fig. 3. Estimated average acreages of contaminated sites by region.
7 For complete solar methodology, please see http://apps1.eere.energy.gov/
states/alternatives/resources_mi.cfm.
S. Adelaja et al. / Energy Policy 38 (2010) 7021–70307026
so the analysis was performed under the following assumptions:(1) the use of 2 megawatt (MW) plate capacity wind turbines,(2) spacing between the turbines was set using the industry ruleof thumb of five times the rotor diameter (or 450 m) or one turbinein every 24 acres (Patel, 2006), and (3) the aggregate acreage wasthen divided by the acreage needed for each turbine. Thismethodology ensures that as sites get larger the amount of windenergy modeled rises in proportion to the site size. In general,economies of scale dictate that larger sites have better return thansmaller sites when developing wind energy as the site design canaccommodate more turbines, this function is mitigated by the factthat the area needed for turbine rises geometrically so considerablymore land is required for large wind developments. For thepurposes of this analysis small and large sites are included andthe economies of scale are not analyzed as this requires an in-depthanalysis of each site to determine the potential. To determine theeconomic impact from the development of these projects, theseresults were then entered into the U.S. Department of Energy’s Jobsand Economic Development Impact (JEDI) model (NREL, 2008a).
To determine the solar resource availability on brownfieldsites in the state, the brownfield point locations were overlaidonto the Michigan data on solar resource capacity. This was
obtained from the National Renewable Energy Laboratory (NREL).Solar productive capacity per acre was also obtained from theNREL data.
For solar potential, the NREL Michigan solar tilt map was used.This map estimated solar power production using a standardizedsolar array, measured against Michigan’s average solar radiationfrom the National Oceanic and Atmospheric Administrationweather data.7 This assessment is based on the PVWATTS model(NREL, 2008a, b, c), which estimates solar capacity using astandardized photovoltaic (PV) array. The PV module powerratings are for Standard Test Conditions (STC) of 1000 watts-per-square-meter solar irradiance and 25 1C PV module temperature.The default PV system size is 4 kW (kilowatt). This corresponds toa PV array area of approximately 35 square meters (377 squarefeet). As the standard array used by NREL requires a footprint of0.15 acres to avoid shadow and other problems, the final potentialestimated for solar is 1535 MW. These acres are assumed to be theremaining acres of suitable brownfields after the footprint of each

S. Adelaja et al. / Energy Policy 38 (2010) 7021–7030 7027
wind tower is subtracted. In other words, the solar arrays wouldoccupy the remainder of brownfield sites once wind towers wereerected and access roads constructed. For sites with the potentialfor both wind and solar deployment, solar potential was loweredby 0.25 acres for each turbine to compensate for shading andother siting issues presented by combination wind/solar deploy-ment. Thus brownfield sites would produce electricity from bothwind and solar energy.
5. Findings
As shown in Fig. 4, Southeast and Southwest Michigan havethe largest number of sites that could potentially be used for windenergy production.
As shown in Table 2, using the estimated average acreages forcontaminated site, 2946 sites have high potential for wind energydevelopment. This translates into 4320 MW of wind power platecapacity. In 2008, the State of Michigan Enacted a RenewablePortfolio Standard, ‘‘The Clean Renewable and Efficient EnergyAct’’, that requires 10% of Michigan’s electricity be fromrenewable sources by the year 2015. Wind energy is expected
Fig. 4. Number of contaminated sites potentia
to provide a large portion of that mandate. Using a 30% capacityfactor, the energy potential on brownfields represents nearly150% of the required MW needed to meet the goals of thismandate. There is the potential to produce 292 MW of wind inNortheast Michigan (NE), 826 MW of wind energy in NorthwestMichigan (NW), 2152 MW of wind energy in Southeast Michigan(SE), 770 MW of wind energy in Southwest Michigan (SW), and280 MW of wind energy in the Upper Peninsula (UP).
Taking into account solar energy potential, as shown inTable 3, an additional 1535 MW of generation capacity exists onMichigan brownfield sites from solar energy. There is thepotential to produce 153 MW of solar power in NortheastMichigan, 288 MW of solar power in Northwest Michigan,727 MW of solar power in Southeast Michigan, 245 MW of solarpower in Southwest Michigan, and 122 MW of solar power in theUpper Peninsula.
As shown in Table 4, the economic development implicationsfor wind energy alone will be significant. This will translate intoan estimated 2162 construction jobs, over $2.1 billion inconstruction dollars, $519 million in construction wages, $8.8billion in total investments, and 196 long-term maintenance andoperating (M&O) jobs.
lly suitable for wind energy development.

Table 2Contaminated site breakdown and wind energy potential for each region of Michigan.
Region Number of brownfield sitessuitable for wind development
Average brownfieldacreage
Acres suitable for windenergy development
Number ofturbines
Potential energyfrom wind (MW)
NE 175 20.1 3515 146 292
NW 465 21.4 9928 413 826
SE 1185 21.8 25,836 1076 2152
SW 918 10.1 9247 385 770
UP 203 16.6 3367 140 280
State total 2946 – 51,893 2160 4320
Table 3Contaminated site breakdown and solar energy potential for each region of Michigan.
Region Number of brownfield sitessuitable for solar development
Average brownfieldacreage
Acres suitable for solarenergy development
Number ofsolar arrays
Potential energyfrom solar (MW)
NE 288 20.1 5748 38,321 153
NW 510 21.4 10,786 71,906 288
SE 1262 21.8 27,246 181,636 727
SW 923 10.1 9201 61,338 245
UP 279 16.6 4593 30,618 122
State total 3262 – 57,574 383,819 1535
Table 4Estimated economic impacts of wind energy development on brownfields in Michigan.
Region Projected number of jobsfrom construction
Projected constructionexpenditures
Projectedconstruction wages
Projected totalinvestment
Projected number oflong term M&O jobs
NE 147 $146,242,109 $35,151,632 $596,281,811 13
NW 413 $413,531,044 $99,245,808 $1,686,734,994 37
SE 1076 $1,077,383,544 $258,567,772 $4,394,496,014 98
SW 385 $385,495,041 $92,517,279 $1,572,380,080 35
UP 141 $140,232,159 $33,707,044 $571,777,079 13
State total 2,162 $2,162,883,897 $519,189,535 $8,821,669,978 196
Table 5Estimated economic impacts of solar energy development on brownfields in Michigan.
Region Projected number of jobsfrom construction
Projected constructionexpenditures
Projectedconstruction wages
Projected totalinvestment
Projected number oflong term M&O jobs
NE 1602 $120,081,815 $112,343,454 $712,648,340 66
NW 2828 $212,047,664 $198,382,803 $1,258,437,143 96
SE 6502 $487,482,557 $456,068,012 $2,893,057,844 169
SW 2446 $183,358,039 $171,542,007 $1,088,173,114 87
UP 1307 $97,966,396 $91,653,207 $581,400,190 57
State total 14,685 $1,100,936,471 $1,029,989,482 $6,533,716,631 475
S. Adelaja et al. / Energy Policy 38 (2010) 7021–70307028
As shown in Table 5, the economic development implicationsfor solar energy will also be significant. This will translate into anestimated 14,685 construction jobs, $1.1 billion in constructionwages, over $1 billion in construction dollars, $6.5 billion in totalinvestment, and 475 long-term M&O jobs.
6. Conclusions
This paper sought to investigate the potential available onbrownfield sites for the deployment of renewable energy in orderto meet several important goals of society. On one hand, states arepushing for renewable energy adoption through a variety ofpolicies, including RPS, but are hampered by number of place andlandscape issues, such as NIMBYism, lack of local capacity to
support and embrace wind energy, limited availability of goodland in good resource locations, and lack of local enabling policies.On the other hand, society is laden with brownfield assets thatrepresent major eyesores and detractors from economic develop-ment. From our case study, Michigan happens to be a state whereenergy potential dovetails well with brownfields, potentiallyoffering opportunities to achieve better results with the state’srenewable energy goals by coupling incentives available forbrownfield redevelopment and renewable energy. The essenceof this study is to uncover information about energy potential onbrownfield sites to enable policy makers and researchers to beginthinking about this potential opportunity.
The federal government began thinking about this combina-tion several years ago and in January 2010 they held a number oflistening sessions to examine the issue in more depth around the

S. Adelaja et al. / Energy Policy 38 (2010) 7021–7030 7029
U.S. The U.S. Environmental Protection Agency is expected tounveil a program to encourage greater connection betweenbrownfield redevelopment and renewable energy. While theresearch reported in this paper played a role in focusing someof this effort at the policy level, it also is valuable to others outsidethe policy-making realm who are struggling with brownfieldremediation in a weak market but are not cognizant of thepotential for renewable energy development.
Virtually every state has a program of incentives and otheroptions to help level the economic and liability playing fieldbetween brownfield development and greenfield development.These programs aim to help reposition brownfields so that at thecommunity level, brownfields can be viewed not as liabilities orblight, but as assets. The power of these programs to createadaptive reuse of brownfields is called into question by thecurrent economic slowdown and its attendant reduction of landdemand. In a period of vanishingly small demand for real estate,incentive programs focused on leveling the playing field betweenbrownfield and greenfield development are rendered dramaticallyless effective.
When the market for real estate was stronger, there weremajor successes in adaptive reuse, driven by various federal andstate incentives. However, in the current down market, successmay require the coupling of alternative markets and new demandfeatures, along with their associated incentives, together withopportunities for brownfield redevelopment. One sector of theeconomy that is still relatively strong, where incentives aregrowing, and where the demand for land is growing is renewableenergy developments in the form of wind farms and solarparks. This growth is driven largely by state-level mandates, suchas RPS laws.
The overall cost and electricity rate implications of deployingrenewable energy versus conventional energy is still a matter ofdebate. However, such state policies as RPS laws are aimeddriving the adoption of renewable energy, notwithstanding theabsence of clarity about rate impact. As long as public policycontinues to emerge driving renewable energy adoption, thedemand for available sites and locations for deployment willcontinue to grow. The rate impacts and associated costs ofrenewable energy development will be borne by ratepayers,regardless of whether the renewable energy is deployed ongreenfield sites or brownfield sites. However, some collateralbenefits could be realized by society if the deployment ofrenewable energy on brownfield sites enables the achievementof other societal goals, such as job creation in blighted neighbor-hoods, environmental remediation, blight removal and the fasterrealization of the goals of state RPSs. Obviously, there aretradeoffs involved, including the benefits of wind farm develop-ment in higher wind resource areas, vis-�a-vis the benefitsassociated with possibly better grid connectivity in old industrialareas with brownfield assets. Clearly, these tradeoffs mean thatrenewable energy development would not be confined only tobrownfield sites if social welfare is to be maximized. This paper issimply implying that given various local, landscape and otherbarriers in greenfield areas, attention focused on brownfield couldpotentially yield beneficial results. In addition, the potentialadvantages available by coupling incentives and the benefits ofbrownfield redevelopment could steer a portion of demand tobrownfields rather than greenfields, steering some growth awayfrom rural areas, which has been another public policy objective.
One reason why the application of renewable energy onbrownfield sites has not taken off is the fact that communities,brownfield redevelopers, state policy makers, brownfield autho-rities and the renewable energy industry have yet to connect thedots. This connection may be greatly facilitated by a concertededucation and outreach effort targeted at connecting brownfield
redevelopment expertise with the renewable energy industry,connecting communities to the process through education anddeliberation, and packaging projects in the context of theincentives available for renewable energy and brownfieldredevelopment. Combing existing incentives for renewableenergy (such as the Federal Production Tax Credit, Federal Grantsin Lieu of Tax Credits, Federal Loan Guarantees) and existingincentives for brownfield redevelopment (in Michigan theseinclude Brownfield Grants and Loans, Tax Increment Financing,Renaissance Zones, State Financed Site Assessments and BusinessTax Credits), and market demand for land could potentiallyreduce the cost of renewable energy development, as well asproviding for brownfield remediation.
Tweaking state and federal incentives to create a platform thatcan rapidly accelerate brownfield redevelopment, while alsoproviding for rapid deployment of significant renewable energygeneration capacity could be a win–win. One example of thesepolicy tweaks could be accomplished within the Michigan RPS.Currently the satisfaction of the 10% mandate is accounted forusing a renewable energy credit (REC) system; one REC is issuedto the generator for every kilowatt hour of renewable energygenerated. The regulation provides for bonuses in the number ofRECs (i.e., more than a one-to-one ratio) under certain conditions,for example bonus credits are granted for the use of in-state labor,as well as for solar energy development. A similar bonus could beapplied to renewable energy on brownfield sites as an incentivefor redevelopment. Similar measures could be incorporated intolegislation, such as the American Clean Energy and Security Act of2009, which was passed by the U.S. House of Representatives buthas yet to be taken up in the Senate. This legislation creates anational renewable energy mandate as well as a REC market.
References
Calvert, S., Thresher, S., Hock, A., Smith, B., 2002. Low wind speed technology in theU.S. Department of Energy Wind Research Program, NREL Report # CP-500-32512.
Dewar, M., 2008. What helps or hinders nonprofit developers in reusing vacant,abandoned, and contaminated property? Findings from Detroit and Cleveland.Lincoln Institute of Land Policy, Cambridge, MA.
Dorsey, J., 2003. Brownfields and greenfields: the intersection of sustainabledevelopment and environmental stewardship. Environmental Practice 5 (1),69–76.
Energy Information Administration, 2008. Revenue and expense statistics formajor U.S. Investor-owned electric utilities, 1997 through 2008. Electric PowerAnnual with Data. /http://www.eia.doe.gov/cneaf/electricity/epa/epat8p1.htmlS, accessed March 24, 2010.
Paull, E., 2008. The environmental and economic impacts of brownfieldredevelopment. Working Draft for Distribution, Northeast-Midwest Institute,July 2008.
Hayward, T., 2008. Current trends in renewable energy. A speech given to theInternational Renewables Energy Conference, Conference Center, Washington,DC, March 4, 2008.
Klepinger, M., 2007. Michigan land use guidelines for siting wind energysystems. Michigan State University Extension Bulletin (WO-1053), EastLansing, MI.
McDaniel, P., 2008. Renewable energy development initiative: siting renewableenergy on contaminated lands and mining sites. Brownfield News andSustainable Development, vol. 12, no. 5, Schaumberg, Illinois.
Meyer, P., Lyons, T., 2000. Lessons learned for private sector brownfieldredevelopers. Journal of the American Planning Association 66 (Part 1), 46–57.
Mian, A. Sufi, R., 2008. The consequences of mortgage credit expansion: evidencefor the 2007 Mortgage Default Crisis. Working Paper #W13936, NationalBureau of Economic Research.
Michigan Department of Environmental Quality, 2008. Brownfield redevelopmentFinancial Incentives in Michigan, Lansing, MI.
Michigan Economic Development Corporation (MEDC), 2008. Brownfield redeve-lopment. The Michigan Economic Development Corporation, /http://ref.themedc.org/cm/attach/b0bc12b6-18b0-4e74-823f-50b40d116e36/BrownfieldSBT.pdfS, accessed October 13, 2008.
Morse, E., Richard, J., 2002. The battle for energy dominance. Foreign Affairs 81 (1),16–22.
National Association of Local Government Environmental Professionals (NALGEP),2004. Unlocking Brownfields—keys to community revitalization. Northeast-Midwest Institute, Washington, DC.

S. Adelaja et al. / Energy Policy 38 (2010) 7021–70307030
National Renewable Energy Laboratory (NREL), 2008a. Jobs and EconomicDevelopment Impact (JEDI) model: a user friendly tool to calculate economicimpacts from wind projects, Golden, CO.
National Renewable Energy Laboratory (NREL), 2008b. Jobs and EconomicDevelopment Impact (JEDI) Solar Model. CSP1.08.02, Golden CO, December2008.
National Renewable Energy Laboratory (NREL), 2008b. PVWATTS: a performancecalculator for grid-connected PV systems, /http://rredc.nrel.gov/solar/calculators/PVWATTSS, accessed October 17, 2008.
Patel, M., 2006. Wind and Solar Power Systems, Design, Analysis and Operation.CRC Press, Boca Raton, FL.
Smedley, R., D. Van Daale, 2007. Brownfield Redevelopment Authority Survey,December, 2007 (draft report). Michigan Department of EnvironmentalQuality, Remediation and Redevelopment Division, East Lansing, MI.
Staba, D. 2007. An old steel mill retools to produce clean energy. The New YorkTimes, May 22, 2007, /www.nytimes.com/2007/05/22/nyregion/22windS,accessed October 25, 2008.
U.S. Congress, 1980. Comprehensive environmental response, compensation, andliability act of 1980—Section 101 (42 U.S.C. 9601), Washington, D.C., U.S.Library of Congress.
Witkin, J.B., 2002. Environmental aspects of real estate and commercial transactions:from brownfields to green buildings. American Bar Association, Washington, D.C.