Embed Size (px)
Citation preview

Reorganization of the Connectivity of Cortical Field DZ inCongenitally Deaf CatPascal Barone1,2*, Ludovic Lacassagne1,2, Andrej Kral3,4
1 Universite Toulouse, CerCo, Universite Paul Sabatier, Toulouse, France, 2 CNRS, UMR 5549, Toulouse, France, 3 Laboratory of Auditory Neuroscience, Department of
Experimental Otology, Institute of Audioneurotechnology, Medical University Hannover, Hannover, Germany, 4 Laboratory of Auditory Neuroscience, Institute of
Neurophysiology, University Clinics Hamburg-Eppendorf, Hamburg, Germany
Abstract
Psychophysics and brain imaging studies in deaf patients have revealed a functional crossmodal reorganization that affectsthe remaining sensory modalities. Similarly, the congenital deaf cat (CDC) shows supra-normal visual skills that aresupported by specific auditory fields (DZ-dorsal zone and P-posterior auditory cortex) but not the primary auditory cortex(A1). To assess the functional reorganization observed in deafness we analyzed the connectivity pattern of the auditorycortex by means of injections of anatomical tracers in DZ and A1 in both congenital deaf and normally hearing cats. Aquantitative analysis of the distribution of the projecting neurons revealed the presence of non-auditory inputs to both A1and DZ of the CDC which were not observed in the hearing cats. Firstly, some visual (areas 19/20) and somatosensory (SIV)areas were projecting toward DZ of the CDC but not in the control. Secondly, A1 of the deaf cat received a weak projectionfrom the visual lateral posterior nuclei (LP). Most of these abnormal projections to A1 and DZ represent only a small fractionof the normal inputs to these areas. In addition, most of the afferents to DZ and A1 appeared normal in terms of arealspecificity and strength of projection, with preserved but smeared nucleotopic gradient of A1 in CDCs. In conclusion, whilethe abnormal projections revealed in the CDC can participate in the crossmodal compensatory mechanisms, theobservation of a limited reorganization of the connectivity pattern of the CDC implies that functional reorganization incongenital deafness is further supported also by normal cortico-cortical connectivity.
Citation: Barone P, Lacassagne L, Kral A (2013) Reorganization of the Connectivity of Cortical Field DZ in Congenitally Deaf Cat. PLoS ONE 8(4): e60093.doi:10.1371/journal.pone.0060093
Editor: Manuel S. Malmierca, University of Salamanca- Institute for Neuroscience of Castille and Leon and Medical School, Spain
Received November 15, 2012; Accepted February 25, 2013; Published April 12, 2013
Copyright: � 2013 Barone et al. This is an open-access article distributed under the terms of the Creative Commons Attribution License, which permitsunrestricted use, distribution, and reproduction in any medium, provided the original author and source are credited.
Funding: Funding was provided by the the ANR Hearing Loss (ANR-06-Neuro-021-04) to LL and PB, la Federation pour la Recherche sur le Cerveau (to BP), theBQR ATUPS program of the Universite P. Sabatier (to LL), the recurrent funding of the CNRS (BP) and Deutsche Forschungsgemeinschaft (Kr 3370 and cluster ofexcellence Hearing4all to AK). The funders had no role in study design, data collection and analysis, decision to publish, or preparation of the manuscript.
Competing Interests: The authors have declared that no competing interests exist.
* E-mail: [email protected]
Introduction
Psychophysical and neuroimaging studies in both animal and
human subjects have demonstrated that sensory deprivation from
early developmental stages leads to a functional reorganization of
the brain favoring the spared modalities [1]. Such crossmodal
reorganization after sensory loss is based on plastic properties of
the brain that allow adaptation to changes in the sensory
environment (reviewed [2,3]). The behavioral consequence of
the crossmodal compensation is an enhancement of the perceptual
skills in the remaining modalities. In early deaf subjects numerous
psychophysical studies revealed visual abilities that surpass those
normally reported in hearing subjects [4], while such improve-
ments were rather limited to an enhanced "reactivity" to visual
events [5] and might more specifically concern attention [6]. Such
crossmodal compensation of perception is accompanied by
functional reorganizations [7] expressed as a colonization of the
deprived cortical areas by the remaining modalities. Brain imaging
studies in deaf individuals have revealed that some deprived
auditory areas can be activated by visual speech information such
as sign language and lipreading [8–10] or even simple visual
moving stimuli [11].
Animal models of sensory loss provide similar observations to
those described in deaf or blind human subjects. Recently, area-
specific visual compensations have been demonstrated in an
animal model of congenital deafness – the congenitally deaf cat
[12]. The congenitally deaf cat (CDC) suffers from a degeneration
of the inner ear at birth while the auditory nerve is preserved,
making these animals a good model to study cortical plasticity
induced by congenital deafness and chronic stimulation with
cochlear implants [13,14]. Using a large battery of behavioral
visual paradigms, it has been demonstrated that the CDCs have
acquired specific visual compensation: firstly, the deaf cats show
visual localization which exceeds hearing cats in the most
peripheral visual field (60–90u eccentricity; [12]). Secondly, in
the CDCs, the threshold for movement detection of a visual target
is significantly lower than that reported in control cats (ibid.).
Further, using a cooling device to inactivate restricted cortical
areas, the study revealed that this visual compensation is supported
by ‘‘auditory‘‘ fields DZ (dorsal zone) and P (posterior auditory
cortex). Altogether, this work, in agreement with human studies
[15,16], attests that crossmodal compensation following blindness
or deafness is based on the recruitment of the cortical areas
deprived of sensory inputs. In the deaf cats the visual compen-
sation can thus be assigned to specific auditory areas [12].
The neuronal mechanism underlying such crossmodal cortical
reorganization is still poorly understood. A common hypothesis
postulates that crossmodal compensation following congenital
PLOS ONE | www.plosone.org 1 April 2013 | Volume 8 | Issue 4 | e60093

sensory loss relies on the reorganization of the brain connectivity
during the early stages of cortical maturation [17]. In support to
this is the observation of altered cortical and thalamic connectivity
of the brain of experimental animal models of blindness [18–20].
In case of congenital deafness, the knowledge of the anatomical
substrate responsible for crossmodal compensation is limited
[21,22], while recent work in human suggests that it can involve
different stages of visual processing down to the retina [23].
Two assumptions can be proposed that would account for
crossmodal reorganization after congenital deafness. Crossmodal
compensation might results from a reorganization of the
connectivity of the auditory areas at either cortical or subcortical
levels. Alternatively, functional reorganization could rely on
changes in synaptic efficiency of normal, existing connections
such as the heteromodal connections recently described. In order
to answer this question, we performed an anatomical study to
analyze the changes in connectivity pattern of the deafferented
auditory cortex of adult congenitally deaf cats [12]. A histological
analysis was performed by means of injections of anatomical
tracers in adult CDC. Based on the previous behavioral study in
deaf cats [12] we targeted the area DZ, known to be cross-modally
reorganized in CDCs [12]. While similarly to area DZ, the
posterior auditory cortex P is involved in crossmodal compensa-
tion, we did not perform dye injections into this area. This was
motivated by the strategy of analyzing the entire connectivity
targeting DZ and A1 including the projection arising from field P
which would have been not available after receiving such an
injection.
The involvement of the primary auditory area A1 in visual
crossmodal reorganization remains controversial in humans and is
probably negligible. In deaf patients some studies reported
activation in secondary auditory areas but not in A1 during visual
sign language or speechreading [10,24] while other studies found
that at least part of A1 can be activated by simple moving visual
stimuli [11]. In the deaf cat, single unit recording in A1 failed to
reveal visual responses [25,26] while it was previously observed
using ERPs recording [27]. Further, when the primary auditory
cortex A1 was transiently inactivated, it did not affect the visual
performances of the CDC [12]. In contrast, after the cooling of
auditory area DZ, the performances of the deaf cats in movement
detection dropped off to the level observed in hearing cat. In
consequence, based on these functional considerations observed in
the deaf cat, at the connectivity level we might expect that A1 and
DZ will be differently affected by the congenital deafness.
Methods
Ethics StatementAll experimental protocols, including care and surgery of
animals, were performed in strict accordance with the recom-
mendations of the German state authorities on the use of
laboratory animals. The protocol was approved by the Committee
on the Ethics of Animal Experiments of the University of
Hamburg (Office of Health and Consumer Protection of the
State of Hamburg, permit number #23/06) and complied with
guidelines of the European Ethics Committee on Use and Care of
Animals.
Surgical procedures and injections of retrograde tracersNormal-hearing cats (NHC, controls) and congenitally deaf cats
(CDC) were obtained from the breeding colony of the University
Clinics Hamburg-Eppendorf. The present study is based on 16
injections of retrograde dyes performed in four adult cats, 2
normal and 2 congenitally deaf cats. All animals were adult (more
than one year old). The deafness of the CDCs was established
during a screenings at the age of 4 weeks by the absence of
auditory-evoked brainstem responses (ABRs) to clicks and tone-
pips of intensities up to 125 dB SPL. These deaf animals show a
Scheibe-type of cochlear dysplasia, including complete loss of
inner and outer hair cells, displacement of the tectorial membrane,
collapse of the Reissner’s membrane, but a good preservation of
the spiral gangion cells (reviewed in [24]).
Prior to surgery, the animals were preanaesthetized with
ketamine (24.5 mg/kg), xylazine (2.1 mg/kg) and atropine
(0.2 mg/kg) i.m. Dexamethasone (0.3 mg/kg) was also adminis-
trated to prevent cerebral oedema. During surgery, heart rate,
respiration rate and body temperature were monitored, the latter
being maintained at 38uC using an electronically-controlled
heating blanket. The anesthesia level was continuously checked
based on physiological parameters (respiration rate, ECG, heart
rate and capnometry, including acoustic alarms if the parameters
exceeded the physiological range) and the presence of an areflexic
state (checked in 15–20 minutes intervals). If necessary, additional
doses of ketamine hydrochloride (12 mg/kg) were administrated.
The head of the animal was then fixed in a holder. The skin was
cut, the temporal muscle retracted, and a craniotomy performed
above the auditory cortex and the dura mater was opened.
Anatomic landmarks, in particular the suprasylvian sulcus (SSS),
the anterior and posterior ectosylvian sulcus (AES and PES) were
used to guide the injections of tracers in the different areas of
interest. Because of the variability in the cerebral cat sulci of the
cat [28], the success in injecting correctly the dye in A1 or DZ was
verified by analyzing the pattern of retrogradely labeled cells in the
thalamic nuclei with respect to the published data [29]. During
surgery, the brain was photographed for documentation of the
injections positions.
After completion of injections an artificial dura was positioned
over the exposed cortex, the bone of the skull was put back and
then covered by dental acrylic. The temporalis muscles and the
skin were sutured. Each animal was monitored closely during 10–
11 days survival time corresponding to the optimal period for the
transport of the tracers. The animals recovered within 48 hours
and, if required, received subcutaneous injections of fluids
(physiological NaCl solution).
The animals received, in both hemispheres, injections of
different retrograde tracers (see table 1 for details and Fig 1–3
for illustration of individual injections). In each animal, we used 4
different types of retrograde dyes with similar sensitivities and
characteristics [30,31]: fast blue (FB), di-amino yellow (DY),
fluororuby (FR) and fluoroemerald (FE). Hamilton syringes, in
some cases equipped with a glass micropipette (50–90 mm inner
diameter) were used to inject 0.3–1 ml of retrograde fluorescent
tracers: fast blue (FB-3% in NaCl), di-amino yellow (DY-3% in
NaCl), fluororuby (FR-10% in H2O) and fluoroemerald (FE-10%
in H2O). Using a syringe holder attached to the head holder
frame, the injections were made perpendicularly to the cortical
surface at a depth of about 600–800 mm and consisted of single or
multiple injections of dyes. In case of multiple injections, they were
performed during a single penetration but at different cortical
depth. Injections were performed ventrally at a distance of 1–
3 mm to the SSS, caudally or rostrally at the level of the PES or
AES. After the histological procedure, we localized the different
injection sites in a region that identified as the dorsal region of the
auditory cortex. This region is limited dorsally by the SSS, at 1–
2 mm in front of the AES and caudally at the level of PES
(figure 1–3).
The cerebral cortex of the cat [32] presents a large variability of
location of the cortical regions with respect to the surface
Connectivity of Congenitally Deaf Cat
PLOS ONE | www.plosone.org 2 April 2013 | Volume 8 | Issue 4 | e60093

landmark (gyri and sulci). In our case we have placed our injection
in areas A1 and DZ with respect to the SSS, AES and PES sulci.
In our 4 experimental animals the dorsal AES-PES distance is of
about 6.460.73 mm in agreement with previous observation [28].
Therefore, we are providing the location of the injection sites with
respect to a normalized distance separating the AES and PAS
succi (see Fig 1C and 2C).
Histological processingAfter the survival period (10–11 days), animals were given a
lethal dose of pentobarbital before being perfused intracardially
with 0.9% saline containing 0.1% heparin, followed by 4%
paraformaldehyde in phosphate buffer pH 7.4 (PB), and with PB
sucrose solutions of increasing concentrations (10, 20 and 30%) for
cryoprotection. Brains were immediately removed and put in a PB
solution of 30% sucrose over night and until the histological
processing. Frontal serial sections (40 mm thick) were made of
freezing microtome. Alternate sections were reacted for neuronal
alkaline phosphatase (NAP, [33], cytochrome oxydase (CO; [34],
SMI-32 [35,36] or stained with Cresyl Violet.
Data analysisSections were analyzed using light or fluorescent microscopy
with a Leica microscope (DMR) equipped with a CCD camera.
Each fluorescent dye presents a unique fluorochrome that under a
specific excitation wavelength results in a specific emission
wavelength that can be visualized with a specific filter. The
characteristics of observation for each dye are: FB emission:
420nm, filter A Leica; DY emission: 390 nm, filter D Leica; FR
emission: 580nm, filter L5 Leica; FE emission: 517 nm, filter N3
Leica.
Labeled neurons were counted based on the identification of a
nucleus. For each cortical area the exact position of labeled
neurons was computed on individual sections observed at regular
intervals using Mercator software (Explora Nova). Sampling
frequencies of analyzed sections were adjusted to the size of the
areas containing labeled neurons (defined as the projection zone
[37]). This allowed constructing two types of graphical represen-
tation of the data. First, we assessed the proportion (in %) of the
number of labeled neurons in a given area with respect to the total
of projecting cells observed in all areas projecting to the injection
site. These values (% of fraction labeled neurons, [38]) are
independent of the size of the injection site. Second, we
constructed a density profile for the individual projections,
representing the distribution of the number of retrogradely labeled
neurons counted in individual sections across a cortical area. Area
and laminar location of projection neurons was performed using
the different adjacent sections stained with histological markers.
The position of each section in the same animal was estimated
using scale photography of the hemisphere and expressed with
distance percentage.
The different thalamic and cortical areas were identified using
differential histological staining patterns. Phosphatase alkaline and
cytochrome oxidase activity associated to Nissl coloration permit
to find the limits between many areas. For example, in the
thalamus, the location of the ventral nuclei of the medial
geniculate body (MGv) was defined using multiple criteria. A
dark CO and NAP background staining labels the latero-ventral
area that correspond to the MGv. In Nissl staining, the MGv
presents a biggest neuron density compare to the others one. All of
these patterns are illustrated in figures 4–6. In order to determine
the localization of the injection sites, we used similar multiple
criteria to define the limits between cortical areas including CO,
NAP and Nissl staining and completed by the sulcal position (see
figure 1–3). For example, the limit between A1 and the secondary
auditory cortex (A2) was identified using the difference of the AP
and CO background staining of the layer 4, which is darker in A1
compared to A2 (Fig 3C). A similar difference was observed when
comparing A1 and DZ as in the later area the AP and CO staining
in the layer 4 is weaker compared to that observed in A1 (Fig 3A).
Finally, SMI-32 provides further distinction of the DZ/A1 border
[35] based on the density of staining in the supragranular layers as
well as the presence of large stained cells in layer V of DZ (Fig 3B
and 3G). Using the combination of these staining techniques, the
location of stained neurons and the position of the injections sites
could be localized.
Results
The aim of the present study was to analyze the changes in the
connectivity pattern of the auditory cortex induced by a congenital
deafness. With the injection of retrograde dyes we targeted two
main auditory areas, the dorsal zone and the primary auditory
cortex A1. These two target areas were selected based on the
behavioral study performed in deaf cats [12]. Compared to the
primary auditory cortex A1, which is now well functionally defined
(see [39] for review), less is known about the functional
organization of the dorsal zone DZ. In cat DZ was initially
designated as the dorso-posterior area DP, dissociated from A1
based on its absence of clear tonotopic organization [40]. The few
electrophysiological studies performed described DZ neurons with
broad frequency tuning and complex temporal firing properties
[41]. A recent study suggests that DZ could be specifically involved
in spatial localization to near-midline targets [42].
Injection sitesThis study is based on 16 injections of different retrograde dyes
performed on 4 cats, 2 NHCs and 2 CDCs. After careful analysis
of the injection sites, 14 injections were used for the connectivity
analysis and 2 were excluded from further analysis because they
were too small to provide reliable assessment of the cortical
connectivity.
DZ injections. The area DZ is located dorsal to A1 and
extends approximately 75% of the total distance into the supra-
sylvian sulcus SSS [43,44]. We attempted to avoid very deep
injections within the SSS so as to prevent a contamination of the
Table 1. Description of the injection sites. FB: Fast Blue; DY:di-amino yellow, FE: fluoroemerald, FR: fluororuby.
Case Hemisphere Tracer (ml) Area
CT10-NHC Left FB simple (0.3) A1
Left DY simple (0.4) A1
Right FR simple (0.8) DZ
CT15-NHC Left FR simple (0.6) A1
Right FB simple (0.4) DZ
Right FE multiple (0.9) DZ
CT11-CDC Left FB simple (0.5) A1
Right FE simple (0.5) DZ
Right FR simple (0.5) DZ
CT16-CDC Left FR multiple (0.8) A1
Left FE multiple (0.9) DZ
doi:10.1371/journal.pone.0060093.t001
Connectivity of Congenitally Deaf Cat
PLOS ONE | www.plosone.org 3 April 2013 | Volume 8 | Issue 4 | e60093

Connectivity of Congenitally Deaf Cat
PLOS ONE | www.plosone.org 4 April 2013 | Volume 8 | Issue 4 | e60093

area ALLS (anterolateral lateral suprasylvian area) located
ventrally in fundus of the sulcus [45]. All the injections sites are
described in Table 1 and figures 1–3.
In NHC, three restricted injections of retrograde dyes were
performed in DZ, which are all illustrated in figure 1 G–H. In
CT10-FR, the location was assigned to DZ. The site was dorsally
close to the SSS and rostrally at half distance between the AES
and PES. The site covered the cortical thickness but it encroached
in the underlying white matter for less than 20% of it total length.
Concerning the cases CT15-FB and CT15-FE (see fig 1H and
3D), the injections were identified in DZ and were similar to the
previous one. The sites covered all laminar layers and were
restricted to a region close to the cortical surface under the ventral
circumvolution of the SSS. No contamination of the white matter
was observed.
Three injections in the deaf cats were allocated to DZ. The
injection CT16-FE was defined as a restricted DZ injection
(Fig 2H). It was located ventrally to the SSS at 1 mm distance.
This injection was small but covered all laminar layers. The
figure 3 presents sections reacted for CO activity (3A) or stained
for SMI-32 (3B) and confirms the restriction of this injection to
area DZ without a clear encroachment into A1 or into the area
ALLS located down in the sulcus. CT11-FE was also allocated to
DZ, but involved the white matter for about 40% of the antero-
posterior length (Fig 2G). In the antero-posterior axis, this
injection was located caudally. Because the retrograde dye
injection was restricted to upper part of the supra-sylvian sulcus,
the involvement of area PLLS is improbable and if present at all it
would have been very small. Concerning the last DZ injection case
CT11-FR (Fig 2F), the injection site was defined as DZ mainly. It
was positioned at 1 mm ventrally to the SSS and covered all
laminar layers. In the rostrocaudal orientation the site was located
rostrally at the half of the distance AES-PES. This injection
covered all the layers from the cortical surface and the labeling
disappeared deep in the sulcus close to the border between DZ
and ALLS.
A1 injections. We injected retrograde dyes in A1 in 3 cases for
NHC and 2 cases for CDC (see Table 1 and figures 1 and 2). Paired
of parallel injections were performed in order to analyze the
topographical organization of the thalamo-cortical projecting
neurons as it provides important information on its nucleotopic
organization.
In NHC, case CT10-FB, the FB injection was clearly within the
cytoarchitectonic boundaries of primary auditory cortex A1
(Fig 1E, 3F) and involved all the thickness of the cortex, from
pia to white matter near the injection deposit center. It was located
at 3 mm ventrally to the SSS and at half distance of the AES-PES
region. In the same animal, the retrograde injection covering all
layers (CT10-DY) was anterior and adjacent to the previous one
and close to the AES (Fig 1D), suggesting a possible small
contamination of the Anterior auditory field (AAF). The third A1
injection (CT15-FR) was similar to the CT10-FB in term of its
antero-posterior position but it was positioned more dorsally
(2 mm ventral from the SSS, Fig 1F). As shown in figure 3C in a
CO stained section, the injection was adjacent to the A1/DZ
border without a contamination of the auditory dorsal zone DZ.
All these injections including their size and location with respect to
the main sulcis (AES and PES) are illustrated in Fig. 1 (D–F).
In CDCs we have considered 2 injections targeting A1. In case
CT11-FB (Fig 2D), the core of the injection was located at 3 mm
ventrally to the SSS and at the half of the distance AES-PES. Close
examination of the pick-up zone suggests that a small encroaching of
DZ cannot be excluded. All laminar layers were covered by the
injection. In the case CT16-FR, the injection site was located in A1
and was adjacent to the previously described injection (Fig 2E). The
injection was located at 1.5 mm ventrally to the SSS but at the level
of the AES and thus it was located at the anterior limit between A1
and AAF. The SMI 32 staining (figure 3G) revealed that the
injection site did not spread into the area DZ. All laminar layers were
covered. The reconstructions on serial sections of these two
injections sites are illustrated in figure 2 D–E.
Other injections. Three of the 14 injections performed in
both CDC and NHC were not included in the quantitative
analysis because their location was overlapping into two other
areas. These 3 injections are described in the Supplementary
Material S1 (Sup. Table 1–4 in S1). One injection in the NHC
targeting DZ (CT10-FE) was entering deep into the sulcus and
involved both DZ and ALLS. In the CDC, one injection (CT11-
DY) was located anteriorly at the level of the AES and was
assigned to both AAF and A1, while the case CT16-DY was in its
majority located to AAF with some involvement of A1. These last
3 injections will be, however, used in the present study for specific
illustration of the topographical organization of the connectivity
pattern (see discussion and Supplementary Material S1). However,
the labeled neurons resulting from these 3 injections are not
included in the quantitative analysis.
Distribution of projecting labeled cells in thalamic nucleiand cortical areas
We mapped the distribution of the retrogradelly labeled cells in
the thalamic structures using the anatomical parcellation described
by Imig and Morel [46,47], see also [48,49] for reviews). The aim
of this study is to detect abnormal connectivity in CDC.
Thalamic projectionsThalamic inputs to A1. Dye injections in the primary
auditory cortex A1 lead to a thalamic distribution of projection
cells mainly in the medial geniculate body in normal hearing cats,
as previously reported [29,46,47,50,51]. Here we found in the
CDCs that thalamic cells projecting to DZ were primarily located
in the MGB (medial geniculate body). A global inspection of the
cell distribution revealed a similar pattern of thalamic projections
in both groups (Fig 4A and Fig 5 and table 2). The ventral
subdivision of the MGB (MGv) constitutes the predominant
nucleus projecting to A1 in both the CDC and NHC (Table 3;
Fig 5) in agreement with previous quantitative studies in normal
hearing cats [29]. The remaining projections are originating
principally from the dorsal and medial MGB subdivisions and
from the lateral part of the posterior thalamic nuclei, PO.
Figure 1. Injection sites in Normal hearing cats. A. Photomicrographs of frontal sections showing the location of three injections sites in A1 (leftand middle panels) and DZ (right panel). The sections were processed for cytochrome oxidase (left panel) or Alkaline phosphatase. B. Schematic viewof a cat brain areas. Each blob indicates a single injection located in A1 or DZ. In C are represented the 2D reconstructions of the individual dyeinjections according to their location (normalized distances) with respect to the distance that separate the anterior and posterior ectosylvian sulci(AES and PES). The color lines represent the antero-posterio extent of the pick-up zone of the retrograde dyes, and each of them (3 injections in caseCT10 and 3 injections in case CT15) are represented with a different color. The lower graphs D–H represent the reconstruction on serial sections ofthe injection sites in A1 (D–F) and DZ (G–H). In each panel the case number are indicated (se table 1). The number of individual sections are indicatedand the low to high numbers underneath the sections, represent the antero-posterior location of individual sections.doi:10.1371/journal.pone.0060093.g001
Connectivity of Congenitally Deaf Cat
PLOS ONE | www.plosone.org 5 April 2013 | Volume 8 | Issue 4 | e60093

Connectivity of Congenitally Deaf Cat
PLOS ONE | www.plosone.org 6 April 2013 | Volume 8 | Issue 4 | e60093

Analysis of the distribution of labeled cells indicates some
disparities between the normal and the deaf cats with a tendency
for a lower inputs density arising from the MGv and a stronger
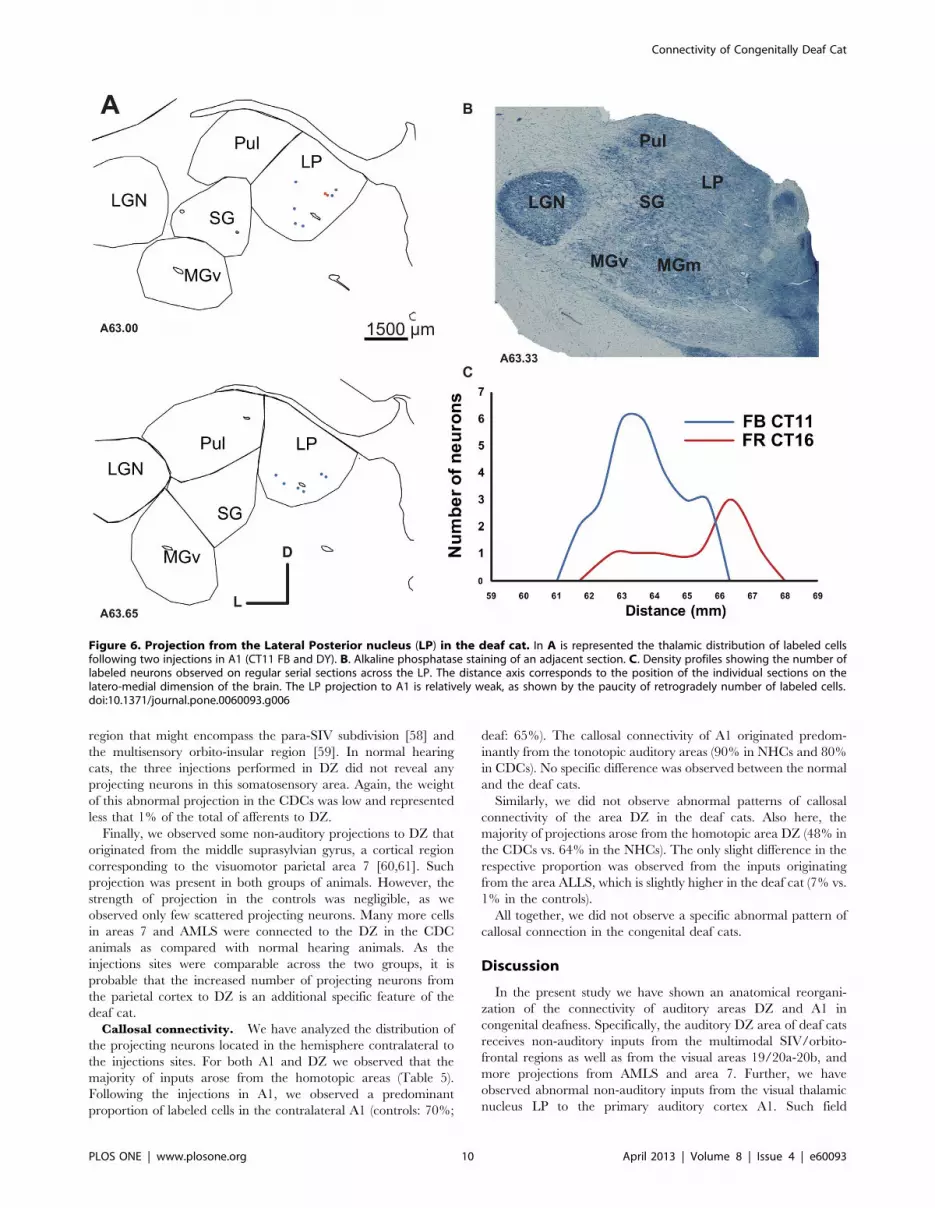
projection from PO in the CDC (Table 2). More importantly, in
the CDCs we observed a specific projection from a visual thalamic
nucleus, the lateral posterior (LP), which was not found in controls.
This projection was observed for the two A1 injections in the
CDCs (Fig 6). The projection was relatively weak, representing less
than 1% of the overall thalamic inputs to A1 in the deaf cat.
However, the projection zone was topographically well organized
in the antero-posterior axis – the labeled neurons were not
randomly scattered across the nucleus. Instead, the density profile
of the labeled neurons showed the bell shape characteristics of a
classical projection [37]. This projection may provide a weak non-
auditory input directly to the auditory cortex of the deaf animals.
In each group, we have performed paired dye injections in the
primary auditory cortex in two frequency representations. In the
NHC (CT10), the FB-DY separation into A1 is of 1.6mm, while it
is slightly greater in the CDC (CT11, 2.3mm). These separations,
which correspond to the distances between dyes deposit centers,
represent approximately a separation of approximately two
octaves according to the tonotopic organization of the cat A1
[28,51]. Because of the tonotopic organization of the MGv [46],
this double injection resulted in a segregation of the projecting
Figure 2. Injection sites in congenital deaf cats. A. Photomicrographs of frontal sections reacted for Alkaline phosphatase showing threeinjections in A1 (left and middle panels) and DZ (right panel). B. Schematic illustration of cat brain areas. Each injection site in A1 and DZ is indictedby a colored blob. C. 2D reconstructions of the individual 5 dye injections (3 in case CT11 and 2 in case CT16). The lower panels D–H represent thereconstruction on serial sections of the injection sites in A1 (D–E) and DZ (F–H). Convention as in figure 1.doi:10.1371/journal.pone.0060093.g002
Figure 3. Microphotographies showing the location of the injection sites in A1 and DZ. In A and B is shown the FE injection in DZ of thedeaf cat (CT–16) with respect to the A1/DZ border revealed by cytochrome oxidase (A) and SMI-32 (B). In G is shown the location of the FR injection inA1 on a cortical section reacted for SMI-32. The A1/DZ border is assessed by the presence of a rich neuropile staining in the upper layers of DZ as wellas the presence of large reactive cells in layer V [35]. In panels C, D and F are illustrated the location of the injection sites in the NHC in A1 (C and F) orDZ (D) after Nissl (F) or CO staining (C–D). E shows a schematic view of a cat brain in which each blob indicates a single injection illustrated in thisfigure. Scale bars: 2 mm.doi:10.1371/journal.pone.0060093.g003
Connectivity of Congenitally Deaf Cat
PLOS ONE | www.plosone.org 7 April 2013 | Volume 8 | Issue 4 | e60093

neurons in the thalamic nucleus as illustrated in the case of control
cat (CT10 FB-DY, Fig 5A). Similarly, in the CDC a double
injection performed in the middle (CT11-FB) and high frequency
representations (CT11-DY, partially spilling over into AAF)
resulted in a complete spatial separation of the projecting cells in
the MGv, demonstrating a preserved nucleotopic organization.
However, the projections were more spread than in NHC,
corresponding to a functional smear of the cochleotopic gradient
(compare [52,53]). The complex topography of the distribution of
labeled cells reflects the complexity of the frequency representation
along the 3D dimension of the MGv [44,46].
Thalamic inputs to DZ. In both normal and congenitally
deaf cats the distribution of the thalamic projections directed
toward DZ can be distinguished from that reported following an
A1 injection. As previously reported [29], the DZ projections are
more equally distributed across the different subdivisions of the
MGB, which constitutes the principal source of projection toward
the area DZ (Tables 2 and 3). Again the patterns of distribution
were similar when comparing the controls and deaf cats (Fig 4B),
including a strong projection arising from the posterior nucleus
PO (above 20% in both groups). A specific set of retrogradely
labeled cells in the visual thalamic nucleus LP was again found
exclusively in deaf cats.
Cortico-cortical connectionsThe cortical auditory system of the cat is composed of several
areas that can be defined anatomically by specific cytoarchitecture
and connectivity patterns as well as electrophysiologically based on
the frequency representation (tonotopic organization). In the
present study we used the subdivisions of the auditory areas
according to the recent work of Winer and colleagues [54]. For
simplicity in the illustration, the charted neurons projecting to A1
(Fig 7) or DZ were grouped together into large classes of source
areas (e.g. tonotopic and non-tonotopic, Fig 8, Fig 9 and 10), but
the individual counts in the cortical regions are provided in table 4.
Concerning the non-auditory areas, we have used the cortical
parcellation of Scannell and col. [55].
Cortical inputs to A1. Following dye injections in the
primary auditory cortex A1 of both controls and deaf cats, we
observed a dense retrograde labeling throughout a large extent of
the auditory cortex. In the rostro-caudal axis, projecting neurons
were observed from the auditory anterior field (AAF) to the
posterior ectosylvian gyrus. In both groups, labeled cells were
observed dorsally in the DZ area as well as in the ventro-posterior
auditory area (VP). Figure 7 illustrates the distribution of
retrogradely labeled cells in serial sections distributed across the
brain of a control (A) and a deaf cat (B). In both groups, the
tonotopic (AAF, P, VP and Ve) and non-tonotopic (A2, AE, DZ)
auditory areas constitute the principal inputs to A1 as they contain
over 80% of the total of projecting cells (Fig 8). In both the CDCs
and the NHCs, the bulk of projections to A1 originate from a
limited number of auditory areas among them the anterior
auditory field AAF, A2 and the dorsal zone DZ (Tables 2 and 4).
Such pattern of auditory projections to A1 is highly consistent with
that demonstrated in normal hearing cats (e.g. [56]). Outside
theses main projections, A1 is receiving sparse inputs from various
areas of the temporal cortex (TE, IN), of the polymodal posterior
ectosylvian gyrus (ED, EI) and of the visuo-auditory areas buried
in the suprasylvian sulcus (areas ALLS, AMLS, PLLS, PMLS). In
theses later cases, the individual proportions originating from a
specific area might vary when comparing the NHCs and CDCs,
but the limited number of cases precludes the application of
statistical tests on these differences.
All together, the comparison of the connectivity pattern of A1 in
CDCs did not substantially differ from that observed in the
controls. We did not observe any abnormal cortical projection to
A1 in deaf cats that was not present in the control group and has
not been previously reported in the literature.
Cortical inputs to DZ. We performed three injections of
dyes in each group of cats. In both the normal and deaf cats we
found the majority of inputs to DZ were located in the tonotopic
auditory areas. These projections constituted over 50% of the total
of afferents to DZ, especially from the areas A1 and AAF
[43,56,57]. Further, the posterior areas ED, EI and EV composed
the second largest set of cortical projections to the dorsal zone. In
consequence, as illustrated by the distribution of charted
projecting neurons across the auditory areas (Fig 9) as well as
the comparison of strength of projection (Fig 10, Tables 2 and 4),
the connectivity patterns of DZ were rather similar between the
deaf and the normal cats.
However, we observed some consistent novel projections to DZ
in deaf cats not present in normal hearing cats. These ‘‘abnormal’’
connections arose from areas that are considered either visual or
somatosensory, but are not associated to the auditory system. All
together, these abnormal projections in the deaf cat represent less
than 6% of the total of inputs to DZ and the individual
contribution of specific areas is quite low. Among them, the visual
Figure 4. Histograms of the means of the distribution (in % of total, ± se) of projecting cells in the thalamic nuclei following aninjection in A1 (A) or DZ (B). Values for normal (NHC) and deaf (CDC) cats are presented separately. No striking differences are observed in theproportions beside an abnormal projection in the deaf cats from the Lateral Posterior nucleus (LP) to A1. The number of injections sites in each groupis indicated (n).doi:10.1371/journal.pone.0060093.g004
Connectivity of Congenitally Deaf Cat
PLOS ONE | www.plosone.org 8 April 2013 | Volume 8 | Issue 4 | e60093

areas of the ventral posterior ectosylvian gyrus constitute the main
source of abnormal projections to DZ in the deaf cat.
In deaf cats, novel topographically organized cortico-cortical
connections from non-primary sensory areas 19-20a-20b/21 to the
DZ were observed (Fig 11, table 4). It is important to note that in
the CDCs, the injections of dyes in A1 did not lead to labeled
neurons in these areas, making these projections specific to DZ.
No labeled cells were observed in these visual regions of normal
cats, neither after DZ nor A1 injections. In addition, in the normal
cat, one DZ injection was analyzed separately because it was
largely spanning into the visual area ALLS in the fundus of the
sulcus (case CT10-FE, Supplementary Material S1, Sup. Table 3).
In this case, we did not observe a projection from the areas 19 and
20a/20b. Thus, methodological reasons for this projection are
unlikely. The weight of this reorganized visuo-auditory pathway is
weak, but it also does not correspond to scattered projecting
neurons, as can be seen from the topographical organization of the
charted neurons (Fig 11). The projection zone shows the typical
density profile of a cortical projection with a bell-shaped peak of
density in the center and minimal values in the periphery [37].
A second set of novel topographically organized cortico-cortical
connections to DZ in deaf cats originated from non-primary areas
AMLS and SIV. The dorsal rim of the anterior end of the anterior
ectosylvian sulcus (AES) hosts the somatosensory area SIV. It is
located ventrally to the secondary somatosensory area (SII, [58]).
We observed retrogradely labeled neurons in the area SIV of the
deaf cat following the DZ injection (Fig 12). In addition, labeled
neurons were observed further ventrally below the area SIV in a
Figure 5. Tonotopic organization of the MGB projections to A1 in the normal (A, case CT10) and deaf (B, CT11) cat. Following a doubleinjection of FB and DY in A1 the distribution of labeled cells are segregated across the MGB in both the normal and deaf cat. In each panel a singledots represents the location of a retrogradely labeled cell following a FB (blue) or a DY (yellow) injection. Nissl (A) and cytochrome oxydase (B)histological staining are shown to identify the location of the thalamic nuclei. Abbreviations: D dorsal, L lateral.doi:10.1371/journal.pone.0060093.g005
Connectivity of Congenitally Deaf Cat
PLOS ONE | www.plosone.org 9 April 2013 | Volume 8 | Issue 4 | e60093
region that might encompass the para-SIV subdivision [58] and
the multisensory orbito-insular region [59]. In normal hearing
cats, the three injections performed in DZ did not reveal any
projecting neurons in this somatosensory area. Again, the weight
of this abnormal projection in the CDCs was low and represented
less that 1% of the total of afferents to DZ.
Finally, we observed some non-auditory projections to DZ that
originated from the middle suprasylvian gyrus, a cortical region
corresponding to the visuomotor parietal area 7 [60,61]. Such
projection was present in both groups of animals. However, the
strength of projection in the controls was negligible, as we
observed only few scattered projecting neurons. Many more cells
in areas 7 and AMLS were connected to the DZ in the CDC
animals as compared with normal hearing animals. As the
injections sites were comparable across the two groups, it is
probable that the increased number of projecting neurons from
the parietal cortex to DZ is an additional specific feature of the
deaf cat.
Callosal connectivity. We have analyzed the distribution of
the projecting neurons located in the hemisphere contralateral to
the injections sites. For both A1 and DZ we observed that the
majority of inputs arose from the homotopic areas (Table 5).
Following the injections in A1, we observed a predominant
proportion of labeled cells in the contralateral A1 (controls: 70%;
deaf: 65%). The callosal connectivity of A1 originated predom-
inantly from the tonotopic auditory areas (90% in NHCs and 80%
in CDCs). No specific difference was observed between the normal
and the deaf cats.
Similarly, we did not observe abnormal patterns of callosal
connectivity of the area DZ in the deaf cats. Also here, the
majority of projections arose from the homotopic area DZ (48% in
the CDCs vs. 64% in the NHCs). The only slight difference in the
respective proportion was observed from the inputs originating
from the area ALLS, which is slightly higher in the deaf cat (7% vs.
1% in the controls).
All together, we did not observe a specific abnormal pattern of
callosal connection in the congenital deaf cats.
Discussion
In the present study we have shown an anatomical reorgani-
zation of the connectivity of auditory areas DZ and A1 in
congenital deafness. Specifically, the auditory DZ area of deaf cats
receives non-auditory inputs from the multimodal SIV/orbito-
frontal regions as well as from the visual areas 19/20a-20b, and
more projections from AMLS and area 7. Further, we have
observed abnormal non-auditory inputs from the visual thalamic
nucleus LP to the primary auditory cortex A1. Such field
Figure 6. Projection from the Lateral Posterior nucleus (LP) in the deaf cat. In A is represented the thalamic distribution of labeled cellsfollowing two injections in A1 (CT11 FB and DY). B. Alkaline phosphatase staining of an adjacent section. C. Density profiles showing the number oflabeled neurons observed on regular serial sections across the LP. The distance axis corresponds to the position of the individual sections on thelatero-medial dimension of the brain. The LP projection to A1 is relatively weak, as shown by the paucity of retrogradely number of labeled cells.doi:10.1371/journal.pone.0060093.g006
Connectivity of Congenitally Deaf Cat
PLOS ONE | www.plosone.org 10 April 2013 | Volume 8 | Issue 4 | e60093
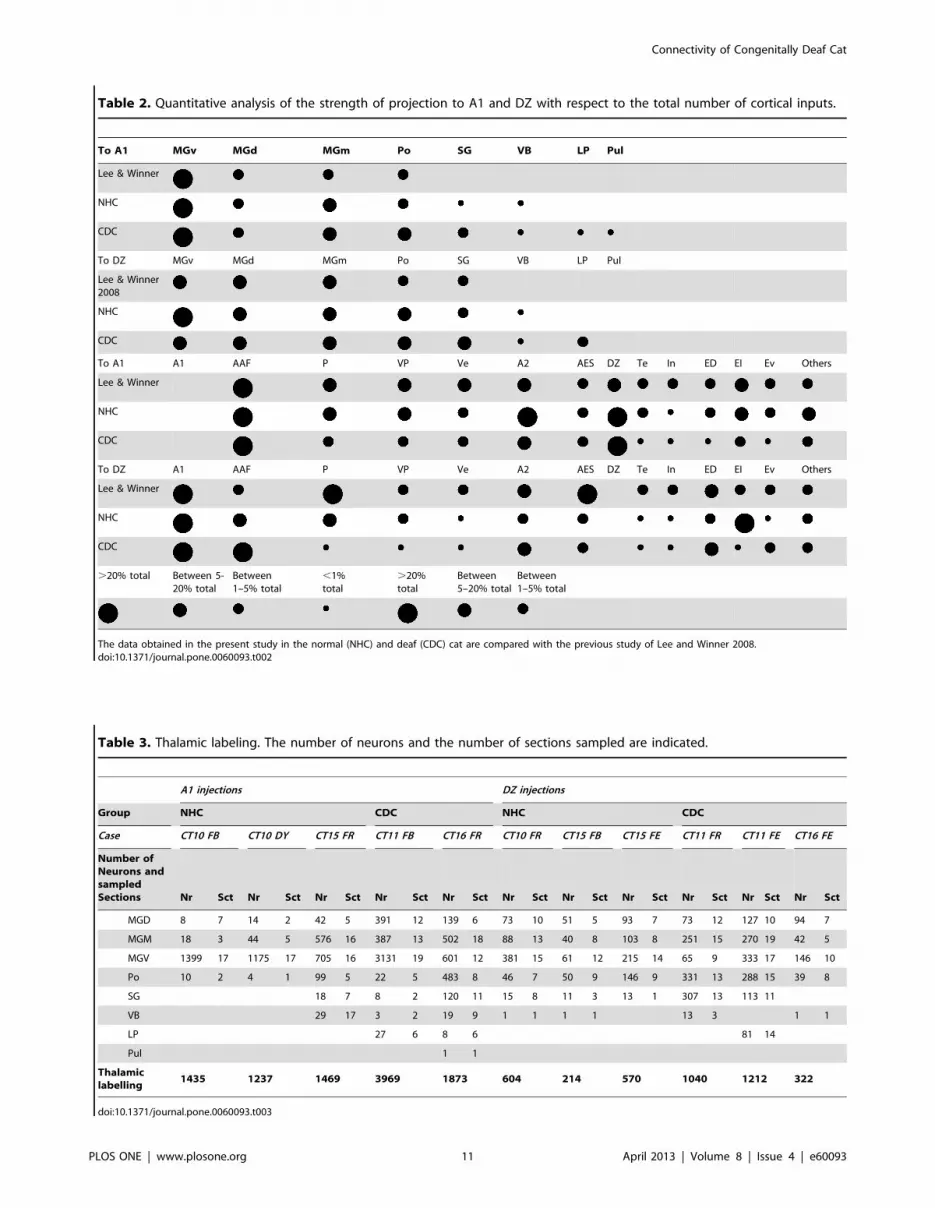
Table 2. Quantitative analysis of the strength of projection to A1 and DZ with respect to the total number of cortical inputs.
To A1 MGv MGd MGm Po SG VB LP Pul
Lee & Winner
NHC
CDC
To DZ MGv MGd MGm Po SG VB LP Pul
Lee & Winner2008
NHC
CDC
To A1 A1 AAF P VP Ve A2 AES DZ Te In ED EI Ev Others
Lee & Winner
NHC
CDC
To DZ A1 AAF P VP Ve A2 AES DZ Te In ED EI Ev Others
Lee & Winner
NHC
CDC
.20% total Between 5-20% total
Between1–5% total
,1%total
.20%total
Between5–20% total
Between1–5% total
The data obtained in the present study in the normal (NHC) and deaf (CDC) cat are compared with the previous study of Lee and Winner 2008.doi:10.1371/journal.pone.0060093.t002
Table 3. Thalamic labeling. The number of neurons and the number of sections sampled are indicated.
A1 injections DZ injections
Group NHC CDC NHC CDC
Case CT10 FB CT10 DY CT15 FR CT11 FB CT16 FR CT10 FR CT15 FB CT15 FE CT11 FR CT11 FE CT16 FE
Number ofNeurons andsampledSections Nr Sct Nr Sct Nr Sct Nr Sct Nr Sct Nr Sct Nr Sct Nr Sct Nr Sct Nr Sct Nr Sct
MGD 8 7 14 2 42 5 391 12 139 6 73 10 51 5 93 7 73 12 127 10 94 7
MGM 18 3 44 5 576 16 387 13 502 18 88 13 40 8 103 8 251 15 270 19 42 5
MGV 1399 17 1175 17 705 16 3131 19 601 12 381 15 61 12 215 14 65 9 333 17 146 10
Po 10 2 4 1 99 5 22 5 483 8 46 7 50 9 146 9 331 13 288 15 39 8
SG 18 7 8 2 120 11 15 8 11 3 13 1 307 13 113 11
VB 29 17 3 2 19 9 1 1 1 1 13 3 1 1
LP 27 6 8 6 81 14
Pul 1 1
Thalamiclabelling
1435 1237 1469 3969 1873 604 214 570 1040 1212 322
doi:10.1371/journal.pone.0060093.t003
Connectivity of Congenitally Deaf Cat
PLOS ONE | www.plosone.org 11 April 2013 | Volume 8 | Issue 4 | e60093

Table 4. Cortical labeling. The number of neurons and the number of sections sampled are indicated.
A1 Injections DZ Injections
Group NHC CDC NHC CDC
Case CT10 FB CT10 DY CT15 FR CT11 FB CT16 FR CT10 FR CT15 FBCT15FE CT11 FR CT11 FE CT16 FE
Number of Neuronsand Sections Used Nr Sct Nr Sct Nr Sct Nr Sct Nr Sct Nr Sct Nr Sct Nr Sct Nr Sct Nr Sct Nr Sct
Areas
Tonotopic A1 /// /// /// /// /// /// /// /// /// /// 3298 21 125 8 684 8 1019 17 719 17 338 9
AAF 125 6 3022 8 584 3 486 8 1387 11 588 6 12 3 194 4 133 7 59 7 580 6
P 48 3 240 4 344 5 153 4 38 4 17 3 187 3 186 3 11 5 36 5 1 1
VP 52 3 558 3 114 5 93 5 3 2 43 3 75 3 2 5 39 5 1 1
Ve 5 2 38 3 125 2 105 5 0 2 5 3 8 2 21 2
Number of neurons 230 3858 1167 837 1425 3911 367 1139 1173 874 920
Non Tonotopic A2 201 9 2035 10 587 8 244 10 115 8 374 10 3 1 254 12 323 12 6 3
AES 19 5 284 10 45 4 38 8 28 3 139 9 37 3 33 7 201 9 79 9 2 1
DZ 131 13 1992 13 906 9 975 17 1145 13 /// /// /// /// /// /// // /// /// /// /// ///
Number of neurons 351 4311 1538 1257 1288 513 37 36 455 402 8
Limbic Te 48 7 357 8 17 5 14 4 0 2 9 1 20 8 40 8 1 1
Insula 5 3 42 7 23 8 42 8 1 6 11 5 2 1 1 1 46 15 26 15
35/36 25 9 43 26 60 26
Number of neurons 53 399 40 81 1 11 11 1 109 126 1
Temporal ED 59 6 103 7 67 5 2 2 10 3 57 6 49 7 8 2 440 14 369 18 27 5
EI 18 3 207 8 355 7 42 4 5 1 504 7 235 6 219 5 287 11 414 11 19 4
Ev 14 4 161 8 22 6 9 3 5 4 39 6 14 2 5 3 502 19 129 19
Number of neurons 91 471 444 53 20 600 298 232 1229 912 46
Parietal SSS ALLS 113 14 508 15 35 5 92 9 65 11 295 14 16 2 31 4 206 8 67 8 53 2
AMLS 2 2 5 1 1 1 1 2 3 3 1 1 54 7 2 7
PLLS 1 1 2 1 49 7 1 1 12 3 21 4 774 26 134 26 13 5
PMLS 10 1 0 1 172 17 6 17 1 1
Number of neurons 116 515 95 93 78 319 16 32 1206 209 67
Posterior EctosylvianGyrus
19 15 8 6 8
20 5 5 159 31 75 31 2 2
21 48 7 13 7
PS 3 1 2 2 4 1 4 1
Number of neurons 3 7 226 98 2
Anterior AES VAE 9 10 21 10
S-IV 4 5 8 5
Number of neurons 13 29
Somato-motor 4 1 2 3 2 3
5 2 2 1 3 9 8 3 3 9 7 4 7
6 13 7 4 7
7 3 1 3 3 4 2 8 5 332 34 13 34 5 2
S2 1 1 4 2 3 3 2 3
Number of neurons 6 4 1 12 4 11 359 25 5
Others PFC 2 2 5 4 10 6 2 1 4 4 75 16 43 16
CG 2 2 0 1 12 8 6 2 11 6 73 28
Number of neurons 4 5 22 8 15 148 43
Total Labeling 841 9554 3297 2325 2825 5388 741 1466 4918 2718 1049
doi:10.1371/journal.pone.0060093.t004
Connectivity of Congenitally Deaf Cat
PLOS ONE | www.plosone.org 12 April 2013 | Volume 8 | Issue 4 | e60093

Connectivity of Congenitally Deaf Cat
PLOS ONE | www.plosone.org 13 April 2013 | Volume 8 | Issue 4 | e60093

specificity of reorganization is in accordance with previous work
[12] that revealed a functional dissociation between A1 and DZ in
crossmodal reorganization after deafness.
In addition, the present study demonstrates that these abnormal
projections represent only a small fraction of total inputs. The
large majority of the afferents to A1 and DZ appeared normal in
their areal specificity.
Reorganization of the connectivity of areas A1 and DZ ofthe congenital deaf cat
The tracer injections in both A1 and DZ revealed a limited set
of abnormal projections present only in the CDC. This abnormal
connectivity originates from structures involved in visual or
somato-motor processing and could provide non-auditory infor-
mation to the deprived auditory system.
Thalamic inputs to the primary auditory cortex A1. A
direct comparison revealed that the thalamic sources of inputs to
A1 after congenital deafness are close to that observed in normal
hearing cats, namely with a major projection from the ventral
subdivision of the MGB. The area A1 showed only a single source
of abnormal afferent which corresponds to the thalamic nucleus
LP. Further, the strength of projections of individual thalamic
pathways in the CDC were close to that of normal hearing cats
(see tables 2-5). Additionally, the nucleotopic organization in the
thalamo-cortical pathway was grossly preserved in the CDC. The
double injections of dyes in two isofrequency bands of A1 lead to a
segregated population of projecting neurons as observed in the
normal hearing cats [44,62,63] or in partially deafened cat [64].
Nonetheless, the spread of the dye was larger following congenital
deafness, indicating a functional smear of the cochleotopic
gradient (compare [52,53]). This suggests that a congenital
deafness does not completely destroy the nucleotopic organization
of the thalamo-cortical projection and that this organization is not
the consequence of plastic adaptation to auditory input. However,
this observation should be taken with precaution, given the
complexity of the frequency representation in the 3D represen-
tation of the MGB [46,65,66]. In addition, electrophysiological
recording of congenitally deaf cats by mean of electrical
stimulation revealed an abnormal pattern of activity in A1 [67]
corresponding to a loose cochleotopic representation [52] for
neonatally deafened cats (see [68] but compare [53,69,70]. A
larger spread could be caused by a higher divergence of the
arborization of the thalamo-cortical projecting neurons [71] and a
reduced intrinsic cortical inhibitory mechanism (ibid).
We observed a single source of non-auditory thalamic inputs to
A1 in the deaf cat. The thalamic nucleus LP (lateral-posterior) is
projecting directly to A1. This nucleus is part of the cat LP/
pulvinar complex that is considered as a visual thalamic relay [72].
The location of the LP projecting neurons could correspond to the
LPm subdivision according to the previous LP segmentation based
on anatomical [73] and electrophysiological grounds [74]. The
visual responses recorded in the LP nucleus [75] derived probably
from its visual inputs arising directly from the superficial layers of
the superior colliculus and from various visual areas of the
suprasylvian sulcus [76,77]. Of interest is that in animal models
where selective neuronal lesions early in life induced a rewiring of
the brain, LP projections have been identified to reach the primary
auditory cortex [78] that had acquired visual functions [79]. It is
possible that the lack of auditory activity reaching AI early during
development makes this area more susceptible to be invaded by
direct projections specifically from the visual LP nucleus.
These inputs from the LP, in addition to a trend for a higher
density of projection from the SG nuclei, contribute probably to
the transmission of non-auditory information (mainly visual) to the
auditory cortex of the deaf cat.
Cortical inputs to area DZ. While we did not observe any
novel cortical projection to A1 in the deaf cat, we found a
consistent projection to area DZ of the CDC from the visual areas
of the posterior suprasylvian gyrus including areas 19/20/21. As
developed further (see methodological considerations), areas 20
and 21 are connected with the dorsal visual areas in the sylvian
sulcus [80–83] for which we cannot rule out the possibility that
they have been contaminated by our dye injections. The cortical
areas 19/20a-20b are considered as purely visual, they contain a
Figure 7. Distribution of the projecting neurons to A1 following a FB (blue) or a DY (yellow) injection in the normal (A, case CT10)and in the deaf (B, case CT11 FB and DY) cat. Only selected sections are shown to illustrate the distribution of labeled cells in the variousauditory areas. The insert shows a schematic view of a cat brain areas and the location of the illustrated sections in the antero-posterior axis.Conventions as in figure 5.doi:10.1371/journal.pone.0060093.g007
Figure 8. Histograms of the means of the distribution of cortical projecting cells following an injection in A1 in the normal (dark)and deaf (light) cat. The cortical regions that are included in each classes are provided in table 4. For simplicity and because of the low number oflabeled cells, projection from the AES and the somato-motor regions are grouped together in the ‘‘motor somesthesic’’ group. The pattern anddensity of projections are similar when comparing both normal and deaf cats. Conventions as in figure 4.doi:10.1371/journal.pone.0060093.g008
Connectivity of Congenitally Deaf Cat
PLOS ONE | www.plosone.org 14 April 2013 | Volume 8 | Issue 4 | e60093

Connectivity of Congenitally Deaf Cat
PLOS ONE | www.plosone.org 15 April 2013 | Volume 8 | Issue 4 | e60093

full representation of the contralateral visual field having neurons
with large receptive fields [84,85]. Indeed, behavioral studies in
cats have implicated the areas 20/21 in visual learning of pattern
discrimination [86–88]. It is consequently probable that the direct
projections we observed from areas 20/21 to DZ contribute to the
visual function supported the dorsal auditory zone.
The upper rim of the anterior part of the anterior ectosylvian
sulcus was shown to project directly to area DZ in deaf cats but not
in hearing controls. This region SIV, located anteriorly to the
auditory and visual fields of the AES [89–91], is defined as a
somatosensory area with a representation of the body surface
distinct from the adjacent area SII [57,58]. In consequence, the
projection observed from SIV to DZ of the deaf cat could provide
somatosensory information but also some visual information
because some (but few) SIV cells respond to moving spots of light
[92]. In addition we observed a consistent projection from the
region located below the SIV area and corresponding probably to
the orbito-insular frontal cortex. This area, which contains both
visual and auditory responsive neurons [59], has been also
implicated in visual behavior such as the localization of visual
target in the peripheral visual field [93]. In agreement with the
present results, previous studies on sensory deprivation from birth
have emphasized on the implication of the cortical region buried
in the AES in crossmodal plasticity [94,95], but no work have yet
studied the role in crossmodal compensation of its anterior part
which is more devoted to somatosensory processing.
Finally, we observed a stronger projection of area 7 and AMLS
into field DZ in deaf cats. This would provide a further route of
visual inputs to DZ and would strengthen its visual reorganization.
Functional dissociation of A1 and DZ in the deaf cat. An
important observation from this anatomical work is the dissoci-
ation in the deafness-induced reorganization of the connectivity of
A1 and DZ. In the normal hearing cat, A1 and DZ can be
functionally dissociated with respect to their implication in spatial
auditory processing [96,97]. A functional dissociation remains
present when considering crossmodal reorganization ([12] and
present study). Area DZ of the deaf cat receives non-auditory
inputs from various sources but most exclusively from cortical
regions. On the opposite, we were able to reveal only a weak
thalamic origin of crossmodal afferents to A1. The lack of cortical
influence from other sensory modality directly to A1 might restrict
such functional reorganization. This is in agreement with the
behavioral and electrophysiological results. Firstly, when area A1
is inactivated, the congenital deaf cats do not present any loss of
their supra-normal visual skills for both visual localization or
motion detection [12]. When DZ is transiently ’’silenced‘‘, the
visual performances fall down to normal levels. Secondly, in
contradiction to early work based on evoked potentials [27], a
systematic study based on electrophysiological recording of single
cells in A1 of the deaf cat failed to reveal visual responses [25,26].
These results strongly suggest that the primary auditory cortex of
the cat is in certain extent ‘‘resistive’’ to a functional colonization
by other sensory modalities. Such hypothesis is in agreement with
some human studies showing that in deaf patients the activation of
the auditory cortex by visual stimuli is restricted to the in
secondary auditory areas but does not encompass in A1 [10,24].
Methodological considerations. The present study is based
on 2 or 3 injections in individual cortical areas, and in each case
the topological distribution as well as the density of labeling were
quite similar across dyes and animals (see fig 4 and 8). Our strategy
of performing large stereotyped tracer injections spanning all the
cortical depth, coupled with a high frequency sampling of the
sections across the brain insures a strong reliability of the results
[37] by reducing the variability [98]. Further, recent work on the
visual cortex connectivity in the monkey showed that the areal
specificity and the strength of connections are relatively constant
across animals [38]. Following the exploration of the entire
projection zone [37] the consistency of a given cortical projection
could be explored even based on a small number of cases as in the
present study [38].
Some injections used here were not restricted to the cortical
plate and encroached the underlying white matter. The influence
of depth injection is problematic in developmental studies because
cortical transient connections do not penetrate the cortical grey
matter [99,100]. However, in the adult. when the dye injections
are invading the white matter, it has no effect on the areal
specificity and the density of labeling [38,101]. This is illustrated in
cases CT-11 FR and FE, which, in spite of one of this injection
located deep in the white matter (CT-11 FE), showed a similar
pattern of labeling including the presence of abnormal projections
from the visual areas. This suggests that the depth of dye injection
Figure 9. Distribution of the projecting neurons to DZ in the normal (A, case CT15 FB and FE) and deaf (B, Case CT11 FE and CT11FR).) cat. Convention as in figure 7.doi:10.1371/journal.pone.0060093.g009
Figure 10. Histograms of the means of the distribution of cortical projecting cells following an injection in DZ in the normal (dark)and deaf (light) cat. Convention as in figure 4 and 8.doi:10.1371/journal.pone.0060093.g010
Connectivity of Congenitally Deaf Cat
PLOS ONE | www.plosone.org 16 April 2013 | Volume 8 | Issue 4 | e60093

is not responsible for the different pattern of connectivity observed
between the normal and the deaf cats.
The main result of the connectivity analysis of A1 in the deaf
cats is the absence of extensive abnormal cortico-cortical
connectivity. In spite of the fact that our injections sites might
not always being restricted to a single area, it is important to note
that the overall pattern of distribution of retrogradely labeled cells
in the CDC correspond to the one previously reported for A1
injections in hearing cats [56]. As previously observed in normal
hearing cats [102–104], the main afferents to AI of the CDC
originate from areas A2, AAF and the posterior temporal auditory
areas (ED, EI, Ev). In any case, the possibility that the injection
might have contaminated the area outside A1 cannot account for
the lack of massive abnormal connectivity pattern of the primary
auditory cortex of the CDC.
While we did not find any abnormal cortical projections to A1,
the dorsal auditory area DZ had novel cortical connectivity
patterns after congenital deafness. We cannot rule out the
possibility that the visual inputs to DZ are resulting from a spread
of the injections sites into the areas ALLS or PLLS because
previous works have reported a weak and variable projection from
the areas 19/20a–20b toward ALLS [80]. However, several
observations suggest that a contamination of the injection in the
area ALLS/PLLS does not account for the entire retrograde
labeling in the non-auditory areas. First, no labeling was observed
in the geniculate thalamic relay known to project to areas PLLS
[105,106], which suggests the absence of a significant contamina-
tion of the area ALLS/PLLS. Second, in the normal hearing cat
we did not observe the abnormal projection from non-auditory
cortical regions (areas 20/21, SIV) following a large injection
encroaching the WM and contaminating the cortical area ALLS
buried in the fundus of the SSS (Case CT10 FE, see Supplemen-
tary Material S1, Sup. Table 3). Third, in a late deafened cat (over
6 months after birth), it has been recently shown [107] that the
Figure 11. Abnormal visual projection from the areas 19/20 to area DZ in the deaf cat (Case CT11 FE and CT11 FR). In A is shown thedistribution of projecting cells in two adjacent sections. The density profiles are presented in B. Convention as in figure 6.doi:10.1371/journal.pone.0060093.g011
Figure 12. Illustration on two representative sections of the presence of an abnormal projection from the somatosensory area S-IVto DZ in the deaf cat (Case CT11 FE and CT11 FR). The panel B is a Nissl staining of an adjacent section. Note the high number of labeled cellslocated in the parietal area 7.doi:10.1371/journal.pone.0060093.g012
Connectivity of Congenitally Deaf Cat
PLOS ONE | www.plosone.org 17 April 2013 | Volume 8 | Issue 4 | e60093

area DZ is receiving a much higher density of visual projections,
including projections from visual areas 19/20a–20b as reported
presently. In consequence, it is probable that the visual inputs that
reach the auditory area DZ in the deaf cat are representing a
smaller proportion that the one reported presently here due to the
possibility of a spread of the injection sites. Concerning the
projection originating from the SIV and orbito-frontal region, no
such projections have been described toward neither DZ nor
toward the areas PLLS/ALLS [57,80] suggesting that such
projections are specific to the deaf cat area DZ.
Role of afferent activity in the establishment of corticalconnectivity
The present results provide evidence of a near normal
connectivity pattern of the auditory areas A1 and DZ. This
restricted impact of a lack of auditory activity during development
is observed both at the levels of the thalamo-cortical pathway and
the cortico-cortical network. Of importance, the basic functional
architecture of the auditory cortex, the tonotopic organization,
appears to be preserved to some extent. Altogether, our results
question the role of sensory activity in governing the cortical
connectivity. While the organization of some functional maps such
as the ocular dominance columns in the primary visual fields V1
are largely dependent of the afferent activity (see [108]),
anatomical works performed at early stages of the development
[109,110] have revealed a precise organization of the visual
pathways before birth (see [111] for review). In particular, in
monkey, the areal specificity and the hierarchical organization of
the connectivity are present during the prenatal stages and no
transient exuberant connections can be observed throughout the
development [100,101,112]. These results are important for
several reasons. First, they weaken the role of experience in
pruning of exuberant immature inter-areal connections after
sensory loss [113]. Such mechanism could nevertheless apply to
rodents that present a poor precision in the formation of their
connectivity pattern (see [114] for review). Second, it suggests that
activity-independent mechanisms play an important role in the
establishment of the connections before birth. In a primate model
of congenital anophtalmia [115,116] we have observed a near-
normal areal specificity of the connectivity pattern of the visual
areas V2 and V4 [117,118], including a preservation of the
retinotopic topology and a lack of crossmodal reorganization
[119]. Altogether, this set of data, including the present work,
supports the hypothesis that in high order species, a sensory
deafferentation at birth cannot extensively alter the cortical
connectivity.
Crossmodal compensation and multisensory integrationBrain imaging studies have revealed abnormal metabolic levels
[120,121] and activations of the auditory cortex of deaf patients by
visual or tactile stimuli [122,123] that could originate from a direct
functional impact of the non-auditory projections presently
Table 5. Callosal cortical labeling. The number of neurons and the number of sections sampled are indicated.
A1 Injections DZ injections
Group NHC CDC NHC CDC
Case CT10 FB CT10 DY CT15 FR CT11 FB CT16 FR CT10 FR CT15 FB CT15 FE CT11 FR CT11 FE CT16 FE
Number of Neuronsand Sections Used Nr Sct Nr Sct Nr Sct Nr Sct Nr Sct Nr Sct Nr Sct Nr Sct Nr Sct Nr Sct Nr Sct
A1 149 13 376 12 65 2 237 14 53 9 45 8 2 1 6 3 27 9 51 10 1 1
AAF 12 3 6 2 9 2 1 1 26 6 9 3 11 4 9 5 2 1
P 1 1 46 1 1 4 2 3 1
VP 1 1 1
Ve 1 1 1 4 2
A2 8 5 63 5 7 1 3 1 1 1 1 15 3 12 6
AES 1 1 4 2 1 6 2 3 2 2 2
DZ 5 4 37 10 52 3 52 12 19 10 54 12 18 5 23 4 119 13 29 9 9 4
Te 2 1 1 1
Insula 7 4 3 2
35/36 4 2
ED 1 1 2 2 5 4 1 1 1 2 1
EI 1 1 1 1 4 3 1 2 2
Ev 2 1
ALLS 1 1 13 3 1 1 2 7 4 73 13 1 1
AMLS 3 3
PLLS 5 18 6
PMLS 2 3 1
20 2 4
PS 1 1
Total Labelling 178 497 132 351 103 126 26 29 283 119 12
doi:10.1371/journal.pone.0060093.t005
Connectivity of Congenitally Deaf Cat
PLOS ONE | www.plosone.org 18 April 2013 | Volume 8 | Issue 4 | e60093

described. However, given the paucity of such abnormal
projections, additional mechanisms should be considered to fully
account for the crossmodal reorganization of the deafened
auditory cortex. It might be possible that some reorganization of
connectivity occurs before the thalamic level as observed in
experimentally rewired brain [124]. Alternatively, crossmodal
functional reorganization observed following congenital deafness
might be supported, at least partly, by the normal network
connecting the auditory system. Indeed, several sources of visual
inputs can reach indirectly the auditory cortex and could
participate to crossmodal reorganization. Visual or visual related
(saccadic) information are reaching the different auditory relays
such as the inferior colliculus and the MGB [125–127]. These
visual activities can originate from direct retinal inputs [128,129]
or from projections from the upper layers of the superior colliculus
[130] reaching the inferior colliculus. In some species (rodents and
ferrets), the primary auditory cortex is receiving direct projections
from visual areas [131], which is not the case in the cat and
monkey (present study, [132]. For example, in areas of the
auditory core of the ferret sparse but direct inputs from visual
areas exist (including the primary visual cortex) that probably
account for the small proportion of neurons that can be driven or
modulated by visual stimulation [133].
This suggests that in some species such as the cat or monkey, the
cortical mechanisms for crossmodal compensation after sensory
loss can rely on unmasking or on an increased efficiency of existing
heteromodal connections linking the auditory cortex to cortical or
thalamic structures involved in processing visual or tactile
modalities (see [17,134–136], reviewed in [137]. Indeed cross-
modal reorganization after total deafness can occur during
adulthood: in the adult deafened ferret, somatosensory responses
can be revealed in A1 neurons in absence of a reorganization of
the connectivity of the auditory cortex [138]. Similarly in normal
adult subjects, a sensory deprivation (complete blindfolding) can
rapidly induce an engagement of the visual cortex including V1, in
processing tactile information [139], adding further evidence that
crossmodal compensation and multisensory integration can share
a common anatomical pathway.
Conclusions
In summary, in the congenital deaf cat, the auditory areas A1
and DZ receive abnormal visual and somatosensory projections
not present in hearing cats. However, the strengths of these
projections are weak, suggesting that crossmodal compensation
after sensory loss results from the complementary contribution of a
reorganized cortical connectivity and the normal network involved
in multisensory processing. Ultimately, these results weaken then
role of activity dependent mechanisms in the establishment of
cortical connections during the development.
Supporting Information
Supplementary Material S1.(DOC)
Acknowledgments
We thank C. Marlot for help in bibliography, L. Renaud for participation
in histological work and Drs. M. Budack and B. Tiemann for care of the
animals.
Author Contributions
Conceived and designed the experiments: PB AK. Performed the
experiments: PB LL AK. Analyzed the data: PB LL AK. Contributed
reagents/materials/analysis tools: PB LL AK. Wrote the paper: PB LL
AK.
References
1. Rauschecker JP (1995) Compensatory plasticity and sensory substitution in thecerebral cortex. Trends Neurosci 18: 36–43.
2. Collignon O, Champoux F, Voss P, Lepore F (2011) Sensory rehabilitation in
the plastic brain. Prog Brain Res 191: 211–231.
3. Roder B, Rosler F (2004) Compensatory plasticity as a consequence of sensory
loss. In: Calvert G, Spence C, Stein BE, editors. The handbook of multisensory
processes. Cambridge, Mass.: MIT Press. 719–747.
4. Bavelier D, Dye MW, Hauser PC (2006) Do deaf individuals see better? Trends
Cogn Sci 10: 512–518.
5. Pavani F, Bottari D (2011) Visual abilities in individuals with profounddeafness: A critical review. In: Murray MM, Wallace MN, editors. Frontiers in
the neural bases of multisensory processes. Boca Raton: CRC Press. in press.
6. Neville HJ, Lawson D (1987) Attention to central and peripheral visual space in
a movement detection task: an event-related potential and behavioral study. II.Congenitally deaf adults. Brain Res 405: 268–283.
7. Kujala T, Alho K, Naatanen R (2000) Cross-modal reorganization of human
cortical functions. Trends Neurosci 23: 115–120.
8. Capek CM, Macsweeney M, Woll B, Waters D, McGuire PK, et al. (2008)
Cortical circuits for silent speechreading in deaf and hearing people.
Neuropsychologia 46: 1233–1241.
9. Ptito M, Giguere JF, Boire D, Frost DO, Casanova C (2001) When the
auditory cortex turns visual. Prog Brain Res 134: 447–458.
10. Nishimura H, Hashikawa K, Doi K, Iwaki T, Watanabe Y, et al. (1999) Signlanguage ‘heard’ in the auditory cortex. Nature 397: 116.
11. Finney EM, Fine I, Dobkins KR (2001) Visual stimuli activate auditory cortex
in the deaf. Nat Neurosci 4: 1171–1173.
12. Lomber SG, Meredith MA, Kral A (2010) Cross-modal plasticity in specific
auditory cortices underlies visual compensations in the deaf. Nat Neurosci 13:
1421–1427.
13. Kral A, Tillein J, Hubka P, Schiemann D, Heid S, et al. (2009) Spatiotemporalpatterns of cortical activity with bilateral cochlear implants in congenital
deafness. J Neurosci 29: 811–827.
14. Kral A, Tillein J, Heid S, Klinke R, Hartmann R (2006) Cochlear implants:cortical plasticity in congenital deprivation. Prog Brain Res 157: 283–313.
15. Cohen LG, Celnik P, Pascual-Leone A, Corwell B, Falz L, et al. (1997)
Functional relevance of cross-modal plasticity in blind humans. Nature 389:180–183.
16. Hamilton R, Keenan JP, Catala M, Pascual-Leone A (2000) Alexia for Braille
following bilateral occipital stroke in an early blind woman. Neuroreport 11:
237–240.
17. Bavelier D, Neville HJ (2002) Cross-modal plasticity: where and how? Nat Rev
Neurosci 3: 443–452.
18. Asanuma C, Stanfield BB (1990) Induction of somatic sensory inputs to the
lateral geniculate nucleus in congenitally blind mice and in phenotypically
normal mice. Neuroscience 39: 533–545.
19. Karlen SJ, Kahn DM, Krubitzer L (2006) Early blindness results in abnormal
corticocortical and thalamocortical connections. Neuroscience 142: 843–858.
20. Chabot N, Charbonneau V, Laramee ME, Tremblay R, Boire D, et al. (2008)
Subcortical auditory input to the primary visual cortex in anophthalmic mice.
Neurosci Lett 433: 129–134.
21. Hunt DL, Yamoah EN, Krubitzer L (2006) Multisensory plasticity in
congenitally deaf mice: how are cortical areas functionally specified?
Neuroscience 139: 1507–1524.
22. Park MH, Lee HJ, Kim JS, Lee JS, Lee DS, et al. (2010) Cross-modal and
compensatory plasticity in adult deafened cats: A longitudinal PET study. Brain
Res 1354: 85–90.
23. Codina C, Pascalis O, Mody C, Toomey P, Rose J (2011) Visual Advantage in
Deaf Adults Linked to Retinal Changes. PLoS ONE 6: e20417.
24. Lambertz N, Gizewski ER, de Greiff A, Forsting M (2005) Cross-modal
plasticity in deaf subjects dependent on the extent of hearing loss. Brain Res
Cogn Brain Res 25: 884–890.
25. Kral A, Schroder JH, Klinke R, Engel AK (2003) Absence of cross-modal
reorganization in the primary auditory cortex of congenitally deaf cats. Exp
Brain Res 153: 605–613.
26. Stewart DL, Starr A (1970) Absence of visually influenced cells in auditory
cortex of normal and congenitally deaf cats. Exp Neurol 28: 525–528.
27. Rebillard G, Carlier E, Rebillard M, Pujol R (1977) Enhancement of visual
responses on the primary auditory cortex of the cat after an early destruction of
cochlear receptors. Brain Res 129: 162–164.
28. Merzenich MM, Knight PL, Roth GL (1975) Representation of cochlea within
primary auditory cortex in the cat. J Neurophysiol 38: 231–249.
29. Lee CC, Winer JA (2008) Connections of cat auditory cortex: I. Thalamocor-
tical system. J Comp Neurol 507: 1879–1900.
Connectivity of Congenitally Deaf Cat
PLOS ONE | www.plosone.org 19 April 2013 | Volume 8 | Issue 4 | e60093

30. Kobbert C, Apps R, Bechmann I, Lanciego JL, Mey J, et al. (2000) Currentconcepts in neuroanatomical tracing. Prog Neurobiol 62: 327–351.
31. Schofield BR, Schofield RM, Sorensen KA, Motts SD (2007) On the use of
retrograde tracers for identification of axon collaterals with multiple fluorescent
retrograde tracers. Neuroscience 146: 773–783.
32. Kawamura K (1971) Variations of the cerebral sulci in the cat. Acta Anat
(Basel) 80: 204–221.
33. Fonta C, Negyessy L, Renaud L, Barone P (2004) Areal and subcellular
localization of the ubiquitous alkaline phosphatase in the primate cerebral
cortex: evidence for a role in neurotransmission. Cereb Cortex 14: 595–609.
34. Wong-Riley M (1979) Changes in the visual system of monocularly sutured orenucleated cats demonstrable with cytochrome oxidase histochemistry. Brain
Res 171: 11–28.
35. Mellott JG, Van der Gucht E, Lee CC, Carrasco A, Winer JA, et al. (2010)Areas of cat auditory cortex as defined by neurofilament proteins expressing
SMI-32. Hear Res 267: 119–136.
36. van der Gucht E, Vandesande F, Arckens L (2001) Neurofilament protein: aselective marker for the architectonic parcellation of the visual cortex in adult
cat brain. J Comp Neurol 441: 345–368.
37. Barone P, Batardiere A, Knoblauch K, Kennedy H (2000) Laminardistribution of neurons in extrastriate areas projecting to V1 and V4 correlates
with the hierarchical rank and indicates the operation of a distance rule.
J Neurosc 20: 3263–3281.
38. Markov NT, Misery P, Falchier A, Lamy C, Vezoli J, et al. (2011) Weight
Consistency Specifies Regularities of Macaque Cortical Networks. Cereb
Cortex 21: 1254–1272.
39. Sharpee TO, Atencio CA, Schreiner CE (2011) Hierarchical representations inthe auditory cortex. Curr Opin Neurobiol 21: 761–767.
40. Reale RA, Imig TJ (1980) Tonotopic organization in auditory cortex of the cat.
J Comp Neurol 192: 265–291.
41. He J, Hashikawa T, Ojima H, Kinouchi Y (1997) Temporal integration and
duration tuning in the dorsal zone of cat auditory cortex. J Neurosci 17: 2615–
2625.
42. Lee CC, Middlebrooks JC (2013) Specialization for Sound Localization in
Fields A1, DZ, and PAF of Cat Auditory Cortex. J Assoc Res Otolaryngol 14:
61–82.
43. He J, Hashikawa T (1998) Connections of the dorsal zone of cat auditory
cortex. J Comp Neurol 400: 334–348.
44. Middlebrooks JC, Zook JM (1983) Intrinsic organization of the cat’s medialgeniculate body identified by projections to binaural response-specific bands in
the primary auditory cortex. J Neurosci 3: 203–224.
45. Palmer LA, Rosenquist AC, Tusa RJ (1978) The retinotopic organization oflateral suprasylvian visual areas in the cat. J Comp Neurol 177: 237–256.
46. Imig TJ, Morel A (1984) Topographic and cytoarchitectonic organization of
thalamic neurons related to their targets in low-, middle-, and high-frequencyrepresentations in cat auditory cortex. J Comp Neurol 227: 511-539.
47. Morel A, Imig TJ (1987) Thalamic projections to fields A, AI, P, and VP in the
cat auditory cortex. J Comp Neurol 265: 119–144.
48. Bank MI, Smith PH (2011) Thalamocortical relations. In: Winer JA, Schreiner
C, editors. The Auditory Cortex. New York, Dordrecht, Heildelberg, London:
Springer. 75–97.
49. Clarey JC, Barone P, Imig TJ (1992) Physiology of Thalamus and Cortex. In:
Fay R, Popper A, editors. The Mammalian Auditory Pathway: Neurophys-
iology. New York: Springer-Verlag. 232–334.
50. Andersen RA, Knight PL, Merzenich MM (1980) The thalamocortical andcorticothalamic connections of AI, AII, and the anterior auditory field (AAF) in
the cat: evidence for two largely segregated systems of connections. J Comp
Neurol 194: 663–701.
51. Read HL, Nauen DW, Escabi MA, Miller LM, Schreiner CE, et al. (2011)
Distinct core thalamocortical pathways to central and dorsal primary auditory
cortex. Hear Res 274: 95–104.
52. Hartmann R, Shepherd RK, Heid S, Klinke R (1997) Response of the primary
auditory cortex to electrical stimulation of the auditory nerve in the
congenitally deaf white cat. Hear Res 112: 115–133.
53. Fallon JB, Irvine DR, Shepherd RK (2009) Cochlear implant use following
neonatal deafness influences the cochleotopic organization of the primary
auditory cortex in cats. J Comp Neurol 512: 101–114.
54. Winer JA, Lee CC (2007) The distributed auditory cortex. Hear Res 229: 3–13.
55. Scannell JW, Blakemore C, Young MP (1995) Analysis of connectivity in the
cat cerebral cortex. J Neurosci 15: 1463–1483.
56. Lee CC, Winer JA (2008) Connections of cat auditory cortex: III.
Corticocortical system. J Comp Neurol 507: 1920–1943.
57. Clemo HR, Meredith MA (2004) Cortico-cortical relations of cat somatosen-sory areas SIV and SV. Somatosens Mot Res 21: 199–209.
58. Clemo HR, Stein BE (1983) Organization of a fourth somatosensory area of
cortex in cat. J Neurophysiol 50: 910–925.
59. Fallon JH, Benevento LA (1977) Auditory-visual interaction in cat orbital-
insular cortex. Neurosci Lett 6: 143–149.
60. Joseph JP, Giroud P (1986) Visuomotor properties of neurons of the anteriorsuprasylvian gyrus in the awake cat. Exp Brain Res 62: 355–362.
61. Yin TC, Greenwood M (1992) Visuomotor interactions in responses of neurons
in the middle and lateral suprasylvian cortices of the behaving cat. Exp Brain
Res 88: 15–32.
62. Brandner S, Redies H (1990) The projection from medial geniculate to field AI
in cat: organization in the isofrequency dimension. J Neurosci 10: 50–61.
63. Huang CL, Winer JA (2000) Auditory thalamocortical projections in the cat:
laminar and areal patterns of input. J Comp Neurol 427: 302–331.
64. Stanton SG, Harrison RV (2000) Projections from the medial geniculate body
to primary auditory cortex in neonatally deafened cats. J Comp Neurol 426:
117–129.
65. Velenovsky DS, Cetas JS, Price RO, Sinex DG, McMullen NT (2003)
Functional subregions in primary auditory cortex defined by thalamocortical
terminal arbors: An electrophysiological and anterograde labeling study.
J Neurosci 23: 308–316.
66. Imig TJ, Morel A (1985) Tonotopic organization in ventral nucleus of medial
geniculate body in the cat. J Neurophysiol 53: 309–340.
67. Klinke R, Kral A, Heid S, Tillein J, Hartmann R (1999) Recruitment of the
auditory cortex in congenitally deaf cats by long- term cochlear electrostim-
ulation. Science 285: 1729–1733.
68. Raggio MW, Schreiner CE (2003) Neuronal responses in cat primary auditory
cortex to electrical cochlear stimulation: IV. Activation pattern for sinusoidal
stimulation. J Neurophysiol 89: 3190–3204.
69. Kral A, Hartmann R, Tillein J, Heid S, Klinke R (2002) Hearing after
congenital deafness: central auditory plasticity and sensory deprivation. Cereb
Cortex 12: 797–807.
70. Kral A, Hartmann R, Tillein J, Heid S, Klinke R (2001) Delayed maturation
and sensitive periods in the auditory cortex. Audiol Neurootol 6: 346–362.
71. Kral A, Tillein J, Heid S, Hartmann R, Klinke R (2005) Postnatal cortical
development in congenital auditory deprivation. Cereb Cortex 15: 552–562.
72. Steriade M, Jones EG, McCormick DA (1997) Thalamus. Volume I.
Organisation and Functions. Amsterdam-Lausanne: Elsevier.
73. Graybiel AM, Berson DM (1980) Histochemical identification and afferent
connections of subdivisions in the lateralis posterior-pulvinar complex and
related thalamic nuclei in the cat. Neuroscience 5: 1175–1238.
74. Chalupa LM, Abramson BP (1989) Visual receptive fields in the striate-
recipient zone of the lateral posterior-pulvinar complex. J Neurosci 9: 347–357.
75. Chalupa LM, Fish SE (1978) Response characteristics of visual and extravisual
neurons in the pulvinar and lateral posterior nuclei of the cat. Exp Neurol 61:
96–120.
76. Updyke BV (1981) Projections from visual areas of the middle suprasylvian
sulcus onto the lateral posterior complex and adjacent thalamic nuclei in cat.
J Comp Neurol 201: 477–506.
77. Berson DM, Graybiel AM (1983) Organization of the striate-recipient zone of
the cats lateralis posterior-pulvinar complex and its relations with the
geniculostriate system. Neuroscience 9: 337–372.
78. Pallas SL, Roe AW, Sur M (1990) Visual projections induced into the auditory
pathway of ferrets. I. Novel inputs to primary auditory cortex (AI) from the LP/
pulvinar complex and the topography of the MGN-AI projection. J Comp
Neurol 298: 50–68.
79. Sur M, Garraghty PE, Roe AW (1988) Experimentally induced visual
projections into auditory thalamus and cortex. Science 242: 1437–1441.
80. Symonds LL, Rosenquist AC (1984) Corticocortical connections among visual
areas in the cat. J Comp Neurol 229: 1–38.
81. Scannell JW, Burns GA, Hilgetag CC, O’Neil MA, Young MP (1999) The
connectional organization of the cortico-thalamic system of the cat. Cereb
Cortex 9: 277–299.
82. Kuchiiwa S, Kuchiiwa T, Matsue H, Sukekawa K (1985) Efferent connections
of area 20 in the cat: HRP-WGA and autoradiographic studies. Exp Brain Res
60: 179–183.
83. Cavada C, Reinoso-Suarez F (1983) Afferent connections of area 20 in the cat
studied by means of the retrograde axonal transport of horseradish peroxidase.
Brain Res 270: 319–324.
84. Tusa RJ, Palmer LA (1980) Retinotopic organization of areas 20 and 21 in the
cat. J Comp Neurol 193: 147–164.
85. Updyke BV (1986) Retinotopic organization within the cat’s posterior
suprasylvian sulcus and gyrus. J Comp Neurol 246: 265–280.
86. Lomber SG, Payne BR, Cornwell P, Long KD (1996) Perceptual and cognitive
visual functions of parietal and temporal cortices in the cat. Cereb Cortex 6:
673–695.
87. Cornwell P, Warren JM (1981) Visual discrimination defects in cats with
temporal or occipital decortications. J Comp Physiol Psychol 95: 603–614.
88. Campbell A Jr. (1978) Deficits in visual learning produced by posterior
temporal lesions in cats. J Comp Physiol Psychol 92: 45–57.
89. Jiang H, Lepore F, Ptito M, Guillemot JP (1994) Sensory modality distribution
in the anterior ectosylvian cortex (AEC) of cats. Exp Brain Res 97: 404–414.
90. Clarey JC, Irvine DR (1990) The anterior ectosylvian sulcal auditory field in
the cat: I. An electrophysiological study of its relationship to surrounding
auditory cortical fields. J Comp Neurol 301: 289–303.
91. Olson CR, Graybiel AM (1987) Ectosylvian visual area of the cat: location,
retinotopic organization, and connections. J Comp Neurol 261: 277–294.
92. Clemo HR, Stein BE (1982) Somatosensory cortex: a ‘new’ somatotopic
representation. Brain Res 235: 162–168.
93. Maire-Lepoivre E, Krupa M, Przybyslawski J, Imbert M (1986) Visual
localization and discrimination after ibotenic lesion of the cat orbito-insular
cortex. Behav Brain Res 22: 53–62.
Connectivity of Congenitally Deaf Cat
PLOS ONE | www.plosone.org 20 April 2013 | Volume 8 | Issue 4 | e60093

94. Meredith MA, Kryklywy J, McMillan AJ, Malhotra S, Lum-Tai R, et al. (2011)
Crossmodal reorganization in the early deaf switches sensory, but notbehavioral roles of auditory cortex. Proc Natl Acad Sci U S A 108: 8856–8861.
95. Korte M, Rauschecker JP (1993) Auditory spatial tuning of cortical neurons is
sharpened in cats with early blindness. J Neurophysiol 70: 1717–1721.
96. Malhotra S, Hall AJ, Lomber SG (2004) Cortical control of sound localization
in the cat: unilateral cooling deactivation of 19 cerebral areas. J Neurophysiol92: 1625–1643.
97. Stecker GC, Harrington IA, Macpherson EA, Middlebrooks JC (2005) Spatial
Sensitivity in the Dorsal Zone (Area DZ) of Cat Auditory Cortex.J Neurophysiol 94: 1267–1280.
98. Scannell JW, Grant S, Payne BR, Baddeley R (2000) On variability in the
density of corticocortical and thalamocortical connections. Philos Trans R SocLond B Biol Sci 355: 21–35.
99. Innocenti GM, Berbel P, Clarke S (1988) Development of projections from
auditory to visual areas in the cat. J Comp Neurol 272: 242–259.
100. Barone P, Dehay C, Berland M, Kennedy H (1996) Role of directed growth
and target selection in the formation of cortical pathways: prenataldevelopment of the projection of area V2 to area V4 in the monkey. J Comp
Neurol 374: 1–20.
101. Batardiere A, Barone P, Knoblauch K, Giroud P, Berland M, et al. (2002)Early specification of the hierarchical organization of visual cortical areas in the
macaque monkey. Cereb Cortex 12: 453–465.
102. Lee CC, Schreiner CE, Imaizumi K, Winer JA (2004) Tonotopic andheterotopic projection systems in physiologically defined auditory cortex.
Neuroscience 128: 871–887.
103. Rouiller EM, Simm GM, Villa AE, de Ribaupierre Y, de Ribaupierre F (1991)
Auditory corticocortical interconnections in the cat: evidence for parallel andhierarchical arrangement of the auditory cortical areas. Exp Brain Res 86:
483–505.
104. Imig TJ, Reale RA (1980) Patterns of cortico-cortical connections related totonotopic maps in cat auditory cortex. J Comp Neurol 192: 293–332.
105. Rauschecker JP, von Grunau MW, Poulin C (1987) Thalamo-cortical
connections and their correlation with receptive field properties in the cat’slateral suprasylvian visual cortex. Exp Brain Res 67: 100–112.
106. Grant S, Shipp S (1991) Visuotopic organization of the lateral suprasylvian
area and of an adjacent area of the ectosylvian gyrus of cat cortex: a
physiological and connectional study. Vis Neurosci 6: 315–338.
107. Kok MA, Chabot N, Lomber SG (2012) Amplified extrastriate visualcorticalprojections to auditory cortical regions following deafness. ARO.
Baltimore.
108. Wiesel TN (1982) Postnatal development of the visual cortex and the influenceof environment. Nature 299: 583–591.
109. Crowley JC, Katz LC (1999) Development of ocular dominance columns in the
absence of retinal input. Nat Neurosci 2: 1125–1130.
110. Huberman AD, Dehay C, Berland M, Chalupa LM, Kennedy H (2005) Earlyand rapid targeting of eye-specific axonal projections to the dorsal lateral
geniculate nucleus in the fetal macaque. J Neurosci 25: 4014–4023.
111. Price DJ, Kennedy H, Dehay C, Zhou L, Mercier M, et al. (2006) The
development of cortical connections. Eur J Neurosci 23: 910–920.
112. Barone P, Dehay C, Berland M, Bullier J, Kennedy H (1995) Developmentalremodeling of primate visual cortical pathways. Cereb Cortex 5: 22–38.
113. Changeux JP, Danchin A (1976) Selective stabilisation of developing synapses
as a mechanism for the specification of neuronal networks. Nature 264: 705–712.
114. Chalupa LM, Dreher B (1991) High precision systems require high precision
‘‘blueprints’’: A new view regarding the formation of connections in themammalian visual system. J Cognit Neurosci 3: 209–218.
115. Dehay C, Giroud P, Berland M, Killackey HP, Kennedy H (1996) Phenotypic
characterisation of respecified visual cortex subsequent to prenatal enucleation
in the monkey: development of acetylcholinesterase and cytochrome oxidasepatterns. J Comp Neurol 376: 386–402.
116. Dehay C, Giroud P, Berland M, Killackey H, Kennedy H (1996) Contribution
of thalamic input to the specification of cytoarchitectonic cortical fields in theprimate: effects of bilateral enucleation in the fetal monkey on the boundaries,
dimensions, and gyrification of striate and extrastriate cortex. J Comp Neurol
367: 70–89.117. Barone P, Dehay C, Berland M, Giroud P, Killackey H, et al. (1997)
Respecification of cortex following prenatal enucleation in the monkey leads to
an important expansion of the ventral visual pathway. Soc Neurosc Abst 23:1993.
118. Barone P, Batardiere A, Dehay C, Berland M, Kennedy H (1996) Effects ofearly prenatal enucleation on cortical connectivity in monkey. Soc Neurosc
Abst 22: 1016.
119. Markov NT, Barone P, Falchier A, Dehay C, Berland M, et al. Prenatalenucleation in macaque monkey shows that ascending sensory input to the
developing cortex controls multiple aspects of the organization of corticalpathways; 2010. Program No. 739.734.
120. Deggouj N, Devolder A, Catalan M, Melin J, Michel C, et al. (1995) Positronemission tomography in deaf patients at rest. Adv Otorhinolaryngol 50: 31–37.
121. Catalan-Ahumada M, Deggouj N, De Volder A, Melin J, Michel C, et al.
(1993) High metabolic activity demonstrated by positron emission tomographyin human auditory cortex in case of deafness of early onset. Brain Res 623:
287–292.122. Finney EM, Clementz BA, Hickok G, Dobkins KR (2003) Visual stimuli
activate auditory cortex in deaf subjects: evidence from MEG. Neuroreport 14:
1425–1427.123. Auer ET Jr., Bernstein LE, Sungkarat W, Singh M (2007) Vibrotactile
activation of the auditory cortices in deaf versus hearing adults. Neuroreport18: 645–648.
124. Horng SH, Sur M (2006) Visual activity and cortical rewiring: activity-dependent plasticity of cortical networks. Prog Brain Res 157: 3–11.
125. Zwiers MP, Versnel H, Van Opstal AJ (2004) Involvement of monkey inferior
colliculus in spatial hearing. J Neurosci 24: 4145–4156.126. Porter KK, Metzger RR, Groh JM (2006) Representation of eye position in
primate inferior colliculus. J Neurophysiol 95: 1826–1842.127. Groh JM, Trause AS, Underhill AM, Clark KR, Inati S (2001) Eye position
influences auditory responses in primate inferior colliculus. Neuron 29: 509–
518.128. Paloff AM, Usunoff KG, Hinova-Palova DV, Ivanov DP (1985) Retinal
innervation of the inferior colliculus in adult cats: electron microscopicobservations. Neurosci Lett 54: 339–344.
129. Itaya SK, Van Hoesen GW (1982) Retinal innervation of the inferior colliculusin rat and monkey. Brain Res 233: 45–52.
130. Doubell TP, Baron J, Skaliora I, King AJ (2000) Topographical projection
from the superior colliculus to the nucleus of the brachium of the inferiorcolliculus in the ferret: convergence of visual and auditory information.
Eur J Neurosci 12: 4290–4308.131. Bizley JK, Nodal FR, Bajo VM, Nelken I, King AJ (2007) Physiological and
anatomical evidence for multisensory interactions in auditory cortex. Cereb
Cortex 17: 2172–2189.132. Falchier A, Schroeder CE, Hackett TA, Lakatos P, Nascimento-Silva S, et al.
(2010) Projection from Visual Areas V2 and Prostriata to Caudal AuditoryCortex in the Monkey. Cereb Cortex 20: 1529–1538.
133. Bizley JK, King AJ (2009) Visual influences on ferret auditory cortex. Hear Res258: 55–63.
134. Wong M, Bhattacharjee A (2011) How does the Visual Cortex of the Blind
Acquire Auditory Responsiveness? Front Neuroanat 5: 52.135. Klinge C, Eippert F, Roder B, Buchel C (2010) Corticocortical connections
mediate primary visual cortex responses to auditory stimulation in the blind.J Neurosci 30: 12798–12805.
136. Merabet LB, Pascual-Leone A (2010) Neural reorganization following sensory
loss: the opportunity of change. Nat Rev Neurosci 11: 44–52.137. Cappe C, Rouiller EM, Barone P (2009) Multisensory anatomical pathways.
Hear Res 258: 28–36.138. Allman BL, Keniston LP, Meredith MA (2009) Adult deafness induces
somatosensory conversion of ferret auditory cortex. Proc Natl Acad Sci U S A
106: 5925–5930.139. Merabet LB, Hamilton R, Schlaug G, Swisher JD, Kiriakopoulos ET, et al.
(2008) Rapid and reversible recruitment of early visual cortex for touch. PLoSONE 3: e3046.
Connectivity of Congenitally Deaf Cat
PLOS ONE | www.plosone.org 21 April 2013 | Volume 8 | Issue 4 | e60093

Supplementary material S1.
We have discarded from the main analysis 3 injections which were not restricted to a single area and which were not directly comparable to the main injections performed in A1 and DZ.
In a normal hearing cat the injection (CT10 FE) was located in DZ but it was also spanning largely in the adjacent cortical area ALLS. In this case the thalamic labeling was similar to that observed in the other cases of DZ injections with a repartition among the 3 main thalamic nuclei. Note that some labeled cells are observed in the LP nucleus probably because of the large spread of the injection into the visual area ALLS which is known to be interconnected with the medial division of the LP [1,2]. The distribution of cortical labeling was close to the one obtained following a DZ injection but with a much stronger projection originating from the cortical areas of the lateral suprasylvian sulcus (areas AMLS, PLLS and PMLS) compared to that observed in case of a restricted DZ injection (8% vs 0.5% respectively). Of importance, no labeled cells was observed in the visual areas 19/20/21 confirming that these abnormal projections to DZ observed in the deaf cats were not due to any encroaching in the area ALLS.
In the deaf cat two injections aimed on A1 were rejected because they were largely spanning on the adjacent area AAF (cases CT11-DY and CT16-DY). In both cases, we observed a small abnormal projection from the LP nucleus as in the other CDC cases of restricted injection into A1. In the normal hearing cat, not such LP projections have been described to target the area AAF [3]. Altogether, it reinforces the observation of an abnormal visual inputs from the LP nucleus to A1 in the deaf cat. At the cortical level, we observed some labeled projecting neurons in S2 not present in the other cases. Further experiments targeting AAF in the CDC should be performed to confirm if these projections correspond to an other set of non auditory inputs to the auditory cortex of the deaf cat.
References.
1. Raczkowski D, Rosenquist AC (1983) Connections of the multiple visual cortical areas with the lateral posterior-‐pulvinar complex and adjacent thalamic nuclei in the cat. J Neurosci 3: 1912-‐1942.
2. Updyke BV (1981) Projections from visual areas of the middle suprasylvian sulcus onto the lateral posterior complex and adjacent thalamic nuclei in cat. J Comp Neurol 201: 477-‐506.
3. Lee CC, Winer JA (2008) Connections of cat auditory cortex: I. Thalamocortical system. J Comp Neurol 507: 1879-‐1900.

Tables.
Animal Hemisphere Tracer (µl) Area Observations CT10-‐NHC Right FE simple (1.0) DZ/ALLS Excluded for quantification CT11-‐CDC Left DY simple (0.3) A1/AAF Excluded for quantification CT16-‐CDC Left DY simple (0.8) AAF /A1 Excluded for quantification
Sup table 1 : Description of the supplementary injection sites.
Case CT10 FE CT11 DY CT16 DY Number of Neurons and Sections Used Nr Sct Nr Sct Nr Sct
Thalamic nuclei MGD 74 9 78 4 273 6
MGM 108 12 321 12 650 18
MGV 223 13 1307 17 482 12
Po 76 6 4 1 452 8
SG 90 10 156 11
VB 1 1 5 9
LP 27 3 3 2 1 6
Pul
Thalamic labelling 598 1714 2019
Sup. table 2 : Thalamic labeling.

Case CT10 FE CT11 DY CT16 DY Number of Neurons and Sections Used Nr Sct Nr Sct Nr Sct
Areas
A1 803 25 1640 11
AAF 114 10
P 28 7 62 3 159 4
VP 1 9 53 5
Tonotopic
Ve 27 8 397 4 30 2
Number of neurons 973 512 1829
A2 65 14 543 9 1026 8
AES 415 14 431 10 419 3 Non Tonotopic
DZ 734 13 1150 13
Number of neurons 351 1708 2595
Te 0 5 86 4 15 2
Insula 99 19 29 6 12 6 Limbic
35/36 0 5 123 14
Number of neurons 99 81 27
ED 284 11 0 3
EI 128 12 35 3 25 1 Temporal
Ev 4 10 46 3 30 4
Number of neurons 416 81 55
ALLS 263 12 117 11
AMLS 67 20 6 3 1 2
PLLS 100 11 3 3 Parietal SSS
PMLS 33 14 2 1
Number of neurons 200 269 123
19
20
21 Posterior Ectosylvian
Gyrus
PS
Number of neurons 0 0 0
VAE Anterior AES
S-IV
Number of neurons 0 0
4 1 11
5 85 22 5 3
6 19 11
7 92 25
Somato-motor
S2 2 6 30 8
Number of neurons 198 30 6
PFC 8 24 1 4 Others
CG 46 30 2 1
Number of neurons 54 0 3
Total Labelling 2420 2838 4638
Sup. table 3 : Cortical labeling. Same convention as in Sup Table 2.

Case CT10 FE CT11 DY CT16 DY Number of Neurons and Sections Used Nr Sct Nr Sct Nr Sct
Areas
A1 5 3 148 9 37 9
AAF 10 39 5 319 6
P 7 25 1
VP 9 7 1
Tonotopic
Ve 8
A2 5 1
AES 12 2 3 1 Non Tonotopic
DZ 24 7 56 9 6 10
Te
Insula 3 2 Limbic
35/36 11 4
ED 2 2
EI Temporal
Ev
ALLS 27 7 1 1
AMLS 2 1
PLLS 1 1 Parietal SSS
PMLS 2 2
19
20
21 Posterior Ectosylvian
Gyrus
PS
VAE Anterior AES
S-IV
4
5
6
7
Somato-motor
S2 4 1
PFC Others
CG
Total Labelling 81 287 371
Sup. table 4 : Cortical callosal labeling. Same convention as in Sup Table 3.


