Embed Size (px)
Citation preview
VOLUME 1
REPORT 2018
PENSION ADEQUACY
CURRENT AND FUTURE INCOME ADEQUACY IN OLD AGE IN THE EU

European CommissionDirectorate-General for Employement, Social Affairs and Inclusion1049 BrusselsBELGIUM
Manuscript completed in 2018
Neither the European Commission nor any person acting on behalf of the Commission is responsible for the use that might be made of the following information.
Luxembourg: Publications Office of the European Union, 2018
© European Union, 2018Reuse is authorised provided the source is acknowledged. The reuse policy of European Commission documents is regulated by Decision 2011/833/EU (OJ L 330, 14.12.2011, p. 39).For any use or reproduction of photos or other material that is not under the EU copyright, permission must be sought directly from the copyright holders.Cover photo: ©Shutterstock
PDF ISBN 978-92-79-85657-0 doi:10.2767/406275 KE-01-18-457-EN-N
European Commission
Directorate-General for Employment, Social Affairs and Inclusion
Social Protection Committee
The 2018 Pension Adequacy Report: current and
future income adequacy in old age in the EU
Volume I
Joint Report prepared by the Social Protection Committee (SPC)
and the European Commission (DG EMPL)
2018

3
Acknowledgements
The 2018 Pension Adequacy Report (PAR) has been prepared by the Directorate General for
Employment, Social Affairs and Inclusion of the European Commission (Unit C2
‘Modernisation of social protection systems’, headed by Radek Malý (until 31 December
2016) and Ana Carla Pereira), in collaboration with the Social Protection Committee (SPC,
chaired by Ulrika Hall) and its Working Group on Ageing Issues (SPC WG-AGE, chaired by
Andraž Rangus) and the Indicators Sub-group (chaired by Rudi Van Dam, with Volker
Schmitt chairing the discussions on the PAR). The report, consisting of two volumes (main
report and country profiles), was adopted by the SPC on 25 April 2018.
The Secretariat of the SPC WG-AGE was coordinated by Audronė Balkytė-De Smedt.
The report was drafted by the EMPL C2 Pension team: Fritz von Nordheim Nielsen (Deputy
Head of Unit, until 30 September 2017), Valdis Zagorskis (team leader), Ettore Marchetti and
Audronė Balkytė-De Smedt.
The drafting of Volume I has integrated important contributions from the ESPN network1
(Slavina Spasova and colleagues), OECD, the SAAGE network2 and SHARE
3.
The report used the underlying assumptions for the 2018 Ageing Report of the European
Commission (Directorate-General for Economic and Financial Affairs) and the Economic
Policy Committee4. Other data used in the report were provided by Eurostat, the Member
States, OECD, SHARE and the ESPN.
1 ESPN – the European Social Policy Network, http://ec.europa.eu/social/main.jsp?catId=1135&langId=en 2 SAAGE – Scientific Analysis and Advice on Gender Equality in the EU (contracted by the European Commission’s
Directorate-General for Justice and Consumers). 3 SHARE – The Survey of Health, Ageing and Retirement in Europe, http://www.share-project.org/ 4 https://ec.europa.eu/info/publications/economy-finance/2018-ageing-report-underlying-assumptions-and-projection-
methodologies_en
4
Members of the Working Group on Ageing Issues of the Social Protection
Committee (SPC WG-AGE)
Chair / Slovenia Mr Andraž RANGUS Institute for Macroeconomic Analysis and
Development
Back-up to the
Chair / Spain
Mr Aurelio FERNÁNDEZ LÓPEZ
* * *
Ministry of Employment and Social Security
Belgium Mr Dirk MOENS Federal Public Service Social Security
Mr Michel ENGLERT Federal Planning Bureau
Mr Gijsbrecht DEKKERS
Bulgaria Ms Gergana PEEVA National Social Security Institute
Mr Mihail ILIEV Ministry of Labour and Social Policy
Czech Republic Ms Zdeňka HLÁSENSKÁ Ministry of Labour and Social Affairs
Mr Jan ŠKORPÍK
Denmark Ms Charlotte Hvid OLAVSGAARD Danish Agency for Labour Market and
Recruitment Mr Vigithan SIVARAJAH
Germany Mr Volker SCHMITT Federal Ministry of Labour and Social Affairs
Mr Francois PEGLOW
Estonia Mr Lauri LEPPIK Estonian Institute for Population Studies
Mr Tõnu LILLELAID
Ireland Mr Darragh DOHERTY Department of Employment Affairs Social
Protection Ms Margaret MULHALL
Greece Ms Aspasia STRANTZALOU Ministry of Labour, Social Security and Social
Solidarity
Spain Mr Aurelio FERNÁNDEZ LÓPEZ Ministry of Employment and Social Security
Mr Antonio BLÁZQUEZ MURILLO
France Ms Maria RHOMARI Ministry of Solidarities and Health
Ms Carine FERRETTI
Croatia Ms Sandra FRANKIĆ Ministry of Labour and Pension System
Mr Alen BUČIĆ Croatian Institute for Pension Insurance
Italy Mr Edmondo SALINARO Italian National Institute of Social Security
Ms Antonella DELLE MONACHE Ministry of Labour and Social Policies
Cyprus Ms Maria CHRYSOSTOMOU Ministry of Labour, Welfare and Social
Insurance Mrs Andri PAVLOU
Latvia Ms Daina FROMHOLDE Ministry of Welfare
Ms Liene RAMANE
5
Lithuania Ms Vidija PAŠTUKIENĖ Ministry of Social Security and Labour
Ms Inga BUŠKUTĖ
Luxembourg Mr Gerard JOHANNS General Inspectorate of Social Security (IGSS)
Mr Kevin EVERARD
Hungary Ms Erika Ildikó LUKÁCS Ministry of Human Capacities
Mr Ádám RÉZMOVITS Hungarian State Treasury
Malta Mr Edward BUTTIGIEG Ministry of Finance
Mr Melchior VELLA Ministry of Finance
Netherlands Mr Lennart JANSSENS Ministry of Social Affairs and Employment
Austria Mr Michael TOPF Federal Ministry of Labour Social Affairs and
Consumer Protection Ms Irene FIEDLER
Poland Mr Krzysztof SZYMAŃSKI Ministry of Family, Labour and Social Policy
Mr Dominik KOMOREK
Mr Ryszard MIKONOWICZ
Portugal Ms Rute GUERRA Ministry of Labour, Solidarity and Social
Security Ms Rita FIGUEIRAS
Romania Ms Mihaela KANOVITS Ministry of Labour, Family and Social
Protection Ms Olivia RUSU
Slovenia Mr Andraž RANGUS Institute for Macroeconomic Analysis and
Development
Mr Davor DOMINKUŠ Ministry of Labour, Family, Social Affairs and
Equal Opportunities
Slovakia Mr Marek PLAVČAN Ministry of Labour, Social Affairs and Family
Mr Miroslav DANČEK
Mr Slavomír ĎURIŠKA
Finland Ms Susanna GRIMM-VIKMAN Ministry of Social Affairs and Health
Ms Marjukka HIETANIEMI Finnish Centre for Pensions
Sweden Ms Elisa BARONI Ministry of Health and Social Affairs
Mr Kristian ÖRNELIUS
Mr Kristoffer LUNDBERG
United Kingdom Mr Alan NAPIER Department for Work and Pensions
6
Contributors in DG EMPL Unit C2 ‘Modernisation of social protection
systems’
Ms Ana Carla PEREIRA, Head of Unit
Mr Fritz VON NORDHEIM NIELSEN, Deputy Head of Unit (until 30 September 2017)
Mr Valdis ZAGORSKIS, Pension Team Leader
Ms Audronė BALKYTĖ-DE SMEDT, Secretary to the SPC WG-AGE
Mr Ettore MARCHETTI, Policy Officer
7
FOREWORD
For the third time already, the European Commission and the Social Protection Committee
have joined efforts to produce the Pension Adequacy Report. This report, published every
three years, provides an unparalleled overview of Member States' pension policies focusing
on the adequacy of old-age incomes today and in the decades to come. It poses the key
questions about how pension systems serve our citizens, namely: How well protected are
older Europeans against poverty today? What levels of protection will future pensioners
enjoy? How does the income of men and women change when they retire? And how to strike
a balance between working life and retirement years, as life expectancy continues improving?
Besides the regular analysis of old-age incomes and pension policies, each edition of the
Pension Adequacy Report brings new issues into focus, reflecting the dynamic EU social
agenda and the profound transformations taking place in European societies and the world of
work. The 2018 report highlights areas that are key to attaining the principles of the European
Pillar of Social Rights. It reflects on the gender differences in old-age poverty and pension
entitlements that, despite incremental improvements, remain staggeringly large. For the first
time, the report explores in detail the opportunities for people in different types of
employment and self-employment to acquire adequate pension rights. The report equally
dwells on how supplementary savings, in particular occupational pensions, contribute to old-
age incomes in different Member States.
As the 2018 Pension Adequacy Report observes, pension adequacy concerns are again high
on the agenda in a number of Member States, as they strive to maintain adequate pension
incomes in ageing societies. We hope that the findings of this report will prove a valuable
source of reference for the policy debates at national and EU level.
Marianne THYSSEN Ulrika HALL
Commissioner for Employment, Chair, Social Protection Committee
Social Affairs, Skills and Labour Mobility
8
TABLE OF CONTENTS
FOREWORD ............................................................................................................................ 7
KEY CONCLUSIONS OF THE PENSION ADEQUACY REPORT .............................. 15
1. INTRODUCTION .............................................................................................................. 21
1.1. Purpose, scope and content ....................................................................................... 21
1.2. Types of pensions covered ......................................................................................... 21
1.3. The three aspects of pension adequacy considered in the report .......................... 22
1.4. Further aspects of the multi-dimensional approach .............................................. 24
1.5. Groups meriting particular attention ...................................................................... 25
1.6. Looking to the future ................................................................................................. 25
2. CURRENT LIVING STANDARDS OF OLDER PEOPLE .......................................... 27
2.1. Poverty risks and severe material deprivation among older Europeans ............. 27
2.1.1. Downward poverty and social exclusion trends ........................................................... 27
2.1.2. Old-age income poverty varies by a factor of eight across Member States ................. 31
2.1.3. Old-age poverty and social exclusion decreasing in most but not all Member
States ........................................................................................................................... 32
2.1.4. Women are at higher risk of poverty or social exclusion ............................................. 32
2.1.5. Depth of income poverty indicates that inequality is at play ....................................... 33
2.2. Relative incomes and inequality among older people ............................................ 34
2.2.1. Pension expenditure is very diverse, even accounting for age and GDP ..................... 34
2.2.2. Older people’s incomes are 7 percent lower than those of people aged below 65 ....... 36
2.2.3. Older people have more equal incomes than people aged below 65 ........................... 37
2.2.4. Is income poverty best reduced by raising total income level or reducing
inequality? .................................................................................................................. 38
2.3. Wider elements in the living standards of older people ......................................... 41
2.3.1. Many elderly people live in their own homes .............................................................. 41
2.3.2. Some older people face housing cost overburden and overcrowding .......................... 42
2.3.3. Can older people’s wealth supplement pension income? ............................................ 43
2.3.4. Health care is generally affordable, but not for everyone ............................................ 45
2.3.5. Long-term care provision can have a large impact, which varies widely among
countries...................................................................................................................... 46
3. THE ROLE OF PENSION SYSTEMS IN SECURING ADEQUATE LIVING
STANDARDS IN OLD AGE ................................................................................................. 47
3.1. Pensions as income replacement .............................................................................. 47
3.1.1. Aggregate income replacement by pension systems .................................................... 47
3.1.2. An individual’s income replacement after a specific career ........................................ 48
3.2. Redistributive elements of public pension schemes ................................................ 51
3.2.1. Distribution of pension income compared to other income ......................................... 52
9
3.2.2. Standard-career pensions are less unequal than work income ..................................... 53
3.2.3. Minimum income provisions for older people ............................................................. 55
3.2.4. Policies favouring public pension scheme income redistribution ................................ 60
3.3. Retirement conditions for the self-employed and for people in non-
standard employment ............................................................................................... 61
3.3.1. Non-standard workers .................................................................................................. 62
3.3.2. The self-employed ....................................................................................................... 63
3.3.3. Impact on old-age income adequacy ............................................................................ 66
3.4. Gender differences and pension entitlements ......................................................... 68
3.4.1. Women have lower pensions than men ........................................................................ 69
3.4.2. Access of men and women to pensions ....................................................................... 71
3.4.3. Drivers of gender differences in pension entitlements ................................................. 73
3.4.4. Policies in reducing gender gaps in pensions ............................................................... 78
3.5. The role of supplementary pensions ........................................................................ 79
3.5.1. The coverage of supplementary pensions across the EU ............................................. 79
3.5.2. Occupational pensions ................................................................................................. 80
3.5.3. Personal pensions ......................................................................................................... 83
3.5.4. Payment duration ......................................................................................................... 84
3.6. Income from work up to and after the pensionable age ........................................ 84
3.6.1. Developments in older people’s employment .............................................................. 85
3.6.2. Trends in late-career employment ................................................................................ 85
3.6.3. Drivers behind the increased employment rates .......................................................... 91
3.6.4. Unemployment and disability limiting increases in older people’s employment ........ 95
3.6.5. Combining pension with work ..................................................................................... 97
4. PENSION REFORMS AND THEIR LIKELY IMPACTS ............................................ 99
4.1. Recent pension reforms: an overview ...................................................................... 99
4.1.1. Refocusing the pension duration: continuation of previous reform patterns ............. 101
4.1.2. Bringing adequacy back in: rebalancing pension duration with poverty reduction
and income maintenance........................................................................................... 103
4.2. Impact of recent pension reforms on present and future adequacy ................... 107
5. ADEQUATE PENSIONS IN A LONG-TERM PERSPECTIVE ................................ 111
5.1. Long-term adequacy prospects and challenges .................................................... 111
5.1.1. Prospective theoretical replacement rates .................................................................. 111
5.1.2. Assessing the severity of adequacy risks ................................................................... 121
5.1.3. The challenge of rising pensionable ages................................................................... 126
5.2. Mitigating the risk of future inadequacy ............................................................... 134
5.2.1. Ensuring adequate coverage and access to pensions for all ....................................... 135
5.2.2. Expansion of complementary retirement savings ...................................................... 137
5.2.3. Identifying ways of raising effective retirement ages ................................................ 140
ANNEXES ............................................................................................................................. 144
ANNEX 1. Methodological background for the theoretical replacement rates ................. 144
10
1. General specifications of the calculations ................................................................. 144
2. Specifications of the base case ................................................................................... 146
3. Specifications of variant cases ................................................................................... 148
4. Data and assumptions ................................................................................................ 151
ANNEX 1.bis List of pension schemes used for the theoretical replacement rates ........... 154
ANNEX 2. List of definition and abbreviations ................................................................... 166
ANNEX 3. View of the European Social Partners and the AGE Platform Europe, a
member of the Social Platform ............................................................................................. 171
BusinessEurope ............................................................................................................... 171
European Association of Craft, Small and Medium-Sized Enterprises
(UEAPME) ............................................................................................................... 174
European Trade Union Confederation (ETUC) .......................................................... 177
AGE Platform Europe .................................................................................................... 180
ANNEX 4. References .......................................................................................................... 182
11
List of Figures
Figure 1: The triangle of pension adequacy .......................................................................................................... 22
Figure 2: At-risk-of-poverty or social exclusion (AROPE) rate by age group and sex in the EU, 2008-2016 ..... 27
Figure 3: Population aged 65 and above by household type, EU-28, 2016, millions ............................................ 27
Figure 4: Proportion of gross income in ‘single-person aged 65+’ households, EU-28, 2015, % ........................ 28
Figure 5: Proportion of gross income in households consisting of a couple, with at least one member aged
65+, EU-28, 2015, % .................................................................................................................. 28
Figure 6: At-risk-of-poverty (AROP) rate by household type, 2016, % ............................................................... 29
Figure 7: At-risk-of-poverty (AROP) and severe material deprivation (SMD) rates by age group in the EU,
2008-2016, % ............................................................................................................................. 29
Figure 8: At risk of poverty and severe material deprivation in old age (65+), 2016, % ...................................... 30
Figure 9: Changes in the AROPE rate, people aged 65 and over, 2013-2016, p.p. ............................................... 31
Figure 10: The AROPE rate of older people (65+), by gender, 2016, % .............................................................. 31
Figure 11: The relative median at-risk-of-poverty gap for older people (65+), 2013-2016 .................................. 33
Figure 12: Pension expenditure per beneficiary for old-age and survivor’s pensions, in ’000 EUR, 2015 .......... 34
Figure 13: Pension expenditure per person aged 65+ as a share of per-capita GDP, 2015 ................................... 34
Figure 14: Relative median income ratio of older people, by gender, 2016 ......................................................... 35
Figure 15: Inequality of income distribution – Income quintile ratio (S80/S20), by age group, 2016 .................. 36
Figure 16: Income inequality – changes in the S80/S20 for the population 65+, 2013-2016 ............................... 37
Figure 17: Simulation: old-age at-risk-of-poverty rates under same equivalised relative median income, 2016,
% ................................................................................................................................................. 38
Figure 18: Simulation: old-age AROP rates under same old-age income dispersion, 2016, % ............................ 39
Figure 19: Owners and tenants (among older households: either single, aged 65 and above, or a couple, at
least one aged 65 and above), 2016, % ....................................................................................... 40
Figure 20: At-risk-of-poverty rate by home ownership, 2016, % ......................................................................... 41
Figure 21: Share of housing cost in disposable household income among older households, 2016, % ................ 41
Figure 22: Population aged 65 and above living in overcrowded households, 2016, % ....................................... 42
Figure 23: Average net wealth, EU-19, 2016, by age, in ’000 EUR ..................................................................... 42
Figure 24: Average net wealth, EU-19, 2016, all ages, by income percentile, in ’000 EUR ................................ 43
Figure 25: Population aged 65 and above who self-reported unmet needs for medical examinations because
they were too expensive, 2016, % .............................................................................................. 44
Figure 26: Public expenditure on long-term care, 2013, % of GDP ..................................................................... 45
Figure 27: Aggregate replacement ratio by gender, 2016 ..................................................................................... 46
Figure 28: Aggregate replacement ratio, 2008-2016 ............................................................................................. 47
Figure 29: Net 2016 theoretical replacement rates, average earner, base case (40 years to SPA), p.p.
difference between men and women (only where this is not zero) ............................................. 49
Figure 30: Net 2016 theoretical replacement rate differences between the AWG case and the base case, p.p. .... 50
Figure 31: Comparison between family income from pensions and from other sources,* averages and
standard errors, 2015, ................................................................................................................. 51
Figure 32: Difference in net 2016 TRRs between different earning profiles, base case (40 years to SPA), p.p. .. 52
Figure 33: Difference in net and gross 2016 TRRs between low and high earners, base case (40 years to
SPA), p.p. ................................................................................................................................... 53
Figure 34: Pension ratio between high and low earners, 2013-2015 ..................................................................... 54
Figure 35: Relative difference in the median equivalised disposable income between retired employees and
retired self-employed, 2017, % ................................................................................................... 66
Figure 36: At-risk-of-poverty rate by former work type, 2017, % ........................................................................ 67
Figure 37: Gender gap in pensions, pensioners aged 65-79, 2009 and 2016, % ................................................... 68
Figure 38: Gender gap in pensions, pensioners aged 65-79, 2009-2016, EU-28, % ............................................. 69
Figure 39: Gender gap in mean pensions, persons aged 65+, total pension income, % ........................................ 70
Figure 40: Gender gap in pension coverage, persons aged 65+ and 65-79, 2016, p.p. ......................................... 71
12
Figure 41: Gender pay gap, 2008-2015, % ........................................................................................................... 73
Figure 42: Gender gap in duration of working life, 2016, years ........................................................................... 74
Figure 43: Decomposition of the explained part of the gender gap in own-pension income, persons aged
65+, % ........................................................................................................................................ 76
Figure 44: Coverage of retirees and working people (aged 50+) by occupational pensions, 2017, % .................. 82
Figure 45: Average effective labour market exit age, EU-28 by gender, 1970-2016, years ................................. 84
Figure 46: Employment rate of people aged 55-64 in 2013 and 2016, % ............................................................. 85
Figure 47: Employment rate of older people (55-64 years), by gender, 2016, % ................................................. 85
Figure 48: Employment rate of older people (65-74), 2016, % ............................................................................ 86
Figure 49: Part-time employment rates by age group, gender and country, 2016, % ........................................... 86
Figure 50: Duration of working life, 2016, years .................................................................................................. 87
Figure 51: Changes in duration of working life, 2013-2016, years ....................................................................... 87
Figure 52: Average time before working, working time and retirement duration, 2017, years ............................ 88
Figure 53: Ratio between average retirement duration and working life, 2016, ratio ........................................... 89
Figure 54: Employment rate increase among the 55-59 years old, 2011-2016, by driver, p.p. ............................. 90
Figure 55: Employment rates of 55-64-year-olds by education level and country in 2016, % ............................. 91
Figure 56: Workers aged 55-64 who underwent training, by country, 2005 and 2015, % .................................... 92
Figure 57: Employment rate by health status, people aged 50-64, 2015, % ......................................................... 93
Figure 58: 50-64-year-olds in self-reported bad health by education level, 2015, % ............................................ 93
Figure 59: Share of 50-64-year-olds reporting bad health over time by gender and employment in 23 EU
countries, % ................................................................................................................................ 94
Figure 60: Changes in 55-64-year-old employed, unemployed and inactive because of own illness or
disability, 2006-2016, p.p. .......................................................................................................... 94
Figure 61: Workers aged 55-69 who reported pressure/physical effort in their job, 2016, % ............................... 95
Figure 62: Net TRR, base case (40 years up to the SPA), men, average earner, p.p. change, 2016-2056 .......... 111
Figure 63: Difference in gross and net TRR between low and high earners, base case (40 years up to the
SPA), 2056, p.p......................................................................................................................... 112
Figure 64: Net TRR, AWG case, men, average earner, p.p. change, 2016-2056 ................................................ 113
Figure 65: Net TRR, AWG case, differences between men and women, average earner, 2056, p.p. ................. 114
Figure 66: Net TRR, differences between the cases retiring 2 years earlier, 2 years later, compared to the base
case, average earner, men, 2056, p.p. ....................................................................................... 115
Figure 67: Net TRR, retirement at SPA, shorter (38 years) and longer (42 years) career, average earner, men,
2056, p.p. difference from base case ........................................................................................ 116
Figure 68: Net TRR, retirement at SPA, career starting at age 20, average earner, men, 2056, p.p. difference
from base case .......................................................................................................................... 117
Figure 69: Net TRR, 20-year career, 2056, p.p. difference from base case ........................................................ 118
Figure 70: Net TRR difference from the base case, same total career duration but with breaks within the
career, men/women, average earner, 2056, p.p. difference from base case .............................. 119
Figure 71: Net TRR, base-case man, 10 years after (2066), p.p. difference from base case ............................... 120
Figure 72: At-risk-of-poverty rate (net equivalent income) in Belgium .............................................................. 122
Figure 73: At-risk-of-poverty rate (net equivalent income) in Italy .................................................................... 122
Figure 74: At-risk-of-poverty rate (net equivalent income) in Sweden ............................................................... 122
Figure 75: Projected exit ages from the labour market, 2017 and 2056, years ................................................... 127
Figure 76: Estimated change in exit age 2015-2035 due to rise in SPA/EPA and other already legislated
pension parameter changes ....................................................................................................... 129
Figure 77: Projected changes in gross theoretical replacement rates by type, 2016-2056, average earners,
men, p.p. ................................................................................................................................... 137
Figure 78: Projected rates of tertiary education level among people aged 55-64, % .......................................... 140
Figure 79: Projected employment rates on the basis of population projection by education level, ages 55-64,
% ............................................................................................................................................... 141
Figure 80: Projected incidences of low health rates (on the basis of population projection by education level
in Figure 78), ages 50-64, % ..................................................................................................... 142
13
List of Tables
Table 1: Countries by old-age income, relative median and standard error, 2016 (relative to EU as a whole) .... 37
Table 2: Net theoretical replacement rates, base case (40 years’ uninterrupted career ending with the standard
pensionable age, men and women, 2016 .................................................................................... 48
Table 3: Types of minimum income provision for older people, 2017 .................................................................. 54
Table 4: Share of recipients of minimum income benefits in the population aged 65 and over by benefit (2013
and latest available data) ........................................................................................................... 57
Table 5: Coverage rate by gender and gender gap in coverage, by pension system, persons aged 65+, based
on SHARE survey, p.p. ................................................................................................................ 71
Table 6: Coverage of supplementary pensions by type, 2016, % of population aged 15-64 ................................. 78
Table 7: Combining work and pensions, 2017 ...................................................................................................... 96
Table 8: Pension reforms adopted in Member States, 1 July 2014 to 1 July 2017 ................................................ 99
Table 9: Gross public pension expenditure as a fraction of GDP ...................................................................... 121
Table 10: Current developments in pensionable ages as effect of reforms (on 1 January of the reference year) 125
Table 11: Projected rise in SPA, exit ages and the gap between the two, base year 2016 .................................. 127
Table 12: Total estimated changes 2015-2035 in exit ages from pension parameter changes, rising
educational attainment, ageing and (only last two columns) an extrapolated past time trend .. 132
List of Boxes
Box 1: Focusing on people aged 65 and above ..................................................................................................... 26
Box 2: Older people and their income sources ..................................................................................................... 27
Box 3: The poverty simulation on income level and distribution ......................................................................... 38
Box 4: Turning one’s house into a flow of cash .................................................................................................... 43
Box 5: Theoretical replacement rates ................................................................................................................... 47
Box 6: Income equalisation vs redistribution ........................................................................................................ 50
Box 7: Pension equality – an alternative view ...................................................................................................... 54
Box 8: Income assessment bases and under-insurance ......................................................................................... 64
Box 9: Factors causing gender differences ........................................................................................................... 76
Box 10: Occupational pension schemes in Denmark, the Netherlands and Sweden ............................................. 80
Box 11: Reversing the rise of the pensionable age in Poland ............................................................................. 108
Box 12: Projecting future labour market exit ages – calculation methods used in the Ageing Report and in the
OECD modelling ...................................................................................................................... 131

15
KEY CONCLUSIONS OF THE PENSION ADEQUACY REPORT
Principle 15 of the European Pillar of Social Rights5 stresses the right of workers and the self-
employed to a pension commensurate with contributions and ensuring an adequate income,
the right of women and men to equal opportunities to acquire pension rights, and the right to
resources that ensure living in dignity. The EU supports Member States’ efforts to ensure a
high level of social protection, including pension adequacy, through facilitating mutual
learning and exchange of best practices. Sustaining adequate pensions in ageing societies is
key to the economic coordination efforts and ensuring inclusive growth in the EU, as pensions
are both the main source of income for older Europeans and an important component of
public expenditure.
The 2018 Pension Adequacy Report prepared jointly by the Social Protection Committee and
the European Commission analyses the adequacy of current and future pensions, that is: how
they help maintain the income of men and women for the duration of their retirement and
prevent old-age poverty. It supports Member States in designing pension systems that are
adequate while remaining financially sustainable, being mutually complementary with the
Ageing Report. The report highlights that:
- despite improvements, there is no room for complacency -
1. Some 17.3 million or 18.2 percent of older people (aged 65 and over) in the EU
remain at risk of poverty or social exclusion, even though they are 1.9 million
fewer than in 2008. Old-age poverty and social exclusion have remained nearly
unchanged since 2013 in the EU on average, with improvement in 16 Member States
and deterioration in 12. Women face a higher risk than men. At the EU level, older
people are less often at risk of income poverty than people of working age, but
significant country differences remain. In seven Member States, the older population
faces higher income poverty risk than the rest of society. As the main source of old-
age income, pensions are key to preventing income poverty.
2. The average income of older people in the EU is 93 percent of the younger
population's income, with large differences by gender and among Member States.
Pensions in the early years after retirement currently amount to more than half
of late-career work income (58 percent in the EU). At national level, the ratio
ranges from above 80 percent to less than 40 percent, having increased in all but three
Member States since 2008.
3. Although the duration of working life is increasing, the duration of retirement is
expected to grow even faster, as life expectancy continues to increase. On average
in the EU, the time spent in retirement is about half (51%) of that spent in
employment. This ratio is projected to increase to 53 percent by 2060, posing the
challenge of finding a new balance between working life and retirement and of
sustaining adequate pensions.
5 Commission Recommendation of 26.4.2017 on the European Pillar of Social Rights, C(2017) 2600 final
16
- inequalities remain and some groups require specific policy attention -
4. Pensions, alongside taxation, help ensure that retirement income is distributed
more equally than income during working life. However, the depth of old-age
income poverty indicates that inequality among older people persists. High at-
risk-of-poverty rates can be caused by low overall income, as well as inequality. In the
EU as a whole, there was an increase in income inequality (up in 16 countries, down in
9) and in poverty depth (up in 19 countries) in old age between 2013 and 2016. Older
people at risk of poverty are now poorer.
5. The risk of poverty or social exclusion in old age increases with age. More than
half of all older people at risk of poverty or social exclusion in the EU are aged 75 or
over (8.8 million in 2016), partly due to past labour market performance. While the
needs increase with age, the value of pensions is eroded during retirement.
Pension indexation and access to publicly provided or subsidised services can help
support the quality of life throughout retirement.
6. More than 20 percent of older women (aged 65 and over) are at risk of poverty or
social exclusion in the EU, compared to 15 percent of older men. Older women are
more likely to live longer, live alone and have lower pensions. As a result, older
women are exposed to a higher risk of poverty or social exclusion in all Member
States. In some countries, more than 10 percent of older women cannot afford the
necessary health care. As the EU population ages, the number and population share of
older women (and, with them, single older women) will increase. Even though
identical careers for men and women would lead to similar pensions, the gender
gap in pensions is 37.2 percent in the EU. Although lower for new retirees, the gap
has remained persistently high in many countries since 2009. Equal opportunities for
women and men to acquire pension rights depend on labour market and pension
policies that support equal careers and earnings.
7. People in non-standard or self-employment often face less favourable conditions
for accessing and accruing pension rights than those in open-ended, full-time job
contracts. For employees who were in non-standard employment, once retired these
barriers can amplify the income gap with those who were in standard employment.
The self-employed are a highly diverse group and are more likely than employees
to build their savings outside the pension system. The retired self-employed have
on average lower pensions, higher assets and a higher risk of income poverty, and
are more exposed to financial hardship. Member States are increasingly taking steps
to facilitate access to pension systems for people in different types of non-standard
employment and self-employment.
8. Career breaks for social reasons, be they related to unemployment, childcare, care
for dependent family members or own disability, result in slightly lower pensions.
Pension credits are a key policy lever that limits the impact on pension adequacy of
such career breaks, compared to career breaks without a social reason.
17
- pension systems and labour markets continue to evolve -
9. Measures to safeguard adequacy of pensions, in particular targeted at low-
income pensioners, are becoming more prominent in the EU. The pension reform
dynamic in Member States started to shift in 2014-2017, reflecting the sustainability
gains achieved through earlier reforms and the recognition that these should be
accompanied by measures to safeguard pension adequacy.
10. The recourse to minimum income provisions for older people has declined
slightly in the past 3 years, possibly thanks to better labour market outcomes. Their
role as an old-age safety net nonetheless remains vital, particularly for older women,
who remain the main beneficiaries of minimum income schemes, even though they
have become less dependent on them.
11. As people remain on the labour market for longer, the employment in the age
group 55–64 grew by 5.1 percentage points or 4.2 million workers (2.2 million
women and 2 million men) in the years 2013-2016, following the trend of the past
10 years. Later retirement is the most important factor behind the growth in
employment; this is also an effect of pension reforms. The share of pensioners in
this age group strongly decreased, while the share of unemployed and those unable to
work due to illness or disability increased slightly. Gains in older people’s labour
participation can also be attributed to new, better-educated age cohorts replacing
previous ones. Depending on specific country situations, effective policies to boost
participation vary from investing in early education to improving access to lifelong
learning, and from improving health conditions to promoting active ageing and age
management in the workplace.
- adequacy of future pensions will require further improvements -
12. As life expectancy improves, longer working lives will be vital to enable men and
women to acquire adequate pensions. People retiring in 2056 will have lower
pensions compared to their work income than a similar career would have
earned them in 2016. Pension systems can promote longer working lives by adjusting
pensionable ages (e.g. by increasing the statutory retirement age to reflect life
expectancy gains), pension benefits or career length requirements, rewarding later
retirement and discouraging early exit. The strength of (dis-)incentives varies across
countries. At the same time, flexible retirement options, including possibilities to
combine pension with income from work, and tax incentives promoting later
retirement are becoming increasingly widespread.
13. While gradually narrowing, the pension gap between women and men is likely to
persist. While the difference in career length is set to shrink, the cumulative effect of
the multiple career gaps affecting women (pay, career duration, childcare breaks, part-
time work, care for dependent adults) is likely to have a continued impact on women’s
pensions, only mildly compensated for by pension systems. Reducing the inequalities
requires equal opportunity policies targeted at women and men of working age
18
(promoting the work-life balance and equal distribution of caring responsibilities,
addressing labour market participation and career opportunities, work intensity and
career breaks) and pension policies that adequately protect care-related breaks.
14. The ability of pension systems to cover different types of economic activity will
have a significant bearing on the future adequacy of old-age incomes. Extending
pension coverage to more people in non-standard or self-employment and adapting
accrual conditions to diverse work patterns can help more people build up adequate
pension rights.
15. Complementing statutory pensions with broad and well-designed supplementary
schemes can help support adequate pension outcomes. While in some Member States
maturing occupational pensions are expected to contribute more to old-age
incomes, in many others, including those facing some of the biggest pension adequacy
challenges, the coverage of any type of supplementary pensions remains very low.
Depending on the national context, mandating, auto-enrolment, collective bargaining
and tax and financial incentives, including cost-effective access for different income
groups, are all avenues to develop supplementary pensions and boost their coverage,
as is promoting awareness of different saving options. The potential contribution of
supplementary schemes to adequacy within the different national pension systems
calls for further in-depth consideration.
16. The living standards of older men and women are influenced by wealth and
access to services, in particular health and long-term care. The wealth of older
people tends to be substantially higher than that of the working-age population, though
it is unevenly distributed. Some individuals at risk of poverty may have an opportunity
to make up for it by using their assets. A large proportion of older people own the
house where they live, while in some countries many older people are overburdened
with housing costs. Quality and affordable public or subsidised services are important
for the living standards of older people. These services are generally accessible in
most Member States, although in some countries worryingly high proportions of older
people do not have sufficient access to health care.
- joint efforts at the EU level need to be pursued –
17. Policy measures at the EU level support Member States in implementing the
principles proclaimed in the European Pillar of Social Rights, including on
gender equality, social protection, pensions and old-age income. The proposed
Directive on work-life balance for parents and carers6 aims to promote equal sharing
of caring responsibilities between women and men that is crucial for equal
opportunities to acquire pension rights. The proposed Recommendation on access to
social protection for workers and the self-employed7 aims to improve the social
6 Proposal for a Directive of the European Parliament and of the Council on work-life balance for parents and carers and
repealing Council Directive 2010/18/EU, COM(2017) 253 final 7 Proposal for a Council Recommendation on access to social protection for workers and the self-employed, COM(2018) 132
final
19
protection of people with different economic statuses, including their right to an
adequate pension. To explore the potential contribution of supplementary pensions to
adequate old-age incomes, the Commission has set up a High-level group of experts
on pensions8.
18. The Social Protection Committee (SPC) stresses the need for a holistic reflection
on the adequacy of old-age incomes and the financial sustainability of pension
systems. In this context, the SPC invites the Economic Policy Committee to jointly
promote the findings of the 2018 Pension Adequacy Report and the 2018 Ageing
Report.
19. In view of the constantly evolving pension policies, demographic situation and labour
markets as well as the diversity of policy issues that merit reflection, pension
adequacy requires continuous monitoring and analysis. In this context, the SPC
intends to prepare the fourth Pension Adequacy Report for adoption in 2021 and
calls on the Commission to work together in the preparation of the report.
8 Commission Decision of 18.12.2017 setting up a High-level group of experts on pensions, C(2017) 8523 final

21
1. INTRODUCTION
1.1. Purpose, scope and content
The European Pillar of Social Rights stresses the right of workers and the self-employed to a
pension that ensures an adequate income, the right of women and men to equal opportunities
to acquire pension rights, and the right to resources that enable to live in dignity (European
Commission, 2017a).
The purpose of the 2018 Pension Adequacy Report (PAR) is to present a comparative analysis
of the degree to which national pension systems in the EU enable older people to retire with
an adequate income. A key aim is to illustrate how previous and recent pension reforms
impact on pension adequacy for people retiring today – and also in the future, when people
who are presently just entering the labour market will retire after having completed their
careers.
The Pension Adequacy Report is produced every 3 years by the Social Protection Committee
(SPC) and the European Commission; this report and the 2018 Ageing Report (to be
published in May 2018 by the Economic Policy Committee (EPC) and the Commission) will
complement one another. The complete report consists of two volumes. Volume I is devoted
to a comparative analysis of pension adequacy in the EU-28, whereas Volume II (country
profiles) provides a detailed discussion of developments in each of the 28 Member States.
The present document, Volume I, examines the current living standards of older Europeans
(Chapter 2) and the role of pension systems in securing them (Chapter 3), by analysing the
consequences of recent and ongoing pension reforms (Chapter 4), by identifying risks to
future pension adequacy, and by outlining what can be done to address such risks, so that
adequate old-age incomes for the young people starting out in some form of employment
today can be secured by the time they reach retirement, four to five decades from now
(Chapter 5).
1.2. Types of pensions covered
The report focuses on the adequacy of pensions. An old-age pension is a type of benefit for
which entitlement is primarily based on some form of prior record of ‘performance’
establishing the right to claim. Pension entitlement can be based on years of contributions
paid or credited, or in some cases on years of residency. Some elements of minimum pension
benefits may also depend on current need and be income or means tested. But an orientation
towards current need is primarily a characteristic of the forms of minimum income provision
that replace or complement a pension for older people with no or insufficient entitlements of
their own. Entitlement can also be based on derived rights, as in the case of a pension
allowance for a spouse and a survivor’s pension.
The report does not deal with disability pensions as such, and only touches on withdrawal
from the labour market due to disability insofar as it affects old-age pensions.
In the report, all forms of old-age pensions will be examined and discussed for their
contribution to the adequacy of pensions as an element in overall access to resources in
retirement and old age. The report seeks to cover the entire national packages of income from
22
pension schemes, whether statutory9 or supplementary,
10 pay-as-you-go or pre-funded.
11 The
report will also briefly discuss minimum income benefits for older people, both within and
outside the pension system.
Where statutory pension provision includes multiple schemes (e.g. a flat rate topped up by an
earnings-related scheme, or a pay-as-you-go scheme accompanied by a statutory funded
scheme12
), income from them all will be included in the analysis. The design of statutory
pension provision in the Member States will be described in more detail in Volume II;
Volume I will only touch upon it in the context of reform trends or adequacy for specific
groups.
The report will discuss the role that supplementary (i.e. occupational and personal) pensions
play in old-age income provision. Occupational pensions are also included in the projections
of theoretical replacement rates (TRRs) in those Member States where they are compulsory or
have broad coverage.
The differences in pension outcomes depending on the duration of the working
career/contributory record, income level and gender will be examined.
The current report does not examine the tax treatment of pensions, which has important
implications for the adequacy and distribution of pension income. It is important to note that
the net (i.e. after-tax) replacement rates presented in the report are affected by the taxation of
salaries and pensions. Furthermore, the analysis presented in this report largely omits those
parallel measures (such as housing benefits) directed at older people within the tax and benefit
system that exist in some Member States and that influence the well-being of pensioners.
1.3. The three aspects of pension adequacy considered in the report
The 2015 edition of the Pension Adequacy Report13
aimed at a multi-dimensional approach to
the adequacy of pensions that will also be applied and expanded in this 2018 edition.
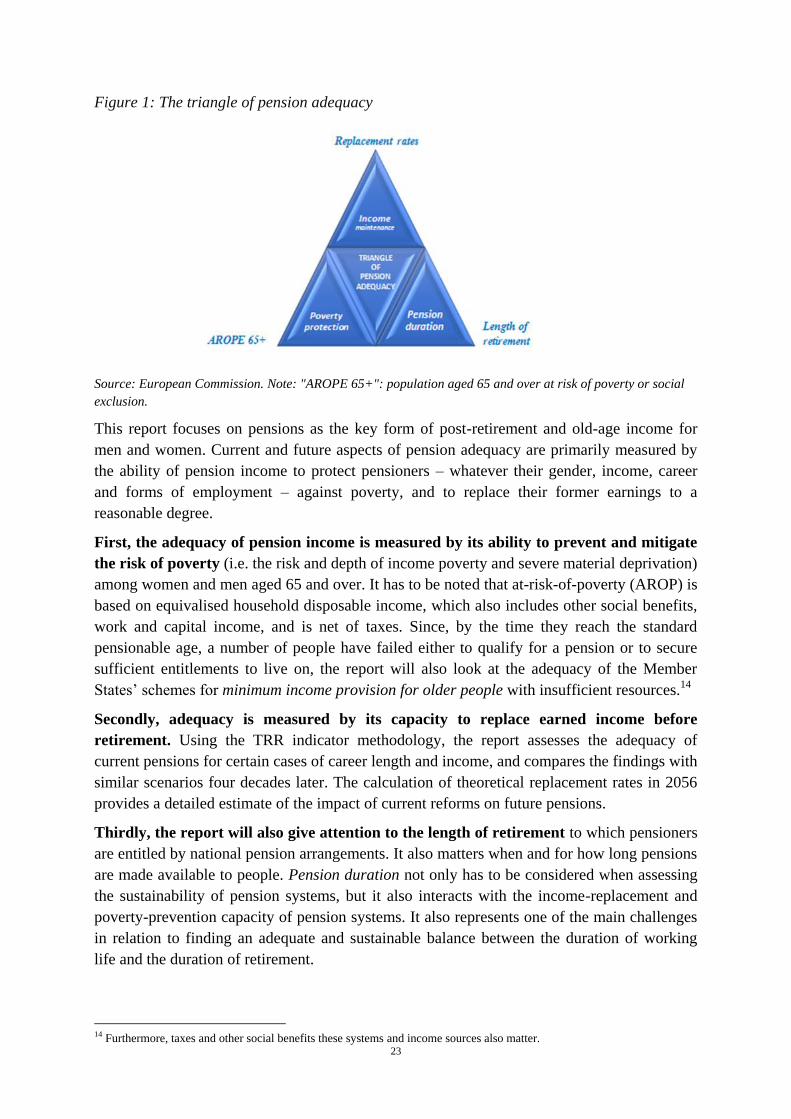
The current report considers three aspects of adequacy: (i) poverty protection, (ii) income
maintenance, and (iii) pension duration (see Figure 1).
9 Statutory pension schemes are those, access to which is established by legislation. These may be universal for all citizens,
mandatory for all employed people with a standard employment contract, limited to certain occupational groups (e.g. public-
sector employees, farmers, workers in arduous or hazardous jobs, etc.). Most statutory schemes are mandatory for the
population or group concerned, but some schemes may be voluntary. 10 That is, occupational and personal pensions. 11 These refer to funding. In pay-as-you-go arrangements, current workers’ contributions are used to pay for current pensions;
in funded systems, contributions are set aside in a fund and used after the workers retire. 12 Statutory funded schemes are legislation-based schemes financed from a general contribution regime, but accumulated in
individual, pre-funded accounts. These should be distinguished from supplementary pensions. 13 http://ec.europa.eu/social/main.jsp?catId=738&langId=en&pubId=7828&visible=0&
23
Figure 1: The triangle of pension adequacy
Source: European Commission. Note: "AROPE 65+": population aged 65 and over at risk of poverty or social
exclusion.
This report focuses on pensions as the key form of post-retirement and old-age income for
men and women. Current and future aspects of pension adequacy are primarily measured by
the ability of pension income to protect pensioners – whatever their gender, income, career
and forms of employment – against poverty, and to replace their former earnings to a
reasonable degree.
First, the adequacy of pension income is measured by its ability to prevent and mitigate
the risk of poverty (i.e. the risk and depth of income poverty and severe material deprivation)
among women and men aged 65 and over. It has to be noted that at-risk-of-poverty (AROP) is
based on equivalised household disposable income, which also includes other social benefits,
work and capital income, and is net of taxes. Since, by the time they reach the standard
pensionable age, a number of people have failed either to qualify for a pension or to secure
sufficient entitlements to live on, the report will also look at the adequacy of the Member
States’ schemes for minimum income provision for older people with insufficient resources.14
Secondly, adequacy is measured by its capacity to replace earned income before
retirement. Using the TRR indicator methodology, the report assesses the adequacy of
current pensions for certain cases of career length and income, and compares the findings with
similar scenarios four decades later. The calculation of theoretical replacement rates in 2056
provides a detailed estimate of the impact of current reforms on future pensions.
Thirdly, the report will also give attention to the length of retirement to which pensioners
are entitled by national pension arrangements. It also matters when and for how long pensions
are made available to people. Pension duration not only has to be considered when assessing
the sustainability of pension systems, but it also interacts with the income-replacement and
poverty-prevention capacity of pension systems. It also represents one of the main challenges
in relation to finding an adequate and sustainable balance between the duration of working
life and the duration of retirement.
14 Furthermore, taxes and other social benefits these systems and income sources also matter.

24
The standard pensionable age and life expectancy at that age differ between Member States
and between the genders. The average length of retirement or pension duration may therefore
vary considerably.
To allow for better comparison between Member States of how they balance these three
dimensions of adequacy, the report looks to measurements of the average length of retirement
and the aggregate value of benefits over the retirement period.
1.4. Further aspects of the multi-dimensional approach
The adequacy of current pensions needs to be contextualised by looking at their relative
importance among other sources of old-age income, at their net value after taxes and their
adequacy in view of the degree of access to free or subsidised public services that pensioners
enjoy in the different Member States, and at elderly people’s needs.
Over their active years, many people manage to accumulate a certain measure of housing and
financial wealth, which they can draw on in retirement. Owner-occupier dwellings are a very
widespread form of housing wealth, which allows pensioners to have lower housing costs,
since typically the mortgage will have been paid off or the outstanding part will be rather low.
By their retirement, many people have some savings that they can draw on as financial
wealth. The report examines the prevalence and distribution of both forms of wealth and
discusses the relative importance of these income sources in assessing the adequacy of
pensions.
As supplements to pensions, most Member States also offer a variety of allowances, services
or reimbursements to help cover the cost of such needs as housing, heating, pharmaceuticals,
transport, etc.; these are typically awarded on a need/resource-tested basis. Such social
protection benefits are particularly important for low-income pensioners, but they may also
function as a pension supplement going to all pensioners. Discounts on publicly provided (or
supported) amenities – such as water, transport, public service radio and TV and cultural
institutions – are often available to people above the pensionable age. These help augment the
relative buying power of the pension.
Access to free public services, or in-kind benefits – notably health care, social services and
long-term care – also helps increase pension adequacy.
Furthermore, the report will focus particularly on the extent to which labour markets across
the EU will be able to absorb the extra late-career labour supply resulting from the increase in
pensionable age and the closing of early-exit routes brought about by pension reforms.
Barriers to, and opportunities for, delivering on higher effective retirement ages will be
analysed from the demand as well as the supply side, and will be used to set out the policies
needed to underpin the rise in pensionable age envisaged in the pension reforms.
Another aspect of alignment with the opportunities in the labour market is whether pension
take-up can be postponed if people work longer, and if postponement will be reasonably
rewarded through pension increments. This is tested in a variant of the TRR cases. The
analysis also includes the extent to which the lower pension that follows from early retirement
and the ‘bonus’ for deferred retirement are well balanced, i.e. are proportional or actuarially
25
neutral. In addition, it is important to consider the conditions under which income from work
can be combined with partial and full pension receipt.
1.5. Groups meriting particular attention
Women on average live longer than men and make up the majority of pensioners. At the same
time, women still face many challenges during their working life – such as a disproportionate
share of caring responsibilities – that undermine the equality of opportunity to build adequate
pension rights proclaimed in the European Pillar of Social Rights. The report will explore
gender differences in the risk of old-age poverty and social exclusion and in pension
entitlements, the factors behind them and the potential policy solutions.
The fact that pension coverage and subsequent outcomes vary by form of employment also
merits attention, as non-standard employment relationships and dependent self-employment
are becoming more widespread on the labour markets. The European Pillar of Social Rights
stipulates the right of workers and the self-employed to adequate social protection and, more
specifically, to a pension that ensures an adequate income. The report will therefore also
consider the pension coverage and accrual conditions of people in non-standard forms of
employment and self-employment and, insofar as is possible, the pension adequacy risks.
The analysis presented in the report complements the initiatives on the work-life balance15
and on access to social protection16
that accompany the European Pillar of Social Rights.
1.6. Looking to the future
The impact of recent pension reforms will become fully apparent in the next few decades.
This is due largely to the necessary transitional measures, but also to the fact that some
aspects play out over time, such as ‘linking’ rules that adapt pensionable ages or benefit levels
to life expectancy. Thus, assessing reforms requires making certain assumptions and looking
at different scenarios. These need to cover employment, financial and economic long-term
perspectives, as well as how today’s young workers will adapt to reformed pension systems.
This report adopts a series of complementary approaches that, taken together, provide an
assessment that is as complete as possible.
The first approach uses TRRs and delves into the intricacies of pension rules to assess how
pensions will differ after different careers. TRRs indicate how the pension system responds to
career choices and events, for instance, predicting if and how a period of unemployment will
reduce pension benefits.
The second approach involves microsimulation. This is more comprehensive and allows an
assessment of the overall impact on the older population in terms of employment, poverty,
inequality and more. Most – possibly all – countries carry out some form of microsimulation
on pensions; however, here a comparable approach is required, and unfortunately so far only a
few countries have models that yield comparable results.
15 Communication from the Commission to the European Parliament, the Council, the European Economic and Social
Committee and the Committee of the Regions, An Initiative to Support Work-Life Balance for Working Parents and Carers,
COM/2017/0252 final. 16 http://ec.europa.eu/social/main.jsp?langId=en&catId=89&newsId=9061&furtherNews=yes

26
The third and last approach involves modelling. This report shows the results from the labour
market model used in the Ageing Report and a model by the Organisation for Economic Co-
operation and Development (OECD). Both models cover each country in the EU. However, to
keep complexity within manageable bounds, modelling focuses on specific aspects of pension
adequacy and assumes other economic variables.
Chapter 5 attempts to bring the results of these approaches together into a future adequacy
assessment and, also building on an observation of policies and practices in Member States,
seeks to identify the most promising policy tools to tackle the challenges ahead.
27
2. CURRENT LIVING STANDARDS OF OLDER PEOPLE
This chapter examines the current material situation of older people aged 65 or over
(see Box 1) relative to the rest of the population, with a focus on relative incomes, poverty
risks and severe material deprivation. The analysis of income poverty trends (i.e. the EU ‘at-
risk-of-poverty’ indicator) across age groups, between men and women and over time helps to
identify the inequalities and main characteristics of people most at risk of poverty or social
exclusion. This investigation is further elaborated by looking at wider elements in the living
standards of older people, such as housing and financial wealth, and the extent to which this
wealth can be used to sustain living standards in old age.
Box 1: Focusing on people aged 65 and above
This chapter (and much of this publication) focuses on people aged 65 and above. This group does
not cover all pensioners; currently in the EU many people younger than 65 receive pensions, and a
2012 survey revealed that at that time people started receiving a pension at the age of 59 on
average.17 However, by the age of 65 a very large majority of Europeans cease to rely on work
income, and pensions become the essential source of sustenance. In addition, as this publication has
a 2016-2056 outlook, and since people are working for longer and longer, the group aged 65 and
above allows better comparison grounds for assessing how pension systems can continue to provide
adequate old-age incomes.
In addition, only people living in households are covered in this chapter; older people living in
institutions are not covered by the surveys used here.
2.1. Poverty risks and severe material deprivation among older Europeans
Pension systems help provide adequate incomes for older people and are key to achieving the
Europe 2020 target of lifting at least 20 million Europeans out of poverty and social exclusion
between 2010 and 2020.
2.1.1. Downward poverty and social exclusion trends
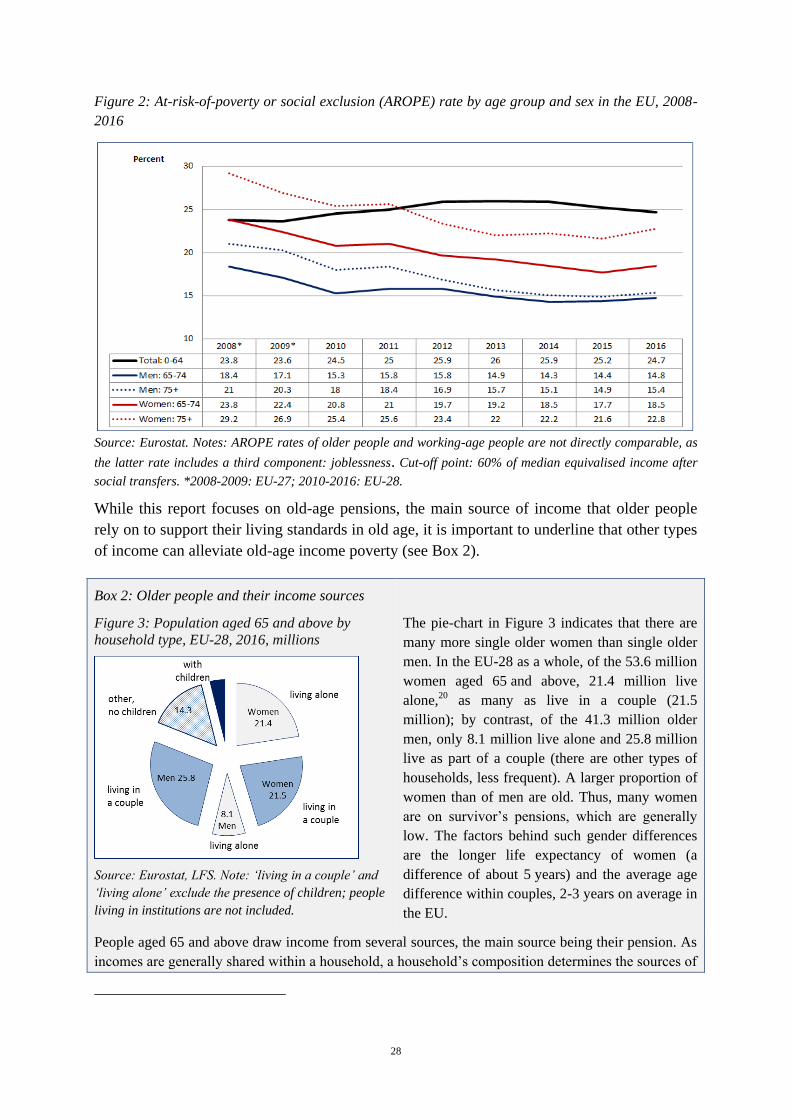
About 18.2 percent (17.3 million) of those aged 65 and over were at risk of poverty or
social exclusion (AROPE)18
in the EU-28 in 2016: 20.6 percent of women (11 million) and
15 percent of men (6.3 million). These rates have been steadily decreasing over several years
(Figure 2).
The pension systems play an important role in redistributing income.19
From 2008 to 2016,
the number of people aged 65 and over at risk of poverty or social exclusion in the EU
decreased by around 1.9 million – this is about 9.5 percent of the Europe 2020 target of
reducing poverty and social exclusion by 20 million by 2020. For contextual illustration,
Figure 2 also provides the AROPE rate for younger people during the same time period. It is
important to note that the AROPE rates of older people and of working-age people are not
directly comparable, as the latter rate includes a third component: joblessness.
17 Eurostat, Labour Force Survey 2012 ad-hoc module. 18 The old-age poverty and social exclusion indicator (AROPE) combines measures of at-risk-of-poverty and severe material
deprivation. 19 Pensions are almost as redistributive as income taxes and are the most important of the social benefits in reducing income
inequalities across all countries (Eurofound, 2017, p. 41).
28
Figure 2: At-risk-of-poverty or social exclusion (AROPE) rate by age group and sex in the EU, 2008-
2016
Source: Eurostat. Notes: AROPE rates of older people and working-age people are not directly comparable, as
the latter rate includes a third component: joblessness. Cut-off point: 60% of median equivalised income after
social transfers. *2008-2009: EU-27; 2010-2016: EU-28.
While this report focuses on old-age pensions, the main source of income that older people
rely on to support their living standards in old age, it is important to underline that other types
of income can alleviate old-age income poverty (see Box 2).
Box 2: Older people and their income sources
Figure 3: Population aged 65 and above by
household type, EU-28, 2016, millions
Source: Eurostat, LFS. Note: ‘living in a couple’ and
‘living alone’ exclude the presence of children; people
living in institutions are not included.
The pie-chart in Figure 3 indicates that there are
many more single older women than single older
men. In the EU-28 as a whole, of the 53.6 million
women aged 65 and above, 21.4 million live
alone,20 as many as live in a couple (21.5
million); by contrast, of the 41.3 million older
men, only 8.1 million live alone and 25.8 million
live as part of a couple (there are other types of
households, less frequent). A larger proportion of
women than of men are old. Thus, many women
are on survivor’s pensions, which are generally
low. The factors behind such gender differences
are the longer life expectancy of women (a
difference of about 5 years) and the average age
difference within couples, 2-3 years on average in
the EU.
People aged 65 and above draw income from several sources, the main source being their pension. As
incomes are generally shared within a household, a household’s composition determines the sources of
29
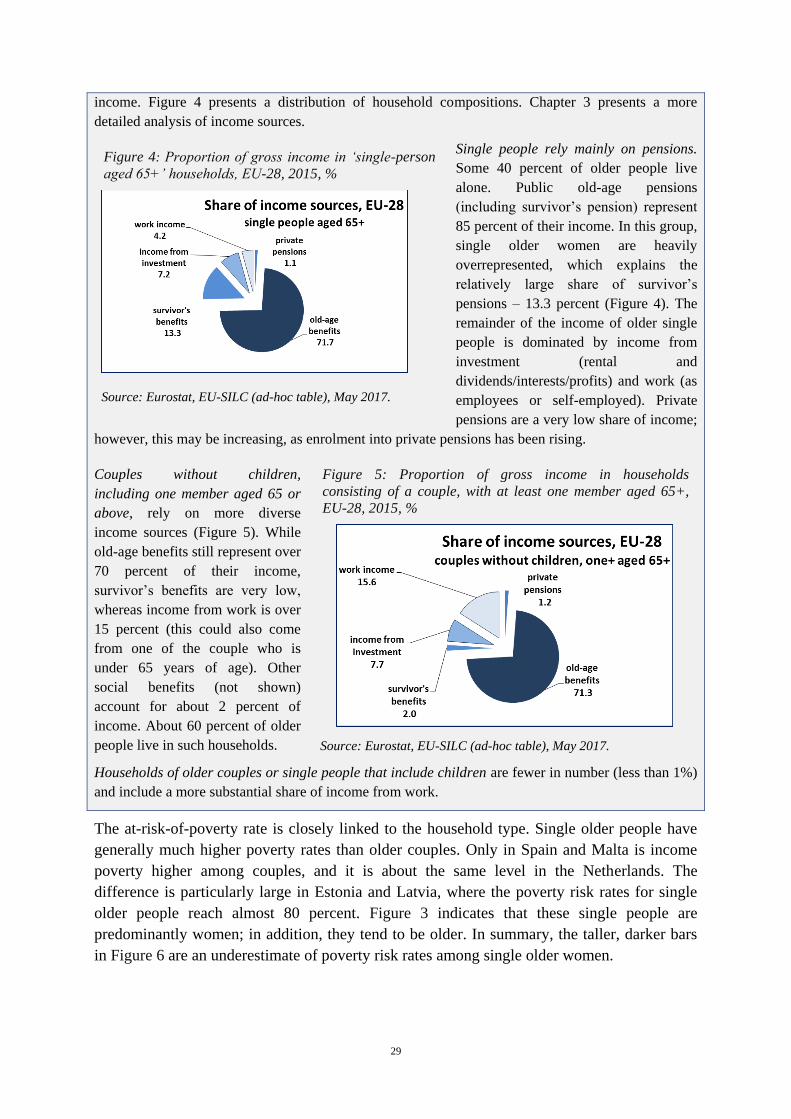
income. Figure 4 presents a distribution of household compositions. Chapter 3 presents a more
detailed analysis of income sources.
Single people rely mainly on pensions.
Some 40 percent of older people live
alone. Public old-age pensions
(including survivor’s pension) represent
85 percent of their income. In this group,
single older women are heavily
overrepresented, which explains the
relatively large share of survivor’s
pensions – 13.3 percent (Figure 4). The
remainder of the income of older single
people is dominated by income from
investment (rental and
dividends/interests/profits) and work (as
employees or self-employed). Private
pensions are a very low share of income;
however, this may be increasing, as enrolment into private pensions has been rising.
Couples without children,
including one member aged 65 or
above, rely on more diverse
income sources (Figure 5). While
old-age benefits still represent over
70 percent of their income,
survivor’s benefits are very low,
whereas income from work is over
15 percent (this could also come
from one of the couple who is
under 65 years of age). Other
social benefits (not shown)
account for about 2 percent of
income. About 60 percent of older
people live in such households.
Households of older couples or single people that include children are fewer in number (less than 1%)
and include a more substantial share of income from work.
Figure 4: Proportion of gross income in ‘single-person
aged 65+’ households, EU-28, 2015, %
Source: Eurostat, EU-SILC (ad-hoc table), May 2017.
Figure 5: Proportion of gross income in households
consisting of a couple, with at least one member aged 65+,
EU-28, 2015, %
Source: Eurostat, EU-SILC (ad-hoc table), May 2017.
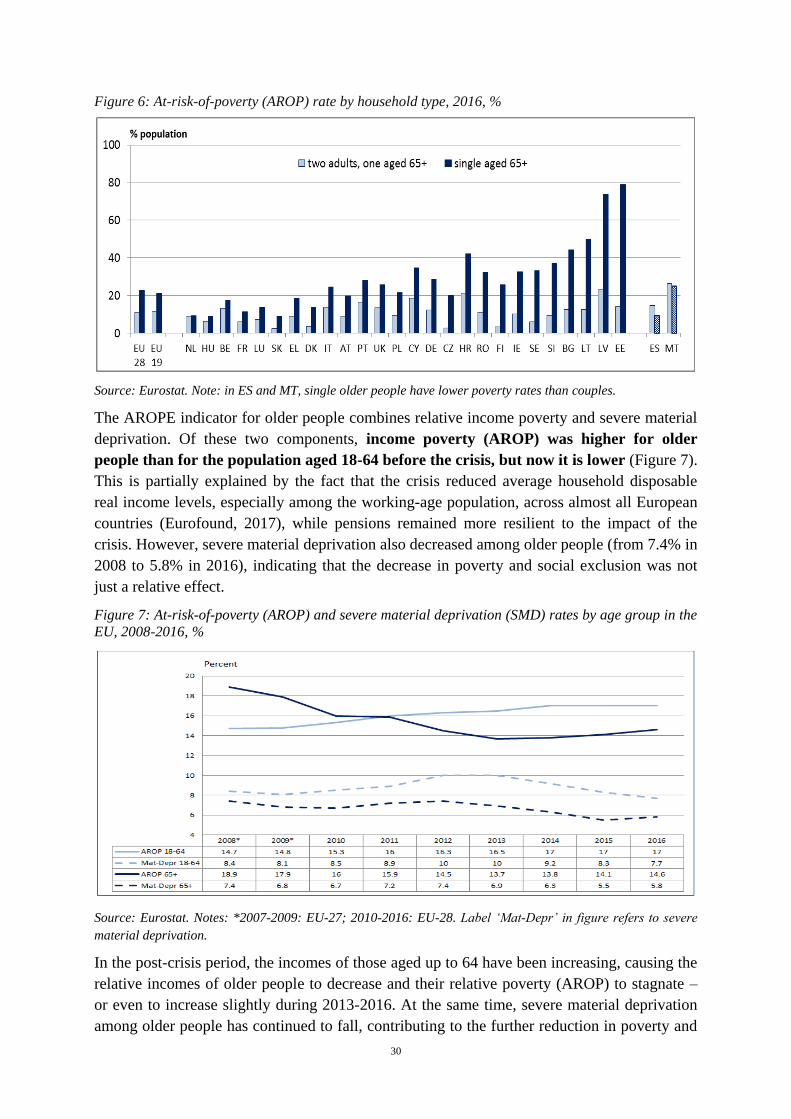
The at-risk-of-poverty rate is closely linked to the household type. Single older people have
generally much higher poverty rates than older couples. Only in Spain and Malta is income
poverty higher among couples, and it is about the same level in the Netherlands. The
difference is particularly large in Estonia and Latvia, where the poverty risk rates for single
older people reach almost 80 percent. Figure 3 indicates that these single people are
predominantly women; in addition, they tend to be older. In summary, the taller, darker bars
in Figure 6 are an underestimate of poverty risk rates among single older women.
30
Figure 6: At-risk-of-poverty (AROP) rate by household type, 2016, %
Source: Eurostat. Note: in ES and MT, single older people have lower poverty rates than couples.
The AROPE indicator for older people combines relative income poverty and severe material
deprivation. Of these two components, income poverty (AROP) was higher for older
people than for the population aged 18-64 before the crisis, but now it is lower (Figure 7).
This is partially explained by the fact that the crisis reduced average household disposable
real income levels, especially among the working-age population, across almost all European
countries (Eurofound, 2017), while pensions remained more resilient to the impact of the
crisis. However, severe material deprivation also decreased among older people (from 7.4% in
2008 to 5.8% in 2016), indicating that the decrease in poverty and social exclusion was not
just a relative effect.
Figure 7: At-risk-of-poverty (AROP) and severe material deprivation (SMD) rates by age group in the
EU, 2008-2016, %
Source: Eurostat. Notes: *2007-2009: EU-27; 2010-2016: EU-28. Label ‘Mat-Depr’ in figure refers to severe
material deprivation.
In the post-crisis period, the incomes of those aged up to 64 have been increasing, causing the
relative incomes of older people to decrease and their relative poverty (AROP) to stagnate –
or even to increase slightly during 2013-2016. At the same time, severe material deprivation
among older people has continued to fall, contributing to the further reduction in poverty and
31
social exclusion among older people in the EU. There was a slight upturn of both indicators
among those aged 65 and above in 2017.
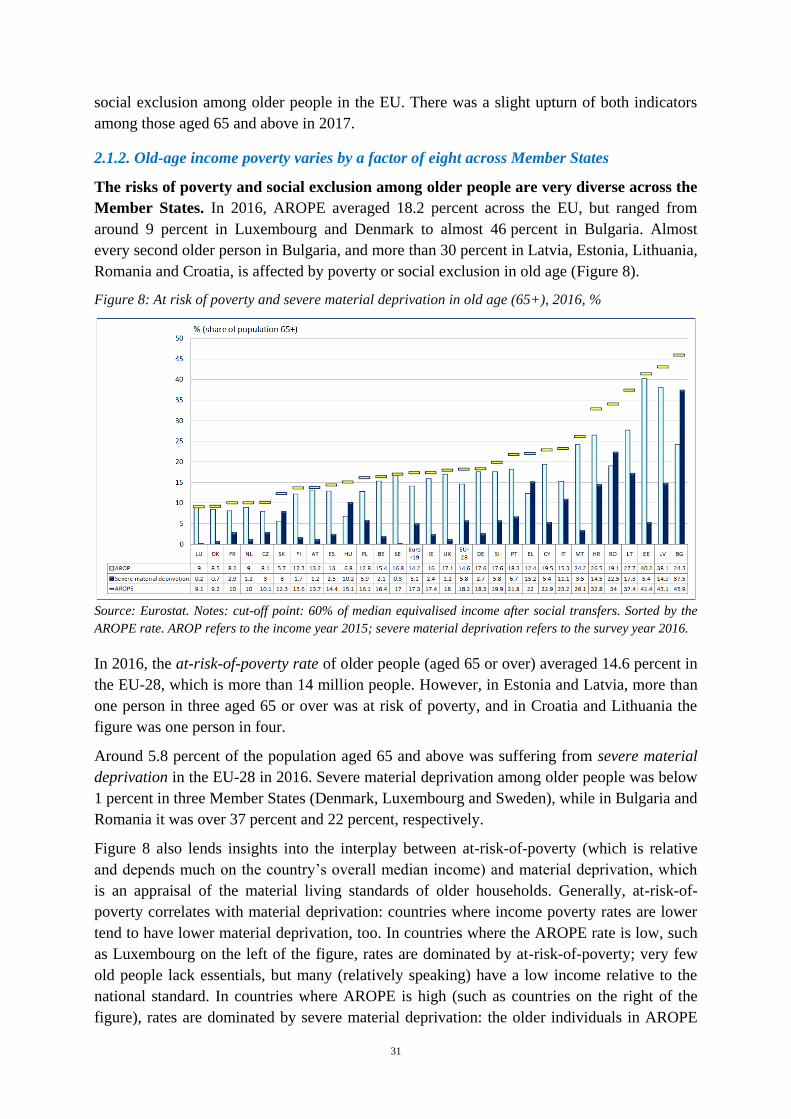
2.1.2. Old-age income poverty varies by a factor of eight across Member States
The risks of poverty and social exclusion among older people are very diverse across the
Member States. In 2016, AROPE averaged 18.2 percent across the EU, but ranged from
around 9 percent in Luxembourg and Denmark to almost 46 percent in Bulgaria. Almost
every second older person in Bulgaria, and more than 30 percent in Latvia, Estonia, Lithuania,
Romania and Croatia, is affected by poverty or social exclusion in old age (Figure 8).
Figure 8: At risk of poverty and severe material deprivation in old age (65+), 2016, %
Source: Eurostat. Notes: cut-off point: 60% of median equivalised income after social transfers. Sorted by the
AROPE rate. AROP refers to the income year 2015; severe material deprivation refers to the survey year 2016.
In 2016, the at-risk-of-poverty rate of older people (aged 65 or over) averaged 14.6 percent in
the EU-28, which is more than 14 million people. However, in Estonia and Latvia, more than
one person in three aged 65 or over was at risk of poverty, and in Croatia and Lithuania the
figure was one person in four.
Around 5.8 percent of the population aged 65 and above was suffering from severe material
deprivation in the EU-28 in 2016. Severe material deprivation among older people was below
1 percent in three Member States (Denmark, Luxembourg and Sweden), while in Bulgaria and
Romania it was over 37 percent and 22 percent, respectively.
Figure 8 also lends insights into the interplay between at-risk-of-poverty (which is relative
and depends much on the country’s overall median income) and material deprivation, which
is an appraisal of the material living standards of older households. Generally, at-risk-of-
poverty correlates with material deprivation: countries where income poverty rates are lower
tend to have lower material deprivation, too. In countries where the AROPE rate is low, such
as Luxembourg on the left of the figure, rates are dominated by at-risk-of-poverty; very few
old people lack essentials, but many (relatively speaking) have a low income relative to the
national standard. In countries where AROPE is high (such as countries on the right of the
figure), rates are dominated by severe material deprivation: the older individuals in AROPE
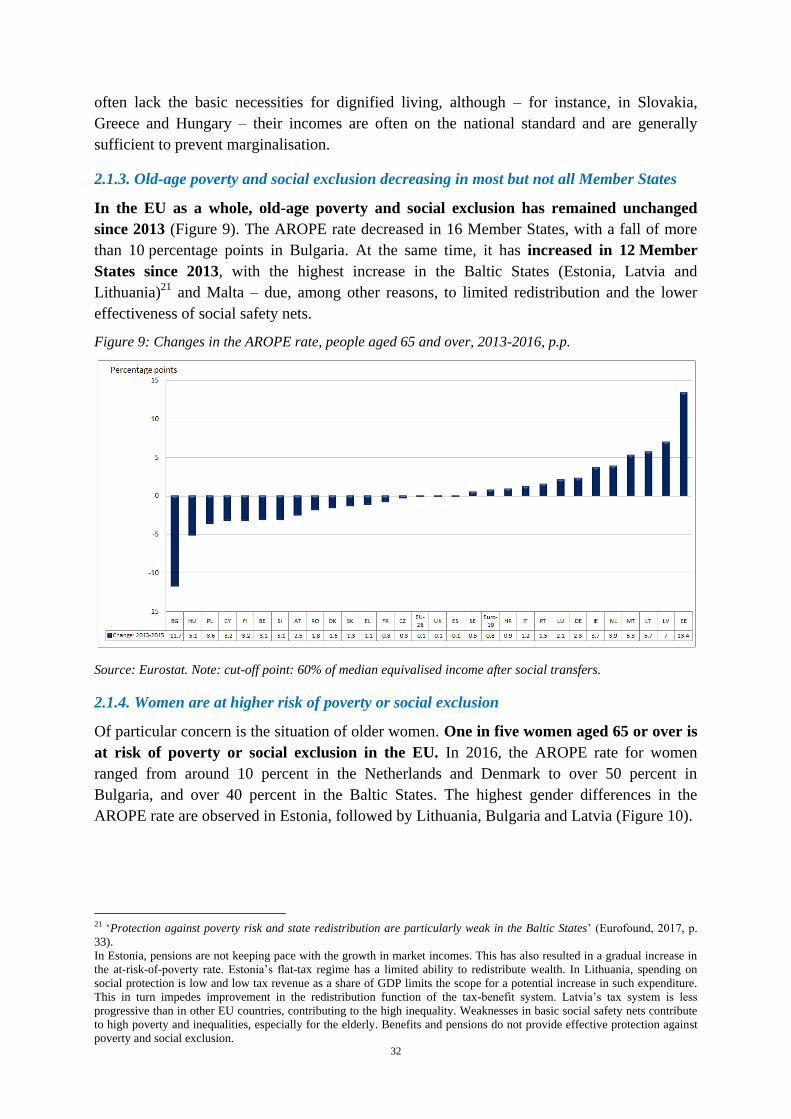
32
often lack the basic necessities for dignified living, although – for instance, in Slovakia,
Greece and Hungary – their incomes are often on the national standard and are generally
sufficient to prevent marginalisation.
2.1.3. Old-age poverty and social exclusion decreasing in most but not all Member States
In the EU as a whole, old-age poverty and social exclusion has remained unchanged
since 2013 (Figure 9). The AROPE rate decreased in 16 Member States, with a fall of more
than 10 percentage points in Bulgaria. At the same time, it has increased in 12 Member
States since 2013, with the highest increase in the Baltic States (Estonia, Latvia and
Lithuania)21
and Malta – due, among other reasons, to limited redistribution and the lower
effectiveness of social safety nets.
Figure 9: Changes in the AROPE rate, people aged 65 and over, 2013-2016, p.p.
Source: Eurostat. Note: cut-off point: 60% of median equivalised income after social transfers.
2.1.4. Women are at higher risk of poverty or social exclusion
Of particular concern is the situation of older women. One in five women aged 65 or over is
at risk of poverty or social exclusion in the EU. In 2016, the AROPE rate for women
ranged from around 10 percent in the Netherlands and Denmark to over 50 percent in
Bulgaria, and over 40 percent in the Baltic States. The highest gender differences in the
AROPE rate are observed in Estonia, followed by Lithuania, Bulgaria and Latvia (Figure 10).
21 ‘Protection against poverty risk and state redistribution are particularly weak in the Baltic States’ (Eurofound, 2017, p.
33).
In Estonia, pensions are not keeping pace with the growth in market incomes. This has also resulted in a gradual increase in
the at-risk-of-poverty rate. Estonia’s flat-tax regime has a limited ability to redistribute wealth. In Lithuania, spending on
social protection is low and low tax revenue as a share of GDP limits the scope for a potential increase in such expenditure.
This in turn impedes improvement in the redistribution function of the tax-benefit system. Latvia’s tax system is less
progressive than in other EU countries, contributing to the high inequality. Weaknesses in basic social safety nets contribute
to high poverty and inequalities, especially for the elderly. Benefits and pensions do not provide effective protection against
poverty and social exclusion.
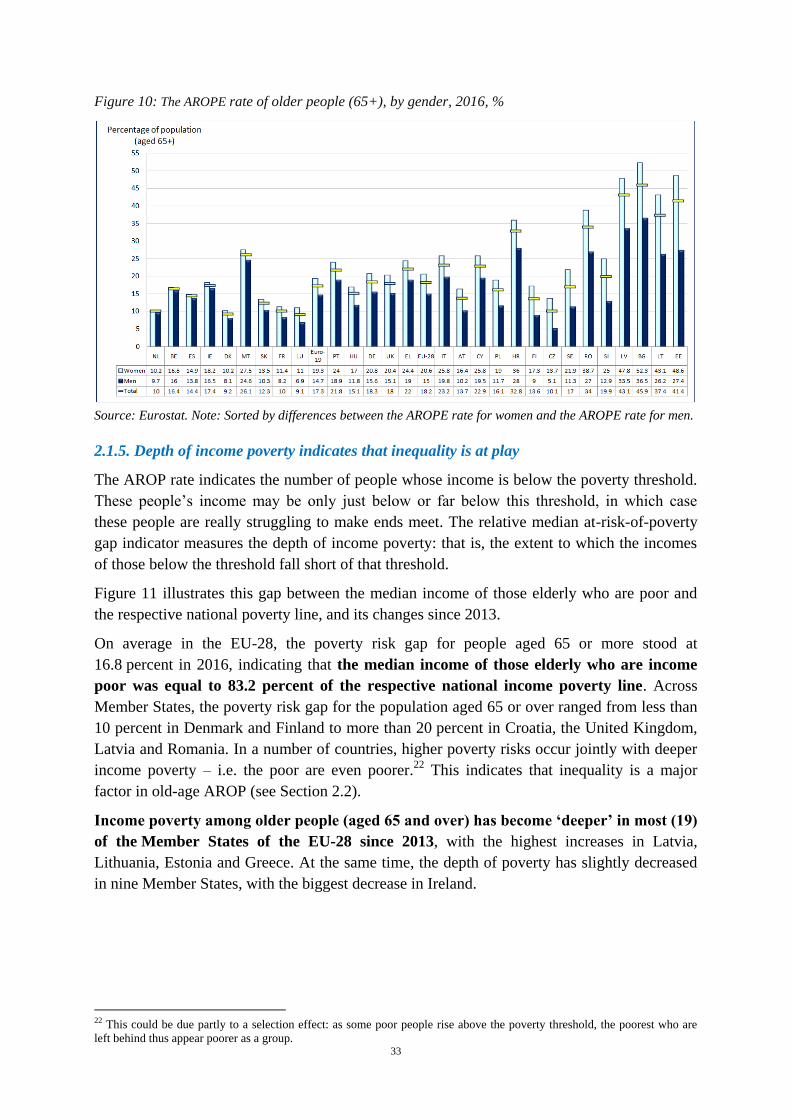
33
Figure 10: The AROPE rate of older people (65+), by gender, 2016, %
Source: Eurostat. Note: Sorted by differences between the AROPE rate for women and the AROPE rate for men.
2.1.5. Depth of income poverty indicates that inequality is at play
The AROP rate indicates the number of people whose income is below the poverty threshold.
These people’s income may be only just below or far below this threshold, in which case
these people are really struggling to make ends meet. The relative median at-risk-of-poverty
gap indicator measures the depth of income poverty: that is, the extent to which the incomes
of those below the threshold fall short of that threshold.
Figure 11 illustrates this gap between the median income of those elderly who are poor and
the respective national poverty line, and its changes since 2013.
On average in the EU-28, the poverty risk gap for people aged 65 or more stood at
16.8 percent in 2016, indicating that the median income of those elderly who are income
poor was equal to 83.2 percent of the respective national income poverty line. Across
Member States, the poverty risk gap for the population aged 65 or over ranged from less than
10 percent in Denmark and Finland to more than 20 percent in Croatia, the United Kingdom,
Latvia and Romania. In a number of countries, higher poverty risks occur jointly with deeper
income poverty – i.e. the poor are even poorer.22
This indicates that inequality is a major
factor in old-age AROP (see Section 2.2).
Income poverty among older people (aged 65 and over) has become ‘deeper’ in most (19)
of the Member States of the EU-28 since 2013, with the highest increases in Latvia,
Lithuania, Estonia and Greece. At the same time, the depth of poverty has slightly decreased
in nine Member States, with the biggest decrease in Ireland.
22 This could be due partly to a selection effect: as some poor people rise above the poverty threshold, the poorest who are
left behind thus appear poorer as a group.
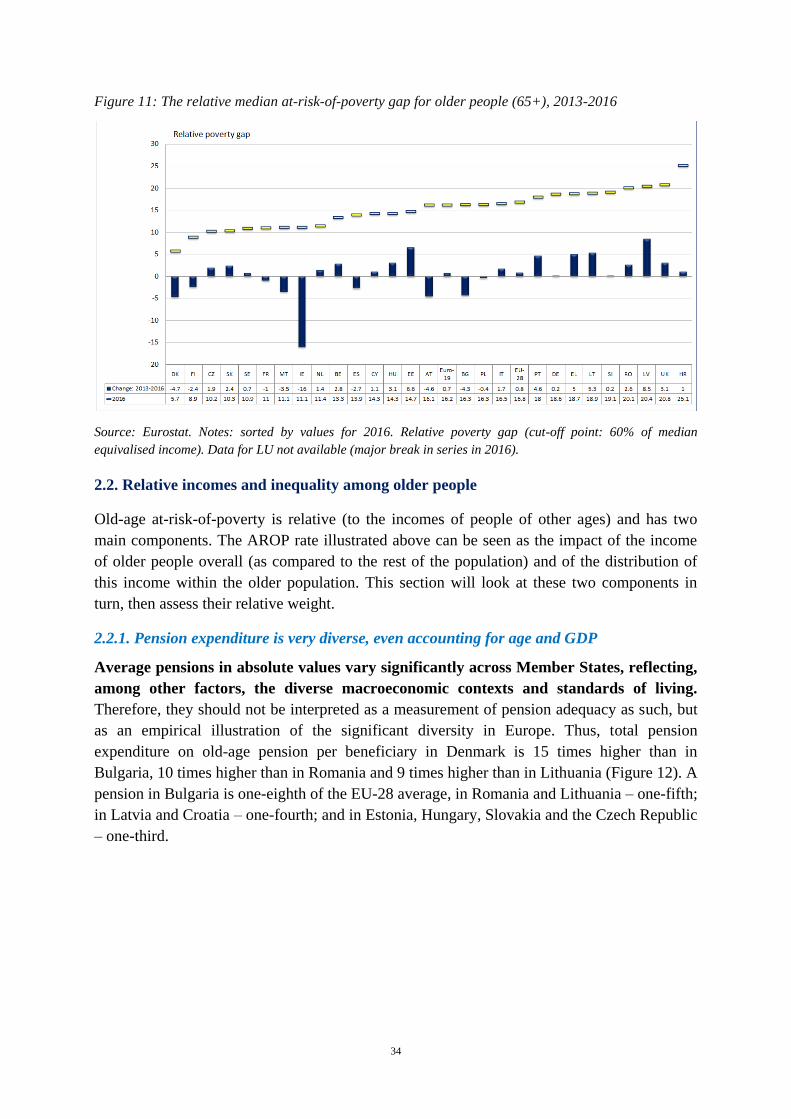
34
Figure 11: The relative median at-risk-of-poverty gap for older people (65+), 2013-2016
Source: Eurostat. Notes: sorted by values for 2016. Relative poverty gap (cut-off point: 60% of median
equivalised income). Data for LU not available (major break in series in 2016).
2.2. Relative incomes and inequality among older people
Old-age at-risk-of-poverty is relative (to the incomes of people of other ages) and has two
main components. The AROP rate illustrated above can be seen as the impact of the income
of older people overall (as compared to the rest of the population) and of the distribution of
this income within the older population. This section will look at these two components in
turn, then assess their relative weight.
2.2.1. Pension expenditure is very diverse, even accounting for age and GDP
Average pensions in absolute values vary significantly across Member States, reflecting,
among other factors, the diverse macroeconomic contexts and standards of living.
Therefore, they should not be interpreted as a measurement of pension adequacy as such, but
as an empirical illustration of the significant diversity in Europe. Thus, total pension
expenditure on old-age pension per beneficiary in Denmark is 15 times higher than in
Bulgaria, 10 times higher than in Romania and 9 times higher than in Lithuania (Figure 12). A
pension in Bulgaria is one-eighth of the EU-28 average, in Romania and Lithuania – one-fifth;
in Latvia and Croatia – one-fourth; and in Estonia, Hungary, Slovakia and the Czech Republic
– one-third.
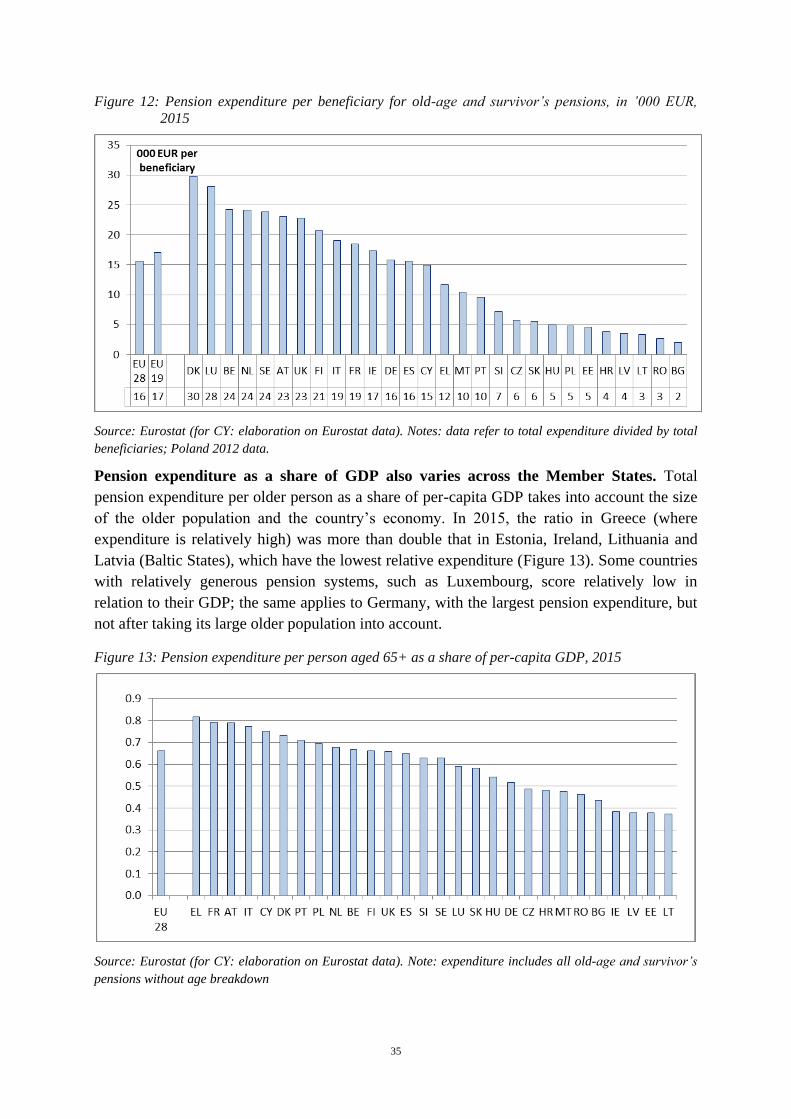
35
Figure 12: Pension expenditure per beneficiary for old-age and survivor’s pensions, in ’000 EUR,
2015
Source: Eurostat (for CY: elaboration on Eurostat data). Notes: data refer to total expenditure divided by total
beneficiaries; Poland 2012 data.
Pension expenditure as a share of GDP also varies across the Member States. Total
pension expenditure per older person as a share of per-capita GDP takes into account the size
of the older population and the country’s economy. In 2015, the ratio in Greece (where
expenditure is relatively high) was more than double that in Estonia, Ireland, Lithuania and
Latvia (Baltic States), which have the lowest relative expenditure (Figure 13). Some countries
with relatively generous pension systems, such as Luxembourg, score relatively low in
relation to their GDP; the same applies to Germany, with the largest pension expenditure, but
not after taking its large older population into account.
Figure 13: Pension expenditure per person aged 65+ as a share of per-capita GDP, 2015
Source: Eurostat (for CY: elaboration on Eurostat data). Note: expenditure includes all old-age and survivor’s
pensions without age breakdown
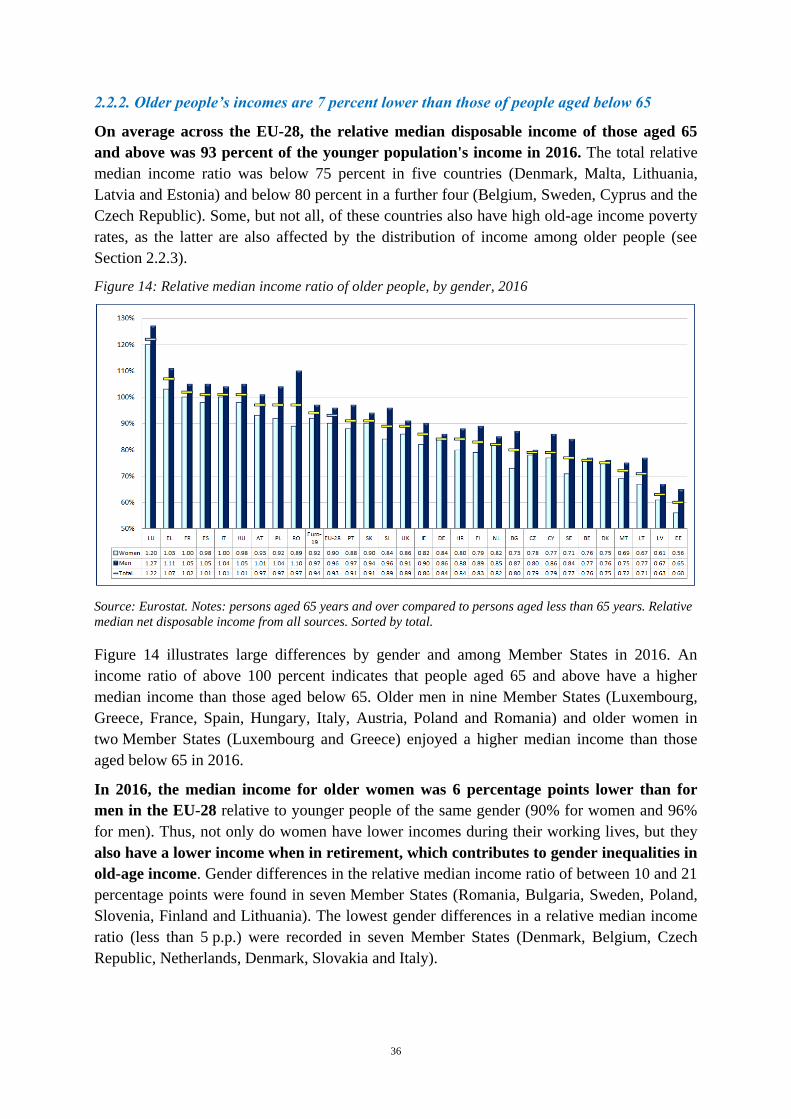
36
2.2.2. Older people’s incomes are 7 percent lower than those of people aged below 65
On average across the EU-28, the relative median disposable income of those aged 65
and above was 93 percent of the younger population's income in 2016. The total relative
median income ratio was below 75 percent in five countries (Denmark, Malta, Lithuania,
Latvia and Estonia) and below 80 percent in a further four (Belgium, Sweden, Cyprus and the
Czech Republic). Some, but not all, of these countries also have high old-age income poverty
rates, as the latter are also affected by the distribution of income among older people (see
Section 2.2.3).
Figure 14: Relative median income ratio of older people, by gender, 2016
Source: Eurostat. Notes: persons aged 65 years and over compared to persons aged less than 65 years. Relative
median net disposable income from all sources. Sorted by total.
Figure 14 illustrates large differences by gender and among Member States in 2016. An
income ratio of above 100 percent indicates that people aged 65 and above have a higher
median income than those aged below 65. Older men in nine Member States (Luxembourg,
Greece, France, Spain, Hungary, Italy, Austria, Poland and Romania) and older women in
two Member States (Luxembourg and Greece) enjoyed a higher median income than those
aged below 65 in 2016.
In 2016, the median income for older women was 6 percentage points lower than for
men in the EU-28 relative to younger people of the same gender (90% for women and 96%
for men). Thus, not only do women have lower incomes during their working lives, but they
also have a lower income when in retirement, which contributes to gender inequalities in
old-age income. Gender differences in the relative median income ratio of between 10 and 21
percentage points were found in seven Member States (Romania, Bulgaria, Sweden, Poland,
Slovenia, Finland and Lithuania). The lowest gender differences in a relative median income
ratio (less than 5 p.p.) were recorded in seven Member States (Denmark, Belgium, Czech
Republic, Netherlands, Denmark, Slovakia and Italy).
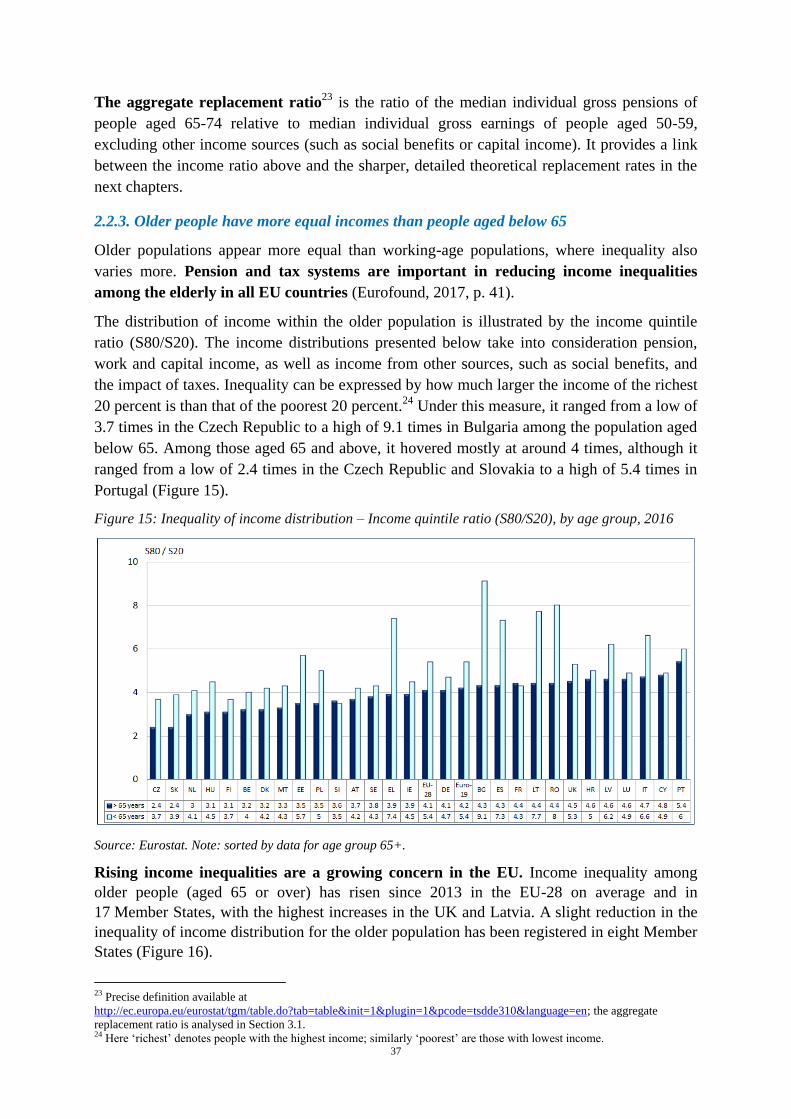
37
The aggregate replacement ratio23
is the ratio of the median individual gross pensions of
people aged 65-74 relative to median individual gross earnings of people aged 50-59,
excluding other income sources (such as social benefits or capital income). It provides a link
between the income ratio above and the sharper, detailed theoretical replacement rates in the
next chapters.
2.2.3. Older people have more equal incomes than people aged below 65
Older populations appear more equal than working-age populations, where inequality also
varies more. Pension and tax systems are important in reducing income inequalities
among the elderly in all EU countries (Eurofound, 2017, p. 41).
The distribution of income within the older population is illustrated by the income quintile
ratio (S80/S20). The income distributions presented below take into consideration pension,
work and capital income, as well as income from other sources, such as social benefits, and
the impact of taxes. Inequality can be expressed by how much larger the income of the richest
20 percent is than that of the poorest 20 percent.24
Under this measure, it ranged from a low of
3.7 times in the Czech Republic to a high of 9.1 times in Bulgaria among the population aged
below 65. Among those aged 65 and above, it hovered mostly at around 4 times, although it
ranged from a low of 2.4 times in the Czech Republic and Slovakia to a high of 5.4 times in
Portugal (Figure 15).
Figure 15: Inequality of income distribution – Income quintile ratio (S80/S20), by age group, 2016
Source: Eurostat. Note: sorted by data for age group 65+.
Rising income inequalities are a growing concern in the EU. Income inequality among
older people (aged 65 or over) has risen since 2013 in the EU-28 on average and in
17 Member States, with the highest increases in the UK and Latvia. A slight reduction in the
inequality of income distribution for the older population has been registered in eight Member
States (Figure 16).
23 Precise definition available at
http://ec.europa.eu/eurostat/tgm/table.do?tab=table&init=1&plugin=1&pcode=tsdde310&language=en; the aggregate
replacement ratio is analysed in Section 3.1. 24 Here ‘richest’ denotes people with the highest income; similarly ‘poorest’ are those with lowest income.
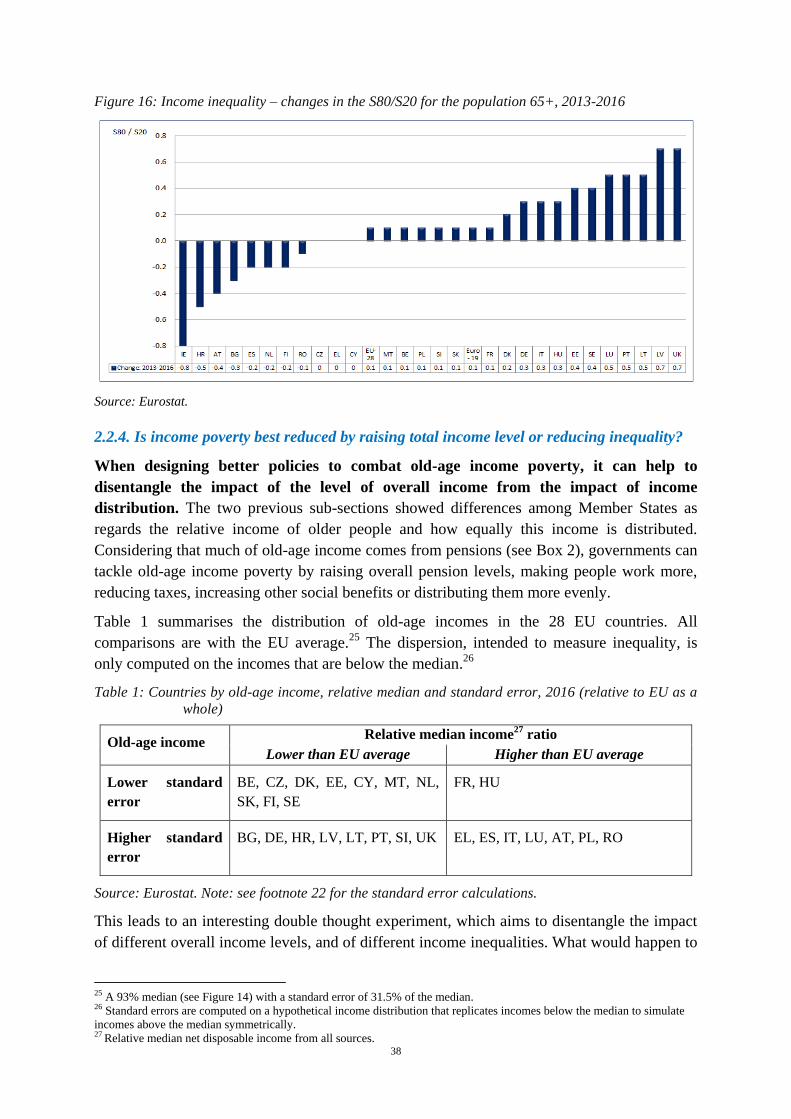
38
Figure 16: Income inequality – changes in the S80/S20 for the population 65+, 2013-2016
Source: Eurostat.
2.2.4. Is income poverty best reduced by raising total income level or reducing inequality?
When designing better policies to combat old-age income poverty, it can help to
disentangle the impact of the level of overall income from the impact of income
distribution. The two previous sub-sections showed differences among Member States as
regards the relative income of older people and how equally this income is distributed.
Considering that much of old-age income comes from pensions (see Box 2), governments can
tackle old-age income poverty by raising overall pension levels, making people work more,
reducing taxes, increasing other social benefits or distributing them more evenly.
Table 1 summarises the distribution of old-age incomes in the 28 EU countries. All
comparisons are with the EU average.25
The dispersion, intended to measure inequality, is
only computed on the incomes that are below the median.26
Table 1: Countries by old-age income, relative median and standard error, 2016 (relative to EU as a
whole)
Old-age income Relative median income
27 ratio
Lower than EU average Higher than EU average
Lower standard
error
BE, CZ, DK, EE, CY, MT, NL,
SK, FI, SE
FR, HU
Higher standard
error
BG, DE, HR, LV, LT, PT, SI, UK EL, ES, IT, LU, AT, PL, RO
Source: Eurostat. Note: see footnote 22 for the standard error calculations.
This leads to an interesting double thought experiment, which aims to disentangle the impact
of different overall income levels, and of different income inequalities. What would happen to
25 A 93% median (see Figure 14) with a standard error of 31.5% of the median. 26 Standard errors are computed on a hypothetical income distribution that replicates incomes below the median to simulate
incomes above the median symmetrically. 27 Relative median net disposable income from all sources.
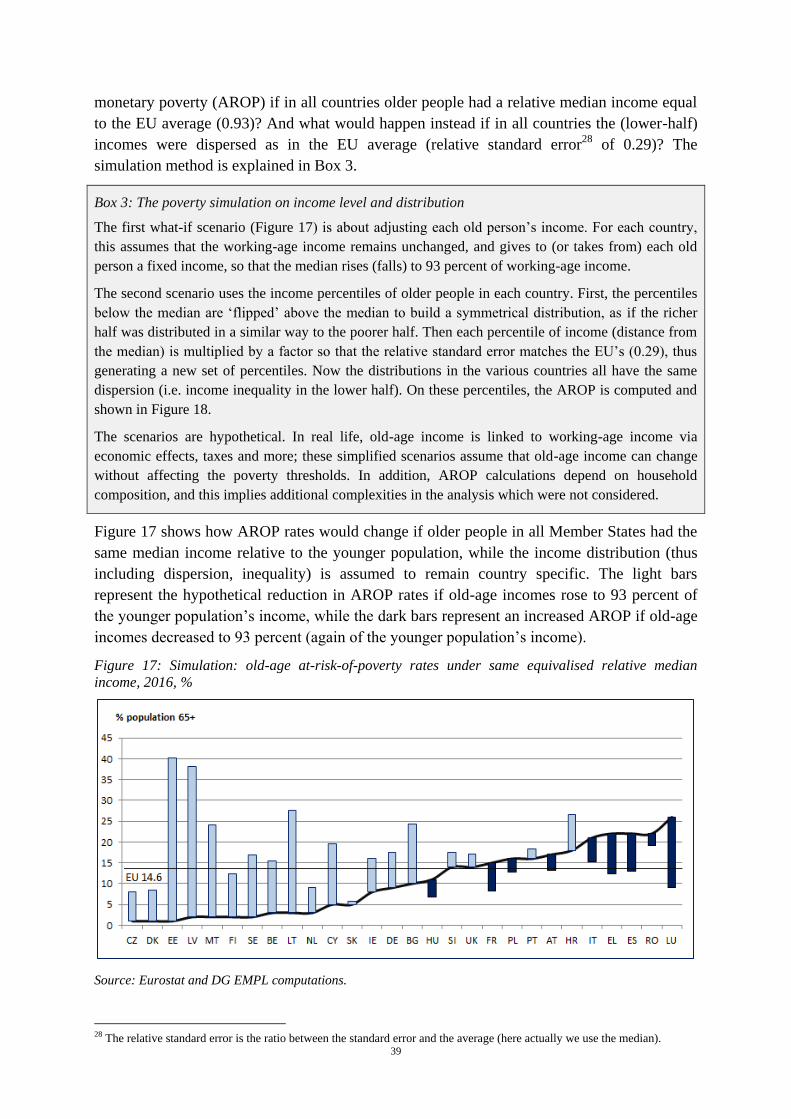
39
monetary poverty (AROP) if in all countries older people had a relative median income equal
to the EU average (0.93)? And what would happen instead if in all countries the (lower-half)
incomes were dispersed as in the EU average (relative standard error28
of 0.29)? The
simulation method is explained in Box 3.
Box 3: The poverty simulation on income level and distribution
The first what-if scenario (Figure 17) is about adjusting each old person’s income. For each country,
this assumes that the working-age income remains unchanged, and gives to (or takes from) each old
person a fixed income, so that the median rises (falls) to 93 percent of working-age income.
The second scenario uses the income percentiles of older people in each country. First, the percentiles
below the median are ‘flipped’ above the median to build a symmetrical distribution, as if the richer
half was distributed in a similar way to the poorer half. Then each percentile of income (distance from
the median) is multiplied by a factor so that the relative standard error matches the EU’s (0.29), thus
generating a new set of percentiles. Now the distributions in the various countries all have the same
dispersion (i.e. income inequality in the lower half). On these percentiles, the AROP is computed and
shown in Figure 18.
The scenarios are hypothetical. In real life, old-age income is linked to working-age income via
economic effects, taxes and more; these simplified scenarios assume that old-age income can change
without affecting the poverty thresholds. In addition, AROP calculations depend on household
composition, and this implies additional complexities in the analysis which were not considered.
Figure 17 shows how AROP rates would change if older people in all Member States had the
same median income relative to the younger population, while the income distribution (thus
including dispersion, inequality) is assumed to remain country specific. The light bars
represent the hypothetical reduction in AROP rates if old-age incomes rose to 93 percent of
the younger population’s income, while the dark bars represent an increased AROP if old-age
incomes decreased to 93 percent (again of the younger population’s income).
Figure 17: Simulation: old-age at-risk-of-poverty rates under same equivalised relative median
income, 2016, %
Source: Eurostat and DG EMPL computations.
28 The relative standard error is the ratio between the standard error and the average (here actually we use the median).
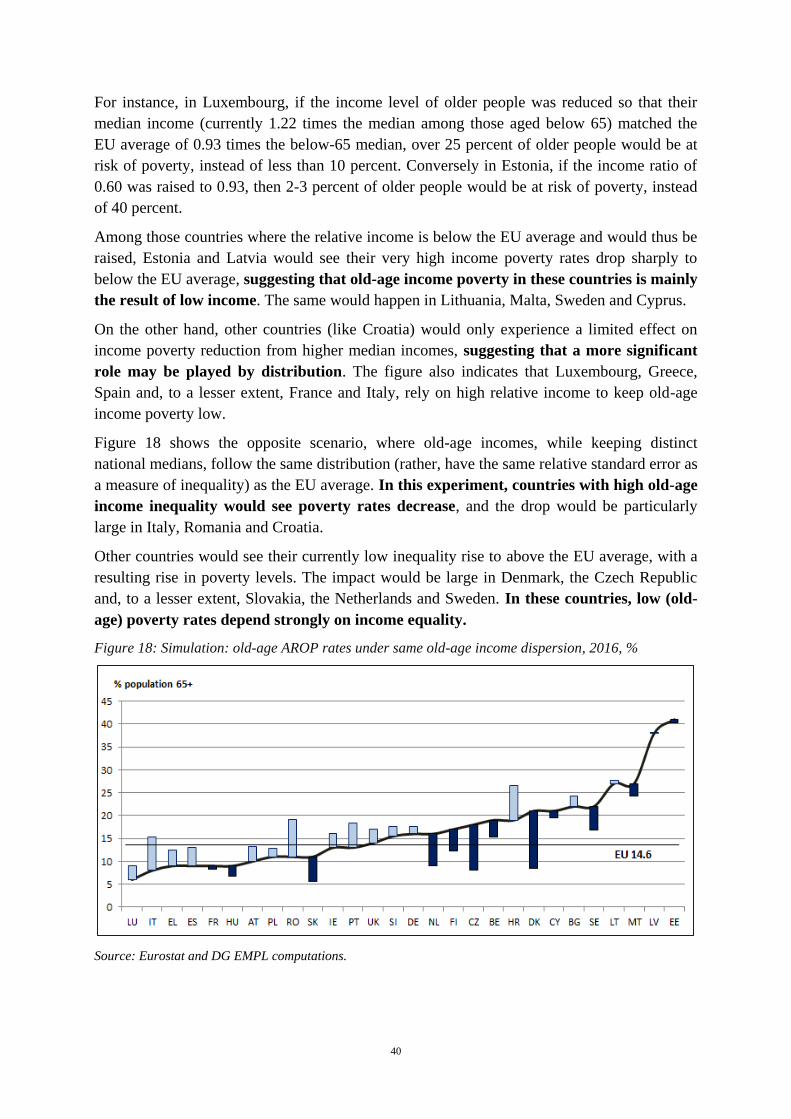
40
For instance, in Luxembourg, if the income level of older people was reduced so that their
median income (currently 1.22 times the median among those aged below 65) matched the
EU average of 0.93 times the below-65 median, over 25 percent of older people would be at
risk of poverty, instead of less than 10 percent. Conversely in Estonia, if the income ratio of
0.60 was raised to 0.93, then 2-3 percent of older people would be at risk of poverty, instead
of 40 percent.
Among those countries where the relative income is below the EU average and would thus be
raised, Estonia and Latvia would see their very high income poverty rates drop sharply to
below the EU average, suggesting that old-age income poverty in these countries is mainly
the result of low income. The same would happen in Lithuania, Malta, Sweden and Cyprus.
On the other hand, other countries (like Croatia) would only experience a limited effect on
income poverty reduction from higher median incomes, suggesting that a more significant
role may be played by distribution. The figure also indicates that Luxembourg, Greece,
Spain and, to a lesser extent, France and Italy, rely on high relative income to keep old-age
income poverty low.
Figure 18 shows the opposite scenario, where old-age incomes, while keeping distinct
national medians, follow the same distribution (rather, have the same relative standard error as
a measure of inequality) as the EU average. In this experiment, countries with high old-age
income inequality would see poverty rates decrease, and the drop would be particularly
large in Italy, Romania and Croatia.
Other countries would see their currently low inequality rise to above the EU average, with a
resulting rise in poverty levels. The impact would be large in Denmark, the Czech Republic
and, to a lesser extent, Slovakia, the Netherlands and Sweden. In these countries, low (old-
age) poverty rates depend strongly on income equality.
Figure 18: Simulation: old-age AROP rates under same old-age income dispersion, 2016, %
Source: Eurostat and DG EMPL computations.
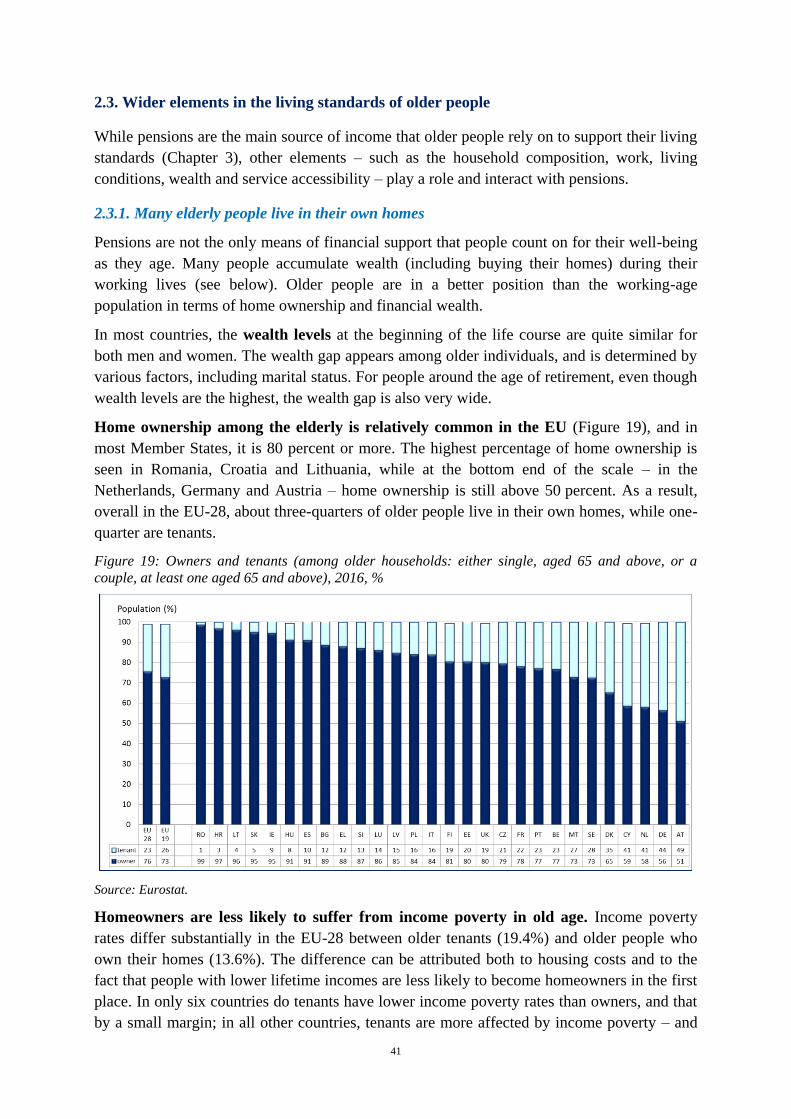
41
2.3. Wider elements in the living standards of older people
While pensions are the main source of income that older people rely on to support their living
standards (Chapter 3), other elements – such as the household composition, work, living
conditions, wealth and service accessibility – play a role and interact with pensions.
2.3.1. Many elderly people live in their own homes
Pensions are not the only means of financial support that people count on for their well-being
as they age. Many people accumulate wealth (including buying their homes) during their
working lives (see below). Older people are in a better position than the working-age
population in terms of home ownership and financial wealth.
In most countries, the wealth levels at the beginning of the life course are quite similar for
both men and women. The wealth gap appears among older individuals, and is determined by
various factors, including marital status. For people around the age of retirement, even though
wealth levels are the highest, the wealth gap is also very wide.
Home ownership among the elderly is relatively common in the EU (Figure 19), and in
most Member States, it is 80 percent or more. The highest percentage of home ownership is
seen in Romania, Croatia and Lithuania, while at the bottom end of the scale – in the
Netherlands, Germany and Austria – home ownership is still above 50 percent. As a result,
overall in the EU-28, about three-quarters of older people live in their own homes, while one-
quarter are tenants.
Figure 19: Owners and tenants (among older households: either single, aged 65 and above, or a
couple, at least one aged 65 and above), 2016, %
Source: Eurostat.
Homeowners are less likely to suffer from income poverty in old age. Income poverty
rates differ substantially in the EU-28 between older tenants (19.4%) and older people who
own their homes (13.6%). The difference can be attributed both to housing costs and to the
fact that people with lower lifetime incomes are less likely to become homeowners in the first
place. In only six countries do tenants have lower income poverty rates than owners, and that
by a small margin; in all other countries, tenants are more affected by income poverty – and
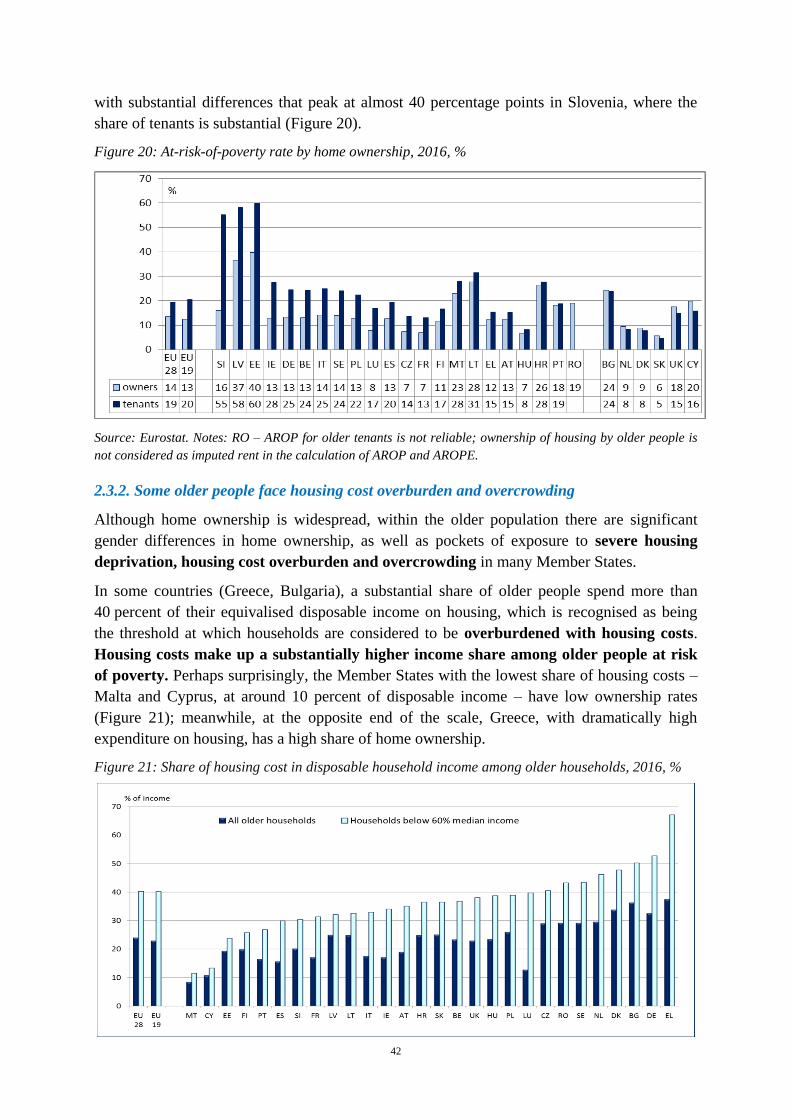
42
with substantial differences that peak at almost 40 percentage points in Slovenia, where the
share of tenants is substantial (Figure 20).
Figure 20: At-risk-of-poverty rate by home ownership, 2016, %
Source: Eurostat. Notes: RO – AROP for older tenants is not reliable; ownership of housing by older people is
not considered as imputed rent in the calculation of AROP and AROPE.
2.3.2. Some older people face housing cost overburden and overcrowding
Although home ownership is widespread, within the older population there are significant
gender differences in home ownership, as well as pockets of exposure to severe housing
deprivation, housing cost overburden and overcrowding in many Member States.
In some countries (Greece, Bulgaria), a substantial share of older people spend more than
40 percent of their equivalised disposable income on housing, which is recognised as being
the threshold at which households are considered to be overburdened with housing costs.
Housing costs make up a substantially higher income share among older people at risk
of poverty. Perhaps surprisingly, the Member States with the lowest share of housing costs –
Malta and Cyprus, at around 10 percent of disposable income – have low ownership rates
(Figure 21); meanwhile, at the opposite end of the scale, Greece, with dramatically high
expenditure on housing, has a high share of home ownership.
Figure 21: Share of housing cost in disposable household income among older households, 2016, %
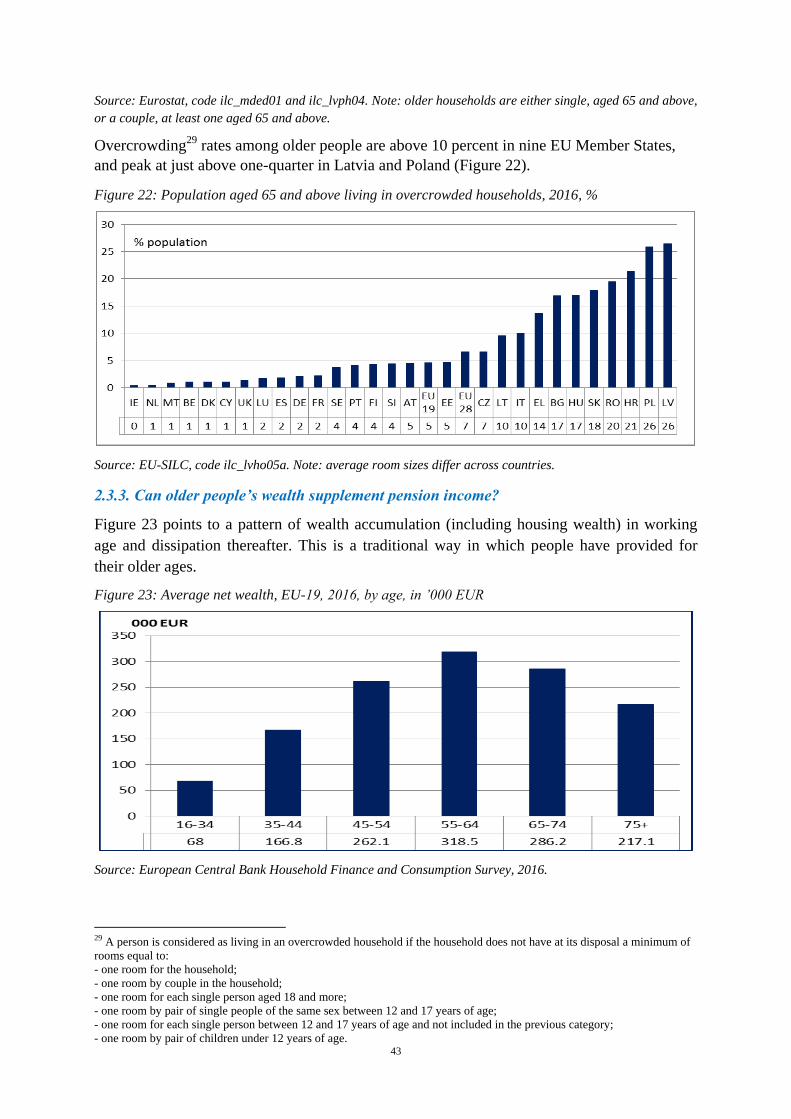
43
Source: Eurostat, code ilc_mded01 and ilc_lvph04. Note: older households are either single, aged 65 and above,
or a couple, at least one aged 65 and above.
Overcrowding29
rates among older people are above 10 percent in nine EU Member States,
and peak at just above one-quarter in Latvia and Poland (Figure 22).
Figure 22: Population aged 65 and above living in overcrowded households, 2016, %
Source: EU-SILC, code ilc_lvho05a. Note: average room sizes differ across countries.
2.3.3. Can older people’s wealth supplement pension income?
Figure 23 points to a pattern of wealth accumulation (including housing wealth) in working
age and dissipation thereafter. This is a traditional way in which people have provided for
their older ages.
Figure 23: Average net wealth, EU-19, 2016, by age, in ’000 EUR
Source: European Central Bank Household Finance and Consumption Survey, 2016.
29 A person is considered as living in an overcrowded household if the household does not have at its disposal a minimum of
rooms equal to:
- one room for the household;
- one room by couple in the household;
- one room for each single person aged 18 and more;
- one room by pair of single people of the same sex between 12 and 17 years of age;
- one room for each single person between 12 and 17 years of age and not included in the previous category;
- one room by pair of children under 12 years of age.
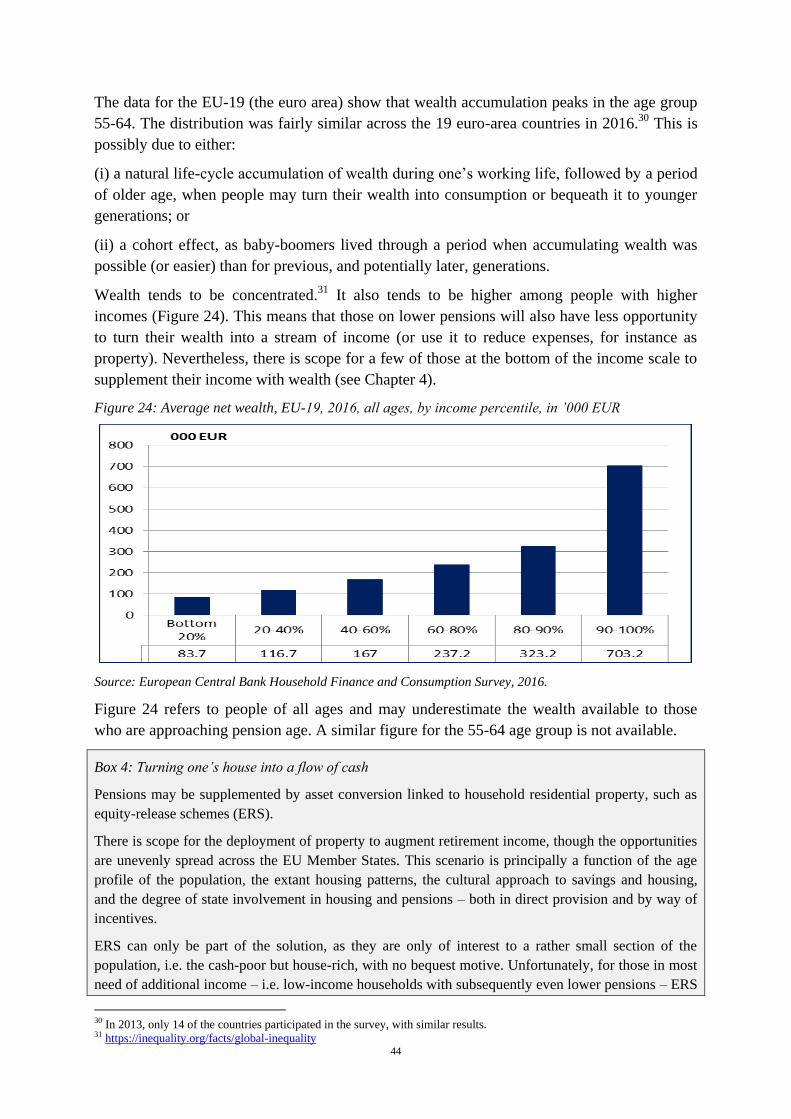
44
The data for the EU-19 (the euro area) show that wealth accumulation peaks in the age group
55-64. The distribution was fairly similar across the 19 euro-area countries in 2016.30
This is
possibly due to either:
(i) a natural life-cycle accumulation of wealth during one’s working life, followed by a period
of older age, when people may turn their wealth into consumption or bequeath it to younger
generations; or
(ii) a cohort effect, as baby-boomers lived through a period when accumulating wealth was
possible (or easier) than for previous, and potentially later, generations.
Wealth tends to be concentrated.31
It also tends to be higher among people with higher
incomes (Figure 24). This means that those on lower pensions will also have less opportunity
to turn their wealth into a stream of income (or use it to reduce expenses, for instance as
property). Nevertheless, there is scope for a few of those at the bottom of the income scale to
supplement their income with wealth (see Chapter 4).
Figure 24: Average net wealth, EU-19, 2016, all ages, by income percentile, in ’000 EUR
Source: European Central Bank Household Finance and Consumption Survey, 2016.
Figure 24 refers to people of all ages and may underestimate the wealth available to those
who are approaching pension age. A similar figure for the 55-64 age group is not available.
Box 4: Turning one’s house into a flow of cash
Pensions may be supplemented by asset conversion linked to household residential property, such as
equity-release schemes (ERS).
There is scope for the deployment of property to augment retirement income, though the opportunities
are unevenly spread across the EU Member States. This scenario is principally a function of the age
profile of the population, the extant housing patterns, the cultural approach to savings and housing,
and the degree of state involvement in housing and pensions – both in direct provision and by way of
incentives.
ERS can only be part of the solution, as they are only of interest to a rather small section of the
population, i.e. the cash-poor but house-rich, with no bequest motive. Unfortunately, for those in most
need of additional income – i.e. low-income households with subsequently even lower pensions – ERS
30 In 2013, only 14 of the countries participated in the survey, with similar results. 31 https://inequality.org/facts/global-inequality
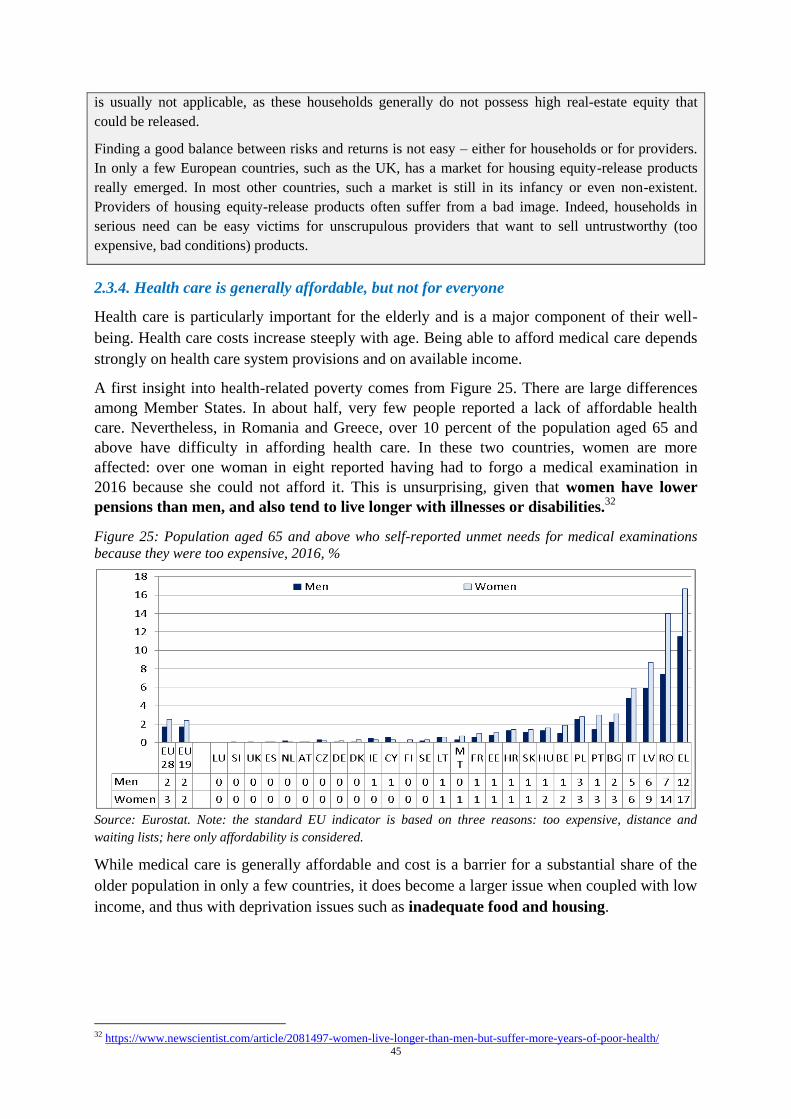
45
is usually not applicable, as these households generally do not possess high real-estate equity that
could be released.
Finding a good balance between risks and returns is not easy – either for households or for providers.
In only a few European countries, such as the UK, has a market for housing equity-release products
really emerged. In most other countries, such a market is still in its infancy or even non-existent.
Providers of housing equity-release products often suffer from a bad image. Indeed, households in
serious need can be easy victims for unscrupulous providers that want to sell untrustworthy (too
expensive, bad conditions) products.
2.3.4. Health care is generally affordable, but not for everyone
Health care is particularly important for the elderly and is a major component of their well-
being. Health care costs increase steeply with age. Being able to afford medical care depends
strongly on health care system provisions and on available income.
A first insight into health-related poverty comes from Figure 25. There are large differences
among Member States. In about half, very few people reported a lack of affordable health
care. Nevertheless, in Romania and Greece, over 10 percent of the population aged 65 and
above have difficulty in affording health care. In these two countries, women are more
affected: over one woman in eight reported having had to forgo a medical examination in
2016 because she could not afford it. This is unsurprising, given that women have lower
pensions than men, and also tend to live longer with illnesses or disabilities.32
Figure 25: Population aged 65 and above who self-reported unmet needs for medical examinations
because they were too expensive, 2016, %
Source: Eurostat. Note: the standard EU indicator is based on three reasons: too expensive, distance and
waiting lists; here only affordability is considered.
While medical care is generally affordable and cost is a barrier for a substantial share of the
older population in only a few countries, it does become a larger issue when coupled with low
income, and thus with deprivation issues such as inadequate food and housing.
32 https://www.newscientist.com/article/2081497-women-live-longer-than-men-but-suffer-more-years-of-poor-health/
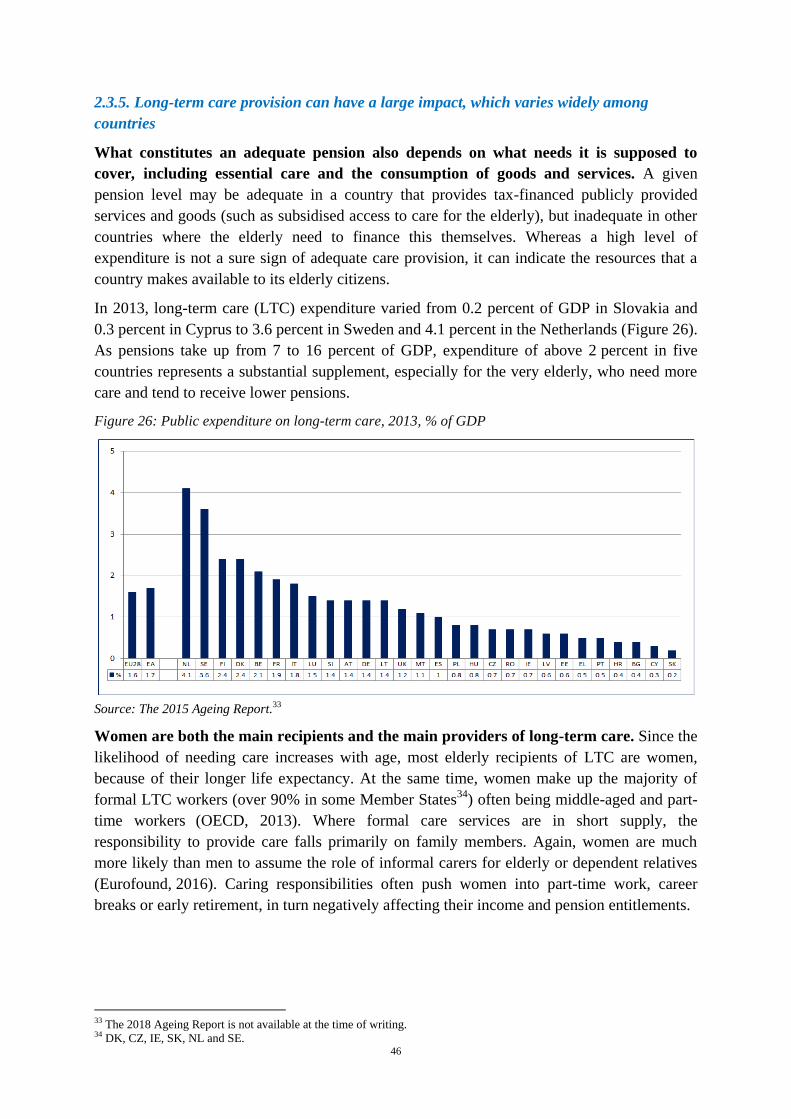
46
2.3.5. Long-term care provision can have a large impact, which varies widely among
countries
What constitutes an adequate pension also depends on what needs it is supposed to
cover, including essential care and the consumption of goods and services. A given
pension level may be adequate in a country that provides tax-financed publicly provided
services and goods (such as subsidised access to care for the elderly), but inadequate in other
countries where the elderly need to finance this themselves. Whereas a high level of
expenditure is not a sure sign of adequate care provision, it can indicate the resources that a
country makes available to its elderly citizens.
In 2013, long-term care (LTC) expenditure varied from 0.2 percent of GDP in Slovakia and
0.3 percent in Cyprus to 3.6 percent in Sweden and 4.1 percent in the Netherlands (Figure 26).
As pensions take up from 7 to 16 percent of GDP, expenditure of above 2 percent in five
countries represents a substantial supplement, especially for the very elderly, who need more
care and tend to receive lower pensions.
Figure 26: Public expenditure on long-term care, 2013, % of GDP
Source: The 2015 Ageing Report.33
Women are both the main recipients and the main providers of long-term care. Since the
likelihood of needing care increases with age, most elderly recipients of LTC are women,
because of their longer life expectancy. At the same time, women make up the majority of
formal LTC workers (over 90% in some Member States34
) often being middle-aged and part-
time workers
(OECD, 2013). Where formal care services are in short supply, the
responsibility to provide care falls primarily on family members. Again, women are much
more likely than men to assume the role of informal carers for elderly or dependent relatives
(Eurofound, 2016). Caring responsibilities often push women into part-time work, career
breaks or early retirement, in turn negatively affecting their income and pension entitlements.
33 The 2018 Ageing Report is not available at the time of writing. 34 DK, CZ, IE, SK, NL and SE.
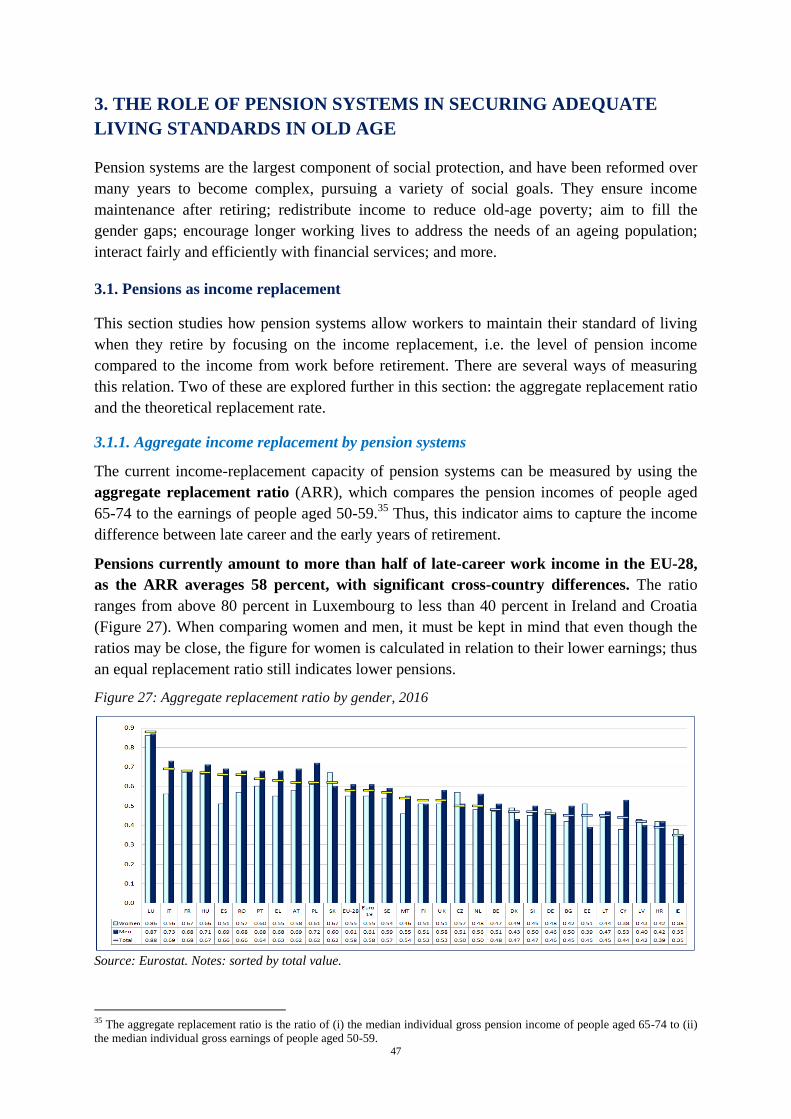
47
3. THE ROLE OF PENSION SYSTEMS IN SECURING ADEQUATE
LIVING STANDARDS IN OLD AGE
Pension systems are the largest component of social protection, and have been reformed over
many years to become complex, pursuing a variety of social goals. They ensure income
maintenance after retiring; redistribute income to reduce old-age poverty; aim to fill the
gender gaps; encourage longer working lives to address the needs of an ageing population;
interact fairly and efficiently with financial services; and more.
3.1. Pensions as income replacement
This section studies how pension systems allow workers to maintain their standard of living
when they retire by focusing on the income replacement, i.e. the level of pension income
compared to the income from work before retirement. There are several ways of measuring
this relation. Two of these are explored further in this section: the aggregate replacement ratio
and the theoretical replacement rate.
3.1.1. Aggregate income replacement by pension systems
The current income-replacement capacity of pension systems can be measured by using the
aggregate replacement ratio (ARR), which compares the pension incomes of people aged
65-74 to the earnings of people aged 50-59.35
Thus, this indicator aims to capture the income
difference between late career and the early years of retirement.
Pensions currently amount to more than half of late-career work income in the EU-28,
as the ARR averages 58 percent, with significant cross-country differences. The ratio
ranges from above 80 percent in Luxembourg to less than 40 percent in Ireland and Croatia
(Figure 27). When comparing women and men, it must be kept in mind that even though the
ratios may be close, the figure for women is calculated in relation to their lower earnings; thus
an equal replacement ratio still indicates lower pensions.
Figure 27: Aggregate replacement ratio by gender, 2016
Source: Eurostat. Notes: sorted by total value.
35 The aggregate replacement ratio is the ratio of (i) the median individual gross pension income of people aged 65-74 to (ii)
the median individual gross earnings of people aged 50-59.
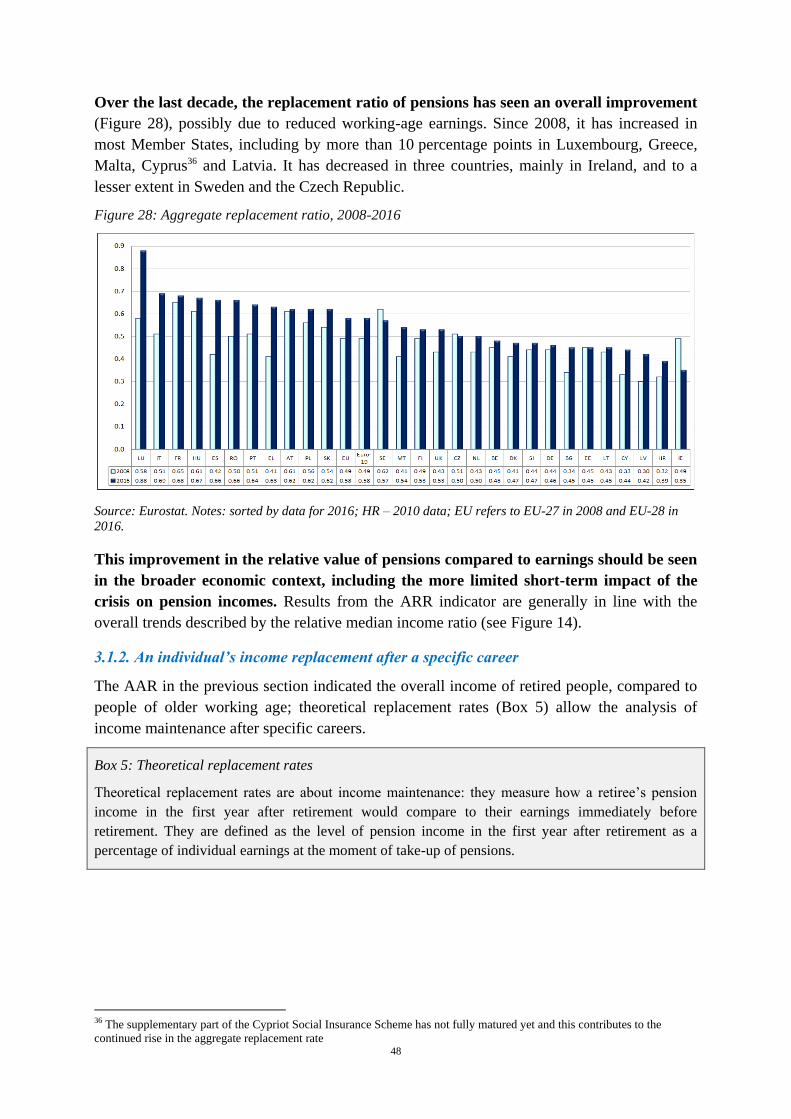
48
Over the last decade, the replacement ratio of pensions has seen an overall improvement
(Figure 28), possibly due to reduced working-age earnings. Since 2008, it has increased in
most Member States, including by more than 10 percentage points in Luxembourg, Greece,
Malta, Cyprus36 and Latvia. It has decreased in three countries, mainly in Ireland, and to a
lesser extent in Sweden and the Czech Republic.
Figure 28: Aggregate replacement ratio, 2008-2016
Source: Eurostat. Notes: sorted by data for 2016; HR – 2010 data; EU refers to EU-27 in 2008 and EU-28 in
2016.
This improvement in the relative value of pensions compared to earnings should be seen
in the broader economic context, including the more limited short-term impact of the
crisis on pension incomes. Results from the ARR indicator are generally in line with the
overall trends described by the relative median income ratio (see Figure 14).
3.1.2. An individual’s income replacement after a specific career
The AAR in the previous section indicated the overall income of retired people, compared to
people of older working age; theoretical replacement rates (Box 5) allow the analysis of
income maintenance after specific careers.
Box 5: Theoretical replacement rates
Theoretical replacement rates are about income maintenance: they measure how a retiree’s pension
income in the first year after retirement would compare to their earnings immediately before
retirement. They are defined as the level of pension income in the first year after retirement as a
percentage of individual earnings at the moment of take-up of pensions.
36 The supplementary part of the Cypriot Social Insurance Scheme has not fully matured yet and this contributes to the
continued rise in the aggregate replacement rate
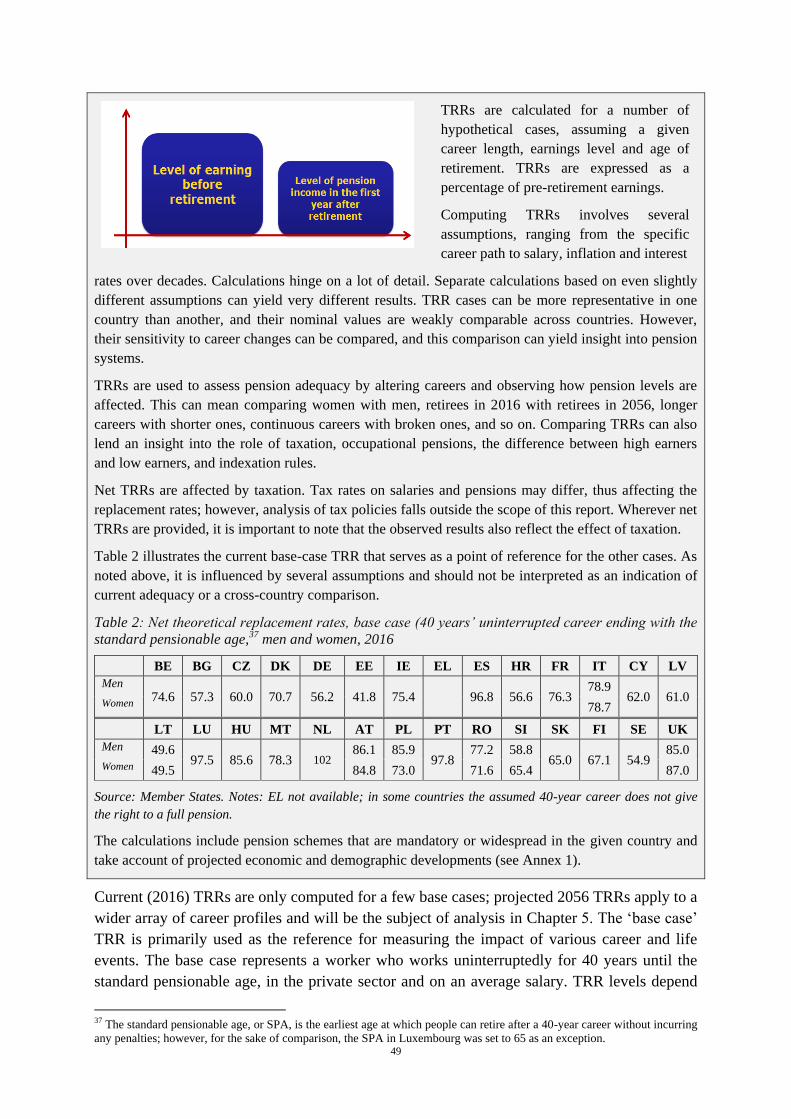
49
TRRs are calculated for a number of
hypothetical cases, assuming a given
career length, earnings level and age of
retirement. TRRs are expressed as a
percentage of pre-retirement earnings.
Computing TRRs involves several
assumptions, ranging from the specific
career path to salary, inflation and interest
rates over decades. Calculations hinge on a lot of detail. Separate calculations based on even slightly
different assumptions can yield very different results. TRR cases can be more representative in one
country than another, and their nominal values are weakly comparable across countries. However,
their sensitivity to career changes can be compared, and this comparison can yield insight into pension
systems.
TRRs are used to assess pension adequacy by altering careers and observing how pension levels are
affected. This can mean comparing women with men, retirees in 2016 with retirees in 2056, longer
careers with shorter ones, continuous careers with broken ones, and so on. Comparing TRRs can also
lend an insight into the role of taxation, occupational pensions, the difference between high earners
and low earners, and indexation rules.
Net TRRs are affected by taxation. Tax rates on salaries and pensions may differ, thus affecting the
replacement rates; however, analysis of tax policies falls outside the scope of this report. Wherever net
TRRs are provided, it is important to note that the observed results also reflect the effect of taxation.
Table 2 illustrates the current base-case TRR that serves as a point of reference for the other cases. As
noted above, it is influenced by several assumptions and should not be interpreted as an indication of
current adequacy or a cross-country comparison.
Table 2: Net theoretical replacement rates, base case (40 years’ uninterrupted career ending with the
standard pensionable age,37 men and women, 2016
BE BG CZ DK DE EE IE EL ES HR FR IT CY LV
Men
74.6 57.3 60.0 70.7 56.2 41.8 75.4
96.8 56.6 76.3 78.9
62.0 61.0 Women 78.7
LT LU HU MT NL AT PL PT RO SI SK FI SE UK
Men 49.6 97.5 85.6 78.3 102
86.1 85.9 97.8
77.2 58.8 65.0 67.1 54.9
85.0
Women 49.5 84.8 73.0 71.6 65.4 87.0
Source: Member States. Notes: EL not available; in some countries the assumed 40-year career does not give
the right to a full pension.
The calculations include pension schemes that are mandatory or widespread in the given country and
take account of projected economic and demographic developments (see Annex 1).
Current (2016) TRRs are only computed for a few base cases; projected 2056 TRRs apply to a
wider array of career profiles and will be the subject of analysis in Chapter 5. The ‘base case’
TRR is primarily used as the reference for measuring the impact of various career and life
events. The base case represents a worker who works uninterruptedly for 40 years until the
standard pensionable age, in the private sector and on an average salary. TRR levels depend
37 The standard pensionable age, or SPA, is the earliest age at which people can retire after a 40-year career without incurring
any penalties; however, for the sake of comparison, the SPA in Luxembourg was set to 65 as an exception.
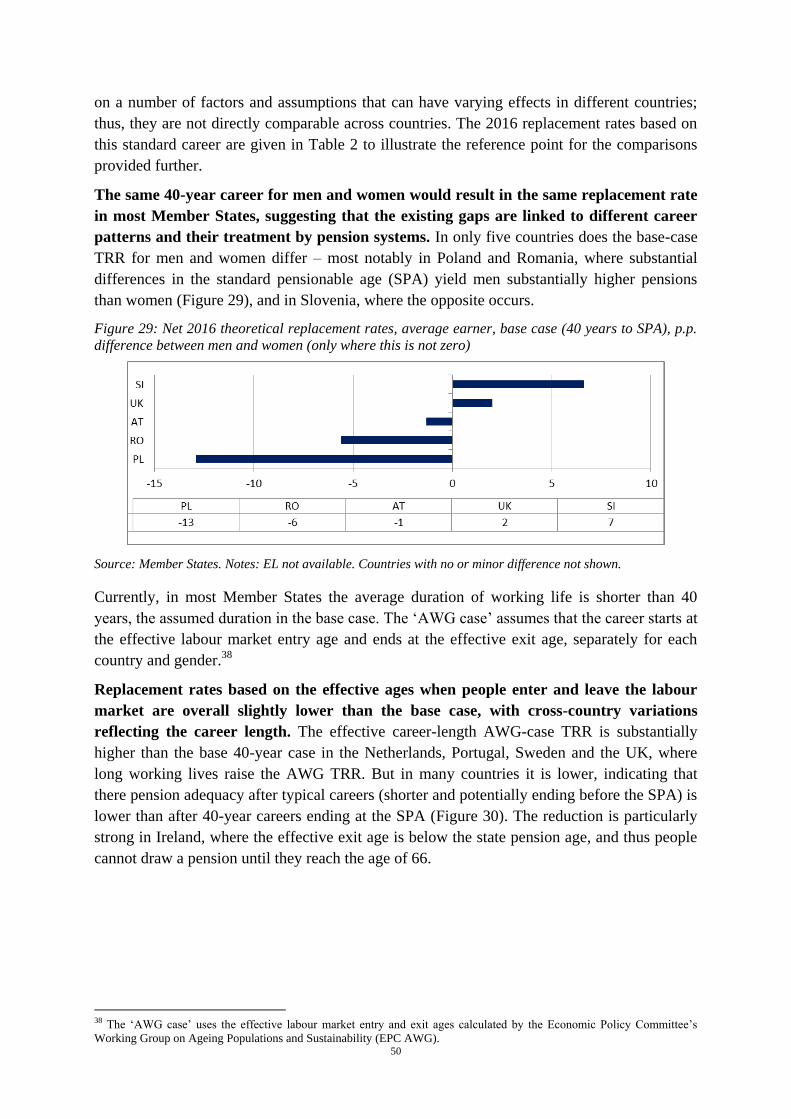
50
on a number of factors and assumptions that can have varying effects in different countries;
thus, they are not directly comparable across countries. The 2016 replacement rates based on
this standard career are given in Table 2 to illustrate the reference point for the comparisons
provided further.
The same 40-year career for men and women would result in the same replacement rate
in most Member States, suggesting that the existing gaps are linked to different career
patterns and their treatment by pension systems. In only five countries does the base-case
TRR for men and women differ – most notably in Poland and Romania, where substantial
differences in the standard pensionable age (SPA) yield men substantially higher pensions
than women (Figure 29), and in Slovenia, where the opposite occurs.
Figure 29: Net 2016 theoretical replacement rates, average earner, base case (40 years to SPA), p.p.
difference between men and women (only where this is not zero)
Source: Member States. Notes: EL not available. Countries with no or minor difference not shown.
Currently, in most Member States the average duration of working life is shorter than 40
years, the assumed duration in the base case. The ‘AWG case’ assumes that the career starts at
the effective labour market entry age and ends at the effective exit age, separately for each
country and gender.38
Replacement rates based on the effective ages when people enter and leave the labour
market are overall slightly lower than the base case, with cross-country variations
reflecting the career length. The effective career-length AWG-case TRR is substantially
higher than the base 40-year case in the Netherlands, Portugal, Sweden and the UK, where
long working lives raise the AWG TRR. But in many countries it is lower, indicating that
there pension adequacy after typical careers (shorter and potentially ending before the SPA) is
lower than after 40-year careers ending at the SPA (Figure 30). The reduction is particularly
strong in Ireland, where the effective exit age is below the state pension age, and thus people
cannot draw a pension until they reach the age of 66.
38 The ‘AWG case’ uses the effective labour market entry and exit ages calculated by the Economic Policy Committee’s
Working Group on Ageing Populations and Sustainability (EPC AWG).
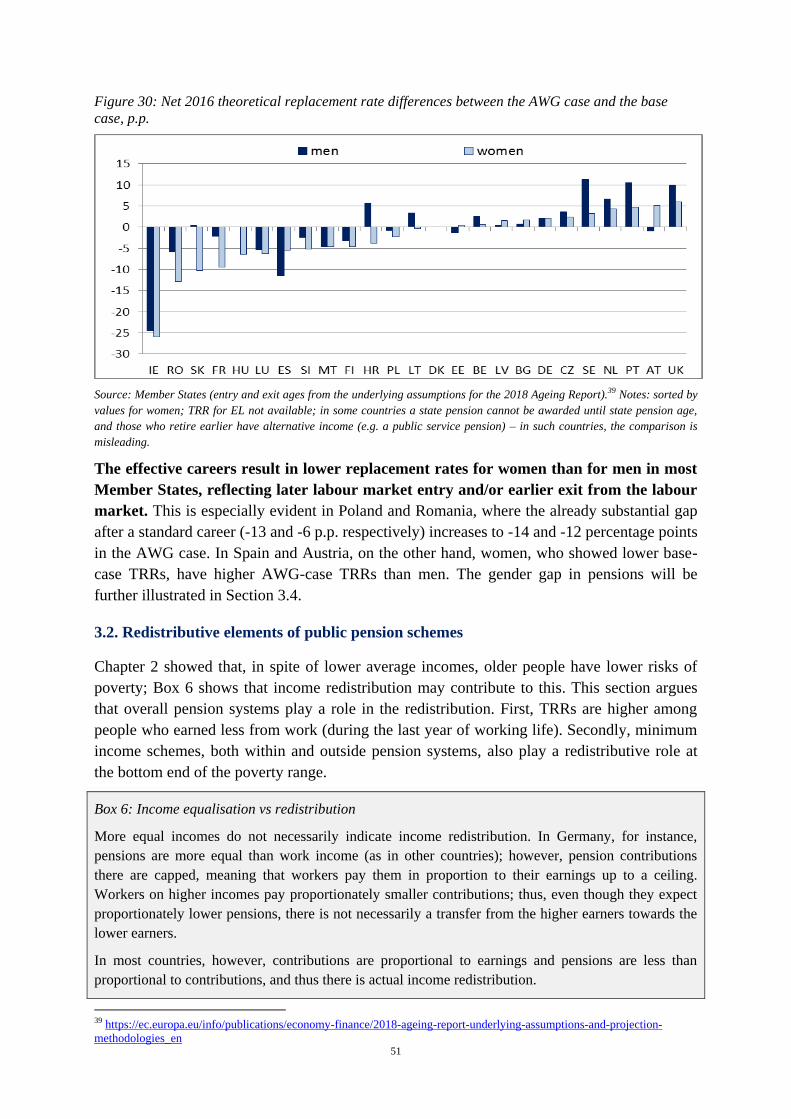
51
Figure 30: Net 2016 theoretical replacement rate differences between the AWG case and the base
case, p.p.
Source: Member States (entry and exit ages from the underlying assumptions for the 2018 Ageing Report).39 Notes: sorted by
values for women; TRR for EL not available; in some countries a state pension cannot be awarded until state pension age,
and those who retire earlier have alternative income (e.g. a public service pension) – in such countries, the comparison is
misleading.
The effective careers result in lower replacement rates for women than for men in most
Member States, reflecting later labour market entry and/or earlier exit from the labour
market. This is especially evident in Poland and Romania, where the already substantial gap
after a standard career (-13 and -6 p.p. respectively) increases to -14 and -12 percentage points
in the AWG case. In Spain and Austria, on the other hand, women, who showed lower base-
case TRRs, have higher AWG-case TRRs than men. The gender gap in pensions will be
further illustrated in Section 3.4.
3.2. Redistributive elements of public pension schemes
Chapter 2 showed that, in spite of lower average incomes, older people have lower risks of
poverty; Box 6 shows that income redistribution may contribute to this. This section argues
that overall pension systems play a role in the redistribution. First, TRRs are higher among
people who earned less from work (during the last year of working life). Secondly, minimum
income schemes, both within and outside pension systems, also play a redistributive role at
the bottom end of the poverty range.
Box 6: Income equalisation vs redistribution
More equal incomes do not necessarily indicate income redistribution. In Germany, for instance,
pensions are more equal than work income (as in other countries); however, pension contributions
there are capped, meaning that workers pay them in proportion to their earnings up to a ceiling.
Workers on higher incomes pay proportionately smaller contributions; thus, even though they expect
proportionately lower pensions, there is not necessarily a transfer from the higher earners towards the
lower earners.
In most countries, however, contributions are proportional to earnings and pensions are less than
proportional to contributions, and thus there is actual income redistribution.
39 https://ec.europa.eu/info/publications/economy-finance/2018-ageing-report-underlying-assumptions-and-projection-
methodologies_en
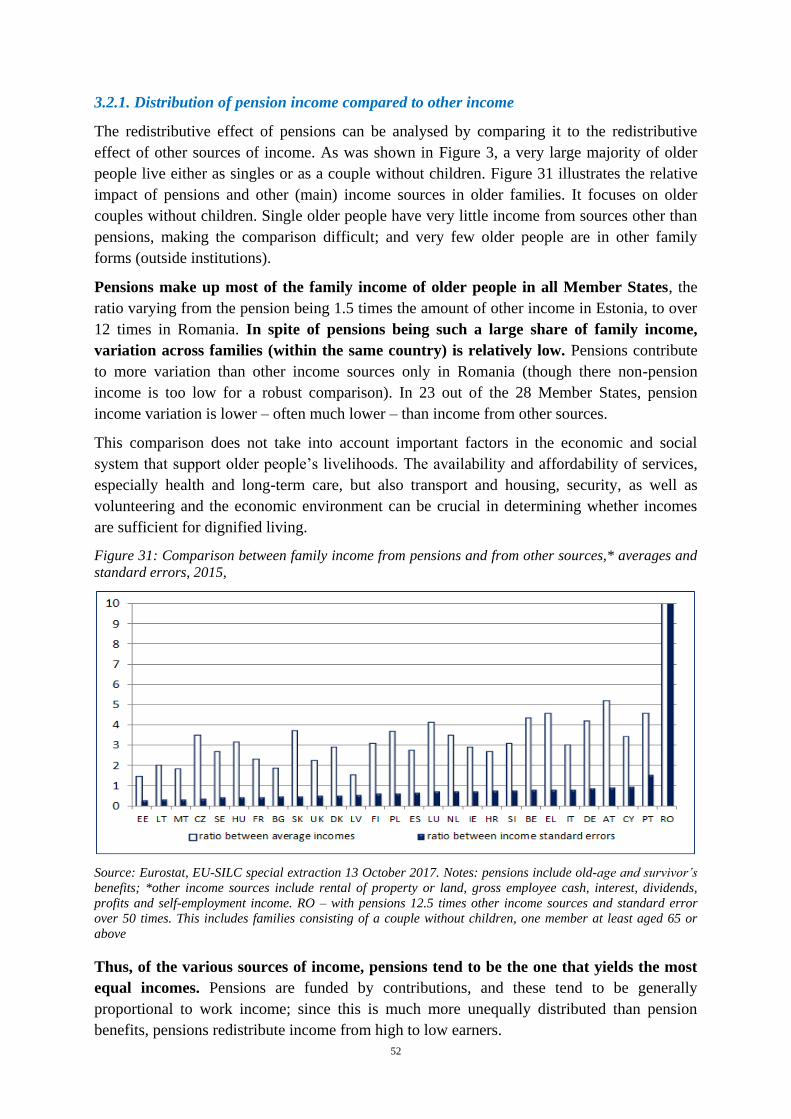
52
3.2.1. Distribution of pension income compared to other income
The redistributive effect of pensions can be analysed by comparing it to the redistributive
effect of other sources of income. As was shown in Figure 3, a very large majority of older
people live either as singles or as a couple without children. Figure 31 illustrates the relative
impact of pensions and other (main) income sources in older families. It focuses on older
couples without children. Single older people have very little income from sources other than
pensions, making the comparison difficult; and very few older people are in other family
forms (outside institutions).
Pensions make up most of the family income of older people in all Member States, the
ratio varying from the pension being 1.5 times the amount of other income in Estonia, to over
12 times in Romania. In spite of pensions being such a large share of family income,
variation across families (within the same country) is relatively low. Pensions contribute
to more variation than other income sources only in Romania (though there non-pension
income is too low for a robust comparison). In 23 out of the 28 Member States, pension
income variation is lower – often much lower – than income from other sources.
This comparison does not take into account important factors in the economic and social
system that support older people’s livelihoods. The availability and affordability of services,
especially health and long-term care, but also transport and housing, security, as well as
volunteering and the economic environment can be crucial in determining whether incomes
are sufficient for dignified living.
Figure 31: Comparison between family income from pensions and from other sources,* averages and
standard errors, 2015,
Source: Eurostat, EU-SILC special extraction 13 October 2017. Notes: pensions include old-age and survivor’s
benefits; *other income sources include rental of property or land, gross employee cash, interest, dividends,
profits and self-employment income. RO – with pensions 12.5 times other income sources and standard error
over 50 times. This includes families consisting of a couple without children, one member at least aged 65 or
above
Thus, of the various sources of income, pensions tend to be the one that yields the most
equal incomes. Pensions are funded by contributions, and these tend to be generally
proportional to work income; since this is much more unequally distributed than pension
benefits, pensions redistribute income from high to low earners.
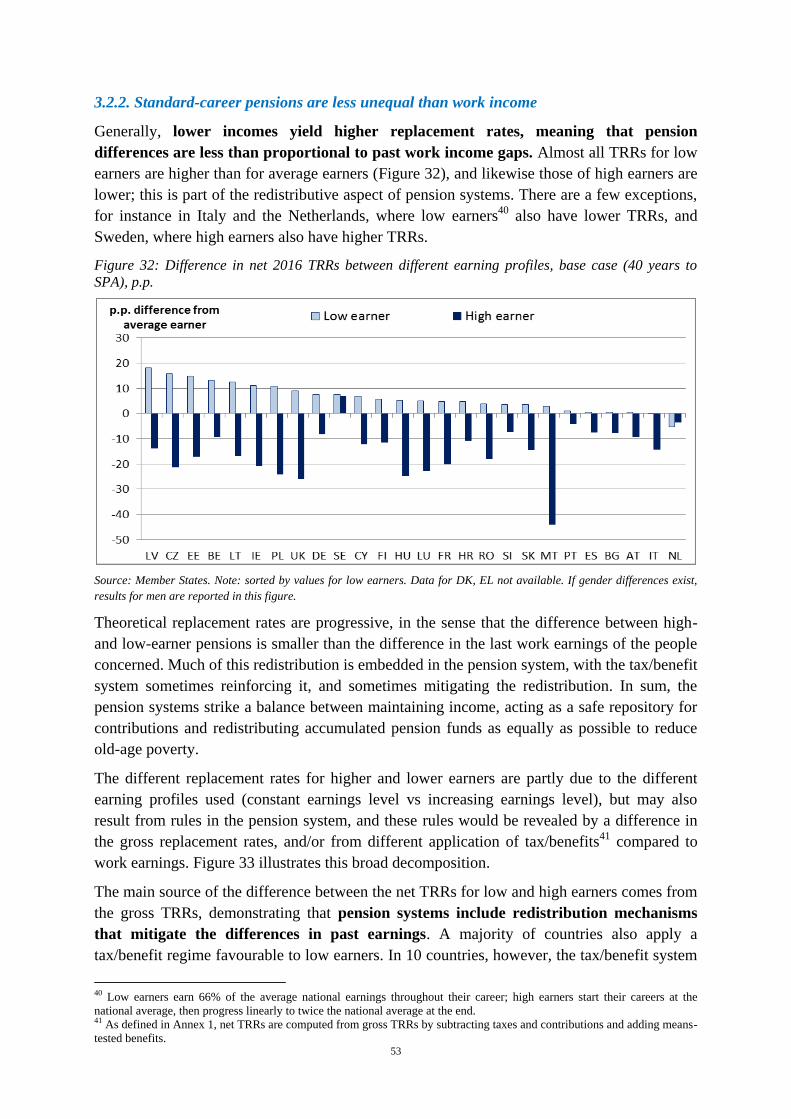
53
3.2.2. Standard-career pensions are less unequal than work income
Generally, lower incomes yield higher replacement rates, meaning that pension
differences are less than proportional to past work income gaps. Almost all TRRs for low
earners are higher than for average earners (Figure 32), and likewise those of high earners are
lower; this is part of the redistributive aspect of pension systems. There are a few exceptions,
for instance in Italy and the Netherlands, where low earners40
also have lower TRRs, and
Sweden, where high earners also have higher TRRs.
Figure 32: Difference in net 2016 TRRs between different earning profiles, base case (40 years to
SPA), p.p.
Source: Member States. Note: sorted by values for low earners. Data for DK, EL not available. If gender differences exist,
results for men are reported in this figure.
Theoretical replacement rates are progressive, in the sense that the difference between high-
and low-earner pensions is smaller than the difference in the last work earnings of the people
concerned. Much of this redistribution is embedded in the pension system, with the tax/benefit
system sometimes reinforcing it, and sometimes mitigating the redistribution. In sum, the
pension systems strike a balance between maintaining income, acting as a safe repository for
contributions and redistributing accumulated pension funds as equally as possible to reduce
old-age poverty.
The different replacement rates for higher and lower earners are partly due to the different
earning profiles used (constant earnings level vs increasing earnings level), but may also
result from rules in the pension system, and these rules would be revealed by a difference in
the gross replacement rates, and/or from different application of tax/benefits41
compared to
work earnings. Figure 33 illustrates this broad decomposition.
The main source of the difference between the net TRRs for low and high earners comes from
the gross TRRs, demonstrating that pension systems include redistribution mechanisms
that mitigate the differences in past earnings. A majority of countries also apply a
tax/benefit regime favourable to low earners. In 10 countries, however, the tax/benefit system
40 Low earners earn 66% of the average national earnings throughout their career; high earners start their careers at the
national average, then progress linearly to twice the national average at the end. 41 As defined in Annex 1, net TRRs are computed from gross TRRs by subtracting taxes and contributions and adding means-
tested benefits.
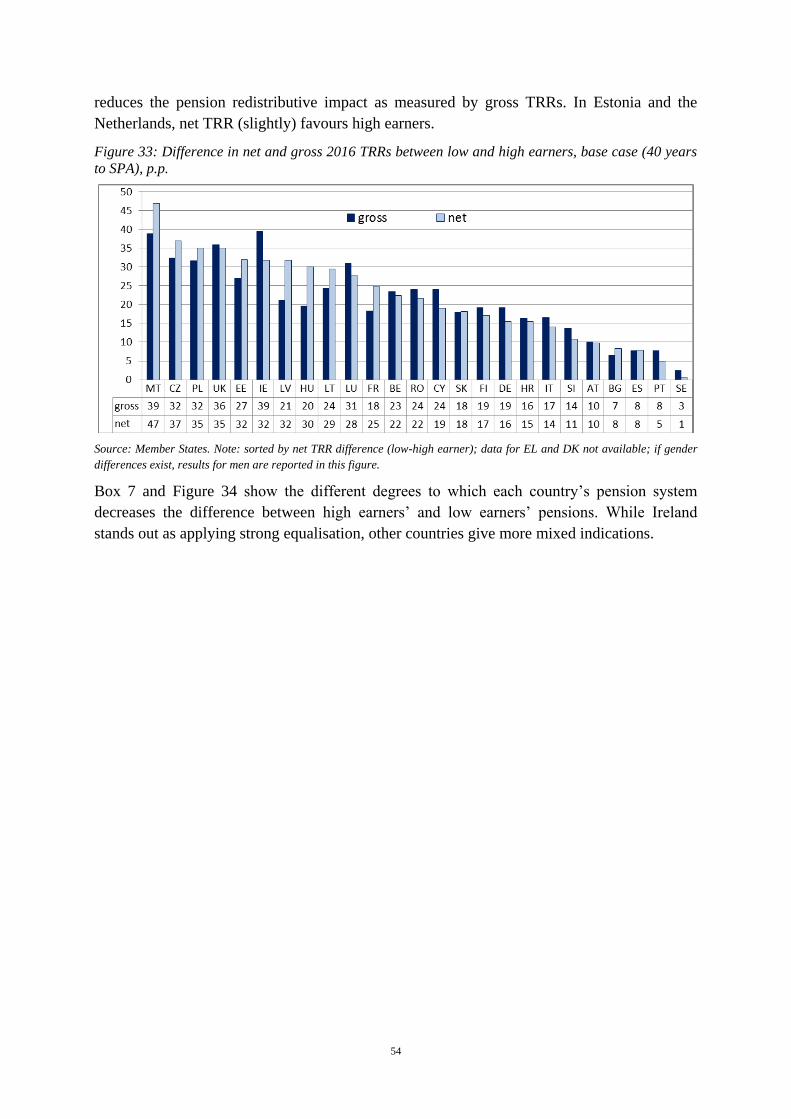
54
reduces the pension redistributive impact as measured by gross TRRs. In Estonia and the
Netherlands, net TRR (slightly) favours high earners.
Figure 33: Difference in net and gross 2016 TRRs between low and high earners, base case (40 years
to SPA), p.p.
Source: Member States. Note: sorted by net TRR difference (low-high earner); data for EL and DK not available; if gender
differences exist, results for men are reported in this figure.
Box 7 and Figure 34 show the different degrees to which each country’s pension system
decreases the difference between high earners’ and low earners’ pensions. While Ireland
stands out as applying strong equalisation, other countries give more mixed indications.
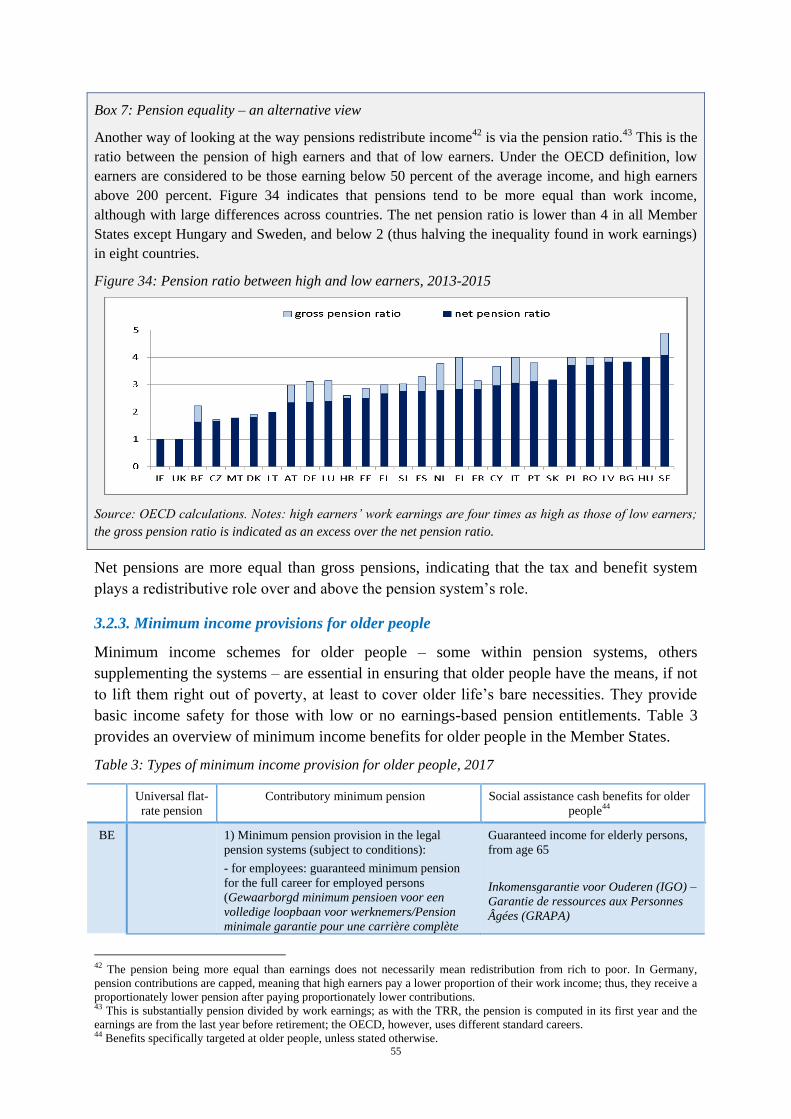
55
Box 7: Pension equality – an alternative view
Another way of looking at the way pensions redistribute income42 is via the pension ratio.43 This is the
ratio between the pension of high earners and that of low earners. Under the OECD definition, low
earners are considered to be those earning below 50 percent of the average income, and high earners
above 200 percent. Figure 34 indicates that pensions tend to be more equal than work income,
although with large differences across countries. The net pension ratio is lower than 4 in all Member
States except Hungary and Sweden, and below 2 (thus halving the inequality found in work earnings)
in eight countries.
Figure 34: Pension ratio between high and low earners, 2013-2015
Source: OECD calculations. Notes: high earners’ work earnings are four times as high as those of low earners;
the gross pension ratio is indicated as an excess over the net pension ratio.
Net pensions are more equal than gross pensions, indicating that the tax and benefit system
plays a redistributive role over and above the pension system’s role.
3.2.3. Minimum income provisions for older people
Minimum income schemes for older people – some within pension systems, others
supplementing the systems – are essential in ensuring that older people have the means, if not
to lift them right out of poverty, at least to cover older life’s bare necessities. They provide
basic income safety for those with low or no earnings-based pension entitlements. Table 3
provides an overview of minimum income benefits for older people in the Member States.
Table 3: Types of minimum income provision for older people, 2017
Universal flat-
rate pension
Contributory minimum pension Social assistance cash benefits for older
people44
BE 1) Minimum pension provision in the legal
pension systems (subject to conditions):
- for employees: guaranteed minimum pension
for the full career for employed persons
(Gewaarborgd minimum pensioen voor een
volledige loopbaan voor werknemers/Pension
minimale garantie pour une carrière complète
Guaranteed income for elderly persons,
from age 65
Inkomensgarantie voor Ouderen (IGO) –
Garantie de ressources aux Personnes
Âgées (GRAPA)
42 The pension being more equal than earnings does not necessarily mean redistribution from rich to poor. In Germany,
pension contributions are capped, meaning that high earners pay a lower proportion of their work income; thus, they receive a
proportionately lower pension after paying proportionately lower contributions. 43 This is substantially pension divided by work earnings; as with the TRR, the pension is computed in its first year and the
earnings are from the last year before retirement; the OECD, however, uses different standard careers. 44 Benefits specifically targeted at older people, unless stated otherwise.
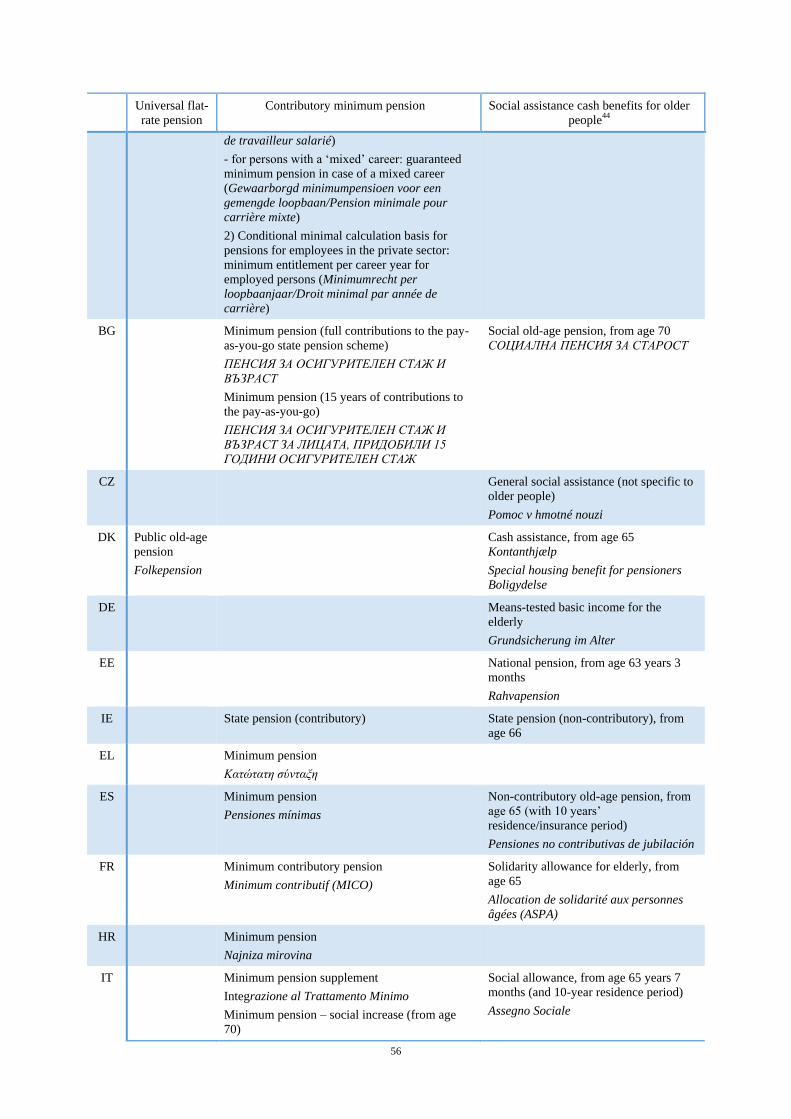
56
Universal flat-
rate pension
Contributory minimum pension Social assistance cash benefits for older
people44
de travailleur salarié)
- for persons with a ‘mixed’ career: guaranteed
minimum pension in case of a mixed career
(Gewaarborgd minimumpensioen voor een
gemengde loopbaan/Pension minimale pour
carrière mixte)
2) Conditional minimal calculation basis for
pensions for employees in the private sector:
minimum entitlement per career year for
employed persons (Minimumrecht per
loopbaanjaar/Droit minimal par année de
carrière)
BG Minimum pension (full contributions to the pay-
as-you-go state pension scheme)
ПЕНСИЯ ЗА ОСИГУРИТЕЛЕН СТАЖ И
ВЪЗРАСТ
Minimum pension (15 years of contributions to
the pay-as-you-go)
ПЕНСИЯ ЗА ОСИГУРИТЕЛЕН СТАЖ И
ВЪЗРАСТ ЗА ЛИЦАТА, ПРИДОБИЛИ 15
ГОДИНИ ОСИГУРИТЕЛЕН СТАЖ
Social old-age pension, from age 70
СОЦИАЛНА ПЕНСИЯ ЗА СТАРОСТ
CZ General social assistance (not specific to
older people)
Pomoc v hmotné nouzi
DK Public old-age
pension
Folkepension
Cash assistance, from age 65
Kontanthjælp
Special housing benefit for pensioners
Boligydelse
DE Means-tested basic income for the
elderly
Grundsicherung im Alter
EE National pension, from age 63 years 3
months
Rahvapension
IE State pension (contributory) State pension (non-contributory), from
age 66
EL Minimum pension
Κατώτατη σύνταξη
ES Minimum pension
Pensiones mínimas
Non-contributory old-age pension, from
age 65 (with 10 years’
residence/insurance period)
Pensiones no contributivas de jubilación
FR Minimum contributory pension
Minimum contributif (MICO)
Solidarity allowance for elderly, from
age 65
Allocation de solidarité aux personnes
âgées (ASPA)
HR Minimum pension
Najniza mirovina
IT Minimum pension supplement
Integrazione al Trattamento Minimo
Minimum pension – social increase (from age
70)
Social allowance, from age 65 years 7
months (and 10-year residence period)
Assegno Sociale
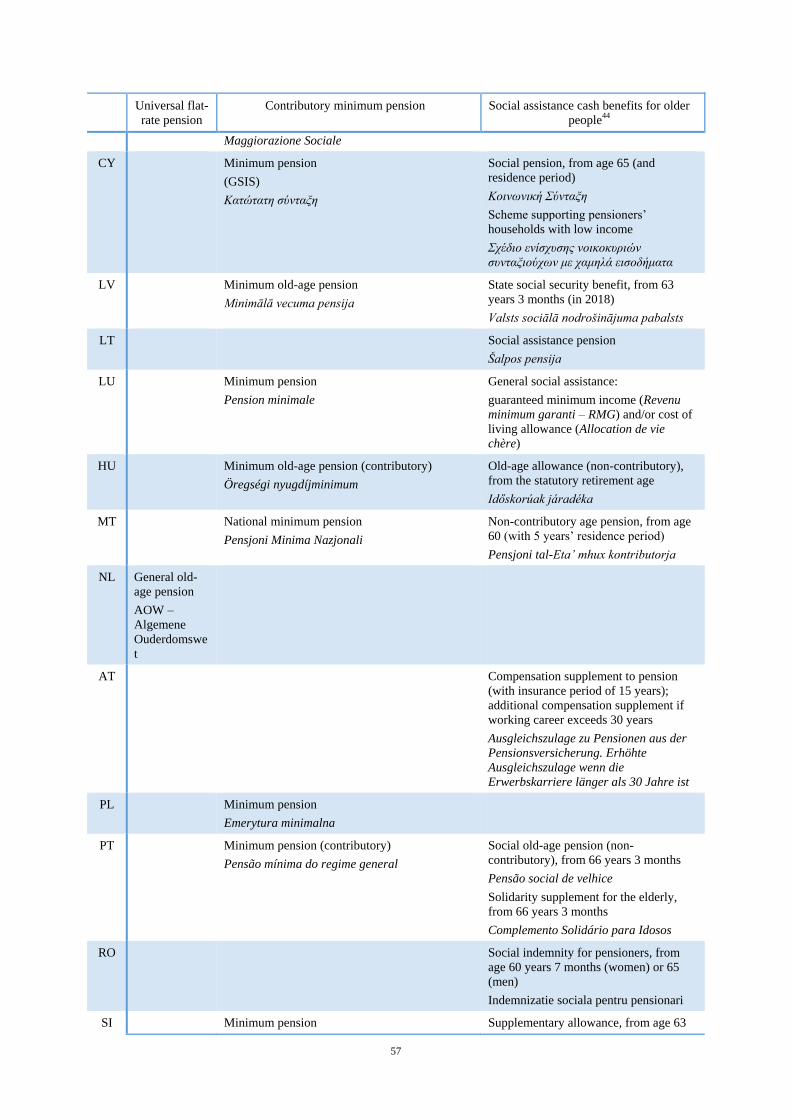
57
Universal flat-
rate pension
Contributory minimum pension Social assistance cash benefits for older
people44
Maggiorazione Sociale
CY Minimum pension
(GSIS)
Κατώτατη σύνταξη
Social pension, from age 65 (and
residence period)
Κοινωνική Σύνταξη
Scheme supporting pensioners’
households with low income
Σχέδιο ενίσχυσης νοικοκυριών
συνταξιούχων με χαμηλά εισοδήματα
LV Minimum old-age pension
Minimālā vecuma pensija
State social security benefit, from 63
years 3 months (in 2018)
Valsts sociālā nodrošinājuma pabalsts
LT Social assistance pension
Šalpos pensija
LU Minimum pension
Pension minimale
General social assistance:
guaranteed minimum income (Revenu
minimum garanti – RMG) and/or cost of
living allowance (Allocation de vie
chère)
HU Minimum old-age pension (contributory)
Öregségi nyugdíjminimum
Old-age allowance (non-contributory),
from the statutory retirement age
Időskorúak járadéka
MT National minimum pension
Pensjoni Minima Nazjonali
Non-contributory age pension, from age
60 (with 5 years’ residence period)
Pensjoni tal-Eta’ mhux kontributorja
NL General old-
age pension
AOW –
Algemene
Ouderdomswe
t
AT Compensation supplement to pension
(with insurance period of 15 years);
additional compensation supplement if
working career exceeds 30 years
Ausgleichszulage zu Pensionen aus der
Pensionsversicherung. Erhöhte
Ausgleichszulage wenn die
Erwerbskarriere länger als 30 Jahre ist
PL Minimum pension
Emerytura minimalna
PT Minimum pension (contributory)
Pensão mínima do regime general
Social old-age pension (non-
contributory), from 66 years 3 months
Pensão social de velhice
Solidarity supplement for the elderly,
from 66 years 3 months
Complemento Solidário para Idosos
RO Social indemnity for pensioners, from
age 60 years 7 months (women) or 65
(men)
Indemnizatie sociala pentru pensionari
SI Minimum pension Supplementary allowance, from age 63
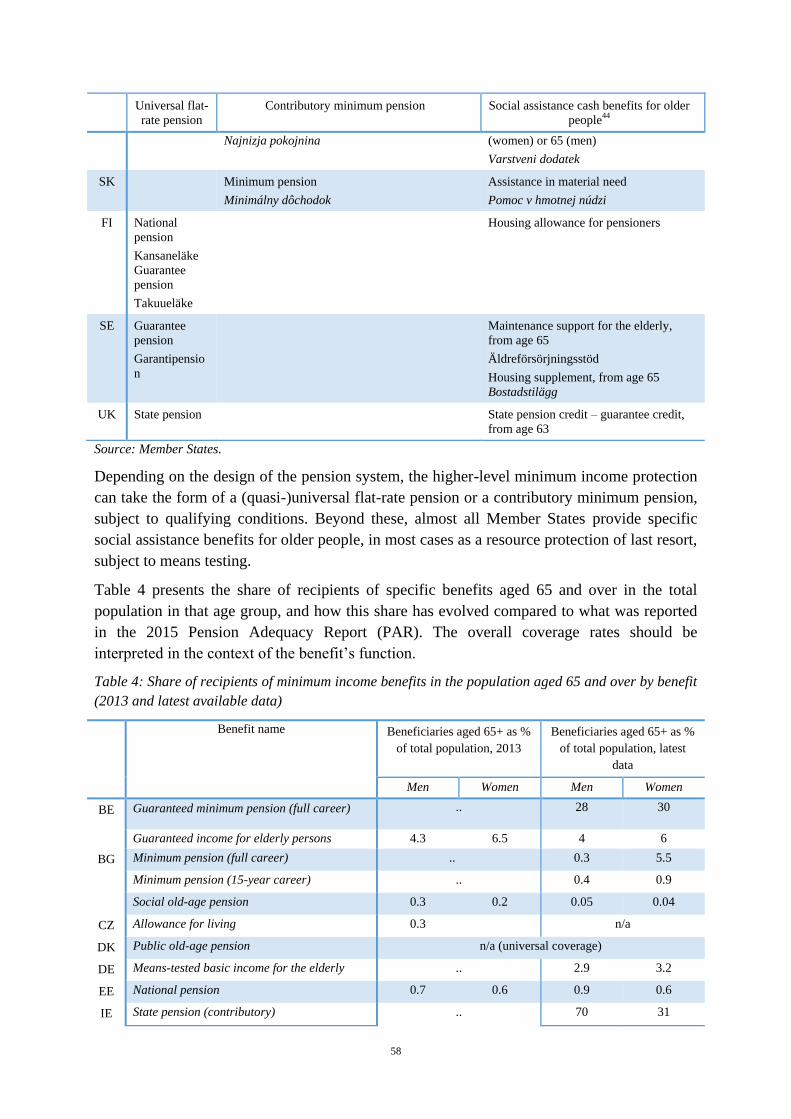
58
Universal flat-
rate pension
Contributory minimum pension Social assistance cash benefits for older
people44
Najnizja pokojnina (women) or 65 (men)
Varstveni dodatek
SK Minimum pension
Minimálny dôchodok
Assistance in material need
Pomoc v hmotnej núdzi
FI National
pension
Kansaneläke
Guarantee
pension
Takuueläke
Housing allowance for pensioners
SE Guarantee
pension
Garantipensio
n
Maintenance support for the elderly,
from age 65
Äldreförsörjningsstöd
Housing supplement, from age 65
Bostadstilägg
UK State pension State pension credit – guarantee credit,
from age 63
Source: Member States.
Depending on the design of the pension system, the higher-level minimum income protection
can take the form of a (quasi-)universal flat-rate pension or a contributory minimum pension,
subject to qualifying conditions. Beyond these, almost all Member States provide specific
social assistance benefits for older people, in most cases as a resource protection of last resort,
subject to means testing.
Table 4 presents the share of recipients of specific benefits aged 65 and over in the total
population in that age group, and how this share has evolved compared to what was reported
in the 2015 Pension Adequacy Report (PAR). The overall coverage rates should be
interpreted in the context of the benefit’s function.
Table 4: Share of recipients of minimum income benefits in the population aged 65 and over by benefit
(2013 and latest available data)
Benefit name Beneficiaries aged 65+ as %
of total population, 2013
Beneficiaries aged 65+ as %
of total population, latest
data
Men Women Men Women
BE Guaranteed minimum pension (full career) .. 28 30
Guaranteed income for elderly persons 4.3 6.5 4 6
BG Minimum pension (full career) .. 0.3 5.5
Minimum pension (15-year career) .. 0.4 0.9
Social old-age pension 0.3 0.2 0.05 0.04
CZ Allowance for living 0.3 n/a
DK Public old-age pension n/a (universal coverage)
DE Means-tested basic income for the elderly .. 2.9 3.2
EE National pension 0.7 0.6 0.9 0.6
IE State pension (contributory) .. 70 31
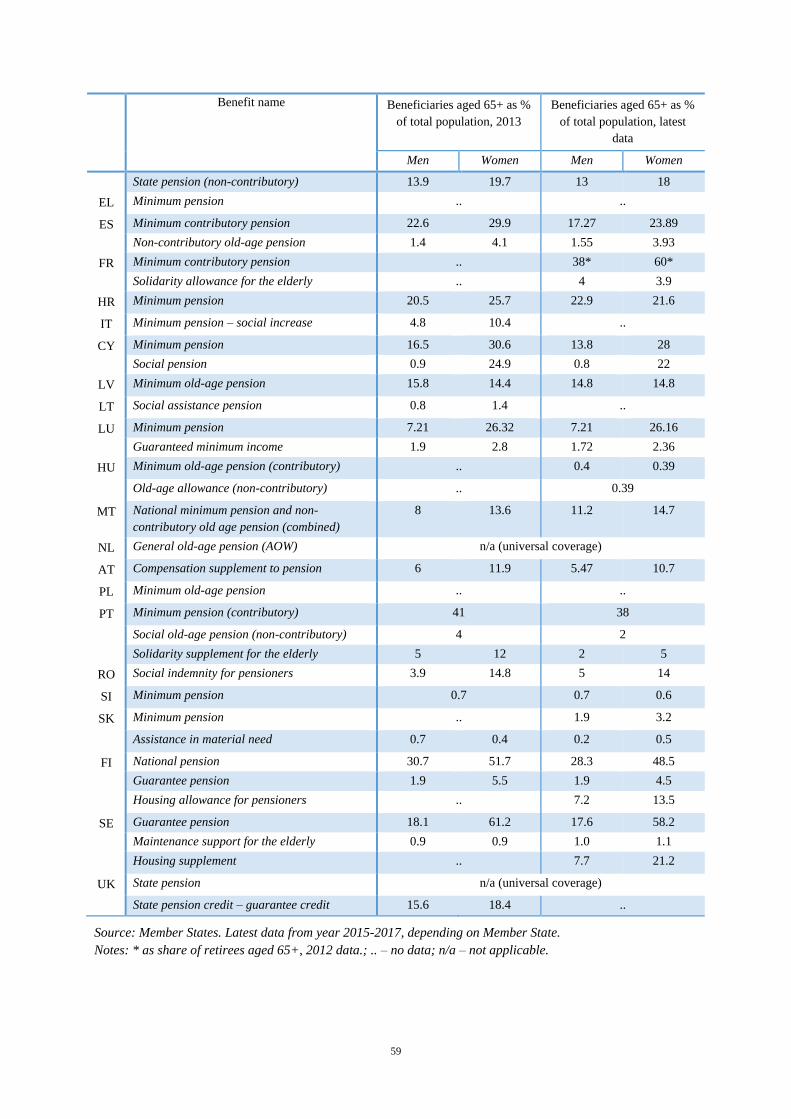
59
Benefit name Beneficiaries aged 65+ as %
of total population, 2013
Beneficiaries aged 65+ as %
of total population, latest
data
Men Women Men Women
State pension (non-contributory) 13.9 19.7 13 18
EL Minimum pension .. ..
ES Minimum contributory pension 22.6 29.9 17.27 23.89
Non-contributory old-age pension 1.4 4.1 1.55 3.93
FR Minimum contributory pension .. 38* 60*
Solidarity allowance for the elderly .. 4 3.9
HR Minimum pension 20.5 25.7 22.9 21.6
IT Minimum pension – social increase 4.8 10.4 ..
CY Minimum pension 16.5 30.6 13.8 28
Social pension 0.9 24.9 0.8 22
LV Minimum old-age pension 15.8 14.4 14.8 14.8
LT Social assistance pension 0.8 1.4 ..
LU Minimum pension 7.21 26.32 7.21 26.16
Guaranteed minimum income 1.9 2.8 1.72 2.36
HU Minimum old-age pension (contributory) .. 0.4 0.39
Old-age allowance (non-contributory) .. 0.39
MT National minimum pension and non-
contributory old age pension (combined)
8 13.6 11.2 14.7
NL General old-age pension (AOW) n/a (universal coverage)
AT Compensation supplement to pension 6 11.9 5.47 10.7
PL Minimum old-age pension .. ..
PT Minimum pension (contributory) 41 38
Social old-age pension (non-contributory) 4 2
Solidarity supplement for the elderly 5 12 2 5
RO Social indemnity for pensioners 3.9 14.8 5 14
SI Minimum pension 0.7 0.7 0.6
SK Minimum pension .. 1.9 3.2
Assistance in material need 0.7 0.4 0.2 0.5
FI National pension 30.7 51.7 28.3 48.5
Guarantee pension 1.9 5.5 1.9 4.5
Housing allowance for pensioners .. 7.2 13.5
SE Guarantee pension 18.1 61.2 17.6 58.2
Maintenance support for the elderly 0.9 0.9 1.0 1.1
Housing supplement .. 7.7 21.2
UK State pension n/a (universal coverage)
State pension credit – guarantee credit 15.6 18.4 ..
Source: Member States. Latest data from year 2015-2017, depending on Member State.
Notes: * as share of retirees aged 65+, 2012 data.; .. – no data; n/a – not applicable.
60
Comparing the latest coverage rates to those reported in the 2015 PAR45
for the same benefits,
one can observe that in the majority of cases the share of beneficiaries of most minimum
income schemes has decreased or remained stable, in particular for contributory minimum
pensions, but also for social assistance benefits.
These observations suggest that the recently retired cohorts are overall less dependent on
minimum income benefits than previous cohorts, possibly due to more robust labour
market performance, in particular for women.
However, women continue to be overrepresented among the recipients of minimum
benefits, despite the fact that the share of minimum income recipients among women has
decreased more rapidly in recent years.
3.2.4. Policies favouring public pension scheme income redistribution
Minimum income provisions for older people play a key role in income redistribution;
however, other measures, such as survivor’s pensions, setting a minimum pension level
and favourable indexation, also tend to have a positive income redistribution impact for
current pensioners.
All Member States provide survivors’ pensions within their statutory pension scheme
(except for Denmark), and these can have a considerable impact on income
redistribution in old age, especially for women. As an example, the Czech Republic paid out
549,000 widow’s pensions in 2016, compared with only 98,000 widower’s pensions; almost
95 percent of these are paid to persons already eligible for an old-age pension. Similarly, in
Romania, the average survivor’s pension is about 46 percent of the average old-age pension
(July 2017).
Minimum pension levels, where these exist, are considered to play an important role in
tilting the balance in favour of people who earned less from work during their working
life. Table 4 indicates that they are set in many countries.
The undeniable significance of indexation mechanisms in income redistribution was
clear during the crisis; these mechanisms were suspended (see Section 4.1, on recent
reforms), negatively impacting on the purchasing power of low-income pensioners in
particular. Indexation suspension or changes to a less favourable formula during the economic
crisis contributed to a drop in the value of pensions in real terms in many countries. During
the post-crisis period, and especially after 2015, several countries lifted the freeze on
indexation mechanisms, with a direct impact on pension benefits.
Finally, while these measures impact on income redistribution among current pensioners,
‘pension credits’ for periods outside gainful employment (e.g. maternity leave,
unemployment) may have a considerable impact on pension accruals, especially in
defined contribution (DC) schemes. Moreover, these credits are particularly important for
women and people in non-standard employment (i.e. those on temporary contracts). For an
overview of the pension impact of current credit regimes, please refer to Section 5.1.1.
45 http://ec.europa.eu/social/BlobServlet?docId=14529&langId=en
61
Finally, taxes, benefits and other publicly provided services play an important role in income
redistribution, as do services.
3.3. Retirement conditions for the self-employed and for people in non-standard
employment
Social protection, including pension systems, has in many countries been geared
primarily to full-time workers in standard employment.46
Most of the theoretical
replacement rates presented in this report also refer to regular employees. At the same time,
around 40 percent of jobs in the EU today are either as self-employed (14%) or in an
employment relationship other than permanent full-time work. The protection of non-standard
workers and the self-employed was often organised by the extension of a system that was
primarily geared towards standard employment; in a number of cases, this resulted in more
marginal coverage, which in turn led to adequacy challenges in terms of both income
replacement and maintaining living standards.
While old-age pensions are among those branches of social protection that offer relatively
broad access to people with diverse employment statuses, multiple gaps in access and in
particular benefit accrual can be observed in most Member States. These gaps can take
several forms. First, some workers may not have access – for instance, because of insufficient
income levels. In other cases, when participation is voluntary, this might lead to many
workers deciding not to join or to opt out. Finally, even if self-employed and non-standard
workers are covered, their protection level may be lower than that of standard workers. The
effect of the frequently interrupted, shorter careers and lower earnings of non-standard
workers on their pension entitlements can be further amplified by the accrual conditions in the
pension system. For the self-employed, identifying the contribution base can be challenging.
Flat-rate or flexible contributions with minimum floors may apply to the self-employed and
some categories of non-standard workers; or such workers may influence their social
insurance treatment by organising their activities accordingly. When people have some
discretion over their coverage, contribution base or rates, they tend to gravitate towards the
lowest level of insurance, at the expense of old-age income safety.
The access gaps can be observed primarily in contribution-based pension schemes. The
residence-based universal pensions that form the public pillar, or its basic component, in some
Member States do not distinguish between different economic statuses. However, these
schemes typically only provide basic protection against poverty, while old-age income
maintenance depends on other, contribution-based components of the pension system. Thus,
access gaps affect people in different pension systems in different parts of the EU.
This section explores the main specificities of pension regimes for the self-employed and
people in non-standard employment, drawing on Spasova et al. (2017), and the social
outcomes for retired self-employed, compared to standard employees, where Survey of
Health, Ageing and Retirement in Europe (SHARE) data provide a valuable insight
(Pettinicchi and Boersch-Supan, 2017). The section focuses mainly on statutory schemes;
46 That is, permanent full-time salaried work for a clearly recognised employer. For more discussion on standard and non-
standard employment, see Spasova et al. (2017).
62
however, it does touch on occupational schemes, in particular where, as in Denmark and the
Netherlands, they play a key role in old-age income replacement.
3.3.1. Non-standard workers
Access
In general, non-standard workers have legal access to statutory pension schemes.
However, the situation varies between countries and some exceptions apply. Categories that
may have no access include casual and seasonal workers,47
apprentices48
and trainees.49
Some specific categories of workers may have only partial access:50
casual workers
(Bulgaria, Romania), seasonal workers (Bulgaria, Hungary), on-call workers (Hungary),
temporary agency workers (Malta), mini-jobbers (Germany), marginal freelancers and
marginal part-timers (Austria). Partial access is typically due to certain conditions for
compulsory coverage, such as contribution periods. Voluntary access may be open to those
failing to meet these conditions. For instance, in Austria, marginal part-timers are not covered
by mandatory insurance, but they can opt in at rather low contribution levels. In Romania,
casual workers can get insured on a voluntary basis by paying contributions on a minimum
insurable income. Part-time workers may have to meet a certain hourly threshold and/or
minimum wage threshold to be compulsorily insured. In Germany, for instance, the vast
majority of these workers, most of whom are women, decide to stay out of social insurance;
moreover, the wage threshold of EUR 450 per week might be a disincentive for mini-jobbers
to increase their working time.
Access to occupational pension schemes may also be hampered for non-standard
workers. In Denmark, the access of non-standard workers to occupational schemes depends
on coverage by collective agreements. In the Netherlands, almost 90 percent of the workforce
is covered by occupational pensions, but conditions may differ greatly for some categories,
such as temporary agency workers and on-call and zero-hour workers. There is a double
condition for temporary agency workers, based on employer liability and the contribution
period: a contract with the same employer for at least 26 weeks is needed to accumulate
pension entitlements.
Benefit accrual
The level of pension entitlements of workers in non-standard employment is often
undermined by interrupted contribution periods and the typically below-average
income. In particular, temporary and agency workers, even when meeting the minimum
eligibility conditions, can have low benefits, because only time spent in actual employment
counts towards their contribution record.
Some categories of non-standard workers may be entitled to lower benefits because of
accrual conditions that differ from those for standard workers. In some cases, non-
standard workers are only entitled to a flat-rate benefit, instead of a pension based on a
47 For example, voucher-based contracts in Lithuania. 48 HR, MT. 49 EL, FR, HU, IT, LT, MT. 50 ‘Partial access’ refers to situations where a) eligibility conditions are different from salaried employment; or b) insurance-
based and non-contributory benefits coexist and individuals can access only the latter.
63
replacement rate. In Latvia, micro-enterprises (i.e. up to five employees) are subject to a
special low-tax regime that results in their employees being socially insured at a level below
the minimum wage.
Non-standard employment can contribute to the gender gap in pension entitlements in
cases where most people employed in this type of job are women. For instance, in the
Austrian and German cases, most workers employed solely in marginal part-time work are
women.
The old-age income situation of non-standard workers is hard to model, due to the
heterogeneity and fluidity of this category of workers. One relatively well-established and
widespread type of non-standard work is part-time work. The impact on the TRR of extended
part-time work due to childcare is presented in Section 5.1.1. The average impact is likely to
be more negative for someone who works part time for reasons other than childcare, as they
would not be entitled to additional pension credits.
3.3.2. The self-employed
Access
In general, the self-employed are mandatorily covered by statutory pension schemes in
all Member States, but some exceptions apply. In some countries, the self-employed may
be exempt from compulsory insurance if they do not reach a certain minimum income
threshold, but have the possibility to opt in, thereby avoiding gaps in their contribution
record.51
In addition, there may be considerable difference in access to old-age pensions, depending on
the categories of the self-employed within a country (e.g. liberal professions and farmers in
Germany, Greece, Finland, Italy, Poland). In Germany, only some categories of the self-
employed are compulsorily insured by the public scheme (dependent self-employed without
employees, some artists and publishers), while others may opt into voluntary funded schemes.
In some countries, such as the UK, the self-employed are subject to tighter eligibility
conditions than standard workers, based on the contribution period or assessment base. In
Romania, most of the self-employed are not covered for old-age pensions, because their de
facto assessment base is lower than the minimum income threshold for statutory insurance.
Most, but not all, statutory pension schemes allow former salaried workers to transit to self-
employment while preserving their pension entitlement.
In Member States that have introduced statutory funded schemes, the self-employed are
typically covered by these, though in some cases access is voluntary.52
The self-employed typically have much more limited access to occupational pension
provision than employees (with a few exceptions for categories such as the liberal
professions). Even in countries where occupational pension provision is quasi-mandatory for
employees, the self-employed may have limited (in the Netherlands53
or no access (in
Denmark) to an occupational pension. In some countries, the self-employed may access
51 BG, IE, FI, RO, SK, UK. 52 DK, EE. 53 In the Netherlands, 85% of occupational funds grant access to the self-employed. However, partly due to the high costs,
only 650 self-employed persons are members of these funds.
64
occupational pensions under less-favourable conditions. In France, supplementary schemes
for the self-employed are subject to different, heterogeneous rules within the same
professional category.
The self-employed may also be excluded from flexible retirement pathways available to
employees.54
The pension coverage of bogus self-employment (disguised employment) is difficult to
estimate but is likely to be lower than among standard workers, as employers use this
form of employment to avoid paying social contributions.
The situation with regard to dependent self-employment55
is also quite complex. Some
countries have granted dependent self-employment a special social protection status,
recognising it as a sort of hybrid between salaried and self-employment. For example, in
Germany, those self-employed without employees who are dependent on a single client are
subject to compulsory pension insurance, while the rest have voluntary access. In Romania,
dependent self-employed with a single client benefit from compulsory pension insurance
(which is conditional on reaching the minimum income threshold for the ‘independent’ self-
employed), while the client is required to pay contributions equivalent to those of an
employer.
The situation of helping partners may pose challenges to self-employed households. In
many small self-employed businesses, the partner or spouse of the self-employed person helps
in the business without a formal contract or a formal wage. The extent of coverage of these
persons varies; in some social protection systems, they may be entitled to derived rights.
Benefit accrual
Effective coverage and benefit accrual for the self-employed depend on eligibility
conditions and the income assessment base taken into account for the calculation of
benefits. The difficulties in building up entitlements and the inadequacy of the benefits are
largely linked to two main elements: a) eligibility conditions tailored to salaried employment
(e.g. contributory periods); and b) inadequate contribution rates and/or income assessment
base, which can be related to several issues: income paid on long previous periods of
earnings, upfront payments (advance social security payments), payments of arrears, under- or
non-reporting of income streams, etc.
Contribution rates and bases are key factors when comparing the pension accrual by
salaried employees and the self-employed. Contributions are paid on specific income bases
within countries, schemes and professional groups. The issue of under-insurance of the self-
employed, and the fact that they frequently insure themselves at the minimum insurance
threshold, is highly problematic in many countries.56
Sometimes, a towering 85 percent of the
self-employed may be insured at the minimum level.57
Under-insurance is also closely linked
to informal work and tax avoidance in some countries.58
54 For example, partial retirement in Spain (although legislation granting access is envisaged). 55 A working relationship where the worker is formally self-employed yet under conditions of work similar to those of
dependent salaried workers (Eichhorst et al., 2013). 56 BG, CZ, EE, EL, ES, HU, PT, PL, RO, SI, SK, FI. 57 BG, EE, ES, PL, RO. 58 BG, EE, LT, LV, SK, RO.
65
In most Member States, pension contribution rates for the self-employed are close to the
total rate of employee and employer contributions for salaried workers; however, in
some countries59
they may be considerably lower (more than 3 p.p.). For instance, in
Belgium, in contrast to salaried workers, the contribution rate for the self-employed is
digressive, and contributions are only paid on income below a certain ceiling.
Income assessment bases play a salient role regarding the accrual of entitlements to
benefits for the self-employed. On the one hand, if the self-employed person pays social
contributions on a very low income-assessment base, they will receive a low level of benefits.
On the other hand, if the reference base is too high, those self-employed with low incomes
may not be able to pay the required contributions without strongly affecting their income or
assets. These issues may be related to the way of calculating the income base, reference
income periods, fixed income, etc.
The fluctuating income of the self-employed can make defining and paying contributions
more complicated than for fixed wage earners. Income assessment bases that are calculated
on previous periods of earnings may not take this into account. The requirements for advance
payments may hamper the self-employed person’s ability to pay social contributions if their
current income falls below estimated income. To account for the income fluctuations of the
self-employed, for instance, Finland allows for temporary flexibility of their contribution
rates. Belgium allows requests for an exemption from payment in situations of high income
insecurity.
An important barrier to the accrual of entitlements to benefits is under-reporting of
income and tax avoidance. The income of the self-employed can be hard to assess for social
insurance purposes, in particular, distinguishing between own consumption and reinvestment.
In some countries, under-declaration of income is often linked to informal work. Among the
main motives for undeclared work are the low revenue of the enterprise, low labour costs for
competitive activities and a lack of control by the authorities – high contribution rates being
perceived as a burden on the budget of the business or household. In some cases, tax and
contribution avoidance may be exacerbated by the low level of benefits and the low trust in
the social insurance system, which act as a disincentive to contribute (or to do so only at a
minimum level).
Box 8 illustrates several examples related to the role of income assessment bases.
Box 8: Income assessment bases and under-insurance
In the Czech Republic, future pension benefits for the same labour costs are projected to be
around 38 percentage points lower for the self-employed than for a standard worker, because of
the income assessment basis on which pension contributions are paid. This is mainly since
expenses can be determined either as expenses incurred or as a lump-sum percentage of revenue;
the majority of the self-employed use the latter option.
In Estonia, there is a legal incentive to declare only ‘passive income’ instead of ‘active income’
(the former is not subject to social tax and income tax). Households with business income are
estimated to under-report 62 percent of their actual active income.
59 BE, BG, HU, EE, IE, IT, UK.
66
In Greece, the differences in pension levels between the self-employed and salaried workers are
not due to different replacement rates, but to different income assessment bases. They are also due
to the fact that the self-employed insure themselves at a low assessment base.
In Latvia, the average self-employed person pays contributions only on an amount slightly above
the minimum possible contribution base: 85-90 percent of the self-employed pay contributions
based only on a minimum monthly wage.
In Poland, almost all the self-employed declare social insurance income equivalent to the
minimum threshold, i.e. 60 percent of the average wage. This is not linked to the taxable income
of the self-employed.
In Slovenia, almost 70 percent of self-employed persons pay social security contributions on the
minimum insurance base for pensions – EUR 870 in 2016 – while their average insurance base
was EUR 1074. In comparison with the average gross salary of EUR 1558, the self-employed on
average accrue substantially lower pension entitlements.
In Spain, the average monthly contribution base of the self-employed is approximately 36 percent
lower than that of salaried workers: 86.1 percent of the self-employed are insured at the minimum
contribution base. This is the case for 90 percent of persons under 40 years and 97.4 percent of
foreigners. From the age of 55, 30.8 percent pay higher contributions than the minimum base to
get higher pensions.
In Slovakia, 72.2 percent of the self-employed pay contributions based on the minimum
assessment base, although this proportion decreased slightly year on year in 2016 (Source:
Spasova et al. (2017).
Career breaks may affect the pension entitlements of the self-employed more than of
employees, because of the way pension systems credit them. For instance, pension credits for
periods of unemployment are usually conditional on entitlement to unemployment benefits
(SPC, 2015), which often exclude the self-employed.
3.3.3. Impact on old-age income adequacy
Non-standard workers
Non-standard workers are exposed to low average incomes and high levels of risk of
poverty during their working life that risks being transmitted into old age. For instance,
the at-risk-of-poverty rate for temporary and part-time workers is three times higher than for
permanent employees in the EU-28 (Spasova et al., 2017). As pension entitlements tend to
become more earnings-based overall, career performance is more directly reflected in old-age
income (SPC, 2015a). However, the precise impact on old-age income of having worked in
non-standard employment is hard to estimate, as the categories in question are diverse and
workers can change their status multiple times. To the extent that non-standard workers tend
to have fragmented careers, the replacement rates for career breaks due to unemployment
presented in section 5.1.1 can serve as an indication, but the outcomes are likely to be more
unfavourable for workers who do not have an uninterrupted career prior to the unemployment
break.
The barriers affecting access to pensions and benefit accrual can amplify the earnings
gap between standard and non-standard employment. Non-standard work is on average
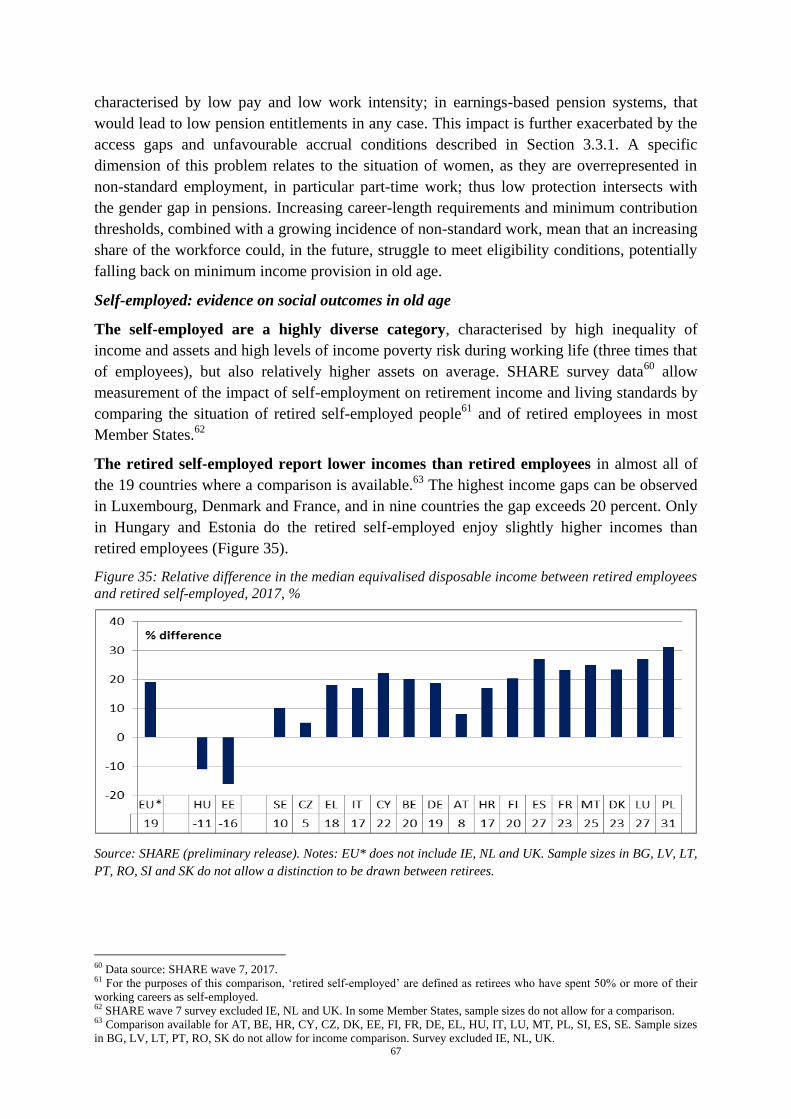
67
characterised by low pay and low work intensity; in earnings-based pension systems, that
would lead to low pension entitlements in any case. This impact is further exacerbated by the
access gaps and unfavourable accrual conditions described in Section 3.3.1. A specific
dimension of this problem relates to the situation of women, as they are overrepresented in
non-standard employment, in particular part-time work; thus low protection intersects with
the gender gap in pensions. Increasing career-length requirements and minimum contribution
thresholds, combined with a growing incidence of non-standard work, mean that an increasing
share of the workforce could, in the future, struggle to meet eligibility conditions, potentially
falling back on minimum income provision in old age.
Self-employed: evidence on social outcomes in old age
The self-employed are a highly diverse category, characterised by high inequality of
income and assets and high levels of income poverty risk during working life (three times that
of employees), but also relatively higher assets on average. SHARE survey data60
allow
measurement of the impact of self-employment on retirement income and living standards by
comparing the situation of retired self-employed people61
and of retired employees in most
Member States.62
The retired self-employed report lower incomes than retired employees in almost all of
the 19 countries where a comparison is available.63
The highest income gaps can be observed
in Luxembourg, Denmark and France, and in nine countries the gap exceeds 20 percent. Only
in Hungary and Estonia do the retired self-employed enjoy slightly higher incomes than
retired employees (Figure 35).
Figure 35: Relative difference in the median equivalised disposable income between retired employees
and retired self-employed, 2017, %
Source: SHARE (preliminary release). Notes: EU* does not include IE, NL and UK. Sample sizes in BG, LV, LT,
PT, RO, SI and SK do not allow a distinction to be drawn between retirees.
60 Data source: SHARE wave 7, 2017. 61 For the purposes of this comparison, ‘retired self-employed’ are defined as retirees who have spent 50% or more of their
working careers as self-employed. 62 SHARE wave 7 survey excluded IE, NL and UK. In some Member States, sample sizes do not allow for a comparison. 63 Comparison available for AT, BE, HR, CY, CZ, DK, EE, FI, FR, DE, EL, HU, IT, LU, MT, PL, SI, ES, SE. Sample sizes
in BG, LV, LT, PT, RO, SK do not allow for income comparison. Survey excluded IE, NL, UK.
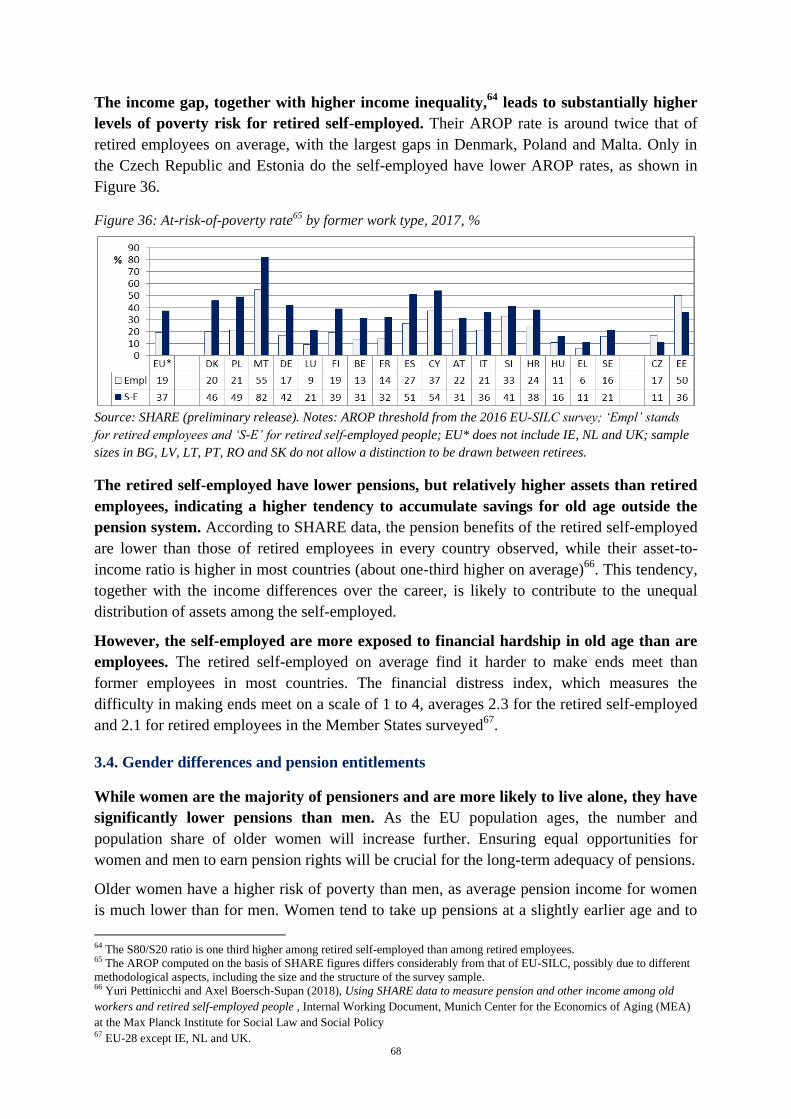
68
The income gap, together with higher income inequality,64
leads to substantially higher
levels of poverty risk for retired self-employed. Their AROP rate is around twice that of
retired employees on average, with the largest gaps in Denmark, Poland and Malta. Only in
the Czech Republic and Estonia do the self-employed have lower AROP rates, as shown in
Figure 36.
Figure 36: At-risk-of-poverty rate65 by former work type, 2017, %
Source: SHARE (preliminary release). Notes: AROP threshold from the 2016 EU-SILC survey; ‘Empl’ stands
for retired employees and ‘S-E’ for retired self-employed people; EU* does not include IE, NL and UK; sample
sizes in BG, LV, LT, PT, RO and SK do not allow a distinction to be drawn between retirees.
The retired self-employed have lower pensions, but relatively higher assets than retired
employees, indicating a higher tendency to accumulate savings for old age outside the
pension system. According to SHARE data, the pension benefits of the retired self-employed
are lower than those of retired employees in every country observed, while their asset-to-
income ratio is higher in most countries (about one-third higher on average)66
. This tendency,
together with the income differences over the career, is likely to contribute to the unequal
distribution of assets among the self-employed.
However, the self-employed are more exposed to financial hardship in old age than are
employees. The retired self-employed on average find it harder to make ends meet than
former employees in most countries. The financial distress index, which measures the
difficulty in making ends meet on a scale of 1 to 4, averages 2.3 for the retired self-employed
and 2.1 for retired employees in the Member States surveyed67
.
3.4. Gender differences and pension entitlements
While women are the majority of pensioners and are more likely to live alone, they have
significantly lower pensions than men. As the EU population ages, the number and
population share of older women will increase further. Ensuring equal opportunities for
women and men to earn pension rights will be crucial for the long-term adequacy of pensions.
Older women have a higher risk of poverty than men, as average pension income for women
is much lower than for men. Women tend to take up pensions at a slightly earlier age and to
64 The S80/S20 ratio is one third higher among retired self-employed than among retired employees. 65 The AROP computed on the basis of SHARE figures differs considerably from that of EU-SILC, possibly due to different
methodological aspects, including the size and the structure of the survey sample. 66 Yuri Pettinicchi and Axel Boersch-Supan (2018), Using SHARE data to measure pension and other income among old
workers and retired self-employed people , Internal Working Document, Munich Center for the Economics of Aging (MEA)
at the Max Planck Institute for Social Law and Social Policy 67 EU-28 except IE, NL and UK.
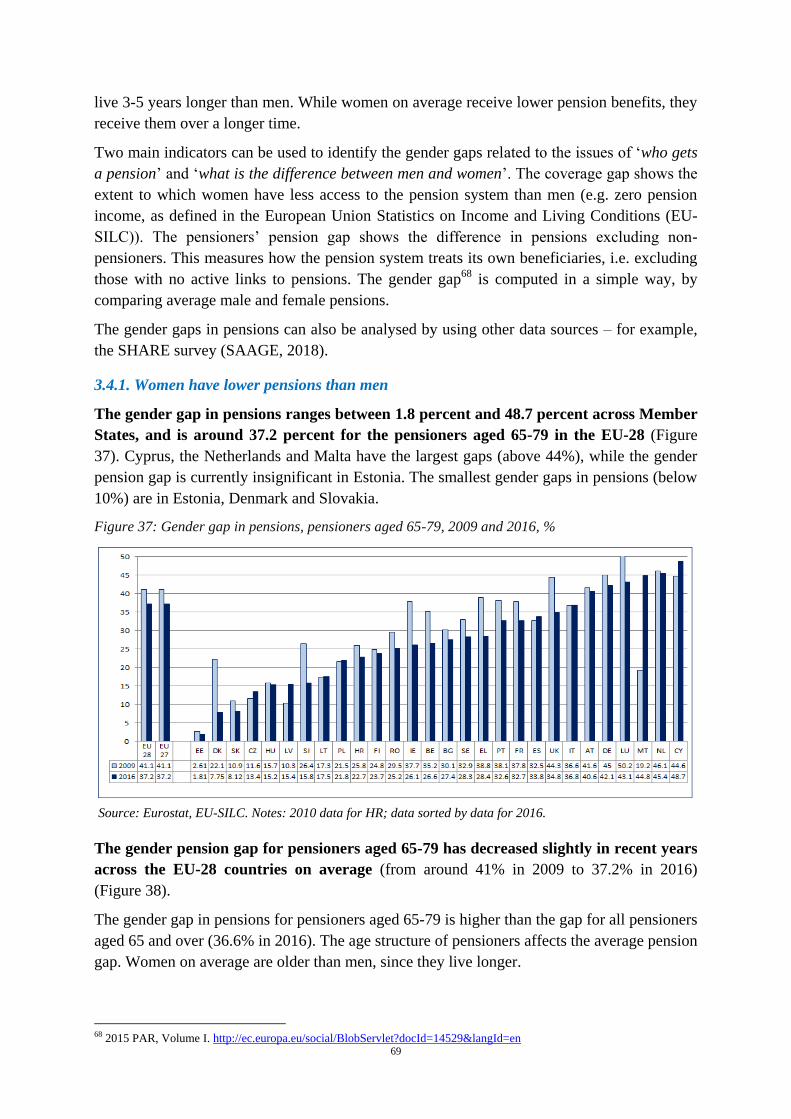
69
live 3-5 years longer than men. While women on average receive lower pension benefits, they
receive them over a longer time.
Two main indicators can be used to identify the gender gaps related to the issues of ‘who gets
a pension’ and ‘what is the difference between men and women’. The coverage gap shows the
extent to which women have less access to the pension system than men (e.g. zero pension
income, as defined in the European Union Statistics on Income and Living Conditions (EU-
SILC)). The pensioners’ pension gap shows the difference in pensions excluding non-
pensioners. This measures how the pension system treats its own beneficiaries, i.e. excluding
those with no active links to pensions. The gender gap68
is computed in a simple way, by
comparing average male and female pensions.
The gender gaps in pensions can also be analysed by using other data sources – for example,
the SHARE survey (SAAGE, 2018).
3.4.1. Women have lower pensions than men
The gender gap in pensions ranges between 1.8 percent and 48.7 percent across Member
States, and is around 37.2 percent for the pensioners aged 65-79 in the EU-28 (Figure
37). Cyprus, the Netherlands and Malta have the largest gaps (above 44%), while the gender
pension gap is currently insignificant in Estonia. The smallest gender gaps in pensions (below
10%) are in Estonia, Denmark and Slovakia.
Figure 37: Gender gap in pensions, pensioners aged 65-79, 2009 and 2016, %
Source: Eurostat, EU-SILC. Notes: 2010 data for HR; data sorted by data for 2016.
The gender pension gap for pensioners aged 65-79 has decreased slightly in recent years
across the EU-28 countries on average (from around 41% in 2009 to 37.2% in 2016)
(Figure 38).
The gender gap in pensions for pensioners aged 65-79 is higher than the gap for all pensioners
aged 65 and over (36.6% in 2016). The age structure of pensioners affects the average pension
gap. Women on average are older than men, since they live longer.
68 2015 PAR, Volume I. http://ec.europa.eu/social/BlobServlet?docId=14529&langId=en
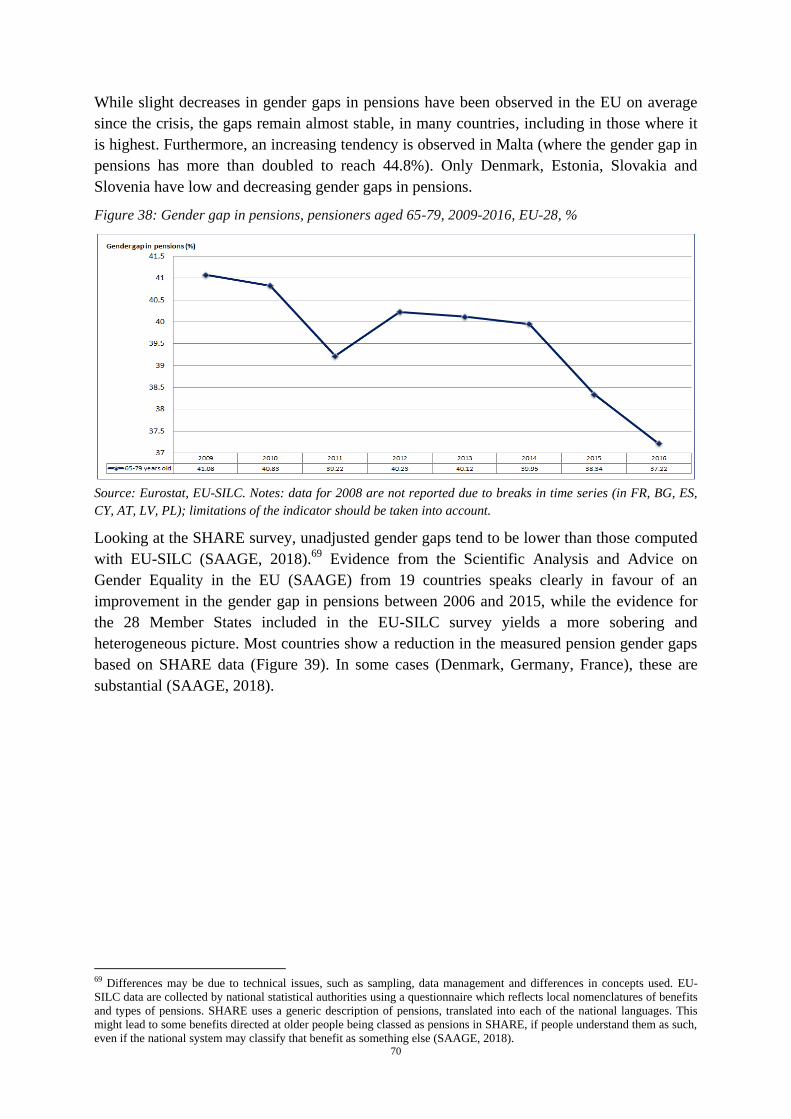
70
While slight decreases in gender gaps in pensions have been observed in the EU on average
since the crisis, the gaps remain almost stable, in many countries, including in those where it
is highest. Furthermore, an increasing tendency is observed in Malta (where the gender gap in
pensions has more than doubled to reach 44.8%). Only Denmark, Estonia, Slovakia and
Slovenia have low and decreasing gender gaps in pensions.
Figure 38: Gender gap in pensions, pensioners aged 65-79, 2009-2016, EU-28, %
Source: Eurostat, EU-SILC. Notes: data for 2008 are not reported due to breaks in time series (in FR, BG, ES,
CY, AT, LV, PL); limitations of the indicator should be taken into account.
Looking at the SHARE survey, unadjusted gender gaps tend to be lower than those computed
with EU-SILC (SAAGE, 2018).69
Evidence from the Scientific Analysis and Advice on
Gender Equality in the EU (SAAGE) from 19 countries speaks clearly in favour of an
improvement in the gender gap in pensions between 2006 and 2015, while the evidence for
the 28 Member States included in the EU-SILC survey yields a more sobering and
heterogeneous picture. Most countries show a reduction in the measured pension gender gaps
based on SHARE data (Figure 39). In some cases (Denmark, Germany, France), these are
substantial (SAAGE, 2018).
69 Differences may be due to technical issues, such as sampling, data management and differences in concepts used. EU-
SILC data are collected by national statistical authorities using a questionnaire which reflects local nomenclatures of benefits
and types of pensions. SHARE uses a generic description of pensions, translated into each of the national languages. This
might lead to some benefits directed at older people being classed as pensions in SHARE, if people understand them as such,
even if the national system may classify that benefit as something else (SAAGE, 2018).
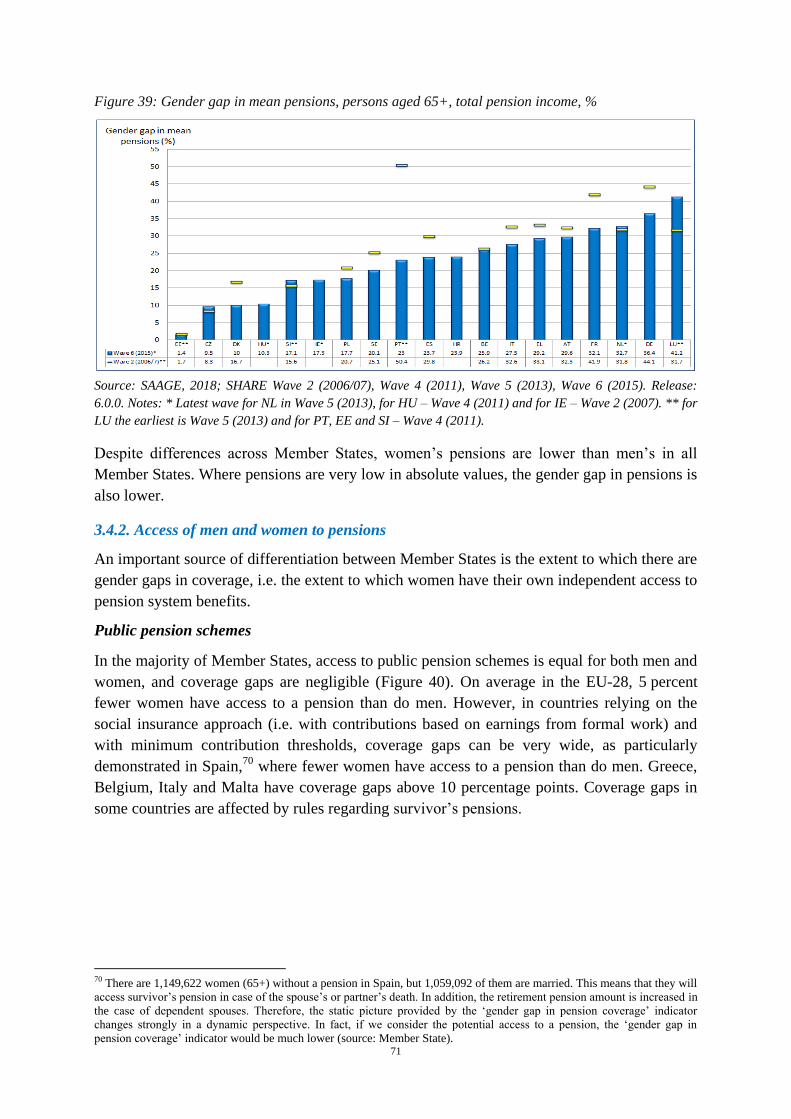
71
Figure 39: Gender gap in mean pensions, persons aged 65+, total pension income, %
Source: SAAGE, 2018; SHARE Wave 2 (2006/07), Wave 4 (2011), Wave 5 (2013), Wave 6 (2015). Release:
6.0.0. Notes: * Latest wave for NL in Wave 5 (2013), for HU – Wave 4 (2011) and for IE – Wave 2 (2007). ** for
LU the earliest is Wave 5 (2013) and for PT, EE and SI – Wave 4 (2011).
Despite differences across Member States, women’s pensions are lower than men’s in all
Member States. Where pensions are very low in absolute values, the gender gap in pensions is
also lower.
3.4.2. Access of men and women to pensions
An important source of differentiation between Member States is the extent to which there are
gender gaps in coverage, i.e. the extent to which women have their own independent access to
pension system benefits.
Public pension schemes
In the majority of Member States, access to public pension schemes is equal for both men and
women, and coverage gaps are negligible (Figure 40). On average in the EU-28, 5 percent
fewer women have access to a pension than do men. However, in countries relying on the
social insurance approach (i.e. with contributions based on earnings from formal work) and
with minimum contribution thresholds, coverage gaps can be very wide, as particularly
demonstrated in Spain,70
where fewer women have access to a pension than do men. Greece,
Belgium, Italy and Malta have coverage gaps above 10 percentage points. Coverage gaps in
some countries are affected by rules regarding survivor’s pensions.
70 There are 1,149,622 women (65+) without a pension in Spain, but 1,059,092 of them are married. This means that they will
access survivor’s pension in case of the spouse’s or partner’s death. In addition, the retirement pension amount is increased in
the case of dependent spouses. Therefore, the static picture provided by the ‘gender gap in pension coverage’ indicator
changes strongly in a dynamic perspective. In fact, if we consider the potential access to a pension, the ‘gender gap in
pension coverage’ indicator would be much lower (source: Member State).
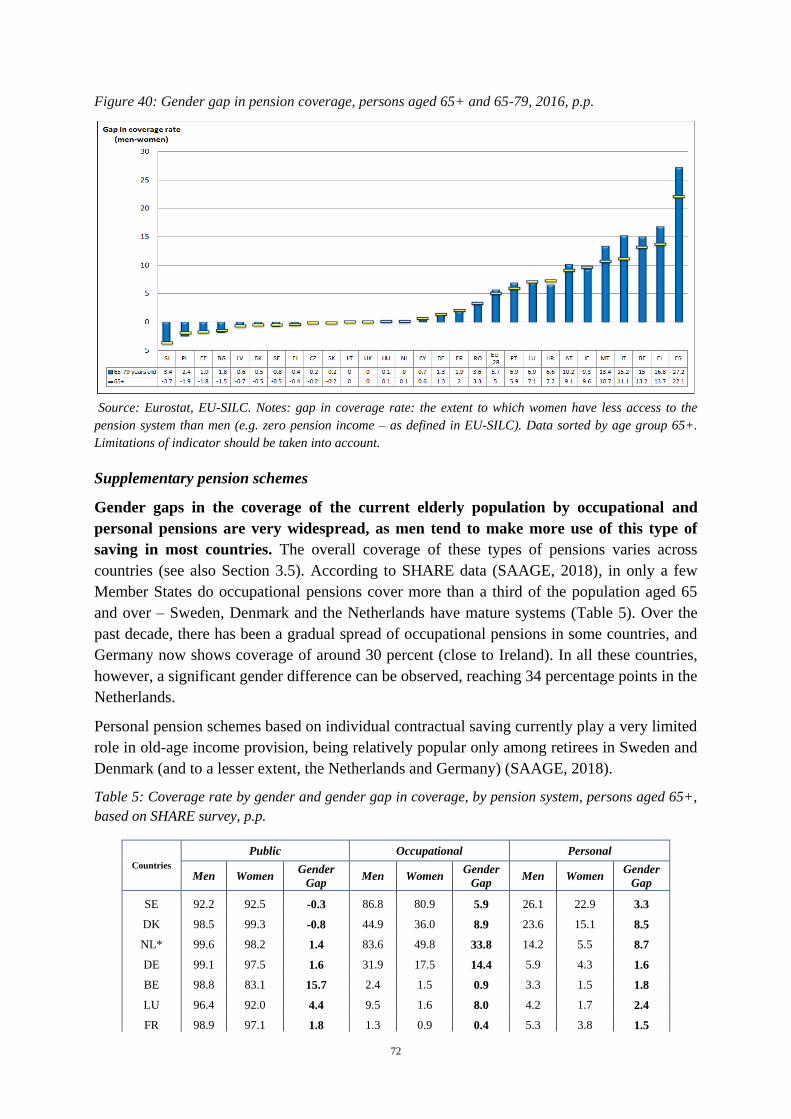
72
Figure 40: Gender gap in pension coverage, persons aged 65+ and 65-79, 2016, p.p.
Source: Eurostat, EU-SILC. Notes: gap in coverage rate: the extent to which women have less access to the
pension system than men (e.g. zero pension income – as defined in EU-SILC). Data sorted by age group 65+.
Limitations of indicator should be taken into account.
Supplementary pension schemes
Gender gaps in the coverage of the current elderly population by occupational and
personal pensions are very widespread, as men tend to make more use of this type of
saving in most countries. The overall coverage of these types of pensions varies across
countries (see also Section 3.5). According to SHARE data (SAAGE, 2018), in only a few
Member States do occupational pensions cover more than a third of the population aged 65
and over – Sweden, Denmark and the Netherlands have mature systems (Table 5). Over the
past decade, there has been a gradual spread of occupational pensions in some countries, and
Germany now shows coverage of around 30 percent (close to Ireland). In all these countries,
however, a significant gender difference can be observed, reaching 34 percentage points in the
Netherlands.
Personal pension schemes based on individual contractual saving currently play a very limited
role in old-age income provision, being relatively popular only among retirees in Sweden and
Denmark (and to a lesser extent, the Netherlands and Germany) (SAAGE, 2018).
Table 5: Coverage rate by gender and gender gap in coverage, by pension system, persons aged 65+,
based on SHARE survey, p.p.
Countries
Public Occupational Personal
Men Women Gender
Gap Men Women
Gender
Gap Men Women
Gender
Gap
SE 92.2 92.5 -0.3 86.8 80.9 5.9 26.1 22.9 3.3
DK 98.5 99.3 -0.8 44.9 36.0 8.9 23.6 15.1 8.5
NL* 99.6 98.2 1.4 83.6 49.8 33.8 14.2 5.5 8.7
DE 99.1 97.5 1.6 31.9 17.5 14.4 5.9 4.3 1.6
BE 98.8 83.1 15.7 2.4 1.5 0.9 3.3 1.5 1.8
LU 96.4 92.0 4.4 9.5 1.6 8.0 4.2 1.7 2.4
FR 98.9 97.1 1.8 1.3 0.9 0.4 5.3 3.8 1.5
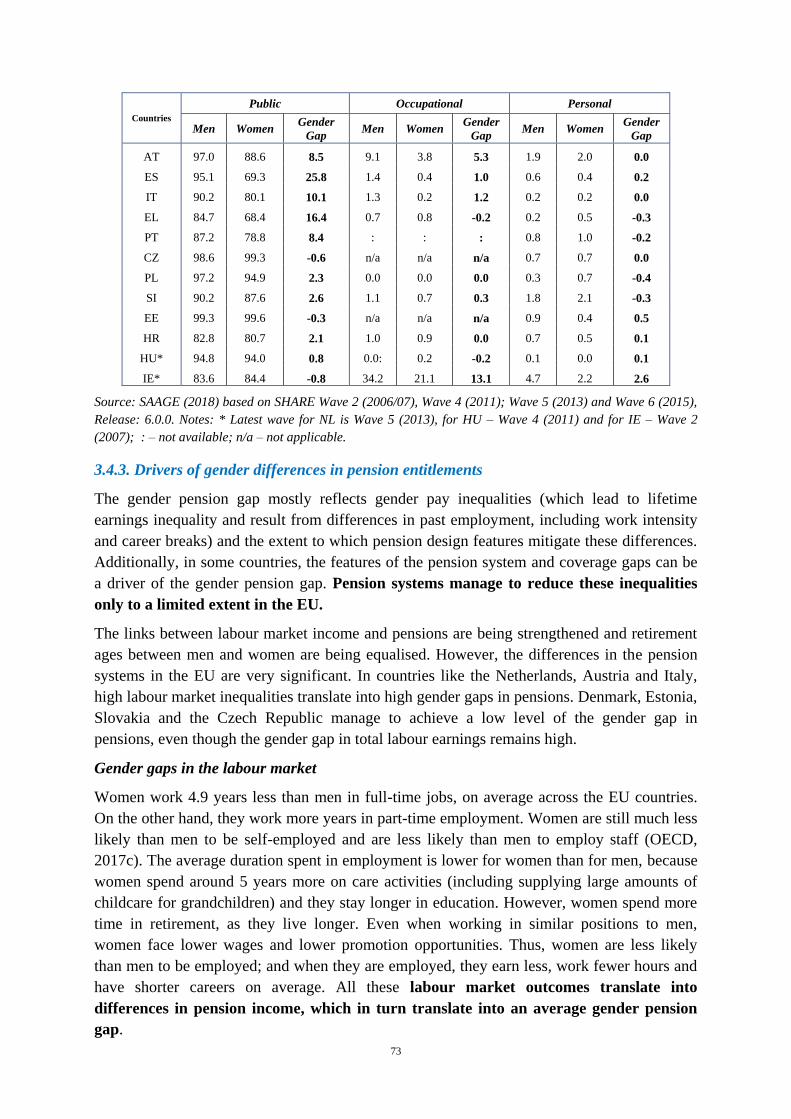
73
Countries
Public Occupational Personal
Men Women Gender
Gap Men Women
Gender
Gap Men Women
Gender
Gap
AT 97.0 88.6 8.5 9.1 3.8 5.3 1.9 2.0 0.0
ES 95.1 69.3 25.8 1.4 0.4 1.0 0.6 0.4 0.2
IT 90.2 80.1 10.1 1.3 0.2 1.2 0.2 0.2 0.0
EL 84.7 68.4 16.4 0.7 0.8 -0.2 0.2 0.5 -0.3
PT 87.2 78.8 8.4 : : : 0.8 1.0 -0.2
CZ 98.6 99.3 -0.6 n/a n/a n/a 0.7 0.7 0.0
PL 97.2 94.9 2.3 0.0 0.0 0.0 0.3 0.7 -0.4
SI 90.2 87.6 2.6 1.1 0.7 0.3 1.8 2.1 -0.3
EE 99.3 99.6 -0.3 n/a n/a n/a 0.9 0.4 0.5
HR 82.8 80.7 2.1 1.0 0.9 0.0 0.7 0.5 0.1
HU* 94.8 94.0 0.8 0.0: 0.2 -0.2 0.1 0.0 0.1
IE* 83.6 84.4 -0.8 34.2 21.1 13.1 4.7 2.2 2.6
Source: SAAGE (2018) based on SHARE Wave 2 (2006/07), Wave 4 (2011); Wave 5 (2013) and Wave 6 (2015),
Release: 6.0.0. Notes: * Latest wave for NL is Wave 5 (2013), for HU – Wave 4 (2011) and for IE – Wave 2
(2007); : – not available; n/a – not applicable.
3.4.3. Drivers of gender differences in pension entitlements
The gender pension gap mostly reflects gender pay inequalities (which lead to lifetime
earnings inequality and result from differences in past employment, including work intensity
and career breaks) and the extent to which pension design features mitigate these differences.
Additionally, in some countries, the features of the pension system and coverage gaps can be
a driver of the gender pension gap. Pension systems manage to reduce these inequalities
only to a limited extent in the EU.
The links between labour market income and pensions are being strengthened and retirement
ages between men and women are being equalised. However, the differences in the pension
systems in the EU are very significant. In countries like the Netherlands, Austria and Italy,
high labour market inequalities translate into high gender gaps in pensions. Denmark, Estonia,
Slovakia and the Czech Republic manage to achieve a low level of the gender gap in
pensions, even though the gender gap in total labour earnings remains high.
Gender gaps in the labour market
Women work 4.9 years less than men in full-time jobs, on average across the EU countries.
On the other hand, they work more years in part-time employment. Women are still much less
likely than men to be self-employed and are less likely than men to employ staff (OECD,
2017c). The average duration spent in employment is lower for women than for men, because
women spend around 5 years more on care activities (including supplying large amounts of
childcare for grandchildren) and they stay longer in education. However, women spend more
time in retirement, as they live longer. Even when working in similar positions to men,
women face lower wages and lower promotion opportunities. Thus, women are less likely
than men to be employed; and when they are employed, they earn less, work fewer hours and
have shorter careers on average. All these labour market outcomes translate into
differences in pension income, which in turn translate into an average gender pension
gap.
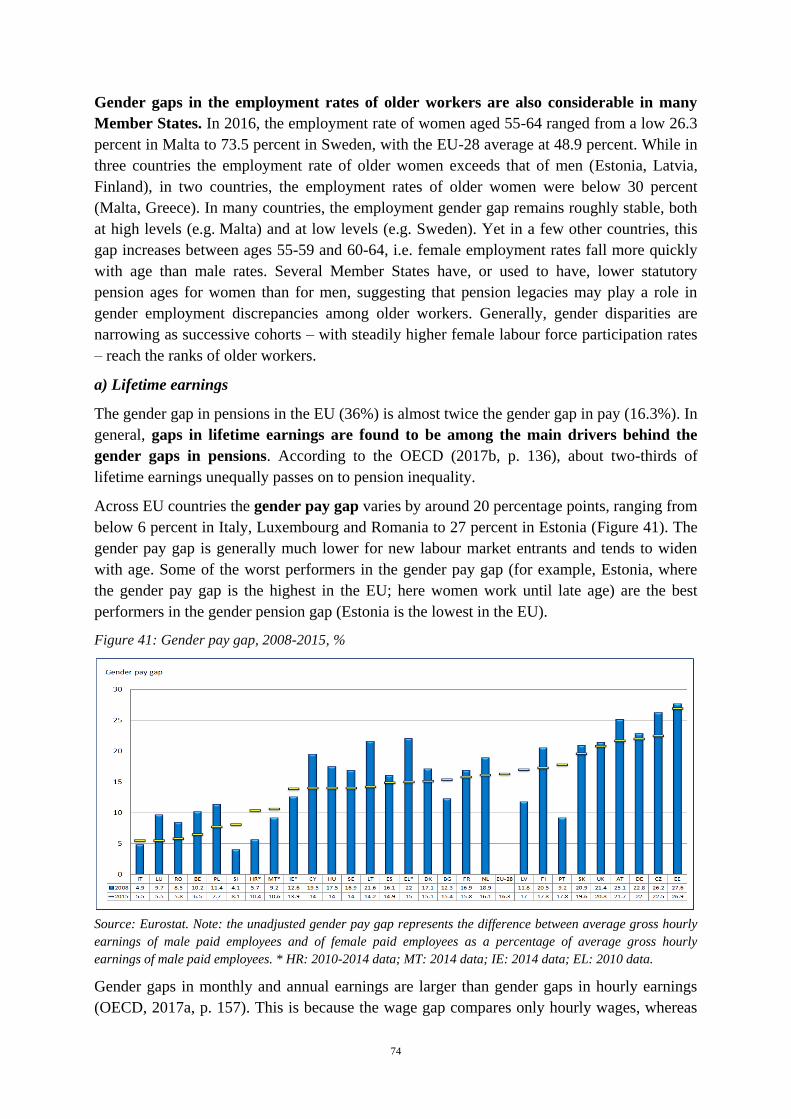
74
Gender gaps in the employment rates of older workers are also considerable in many
Member States. In 2016, the employment rate of women aged 55-64 ranged from a low 26.3
percent in Malta to 73.5 percent in Sweden, with the EU-28 average at 48.9 percent. While in
three countries the employment rate of older women exceeds that of men (Estonia, Latvia,
Finland), in two countries, the employment rates of older women were below 30 percent
(Malta, Greece). In many countries, the employment gender gap remains roughly stable, both
at high levels (e.g. Malta) and at low levels (e.g. Sweden). Yet in a few other countries, this
gap increases between ages 55-59 and 60-64, i.e. female employment rates fall more quickly
with age than male rates. Several Member States have, or used to have, lower statutory
pension ages for women than for men, suggesting that pension legacies may play a role in
gender employment discrepancies among older workers. Generally, gender disparities are
narrowing as successive cohorts – with steadily higher female labour force participation rates
– reach the ranks of older workers.
a) Lifetime earnings
The gender gap in pensions in the EU (36%) is almost twice the gender gap in pay (16.3%). In
general, gaps in lifetime earnings are found to be among the main drivers behind the
gender gaps in pensions. According to the OECD (2017b, p. 136), about two-thirds of
lifetime earnings unequally passes on to pension inequality.
Across EU countries the gender pay gap varies by around 20 percentage points, ranging from
below 6 percent in Italy, Luxembourg and Romania to 27 percent in Estonia (Figure 41). The
gender pay gap is generally much lower for new labour market entrants and tends to widen
with age. Some of the worst performers in the gender pay gap (for example, Estonia, where
the gender pay gap is the highest in the EU; here women work until late age) are the best
performers in the gender pension gap (Estonia is the lowest in the EU).
Figure 41: Gender pay gap, 2008-2015, %
Source: Eurostat. Note: the unadjusted gender pay gap represents the difference between average gross hourly
earnings of male paid employees and of female paid employees as a percentage of average gross hourly
earnings of male paid employees. * HR: 2010-2014 data; MT: 2014 data; IE: 2014 data; EL: 2010 data.
Gender gaps in monthly and annual earnings are larger than gender gaps in hourly earnings
(OECD, 2017a, p. 157). This is because the wage gap compares only hourly wages, whereas
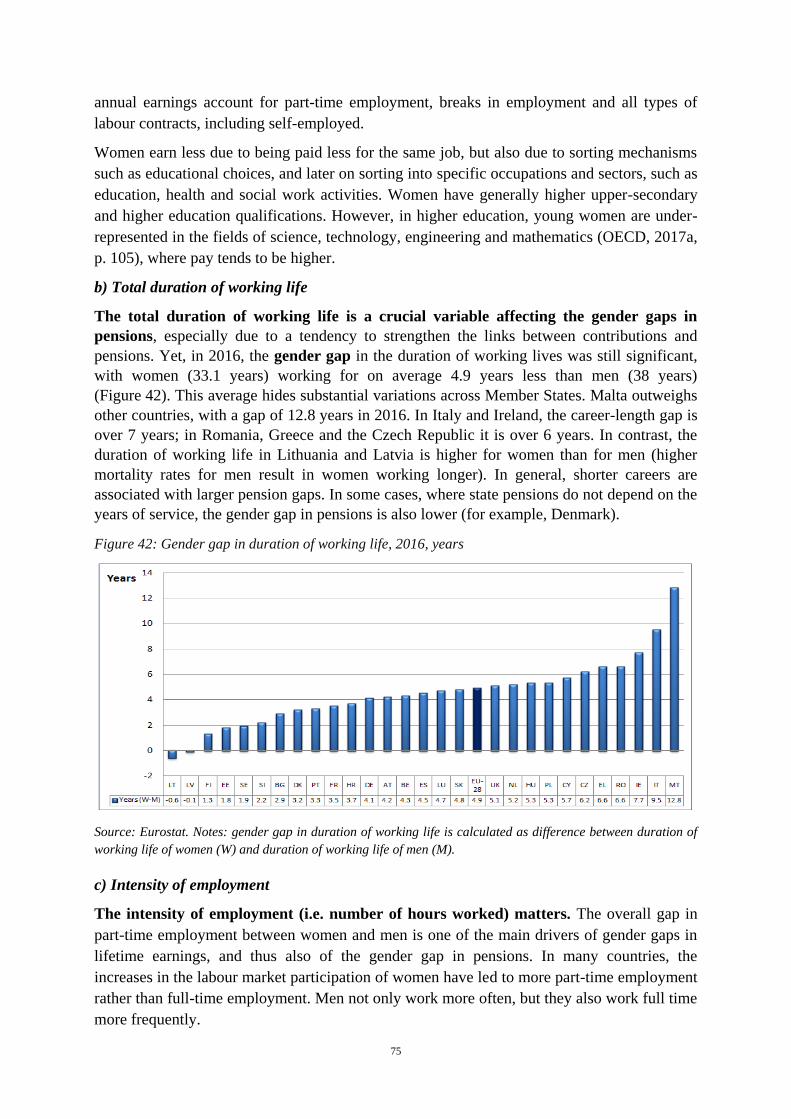
75
annual earnings account for part-time employment, breaks in employment and all types of
labour contracts, including self-employed.
Women earn less due to being paid less for the same job, but also due to sorting mechanisms
such as educational choices, and later on sorting into specific occupations and sectors, such as
education, health and social work activities. Women have generally higher upper-secondary
and higher education qualifications. However, in higher education, young women are under-
represented in the fields of science, technology, engineering and mathematics (OECD, 2017a,
p. 105), where pay tends to be higher.
b) Total duration of working life
The total duration of working life is a crucial variable affecting the gender gaps in
pensions, especially due to a tendency to strengthen the links between contributions and
pensions. Yet, in 2016, the gender gap in the duration of working lives was still significant,
with women (33.1 years) working for on average 4.9 years less than men (38 years)
(Figure 42). This average hides substantial variations across Member States. Malta outweighs
other countries, with a gap of 12.8 years in 2016. In Italy and Ireland, the career-length gap is
over 7 years; in Romania, Greece and the Czech Republic it is over 6 years. In contrast, the
duration of working life in Lithuania and Latvia is higher for women than for men (higher
mortality rates for men result in women working longer). In general, shorter careers are
associated with larger pension gaps. In some cases, where state pensions do not depend on the
years of service, the gender gap in pensions is also lower (for example, Denmark).
Figure 42: Gender gap in duration of working life, 2016, years
Source: Eurostat. Notes: gender gap in duration of working life is calculated as difference between duration of
working life of women (W) and duration of working life of men (M).
c) Intensity of employment
The intensity of employment (i.e. number of hours worked) matters. The overall gap in
part-time employment between women and men is one of the main drivers of gender gaps in
lifetime earnings, and thus also of the gender gap in pensions. In many countries, the
increases in the labour market participation of women have led to more part-time employment
rather than full-time employment. Men not only work more often, but they also work full time
more frequently.

76
On average in the EU-28, 31.6 percent of women (aged 15-64) work in part-time
employment, compared to 7 percent of men. The gender pension gap tends to be lower in
many Central and Eastern European countries, where gender differences in the use of part-
time work are less pronounced than in Western Europe. But it comes at the expense of female
employment rates, which are generally lower for those countries. Part-time work is often a
consequence of family duties (care activities) and inadequate childcare services. Childcare
and other unpaid care work exacerbate the pension gap particularly where childcare (or other
care) is expensive, of inadequate quality, unsuitable or not available.
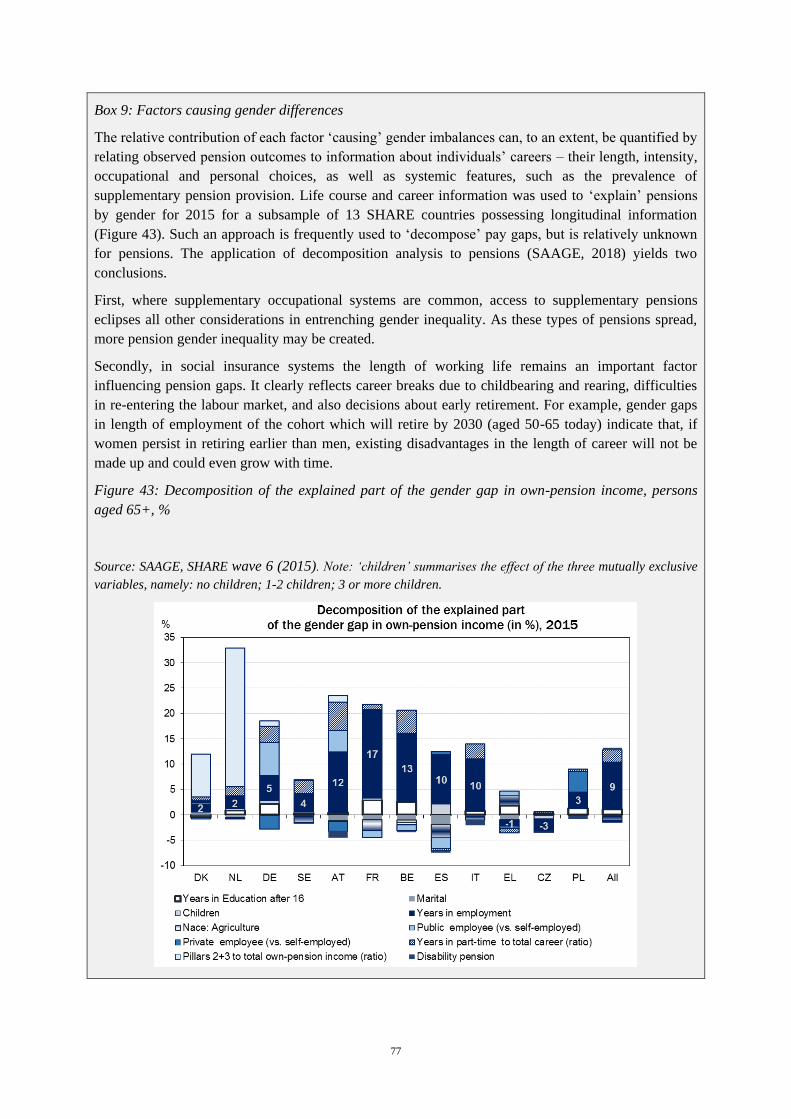
77
Box 9: Factors causing gender differences
The relative contribution of each factor ‘causing’ gender imbalances can, to an extent, be quantified by
relating observed pension outcomes to information about individuals’ careers – their length, intensity,
occupational and personal choices, as well as systemic features, such as the prevalence of
supplementary pension provision. Life course and career information was used to ‘explain’ pensions
by gender for 2015 for a subsample of 13 SHARE countries possessing longitudinal information
(Figure 43). Such an approach is frequently used to ‘decompose’ pay gaps, but is relatively unknown
for pensions. The application of decomposition analysis to pensions (SAAGE, 2018) yields two
conclusions.
First, where supplementary occupational systems are common, access to supplementary pensions
eclipses all other considerations in entrenching gender inequality. As these types of pensions spread,
more pension gender inequality may be created.
Secondly, in social insurance systems the length of working life remains an important factor
influencing pension gaps. It clearly reflects career breaks due to childbearing and rearing, difficulties
in re-entering the labour market, and also decisions about early retirement. For example, gender gaps
in length of employment of the cohort which will retire by 2030 (aged 50-65 today) indicate that, if
women persist in retiring earlier than men, existing disadvantages in the length of career will not be
made up and could even grow with time.
Figure 43: Decomposition of the explained part of the gender gap in own-pension income, persons
aged 65+, %
Source: SAAGE, SHARE wave 6 (2015). Note: ‘children’ summarises the effect of the three mutually exclusive
variables, namely: no children; 1-2 children; 3 or more children.
78
3.4.4. Policies in reducing gender gaps in pensions
Several features of pension systems influence the gender gaps in pensions: changes in pension
systems affecting cohorts differently, indexation of pensions in payment, the generosity of
survivor’s pensions, career break compensation, and gender differences in effective retirement
ages.
Pension systems can either attenuate or widen the gap. There are two direct mechanisms in
the pension system that mitigate the gender gaps in pensions at the lower and the upper tails
of the distribution. First, basic and minimum pensions provide a lower bound for pensions. At
the other end of the distribution, the ceiling for coverage or a direct cap on pensions provides
an upper bound for pensions paid.
The redistributive elements of pensions and tax systems and the coverage of non-
employment spells related to care activities mitigate the gender difference in labour
market earnings (see Section 3.2). The coverage or premium for childcare, gender-specific
retirement ages and work experience-based eligibility conditions have an important impact on
the gender pension gap among both high and low pensions.
In all Member States, women are granted pension rights for childcare subject to certain
conditions. Moreover, surviving spouses can be granted survivor’s pensions in almost all
Member States.71
Reducing the gender pension gap also requires equal opportunity policies before people
reach pensionable age. Inequalities in education, health, employment and income build up
from an early age. The redistributive function of most pension and tax systems has limited
impact on the wide inequalities that develop over the life course. Pension systems cannot
compensate for all the consequences of adverse events and developments that build up over
people’s working lives.
Cohorts differ in mortality and labour market histories. Entering the labour market late and
being unemployed for long periods both substantially reduce pensions in most countries,
where younger generations might find it harder to earn sufficient pensions (OECD, 2017b,
p. 136).
Looking beyond pensions specifically and tackling issues facing women in the workplace
would also result in improved retirement savings for women. Given the importance of
employment history for income prospects at older ages, increased female labour market
participation across cohorts is likely to help reduce future age-related income inequality
(OECD, 2017b, p. 123).
The new cohorts of women who are pensioners are more educated, on average, than the
cohorts of incumbent pensioners. Higher education generally goes along with stronger labour
market attachment, more years in employment, higher earnings and, ultimately, better
contributory records (SAAGE, 2018).
While the gender gap in employment is decreasing, the continuing stable gender pay gap
will still determine the gender pension gap in years to come.
71 For more information on survivor’s pensions, see 2015 PAR, Volume I, section 3.4.
http://ec.europa.eu/social/BlobServlet?docId=14529&langId=en
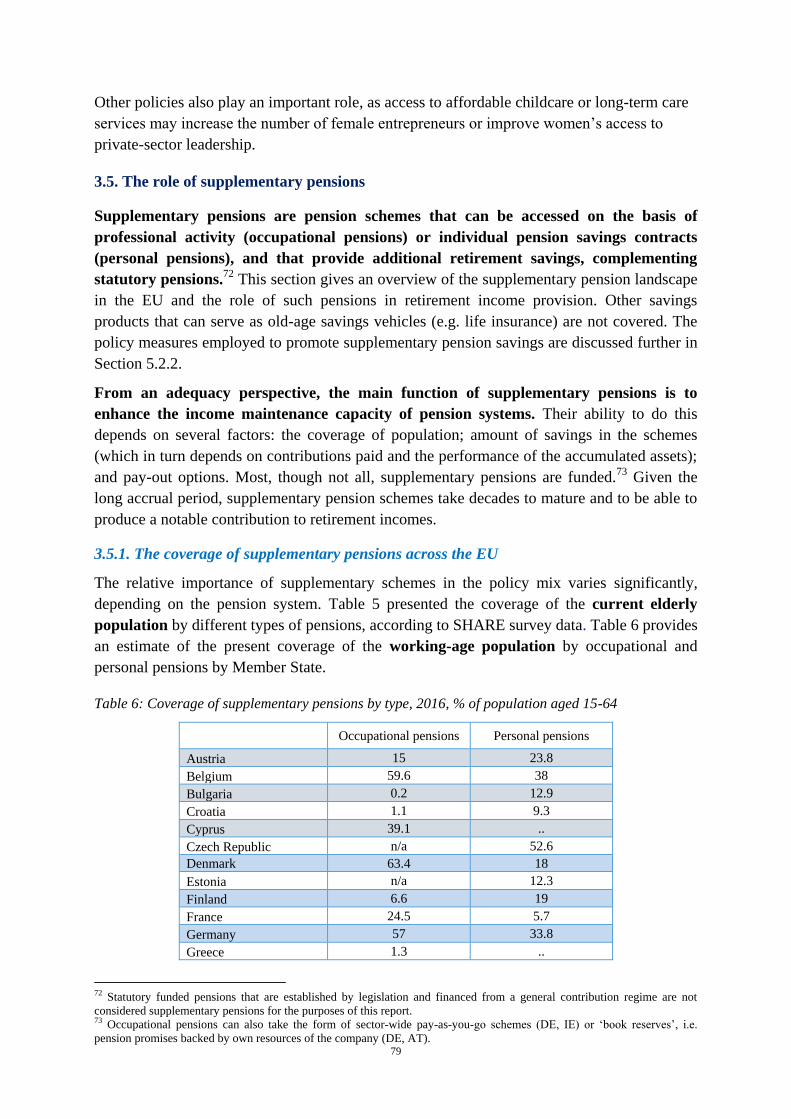
79
Other policies also play an important role, as access to affordable childcare or long-term care
services may increase the number of female entrepreneurs or improve women’s access to
private-sector leadership.
3.5. The role of supplementary pensions
Supplementary pensions are pension schemes that can be accessed on the basis of
professional activity (occupational pensions) or individual pension savings contracts
(personal pensions), and that provide additional retirement savings, complementing
statutory pensions.72
This section gives an overview of the supplementary pension landscape
in the EU and the role of such pensions in retirement income provision. Other savings
products that can serve as old-age savings vehicles (e.g. life insurance) are not covered. The
policy measures employed to promote supplementary pension savings are discussed further in
Section 5.2.2.
From an adequacy perspective, the main function of supplementary pensions is to
enhance the income maintenance capacity of pension systems. Their ability to do this
depends on several factors: the coverage of population; amount of savings in the schemes
(which in turn depends on contributions paid and the performance of the accumulated assets);
and pay-out options. Most, though not all, supplementary pensions are funded.73
Given the
long accrual period, supplementary pension schemes take decades to mature and to be able to
produce a notable contribution to retirement incomes.
3.5.1. The coverage of supplementary pensions across the EU
The relative importance of supplementary schemes in the policy mix varies significantly,
depending on the pension system. Table 5 presented the coverage of the current elderly
population by different types of pensions, according to SHARE survey data. Table 6 provides
an estimate of the present coverage of the working-age population by occupational and
personal pensions by Member State.
Table 6: Coverage of supplementary pensions by type, 2016, % of population aged 15-64
Occupational pensions Personal pensions
Austria 15 23.8
Belgium 59.6 38
Bulgaria 0.2 12.9
Croatia 1.1 9.3
Cyprus 39.1 ..
Czech Republic n/a 52.6
Denmark 63.4 18
Estonia n/a 12.3
Finland 6.6 19
France 24.5 5.7
Germany 57 33.8
Greece 1.3 ..
72 Statutory funded pensions that are established by legislation and financed from a general contribution regime are not
considered supplementary pensions for the purposes of this report. 73 Occupational pensions can also take the form of sector-wide pay-as-you-go schemes (DE, IE) or ‘book reserves’, i.e.
pension promises backed by own resources of the company (DE, AT).
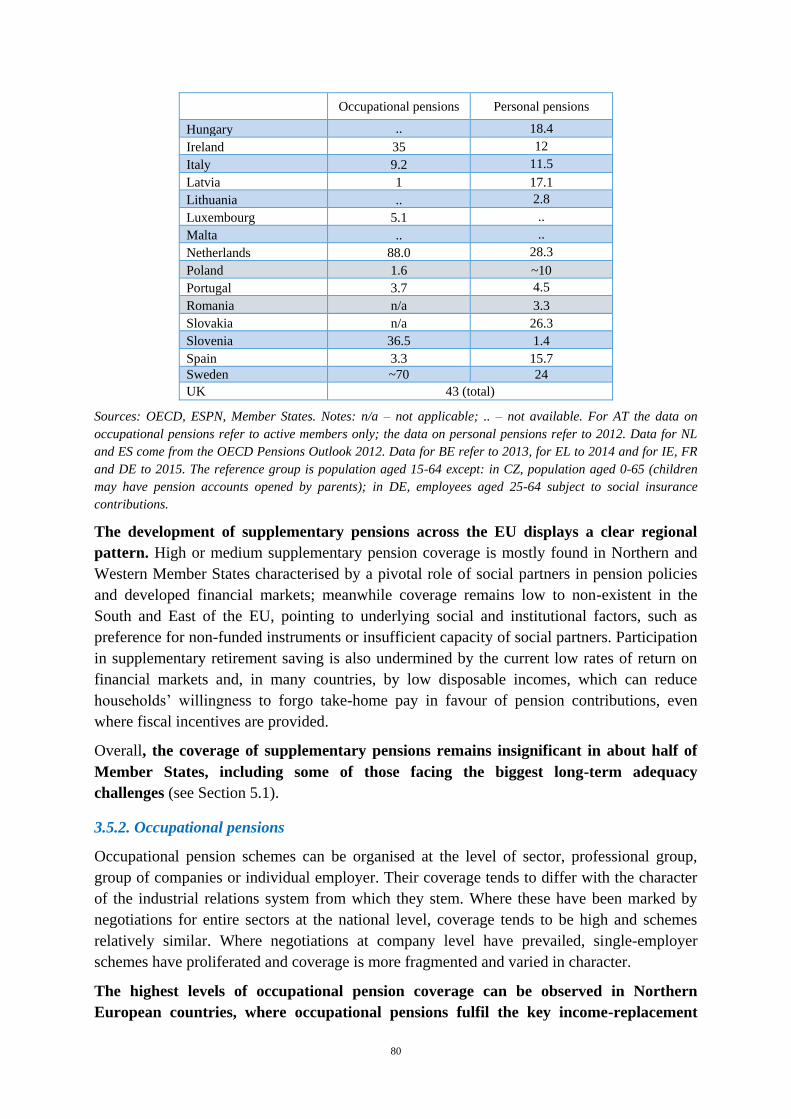
80
Occupational pensions Personal pensions
Hungary .. 18.4
Ireland 35 12
Italy 9.2 11.5
Latvia 1 17.1
Lithuania .. 2.8
Luxembourg 5.1 ..
Malta .. ..
Netherlands 88.0 28.3
Poland 1.6 ~10
Portugal 3.7 4.5
Romania n/a 3.3
Slovakia n/a 26.3
Slovenia 36.5 1.4
Spain 3.3 15.7
Sweden ~70 24
UK 43 (total)
Sources: OECD, ESPN, Member States. Notes: n/a – not applicable; .. – not available. For AT the data on
occupational pensions refer to active members only; the data on personal pensions refer to 2012. Data for NL
and ES come from the OECD Pensions Outlook 2012. Data for BE refer to 2013, for EL to 2014 and for IE, FR
and DE to 2015. The reference group is population aged 15-64 except: in CZ, population aged 0-65 (children
may have pension accounts opened by parents); in DE, employees aged 25-64 subject to social insurance
contributions.
The development of supplementary pensions across the EU displays a clear regional
pattern. High or medium supplementary pension coverage is mostly found in Northern and
Western Member States characterised by a pivotal role of social partners in pension policies
and developed financial markets; meanwhile coverage remains low to non-existent in the
South and East of the EU, pointing to underlying social and institutional factors, such as
preference for non-funded instruments or insufficient capacity of social partners. Participation
in supplementary retirement saving is also undermined by the current low rates of return on
financial markets and, in many countries, by low disposable incomes, which can reduce
households’ willingness to forgo take-home pay in favour of pension contributions, even
where fiscal incentives are provided.
Overall, the coverage of supplementary pensions remains insignificant in about half of
Member States, including some of those facing the biggest long-term adequacy
challenges (see Section 5.1).
3.5.2. Occupational pensions
Occupational pension schemes can be organised at the level of sector, professional group,
group of companies or individual employer. Their coverage tends to differ with the character
of the industrial relations system from which they stem. Where these have been marked by
negotiations for entire sectors at the national level, coverage tends to be high and schemes
relatively similar. Where negotiations at company level have prevailed, single-employer
schemes have proliferated and coverage is more fragmented and varied in character.
The highest levels of occupational pension coverage can be observed in Northern
European countries, where occupational pensions fulfil the key income-replacement
81
function in old age and are quasi-mandatory74
(the Netherlands, Sweden, Denmark). The
same countries, along with the UK, have the highest rates of pension assets relative to GDP
(OECD, 2017a). Among the Nordic countries, Finland stands apart with a relatively low
coverage of supplementary pensions; however, the earnings-related component of the public
pillar is organised in a semi-occupational manner, with a strong role of social partners.
Box 10: Occupational pension schemes in Denmark, the Netherlands and Sweden
In Denmark, occupational pension schemes based on collective agreements provide compulsory
coverage for employees. These, mostly sector-wide, schemes cover about 90 percent of wage earners.
In 2014, only 6 percent of full-time employed persons did not contribute to occupational pensions.
Low coverage rates are found in sectors with a large share of unskilled and non-organised labour, such
as agriculture, sales and restaurants. The bulk of occupational pensions in Denmark are fully funded
DC schemes. Contributions vary across sectors and depend on the amount of eligible work in the
reference year. On average, employees covered by occupational pensions paid 12 percent of their
income in pension contributions in 2014.
In the Netherlands, occupational pension schemes are collectively organised by employers and
unions, as part of collective agreements, and are quasi-mandatory. Legislation on the extension of
collective agreements to entire sectors and the wide coverage of such agreements ensure very high
participation (88% of the population aged 15-64). The self-employed without personnel and those
working very few hours are less likely to be covered. Occupational pensions are closely integrated
with the public old-age pension (AOW) and typically pay a defined benefit equal to 70 percent of
average wages (including AOW) for 40 years of service. Employers typically pay two-thirds of the
pension contribution, and employees the rest. All participants in the same scheme pay the same
contribution rate. Most schemes base their pensionable age on the statutory retirement age.
In Sweden, occupational pension plans are also negotiated between the social partners. Occupational
pensions have become increasingly important, as four broad agreements cover nearly 90 percent of
Swedish wage earners (blue-collar private-sector workers, white-collar private-sector workers, state
employees and municipal employees). In general, the new occupational DC pension schemes have a
contribution rate of 4.5 percent of wages below the statutory pension ceiling, and 30 percent of wages
above it.
Some Bismarckian pension systems, where occupational pensions play a more
complementary role to public pensions and have largely developed in a decentralised
manner, have also attained remarkably broad coverage (Belgium, Germany). However,
the level of savings – and, by implication, the capacity to contribute to income replacement in
old age – still remains much more limited in these countries. Germany, in particular, is
characterised by a highly fragmented occupational pension landscape, with many small,
single-employer schemes. In 2015, 57 percent of employees acquired entitlements in an
occupational pension scheme, with significant differences between sectors of the economy,
company size and gender. In an attempt to facilitate occupational pension provision,
significant changes to the regulatory framework were agreed in 2017, making it more flexible
in terms of type of entitlements and scheme set-up.
74 That is, these schemes are not mandated by legislation, but industry- and nation-wide collective agreements require
employers to establish schemes and employees to join them. Some categories, such as self-employed and non-standard
workers, may still be exempt, hence the coverage falls short of universal.
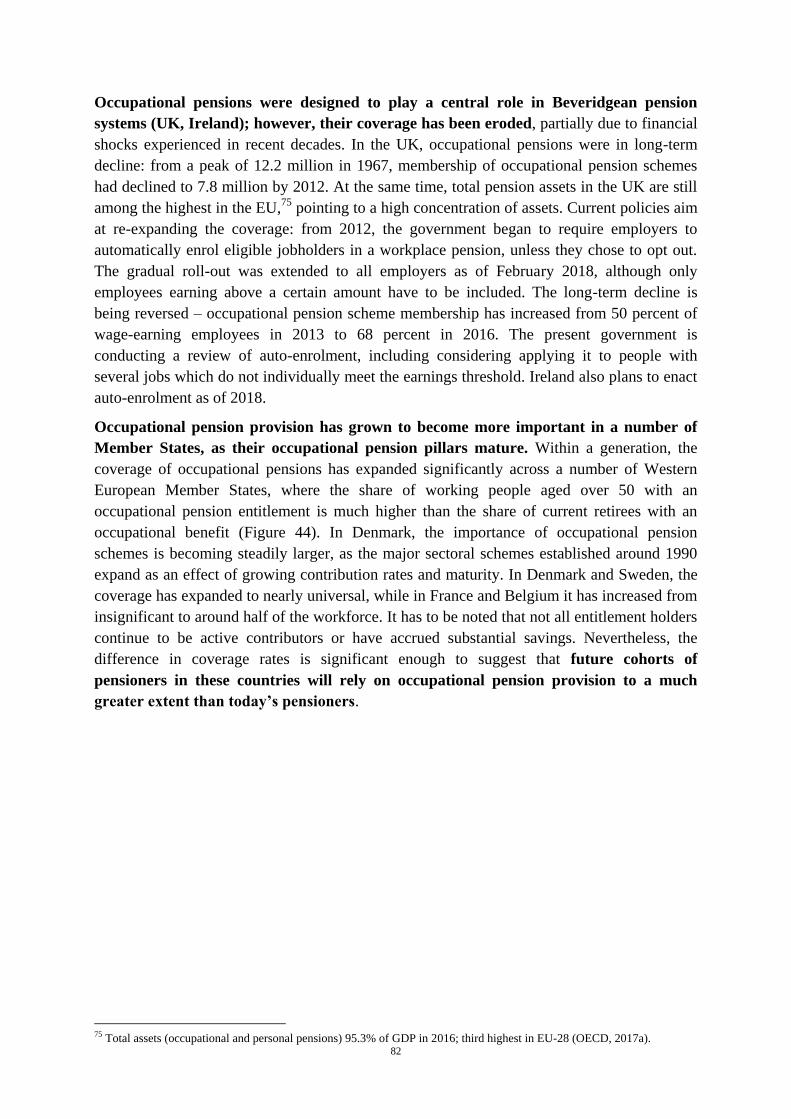
82
Occupational pensions were designed to play a central role in Beveridgean pension
systems (UK, Ireland); however, their coverage has been eroded, partially due to financial
shocks experienced in recent decades. In the UK, occupational pensions were in long-term
decline: from a peak of 12.2 million in 1967, membership of occupational pension schemes
had declined to 7.8 million by 2012. At the same time, total pension assets in the UK are still
among the highest in the EU,75
pointing to a high concentration of assets. Current policies aim
at re-expanding the coverage: from 2012, the government began to require employers to
automatically enrol eligible jobholders in a workplace pension, unless they chose to opt out.
The gradual roll-out was extended to all employers as of February 2018, although only
employees earning above a certain amount have to be included. The long-term decline is
being reversed – occupational pension scheme membership has increased from 50 percent of
wage-earning employees in 2013 to 68 percent in 2016. The present government is
conducting a review of auto-enrolment, including considering applying it to people with
several jobs which do not individually meet the earnings threshold. Ireland also plans to enact
auto-enrolment as of 2018.
Occupational pension provision has grown to become more important in a number of
Member States, as their occupational pension pillars mature. Within a generation, the
coverage of occupational pensions has expanded significantly across a number of Western
European Member States, where the share of working people aged over 50 with an
occupational pension entitlement is much higher than the share of current retirees with an
occupational benefit (Figure 44). In Denmark, the importance of occupational pension
schemes is becoming steadily larger, as the major sectoral schemes established around 1990
expand as an effect of growing contribution rates and maturity. In Denmark and Sweden, the
coverage has expanded to nearly universal, while in France and Belgium it has increased from
insignificant to around half of the workforce. It has to be noted that not all entitlement holders
continue to be active contributors or have accrued substantial savings. Nevertheless, the
difference in coverage rates is significant enough to suggest that future cohorts of
pensioners in these countries will rely on occupational pension provision to a much
greater extent than today’s pensioners.
75 Total assets (occupational and personal pensions) 95.3% of GDP in 2016; third highest in EU-28 (OECD, 2017a).
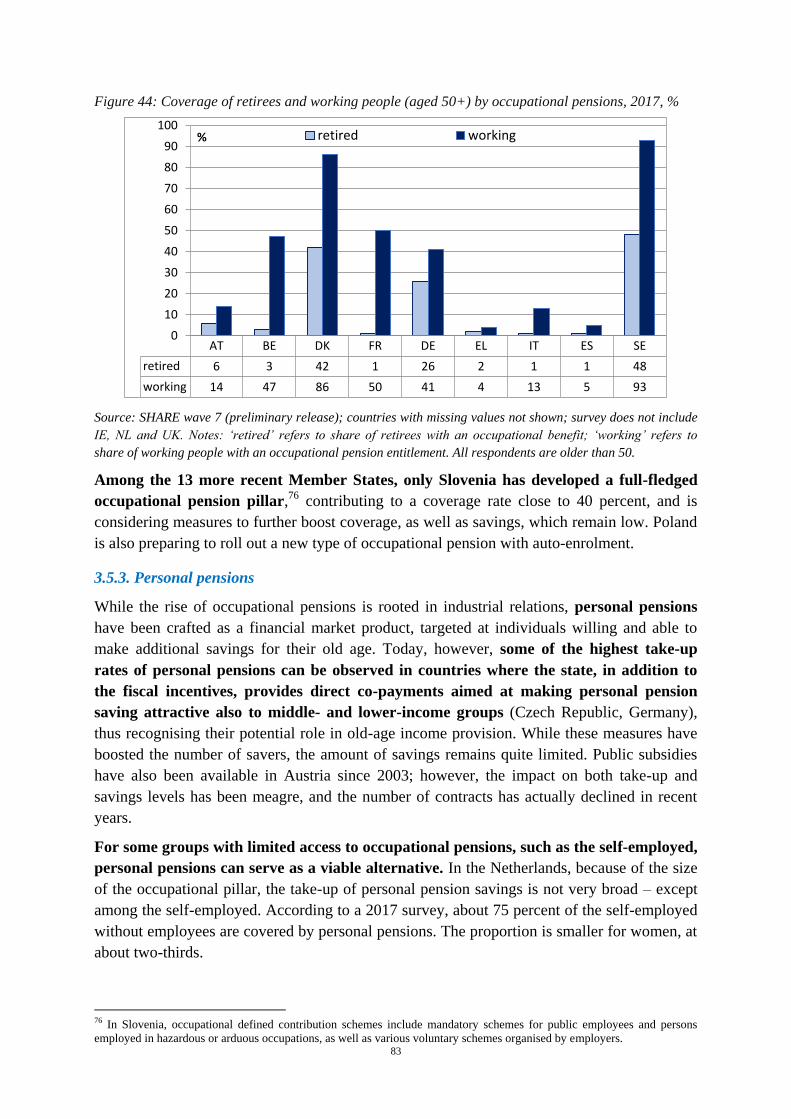
83
Figure 44: Coverage of retirees and working people (aged 50+) by occupational pensions, 2017, %
Source: SHARE wave 7 (preliminary release); countries with missing values not shown; survey does not include
IE, NL and UK. Notes: ‘retired’ refers to share of retirees with an occupational benefit; ‘working’ refers to
share of working people with an occupational pension entitlement. All respondents are older than 50.
Among the 13 more recent Member States, only Slovenia has developed a full-fledged
occupational pension pillar,76
contributing to a coverage rate close to 40 percent, and is
considering measures to further boost coverage, as well as savings, which remain low. Poland
is also preparing to roll out a new type of occupational pension with auto-enrolment.
3.5.3. Personal pensions
While the rise of occupational pensions is rooted in industrial relations, personal pensions
have been crafted as a financial market product, targeted at individuals willing and able to
make additional savings for their old age. Today, however, some of the highest take-up
rates of personal pensions can be observed in countries where the state, in addition to
the fiscal incentives, provides direct co-payments aimed at making personal pension
saving attractive also to middle- and lower-income groups (Czech Republic, Germany),
thus recognising their potential role in old-age income provision. While these measures have
boosted the number of savers, the amount of savings remains quite limited. Public subsidies
have also been available in Austria since 2003; however, the impact on both take-up and
savings levels has been meagre, and the number of contracts has actually declined in recent
years.
For some groups with limited access to occupational pensions, such as the self-employed,
personal pensions can serve as a viable alternative. In the Netherlands, because of the size
of the occupational pillar, the take-up of personal pension savings is not very broad – except
among the self-employed. According to a 2017 survey, about 75 percent of the self-employed
without employees are covered by personal pensions. The proportion is smaller for women, at
about two-thirds.
76 In Slovenia, occupational defined contribution schemes include mandatory schemes for public employees and persons
employed in hazardous or arduous occupations, as well as various voluntary schemes organised by employers.
AT BE DK FR DE EL IT ES SE
retired 6 3 42 1 26 2 1 1 48
working 14 47 86 50 41 4 13 5 93
0
10
20
30
40
50
60
70
80
90
100% retired working
84
Personal pensions can sometimes develop in the direction of occupational pensions. In
some Central European Member States, in particular the Czech Republic, employer co-
payments to employee personal pension plans are becoming an increasingly popular element
of the pay package, suggesting that they are to an extent taking on the function of
occupational pensions.
3.5.4. Payment duration
The eligibility age and rules governing the payment of supplementary pensions vary
widely and can differ from those that apply to statutory pensions.
In some cases, supplementary pensions can serve as a de facto bridging benefit with a
lower eligibility age, aimed at providing income replacement during the gap between
labour market withdrawal and reaching the statutory pensionable age. In Slovenia, a
special scheme for workers employed in hazardous or arduous jobs offers them bridging
pensions up to the standard pensionable age, should they retire early. In the Czech Republic,
since 2013 it has been possible to claim personal pension benefits up to 5 years before
reaching the pensionable age and drawing the public old-age pension (also primarily targeting
arduous work, though this is not a precondition).
Supplementary pensions can be designed to accommodate flexible retirement pathways.
In Latvia, supplementary pension benefits can be claimed from 55 years and can be fully
combined with work income, without affecting the accumulation of statutory pension rights.
In the Netherlands, many collectively negotiated occupational pensions offer flexibility
concerning partial or full early retirement, but there is wide variation across collective
agreements. The social partners have introduced measures in most pension schemes that allow
flexible retirement, mainly by combining part-time work with a part-time pension.
Pay-out options are more diverse and flexible than for statutory pensions, ranging from
lifetime annuities to lump-sum pay-outs, with several options in between (accelerated
annuities, gradual draw-down). In general, where supplementary pension schemes are
designed to play a central role in old-age income replacement, pay-out options tend to be
more restrictive and more likely to impose a lifetime annuity to protect the beneficiary’s
income from the longevity risk (with exceptions, such as the recent abolition of lifetime
annuity obligation in the UK).
3.6. Income from work up to and after the pensionable age
As contributory period requirements and eligibility ages for public pensions are increasing in
nearly all Member States, building an entitlement to an adequate pension will increasingly
depend on people’s ability to have longer working lives. Longer working lives will also be
necessary for people to sustain themselves until they can receive a pension; and to
compensate for otherwise decreasing benefits in view of longer lives. The success of pension
reforms that seek to contain cost by raising the pensionable age and reducing early-exit
pathways out of the labour market is predicated on people extending their employment and
avoiding having to draw on alternative transfer incomes before they reach the pensionable
age.
85
3.6.1. Developments in older people’s employment
Since the beginning of the millennium, the average effective age of labour market exit (i.e.
effective retirement age) has again been increasing, after a long decline (Figure 45). The
recent increase has been stronger among women, who narrowed the gender gap in the
effective age of retirement to about 1 year in 2016. Several factors are likely to have
contributed to this. The structural rise in labour force participation and employment rates for
women would be one. The overall increase in educational achievement levels (which impact
on employability, adaptability, age of entry into the workforce, etc.) is another. The very
significant growth in the share of service sector and public employment since the 1970s (at
the cost of manufacture and primary occupations), as well as improvements in average health,
should be counted among likely drivers of the change.
Figure 45: Average effective labour market exit age, EU-28 by gender, 1970-2016, years
Source: OECD estimates for EU-28 based on the results of national labour force surveys, the European Union
Labour Force Survey and, for earlier years in some countries, national censuses.
Reforms raising eligibility ages, restricting early-retirement pathways and improving financial
incentives to continue working have also mattered, but they would be just one set of
contributory factors among several.
3.6.2. Trends in late-career employment
An important proxy for the degree to which people work until the pensionable age, before
they retire and start claiming a pension, is the employment rate of older workers, referring
to the age group 55-64. This rate has increased considerably since the last report (Figure 46).
In 2013-2016, older workers accounted for most of the overall employment increase in
the EU-28 (4.25 million out of a total increase of 8.8 million).77
This trend is a continuation
of previous years. In the last decade, the number of employed older workers in the EU has
risen by 11.3 million. The increase is partly driven by ageing, as the overall number of people
in this age group has grown by 8.3 million (which corresponds to an increase of a little over 4
million workers at the current rates), although higher employment rates have played a more
77 Source: Eurostat, code lfsa_egan.
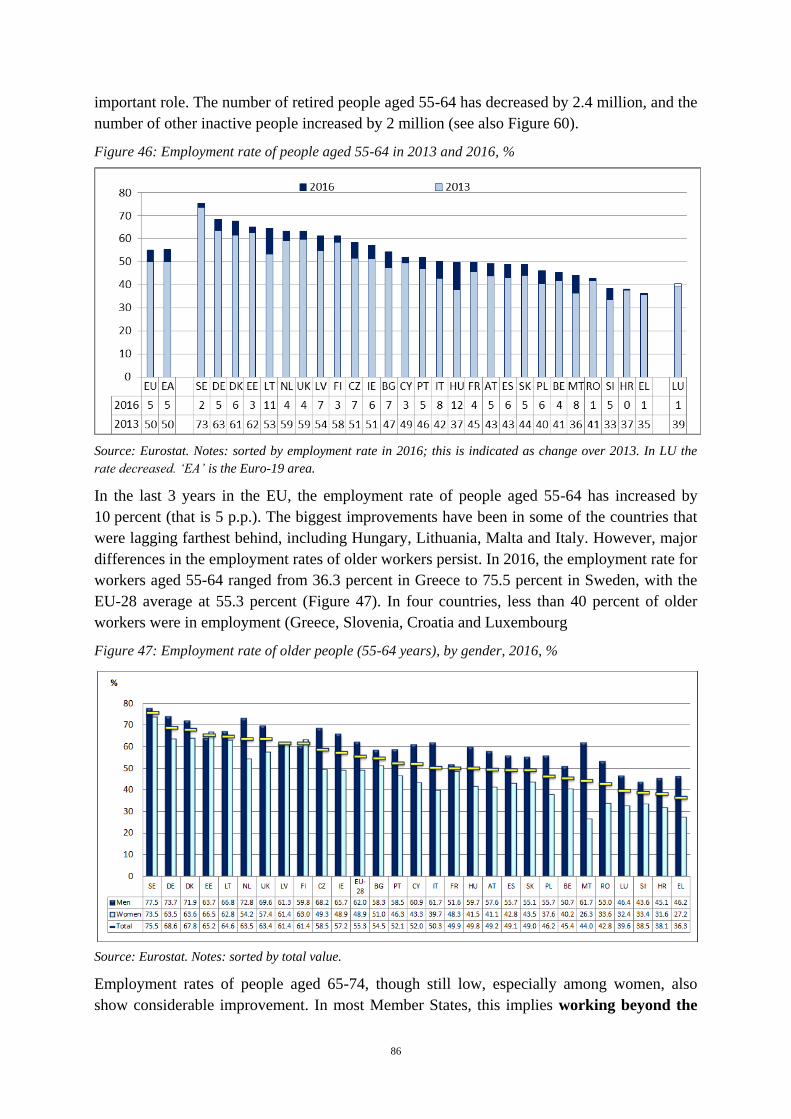
86
important role. The number of retired people aged 55-64 has decreased by 2.4 million, and the
number of other inactive people increased by 2 million (see also Figure 60).
Figure 46: Employment rate of people aged 55-64 in 2013 and 2016, %
Source: Eurostat. Notes: sorted by employment rate in 2016; this is indicated as change over 2013. In LU the
rate decreased. ‘EA’ is the Euro-19 area.
In the last 3 years in the EU, the employment rate of people aged 55-64 has increased by
10 percent (that is 5 p.p.). The biggest improvements have been in some of the countries that
were lagging farthest behind, including Hungary, Lithuania, Malta and Italy. However, major
differences in the employment rates of older workers persist. In 2016, the employment rate for
workers aged 55-64 ranged from 36.3 percent in Greece to 75.5 percent in Sweden, with the
EU-28 average at 55.3 percent (Figure 47). In four countries, less than 40 percent of older
workers were in employment (Greece, Slovenia, Croatia and Luxembourg
Figure 47: Employment rate of older people (55-64 years), by gender, 2016, %
Source: Eurostat. Notes: sorted by total value.
Employment rates of people aged 65-74, though still low, especially among women, also
show considerable improvement. In most Member States, this implies working beyond the
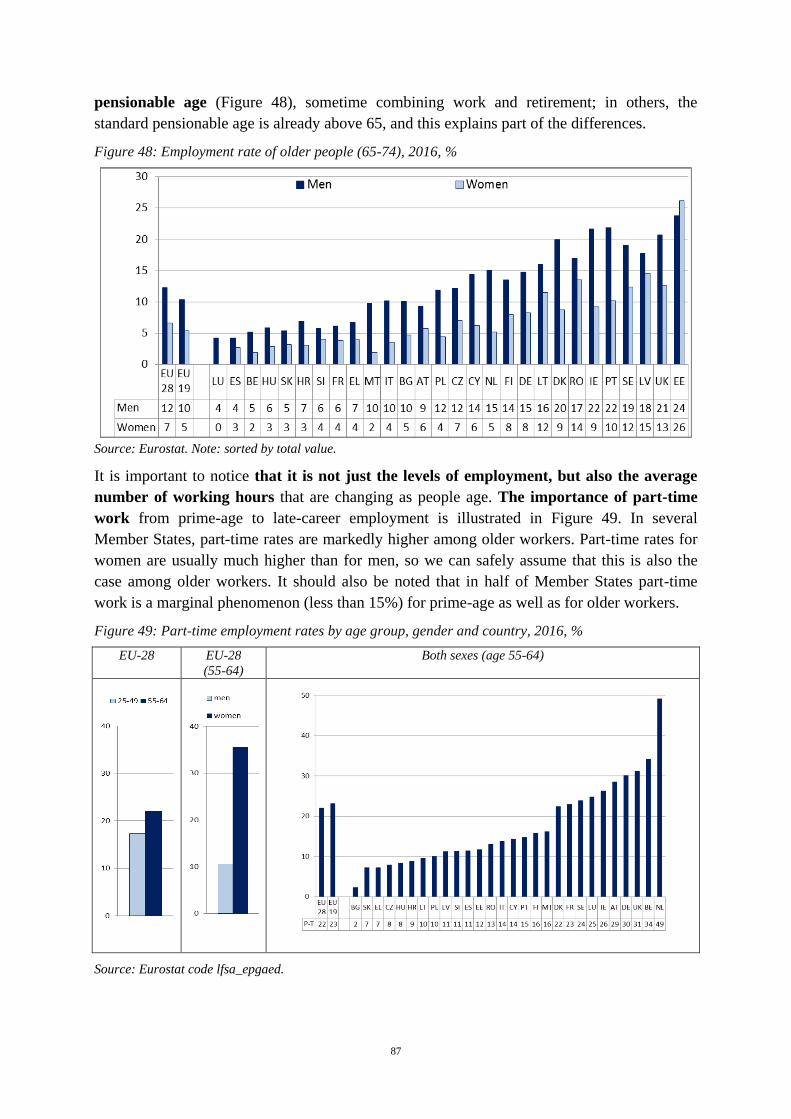
87
pensionable age (Figure 48), sometime combining work and retirement; in others, the
standard pensionable age is already above 65, and this explains part of the differences.
Figure 48: Employment rate of older people (65-74), 2016, %
Source: Eurostat. Note: sorted by total value.
It is important to notice that it is not just the levels of employment, but also the average
number of working hours that are changing as people age. The importance of part-time
work from prime-age to late-career employment is illustrated in Figure 49. In several
Member States, part-time rates are markedly higher among older workers. Part-time rates for
women are usually much higher than for men, so we can safely assume that this is also the
case among older workers. It should also be noted that in half of Member States part-time
work is a marginal phenomenon (less than 15%) for prime-age as well as for older workers.
Figure 49: Part-time employment rates by age group, gender and country, 2016, %
EU-28 EU-28
(55-64)
Both sexes (age 55-64)
Source: Eurostat code lfsa_epgaed.
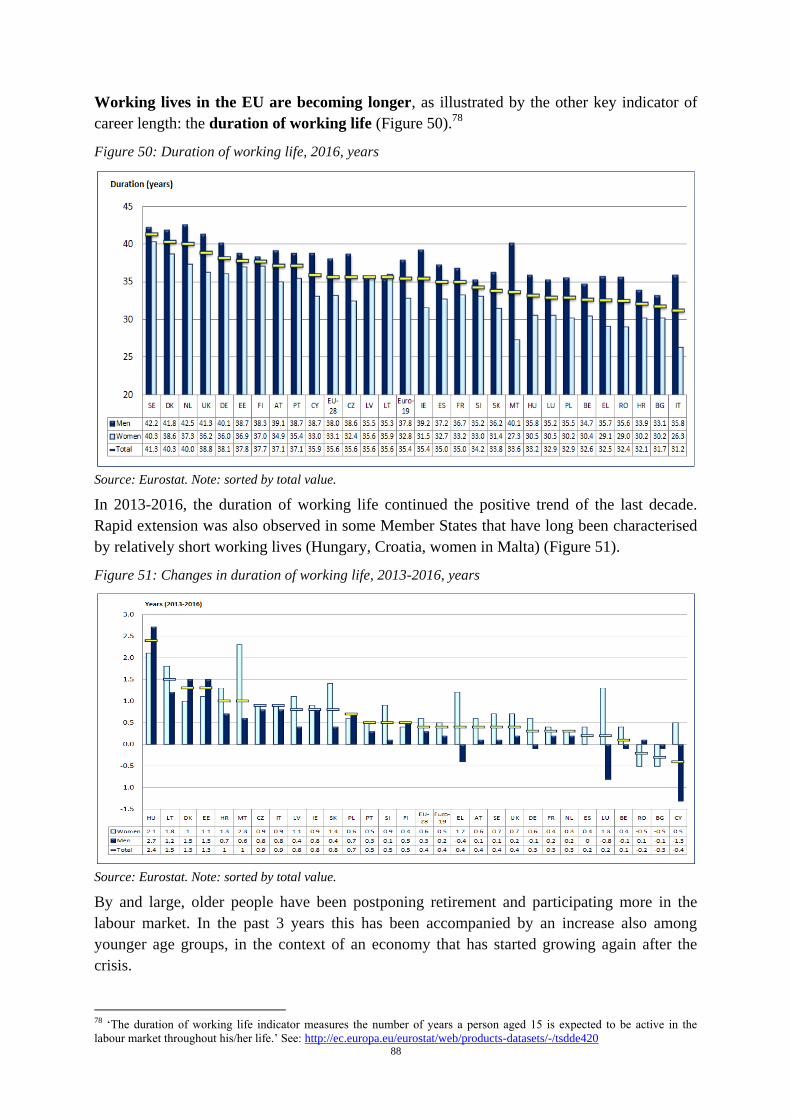
88
Working lives in the EU are becoming longer, as illustrated by the other key indicator of
career length: the duration of working life (Figure 50).78
Figure 50: Duration of working life, 2016, years
Source: Eurostat. Note: sorted by total value.
In 2013-2016, the duration of working life continued the positive trend of the last decade.
Rapid extension was also observed in some Member States that have long been characterised
by relatively short working lives (Hungary, Croatia, women in Malta) (Figure 51).
Figure 51: Changes in duration of working life, 2013-2016, years
Source: Eurostat. Note: sorted by total value.
By and large, older people have been postponing retirement and participating more in the
labour market. In the past 3 years this has been accompanied by an increase also among
younger age groups, in the context of an economy that has started growing again after the
crisis.
78 ‘The duration of working life indicator measures the number of years a person aged 15 is expected to be active in the
labour market throughout his/her life.’ See: http://ec.europa.eu/eurostat/web/products-datasets/-/tsdde420
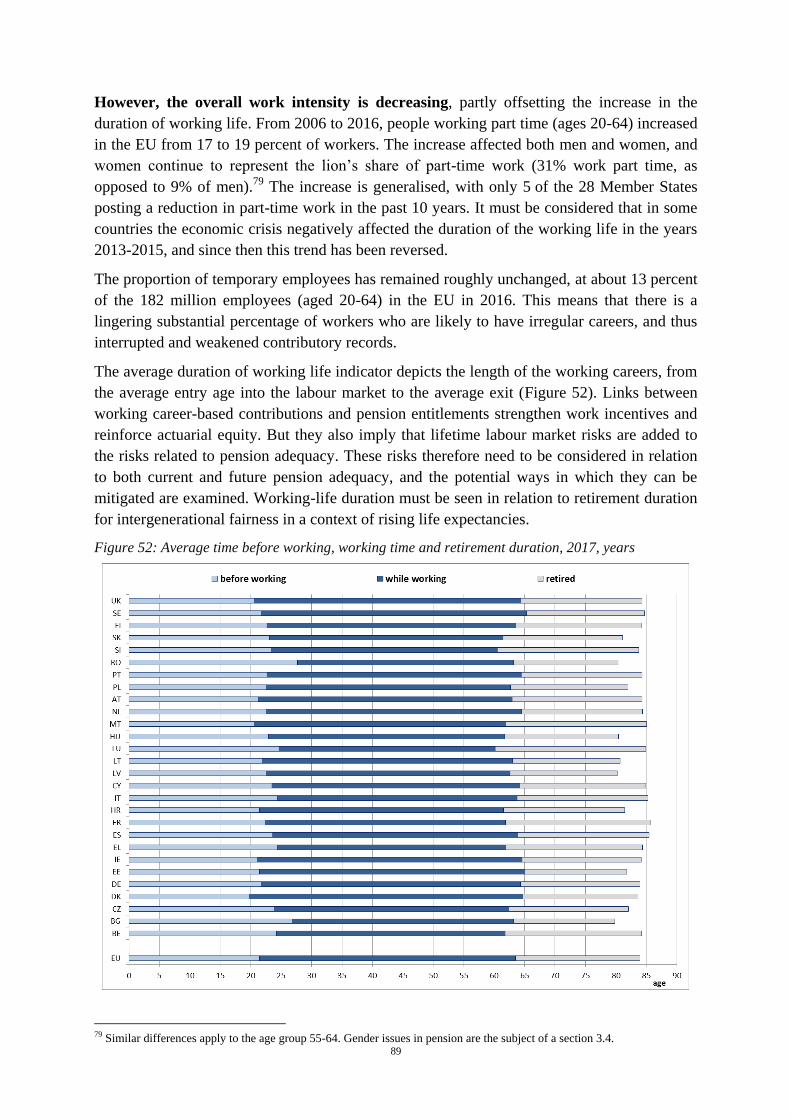
89
However, the overall work intensity is decreasing, partly offsetting the increase in the
duration of working life. From 2006 to 2016, people working part time (ages 20-64) increased
in the EU from 17 to 19 percent of workers. The increase affected both men and women, and
women continue to represent the lion’s share of part-time work (31% work part time, as
opposed to 9% of men).79
The increase is generalised, with only 5 of the 28 Member States
posting a reduction in part-time work in the past 10 years. It must be considered that in some
countries the economic crisis negatively affected the duration of the working life in the years
2013-2015, and since then this trend has been reversed.
The proportion of temporary employees has remained roughly unchanged, at about 13 percent
of the 182 million employees (aged 20-64) in the EU in 2016. This means that there is a
lingering substantial percentage of workers who are likely to have irregular careers, and thus
interrupted and weakened contributory records.
The average duration of working life indicator depicts the length of the working careers, from
the average entry age into the labour market to the average exit (Figure 52). Links between
working career-based contributions and pension entitlements strengthen work incentives and
reinforce actuarial equity. But they also imply that lifetime labour market risks are added to
the risks related to pension adequacy. These risks therefore need to be considered in relation
to both current and future pension adequacy, and the potential ways in which they can be
mitigated are examined. Working-life duration must be seen in relation to retirement duration
for intergenerational fairness in a context of rising life expectancies.
Figure 52: Average time before working, working time and retirement duration, 2017, years
79 Similar differences apply to the age group 55-64. Gender issues in pension are the subject of a section 3.4.
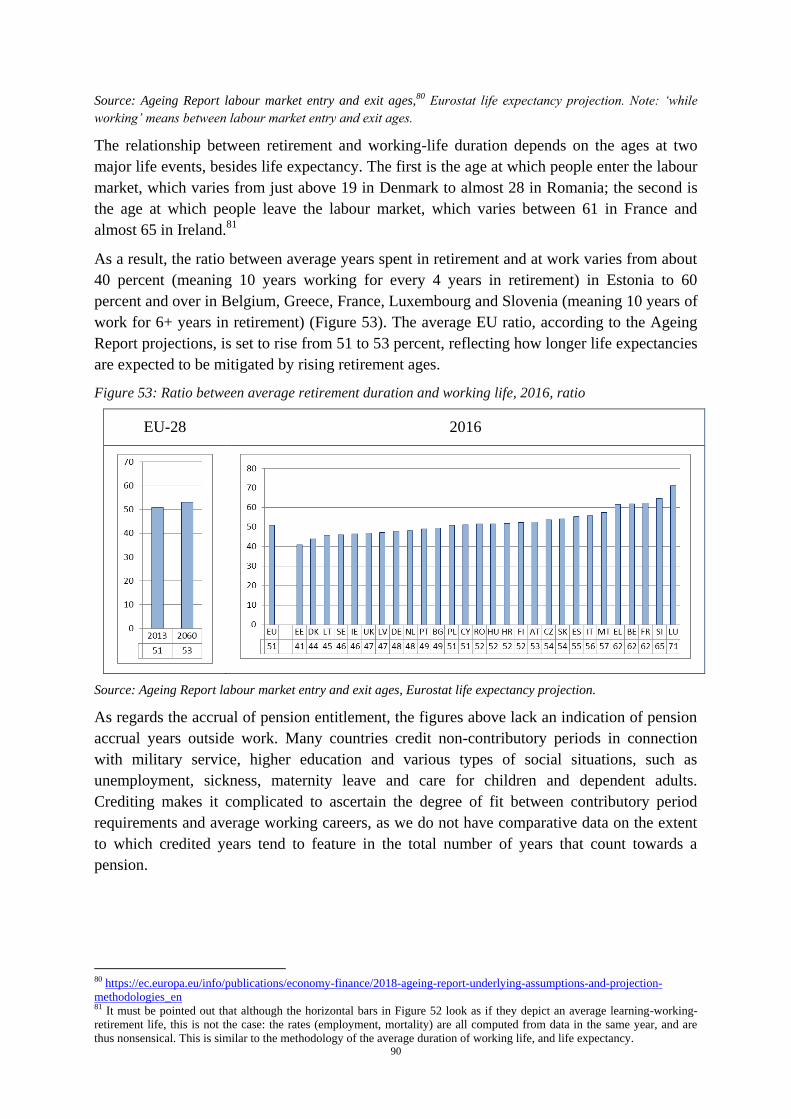
90
Source: Ageing Report labour market entry and exit ages,80 Eurostat life expectancy projection. Note: ‘while
working’ means between labour market entry and exit ages.
The relationship between retirement and working-life duration depends on the ages at two
major life events, besides life expectancy. The first is the age at which people enter the labour
market, which varies from just above 19 in Denmark to almost 28 in Romania; the second is
the age at which people leave the labour market, which varies between 61 in France and
almost 65 in Ireland.81
As a result, the ratio between average years spent in retirement and at work varies from about
40 percent (meaning 10 years working for every 4 years in retirement) in Estonia to 60
percent and over in Belgium, Greece, France, Luxembourg and Slovenia (meaning 10 years of
work for 6+ years in retirement) (Figure 53). The average EU ratio, according to the Ageing
Report projections, is set to rise from 51 to 53 percent, reflecting how longer life expectancies
are expected to be mitigated by rising retirement ages.
Figure 53: Ratio between average retirement duration and working life, 2016, ratio
EU-28 2016
Source: Ageing Report labour market entry and exit ages, Eurostat life expectancy projection.
As regards the accrual of pension entitlement, the figures above lack an indication of pension
accrual years outside work. Many countries credit non-contributory periods in connection
with military service, higher education and various types of social situations, such as
unemployment, sickness, maternity leave and care for children and dependent adults.
Crediting makes it complicated to ascertain the degree of fit between contributory period
requirements and average working careers, as we do not have comparative data on the extent
to which credited years tend to feature in the total number of years that count towards a
pension.
80 https://ec.europa.eu/info/publications/economy-finance/2018-ageing-report-underlying-assumptions-and-projection-
methodologies_en 81 It must be pointed out that although the horizontal bars in Figure 52 look as if they depict an average learning-working-
retirement life, this is not the case: the rates (employment, mortality) are all computed from data in the same year, and are
thus nonsensical. This is similar to the methodology of the average duration of working life, and life expectancy.
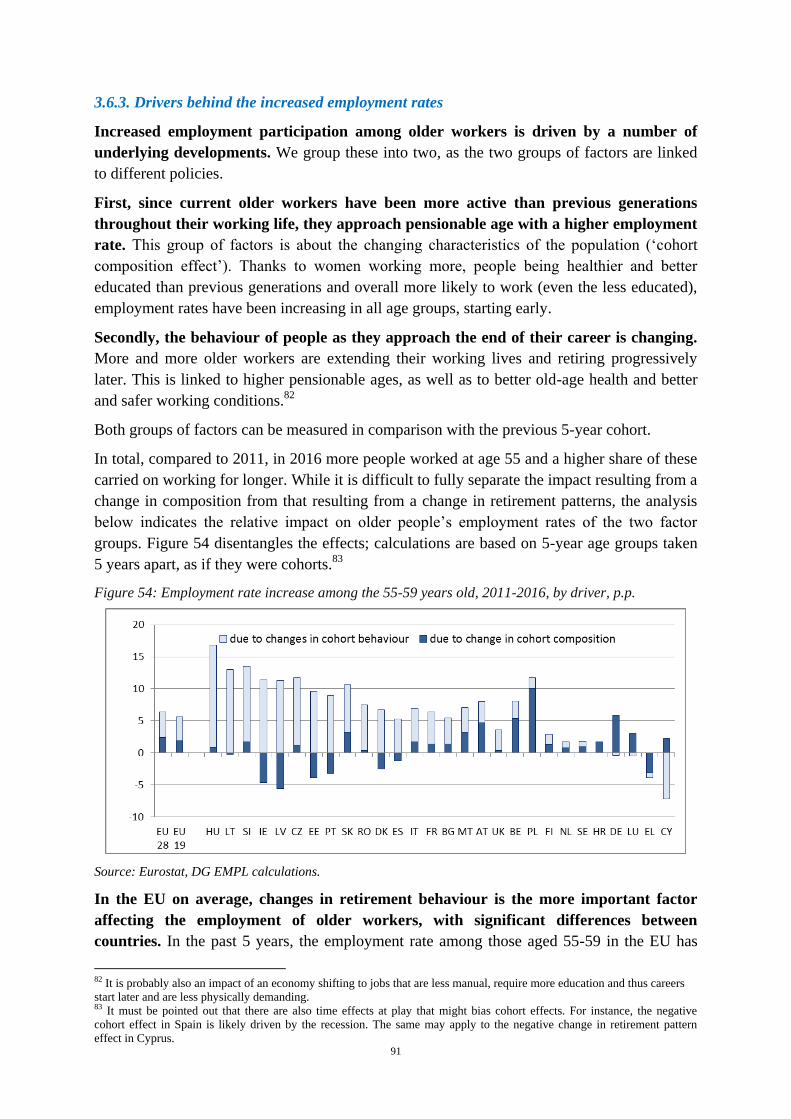
91
3.6.3. Drivers behind the increased employment rates
Increased employment participation among older workers is driven by a number of
underlying developments. We group these into two, as the two groups of factors are linked
to different policies.
First, since current older workers have been more active than previous generations
throughout their working life, they approach pensionable age with a higher employment
rate. This group of factors is about the changing characteristics of the population (‘cohort
composition effect’). Thanks to women working more, people being healthier and better
educated than previous generations and overall more likely to work (even the less educated),
employment rates have been increasing in all age groups, starting early.
Secondly, the behaviour of people as they approach the end of their career is changing.
More and more older workers are extending their working lives and retiring progressively
later. This is linked to higher pensionable ages, as well as to better old-age health and better
and safer working conditions.82
Both groups of factors can be measured in comparison with the previous 5-year cohort.
In total, compared to 2011, in 2016 more people worked at age 55 and a higher share of these
carried on working for longer. While it is difficult to fully separate the impact resulting from a
change in composition from that resulting from a change in retirement patterns, the analysis
below indicates the relative impact on older people’s employment rates of the two factor
groups. Figure 54 disentangles the effects; calculations are based on 5-year age groups taken
5 years apart, as if they were cohorts.83
Figure 54: Employment rate increase among the 55-59 years old, 2011-2016, by driver, p.p.
Source: Eurostat, DG EMPL calculations.
In the EU on average, changes in retirement behaviour is the more important factor
affecting the employment of older workers, with significant differences between
countries. In the past 5 years, the employment rate among those aged 55-59 in the EU has
82 It is probably also an impact of an economy shifting to jobs that are less manual, require more education and thus careers
start later and are less physically demanding. 83 It must be pointed out that there are also time effects at play that might bias cohort effects. For instance, the negative
cohort effect in Spain is likely driven by the recession. The same may apply to the negative change in retirement pattern
effect in Cyprus.
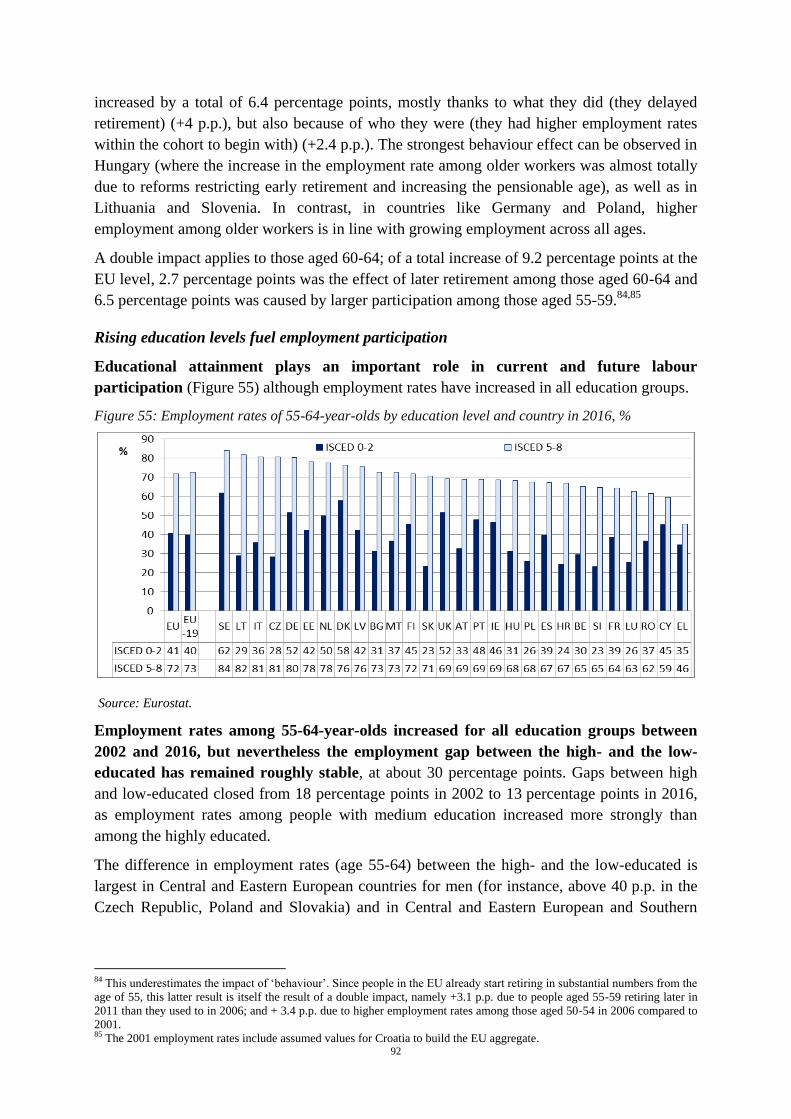
92
increased by a total of 6.4 percentage points, mostly thanks to what they did (they delayed
retirement) (+4 p.p.), but also because of who they were (they had higher employment rates
within the cohort to begin with) (+2.4 p.p.). The strongest behaviour effect can be observed in
Hungary (where the increase in the employment rate among older workers was almost totally
due to reforms restricting early retirement and increasing the pensionable age), as well as in
Lithuania and Slovenia. In contrast, in countries like Germany and Poland, higher
employment among older workers is in line with growing employment across all ages.
A double impact applies to those aged 60-64; of a total increase of 9.2 percentage points at the
EU level, 2.7 percentage points was the effect of later retirement among those aged 60-64 and
6.5 percentage points was caused by larger participation among those aged 55-59.84,85
Rising education levels fuel employment participation
Educational attainment plays an important role in current and future labour
participation (Figure 55) although employment rates have increased in all education groups.
Figure 55: Employment rates of 55-64-year-olds by education level and country in 2016, %
Source: Eurostat.
Employment rates among 55-64-year-olds increased for all education groups between
2002 and 2016, but nevertheless the employment gap between the high- and the low-
educated has remained roughly stable, at about 30 percentage points. Gaps between high
and low-educated closed from 18 percentage points in 2002 to 13 percentage points in 2016,
as employment rates among people with medium education increased more strongly than
among the highly educated.
The difference in employment rates (age 55-64) between the high- and the low-educated is
largest in Central and Eastern European countries for men (for instance, above 40 p.p. in the
Czech Republic, Poland and Slovakia) and in Central and Eastern European and Southern
84 This underestimates the impact of ‘behaviour’. Since people in the EU already start retiring in substantial numbers from the
age of 55, this latter result is itself the result of a double impact, namely +3.1 p.p. due to people aged 55-59 retiring later in
2011 than they used to in 2006; and + 3.4 p.p. due to higher employment rates among those aged 50-54 in 2006 compared to
2001. 85 The 2001 employment rates include assumed values for Croatia to build the EU aggregate.
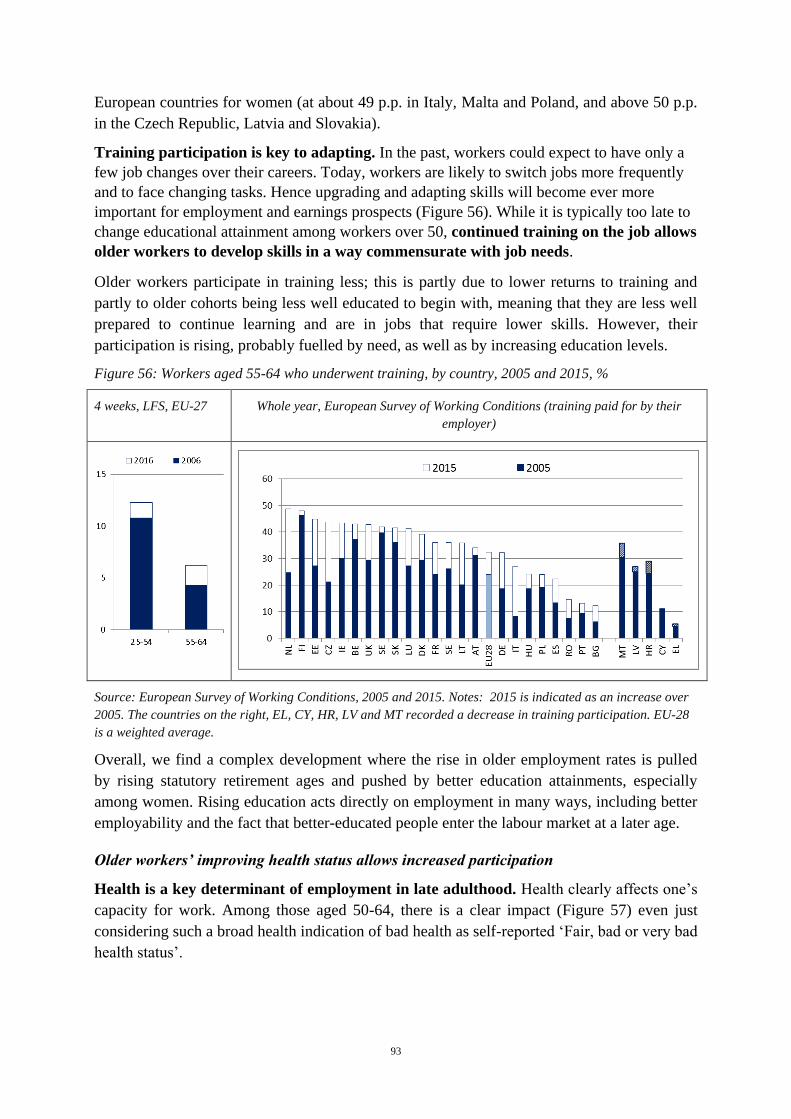
93
European countries for women (at about 49 p.p. in Italy, Malta and Poland, and above 50 p.p.
in the Czech Republic, Latvia and Slovakia).
Training participation is key to adapting. In the past, workers could expect to have only a
few job changes over their careers. Today, workers are likely to switch jobs more frequently
and to face changing tasks. Hence upgrading and adapting skills will become ever more
important for employment and earnings prospects (Figure 56). While it is typically too late to
change educational attainment among workers over 50, continued training on the job allows
older workers to develop skills in a way commensurate with job needs.
Older workers participate in training less; this is partly due to lower returns to training and
partly to older cohorts being less well educated to begin with, meaning that they are less well
prepared to continue learning and are in jobs that require lower skills. However, their
participation is rising, probably fuelled by need, as well as by increasing education levels.
Figure 56: Workers aged 55-64 who underwent training, by country, 2005 and 2015, %
4 weeks, LFS, EU-27 Whole year, European Survey of Working Conditions (training paid for by their
employer)
Source: European Survey of Working Conditions, 2005 and 2015. Notes: 2015 is indicated as an increase over
2005. The countries on the right, EL, CY, HR, LV and MT recorded a decrease in training participation. EU-28
is a weighted average.
Overall, we find a complex development where the rise in older employment rates is pulled
by rising statutory retirement ages and pushed by better education attainments, especially
among women. Rising education acts directly on employment in many ways, including better
employability and the fact that better-educated people enter the labour market at a later age.
Older workers’ improving health status allows increased participation
Health is a key determinant of employment in late adulthood. Health clearly affects one’s
capacity for work. Among those aged 50-64, there is a clear impact (Figure 57) even just
considering such a broad health indication of bad health as self-reported ‘Fair, bad or very bad
health status’.
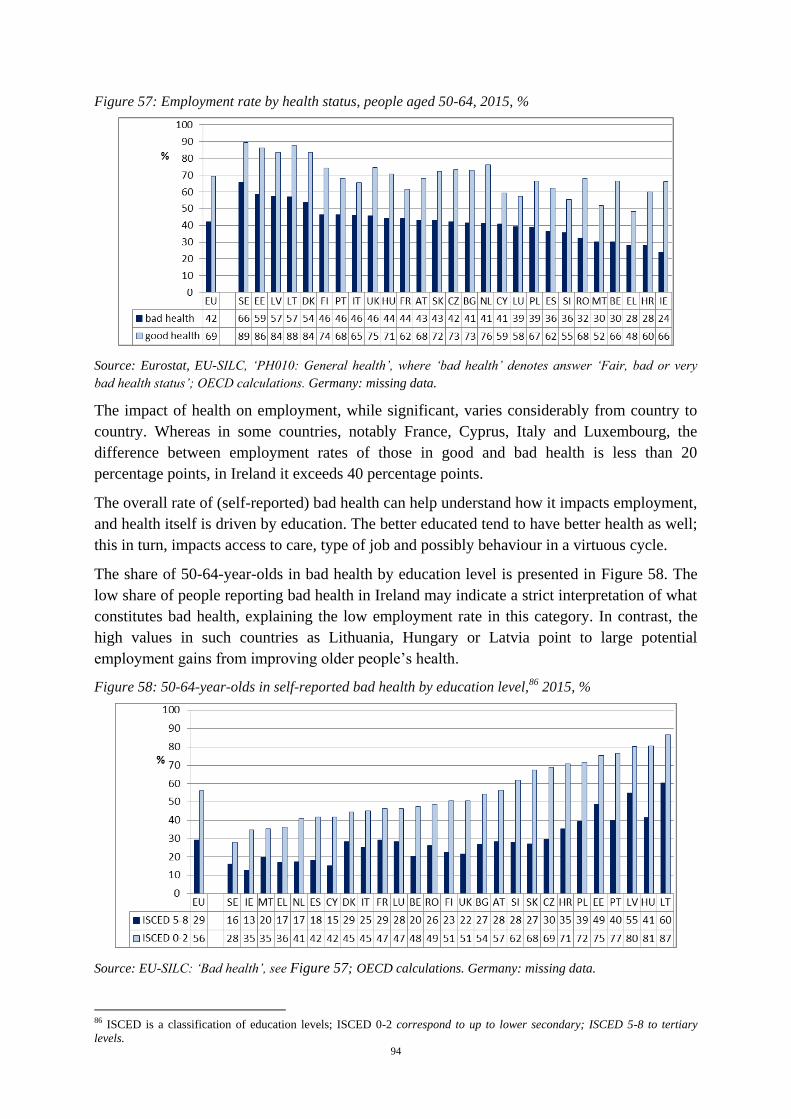
94
Figure 57: Employment rate by health status, people aged 50-64, 2015, %
Source: Eurostat, EU-SILC, ‘PH010: General health’, where ‘bad health’ denotes answer ‘Fair, bad or very
bad health status’; OECD calculations. Germany: missing data.
The impact of health on employment, while significant, varies considerably from country to
country. Whereas in some countries, notably France, Cyprus, Italy and Luxembourg, the
difference between employment rates of those in good and bad health is less than 20
percentage points, in Ireland it exceeds 40 percentage points.
The overall rate of (self-reported) bad health can help understand how it impacts employment,
and health itself is driven by education. The better educated tend to have better health as well;
this in turn, impacts access to care, type of job and possibly behaviour in a virtuous cycle.
The share of 50-64-year-olds in bad health by education level is presented in Figure 58. The
low share of people reporting bad health in Ireland may indicate a strict interpretation of what
constitutes bad health, explaining the low employment rate in this category. In contrast, the
high values in such countries as Lithuania, Hungary or Latvia point to large potential
employment gains from improving older people’s health.
Figure 58: 50-64-year-olds in self-reported bad health by education level,86 2015, %
Source: EU-SILC: ‘Bad health’, see Figure 57; OECD calculations. Germany: missing data.
86 ISCED is a classification of education levels; ISCED 0-2 correspond to up to lower secondary; ISCED 5-8 to tertiary
levels.
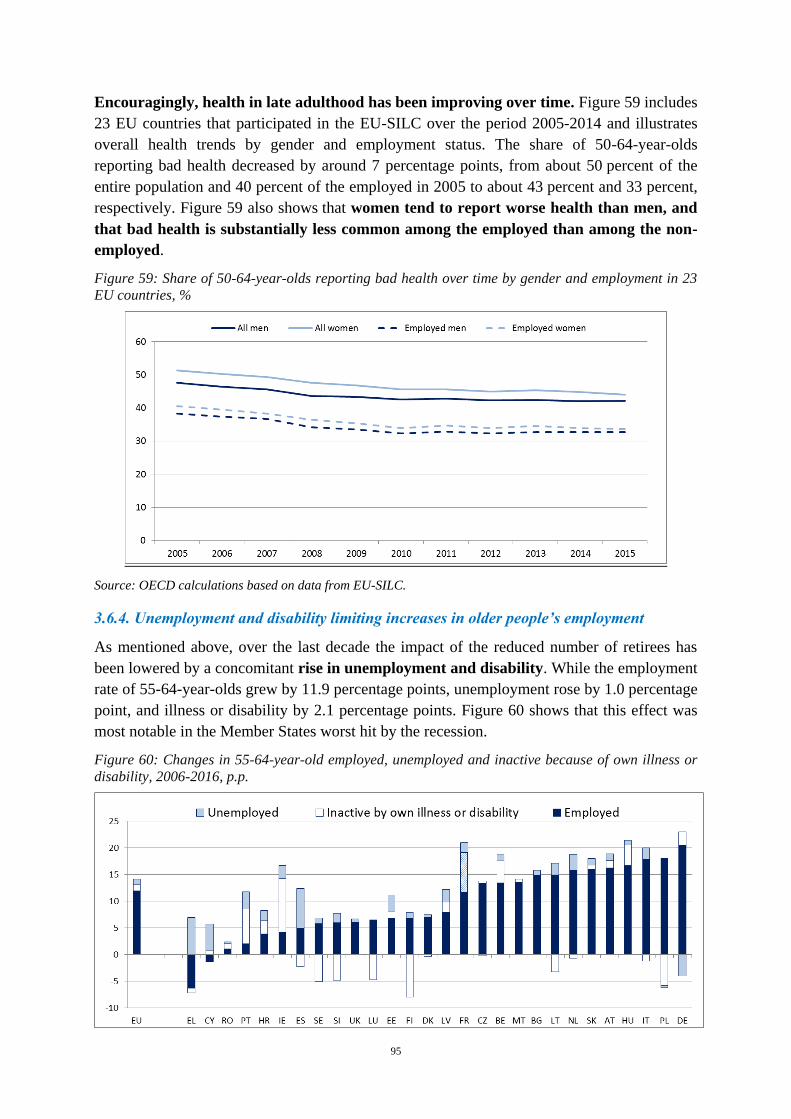
95
Encouragingly, health in late adulthood has been improving over time. Figure 59 includes
23 EU countries that participated in the EU-SILC over the period 2005-2014 and illustrates
overall health trends by gender and employment status. The share of 50-64-year-olds
reporting bad health decreased by around 7 percentage points, from about 50 percent of the
entire population and 40 percent of the employed in 2005 to about 43 percent and 33 percent,
respectively. Figure 59 also shows that women tend to report worse health than men, and
that bad health is substantially less common among the employed than among the non-
employed.
Figure 59: Share of 50-64-year-olds reporting bad health over time by gender and employment in 23
EU countries, %
Source: OECD calculations based on data from EU-SILC.
3.6.4. Unemployment and disability limiting increases in older people’s employment
As mentioned above, over the last decade the impact of the reduced number of retirees has
been lowered by a concomitant rise in unemployment and disability. While the employment
rate of 55-64-year-olds grew by 11.9 percentage points, unemployment rose by 1.0 percentage
point, and illness or disability by 2.1 percentage points. Figure 60 shows that this effect was
most notable in the Member States worst hit by the recession.
Figure 60: Changes in 55-64-year-old employed, unemployed and inactive because of own illness or
disability, 2006-2016, p.p.
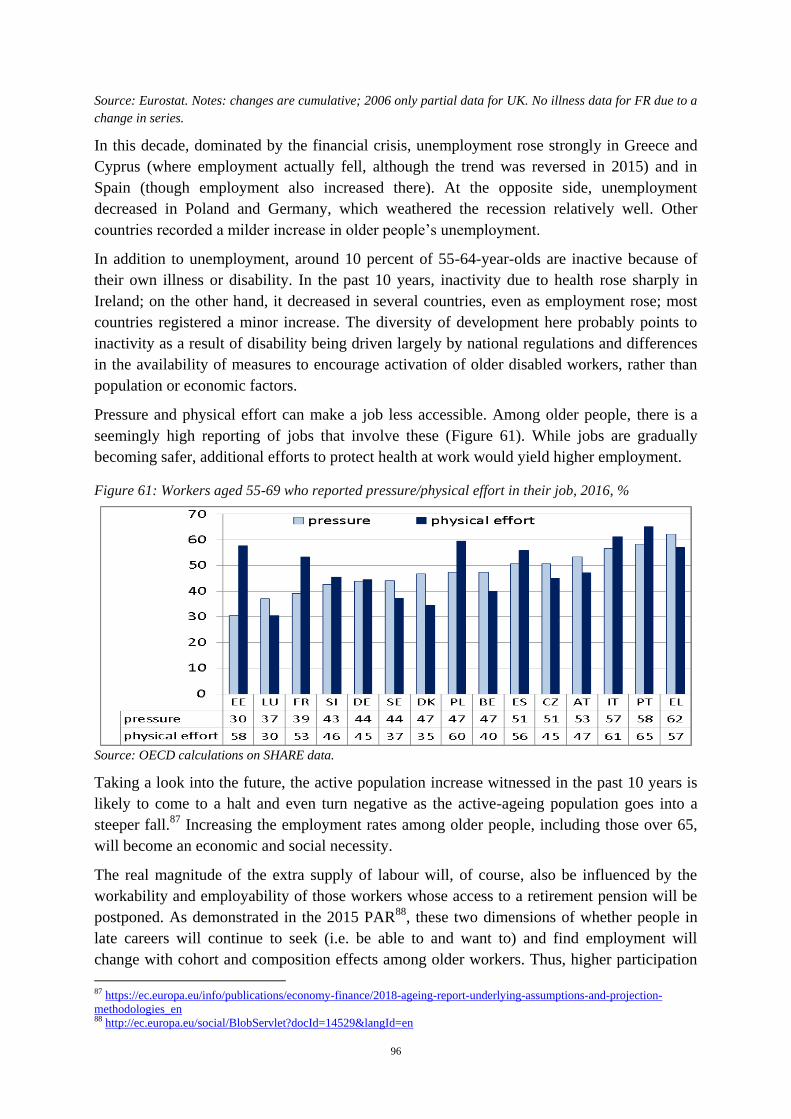
96
Source: Eurostat. Notes: changes are cumulative; 2006 only partial data for UK. No illness data for FR due to a
change in series.
In this decade, dominated by the financial crisis, unemployment rose strongly in Greece and
Cyprus (where employment actually fell, although the trend was reversed in 2015) and in
Spain (though employment also increased there). At the opposite side, unemployment
decreased in Poland and Germany, which weathered the recession relatively well. Other
countries recorded a milder increase in older people’s unemployment.
In addition to unemployment, around 10 percent of 55-64-year-olds are inactive because of
their own illness or disability. In the past 10 years, inactivity due to health rose sharply in
Ireland; on the other hand, it decreased in several countries, even as employment rose; most
countries registered a minor increase. The diversity of development here probably points to
inactivity as a result of disability being driven largely by national regulations and differences
in the availability of measures to encourage activation of older disabled workers, rather than
population or economic factors.
Pressure and physical effort can make a job less accessible. Among older people, there is a
seemingly high reporting of jobs that involve these (Figure 61). While jobs are gradually
becoming safer, additional efforts to protect health at work would yield higher employment.
Figure 61: Workers aged 55-69 who reported pressure/physical effort in their job, 2016, %
Source: OECD calculations on SHARE data.
Taking a look into the future, the active population increase witnessed in the past 10 years is
likely to come to a halt and even turn negative as the active-ageing population goes into a
steeper fall.87
Increasing the employment rates among older people, including those over 65,
will become an economic and social necessity.
The real magnitude of the extra supply of labour will, of course, also be influenced by the
workability and employability of those workers whose access to a retirement pension will be
postponed. As demonstrated in the 2015 PAR88
, these two dimensions of whether people in
late careers will continue to seek (i.e. be able to and want to) and find employment will
change with cohort and composition effects among older workers. Thus, higher participation
87 https://ec.europa.eu/info/publications/economy-finance/2018-ageing-report-underlying-assumptions-and-projection-
methodologies_en 88 http://ec.europa.eu/social/BlobServlet?docId=14529&langId=en
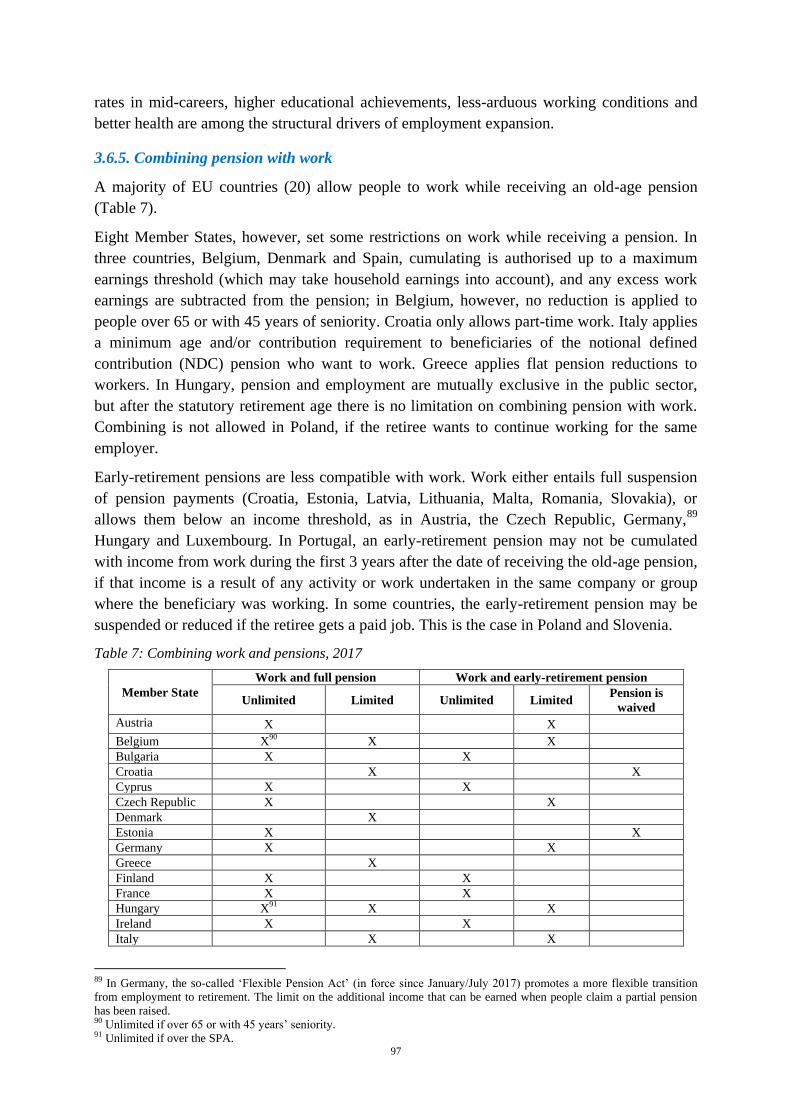
97
rates in mid-careers, higher educational achievements, less-arduous working conditions and
better health are among the structural drivers of employment expansion.
3.6.5. Combining pension with work
A majority of EU countries (20) allow people to work while receiving an old-age pension
(Table 7).
Eight Member States, however, set some restrictions on work while receiving a pension. In
three countries, Belgium, Denmark and Spain, cumulating is authorised up to a maximum
earnings threshold (which may take household earnings into account), and any excess work
earnings are subtracted from the pension; in Belgium, however, no reduction is applied to
people over 65 or with 45 years of seniority. Croatia only allows part-time work. Italy applies
a minimum age and/or contribution requirement to beneficiaries of the notional defined
contribution (NDC) pension who want to work. Greece applies flat pension reductions to
workers. In Hungary, pension and employment are mutually exclusive in the public sector,
but after the statutory retirement age there is no limitation on combining pension with work.
Combining is not allowed in Poland, if the retiree wants to continue working for the same
employer.
Early-retirement pensions are less compatible with work. Work either entails full suspension
of pension payments (Croatia, Estonia, Latvia, Lithuania, Malta, Romania, Slovakia), or
allows them below an income threshold, as in Austria, the Czech Republic, Germany,89
Hungary and Luxembourg. In Portugal, an early-retirement pension may not be cumulated
with income from work during the first 3 years after the date of receiving the old-age pension,
if that income is a result of any activity or work undertaken in the same company or group
where the beneficiary was working. In some countries, the early-retirement pension may be
suspended or reduced if the retiree gets a paid job. This is the case in Poland and Slovenia.
Table 7: Combining work and pensions, 2017
Member State
Work and full pension Work and early-retirement pension
Unlimited Limited Unlimited Limited Pension is
waived
Austria X X
Belgium X90
X X
Bulgaria X X
Croatia X X
Cyprus X X
Czech Republic X X
Denmark X
Estonia X X
Germany X X
Greece X
Finland X X
France X X
Hungary X91
X X
Ireland X X
Italy X X
89 In Germany, the so-called ‘Flexible Pension Act’ (in force since January/July 2017) promotes a more flexible transition
from employment to retirement. The limit on the additional income that can be earned when people claim a partial pension
has been raised. 90 Unlimited if over 65 or with 45 years’ seniority. 91 Unlimited if over the SPA.
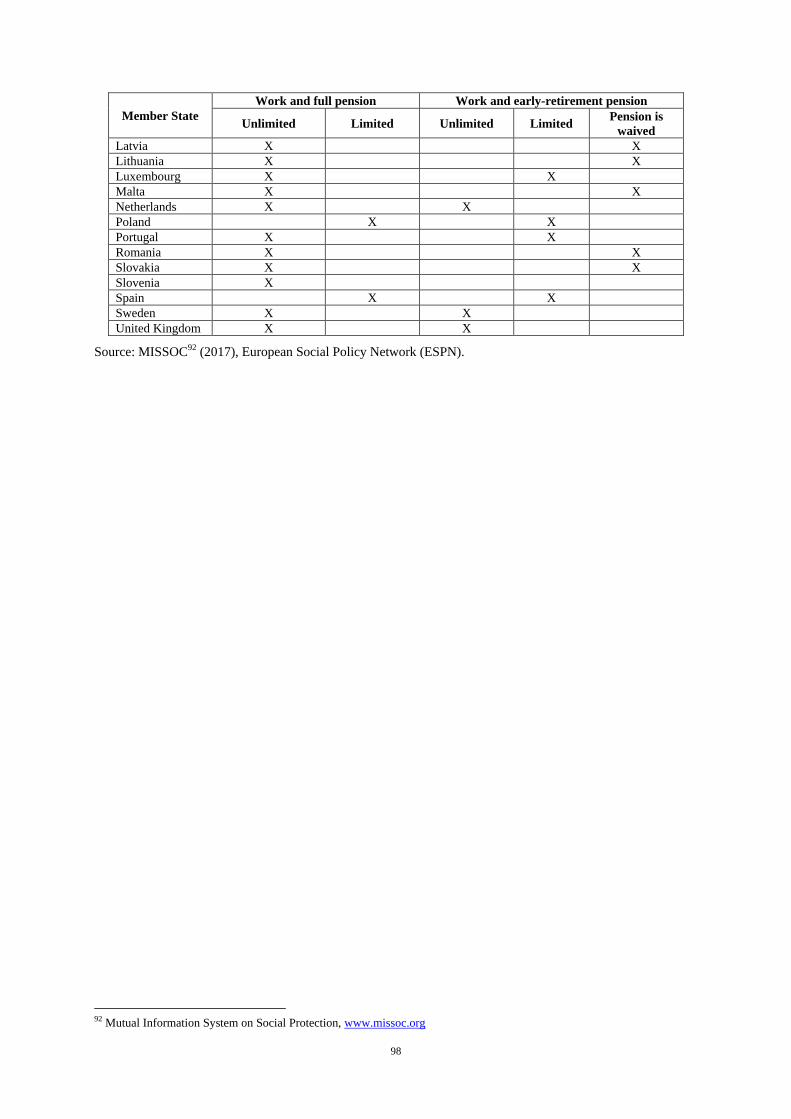
98
Member State
Work and full pension Work and early-retirement pension
Unlimited Limited Unlimited Limited Pension is
waived
Latvia X X
Lithuania X X
Luxembourg X X
Malta X X
Netherlands X X
Poland X X
Portugal X X
Romania X X
Slovakia X X
Slovenia X
Spain X X
Sweden X X
United Kingdom X X
Source: MISSOC92 (2017), European Social Policy Network (ESPN).
92 Mutual Information System on Social Protection, www.missoc.org
99
4. PENSION REFORMS AND THEIR LIKELY IMPACTS
While national reform trends remain diverse, an overall shift in the general dynamic of
old-age pension reforms could be observed around 2015. Over the last decade, most
pension reforms in the EU have focused on safeguarding the financial sustainability of
pension systems and promoting later retirement. Member State governments agreed that steps
‘need to be taken by Member States, though to varying degrees, to raise the effective
retirement age, including by avoiding early exit from the labour market and by linking the
retirement age or pension benefits to life expectancy’.93
As a result, expenditure projections in 2015 predicted a slight long-term decrease in pension
spending in most Member States. This trend, however, is likely to reduce the future generosity
of public pensions, making adequacy increasingly contingent on long and full careers,
supplementary savings and minimum guarantees for those falling short of an entitlement to a
full pension (SPC, 2015).
In this context, the reforms adopted by Member States since 2015 present a significantly more
diverse picture. While measures to improve financial sustainability are still high on many
Member States’ pension agendas, this process has been coupled with measures recalibrating
the scope of the pension mix to respond to some key labour market and pension system
challenges: safeguarding pension adequacy, combining work with pensions, and tailoring
pensionable rights to specific categories of workers.
In general, new reforms (often within the same country) can be seen as attempts to rebalance
the ‘triangle’ of pension adequacy (i.e. income maintenance, poverty protection and pension
duration). Unlike in the crisis and post-crisis period, measures aimed at improving
financial sustainability (mainly through rebalancing pension duration with life
expectancy) have been accompanied by measures aimed at to reducing poverty (e.g.
minimum guarantees) and increasing income maintenance (e.g. favourable indexation,
enhancing the role of supplementary pensions). These reforms point to the search for a
(new) equilibrium between life expectancy, the time spent in work and the time spent outside
the labour market, which will also affect the legitimacy of pension systems and their social
support.
4.1. Recent pension reforms: an overview
Table 8 provides an overview of the reform dynamic in Member States, showing which key
parameters of pension systems were reformed between 1 July 2014 and 1 July 2017. The table
covers reforms adopted during the reference period and excludes implementation of
previously adopted reforms or bills under preparation.
During this period, most Member States focused on specific parametric reforms that mainly
had an impact on pensionable age, qualifying conditions and indexation rules. Belgium,
Bulgaria, Finland and Greece adopted overarching reforms, affecting numerous aspects of
their pension systems, as shown in the table.
93 EU Council (ECOFIN) conclusions of 12 May 2015.
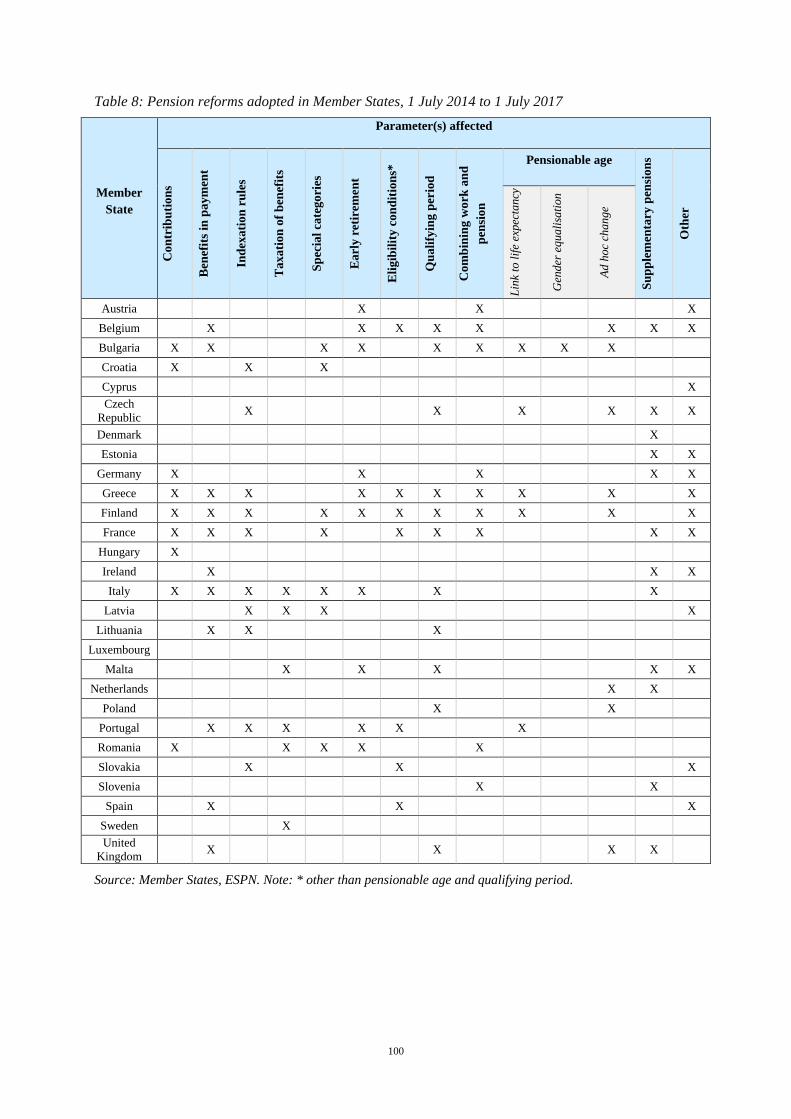
100
Table 8: Pension reforms adopted in Member States, 1 July 2014 to 1 July 2017
Source: Member States, ESPN. Note: * other than pensionable age and qualifying period.
Member
State
Parameter(s) affected
Con
trib
uti
on
s
Ben
efit
s in
paym
ent
Ind
exati
on
ru
les
Taxati
on
of
ben
efit
s
Sp
ecia
l ca
tego
ries
Earl
y r
etir
emen
t
Eli
gib
ilit
y c
on
dit
ion
s*
Qu
ali
fyin
g p
erio
d
Com
bin
ing w
ork
an
d
pen
sion
Pensionable age
Su
pp
lem
enta
ry p
ensi
on
s
Oth
er
Lin
k to
lif
e ex
pec
tancy
Gen
der
equali
sati
on
Ad h
oc
change
Austria X X X
Belgium X X X X X X X X
Bulgaria X X X X X X X X X
Croatia X X X
Cyprus X
Czech
Republic X X X X X X
Denmark X
Estonia X X
Germany X X X X X
Greece X X X X X X X X X X
Finland X X X X X X X X X X X
France X X X X X X X X X
Hungary X
Ireland X X X
Italy X X X X X X X X
Latvia X X X X
Lithuania X X X
Luxembourg
Malta X X X X X
Netherlands X X
Poland X X
Portugal X X X X X X
Romania X X X X X
Slovakia X X X
Slovenia X X
Spain X X X
Sweden X
United
Kingdom X X X X
101
4.1.1. Refocusing the pension duration: continuation of previous reform patterns
In line with the pattern of crisis and post-crisis reforms observed in the 2015 Pension
Adequacy Report, improving pension sustainability, mostly by means of adjusting the
pension duration to life expectancy, continued to be among the key focuses of pension
reforms during the reference period. The main levers of these reforms were the
introduction of higher pensionable ages, tighter eligibility conditions and reductions in
early-retirement opportunities. Most reforms took place in 2014-2015; since 2015, policies
striking a new balance between the time spent in work and the time spent in retirement have
also been coupled with the (re-)introduction of adequacy safeguards (see Section 4.1.2).
Raising the pensionable age and increasing contributory period requirements
While during the crisis period, the immediate purpose of raising the pensionable age was to
improve the sustainability of public pensions, the underlying long-term policy rationale has
been to extend working life in line with increasing life expectancy. In this respect, in the
last 3 years some Member States (Belgium, Bulgaria, Greece, Finland, the Netherlands,
UK) have adopted new increases in the pensionable age (or have brought forward those
previously planned), including by linking it to life expectancy.
In Finland, according to the reform adopted in 2015, the lowest pensionable age will be
gradually increased from 63 to 65 years by 2027, while retaining a 5-year difference between
the lowest and highest pensionable ages. As of 2030, the pensionable age will be directly
linked to life expectancy, growing by 1-2 months per cohort, in line with the longevity gains.
Portugal adjusted the parameters of the link to life expectancy in 2015.
Bulgaria and the Czech Republic also foresee that the pensionable age, after ad hoc increases,
will be linked to life expectancy in the 2030s, although further legislation will be required to
enact the link. Remarkably, the two reforms build on very different starting positions. In
2015, Bulgaria adopted a landmark equalisation and increase in the pensionable age of men
and women to 65 by 2037. In contrast, the 2017 reform in the Czech Republic capped the
already ongoing increase in the pensionable age at 65, to be reached in 2030.
Some recent reforms, however, go against the trend of increasing pensionable ages. Most
notably, Poland has reversed earlier reforms by reintroducing lower pensionable ages
for men and women (65 and 60 years, respectively), in spite of the projected demographic
ageing (see Box 11).
In addition to raising the pensionable age, a key feature of the reforms that aims to
extend the time spent in work in order to ensure the sustainability of the system has
been an increase in career-length requirements (e.g. Belgium, Bulgaria, Czech Republic,
France, Lithuania, Malta, Spain, UK). The average increase amounts to 5 years of career over
the next 15-20 years. In Lithuania, for example, the length of the contributory period will
gradually increase, from 30 years in 2017 to 35 years by 2027. In Bulgaria, the required
length of service will increase by 2 months each year until it reaches 40 years for men and 37
years for women.
Along with raising the pensionable age and extending the time spent in work, some countries
have also increased contribution rates for pensions (e.g. Bulgaria, France) with a view to
102
improving sustainability. The comprehensive pension reform in Greece imposed a freeze on
pensions in payment and revised the calculation rules to improve pension sustainability (e.g.
the average pension benefits paid over a working life are now taken into account, instead of
the years of best earnings; the contributory ceiling for pensions and the ceiling for the net
amount of pensions have been decreased). Similarly, Belgium and Bulgaria have adopted an
overarching reform package, including not only a statutory pensionable age increase and
longer career requirements, but also tightened access to early retirement. Finland has adjusted
the parameters of the link between pension benefits and life expectancy.
More pensionable age reforms are expected in the years to come. For example, in Sweden a
political agreement has been reached to increase the pensionable age in line with longevity
gains.
Reducing early-retirement opportunities
A second major trend in Member State reforms which has continued in the post-crisis
period is to reduce opportunities for early retirement (e.g. Austria, Belgium, Bulgaria,
Denmark, Finland, Luxembourg, Portugal). The key leverages in these reforms have been
raising the minimum pensionable age, increasing contributory periods and/or penalties
relating to early-retirement schemes (e.g. Austria, Belgium, Bulgaria, Denmark, Greece) and
phasing out such early-retirement schemes (e.g. Austria, Luxembourg) or transforming them
(e.g. Finland, Germany). Some countries have applied changes in regard to access to disability
(e.g. Austria, Bulgaria, Denmark) and unemployment (e.g. Belgium) benefits, in order to
make it more difficult to use these as ‘proxy early-retirement’ schemes.
An example of considerable changes to the eligibility conditions for early retirement is
offered by Portugal. Early retirement was suspended during the bailout assistance agreement,
but in 2015 the suspension was partially lifted for those aged 60 and with 40 years of
contributions, with actuarial penalties (reduction of 0.5% for each month claimed before the
pensionable age and the sustainability factor plus the effect of the sustainability factor).
However, since, 2017, early retirement without penalties can be taken by workers with a
contribution record of 48 years and by workers aged 60 or more with a contribution record of
46 years who started their working life at the age of 14 or younger.
In contrast to the above developments, some Member States (e.g. Germany, Italy, Romania)
have enacted reforms which enhance the opportunities for early retirement, though in some
cases only for specific groups of workers. Thus, Italy has adopted measures facilitating early
retirement for some selected categories of ‘disadvantaged’ workers: the APE pension
(Anticipo finanziario a garanzia pensionistica) which provides two different options.94
Finland has introduced time-limited easier access to early retirement for the unemployed aged
over 60 who have been unemployed for over 5 years. Romania has considerably reduced the
penalties for early retirement – from 9 percent previously, to between 1.8 percent and 6
percent (depending on circumstances) for each year until pensionable age. Such reforms may
94 The financial APE consists of a loan allowing an individual to leave the labour market up to 3 years and 7 months earlier
than the pensionable age (i.e. at 63 years) by means of a loan issued by a bank. The ‘social APE’ is state-subsidised. It allows
certain categories of disadvantaged workers, with at least 30 years of paid contributions, to exit early from the labour market
(also up to 3 years and 7 months before the pensionable age) through the provision of an allowance of maximum EUR
1500/month.
103
be inspired by possible social opposition to ever tightening reforms that may lead to a loss of
societal support.
Promoting flexible retirement pathways
Flexible retirement rules aimed at facilitating longer working lives and smoothing the
transition into retirement are becoming more widespread, and have been recently adopted
in Austria, Finland, Germany and Slovenia. In Slovenia, the payment of pensions is no longer
limited to the age of 65, and flexible forms of transition from employment to full retirement
have been implemented: the minimum threshold is now 2 hours per day (compared with the
previous minimum threshold of 4 hours a day) with a proportionate share of pension.
Finland has replaced the previous part-time pension and has closed early-exit routes, replacing
them with more flexible possibilities to combine partial retirement with employment. In the
context of the 2017 pension reform, a new pension form, a flexible partial old age (FPOA)
pension, was introduced as of 61 years of age, with no restrictions on work or earnings: 25 or
50 percent may be drawn from the pension entitlements. Whereas it is possible later to
increase the take-up rate from 25 to 50 percent, the opposite move is forbidden. If the
claimants take out a partial old-age pension early, the part they are taking out will be
permanently reduced by 0.4 percent for each month until they reach the pensionable age. In
Germany, the ‘Flexible Pension Act’ (in force since January/July 2017) includes a statutory
entitlement to participation benefits (prevention and rehabilitation) and promotes a more
flexible transition from employment to retirement and extension of an individual’s working
life.
Facilitating deferred retirement
Facilitating and rewarding deferred retirement is another tool for promoting longer
working lives. Several countries have introduced measures going in this direction (e.g.
Austria, Croatia, Denmark, Finland and France). In Austria, pension insurance contributions
are cut by half for a period of 3 years if a person chooses to work beyond the pensionable age.
In Croatia, since 2014, full deferred retirement has been encouraged by an accrual bonus of
0.15 percent per month of later retirement, but for a maximum of 5 years (hence currently up
to the age of 70).
4.1.2. Bringing adequacy back in: rebalancing pension duration with poverty reduction and
income maintenance
The pension reform dynamic in Member States shifted somewhat around 2015, partially
reflecting opportunities opened up by the easing of fiscal pressures and a growing
recognition of the need to accompany sustainability-enhancing reforms with adequacy-
focused safeguards. To some extent, this change in the reform dynamic reflects the fact that
most Member States have already adopted and are implementing (mostly gradual)
pensionable age increases in reaction to the ageing of their population, while the economic
recovery is leaving more fiscal space for adequacy-focused reforms, such as reinforcing
minimum guarantees and (re-)introducing favourable indexation mechanisms. In some cases,
the shift was the direct effect of the lifting of crisis-induced temporary measures, such as
104
indexation and early-retirement freezes. Along with these parametric changes, some countries
have either granted or improved access to pension insurance for certain categories of workers,
such as non-standard workers or the self-employed (Greece, Poland, Lithuania, Romania) or
workers in arduous or hazardous jobs (Finland, France, Italy).
Protecting low-income pensioners
After a period of reforms during the crisis, which in some cases directly affected the
level of current pensions such as direct cuts in benefit paid, several Member States in
2014-2017 have sought to improve the protection of low-income pensioners. They have
done so mainly by introducing basic pensions (Greece) or raising/improving minimum and/or
basic pensions (e.g. Austria, Belgium, Bulgaria, Cyprus, Ireland, Malta, Poland, Romania,
Slovakia, Slovenia) and/or targeted additional benefits (Czech Republic, Estonia, Italy,
Sweden). Moreover, several countries have removed the freeze on indexation or have
introduced new indexation mechanisms (e.g. Bulgaria, Cyprus, Lithuania, Portugal).
Greece has introduced a state-funded (basic) national pension equal to the at-risk-of-poverty
threshold for a single person, which was set (for 2016) at EUR 384 per month for a person
with 20 years of contributions. This amount is reduced by 2 percent for every year which falls
short of 20, down to 15 years of insurance (15 years being the minimum contributory period
for pension entitlement). Moreover, a means-tested social solidarity allowance has been
established – EUR 360 per month – for uninsured elderly persons.
Latvia, Malta and Romania have raised the non-taxable minima, which should benefit the
recipients of lower pensions. Minimum pensions were increased in Bulgaria, Poland and
Romania, where a significant 30 percent raise was granted from February 2017. Portugal
enacted a rise of a maximum of EUR 10 per month for low pensions (less than EUR 631.98
per month) to compensate for the loss of purchasing power caused by the suspension, from
2011 to 2015, of the indexation mechanism. Italy increased the amount of the 14th monthly
pension instalment and extended it to around 1.2 million individuals on low pension benefits;
it also raised the minimum non-taxable pension level to EUR 8000 per year for pensioners
below the age of 75. In Austria, in January 2017 the minimum pension was raised from EUR
883 to EUR 1000 per month for people with at least 30 years of contributions. Spain
introduced a supplement to contributory pensions for mothers with two or more children.
Several countries have used the leverage of indexation to improve the real value of
pensions (e.g. Bulgaria, Cyprus, Czech Republic, Latvia, Lithuania, Portugal, Romania and
Slovenia). Latvia adjusted its pension accrual rules to protect entitlements during the
economic downturn, while Lithuania introduced indexation rules and Portugal reintroduced
indexation for all pensions and increased the threshold for the most beneficial indexation rate.
Croatia introduced a new rotating indexation system, index-proofing pensions twice a year.
Latvia applied a new annual indexation formula to all pensions (but the share of the benefit
subject to indexation is only equivalent to 50% of the average insured wage for the previous
year).
Other measures, such as additional safeguards for pensioners with long careers, have been
introduced by Austria, Belgium, Latvia and Malta.
105
Improving access to old-age protection for specific categories of workers
Unlike the crisis reform period – during which favourable conditions for some
categories of workers were mostly tightened or phased out – one of the key features in
the reform period under scrutiny has been an improvement in statutory and effective
access to retirement. This has taken place through several routes: granting legal access to
previously excluded categories or making statutory access compulsory for the self-employed
(e.g. Lithuania, Romania), creating schemes for workers in arduous and hazardous jobs (e.g.
Finland, France), improving effective access to old-age schemes by tailoring favourable
eligibility conditions (e.g. Italy) and improving the transferability of entitlements between
old-age schemes related to different categories of workers (e.g. France, Greece, Italy, Poland).
Lithuania granted access to the statutory pension scheme to ‘persons engaged in individual
activities under business certificates’: these statuses became fully integrated into the statutory
scheme at the beginning of 2017. In 2016, Romania extended eligibility for the statutory
pension scheme to some categories, such as notaries, clercs and lawyers, who can now opt in
voluntarily. In addition, mandatory enrolment was extended to all the self-employed whose
earnings are higher than a certain income threshold. As of 2015, Romania also restored the
‘special service schemes’ (with more advantageous pension calculation algorithms and lower
overall contribution levels) for some public-sector employees. Poland extended its social
insurance coverage to workers on ‘civil contracts’. And Spain modified the eligibility
conditions (e.g. career-length requirements) of part-time workers, in order to maintain
proportionality with full-time workers.
A specific category that often benefits from more favourable schemes and rules covers
workers in arduous and hazardous jobs. Even though, during the past decade, the main trend
has been towards tightening eligibility conditions and phasing out schemes (Natali et al,
2016), some countries have pushed through reforms creating more favourable conditions for
this category. Finland has created a new scheme for workers in arduous and hazardous jobs:
the ‘years-of-service pension’ (minimum pensionable age of 63 years). France has established
a ‘personal prevention account’ (Compte Professionnel de Prévention), which allows workers
to acquire points as a result of exposure to six risk factors – to be used for vocational training,
part-time work at the same rate of pay and early retirement. However, it is worth noting that
this account only includes 6 of the initial 10 criteria on arduous conditions, and the financing
will no longer be covered by specific employer contributions, but by the state. Italy modified
the special rules for workers in arduous and hazardous working jobs, allowing them to retire
before reaching the pensionable age, provided they have worked as employees in relevant
jobs for at least 7 of the previous 10 years before applying for retirement, or alternatively, if
they have worked in such jobs for half their career. On-going policy discussions along these
lines are currently taking place in Belgium, Croatia and Slovakia.
Several countries with multiple retirement schemes for different categories of workers within
the statutory pension scheme have also improved transferability between schemes. Italy and
France now facilitate the cumulation of contributions paid into different first-pillar pension
regimes. In Greece, all main statutory (contributory) pension funds have been combined into
the Unified Agency for Social Insurance (EFKA) and all the statutory auxiliary pension and
106
lump-sum benefit funds integrated into the Unified Fund for Auxiliary Social Insurance and
Lump Sum Benefits (ETEAEP).
Reinforcing the role of supplementary pension schemes
Since 2015, reforms of supplementary pension schemes (occupational and personal
pension schemes)95
have been launched or are envisaged in several countries, with the
aim of market diversification, individualisation of old-age risk and improvement of
income maintenance (e.g. Belgium, Denmark, Estonia, France, Germany, Ireland, Slovenia).
In most cases, these schemes have undergone parametric reforms to improve their coverage
and adequacy, as well as their regulatory structure.
Attempts to reinforce the coverage of occupational pension plans have been made in
several countries, including by making the provision of occupational pensions more
attractive and less burdensome for employers. In order to increase employer involvement
in occupational pension plans, Estonia gave employers more rights to decide on a minimum
age for pay-outs from occupational schemes. Belgium lowered the minimum return
guarantees from occupational pension funds. It is also considering additional incentives to
further promote voluntary contributions to these schemes. For instance, workers could ask
their employers to contribute a further share of their wages to a second pillar. Germany voted
a special ‘Act on Strengthening Occupational Pensions’, which entered into force in January
2018. The key feature of this Act is the introduction of pure DC schemes without the
imposition on the company of any warranty liability concerning minimum benefits or interest
rates, so long as the schemes are negotiated as part of the collective bargaining process. These
schemes are meant to complement existing occupational systems, which are mainly defined
benefit (DB) plans, but which many employers shy away from because of the associated long-
term liabilities and the required top-up payments for guarantees. It is expected that the
exclusion of performance guarantees will increase investment opportunities.
In Denmark, an agreement has been reached to address the savings disincentive problem. It
sets the annual maximum contribution that can be paid into old-age savings without a
reduction in the part of the national pension tested against other pension income at EUR 670
for individuals with more than 5 years until pensionable age (which is of particular relevance
to people on a low income). The annual maximum contribution is set at EUR 6700 for
individuals with less than 5 years to retirement, as well as individuals already claiming a
national old-age pension, so long as they have not already begun to draw down their pension
savings (previously the annual maximum contribution was EUR 4000, irrespective of time to
retirement).
Slovenia introduced changes to the occupational insurance system, reinforcing its solidarity
element (increase in the lowest occupational pension, a ceiling on the highest pension and the
introduction of solidarity reserves). In France, the reform has significantly changed the rules
applicable to mandatory occupational schemes in terms of the age of retirement. From
January 2019, the reform establishes a 10 percent reduction in pensions for employees who do
95 This section does not cover statutory funded pension schemes. These were subject to extensive reforms during the period
2009-2014 (see PAR 2015). Only some countries have proceeded to minor changes in these schemes (e.g. BG, EE, LT; see
Volume II of the 2018 Pension Adequacy Report).
107
not continue to work for an extra year after reaching the pensionable age, which amounts to
an inducement to extend working life.
Regulatory measures have been introduced in several countries to strengthen the functioning
of supplementary pensions and bring confidence to members. In Ireland, the need to safeguard
the pension benefits for scheme members and to enhance employers’ responsibilities for their
DB pension schemes has been recognised. The Social Welfare, Pensions and Civil
Registration Bill 2017 will enhance the regulatory and supervisory oversight of DB pension
schemes to ensure that timely action is taken to restore a scheme’s funding position in the
case of a deficit – for instance, by stipulating that where a scheme is in deficit, a funding
proposal must be submitted to the Pensions Authority within 6 months. The aim of this
legislation is to ensure that the scheme members’ pension benefits are protected, and the
future viability and sustainability of their schemes are ensured and made safer.
Some other Member States (Cyprus, Netherlands, Poland, Slovenia) have outlined plans to
reform supplementary pension provision, though these are also still to be finalised and
adopted in legislation.
4.2. Impact of recent pension reforms on present and future adequacy
As outlined in Section 4.1, pension reforms in 2014-2017 were less intense overall than in the
preceding years in most Member States. Typically, previous cost-containment reform patterns
were consolidated through smaller, ‘parametric’ changes. However, once sustainability
gains were achieved, recognition grew in many countries that these reforms should be
accompanied by measures to safeguard adequacy. Policy-makers indeed aimed at
‘rebalancing’ the pension reform mix, as since 2015 more reforms have focused on
poverty protection and income maintenance.
In the post-2015 reforms, the main measures affecting the pension duration aspect continued
to relate to raising the pensionable age, extending contributory periods and reducing early-
retirement opportunities. Compared to the previous reform period, measures focused more
frequently on incentives (e.g. introducing flexible retiring rules, bonuses for retirement later
than the pensionable age, etc.). Moreover, to enhance poverty protection and income
maintenance, Member States reinforced the minimum guarantees to low-income pensioners
and removed freezes on pension indexation. Many countries also tried to address some key
challenges through diversifying pension benefits and better covering certain categories of
workers. All these developments can be considered as efforts to prevent poverty among
current pensioners.
The rationale behind reforms raising the pensionable age, extending contributory
periods and cutting back on early-retirement opportunities is to improve the
sustainability of pension systems, by attempting to prolong working lives in line with the
evolving longevity, while also maintaining pension income for those able to work long
and full careers. At the same time, labour market duality and persistent youth unemployment
in several Member States could make it more challenging for generations of future retirees to
achieve full careers (European Commission, 2017b). As eligibility conditions for full pensions
become more demanding, policy measures aimed at minimum income protection will play a
central role in preventing and mitigating old-age poverty.
108
The impact of recent reforms on future adequacy is very difficult to pin down; nor can it be
deduced from changes in TRR projections, which are influenced by several contextual factors
besides policy reforms. Therefore, the following examples mostly present a tentative
qualitative assessment of the likely impact of the reforms in question.
For instance, as of 2019, France will cut occupational pensions by 10 percent for employees
who do not continue to work for an extra year after reaching the pensionable age (62 years).
Nevertheless, it is estimated that the introduction of this measure will only have a limited
impact on the average retirement age, moving it up 0.1 years as of 2019. In terms of its impact
on pension levels – assuming that some workers will not postpone retirement and will accept
a drop in their pensions – estimates point to a 1 percent decrease in pensions measured over
the entire duration of retirement. Other measures in France – legislated in 2015 and aimed at
improving sustainability – relate to indexation mechanisms both in the statutory pension
scheme and for occupational pensions; they are expected to lead to a downward trend in
replacement rates (though no reduction has yet been observed year on year). This strong trend
results partly from the arrival of new retirees with higher pension rights, and partly from the
death of older pensioners, who generally received lower-than-average pensions.
In the UK, the government intends to increase the state pension age from 67 to 68 years in
2037-2039. The target is for up to 32 percent of adult life to be spent on a state pension. In
Malta, the gradual increase in the pensionable age to 65 years is estimated to boost the labour
supply by 7200 individuals by 2026; about 56 percent of this increase should be among men.
A new indexation mechanism in Croatia aims at improving the income maintenance of old-
age pensions by introducing a rotating formula. The first annual indexation continues to be
based on the Swiss formula (50% wages: 50% prices), which was used between 1999 and
2013, while the second annual indexation is based on whichever of three wage-to-price ratios
(70:30, 50:50 or 30:70) gives the highest increase. In addition, pensions cannot be indexed
downwards. In Slovakia, the adopted indexation changes are designed to increase the lowest
pensions and guarantee their stable and predictable growth for the period 2018-2021. The
similar indexation change in the Czech Republic is estimated to influence all pensions, with a
slightly greater impact on above-average pensions, as these were previously indexed at a
lower rate than below-average ones.
In Lithuania, the contributory period required for entitlement to the basic component of an
old-age pension will increase from the current 30 years to 35 years by 2027. Although this
increase is related to the rise in the pensionable age, it is expected to reduce the basic pension
component for those with a shorter work history. This corresponds to a 14 percent cut in the
basic component for persons with the required 15-year minimum contribution period in 2027.
Greece, as was shown in Section 4.1, is implementing an overarching pension reform
addressing various shortcomings of the past and providing more guarantees to low-income
pensioners. However, many reform provisions have had a negative impact on pension
adequacy. The expected downward pension adjustments, through the reduction in replacement
rates for all pensions from January 2019 onwards and the calculation of pension benefits on
the basis of average lifetime earnings, instead of the best years of earnings, is likely to lead to
a decrease in the level of benefits.
109
In Finland, simulations regarding the new reform implemented as of 2017 (see Section 4.1),
introducing a link between pensionable age and life expectancy, show that the reform will
have a positive impact on lengthening working careers, improving the sustainability of the
pension system and equalising pension income.
It is also worth taking a closer look at the Polish example of lowering the pensionable age
(going against the trend of raising it) and its estimated impact on sustainability, adequacy and
labour market developments (see Box 11). As mentioned in Section 4.1, Poland has at the
same time been phasing out early-retirement schemes.
Box 11: Reversing the rise of the pensionable age in Poland
In 2016, the pensionable age was lowered back to 60 (from 61) years for women and to 65 (from
66) for men, and will remain at that level, instead of the gradual increase to 67 for both sexes, as
foreseen in previous legislation.
In the Polish NDC pension system, the benefit amount is based on the total contributions paid and
life expectancy at the age of claim. Thus, the age at which one claims a pension is paramount for
pension adequacy.
The reform reducing the legislated pensionable age has had an immediate impact on pension
claims. In October and November 2017 (i.e. the first 2 months after the lowering of the
pensionable age), almost 350,000 new pensions were granted (compared to less than 230,000 in
the whole of 2016), of which almost 60 percent were for women. For women, the average amount
of the newly granted pensions was almost half the average amount for men, i.e. PLN 1627.11
(EUR 378) and PLN 2791.73 (EUR 634), respectively.
According to the Ageing Report projections, the current retirement duration is 17.2 years for men
and 24.0 years for women (2016) will increase by around 4 years for both men and women by
2056, reflecting the growing gap between increasing life expectancy and the retirement age.
Another lever for reducing pension duration is to introduce incentives for later retirement. For
instance, in Malta in the reform period under scrutiny, such provisions were introduced for
private-sector workers, and have had a positive impact. It is reported that 28 percent of
persons aged 61 have taken up the incentives to defer drawing their pension, even if they were
eligible to do so.
As for the aspect of poverty reduction, as shown in Section 4.1, several countries have
introduced minimum pensions and minimum income guarantees (or have improved their
levels). These measures are expected to have a direct impact on current low pensions.
However, they only partially alleviate the risk of poverty among pensioners.
Finland introduced a temporary law in 2016 transferring older (60+) long-term unemployed to
the pension system. Unemployed people who reached the age of 60 (around 15% of this age
cohort) before 1 September 2016 and who had received basic unemployment benefits for
more than 5 years became entitled to a pension subsidy of EUR 760.26 a month until they
qualify for an old-age pension or reach the age of 65. During the first month (June 2016),
some 3000 applications were submitted, though the number decreased in later months. By
November 2017, some 3170 persons were receiving pension subsidies instead of the labour
market subsidy paid to the long-term unemployed.
110
In some countries (e.g. Belgium, Greece, Italy), providing minimum guarantees to pensioners
has also been coupled with broader reforms aimed mainly at improving the sustainability of
state pensions and reducing pension duration. Italy is an example of steering away from
previous austerity-driven reforms, instead now introducing measures aimed at safeguarding
adequacy (see Section 4.1). These measures include the social version of APE (see Section
4.1), which allows earlier retirement but sets strict eligibility conditions, leading to around 35
percent of applications being rejected. In addition, the tight contribution requirements vis-à-
vis the short (on average) career length of Italian women has contributed to the significant
under-representation of female applicants/beneficiaries of this new provision. Greece has
implemented a means-tested social solidarity allowance of EUR 360 per month for uninsured
elderly persons. However, at the same time the country is to phase out the more generous
means-tested Pensioners’ Social Solidarity Benefit (EKAS) by the end of 2019.
In Croatia, changes to the eligibility criteria for disability pensions were introduced in 2014:
now based on residual work capacity, a control examination must be performed no later than
3 years from the date when reduced working capacity – or a partial or complete loss of
working capacity – occurs. The need for an additional control examination may be established
during the initial examination. From 2015 onwards, all disability pensions are converted to
old-age pensions when the recipient reaches retirement age. While this measure cut the
number of disability pensions, it had no impact on pension expenditure.
These examples highlight the importance of putting in perspective the ability of the new
safeguards to mitigate the risk of poverty with broader elements of the pension policy mix.
Making retirement more flexible by promoting favourable possibilities to combine work with
a pension has been a way of rebalancing pension duration and income maintenance in many
countries. The new Finnish flexible retirement scheme (see Section 4.1.1) appears to be quite
popular: as many as 12,500 persons used the possibility in 2017: 87 percent of claimants took
out 50 percent of their accrued pension. The scheme is more popular among men (60% of
applications) than women, and more popular among private-sector (70%) than public-sector
employees. However, the lucrativeness of this system may be a trap for those on low incomes,
as the amount of the final old-age pension will be reduced in accordance with the early take-
up, meaning that the final pension may come as a negative surprise.
Some positive impact on pension adequacy can be expected also from the trend in some
countries to provide or improve effective access to old-age protection for certain categories of
workers. For instance, making access compulsory for the self-employed in Romania (even
though conditional on a certain threshold) can be expected to improve their coverage rate. As
for granting more favourable rules to workers in arduous or hazardous jobs, these measures
have also been considered as a way to considerably improve the pension adequacy of this
category (e.g. Italy, Slovakia).
111
5. ADEQUATE PENSIONS IN A LONG-TERM PERSPECTIVE
5.1. Long-term adequacy prospects and challenges
5.1.1. Prospective theoretical replacement rates
Chapter 3 illustrated the current outcome of pension systems. However, current pensioners are
mostly affected by pension systems as they were before the recent flurry of reforms. Recent
pension reforms will play out their main impact in decades to come, as transitional rules are
progressively implemented. This section focuses on theoretical replacement rates in 2056,
thus reflecting the full impact of reformed pension systems on future adequacy, as a standard
40-year career would begin in 2016 and be (almost) fully impacted by recent reforms.
The projected 2056 TRRs depend strongly on the underlying assumptions concerning salary
growth and inflation. These were taken from the base-case EPC AWG assumptions.
Theoretical replacement rates measure how a retiree’s pension income in the first year after
retirement would compare to their earnings immediately before retirement, taking into
account the national pension rules. Please refer to Box 5 in Chapter 3.
Baseline, the base case of a 40-year career
The ‘base case’ represents the pension of a male worker who retires at the standard
pensionable age96
after an uninterrupted 40-year career on a standard employment contract.97
The base case is the standard scenario, against which the other cases are compared. While
comparing countries, one must bear in mind that in those countries where pension benefits are
computed on careers longer than 40 years, the results based on 40 years will correspond to
incomplete careers or to pensions that are lower than theoretically possible, while in other
Member States, they will correspond to the maximum possible pensions.
Standard career pension benefits are set to decrease. Theoretical replacement rates after an
uninterrupted 40-year career are projected to decline. From the 2016 values (see Table 2) they
will rise in a few countries, but decrease in most (Figure 62). One way of looking at this is to
say that a 40-year career was more adequate in 2016 than it will be in 2056: adequate
pensions will increasingly depend on longer careers. Strong decreases are projected in
Romania, Croatia, Poland and the UK. Substantial increases are projected in Estonia and
Bulgaria. In all other countries, the changes are not substantial.
96 The SPA is the earliest age at which people may retire without incurring pension penalties linked to their age; as an
exception, and for comparison purposes, this is set to age 65 in Luxembourg. 97 Base case of the 2012 Report and Base case I of the 2015 Report assumed a career from age 25 to 65. This case could no
longer be computed for a growing number of countries, where pension rules will not allow someone to claim a pension at 65.
The old base case has been computed for comparisons wherever possible.
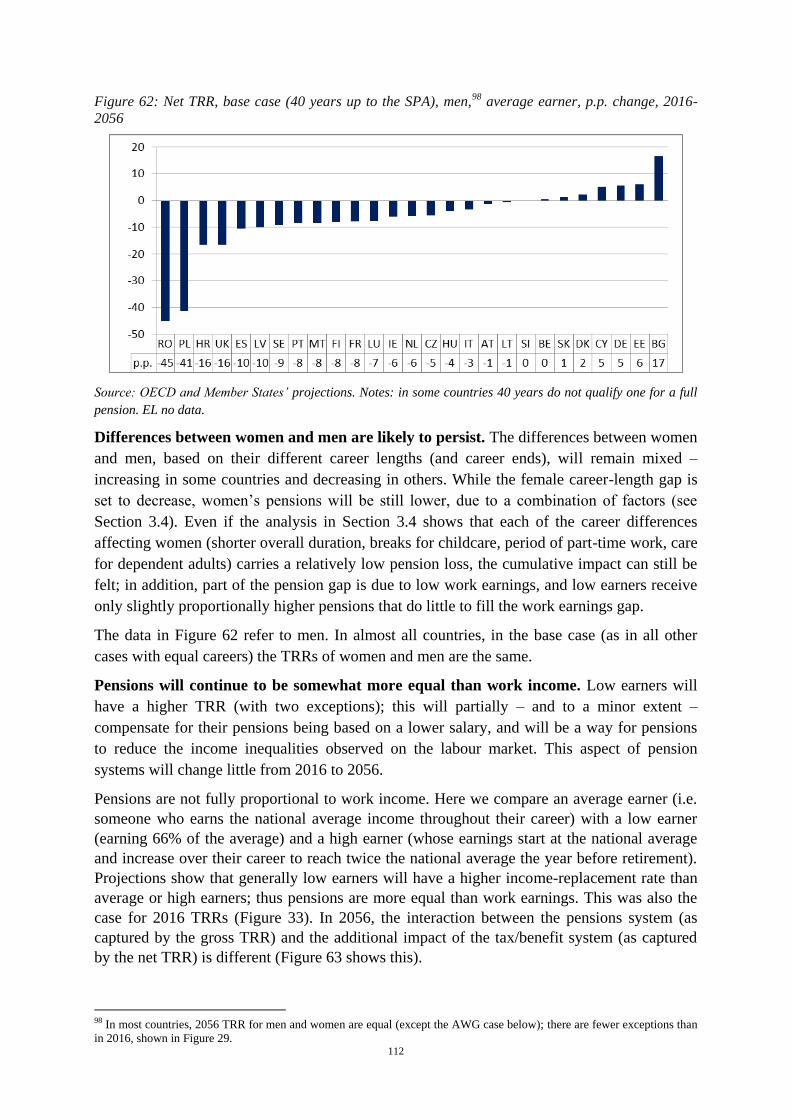
112
Figure 62: Net TRR, base case (40 years up to the SPA), men,98 average earner, p.p. change, 2016-
2056
Source: OECD and Member States’ projections. Notes: in some countries 40 years do not qualify one for a full
pension. EL no data.
Differences between women and men are likely to persist. The differences between women
and men, based on their different career lengths (and career ends), will remain mixed –
increasing in some countries and decreasing in others. While the female career-length gap is
set to decrease, women’s pensions will be still lower, due to a combination of factors (see
Section 3.4). Even if the analysis in Section 3.4 shows that each of the career differences
affecting women (shorter overall duration, breaks for childcare, period of part-time work, care
for dependent adults) carries a relatively low pension loss, the cumulative impact can still be
felt; in addition, part of the pension gap is due to low work earnings, and low earners receive
only slightly proportionally higher pensions that do little to fill the work earnings gap.
The data in Figure 62 refer to men. In almost all countries, in the base case (as in all other
cases with equal careers) the TRRs of women and men are the same.
Pensions will continue to be somewhat more equal than work income. Low earners will
have a higher TRR (with two exceptions); this will partially – and to a minor extent –
compensate for their pensions being based on a lower salary, and will be a way for pensions
to reduce the income inequalities observed on the labour market. This aspect of pension
systems will change little from 2016 to 2056.
Pensions are not fully proportional to work income. Here we compare an average earner (i.e.
someone who earns the national average income throughout their career) with a low earner
(earning 66% of the average) and a high earner (whose earnings start at the national average
and increase over their career to reach twice the national average the year before retirement).
Projections show that generally low earners will have a higher income-replacement rate than
average or high earners; thus pensions are more equal than work earnings. This was also the
case for 2016 TRRs (Figure 33). In 2056, the interaction between the pensions system (as
captured by the gross TRR) and the additional impact of the tax/benefit system (as captured
by the net TRR) is different (Figure 63 shows this).
98 In most countries, 2056 TRR for men and women are equal (except the AWG case below); there are fewer exceptions than
in 2016, shown in Figure 29.
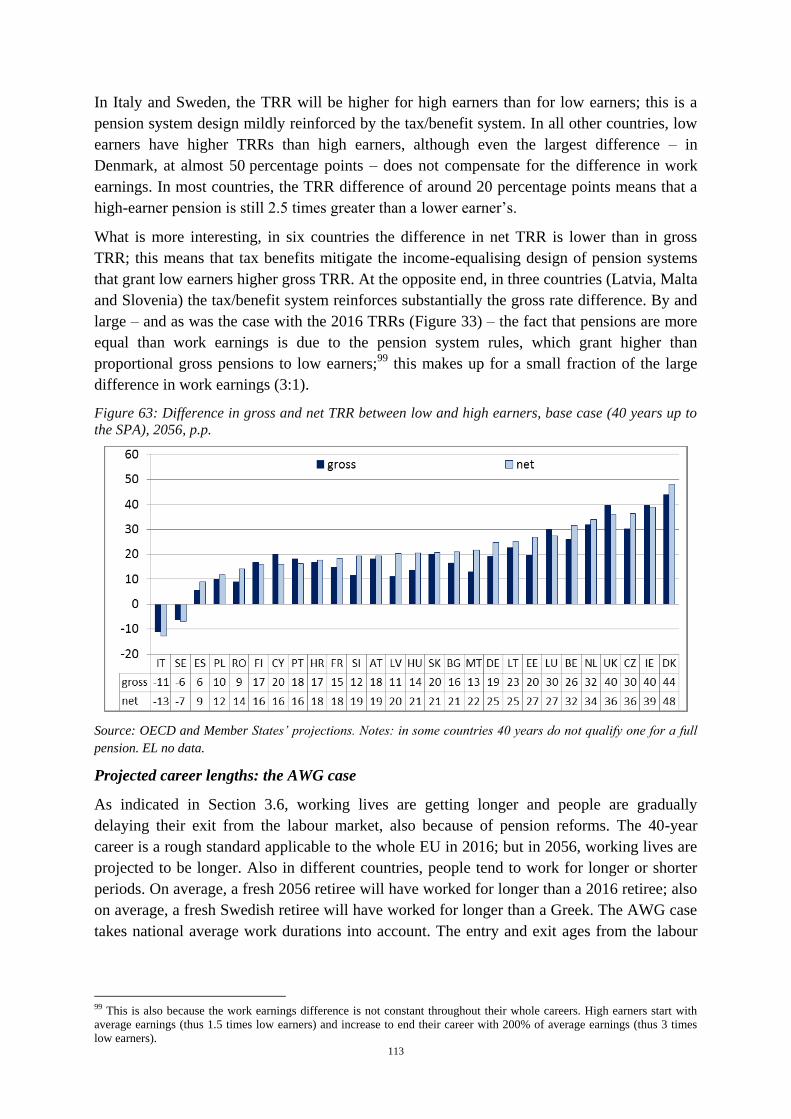
113
In Italy and Sweden, the TRR will be higher for high earners than for low earners; this is a
pension system design mildly reinforced by the tax/benefit system. In all other countries, low
earners have higher TRRs than high earners, although even the largest difference – in
Denmark, at almost 50 percentage points – does not compensate for the difference in work
earnings. In most countries, the TRR difference of around 20 percentage points means that a
high-earner pension is still 2.5 times greater than a lower earner’s.
What is more interesting, in six countries the difference in net TRR is lower than in gross
TRR; this means that tax benefits mitigate the income-equalising design of pension systems
that grant low earners higher gross TRR. At the opposite end, in three countries (Latvia, Malta
and Slovenia) the tax/benefit system reinforces substantially the gross rate difference. By and
large – and as was the case with the 2016 TRRs (Figure 33) – the fact that pensions are more
equal than work earnings is due to the pension system rules, which grant higher than
proportional gross pensions to low earners;99
this makes up for a small fraction of the large
difference in work earnings (3:1).
Figure 63: Difference in gross and net TRR between low and high earners, base case (40 years up to
the SPA), 2056, p.p.
Source: OECD and Member States’ projections. Notes: in some countries 40 years do not qualify one for a full
pension. EL no data.
Projected career lengths: the AWG case
As indicated in Section 3.6, working lives are getting longer and people are gradually
delaying their exit from the labour market, also because of pension reforms. The 40-year
career is a rough standard applicable to the whole EU in 2016; but in 2056, working lives are
projected to be longer. Also in different countries, people tend to work for longer or shorter
periods. On average, a fresh 2056 retiree will have worked for longer than a 2016 retiree; also
on average, a fresh Swedish retiree will have worked for longer than a Greek. The AWG case
takes national average work durations into account. The entry and exit ages from the labour
99 This is also because the work earnings difference is not constant throughout their whole careers. High earners start with
average earnings (thus 1.5 times low earners) and increase to end their career with 200% of average earnings (thus 3 times
low earners).
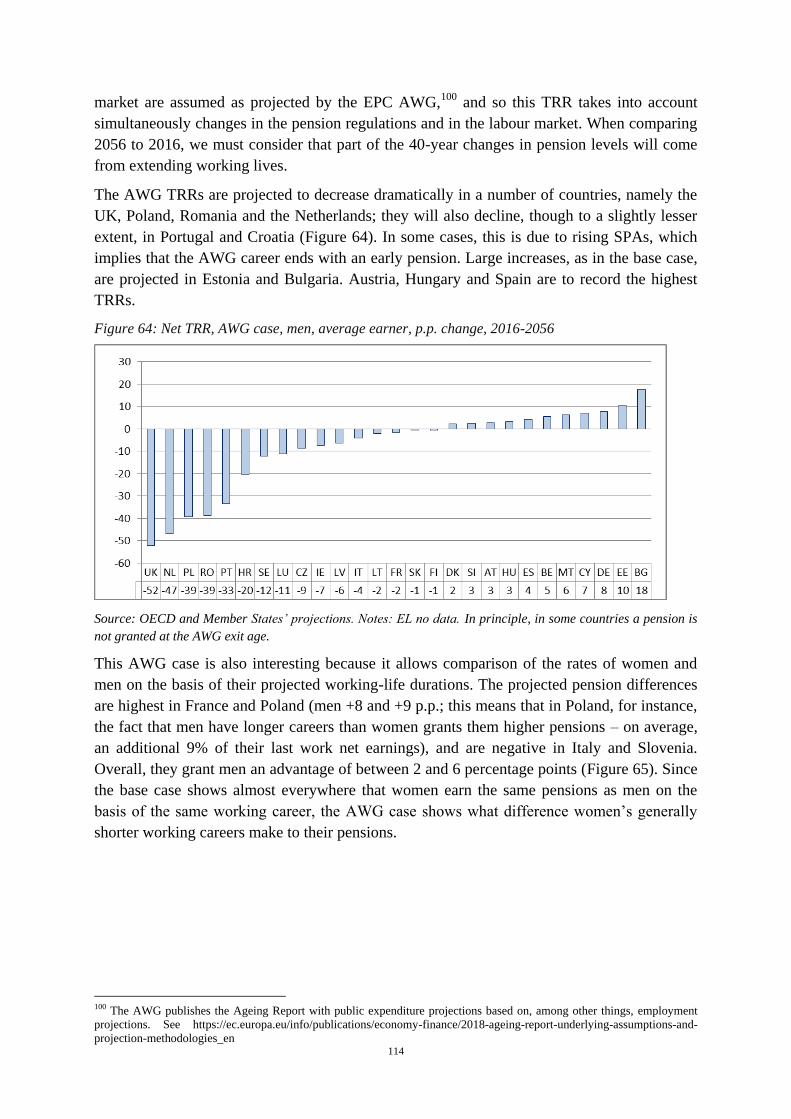
114
market are assumed as projected by the EPC AWG,100
and so this TRR takes into account
simultaneously changes in the pension regulations and in the labour market. When comparing
2056 to 2016, we must consider that part of the 40-year changes in pension levels will come
from extending working lives.
The AWG TRRs are projected to decrease dramatically in a number of countries, namely the
UK, Poland, Romania and the Netherlands; they will also decline, though to a slightly lesser
extent, in Portugal and Croatia (Figure 64). In some cases, this is due to rising SPAs, which
implies that the AWG career ends with an early pension. Large increases, as in the base case,
are projected in Estonia and Bulgaria. Austria, Hungary and Spain are to record the highest
TRRs.
Figure 64: Net TRR, AWG case, men, average earner, p.p. change, 2016-2056
Source: OECD and Member States’ projections. Notes: EL no data. In principle, in some countries a pension is
not granted at the AWG exit age.
This AWG case is also interesting because it allows comparison of the rates of women and
men on the basis of their projected working-life durations. The projected pension differences
are highest in France and Poland (men +8 and +9 p.p.; this means that in Poland, for instance,
the fact that men have longer careers than women grants them higher pensions – on average,
an additional 9% of their last work net earnings), and are negative in Italy and Slovenia.
Overall, they grant men an advantage of between 2 and 6 percentage points (Figure 65). Since
the base case shows almost everywhere that women earn the same pensions as men on the
basis of the same working career, the AWG case shows what difference women’s generally
shorter working careers make to their pensions.
100 The AWG publishes the Ageing Report with public expenditure projections based on, among other things, employment
projections. See https://ec.europa.eu/info/publications/economy-finance/2018-ageing-report-underlying-assumptions-and-
projection-methodologies_en
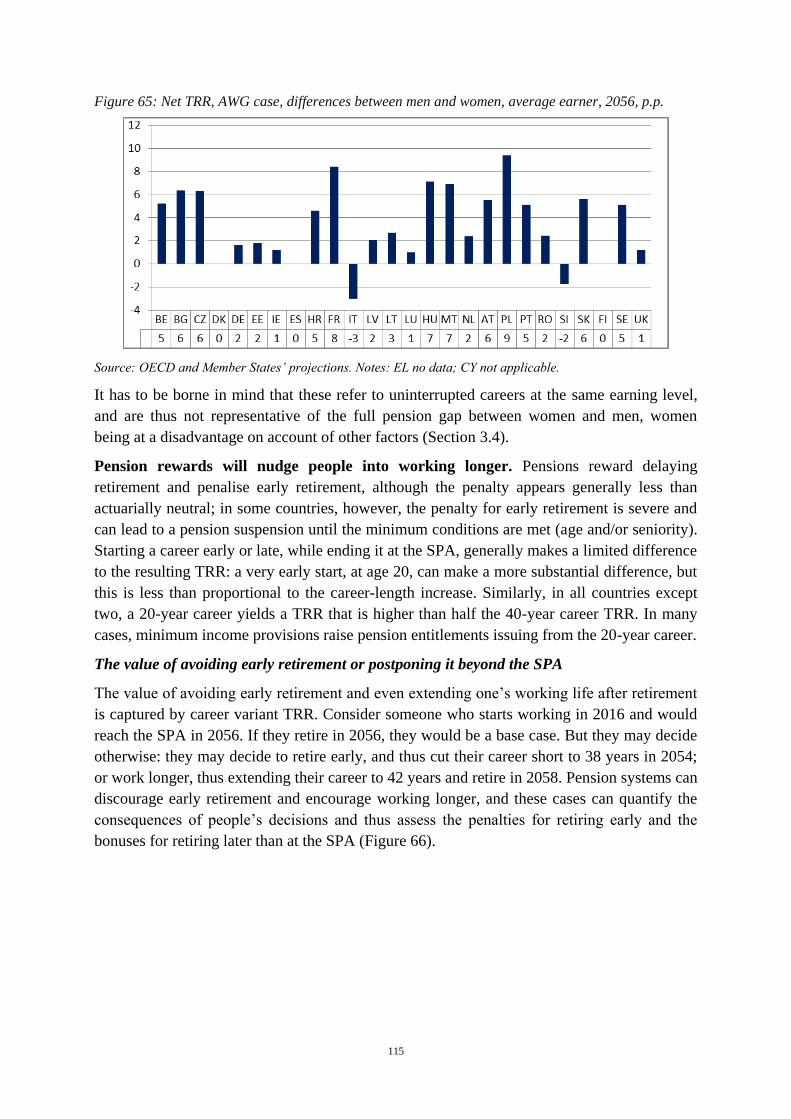
115
Figure 65: Net TRR, AWG case, differences between men and women, average earner, 2056, p.p.
Source: OECD and Member States’ projections. Notes: EL no data; CY not applicable.
It has to be borne in mind that these refer to uninterrupted careers at the same earning level,
and are thus not representative of the full pension gap between women and men, women
being at a disadvantage on account of other factors (Section 3.4).
Pension rewards will nudge people into working longer. Pensions reward delaying
retirement and penalise early retirement, although the penalty appears generally less than
actuarially neutral; in some countries, however, the penalty for early retirement is severe and
can lead to a pension suspension until the minimum conditions are met (age and/or seniority).
Starting a career early or late, while ending it at the SPA, generally makes a limited difference
to the resulting TRR: a very early start, at age 20, can make a more substantial difference, but
this is less than proportional to the career-length increase. Similarly, in all countries except
two, a 20-year career yields a TRR that is higher than half the 40-year career TRR. In many
cases, minimum income provisions raise pension entitlements issuing from the 20-year career.
The value of avoiding early retirement or postponing it beyond the SPA
The value of avoiding early retirement and even extending one’s working life after retirement
is captured by career variant TRR. Consider someone who starts working in 2016 and would
reach the SPA in 2056. If they retire in 2056, they would be a base case. But they may decide
otherwise: they may decide to retire early, and thus cut their career short to 38 years in 2054;
or work longer, thus extending their career to 42 years and retire in 2058. Pension systems can
discourage early retirement and encourage working longer, and these cases can quantify the
consequences of people’s decisions and thus assess the penalties for retiring early and the
bonuses for retiring later than at the SPA (Figure 66).
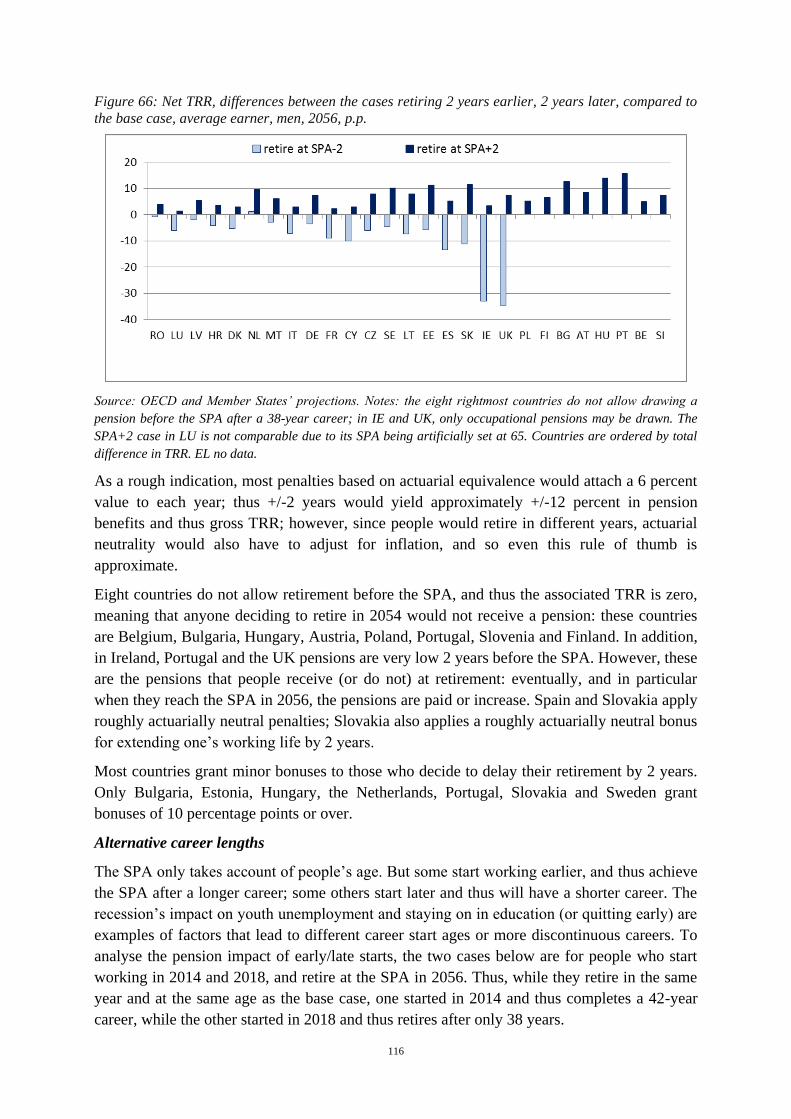
116
Figure 66: Net TRR, differences between the cases retiring 2 years earlier, 2 years later, compared to
the base case, average earner, men, 2056, p.p.
Source: OECD and Member States’ projections. Notes: the eight rightmost countries do not allow drawing a
pension before the SPA after a 38-year career; in IE and UK, only occupational pensions may be drawn. The
SPA+2 case in LU is not comparable due to its SPA being artificially set at 65. Countries are ordered by total
difference in TRR. EL no data.
As a rough indication, most penalties based on actuarial equivalence would attach a 6 percent
value to each year; thus +/-2 years would yield approximately +/-12 percent in pension
benefits and thus gross TRR; however, since people would retire in different years, actuarial
neutrality would also have to adjust for inflation, and so even this rule of thumb is
approximate.
Eight countries do not allow retirement before the SPA, and thus the associated TRR is zero,
meaning that anyone deciding to retire in 2054 would not receive a pension: these countries
are Belgium, Bulgaria, Hungary, Austria, Poland, Portugal, Slovenia and Finland. In addition,
in Ireland, Portugal and the UK pensions are very low 2 years before the SPA. However, these
are the pensions that people receive (or do not) at retirement: eventually, and in particular
when they reach the SPA in 2056, the pensions are paid or increase. Spain and Slovakia apply
roughly actuarially neutral penalties; Slovakia also applies a roughly actuarially neutral bonus
for extending one’s working life by 2 years.
Most countries grant minor bonuses to those who decide to delay their retirement by 2 years.
Only Bulgaria, Estonia, Hungary, the Netherlands, Portugal, Slovakia and Sweden grant
bonuses of 10 percentage points or over.
Alternative career lengths
The SPA only takes account of people’s age. But some start working earlier, and thus achieve
the SPA after a longer career; some others start later and thus will have a shorter career. The
recession’s impact on youth unemployment and staying on in education (or quitting early) are
examples of factors that lead to different career start ages or more discontinuous careers. To
analyse the pension impact of early/late starts, the two cases below are for people who start
working in 2014 and 2018, and retire at the SPA in 2056. Thus, while they retire in the same
year and at the same age as the base case, one started in 2014 and thus completes a 42-year
career, while the other started in 2018 and thus retires after only 38 years.
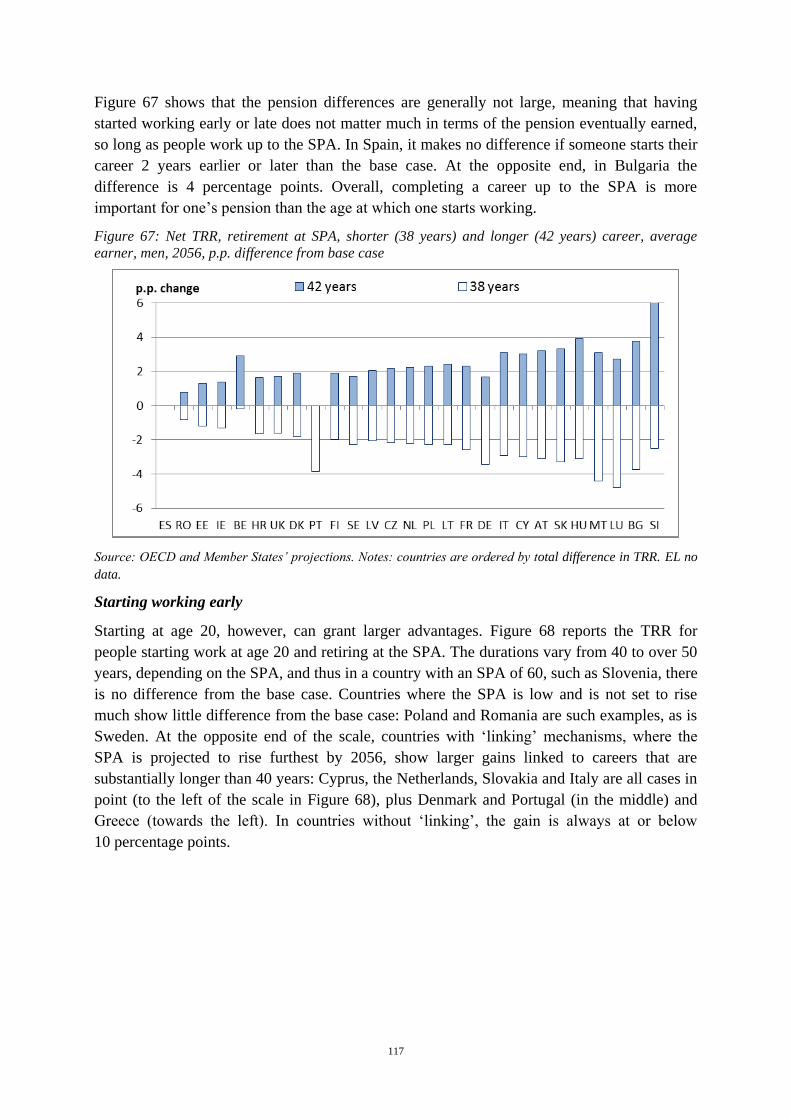
117
Figure 67 shows that the pension differences are generally not large, meaning that having
started working early or late does not matter much in terms of the pension eventually earned,
so long as people work up to the SPA. In Spain, it makes no difference if someone starts their
career 2 years earlier or later than the base case. At the opposite end, in Bulgaria the
difference is 4 percentage points. Overall, completing a career up to the SPA is more
important for one’s pension than the age at which one starts working.
Figure 67: Net TRR, retirement at SPA, shorter (38 years) and longer (42 years) career, average
earner, men, 2056, p.p. difference from base case
Source: OECD and Member States’ projections. Notes: countries are ordered by total difference in TRR. EL no
data.
Starting working early
Starting at age 20, however, can grant larger advantages. Figure 68 reports the TRR for
people starting work at age 20 and retiring at the SPA. The durations vary from 40 to over 50
years, depending on the SPA, and thus in a country with an SPA of 60, such as Slovenia, there
is no difference from the base case. Countries where the SPA is low and is not set to rise
much show little difference from the base case: Poland and Romania are such examples, as is
Sweden. At the opposite end of the scale, countries with ‘linking’ mechanisms, where the
SPA is projected to rise furthest by 2056, show larger gains linked to careers that are
substantially longer than 40 years: Cyprus, the Netherlands, Slovakia and Italy are all cases in
point (to the left of the scale in Figure 68), plus Denmark and Portugal (in the middle) and
Greece (towards the left). In countries without ‘linking’, the gain is always at or below
10 percentage points.
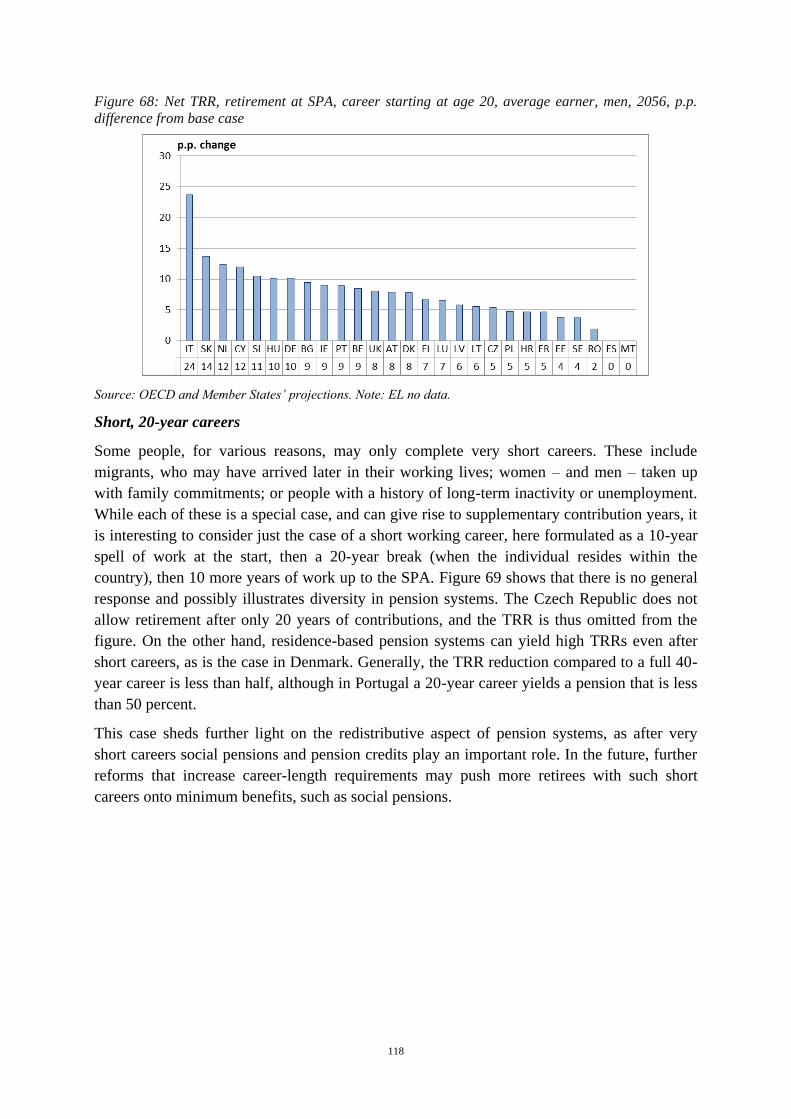
118
Figure 68: Net TRR, retirement at SPA, career starting at age 20, average earner, men, 2056, p.p.
difference from base case
Source: OECD and Member States’ projections. Note: EL no data.
Short, 20-year careers
Some people, for various reasons, may only complete very short careers. These include
migrants, who may have arrived later in their working lives; women – and men – taken up
with family commitments; or people with a history of long-term inactivity or unemployment.
While each of these is a special case, and can give rise to supplementary contribution years, it
is interesting to consider just the case of a short working career, here formulated as a 10-year
spell of work at the start, then a 20-year break (when the individual resides within the
country), then 10 more years of work up to the SPA. Figure 69 shows that there is no general
response and possibly illustrates diversity in pension systems. The Czech Republic does not
allow retirement after only 20 years of contributions, and the TRR is thus omitted from the
figure. On the other hand, residence-based pension systems can yield high TRRs even after
short careers, as is the case in Denmark. Generally, the TRR reduction compared to a full 40-
year career is less than half, although in Portugal a 20-year career yields a pension that is less
than 50 percent.
This case sheds further light on the redistributive aspect of pension systems, as after very
short careers social pensions and pension credits play an important role. In the future, further
reforms that increase career-length requirements may push more retirees with such short
careers onto minimum benefits, such as social pensions.
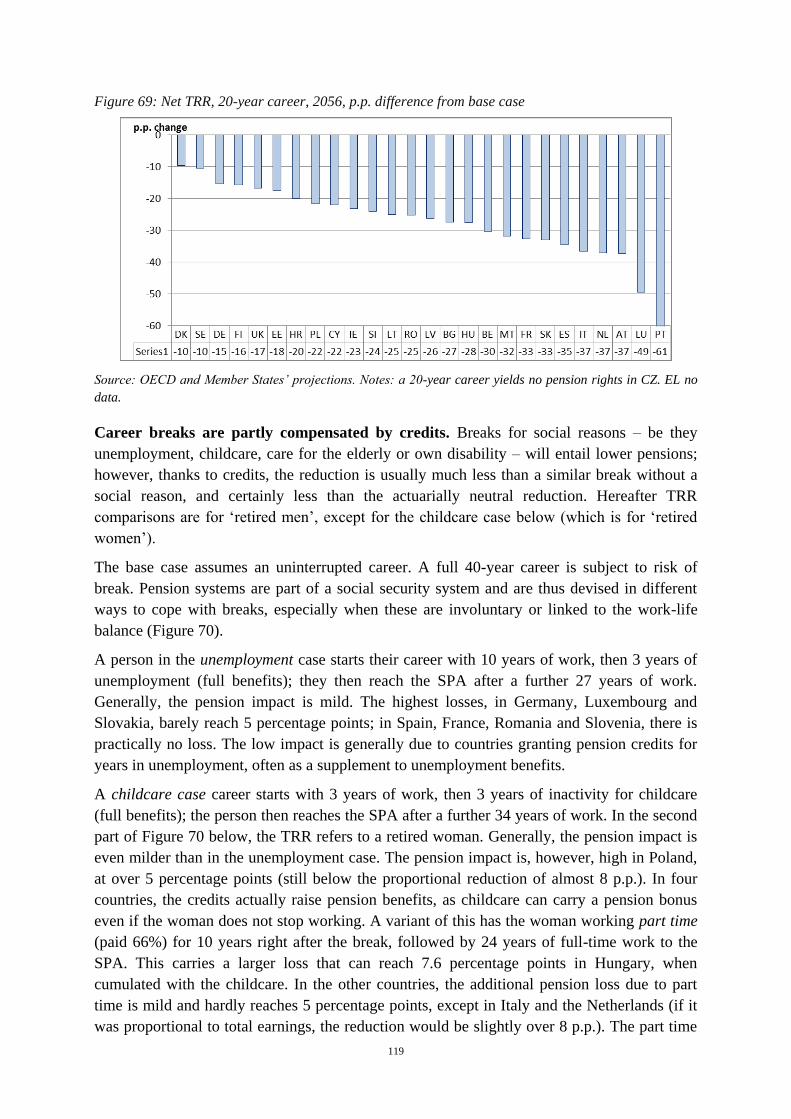
119
Figure 69: Net TRR, 20-year career, 2056, p.p. difference from base case
Source: OECD and Member States’ projections. Notes: a 20-year career yields no pension rights in CZ. EL no
data.
Career breaks are partly compensated by credits. Breaks for social reasons – be they
unemployment, childcare, care for the elderly or own disability – will entail lower pensions;
however, thanks to credits, the reduction is usually much less than a similar break without a
social reason, and certainly less than the actuarially neutral reduction. Hereafter TRR
comparisons are for ‘retired men’, except for the childcare case below (which is for ‘retired
women’).
The base case assumes an uninterrupted career. A full 40-year career is subject to risk of
break. Pension systems are part of a social security system and are thus devised in different
ways to cope with breaks, especially when these are involuntary or linked to the work-life
balance (Figure 70).
A person in the unemployment case starts their career with 10 years of work, then 3 years of
unemployment (full benefits); they then reach the SPA after a further 27 years of work.
Generally, the pension impact is mild. The highest losses, in Germany, Luxembourg and
Slovakia, barely reach 5 percentage points; in Spain, France, Romania and Slovenia, there is
practically no loss. The low impact is generally due to countries granting pension credits for
years in unemployment, often as a supplement to unemployment benefits.
A childcare case career starts with 3 years of work, then 3 years of inactivity for childcare
(full benefits); the person then reaches the SPA after a further 34 years of work. In the second
part of Figure 70 below, the TRR refers to a retired woman. Generally, the pension impact is
even milder than in the unemployment case. The pension impact is, however, high in Poland,
at over 5 percentage points (still below the proportional reduction of almost 8 p.p.). In four
countries, the credits actually raise pension benefits, as childcare can carry a pension bonus
even if the woman does not stop working. A variant of this has the woman working part time
(paid 66%) for 10 years right after the break, followed by 24 years of full-time work to the
SPA. This carries a larger loss that can reach 7.6 percentage points in Hungary, when
cumulated with the childcare. In the other countries, the additional pension loss due to part
time is mild and hardly reaches 5 percentage points, except in Italy and the Netherlands (if it
was proportional to total earnings, the reduction would be slightly over 8 p.p.). The part time
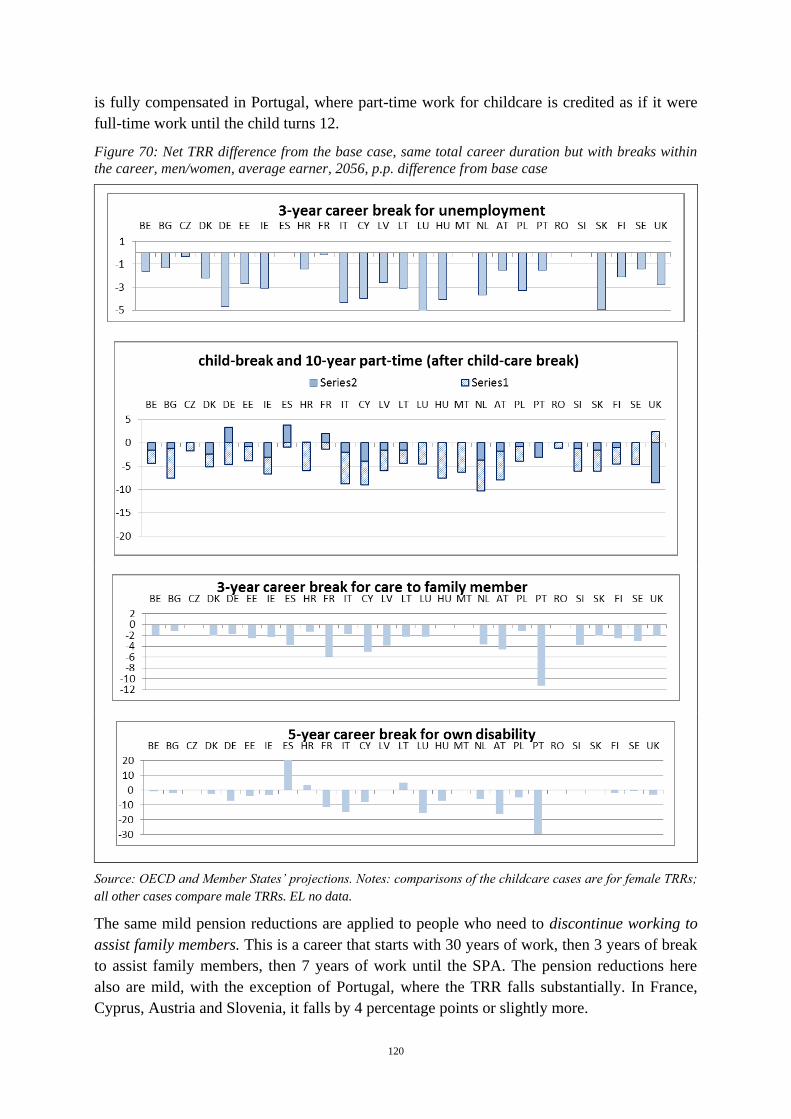
120
is fully compensated in Portugal, where part-time work for childcare is credited as if it were
full-time work until the child turns 12.
Figure 70: Net TRR difference from the base case, same total career duration but with breaks within
the career, men/women, average earner, 2056, p.p. difference from base case
Source: OECD and Member States’ projections. Notes: comparisons of the childcare cases are for female TRRs;
all other cases compare male TRRs. EL no data.
The same mild pension reductions are applied to people who need to discontinue working to
assist family members. This is a career that starts with 30 years of work, then 3 years of break
to assist family members, then 7 years of work until the SPA. The pension reductions here
also are mild, with the exception of Portugal, where the TRR falls substantially. In France,
Cyprus, Austria and Slovenia, it falls by 4 percentage points or slightly more.
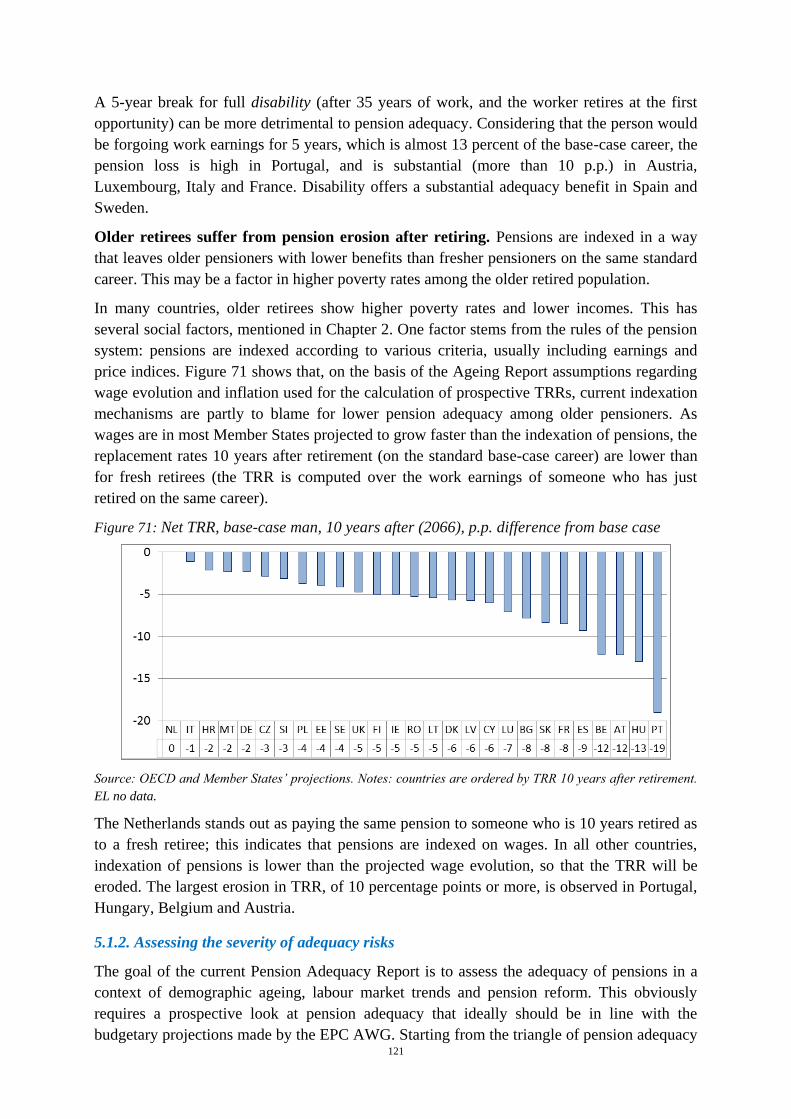
121
A 5-year break for full disability (after 35 years of work, and the worker retires at the first
opportunity) can be more detrimental to pension adequacy. Considering that the person would
be forgoing work earnings for 5 years, which is almost 13 percent of the base-case career, the
pension loss is high in Portugal, and is substantial (more than 10 p.p.) in Austria,
Luxembourg, Italy and France. Disability offers a substantial adequacy benefit in Spain and
Sweden.
Older retirees suffer from pension erosion after retiring. Pensions are indexed in a way
that leaves older pensioners with lower benefits than fresher pensioners on the same standard
career. This may be a factor in higher poverty rates among the older retired population.
In many countries, older retirees show higher poverty rates and lower incomes. This has
several social factors, mentioned in Chapter 2. One factor stems from the rules of the pension
system: pensions are indexed according to various criteria, usually including earnings and
price indices. Figure 71 shows that, on the basis of the Ageing Report assumptions regarding
wage evolution and inflation used for the calculation of prospective TRRs, current indexation
mechanisms are partly to blame for lower pension adequacy among older pensioners. As
wages are in most Member States projected to grow faster than the indexation of pensions, the
replacement rates 10 years after retirement (on the standard base-case career) are lower than
for fresh retirees (the TRR is computed over the work earnings of someone who has just
retired on the same career).
Figure 71: Net TRR, base-case man, 10 years after (2066), p.p. difference from base case
Source: OECD and Member States’ projections. Notes: countries are ordered by TRR 10 years after retirement.
EL no data.
The Netherlands stands out as paying the same pension to someone who is 10 years retired as
to a fresh retiree; this indicates that pensions are indexed on wages. In all other countries,
indexation of pensions is lower than the projected wage evolution, so that the TRR will be
eroded. The largest erosion in TRR, of 10 percentage points or more, is observed in Portugal,
Hungary, Belgium and Austria.
5.1.2. Assessing the severity of adequacy risks
The goal of the current Pension Adequacy Report is to assess the adequacy of pensions in a
context of demographic ageing, labour market trends and pension reform. This obviously
requires a prospective look at pension adequacy that ideally should be in line with the
budgetary projections made by the EPC AWG. Starting from the triangle of pension adequacy
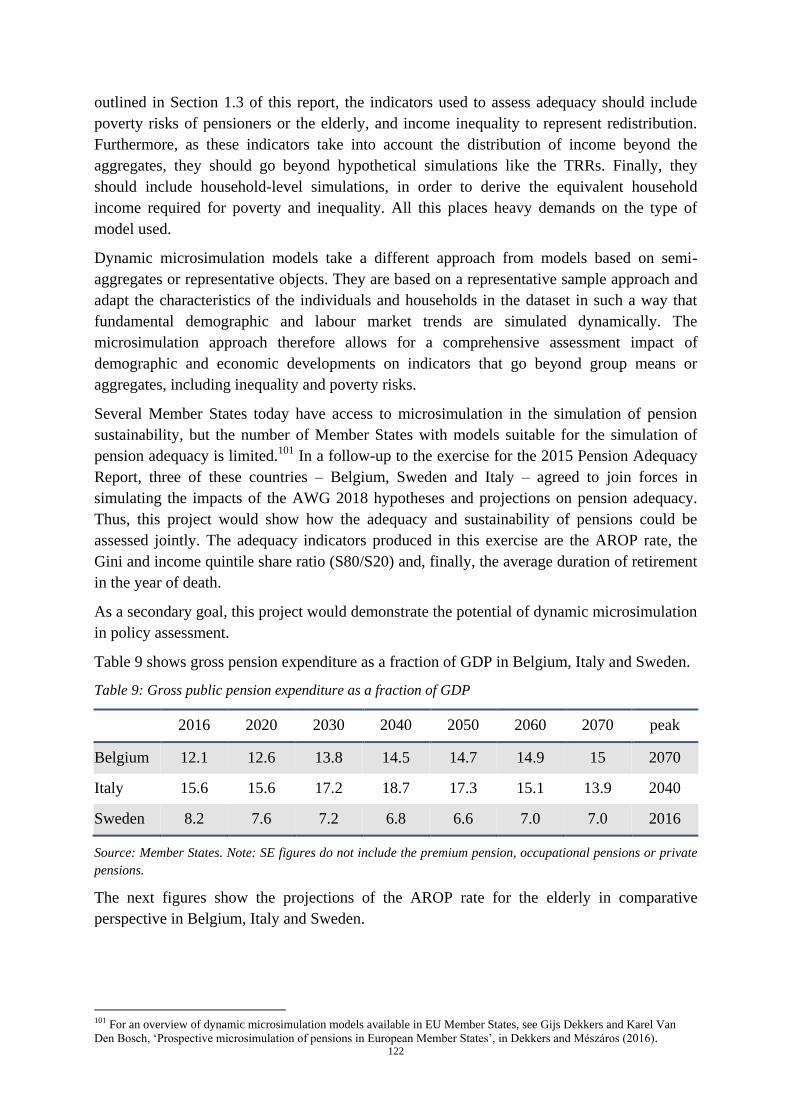
122
outlined in Section 1.3 of this report, the indicators used to assess adequacy should include
poverty risks of pensioners or the elderly, and income inequality to represent redistribution.
Furthermore, as these indicators take into account the distribution of income beyond the
aggregates, they should go beyond hypothetical simulations like the TRRs. Finally, they
should include household-level simulations, in order to derive the equivalent household
income required for poverty and inequality. All this places heavy demands on the type of
model used.
Dynamic microsimulation models take a different approach from models based on semi-
aggregates or representative objects. They are based on a representative sample approach and
adapt the characteristics of the individuals and households in the dataset in such a way that
fundamental demographic and labour market trends are simulated dynamically. The
microsimulation approach therefore allows for a comprehensive assessment impact of
demographic and economic developments on indicators that go beyond group means or
aggregates, including inequality and poverty risks.
Several Member States today have access to microsimulation in the simulation of pension
sustainability, but the number of Member States with models suitable for the simulation of
pension adequacy is limited.101
In a follow-up to the exercise for the 2015 Pension Adequacy
Report, three of these countries – Belgium, Sweden and Italy – agreed to join forces in
simulating the impacts of the AWG 2018 hypotheses and projections on pension adequacy.
Thus, this project would show how the adequacy and sustainability of pensions could be
assessed jointly. The adequacy indicators produced in this exercise are the AROP rate, the
Gini and income quintile share ratio (S80/S20) and, finally, the average duration of retirement
in the year of death.
As a secondary goal, this project would demonstrate the potential of dynamic microsimulation
in policy assessment.
Table 9 shows gross pension expenditure as a fraction of GDP in Belgium, Italy and Sweden.
Table 9: Gross public pension expenditure as a fraction of GDP
2016 2020 2030 2040 2050 2060 2070 peak
Belgium 12.1 12.6 13.8 14.5 14.7 14.9 15 2070
Italy 15.6 15.6 17.2 18.7 17.3 15.1 13.9 2040
Sweden 8.2 7.6 7.2 6.8 6.6 7.0 7.0 2016
Source: Member States. Note: SE figures do not include the premium pension, occupational pensions or private
pensions.
The next figures show the projections of the AROP rate for the elderly in comparative
perspective in Belgium, Italy and Sweden.
101 For an overview of dynamic microsimulation models available in EU Member States, see Gijs Dekkers and Karel Van
Den Bosch, ‘Prospective microsimulation of pensions in European Member States’, in Dekkers and Mészáros (2016).
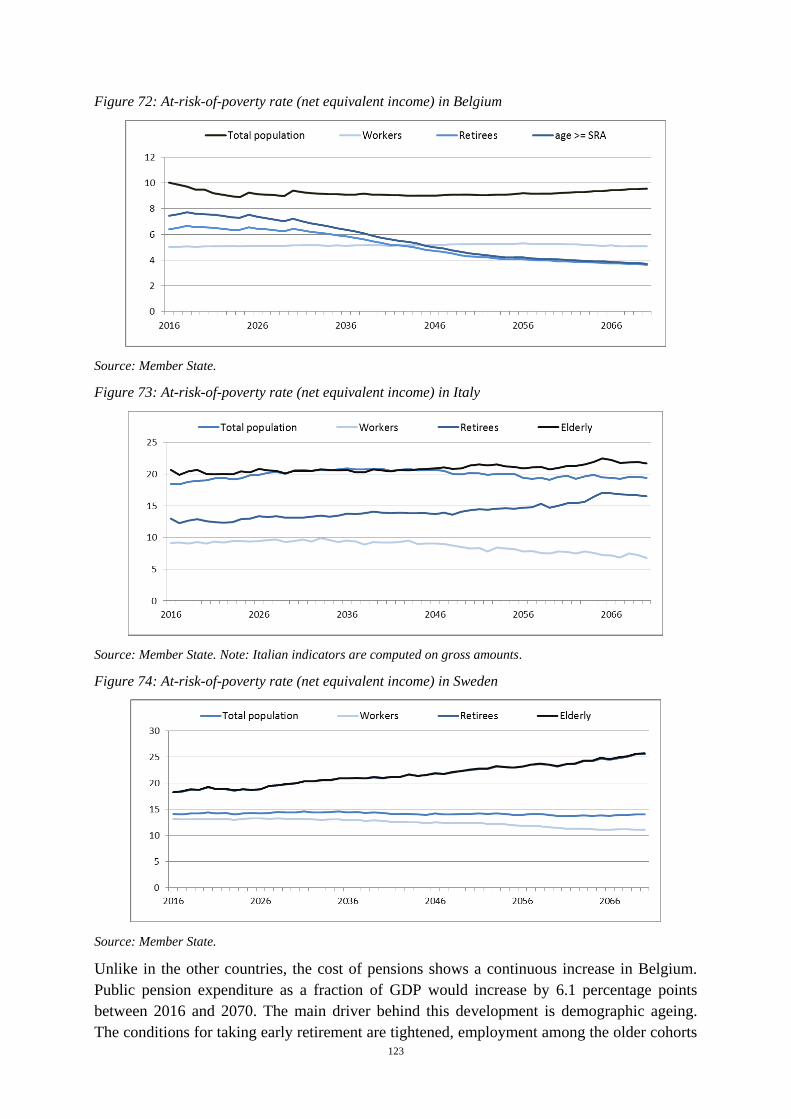
123
Figure 72: At-risk-of-poverty rate (net equivalent income) in Belgium
Source: Member State.
Figure 73: At-risk-of-poverty rate (net equivalent income) in Italy
Source: Member State. Note: Italian indicators are computed on gross amounts.
Figure 74: At-risk-of-poverty rate (net equivalent income) in Sweden
Source: Member State.
Unlike in the other countries, the cost of pensions shows a continuous increase in Belgium.
Public pension expenditure as a fraction of GDP would increase by 6.1 percentage points
between 2016 and 2070. The main driver behind this development is demographic ageing.
The conditions for taking early retirement are tightened, employment among the older cohorts
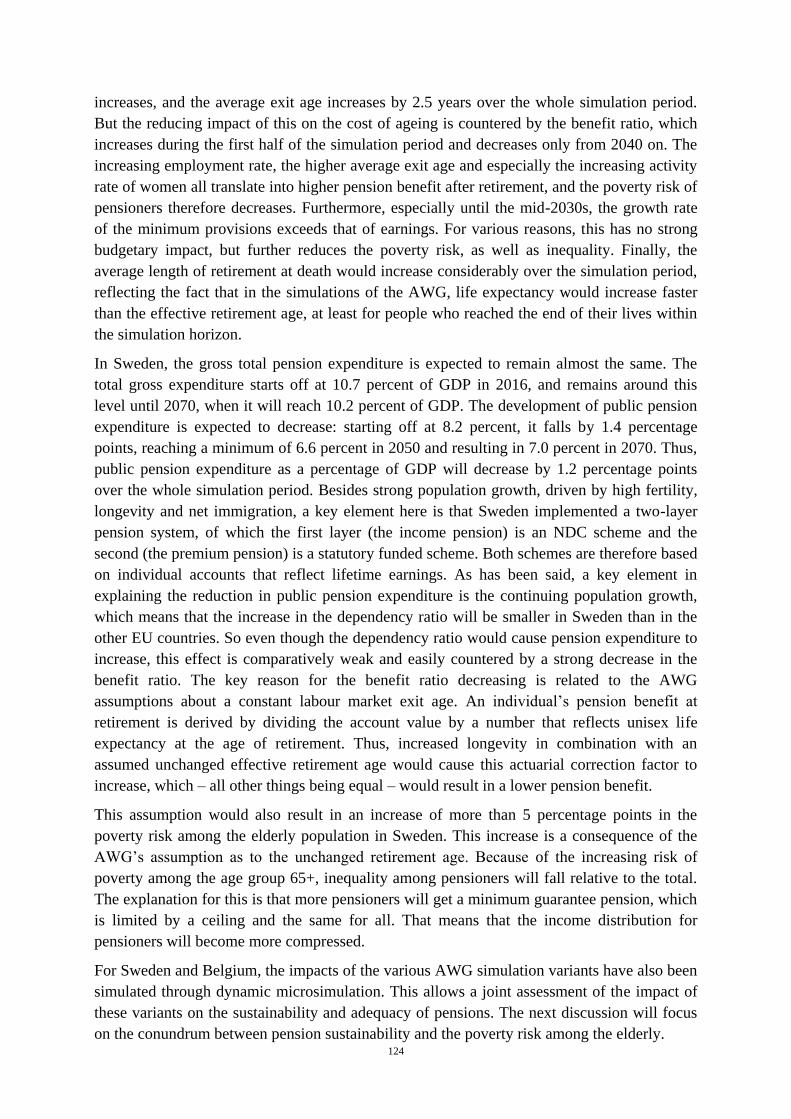
124
increases, and the average exit age increases by 2.5 years over the whole simulation period.
But the reducing impact of this on the cost of ageing is countered by the benefit ratio, which
increases during the first half of the simulation period and decreases only from 2040 on. The
increasing employment rate, the higher average exit age and especially the increasing activity
rate of women all translate into higher pension benefit after retirement, and the poverty risk of
pensioners therefore decreases. Furthermore, especially until the mid-2030s, the growth rate
of the minimum provisions exceeds that of earnings. For various reasons, this has no strong
budgetary impact, but further reduces the poverty risk, as well as inequality. Finally, the
average length of retirement at death would increase considerably over the simulation period,
reflecting the fact that in the simulations of the AWG, life expectancy would increase faster
than the effective retirement age, at least for people who reached the end of their lives within
the simulation horizon.
In Sweden, the gross total pension expenditure is expected to remain almost the same. The
total gross expenditure starts off at 10.7 percent of GDP in 2016, and remains around this
level until 2070, when it will reach 10.2 percent of GDP. The development of public pension
expenditure is expected to decrease: starting off at 8.2 percent, it falls by 1.4 percentage
points, reaching a minimum of 6.6 percent in 2050 and resulting in 7.0 percent in 2070. Thus,
public pension expenditure as a percentage of GDP will decrease by 1.2 percentage points
over the whole simulation period. Besides strong population growth, driven by high fertility,
longevity and net immigration, a key element here is that Sweden implemented a two-layer
pension system, of which the first layer (the income pension) is an NDC scheme and the
second (the premium pension) is a statutory funded scheme. Both schemes are therefore based
on individual accounts that reflect lifetime earnings. As has been said, a key element in
explaining the reduction in public pension expenditure is the continuing population growth,
which means that the increase in the dependency ratio will be smaller in Sweden than in the
other EU countries. So even though the dependency ratio would cause pension expenditure to
increase, this effect is comparatively weak and easily countered by a strong decrease in the
benefit ratio. The key reason for the benefit ratio decreasing is related to the AWG
assumptions about a constant labour market exit age. An individual’s pension benefit at
retirement is derived by dividing the account value by a number that reflects unisex life
expectancy at the age of retirement. Thus, increased longevity in combination with an
assumed unchanged effective retirement age would cause this actuarial correction factor to
increase, which – all other things being equal – would result in a lower pension benefit.
This assumption would also result in an increase of more than 5 percentage points in the
poverty risk among the elderly population in Sweden. This increase is a consequence of the
AWG’s assumption as to the unchanged retirement age. Because of the increasing risk of
poverty among the age group 65+, inequality among pensioners will fall relative to the total.
The explanation for this is that more pensioners will get a minimum guarantee pension, which
is limited by a ceiling and the same for all. That means that the income distribution for
pensioners will become more compressed.
For Sweden and Belgium, the impacts of the various AWG simulation variants have also been
simulated through dynamic microsimulation. This allows a joint assessment of the impact of
these variants on the sustainability and adequacy of pensions. The next discussion will focus
on the conundrum between pension sustainability and the poverty risk among the elderly.
125
The impact of an increasing overall employment rate hinges on two countering effects. First,
having more people working means that median equivalent income and the poverty threshold
both increase. This indirect effect causes the poverty rate of the elderly to increase. But more
employment means that when those workers reach retirement, they will receive a higher
pension benefit and the poverty risk will therefore decrease. This is the direct effect of these
variants. In Sweden, the indirect effect in the high-employment scenario exceeds the direct
effect, so the poverty risk of the elderly increases. In Belgium, the two effects are more or less
the same and cancel each other out, so that the impact of the high-employment scenario on the
poverty risk of the elderly is small. Thus, increasing overall employment will reduce the costs
of ageing, but at the price of increasing poverty risks among the elderly, particularly in
Sweden.
In Belgium and Sweden, the simulations find a negative impact of the higher employment rate
among older workers and the policy scenario on the poverty risk among the elderly. This is
because the indirect effect is almost absent (the additional number of older active that go into
work is not strong enough to increase median income) and the direct effect therefore reduces
the poverty risk. Hence, in both countries, increasing the employment rate among older
workers could jointly improve the sustainability of the pension system (i.e. reduce the cost of
ageing) and improve adequacy reflected by the poverty risks of the elderly.
Finally, in both countries, increasing productivity will increase the poverty risk of the elderly,
while poverty will decrease in the lower-productivity scenario. The reasons underlying these
effects are, however, partially different.
Pension spending in Italy would remain stable at 15.6 percent of GDP up to about 2020. This
stability would mainly be the result of the tightening of the eligibility requirements for old-
age and early pensions, linking them to life expectancy from 2013 on. From about 2020 and
up to 2040, the increase in pension spending would set in, mainly driven by low productivity
growth projections, combined with the transition of large baby-boom cohorts into old age.
However, the 1995 pension law adopted an NDC system, and the 2011 pension law
strengthened it. As time goes by, new pensioners that have a benefit under this new regime
would gradually replace the stock of pensioners that have a benefit under the old defined
benefit regime. This ‘gradual introduction’ of the NDC would cause the benefit ratio to
decrease. The new NDC scheme is overall less generous, especially towards short and
exponential careers, which enjoyed higher internal rates of return on contributions accrued
under the old DB scheme, while NDC rules apply the same internal rates of return to all
pensioners.
Between 2020 and 2040, this effect would not be strong enough to counter the
aforementioned demographic and productivity developments that cause the budgetary cost of
ageing to increase; but after 2040, pension spending would fall back again to 13.9 percent in
2070, thanks to the compensating effects of the substantial pension reforms adopted in the
past, and in particular: i) the introduction of the NDC scheme and the indexation of pensions
to price inflation; ii) the increase in the eligibility requirements and their automatic linkage to
changes in life expectancy which will reduce the coverage ratio; and iii) higher employment
rates among the elderly, mainly boosted by the postponement of the retirement age.
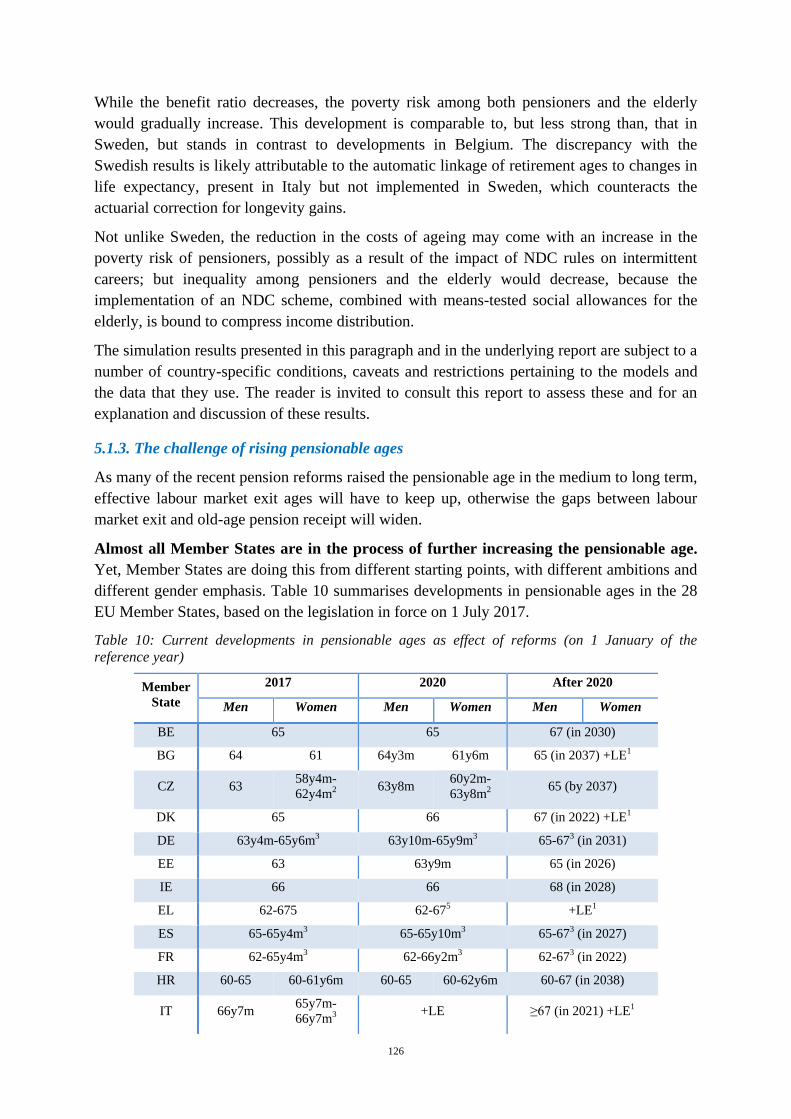
126
While the benefit ratio decreases, the poverty risk among both pensioners and the elderly
would gradually increase. This development is comparable to, but less strong than, that in
Sweden, but stands in contrast to developments in Belgium. The discrepancy with the
Swedish results is likely attributable to the automatic linkage of retirement ages to changes in
life expectancy, present in Italy but not implemented in Sweden, which counteracts the
actuarial correction for longevity gains.
Not unlike Sweden, the reduction in the costs of ageing may come with an increase in the
poverty risk of pensioners, possibly as a result of the impact of NDC rules on intermittent
careers; but inequality among pensioners and the elderly would decrease, because the
implementation of an NDC scheme, combined with means-tested social allowances for the
elderly, is bound to compress income distribution.
The simulation results presented in this paragraph and in the underlying report are subject to a
number of country-specific conditions, caveats and restrictions pertaining to the models and
the data that they use. The reader is invited to consult this report to assess these and for an
explanation and discussion of these results.
5.1.3. The challenge of rising pensionable ages
As many of the recent pension reforms raised the pensionable age in the medium to long term,
effective labour market exit ages will have to keep up, otherwise the gaps between labour
market exit and old-age pension receipt will widen.
Almost all Member States are in the process of further increasing the pensionable age.
Yet, Member States are doing this from different starting points, with different ambitions and
different gender emphasis. Table 10 summarises developments in pensionable ages in the 28
EU Member States, based on the legislation in force on 1 July 2017.
Table 10: Current developments in pensionable ages as effect of reforms (on 1 January of the
reference year)
Member
State
2017 2020 After 2020
Men Women Men Women Men Women
BE 65 65 67 (in 2030)
BG 64 61 64y3m 61y6m 65 (in 2037) +LE1
CZ 63 58y4m-
62y4m2 63y8m
60y2m-
63y8m2 65 (by 2037)
DK 65 66 67 (in 2022) +LE1
DE 63y4m-65y6m3 63y10m-65y9m3 65-673 (in 2031)
EE 63 63y9m 65 (in 2026)
IE 66 66 68 (in 2028)
EL 62-675 62-675 +LE1
ES 65-65y4m3 65-65y10m3 65-673 (in 2027)
FR 62-65y4m3 62-66y2m3 62-673 (in 2022)
HR 60-65 60-61y6m 60-65 60-62y6m 60-67 (in 2038)
IT 66y7m 65y7m-
66y7m3 +LE ≥67 (in 2021) +LE1
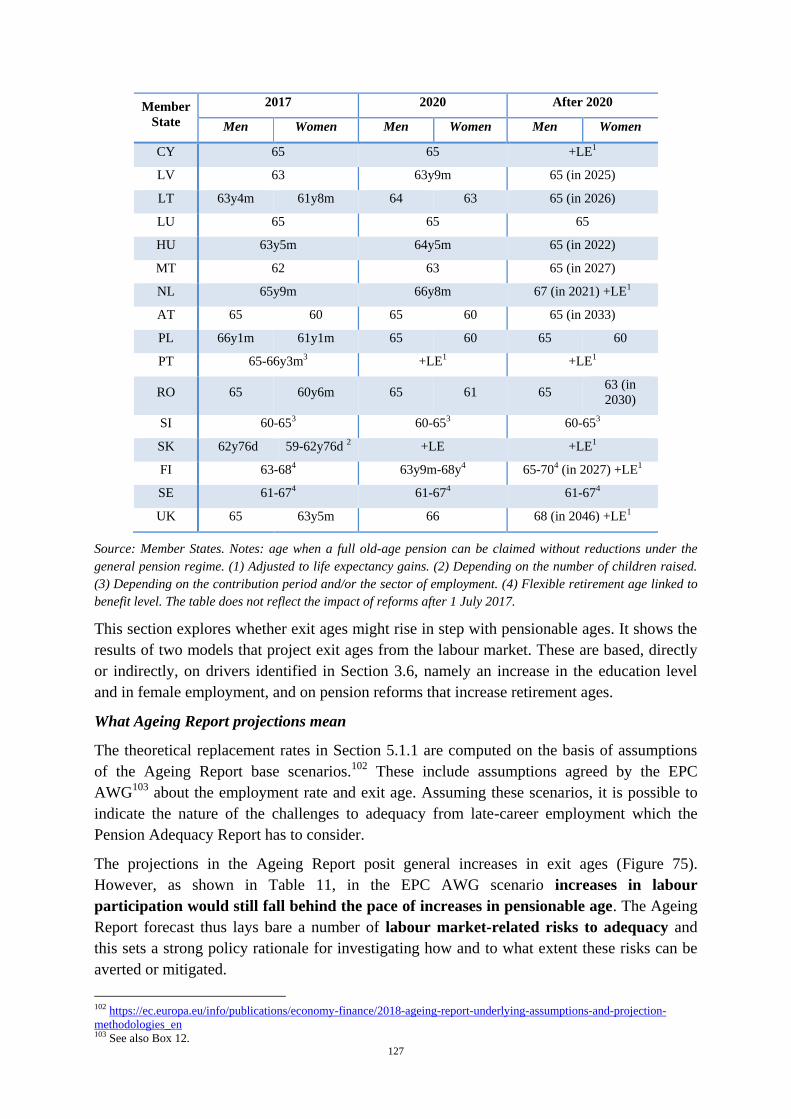
127
Member
State
2017 2020 After 2020
Men Women Men Women Men Women
CY 65 65 +LE1
LV 63 63y9m 65 (in 2025)
LT 63y4m 61y8m 64 63 65 (in 2026)
LU 65 65 65
HU 63y5m 64y5m 65 (in 2022)
MT 62 63 65 (in 2027)
NL 65y9m 66y8m 67 (in 2021) +LE1
AT 65 60 65 60 65 (in 2033)
PL 66y1m 61y1m 65 60 65 60
PT 65-66y3m3 +LE1 +LE1
RO 65 60y6m 65 61 65 63 (in
2030)
SI 60-653 60-653 60-653
SK 62y76d 59-62y76d 2 +LE +LE1
FI 63-684 63y9m-68y4 65-704 (in 2027) +LE1
SE 61-674 61-674 61-674
UK 65 63y5m 66 68 (in 2046) +LE1
Source: Member States. Notes: age when a full old-age pension can be claimed without reductions under the
general pension regime. (1) Adjusted to life expectancy gains. (2) Depending on the number of children raised.
(3) Depending on the contribution period and/or the sector of employment. (4) Flexible retirement age linked to
benefit level. The table does not reflect the impact of reforms after 1 July 2017.
This section explores whether exit ages might rise in step with pensionable ages. It shows the
results of two models that project exit ages from the labour market. These are based, directly
or indirectly, on drivers identified in Section 3.6, namely an increase in the education level
and in female employment, and on pension reforms that increase retirement ages.
What Ageing Report projections mean
The theoretical replacement rates in Section 5.1.1 are computed on the basis of assumptions
of the Ageing Report base scenarios.102
These include assumptions agreed by the EPC
AWG103
about the employment rate and exit age. Assuming these scenarios, it is possible to
indicate the nature of the challenges to adequacy from late-career employment which the
Pension Adequacy Report has to consider.
The projections in the Ageing Report posit general increases in exit ages (Figure 75).
However, as shown in Table 11, in the EPC AWG scenario increases in labour
participation would still fall behind the pace of increases in pensionable age. The Ageing
Report forecast thus lays bare a number of labour market-related risks to adequacy and
this sets a strong policy rationale for investigating how and to what extent these risks can be
averted or mitigated.
102 https://ec.europa.eu/info/publications/economy-finance/2018-ageing-report-underlying-assumptions-and-projection-
methodologies_en 103 See also Box 12.
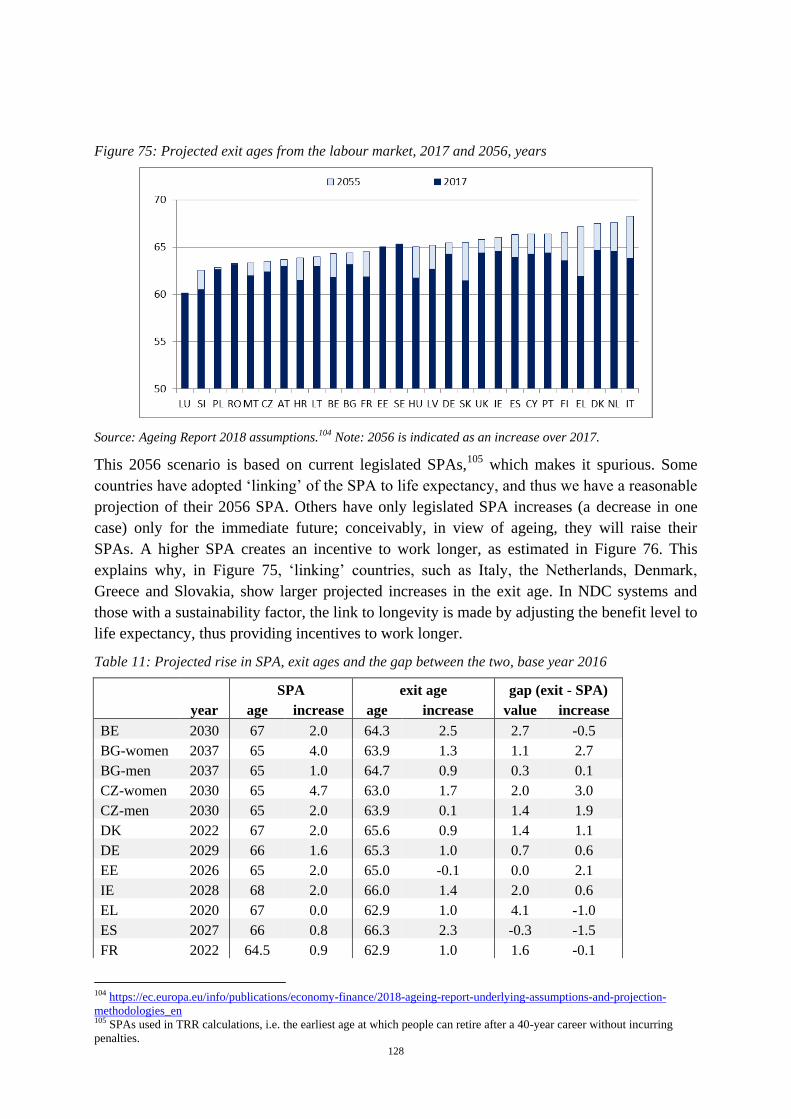
128
Figure 75: Projected exit ages from the labour market, 2017 and 2056, years
Source: Ageing Report 2018 assumptions.104 Note: 2056 is indicated as an increase over 2017.
This 2056 scenario is based on current legislated SPAs,105
which makes it spurious. Some
countries have adopted ‘linking’ of the SPA to life expectancy, and thus we have a reasonable
projection of their 2056 SPA. Others have only legislated SPA increases (a decrease in one
case) only for the immediate future; conceivably, in view of ageing, they will raise their
SPAs. A higher SPA creates an incentive to work longer, as estimated in Figure 76. This
explains why, in Figure 75, ‘linking’ countries, such as Italy, the Netherlands, Denmark,
Greece and Slovakia, show larger projected increases in the exit age. In NDC systems and
those with a sustainability factor, the link to longevity is made by adjusting the benefit level to
life expectancy, thus providing incentives to work longer.
Table 11: Projected rise in SPA, exit ages and the gap between the two, base year 2016
SPA exit age gap (exit - SPA)
year age increase age increase value increase
BE 2030 67 2.0 64.3 2.5 2.7 -0.5
BG-women 2037 65 4.0 63.9 1.3 1.1 2.7
BG-men 2037 65 1.0 64.7 0.9 0.3 0.1
CZ-women 2030 65 4.7 63.0 1.7 2.0 3.0
CZ-men 2030 65 2.0 63.9 0.1 1.4 1.9
DK 2022 67 2.0 65.6 0.9 1.4 1.1
DE 2029 66 1.6 65.3 1.0 0.7 0.6
EE 2026 65 2.0 65.0 -0.1 0.0 2.1
IE 2028 68 2.0 66.0 1.4 2.0 0.6
EL 2020 67 0.0 62.9 1.0 4.1 -1.0
ES 2027 66 0.8 66.3 2.3 -0.3 -1.5
FR 2022 64.5 0.9 62.9 1.0 1.6 -0.1
104 https://ec.europa.eu/info/publications/economy-finance/2018-ageing-report-underlying-assumptions-and-projection-
methodologies_en 105 SPAs used in TRR calculations, i.e. the earliest age at which people can retire after a 40-year career without incurring
penalties.
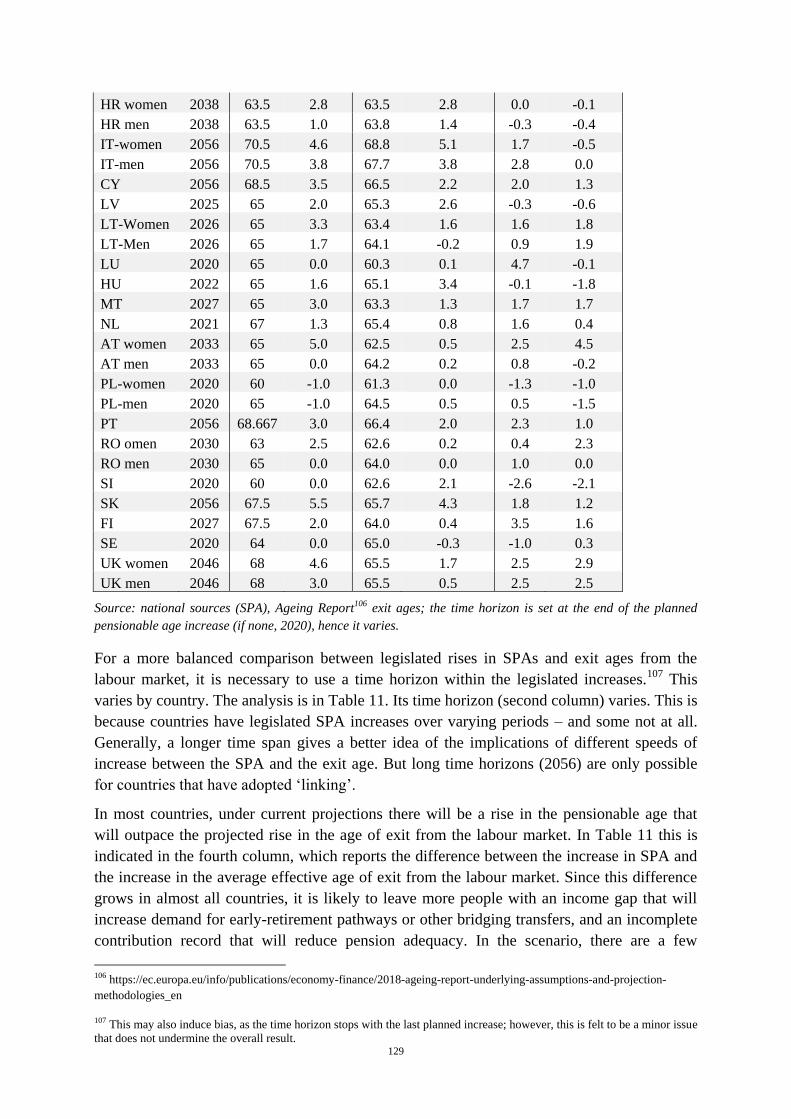
129
HR women 2038 63.5 2.8 63.5 2.8 0.0 -0.1
HR men 2038 63.5 1.0 63.8 1.4 -0.3 -0.4
IT-women 2056 70.5 4.6 68.8 5.1 1.7 -0.5
IT-men 2056 70.5 3.8 67.7 3.8 2.8 0.0
CY 2056 68.5 3.5 66.5 2.2 2.0 1.3
LV 2025 65 2.0 65.3 2.6 -0.3 -0.6
LT-Women 2026 65 3.3 63.4 1.6 1.6 1.8
LT-Men 2026 65 1.7 64.1 -0.2 0.9 1.9
LU 2020 65 0.0 60.3 0.1 4.7 -0.1
HU 2022 65 1.6 65.1 3.4 -0.1 -1.8
MT 2027 65 3.0 63.3 1.3 1.7 1.7
NL 2021 67 1.3 65.4 0.8 1.6 0.4
AT women 2033 65 5.0 62.5 0.5 2.5 4.5
AT men 2033 65 0.0 64.2 0.2 0.8 -0.2
PL-women 2020 60 -1.0 61.3 0.0 -1.3 -1.0
PL-men 2020 65 -1.0 64.5 0.5 0.5 -1.5
PT 2056 68.667 3.0 66.4 2.0 2.3 1.0
RO omen 2030 63 2.5 62.6 0.2 0.4 2.3
RO men 2030 65 0.0 64.0 0.0 1.0 0.0
SI 2020 60 0.0 62.6 2.1 -2.6 -2.1
SK 2056 67.5 5.5 65.7 4.3 1.8 1.2
FI 2027 67.5 2.0 64.0 0.4 3.5 1.6
SE 2020 64 0.0 65.0 -0.3 -1.0 0.3
UK women 2046 68 4.6 65.5 1.7 2.5 2.9
UK men 2046 68 3.0 65.5 0.5 2.5 2.5
Source: national sources (SPA), Ageing Report106 exit ages; the time horizon is set at the end of the planned
pensionable age increase (if none, 2020), hence it varies.
For a more balanced comparison between legislated rises in SPAs and exit ages from the
labour market, it is necessary to use a time horizon within the legislated increases.107
This
varies by country. The analysis is in Table 11. Its time horizon (second column) varies. This is
because countries have legislated SPA increases over varying periods – and some not at all.
Generally, a longer time span gives a better idea of the implications of different speeds of
increase between the SPA and the exit age. But long time horizons (2056) are only possible
for countries that have adopted ‘linking’.
In most countries, under current projections there will be a rise in the pensionable age that
will outpace the projected rise in the age of exit from the labour market. In Table 11 this is
indicated in the fourth column, which reports the difference between the increase in SPA and
the increase in the average effective age of exit from the labour market. Since this difference
grows in almost all countries, it is likely to leave more people with an income gap that will
increase demand for early-retirement pathways or other bridging transfers, and an incomplete
contribution record that will reduce pension adequacy. In the scenario, there are a few
106 https://ec.europa.eu/info/publications/economy-finance/2018-ageing-report-underlying-assumptions-and-projection-
methodologies_en
107 This may also induce bias, as the time horizon stops with the last planned increase; however, this is felt to be a minor issue
that does not undermine the overall result.
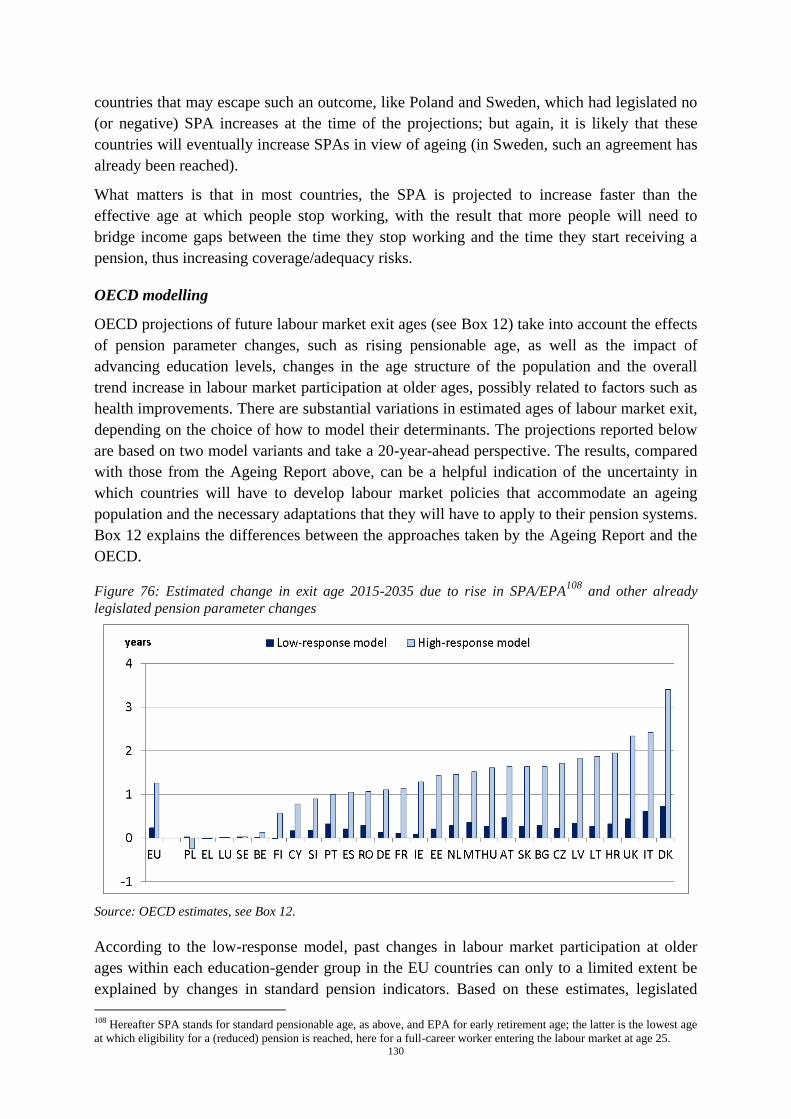
130
countries that may escape such an outcome, like Poland and Sweden, which had legislated no
(or negative) SPA increases at the time of the projections; but again, it is likely that these
countries will eventually increase SPAs in view of ageing (in Sweden, such an agreement has
already been reached).
What matters is that in most countries, the SPA is projected to increase faster than the
effective age at which people stop working, with the result that more people will need to
bridge income gaps between the time they stop working and the time they start receiving a
pension, thus increasing coverage/adequacy risks.
OECD modelling
OECD projections of future labour market exit ages (see Box 12) take into account the effects
of pension parameter changes, such as rising pensionable age, as well as the impact of
advancing education levels, changes in the age structure of the population and the overall
trend increase in labour market participation at older ages, possibly related to factors such as
health improvements. There are substantial variations in estimated ages of labour market exit,
depending on the choice of how to model their determinants. The projections reported below
are based on two model variants and take a 20-year-ahead perspective. The results, compared
with those from the Ageing Report above, can be a helpful indication of the uncertainty in
which countries will have to develop labour market policies that accommodate an ageing
population and the necessary adaptations that they will have to apply to their pension systems.
Box 12 explains the differences between the approaches taken by the Ageing Report and the
OECD.
Figure 76: Estimated change in exit age 2015-2035 due to rise in SPA/EPA108
and other already
legislated pension parameter changes
Source: OECD estimates, see Box 12.
According to the low-response model, past changes in labour market participation at older
ages within each education-gender group in the EU countries can only to a limited extent be
explained by changes in standard pension indicators. Based on these estimates, legislated
108 Hereafter SPA stands for standard pensionable age, as above, and EPA for early retirement age; the latter is the lowest age
at which eligibility for a (reduced) pension is reached, here for a full-career worker entering the labour market at age 25.
131
future changes in the SPA and the early pension age (EPA) and other pension parameters,
including through links to life expectancy, would translate only to a limited extent into
increases in exit ages (Figure 76). On average across the countries, changes in statutory
retirement ages would increase the effective retirement age by 0.4 years for women and 0.1
years for men. Changes projected by the high-response model substantially exceed those in
the low-response model, amounting to an increase between 2015 and 2035 of 1.4 and 1.1
years for women and men, respectively. The main reason is that the high-response model
imposes a larger impact of pensionable ages on labour market participation (cf. Box 12).
Hence, this assumption leads to a higher estimated impact of pension policies. The impact of
automatic adjustments in benefits in line with changes in life expectancy is statistically
significant in both model variants, but is quantitatively small. In practice, financial incentives
might have a larger impact on retirement-age behaviours in some countries than in others; the
effect here reflects average parameter estimates applied to country-specific policy changes.
Some countries are expected to exceed these estimated effects, while the opposite is true in
others, depending on the implementation of complementary policies, in particular in the
health and employment areas.
Pensionable ages influence behaviours by providing a standard reference age for the end
career and by affecting expectations about material conditions during retirement. Based on the
high-response estimates, the SPA is of larger importance for the timing of the retirement
decision than is the EPA. In Finland, for example, an increase in both early and standard
pensionable ages of 1 year is estimated to raise the exit age according to the high-response
model by about 0.5 years. Germany’s planned increase in the SPA of 1.7 years without a
concurrent increase in the EPA, on the other hand, may increase exit ages by 1.1 years.
However, these differences largely diminish in the low-response model.
The effect of pension policies on retirement behaviour might vary across socio-economic
groups. Estimates in the high-response model focusing on educational groups suggest that this
is indeed the case for women, but that differences are negligible for men. On average, over 20
years, medium- and high-educated women are estimated to respond more strongly (+1.4 and
+1.7 years, respectively) to an increase in SPA and EPA than low-educated women (+1.0
years). The differences between education groups among men are rather negligible.
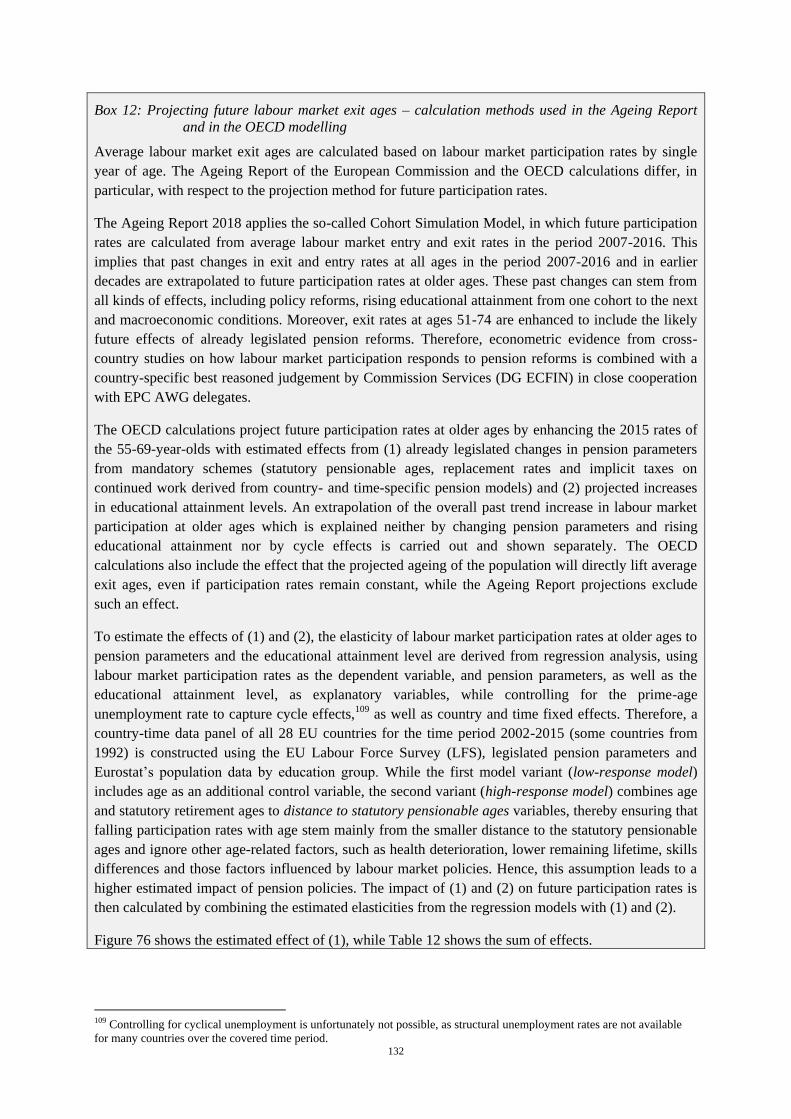
132
Box 12: Projecting future labour market exit ages – calculation methods used in the Ageing Report
and in the OECD modelling
Average labour market exit ages are calculated based on labour market participation rates by single
year of age. The Ageing Report of the European Commission and the OECD calculations differ, in
particular, with respect to the projection method for future participation rates.
The Ageing Report 2018 applies the so-called Cohort Simulation Model, in which future participation
rates are calculated from average labour market entry and exit rates in the period 2007-2016. This
implies that past changes in exit and entry rates at all ages in the period 2007-2016 and in earlier
decades are extrapolated to future participation rates at older ages. These past changes can stem from
all kinds of effects, including policy reforms, rising educational attainment from one cohort to the next
and macroeconomic conditions. Moreover, exit rates at ages 51-74 are enhanced to include the likely
future effects of already legislated pension reforms. Therefore, econometric evidence from cross-
country studies on how labour market participation responds to pension reforms is combined with a
country-specific best reasoned judgement by Commission Services (DG ECFIN) in close cooperation
with EPC AWG delegates.
The OECD calculations project future participation rates at older ages by enhancing the 2015 rates of
the 55-69-year-olds with estimated effects from (1) already legislated changes in pension parameters
from mandatory schemes (statutory pensionable ages, replacement rates and implicit taxes on
continued work derived from country- and time-specific pension models) and (2) projected increases
in educational attainment levels. An extrapolation of the overall past trend increase in labour market
participation at older ages which is explained neither by changing pension parameters and rising
educational attainment nor by cycle effects is carried out and shown separately. The OECD
calculations also include the effect that the projected ageing of the population will directly lift average
exit ages, even if participation rates remain constant, while the Ageing Report projections exclude
such an effect.
To estimate the effects of (1) and (2), the elasticity of labour market participation rates at older ages to
pension parameters and the educational attainment level are derived from regression analysis, using
labour market participation rates as the dependent variable, and pension parameters, as well as the
educational attainment level, as explanatory variables, while controlling for the prime-age
unemployment rate to capture cycle effects,109 as well as country and time fixed effects. Therefore, a
country-time data panel of all 28 EU countries for the time period 2002-2015 (some countries from
1992) is constructed using the EU Labour Force Survey (LFS), legislated pension parameters and
Eurostat’s population data by education group. While the first model variant (low-response model)
includes age as an additional control variable, the second variant (high-response model) combines age
and statutory retirement ages to distance to statutory pensionable ages variables, thereby ensuring that
falling participation rates with age stem mainly from the smaller distance to the statutory pensionable
ages and ignore other age-related factors, such as health deterioration, lower remaining lifetime, skills
differences and those factors influenced by labour market policies. Hence, this assumption leads to a
higher estimated impact of pension policies. The impact of (1) and (2) on future participation rates is
then calculated by combining the estimated elasticities from the regression models with (1) and (2).
Figure 76 shows the estimated effect of (1), while Table 12 shows the sum of effects.
109 Controlling for cyclical unemployment is unfortunately not possible, as structural unemployment rates are not available
for many countries over the covered time period.
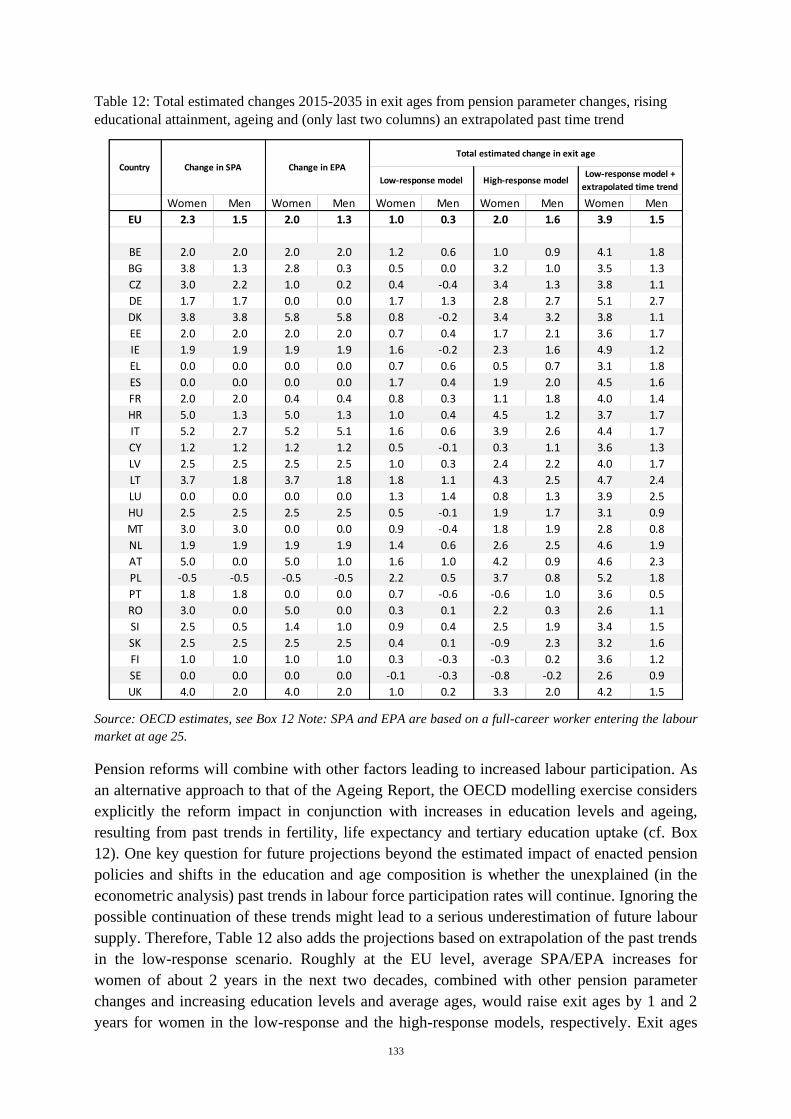
133
Table 12: Total estimated changes 2015-2035 in exit ages from pension parameter changes, rising
educational attainment, ageing and (only last two columns) an extrapolated past time trend
Source: OECD estimates, see Box 12 Note: SPA and EPA are based on a full-career worker entering the labour
market at age 25.
Pension reforms will combine with other factors leading to increased labour participation. As
an alternative approach to that of the Ageing Report, the OECD modelling exercise considers
explicitly the reform impact in conjunction with increases in education levels and ageing,
resulting from past trends in fertility, life expectancy and tertiary education uptake (cf. Box
12). One key question for future projections beyond the estimated impact of enacted pension
policies and shifts in the education and age composition is whether the unexplained (in the
econometric analysis) past trends in labour force participation rates will continue. Ignoring the
possible continuation of these trends might lead to a serious underestimation of future labour
supply. Therefore, Table 12 also adds the projections based on extrapolation of the past trends
in the low-response scenario. Roughly at the EU level, average SPA/EPA increases for
women of about 2 years in the next two decades, combined with other pension parameter
changes and increasing education levels and average ages, would raise exit ages by 1 and 2
years for women in the low-response and the high-response models, respectively. Exit ages
Women Men Women Men Women Men Women Men Women Men
EU 2.3 1.5 2.0 1.3 1.0 0.3 2.0 1.6 3.9 1.5
BE 2.0 2.0 2.0 2.0 1.2 0.6 1.0 0.9 4.1 1.8
BG 3.8 1.3 2.8 0.3 0.5 0.0 3.2 1.0 3.5 1.3
CZ 3.0 2.2 1.0 0.2 0.4 -0.4 3.4 1.3 3.8 1.1
DE 1.7 1.7 0.0 0.0 1.7 1.3 2.8 2.7 5.1 2.7
DK 3.8 3.8 5.8 5.8 0.8 -0.2 3.4 3.2 3.8 1.1
EE 2.0 2.0 2.0 2.0 0.7 0.4 1.7 2.1 3.6 1.7
IE 1.9 1.9 1.9 1.9 1.6 -0.2 2.3 1.6 4.9 1.2
EL 0.0 0.0 0.0 0.0 0.7 0.6 0.5 0.7 3.1 1.8
ES 0.0 0.0 0.0 0.0 1.7 0.4 1.9 2.0 4.5 1.6
FR 2.0 2.0 0.4 0.4 0.8 0.3 1.1 1.8 4.0 1.4
HR 5.0 1.3 5.0 1.3 1.0 0.4 4.5 1.2 3.7 1.7
IT 5.2 2.7 5.2 5.1 1.6 0.6 3.9 2.6 4.4 1.7
CY 1.2 1.2 1.2 1.2 0.5 -0.1 0.3 1.1 3.6 1.3
LV 2.5 2.5 2.5 2.5 1.0 0.3 2.4 2.2 4.0 1.7
LT 3.7 1.8 3.7 1.8 1.8 1.1 4.3 2.5 4.7 2.4
LU 0.0 0.0 0.0 0.0 1.3 1.4 0.8 1.3 3.9 2.5
HU 2.5 2.5 2.5 2.5 0.5 -0.1 1.9 1.7 3.1 0.9
MT 3.0 3.0 0.0 0.0 0.9 -0.4 1.8 1.9 2.8 0.8
NL 1.9 1.9 1.9 1.9 1.4 0.6 2.6 2.5 4.6 1.9
AT 5.0 0.0 5.0 1.0 1.6 1.0 4.2 0.9 4.6 2.3
PL -0.5 -0.5 -0.5 -0.5 2.2 0.5 3.7 0.8 5.2 1.8
PT 1.8 1.8 0.0 0.0 0.7 -0.6 -0.6 1.0 3.6 0.5
RO 3.0 0.0 5.0 0.0 0.3 0.1 2.2 0.3 2.6 1.1
SI 2.5 0.5 1.4 1.0 0.9 0.4 2.5 1.9 3.4 1.5
SK 2.5 2.5 2.5 2.5 0.4 0.1 -0.9 2.3 3.2 1.6
FI 1.0 1.0 1.0 1.0 0.3 -0.3 -0.3 0.2 3.6 1.2
SE 0.0 0.0 0.0 0.0 -0.1 -0.3 -0.8 -0.2 2.6 0.9
UK 4.0 2.0 4.0 2.0 1.0 0.2 3.3 2.0 4.2 1.5
Low-response model
Total estimated change in exit age
Country Change in EPAChange in SPA
High-response modelLow-response model +
extrapolated time trend
134
for men would increase by 0.3 and 1.6 years, respectively. When adding the extrapolation of
past trends in labour market participation at older ages, exit ages rise by 1.5 years among men
and 3.9 years among women. These are higher increases than projected within the Ageing
Report, and would actually reduce, on average, the gap between the end of the career and the
beginning of a (full) pension.
Rising average exit ages also translate into a higher total number of employed people aged 55-
69 in the EU. The low-response model projects an increase in 2015-2035 of 7.5 percent, while
the high-response model predicts a 27 percent increase. Extrapolating the past time trend of
rising labour market participation at older working ages into the future would lead to a
projected increase of 45 percent (+18 million workers aged 55-69); this compares to a 47
percent increase among the 55-69-year-olds in the EU over the past 10 years (+13 million).
Pension adequacy for those who cannot work longer
As observed in Section 3.6, the increase in active people among those aged 55-64 in the past
10 years has been accompanied by a (minor) increase in unemployment and disability (the
latter measured in terms of people not in the labour force for health reasons). The 2015
PAR110
advocated longer working lives, but also expressed the need to provide targeted social
protection for those unable to work longer.
Figure 70 shows the TRR loss from career breaks linked to unemployment111
or disability,
expressed in percentage points. The unemployment case is not representative of late-career
unemployment, as the break is assumed to occur in the middle of the 40-year career; however,
it can serve as a broad proxy for the impact of unemployment on retirement income. The
disability break is computed as occurring in the last 5 years before retirement. Positive values
indicate that the TRR is actually higher than the full-career case.
The upshot is that the penalties for breaks due to unemployment are minor – always below the
proportional cut (3 years is 7.5% of a 40-year career) – or even have no negative impact at all.
In contrast, early exit due to disability (during the last 5 years of the career, with the person
retiring at the first opportunity) produces strongly varying outcomes. While in a few countries
the break results in higher TRR than the 40-year uninterrupted career, in several others a 5-
year break due to disability can be penalising and may even exceed the cut proportional to
duration (-12.5%). In some countries, people receive a disability pension from the moment of
disability. A lower TRR at SPA (5 years later) is therefore also partly due to pension erosion,
as described in Section 5.1.1. These projections suggest that when pensionable age increases,
the adequacy risk stemming from unemployment is lower than that linked to health concerns
and disability.
5.2. Mitigating the risk of future inadequacy
Successfully addressing the challenges facing pension systems and helping more retirees
reach adequate pensions is likely to require a broad range of policy measures, spanning
pension, labour market and health policies (European Commission, 2012b). In this context,
110 http://ec.europa.eu/social/BlobServlet?docId=14529&langId=en
111 The unemployment is computed as having occurred in the early career; as an approximation, it is used to assess the
pension reduction for unemployment at later ages.
135
the present section focuses on three directions of action for mitigating the risk of future
inadequacy.
The capacity of pension systems to secure adequate living standards increasingly depends on
more people having access to – and saving more in – the different components of the pension
system, to prevent them from falling back onto minimum income provisions. This section
discusses, first, how non-standard workers and the self-employed could be better covered
by pension systems and could accrue pension rights more easily; and, secondly, how the role
of complementary savings in ensuring adequate old-age incomes could be boosted. Some
of the policy choices are similar in both cases, such as mandatory vs voluntary coverage and
the modalities of the latter.
Future adequacy will also be affected by the ability of people to work sufficiently long to
match the planned increase in pensionable age. This section discusses how pension adequacy
can be buttressed by policies that extend working lives, leveraging on the pension systems
themselves, but also on developing additional potential in the labour market.
5.2.1. Ensuring adequate coverage and access to pensions for all
In view of the evolving world of labour relations, the ability of pension systems to cover
different types of economic activity will have a significant bearing on the future
adequacy of old-age incomes. Section 3.3 described the multiple barriers that people in non-
standard and self-employment currently face and the unfavourable social outcomes for the
retired self-employed, despite relatively higher non-pension assets. This suggests that better
coverage by pension systems may be explored as a more effective way to prevent poverty and
financial distress in old age. The present section outlines some of the policy options that
Member States may employ to address those barriers.
Boosting access and coverage
First, pension systems can grant the possibility of enrolling in pension schemes to those who
currently have no access at all. In some cases, this may involve revising or revoking access
criteria, such as income thresholds.
Secondly, where access exists, but is voluntary, the following options for boosting coverage
could be considered, listed by degree of compulsion:
1) upgrading voluntary enrolment to mandatory and reducing possibilities for
exemption;
2) changing voluntary enrolment from opt-in to opt-out;
3) providing additional incentives to join pension insurance;
4) raising pension awareness.
The mandatory/voluntary character of access to pension insurance is a key variable that can
have a strong influence on the coverage rate. Both approaches have pros and cons:
(i) Mandatory coverage has the advantage of setting the same type of protection as for
standard workers, and can be more effective in ensuring protection. This choice may,
however, be more contentious among certain groups of self-employed and employers,

136
who will see this as a mandatory increase in their labour costs and a risk to their
competitiveness.
(ii) Voluntary access gives the individual the ultimate choice of being protected or not.
This flexibility may be attractive in particular to those self-employed who rely on non-
pension assets for their old-age income. At the same time, experience of existing
voluntary schemes points to the risk of low take-up, including by those in need of social
protection.
For mandatory coverage to function effectively, it is important to close loopholes that allow
individuals to avoid contributions, e.g. by formally declaring their activity or income under a
different status without changing the nature of the activity.
The choice of implementing voluntary access via opt-in or opt-out has important
implications for the number of people who will eventually benefit from the initiative. Opt-in
solutions require potential beneficiaries to actively choose coverage, whereas opt-out designs
imply being covered as the default option. Experiments and observational studies show that
making an option a default increases the likelihood that it is chosen (‘default effect’). A large
body of empirical literature shows the importance of default options in shaping decisions
about retirement savings, including savings plan participation and level of contributions.
Setting defaults can therefore be an effective way of influencing behaviour in the context of
providing access to pensions.
Pension systems can seek to incentivise self-employed and non-standard workers to save for
retirement in pension schemes, e.g. by offering tax incentives. For instance, such incentives
can promote the take-up of personal pensions by self-employed persons where they have no
access to occupational pension provision.
It is also important that people taking up entrepreneurship or self-employment are aware of
the risks that this type of economic activity entails, including for their pension entitlements.
Targeted pension information activities for new entrepreneurs, such as those already being
carried out in some Member States (Finland, Sweden), can be helpful in this regard.
Improving accrual conditions
With a view to improving pension accrual, Member States can adapt the rules of pension
schemes, insofar as these are tailored to workers in regular employment, to reflect diverse
work patterns that allow non-standard workers and the self-employed to build up adequate
entitlements more easily.
When adjusting contribution and entitlement thresholds, a balance needs to be struck
between offering an adequate degree of protection and not imposing an excessive burden on
the insured, considering the economic context.
To allow all workers, including temporary and temporary agency workers, to accumulate and
preserve pension rights for every day worked, Member States may consider reducing waiting
and vesting time, i.e. allowing people to contribute from the day they start work, shortening
length requirements for contribution periods to be counted towards pension rights and
considering interrupted contribution periods.
137
Member States and social partners may examine the scope for granting non-standard workers
and dependent self-employed the right to participate in the negotiation and conclusion of
collective agreements, including as regards participation in occupational pension schemes.
A clearly defined contribution base for the self-employed that corresponds as far as possible
to their actual earnings can contribute to a more favourable accrual. It should be noted,
though, that its feasibility depends on the broader context of the regulation of self-
employment in the country, such as availability of reliable income data. The income volatility
risk for the self-employed, due to the economic risk that they are exposed to, is another
challenge to defining a fair and feasible contribution base; a degree of flexibility allowing for
income fluctuation may provide a solution.
Transferability and transparency
Transferability and transparency of pension rights are important elements of improving
pension outcomes for persons with diverse careers.
Statutory pension systems can streamline pension insurance throughout career changes, by
crediting all contributions paid by/for an individual to a single account, irrespective of the
economic status or the type or duration of contract under which they were paid.
Occupational pension pillars can support career transitions by facilitating portability of
pension rights between different schemes, i.e. transferring the pension rights into the new
scheme when changing jobs or economic status.
Better transparency and easy ways to access information about the entitlements people have
earned in different economic statuses can help them manage their working careers. In this
context, Member States may take actions to facilitate the access to information on social
protection entitlements for people with diverse careers, notably through development of web-
based accounts of individual entitlements to social protection benefits and services.
5.2.2. Expansion of complementary retirement savings
One of the avenues that Member States may pursue to maintain adequate old-age
incomes is to complement statutory pensions by facilitating access to high-quality, safe
and cost-effective complementary retirement saving vehicles. This section provides an
insight into the expected contribution of complementary savings to retirement incomes and
the main policy tools to boost their coverage and amount of savings, mainly focusing on
supplementary pensions (occupational and personal), but also touching on asset-conversion
instruments.
Projected role of supplementary pensions in income replacement
Supplementary pensions, by their very definition, complement statutory pensions, and their
role should be seen as part of the broader pension mix in the respective national system.
Figure 77 shows the projected changes in the contribution of different pillars to income
replacement in Member States between 2016 and 2056.
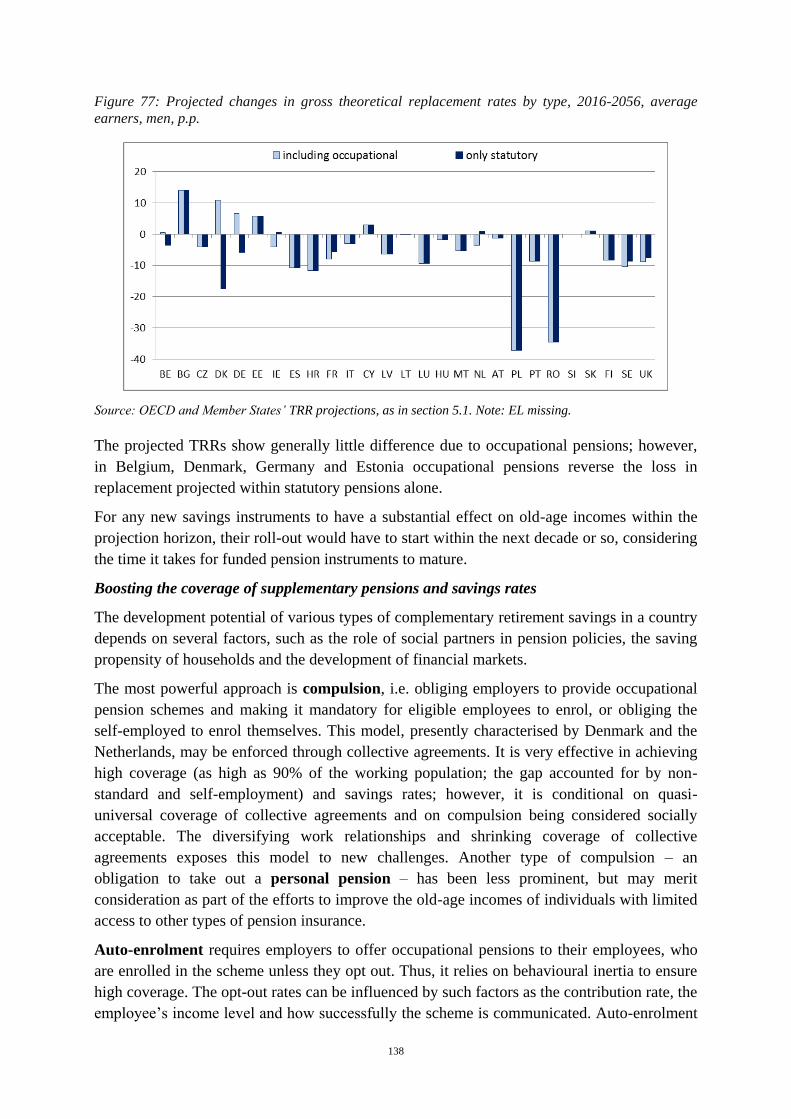
138
Figure 77: Projected changes in gross theoretical replacement rates by type, 2016-2056, average
earners, men, p.p.
Source: OECD and Member States’ TRR projections, as in section 5.1. Note: EL missing.
The projected TRRs show generally little difference due to occupational pensions; however,
in Belgium, Denmark, Germany and Estonia occupational pensions reverse the loss in
replacement projected within statutory pensions alone.
For any new savings instruments to have a substantial effect on old-age incomes within the
projection horizon, their roll-out would have to start within the next decade or so, considering
the time it takes for funded pension instruments to mature.
Boosting the coverage of supplementary pensions and savings rates
The development potential of various types of complementary retirement savings in a country
depends on several factors, such as the role of social partners in pension policies, the saving
propensity of households and the development of financial markets.
The most powerful approach is compulsion, i.e. obliging employers to provide occupational
pension schemes and making it mandatory for eligible employees to enrol, or obliging the
self-employed to enrol themselves. This model, presently characterised by Denmark and the
Netherlands, may be enforced through collective agreements. It is very effective in achieving
high coverage (as high as 90% of the working population; the gap accounted for by non-
standard and self-employment) and savings rates; however, it is conditional on quasi-
universal coverage of collective agreements and on compulsion being considered socially
acceptable. The diversifying work relationships and shrinking coverage of collective
agreements exposes this model to new challenges. Another type of compulsion – an
obligation to take out a personal pension – has been less prominent, but may merit
consideration as part of the efforts to improve the old-age incomes of individuals with limited
access to other types of pension insurance.
Auto-enrolment requires employers to offer occupational pensions to their employees, who
are enrolled in the scheme unless they opt out. Thus, it relies on behavioural inertia to ensure
high coverage. The opt-out rates can be influenced by such factors as the contribution rate, the
employee’s income level and how successfully the scheme is communicated. Auto-enrolment
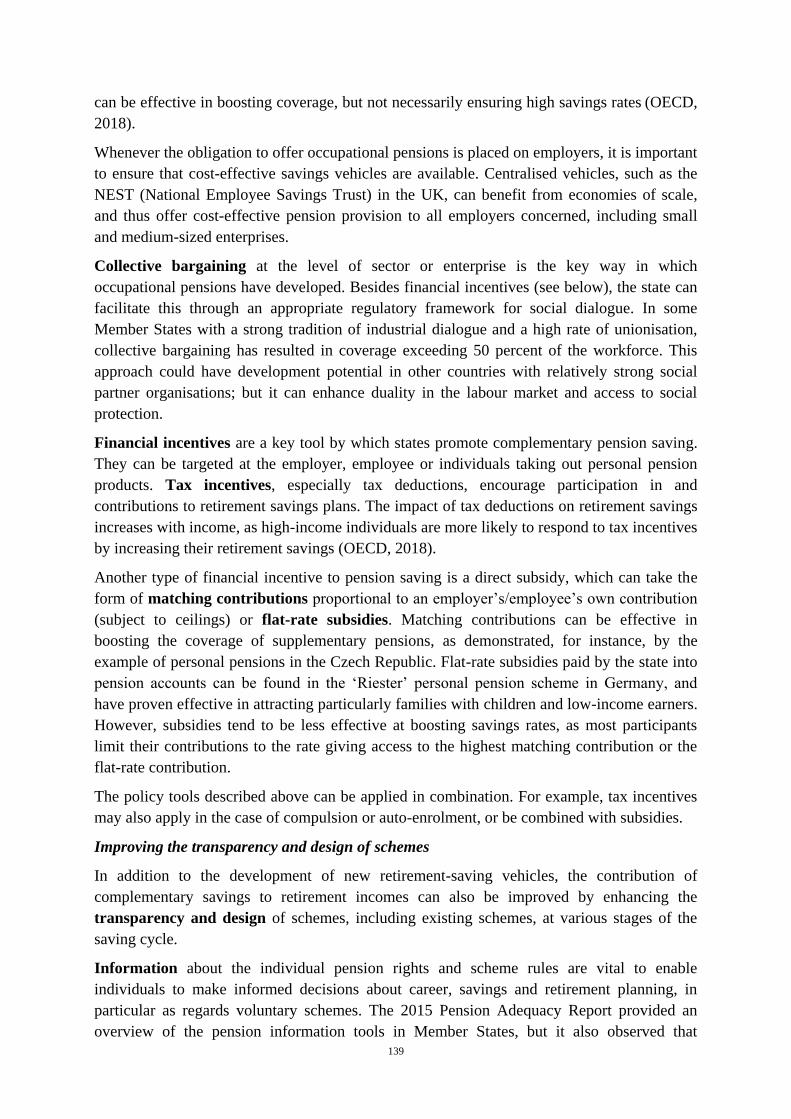
139
can be effective in boosting coverage, but not necessarily ensuring high savings rates (OECD,
2018).
Whenever the obligation to offer occupational pensions is placed on employers, it is important
to ensure that cost-effective savings vehicles are available. Centralised vehicles, such as the
NEST (National Employee Savings Trust) in the UK, can benefit from economies of scale,
and thus offer cost-effective pension provision to all employers concerned, including small
and medium-sized enterprises.
Collective bargaining at the level of sector or enterprise is the key way in which
occupational pensions have developed. Besides financial incentives (see below), the state can
facilitate this through an appropriate regulatory framework for social dialogue. In some
Member States with a strong tradition of industrial dialogue and a high rate of unionisation,
collective bargaining has resulted in coverage exceeding 50 percent of the workforce. This
approach could have development potential in other countries with relatively strong social
partner organisations; but it can enhance duality in the labour market and access to social
protection.
Financial incentives are a key tool by which states promote complementary pension saving.
They can be targeted at the employer, employee or individuals taking out personal pension
products. Tax incentives, especially tax deductions, encourage participation in and
contributions to retirement savings plans. The impact of tax deductions on retirement savings
increases with income, as high-income individuals are more likely to respond to tax incentives
by increasing their retirement savings (OECD, 2018).
Another type of financial incentive to pension saving is a direct subsidy, which can take the
form of matching contributions proportional to an employer’s/employee’s own contribution
(subject to ceilings) or flat-rate subsidies. Matching contributions can be effective in
boosting the coverage of supplementary pensions, as demonstrated, for instance, by the
example of personal pensions in the Czech Republic. Flat-rate subsidies paid by the state into
pension accounts can be found in the ‘Riester’ personal pension scheme in Germany, and
have proven effective in attracting particularly families with children and low-income earners.
However, subsidies tend to be less effective at boosting savings rates, as most participants
limit their contributions to the rate giving access to the highest matching contribution or the
flat-rate contribution.
The policy tools described above can be applied in combination. For example, tax incentives
may also apply in the case of compulsion or auto-enrolment, or be combined with subsidies.
Improving the transparency and design of schemes
In addition to the development of new retirement-saving vehicles, the contribution of
complementary savings to retirement incomes can also be improved by enhancing the
transparency and design of schemes, including existing schemes, at various stages of the
saving cycle.
Information about the individual pension rights and scheme rules are vital to enable
individuals to make informed decisions about career, savings and retirement planning, in
particular as regards voluntary schemes. The 2015 Pension Adequacy Report provided an
overview of the pension information tools in Member States, but it also observed that
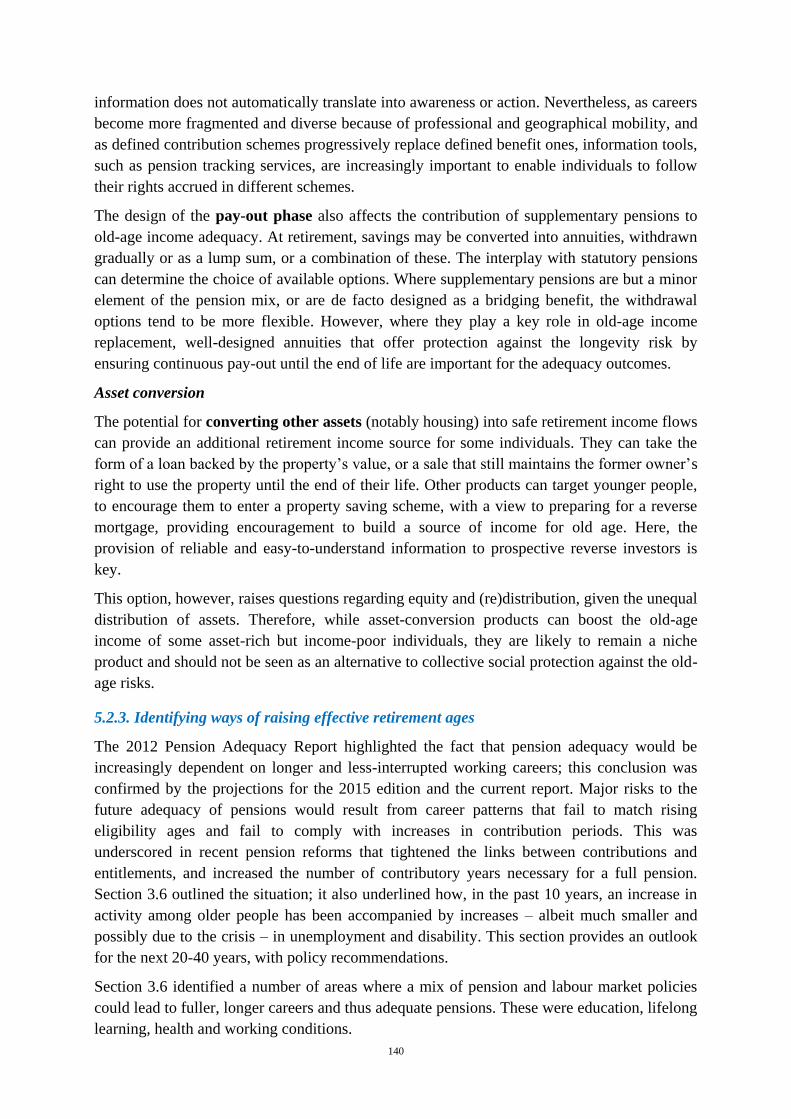
140
information does not automatically translate into awareness or action. Nevertheless, as careers
become more fragmented and diverse because of professional and geographical mobility, and
as defined contribution schemes progressively replace defined benefit ones, information tools,
such as pension tracking services, are increasingly important to enable individuals to follow
their rights accrued in different schemes.
The design of the pay-out phase also affects the contribution of supplementary pensions to
old-age income adequacy. At retirement, savings may be converted into annuities, withdrawn
gradually or as a lump sum, or a combination of these. The interplay with statutory pensions
can determine the choice of available options. Where supplementary pensions are but a minor
element of the pension mix, or are de facto designed as a bridging benefit, the withdrawal
options tend to be more flexible. However, where they play a key role in old-age income
replacement, well-designed annuities that offer protection against the longevity risk by
ensuring continuous pay-out until the end of life are important for the adequacy outcomes.
Asset conversion
The potential for converting other assets (notably housing) into safe retirement income flows
can provide an additional retirement income source for some individuals. They can take the
form of a loan backed by the property’s value, or a sale that still maintains the former owner’s
right to use the property until the end of their life. Other products can target younger people,
to encourage them to enter a property saving scheme, with a view to preparing for a reverse
mortgage, providing encouragement to build a source of income for old age. Here, the
provision of reliable and easy-to-understand information to prospective reverse investors is
key.
This option, however, raises questions regarding equity and (re)distribution, given the unequal
distribution of assets. Therefore, while asset-conversion products can boost the old-age
income of some asset-rich but income-poor individuals, they are likely to remain a niche
product and should not be seen as an alternative to collective social protection against the old-
age risks.
5.2.3. Identifying ways of raising effective retirement ages
The 2012 Pension Adequacy Report highlighted the fact that pension adequacy would be
increasingly dependent on longer and less-interrupted working careers; this conclusion was
confirmed by the projections for the 2015 edition and the current report. Major risks to the
future adequacy of pensions would result from career patterns that fail to match rising
eligibility ages and fail to comply with increases in contribution periods. This was
underscored in recent pension reforms that tightened the links between contributions and
entitlements, and increased the number of contributory years necessary for a full pension.
Section 3.6 outlined the situation; it also underlined how, in the past 10 years, an increase in
activity among older people has been accompanied by increases – albeit much smaller and
possibly due to the crisis – in unemployment and disability. This section provides an outlook
for the next 20-40 years, with policy recommendations.
Section 3.6 identified a number of areas where a mix of pension and labour market policies
could lead to fuller, longer careers and thus adequate pensions. These were education, lifelong
learning, health and working conditions.
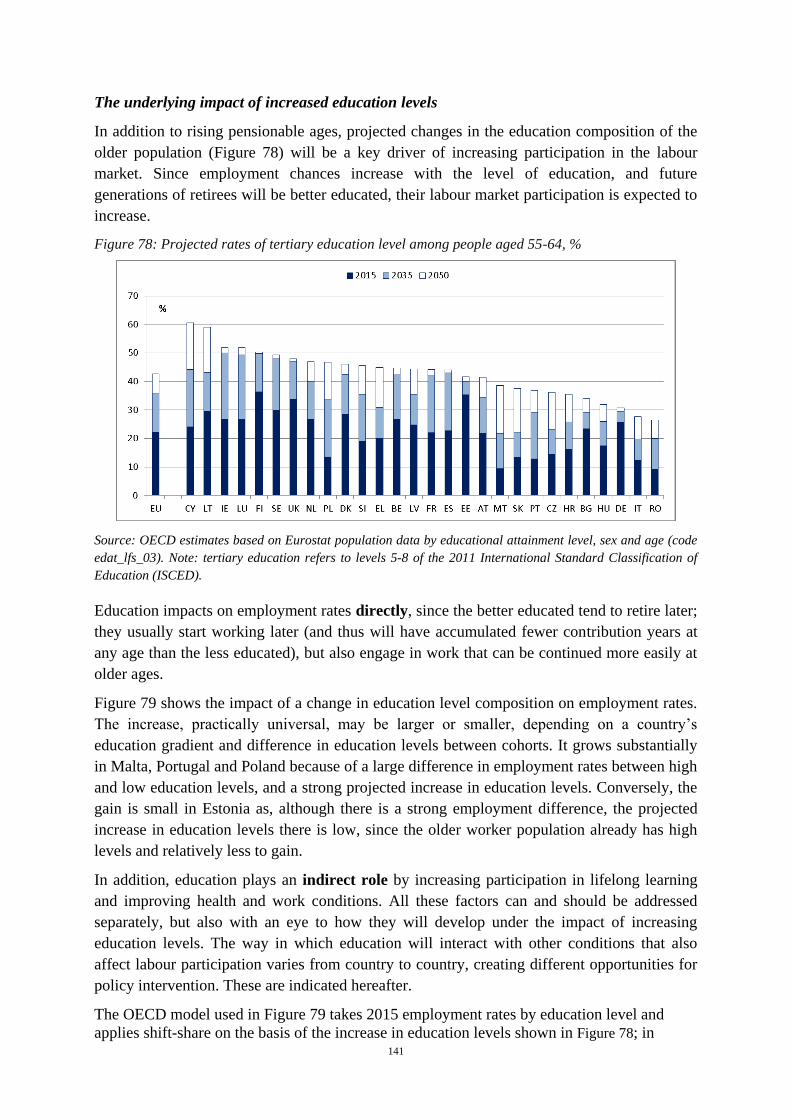
141
The underlying impact of increased education levels
In addition to rising pensionable ages, projected changes in the education composition of the
older population (Figure 78) will be a key driver of increasing participation in the labour
market. Since employment chances increase with the level of education, and future
generations of retirees will be better educated, their labour market participation is expected to
increase.
Figure 78: Projected rates of tertiary education level among people aged 55-64, %
Source: OECD estimates based on Eurostat population data by educational attainment level, sex and age (code
edat_lfs_03). Note: tertiary education refers to levels 5-8 of the 2011 International Standard Classification of
Education (ISCED).
Education impacts on employment rates directly, since the better educated tend to retire later;
they usually start working later (and thus will have accumulated fewer contribution years at
any age than the less educated), but also engage in work that can be continued more easily at
older ages.
Figure 79 shows the impact of a change in education level composition on employment rates.
The increase, practically universal, may be larger or smaller, depending on a country’s
education gradient and difference in education levels between cohorts. It grows substantially
in Malta, Portugal and Poland because of a large difference in employment rates between high
and low education levels, and a strong projected increase in education levels. Conversely, the
gain is small in Estonia as, although there is a strong employment difference, the projected
increase in education levels there is low, since the older worker population already has high
levels and relatively less to gain.
In addition, education plays an indirect role by increasing participation in lifelong learning
and improving health and work conditions. All these factors can and should be addressed
separately, but also with an eye to how they will develop under the impact of increasing
education levels. The way in which education will interact with other conditions that also
affect labour participation varies from country to country, creating different opportunities for
policy intervention. These are indicated hereafter.
The OECD model used in Figure 79 takes 2015 employment rates by education level and
applies shift-share on the basis of the increase in education levels shown in Figure 78; in
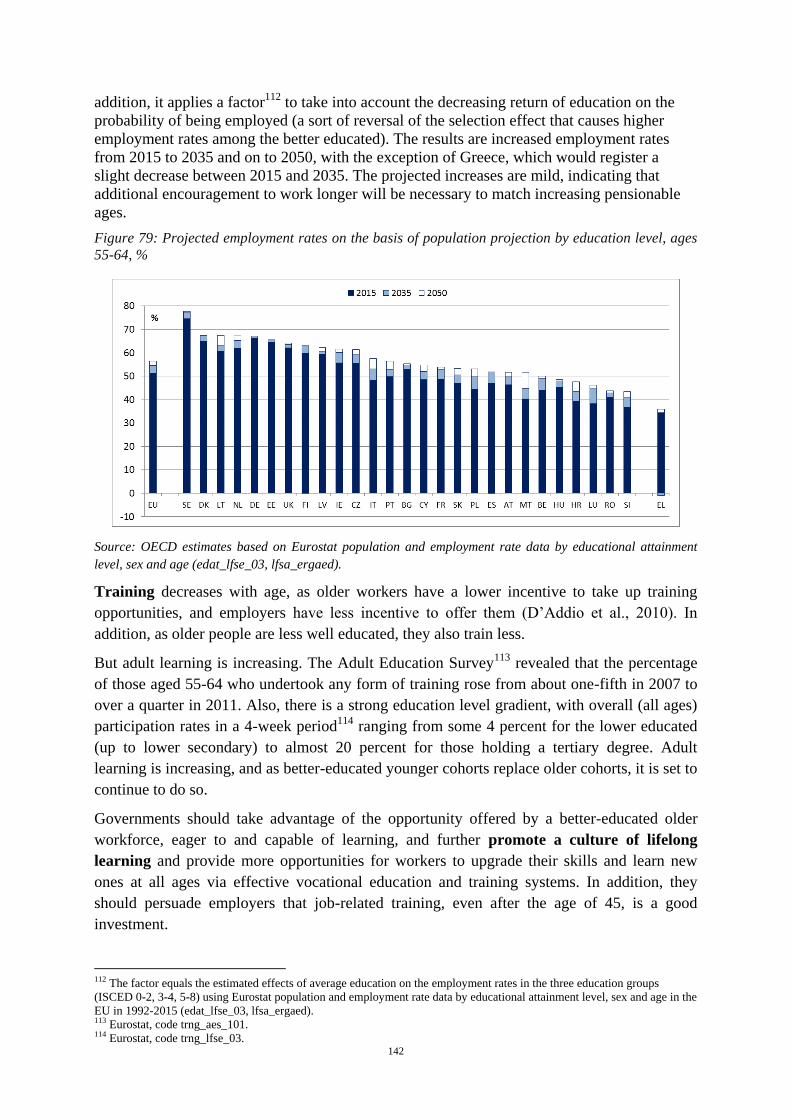
142
addition, it applies a factor112
to take into account the decreasing return of education on the
probability of being employed (a sort of reversal of the selection effect that causes higher
employment rates among the better educated). The results are increased employment rates
from 2015 to 2035 and on to 2050, with the exception of Greece, which would register a
slight decrease between 2015 and 2035. The projected increases are mild, indicating that
additional encouragement to work longer will be necessary to match increasing pensionable
ages.
Figure 79: Projected employment rates on the basis of population projection by education level, ages
55-64, %
Source: OECD estimates based on Eurostat population and employment rate data by educational attainment
level, sex and age (edat_lfse_03, lfsa_ergaed).
Training decreases with age, as older workers have a lower incentive to take up training
opportunities, and employers have less incentive to offer them (D’Addio et al., 2010). In
addition, as older people are less well educated, they also train less.
But adult learning is increasing. The Adult Education Survey113
revealed that the percentage
of those aged 55-64 who undertook any form of training rose from about one-fifth in 2007 to
over a quarter in 2011. Also, there is a strong education level gradient, with overall (all ages)
participation rates in a 4-week period114
ranging from some 4 percent for the lower educated
(up to lower secondary) to almost 20 percent for those holding a tertiary degree. Adult
learning is increasing, and as better-educated younger cohorts replace older cohorts, it is set to
continue to do so.
Governments should take advantage of the opportunity offered by a better-educated older
workforce, eager to and capable of learning, and further promote a culture of lifelong
learning and provide more opportunities for workers to upgrade their skills and learn new
ones at all ages via effective vocational education and training systems. In addition, they
should persuade employers that job-related training, even after the age of 45, is a good
investment.
112 The factor equals the estimated effects of average education on the employment rates in the three education groups
(ISCED 0-2, 3-4, 5-8) using Eurostat population and employment rate data by educational attainment level, sex and age in the
EU in 1992-2015 (edat_lfse_03, lfsa_ergaed). 113 Eurostat, code trng_aes_101. 114 Eurostat, code trng_lfse_03.
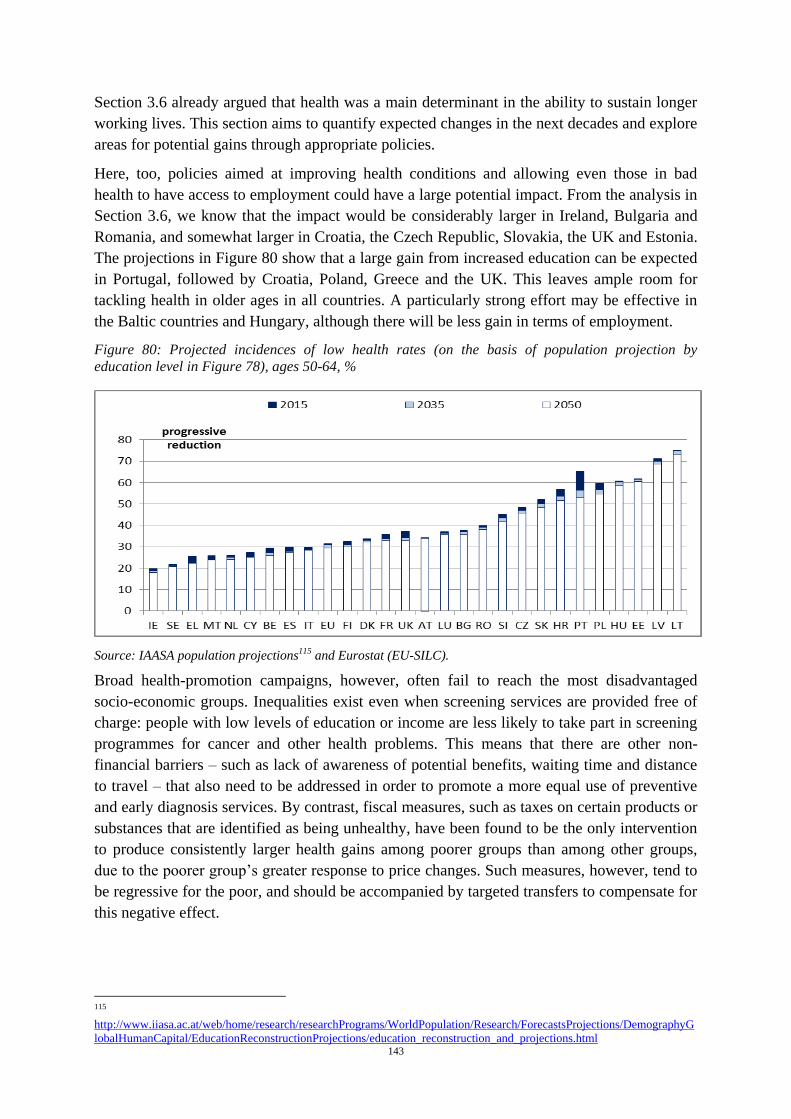
143
Section 3.6 already argued that health was a main determinant in the ability to sustain longer
working lives. This section aims to quantify expected changes in the next decades and explore
areas for potential gains through appropriate policies.
Here, too, policies aimed at improving health conditions and allowing even those in bad
health to have access to employment could have a large potential impact. From the analysis in
Section 3.6, we know that the impact would be considerably larger in Ireland, Bulgaria and
Romania, and somewhat larger in Croatia, the Czech Republic, Slovakia, the UK and Estonia.
The projections in Figure 80 show that a large gain from increased education can be expected
in Portugal, followed by Croatia, Poland, Greece and the UK. This leaves ample room for
tackling health in older ages in all countries. A particularly strong effort may be effective in
the Baltic countries and Hungary, although there will be less gain in terms of employment.
Figure 80: Projected incidences of low health rates (on the basis of population projection by
education level in Figure 78), ages 50-64, %
Source: IAASA population projections115 and Eurostat (EU-SILC).
Broad health-promotion campaigns, however, often fail to reach the most disadvantaged
socio-economic groups. Inequalities exist even when screening services are provided free of
charge: people with low levels of education or income are less likely to take part in screening
programmes for cancer and other health problems. This means that there are other non-
financial barriers – such as lack of awareness of potential benefits, waiting time and distance
to travel – that also need to be addressed in order to promote a more equal use of preventive
and early diagnosis services. By contrast, fiscal measures, such as taxes on certain products or
substances that are identified as being unhealthy, have been found to be the only intervention
to produce consistently larger health gains among poorer groups than among other groups,
due to the poorer group’s greater response to price changes. Such measures, however, tend to
be regressive for the poor, and should be accompanied by targeted transfers to compensate for
this negative effect.
115
http://www.iiasa.ac.at/web/home/research/researchPrograms/WorldPopulation/Research/ForecastsProjections/DemographyG
lobalHumanCapital/EducationReconstructionProjections/education_reconstruction_and_projections.html
144
ANNEXES
ANNEX 1. Methodological background for the theoretical replacement rates
These guidelines provide information on (1) the general specifications of the calculations, (2) the main
hypothesis of the base case, (3) the specifications for variant cases, (4) the main data and assumptions
needed for the calculations, (5) the main background information needed on representativeness and
assumptions and (6) the presentation of results. A final section on other issues concludes (7).
1. General specifications of the calculations
The definition used for TRR refers to the replacement of income obtained when people retire: it is at
the moment of take-up, the ratio of pension income in the first year of retirement divided by work
income in the last year before retiring. The following presents the main specifications of this general
definition for this exercise.
Definition of the TRR = pension income (at take up) / work income (last year)116
The numerator ‘pension income at the moment of take-up’ refers to income in the form of
pensions from all mandatory, typical and relevant pension schemes (see Section 2 below), as well as
other social benefits, as applicable to the selected case (e.g. housing benefits, holiday allowance).
Housing supplements can be included in the calculations, depending on each Member State
framework, as means-tested benefits. Benefits in kind should not be considered in the calculations, as
they are not part of the disposable income.
The denominator ‘work income in the last year before retiring’ should include earned income
(including overtime pay, bonuses, 13th month, etc.) and social benefits as applicable to the selected
case (see Section 2 below for more details). The denominator ‘work income in the last year before
retiring’ should be adjusted for 1 year of inflation assumed at 2 percent.
1.1. Current and Prospective TRR (2016 and 2056 respectively in the base case)
Current TRRs describe the situation of people who retire today, while prospective TRRs will describe
the situation of people who start working today and will be retiring in the future.
Results for current TRRs should present the pension outcome for people retiring today, under the
relevant pension legislation (i.e. the worker started working in 1976 and retired in 2016 in the base
case, under whichever rules applied during their career). Results for prospective TRRs should present
the pension outcome for people retiring in the future under the pension legislation enacted by 2016,
including transitional rules to be implemented gradually that may be legislated in enacted reforms.
This includes the currently legislated indexation rules for different benefits. The calculations for
prospective TRRs should typically reflect reformed pension systems in full maturity.
1.2. Gross and net TRR
The calculations take into consideration social security contributions to statutory and supplementary
pension schemes or funds. Taxes and means-tested social benefits are also included in the calculations.
This makes it possible to determine the contributions of the different components of the pension
systems to the pensioner’s income replacement at the point of retirement.
In particular, the gross replacement rate is defined according to the pre-taxed income (after employer
contributions, but including employee contributions). The net replacement rate is calculated as net of
income taxes and employee contributions and including means-tested benefits. The comparison
116 There are minor variations to this principal definition in the variant cases as indicated below.
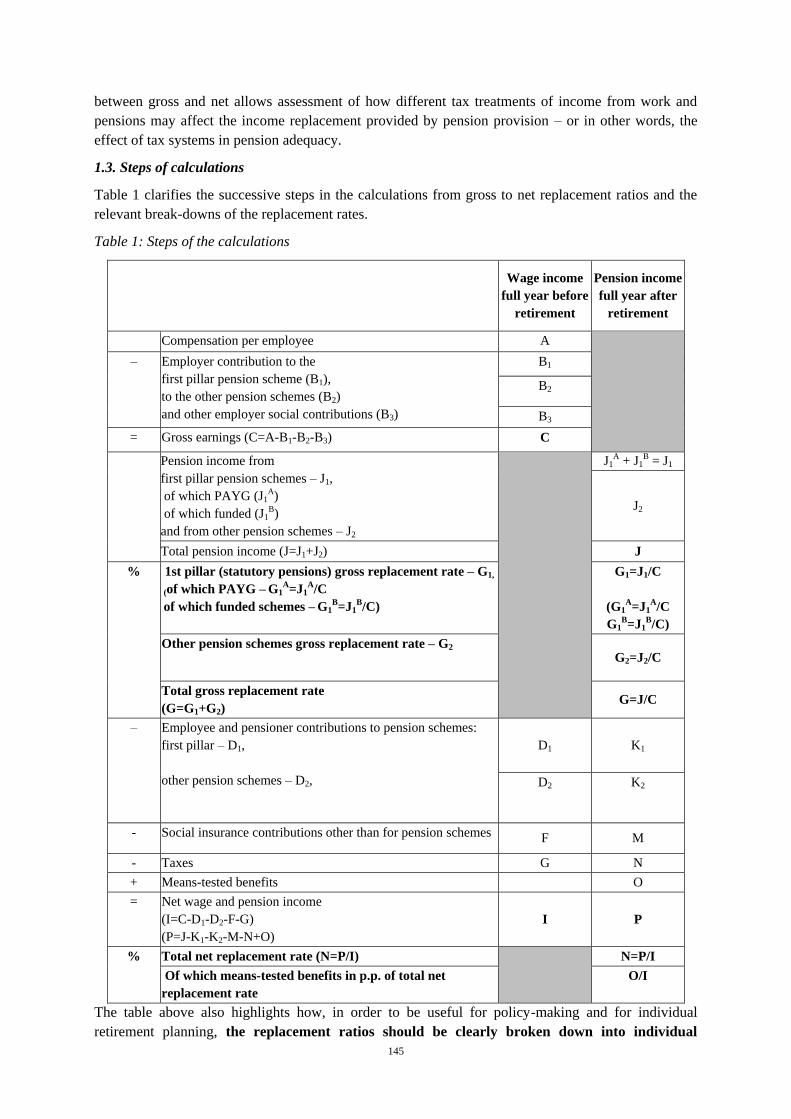
145
between gross and net allows assessment of how different tax treatments of income from work and
pensions may affect the income replacement provided by pension provision – or in other words, the
effect of tax systems in pension adequacy.
1.3. Steps of calculations
Table 1 clarifies the successive steps in the calculations from gross to net replacement ratios and the
relevant break-downs of the replacement rates.
Table 1: Steps of the calculations
Wage income
full year before
retirement
Pension income
full year after
retirement
Compensation per employee A
– Employer contribution to the
first pillar pension scheme (B1),
to the other pension schemes (B2)
and other employer social contributions (B3)
B1
B2
B3
= Gross earnings (C=A-B1-B2-B3) C
Pension income from
first pillar pension schemes – J1,
of which PAYG (J1A)
of which funded (J1B)
and from other pension schemes – J2
J1A + J1
B = J1
J2
Total pension income (J=J1+J2) J
% 1st pillar (statutory pensions) gross replacement rate – G1,
(of which PAYG – G1A=J1
A/C
of which funded schemes – G1B=J1
B/C)
G1=J1/C
(G1A=J1
A/C
G1B=J1
B/C)
Other pension schemes gross replacement rate – G2 G2=J2/C
Total gross replacement rate
(G=G1+G2) G=J/C
– Employee and pensioner contributions to pension schemes:
first pillar – D1,
other pension schemes – D2,
D1
K1
D2
K2
- Social insurance contributions other than for pension schemes F M
- Taxes G N
+ Means-tested benefits O
= Net wage and pension income
(I=C-D1-D2-F-G)
(P=J-K1-K2-M-N+O)
I P
% Total net replacement rate (N=P/I) N=P/I
Of which means-tested benefits in p.p. of total net
replacement rate
O/I
The table above also highlights how, in order to be useful for policy-making and for individual
retirement planning, the replacement ratios should be clearly broken down into individual
146
components of retirement income. For instance, countries with a two-tiered first pillar should
present the pay-as-you-go (PAYG) and funded components separately, rather than merging them
into a single first-pillar replacement rate. Likewise the ‘means-tested benefit’ component of the total
net replacement rate should also be reported separately. This will also make it possible to examine the
extent to which one’s own pension arrangements (or those of certain groups) depart from the ‘typical’
situations described by the replacement ratios.
2. Specifications of the base case
In the base case, TRRs are calculated for an assumed hypothetical worker with a given earnings and
career profile and a corresponding affiliation to pension schemes. The base-case individual is chosen
in order to reflect as closely as possible current actual situations and institutional frameworks.
However, given the diversity of situations across Member States, the base case may not necessarily be
representative of workers in all Member States, and therefore TRRs need to be analysed in the light
of background information aimed at showing in particular how ‘representative’ the hypothetical
worker is in a specific Member State (see Section 5 below).
Table 2 summarises the main assumptions for the base case.
Table 2: The main assumptions for the base case
Professional status
Workers covered by the most general scheme (i.e. private-sector scheme: if
there are different schemes by professions/sectors, assumptions of the work
sector are necessary. If considered relevant, Member States may also
calculate replacement ratios for public-sector employees, self-employed or
other professional groups)
Career length 40 years (starting an uninterrupted career in 2016 for projected 2056 TRRs)
Age at retirement National sex-specific standard pensionable age (SPA)117 (starting the career
at age SPA-40)
Type of employment Full-time work
Marital status Single person (calculated for both men and women)
Year of retirement
Current replacement rates should be calculated for retirement in 2016
(pension in 2016 with respect to work earnings in 2015 adjusted for 1 year
of inflation at 2%).118 Prospective replacement rates should be calculated for
retirement in 2056.
Coverage of pillars
in pension income
First pillar, supplementary (occupational or personal) provision and means-
tested supplements as applicable to the selected case (see below)
Earnings level
100% of average earnings of the corresponding year; the base case is
computed on three earning profiles, namely average, low and high (see
below)
Earnings profile Constant relation to current average earnings (100%) over the whole period
of employment
Coverage of pillars in pension income of the theoretical individual
Calculations should include all (and only) pension schemes that are mandatory, typical or with
wide-reaching coverage in a country. For each country, the main schemes for private-sector
117 The standard pensionable age is defined as the earliest age at which an individual with a 40-year career can retire without
any exit penalty for 2016 and 2056. There is one exception, Luxembourg, whose SPA is currently set at 65 to enhance TRR
comparability. 118 Except if a Member State needs to refer to a different moment of time.
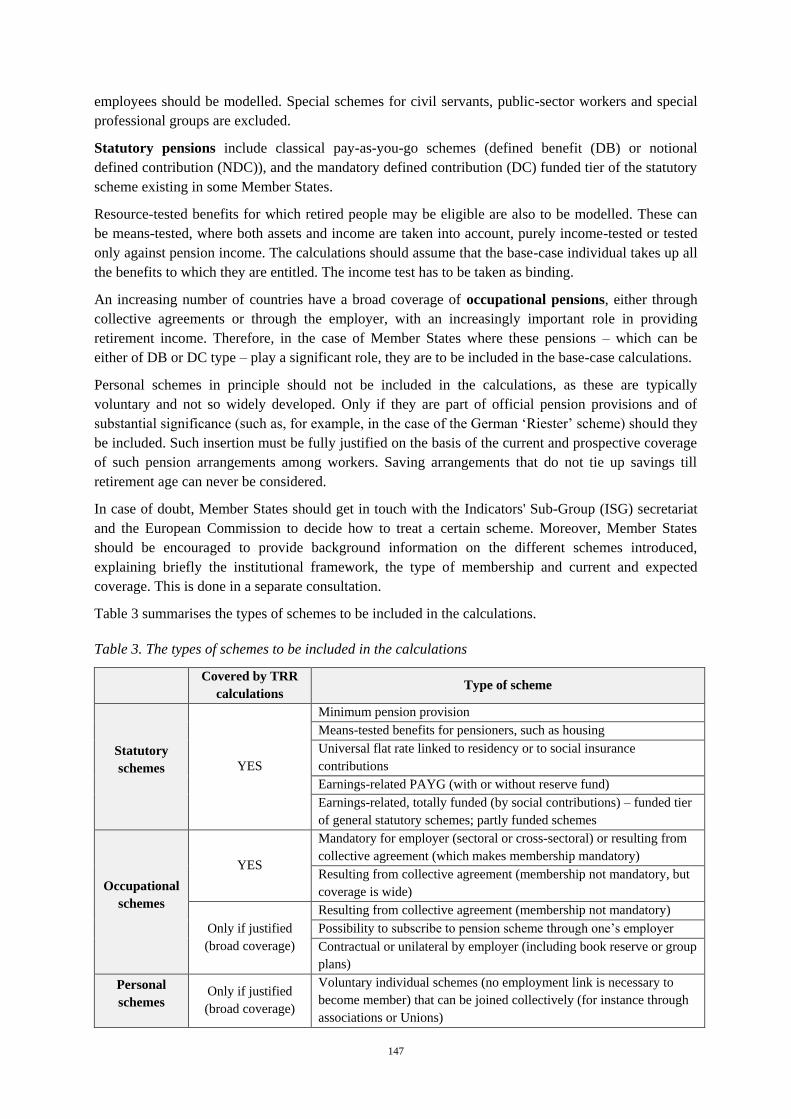
147
employees should be modelled. Special schemes for civil servants, public-sector workers and special
professional groups are excluded.
Statutory pensions include classical pay-as-you-go schemes (defined benefit (DB) or notional
defined contribution (NDC)), and the mandatory defined contribution (DC) funded tier of the statutory
scheme existing in some Member States.
Resource-tested benefits for which retired people may be eligible are also to be modelled. These can
be means-tested, where both assets and income are taken into account, purely income-tested or tested
only against pension income. The calculations should assume that the base-case individual takes up all
the benefits to which they are entitled. The income test has to be taken as binding.
An increasing number of countries have a broad coverage of occupational pensions, either through
collective agreements or through the employer, with an increasingly important role in providing
retirement income. Therefore, in the case of Member States where these pensions – which can be
either of DB or DC type – play a significant role, they are to be included in the base-case calculations.
Personal schemes in principle should not be included in the calculations, as these are typically
voluntary and not so widely developed. Only if they are part of official pension provisions and of
substantial significance (such as, for example, in the case of the German ‘Riester’ scheme) should they
be included. Such insertion must be fully justified on the basis of the current and prospective coverage
of such pension arrangements among workers. Saving arrangements that do not tie up savings till
retirement age can never be considered.
In case of doubt, Member States should get in touch with the Indicators' Sub-Group (ISG) secretariat
and the European Commission to decide how to treat a certain scheme. Moreover, Member States
should be encouraged to provide background information on the different schemes introduced,
explaining briefly the institutional framework, the type of membership and current and expected
coverage. This is done in a separate consultation.
Table 3 summarises the types of schemes to be included in the calculations.
Table 3. The types of schemes to be included in the calculations
Covered by TRR
calculations Type of scheme
Statutory
schemes YES
Minimum pension provision
Means-tested benefits for pensioners, such as housing
Universal flat rate linked to residency or to social insurance
contributions
Earnings-related PAYG (with or without reserve fund)
Earnings-related, totally funded (by social contributions) – funded tier
of general statutory schemes; partly funded schemes
Occupational
schemes
YES
Mandatory for employer (sectoral or cross-sectoral) or resulting from
collective agreement (which makes membership mandatory)
Resulting from collective agreement (membership not mandatory, but
coverage is wide)
Only if justified
(broad coverage)
Resulting from collective agreement (membership not mandatory)
Possibility to subscribe to pension scheme through one’s employer
Contractual or unilateral by employer (including book reserve or group
plans)
Personal
schemes Only if justified
(broad coverage)
Voluntary individual schemes (no employment link is necessary to
become member) that can be joined collectively (for instance through
associations or Unions)
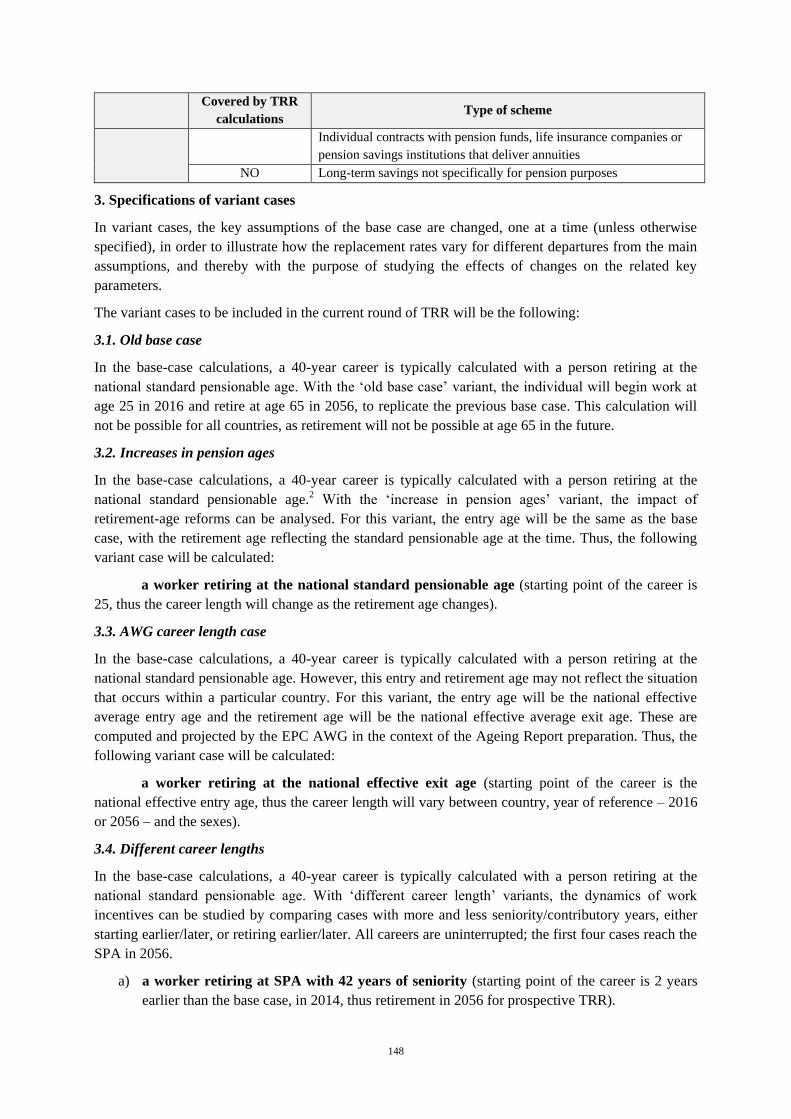
148
Covered by TRR
calculations Type of scheme
Individual contracts with pension funds, life insurance companies or
pension savings institutions that deliver annuities
NO Long-term savings not specifically for pension purposes
3. Specifications of variant cases
In variant cases, the key assumptions of the base case are changed, one at a time (unless otherwise
specified), in order to illustrate how the replacement rates vary for different departures from the main
assumptions, and thereby with the purpose of studying the effects of changes on the related key
parameters.
The variant cases to be included in the current round of TRR will be the following:
3.1. Old base case
In the base-case calculations, a 40-year career is typically calculated with a person retiring at the
national standard pensionable age. With the ‘old base case’ variant, the individual will begin work at
age 25 in 2016 and retire at age 65 in 2056, to replicate the previous base case. This calculation will
not be possible for all countries, as retirement will not be possible at age 65 in the future.
3.2. Increases in pension ages
In the base-case calculations, a 40-year career is typically calculated with a person retiring at the
national standard pensionable age.2 With the ‘increase in pension ages’ variant, the impact of
retirement-age reforms can be analysed. For this variant, the entry age will be the same as the base
case, with the retirement age reflecting the standard pensionable age at the time. Thus, the following
variant case will be calculated:
a worker retiring at the national standard pensionable age (starting point of the career is
25, thus the career length will change as the retirement age changes).
3.3. AWG career length case
In the base-case calculations, a 40-year career is typically calculated with a person retiring at the
national standard pensionable age. However, this entry and retirement age may not reflect the situation
that occurs within a particular country. For this variant, the entry age will be the national effective
average entry age and the retirement age will be the national effective average exit age. These are
computed and projected by the EPC AWG in the context of the Ageing Report preparation. Thus, the
following variant case will be calculated:
a worker retiring at the national effective exit age (starting point of the career is the
national effective entry age, thus the career length will vary between country, year of reference – 2016
or 2056 – and the sexes).
3.4. Different career lengths
In the base-case calculations, a 40-year career is typically calculated with a person retiring at the
national standard pensionable age. With ‘different career length’ variants, the dynamics of work
incentives can be studied by comparing cases with more and less seniority/contributory years, either
starting earlier/later, or retiring earlier/later. All careers are uninterrupted; the first four cases reach the
SPA in 2056.
a) a worker retiring at SPA with 42 years of seniority (starting point of the career is 2 years
earlier than the base case, in 2014, thus retirement in 2056 for prospective TRR).
149
b) a worker retiring at SPA with 38 years of seniority (starting point of the career is 2 years
later than the base case, in 2018, thus retirement in 2056 for prospective TRR).
c) a worker retiring 2 years after national standard pensionable age (starting point of the
career is as in base case, now with 42-year career, retirement in 2058).
d) a worker retiring 2 years before national standard pensionable age (starting point of the
career is as in base case, now with 38-year career, retirement in 2054).
e) a worker starting to work at age 20 and retiring at SPA (starting point of the career is in
2016, when the individual was 20; retirement at SPA, year 2016+SPA-20; this is the ‘early
entry case’).
3.5. Different earning profiles
The analysis of variant cases should be considered with respect to earning profiles, thus considering a
low-income earner and a high-income earner (as compared to the average income earner of the base
case). The following variant cases of TRRs are to be calculated in this exercise:
a) Low-income earner: only the earnings assumptions are changed, corresponding then to a
constant level of 66 percent of the average earning profile each year. This is computed and/or
projected for several cases, namely (1) the base case, (2) the old base case, (4) the AWG cases
(separately women and men), (7) and (8) career breaks for unemployment and childcare, and
(10) short career.
b) High-income earner: only the earnings assumptions are changed, assuming now that earnings
grow linearly every year from 100 percent of average earnings to 200 percent. The aim of this
variant is to represent career profiles where earnings grow over time typically at a faster pace
than they do for the average earner. This is computed and projected on the (1) base case only.
3.6. A worker 10 years after retirement
This replacement rate is calculated based on the indexation formula that applies after retirement. If
indexation of all components is to wage growth, then the replacement rate will remain unchanged.
However, if indexation of at least one component is to something other than wage growth, then the
replacement rate will change. If this is the case, then the replacement rate for 10 years after retirement
should be calculated as follows:
Take the relative change in pensions from 2056 to 2066 according to the indexation rule:
pension(2066) – pension(2056) / pension(2066); this is the ‘indexation rule’;
Take the ratio between (1+the value in (1)) and ((1) + the 10-year rate of wage increase) (note
that this is compounded; this is not in the sheets, but it can be assumed to continue at a
constant rate after 2060). This is the ‘TRR 10 years after retirement’.
Note that if the indexation rules differ between components (statutory, occupational, etc.), then each
individual component needs to be calculated separately.
3.7. Variant cases with career breaks
It is important to study with TRRs the extent to which social protection systems protect not only the
current loss of income due to career breaks (for care responsibilities or in the event of unemployment),
but also future incomes in the form of pension entitlements. This is becoming increasingly important,
as the number of contributory years needed for a full pension is being extended in many Member
States. The following variant cases with career breaks are to be calculated in the present exercise:
a) Career breaks for childcare years: this variant case includes different sub-cases:

150
Career break for 3-year periods of childcare The assumption for this case is that the typical earner is
considered to be an average earner (both male and female) retiring at the country-specific standard
pensionable age, who entered the labour market at the base-case age. The exercise assumes a childcare
covering period of 3 years of absence. For the modelling, it is assumed that two children are born 2
years apart. The first child is assumed to be born 3 years after the start of the career; the career is thus
3-3-34.119 The assumption is that the highest full benefits can be received by the individual. The
childcare credits are typically assumed for two children born.
Part-time work for 10 years after 3-year break for childcare The assumption for this case is that the
typical earner is considered to be an average earner (both male and female) retiring at the country-
specific standard pensionable age, who entered the labour market at the base-case age. The exercise
assumes a childcare covering period of 3 years of absence, as for the standard childcare case (first
child born 3 years after career start, second child 2 years later). After the 3-year break, there follows a
period of 10 years of part-time work at 66 percent of average earnings before full-time work resumes
until the SPA (career 3-3-10-24).
b) Unemployment breaks: this variant case includes different sub-cases:
Career break for 3-year periods of unemployment: In this case, the typical earner will be considered to
be an average earner (both male and female) retiring at the country-specific standard pensionable age,
who entered the labour market at the base-case age. Three consecutive years of unemployment are
assumed to take place, when the individual is allowed the highest full unemployment benefits
available under the legislation during the entire unemployment period (10 years after career start, for a
career 10-3-27). Although several countries have early-retirement schemes, the effects of such
schemes are not taken into consideration in these calculations.
Twenty non-contributory years out of the labour market: This variant is defined as an average-earner
worker, both male and female, who retires at the national retirement age and entered the labour market
at the base-case age. They work for 10 years, then have a 20-year career break and then work 10 years
until the national standard pensionable age. During the 20-year break, the worker is assumed not to
contribute to the pension system at all and not to receive any social benefit or contribution credits, but
to remain resident in the Member State (career 10-20-10).
c) Career breaks for family care years
In this case, the typical earner will be considered to be an average earner (both male and female)
retiring at the country-specific standard pensionable age, who entered the labour market at the base-
case age. Three consecutive years of family care are assumed to take place, when the individual is 10
years from SPA (career 30-3-7).
3.8. Early retirement due to disability
In this case, the typical earner will be considered to be an average earner (both male and female) who
entered the labour market at the base-case age and left it 5 years prior to the national standard
pensionable age because of 100 percent disability, during which the individual is eligible for the
maximum level of credit. The individual claims the pension at the earliest possible point through any
early-retirement schemes (career 35-x). However, the replacement rate is calculated at the national
standard pensionable age, indexing benefits in payment where required.
3.9. Pension rights of surviving spouses (provisional)
The assumption for this case is that only one partner (the man) has a career history. The exercise
assumes that the man was an average earner throughout his career, while the woman has no career
119 That is: 3 years of work, then 3 years of break for childcare, then 34 years of work.

151
history. The working partner retires at the country-specific national standard pensionable age, having
entered the labour market at the base-case age. For the modelling, it is assumed that the man dies
immediately after reaching standard pensionable age. The TRR is computed by dividing the (possible)
pension that the surviving spouse receives as the spouse of a deceased pensioner by the man’s work
income in his last year of work (+2% adjustment as usual).
3.10. Average replacement rate (provisional)
This indicator is an attempt to calculate the average replacement rate based on real administrative data
which accounts for differences in career lengths, wages and retirement age among other things. The
indicator should be calculated based on only the income from the schemes included in the TRR
exercise under the following formula:
Average Replacement Rate 2016
=∑
𝑇𝑜𝑡𝑎𝑙 𝐺𝑟𝑜𝑠𝑠 𝑃𝑒𝑛𝑠𝑖𝑜𝑛 𝐼𝑛𝑐𝑜𝑚𝑒 𝑓𝑟𝑜𝑚 𝑚𝑎𝑛𝑑𝑎𝑡𝑜𝑟𝑦 𝑠𝑐ℎ𝑒𝑚𝑒𝑠 𝑎𝑡 𝑡𝑎𝑘𝑒 𝑢𝑝𝑖𝐿𝑎𝑠𝑡 𝐶𝑜𝑛𝑡𝑟𝑖𝑏𝑢𝑡𝑖𝑜𝑛 𝐵𝑎𝑠𝑒𝑖
𝑛𝑖=0
𝑛
Where:
i = individual worker who retires in 2016
n = total of workers retired in 2016
Total Gross Pension Income from mandatory schemes at take-up = Total pension income as it
is defined in the TRR calculation. Pensioners who remain working after pension take-up
should be excluded.
Last Contribution Base = Part of the last salary from which the contributions are calculated.
Both pension income and contribution base must incorporate the proportional part of the extra
payments in those countries that have, for example, 13 or 14 monthly payments in a year.
This indicator should be calculated separately for those retiring at SPA or later in 2016, for those
retiring at earlier ages, and for both combined.
This indicator is not obligatory. Nevertheless, delegates who are able to compute it could do so.
Depending on the number of countries for which the case is computed, we will decide on how to
include the results in the PAR 2018.
3.11. Other possible variants
Furthermore, Member States are strongly encouraged to elaborate some other variants, reflecting other
key dimensions that can strengthen the quality of information provided by mandatory variants, in
particular, variants that they would consider relevant in their national context. These may in particular
include calculations for different ages of retirement that would seem more representative of the
national situation, or calculations for civil servants, the self-employed or farmers.
4. Data and assumptions
In addition to the specifications listed above for the base case and variant cases, the following data
are typically needed for the modelling of current and prospective TRR calculations:
- average earnings of the base-case theoretical individual
- wage growth
- GDP growth
- inflation rate
152
- rates of return and annuities
- tax and social insurance data
- demographic variables (life expectancy/mortality tables).
Input data on these variables are needed for the whole 40-year period of the individual’s career: either
historical data referred to the past 40 years (for the calculation of current TRR) or assumptions on the
relevant variables for the next 40 years (for the calculation of prospective TRR). The following
explains in more detail what input data should be used in this round of TRR.
4.1. Current TRR calculations: based on past historical data
Calculations of current TRR should be based on historical data for all the macroeconomic and
demographic variables listed above. Country delegates were invited to use EU-level statistics, such as
the AMECO macroeconomic databank of DG ECFIN,120 Eurostat data121 or national sources to
extract the necessary input data for the modelling. The data sources used should be indicated when
reporting the results.
The average earnings of the base-case theoretical individual can be calculated either as (i)
‘Compensation of employees (before employers’ social contributions) divided by the number of
salaried employees in each country’ or else as (ii) ‘wages and salaries (after employers’ social
contributions) divided by the number of salaried employees in each country’. In any case, note that
employers’ social security contributions should be netted out for the calculation of gross TRR (see
section 1 above), thus if option (i) is taken, employers’ social contributions have to be deducted from
the aggregate ‘compensation of employees’. Furthermore, in the denominator, it would be more
appropriate to use data on full-time equivalent wage and salary employees, since the structure of
employment in terms of hours worked differs greatly across countries.
As for the reference population, the Secretariat suggests using economy-wide averages, with no
breakdown by gender or sector. The purpose, in fact, is not to reflect very accurately average earnings
or cross-sectoral differences in average earnings in a given country at a given point in time, but to have
a consistent image of cross-country differences in levels and past trends of earnings. However, if the
pension scheme to which the calculations refer only concerns a particular section of the economy for
which average earnings are significantly different from the economy-wide average, then it is possible
to use earnings related to that section of the economy, provided they are available based on national
accounts definitions.
4.2. Prospective TRR calculations: based on assumed data for the future
The calculation of prospective TRR asks for assumptions on future values of all the above-listed
macroeconomic and demographic variables. In that sense, the assumptions agreed in the AWG should
be used here to calculate projected TRR.
The tables provided with these guidelines for calculation of 2016-2056 TRR include such AWG
assumptions on:
(i) average earnings (without employers’ social security contributions) in 2016;
(ii) assumed annual average earnings’ growth in real terms 2016-2056;
(iii) assumed annual GDP growth in real terms 2016-2056;
(iv) assumed annual inflation 2016-2056;
(v) assumed real interest rates 2016-2056.
120 http://ec.europa.eu/economy_finance/db_indicators/ameco/index_en.htm 121 http://ec.europa.eu/eurostat/data/browse-statistics-by-theme
153
The AWG assumes year-on-year figures for earnings’ growth and GDP growth for the time span
2016-2056, while it assumes a path of linear convergence in both nominal interest rates (convergence
to the 5% rate by 2026, and constant rate thereafter) and inflation rates (convergence to the 2% rate by
2021 and constant rate thereafter).
Interest rates and earnings growth in real terms can be computed by deflating growth in nominal terms
by the inflation rate, as follows:
The following clarifies further the use of some of the variables in the modelling exercise of
prospective TRR.
Inflation rate
Assumptions about indexation of pensions should be made according to national legislation.
Concerning discretional increases in pensions, in calculating the pension/wage ratio after 10 years,
only legislated or automatic increases in pensions should be considered, not discretional ones. If one
Member State feels it relevant also to consider some discretional increase, this should be declared and
done only if the same discretional increase is expected to be considered in the pension expenditure
projection exercise.
Tax and social insurance
As in previous exercises, in the absence of a clear legislative commitment to conduct a different
policy, Member States should raise income tax and social insurance thresholds in line with earnings,
so as to avoid a reduction in net replacement rates resulting from an increasing tax burden or a gradual
reduction in the scope of social insurance. Departures from this assumption have to be duly justified.
Rates of return and annuities
It should be assumed that when DC benefits are received on retirement, they are paid out as an
annuity. Annuities are calculated according to government policies. The interest rate assumed to
calculate the annuity is 0.8% lower than the assumed rate used during the accumulation phase, in order
to account for the cost of buying the annuity, administrative and management expenses. Therefore, for
the base case the assumed rate is 3%, giving an annuity rate of 2.2%. The cases for the lower and
higher rates of return are adjusted accordingly. The annuity coefficients used in the calculations take
into account changes in life expectancy and are based on the demographic projections by Eurostat.
Life expectancy
Eurostat’s demographic projections based on EUROPOP2016 should be used, as will be the case for
the AWG projections. The tables provided with these guidelines for the calculation of 2016-2056 TRR
contain the demographic data needed for the exercise, broken down by gender, single year of age
(from 1 to 100) and single year time period (from 2016 to 2070) for each Member State.
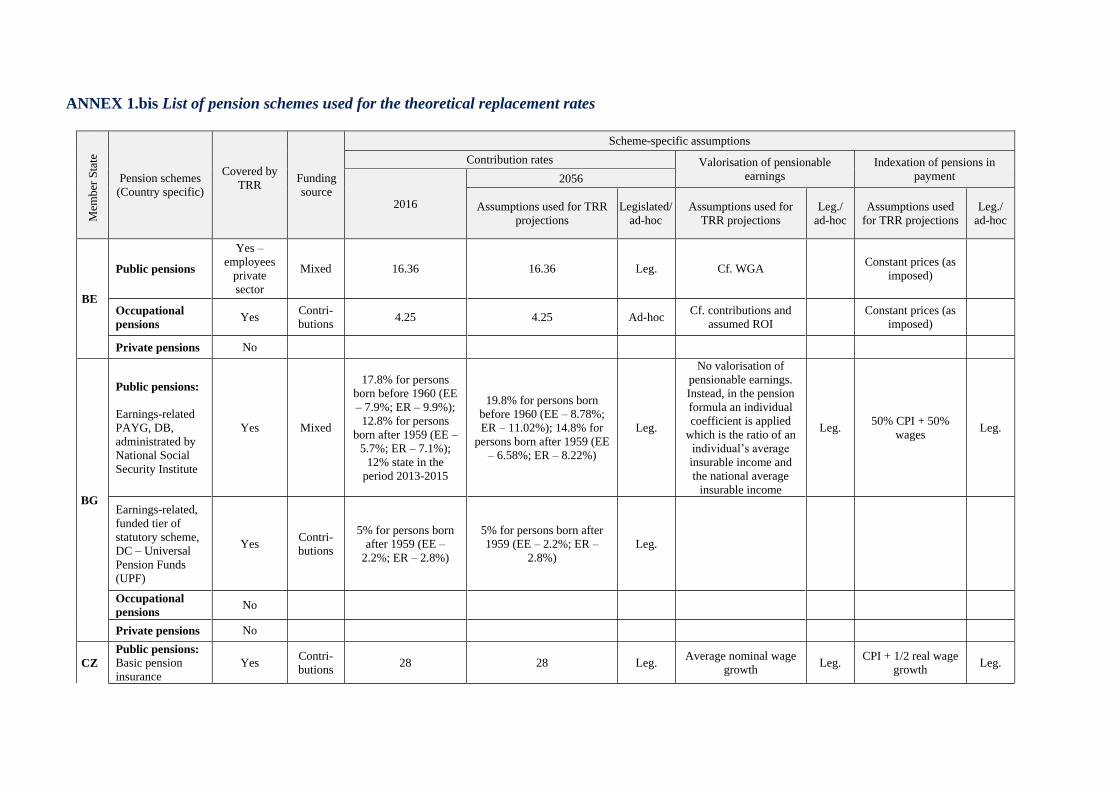
ANNEX 1.bis List of pension schemes used for the theoretical replacement rates M
ember
Sta
te
Pension schemes
(Country specific)
Covered by
TRR
Funding
source
Scheme-specific assumptions
Contribution rates Valorisation of pensionable
earnings
Indexation of pensions in
payment
2016
2056
Assumptions used for TRR
projections
Legislated/
ad-hoc
Assumptions used for
TRR projections
Leg./
ad-hoc
Assumptions used
for TRR projections
Leg./
ad-hoc
BE
Public pensions
Yes –
employees
private
sector
Mixed 16.36 16.36 Leg. Cf. WGA
Constant prices (as
imposed)
Occupational
pensions Yes
Contri-
butions 4.25 4.25 Ad-hoc
Cf. contributions and
assumed ROI
Constant prices (as
imposed)
Private pensions No
BG
Public pensions:
Earnings-related
PAYG, DB,
administrated by
National Social
Security Institute
Yes Mixed
17.8% for persons
born before 1960 (EE
– 7.9%; ER – 9.9%);
12.8% for persons
born after 1959 (EE –
5.7%; ER – 7.1%);
12% state in the
period 2013-2015
19.8% for persons born
before 1960 (EE – 8.78%;
ER – 11.02%); 14.8% for
persons born after 1959 (EE
– 6.58%; ER – 8.22%)
Leg.
No valorisation of
pensionable earnings.
Instead, in the pension
formula an individual
coefficient is applied
which is the ratio of an
individual’s average
insurable income and
the national average
insurable income
Leg. 50% CPI + 50%
wages Leg.
Earnings-related,
funded tier of
statutory scheme,
DC – Universal
Pension Funds
(UPF)
Yes Contri-
butions
5% for persons born
after 1959 (EE –
2.2%; ER – 2.8%)
5% for persons born after
1959 (EE – 2.2%; ER –
2.8%)
Leg.
Occupational
pensions No
Private pensions No
CZ
Public pensions: Basic pension
insurance
Yes Contri-
butions 28 28 Leg.
Average nominal wage
growth Leg.
CPI + 1/2 real wage
growth Leg.
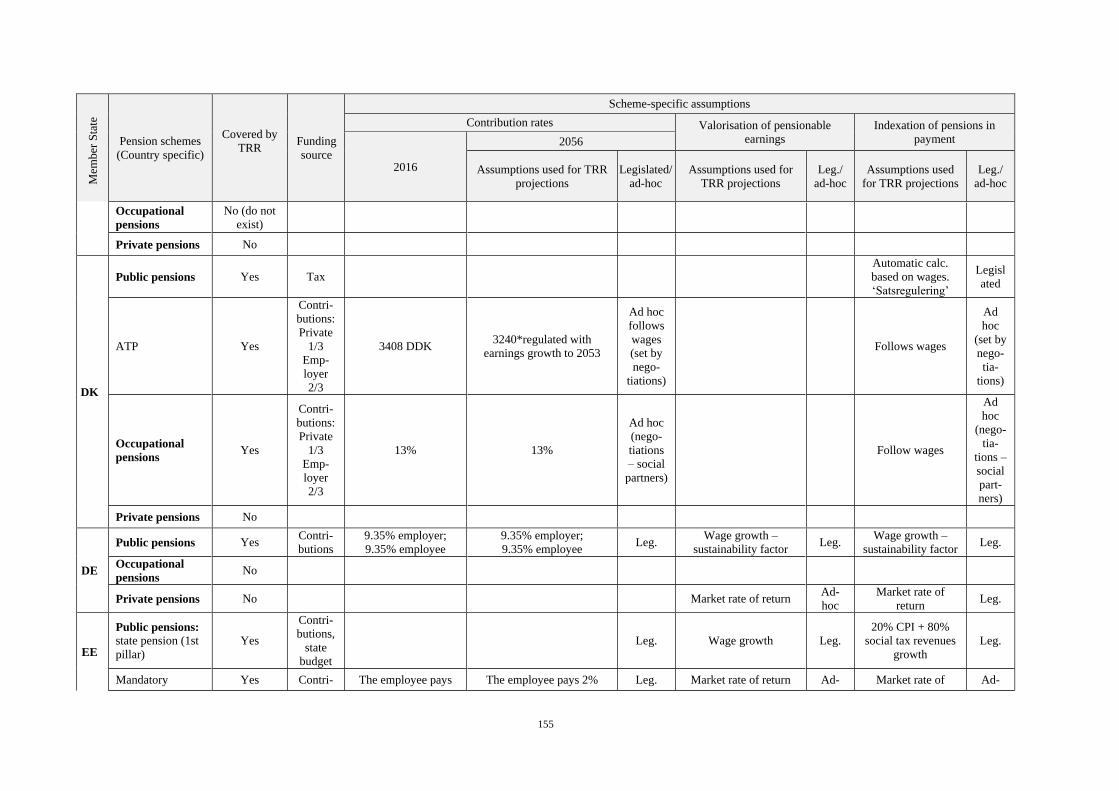
155
Mem
ber
Sta
te
Pension schemes
(Country specific)
Covered by
TRR
Funding
source
Scheme-specific assumptions
Contribution rates Valorisation of pensionable
earnings
Indexation of pensions in
payment
2016
2056
Assumptions used for TRR
projections
Legislated/
ad-hoc
Assumptions used for
TRR projections
Leg./
ad-hoc
Assumptions used
for TRR projections
Leg./
ad-hoc
Occupational
pensions
No (do not
exist)
Private pensions No
DK
Public pensions Yes Tax
Automatic calc.
based on wages.
‘Satsregulering’
Legisl
ated
ATP Yes
Contri-
butions:
Private
1/3
Emp-
loyer
2/3
3408 DDK 3240*regulated with
earnings growth to 2053
Ad hoc
follows
wages
(set by
nego-
tiations)
Follows wages
Ad
hoc
(set by
nego-
tia-
tions)
Occupational
pensions Yes
Contri-
butions:
Private
1/3
Emp-
loyer
2/3
13% 13%
Ad hoc
(nego-
tiations
– social
partners)
Follow wages
Ad
hoc
(nego-
tia-
tions –
social
part-
ners)
Private pensions No
DE
Public pensions Yes Contri-
butions
9.35% employer;
9.35% employee
9.35% employer;
9.35% employee Leg.
Wage growth –
sustainability factor Leg.
Wage growth –
sustainability factor Leg.
Occupational
pensions No
Private pensions No Market rate of return Ad-
hoc
Market rate of
return Leg.
EE
Public pensions:
state pension (1st
pillar)
Yes
Contri-
butions,
state
budget
Leg. Wage growth Leg.
20% CPI + 80%
social tax revenues
growth
Leg.
Mandatory Yes Contri- The employee pays The employee pays 2% Leg. Market rate of return Ad- Market rate of Ad-
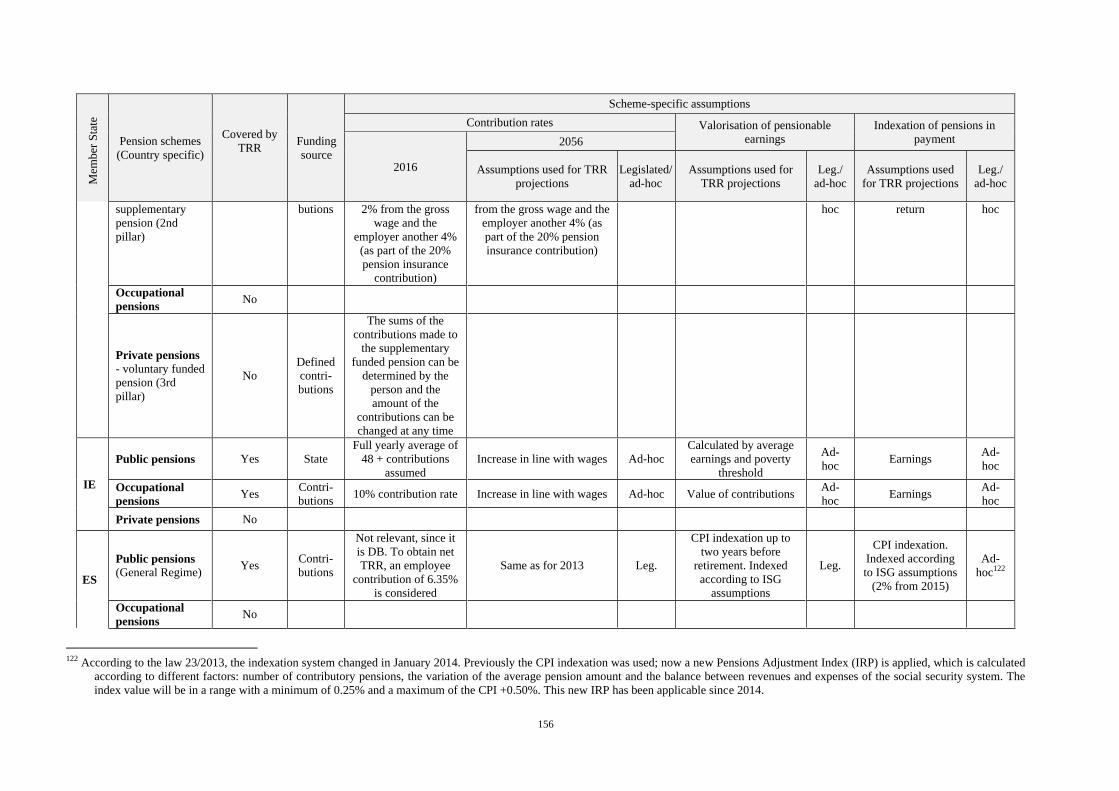
156
Mem
ber
Sta
te
Pension schemes
(Country specific)
Covered by
TRR
Funding
source
Scheme-specific assumptions
Contribution rates Valorisation of pensionable
earnings
Indexation of pensions in
payment
2016
2056
Assumptions used for TRR
projections
Legislated/
ad-hoc
Assumptions used for
TRR projections
Leg./
ad-hoc
Assumptions used
for TRR projections
Leg./
ad-hoc
supplementary
pension (2nd
pillar)
butions 2% from the gross
wage and the
employer another 4%
(as part of the 20%
pension insurance
contribution)
from the gross wage and the
employer another 4% (as
part of the 20% pension
insurance contribution)
hoc return hoc
Occupational
pensions No
Private pensions
- voluntary funded
pension (3rd
pillar)
No
Defined
contri-
butions
The sums of the
contributions made to
the supplementary
funded pension can be
determined by the
person and the
amount of the
contributions can be
changed at any time
IE
Public pensions Yes State
Full yearly average of
48 + contributions
assumed
Increase in line with wages Ad-hoc
Calculated by average
earnings and poverty
threshold
Ad-
hoc Earnings
Ad-
hoc
Occupational
pensions Yes
Contri-
butions 10% contribution rate Increase in line with wages Ad-hoc Value of contributions
Ad-
hoc Earnings
Ad-
hoc
Private pensions No
ES
Public pensions (General Regime)
Yes Contri-
butions
Not relevant, since it
is DB. To obtain net
TRR, an employee
contribution of 6.35%
is considered
Same as for 2013 Leg.
CPI indexation up to
two years before
retirement. Indexed
according to ISG
assumptions
Leg.
CPI indexation.
Indexed according
to ISG assumptions
(2% from 2015)
Ad-
hoc122
Occupational
pensions No
122 According to the law 23/2013, the indexation system changed in January 2014. Previously the CPI indexation was used; now a new Pensions Adjustment Index (IRP) is applied, which is calculated
according to different factors: number of contributory pensions, the variation of the average pension amount and the balance between revenues and expenses of the social security system. The
index value will be in a range with a minimum of 0.25% and a maximum of the CPI +0.50%. This new IRP has been applicable since 2014.
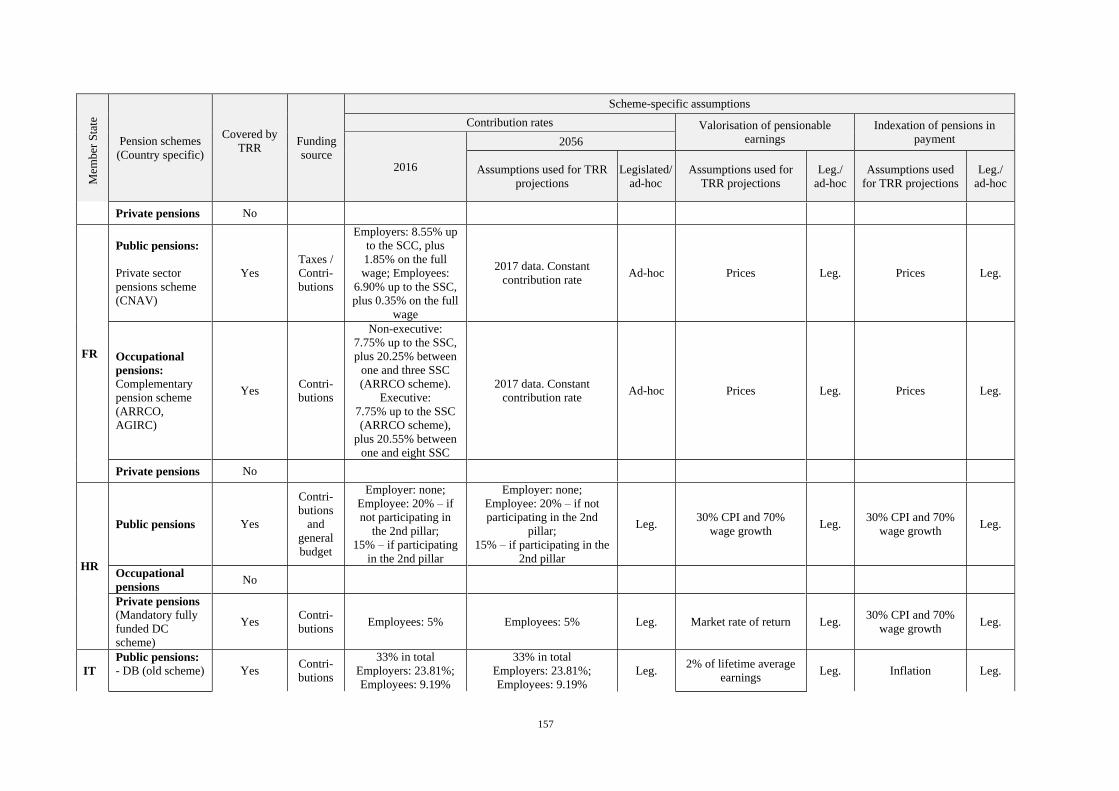
157
Mem
ber
Sta
te
Pension schemes
(Country specific)
Covered by
TRR
Funding
source
Scheme-specific assumptions
Contribution rates Valorisation of pensionable
earnings
Indexation of pensions in
payment
2016
2056
Assumptions used for TRR
projections
Legislated/
ad-hoc
Assumptions used for
TRR projections
Leg./
ad-hoc
Assumptions used
for TRR projections
Leg./
ad-hoc
Private pensions No
FR
Public pensions:
Private sector
pensions scheme
(CNAV)
Yes
Taxes /
Contri-
butions
Employers: 8.55% up
to the SCC, plus
1.85% on the full
wage; Employees:
6.90% up to the SSC,
plus 0.35% on the full
wage
2017 data. Constant
contribution rate Ad-hoc Prices Leg. Prices Leg.
Occupational
pensions: Complementary
pension scheme
(ARRCO,
AGIRC)
Yes Contri-
butions
Non-executive:
7.75% up to the SSC,
plus 20.25% between
one and three SSC
(ARRCO scheme).
Executive:
7.75% up to the SSC
(ARRCO scheme),
plus 20.55% between
one and eight SSC
2017 data. Constant
contribution rate Ad-hoc Prices Leg. Prices Leg.
Private pensions No
HR
Public pensions Yes
Contri-
butions
and
general
budget
Employer: none;
Employee: 20% – if
not participating in
the 2nd pillar;
15% – if participating
in the 2nd pillar
Employer: none;
Employee: 20% – if not
participating in the 2nd
pillar;
15% – if participating in the
2nd pillar
Leg. 30% CPI and 70%
wage growth Leg.
30% CPI and 70%
wage growth Leg.
Occupational
pensions No
Private pensions
(Mandatory fully
funded DC
scheme)
Yes Contri-
butions Employees: 5% Employees: 5% Leg. Market rate of return Leg.
30% CPI and 70%
wage growth Leg.
IT
Public pensions:
- DB (old scheme)
Yes Contri-
butions
33% in total
Employers: 23.81%;
Employees: 9.19%
33% in total
Employers: 23.81%;
Employees: 9.19%
Leg. 2% of lifetime average
earnings Leg. Inflation Leg.
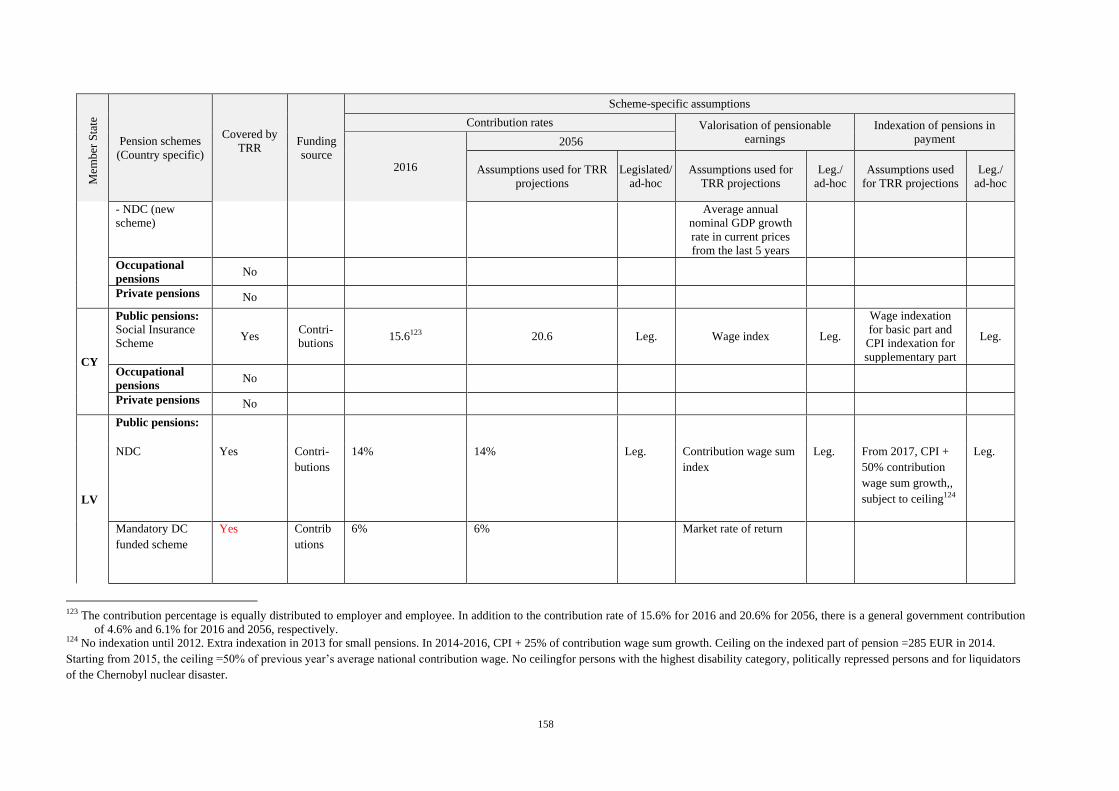
158
Mem
ber
Sta
te
Pension schemes
(Country specific)
Covered by
TRR
Funding
source
Scheme-specific assumptions
Contribution rates Valorisation of pensionable
earnings
Indexation of pensions in
payment
2016
2056
Assumptions used for TRR
projections
Legislated/
ad-hoc
Assumptions used for
TRR projections
Leg./
ad-hoc
Assumptions used
for TRR projections
Leg./
ad-hoc
- NDC (new
scheme)
Average annual
nominal GDP growth
rate in current prices
from the last 5 years
Occupational
pensions No
Private pensions No
CY
Public pensions:
Social Insurance
Scheme Yes
Contri-
butions 15.6123 20.6 Leg. Wage index Leg.
Wage indexation
for basic part and
CPI indexation for
supplementary part
Leg.
Occupational
pensions No
Private pensions No
LV
Public pensions:
NDC Yes Contri-
butions
14% 14% Leg. Contribution wage sum
index
Leg. From 2017, CPI +
50% contribution
wage sum growth,,
subject to ceiling124
Leg.
Mandatory DC
funded scheme
Yes Contrib
utions
6% 6% Market rate of return
123 The contribution percentage is equally distributed to employer and employee. In addition to the contribution rate of 15.6% for 2016 and 20.6% for 2056, there is a general government contribution
of 4.6% and 6.1% for 2016 and 2056, respectively. 124 No indexation until 2012. Extra indexation in 2013 for small pensions. In 2014-2016, CPI + 25% of contribution wage sum growth. Ceiling on the indexed part of pension =285 EUR in 2014.
Starting from 2015, the ceiling =50% of previous year’s average national contribution wage. No ceilingfor persons with the highest disability category, politically repressed persons and for liquidators
of the Chernobyl nuclear disaster.
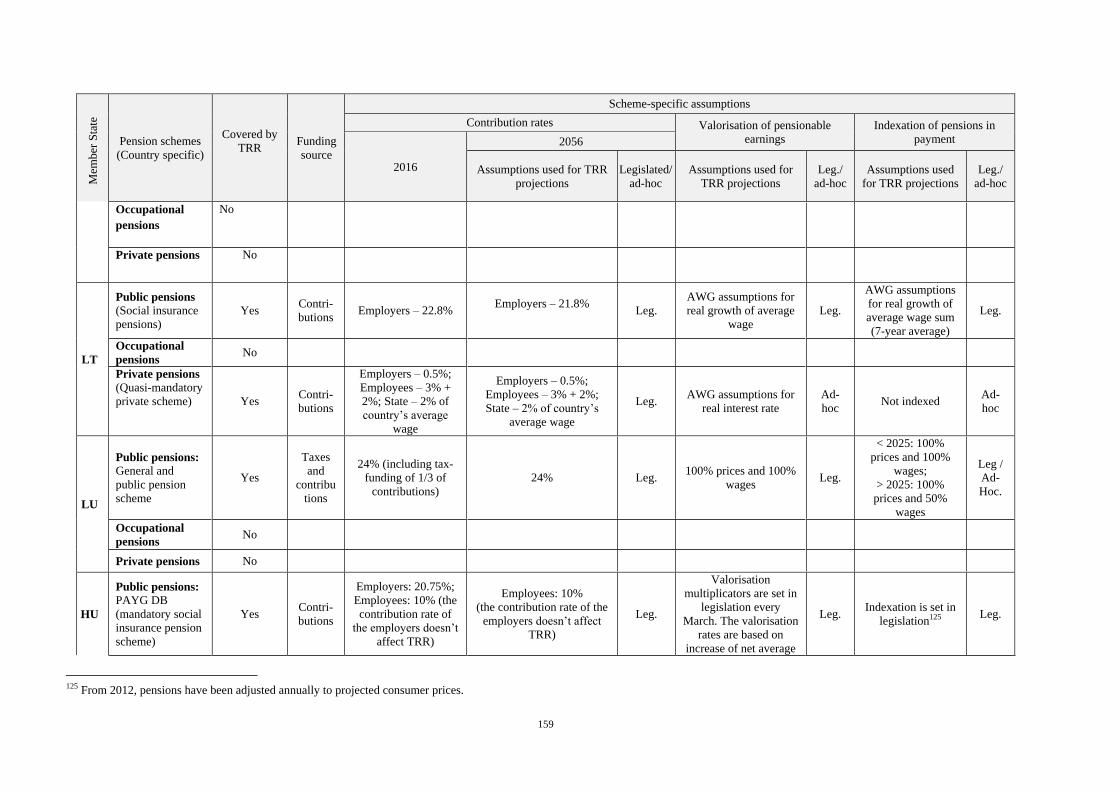
159
Mem
ber
Sta
te
Pension schemes
(Country specific)
Covered by
TRR
Funding
source
Scheme-specific assumptions
Contribution rates Valorisation of pensionable
earnings
Indexation of pensions in
payment
2016
2056
Assumptions used for TRR
projections
Legislated/
ad-hoc
Assumptions used for
TRR projections
Leg./
ad-hoc
Assumptions used
for TRR projections
Leg./
ad-hoc
Occupational
pensions
No
Private pensions No
LT
Public pensions (Social insurance
pensions)
Yes Contri-
butions Employers – 22.8%
Employers – 21.8%
Leg.
AWG assumptions for
real growth of average
wage
Leg.
AWG assumptions
for real growth of
average wage sum
(7-year average)
Leg.
Occupational
pensions No
Private pensions (Quasi-mandatory
private scheme) Yes Contri-
butions
Employers – 0.5%;
Employees – 3% +
2%; State – 2% of
country’s average
wage
Employers – 0.5%;
Employees – 3% + 2%;
State – 2% of country’s
average wage
Leg. AWG assumptions for
real interest rate
Ad-
hoc Not indexed
Ad-
hoc
LU
Public pensions:
General and
public pension
scheme
Yes
Taxes
and
contribu
tions
24% (including tax-
funding of 1/3 of
contributions)
24% Leg. 100% prices and 100%
wages Leg.
< 2025: 100%
prices and 100%
wages;
> 2025: 100%
prices and 50%
wages
Leg /
Ad-
Hoc.
Occupational
pensions No
Private pensions No
HU
Public pensions: PAYG DB
(mandatory social
insurance pension
scheme)
Yes Contri-
butions
Employers: 20.75%;
Employees: 10% (the
contribution rate of
the employers doesn’t
affect TRR)
Employees: 10%
(the contribution rate of the
employers doesn’t affect
TRR)
Leg.
Valorisation
multiplicators are set in
legislation every
March. The valorisation
rates are based on
increase of net average
Leg. Indexation is set in
legislation125 Leg.
125 From 2012, pensions have been adjusted annually to projected consumer prices.
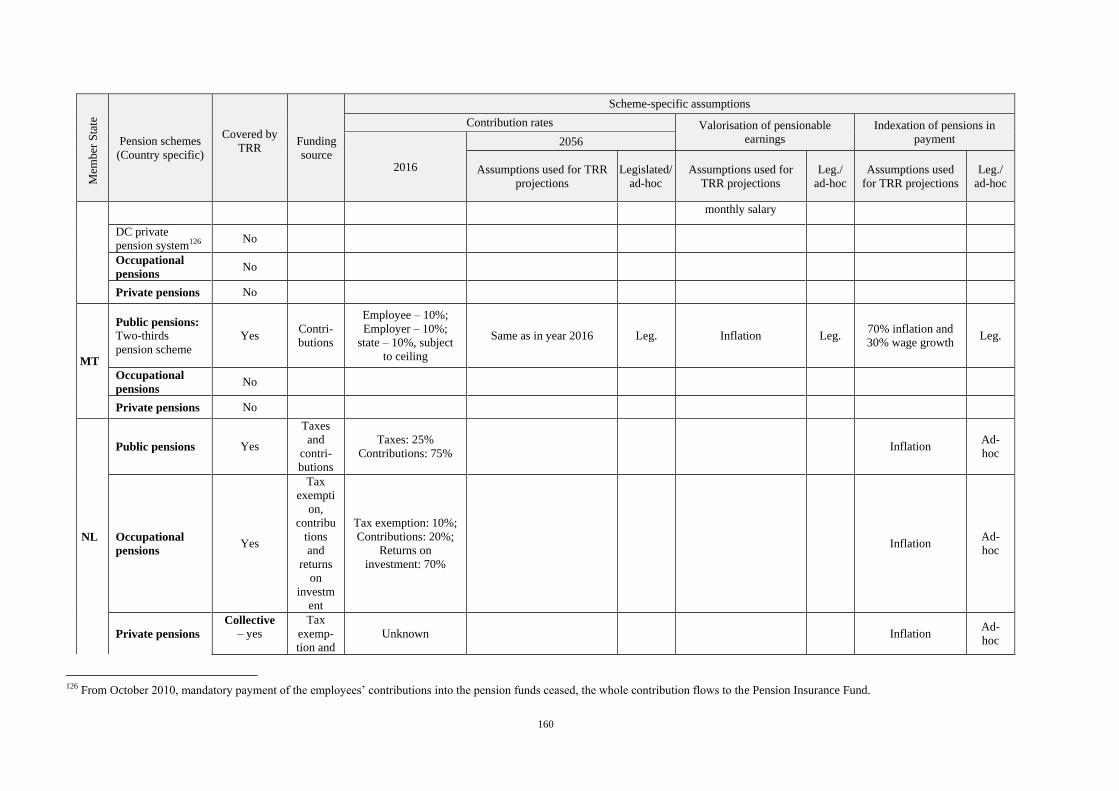
160
Mem
ber
Sta
te
Pension schemes
(Country specific)
Covered by
TRR
Funding
source
Scheme-specific assumptions
Contribution rates Valorisation of pensionable
earnings
Indexation of pensions in
payment
2016
2056
Assumptions used for TRR
projections
Legislated/
ad-hoc
Assumptions used for
TRR projections
Leg./
ad-hoc
Assumptions used
for TRR projections
Leg./
ad-hoc
monthly salary
DC private
pension system126 No
Occupational
pensions No
Private pensions No
MT
Public pensions: Two-thirds
pension scheme
Yes Contri-
butions
Employee – 10%;
Employer – 10%;
state – 10%, subject
to ceiling
Same as in year 2016 Leg. Inflation Leg. 70% inflation and
30% wage growth Leg.
Occupational
pensions No
Private pensions No
NL
Public pensions Yes
Taxes
and
contri-
butions
Taxes: 25%
Contributions: 75% Inflation
Ad-
hoc
Occupational
pensions Yes
Tax
exempti
on,
contribu
tions
and
returns
on
investm
ent
Tax exemption: 10%;
Contributions: 20%;
Returns on
investment: 70%
Inflation Ad-
hoc
Private pensions
Collective – yes
Tax
exemp-
tion and
Unknown Inflation Ad-
hoc
126 From October 2010, mandatory payment of the employees’ contributions into the pension funds ceased, the whole contribution flows to the Pension Insurance Fund.
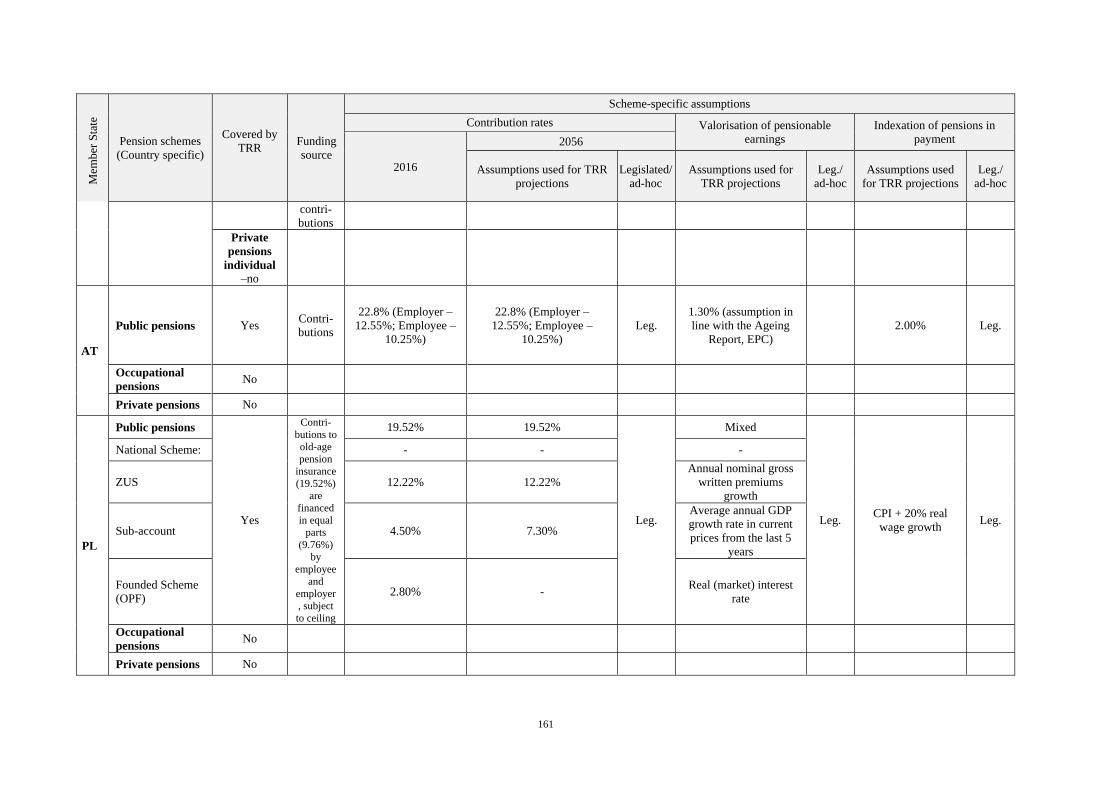
161
Mem
ber
Sta
te
Pension schemes
(Country specific)
Covered by
TRR
Funding
source
Scheme-specific assumptions
Contribution rates Valorisation of pensionable
earnings
Indexation of pensions in
payment
2016
2056
Assumptions used for TRR
projections
Legislated/
ad-hoc
Assumptions used for
TRR projections
Leg./
ad-hoc
Assumptions used
for TRR projections
Leg./
ad-hoc
contri-
butions
Private
pensions
individual –no
AT
Public pensions Yes Contri-
butions
22.8% (Employer –
12.55%; Employee –
10.25%)
22.8% (Employer –
12.55%; Employee –
10.25%)
Leg.
1.30% (assumption in
line with the Ageing
Report, EPC)
2.00% Leg.
Occupational
pensions No
Private pensions No
PL
Public pensions
Yes
Contri-
butions to
old-age
pension
insurance
(19.52%)
are
financed
in equal
parts
(9.76%)
by
employee
and
employer
, subject
to ceiling
19.52% 19.52%
Leg.
Mixed
Leg. CPI + 20% real
wage growth Leg.
National Scheme: - - -
ZUS 12.22% 12.22%
Annual nominal gross
written premiums
growth
Sub-account 4.50% 7.30%
Average annual GDP
growth rate in current
prices from the last 5
years
Founded Scheme
(OPF) 2.80% -
Real (market) interest
rate
Occupational
pensions No
Private pensions No
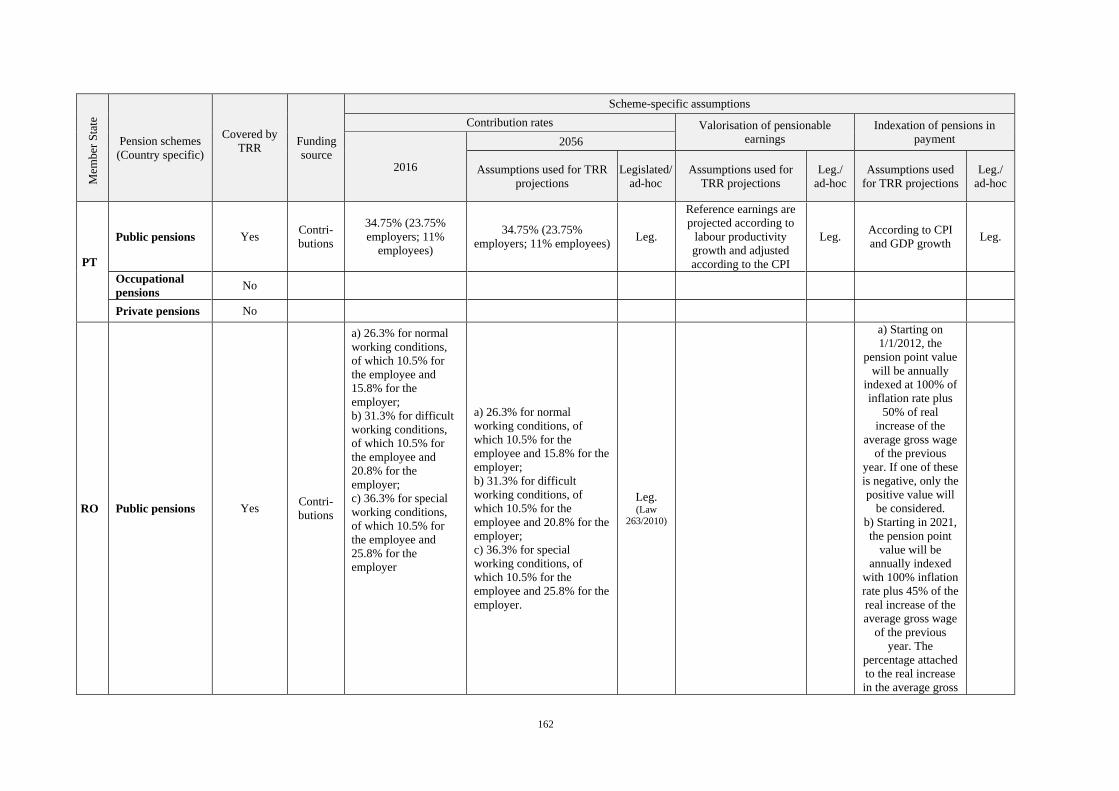
162
Mem
ber
Sta
te
Pension schemes
(Country specific)
Covered by
TRR
Funding
source
Scheme-specific assumptions
Contribution rates Valorisation of pensionable
earnings
Indexation of pensions in
payment
2016
2056
Assumptions used for TRR
projections
Legislated/
ad-hoc
Assumptions used for
TRR projections
Leg./
ad-hoc
Assumptions used
for TRR projections
Leg./
ad-hoc
PT
Public pensions Yes Contri-
butions
34.75% (23.75%
employers; 11%
employees)
34.75% (23.75%
employers; 11% employees) Leg.
Reference earnings are
projected according to
labour productivity
growth and adjusted
according to the CPI
Leg. According to CPI
and GDP growth Leg.
Occupational
pensions No
Private pensions No
RO Public pensions Yes Contri-
butions
a) 26.3% for normal
working conditions,
of which 10.5% for
the employee and
15.8% for the
employer;
b) 31.3% for difficult
working conditions,
of which 10.5% for
the employee and
20.8% for the
employer;
c) 36.3% for special
working conditions,
of which 10.5% for
the employee and
25.8% for the
employer
a) 26.3% for normal
working conditions, of
which 10.5% for the
employee and 15.8% for the
employer;
b) 31.3% for difficult
working conditions, of
which 10.5% for the
employee and 20.8% for the
employer;
c) 36.3% for special
working conditions, of
which 10.5% for the
employee and 25.8% for the
employer.
Leg. (Law
263/2010)
a) Starting on
1/1/2012, the
pension point value
will be annually
indexed at 100% of
inflation rate plus
50% of real
increase of the
average gross wage
of the previous
year. If one of these
is negative, only the
positive value will
be considered.
b) Starting in 2021,
the pension point
value will be
annually indexed
with 100% inflation
rate plus 45% of the
real increase of the
average gross wage
of the previous
year. The
percentage attached
to the real increase
in the average gross
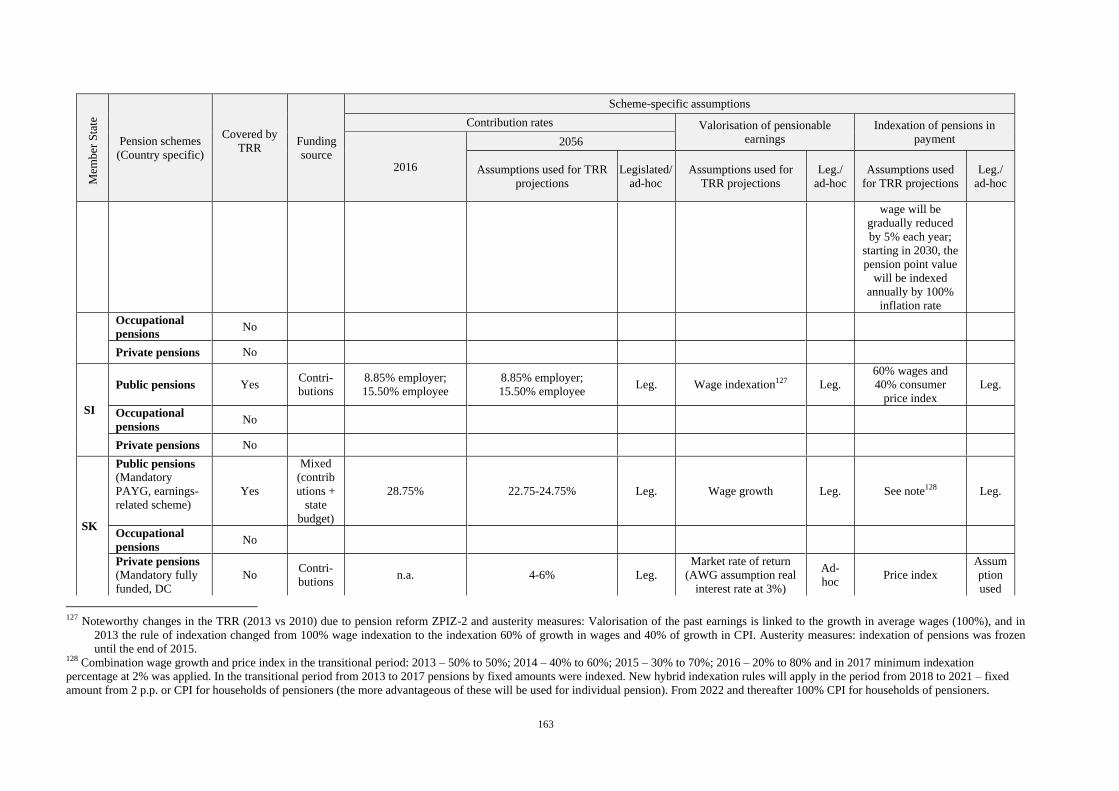
163
Mem
ber
Sta
te
Pension schemes
(Country specific)
Covered by
TRR
Funding
source
Scheme-specific assumptions
Contribution rates Valorisation of pensionable
earnings
Indexation of pensions in
payment
2016
2056
Assumptions used for TRR
projections
Legislated/
ad-hoc
Assumptions used for
TRR projections
Leg./
ad-hoc
Assumptions used
for TRR projections
Leg./
ad-hoc
wage will be
gradually reduced
by 5% each year;
starting in 2030, the
pension point value
will be indexed
annually by 100%
inflation rate
Occupational
pensions No
Private pensions No
SI
Public pensions Yes Contri-
butions
8.85% employer;
15.50% employee
8.85% employer;
15.50% employee Leg. Wage indexation127 Leg.
60% wages and
40% consumer
price index
Leg.
Occupational
pensions No
Private pensions No
SK
Public pensions (Mandatory
PAYG, earnings-
related scheme)
Yes
Mixed
(contrib
utions +
state
budget)
28.75% 22.75-24.75% Leg. Wage growth Leg. See note128 Leg.
Occupational
pensions No
Private pensions (Mandatory fully
funded, DC
No Contri-
butions n.a. 4-6% Leg.
Market rate of return
(AWG assumption real
interest rate at 3%)
Ad-
hoc Price index
Assum
ption
used
127 Noteworthy changes in the TRR (2013 vs 2010) due to pension reform ZPIZ-2 and austerity measures: Valorisation of the past earnings is linked to the growth in average wages (100%), and in
2013 the rule of indexation changed from 100% wage indexation to the indexation 60% of growth in wages and 40% of growth in CPI. Austerity measures: indexation of pensions was frozen
until the end of 2015. 128 Combination wage growth and price index in the transitional period: 2013 – 50% to 50%; 2014 – 40% to 60%; 2015 – 30% to 70%; 2016 – 20% to 80% and in 2017 minimum indexation
percentage at 2% was applied. In the transitional period from 2013 to 2017 pensions by fixed amounts were indexed. New hybrid indexation rules will apply in the period from 2018 to 2021 – fixed
amount from 2 p.p. or CPI for households of pensioners (the more advantageous of these will be used for individual pension). From 2022 and thereafter 100% CPI for households of pensioners.
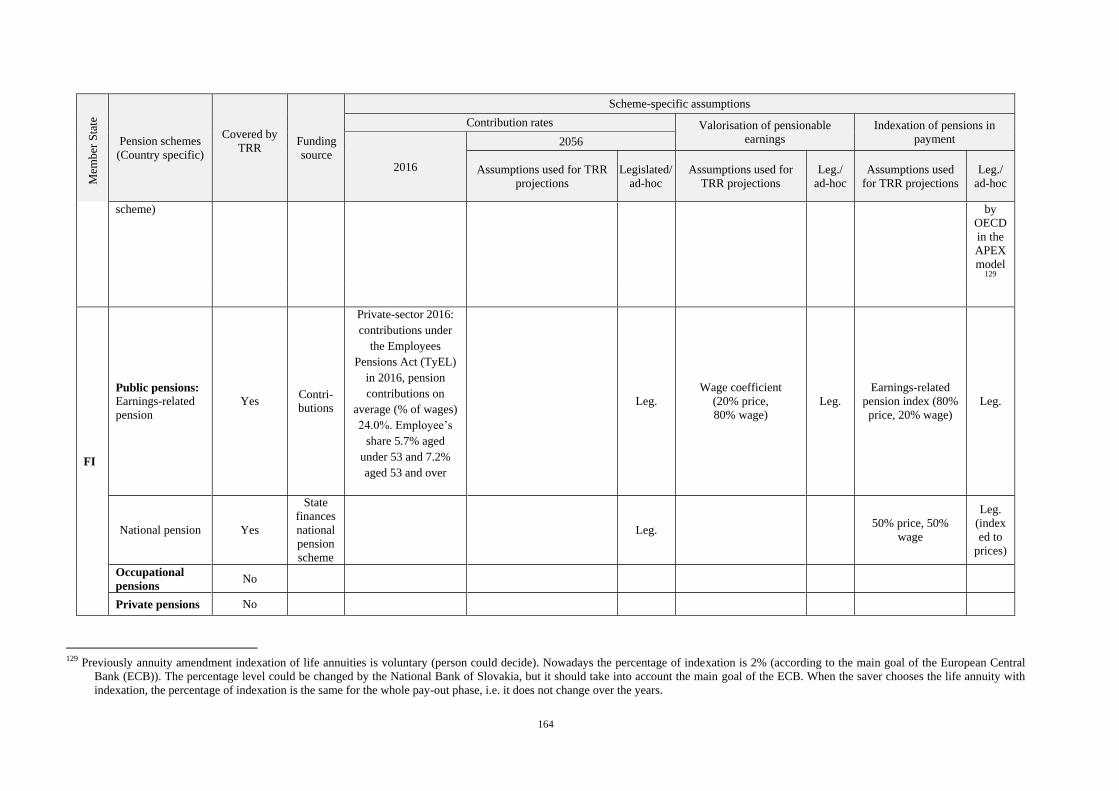
164
Mem
ber
Sta
te
Pension schemes
(Country specific)
Covered by
TRR
Funding
source
Scheme-specific assumptions
Contribution rates Valorisation of pensionable
earnings
Indexation of pensions in
payment
2016
2056
Assumptions used for TRR
projections
Legislated/
ad-hoc
Assumptions used for
TRR projections
Leg./
ad-hoc
Assumptions used
for TRR projections
Leg./
ad-hoc
scheme) by
OECD
in the
APEX
model129
FI
Public pensions:
Earnings-related
pension
Yes Contri-
butions
Private-sector 2016:
contributions under
the Employees
Pensions Act (TyEL)
in 2016, pension
contributions on
average (% of wages)
24.0%. Employee’s
share 5.7% aged
under 53 and 7.2%
aged 53 and over
Leg.
Wage coefficient
(20% price,
80% wage)
Leg.
Earnings-related
pension index (80%
price, 20% wage)
Leg.
National pension Yes
State
finances
national
pension
scheme
Leg. 50% price, 50%
wage
Leg.
(index
ed to
prices)
Occupational
pensions No
Private pensions No
129 Previously annuity amendment indexation of life annuities is voluntary (person could decide). Nowadays the percentage of indexation is 2% (according to the main goal of the European Central
Bank (ECB)). The percentage level could be changed by the National Bank of Slovakia, but it should take into account the main goal of the ECB. When the saver chooses the life annuity with
indexation, the percentage of indexation is the same for the whole pay-out phase, i.e. it does not change over the years.
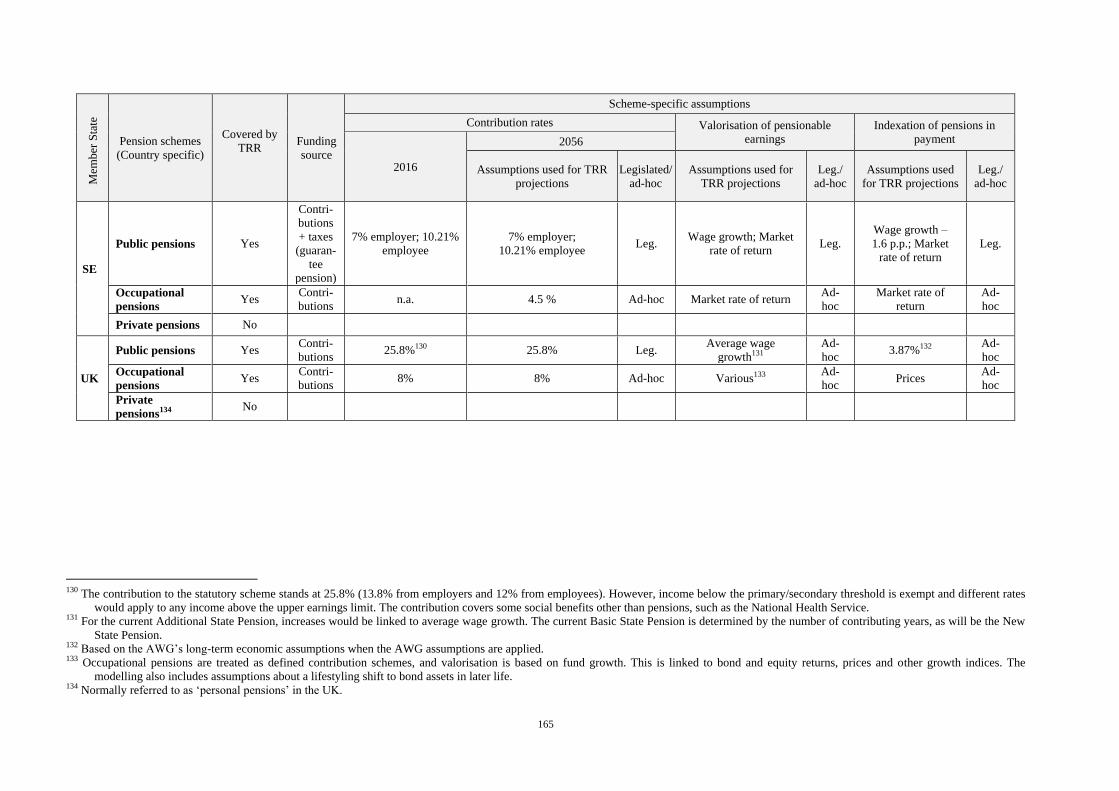
165
Mem
ber
Sta
te
Pension schemes
(Country specific)
Covered by
TRR
Funding
source
Scheme-specific assumptions
Contribution rates Valorisation of pensionable
earnings
Indexation of pensions in
payment
2016
2056
Assumptions used for TRR
projections
Legislated/
ad-hoc
Assumptions used for
TRR projections
Leg./
ad-hoc
Assumptions used
for TRR projections
Leg./
ad-hoc
SE
Public pensions Yes
Contri-
butions
+ taxes
(guaran-
tee
pension)
7% employer; 10.21%
employee
7% employer;
10.21% employee Leg.
Wage growth; Market
rate of return Leg.
Wage growth –
1.6 p.p.; Market
rate of return
Leg.
Occupational
pensions Yes
Contri-
butions n.a. 4.5 % Ad-hoc Market rate of return
Ad-
hoc
Market rate of
return
Ad-
hoc
Private pensions No
UK
Public pensions Yes Contri-
butions 25.8%130 25.8% Leg.
Average wage
growth131
Ad-
hoc 3.87%132
Ad-
hoc
Occupational
pensions Yes
Contri-
butions 8% 8% Ad-hoc Various133
Ad-
hoc Prices
Ad-
hoc
Private
pensions134
No
130 The contribution to the statutory scheme stands at 25.8% (13.8% from employers and 12% from employees). However, income below the primary/secondary threshold is exempt and different rates
would apply to any income above the upper earnings limit. The contribution covers some social benefits other than pensions, such as the National Health Service. 131 For the current Additional State Pension, increases would be linked to average wage growth. The current Basic State Pension is determined by the number of contributing years, as will be the New
State Pension. 132 Based on the AWG’s long-term economic assumptions when the AWG assumptions are applied. 133 Occupational pensions are treated as defined contribution schemes, and valorisation is based on fund growth. This is linked to bond and equity returns, prices and other growth indices. The
modelling also includes assumptions about a lifestyling shift to bond assets in later life. 134 Normally referred to as ‘personal pensions’ in the UK.
ANNEX 2. List of definition and abbreviations
Defined benefit (DB) schemes – pension schemes where the benefits accrued are linked to
earnings and the employment career (the future pension benefit is pre-defined and promised to
the member). It is normally the state (in public DB schemes) or scheme sponsor (in
occupational DB schemes) who bears the investment risk and often also the longevity risk
(see also: Defined contribution (DC) schemes).
Defined contribution (DC) schemes – pension schemes where the level of contributions, and
not the final benefit, is pre-defined: no final pension promise is made. DC schemes can be
public, occupational or personal: contributions can be made by the individual, the employer
and/or the state, depending on scheme rules. The pension level will depend on the
performance of the chosen investment strategy and the level of contributions. The individual
member therefore bears the investment risk. PAYG-financed defined contribution schemes
are known as notional defined contribution (NDC) schemes (see also: Defined benefit (DB)
schemes).
Funded scheme – a pension scheme whose benefit promises are backed by a fund of assets
set aside and invested for the purpose of meeting the scheme's liability for benefit payments
as they arise. Funded schemes can be either statutory, occupational or personal (see also: Pay-
As-You- Go schemes).
Legislated pensionable age – legislated age at which a member of the pension scheme is
eligible to receive full pension benefits, subject to meeting qualifying conditions.
Occupational pension schemes – a pension plan where access is linked to an employment or
professional relationship between the plan member and the entity that sets up the plan (the
plan sponsor). Occupational pension schemes may be established by employers or groups of
employers (e.g. industry associations) or labour or professional associations, jointly or
separately, or by self-employed persons. The scheme may be administered directly by the
sponsor or by an independent entity (a pension fund or a financial institution acting as pension
provider). In the latter case, the sponsor may still have responsibility for overseeing the
operation of the scheme.
Pay-As-You-Go (PAYG) schemes – pension schemes where current contributions finance
current pension expenditure (see also: Funded schemes).
Pension pillar – different types of pension schemes are usually grouped into two, three, four
or more pillars of the pension system. There is however no universally agreed classification.
Many pension systems distinguish between statutory, statutory funded, occupational and
individual pension schemes.
Personal pension schemes – supplementary pension schemes, access to which does not
depend on an employment relationship. The schemes are set up and administered directly by a
pension fund or a financial institution acting as pension provider without the involvement of
employers. Individuals independently purchase and select material aspects of the
arrangements. The employer may nonetheless make contributions to personal pension
schemes. Some schemes may have restricted membership.
Standard pensionable age (SPA) – the earliest age at which an individual with a 40-year
career can retire without any exit penalty (used in the calculations of the Theoretical
Replacement Rates).
Statutory pension scheme – social security and similar programmes administered by the
general government (that is central, state, and local governments, plus other public sector
bodies such as social security institutions), access to which is based on legislation. Public
167
pension plans can be financed from social security contributions or general taxation and have
traditionally been of the PAYG type, but can also be funded (see also: Statutory funded
pension schemes).
Statutory funded pension schemes – funded pension schemes, access to which is based on
legislation. In statutory funded schemes, part of participants' social security contributions are
converted into funded assets, typically administered by authorised private managers.
Participation in these schemes can be mandatory or voluntary.
Supplementary pension schemes – pension schemes, which can be accessed on the basis of
employment relationship (occupational pension schemes) or an individual pension saving
contract (personal pension schemes), generally providing additional retirement income to the
statutory pension schemes. (See also: Occupational pension schemes; Personal pension
schemes).
Theoretical Replacement Rate (TRR) – generally refers to an indicator showing the level of
pension income after retirement as a percentage of individual earnings at the moment of take-
up of pensions or of average earnings. Replacement rates measure the extent to which pension
systems enable typical workers to preserve their previous living standard when moving from
employment to retirement.

168
Abbreviations
AR Ageing Report
AROP At-risk-of-poverty rate
AROPE At-risk-of-poverty or social exclusion
ARR Aggregate replacement ratio
AWG Ageing Working Group (of the EPC)
AWL Average duration of past average working life
BR Benefit ratio
CEE Central Eastern European countries
CSM Cohort simulation model
CSR Country Specific Recommendation
DB Defined benefits
DC Defined contributions
EC European Commission
ECB European Central Bank
EPSCO Employment, Social Policy, Health and Consumer Affairs Council
EMCO Employment Committee
EMU Economic and Monetary Union
ENEGE European Network of Experts on Gender Equality
EPC Economic Policy Committee
EU European Union
EUR Euro
EUROMOD Tax-benefit microsimulation model for the European Union
EU-SILC European Union Statistics on Income and Living Conditions
GaRR Gross aggregate replacement ratio
GDP Gross Domestic Product
GGP Gender gap in pensions
HFCS Eurosystem Household Finance and Consumption Survey
ILO International Labour Organisation
JAF Joint Assessment Framework
LE Life expectancy
LFS Labour Force Survey
LFS AHM Labour Force Survey ad-hoc module
LTC Long-term care
MIPOP Minimum income provision for older people
MISSOC Mutual Information System on Social Protection
NDC Notionally defined contributions
OECD Organisation for Economic Co-operation and Development
OMC Open Method of Coordination
p.p. Percentage points
PAR Pension Adequacy Report
PAYG Pay-as-you-go pension scheme
PPP Purchasing power parity
RMIR Relative median income ratio
SHARE
SME
Survey of Health, Ageing and Retirement in Europe
Small and medium-sized enterprise
SPA Standard pensionable age
SPC Social Protection Committee
SRA Statutory retirement age
TRR Theoretical Replacement Rate


170
Member States
BE Belgium
BG Bulgaria
CZ Czech Republic
DK Denmark
DE Germany
EE Estonia
IE Ireland
EL Greece
ES Spain
HR Croatia
FR France
IT Italy
CY Cyprus
LV Latvia
LT Lithuania
LU Luxemburg
HU Hungary
MT Malta
NL The Netherlands
AT Austria
PL Poland
PT Portugal
RO Romania
SI Slovenia
SK Slovakia
FI Finland
SE Sweden
UK United Kingdom
171
ANNEX 3. View of the European Social Partners and the AGE Platform Europe, a
member of the Social Platform
BusinessEurope
General comments
Sustainability and adequacy of pensions are two sides of the same coin. We therefore
support a holistic reflection on the adequacy of old-age incomes and the financial
sustainability of pension systems and welcome complementary work between the
Social Protection Committee on its Pension Adequacy Report and the Economic
Policy Committee on its Ageing report.
This is an area of member state competence and national social partners often play a
role. The EU has a coordination role. The different levels of competence should be
respected.
It is important, as is the case in the report, to look across the different pillars of
pensions, as a mixture of different sources of retirement income is important for
adequacy and sustainability. The EU should encourage and support the supply of
occupational pensions and other retirement savings vehicles, whilst taking into
account that the balance between the different pillars is a decision for the national
level.
When looking at living standards of older people and alleviating poverty, we welcome
that other sources of old-age income are taken into account, e.g. housing and financial
wealth, allowances, in-kind benefits and public services targeted at pensioners and
elderly persons. We note that almost all Member States provide specific social
assistance benefits for older people, subject to means testing, as well as providing
minimum income schemes. It is also important to take account of the household
situation of people.
We also note that older people have lower risks of poverty partly due to the
redistribution role of pension systems. If pensions are to continue to play this role for
future generations, it is essential that they are economically and fiscally sustainable.
Trends and reforms
We welcome the positive developments highlighted in the report in terms of
strengthened pension adequacy and the continuing decrease in the rate of those over
65 at risk of poverty and social exclusion. However, we also note that there are large
differences between countries.
The focus should continue to be on facilitating longer working lives - we welcome that
this is highlighted in the report. Whilst national reforms over the last years, for
example linking retirement age to life expectancy and giving incentives within the
pension system to work longer are important, further reforms are still necessary.
Member States should make use of the current positive economic climate. On 8 March
2017 European Social Partners signed a Framework Agreement on active ageing and
an inter-generational approach, which aims to improve the ability of workers to stay in
the labour market, healthy and active until the legal retirement age.
172
In our 2018 reform barometer, our member federations still find implementation of the
country specific recommendations of the European Semester process unsatisfactory,
with only 22% of the CSRs assessed to have been implemented appropriately. Pension
reforms remain a priority for member federations, as well as labour market and skills
reforms which come top of the list for our members this year.
It is not appropriate to ask the question of how labour markets will be able to absorb
the extra labour supply resulting from the increase in pensionable age and the closing
of early-exit routes brought about by pension reforms. In fact, the situation is the
opposite. With the shift in the demographic profile of the population, leading to fewer
people of working age and more in retirement, there is in fact a need to raise
retirement ages so that there are more people on the labour market. This is also crucial
to ensure the sustainability of pension systems. Whilst it is important that jobs exist,
including for older workers, so that not only legal, but also actual retirement ages rise,
it is not the case that there will be a surplus of labour supply in the future, on the
contrary, there are growing labour shortages in many Member States.
As noted in the report, the employment rates of older people are increasing, which is a
positive result of national reforms raising pension ages, restricting early retirement,
improving financial incentives to continue working and promoting flexible retirement.
However, considering the differences between Member States, facilitating learning
between them remains important. Benchmarking activities, for example, such as the
one undertaken by the Employment Committee on Active Labour Market Policies are
useful. Whilst individual behaviour has an impact on whether older people stay in the
labour market, this is clearly supported and motivated through reforms.
Specific groups
We note positively that the average gender gap in pensions in the EU has decreased
slightly over the last few years, however that it still persists. We also note that the
same 40-year career for men and women would result in the same replacement rate in
most member states. This makes it clear that the gaps are linked to different career
patterns, in particular length of career and gender gaps in employment rates.
Therefore, to reduce the gender pension gap, the most important action is raising
female employment levels and ensuring more continuity in employment.
We agree that to grasp the opportunities and accompany the changes in the world of
work, it is important to encourage Member States to provide access to social
protection, including pensions, for people with diverse employment statuses. This
should be done in an economically and fiscally sustainable way.
To allow for an approach adapted to the national pension systems and the situation in
terms of coverage and gaps, it is for Member States to decide how to provide for
coverage, including the mix of state, occupational and private provision, the mixture
between tax- and insurance-based schemes, whether to use opt-in or opt-out systems
and to which groups of workers to provide coverage. Discussions on making pension
coverage broader or more universal should not imply a preference for certain types of
schemes and the long-standing role of social partners in the governance of insurance-
based schemes should be respected.
173
It is important that action at national level takes a balanced approach between
providing adequate levels of pension coverage for different forms of work whilst not
deterring employers, workers and individuals from using diverse contract forms,
becoming self-employed, transiting between or combining different forms of work.
Also, the definition of employee and self-employed should remain in the hands of the
Member States.
We acknowledge that providing coverage and effective access to pensions is not the
same. The conditions for effective access, which affect the ability to accrue and take
up entitlements, need to take account of the differences between labour market
statuses and types of employment relationships. It is important that there is a clear link
between the contributions paid and the entitlements provided.
There is a need to respect the different situations of workers and self-employed. At the
same time, to safeguard the sustainability of the overall system, self-employed should
be formally covered in case of potential social risks, including lack of income in
retirement, and contribute in an appropriate way, to avoid reliance on tax-financed
pensions without the necessary contribution base. However, they should be able to
choose the type of scheme and provider which best corresponds to their situation.
For those workers with interruptions in their career, it is important to look at how to
facilitate access and return to work, and transitions between work periods. Skills
updating, particularly for older workers is important in this respect. It is also about
creating the right conditions on the labour market for people to move between jobs
and work statuses, such as avoiding overly rigid employment protection legislation
and ensuring effective active labour market policies. Accumulation, preservation and
transferability of entitlements is also an important area to look at, whilst bearing in
mind that this can be very complex and costly, both within and between Member
States, for example between pay-as-you-go and capital funded systems and due to the
different financing models of national pension systems.
174
European Association of Craft, Small and Medium-Sized Enterprises
(UEAPME)
General comments
1. UEAPME welcomes the 2018 Pension Adequacy Report of the Social Protection
Committee, observing important trends and challenges.
2. The design of pension systems is the prerogative of the Member States; however
UEAPME welcomes efforts made at EU level through the EU Semester and the Open Method
of Coordination to modernise social protection systems, as an effective means to support and
encourage the Member States in this area. Reforms need to be done with close involvement of
social partners at national level.
3. Different policy measures work in different countries but there is a general need for
pension reforms in all Member States in view of an ageing population and the changing
labour markets. In several Member States we can already observe a strong increase in
government spending on pensions, and forecasts show that this will continue in the context of
the ‘baby boom’ generation going in retirement.
4. Sustainability and adequacy of pension systems need to be seen in a holistic approach.
Both for the purposes of adequate old-age income of European citizens and the sustainability
of public finances, it is key to apply the appropriate mix of policies and measures for each
Member State.
5. Replacement rates keep decreasing. Financial stability, including of pension funds, on
the long term cannot be taken for granted. Part of the solution has to be strengthening 2nd
and
3rd
pillar pensions. A multi-pillar system releases pressure from state pensions which heavily
rely on sufficient levels of employment. Further options can be better aligning the statutory
and effective retirement ages, increasing in some cases the formal retirement age, e.g. linked
to life expectancy, decreasing incentives for early retirement, and aligning the retirement age
of men and women where this is not yet the case.
6. These measures need to be balanced with other integration measures on the labour
market (including ALMP), such as for young generations, and measures conducive to longer
professional activity. In the autonomous Framework Agreement of the European social
partners on Active Ageing and an Intergenerational Approach (2017), some tools are listed for
national social partners to find a balance in retaining employees until retirement age and an
intergenerational approach, ensuring that young people can also be integrated on the labour
market.
7. The Pension Adequacy Report is very comprehensive and addresses many aspects
related to old-age income. It is good that for the calculation of this income, the report draws
attention to the overall household income and to other sources of income than those through
pensions.
8. With regard to the technical assumptions underpinning the report, UEAPME points to
the nuanced approach necessary for projections of future interest and return rates. Overly
optimistic projections can have a serious impact on future replacement rates. Lower interest
175
rates may in the meantime cause serious risks for the financial stability of occupational
pension institutions.
9. With regard to the gender dimension of pension adequacy, the cumulative effect of
horizontal and vertical segregation and career patterns is crucial to understand the pension
gap. Fuller working lives and smaller pension gaps for women are also achieved by improving
the reconciliation of work and family life, in particular through the provision of more and
affordable childcare infrastructures as foreseen by the Barcelona targets.
Pension adequacy for self-employed
10. The focus in the Report on the pension adequacy for self-employed is timely and
relevant. With growing concerns for the sustainability of pension systems, this needs to be
addressed. However nuanced analysis is needed to ensure the right response and avoid
premature solutions that fail to grasp the complexity of the issue. The needs of self-employed
should be at the basis of discussions and additional obstacles for entrepreneurship should be
avoided. Representing entrepreneurs and self-employed, UEAPME advocates that self-
employed have access to a minimum social protection including pensions at a reasonable cost.
Member States should therefore create incentives and remove obstacles for subscribing to
higher protection levels on a flexible, voluntary basis.
11. Entrepreneurship and self-employment, with its contribution to growth, innovation and
job creation in the European economy, needs to be supported. Imbalances and potential
inequalities cannot be used as a pretext for discouraging self-employment. In terms of policy
avenues, UEAPME supports in particular that Member States explore and implement
effective ways to facilitate transitions between different employment statuses, in order to
ensure that everyone, whether employee or self-employed, can act with confidence in our
modern economies.
12. Adequate pensions have always been an issue, in particular for traditional
entrepreneurs suffering from risks stemming from low income. It is important that self-
employed have, aside from formal coverage, effective access to social protection schemes.
However, they should be able to choose the type of scheme and provider which best
corresponds to their situation (e.g. public or private schemes). The decision whether or not to
participate in insurance schemes is often part of the consideration whether or not to become
self-employed.
13. The attention in the Report for the diverse situation of self-employed is positive, as
regards their heterogeneity, different sources of income, the eligibility criteria and conditions,
and the acknowledgement of factors that make paying contributions more complicated for
self-employed, such as fluctuating income, low levels of benefits, and other disincentives to
contribute.
14. When discussing under-insurance, it is essential to look at the affordability of the
insurance offer. Self- employed are diverse also in their dependency on 1st or 2nd pillar
pensions and the degree of reliance on social assistance which varies among Member States.
Old-age insurance for self-employed needs to be offered at a reasonable cost, and the level of
benefits should reflect the level of contributions, in order to make it accessible and attractive.
It is the responsibility of the national level to ensure and facilitate effective access, be it

176
through public or private schemes. A more thorough analysis of the diversity of offer and
reasons for (non) take-up would have been welcome.
15. Mandatory coverage of pension systems is not only, as the Report says (Par. 5.2.1),
“contentious among certain groups of self-employed because of a mandatory increase in their
labour costs and a risk to their competitiveness.” The crucial element here is the link between
contributions and entitlements, as well as the principle of choice.
177
European Trade Union Confederation (ETUC)
The ETUC thanks the European Commission and the Social Protection Committee for the
Pension Adequacy Report and welcomes all opportunities for dialogue and exchange of
views. The PAR represents a challenging piece of work. It comprises a wide collection of data
regarding current and expected outcomes of pension systems. The focus on adequacy, the
benefit side of pensions, makes it even more important, given the current social outlook in
terms of poverty prevention, income replacement and equality.
Extensive data on pension adequacy are crucial both for governments and social partners for
assessing pros and cons of different pension policy options. Thus, the report represents an
indispensable tool to interpret the upcoming Ageing Report, as it provides elements to balance
the supremacy of fiscal sustainability in the discourse on pensions in the framework of the
European economic governance.
Pensions are the main source of income for retired and elderly people. Adequate income
replacement after a life at work must be the key goal of pension policy. |It should aim at
ensuring a life in dignity and full opportunities to participate in society for all European
citizens and residents. Well-functioning pension systems provide adequate income
replacement that automatically eliminates the risk of poverty during retirement for most
workers.
The reported data provide an insight into the crucial role of public and statutory pension
systems in this sense, especially for the most vulnerable groups of retirees and elderly people.
Such a role deserves to be highlighted among the main messages emerging from the report.
In general, public systems greatly contribute to adequate pension incomes. They ensure the
widest coverage and are effective economic stabilisers. Highly inclusive, based on solidarity
and risk-sharing, public pension schemes ensure greater equality between generations and
within the whole of society. There is a need to foster strong public pension systems and their
role in ensuring pension adequacy, as in the principles of the European Pillar of Social Rights.
The ETUC endorses the commitment to incentivise second-pillar complementary collective
schemes. Nevertheless, their role, as stated, is complementary. They are not suitable to
guarantee security and adequacy of pension incomes, due to their continuing low coverage,
their uneven weight across sectors as well as across different Member States, and their limited
impact in providing significant income support.
Moreover, pension adequacy should not rely on private savings nor on private and individual
wealth and resources. Voluntary schemes are accessible only to a very limited proportion of
workers and citizens. Private assets are unequally distributed. The social and economic
primacy of pension adequacy should not be jeopardised and should not be further linked to
income and wealth inequalities that are currently striking in Europe.
178
The predictions that public pension systems will not be able to ensure pension adequacy are
not cast in stone. Such a narrative pertains to the view of pension adequacy as an adjustment
feature with respect to fiscal sustainability. This is a partial approach.
A more constructive one would see the failure of pension expenditure to evolve coherently in
line with demographic developments as anachronistic. Member States should adapt their
future cost- of-ageing predictions to maintain adequacy, while preserving sustainability via
investments in structural reforms aimed at reducing the economic dependency ratio.
Secondly, the social impact of the recent pension policy reforms, devoted largely to
preserving long-term fiscal sustainability, should be recognised. In expectation of longer lives
and longer periods spent in retirement, reforms have imposed indiscriminate increases in the
legal retirement age, erased indexation, failed to protect pension purchasing power, and
shifted from pay-as-you-go solidarity-based systems to fully funded ones, based on individual
contributions. Future PAR editions will certainly report more data on the consequences of
such reforms on pension adequacy, in general terms, and more specifically in relation to
groups identified, for example, by distinctive socio-economic factors.
While squeezing access to pensions and their adequacy produces pro-cyclical economic and
social effects, the sustainability of adequate pensions can be increased via the quality of
employment and the inclusiveness of the labour market.
Future reports, as well as upcoming policy decisions, should also consider the impact on
pension adequacy of reforms focusing on the quality of the “time spent in employment”.
Upcoming research should focus on developments in pension adequacy determined by
reforms aimed at better labour market integration of people across all working ages,
eliminating education and training gaps, better reconciling work and family life, better
integrating migrants into employment, improving health protection at work, supporting people
with reduced work capacity and creating adequate jobs for peopled aged 55+.
A link should also be made to wage and remuneration trends, as well as to the duration of
employment, which is crucial to the effective possibility of accruing entitlements for adequate
pensions.
The PAR has been drafted in a context of increased knowledge of the lack of access to
adequate social protection for a great share of the European workforce. The phenomenon is
reaching worrying proportions. The European Commission has proposed a series of
recommendations for the Member States to adopt. The ETUC is committed to pressing for a
prompt adoption of the proposed Recommendation and demanding its substantial
implementation.
The European Pillar of Social Rights clearly asserts the right to adequate social protection.
The only way to guarantee such a right to people in all forms of employment is to invest in
systems which are solidarity-based; anchored to an extended guarantee of equal treatment;
highly inclusive; including safety nets for those who are not able to reach minimum
entitlement thresholds; and effective.

179
The Report offers a series of data and hints for further research and alternative angles of
approach on pension adequacy. They will certainly be useful in elaborating policy options
which are truly capable of ensuring adequacy, inclusiveness, fairness and equality of social
protection in a wider perspective of societal and economic growth.
180
AGE Platform Europe
AGE Platform Europe (AGE) and its members thank the Social Protection Committee (SPC)
for the opportunity to comment the 2018 Pension Adequacy Report. The report constitutes a
comprehensive stocktaking of adequacy challenges, proposing a set of concrete
recommendations for future reforms. The proposed shift of policy attention towards adequacy
is more than welcome because the question of sustainability will always prevail if both
aspects are not tackled together on equal footing. Strengthening the ability of pension systems
to prevent old-age poverty and combat gender and other inequalities across the life span
should be included in all structural reforms of pension systems.
AGE welcomes the report’s reference to the European Pillar of Social Rights and its principle
15 on old-age income and pensions. Going beyond the existing acquis in the field of social
protection, we are pleased that the Pillar recognises that “Everyone in old age has the right to
resources that ensure living in dignity”, and emphasises the right for both workers and self-
employed to an adequate pension based on their contributions. Promoting sustainable
employment for older workers, equal opportunities for women and men to acquire adequate
pension rights, and the impact of accessibility and affordability of public services, in
particular health and long-term care are now all rightly identified as directly related to the
notion of pension adequacy.
Furthermore we strongly support the reference to the importance of measures for work-life
balance for parents and informal carers. The issue which is currently high on the EU agenda
thanks to the Commission’s package on work-life balance, will however need further
ambition and political will from member states to make a difference in the lives of millions of
workers faced with caring duties. Indeed pursuing austerity measures, many member states
continue to cut in child and eldercare budgets to reduce their public deficit. Yet, the lack of
quality care facilities has a direct detrimental impact on carers – mainly women - who are
forced to move to part-time, take a long career break or retire earlier than wished. This will
continue to prevent women from contributing equally to men toward their future pension
rights and will increase the already very high gender pension gap in the future.
Unfortunately the following suggestions presented by AGE to the extended report’s outline in
March 2017 have not been taken into consideration and we would like to recommend more
attention to be paid to these issues in future SPC work:
The need for breakdown of data collected on older people by gender and age
groups: Breaking down data by gender and age (sub groups 65-74, 75-85 and over 85 years
old) and comparing their income with what they need to pay out of their own pocket to cover
all their needs, would help policy makers get a better understanding of the specificity of old-
age poverty risks, its ‘feminisation’ and the phenomenon of old age income erosion combined
with higher needs among the oldest old. We feel that more attention will be paid to the
increased gender pension gap in particular in the very old age group if data is available for
gender and age sub-groups, and a projection of the gender pension gap phenomenon in the
future takes into account the reforms that have altered indexation mechanisms of public
pensions.
181
Strengthening pensions’ adequacy from the perspective of access to services –
although the report recognises that living standards of older persons are influenced by wealth
and access to services, in particular health and long-term care, pension adequacy should be
assessed also in conjunction with non-monetary aspects. While Vol. I contains a reference to
the importance of services, Vol. II often omits this dimension of adequacy. One concrete way
to monitor old-age income adequacy is through reference budgets. Specific reference budgets
should be developed for the above three old age sub-groups to assess adequacy of pensions,
including minimum pension schemes, in terms of purchasing power older people need to have
in a given national context to live and age in dignity. While the large inequalities between
older home owners and older tenants are mentioned, a wider analysis of inequalities and the
adequacy specifically for tenants and persons with health care needs would have been more
than welcome.
Developing measures that help combat ageism and create age-friendly working
conditions and labour market: Age discrimination is the strongest factor inhibiting
employment of older workers before and after retirement age. More consideration should has
been paid to the importance of public career management programmes, the fight of age
discrimination in the labour market, incentives for employers to employ older women and
men, and policies aiming for sustained employability.
Redistributive elements of public pension schemes: we welcome the review of the
redistributive elements of public pension schemes including the role minimum pensions play
in lifting people, and especially older women, above the poverty risk threshold. However we
miss the assessment of the situation of older persons with pensions just above the poverty
threshold and below the average pension (broken down by gender and age groups), to assess
to what extend having worked for some years has helped them get more than the minimum
pension and above the poverty threshold.
The role of supplementary pensions: the report does not adequately assess the
decumulation phase of pension products. Moreover solidarity/redistributive elements to
address gender inequalities are not addressed in relation to supplementary pensions expected
to play a great role in pension adequacy. Women may live longer than men but their monthly
needs in terms of disposable income are the same as for men or even greater since they live
longer but in poorer health and more often alone. In terms of supplementary pensions, women
are less likely to be covered by these arrangements
Adjustment mechanisms: if they are to be introduced to follow gains in life
expectancy, it is important to link statutory retirement age to the healthy life expectancy
(HLY) rather than life expectancy only. The disability-free life expectancy is not increasing
in parallel with life expectancy and is even decreasing in some countries. It is important that
pensions maintain a certain standard of living and that indexation mechanisms are therefore
keeping up with cost of living developments
Overall, AGE congratulates the SPC for its analysis and hopes that the findings from the 2018
Pension Adequacy Report will be the basis for further debate by all relevant formations of the
European Council, in order to ensure that pension reforms are designed, implemented and
monitored via the European Semester a coordinated way that pays due attention to ensuring
adequacy for all and taking all relevant dimensions on board beyond pensions policy.
182
ANNEX 4. References
D’Addio, A., M. Keese and E. Whitehouse, ‘Population ageing and labour markets’, Oxford Review of
Economic Policy, Vol. 26, No. 4, 2010, pp. 613-635.
Dekkers, G. and J. Mészáros (eds), Applications of Microsimulation Modelling, Társadalombiztosítási
Könyvtár, Budapest, 2016.
Eichhorst W. et al., Social Protection Rights of Economically Dependent Self-Employed Workers,
Directorate-General for Internal Policies, European Parliament, 2013.
Eurofound, The Gender Employment Gap: Challenges and solutions, Publications Office of the
European Union, Luxembourg, 2016.
Eurofound, Income Inequalities and Employment Patterns in Europe before and after the Great
Recession, Publications Office of the European Union, Luxembourg, 2017.
European Commission, ‘EUROPE 2020: A strategy for smart, sustainable and inclusive growth’,
COM(2010) 2020 final, Brussels, 2010.
European Commission, Pension Adequacy in the European Union 2010-2050, Publications Office of
the European Union, Luxembourg, 2012.
European Commission, ‘White Paper: An agenda for adequate, safe and sustainable pensions’,
COM(2012) 55 final, Brussels, 2012a.
European Commission, ‘Communication on the European Pillar of Social Rights’, COM(2017)250
final, Brussels, 2017a.
European Commission, Employment and Social Developments in Europe, Annual Review 2017,
Publications Office of the European Union, Luxembourg, 2017b.
Eurostat, 2017. Available at: http://ec.europa.eu/eurostat
Natali D., S. Spasova and B. Vanhercke, Retirement regimes for workers in arduous or hazardous jobs
in Europe: A study of national policies, European Social Policy Network (ESPN), European
Commission, Brussels, 2017
OECD, Health at a Glance 2013: OECD Indicators, OECD Publishing, Paris, 2013.
OECD, Pensions at a glance 2017: OECD and G20 Indicators, OECD Publishing, Paris, 2017a.
OECD, Preventing Ageing Unequally, OECD Publishing, Paris, 2017b.
OECD, The Pursuit of Gender Equality: An uphill battle, OECD Publishing, Paris, 2017c.
OECD, Financial Incentives and Retirement Savings, OECD Publishing, Paris, forthcoming, 2018.
Pettinicchi, Y. and Boersch-Supan, A., ‘Pension adequacy in Europe: a SHARE analysis’, Internal
Working Document, Munich Center for the Economics of Aging (MEA) at the Max Planck Institute
for Social Law and Social Policy, 2017.
Bettio F., Tinios P. and Georgiadis T., "Future risks for gender equality in old age and income
security", Report prepared for the European Commission, 2018 (forthcoming )

183
Social Protection Committee (SPC) and the European Commission, The 2018 Pension Adequacy
Report, Vol. II: Country Profiles, Publications Office of the European Union, Luxembourg, 2018.
Spasova, S., Bouget, D., Ghailani, D. and Vanhercke, B., Access to Social Protection for People
Working on Non-Standard Contracts and as Self-Employed in Europe: A study of national policies,
European Social Policy Network (ESPN), European Commission, Brussels, 2017.

184
[Short summary of the report for the back-cover page]
The 2018 edition of the triennial Pension Adequacy Report, published in two volumes,
analyses how current and future pensions help prevent old-age poverty and maintain the
income of men and women for the duration of their retirement.
Volume I is devoted to comparative analysis of pension adequacy in the EU-28. It examines
the current living standards of older people and how they are shaped by pension systems,
proceeds with an overview of recent pension reforms and concludes by analysing the main
challenges to the adequacy of future pensions and ways of tackling them. Among other issues,
the report highlights the gender differences in pension entitlements, the pension adequacy of
persons in non-standard or self-employment and the role of supplementary pensions.
Volume II provides a more detailed description of the pension system and pension adequacy
in each of the 28 Member States.
This publication is available in English only.

Getting in touch with the EU
ONLINE
Information in all the official languages of the European Union is available on the Europa website:europa.eu
IN PERSON
All over Europe there are hundreds of local EU information centres.You can find the address of the centre nearest to you at:europa.eu/contact
ON THE PHONE OR BY EMAIL
Europe Direct is a service that answers your questions about the European Union. You can contact this service by freephone:00 800 6 7 8 9 10 11 (certain mobile telephone operators do not allow access to 00 800 numbers or may charge for these calls), orby payphone from outside the EU: +32 22999696, or by email via europa.eu/contact
READ ABOUT EUROPE
Publications about the EU are only a click away on the EU Bookshop website:bookshop.europa.eu
KE-01-18-457-EN-N
doi:10.2767/406275
The 2018 edition of the triennial Pension Adequacy Report, published in two volumes, analyses how current and future pensions help prevent old-age poverty and maintain the income of men and women for the duration of their retirement.
Volume I is devoted to comparative analysis of pension adequacy in the EU-28. It examines the current living standards of older people and how they are shaped by pension systems, proceeds with an overview of recent pension reforms and concludes by analysing the main challenges to the adequacy of future pensions and ways of tackling them. Among other issues, the report highlights the gender differences in pension entitlements, the pension adequacy of persons in non-standard or self-employment and the role of supplementary pensions.
Volume II provides a more detailed description of the pension system and pension adequacy in each of the 28 Member States.
This publication is available in English only.


