Embed Size (px)
Citation preview

R:\MAD\Documents\Reports\Archive\2013\GWA, IL\FP.1278.047.tws.sep\Report\!Front Cover (Periwinkle=Wastewater).docx
Report Glenbard Wastewater
Authority, IL
June 2013
Facilities Plan


i
TABLE OF CONTENTS Page No.
or Following
EXECUTIVE SUMMARY SECTION 1–INTRODUCTION
1.01 Purpose and Scope .................................................................................. 1-1 1.02 Location of Study ...................................................................................... 1-1 1.03 Related Studies and Reports .................................................................... 1-1 1.04 Abbreviations ........................................................................................... 1-1
SECTION 2–EXISTING WASTEWATER CONVEYANCE FACILITIES
2.01 Background .............................................................................................. 2-1 2.02 NRI Conveyance Facilities ....................................................................... 2-1 2.03 LCSTF Facilities ....................................................................................... 2-1 2.04 SRI Conveyance Facilities ........................................................................ 2-3 2.05 Previous Conveyance System Evaluations and Projects .......................... 2-3 2.06 VVPS Upgrades ....................................................................................... 2-4
SECTION 3–EXISTING WWTP FACILITIES
3.01 Background .............................................................................................. 3-1 3.02 Description of Existing Facilities ............................................................... 3-1 3.03 NPDES Permit Requirements................................................................... 3-9 3.04 Existing Flows and Loadings .................................................................... 3-10 3.05 Wastewater Treatment Performance ........................................................ 3-11
SECTION 4–WASTE LOAD AND FLOW FORECASTS
4.01 Population Projections .............................................................................. 4-1 4.02 Future Flows and Loadings ...................................................................... 4-3
SECTION 5–REGULATORY AND NPDES PERMITTING ISSUES
5.01 Regulatory and NPDES Permitting Issues ................................................ 5-1
SECTION 6–EVALUATION OF EXISTING WWTP FACILITIES AND SCREENING
ALTERNATIVES 6.01 Summary of Existing Facilities and Plant Needs ....................................... 6-1 6.02 Common WWTP Needs ........................................................................... 6-5
SECTION 7–WASTEWATER TREATMENT ALTERNATIVES EVALUATIONS
7.01 Introduction .............................................................................................. 7-1 7.02 Influent Pump Station Alternatives Analysis .............................................. 7-1 7.03 Activated Sludge Alternatives Analysis ..................................................... 7-5 7.04 Digested Biosolids Dewatering ................................................................. 7-15 7.05 Codigestion and Cogeneration Analyses .................................................. 7-17 7.06 Other Recommended Plan Elements ....................................................... 7-28
TABLE OF CONTENTS Continued Page No.
or Following
ii
SECTION 8–RECOMMENDED PLAN AND FISCAL IMPACT ANALYSIS 8.01 Recommended Plan Summary ................................................................. 8-1 8.02 Future Nutrient Removal Considerations .................................................. 8-13 8.03 Future Ammonia Limit Considerations ...................................................... 8-13 8.04 Opinion of Capital Costs and Project Financing ........................................ 8-13 8.05 Fiscal Impact Analysis .............................................................................. 8-16 8.06 Project Implementation Schedule ............................................................. 8-17 8.07 Environmental Impact Summary ............................................................... 8-17
TABLES
ES.04-1 Design Flows and Loads .......................................................................... ES-2 ES.08-1 Opinions of Project Cost and Implementation Schedule ........................... ES-9 ES.08-2 Effluent Filtration, UV Disinfection, and Biosolids Storage Project Cost Opinion........................................................................................ ES-11 ES-08-3 Effluent Filtration, UV Disinfection, and Biosolids Storage Project Implementation Schedule .................................................................... ES-11 2.03-1 NPDES Effluent Limitations for LCSTF ..................................................... 2-2 2.06-1 Preliminary Opinion of Probable Cost ....................................................... 2-9 3.02-1 Unit Processes and Design Criteria .......................................................... 3-2 3.03-1 NPDES Effluent Limitations for GWA WWTP ........................................... 3-9 3.04-1 Summary of Influent Wastewater and Primary Effluent Data for BOD and TSS ...................................................................................... 3-10 3.04-2 Summary of Influent Wastewater Ammonia Data ..................................... 3-10 3.04-3 Digester Loading Summary ...................................................................... 3-11 3.05-1 Summary of Effluent CBOD5 Data ............................................................ 3-11 3.05-2 Summary of Effluent TSS Data ................................................................. 3-12 3.05-3 Summary of Effluent Ammonia Data ......................................................... 3-12 4.01-1 Glenbard Wastewater Treatment Facilities Ultimate Design Flows and Loadings–1989 Long Range Planning Study ...................... 4-1 4.01-2 Existing and 20-Year Projected Population ............................................... 4-2 4.02-1 Average Flows During Dry Weather Periods ............................................ 4-3 4.02-2 Maximum Daily Flows............................................................................... 4-3 4.02-3 Per Capita Loadings ................................................................................. 4-3 4.02-4 Projected Design Flows and Loadings ...................................................... 4-4 5.01-1 USEPA Recommended Nutrient Criteria for Rivers in Ecoregion VI ......... 5-2 5.01-2 Impaired Waters in the Vicinity of the GWA WWTP Outfall ....................... 5-4 5.01-3 Existing Permit and Estimated Future Ammonia Limits ............................. 5-9 7.02-1 Influent Pumping Station Opinion of Present Worth Summary ............................................................. 7-4 7.02-2 Nonmonetary Evaluations of Influent Pump Station Alternatives .............. 7-4 7.03-1 Activated Sludge Treatment Opinion of Present Worth Summary ............. 7-11 7.03-2 Nonmonetary Evaluations of Activated Sludge Treatment Alternatives ..... 7-11 7.03-3 Activated Sludge Projects ......................................................................... 7-15 7.04-1 Biosolids Dewatering Alternatives Opinion of Present Worth Summary .... 7-16 7.04-2 Dewatering Nonmonetary Evaluation ....................................................... 7-17 7.05-1 Sludge Data Summary ............................................................................. 7-18 7.05-2 Digestion Performance Summary ............................................................. 7-18 7.05-3 Biogas Quality Sampling Results .............................................................. 7-19 7.05-4 Alternatives Evaluated .............................................................................. 7-25
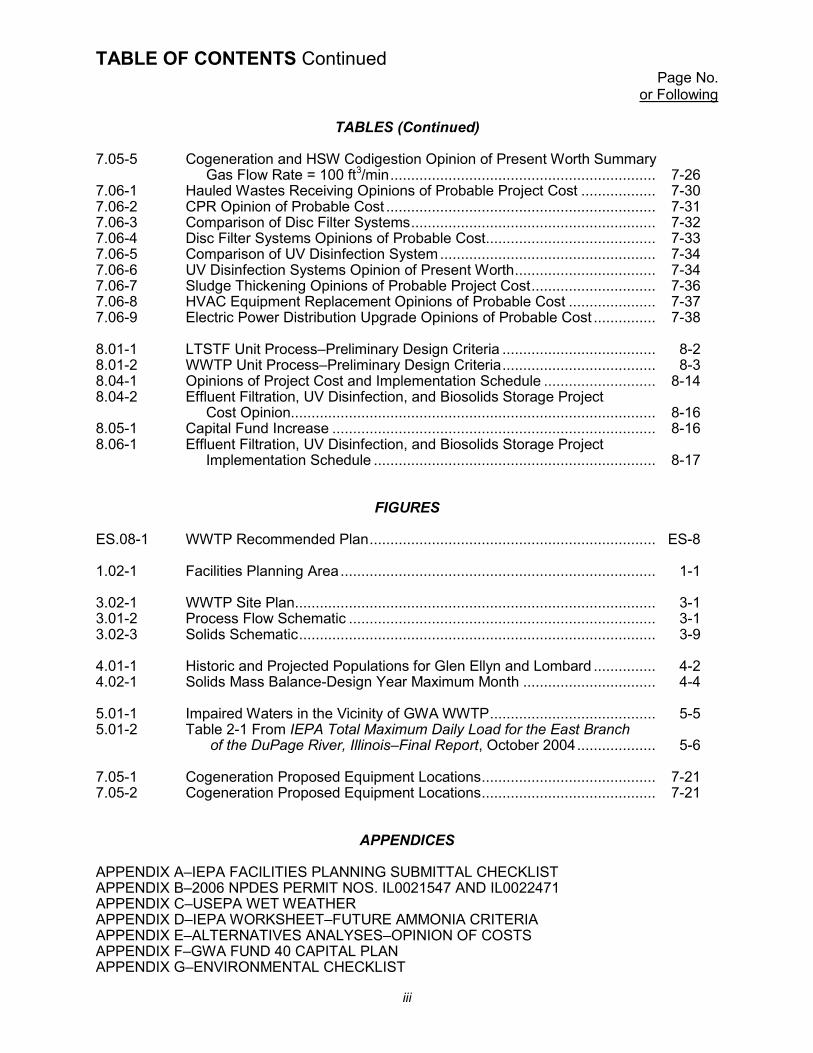
TABLE OF CONTENTS Continued Page No.
or Following
iii
TABLES (Continued)
7.05-5 Cogeneration and HSW Codigestion Opinion of Present Worth Summary Gas Flow Rate = 100 ft3/min ................................................................ 7-26 7.06-1 Hauled Wastes Receiving Opinions of Probable Project Cost .................. 7-30 7.06-2 CPR Opinion of Probable Cost ................................................................. 7-31 7.06-3 Comparison of Disc Filter Systems ........................................................... 7-32 7.06-4 Disc Filter Systems Opinions of Probable Cost......................................... 7-33 7.06-5 Comparison of UV Disinfection System .................................................... 7-34 7.06-6 UV Disinfection Systems Opinion of Present Worth .................................. 7-34 7.06-7 Sludge Thickening Opinions of Probable Project Cost .............................. 7-36 7.06-8 HVAC Equipment Replacement Opinions of Probable Cost ..................... 7-37 7.06-9 Electric Power Distribution Upgrade Opinions of Probable Cost ............... 7-38 8.01-1 LTSTF Unit Process–Preliminary Design Criteria ..................................... 8-2 8.01-2 WWTP Unit Process–Preliminary Design Criteria ..................................... 8-3 8.04-1 Opinions of Project Cost and Implementation Schedule ........................... 8-14 8.04-2 Effluent Filtration, UV Disinfection, and Biosolids Storage Project Cost Opinion........................................................................................ 8-16 8.05-1 Capital Fund Increase .............................................................................. 8-16 8.06-1 Effluent Filtration, UV Disinfection, and Biosolids Storage Project Implementation Schedule .................................................................... 8-17
FIGURES ES.08-1 WWTP Recommended Plan ..................................................................... ES-8 1.02-1 Facilities Planning Area ............................................................................ 1-1 3.02-1 WWTP Site Plan....................................................................................... 3-1 3.01-2 Process Flow Schematic .......................................................................... 3-1 3.02-3 Solids Schematic ...................................................................................... 3-9 4.01-1 Historic and Projected Populations for Glen Ellyn and Lombard ............... 4-2 4.02-1 Solids Mass Balance-Design Year Maximum Month ................................ 4-4 5.01-1 Impaired Waters in the Vicinity of GWA WWTP ........................................ 5-5 5.01-2 Table 2-1 From IEPA Total Maximum Daily Load for the East Branch of the DuPage River, Illinois–Final Report, October 2004 ................... 5-6 7.05-1 Cogeneration Proposed Equipment Locations .......................................... 7-21 7.05-2 Cogeneration Proposed Equipment Locations .......................................... 7-21
APPENDICES APPENDIX A–IEPA FACILITIES PLANNING SUBMITTAL CHECKLIST APPENDIX B–2006 NPDES PERMIT NOS. IL0021547 AND IL0022471 APPENDIX C–USEPA WET WEATHER APPENDIX D–IEPA WORKSHEET–FUTURE AMMONIA CRITERIA APPENDIX E–ALTERNATIVES ANALYSES–OPINION OF COSTS APPENDIX F–GWA FUND 40 CAPITAL PLAN APPENDIX G–ENVIRONMENTAL CHECKLIST


EXECUTIVE SUMMARY


Glenbard Wastewater Authority Facilities Plan Executive Summary
Prepared by Strand Associates, Inc. ES-1 R:\MAD\Documents\Reports\Archive\2013\GWA, IL\FP.1278.047.tws.sep\Report\ES 062113.docx\062613
This Executive Summary presents the highlights of the facilities planning effort. Each section of the facilities plan is condensed and summarized. ES.01 PURPOSE AND SCOPE OF REPORT The Glenbard Wastewater Authority (GWA) provides wastewater treatment for the communities of Glen Ellyn, Lombard, and adjacent unincorporated areas. This study was conducted to develop an overall wastewater management plan for the GWA facilities to meet the anticipated future growth as well as the anticipated state and federal water quality protection requirements. The facilities plan has a specific focus with respect to the influent pumping station, the activated sludge system operation, nutrient removal, effluent filtration, ultraviolet (UV) disinfection, and biosolids management. In addition, the Lombard Combined Sewage Treatment Facility (LCSTF) and Valley View Lift Station are evaluated and recommended improvements are included. The existing treatment facilities were evaluated for their ability to serve the GWA sewer service area for a period of 20 years through 2033. ES.02 EXISTING WASTEWATER CONVEYANCE FACILITIES The 2006 Facilities Plan included a detailed description of the wastewater conveyance facilities owned and operated by the GWA as well as a discussion of previous, current, and planned evaluations. Each customer community served by GWA owns and maintains a locally owned collection system. The entire collection system is comprised of separate sanitary sewers with the exception of portions of Lombard, which has combined sewers. GWA owns and operates the major interceptors that convey wastewater from the customer communities to the GWA WWTP which include the North Regional Interceptor (NRI) and the South Regional Interceptor (SRI). The GWA also owns and maintains five pumping stations–the St. Charles Road, Hill Avenue, Sunny Side, Valley View, and SRI Pump Stations. The LCSTF receives peak wet weather flows from a portion of the Village of Lombard. Several components of the LCSTF have been identified as requiring replacement within the facilities planning period and are discussed further in Sections 6 and 7 of the facilities plan. A. Valley View Pumping Station Upgrades The existing wet well/dry well pump station rated for 2.2 million gallons per day (mgd) includes two 75 horsepower (hp), two-speed, dry pit centrifugal pumps. A drawdown test completed January 10, 2013, however, determined the actual firm pumping station capacity is only 1.7 mgd. The pump station upgrades will increase the firm capacity to the rated pump capacity of 1,540 gpm or 2.2 mgd. The proposed project includes installation of two 85 hp submersible pumps, a valve vault, emergency bypass connections, and magnetic flow metering. In addition to the pump station upgrades, a building will be constructed to house a standby generator, fuel tank, and electrical equipment.

Glenbard Wastewater Authority Facilities Plan Executive Summary
Prepared by Strand Associates, Inc. ES-2 R:\MAD\Documents\Reports\Archive\2013\GWA, IL\FP.1278.047.tws.sep\Report\ES 062113.docx\062613
ES.03 EXISTING WASTEWATER TREATMENT PLANT (WWTP) FACILITIES The GWA WWTP was constructed in 1977. A number of projects in the past 20 years have replaced or modified portions of the WWTP facilities. The WWTP is rated for an annual average flow of 16.02 mgd and a maximum daily flow of 47 mgd, which are reflected in the National Pollutant Discharge Elimination System (NPDES) permit. Treatment consists of deep mechanical fine screening, pumping, grit removal, primary sedimentation, two-stage high purity oxygen-activated sludge treatment (TS-HPOAS), intermediate clarification, final clarification, granular media filtration, and UV disinfection. The treated effluent is discharged to the East Branch of the DuPage River. ES.04 WASTELOAD AND FLOW FORECASTS The GWA serves the communities of Glen Ellyn and Lombard, and adjacent unincorporated areas including Glen Ellyn Heights (DuPage County) and Citizen Utilities Company’s Valley View service area. The projected Year 2033 population for the GWA is 109,125, which has not changed from the 2006 Facilities Plan. These population projections were used in conjunction with existing flow data and Illinois Environmental Protection Agency (IEPA)-recommended per capita loadings to project future wastewater flows and loadings at the plant. The resulting design flows and loadings are as follows:
ES.05 REGULATORY AND NPDES PERMITTING ISSUES The purpose of this section is to discuss regulatory initiatives now under consideration, review their impact on the GWA WWTP, and recommend provisions that should be included in any proposed WWTP modifications to address these future regulatory concerns. Nutrient limits for total nitrogen (TN) and total phosphorus (TP) are not anticipated in the next permit cycle. However, it is likely that effluent nutrient limits will be imposed within the 20-year planning period of this facilities plan. Limits could be contained in the 2017 reissued permit and a 3-year or longer compliance schedule may be included. Additionally, more stringent ammonia limits could be contained in the 2017 reissued permit and a three year or longer compliance schedule may be included. TP is a concern because of the impaired status of the East Branch of the Dupage River. Based on current IEPA thinking and experience from other states, an effluent limit of about 0.3 to
Parameter Year 2033 Design Average Flow (DAF), mgd 16.02 Design Maximum Hourly Flow, mgd 47.00 Annual Average BOD5, lb/day 18,600 Annual Average TSS, lb/day 21,800 Annual Average TKN, lb/day 3,800 Annual Average TP, lb/day 800
Table ES.04-1 Design Flows and Loadings

Glenbard Wastewater Authority Facilities Plan Executive Summary
Prepared by Strand Associates, Inc. ES-3 R:\MAD\Documents\Reports\Archive\2013\GWA, IL\FP.1278.047.tws.sep\Report\ES 062113.docx\062613
0.5 milligrams per liter (mg/L) or less could be implemented in one of GWA’s future permits. Because of the uncertainties surrounding the timing of future nutrient limits, assumptions were made in this facilities plan to evaluate the treatment processes. Stabilized biosolids from the GWA WWTP are considered Class B and are disposed on land application sites. Regulations for sludge application on agricultural was enacted in August 2011 that limits stockpiling of sludge at the same site to 30 days. There are no current or anticipated regulatory initiatives that would restrict GWA’s ability to continue beneficial reuse of biosolids generated at the WWTP. ES.06 EVALUATION OF EXISTING FACILITIES AND SCREENING ALTERNATIVES Significant upgrades in capacity at the GWA WWTP are not anticipated to meet the future average and peak design flows and loadings to the plant. However, specific unit processes are in need of upgrading to maintain treatment efficiency and to better provide capacity. The alternative technology evaluations include the following:
1. Influent Pump Station 2. Activated Sludge Treatment 3. Digested Biosolids Dewatering 4. Cogeneration and High-Strength Waste Codigestion
Additional improvements were identified that were not subject to alternative analysis and were included as common needs. ES.07 ALTERNATIVE ANALYSIS A. Influent Pump Station Alternatives Analysis Two alternatives were analyzed for replacement of the existing influent pumps. Alternative IPS-1: Install three new dry-pit submersible pumps in the existing dry well. Alternative IPS-2: Modify existing wet well for prerotational suction intake, and provide four new
dry-pit centrifugal pumps. This project also includes a new conditioned motor control center (MCC) space, replacement of the existing variable frequency drives, and replacement of the plug valve and sluice gate hydraulic operators with electric operators. These two alternatives were considered equal on a total present worth basis. Alternative IPS-2, with the prerotation basins, is the recommended alternative because of the nonmonetary factors associated with the prerotation basin to maintain a lower wet well level. B. Activated Sludge Alternatives Analysis Four activated sludge alternatives were reviewed in this analysis:

Glenbard Wastewater Authority Facilities Plan Executive Summary
Prepared by Strand Associates, Inc. ES-4 R:\MAD\Documents\Reports\Archive\2013\GWA, IL\FP.1278.047.tws.sep\Report\ES 062113.docx\062613
Alternative AS-1: Two-Stage HPOAS and continued cryogenic oxygen generation. Alternative AS-2: Single-stage HPOAS and continued cryogenic oxygen generation. Alternative AS-3: Single-stage air activated sludge and new aeration blowers. Alternative AS-4: Single-stage integrated fixed film activated sludge (IFAS) and new aeration
blowers. Each of the alternatives assumes a design to meet a future phosphorus and TN limits of 0.5 mg/L and 10 mg/L, respectively. To meet the future TN limit, biological nitrogen removal (BNR) is assumed. For phosphorus removal, chemical phosphorus removal (CPR) and biological phosphorus removal (BPR) were considered. BPR testing was conducted in November 2012 to evaluate the ability for GWA to achieve BPR, which indicated insufficient volatile fatty acids are available for BPR at the time of the testing. For this reason, BPR was excluded as an option and CPR was included for all the activated sludge alternatives. Additional BPR testing is recommended to confirm these results. A separate analysis for bioaugmentation as a side stream add-on process for Alternative AS-2 is also included. Bioaugmentation would include separate biological treatment of recycled dewatering filtrate and produce supplemental nitrifiers with the objective of increasing nitrification performance and reducing ammonia loading to the main biological process. From the total present worth analyses, Alternatives AS-3 and AS-4 have significantly greater capital costs than Alternatives AS-1 and AS-2. Because of the good operating condition of the cryogenic plant, it is recommended this high purity oxygen (HPO) system be maintained. In the near term, Alternative AS-2 has fewer pieces of equipment which will provide maintenance benefits over Alternative AS-1. At the time of this report, the ability of the GWA WWTP to reliably nitrify while operating the activated sludge facilities in single-stage has not been fully evaluated. After evaluation of the single-stage operation, GWA could consider potentially improving nitrification with modifications to the last stage of the aeration basins which would increase the pH. Bioaugmentation could be implemented to potentially improve nitrification and reduce the ammonia loading to the activated sludge process as well. When the actual TP and/or TN nutrient limits are known, the single-stage HPOAS should be further evaluated to incorporate BNR. Large scale pilot testing by converting one of activated sludge trains to include denitrification is recommended. The recommended Alternative AS-2 is separated into the following projects because of differing priorities:
Intermediate Pump Station Modifications UNOX Deck Control Improvements Activated Sludge Final Stage Modifications Cryo Building MCC and PLC Replacement Denitrification Modifications Bioaugmentation

Glenbard Wastewater Authority Facilities Plan Executive Summary
Prepared by Strand Associates, Inc. ES-5 R:\MAD\Documents\Reports\Archive\2013\GWA, IL\FP.1278.047.tws.sep\Report\ES 062113.docx\062613
C. Digested Biosolids Dewatering The following two digested biosolids dewatering alternatives were considered: Alternative BD-1: Install two new BFPs in the Dewatering Building. Alternative BD-2: Install one new centrifuge and maintain one existing BFP. The dewatering performance of Alternative BD-1 and Alternative BD-2 are 18 percent and 25 percent, respectively. This results in the centrifuge with Alternative BD-2 providing biosolids disposal savings compared to Alternative BD-1. Additionally, biosolids storage building costs are impacted by the selection of this alternative because of the dewatering performance differences. Because of the nonmonetary considerations and potential saving in biosolids storage costs, Alternative BD-2 is recommended. D. Codigestion and Cogeneration Analyses Biogas produced from anaerobic digestion at the GWA WWTP is used in the plant boilers to heat the digestion process and any excess is flared. This alternative analysis evaluations the potential for codigestion of high strength waste (HSW) and cogeneration. was also evaluated because of potential revenue from the additional biogas generation. HSW could provide revenue from HSW tipping fees, improved volatile solids (VS) destruction, and potential reduction of grease loads to the collection system. As a part of this study, the following codigestion and cogeneration alternatives are discussed and evaluated: Alternative CC-1a: Convert one or more of the existing natural gas engines to use biogas for
electricity production and heat recovery. Digest municipal sludge only (no codigestion).
Alternative CC-1b: Convert one or more of the existing natural gas engines to use biogas for
electricity production and heat recovery. Construct HSW receiving station for codigestion up to the loading limit of the existing digestion facilities.
Alternative CC-2a: Install new internal combustion engines to use biogas for electricity production
and heat recovery. Digest municipal sludge only (no codigestion).
Alternative CC-2b: Install new internal combustion engines to use biogas for electricity production and heat recovery. Construct HSW receiving station for codigestion up to the loading limit of the existing digestion facilities.
Each of these alternatives includes a reciprocating gas engine, which requires biogas to be treated for hydrogen sulfide, siloxanes, and moisture removal. The total present worth analysis also evaluated three different biogas production rates which were used for the applicable alternatives. From the total

Glenbard Wastewater Authority Facilities Plan Executive Summary
Prepared by Strand Associates, Inc. ES-6 R:\MAD\Documents\Reports\Archive\2013\GWA, IL\FP.1278.047.tws.sep\Report\ES 062113.docx\062613
present worth analysis, cogeneration is not considered favorable at this time. This is mainly the result of the very low electrical rates currently paid by GWA. Reevaluation of these alternatives is recommended in future planning efforts and as electrical costs increase. E. Common Needs In addition to these alternative analyses, this section also reviews other recommended improvements at the WWTP. These project elements are developed and described based on the technology selections of the major alternative analyses presented above. These additional project elements include:
LCSTF Equipment Upgrades Hauled Waste Receiving Screenings Washer and Compactor Peak Flow Storage Chemical Phosphorus Removal Effluent Filtration Disinfection Sludge Thickening Liquid Biosolids Storage Dewatered Biosolids Storage Plant Utilities HVAC System Replacement Electrical Service, Backup, and Redundancy Remote Site Communication Site Lighting MCC Replacement PLC Replacements Electronic O&M Manual
The chemical phosphorus removal, effluent filtration, disinfection, and sludge thickening projects are described in greater detail below.
1. Chemical Phosphorus Removal (CPR) As previously discussed in the activated sludge alternatives analysis, CPR is assumed to be required for each of the activated sludge alternatives. Costs are included in the plan for a new CPR Building located near the Pump and Electrical Building. Because of the significance in chemical costs and the uncertainty of the future phosphorus limit, CPR jar testing, BPR testing, and pilot testing are recommended before design of CPR. 2. Effluent Filtration Effluent filtration improvements to the existing deep bed filters are needed because of hydraulic issues with flow distribution, high maintenance, and significant filter recycle flows to influent pump station. This plan includes costs for replacement of the ten deep bed filters with disc filters and evaluated four different manufacturers of this equipment. The opinions of probable cost for

Glenbard Wastewater Authority Facilities Plan Executive Summary
Prepared by Strand Associates, Inc. ES-7 R:\MAD\Documents\Reports\Archive\2013\GWA, IL\FP.1278.047.tws.sep\Report\ES 062113.docx\062613
this project are within 5 percent of each other for the three manufacturers evaluated (Nova Water Technologies, Siemens, and Kruger), and review of these three disc filter units is recommended during design. 3. Disinfection The existing UV disinfection equipment is nearing 20 years in service, which is beyond the normal life of such equipment. In addition, newer UV equipment is more energy-efficient, uses fewer UV lamps, and has longer lamp life. Five different options including horizontal, vertical, and inclined-style UV systems were considered for replacement of the existing system. The Xylem-Wedeco Duron equipment (both arrangements), Ozonia Aquaray 3X equipment, and the TrojanUV 3000 Plus equipment are considered equal on a cost basis because the total present worths are within 10 percent. Further evaluations of the different equipment on a nonmonetary basis is recommended during design. 4. Sludge Thickening
Currently, primary sludge, carbo WAS, and nitro WAS are cothickened in the single gravity thickener, and thickened sludge is pumped from the gravity thickener to the anaerobic digesters. Sludge withdrawal piping issues require the gravity thickener to be operated to produce a lower-than-desired sludge thickness. The thickness of the feed sludge to the anaerobic digesters is an important parameter in the overall operations of the plant. The solids concentration dictates the volume of sludge pumped to the digesters, the energy required to heat the sludge, and the hydraulic retention time (HRT) within the digesters. Feeding the digesters with thicker sludge reduces the energy required and increases the digestion performance because of longer HRTs in the digesters. Therefore, for the purpose of this analysis, the feed sludge to the digesters is desired to have a solids concentration of 3.5 percent, minimum, although 5.0 percent is preferred. The recommended plan includes the following stepwise approach to improve the thickening operations at the plant. This approach also develops future options to provide better flexibility to the plant.
Phase 1–Install solids density meters to control gravity thickener underflow: The plant will investigate whether the density meters provide the required monitoring and control to consistently achieve a 3.5 percent solids feed to the digesters.
Phase 2–Install New Thickened Sludge Suction Piping/New Building: This phase includes a sludge pumping structure to be constructed immediately adjacent to the gravity thickener to significantly shorten the suction piping. Underground sludge piping improvements would also provide redundant sludge lines across the site.
Phase 3–Utilize the Gravity Belt Thickener (GBT) for WAS Thickening: This scenario would include using the existing GBT to thicken WAS only and would allow the gravity thickener to be used for primary sludge. The existing filter backwash storage tank may

Glenbard Wastewater Authority Facilities Plan Executive Summary
Prepared by Strand Associates, Inc. ES-8 R:\MAD\Documents\Reports\Archive\2013\GWA, IL\FP.1278.047.tws.sep\Report\ES 062113.docx\062613
be repurposed as a WAS holding tank upstream of the GBT, or, if the filter backwash storage tank is not available, the WAS pumps could feed the GBT directly.
ES.08 RECOMMENDED PLAN AND ENVIRONMENTAL IMPACT SUMMARY A. Recommended Plan Summary and Opinion of Capital Costs The recommended plan includes modifications to many portions of the existing GWA LCSTF and WWTP. The recommended alternatives and common needs projects are summarized in Table ES.08-1 along with the implementation schedule and opinions of probable cost. The opinions of capital costs are also projected to the planned project year cost by applying a construction inflation rate of 3 percent annually. Table ES.08-1 also proposes combining several projects because of priorities for implementation and potential cost savings that could be achieved with related projects. The proposed site plan for the recommended projects at the WWTP are shown in Figure ES.08-1. B. Project Financing The opinions of capital costs for each of the recommended improvements are summarized in Table ES.08-1. The opinions of capital costs are also projected to the planned project bid year cost by applying a construction inflation rate of 3 percent annually. A more detailed capital plan is included in Appendix F. The WWTP improvements are anticipated to be funded through capital fund contributions by the Glen Ellyn and Lombard. The Effluent Filtration, UV Disinfection, and Biosolids Storage project is anticipated to be funded by a low-interest loan from the IEPA, Table ES.08-2. The existing LSCTF project debt service will have a final payment in 2015, the existing Biosolids Improvements Project debt service will have a final payment in 2016, and, in 2026, the existing Digester Improvements Project debt service will have its final payment due. A debt service payment of $980,000 was estimated based on the current fiscal year 2013 IEPA interest rate of 1.93 percent and a 15-year term. C. Fiscal Impact Analysis Through staging the projects over the planning period, the customer communities will have a gradual change in their rates. Glen Ellyn and Lombard provide annual contributions to the GWA capital fund, which will be used to fund these projects. The residential user charges of Glen Ellyn and Lombard are determined by their respective community. An average annual capital fund increase of 10 percent is planned to fund the recommended projects.

This image cannot currently be displayed.
MAINTENANCE BUILDING
UV BUILDING
LIQUID BIOSOLIDS STORAGE
FILTER BUILDING
SLUDGE DEWATERING
BUILDING RAW
SEWAGE HANDLING
ANAEROBIC DIGESTER
NO. 1
ANAEROBIC DIGESTER
NO. 2
ANAEROBIC DIGESTER
NO. 3
FINAL CLARIFIER
NO. 1
FINAL CLARIFIER
NO. 2
FINAL CLARIFIER
NO. 4
FINAL CLARIFIER
NO. 3 SLUDGE THICKENER
SLUDGE PUMP & METER BUILDING
AERATION INTERMEDIATE
CLARIFIER NO. 2
(DECOMMISSIONED)
INTERMEDIATE PUMP STATION
PRIMARY CLARIFIER
NO. 1
PRIMARY CLARIFIER
NO. 2
DIVERSION STRUCTURE NO. 1
PRIMARY SCUM BUILDING
GRIT BUILDING
DIVERSION STRUCTURE NO. 2
DIVERSION STRUCTURE NO. 3
PUMP AND ELECTRICAL BUILDING
ADMINISTRATION BUILDING
COGEN BUILDING
CHLORINE BUILDING
BIOAUGMENTATION AND/OR HAULED WASTES EQUALIZATION
CRYOGENIC BUILDING
BAR SCREEN BUILDING
ANAEROBIC DIGESTER BUILDING
INTERMEDIATE
CLARIFIER NO. 1
(DECOMMISSIONED)
FIGURE ES.08-1
WW
TP
RE
CO
MM
EN
DE
D P
LAN
DEWATERED BIOSOLIDS COVERED STORAGE
CPR BUILDING
THICKENED SLUDGE PUMP STATION
HAULED WASTES RECEIVING
DEWATERED BIOSOLIDS COVERED STORAGE


Glenbard Wastewater Authority Facilities Plan Executive Summary
Prepared by Strand Associates, Inc. ES-9 R:\MAD\Documents\Reports\Archive\2013\GWA, IL\FP.1278.047.tws.sep\Report\ES 062113.docx\062613
TABLE ES.08-1 OPINIONS OF PROJECT COST AND IMPLEMENTATION SCHEDULE
Project Year Project
Opinion of Probable Cost1
Project Year Projected Cost2
2014 Valley View Pump Station 2,047,000$ 2,108,000$ LCSTF Clarifier Mechanism Replacement 277,000 285,000 2014 Total 2,393,000$
2015 Remote Site Communication 160,000$ 170,000$ 2015 Total 4,956,000$
2016 Screening and Influent Pumping Improvements:Screening Building HVAC Replacement 18,000$ 20,000$ Influent Pump Replacement and Improvements 4,115,000 4,497,000
Effluent Filtration, UV Disinfection Project, and Biosolids StorageEffluent Filtration 6,982,000 7,629,000 UV Disinfection 2,330,000 2,546,000 Dewatered Biosolids Covered Storage 2,456,000 2,684,000
IEPA Loan Project Subtotal 12,859,000$ 2016 Total 17,376,000$
2017 Electronic O&M Manual 300,000$ 338,000$ 2017 Total 338,000$
2018 Activated Sludge Improvements Project:Intermediate Pump Station Modifications 1,423,000$ 1,650,000$ UNOX Deck Control Improvements 368,000 427,000
Activated Sludge Final Stage Modifications4 218,000 253,000 2018 Total 2,330,000$
2019 Hauled Wastes Receiving Phase 1 238,000$ 284,000$
Sludge Thickening Phase 2 Improvements3 873,000 1,042,000
Sludge Thickening Phase 3 Improvements5 560,000 669,000 2019 Total 1,995,000$
2020 Biosolids Dewatering Equipment Replacement 2,292,000$ 2,819,000$
Liquid Biosolids Storage Improvements6 1,850,000 2,275,000 2020 Total 5,094,000$
2021 Chemical Phosphorus Removal7 601,000$ 761,000$ 2021 Total 761,000$
2022 Electrical Improvements:Grit Building MCC Replacement 200,000$ 261,000$ Cryo Building MCC and PLC Replacement 251,000 327,000 Electrical Service, Backup, and Redundancy 1,480,000 1,931,000 PLC Replacements 750,000 979,000 Site Lighting 230,000 300,000
2022 Total 3,798,000$

Glenbard Wastewater Authority Facilities Plan Executive Summary
Prepared by Strand Associates, Inc. ES-10 R:\MAD\Documents\Reports\Archive\2013\GWA, IL\FP.1278.047.tws.sep\Report\ES 062113.docx\062613
1 The opinion of probable cost is based on fourth quarter 2012 costs. Includes construction, engineering, and contingency. 2 Costs are projected with an inflation factor of 3 percent based on 2012 annual Engineering News Record construction cost
index increase. 3 This project is assumed to occur with Sludge Thickening Phase 3 Improvements. 4 The activated sludge final stage modifications project to potentially improve nitrification may be required at an earlier date
depending on activated sludge performance. An additional study and pilot testing could be conducted to verify the effects of opening the final stage on nitrification before this project.
5 This cost assumes direct WAS pumping to the GBT without WAS storage. 6 This project assumes the backwash filter clarifier is available to be repurposed for liquid biosolids storage. 7 The implementation schedule for this project could change because of the uncertainty of future regulatory requirements and
its timing. Additional study and pilot testing may be required. 8 Equalization of hauled wastes may not be required. 9 Bioaugmentation may not be required.
Project Year Project
Opinion of Probable Cost1
Project Year Projected Cost2
2023 LCSTF and WWTP Lagoon Dredging 1,000,000$ 1,344,000$ LCSTF Screening Improvements 1,000,000 1,344,000 2023 Total 2,688,000$
2024 LCSTF Grit Removal Improvements 2,510,000$ 3,474,000$ LCSTF Grit Building HVAC Replacement 18,000 25,000
2024 Total 3,499,000$ 2025 Plant Utilities Yard Piping Improvements 985,000$ 1,404,000$
2025 Total 1,404,000$ 2026 Hauled Wastes Receiving Phase 28 336,000$ 493,000$
Bioaugmentation9 1,459,000 2,143,000 2026 Total 2,636,000$
2027-31 No Projects Planned2032 Denitrification Modifications7 1,322,000$ 2,318,000$
2032 Total 2,318,000$

Glenbard Wastewater Authority Facilities Plan Executive Summary
Prepared by Strand Associates, Inc. ES-11 R:\MAD\Documents\Reports\Archive\2013\GWA, IL\FP.1278.047.tws.sep\Report\ES 062113.docx\062613
D. Project Implementation Schedule The preliminary project implementation schedule for the Effluent Filtration, UV Disinfection, and Biosolids Storage project is presented in Table ES.08-3.
E. Environmental Impact Summary Construction will be located within the existing site limits. No known threatened or endangered species would be adversely affected by the proposed project. In addition, there are no known significant adverse impacts to waterways, wetlands, or other resources. The Applicant Environmental Checklist and other correspondence are included in Appendix G.
1 Costs are inflated to construction year 2016 dollars with
an inflation factor of 3 percent based on 2012 annual Engineering News Record construction cost index increase.
Table ES.08-2 Effluent Filtration, UV Disinfection, and Biosolids Storage Project Cost Opinion
Cost Opinion1
Construction 9,876,000$ Contingency (10%) 988,000 Design Technical Services 835,000 Construction Technical Services 1,160,000 Total 12,859,000$
Submit Facilities Plan to IEPA June 2013 IEPA Approval of Facilities Plan October 2013 Submit Design to IEPA October 2014 Submit IEPA Loan Application October 2014 IEPA Approval of Design January 2015 Advertise for Bids February 2015 Construction Bid Date March 2015 Construction Start Date May 2015 Construction Completion May 2017
Table ES.08-3 Effluent Filtration, UV Disinfection, and
Biosolids Storage Project Implementation Schedule


SECTION 1 INTRODUCTION


Glenbard Wastewater Authority Facilities Plan Section 1–Introduction
Prepared by Strand Associates, Inc. 1-1 R:\MAD\Documents\Reports\Archive\2013\GWA, IL\FP.1278.047.tws.sep\Report\S1.TM1-Intro with Updated Acronyms 062113.docx\062613
This section describes the purpose and scope of the facilities plan and the location of the study area. It also summarizes previous and related studies and reports. A list of definitions and abbreviations is provided as an aid to the reader. 1.01 PURPOSE AND SCOPE This study was conducted to develop an overall wastewater management plan for the Glenbard Wastewater Authority (GWA) to meet anticipated future growth as well as the anticipated state and federal water quality protection requirement, and the specific focus of this planning activity included influent pumping station, the activated sludge system operation, nutrient removal, effluent filtration, ultraviolet (UV) disinfection, and biosolids management. The existing and potential new treatment facilities are evaluated for their ability to serve the GWA sewer service area for a period of 20 years through year 2033. The Illinois Environmental Protection Agency (IEPA) Facilities Planning Checklist is included in Appendix A. 1.02 LOCATION OF STUDY The Glenbard Wastewater Authority (GWA) provides wastewater treatment for the communities of Glen Ellyn, Lombard, and adjacent unincorporated areas. The GWA facilities planning area (FPA), within which GWA will continue to provide wastewater treatment services, is shown in Figure 1.02-1. This facilities plan assumes the population growth occurs within the current FPA. 1.03 RELATED STUDIES AND REPORTS The following studies and reports were used in the preparation of this plan.
1. Intermediate Pump Station Alternatives Evaluation, Strand Associates, Inc.®, 2012. 2. Asset Analysis and Cost Allocation Study, Baxter and Woodman, Inc., 2011. 3. Facility Plan Amendment-Anaerobic Digester Improvements, Strand Associates, Inc.®,
2007. 4. Facilities Plan, Strand Associates, Inc.®, 2006. 5. Sanitary Sewer Evaluation Study, RJN Group, Inc., 2003 6. Facility Plan, Camp Dresser and McKee Inc., 1999. 7. High Flow Study, Rezek, Henry, Meisenheimer and Gende, Inc., 1991. 8. Long Range Planning Study, Rezek, Henry, Meisenheimer and Gende, Inc., 1989.
1.04 ABBREVIATIONS AS activated sludge AT-3 Aeration Tank 3 ATAD autoheated thermophilic aerobic digestion BAR bioaugmentation reaeration/regeneration BD biosolids dewatering

Glenbard Wastewater Authority Facilities Plan Section 1–Introduction
Prepared by Strand Associates, Inc. 1-2 R:\MAD\Documents\Reports\Archive\2013\GWA, IL\FP.1278.047.tws.sep\Report\S1.TM1-Intro with Updated Acronyms 062113.docx\062613
BFP belt filter press BOD biochemical oxygen demand BOD5 five-day biochemical oxygen demand BNR biological nutrient removal BPR biological phosphorus removal BTU/hr British Thermal Units/hour BTU/scf British Thermal Units/standard cubic feet Carbo first-stage high purity oxygen carbonaceous aeration basins CBOD5 five-day carbonaceous biochemical oxygen demand CC cogeneration and codigestion cfm cubic feet per meter cfs cubic feet per second cfu colony forming units CHP combined heat and power CMAP Chicago Metropolitan Area for Planning CMOM Capacity, Management, Operation, and Maintenance COD chemical oxygen demand col/100 mL colonies (bacteria) per 100 milliliters CPR chemical phosphorus removal CSO combined sewer overflow CWA Clean Water Act DAF design average flow DMF design maximum flow DO dissolved oxygen DRSCW DuPage River Salt Creek Workgroup E. coli Escherichia coli FPA facilities planning area FOG fat, oils, and grease ft feet ft2 square feet ft3 cubic feet ft3/day cubic feet per day ft3/lb cubic feet per pound ft3/min cubic feet per minute GBT gravity belt thickener gcd Gallons per capita per day gpd gallons per day gpd/ft2 gallons per day per square feet GWA Glenbard Wastewater Authority hp Horsepower HPO high purity oxygen HPOAS high purity oxygen activated sludge HRT hydraulic retention time HSW high-strength waste

LCSTF
VALLEY VIEW PUMP STATION


Glenbard Wastewater Authority Facilities Plan Section 1–Introduction
Prepared by Strand Associates, Inc. 1-3 R:\MAD\Documents\Reports\Archive\2013\GWA, IL\FP.1278.047.tws.sep\Report\S1.TM1-Intro with Updated Acronyms 062113.docx\062613
HVAC heating, ventilation, and air conditioning IAWA Association of Wastewater Agencies IEPA Illinois Environmental Protection Agency IFAS integrated fixed film activated sludge I/I infiltration/inflow in inch IPS influent pump station FPA facilities planning area gpm gallons per minute GWA Glenbard Wastewater Authority kW kilowatt kWh kilowatt hours I/I infiltration/inflow lbs pounds lb/day pounds per day lb/day/ft2 pounds per day/square feet LCSTF Lombard Combined Sewerage Treatment Facility LED light-emitting diode LV low voltage /W micrograms max maximum mg/L milligrams per liter mgd million gallons per day mL milliliters MBBR moving bed bioreactor MCC motor control center min minimum MLSS mixed liquor suspended solids MLVSS mixed liquor volatile suspended solids MPN most probable number MV medium voltage NASS Northern Area Sanitary Sewer NH3-N ammonia nitrogen Nitro second-stage nitrification aeration tanks NPDES National Pollutant Discharge Elimination System NPW nonpotable water NRI North Regional Interceptor O&M operation and maintenance OTE oxygen transfer efficiency PCBs polychlorinated Biphenyls pcd pounds per capita per day psig pounds per square inch gauge PHF peak hourly flow PRE primary sedimentation tank effluent

Glenbard Wastewater Authority Facilities Plan Section 1–Introduction
Prepared by Strand Associates, Inc. 1-4 R:\MAD\Documents\Reports\Archive\2013\GWA, IL\FP.1278.047.tws.sep\Report\S1.TM1-Intro with Updated Acronyms 062113.docx\062613
PRI primary sedimentation tank influent PRS primary sludge RAS return activated sludge RTU remote telemetry units SCADA supervisory control and data acquisition scfm standard cubic feet per minute sec/cm2 seconds per cubic meter SOR surface overflow rate SRI South Regional Interceptor SRT solids retention time SS-HPOAS single-stage high purity oxygen-activated sludge treatment SSES sewer system evaluation survey SSO sanitary sewer overflow ST sludge thickening SWD side water depth TDH total dynamic head TDS total dissolved solids TKN total Kjeldahl nitrogen TMDL total maximum daily load TN total nitrogen TP total phosphorus TS total solids TS-HPOAS two-stage high purity oxygen-activated sludge treatment TSS total suspended solids USEPA United States Environmental Protection Agency UV ultraviolet UVT ultraviolet transmittance VFD variable frequency drive VS volatile solids VSA vacuum swing adsorption VSR volatile solids reduction VSS volatile suspended solids WAS waste activated sludge WLA waste load allocation WQBEL water quality-based effluent limits WWTP wastewater treatment plant

SECTION 2
EXISTING WASTEWATER CONVEYANCE FACILITIES


Glenbard Wastewater Authority Facilities Plan Section 2–Existing Wastewater Conveyance Facilities
Prepared by Strand Associates, Inc. 2-1 R:\MAD\Documents\Reports\Archive\2013\GWA, IL\FP.1278.047.tws.sep\Report\S2 062013.docx\062613
The 2006 Facilities Plan included a detailed description of the wastewater conveyance facilities owned and operated by the GWA, as well as a discussion of previous, current, and planned evaluations. That information is updated herein, and a summary of ongoing conveyance system projects and planned future investigations are presented below. A detailed analysis of the GWA conveyance facilities is beyond the scope of this facilit ies plan. Several components of the Lombard Combined Sewerage Treatment Facility (LCSTF), however, have been identified as requiring replacement within the facilities planning period and are discussed further in Sections 6 and 7. The recommended improvements to the Valley View Pump Station (VVPS) are included in this section. 2.01 BACKGROUND Each customer community served by GWA owns and maintains a locally owned collection system. The entire collection system is comprised of separate sanitary sewers with the exception of portions of Lombard, which has combined sewers. GWA owns and operates the major interceptors that convey wastewater from the customer communities to the GWA WWTP which include the North Regional Interceptor (NRI) and the South Regional Interceptor (SRI). The GWA also owns and maintains five pumping stations–the St. Charles Road, Hill Avenue, Sunny Side, Valley View, and SRI Pump Stations. The NRI, SRI, and the 22nd Street gravity interceptor (owned by Lombard) all discharge to a junction chamber east of the existing lagoons on the east side of the East Branch of the DuPage River. Wastewater then flows from the junction chamber under the lagoons and the DuPage River via a 60-inch gravity sewer to the headworks of the GWA WWTP. The West Glen Ellyn Interceptor owned by Glen Ellyn enters the plant site from the west and discharges directly to the headworks of the treatment plant. The Sunny Side Pump Station is a small pumping station located at the GWA WWTP site and serves a few homes adjacent to the plant site. 2.02 NRI CONVEYANCE FACILITIES The NRI extends approximately 20,500 feet to the north of the plant and serves Lombard, the northern portion of Glen Ellyn, and Glen Ellyn Heights. The NRI is constructed entirely of prestressed concrete cylinder pipe ranging in size from 18 inches in diameter at the upstream end to 66 inches in diameter at its termination near the GWA WWTP. The St. Charles Road pump station, which was upgraded in 2011 to increase the capacity of the station, receives gravity flows from the northwest portion of the Village of Glen Ellyn and from a portion of Glen Ellyn Heights, served by DuPage County. A 2,700-foot-long, 18-inch-diameter prestressed concrete cylinder pipe force main from the St. Charles Road pump station discharges into the upper end of the NRI. 2.03 LCSTF FACILITIES The LCSTF receives peak wet weather flows from a portion of the Village of Lombard. Three combined sewers in Lombard (30-inch-diameter Northern Area, 54-inch-diameter North Lombard, and 108-inch-diameter Central Lombard) discharge to the NRI. Flow regulators on each of these combined sewers divert flows in excess of 2.5 times dry weather flow to the LCSTF for treatment.

Glenbard Wastewater Authority Facilities Plan Section 2–Existing Wastewater Conveyance Facilities
Prepared by Strand Associates, Inc. 2-2 R:\MAD\Documents\Reports\Archive\2013\GWA, IL\FP.1278.047.tws.sep\Report\S2 062013.docx\062613
Excess flows from the 30-inch Northern Area Sanitary Sewer (NASS) basin is discharged to the Hill Avenue pump station, which pumps to the LCSTF. Excess flows from the regulators on the 54-inch North Lombard and 108-inch Central Lombard interceptor sewers flow to the LCSTF by gravity. The LCSTF was constructed at the same time as the Glenbard Wastewater Treatment Plant. The LCSTF was originally designed to provide primary treatment and disinfection for flows up to 58 mgd. The LCSTF is owned by the Village of Lombard but is operated and maintained by the GWA. Effluent from the facility is discharged to the East Branch of the DuPage River. According to the 2002 GWA CSO Operational Plan, the LCSTF includes the following facilities: combined sewage first flows through an automatic mechanically cleaned coarse bar screen to remove large debris prior to entering the pump station, which contains four pumps [19.3 mgd each at 33 feet total dynamic heat (TDH)]. Three of the pumps operate on automatic with the fourth available for operation in hand as needed. Flow is pumped through a magnetic flow meter into two aerated, mechanically cleaned grit tanks designed for 29 mgd each, where heavy inorganic material is removed. The screened material and grit are disposed of in a landfill. Liquid sodium hypochlorite is added at the discharge end of the grit tanks before the flow enters two 145-foot-diameter clarifiers. The clarifiers provide detention time for disinfection as well as sedimentation. During peak flows, the detention time in the clarifier is about one hour. Before clarified effluent enters the receiving stream (Outfall 001), it is dechlorinated with sodium thiosulfate. Effluent samples are collected daily when the plant is in operation and tested for fecal coliform, pH, chlorine residual, BOD5, and suspended solids. Organic solids that have settled to the bottom of the clarifiers are discharged to the NRI for treatment at the main WWTP. The National Pollutant Discharge Elimination System (NPDES) effluent limits for the LCSTF is presented in Table 2.03-1. The LCSTF is currently operating under an NPDES permit that became effective December 1, 2006, and expired on November 30, 2011. A copy the NPDES Permit is included in Appendix A.
Flows in excess of the 58 mgd capacity of the LCSTF are diverted to two lagoons. The lagoons have a design capacity of 14.5 mgd. The excess flows are stored in these lagoons until the level exceeds the elevation of the lagoon outfall weir. At this point, the flow begins to discharge to the receiving stream through Outfall 002. This discharge will continue as long as the lagoon liquid level is above the outfall weir. Effluent samples are collected daily. The samples are tested for coliform, pH, chlorine residual, BOD5, and suspended solids. When the flow to the Lombard CSO treatment facilities begins to subside, the wastewater stored in the lagoons will automatically be discharged to the Lombard CSO treatment facilities for treatment.
Outfall 001 (Lombard Combined Sewage Treatment Facilities Outfall)
Notes Concentration Limits
(mg/L) Parameter Average Monthly Fecal Coliform Daily maximum shall not exceed 400 per 100 mL pH Shall be in the range of 6 to 9 Standard Units Chlorine Residual 0.75 Table 2.03-1 NPDES Effluent Limitations for LCSTF

Glenbard Wastewater Authority Facilities Plan Section 2–Existing Wastewater Conveyance Facilities
Prepared by Strand Associates, Inc. 2-3 R:\MAD\Documents\Reports\Archive\2013\GWA, IL\FP.1278.047.tws.sep\Report\S2 062013.docx\062613
There are several other gravity sewer connections on the NRI including the 36-inch Wilson Avenue Interceptor, 36-inch and 15-inch Roosevelt Road Interceptors, and the 10-inch Maryknoll Interceptor. 2.04 SRI CONVEYANCE FACILITIES The SRI extends approximately 15,000 feet to the south of the GWA plant and serves Citizen’s Utilities. The SRI is constructed mainly of prestressed concrete cylinder pipe ranging in size from 18 inches in diameter at the upstream end to 30 inches in diameter at its termination near the GWA SRI pumping station. The SRI portion of the Glenbard intercepting sewer system includes the VVPS and force main, which discharges to the upstream end of the SRI. The VVPS receives gravity flows from the area south of Butterfield Road. In addition, there are seven gravity sewer connections on the SRI serving Citizen’s Utility. The SRI discharges to the SRI Pump Station, which was constructed in 1992. Three submersible pumps, each with a rated capacity of 950 gpm at 25 ft TDH, are located at the station. The SRI Pump Station is located near the southeast corner of the GWA WWTP site. 2.05 PREVIOUS CONVEYANCE SYSTEM EVALUATIONS AND PROJECTS GWA previously conducted comprehensive studies on the NRI and SRI to identify, quantify and mitigate the impacts of wet weather flows. The NRI Conveyance Capacity Study (2001) and the SRI Conveyance Capacity Study (2003) included physical inspections, flow metering and hydraulic computer (SWMM) flow modeling of the NRI and SRI. Flow metering near the downstream end of the NRI, 22nd Street and West Glen Ellyn Interceptors was also conducted as part of the SRI Study. The recommendations from these studies are summarized in the 2006 Facilities Plan. A. St. Charles Road Pump Station Upgrades In 2010 the St. Charles Road Pump Station was upgraded from a capacity of 7.5 mgd to 10.6 mgd and converted from a wet well/dry to a submersible pump station. The upgrades included the replacement of four 50 hp (2,400 gpm @ 56 feet total dynamic head [TDH]) dry pit centrifugal pumps with two 34 hp dry weather (1,580 gpm @ 55 feet TDH) and three 215 hp wet weather (5,800 gpm @ 85 feet TDH) submersible pumps. The firm capacity of the upgraded pump station with two wet weather pumps operating is 10.6 mgd, which is roughly equivalent to the 10-year rainfall event. The maximum projected flow tributary to the pump station is 15.24 mgd; however the station capacity was limited to 10.6 mgd, so the capacity of the 18-inch force main and downstream 18-inch gravity sewers are not exceeded. Because of the wide range of flows to the pump station two dry weather pumps were installed that are capable of pumping twice the average daily flow. Variable frequency drives were installed on all pumps to improve the energy efficiency of the pump station. In addition to the pump upgrades, several other upgrades were completed as a part of the project. A new wet well and valve vault were constructed adjacent to the existing wet well, which was kept service. Wastewater flow metering was added via a magnetic flow meter located in a metering manhole downstream of the pump station discharge. Emergency bypass connections were installed in the wet well and force main to allow for connection of a portable pump. A surge relief
Glenbard Wastewater Authority Facilities Plan Section 2–Existing Wastewater Conveyance Facilities
Prepared by Strand Associates, Inc. 2-4 R:\MAD\Documents\Reports\Archive\2013\GWA, IL\FP.1278.047.tws.sep\Report\S2 062013.docx\062613
valve was installed in the valve vault to protect the 2,700 feet of force main from surge pressures. Two basket bar screens were installed at the discharge point of the two influent sewers to remove large debris from the system. A building was constructed to house the 600 kW diesel-powered standby generator, fuel tank, and electrical equipment. 2.06 VVPS UPGRADES The existing VVPS was constructed in 1977 and serves a portion of the Village of Glen Ellyn. The pumping station is owned and operated by the Glenbard Wastewater Authority (GWA). Because of the age of the VVPS (35+ years), maintenance activities associated with the facilities have been increasing. The pumps and controls are located in a dry pit, which requires confined space entry procedures to perform routine maintenance. The dry pit has limited space, making maintenance difficult. The plug valves used to isolate the pumps are inoperable and cannot be easily accessed for replacement. For these reasons, GWA staff determined that the station is in need of upgrades. A. Purpose and Scope The scope of the evaluation for VVPS alternatives and a recommended plan includes:
Performing preliminary design evaluations to identify alternate means of upgrading the existing pumping station to meet a firm capacity of 1,540 gpm or 2.2 mgd.
Completing preliminary equipment selection and developing proposed station layout and opinion of probable construction costs.
Preparing an Engineering Report for submittal to the Illinois Environmental Protection Agency (IEPA).
B. Existing Pumping Station The VVPS is located on a 0.27-acre parcel south of Arbor Lane in unincorporated DuPage County. Flow enters the approximately 24 foot-deep, 8-foot-diameter wet well from 15-inch and 10-inch gravity sewers from the north and west, respectively. The discharge from the station is conveyed via an approximately 6,190 foot long, 10-inch force main to the GWA SRI. The VVPS has two 75 hp, two-speed pumps, each of which is rated at 1,540 gallons per minute (gpm) at 76 feet of head. The VVPS is designed for a firm capacity of 1,540 gpm and based on discussions with GWA staff one pump is able to convey all flow tributary to the VVPS. Pumps are operated using an ultrasonic level transmitter, which has replaced the bubbler system originally installed with the pumps. The pumps have four operating levels, low speed pump on, low speed to high speed, high speed to low speed, and pump off. Alternation of the lead pump occurs via an electronic alternator after the lead pump stops. A level transducer is used to measure and transmit wet well levels to the wastewater treatment plant (WWTP) via a telemetry system. To estimate the VVPS capacity a wet well draw down test was completed January 10, 2013 by measuring the time required to pump a known wet well volume with one pump operating at full speed. A “high wet well level” and “low wet well level” were determined utilizing the read out from the level transducer. The high wet well level corresponded to the invert of the lowest incoming sewer and the low

Glenbard Wastewater Authority Facilities Plan Section 2–Existing Wastewater Conveyance Facilities
Prepared by Strand Associates, Inc. 2-5 R:\MAD\Documents\Reports\Archive\2013\GWA, IL\FP.1278.047.tws.sep\Report\S2 062013.docx\062613
wet well level the top of the benching in the wet well. The wet well level was allowed to fill several inches above the high wet well level elevation prior to pump operation to allow time for the pumps to ramp up to full speed before the high wet well level was reached. The drawdown test results indicate the pump station is operating at approximately 1,270 gpm. The pumping pressure is not known since there are no gauges installed or locations available to easily install gauges on the force main. To determine the theoretical head required at 1,270 gpm and 1,540 gpm, a hydraulic analysis of the force main was completed. At 1,270 gpm, the total dynamic head (TDH) required based on the pump curve is approximately 83 feet, which is higher than the pumps rated TDH of 76 feet, and between the theoretical head calculated assuming a low friction factor (74 feet) and high friction factor (96 feet). At 1,540 gpm the TDH required is much higher than the pumps rated TDH of 76 feet. Using the maximum Illinois Environmental Protection Agency (IEPA) allowed friction factor the calculated TDH is approximately 116 feet at a flow rate of 1,540 gpm. For the St. Charles Road Pumping Station project a slightly more conservative friction factor was applied that would result in a TDH of approximately 136 feet for the VVPS. The new pumps for VVPS are designed for 1,540 gpm @ 138 feet TDH. Electrical power to the site is supplied by Commonwealth Edison. The 480-volt feed is supplied via an overhead feed from lines located on the south east corner of the site. Emergency power is supplied by a 100 kW diesel generator with a 500-gallon outdoor, aboveground, double-walled storage tank with an average fuel consumption of 8.4 gallons/hour, which provides 60 hours maximum continuous runtime. The generator is 30+ years old and is housed in a small building located on the east side of the site. The size of the building makes it difficult to perform routine maintenance on the generator. A review of current flood mapping (DFRM–Panel 0154A, Dated July 7, 2010) indicates the 100-year floodplain elevation at the pump station site is approximately 673.0. The majority of the site is located below elevation 673.0 with the highest location being the wet well top slab with an elevation of approximately 673.0. The site generally slopes down from the wet well top slab towards the fence line. Compensatory storage will be required to compensate for fill in the floodplain for the new generator building. During periods of heavy rain, surface water impacts the site as the water level rises in the East Branch of the DuPage River. There is a drainage ditch on the east side of the site that conveys flow to the river during smaller events. During large rain events, the river level rises and begins to back up the drainage ditch and impact the low areas on the site. C. Existing Flow Rates The tributary area for the VVPS includes approximately 850 parcels with no commercial or high density housing located in the tributary area. There remains very little undeveloped land in the tributary areas; therefore, the existing flow rates to the VVPS are not expected to change because of development. Flow metering was conducted in 2012, by others, in the sewershed tributary to the VVPS. The following flows were metered:
Low Hour Flow 126 gpm Average Dry Weather Flow 169 gpm Peak Hourly Flow 213 gpm

Glenbard Wastewater Authority Facilities Plan Section 2–Existing Wastewater Conveyance Facilities
Prepared by Strand Associates, Inc. 2-6 R:\MAD\Documents\Reports\Archive\2013\GWA, IL\FP.1278.047.tws.sep\Report\S2 062013.docx\062613
The flow metering was conducted during a period of very dry weather with no major storm events. Based on discussions with plant staff, during periods of wet weather, flows to the station increase significantly, but one pump is able to convey all flow. The projected peak design flow to the VVPS is assumed to be the existing VVPS design capacity of 1,540 gpm. D. Alternative Analysis
1. General Design Concepts The following general design concepts were considered for all alternatives evaluated. These general design concepts are intended to improve the overall operation and flexibility of the upgraded station.
a. All controls are to be located above ground in a new building.
b. A new emergency power generator will be provided and housed in the new building with a diesel storage tank located below the generator.
c. All electrical equipment will be housed in a separate room within the generator
building. The room will be cooled with fans.
d. A new station bypass connection will be installed to the existing force main to allow GWA staff to utilize portable pumps to convey flows when necessary.
e. A magnetic flow meter will be installed in a precast manhole to meter pump
station flows.
f. Communication from the site to the WWTP will be converted from telemetry to radio or cellular. The telemetry system is considered to be outdated and is not fully supported by the utility company.
g. A dry well will be installed separate from the wet well using a square precast
structure. h. Compensatory storage will be required and potentially installed on the east side
of the site. The storage volume required is 1.5 times the amount of fill placed in the floodplain.
i. A surge relief valve will be installed in the dry well and piped back to the wet well. j. A yard hydrant will be provided on the site.
In addition to the above general design concepts, it will be important to maintain the operation of the existing station as much as possible during construction. Maintaining the operation of the existing station minimizes the potential for operational problems and overflows during wet weather events. Some bypass pumping will be required during the course of the upgrade.

Glenbard Wastewater Authority Facilities Plan Section 2–Existing Wastewater Conveyance Facilities
Prepared by Strand Associates, Inc. 2-7 R:\MAD\Documents\Reports\Archive\2013\GWA, IL\FP.1278.047.tws.sep\Report\S2 062013.docx\062613
2. Pumping Station Upgrade Alternatives All alternatives had to be able to pump a wide range of flows. As stated above, the average daily flow is 169 gpm and the peak design flow rate is 1,540 gpm. The existing force main is 10-inch-diameter, which requires a flow of approximately 500 gpm to maintain a velocity of 2 feet per second (ft/s) in the force main, which is required by IEPA to maintain a cleansing velocity. In cases where continuous flow can be maintained by use of variable speed pumping, lower velocities down to about 1 ft/s (approximately 250 gpm) may be considered. Considering the above flow rates several pump station alternatives were evaluated:
PS-1. Two-Pump Station–This alternative involves installing two new pumps with or without variable frequency drives (VFDs) in a new 10-foot-diameter wet well, with a capacity 1,540 gpm, each. The pumps flow rate at the minimum operating speed is approximately 600 gpm, which results in pump cycling during periods of average daily flow. If pumps are operated without VFDs (1,540 gpm) and with VFDs (at flow rate of 600 gpm), the approximate number of pump starts per hour will be approximately 4.4 and 3.5, respectively, at the average daily flow rate of 169 gpm. The installation of VFDs does not reduce the pump starts per hour significantly from constant speed operation. The costs of VFDs and soft starts were compared, and because of significantly lower costs, soft starts will be installed for the pumps. PS-2. Three-Pump Station–This alternative involves installing three new pumps with two pumps having a combined capacity of 1,540 gpm. The pumps flow rate at the minimum operating speed is approximately 500 gpm, which is only 100 gpm lower than the two pump station option. Pump cycling will be required during periods of average daily flow. PS-3. Three-Pump Station–Two Wet Weather Pumps–One Dry Weather Pump–This alternative includes installation of two pumps to convey wet weather flows and one pump to convey dry weather flows. Ideally the dry weather flow pump would be designed to pump twice the average daily flow, or 340 gpm, which does not maintain a velocity of 2 ft/s in the force main, but would maintain a velocity greater than 1 ft/s which is typically acceptable for pumping at a constant rate. However, the pump would still cycle to meet average daily flow rates.
All alternatives evaluated require pump cycling to meet daily average flow rates. Alternatives PS-2 and 3 have substantial additional capital costs associated with addition of a third pump. The following general wet well upgrade alternatives were considered as a part of the alternatives process:
WW-1. New submersible pump station using the existing wet well–This alternative includes reusing the existing 8-foot-diameter wet well and installing two new submersible pumps. This alternative includes removing the existing concrete fillets in the wet well and installing a new top slab to allow for pump installation and retrieval. As a part of the alternative, the wet well operating volume was evaluated for a submersible pump station and found to be inadequate to meet pump cycling requirements. This alternative also presents constructability concerns since the existing wet well would need to be

Glenbard Wastewater Authority Facilities Plan Section 2–Existing Wastewater Conveyance Facilities
Prepared by Strand Associates, Inc. 2-8 R:\MAD\Documents\Reports\Archive\2013\GWA, IL\FP.1278.047.tws.sep\Report\S2 062013.docx\062613
bypassed for an extended period of time while the fillets are removed, and whether is uncertain if the wet well walls or base slab will be damaged by the removal of the fillets.
WW-2. Installation of a new submersible pump station using a new precast wet well–This alternative considers the installation of a new 10-foot-diameter precast wet well and rerouting of the existing influent sewers. The new wet well will be installed while the existing wet well remains in service. Bypass pumping should be reduced significantly with this alternative. Several alternate layouts are feasible with the alternative and discussed below. The wet well will be sized to reduce the amount of pumps starts per hour to less than six during average daily flows and less than twelve at the highest pump cycle flow of 770 gpm.
3. Permitting Requirements
a. Building Code Requirements–The VVPS is located within unincorporated
DuPage County. DuPage County was contacted to discuss code requirements for diesel fuel storage tanks. The following is a summary of the requirements:
a. Outdoor Installation–Maximum storage tank size is 300 gallons. A variance is required for tanks over 300 gallons.
b. Indoor installation–No maximum tank size requirement. Fire protection is not required according to DuPage County code and Lisle/Woodridge fire district.
b. DuPage County Stormwater Permitting–Portions of the existing site are located
within the 100-year floodplain and require a DuPage County Flood Plain submittal. Postconstruction stormwater management facilities will not be required if less than 2,500 square feet of net impervious area is added. The site is located outside of the 50-foot wetland buffer required by DuPage County. The site is located inside the floodplain buffer and mitigation will be required.
c. Water Service–Permitting through Illinois American Water Company will be
required for the water service. d. Illinois Department of Natural Resources–An EcoCAT clearance letter dated
December 27, 2012, has been obtained with construction activity restricted during March through June. We spoke with the IDNR and the restriction will be waived based on supplementary information provided to IDNR on January 21, 2013.
e. Illinois Environmental Protection Agency–Schedule F (Lift Station) and Schedule P (erosion control) permits will be required.
f. Milton Township–Milton township owns the roadway and storm sewer system
adjacent to the Valley View site. No permits are required from Milton Township, however, specific township requirements will need to be incorporated into the bid documents.

Glenbard Wastewater Authority Facilities Plan Section 2–Existing Wastewater Conveyance Facilities
Prepared by Strand Associates, Inc. 2-9 R:\MAD\Documents\Reports\Archive\2013\GWA, IL\FP.1278.047.tws.sep\Report\S2 062013.docx\062613
4. Recommended Alternative and Opinion of Probable Cost Alternative PS-1 with a new wet well, Alternative WW-2, is recommended based on constructability and a lower opinion of probable cost. The proposed project includes installation of two 85 hp submersible pumps, a valve vault, emergency bypass connections, and magnetic flow metering. In addition to the pump station upgrades, a building will be constructed to house a 150 kW diesel powered standby generator, fuel tank, and electrical equipment. The opinion of probable cost for this project is $2,047,000 and is presented in Table 2.06-1.
1 Costs in 2nd Quarter 2013 dollars. Table 2.06-1 Preliminary Opinion of Probable Cost
Glenbard Wastewater Authority
Valley View Lift Station ImprovementsOpinion of Probable CostSubmersible Pump Station/Valve Vault and Generator Building
Installed
CostCapital Costs1
A. Equipment and Facilities
2-85 hp Flygt Submersible Pumps NP-3202 145,000$
150 kW Generator 95,000$
Precast Structures (Wetw ell, Valve Vault, Meter MH, Bypass MH) 120,000$
Generator Building 240,000$
Subtotal A (Structures and Equipment) 600,000$
B. Ancillary Captial Costs
Mechanical and Underground Pipe 165,000$
HVAC 50,000$
Site Work/Excavation 220,000$
Demolition/Bypass Pumping/Dew atering 45,000$
Electrical and Controls 330,000$
Subtotal B 810,000$
Total (A & B Subtotals) 1,410,000$
Contractors General Conditions @ 10% 141,000$
Subtotal C 1,551,000$
Contingencies @ 10% 155,000$
Total Construction Costs 1,706,000$
Technical Services @ 20% 341,000$
Total Project Costs 2,047,000$
1Costs based on 2nd Quarter 2013


SECTION 3
EXISTING WWTP FACILITIES


Glenbard Wastewater Authority Facilities Plan Section 3–Existing WWTP Facilities
Prepared by Strand Associates, Inc. 3-1 R:\MAD\Documents\Reports\Archive\2013\GWA, IL\FP.1278.047.tws.sep\Report\S3.TM1-Existing WWTP Facilities 062013.docx\062413
3.01 BACKGROUND This section includes a summary of existing units and capacities, discusses NPDES permit requirements, and summarizes the GWA WWTP performance. The description of the LCSTP and summary of the LCSTP NPDES permit requirements are included in Section 2. 3.02 DESCRIPTION OF EXISTING FACILITIES The GWA WWTP was constructed in 1977. A number of projects in the past 20 years have replaced or modified portions of the WWTP facilities. The basis of design and size of the major unit processes are presented in Table 3.02-1. The WWTP is rated for an annual average flow of 16.02 mgd and a maximum daily flow of 47 mgd, which are reflected in the NPDES permit (Appendix B). A site plan of the GWA WWTP is shown in Figure 3.02-1. Figure 3.02-2 includes a process flow schematic for the GWA WWTP. Treatment consists of deep mechanical fine screening, pumping, grit removal, primary sedimentation, two-stage high purity oxygen-activated sludge treatment (TS-HPOAS), intermediate clarification, final clarification, granular media filtration, and UV disinfection. The treated effluent is discharged to the East Branch of the DuPage River. Primary and waste activated sludge (WAS) is cothickened in a gravity thickener and then pumped to the anaerobic digesters before dewatering and land application. The 2011 Asset Analysis and Cost Allocation Study reviewed the existing GWA mechanical, electrical, and heating, ventilation, and air conditioning (HVAC) assets. A. Liquid Treatment Screening is provided by two deep mechanical bar screens that were installed in 2006. The screened wastewater is pumped from the headworks facilities to the vortex grit removal tanks (2004) located on the west side of the site. After primary clarification, the primary effluent flows to the activated sludge facilities. The existing activated sludge facilities include first-stage high purity oxygen carbonaceous aeration basins (Carbo), intermediate clarification, intermediate screw pumping station, second-stage nitrification aeration tanks (Nitro), and final clarification. Historically, the WWTP has operated in a two-stage mode with all flows less than about 16 mgd discharged to the Carbo stage and remaining flows in excess of 16 mgd diverted to the Nitro stage. The two Carbo stage aeration basins discharge to two intermediate clarifiers. Settled sludge from the intermediate clarifiers is returned to the head of the Carbo trains. At the intermediate pump station, the intermediate clarifier overflow and Nitro return activated sludge (RAS) are blended and then pumped to the head of the eight Nitro trains. Oxygen is produced with a cryogenic high-purity oxygen system to all ten trains of covered aeration basins, each with four basins per train. The final clarifier effluent flows to the granular media filters. The UV system, which was installed in 1995, disinfects the final effluent.

Glenbard Wastewater Authority Facilities Plan Section 3–Existing WWTP Facilities
Prepared by Strand Associates, Inc. 3-2 R:\MAD\Documents\Reports\Archive\2013\GWA, IL\FP.1278.047.tws.sep\Report\S3.TM1-Existing WWTP Facilities 062013.docx\062413
TABLE 3.02-1 UNIT PROCESS SIZES AND DESIGN CRITERIA
Item Design Parameter Mechanical Bar Screens Number of Units 2 Bar Spacing 3/16 inches Capacity Each, mgd 47 Screenings Handling Type, Number of Units Washer Compactor, 2 Raw Sewage Pumps Number of Pumps 3 Type Centrifugal, VFD Rated Capacity of Each Unit, mgd 22.5 TDH, feet 65 Motor hp, each 350 Capacity @ High Wet Well Level and Two Pumps Running, mgd1 44.6 Grit Removal System Number of Grit Basins 2 Type Vortex Grit Collector Capacity Each, mgd 23.5 Number of Grit Pumps 2 Grit Pump Capacity Each, gpm 250 Type of Grit Washer Vortex Number of Grit Washers 2 Primary Clarifiers Number of Units 2 Diameter, feet 110 SWD, feet 10 Surface Overflow Rate (SOR), gpd/ft2 @ 16 mgd 844 @ 47 mgd 2,470 Peak Flow Capacity, mgd (Based on 1,800 gpd/ft2 SOR) 34.2 Weir Overflow Rate, gpd/ft. @ 47 mgd 68,000
1 From 1991 High Flow Study
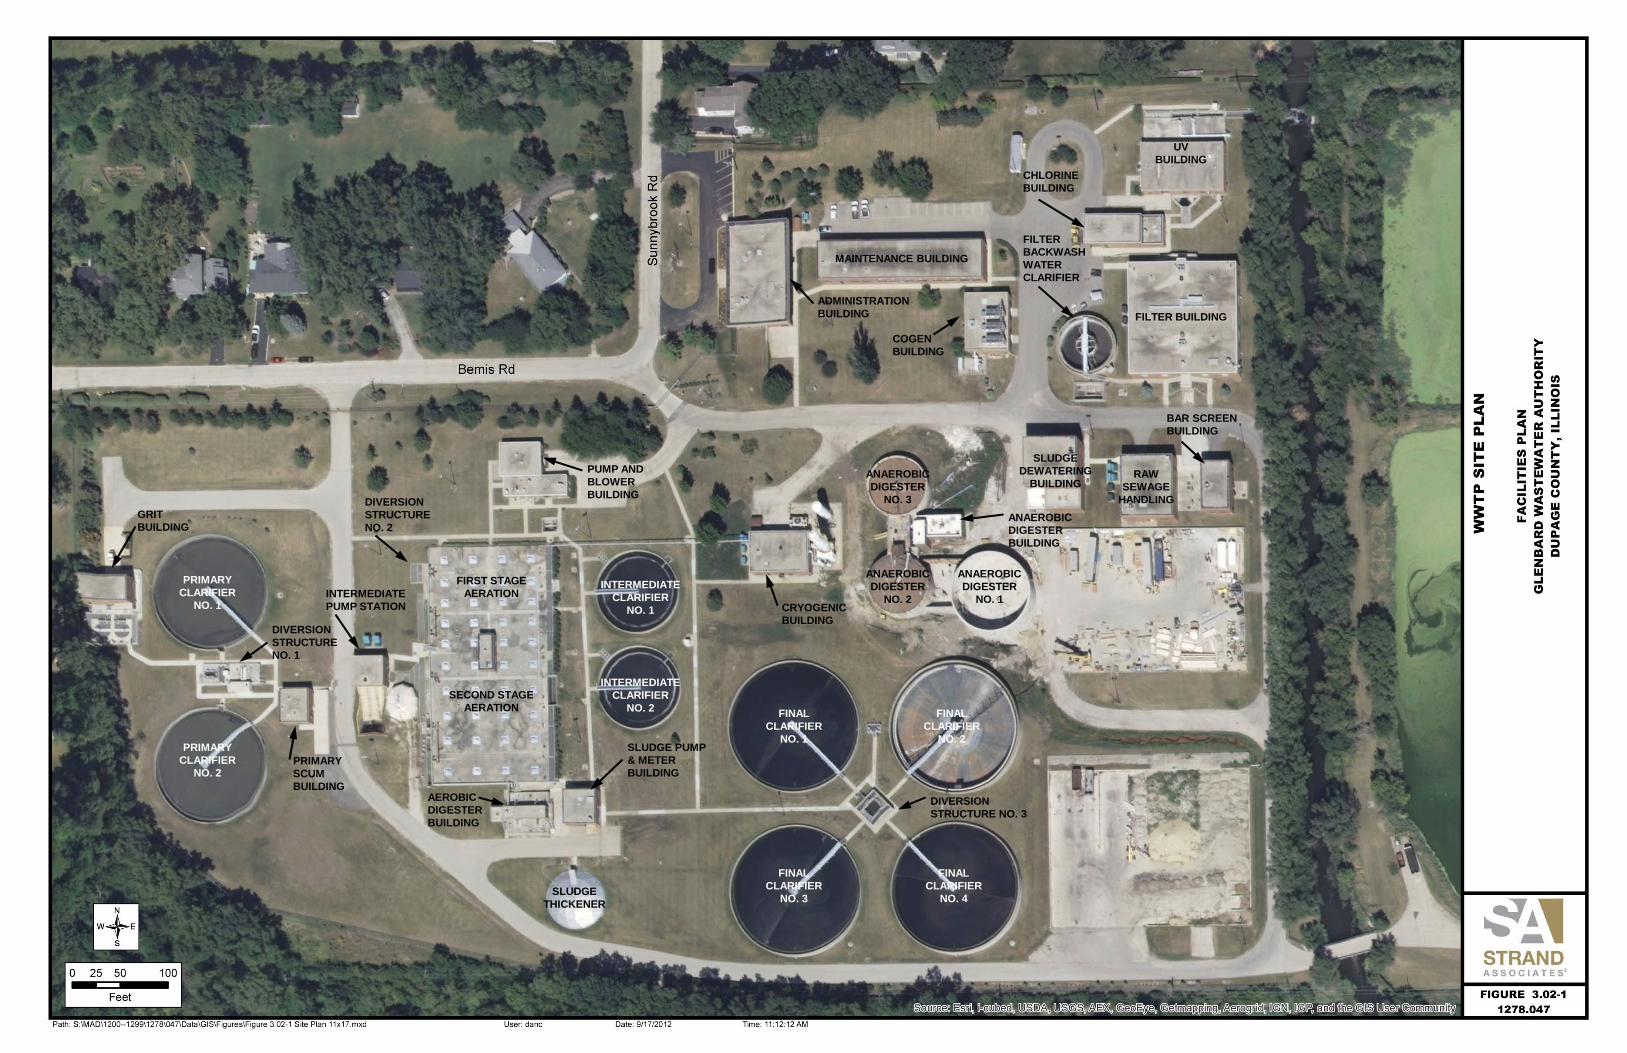
This image cannot currently be displayed.
MAINTENANCE BUILDING
UV BUILDING
FILTER BACKWASH WATER CLARIFIER
FILTER BUILDING
SLUDGE DEWATERING
BUILDING RAW
SEWAGE HANDLING
ANAEROBIC DIGESTER
NO. 1
ANAEROBIC DIGESTER
NO. 2
ANAEROBIC DIGESTER
NO. 3
FINAL CLARIFIER
NO. 1
FINAL CLARIFIER
NO. 2
FINAL CLARIFIER
NO. 4
FINAL CLARIFIER
NO. 3 SLUDGE THICKENER
SLUDGE PUMP & METER BUILDING
SECOND STAGE AERATION
FIRST STAGE AERATION
INTERMEDIATE
CLARIFIER NO. 2
INTERMEDIATE PUMP STATION
PRIMARY CLARIFIER
NO. 1
PRIMARY CLARIFIER
NO. 2
DIVERSION STRUCTURE NO. 1
PRIMARY SCUM BUILDING
GRIT BUILDING
DIVERSION STRUCTURE NO. 2
DIVERSION STRUCTURE NO. 3
PUMP AND BLOWER BUILDING
ADMINISTRATION BUILDING
COGEN BUILDING
CHLORINE BUILDING
AEROBIC DIGESTER BUILDING
CRYOGENIC BUILDING
BAR SCREEN BUILDING
ANAEROBIC DIGESTER BUILDING
INTERMEDIATE
CLARIFIER NO. 1


®
PR
OC
ES
S F
LOW
SC
HE
MA
TIC
FAC
ILIT
IES
PLA
NG
LEN
BA
RD
WA
ST
EW
AT
ER
AU
TH
OR
ITY
DU
PA
GE
CO
UN
TY
, ILL
INO
IS
FIGURE 3.02-21278.047


Glenbard Wastewater Authority Facilities Plan Section 3–Existing WWTP Facilities
Prepared by Strand Associates, Inc. 3-3 R:\MAD\Documents\Reports\Archive\2013\GWA, IL\FP.1278.047.tws.sep\Report\S3.TM1-Existing WWTP Facilities 062013.docx\062413
Item Design Parameter Primary Sludge Pumps Number of Units 2
Type Progressing Cavity Capacity Each, gpm 300 TDH, feet 125 hp, each 30 Carbonaceous Aeration Trains Train 1 Volume, gallons 337,000
Dimensions, feet 127 x 25 x 14.17 (SWD) Number of Mixers 4 Mixer Motor hp Each 30, 15, 10, 7.5
Train 2 Volume, gallons 269,000
Dimensions, feet 127 x 20 x 14.17 (SWD) Number of Mixers 4 Mixer Motor hp Each 25, 10, 7.5, 7.5
Total Carbonaceous Volume, gallons 606,000 Maximum Flow to Carbonaceous Stage, mgd 16 Design MLSS, mg/L @ 10°C 3,350 F/M @ 10°C, lbs BOD/lb MLSS/day 0.7 Influent BOD, lbs/day 11,850 Intermediate Clarifiers Number of Units 2 Diameter, feet 85 SWD, feet 12 SOR, gpd/ft2 @ 9.1 mgd 802 @ 17 mgd 1,498 Peak Hour Flow Capacity, mgd 11.3 (Based on 1,000 gpd/ft2 for AS at peak hour–IEPA Code) Weir Overflow Rate, gpd/ft @ 17 mgd 31,800 Intermediate Pumping Station Number of Units 3 Type Screw, 7 feet diameter Capacity Each, gpm 12,500 TDH, feet 22 hp, each 125

Glenbard Wastewater Authority Facilities Plan Section 3–Existing WWTP Facilities
Prepared by Strand Associates, Inc. 3-4 R:\MAD\Documents\Reports\Archive\2013\GWA, IL\FP.1278.047.tws.sep\Report\S3.TM1-Existing WWTP Facilities 062013.docx\062413
Item Design Parameter Carbo RAS Pumps Number of Units 4 Type Centrifugal Capacity Each, gpm 1,800 TDH, feet 36 Carbo WAS Pumps Number of Units 1 Type Submersible Average, gpm ~100 Nitrification Aeration Trains Number of Trains 8 Trains 3, 4, and 5 Volume Each, gallons 280,000 Dimensions Each, feet 127 x 20 x 14.73 (SWD)
Number of Mixers Each Train 4 Mixer Motor hp Each Train 15, 7.5, 7.5, 7.5
Trains 6, 7, 8, 9, and 10 Volume Each, gallons 350,000 Dimensions Each, feet 127 x 25 x 14.73 (SWD)
Number of Mixers Each Train 4 Mixer Motor hp Each Train 20, 10, 7.5, 7.5
Total Volume, gallons 2,590,000 Design MLSS @ 10°C, mg/L 6,200 Cryogenic Oxygen Plant Maximum Capacity, tons/day 32 Minimum Stable Operating Capacity, tons/day 20 to 23 Compressor Motor hp 700 Final Clarifiers Number of Units 4 Diameter, feet 135 SWD, feet 14 Surface Overflow Rate, gpd/ft2 @ 16 mgd 279 @ 47 mgd 818 Solids Loading, lbs/ft2/day.@ 16 mgd, RAS=8 mgd, and 5,500 mg/L MLSS 19.2 Peak Hour Capacity, mgd (800 gpd/ft2 for Nitrification Stage) 46 Weir Overflow rate, gpd/ft @ 47 mgd 27,700

Glenbard Wastewater Authority Facilities Plan Section 3–Existing WWTP Facilities
Prepared by Strand Associates, Inc. 3-5 R:\MAD\Documents\Reports\Archive\2013\GWA, IL\FP.1278.047.tws.sep\Report\S3.TM1-Existing WWTP Facilities 062013.docx\062413
Item Design Parameter Nitro WAS Pumps Number of Units 2 Granular Media Filters Number of Units 10 Dimensions of Each Filter, feet Length 37 Width 18 Filtration Rate, gpm/ft2 @ 16 mgd 1.68 @ 47 mgd (all units in service) 4.91 Peak Flow Capacity, mgd @ 5 gpm/ft2, With One Unit Out of Service 43.2 Filter Backwash Pumps Number of Units 2 Type Vertical Turbine Capacity each, gpm 8,000 TDH, feet 16 hp, each 75
Mud Well (Spent Backwash) Pumps Number of Units 2 Type Centrifugal Capacity, gpm 1,600 TDH, feet 28 Filter Backwash Water Clarifier Number of Units 1 Diameter, feet 55 SWD, feet 13.6 SOR, gpd/ft2 600 UV Disinfection Number of Channels 4 Number of Banks/Channel 2 Number of Lamps/Bank 288 Total Number of Lamps 2,304 Rated Hydraulic Capacity per Channel, mgd 14.3

Glenbard Wastewater Authority Facilities Plan Section 3–Existing WWTP Facilities
Prepared by Strand Associates, Inc. 3-6 R:\MAD\Documents\Reports\Archive\2013\GWA, IL\FP.1278.047.tws.sep\Report\S3.TM1-Existing WWTP Facilities 062013.docx\062413
Item Design Parameter Gravity Sludge Thickener Number of Units 1 Diameter, feet 55 SWD, feet 10 Design Solids Loading Rate, lbs/day/ft2 600 Design Overflow Rate, gpd/ft2 600 GBT Feed Pumps Number of Units 2 Type Progressing Cavity Capacity, gpm 375 TDH, feet 48 hp, each 25 GBT Number of Units 1 Capacity, gpm 375 GBT Thickened Sludge Pumps Number of Units 1 Type Progressing Cavity Capacity, gpm 125 TDH, feet 47 hp, each 25 Anaerobic Digester No. 1 Type Primary Cover Type Floating Holder Diameter 80 ft SWD 23.5 ft Volume 933,000 gallons Anaerobic Digester No. 2 Type Primary Cover Type Floating Holder Diameter 60 ft Side Water Depth 23.5 ft Volume 525,000 gallons

Glenbard Wastewater Authority Facilities Plan Section 3–Existing WWTP Facilities
Prepared by Strand Associates, Inc. 3-7 R:\MAD\Documents\Reports\Archive\2013\GWA, IL\FP.1278.047.tws.sep\Report\S3.TM1-Existing WWTP Facilities 062013.docx\062413
Item Design Parameter Anaerobic Digester No. 3 Type Secondary Cover Type Floating Gas Holder Diameter 60 ft Side Water Depth 18.5 ft Volume 375,000 gallons Sludge Recirculation Pumps Number of Units 3 Type Progressing Cavity Capacity, gpm 360 TDH, feet 35 hp, each 15 Digester Sludge Transfer Pumps Number of Units 2 Type Centrifugal Capacity, gpm 350 TDH, feet 30 hp, each 10 Combination Boiler/Heat Exchangers Number 2 Capacity Each, million BTU/hr 1.5 Digester Mixing Pumps Type Dry Pit Horizontal Anaerobic Digester No. 1 Number 2 Capacity Each, gpm 2,290 Anaerobic Digester No. 2 and No. 3 Number 2 (1 per digester) Capacity Each, gpm 3,024 Digested Sludge Transfer Pumps Number of Units 2 Type Progressing Cavity Capacity, gpm 160 TDH, feet 126 hp, each 15

Glenbard Wastewater Authority Facilities Plan Section 3–Existing WWTP Facilities
Prepared by Strand Associates, Inc. 3-8 R:\MAD\Documents\Reports\Archive\2013\GWA, IL\FP.1278.047.tws.sep\Report\S3.TM1-Existing WWTP Facilities 062013.docx\062413
Item Design Parameter Digested Sludge Transfer Tanks Number 2 Capacity Each, gallons 35,000 Belt Filter Press Feed Pumps Number of Units 3 Type Progressing Cavity Sludge Dewatering Type Belt Filter Press Number of Units 2 Size, meters 2.2 Electrical Generators Number of Units 3 Capacity Each, kW 815
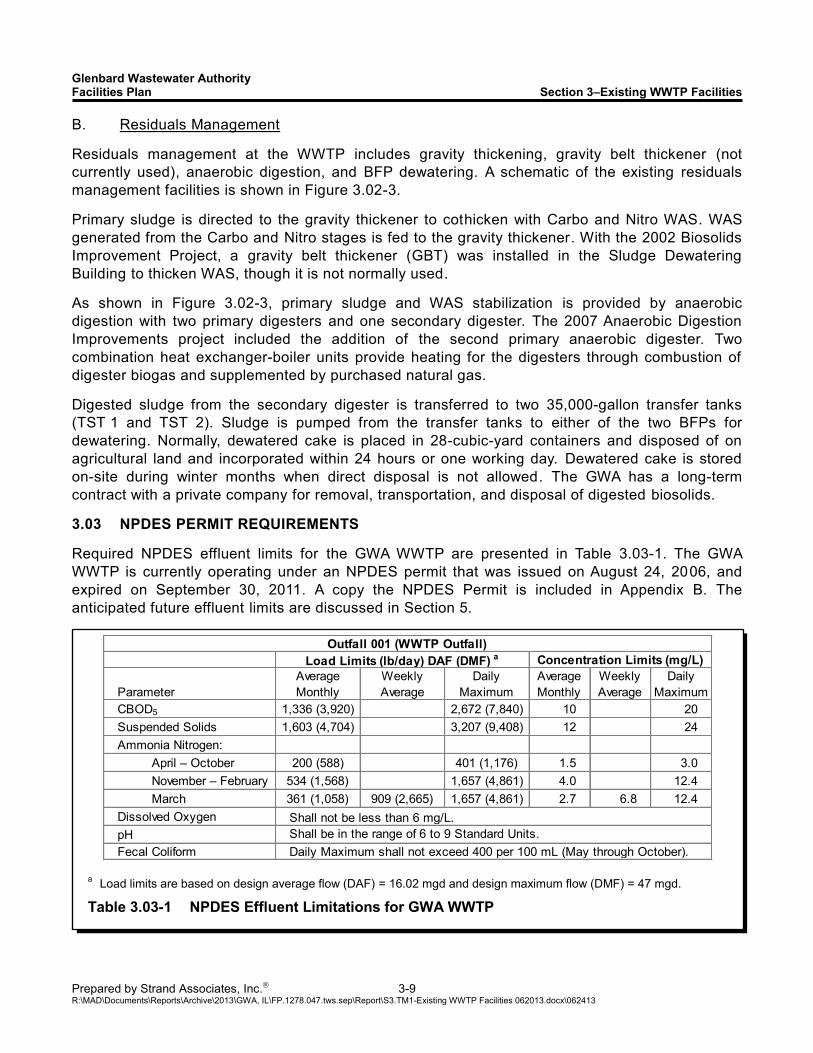
Glenbard Wastewater Authority Facilities Plan Section 3–Existing WWTP Facilities
Prepared by Strand Associates, Inc. 3-9 R:\MAD\Documents\Reports\Archive\2013\GWA, IL\FP.1278.047.tws.sep\Report\S3.TM1-Existing WWTP Facilities 062013.docx\062413
B. Residuals Management
Residuals management at the WWTP includes gravity thickening, gravity belt thickener (not currently used), anaerobic digestion, and BFP dewatering. A schematic of the existing residuals management facilities is shown in Figure 3.02-3.
Primary sludge is directed to the gravity thickener to cothicken with Carbo and Nitro WAS. WAS generated from the Carbo and Nitro stages is fed to the gravity thickener. With the 2002 Biosolids Improvement Project, a gravity belt thickener (GBT) was installed in the Sludge Dewatering Building to thicken WAS, though it is not normally used.
As shown in Figure 3.02-3, primary sludge and WAS stabilization is provided by anaerobic digestion with two primary digesters and one secondary digester. The 2007 Anaerobic Digestion Improvements project included the addition of the second primary anaerobic digester. Two combination heat exchanger-boiler units provide heating for the digesters through combustion of digester biogas and supplemented by purchased natural gas.
Digested sludge from the secondary digester is transferred to two 35,000-gallon transfer tanks (TST 1 and TST 2). Sludge is pumped from the transfer tanks to either of the two BFPs for dewatering. Normally, dewatered cake is placed in 28-cubic-yard containers and disposed of on agricultural land and incorporated within 24 hours or one working day. Dewatered cake is stored on-site during winter months when direct disposal is not allowed. The GWA has a long-term contract with a private company for removal, transportation, and disposal of digested biosolids.
3.03 NPDES PERMIT REQUIREMENTS
Required NPDES effluent limits for the GWA WWTP are presented in Table 3.03-1. The GWA WWTP is currently operating under an NPDES permit that was issued on August 24, 2006, and expired on September 30, 2011. A copy the NPDES Permit is included in Appendix B. The anticipated future effluent limits are discussed in Section 5.
a Load limits are based on design average flow (DAF) = 16.02 mgd and design maximum flow (DMF) = 47 mgd.
Table 3.03-1 NPDES Effluent Limitations for GWA WWTP
ParameterAverage Monthly
Weekly Average
Daily Maximum
Average Monthly
Weekly Average
Daily Maximum
CBOD5 1,336 (3,920) 2,672 (7,840) 10 20Suspended Solids 1,603 (4,704) 3,207 (9,408) 12 24Ammonia Nitrogen:
April – October 200 (588) 401 (1,176) 1.5 3.0November – February 534 (1,568) 1,657 (4,861) 4.0 12.4March 361 (1,058) 909 (2,665) 1,657 (4,861) 2.7 6.8 12.4
Dissolved OxygenpHFecal Coliform
Load Limits (lb/day) DAF (DMF) a Concentration Limits (mg/L)Outfall 001 (WWTP Outfall)
Daily Maximum shall not exceed 400 per 100 mL (May through October).Shall be in the range of 6 to 9 Standard Units.Shall not be less than 6 mg/L.

1278.047
SO
LIDS
SC
HE
MA
TIC
FAC
ILITIE
S P
LAN
G
LEN
BA
RD
WA
ST
EW
AT
ER
AU
TH
OR
ITY
D
UP
AG
E C
OU
NT
Y, ILLIN
OIS
FIG
UR
E 3.02-3
SECONDARY DIGESTER
STORAGE TANKS
2 BELT FILTER PRESSES
PRIMARY DIGESTERS
GRAVITY THICKENER
THICKENED WAS/PRIMARY SLUDGE
DIGESTED BIOSOLIDS
CARBO AND NITRO WAS
PRIMARY SLUDGE
FINAL BIOSOLIDS
PRIMARY CLARIFIERS
CARBO AERATION
NITRO AERATION
GRAVITY BELT THICKENER
PRIMARY EFFLUENT
RAW WASTEWATER

Glenbard Wastewater Authority Facilities Plan Section 3–Existing WWTP Facilities
Prepared by Strand Associates, Inc. 3-10 R:\MAD\Documents\Reports\Archive\2013\GWA, IL\FP.1278.047.tws.sep\Report\S3.TM1-Existing WWTP Facilities 062013.docx\062413
3.04 EXISTING FLOWS AND LOADINGS A. Existing Influent Flows and Loadings A summary of average daily flows for the period 2009 through July 2012 is shown in Table 3.04-1. Additionally, Table 3.04-1 includes a review of plant influent loadings, primary effluent loadings, and primary removal performance for BOD and total suspended solids (TSS).
The BOD primary removal efficiency has averaged approximately 47 percent for 2009 through July 2012, which is higher than the typical range of 25 to 35 percent. The TSS percent removal is within the range of typical primary TSS removal performance at 62 percent removal. The influent loadings for ammonia are summarized in Table 3.04-2.
B. Existing Digester Loadings Using data from January 2009 through July 2012, the maximum month to average annual volatile solids (VS) loading to digestion ratio was determined to be approximately 1.15:1. Annual average and
Table 3.04-1 Summary of Influent Wastewater and Primary Effluent Data for BOD and TSS
Table 3.04-2 Summary of Influent
Wastewater Ammonia Data

Glenbard Wastewater Authority Facilities Plan Section 3–Existing WWTP Facilities
Prepared by Strand Associates, Inc. 3-11 R:\MAD\Documents\Reports\Archive\2013\GWA, IL\FP.1278.047.tws.sep\Report\S3.TM1-Existing WWTP Facilities 062013.docx\062413
maximum month VS loadings and detention times to the two primary digesters are shown in Table 3.04-3. The average annual and maximum month detention times in all three digesters are also shown in Table 3.04-3. The annual average digester influent percent VS is 81 percent.
3.05 WASTEWATER TREATMENT PERFORMANCE The Glenbard WWTP has met applicable five-day carbonaceous biochemical oxygen demand (CBOD5), TSS, ammonia, and fecal coliform discharge limits during the past three years. Ammonia limits have been met during the past three years except for two days in April 2010 because of a biological upset. Tables 3.05-1, 3.05-2, and 3.05-3 summarize the average monthly effluent CBOD5, TSS, and ammonia, respectively, from the WWTP.
Table 3.04-3 Digester Loading Summary
Table 3.05-1 Summary of Effluent CBOD5 Data

Glenbard Wastewater Authority Facilities Plan Section 3–Existing WWTP Facilities
Prepared by Strand Associates, Inc. 3-12 R:\MAD\Documents\Reports\Archive\2013\GWA, IL\FP.1278.047.tws.sep\Report\S3.TM1-Existing WWTP Facilities 062013.docx\062413
Table 3.05-2 Summary of Effluent TSS Data
Table 3.05-3 Summary of Effluent Ammonia Data


SECTION 4 WASTE LOAD AND FLOW FORECASTS


Glenbard Wastewater Authority Facilities Plan Section 4–Waste Load and Flow Forecasts
Prepared by Strand Associates, Inc. 4-1 R:\MAD\Documents\Reports\Archive\2013\GWA, IL\FP.1278.047.tws.sep\Report\S4.TM1-Future Flows and Loads 062013.docx\062413
4.01 POPULATION PROJECTIONS The GWA serves the communities of Glen Ellyn and Lombard and adjacent unincorporated areas including Glen Ellyn Heights (DuPage County) and Citizen Utilities Company’s Valley View service area. Except for small areas served by other utilities, GWA services all of the areas within the current Glen Ellyn and Lombard corporate limits. A. Summary of Previous Planning Reports The following discussion summarizes the Facility Planning reports prepared for GWA. The Glenbard Wastewater Treatment Facilities were placed into operation in 1981 with a design year of 2000. The 1989 Long Range Planning Study by Rezek, Henry, Meisenheimer and Gende, Inc. projected future flows and loadings for ultimate development within the FPA based on a population equivalent of 109,125. The Glenbard Wastewater Treatment Facilities ultimate design flows and loadings from the 1989 Long Range Planning Study are shown in Table 4.01-1. The 1991 High Flow Study by Rezek, Henry, Meisenheimer and Gende, Inc. projected a 57.34 mgd peak flow from computer modeling of a five-year frequency storm. This report along with the 1989 Long Range Planning Study recommended rerating the WWTP capacity to 16.02 mgd design average flow. The IEPA accepted this recommendation and the current NPDES permit rates the WWTP at 16.02 mgd design average flow and 47 mgd peak capacity. B. Population Projections Glen Ellyn and Lombard historic populations and Chicago Metropolitan Area for Planning (CMAP) projected populations for the year 2040 are shown in Figure 4.01-1. The population growth between 2000 and 2010 for both Glen Ellyn and Lombard was approximately 2 percent over this period. Design Year 2033 Glen Ellyn and Lombard population projections were interpolated from the 2010 US Census populations and the 2040 CMAP projected populations. The 2011 population equivalent and 2033 design year projected population equivalents for the GWA service area were estimated based on populations from US Census, CMAP, and the 2006 Facilities Plan. Summarized in Table 4.01-2 are the 2005 and 2027 population equivalents from the 2006 Facilities Plan, as well as the 2011 and 2033 population equivalents estimated for this report. Although the populations for Glen Ellyn and Lombard decreased in 2011 from the 2005 estimated populations in the 2006 Facilities Plan, the 2011 population of the unincorporated areas was assumed to be equal to the volumes in the 2006 Facilities Plan, and the unincorporated areas population of 7,493 in the 2006 Facilities Plan for the year 2027 is assumed to be the same for the 2033 design year of this
Average Daily Flow, mgd 16.02 Peak Daily Flow, mgd > 41.01 BOD, lbs/day 13,625 TSS, lbs/day 19,292 NH3N, lbs/day 1,684 Sludge Projection, tons/day 7.69
1 Rated for 47 mgd in current NPDES permit. Table 4.01-1 Glenbard Wastewater
Treatment Facilities Ultimate Design Flows and Loadings-1989 Long Range Planning Study

Glenbard Wastewater Authority Facilities Plan Section 4–Waste Load and Flow Forecasts
Prepared by Strand Associates, Inc. 4-2 R:\MAD\Documents\Reports\Archive\2013\GWA, IL\FP.1278.047.tws.sep\Report\S4.TM1-Future Flows and Loads 062013.docx\062413
report. Current and design year population equivalents for College of DuPage and Yorktown Shopping Center are assumed to be equal to the 2005 and 2027 population equivalents of the 2006 Facilities Plan, respectively. Currently GWA does not serve any large industrial dischargers, and neither Glen Ellyn nor Lombard expect significant industrial growth in their communities. The Year 2033 projected population within the GWA service area has not changed from the 2006 Facilities Plan.
1US Census 2011 population estimate for Glen Ellyn and Lombard. 2Glen Ellyn and Lombard populations interpolated from US Census 2011 population estimate and CMAP 2040 population forecast.
Table 4.01-2 Existing and 20-Year Projected Population
Year 2005(2006 FP)
Year 2027 (2006 FP)
Year 2011 Estimate1
Design Year 20332
Village of Glen Ellyn 28,000 32,291 27,648 35,872 Village of Lombard 45,000 50,618 43,462 55,161 Unincorporated Areas 13,200 7,493 13,200 7,493 College of DuPage 3,500 4,200 3,500 4,200 Yorktown Shopping Center 5,000 5,000 5,000 5,000 Unforeseen Commercial/ Industrial 9,523 1,399 Total Population Equivalent 94,700 109,125 92,810 109,125
Figure 4.01-1 Historic and Projected Populations for Glen Ellyn and Lombard
24,944 26,999 27,450
39,408 42,322 43,39538,489
58,883
0
10,000
20,000
30,000
40,000
50,000
60,000
70,000
1980 1990 2000 2010 2020 2030 2040 2050
Popu
latio
n
Glen Ellyn, US Census Lombard, US Census
Glen Ellyn, 2040 CMAP Projection Lombard, 2040 CMAP Projection

Glenbard Wastewater Authority Facilities Plan Section 4–Waste Load and Flow Forecasts
Prepared by Strand Associates, Inc. 4-3 R:\MAD\Documents\Reports\Archive\2013\GWA, IL\FP.1278.047.tws.sep\Report\S4.TM1-Future Flows and Loads 062013.docx\062413
Dry Weather Period
Flow (mgd)
September 2009 8.81 October 2010 8.04 November 2010 8.95 June 2012 8.81 Average 8.65
Table 4.02-1 Average Flows During
Dry Weather Periods
Current Average
(lbs/day) Per Capita Day
(pcd) BOD1 15,054 0.16 TSS1 16,865 0.18
NH3N2 1,895 0.020 1BOD and TSS average loadings from Table 3.04-1. 2NH3N average loading from Table 3.04-2. Table 4.02-3 Per Capita Loadings
4.02 FUTURE FLOWS AND LOADINGS A. Future Influent Flows and Loadings Future plant flows were based on existing flows plus an allowance for future population equivalents. Monthly average flows during dry weather periods are shown in Table 4.02-1. Based on an average daily dry weather flow of 8.65 mgd and an existing population equivalent of 92,810, the existing per capita dry weather flow would be about 93 gallons per capita per day (gcd). The average daily flow for years 2009, 2010, and 2011 is 13.27 mgd, and the existing per capita average daily flow is 143 gcd. The average daily flow from future growth was assumed to be at an average rate of 143 gcd. The resultant projected design average flow is 15.60 mgd. Because the calculated design average flow is less than 3 percent of the existing rated design average flow of 16.02 mgd, a design average flow of 16.02 mgd is recommended. The existing maximum daily flows received at the Glenbard WWTP are shown in Table 4.02-2. The average of the four highest average daily flows from 2009 through July 2012 is 38.93 mgd. For future growth; 100 gcd is assumed because the FPA is fully developed and, therefore, additional I/I is not anticipated.
During high flows, the influent pumping station typically operates at a higher wet well level, which surcharges the influent sewer. The influent flow meter is located in the Grit Removal Building, which is downstream of the influent pump station. The average peaking factor of peak hourly flow over the daily flow for selected high flow days is 1.16. The resultant design peak hourly flow is 47.0 mgd using the design year maximum day flow of 40.56 mgd. Existing average BOD, TSS, and ammonia per capita loadings, summarized in Table 4.02-3, are based on the annual average loadings presented in Tables 3.04-1 and 3.04-2 and an existing population equivalent of 92,810. The existing average per capita loadings for BOD, TSS, and ammonia are about 0.16, 0.18, and .020, respectively. However, future loadings were projected based on typical BOD, TSS, and total Kjeldahl nitrogen (TKN) per capita values of 0.17, 0.20, and 0.035, respectively. A typical per capita value of 0.007 is used for future phosphorus loadings.
Date Flow (mgd)
February 27, 2009 36.89 March 8, 2009 40.51 December 25, 2009 37.72 July 24, 2010 40.58 Average 38.93
Table 4.02-2 Maximum Daily Flows

Glenbard Wastewater Authority Facilities Plan Section 4–Waste Load and Flow Forecasts
Prepared by Strand Associates, Inc. 4-4 R:\MAD\Documents\Reports\Archive\2013\GWA, IL\FP.1278.047.tws.sep\Report\S4.TM1-Future Flows and Loads 062013.docx\062413
The design flows and loadings are summarized in Table 4.02-4 and are equivalent to loading projections developed in the 2006 Facilities Plan.
B. Future Digester Loadings A sludge mass balance was prepared for the future maximum monthly condition. A population equivalent of 109,125 was assumed, and the future maximum monthly to annual average ratio was assumed to be 1.33:1. The current plant is designed for a population equivalent of 109,125. The maximum monthly to annual average ration of 1:33 is more typical than the calculated current value at 1:15. It was also assumed chemical phosphorus removal (CPR), with anticipated higher sludge quantities, would be included. For purposes of this report, it was assumed phosphorus limits would be imposed at GWA within about 10 years. The average plant influent phosphorus is about 6.6 mg/L, based on six samples collected in 2003 and 2004. Assuming alum would be used for phosphorus removal, total sludge solids may increase by about 8,600 lbs/day (2006 Facilities Plan). Alum addition would not increase the projected VS loading. The mass balance is shown in Figure 4.02-1. The maximum month VS loading to the primary digester in 2033 is projected to be 22,300 lbs/day, which would be about 0.11 lbs/day/ft3. The projected 2033 VA loading is less than the 24,300 lbs/day VA loading used for the 2007 Anaerobic Digestion Improvements design. The hydraulic or solids detention time would be about 14.9 days.
Population Equivalent 109,125 Population Increase From 2011 16,315
Current Daily Average Flow (mgd) 13.27 Projected Additional Growth @ 143 gcd (mgd) 2.33 Projected Design Average Flow (mgd) 15.60 Recommended Design Average Flow (mgd) 16.02
Current Maximum Day Flow (mgd) 38.93 Projected Additional Growth @ 100 gcd (mgd) 1.63 Design Maximum Daily Flow (mgd) 40.56
Design Maximum Hourly Flow (mgd) 47.00
Design BOD @ 0.17 pcd (lbs/day)1 18,600 Design TSS @ 0.20 pcd (lbs/day)1 21,800 Design NH3N @ 0.035 pcd (lbs/day)1 3,800 Design Phosphorus @ 0.007 pcd (lbs/day)1 800
1 Rounded to the nearest hundred.
Table 4.02-4 Projected Design Flows and Loadings

FIGURE 4.02-1
SOLI
DS
MAS
S B
ALAN
CE-
DES
IGN
YEA
R M
AXIM
UM
MO
NTH
FAC
ILIT
IES
PLAN
G
LEN
BAR
D W
ASTE
WAT
ER A
UTH
OR
ITY
DU
PAG
E C
OU
NTY
, ILL
INO
IS
1278.047
SECONDARY DIGESTER
STORAGE TANKS 2 BELT FILTER PRESSES
PRIMARY DIGESTERS
GRAVITY THICKENER
THICKENED WAS/PRIMARY SLUDGE
DIGESTED BIOSOLIDS
CARBO AND NITRO WAS
PRIMARY SLUDGE
FINAL BIOSOLIDS
PRIMARY CLARIFIERS
CARBO AERATION
NITRO AERATION
GRAVITY BELT THICKENER
BOD (lbs/day) 24,700
TSS (lbs/day) 29,000
BOD (lbs/day) 200
TSS (lbs/day) 1,700
TS (lbs/day) 19,100
VS (lbs/day)
% TS 3.0
% VS
Q (gpd) 76,000
BOD (lbs/day) 13,200
TSS (lbs/day) 11,700 TS (lbs/day) 8,700
VS (lbs/day)
% TS 1.8
% VS
Q (gpd) 62,000
TS (lbs/day) 35,900
VS (lbs/day) 22,300
% TS 3.5
% VS 62
Q (gpd) 123,000
TS (lbs/day) 8,600
VS (lbs/day) 0
% TS
% VS
Q (gpd)
TS (lbs/day) 25,900
VS (lbs/day) 11,100
% TS 2.4
% VS
Q (gpd) 123,000
TS (lbs/day) 23,600
VS (lbs/day)
% TS 16
% VS
Q (gpd)
FUTURE PHOSPHORUS CHEMICAL SLUDGE
PRIMARY EFFLUENT
RAW WASTEWATER
RECYCLE


SECTION 5
REGULATORY AND NPDES PERMITTING ISSUES


Glenbard Wastewater Authority Facilities Plan Section 5–Regulatory and NPDES Permitting Issues
Prepared by Strand Associates, Inc.® 5-1 R:\MAD\Documents\Reports\Archive\2013\GWA, IL\FP.1278.047.tws.sep\Report\S5 062113.doc
This section examines current and expected regulatory issues and the anticipated impact on future NPDES permit requirements. 5.01 REGULATORY AND NPDES PERMITTING ISSUES Permit limits and regulatory standards are revised as society’s understanding of its environmental impact grows. Implementation of new permit limits and regulatory standards can require substantial changes in WWTP operations and treatment facility needs. New regulations affect effluent limits and the disposal of sludge or biosolids, among other things. The purpose of this section is to discuss regulatory initiatives now under consideration, review their impact on the GWA WWTP, and recommend provisions that should be included in any proposed WWTP modifications to address these future regulatory concerns. A. Pending Sanitary Sewer Overflow and Bypass Rules The Clean Water Act (CWA) contains a strict prohibition against sanitary sewer overflows (SSOs). In January 2001, the United States Environmental Protection Agency (USEPA) administrator signed a new SSO rule. However, it was never published and is still under debate. The proposed SSO rule resulted from extensive dialogue with the regulated community, which is ongoing. The rule contains provisions for capacity management operation and maintenance (CMOM) programs and an SSO monitoring and reporting scheme for collection system permittees. Under the rules being considered, wet weather excess flow discharges and other WWTP “bypasses” may not be allowed unless the permittee determines there is no feasible alternative. The IEPA has placed requirements for no feasible alternative determinations in recent draft permits for facilities that have had wet weather issues or excess flow outfalls. This provision would have required permittees to prepare and implement a plan to evaluate and eliminate discharges from excess flow outfalls or provide an economic analysis demonstrating that no feasible alternative exists. The Illinois Association of Wastewater Agencies (IAWA) strongly objected to these requirements on the basis that they are a major change in policy that has not been through proper rulemaking processes including public notice and comment. The IAWA has also presented the case that excess flow outfalls are intentional treatment systems designed to meet secondary treatment effluent limits and are, therefore, not “bypasses” as defined by the CWA. Other commenters have cited an October 27, 2011, memorandum from the USEPA that encourages cost-effective solutions to wet weather issues. As of mid-October 2012, the IEPA has not issued any final permits containing the no feasible alternative requirements and has indicated that it will not be incorporating these requirements in permits. This is in response to a February 8, 2012, letter from USEPA Region 5 to IEPA (Appendix C) that indicates for separate sanitary sewer systems the no feasible alternative analysis is not required if secondary effluent limitations are included for the excess flow outfall. B. National Nutrient Strategy In December 2000, the USEPA published recommended regional water quality criteria with the goal of reducing the impact of excess nutrient discharges to the nation’s waterbodies. The parameters represent both causal criteria [total phosphorus (TP) and total nitrogen (TN)] as well as physical/biological responses (chlorophyll a and turbidity). The goal was for the USEPA to work with the states to adopt the recommended criteria or to develop more regionally specific water quality criteria for

Glenbard Wastewater Authority Facilities Plan Section 5–Regulatory and NPDES Permitting Issues
Prepared by Strand Associates, Inc.® 5-2 R:\MAD\Documents\Reports\Archive\2013\GWA, IL\FP.1278.047.tws.sep\Report\S5 062113.doc
nutrients. States were expected to adopt or revise water quality standards by 2004, but this schedule has been revised several times to allow states more time to develop rules. At the time of writing this report, most states, including Illinois, have not yet adopted new water quality standards for nutrients. The USEPA is now pushing states to enforce existing state narrative water quality standards for algae, aquatic plants, and similar offensive conditions at least until numeric nutrient criteria are developed. The GWA WWTP discharges to East Branch of the DuPage River in the DuPage River watershed, located in Ecoregion VI as defined by the USEPA. The USEPA’s baseline water quality criteria for rivers in this ecoregion are presented in Table 5.01-1. Note that a criterion is the allowable concentration of a substance in the waterbody. Permit limits will sometimes be higher than a criterion because consideration can be given to dilution of the effluent with the receiving water body. In the case where the receiving water body’s background water quality is higher than the criterion, or upstream flow is zero, the permit limit may be set at the criterion. C. Illinois Nutrient Strategies and Status The Illinois Nutrient Standards Workgroup has convened to develop nutrient standards. Numeric water quality standards for TP and TN have been considered; however, there appear to be poor correlations between nutrient concentrations and biological conditions in many Illinois waterbodies. Therefore, the Workgroup proposed several scenarios. One of these scenarios that appeared to be gaining traction includes a categorical effluent phosphorus limit for WWTPs of around 1 milligram per liter (mg/L) TP, with lower limits for WWTPs discharging to waters that exhibit nutrient-related problems such as excessive algae or diurnal swings in dissolved oxygen (DO) concentrations. In January 2011, the USEPA sent the IEPA a letter regarding the impact of WWTP effluent nutrients on water quality. The letter stated that IEPA failed to determine whether the discharge of nutrients from several WWTPs was causing or contributing to violations of Illinois’ narrative offensive condition standard at s. IAC 302.203. This standard is as follows:
“Waters of the State shall be free from sludge or bottom deposits, floating debris, visible oil, odor, plant or algal growth, color or turbidity of other than natural origin. The allowed mixing provisions of Section 302.102 shall not be used to comply with the provisions of this Section.”
The IEPA responded to USEPA’s letter on November 2, 2011. In the response, the IEPA stated that it is doing or will do the following: Step 1
1. General
a. The IEPA is enforcing its numeric TP water quality standard for reservoirs and lakes.
Parameter Nutrient Criteria TP 76.25 g/L TN 2.18 mg/L Chlorophyll a 2.7 g/L Turbidity 6.36 NTU
Table 5.01-1 USEPA Recommended Nutrient Criteria for Rivers in Ecoregion VI

Glenbard Wastewater Authority Facilities Plan Section 5–Regulatory and NPDES Permitting Issues
Prepared by Strand Associates, Inc.® 5-3 R:\MAD\Documents\Reports\Archive\2013\GWA, IL\FP.1278.047.tws.sep\Report\S5 062113.doc
b. The IEPA is implementing 1 mg/L effluent standards for TP for new and expanding publicly owned WWTPs 1 mgd and above and industrial sources discharging at least 25 pounds of TP a day.
c. The IEPA is incorporating waste load allocations (WLAs) or conditions into WWTP permits where a total maximum daily load (TMDL) exists. Some of these have resulted in TP or nitrate limits at WWTPs.
d. The IEPA is enforcing its antidegradation analysis requirements for WWTPs that are expanding, and some of these have resulted in WWTP TP limits and/or TN goals.
2. Algae-Impaired Streams
a. The IEPA will develop TMDLs for waterbodies that are on the state’s 303(d) impaired waters list for not meeting the offensive condition standards. This may result in WLAs for nutrients and corresponding effluent limits in permits.
b. Where data are not yet sufficient to develop a TMDL, the IEPA may require a WWTP that is a major source of nutrients to collect more data for use in a TMDL, and the permit may contain a reopener clause allowing the IEPA to incorporate limits or conditions based on the eventual TMDL. The IEPA may consider including a 1 mg/L limit or lower in the permit.
c. The IEPA may include a condition in a permit to evaluate the operation of biological phosphorus removal (BPR) or other WWTP modifications; an economic analysis would be used to determine what level of nutrient removal is affordable for the community.
Step 2
1. The IEPA and the Stakeholder Workgroup will continue to establish new regulations addressing nutrients by late 2012 or later. The IEPA is working toward establishing a new narrative standard for “cultural eutrophication” that is linked to aquatic life impact and uses measureable parameters such as DO. The IEPA may also include other specific parameters like DO flux and chlorophyll a. The presence of cultural eutrophication would trigger a technology-based TP limit for WWTPs that are a significant source.
2. The IEPA may establish technology-based TP limits for existing plants undergoing expansion and TP limits for WWTPs undergoing significant upgrade without expansion.
3. The IEPA will establish an approach for protecting streams that presently have low TP concentrations.

Glenbard Wastewater Authority Facilities Plan Section 5–Regulatory and NPDES Permitting Issues
Prepared by Strand Associates, Inc.® 5-4 R:\MAD\Documents\Reports\Archive\2013\GWA, IL\FP.1278.047.tws.sep\Report\S5 062113.doc
Step 3
1. The IEPA will continue to work toward developing scientifically defensible numeric criteria for streams and rivers from which WWTP water quality-based effluent limits (WQBELs) can be calculated.
There is current debate on the appropriate technology-based TP limit. A limit of approximately 1 mg/L has been proposed but may be considered too high by the IEPA. Based on experience in other states, it is possible the technology-based limit could be as low as 0.1 mg/L. IEPA is now placing effluent TN and TP monitoring requirements in reissued NPDES permits in preparation for new TMDLs and narrative and numeric standards. D. Impaired Waters and TMDL Impacts The CWA provides special authority for restoring polluted or impaired waters. For waterbodies that appear on the list of impaired waters [303(d) list], the CWA mandated development of the maximum amount of a specific pollutant that a waterbody can receive and still meet water quality standards, referred to as the TMDL. A TMDL also allocates the maximum amount of each identified pollutant of concern that can be contributed from both NPDES permitted discharges and nonpoint (surface runoff) sources. Figure 5.01-1 shows the water bodies in the vicinity of the GWA WWTP that are on the 2010 impaired waters list. Table 5.01-2 lists the water bodies on the 2010 impaired waters list at or downstream of the GWA WWTP outfall. For the East Branch of the DuPage River segments listed in Table 5.01-2, the addition of DO to impairment segment IL_GBL-02 is the only proposed change in the draft 2012 list.
Water Body Name IEPA ID Impaired Use(s) Impairment Causes(s) Receiving Stream Segment East Branch of the DuPage River
IL_GBL-10 Aquatic Life
Arsenic, Dieldrin, Hexachlorobenzene, Methoxychlor, pH, Phosphorus (Total)
Fish consumption PCBs Primary Contact Recreation Fecal Coliform
Downstream Segment East Branch of the DuPage River
IL_GBL-05 Aquatic Life TSS
Phosphorus (Total)
Fish consumption Polychorinated Biphenyls (PCBs) East Branch of the DuPage River
IL_GBL-02 Aquatic Life Arsenic, Methoxychlor, Phosphorus (Total)
Fish consumption PCBs Table 5.01-2 Impaired Waters in the Vicinity of the GWA WWTP Outfall

Glenbard Wastewater Authority Facilities Plan Section 5–Regulatory and NPDES Permitting Issues
Prepared by Strand Associates, Inc.® 5-5 R:\MAD\Documents\Reports\Archive\2013\GWA, IL\FP.1278.047.tws.sep\Report\S5 062113.doc
FIGURE 5.01-1 IMPAIRED WATERS IN THE VICINITY OF GWA WWTP
Source: IEPA Web site
WWTP

Glenbard Wastewater Authority Facilities Plan Section 5–Regulatory and NPDES Permitting Issues
Prepared by Strand Associates, Inc.® 5-6 R:\MAD\Documents\Reports\Archive\2013\GWA, IL\FP.1278.047.tws.sep\Report\S5 062113.doc\062413
Source: IEPA Web site Figure 5.01-2 Table 2-1 From IEPA Total
Maximum Daily Loads for the East Branch of the DuPage River, Illinois–Final Report, October 2004
Several TMDLs were developed for the East Branch of the DuPage River and were approved by USEPA in 2004. The impairments considered in the TMDLs are shown in Figure 5.01-2. The addition of DO for segment IL_GBL-02 to the draft 2012 303d list is not expected to impact GWA because the 2004 TMDL report included this segment in the model. The 2004 TMDLs resulted in the formation of a watershed-based group, the DuPage River Salt Creek Workgroup (DRSCW), that is working toward DO, total dissolved solids (TDS)/chloride, and other water quality improvements in the Salt Creek and East and West Branch DuPage River watersheds. The IEPA has agreed to postpone more stringent biochemical oxygen demand (BOD) and ammonia limits at WWTPs as long as the group continues to make good progress toward water quality goals. The IEPA’s 2004 Permit Link Document for these watersheds outlines this approach and allows other actions to be implemented and monitored such as dam removal, stream or impoundment aeration, stream restoration, and stormwater best management practices. These projects are likely much more cost-effective for municipalities compared to constructing related improvements at the WWTPs. Most of these projects are more beneficial to the receiving streams than WWTP improvements because they tend to address physical habitat and biological conditions in addition to water chemistry. In the East Branch of the DuPage River watershed, a feasibility study was completed in 2008 to help identify the best projects and a copy can be found on the IEPA Web site at the following address: http://www.epa.state.il.us/water/tmdl/implementation/dupage-river/stream-do-improvement-fs-east-br-dupage.pdf. A copy of the Permit Link Document is located on the IEPA Web site at the following address: http://www.epa.state.il.us/water/tmdl/stakeholders/tmdl-npdes-link-paper.pdf. The 2004 TMDL report provided two alternatives to meet the DO TMDL including one alternative with reduced point source limits for CBOD and ammonia and a second alternative with the current permit limits along with removing existing dams and/or in-stream aeration. The 2008 feasibility study by DRSCW recommended the removal of the Churchill Woods Dam, located upstream of GWA WWTP, and this project was completed in 2011. Reduced CBOD and ammonia limits are not anticipated because of the DRSCW projects and DO monitoring. The IEPA is now in the process of completing fecal coliform TMDLs to address impairments in East Branch of the DuPage River. The DRSCW is actively involved in contributing data and reviewing TMDL workproduct.

Glenbard Wastewater Authority Facilities Plan Section 5–Regulatory and NPDES Permitting Issues
Prepared by Strand Associates, Inc.® 5-7 R:\MAD\Documents\Reports\Archive\2013\GWA, IL\FP.1278.047.tws.sep\Report\S5 062113.doc\062413
The GWA is a member of the DRSCW. We recommend continued participation because of the DRSCW’s focus on low-cost, high-impact projects, its “voice” with the IEPA, and its ability to obtain significant grant funding. As noted in Paragraph C above, the IEPA has considered imposing TP limits in NPDES permits where discharge is to a phosphorus-impaired stream, particularly for expanding WWTPs and possibly for those undergoing a major upgrade. This may be a consideration in one of GWA’s future permit reissuances. E. Antidegradation Analysis Within the USEPA’s framework of water quality criteria, the nation’s waterbodies are to be protected through compliance with water quality standards. All water quality standards are composed of the following:
1. Designated uses. 2. Instream water quality criteria (both numeric and narrative) required to support the
designated use. 3. An antidegradation policy intended to prevent waterbodies that do meet water quality
criteria from deteriorating beyond their current condition. For the 20-year design period considered in this report, the projected average annual design flow is equal to the previously established design average daily flow. Therefore, the design average flow will remain at 16.02 mgd and an antidegradation analysis is not required. F. Anticipated NPDES Permit Requirements for 2012 The current NPDES permit was issued in 2006 with an expiration date of 2011. The permits limits are listed in Section 3 and the permit is included in Appendix B. The Outfall 001 NPDES effluent limits for CBOD5, TSS, and NH3-N are not expected to change. Monthly monitoring for TP and TN with no effluent limits for these parameters is anticipated. The LCSTP limits are not expected to change in the reissued permit. G. Future Nutrient Limits Nutrient limits for TN and TP are not anticipated in the next permit cycle. However, it is likely that effluent nutrient limits will be imposed within the 20-year planning period of this facilities plan. Limits could be contained in the 2017 reissued permit and a three-year or longer compliance schedule may be included.

Glenbard Wastewater Authority Facilities Plan Section 5–Regulatory and NPDES Permitting Issues
Prepared by Strand Associates, Inc.® 5-8 R:\MAD\Documents\Reports\Archive\2013\GWA, IL\FP.1278.047.tws.sep\Report\S5 062113.doc\062613
TP is a concern because of the impaired status of the East Branch of the DuPage River. Based on current IEPA thinking and experience from other states, an effluent limit of about 0.3 to 0.5 mg/L or less could be implemented in one of GWA’s future permits. The other major nutrient concern for discharges to the Mississippi River Basin is hypoxia in the Gulf of Mexico related to TN loadings. The WWTP is within the Mississippi-Atchafalaya River Basin. Hypoxic zones are low in DO and are incapable of supporting desirable natural marine life. Fish and other mobile aquatic species are forced to migrate from hypoxic areas, and less mobile species may experience considerable die-off. Based on TN effluent goals that are already in place for several Illinois WWTPs, a TN effluent limit of 10 mg/L or less could be implemented at GWA. Section 6 includes a discussion of the activated sludge alternatives to meet a future effluent TP and TN limits of 0.5 mg/L and 10 mg/L, respectively. However, it should be noted there are uncertainties surrounding the timing of future nutrient limits, as well as the magnitude of any future limits . For all process alternatives evaluated, the impacts required to construct future nutrient removal facilities and operations will be carefully considered and flexibility for physical adaptation will be included. H. Future Ammonia Limits The USEPA has proposed more stringent draft ammonia water quality criteria because of toxicity to sensitive fresh water mussel and snail species in the Draft 2009 Update Aquatic Life Ambient Water Quality Criteria for Ammonia–Freshwater report. This includes both acute and chronic criteria, affecting maximum day, weekly average, and monthly average limits. These revisions may result in more stringent ammonia limits for GWA within the 20-year planning period. More stringent ammonia limits could be contained in the 2017 reissued permit and a three-year or longer compliance schedule may be included. Strand contacted IEPA for GWA’s estimated limits based on the proposed USEPA ammonia criteria. The estimated limits, Table 5.01-3, are based on sampling of the East Branch of the DuPage River at Route 34 Bridge monitoring station. This monitoring station is located approximately 4 miles downstream of the GWA WWTP outfall. Included in Appendix D is the IEPA ammonia worksheet. The effluent ammonia data from January 2009 through July 2012 are shown with the existing limits and estimated future limits for the daily maximum, weekly average, and 30-day average in Figures 5.01-3, 5.01-4, and 5.01-4, respectively. For this observed period, the WWTP was in a two-stage activated sludge operation. Based on the effluent data for this period, the month of March could be a concern for meeting the estimated future weekly average and 30-day average ammonia limits. It is recommended the WWTP employ operational strategies to meet the estimated ammonia limits over the next several years. Conversion to single-stage operation is unlikely to improve nitrification, and therefore, maintaining the flexibility to operate in two-stage is recommended. Additional activated sludge tankage and/or conversion to air activated sludge may be required if the WWTP cannot demonstrate meeting these estimated limits. The pH and temperature have a significant effect on the ammonia limits. The background ammonia concentration has a negligible impact on the limits because the East Branch of the

Glenbard Wastewater Authority Facilities Plan Section 5–Regulatory and NPDES Permitting Issues
Prepared by Strand Associates, Inc.® 5-9 R:\MAD\Documents\Reports\Archive\2013\GWA, IL\FP.1278.047.tws.sep\Report\S5 062113.doc\062613
DuPage River is effluent-dominated at this location. A sampling program measuring pH and temperature at a location closer to the outfall to determine limits rather than using the monitoring station data 4 miles downstream could be beneficial for GWA. IEPA was contacted regarding performing a sampling plan closer to the WWTP outfall. The representative from IEPA was unsure if a sampling plan would be allowed but said GWA could discuss with IEPA further. Scott Twait or Bob Mosher from IEPA, Division of Water Pollution Control, Water Quality Standards Section can be contacted at 217-558-2012
Daily Maximum
Weekly Average
30-Day Maximum
Daily Maximum
Weekly Average
30-Day Maximum
January 12.4 - 4.0 8.8 3.5 1.4February 12.4 - 4.0 8.8 3.5 1.4March 12.4 6.8 2.7 7.5 1.6 0.6April 3.0 - 1.5 7.5 1.6 0.6May 3.0 - 1.5 7.5 1.6 0.6June 3.0 - 1.5 5.6 1.3 0.5July 3.0 - 1.5 5.6 1.3 0.5August 3.0 - 1.5 5.6 1.3 0.5September 3.0 - 1.5 7.5 1.6 0.6October 3.0 - 1.5 7.5 1.6 0.6November 12.4 - 4.0 8.8 3.5 1.4December 12.4 - 4.0 8.8 3.5 1.4
Existing Permit Limits (mg/L)
Month
Estimated Future Limits (mg/L)
Table 5.01-3 Existing Permit and Estimated Future Ammonia Limits
Note: A biological upset occurred in April 2010.
Figure 5.01-3 Daily Maximum Effluent Ammonia Limits

Glenbard Wastewater Authority Facilities Plan Section 5–Regulatory and NPDES Permitting Issues
Prepared by Strand Associates, Inc.® 5-10 R:\MAD\Documents\Reports\Archive\2013\GWA, IL\FP.1278.047.tws.sep\Report\S5 062113.doc\062613
Note: A biological upset occurred in April 2010.
Figure 5.01-4 Weekly Average Effluent Ammonia Limits
Note: A biological upset occurred in April 2010.
Figure 5.01-5 30-Day Average Effluent Ammonia Limits

Glenbard Wastewater Authority Facilities Plan Section 5–Regulatory and NPDES Permitting Issues
Prepared by Strand Associates, Inc.® 5-11 R:\MAD\Documents\Reports\Archive\2013\GWA, IL\FP.1278.047.tws.sep\Report\S5 062113.doc\062613
I. Biosolids Disposal and Beneficial Reuse Stabilized biosolids from the GWA WWTP are considered Class B based on the fecal coliform level. The biosolids are currently dewatered and disposed on land application sites. Regulations for sludge application on agricultural land were enacted in August 2011 that limits stockpiling of sludge at the same site to 30 days. There are no current or anticipated regulatory initiatives that would restrict GWA’s ability to continue beneficial reuse of biosolids generated at the WWTP. Regional farmers have accepted Class B biosolids and the majority of municipal WWTPs in the area produce Class B. However, there is a trend in some parts of the country toward Class A biosolids production. Class A biosolids are produced through an approved method, such as lime stabilization or certain temperature phased anaerobic digestion systems, or produced using similar processes and verified by testing for pathogens. Fecal coliform levels must be less than 1,000 most probable number (MPN) per gram total solids. Producing Class A biosolids would provide the GWA with more options for distribution of biosolids (for example, marketing the biosolids for use on residential lawns and gardens) and lower reporting requirements. Since Class A is not required and is more costly than Class B, it does not need to be considered by GWA unless problems arise with the existing practices or the market conditions are more favorable for Class A. J. Recreational Use Standards Following several studies and a previous round of draft standards and public comments, the USEPA published draft recreational use criteria in January 2011 and public comments were due in February 2011. The USEPA is recommending that Escherichia coli (E. coli) or enterococci be used as indicator organisms in lieu of fecal coliform. If the standards are finalized by USEPA, Illinois will eventually adopt associated statewide standards. If E. coli is used, the standard would be on the order of 126 colony-forming units (cfu) per 100 milliliters (mL) as a geometric mean with a threshold value of 235 cfu/100 mL. The threshold value would need to be met 75 percent of the time. If the new standards are adopted in Illinois, the IEPA will begin replacing fecal coliform limits with the new limits when it reissues permits. In general, WWTPs that currently meet their fecal coliform limits are expected to meet the new limits. However, a review of several WWTPs conducted by the Wisconsin Section Central States Water Environment Association in 2004 found that facilities using chlorine disinfection and the IDEXX method for E. coli analysis tended to have higher E. coli/fecal coliform ratios and could possibly have more problems showing compliance. This was thought to be because the IDEXX method may recover more chlorine-stressed E. coli organisms than other test methods. Facilities that used ultraviolet disinfection had lower E. coli/fecal coliform ratios in their effluents.


SECTION 6
EVALUATION OF EXISTING FACILITIES AND SCREENING ALTERNATIVES


Glenbard Wastewater Authority Section 6–Evaluation of Existing Facilities Wastewater Facilities Plan and Screening of Alternatives
Prepared by Strand Associates, Inc.® 6-1 R:\MAD\Documents\Reports\Archive\2013\GWA, IL\FP.1278.047.tws.sep\Report\S6 062013.doc\062413
This section evaluates the ability of the existing WWTP to treat the projected future flows and loadings (developed in Section 4) while meeting the anticipated future NPDES permit requirements presented in Section 5. Where applicable, treatment alternatives are identified for detailed evaluation and consideration in Section 7. 6.01 SUMMARY OF EXISTING FACILITIES AND PLANT NEEDS Significant upgrades in capacity at the GWA WWTP are not anticipated to meet the future average and peak design flows and loadings to the plant. However, specific unit processes are in need of upgrading to maintain treatment efficiency and to better provide capacity. Each unit process is discussed below, and where upgrading is recommended, the alternatives that will be further considered in Section 7 are identified and discussed briefly. A. Influent Screening The influent screens and screenings handling facilities were installed in 2007 and are working well. No upgrades or modifications to these facilities are recommended except replacement of the screenings washer/compactor, which will be included as a common need. B. Influent Pump Station Based on the 2006 facilities planning report, the existing dry-pit influent pump station (IPS) has a firm capacity of about 45 mgd when the wet well is surcharged significantly. Based on observations by plant staff, however, the influent sewer surcharges at times, indicating that the influent flows to the station exceed 45 mgd. These pumps were installed in 1977 and rehabilitated in 2001, and therefore, replacement should be considered. In addition, the existing hydraulic controls for the influent gates and influent pump valves are obsolete, and maintenance of this system is difficult and expensive. The existing pumps are controlled from VFDs that were installed in 1993 and are reaching the end of their useful life. VFD replacement options will be considered, including creation of a dedicated conditioned space for the motor control equipment. In addition, the existing pumps and hydraulic system are not submersible and would be inoperable and could be damaged if the dry well flooded. Therefore, this facilities plan will evaluate the following alternatives for upgrading the station with new pumps to deliver 47 mgd of firm pumping capacity without wet well surcharging:
Alternative IPS-1: Install new dry-pit submersible pumps in the existing dry well. Provide new controls and electric actuators in lieu of the existing hydraulic actuators. Consideration will be given to including two smaller pumps with three large pumps to better match pump output with the range of flows.
Alternative IPS-2: Convert the IPS to a vortex-induced/prerotational pumping station. This
option would retrofit the existing station to include three prerotational type pumps to utilize the three influent chambers existing at the pump station.
The influent pumping station will have a firm capacity of 47 mgd to match the existing design peak flow of the plant. It is noted that continuing I/I reduction within the customer communities was recommended in the 2006 Facilities Plan and continues to be recommended in this facilities plan.

Glenbard Wastewater Authority Section 6–Evaluation of Existing Facilities Wastewater Facilities Plan and Screening of Alternatives
Prepared by Strand Associates, Inc.® 6-2 R:\MAD\Documents\Reports\Archive\2013\GWA, IL\FP.1278.047.tws.sep\Report\S6 062013.doc\062413
C. Grit Removal The vortex grit traps and associated grit washing equipment were installed in 2005 and are operating well. No upgrades or modifications to these facilities are recommended. D. Primary Clarification The primary clarifier mechanisms were replaced within the last 10 years and generally perform well. Primary clarifier treatment efficiencies are higher than typical for municipal treatment plants, which is likely the result of higher sludge pumping rate. Primary sludge is pumped with progressive cavity pumps at a continuous rate of about 360 gallons per minute (gpm) to the gravity thickener for cothickening primary sludge and WAS. This high rate of primary sludge pumping is conducted to reduce the sludge blanket and sludge thickness, which has created high primary sludge pump discharge pressures and significant maintenance requirements associated with rotor/stator wear as a result of these high pressures. This high rate of pumping also reduces/eliminates the need for “freshening” water being added to the sludge thickener. Potential modifications to the primary sludge handling facilities are discussed in the Sludge Thickening section below. E. Activated Sludge Treatment The activated sludge facilities discussed herein include the carbonaceous BOD aeration basins (carbo tanks), the intermediate clarifiers, the intermediate/return activated sludge (RAS) pumping station, the nitrogenous BOD removal basins (nitro tanks), and the final clarifiers. WAS pumping from the intermediate and final clarifiers is discussed in the Sludge Thickening section below. These facilities have adequate capacity to meet the future design loadings to the plant; however, the following drivers warrant consideration of process variations:
1. The existing two-stage system is complex and equipment intensive, which requires more maintenance and operator attention.
2. Future phosphorus and nitrogen limits will likely require significant modifications to the
existing facilities. HPOAS systems are not traditionally used for biological nutrient removal (BNR) because of the high-rate conditions requiring high dissolved oxygen concentrations. BNR applications require anaerobic and anoxic zones within the activated sludge basins, which can be challenging to attain. In addition, because the GWA cryogenic oxygen generation plant cannot be turned down adequately, the GWA activated sludge DO levels are very high.
It is noted that nutrient limits are not currently in place and may not be implemented for several years. In addition, the specific nutrient limits are not known at this time. Therefore, this report does not recommend a specific activated sludge alternative, but rather demonstrates the feasibility of each alternative to meet the anticipated future effluent nutrient limits. For the purpose of this facilities plan, we have assumed future effluent phosphorus and TN limits of 0.5 and 10 mg/L, respectively. The following activated sludge (AS) alternatives are investigated:

Glenbard Wastewater Authority Section 6–Evaluation of Existing Facilities Wastewater Facilities Plan and Screening of Alternatives
Prepared by Strand Associates, Inc.® 6-3 R:\MAD\Documents\Reports\Archive\2013\GWA, IL\FP.1278.047.tws.sep\Report\S6 062013.doc\062413
Alternative AS-1: Continue two-stage HPOAS operations. This option would include improvements to the intermediate clarifiers and related sludge removal system as well as an upgrade to the intermediate pumping/RAS pumping station. Cryogenic oxygen generation would continue.
Alternative AS-2: Convert to single-stage HPOAS, including discontinuing the use of the
intermediate clarifiers. The intermediate/Nitro RAS pumping station would be modified to pump RAS only, although under this scenario the capacity of the station could provided for forward flow as well in the event that that plant converted back to two-stage HPOAS. Cryogenic oxygen generation would continue.
Alternative AS-3: Convert to single-stage air activated sludge. New aeration blowers and
diffusion equipment would be provided and an expansion of the aeration basins would also be needed.
Alternative AS-4: Convert to single-stage integrated fixed film activated sludge (IFAS) or
moving bed bioreactor (MBBR) activated sludge to reduce the aeration basin volume associated with air activated sludge. New aeration blowers and diffusion equipment would be provided, and an expansion of the aeration basins may also be needed.
The following activated sludge alternative will be investigated as an add-on technology and is not an independent alternative: Bioaugmentation: Incorporate side stream in-situ bioaugmentation to provide a more stable
nitrifying system for the activated sludge alternatives (AS-2 through AS-4). This would include construction of new aeration basin (or repurposing of an existing basin) to treat the dewatering return flows, which are very high in ammonia and contribute significant ammonia loadings to the WWTP. This return flow would be treated in a new or reconfigured basin and some RAS would be added to this basin. Because of the very high ammonia concentrations, the bacterial populations that grow are high in nitrifiers, which augment the forward flow treatment with improved nitrifier concentrations and would make the process more stable at the lower solids retention time (SRT) available within the existing activated sludge basins. Several variations of this process exist and have been successfully demonstrated, including denitrification systems before discharging back to the forward flow.
F. Anaerobic Digestion The anaerobic digestion facilities were upgraded with a third digester in 2007. The digestion capacity is adequate for the future design loadings, and upgrades are not anticipated in the near future. However, related considerations are evaluated herein and include biogas storage to improve overall biogas use, codigestion of high-strength wastes (HSW) including a HSW receiving and storage station, and potential biogas cogeneration facilities to generate electricity and heat from biogas. These evaluations are discussed under the Cogeneration and High-Strength Waste Codigestion section presented below.

Glenbard Wastewater Authority Section 6–Evaluation of Existing Facilities Wastewater Facilities Plan and Screening of Alternatives
Prepared by Strand Associates, Inc.® 6-4 R:\MAD\Documents\Reports\Archive\2013\GWA, IL\FP.1278.047.tws.sep\Report\S6 062013.doc\062413
G. Digested Biosolids Dewatering Digested biosolids are dewatered on two BFPs before on-site storage in an uncovered storage area. The BFPs were installed in 1991 and will be in need of replacement within the 20-year planning period evaluated herein. Numerous technologies exist that could be used at the plant including BFPs, centrifuges, screw presses, rotary fan presses, and a new technology termed the Dehydris™ Twist dewatering system. Screw presses and rotary fan presses are normally used at smaller WWTPs because of their limited throughput capacity and will not be further evaluated. The Dehydris™ Twist system has no installations in the United States at municipal WWTPs, and based on our initial evaluations at other facilities, the capital cost is significantly higher than competing technologies. The process produces a drier cake than either BFPs or centrifuges, however, resulting in lower disposal costs for trucking. Pilot testing of this technology should be considered if GWA would like to consider it further. For the purposes of this planning, the following biosolids dewatering (BD) alternatives will be considered:
Alternative BD-1: Install new BFPs within the existing solids building. Alternative BD-2: Install one new centrifuge within the existing solids building and use one
existing BFP as a backup. H. Cogeneration and High-Strength Waste Codigestion The plant has had natural gas cogeneration facilities using three 800-kilowatt (kW) internal combustion gas engines installed in the 1980s, and these engines also provide backup power to the plant. These engines are rarely used. GWA currently has a very low electrical rate [less than $0.04/per kilowatt hours (kWH)] locked in for the short term, and natural gas prices are also very low currently. Therefore, the current economic drivers for cogeneration are not significant. However, GWA is interested in receiving HSW and injecting these directly into the anaerobic digesters (termed codigestion). The benefits of codigestion include:
1. GWA would receive tipping fees for the HSW, which are normally in the range of $0.01 to $0.10 per gallon.
2. Codigestion has been shown to improve volatile solids (VS) destruction of municipal sludge in many circumstances.
3. The additional biogas provides additional renewable fuel for potential cogeneration.
4. If the customer communities bring their fat, oils, and grease (FOG) wastes to the HSW receiving station, there is a dual benefit of reducing grease loads to the collection system and codigestion of FOG wastes in the digesters.
Therefore, the following cogeneration and codigestion (CC) combinations of alternatives will be evaluated:

Glenbard Wastewater Authority Section 6–Evaluation of Existing Facilities Wastewater Facilities Plan and Screening of Alternatives
Prepared by Strand Associates, Inc.® 6-5 R:\MAD\Documents\Reports\Archive\2013\GWA, IL\FP.1278.047.tws.sep\Report\S6 062013.doc\062413
Alternative CC-1a: Convert one or more of the existing natural gas engines to use biogas for electricity production and heat recovery. Digest municipal sludge only (no codigestion).
Alternative CC-1b: Convert one or more of the existing natural gas engines to use biogas for
electricity production and heat recovery. Construct HSW receiving station for codigestion up to the loading limit of the existing digestion facilities.
Alternative CC-2a: Install new internal combustion engines to use biogas for electricity
production and heat recovery. Digest municipal sludge only (no codigestion).
Alternative CC-2b: Install new internal combustion engines to use biogas for electricity
production and heat recovery. Construct HSW receiving station for codigestion up to the loading limit of the existing digestion facilities.
Note that for Alternatives CC-1b and 2b, which include codigestion of HSW, an alternate access road to the plant would be beneficial to limit truck traffic down Bemis Road. This access road is being evaluated by a third party firm, and the costs of the access road will not be considered in this analysis since the access road is desired regardless of whether HSW codigestion occurs. 6.02 COMMON WWTP NEEDS Performance and upgrade requirements of certain processes and facilities at the treatment facility are independent of the alternatives previously discussed. These elements require replacement or modification regardless of the treatment alternatives selected. These project elements are identified below and evaluated in Section 7. A. LCSTF Equipment Upgrades The LCSTF mechanical screen, grit collectors, and clarifier mechanisms are original equipment to the 1982 construction and are beyond their expected service life. B. Hauled Wastes Receiving Facilities
GWA would like to have the ability to receive septage, FOG, landfill leachate, and materials (hereinafter collectively referred to as “hauled wastes”) at the plant. Such facilities would allow GWA to provide a needed service in the area as well as to generate additional revenue from tipping fees. Hauled waste receiving facilities could use a portion of the ATAD tanks, and for the purpose of this planning effort, we have assumed that such facilities may be installed in a phased approach, which could be expanded and improved over time if the need or demand dictates. A plan for installing these facilities is included in Section 7. C. Screenings Washer and Compactor As discussed previously, replacement of the screening washer and compactor is included in the plan.

Glenbard Wastewater Authority Section 6–Evaluation of Existing Facilities Wastewater Facilities Plan and Screening of Alternatives
Prepared by Strand Associates, Inc.® 6-6 R:\MAD\Documents\Reports\Archive\2013\GWA, IL\FP.1278.047.tws.sep\Report\S6 062013.doc\062413
D. Peak Flow Storage As noted previously, the influent flows to the IPS, along with the high recycle flows from the existing deep bed filters, exceed the existing capacity of the IPS. The two lagoons located immediately east of the WWTP could be cleaned and converted to raw wastewater storage lagoons. These lagoons would serve to store wastewater temporarily until influent flows decrease, and would then be drained back to the plant for full treatment. This analysis is reserved for a future planning study for the following reasons. First, replacing the effluent filters with a new style filter should reduce the amount of recycle flow by more than 90 percent, which will increase the actual forward flow pumping of influent wastewater by this same amount and should reduce surcharging in the collection system. Second, a noted previously, reduction of I/I from the collection systems within the customer communities will reduce peak flows to the plant. D. Chemical Phosphorus Removal The ability of the GWA WWTP to meet future phosphorus limits will be discussed in the activated sludge alternatives analysis. Additionally, the potential for BPR is evaluated and discussed in the activated sludge alternative analysis. If all the activated sludge alternative are expected to have identical CPR demand, CPR will be included as a common need. E. Effluent Filtration The deep bed effluent filters are in need of hydraulic improvements. The ten filters do not receive equal flow distribution and have become maintenance intensive. In addition, during wet weather flows, the recycle flows from the filters to the IPS are typically more than 10 mgd, which significantly reduces the forward flow capacity of the IPS. This style of filter is still commonly used at municipal WWTPs; however, newer technology has become more favored because of reduce space requirements, simpler maintenance, and improved performance. This plan develops the costs to replace the existing deep bed filters with disc filters. Multiple alternatives are available and will be considered in the analyses. F. Disinfection The existing UV disinfection equipment was installed in 1995. The manufacturer went out of business soon thereafter, which has made purchasing replacement parts for the equipment both expensive and difficult. The existing equipment is nearing 20 years in service, which is beyond the normal life of such equipment. In addition, newer UV equipment is more energy-efficient, uses fewer UV lamps, and has longer lamps life. Horizontal, vertical, and inclined UV systems will be considered.
G. Sludge Thickening
Currently, primary sludge, carbo WAS, and nitro WAS are cothickened in the single gravity thickener, and thickened sludge is pumped from the gravity thickener to the anaerobic digesters. The sludge withdrawal line from the gravity thickener is long and includes numerous bends, elbows, and tees. Because of this, the solids concentration of the thickener underflow needs to be managed to maintain a lower-than-desired thickness. When the thickened sludge becomes too thick, the sludge is difficult to remove. The maximum thickened sludge concentration that can effectively be managed is not known at
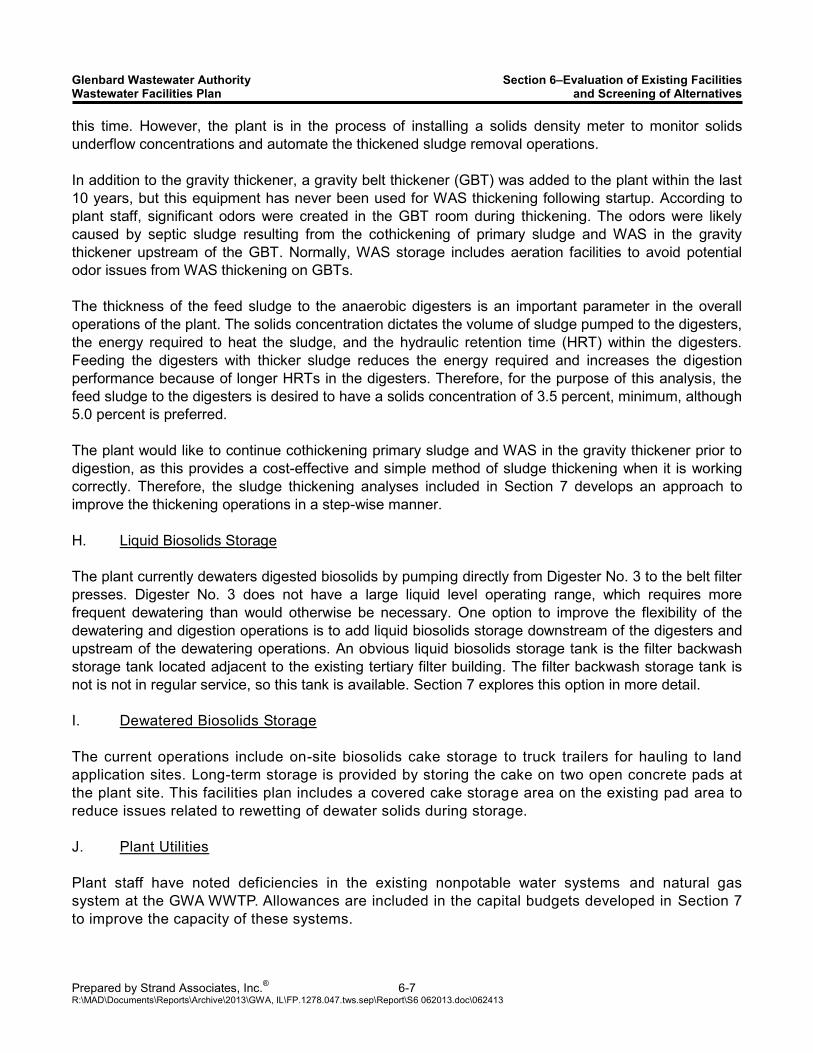
Glenbard Wastewater Authority Section 6–Evaluation of Existing Facilities Wastewater Facilities Plan and Screening of Alternatives
Prepared by Strand Associates, Inc.® 6-7 R:\MAD\Documents\Reports\Archive\2013\GWA, IL\FP.1278.047.tws.sep\Report\S6 062013.doc\062413
this time. However, the plant is in the process of installing a solids density meter to monitor solids underflow concentrations and automate the thickened sludge removal operations.
In addition to the gravity thickener, a gravity belt thickener (GBT) was added to the plant within the last 10 years, but this equipment has never been used for WAS thickening following startup. According to plant staff, significant odors were created in the GBT room during thickening. The odors were likely caused by septic sludge resulting from the cothickening of primary sludge and WAS in the gravity thickener upstream of the GBT. Normally, WAS storage includes aeration facilities to avoid potential odor issues from WAS thickening on GBTs.
The thickness of the feed sludge to the anaerobic digesters is an important parameter in the overall operations of the plant. The solids concentration dictates the volume of sludge pumped to the digesters, the energy required to heat the sludge, and the hydraulic retention time (HRT) within the digesters. Feeding the digesters with thicker sludge reduces the energy required and increases the digestion performance because of longer HRTs in the digesters. Therefore, for the purpose of this analysis, the feed sludge to the digesters is desired to have a solids concentration of 3.5 percent, minimum, although 5.0 percent is preferred. The plant would like to continue cothickening primary sludge and WAS in the gravity thickener prior to digestion, as this provides a cost-effective and simple method of sludge thickening when it is working correctly. Therefore, the sludge thickening analyses included in Section 7 develops an approach to improve the thickening operations in a step-wise manner.
H. Liquid Biosolids Storage The plant currently dewaters digested biosolids by pumping directly from Digester No. 3 to the belt filter presses. Digester No. 3 does not have a large liquid level operating range, which requires more frequent dewatering than would otherwise be necessary. One option to improve the flexibility of the dewatering and digestion operations is to add liquid biosolids storage downstream of the digesters and upstream of the dewatering operations. An obvious liquid biosolids storage tank is the filter backwash storage tank located adjacent to the existing tertiary filter building. The filter backwash storage tank is not is not in regular service, so this tank is available. Section 7 explores this option in more detail.
I. Dewatered Biosolids Storage The current operations include on-site biosolids cake storage to truck trailers for hauling to land application sites. Long-term storage is provided by storing the cake on two open concrete pads at the plant site. This facilities plan includes a covered cake storage area on the existing pad area to reduce issues related to rewetting of dewater solids during storage. J. Plant Utilities Plant staff have noted deficiencies in the existing nonpotable water systems and natural gas system at the GWA WWTP. Allowances are included in the capital budgets developed in Section 7 to improve the capacity of these systems.

Glenbard Wastewater Authority Section 6–Evaluation of Existing Facilities Wastewater Facilities Plan and Screening of Alternatives
Prepared by Strand Associates, Inc.® 6-8 R:\MAD\Documents\Reports\Archive\2013\GWA, IL\FP.1278.047.tws.sep\Report\S6 062013.doc\062413
K. HVAC System Replacement Several buildings have aging HVAC equipment that is need of replacement. Costs for this equipment replacement are included in the capital plan. L. Electrical Service, Backup, and Redundancy The electrical power distribution system is served from a single connection to the local electric utility’s distribution system. In the event of loss of utility supply, three on-site 800 kW natural gas generators can produce ample power to serve the facility. The facility has two medium voltage underground distribution circuits, and either circuit can be used to serve all critical plant loads–from the utility or from the generators. However, the two underground circuits share common duct banks and common manholes. Thus, a single event could cause failure of both underground circuits. Alternatives to mitigate these single points of failure will be considered in the analyses. While all the critical plant loads are connected to both medium voltage underground distribution circuits, the Main Cryogenic Compressor and the Administration Building do not have redundant step-down transformers. Thus, a single failure of the step-down transformer to these loads will result in loss of critical power. Alternatives for a redundant transformer or back-up 480 V supply to these two critical loads will be addressed in the analyses. A previous power system study has identified that the protective devices in the supply to the Sludge Dewatering Building and the Digester Building are not appropriately rated to interrupt a worst-case short-circuit event. Appropriate equipment replacement will be addressed in the analyses. As part of the facility’s existing maintenance and testing plan, plant staff periodically performs cable testing on the distribution network. The cables being tested must be isolated from the system prior to testing, and the act of cable disconnection (determination) is very time-consuming. Plant staff have expressed an interest in adding disconnect switches to specific circuits to reduce man-hours required to perform the cable testing. Alternatives for more efficient cable testing will be developed in the analyses. M. Remote Site Communication Rates have increased for the leased lines used to communicate with remote sites in the collection system. This plan evaluates other options for remote site communication. N. Site Lighting The site lighting is aging and appear to be corroding. Replacement of the site lighting is included in the capital plan. O. Motor Control Center (MCC) Replacement Several MCCs are original equipment and their replacement is including in this plan.

Glenbard Wastewater Authority Section 6–Evaluation of Existing Facilities Wastewater Facilities Plan and Screening of Alternatives
Prepared by Strand Associates, Inc.® 6-9 R:\MAD\Documents\Reports\Archive\2013\GWA, IL\FP.1278.047.tws.sep\Report\S6 062013.doc\062413
P. Programmable Logic Controller (PLC) Replacement Several PLCs are original equipment and their replacement is included in this plan. Q. Electronic O&M Manual The development of an O&M manual with reference information for processes, equipment, operations, controls, and maintenance is included in the plan.


SECTION 7
WASTEWATER TREATMENT ALTERNATIVES EVALUATIONS


Glenbard Wastewater Authority Facilities Plan Section 7–Wastewater Treatment Alternatives Evaluations
Prepared by Strand Associates, Inc. 7-1 R:\MAD\Documents\Reports\Archive\2013\GWA, IL\FP.1278.047.tws.sep\Report\S7 062013.doc\062413
This section presents the analyses of alternatives identified in Section 6 as well as the other recommended common project elements discussed in Section 6. 7.01 INTRODUCTION The design flows and loadings that provide the basis for the alternative analysis presented in this section were developed in Section 4. Section 5 presents a summary of anticipated regulatory initiatives that may impact GWA’s NPDES permit. Section 6 described the deficiencies of the existing WWTP to meet the future design conditions and anticipated NPDES permit limits and identified treatment alternatives recommended for evaluation. This section evaluates the treatment alternatives identified in Section 6 on the basis of capital costs, annual O&M costs, 20-year present worth costs, nonmonetary issues, and environmental issues. These alternative technology evaluations include the following:
1. Influent Pump Station 2. Activated Sludge Treatment 3. Digested Biosolids Dewatering 4. Cogeneration and High-Strength Waste Codigestion
In addition to these alternative analyses, this section also reviews other recommended improvements at the WWTP. These project elements are developed and described based on the technology selections of the major alternative analyses presented above. These additional project elements include:
1. LCSTF Equipment Upgrades 2. Hauled Wastes Receiving 3. Screenings Washer and Compactor 4. Peak Flow Storage 5. Chemical Phosphorus Removal 6. Effluent Filtration 7. Disinfection 8. Sludge Thickening 9. Liquid Biosolids Storage 10. Dewatered Biosolids Storage 11. Plant Utilities 12. HVAC Replacement 13. Electrical Service, Backup, and Redundancy 14. Remote Site Communication 15. Site Lighting 16. Motor Control Center (MCC) Replacement 17. Programmable Logic Controller (PLC) Replacements 18. Electronic O&M Manual
7.02 INFLUENT PUMP STATION ALTERNATIVES ANALYSIS A. Description of Alternatives Two alternatives were analyzed for replacement of the existing influent pumps.

Glenbard Wastewater Authority Facilities Plan Section 7–Wastewater Treatment Alternatives Evaluations
Prepared by Strand Associates, Inc. 7-2 R:\MAD\Documents\Reports\Archive\2013\GWA, IL\FP.1278.047.tws.sep\Report\S7 062013.doc\062413
Alternative IPS-1: Install three new dry-pit submersible pumps in the existing dry well. Alternative IPS-2: Modify existing wet well for prerotational suction intake, and provide four new
dry-pit centrifugal pumps. For both alternatives, the existing hydraulically operated wet well slide gates and influent pump plug valves will be replaced and provided with electric actuators and controls. Pump sizing is based on a peak flow of 47 mgd of firm pumping capacity without wet well surcharging. Alternative IPS-1–This alternative includes the use of submersible dry pit pumps for dry well flood protection. This option is the most similar to the existing option with three identically sized pumps. The electrical cost difference of this alternative to a four-pump arrangement or a five pumps arrangement (three larger sized pumps and two smaller sized pumps) could be evaluated during design. At the current electrical rate of $0.04/kWh, however, a small pump arrangement is not considered to be cost effective. The following elements are included:
1. Replace existing pumps with three submersible dry-pit pumps and install new piping as necessary. Each pump would have a capacity of 23.5 mgd to provide 47 mgd of firm capacity.
2. Replace existing VFDs, MCCs, and PLCs.
3. Construct a new dedicated conditioned space for the motor control equipment on the first floor of the existing influent pump station.
4. Replace existing hydraulically operated plug valves with electrically operated actuators and controls. Temporary bypass pumping is assumed to be required for replacement of the pump discharge valves.
5. Replace sluice gate hydraulic operators with electric operators (7 total).
Alternative IPS-2–The prerotation basin required for this alternative is the main difference between Alternative IPS-1 and Alternative IPS-2. Prerotation allows the pump to operate at lower flows without the need for a VFD. VFDs are included in this alternative, however, to provide flow control. The prerotation also assists in wet well cleaning because of its low wet well level drawdown capability. Oil-cooled immersible pump motors that can operate in dry and submerged conditions for flood protection are recommended for these pumps. However, the manufacturer has indicated immersible motors are not available to handle the design flows with only three pumps. For this reason, this alternative assumes an arrangement with four pumps and the suction piping of the four pumps manifolded to the three wet wells (Figure 7.02-1). The following elements are included:
1. Replace existing pumps with four dry-pit pumps and install new piping as necessary. These dry-pit pumps would have immersible motors. Each pump would have a capacity of approximately 15.7 mgd to provide 47 mgd of firm capacity.
2. Install prerotation basins in each of the three existing wet wells. The wet well floor will have approximately one foot of concrete placed on top of the existing elevation to provide the prerotation basin low point at the suction bell. Raising the floor elevation also requires the wet well sluice gates and wall openings to be raised.

Glenbard Wastewater Authority Facilities Plan Section 7–Wastewater Treatment Alternatives Evaluations
Prepared by Strand Associates, Inc. 7-3 R:\MAD\Documents\Reports\Archive\2013\GWA, IL\FP.1278.047.tws.sep\Report\S7 062013.doc\062413
3. Replace existing VFDs, MCCs, and PLCs.
4. Construct a new dedicated conditioned space for the motor control equipment on the first floor of the existing influent pump station.
5. Remove existing hydraulically operated plug valves. All new valves will have electric operators.
6. Replace sluice gate hydraulic operators with electric operators (7 total). Modify stems for
raising the wet well gate elevations for the prerotation basins. Temporary bypass pumping is required for this work.
B. Monetary Comparisons Monetary comparisons include capital costs for equipment and structures and operation and maintenance costs for labor, power, and maintenance. Labor costs are assumed at $40 an hour and are evaluated as a comparison between the alternatives of the expected level of efforts. Power costs are assumed at $0.04 per kilowatt-hour.
Figure 7.02-1 Preliminary Influent Pump Station Layout Alternative IPS-2 Prerotation Basins and Pumps

Glenbard Wastewater Authority Facilities Plan Section 7–Wastewater Treatment Alternatives Evaluations
Prepared by Strand Associates, Inc. 7-4 R:\MAD\Documents\Reports\Archive\2013\GWA, IL\FP.1278.047.tws.sep\Report\S7 062013.doc\062413
The total present worth values between the alternatives are within 10 percent of each other, so these alternatives are considered equal on a cost basis.
C. Nonmonetary Considerations Alternatives IPS-1 and IPS-2 were evaluated with respect to these criteria. A subjective numerical value was assigned for each category for comparison of the alternatives. Table 7.02-2 presents a summary of nonmonetary factors and scores for the treatment alternatives. A score of +1 is a positive nonmonetary consideration, a score of 0 is a neutral consideration, and a score of -1 is a negative consideration.
Nonmonetary Evaluation Factor
Alternative Submersible
IPS-1 Prerotation
IPS-2 Reliability +1 +1 Ease of Operation/Complexity 0 0 Ease of Maintenance +1 +1 Ease of Construction +1
-1
Interceptor Capacity 0 +1 First Flush Interceptor Cleaning 0 +1 Wet Well Cleaning -1 +1 Total Nonmonetary Score 2 4 Table 7.02-2 Nonmonetary Evaluations of Influent Pump
Station Alternatives
IPS-1 IPS-2Submersible Prerotation
3,602,000$ 4,115,000$
Relative Labor1 3,000$ -$ Maintenance 21,000$ 23,000$ Power 77,000$ 74,000$
1,158,000$ 1,113,000$ -$ -$
(16,000)$ (34,000)$ 4,744,000$ 5,194,000$
100% 109%
Subtotal Opinion of Annual O&M2
Alternative
Opinion of Capital Costs
Annual O&M Costs
Present Worth of O&MPresent Worth of Future EquipmentPresent Worth of SalvageTOTAL OPINION OF PRESENT WORTH2
Percent of Lowest (Present Worth Basis)
1 Estimated relative labor cost for wet well cleaning. 2 Project life = 20 years; discount rate = 6 percent. 3 Refer to Appendix E for further opinion of cost details.
Table 7.02-1 Influent Pumping Station Opinion of Present Worth Summary3

Glenbard Wastewater Authority Facilities Plan Section 7–Wastewater Treatment Alternatives Evaluations
Prepared by Strand Associates, Inc. 7-5 R:\MAD\Documents\Reports\Archive\2013\GWA, IL\FP.1278.047.tws.sep\Report\S7 062013.doc\062413
The following nonmonetary factors were evaluated for the influent pump station alternatives.
Reliability Ease of Operation/Complexity Ease of Maintenance Ease of Construction Interceptor Capacity First Flush Interceptor Cleaning Wet Well Cleaning
Reliability–Both of these alternatives include pumps that are common for WWTPs and are considered equally reliable. Ease of Operation/Complexity–Operational ease relates to the level of effort required for the system to function as intended. Alternative IPS-1 is the most similar to the existing operation, so a neutral score is provided. Ease of Maintenance–The prerotation basin of Alternative IPS-2 does not provide an additional maintenance burden. The pump maintenance for the alternatives are considered equal. Ease of Construction–Installation of the prerotation basins and raising the wet well sluice gates will require a longer bypass pumping duration for Alternative IPS-2 compared to Alternative IPS-1. Interceptor Capacity–During wet weather events, the interceptors are frequently surcharged. Previous planning recommended maintaining a wet well level below the North Regional Interceptor invert elevation. Alternative IPS-2, because of the prerotation, could provide a lower operating wet well level. For this reason, Alternative IPS-2 is provided a positive score. First Flush Interceptor Cleaning–The low wet well operating level of Alternative IPS-2 also allows for the ability for interceptor cleaning which could reduce first flush solids during wet weather events. Wet Well Cleaning–The prerotation basin of Alternative IPS-2 could draw down the wet well to a few inches and allows for better wet well cleaning performance than Alternative IPS-1. D. Recommended Alternative On a monetary basis, the two alternatives are considered equal. Alternative IPS-2, with the prerotation basins, is the recommended alternative because of the nonmonetary factors including potentially increased interceptor capacity, interceptor cleaning, and wet well cleaning. 7.03 ACTIVATED SLUDGE ALTERNATIVES ANALYSIS The GWA WWTP activated sludge facilities were discussed in Section 3. Since the summer of 2012, GWA has operated the activated sludge facilities in a single-stage operation rather than a two-stage process. Modifications are underway that will allow the two carbo trains to operate in the single-stage activated sludge mode with the eight nitro trains.

Glenbard Wastewater Authority Facilities Plan Section 7–Wastewater Treatment Alternatives Evaluations
Prepared by Strand Associates, Inc. 7-6 R:\MAD\Documents\Reports\Archive\2013\GWA, IL\FP.1278.047.tws.sep\Report\S7 062013.doc\062413
Currently, oxygen is provided by an on-site cryogenic plant. Replacement of the cryogenic plant with leased on-site vacuum swing adsorption (VSA) equipment was reviewed. The VSA equipment would be owned, operated, and installed by the oxygen supplier. Leasing costs for the VSA exceed the current operating and maintenance costs of the cryogenic plant, so the VSA was not evaluated further in this facilities plan. Another option for consideration is for hauled liquid oxygen to be supplied, which at current prices of approximately $75/ton of oxygen, would have an annual cost less than the VSA on-site oxygen generation plant lease. These alternatives should be evaluated in more detail when the cryogenic plant is required to be replaced. A. Description of Alternatives Four activated sludge alternatives will be reviewed in this analysis: Alternative AS-1: Two-Stage HPOAS and continued cryogenic oxygen generation. Alternative AS-2: Single-stage HPOAS and continued cryogenic oxygen generation. Alternative AS-3: Single-stage air activated sludge and new aeration blowers. Alternative AS-4: Single-stage IFAS and new aeration blowers. A separate analysis for bioaugmentation as a side stream add-on process is also included.
Each of the alternatives assumes a design to meet a future phosphorus and TN limits of 0.5 mg/L and 10 mg/L, respectively. To meet the future TN limit, biological nitrogen removal is assumed. For phosphorus removal, CPR and BPR were considered. BPR testing was conducted in November 2012 to evaluate the ability for GWA to achieve BPR, and the results are summarized in Figure 7.03-1. The BPR testing includes two samples; the first with the raw wastewater, and a second, control, sample that includes raw wastewater with sodium acetate addition. The sodium acetate in the second sample is a volatile fatty acid (VFA), which is required for biological phosphorus release. The difference in the phosphorus release between the wastewater sample including sodium acetate and the sample including only wastewater indicates insufficient VFAs are available for BPR at the time of the testing. Additional BPR testing is recommended to confirm these results are representative. Fermentation of primary sludge could provide additional VFAs to improve BPR. Fermentation could be done in the existing primaries, existing sludge thickener, or a newly constructed fermenter tank. Odor control would be required for a fermentation tank because the of the adjacent residential areas. Because of the odor concerns and significant cost, fermentation is not included as a part of this plan. Based on the BPR testing, CPR is assumed to be required for all the activated sludge alternatives. CPR improvements are included as a common project element in Section 7.06, because the chemical demand and capital costs are considered equal among the four activated sludge alternatives,

Glenbard Wastewater Authority Facilities Plan Section 7–Wastewater Treatment Alternatives Evaluations
Prepared by Strand Associates, Inc. 7-7 R:\MAD\Documents\Reports\Archive\2013\GWA, IL\FP.1278.047.tws.sep\Report\S7 062013.doc\062413
Alternative AS-1–This alternative includes maintaining the existing system as two-stage HPOAS. Modifications to meet future limits are included in this alternative. The existing cryogenic system is assumed to be maintained by annual turnarounds and more extensive turnarounds every five years. The existing aerators are assumed to be maintained and replaced as necessary with the annual operations budget. The following elements are included in this alternative:
1. Reconfigure the eight nitrogenous trains to provide anoxic zones with new mixers. Primary effluent would be fed to the nitrogenous train to provide supplemental BOD for denitrification reactions. Large scale pilot testing is recommended.
2. Install nitrate recycle station, pumps, and recycle piping, for the eight nitrogenous trains.
3. Modify the first stage deck (anoxic zone) and the final nitrification stage deck in each of
the eight nitrogenous trains. The final stage would be modified for stripping dissolved carbon dioxide, which will increase the pH and could promote an increased nitrifier growth rate. Modifications would include the addition of a vent to open the stage to the atmosphere, mechanical modifications to the air monitoring system, oxygen supply piping modifications, and the addition of piping and an isolation valve to shut off oxygen migration.
4. Install new weirs and troughs in the intermediate clarifiers. 5. Apply tank lining system to interior of intermediate clarifiers. 6. Sandblast and paint intermediate clarifier equipment. Replacement of the intermediate
clarifiers mechanisms is assumed to be required in approximately 10 years.
Figure 7.03-1 Phosphorus Release Comparison (November 2012)

Glenbard Wastewater Authority Facilities Plan Section 7–Wastewater Treatment Alternatives Evaluations
Prepared by Strand Associates, Inc. 7-8 R:\MAD\Documents\Reports\Archive\2013\GWA, IL\FP.1278.047.tws.sep\Report\S7 062013.doc\062413
7. Replace carbo RAS pumps and WAS pumps in the Pump and Electrical Building, also known as Building T.
8. Modify sludge piping from the intermediate clarifier to the carbo RAS pumps and remove
t-valves for improved solids handling.
9. Replace Intermediate Pump Station pumps. Two options, (1) in-kind screw pumps and (2) conversion to a prerotation type submersible pump station, were recommended in the previous 2012 Intermediate Pump Station Alternatives Evaluation report by Strand to replace the existing intermediate pump station pumps. Both of these options had comparable opinions of capital costs.
10. Provide structural and electrical improvements to the Intermediate Pump Station.
11. Replace Cryo Building MCCs, PLCs, and UNOX system controls.
Alternative AS-2–This alternative includes operating the existing system as single-stage HPOAS. Modifications to meet future limits are included in this alternative. The following elements are included:
1. Reconfigure all 10 trains to provide anoxic zones including new anoxic mixers. Large scale pilot testing is recommended.
2. Install nitrate recycle station, pumps, and recycle piping for the 10 trains.
3. Modify the first stage deck (anoxic zone) and the final nitrification stage deck in each train. The final stage would be modified for stripping dissolved carbon dioxide, which will increase the pH and could promote an increased nitrifier growth rate. Modifications would include the addition of a vent to open the stage to the atmosphere, mechanical modifications to the air monitoring system, oxygen supply piping modifications, and the addition of piping and an isolation valve to shut off oxygen migration.
4. Decommission intermediate clarifiers. 5. Remove carbo RAS pumps and carbo WAS pumps. This portion of the Pump and
Electrical Building could be repurposed (see cogeneration and high-strength waste alternatives discussed in this section).
6. Replace Intermediate Pump Station pumps to serve as the RAS pump station. With this
alternative, this station would only pump RAS flow, so the pumping capacity could be reduced from the existing two-stage operation. For planning purposes, however, the station is assumed to provide capacity for forward flow as well in the event that the activated sludge process is converted back to two-stage HPOAS.
7. Provide structural and electrical improvements to the Intermediate Pump Station. 8. Replace Cryo Building MCCs, PLCs and UNOX system controls.

Glenbard Wastewater Authority Facilities Plan Section 7–Wastewater Treatment Alternatives Evaluations
Prepared by Strand Associates, Inc. 7-9 R:\MAD\Documents\Reports\Archive\2013\GWA, IL\FP.1278.047.tws.sep\Report\S7 062013.doc\062413
Alternative AS-3–This alternative represents a significant change from the HPO system to a more conventional air activated sludge system. The average design BOD5 loading rates of approximately 23 lbs BOD/1,000 ft3/day were used to develop the required additional aeration basin volumes. The following elements are included:
1. Construct a 2.8-million-gallon aeration basin addition. The addition would extend 110 feet to the east from the existing tanks and would maintain the existing 15.25-foot side water depth (SWD). Replace effluent mixed liquor piping to accommodate the new tanks. Temporary piping and pumping of mixed liquor are required for a portion of this work. Underground electrical feed lines will also need to be rerouted for the new tank construction.
2. Reconfigure the existing first two stages in each train to anoxic zones including new
anoxic mixers. Large scale pilot testing is recommended. 3. Install nitrate recycle station, pumps, and recycle piping for the 10 trains. 4. Install new fine bubble membrane diffusers and DO probes for automated DO control in
the existing and new aeration basins including new air piping.
5. Construct a new Blower Building near the Pump and Electrical Building and install five high speed turbo blowers.
6. Replace intermediate pump station pumps to serve as the RAS pump station. Three
pumps with 8 mgd capacity each are assumed for capacity to pump RAS only. 7. Demolish intermediate clarifiers to accommodate the new aeration basins. 8. Remove carbo RAS and carbo WAS pumps. 9. Demolish the cryogenic system. The Cryo Building can be repurposed. 10. Demolish concrete deck, surface aerators, oxygen piping, controls, and ancillary oxygen
equipment. Alternative AS-4–This alternative is similar to Alternative AS-3 (conversion to air activated sludge) except that IFAS is used to reduce the volume of aeration required. The following elements are included.
1. Construct a 1.3-million-gallon aeration basin addition. The addition would extend 52 feet to the east from the existing tanks and would maintain the existing 15.25-foot SWD. Replace effluent mixed liquor piping to accommodate the new tanks. Temporary piping and pumping of mixed liquor are required for a portion of this work. Underground electrical feed lines will also need to be rerouted for the new tank construction.

Glenbard Wastewater Authority Facilities Plan Section 7–Wastewater Treatment Alternatives Evaluations
Prepared by Strand Associates, Inc. 7-10 R:\MAD\Documents\Reports\Archive\2013\GWA, IL\FP.1278.047.tws.sep\Report\S7 062013.doc\062413
2. Reconfigure the first two existing stages in each train to anoxic zones including new anoxic mixers.
3. Install nitrate recycle station, pumps, and recycle piping for the 10 trains.
4. Install new medium bubble membrane diffusers in the existing and new aeration basins
including new air piping. 5. Install screens for IFAS system in existing and new aeration basins. 6. Construct a new Blower Building near the Pump and Electrical Building and install five
high speed turbo blowers 7. Replace intermediate pump station pumps to serve as the RAS pump station. As with
Alternative AS-3, three pumps with 8 mgd capacity each are assumed. 8. Demolish the intermediate clarifiers for the aeration basin addition 9. Remove carbo RAS and carbo WAS pumps. 10. Demolish the cryo system. The Cryo Building can be repurposed. 11. Demolish concrete deck, surface aerators, oxygen piping, controls, and ancillary oxygen
equipment.
B. Monetary Comparisons The total present worth of the activated sludge alternatives is presented in Table 7.03-1. The opinions of probable capital costs for Alternatives AS-1 and AS-2 are significantly less than the capital costs of Alternative AS-3 and Alternative AS-4. Alternatives AS-2, single stage HPOAS, is the lowest total present worth costs.

Glenbard Wastewater Authority Facilities Plan Section 7–Wastewater Treatment Alternatives Evaluations
Prepared by Strand Associates, Inc. 7-11 R:\MAD\Documents\Reports\Archive\2013\GWA, IL\FP.1278.047.tws.sep\Report\S7 062013.doc\062413
C. Nonmonetary Considerations Nonmonetary issues should be considered when evaluating alternatives, which include:
Treatment reliability Operation and process complexity Ease of maintenance Ease of construction Ability to provide nutrient removal
Alternatives AS-1 through AS-4 were evaluated with respect to these criteria. A subjective numerical value was assigned for each category for comparison of the alternatives. Table 7.03-2 presents a summary of nonmonetary factors and scores for the treatment alternatives.
AS-1 AS-2 AS-3 AS-4Two Stage
HPOASSingle Stage
HPOASAir Activated
SludgeIFAS
4,653,000$ 3,582,000$ 17,451,000$ 24,303,000$
Relative Labor 63,000$ 62,000$ 41,000$ 36,000$ Maintenance 171,000$ 164,000$ 58,000$ 108,000$ Power 312,000$ 284,000$ 207,000$ 285,000$
546,000$ 510,000$ 306,000$ 429,000$
6,263,000$ 5,850,000$ 3,510,000$ 4,921,000$ -$ -$ -$ -$
(109,000)$ (84,000)$ (733,000)$ (468,000)$ 10,807,000$ 9,348,000$ 20,228,000$ 28,756,000$
116% 100% 216% 308%
Present Worth of Future EquipmentPresent Worth of SalvageTOTAL OPINION OF PRESENT WORTH1
Percent of Lowest (Present Worth Basis)
Subtotal Opinion of Annual O&M1
Present Worth of O&M
Alternative
Opinion of Capital Costs
Annual O&M Costs
1 Project life = 20 years; discount rate = 6 percent. 2 Refer to Appendix E for further opinion of cost details. Table 7.03-1 Activated Sludge Treatment Opinion of Present Worth Summary2
Nonmonetary Evaluation Factor
Alternative AS-1 AS-2 AS-3 AS-4
Treatment Reliability 0 0 +1 +1 Ease of Operation/Complexity -1 +1 +1 -1
Ease of Maintenance -1 0 +1 -1 Ease of Construction +1 +1 -1
-1
Provide Nutrient Removal 0 0 +1 +1 Total Nonmonetary Score -1 2 3 -2
Table 7.03-2 Nonmonetary Evaluations of Activated Sludge Treatment Alternatives

Glenbard Wastewater Authority Facilities Plan Section 7–Wastewater Treatment Alternatives Evaluations
Prepared by Strand Associates, Inc. 7-12 R:\MAD\Documents\Reports\Archive\2013\GWA, IL\FP.1278.047.tws.sep\Report\S7 062013.doc\062413
Treatment Reliability–A reliable system experiences fewer problems and unplanned expenditures. The biological treatment processes are of specific concern with higher peak flows because of low hydraulic residence times and the high ratio of peak to average flow. These can lead to solids washout, incomplete nitrification, and performance instability. Therefore, Alternative AS-1 and AS-2 received a positive score because of the aeration basin addition. Ease of Operation/Complexity–Operational ease relates to the level of effort required for the system to function as intended. The two-stage operation of Alternative AS-1 requires more processes to monitor than the other alternatives. Alternative AS-4 received a negative score because of media replacement compared to Alternative AS-3.
Ease of Maintenance–The level of ease to perform maintenance on the equipment is considered lower for Alternative AS-1 than the other alternatives because of the additional equipment with this alternative associated with the two-stage activated sludge operation.
Ease of Construction–The ability to construct the selected alternative while still maintaining plant operations should be considered. Alternatives AS-3 and AS-4 received a negative score because of the bypass pumping, electrical relocation, and other work associated with the construction of additional basin volume.
Ability to Provide Nutrient Removal–GWA WWTP will likely be subject to more stringent nutrient limits in the future. The ability of the selected treatment system to meet these limits is an important consideration. Alternatives AS-1, AS-2, and AS-4 would require large scale pilot testing to incorporate BNR. Alternative AS-3, conventional air activated sludge, would likely provide reliable BNR. D. Bioaugmentation This discussion is for a side-stream bioaugmentation process to improve the nitrifying ability for all the alternatives, but specifically for Alternative AS-2 since single-stage HPO is not traditionally used for nitrification. This process would include separate biological treatment of recycled dewatering filtrate and produce supplemental nitrifiers for the main biological process. Bioaugmentation could provide the following benefits to the activated sludge process:
Provides equalization of dewatering filtrate return flows. Reduces the ammonia loading to the main activated sludge process. Provides more stable nitrification because of additional nitrifiers fed from bioaugmentation. Provides a source of seed nitrifiers in the event of peak flow solids washout or biological upsets.
The current annual average BFP filtrate flow is approximately 42,000 gpd. Typically, the filtrate has an ammonia concentration of approximately 700 mg/L and concentrations up to 1,000 mg/L have been recorded. BFP filtrate ammonia loading represents approximately 18 percent of the total influent ammonia loading.
Bioaugmentation processes such as the Aeration Tank 3 (AT-3, Figure 7.03-2) and the Bioaugmentation Reaeration/Regeneration (BAR, Figure 7.03-3) could be used. Both of these processes were developed to nitrify dewatering filtrate and provide supplemental nitrifiers for the main activated sludge process stream. The main difference is that in the AT-3 process, only a portion of the

Glenbard Wastewater Authority Facilities Plan Section 7–Wastewater Treatment Alternatives Evaluations
Prepared by Strand Associates, Inc. 7-13 R:\MAD\Documents\Reports\Archive\2013\GWA, IL\FP.1278.047.tws.sep\Report\S7 062013.doc\062413
RAS is pumped to the bioaugmentation basin, and in the BAR process, all the RAS is pumped to this basin.
For incorporation of an AT-3 bioaugmentation process to the GWA WWTP, dewatering filtrate would be pumped from the dewatering building to the bioaugmentation aeration basin. Both of the existing ATAD basins, not in operation, could be converted to AT-3 bioaugmentation basin. The existing cryogenic plant provides excess oxygen that can provide bioaugmentation aeration with the existing oxygen supply piping to the ATAD basins. A portion of RAS from the mainstream process would be pumped from the Intermediate Pump Station (RAS pump station) to the bioaugmentation basin. In addition to providing seed nitrifiers, the RAS reduces the temperature of the dewatering filtrate and provides alkalinity. The bioaugmentation basin effluent (high in nitrifiers) can be continuously added by gravity to the main process aeration tanks. For this process, CPR of the main process stream is assumed. In contrast, the BAR process would require a more significant modification of the mainstream process than the AT-3 process. The BAR process returns the dewatering filtrate to an initial reaeration zone with all the main stream RAS. For GWA, this process would likely require a volume equivalent to about two of the existing aeration basins to be converted to RAS reaeration. The ATAD basins could be available
PrimaryInfluent Secondary Effluent
Activated Sludge
RAS
Centrate(NH3-N)
Final
Reaeration Zone
Alkalinity
Figure 7.03-3 Bioaugmentation–BAR Schematic
PrimaryInfluent Secondary Effluent
Activated Sludge
RAS
Centrate(NH3-N)
NitrificationReactor
Nitrifier Rich MLSS
Alkalinity
Final
Figure 7.03-2 Bioaugmentation–AT-3 Schematic

Glenbard Wastewater Authority Facilities Plan Section 7–Wastewater Treatment Alternatives Evaluations
Prepared by Strand Associates, Inc. 7-14 R:\MAD\Documents\Reports\Archive\2013\GWA, IL\FP.1278.047.tws.sep\Report\S7 062013.doc\062413
for this process, but additional volume would be required. Because the AT-3 is considered to have less constructability concerns, the BAR process was not evaluated further. The BAR process could be evaluated further if GWA proceeds with a bioaugmentation project. A preliminary cost opinion was developed for the AT-3 process and is based on Alternative AS-2. Included in the costs are the following elements:
1. Convert both existing ATAD basins (260,000 gallons) into a bioaugmentation aeration basins. Existing weir elevations would need to be raised to allow for gravity flow to the main stream aeration basins. The ATAD basins could be modified to operate as two basins, as it is currently, or as one basin with four stages.
2. For Alternative AS-2, the existing oxygen supply line can be used for bioaugmentation.
Replacement of the existing surface aerators is assumed. The final stage could be open to the air and include a mixer similar to Alternatives AS-1 and AS-2 to increase the pH and could reduce alkalinity addition.
3. Install two new dewatering filtrate pumps in the Sludge Dewatering Building, using one
of the existing sludge transfer tanks. Install new underground piping to deliver the dewatering filtrate from the Sludge Dewatering Building to the bioaugmentation aeration basin. One of the existing sludge holding tanks at the Dewatering Building could be used as a dewatering filtrate pump station.
4. The main process RAS feed to the bioaugmentation basins could be pumped from the
Intermediate Pump Station. If screw pumps are installed, a submersible pump could be installed to pump bioaugmentation feed RAS. With a prerotation or submersible RAS pump station, a branch piping feed to the bioaugmentation basin could be installed with a control valve and flow meter.
5. Install underground piping to deliver bioaugmentation mixed liquor effluent to the
aeration basin influent channel. 6. Install alkalinity addition chemical storage tanks and chemical feed system. A portion of
the existing ATAD Building could be used if only tote storage of chemical is required. If bulk storage is required, however, construction of a separate building is required. Pilot testing is recommended to determine the alkalinity chemical demand. Tote storage and use of the existing ATAD Building alkalinity addition are assumed for the purposes of this plan.
The preliminary opinion of probable cost for an AT-3 bioaugmentation system is $1,459,000. See Appendix E for further details of the opinion of probable cost. E. Conclusions Alternatives AS-3 and AS-4 have significantly greater capital costs than Alternatives AS-1 and AS-2 and, because of the good operating condition of the cryogenic plant, it is recommended this HPO system be maintained. The air activated sludge alternatives could be reevaluated when the cryogenic

Glenbard Wastewater Authority Facilities Plan Section 7–Wastewater Treatment Alternatives Evaluations
Prepared by Strand Associates, Inc. 7-15 R:\MAD\Documents\Reports\Archive\2013\GWA, IL\FP.1278.047.tws.sep\Report\S7 062013.doc\062613
plant requires replacement. In the near term, Alternative AS-2 will provide maintenance benefits over AS-1 including removal of the carbo intermediate clarifiers, carbo RAS pumps, and carbo WAS pumps. At the time of this report, the ability of the GWA WWTP to reliably nitrify while operating the activated sludge facilities in the single stage has not been fully evaluated. After evaluation of the single-stage operation, GWA could consider potentially improving nitrification with modifications to the last stage of the aeration basins which would increase the pH. Bioaugmentation could be implemented to potentially improve nitrification and reduce the ammonia loading to the activated sludge process as well. A detailed study and pilot testing are recommended before considering bioaugmentation. The cost of a bioaugmentation project, however, could exceed short-term costs to change the activated sludge process back to a two-stage activated sludge operation. The activated sludge alternative analysis assumed limits of 0.5 mg/L for TP and 10 mg/L for TN. When the actual TP and/or TN nutrient limits are known, the single-stage HPOAS should be further evaluated to incorporate BNR. Large scale pilot testing by converting one of activated sludge trains to include denitrification is recommended. The recommended Alternative AS-2 is separated into multiple projects because of differing priorities and are summarized in Table 7.03-3. Section 8 includes an implementation schedule for these projects.
7.04 DIGESTED BIOSOLIDS DEWATERING A. Description of Alternatives The following dewatering alternatives are considered for the GWA WWTP. Alternative BD-1–Install two new BFPs within the existing solids dewatering facility. This alternative includes replacing the existing BFPs with new BFP equipment, which would require few modifications to the solids dewatering facility. The performance from a new BFP is expected to be better than the existing BFPs (18 to 20 percent cake solids versus 15 to 16 percent). The existing polymer system and conveyors would be reused and require minor modifications. Polymer use for the new system is anticipated to be 15 pounds of polymer per dry ton solids. The capacity of the new BFPs would be approximately 240 gpm total with an operating time of approximately 8 to 9 hours a day for three days per week. Costs for installation of two new BFPs with PLC control systems are summarized in Table 7.04-1.
Table 7.03-3 Activated Sludge Projects

Glenbard Wastewater Authority Facilities Plan Section 7–Wastewater Treatment Alternatives Evaluations
Prepared by Strand Associates, Inc. 7-16 R:\MAD\Documents\Reports\Archive\2013\GWA, IL\FP.1278.047.tws.sep\Report\S7 062013.doc\062413
Alternative BD-2–Install one new centrifuge and maintain one existing BFP in the existing solids dewatering facility. This alternative includes replacing one BFP with a centrifuge while maintaining the second BFP as an emergency backup. Based on previous experience with centrifuges, we expect 25 percent solids with a maximum of 20 pounds polymer per dry ton of solids. The centrifuge alternative may require additional structural support for the more concentrated centrifuge load, an overhead crane for maintenance, conveyor replacement, piping modifications, and polymer system modifications. It is anticipated that the majority of the polymer system will be reused; however, additional pump capacity may be required. The capacity of the new centrifuge would be approximately 250 gpm with an operating time of approximately 8 to 9 hours a day for three days per week. Costs for installation of one new centrifuge with control system are summarized in Table 7.04-1. B. Monetary Comparisons Table 7.04-1 is a comparison of the capital costs and present worth analysis for the two alternatives. The BFP alternative has the lowest capital cost and opinion of present worth. The centrifuge provides biosolids disposal savings. Biosolids storage building costs are impacted by the selection of this alternative because of the dewatering performance differences. The biosolids storage project costs, however, are included in the common needs in Section 7.06 and are not included in this monetary analysis because the biosolids storage project is expected to be installed before a the biosolids dewatering project. As discussed further in Section 7.06, the centrifuge alternative BS-2 could reduce to building size and, therefore, the overall cost of the centrifuge option compared to the belt filter press option.
BD-1 BD-2Two New
BFPsOne New
CentrifugeOpinion of Total Construction Capital Costs 1,820,000$ 2,292,000$
Annual O&M CostsPower Requirements ($0.04/kWh) 400$ 6,000$ Polymer Requirements1 40,000$ 53,000$ Biosolids Disposal 146,000$ 116,600$ Maintenance and Supplies 20,000$ 20,000$
Subtotal Opinion of Annual O&M 206,400$ 195,600$
Present Worth of O&M4 2,367,000$ 2,244,000$ TOTAL OPINION OF PRESENT WORTH4 4,187,000$ 4,536,000$
Percent of Lowest (Present Worth Basis) 100% 108%
Alternative
1 Chemical requirements based on $2.00 per pound of polymer. 2 Biosolids disposal is based on a cost of $22 per wet ton. 3 Maintenance and supplies are approximately 2 percent of equipment cost. 4 Project life = 20 years; discount rate = 6 percent.
Table 7.04-1 Biosolids Dewatering Alternatives Opinion of Present Worth Summary

Glenbard Wastewater Authority Facilities Plan Section 7–Wastewater Treatment Alternatives Evaluations
Prepared by Strand Associates, Inc. 7-17 R:\MAD\Documents\Reports\Archive\2013\GWA, IL\FP.1278.047.tws.sep\Report\S7 062013.doc\062413
C. Nonmonetary Considerations Five nonmonetary factors were considered in this evaluation. They include wash water use, odor control, room environment, cleanup effort, and operator familiarity. Each alternative was given a score 1, 0, or -1 for each of the factors, with 1 as the most favorable alternative and -1 as the least favorable alternative. The alternative with the highest nonmonetary score is the most favorable alternative. The nonmonetary evaluation is shown in Table 7.04-2. Alternative BD-2 has a significantly higher nonmonetary score primarily because of the centrifuge enclosure. Even though labor savings are not included in the monetary analysis, Alternative BD-2 with the centrifuge would require less labor to operate than Alternative BD-1 with the BFP. Because of the reduced operator demand of Alternative BD-2, operator responsibilities could be focused elsewhere if this alternative is selected.
D. Recommended Alternative Although Alternative BD-1 has a lower total present worth than Alternative BD-2, the nonmonetary benefits of Alternative BD-2 are significantly greater than Alternative BD-1. Because of the nonmonetary considerations and potential saving in biosolids storage costs, Alternative BD-2 is recommended. 7.05 CODIGESTION AND COGENERATION ANALYSES A. Existing Sludge and Biogas Production Data Summary The GWA provided approximately 45 months of biosolids data from January 1, 2009, to September 30, 2012. The data provides pumping volumes as well as total and volatile solids (VS) concentrations for cothickened PRS, Carbo WAS, and Nitro WAS. A summary of the biosolids data is presented in Table 7.05-1. The total digester feed loadings have remained very stable over the last several years, averaging approximately 54,000 gpd and 15,700 pounds per day (lbs/day).
Alternative BD-1
Two New BFPs BD-2
One New Centrifuge Wash Water Use -1 +1 Odor Control -1 +1 Room Environment -1 +1 Cleanup Effort -1 +1 Operator Familiarity +1 -1
Total -3 +3 Table 7.04-2 Dewatering Nonmonetary Evaluation

Glenbard Wastewater Authority Facilities Plan Section 7–Wastewater Treatment Alternatives Evaluations
Prepared by Strand Associates, Inc. 7-18 R:\MAD\Documents\Reports\Archive\2013\GWA, IL\FP.1278.047.tws.sep\Report\S7 062013.doc\062413
Biogas production at the plant is measured but is not recorded. Using the data presented in Table 7.05-1, an approximation of the amount of biogas produced through anaerobic digestion can be calculated. Sludge entering the WWTP contains fixed solids and VS. A percentage of the VSS is removed by the anaerobic digestion process and creates biogas. The amount of biogas generated from anaerobic digestion is typically 12 to 18 cubic feet per pound (ft3/lb) VS destroyed. For the purpose of this report, we have assumed an average biogas production of 15 ft3/lb of VS destroyed. Table 7.05-2 summarizes the volatile biosolids loading to the digesters and estimated volume of biogas produced. The percent volatile solids reduction is approximately 60 percent based on the Van Kleeck equation. The average biogas production from 2009 to September 2012 is estimated to be 90 cubic feet per minute (ft3/min). A third digester was started up in 2009, and it appears biogas production has increased each year since the new digester became operational. The 2033 projected biogas production from municipal sludge only, assuming a VS loading of 16,800 lbs/day and a VSR reduction of 60 percent, is approximately 130 ft3/min.
B. Biogas Quality Summary The GWA uses biogas to fuel boilers without any conditioning other than gross moisture removal using condensate traps. Sampling of the biogas has been completed by GWA to determine the concentration of the various constituents. The results of the sampling are summarized in Table 7.05-3 and indicate
Year PRS+WAS+NITRO
(lbs VS/day) DSL
(lbs VS/day)
Total VS Destroyed
(lbs VS/day) Supernatant1 (lbs VS/day)
VSR (%)
Biogas3 Production
(ft3/min) 2009 12,440 4,670 7,790 22 59 81 20102 12,490 4,150 8,360 22 * 87 2011 13,090 4,310 8,800 22 61 91 2012 12,910 3,410 9,520 22 61 99
Average 12,730 4,140 8,620 22 60 90
1 Supernatant VS data is based on limited data samples. 2 VSR is based on the average VSR from 2009 because of a data gap from June 3, 2009 to March 1, 2011. 3 Biogas production based on 15 ft3/lb of VS destroyed. Table 7.05-2 Digestion Performance Summary
Year PRS+WAS+NITRO
(gpd)
Total Digester Feed
(lbs/day)
Volatile Solids Percentage
(%VS)
Volatile Solids Loading (lbs/day)
2009 53,800 15,300 81 12,440 2010 54,300 15,420 81 12,490 2011 54,200 16,450 80 13,090 2012 52,100 15,610 83 12,910
Average 53,600 15,700 81 12,730 Table 7.05-1 Sludge Data Summary

Glenbard Wastewater Authority Facilities Plan Section 7–Wastewater Treatment Alternatives Evaluations
Prepared by Strand Associates, Inc. 7-19 R:\MAD\Documents\Reports\Archive\2013\GWA, IL\FP.1278.047.tws.sep\Report\S7 062013.doc\062413
the biogas has relatively low concentrations of hydrogen sulfide and high concentrations of siloxanes, which will likely require treatment if biogas is to be used for cogeneration.
C. High Strength Waste (HSW) and Codigestion Capacity Analysis GWA has accepted some landfill leachate and may enter into a long-term contract to accept more leachate. Currently, GWA does not accept HSW such as septage, grease, food wastes, and other HSW. Common HSW feed stocks are from beverage plants, cheese plants, and other food processing plants, as well as grease trap wastes from restaurants and similar facilities. Many WWTPs with anaerobic digesters have begun accepting HSW because of potential revenue from the additional biogas generation and tipping fees for HSW acceptance. In many areas, there is a considerable market for WWTPs to receive HSW and codigest the material with normal municipal sludge. The following Midwest communities/Districts are either currently accepting or are constructing facilities to accept HSW for codigestion (not a complete list): Milwaukee MSD, Fond du Lac, Sheboygan, Stevens Point, and Janesville, Wisconsin, and Dubuque and Des Moines, Iowa. Many other WWTPs are considering the opportunities available to accept HSW. The GWA WWTP has primary digester capacity available to accept HSW as indicated below. The three existing anaerobic digesters, Digesters No. 1, No. 2, and No. 3, have a volume of 124,700 ft3, 70,200 ft3, and 50,100 ft3, respectively (approximately 1,830,000 gallons total). Typical digester capacity is estimated by assuming the digestion system can be loaded at 80 to 100 lbs VS/1,000 ft3/day for a total loading capacity of approximately 19,500 lbs VS/day for the two primary digesters. Converting Digester No. 3 to a primary digester increases the loading capacity to approximately 24,500 lbs VS/day. The current digester loading (sum of primary, Carbo, and Nitro sludge) is approximately 12,700 lbs VS/day, which equates to an excess loading capacity of approximately 6,800 lbs VS/day (existing system), and 11,800 lbs VS/day if all three digesters are operated as primary digesters. In addition, at some facilities it has been demonstrated that codigestion actually improves the VSR of municipal sewage sludge feed solids, resulting in the ability to load the digesters at even higher VS loading rates. This available digester capacity can be used for codigesting HSW. The organic loading value of HSW is typically measured in terms of BOD or chemical oxygen demand (COD) rather than volatile solids, since HSW is often very soluble with low solids content. Typical HSW COD values are above 20,000 mg/L and can be in excess of 1,000,000 mg/L for very concentrated material such as glycerin or sugar wastes. To estimate the volume of HSW that could be trucked into the plant, as well as the potential additional biogas generation, the following assumptions have been made:
Year Hydrogen Sulfide
(ppmV) Siloxanes
(ppmV, Si) Carbon Dioxide
Mol % Methane
Mol % 12/18/2008 302 8.72 36.9 61.2 05/31/2012 Not Sampled 10.85 36.9 62.2
Table 7.05-3 Biogas Quality Sampling Results

Glenbard Wastewater Authority Facilities Plan Section 7–Wastewater Treatment Alternatives Evaluations
Prepared by Strand Associates, Inc. 7-20 R:\MAD\Documents\Reports\Archive\2013\GWA, IL\FP.1278.047.tws.sep\Report\S7 062013.doc\062413
1. Available digester capacity can be loaded at 100 lbs COD/1,000 ft3/day. 2. The HSW has a COD of approximately 60,000 mg/L. In reality, the COD concentration
could vary between 10,000 mg/L and several hundred thousand mg/L (or more). 3. COD reduction in digesters is approximately 80 percent. 4. Approximately 5.5 ft3 of methane per lb COD removed will be generated.
Based on a COD concentration of 60,000 mg/L, the volume of HSW that can be accepted is approximately 18,000 and 32,000 gpd for two and three primary digesters, respectively. These additional HSW loadings would be anticipated to generate approximately 35 ft3/min of additional biogas using only the two existing primary digesters and approximately 60 ft3/min of additional biogas if all three digesters are used as primary digesters. This represents an increase of biogas of approximately 40 and 67 percent, respectively. Therefore, with HSW codigestion, the total estimated biogas production from the digesters is approximately 125 and 150 ft3/min of biogas, respectively, assuming full loading of two primary digesters or three primary digesters. If higher strength wastes are brought into the plant, these biogas production rates would increase. Numerous options are available to accept HSW. HSW can be received directly at the plant without any pretreatment by direct discharge into a manhole or wet well. A coarse bar screen can be added to a manhole to remove large debris. Packaged receiving equipment is commonly used to accept HSW, especially high solids wastes such as septage, and typically includes a rock trap, flow meter, fine screen, sampling, screenings washing, and screenings discharge to a dumpster. Automation options that require haulers to enter an access code or swipe a card to gain access to the plant are also available for such packaged receiving stations. The GWA has a couple options to accept HSW. The ATAD basins could be used, but these are currently being evaluated for use as dewatering storage and bioaugmentation facilities. If the intermediate clarifiers are taken out of service (convert to single-stage HPO versus two-stage HPO), which is likely, the Pump and Electrical Building RAS/WAS wet well could be used for HSW receiving. At the Pump and Electrical Building, the two existing belowgrade wet wells (current Carbo RAS/WAS pump station wet well) adjacent to the building have a total volume of approximately 16,000 gallons, which is a sufficient volume to meet the near-term HSW receiving needs. If HSW receiving needs increase above 16,000 gpd, an additional wet well can be constructed adjacent to the existing wet well. HSW pumping equipment would be housed in the basement of the Pump and Electric Building in the space currently occupied by the Carbo RAS pumps. Space is available for packaged HSW receiving equipment (if determined to be needed) in the blower room located in the Pump and Electric Building. The roof would need to be raised in the vicinity of the equipment to provide adequate clearance for maintenance. Piping would be installed to allow direct discharge to the anaerobic digesters or the influent sewer (connection at MH-18). D. Codigestion and Cogeneration Alternatives Analysis Biogas from anaerobic digestion at the GWA WWTP is used in the plant boilers to heat the digestion process or is flared. However, the GWA is interested in accepting high strength waste to generate

Glenbard Wastewater Authority Facilities Plan Section 7–Wastewater Treatment Alternatives Evaluations
Prepared by Strand Associates, Inc. 7-21 R:\MAD\Documents\Reports\Archive\2013\GWA, IL\FP.1278.047.tws.sep\Report\S7 062013.doc\062413
additional revenue from tipping fees and increase biogas production, as well as potential cogeneration from biogas. As a part of this study, the following codigestion and cogeneration alternatives are discussed and evaluated:
1. Alternative CC-1a–Convert one or more of the existing natural gas engines to use biogas for electricity production and heat recovery. Digest municipal sludge only (no codigestion).
2. Alternative CC-1b–Convert one or more of the existing natural gas engines to use
biogas for electricity production and heat recovery. Construct HSW receiving station for codigestion up to the loading limit of the existing digestion facilities.
3. Alternative CC-2a–Install new internal combustion engines to use biogas for electricity
production and heat recovery. Digest municipal sludge only (no codigestion). 4. Alternative CC-2b–Install new internal combustion engines to use biogas for electricity
production and heat recovery. Construct HSW receiving station for codigestion up to the loading limit of the existing digestion facilities.
All the above alternatives involve a reciprocating gas engine, which requires biogas to be treated for hydrogen sulfide (required to lengthen the life of the downstream siloxane media), siloxanes, and moisture removal. Proposed equipment locations for biogas treatment (all alternatives) and a new internal combustion engine (Alternatives CC-2a and CC-2b only) are shown in Figures 7.05-1 and 7.05-2. Common gas conditioning requirements are provided in the following list:
a. Lower Heating Value 600 British Thermal Units/standard cubic feet (BTU/scf).
b. Biogas compression to 3 to 5 pounds per square inch (psi).
c. Hydrogen sulfide removal to less than 500 to 1,000 parts per million (ppm).
d. Siloxane removal to less than 0.6 µg/BTU (Lower Efficiency Engine) or 0.25 µg/BTU (Higher Efficiency Engine).
e. Moisture removal to about 50 percent relative humidity at 80 °F. Each alternative is described in detail along with a description of the various biogas treatment systems. The potential locations for equipment installations are also identified.
1. Alternative CC-1a–Utilize Biogas with Existing Engine(s) for Municipal Sludge Only
This alternative involves modifying one of the three existing reciprocating natural gas engines (815 kW each) for biogas service. The engine would need to handle larger volumes of fuel because of the greater percentage of carbon dioxide in biogas, as well as higher levels of contaminants. Heat would be recovered off the engine and the exhaust in the form of hot water.

Glenbard Wastewater Authority Facilities Plan Section 7–Wastewater Treatment Alternatives Evaluations
Prepared by Strand Associates, Inc. 7-22 R:\MAD\Documents\Reports\Archive\2013\GWA, IL\FP.1278.047.tws.sep\Report\S7 062013.doc\062413
Based on information received from the engine manufacturer, this alternative is not likely feasible at the current and projected future gas flow rates without HSW codigestion. The minimum biogas flow rate is 142 ft3/min. Currently, the WWTP generates an average of 90 to 100 ft3/min of biogas, which is well below the minimum gas flow required. This alternative will not be evaluated any further as a part of this report.
2. Alternative CC-1b–Utilize Biogas with Existing Engine(s) for Municipal Sludge and HSW This alternative involves modifying an existing reciprocating natural gas engine for use on biogas as described in Alternative CC-1a and also includes the addition of high strength waste receiving for codigestion. As described previously, accepting high strength has the potential to increase gas production to 150 ft3/min (or more) if the existing digester loading capacity if fully utilized and the existing secondary digester is converted to a primary digester. Biogas conditioning will be required to remove hydrogen sulfide (required to lengthen the life of downstream siloxane media), siloxanes, and moisture. A monetary evaluation of this alternative is presented later in this section. 3. Alternative CC-2a–Utilize Biogas with New Engine(s) for Municipal Sludge Only
This alternative involves installation of a new gas engine dedicated to cogeneration utilizing biogas as the fuel source. For this alternative, HSW receiving facilities will not be constructed. Based on projected future digester VS loadings, the future design biogas production from municipal sludge would be approximately 130 ft3/min. For this analysis, a 600 kW gas engine was considered for the 100 and 125 ft3/min gas flow rates. A 475 kW engine with a lower capital cost was evaluated, but because of lower electrical efficiencies and overall capacity, it was not included in the analysis. An 800 kW engine was also evaluated; however, the minimum gas flow rate required is 102 ft3/min (50 percent load), which is currently higher than the average daily gas flow rate. These engines all have different electrical and heat recovery efficiencies as well as long-term maintenance requirements and anticipated longevity. If this alternative is selected as the preferred alternative, a more detailed comparison should be made between these and other manufacturers’ engines.
4. Alternative CC-2b–Utilize Biogas with New Engine(s) for Municipal Sludge and HSW
This alternative involves installation of a new gas engine dedicated to cogeneration utilizing biogas as a fuel source and the installation of HSW receiving facilities. This alternative has the potential to produce at least 150 ft3/min of biogas if the existing secondary digester is converted to a primary digester and the full digester loading capacity is utilized. HSW has been shown to improve volatile solids reduction in municipal sludge, which could increase gas flows above 150 ft3/min. For this analysis, a 600 kW engine was used for the 100, 125, and 150 ft3/min gas flow rates. Note, the 600 kW engine utilizes 137 ft3/min of biogas at full load requiring gas in excess of 137 ft3/min to be flared or taken to the boiler. If biogas production increases substantially beyond 137 ft3/min, a second 600 kW unit would be purchased to utilize all biogas generated and provide a second unit to maintain cogeneration while a unit is down for maintenance.


Glenbard Wastewater Authority Facilities Plan Section 7–Wastewater Treatment Alternatives Evaluations
Prepared by Strand Associates, Inc. 7-23 R:\MAD\Documents\Reports\Archive\2013\GWA, IL\FP.1278.047.tws.sep\Report\S7 062013.doc\062413
Similar to Alternative CC-2a, 475 kW and 800 kW engines were evaluated and found not be as cost-effective at current and projected gas flow rates. If this alternative is selected as the preferred alternative, a more detailed comparison should be made between these and other manufacturers’ engines.
E. Biogas Conditioning Currently, GWA does not treat digester gas for removal of any contaminants other than limited moisture removal. Based on the biogas quality data and the maintenance issues with the boilers, some additional biogas conditioning equipment is recommended for all the biogas use alternatives described. Before final design of any improvements, we recommend additional biogas testing to better define hydrogen sulfide and siloxane concentrations. Previous testing indicated that siloxanes had increased between 2008 and 2012. However, these observations are based on only two samples. We recommend samples to be collected at least annually better define actual biogas characteristics. Additionally, hydrogen sulfide should be sampled to confirm hydrogen sulfide levels have not changed significantly. Included in the following is a brief description of the biogas conditioning equipment that may be used here.
1. Hydrogen Sulfide Removal
Hydrogen sulfide is removed from biogas using either biological or chemical removal systems. Biological removal systems convert hydrogen sulfide to sulfate (SO4), which is then discharged into the plant return flow. Chemical systems rely on chemical reactions and stabilization of reduced sulfur with oxidizing compounds typically impregnated in an inorganic, nonreactive media. Biological systems have higher capital and lower O&M costs and become economically feasible as hydrogen sulfide concentrations and gas flows increase. Chemical systems (i.e., iron sponges and other proprietary media systems) have lower capital costs, but they require routine media removal and replacement resulting in higher O&M costs. Based on the low hydrogen sulfide concentrations, a chemical system was evaluated for this report.
2. Siloxane Removal
Siloxanes are removed from biogas using activated carbon or similar proprietary media. The media is housed in a steel vessel and requires periodic replacement depending on the vessel size, operating pressure, and siloxane concentration in the biogas. Hydrogen sulfide and moisture removal are required upstream to lengthen the life of the siloxane media.
3. Moisture Removal
Moisture removal is an important process as it impacts the efficiency of downstream siloxane removal as well as the efficiencies of the gas utilization equipment. Generally, dry biogas provides a better fuel than a moist gas. A glycol-chilled system for moisture removal system is required for the gas engine combined heat and power (CHP) systems considered in this report.

Glenbard Wastewater Authority Facilities Plan Section 7–Wastewater Treatment Alternatives Evaluations
Prepared by Strand Associates, Inc. 7-24 R:\MAD\Documents\Reports\Archive\2013\GWA, IL\FP.1278.047.tws.sep\Report\S7 062013.doc\062413
These systems are typically installed as skid-mounted systems as part of the overall conditioning system. 4. Biogas Conditioning Equipment Locations
The digester gas equipment is currently located in the digester control building. The digester control building houses the digested sludge recirculation pumps, digested sludge mixing pumps, belt filter press feed pumps, grinders, boilers, and other sludge processing equipment and piping. Space is available on the first floor of the digester control building between Digesters No. 1 and No. 2 to house the gas compression and moisture removal equipment and one gas engine. The equipment required for hydrogen sulfide and siloxane removal would be housed outside on the south side of the digester complex. Electrical equipment will be housed in the existing MCC room and will require consolidation of existing control panels to provide the required space. Approximate locations for the gas conditioning and cogeneration equipment are shown in Figures 7.05-1 and 7.05-2.
F. Digester Gas Holding Capacity Increases Currently GWA uses the gas holding cover on Digester No. 3 to store biogas generated by the digestion process. Cogeneration at the plant will likely require additional biogas storage because of the higher rate of use of the biogas. Therefore, for the cogeneration alternatives, we have included additional biogas storage capacity. This capacity would likely be provided by including a new gas holding cover on Digester No. 2. The cover could be a steel gas holding cover, similar to the cover on Digester No. 3, or a membrane-style cover. Membrane covers are more expensive but provide considerably more storage over a given tank than steel gas holders provide. Alternatively, a separate gas holding cover could be installed on a separate liquid biosolids storage tank. For example, if the filter backwash holding tank were repurposed as a liquid biosolids storage tank, it could include a membrane gas holding cover to provide additional biogas storage as well. For the purpose of this analyses, we have assumed a membrane-style cover would be provided on Digester No. 2. The capital costs for the cover are included in the cogeneration and codigestion analyses. G. Monetary Comparisons Opinion of probable costs were developed for the alternatives previously described assuming three different biogas production rates of 100, 125, and 150 ft3/min as noted in Table 7.05-4. The gas flow rates are representative of the approximate current gas production, gas production with two digesters at full loading capacity, and gas production with three digesters at full loading capacity, respectively. Table 7.05-4 shows a summary of the of the alternatives evaluated at various gas flow rates.
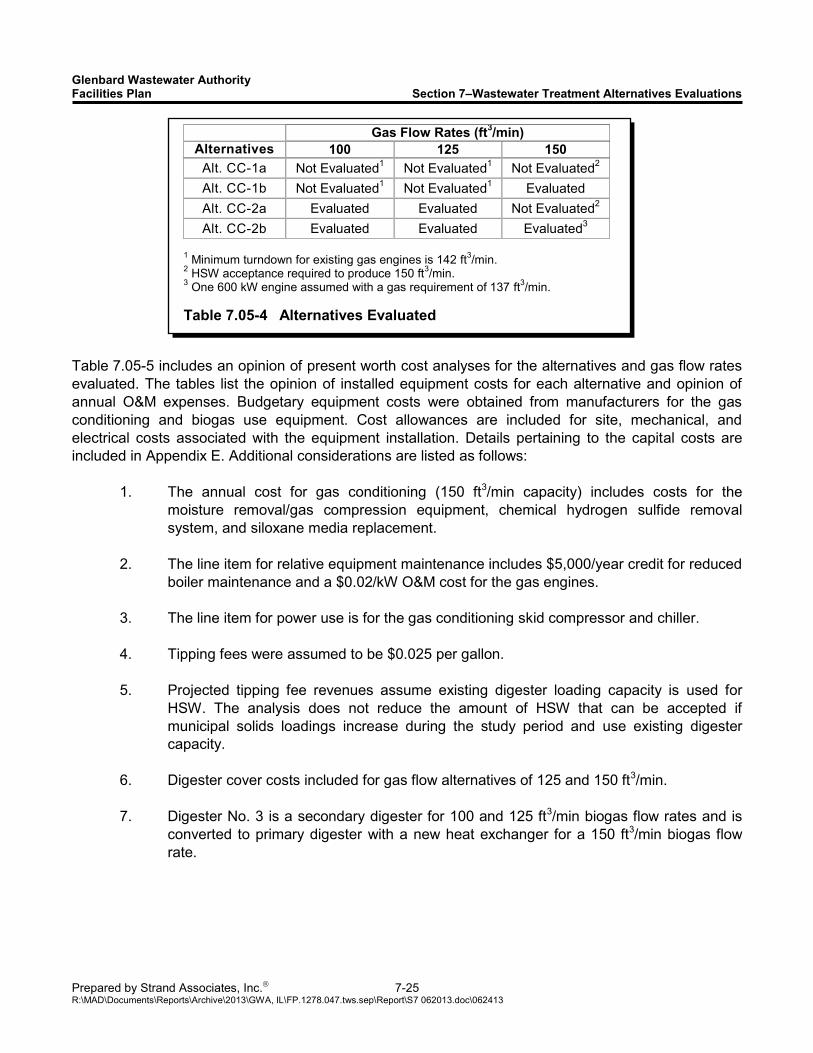
Glenbard Wastewater Authority Facilities Plan Section 7–Wastewater Treatment Alternatives Evaluations
Prepared by Strand Associates, Inc. 7-25 R:\MAD\Documents\Reports\Archive\2013\GWA, IL\FP.1278.047.tws.sep\Report\S7 062013.doc\062413
Table 7.05-5 includes an opinion of present worth cost analyses for the alternatives and gas flow rates evaluated. The tables list the opinion of installed equipment costs for each alternative and opinion of annual O&M expenses. Budgetary equipment costs were obtained from manufacturers for the gas conditioning and biogas use equipment. Cost allowances are included for site, mechanical, and electrical costs associated with the equipment installation. Details pertaining to the capital costs are included in Appendix E. Additional considerations are listed as follows:
1. The annual cost for gas conditioning (150 ft3/min capacity) includes costs for the moisture removal/gas compression equipment, chemical hydrogen sulfide removal system, and siloxane media replacement.
2. The line item for relative equipment maintenance includes $5,000/year credit for reduced boiler maintenance and a $0.02/kW O&M cost for the gas engines.
3. The line item for power use is for the gas conditioning skid compressor and chiller.
4. Tipping fees were assumed to be $0.025 per gallon.
5. Projected tipping fee revenues assume existing digester loading capacity is used for HSW. The analysis does not reduce the amount of HSW that can be accepted if municipal solids loadings increase during the study period and use existing digester capacity.
6. Digester cover costs included for gas flow alternatives of 125 and 150 ft3/min.
7. Digester No. 3 is a secondary digester for 100 and 125 ft3/min biogas flow rates and is converted to primary digester with a new heat exchanger for a 150 ft3/min biogas flow rate.
Gas Flow Rates (ft3/min) Alternatives 100 125 150
Alt. CC-1a Not Evaluated1 Not Evaluated1 Not Evaluated2 Alt. CC-1b Not Evaluated1 Not Evaluated1 Evaluated Alt. CC-2a Evaluated Evaluated Not Evaluated2 Alt. CC-2b Evaluated Evaluated Evaluated3
1 Minimum turndown for existing gas engines is 142 ft3/min. 2 HSW acceptance required to produce 150 ft3/min. 3 One 600 kW engine assumed with a gas requirement of 137 ft3/min. Table 7.05-4 Alternatives Evaluated

Glenbard Wastewater Authority Facilities Plan Section 7–Wastewater Treatment Alternatives Evaluations
Prepared by Strand Associates, Inc. 7-26 R:\MAD\Documents\Reports\Archive\2013\GWA, IL\FP.1278.047.tws.sep\Report\S7 062013.doc\062413
TABLE 7.05-5 COGENERATION AND HSW CODIGESTION OPINION OF PRESENT WORTH SUMMARY GAS FLOW RATE = 100 FT3/MIN
Alt. CC-1a Alt. CC-1b1 Alt. CC-2a Alt. CC-2bExisting Engines
Biogas Gas Flow Rate Not Feasible 150 SCFM 100 SCFM 125 SCFM 125 SCFM 150 SCFM
4,489,000$ 3,969,000$ 5,299,000$ 5,931,000$ 6,337,000$ Cost Adder for 200 ft3/min Gas Cond. Equip. (Cost not included in Capital Costs Above) 75,000$ 75,000$ 75,000$ 75,000$ 75,000$
Gas Conditioning Equipment 43,000$ 29,000$ 36,000$ 36,000$ 43,000$ Gas Engine Equip. Maintenance 73,000$ 66,000$ 88,000$ 88,000$ 100,000$ Electrical Savings ($0.04/kWH) (155,000)$ (142,000)$ (186,000)$ (186,000)$ (210,000)$ 3
Power Use ($0.04/kWH) 9,000$ 6,000$ 8,000$ 8,000$ 9,000$ Tipping Fee Revenue (287,000)$ 5 $ - $ - (164,000)$ 4 (287,000)$ 5
(317,000)$ (41,000)$ (54,000)$ (218,000)$ (345,000)$ Direct Payback 14 Years 97 Years 98 years 27 years 18 years
(3,636,000)$ (470,000)$ (619,000)$ (2,500,000)$ (3,957,000)$ 853,000$ 3,499,000$ 4,680,000$ 3,431,000$ 2,380,000$
100% 410% 549% 402% 279%TOTAL OPINION OF PRESENT WORTH6
Percent of Lowest (Present Worth Basis)
Existing Engines with HSW New Engines
Opinion of Total Construction Capital Costs2
Annual O&M Costs
Subtotal Opinion of Annual O&M (Savings)
Present Worth of O&M6
New Engines with HSW
Notes: 1Minimum required gas flow is 142 ft3/min.
2Gas conditioning equipment with 150 ft3 capacity included 3Electrical savings is based on 137 ft3/min and 600 BTU/ft3. 4Based on $0.025/gallon and 18,000 gallons per day of HSW 5Based on $0.025/gallon and 31,400 gallons per day of HSW 6Project life = 20 years; discount rate = 6 percent.

Glenbard Wastewater Authority Facilities Plan Section 7–Wastewater Treatment Alternatives Evaluations
Prepared by Strand Associates, Inc. 7-27 R:\MAD\Documents\Reports\Archive\2013\GWA, IL\FP.1278.047.tws.sep\Report\S7 062013.doc\062413
1. 100 ft3/min BioGas Flow Alternative CC-2a is the only feasible alternative for this biogas flow rate and a present worth cost analysis is included in Table 7.06-4. Alternative CC-2b includes construction of HSW receiving facilities, which are not required for a gas flow rate of 100 ft3/min. Alternatives CC-1a and 1b were not considered for this gas flow rate because the minimum gas flow required for continuous operation of a converted G3516 engine to utilize biogas is 142 ft3/min.
2. 125 ft3/min Biogas Flow Alternative CC-2b has the lowest opinion of present worth cost for a gas flow rate of 125 ft3/min because of increased revenue from tipping fees when compared to Alternative CC-2a. Note, the tipping fee revenue is assumed to be $0.025/gallon and generally ranges from $0.01 to $0.10/gallon. A market study is recommended to investigate local interest, demand, and potential fees for high strength waste receiving facilities. Additionally, an electrical unit cost of $0.04/kWh was included, which is likely to increase in the future. This would improve the economic payback of the alternatives. Alternatives CC-1a and 1b were not considered for this gas flow rate because the minimum gas flow required for continuous operation of a converted G3516 engine is 142 ft3/min.
3. 150 ft3/min Biogas Flow Alternative CC-1b has the lowest opinion of present worth cost for a gas flow rate of 150 ft3/min because of decreased capital costs associated with converting an existing G3516 gas engine to an engine that can utilize biogas. This alternative also includes the conversion of Digester No. 3 to a primary digester and construction of HSW receiving facilities. Note, Alternative CC-1b requires GWA to begin accepting HSW to increase gas production to 142 ft3/min before the existing engine could be utilized continuously and, therefore, may not be a feasible alternative. Alternatives CC-1a and CC-1b were not considered for this gas flow rate because HSW facilities are required to increase gas flow to 150 ft3/min. Alternative CC-2b does not utilize all biogas for this alternative as the capacity of the engine is 137 ft3/min. A second engine could be purchased to utilize gas flow above 137 ft3/min or excess gas can be flared or used in a boiler. It was assumed that excess gas would be flared in the present worth analysis.
As discussed above, the tipping fees for HSW were assumed to be $0.025/gallon and electrical savings are based on $0.04/kWh. If a market study demonstrates high demand and fees for HSW, an 800 kW engine could be considered in lieu of the 600 kW engine to utilize up to 183 ft3/min of biogas. A drawback of a new 800 kW engine is the minimum required gas flow is approximately 102 ft3/min, which is above the current gas production rate of approximately 90 to 100 ft3/min.
An additional design consideration is upsizing the gas conditioning system to treat flows up to 200 ft3/min to provide additional capacity for gas production beyond these projections. Upsizing the system would add approximately $75,000 in additional capital costs but provides additional capacity if HSW acceptance improves volatile solids destruction and increases gas flow beyond the projected 150 ft3/min gas flow rate.

Glenbard Wastewater Authority Facilities Plan Section 7–Wastewater Treatment Alternatives Evaluations
Prepared by Strand Associates, Inc. 7-28 R:\MAD\Documents\Reports\Archive\2013\GWA, IL\FP.1278.047.tws.sep\Report\S7 062013.doc\062413
H. Nonmonetary Considerations Because of the similarity of the alternatives, there are only a couple of nonmonetary considerations when comparing the alternatives.
1. Alternatives CC-1a and CC-1b do not require the installation of a new gas engine, which allows the space planned for the engine in the digester control building to be utilized for alternative uses.
2. Alternatives CC-1a and CC-2a do not require the installation of HSW receiving facilities,
which allows the space planned for the facilities to be available for alternative uses.
3. Alternatives CC-2a and CC-2b do not use an existing generator, which allows the existing generators to remain as dedicated standby power sources for the WWTP.
I. Conclusions The codigestion and cogeneration alternatives are not recommended at this time as the economic return is not favorable. This is mainly the result of the very low electrical rates currently paid by GWA. Reevaluation of these alternatives is recommended in future planning efforts and as electrical costs increase. 7.06 OTHER RECOMMENDED PLAN ELEMENTS This section reviews other recommended plan elements. These recommended improvements are based on a number of criteria, including equipment age and maintenance issues, process reliability issues, and similar concerns. The following elements are discussed:
LCSTF Equipment Upgrades Hauled Waste Receiving Screenings Washer and Compactor Peak Flow Storage Chemical Phosphorus Removal Effluent Filtration Disinfection Sludge Thickening Liquid Biosolids Storage Dewatered Biosolids Storage Plant Utilities HVAC System Replacement Electrical Service, Backup, and Redundancy Remote Site Communication Site Lighting MCC Replacement PLC Replacements Electronic O&M Manual

Glenbard Wastewater Authority Facilities Plan Section 7–Wastewater Treatment Alternatives Evaluations
Prepared by Strand Associates, Inc. 7-29 R:\MAD\Documents\Reports\Archive\2013\GWA, IL\FP.1278.047.tws.sep\Report\S7 062013.doc\062413
Each element is further discussed. Section 8 presents the overall project implementation schedule as well as a financial impact summary for these improvements. A. LCSTF Equipment Upgrades
1. Screening
The LCSTF includes one 58 mgd capacity coarse mechanical bar screen and one manual bar screen. The existing screen is original equipment and was rehabilitated in 2009. This screen is beyond its expected service life and replacement with a fine screen recommended. The opinion of probable cost for replacement of the mechanical screen with a fine screen including channel modifications to retrofit the new screen is $1,000,000. A detailed hydraulic evaluation is required during design.
2. Grit Removal
The LCSTF currently has two aerated grit removal tanks with equipment that is beyond their expected service life. Conversion to a vortex grit removal system is recommended to replace the equipment and improve grit removal performance. Two 18-foot-diameter, 30 mgd capacity vortex grit removal tanks would be required. The two newly constructed circular tanks could be partially installed in the existing tanks with the influent and discharge channels installed in the existing tanks. The opinion of probable cost including contractor’s general conditions, contingencies, and technical services is $2,510,000
3. Clarifier Mechanisms The LCSTF includes two 145-foot-diameter clarifiers which have original mechanisms. In 2011, the weirs were replaced with concrete outboard weir and the clarifier mechanism skimmer arms were modified. In January 2013, Walker Process inspected the clarifier equipment and determined the drives do not need to be replaced. This project assumed replacement of the clarifier mechanisms only. The opinion of probable cost for replacement of the LCSTF clarifier mechanisms including contractor’s general conditions, contingencies, and technical services is $277,000. Alternatively, the mechanisms could be rehabilitated.
B. Hauled Waste Receiving GWA currently does not have dedicated facilities to receive and handle hauled wastes at the plant. Many plants are currently including such facilities to enable additional revenue to be generated through tipping fees. At plants with anaerobic digestion, high-strength waste can be injected directly to the digesters to increase biogas production, which can then be used to generate electricity and heat. Previously in this report, the potential for HSW receiving, codigestion, and cogeneration was investigated and determined to not be cost-effective at this time. However, it is still feasible to accept hauled wastes at the plant, and this section defines how that could be done in a phased approach:
Phase 1–Construct Receiving Catch Basin with Manual Bar Rack: The initial project incudes construction of a simple receiving station near the gravity thickener and ATAD tanks to allow the

Glenbard Wastewater Authority Facilities Plan Section 7–Wastewater Treatment Alternatives Evaluations
Prepared by Strand Associates, Inc. 7-30 R:\MAD\Documents\Reports\Archive\2013\GWA, IL\FP.1278.047.tws.sep\Report\S7 062013.doc\062413
plant to accept relatively low strength hauled wastes such as leachate, holding tank wastes, and possibly septage. A channel with manually cleaned bar rack would be included to remove large solids, and the channel would be connected via sewer to the West Glen Ellyn interceptor and ultimately discharge to the influent wet well. The receiving station could include a fenced area with monitoring/metering station to measure volumes of hauled wastes received with each load.
Phase 2–Utilize ATAD Basin(s) for Hauled Waste Equalization: In the future, if hauled waste
volumes and/or loadings dictate the need to equalize the loadings to the plant, one or more of the ATAD tanks could be used to receive, store, and mix the hauled wastes. The channel described in Phase 1 would be designed to flow into the ATAD tank(s). Mixing could be provided for the tanks if the type of hauled wastes require mixing, and a pumping system would be needed to deliver the hauled wastes from the ATAD tank(s) to the West Glen Ellyn interceptor.
C. Screenings Washer and Compactor Replacement of the existing screenings washer/compactor is recommended. The opinion of cost to provide one washer/compactor in-kind replacement including contractor’s general conditions, contingencies, and technical services is $195,000. This equipment is assumed to be replaced through the annual capital replacement budget. D. Peak Flow Storage The LCSTF has two lagoons for peak flow storage. These lagoons likely require sludge dredging and repairs to the lagoon in the next 10 years. A study is recommended to evaluate the condition of the lagoons and determine the sludge quantity. The study could require further investigations including a survey of lagoon sludge depth, sludge samples, liner evaluation, berm evaluations, and soil borings. The GWA WWTP has two lagoons with an approximate storage volume of 5.8 million gallons that could be converted for peak flow storage and equalization. Similar to the LCSTF lagoons, these lagoons will require evaluation of the sludge quantity, condition of the liner, and subgrade conditions. In 2009, a contractor had inspected the lagoons and estimated a removal 19,000 cubic yards of material. Based on $19 per cubic yard, the opinion of probable cost for lagoon dredging is $361,000. For capital planning purposes, a total cost for dredging at the LCSTF and WWTP lagoons is assumed to be $1,000,000. More detailed project costs should be developed in the next facilities plan after evaluations of the lagoons at both facilities are completed.
Opinion of Project Cost
Phase 1-Receiving Catch Basin and Bar Rack 238,000$ Phase 2-Hauled Wastes Equalization 336,000$
Table 7.06-1 Hauled Wastes Receiving Opinions of Probable Project Cost

Glenbard Wastewater Authority Facilities Plan Section 7–Wastewater Treatment Alternatives Evaluations
Prepared by Strand Associates, Inc. 7-31 R:\MAD\Documents\Reports\Archive\2013\GWA, IL\FP.1278.047.tws.sep\Report\S7 062013.doc\062413
E. Chemical Phosphorus Removal As previously discussed in the activated sludge alternatives analysis, CPR is assumed to be required for each of the activated sludge alternatives. The capital and operating costs for CPR are considered equal for each of the activated sludge alternatives, and, therefore, is presented as a common element in this plan. The pH suppression of ferric chloride and alum phosphorus removal chemicals could be a concern for nitrification in conjunction with the lower pH associated with HPO (Alternatives AS-1 and AS-2). The costs included herein assume sodium aluminate may be required in lieu of the more common ferric chloride or alum. Sodium aluminate, in addition to phosphorus removal, would provide alkalinity. Jar testing is required for selection between ferric chloride, alum, and sodium aluminate as well as determining the site-specific chemical demand. The CPR project would include the following elements:
1. Construct new CPR building for bulk storage and pumping. The CPR Building could be located near the Pump and Electrical Building.
2. Install bulk storage tanks and CPR pumps. 3. Install CPR piping from the CPR Building to the application points. Multiple application
points are assumed for flexibility of chemical addition. 4. Install phosphorus monitoring equipment for CPR chemical feed control.
The opinion of probable construction cost and O&M costs for the CPR project are summarized in Table 7.06-2. Because of the significance in chemical costs and the uncertainty of the future phosphorus limit, CPR jar testing, BPR testing, and pilot testing are recommended before design of CPR.
F. Effluent Filtration Each of the disc filter units would be installed in an existing deep bed effluent filter. The new disc filters do not require all ten of the existing deep bed filters. The remaining deep bed effluent filters could
601,000$
Relative Labor 4,000$ Maintenance 2,000$ Power 1,000$ Phosphorus Removal Chemical ($1.40/gal) 1,022,000$
1,029,000$
Opinion of Capital Costs
Annual O&M Costs
Subtotal Opinion of Annual O&M
Table 7.06-2 CPR Opinion of Probable Cost

Glenbard Wastewater Authority Facilities Plan Section 7–Wastewater Treatment Alternatives Evaluations
Prepared by Strand Associates, Inc. 7-32 R:\MAD\Documents\Reports\Archive\2013\GWA, IL\FP.1278.047.tws.sep\Report\S7 062013.doc\062413
remain in service for additional redundancy or could be removed along with the associated equipment. For planning purposes, costs for demolition of all tanks are included for each of the evaluated disc filter units. The effluent filtration project would include the following elements:
1. Demolish the existing deep bed effluent filters to accommodate the new disc filters. 2. Demolish remaining deep bed effluent filters and ancillary equipment including the
blowers and compressors. 3. Provide structural modifications to the existing deep bed effluent filter basins for disc
filter equipment. 4. Install new disc filter equipment, associated piping, and walkways. 5. Repurpose the existing filter backwash basin, possibly for WAS storage. The remaining
filter basins could be reserved for future filter units.
The equipment filtration systems are summarized in Table 7.06-3, and their respective opinions of capital cost are summarized in Table 7.06-4. The IEPA 370 code for filtration requires a filtration rate of 5 gpm/ft2 at peak hourly flow with one unit out of service. The Nova Water Technologies disk filter is a higher rate system that operates at a filtration rate greater than 15 gpm/ft2 at peak hourly flows. Because this filtration rate exceeds the IEPA 370 code, further review is required. The opinion of probable cost for this project are within 5 percent of each other for the Nova Water Technologies, Siemens, and Kruger disc filter equipment. The project cost opinion for the Ashbrook Simon-Hartley equipment is significantly greater than the other three. Of the equipment evaluated, the Kruger Hydrotech Disc Filter has the lowest opinion of capital cost. Because of the design differences between the Nova Water Technologies, Siemens, and Kruger disc filter equipment, review of these three is recommended during design. For planning purposes, the lowest capital cost of these three manufacturers, Kruger, is used in Section 8. Additionally, future phosphorus limits could impact the selected equipment for this effluent filtration project. Pilot testing of a disc filter unit with CPR could be done to measure CPR potential.
Nova Water TechnologiesUltrascreen Disk Filter
KrugerHydrotech Disc Filter
SiemensForty-X Disc
Filter
Ashbrook Simon-Hartley
Iso-Disc1
Number of Filter Units 5 5 7 14Existing Basins Used 5 5 7 7Filter Rate at 14.5 mgd (all units), gpm/ft2 4 1 1 1Filter Rate at 47 mgd (One Out of Service) gpm/ft2 15 5 5 5 1 One existing basin out of service includes two Iso-Disc units Table 7.06-3 Comparison of Disc Filter Systems

Glenbard Wastewater Authority Facilities Plan Section 7–Wastewater Treatment Alternatives Evaluations
Prepared by Strand Associates, Inc. 7-33 R:\MAD\Documents\Reports\Archive\2013\GWA, IL\FP.1278.047.tws.sep\Report\S7 062013.doc\062413
G. Disinfection Horizontal, vertical, and inclined-style UV systems were considered for replacement of the existing system. A summary of each system and the opinion of probable cost for each system are found in Tables 7.06-5 and Table 7.06-6, respectively. These new systems require significantly fewer lamps compared to the existing system, which has 2,304 lamps. The TrojanUV 3000Plus equipment can be installed in three of the existing channels with new concrete baffle walls at the equipment. The Xylem Wedeco Duron equipment could be installed either in a four-channel or two-channel arrangement. The two-channel arrangement for the Xylem Wedeco Duron equipment requires two of the existing channels to be widened to accommodate the equipment. The four-channel arrangement for the Xylem Wedeco Duron equipment can be installed in the four existing channels with baffle walls at the equipment. The TrojanUV Signa and Ozonia Aquaray 3X equipment requires channel modifications to provide a deeper and wider channels.
Nova Water TechnologiesUltrascreen Disk Filter
KrugerHydrotech Disc Filter
SiemensForty-X Disc
Filter
Ashbrook Simon-Hartley
Iso-Disc Opinion of Probable Cost
Disc Filter Equipment 3,012,000$ 2,798,000$ 2,966,000$ 4,485,000$ Structural Modifications and Demolition 844,000$ 819,000$ 1,009,000$ 1,023,000$ Mechanical and Electrical 1,349,000$ 1,349,000$ 1,367,000$ 1,367,000$ Contractor General Conditions 416,000$ 397,000$ 427,000$ 550,000$ Construction Total 5,621,000$ 5,363,000$ 5,769,000$ 7,425,000$ Contingencies (10%) 562,000$ 536,000$ 534,000$ 688,000$ Technical Services 1,083,000$ 1,083,000$ 1,083,000$ 1,083,000$
Total Opinion of Probable Cost 7,266,000$ 6,982,000$ 7,386,000$ 9,196,000$ Percent of Lowest Opinion of Probable Cost 104% 100% 106% 132% Table 7.06-4 Disc Filter Systems Opinions of Probable Cost

Glenbard Wastewater Authority Facilities Plan Section 7–Wastewater Treatment Alternatives Evaluations
Prepared by Strand Associates, Inc. 7-34 R:\MAD\Documents\Reports\Archive\2013\GWA, IL\FP.1278.047.tws.sep\Report\S7 062013.doc\062413
UVT can have a significant impact on the cost of the system and testing should be conducted during design. The evaluated systems in Table 7.06-3 are based on a UVT of 65 percent, which was used for the design of the original UV system.
TrojanUV-3000Plus
TrojanUV-Signa
Xylem Wedeco-
Duron (2-Channel)
Xylem Wedeco-
Duron (4-Channel)
Ozonia-Aquaray 3X
Opinion of Capital CostsUV Equipment Cost 1,317,000$ 1,492,000$ 1,300,000$ 1,300,000$ 872,000$ Structural Costs 44,000$ 428,000$ 85,000$ 80,000$ 369,000$ Electrical Costs 272,000$ 272,000$ 272,000$ 272,000$ 272,000$ Contractor General Conditions 131,000$ 175,000$ 133,000$ 132,000$ 121,000$ Contingencies 176,000$ 237,000$ 179,000$ 178,000$ 163,000$ Technical Services 361,000$ 495,000$ 361,000$ 361,000$ 495,000$
Total Opinion of Capital Cost 2,301,000$ 3,099,000$ 2,330,000$ 2,323,000$ 2,292,000$
Annual O&M CostsPower Costs 5,000$ 7,000$ 6,000$ 6,000$ 9,000$ Annual Replacement Costs 20,000$ 9,000$ 10,000$ 10,000$ 18,000$
Present Worth of O&M 287,000$ 184,000$ 184,000$ 184,000$ 310,000$ Total Opinion of Present Worth1 2,584,000$ 3,230,000$ 2,505,000$ 2,497,000$ 2,558,000$ Percent of Lowest (Present Worth Basis) 103% 129% 100% 100% 102%
1 Project life = 20 years; discount rate = 6 percent. Table 7.06-6 UV Disinfection Systems Opinions of Present Worth
TrojanUV-3000Plus
TrojanUV-Signa
Xylem Wedeco-
Duron (2-Channel)
Xylem Wedeco-
Duron (4-Channel)
Ozonia-Aquaray 3X
Lamp Orientation Horizontal Inclined Inclined Inclined VerticalChannels 3 2 2 4 2Banks per Channel 2 2 3 (6 modules) 3 (3 modules) 2 (4 modules)Total Banks 6 4 6 12 4Total Modules - - 12 12 8Total Lamps 480 108 144 144 288Flow Capacity Per Channel (mgd) 16 24 24 24 24Channel Modifications Required No Yes Yes No Yes
Table 7.06-5 Comparison of UV Disinfection Systems

Glenbard Wastewater Authority Facilities Plan Section 7–Wastewater Treatment Alternatives Evaluations
Prepared by Strand Associates, Inc. 7-35 R:\MAD\Documents\Reports\Archive\2013\GWA, IL\FP.1278.047.tws.sep\Report\S7 062013.doc\062413
The lowest opinion of total present worth is the Xylem Wedeco Duron UV equipment. The highest opinion of total present worth is the TrojanUV Signa equipment, and this unit on a cost basis is not recommended. The Xylem-Wedeco Duron equipment (both arrangements), Ozonia Aquaray 3X equipment, and the TrojanUV 3000 Plus equipment are considered equal on a cost basis because the total present worths are within 10 percent. The Xylem-Wedeco Duron and TrojanUV 3000Plus equipment is easier to construct than Ozonia Aquaray 3X because less channel modifications are required. Further evaluation of the Xylem-Wedeco Duron, Ozonia Aquaray 3X, and TrojanUV 3000Plus equipment nonmonetary factors is recommended during design. H. Sludge Thickening The justification for sludge thickening improvements was developed in Section 6. The following presents a stepwise approach to improve the thickening operations at the plant. This approach allows the plant to optimize, to the extent practical, the current practice of cothickening in the gravity thickener. This approach also develops future options to provide better flexibility to the plant. The costs associated with this approach are included in Table 7.06-7. However, these costs would only be necessary if the solids density meter control is not successful.
Phase 1–Install Solids Density Meters to Control Gravity Thickener Underflow: As noted, the plant would like to continue cothickening primary sludge and WAS in the gravity thickener. However, under current conditions the underflow concentration is fairly thin, resulting in high hydraulic loadings to the digesters. The plant will investigate whether the density meters provide the required monitoring and control to consistently achieve a 3.5 percent solids feed to the digesters.
Phase 2–Install New Thickened Sludge Suction Piping/New Building: The existing suction
withdrawal piping from the gravity thickener follows a relatively long and tortuous path to the thickened sludge pumps. To improve these conditions, it may be feasible to install a new suction pipe from the thickener to the sludge pumps, but this could be a challenging project and may not solve the problem. Therefore, a better option would be to construct a small below-grade sludge pumping structure immediately adjacent to the gravity thickener to significantly shorten the suction piping. The existing thickened sludge pumps would be relocated to this new structure, and a new thickened sludge force main would be constructed to connect to an existing 6-inch line in the yard to provide dual sludge lines to the digesters. The installation of this line would also enable the plant to pump primary sludge directly from the primary clarifiers to the digesters separately from the thickener underflow. This would provide improved flexibility to separately thicken primary sludge and WAS and would also provide redundant sludge lines across the site.
Phase 3–Utilize the GBT for WAS Thickening: This scenario would include using the existing GBT to thicken WAS only and would allow the gravity thickener to be used for primary sludge, which is more common by today’s standards than gravity thickening of WAS. Under this future scenario, the existing filter backwash storage tank may be repurposed as a WAS holding tank upstream of the GBT. This tank would require aeration to avoid septic conditions and severe odors in the GBT room. The existing WAS pumps in the Sludge Pump and Metering Building would be replaced to pump WAS to the gravity thickener, GBT, or WAS storage tank. Alternatively, the existing filter backwash storage tank could be repurposed for other uses such

Glenbard Wastewater Authority Facilities Plan Section 7–Wastewater Treatment Alternatives Evaluations
Prepared by Strand Associates, Inc. 7-36 R:\MAD\Documents\Reports\Archive\2013\GWA, IL\FP.1278.047.tws.sep\Report\S7 062013.doc\062413
as liquid biosolids storage, which is further discussed in Paragraph I below. If the filter backwash storage tank is not available for WAS storage, the WAS pumps could feed the GBT directly. The cost opinions for the options Phase 3 with WAS storage and Phase 3 with direct WAS pumping to the GBT are included in Table 7.06-6 as Phase 3a and Phase 3b, respectively.
I. Liquid Biosolids Storage The plant currently dewaters biosolids 7 days per week and about 5 to 6 hours per day. Adding liquid storage facilities for digested biosolids would allow the plant to dewater biosolids less frequently and would also improve flexibility for the digestion and dewatering operations. In addition, the storage tank could be fitted with a membrane biogas storage cover to provide both biosolids and biogas storage improvements. A membrane-type cover would be recommended in this case to allow the liquid level in the tank to vary from empty to full. The best option at the plant for such a tank would be the existing filter backwash storage tank. This tank is not in regular use and is available. However, as noted in Paragraph K above, this tank may be repurposed for WAS holding, depending on the success of the interim sludge thickening operations and modifications implemented. Therefore, the decision as to which use is best for filter backwash storage tank should be made in the future based on the plant’s experience with the sludge thickening operations. The opinion of probable cost for this project is $1,850,000. J. Dewatered Biosolids Storage Covering of the biosolids storage pads is considered to prevent precipitation from wetting the dewatered biosolids. Two storage buildings will be located to cover the existing storage pads. A building area of approximately 72,000 ft2 is assumed based on projected future biosolids production including future chemical phosphorus removal sludge, 150 days of storage in accordance with IEPA 370, and a biosolids stack height of 4 feet. At $35 per square foot plus contingencies, contractor’s general conditions, and technical services, the opinion of probable construction cost is $3,800,000 for covered biosolids storage. This cost could be reduced if a centrifuge is installed, as described in biosolids dewatering Alternative BD-2, because of the increased dewatering performance. The centrifuge could likely produce 25 percent TS, which would reduce the biosolids volume to be stored by approximately 36 percent, and, as a result, the biosolids storage building footprint and cost would be proportionally reduced. A building area required for future biosolids production at 25 percent TS, and a 4 foot stack height is approximately 46,000 ft2. Also note that the stack height would likely be greater than 4 feet if the
Opinion of Project Cost
Phase 1-Gravity Thickener Sludge Density Meter Control -$ Phase 2-Thickened Sludge Pump Station and Piping Improvements 873,000$ Phase 3a-GBT WAS Thickening Improvements (with WAS storage) 1,226,000$ Phase 3b-GBT WAS Thickening Improvements (direct pumping to GBT) 560,000$ Table 7.06-7 Sludge Thickening Opinions of Probable Project Cost

Glenbard Wastewater Authority Facilities Plan Section 7–Wastewater Treatment Alternatives Evaluations
Prepared by Strand Associates, Inc. 7-37 R:\MAD\Documents\Reports\Archive\2013\GWA, IL\FP.1278.047.tws.sep\Report\S7 062013.doc\062413
biosolids concentration is 25 percent. However, since this material is not available to measure, we have assumed a 4-foot stack height for planning purposes. The opinion of probable construction cost of covered storage assuming centrifuge dewatering is $2,456,000. This cost is included in Section 8 because Alternative BD-2 is recommended. K. Plant Utilities Replacement of the nonpotable water (NPW) systems was evaluated for the GWA WWTP including new NPW yard piping and yard hydrants. The opinion of probable cost for the GWA WWTP NPW yard piping replacement is $925,000. Additionally, the opinion of probable cost for replacement of the GWA WWTP site natural gas piping is approximately $60,000. L. HVAC System Replacement Several HVAC systems have been identified as exceeding its expected life and is in need of replacement. The costs presented only include replacement of the equipment and does not include replacement of ductwork, insulation, or piping. The Screenings Building has four explosion-proof electric forced air heaters, the Grit Building has two explosion-proof electric forced air heaters, and the LCSTF has four explosion-proof electric forced air heaters that require replacement. In the Administration Building, the chiller, duct heater, and the building controls are in need of replacement. The HVAC equipment replacement in each of these buildings would likely coincide with other projects that include work in these buildings. The Administration Building HVAC replacement is assumed to be included in the annual capital replacement budget. The opinions of probable cost for each of these buildings are included in Table 7.06-8.
M. Electrical Service, Backup, and Redundancy The main facility electric distribution system to the individual buildings consists of two underground Medium Voltage (MV) distribution circuits. Either MV circuit can be used to serve all critical plant loads. However, these two underground circuits share common duct banks and three common manholes, which introduce common points of failure to both circuits. The two circuits can be made independent by adding a new duct bank and by adding two pad-mounted switchgear enclosures near each existing manhole. In addition, most of the existing MV cabling is approaching the end of its expected life and should be scheduled for replacement.
Opinion of Project Cost
Screenings Building HVAC Replacement $ 18,000 Grit Building HVAC Replacement $ 9,000 LCSTF Grit Building HVAC Replacement $ 18,000 Administration Building HVAC Replacement $ 120,000
Table 7.06-8 HVAC Equipment Replacement Opinions of
Probable Cost

Glenbard Wastewater Authority Facilities Plan Section 7–Wastewater Treatment Alternatives Evaluations
Prepared by Strand Associates, Inc. 7-38 R:\MAD\Documents\Reports\Archive\2013\GWA, IL\FP.1278.047.tws.sep\Report\S7 062013.doc\062413
There are also two areas that do not have redundant step-down transformers: the Main Cryogenic Compressor and the Administration Building. Redundant transformers and 480 V feeders to the areas should be considered. The Main Cryogenic Compressor Service Entrance/Starter is at the end of its useful life and should be scheduled for replacement. Finally, cable testing efforts require significant de-termination of cabling. Addition of circuit breakers at the Low Voltage (LV) terminals of the step-down transformers would reduce cable testing efforts. An opinion of probable cost is shown in Table 7.06-9.
N. Remote Site Communication GWA currently uses leased-line (telephone) telemetry to communicate with nine remote sites. Recently, GWA has experienced a sharp increase in rates for the leased lines. While leased lines have generally been reliable, outages can be lengthy if the phone company is not responsive. Therefore, given the increase in rates, it may be prudent to consider radio communication for the remote sites. A general opinion of probable cost for conversion to radio communication is $7,000 to $11,000 per site, plus $10,000 for a radio path survey and $12,000 for design fees. Six of the remote sites are flowmeter remote telemetry unit (RTU) sites that would likely require very tall antenna towers for reliable communication. Thus, given the likely objection of nearby residents, an on-demand cell phone based alternative could be considered for these six sites. The on-demand communication would store the flow metering data and upload to the SCADA system several times daily. On-demand communication equipment costs and cell phone charges will be approximately $90 per month. For the purposes of planning, cellular on-demand communication is assumed for the six remote metering sites and radio communication equipment is assumed for the remaining three sites. An allowance of $160,000 is included in the capital plan in Section 8 for this project. O. Site Lighting Many of the existing poles used for site lighting are corroded, which reduces their ability to withstand high winds. The poles should be scheduled for replacement. At the time of pole replacement, we recommend that the wiring be replaced and that the site lighting fixtures be converted to light-emitting diode (LED). LED fixtures more efficiently disperse the light, which allows fixture wattages to be reduced and/or fixture spacing to be increased. A new site lighting design should be performed to incorporate energy-saving control features available with LED lamps. The site lighting design may result in elimination or reduction of lighting in some areas and addition of lighting in other areas. A general opinion of probable cost for new lighting and associated poles, wiring, and controls is $5,000 to
MV Grid Separation and
MV Cable Replacement
Cryogenic Compressor Redundant
Supply and New Service
Admin Building Redundant
Supply
Isolation Breakers at
Transformer LV Terminals for Cable Testing
Material Cost $ 350,000 $ 170,000 $ 80,000 $ 180,000 Total Opinion of Probable Cost $ 830,000 $ 250,000 $ 160,000 $ 240,000 Table 7.06-9 Electric Power Distribution Upgrade Opinions of Probable Cost
Glenbard Wastewater Authority Facilities Plan Section 7–Wastewater Treatment Alternatives Evaluations
Prepared by Strand Associates, Inc. 7-39 R:\MAD\Documents\Reports\Archive\2013\GWA, IL\FP.1278.047.tws.sep\Report\S7 062013.doc\062413
$7,000 per pole. Overall, a cost of $160,000 to $230,000 should be expected. There are currently some funding opportunities through the Department of Commerce and Economic Opportunity that will help to offset the cost. P. MCC Replacement MCCs in the Grit, Cryo, and Raw Sewage Pumping Buildings are original equipment and should be scheduled for replacement. The cost opinions for replacement of the MCCs in the Cryo and Raw Sewage Pumping Buildings are included with the electrical costs for recommended process improvements in those buildings noted elsewhere in this facilities plan. Our opinion of probable cost of replacement of the Grit MCC is $200,000. Q. PLC Replacements PLCs throughout the facility are Allen-Bradley-type SLC, which is no longer a supported platform in the Allen-Bradley PLC family. Over the next several years, maintenance and replacement parts will become difficult commodities to procure. Thus, to ensure that the control schemes are relatively current and serviceable, the PLCs should be scheduled for replacement with ControlLogix PLCs. The cost opinions for replacement of the PLCs in the Cryo and Raw Sewage Pumping Buildings are included with the electrical costs for recommended process improvements in those buildings noted elsewhere in this facilities plan. The costs for PLC replacement associated with other buildings and processes will range from $25,000 to $50,000 per application. Assuming the quantity of PLCs is approximately 20, an overall budget of $750,000. This opinion does not include programming, which has historically been performed by GWA personnel. R. Electronic O&M Manual The electronic O&M manual project includes the preparation of written introduction, process, and utility sections of the GWA WWTP facility. The individual process section include written descriptions and information for processes, equipment, operations, controls, and maintenance. The document will be provided as a hard copy and as an electronic copy in Adobe Portable Document Format (pdf) or equivalent. Preliminary opinion of services for the preparation of the electronic O&M manual is $300,000. The final cost of services for preparing the electronic O&M manual will vary depending on the detail and scope desired.


SECTION 8 RECOMMENDED PLAN AND FISCAL IMPACT ANALYSIS


Glenbard Wastewater Authority Facilities Plan Section 8–Recommended Plan and Fiscal Impact Analysis
Prepared by Strand Associates, Inc. 8-1 R:\MAD\Documents\Reports\Archive\2013\GWA, IL\FP.1278.047.tws.sep\Report\S8 062013.docx\062613
Previous sections of this report presented background information, described and evaluated the GWA WWTP projected flows and loadings, and reviewed alternatives necessary to meet the projected needs at the LCSTF and WWTP. This section presents a summary of the proposed modifications to the GWA LCSTF and WWTP, an overall cost summary, preliminary financing plan for the proposed improvements, and the fiscal impact of the recommended plan on the GWA’s customers. 8.01 RECOMMENDED PLAN SUMMARY The recommended plan includes modifications to many portions of the existing GWA LCSTF and WWTP. The recommended alternatives and common needs projects are summarized in Table 8.03-1 along with the implementation schedule and opinions of probable cost . Table 8.02-1 also proposes combining several projects based on project need and potential cost savings that could be achieved with related projects. Figure 8.01-1 presents the preliminary site plans for the recommended improvements at the WWTP. The preliminary design conditions for the recommended plan are summarized in Tables 8.01-2 and 8.01-3 for the LCSTF and WWTP, respectively. A brief summary of the recommended improvements for each project are summarized below. A. Valley View Lift Station This project includes the following:
1. Replace existing pumps with two submersible pumps, and install a valve vault, emergency bypass connections, and magnetic flow metering.
2. Construct a building and install a 100 kW diesel-powered standby generator, fuel
tank, and electrical equipment. B. Remote Site Communication This project includes installation of radio communication equipment at three pump stations, on-demand cell phone communication at six flowmeter RTU sites, and SCADA integration. C. LCSTF Screening Improvements The existing mechanical coarse screen will be replaced with a new mechanical fine screen with this project as well as modifications to the screen channel to accommodate the narrower mechanical fine screen.

Glenbard Wastewater Authority Facilities Plan Section 8–Recommended Plan and Fiscal Impact Analysis
Prepared by Strand Associates, Inc. 8-2 R:\MAD\Documents\Reports\Archive\2013\GWA, IL\FP.1278.047.tws.sep\Report\S8 062013.docx\062613
TABLE 8.01-1–LCSTF UNIT PROCESS–PRELIMINARY DESIGN CRITERIA
Item Design Parameter Design Year 2033 Flows and Loadings
Maximum Hour Flow (mgd) 58
Mechanical Fine Screen (LCSTF Screening Improvements Project) Number of units 1 Size of Openings 1/4 inch Capacity (mgd) 58
Grit Removal (LCSTF Grit Removal Improvements Project) Number of units 2 Type Vortex Capacity, each (mgd) 30
Final Clarifiers (LCSTF Clarifier Mechanism Replacement Project) Number of units 2 Diameter (feet) 145
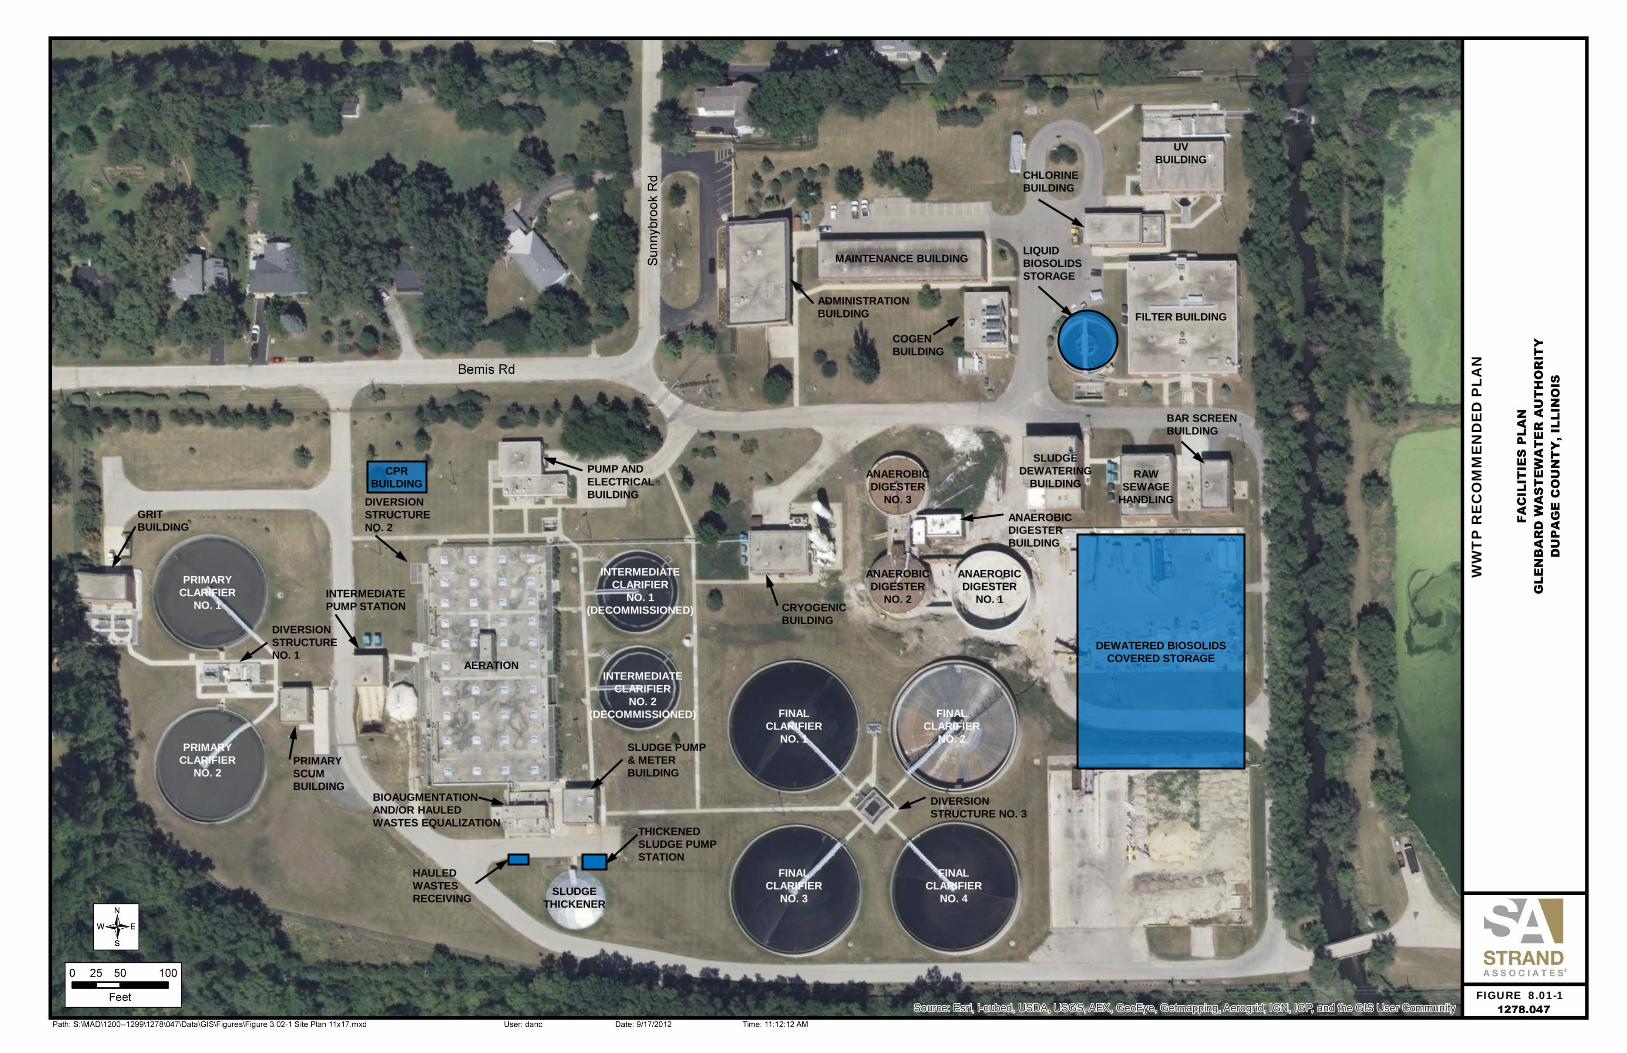
This image cannot currently be displayed.
MAINTENANCE BUILDING
UV BUILDING
LIQUID BIOSOLIDS STORAGE
FILTER BUILDING
SLUDGE DEWATERING
BUILDING RAW
SEWAGE HANDLING
ANAEROBIC DIGESTER
NO. 1
ANAEROBIC DIGESTER
NO. 2
ANAEROBIC DIGESTER
NO. 3
FINAL CLARIFIER
NO. 1
FINAL CLARIFIER
NO. 2
FINAL CLARIFIER
NO. 4
FINAL CLARIFIER
NO. 3 SLUDGE THICKENER
SLUDGE PUMP & METER BUILDING
AERATION INTERMEDIATE
CLARIFIER NO. 2
(DECOMMISSIONED)
INTERMEDIATE PUMP STATION
PRIMARY CLARIFIER
NO. 1
PRIMARY CLARIFIER
NO. 2
DIVERSION STRUCTURE NO. 1
PRIMARY SCUM BUILDING
GRIT BUILDING
DIVERSION STRUCTURE NO. 2
DIVERSION STRUCTURE NO. 3
PUMP AND ELECTRICAL BUILDING
ADMINISTRATION BUILDING
COGEN BUILDING
CHLORINE BUILDING
BIOAUGMENTATION AND/OR HAULED WASTES EQUALIZATION
CRYOGENIC BUILDING
BAR SCREEN BUILDING
ANAEROBIC DIGESTER BUILDING
INTERMEDIATE
CLARIFIER NO. 1
(DECOMMISSIONED)
FIGURE 8.01-1
WW
TP
RE
CO
MM
EN
DE
D P
LAN
DEWATERED BIOSOLIDS COVERED STORAGE
CPR BUILDING
THICKENED SLUDGE PUMP STATION
HAULED WASTES RECEIVING


Glenbard Wastewater Authority Facilities Plan Section 8–Recommended Plan and Fiscal Impact Analysis
Prepared by Strand Associates, Inc. 8-3 R:\MAD\Documents\Reports\Archive\2013\GWA, IL\FP.1278.047.tws.sep\Report\S8 062013.docx\062613
TABLE 8.01-2–WWTP UNIT PROCESS–PRELIMINARY DESIGN CRITERIA
Item Design Parameter Design Year 2033 Flows and Loadings
Average Annual Flow (mgd) 16.02 Maximum Day Flow (mgd) 40.56 Maximum Hour Flow (mgd) 47.00
Average BOD Load (lbs/day) 18,600 Maximum Month BOD Load (lbs/day) 24,700
Average TSS Load (lbs/day) 21,800 Maximum Month TSS Load (lbs/day) 29,000
Average NH3N Load (lbs/day) 3,800 Average Phosphorus Load (lbs/day) 800
Mechanical Bar Screens Number of Units 2 Bar Spacing 3/16 inches Capacity Each, mgd 47
Screenings Washer and Compactor Number of Units 1
Raw Sewage Pumps (2018 Upgrades Project) Number of Pumps 4 Type Centrifugal, VFD
Wet Well Type Prerotational Rated Capacity of Each Unit, mgd 15.7
TDH, feet 65 Firm Capacity, mgd 47
Grit Removal System Number of Grit Basins 2 Type Vortex Grit Collector Capacity Each, mgd 23.5 Number of Grit Pumps 2 Grit Pump Capacity Each, gpm 250 Type of Grit Washer Vortex Number of Grit Washers 2
Primary Clarifiers Number of Units 2 Diameter, feet 110 SWD, feet 10 Surface Overflow Rate, gpd/ft2 @ 16 mgd 844 @ 47 mgd 2,470 Peak Flow Capacity, mgd (Based on 1,800 gpd/ft2 SOR) 34.2 Weir Overflow Rate, gpd/ft.
@ 47 mgd 68,000

Glenbard Wastewater Authority Facilities Plan Section 8–Recommended Plan and Fiscal Impact Analysis
Prepared by Strand Associates, Inc. 8-4 R:\MAD\Documents\Reports\Archive\2013\GWA, IL\FP.1278.047.tws.sep\Report\S8 062013.docx\062613
Item Design Parameter Primary Sludge Pumps Number of Units 2 Type Progressing Cavity Capacity Each, gpm 300
Activated Sludge Mode of Operation Single-Stage HPO Train 1 Volume, gallons 337,000 Dimensions, feet 127 x 25 x 14.17 (SWD) Number of Mixers 4 Mixer Motor hp Each 30, 15, 10, 7.5 Train 2 Volume, gallons 269,000 Dimensions, feet 127 x 20 x 14.17 (SWD) Number of Mixers 4 Mixer Motor hp Each 25, 10, 7.5, 7.5 Trains 3, 4, and 5 Volume Each, gallons 280,000 Dimensions Each, feet 127 x 20 x 14.73 (SWD) Number of Mixers Each Train 4 Mixer Motor hp Each Train 15, 7.5, 7.5, 7.5 Trains 6, 7, 8, 9, and 10 Volume Each, gallons 350,000 Dimensions Each, feet 127 x 25 x 14.73 (SWD) Number of Mixers Each Train 4 Mixer Motor hp Each Train 20, 10, 7.5, 7.5 Total Activated Sludge Volume, gallons 3,196,000 Intermediate Clarifiers Number of Units (Decommission) 2 Diameter, feet 85
Intermediate/RAS Pump Station Pumps (2018 Upgrades Project) Number of Units 3 Type Determine at Design Capacity Each, gpm 12,500 Nitrate Recycle Pump Station Pumps (Denitrification Modifications Project) Number of Units 3 Type Determine at Design Capacity Each, gpm Determine at Design Carbo RAS Pumps (Decommission) Number of Units 4 Type Centrifugal Carbo WAS Pumps (Decommission) Number of Units 1 Type Submersible

Glenbard Wastewater Authority Facilities Plan Section 8–Recommended Plan and Fiscal Impact Analysis
Prepared by Strand Associates, Inc. 8-5 R:\MAD\Documents\Reports\Archive\2013\GWA, IL\FP.1278.047.tws.sep\Report\S8 062013.docx\062613
Item Design Parameter Cryogenic Oxygen Plant Maximum Capacity, tons/day 32 Minimum Stable Operating Capacity, tons/day 20 to 23 Compressor Motor hp 700 Chemical Phosphorus Removal (Chemical Phosphorus Removal Project)
Phosphorus Removal Chemical Determine with jar testing
Bulk Storage, gallons Bioaugmentation (Bioaugmentation Project, if required) Volume, gallons (Repurposed ATAD tanks less volume for hauled wastes, if used) 60,000 to 120,000
Final Clarifiers Number of Units 4 Diameter, feet 135 SWD, feet 14 Surface Overflow Rate, gpd/ft2 @ 16 mgd 279 @ 47 mgd 818 Solids Loading, lbs/ft2/day.@ 16 mgd, RAS=8 mgd, and 5,500 mg/L MLSS 19.2 Peak Hour Capacity, mgd (800 gpd/ ft2 for nitrification stage) 46 Weir Overflow rate, gpd/ft @ 47 mgd 27,700 WAS Pumps (Sludge Thickening Phase 3 Improvements Project) Number of Units 2 Effluent Filtration (2018 Upgrades Project) Number of New Disc Filter Units 5 to 7 Dimensions of Each Filter Basin, feet Length 37 Width 18 Filtration Rate, gpm/ft2 @ 14.5 mgd 1 @ 47 mgd (One unit out of service) 5 Filter Backwash Pumps (2018 Upgrades Project) Number of Units 2
Spent Backwash Pumps (2018 Upgrades Project) Number of Units 2
UV Disinfection (2018 Upgrades Project) Number of Channels (Modify existing depending on selected equipment) - Gravity Sludge Thickener Number of Units 1 Diameter, feet 55 SWD, feet 10 Design Solids Loading Rate, lbs/day/ft2 600 Design Overflow Rate, gpd/ft2 600

Glenbard Wastewater Authority Facilities Plan Section 8–Recommended Plan and Fiscal Impact Analysis
Prepared by Strand Associates, Inc. 8-6 R:\MAD\Documents\Reports\Archive\2013\GWA, IL\FP.1278.047.tws.sep\Report\S8 062013.docx\062613
Item Design Parameter Thickened Sludge Pumps (Sludge Thickening Improvements) Number of Units (relocate existing pumps to new Thickened Sludge Pump Station) 2 Type Progressing Cavity Capacity, gpm 375 TDH, feet 48 hp, each 25 Gravity Belt Thickener (GBT) Number of Units 1 GBT Thickened Sludge Pumps Number of Units 1 Type Progressing Cavity Capacity, gpm 125 TDH, feet 47 hp, each 25 Anaerobic Digester No. 1 Type Primary Cover Type Floating Holder Diameter 80 ft Side Water Depth 23.5 ft Volume 933,000 gallons Anaerobic Digester No. 2 Type Primary Cover Type Floating Holder Diameter 60 ft Side Water Depth 23.5 ft Volume 525,000 gallons Anaerobic Digester No. 3 Type Secondary Cover Type Floating Gas Holder Diameter 60 ft Side Water Depth 18.5 ft Volume 375,000 gallons Liquid Biosolids Storage (Liquid Biosolids Storage Improvements Project) Number of Units (Repurposed Filter Backwash Water Clarifier) 1 Diameter, feet 55 Cover Type Membrane Volume, gallons 240,000
Liquid Biosolids Transfer Pumps–Filter Building (Liquid Biosolids Storage Improvements Project)
Number of Units 2 Capacity Each, gpm (match centrifuge) 250
Sludge Recirculation Pumps Number of Units 3 Type Progressing Cavity Capacity, gpm 360 TDH, feet 35 hp, each 15 Digester Sludge Transfer Pumps

Glenbard Wastewater Authority Facilities Plan Section 8–Recommended Plan and Fiscal Impact Analysis
Prepared by Strand Associates, Inc. 8-7 R:\MAD\Documents\Reports\Archive\2013\GWA, IL\FP.1278.047.tws.sep\Report\S8 062013.docx\062613
Item Design Parameter Number of Units 2 Type Centrifugal Capacity, gpm 350 TDH, feet 30 hp, each 10 Combination Boiler/Heat Exchangers Number 2 Capacity Each, million BTU/hr 1.5
Digester Mixing Pumps Type Dry Pit Horizontal Anaerobic Digester No. 1 Number 2 Capacity Each, gpm 2,290 Anaerobic Digester No. 2 and No. 3 Number 2 (1 per digester) Capacity Each, gpm 3,024
Digested Sludge Transfer Pumps Number of Units 2 Type Progressing Cavity Capacity, gpm 160 TDH, feet 126 hp, each 15
Digested Sludge Transfer Tanks Number (One repurposed to TWAS Storage) 1 Capacity Each, gallons 35,000 TWAS Storage (Sludge Thickening Phase 3) Number (Repurposed Digested Sludge Transfer Tank) 1 Capacity Each, gallons 35,000
Biosolids Dewatering Feed Pumps–Anaerobic Digester Number of Units 3 Type Progressing Cavity
Sludge Dewatering BFP (Biosolids Dewatering Equipment Replacement Project) Number of Units (One unit removed) 1 Size, meters 2.2
Sludge Dewatering Centrifuge (Biosolids Dewatering Equipment Replacement Project) Number of Units 1 Capacity, gpm 250 Dewatered Biosolids Covered Storage (2018 Upgrades Project)

Glenbard Wastewater Authority Facilities Plan Section 8–Recommended Plan and Fiscal Impact Analysis
Prepared by Strand Associates, Inc. 8-8 R:\MAD\Documents\Reports\Archive\2013\GWA, IL\FP.1278.047.tws.sep\Report\S8 062013.docx\062613
Item Design Parameter Average Biosolids Cake @ 25% Solids, ft3/week (includes phosphorus sludge) 6,840 Storage Capacity (days) 150 Volume Required @ 25% Solids, ft3 146,600 Stacking Height (feet) 4 Required Area, ft2 (includes working area) 46,000
Hauled Wastes Equalization (Hauled Wastes Receiving Phase 2, if required) Volume, gallons (Repurposed ATAD Tanks, size to be determined at design) 20,000-60,000 Electrical Generators Number of Units 3 Capacity Each, kW 815
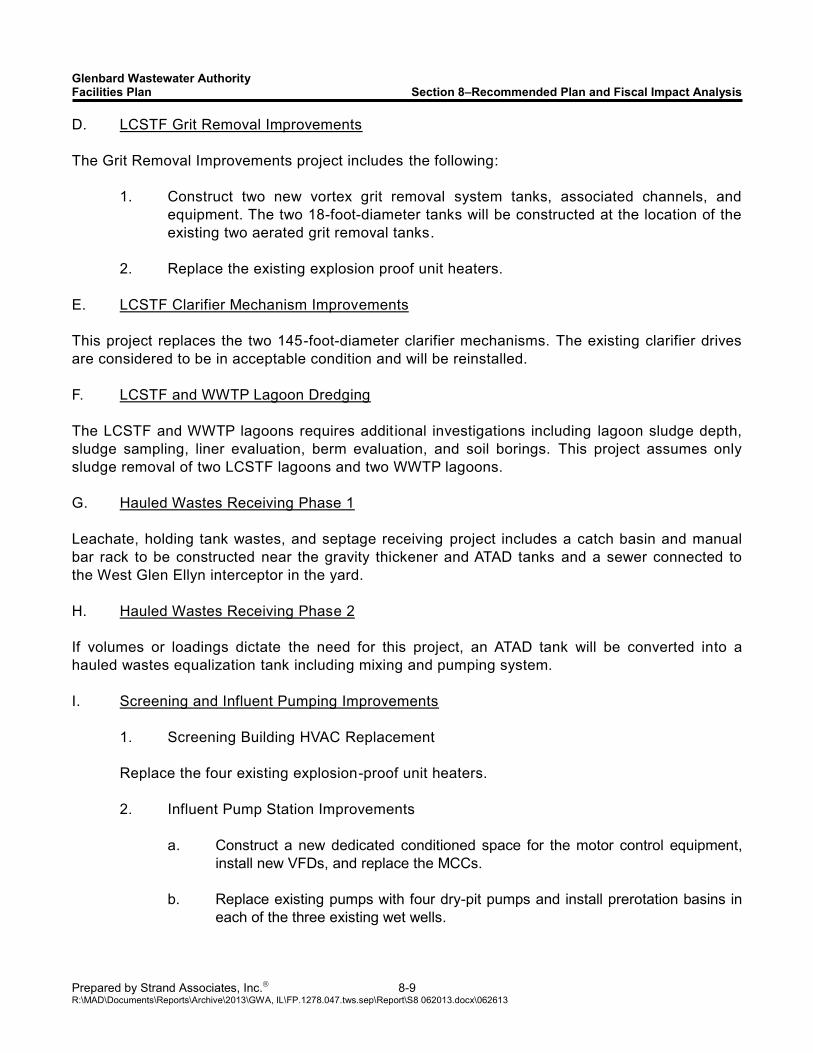
Glenbard Wastewater Authority Facilities Plan Section 8–Recommended Plan and Fiscal Impact Analysis
Prepared by Strand Associates, Inc. 8-9 R:\MAD\Documents\Reports\Archive\2013\GWA, IL\FP.1278.047.tws.sep\Report\S8 062013.docx\062613
D. LCSTF Grit Removal Improvements The Grit Removal Improvements project includes the following:
1. Construct two new vortex grit removal system tanks, associated channels, and equipment. The two 18-foot-diameter tanks will be constructed at the location of the existing two aerated grit removal tanks.
2. Replace the existing explosion proof unit heaters.
E. LCSTF Clarifier Mechanism Improvements This project replaces the two 145-foot-diameter clarifier mechanisms. The existing clarifier drives are considered to be in acceptable condition and will be reinstalled. F. LCSTF and WWTP Lagoon Dredging The LCSTF and WWTP lagoons requires additional investigations including lagoon sludge depth, sludge sampling, liner evaluation, berm evaluation, and soil borings. This project assumes only sludge removal of two LCSTF lagoons and two WWTP lagoons.
G. Hauled Wastes Receiving Phase 1 Leachate, holding tank wastes, and septage receiving project includes a catch basin and manual bar rack to be constructed near the gravity thickener and ATAD tanks and a sewer connected to the West Glen Ellyn interceptor in the yard. H. Hauled Wastes Receiving Phase 2 If volumes or loadings dictate the need for this project, an ATAD tank will be converted into a hauled wastes equalization tank including mixing and pumping system. I. Screening and Influent Pumping Improvements
1. Screening Building HVAC Replacement Replace the four existing explosion-proof unit heaters. 2. Influent Pump Station Improvements
a. Construct a new dedicated conditioned space for the motor control equipment, install new VFDs, and replace the MCCs.
b. Replace existing pumps with four dry-pit pumps and install prerotation basins in
each of the three existing wet wells.

Glenbard Wastewater Authority Facilities Plan Section 8–Recommended Plan and Fiscal Impact Analysis
Prepared by Strand Associates, Inc. 8-10 R:\MAD\Documents\Reports\Archive\2013\GWA, IL\FP.1278.047.tws.sep\Report\S8 062013.docx\062613
c. Replace the existing hydraulically operated plug valves. All new valves will have electric operators.
d. Replace sluice gate hydraulic operators with electric operators (7 total). Modify
stems for raising the wet well gate elevations for the prerotation basins. Temporary bypass pumping is required for this work.
J. Intermediate Pump Station Modifications
1. Replace Intermediate Pump Station pumps. The station would only pump RAS in single-stage operation, but it is assumed to provide capacity for forward flow as well in the event that the activated sludge process is converted back to two-stage HPOAS.
2. Provide structural and electrical improvements to the Intermediate Pump Station.
K. Activated Sludge Improvements 1. UNOX Deck Control Improvements Replace and upgrade controls and valves on the UNOX deck. 2. Activated Sludge Final Stage Modifications Modify the final nitrification stage deck in each train for stripping dissolved carbon dioxide, which
will increase the pH and could promote an increased nitrifier growth rate. Modifications would include the addition of a vent to open the stage to the atmosphere, mechanical modifications to the air monitoring system, oxygen supply piping modifications, and the addition of piping and an isolation valve to shut off oxygen migration.
L. Bioaugmentation The bioaugmentation project converts the ATAD basins to a side-stream bioaugmentation process to improve the nitrification ability of the single-stage HPOAS process. A study with a detailed evaluation of the bioaugmentation process is recommended before design. The project includes conversion of the ATAD basins into bioaugmentation basins, surface aerator replacement, installation of an alkalinity addition system, installation of dewatering filtrate pumps in the Sludge Dewatering Building, and installation of associated underground RAS, centrate, and bioaugmentation mixed liquor piping. M. Denitrification Modifications
1. Reconfigure all ten trains to provide anoxic zones including new anoxic mixers. Large scale pilot testing is recommended.
2. Install nitrate recycle station, pumps, and recycle piping for the 10 trains.
Glenbard Wastewater Authority Facilities Plan Section 8–Recommended Plan and Fiscal Impact Analysis
Prepared by Strand Associates, Inc. 8-11 R:\MAD\Documents\Reports\Archive\2013\GWA, IL\FP.1278.047.tws.sep\Report\S8 062013.docx\062613
3. Modify the first stage deck to an anoxic zone. Modifications would include the addition of a vent to open the stage to the atmosphere, mechanical modifications to the air monitoring system, oxygen supply piping modifications, and the addition of piping and an isolation valve to shut off oxygen migration.
N. Chemical Phosphorus Removal This project includes construction of a new CPR building for bulk storage and pumping located near the Pump and Electrical Building, CPR piping, and control equipment. Evaluations that should be conducted when the phosphorus limit is known include CPR jar testing to select the phosphorus removal chemical and site specific chemical demand, BPR testing, and pilot testing. O. Effluent Filtration, UV Disinfection, and Biosolids Storage Project The effluent filtration, UV disinfection, and dewatered biosolids covered storage improvements are combined as a single project because of similar priorities for implementation and vicinity of these projects. 1. Effluent Filtration
Conversion from the existing deep bed effluent filtration to disc filters includes demolition of the deep bed filter basins for installation of the new filter units (five basins required for the Kruger Hydrotech Disc Filter), structural modifications to the disc filter basins, new walkways over the disc filter basins, and piping changes. The disc filter manufacturers should be further evaluated during design. 2. UV Disinfection This portion of the project includes replacement of the existing UV disinfection equipment with a new disinfection system and the associated structural modifications to retrofit new equipment to the channels. Further evaluation of the Xylem-Wedeco Duron, Ozonia Aquaray 3X, and TrojanUV 3000Plus equipment nonmonetary factors is recommended during design. 3. Dewatered Biosolids Covered Storage This project includes the construction of a 46,000 ft2 building for dewatered biosolids storage located at the existing dewatered biosolids storage pads.
P. Sludge Thickening Phase 2 Improvements This project is an option if the Phase 1 sludge thickening with the solids density meters does not consistently achieve a 3.5 percent solids feed to the digesters. The Phase 2 sludge thickening improvements includes a new thickened sludge pump station located at the gravity sludge thickener, relocation of the existing thickened sludge pumps to the new pump station, and connection of a new sludge force main to the existing 6-inch line in the yard.

Glenbard Wastewater Authority Facilities Plan Section 8–Recommended Plan and Fiscal Impact Analysis
Prepared by Strand Associates, Inc. 8-12 R:\MAD\Documents\Reports\Archive\2013\GWA, IL\FP.1278.047.tws.sep\Report\S8 062013.docx\062613
Q. Sludge Thickening Phase 3 Improvements This project provides additional sludge thickening flexibility with the modifications to allow GBT thickening of WAS only and gravity thickening of primary sludge only. For this plan, the filter backwash tank is assumed to be used for liquid biosolids storage rather than WAS storage. Further evaluation may be required during design to decide if WAS storage is required. This project includes new WAS pumps, and piping modifications in the Sludge Dewatering Building. R. Sludge Thickening and Biosolids Improvements 1. Liquid Biosolids Storage Improvements
Liquid biosolids storage would allow the plant to dewater biosolids less frequently and would also improve flexibility for the digestion and dewatering operations. The liquid biosolids storage project includes conversion of the filter backwash tank for liquid biosolids storage and installation of a membrane cover, underground sludge piping, digester gas piping, and centrifuge feed pumps at the Filtration Building. 2. Biosolids Dewatering The Biosolids Dewatering project replaces one of the existing BFPs with a centrifuge. The remaining BFP will serve as an emergency backup.
S. Nonpotable Water and Natural Gas Yard Piping Improvements The nonpotable water and natural gas yard piping at the WWTP will be replaced with this project. T. Electrical Improvements This project includes replacement of the following:
1. Grit Building MCC replacement 2. Cryo Building MCC and PLC replacement 3. Electrical Service, Backup, and Redundancy
a. MV grid separation and MV cable replacement b. Cryogenic compressor redundant supply and new service entrance/starter c. Administration Building redundant supply d. Isolation breakers at transformer LV terminals for cable testing 4. PLC replacements 5. Site lighting replacement T. Electronic O&M Manual The electronic O&M manual project includes the preparation of a written document including individual process descriptions and information for processes, equipment, operations, controls, and maintenance.

Glenbard Wastewater Authority Facilities Plan Section 8–Recommended Plan and Fiscal Impact Analysis
Prepared by Strand Associates, Inc. 8-13 R:\MAD\Documents\Reports\Archive\2013\GWA, IL\FP.1278.047.tws.sep\Report\S8 062013.docx\062613
8.02 FUTURE NUTRIENT REMOVAL CONSIDERATIONS The potential for future TP and TN discharge limits and their impact on treatment processes was discussed in Sections 5, 6, and 7. The biological treatment system selected for the recommended plan is amenable to modification for the purpose of meeting future nutrient limits. Consideration will be given to potential modifications during design of the aeration tanks. If future lab-scale assessment determines potential for BPR, the activated sludge system could be evaluated further to promote phosphorus removal by converting a portion of the first stage of the aeration basins to an anaerobic zone. Achieving an anaerobic zone may be difficult, however, because of the high purity oxygen process and limited control of the cryogenic plan oxygen generation. This plan assumes TP limits are 0.5 mg/L, there is inadequate potential for BPR, and chemical phosphorus removal addition is required. A new chemical building with chemical storage tanks and feed pumps will be constructed. To reliably remove phosphorus to 0.5 mg/L, the WWTP would likely also require upgrades to the existing sand filters with cloth media, which is also included in the plan. Modification of the WWTP to meet future TN limits of 10 mg/L would require the reconfiguration of the aeration basins to implement a process that removes nitrogen using one or more anoxic zones. Simultaneous nitrogen and phosphorus removal could also be achieved by implementing anaerobic, anoxic, and aerobic zones in the biological treatment system. If TN limits are lower, such as 3 mg/L, additional tankage and supplemental carbon addition would likely also be required. 8.03 FUTURE AMMONIA LIMIT CONSIDERATIONS More stringent ammonia limits could be contained in the 2017 reissued permit and a three-year or longer compliance may be included. Maintaining the flexibility to operate in two-stage is recommended. Additional activated sludge tankage and/or conversion to air activated sludge may be required if the WWTP cannot demonstrate meeting these estimated limits 8.04 OPINION OF CAPITAL COSTS AND PROJECT FINANCING The opinions of capital costs for each of the recommended improvements are summarized in Table 8.04-1. Each project is listed on the year of anticipated bidding. The opinions of capital costs are also projected to the planned project bid year cost by applying a construction inflation rate of 3 percent annually. A more detailed capital plan is included in Appendix F. The WWTP improvements are anticipated to be funded through capital fund contributions by the Glen Ellyn and Lombard. The Effluent Filtration, UV Disinfection, and Biosolids Storage project in 2016 is anticipated to be funded by a low-interest loan from the IEPA, Table 8.04-2. The existing LSCTF project debt service will have a final payment in 2015, the existing Biosolids Improvements Project debt service will have a final payment in in 2016, and, in 2026, the existing Digester Improvements Project debt service will have its final payment due. A debt service payment for the Effluent Filtration, UV Disinfection, and Biosolids Storage project of $980,000 was estimated based on the current fiscal year 2013 IEPA interest rate of 1.93 percent and a 15-year term.

Glenbard Wastewater Authority Facilities Plan Section 8–Recommended Plan and Fiscal Impact Analysis
Prepared by Strand Associates, Inc. 8-14 R:\MAD\Documents\Reports\Archive\2013\GWA, IL\FP.1278.047.tws.sep\Report\S8 062013.docx\062613
TABLE 8.04-1–OPINIONS OF PROJECT COST AND IMPLEMENTATION SCHEDULE
Project Year Project
Opinion of Probable Cost1
Project Year Projected Cost2
2014 Valley View Pump Station 2,047,000$ 2,108,000$ LCSTF Clarifier Mechanism Replacement 277,000 285,000 2014 Total 2,393,000$
2015 Remote Site Communication 160,000$ 170,000$ 2015 Total 4,956,000$
2016 Screening and Influent Pumping Improvements:Screening Building HVAC Replacement 18,000$ 20,000$ Influent Pump Replacement and Improvements 4,115,000 4,497,000
Effluent Filtration, UV Disinfection Project, and Biosolids StorageEffluent Filtration 6,982,000 7,629,000 UV Disinfection 2,330,000 2,546,000 Dewatered Biosolids Covered Storage 2,456,000 2,684,000
IEPA Loan Project Subtotal 12,859,000$ 2016 Total 17,376,000$
2017 Electronic O&M Manual 300,000$ 338,000$ 2017 Total 338,000$
2018 Activated Sludge Improvements Project:Intermediate Pump Station Modifications 1,423,000$ 1,650,000$ UNOX Deck Control Improvements 368,000 427,000
Activated Sludge Final Stage Modifications4 218,000 253,000 2018 Total 2,330,000$
2019 Hauled Wastes Receiving Phase 1 238,000$ 284,000$
Sludge Thickening Phase 2 Improvements3 873,000 1,042,000
Sludge Thickening Phase 3 Improvements5 560,000 669,000 2019 Total 1,995,000$
2020 Biosolids Dewatering Equipment Replacement 2,292,000$ 2,819,000$
Liquid Biosolids Storage Improvements6 1,850,000 2,275,000 2020 Total 5,094,000$
2021 Chemical Phosphorus Removal7 601,000$ 761,000$ 2021 Total 761,000$
2022 Electrical Improvements:Grit Building MCC Replacement 200,000$ 261,000$ Cryo Building MCC and PLC Replacement 251,000 327,000 Electrical Service, Backup, and Redundancy 1,480,000 1,931,000 PLC Replacements 750,000 979,000 Site Lighting 230,000 300,000
2022 Total 3,798,000$

Glenbard Wastewater Authority Facilities Plan Section 8–Recommended Plan and Fiscal Impact Analysis
Prepared by Strand Associates, Inc. 8-15 R:\MAD\Documents\Reports\Archive\2013\GWA, IL\FP.1278.047.tws.sep\Report\S8 062013.docx\062613
1 The opinion of probable cost is based on fourth quarter 2012 costs. Includes construction, engineering, and contingency. 2 Costs are projected with an inflation factor of 3 percent based on 2012 annual Engineering News Record construction
cost index increase. 3 This project is assumed to occur with Sludge Thickening Phase 3 Improvements. 4 The activated sludge final stage modifications project to potentially improve nitrification may be required at an earlier date
depending on activated sludge performance. An additional study and pilot testing could be conducted to verify the effects of opening the final stage on nitrification before this project.
5 This cost assumes direct WAS pumping to the GBT without WAS storage. 6 This project assumes the backwash filter clarifier is available to be repurposed for liquid biosolids storage. 7 The implementation schedule for this project could change because of the uncertainty of future regulatory requirements
and its timing. Additional study and pilot testing may be required. 8 Equalization of hauled wastes may not be required. 9 Bioaugmentation may not be required.
Project Year Project
Opinion of Probable Cost1
Project Year Projected Cost2
2023 LCSTF and WWTP Lagoon Dredging 1,000,000$ 1,344,000$ LCSTF Screening Improvements 1,000,000 1,344,000 2023 Total 2,688,000$
2024 LCSTF Grit Removal Improvements 2,510,000$ 3,474,000$ LCSTF Grit Building HVAC Replacement 18,000 25,000
2024 Total 3,499,000$ 2025 Plant Utilities Yard Piping Improvements 985,000$ 1,404,000$
2025 Total 1,404,000$ 2026 Hauled Wastes Receiving Phase 28 336,000$ 493,000$
Bioaugmentation9 1,459,000 2,143,000 2026 Total 2,636,000$
2027-31 No Projects Planned2032 Denitrification Modifications7 1,322,000$ 2,318,000$
2032 Total 2,318,000$

Glenbard Wastewater Authority Facilities Plan Section 8–Recommended Plan and Fiscal Impact Analysis
Prepared by Strand Associates, Inc. 8-16 R:\MAD\Documents\Reports\Archive\2013\GWA, IL\FP.1278.047.tws.sep\Report\S8 062013.docx\062613
8.05 FISCAL IMPACT ANALYSIS Through staging the projects over the planning period, the customer communities will have a gradual change in their rates. Glen Ellyn and Lombard provide annual contributions to the GWA capital fund, which will be used to fund these projects. The residential user charges of Glen Ellyn and Lombard are determined by their respective community. An average annual capital fund increase of 10 percent is planned to fund the recommended projects; see Table 8.05-1.
1 Costs are inflated to construction year 2016 dollars with
an inflation factor of 3 percent based on 2012 annual Engineering News Record construction cost index increase.
Table 8.04-2 Effluent Filtration, UV Disinfection, and Biosolids Storage Project Cost Opinion
Table 8.05-1 Capital Fund Increase

Glenbard Wastewater Authority Facilities Plan Section 8–Recommended Plan and Fiscal Impact Analysis
Prepared by Strand Associates, Inc. 8-17 R:\MAD\Documents\Reports\Archive\2013\GWA, IL\FP.1278.047.tws.sep\Report\S8 062013.docx\062613
8.06 PROJECT IMPLEMENTATION SCHEDULE Table 8.06-1 includes a preliminary project implementation schedule for the Effluent Filtration, UV Disinfection, and Biosolids Storage improvements project. In addition, the schedule assumes an approximate three-month review and approval duration by the IEPA for the facilities plan.
8.07 ENVIRONMENTAL IMPACT SUMMARY The IEPA Environmental Checklist and associated correspondence to the various agencies are included in Appendix G. No difficulties are anticipated with the process of obtaining IEPA confirmation of the environmental status of the project. The Valley View Pump Station project and LCSTF projects are planned to be funded through the GWA capital fund. The GWA WWTP projects are planned to be funded through the GWA capital fund except for the Effluent Filtration, UV Disinfection, and Biosolids Storage project, which is anticipated to be financed through an IEPA low interest loan. A. Rare and Endangered Species The IDNR’s EcoCAT system was used to confirm there were no occurrences of wetlands, listed endangered or threatened species, Illinois Natural Area Inventory Sites, dedicated Illinois Nature Preserves, or registered Land and Water reserves in the vicinity of the LCSTF and WWTP project sites. This information is included in Appendix G. The wetland review and consultation were terminated by the IDNR for the LCSTF and WWTP, and it is anticipated that no further IDNR coordination will be needed unless wetlands or other features are identified in the vicinity in the future. The consultation with IDNR’s EcoCAT is valid for two years, so projects implemented in 2015 and later will require a new consultation.
Submit Facilities Plan to IEPA June 2013 IEPA Approval of Facilities Plan October 2013 Submit Design to IEPA October 2014 Submit IEPA Loan Application October 2014 IEPA Approval of Design January 2015 Advertise for Bids February 2015 Construction Bid Date March 2015 Construction Start Date May 2015 Construction Completion May 2017
Table 8.06-1 Effluent Filtration, UV Disinfection, and
Biosolids Storage Project Implementation Schedule

Glenbard Wastewater Authority Facilities Plan Section 8–Recommended Plan and Fiscal Impact Analysis
Prepared by Strand Associates, Inc. 8-18 R:\MAD\Documents\Reports\Archive\2013\GWA, IL\FP.1278.047.tws.sep\Report\S8 062013.docx\062613
B. Historical and Cultural Resources
1. Land Use
The Valley View Pump Station, GWA LCSTF, and WWTP projects include work on the existing sites, which are owned by the GWA.
2. Cultural and Historic Resources
A letter for the LCSTF and WWTP sites was sent to the Illinois Historic Preservation Agency (IHPA) regarding the potential effect of the projects on historic properties. No issues are anticipated. The letters sent to IHPA are included in Appendix G.
C. Air and Water Quality
1. Air Quality: Air quality should not be impacted by the proposed projects.
2. Lakes: No lakes would be directly impacted by the proposed projects.
3. Rivers: The GWA WWTP discharges to the East Branch of the DuPage River. Because the proposed WWTP design will incorporate new equipment and more efficient treatment processes, the WWTP should have improved effluent characteristics and treatment reliability.
4. Groundwater: The proposed modifications would not be expected to impact groundwater
quantity or quality. D. Recreational Areas No parks, shorelands, or other recreational areas are anticipated to be directly impacted by the proposed projects. E. Floodplains The modifications and construction at the Valley View Pump Station, LCSTF, and GWA WWTP would be above 100-year floodplain elevations. The tops of tank walls and the ground floors of buildings will be constructed 1 foot above the 100-year floodplain elevation or higher.
F. Other Sensitive Environmental Areas The proposed Valley View Pump Station, LCSTF, and WWTP construction does not infringe on any known existing wetlands. There should be no further action necessary regarding wetlands impacts to the Valley View Pump Station, LCSTF, and WWTP sites. The proposed projects are not expected to have a negative impact on flora or fauna. Impacts of construction would be temporary in nature. Disturbed vegetation would be restored during construction and would return rapidly.

APPENDIX A IEPA FACILITIES PLANNING SUBMITTAL CHECKLIST


IEPA - Facilities Planning Submittal Checklist Page 1 of 2For Projects Seeking Assistance Under the ARRA of 2009
Before the Agency will begin review of a Facilities Plan, ALL of the items below comprising the basicminimum requirements of a Facilities Plan must be included and the page number(s) of ALL items noted.If any of the basic information is not provided the planning and loan application will be returned.
Facilities planning should contain all pertinent information detailed in emergency rules filed to implementprovisions of the American Recovery and Reinvestment Act of 2009. Loan applicants should be familiarwith their planning responsibilities as detailed in those rules and as derived from Ill. Adm. Code 35, Sections 365.520 and 530.
Loan Applicant: Agency Use: L17
Consulting Engineer: Phone:
Project Description:
Page(s)Loan applicant's background information including location, historical population, makeup ofcustomer base, conditions effecting growth, and 20 year design population/customer base.
Map(s) of existing FPA boundaries and discussion of any necessary modifications.Note: FPA boundary modifications entail additional requirements, review and sign-offs.
Detailed description of the EXISTING collection system and treatment facilities, alongwith a clear identification for the need of the proposed project(s).
Where applicable, information regarding an anti-degradation analysis pursuant to Ill. Adm.Code 35 Section 302.105 for a new or modified NPDES Permit.
Discussion of existing and proposed NPDES Permit limits.
Detailed discussion of the chosen alternative's capability to maintain compliance with all applicable laws and regulations in addition to addressing the identified system need(s).
Basis of Design for Chosen Alternative. The preliminary engineering data should include,to the extent appropriate, flow diagrams, unit process descriptions, detention times, flow rates, unit capacities, etc. to demonstrate that the proposed project will be designedin accordance with 35 Ill. Adm Code 370.
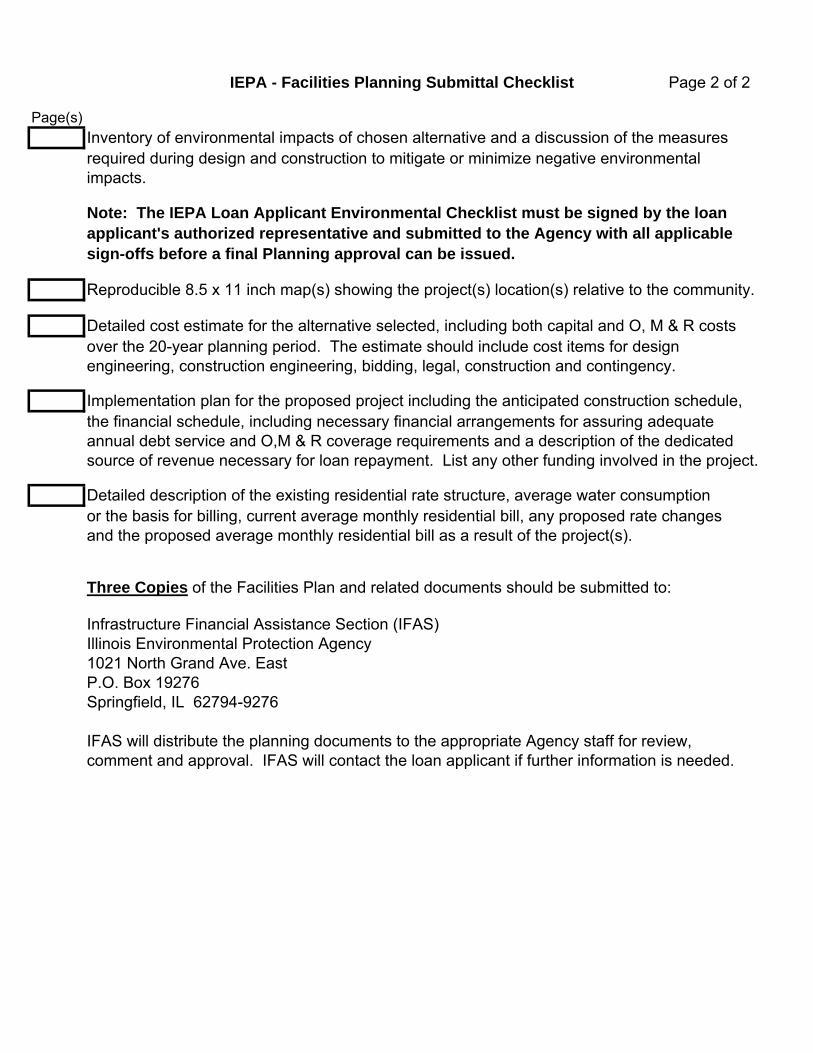
IEPA - Facilities Planning Submittal Checklist Page 2 of 2
Page(s)Inventory of environmental impacts of chosen alternative and a discussion of the measuresrequired during design and construction to mitigate or minimize negative environmentalimpacts.
Note: The IEPA Loan Applicant Environmental Checklist must be signed by the loanapplicant's authorized representative and submitted to the Agency with all applicablesign-offs before a final Planning approval can be issued.
Reproducible 8.5 x 11 inch map(s) showing the project(s) location(s) relative to the community.
Detailed cost estimate for the alternative selected, including both capital and O, M & R costsover the 20-year planning period. The estimate should include cost items for design engineering, construction engineering, bidding, legal, construction and contingency.
Implementation plan for the proposed project including the anticipated construction schedule, the financial schedule, including necessary financial arrangements for assuring adequateannual debt service and O,M & R coverage requirements and a description of the dedicatedsource of revenue necessary for loan repayment. List any other funding involved in the project.
Detailed description of the existing residential rate structure, average water consumption or the basis for billing, current average monthly residential bill, any proposed rate changesand the proposed average monthly residential bill as a result of the project(s).
Three Copies of the Facilities Plan and related documents should be submitted to:
Infrastructure Financial Assistance Section (IFAS)Illinois Environmental Protection Agency1021 North Grand Ave. EastP.O. Box 19276Springfield, IL 62794-9276
IFAS will distribute the planning documents to the appropriate Agency staff for review, comment and approval. IFAS will contact the loan applicant if further information is needed.

APPENDIX B 2006 NPDES PERMIT NOS. IL0021547 AND IL0022471


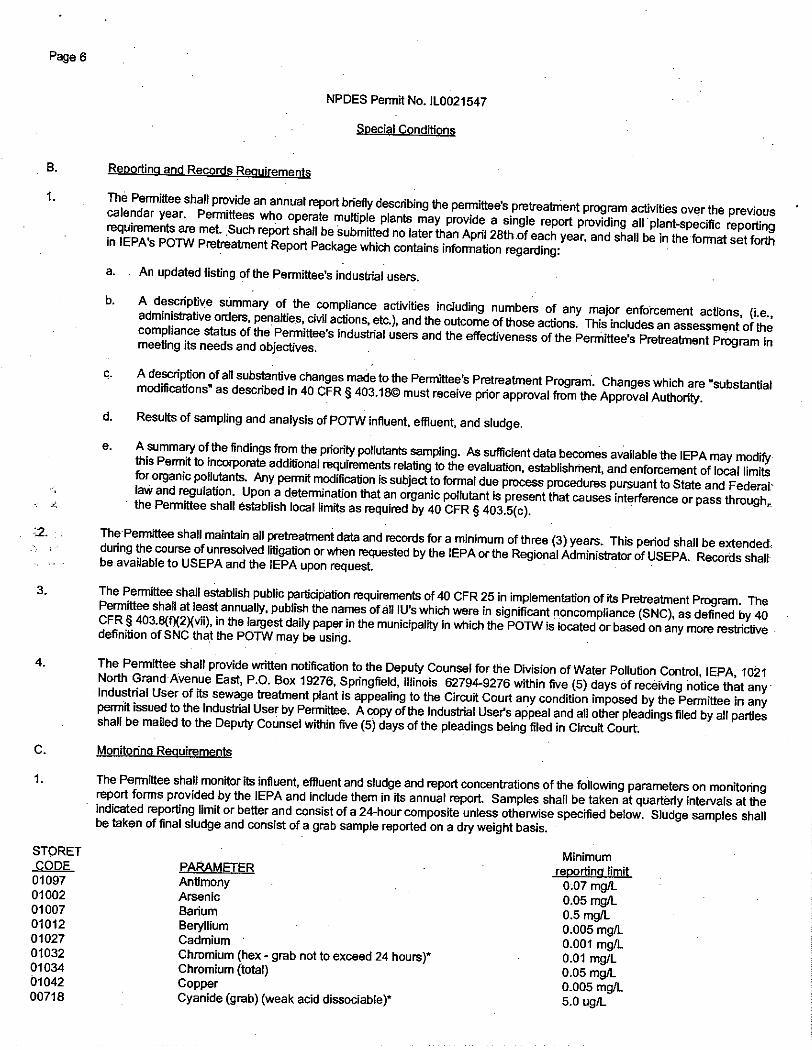


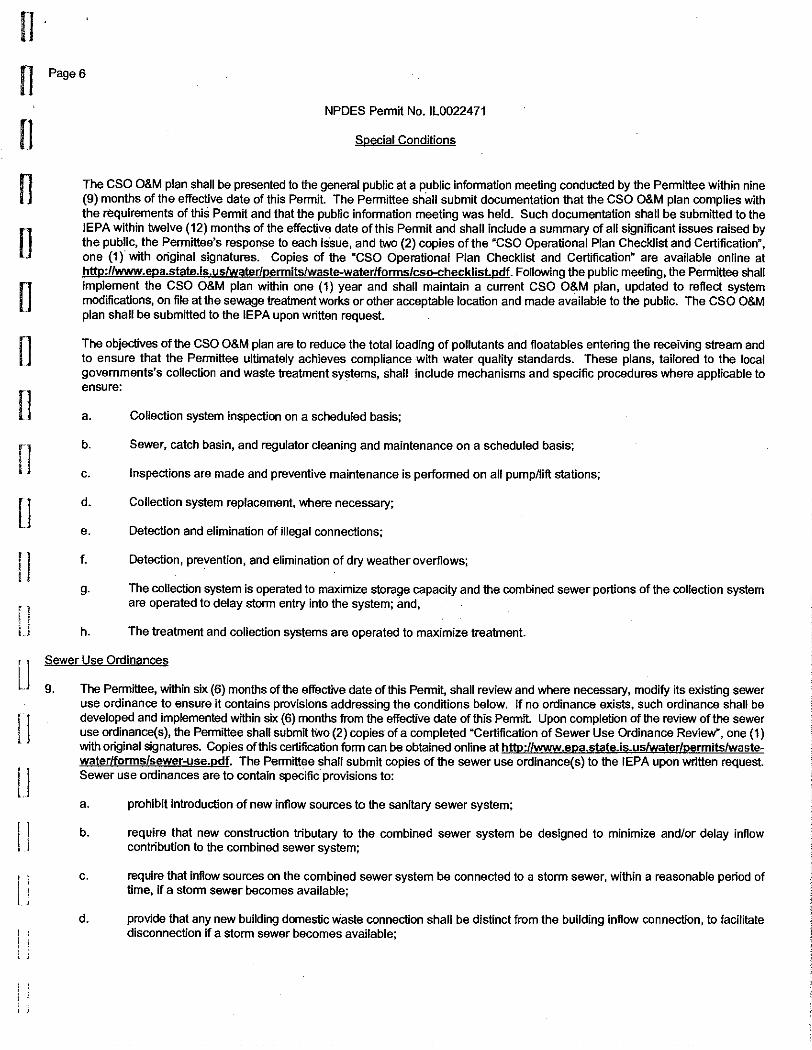


APPENDIX C
USEPA WET WEATHER


APPENDIX D
IEPA AMMONIA WORKSHEET–FUTURE AMMONIA CRITERIA


S:\MAD\1200--1299\1278\047\Spr\Ammonia\Glenbard-proposedAMMcriteria.16.02mgdDAF.xlsx
Ammonia Worksheet
Discharger: Glenbard Wastewater Authority NPDES: Date: 6/20/13
Receiving Stream: East Branch of the DuPage River
Calculation of the total ammonia (as N) water quality standard
pH and temperature values used in calculation Total ammonia (as N) water quality standard pH temp Chronic Acute
50th %ile 75th %ile 75th %ile (50th %ile) (75th %ile) (75th %ile)Spring/Fall 7.59 7.71 19.7 Spring/Fall 0.596 0.525 7.54Summer 7.55 7.71 23.3 Summer 0.491 0.416 5.59Winter 7.52 8.06 8.5 Winter 1.306 0.679 8.75
Data Source: AWQMN station, GBL-10, East Branch DuPage River, at Rt. 34 Bridge,for the dates Jan. 2006 to Dec. 2010.
Note: Calculation of total ammonia (as N) water quality standards are based on the algorithms found at 35 IAC 302.212(b) and recommended water quality based limits for ammonia are derived pursuant to methodologies outlined at 35 IAC Part 355. Spring/Fall constists of March - May, September - October. Summer consists of June - August. Winter consists of November - February.
Chronic Wasteload Allocation Ce= [Cds(Qus+Qe)-CusQus] / Qe
Effluent Flow (Qe): 24.79 cfs 16.02 mgd DAFUpstream 7Q10: 5 cfs Source: ISWS map of the Northeastern Region.
7Q10 for dilution (Qus): 2.5 cfsbackground concentrations: spring/fall 0.290 mg/L Source: AWQMN station, GBL-10, East Branch DuPage River, at Rt. 34 Bridge, summer 0.130 mg/L for the dates Jan. 2006 to Dec. 2010. winter 0.200 mg/L
wasteload allocation: spring/fall 0.6 mg/L (based on 75th percentile pH and mixing) summer 0.5 mg/L (based on 75th percentile pH and mixing) winter 1.4 mg/L (based on 75th percentile pH and mixing)
Note: Chronic wasteload allocations are calculated using a steady-state mass balance approach and procedures found at 35 IAC 355.203.
Acute Wasteload Allocation Ce= S(Cds-Cus)+Cus
(Note: Insufficient stream width for discharge induced mixing.)predicted stream width: ft.diameter of outfall pipe (d): ft. wasteload allocation: spring/fall 7.5 mg/Lmaximum ZID radius (x): 0 ft. summer 5.6 mg/L S = 0.3 (x/d) = winter 8.8 mg/L
Note: Acute wasteload allocations are determined using the jet-momentum equation found in USEPA's Technical Support Document for predicting near-field mixing characteristics. Outfall pipe diameters are based on Manning's equation and n=0.013.
WQBELs Recommended: Daily Maximum: spring/fall 7.5 mg/Lsummer 5.6 mg/Lwinter 8.8 mg/L
30-day Average: spring/fall 0.6 mg/Lsummer 0.5 mg/Lwinter 1.4 mg/L
Weekly Average*: spring/fall 1.6 mg/Lsummer 1.3 mg/Lwinter 3.5 mg/L
* Note: Weekly average limits are based on the subchronic standard which is defined as 2.5 times the chronic limit at 35 IAC 302.212(b)(3) and Part 355.
APPENDIX D


APPENDIX E ALTERNATIVES ANALYSES–OPINION OF COSTS


S:\MAD\1200--1299\1278\047\Spr\Alternative Analysis\TPW.IPS-1&2.xlsx\IPS-1\6/20/2013
Glenbard Wastewater AuthorityFacilities PlanTable E-1 20-Year Total Present Worth: Alternative IPS-1, Three Submersible Dry-Pit Pumps
Discount Rate = 6.00%Initial Future
Capital Capital Service Replacement 20 yr Salvage SalvageCost Cost Life Cost (P.W.) Value Value (P.W.)
A. Influent Pump StationDry-Pit Pumps (3 Pumps, submersible) 891,000$ -$ 20 -$ -$ -$ Plug Valves & Electronic Actuators 450,000$ -$ 20 -$ -$ -$ Slide Gate Electronic Actuators 63,000$ -$ 20 -$ -$ -$ Structural Modifications 16,000$ -$ 40 -$ 8,000$ 2,500$ Electrical Room Structural 85,000$ -$ 40 -$ 42,500$ 13,300$ Bypass Pumping 30,000$ -$ 20 -$ -$ -$ Demolition 15,000$ -$ 20 -$ -$ -$
Subtotal 1,550,000$
Sitework (0%) -$ Mechanical (10%) 155,000$ HVAC1 52,000$ Underground Piping (0%) -$ Electrical and Controls2 690,000$
Subtotal 2,447,000$
Contractors General Conditions @ 8% 196,000$ Contingencies @20% 489,000$ Total Construction Costs 3,132,000$
Technical Services @ 15% 470,000$
Total Construction Capital Costs 3,602,000$ -$ 50,500$ 15,800$
Present Worth 3,602,000$ -$ 16,000$
Estimated Annual O&M CostsRelative Labor ($40/hr) 3,000$ Relative Maintenance 21,000$ Relative Power Use ($0.04/kWH) 77,000$ Total 101,000$ Present Worth of O&M 1,158,000$
Summary of Present Worth CostsCapital Cost 3,602,000$ O&M Cost 1,158,000$ Salvage Value (16,000)$ TOTAL PRESENT WORTH 4,744,000$
1 HVAC for the new electrical room only. 2 Electrical and controls includes new MCCs, PLCs, equipment electrical installation, pump VFDs, and plug valve and gate controls.

S:\MAD\1200--1299\1278\047\Spr\Alternative Analysis\TPW.IPS-1&2.xlsx\IPS-2\6/20/2013
Glenbard Wastewater AuthorityFacilities PlanTable E-2 20-Year Total Present Worth: Alternative IPS-2, Four Dry-Pit Pumps and Prerotation
Discount Rate = 6.00%Initial Future
Capital Capital Service Replacement 20 yr Salvage SalvageCost Cost Life Cost (P.W.) Value Value (P.W.)
A. Influent Pump StationDry-Pit Pumps (4 Pumps, immersible) 865,000$ -$ 20 -$ -$ -$ Plug Valves & Electronic Actuators 535,000$ -$ 20 -$ -$ -$ Slide Gate Electronic Actuators 63,000$ -$ 20 -$ -$ -$ Structural Modifications 70,000$ -$ 40 -$ 35,000$ 10,900$ Prerotation Basins and Wet Well 60,000$ -$ 40 -$ 30,000$ 9,400$ Electrical Room Structural 85,000$ -$ 40 -$ 42,500$ 13,300$ Bypass Pumping 50,000$ -$ 20 -$ -$ -$ Demolition 22,000$ -$ 20 -$ -$ -$
Subtotal 1,750,000$
Sitework (0%) -$ Mechanical (15%)1 263,000$ HVAC2 52,000$ Underground Piping (0%) -$ Electrical and Controls3 730,000$
Subtotal 2,795,000$
Contractors General Conditions @ 8% 224,000$ Contingencies @20% 559,000$ Total Construction Costs 3,578,000$
Technical Services @ 15% 537,000$
Total Construction Capital Costs 4,115,000$ -$ 107,500$ 33,600$
Present Worth 4,115,000$ -$ 34,000$
Estimated Annual O&M CostsRelative Labor ($40/hr) -$ Relative Maintenance 23,000$ Relative Power Use ($0.04/kWH) 74,000$ Total 97,000$ Present Worth of O&M 1,113,000$
Summary of Present Worth CostsCapital Cost 4,115,000$ O&M Cost 1,113,000$ Salvage Value (34,000)$ TOTAL PRESENT WORTH 5,194,000$
1 A mechanical piping factor of 20% is assumed versus as 10% becuase of the additonal suction piping and valves. 2 HVAC for the new electrical room only. 3 Electrical and controls includes new MCCs, PLCs, equipment electrical installation, pump VFDs, and plug valve and gate controls.

S:\MAD\1200--1299\1278\047\Spr\Alternative Analysis\TPW.AS-1to4& BioA.xlsx\AS-1\6/20/2013
Glenbard Wastewater AuthorityFacilities PlanTable E-3 20-Year Total Present Worth: Alternative AS-1, Two-Stage HPOAS
Discount Rate = 6.00%Initial Future
Capital Capital Service Replacement 20 yr Salvage SalvageCost Cost Life Cost (P.W.) Value Value (P.W.)
A. Aeration Basins & UNOX DeckStructural Modifications 65,000$ -$ 40 -$ 32,500$ 10,100$ Nitrate Recycle Station and Pumps 250,000$ -$ 40 -$ 125,000$ 39,000$ Anoxic Mixers (8) 225,000$ -$ 20 -$ -$ -$
B. Intermediate ClarifiersT-Valve Removal and Piping Modifications1 60,000$ -$ 20 -$ -$ -$ Tank Lining System 77,000$ -$ 20 -$ -$ -$ New Weirs/Troughs 20,000$ -$ 20 -$ -$ -$ Equipment Painting 95,000$ -$ 20 -$ -$ -$ Replace Mechanisms (year 10 cost) -$ 255,000$ 20 142,400$ 127,500$ 39,800$
C. Intermediate Pump StationDemolition 52,000$ -$ 20 -$ -$ -$ Pumps (3 at 18 mgd capacity each) 532,000$ -$ 20 -$ -$ -$ Structural Modifications 126,000$ -$ 40 -$ 63,000$ 19,600$
D. Pump and Electrical BuildingDemolition 16,000$ -$ 20 -$ -$ -$ CRAS and CWAS Pumps (4) 140,000$ -$ 20 -$ -$ -$
Subtotal 1,658,000$
Sitework (8%) 133,000$ Mechanical (10%) 166,000$ HVAC -$ Underground Piping/Bypass Pumping2 259,000$ Electrical and Controls3 945,000$
Subtotal 3,161,000$
Contractors General Conditions @ 8% 253,000$ Contingencies @ 20% 632,000$ Total Construction Costs 4,046,000$
Technical Services @ 15% 607,000$ Total Construction Capital Costs 4,653,000$ 142,400$ 348,000$ 108,500$
Present Worth 4,653,000$ 142,000$ 109,000$
Estimated Annual O&M CostsRelative Labor ($40/hr) 63,000$ Relative Maintenance 171,000$ Relative Power Use ($0.04/kWH) 312,000$ Total 546,000$ Present Worth of O&M 6,263,000$
Summary of Present Worth CostsCapital Cost 4,653,000$ O&M Cost 6,263,000$ Salvage Value (109,000)$ TOTAL PRESENT WORTH 10,807,000$
1 See Underground Piping/Bypass Pumping for other carbo RAS withdawl costs. 2 Underground piping installation for carbo RAS line from intermediate clarifiers to Pump and Electrical Building including control valves and flow meters. 3 Electrical and Controls cost includes $329,000 for Intermediate Pump Station work, $120,000 for the Cyro Building MCCs, $50,000 for Cyro Building PLCs, $250,000 for UNOX controls and automation, and a 40% factor of new mixer and nitrate recycle equipment cost.

S:\MAD\1200--1299\1278\047\Spr\Alternative Analysis\TPW.AS-1to4& BioA.xlsx\AS-2\6/20/2013
Glenbard Wastewater AuthorityFacilities PlanTable E-4 20-Year Total Present Worth: Alternative AS-2, Single-Stage HPOAS
Discount Rate = 6.00%Initial Future
Capital Capital Service Replacement 20 yr Salvage SalvageCost Cost Life Cost (P.W.) Value Value (P.W.)
A. Aeration Basins & UNOX DeckStructural Modifications 165,000$ -$ 40 -$ 82,500$ 25,700$ Nitrate Recycle Station and Pumps 250,000$ -$ 40 -$ 125,000$ 39,000$ Anoxic Mixers (10) 257,000$ -$ 20 -$ -$ -$
B. Intermediate ClarifiersDecommission Clarifiers 20,000$ -$ 20 -$ -$ -$
C. Intermediate Pump StationDemolition 52,000$ -$ 20 -$ -$ -$ Pumps (3 at 8 mgd capacity each) 327,000$ -$ 20 -$ -$ -$ Structural Modifications 126,000$ -$ 40 -$ 63,000$ 19,600$
D. Pump and Electrical BuildingDemolition CRAS/WAS Pumps 16,000$ -$ 20 -$ -$ -$
Subtotal 1,213,000$
Sitework (8%) 97,000$ Mechanical (10%) 121,000$ HVAC1 -$ Underground Piping/Bypass Pumping -$ Electrical and Controls1 1,002,000$
Subtotal 2,433,000$
Contractors General Conditions @ 8% 195,000$ Contingencies @ 20% 487,000$ Total Construction Costs 3,115,000$
Technical Services @ 15% 467,000$
Total Construction Capital Costs 3,582,000$ -$ 270,500$ 84,300$
Present Worth 3,582,000$ -$ 84,000$
Estimated Annual O&M CostsRelative Labor ($40/hr) 62,000$ Relative Maintenance 164,000$ Relative Power Use ($0.04/kWH) 284,000$ Total 510,000$ Present Worth of O&M 5,850,000$
Summary of Present Worth CostsCapital Cost 3,582,000$ O&M Cost 5,850,000$ Salvage Value (84,000)$ TOTAL PRESENT WORTH 9,348,000$
1 Electrical and Controls cost includes $329,000 for Intermediate Pump Station work, $120,000 for the Cyro Building MCCs, $50,000 for Cyro Building PLCs, $250,00 0for Cryo Building controls and automation, $50,000 for final stage modifcations, and a 40% factor of new mixer and nitrate recycle equipment cost. 4 Assumes 2,500 gallons per day to meet a 0.5 mg/L phosphorus limit.

S:\MAD\1200--1299\1278\047\Spr\Alternative Analysis\TPW.AS-1to4& BioA.xlsx\AS-3\6/20/2013
Glenbard Wastewater AuthorityFacilities PlanTable E-5 20-Year Total Present Worth: Alternative AS-3, Air Activated Sludge
Discount Rate = 6.00%Initial Future
Capital Capital Service Replacement 20 yr Salvage SalvageCost Cost Life Cost (P.W.) Value Value (P.W.)
A. Aeration Basins & UNOX DeckExisting Basin Demolition and Structural 360,000$ -$ 40 -$ 180,000$ 56,100$ New Aeration Basins (2.8 million gallons) 3,390,000$ -$ 40 -$ 1,695,000$ 528,500$ Aeration Equipment 476,000$ -$ 20 -$ -$ -$ Nitrate Recycle Station and Pumps 250,000$ -$ 40 -$ 125,000$ 39,000$ Anoxic Mixers (10) 257,000$ -$ 20 -$ -$ -$
B. Intermediate ClarifiersDemolition for New Tank Construction 150,000$ -$ 20 -$ -$ -$
C. Intermediate Pump StationDemolition 52,000$ -$ 20 -$ -$ -$ Pumps (3 at 8 mgd capacity each) 327,000$ -$ 20 -$ -$ -$ Structural Modifications 126,000$ -$ 40 -$ 63,000$ 19,600$
D. Cryogenic BuildingDemolition 160,000$ -$ 20 -$ -$ -$
E. Pump and Electrical BuildingDemolition CRAS/WAS Pumps 16,000$ -$ 20 -$ -$ -$
F. Blower BuildingStructural 575,000$ -$ 40 -$ 287,500$ 89,600$ New Blowers (5) 1,794,000$ -$ 20 -$ -$ -$
Subtotal 7,933,000$
Sitework (8%) 635,000$ Mechanical (10%) 793,000$ HVAC1 38,000$ Underground Piping/Bypass Pumping (10%)2 793,000$ Electrical and Controls3 1,664,000$
Subtotal 11,856,000$
Contractors General Conditions @ 8% 948,000$ Contingencies @ 20% 2,371,000$ Total Construction Costs 15,175,000$
Technical Services @ 15% 2,276,000$
Total Construction Capital Costs 17,451,000$ -$ 2,350,500$ 732,800$
Present Worth 17,451,000$ -$ 733,000$
Estimated Annual O&M CostsRelative Labor ($40/hr) 41,000$ Relative Maintenance 58,000$ Relative Power Use ($0.04/kWH) 207,000$ Total 306,000$ Present Worth of O&M 3,510,000$
Summary of Present Worth CostsCapital Cost 17,451,000$ O&M Cost 3,510,000$ Salvage Value (733,000)$ TOTAL PRESENT WORTH 20,228,000$
1 HVAC for new Blower Building. 2 Underground piping installation for effluent ML replacement and phosphorus removal checmical lines. 3 Electrical and Controls cost includes $329,000 for Intermediate Pump Station work, relocated site electrical for new tank construction, plus a 40% factor on the equipment cost for new mixers, nitrate recycle equipment,and blowers.

S:\MAD\1200--1299\1278\047\Spr\Alternative Analysis\TPW.AS-1to4& BioA.xlsx\AS-4 AK\6/20/2013
Glenbard Wastewater AuthorityFacilities PlanTable E-6 20-Year Total Present Worth: Alternative AS-4, IFAS
Discount Rate = 6.00%Initial Future
Capital Capital Service Replacement 20 yr Salvage SalvageCost Cost Life Cost (P.W.) Value Value (P.W.)
A. Aeration Basins & UNOX DeckExisting Basin Demolition and Structural 480,000$ -$ 40 -$ 240,000$ 74,800$ New Aeration Basins (1.3 million gallons) 1,574,000$ -$ 40 -$ 787,000$ 245,400$ Aeration and IFAS Equipment 6,826,000$ -$ 20 -$ -$ -$ Nitrate Recycle Station and Pumps 250,000$ -$ 40 -$ 125,000$ 39,000$ Anoxic Mixers (10) 257,000$ -$ 20 -$ -$ -$
B. Existing Intermediate ClarifiersDemolition 150,000$ -$ 20 -$ -$ -$
C. Intermediate Pump StationDemolition 52,000$ -$ 20 -$ -$ -$ Pumps (3 at 8 mgd capacity each) 327,000$ -$ 20 -$ -$ -$ Structural Modifications 126,000$ -$ 40 -$ 63,000$ 19,600$
D. Cryogenic PlantDemolition 160,000$ -$ 20 -$ -$ -$
E. Pump and Electrical BuildingDemolition CRAS/WAS Pumps 16,000$ -$ 20 -$ -$ -$
F. Blower BuildingStructural Modifications 575,000$ -$ 40 -$ 287,500$ 89,600$ Blowers (5) 1,794,000$ -$ 20 -$ -$ -$
Subtotal 12,587,000$
Sitework (8%)1 635,000$ Mechanical1 793,000$ HVAC1 38,000$ Underground Piping & Bypass Pumping1 793,000$ Electrical and Controls1 1,664,000$
Subtotal 16,510,000$
Contractors General Conditions @ 8% 1,321,000$ Contingencies @ 20% 3,302,000$ Total Construction Costs 21,133,000$
Technical Services @ 15% 3,170,000$
Total Construction Capital Costs 24,303,000$ -$ 1,502,500$ 468,400$
Present Worth 24,303,000$ -$ 468,000$
Estimated Annual O&M CostsRelative Labor ($40/hr) 36,000$ Relative Maintenance 108,000$ Relative Power Use ($0.04/kWH) 285,000$ Total 429,000$ Present Worth of O&M 4,921,000$
Summary of Present Worth CostsCapital Cost 24,303,000$ O&M Cost 4,921,000$ Salvage Value (468,000)$ TOTAL PRESENT WORTH 28,756,000$
1 An equivalent cost to Alternative AS-3 is assumed.

S:\MAD\1200--1299\1278\047\Spr\Alternative Analysis\TPW.AS-1to4& BioA.xlsx\BioA\6/20/2013
Glenbard Wastewater AuthorityFacilities PlanTable E-7 Capital Costs: Bioaugmentation
InitialCapitalCost
A. ATAD TanksDemolition 19,000$ New Surface Aerators/Mixers 140,000$ Alkalinity Addition System 22,000$ Structural Modifications 122,000$
B. Sludge Dewatering BuildingDemolition 12,000$ Dewatering Filtrate Pumps 62,000$ Filtrate Pump Station Structural Modifications 52,000$
C. Intermediate Pump StationSubmersible RAS Pump 36,000$
Subtotal 465,000$
Sitework (15%) 70,000$ Mechanical (20%) 93,000$ HVAC (0%) -$ Underground Piping/Bypass Pumping 136,000$ Electrical and Controls (40%) 186,000$
Subtotal 950,000$
Contractors General Conditions @ 8% 76,000$ Contingencies @ 20% 190,000$ Total Construction Costs 1,216,000$
Technical Services @ 20%1243,000$
Total Construction Capital Costs 1,459,000$
1 A 20% technical services factor is assumed because an additional detailed study is required.

Glenbard Wastewater AuthorityFacilities PlanTable E-8 20-Year Total Present Worth: Alternative BD-1,Two New Belt Filter Presses
Discount Rate = 6.00%Initial Future
Capital Capital Service Replacement 20 yr Salvage SalvageCost Cost Life Cost (P.W.) Value Value (P.W.)
Two New Belt Filter Presses with PLCs 929,000$ -$ 20 -$ -$ -$ Demolition 50,000$ -$ 20 -$ -$ -$ Conveyors 75,000$ -$ 20 -$ -$ -$ Subtotal 1,054,000$
Piping/Mechanical 50,000$ Electrical 100,000$ HVAC (0%) -$ Sitework (0%) -$ Subtotal 1,204,000$
Contractor's General Conditions @ 8% 96,000$ Total Construction Costs 1,300,000$ Contingencies & Technical Services @ 40% 520,000$
Total Capital Costs 1,820,000$ -$ -$ -$ -$
Present Worth 1,820,000$ -$ -$
Estimated Annual O&M CostsOvertime Labor -$ Power 400$ Polymer 40,000$ Biosolids Disposal 146,000$ Maintenance and Supplies 20,000$ Total 206,400$ Present Worth of O&M 2,367,000$
Summary of Present Worth CostsCapital Cost 1,820,000$ Replacement -$ O&M Cost 2,367,000$ Salvage Value -$ TOTAL PRESENT WORTH 4,187,000$
Annualized PW 365,000$
Notes: All costs are fourth quarter 2012 dollars.Present worth is calculated on a 20-year basis at discount rate shown.

Glenbard Wastewater AuthorityFacilities PlanTable E-9 20-Year Total Present Worth: Alternative BD-2, One New Centrifuge
Discount Rate = 6.00%Initial Future
Capital Capital Service Replacement 20 yr Salvage SalvageCost Cost Life Cost (P.W.) Value Value (P.W.)
One New Centrifuge with a common PLC 1,011,000$ -$ 20 -$ -$ -$ Demolition 30,000$ -$ 20 -$ -$ -$ Overhead Crane 50,000$ -$ 20 -$ -$ -$ Additional Structural Supports 100,000$ -$ 20 -$ -$ -$ Conveyors 50,000$ -$ 20 -$ -$ -$ Subtotal 1,241,000$
Piping/Mechanical 75,000$ Electrical 200,000$ HVAC (0%) -$ Sitework (0%) -$
Subtotal 1,516,000$
Contractor's General Conditions @ 8% 121,000$ Total Construction Costs 1,637,000$ Contingencies & Technical Services @ 40% 655,000$
Total Capital Costs 2,292,000$ -$ -$ -$ -$
Present Worth 2,292,000$ -$ -$
Estimated Annual O&M CostsOvertime Labor -$ Power 6,000$ Polymer 53,000$ Biosolids Disposal 116,600$ Maintenance and Supplies 20,000$ Total 195,600$ Present Worth of O&M 2,244,000$
Summary of Present Worth CostsCapital Cost 2,292,000$ Replacement -$ O&M Cost 2,244,000$ Salvage Value -$ TOTAL PRESENT WORTH 4,536,000$
Annualized PW 395,000$
Notes: All costs are fourth quarter 2012 dollars.Present worth is calculated on a 20-year basis at discount rate shown.

Glenbard Wastewater AuthorityFacilities PlanTable E-10 20-Year Total Present Worth: Alternative CC-1b -Gas Engine Cogeneration System,
High Strength Waste- 150 SCFM Biogas Flow RateDiscount Rate = 6.00%
Initial FutureCapital Capital Service Replacement 20 yr Salvage SalvageCost Cost Life Cost (P.W.) Value Value (P.W.)
A. EquipmentGas Conditioning Equipment 768,000$ -$ 20 -$ -$ -$ Gas Engine Cogeneration System 270,000$ -$ 20 -$ -$ -$ Paralleling Switchgear -$ -$ 20 -$ -$ -$ Digester No. 3 Additional Equipment 300,000$ -$ 20 -$ -$ -$ Biogas Storage 690,000$ -$ 20 -$ -$ -$ Digester Gas Safety Equipment 125,000$ -$ 20 -$ -$ -$ High Strength Waste Receiving Facilities 329,000$ -$ 20 -$ -$ -$
Subtotal A 2,482,000$
B. Ancillary Captial CostsSite Work (2% of Subtotal A) 50,000$ Mechanical (15% of Subtotal A) 372,000$ Electrical and Controls (15% of Subtotal A) 372,000$
Subtotal B 794,000$
Total (A & B Subtotals) 3,276,000$
Contractors General Conditions @ 8% 262,000$ Total Construction Costs 3,538,000$
Contingencies and Technical Services @ 35% 1,238,000$
Total Construction Capital Costs 4,776,000$
Present Worth 4,776,000$
Estimated Annual O&M CostsGas Conditioning Equip. O&M and Media Replacem 43,000$ Relative Equipment Maintenance2 73,000$ Electrical Savings ($0.04/kWH)3 (155,000)$ Power Use ($0.04/kWH)4 9,000$ Tipping Fee Revenue5 (287,000)$ Total (317,000)$ Present Worth of O&M (3,636,000)$
Summary of Present Worth CostsCapital Cost 4,776,000$ O&M Cost (3,636,000)$ TOTAL PRESENT WORTH 1,140,000$
Notes: 1 Includes biological hydrogen sulfide removal O&M, siloxane media, and moisture removal/compression skid maintenance.2 Includes scheduled gas engine overhauls and $5,000 credit for eliminating boiler maintenance.3 Electrical savings is based on 150 scfm and 600 BTU/ft3.4 Power required for gas conditioning skid compressor and chiller.5 Based on $0.025/gallon and 31,400 gallons/day of HSW

Glenbard Wastewater AuthorityFacilities PlanTable E-11 20-Year Total Present Worth: Alternative CC-2a - Gas Engine Cogeneration System
100 SCFM Biogas Flow RateDiscount Rate = 6.00%
Initial FutureCapital Capital Service Replacement 20 yr Salvage SalvageCost Cost Life Cost (P.W.) Value Value (P.W.)
A. EquipmentGas Conditioning Equipment 768,000$ -$ 20 -$ -$ -$ Gas Engine Cogeneration System 727,785$ -$ 20 -$ -$ -$ Paralleling Switchgear 442,395$ -$ 20 -$ -$ -$ Digester No. 3 Additional Equipment -$ -$ 20 -$ -$ -$ Biogas Storage -$ -$ 20 -$ -$ -$ Digester Gas Safety Equipment 125,000$ -$ 20 -$ -$ -$ High Strength Waste Receiving Facilities -$ -$ 20 -$ -$ -$
Subtotal A 2,063,000$
B. Ancillary Captial CostsSite Work (2% of Subtotal A) 41,000$ Mechanical (15% of Subtotal A) 309,000$ Electrical and Controls (15% of Subtotal A) 309,000$
Subtotal B 659,000$
Total (A & B Subtotals) 2,722,000$
Contractors General Conditions @ 8% 218,000$ Total Construction Costs 2,940,000$
Contingencies and Technical Services @ 35% 1,029,000$
Total Construction Capital Costs 3,969,000$
Present Worth 3,969,000$
Estimated Annual O&M CostsGas Conditioning Equip. O&M and Media Replacem 29,000$ Relative Equipment Maintenance2 66,000$ Electrical Savings ($0.04/kWH)3 (142,000)$ Power Use ($0.04/kWH)4 6,000$ Tipping Fee Revenue5 -$ Total (41,000)$ Present Worth of O&M (470,000)$
Summary of Present Worth CostsCapital Cost 3,969,000$ O&M Cost (470,000)$ TOTAL PRESENT WORTH 3,499,000$
Notes: 1 Includes biological hydrogen sulfide removal O&M, siloxane media, and moisture removal/compression skid maintenance.2 Includes scheduled gas engine overhauls and $5,000 credit for eliminating boiler maintenance.3 Electrical savings is based on 100 scfm and 600 BTU/ft3.4 Power required for gas conditioning skid compressor and chiller.5 Based on $0.025/gallon
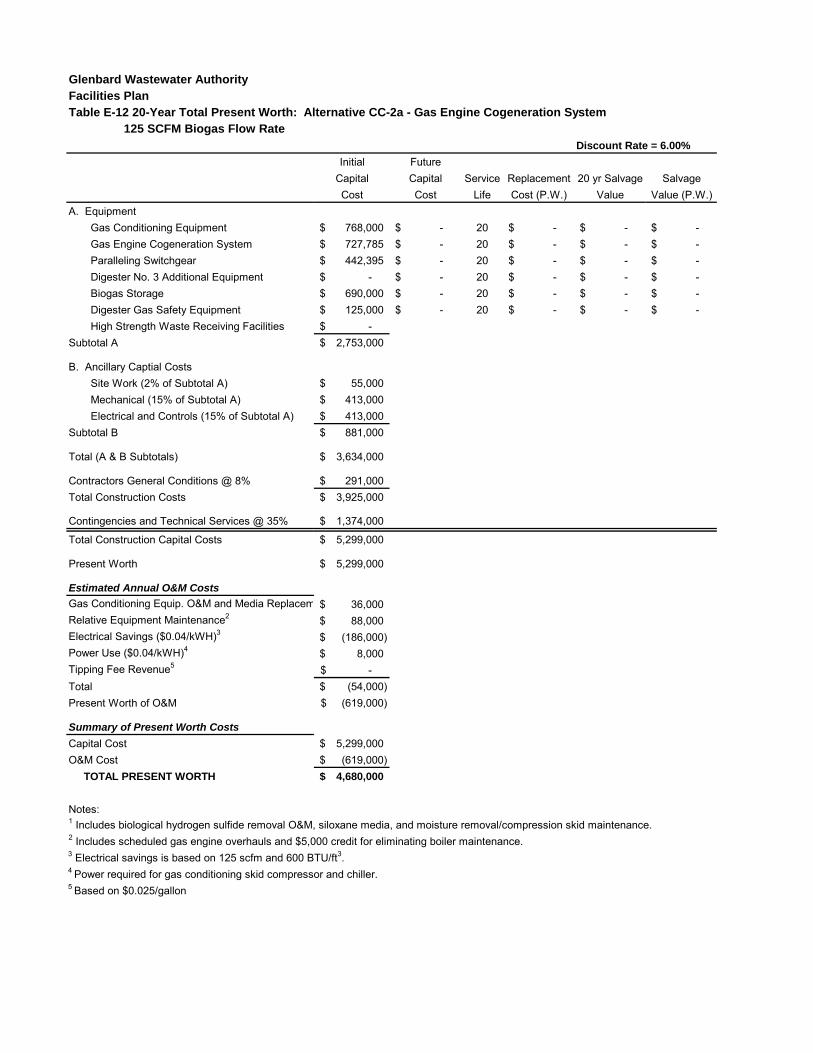
Glenbard Wastewater AuthorityFacilities PlanTable E-12 20-Year Total Present Worth: Alternative CC-2a - Gas Engine Cogeneration System
125 SCFM Biogas Flow RateDiscount Rate = 6.00%
Initial FutureCapital Capital Service Replacement 20 yr Salvage SalvageCost Cost Life Cost (P.W.) Value Value (P.W.)
A. EquipmentGas Conditioning Equipment 768,000$ -$ 20 -$ -$ -$ Gas Engine Cogeneration System 727,785$ -$ 20 -$ -$ -$ Paralleling Switchgear 442,395$ -$ 20 -$ -$ -$ Digester No. 3 Additional Equipment -$ -$ 20 -$ -$ -$ Biogas Storage 690,000$ -$ 20 -$ -$ -$ Digester Gas Safety Equipment 125,000$ -$ 20 -$ -$ -$ High Strength Waste Receiving Facilities -$
Subtotal A 2,753,000$
B. Ancillary Captial CostsSite Work (2% of Subtotal A) 55,000$ Mechanical (15% of Subtotal A) 413,000$ Electrical and Controls (15% of Subtotal A) 413,000$
Subtotal B 881,000$
Total (A & B Subtotals) 3,634,000$
Contractors General Conditions @ 8% 291,000$ Total Construction Costs 3,925,000$
Contingencies and Technical Services @ 35% 1,374,000$
Total Construction Capital Costs 5,299,000$
Present Worth 5,299,000$
Estimated Annual O&M CostsGas Conditioning Equip. O&M and Media Replacem 36,000$ Relative Equipment Maintenance2 88,000$ Electrical Savings ($0.04/kWH)3 (186,000)$ Power Use ($0.04/kWH)4 8,000$ Tipping Fee Revenue5 -$ Total (54,000)$ Present Worth of O&M (619,000)$
Summary of Present Worth CostsCapital Cost 5,299,000$ O&M Cost (619,000)$ TOTAL PRESENT WORTH 4,680,000$
Notes: 1 Includes biological hydrogen sulfide removal O&M, siloxane media, and moisture removal/compression skid maintenance.2 Includes scheduled gas engine overhauls and $5,000 credit for eliminating boiler maintenance.3 Electrical savings is based on 125 scfm and 600 BTU/ft3.4 Power required for gas conditioning skid compressor and chiller.5 Based on $0.025/gallon

Glenbard Wastewater AuthorityFacilities PlanTable E-13 20-Year Total Present Worth: Alternative CC-2b - Gas Engine Cogeneration System,
High Strength Waste- 125 SCFM Biogas Flow RateDiscount Rate = 6.00%
Initial FutureCapital Capital Service Replacement 20 yr Salvage SalvageCost Cost Life Cost (P.W.) Value Value (P.W.)
A. EquipmentGas Conditioning Equipment 768,000$ -$ 20 -$ -$ -$ Gas Engine Cogeneration System 727,785$ -$ 20 -$ -$ -$ Paralleling Switchgear 442,395$ -$ 20 -$ -$ -$ Digester No. 3 Additional Equipment -$ -$ 20 -$ -$ -$ Biogas Storage 690,000$ -$ 20 -$ -$ -$ Digester Gas Safety Equipment 125,000$ -$ 20 -$ -$ -$ High Strength Waste Receiving Facilities 329,000$ -$ 20 -$ -$ -$
Subtotal A 3,082,000$
B. Ancillary Captial CostsSite Work (2% of Subtotal A) 62,000$ Mechanical (15% of Subtotal A) 462,000$ Electrical and Controls (15% of Subtotal A) 462,000$
Subtotal B 986,000$
Total (A & B Subtotals) 4,068,000$
Contractors General Conditions @ 8% 325,000$ Total Construction Costs 4,393,000$
Contingencies and Technical Services @ 35% 1,538,000$
Total Construction Capital Costs 5,931,000$
Present Worth 5,931,000$
Estimated Annual O&M CostsGas Conditioning Equip. O&M and Media Replacem 36,000$ Relative Equipment Maintenance2 88,000$ Electrical Savings ($0.04/kWH)3 (186,000)$ Power Use ($0.04/kWH)4 8,000$ Tipping Fee Revenue5 (164,000)$ Total (218,000)$ Present Worth of O&M (2,500,000)$
Summary of Present Worth CostsCapital Cost 5,931,000$ O&M Cost (2,500,000)$ TOTAL PRESENT WORTH 3,431,000$
Notes: 1 Includes biological hydrogen sulfide removal O&M, siloxane media, and moisture removal/compression skid maintenance.2 Includes scheduled gas engine overhauls and $5,000 credit for eliminating boiler maintenance.3 Electrical savings is based on 125 scfm and 600 BTU/ft3.4 Power required for gas conditioning skid compressor and chiller.5 Based on $0.025/gallon and 18,000 gallons/day of HSW
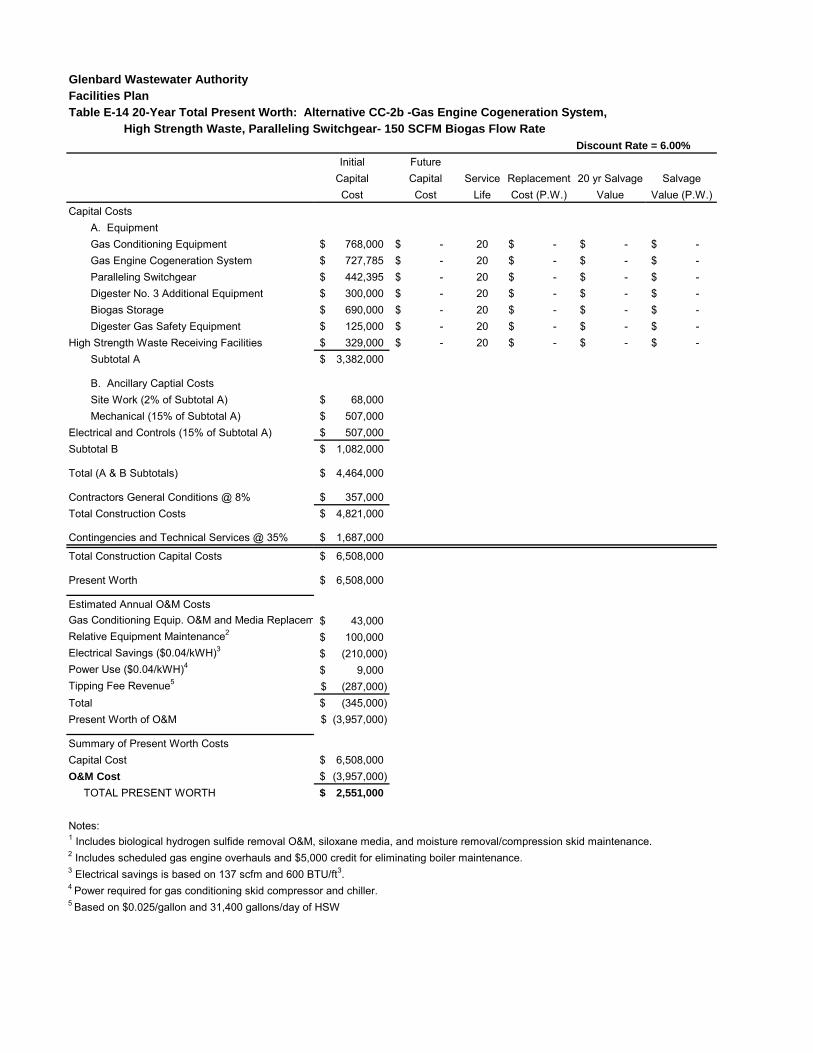
Glenbard Wastewater AuthorityFacilities PlanTable E-14 20-Year Total Present Worth: Alternative CC-2b -Gas Engine Cogeneration System,
High Strength Waste, Paralleling Switchgear- 150 SCFM Biogas Flow RateDiscount Rate = 6.00%
Initial FutureCapital Capital Service Replacement 20 yr Salvage SalvageCost Cost Life Cost (P.W.) Value Value (P.W.)
Capital CostsA. EquipmentGas Conditioning Equipment 768,000$ -$ 20 -$ -$ -$ Gas Engine Cogeneration System 727,785$ -$ 20 -$ -$ -$ Paralleling Switchgear 442,395$ -$ 20 -$ -$ -$ Digester No. 3 Additional Equipment 300,000$ -$ 20 -$ -$ -$ Biogas Storage 690,000$ -$ 20 -$ -$ -$ Digester Gas Safety Equipment 125,000$ -$ 20 -$ -$ -$
High Strength Waste Receiving Facilities 329,000$ -$ 20 -$ -$ -$ Subtotal A 3,382,000$
B. Ancillary Captial CostsSite Work (2% of Subtotal A) 68,000$ Mechanical (15% of Subtotal A) 507,000$
Electrical and Controls (15% of Subtotal A) 507,000$ Subtotal B 1,082,000$
Total (A & B Subtotals) 4,464,000$
Contractors General Conditions @ 8% 357,000$ Total Construction Costs 4,821,000$
Contingencies and Technical Services @ 35% 1,687,000$
Total Construction Capital Costs 6,508,000$
Present Worth 6,508,000$
Estimated Annual O&M CostsGas Conditioning Equip. O&M and Media Replacem 43,000$ Relative Equipment Maintenance2 100,000$ Electrical Savings ($0.04/kWH)3 (210,000)$ Power Use ($0.04/kWH)4 9,000$ Tipping Fee Revenue5 (287,000)$ Total (345,000)$ Present Worth of O&M (3,957,000)$
Summary of Present Worth CostsCapital Cost 6,508,000$ O&M Cost (3,957,000)$ TOTAL PRESENT WORTH 2,551,000$
Notes: 1 Includes biological hydrogen sulfide removal O&M, siloxane media, and moisture removal/compression skid maintenance.2 Includes scheduled gas engine overhauls and $5,000 credit for eliminating boiler maintenance.3 Electrical savings is based on 137 scfm and 600 BTU/ft3.4 Power required for gas conditioning skid compressor and chiller.5 Based on $0.025/gallon and 31,400 gallons/day of HSW

S:\MAD\1200--1299\1278\047\Spr\Alternative Analysis\Common-CPR.xlsx\CPR\6/20/2013
Glenbard Wastewater AuthorityFacilities PlanTable E-15 Capital and O&M Costs for CPR
InitialCapitalCost
A. CPR BuildingStructural 120,000$ CPR Pumps and Storage Tanks 115,000$
Subtotal 235,000$
Sitework (8%) 19,000$ Mechanical 12,000$ HVAC 24,000$ Underground Piping/Bypass Pumping (25%) 59,000$ Electrical and Controls (25%) 59,000$
Subtotal 408,000$
Contractors General Conditions @ 8% 33,000$ Contingencies @ 20% 82,000$ Total Construction Costs 523,000$
Technical Services @ 15% 78,000$ Total Construction Capital Costs 601,000$
Present Worth 601,000$
Estimated Annual O&M CostsRelative Labor ($40/hr) 4,000$ Relative Maintenance 2,000$ Relative Power Use ($0.04/kWH) 1,000$ Phosphorus Removal Chemical ($1.40/gal)1 1,022,000$ Total 1,029,000$
1 Assumes 2,000 gallons per day to meet a 0.5 mg/L phosphorus limit.

Glenbard Wastewater AuthorityFacilities PlanTable E-16 Sludge Thickening Phase 2, Thickened Sludge Pump Station and Piping Improvements
CapitalCost
A. Thickened Sludge Pump StationBuilding-Structural 254,000$ Relocation of GBT Feed Pumps 35,000$
Subtotal A 289,000$
B. Ancillary Captial CostsSite Work 10,000$ Mechanical (30% of Subtotal A) 87,000$ HVAC (10% of Subtotal A) 29,000$ Underground Piping 101,000$ Electrical and Controls (25% of Subtotal A) 72,000$
Subtotal B 299,000$
Total (A & B Subtotals) 588,000$
Contractors General Conditions @ 10% 59,000$ Total Construction Costs 647,000$
Contingencies and Technical Services @ 35% 226,000$
Total Construction Capital Costs 873,000$

Glenbard Wastewater AuthorityFacilities PlanTable E-17 Sludge Thickening Phase 3a, GBT WAS Thickening Improvements with WAS Storage
CapitalCost
A. Capital CostsConvert Filter Backwash Tank to WAS Storage1 120,000$ Replace WAS Pumps 115,000$ New WAS GBT Feed Pumps in Filter Building1 105,000$ New TWAS Transfer Pumps in Dewatering Building 105,000$ Convert Sludge Holding to TWAS Storage 15,000$
Subtotal A 460,000$
B. Ancillary Captial CostsSite Work1 20,000$ Mechanical (30% of Subtotal A) 138,000$ Underground Piping1 115,000$ Electrical and Controls (20% of Subtotal A) 92,000$
Subtotal B 365,000$
Total (A & B Subtotals) 825,000$
Contractors General Conditions @ 10% 83,000$ Total Construction Costs 908,000$
Contingencies and Technical Services @ 35% 318,000$
Total Construction Capital Costs 1,226,000$

Glenbard Wastewater AuthorityFacilities PlanTable E-18 Sludge Thickening Phase 3b, GBT WAS Thickening Improvements with WAS Direclty to GBT
CapitalCost
A. Capital Costs-$
Replace WAS Pumps 115,000$ New TWAS Transfer Pumps in Dewatering Building 105,000$ Convert Sludge Holding to TWAS Storage 15,000$
Subtotal A 235,000$
B. Ancillary Captial CostsSite Work1
Mechanical (30% of Subtotal A) 71,000$ Underground Piping1
Electrical and Controls (30% of Subtotal A) 71,000$ Subtotal B 142,000$
Total (A & B Subtotals) 377,000$
Contractors General Conditions @ 10% 38,000$ Total Construction Costs 415,000$
Contingencies and Technical Services @ 35% 145,000$
Total Construction Capital Costs 560,000$

Glenbard Wastewater AuthorityFacilities PlanTable E-19 Liquid Sludge Storage and Gas Holding
CapitalCost
A. Capital CostsConvert Filter Backwash Tank to Liquid Biosolids Storage 50,000$ Membrane Gas Holder 640,000$ New Dewatering Feed Pumps in Filter Building 105,000$
Subtotal A 795,000$
B. Ancillary Captial CostsSite Work 20,000$ Mechanical (30% of Subtotal A) 239,000$ Underground Piping 92,000$ Electrical and Controls (15% of Subtotal A) 119,000$
Subtotal B 450,000$
Total (A & B Subtotals) 1,245,000$
Contractors General Conditions @ 10% 125,000$ Total Construction Costs 1,370,000$
Contingencies and Technical Services @ 35% 480,000$
Total Construction Capital Costs 1,850,000$

Glenbard Wastewater AuthorityFacilities PlanTable E-20 Dewatered Sludge Storage
CapitalCost
A. Capital CostsCovered Storage Structure ($35/ft2) 1,610,000$
Subtotal A 1,610,000$
B. Ancillary Captial CostsSite Work (4% of Subtotal A) 81,000$ Mechanical -$ Underground Piping -$ Electrical and Controls 55,000$
Subtotal B 136,000$
Total (A & B Subtotals) 1,746,000$
Contractors General Conditions @ 8% 140,000$ Total Construction Costs 1,886,000$
Contingencies (10%) 189,000$ Total Construction and Contingencies 2,075,000$
Technical Services 381,000$
Total Construction Capital Costs 2,456,000$

APPENDIX F GWA FUND 40 CAPITAL PLAN


REV
ENU
E in
Tho
usan
ds $
FY(2
013)
FY(2
014)
FY(2
015)
FY(2
016)
FY(2
017)
FY(2
018)
FY(2
019)
FY(2
020)
FY(2
021)
FY(2
022)
FY(2
023)
FY(2
024)
Estim
ated
Bud
getin
gPl
anni
ngPl
anni
ngPl
anni
ngPl
anni
ngPl
anni
ngPl
anni
ngPl
anni
ngPl
anni
ngPl
anni
ngPl
anni
ngP
roce
eds
from
Bor
row
ing
00
066
4860
120
00
00
00
Inve
stm
ent I
ncom
e7
1012
1417
2020
2020
2020
20G
len
Elly
n C
onn
Fees
3525
2525
2525
2525
2525
2525
Lom
bard
Con
n Fe
es30
2525
2525
2525
2525
2525
25In
terfu
nd T
ranf
er F
rom
Fun
d 41
021
0In
terfu
nd T
ranf
er F
rom
Fun
d 42
031
1In
terfu
nd T
ranf
er F
rom
Fun
d 43
014
2In
terfu
nd T
ranf
er F
rom
Fun
d 44
011
0In
terfu
nd T
ranf
er F
rom
Fun
d 45
029
Inte
rfund
Tra
nfer
Fro
m F
und
460
91In
terfu
nd T
ranf
er F
rom
Fun
d 47
023
Ene
rNoc
Dem
and
Res
pons
e P
rogr
am1
38
3836
48Le
acha
te R
even
ue2
113
117
117
117
117
117
117
117
117
117
117
117
Cel
l Tow
er R
even
ue3
2724
2424
2424
2424
2424
2424
Mis
cella
neou
s R
even
ue70
1010
1010
1010
1010
1010
10
Cap
ital F
und
Con
tribu
tion
- Gle
n E
llyn
758
1318
1443
1587
1746
1921
2118
2324
2557
2812
3093
3417
C
apita
l Fun
d C
ontri
butio
n - L
omba
rd84
313
8215
2716
8018
4820
3222
4024
5927
0529
7632
7336
16To
tal C
apita
l Fun
d C
ontri
butio
n4
1601
2700
2970
3267
3594
3953
4358
4783
5262
5788
6366
7033
TOTA
L R
EVEN
UE
1886
3835
3221
1016
698
7241
7445
7950
0454
8360
0965
8772
54
EXPE
NSE
S in
Tho
usan
ds $
FY(2
013)
FY(2
014)
FY(2
015)
FY(2
016)
FY(2
017)
FY(2
018)
FY(2
019)
FY(2
020)
FY(2
021)
FY(2
022)
FY(2
023)
FY(2
024)
Deb
t Ser
vice
Pay
men
ts:
Estim
ated
Bud
getin
gPl
anni
ngPl
anni
ngPl
anni
ngPl
anni
ngPl
anni
ngPl
anni
ngPl
anni
ngPl
anni
ngPl
anni
ngPl
anni
ngC
SO
Pro
ject
Deb
t Pay
men
t (P
&I)
-5
7474
37B
IP P
roje
ct D
ebt P
aym
ent (
P&
I)6
380
379
379
190
Ana
Dig
este
r Pro
ject
Deb
t Pay
men
t (P
&I)
758
959
659
659
659
659
659
659
659
659
659
659
6S
and
Filte
r Pro
ject
Deb
t Pay
men
t (P
&I)
980
980
980
980
980
980
980
Deb
t Ser
vice
Sub
tota
l10
4310
4910
1278
659
615
7615
7615
7615
7615
7615
7615
76C
apita
l Im
prov
emen
tsR
olin
g S
tock
814
511
192
103
110
134
157
146
138
3474
130
Sm
all C
apita
l Pro
ject
s9
100
109
100
100
100
100
100
100
100
100
100
100
Infa
stru
ctur
e Im
prov
emen
ts10
700
429
200
300
300
300
300
300
300
300
300
300
Roo
f Rep
lace
men
ts -
Upd
ated
bas
ed o
n R
epl.
Sch
edul
e11
165
6157
200
100
690
00
00
0P
lant
Equ
ipm
ent R
ehab
ilitat
ion
1230
300
300
300
300
300
300
300
300
300
300
300
Oxy
gen
Sys
tem
Reh
abilit
atio
n10
040
0Fa
cilit
y P
lan
9012
015
0D
iges
ter I
mpr
ovem
ent P
roje
ct -
FY13
Med
iate
d40
5V
alle
y V
iew
Pum
p S
tatio
n13
E
ngin
eerin
g12
418
1
Con
stru
ctio
n17
04R
emot
e S
ite C
omm
unic
atio
n
Eng
inee
ring
26
Con
stru
ctio
n14
4LC
STF
Cla
rifie
r Mec
hani
sm R
epla
cem
ent
14
Eng
inee
ring
35
Con
stru
ctio
n25
0S
cree
ning
Bui
ldin
g H
VA
C R
epla
cem
ent
E
ngin
eerin
g3
C
onst
ruct
ion
17In
fluen
t Pum
p R
epla
cem
ent a
nd Im
prov
emen
ts15
E
ngin
eerin
g24
122
822
8
Con
stru
ctio
n19
0019
00In
term
edia
te P
ump
Sta
tion
Mod
ifica
tions
E
ngin
eerin
g10
714
9
Con
stru
ctio
n13
94U
NO
X D
eck
Con
trol I
mpr
ovem
ents
E
ngin
eerin
g28
38
Con
stru
ctio
n36
1Fi
nal S
tage
Mod
ifica
tions
E
ngin
eerin
g16
23
Con
stru
ctio
n21
4O
&M
Man
ual U
pdat
e33
8S
and
Filte
r Upg
rade
Pro
ject
- B
undl
e w
ith U
V a
nd S
tora
ge
Eng
inee
ring
496
344
344
C
onst
ruct
ion
(IEP
A L
oan)
3223
3223
UV
Dis
infe
ctio
n U
pgra
de -
Bun
dle
with
San
d Fi
lter a
nd S
tora
ge
Eng
inee
ring
165
115
115
C
onst
ruct
ion
(IEP
A L
oan)
1075
1075
Bio
solid
s C
over
ed S
tora
ge- B
undl
e W
ith S
and
Filte
r and
UV
E
ngin
eerin
g17
412
112
1
Con
stru
ctio
n (IE
PA
Loa
n)11
3411
34H
aule
d W
aste
s R
ecei
ving
Pha
se 1
E
ngin
eerin
g18
26
Con
stru
ctio
n24
0P
rimar
y / W
aste
Act
ivat
ed S
ludg
e Th
icke
ning
Pha
se 2
& 3
E
ngin
eerin
g11
115
4
Con
stru
ctio
n14
46B
ioso
lids
Dew
ater
ing
Equ
ipm
ent R
epla
cem
ent
E
ngin
eerin
g18
312
712
7
Con
stru
ctio
n11
9111
91Li
quid
Bio
solid
s S
tora
ge Im
prov
emen
ts
Eng
inee
ring
148
103
103
C
onst
ruct
ion
961
961
Che
mic
al P
hosp
horu
s R
emov
al
Eng
inee
ring
4968
C
onst
ruct
ion
643
Grit
Bui
ldin
g M
CC
Rep
lace
men
t
Eng
inee
ring
1722
C
onst
ruct
ion
221
Cry
o B
uild
ing
MC
C a
nd P
LC R
epla
cem
ent
E
ngin
eerin
g21
29
Con
stru
ctio
n27
7E
lect
. Ser
vice
, Bac
kup
& R
edun
danc
y P
roje
cts
E
ngin
eerin
g12
617
4
Con
stru
ctio
n16
31P
LC R
epla
cem
ents
E
ngin
eerin
g64
88
Con
stru
ctio
n82
7S
ite L
ight
ing
E
ngin
eerin
g20
27
Con
stru
ctio
n25
3S
torm
wat
er P
lant
Lag
oon
Dre
dgin
g
Eng
inee
ring
C
onst
ruct
ion
1344
Sto
rmw
ater
Pla
nt B
arsc
reen
Upg
rade
E
ngin
eerin
g87
121
C
onst
ruct
ion
1136
Sto
rmw
ater
Pla
nt G
rit C
olle
ctio
n U
pgra
de a
nd H
VA
C
Eng
inee
ring
226
313
C
onst
ruct
ion
2960
P
roje
ct T
otal
1859
3421
1580
8308
8458
4586
4309
3277
4179
4370
3751
4103
IFT/
DEB
T SE
RVI
CES
/ PR
OJ
TOTA
L29
0244
7025
9290
9490
5461
6258
8548
5357
5559
4653
2756
79
Cas
h on
Han
d 5/
134
1023
9417
5923
8834
6042
7822
9098
411
3586
392
521
85
G
ain/
Loss
FY
(101
6)(6
35)
629
1072
818
(198
8)(1
306)
151
(272
)63
1260
1575
Cas
h on
Han
d 4/
3023
9417
5923
8834
6042
7822
9098
411
3586
392
521
8537
60
GL
EN
BA
RD
WA
STE
WA
TE
R A
UT
HO
RIT
Y F
UN
D 4
0 C
AP
ITA
L P
LA
N
Footnotes


APPENDIX G ENVIRONMENTAL CHECKLIST


IEPA Loan Applicant Environmental Checklist – Instructions
Prior to Project/Facility Plan approval, a loan applicant must satisfy the IEPA that it will comply with various State and Federal enactments for protection of historical/cultural resources, recreational areas, wetlands, floodplains and stream banks, rare and endangered species, prime agricultural land, air and water quality and other sensitive environmental areas. This requirement can be satisfied by providing the information required on this IEPA checklist. The checklist must be submitted to IEPA and signed by the loan applicant’s Authorized Representative. Instructions for completing the checklist follow. 1) Historical/Cultural Resources - National Historic Preservation Act, Section 106 A sign-off from the Illinois Historic Preservation Agency’s (IHPA) State Historic Preservation Officer (SHPO) must be submitted. In requesting a sign-off, you must indicate that the project will be funded through the IEPA loan program and therefore will require a federal Section 106 Sign-off (this will also satisfy the State Agency Historic Preservation Protection Act of 1990). The sign-off may be unconditional, or it may be conditional upon the applicant agreeing to incorporate measures to protect or recover historic or archeological resources.
More information via the internet: www.illinoishistory.gov/ps/rcdocument.htm
Direct the request for SHPO review to: Illinois State Historic Preservation Agency
Attn: (*See list below for appropriate person) Preservation Services Division 1 Old State Capitol Springfield, Illinois 62701
*DAVID HALPIN Adams, Boone, Brown, Bureau, Carroll, Cass, DeKalb, DeWitt, Ford, Fulton, Grundy, Hancock, Henderson, Henry, Iroquois, Jo Daviess, Kane, Kankakee, Kendall, Knox, LaSalle, Lee, Livingston, Logan, Marshall, Mason, McDonough, McHenry, McLean, Menard, Mercer, Ogle, Peoria, Piatt, Putnam, Rock Island, Schuyler, Stark, Stephenson, Tazewell, Warren, Whiteside, Will, Winnebago, Woodford.
*JOE PHILLIPPE Alexander, Bond, Calhoun, Champaign, Christian, Clark, Clay, Clinton, Coles, Cook, Crawford, Cumberland, Douglas, DuPage, Edgar, Edwards, Effingham, Fayette, Franklin, Gallatin, Greene, Hardin, Hamilton, Jackson, Jasper, Jefferson, Jersey, Johnson, Lake, Lawrence, Macon, Macoupin, Madison, Marion, Massac, Monroe, Montgomery, Morgan, Moultrie, Perry, Pike, Pope, Pulaski, Randolph, Richland, Saline, Sangamon, Scott, Shelby, St. Clair, Union, Vermilion, Wabash, Washington, Wayne, White, Williamson.
2) Threatened & Endangered Species, Natural Areas, Wetlands - Illinois Endangered Species
Protection Act, Illinois Natural Areas Preservation Act, Illinois Interagency Wetland Policy Act If the project will result in a change in existing environmental conditions per Title 17 Ill. Adm. Code Section 1075.30(a) or result in an adverse impact to a wetland per Section 1090.20, it must be reviewed by the Illinois Department of Natural Resources (IDNR) Office of Realty and Environmental Planning for potential adverse effects to protected natural resources. (NOTE: IDNR reviews are not required for equipment purchase or replacement, or rehabilitation of existing structures) Loan applicants should submit the project via IDNR’s EcoCAT website at: http://dnrecocat.state.il.us/ecopublic/. Applicants must then provide to IEPA either:
• An EcoCAT review report which states that consultation under Part 1075 is terminated and that the wetland review under Part 1090 is terminated,
• A letter from IDNR terminating the 1075 consultation and the 1090 wetland review because adverse effects are unlikely, or
• A letter from IDNR detailing any measures which must be taken to avoid, minimize or mitigate adverse effects. These measures must be incorporated into the project specifications.
Loan applicants may contact IDNR in writing: Illinois Department of Natural Resources
Division of Ecosystems and Environment One Natural Resources Way Springfield, Illinois 62702-1271
3) Construction in Floodways, Wetlands, and on Stream Banks (including stream crossings) Illinois Lakes, Rivers, and Streams Act & Section 404 of the Federal Clean Water Act Projects involving piping construction across defined waterways, or construction in floodways, wetlands, or any body of water, require the applicant to certify to IEPA that the project will comply with the Illinois Lakes, Rivers, and Streams Act. These same projects may ultimately also require a U.S. Army Corps of Engineers Section 404 Permit.
The requirements to receive a permit for work under the jurisdiction of IDNR – Office of Water Resources are available on the IDNR website at: http://dnr.state.il.us/owr/resman/permitprogs.htm Or by writing: Illinois Department of Natural Resources – Office of Water Resources
Division of Resource Management 2050 West Stearns Road Bartlett, Illinois 60103 847/608-3100 (Projects in Cook, Lake, McHenry, DuPage, Kane and Will Counties)
Illinois Department of Natural Resources – Office of Water Resources Downstate Regulatory Programs Section One Natural Resources Way Springfield, Illinois 62702-1271 217/782-3863 (Projects in remainder of the State)
At the same time, comments should be sought from the Corps to determine whether a 404 Permit is needed. Attachment A to this guidance will provide you with a map and address to help you determine the appropriate Army Corps of Engineers District Office for your project. 4) Conversion of Prime Agricultural Land to Other Uses If the project involves conversion of prime agricultural land to other uses, a description and map of the area to be converted along with a discussion of the necessity of utilizing prime agricultural land for the project must be provided. 5) Secondary Environmental Impacts Projects which include an allowance for more than 30% reserve growth capacity in the present or projected service area must attach or include in planning documents a discussion of the potential secondary impacts of the proposed project(s) such as changes in the rate, density, type of development or use of open space, floodplain, or prime agricultural land. Also, the impacts of sensitive ecosystems due to induced growth must be evaluated and appropriate measures for mitigation proposed if necessary.
6A) Designated Water Quality Management Agency (DWQMA) Consultation/Sign-off. This is applicable only to wastewater or sewer projects located in one of the DWQMA Areas (See Attachment B - applicable counties and contact info below). Loan applicants should contact the DWQMA to request comments on the scope of the proposed project and the future growth anticipated for the service area. For projects which propose a change in a Facility Planning Area a sign-off must be obtained from the DWQMA, indicating that the proposed project is not in conflict with the Water Quality Management Plan. Request comments and sign-offs as necessary from:
Chicago Metropolitan Agency for Planning (CMAP) Counties: Cook, DuPage, Kane, 233 South Wacker Drive Kendall, Lake, McHenry, Will Suite 800 Chicago, Illinois 60606 (312) 454-0400 FAX (312) 454-0411 www.chicagoareaplanning.org
Greater Egypt Regional Planning & Development Commission Counties: Franklin, Gallatin, 3000 West DeYoung St. Hamilton, Hardin, Jefferson Suite 800B-3 Jackson, Perry, Pope, Saline Marion, Illinois 62959 Williamson (618) 997-9351 FAX (618) 997-9354
Southwestern Illinois Planning Commission Counties: Bond, Clinton, Madison 2511 Vandalia Street Monroe, Randolph, St. Clair, Collinsville, Illinois 62234-5034 Washington (618) 344-4250 FAX (618) 344-4253
6B) Proposed Change to Facility Planning Area Boundaries
Consultation with the Illinois Department of Agriculture (IDOA) is required for wastewater projects requesting a change in the boundaries of a Facility Planning Area. Details on the information required by IDOA can be accessed on the internet at: http://www.agr.state.il.us/Environment/LandWater/FPAboundarychangerequest.pdf
Or by writing or calling: Illinois Department of Agriculture Bureau of Land and Water Resources P.O. Box 19281 State Fairgrounds Springfield, IL 62794-9281
217-785-4389
Guidance on information required by IEPA in Facility Planning Reports concerning a requested modification to a Facility Planning Area boundary is available. If you have any questions regarding this package, please contact the IEPA Infrastructure Financial Assistance Sections at 217/782-2027.

JO DAVIESS STEPHENSON WINNEBAGO BOONE MC HENRY LAKE
COOKDU PAGE
KANEDE KALB
OGLECARROLL
WHITESIDELEE
ROCK ISLANDHENRY
MERCER
BUREAU LA SALLE
KENDALL
GRUNDYWILL
WARREN
HE
ND
ER
SO
N
HANCOCK
MC DONOUGH
FULTON
ADAMS
SCHUYLER
BROWN
PIKE
CA
LH
OU
N
SCOTT
GREENE
JERSEY
MACOUPIN
MONTGOMERY
MORGAN
CASS
MASON
MENARD
SANGAMON
CHRISTIAN
SHELBY
MACON
LOGAN
PIATT
CHAMPAIGN
FORD
DEWITT
MC LEAN
TAZEWELL
KNOX
PEORIA
STARKMARSHALL
KANKAKEE
IROQUOIS
VERMILION
MOULTRIE
COLES
DOUGLAS
EDGAR
CLARKCUMBERLAND
MADISON BOND
FAYETTEEFFINGHAM JASPER
CRAWFORD
ST. CLAIR
WASHINGTON
CLINTON
MARION
JEFFERSON
CLAY
RICHLAND LAWRENCE
WAYNE
ED
WA
RD
S
WA
BA
SH
MONROE
RANDOLPHPERRY
JACKSON
FRANKLIN
HAMILTON
SALINE
WHITE
GALLATIN
HARDINPOPE
WILLIAMSON
JOHNSONUNION
ALE
XA
ND
ER
PULASKIMASSAC
PUTNAM
WOODFORD
LIVINGSTON
�
�
� CHICAGO
SPRINGFIELD
ST. LOUIS
REGULATORY JURISDICTIONAL BOUNDARIES
US ARMY CORPS OF ENGINEERS
CHICAGO DISTRICT
111 NORTH CANAL
CHICAGO, IL 60606-7206
312-353-6400 x4020
US ARMY CORPS OF ENGINEERS
ROCK ISLAND DISTRICT
CLOCKTOWER BUILDING
P.O. BOX 2004
ROCK ISLAND, IL 61204-2004
309-794-5373
US ARMY CORPS OF ENGINEERS
ST. LOUIS DISTRICT
1222 SPRUCE
ST. LOUIS, MO 63103-2833
314-331-8575
US ARMY CORPS OF ENGINEERS
MEMPHIS DISTRICT
167 NORTH MAIN
B-202
MEMPHIS,TN 38103-1894
901-544-3471
�
ROCK ISLAND
ILLINOIS DEPT. OF NATURAL RESOURCES
OFFICE OF WATER RESOURCES
LAKE MICHIGAN MANAGEMENT SECTION
ROOM 1606
310 SOUTH MICHIGAN
CHICAGO, IL 60604-4205
312-793-3123
NORTHEASTERN ILLINOIS REGULATORY
PROGRAMS SECTION
ILLINOIS DEPARTMENT OF NATURAL
RESOURCES, REGION II OFFICE
2050 WEST STEARNS ROAD
BARTLETT, ILLINOIS 60103
ILLINOIS DEPT. OF NATURAL RESOURCES
OFFICE OF WATER RESOURCES
ONE NATURAL RESOURCES WAY
SPRINGFIELD, IL 62702-1271
217-782-3863
US ARMY CORPS OF ENGINEERS
LOUISVILLE DISTRICT
P.O. BOX 59
LOUISVILLE, KY 40201-0059
502-315-6675
NOTE FOR CERTAIN PORTIONS OF
LOWER ALEXANDER AND PULASKI
COUNTIES, CONTACT THE MEMPHIS
DISTRICT FOR INFORMATION
ILLINOIS ENVIRONMENTAL PROTECTION AGENCY
BUREAU OF WATER
WATERSHED MANAGEMENT SERVICES
1021 GRAND AVENUE EAST
POST OFFICE BOX 19276
SPRINGFIELD, IL 62794-9276
217-782-3362
JONESBORO
UNION
ALEXANDER
PULASKICAC HE RIVER
Rock IslandD
istC
hica
goD
ist
Roc
kIs
land
Dis
t
St. Louis Dist
St.Louis
Dist
Loui
sv
ill eD
ist
Wa
bash
Riv
er
Kask
a
skia
Riv
er
LakeM
ichigan
Miss issippi
River
Mississippi
River
Ohio
Rive
r
FoxR
iver
Sanga
mon
Riv
er
Illino
is
Rive
r
Em
barassR
iver
Big
Mud dy
Riv
er
Rock
River
Attachment A


Madison, WI 53715
RE: Glenbard Wastewater Authority Lombard Combined Sewage Treatment Facility Project Number(s): 1309435 County: DuPage
Dear Applicant:
Tracy EvansDivision of Ecosystems and Environment217-785-5500
February 11, 2013
Phil SeversonStrand Associates, Inc.910 West Wingra Drive
This letter is in reference to the project you recently submitted for consultation. The natural resource review provided by EcoCAT identified protected resources that may be in the vicinity of the proposed action. The Department has evaluated this information and concluded that adverse effects are unlikely. Therefore, consultation under 17 Ill. Adm. Code Part 1075 and 1090 is terminated.
Consultation for Part 1075 is valid for two years unless new information becomes available that was not previously considered; the proposed action is modified; or additional species, essential habitat, or Natural Areas are identified in the vicinity. If the project has not been implemented within two years of the date of this letter, or any of the above listed conditions develop, a new consultation is necessary. Consultation for Part 1090 (Interagency Wetland Policy Act) is valid for three years.
The natural resource review reflects the information existing in the Illinois Natural Heritage Database and the Illinois Wetlands Inventory at the time of the project submittal, and should not be regarded as a final statement on the site being considered, nor should it be a substitute for detailed site surveys or field surveys required for environmental assessments. If additional protected resources are encountered during the project’s implementation, you must comply with the applicable statutes and regulations. Also, note that termination does not imply IDNR's authorization or endorsement of the proposed action.
Please contact me if you have questions regarding this review.

Madison, WI 53715
RE: Glenbard Wastewater Authority WWTP Project Number(s): 1309431 County: DuPage
Dear Applicant:
Tracy EvansDivision of Ecosystems and Environment217-785-5500
February 11, 2013
Phil SeversonStrand Associates, Inc.910 West Wingra Drive
This letter is in reference to the project you recently submitted for consultation. The natural resource review provided by EcoCAT identified protected resources that may be in the vicinity of the proposed action. The Department has evaluated this information and concluded that adverse effects are unlikely. Therefore, consultation under 17 Ill. Adm. Code Part 1075 and 1090 is terminated.
Consultation for Part 1075 is valid for two years unless new information becomes available that was not previously considered; the proposed action is modified; or additional species, essential habitat, or Natural Areas are identified in the vicinity. If the project has not been implemented within two years of the date of this letter, or any of the above listed conditions develop, a new consultation is necessary. Consultation for Part 1090 (Interagency Wetland Policy Act) is valid for three years.
The natural resource review reflects the information existing in the Illinois Natural Heritage Database and the Illinois Wetlands Inventory at the time of the project submittal, and should not be regarded as a final statement on the site being considered, nor should it be a substitute for detailed site surveys or field surveys required for environmental assessments. If additional protected resources are encountered during the project’s implementation, you must comply with the applicable statutes and regulations. Also, note that termination does not imply IDNR's authorization or endorsement of the proposed action.
Please contact me if you have questions regarding this review.