Embed Size (px)
Citation preview
Report on
Baseline Survey of SWAPNO II
Submitted to:
Local Government Division, MoLGRD&C United Nations Development Programme (UNDP)
Strengthening Women’s Ability for Productive New Opportunities (SWAPNO) DPHE Bhaban (8th Floor)
14 Shahid Captain Mansur Ali Sharani, Kakrail, Dhaka 1000
Submitted by
Abul Barkat Faisal M Ahamed, Mahmudul Hasan Mamun
House 5, Road 8, Mohammadia Housing Society, Mohammadpur, Dhaka 1207 Phone: +88 017 0074 3020, Fax: (+88 02) 5815 7620
E-mail: [email protected] Website: www.hdrc-bd.com
Dhaka: May 2020
Report on
Baseline Survey of SWAPNO II
Submitted to: Local Government Division, MoLGRD&C
United Nations Development Programme (UNDP) Strengthening Women’s Ability for Productive New Opportunities (SWAPNO)
DPHE Bhaban (8th Floor) 14 Shahid Captain Mansur Ali Sharani,
Kakrail, Dhaka 1000
Submitted by
Abul Barkat, PhD.1 Faisal M Ahamed, MS2
Mahmudul Hasan Mamun, MS3
House 5, Road 8, Mohammadia Housing Society, Mohammadpur, Dhaka 1207 Phone: +88 017 0074 3020, Fax: (+88 02) 5815 7620
E-mail: [email protected] Website: www.hdrc-bd.com
Dhaka: May 2020
1 Study Team Leader and Chief Advisor (Hon.), Human Development Research Centre 2 Research Consultant, Human Development Research Centre 3Senior Research Associate, Human Development Research Centre
Acknowledgement Strengthening Women’s Ability for Productive New Opportunities (SWAPNO) is a poverty alleviation project under implementation in 99 Union Parishads (UP) of Lalmonirhat, Gaibandha and Jamalpur districts in its third phase. The Local Government Division, Ministry of Local Government, Rural Development and Cooperatives (MoLGRD&C) implements the SWAPNO project in partnership with the United Nations Development Programme (UNDP). The purpose of this baseline survey is to establish benchmarks of the prevailing situation of the project before the project interventions and to serve as the basis for impact assessment of the project’s interventions. Human Development Research Centre (HDRC) has successfully conducted the baseline survey. The baseline survey has covered 34 project unions under three districts.
We are greatly indebted to SWAPNO, UNDP, and the Local Government Division (LGD) of the Ministry of Local Government, Rural Development & Cooperatives (MoLGRD&C) for entrusting us with the responsibility to undertake this baseline assignment. With the continuous and prompt support of the SWAPNO team, we were able to complete the household-level baseline survey successfully.
We are thankful to Mr Kajal Chatterjee, National Project Manager, SWAPNO, for his passionate support and guidance extended throughout the study.
We gratefully acknowledge the whole-hearted support received in all the stages from Mr Durani Md Abul Ahsan, MIS Officer of SWAPNO. Ms Selina Chowdhury, Gender and Social Development Specialist; Kashfia Sharmin, UNV Research Support Officer; and Hossain Ishrak Hridoy, UNV Software & IT Support Assistant of SWAPNO have provided their professional feedback on the data collection instruments and field implementation- we remain ever grateful to them.
We highly appreciate the valuable contribution of Göran Jonsson, International Consultant, for his in-depth review, pertinent comments, and useful feedback on the Draft Report. Mr Jonsson’s professional support has been instrumental in enhancing the quality of this study report.
We benefitted from support from Mohammad Rajib Ahmed Bijoy, Finance & Admin Officer and Muhammad Rajiur Rahman, Administrative Associate. We gratefully acknowledge their proactive support throughout the process.
We are indebted to Md. Mahmood Hossain, District Manager (Jamalpur); Mohammudul Hoque, District Manager (Lalmonirhat); Md. Zahidul Haque, Financial Monitoring Associate (Gaibandha); Md Amir Ali, Financial Monitoring Associate (Jamalpur); and other field-level staff for their support in the field-level implementation of the baseline survey.
We gratefully acknowledge the respondents and participants of the survey, without whose profound support, the implementation of the study would have been impossible.
We are grateful to all the field enumerators, field supervisors, FGD moderators and notetakers, and quality control staff deployed by the HDRC. Despite various challenges, they stood firm and have collected all relevant data and information from the respondents and participants in congruence with the well-crafted data collection instruments. These data and information form the solid foundation of the accompanying baseline study. In the collection of data/information, maintaining all necessary ethical norms, the highest level of data accuracy and validity was ensured.
We thank Ms Laila Begum, Sr. Research Associate and Mr Nawal Sarwer, Research Associate of Human Development Research Centre for their active participation in various stages of this baseline survey. Ms Laila Begum deserves special thanks for her highly dedicated efforts in managing data and making database to generate findings.
We are grateful to Mr Abu Taleb, Director Finance & Admin and Mr Kabiruzzaman Lappu, Program Officer, for arranging all the financial, administrative and logistics supports extended towards the smooth implementation of the survey. We gratefully acknowledge Mr Ajoy Kumar Saha, Data and IT Manager for his technical support in Tab-based data collection program management. We are thankful to all the lovely souls-the staff members of HDRC, for their uncomplaining support at all the stages of this study.
Professor Dr Abul Barkat Dhaka: 10 May 2020 Study Team Leader
Abbreviations BCG Bacille Calmette Guerin
BDT Bangladesh Taka
BMI Body Mass Index
DPT Diphtheria Pertussis Tetanus
EPI Expanded Programme on Immunization
FFW Food for Work
FGD Focus Group Discussion
FWC Family Welfare Centre
G2P Government-to-Person
GO Government Organization
GoB Government of Bangladesh
GR Gratuitous Relief
HAZ Height-for-Age Z-score
HDDS Household Dietary Diversity Score
HDRC Human Development Research Centre
HFIAS Household Food Insecurity Access Scale
HH Household
HIES Household Income and Expenditure Survey
KII Key Informant Interview
LGD Local Government Division
LPL Lower Poverty Line
MBBS Bachelor of Medicine, Bachelor of Surgery
MDG Millennium Development Goal
MFI Microfinance Institution
MoLGRD&C Ministry of Local Government, Rural Development and Cooperatives
MPI Multidimensional Poverty Index
NGO Non-Government Organization
OPHI Oxford Poverty and Human Development Initiative
OPV Oral Polio Vaccine
PPS Probability Proportional to Size
PSU Primary Sampling Unit
QUAL Qualitative
QUANT Quantitative
RCT Randomized Control Trial
REOPA Rural Employment Opportunities for Public Assets
ROSCA Rotating Savings and Credit Association
SD Standard Deviation
SME Small and Medium Enterprise
SPSS Statistical Package for the Social Sciences
SWAPNO Strengthening Women’s Ability for Productive New Opportunities
TR Test Relief
TT Tetanus Toxoid
U-5 Under five-years-of-age
UH&FWC Union Health & Family Welfare Centre
UNDP United Nations Development Programme
UP Union Parishad
UPL Upper Poverty Line
VGD Vulnerable Group Development
VGF Vulnerable Group Feeding
VAW Violence Against Women
WAZ Weight-for-Age Z-score
WHO World Health Organization
WHZ Weight-for-Height Z-score
CONTENTS Abbreviations Executive Summary ....................................................................................................................... i-v CHAPTER 1: INTRODUCTION ......................................................................................................... 1 1.1 SWAPNO Project ....................................................................................................................... 1 1.2 Objective of the Baseline Survey ............................................................................................... 2 1.3 Scope of Work ......................................................................................................................... 2 1.4 Organization of the Report ........................................................................................................ 2 CHAPTER 2: METHODOLOGY ........................................................................................................ 3 2.1 Study Approach ......................................................................................................................... 3 2.2 Study Locations ......................................................................................................................... 3 2.3 Quantitative Design ................................................................................................................... 4 2.3.1 Sampling and Sample Size .......................................................................................................... 4 2.3.2 Sample Design for Quantitative Survey ..................................................................................... 4 2.3.3 Sample Size of Disadvantaged Women ..................................................................................... 4 2.3.4 Survey Response Rate ............................................................................................................... 5 2.4 Qualitative Design ...................................................................................................................... 5 2.4.1 Sample Size: Qualitative Methods ............................................................................................. 5 2.5 Ethical Consideration ................................................................................................................ 5 2.6 Data/information Analysis Plan ................................................................................................. 6 2.6.1 Quantitative Data Analysis ......................................................................................................... 6 2.6.2 Qualitative Data Analysis .......................................................................................................... 6 2.6.3 Triangulation ......................................................................................................................... 6 2.7 Quality Control Measures ......................................................................................................... 7 2.7.1 Field Data Collection ................................................................................................................. 7 2.7.2 Data Quality Control ................................................................................................................. 8 2.8 Limitations ......................................................................................................................... 8 CHAPTER 3: DEMOGRAPHIC AND SOCIO-ECONOMIC PROFILE OF SAMPLE HOUSEHOLDS ............... 9 3.1 Demographic Characteristics of Sample Households ................................................................ 9 3.1.1 Household Size ......................................................................................................................... 9 3.1.2 Household Headship ................................................................................................................ 10 3.1.3 Age-Sex Composition ............................................................................................................... 10 3.1.4 Marital Status ....................................................................................................................... 11 3.1.5 Different Demographic Ratios ................................................................................................. 12 3.2 Household Socioeconomic Characteristics ............................................................................. 13 3.2.1 Education ....................................................................................................................... 13 3.2.2 School Enrolment of Children ................................................................................................. 14 3.2.3 Occupation ....................................................................................................................... 15 3.3 Characteristics of Disadvantaged Women .............................................................................. 16 CHAPTER 4: ASSET HOLDING STATUS .......................................................................................... 21 4.1 Ownership of Land ................................................................................................................... 21 4.2 Ownership of Productive Assets .............................................................................................. 23 4.3 Housing Structure .................................................................................................................... 24 4.4 Energy Use ....................................................................................................................... 24 4.5 Access to Public Assets ............................................................................................................ 25
CHAPTER 5: INCOME AND EXPENDITURE .................................................................................... 29 5.1 Household Income ................................................................................................................... 29 5.1.1 Primary Income Earner ............................................................................................................ 29 5.1.2 Sources of Income .................................................................................................................... 30 5.1.3 Household Average Monthly Income ...................................................................................... 31 5.2 Household Expenditure ........................................................................................................... 33 5.2.1 Household Average Monthly Expenditure ............................................................................... 33 5.2.2 Expenditure Share .................................................................................................................... 33 CHAPTER 6: SAVINGS AND CREDIT .............................................................................................. 35 6.1 Household Savings .................................................................................................................. 35 6.1.1 Amount of Household Savings ................................................................................................ 35 6.1.2 Place of Savings ....................................................................................................................... 35 6.2 Household Credit ..................................................................................................................... 36 6.3 Access to Financial Benefits .................................................................................................... 37 CHAPTER 7: FOOD SECURITY AND NUTRITIONAL STATUS ............................................................ 38 7.1 Food Items and their Frequency of Intake ............................................................................... 38 7.2 Shortage of Food ...................................................................................................................... 38 7.3 Household Dietary Diversity Score (HDDS) .............................................................................. 40 7.4 Household Food Insecurity Access Scale (HFIAS) .................................................................... 41 7.5 Nutritional Status .................................................................................................................... 42 CHAPTER 8: HEALTH STATUS ...................................................................................................... 44 8.1 Disease Prevalence in Last One Year ...................................................................................... 44 8.2 Health Status in Last Six Months .............................................................................................. 45 8.3 Service Seeking Behaviour from the Health Centre ................................................................ 46 8.4 Child Immunization .................................................................................................................. 47 8.5 Sources of Drinking Water and its Quality ............................................................................... 48 8.6 Sanitation ....................................................................................................................... 49 8.7 Satisfaction with Life ................................................................................................................ 51 8.8 Optimism about the Future ..................................................................................................... 51 CHAPTER 9: HOUSEHOLD POVERTY SCENARIO ............................................................................ 54 9.1 Poverty Status ....................................................................................................................... 54 9.2 Poverty as per Multidimensional Poverty Index (MPI) ............................................................ 55 CHAPTER 10: COPING WITH DISASTERS AND CRISIS .................................................................... 60 10.1 Disaster and Crisis Encountered .............................................................................................. 60 10.2 Coping Strategy ....................................................................................................................... 62 10.3 Resilience to Crisis and Lean Seasons ...................................................................................... 64 CHAPTER 11: VIOLENCE, HARASSMENT, EMPOWERMENT AND DECISION-MAKING ..................... 65 11.1 Violence Faced ....................................................................................................................... 65 11.2 Harassment Faced ................................................................................................................... 67 11.3 Mobility of Women .................................................................................................................. 68 11.4 Participation in Decision-Making Activity ................................................................................ 69 11.5 Organizational Affiliation ......................................................................................................... 72 11.6 Access to Financial Services ..................................................................................................... 73 11.7 Knowledge & Awareness of Legal Issues and Government Services ....................................... 74 11.7.1 Awareness on Rights-based Issues .......................................................................................... 74 11.7.2 Knowledge of Selected Government Services and Legal issues .............................................. 74 11.7.3 Knowledge and Information about Marital Issues and Future Plan ........................................ 75 11.7.4 Knowledge about Initiatives/Programmes Undertaken by Local Government Agencies ....... 76 11.8 Knowledge and Information about Digital Financial Services ................................................. 77
List of Figures Figure 3.1: Female-headed household (per cent) .......................................................................... 10 Figure 3.2: Population pyramid for intervention households ........................................................ 11 Figure 3.3: Population pyramid for control households ................................................................ 11 Figure 3.4: Illiteracy among household members aged 6+ (per cent) ........................................... 13 Figure 3.5: Main income earner among disadvantaged women (per cent) ................................... 19 Figure 3.6: Average no. of years of residency in the surveyed area ............................................. 20 Figure 4.1a: Household ownership of homestead land (per cent)................................................... 21 Figure 4.1b: Household ownership of agricultural land (per cent) .................................................. 22 Figure 4.2: Household access to electricity (per cent) ................................................................... 25 Figure 5.1: Household with less than a dollar a day per capita income (per cent) ........................ 32 Figure 5.2a: Expenditure share of intervention households (per cent) ........................................... 34 Figure 5.2b: Expenditure share of control households (per cent) ................................................... 34 Figure 7.1: Status of food availability in last 12 months in percentage ........................................ 39 Figure 7.2: Number of days food shortage in last year in percentage ........................................... 40 Figure 7.3: Household Food Insecurity Access Scale ...................................................................... 41 Figure 7.4: Stunting, underweight and wasting among children under five-years-of-age (U-5) (per cent) ................................................................................ 43 Figure 8.1: Frequency of suffering from disease by respondent in the last year (per cent) .......... 44 Figure 8.2: Self-reported health status of the respondent in last six months (per cent) ............... 46 Figure 8.3: Complete immunization of children (per cent) ............................................................ 48 Figure 8.4: Presence of arsenic in drinking water (per cent) ......................................................... 49 Figure 10.1: Distress sale of household assets during crisis and lean seasons (per cent) ............... 64 Figure 11.1: Violence faced by household members (per cent) ...................................................... 65 Figure 11.2 Harrasment faced by household members (per cent) ................................................. 67 Figure 11.3: Awareness about rights-based issues (per cent) .......................................................... 74
List of Tables
Table 2.1: Estimated sample size of disadvantaged women .......................................................... 5 Table 3.1: Distribution of households according to household size ............................................. 10 Table 3.2: Marital status of household members (per cent) ........................................................ 11 Table 3.3: Distribution of population by sex (per cent) ................................................................ 12 Table 3.4: Demographic dependency ratio of household members ............................................ 12 Table 3.5: Educational attainments among household members aged 6+ (per cent) .................. 13 Table 3.6a: Percentage distribution of households by the status of children’s school enrolment
(intervention) ............................................................................................................... 14 Table 3.6b: Percentage distribution of households by the status of children’s school enrolment
(control) ....................................................................................................................... 14 Table 3.7a: Percentage of households by reasons of children not attending school regularly
(multiple responses) (intervention) ............................................................................. 15 Table 3.7b: Percentage of households by reasons of children not attending school regularly
(multiple responses) (Control) ..................................................................................... 15 Table 3.8: Primary occupation of household members aged 15+ in percentage ......................... 16 Table 3.9: Involvement of household members in non-agricultural labour by sex (per cent) ..... 16 Table 3.10: Age distribution of the disadvantaged women (per cent) ........................................... 17 Table 3.11: Marital status of the disadvantaged women (per cent) ............................................... 17 Table 3.12: Educational attainment of the disadvantaged women (per cent) ............................... 18 Table 3.13: Literacy status of the disadvantaged women (per cent) .............................................. 18
Table 3.14: Major occupation of the disadvantaged women (per cent) ........................................ 19 Table 4.1: Percentage distribution of households by ownership of land (per cent) .................... 22 Table 4.2: Household ownership of productive assets (per cent) ............................................... 23 Table 4.3: Distribution of households according to the value of productive assets (including
cultivable land) ............................................................................................................. 24 Table 4.4: Type of dwelling house (per cent) ................................................................................ 24 Table 4.5: Fuel for cooking at the household level (per cent) ...................................................... 25 Table 4.6: Use of public assets, their average distance and satisfaction of the users (per cent) ...................................................................................................... 26 Table 5.1a: Average number of income-earning members and percentage of
primary/principal/main income earners ...................................................................... 29 Table 5.1b: Principal/primary/main income earners by sex (per cent) .......................................... 29 Table 5.2a: Percentage distribution of household income sources ................................................ 30 Table 5.2b: Composition of household income in percentage ....................................................... 31 Table 5.2c: Percentage distribution of households by monthly household income ...................... 32 Table 5.3a: Percentage distribution of households by average monthly household expenditure ................................................................................................ 33 Table 5.4: Composition of household expenditure (per cent) ...................................................... 34 Table 6.1: Percentage distribution of households by savings ....................................................... 35 Table 6.2: Percentage distribution of households by place of savings ......................................... 36 Table 6.3: Credit-receiving status at the household level ............................................................. 36 Table 6.4: Percentage of households by access to savings, credit and insurance ........................ 37 Table 7.1: Average number of days of consumption of food items in week preceding the survey (per cent) ................................................................................... 38 Table 7.2: Food deficiency months in percentage ........................................................................ 39 Table 7.3: Percentage distribution of households by HDDS score ................................................ 40 Table 7.4: BMI status of women (per cent) ................................................................................... 42 Table 7.5: Distribution of Z-score among the children under five years (0-59 months) ............... 43 Table 8.1: Health seeking behaviour of the respondent ............................................................... 45 Table 8.2: Respondents sought health-related service or information from health centres in the
last six months (per cent) ............................................................................................. 46 Table 8.3: Sources of drinking water in percentage ..................................................................... 48 Table 8.4: Purifying water (per cent) ............................................................................................ 49 Table 8.5: Water source usable during natural disaster (per cent) .............................................. 49 Table 8.6: Possession and use of latrines in percentage ............................................................... 50 Table 8.7: Overall satisfaction with life in percentage .................................................................. 51 Table 8.8: Optimism of disadvantaged women about their future (per cent) ............................. 52 Table 8.9: Optimism of disadvantaged women about their children’s future (per cent) ............. 52 Table 8.10: Optimism of disadvantaged women by level of satisfaction with life (per cent)......... 53 Table 9.1: Incidence, depth and severity of poverty (per cent) .................................................... 55 Table 9.2a: Deprivation of households against ten indicators of MPI (per cent) ........................... 58 Table 9.2b: Households poverty level based on MPI ...................................................................... 59 Table 10.1: Type of disaster and crisis/shocks encountered in percentage (multiple responses possible) ....................................................................................... 60 Table 10.2: Month of disaster and crisis/shocks encountered most (per cent) ............................. 61 Table 10.3: Coping strategy adopted for encountering the disaster and crises/ shocks faced most (per cent) ....................................................................................... 63 Table 10.4: Average number of days needed to cope with the disaster and crisis encountered most ............................................................................................... 64 Table 11.1: Knowledge and awareness of violence-related incidences (per cent) ......................... 66
Table 11.2: Harassment related issues in percentage .................................................................... 67 Table 11.3: Mobility of women in percentage ................................................................................ 68 Table 11.4a: Decision making on women’s personal issues (per cent) ............................................ 70 Table 11.4b: Decision making on household issues in percentage ................................................... 70 Table 11.4c: Decision-making on social issues in percentage .......................................................... 72 Table 11.5: Percentage distribution of women by organizational affiliation (per cent) ................. 72 Table 11.6: Percentage of respondents by access to financial services.......................................... 73 Table 11.7: Knowledge and information on different services and legal issues in percentage ...... 75 Table 11.8: Knowledge and information about life skill management issues in percentage ......... 76 Table 11.9: Knowledge about initiatives/programmes undertaken by local govt. agencies in
percentage .................................................................................................................... 76 Table 11.10: Knowledge and information about digital financial services in percentage ................ 77 List of Diagrams Diagram 2.1: Study Design .................................................................................................................. 3 Diagram 2.2: Synthesizing qualitative and quantitative findings ........................................................ 7 Annexure Annex 1: Data Tables .............................................................................................................. 79-84 Annex 2: Questionnaires for the Survey ............................................................................... 85-120
HDRC Report on Baseline Survey of SWAPNO II
i
Executive Summary
Introduction
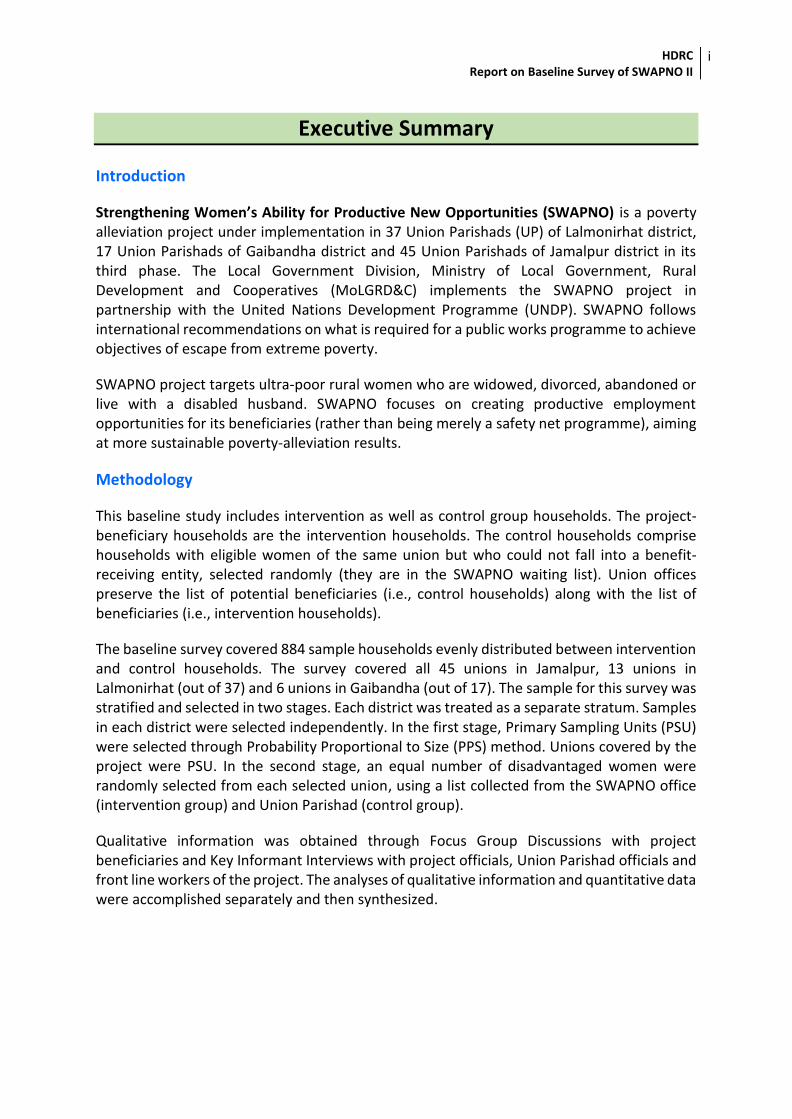
Strengthening Women’s Ability for Productive New Opportunities (SWAPNO) is a poverty alleviation project under implementation in 37 Union Parishads (UP) of Lalmonirhat district, 17 Union Parishads of Gaibandha district and 45 Union Parishads of Jamalpur district in its third phase. The Local Government Division, Ministry of Local Government, Rural Development and Cooperatives (MoLGRD&C) implements the SWAPNO project in partnership with the United Nations Development Programme (UNDP). SWAPNO follows international recommendations on what is required for a public works programme to achieve objectives of escape from extreme poverty.
SWAPNO project targets ultra-poor rural women who are widowed, divorced, abandoned or live with a disabled husband. SWAPNO focuses on creating productive employment opportunities for its beneficiaries (rather than being merely a safety net programme), aiming at more sustainable poverty-alleviation results.
Methodology
This baseline study includes intervention as well as control group households. The project-beneficiary households are the intervention households. The control households comprise households with eligible women of the same union but who could not fall into a benefit- receiving entity, selected randomly (they are in the SWAPNO waiting list). Union offices preserve the list of potential beneficiaries (i.e., control households) along with the list of beneficiaries (i.e., intervention households).
The baseline survey covered 884 sample households evenly distributed between intervention and control households. The survey covered all 45 unions in Jamalpur, 13 unions in Lalmonirhat (out of 37) and 6 unions in Gaibandha (out of 17). The sample for this survey was stratified and selected in two stages. Each district was treated as a separate stratum. Samples in each district were selected independently. In the first stage, Primary Sampling Units (PSU) were selected through Probability Proportional to Size (PPS) method. Unions covered by the project were PSU. In the second stage, an equal number of disadvantaged women were randomly selected from each selected union, using a list collected from the SWAPNO office (intervention group) and Union Parishad (control group).
Qualitative information was obtained through Focus Group Discussions with project beneficiaries and Key Informant Interviews with project officials, Union Parishad officials and front line workers of the project. The analyses of qualitative information and quantitative data were accomplished separately and then synthesized.
HDRC Report on Baseline Survey of SWAPNO II
ii
Key Findings
The findings revealed that most of the targeted disadvantaged women were widowed, separated, divorced or abandoned as expected in the project design. They were household head and primary income earners in most of the households. The average age of women was 36.2 and 36 years in intervention and control households, respectively. Almost all respondents had a poor educational background with about 35.4 per cent in the intervention group, compared to 33.8 per cent in control households, never attending any school. More than 80 per cent of women had below primary level education. Women were basically engaged in three types of occupations: work in other’s house (maid), agricultural labour and non-agricultural labour.
The surveyed households had 3.2 members in the intervention compared to 3.3 in the control group. The estimated dependency ratio was close to 90 per cent in intervention and about 80 per cent in control households.
Educational poverty is highly pronounced among the target households. Nearly one-fourth of the household members (aged 6+) had no formal education; about 40 per cent of them were illiterate. Still, about 20 per cent of the 5-16 years old children were not attending school.
Close to two-thirds of the households in both intervention and control households had no homestead land, while agricultural landlessness was more widespread. Only 1.1 per cent of the intervention households own agricultural land compared to 1.6 per cent in the control group. The asset base of the households was appallingly poor.
For their livelihood, households were mostly dependent on agricultural labour, non-agricultural labour and work in others’ home (maid); close to 80 per cent of the household income comes from these three sources. Most of the households were unable to spend enough to uphold a minimum level of living standard. Moreover, about 90 per cent of them had no savings and those who saved had an insignificant amount of money.
Most of the households were food insecure; their dietary diversity was not up to the mark. More than 80 per cent of women in both intervention and control households were malnourished. About 49 per cent of children in the intervention households were stunted compared to about 40 per cent in the control group. High malnutrition of women and children leads to high disease prevalence. About one-fourth of the children aged 12-59 months living in the households were not fully immunized.
Almost all the households collected their drinking water from a tube well. However, about half of them did not know whether the water source is free from arsenic, and 12.9 per cent in the intervention and 12.5 per cent in the control group used an arsenic-contaminated water source. Sanitation of the household was even worse—about one-third of surveyed households had no access to improved sanitation, while close to 50 per cent had no ownership of latrine.
HDRC Report on Baseline Survey of SWAPNO II
iii
Above 90 per of intervention and control households fall below both the upper and the lower poverty line. About two-thirds of them were multidimensionally poor. Most of the households were also vulnerable to disasters and crises or shocks. Their resilience to crises and lean seasons was fragile.
Reportedly, very few women were victims of violence and harassment. However, they reported psychological oppression as the most common violence faced by households in the last one year preceding the survey. Though the women had good knowledge of redress and complaint mechanisms, most of them did not complain about violence and harassment they faced.
Women in the surveyed households had comparatively higher mobility and involvement in household decision-making than women of extreme-poor households in general. However, this ‘empowerment’ comes from the hardship of life they face. They have been bound to do these things on their own for their subsistence.
Women had abysmal access to digital financial services. While two-thirds of them knew about property rights, only 33.9 per cent in the intervention group and 29.8 per cent in the control group had knowledge about fundamental civil rights. Overall, more than two-thirds of the women were dissatisfied with life in the baseline situation.
HDRC Report on Baseline Survey of SWAPNO II
iv
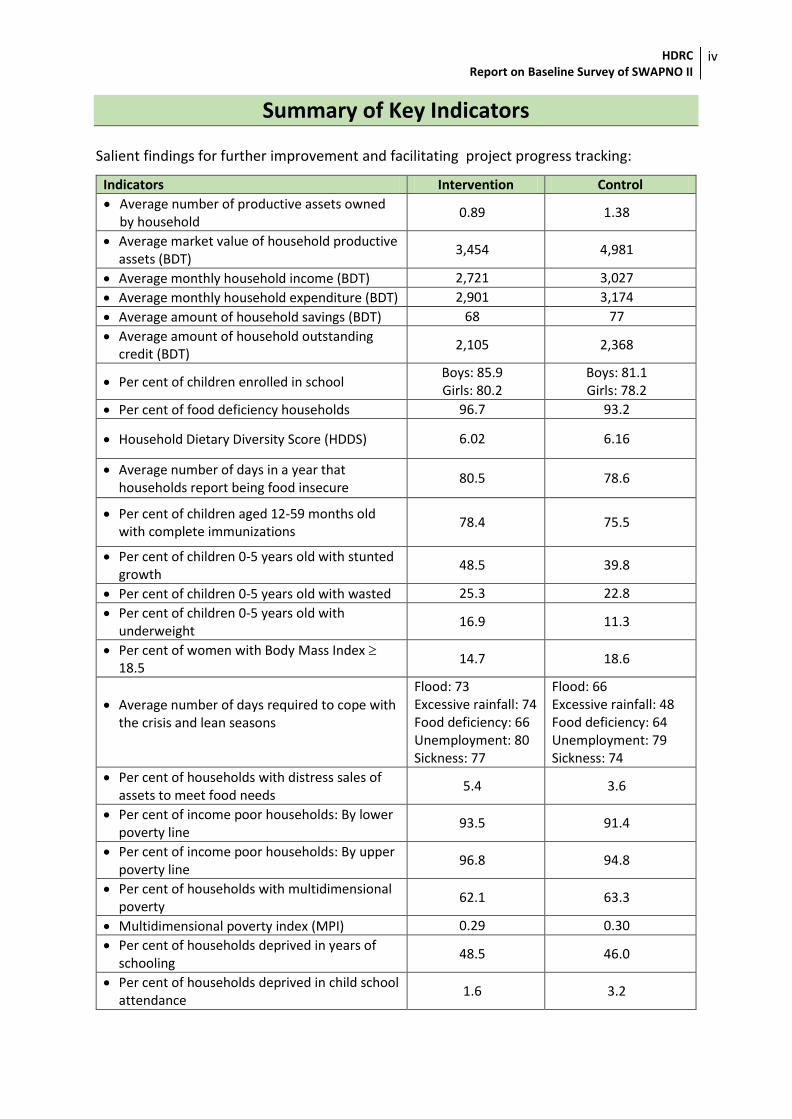
Summary of Key Indicators Salient findings for further improvement and facilitating project progress tracking:
Indicators Intervention Control
Average number of productive assets owned by household
0.89 1.38
Average market value of household productive assets (BDT)
3,454 4,981
Average monthly household income (BDT) 2,721 3,027
Average monthly household expenditure (BDT) 2,901 3,174
Average amount of household savings (BDT) 68 77
Average amount of household outstanding credit (BDT)
2,105 2,368
Per cent of children enrolled in school Boys: 85.9 Girls: 80.2
Boys: 81.1 Girls: 78.2
Per cent of food deficiency households 96.7 93.2
Household Dietary Diversity Score (HDDS) 6.02 6.16
Average number of days in a year that households report being food insecure
80.5 78.6
Per cent of children aged 12-59 months old with complete immunizations
78.4 75.5
Per cent of children 0-5 years old with stunted growth
48.5 39.8
Per cent of children 0-5 years old with wasted 25.3 22.8
Per cent of children 0-5 years old with underweight
16.9 11.3
Per cent of women with Body Mass Index 18.5
14.7 18.6
Average number of days required to cope with the crisis and lean seasons
Flood: 73 Excessive rainfall: 74 Food deficiency: 66 Unemployment: 80 Sickness: 77
Flood: 66 Excessive rainfall: 48 Food deficiency: 64 Unemployment: 79 Sickness: 74
Per cent of households with distress sales of assets to meet food needs
5.4 3.6
Per cent of income poor households: By lower poverty line
93.5 91.4
Per cent of income poor households: By upper poverty line
96.8 94.8
Per cent of households with multidimensional poverty
62.1 63.3
Multidimensional poverty index (MPI) 0.29 0.30
Per cent of households deprived in years of schooling
48.5 46.0
Per cent of households deprived in child school attendance
1.6 3.2
HDRC Report on Baseline Survey of SWAPNO II
v
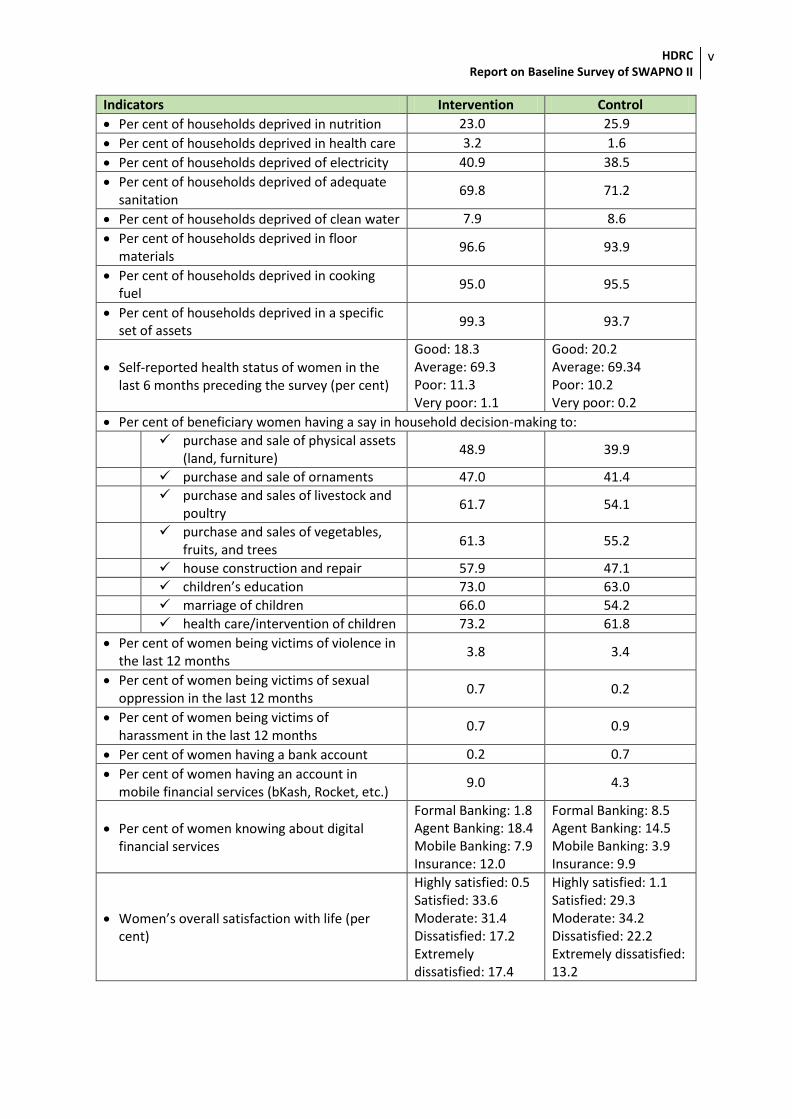
Indicators Intervention Control
Per cent of households deprived in nutrition 23.0 25.9
Per cent of households deprived in health care 3.2 1.6
Per cent of households deprived of electricity 40.9 38.5
Per cent of households deprived of adequate sanitation
69.8 71.2
Per cent of households deprived of clean water 7.9 8.6
Per cent of households deprived in floor materials
96.6 93.9
Per cent of households deprived in cooking fuel
95.0 95.5
Per cent of households deprived in a specific set of assets
99.3 93.7
Self-reported health status of women in the last 6 months preceding the survey (per cent)
Good: 18.3 Average: 69.3 Poor: 11.3 Very poor: 1.1
Good: 20.2 Average: 69.34 Poor: 10.2 Very poor: 0.2
Per cent of beneficiary women having a say in household decision-making to:
purchase and sale of physical assets
(land, furniture) 48.9 39.9
purchase and sale of ornaments 47.0 41.4
purchase and sales of livestock and
poultry 61.7 54.1
purchase and sales of vegetables,
fruits, and trees 61.3 55.2
house construction and repair 57.9 47.1
children’s education 73.0 63.0
marriage of children 66.0 54.2
health care/intervention of children 73.2 61.8
Per cent of women being victims of violence in the last 12 months
3.8 3.4
Per cent of women being victims of sexual oppression in the last 12 months
0.7 0.2
Per cent of women being victims of harassment in the last 12 months
0.7 0.9
Per cent of women having a bank account 0.2 0.7
Per cent of women having an account in mobile financial services (bKash, Rocket, etc.)
9.0 4.3
Per cent of women knowing about digital financial services
Formal Banking: 1.8 Agent Banking: 18.4 Mobile Banking: 7.9 Insurance: 12.0
Formal Banking: 8.5 Agent Banking: 14.5 Mobile Banking: 3.9 Insurance: 9.9
Women’s overall satisfaction with life (per cent)
Highly satisfied: 0.5 Satisfied: 33.6 Moderate: 31.4 Dissatisfied: 17.2 Extremely dissatisfied: 17.4
Highly satisfied: 1.1 Satisfied: 29.3 Moderate: 34.2 Dissatisfied: 22.2 Extremely dissatisfied: 13.2
CHAPTER 1: INTRODUCTION
1.1 SWAPNO Project
Strengthening Women’s Ability for Productive New Opportunities (SWAPNO) is a poverty alleviation project. The Local Government Division (LGD), Ministry of Local Government, Rural Development and Cooperatives (MoLGRD&C) implements SWAPNO project, in partnership with the United Nations Development Programme (UNDP). This partnership project was built on UNDP’s experience with the Rural Employment Opportunities for Public Assets (REOPA) project intervention and started its first phase in 2015. The project has demonstrated encouraging outcomes in poverty reduction in its first two phases. Currently, the project is continuing its third phase and providing support to 3564 women beneficiaries in 99 Union Parishads of Jamalpur, Lalmonirhat and Gaibandha districts.
SWAPNO is a public-works and social transfer-based poverty graduation project that targets ultra-poor rural women who are widowed, divorced, abandoned or live with a disabled husband. The project aims not only at lifting poor women out of poverty during the project period, but also intends to assist them in sustaining with a higher income level after the end of project support. To achieve this goal, SWAPNO focuses on creating productive employment opportunities for its beneficiaries (rather than being merely a safety net programme), with an aim towards more sustainable results in favour of poverty alleviation. The idea is that the set of skills learnt from training will help women invest their savings for productive purposes, which would yield a stream of income in years to come. In addition to self-employment, SWAPNO also helps place women in jobs in local Small and Medium Enterprises (SMEs) and private sector companies in both formal and informal sectors.
By integrating the lessons learned in the last two phases, SWAPNO’s strategy is to support women’s access to decent employment, ensure a discrimination-free environment in public workplaces, develop adaptive livelihoods and access to financial services for sustainable graduation from extreme poverty, and develop local government capacity to implement pro-poor projects.
SWAPNO envisages to achieve the following outcomes:
Increased income and assets by expanding options Enhanced human capabilities for exercising choices Strengthened resilience to shocks including disasters and climate change Enhanced financial inclusion for equitable opportunities Improved policies and mechanisms for sustaining SWAPNO’s benefits
The most critical interventions of the project are:
Fixed wage contract for 15 months under public asset maintenance component Encourage responsible attitude and behaviour as related to saving and spending
by facilitating formal and informal savings Need-based life skills and market-driven livelihood skills training Financial inclusion (government-to-person, G2P)
HDRC Report on Baseline Survey of SWAPNO II
2
The envisaged outputs (results) of the project are:
1. Core beneficiary households are able to protect their post-project food security and livelihoods.
2. Core beneficiaries and their dependents have improved their human capital in terms of nutrition, health, education and voice for rights against discrimination and violence.
3. Core beneficiary households have access to public services essential for their livelihood activities and family well-being.
4. Public assets promoting economic growth, improving social conditions and enhancing environmental conditions are maintained and developed for the benefit of the poor of the participating rural communities.
5. Local communities have a better capacity to withstand natural disasters and recover after disasters.
6. Local government has the capacity to improve social transfer projects with accountability, transparency, gender sensitivity and pro-poor approach.
1.2 Objective of the Baseline Survey
The objective of this assignment is to prepare baseline benchmarks for selected outputs and indicators of the project through the household survey adopting Randomized Control Trial (RCT) design.
1.3 Scope of Work
This baseline survey is intended to establish benchmarks of the prevailing situation of the project before the project interventions and to serve as the basis for impact assessment of the project’s interventions. The baseline household survey on SWAPNO women beneficiary adopts the Randomized Control Trial (RCT) design, so that the impact of the interventions can be determined with proper counterfactual at the end of the project cycle.
1.4 Organization of the Report
This report on the baseline survey of SWAPNO II project is an attempt to provide a comprehensive picture of the SWAPNO beneficiary as well as control households using selected indicators reflecting the interventions and their expected results. The accompanying report comprises 12 Chapters where Chapter-1 introduces the scope of the baseline survey and context of the SWAPNO project. Chapter-2 explains the methodology with study design. Baseline survey findings are presented in Chapters 3 through 12, with each chapter having a specific focus. Chapter-3 provides the demographic and socio-economic features of the survey population and profile of disadvantaged women living in the surveyed households. Chapter-4 captures the asset holding status of the households. Chapter-5 presents findings related to household income and expenditure, while Chapter-6 discusses household savings and credit. Chapter-7 sheds light on food security and nutrition. Chapter-8 deals with issues related to health. Chapter-9 delineates households’ deprivation and poverty status. Chapter-10 discusses household resilience to various types of disasters and crises. Chapter-11 presents pertinent findings on women empowerment and violence against women. The annex provides data collection tools used in the survey, as well as relevant detailed data tables.
HDRC Report on Baseline Survey of SWAPNO II
3
CHAPTER 2: METHODOLOGY
The accompanying cross-sectional baseline survey intends to provide necessary measures reflecting the current status of the beneficiary households (regarding the outcome/results mentioned in section 1.1). The survey results, as per design, are the benchmarks for impact assessment of the project’s interventions. Moreover, the study intends to assist the project’s management in determining the priority intervention areas. This baseline study includes both quantitative and qualitative methods for collection of data and information, which allowed responding to the ‘what’ questions in numerical value and ‘how’ questions through qualitative descriptive judgment, opinion, perception and attitude.
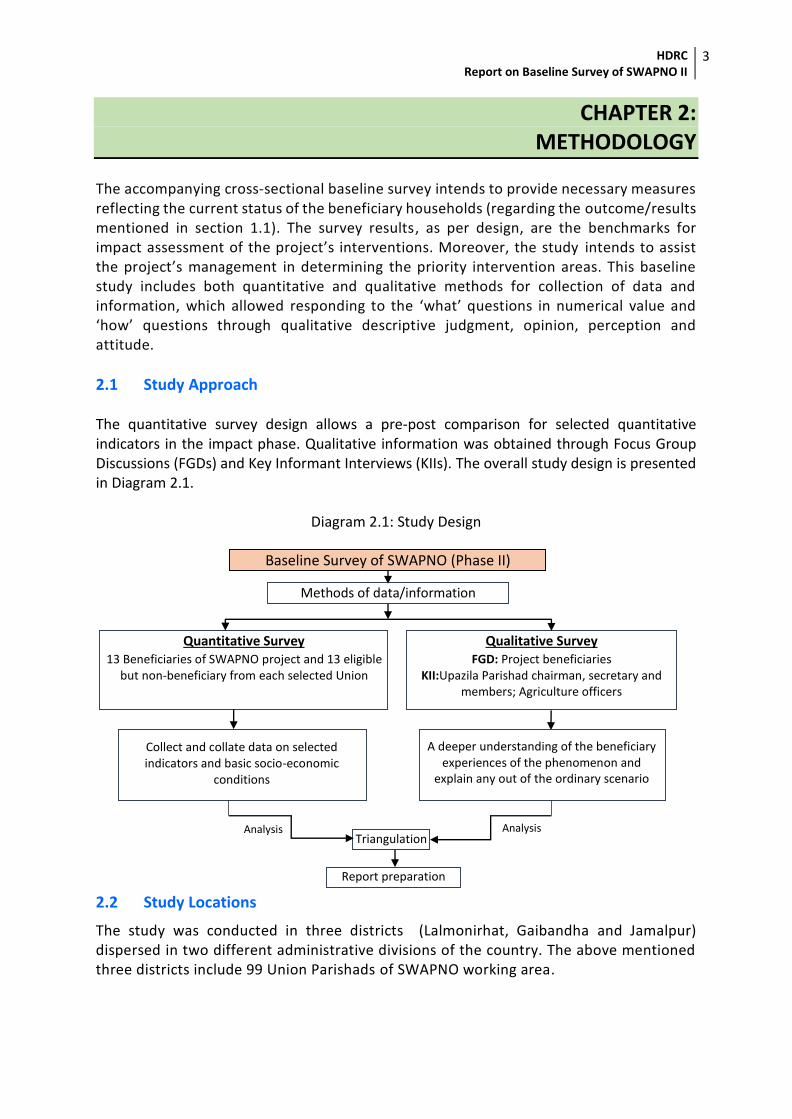
2.1 Study Approach The quantitative survey design allows a pre-post comparison for selected quantitative indicators in the impact phase. Qualitative information was obtained through Focus Group Discussions (FGDs) and Key Informant Interviews (KIIs). The overall study design is presented in Diagram 2.1.
Diagram 2.1: Study Design
2.2 Study Locations
The study was conducted in three districts (Lalmonirhat, Gaibandha and Jamalpur) dispersed in two different administrative divisions of the country. The above mentioned three districts include 99 Union Parishads of SWAPNO working area.
Analysis Analysis
Baseline Survey of SWAPNO (Phase II)
Quantitative Survey 13 Beneficiaries of SWAPNO project and 13 eligible
but non-beneficiary from each selected Union
Methods of data/information Collection
Qualitative Survey FGD: Project beneficiaries
KII:Upazila Parishad chairman, secretary and members; Agriculture officers
Collect and collate data on selected indicators and basic socio-economic
conditions
A deeper understanding of the beneficiary experiences of the phenomenon and
explain any out of the ordinary scenario
Triangulation
Report preparation
HDRC Report on Baseline Survey of SWAPNO II
4
2.3 Quantitative Design
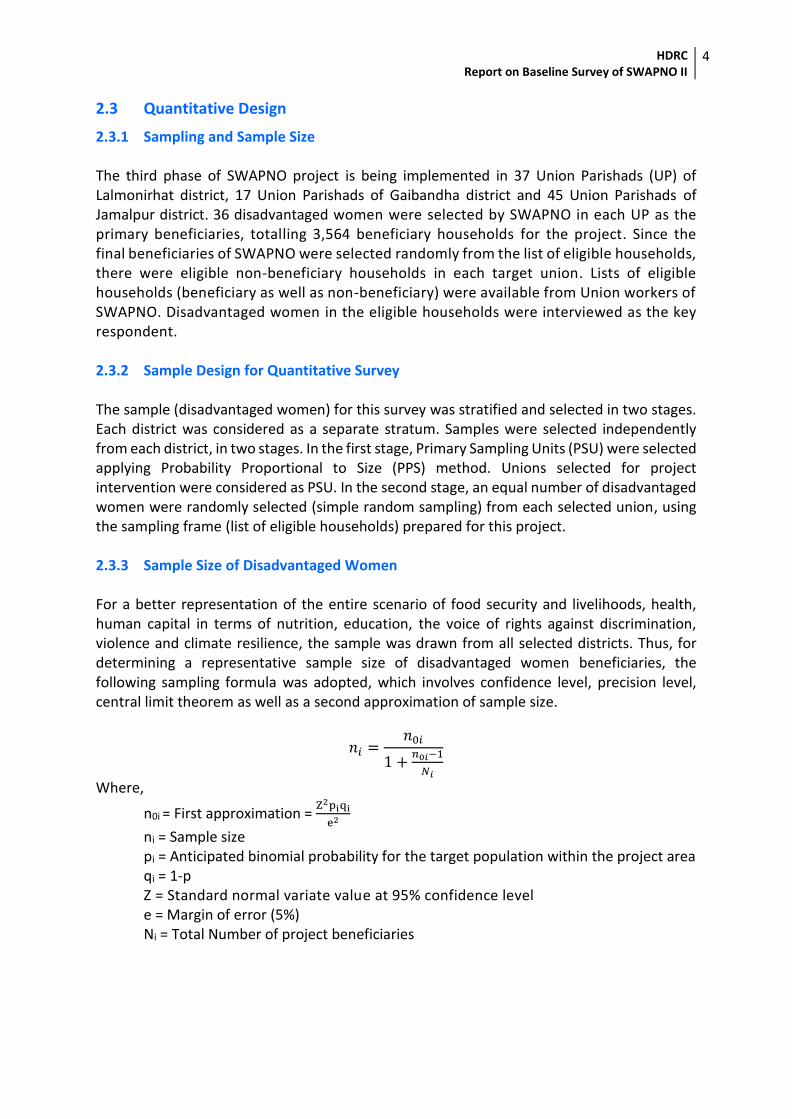
2.3.1 Sampling and Sample Size The third phase of SWAPNO project is being implemented in 37 Union Parishads (UP) of Lalmonirhat district, 17 Union Parishads of Gaibandha district and 45 Union Parishads of Jamalpur district. 36 disadvantaged women were selected by SWAPNO in each UP as the primary beneficiaries, totalling 3,564 beneficiary households for the project. Since the final beneficiaries of SWAPNO were selected randomly from the list of eligible households, there were eligible non-beneficiary households in each target union. Lists of eligible households (beneficiary as well as non-beneficiary) were available from Union workers of SWAPNO. Disadvantaged women in the eligible households were interviewed as the key respondent. 2.3.2 Sample Design for Quantitative Survey The sample (disadvantaged women) for this survey was stratified and selected in two stages. Each district was considered as a separate stratum. Samples were selected independently from each district, in two stages. In the first stage, Primary Sampling Units (PSU) were selected applying Probability Proportional to Size (PPS) method. Unions selected for project intervention were considered as PSU. In the second stage, an equal number of disadvantaged women were randomly selected (simple random sampling) from each selected union, using the sampling frame (list of eligible households) prepared for this project. 2.3.3 Sample Size of Disadvantaged Women For a better representation of the entire scenario of food security and livelihoods, health, human capital in terms of nutrition, education, the voice of rights against discrimination, violence and climate resilience, the sample was drawn from all selected districts. Thus, for determining a representative sample size of disadvantaged women beneficiaries, the following sampling formula was adopted, which involves confidence level, precision level, central limit theorem as well as a second approximation of sample size.
𝑛𝑖 =𝑛0𝑖
1 +𝑛0𝑖−1
𝑁𝑖
Where,
n0i = First approximation = Z2piqi
e2
ni = Sample size pi = Anticipated binomial probability for the target population within the project area qi = 1-p Z = Standard normal variate value at 95% confidence level e = Margin of error (5%) Ni = Total Number of project beneficiaries
HDRC Report on Baseline Survey of SWAPNO II
5
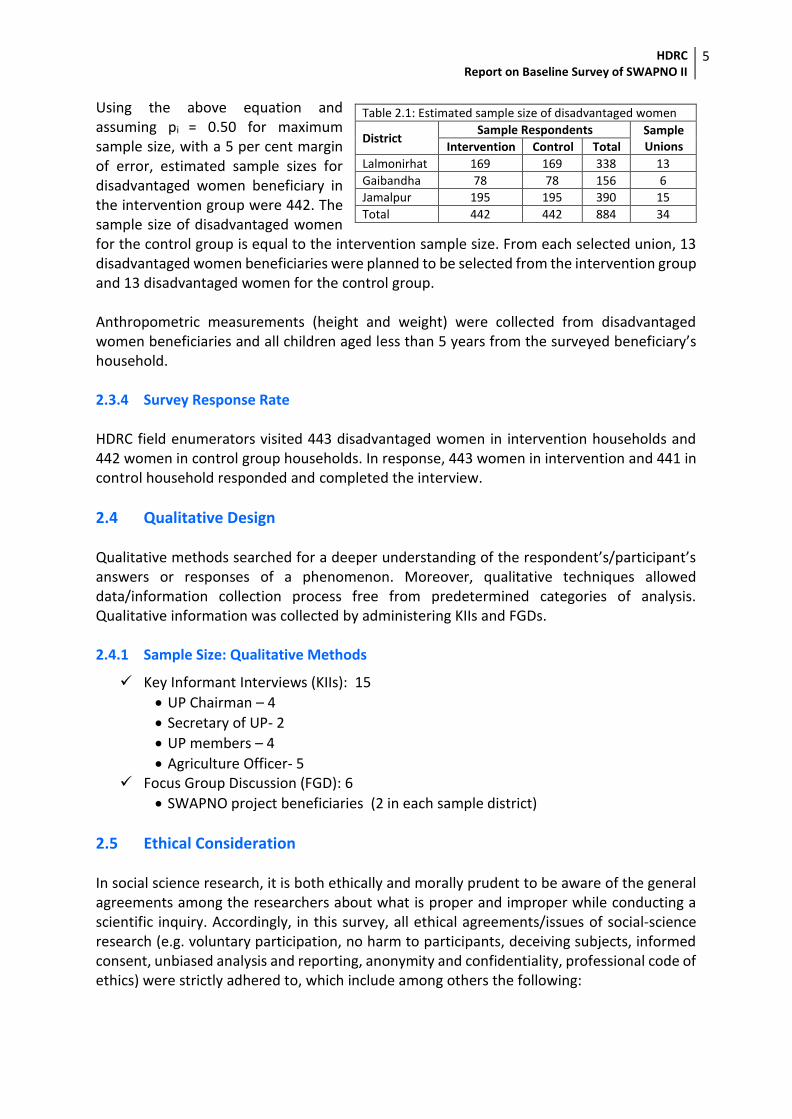
Using the above equation and assuming pi = 0.50 for maximum sample size, with a 5 per cent margin of error, estimated sample sizes for disadvantaged women beneficiary in the intervention group were 442. The sample size of disadvantaged women for the control group is equal to the intervention sample size. From each selected union, 13 disadvantaged women beneficiaries were planned to be selected from the intervention group and 13 disadvantaged women for the control group. Anthropometric measurements (height and weight) were collected from disadvantaged women beneficiaries and all children aged less than 5 years from the surveyed beneficiary’s household. 2.3.4 Survey Response Rate HDRC field enumerators visited 443 disadvantaged women in intervention households and 442 women in control group households. In response, 443 women in intervention and 441 in control household responded and completed the interview.
2.4 Qualitative Design Qualitative methods searched for a deeper understanding of the respondent’s/participant’s answers or responses of a phenomenon. Moreover, qualitative techniques allowed data/information collection process free from predetermined categories of analysis. Qualitative information was collected by administering KIIs and FGDs. 2.4.1 Sample Size: Qualitative Methods
Key Informant Interviews (KIIs): 15
UP Chairman – 4
Secretary of UP- 2
UP members – 4
Agriculture Officer- 5 Focus Group Discussion (FGD): 6
SWAPNO project beneficiaries (2 in each sample district)
2.5 Ethical Consideration In social science research, it is both ethically and morally prudent to be aware of the general agreements among the researchers about what is proper and improper while conducting a scientific inquiry. Accordingly, in this survey, all ethical agreements/issues of social-science research (e.g. voluntary participation, no harm to participants, deceiving subjects, informed consent, unbiased analysis and reporting, anonymity and confidentiality, professional code of ethics) were strictly adhered to, which include among others the following:
Table 2.1: Estimated sample size of disadvantaged women
District Sample Respondents Sample
Unions Intervention Control Total
Lalmonirhat 169 169 338 13
Gaibandha 78 78 156 6
Jamalpur 195 195 390 15
Total 442 442 884 34
HDRC Report on Baseline Survey of SWAPNO II
6
The purpose and objective of the study was explained to the respondent/participant; The respondent was informed that his/her identity would be kept confidential; The permission of the respondent was sought; All the gender issues have been adhered to; All gender-sensitive relevant topics (for example, anthropometric measures of
women, issues related to violence against women and alike) have been dealt with by female enumerators to ensure both privacy and respect to cultural norms.
2.6 Data/information Analysis Plan
The primary unit of analysis in the study is disadvantaged women (households), with results summarized for districts and the total sample. Data have been analyzed using SPSS. In data analysis, the diversification of locations has been taken into consideration. 2.6.1 Quantitative Data Analysis Quantitative data analysis techniques included univariate analysis and bivariate analysis. The measurement levels of the variables have been taken into account while analyzing the data, as special statistical techniques are available for each level. The necessary statistical tools used for data analysis are as follows:
Frequency distributions, statistics, and graphical representations (numbers, proportions, percentages, mean, standard deviation),
Cross tabulations, Graphical representations, Comparative analysis between intervention and control group.
2.6.2 Qualitative Data Analysis Approaches to qualitative data analysis were as follows:
Documentation of the data and the process of data collection; Organization/categorization of the data into concepts; Connection of the data to show how one concept may influence another; Corroboration/legitimization, by evaluating alternative explanations, disconfirming
evidence, and searching for negative cases; Representing the account (reporting the findings).
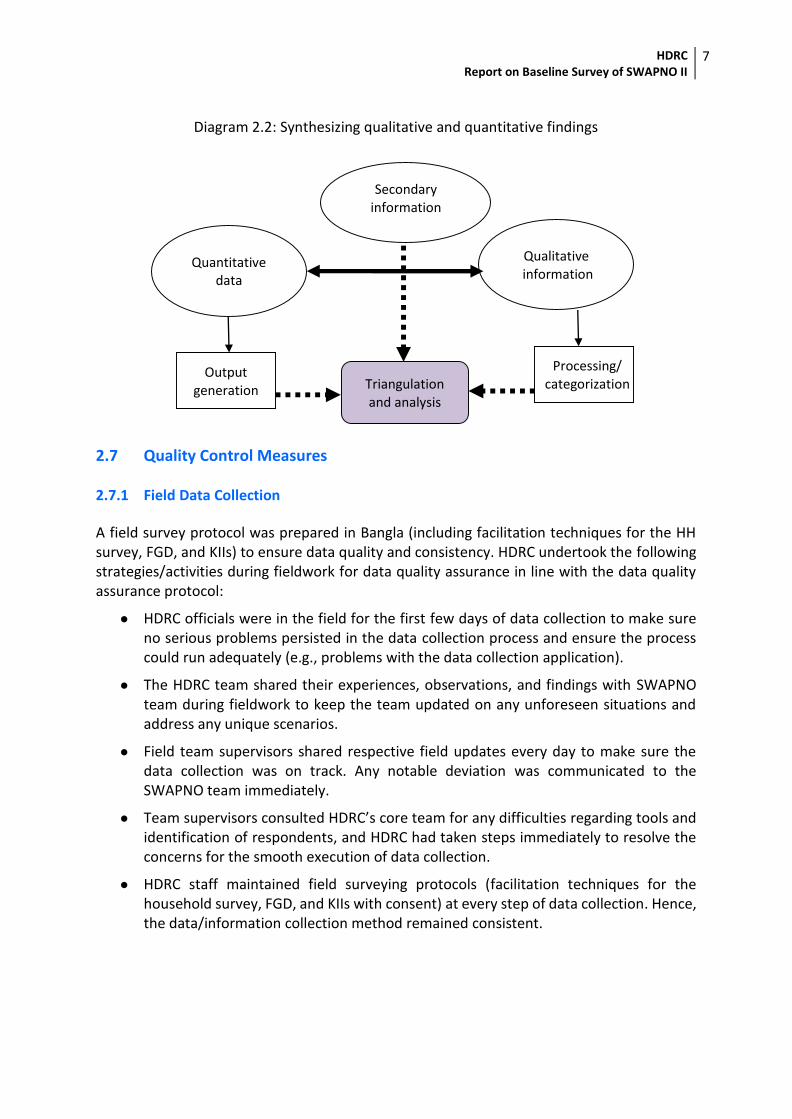
2.6.3 Triangulation Content analysis was performed to make replicable and valid inferences from information to their context, for the purpose of new insights, a representation of facts and a practical guide for action. The qualitative information and quantitative data were analyzed separately, and their findings have been synthesized (Diagram 2.2).
HDRC Report on Baseline Survey of SWAPNO II
7
Diagram 2.2: Synthesizing qualitative and quantitative findings
2.7 Quality Control Measures 2.7.1 Field Data Collection
A field survey protocol was prepared in Bangla (including facilitation techniques for the HH survey, FGD, and KIIs) to ensure data quality and consistency. HDRC undertook the following strategies/activities during fieldwork for data quality assurance in line with the data quality assurance protocol:
● HDRC officials were in the field for the first few days of data collection to make sure no serious problems persisted in the data collection process and ensure the process could run adequately (e.g., problems with the data collection application).
● The HDRC team shared their experiences, observations, and findings with SWAPNO team during fieldwork to keep the team updated on any unforeseen situations and address any unique scenarios.
● Field team supervisors shared respective field updates every day to make sure the data collection was on track. Any notable deviation was communicated to the SWAPNO team immediately.
● Team supervisors consulted HDRC’s core team for any difficulties regarding tools and identification of respondents, and HDRC had taken steps immediately to resolve the concerns for the smooth execution of data collection.
● HDRC staff maintained field surveying protocols (facilitation techniques for the household survey, FGD, and KIIs with consent) at every step of data collection. Hence, the data/information collection method remained consistent.
Quantitative data
Qualitative information
Secondary information
Output generation
Processing/ categorization Triangulation
and analysis
HDRC Report on Baseline Survey of SWAPNO II
8
2.7.2 Data Quality Control HDRC took the following steps for assuring quality control during data management, computerization, and cleaning:
● Checking uploaded data for consistency and recoding of ‘other’ responses to structured questions;
● Uploading data regularly and communicating inconsistencies back to field personnel; resolving these by asking the field enumerator and his/her supervisor for clarification;
● Instituting logical checks in the android based application to reduce errors;
Generating single variable tables for consistency checks; and
● Cleaning data using consistency checks; doing cross-tabulations and cross-checking values with the original questionnaire.
2.8 Limitations
In many instances such as household income, expenditure, nutrition, disaster etc. respondents had to respond from their memory from the past one week to 5 years preceding the survey, and recall bias may occur in those parts.
The self-reported responses in health status, food security, overall satisfaction etc. may contain personal bias of the respondents’ perceptions.
Some percentage figures for violence and harassment related issues have been calculated from small sample sizes (<30), and these figures need to be used with caution.
HDRC Report on Baseline Survey of SWAPNO II
9
CHAPTER 3: DEMOGRAPHIC AND SOCIO-ECONOMIC PROFILE
OF SAMPLE HOUSEHOLDS A household is a social unit composed of those living together in the same dwelling. It is treated as the unit of analysis in social research as almost all socio-economic activities are performed around this unit (Barkat et al., 2017). This study refers to the ‘household’ as a group of persons living under the same roof and taking food from the same kitchen at least once a day in the last six months. This chapter maps out the demographic, social and economic characteristics of the sample households concerning household size, sex ratio, age, marital status, occupation and education etc.
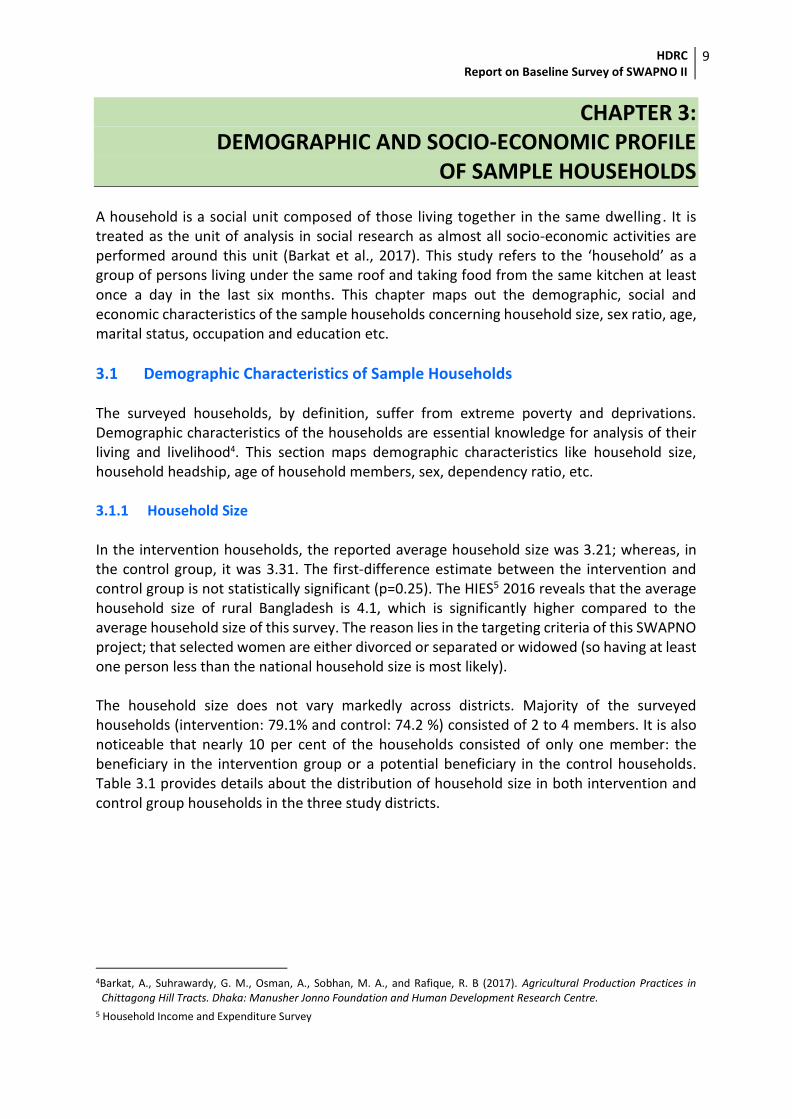
3.1 Demographic Characteristics of Sample Households The surveyed households, by definition, suffer from extreme poverty and deprivations. Demographic characteristics of the households are essential knowledge for analysis of their living and livelihood4. This section maps demographic characteristics like household size, household headship, age of household members, sex, dependency ratio, etc. 3.1.1 Household Size In the intervention households, the reported average household size was 3.21; whereas, in the control group, it was 3.31. The first-difference estimate between the intervention and control group is not statistically significant (p=0.25). The HIES5 2016 reveals that the average household size of rural Bangladesh is 4.1, which is significantly higher compared to the average household size of this survey. The reason lies in the targeting criteria of this SWAPNO project; that selected women are either divorced or separated or widowed (so having at least one person less than the national household size is most likely). The household size does not vary markedly across districts. Majority of the surveyed households (intervention: 79.1% and control: 74.2 %) consisted of 2 to 4 members. It is also noticeable that nearly 10 per cent of the households consisted of only one member: the beneficiary in the intervention group or a potential beneficiary in the control households. Table 3.1 provides details about the distribution of household size in both intervention and control group households in the three study districts.
4Barkat, A., Suhrawardy, G. M., Osman, A., Sobhan, M. A., and Rafique, R. B (2017). Agricultural Production Practices in
Chittagong Hill Tracts. Dhaka: Manusher Jonno Foundation and Human Development Research Centre.
5 Household Income and Expenditure Survey
HDRC Report on Baseline Survey of SWAPNO II
10
Table 3.1: Distribution of households according to household size
Household size Lalmonirhat Gaibandha Jamalpur Total
Intervention Control Intervention Control Intervention Control Intervention Control
One 8.3 8.4 7.7 13.8 6.6 6.7 7.4 8.6
Two 20.7 22.2 15.4 21.3 23.0 19.1 20.8 20.6
Three 34.9 32.3 37.2 31.3 35.7 27.8 35.7 30.2
Four 21.9 18.0 25.6 25.0 21.9 27.3 22.6 23.4
Five 9.5 10.2 14.1 5.0 7.7 11.3 9.5 9.8
Six 3.0 6.0 0.0 3.8 3.6 4.6 2.7 5.0
> Six 1.8 3.0 0.0 0.0 1.5 3.1 1.4 2.5
N 169 167 78 80 196 194 443 441
Average household size
3.21 3.31 3.23 2.98 3.19 3.45 3.21 3.31
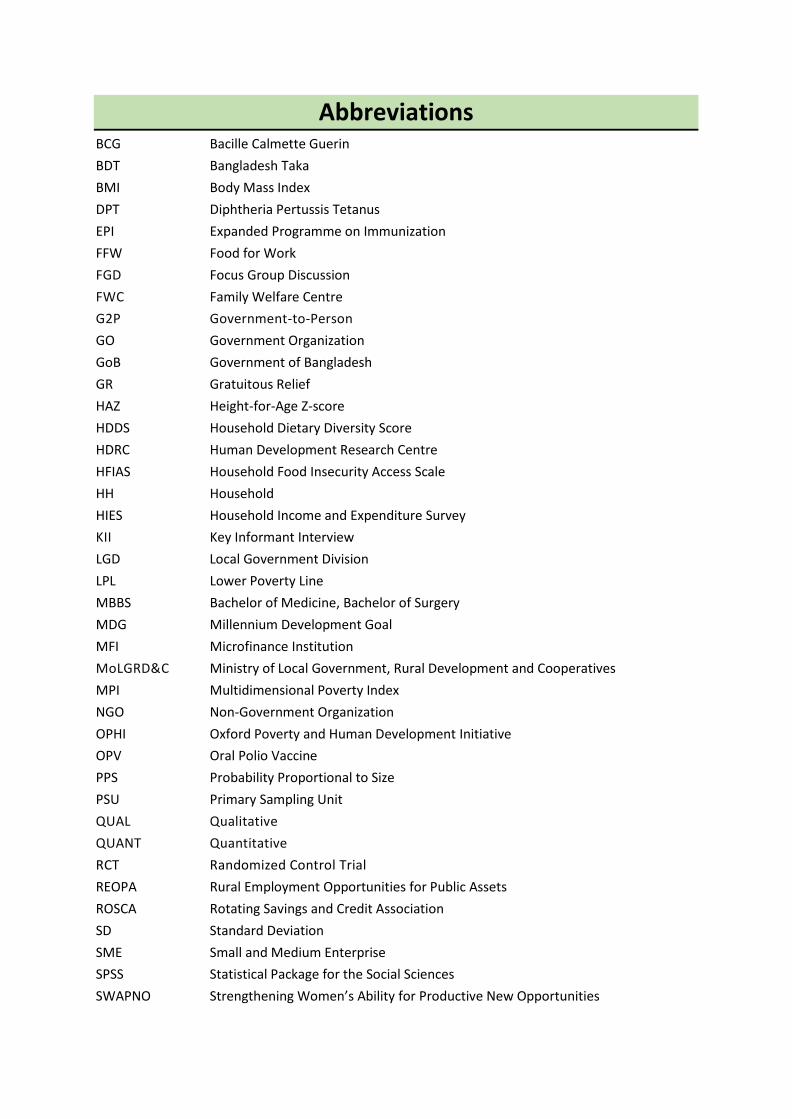
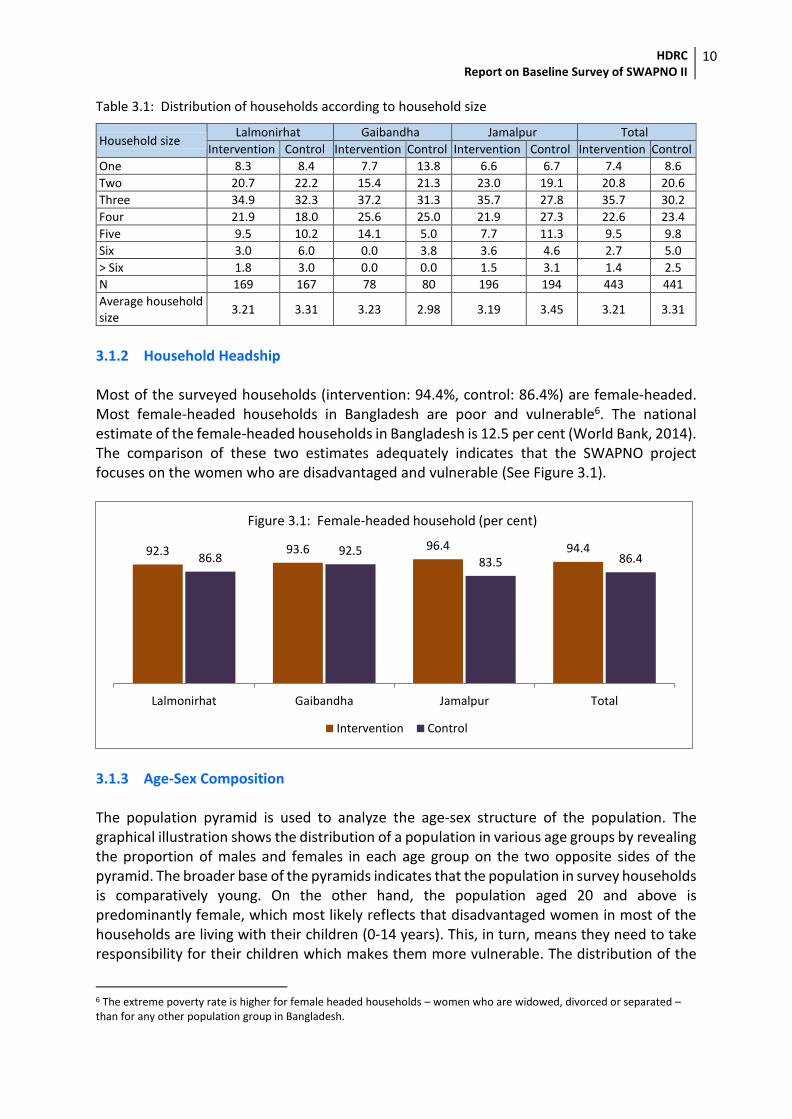
3.1.2 Household Headship Most of the surveyed households (intervention: 94.4%, control: 86.4%) are female-headed. Most female-headed households in Bangladesh are poor and vulnerable6. The national estimate of the female-headed households in Bangladesh is 12.5 per cent (World Bank, 2014). The comparison of these two estimates adequately indicates that the SWAPNO project focuses on the women who are disadvantaged and vulnerable (See Figure 3.1).
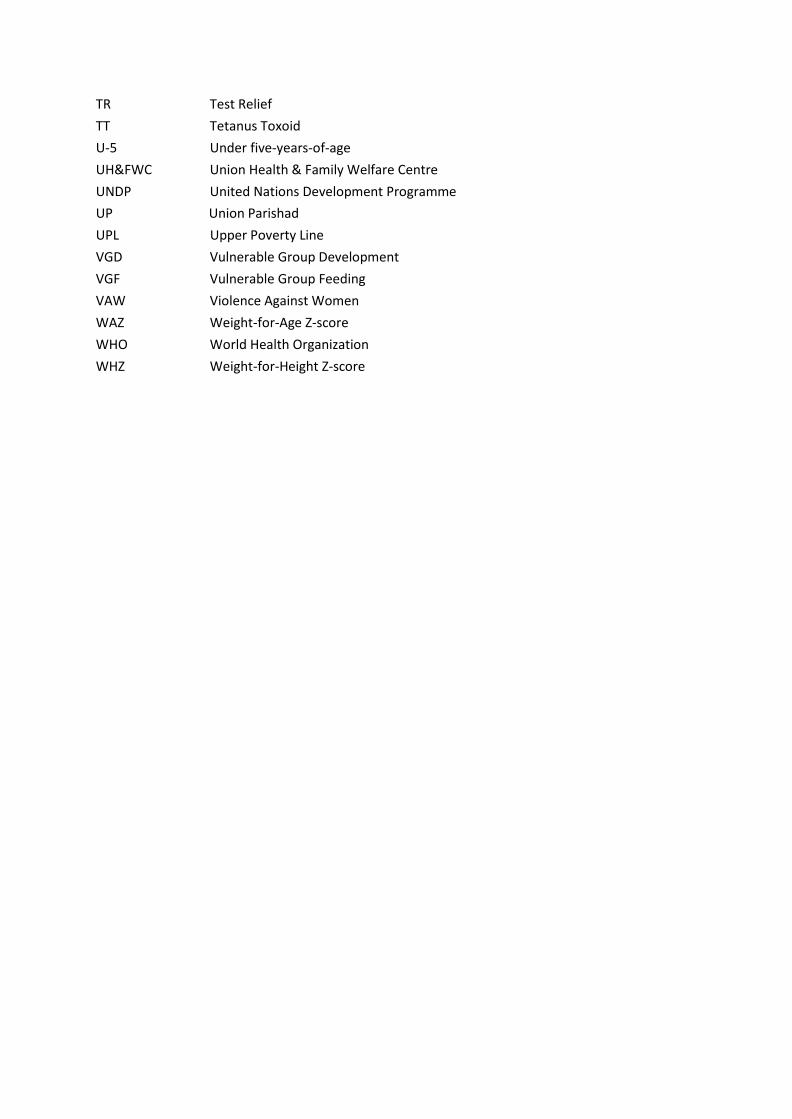
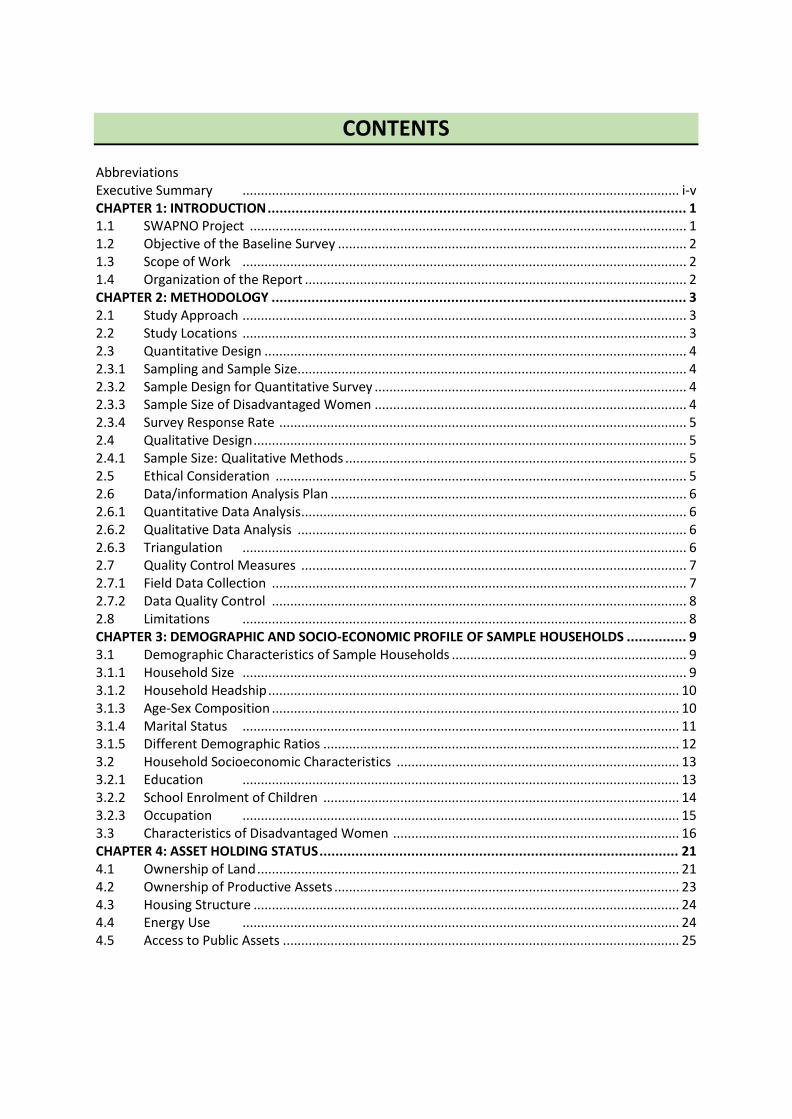
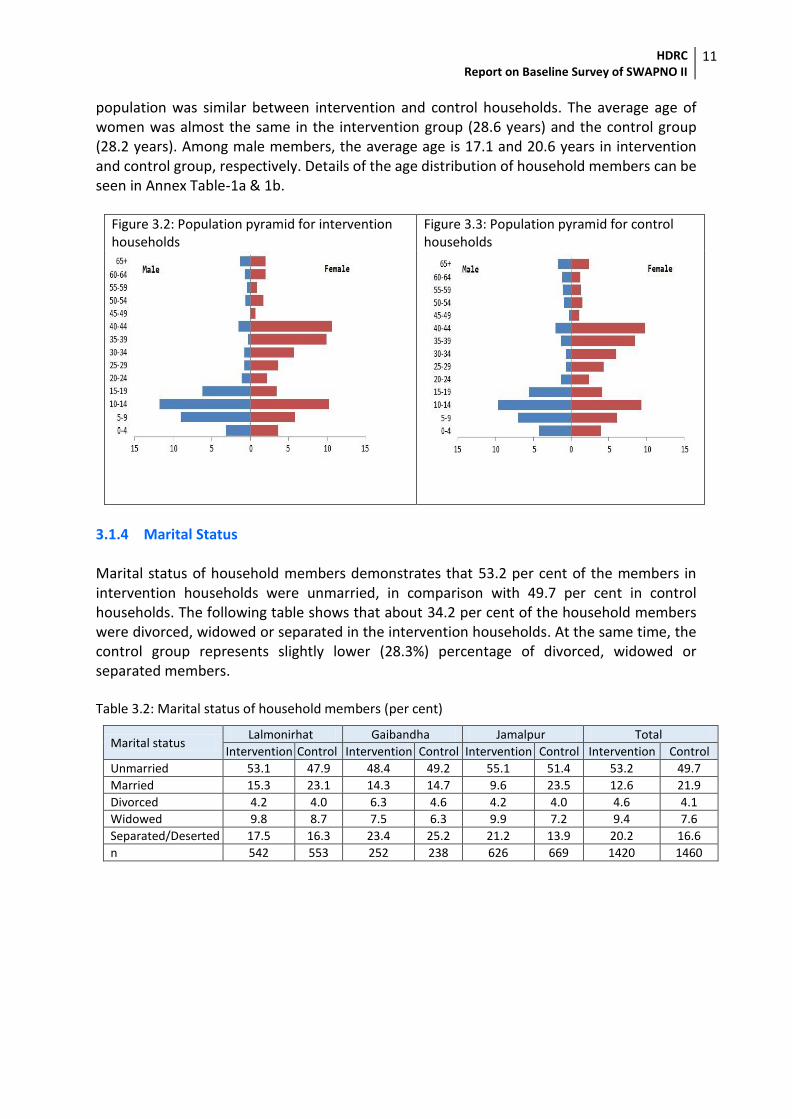
3.1.3 Age-Sex Composition The population pyramid is used to analyze the age-sex structure of the population. The graphical illustration shows the distribution of a population in various age groups by revealing the proportion of males and females in each age group on the two opposite sides of the pyramid. The broader base of the pyramids indicates that the population in survey households is comparatively young. On the other hand, the population aged 20 and above is predominantly female, which most likely reflects that disadvantaged women in most of the households are living with their children (0-14 years). This, in turn, means they need to take responsibility for their children which makes them more vulnerable. The distribution of the
6 The extreme poverty rate is higher for female headed households – women who are widowed, divorced or separated – than for any other population group in Bangladesh.
92.3 93.6 96.4 94.486.8
92.583.5 86.4
Lalmonirhat Gaibandha Jamalpur Total
Intervention Control
Figure 3.1: Female-headed household (per cent)
HDRC Report on Baseline Survey of SWAPNO II
11
population was similar between intervention and control households. The average age of women was almost the same in the intervention group (28.6 years) and the control group (28.2 years). Among male members, the average age is 17.1 and 20.6 years in intervention and control group, respectively. Details of the age distribution of household members can be seen in Annex Table-1a & 1b.
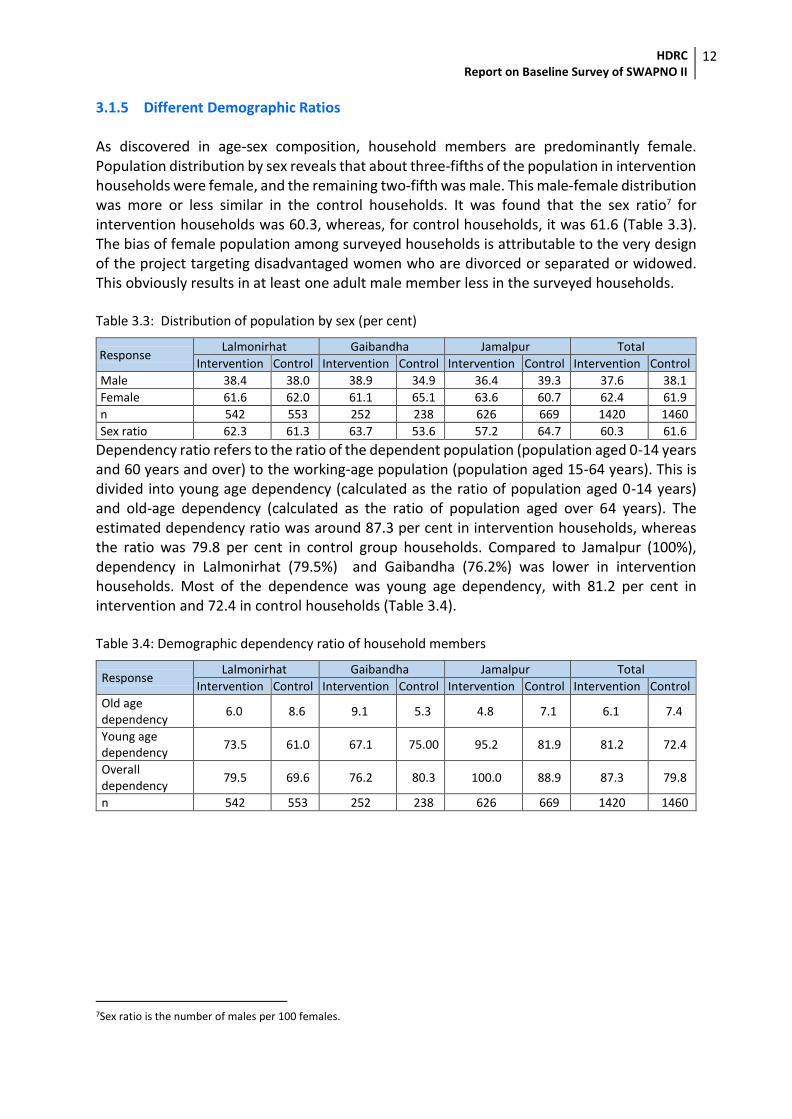
3.1.4 Marital Status Marital status of household members demonstrates that 53.2 per cent of the members in intervention households were unmarried, in comparison with 49.7 per cent in control households. The following table shows that about 34.2 per cent of the household members were divorced, widowed or separated in the intervention households. At the same time, the control group represents slightly lower (28.3%) percentage of divorced, widowed or separated members. Table 3.2: Marital status of household members (per cent)
Marital status Lalmonirhat Gaibandha Jamalpur Total
Intervention Control Intervention Control Intervention Control Intervention Control
Unmarried 53.1 47.9 48.4 49.2 55.1 51.4 53.2 49.7
Married 15.3 23.1 14.3 14.7 9.6 23.5 12.6 21.9
Divorced 4.2 4.0 6.3 4.6 4.2 4.0 4.6 4.1
Widowed 9.8 8.7 7.5 6.3 9.9 7.2 9.4 7.6
Separated/Deserted 17.5 16.3 23.4 25.2 21.2 13.9 20.2 16.6
n 542 553 252 238 626 669 1420 1460
Figure 3.2: Population pyramid for intervention households
Figure 3.3: Population pyramid for control households
HDRC Report on Baseline Survey of SWAPNO II
12
3.1.5 Different Demographic Ratios As discovered in age-sex composition, household members are predominantly female. Population distribution by sex reveals that about three-fifths of the population in intervention households were female, and the remaining two-fifth was male. This male-female distribution was more or less similar in the control households. It was found that the sex ratio7 for intervention households was 60.3, whereas, for control households, it was 61.6 (Table 3.3). The bias of female population among surveyed households is attributable to the very design of the project targeting disadvantaged women who are divorced or separated or widowed. This obviously results in at least one adult male member less in the surveyed households. Table 3.3: Distribution of population by sex (per cent)
Response Lalmonirhat Gaibandha Jamalpur Total
Intervention Control Intervention Control Intervention Control Intervention Control
Male 38.4 38.0 38.9 34.9 36.4 39.3 37.6 38.1
Female 61.6 62.0 61.1 65.1 63.6 60.7 62.4 61.9
n 542 553 252 238 626 669 1420 1460
Sex ratio 62.3 61.3 63.7 53.6 57.2 64.7 60.3 61.6
Dependency ratio refers to the ratio of the dependent population (population aged 0-14 years and 60 years and over) to the working-age population (population aged 15-64 years). This is divided into young age dependency (calculated as the ratio of population aged 0-14 years) and old-age dependency (calculated as the ratio of population aged over 64 years). The estimated dependency ratio was around 87.3 per cent in intervention households, whereas the ratio was 79.8 per cent in control group households. Compared to Jamalpur (100%), dependency in Lalmonirhat (79.5%) and Gaibandha (76.2%) was lower in intervention households. Most of the dependence was young age dependency, with 81.2 per cent in intervention and 72.4 in control households (Table 3.4). Table 3.4: Demographic dependency ratio of household members
Response Lalmonirhat Gaibandha Jamalpur Total
Intervention Control Intervention Control Intervention Control Intervention Control
Old age dependency
6.0 8.6 9.1 5.3 4.8 7.1 6.1 7.4
Young age dependency
73.5 61.0 67.1 75.00 95.2 81.9 81.2 72.4
Overall dependency
79.5 69.6 76.2 80.3 100.0 88.9 87.3 79.8
n 542 553 252 238 626 669 1420 1460
7Sex ratio is the number of males per 100 females.
HDRC Report on Baseline Survey of SWAPNO II
13
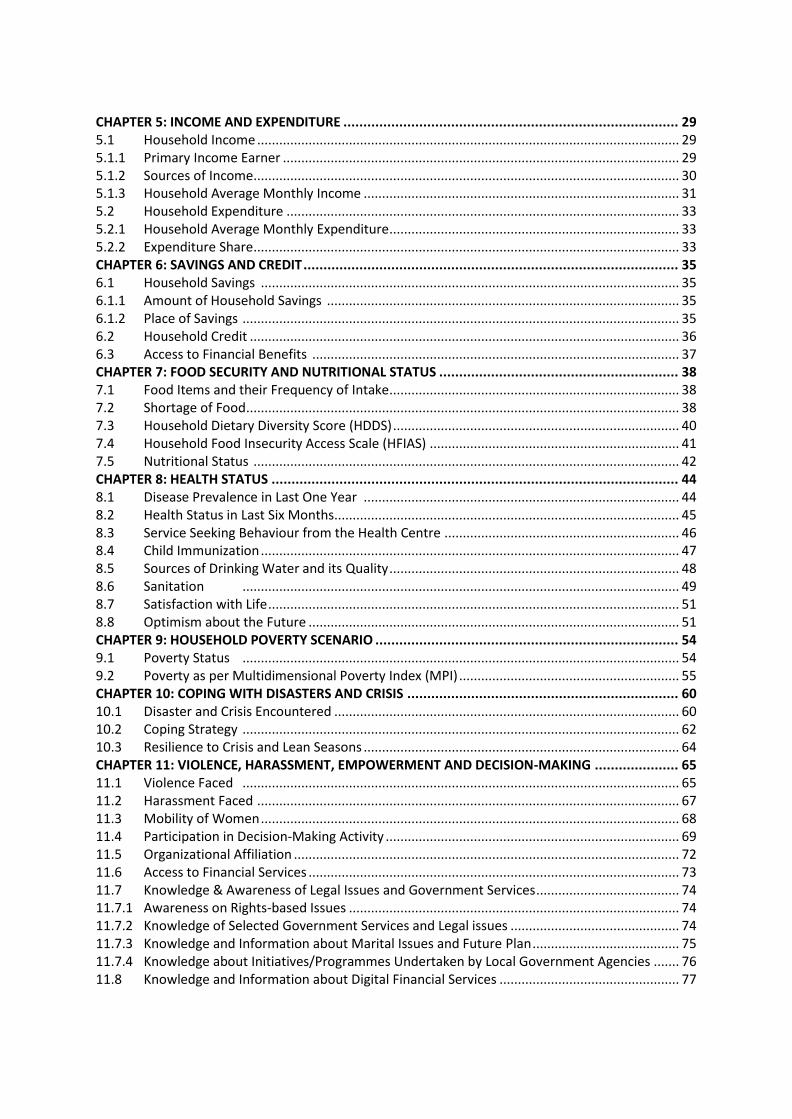
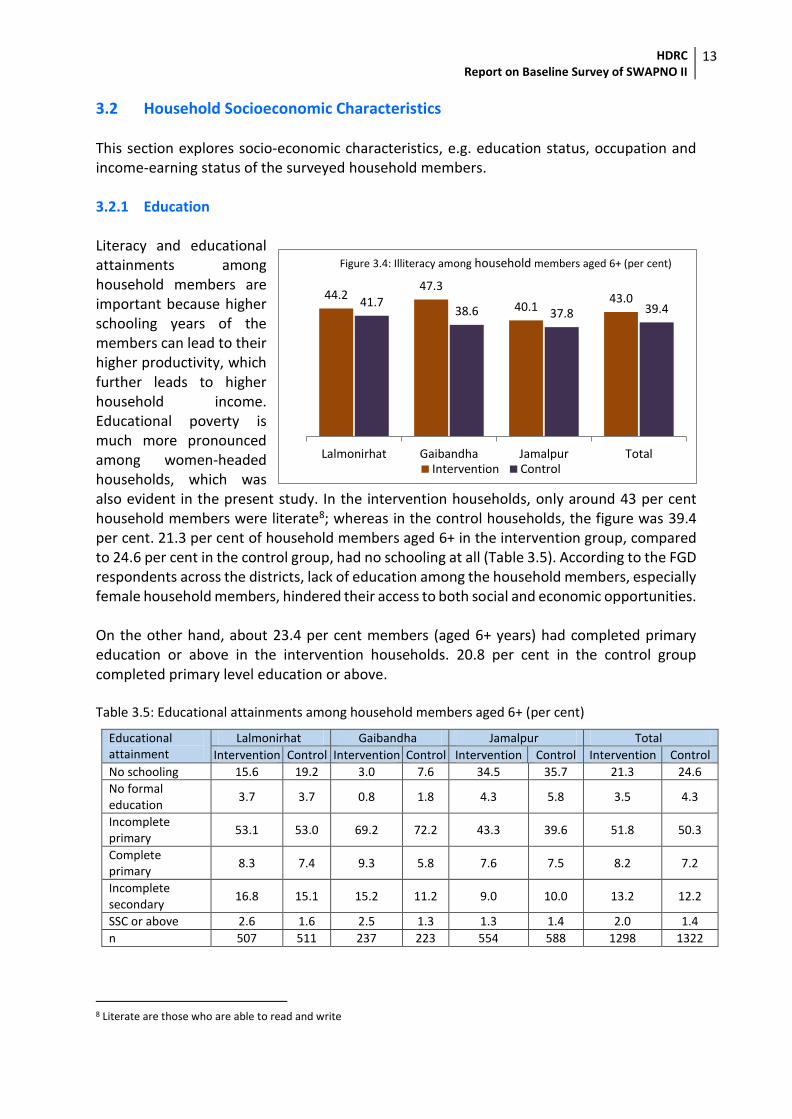
3.2 Household Socioeconomic Characteristics This section explores socio-economic characteristics, e.g. education status, occupation and income-earning status of the surveyed household members. 3.2.1 Education Literacy and educational attainments among household members are important because higher schooling years of the members can lead to their higher productivity, which further leads to higher household income. Educational poverty is much more pronounced among women-headed households, which was also evident in the present study. In the intervention households, only around 43 per cent household members were literate8; whereas in the control households, the figure was 39.4 per cent. 21.3 per cent of household members aged 6+ in the intervention group, compared to 24.6 per cent in the control group, had no schooling at all (Table 3.5). According to the FGD respondents across the districts, lack of education among the household members, especially female household members, hindered their access to both social and economic opportunities. On the other hand, about 23.4 per cent members (aged 6+ years) had completed primary education or above in the intervention households. 20.8 per cent in the control group completed primary level education or above. Table 3.5: Educational attainments among household members aged 6+ (per cent)
Educational attainment
Lalmonirhat Gaibandha Jamalpur Total
Intervention Control Intervention Control Intervention Control Intervention Control
No schooling 15.6 19.2 3.0 7.6 34.5 35.7 21.3 24.6
No formal education
3.7 3.7 0.8 1.8 4.3 5.8 3.5 4.3
Incomplete primary
53.1 53.0 69.2 72.2 43.3 39.6 51.8 50.3
Complete primary
8.3 7.4 9.3 5.8 7.6 7.5 8.2 7.2
Incomplete secondary
16.8 15.1 15.2 11.2 9.0 10.0 13.2 12.2
SSC or above 2.6 1.6 2.5 1.3 1.3 1.4 2.0 1.4
n 507 511 237 223 554 588 1298 1322
8 Literate are those who are able to read and write
44.247.3
40.143.041.7
38.6 37.8 39.4
Lalmonirhat Gaibandha Jamalpur TotalIntervention Control
Figure 3.4: Illiteracy among household members aged 6+ (per cent)
HDRC Report on Baseline Survey of SWAPNO II
14
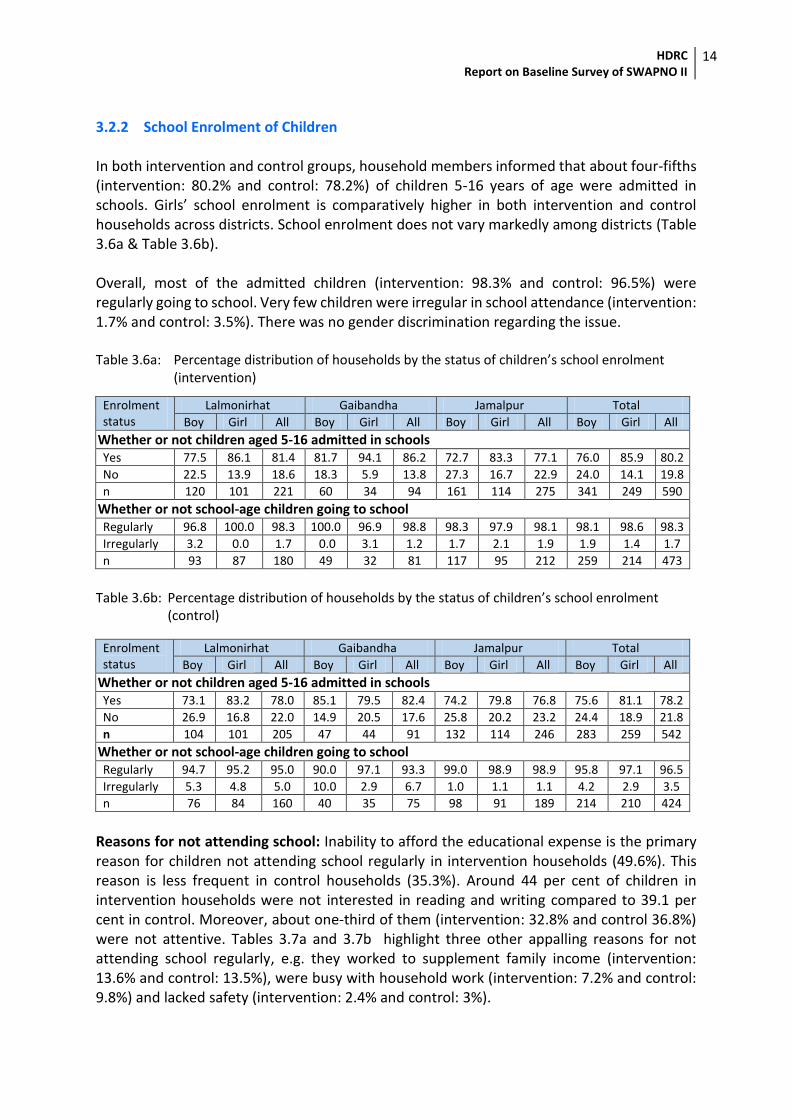
3.2.2 School Enrolment of Children In both intervention and control groups, household members informed that about four-fifths (intervention: 80.2% and control: 78.2%) of children 5-16 years of age were admitted in schools. Girls’ school enrolment is comparatively higher in both intervention and control households across districts. School enrolment does not vary markedly among districts (Table 3.6a & Table 3.6b). Overall, most of the admitted children (intervention: 98.3% and control: 96.5%) were regularly going to school. Very few children were irregular in school attendance (intervention: 1.7% and control: 3.5%). There was no gender discrimination regarding the issue. Table 3.6a: Percentage distribution of households by the status of children’s school enrolment (intervention)
Enrolment status
Lalmonirhat Gaibandha Jamalpur Total
Boy Girl All Boy Girl All Boy Girl All Boy Girl All
Whether or not children aged 5-16 admitted in schools
Yes 77.5 86.1 81.4 81.7 94.1 86.2 72.7 83.3 77.1 76.0 85.9 80.2
No 22.5 13.9 18.6 18.3 5.9 13.8 27.3 16.7 22.9 24.0 14.1 19.8
n 120 101 221 60 34 94 161 114 275 341 249 590
Whether or not school-age children going to school Regularly 96.8 100.0 98.3 100.0 96.9 98.8 98.3 97.9 98.1 98.1 98.6 98.3
Irregularly 3.2 0.0 1.7 0.0 3.1 1.2 1.7 2.1 1.9 1.9 1.4 1.7
n 93 87 180 49 32 81 117 95 212 259 214 473
Table 3.6b: Percentage distribution of households by the status of children’s school enrolment
(control)
Enrolment status
Lalmonirhat Gaibandha Jamalpur Total
Boy Girl All Boy Girl All Boy Girl All Boy Girl All
Whether or not children aged 5-16 admitted in schools Yes 73.1 83.2 78.0 85.1 79.5 82.4 74.2 79.8 76.8 75.6 81.1 78.2
No 26.9 16.8 22.0 14.9 20.5 17.6 25.8 20.2 23.2 24.4 18.9 21.8
n 104 101 205 47 44 91 132 114 246 283 259 542
Whether or not school-age children going to school Regularly 94.7 95.2 95.0 90.0 97.1 93.3 99.0 98.9 98.9 95.8 97.1 96.5
Irregularly 5.3 4.8 5.0 10.0 2.9 6.7 1.0 1.1 1.1 4.2 2.9 3.5
n 76 84 160 40 35 75 98 91 189 214 210 424
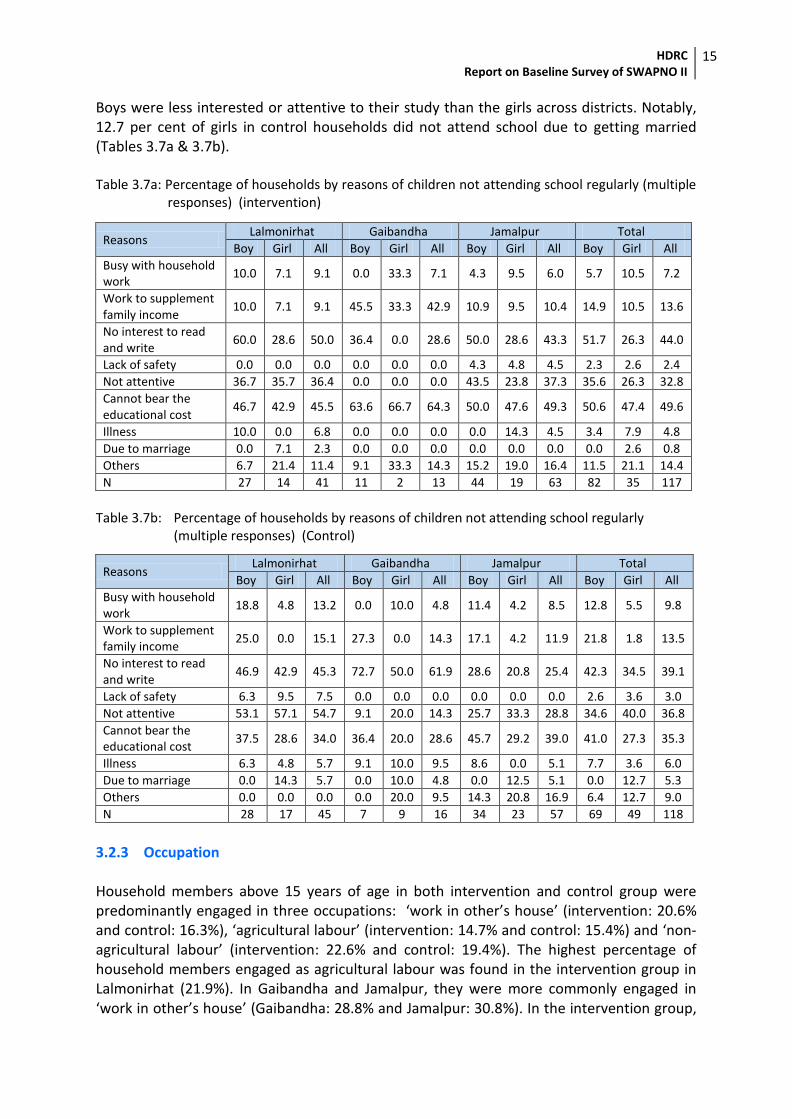
Reasons for not attending school: Inability to afford the educational expense is the primary reason for children not attending school regularly in intervention households (49.6%). This reason is less frequent in control households (35.3%). Around 44 per cent of children in intervention households were not interested in reading and writing compared to 39.1 per cent in control. Moreover, about one-third of them (intervention: 32.8% and control 36.8%) were not attentive. Tables 3.7a and 3.7b highlight three other appalling reasons for not attending school regularly, e.g. they worked to supplement family income (intervention: 13.6% and control: 13.5%), were busy with household work (intervention: 7.2% and control: 9.8%) and lacked safety (intervention: 2.4% and control: 3%).
HDRC Report on Baseline Survey of SWAPNO II
15
Boys were less interested or attentive to their study than the girls across districts. Notably, 12.7 per cent of girls in control households did not attend school due to getting married (Tables 3.7a & 3.7b). Table 3.7a: Percentage of households by reasons of children not attending school regularly (multiple
responses) (intervention)
Reasons Lalmonirhat Gaibandha Jamalpur Total
Boy Girl All Boy Girl All Boy Girl All Boy Girl All
Busy with household work
10.0 7.1 9.1 0.0 33.3 7.1 4.3 9.5 6.0 5.7 10.5 7.2
Work to supplement family income
10.0 7.1 9.1 45.5 33.3 42.9 10.9 9.5 10.4 14.9 10.5 13.6
No interest to read and write
60.0 28.6 50.0 36.4 0.0 28.6 50.0 28.6 43.3 51.7 26.3 44.0
Lack of safety 0.0 0.0 0.0 0.0 0.0 0.0 4.3 4.8 4.5 2.3 2.6 2.4
Not attentive 36.7 35.7 36.4 0.0 0.0 0.0 43.5 23.8 37.3 35.6 26.3 32.8
Cannot bear the educational cost
46.7 42.9 45.5 63.6 66.7 64.3 50.0 47.6 49.3 50.6 47.4 49.6
Illness 10.0 0.0 6.8 0.0 0.0 0.0 0.0 14.3 4.5 3.4 7.9 4.8
Due to marriage 0.0 7.1 2.3 0.0 0.0 0.0 0.0 0.0 0.0 0.0 2.6 0.8
Others 6.7 21.4 11.4 9.1 33.3 14.3 15.2 19.0 16.4 11.5 21.1 14.4
N 27 14 41 11 2 13 44 19 63 82 35 117
Table 3.7b: Percentage of households by reasons of children not attending school regularly
(multiple responses) (Control)
Reasons Lalmonirhat Gaibandha Jamalpur Total
Boy Girl All Boy Girl All Boy Girl All Boy Girl All
Busy with household work
18.8 4.8 13.2 0.0 10.0 4.8 11.4 4.2 8.5 12.8 5.5 9.8
Work to supplement family income
25.0 0.0 15.1 27.3 0.0 14.3 17.1 4.2 11.9 21.8 1.8 13.5
No interest to read and write
46.9 42.9 45.3 72.7 50.0 61.9 28.6 20.8 25.4 42.3 34.5 39.1
Lack of safety 6.3 9.5 7.5 0.0 0.0 0.0 0.0 0.0 0.0 2.6 3.6 3.0
Not attentive 53.1 57.1 54.7 9.1 20.0 14.3 25.7 33.3 28.8 34.6 40.0 36.8
Cannot bear the educational cost
37.5 28.6 34.0 36.4 20.0 28.6 45.7 29.2 39.0 41.0 27.3 35.3
Illness 6.3 4.8 5.7 9.1 10.0 9.5 8.6 0.0 5.1 7.7 3.6 6.0
Due to marriage 0.0 14.3 5.7 0.0 10.0 4.8 0.0 12.5 5.1 0.0 12.7 5.3
Others 0.0 0.0 0.0 0.0 20.0 9.5 14.3 20.8 16.9 6.4 12.7 9.0
N 28 17 45 7 9 16 34 23 57 69 49 118
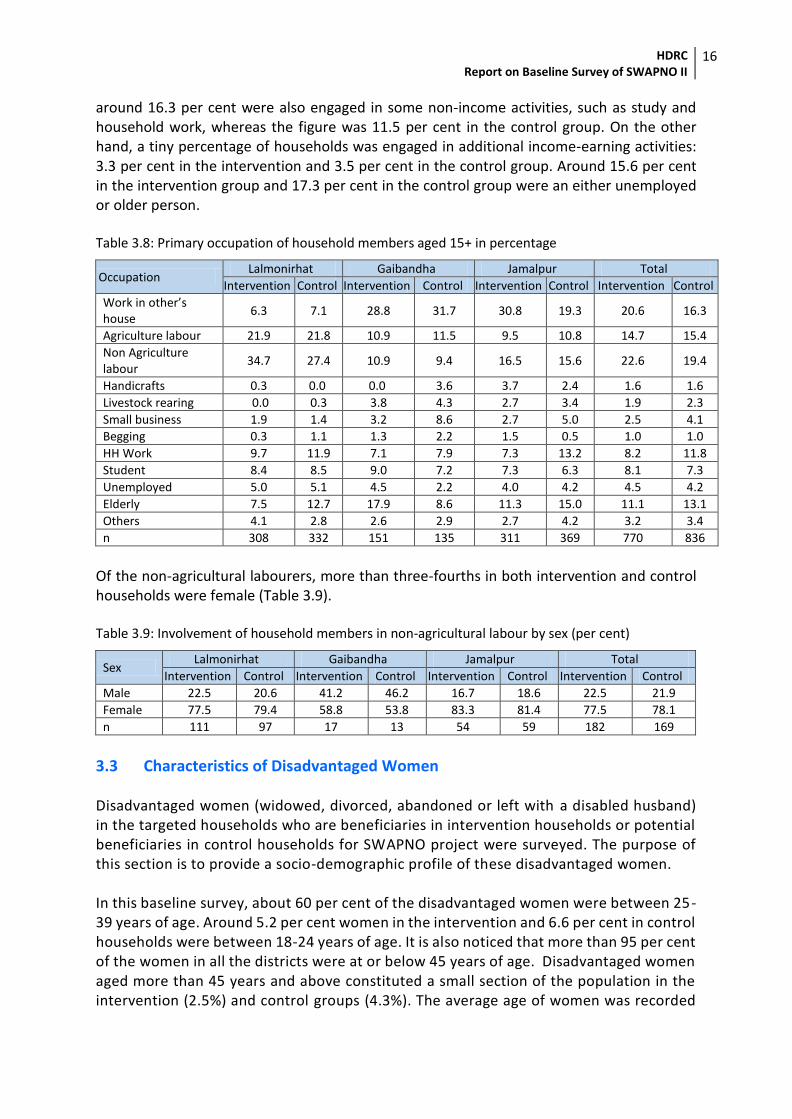
3.2.3 Occupation Household members above 15 years of age in both intervention and control group were predominantly engaged in three occupations: ‘work in other’s house’ (intervention: 20.6% and control: 16.3%), ‘agricultural labour’ (intervention: 14.7% and control: 15.4%) and ‘non-agricultural labour’ (intervention: 22.6% and control: 19.4%). The highest percentage of household members engaged as agricultural labour was found in the intervention group in Lalmonirhat (21.9%). In Gaibandha and Jamalpur, they were more commonly engaged in ‘work in other’s house’ (Gaibandha: 28.8% and Jamalpur: 30.8%). In the intervention group,
HDRC Report on Baseline Survey of SWAPNO II
16
around 16.3 per cent were also engaged in some non-income activities, such as study and household work, whereas the figure was 11.5 per cent in the control group. On the other hand, a tiny percentage of households was engaged in additional income-earning activities: 3.3 per cent in the intervention and 3.5 per cent in the control group. Around 15.6 per cent in the intervention group and 17.3 per cent in the control group were an either unemployed or older person. Table 3.8: Primary occupation of household members aged 15+ in percentage
Occupation Lalmonirhat Gaibandha Jamalpur Total
Intervention Control Intervention Control Intervention Control Intervention Control
Work in other’s house
6.3 7.1 28.8 31.7 30.8 19.3 20.6 16.3
Agriculture labour 21.9 21.8 10.9 11.5 9.5 10.8 14.7 15.4
Non Agriculture labour
34.7 27.4 10.9 9.4 16.5 15.6 22.6 19.4
Handicrafts 0.3 0.0 0.0 3.6 3.7 2.4 1.6 1.6
Livestock rearing 0.0 0.3 3.8 4.3 2.7 3.4 1.9 2.3
Small business 1.9 1.4 3.2 8.6 2.7 5.0 2.5 4.1
Begging 0.3 1.1 1.3 2.2 1.5 0.5 1.0 1.0
HH Work 9.7 11.9 7.1 7.9 7.3 13.2 8.2 11.8
Student 8.4 8.5 9.0 7.2 7.3 6.3 8.1 7.3
Unemployed 5.0 5.1 4.5 2.2 4.0 4.2 4.5 4.2
Elderly 7.5 12.7 17.9 8.6 11.3 15.0 11.1 13.1
Others 4.1 2.8 2.6 2.9 2.7 4.2 3.2 3.4
n 308 332 151 135 311 369 770 836
Of the non-agricultural labourers, more than three-fourths in both intervention and control households were female (Table 3.9). Table 3.9: Involvement of household members in non-agricultural labour by sex (per cent)
Sex Lalmonirhat Gaibandha Jamalpur Total
Intervention Control Intervention Control Intervention Control Intervention Control
Male 22.5 20.6 41.2 46.2 16.7 18.6 22.5 21.9
Female 77.5 79.4 58.8 53.8 83.3 81.4 77.5 78.1
n 111 97 17 13 54 59 182 169
3.3 Characteristics of Disadvantaged Women Disadvantaged women (widowed, divorced, abandoned or left with a disabled husband) in the targeted households who are beneficiaries in intervention households or potential beneficiaries in control households for SWAPNO project were surveyed. The purpose of this section is to provide a socio-demographic profile of these disadvantaged women. In this baseline survey, about 60 per cent of the disadvantaged women were between 25-39 years of age. Around 5.2 per cent women in the intervention and 6.6 per cent in control households were between 18-24 years of age. It is also noticed that more than 95 per cent of the women in all the districts were at or below 45 years of age. Disadvantaged women aged more than 45 years and above constituted a small section of the population in the intervention (2.5%) and control groups (4.3%). The average age of women was recorded
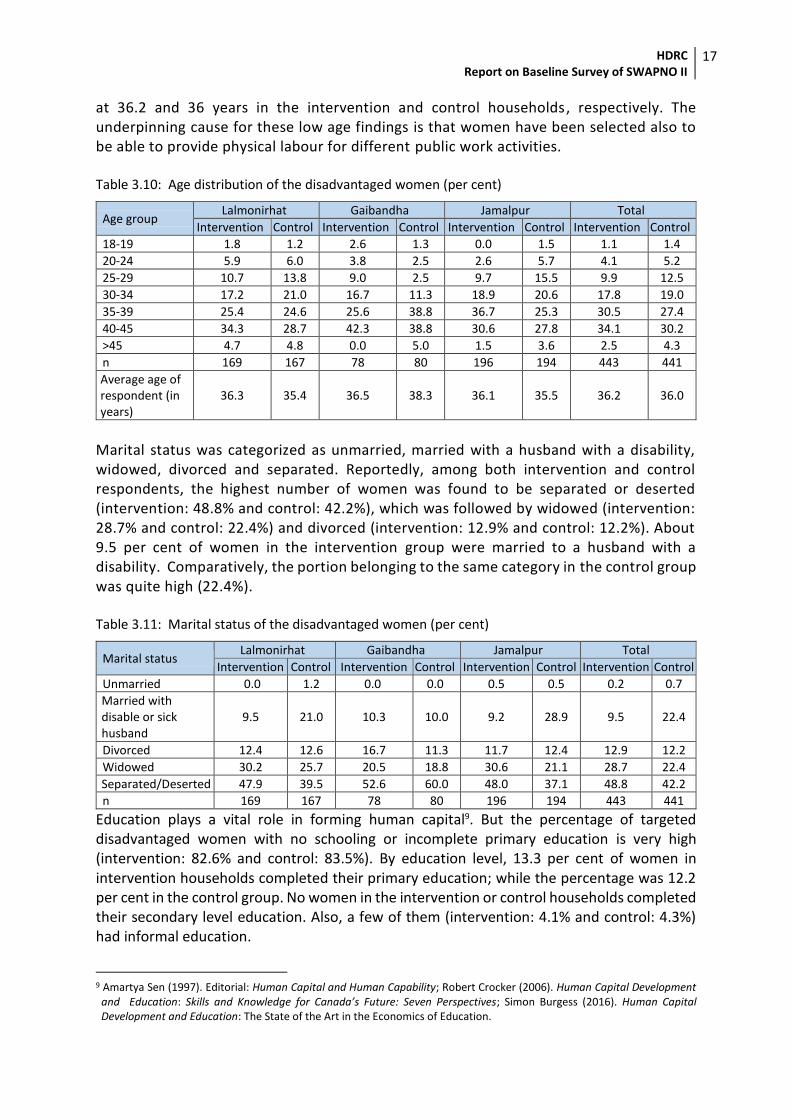
HDRC Report on Baseline Survey of SWAPNO II
17
at 36.2 and 36 years in the intervention and control households, respectively. The underpinning cause for these low age findings is that women have been selected also to be able to provide physical labour for different public work activities. Table 3.10: Age distribution of the disadvantaged women (per cent)
Age group Lalmonirhat Gaibandha Jamalpur Total
Intervention Control Intervention Control Intervention Control Intervention Control
18-19 1.8 1.2 2.6 1.3 0.0 1.5 1.1 1.4
20-24 5.9 6.0 3.8 2.5 2.6 5.7 4.1 5.2
25-29 10.7 13.8 9.0 2.5 9.7 15.5 9.9 12.5
30-34 17.2 21.0 16.7 11.3 18.9 20.6 17.8 19.0
35-39 25.4 24.6 25.6 38.8 36.7 25.3 30.5 27.4
40-45 34.3 28.7 42.3 38.8 30.6 27.8 34.1 30.2
>45 4.7 4.8 0.0 5.0 1.5 3.6 2.5 4.3
n 169 167 78 80 196 194 443 441
Average age of respondent (in years)
36.3 35.4 36.5 38.3 36.1 35.5 36.2 36.0
Marital status was categorized as unmarried, married with a husband with a disability, widowed, divorced and separated. Reportedly, among both intervention and control respondents, the highest number of women was found to be separated or deserted (intervention: 48.8% and control: 42.2%), which was followed by widowed (intervention: 28.7% and control: 22.4%) and divorced (intervention: 12.9% and control: 12.2%). About 9.5 per cent of women in the intervention group were married to a husband with a disability. Comparatively, the portion belonging to the same category in the control group was quite high (22.4%). Table 3.11: Marital status of the disadvantaged women (per cent)
Marital status Lalmonirhat Gaibandha Jamalpur Total
Intervention Control Intervention Control Intervention Control Intervention Control
Unmarried 0.0 1.2 0.0 0.0 0.5 0.5 0.2 0.7
Married with disable or sick husband
9.5 21.0 10.3 10.0 9.2 28.9 9.5 22.4
Divorced 12.4 12.6 16.7 11.3 11.7 12.4 12.9 12.2
Widowed 30.2 25.7 20.5 18.8 30.6 21.1 28.7 22.4
Separated/Deserted 47.9 39.5 52.6 60.0 48.0 37.1 48.8 42.2
n 169 167 78 80 196 194 443 441
Education plays a vital role in forming human capital9. But the percentage of targeted disadvantaged women with no schooling or incomplete primary education is very high (intervention: 82.6% and control: 83.5%). By education level, 13.3 per cent of women in intervention households completed their primary education; while the percentage was 12.2 per cent in the control group. No women in the intervention or control households completed their secondary level education. Also, a few of them (intervention: 4.1% and control: 4.3%) had informal education.
9 Amartya Sen (1997). Editorial: Human Capital and Human Capability; Robert Crocker (2006). Human Capital Development
and Education: Skills and Knowledge for Canada’s Future: Seven Perspectives; Simon Burgess (2016). Human Capital Development and Education: The State of the Art in the Economics of Education.
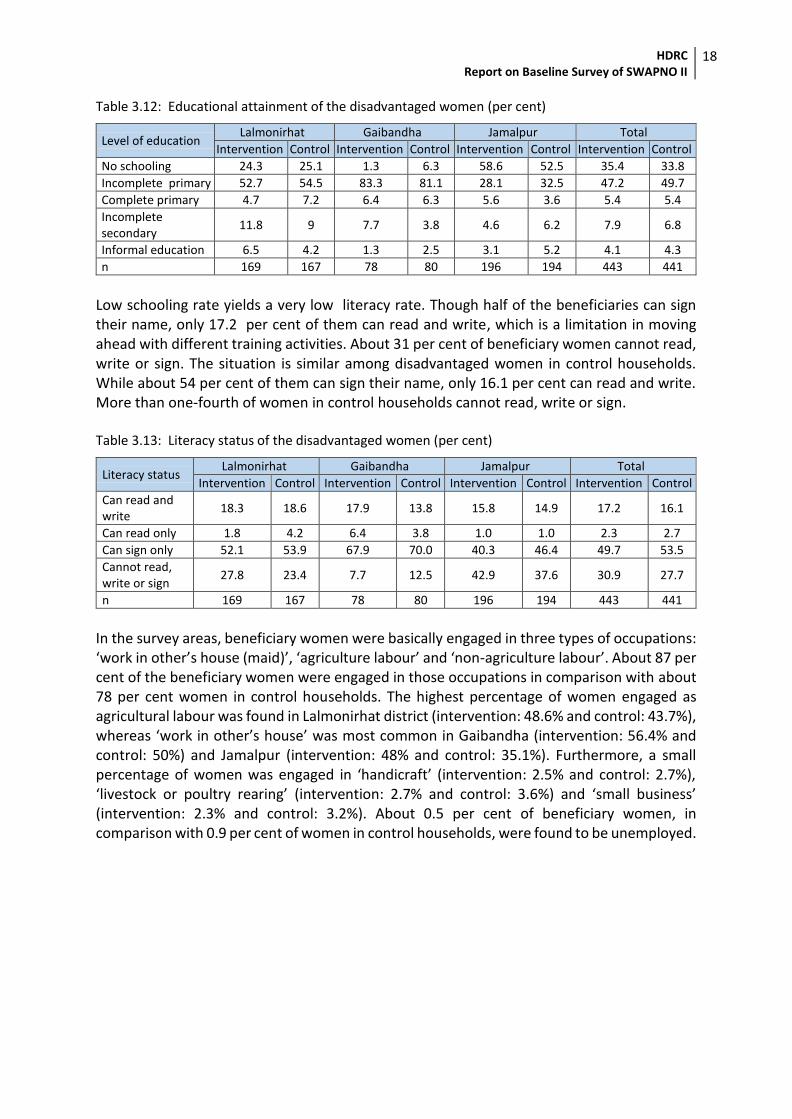
HDRC Report on Baseline Survey of SWAPNO II
18
Table 3.12: Educational attainment of the disadvantaged women (per cent)
Level of education Lalmonirhat Gaibandha Jamalpur Total
Intervention Control Intervention Control Intervention Control Intervention Control
No schooling 24.3 25.1 1.3 6.3 58.6 52.5 35.4 33.8
Incomplete primary 52.7 54.5 83.3 81.1 28.1 32.5 47.2 49.7
Complete primary 4.7 7.2 6.4 6.3 5.6 3.6 5.4 5.4
Incomplete secondary
11.8 9 7.7 3.8 4.6 6.2 7.9 6.8
Informal education 6.5 4.2 1.3 2.5 3.1 5.2 4.1 4.3
n 169 167 78 80 196 194 443 441
Low schooling rate yields a very low literacy rate. Though half of the beneficiaries can sign their name, only 17.2 per cent of them can read and write, which is a limitation in moving ahead with different training activities. About 31 per cent of beneficiary women cannot read, write or sign. The situation is similar among disadvantaged women in control households. While about 54 per cent of them can sign their name, only 16.1 per cent can read and write. More than one-fourth of women in control households cannot read, write or sign. Table 3.13: Literacy status of the disadvantaged women (per cent)
Literacy status Lalmonirhat Gaibandha Jamalpur Total
Intervention Control Intervention Control Intervention Control Intervention Control
Can read and write
18.3 18.6 17.9 13.8 15.8 14.9 17.2 16.1
Can read only 1.8 4.2 6.4 3.8 1.0 1.0 2.3 2.7
Can sign only 52.1 53.9 67.9 70.0 40.3 46.4 49.7 53.5
Cannot read, write or sign
27.8 23.4 7.7 12.5 42.9 37.6 30.9 27.7
n 169 167 78 80 196 194 443 441
In the survey areas, beneficiary women were basically engaged in three types of occupations: ‘work in other’s house (maid)’, ‘agriculture labour’ and ‘non-agriculture labour’. About 87 per cent of the beneficiary women were engaged in those occupations in comparison with about 78 per cent women in control households. The highest percentage of women engaged as agricultural labour was found in Lalmonirhat district (intervention: 48.6% and control: 43.7%), whereas ‘work in other’s house’ was most common in Gaibandha (intervention: 56.4% and control: 50%) and Jamalpur (intervention: 48% and control: 35.1%). Furthermore, a small percentage of women was engaged in ‘handicraft’ (intervention: 2.5% and control: 2.7%), ‘livestock or poultry rearing’ (intervention: 2.7% and control: 3.6%) and ‘small business’ (intervention: 2.3% and control: 3.2%). About 0.5 per cent of beneficiary women, in comparison with 0.9 per cent of women in control households, were found to be unemployed.
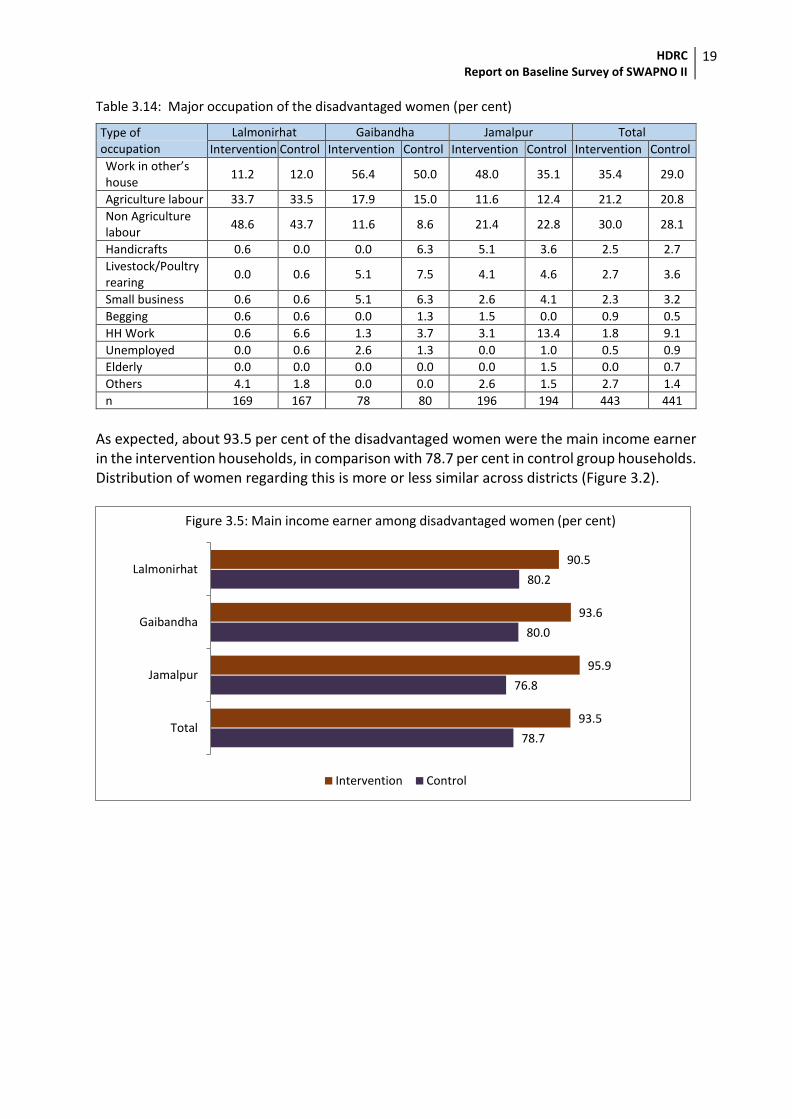
HDRC Report on Baseline Survey of SWAPNO II
19
Table 3.14: Major occupation of the disadvantaged women (per cent)
Type of occupation
Lalmonirhat Gaibandha Jamalpur Total
Intervention Control Intervention Control Intervention Control Intervention Control
Work in other’s house
11.2 12.0 56.4 50.0 48.0 35.1 35.4 29.0
Agriculture labour 33.7 33.5 17.9 15.0 11.6 12.4 21.2 20.8
Non Agriculture labour
48.6 43.7 11.6 8.6 21.4 22.8 30.0 28.1
Handicrafts 0.6 0.0 0.0 6.3 5.1 3.6 2.5 2.7
Livestock/Poultry rearing
0.0 0.6 5.1 7.5 4.1 4.6 2.7 3.6
Small business 0.6 0.6 5.1 6.3 2.6 4.1 2.3 3.2
Begging 0.6 0.6 0.0 1.3 1.5 0.0 0.9 0.5
HH Work 0.6 6.6 1.3 3.7 3.1 13.4 1.8 9.1
Unemployed 0.0 0.6 2.6 1.3 0.0 1.0 0.5 0.9
Elderly 0.0 0.0 0.0 0.0 0.0 1.5 0.0 0.7
Others 4.1 1.8 0.0 0.0 2.6 1.5 2.7 1.4
n 169 167 78 80 196 194 443 441
As expected, about 93.5 per cent of the disadvantaged women were the main income earner in the intervention households, in comparison with 78.7 per cent in control group households. Distribution of women regarding this is more or less similar across districts (Figure 3.2).
78.7
76.8
80.0
80.2
93.5
95.9
93.6
90.5
Total
Jamalpur
Gaibandha
Lalmonirhat
Intervention Control
Figure 3.5: Main income earner among disadvantaged women (per cent)
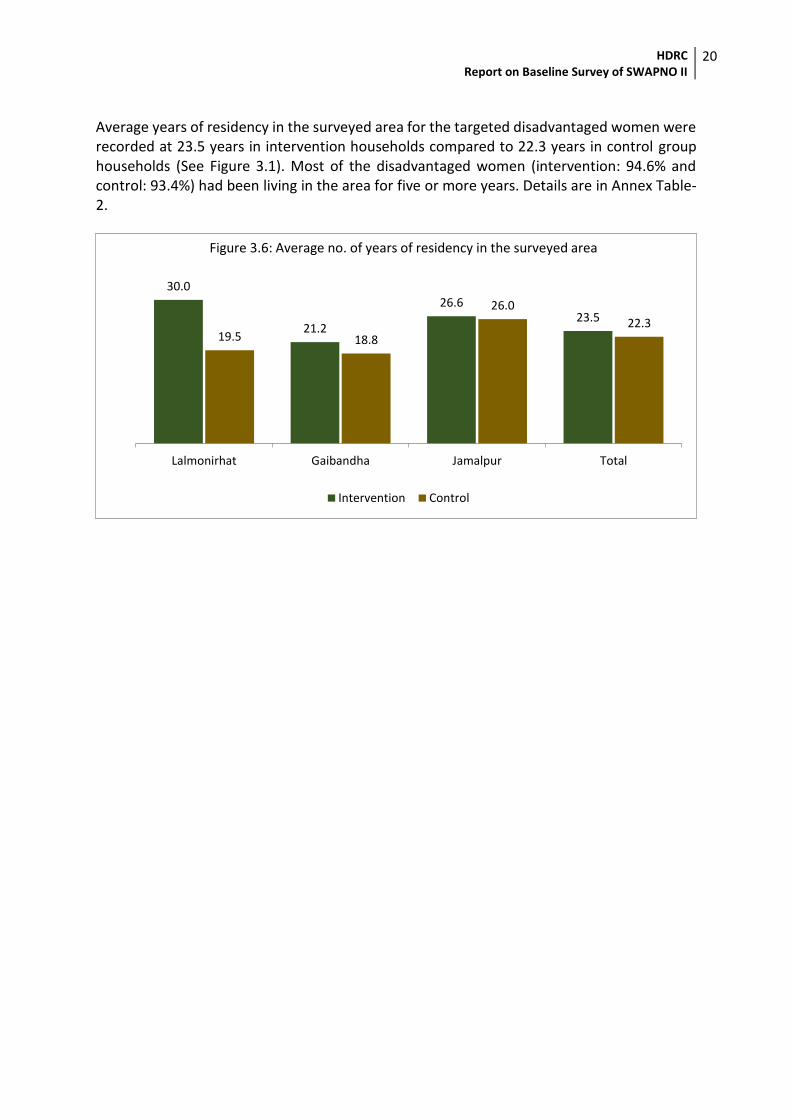
HDRC Report on Baseline Survey of SWAPNO II
20
Average years of residency in the surveyed area for the targeted disadvantaged women were recorded at 23.5 years in intervention households compared to 22.3 years in control group households (See Figure 3.1). Most of the disadvantaged women (intervention: 94.6% and control: 93.4%) had been living in the area for five or more years. Details are in Annex Table-2.
30.0
21.2
26.623.5
19.5 18.8
26.0
22.3
Lalmonirhat Gaibandha Jamalpur Total
Intervention Control
Figure 3.6: Average no. of years of residency in the surveyed area
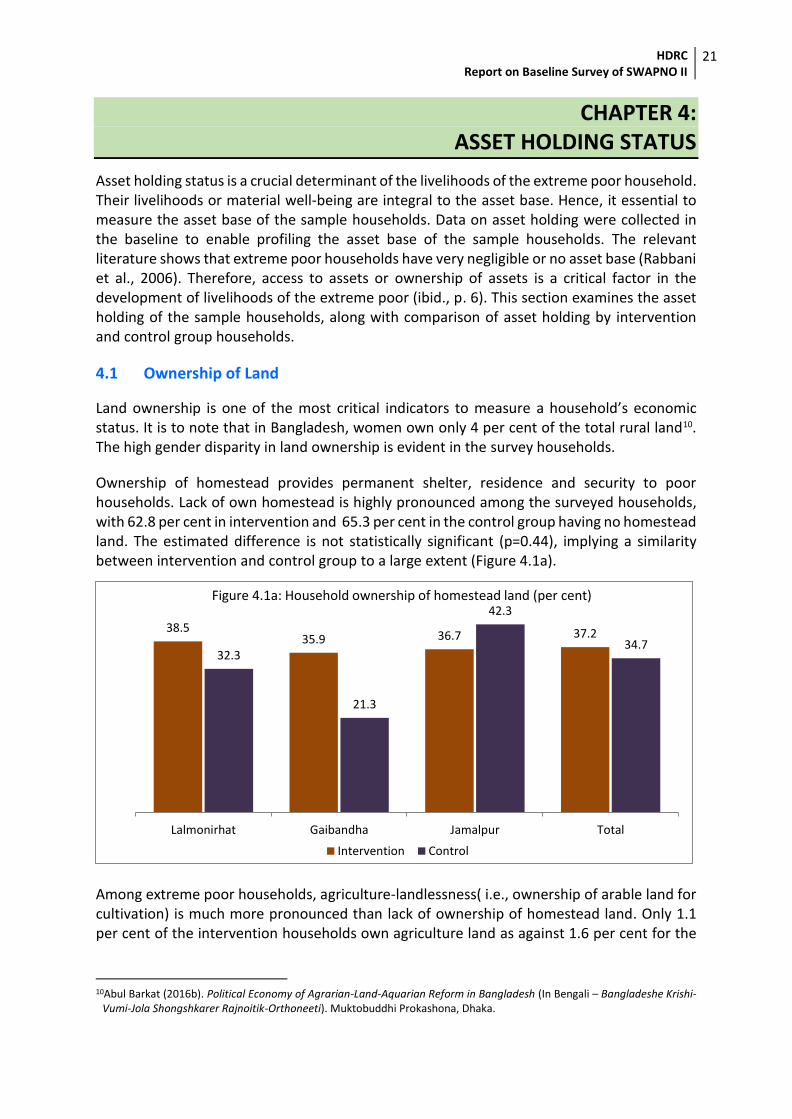
HDRC Report on Baseline Survey of SWAPNO II
21
CHAPTER 4: ASSET HOLDING STATUS
Asset holding status is a crucial determinant of the livelihoods of the extreme poor household. Their livelihoods or material well-being are integral to the asset base. Hence, it essential to measure the asset base of the sample households. Data on asset holding were collected in the baseline to enable profiling the asset base of the sample households. The relevant literature shows that extreme poor households have very negligible or no asset base (Rabbani et al., 2006). Therefore, access to assets or ownership of assets is a critical factor in the development of livelihoods of the extreme poor (ibid., p. 6). This section examines the asset holding of the sample households, along with comparison of asset holding by intervention and control group households.
4.1 Ownership of Land
Land ownership is one of the most critical indicators to measure a household’s economic status. It is to note that in Bangladesh, women own only 4 per cent of the total rural land10. The high gender disparity in land ownership is evident in the survey households.
Ownership of homestead provides permanent shelter, residence and security to poor households. Lack of own homestead is highly pronounced among the surveyed households, with 62.8 per cent in intervention and 65.3 per cent in the control group having no homestead land. The estimated difference is not statistically significant (p=0.44), implying a similarity between intervention and control group to a large extent (Figure 4.1a).
Among extreme poor households, agriculture-landlessness( i.e., ownership of arable land for cultivation) is much more pronounced than lack of ownership of homestead land. Only 1.1 per cent of the intervention households own agriculture land as against 1.6 per cent for the
10Abul Barkat (2016b). Political Economy of Agrarian-Land-Aquarian Reform in Bangladesh (In Bengali – Bangladeshe Krishi-
Vumi-Jola Shongshkarer Rajnoitik-Orthoneeti). Muktobuddhi Prokashona, Dhaka.
38.535.9 36.7 37.2
32.3
21.3
42.3
34.7
Lalmonirhat Gaibandha Jamalpur Total
Intervention Control
Figure 4.1a: Household ownership of homestead land (per cent)
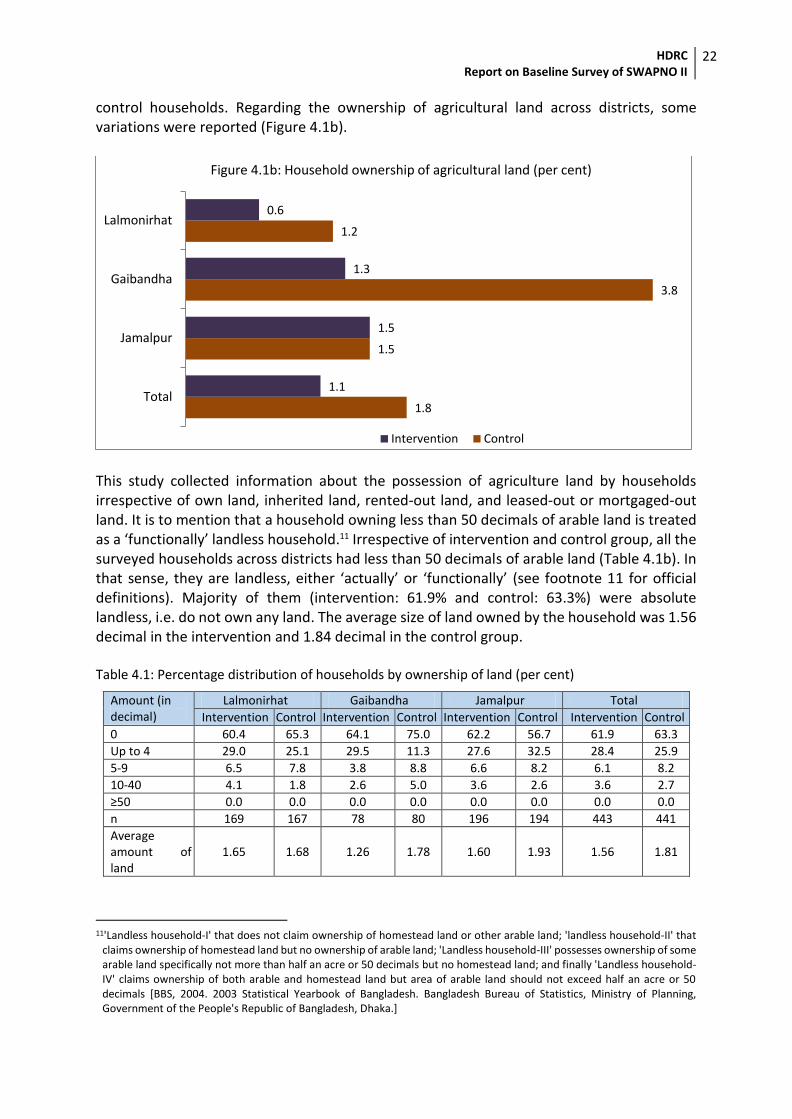
HDRC Report on Baseline Survey of SWAPNO II
22
control households. Regarding the ownership of agricultural land across districts, some variations were reported (Figure 4.1b).
This study collected information about the possession of agriculture land by households irrespective of own land, inherited land, rented-out land, and leased-out or mortgaged-out land. It is to mention that a household owning less than 50 decimals of arable land is treated as a ‘functionally’ landless household.11 Irrespective of intervention and control group, all the surveyed households across districts had less than 50 decimals of arable land (Table 4.1b). In that sense, they are landless, either ‘actually’ or ‘functionally’ (see footnote 11 for official definitions). Majority of them (intervention: 61.9% and control: 63.3%) were absolute landless, i.e. do not own any land. The average size of land owned by the household was 1.56 decimal in the intervention and 1.84 decimal in the control group. Table 4.1: Percentage distribution of households by ownership of land (per cent)
Amount (in decimal)
Lalmonirhat Gaibandha Jamalpur Total
Intervention Control Intervention Control Intervention Control Intervention Control
0 60.4 65.3 64.1 75.0 62.2 56.7 61.9 63.3
Up to 4 29.0 25.1 29.5 11.3 27.6 32.5 28.4 25.9
5-9 6.5 7.8 3.8 8.8 6.6 8.2 6.1 8.2
10-40 4.1 1.8 2.6 5.0 3.6 2.6 3.6 2.7
≥50 0.0 0.0 0.0 0.0 0.0 0.0 0.0 0.0
n 169 167 78 80 196 194 443 441
Average amount of land
1.65 1.68 1.26 1.78 1.60 1.93 1.56 1.81
11'Landless household-I' that does not claim ownership of homestead land or other arable land; 'landless household-II' that
claims ownership of homestead land but no ownership of arable land; 'Landless household-III' possesses ownership of some arable land specifically not more than half an acre or 50 decimals but no homestead land; and finally 'Landless household-IV' claims ownership of both arable and homestead land but area of arable land should not exceed half an acre or 50 decimals [BBS, 2004. 2003 Statistical Yearbook of Bangladesh. Bangladesh Bureau of Statistics, Ministry of Planning, Government of the People's Republic of Bangladesh, Dhaka.]
1.8
1.5
3.8
1.2
1.1
1.5
1.3
0.6
Total
Jamalpur
Gaibandha
Lalmonirhat
Intervention Control
Figure 4.1b: Household ownership of agricultural land (per cent)
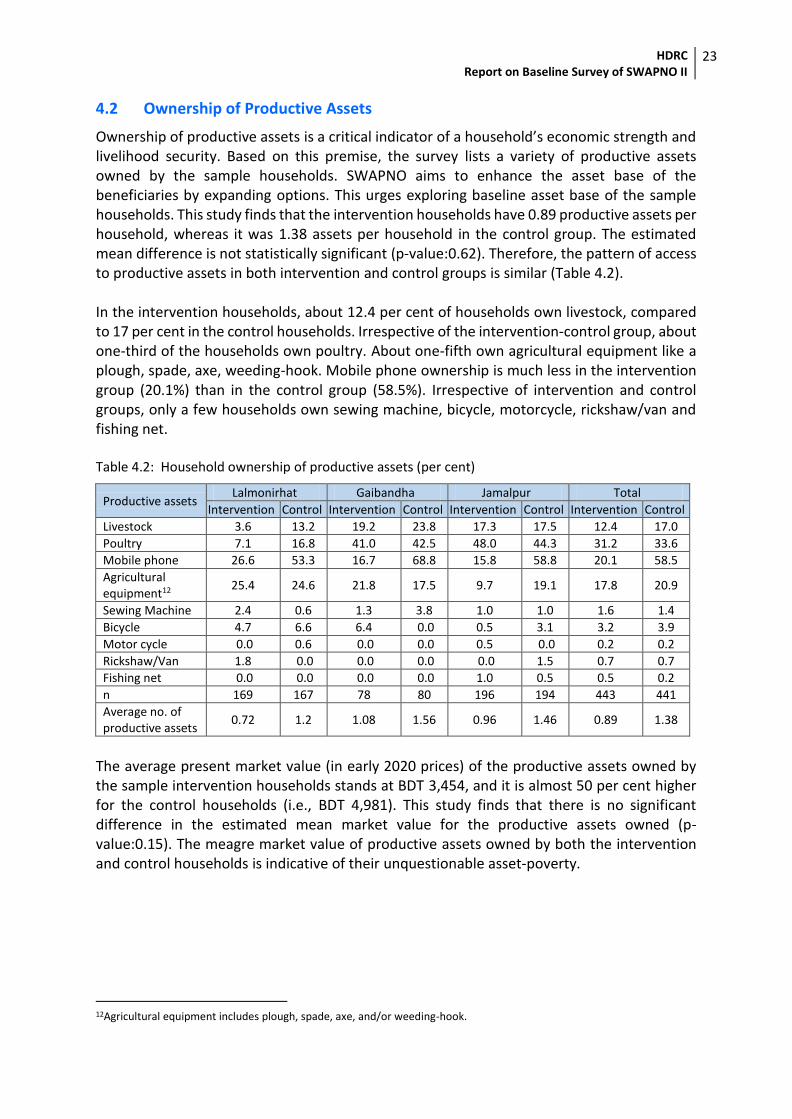
HDRC Report on Baseline Survey of SWAPNO II
23
4.2 Ownership of Productive Assets
Ownership of productive assets is a critical indicator of a household’s economic strength and livelihood security. Based on this premise, the survey lists a variety of productive assets owned by the sample households. SWAPNO aims to enhance the asset base of the beneficiaries by expanding options. This urges exploring baseline asset base of the sample households. This study finds that the intervention households have 0.89 productive assets per household, whereas it was 1.38 assets per household in the control group. The estimated mean difference is not statistically significant (p-value:0.62). Therefore, the pattern of access to productive assets in both intervention and control groups is similar (Table 4.2). In the intervention households, about 12.4 per cent of households own livestock, compared to 17 per cent in the control households. Irrespective of the intervention-control group, about one-third of the households own poultry. About one-fifth own agricultural equipment like a plough, spade, axe, weeding-hook. Mobile phone ownership is much less in the intervention group (20.1%) than in the control group (58.5%). Irrespective of intervention and control groups, only a few households own sewing machine, bicycle, motorcycle, rickshaw/van and fishing net. Table 4.2: Household ownership of productive assets (per cent)
Productive assets Lalmonirhat Gaibandha Jamalpur Total
Intervention Control Intervention Control Intervention Control Intervention Control
Livestock 3.6 13.2 19.2 23.8 17.3 17.5 12.4 17.0
Poultry 7.1 16.8 41.0 42.5 48.0 44.3 31.2 33.6
Mobile phone 26.6 53.3 16.7 68.8 15.8 58.8 20.1 58.5
Agricultural equipment12
25.4 24.6 21.8 17.5 9.7 19.1 17.8 20.9
Sewing Machine 2.4 0.6 1.3 3.8 1.0 1.0 1.6 1.4
Bicycle 4.7 6.6 6.4 0.0 0.5 3.1 3.2 3.9
Motor cycle 0.0 0.6 0.0 0.0 0.5 0.0 0.2 0.2
Rickshaw/Van 1.8 0.0 0.0 0.0 0.0 1.5 0.7 0.7
Fishing net 0.0 0.0 0.0 0.0 1.0 0.5 0.5 0.2
n 169 167 78 80 196 194 443 441
Average no. of productive assets
0.72 1.2 1.08 1.56 0.96 1.46 0.89 1.38
The average present market value (in early 2020 prices) of the productive assets owned by the sample intervention households stands at BDT 3,454, and it is almost 50 per cent higher for the control households (i.e., BDT 4,981). This study finds that there is no significant difference in the estimated mean market value for the productive assets owned (p-value:0.15). The meagre market value of productive assets owned by both the intervention and control households is indicative of their unquestionable asset-poverty.
12Agricultural equipment includes plough, spade, axe, and/or weeding-hook.
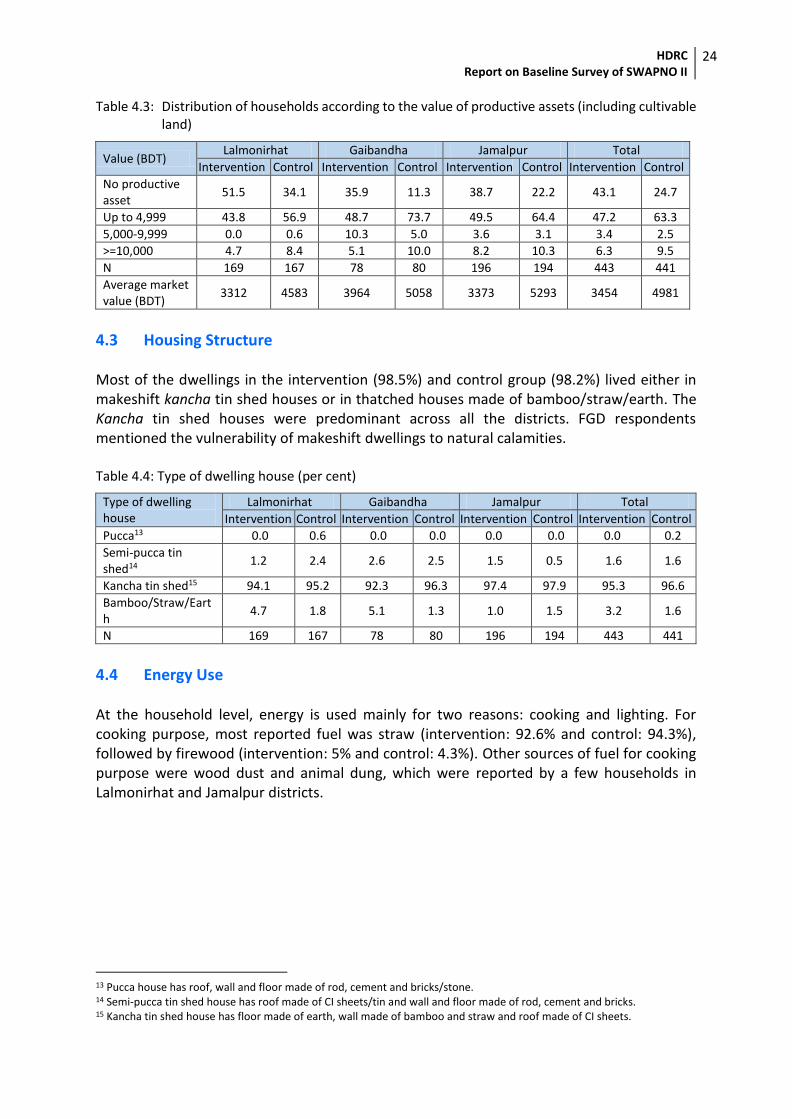
HDRC Report on Baseline Survey of SWAPNO II
24
Table 4.3: Distribution of households according to the value of productive assets (including cultivable land)
Value (BDT) Lalmonirhat Gaibandha Jamalpur Total
Intervention Control Intervention Control Intervention Control Intervention Control
No productive asset
51.5 34.1 35.9 11.3 38.7 22.2 43.1 24.7
Up to 4,999 43.8 56.9 48.7 73.7 49.5 64.4 47.2 63.3
5,000-9,999 0.0 0.6 10.3 5.0 3.6 3.1 3.4 2.5
>=10,000 4.7 8.4 5.1 10.0 8.2 10.3 6.3 9.5
N 169 167 78 80 196 194 443 441
Average market value (BDT)
3312 4583 3964 5058 3373 5293 3454 4981
4.3 Housing Structure Most of the dwellings in the intervention (98.5%) and control group (98.2%) lived either in makeshift kancha tin shed houses or in thatched houses made of bamboo/straw/earth. The Kancha tin shed houses were predominant across all the districts. FGD respondents mentioned the vulnerability of makeshift dwellings to natural calamities. Table 4.4: Type of dwelling house (per cent)
Type of dwelling house
Lalmonirhat Gaibandha Jamalpur Total
Intervention Control Intervention Control Intervention Control Intervention Control
Pucca13 0.0 0.6 0.0 0.0 0.0 0.0 0.0 0.2
Semi-pucca tin shed14
1.2 2.4 2.6 2.5 1.5 0.5 1.6 1.6
Kancha tin shed15 94.1 95.2 92.3 96.3 97.4 97.9 95.3 96.6
Bamboo/Straw/Earth
4.7 1.8 5.1 1.3 1.0 1.5 3.2 1.6
N 169 167 78 80 196 194 443 441
4.4 Energy Use At the household level, energy is used mainly for two reasons: cooking and lighting. For cooking purpose, most reported fuel was straw (intervention: 92.6% and control: 94.3%), followed by firewood (intervention: 5% and control: 4.3%). Other sources of fuel for cooking purpose were wood dust and animal dung, which were reported by a few households in Lalmonirhat and Jamalpur districts.
13 Pucca house has roof, wall and floor made of rod, cement and bricks/stone. 14 Semi-pucca tin shed house has roof made of CI sheets/tin and wall and floor made of rod, cement and bricks. 15 Kancha tin shed house has floor made of earth, wall made of bamboo and straw and roof made of CI sheets.
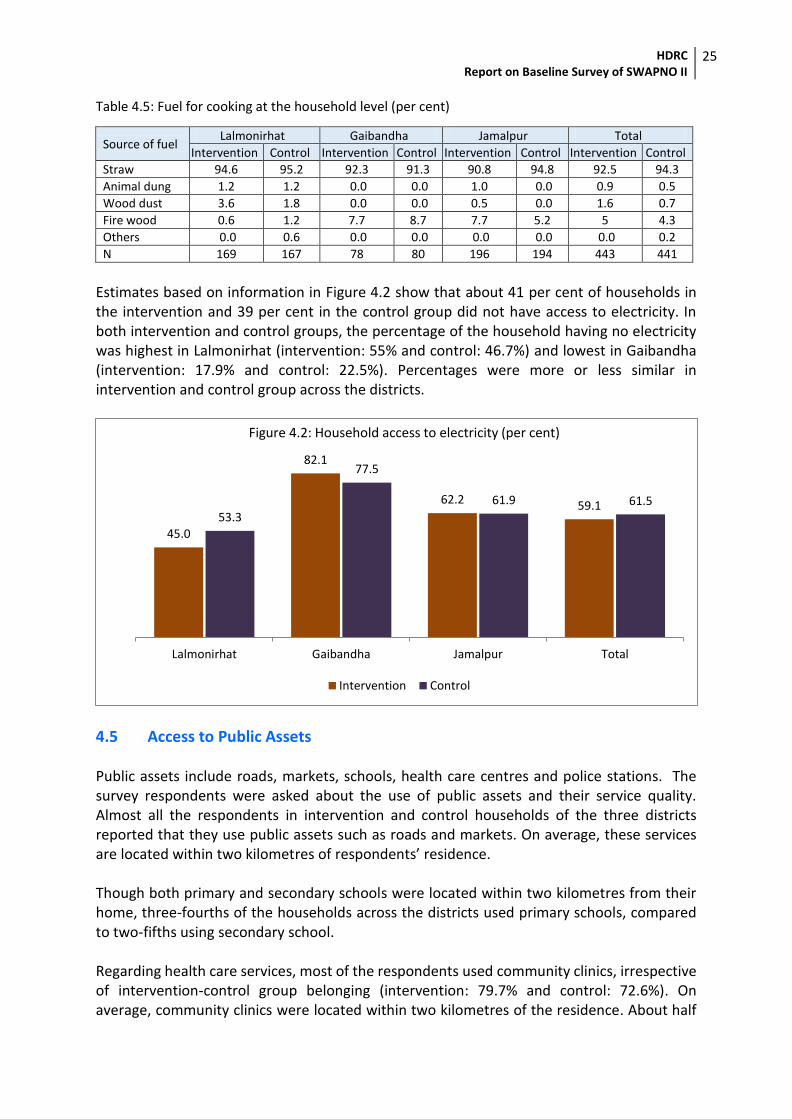
HDRC Report on Baseline Survey of SWAPNO II
25
Table 4.5: Fuel for cooking at the household level (per cent)
Source of fuel Lalmonirhat Gaibandha Jamalpur Total
Intervention Control Intervention Control Intervention Control Intervention Control
Straw 94.6 95.2 92.3 91.3 90.8 94.8 92.5 94.3
Animal dung 1.2 1.2 0.0 0.0 1.0 0.0 0.9 0.5
Wood dust 3.6 1.8 0.0 0.0 0.5 0.0 1.6 0.7
Fire wood 0.6 1.2 7.7 8.7 7.7 5.2 5 4.3
Others 0.0 0.6 0.0 0.0 0.0 0.0 0.0 0.2
N 169 167 78 80 196 194 443 441
Estimates based on information in Figure 4.2 show that about 41 per cent of households in the intervention and 39 per cent in the control group did not have access to electricity. In both intervention and control groups, the percentage of the household having no electricity was highest in Lalmonirhat (intervention: 55% and control: 46.7%) and lowest in Gaibandha (intervention: 17.9% and control: 22.5%). Percentages were more or less similar in intervention and control group across the districts.
4.5 Access to Public Assets Public assets include roads, markets, schools, health care centres and police stations. The survey respondents were asked about the use of public assets and their service quality. Almost all the respondents in intervention and control households of the three districts reported that they use public assets such as roads and markets. On average, these services are located within two kilometres of respondents’ residence. Though both primary and secondary schools were located within two kilometres from their home, three-fourths of the households across the districts used primary schools, compared to two-fifths using secondary school. Regarding health care services, most of the respondents used community clinics, irrespective of intervention-control group belonging (intervention: 79.7% and control: 72.6%). On average, community clinics were located within two kilometres of the residence. About half
45.0
82.1
62.2 59.153.3
77.5
61.9 61.5
Lalmonirhat Gaibandha Jamalpur Total
Intervention Control
Figure 4.2: Household access to electricity (per cent)
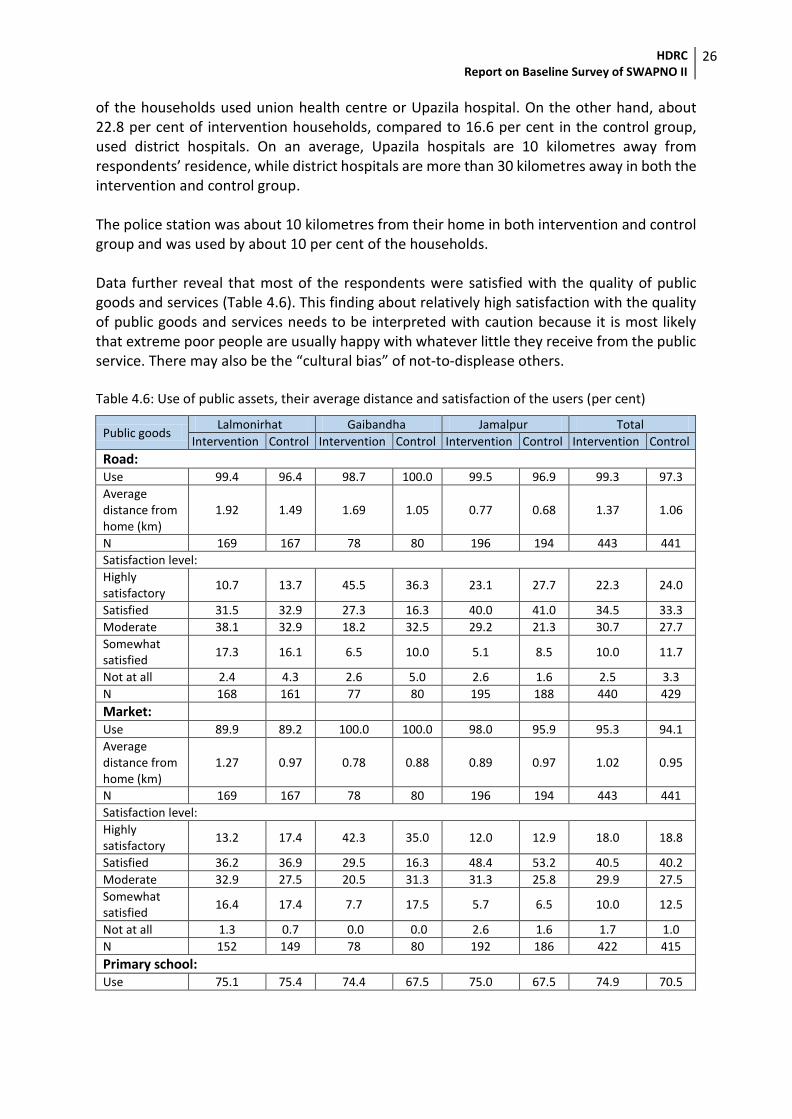
HDRC Report on Baseline Survey of SWAPNO II
26
of the households used union health centre or Upazila hospital. On the other hand, about 22.8 per cent of intervention households, compared to 16.6 per cent in the control group, used district hospitals. On an average, Upazila hospitals are 10 kilometres away from respondents’ residence, while district hospitals are more than 30 kilometres away in both the intervention and control group. The police station was about 10 kilometres from their home in both intervention and control group and was used by about 10 per cent of the households. Data further reveal that most of the respondents were satisfied with the quality of public goods and services (Table 4.6). This finding about relatively high satisfaction with the quality of public goods and services needs to be interpreted with caution because it is most likely that extreme poor people are usually happy with whatever little they receive from the public service. There may also be the “cultural bias” of not-to-displease others. Table 4.6: Use of public assets, their average distance and satisfaction of the users (per cent)
Public goods Lalmonirhat Gaibandha Jamalpur Total
Intervention Control Intervention Control Intervention Control Intervention Control
Road: Use 99.4 96.4 98.7 100.0 99.5 96.9 99.3 97.3
Average distance from home (km)
1.92 1.49 1.69 1.05 0.77 0.68 1.37 1.06
N 169 167 78 80 196 194 443 441
Satisfaction level:
Highly satisfactory
10.7 13.7 45.5 36.3 23.1 27.7 22.3 24.0
Satisfied 31.5 32.9 27.3 16.3 40.0 41.0 34.5 33.3
Moderate 38.1 32.9 18.2 32.5 29.2 21.3 30.7 27.7
Somewhat satisfied
17.3 16.1 6.5 10.0 5.1 8.5 10.0 11.7
Not at all 2.4 4.3 2.6 5.0 2.6 1.6 2.5 3.3
N 168 161 77 80 195 188 440 429
Market:
Use 89.9 89.2 100.0 100.0 98.0 95.9 95.3 94.1
Average distance from home (km)
1.27 0.97 0.78 0.88 0.89 0.97 1.02 0.95
N 169 167 78 80 196 194 443 441
Satisfaction level:
Highly satisfactory
13.2 17.4 42.3 35.0 12.0 12.9 18.0 18.8
Satisfied 36.2 36.9 29.5 16.3 48.4 53.2 40.5 40.2
Moderate 32.9 27.5 20.5 31.3 31.3 25.8 29.9 27.5
Somewhat satisfied
16.4 17.4 7.7 17.5 5.7 6.5 10.0 12.5
Not at all 1.3 0.7 0.0 0.0 2.6 1.6 1.7 1.0
N 152 149 78 80 192 186 422 415
Primary school: Use 75.1 75.4 74.4 67.5 75.0 67.5 74.9 70.5
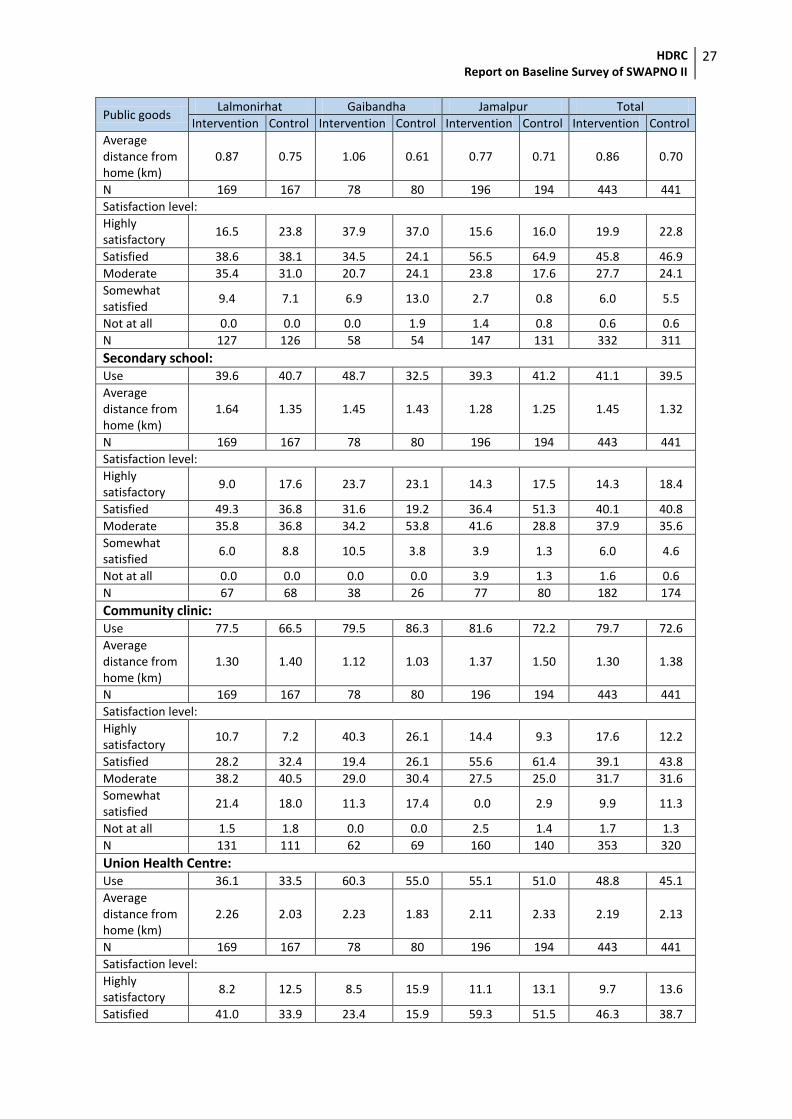
HDRC Report on Baseline Survey of SWAPNO II
27
Public goods Lalmonirhat Gaibandha Jamalpur Total
Intervention Control Intervention Control Intervention Control Intervention Control
Average distance from home (km)
0.87 0.75 1.06 0.61 0.77 0.71 0.86 0.70
N 169 167 78 80 196 194 443 441
Satisfaction level:
Highly satisfactory
16.5 23.8 37.9 37.0 15.6 16.0 19.9 22.8
Satisfied 38.6 38.1 34.5 24.1 56.5 64.9 45.8 46.9
Moderate 35.4 31.0 20.7 24.1 23.8 17.6 27.7 24.1
Somewhat satisfied
9.4 7.1 6.9 13.0 2.7 0.8 6.0 5.5
Not at all 0.0 0.0 0.0 1.9 1.4 0.8 0.6 0.6
N 127 126 58 54 147 131 332 311
Secondary school: Use 39.6 40.7 48.7 32.5 39.3 41.2 41.1 39.5
Average distance from home (km)
1.64 1.35 1.45 1.43 1.28 1.25 1.45 1.32
N 169 167 78 80 196 194 443 441
Satisfaction level:
Highly satisfactory
9.0 17.6 23.7 23.1 14.3 17.5 14.3 18.4
Satisfied 49.3 36.8 31.6 19.2 36.4 51.3 40.1 40.8
Moderate 35.8 36.8 34.2 53.8 41.6 28.8 37.9 35.6
Somewhat satisfied
6.0 8.8 10.5 3.8 3.9 1.3 6.0 4.6
Not at all 0.0 0.0 0.0 0.0 3.9 1.3 1.6 0.6
N 67 68 38 26 77 80 182 174
Community clinic: Use 77.5 66.5 79.5 86.3 81.6 72.2 79.7 72.6
Average distance from home (km)
1.30 1.40 1.12 1.03 1.37 1.50 1.30 1.38
N 169 167 78 80 196 194 443 441
Satisfaction level:
Highly satisfactory
10.7 7.2 40.3 26.1 14.4 9.3 17.6 12.2
Satisfied 28.2 32.4 19.4 26.1 55.6 61.4 39.1 43.8
Moderate 38.2 40.5 29.0 30.4 27.5 25.0 31.7 31.6
Somewhat satisfied
21.4 18.0 11.3 17.4 0.0 2.9 9.9 11.3
Not at all 1.5 1.8 0.0 0.0 2.5 1.4 1.7 1.3
N 131 111 62 69 160 140 353 320
Union Health Centre: Use 36.1 33.5 60.3 55.0 55.1 51.0 48.8 45.1
Average distance from home (km)
2.26 2.03 2.23 1.83 2.11 2.33 2.19 2.13
N 169 167 78 80 196 194 443 441
Satisfaction level:
Highly satisfactory
8.2 12.5 8.5 15.9 11.1 13.1 9.7 13.6
Satisfied 41.0 33.9 23.4 15.9 59.3 51.5 46.3 38.7
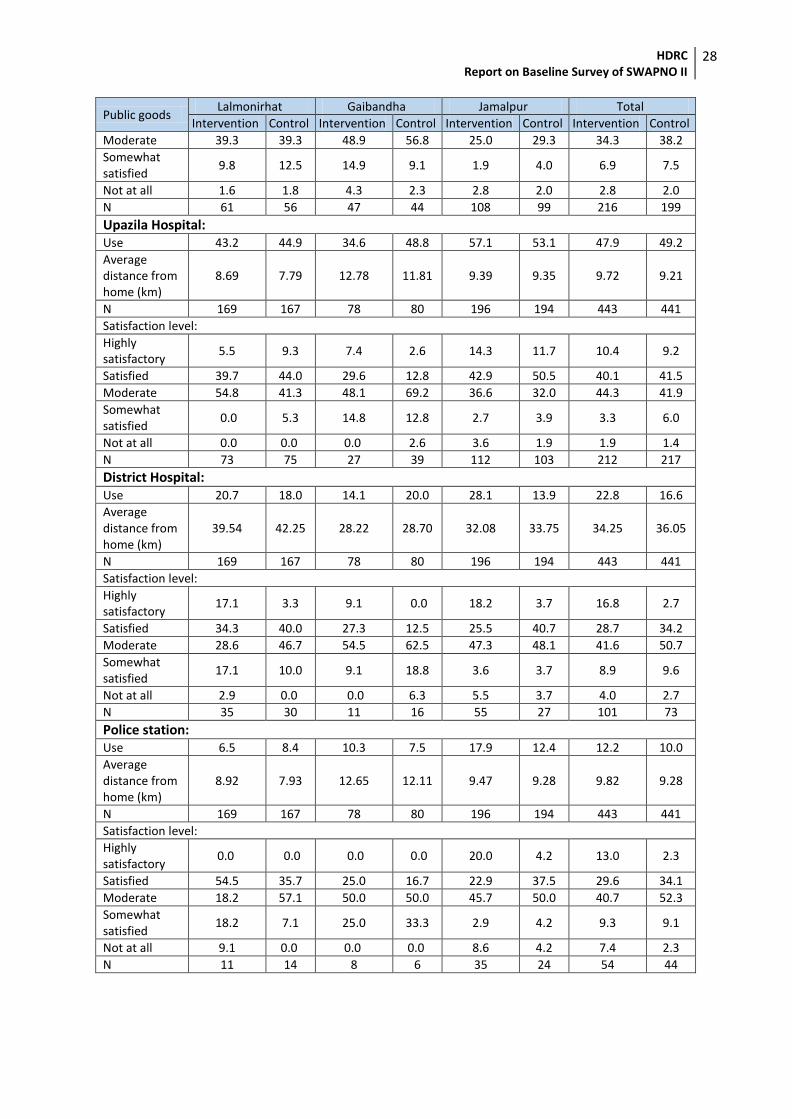
HDRC Report on Baseline Survey of SWAPNO II
28
Public goods Lalmonirhat Gaibandha Jamalpur Total
Intervention Control Intervention Control Intervention Control Intervention Control
Moderate 39.3 39.3 48.9 56.8 25.0 29.3 34.3 38.2
Somewhat satisfied
9.8 12.5 14.9 9.1 1.9 4.0 6.9 7.5
Not at all 1.6 1.8 4.3 2.3 2.8 2.0 2.8 2.0
N 61 56 47 44 108 99 216 199
Upazila Hospital: Use 43.2 44.9 34.6 48.8 57.1 53.1 47.9 49.2
Average distance from home (km)
8.69 7.79 12.78 11.81 9.39 9.35 9.72 9.21
N 169 167 78 80 196 194 443 441
Satisfaction level:
Highly satisfactory
5.5 9.3 7.4 2.6 14.3 11.7 10.4 9.2
Satisfied 39.7 44.0 29.6 12.8 42.9 50.5 40.1 41.5
Moderate 54.8 41.3 48.1 69.2 36.6 32.0 44.3 41.9
Somewhat satisfied
0.0 5.3 14.8 12.8 2.7 3.9 3.3 6.0
Not at all 0.0 0.0 0.0 2.6 3.6 1.9 1.9 1.4
N 73 75 27 39 112 103 212 217
District Hospital: Use 20.7 18.0 14.1 20.0 28.1 13.9 22.8 16.6
Average distance from home (km)
39.54 42.25 28.22 28.70 32.08 33.75 34.25 36.05
N 169 167 78 80 196 194 443 441
Satisfaction level:
Highly satisfactory
17.1 3.3 9.1 0.0 18.2 3.7 16.8 2.7
Satisfied 34.3 40.0 27.3 12.5 25.5 40.7 28.7 34.2
Moderate 28.6 46.7 54.5 62.5 47.3 48.1 41.6 50.7
Somewhat satisfied
17.1 10.0 9.1 18.8 3.6 3.7 8.9 9.6
Not at all 2.9 0.0 0.0 6.3 5.5 3.7 4.0 2.7
N 35 30 11 16 55 27 101 73
Police station: Use 6.5 8.4 10.3 7.5 17.9 12.4 12.2 10.0
Average distance from home (km)
8.92 7.93 12.65 12.11 9.47 9.28 9.82 9.28
N 169 167 78 80 196 194 443 441
Satisfaction level:
Highly satisfactory
0.0 0.0 0.0 0.0 20.0 4.2 13.0 2.3
Satisfied 54.5 35.7 25.0 16.7 22.9 37.5 29.6 34.1
Moderate 18.2 57.1 50.0 50.0 45.7 50.0 40.7 52.3
Somewhat satisfied
18.2 7.1 25.0 33.3 2.9 4.2 9.3 9.1
Not at all 9.1 0.0 0.0 0.0 8.6 4.2 7.4 2.3
N 11 14 8 6 35 24 54 44
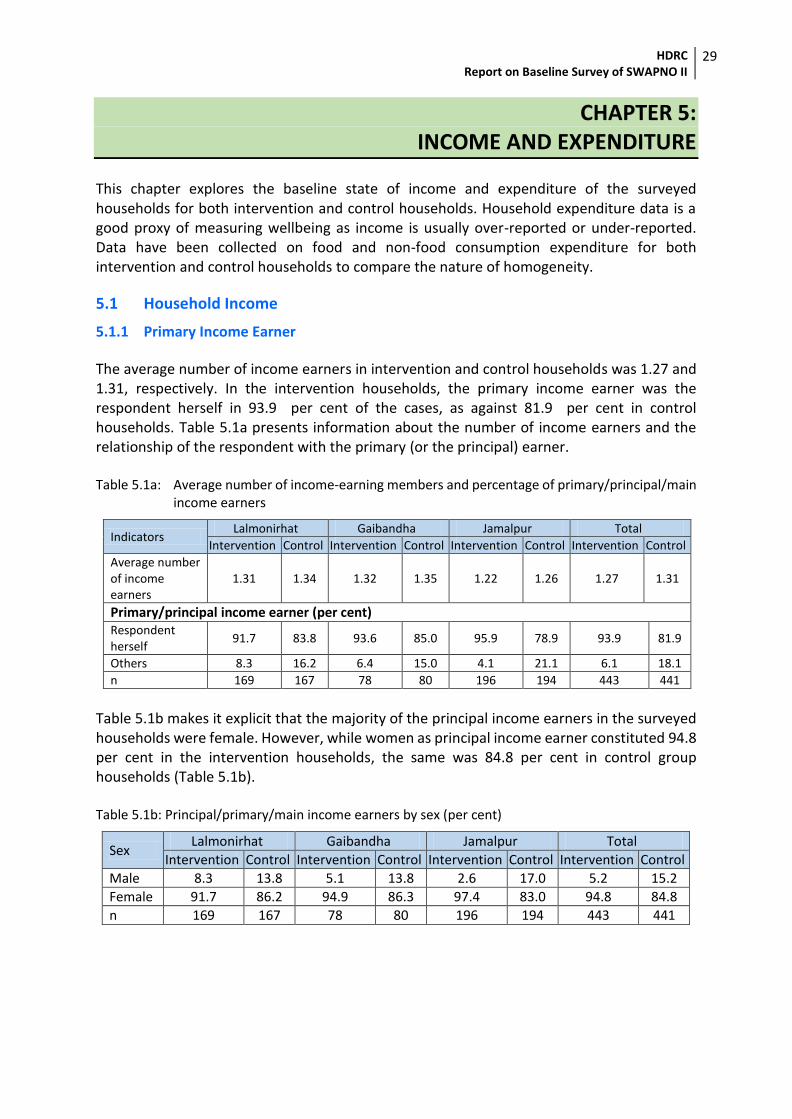
HDRC Report on Baseline Survey of SWAPNO II
29
CHAPTER 5: INCOME AND EXPENDITURE
This chapter explores the baseline state of income and expenditure of the surveyed households for both intervention and control households. Household expenditure data is a good proxy of measuring wellbeing as income is usually over-reported or under-reported. Data have been collected on food and non-food consumption expenditure for both intervention and control households to compare the nature of homogeneity.
5.1 Household Income
5.1.1 Primary Income Earner
The average number of income earners in intervention and control households was 1.27 and 1.31, respectively. In the intervention households, the primary income earner was the respondent herself in 93.9 per cent of the cases, as against 81.9 per cent in control households. Table 5.1a presents information about the number of income earners and the relationship of the respondent with the primary (or the principal) earner. Table 5.1a: Average number of income-earning members and percentage of primary/principal/main
income earners
Indicators Lalmonirhat Gaibandha Jamalpur Total
Intervention Control Intervention Control Intervention Control Intervention Control
Average number of income earners
1.31 1.34 1.32 1.35 1.22 1.26 1.27 1.31
Primary/principal income earner (per cent) Respondent herself
91.7 83.8 93.6 85.0 95.9 78.9 93.9 81.9
Others 8.3 16.2 6.4 15.0 4.1 21.1 6.1 18.1
n 169 167 78 80 196 194 443 441
Table 5.1b makes it explicit that the majority of the principal income earners in the surveyed households were female. However, while women as principal income earner constituted 94.8 per cent in the intervention households, the same was 84.8 per cent in control group households (Table 5.1b). Table 5.1b: Principal/primary/main income earners by sex (per cent)
Sex Lalmonirhat Gaibandha Jamalpur Total
Intervention Control Intervention Control Intervention Control Intervention Control
Male 8.3 13.8 5.1 13.8 2.6 17.0 5.2 15.2
Female 91.7 86.2 94.9 86.3 97.4 83.0 94.8 84.8
n 169 167 78 80 196 194 443 441
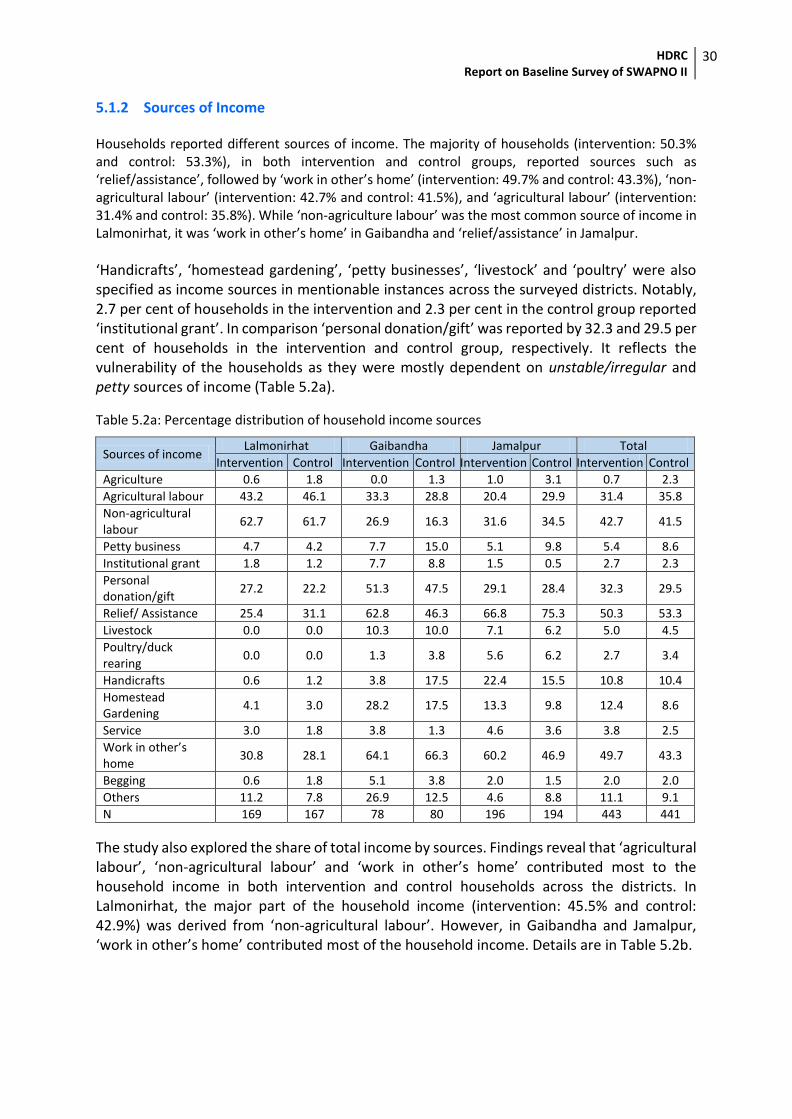
HDRC Report on Baseline Survey of SWAPNO II
30
5.1.2 Sources of Income Households reported different sources of income. The majority of households (intervention: 50.3% and control: 53.3%), in both intervention and control groups, reported sources such as ‘relief/assistance’, followed by ‘work in other’s home’ (intervention: 49.7% and control: 43.3%), ‘non-agricultural labour’ (intervention: 42.7% and control: 41.5%), and ‘agricultural labour’ (intervention: 31.4% and control: 35.8%). While ‘non-agriculture labour’ was the most common source of income in Lalmonirhat, it was ‘work in other’s home’ in Gaibandha and ‘relief/assistance’ in Jamalpur.
‘Handicrafts’, ‘homestead gardening’, ‘petty businesses’, ‘livestock’ and ‘poultry’ were also specified as income sources in mentionable instances across the surveyed districts. Notably, 2.7 per cent of households in the intervention and 2.3 per cent in the control group reported ‘institutional grant’. In comparison ‘personal donation/gift’ was reported by 32.3 and 29.5 per cent of households in the intervention and control group, respectively. It reflects the vulnerability of the households as they were mostly dependent on unstable/irregular and petty sources of income (Table 5.2a).
Table 5.2a: Percentage distribution of household income sources
Sources of income Lalmonirhat Gaibandha Jamalpur Total
Intervention Control Intervention Control Intervention Control Intervention Control
Agriculture 0.6 1.8 0.0 1.3 1.0 3.1 0.7 2.3
Agricultural labour 43.2 46.1 33.3 28.8 20.4 29.9 31.4 35.8
Non-agricultural labour
62.7 61.7 26.9 16.3 31.6 34.5 42.7 41.5
Petty business 4.7 4.2 7.7 15.0 5.1 9.8 5.4 8.6
Institutional grant 1.8 1.2 7.7 8.8 1.5 0.5 2.7 2.3
Personal donation/gift
27.2 22.2 51.3 47.5 29.1 28.4 32.3 29.5
Relief/ Assistance 25.4 31.1 62.8 46.3 66.8 75.3 50.3 53.3
Livestock 0.0 0.0 10.3 10.0 7.1 6.2 5.0 4.5
Poultry/duck rearing
0.0 0.0 1.3 3.8 5.6 6.2 2.7 3.4
Handicrafts 0.6 1.2 3.8 17.5 22.4 15.5 10.8 10.4
Homestead Gardening
4.1 3.0 28.2 17.5 13.3 9.8 12.4 8.6
Service 3.0 1.8 3.8 1.3 4.6 3.6 3.8 2.5
Work in other’s home
30.8 28.1 64.1 66.3 60.2 46.9 49.7 43.3
Begging 0.6 1.8 5.1 3.8 2.0 1.5 2.0 2.0
Others 11.2 7.8 26.9 12.5 4.6 8.8 11.1 9.1
N 169 167 78 80 196 194 443 441
The study also explored the share of total income by sources. Findings reveal that ‘agricultural labour’, ‘non-agricultural labour’ and ‘work in other’s home’ contributed most to the household income in both intervention and control households across the districts. In Lalmonirhat, the major part of the household income (intervention: 45.5% and control: 42.9%) was derived from ‘non-agricultural labour’. However, in Gaibandha and Jamalpur, ‘work in other’s home’ contributed most of the household income. Details are in Table 5.2b.
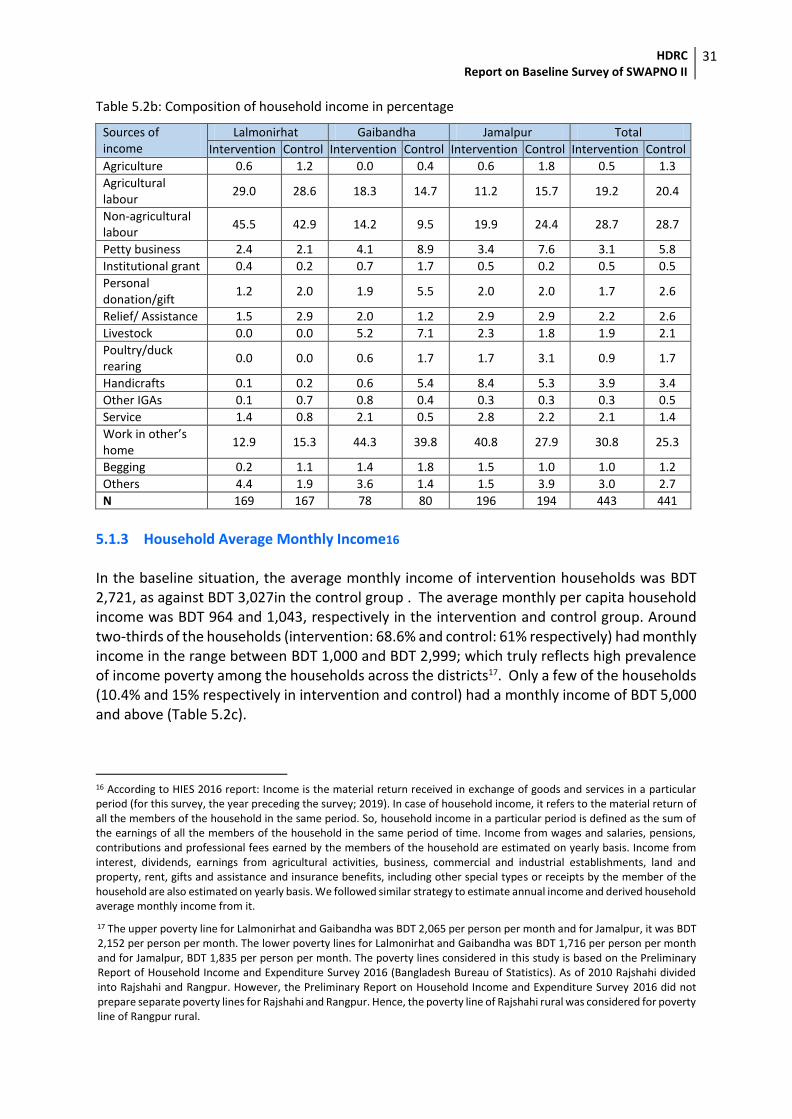
HDRC Report on Baseline Survey of SWAPNO II
31
Table 5.2b: Composition of household income in percentage
Sources of income
Lalmonirhat Gaibandha Jamalpur Total
Intervention Control Intervention Control Intervention Control Intervention Control
Agriculture 0.6 1.2 0.0 0.4 0.6 1.8 0.5 1.3
Agricultural labour
29.0 28.6 18.3 14.7 11.2 15.7 19.2 20.4
Non-agricultural labour
45.5 42.9 14.2 9.5 19.9 24.4 28.7 28.7
Petty business 2.4 2.1 4.1 8.9 3.4 7.6 3.1 5.8
Institutional grant 0.4 0.2 0.7 1.7 0.5 0.2 0.5 0.5
Personal donation/gift
1.2 2.0 1.9 5.5 2.0 2.0 1.7 2.6
Relief/ Assistance 1.5 2.9 2.0 1.2 2.9 2.9 2.2 2.6
Livestock 0.0 0.0 5.2 7.1 2.3 1.8 1.9 2.1
Poultry/duck rearing
0.0 0.0 0.6 1.7 1.7 3.1 0.9 1.7
Handicrafts 0.1 0.2 0.6 5.4 8.4 5.3 3.9 3.4
Other IGAs 0.1 0.7 0.8 0.4 0.3 0.3 0.3 0.5
Service 1.4 0.8 2.1 0.5 2.8 2.2 2.1 1.4
Work in other’s home
12.9 15.3 44.3 39.8 40.8 27.9 30.8 25.3
Begging 0.2 1.1 1.4 1.8 1.5 1.0 1.0 1.2
Others 4.4 1.9 3.6 1.4 1.5 3.9 3.0 2.7
N 169 167 78 80 196 194 443 441
5.1.3 Household Average Monthly Income16 In the baseline situation, the average monthly income of intervention households was BDT 2,721, as against BDT 3,027in the control group . The average monthly per capita household income was BDT 964 and 1,043, respectively in the intervention and control group. Around two-thirds of the households (intervention: 68.6% and control: 61% respectively) had monthly income in the range between BDT 1,000 and BDT 2,999; which truly reflects high prevalence of income poverty among the households across the districts17. Only a few of the households (10.4% and 15% respectively in intervention and control) had a monthly income of BDT 5,000 and above (Table 5.2c).
16 According to HIES 2016 report: Income is the material return received in exchange of goods and services in a particular period (for this survey, the year preceding the survey; 2019). In case of household income, it refers to the material return of all the members of the household in the same period. So, household income in a particular period is defined as the sum of the earnings of all the members of the household in the same period of time. Income from wages and salaries, pensions, contributions and professional fees earned by the members of the household are estimated on yearly basis. Income from interest, dividends, earnings from agricultural activities, business, commercial and industrial establishments, land and property, rent, gifts and assistance and insurance benefits, including other special types or receipts by the member of the household are also estimated on yearly basis. We followed similar strategy to estimate annual income and derived household average monthly income from it.
17 The upper poverty line for Lalmonirhat and Gaibandha was BDT 2,065 per person per month and for Jamalpur, it was BDT 2,152 per person per month. The lower poverty lines for Lalmonirhat and Gaibandha was BDT 1,716 per person per month and for Jamalpur, BDT 1,835 per person per month. The poverty lines considered in this study is based on the Preliminary Report of Household Income and Expenditure Survey 2016 (Bangladesh Bureau of Statistics). As of 2010 Rajshahi divided into Rajshahi and Rangpur. However, the Preliminary Report on Household Income and Expenditure Survey 2016 did not prepare separate poverty lines for Rajshahi and Rangpur. Hence, the poverty line of Rajshahi rural was considered for poverty line of Rangpur rural.
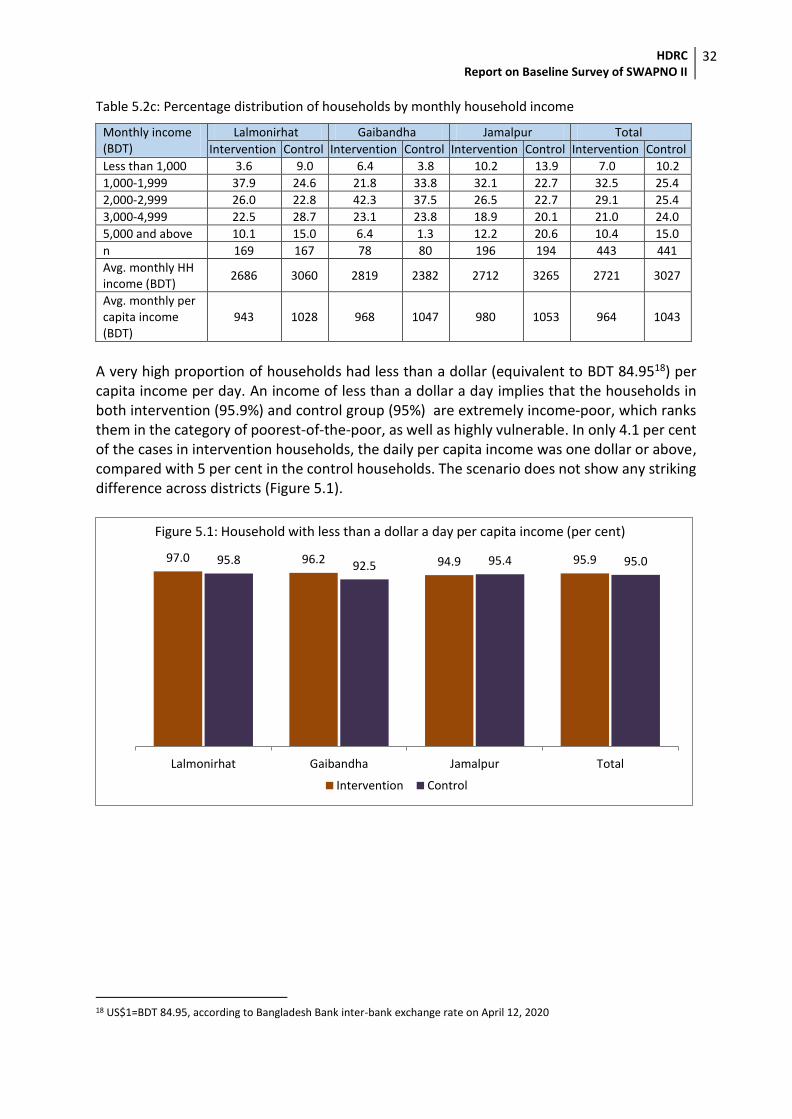
HDRC Report on Baseline Survey of SWAPNO II
32
Table 5.2c: Percentage distribution of households by monthly household income
Monthly income (BDT)
Lalmonirhat Gaibandha Jamalpur Total
Intervention Control Intervention Control Intervention Control Intervention Control
Less than 1,000 3.6 9.0 6.4 3.8 10.2 13.9 7.0 10.2
1,000-1,999 37.9 24.6 21.8 33.8 32.1 22.7 32.5 25.4
2,000-2,999 26.0 22.8 42.3 37.5 26.5 22.7 29.1 25.4
3,000-4,999 22.5 28.7 23.1 23.8 18.9 20.1 21.0 24.0
5,000 and above 10.1 15.0 6.4 1.3 12.2 20.6 10.4 15.0
n 169 167 78 80 196 194 443 441
Avg. monthly HH income (BDT)
2686 3060 2819 2382 2712 3265 2721 3027
Avg. monthly per capita income (BDT)
943 1028 968 1047 980 1053 964 1043
A very high proportion of households had less than a dollar (equivalent to BDT 84.9518) per capita income per day. An income of less than a dollar a day implies that the households in both intervention (95.9%) and control group (95%) are extremely income-poor, which ranks them in the category of poorest-of-the-poor, as well as highly vulnerable. In only 4.1 per cent of the cases in intervention households, the daily per capita income was one dollar or above, compared with 5 per cent in the control households. The scenario does not show any striking difference across districts (Figure 5.1).
18 US$1=BDT 84.95, according to Bangladesh Bank inter-bank exchange rate on April 12, 2020
97.0 96.2 94.9 95.995.8 92.5 95.4 95.0
Lalmonirhat Gaibandha Jamalpur Total
Intervention Control
Figure 5.1: Household with less than a dollar a day per capita income (per cent)
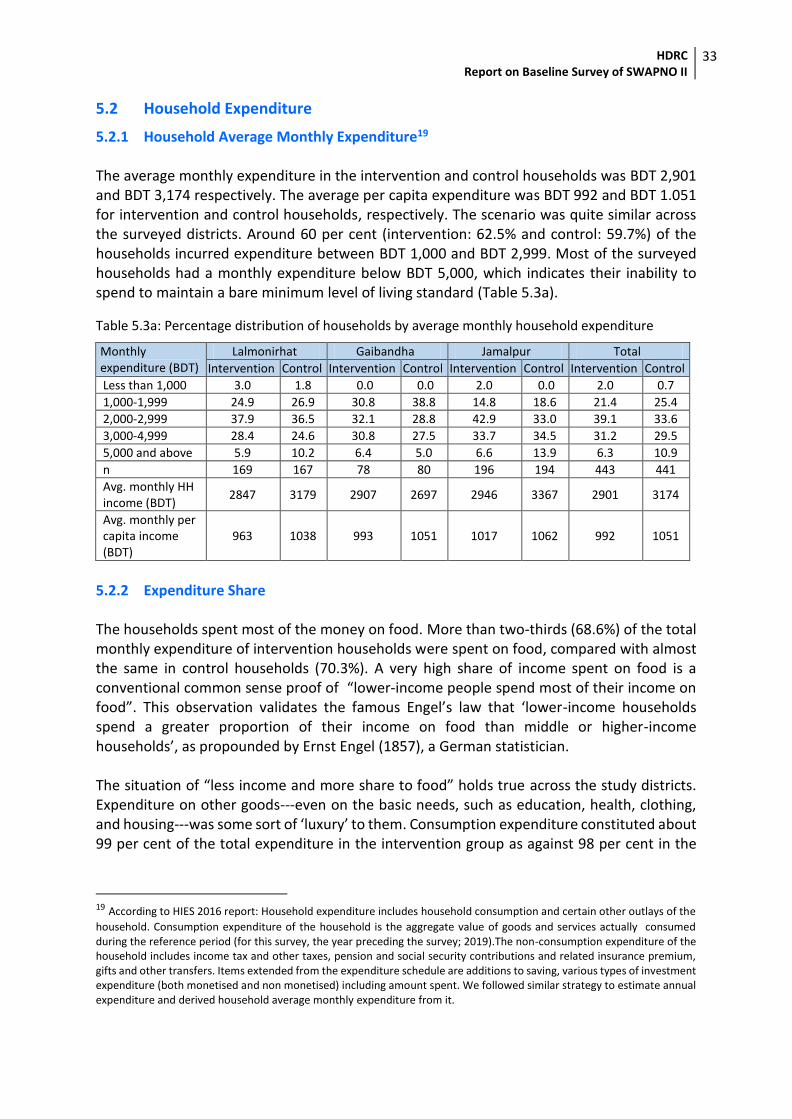
HDRC Report on Baseline Survey of SWAPNO II
33
5.2 Household Expenditure
5.2.1 Household Average Monthly Expenditure19 The average monthly expenditure in the intervention and control households was BDT 2,901 and BDT 3,174 respectively. The average per capita expenditure was BDT 992 and BDT 1.051 for intervention and control households, respectively. The scenario was quite similar across the surveyed districts. Around 60 per cent (intervention: 62.5% and control: 59.7%) of the households incurred expenditure between BDT 1,000 and BDT 2,999. Most of the surveyed households had a monthly expenditure below BDT 5,000, which indicates their inability to spend to maintain a bare minimum level of living standard (Table 5.3a).
Table 5.3a: Percentage distribution of households by average monthly household expenditure
Monthly expenditure (BDT)
Lalmonirhat Gaibandha Jamalpur Total
Intervention Control Intervention Control Intervention Control Intervention Control
Less than 1,000 3.0 1.8 0.0 0.0 2.0 0.0 2.0 0.7
1,000-1,999 24.9 26.9 30.8 38.8 14.8 18.6 21.4 25.4
2,000-2,999 37.9 36.5 32.1 28.8 42.9 33.0 39.1 33.6
3,000-4,999 28.4 24.6 30.8 27.5 33.7 34.5 31.2 29.5
5,000 and above 5.9 10.2 6.4 5.0 6.6 13.9 6.3 10.9
n 169 167 78 80 196 194 443 441
Avg. monthly HH income (BDT)
2847 3179 2907 2697 2946 3367 2901 3174
Avg. monthly per capita income (BDT)
963 1038 993 1051 1017 1062 992 1051
5.2.2 Expenditure Share The households spent most of the money on food. More than two-thirds (68.6%) of the total monthly expenditure of intervention households were spent on food, compared with almost the same in control households (70.3%). A very high share of income spent on food is a conventional common sense proof of “lower-income people spend most of their income on food”. This observation validates the famous Engel’s law that ‘lower-income households spend a greater proportion of their income on food than middle or higher-income households’, as propounded by Ernst Engel (1857), a German statistician. The situation of “less income and more share to food” holds true across the study districts. Expenditure on other goods---even on the basic needs, such as education, health, clothing, and housing---was some sort of ‘luxury’ to them. Consumption expenditure constituted about 99 per cent of the total expenditure in the intervention group as against 98 per cent in the
19 According to HIES 2016 report: Household expenditure includes household consumption and certain other outlays of the
household. Consumption expenditure of the household is the aggregate value of goods and services actually consumed during the reference period (for this survey, the year preceding the survey; 2019).The non-consumption expenditure of the household includes income tax and other taxes, pension and social security contributions and related insurance premium, gifts and other transfers. Items extended from the expenditure schedule are additions to saving, various types of investment expenditure (both monetised and non monetised) including amount spent. We followed similar strategy to estimate annual expenditure and derived household average monthly expenditure from it.
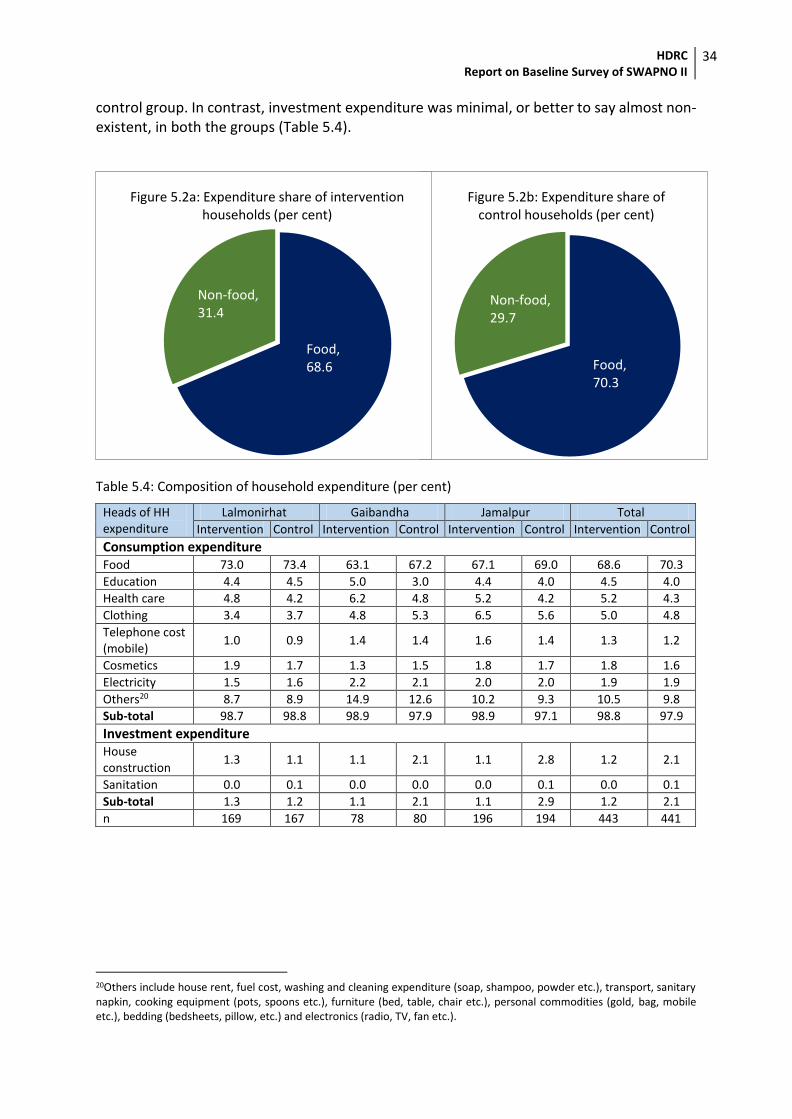
HDRC Report on Baseline Survey of SWAPNO II
34
control group. In contrast, investment expenditure was minimal, or better to say almost non-existent, in both the groups (Table 5.4).
Table 5.4: Composition of household expenditure (per cent)
Heads of HH expenditure
Lalmonirhat Gaibandha Jamalpur Total
Intervention Control Intervention Control Intervention Control Intervention Control
Consumption expenditure
Food 73.0 73.4 63.1 67.2 67.1 69.0 68.6 70.3
Education 4.4 4.5 5.0 3.0 4.4 4.0 4.5 4.0
Health care 4.8 4.2 6.2 4.8 5.2 4.2 5.2 4.3
Clothing 3.4 3.7 4.8 5.3 6.5 5.6 5.0 4.8
Telephone cost (mobile)
1.0 0.9 1.4 1.4 1.6 1.4 1.3 1.2
Cosmetics 1.9 1.7 1.3 1.5 1.8 1.7 1.8 1.6
Electricity 1.5 1.6 2.2 2.1 2.0 2.0 1.9 1.9
Others20 8.7 8.9 14.9 12.6 10.2 9.3 10.5 9.8
Sub-total 98.7 98.8 98.9 97.9 98.9 97.1 98.8 97.9
Investment expenditure
House construction
1.3 1.1 1.1 2.1 1.1 2.8 1.2 2.1
Sanitation 0.0 0.1 0.0 0.0 0.0 0.1 0.0 0.1
Sub-total 1.3 1.2 1.1 2.1 1.1 2.9 1.2 2.1
n 169 167 78 80 196 194 443 441
20Others include house rent, fuel cost, washing and cleaning expenditure (soap, shampoo, powder etc.), transport, sanitary napkin, cooking equipment (pots, spoons etc.), furniture (bed, table, chair etc.), personal commodities (gold, bag, mobile etc.), bedding (bedsheets, pillow, etc.) and electronics (radio, TV, fan etc.).
Figure 5.2b: Expenditure share of control households (per cent)
Non-food, 29.7
Food, 70.3
Figure 5.2a: Expenditure share of intervention households (per cent)
Non-food, 31.4
Food, 68.6
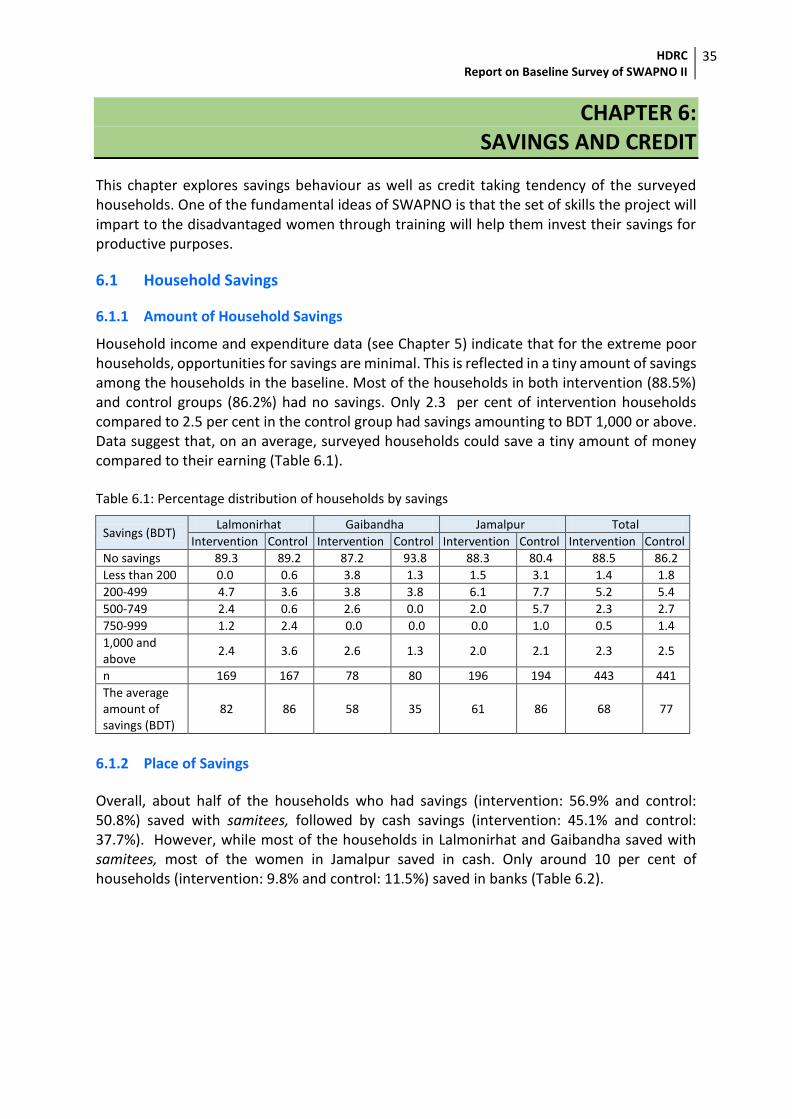
HDRC Report on Baseline Survey of SWAPNO II
35
CHAPTER 6: SAVINGS AND CREDIT
This chapter explores savings behaviour as well as credit taking tendency of the surveyed households. One of the fundamental ideas of SWAPNO is that the set of skills the project will impart to the disadvantaged women through training will help them invest their savings for productive purposes.
6.1 Household Savings
6.1.1 Amount of Household Savings
Household income and expenditure data (see Chapter 5) indicate that for the extreme poor households, opportunities for savings are minimal. This is reflected in a tiny amount of savings among the households in the baseline. Most of the households in both intervention (88.5%) and control groups (86.2%) had no savings. Only 2.3 per cent of intervention households compared to 2.5 per cent in the control group had savings amounting to BDT 1,000 or above. Data suggest that, on an average, surveyed households could save a tiny amount of money compared to their earning (Table 6.1). Table 6.1: Percentage distribution of households by savings
Savings (BDT) Lalmonirhat Gaibandha Jamalpur Total
Intervention Control Intervention Control Intervention Control Intervention Control
No savings 89.3 89.2 87.2 93.8 88.3 80.4 88.5 86.2
Less than 200 0.0 0.6 3.8 1.3 1.5 3.1 1.4 1.8
200-499 4.7 3.6 3.8 3.8 6.1 7.7 5.2 5.4
500-749 2.4 0.6 2.6 0.0 2.0 5.7 2.3 2.7
750-999 1.2 2.4 0.0 0.0 0.0 1.0 0.5 1.4
1,000 and above
2.4 3.6 2.6 1.3 2.0 2.1 2.3 2.5
n 169 167 78 80 196 194 443 441
The average amount of savings (BDT)
82 86 58 35 61 86 68 77
6.1.2 Place of Savings
Overall, about half of the households who had savings (intervention: 56.9% and control: 50.8%) saved with samitees, followed by cash savings (intervention: 45.1% and control: 37.7%). However, while most of the households in Lalmonirhat and Gaibandha saved with samitees, most of the women in Jamalpur saved in cash. Only around 10 per cent of households (intervention: 9.8% and control: 11.5%) saved in banks (Table 6.2).
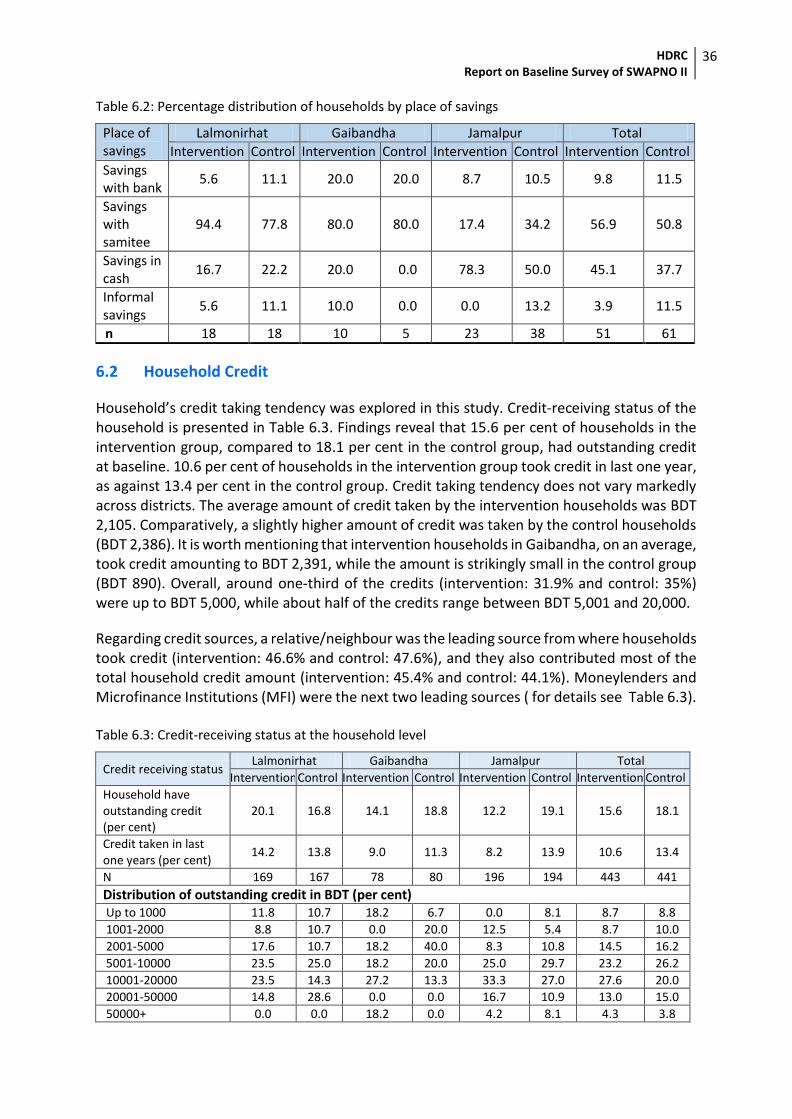
HDRC Report on Baseline Survey of SWAPNO II
36
Table 6.2: Percentage distribution of households by place of savings
Place of savings
Lalmonirhat Gaibandha Jamalpur Total
Intervention Control Intervention Control Intervention Control Intervention Control
Savings with bank
5.6 11.1 20.0 20.0 8.7 10.5 9.8 11.5
Savings with samitee
94.4 77.8 80.0 80.0 17.4 34.2 56.9 50.8
Savings in cash
16.7 22.2 20.0 0.0 78.3 50.0 45.1 37.7
Informal savings
5.6 11.1 10.0 0.0 0.0 13.2 3.9 11.5
n 18 18 10 5 23 38 51 61
6.2 Household Credit
Household’s credit taking tendency was explored in this study. Credit-receiving status of the household is presented in Table 6.3. Findings reveal that 15.6 per cent of households in the intervention group, compared to 18.1 per cent in the control group, had outstanding credit at baseline. 10.6 per cent of households in the intervention group took credit in last one year, as against 13.4 per cent in the control group. Credit taking tendency does not vary markedly across districts. The average amount of credit taken by the intervention households was BDT 2,105. Comparatively, a slightly higher amount of credit was taken by the control households (BDT 2,386). It is worth mentioning that intervention households in Gaibandha, on an average, took credit amounting to BDT 2,391, while the amount is strikingly small in the control group (BDT 890). Overall, around one-third of the credits (intervention: 31.9% and control: 35%) were up to BDT 5,000, while about half of the credits range between BDT 5,001 and 20,000.
Regarding credit sources, a relative/neighbour was the leading source from where households took credit (intervention: 46.6% and control: 47.6%), and they also contributed most of the total household credit amount (intervention: 45.4% and control: 44.1%). Moneylenders and Microfinance Institutions (MFI) were the next two leading sources ( for details see Table 6.3). Table 6.3: Credit-receiving status at the household level
Credit receiving status Lalmonirhat Gaibandha Jamalpur Total
Intervention Control Intervention Control Intervention Control Intervention Control
Household have outstanding credit (per cent)
20.1 16.8 14.1 18.8 12.2 19.1 15.6 18.1
Credit taken in last one years (per cent)
14.2 13.8 9.0 11.3 8.2 13.9 10.6 13.4
N 169 167 78 80 196 194 443 441
Distribution of outstanding credit in BDT (per cent) Up to 1000 11.8 10.7 18.2 6.7 0.0 8.1 8.7 8.8
1001-2000 8.8 10.7 0.0 20.0 12.5 5.4 8.7 10.0
2001-5000 17.6 10.7 18.2 40.0 8.3 10.8 14.5 16.2
5001-10000 23.5 25.0 18.2 20.0 25.0 29.7 23.2 26.2
10001-20000 23.5 14.3 27.2 13.3 33.3 27.0 27.6 20.0
20001-50000 14.8 28.6 0.0 0.0 16.7 10.9 13.0 15.0
50000+ 0.0 0.0 18.2 0.0 4.2 8.1 4.3 3.8
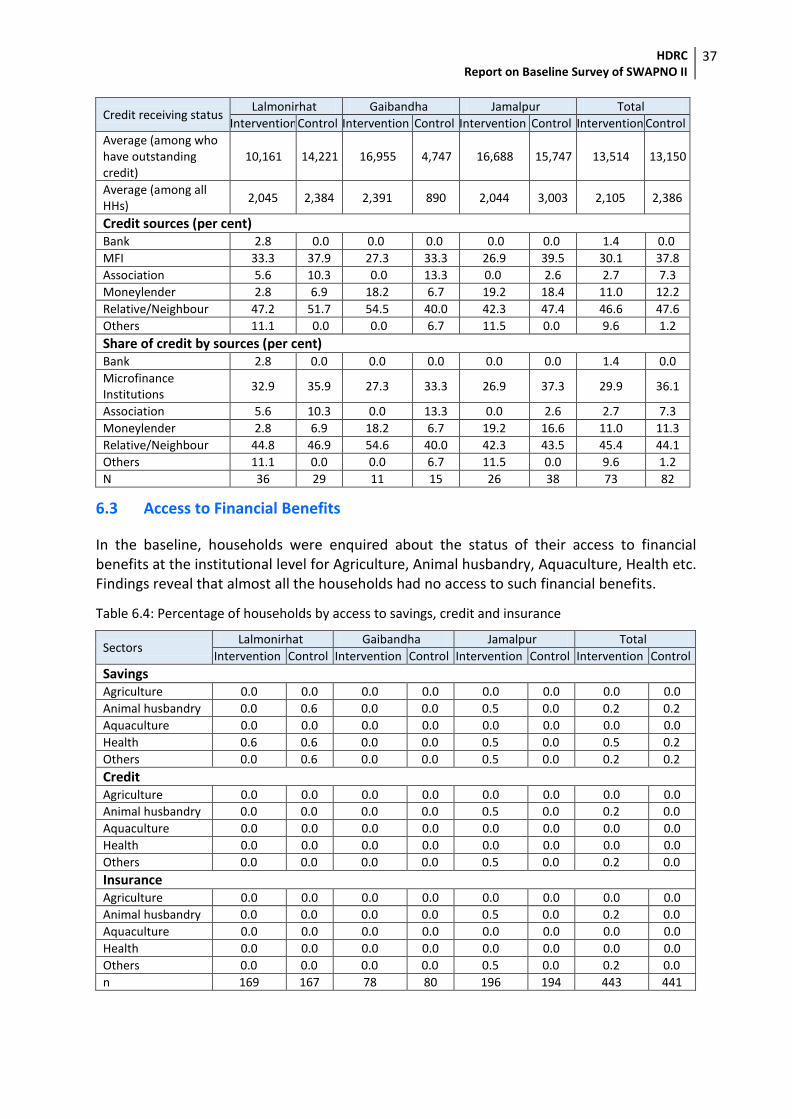
HDRC Report on Baseline Survey of SWAPNO II
37
Credit receiving status Lalmonirhat Gaibandha Jamalpur Total
Intervention Control Intervention Control Intervention Control Intervention Control
Average (among who have outstanding credit)
10,161 14,221 16,955 4,747 16,688 15,747 13,514 13,150
Average (among all HHs)
2,045 2,384 2,391 890 2,044 3,003 2,105 2,386
Credit sources (per cent) Bank 2.8 0.0 0.0 0.0 0.0 0.0 1.4 0.0
MFI 33.3 37.9 27.3 33.3 26.9 39.5 30.1 37.8
Association 5.6 10.3 0.0 13.3 0.0 2.6 2.7 7.3
Moneylender 2.8 6.9 18.2 6.7 19.2 18.4 11.0 12.2
Relative/Neighbour 47.2 51.7 54.5 40.0 42.3 47.4 46.6 47.6
Others 11.1 0.0 0.0 6.7 11.5 0.0 9.6 1.2
Share of credit by sources (per cent) Bank 2.8 0.0 0.0 0.0 0.0 0.0 1.4 0.0
Microfinance Institutions
32.9 35.9 27.3 33.3 26.9 37.3 29.9 36.1
Association 5.6 10.3 0.0 13.3 0.0 2.6 2.7 7.3
Moneylender 2.8 6.9 18.2 6.7 19.2 16.6 11.0 11.3
Relative/Neighbour 44.8 46.9 54.6 40.0 42.3 43.5 45.4 44.1
Others 11.1 0.0 0.0 6.7 11.5 0.0 9.6 1.2
N 36 29 11 15 26 38 73 82
6.3 Access to Financial Benefits
In the baseline, households were enquired about the status of their access to financial benefits at the institutional level for Agriculture, Animal husbandry, Aquaculture, Health etc. Findings reveal that almost all the households had no access to such financial benefits.
Table 6.4: Percentage of households by access to savings, credit and insurance
Sectors Lalmonirhat Gaibandha Jamalpur Total
Intervention Control Intervention Control Intervention Control Intervention Control
Savings
Agriculture 0.0 0.0 0.0 0.0 0.0 0.0 0.0 0.0
Animal husbandry 0.0 0.6 0.0 0.0 0.5 0.0 0.2 0.2
Aquaculture 0.0 0.0 0.0 0.0 0.0 0.0 0.0 0.0
Health 0.6 0.6 0.0 0.0 0.5 0.0 0.5 0.2
Others 0.0 0.6 0.0 0.0 0.5 0.0 0.2 0.2
Credit
Agriculture 0.0 0.0 0.0 0.0 0.0 0.0 0.0 0.0
Animal husbandry 0.0 0.0 0.0 0.0 0.5 0.0 0.2 0.0
Aquaculture 0.0 0.0 0.0 0.0 0.0 0.0 0.0 0.0
Health 0.0 0.0 0.0 0.0 0.0 0.0 0.0 0.0
Others 0.0 0.0 0.0 0.0 0.5 0.0 0.2 0.0
Insurance
Agriculture 0.0 0.0 0.0 0.0 0.0 0.0 0.0 0.0
Animal husbandry 0.0 0.0 0.0 0.0 0.5 0.0 0.2 0.0
Aquaculture 0.0 0.0 0.0 0.0 0.0 0.0 0.0 0.0
Health 0.0 0.0 0.0 0.0 0.0 0.0 0.0 0.0
Others 0.0 0.0 0.0 0.0 0.5 0.0 0.2 0.0
n 169 167 78 80 196 194 443 441
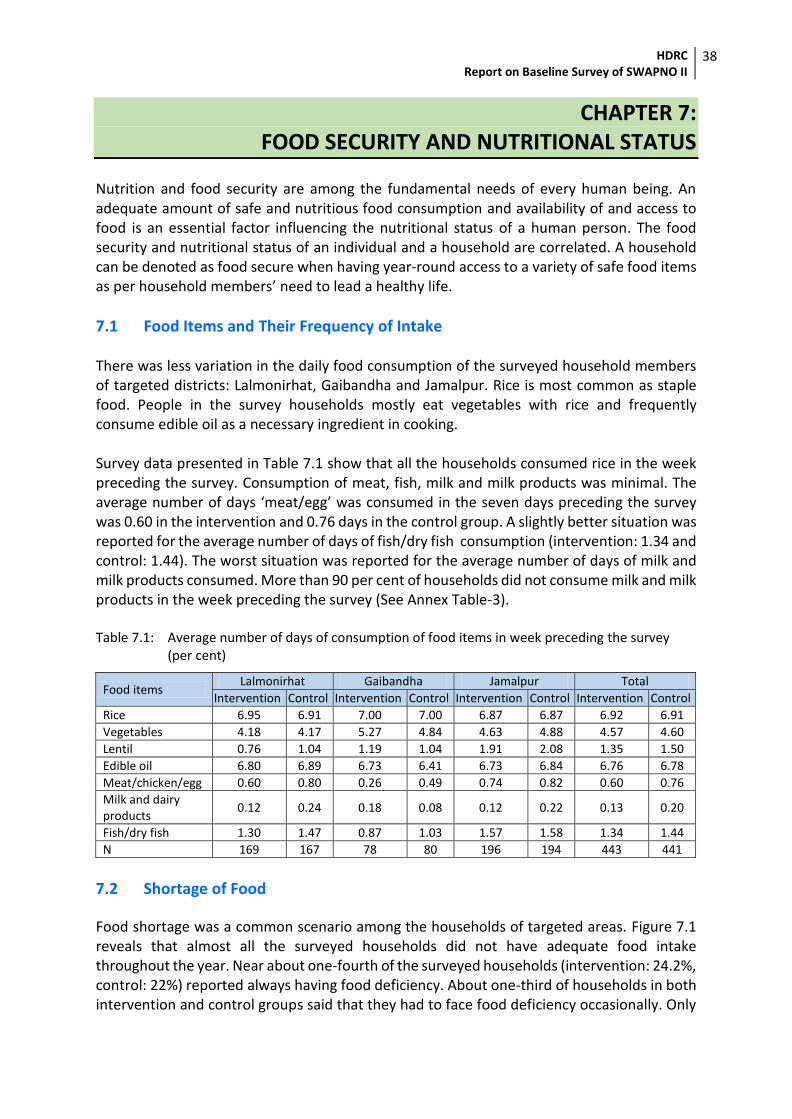
HDRC Report on Baseline Survey of SWAPNO II
38
CHAPTER 7: FOOD SECURITY AND NUTRITIONAL STATUS
Nutrition and food security are among the fundamental needs of every human being. An adequate amount of safe and nutritious food consumption and availability of and access to food is an essential factor influencing the nutritional status of a human person. The food security and nutritional status of an individual and a household are correlated. A household can be denoted as food secure when having year-round access to a variety of safe food items as per household members’ need to lead a healthy life.
7.1 Food Items and Their Frequency of Intake There was less variation in the daily food consumption of the surveyed household members of targeted districts: Lalmonirhat, Gaibandha and Jamalpur. Rice is most common as staple food. People in the survey households mostly eat vegetables with rice and frequently consume edible oil as a necessary ingredient in cooking. Survey data presented in Table 7.1 show that all the households consumed rice in the week preceding the survey. Consumption of meat, fish, milk and milk products was minimal. The average number of days ‘meat/egg’ was consumed in the seven days preceding the survey was 0.60 in the intervention and 0.76 days in the control group. A slightly better situation was reported for the average number of days of fish/dry fish consumption (intervention: 1.34 and control: 1.44). The worst situation was reported for the average number of days of milk and milk products consumed. More than 90 per cent of households did not consume milk and milk products in the week preceding the survey (See Annex Table-3). Table 7.1: Average number of days of consumption of food items in week preceding the survey (per cent)
Food items Lalmonirhat Gaibandha Jamalpur Total
Intervention Control Intervention Control Intervention Control Intervention Control
Rice 6.95 6.91 7.00 7.00 6.87 6.87 6.92 6.91
Vegetables 4.18 4.17 5.27 4.84 4.63 4.88 4.57 4.60
Lentil 0.76 1.04 1.19 1.04 1.91 2.08 1.35 1.50
Edible oil 6.80 6.89 6.73 6.41 6.73 6.84 6.76 6.78
Meat/chicken/egg 0.60 0.80 0.26 0.49 0.74 0.82 0.60 0.76
Milk and dairy products
0.12 0.24 0.18 0.08 0.12 0.22 0.13 0.20
Fish/dry fish 1.30 1.47 0.87 1.03 1.57 1.58 1.34 1.44
N 169 167 78 80 196 194 443 441
7.2 Shortage of Food
Food shortage was a common scenario among the households of targeted areas. Figure 7.1 reveals that almost all the surveyed households did not have adequate food intake throughout the year. Near about one-fourth of the surveyed households (intervention: 24.2%, control: 22%) reported always having food deficiency. About one-third of households in both intervention and control groups said that they had to face food deficiency occasionally. Only
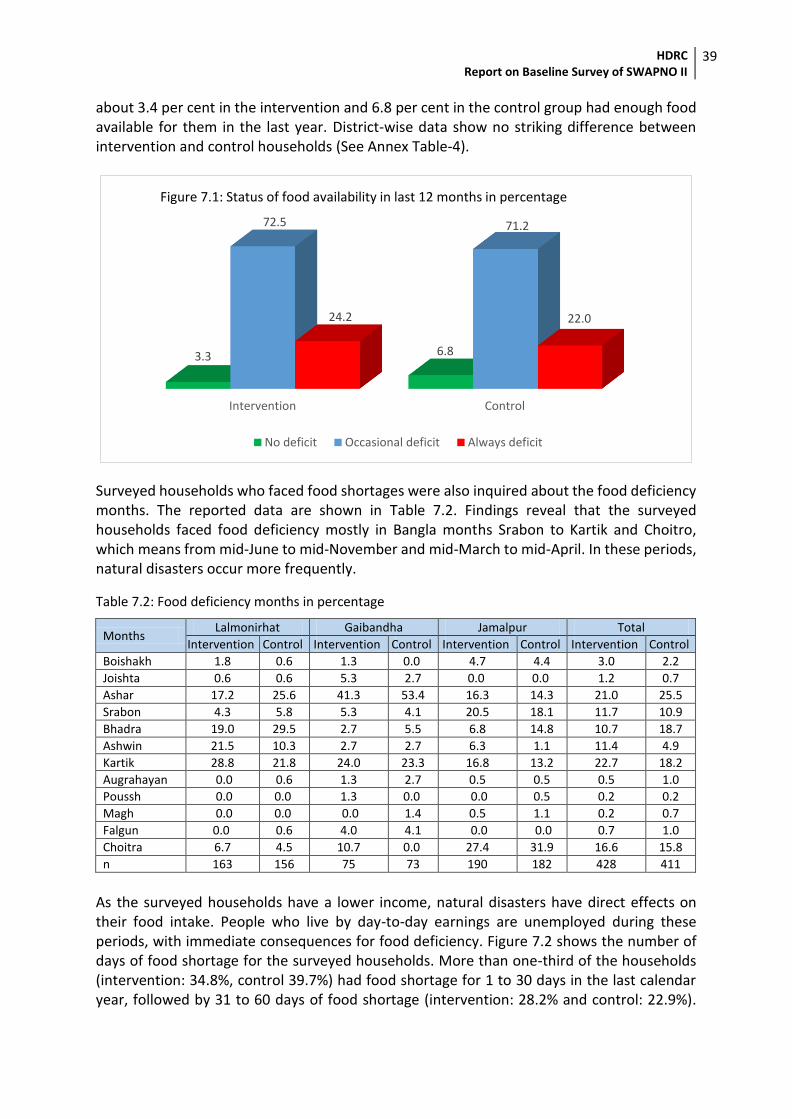
HDRC Report on Baseline Survey of SWAPNO II
39
about 3.4 per cent in the intervention and 6.8 per cent in the control group had enough food available for them in the last year. District-wise data show no striking difference between intervention and control households (See Annex Table-4).
Surveyed households who faced food shortages were also inquired about the food deficiency months. The reported data are shown in Table 7.2. Findings reveal that the surveyed households faced food deficiency mostly in Bangla months Srabon to Kartik and Choitro, which means from mid-June to mid-November and mid-March to mid-April. In these periods, natural disasters occur more frequently.
Table 7.2: Food deficiency months in percentage
Months Lalmonirhat Gaibandha Jamalpur Total
Intervention Control Intervention Control Intervention Control Intervention Control
Boishakh 1.8 0.6 1.3 0.0 4.7 4.4 3.0 2.2
Joishta 0.6 0.6 5.3 2.7 0.0 0.0 1.2 0.7
Ashar 17.2 25.6 41.3 53.4 16.3 14.3 21.0 25.5
Srabon 4.3 5.8 5.3 4.1 20.5 18.1 11.7 10.9
Bhadra 19.0 29.5 2.7 5.5 6.8 14.8 10.7 18.7
Ashwin 21.5 10.3 2.7 2.7 6.3 1.1 11.4 4.9
Kartik 28.8 21.8 24.0 23.3 16.8 13.2 22.7 18.2
Augrahayan 0.0 0.6 1.3 2.7 0.5 0.5 0.5 1.0
Poussh 0.0 0.0 1.3 0.0 0.0 0.5 0.2 0.2
Magh 0.0 0.0 0.0 1.4 0.5 1.1 0.2 0.7
Falgun 0.0 0.6 4.0 4.1 0.0 0.0 0.7 1.0
Choitra 6.7 4.5 10.7 0.0 27.4 31.9 16.6 15.8
n 163 156 75 73 190 182 428 411
As the surveyed households have a lower income, natural disasters have direct effects on their food intake. People who live by day-to-day earnings are unemployed during these periods, with immediate consequences for food deficiency. Figure 7.2 shows the number of days of food shortage for the surveyed households. More than one-third of the households (intervention: 34.8%, control 39.7%) had food shortage for 1 to 30 days in the last calendar year, followed by 31 to 60 days of food shortage (intervention: 28.2% and control: 22.9%).
Intervention Control
3.3 6.8
72.5 71.2
24.2 22.0
No deficit Occasional deficit Always deficit
Figure 7.1: Status of food availability in last 12 months in percentage
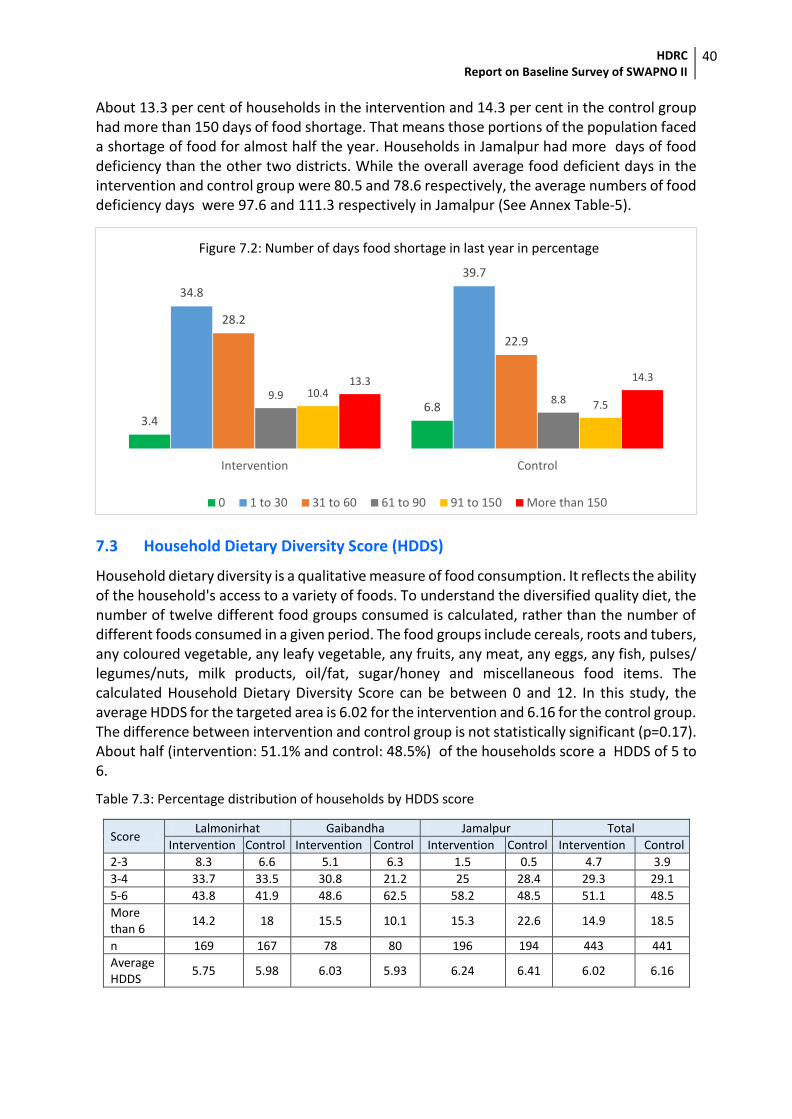
HDRC Report on Baseline Survey of SWAPNO II
40
About 13.3 per cent of households in the intervention and 14.3 per cent in the control group had more than 150 days of food shortage. That means those portions of the population faced a shortage of food for almost half the year. Households in Jamalpur had more days of food deficiency than the other two districts. While the overall average food deficient days in the intervention and control group were 80.5 and 78.6 respectively, the average numbers of food deficiency days were 97.6 and 111.3 respectively in Jamalpur (See Annex Table-5).
7.3 Household Dietary Diversity Score (HDDS)
Household dietary diversity is a qualitative measure of food consumption. It reflects the ability of the household's access to a variety of foods. To understand the diversified quality diet, the number of twelve different food groups consumed is calculated, rather than the number of different foods consumed in a given period. The food groups include cereals, roots and tubers, any coloured vegetable, any leafy vegetable, any fruits, any meat, any eggs, any fish, pulses/ legumes/nuts, milk products, oil/fat, sugar/honey and miscellaneous food items. The calculated Household Dietary Diversity Score can be between 0 and 12. In this study, the average HDDS for the targeted area is 6.02 for the intervention and 6.16 for the control group. The difference between intervention and control group is not statistically significant (p=0.17). About half (intervention: 51.1% and control: 48.5%) of the households score a HDDS of 5 to 6.
Table 7.3: Percentage distribution of households by HDDS score
Score Lalmonirhat Gaibandha Jamalpur Total
Intervention Control Intervention Control Intervention Control Intervention Control
2-3 8.3 6.6 5.1 6.3 1.5 0.5 4.7 3.9
3-4 33.7 33.5 30.8 21.2 25 28.4 29.3 29.1
5-6 43.8 41.9 48.6 62.5 58.2 48.5 51.1 48.5
More than 6
14.2 18 15.5 10.1 15.3 22.6 14.9 18.5
n 169 167 78 80 196 194 443 441
Average HDDS
5.75 5.98 6.03 5.93 6.24 6.41 6.02 6.16
3.46.8
34.8
39.7
28.2
22.9
9.9 8.810.4
7.5
13.3 14.3
Intervention Control
0 1 to 30 31 to 60 61 to 90 91 to 150 More than 150
Figure 7.2: Number of days food shortage in last year in percentage
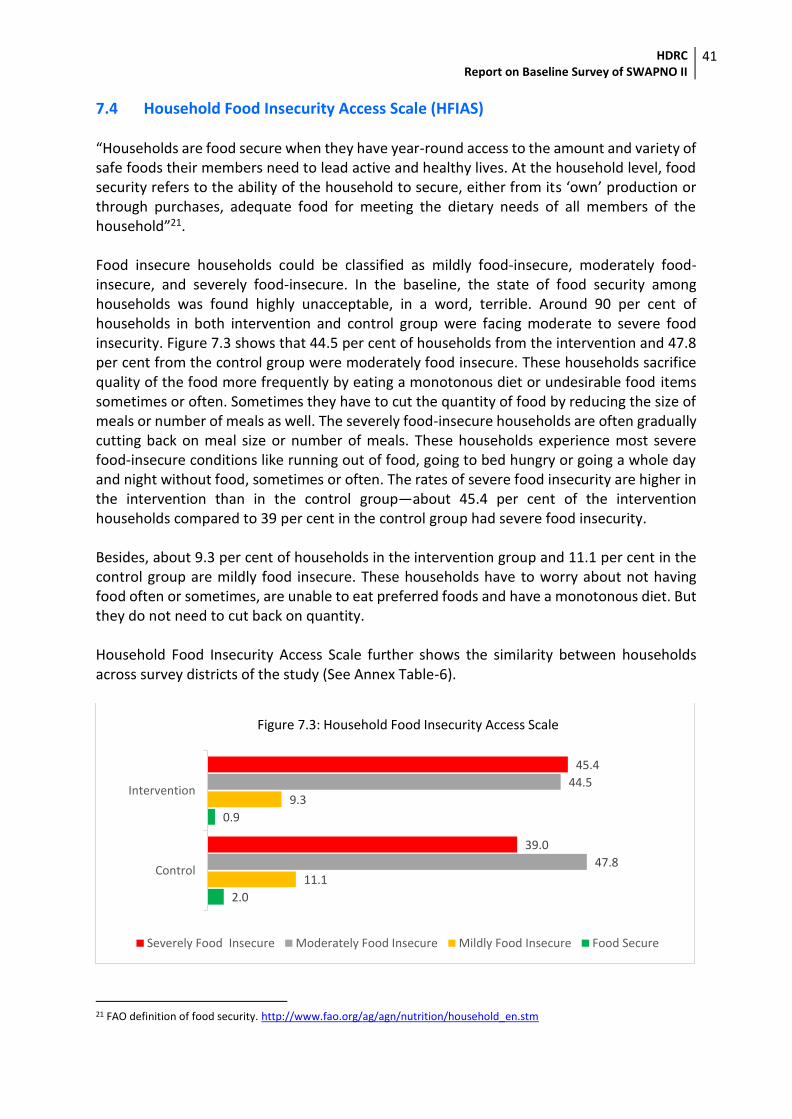
HDRC Report on Baseline Survey of SWAPNO II
41
7.4 Household Food Insecurity Access Scale (HFIAS) “Households are food secure when they have year-round access to the amount and variety of safe foods their members need to lead active and healthy lives. At the household level, food security refers to the ability of the household to secure, either from its ‘own’ production or through purchases, adequate food for meeting the dietary needs of all members of the household”21. Food insecure households could be classified as mildly food-insecure, moderately food- insecure, and severely food-insecure. In the baseline, the state of food security among households was found highly unacceptable, in a word, terrible. Around 90 per cent of households in both intervention and control group were facing moderate to severe food insecurity. Figure 7.3 shows that 44.5 per cent of households from the intervention and 47.8 per cent from the control group were moderately food insecure. These households sacrifice quality of the food more frequently by eating a monotonous diet or undesirable food items sometimes or often. Sometimes they have to cut the quantity of food by reducing the size of meals or number of meals as well. The severely food-insecure households are often gradually cutting back on meal size or number of meals. These households experience most severe food-insecure conditions like running out of food, going to bed hungry or going a whole day and night without food, sometimes or often. The rates of severe food insecurity are higher in the intervention than in the control group—about 45.4 per cent of the intervention households compared to 39 per cent in the control group had severe food insecurity. Besides, about 9.3 per cent of households in the intervention group and 11.1 per cent in the control group are mildly food insecure. These households have to worry about not having food often or sometimes, are unable to eat preferred foods and have a monotonous diet. But they do not need to cut back on quantity. Household Food Insecurity Access Scale further shows the similarity between households across survey districts of the study (See Annex Table-6).
21 FAO definition of food security. http://www.fao.org/ag/agn/nutrition/household_en.stm
2.0
0.9
11.1
9.3
47.8
44.5
39.0
45.4
Control
Intervention
Severely Food Insecure Moderately Food Insecure Mildly Food Insecure Food Secure
Figure 7.3: Household Food Insecurity Access Scale
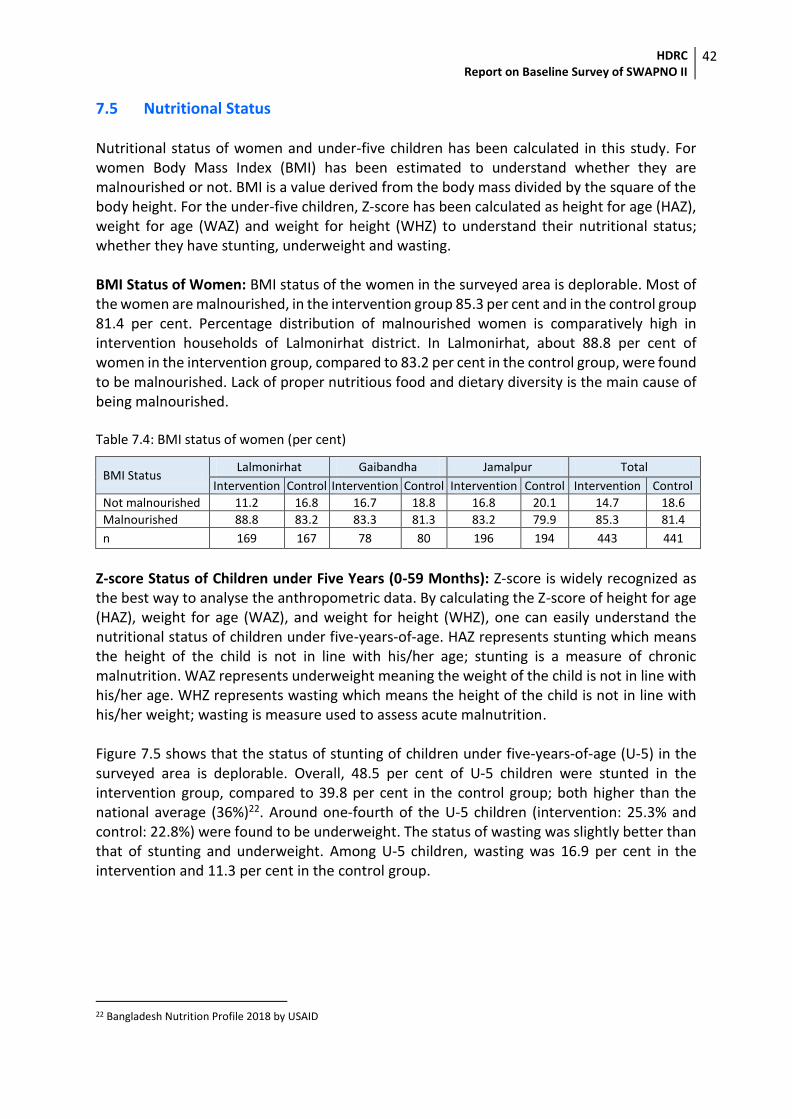
HDRC Report on Baseline Survey of SWAPNO II
42
7.5 Nutritional Status Nutritional status of women and under-five children has been calculated in this study. For women Body Mass Index (BMI) has been estimated to understand whether they are malnourished or not. BMI is a value derived from the body mass divided by the square of the body height. For the under-five children, Z-score has been calculated as height for age (HAZ), weight for age (WAZ) and weight for height (WHZ) to understand their nutritional status; whether they have stunting, underweight and wasting. BMI Status of Women: BMI status of the women in the surveyed area is deplorable. Most of the women are malnourished, in the intervention group 85.3 per cent and in the control group 81.4 per cent. Percentage distribution of malnourished women is comparatively high in intervention households of Lalmonirhat district. In Lalmonirhat, about 88.8 per cent of women in the intervention group, compared to 83.2 per cent in the control group, were found to be malnourished. Lack of proper nutritious food and dietary diversity is the main cause of being malnourished. Table 7.4: BMI status of women (per cent)
BMI Status Lalmonirhat Gaibandha Jamalpur Total
Intervention Control Intervention Control Intervention Control Intervention Control
Not malnourished 11.2 16.8 16.7 18.8 16.8 20.1 14.7 18.6
Malnourished 88.8 83.2 83.3 81.3 83.2 79.9 85.3 81.4
n 169 167 78 80 196 194 443 441
Z-score Status of Children under Five Years (0-59 Months): Z-score is widely recognized as the best way to analyse the anthropometric data. By calculating the Z-score of height for age (HAZ), weight for age (WAZ), and weight for height (WHZ), one can easily understand the nutritional status of children under five-years-of-age. HAZ represents stunting which means the height of the child is not in line with his/her age; stunting is a measure of chronic malnutrition. WAZ represents underweight meaning the weight of the child is not in line with his/her age. WHZ represents wasting which means the height of the child is not in line with his/her weight; wasting is measure used to assess acute malnutrition. Figure 7.5 shows that the status of stunting of children under five-years-of-age (U-5) in the surveyed area is deplorable. Overall, 48.5 per cent of U-5 children were stunted in the intervention group, compared to 39.8 per cent in the control group; both higher than the national average (36%)22. Around one-fourth of the U-5 children (intervention: 25.3% and control: 22.8%) were found to be underweight. The status of wasting was slightly better than that of stunting and underweight. Among U-5 children, wasting was 16.9 per cent in the intervention and 11.3 per cent in the control group.
22 Bangladesh Nutrition Profile 2018 by USAID
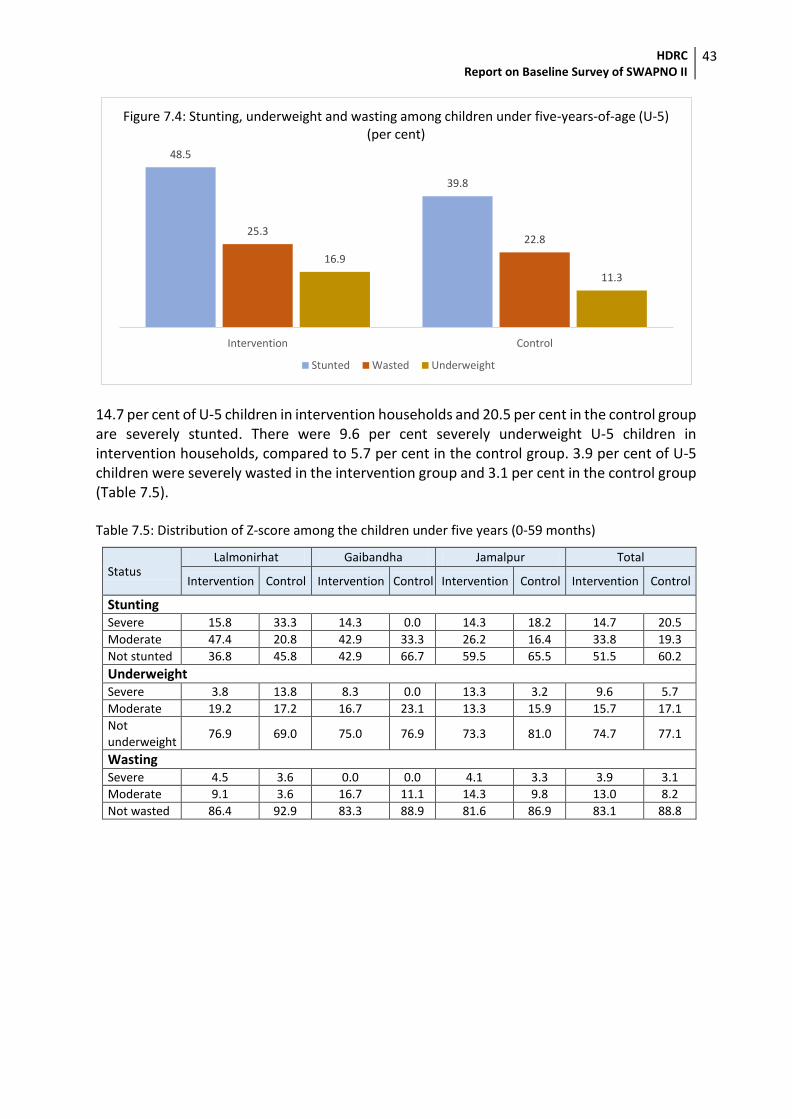
HDRC Report on Baseline Survey of SWAPNO II
43
14.7 per cent of U-5 children in intervention households and 20.5 per cent in the control group are severely stunted. There were 9.6 per cent severely underweight U-5 children in intervention households, compared to 5.7 per cent in the control group. 3.9 per cent of U-5 children were severely wasted in the intervention group and 3.1 per cent in the control group (Table 7.5). Table 7.5: Distribution of Z-score among the children under five years (0-59 months)
Status Lalmonirhat Gaibandha Jamalpur Total
Intervention Control Intervention Control Intervention Control Intervention Control
Stunting Severe 15.8 33.3 14.3 0.0 14.3 18.2 14.7 20.5
Moderate 47.4 20.8 42.9 33.3 26.2 16.4 33.8 19.3
Not stunted 36.8 45.8 42.9 66.7 59.5 65.5 51.5 60.2
Underweight Severe 3.8 13.8 8.3 0.0 13.3 3.2 9.6 5.7
Moderate 19.2 17.2 16.7 23.1 13.3 15.9 15.7 17.1
Not underweight
76.9 69.0 75.0 76.9 73.3 81.0 74.7 77.1
Wasting Severe 4.5 3.6 0.0 0.0 4.1 3.3 3.9 3.1
Moderate 9.1 3.6 16.7 11.1 14.3 9.8 13.0 8.2
Not wasted 86.4 92.9 83.3 88.9 81.6 86.9 83.1 88.8
48.5
39.8
25.322.8
16.9
11.3
Intervention Control
Stunted Wasted Underweight
Figure 7.4: Stunting, underweight and wasting among children under five-years-of-age (U-5) (per cent)
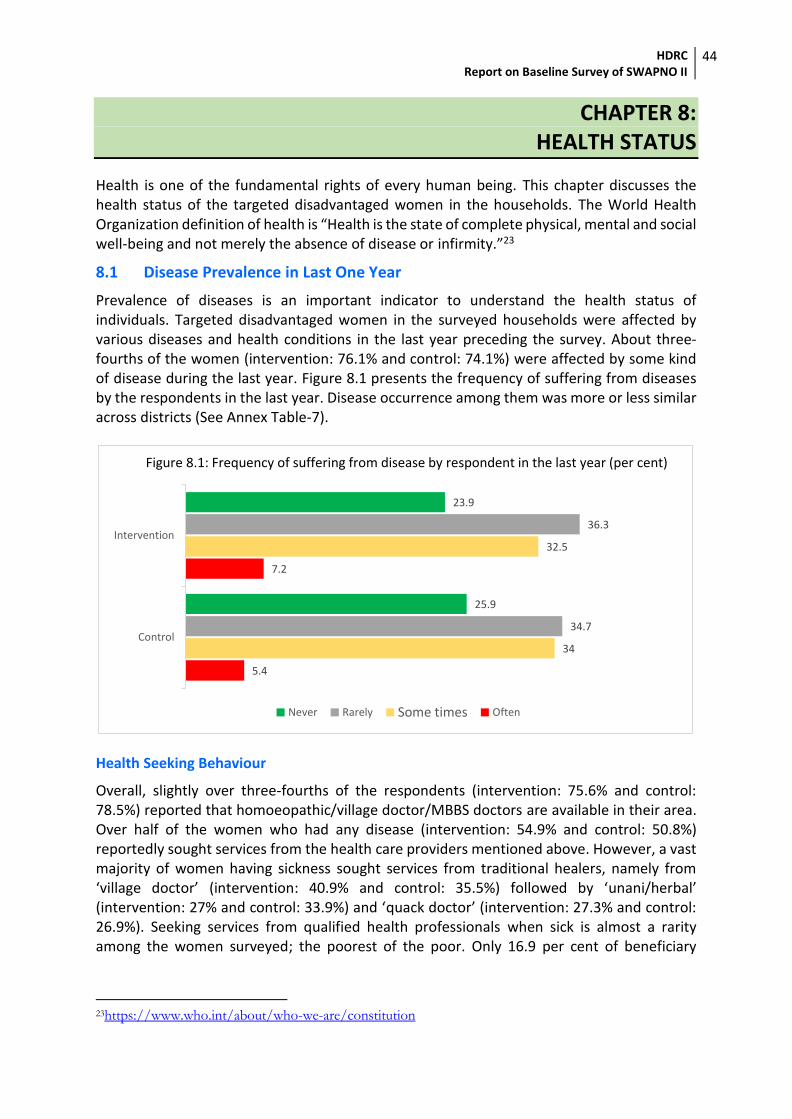
HDRC Report on Baseline Survey of SWAPNO II
44
CHAPTER 8: HEALTH STATUS
Health is one of the fundamental rights of every human being. This chapter discusses the health status of the targeted disadvantaged women in the households. The World Health Organization definition of health is “Health is the state of complete physical, mental and social well-being and not merely the absence of disease or infirmity.”23
8.1 Disease Prevalence in Last One Year
Prevalence of diseases is an important indicator to understand the health status of individuals. Targeted disadvantaged women in the surveyed households were affected by various diseases and health conditions in the last year preceding the survey. About three-fourths of the women (intervention: 76.1% and control: 74.1%) were affected by some kind of disease during the last year. Figure 8.1 presents the frequency of suffering from diseases by the respondents in the last year. Disease occurrence among them was more or less similar across districts (See Annex Table-7).
Health Seeking Behaviour
Overall, slightly over three-fourths of the respondents (intervention: 75.6% and control: 78.5%) reported that homoeopathic/village doctor/MBBS doctors are available in their area. Over half of the women who had any disease (intervention: 54.9% and control: 50.8%) reportedly sought services from the health care providers mentioned above. However, a vast majority of women having sickness sought services from traditional healers, namely from ‘village doctor’ (intervention: 40.9% and control: 35.5%) followed by ‘unani/herbal’ (intervention: 27% and control: 33.9%) and ‘quack doctor’ (intervention: 27.3% and control: 26.9%). Seeking services from qualified health professionals when sick is almost a rarity among the women surveyed; the poorest of the poor. Only 16.9 per cent of beneficiary
23https://www.who.int/about/who-we-are/constitution
5.4
7.2
34
32.5
34.7
36.3
25.9
23.9
Control
Intervention
Never Rarely Some times Often
Figure 8.1: Frequency of suffering from disease by respondent in the last year (per cent)
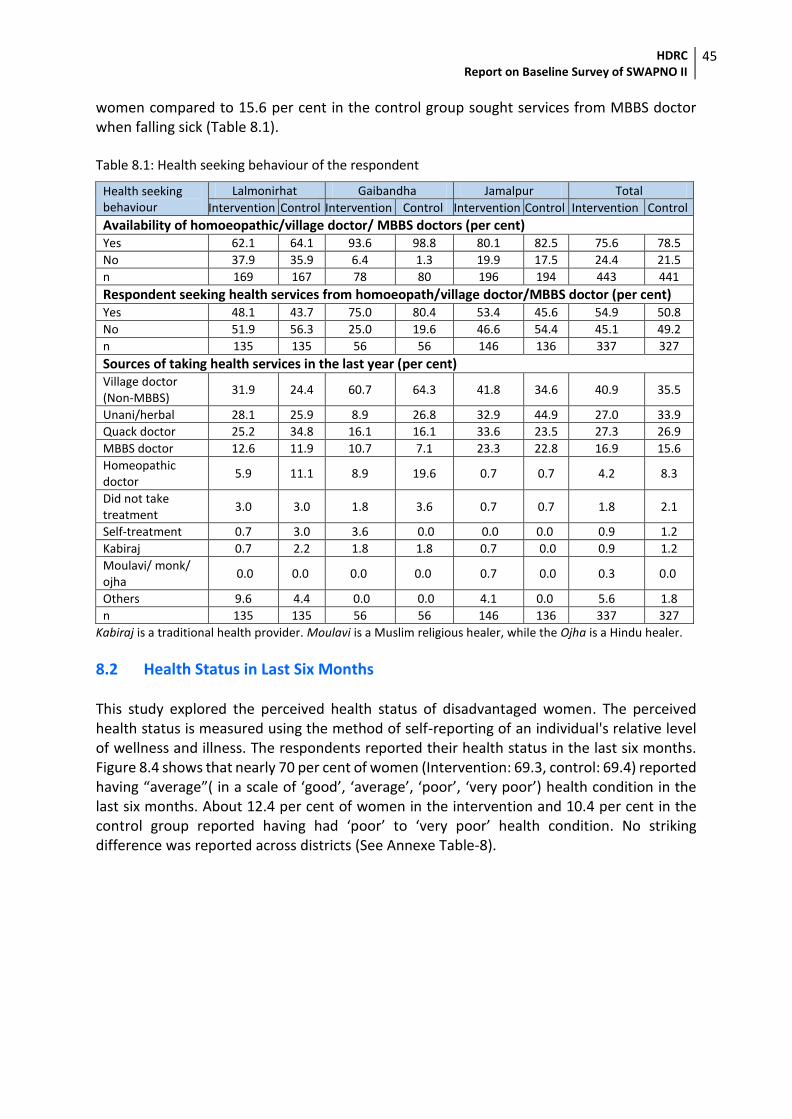
HDRC Report on Baseline Survey of SWAPNO II
45
women compared to 15.6 per cent in the control group sought services from MBBS doctor when falling sick (Table 8.1). Table 8.1: Health seeking behaviour of the respondent
Health seeking behaviour
Lalmonirhat Gaibandha Jamalpur Total
Intervention Control Intervention Control Intervention Control Intervention Control
Availability of homoeopathic/village doctor/ MBBS doctors (per cent) Yes 62.1 64.1 93.6 98.8 80.1 82.5 75.6 78.5
No 37.9 35.9 6.4 1.3 19.9 17.5 24.4 21.5
n 169 167 78 80 196 194 443 441
Respondent seeking health services from homoeopath/village doctor/MBBS doctor (per cent) Yes 48.1 43.7 75.0 80.4 53.4 45.6 54.9 50.8
No 51.9 56.3 25.0 19.6 46.6 54.4 45.1 49.2
n 135 135 56 56 146 136 337 327
Sources of taking health services in the last year (per cent) Village doctor (Non-MBBS)
31.9 24.4 60.7 64.3 41.8 34.6 40.9 35.5
Unani/herbal 28.1 25.9 8.9 26.8 32.9 44.9 27.0 33.9
Quack doctor 25.2 34.8 16.1 16.1 33.6 23.5 27.3 26.9
MBBS doctor 12.6 11.9 10.7 7.1 23.3 22.8 16.9 15.6
Homeopathic doctor
5.9 11.1 8.9 19.6 0.7 0.7 4.2 8.3
Did not take treatment
3.0 3.0 1.8 3.6 0.7 0.7 1.8 2.1
Self-treatment 0.7 3.0 3.6 0.0 0.0 0.0 0.9 1.2
Kabiraj 0.7 2.2 1.8 1.8 0.7 0.0 0.9 1.2
Moulavi/ monk/ ojha
0.0 0.0 0.0 0.0 0.7 0.0 0.3 0.0
Others 9.6 4.4 0.0 0.0 4.1 0.0 5.6 1.8
n 135 135 56 56 146 136 337 327
Kabiraj is a traditional health provider. Moulavi is a Muslim religious healer, while the Ojha is a Hindu healer.
8.2 Health Status in Last Six Months This study explored the perceived health status of disadvantaged women. The perceived health status is measured using the method of self-reporting of an individual's relative level of wellness and illness. The respondents reported their health status in the last six months. Figure 8.4 shows that nearly 70 per cent of women (Intervention: 69.3, control: 69.4) reported having “average”( in a scale of ‘good’, ‘average’, ‘poor’, ‘very poor’) health condition in the last six months. About 12.4 per cent of women in the intervention and 10.4 per cent in the control group reported having had ‘poor’ to ‘very poor’ health condition. No striking difference was reported across districts (See Annexe Table-8).
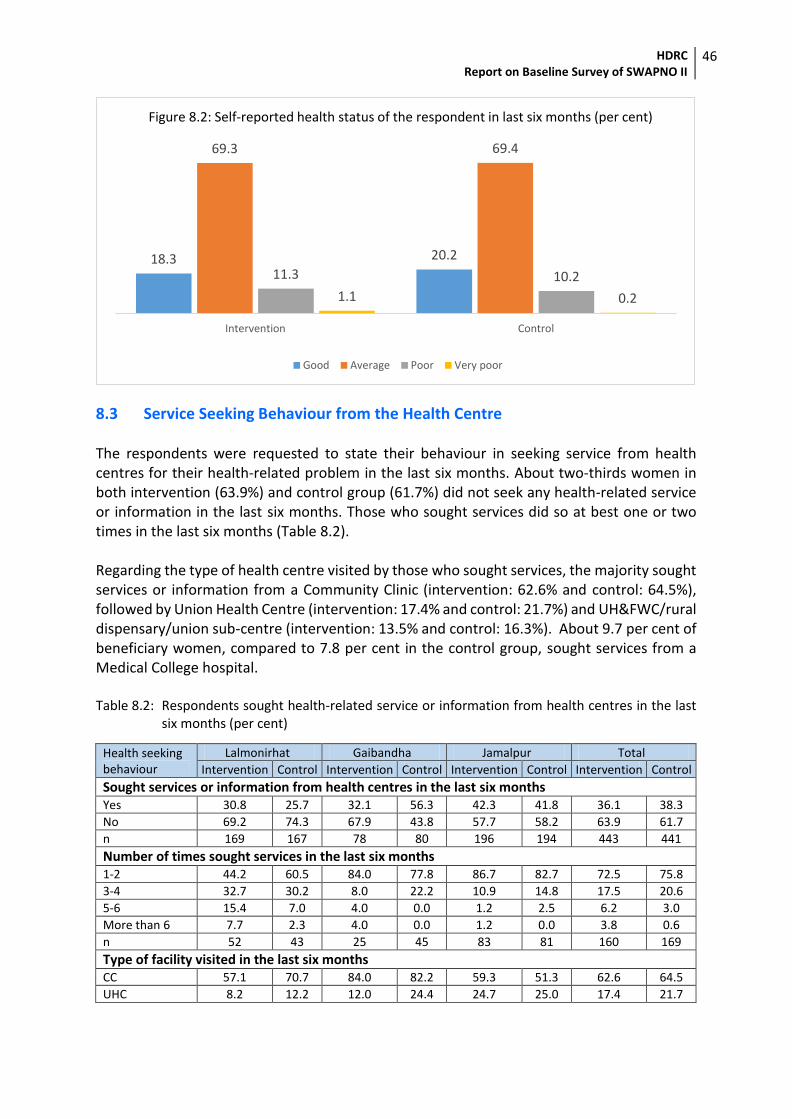
HDRC Report on Baseline Survey of SWAPNO II
46
8.3 Service Seeking Behaviour from the Health Centre The respondents were requested to state their behaviour in seeking service from health centres for their health-related problem in the last six months. About two-thirds women in both intervention (63.9%) and control group (61.7%) did not seek any health-related service or information in the last six months. Those who sought services did so at best one or two times in the last six months (Table 8.2). Regarding the type of health centre visited by those who sought services, the majority sought services or information from a Community Clinic (intervention: 62.6% and control: 64.5%), followed by Union Health Centre (intervention: 17.4% and control: 21.7%) and UH&FWC/rural dispensary/union sub-centre (intervention: 13.5% and control: 16.3%). About 9.7 per cent of beneficiary women, compared to 7.8 per cent in the control group, sought services from a Medical College hospital. Table 8.2: Respondents sought health-related service or information from health centres in the last
six months (per cent)
Health seeking behaviour
Lalmonirhat Gaibandha Jamalpur Total
Intervention Control Intervention Control Intervention Control Intervention Control
Sought services or information from health centres in the last six months
Yes 30.8 25.7 32.1 56.3 42.3 41.8 36.1 38.3
No 69.2 74.3 67.9 43.8 57.7 58.2 63.9 61.7
n 169 167 78 80 196 194 443 441
Number of times sought services in the last six months
1-2 44.2 60.5 84.0 77.8 86.7 82.7 72.5 75.8
3-4 32.7 30.2 8.0 22.2 10.9 14.8 17.5 20.6
5-6 15.4 7.0 4.0 0.0 1.2 2.5 6.2 3.0
More than 6 7.7 2.3 4.0 0.0 1.2 0.0 3.8 0.6
n 52 43 25 45 83 81 160 169
Type of facility visited in the last six months
CC 57.1 70.7 84.0 82.2 59.3 51.3 62.6 64.5
UHC 8.2 12.2 12.0 24.4 24.7 25.0 17.4 21.7
18.3 20.2
69.3 69.4
11.3 10.2
1.1 0.2
Intervention Control
Good Average Poor Very poor
Figure 8.2: Self-reported health status of the respondent in last six months (per cent)
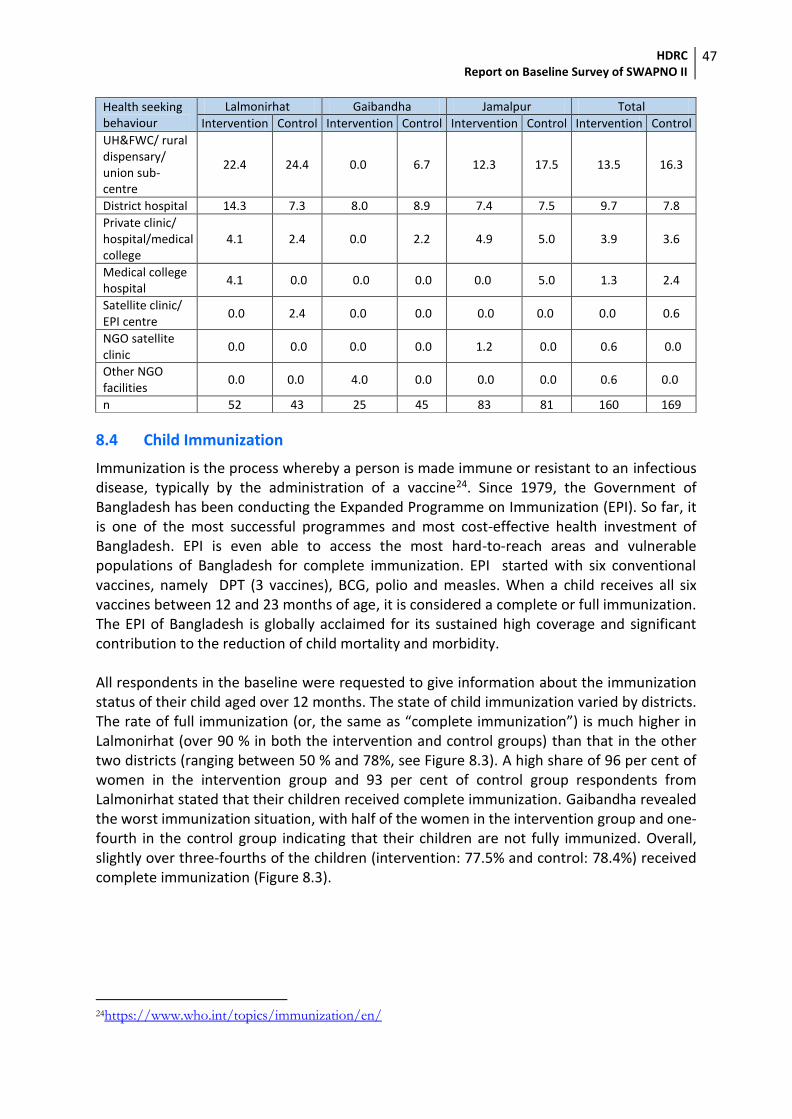
HDRC Report on Baseline Survey of SWAPNO II
47
Health seeking behaviour
Lalmonirhat Gaibandha Jamalpur Total
Intervention Control Intervention Control Intervention Control Intervention Control
UH&FWC/ rural dispensary/ union sub-centre
22.4 24.4 0.0 6.7 12.3 17.5 13.5 16.3
District hospital 14.3 7.3 8.0 8.9 7.4 7.5 9.7 7.8
Private clinic/ hospital/medical college
4.1 2.4 0.0 2.2 4.9 5.0 3.9 3.6
Medical college hospital
4.1 0.0 0.0 0.0 0.0 5.0 1.3 2.4
Satellite clinic/ EPI centre
0.0 2.4 0.0 0.0 0.0 0.0 0.0 0.6
NGO satellite clinic
0.0 0.0 0.0 0.0 1.2 0.0 0.6 0.0
Other NGO facilities
0.0 0.0 4.0 0.0 0.0 0.0 0.6 0.0
n 52 43 25 45 83 81 160 169
8.4 Child Immunization
Immunization is the process whereby a person is made immune or resistant to an infectious disease, typically by the administration of a vaccine24. Since 1979, the Government of Bangladesh has been conducting the Expanded Programme on Immunization (EPI). So far, it is one of the most successful programmes and most cost-effective health investment of Bangladesh. EPI is even able to access the most hard-to-reach areas and vulnerable populations of Bangladesh for complete immunization. EPI started with six conventional vaccines, namely DPT (3 vaccines), BCG, polio and measles. When a child receives all six vaccines between 12 and 23 months of age, it is considered a complete or full immunization. The EPI of Bangladesh is globally acclaimed for its sustained high coverage and significant contribution to the reduction of child mortality and morbidity. All respondents in the baseline were requested to give information about the immunization status of their child aged over 12 months. The state of child immunization varied by districts. The rate of full immunization (or, the same as “complete immunization”) is much higher in Lalmonirhat (over 90 % in both the intervention and control groups) than that in the other two districts (ranging between 50 % and 78%, see Figure 8.3). A high share of 96 per cent of women in the intervention group and 93 per cent of control group respondents from Lalmonirhat stated that their children received complete immunization. Gaibandha revealed the worst immunization situation, with half of the women in the intervention group and one-fourth in the control group indicating that their children are not fully immunized. Overall, slightly over three-fourths of the children (intervention: 77.5% and control: 78.4%) received complete immunization (Figure 8.3).
24https://www.who.int/topics/immunization/en/
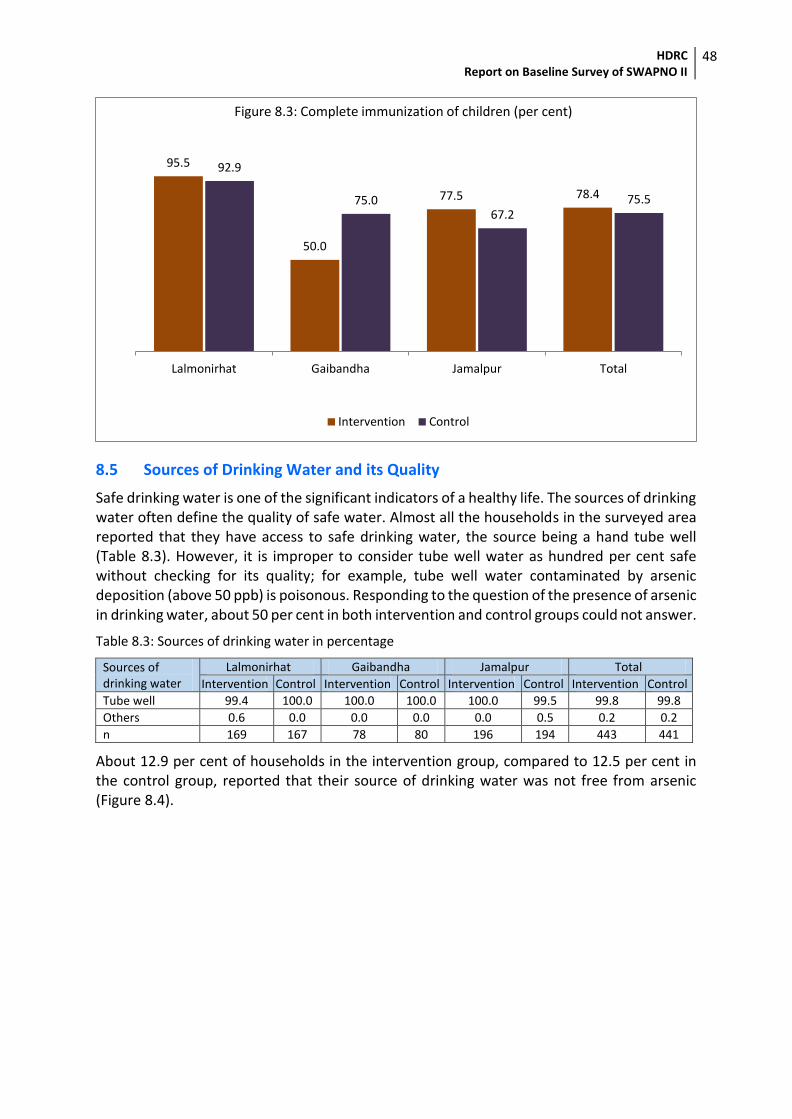
HDRC Report on Baseline Survey of SWAPNO II
48
8.5 Sources of Drinking Water and its Quality
Safe drinking water is one of the significant indicators of a healthy life. The sources of drinking water often define the quality of safe water. Almost all the households in the surveyed area reported that they have access to safe drinking water, the source being a hand tube well (Table 8.3). However, it is improper to consider tube well water as hundred per cent safe without checking for its quality; for example, tube well water contaminated by arsenic deposition (above 50 ppb) is poisonous. Responding to the question of the presence of arsenic in drinking water, about 50 per cent in both intervention and control groups could not answer.
Table 8.3: Sources of drinking water in percentage
Sources of drinking water
Lalmonirhat Gaibandha Jamalpur Total
Intervention Control Intervention Control Intervention Control Intervention Control
Tube well 99.4 100.0 100.0 100.0 100.0 99.5 99.8 99.8
Others 0.6 0.0 0.0 0.0 0.0 0.5 0.2 0.2
n 169 167 78 80 196 194 443 441
About 12.9 per cent of households in the intervention group, compared to 12.5 per cent in the control group, reported that their source of drinking water was not free from arsenic (Figure 8.4).
95.5
50.0
77.5 78.4
92.9
75.067.2
75.5
Lalmonirhat Gaibandha Jamalpur Total
Intervention Control
Figure 8.3: Complete immunization of children (per cent)
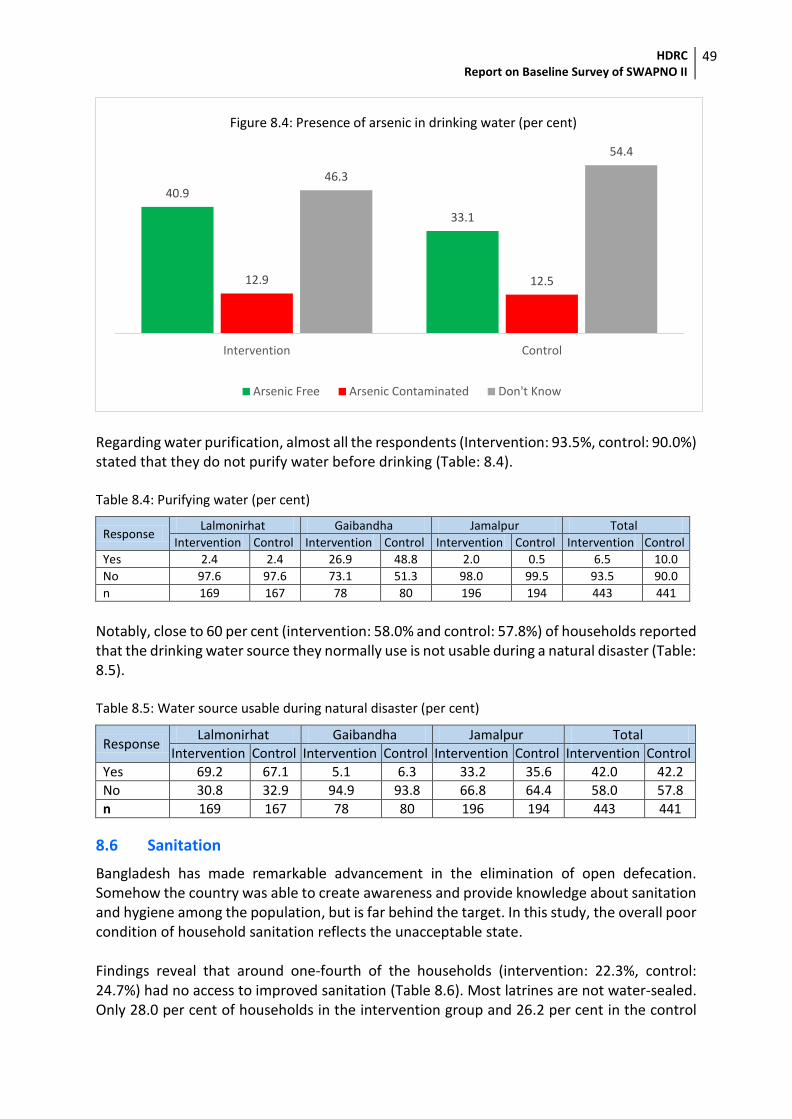
HDRC Report on Baseline Survey of SWAPNO II
49
Regarding water purification, almost all the respondents (Intervention: 93.5%, control: 90.0%) stated that they do not purify water before drinking (Table: 8.4). Table 8.4: Purifying water (per cent)
Response Lalmonirhat Gaibandha Jamalpur Total
Intervention Control Intervention Control Intervention Control Intervention Control
Yes 2.4 2.4 26.9 48.8 2.0 0.5 6.5 10.0
No 97.6 97.6 73.1 51.3 98.0 99.5 93.5 90.0
n 169 167 78 80 196 194 443 441
Notably, close to 60 per cent (intervention: 58.0% and control: 57.8%) of households reported that the drinking water source they normally use is not usable during a natural disaster (Table: 8.5). Table 8.5: Water source usable during natural disaster (per cent)
Response Lalmonirhat Gaibandha Jamalpur Total
Intervention Control Intervention Control Intervention Control Intervention Control
Yes 69.2 67.1 5.1 6.3 33.2 35.6 42.0 42.2
No 30.8 32.9 94.9 93.8 66.8 64.4 58.0 57.8
n 169 167 78 80 196 194 443 441
8.6 Sanitation
Bangladesh has made remarkable advancement in the elimination of open defecation. Somehow the country was able to create awareness and provide knowledge about sanitation and hygiene among the population, but is far behind the target. In this study, the overall poor condition of household sanitation reflects the unacceptable state. Findings reveal that around one-fourth of the households (intervention: 22.3%, control: 24.7%) had no access to improved sanitation (Table 8.6). Most latrines are not water-sealed. Only 28.0 per cent of households in the intervention group and 26.2 per cent in the control
40.9
33.1
12.9 12.5
46.3
54.4
Intervention Control
Arsenic Free Arsenic Contaminated Don't Know
Figure 8.4: Presence of arsenic in drinking water (per cent)
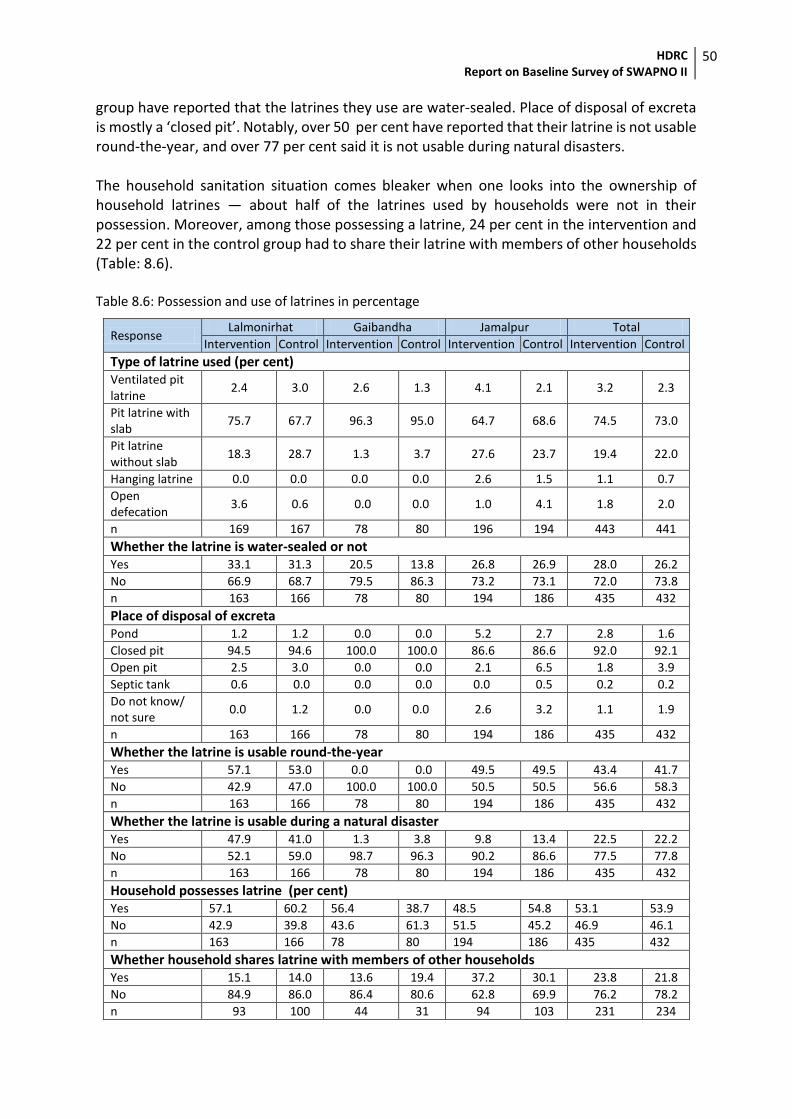
HDRC Report on Baseline Survey of SWAPNO II
50
group have reported that the latrines they use are water-sealed. Place of disposal of excreta is mostly a ‘closed pit’. Notably, over 50 per cent have reported that their latrine is not usable round-the-year, and over 77 per cent said it is not usable during natural disasters. The household sanitation situation comes bleaker when one looks into the ownership of household latrines — about half of the latrines used by households were not in their possession. Moreover, among those possessing a latrine, 24 per cent in the intervention and 22 per cent in the control group had to share their latrine with members of other households (Table: 8.6). Table 8.6: Possession and use of latrines in percentage
Response Lalmonirhat Gaibandha Jamalpur Total
Intervention Control Intervention Control Intervention Control Intervention Control
Type of latrine used (per cent)
Ventilated pit latrine
2.4 3.0 2.6 1.3 4.1 2.1 3.2 2.3
Pit latrine with slab
75.7 67.7 96.3 95.0 64.7 68.6 74.5 73.0
Pit latrine without slab
18.3 28.7 1.3 3.7 27.6 23.7 19.4 22.0
Hanging latrine 0.0 0.0 0.0 0.0 2.6 1.5 1.1 0.7
Open defecation
3.6 0.6 0.0 0.0 1.0 4.1 1.8 2.0
n 169 167 78 80 196 194 443 441
Whether the latrine is water-sealed or not
Yes 33.1 31.3 20.5 13.8 26.8 26.9 28.0 26.2
No 66.9 68.7 79.5 86.3 73.2 73.1 72.0 73.8
n 163 166 78 80 194 186 435 432
Place of disposal of excreta
Pond 1.2 1.2 0.0 0.0 5.2 2.7 2.8 1.6
Closed pit 94.5 94.6 100.0 100.0 86.6 86.6 92.0 92.1
Open pit 2.5 3.0 0.0 0.0 2.1 6.5 1.8 3.9
Septic tank 0.6 0.0 0.0 0.0 0.0 0.5 0.2 0.2
Do not know/ not sure
0.0 1.2 0.0 0.0 2.6 3.2 1.1 1.9
n 163 166 78 80 194 186 435 432
Whether the latrine is usable round-the-year
Yes 57.1 53.0 0.0 0.0 49.5 49.5 43.4 41.7
No 42.9 47.0 100.0 100.0 50.5 50.5 56.6 58.3
n 163 166 78 80 194 186 435 432
Whether the latrine is usable during a natural disaster
Yes 47.9 41.0 1.3 3.8 9.8 13.4 22.5 22.2
No 52.1 59.0 98.7 96.3 90.2 86.6 77.5 77.8
n 163 166 78 80 194 186 435 432
Household possesses latrine (per cent) Yes 57.1 60.2 56.4 38.7 48.5 54.8 53.1 53.9
No 42.9 39.8 43.6 61.3 51.5 45.2 46.9 46.1
n 163 166 78 80 194 186 435 432
Whether household shares latrine with members of other households
Yes 15.1 14.0 13.6 19.4 37.2 30.1 23.8 21.8
No 84.9 86.0 86.4 80.6 62.8 69.9 76.2 78.2
n 93 100 44 31 94 103 231 234
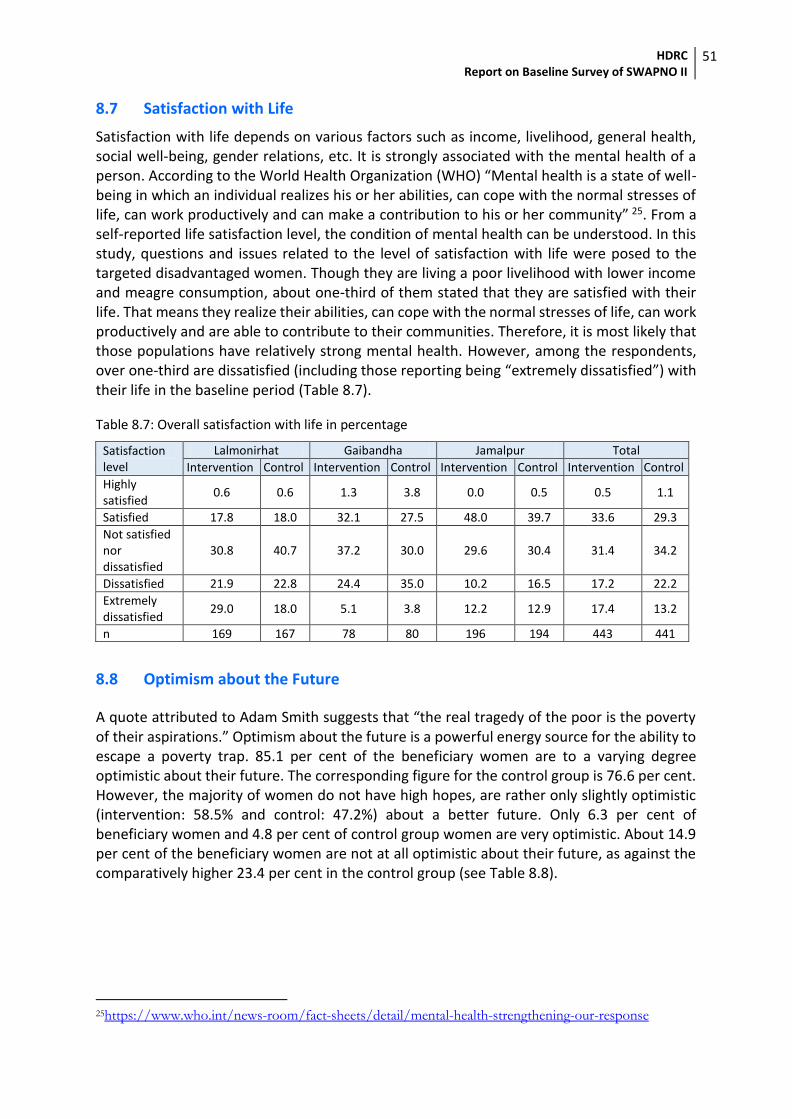
HDRC Report on Baseline Survey of SWAPNO II
51
8.7 Satisfaction with Life
Satisfaction with life depends on various factors such as income, livelihood, general health, social well-being, gender relations, etc. It is strongly associated with the mental health of a person. According to the World Health Organization (WHO) “Mental health is a state of well-being in which an individual realizes his or her abilities, can cope with the normal stresses of life, can work productively and can make a contribution to his or her community” 25. From a self-reported life satisfaction level, the condition of mental health can be understood. In this study, questions and issues related to the level of satisfaction with life were posed to the targeted disadvantaged women. Though they are living a poor livelihood with lower income and meagre consumption, about one-third of them stated that they are satisfied with their life. That means they realize their abilities, can cope with the normal stresses of life, can work productively and are able to contribute to their communities. Therefore, it is most likely that those populations have relatively strong mental health. However, among the respondents, over one-third are dissatisfied (including those reporting being “extremely dissatisfied”) with their life in the baseline period (Table 8.7).
Table 8.7: Overall satisfaction with life in percentage
Satisfaction level
Lalmonirhat Gaibandha Jamalpur Total
Intervention Control Intervention Control Intervention Control Intervention Control
Highly satisfied
0.6 0.6 1.3 3.8 0.0 0.5 0.5 1.1
Satisfied 17.8 18.0 32.1 27.5 48.0 39.7 33.6 29.3
Not satisfied nor dissatisfied
30.8 40.7 37.2 30.0 29.6 30.4 31.4 34.2
Dissatisfied 21.9 22.8 24.4 35.0 10.2 16.5 17.2 22.2
Extremely dissatisfied
29.0 18.0 5.1 3.8 12.2 12.9 17.4 13.2
n 169 167 78 80 196 194 443 441
8.8 Optimism about the Future
A quote attributed to Adam Smith suggests that “the real tragedy of the poor is the poverty of their aspirations.” Optimism about the future is a powerful energy source for the ability to escape a poverty trap. 85.1 per cent of the beneficiary women are to a varying degree optimistic about their future. The corresponding figure for the control group is 76.6 per cent. However, the majority of women do not have high hopes, are rather only slightly optimistic (intervention: 58.5% and control: 47.2%) about a better future. Only 6.3 per cent of beneficiary women and 4.8 per cent of control group women are very optimistic. About 14.9 per cent of the beneficiary women are not at all optimistic about their future, as against the comparatively higher 23.4 per cent in the control group (see Table 8.8).
25https://www.who.int/news-room/fact-sheets/detail/mental-health-strengthening-our-response
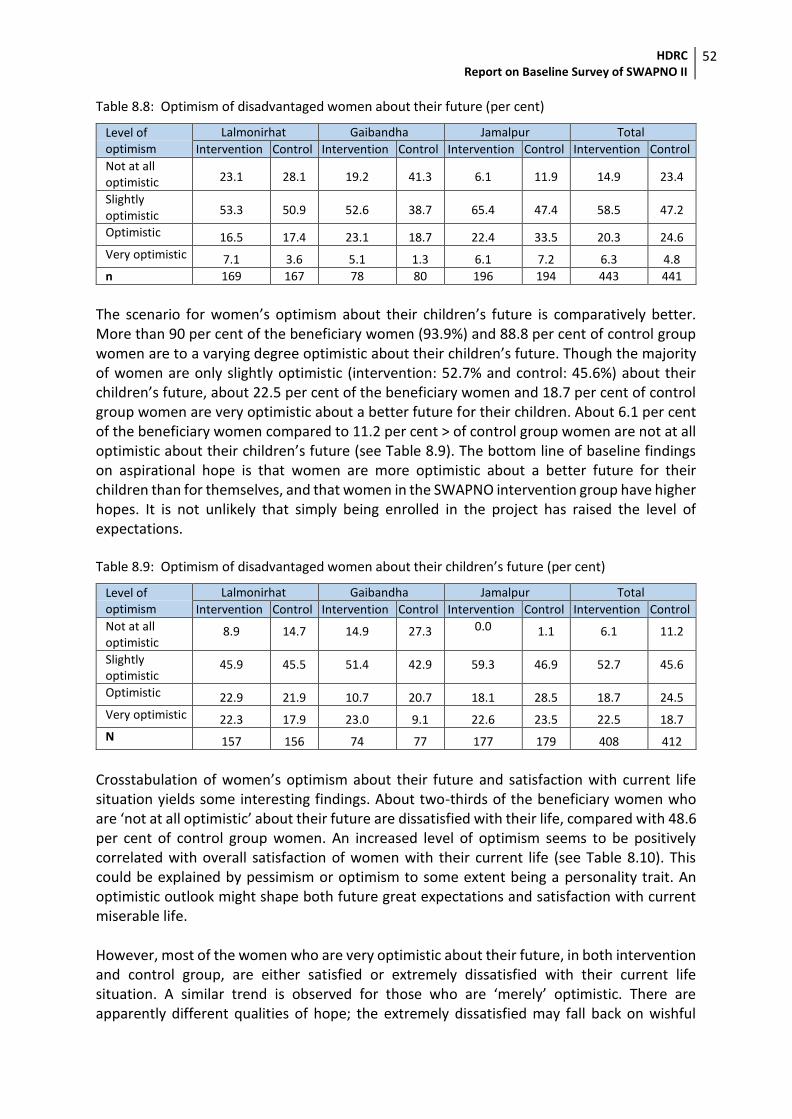
HDRC Report on Baseline Survey of SWAPNO II
52
Table 8.8: Optimism of disadvantaged women about their future (per cent)
Level of optimism
Lalmonirhat Gaibandha Jamalpur Total
Intervention Control Intervention Control Intervention Control Intervention Control
Not at all optimistic 23.1 28.1 19.2 41.3 6.1 11.9 14.9 23.4
Slightly optimistic 53.3 50.9 52.6 38.7 65.4 47.4 58.5 47.2
Optimistic 16.5 17.4 23.1 18.7 22.4 33.5 20.3 24.6
Very optimistic 7.1 3.6 5.1 1.3 6.1 7.2 6.3 4.8
n 169 167 78 80 196 194 443 441
The scenario for women’s optimism about their children’s future is comparatively better. More than 90 per cent of the beneficiary women (93.9%) and 88.8 per cent of control group women are to a varying degree optimistic about their children’s future. Though the majority of women are only slightly optimistic (intervention: 52.7% and control: 45.6%) about their children’s future, about 22.5 per cent of the beneficiary women and 18.7 per cent of control group women are very optimistic about a better future for their children. About 6.1 per cent of the beneficiary women compared to 11.2 per cent > of control group women are not at all optimistic about their children’s future (see Table 8.9). The bottom line of baseline findings on aspirational hope is that women are more optimistic about a better future for their children than for themselves, and that women in the SWAPNO intervention group have higher hopes. It is not unlikely that simply being enrolled in the project has raised the level of expectations. Table 8.9: Optimism of disadvantaged women about their children’s future (per cent)
Level of optimism
Lalmonirhat Gaibandha Jamalpur Total
Intervention Control Intervention Control Intervention Control Intervention Control
Not at all optimistic
8.9 14.7 14.9 27.3 0.0 1.1 6.1 11.2
Slightly optimistic
45.9 45.5 51.4 42.9 59.3 46.9 52.7 45.6
Optimistic 22.9 21.9 10.7 20.7 18.1 28.5 18.7 24.5
Very optimistic 22.3 17.9 23.0 9.1 22.6 23.5 22.5 18.7
N 157 156 74 77 177 179 408 412
Crosstabulation of women’s optimism about their future and satisfaction with current life situation yields some interesting findings. About two-thirds of the beneficiary women who are ‘not at all optimistic’ about their future are dissatisfied with their life, compared with 48.6 per cent of control group women. An increased level of optimism seems to be positively correlated with overall satisfaction of women with their current life (see Table 8.10). This could be explained by pessimism or optimism to some extent being a personality trait. An optimistic outlook might shape both future great expectations and satisfaction with current miserable life. However, most of the women who are very optimistic about their future, in both intervention and control group, are either satisfied or extremely dissatisfied with their current life situation. A similar trend is observed for those who are ‘merely’ optimistic. There are apparently different qualities of hope; the extremely dissatisfied may fall back on wishful
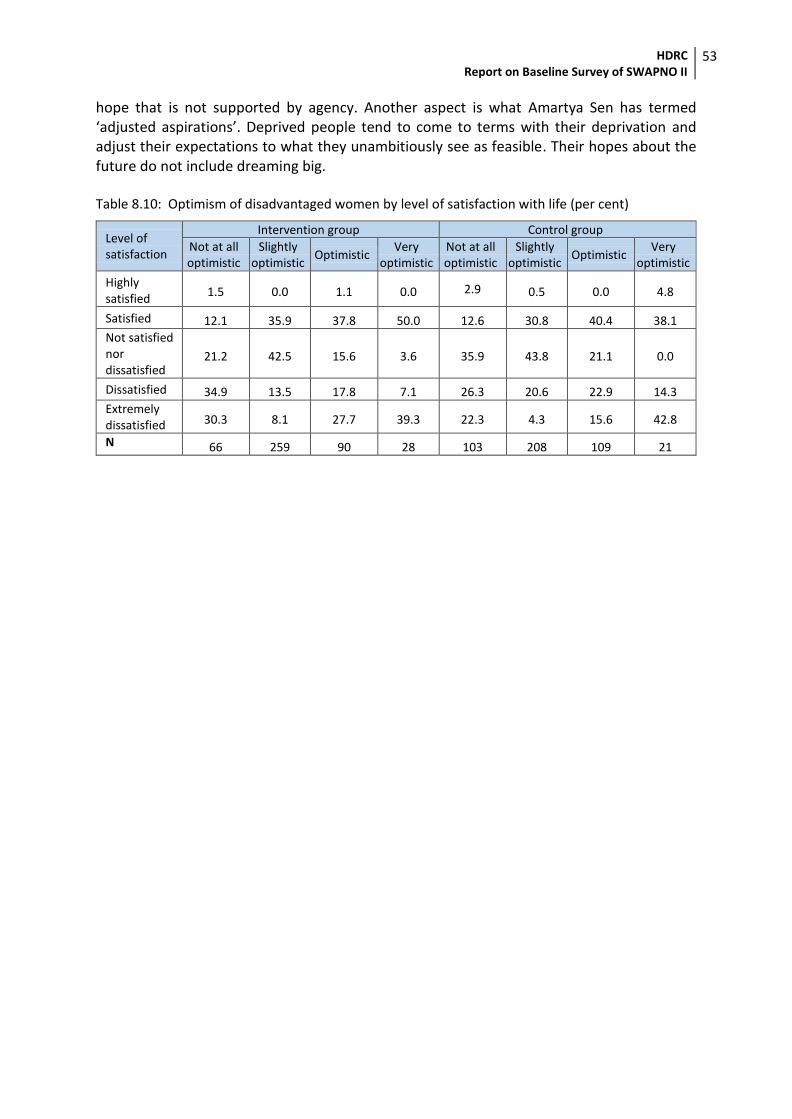
HDRC Report on Baseline Survey of SWAPNO II
53
hope that is not supported by agency. Another aspect is what Amartya Sen has termed ‘adjusted aspirations’. Deprived people tend to come to terms with their deprivation and adjust their expectations to what they unambitiously see as feasible. Their hopes about the future do not include dreaming big. Table 8.10: Optimism of disadvantaged women by level of satisfaction with life (per cent)
Level of satisfaction
Intervention group Control group
Not at all optimistic
Slightly optimistic
Optimistic Very
optimistic Not at all optimistic
Slightly optimistic
Optimistic Very
optimistic
Highly satisfied
1.5 0.0 1.1 0.0 2.9 0.5 0.0 4.8
Satisfied 12.1 35.9 37.8 50.0 12.6 30.8 40.4 38.1
Not satisfied nor dissatisfied
21.2 42.5 15.6 3.6 35.9 43.8 21.1 0.0
Dissatisfied 34.9 13.5 17.8 7.1 26.3 20.6 22.9 14.3
Extremely dissatisfied 30.3 8.1 27.7 39.3 22.3 4.3 15.6 42.8
N 66 259 90 28 103 208 109 21
HDRC Report on Baseline Survey of SWAPNO II
54
CHAPTER 9: HOUSEHOLD POVERTY SCENARIO
This chapter explores the household poverty scenario from two perspectives: i) household poverty status based on their expenditure capacity to meet their cost of basic needs, and ii) household poverty status as per Multidimensional Poverty Index (MPI).
9.1 Poverty Status Almost all survey households across districts were poor with the poverty rates being significantly higher than the respective divisional averages. Using the measure of ‘upper poverty line’ (UPL)26, 96.8 per cent of the intervention households and 94.8 per cent of the control households were in the UPL group. Irrespective of intervention-control, more than 90 per cent of households across districts belonged to the UPL group. It is important to mention here that according to the Household Income and Expenditure Survey (HIES) 2016, households below the upper poverty line (UPL) for Lalmonirhat, Gaibandha and Jamalpur as a whole were 42, 46.7 and 52.5 per cent respectively. Using the upper poverty line (UPL), the test of significance showed no statistically significant differences in the poverty level between intervention and control households (p=0.14). This is most likely attributable to the fact that almost all households (around 95 %), irrespective of intervention or control, belong to the “below upper poverty line” group. Using the ‘lower poverty line’ (LPL)27, 93.5 per cent of intervention households were below the lower poverty line, compared to 91.4 per cent for the control group. Again, using the lower poverty line as well, more than 90 per cent households across districts were poor irrespective of intervention-control group. The Chi-square tests showed that there were no statistically significant differences in the poverty level (measured using below LPL) between intervention and control households (p=0.238). The ‘poverty gap’ and ‘squared poverty gap’ were estimated to understand the baseline scenario of the depth and severity of poverty among households. The ‘poverty gaps’ estimate the depth of poverty of a population. It measures the distance of the poor households from the poverty line. The estimated poverty gap (using the upper poverty line) for intervention households was 53 per cent, and 50 per cent for control group households. The national rural poverty gap for Bangladesh is only 5.4 per cent (HIES 2016), which indicates that both beneficiary and control group households in the sample are far below the poverty line compared with the ‘average’ poor household. They are actually also far below the extreme poverty line.
26The poverty lines considered in this study is based on the Household Income and Expenditure Survey 2016 (Bangladesh Bureau of Statistics). According to HIES 2016, Upper poverty line for Lalmonirhat and Gaibandha is BDT 2065 per person per month while Lower poverty line is BDT 1716. On the other hand, Upper poverty line for Jamalpur is BDT 2152 per person per month and lower poverty line is BDT 1835.
27Ibid.
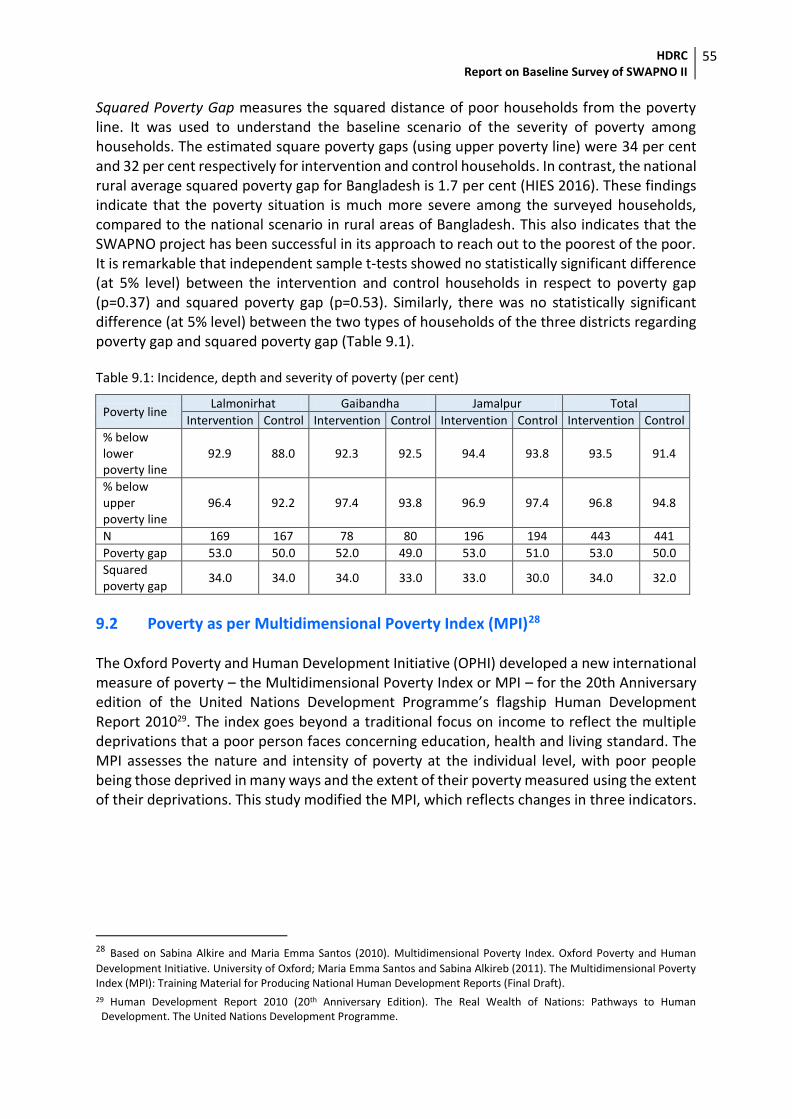
HDRC Report on Baseline Survey of SWAPNO II
55
Squared Poverty Gap measures the squared distance of poor households from the poverty line. It was used to understand the baseline scenario of the severity of poverty among households. The estimated square poverty gaps (using upper poverty line) were 34 per cent and 32 per cent respectively for intervention and control households. In contrast, the national rural average squared poverty gap for Bangladesh is 1.7 per cent (HIES 2016). These findings indicate that the poverty situation is much more severe among the surveyed households, compared to the national scenario in rural areas of Bangladesh. This also indicates that the SWAPNO project has been successful in its approach to reach out to the poorest of the poor. It is remarkable that independent sample t-tests showed no statistically significant difference (at 5% level) between the intervention and control households in respect to poverty gap (p=0.37) and squared poverty gap (p=0.53). Similarly, there was no statistically significant difference (at 5% level) between the two types of households of the three districts regarding poverty gap and squared poverty gap (Table 9.1). Table 9.1: Incidence, depth and severity of poverty (per cent)
Poverty line Lalmonirhat Gaibandha Jamalpur Total
Intervention Control Intervention Control Intervention Control Intervention Control
% below lower poverty line
92.9 88.0 92.3 92.5 94.4 93.8 93.5 91.4
% below upper poverty line
96.4 92.2 97.4 93.8 96.9 97.4 96.8 94.8
N 169 167 78 80 196 194 443 441
Poverty gap 53.0 50.0 52.0 49.0 53.0 51.0 53.0 50.0
Squared poverty gap
34.0 34.0 34.0 33.0 33.0 30.0 34.0 32.0
9.2 Poverty as per Multidimensional Poverty Index (MPI)28 The Oxford Poverty and Human Development Initiative (OPHI) developed a new international measure of poverty – the Multidimensional Poverty Index or MPI – for the 20th Anniversary edition of the United Nations Development Programme’s flagship Human Development Report 201029. The index goes beyond a traditional focus on income to reflect the multiple deprivations that a poor person faces concerning education, health and living standard. The MPI assesses the nature and intensity of poverty at the individual level, with poor people being those deprived in many ways and the extent of their poverty measured using the extent of their deprivations. This study modified the MPI, which reflects changes in three indicators.
28 Based on Sabina Alkire and Maria Emma Santos (2010). Multidimensional Poverty Index. Oxford Poverty and Human
Development Initiative. University of Oxford; Maria Emma Santos and Sabina Alkireb (2011). The Multidimensional Poverty Index (MPI): Training Material for Producing National Human Development Reports (Final Draft). 29 Human Development Report 2010 (20th Anniversary Edition). The Real Wealth of Nations: Pathways to Human
Development. The United Nations Development Programme.
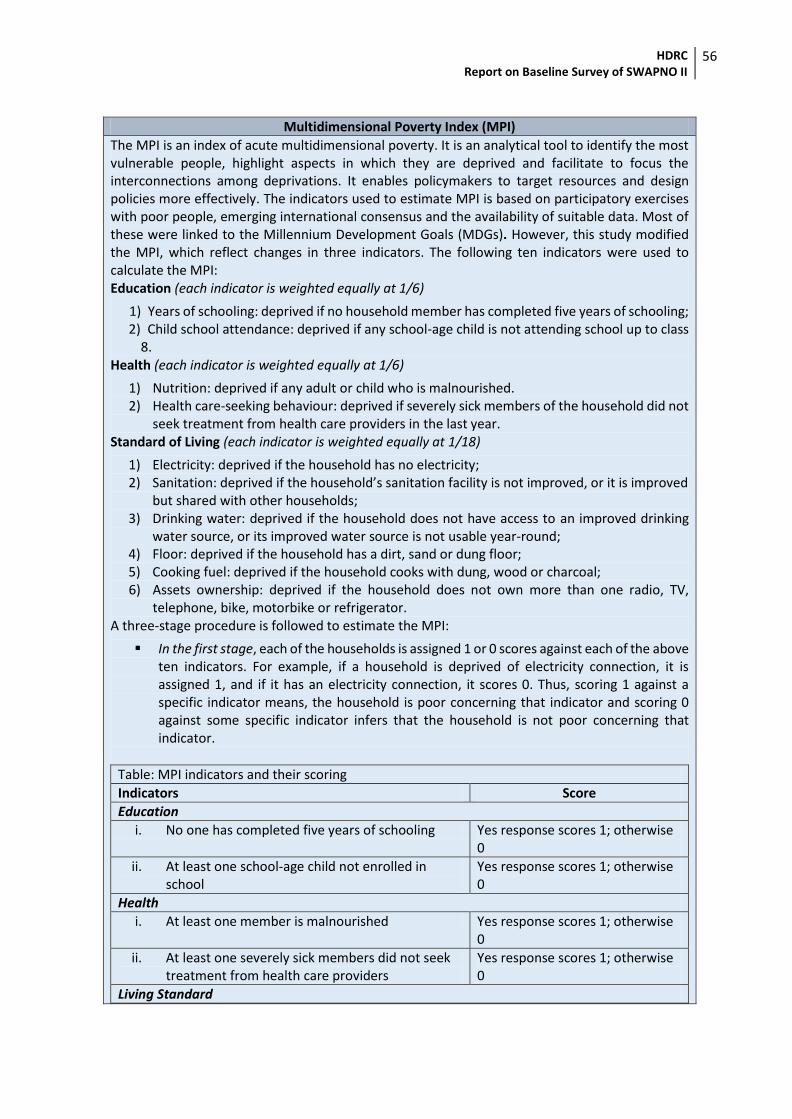
HDRC Report on Baseline Survey of SWAPNO II
56
Multidimensional Poverty Index (MPI)
The MPI is an index of acute multidimensional poverty. It is an analytical tool to identify the most vulnerable people, highlight aspects in which they are deprived and facilitate to focus the interconnections among deprivations. It enables policymakers to target resources and design policies more effectively. The indicators used to estimate MPI is based on participatory exercises with poor people, emerging international consensus and the availability of suitable data. Most of these were linked to the Millennium Development Goals (MDGs). However, this study modified the MPI, which reflect changes in three indicators. The following ten indicators were used to calculate the MPI: Education (each indicator is weighted equally at 1/6)
1) Years of schooling: deprived if no household member has completed five years of schooling; 2) Child school attendance: deprived if any school-age child is not attending school up to class
8. Health (each indicator is weighted equally at 1/6)
1) Nutrition: deprived if any adult or child who is malnourished. 2) Health care-seeking behaviour: deprived if severely sick members of the household did not
seek treatment from health care providers in the last year. Standard of Living (each indicator is weighted equally at 1/18)
1) Electricity: deprived if the household has no electricity; 2) Sanitation: deprived if the household’s sanitation facility is not improved, or it is improved
but shared with other households; 3) Drinking water: deprived if the household does not have access to an improved drinking
water source, or its improved water source is not usable year-round; 4) Floor: deprived if the household has a dirt, sand or dung floor; 5) Cooking fuel: deprived if the household cooks with dung, wood or charcoal; 6) Assets ownership: deprived if the household does not own more than one radio, TV,
telephone, bike, motorbike or refrigerator. A three-stage procedure is followed to estimate the MPI:
In the first stage, each of the households is assigned 1 or 0 scores against each of the above ten indicators. For example, if a household is deprived of electricity connection, it is assigned 1, and if it has an electricity connection, it scores 0. Thus, scoring 1 against a specific indicator means, the household is poor concerning that indicator and scoring 0 against some specific indicator infers that the household is not poor concerning that indicator.
Table: MPI indicators and their scoring
Indicators Score
Education
i. No one has completed five years of schooling Yes response scores 1; otherwise 0
ii. At least one school-age child not enrolled in school
Yes response scores 1; otherwise 0
Health
i. At least one member is malnourished Yes response scores 1; otherwise 0
ii. At least one severely sick members did not seek treatment from health care providers
Yes response scores 1; otherwise 0
Living Standard
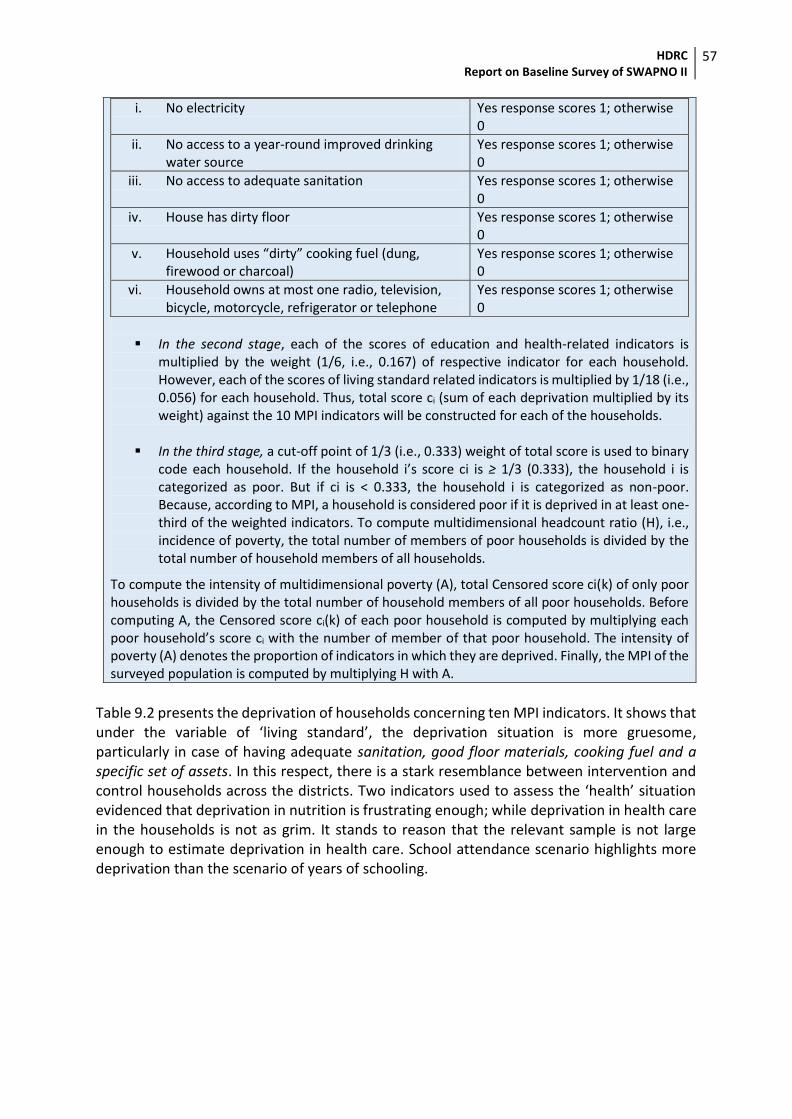
HDRC Report on Baseline Survey of SWAPNO II
57
i. No electricity Yes response scores 1; otherwise 0
ii. No access to a year-round improved drinking water source
Yes response scores 1; otherwise 0
iii. No access to adequate sanitation Yes response scores 1; otherwise 0
iv. House has dirty floor Yes response scores 1; otherwise 0
v. Household uses “dirty” cooking fuel (dung, firewood or charcoal)
Yes response scores 1; otherwise 0
vi. Household owns at most one radio, television, bicycle, motorcycle, refrigerator or telephone
Yes response scores 1; otherwise 0
In the second stage, each of the scores of education and health-related indicators is
multiplied by the weight (1/6, i.e., 0.167) of respective indicator for each household. However, each of the scores of living standard related indicators is multiplied by 1/18 (i.e., 0.056) for each household. Thus, total score ci (sum of each deprivation multiplied by its weight) against the 10 MPI indicators will be constructed for each of the households.
In the third stage, a cut-off point of 1/3 (i.e., 0.333) weight of total score is used to binary code each household. If the household i’s score ci is ≥ 1/3 (0.333), the household i is categorized as poor. But if ci is < 0.333, the household i is categorized as non-poor. Because, according to MPI, a household is considered poor if it is deprived in at least one-third of the weighted indicators. To compute multidimensional headcount ratio (H), i.e., incidence of poverty, the total number of members of poor households is divided by the total number of household members of all households.
To compute the intensity of multidimensional poverty (A), total Censored score ci(k) of only poor households is divided by the total number of household members of all poor households. Before computing A, the Censored score ci(k) of each poor household is computed by multiplying each poor household’s score ci with the number of member of that poor household. The intensity of poverty (A) denotes the proportion of indicators in which they are deprived. Finally, the MPI of the surveyed population is computed by multiplying H with A.
Table 9.2 presents the deprivation of households concerning ten MPI indicators. It shows that under the variable of ‘living standard’, the deprivation situation is more gruesome, particularly in case of having adequate sanitation, good floor materials, cooking fuel and a specific set of assets. In this respect, there is a stark resemblance between intervention and control households across the districts. Two indicators used to assess the ‘health’ situation evidenced that deprivation in nutrition is frustrating enough; while deprivation in health care in the households is not as grim. It stands to reason that the relevant sample is not large enough to estimate deprivation in health care. School attendance scenario highlights more deprivation than the scenario of years of schooling.
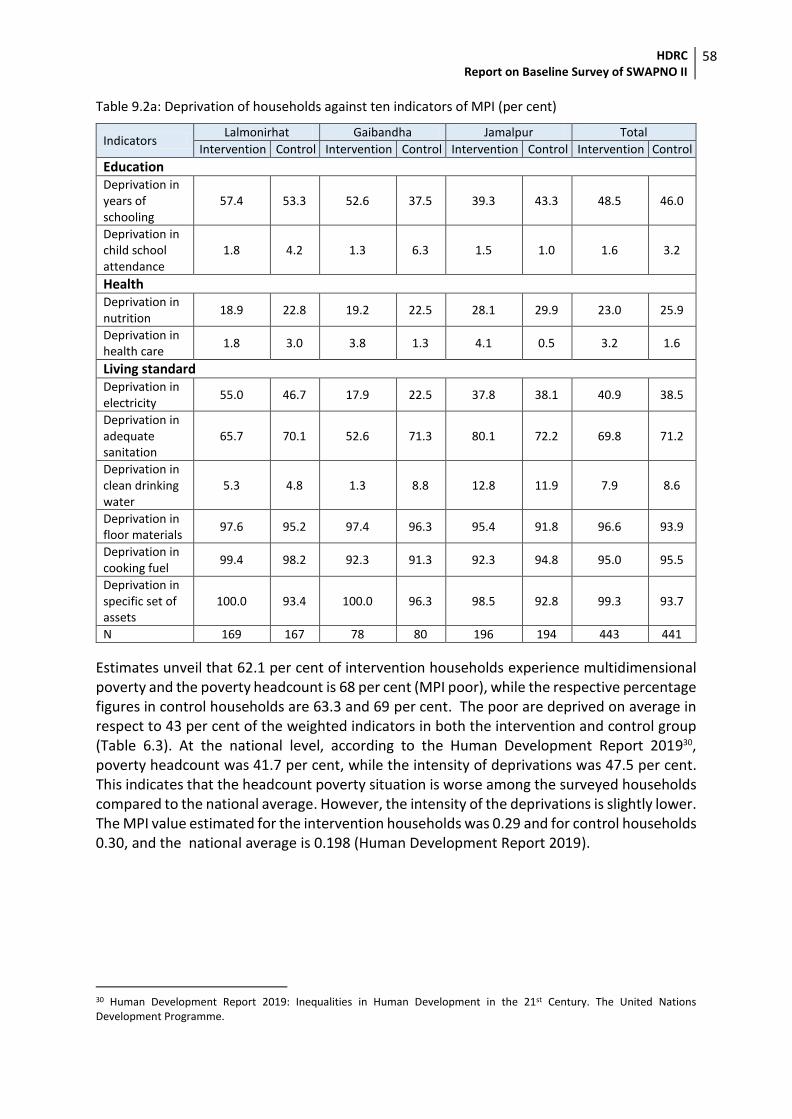
HDRC Report on Baseline Survey of SWAPNO II
58
Table 9.2a: Deprivation of households against ten indicators of MPI (per cent)
Indicators Lalmonirhat Gaibandha Jamalpur Total
Intervention Control Intervention Control Intervention Control Intervention Control
Education Deprivation in years of schooling
57.4 53.3 52.6 37.5 39.3 43.3 48.5 46.0
Deprivation in child school attendance
1.8 4.2 1.3 6.3 1.5 1.0 1.6 3.2
Health Deprivation in nutrition
18.9 22.8 19.2 22.5 28.1 29.9 23.0 25.9
Deprivation in health care
1.8 3.0 3.8 1.3 4.1 0.5 3.2 1.6
Living standard Deprivation in electricity
55.0 46.7 17.9 22.5 37.8 38.1 40.9 38.5
Deprivation in adequate sanitation
65.7 70.1 52.6 71.3 80.1 72.2 69.8 71.2
Deprivation in clean drinking water
5.3 4.8 1.3 8.8 12.8 11.9 7.9 8.6
Deprivation in floor materials
97.6 95.2 97.4 96.3 95.4 91.8 96.6 93.9
Deprivation in cooking fuel
99.4 98.2 92.3 91.3 92.3 94.8 95.0 95.5
Deprivation in specific set of assets
100.0 93.4 100.0 96.3 98.5 92.8 99.3 93.7
N 169 167 78 80 196 194 443 441
Estimates unveil that 62.1 per cent of intervention households experience multidimensional poverty and the poverty headcount is 68 per cent (MPI poor), while the respective percentage figures in control households are 63.3 and 69 per cent. The poor are deprived on average in respect to 43 per cent of the weighted indicators in both the intervention and control group (Table 6.3). At the national level, according to the Human Development Report 201930, poverty headcount was 41.7 per cent, while the intensity of deprivations was 47.5 per cent. This indicates that the headcount poverty situation is worse among the surveyed households compared to the national average. However, the intensity of the deprivations is slightly lower. The MPI value estimated for the intervention households was 0.29 and for control households 0.30, and the national average is 0.198 (Human Development Report 2019).
30 Human Development Report 2019: Inequalities in Human Development in the 21st Century. The United Nations Development Programme.
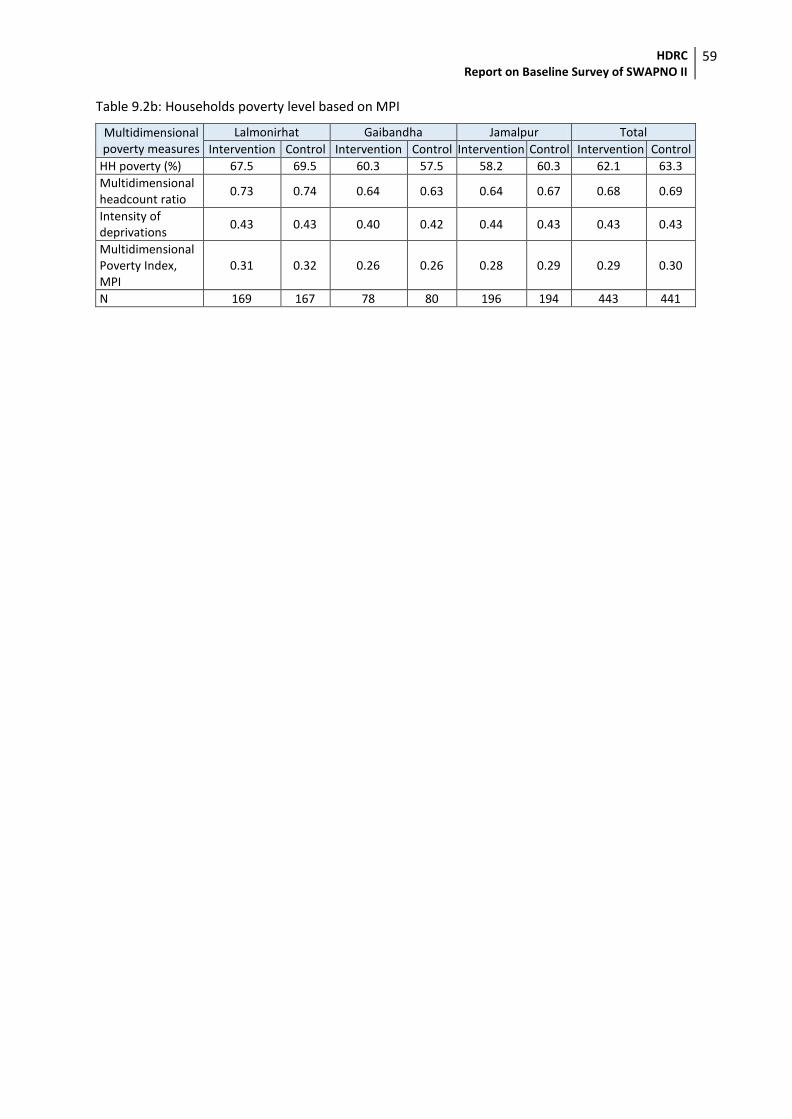
HDRC Report on Baseline Survey of SWAPNO II
59
Table 9.2b: Households poverty level based on MPI
Multidimensional poverty measures
Lalmonirhat Gaibandha Jamalpur Total
Intervention Control Intervention Control Intervention Control Intervention Control
HH poverty (%) 67.5 69.5 60.3 57.5 58.2 60.3 62.1 63.3
Multidimensional headcount ratio
0.73 0.74 0.64 0.63 0.64 0.67 0.68 0.69
Intensity of deprivations
0.43 0.43 0.40 0.42 0.44 0.43 0.43 0.43
Multidimensional Poverty Index, MPI
0.31 0.32 0.26 0.26 0.28 0.29 0.29 0.30
N 169 167 78 80 196 194 443 441
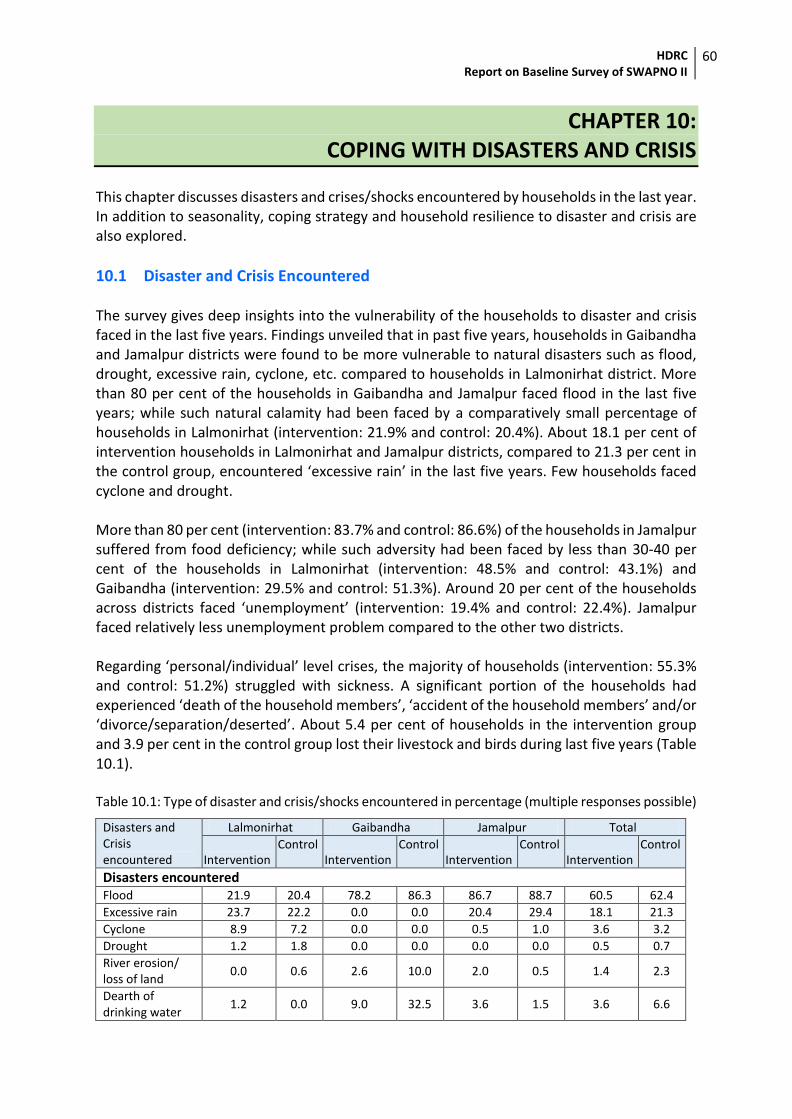
HDRC Report on Baseline Survey of SWAPNO II
60
CHAPTER 10: COPING WITH DISASTERS AND CRISIS
This chapter discusses disasters and crises/shocks encountered by households in the last year. In addition to seasonality, coping strategy and household resilience to disaster and crisis are also explored.
10.1 Disaster and Crisis Encountered The survey gives deep insights into the vulnerability of the households to disaster and crisis faced in the last five years. Findings unveiled that in past five years, households in Gaibandha and Jamalpur districts were found to be more vulnerable to natural disasters such as flood, drought, excessive rain, cyclone, etc. compared to households in Lalmonirhat district. More than 80 per cent of the households in Gaibandha and Jamalpur faced flood in the last five years; while such natural calamity had been faced by a comparatively small percentage of households in Lalmonirhat (intervention: 21.9% and control: 20.4%). About 18.1 per cent of intervention households in Lalmonirhat and Jamalpur districts, compared to 21.3 per cent in the control group, encountered ‘excessive rain’ in the last five years. Few households faced cyclone and drought. More than 80 per cent (intervention: 83.7% and control: 86.6%) of the households in Jamalpur suffered from food deficiency; while such adversity had been faced by less than 30-40 per cent of the households in Lalmonirhat (intervention: 48.5% and control: 43.1%) and Gaibandha (intervention: 29.5% and control: 51.3%). Around 20 per cent of the households across districts faced ‘unemployment’ (intervention: 19.4% and control: 22.4%). Jamalpur faced relatively less unemployment problem compared to the other two districts. Regarding ‘personal/individual’ level crises, the majority of households (intervention: 55.3% and control: 51.2%) struggled with sickness. A significant portion of the households had experienced ‘death of the household members’, ‘accident of the household members’ and/or ‘divorce/separation/deserted’. About 5.4 per cent of households in the intervention group and 3.9 per cent in the control group lost their livestock and birds during last five years (Table 10.1). Table 10.1: Type of disaster and crisis/shocks encountered in percentage (multiple responses possible)
Disasters and Crisis encountered
Lalmonirhat Gaibandha Jamalpur Total
Intervention Control
Intervention Control
Intervention Control
Intervention Control
Disasters encountered Flood 21.9 20.4 78.2 86.3 86.7 88.7 60.5 62.4
Excessive rain 23.7 22.2 0.0 0.0 20.4 29.4 18.1 21.3
Cyclone 8.9 7.2 0.0 0.0 0.5 1.0 3.6 3.2
Drought 1.2 1.8 0.0 0.0 0.0 0.0 0.5 0.7
River erosion/ loss of land
0.0 0.6 2.6 10.0 2.0 0.5 1.4 2.3
Dearth of drinking water
1.2 0.0 9.0 32.5 3.6 1.5 3.6 6.6
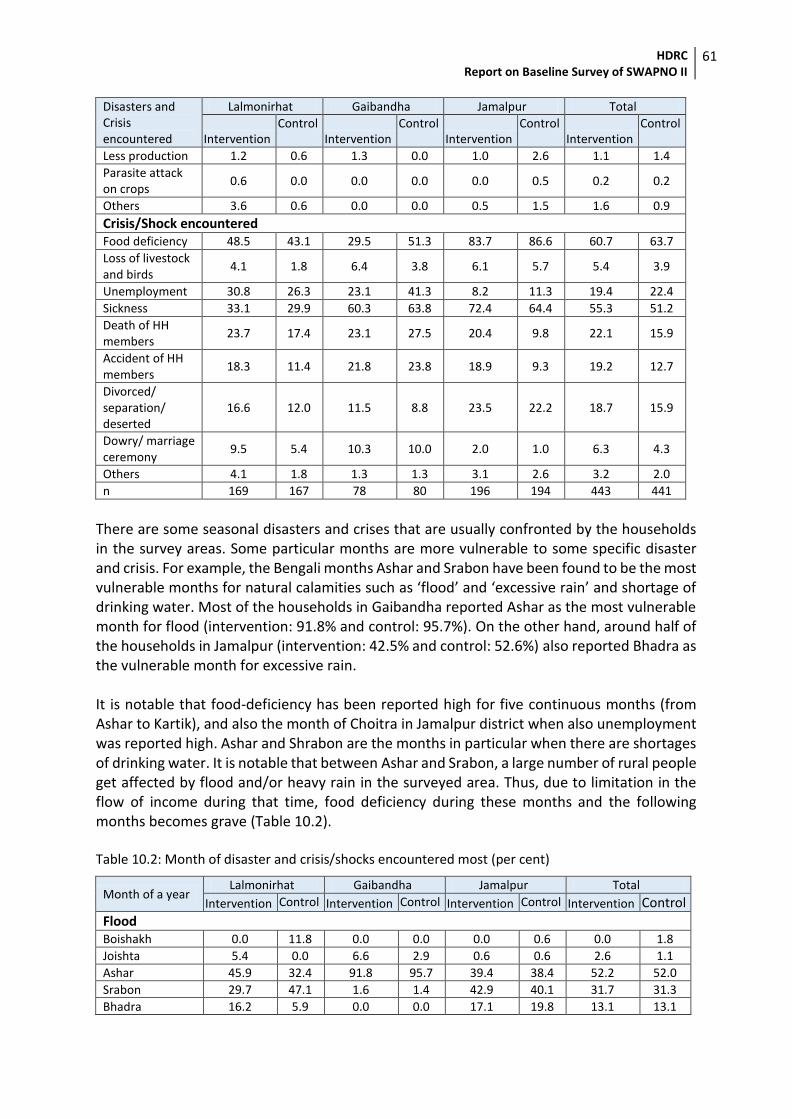
HDRC Report on Baseline Survey of SWAPNO II
61
Disasters and Crisis encountered
Lalmonirhat Gaibandha Jamalpur Total
Intervention Control
Intervention Control
Intervention Control
Intervention Control
Less production 1.2 0.6 1.3 0.0 1.0 2.6 1.1 1.4
Parasite attack on crops
0.6 0.0 0.0 0.0 0.0 0.5 0.2 0.2
Others 3.6 0.6 0.0 0.0 0.5 1.5 1.6 0.9
Crisis/Shock encountered Food deficiency 48.5 43.1 29.5 51.3 83.7 86.6 60.7 63.7
Loss of livestock and birds
4.1 1.8 6.4 3.8 6.1 5.7 5.4 3.9
Unemployment 30.8 26.3 23.1 41.3 8.2 11.3 19.4 22.4
Sickness 33.1 29.9 60.3 63.8 72.4 64.4 55.3 51.2
Death of HH members
23.7 17.4 23.1 27.5 20.4 9.8 22.1 15.9
Accident of HH members
18.3 11.4 21.8 23.8 18.9 9.3 19.2 12.7
Divorced/ separation/ deserted
16.6 12.0 11.5 8.8 23.5 22.2 18.7 15.9
Dowry/ marriage ceremony
9.5 5.4 10.3 10.0 2.0 1.0 6.3 4.3
Others 4.1 1.8 1.3 1.3 3.1 2.6 3.2 2.0
n 169 167 78 80 196 194 443 441
There are some seasonal disasters and crises that are usually confronted by the households in the survey areas. Some particular months are more vulnerable to some specific disaster and crisis. For example, the Bengali months Ashar and Srabon have been found to be the most vulnerable months for natural calamities such as ‘flood’ and ‘excessive rain’ and shortage of drinking water. Most of the households in Gaibandha reported Ashar as the most vulnerable month for flood (intervention: 91.8% and control: 95.7%). On the other hand, around half of the households in Jamalpur (intervention: 42.5% and control: 52.6%) also reported Bhadra as the vulnerable month for excessive rain. It is notable that food-deficiency has been reported high for five continuous months (from Ashar to Kartik), and also the month of Choitra in Jamalpur district when also unemployment was reported high. Ashar and Shrabon are the months in particular when there are shortages of drinking water. It is notable that between Ashar and Srabon, a large number of rural people get affected by flood and/or heavy rain in the surveyed area. Thus, due to limitation in the flow of income during that time, food deficiency during these months and the following months becomes grave (Table 10.2). Table 10.2: Month of disaster and crisis/shocks encountered most (per cent)
Month of a year Lalmonirhat Gaibandha Jamalpur Total
Intervention Control Intervention Control Intervention Control Intervention Control
Flood Boishakh 0.0 11.8 0.0 0.0 0.0 0.6 0.0 1.8
Joishta 5.4 0.0 6.6 2.9 0.6 0.6 2.6 1.1
Ashar 45.9 32.4 91.8 95.7 39.4 38.4 52.2 52.0
Srabon 29.7 47.1 1.6 1.4 42.9 40.1 31.7 31.3
Bhadra 16.2 5.9 0.0 0.0 17.1 19.8 13.1 13.1
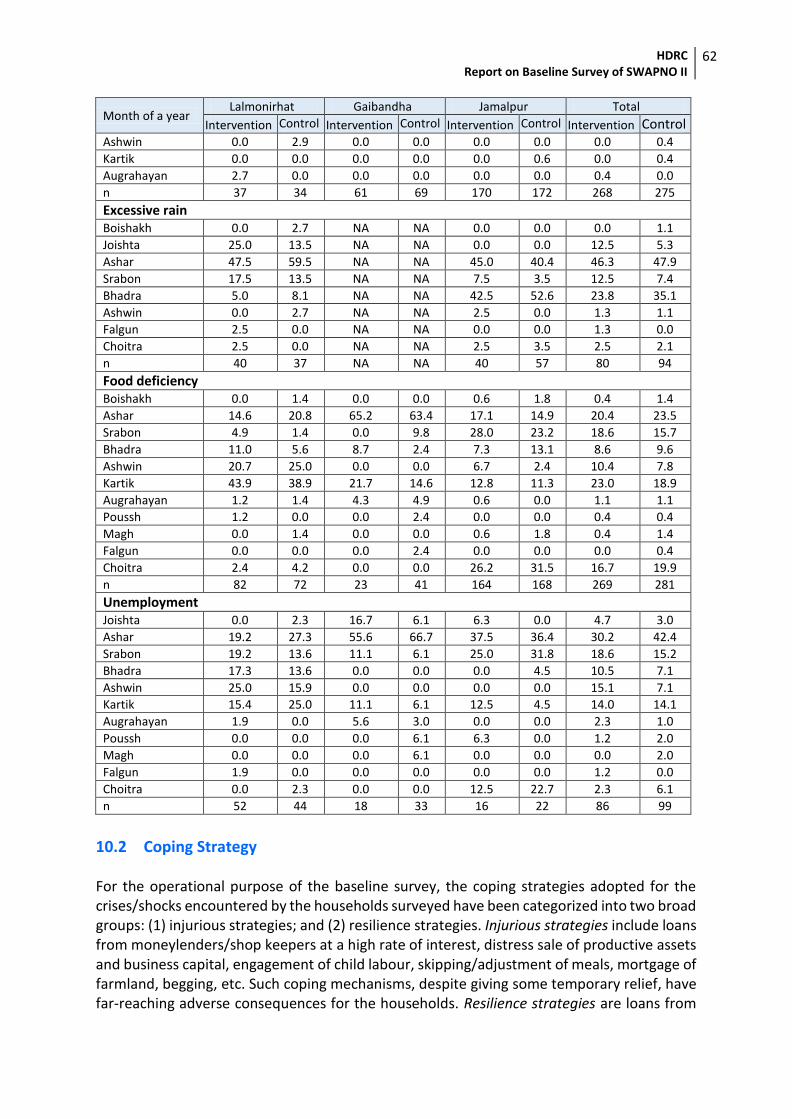
HDRC Report on Baseline Survey of SWAPNO II
62
Month of a year Lalmonirhat Gaibandha Jamalpur Total
Intervention Control Intervention Control Intervention Control Intervention Control Ashwin 0.0 2.9 0.0 0.0 0.0 0.0 0.0 0.4
Kartik 0.0 0.0 0.0 0.0 0.0 0.6 0.0 0.4
Augrahayan 2.7 0.0 0.0 0.0 0.0 0.0 0.4 0.0
n 37 34 61 69 170 172 268 275
Excessive rain Boishakh 0.0 2.7 NA NA 0.0 0.0 0.0 1.1
Joishta 25.0 13.5 NA NA 0.0 0.0 12.5 5.3
Ashar 47.5 59.5 NA NA 45.0 40.4 46.3 47.9
Srabon 17.5 13.5 NA NA 7.5 3.5 12.5 7.4
Bhadra 5.0 8.1 NA NA 42.5 52.6 23.8 35.1
Ashwin 0.0 2.7 NA NA 2.5 0.0 1.3 1.1
Falgun 2.5 0.0 NA NA 0.0 0.0 1.3 0.0
Choitra 2.5 0.0 NA NA 2.5 3.5 2.5 2.1
n 40 37 NA NA 40 57 80 94
Food deficiency Boishakh 0.0 1.4 0.0 0.0 0.6 1.8 0.4 1.4
Ashar 14.6 20.8 65.2 63.4 17.1 14.9 20.4 23.5
Srabon 4.9 1.4 0.0 9.8 28.0 23.2 18.6 15.7
Bhadra 11.0 5.6 8.7 2.4 7.3 13.1 8.6 9.6
Ashwin 20.7 25.0 0.0 0.0 6.7 2.4 10.4 7.8
Kartik 43.9 38.9 21.7 14.6 12.8 11.3 23.0 18.9
Augrahayan 1.2 1.4 4.3 4.9 0.6 0.0 1.1 1.1
Poussh 1.2 0.0 0.0 2.4 0.0 0.0 0.4 0.4
Magh 0.0 1.4 0.0 0.0 0.6 1.8 0.4 1.4
Falgun 0.0 0.0 0.0 2.4 0.0 0.0 0.0 0.4
Choitra 2.4 4.2 0.0 0.0 26.2 31.5 16.7 19.9
n 82 72 23 41 164 168 269 281
Unemployment Joishta 0.0 2.3 16.7 6.1 6.3 0.0 4.7 3.0
Ashar 19.2 27.3 55.6 66.7 37.5 36.4 30.2 42.4
Srabon 19.2 13.6 11.1 6.1 25.0 31.8 18.6 15.2
Bhadra 17.3 13.6 0.0 0.0 0.0 4.5 10.5 7.1
Ashwin 25.0 15.9 0.0 0.0 0.0 0.0 15.1 7.1
Kartik 15.4 25.0 11.1 6.1 12.5 4.5 14.0 14.1
Augrahayan 1.9 0.0 5.6 3.0 0.0 0.0 2.3 1.0
Poussh 0.0 0.0 0.0 6.1 6.3 0.0 1.2 2.0
Magh 0.0 0.0 0.0 6.1 0.0 0.0 0.0 2.0
Falgun 1.9 0.0 0.0 0.0 0.0 0.0 1.2 0.0
Choitra 0.0 2.3 0.0 0.0 12.5 22.7 2.3 6.1
n 52 44 18 33 16 22 86 99
10.2 Coping Strategy For the operational purpose of the baseline survey, the coping strategies adopted for the crises/shocks encountered by the households surveyed have been categorized into two broad groups: (1) injurious strategies; and (2) resilience strategies. Injurious strategies include loans from moneylenders/shop keepers at a high rate of interest, distress sale of productive assets and business capital, engagement of child labour, skipping/adjustment of meals, mortgage of farmland, begging, etc. Such coping mechanisms, despite giving some temporary relief, have far-reaching adverse consequences for the households. Resilience strategies are loans from
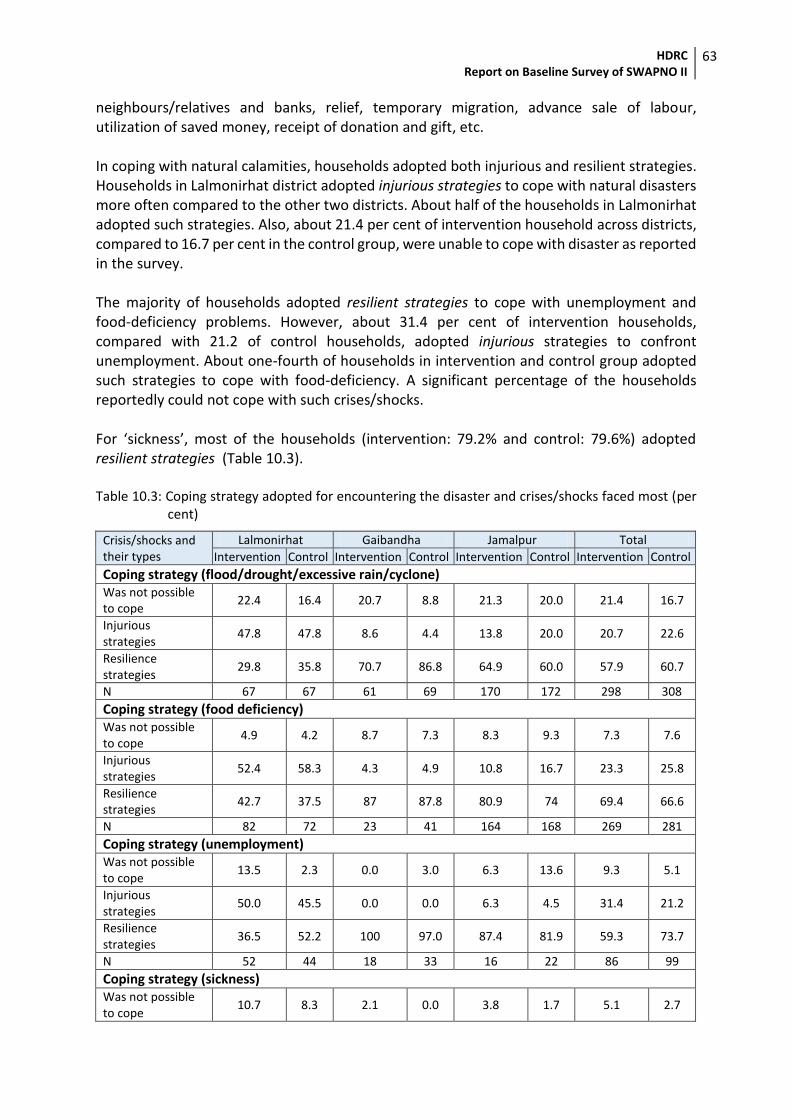
HDRC Report on Baseline Survey of SWAPNO II
63
neighbours/relatives and banks, relief, temporary migration, advance sale of labour, utilization of saved money, receipt of donation and gift, etc. In coping with natural calamities, households adopted both injurious and resilient strategies. Households in Lalmonirhat district adopted injurious strategies to cope with natural disasters more often compared to the other two districts. About half of the households in Lalmonirhat adopted such strategies. Also, about 21.4 per cent of intervention household across districts, compared to 16.7 per cent in the control group, were unable to cope with disaster as reported in the survey. The majority of households adopted resilient strategies to cope with unemployment and food-deficiency problems. However, about 31.4 per cent of intervention households, compared with 21.2 of control households, adopted injurious strategies to confront unemployment. About one-fourth of households in intervention and control group adopted such strategies to cope with food-deficiency. A significant percentage of the households reportedly could not cope with such crises/shocks. For ‘sickness’, most of the households (intervention: 79.2% and control: 79.6%) adopted resilient strategies (Table 10.3). Table 10.3: Coping strategy adopted for encountering the disaster and crises/shocks faced most (per
cent)
Crisis/shocks and their types
Lalmonirhat Gaibandha Jamalpur Total
Intervention Control Intervention Control Intervention Control Intervention Control
Coping strategy (flood/drought/excessive rain/cyclone) Was not possible to cope
22.4 16.4 20.7 8.8 21.3 20.0 21.4 16.7
Injurious strategies
47.8 47.8 8.6 4.4 13.8 20.0 20.7 22.6
Resilience strategies
29.8 35.8 70.7 86.8 64.9 60.0 57.9 60.7
N 67 67 61 69 170 172 298 308
Coping strategy (food deficiency) Was not possible to cope
4.9 4.2 8.7 7.3 8.3 9.3 7.3 7.6
Injurious strategies
52.4 58.3 4.3 4.9 10.8 16.7 23.3 25.8
Resilience strategies
42.7 37.5 87 87.8 80.9 74 69.4 66.6
N 82 72 23 41 164 168 269 281
Coping strategy (unemployment) Was not possible to cope
13.5 2.3 0.0 3.0 6.3 13.6 9.3 5.1
Injurious strategies
50.0 45.5 0.0 0.0 6.3 4.5 31.4 21.2
Resilience strategies
36.5 52.2 100 97.0 87.4 81.9 59.3 73.7
N 52 44 18 33 16 22 86 99
Coping strategy (sickness)
Was not possible to cope
10.7 8.3 2.1 0.0 3.8 1.7 5.1 2.7
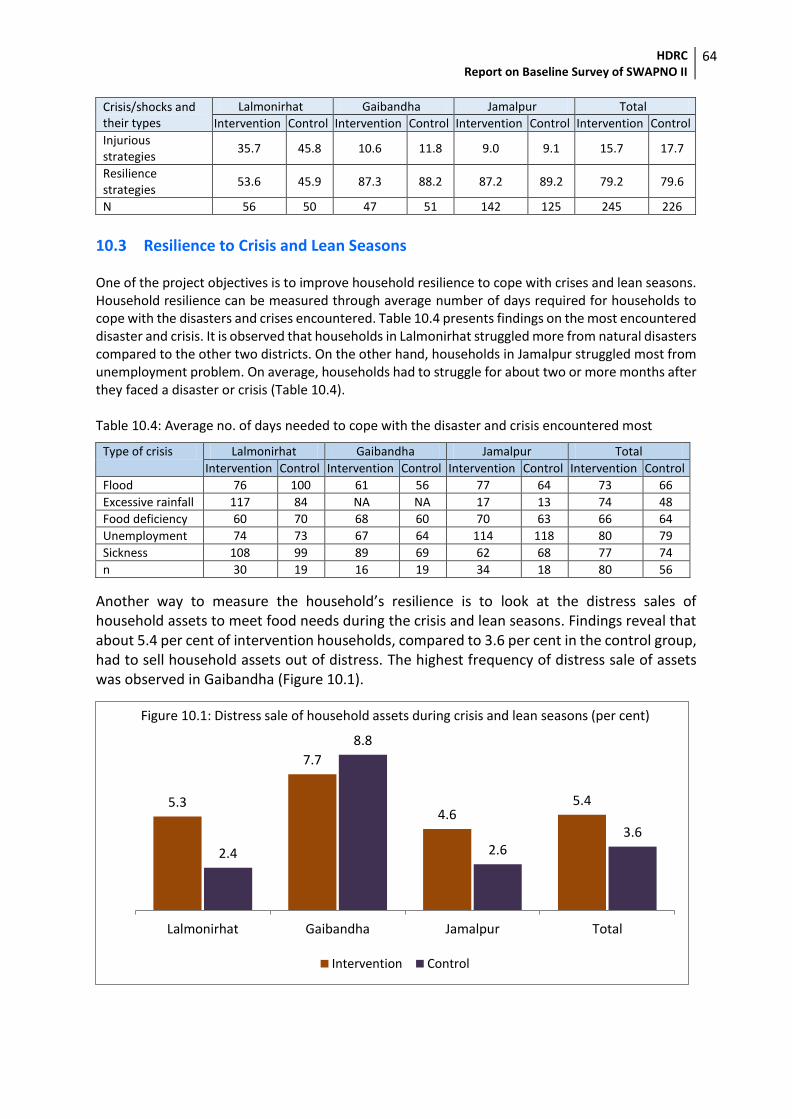
HDRC Report on Baseline Survey of SWAPNO II
64
Crisis/shocks and their types
Lalmonirhat Gaibandha Jamalpur Total
Intervention Control Intervention Control Intervention Control Intervention Control
Injurious strategies
35.7 45.8 10.6 11.8 9.0 9.1 15.7 17.7
Resilience strategies
53.6 45.9 87.3 88.2 87.2 89.2 79.2 79.6
N 56 50 47 51 142 125 245 226
10.3 Resilience to Crisis and Lean Seasons One of the project objectives is to improve household resilience to cope with crises and lean seasons. Household resilience can be measured through average number of days required for households to cope with the disasters and crises encountered. Table 10.4 presents findings on the most encountered disaster and crisis. It is observed that households in Lalmonirhat struggled more from natural disasters compared to the other two districts. On the other hand, households in Jamalpur struggled most from unemployment problem. On average, households had to struggle for about two or more months after they faced a disaster or crisis (Table 10.4). Table 10.4: Average no. of days needed to cope with the disaster and crisis encountered most
Type of crisis Lalmonirhat Gaibandha Jamalpur Total
Intervention Control Intervention Control Intervention Control Intervention Control
Flood 76 100 61 56 77 64 73 66
Excessive rainfall 117 84 NA NA 17 13 74 48
Food deficiency 60 70 68 60 70 63 66 64
Unemployment 74 73 67 64 114 118 80 79
Sickness 108 99 89 69 62 68 77 74
n 30 19 16 19 34 18 80 56
Another way to measure the household’s resilience is to look at the distress sales of household assets to meet food needs during the crisis and lean seasons. Findings reveal that about 5.4 per cent of intervention households, compared to 3.6 per cent in the control group, had to sell household assets out of distress. The highest frequency of distress sale of assets was observed in Gaibandha (Figure 10.1).
5.3
7.7
4.65.4
2.4
8.8
2.63.6
Lalmonirhat Gaibandha Jamalpur Total
Intervention Control
Figure 10.1: Distress sale of household assets during crisis and lean seasons (per cent)
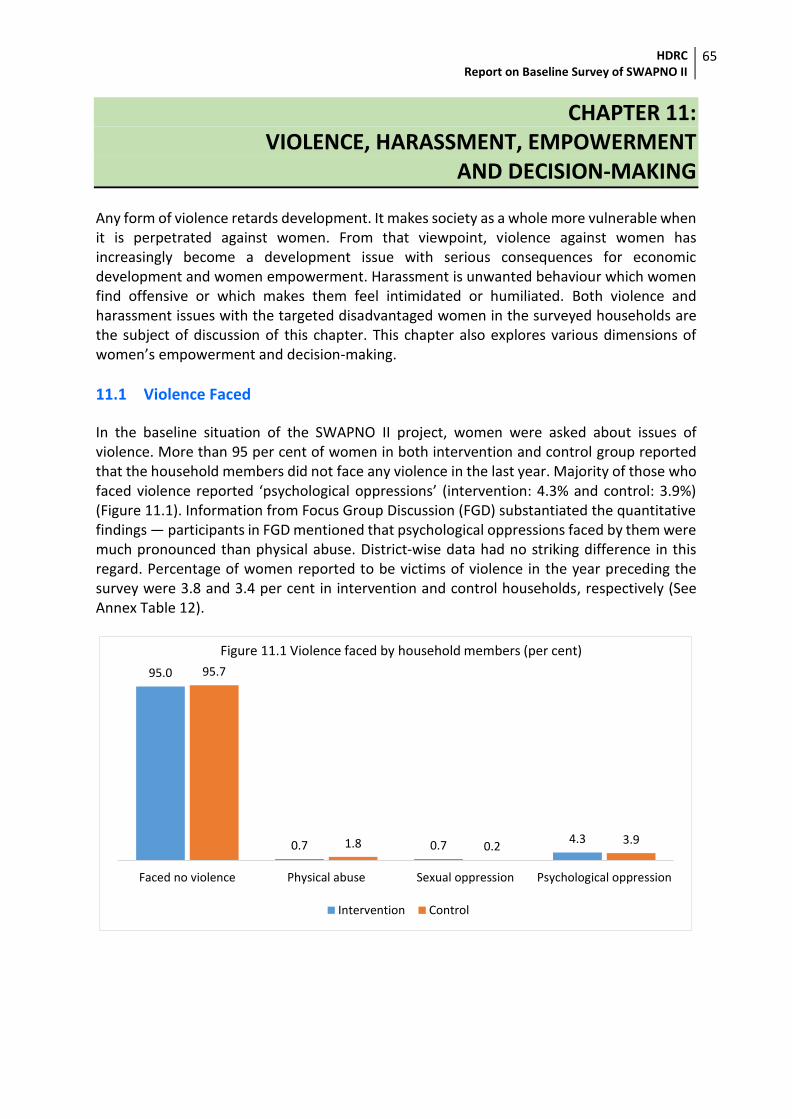
HDRC Report on Baseline Survey of SWAPNO II
65
CHAPTER 11: VIOLENCE, HARASSMENT, EMPOWERMENT
AND DECISION-MAKING Any form of violence retards development. It makes society as a whole more vulnerable when it is perpetrated against women. From that viewpoint, violence against women has increasingly become a development issue with serious consequences for economic development and women empowerment. Harassment is unwanted behaviour which women find offensive or which makes them feel intimidated or humiliated. Both violence and harassment issues with the targeted disadvantaged women in the surveyed households are the subject of discussion of this chapter. This chapter also explores various dimensions of women’s empowerment and decision-making.
11.1 Violence Faced
In the baseline situation of the SWAPNO II project, women were asked about issues of violence. More than 95 per cent of women in both intervention and control group reported that the household members did not face any violence in the last year. Majority of those who faced violence reported ‘psychological oppressions’ (intervention: 4.3% and control: 3.9%) (Figure 11.1). Information from Focus Group Discussion (FGD) substantiated the quantitative findings — participants in FGD mentioned that psychological oppressions faced by them were much pronounced than physical abuse. District-wise data had no striking difference in this regard. Percentage of women reported to be victims of violence in the year preceding the survey were 3.8 and 3.4 per cent in intervention and control households, respectively (See Annex Table 12).
95.0
0.7 0.7 4.3
95.7
1.8 0.23.9
Faced no violence Physical abuse Sexual oppression Psychological oppression
Intervention Control
Figure 11.1 Violence faced by household members (per cent)
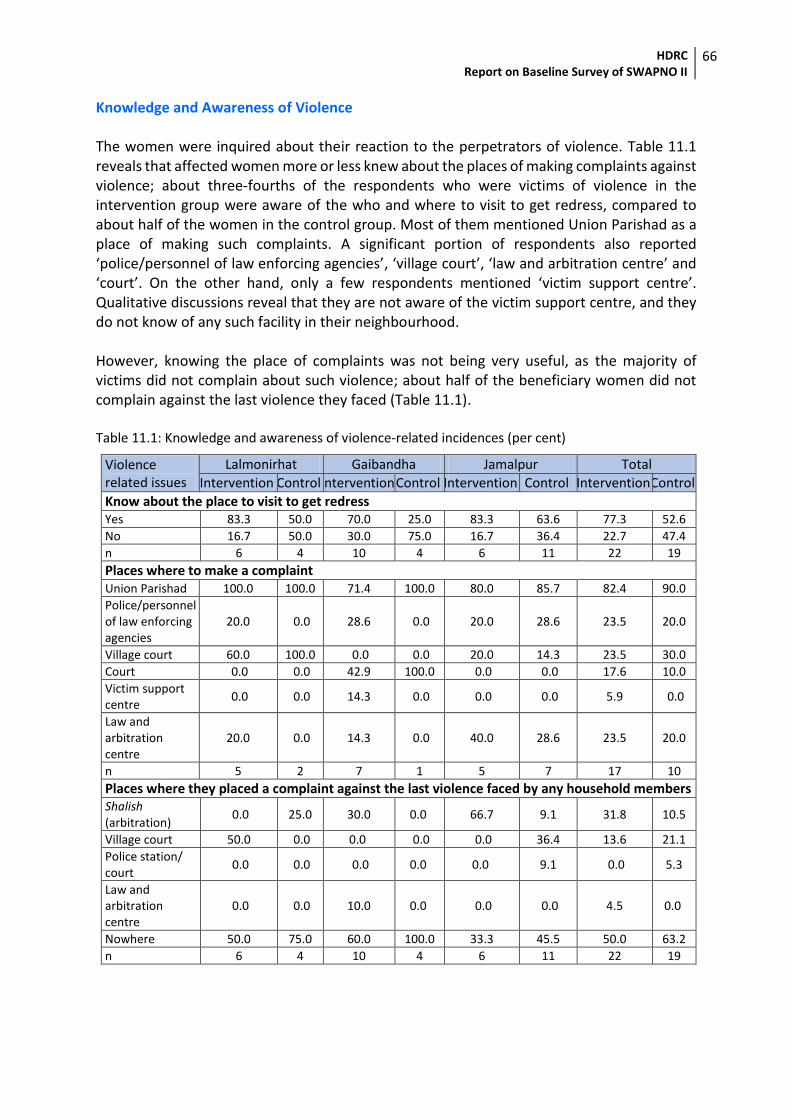
HDRC Report on Baseline Survey of SWAPNO II
66
Knowledge and Awareness of Violence The women were inquired about their reaction to the perpetrators of violence. Table 11.1 reveals that affected women more or less knew about the places of making complaints against violence; about three-fourths of the respondents who were victims of violence in the intervention group were aware of the who and where to visit to get redress, compared to about half of the women in the control group. Most of them mentioned Union Parishad as a place of making such complaints. A significant portion of respondents also reported ‘police/personnel of law enforcing agencies’, ‘village court’, ‘law and arbitration centre’ and ‘court’. On the other hand, only a few respondents mentioned ‘victim support centre’. Qualitative discussions reveal that they are not aware of the victim support centre, and they do not know of any such facility in their neighbourhood. However, knowing the place of complaints was not being very useful, as the majority of victims did not complain about such violence; about half of the beneficiary women did not complain against the last violence they faced (Table 11.1). Table 11.1: Knowledge and awareness of violence-related incidences (per cent)
Violence related issues
Lalmonirhat Gaibandha Jamalpur Total
Intervention Control Intervention Control Intervention Control Intervention Control
Know about the place to visit to get redress Yes 83.3 50.0 70.0 25.0 83.3 63.6 77.3 52.6
No 16.7 50.0 30.0 75.0 16.7 36.4 22.7 47.4
n 6 4 10 4 6 11 22 19
Places where to make a complaint Union Parishad 100.0 100.0 71.4 100.0 80.0 85.7 82.4 90.0
Police/personnel of law enforcing agencies
20.0 0.0 28.6 0.0 20.0 28.6 23.5 20.0
Village court 60.0 100.0 0.0 0.0 20.0 14.3 23.5 30.0
Court 0.0 0.0 42.9 100.0 0.0 0.0 17.6 10.0
Victim support centre
0.0 0.0 14.3 0.0 0.0 0.0 5.9 0.0
Law and arbitration centre
20.0 0.0 14.3 0.0 40.0 28.6 23.5 20.0
n 5 2 7 1 5 7 17 10
Places where they placed a complaint against the last violence faced by any household members Shalish (arbitration)
0.0 25.0 30.0 0.0 66.7 9.1 31.8 10.5
Village court 50.0 0.0 0.0 0.0 0.0 36.4 13.6 21.1
Police station/ court
0.0 0.0 0.0 0.0 0.0 9.1 0.0 5.3
Law and arbitration centre
0.0 0.0 10.0 0.0 0.0 0.0 4.5 0.0
Nowhere 50.0 75.0 60.0 100.0 33.3 45.5 50.0 63.2
n 6 4 10 4 6 11 22 19
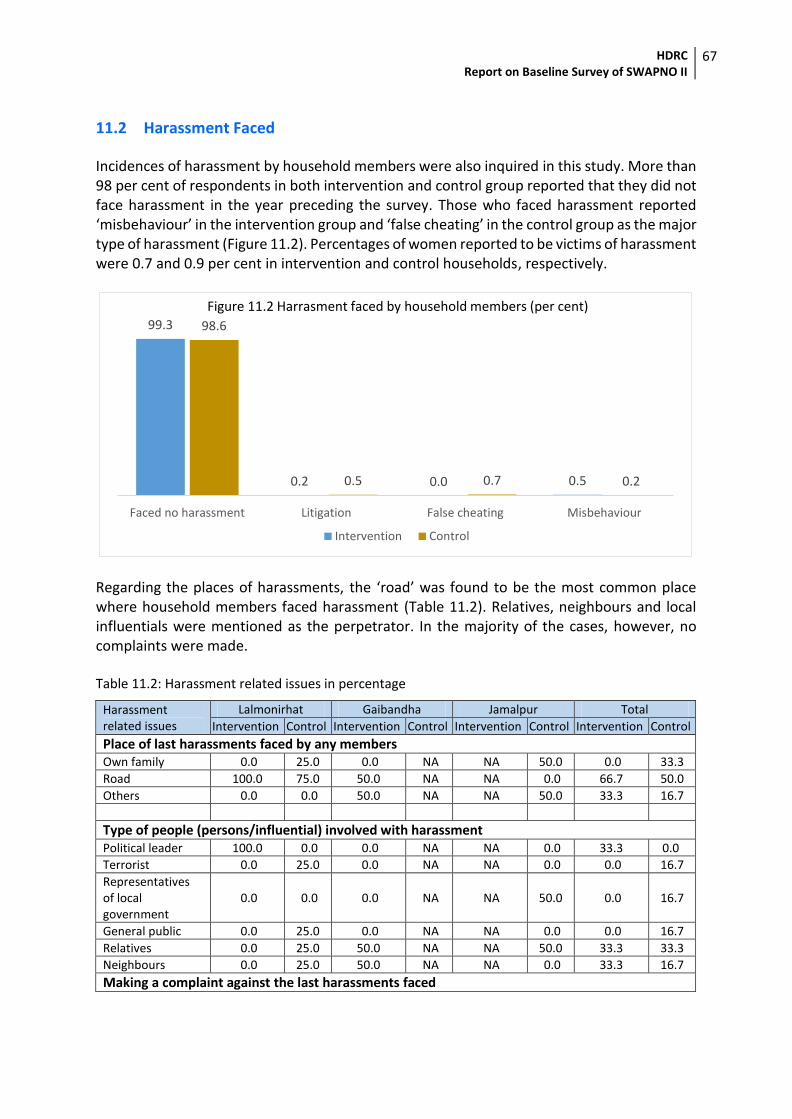
HDRC Report on Baseline Survey of SWAPNO II
67
11.2 Harassment Faced
Incidences of harassment by household members were also inquired in this study. More than 98 per cent of respondents in both intervention and control group reported that they did not face harassment in the year preceding the survey. Those who faced harassment reported ‘misbehaviour’ in the intervention group and ‘false cheating’ in the control group as the major type of harassment (Figure 11.2). Percentages of women reported to be victims of harassment were 0.7 and 0.9 per cent in intervention and control households, respectively.
Regarding the places of harassments, the ‘road’ was found to be the most common place where household members faced harassment (Table 11.2). Relatives, neighbours and local influentials were mentioned as the perpetrator. In the majority of the cases, however, no complaints were made. Table 11.2: Harassment related issues in percentage
Harassment related issues
Lalmonirhat Gaibandha Jamalpur Total
Intervention Control Intervention Control Intervention Control Intervention Control
Place of last harassments faced by any members Own family 0.0 25.0 0.0 NA NA 50.0 0.0 33.3
Road 100.0 75.0 50.0 NA NA 0.0 66.7 50.0
Others 0.0 0.0 50.0 NA NA 50.0 33.3 16.7
Type of people (persons/influential) involved with harassment Political leader 100.0 0.0 0.0 NA NA 0.0 33.3 0.0
Terrorist 0.0 25.0 0.0 NA NA 0.0 0.0 16.7
Representatives of local government
0.0 0.0 0.0 NA NA 50.0 0.0 16.7
General public 0.0 25.0 0.0 NA NA 0.0 0.0 16.7
Relatives 0.0 25.0 50.0 NA NA 50.0 33.3 33.3
Neighbours 0.0 25.0 50.0 NA NA 0.0 33.3 16.7
Making a complaint against the last harassments faced
99.3
0.2 0.0 0.5
98.6
0.5 0.7 0.2
Faced no harassment Litigation False cheating Misbehaviour
Intervention Control
Figure 11.2 Harrasment faced by household members (per cent)
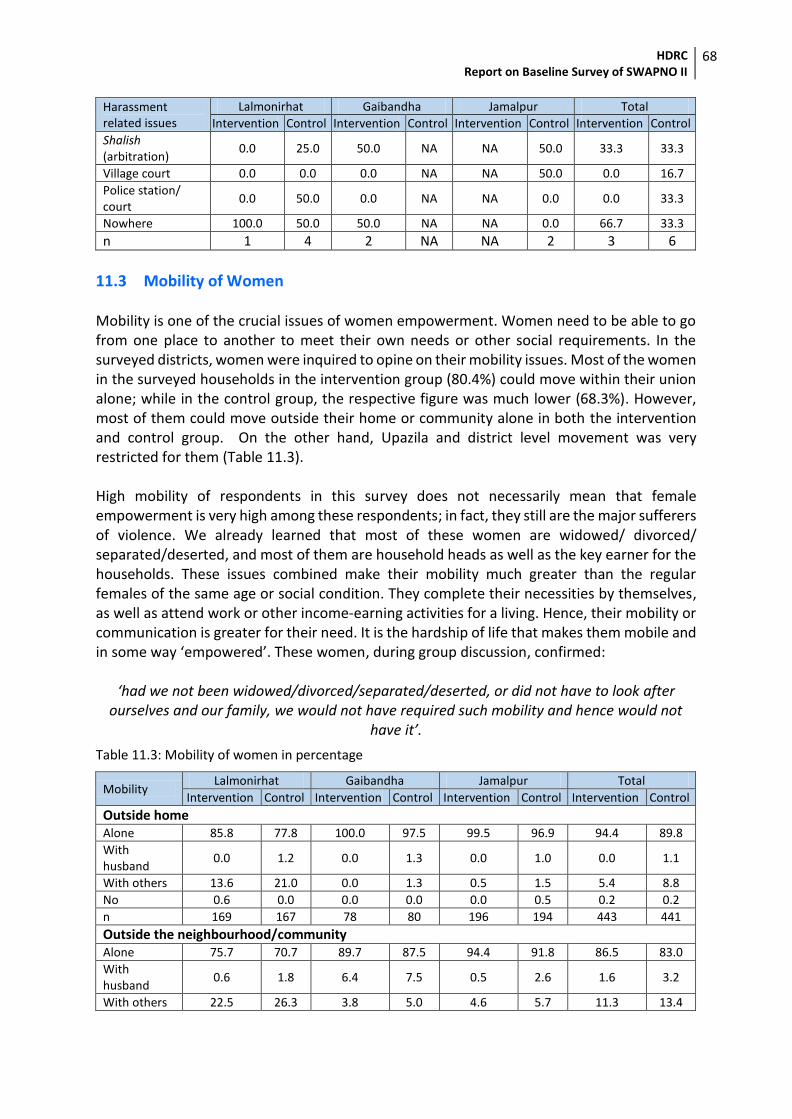
HDRC Report on Baseline Survey of SWAPNO II
68
Harassment related issues
Lalmonirhat Gaibandha Jamalpur Total
Intervention Control Intervention Control Intervention Control Intervention Control
Shalish (arbitration)
0.0 25.0 50.0 NA NA 50.0 33.3 33.3
Village court 0.0 0.0 0.0 NA NA 50.0 0.0 16.7
Police station/ court
0.0 50.0 0.0 NA NA 0.0 0.0 33.3
Nowhere 100.0 50.0 50.0 NA NA 0.0 66.7 33.3
n 1 4 2 NA NA 2 3 6
11.3 Mobility of Women Mobility is one of the crucial issues of women empowerment. Women need to be able to go from one place to another to meet their own needs or other social requirements. In the surveyed districts, women were inquired to opine on their mobility issues. Most of the women in the surveyed households in the intervention group (80.4%) could move within their union alone; while in the control group, the respective figure was much lower (68.3%). However, most of them could move outside their home or community alone in both the intervention and control group. On the other hand, Upazila and district level movement was very restricted for them (Table 11.3). High mobility of respondents in this survey does not necessarily mean that female empowerment is very high among these respondents; in fact, they still are the major sufferers of violence. We already learned that most of these women are widowed/ divorced/ separated/deserted, and most of them are household heads as well as the key earner for the households. These issues combined make their mobility much greater than the regular females of the same age or social condition. They complete their necessities by themselves, as well as attend work or other income-earning activities for a living. Hence, their mobility or communication is greater for their need. It is the hardship of life that makes them mobile and in some way ‘empowered’. These women, during group discussion, confirmed:
‘had we not been widowed/divorced/separated/deserted, or did not have to look after ourselves and our family, we would not have required such mobility and hence would not
have it’.
Table 11.3: Mobility of women in percentage
Mobility Lalmonirhat Gaibandha Jamalpur Total
Intervention Control Intervention Control Intervention Control Intervention Control
Outside home Alone 85.8 77.8 100.0 97.5 99.5 96.9 94.4 89.8
With husband
0.0 1.2 0.0 1.3 0.0 1.0 0.0 1.1
With others 13.6 21.0 0.0 1.3 0.5 1.5 5.4 8.8
No 0.6 0.0 0.0 0.0 0.0 0.5 0.2 0.2
n 169 167 78 80 196 194 443 441
Outside the neighbourhood/community Alone 75.7 70.7 89.7 87.5 94.4 91.8 86.5 83.0
With husband
0.6 1.8 6.4 7.5 0.5 2.6 1.6 3.2
With others 22.5 26.3 3.8 5.0 4.6 5.7 11.3 13.4
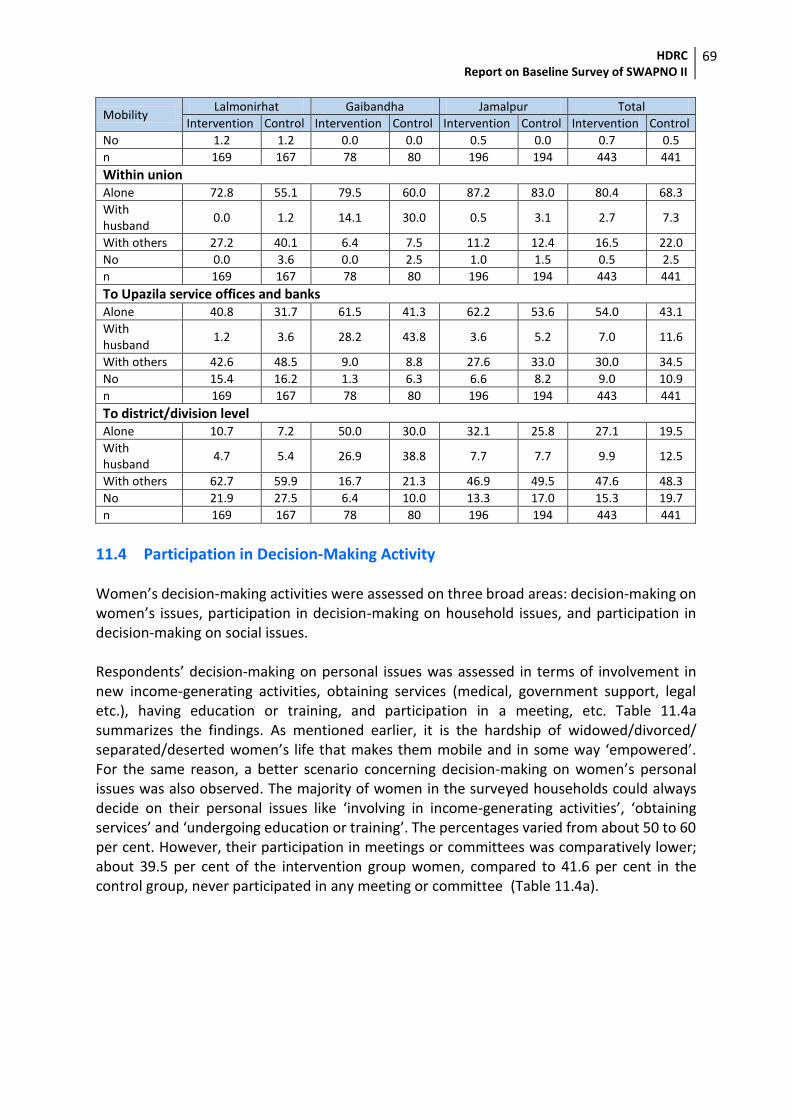
HDRC Report on Baseline Survey of SWAPNO II
69
Mobility Lalmonirhat Gaibandha Jamalpur Total
Intervention Control Intervention Control Intervention Control Intervention Control
No 1.2 1.2 0.0 0.0 0.5 0.0 0.7 0.5
n 169 167 78 80 196 194 443 441
Within union Alone 72.8 55.1 79.5 60.0 87.2 83.0 80.4 68.3
With husband
0.0 1.2 14.1 30.0 0.5 3.1 2.7 7.3
With others 27.2 40.1 6.4 7.5 11.2 12.4 16.5 22.0
No 0.0 3.6 0.0 2.5 1.0 1.5 0.5 2.5
n 169 167 78 80 196 194 443 441
To Upazila service offices and banks Alone 40.8 31.7 61.5 41.3 62.2 53.6 54.0 43.1
With husband
1.2 3.6 28.2 43.8 3.6 5.2 7.0 11.6
With others 42.6 48.5 9.0 8.8 27.6 33.0 30.0 34.5
No 15.4 16.2 1.3 6.3 6.6 8.2 9.0 10.9
n 169 167 78 80 196 194 443 441
To district/division level Alone 10.7 7.2 50.0 30.0 32.1 25.8 27.1 19.5
With husband
4.7 5.4 26.9 38.8 7.7 7.7 9.9 12.5
With others 62.7 59.9 16.7 21.3 46.9 49.5 47.6 48.3
No 21.9 27.5 6.4 10.0 13.3 17.0 15.3 19.7
n 169 167 78 80 196 194 443 441
11.4 Participation in Decision-Making Activity Women’s decision-making activities were assessed on three broad areas: decision-making on women’s issues, participation in decision-making on household issues, and participation in decision-making on social issues. Respondents’ decision-making on personal issues was assessed in terms of involvement in new income-generating activities, obtaining services (medical, government support, legal etc.), having education or training, and participation in a meeting, etc. Table 11.4a summarizes the findings. As mentioned earlier, it is the hardship of widowed/divorced/ separated/deserted women’s life that makes them mobile and in some way ‘empowered’. For the same reason, a better scenario concerning decision-making on women’s personal issues was also observed. The majority of women in the surveyed households could always decide on their personal issues like ‘involving in income-generating activities’, ‘obtaining services’ and ‘undergoing education or training’. The percentages varied from about 50 to 60 per cent. However, their participation in meetings or committees was comparatively lower; about 39.5 per cent of the intervention group women, compared to 41.6 per cent in the control group, never participated in any meeting or committee (Table 11.4a).
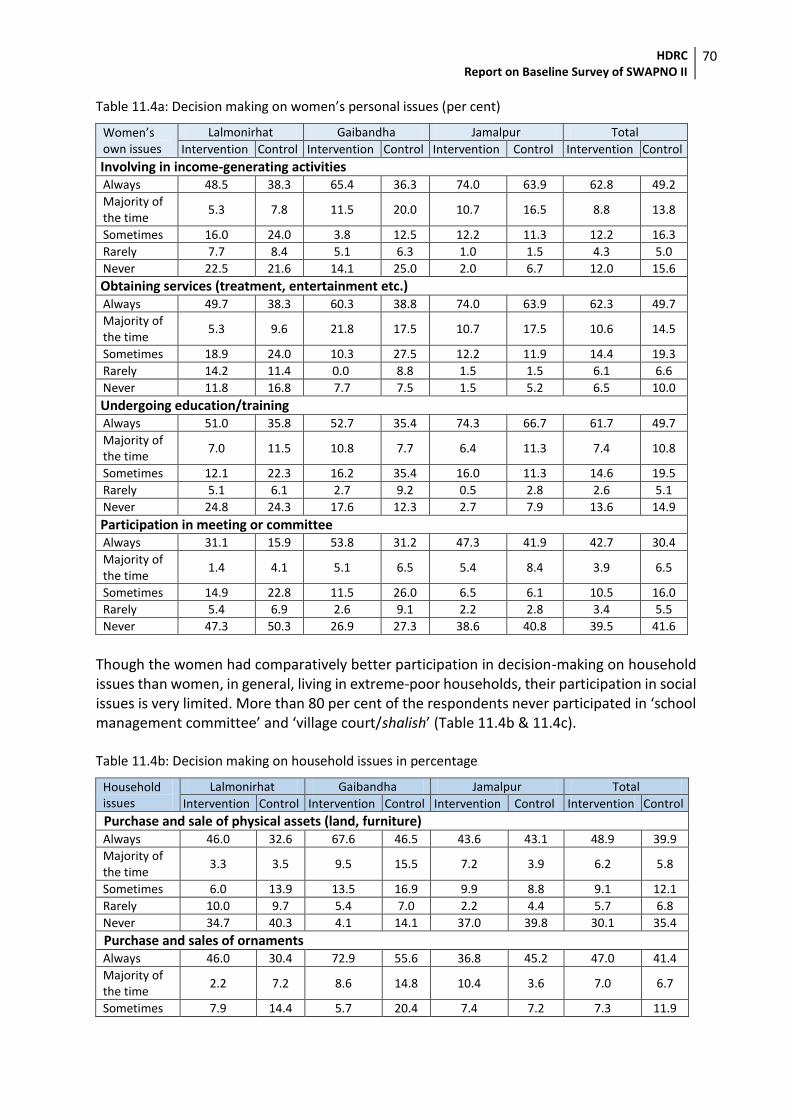
HDRC Report on Baseline Survey of SWAPNO II
70
Table 11.4a: Decision making on women’s personal issues (per cent)
Women’s own issues
Lalmonirhat Gaibandha Jamalpur Total
Intervention Control Intervention Control Intervention Control Intervention Control
Involving in income-generating activities Always 48.5 38.3 65.4 36.3 74.0 63.9 62.8 49.2
Majority of the time
5.3 7.8 11.5 20.0 10.7 16.5 8.8 13.8
Sometimes 16.0 24.0 3.8 12.5 12.2 11.3 12.2 16.3
Rarely 7.7 8.4 5.1 6.3 1.0 1.5 4.3 5.0
Never 22.5 21.6 14.1 25.0 2.0 6.7 12.0 15.6
Obtaining services (treatment, entertainment etc.) Always 49.7 38.3 60.3 38.8 74.0 63.9 62.3 49.7
Majority of the time
5.3 9.6 21.8 17.5 10.7 17.5 10.6 14.5
Sometimes 18.9 24.0 10.3 27.5 12.2 11.9 14.4 19.3
Rarely 14.2 11.4 0.0 8.8 1.5 1.5 6.1 6.6
Never 11.8 16.8 7.7 7.5 1.5 5.2 6.5 10.0
Undergoing education/training Always 51.0 35.8 52.7 35.4 74.3 66.7 61.7 49.7
Majority of the time
7.0 11.5 10.8 7.7 6.4 11.3 7.4 10.8
Sometimes 12.1 22.3 16.2 35.4 16.0 11.3 14.6 19.5
Rarely 5.1 6.1 2.7 9.2 0.5 2.8 2.6 5.1
Never 24.8 24.3 17.6 12.3 2.7 7.9 13.6 14.9
Participation in meeting or committee Always 31.1 15.9 53.8 31.2 47.3 41.9 42.7 30.4
Majority of the time
1.4 4.1 5.1 6.5 5.4 8.4 3.9 6.5
Sometimes 14.9 22.8 11.5 26.0 6.5 6.1 10.5 16.0
Rarely 5.4 6.9 2.6 9.1 2.2 2.8 3.4 5.5
Never 47.3 50.3 26.9 27.3 38.6 40.8 39.5 41.6
Though the women had comparatively better participation in decision-making on household issues than women, in general, living in extreme-poor households, their participation in social issues is very limited. More than 80 per cent of the respondents never participated in ‘school management committee’ and ‘village court/shalish’ (Table 11.4b & 11.4c). Table 11.4b: Decision making on household issues in percentage
Household issues
Lalmonirhat Gaibandha Jamalpur Total
Intervention Control Intervention Control Intervention Control Intervention Control
Purchase and sale of physical assets (land, furniture) Always 46.0 32.6 67.6 46.5 43.6 43.1 48.9 39.9
Majority of the time
3.3 3.5 9.5 15.5 7.2 3.9 6.2 5.8
Sometimes 6.0 13.9 13.5 16.9 9.9 8.8 9.1 12.1
Rarely 10.0 9.7 5.4 7.0 2.2 4.4 5.7 6.8
Never 34.7 40.3 4.1 14.1 37.0 39.8 30.1 35.4
Purchase and sales of ornaments Always 46.0 30.4 72.9 55.6 36.8 45.2 47.0 41.4
Majority of the time
2.2 7.2 8.6 14.8 10.4 3.6 7.0 6.7
Sometimes 7.9 14.4 5.7 20.4 7.4 7.2 7.3 11.9
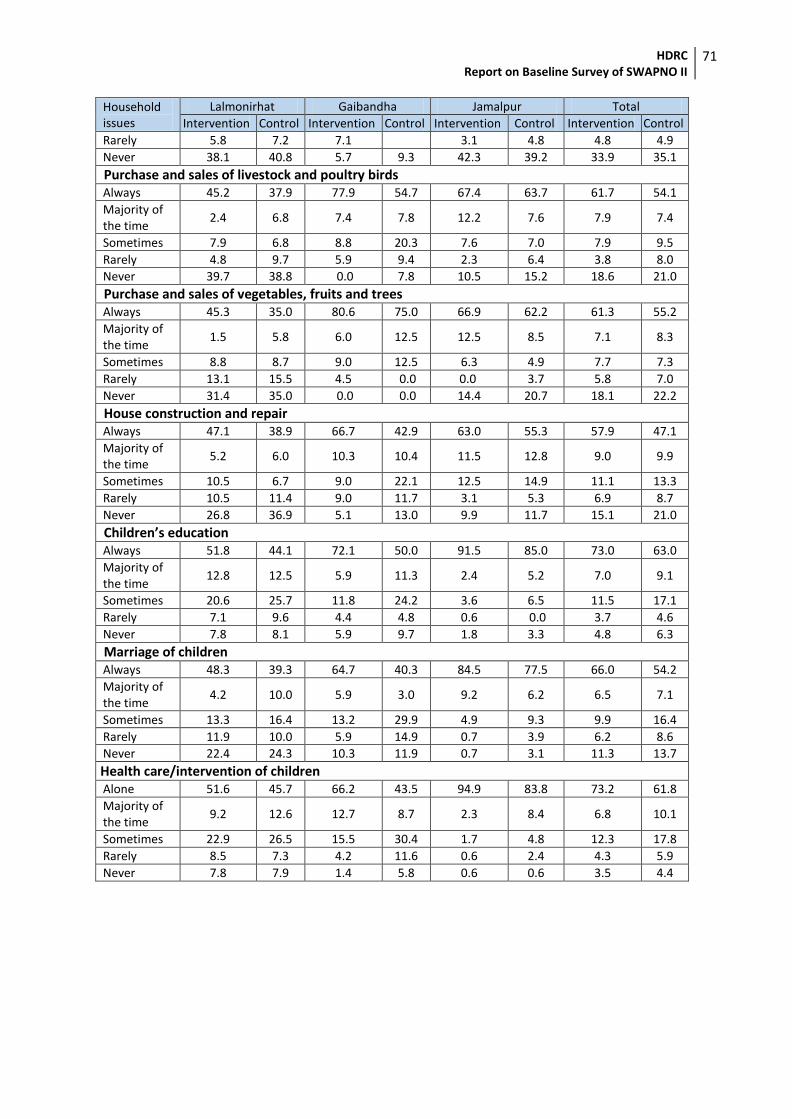
HDRC Report on Baseline Survey of SWAPNO II
71
Household issues
Lalmonirhat Gaibandha Jamalpur Total
Intervention Control Intervention Control Intervention Control Intervention Control
Rarely 5.8 7.2 7.1 3.1 4.8 4.8 4.9
Never 38.1 40.8 5.7 9.3 42.3 39.2 33.9 35.1
Purchase and sales of livestock and poultry birds Always 45.2 37.9 77.9 54.7 67.4 63.7 61.7 54.1
Majority of the time
2.4 6.8 7.4 7.8 12.2 7.6 7.9 7.4
Sometimes 7.9 6.8 8.8 20.3 7.6 7.0 7.9 9.5
Rarely 4.8 9.7 5.9 9.4 2.3 6.4 3.8 8.0
Never 39.7 38.8 0.0 7.8 10.5 15.2 18.6 21.0
Purchase and sales of vegetables, fruits and trees Always 45.3 35.0 80.6 75.0 66.9 62.2 61.3 55.2
Majority of the time
1.5 5.8 6.0 12.5 12.5 8.5 7.1 8.3
Sometimes 8.8 8.7 9.0 12.5 6.3 4.9 7.7 7.3
Rarely 13.1 15.5 4.5 0.0 0.0 3.7 5.8 7.0
Never 31.4 35.0 0.0 0.0 14.4 20.7 18.1 22.2
House construction and repair Always 47.1 38.9 66.7 42.9 63.0 55.3 57.9 47.1
Majority of the time
5.2 6.0 10.3 10.4 11.5 12.8 9.0 9.9
Sometimes 10.5 6.7 9.0 22.1 12.5 14.9 11.1 13.3
Rarely 10.5 11.4 9.0 11.7 3.1 5.3 6.9 8.7
Never 26.8 36.9 5.1 13.0 9.9 11.7 15.1 21.0
Children’s education Always 51.8 44.1 72.1 50.0 91.5 85.0 73.0 63.0
Majority of the time
12.8 12.5 5.9 11.3 2.4 5.2 7.0 9.1
Sometimes 20.6 25.7 11.8 24.2 3.6 6.5 11.5 17.1
Rarely 7.1 9.6 4.4 4.8 0.6 0.0 3.7 4.6
Never 7.8 8.1 5.9 9.7 1.8 3.3 4.8 6.3
Marriage of children Always 48.3 39.3 64.7 40.3 84.5 77.5 66.0 54.2
Majority of the time
4.2 10.0 5.9 3.0 9.2 6.2 6.5 7.1
Sometimes 13.3 16.4 13.2 29.9 4.9 9.3 9.9 16.4
Rarely 11.9 10.0 5.9 14.9 0.7 3.9 6.2 8.6
Never 22.4 24.3 10.3 11.9 0.7 3.1 11.3 13.7
Health care/intervention of children Alone 51.6 45.7 66.2 43.5 94.9 83.8 73.2 61.8
Majority of the time
9.2 12.6 12.7 8.7 2.3 8.4 6.8 10.1
Sometimes 22.9 26.5 15.5 30.4 1.7 4.8 12.3 17.8
Rarely 8.5 7.3 4.2 11.6 0.6 2.4 4.3 5.9
Never 7.8 7.9 1.4 5.8 0.6 0.6 3.5 4.4
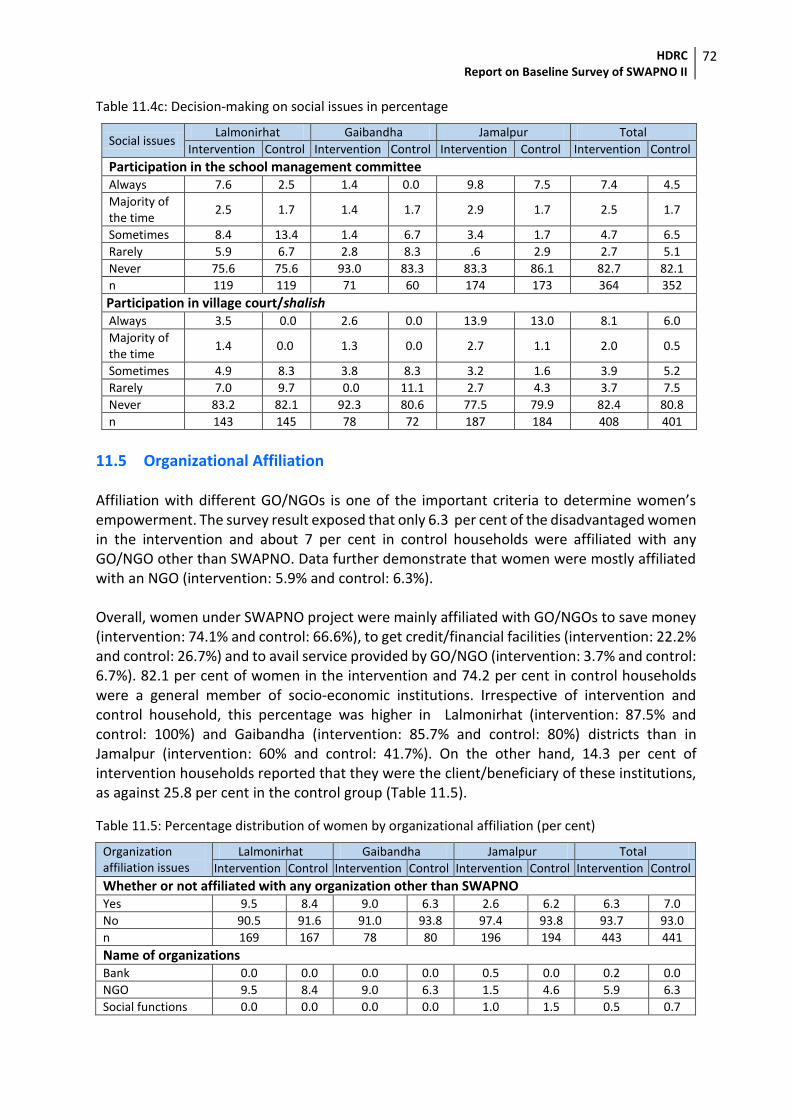
HDRC Report on Baseline Survey of SWAPNO II
72
Table 11.4c: Decision-making on social issues in percentage
Social issues Lalmonirhat Gaibandha Jamalpur Total
Intervention Control Intervention Control Intervention Control Intervention Control
Participation in the school management committee Always 7.6 2.5 1.4 0.0 9.8 7.5 7.4 4.5
Majority of the time
2.5 1.7 1.4 1.7 2.9 1.7 2.5 1.7
Sometimes 8.4 13.4 1.4 6.7 3.4 1.7 4.7 6.5
Rarely 5.9 6.7 2.8 8.3 .6 2.9 2.7 5.1
Never 75.6 75.6 93.0 83.3 83.3 86.1 82.7 82.1
n 119 119 71 60 174 173 364 352
Participation in village court/shalish Always 3.5 0.0 2.6 0.0 13.9 13.0 8.1 6.0
Majority of the time
1.4 0.0 1.3 0.0 2.7 1.1 2.0 0.5
Sometimes 4.9 8.3 3.8 8.3 3.2 1.6 3.9 5.2
Rarely 7.0 9.7 0.0 11.1 2.7 4.3 3.7 7.5
Never 83.2 82.1 92.3 80.6 77.5 79.9 82.4 80.8
n 143 145 78 72 187 184 408 401
11.5 Organizational Affiliation Affiliation with different GO/NGOs is one of the important criteria to determine women’s empowerment. The survey result exposed that only 6.3 per cent of the disadvantaged women in the intervention and about 7 per cent in control households were affiliated with any GO/NGO other than SWAPNO. Data further demonstrate that women were mostly affiliated with an NGO (intervention: 5.9% and control: 6.3%). Overall, women under SWAPNO project were mainly affiliated with GO/NGOs to save money (intervention: 74.1% and control: 66.6%), to get credit/financial facilities (intervention: 22.2% and control: 26.7%) and to avail service provided by GO/NGO (intervention: 3.7% and control: 6.7%). 82.1 per cent of women in the intervention and 74.2 per cent in control households were a general member of socio-economic institutions. Irrespective of intervention and control household, this percentage was higher in Lalmonirhat (intervention: 87.5% and control: 100%) and Gaibandha (intervention: 85.7% and control: 80%) districts than in Jamalpur (intervention: 60% and control: 41.7%). On the other hand, 14.3 per cent of intervention households reported that they were the client/beneficiary of these institutions, as against 25.8 per cent in the control group (Table 11.5).
Table 11.5: Percentage distribution of women by organizational affiliation (per cent)
Organization affiliation issues
Lalmonirhat Gaibandha Jamalpur Total
Intervention Control Intervention Control Intervention Control Intervention Control
Whether or not affiliated with any organization other than SWAPNO Yes 9.5 8.4 9.0 6.3 2.6 6.2 6.3 7.0
No 90.5 91.6 91.0 93.8 97.4 93.8 93.7 93.0
n 169 167 78 80 196 194 443 441
Name of organizations Bank 0.0 0.0 0.0 0.0 0.5 0.0 0.2 0.0
NGO 9.5 8.4 9.0 6.3 1.5 4.6 5.9 6.3
Social functions 0.0 0.0 0.0 0.0 1.0 1.5 0.5 0.7
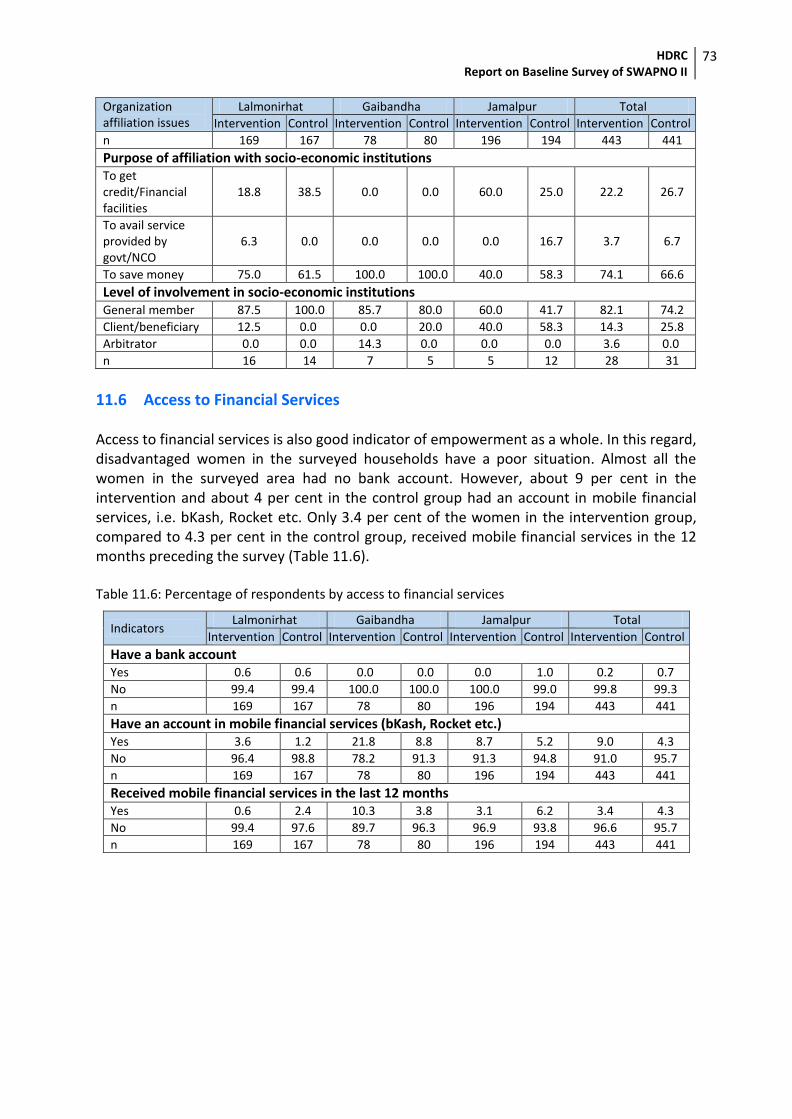
HDRC Report on Baseline Survey of SWAPNO II
73
Organization affiliation issues
Lalmonirhat Gaibandha Jamalpur Total
Intervention Control Intervention Control Intervention Control Intervention Control
n 169 167 78 80 196 194 443 441
Purpose of affiliation with socio-economic institutions To get credit/Financial facilities
18.8 38.5 0.0 0.0 60.0 25.0 22.2 26.7
To avail service provided by govt/NCO
6.3 0.0 0.0 0.0 0.0 16.7 3.7 6.7
To save money 75.0 61.5 100.0 100.0 40.0 58.3 74.1 66.6
Level of involvement in socio-economic institutions General member 87.5 100.0 85.7 80.0 60.0 41.7 82.1 74.2
Client/beneficiary 12.5 0.0 0.0 20.0 40.0 58.3 14.3 25.8
Arbitrator 0.0 0.0 14.3 0.0 0.0 0.0 3.6 0.0
n 16 14 7 5 5 12 28 31
11.6 Access to Financial Services Access to financial services is also good indicator of empowerment as a whole. In this regard, disadvantaged women in the surveyed households have a poor situation. Almost all the women in the surveyed area had no bank account. However, about 9 per cent in the intervention and about 4 per cent in the control group had an account in mobile financial services, i.e. bKash, Rocket etc. Only 3.4 per cent of the women in the intervention group, compared to 4.3 per cent in the control group, received mobile financial services in the 12 months preceding the survey (Table 11.6). Table 11.6: Percentage of respondents by access to financial services
Indicators Lalmonirhat Gaibandha Jamalpur Total
Intervention Control Intervention Control Intervention Control Intervention Control
Have a bank account Yes 0.6 0.6 0.0 0.0 0.0 1.0 0.2 0.7
No 99.4 99.4 100.0 100.0 100.0 99.0 99.8 99.3
n 169 167 78 80 196 194 443 441
Have an account in mobile financial services (bKash, Rocket etc.) Yes 3.6 1.2 21.8 8.8 8.7 5.2 9.0 4.3
No 96.4 98.8 78.2 91.3 91.3 94.8 91.0 95.7
n 169 167 78 80 196 194 443 441
Received mobile financial services in the last 12 months Yes 0.6 2.4 10.3 3.8 3.1 6.2 3.4 4.3
No 99.4 97.6 89.7 96.3 96.9 93.8 96.6 95.7
n 169 167 78 80 196 194 443 441
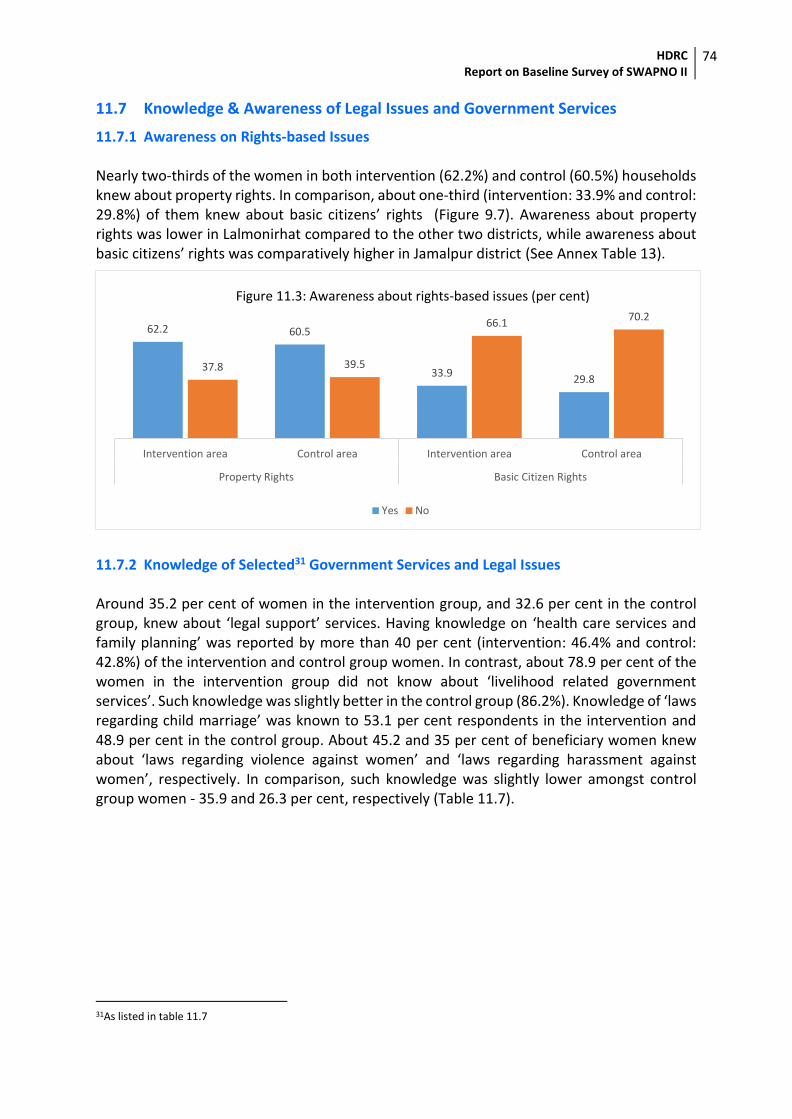
HDRC Report on Baseline Survey of SWAPNO II
74
11.7 Knowledge & Awareness of Legal Issues and Government Services
11.7.1 Awareness on Rights-based Issues Nearly two-thirds of the women in both intervention (62.2%) and control (60.5%) households knew about property rights. In comparison, about one-third (intervention: 33.9% and control: 29.8%) of them knew about basic citizens’ rights (Figure 9.7). Awareness about property rights was lower in Lalmonirhat compared to the other two districts, while awareness about basic citizens’ rights was comparatively higher in Jamalpur district (See Annex Table 13).
11.7.2 Knowledge of Selected31 Government Services and Legal Issues Around 35.2 per cent of women in the intervention group, and 32.6 per cent in the control group, knew about ‘legal support’ services. Having knowledge on ‘health care services and family planning’ was reported by more than 40 per cent (intervention: 46.4% and control: 42.8%) of the intervention and control group women. In contrast, about 78.9 per cent of the women in the intervention group did not know about ‘livelihood related government services’. Such knowledge was slightly better in the control group (86.2%). Knowledge of ‘laws regarding child marriage’ was known to 53.1 per cent respondents in the intervention and 48.9 per cent in the control group. About 45.2 and 35 per cent of beneficiary women knew about ‘laws regarding violence against women’ and ‘laws regarding harassment against women’, respectively. In comparison, such knowledge was slightly lower amongst control group women - 35.9 and 26.3 per cent, respectively (Table 11.7).
31As listed in table 11.7
62.2 60.5
33.929.8
37.8 39.5
66.170.2
Intervention area Control area Intervention area Control area
Property Rights Basic Citizen Rights
Yes No
Figure 11.3: Awareness about rights-based issues (per cent)
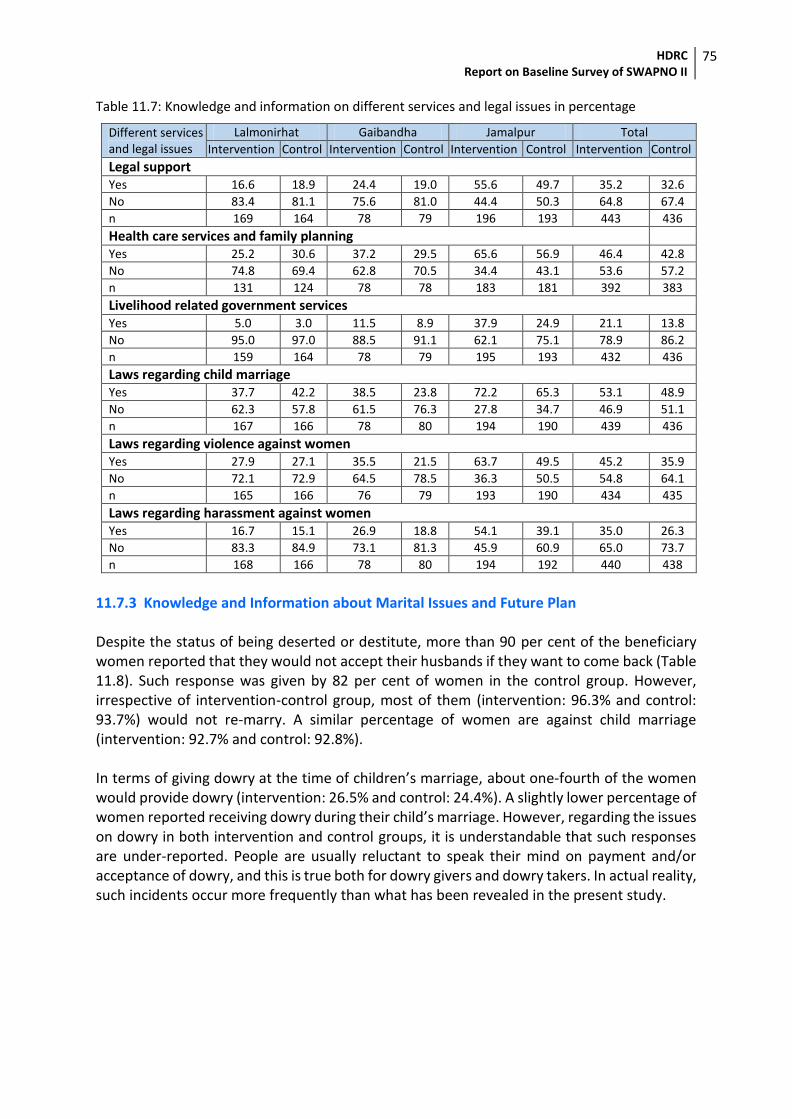
HDRC Report on Baseline Survey of SWAPNO II
75
Table 11.7: Knowledge and information on different services and legal issues in percentage
Different services and legal issues
Lalmonirhat Gaibandha Jamalpur Total
Intervention Control Intervention Control Intervention Control Intervention Control
Legal support Yes 16.6 18.9 24.4 19.0 55.6 49.7 35.2 32.6
No 83.4 81.1 75.6 81.0 44.4 50.3 64.8 67.4
n 169 164 78 79 196 193 443 436
Health care services and family planning Yes 25.2 30.6 37.2 29.5 65.6 56.9 46.4 42.8
No 74.8 69.4 62.8 70.5 34.4 43.1 53.6 57.2
n 131 124 78 78 183 181 392 383
Livelihood related government services Yes 5.0 3.0 11.5 8.9 37.9 24.9 21.1 13.8
No 95.0 97.0 88.5 91.1 62.1 75.1 78.9 86.2
n 159 164 78 79 195 193 432 436
Laws regarding child marriage Yes 37.7 42.2 38.5 23.8 72.2 65.3 53.1 48.9
No 62.3 57.8 61.5 76.3 27.8 34.7 46.9 51.1
n 167 166 78 80 194 190 439 436
Laws regarding violence against women Yes 27.9 27.1 35.5 21.5 63.7 49.5 45.2 35.9
No 72.1 72.9 64.5 78.5 36.3 50.5 54.8 64.1
n 165 166 76 79 193 190 434 435
Laws regarding harassment against women Yes 16.7 15.1 26.9 18.8 54.1 39.1 35.0 26.3
No 83.3 84.9 73.1 81.3 45.9 60.9 65.0 73.7
n 168 166 78 80 194 192 440 438
11.7.3 Knowledge and Information about Marital Issues and Future Plan Despite the status of being deserted or destitute, more than 90 per cent of the beneficiary women reported that they would not accept their husbands if they want to come back (Table 11.8). Such response was given by 82 per cent of women in the control group. However, irrespective of intervention-control group, most of them (intervention: 96.3% and control: 93.7%) would not re-marry. A similar percentage of women are against child marriage (intervention: 92.7% and control: 92.8%). In terms of giving dowry at the time of children’s marriage, about one-fourth of the women would provide dowry (intervention: 26.5% and control: 24.4%). A slightly lower percentage of women reported receiving dowry during their child’s marriage. However, regarding the issues on dowry in both intervention and control groups, it is understandable that such responses are under-reported. People are usually reluctant to speak their mind on payment and/or acceptance of dowry, and this is true both for dowry givers and dowry takers. In actual reality, such incidents occur more frequently than what has been revealed in the present study.
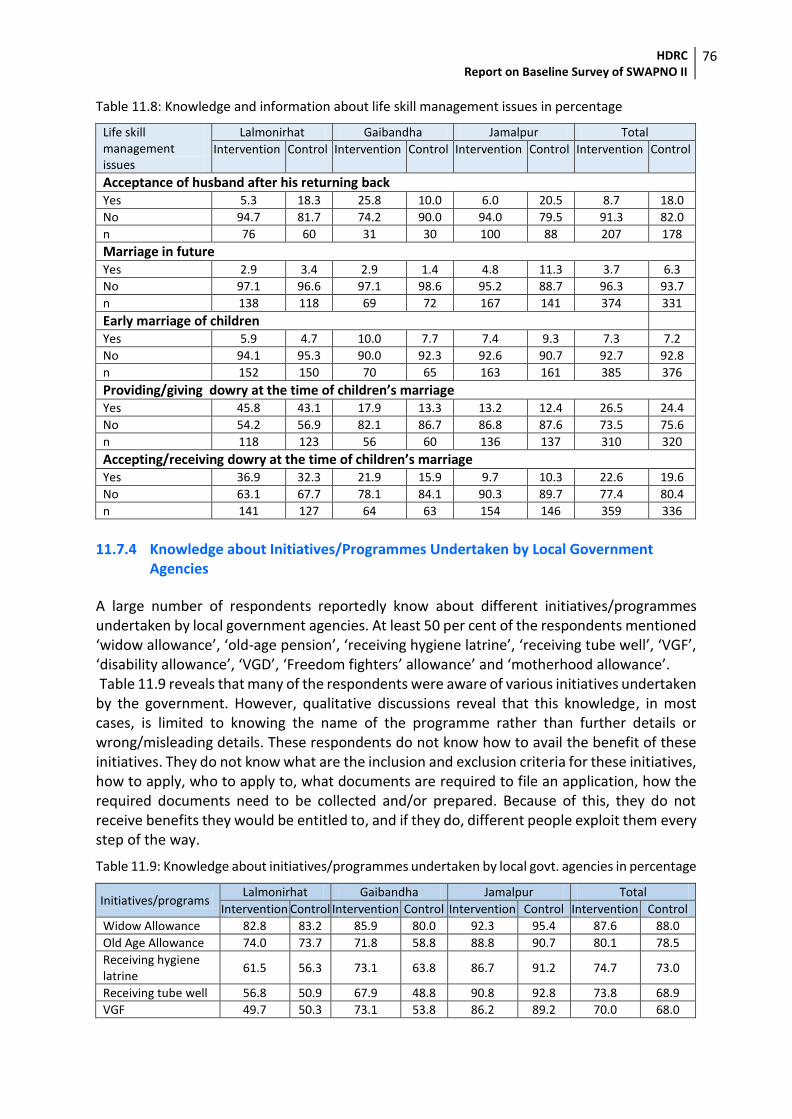
HDRC Report on Baseline Survey of SWAPNO II
76
Table 11.8: Knowledge and information about life skill management issues in percentage
Life skill management issues
Lalmonirhat Gaibandha Jamalpur Total
Intervention Control Intervention Control Intervention Control Intervention Control
Acceptance of husband after his returning back Yes 5.3 18.3 25.8 10.0 6.0 20.5 8.7 18.0
No 94.7 81.7 74.2 90.0 94.0 79.5 91.3 82.0
n 76 60 31 30 100 88 207 178
Marriage in future
Yes 2.9 3.4 2.9 1.4 4.8 11.3 3.7 6.3
No 97.1 96.6 97.1 98.6 95.2 88.7 96.3 93.7
n 138 118 69 72 167 141 374 331
Early marriage of children
Yes 5.9 4.7 10.0 7.7 7.4 9.3 7.3 7.2
No 94.1 95.3 90.0 92.3 92.6 90.7 92.7 92.8
n 152 150 70 65 163 161 385 376
Providing/giving dowry at the time of children’s marriage Yes 45.8 43.1 17.9 13.3 13.2 12.4 26.5 24.4
No 54.2 56.9 82.1 86.7 86.8 87.6 73.5 75.6
n 118 123 56 60 136 137 310 320
Accepting/receiving dowry at the time of children’s marriage Yes 36.9 32.3 21.9 15.9 9.7 10.3 22.6 19.6
No 63.1 67.7 78.1 84.1 90.3 89.7 77.4 80.4
n 141 127 64 63 154 146 359 336
11.7.4 Knowledge about Initiatives/Programmes Undertaken by Local Government
Agencies
A large number of respondents reportedly know about different initiatives/programmes undertaken by local government agencies. At least 50 per cent of the respondents mentioned ‘widow allowance’, ‘old-age pension’, ‘receiving hygiene latrine’, ‘receiving tube well’, ‘VGF’, ‘disability allowance’, ‘VGD’, ‘Freedom fighters’ allowance’ and ‘motherhood allowance’. Table 11.9 reveals that many of the respondents were aware of various initiatives undertaken by the government. However, qualitative discussions reveal that this knowledge, in most cases, is limited to knowing the name of the programme rather than further details or wrong/misleading details. These respondents do not know how to avail the benefit of these initiatives. They do not know what are the inclusion and exclusion criteria for these initiatives, how to apply, who to apply to, what documents are required to file an application, how the required documents need to be collected and/or prepared. Because of this, they do not receive benefits they would be entitled to, and if they do, different people exploit them every step of the way.
Table 11.9: Knowledge about initiatives/programmes undertaken by local govt. agencies in percentage
Initiatives/programs Lalmonirhat Gaibandha Jamalpur Total
Intervention Control Intervention Control Intervention Control Intervention Control
Widow Allowance 82.8 83.2 85.9 80.0 92.3 95.4 87.6 88.0
Old Age Allowance 74.0 73.7 71.8 58.8 88.8 90.7 80.1 78.5
Receiving hygiene latrine
61.5 56.3 73.1 63.8 86.7 91.2 74.7 73.0
Receiving tube well 56.8 50.9 67.9 48.8 90.8 92.8 73.8 68.9
VGF 49.7 50.3 73.1 53.8 86.2 89.2 70.0 68.0
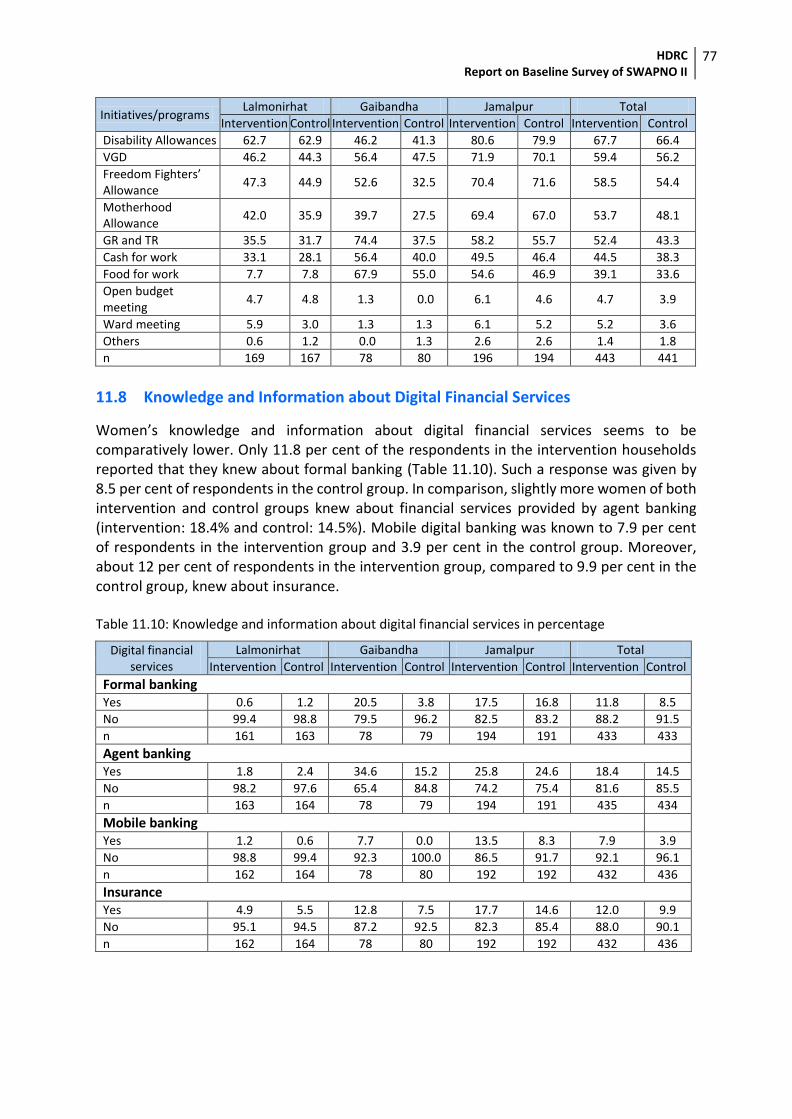
HDRC Report on Baseline Survey of SWAPNO II
77
Initiatives/programs Lalmonirhat Gaibandha Jamalpur Total
Intervention Control Intervention Control Intervention Control Intervention Control
Disability Allowances 62.7 62.9 46.2 41.3 80.6 79.9 67.7 66.4
VGD 46.2 44.3 56.4 47.5 71.9 70.1 59.4 56.2
Freedom Fighters’ Allowance
47.3 44.9 52.6 32.5 70.4 71.6 58.5 54.4
Motherhood Allowance
42.0 35.9 39.7 27.5 69.4 67.0 53.7 48.1
GR and TR 35.5 31.7 74.4 37.5 58.2 55.7 52.4 43.3
Cash for work 33.1 28.1 56.4 40.0 49.5 46.4 44.5 38.3
Food for work 7.7 7.8 67.9 55.0 54.6 46.9 39.1 33.6
Open budget meeting
4.7 4.8 1.3 0.0 6.1 4.6 4.7 3.9
Ward meeting 5.9 3.0 1.3 1.3 6.1 5.2 5.2 3.6
Others 0.6 1.2 0.0 1.3 2.6 2.6 1.4 1.8
n 169 167 78 80 196 194 443 441
11.8 Knowledge and Information about Digital Financial Services
Women’s knowledge and information about digital financial services seems to be comparatively lower. Only 11.8 per cent of the respondents in the intervention households reported that they knew about formal banking (Table 11.10). Such a response was given by 8.5 per cent of respondents in the control group. In comparison, slightly more women of both intervention and control groups knew about financial services provided by agent banking (intervention: 18.4% and control: 14.5%). Mobile digital banking was known to 7.9 per cent of respondents in the intervention group and 3.9 per cent in the control group. Moreover, about 12 per cent of respondents in the intervention group, compared to 9.9 per cent in the control group, knew about insurance. Table 11.10: Knowledge and information about digital financial services in percentage
Digital financial services
Lalmonirhat Gaibandha Jamalpur Total
Intervention Control Intervention Control Intervention Control Intervention Control
Formal banking Yes 0.6 1.2 20.5 3.8 17.5 16.8 11.8 8.5
No 99.4 98.8 79.5 96.2 82.5 83.2 88.2 91.5
n 161 163 78 79 194 191 433 433
Agent banking Yes 1.8 2.4 34.6 15.2 25.8 24.6 18.4 14.5
No 98.2 97.6 65.4 84.8 74.2 75.4 81.6 85.5
n 163 164 78 79 194 191 435 434
Mobile banking Yes 1.2 0.6 7.7 0.0 13.5 8.3 7.9 3.9
No 98.8 99.4 92.3 100.0 86.5 91.7 92.1 96.1
n 162 164 78 80 192 192 432 436
Insurance Yes 4.9 5.5 12.8 7.5 17.7 14.6 12.0 9.9
No 95.1 94.5 87.2 92.5 82.3 85.4 88.0 90.1
n 162 164 78 80 192 192 432 436
HDRC Report on Baseline Survey of SWAPNO II
78
Annexure: Annex-1: Data Tables Annex-2: Questionnarire for the Survey
HDRC Report on Baseline Survey of SWAPNO II
79
Annex-1: Data Tables
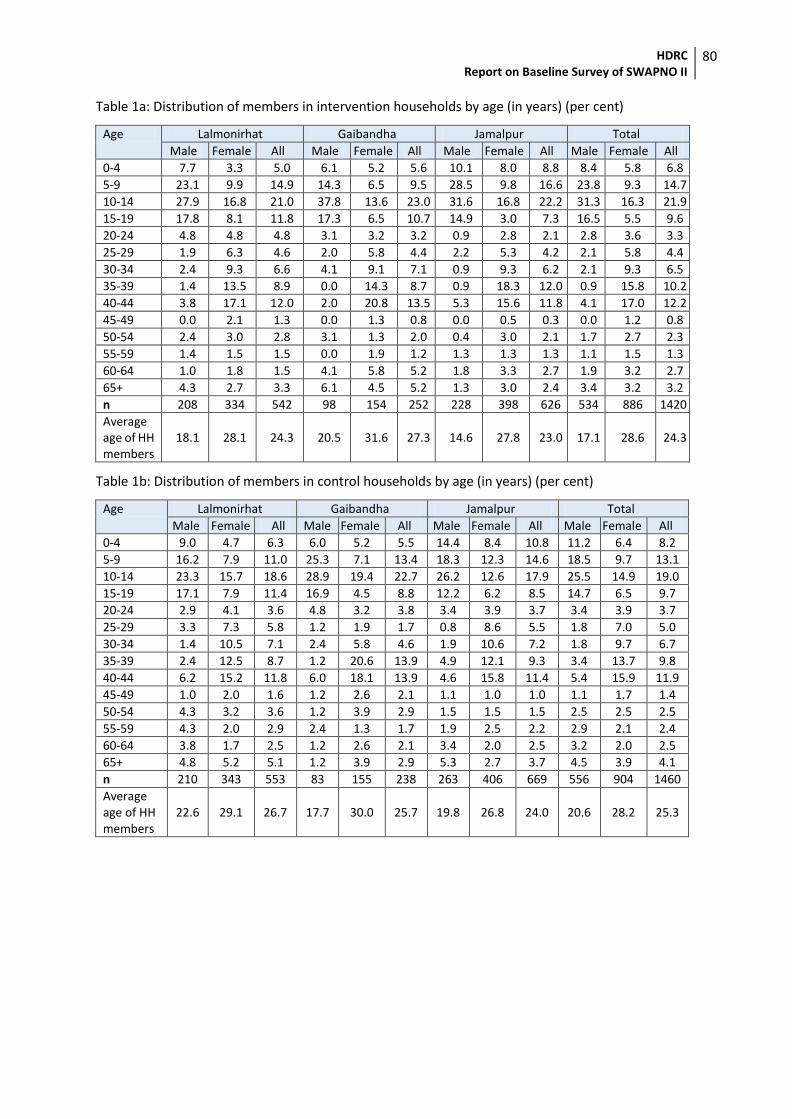
HDRC Report on Baseline Survey of SWAPNO II
80
Table 1a: Distribution of members in intervention households by age (in years) (per cent)
Age Lalmonirhat Gaibandha Jamalpur Total
Male Female All Male Female All Male Female All Male Female All
0-4 7.7 3.3 5.0 6.1 5.2 5.6 10.1 8.0 8.8 8.4 5.8 6.8
5-9 23.1 9.9 14.9 14.3 6.5 9.5 28.5 9.8 16.6 23.8 9.3 14.7
10-14 27.9 16.8 21.0 37.8 13.6 23.0 31.6 16.8 22.2 31.3 16.3 21.9
15-19 17.8 8.1 11.8 17.3 6.5 10.7 14.9 3.0 7.3 16.5 5.5 9.6
20-24 4.8 4.8 4.8 3.1 3.2 3.2 0.9 2.8 2.1 2.8 3.6 3.3
25-29 1.9 6.3 4.6 2.0 5.8 4.4 2.2 5.3 4.2 2.1 5.8 4.4
30-34 2.4 9.3 6.6 4.1 9.1 7.1 0.9 9.3 6.2 2.1 9.3 6.5
35-39 1.4 13.5 8.9 0.0 14.3 8.7 0.9 18.3 12.0 0.9 15.8 10.2
40-44 3.8 17.1 12.0 2.0 20.8 13.5 5.3 15.6 11.8 4.1 17.0 12.2
45-49 0.0 2.1 1.3 0.0 1.3 0.8 0.0 0.5 0.3 0.0 1.2 0.8
50-54 2.4 3.0 2.8 3.1 1.3 2.0 0.4 3.0 2.1 1.7 2.7 2.3
55-59 1.4 1.5 1.5 0.0 1.9 1.2 1.3 1.3 1.3 1.1 1.5 1.3
60-64 1.0 1.8 1.5 4.1 5.8 5.2 1.8 3.3 2.7 1.9 3.2 2.7
65+ 4.3 2.7 3.3 6.1 4.5 5.2 1.3 3.0 2.4 3.4 3.2 3.2
n 208 334 542 98 154 252 228 398 626 534 886 1420
Average age of HH members
18.1 28.1 24.3 20.5 31.6 27.3 14.6 27.8 23.0 17.1 28.6 24.3
Table 1b: Distribution of members in control households by age (in years) (per cent)
Age Lalmonirhat Gaibandha Jamalpur Total
Male Female All Male Female All Male Female All Male Female All
0-4 9.0 4.7 6.3 6.0 5.2 5.5 14.4 8.4 10.8 11.2 6.4 8.2
5-9 16.2 7.9 11.0 25.3 7.1 13.4 18.3 12.3 14.6 18.5 9.7 13.1
10-14 23.3 15.7 18.6 28.9 19.4 22.7 26.2 12.6 17.9 25.5 14.9 19.0
15-19 17.1 7.9 11.4 16.9 4.5 8.8 12.2 6.2 8.5 14.7 6.5 9.7
20-24 2.9 4.1 3.6 4.8 3.2 3.8 3.4 3.9 3.7 3.4 3.9 3.7
25-29 3.3 7.3 5.8 1.2 1.9 1.7 0.8 8.6 5.5 1.8 7.0 5.0
30-34 1.4 10.5 7.1 2.4 5.8 4.6 1.9 10.6 7.2 1.8 9.7 6.7
35-39 2.4 12.5 8.7 1.2 20.6 13.9 4.9 12.1 9.3 3.4 13.7 9.8
40-44 6.2 15.2 11.8 6.0 18.1 13.9 4.6 15.8 11.4 5.4 15.9 11.9
45-49 1.0 2.0 1.6 1.2 2.6 2.1 1.1 1.0 1.0 1.1 1.7 1.4
50-54 4.3 3.2 3.6 1.2 3.9 2.9 1.5 1.5 1.5 2.5 2.5 2.5
55-59 4.3 2.0 2.9 2.4 1.3 1.7 1.9 2.5 2.2 2.9 2.1 2.4
60-64 3.8 1.7 2.5 1.2 2.6 2.1 3.4 2.0 2.5 3.2 2.0 2.5
65+ 4.8 5.2 5.1 1.2 3.9 2.9 5.3 2.7 3.7 4.5 3.9 4.1
n 210 343 553 83 155 238 263 406 669 556 904 1460
Average age of HH members
22.6 29.1 26.7 17.7 30.0 25.7 19.8 26.8 24.0 20.6 28.2 25.3
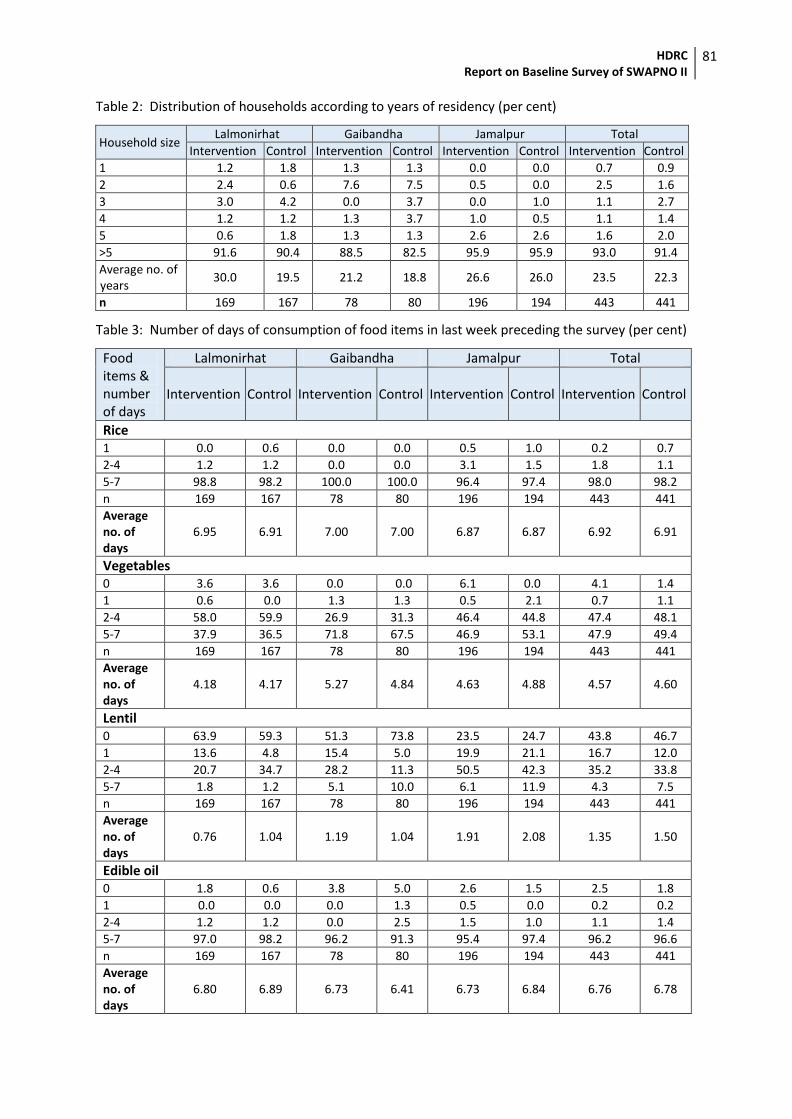
HDRC Report on Baseline Survey of SWAPNO II
81
Table 2: Distribution of households according to years of residency (per cent)
Household size Lalmonirhat Gaibandha Jamalpur Total
Intervention Control Intervention Control Intervention Control Intervention Control
1 1.2 1.8 1.3 1.3 0.0 0.0 0.7 0.9
2 2.4 0.6 7.6 7.5 0.5 0.0 2.5 1.6
3 3.0 4.2 0.0 3.7 0.0 1.0 1.1 2.7
4 1.2 1.2 1.3 3.7 1.0 0.5 1.1 1.4
5 0.6 1.8 1.3 1.3 2.6 2.6 1.6 2.0
>5 91.6 90.4 88.5 82.5 95.9 95.9 93.0 91.4
Average no. of years
30.0 19.5 21.2 18.8 26.6 26.0 23.5 22.3
n 169 167 78 80 196 194 443 441
Table 3: Number of days of consumption of food items in last week preceding the survey (per cent)
Food items & number of days
Lalmonirhat Gaibandha Jamalpur Total
Intervention Control Intervention Control Intervention Control Intervention Control
Rice 1 0.0 0.6 0.0 0.0 0.5 1.0 0.2 0.7
2-4 1.2 1.2 0.0 0.0 3.1 1.5 1.8 1.1
5-7 98.8 98.2 100.0 100.0 96.4 97.4 98.0 98.2
n 169 167 78 80 196 194 443 441
Average no. of days
6.95 6.91 7.00 7.00 6.87 6.87 6.92 6.91
Vegetables 0 3.6 3.6 0.0 0.0 6.1 0.0 4.1 1.4
1 0.6 0.0 1.3 1.3 0.5 2.1 0.7 1.1
2-4 58.0 59.9 26.9 31.3 46.4 44.8 47.4 48.1
5-7 37.9 36.5 71.8 67.5 46.9 53.1 47.9 49.4
n 169 167 78 80 196 194 443 441
Average no. of days
4.18 4.17 5.27 4.84 4.63 4.88 4.57 4.60
Lentil 0 63.9 59.3 51.3 73.8 23.5 24.7 43.8 46.7
1 13.6 4.8 15.4 5.0 19.9 21.1 16.7 12.0
2-4 20.7 34.7 28.2 11.3 50.5 42.3 35.2 33.8
5-7 1.8 1.2 5.1 10.0 6.1 11.9 4.3 7.5
n 169 167 78 80 196 194 443 441
Average no. of days
0.76 1.04 1.19 1.04 1.91 2.08 1.35 1.50
Edible oil 0 1.8 0.6 3.8 5.0 2.6 1.5 2.5 1.8
1 0.0 0.0 0.0 1.3 0.5 0.0 0.2 0.2
2-4 1.2 1.2 0.0 2.5 1.5 1.0 1.1 1.4
5-7 97.0 98.2 96.2 91.3 95.4 97.4 96.2 96.6
n 169 167 78 80 196 194 443 441
Average no. of days
6.80 6.89 6.73 6.41 6.73 6.84 6.76 6.78
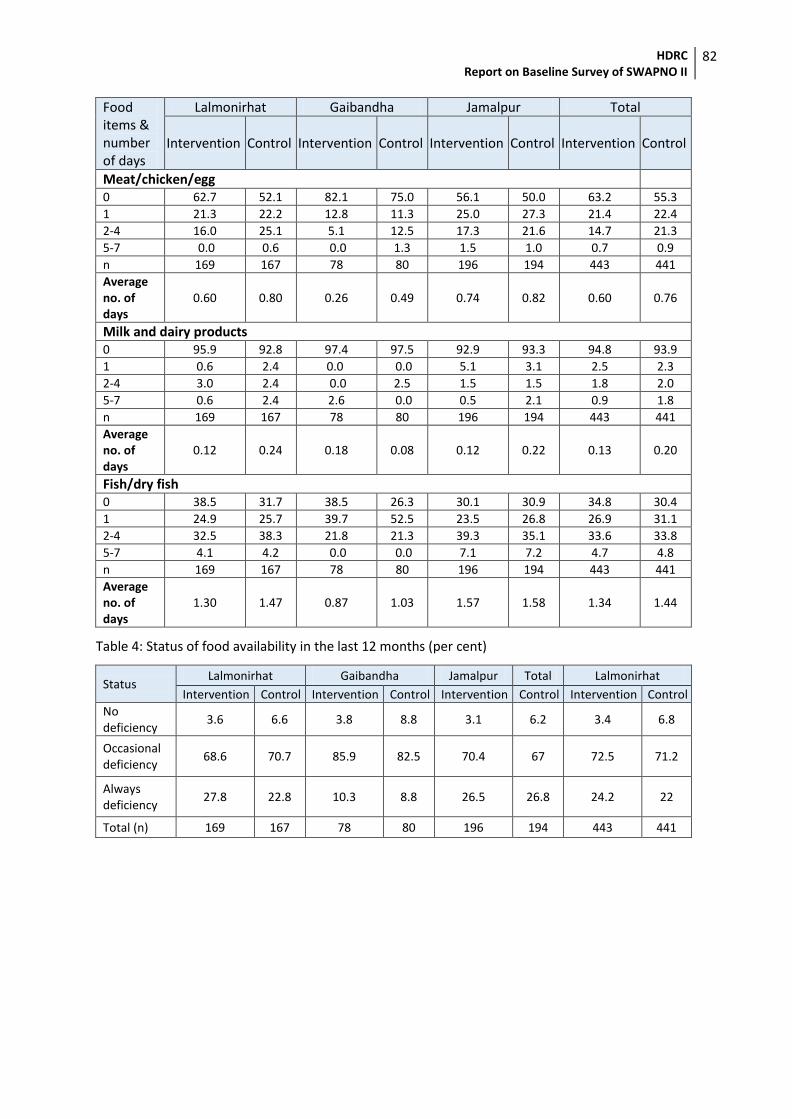
HDRC Report on Baseline Survey of SWAPNO II
82
Food items & number of days
Lalmonirhat Gaibandha Jamalpur Total
Intervention Control Intervention Control Intervention Control Intervention Control
Meat/chicken/egg 0 62.7 52.1 82.1 75.0 56.1 50.0 63.2 55.3
1 21.3 22.2 12.8 11.3 25.0 27.3 21.4 22.4
2-4 16.0 25.1 5.1 12.5 17.3 21.6 14.7 21.3
5-7 0.0 0.6 0.0 1.3 1.5 1.0 0.7 0.9
n 169 167 78 80 196 194 443 441
Average no. of days
0.60 0.80 0.26 0.49 0.74 0.82 0.60 0.76
Milk and dairy products 0 95.9 92.8 97.4 97.5 92.9 93.3 94.8 93.9
1 0.6 2.4 0.0 0.0 5.1 3.1 2.5 2.3
2-4 3.0 2.4 0.0 2.5 1.5 1.5 1.8 2.0
5-7 0.6 2.4 2.6 0.0 0.5 2.1 0.9 1.8
n 169 167 78 80 196 194 443 441
Average no. of days
0.12 0.24 0.18 0.08 0.12 0.22 0.13 0.20
Fish/dry fish 0 38.5 31.7 38.5 26.3 30.1 30.9 34.8 30.4
1 24.9 25.7 39.7 52.5 23.5 26.8 26.9 31.1
2-4 32.5 38.3 21.8 21.3 39.3 35.1 33.6 33.8
5-7 4.1 4.2 0.0 0.0 7.1 7.2 4.7 4.8
n 169 167 78 80 196 194 443 441
Average no. of days
1.30 1.47 0.87 1.03 1.57 1.58 1.34 1.44
Table 4: Status of food availability in the last 12 months (per cent)
Status Lalmonirhat Gaibandha Jamalpur Total Lalmonirhat
Intervention Control Intervention Control Intervention Control Intervention Control
No deficiency
3.6 6.6 3.8 8.8 3.1 6.2 3.4 6.8
Occasional deficiency
68.6 70.7 85.9 82.5 70.4 67 72.5 71.2
Always deficiency
27.8 22.8 10.3 8.8 26.5 26.8 24.2 22
Total (n) 169 167 78 80 196 194 443 441
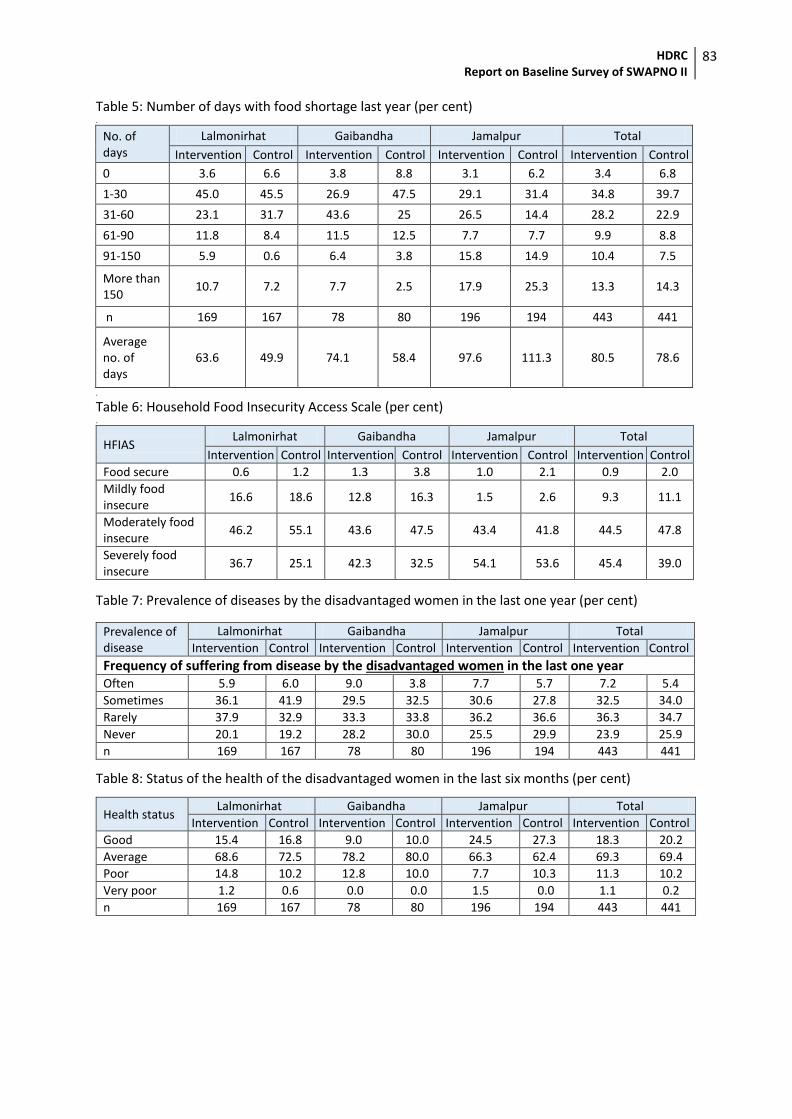
HDRC Report on Baseline Survey of SWAPNO II
83
Table 5: Number of days with food shortage last year (per cent) .
No. of days
Lalmonirhat Gaibandha Jamalpur Total
Intervention Control Intervention Control Intervention Control Intervention Control
0 3.6 6.6 3.8 8.8 3.1 6.2 3.4 6.8
1-30 45.0 45.5 26.9 47.5 29.1 31.4 34.8 39.7
31-60 23.1 31.7 43.6 25 26.5 14.4 28.2 22.9
61-90 11.8 8.4 11.5 12.5 7.7 7.7 9.9 8.8
91-150 5.9 0.6 6.4 3.8 15.8 14.9 10.4 7.5
More than 150
10.7 7.2 7.7 2.5 17.9 25.3 13.3 14.3
n 169 167 78 80 196 194 443 441
Average no. of days
63.6 49.9 74.1 58.4 97.6 111.3 80.5 78.6
. Table 6: Household Food Insecurity Access Scale (per cent) .
HFIAS Lalmonirhat Gaibandha Jamalpur Total
Intervention Control Intervention Control Intervention Control Intervention Control
Food secure 0.6 1.2 1.3 3.8 1.0 2.1 0.9 2.0
Mildly food insecure
16.6 18.6 12.8 16.3 1.5 2.6 9.3 11.1
Moderately food insecure
46.2 55.1 43.6 47.5 43.4 41.8 44.5 47.8
Severely food insecure
36.7 25.1 42.3 32.5 54.1 53.6 45.4 39.0
Table 7: Prevalence of diseases by the disadvantaged women in the last one year (per cent)
Prevalence of disease
Lalmonirhat Gaibandha Jamalpur Total
Intervention Control Intervention Control Intervention Control Intervention Control
Frequency of suffering from disease by the disadvantaged women in the last one year Often 5.9 6.0 9.0 3.8 7.7 5.7 7.2 5.4
Sometimes 36.1 41.9 29.5 32.5 30.6 27.8 32.5 34.0
Rarely 37.9 32.9 33.3 33.8 36.2 36.6 36.3 34.7
Never 20.1 19.2 28.2 30.0 25.5 29.9 23.9 25.9
n 169 167 78 80 196 194 443 441
Table 8: Status of the health of the disadvantaged women in the last six months (per cent)
Health status Lalmonirhat Gaibandha Jamalpur Total
Intervention Control Intervention Control Intervention Control Intervention Control
Good 15.4 16.8 9.0 10.0 24.5 27.3 18.3 20.2
Average 68.6 72.5 78.2 80.0 66.3 62.4 69.3 69.4
Poor 14.8 10.2 12.8 10.0 7.7 10.3 11.3 10.2
Very poor 1.2 0.6 0.0 0.0 1.5 0.0 1.1 0.2
n 169 167 78 80 196 194 443 441
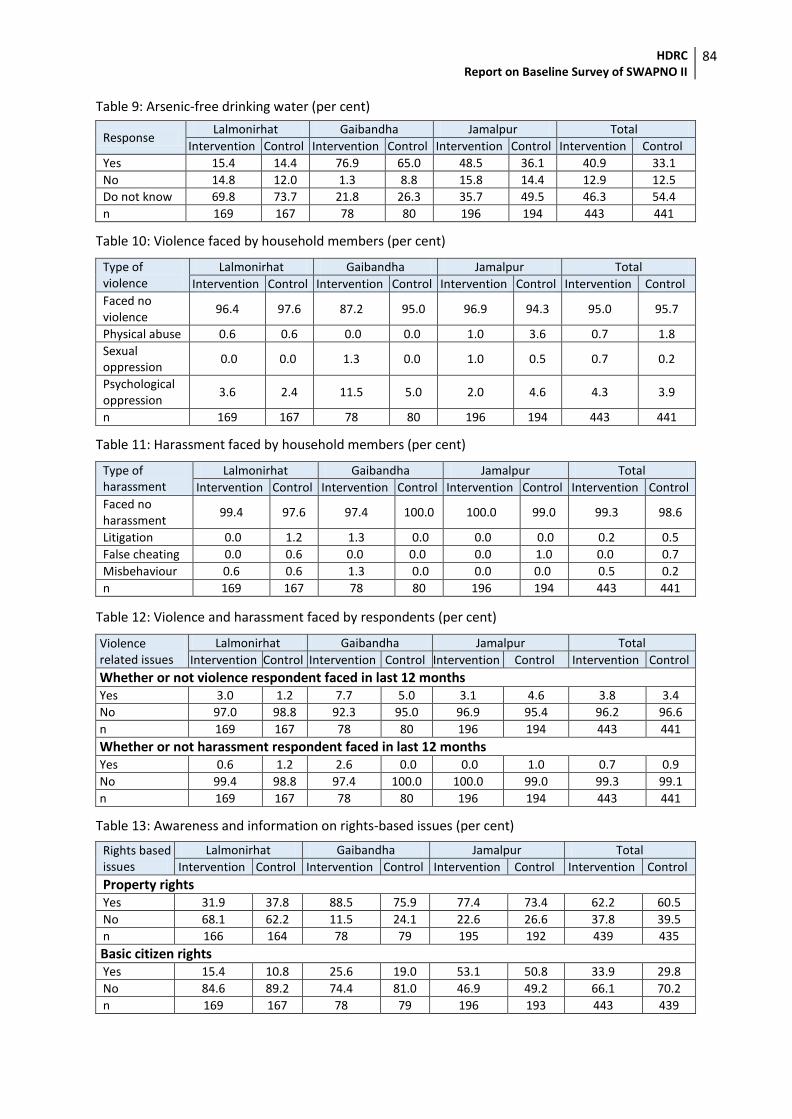
HDRC Report on Baseline Survey of SWAPNO II
84
Table 9: Arsenic-free drinking water (per cent)
Response Lalmonirhat Gaibandha Jamalpur Total
Intervention Control Intervention Control Intervention Control Intervention Control
Yes 15.4 14.4 76.9 65.0 48.5 36.1 40.9 33.1
No 14.8 12.0 1.3 8.8 15.8 14.4 12.9 12.5
Do not know 69.8 73.7 21.8 26.3 35.7 49.5 46.3 54.4
n 169 167 78 80 196 194 443 441
Table 10: Violence faced by household members (per cent)
Type of violence
Lalmonirhat Gaibandha Jamalpur Total
Intervention Control Intervention Control Intervention Control Intervention Control
Faced no violence
96.4 97.6 87.2 95.0 96.9 94.3 95.0 95.7
Physical abuse 0.6 0.6 0.0 0.0 1.0 3.6 0.7 1.8
Sexual oppression
0.0 0.0 1.3 0.0 1.0 0.5 0.7 0.2
Psychological oppression
3.6 2.4 11.5 5.0 2.0 4.6 4.3 3.9
n 169 167 78 80 196 194 443 441
Table 11: Harassment faced by household members (per cent)
Type of harassment
Lalmonirhat Gaibandha Jamalpur Total
Intervention Control Intervention Control Intervention Control Intervention Control
Faced no harassment
99.4 97.6 97.4 100.0 100.0 99.0 99.3 98.6
Litigation 0.0 1.2 1.3 0.0 0.0 0.0 0.2 0.5
False cheating 0.0 0.6 0.0 0.0 0.0 1.0 0.0 0.7
Misbehaviour 0.6 0.6 1.3 0.0 0.0 0.0 0.5 0.2
n 169 167 78 80 196 194 443 441
Table 12: Violence and harassment faced by respondents (per cent)
Violence related issues
Lalmonirhat Gaibandha Jamalpur Total
Intervention Control Intervention Control Intervention Control Intervention Control
Whether or not violence respondent faced in last 12 months Yes 3.0 1.2 7.7 5.0 3.1 4.6 3.8 3.4
No 97.0 98.8 92.3 95.0 96.9 95.4 96.2 96.6
n 169 167 78 80 196 194 443 441
Whether or not harassment respondent faced in last 12 months Yes 0.6 1.2 2.6 0.0 0.0 1.0 0.7 0.9
No 99.4 98.8 97.4 100.0 100.0 99.0 99.3 99.1
n 169 167 78 80 196 194 443 441
Table 13: Awareness and information on rights-based issues (per cent)
Rights based issues
Lalmonirhat Gaibandha Jamalpur Total
Intervention Control Intervention Control Intervention Control Intervention Control
Property rights Yes 31.9 37.8 88.5 75.9 77.4 73.4 62.2 60.5
No 68.1 62.2 11.5 24.1 22.6 26.6 37.8 39.5
n 166 164 78 79 195 192 439 435
Basic citizen rights Yes 15.4 10.8 25.6 19.0 53.1 50.8 33.9 29.8
No 84.6 89.2 74.4 81.0 46.9 49.2 66.1 70.2
n 169 167 78 79 196 193 443 439
HDRC Report on Baseline Survey of SWAPNO II
85
Annex-2: Questionnaires for the Survey
HDRC Report on Baseline Survey of SWAPNO II
86
Questionnaire No:
Human Development Research Centre (HDRC)
Date of interview:
Starting time of interview: End of interview:
Agreement
AssalamWalikum. After stating your name, identity and a brief exchange of greetings please mention- Under the Local Government Division of Bangladesh government with the financial support of UNDP, the SWAPNO Project is being implemented by the Union Parishad for socio-economic development of your household members. Some information i.e. income, expenditure, loan, savings, food habit, residence and social status including weight and height of your household members will be sought and gathered to facilitate the activities of this project. All information will be utilised for the present status and progress assessment of the project in future. All information provided by you will be preserved with the highest privacy and it will not be disclosed anywhere other than for the project requirement.
I,……………………………………, do hereby give my consent to provide information. -------------------------- Signature/fingerprint of respondent
Data Collection Instrument 1: Household Survey Questionnaire
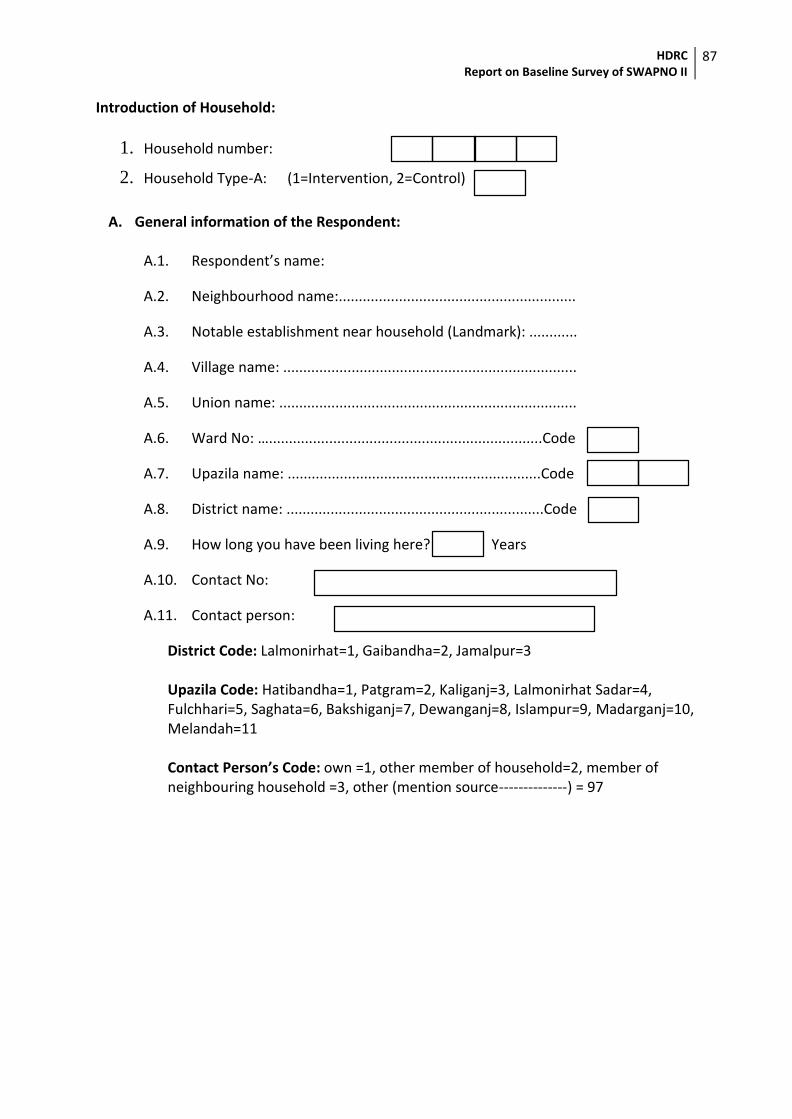
HDRC Report on Baseline Survey of SWAPNO II
87
Introduction of Household:
1. Household number:
2. Household Type-A: (1=Intervention, 2=Control)
A. General information of the Respondent:
A.1. Respondent’s name:
A.2. Neighbourhood name:...........................................................
A.3. Notable establishment near household (Landmark): ............
A.4. Village name: .........................................................................
A.5. Union name: ..........................................................................
A.6. Ward No: …....................................................................Code
A.7. Upazila name: ...............................................................Code
A.8. District name: ................................................................Code
A.9. How long you have been living here? Years
A.10. Contact No:
A.11. Contact person:
District Code: Lalmonirhat=1, Gaibandha=2, Jamalpur=3 Upazila Code: Hatibandha=1, Patgram=2, Kaliganj=3, Lalmonirhat Sadar=4, Fulchhari=5, Saghata=6, Bakshiganj=7, Dewanganj=8, Islampur=9, Madarganj=10, Melandah=11 Contact Person’s Code: own =1, other member of household=2, member of neighbouring household =3, other (mention source--------------) = 97
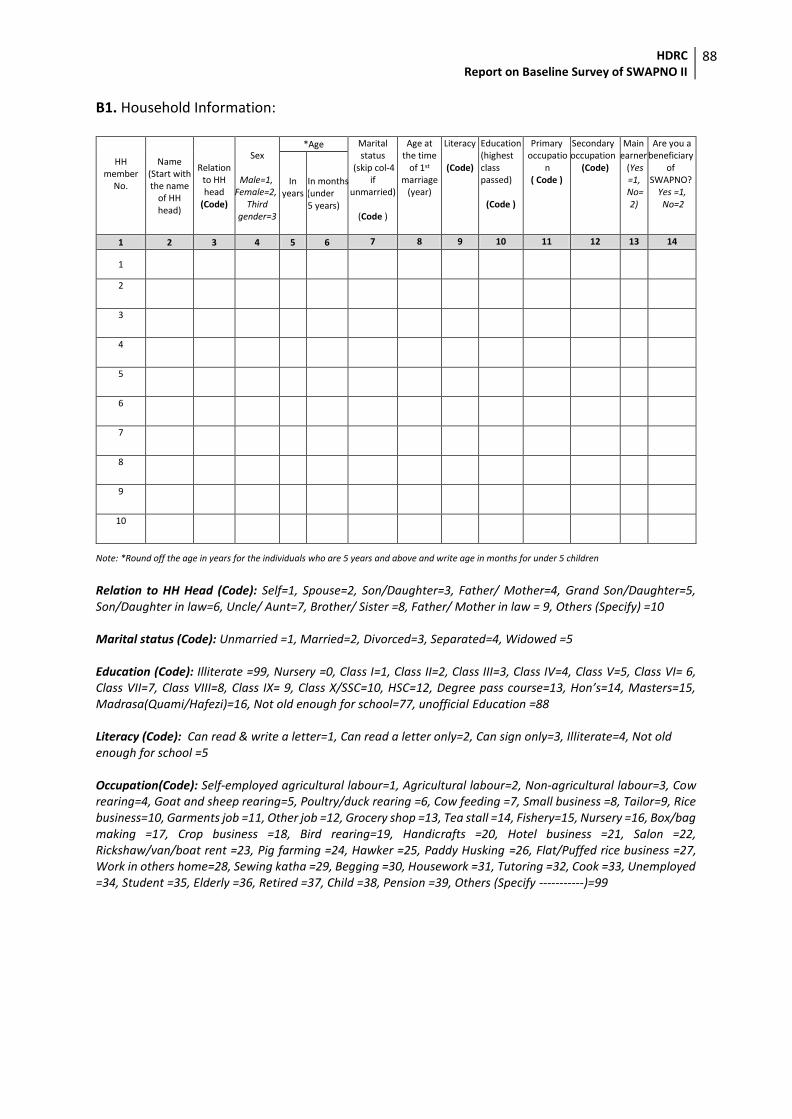
HDRC Report on Baseline Survey of SWAPNO II
88
B1. Household Information:
Note: *Round off the age in years for the individuals who are 5 years and above and write age in months for under 5 children
Relation to HH Head (Code): Self=1, Spouse=2, Son/Daughter=3, Father/ Mother=4, Grand Son/Daughter=5, Son/Daughter in law=6, Uncle/ Aunt=7, Brother/ Sister =8, Father/ Mother in law = 9, Others (Specify) =10 Marital status (Code): Unmarried =1, Married=2, Divorced=3, Separated=4, Widowed =5 Education (Code): Illiterate =99, Nursery =0, Class I=1, Class II=2, Class III=3, Class IV=4, Class V=5, Class VI= 6, Class VII=7, Class VIII=8, Class IX= 9, Class X/SSC=10, HSC=12, Degree pass course=13, Hon’s=14, Masters=15, Madrasa(Quami/Hafezi)=16, Not old enough for school=77, unofficial Education =88 Literacy (Code): Can read & write a letter=1, Can read a letter only=2, Can sign only=3, Illiterate=4, Not old enough for school =5 Occupation(Code): Self-employed agricultural labour=1, Agricultural labour=2, Non-agricultural labour=3, Cow rearing=4, Goat and sheep rearing=5, Poultry/duck rearing =6, Cow feeding =7, Small business =8, Tailor=9, Rice business=10, Garments job =11, Other job =12, Grocery shop =13, Tea stall =14, Fishery=15, Nursery =16, Box/bag making =17, Crop business =18, Bird rearing=19, Handicrafts =20, Hotel business =21, Salon =22, Rickshaw/van/boat rent =23, Pig farming =24, Hawker =25, Paddy Husking =26, Flat/Puffed rice business =27, Work in others home=28, Sewing katha =29, Begging =30, Housework =31, Tutoring =32, Cook =33, Unemployed =34, Student =35, Elderly =36, Retired =37, Child =38, Pension =39, Others (Specify -----------)=99
HH member
No.
Name (Start with the name
of HH head)
Relation to HH head
(Code)
Sex
Male=1, Female=2,
Third gender=3
*Age Marital status
(skip col-4 if
unmarried)
(Code )
Age at the time
of 1st marriage
(year)
Literacy
(Code)
Education (highest class passed)
(Code )
Primary occupatio
n ( Code )
Secondary occupation
(Code)
Main earner (Yes =1,
No= 2)
Are you a beneficiary
of SWAPNO?
Yes =1, No=2
In years
In months (under 5 years)
1 2 3 4 5 6 7 8 9 10 11 12 13 14
1
2
3
4
5
6
7
8
9
10
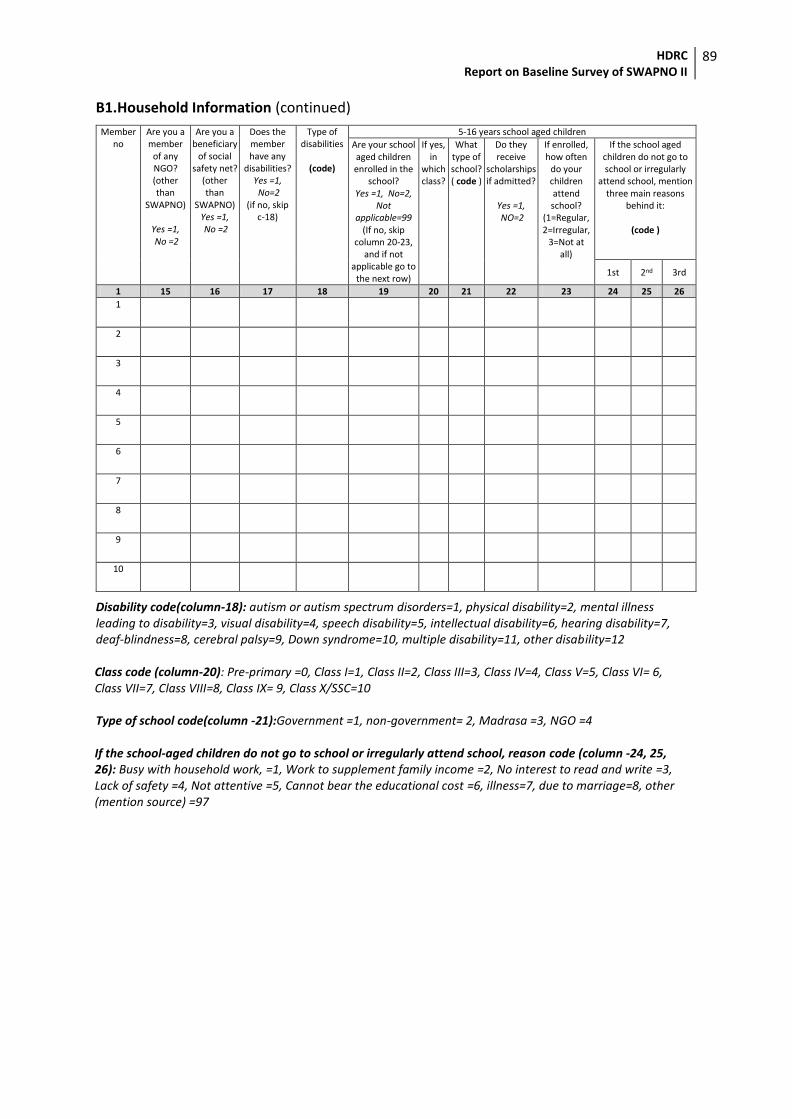
HDRC Report on Baseline Survey of SWAPNO II
89
B1.Household Information (continued)
Disability code(column-18): autism or autism spectrum disorders=1, physical disability=2, mental illness leading to disability=3, visual disability=4, speech disability=5, intellectual disability=6, hearing disability=7, deaf-blindness=8, cerebral palsy=9, Down syndrome=10, multiple disability=11, other disability=12 Class code (column-20): Pre-primary =0, Class I=1, Class II=2, Class III=3, Class IV=4, Class V=5, Class VI= 6, Class VII=7, Class VIII=8, Class IX= 9, Class X/SSC=10 Type of school code(column -21):Government =1, non-government= 2, Madrasa =3, NGO =4 If the school-aged children do not go to school or irregularly attend school, reason code (column -24, 25, 26): Busy with household work, =1, Work to supplement family income =2, No interest to read and write =3, Lack of safety =4, Not attentive =5, Cannot bear the educational cost =6, illness=7, due to marriage=8, other (mention source) =97
Member no
Are you a member
of any NGO? (other than
SWAPNO)
Yes =1, No =2
Are you a beneficiary
of social safety net?
(other than
SWAPNO) Yes =1, No =2
Does the member have any
disabilities? Yes =1, No=2
(if no, skip c-18)
Type of disabilities
(code)
5-16 years school aged children
Are your school aged children enrolled in the
school? Yes =1, No=2,
Not applicable=99
(If no, skip column 20-23,
and if not applicable go to
the next row)
If yes, in
which class?
What type of school? ( code )
Do they receive
scholarships if admitted?
Yes =1, NO=2
If enrolled, how often
do your children attend school?
(1=Regular, 2=Irregular,
3=Not at all)
If the school aged children do not go to school or irregularly
attend school, mention three main reasons
behind it:
(code )
1st 2nd 3rd
1 15 16 17 18 19 20 21 22 23 24 25 26
1
2
3
4
5
6
7
8
9
10
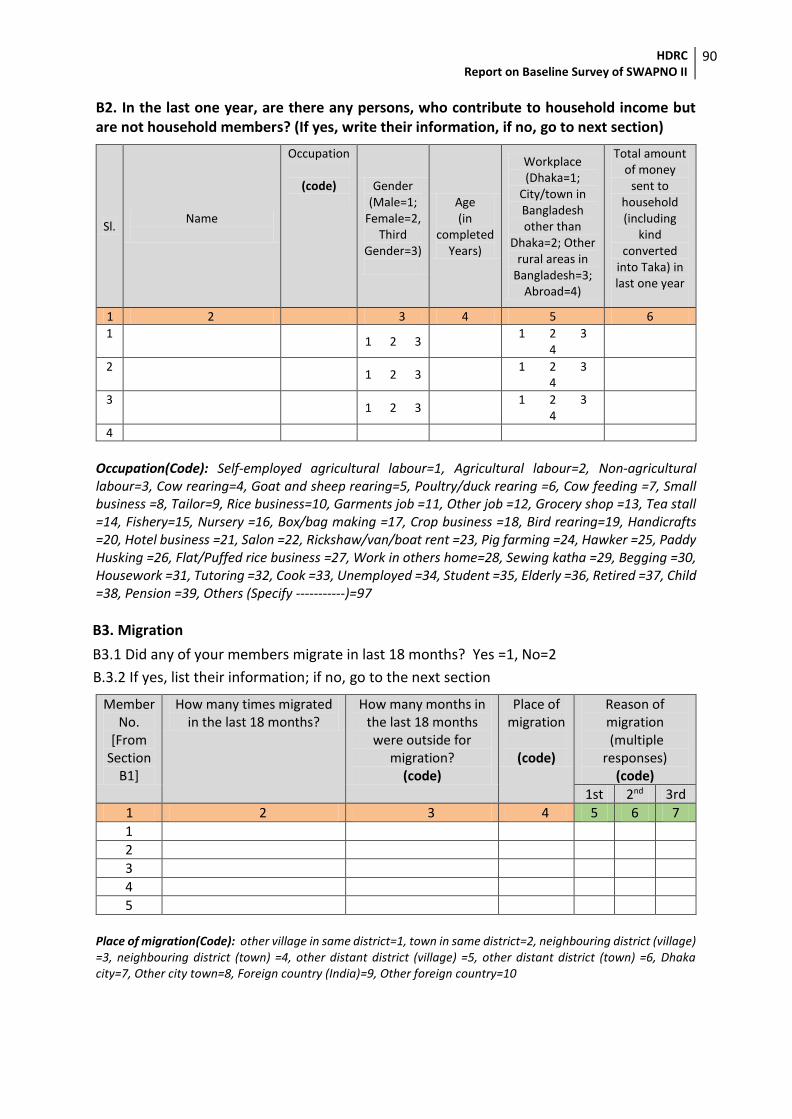
HDRC Report on Baseline Survey of SWAPNO II
90
B2. In the last one year, are there any persons, who contribute to household income but are not household members? (If yes, write their information, if no, go to next section)
Sl. Name
Occupation
(code)
Gender (Male=1;
Female=2, Third
Gender=3)
Age (in
completed Years)
Workplace (Dhaka=1;
City/town in Bangladesh other than
Dhaka=2; Other rural areas in
Bangladesh=3; Abroad=4)
Total amount of money
sent to household (including
kind converted
into Taka) in last one year
1 2 3 4 5 6
1 1 2 3
1 2 3 4
2 1 2 3
1 2 3 4
3 1 2 3
1 2 3 4
4
Occupation(Code): Self-employed agricultural labour=1, Agricultural labour=2, Non-agricultural labour=3, Cow rearing=4, Goat and sheep rearing=5, Poultry/duck rearing =6, Cow feeding =7, Small business =8, Tailor=9, Rice business=10, Garments job =11, Other job =12, Grocery shop =13, Tea stall =14, Fishery=15, Nursery =16, Box/bag making =17, Crop business =18, Bird rearing=19, Handicrafts =20, Hotel business =21, Salon =22, Rickshaw/van/boat rent =23, Pig farming =24, Hawker =25, Paddy Husking =26, Flat/Puffed rice business =27, Work in others home=28, Sewing katha =29, Begging =30, Housework =31, Tutoring =32, Cook =33, Unemployed =34, Student =35, Elderly =36, Retired =37, Child =38, Pension =39, Others (Specify -----------)=97
B3. Migration
B3.1 Did any of your members migrate in last 18 months? Yes =1, No=2
B.3.2 If yes, list their information; if no, go to the next section
Member No.
[From Section
B1]
How many times migrated in the last 18 months?
How many months in the last 18 months were outside for
migration? (code)
Place of migration
(code)
Reason of migration (multiple
responses) (code)
1st 2nd 3rd
1 2 3 4 5 6 7
1
2
3
4
5
Place of migration(Code): other village in same district=1, town in same district=2, neighbouring district (village) =3, neighbouring district (town) =4, other distant district (village) =5, other distant district (town) =6, Dhaka city=7, Other city town=8, Foreign country (India)=9, Other foreign country=10
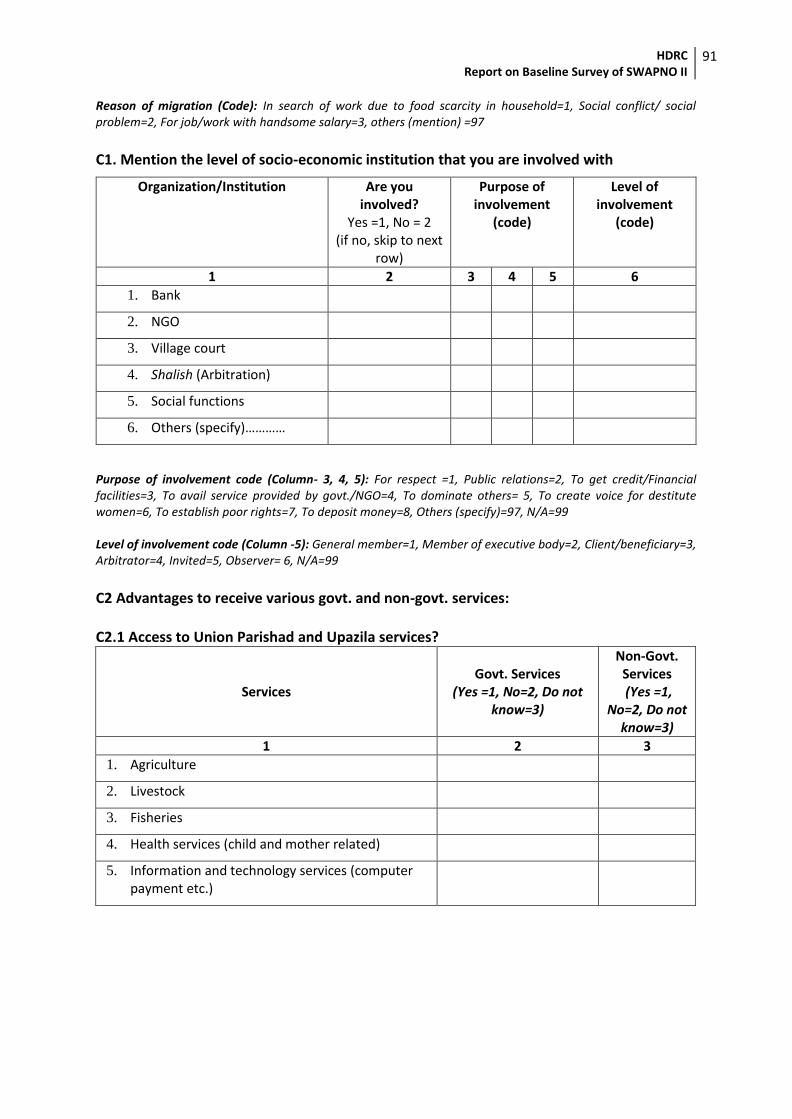
HDRC Report on Baseline Survey of SWAPNO II
91
Reason of migration (Code): In search of work due to food scarcity in household=1, Social conflict/ social problem=2, For job/work with handsome salary=3, others (mention) =97
C1. Mention the level of socio-economic institution that you are involved with
Organization/Institution
Are you involved?
Yes =1, No = 2 (if no, skip to next
row)
Purpose of involvement
(code)
Level of involvement
(code)
1 2 3 4 5 6
1. Bank
2. NGO
3. Village court
4. Shalish (Arbitration)
5. Social functions
6. Others (specify)…………
Purpose of involvement code (Column- 3, 4, 5): For respect =1, Public relations=2, To get credit/Financial facilities=3, To avail service provided by govt./NGO=4, To dominate others= 5, To create voice for destitute women=6, To establish poor rights=7, To deposit money=8, Others (specify)=97, N/A=99 Level of involvement code (Column -5): General member=1, Member of executive body=2, Client/beneficiary=3, Arbitrator=4, Invited=5, Observer= 6, N/A=99
C2 Advantages to receive various govt. and non-govt. services: C2.1 Access to Union Parishad and Upazila services?
Services Govt. Services
(Yes =1, No=2, Do not know=3)
Non-Govt. Services (Yes =1,
No=2, Do not know=3)
1 2 3
1. Agriculture
2. Livestock
3. Fisheries
4. Health services (child and mother related)
5. Information and technology services (computer payment etc.)
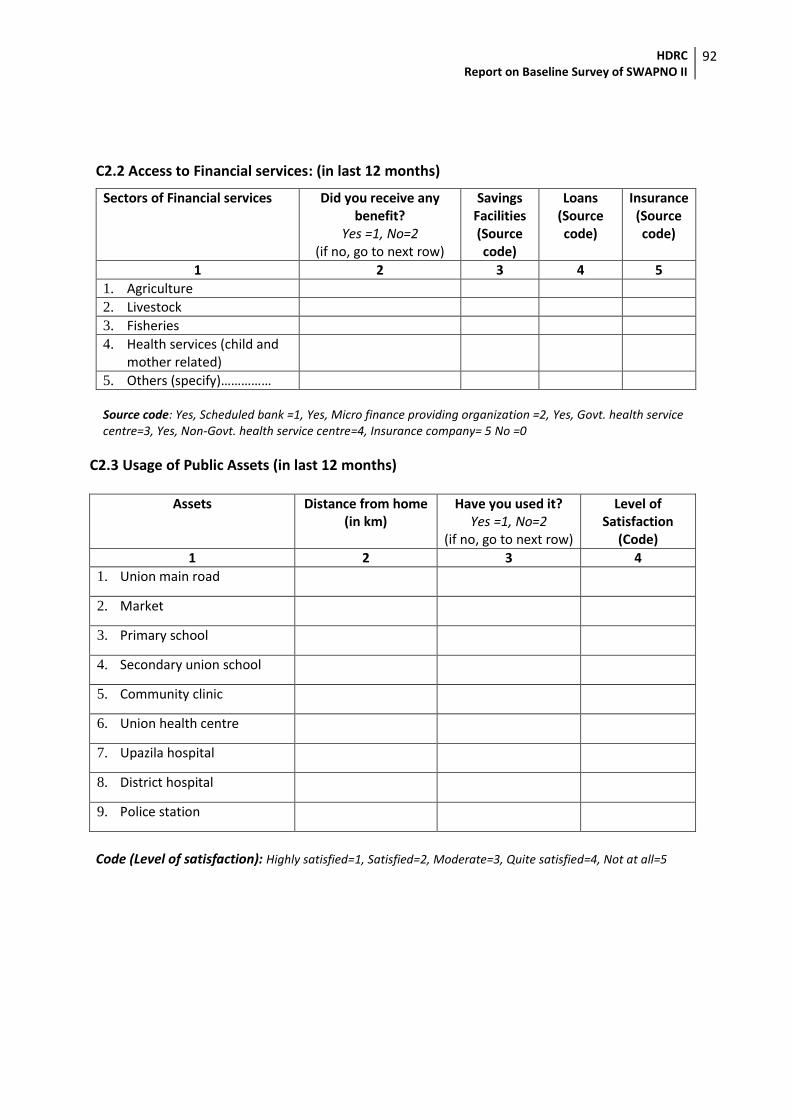
HDRC Report on Baseline Survey of SWAPNO II
92
C2.2 Access to Financial services: (in last 12 months)
Sectors of Financial services Did you receive any benefit?
Yes =1, No=2 (if no, go to next row)
Savings Facilities (Source code)
Loans (Source code)
Insurance (Source code)
1 2 3 4 5
1. Agriculture
2. Livestock
3. Fisheries
4. Health services (child and mother related)
5. Others (specify)…………… Source code: Yes, Scheduled bank =1, Yes, Micro finance providing organization =2, Yes, Govt. health service centre=3, Yes, Non-Govt. health service centre=4, Insurance company= 5 No =0
C2.3 Usage of Public Assets (in last 12 months)
Assets Distance from home (in km)
Have you used it? Yes =1, No=2
(if no, go to next row)
Level of Satisfaction
(Code)
1 2 3 4
1. Union main road
2. Market
3. Primary school
4. Secondary union school
5. Community clinic
6. Union health centre
7. Upazila hospital
8. District hospital
9. Police station
Code (Level of satisfaction): Highly satisfied=1, Satisfied=2, Moderate=3, Quite satisfied=4, Not at all=5
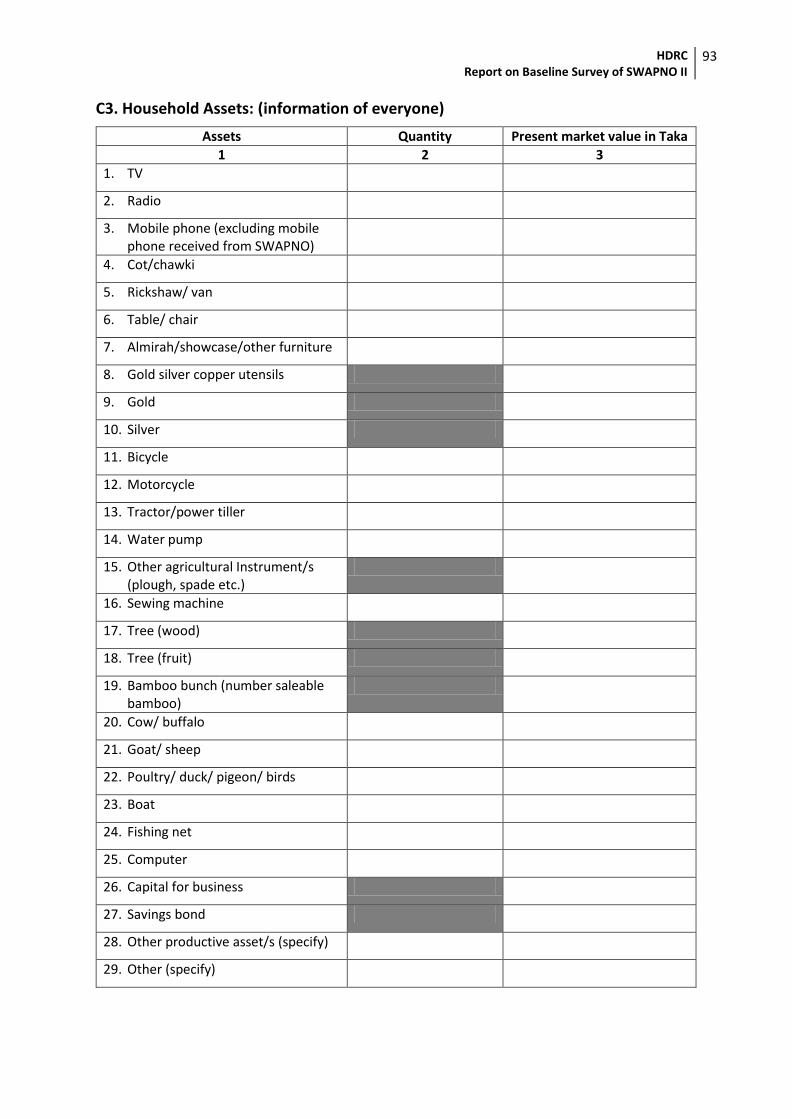
HDRC Report on Baseline Survey of SWAPNO II
93
C3. Household Assets: (information of everyone)
Assets Quantity Present market value in Taka
1 2 3
1. TV
2. Radio
3. Mobile phone (excluding mobile phone received from SWAPNO)
4. Cot/chawki
5. Rickshaw/ van
6. Table/ chair
7. Almirah/showcase/other furniture
8. Gold silver copper utensils
9. Gold
10. Silver
11. Bicycle
12. Motorcycle
13. Tractor/power tiller
14. Water pump
15. Other agricultural Instrument/s (plough, spade etc.)
16. Sewing machine
17. Tree (wood)
18. Tree (fruit)
19. Bamboo bunch (number saleable bamboo)
20. Cow/ buffalo
21. Goat/ sheep
22. Poultry/ duck/ pigeon/ birds
23. Boat
24. Fishing net
25. Computer
26. Capital for business
27. Savings bond
28. Other productive asset/s (specify)
29. Other (specify)
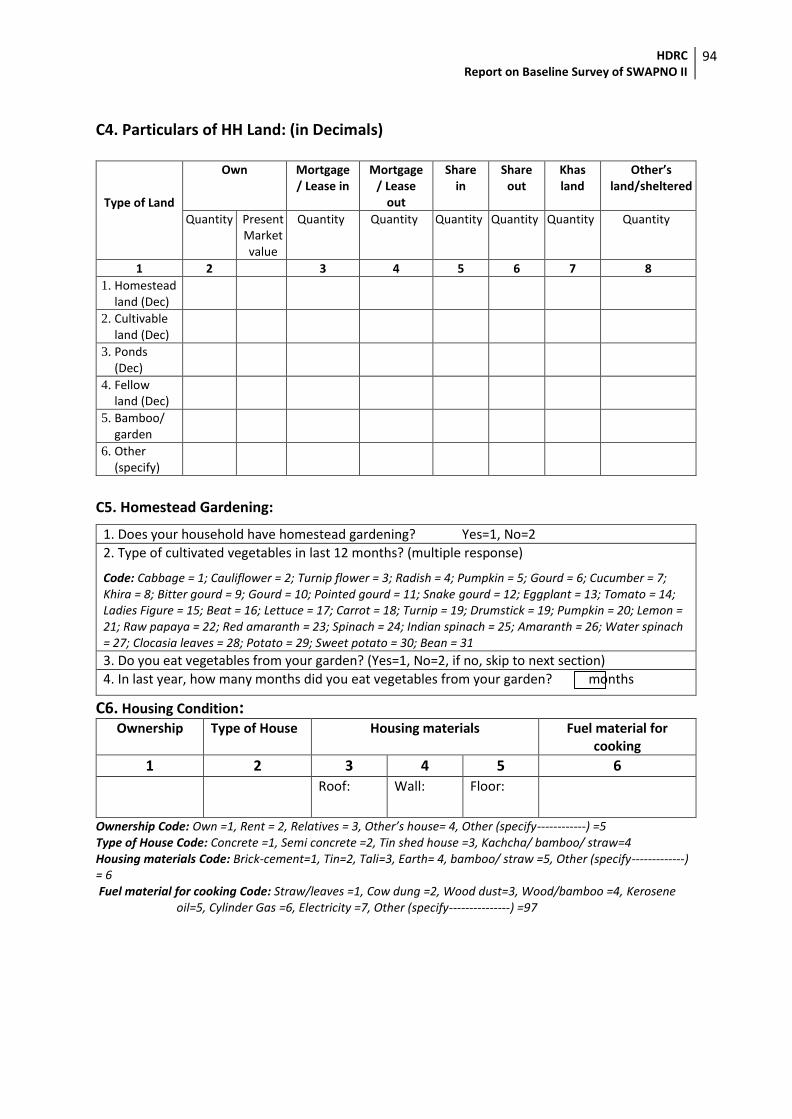
HDRC Report on Baseline Survey of SWAPNO II
94
C4. Particulars of HH Land: (in Decimals)
Type of Land
Own
Mortgage/ Lease in
Mortgage/ Lease
out
Share in
Share out
Khas land
Other’s land/sheltered
Quantity
Present Market value
Quantity Quantity Quantity Quantity Quantity Quantity
1 2 3 4 5 6 7 8
1. Homestead land (Dec)
2. Cultivable land (Dec)
3. Ponds (Dec)
4. Fellow land (Dec)
5. Bamboo/ garden
6. Other (specify)
C5. Homestead Gardening:
1. Does your household have homestead gardening? Yes=1, No=2 2. Type of cultivated vegetables in last 12 months? (multiple response)
Code: Cabbage = 1; Cauliflower = 2; Turnip flower = 3; Radish = 4; Pumpkin = 5; Gourd = 6; Cucumber = 7; Khira = 8; Bitter gourd = 9; Gourd = 10; Pointed gourd = 11; Snake gourd = 12; Eggplant = 13; Tomato = 14; Ladies Figure = 15; Beat = 16; Lettuce = 17; Carrot = 18; Turnip = 19; Drumstick = 19; Pumpkin = 20; Lemon = 21; Raw papaya = 22; Red amaranth = 23; Spinach = 24; Indian spinach = 25; Amaranth = 26; Water spinach = 27; Clocasia leaves = 28; Potato = 29; Sweet potato = 30; Bean = 31 3. Do you eat vegetables from your garden? (Yes=1, No=2, if no, skip to next section)
4. In last year, how many months did you eat vegetables from your garden? months
C6. Housing Condition: Ownership Type of House Housing materials Fuel material for
cooking 1 2 3 4 5 6
Roof: Wall: Floor:
Ownership Code: Own =1, Rent = 2, Relatives = 3, Other’s house= 4, Other (specify------------) =5 Type of House Code: Concrete =1, Semi concrete =2, Tin shed house =3, Kachcha/ bamboo/ straw=4 Housing materials Code: Brick-cement=1, Tin=2, Tali=3, Earth= 4, bamboo/ straw =5, Other (specify-------------) = 6 Fuel material for cooking Code: Straw/leaves =1, Cow dung =2, Wood dust=3, Wood/bamboo =4, Kerosene
oil=5, Cylinder Gas =6, Electricity =7, Other (specify---------------) =97
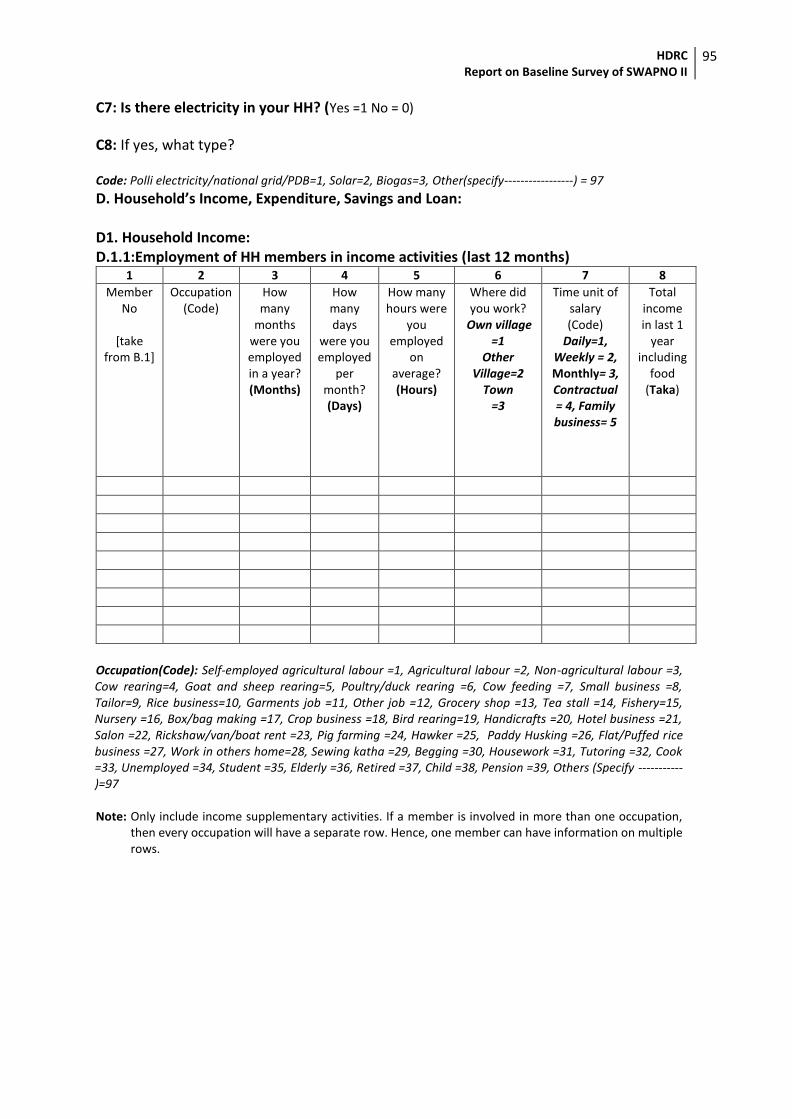
HDRC Report on Baseline Survey of SWAPNO II
95
C7: Is there electricity in your HH? (Yes =1 No = 0)
C8: If yes, what type? Code: Polli electricity/national grid/PDB=1, Solar=2, Biogas=3, Other(specify-----------------) = 97
D. Household’s Income, Expenditure, Savings and Loan: D1. Household Income: D.1.1:Employment of HH members in income activities (last 12 months)
1 2 3 4 5 6 7 8
Member No
[take
from B.1]
Occupation (Code)
How many
months were you employed in a year? (Months)
How many days
were you employed
per month? (Days)
How many hours were
you employed
on average? (Hours)
Where did you work?
Own village =1
Other Village=2
Town =3
Time unit of salary (Code)
Daily=1, Weekly = 2, Monthly= 3, Contractual = 4, Family business= 5
Total income in last 1
year including
food (Taka)
Occupation(Code): Self-employed agricultural labour =1, Agricultural labour =2, Non-agricultural labour =3, Cow rearing=4, Goat and sheep rearing=5, Poultry/duck rearing =6, Cow feeding =7, Small business =8, Tailor=9, Rice business=10, Garments job =11, Other job =12, Grocery shop =13, Tea stall =14, Fishery=15, Nursery =16, Box/bag making =17, Crop business =18, Bird rearing=19, Handicrafts =20, Hotel business =21, Salon =22, Rickshaw/van/boat rent =23, Pig farming =24, Hawker =25, Paddy Husking =26, Flat/Puffed rice business =27, Work in others home=28, Sewing katha =29, Begging =30, Housework =31, Tutoring =32, Cook =33, Unemployed =34, Student =35, Elderly =36, Retired =37, Child =38, Pension =39, Others (Specify -----------)=97
Note: Only include income supplementary activities. If a member is involved in more than one occupation,
then every occupation will have a separate row. Hence, one member can have information on multiple rows.
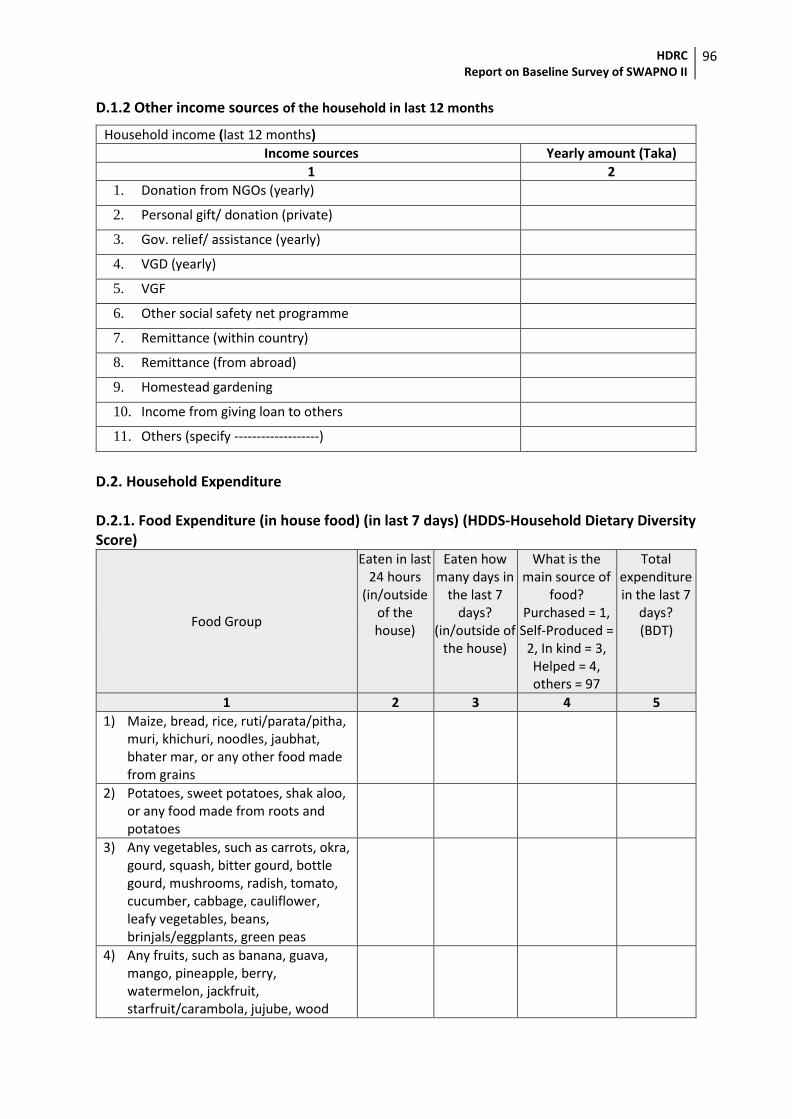
HDRC Report on Baseline Survey of SWAPNO II
96
D.1.2 Other income sources of the household in last 12 months
Household income (last 12 months)
Income sources Yearly amount (Taka)
1 2
1. Donation from NGOs (yearly)
2. Personal gift/ donation (private)
3. Gov. relief/ assistance (yearly)
4. VGD (yearly)
5. VGF
6. Other social safety net programme
7. Remittance (within country)
8. Remittance (from abroad)
9. Homestead gardening
10. Income from giving loan to others
11. Others (specify -------------------)
D.2. Household Expenditure D.2.1. Food Expenditure (in house food) (in last 7 days) (HDDS-Household Dietary Diversity Score)
Food Group
Eaten in last 24 hours
(in/outside of the house)
Eaten how many days in
the last 7 days?
(in/outside of the house)
What is the main source of
food? Purchased = 1,
Self-Produced = 2, In kind = 3, Helped = 4, others = 97
Total expenditure in the last 7
days? (BDT)
1 2 3 4 5
1) Maize, bread, rice, ruti/parata/pitha, muri, khichuri, noodles, jaubhat, bhater mar, or any other food made from grains
2) Potatoes, sweet potatoes, shak aloo, or any food made from roots and potatoes
3) Any vegetables, such as carrots, okra, gourd, squash, bitter gourd, bottle gourd, mushrooms, radish, tomato, cucumber, cabbage, cauliflower, leafy vegetables, beans, brinjals/eggplants, green peas
4) Any fruits, such as banana, guava, mango, pineapple, berry, watermelon, jackfruit, starfruit/carambola, jujube, wood
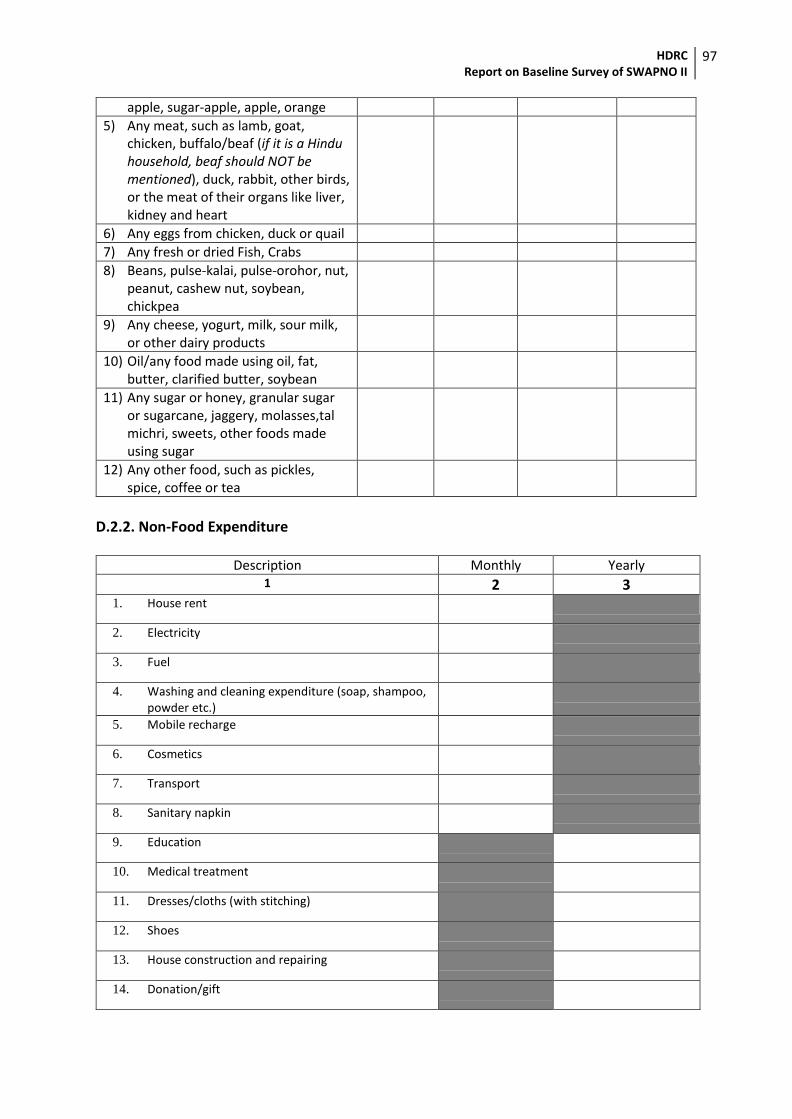
HDRC Report on Baseline Survey of SWAPNO II
97
apple, sugar-apple, apple, orange
5) Any meat, such as lamb, goat, chicken, buffalo/beaf (if it is a Hindu household, beaf should NOT be mentioned), duck, rabbit, other birds, or the meat of their organs like liver, kidney and heart
6) Any eggs from chicken, duck or quail
7) Any fresh or dried Fish, Crabs
8) Beans, pulse-kalai, pulse-orohor, nut, peanut, cashew nut, soybean, chickpea
9) Any cheese, yogurt, milk, sour milk, or other dairy products
10) Oil/any food made using oil, fat, butter, clarified butter, soybean
11) Any sugar or honey, granular sugar or sugarcane, jaggery, molasses,tal michri, sweets, other foods made using sugar
12) Any other food, such as pickles, spice, coffee or tea
D.2.2. Non-Food Expenditure
Description Monthly Yearly 1 2 3
1. House rent
2. Electricity
3. Fuel
4. Washing and cleaning expenditure (soap, shampoo, powder etc.)
5. Mobile recharge
6. Cosmetics
7. Transport
8. Sanitary napkin
9. Education
10. Medical treatment
11. Dresses/cloths (with stitching)
12. Shoes
13. House construction and repairing
14. Donation/gift
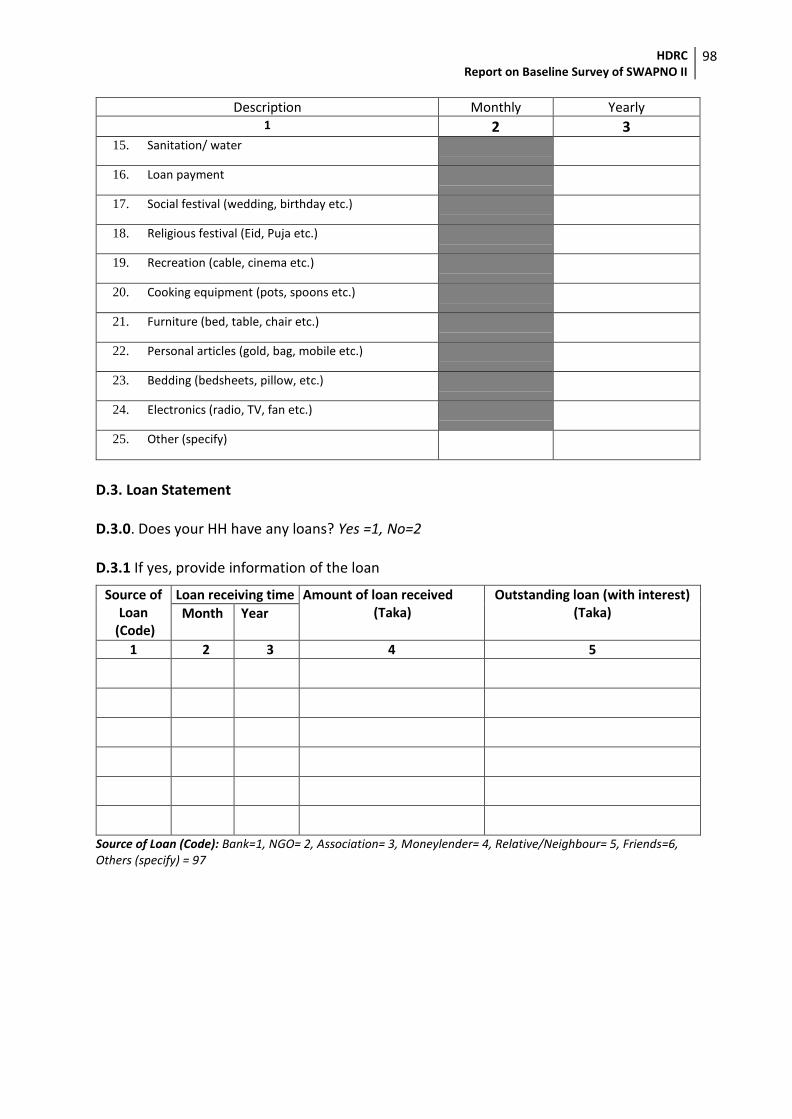
HDRC Report on Baseline Survey of SWAPNO II
98
Description Monthly Yearly 1 2 3
15. Sanitation/ water
16. Loan payment
17. Social festival (wedding, birthday etc.)
18. Religious festival (Eid, Puja etc.)
19. Recreation (cable, cinema etc.)
20. Cooking equipment (pots, spoons etc.)
21. Furniture (bed, table, chair etc.)
22. Personal articles (gold, bag, mobile etc.)
23. Bedding (bedsheets, pillow, etc.)
24. Electronics (radio, TV, fan etc.)
25. Other (specify)
D.3. Loan Statement D.3.0. Does your HH have any loans? Yes =1, No=2 D.3.1 If yes, provide information of the loan
Source of Loan
(Code)
Loan receiving time Amount of loan received (Taka)
Outstanding loan (with interest) (Taka) Month
Year
1 2 3 4 5
Source of Loan (Code): Bank=1, NGO= 2, Association= 3, Moneylender= 4, Relative/Neighbour= 5, Friends=6, Others (specify) = 97
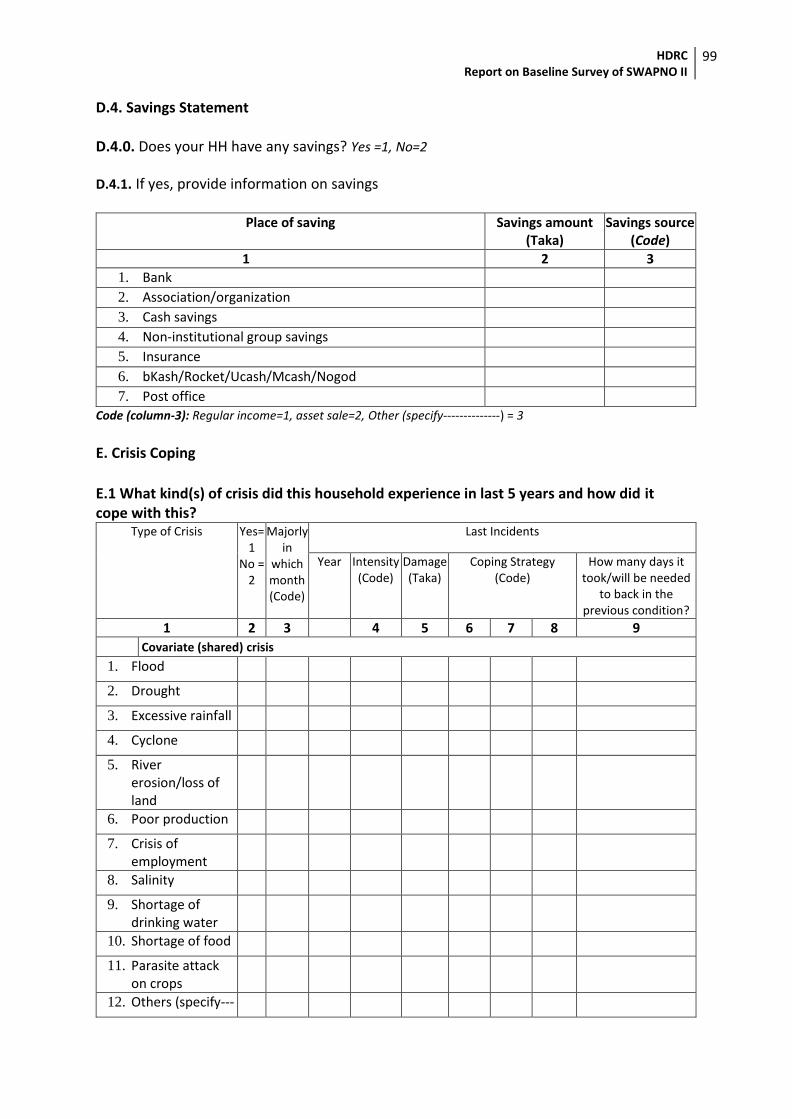
HDRC Report on Baseline Survey of SWAPNO II
99
D.4. Savings Statement D.4.0. Does your HH have any savings? Yes =1, No=2
D.4.1. If yes, provide information on savings
Place of saving
Savings amount (Taka)
Savings source (Code)
1 2 3
1. Bank
2. Association/organization
3. Cash savings
4. Non-institutional group savings
5. Insurance
6. bKash/Rocket/Ucash/Mcash/Nogod
7. Post office
Code (column-3): Regular income=1, asset sale=2, Other (specify--------------) = 3
E. Crisis Coping
E.1 What kind(s) of crisis did this household experience in last 5 years and how did it cope with this?
Type of Crisis
Yes= 1
No = 2
Majorly in
which month (Code)
Last Incidents
Year Intensity (Code)
Damage (Taka)
Coping Strategy (Code)
How many days it took/will be needed
to back in the previous condition?
1 2 3 4 5 6 7 8 9 Covariate (shared) crisis
1. Flood
2. Drought
3. Excessive rainfall
4. Cyclone
5. River erosion/loss of land
6. Poor production
7. Crisis of employment
8. Salinity
9. Shortage of drinking water
10. Shortage of food
11. Parasite attack on crops
12. Others (specify---
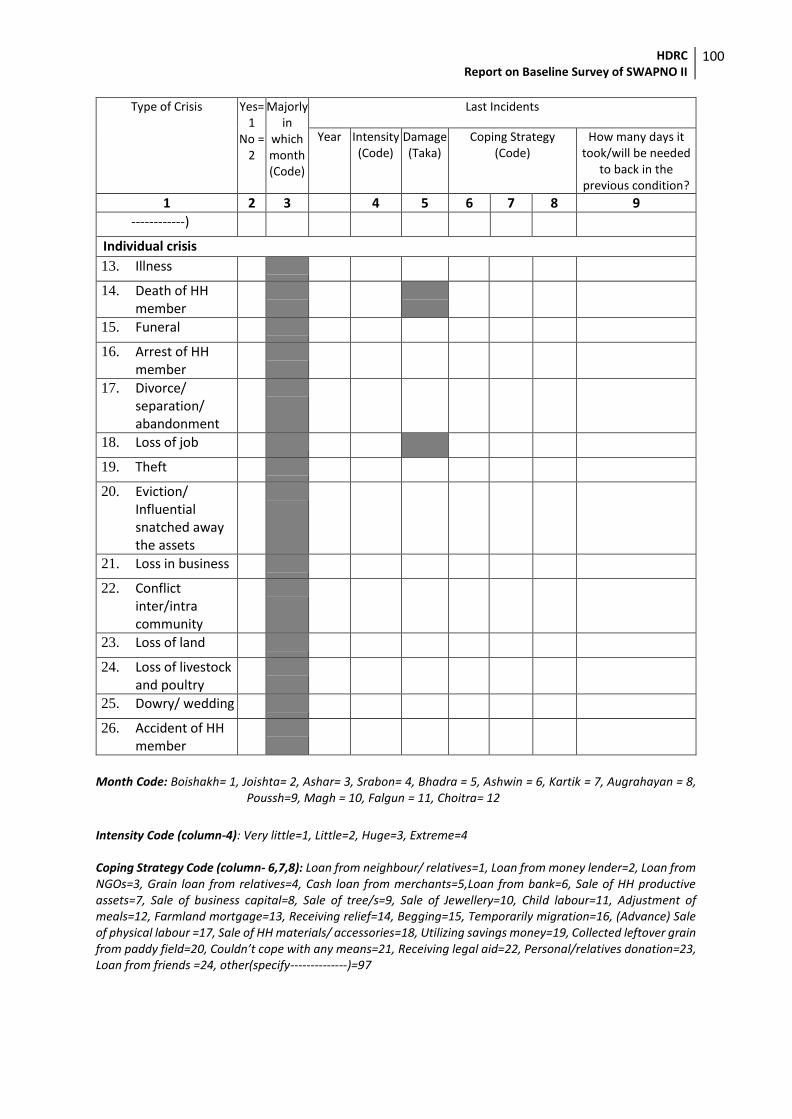
HDRC Report on Baseline Survey of SWAPNO II
100
Type of Crisis
Yes= 1
No = 2
Majorly in
which month (Code)
Last Incidents
Year Intensity (Code)
Damage (Taka)
Coping Strategy (Code)
How many days it took/will be needed
to back in the previous condition?
1 2 3 4 5 6 7 8 9
------------)
Individual crisis
13. Illness
14. Death of HH member
15. Funeral
16. Arrest of HH member
17. Divorce/ separation/ abandonment
18. Loss of job
19. Theft
20. Eviction/ Influential snatched away the assets
21. Loss in business
22. Conflict inter/intra community
23. Loss of land
24. Loss of livestock and poultry
25. Dowry/ wedding
26. Accident of HH member
Month Code: Boishakh= 1, Joishta= 2, Ashar= 3, Srabon= 4, Bhadra = 5, Ashwin = 6, Kartik = 7, Augrahayan = 8,
Poussh=9, Magh = 10, Falgun = 11, Choitra= 12
Intensity Code (column-4): Very little=1, Little=2, Huge=3, Extreme=4 Coping Strategy Code (column- 6,7,8): Loan from neighbour/ relatives=1, Loan from money lender=2, Loan from NGOs=3, Grain loan from relatives=4, Cash loan from merchants=5,Loan from bank=6, Sale of HH productive assets=7, Sale of business capital=8, Sale of tree/s=9, Sale of Jewellery=10, Child labour=11, Adjustment of meals=12, Farmland mortgage=13, Receiving relief=14, Begging=15, Temporarily migration=16, (Advance) Sale of physical labour =17, Sale of HH materials/ accessories=18, Utilizing savings money=19, Collected leftover grain from paddy field=20, Couldn’t cope with any means=21, Receiving legal aid=22, Personal/relatives donation=23, Loan from friends =24, other(specify--------------)=97
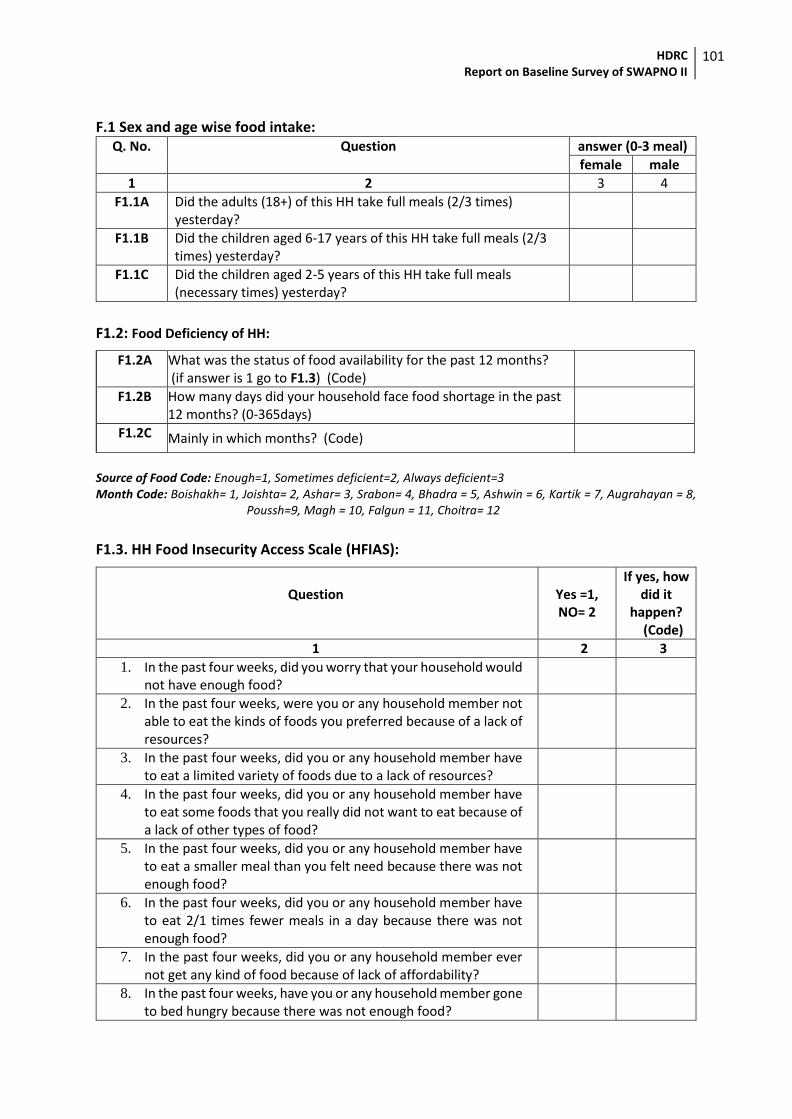
HDRC Report on Baseline Survey of SWAPNO II
101
F.1 Sex and age wise food intake:
Q. No. Question answer (0-3 meal)
female male
1 2 3 4
F1.1A Did the adults (18+) of this HH take full meals (2/3 times) yesterday?
F1.1B Did the children aged 6-17 years of this HH take full meals (2/3 times) yesterday?
F1.1C Did the children aged 2-5 years of this HH take full meals (necessary times) yesterday?
F1.2: Food Deficiency of HH:
F1.2A What was the status of food availability for the past 12 months? (if answer is 1 go to F1.3) (Code)
F1.2B How many days did your household face food shortage in the past 12 months? (0-365days)
F1.2C Mainly in which months? (Code)
Source of Food Code: Enough=1, Sometimes deficient=2, Always deficient=3 Month Code: Boishakh= 1, Joishta= 2, Ashar= 3, Srabon= 4, Bhadra = 5, Ashwin = 6, Kartik = 7, Augrahayan = 8,
Poussh=9, Magh = 10, Falgun = 11, Choitra= 12
F1.3. HH Food Insecurity Access Scale (HFIAS):
Question Yes =1,
NO= 2
If yes, how did it
happen? (Code)
1 2 3
1. In the past four weeks, did you worry that your household would not have enough food?
2. In the past four weeks, were you or any household member not able to eat the kinds of foods you preferred because of a lack of resources?
3. In the past four weeks, did you or any household member have to eat a limited variety of foods due to a lack of resources?
4. In the past four weeks, did you or any household member have to eat some foods that you really did not want to eat because of a lack of other types of food?
5. In the past four weeks, did you or any household member have to eat a smaller meal than you felt need because there was not enough food?
6. In the past four weeks, did you or any household member have to eat 2/1 times fewer meals in a day because there was not enough food?
7. In the past four weeks, did you or any household member ever not get any kind of food because of lack of affordability?
8. In the past four weeks, have you or any household member gone to bed hungry because there was not enough food?
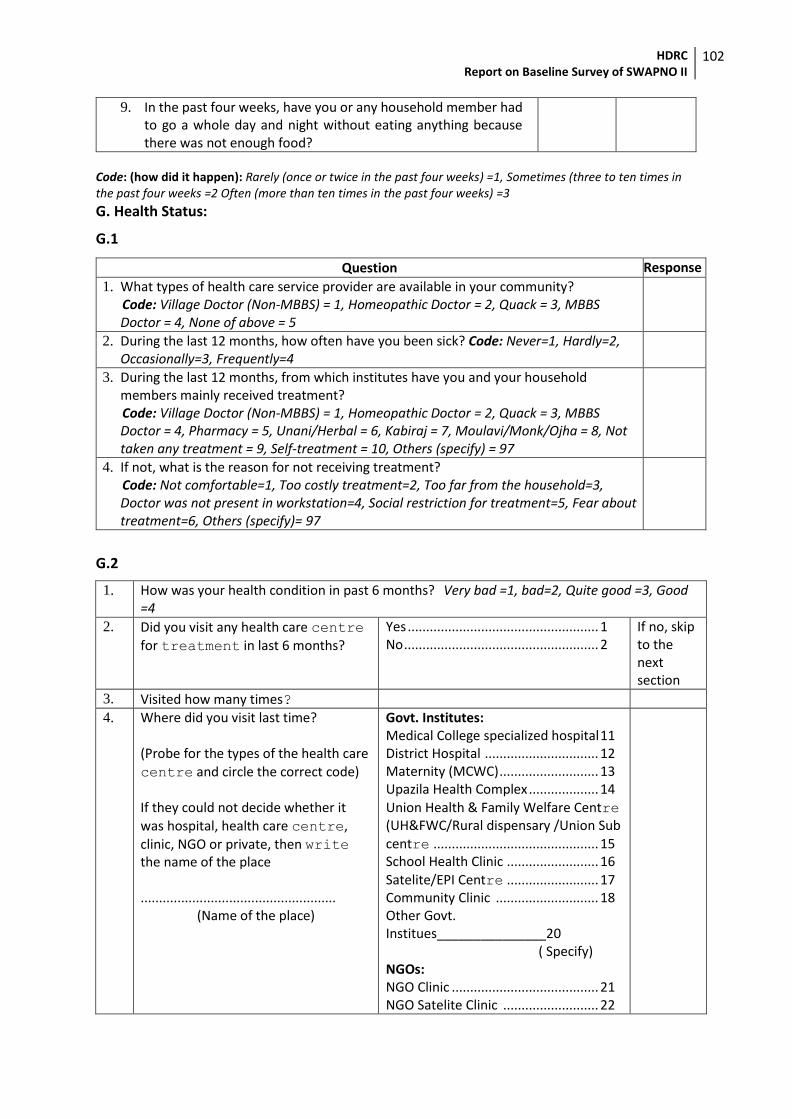
HDRC Report on Baseline Survey of SWAPNO II
102
9. In the past four weeks, have you or any household member had to go a whole day and night without eating anything because there was not enough food?
Code: (how did it happen): Rarely (once or twice in the past four weeks) =1, Sometimes (three to ten times in the past four weeks =2 Often (more than ten times in the past four weeks) =3
G. Health Status:
G.1
Question Response 1. What types of health care service provider are available in your community?
Code: Village Doctor (Non-MBBS) = 1, Homeopathic Doctor = 2, Quack = 3, MBBS Doctor = 4, None of above = 5
2. During the last 12 months, how often have you been sick? Code: Never=1, Hardly=2, Occasionally=3, Frequently=4
3. During the last 12 months, from which institutes have you and your household members mainly received treatment? Code: Village Doctor (Non-MBBS) = 1, Homeopathic Doctor = 2, Quack = 3, MBBS Doctor = 4, Pharmacy = 5, Unani/Herbal = 6, Kabiraj = 7, Moulavi/Monk/Ojha = 8, Not taken any treatment = 9, Self-treatment = 10, Others (specify) = 97
4. If not, what is the reason for not receiving treatment? Code: Not comfortable=1, Too costly treatment=2, Too far from the household=3, Doctor was not present in workstation=4, Social restriction for treatment=5, Fear about treatment=6, Others (specify)= 97
G.2
1. How was your health condition in past 6 months? Very bad =1, bad=2, Quite good =3, Good =4
2. Did you visit any health care centre
for treatment in last 6 months?
Yes .................................................... 1 No ..................................................... 2
If no, skip to the next section
3. Visited how many times?
4. Where did you visit last time? (Probe for the types of the health care
centre and circle the correct code) If they could not decide whether it was hospital, health care centre, clinic, NGO or private, then write the name of the place .....................................................
(Name of the place)
Govt. Institutes: Medical College specialized hospital 11 District Hospital ............................... 12 Maternity (MCWC) ........................... 13 Upazila Health Complex ................... 14
Union Health & Family Welfare Centre (UH&FWC/Rural dispensary /Union Sub
centre ............................................. 15 School Health Clinic ......................... 16
Satelite/EPI Centre ......................... 17 Community Clinic ............................ 18 Other Govt. Institues_______________20 ( Specify) NGOs: NGO Clinic ........................................ 21 NGO Satelite Clinic .......................... 22
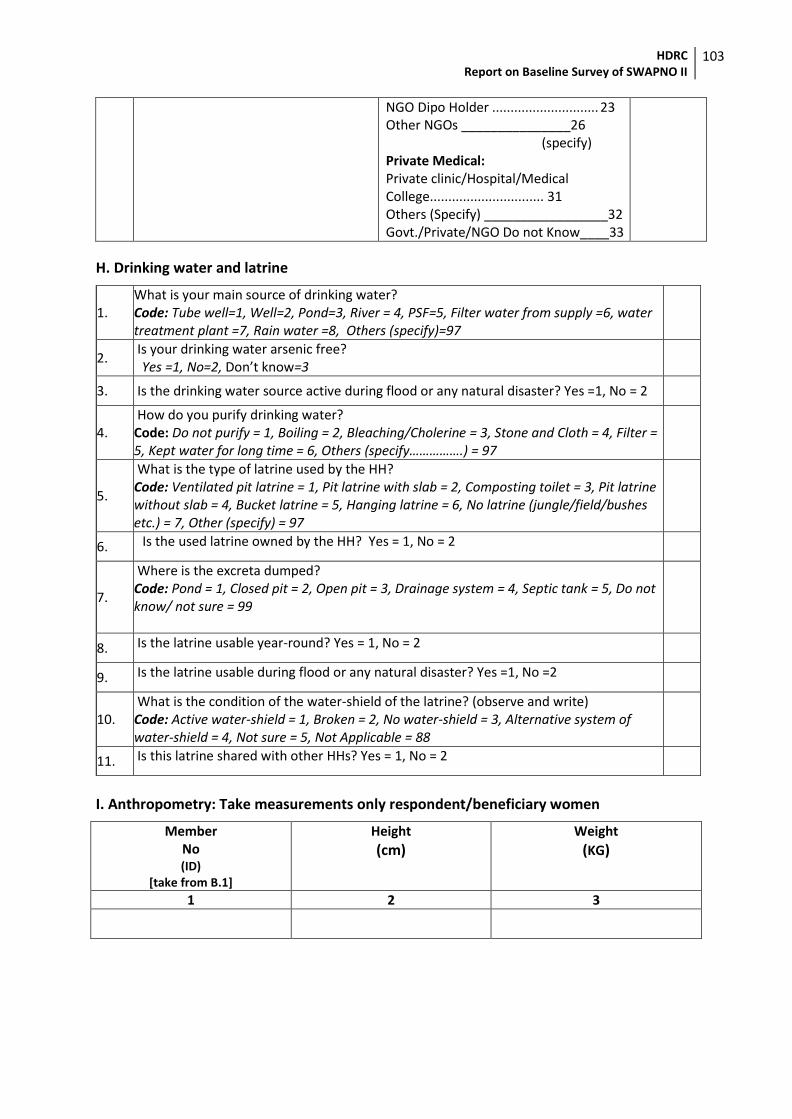
HDRC Report on Baseline Survey of SWAPNO II
103
NGO Dipo Holder ............................. 23 Other NGOs _______________26 (specify) Private Medical: Private clinic/Hospital/Medical College............................... 31 Others (Specify) _________________32 Govt./Private/NGO Do not Know____33
H. Drinking water and latrine
1. What is your main source of drinking water? Code: Tube well=1, Well=2, Pond=3, River = 4, PSF=5, Filter water from supply =6, water treatment plant =7, Rain water =8, Others (specify)=97
2. Is your drinking water arsenic free?
Yes =1, No=2, Don’t know=3
3. Is the drinking water source active during flood or any natural disaster? Yes =1, No = 2
4. How do you purify drinking water? Code: Do not purify = 1, Boiling = 2, Bleaching/Cholerine = 3, Stone and Cloth = 4, Filter = 5, Kept water for long time = 6, Others (specify…………….) = 97
5.
What is the type of latrine used by the HH? Code: Ventilated pit latrine = 1, Pit latrine with slab = 2, Composting toilet = 3, Pit latrine without slab = 4, Bucket latrine = 5, Hanging latrine = 6, No latrine (jungle/field/bushes etc.) = 7, Other (specify) = 97
6. Is the used latrine owned by the HH? Yes = 1, No = 2
7.
Where is the excreta dumped? Code: Pond = 1, Closed pit = 2, Open pit = 3, Drainage system = 4, Septic tank = 5, Do not know/ not sure = 99
8. Is the latrine usable year-round? Yes = 1, No = 2
9. Is the latrine usable during flood or any natural disaster? Yes =1, No =2
10. What is the condition of the water-shield of the latrine? (observe and write) Code: Active water-shield = 1, Broken = 2, No water-shield = 3, Alternative system of water-shield = 4, Not sure = 5, Not Applicable = 88
11. Is this latrine shared with other HHs? Yes = 1, No = 2
I. Anthropometry: Take measurements only respondent/beneficiary women
Member No (ID)
[take from B.1]
Height (cm)
Weight (KG)
1 2 3
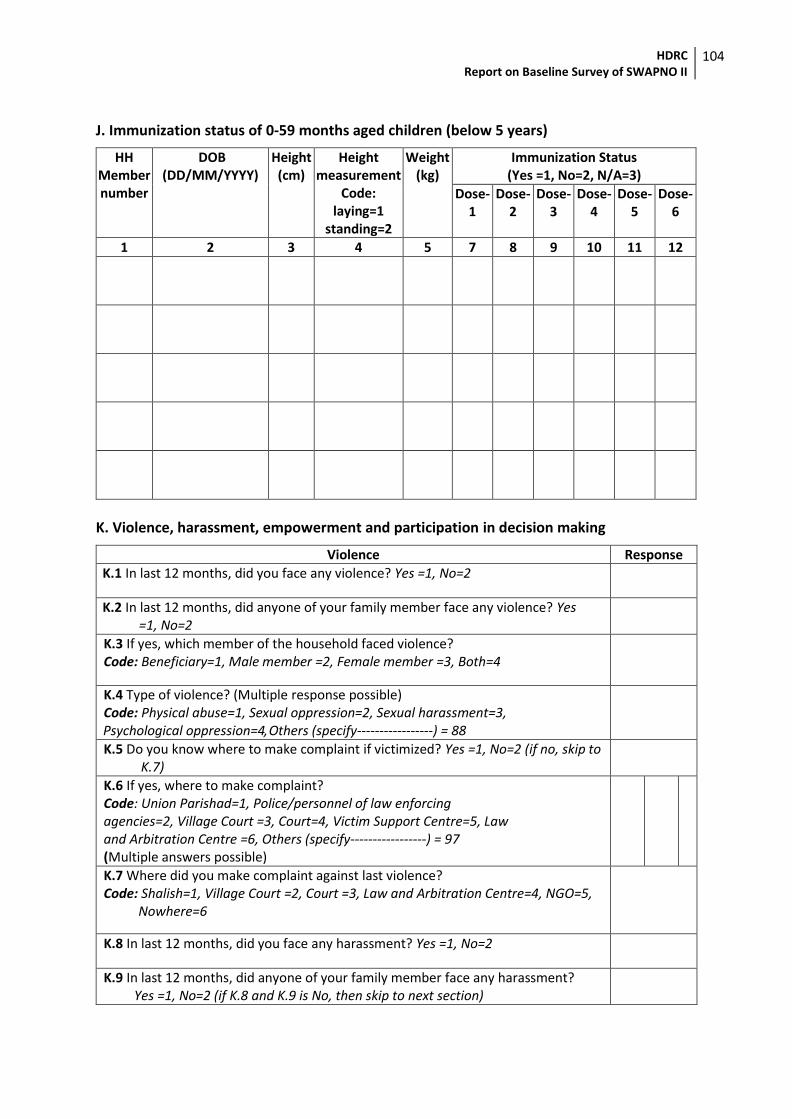
HDRC Report on Baseline Survey of SWAPNO II
104
J. Immunization status of 0-59 months aged children (below 5 years)
HH Member number
DOB (DD/MM/YYYY)
Height (cm)
Height measurement
Code: laying=1
standing=2
Weight (kg)
Immunization Status (Yes =1, No=2, N/A=3)
Dose-1
Dose-2
Dose-3
Dose-4
Dose-5
Dose-6
1 2 3 4 5 7 8 9 10 11 12
K. Violence, harassment, empowerment and participation in decision making
Violence Response
K.1 In last 12 months, did you face any violence? Yes =1, No=2
K.2 In last 12 months, did anyone of your family member face any violence? Yes =1, No=2
K.3 If yes, which member of the household faced violence? Code: Beneficiary=1, Male member =2, Female member =3, Both=4
K.4 Type of violence? (Multiple response possible) Code: Physical abuse=1, Sexual oppression=2, Sexual harassment=3,
Psychological oppression=4, Others (specify-----------------) = 88
K.5 Do you know where to make complaint if victimized? Yes =1, No=2 (if no, skip to K.7)
K.6 If yes, where to make complaint? Code: Union Parishad=1, Police/personnel of law enforcing agencies=2, Village Court =3, Court=4, Victim Support Centre=5, Law and Arbitration Centre =6, Others (specify-----------------) = 97 (Multiple answers possible)
K.7 Where did you make complaint against last violence? Code: Shalish=1, Village Court =2, Court =3, Law and Arbitration Centre=4, NGO=5,
Nowhere=6
K.8 In last 12 months, did you face any harassment? Yes =1, No=2
K.9 In last 12 months, did anyone of your family member face any harassment? Yes =1, No=2 (if K.8 and K.9 is No, then skip to next section)
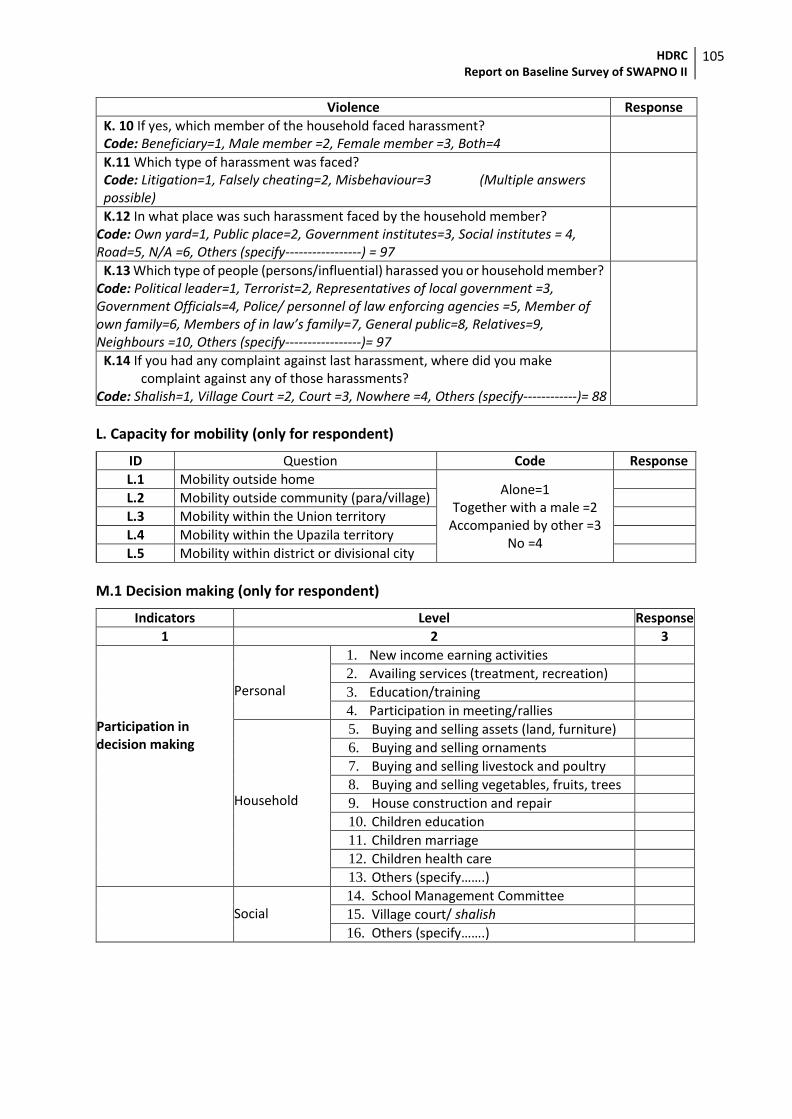
HDRC Report on Baseline Survey of SWAPNO II
105
Violence Response
K. 10 If yes, which member of the household faced harassment? Code: Beneficiary=1, Male member =2, Female member =3, Both=4
K.11 Which type of harassment was faced? Code: Litigation=1, Falsely cheating=2, Misbehaviour=3 (Multiple answers possible)
K.12 In what place was such harassment faced by the household member? Code: Own yard=1, Public place=2, Government institutes=3, Social institutes = 4, Road=5, N/A =6, Others (specify-----------------) = 97
K.13 Which type of people (persons/influential) harassed you or household member? Code: Political leader=1, Terrorist=2, Representatives of local government =3, Government Officials=4, Police/ personnel of law enforcing agencies =5, Member of own family=6, Members of in law’s family=7, General public=8, Relatives=9, Neighbours =10, Others (specify-----------------)= 97
K.14 If you had any complaint against last harassment, where did you make complaint against any of those harassments?
Code: Shalish=1, Village Court =2, Court =3, Nowhere =4, Others (specify------------)= 88
L. Capacity for mobility (only for respondent)
ID Question Code Response
L.1 Mobility outside home Alone=1
Together with a male =2 Accompanied by other =3
No =4
L.2 Mobility outside community (para/village)
L.3 Mobility within the Union territory
L.4 Mobility within the Upazila territory
L.5 Mobility within district or divisional city
M.1 Decision making (only for respondent)
Indicators Level Response
1 2 3
Participation in decision making
Personal
1. New income earning activities
2. Availing services (treatment, recreation)
3. Education/training
4. Participation in meeting/rallies
Household
5. Buying and selling assets (land, furniture)
6. Buying and selling ornaments
7. Buying and selling livestock and poultry
8. Buying and selling vegetables, fruits, trees
9. House construction and repair
10. Children education
11. Children marriage
12. Children health care
13. Others (specify…….)
Social
14. School Management Committee
15. Village court/ shalish
16. Others (specify…….)
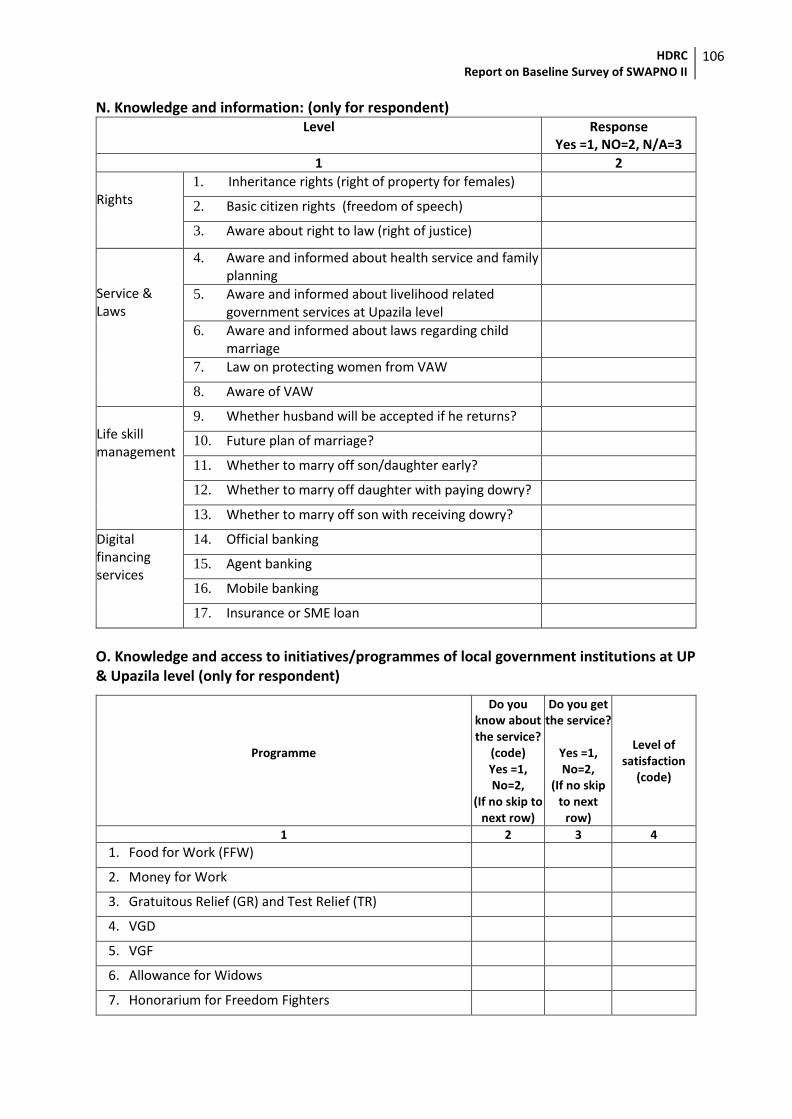
HDRC Report on Baseline Survey of SWAPNO II
106
N. Knowledge and information: (only for respondent) Level Response
Yes =1, NO=2, N/A=3
1 2
Rights
1. Inheritance rights (right of property for females)
2. Basic citizen rights (freedom of speech)
3. Aware about right to law (right of justice)
Service & Laws
4. Aware and informed about health service and family planning
5. Aware and informed about livelihood related government services at Upazila level
6. Aware and informed about laws regarding child marriage
7. Law on protecting women from VAW
8. Aware of VAW
Life skill management
9. Whether husband will be accepted if he returns?
10. Future plan of marriage?
11. Whether to marry off son/daughter early?
12. Whether to marry off daughter with paying dowry?
13. Whether to marry off son with receiving dowry?
Digital financing services
14. Official banking
15. Agent banking
16. Mobile banking
17. Insurance or SME loan
O. Knowledge and access to initiatives/programmes of local government institutions at UP & Upazila level (only for respondent)
Programme
Do you know about the service?
(code) Yes =1, No=2,
(If no skip to next row)
Do you get the service?
Yes =1, No=2,
(If no skip to next
row)
Level of satisfaction
(code)
1 2 3 4
1. Food for Work (FFW)
2. Money for Work
3. Gratuitous Relief (GR) and Test Relief (TR)
4. VGD
5. VGF
6. Allowance for Widows
7. Honorarium for Freedom Fighters
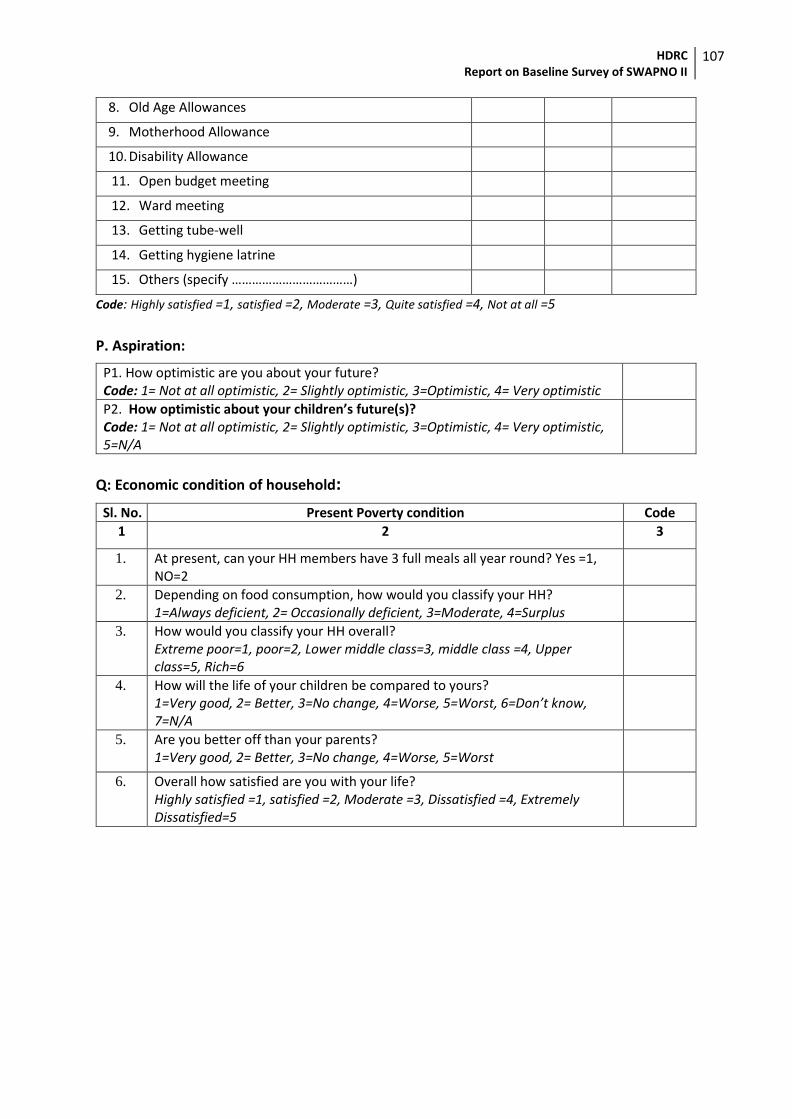
HDRC Report on Baseline Survey of SWAPNO II
107
8. Old Age Allowances
9. Motherhood Allowance
10. Disability Allowance
11. Open budget meeting
12. Ward meeting
13. Getting tube-well
14. Getting hygiene latrine
15. Others (specify ………………………………)
Code: Highly satisfied =1, satisfied =2, Moderate =3, Quite satisfied =4, Not at all =5
P. Aspiration:
P1. How optimistic are you about your future? Code: 1= Not at all optimistic, 2= Slightly optimistic, 3=Optimistic, 4= Very optimistic
P2. How optimistic about your children’s future(s)? Code: 1= Not at all optimistic, 2= Slightly optimistic, 3=Optimistic, 4= Very optimistic, 5=N/A
Q: Economic condition of household:
Sl. No. Present Poverty condition Code
1 2 3
1. At present, can your HH members have 3 full meals all year round? Yes =1, NO=2
2. Depending on food consumption, how would you classify your HH? 1=Always deficient, 2= Occasionally deficient, 3=Moderate, 4=Surplus
3. How would you classify your HH overall? Extreme poor=1, poor=2, Lower middle class=3, middle class =4, Upper class=5, Rich=6
4. How will the life of your children be compared to yours? 1=Very good, 2= Better, 3=No change, 4=Worse, 5=Worst, 6=Don’t know, 7=N/A
5. Are you better off than your parents? 1=Very good, 2= Better, 3=No change, 4=Worse, 5=Worst
6. Overall how satisfied are you with your life? Highly satisfied =1, satisfied =2, Moderate =3, Dissatisfied =4, Extremely Dissatisfied=5
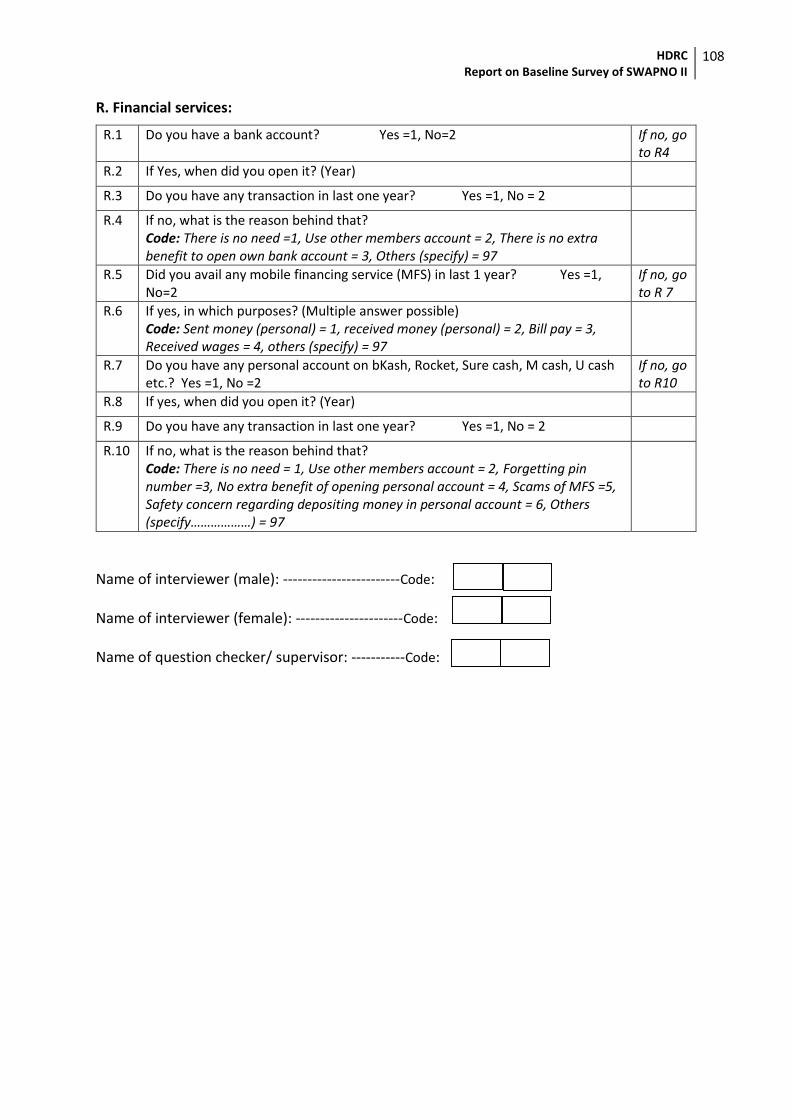
HDRC Report on Baseline Survey of SWAPNO II
108
R. Financial services:
R.1 Do you have a bank account? Yes =1, No=2 If no, go to R4
R.2 If Yes, when did you open it? (Year)
R.3 Do you have any transaction in last one year? Yes =1, No = 2
R.4 If no, what is the reason behind that? Code: There is no need =1, Use other members account = 2, There is no extra benefit to open own bank account = 3, Others (specify) = 97
R.5 Did you avail any mobile financing service (MFS) in last 1 year? Yes =1, No=2
If no, go to R 7
R.6 If yes, in which purposes? (Multiple answer possible) Code: Sent money (personal) = 1, received money (personal) = 2, Bill pay = 3, Received wages = 4, others (specify) = 97
R.7 Do you have any personal account on bKash, Rocket, Sure cash, M cash, U cash etc.? Yes =1, No =2
If no, go to R10
R.8 If yes, when did you open it? (Year)
R.9 Do you have any transaction in last one year? Yes =1, No = 2
R.10 If no, what is the reason behind that? Code: There is no need = 1, Use other members account = 2, Forgetting pin number =3, No extra benefit of opening personal account = 4, Scams of MFS =5, Safety concern regarding depositing money in personal account = 6, Others (specify………………) = 97
Name of interviewer (male): ------------------------Code: Name of interviewer (female): ----------------------Code: Name of question checker/ supervisor: -----------Code:
HDRC Report on Baseline Survey of SWAPNO II
109
Baseline Survey of SWAPNO II
Data Collection Instrument 2: Focus Group Discussion Guideline
Introduction As a development project of the United Nations Development Programme (UNDP), Strengthening Women’s Ability for Productive New Opportunities (SWAPNO project) was launched in 2015 in association with the local government division under the Government of Bangladesh. The SWAPNO project is a social transfer project for ultra-poor women to be engaged in public works essential for the economic and social life for rural communities. It promotes employment, and most importantly future employability, of extreme poor rural women. Generally, the most resourceful way to secure poverty reduction and inclusive growth is to create productive employment opportunities. Thus the project focuses on the women, particularly in the age of 18-45, who are able both physically and mentally to undertake the endeavours of the project. The project emphasizes on promoting and testing innovations, offering a replicable model that can inform social protection strategy through a parallel policy programme designed to strengthen governance and the systems of social protection programmes in Bangladesh. As a part of the programme, UNDP has assigned the Human Development Research Centre (HDRC) to carry out a baseline survey of SWAPNO II project. We have come from HDRC (Dhaka) to collect data from the field. We want to discuss some selected issues with all of you. We humbly request all of you to participate in this group discussion. The entire discussion is expected to take about 1 to 2 hours. All information provided by you will be confidential and shall not be used for any purpose other than this research study.
Study conducted for
SWAPNO Strengthening Women’s Ability for Productive New Opportunities
United Nations Development Programme (UNDP) Strengthening Women’s Ability for productive New Opportunities (SWAPNO project)
Local Government Division, MolGRD&C DPHE Bhaban (8th Floor)
14 Shahid Captain Mansur Ali Sharani, Kakrail, Dhaka 1000
Study conducted by
Road 8, House 5, Mohammadia Housing Society Mohammadpur, Dhaka - 1207, Bangladesh
Phone: (+88 02) 58150381, 8101704, Fax: (+88 02) 58157620 Email: [email protected]; [email protected]; Web: www.hdrc-bd.com
February 2020
FGD #
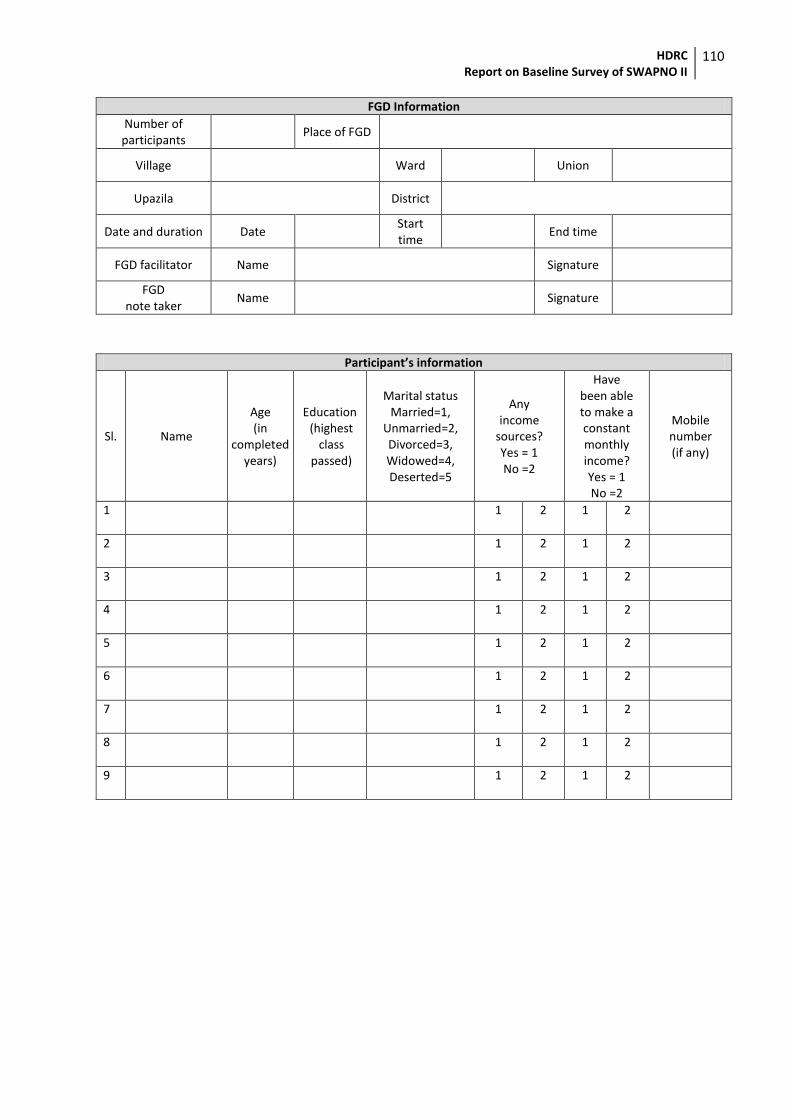
HDRC Report on Baseline Survey of SWAPNO II
110
FGD Information
Number of participants
Place of FGD
Village
Ward Union
Upazila
District
Date and duration Date
Start time
End time
FGD facilitator Name
Signature
FGD note taker
Name
Signature
Participant’s information
Sl. Name
Age (in
completed years)
Education (highest
class passed)
Marital status Married=1,
Unmarried=2, Divorced=3, Widowed=4, Deserted=5
Any income
sources? Yes = 1 No =2
Have been able to make a constant monthly income? Yes = 1 No =2
Mobile number (if any)
1
1 2 1 2
2
1 2 1 2
3
1 2 1 2
4
1 2 1 2
5
1 2 1 2
6
1 2 1 2
7
1 2 1 2
8
1 2 1 2
9
1 2 1 2
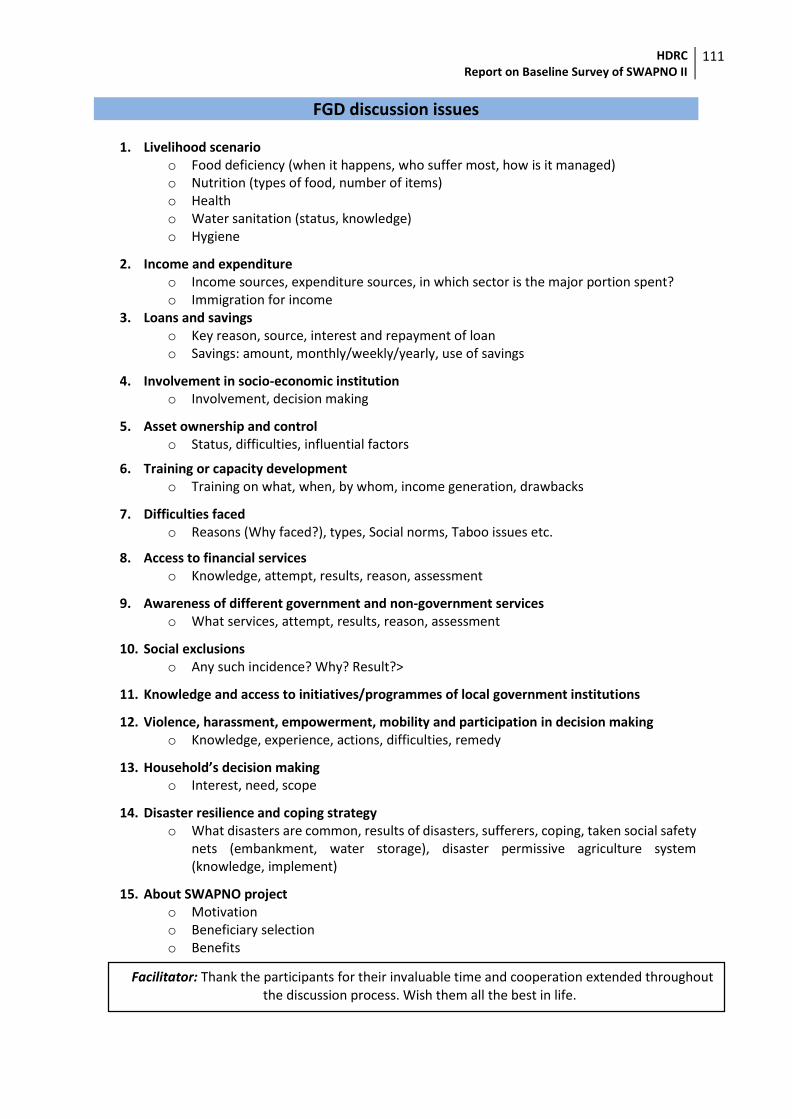
HDRC Report on Baseline Survey of SWAPNO II
111
FGD discussion issues
1. Livelihood scenario o Food deficiency (when it happens, who suffer most, how is it managed) o Nutrition (types of food, number of items) o Health o Water sanitation (status, knowledge) o Hygiene
2. Income and expenditure o Income sources, expenditure sources, in which sector is the major portion spent? o Immigration for income
3. Loans and savings o Key reason, source, interest and repayment of loan o Savings: amount, monthly/weekly/yearly, use of savings
4. Involvement in socio-economic institution o Involvement, decision making
5. Asset ownership and control o Status, difficulties, influential factors
6. Training or capacity development o Training on what, when, by whom, income generation, drawbacks
7. Difficulties faced o Reasons (Why faced?), types, Social norms, Taboo issues etc.
8. Access to financial services o Knowledge, attempt, results, reason, assessment
9. Awareness of different government and non-government services o What services, attempt, results, reason, assessment
10. Social exclusions o Any such incidence? Why? Result?>
11. Knowledge and access to initiatives/programmes of local government institutions
12. Violence, harassment, empowerment, mobility and participation in decision making o Knowledge, experience, actions, difficulties, remedy
13. Household’s decision making o Interest, need, scope
14. Disaster resilience and coping strategy o What disasters are common, results of disasters, sufferers, coping, taken social safety
nets (embankment, water storage), disaster permissive agriculture system (knowledge, implement)
15. About SWAPNO project o Motivation o Beneficiary selection o Benefits
Facilitator: Thank the participants for their invaluable time and cooperation extended throughout the discussion process. Wish them all the best in life.
HDRC Report on Baseline Survey of SWAPNO II
112
Baseline Survey of SWAPNO II
Data Collection Instrument 3: Key Informant Interview Guideline (UP Chairman, Secretary of UP, UP Male members, and UP Female members/Nominated
Person)
Introduction As a development project of the United Nations Development Programme (UNDP), Strengthening Women’s Ability for Productive New Opportunities (SWAPNO project) was launched in 2015 in association with the local government division under the Government of Bangladesh. The SWAPNO project is basically a social transfer project for ultra-poor women to be engaged in public works essential for the economic and social life for rural communities. It promotes employment, and most importantly future employability, of extreme poor rural women. Generally, the most resourceful way to secure poverty reduction and inclusive growth is to create productive employment opportunities. Thus the project focuses on the women, particularly in the age of 18-45, who are able both physically and mentally to undertake the endeavours of the project. The project emphasizes on promoting and testing innovations, offering a replicable model that can inform social protection strategy through a parallel policy programme designed to strengthen governance and the systems of social protection programmes in Bangladesh. As a part of the programme, UNDP has assigned the Human Development Research Centre (HDRC) to carry out a baseline survey of the SWAPNO II project. We have come from HDRC (Dhaka) to collect data from the field. We want to discuss some selected issues with all of you. We humbly request all of you to participate in this group discussion. The entire discussion is expected to take about 1 to 2 hours. All information provided by you will be confidential and shall not be used for any purpose other than this research study.
Study conducted for
SWAPNO Strengthening Women’s Ability for Productive New Opportunities
United Nations Development Programme (UNDP) Strengthening Women’s Ability for productive New Opportunities (SWAPNO project)
Local Government Division, MolGRD&C DPHE Bhaban (8th Floor)
14 Shahid Captain Mansur Ali Sharani, Kakrail, Dhaka 1000
Study conducted by
Road 8, House 5, Mohammadia Housing Society Mohammadpur, Dhaka - 1207, Bangladesh
Phone: (+88 02) 58150381, 8101704, Fax: (+88 02) 58157620 Email: [email protected]; [email protected]; Web: www.hdrc-bd.com
February 2020
KII #

HDRC Report on Baseline Survey of SWAPNO II
113
Background information of the interviewee
Name of the informant
Designation
Length of service (years)
Length of service within this area (years)
Address
Contact number
0 1
Email ID (if any)
Interview team information
Date
Place of interview
Start time End time
Name of interviewer Signature of
interviewer
Name of note taker Signature of
note taker
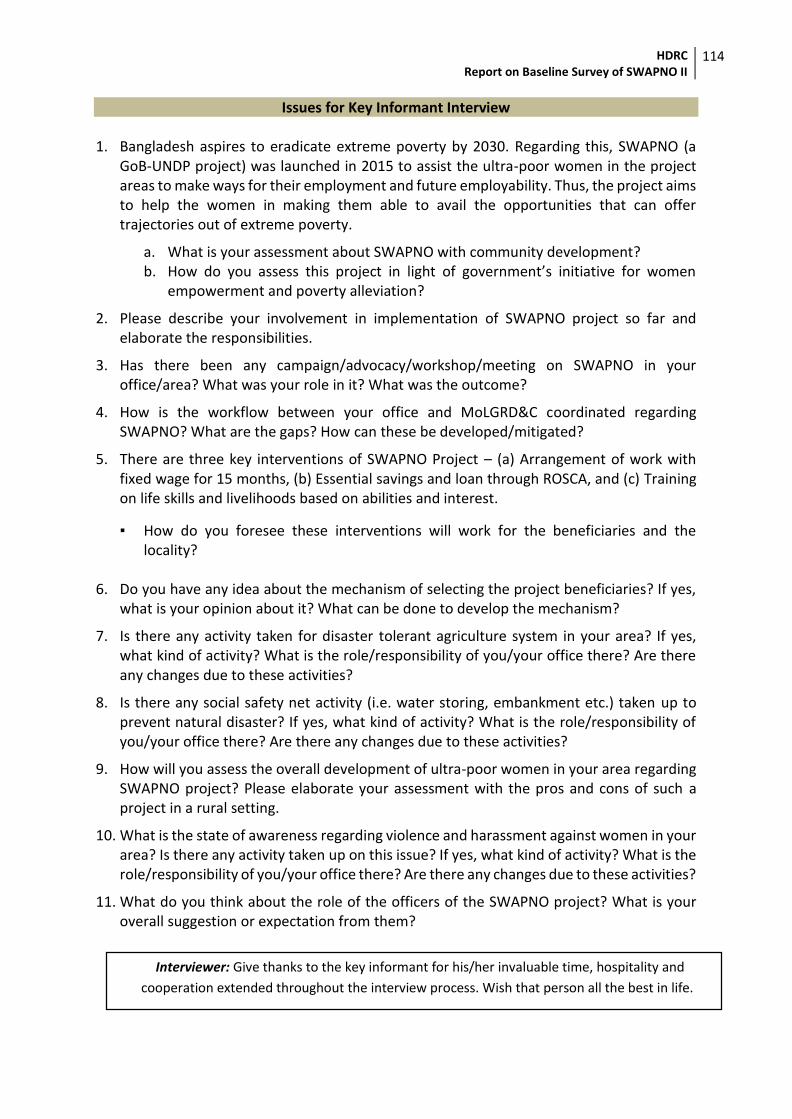
HDRC Report on Baseline Survey of SWAPNO II
114
Issues for Key Informant Interview 1. Bangladesh aspires to eradicate extreme poverty by 2030. Regarding this, SWAPNO (a
GoB-UNDP project) was launched in 2015 to assist the ultra-poor women in the project areas to make ways for their employment and future employability. Thus, the project aims to help the women in making them able to avail the opportunities that can offer trajectories out of extreme poverty.
a. What is your assessment about SWAPNO with community development? b. How do you assess this project in light of government’s initiative for women
empowerment and poverty alleviation?
2. Please describe your involvement in implementation of SWAPNO project so far and elaborate the responsibilities.
3. Has there been any campaign/advocacy/workshop/meeting on SWAPNO in your office/area? What was your role in it? What was the outcome?
4. How is the workflow between your office and MoLGRD&C coordinated regarding SWAPNO? What are the gaps? How can these be developed/mitigated?
5. There are three key interventions of SWAPNO Project – (a) Arrangement of work with fixed wage for 15 months, (b) Essential savings and loan through ROSCA, and (c) Training on life skills and livelihoods based on abilities and interest.
▪ How do you foresee these interventions will work for the beneficiaries and the locality?
6. Do you have any idea about the mechanism of selecting the project beneficiaries? If yes,
what is your opinion about it? What can be done to develop the mechanism?
7. Is there any activity taken for disaster tolerant agriculture system in your area? If yes, what kind of activity? What is the role/responsibility of you/your office there? Are there any changes due to these activities?
8. Is there any social safety net activity (i.e. water storing, embankment etc.) taken up to prevent natural disaster? If yes, what kind of activity? What is the role/responsibility of you/your office there? Are there any changes due to these activities?
9. How will you assess the overall development of ultra-poor women in your area regarding SWAPNO project? Please elaborate your assessment with the pros and cons of such a project in a rural setting.
10. What is the state of awareness regarding violence and harassment against women in your area? Is there any activity taken up on this issue? If yes, what kind of activity? What is the role/responsibility of you/your office there? Are there any changes due to these activities?
11. What do you think about the role of the officers of the SWAPNO project? What is your overall suggestion or expectation from them?
Interviewer: Give thanks to the key informant for his/her invaluable time, hospitality and
cooperation extended throughout the interview process. Wish that person all the best in life.
HDRC Report on Baseline Survey of SWAPNO II
115
Baseline Survey of SWAPNO II
Data Collection Instrument 4: Key Informant Interview Guideline (Local Govt. Official/Nominated person)
Introduction As a development project of the United Nations Development Programme (UNDP), Strengthening Women’s Ability for Productive New Opportunities (SWAPNO project) was launched in 2015 in association with the local government division under the Government of Bangladesh. The SWAPNO project is a social transfer project for ultra-poor women to be engaged in public works essential for the economic and social life for rural communities. It promotes employment, and most importantly future employability, of extreme poor rural women. Generally, the most resourceful way to secure poverty reduction and inclusive growth is to create productive employment opportunities. Thus, the project focuses on the women, particularly in the age of 18-45, who are able both physically and mentally to undertake the endeavours of the project. The project emphasizes on promoting and testing innovations, offering a replicable model that can inform social protection strategy through a parallel policy programme designed to strengthen governance and the systems of social protection programmes in Bangladesh. As a part of the programme, UNDP has assigned the Human Development Research Centre (HDRC) to carry out a baseline survey of the SWAPNO II project. We have come from HDRC (Dhaka) to collect data from the field. We want to discuss some selected issues with all of you. We humbly request all of you to participate in this group discussion. The entire discussion is expected to take about 1 to 2 hours. All information provided by you will be confidential and shall not be used for any purpose other than this research study.
Study conducted for
SWAPNO Strengthening Women’s Ability for Productive New Opportunities
United Nations Development Programme (UNDP) Strengthening Women’s Ability for productive New Opportunities (SWAPNO project)
Local Government Division, MolGRD&C DPHE Bhaban (8th Floor)
14 Shahid Captain Mansur Ali Sharani, Kakrail, Dhaka 1000
Study conducted by
Road 8, House 5, Mohammadia Housing Society Mohammadpur, Dhaka - 1207, Bangladesh
Phone: (+88 02) 58150381, 8101704, Fax: (+88 02) 58157620 Email: [email protected]; [email protected]; Web: www.hdrc-bd.com
February 2020
KII #
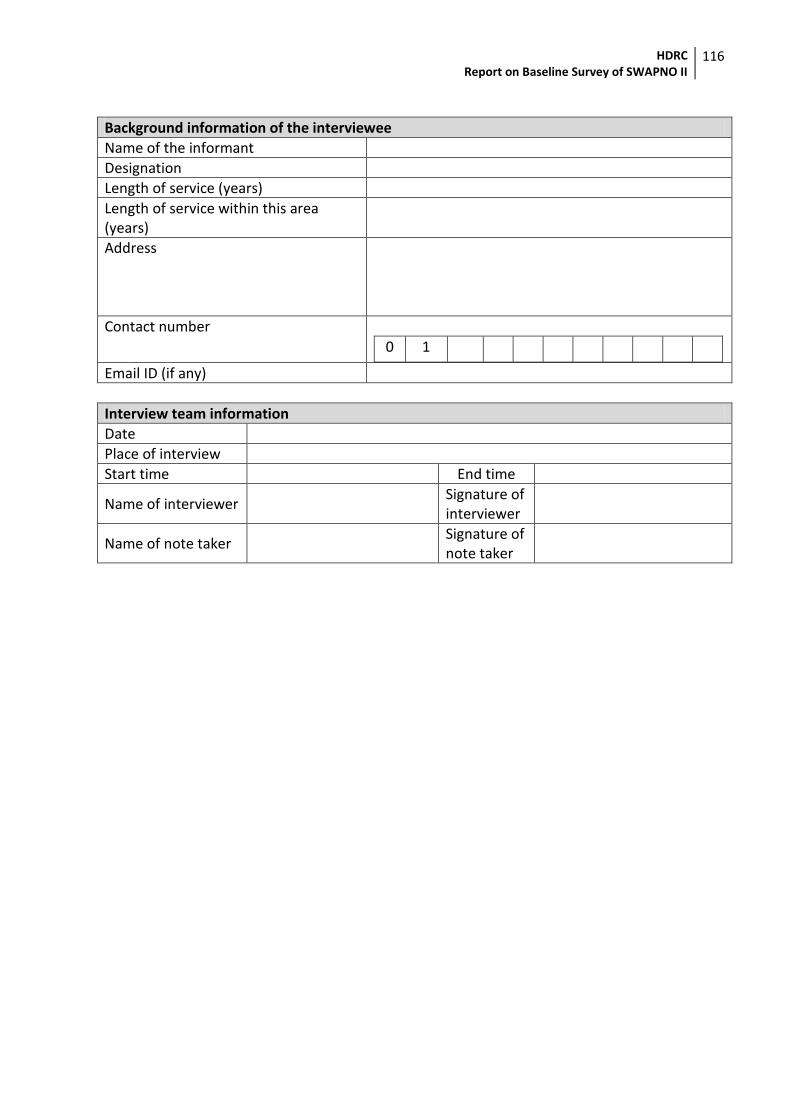
HDRC Report on Baseline Survey of SWAPNO II
116
Background information of the interviewee
Name of the informant
Designation
Length of service (years)
Length of service within this area (years)
Address
Contact number
0 1
Email ID (if any)
Interview team information
Date
Place of interview
Start time End time
Name of interviewer Signature of
interviewer
Name of note taker Signature of
note taker
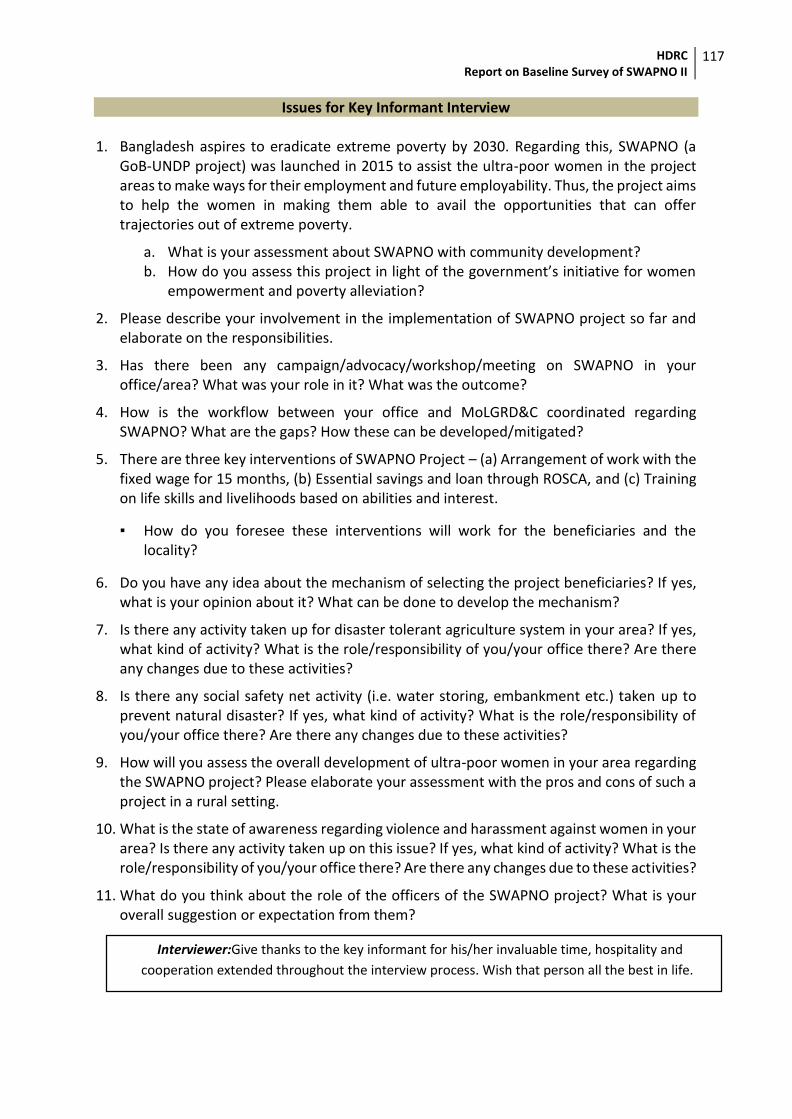
HDRC Report on Baseline Survey of SWAPNO II
117
Issues for Key Informant Interview 1. Bangladesh aspires to eradicate extreme poverty by 2030. Regarding this, SWAPNO (a
GoB-UNDP project) was launched in 2015 to assist the ultra-poor women in the project areas to make ways for their employment and future employability. Thus, the project aims to help the women in making them able to avail the opportunities that can offer trajectories out of extreme poverty.
a. What is your assessment about SWAPNO with community development? b. How do you assess this project in light of the government’s initiative for women
empowerment and poverty alleviation?
2. Please describe your involvement in the implementation of SWAPNO project so far and elaborate on the responsibilities.
3. Has there been any campaign/advocacy/workshop/meeting on SWAPNO in your office/area? What was your role in it? What was the outcome?
4. How is the workflow between your office and MoLGRD&C coordinated regarding SWAPNO? What are the gaps? How these can be developed/mitigated?
5. There are three key interventions of SWAPNO Project – (a) Arrangement of work with the fixed wage for 15 months, (b) Essential savings and loan through ROSCA, and (c) Training on life skills and livelihoods based on abilities and interest.
▪ How do you foresee these interventions will work for the beneficiaries and the locality?
6. Do you have any idea about the mechanism of selecting the project beneficiaries? If yes, what is your opinion about it? What can be done to develop the mechanism?
7. Is there any activity taken up for disaster tolerant agriculture system in your area? If yes, what kind of activity? What is the role/responsibility of you/your office there? Are there any changes due to these activities?
8. Is there any social safety net activity (i.e. water storing, embankment etc.) taken up to prevent natural disaster? If yes, what kind of activity? What is the role/responsibility of you/your office there? Are there any changes due to these activities?
9. How will you assess the overall development of ultra-poor women in your area regarding the SWAPNO project? Please elaborate your assessment with the pros and cons of such a project in a rural setting.
10. What is the state of awareness regarding violence and harassment against women in your area? Is there any activity taken up on this issue? If yes, what kind of activity? What is the role/responsibility of you/your office there? Are there any changes due to these activities?
11. What do you think about the role of the officers of the SWAPNO project? What is your overall suggestion or expectation from them?
Interviewer:Give thanks to the key informant for his/her invaluable time, hospitality and
cooperation extended throughout the interview process. Wish that person all the best in life.
HDRC Report on Baseline Survey of SWAPNO II
118
Baseline Survey of SWAPNO II
Data Collection Instrument 5: Key Informant Interview Guideline (Local Agriculture Officer/Nominated Person)
Introduction As a development project of the United Nations Development Programme (UNDP), Strengthening Women’s Ability for Productive New Opportunities (SWAPNO project) was launched in 2015 in association with the local government division under the Government of Bangladesh. The SWAPNO project is a social transfer project for ultra-poor women to be engaged in public works essential for the economic and social life for rural communities. It promotes employment, and most importantly future employability, of extreme poor rural women. Generally, the most resourceful way to secure poverty reduction and inclusive growth is to create productive employment opportunities. Thus, the project focuses on the women, particularly in the age of 18-45, who are able both physically and mentally to undertake the endeavours of the project. The project emphasizes on promoting and testing innovations, offering a replicable model that can inform social protection strategy through a parallel policy programme designed to strengthen governance and the systems of social protection programmes in Bangladesh. As a part of the programme, UNDP has assigned the Human Development Research Centre (HDRC) to carry out a baseline survey of the SWAPNO II project. We have come from HDRC (Dhaka) to collect data from the field. We want to discuss some selected issues with all of you. We humbly request all of you to participate in this group discussion. The entire discussion is expected to take about 1 to 2 hours. All information provided by you will be confidential and shall not be used for any purpose other than this research study.
Study conducted for
SWAPNO Strengthening Women’s Ability for Productive New Opportunities
United Nations Development Programme (UNDP) Strengthening Women’s Ability for productive New Opportunities (SWAPNO project)
Local Government Division, MolGRD&C DPHE Bhaban (8th Floor)
14 Shahid Captain Mansur Ali Sharani, Kakrail, Dhaka 1000
Study conducted by
Road 8, House 5, Mohammadia Housing Society Mohammadpur, Dhaka - 1207, Bangladesh
Phone: (+88 02) 58150381, 8101704, Fax: (+88 02) 58157620 Email: [email protected]; [email protected]; Web: www.hdrc-bd.com
February 2020
KII #

HDRC Report on Baseline Survey of SWAPNO II
119
Background information of the interviewee
Name of the informant
Designation
Length of service (years)
Length of service within this area (years)
Address
Contact number
0 1
Email ID (if any)
Interview team information
Date
Place of interview
Start time End time
Name of interviewer Signature of
interviewer
Name of note taker Signature of
note taker
HDRC Report on Baseline Survey of SWAPNO II
120
Issues for Key Informant Interview 1. What types of activity have been done in your area and how?
Agriculture and grain development, forest development, fisheries development and livestock development?
2. What types of works were performed by your office for the farmers and how? 3. What types of crops/vegetable/fish have been cultivated? 4. How is the crop damaged in flood, drought or other natural disasters? 5. Is there any activity taken up for disaster tolerant agriculture system in your area? If yes,
what kind of activity? What is the role/responsibility of you/your office there? Are there any changes due to these activities?
6. Is there any social safety net activity (i.e. water storing, embankment, etc.) taken up to
prevent natural disaster? If yes, what kind of activity? What is the role/responsibility of you/your office there? Are there any changes due to these activities?


