Embed Size (px)
Citation preview

126
REPORT ON EFFICIENCY AND PRODUCTIVITY IN FISH CAPTURE OPERATIONS
by
Bjarti Thomsen, Andrew Revill, Dominic Rihan, Ole Eigaard
127
3 Report on Efficiency and productivity in fish capture operations 126
3.1 SUMMARY OF THE WORK ............................................................................................128
3.1.1 Terms of reference 1: Identification of advances and practices which increase efficiency .................................................................................................................................130 3.1.2 Terms of reference 2 and 3: Quantification of technological advances and review of work undertaken in this field ......................................................................................................131
3.1.2.1 Existing Studies on Production Efficiency and Production Frontiers .................131 3.1.2.2 Studies using reference points.............................................................................131
3.2 INTRODUCTION: TECHNOLOGICAL ADVANCEMENT.........................................152
3.2.1 The Drivers of Technological Advancement ...........................................................152 3.2.2 Fisheries Management Schemes and the Associated Incentives for Fishers to Increase Efficiency and Productivity ........................................................................................................153 3.2.3 What Data is Required to Assess the Production Efficiency and Productivity ........154
3.3 Case Studies ..........................................................................................................................155
3.3.1 Case Study 1: Efficiency change in Faroese pair-trawler fleet ................................155 3.3.1.1 The Faroese management regime........................................................................155 3.3.1.2 Questionnaire survey...........................................................................................156 3.3.1.3 Pair trawler data ..................................................................................................156 3.3.1.4 Conversion to pair-trawl .....................................................................................157 3.3.1.5 Catch, CPUE and stock .......................................................................................157 3.3.1.6 Tow duration and trawling hours per day ...........................................................158 3.3.1.7 Change in trawl gear and trawl speed .................................................................159 3.3.1.8 Symmetry sensors ...............................................................................................159 3.3.1.9 New vessels.........................................................................................................160 3.3.1.10 Conclusions ....................................................................................................161 3.3.1.11 References ......................................................................................................161
3.3.2 Appendix 2.b. Innovation questionnaire ..................................................................161 3.3.3 Case Study 2: A Comparison of Twin-Rig Trawling and Single Rig Trawling in terms of Relative Fishing Efficiency. Dominic Rihan, BIM, Dublin, Ireland. ...........................166
3.3.3.1 Background .........................................................................................................166 3.3.3.2 Fleet Métiers .......................................................................................................166 3.3.3.3 Case Study ..........................................................................................................167 3.3.3.4 Discussion of Results ..........................................................................................170 3.3.3.5 Conclusions.........................................................................................................175
3.3.4 Case Study 3: Efficiency change in the Faroese long line fishery. Ole Eigaard, DIFRES, Denmark......................................................................................................................176
3.3.4.1 Temporal trends in fishing effort ........................................................................176 3.3.4.2 Methods...............................................................................................................177 3.3.4.3 Results.................................................................................................................178 3.3.4.4 Discussion ...........................................................................................................179 3.3.4.5 Methods...............................................................................................................181 3.3.4.6 Discussion ...........................................................................................................183 3.3.4.7 Future work .........................................................................................................183 3.3.4.8 Conclusions.........................................................................................................184 3.3.4.9 References...........................................................................................................184
3.4 Bibliography .........................................................................................................................185
128
Terms of reference
‘Efficiency increases in the fish capture process is a continual and incremental process generally stimulated by an economic drive to increase the profitability of fishing operations’
It was proposed at the 2003 ICES-FAO FTFB working group meeting in Bergen, Norway that the following work be undertaken for presentation and discussion at the 2004 meeting of the FTFB working group.
1. Identification of advances and practices, which increase fishing efficiency
2. Quantify such advances wherever possible
3. Review work undertaken in this field
Justification
Increases in the technical efficiency of fish capture processes are not currently accounted for in estimates of fishing effort. Such efficiency increases may therefore undermine management protocols, which utilise estimates of fishing effort as a management tool.
3.1 SUMMARY OF THE WORK
The role of ICES as an advisor to its clients on the utilisation of fish stocks is about to change from short term predictions of stock status and recommended F levels to longer term management and strategic planning. There is likely to be an increased emphasis on effort control and advice will be on target F in the future.
One aspect of these new procedures will be to estimate technological efficiency increases in order to optimise and maintain F.
The terms of reference are addressed in the body of this report and include a summary table and breakdown of studies previously undertaken in this field.
Appendix 1: This work gives an overview of the concept of production efficiency in fishing operations and lists the major causes of variations in efficiency and productivity. Technological innovations are identified as responsible for many of these changes, although not all such technologies have such an effect. The drivers for technological innovation are described. The effect of differing fisheries management regimes and incentives to improve efficiency / productivity are described.
Appendices 2, 3 and 4: Case studies undertaken on fleet sectors from the Faroe Islands and Ireland.
The work done by the authors of the report was presented and discussed in a topic group at the FTFB meeting in Gdynia, Poland on 20 April 2004. Following the discussion the report was rearranged and minor alterations made. The topic group participants were: Bjarti Thomsen, Faroe Islands Andrew Revill, UK Dominic Rihan, Ireland Ole R. Eigaard, Denmark
Formatted: Bullets andNumbering

129
Barry O’Neill, Scotland Stan Kotwicki, USA Ken Weinberg, USA Alessandro Luccnetti, Italy Mats Ulmestrand, Sweden Arill Engås, Norway Hallvard Godøy, Norway Gérard Bavouzet, France
130
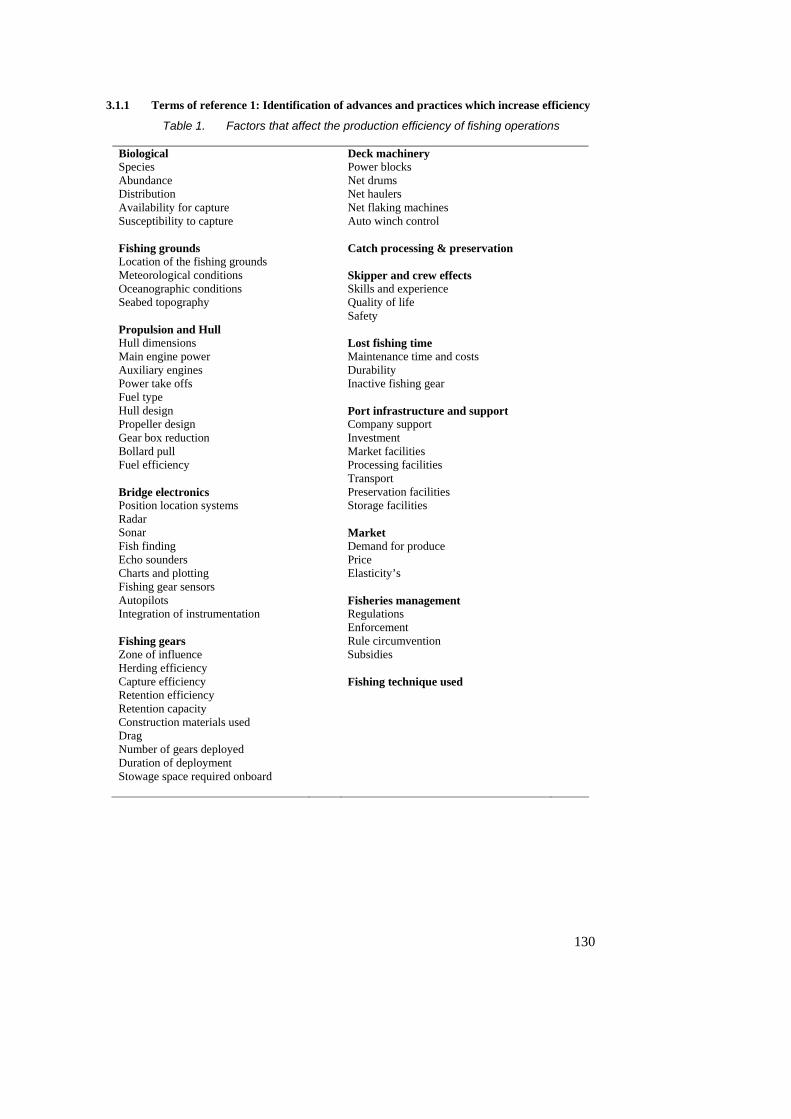
3.1.1 Terms of reference 1: Identification of advances and practices which increase efficiency
Table 1. Factors that affect the production efficiency of fishing operations
Biological Deck machinery Species Power blocks Abundance Net drums Distribution Net haulers Availability for capture Net flaking machines Susceptibility to capture Auto winch control Fishing grounds Catch processing & preservation Location of the fishing grounds Meteorological conditions Skipper and crew effects Oceanographic conditions Skills and experience Seabed topography Quality of life Safety Propulsion and Hull Hull dimensions Lost fishing time Main engine power Maintenance time and costs Auxiliary engines Durability Power take offs Inactive fishing gear Fuel type Hull design Port infrastructure and support Propeller design Company support Gear box reduction Investment Bollard pull Market facilities Fuel efficiency Processing facilities Transport Bridge electronics Preservation facilities Position location systems Storage facilities Radar Sonar Market Fish finding Demand for produce Echo sounders Price Charts and plotting Elasticity’s Fishing gear sensors Autopilots Fisheries management Integration of instrumentation Regulations Enforcement Fishing gears Rule circumvention Zone of influence Subsidies Herding efficiency Capture efficiency Fishing technique used Retention efficiency Retention capacity Construction materials used Drag Number of gears deployed Duration of deployment Stowage space required onboard

131
3.1.2 Terms of reference 2 and 3: Quantification of technological advances and review of work undertaken in this field
3.1.2.1 Existing Studies on Production Efficiency and Production Frontiers
Numerous quantitative and qualitative studies have been undertaken, many of which are described in Table 2. Examples of the main methods used in these studies are:
I. Maximum production frontier studies and the relative position of vessels to frontiers
II. Analyses of variance in fishing operations
III. Cost-benefit analyses of fishing operations
IV. Catch per unit effort (CPUE) / Fishing mortality (F) relative to reference vessels
V. Catch per unit effort (CPUE) / Fishing mortality (F) relative to stock indices
VI. Fishing mortality (F) relative to fishing effort
3.1.2.2 Studies using reference points
Various studies use reference points (see below) as a baseline to contrast changes in efficiency and productivity, i.e.
I. Indices of stock / abundance
II. Reference vessels (vessels that have changed little over time)
III. The most efficient vessels in the fleet
Formatted: Bullets andNumbering
Formatted: Bullets andNumbering
132
Temporal trends in efficiency
60
70
80
90
100
110
120
130
140
1983 1987 1991 1995 1999
Year
trend
rela
tive
to 1
988 Baltic-Cod_traw l-A
Baltic-Cod-traw l-B
French traw lers,mediterranian
Dutch Beamers
Scotland_pelagic_Traw lers
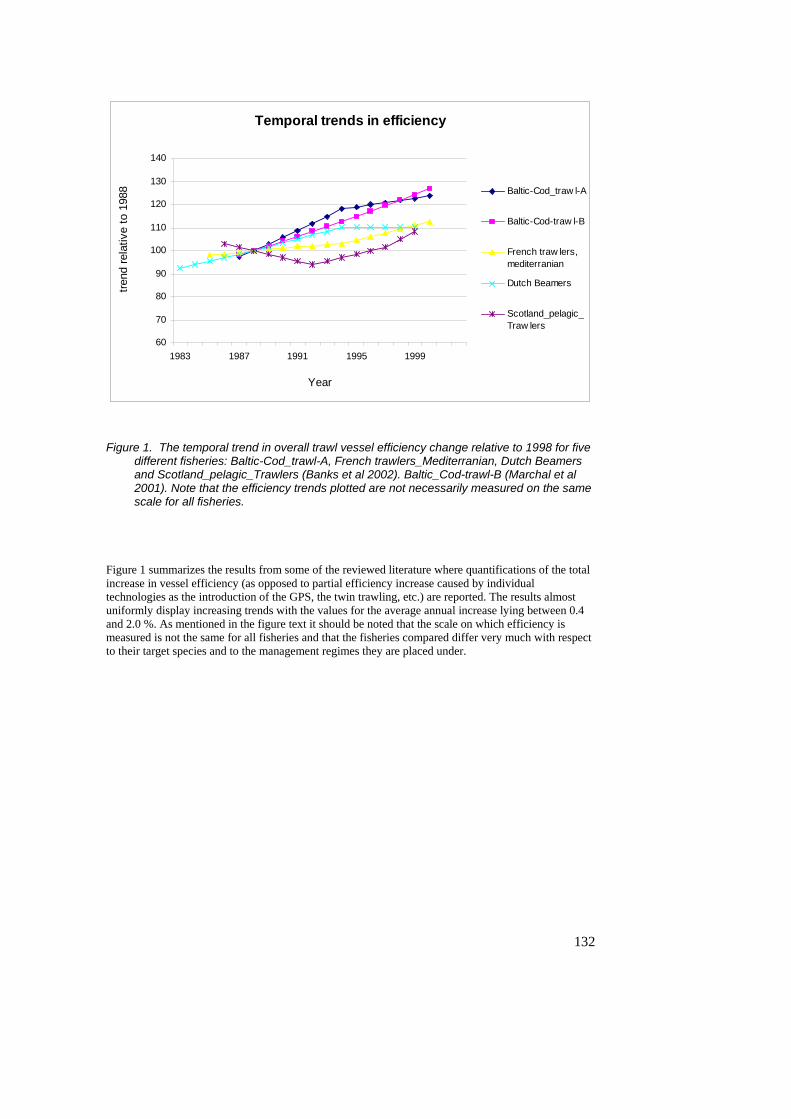
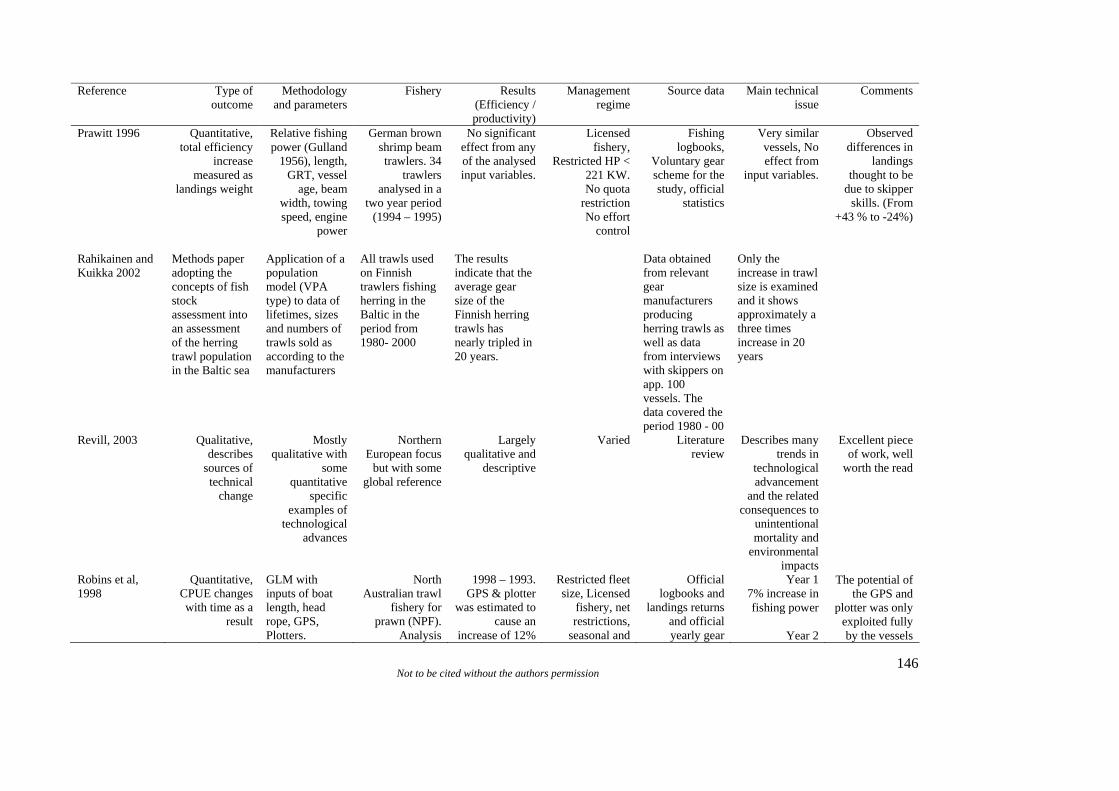
Figure 1. The temporal trend in overall trawl vessel efficiency change relative to 1998 for five different fisheries: Baltic-Cod_trawl-A, French trawlers_Mediterranian, Dutch Beamers and Scotland_pelagic_Trawlers (Banks et al 2002). Baltic_Cod-trawl-B (Marchal et al 2001). Note that the efficiency trends plotted are not necessarily measured on the same scale for all fisheries.
Figure 1 summarizes the results from some of the reviewed literature where quantifications of the total increase in vessel efficiency (as opposed to partial efficiency increase caused by individual technologies as the introduction of the GPS, the twin trawling, etc.) are reported. The results almost uniformly display increasing trends with the values for the average annual increase lying between 0.4 and 2.0 %. As mentioned in the figure text it should be noted that the scale on which efficiency is measured is not the same for all fisheries and that the fisheries compared differ very much with respect to their target species and to the management regimes they are placed under.
Not to be cited without the authors permission 133
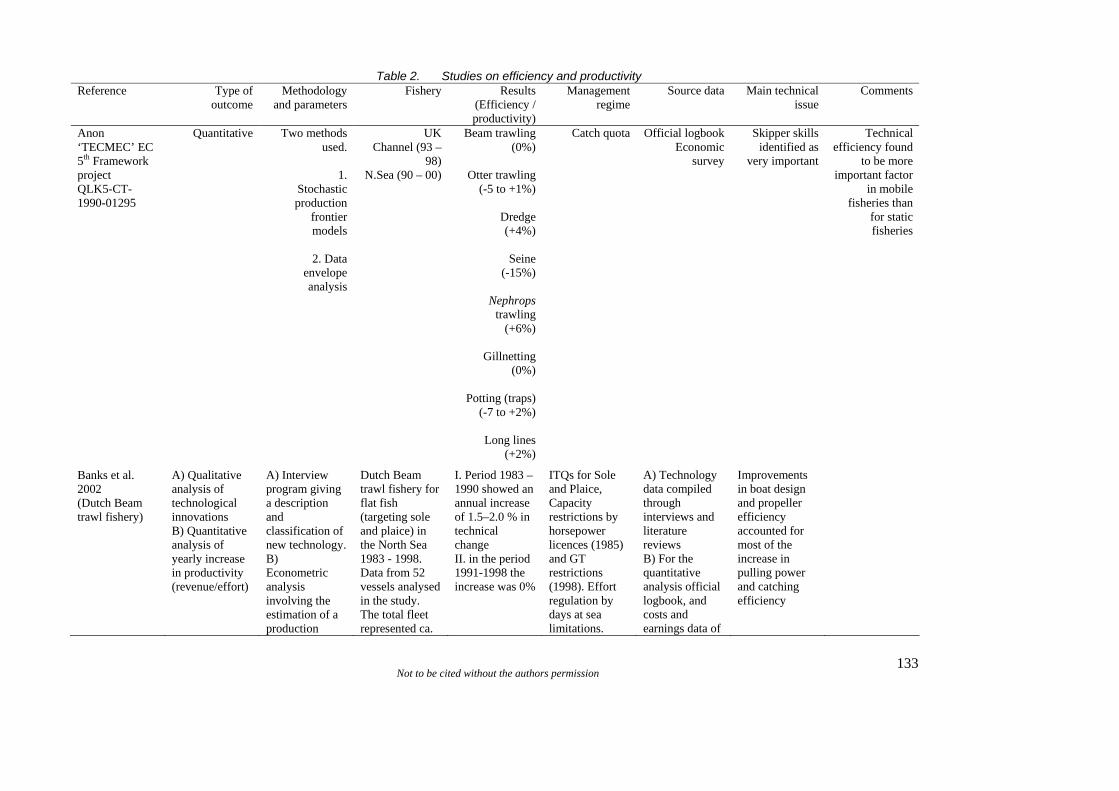
Table 2. Studies on efficiency and productivity Reference
Type of outcome
Methodology and parameters
Fishery
Results (Efficiency / productivity)
Management regime
Source data
Main technical issue
Comments
Anon ‘TECMEC’ EC 5th Framework project QLK5-CT-1990-01295
Quantitative Two methods used.
1.
Stochastic production
frontier models
2. Data
envelope analysis
UK Channel (93 –
98) N.Sea (90 – 00)
Beam trawling (0%)
Otter trawling
(-5 to +1%)
Dredge (+4%)
Seine
(-15%)
Nephrops trawling
(+6%)
Gillnetting (0%)
Potting (traps)
(-7 to +2%)
Long lines (+2%)
Catch quota Official logbook Economic
survey
Skipper skills identified as
very important
Technical efficiency found
to be more important factor
in mobile fisheries than
for static fisheries
Banks et al. 2002 (Dutch Beam trawl fishery)
A) Qualitative analysis of technological innovations B) Quantitative analysis of yearly increase in productivity (revenue/effort)
A) Interview program giving a description and classification of new technology. B) Econometric analysis involving the estimation of a production
Dutch Beam trawl fishery for flat fish (targeting sole and plaice) in the North Sea 1983 - 1998. Data from 52 vessels analysed in the study. The total fleet represented ca.
I. Period 1983 – 1990 showed an annual increase of 1.5–2.0 % in technical change II. in the period 1991-1998 the increase was 0%
ITQs for Sole and Plaice, Capacity restrictions by horsepower licences (1985) and GT restrictions (1998). Effort regulation by days at sea limitations.
A) Technology data compiled through interviews and literature reviews B) For the quantitative analysis official logbook, and costs and earnings data of
Improvements in boat design and propeller efficiency accounted for most of the increase in pulling power and catching efficiency

Not to be cited without the authors permission 134
function. 200 vessels in 1998.
the vessels were used
Not to be cited without the authors permission 135
Reference
Type of outcome
Methodology and parameters
Fishery
Results (Efficiency / productivity)
Management regime
Source data
Main technical issue
Comments
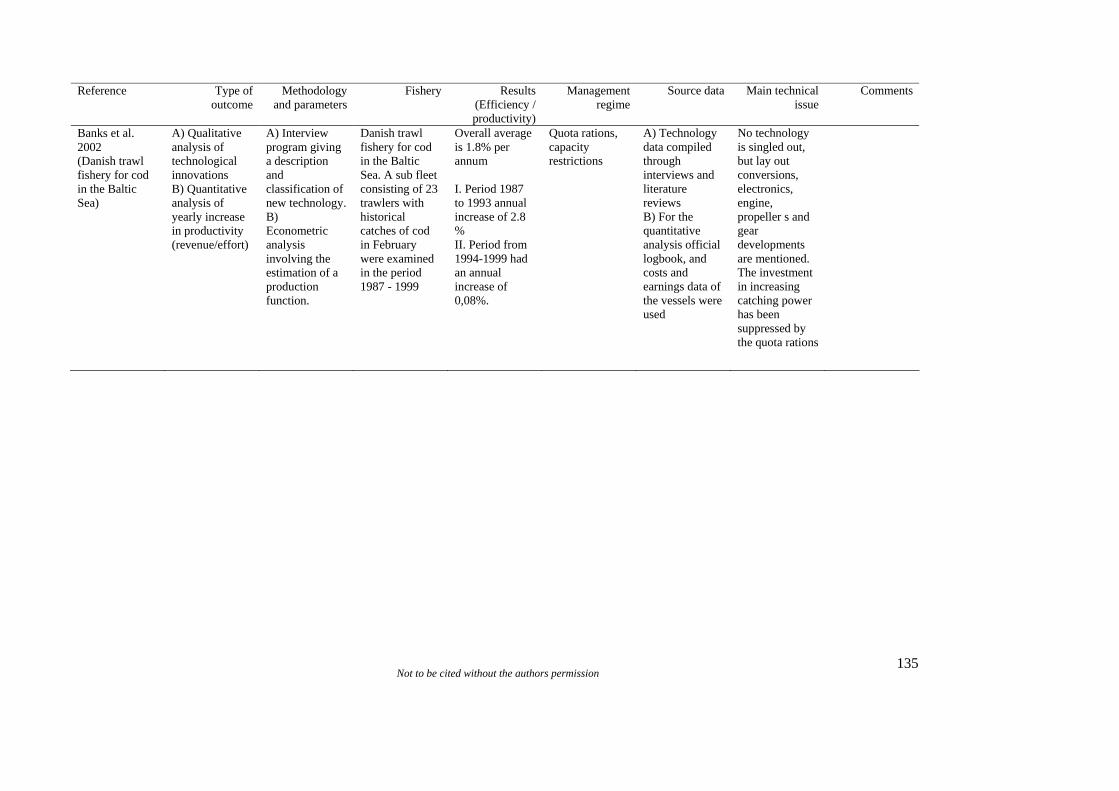
Banks et al. 2002 (Danish trawl fishery for cod in the Baltic Sea)
A) Qualitative analysis of technological innovations B) Quantitative analysis of yearly increase in productivity (revenue/effort)
A) Interview program giving a description and classification of new technology. B) Econometric analysis involving the estimation of a production function.
Danish trawl fishery for cod in the Baltic Sea. A sub fleet consisting of 23 trawlers with historical catches of cod in February were examined in the period 1987 - 1999
Overall average is 1.8% per annum I. Period 1987 to 1993 annual increase of 2.8 % II. Period from 1994-1999 had an annual increase of 0,08%.
Quota rations, capacity restrictions
A) Technology data compiled through interviews and literature reviews B) For the quantitative analysis official logbook, and costs and earnings data of the vessels were used
No technology is singled out, but lay out conversions, electronics, engine, propeller s and gear developments are mentioned. The investment in increasing catching power has been suppressed by the quota rations
Not to be cited without the authors permission 136
Reference
Type of outcome
Methodology and parameters
Fishery
Results (Efficiency / productivity)
Management regime
Source data
Main technical issue
Comments
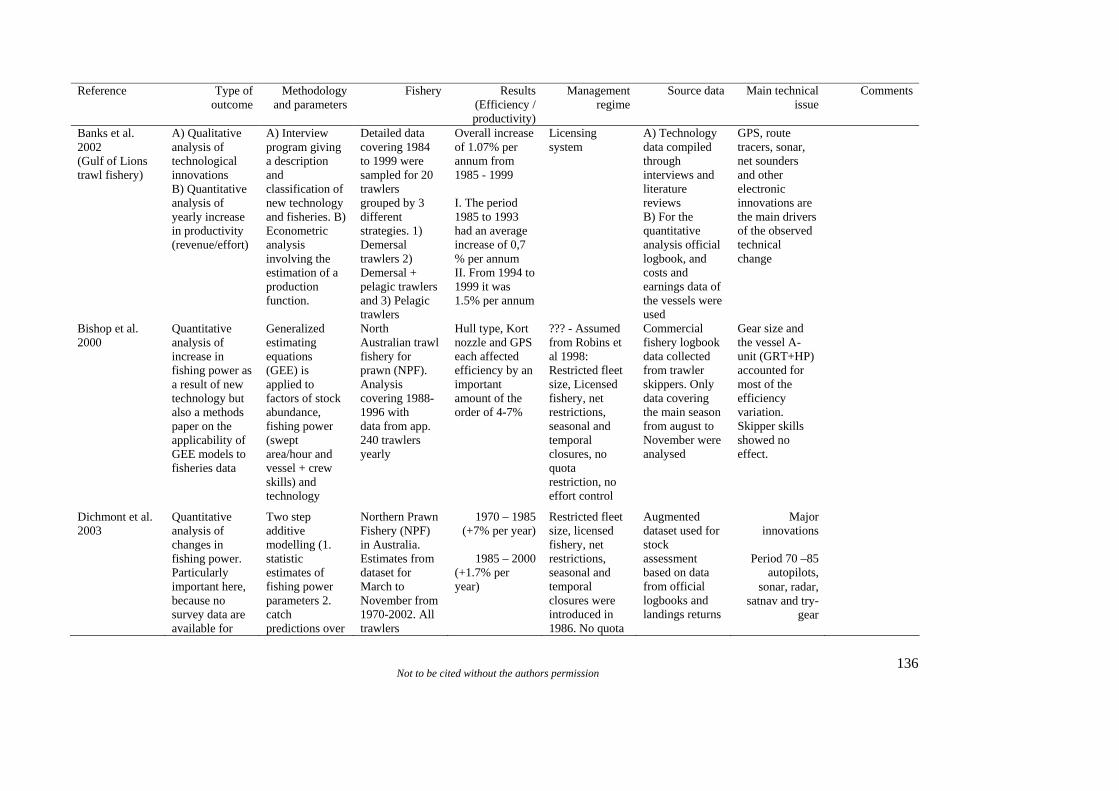
Banks et al. 2002 (Gulf of Lions trawl fishery)
A) Qualitative analysis of technological innovations B) Quantitative analysis of yearly increase in productivity (revenue/effort)
A) Interview program giving a description and classification of new technology and fisheries. B) Econometric analysis involving the estimation of a production function.
Detailed data covering 1984 to 1999 were sampled for 20 trawlers grouped by 3 different strategies. 1) Demersal trawlers 2) Demersal + pelagic trawlers and 3) Pelagic trawlers
Overall increase of 1.07% per annum from 1985 - 1999 I. The period 1985 to 1993 had an average increase of 0,7 % per annum II. From 1994 to 1999 it was 1.5% per annum
Licensing system
A) Technology data compiled through interviews and literature reviews B) For the quantitative analysis official logbook, and costs and earnings data of the vessels were used
GPS, route tracers, sonar, net sounders and other electronic innovations are the main drivers of the observed technical change
Bishop et al. 2000
Quantitative analysis of increase in fishing power as a result of new technology but also a methods paper on the applicability of GEE models to fisheries data
Generalized estimating equations (GEE) is applied to factors of stock abundance, fishing power (swept area/hour and vessel + crew skills) and technology
North Australian trawl fishery for prawn (NPF). Analysis covering 1988-1996 with data from app. 240 trawlers yearly
Hull type, Kort nozzle and GPS each affected efficiency by an important amount of the order of 4-7%
??? - Assumed from Robins et al 1998: Restricted fleet size, Licensed fishery, net restrictions, seasonal and temporal closures, no quota restriction, no effort control
Commercial fishery logbook data collected from trawler skippers. Only data covering the main season from august to November were analysed
Gear size and the vessel A-unit (GRT+HP) accounted for most of the efficiency variation. Skipper skills showed no effect.
Dichmont et al. 2003
Quantitative analysis of changes in fishing power. Particularly important here, because no survey data are available for
Two step additive modelling (1. statistic estimates of fishing power parameters 2. catch predictions over
Northern Prawn Fishery (NPF) in Australia. Estimates from dataset for March to November from 1970-2002. All trawlers
1970 – 1985 (+7% per year)
1985 – 2000
(+1.7% per year)
Restricted fleet size, licensed fishery, net restrictions, seasonal and temporal closures were introduced in 1986. No quota
Augmented dataset used for stock assessment based on data from official logbooks and landings returns
Major innovations
Period 70 –85
autopilots, sonar, radar,
satnav and try-gear

Not to be cited without the authors permission 137
stock estimation – only commercial catch and effort data
time by application of parameters to a standard abundance and effort situation before comparing to a standard vessel.
targeting tiger, banana and endeavour prawns.
restriction, no effort control
Period 85 – 00 GPS, plotters and TED’s*
(*Which reduced efficiency
Not to be cited without the authors permission 138
Reference
Type of outcome
Methodology and parameters
Fishery
Results (Efficiency / productivity)
Management regime
Source data
Main technical issue
Comments
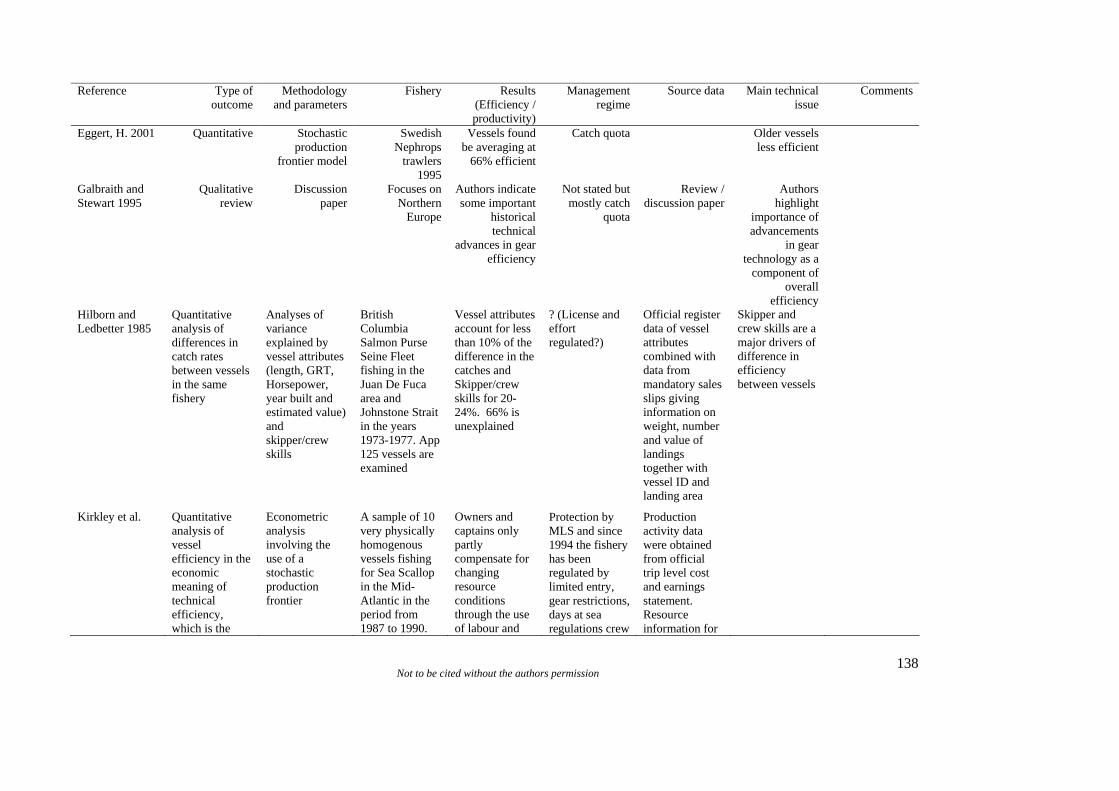
Eggert, H. 2001 Quantitative Stochastic production
frontier model
Swedish Nephrops
trawlers 1995
Vessels found be averaging at
66% efficient
Catch quota Older vessels less efficient
Galbraith and Stewart 1995
Qualitative review
Discussion paper
Focuses on Northern
Europe
Authors indicate some important
historical technical
advances in gear efficiency
Not stated but mostly catch
quota
Review / discussion paper
Authors highlight
importance of advancements
in gear technology as a
component of overall
efficiency
Hilborn and Ledbetter 1985
Quantitative analysis of differences in catch rates between vessels in the same fishery
Analyses of variance explained by vessel attributes (length, GRT, Horsepower, year built and estimated value) and skipper/crew skills
British Columbia Salmon Purse Seine Fleet fishing in the Juan De Fuca area and Johnstone Strait in the years 1973-1977. App 125 vessels are examined
Vessel attributes account for less than 10% of the difference in the catches and Skipper/crew skills for 20-24%. 66% is unexplained
? (License and effort regulated?)
Official register data of vessel attributes combined with data from mandatory sales slips giving information on weight, number and value of landings together with vessel ID and landing area
Skipper and crew skills are a major drivers of difference in efficiency between vessels
Kirkley et al. Quantitative analysis of vessel efficiency in the economic meaning of technical efficiency, which is the
Econometric analysis involving the use of a stochastic production frontier
A sample of 10 very physically homogenous vessels fishing for Sea Scallop in the Mid-Atlantic in the period from 1987 to 1990.
Owners and captains only partly compensate for changing resource conditions through the use of labour and
Protection by MLS and since 1994 the fishery has been regulated by limited entry, gear restrictions, days at sea regulations crew
Production activity data were obtained from official trip level cost and earnings statement. Resource information for

Not to be cited without the authors permission 139
vessels ability to produce maximum output with a given set of inputs and technology
The vessels are not very representative of the entire fleet
fishing effort size limits and vessel tracking system requirements
the period was obtained from a resource-monitoring program.
Not to be cited without the authors permission 140
Reference
Type of outcome
Methodology and parameters
Fishery
Results (Efficiency / productivity)
Management regime
Source data
Main technical issue
Comments
Kirkley et al, 2004
Quantitative analysis
Stochastic production
frontier model
Standard econometric (PC – TSP)
Sete trawl fishery
Mediterranean France
(1985 – 1999)
+ 1% per year (Technical efficiency)
Effort Detailed data from 19 vessels
Official LPUE
data
Mahevas 2003 Quantitative, total efficiency
increase measured as
change in catch per unit effort
GLM + index of abundance from
CPUE of reference vessel only having by-
catches of species in
question
25 French bottom trawlers (Bay of Biscay)
targeting anglerfish (1983
– 1998)
I. 1983 – 1991a reduction in
overall efficiency
– 0.5% II. 1992 – 1997
rise to -0.2% relative to first
year
Not specified Official logbook data on catch
and effort. Interviews on
gear and vessel development
Partial contribution,
Engine power: 58%
Twin trawl: 30% Head line: 28%
Skipper: 2%
Weak assumptions and
not very causal construction of
model or interpretation of
results
Marchal et al. 2001
Quantitative analysis of temporal development in overall fishing power of two fleets
An index of fishing power for a fleet (IVFP) is derived based on the ratio of CPUE between the fleet and a group of standard vessels with constant fishing power. Makes use of General Linear Models (GLM)
Two vessel groups fishing cod in the Baltic sea are analysed for the period 1987 -1998. I. Trawlers using 105-120 mm mesh size and II. Gill netters using 105-159 mm meshes
The results show a yearly increase in Fishing Power from 1987 to 1998 of 2% for the trawlers and of 6% for the gill-netters.
Not described (quota rations and various technical measures?)
Commercial catch and effort data from official registers and The Danish Institute for Fisheries databases as well as international survey data from ICES covering the examined period
At vessel level the increase is assumed caused by skipper effects and better technology use. On a fleet level either decommissioning of less efficient vessels or recruitment of modern vessels can explain the increase
Not to be cited without the authors permission 141
Reference
Type of outcome
Methodology and parameters
Fishery
Results (Efficiency / productivity)
Management regime
Source data
Main technical issue
Comments
Marchal et al 1999
Quantitative. Comparison of three methods
1. IVC. Changes in catchability
and fishing effort
2. IVFP.
Changes in CPUE
compared to standard vessels
3. IVTE
Stochastic production
frontier model of economics
related to fishing activity
Dutch North Sea beam trawl fishery (1995 –
1997). Up to 30% of fleet
examined
Different methods gave
different results.
Method 1 and 2 indicated a slow
decline in efficiency.
Method 3
indicated an increase in efficiency
I.T. catch quota Official logbook database on
catch and effort (DAFIST). LEI
cost and earnings
database.
Introduction of mesh size
regulations reduced
efficiency by -19%. Plaice box
increased efficiency of
small beam trawlers
(<221kW) by +14%.
Not to be cited without the authors permission 142
Reference
Type of outcome
Methodology and parameters
Fishery
Results (Efficiency / productivity)
Management regime
Source data
Main technical issue
Comments
Marchal et al, 2002
Quantitative analysis
Three different methods used
IFP1. Fishing mortality compared to fishing effort IFP2. CPUE of vessels compared to reference vessels IFP3. CPUE compared to abundance data from fish surveys
Northern Europe
Demersal fisheries
Norway
(1980 –1998)
UK (1989 – 1998)
Denmark
(1987 – 1998)
Netherlands (1991 – 1998)
Danish flatfish fleets
(+ 12-27%)
Dutch beam trawlers
(<300HP) (+ 22%)
Norway long
liners, gill netters, small
saithe trawlers (+ 18 – 44%)
Norway small
cod trawlers (+ 11%)
Danish large otter trawlers
and seine netters (+ 4 – 9%)
Dutch sole
beam trawlers (> 300HP)
(+ 6 – 8 %)
Norway haddock gill
netters and medium trawlers
(+ 6 – 8 %)
Norway
Catch quota Official logbook data and IBTS (International
groundfish surveys)
Paper describes and contrasts
three different methods to
assess increases in technical
capture efficiency.
Indicates relative merits, limitations and
assumptions associated with
each method
A comprehensive
study proposing alternative methods to
assess technical efficiency. Does
not use economic data.

Not to be cited without the authors permission 143
medium / large trawlers cod and
saithe (+ 2 – 10%)
Not to be cited without the authors permission 144
Reference
Type of outcome
Methodology and parameters
Fishery
Results (Efficiency / productivity)
Management regime
Source data
Main technical issue
Comments
Millischer et al. 1999
Quantitative analysis of the development of fishing power in three industrial fleets of Brittany
By the use of GLM Fishing Power estimates are derived from catchability quantifications based on fishing mortality coefficients (F) as calculated by VPA
Catch per vessel data for three homogeneous Brittany Fleets targeting Gadoids in ICES area VIa and VIIf,g,h. Main target species are saithe , cod, whiting and haddock from 1983 to 1994
From 1983-1994 the fleets on average showed a 15% decrease in fishing power for haddock and 25% for whiting. Opposite for saithe where fishing power increased with 15%. For cod no changes.
I. Official vessel logbook information compiled to catches by stock and year and total nominal effort per area and year for each vessel. II. Fishing mortality data from ICES working groups on stock assessment
The observed changes are assumed to be mainly driven by strategic choices of the fishermen
Pascoe et al, 20001
Quantitative analysis
Stochastic production
frontier model
Netherlands beam trawl fleet
(1980 – 1997)
Overall efficiency of the
fleet was fairly stable during study period,
but fluctuated up & down throughout
(linked to the various
management interventions)
ITQ Plaice box
Gear restrictions
LEI Dutch economic
Database, Dutch beam trawl
surveys, N.Sea stock
assessment
ITQs increased efficiency
Newer larger vessels more
efficient Gear restrictions
and TAC’s reduced
efficiency Plaice box increased
efficiency by dispersing effort
Paper describes the effect of
management regulations on
technical efficiency
Pascoe and Robinson 1996
Quantitative Artificial data set subjected to
stochastic variation.
Method uses catch and stock
Artificial data set, but method
tested on English Channel sole fishery also
Method can detect changes
in efficiency
Not applicable Artificial data sets with
stochastic variation
Paper describes a methodology
Method appears to work

Not to be cited without the authors permission 145
data as main inputs to model
.
Not to be cited without the authors permission 146
Reference
Type of outcome
Methodology and parameters
Fishery
Results (Efficiency / productivity)
Management regime
Source data
Main technical issue
Comments
Prawitt 1996 Quantitative, total efficiency
increase measured as
landings weight
Relative fishing power (Gulland
1956), length, GRT, vessel
age, beam width, towing speed, engine
power
German brown shrimp beam trawlers. 34
trawlers analysed in a
two year period (1994 – 1995)
No significant effect from any of the analysed input variables.
Licensed fishery,
Restricted HP < 221 KW. No quota
restriction No effort
control
Fishing logbooks,
Voluntary gear scheme for the study, official
statistics
Very similar vessels, No effect from
input variables.
Observed differences in
landings thought to be
due to skipper skills. (From
+43 % to -24%)
Rahikainen and Kuikka 2002
Methods paper adopting the concepts of fish stock assessment into an assessment of the herring trawl population in the Baltic sea
Application of a population model (VPA type) to data of lifetimes, sizes and numbers of trawls sold as according to the manufacturers
All trawls used on Finnish trawlers fishing herring in the Baltic in the period from 1980- 2000
The results indicate that the average gear size of the Finnish herring trawls has nearly tripled in 20 years.
Data obtained from relevant gear manufacturers producing herring trawls as well as data from interviews with skippers on app. 100 vessels. The data covered the period 1980 - 00
Only the increase in trawl size is examined and it shows approximately a three times increase in 20 years
Revill, 2003 Qualitative, describes
sources of technical
change
Mostly qualitative with
some quantitative
specific examples of
technological advances
Northern European focus
but with some global reference
Largely qualitative and
descriptive
Varied Literature review
Describes many trends in
technological advancement
and the related consequences to
unintentional mortality and
environmental impacts
Excellent piece of work, well
worth the read
Robins et al, 1998
Quantitative, CPUE changes with time as a
result
GLM with inputs of boat length, head rope, GPS, Plotters.
North Australian trawl
fishery for prawn (NPF).
Analysis
1998 – 1993. GPS & plotter
was estimated to cause an
increase of 12%
Restricted fleet size, Licensed
fishery, net restrictions,
seasonal and
Official logbooks and
landings returns and official yearly gear
Year 1 7% increase in fishing power
Year 2
The potential of the GPS and
plotter was only exploited fully by the vessels
Not to be cited without the authors permission 147
Assumptions of continuous recruitment, spatial and temporal heterogeneity
covering 1988-1992 with
data from circa. 200 trawlers
yearly
in fishing efficiency
temporal closures
No quota restriction No effort
control
records. 9% increase
Year 3 12% increase
after three years of experience:
Not to be cited without the authors permission 148
Reference
Type of outcome
Methodology and parameters
Fishery
Results (Efficiency /
productivity )
Management regime
Source data
Main technical issue
Comments
Squires et al, 2002
Quantitative Stochastic production
frontier models
Malaysian artisinal gill net
fishery
Most vessels are highly efficient
Effort control through licensed
access
Skipper skills important in
many regions
Squires 1994 Quantitative Ratio of economic
inputs: outputs
Inputs: Labour, capital, energy
Outputs:
Quantity of fish landed and
revenue
US Pacific coast ground fish
trawl
1981 – 1989
Total productivity
growth averaged at
2.8% over the period but with
sharp swings (+28%, -12%)
ITQ and effort control
Official statistics
Company records
Most important advancement was probably
the adoption of electronics
Valdermarsen 2001
Qualitative / descriptive
Descriptions of technical
changes and observed trends
Global view Qualitative Global and varied
FAO and scientific literature
Holistic view of trends in
technological advancement
Gives an overview of
major global technical
changes that have occurred in
recent decades
Viswanathan et al,
Quantitative Stochastic production
frontier model
Malaysia trawl fishery
Effort control through licensed
access
126 skipper interviews
Efficiency linked to:
Skipper ethnicity
Season Vessel tonnage
149
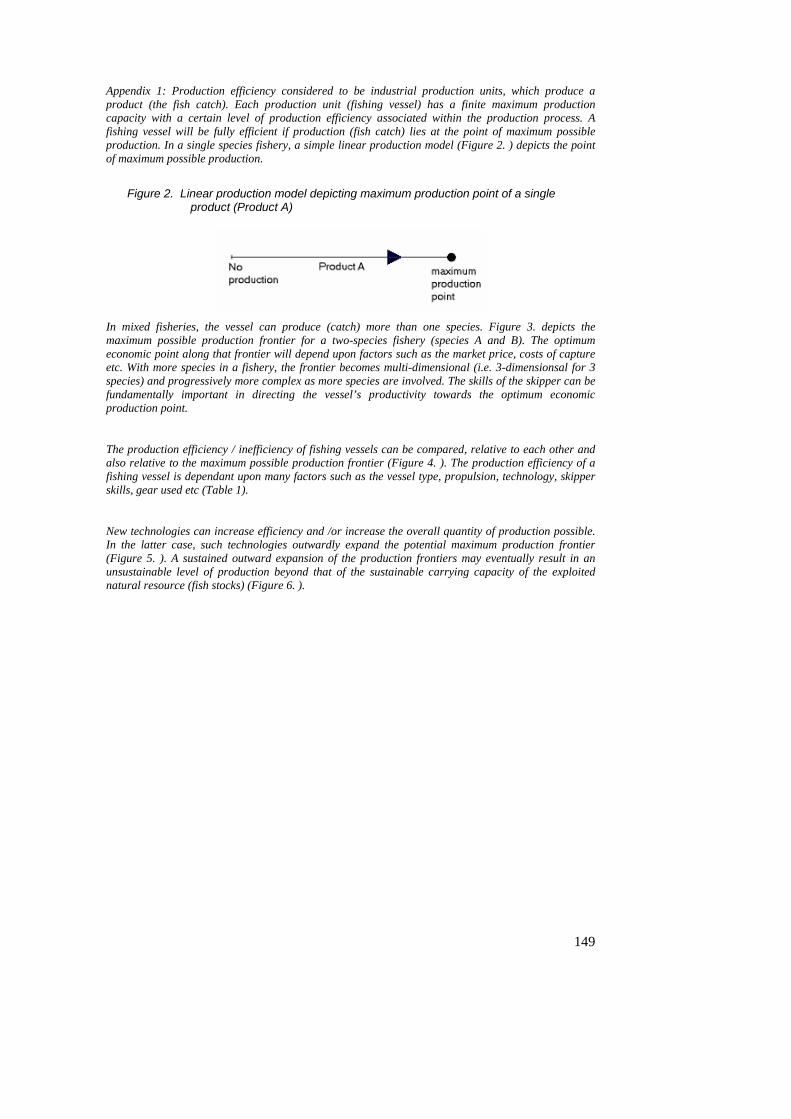
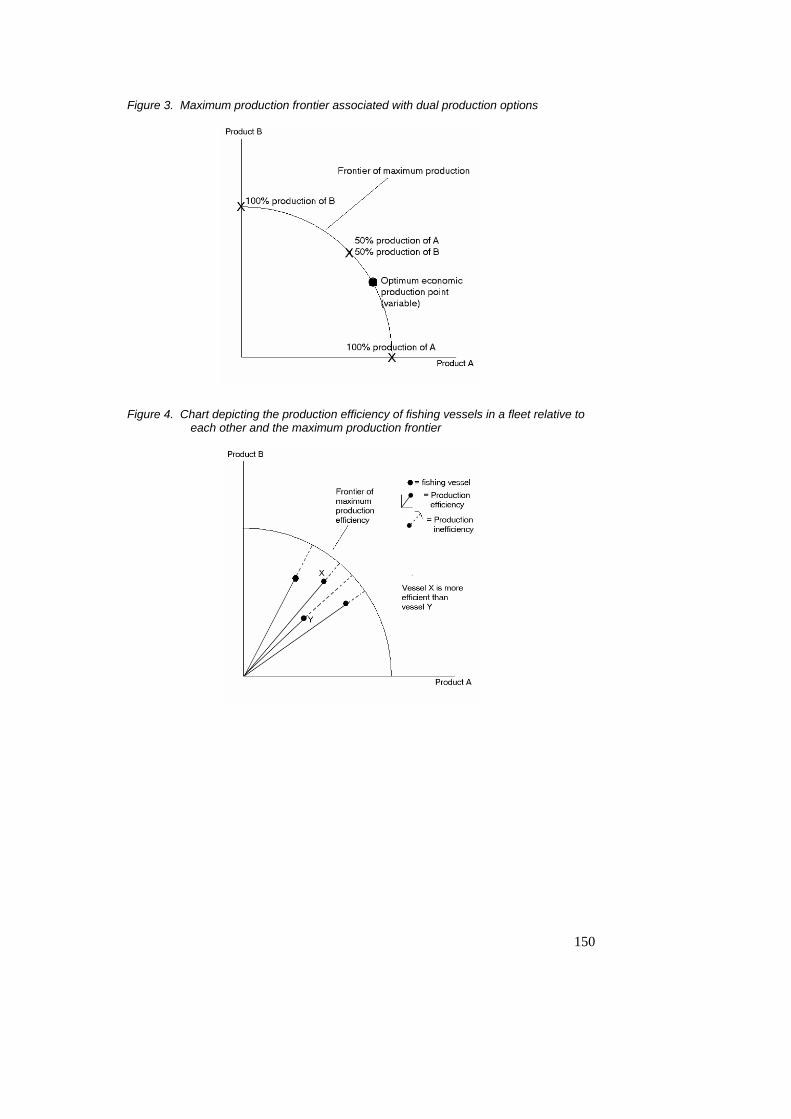
Appendix 1: Production efficiency considered to be industrial production units, which produce a product (the fish catch). Each production unit (fishing vessel) has a finite maximum production capacity with a certain level of production efficiency associated within the production process. A fishing vessel will be fully efficient if production (fish catch) lies at the point of maximum possible production. In a single species fishery, a simple linear production model (Figure 2. ) depicts the point of maximum possible production.
Figure 2. Linear production model depicting maximum production point of a single product (Product A)
In mixed fisheries, the vessel can produce (catch) more than one species. Figure 3. depicts the maximum possible production frontier for a two-species fishery (species A and B). The optimum economic point along that frontier will depend upon factors such as the market price, costs of capture etc. With more species in a fishery, the frontier becomes multi-dimensional (i.e. 3-dimensionsal for 3 species) and progressively more complex as more species are involved. The skills of the skipper can be fundamentally important in directing the vessel’s productivity towards the optimum economic production point.
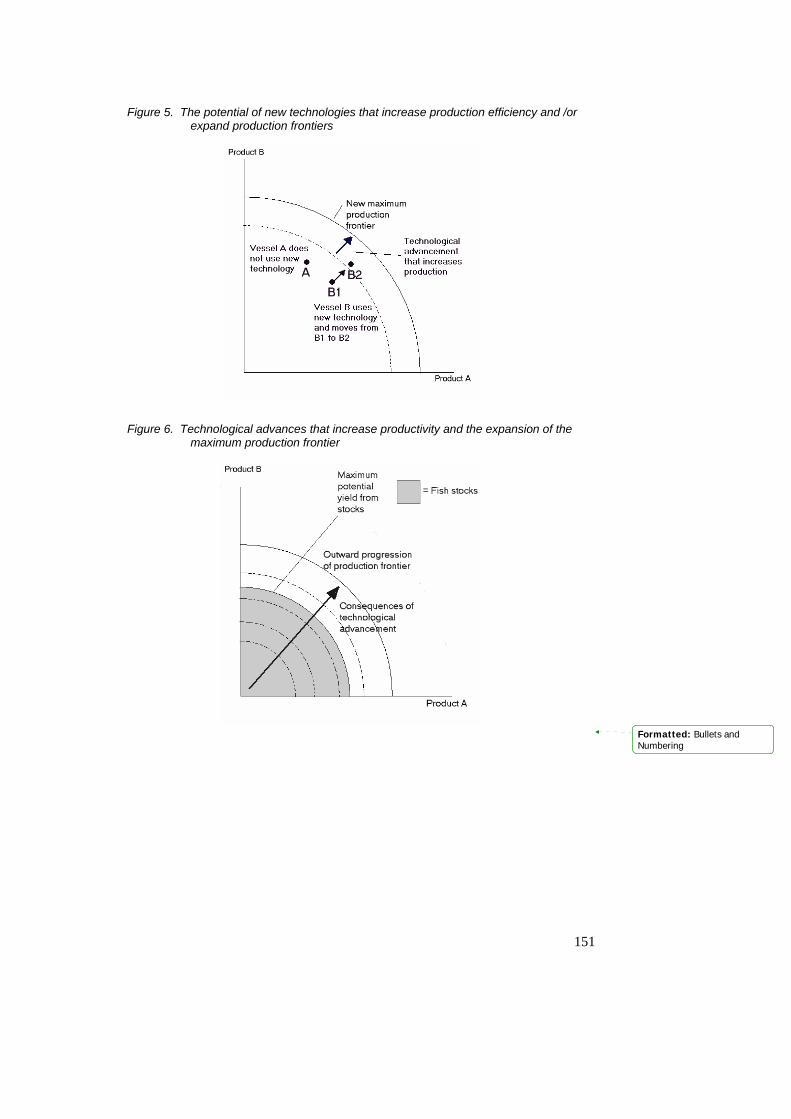
The production efficiency / inefficiency of fishing vessels can be compared, relative to each other and also relative to the maximum possible production frontier (Figure 4. ). The production efficiency of a fishing vessel is dependant upon many factors such as the vessel type, propulsion, technology, skipper skills, gear used etc (Table 1).
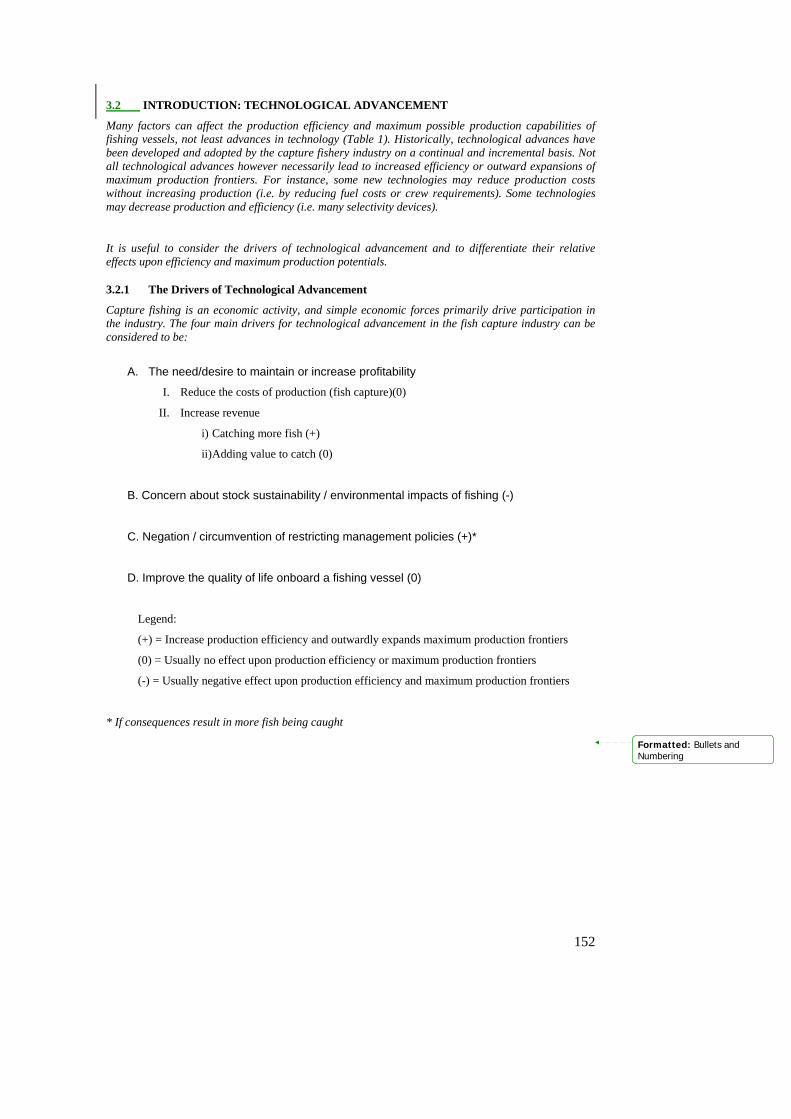
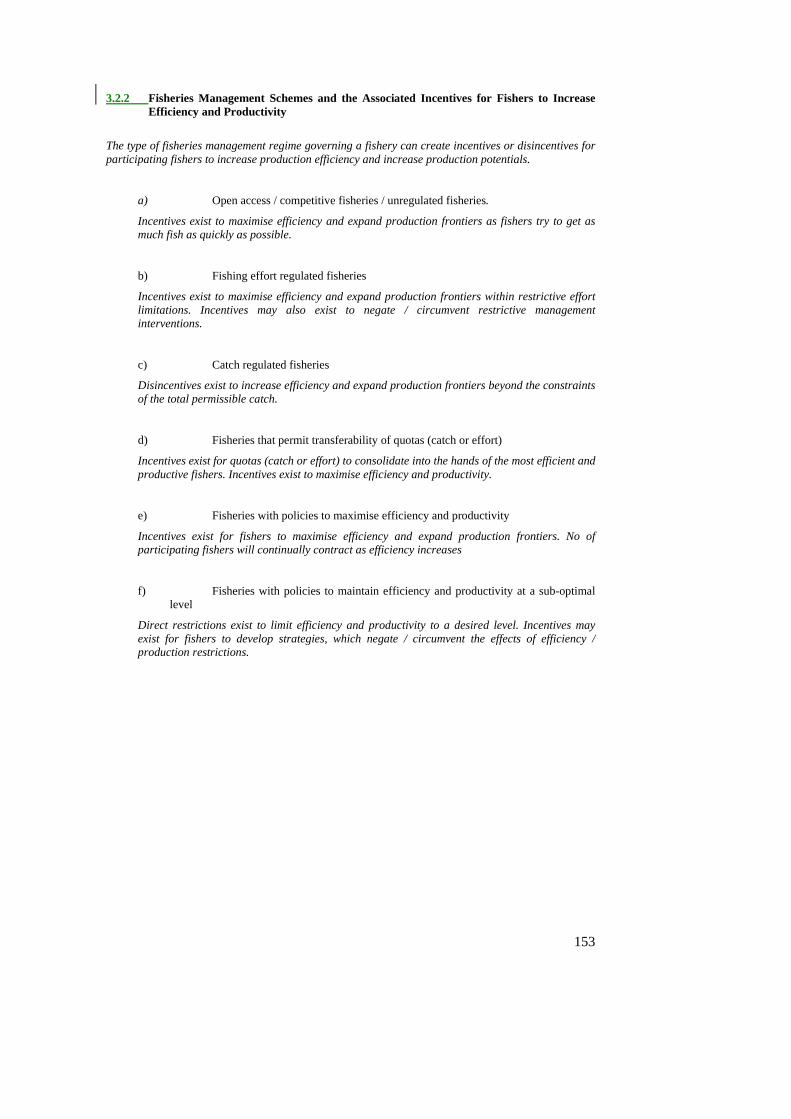
New technologies can increase efficiency and /or increase the overall quantity of production possible. In the latter case, such technologies outwardly expand the potential maximum production frontier (Figure 5. ). A sustained outward expansion of the production frontiers may eventually result in an unsustainable level of production beyond that of the sustainable carrying capacity of the exploited natural resource (fish stocks) (Figure 6. ).
150
Figure 3. Maximum production frontier associated with dual production options
Figure 4. Chart depicting the production efficiency of fishing vessels in a fleet relative to each other and the maximum production frontier
151
Figure 5. The potential of new technologies that increase production efficiency and /or expand production frontiers
Figure 6. Technological advances that increase productivity and the expansion of the maximum production frontier
Formatted: Bullets andNumbering
152
3.2 INTRODUCTION: TECHNOLOGICAL ADVANCEMENT
Many factors can affect the production efficiency and maximum possible production capabilities of fishing vessels, not least advances in technology (Table 1). Historically, technological advances have been developed and adopted by the capture fishery industry on a continual and incremental basis. Not all technological advances however necessarily lead to increased efficiency or outward expansions of maximum production frontiers. For instance, some new technologies may reduce production costs without increasing production (i.e. by reducing fuel costs or crew requirements). Some technologies may decrease production and efficiency (i.e. many selectivity devices).
It is useful to consider the drivers of technological advancement and to differentiate their relative effects upon efficiency and maximum production potentials.
3.2.1 The Drivers of Technological Advancement
Capture fishing is an economic activity, and simple economic forces primarily drive participation in the industry. The four main drivers for technological advancement in the fish capture industry can be considered to be:
A. The need/desire to maintain or increase profitability
I. Reduce the costs of production (fish capture)(0)
II. Increase revenue
i) Catching more fish (+)
ii) Adding value to catch (0)
B. Concern about stock sustainability / environmental impacts of fishing (-)
C. Negation / circumvention of restricting management policies (+)*
D. Improve the quality of life onboard a fishing vessel (0)
Legend:
(+) = Increase production efficiency and outwardly expands maximum production frontiers
(0) = Usually no effect upon production efficiency or maximum production frontiers
(-) = Usually negative effect upon production efficiency and maximum production frontiers
* If consequences result in more fish being caught
Formatted: Bullets andNumbering
153
3.2.2 Fisheries Management Schemes and the Associated Incentives for Fishers to Increase Efficiency and Productivity
The type of fisheries management regime governing a fishery can create incentives or disincentives for participating fishers to increase production efficiency and increase production potentials.
a) Open access / competitive fisheries / unregulated fisheries.
Incentives exist to maximise efficiency and expand production frontiers as fishers try to get as much fish as quickly as possible.
b) Fishing effort regulated fisheries
Incentives exist to maximise efficiency and expand production frontiers within restrictive effort limitations. Incentives may also exist to negate / circumvent restrictive management interventions.
c) Catch regulated fisheries
Disincentives exist to increase efficiency and expand production frontiers beyond the constraints of the total permissible catch.
d) Fisheries that permit transferability of quotas (catch or effort)
Incentives exist for quotas (catch or effort) to consolidate into the hands of the most efficient and productive fishers. Incentives exist to maximise efficiency and productivity.
e) Fisheries with policies to maximise efficiency and productivity
Incentives exist for fishers to maximise efficiency and expand production frontiers. No of participating fishers will continually contract as efficiency increases
f) Fisheries with policies to maintain efficiency and productivity at a sub-optimal level
Direct restrictions exist to limit efficiency and productivity to a desired level. Incentives may exist for fishers to develop strategies, which negate / circumvent the effects of efficiency / production restrictions.
154
3.2.3 What Data is Required to Assess the Production Efficiency and Productivity
The type of management regimes in place may largely dictate the data requirements on efficiency and productivity. Fisheries are most usually managed using biological reference points such as the maximum sustainable yield (MSY) etc. In such fisheries, two basic types of data are required to monitor efficiency and productivity:
I. Catch per unit of fishing effort
II. Indices of abundance of the exploited fish stocks
In fisheries where production efficiency and productivity are desirable, information detailing the causality of changes in efficiency / productivity may not necessarily be required. Management may choose to grossly adjust quotas (catch or effort) to maintain sustainable stock exploitation rates and allow internal transfer. Consolidation of the quotas to the most efficient and productive vessel operators usually results in fisheries operating under such management schemes.
In fisheries where management aim to restrict production efficiency and productivity at sub optimal levels, knowledge detailing the specific causality of changes (or potential changes) in efficiency / productivity may be desirable. In such cases, specific focussed studies are probably the best mechanism to achieve this.
The identification of the causality of changes in efficiency or productivity of fishing vessels may also be useful for management to justify to fishers any related interventions made
In fisheries where economic performance criteria and targets underpin management policy, continuous based assessments of both the economic and biological efficiency and productivity of vessels and fleets are likely to be of considerable importance.
155
3.3 Case Studies
3.3.1 Case Study 1: Efficiency change in Faroese pair-trawler fleet
Two types of marine resource management regimes can be identified, one output controlled (catch quotas) and one input controlled (effort limitations). In an output controlled system the effect from vessel efficiency increase or creeping is self adjusted, whereas in an input controlled system a range of input variables that are not readily controlled can result in an efficiency increase that will undermine the management regime. An example of an input controlled system is the Faroese fishing days management system. In this system it is of utmost interest to know whether the efficiency of single vessels change over time or not. In the following text data from a particular fleet working in the Faroese area will be examined to identify possible efficiency changes over time. 3.3.1.1 The Faroese management regime
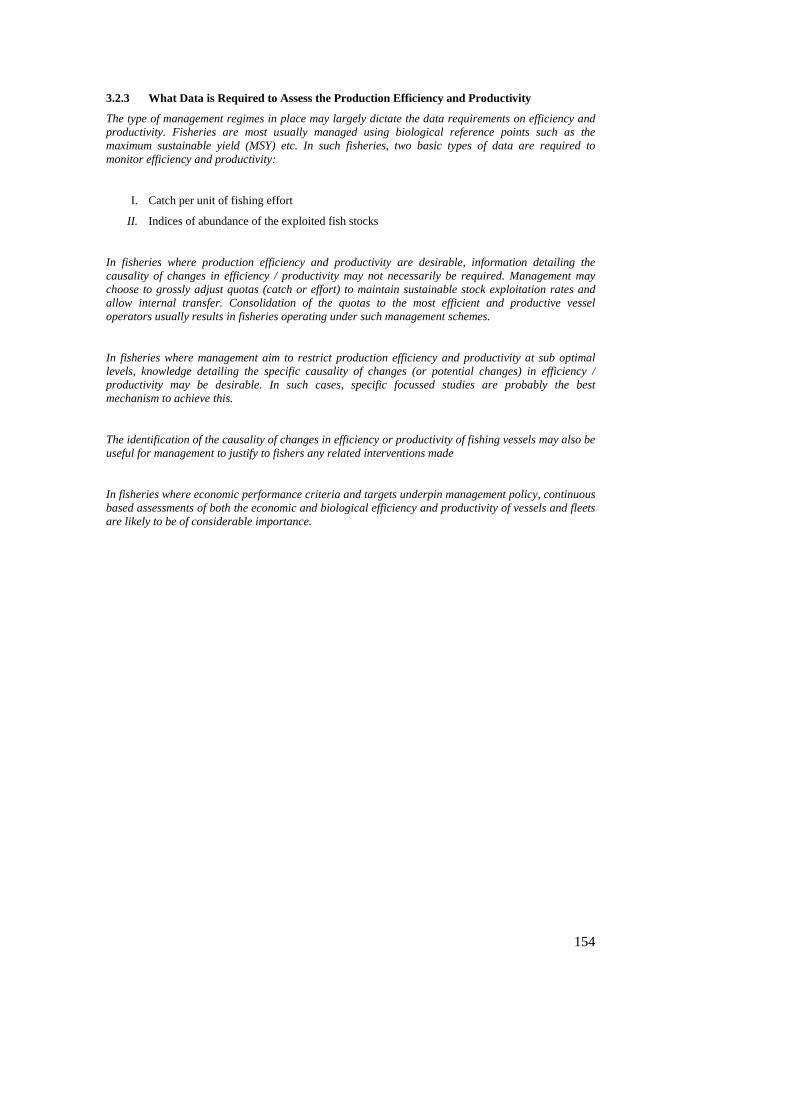
The economy of the Faroe Island is totally dependent on the fisheries. The most important demersal fish species in Faroese waters have been cod (Gadus morhua), haddock (Melanogrammus aeglefinus) and saithe (Polaccius virens) of which a total of between 43,676 and 119,441 tonnes have been harvested each year since 1990, figure 1.
Landings from the Faroese area
0
10.000
20.000
30.000
40.000
50.000
60.000
70.000
1990 1992 1994 1996 1998 2000 2002
Tonnes
Cod Haddock Saithe
Figure 1. Landings of cod, haddock and saithe from the Faroese area 1990-2002 (data from the Faroese Fisheries Laboratory)
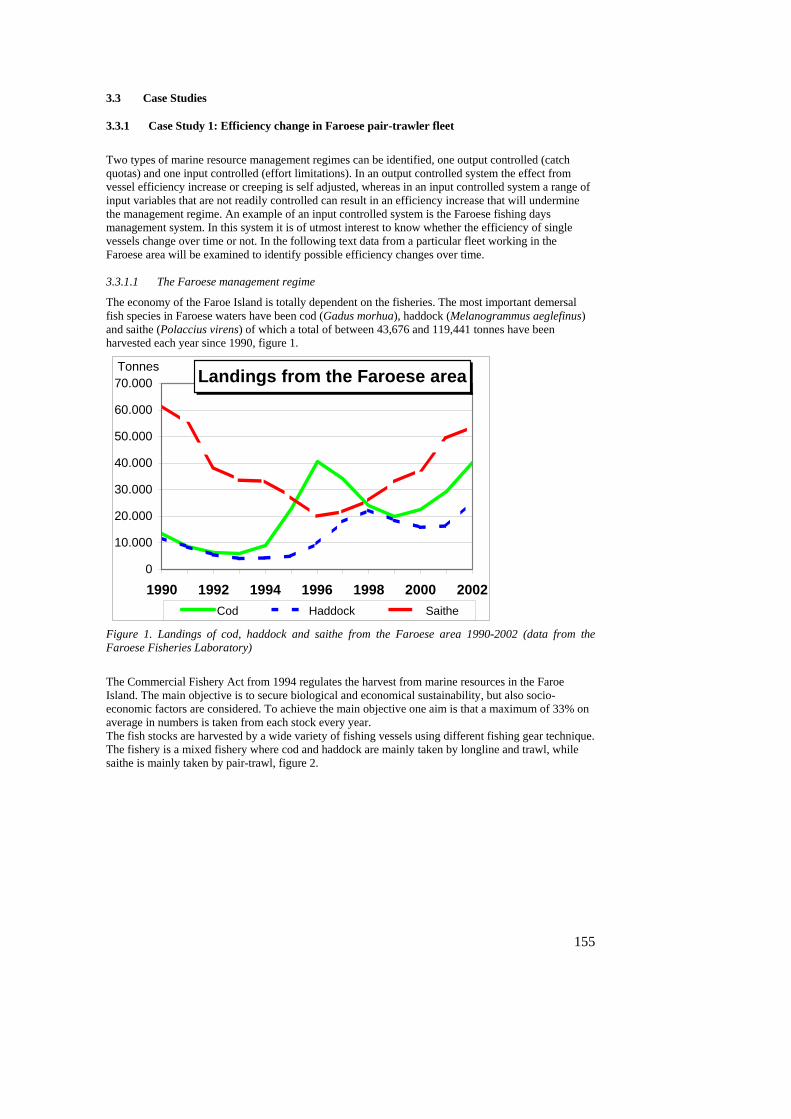
The Commercial Fishery Act from 1994 regulates the harvest from marine resources in the Faroe Island. The main objective is to secure biological and economical sustainability, but also socio-economic factors are considered. To achieve the main objective one aim is that a maximum of 33% on average in numbers is taken from each stock every year. The fish stocks are harvested by a wide variety of fishing vessels using different fishing gear technique. The fishery is a mixed fishery where cod and haddock are mainly taken by longline and trawl, while saithe is mainly taken by pair-trawl, figure 2.
156
Cod
Longline Trawl Pairtrawl Jigging Other
Haddock Saithe
Figure 2. Catch by gear of cod, haddock and saithe in the Faroese area 2000-2002 (data from the Faroese Fisheries Laboratory)
In addition to technical measures such as minimum mesh size and closed areas the fishing activity is controlled by quotas given as fishing days to various groups of fishing vessels and for larger vessels to single vessels within the groups. The system, which has been in effect since June 1st 1996, was originally based on an assessment of the fishing power of each vessel group according to a data series from 1985-1994. The Committee on Fishing days advises the Minister on the number of fishing days to be allocated for each fishing year, which runs from September 1st – August 31st. The Fisheries Laboratory also advises the Minister on the state of the stocks and on adjustments of fishing effort. One question that arises every year when the fishing days are allocated is whether the efficiency of a single fishing vessel has increased over time or not. If the efficiency has increased the fishing days should be decreased accordingly to maintain the same pressure on the stocks. Since the introduction of the system in 1996 the number of fishing days has been reduced by 16-17 %. In their advice for 2003-2004 the Fisheries Laboratory refer to ICES that has estimated the pressure on the cod, haddock and saithe stocks at present to be 42%, 33% and 29% respectively and that due to precautions against low recruitment and low growth suggest a more correct pressure for the three stocks to be 27%, 20% og 22% respectively. The recommendation therefore was a 25% reduction in fishing days over the next 2-3 years. The Committee on Fishing days on the other hand did not recommend any further reductions on fishing days this year. 3.3.1.2 Questionnaire survey
As a first attempt to address the question on efficiency change within the Faroese fisheries the Faroese Fisheries Laboratory conducted a questionnaire survey among 200 skippers in 2000. The results are summarized in appendix 2.b. in 7.13 below (Reprint from Jákupssovu et al, 2001). The answers give an overview of when changes have been made to fishing vessels and gears and opinions from individual skippers on the related efficiency change. As the number of answers for each item are limited and the numbers given are opinions rather than facts the results should only be taken as indicative. 3.3.1.3 Pair trawler data
One of the largest vessel operators working in the Faroes area is the company BETA. In the late 1970’s this company invested in three sister ships with steel hulls 37.7 meter long and had 1200 horsepower engine. The eight vessels operated as single trawlers for a couple of years and were then converted into 4 sets of pair-trawlers. The company has been very keen to keep track of all statistics concerning landings (catch) as well as economics. Also information on all technical changes during the 25-year working period is available. Agreement has been made with the vessel owner to computerize all these data for future scientific analysis. In addition to the records kept by the vessel owner, logbooks from the vessels have been handed in to the authorities. As these logbooks, together with the information from the vessel owner, is thought to be a valuable data series, the Faroese Fisheries Laboratory has made an extra effort to validate and upgrade the logbooks from these vessels. This has resulted in a high quality logbook database with variables on single hauls, such as towing time, position, depth, weather and skippers estimates of catches per species. Unfortunately, despite a special effort, the logbook data does not fully cover all activities of the vessels. The vessel owner has catch records from 1979 to present, while the logbook database has data from 1985 onwards. From 1985 to 1995 the logbooks corresponds to 80%-
157
100% of the catches whereas from 1995 the logbooks corresponds well to the total catches recorded by the company. For the years 1985 to 2002 the database holds 45,986 records on individual hauls taken by the eight sister vessels. When hauls outside the Faroese area and hauls with low quality data were excluded (no towing time, no catch reported etc.) 38,721 records could be used for the present analysis. In 28,062 records the catch was more than 60% saithe. As the data from the vessel owner is not fully computerized yet, the following analysis is mainly based on the logbook database, but with some input from the vessels owner. 3.3.1.4 Conversion to pair-trawl
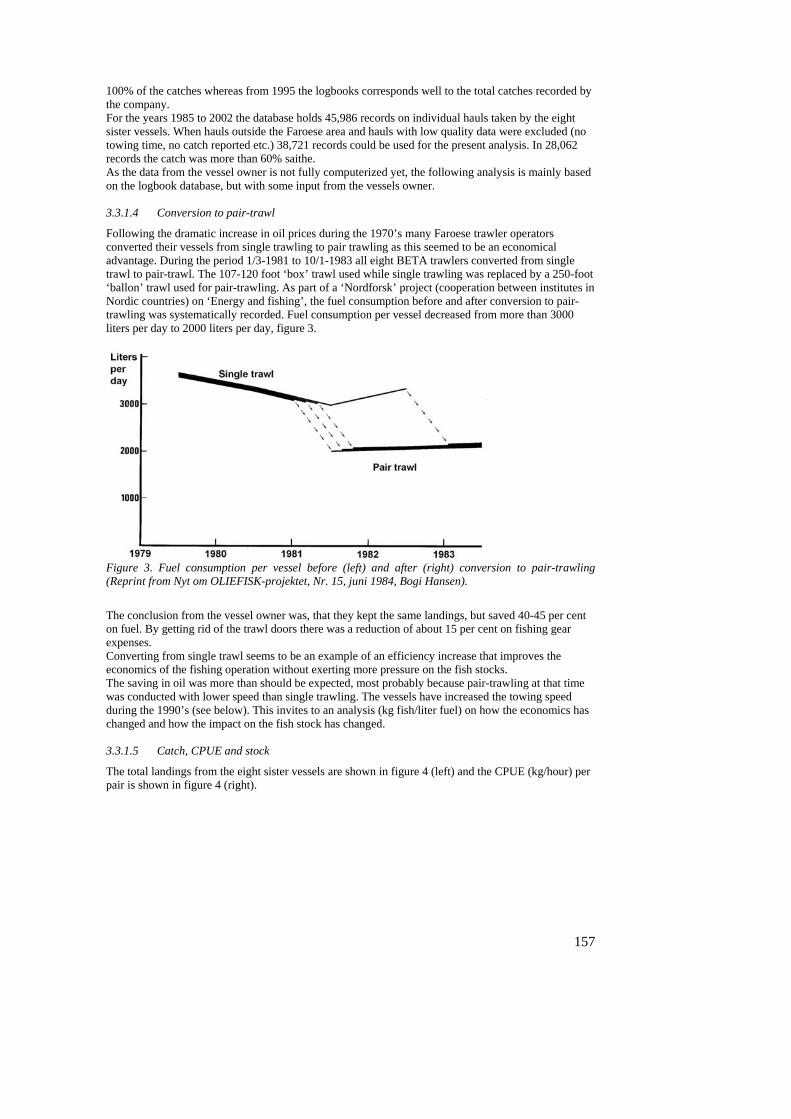
Following the dramatic increase in oil prices during the 1970’s many Faroese trawler operators converted their vessels from single trawling to pair trawling as this seemed to be an economical advantage. During the period 1/3-1981 to 10/1-1983 all eight BETA trawlers converted from single trawl to pair-trawl. The 107-120 foot ‘box’ trawl used while single trawling was replaced by a 250-foot ‘ballon’ trawl used for pair-trawling. As part of a ‘Nordforsk’ project (cooperation between institutes in Nordic countries) on ‘Energy and fishing’, the fuel consumption before and after conversion to pair-trawling was systematically recorded. Fuel consumption per vessel decreased from more than 3000 liters per day to 2000 liters per day, figure 3.
Figure 3. Fuel consumption per vessel before (left) and after (right) conversion to pair-trawling (Reprint from Nyt om OLIEFISK-projektet, Nr. 15, juni 1984, Bogi Hansen).
The conclusion from the vessel owner was, that they kept the same landings, but saved 40-45 per cent on fuel. By getting rid of the trawl doors there was a reduction of about 15 per cent on fishing gear expenses. Converting from single trawl seems to be an example of an efficiency increase that improves the economics of the fishing operation without exerting more pressure on the fish stocks. The saving in oil was more than should be expected, most probably because pair-trawling at that time was conducted with lower speed than single trawling. The vessels have increased the towing speed during the 1990’s (see below). This invites to an analysis (kg fish/liter fuel) on how the economics has changed and how the impact on the fish stock has changed. 3.3.1.5 Catch, CPUE and stock
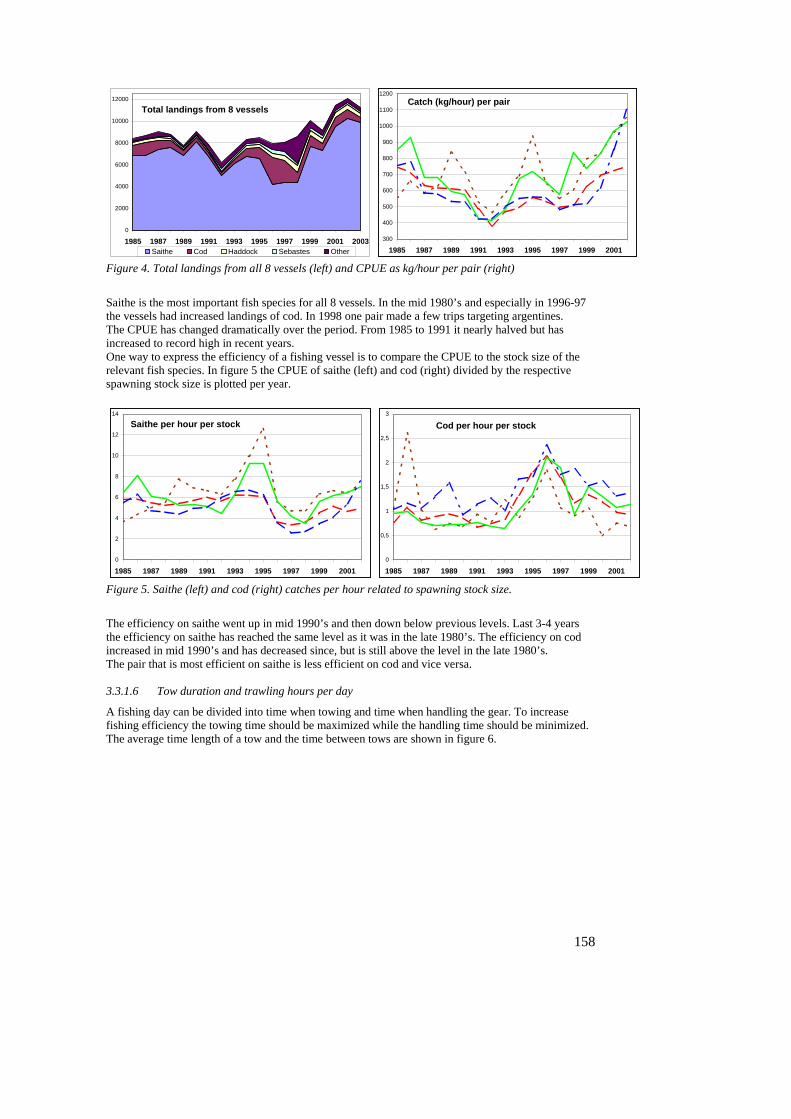
The total landings from the eight sister vessels are shown in figure 4 (left) and the CPUE (kg/hour) per pair is shown in figure 4 (right).
158
Catch (kg/hour) per pair
300
400
500
600
700
800
900
1000
1100
1200
1985 1987 1989 1991 1993 1995 1997 1999 2001
Total landings from 8 vessels
0
2000
4000
6000
8000
10000
12000
1985 1987 1989 1991 1993 1995 1997 1999 2001 2003Saithe Cod Haddock Sebastes Other
Figure 4. Total landings from all 8 vessels (left) and CPUE as kg/hour per pair (right)
Saithe is the most important fish species for all 8 vessels. In the mid 1980’s and especially in 1996-97 the vessels had increased landings of cod. In 1998 one pair made a few trips targeting argentines. The CPUE has changed dramatically over the period. From 1985 to 1991 it nearly halved but has increased to record high in recent years. One way to express the efficiency of a fishing vessel is to compare the CPUE to the stock size of the relevant fish species. In figure 5 the CPUE of saithe (left) and cod (right) divided by the respective spawning stock size is plotted per year.
Saithe per hour per stock
0
2
4
6
8
10
12
14
1985 1987 1989 1991 1993 1995 1997 1999 2001
Cod per hour per stock
0
0,5
1
1,5
2
2,5
3
1985 1987 1989 1991 1993 1995 1997 1999 2001
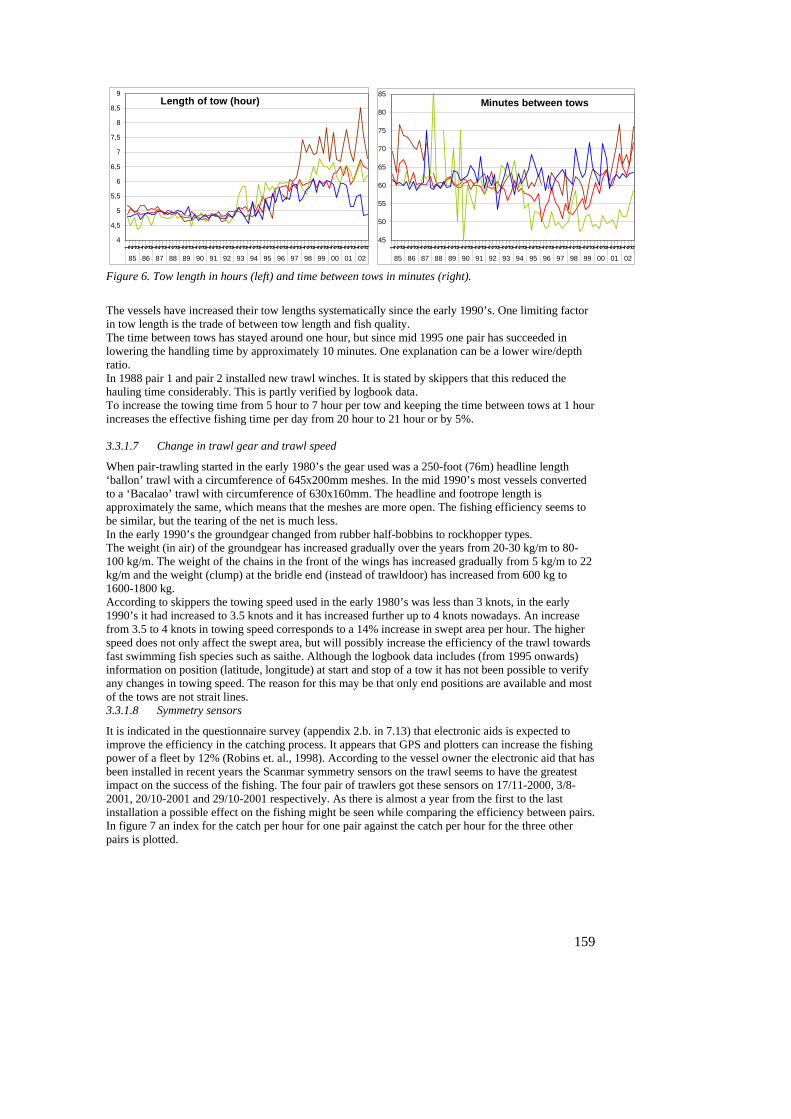
Figure 5. Saithe (left) and cod (right) catches per hour related to spawning stock size.
The efficiency on saithe went up in mid 1990’s and then down below previous levels. Last 3-4 years the efficiency on saithe has reached the same level as it was in the late 1980’s. The efficiency on cod increased in mid 1990’s and has decreased since, but is still above the level in the late 1980’s. The pair that is most efficient on saithe is less efficient on cod and vice versa. 3.3.1.6 Tow duration and trawling hours per day
A fishing day can be divided into time when towing and time when handling the gear. To increase fishing efficiency the towing time should be maximized while the handling time should be minimized. The average time length of a tow and the time between tows are shown in figure 6.
159
Minutes between tows
45
50
55
60
65
70
75
80
85
1 2 3 4 1 2 3 4 1 2 3 4 1 2 3 4 1 2 3 4 1 2 3 4 1 2 3 4 1 2 3 4 1 2 3 4 1 2 3 4 1 2 3 4 1 2 3 4 1 2 3 4 1 2 3 4 1 2 3 4 1 2 3 4 1 2 3 4 1 2 3 4
85 86 87 88 89 90 91 92 93 94 95 96 97 98 99 00 01 02
Length of tow (hour)
4
4,5
5
5,5
6
6,5
7
7,5
8
8,5
9
1 2 3 4 1 2 3 4 1 2 3 4 1 2 3 4 1 2 3 4 1 2 3 4 1 2 3 4 1 2 3 4 1 2 3 4 1 2 3 4 1 2 3 4 1 2 3 4 1 2 3 4 1 2 3 4 1 2 3 4 1 2 3 4 1 2 3 4 1 2 3 4
85 86 87 88 89 90 91 92 93 94 95 96 97 98 99 00 01 02
Figure 6. Tow length in hours (left) and time between tows in minutes (right).
The vessels have increased their tow lengths systematically since the early 1990’s. One limiting factor in tow length is the trade of between tow length and fish quality. The time between tows has stayed around one hour, but since mid 1995 one pair has succeeded in lowering the handling time by approximately 10 minutes. One explanation can be a lower wire/depth ratio. In 1988 pair 1 and pair 2 installed new trawl winches. It is stated by skippers that this reduced the hauling time considerably. This is partly verified by logbook data. To increase the towing time from 5 hour to 7 hour per tow and keeping the time between tows at 1 hour increases the effective fishing time per day from 20 hour to 21 hour or by 5%. 3.3.1.7 Change in trawl gear and trawl speed
When pair-trawling started in the early 1980’s the gear used was a 250-foot (76m) headline length ‘ballon’ trawl with a circumference of 645x200mm meshes. In the mid 1990’s most vessels converted to a ‘Bacalao’ trawl with circumference of 630x160mm. The headline and footrope length is approximately the same, which means that the meshes are more open. The fishing efficiency seems to be similar, but the tearing of the net is much less. In the early 1990’s the groundgear changed from rubber half-bobbins to rockhopper types. The weight (in air) of the groundgear has increased gradually over the years from 20-30 kg/m to 80-100 kg/m. The weight of the chains in the front of the wings has increased gradually from 5 kg/m to 22 kg/m and the weight (clump) at the bridle end (instead of trawldoor) has increased from 600 kg to 1600-1800 kg. According to skippers the towing speed used in the early 1980’s was less than 3 knots, in the early 1990’s it had increased to 3.5 knots and it has increased further up to 4 knots nowadays. An increase from 3.5 to 4 knots in towing speed corresponds to a 14% increase in swept area per hour. The higher speed does not only affect the swept area, but will possibly increase the efficiency of the trawl towards fast swimming fish species such as saithe. Although the logbook data includes (from 1995 onwards) information on position (latitude, longitude) at start and stop of a tow it has not been possible to verify any changes in towing speed. The reason for this may be that only end positions are available and most of the tows are not strait lines. 3.3.1.8 Symmetry sensors
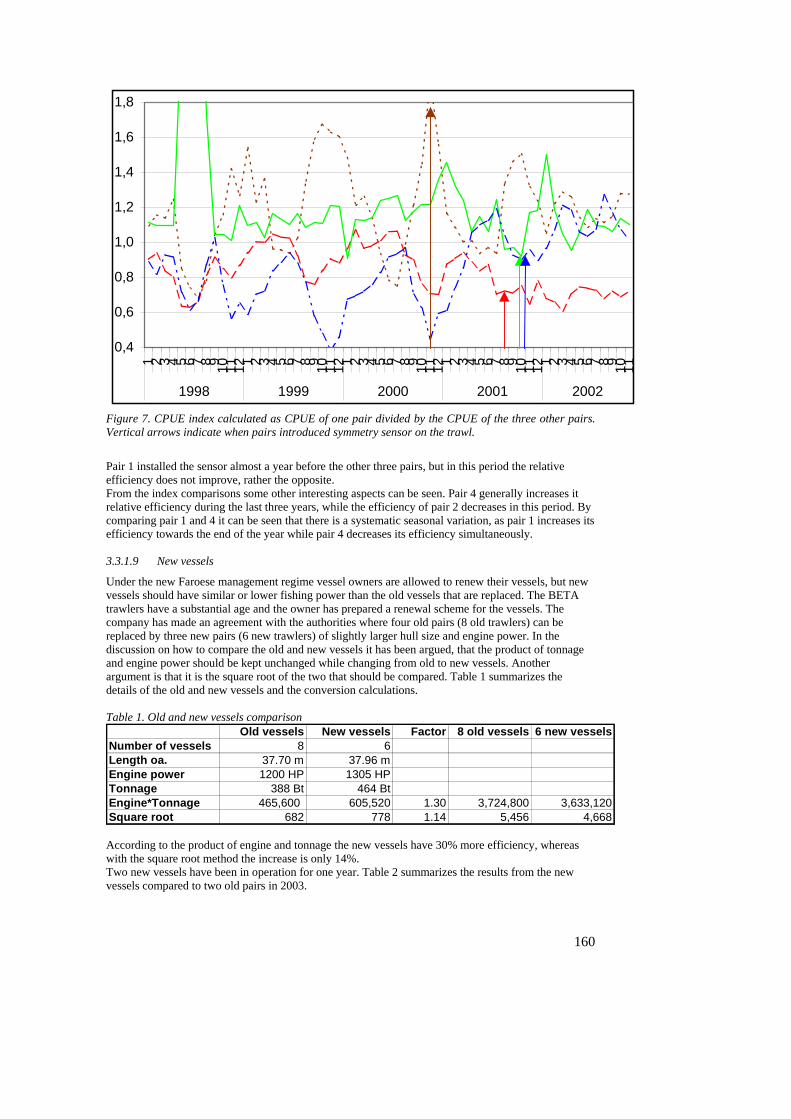
It is indicated in the questionnaire survey (appendix 2.b. in 7.13) that electronic aids is expected to improve the efficiency in the catching process. It appears that GPS and plotters can increase the fishing power of a fleet by 12% (Robins et. al., 1998). According to the vessel owner the electronic aid that has been installed in recent years the Scanmar symmetry sensors on the trawl seems to have the greatest impact on the success of the fishing. The four pair of trawlers got these sensors on 17/11-2000, 3/8-2001, 20/10-2001 and 29/10-2001 respectively. As there is almost a year from the first to the last installation a possible effect on the fishing might be seen while comparing the efficiency between pairs. In figure 7 an index for the catch per hour for one pair against the catch per hour for the three other pairs is plotted.
160
0,4
0,6
0,8
1,0
1,2
1,4
1,6
1,8
1 2 3 4 5 6 7 8 9 10 11 12 1 2 3 4 5 6 7 8 9 10 11 12 1 2 3 4 5 6 7 8 9 10 11 12 1 2 3 4 5 6 7 8 9 10 11 12 1 2 3 4 5 6 7 8 9 10 11
1998 1999 2000 2001 2002
Figure 7. CPUE index calculated as CPUE of one pair divided by the CPUE of the three other pairs. Vertical arrows indicate when pairs introduced symmetry sensor on the trawl.
Pair 1 installed the sensor almost a year before the other three pairs, but in this period the relative efficiency does not improve, rather the opposite. From the index comparisons some other interesting aspects can be seen. Pair 4 generally increases it relative efficiency during the last three years, while the efficiency of pair 2 decreases in this period. By comparing pair 1 and 4 it can be seen that there is a systematic seasonal variation, as pair 1 increases its efficiency towards the end of the year while pair 4 decreases its efficiency simultaneously. 3.3.1.9 New vessels
Under the new Faroese management regime vessel owners are allowed to renew their vessels, but new vessels should have similar or lower fishing power than the old vessels that are replaced. The BETA trawlers have a substantial age and the owner has prepared a renewal scheme for the vessels. The company has made an agreement with the authorities where four old pairs (8 old trawlers) can be replaced by three new pairs (6 new trawlers) of slightly larger hull size and engine power. In the discussion on how to compare the old and new vessels it has been argued, that the product of tonnage and engine power should be kept unchanged while changing from old to new vessels. Another argument is that it is the square root of the two that should be compared. Table 1 summarizes the details of the old and new vessels and the conversion calculations. Table 1. Old and new vessels comparison
Old vessels New vessels Factor 8 old vessels 6 new vesselsNumber of vessels 8 6Length oa. 37.70 m 37.96 mEngine power 1200 HP 1305 HPTonnage 388 Bt 464 BtEngine*Tonnage 465,600 605,520 1.30 3,724,800 3,633,120Square root 682 778 1.14 5,456 4,668 According to the product of engine and tonnage the new vessels have 30% more efficiency, whereas with the square root method the increase is only 14%. Two new vessels have been in operation for one year. Table 2 summarizes the results from the new vessels compared to two old pairs in 2003.
161
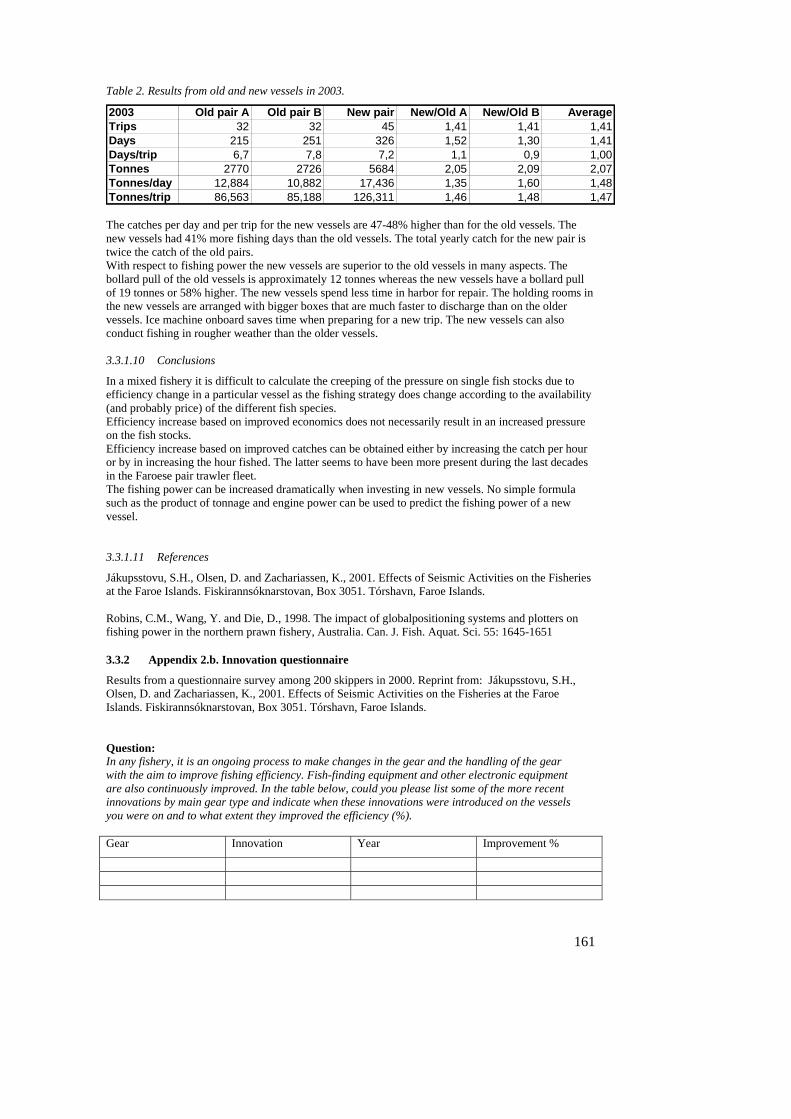
Table 2. Results from old and new vessels in 2003.
2003 Old pair A Old pair B New pair New/Old A New/Old B AverageTrips 32 32 45 1,41 1,41 1,41Days 215 251 326 1,52 1,30 1,41Days/trip 6,7 7,8 7,2 1,1 0,9 1,00Tonnes 2770 2726 5684 2,05 2,09 2,07Tonnes/day 12,884 10,882 17,436 1,35 1,60 1,48Tonnes/trip 86,563 85,188 126,311 1,46 1,48 1,47 The catches per day and per trip for the new vessels are 47-48% higher than for the old vessels. The new vessels had 41% more fishing days than the old vessels. The total yearly catch for the new pair is twice the catch of the old pairs. With respect to fishing power the new vessels are superior to the old vessels in many aspects. The bollard pull of the old vessels is approximately 12 tonnes whereas the new vessels have a bollard pull of 19 tonnes or 58% higher. The new vessels spend less time in harbor for repair. The holding rooms in the new vessels are arranged with bigger boxes that are much faster to discharge than on the older vessels. Ice machine onboard saves time when preparing for a new trip. The new vessels can also conduct fishing in rougher weather than the older vessels. 3.3.1.10 Conclusions
In a mixed fishery it is difficult to calculate the creeping of the pressure on single fish stocks due to efficiency change in a particular vessel as the fishing strategy does change according to the availability (and probably price) of the different fish species. Efficiency increase based on improved economics does not necessarily result in an increased pressure on the fish stocks. Efficiency increase based on improved catches can be obtained either by increasing the catch per hour or by in increasing the hour fished. The latter seems to have been more present during the last decades in the Faroese pair trawler fleet. The fishing power can be increased dramatically when investing in new vessels. No simple formula such as the product of tonnage and engine power can be used to predict the fishing power of a new vessel. 3.3.1.11 References
Jákupsstovu, S.H., Olsen, D. and Zachariassen, K., 2001. Effects of Seismic Activities on the Fisheries at the Faroe Islands. Fiskirannsóknarstovan, Box 3051. Tórshavn, Faroe Islands. Robins, C.M., Wang, Y. and Die, D., 1998. The impact of globalpositioning systems and plotters on fishing power in the northern prawn fishery, Australia. Can. J. Fish. Aquat. Sci. 55: 1645-1651
3.3.2 Appendix 2.b. Innovation questionnaire
Results from a questionnaire survey among 200 skippers in 2000. Reprint from: Jákupsstovu, S.H., Olsen, D. and Zachariassen, K., 2001. Effects of Seismic Activities on the Fisheries at the Faroe Islands. Fiskirannsóknarstovan, Box 3051. Tórshavn, Faroe Islands. Question: In any fishery, it is an ongoing process to make changes in the gear and the handling of the gear with the aim to improve fishing efficiency. Fish-finding equipment and other electronic equipment are also continuously improved. In the table below, could you please list some of the more recent innovations by main gear type and indicate when these innovations were introduced on the vessels you were on and to what extent they improved the efficiency (%). Gear Innovation Year Improvement %
162
Answers: Larger single trawlers (Group 1)
Innovation Answered * Year Impr. % Avg. Impr. % Comments Trawl sonde 12 (8) 89 - 92 0 - 50 18
Scanmar 9 (6) 81 - 91 0 - 50 13 Rock hopper 12 (7) 89 – 92 0 - 50 36 Doors sensors 1 (1) 99 5 5
Doors 1 (0) 99 Double trawl** 2 (2) 94 - 95 50 - 100 50
* The numbers in brackets indicate the number of answers indicating improvement in %. Some of the skippers say that it is impossible to give a percentage. The reason is that the fishery is affected by too many factors.
**Double trawl is not used in the Faroese area. Double trawl is used in the shrimp fishery. Pair trawlers (Group 2)
Innovation Answered * Year Imp. % Avg. Impr. % Comments Trawl sonde 13 (6) 92 – 98 0 - 40 14
Scanmar 16 (6) 85 - 94 10 - 40 23 Rock hopper 31 (14) 90 - 95 1 - 50 15 Double trawl 2 (2) 98 50-90 70 Used for 2 months Better trawls 2 (1) 97 10 10 Kitler chain 1 (0)
Symmetry sensor 2 (1) 96 10 10 Others 5 (1) 97 10 10
* The numbers in brackets indicate the number of answers indicating improvement in %. Some of the skippers say that it is impossible to give a percentage. The reason is that the fishery is affected by too many factors.
Smaller single trawlers (Group 4) Innovation Answered * Year Impr. % Avg. Impr. % Comments
Trawl sonde 2 (1) 89 - 97 0 0 Rock hopper 10 (6) 88 - 98 10 - 40 23 Kitler chain 1 (1) 92 100 100 For monkfish
GPS 1 (0) Nav. instrument Trawl doors 1 (0)
* The numbers in brackets indicate the number of answers indicating improvement in %. Some of the skippers say that it is impossible to give a percentage. The reason is that the fishery is affected by too many factors.
Larger longline vessels (Group 3)
Innovation Answered * Year Impr. % Avg. Impr. % Comments Automatic baiter 18 (9) 78 - 93 0 - 30 16 Per vessel
Skewed hooks 17 (14) 90 - 96 5 - 50 21 Stability tanks 10 (5) 91 - 99 5 - 30 13
Swivel line 17 (14) 92 - 96 10 - 50 34 Better for e.g. haddock
Snood line 5 (3) 92 - 96 10 - 20 13 Line tec 3 (0) 97 - 99 Others 1 (0) 91
* The numbers in brackets indicate the number of answers indicating improvement in %. Some of the skippers say that it is impossible to give a percentage. The reason is that the fishery is affected by too many factors.
163
Smaller longline vessels (Group 4) Innovation Answered * Year Impr. % Avg. Impr. % Comments
Automatic baiter 6 (0) 96 - 98 Per vessel Skewed hooks 23 (15) 93 - 98 3 - 40 17 Better for e.g.
haddock Swivel line 29 (23) 10 - 50 10 - 50 28 Snood line 7 (3) 98 - 99 0 - 10 3
Others 2 (0) 90 * The numbers in brackets indicate the number of answers indicating improvement in %. Some of the skippers say that it is impossible to give percentages. The reason is that the fishery is affected by too many factors.
Smaller longline vessels (Group 5)
Innovation Answered * Year Impr. % Avg. Impr. % Comments Automatic baiter 7(4) 90 - 99 0 - 50 22 Per vessel
Skewed hooks 19 (15) 87 - 99 0 - 50 16 Swivel line 32 (26) 94 - 99 0 - 50 19 Snood line 6 (2) 89 - 96 0 - 5 3
Others 5 (0) 97 * The numbers in brackets indicate the number of answers indicating improvement in %. Some of the skippers say that it is impossible to give percentages. The reason is that the fishery is affected by too many factors.
Jigging vessels (Group 4)
Innovation Answered * Year Impr. % Avg. Impr. % Comments Automatic Jiggers 17 (11) 82 - 88 0 - 50 35
Electric Jiggers 2 (2) 96 - 97 40 40 Skewed hooks 9 (4) 94 -96 10 - 15 12
Nav. equipment 1 (0) GPS and plotter Others 1 (1) 97 20 20
* The numbers in brackets indicate the number of answers indicating improvement in %. Some of the skippers say that it is impossible to give percentages. The reason is that the fishery is affected by too many factors.
Jigging vessels (Group 5)
Innovation Answered * Year Impr. % Avg. Impr. % Comments Aut. Jiggers 20 (11) 87 - 98 0 – 50 33
Electric Jiggers 5 (4) 95 – 97 20 - 50 38 Skewed hooks 10 (5) 92 - 95 10 - 50 18
* The numbers in brackets indicate the number of answers indicating improvement in %. Some of the skippers say that it is impossible to give percentages. The reason is that the fishery is affected by too many factors.
Gill-net vessels
Innovation Answered * Year Impr. % Avg. Impr. % Comments Smaller meshes 1 (0)
Floating line 1 (1) 97 20 20 For monkfish New gear 1 (1) 100 100 same type
*The numbers in brackets indicate the number of answers indicating improvement in %. Some of the skippers say that it is impossible to give percentages. The reason is that the fishery is affected by too many factors.
Pelagic trawlers Innovation Answered * Year Impr. % Avg. Impr. % Comments
Lighter material 2 (1) 20 20 Bigger trawl 2 (2) 70 – 99 35 - 100 68 Bigger engine 2 (2) 77 - 99 100 - 150 125
164
Trawl sonde 1 (0) 89 * The numbers in brackets indicate the number of answers indicating improvement in %. Some of the skippers say that it is impossible to give percentages. The reason is that the fishery is affected by too many factors.
Purse seine vessels Innovation Answered * Year Impr. % Avg. Impr. % Comments Better asdic 3 (1) 87 – 99 5 5 Bigger seine 3 (1) - 99 100 100
Bigger meshes 1 (1) 93 10 10 Others 1 (0)
* The numbers in brackets indicate the number of answers indicating improvement in %. Some of the skippers say that it is impossible to give percentages. The reason is that the fishery is affected by too many factors.
Have there been any changes in the planning of the fishery since the fishing-day regulation was introduced, e.g., planning the trips differently, using more longline, more concern about weather conditions, etc?
Yes/No 98/45 Please, could you elaborate a little. Group 1. Group 1 is not regulated by fishing days, but by a quota system.
Group 2. Yes/no 27/2 The “yes” answers specified:
23 answered: In bad weather, they do not wait for better weather at sea, but return to the harbour to land the catch in order to save fishing days. 16 answered: Do not have any dead time at sea. 3 answered: Buy fishing days from others. 6 answered: Try to do some trips in the outer fishing areas, which yields 3 days of fishing for 1 “fishing day”.
The two respondents who answered "no" stated that they buy days if they have problems.
Group 3. Yes/no 15/1 The “yes” answers specified:
11 answered: Do not fish in bad current conditions. 11 answered: In bad weather, they do not wait for better weather at sea, but return to the harbour to land the catch in order to save fishing days. 2 answered: Fish in worse weather than previously. 15 answered: Do not have any dead time at sea. 1 answered: Save days. They have gone from 295 fishing days down to 240 fishing days.
Group 4. Trawl. Yes/no 12/0 The “yes” answers specified:
1 answered: Fish in worse weather than previously. 8 answered: Do not have any dead time at sea. 2 answered: Only start a trip if the weather forecast is favourable for more than two days. 8 answered: Are aware of trying to use their fishing days optimally.
Group 4. Longline and jigging. Yes/no 33/11 The “yes” answers specified:
26 answered: Are aware of trying to use their fishing days optimally. 19 answered: Use more longline. 21 answered: Are more aware of weather and current conditions. 19 answered: Try not to have any dead time at sea.
1 answered: Buy and sell fishing days.

165
33 answered: Are generally more aware of the fishing days. Of the 11 "no" answers, many are skippers on jigging vessels. The jigging vessels get two days at sea for one “fishing day” Group 5. Longline and jigging. Yes/no 11/31 The “yes” answers specified:
2 answered: Are more aware of weather and current conditions. 8 answered: Do not have any dead time at sea. 6 answered: Use more longline 6 answered: Save fishing days.
If there is something else you would like to add, or if some of the questions need a comment, please write it below.
46 had comments and 122 had no comments.
166
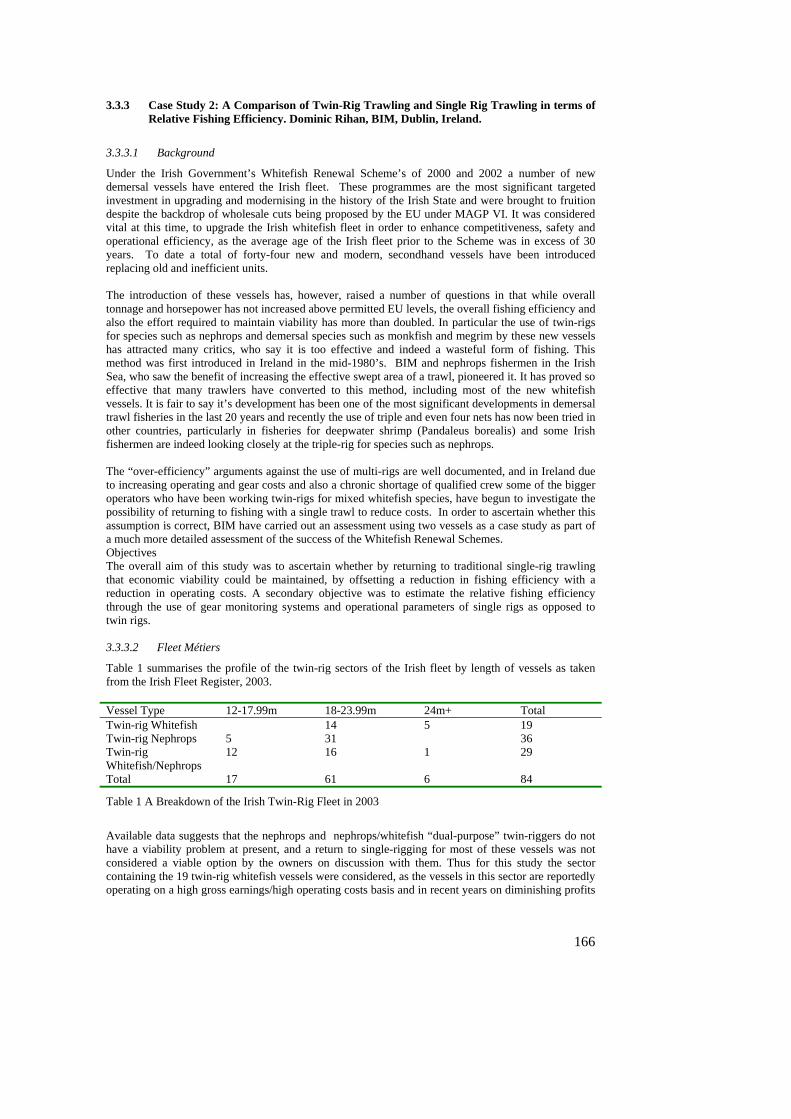
3.3.3 Case Study 2: A Comparison of Twin-Rig Trawling and Single Rig Trawling in terms of Relative Fishing Efficiency. Dominic Rihan, BIM, Dublin, Ireland.
3.3.3.1 Background
Under the Irish Government’s Whitefish Renewal Scheme’s of 2000 and 2002 a number of new demersal vessels have entered the Irish fleet. These programmes are the most significant targeted investment in upgrading and modernising in the history of the Irish State and were brought to fruition despite the backdrop of wholesale cuts being proposed by the EU under MAGP VI. It was considered vital at this time, to upgrade the Irish whitefish fleet in order to enhance competitiveness, safety and operational efficiency, as the average age of the Irish fleet prior to the Scheme was in excess of 30 years. To date a total of forty-four new and modern, secondhand vessels have been introduced replacing old and inefficient units. The introduction of these vessels has, however, raised a number of questions in that while overall tonnage and horsepower has not increased above permitted EU levels, the overall fishing efficiency and also the effort required to maintain viability has more than doubled. In particular the use of twin-rigs for species such as nephrops and demersal species such as monkfish and megrim by these new vessels has attracted many critics, who say it is too effective and indeed a wasteful form of fishing. This method was first introduced in Ireland in the mid-1980’s. BIM and nephrops fishermen in the Irish Sea, who saw the benefit of increasing the effective swept area of a trawl, pioneered it. It has proved so effective that many trawlers have converted to this method, including most of the new whitefish vessels. It is fair to say it’s development has been one of the most significant developments in demersal trawl fisheries in the last 20 years and recently the use of triple and even four nets has now been tried in other countries, particularly in fisheries for deepwater shrimp (Pandaleus borealis) and some Irish fishermen are indeed looking closely at the triple-rig for species such as nephrops. The “over-efficiency” arguments against the use of multi-rigs are well documented, and in Ireland due to increasing operating and gear costs and also a chronic shortage of qualified crew some of the bigger operators who have been working twin-rigs for mixed whitefish species, have begun to investigate the possibility of returning to fishing with a single trawl to reduce costs. In order to ascertain whether this assumption is correct, BIM have carried out an assessment using two vessels as a case study as part of a much more detailed assessment of the success of the Whitefish Renewal Schemes. Objectives The overall aim of this study was to ascertain whether by returning to traditional single-rig trawling that economic viability could be maintained, by offsetting a reduction in fishing efficiency with a reduction in operating costs. A secondary objective was to estimate the relative fishing efficiency through the use of gear monitoring systems and operational parameters of single rigs as opposed to twin rigs. 3.3.3.2 Fleet Métiers
Table 1 summarises the profile of the twin-rig sectors of the Irish fleet by length of vessels as taken from the Irish Fleet Register, 2003. Vessel Type 12-17.99m 18-23.99m 24m+ Total Twin-rig Whitefish 14 5 19 Twin-rig Nephrops 5 31 36 Twin-rig Whitefish/Nephrops
12 16 1 29
Total 17 61 6 84
Table 1 A Breakdown of the Irish Twin-Rig Fleet in 2003
Available data suggests that the nephrops and nephrops/whitefish “dual-purpose” twin-riggers do not have a viability problem at present, and a return to single-rigging for most of these vessels was not considered a viable option by the owners on discussion with them. Thus for this study the sector containing the 19 twin-rig whitefish vessels were considered, as the vessels in this sector are reportedly operating on a high gross earnings/high operating costs basis and in recent years on diminishing profits
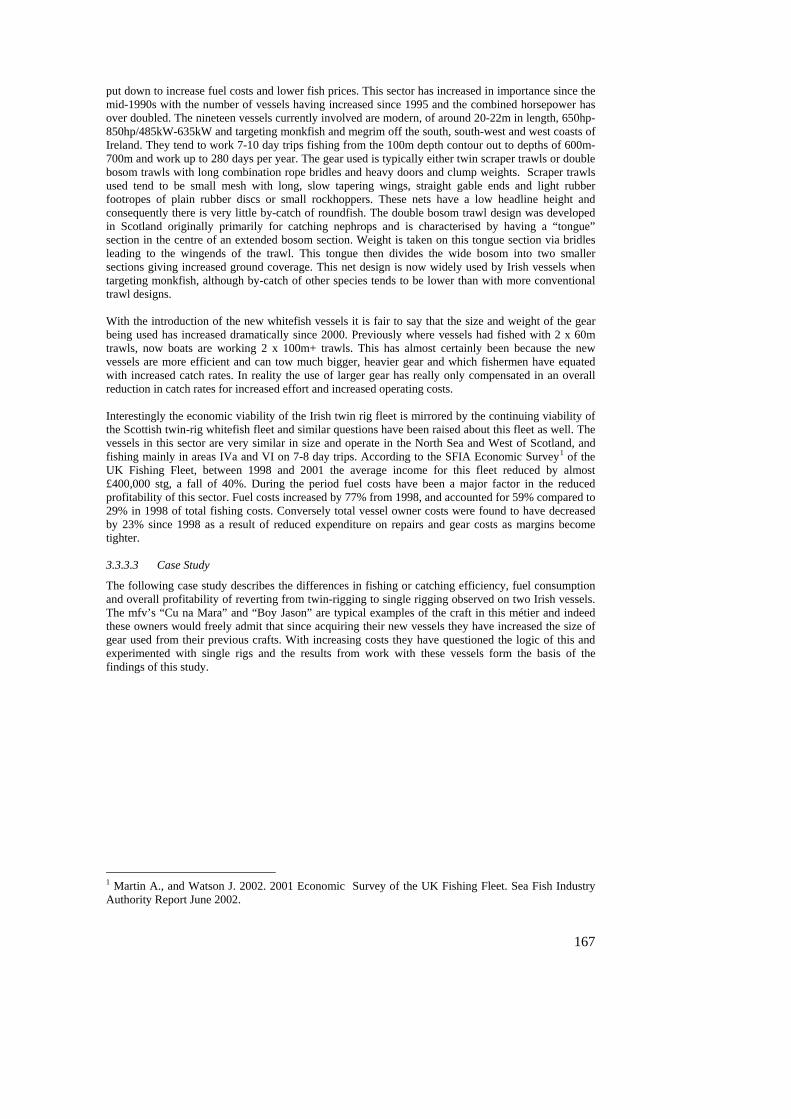
167
put down to increase fuel costs and lower fish prices. This sector has increased in importance since the mid-1990s with the number of vessels having increased since 1995 and the combined horsepower has over doubled. The nineteen vessels currently involved are modern, of around 20-22m in length, 650hp-850hp/485kW-635kW and targeting monkfish and megrim off the south, south-west and west coasts of Ireland. They tend to work 7-10 day trips fishing from the 100m depth contour out to depths of 600m-700m and work up to 280 days per year. The gear used is typically either twin scraper trawls or double bosom trawls with long combination rope bridles and heavy doors and clump weights. Scraper trawls used tend to be small mesh with long, slow tapering wings, straight gable ends and light rubber footropes of plain rubber discs or small rockhoppers. These nets have a low headline height and consequently there is very little by-catch of roundfish. The double bosom trawl design was developed in Scotland originally primarily for catching nephrops and is characterised by having a “tongue” section in the centre of an extended bosom section. Weight is taken on this tongue section via bridles leading to the wingends of the trawl. This tongue then divides the wide bosom into two smaller sections giving increased ground coverage. This net design is now widely used by Irish vessels when targeting monkfish, although by-catch of other species tends to be lower than with more conventional trawl designs. With the introduction of the new whitefish vessels it is fair to say that the size and weight of the gear being used has increased dramatically since 2000. Previously where vessels had fished with 2 x 60m trawls, now boats are working 2 x 100m+ trawls. This has almost certainly been because the new vessels are more efficient and can tow much bigger, heavier gear and which fishermen have equated with increased catch rates. In reality the use of larger gear has really only compensated in an overall reduction in catch rates for increased effort and increased operating costs. Interestingly the economic viability of the Irish twin rig fleet is mirrored by the continuing viability of the Scottish twin-rig whitefish fleet and similar questions have been raised about this fleet as well. The vessels in this sector are very similar in size and operate in the North Sea and West of Scotland, and fishing mainly in areas IVa and VI on 7-8 day trips. According to the SFIA Economic Survey1 of the UK Fishing Fleet, between 1998 and 2001 the average income for this fleet reduced by almost £400,000 stg, a fall of 40%. During the period fuel costs have been a major factor in the reduced profitability of this sector. Fuel costs increased by 77% from 1998, and accounted for 59% compared to 29% in 1998 of total fishing costs. Conversely total vessel owner costs were found to have decreased by 23% since 1998 as a result of reduced expenditure on repairs and gear costs as margins become tighter. 3.3.3.3 Case Study
The following case study describes the differences in fishing or catching efficiency, fuel consumption and overall profitability of reverting from twin-rigging to single rigging observed on two Irish vessels. The mfv’s “Cu na Mara” and “Boy Jason” are typical examples of the craft in this métier and indeed these owners would freely admit that since acquiring their new vessels they have increased the size of gear used from their previous crafts. With increasing costs they have questioned the logic of this and experimented with single rigs and the results from work with these vessels form the basis of the findings of this study.
1 Martin A., and Watson J. 2002. 2001 Economic Survey of the UK Fishing Fleet. Sea Fish Industry Authority Report June 2002.
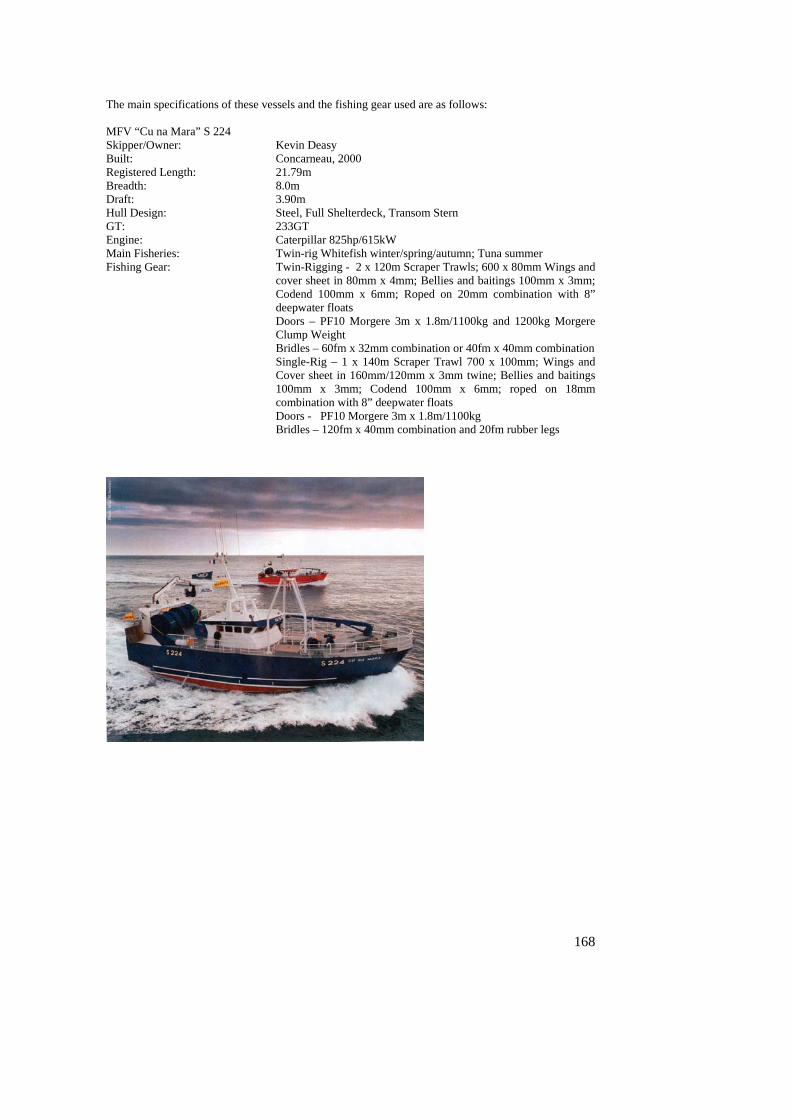
168
The main specifications of these vessels and the fishing gear used are as follows: MFV “Cu na Mara” S 224 Skipper/Owner: Kevin Deasy Built: Concarneau, 2000 Registered Length: 21.79m Breadth: 8.0m Draft: 3.90m Hull Design: Steel, Full Shelterdeck, Transom Stern GT: 233GT Engine: Caterpillar 825hp/615kW Main Fisheries: Twin-rig Whitefish winter/spring/autumn; Tuna summer Fishing Gear: Twin-Rigging - 2 x 120m Scraper Trawls; 600 x 80mm Wings and
cover sheet in 80mm x 4mm; Bellies and baitings 100mm x 3mm; Codend 100mm x 6mm; Roped on 20mm combination with 8” deepwater floats
Doors – PF10 Morgere 3m x 1.8m/1100kg and 1200kg Morgere Clump Weight
Bridles – 60fm x 32mm combination or 40fm x 40mm combination Single-Rig – 1 x 140m Scraper Trawl 700 x 100mm; Wings and
Cover sheet in 160mm/120mm x 3mm twine; Bellies and baitings 100mm x 3mm; Codend 100mm x 6mm; roped on 18mm combination with 8” deepwater floats
Doors - PF10 Morgere 3m x 1.8m/1100kg Bridles – 120fm x 40mm combination and 20fm rubber legs
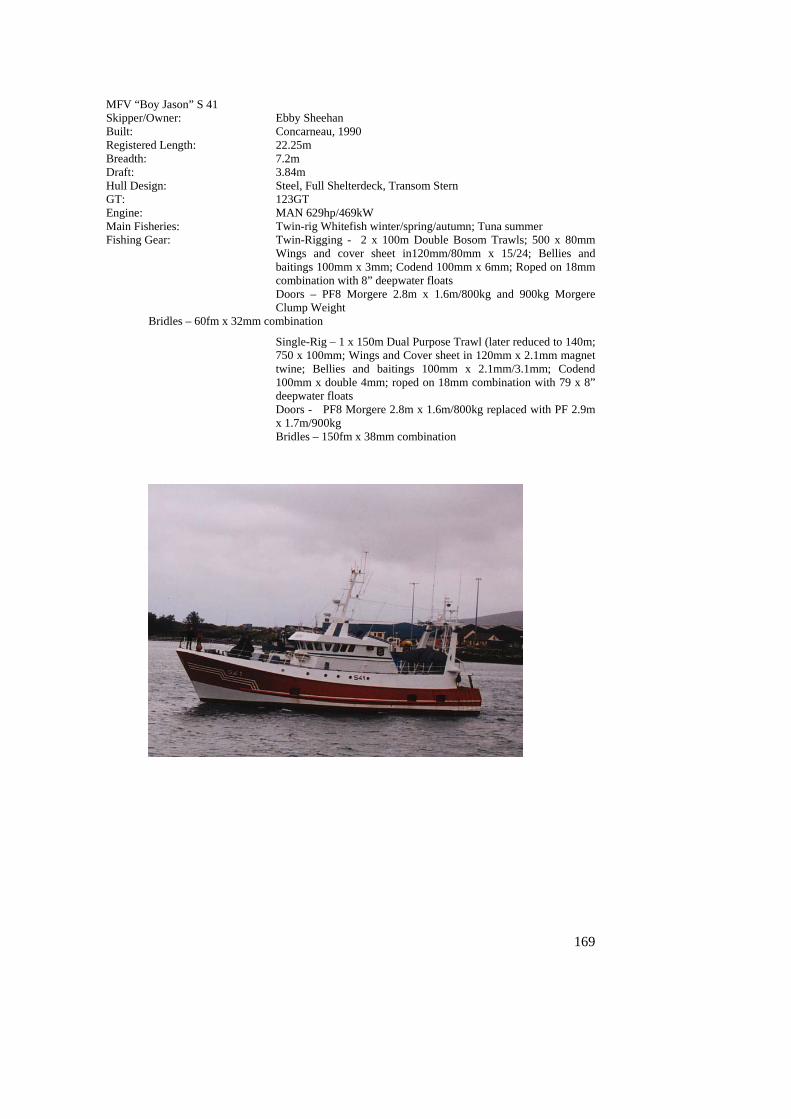
169
MFV “Boy Jason” S 41 Skipper/Owner: Ebby Sheehan Built: Concarneau, 1990 Registered Length: 22.25m Breadth: 7.2m Draft: 3.84m Hull Design: Steel, Full Shelterdeck, Transom Stern GT: 123GT Engine: MAN 629hp/469kW Main Fisheries: Twin-rig Whitefish winter/spring/autumn; Tuna summer Fishing Gear: Twin-Rigging - 2 x 100m Double Bosom Trawls; 500 x 80mm
Wings and cover sheet in120mm/80mm x 15/24; Bellies and baitings 100mm x 3mm; Codend 100mm x 6mm; Roped on 18mm combination with 8” deepwater floats
Doors – PF8 Morgere 2.8m x 1.6m/800kg and 900kg Morgere Clump Weight
Bridles – 60fm x 32mm combination
Single-Rig – 1 x 150m Dual Purpose Trawl (later reduced to 140m; 750 x 100mm; Wings and Cover sheet in 120mm x 2.1mm magnet twine; Bellies and baitings 100mm x 2.1mm/3.1mm; Codend 100mm x double 4mm; roped on 18mm combination with 79 x 8” deepwater floats
Doors - PF8 Morgere 2.8m x 1.6m/800kg replaced with PF 2.9m x 1.7m/900kg
Bridles – 150fm x 38mm combination
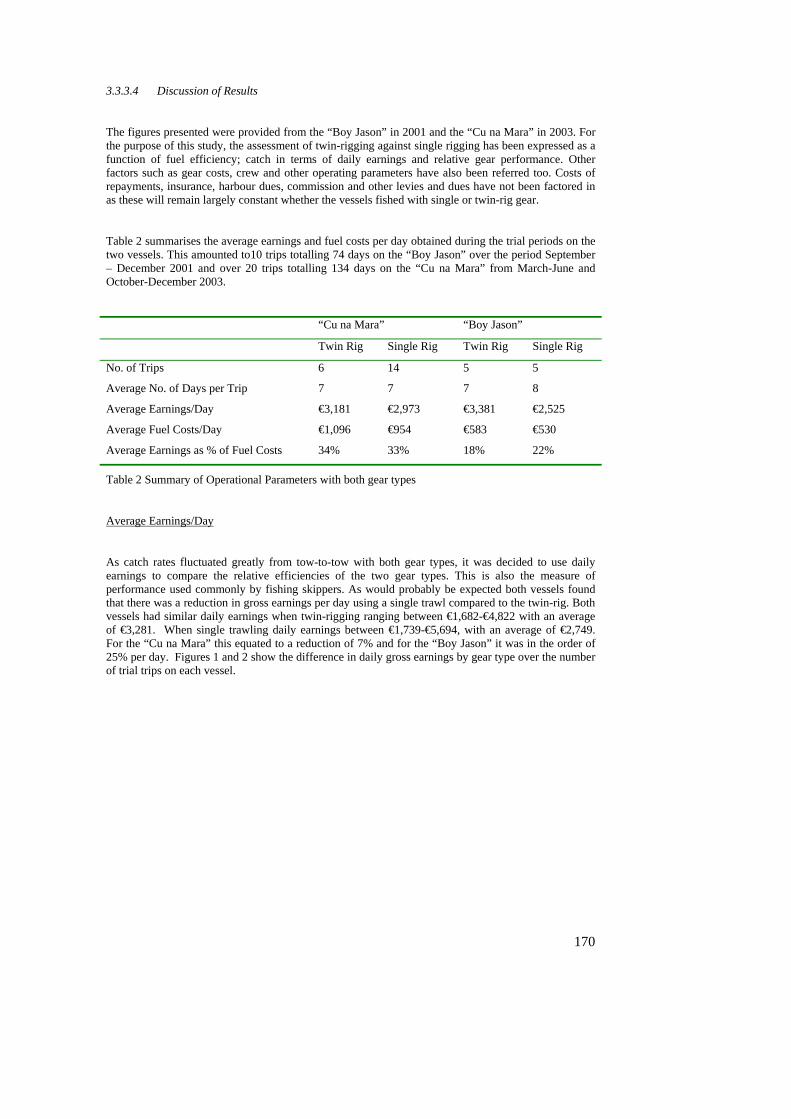
170
3.3.3.4 Discussion of Results
The figures presented were provided from the “Boy Jason” in 2001 and the “Cu na Mara” in 2003. For the purpose of this study, the assessment of twin-rigging against single rigging has been expressed as a function of fuel efficiency; catch in terms of daily earnings and relative gear performance. Other factors such as gear costs, crew and other operating parameters have also been referred too. Costs of repayments, insurance, harbour dues, commission and other levies and dues have not been factored in as these will remain largely constant whether the vessels fished with single or twin-rig gear.
Table 2 summarises the average earnings and fuel costs per day obtained during the trial periods on the two vessels. This amounted to10 trips totalling 74 days on the “Boy Jason” over the period September – December 2001 and over 20 trips totalling 134 days on the “Cu na Mara” from March-June and October-December 2003.
“Cu na Mara” “Boy Jason”
Twin Rig Single Rig Twin Rig Single Rig
No. of Trips 6 14 5 5
Average No. of Days per Trip 7 7 7 8
Average Earnings/Day €3,181 €2,973 €3,381 €2,525
Average Fuel Costs/Day €1,096 €954 €583 €530
Average Earnings as % of Fuel Costs 34% 33% 18% 22%
Table 2 Summary of Operational Parameters with both gear types
Average Earnings/Day
As catch rates fluctuated greatly from tow-to-tow with both gear types, it was decided to use daily earnings to compare the relative efficiencies of the two gear types. This is also the measure of performance used commonly by fishing skippers. As would probably be expected both vessels found that there was a reduction in gross earnings per day using a single trawl compared to the twin-rig. Both vessels had similar daily earnings when twin-rigging ranging between €1,682-€4,822 with an average of €3,281. When single trawling daily earnings between €1,739-€5,694, with an average of €2,749. For the “Cu na Mara” this equated to a reduction of 7% and for the “Boy Jason” it was in the order of 25% per day. Figures 1 and 2 show the difference in daily gross earnings by gear type over the number of trial trips on each vessel.
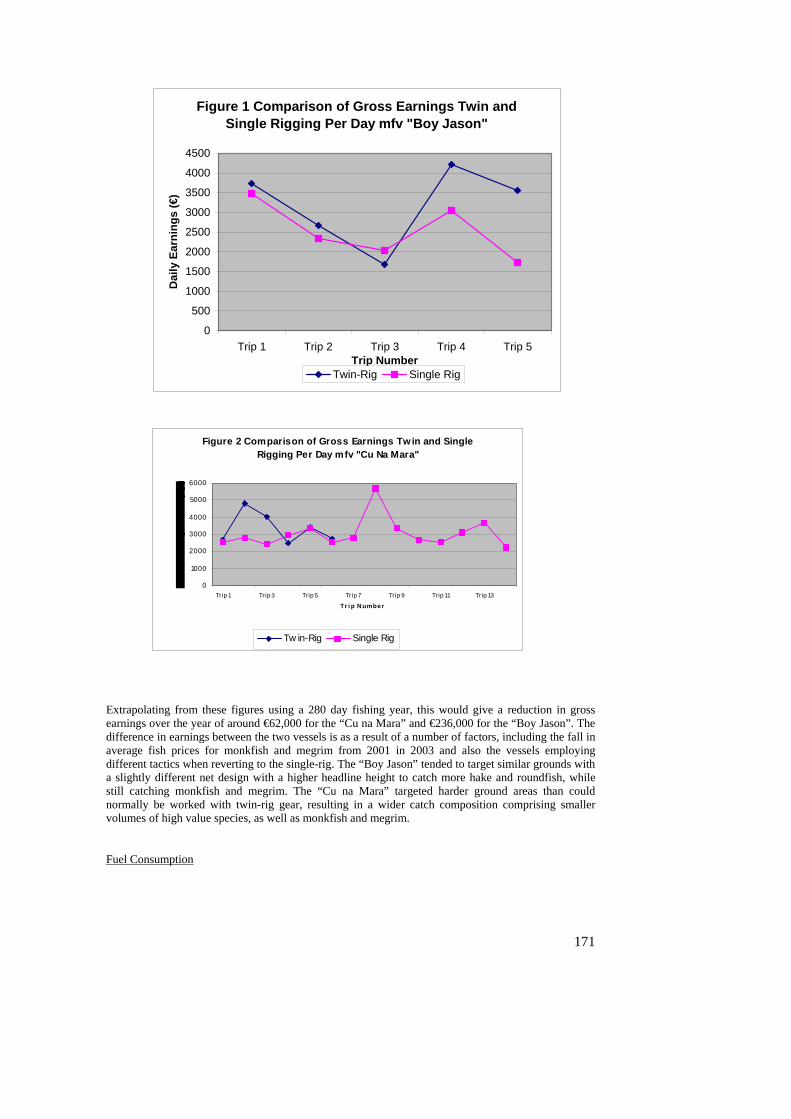
171
Figure 1 Comparison of Gross Earnings Twin and Single Rigging Per Day mfv "Boy Jason"
0
500
1000
1500
2000
2500
3000
3500
4000
4500
Trip 1 Trip 2 Trip 3 Trip 4 Trip 5Trip Number
Dai
ly E
arni
ngs
(€)
Twin-Rig Single Rig
Figure 2 Comparison of Gross Earnings Twin and Single Rigging Per Day mfv "Cu Na Mara"
0
1000
2000
3000
4000
5000
6000
Trip 1 Tr ip 3 Trip 5 Tr ip 7 Trip 9 Trip 11 Trip 13
Tr i p N umbe r
Tw in-Rig Single Rig
Extrapolating from these figures using a 280 day fishing year, this would give a reduction in gross earnings over the year of around €62,000 for the “Cu na Mara” and €236,000 for the “Boy Jason”. The difference in earnings between the two vessels is as a result of a number of factors, including the fall in average fish prices for monkfish and megrim from 2001 in 2003 and also the vessels employing different tactics when reverting to the single-rig. The “Boy Jason” tended to target similar grounds with a slightly different net design with a higher headline height to catch more hake and roundfish, while still catching monkfish and megrim. The “Cu na Mara” targeted harder ground areas than could normally be worked with twin-rig gear, resulting in a wider catch composition comprising smaller volumes of high value species, as well as monkfish and megrim.
Fuel Consumption
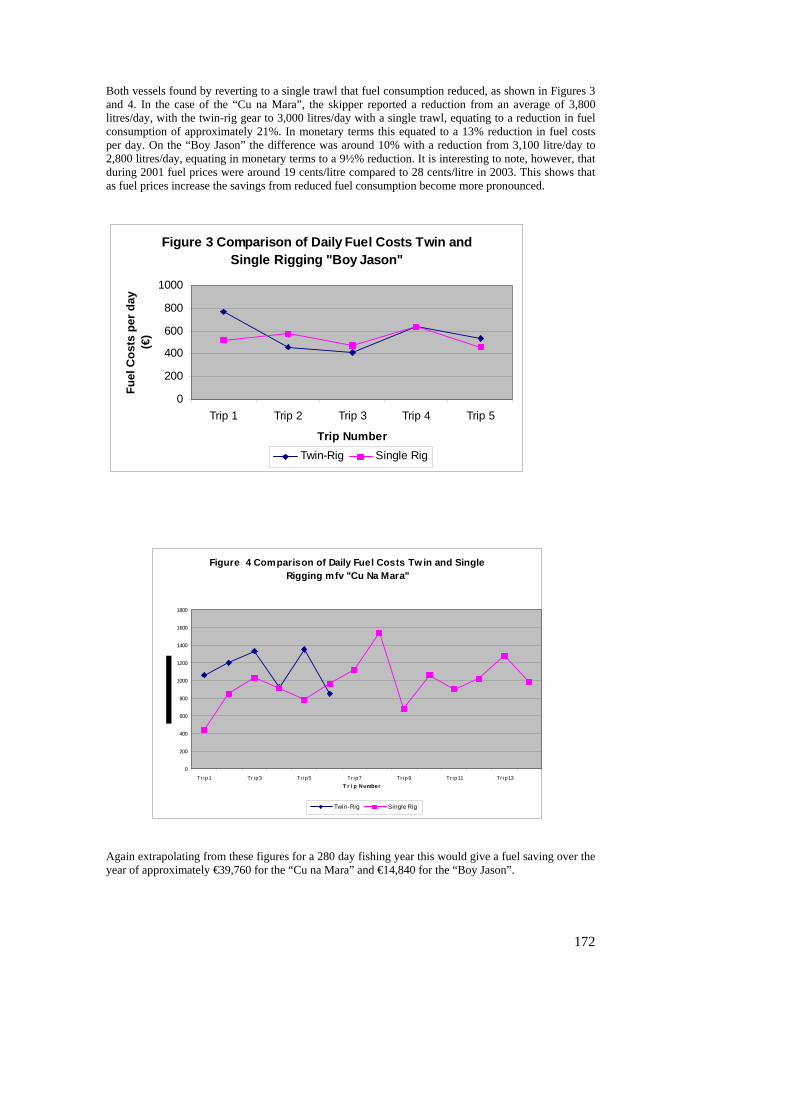
172
Both vessels found by reverting to a single trawl that fuel consumption reduced, as shown in Figures 3 and 4. In the case of the “Cu na Mara”, the skipper reported a reduction from an average of 3,800 litres/day, with the twin-rig gear to 3,000 litres/day with a single trawl, equating to a reduction in fuel consumption of approximately 21%. In monetary terms this equated to a 13% reduction in fuel costs per day. On the “Boy Jason” the difference was around 10% with a reduction from 3,100 litre/day to 2,800 litres/day, equating in monetary terms to a 9½% reduction. It is interesting to note, however, that during 2001 fuel prices were around 19 cents/litre compared to 28 cents/litre in 2003. This shows that as fuel prices increase the savings from reduced fuel consumption become more pronounced.
Figure 3 Comparison of Daily Fuel Costs Twin and Single Rigging "Boy Jason"
0
200
400
600
800
1000
Trip 1 Trip 2 Trip 3 Trip 4 Trip 5
Trip Number
Fuel
Cos
ts p
er d
ay
(€)
Twin-Rig Single Rig
Figure 4 Comparison of Daily Fuel Costs Twin and Single Rigging mfv "Cu Na Mara"
0
200
400
600
800
1000
1200
1400
1600
1800
Tr ip 1 Tr ip 3 Tr ip 5 Tr ip 7 Tr ip 9 Tr ip 11 Tr ip 13T r i p Number
Twin-Rig Single Rig
Again extrapolating from these figures for a 280 day fishing year this would give a fuel saving over the year of approximately €39,760 for the “Cu na Mara” and €14,840 for the “Boy Jason”.
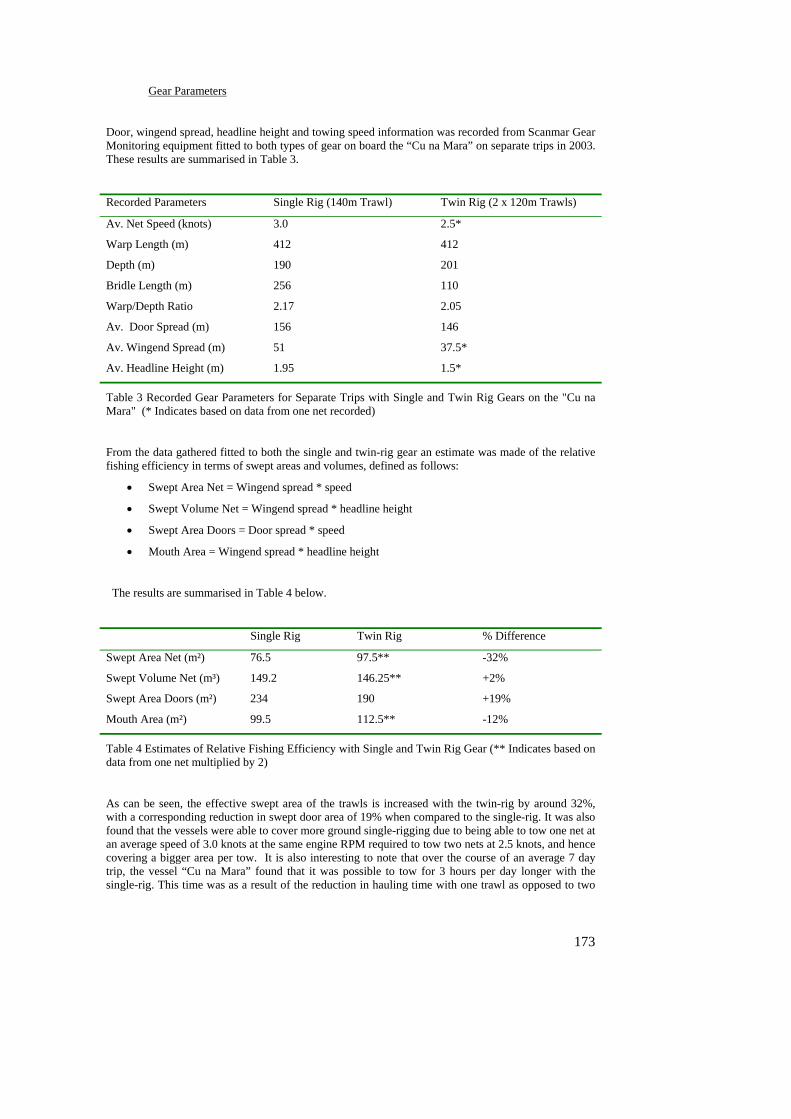
173
Gear Parameters
Door, wingend spread, headline height and towing speed information was recorded from Scanmar Gear Monitoring equipment fitted to both types of gear on board the “Cu na Mara” on separate trips in 2003. These results are summarised in Table 3.
Recorded Parameters Single Rig (140m Trawl) Twin Rig (2 x 120m Trawls)
Av. Net Speed (knots) 3.0 2.5*
Warp Length (m) 412 412
Depth (m) 190 201
Bridle Length (m) 256 110
Warp/Depth Ratio 2.17 2.05
Av. Door Spread (m) 156 146
Av. Wingend Spread (m) 51 37.5*
Av. Headline Height (m) 1.95 1.5*
Table 3 Recorded Gear Parameters for Separate Trips with Single and Twin Rig Gears on the "Cu na Mara" (* Indicates based on data from one net recorded)
From the data gathered fitted to both the single and twin-rig gear an estimate was made of the relative fishing efficiency in terms of swept areas and volumes, defined as follows:
• Swept Area Net = Wingend spread * speed
• Swept Volume Net = Wingend spread * headline height
• Swept Area Doors = Door spread * speed
• Mouth Area = Wingend spread * headline height
The results are summarised in Table 4 below.
Single Rig Twin Rig % Difference
Swept Area Net (m²) 76.5 97.5** -32%
Swept Volume Net (m³) 149.2 146.25** +2%
Swept Area Doors (m²) 234 190 +19%
Mouth Area (m²) 99.5 112.5** -12%
Table 4 Estimates of Relative Fishing Efficiency with Single and Twin Rig Gear (** Indicates based on data from one net multiplied by 2)
As can be seen, the effective swept area of the trawls is increased with the twin-rig by around 32%, with a corresponding reduction in swept door area of 19% when compared to the single-rig. It was also found that the vessels were able to cover more ground single-rigging due to being able to tow one net at an average speed of 3.0 knots at the same engine RPM required to tow two nets at 2.5 knots, and hence covering a bigger area per tow. It is also interesting to note that over the course of an average 7 day trip, the vessel “Cu na Mara” found that it was possible to tow for 3 hours per day longer with the single-rig. This time was as a result of the reduction in hauling time with one trawl as opposed to two
174
nets. Over the course of a 7 day trip, the time thus gained is estimated at around 18 hours per trip, equivalent to 4½ x 4 hour tows extra per trip.
These results should be treated with caution as they are based on trials over a short time period and do not necessarily equate to optimum catch rates with either gears, although at these values the nets are fishing with similar bridle angles of 12º-14º.
Other Factors
According to the skippers interviewed, reverting to single-rigging had a number of other potential benefits aside from the improved fuel efficiency and only slight differences in gear efficiency found.
The gear expenses associated with twin-rigging have become increasingly prohibitive as reported by both skippers. Reverting to single rigging effectively means that a vessel does not need a clump weight, warp for the middle wire in a twin-rig system and only one set of bridles. At current prices this equates to a saving of around €16,000. Other gear expenses made up mainly of chandlery e.g. (shackles, hammerlocks, chain etc.) are also reduced, and during this study equated to on average between €500-1,000 per trip. Labour costs of mending nets ashore were also reduced by around €1,500 per month due to a reduced need to leave nets ashore to be repaired during trips. This is common practice for Irish twin-rig vessels as gear damage has increased as new grounds have been attempted to be opened up and is now accepted as an added cost to these vessels. This represents a saving per year of approximately €30,000-36,000 in gear and repair costs. The skipper of the “Cu na Mara” also reported an added benefit of the single-rig was that he did not have to use the Auto Trawl System other than to shoot and haul the gear. This dramatically reduced, not only wear and tear on the warps on the vessel but also on the vessels hydraulics.
As discussed single-rigging also allows the vessels to work much harder ground, working along the edges of banks and on stony ground. This resulted in a different catch composition comprising small volumes of high value species such as John Dory, lemon sole and red mullet, along with monkfish and megrim. With the single-rigs landings contained around 45-55% monkfish, in comparison to landings with the twin-rig gear, which was made up of 85%-95% of monkfish. The over reliance on one species for the majority of a vessel’s earnings is a cause for concern of many of the skippers in the twin-rig sector and small catches of high values species are seen as one way to supplement earnings. Should monkfish quotas in particular come under further pressure or, as has been the case in the last 2 years, prices for monkfish and other “Spanish” species drop further, the economic viability of Irish twin-rig vessels is further in question.
The “Boy Jason” also found crew numbers could be reduced by one man at least with the single-rig gear, due to the less time spent hauling and shooting and a reduction in gear damage. Working with one less crew would represent a saving of around €25,000 per year for one of these vessels. The “Cu na Mara”, however, has maintained the same crew size as the vessel tended to work harder crew and incurred significant gear damage, although with one net the crew can cope with this level of damage without downtime at sea. Whether single rigging ultimately will allow a reduction in crew numbers is therefore based very much on the fishing tactics employed.

175
3.3.3.5 Conclusions
The findings suggest that, for this sector of the Irish fleet a return to single-rig trawling has some obvious advantages, particularly in terms of fuel and other cost savings but there will be a corresponding loss of earnings, which from the results from these two vessels averages out at 16%. Extrapolating from the fuel savings and the indicative reduction in gear and crew costs, showed the reduction in gross earnings to be almost negated on the “Cu na Mara”. This vessel has remained single trawling. Results from the “Boy Jason” showed savings not as high compared to the reduction in earnings, due largely to lower fuel costs and higher prices for monkfish at the time of the first part of the study. The owner of this vessel was less convinced about the benefits of single trawling at the time and the vessel reverted back to twin-rigging at the beginning of 2002. Subsequently the vessel switched to single trawling during the summer months in 2002 and 2003 when monkfish are generally less prolific on the grounds and intends doing the same in 2004, targeting megrim and hake which currently have less quota restraints. The differences in earnings also reflect the different strategies adopted by the vessels when reverting to single-rig trawling, and in this respect there is no doubt that when monkfish are the main target species the twin-rig has a significant advantage over the single rig. The over reliance on this species, however, raises serious questions and it is fully accepted by all of the operators in the twin-rig sector that there is a need to diversify to other species. In terms of relative fishing efficiency twin-rig gear has an advantage in terms of swept net area but again this is largely counteracted by the fact that much longer bridles can be worked with a single net, giving a larger swept door area. Towing one net also had the added advantage of increasing the effective fishing time by up to 3 hours per day, equivalent to 4 complete tows a trip. This study was not designed to be a full economic analysis of the profitability of twin-rigging compared to single rigging for the entire sector, but more as an indication to the skippers involved in this sector to examine closely their current operations and assess whether there is a need to consider other options for their vessels, including looking at returning for part or all of the time to single trawling. In this respect it has raised a number of interesting points.
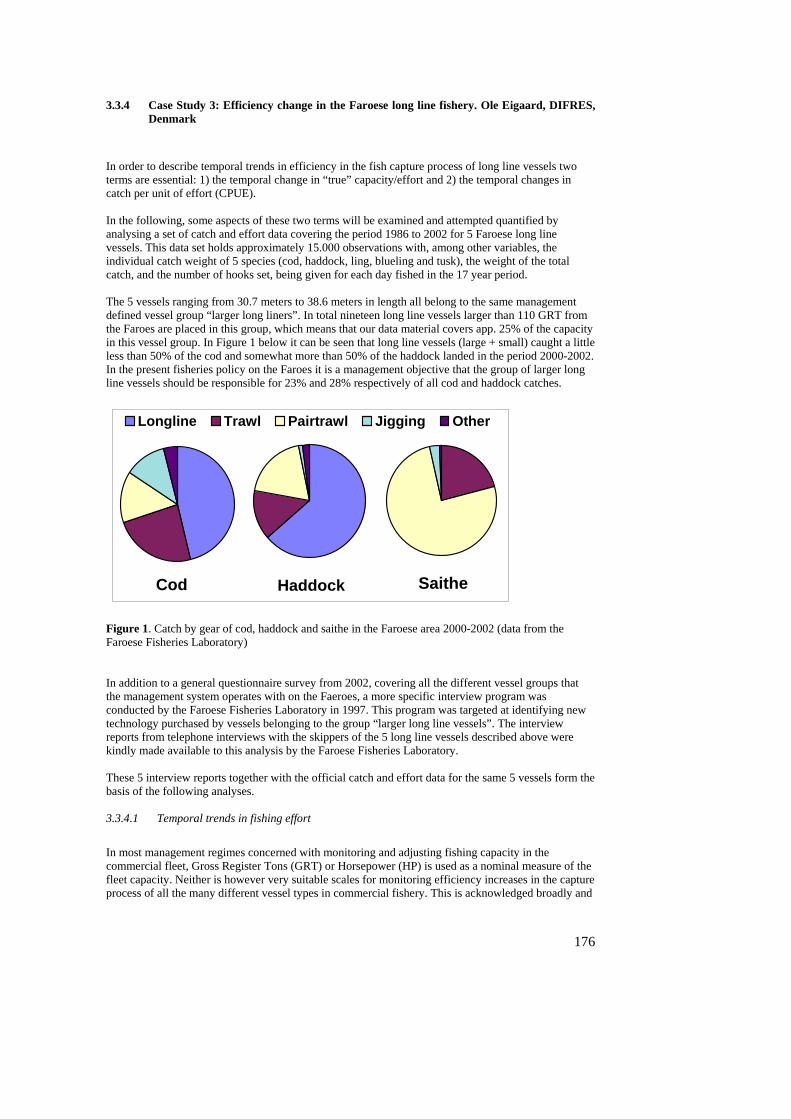
176
3.3.4 Case Study 3: Efficiency change in the Faroese long line fishery. Ole Eigaard, DIFRES, Denmark
In order to describe temporal trends in efficiency in the fish capture process of long line vessels two terms are essential: 1) the temporal change in “true” capacity/effort and 2) the temporal changes in catch per unit of effort (CPUE). In the following, some aspects of these two terms will be examined and attempted quantified by analysing a set of catch and effort data covering the period 1986 to 2002 for 5 Faroese long line vessels. This data set holds approximately 15.000 observations with, among other variables, the individual catch weight of 5 species (cod, haddock, ling, blueling and tusk), the weight of the total catch, and the number of hooks set, being given for each day fished in the 17 year period. The 5 vessels ranging from 30.7 meters to 38.6 meters in length all belong to the same management defined vessel group “larger long liners”. In total nineteen long line vessels larger than 110 GRT from the Faroes are placed in this group, which means that our data material covers app. 25% of the capacity in this vessel group. In Figure 1 below it can be seen that long line vessels (large + small) caught a little less than 50% of the cod and somewhat more than 50% of the haddock landed in the period 2000-2002. In the present fisheries policy on the Faroes it is a management objective that the group of larger long line vessels should be responsible for 23% and 28% respectively of all cod and haddock catches.
Cod
Longline Trawl Pairtrawl Jigging Other
Haddock Saithe
Figure 1. Catch by gear of cod, haddock and saithe in the Faroese area 2000-2002 (data from the Faroese Fisheries Laboratory) In addition to a general questionnaire survey from 2002, covering all the different vessel groups that the management system operates with on the Faeroes, a more specific interview program was conducted by the Faroese Fisheries Laboratory in 1997. This program was targeted at identifying new technology purchased by vessels belonging to the group “larger long line vessels”. The interview reports from telephone interviews with the skippers of the 5 long line vessels described above were kindly made available to this analysis by the Faroese Fisheries Laboratory. These 5 interview reports together with the official catch and effort data for the same 5 vessels form the basis of the following analyses. 3.3.4.1 Temporal trends in fishing effort
In most management regimes concerned with monitoring and adjusting fishing capacity in the commercial fleet, Gross Register Tons (GRT) or Horsepower (HP) is used as a nominal measure of the fleet capacity. Neither is however very suitable scales for monitoring efficiency increases in the capture process of all the many different vessel types in commercial fishery. This is acknowledged broadly and
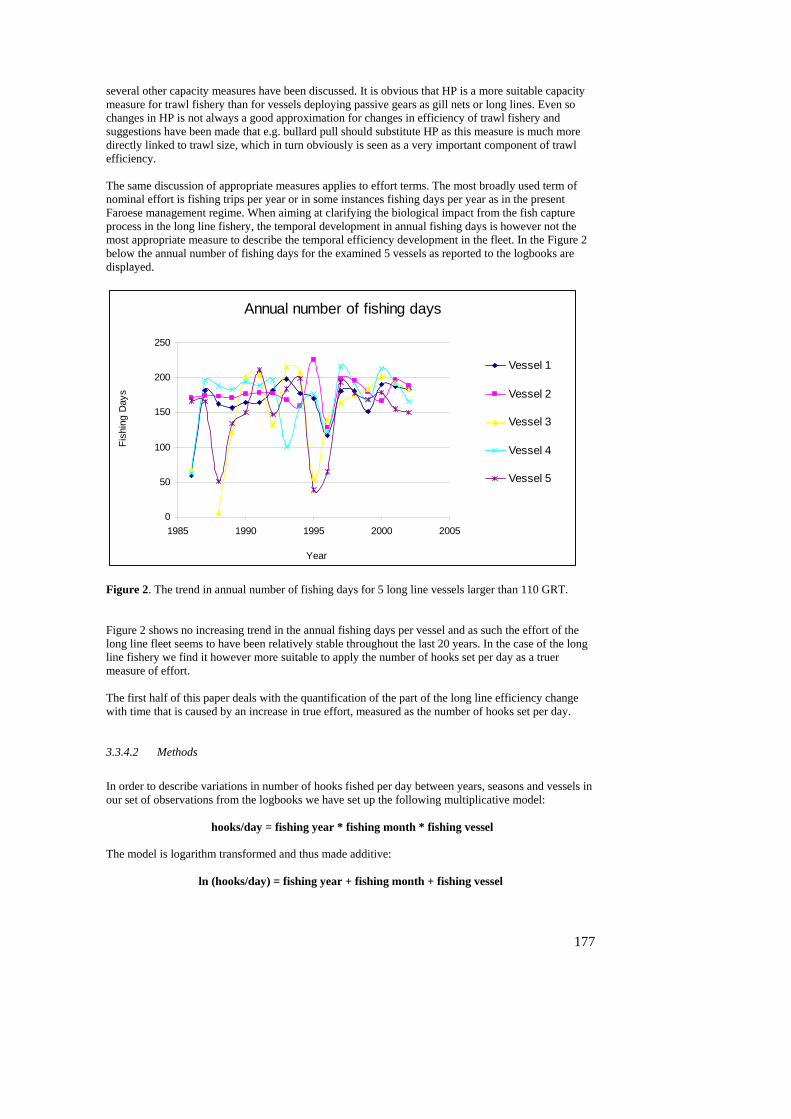
177
several other capacity measures have been discussed. It is obvious that HP is a more suitable capacity measure for trawl fishery than for vessels deploying passive gears as gill nets or long lines. Even so changes in HP is not always a good approximation for changes in efficiency of trawl fishery and suggestions have been made that e.g. bullard pull should substitute HP as this measure is much more directly linked to trawl size, which in turn obviously is seen as a very important component of trawl efficiency. The same discussion of appropriate measures applies to effort terms. The most broadly used term of nominal effort is fishing trips per year or in some instances fishing days per year as in the present Faroese management regime. When aiming at clarifying the biological impact from the fish capture process in the long line fishery, the temporal development in annual fishing days is however not the most appropriate measure to describe the temporal efficiency development in the fleet. In the Figure 2 below the annual number of fishing days for the examined 5 vessels as reported to the logbooks are displayed.
Annual number of fishing days
0
50
100
150
200
250
1985 1990 1995 2000 2005
Year
Fish
ing
Day
s
Vessel 1
Vessel 2
Vessel 3
Vessel 4
Vessel 5
Figure 2. The trend in annual number of fishing days for 5 long line vessels larger than 110 GRT. Figure 2 shows no increasing trend in the annual fishing days per vessel and as such the effort of the long line fleet seems to have been relatively stable throughout the last 20 years. In the case of the long line fishery we find it however more suitable to apply the number of hooks set per day as a truer measure of effort. The first half of this paper deals with the quantification of the part of the long line efficiency change with time that is caused by an increase in true effort, measured as the number of hooks set per day. 3.3.4.2 Methods
In order to describe variations in number of hooks fished per day between years, seasons and vessels in our set of observations from the logbooks we have set up the following multiplicative model:
hooks/day = fishing year * fishing month * fishing vessel The model is logarithm transformed and thus made additive:
ln (hooks/day) = fishing year + fishing month + fishing vessel
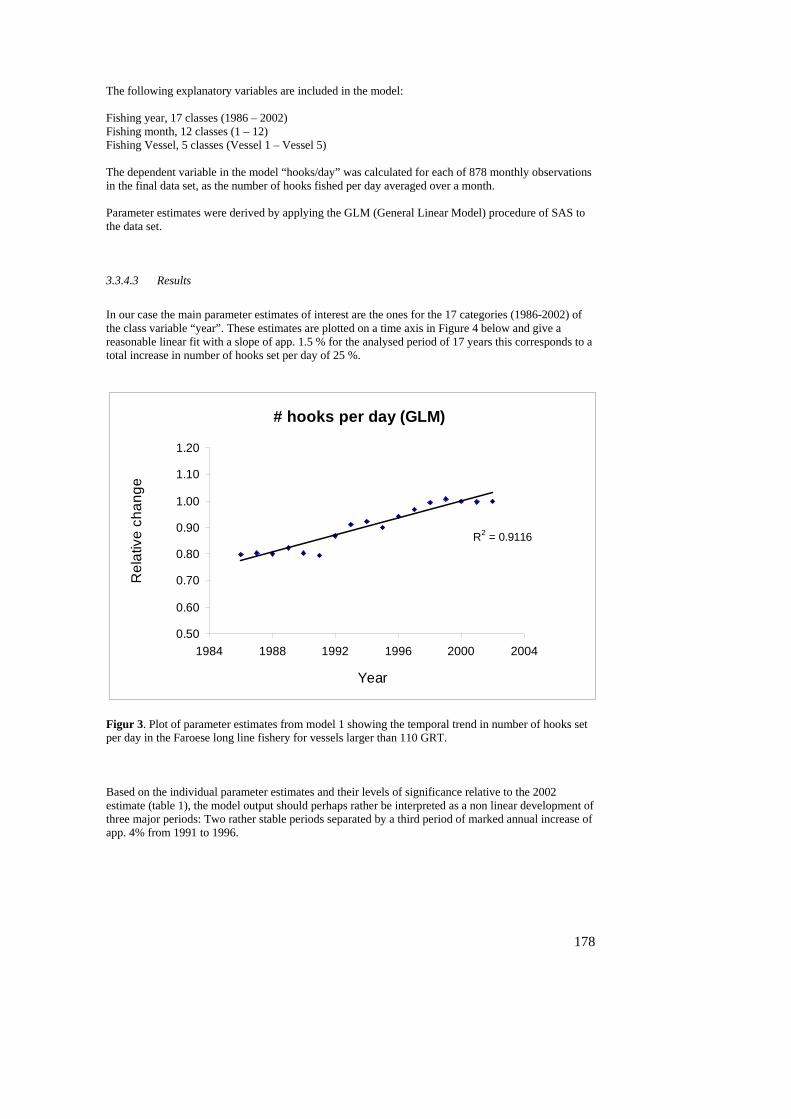
178
The following explanatory variables are included in the model: Fishing year, 17 classes (1986 – 2002) Fishing month, 12 classes (1 – 12) Fishing Vessel, 5 classes (Vessel 1 – Vessel 5) The dependent variable in the model “hooks/day” was calculated for each of 878 monthly observations in the final data set, as the number of hooks fished per day averaged over a month. Parameter estimates were derived by applying the GLM (General Linear Model) procedure of SAS to the data set. 3.3.4.3 Results
In our case the main parameter estimates of interest are the ones for the 17 categories (1986-2002) of the class variable “year”. These estimates are plotted on a time axis in Figure 4 below and give a reasonable linear fit with a slope of app. 1.5 % for the analysed period of 17 years this corresponds to a total increase in number of hooks set per day of 25 %.
# hooks per day (GLM)
R2 = 0.9116
0.50
0.60
0.70
0.80
0.90
1.00
1.10
1.20
1984 1988 1992 1996 2000 2004
Year
Rel
ativ
e ch
ange
Figur 3. Plot of parameter estimates from model 1 showing the temporal trend in number of hooks set per day in the Faroese long line fishery for vessels larger than 110 GRT. Based on the individual parameter estimates and their levels of significance relative to the 2002 estimate (table 1), the model output should perhaps rather be interpreted as a non linear development of three major periods: Two rather stable periods separated by a third period of marked annual increase of app. 4% from 1991 to 1996.
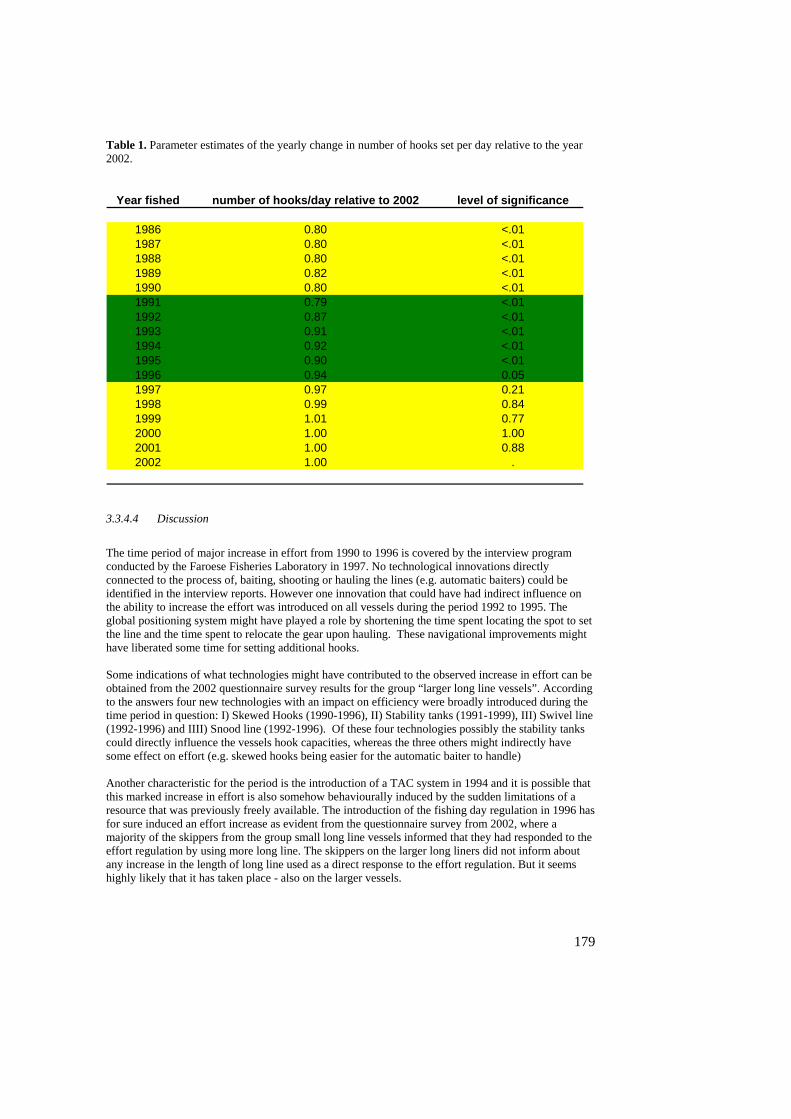
179
Table 1. Parameter estimates of the yearly change in number of hooks set per day relative to the year 2002.
Year fished number of hooks/day relative to 2002 level of significance
1986 0.80 <.011987 0.80 <.011988 0.80 <.011989 0.82 <.011990 0.80 <.011991 0.79 <.011992 0.87 <.011993 0.91 <.011994 0.92 <.011995 0.90 <.011996 0.94 0.051997 0.97 0.211998 0.99 0.841999 1.01 0.772000 1.00 1.002001 1.00 0.882002 1.00 .
3.3.4.4 Discussion
The time period of major increase in effort from 1990 to 1996 is covered by the interview program conducted by the Faroese Fisheries Laboratory in 1997. No technological innovations directly connected to the process of, baiting, shooting or hauling the lines (e.g. automatic baiters) could be identified in the interview reports. However one innovation that could have had indirect influence on the ability to increase the effort was introduced on all vessels during the period 1992 to 1995. The global positioning system might have played a role by shortening the time spent locating the spot to set the line and the time spent to relocate the gear upon hauling. These navigational improvements might have liberated some time for setting additional hooks. Some indications of what technologies might have contributed to the observed increase in effort can be obtained from the 2002 questionnaire survey results for the group “larger long line vessels”. According to the answers four new technologies with an impact on efficiency were broadly introduced during the time period in question: I) Skewed Hooks (1990-1996), II) Stability tanks (1991-1999), III) Swivel line (1992-1996) and IIII) Snood line (1992-1996). Of these four technologies possibly the stability tanks could directly influence the vessels hook capacities, whereas the three others might indirectly have some effect on effort (e.g. skewed hooks being easier for the automatic baiter to handle) Another characteristic for the period is the introduction of a TAC system in 1994 and it is possible that this marked increase in effort is also somehow behaviourally induced by the sudden limitations of a resource that was previously freely available. The introduction of the fishing day regulation in 1996 has for sure induced an effort increase as evident from the questionnaire survey from 2002, where a majority of the skippers from the group small long line vessels informed that they had responded to the effort regulation by using more long line. The skippers on the larger long liners did not inform about any increase in the length of long line used as a direct response to the effort regulation. But it seems highly likely that it has taken place - also on the larger vessels.
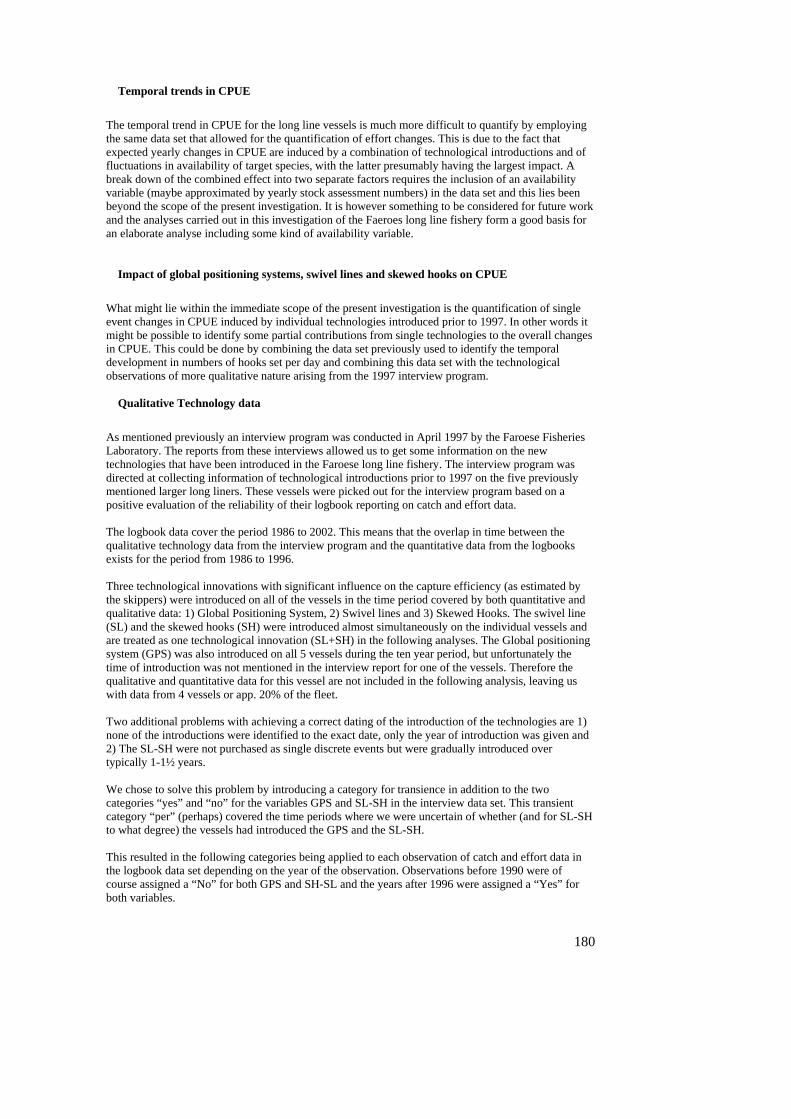
180
Temporal trends in CPUE
The temporal trend in CPUE for the long line vessels is much more difficult to quantify by employing the same data set that allowed for the quantification of effort changes. This is due to the fact that expected yearly changes in CPUE are induced by a combination of technological introductions and of fluctuations in availability of target species, with the latter presumably having the largest impact. A break down of the combined effect into two separate factors requires the inclusion of an availability variable (maybe approximated by yearly stock assessment numbers) in the data set and this lies been beyond the scope of the present investigation. It is however something to be considered for future work and the analyses carried out in this investigation of the Faeroes long line fishery form a good basis for an elaborate analyse including some kind of availability variable.
Impact of global positioning systems, swivel lines and skewed hooks on CPUE
What might lie within the immediate scope of the present investigation is the quantification of single event changes in CPUE induced by individual technologies introduced prior to 1997. In other words it might be possible to identify some partial contributions from single technologies to the overall changes in CPUE. This could be done by combining the data set previously used to identify the temporal development in numbers of hooks set per day and combining this data set with the technological observations of more qualitative nature arising from the 1997 interview program.
Qualitative Technology data
As mentioned previously an interview program was conducted in April 1997 by the Faroese Fisheries Laboratory. The reports from these interviews allowed us to get some information on the new technologies that have been introduced in the Faroese long line fishery. The interview program was directed at collecting information of technological introductions prior to 1997 on the five previously mentioned larger long liners. These vessels were picked out for the interview program based on a positive evaluation of the reliability of their logbook reporting on catch and effort data. The logbook data cover the period 1986 to 2002. This means that the overlap in time between the qualitative technology data from the interview program and the quantitative data from the logbooks exists for the period from 1986 to 1996. Three technological innovations with significant influence on the capture efficiency (as estimated by the skippers) were introduced on all of the vessels in the time period covered by both quantitative and qualitative data: 1) Global Positioning System, 2) Swivel lines and 3) Skewed Hooks. The swivel line (SL) and the skewed hooks (SH) were introduced almost simultaneously on the individual vessels and are treated as one technological innovation (SL+SH) in the following analyses. The Global positioning system (GPS) was also introduced on all 5 vessels during the ten year period, but unfortunately the time of introduction was not mentioned in the interview report for one of the vessels. Therefore the qualitative and quantitative data for this vessel are not included in the following analysis, leaving us with data from 4 vessels or app. 20% of the fleet. Two additional problems with achieving a correct dating of the introduction of the technologies are 1) none of the introductions were identified to the exact date, only the year of introduction was given and 2) The SL-SH were not purchased as single discrete events but were gradually introduced over typically 1-1½ years. We chose to solve this problem by introducing a category for transience in addition to the two categories “yes” and “no” for the variables GPS and SL-SH in the interview data set. This transient category “per” (perhaps) covered the time periods where we were uncertain of whether (and for SL-SH to what degree) the vessels had introduced the GPS and the SL-SH. This resulted in the following categories being applied to each observation of catch and effort data in the logbook data set depending on the year of the observation. Observations before 1990 were of course assigned a “No” for both GPS and SH-SL and the years after 1996 were assigned a “Yes” for both variables.
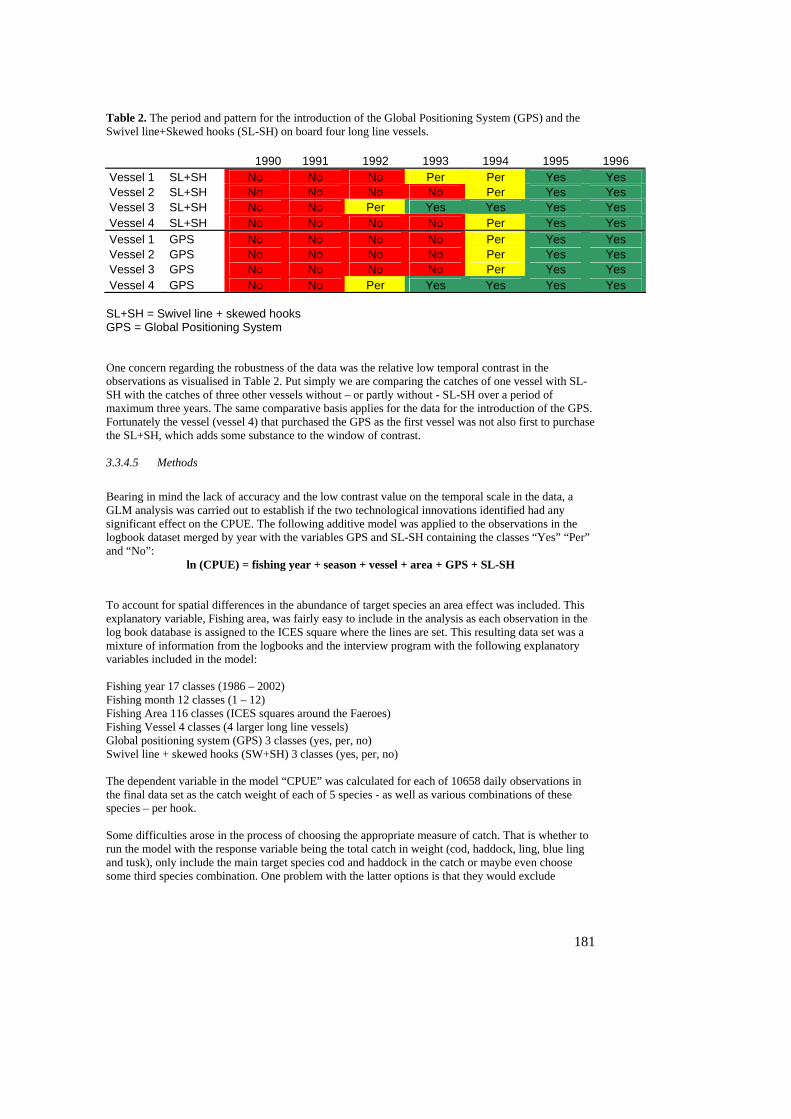
181
Table 2. The period and pattern for the introduction of the Global Positioning System (GPS) and the Swivel line+Skewed hooks (SL-SH) on board four long line vessels. 1990 1991 1992 1993 1994 1995 1996 Vessel 1 SL+SH No No No Per Per Yes Yes Vessel 2 SL+SH No No No No Per Yes Yes Vessel 3 SL+SH No No Per Yes Yes Yes Yes Vessel 4 SL+SH No No No No Per Yes Yes Vessel 1 GPS No No No No Per Yes Yes Vessel 2 GPS No No No No Per Yes Yes Vessel 3 GPS No No No No Per Yes Yes Vessel 4 GPS No No Per Yes Yes Yes Yes SL+SH = Swivel line + skewed hooks GPS = Global Positioning System One concern regarding the robustness of the data was the relative low temporal contrast in the observations as visualised in Table 2. Put simply we are comparing the catches of one vessel with SL-SH with the catches of three other vessels without – or partly without - SL-SH over a period of maximum three years. The same comparative basis applies for the data for the introduction of the GPS. Fortunately the vessel (vessel 4) that purchased the GPS as the first vessel was not also first to purchase the SL+SH, which adds some substance to the window of contrast. 3.3.4.5 Methods
Bearing in mind the lack of accuracy and the low contrast value on the temporal scale in the data, a GLM analysis was carried out to establish if the two technological innovations identified had any significant effect on the CPUE. The following additive model was applied to the observations in the logbook dataset merged by year with the variables GPS and SL-SH containing the classes “Yes” “Per” and “No”:
ln (CPUE) = fishing year + season + vessel + area + GPS + SL-SH To account for spatial differences in the abundance of target species an area effect was included. This explanatory variable, Fishing area, was fairly easy to include in the analysis as each observation in the log book database is assigned to the ICES square where the lines are set. This resulting data set was a mixture of information from the logbooks and the interview program with the following explanatory variables included in the model: Fishing year 17 classes (1986 – 2002) Fishing month 12 classes (1 – 12) Fishing Area 116 classes (ICES squares around the Faeroes) Fishing Vessel 4 classes (4 larger long line vessels) Global positioning system (GPS) 3 classes (yes, per, no) Swivel line + skewed hooks (SW+SH) 3 classes (yes, per, no) The dependent variable in the model “CPUE” was calculated for each of 10658 daily observations in the final data set as the catch weight of each of 5 species - as well as various combinations of these species – per hook. Some difficulties arose in the process of choosing the appropriate measure of catch. That is whether to run the model with the response variable being the total catch in weight (cod, haddock, ling, blue ling and tusk), only include the main target species cod and haddock in the catch or maybe even choose some third species combination. One problem with the latter options is that they would exclude
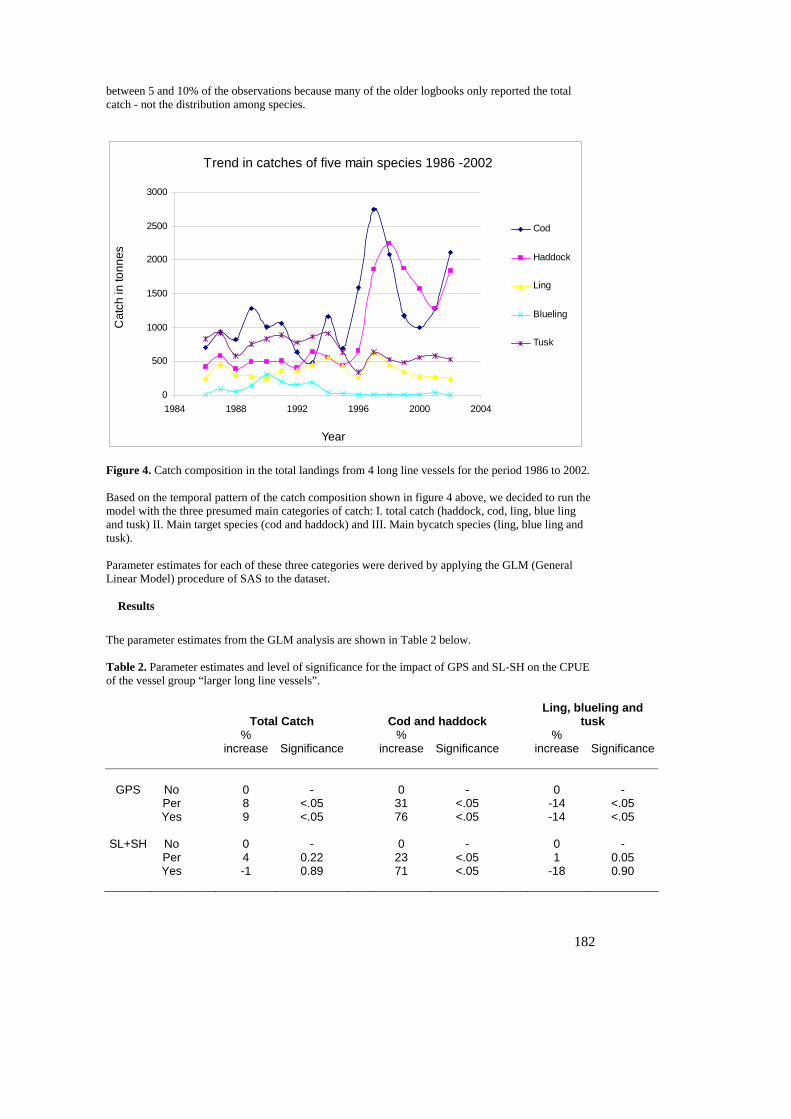
182
between 5 and 10% of the observations because many of the older logbooks only reported the total catch - not the distribution among species.
Trend in catches of five main species 1986 -2002
0
500
1000
1500
2000
2500
3000
1984 1988 1992 1996 2000 2004
Cat
ch in
tonn
es
Year
Cod
Haddock
Ling
Blueling
Tusk
Figure 4. Catch composition in the total landings from 4 long line vessels for the period 1986 to 2002. Based on the temporal pattern of the catch composition shown in figure 4 above, we decided to run the model with the three presumed main categories of catch: I. total catch (haddock, cod, ling, blue ling and tusk) II. Main target species (cod and haddock) and III. Main bycatch species (ling, blue ling and tusk). Parameter estimates for each of these three categories were derived by applying the GLM (General Linear Model) procedure of SAS to the dataset.
Results
The parameter estimates from the GLM analysis are shown in Table 2 below. Table 2. Parameter estimates and level of significance for the impact of GPS and SL-SH on the CPUE of the vessel group “larger long line vessels”.
Total Catch Cod and haddock Ling, blueling and
tusk
%
increase Significance %
increase Significance %
increase Significance
GPS No 0 - 0 - 0 - Per 8 <.05 31 <.05 -14 <.05 Yes 9 <.05 76 <.05 -14 <.05
SL+SH No 0 - 0 - 0 - Per 4 0.22 23 <.05 1 0.05 Yes -1 0.89 71 <.05 -18 0.90
183
The figures in Table 2 display some rather dramatic – but in most cases significant - results from the GLM analysis. The results for the effect of the GPS contradict each other across the three different categories of catch composition chosen for the model runs. The most conspicuous discrepancy being the GPS causing an increase in CPUE of 76% when modelled for the target species cod and haddock but inducing a decrease of 14 % when modelled for the bycatch species of ling, blue ling and tusk. For SL-SH the parameter estimates show an increase of 71% when modelled for the target species and no significant effect when modelled for the bycatch species. When the model is run with the catch being composed of both target and bycatch species (total catch) the result can be interpreted as a kind of means between the two other results. 3.3.4.6 Discussion
The results from the GLM analysis of the effect from global positioning systems and Swivel lines + skewed hooks should be treated with large reservations. It goes without saying that a 1.75 * 1.75 increase in CPUE being exclusively a result of the acquisition of both the technologies on a long line vessel is a bit unrealistic. Previous findings on the effect of GPS in the fishery for northern prawn in Australia show a 12% increase in CPUE (Robins et al. 1998) and another investigation in the same fishery report a 4-7% increase (Bishop et al. 2000). Probably the obtained results should be interpreted in the light of a high degree of temporal overlap between the recruitment of some very large year classes of cod and haddock in the fishery (Jakupsstovu et al.) and the introduction in the fleet of the two investigated technologies. Serious bias from the fluctuations in the stock availability in the examined period should however have been avoided by the inclusion of the year effect in the model. But probably the temporal and spatial scales of the data (years and ICES squares) have not had detail enough to counter the availability effect on the CPUE. Also undermining the reliability of the parameter estimates is the previously discussed low robustness of the qualitative technological data that had only little temporal contrast and precision. One result giving a little credit on the validity side is that the transient category “per” displays values placed nicely between the category yes and the category no for practically all the significant results. The reliability of the parameter estimates is also strengthened by the seemingly contradictory result of the cod and haddock CPUE being positively influenced by the GPS and the ling-blueling-tusk CPUE being negatively influenced by the same technology. It might well be expected that new technology improving the precision/selectivity in the fish capture process – like the GPS - would increase the proportion of the target species and minimize the proportion of bycatch in the total catches. When it all sums up we find the results for the parameter estimates highly debatable and hesitate to conclude further than: That both the GPS and the SL-SH seems to have had significant impact on the CPUE of the target species and seemingly none or insignificant impact on the CPUE of a combination of bycatch species (ling, blueling and tusk) Some of this general picture is recognized in the answers from the questionnaire survey, where the majority of the informants from the long line fishery replied that the Swivel line and skewed hooks had significant effect on efficiency for especially haddock. The answers in the questionnaire reported efficiency increases varying between 10 and 50%. 3.3.4.7 Future work
Achieving a higher degree of precision in the Repeated and very focused technology interviews to achieve robust and precise data Treating the logbook and interview data as the result from a controlled experimental fishery by isolating observations from vessels with technology and vessels without technology with exact overlap in time and space (same ICES square and date) and comparing their catch and effort data. A GLM on the logbook data with an availability variable added (Stock assessment index)
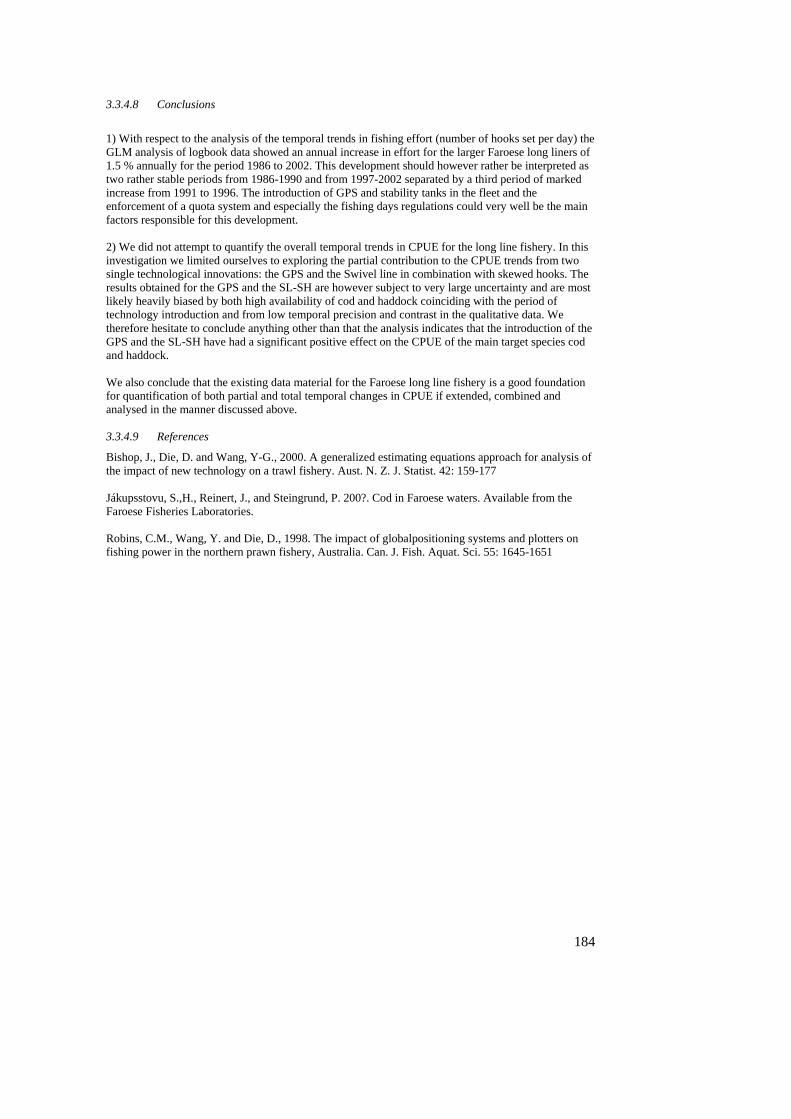
184
3.3.4.8 Conclusions
1) With respect to the analysis of the temporal trends in fishing effort (number of hooks set per day) the GLM analysis of logbook data showed an annual increase in effort for the larger Faroese long liners of 1.5 % annually for the period 1986 to 2002. This development should however rather be interpreted as two rather stable periods from 1986-1990 and from 1997-2002 separated by a third period of marked increase from 1991 to 1996. The introduction of GPS and stability tanks in the fleet and the enforcement of a quota system and especially the fishing days regulations could very well be the main factors responsible for this development. 2) We did not attempt to quantify the overall temporal trends in CPUE for the long line fishery. In this investigation we limited ourselves to exploring the partial contribution to the CPUE trends from two single technological innovations: the GPS and the Swivel line in combination with skewed hooks. The results obtained for the GPS and the SL-SH are however subject to very large uncertainty and are most likely heavily biased by both high availability of cod and haddock coinciding with the period of technology introduction and from low temporal precision and contrast in the qualitative data. We therefore hesitate to conclude anything other than that the analysis indicates that the introduction of the GPS and the SL-SH have had a significant positive effect on the CPUE of the main target species cod and haddock. We also conclude that the existing data material for the Faroese long line fishery is a good foundation for quantification of both partial and total temporal changes in CPUE if extended, combined and analysed in the manner discussed above. 3.3.4.9 References
Bishop, J., Die, D. and Wang, Y-G., 2000. A generalized estimating equations approach for analysis of the impact of new technology on a trawl fishery. Aust. N. Z. J. Statist. 42: 159-177 Jákupsstovu, S.,H., Reinert, J., and Steingrund, P. 200?. Cod in Faroese waters. Available from the Faroese Fisheries Laboratories. Robins, C.M., Wang, Y. and Die, D., 1998. The impact of globalpositioning systems and plotters on fishing power in the northern prawn fishery, Australia. Can. J. Fish. Aquat. Sci. 55: 1645-1651
185
3.4 Bibliography
Banks, R., Cunningham, S., Davidse, W. P., Lindebo, E., Reed, A. Sourisseau, E. and De Wilde, J.W., 2002. The impact of technological progress on fishing effort. EU XIV-C-1/99/02 Bishop, J., Die, D. and Wang, Y-G., 2000. A generalized estimating equations approach for analysis of the impact of new technology on a trawl fishery. Aust. N. Z. J. Statist. 42: 159-177 Dichmont, C., Bishop, J., Sterling, D., Penrose, J., Rawlinson, N., Eayrs, S. and Venables, B., 2003. A new approach to fishing power analysis and its application in the Northern Prawn Fishery. Summary Report 2003 for the NPFAG. Eggert, H., 2001. Technical efficiency in the Swedish trawl fishery for Norway Lobster.Working papers in economics No53. Published by the Department of Economics, Goteborg University, Box 640, SE 405 30, Goteborg, Sweden Galbraith, R. D. and Stewart, P A. M., 1995. Fishing effort: A gear technologist’s perspective. ICES CM 1995/B: Hilborn, R. and Ledbetter, M., 1985. Determinants of catching power in the British Columbia salmon purse seine fleet. Canadian Journal of Fisheries and Aquatic Sciences 42 (1985), pp. 51–56. Kirkley, J. E., Squires, D. and Strand, I. E., 1995. Assessing technical efficiency in commercial fisheries: The Mid-Atlantic Sea Scallop Fishery, American. Journal of Agricultural Economics 77 (1995), pp. 686–697. Kirkley, J., Morrison-Paul, C. J., Cunningham, S. and Catanzano, J., 2004. Embodied and Disembodied Technical Change in Fisheries: An Analysis of the Séte Trawl Fishery, 1985-1999. Environment and Resource Economics 00: 1-27, 2004. Mahevas, S., Sandon, Y. and Biseau, A., 2003. Quantification of annual variations in fishing power due to vessel characteristics: an application to the bottom-trawlers of South-Brittany targeting anglerfish (Lophius budegassa and Lophius piscatorius). ICES, Journal of Marine Science, 00: 1-13. 2003. Marchal, P., Andersen, J., De Wilde, J-W., Hovgård, H., Pascoe, S. and Pastoors, M. 1999. A comnparison of biological and economic indicators to estimate efficency creeping in the Dutch flatfish fisheries in the North Sea. ICES CM 1999/R:11 Marchal, P., Nielsen, J. R., Hovgård H. and Lassen, H., 2001. Time changes in fishing power in the Danish cod fisheries of the Baltic Sea. ICES Journal of marine Science 58 (2001), pp. 298–310. Marchal, P., Ulrich, C., Korsbrekke, K., Pastoors, M. and Rackham, B., 2002. A comparison of three indices of fishing power on some demersal fisheries of the North Sea. ICES Journal of Marine Science [ICES J. Mar. Sci.]. Vol. 59, no. 3, pp. 604-623. 2002. Millischer, L., Gascuel, D. and Biseau, A., 1998. Estimation of the overall fishing power: A study of the dynamics and fishing strategies of Brittany's industrial fleets. Aquatic Living Resource 12 (1998), pp. 89–103. Pascoe, S. and Robinson, C., 1996. Measuring changes in technical efficiency over time using catch and stock information. Fisheries Research 28 (1996), pp. 305–319. Pascoe, S., Andersen, J. and De Wilde, J.W., 2001. The impact of management regulation on the technical efficiency of vessels in the Dutch beam trawl fleet. European Review of Agricultural Economics 28 (2001), pp. 187–206.
186
Prawitt, O., Rosenthal, H. and Thiele, W., 1996. Relationship between fishing power and vessel characteristics of German beam trawlers fishing for brown shrimp in the North Sea. ICES CM 1996/B:9. Rahikainen, M. and Kuikka, S., 2002. Fleet dynamics of herring trawlers - change in gear size and implications for interpretation of catch per unit effort. Can. J. Fish. Aquat. Sci. 59: 531-541 Revill, A., 2003. A study on the consequences of technological innovation in the capture fishing industry and the likely effects upon environmental impacts. CEFAS Contract report C1823. Robins, C.M., Wang, Y. and Die, D., 1998. The impact of globalpositioning systems and plotters on fishing power in the northern prawn fishery, Australia. Can. J. Fish. Aquat. Sci. 55: 1645-1651 Squires, D., 1994. Sources of growth in marine fishing industries. Marine Policy 18 (1994), pp. 5–18. Squires, D., Grafton, R. Q., Alam, M. F. and Omar, I, H., 2002. Technical efficiency in the malaysian gill net artisanal fishery. EEN0204. The Australian National University. Valdemarsen, J. W., 2001. Technological trends in capture fisheries. Ocean & Coastal Management 22 (2001) 635-651. Viswanathan, K. K., Jeon, Y., Omar, I. H., Kirkley, J., Squires, D. and Susilowati, I., ????. Technical Efficiency and Fishing Skill in Developing Country Fisheries: The Kedah, Malaysia Trawl Fishery.


