Embed Size (px)
Citation preview
Republic of
South Sudan
Company
Logo
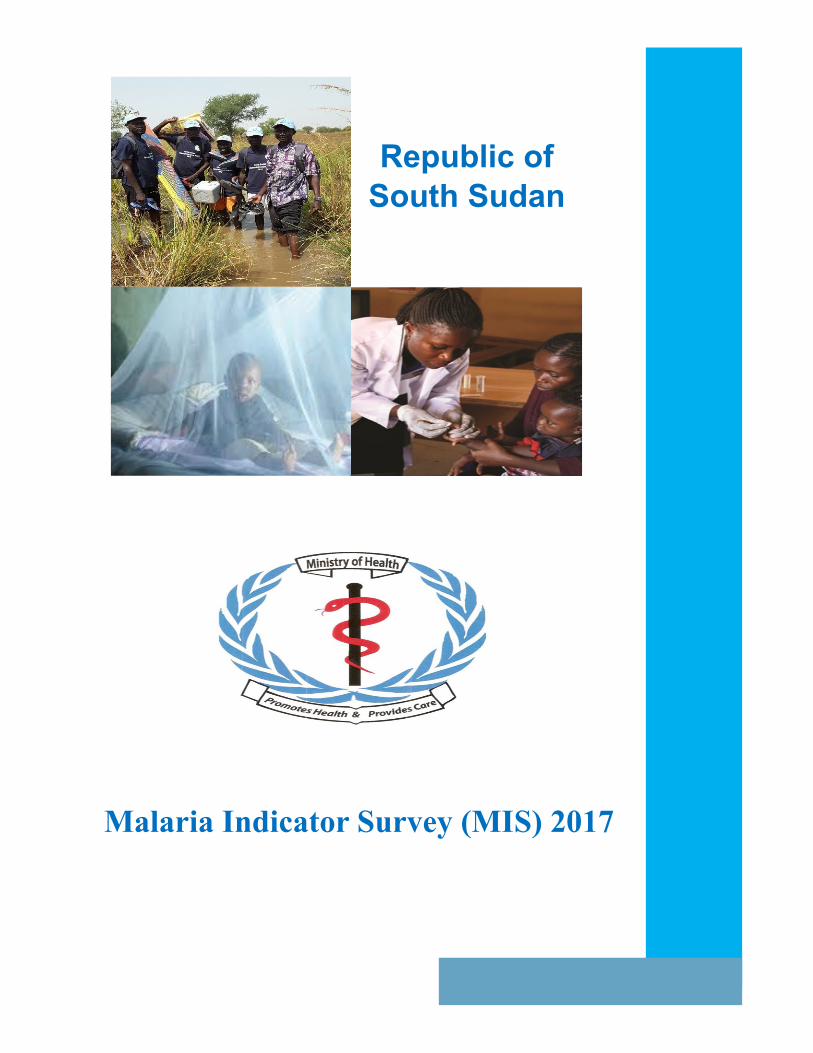
Malaria Indicator Survey (MIS) 2017

REPUBLIC OF SOUTH SUDAN
Malaria Indicator Survey
2017
Final Report
‘
Ministry of Health
Juba, South Sudan
Contents ● ii
CONTENTS TABLES AND FIGURES ................................................................................................................... iv
FOREWORD ........................................................................................................................................ vi
ACKNOWLEDGEMENT ................................................................................................................... vii
ACRONYMS AND ABBREVIATIONS .......................................................................................... viii
READING AND UNDERSTANDING THE 2017 ............................................................................. x
SOUTH SUDAN MALARIA INDICATOR SURVEY (SSMIS) ....................................................... x
MAP OF SOUTH SUDAN ................................................................................................................... 1
1 INTRODUCTION ............................................................................................................................... 2
1.1 Country Profile ......................................................................................................................... 2
1.3 Objectives of the 2017 South Sudan Malaria Indicator Survey .................................. 3
1.4 Methodology of the South Sudan Malaria Indicator Survey ........................................ 3
1.5 Challenges and Limitations .................................................................................................. 8
1.6 Response Rates .................................................................................................................... 10
1.7 Recommendations for next SSMIS................................................................................... 11
2 CHARACTERISTICS OF HOUSEHOLDS AND WOMEN ....................................................... 12
2.1 Household Population and Composition ....................................................................... 12
2.2 Drinking Water Sources and Treatment .......................................................................... 18
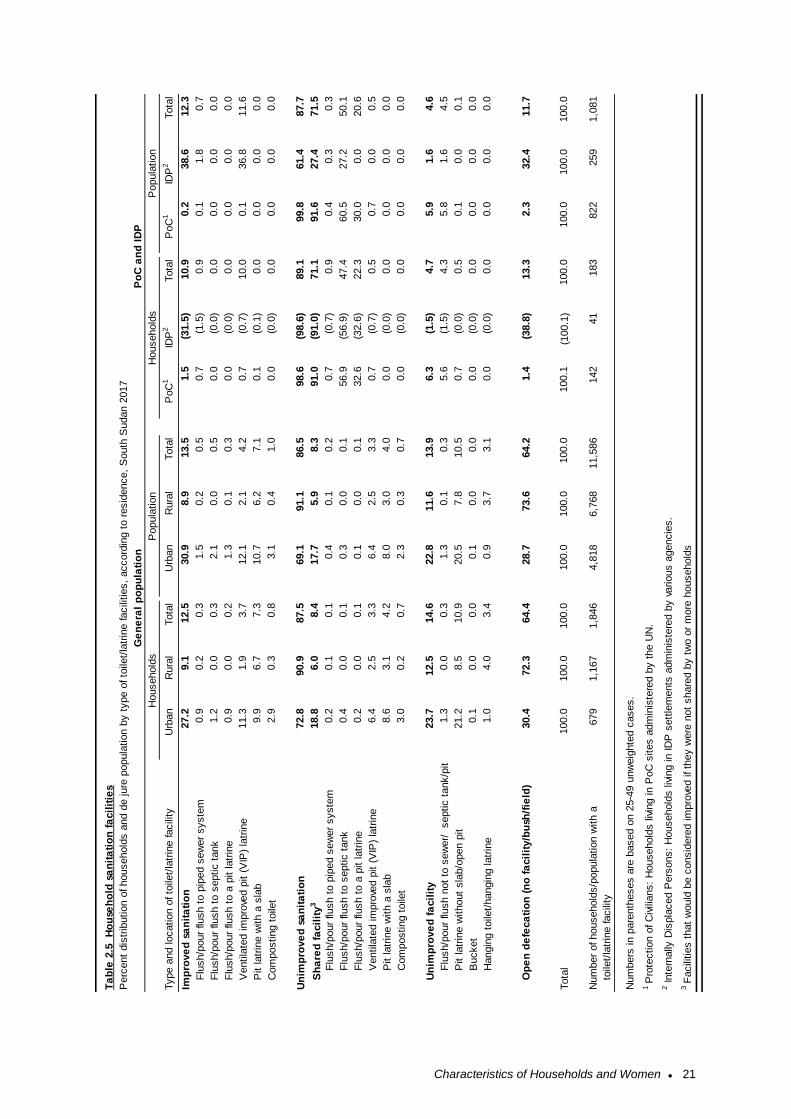
2.3 Sanitation ................................................................................................................................ 20
2.4 Housing Characteristics ...................................................................................................... 22
2.5 Household Wealth ................................................................................................................. 26
2.6 Educational attainment of women .................................................................................... 27
2.7 Literacy of Women ................................................................................................................ 29
3 MALARIA PREVENTION .............................................................................................................. 31
3.1 Background on Malaria Control in South Sudan .......................................................... 31
3.2 Ownership of Insecticide-Treated Nets ........................................................................... 32
3.3 Household Access and Use of ITNs................................................................................. 35
3.5 Malaria in Pregnancy ............................................................................................................ 43
3.5 Media exposure ..................................................................................................................... 44
4 MALARIA IN CHILDREN .............................................................................................................. 47
4.1 Care Seeking for Fever in Children .................................................................................. 47
4.2 Diagnostic Testing of Children with Fever ..................................................................... 49
Contents ● iii
4.3 Use of Recommended Antimalarials ............................................................................... 50
4.4 Prevalence of Low Haemoglobin in Children ................................................................ 52
4.5 Prevalence of Malaria in Children ..................................................................................... 54
REFERENCES ................................................................................................................................... 57
APPENDIX A: DETAIL ON TECHNICAL ISSUES ...................................................................... 58
APPENDIX B: KEY PARTNERS AND SURVEY PERSONNEL ............................................... 60
APPENDIX C: QUESTIfONNAIRES .............................................................................................. 64
Tables and Figures ● iv
TABLES AND FIGURES
Table 1.1 Distribution of South Sudan population by statistical areas 3
Table 1.2 Trainings and participants 6
Table 1.3 Enumeration areas and accessibility by statistical area 9
Table 1.3 Results of the household and individual interviews 10
Table 2.1 Household population by age, sex, and residence, general population 13
Table 2.1B Household population by age, sex, and residence, PoC and IDP 14
Figure 2.1 Population pyramid, general population 15
Table 2.2 Household composition 16
Table 2.3 Background characteristics of respondents 17
Table 2.4 Household drinking water, general population 18
Table 2.4B Household drinking water, PoC and IDP 19
Table 2.5 Household sanitation facilities 21
Table 2.6 Household characteristics, general population 23
Table 2.6B Household characteristics, PoC and IDP 24
Table 2.7 Household possessions 25
Table 2.8 Wealth quintiles 27
Table 2.9 Educational attainment of survey respondents 28
Table 2.10 Literacy 30
Table 3.1 Household possession of mosquito nets 33
Table 3.2 Source of mosquito nets 34
Table 3.3 Access to an insecticide-treated net (ITN) 36
Table 3.4 Access to an ITN 37
Table 3.5 Use of mosquito nets by persons in the household 38
Table 3.6 Use of existing ITNs 39
Table 3.7 Use of mosquito nets by children 41
Table 3.8 Use of mosquito nets by pregnant women 42
Table 3.9 Use of intermittent preventive treatment (IPTp) by women during pregnancy 44
Table 3.10 Media exposure to malaria messages 46
Table 4.1 Prevalence, diagnosis, and prompt treatment of children with fever 48
Table 4.2 Source of advice or treatment for children with fever 49
Table 4.3 Type of antimalarial drugs used 51
Table 4.4 Coverage of testing for anaemia and malaria in children 53
Tables and Figures ● v
Table 4.5 Haemoglobin <7.0 g/dl in children 54
Table 4.6 Prevalence of malaria in children 56
Foreword ● vi
FOREWORD
Acknowledgement ● vii
ACKNOWLEDGEMENT
Acronyms and Abbreviations ● viii
ACRONYMS AND ABBREVIATIONS
ACT Artemesinin-combination therapy
ANC Antenatal Care
AS+AQ Artesunate plus Amodiaquine
DG Director General
DFID Department for International Development
DHS Demographic and Health Survey
EA Enumeration Area
GFATM Global Fund AIDS Tuberculosis and Malaria
GPS Global Positioning System
Hb Haemoglobin
HRP Histidine Rich Protein
HSSP Health Sector Strategic Plan
HSDP Health Sector Development Plan
IDP Internally Displaced Persons
IMA Interchurch Medical Assistance
IPT
IPTp
IPTp3+
Intermittent Preventive Treatment
Intermittent preventive treatment during pregnancy
Intermittent preventive treatment during pregnancy, 3+ doses
IRS Indoor Residual Spraying
ITN Insecticide Treated Net
LLIN Long Lasting Insecticide Treated Net
MC Malaria Consortium
M&E Monitoring and Evaluation
MIS Malaria Indicator Survey
MOH Ministry of Health
NGO Non-Governmental Organisation
NBS National Bureau of Statistics
NMCP National Malaria Control Programme
PoC Protection of Civilians
PSI Population Services International
RDT Rapid Diagnostic Test
SEA Standard Enumeration Areas
SA Statistical Area
SP Sulphadoxine-pyrimethamine
Acronyms and Abbreviations ● ix
SPLA Sudan People’s Liberation Army
SSMIS South Sudan Malaria Indicator Survey
ToT Training of Trainers
TWG Technical Working Group
UNDP United Nations Development Programme
WHO World Health Organization
Reading and Understanding the 2017 SSMIS ● x
READING AND UNDERSTANDING THE 2017 SOUTH SUDAN MALARIA INDICATOR SURVEY (SSMIS)
The 2017 South Sudan Malaria Indicator Survey (2017 SSMIS) report is very similar in content to the
2013 South Sudan Malaria Indicator Survey (2013 SSMIS) but is presented in a new format. The new
style features more figures to highlight trends, subnational patterns, and background characteristics.
The text has been simplified to highlight key points in bullets and to clearly identify indicator definitions
in boxes. The tables in this report are located at the end of each chapter instead of being imbedded in
the chapter text. This final report is based on approximately 35 tables of data. While the text and figures
featured in each chapter highlight some of the most important findings from the tables, not every finding
can be discussed or displayed graphically. For this reason, data users should be comfortable reading
and interpreting tables.
The following pages introduce the organisation of Malaria Indicator Survey (MIS) tables, the
presentation of background characteristics, and a summary of sampling and understanding
denominators. In addition, this section provides some exercises for users as they practice their new
skills in interpreting MIS tables.
Reading and Understanding the 2017 SSMIS ● xi
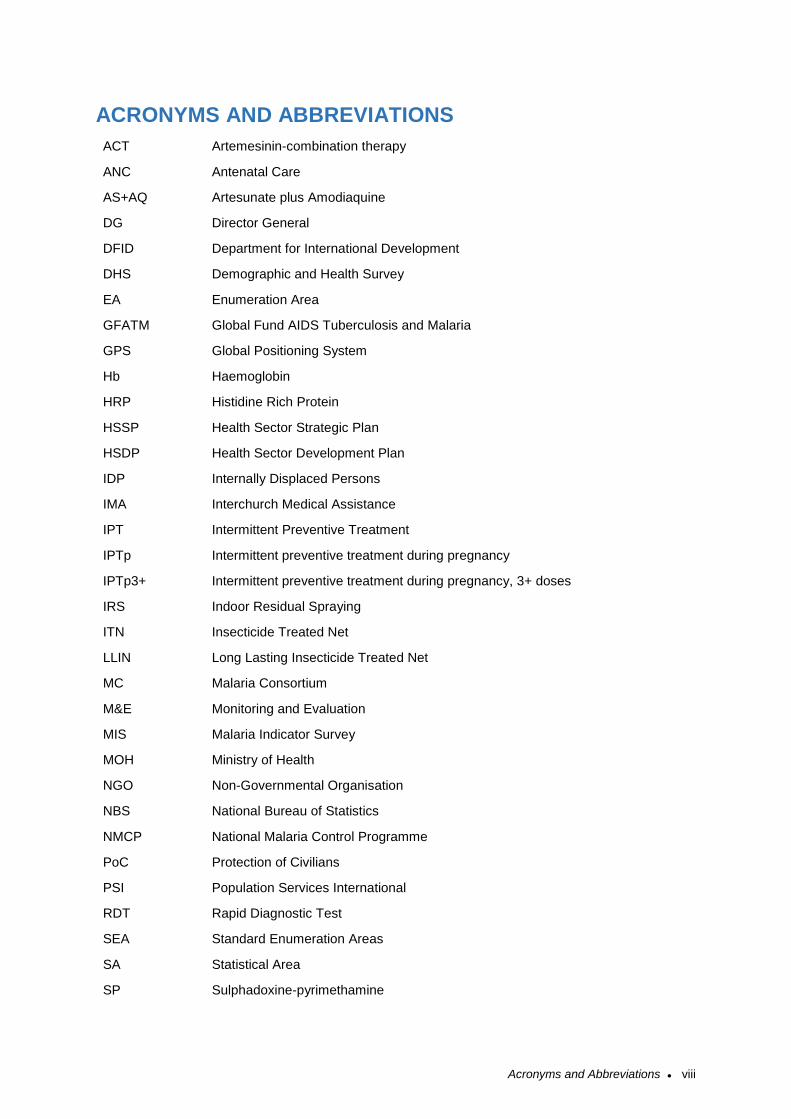
EXAMPLE 1: PREVALENCE OF MALARIA IN CHILDREN
Step 1: Read the title and subtitle. They tell you the topic and the specific population group being
described. In this case, the table is about children aged 6-59 months who were tested for malaria.
Step 2: Scan the column headings—highlighted in green in Example 1. They describe how the
information is categorised. In this table, the first column of data shows children who tested positive for
malaria according to the rapid diagnostic test (RDT). The second column lists the number of children
aged 6-59 months who were tested for malaria using RDT in the survey. The third column shows
children who tested positive for malaria according to microscopy. The last column lists the number of
children aged 6-59 months who were tested for malaria using microscopy in the survey.
Reading and Understanding the 2017 SSMIS ● xii
Step 3: Scan the row headings—the first vertical column highlighted in blue in Example 1. These show
the different ways the data are divided into categories based on population characteristics. In this case,
the table presents prevalence of malaria by age, sex, mother’s interview status, urban-rural residence,
statistical area, mother’s educational level, and wealth quintile.
Step 4: Look at the row at the bottom of the table highlighted in red. These percentages represent the
totals of children aged 6-59 months who tested positive for malaria according to the different tests. In
this case, 32% of children aged 6-59 months tested positive for malaria according to RDT, while 21%t
ested positive for malaria according to microscopy. In some tables there are additional rows for
Protection of Civilian (PoC) and Internally Displaced Persons (IDP) populations.
Step 5: To find out what percentage of children aged 6-59 in rural areas tested positive for malaria
according to RDT, draw two imaginary lines, as shown on the table. This shows that 32% of children
aged 6-59 months in rural areas tested positive for malaria according to microscopy.
Step 6: By looking at patterns by background characteristics, we can see how malaria prevalence
varies across South Sudan. Resources are often limited; knowing how malaria prevalence varies
among different groups can help programme planners and policy makers determine how to most
effectively use resources.
Reading and Understanding the 2017 SSMIS ● xiii
EXAMPLE 2: USE OF MOSQUITO NETS BY PREGNANT WOMEN
Step 1: Read the title and subtitle. In this case, the table is about two separate groups of pregnant
women: all pregnant women aged 15-49 in all households (a) and pregnant women aged 15-49 in
households with at least one insecticide-treated net (ITN) (b).
Step 2: Identify the two panels. First, identify the columns that refer to all pregnant women aged 15-49
in all households (a), and then isolate the columns that refer only to pregnant women aged 15-49 in
households with at least one ITN (b).
Reading and Understanding the 2017 SSMIS ● xiv
Step 3: Look at the number of women included in this table. How many pregnant women aged 15-49
in all households were interviewed? It’s 743. Now look at the second panel. How many pregnant women
aged 15-49 in households with at least one ITN were interviewed? It’s 495.
Step 4: Only 743 pregnant women aged 15-49 in all households and 495 pregnant women in
households with at least one ITN were interviewed in the 2017 SSMIS. Once these pregnant women
are further divided into the background characteristic categories, there may be too few cases for the
percentages to be reliable.
• What percentage of pregnant women aged 15-49 in all households in Western Equatoria statistical
area slept under an ITN the night before the survey? 60%. This percentage is in parentheses
because there are between 25 and 49 pregnant women (unweighted) in this category. Readers
should use this number with caution—it may not be reliable. (For more information on weighted and
unweighted numbers, see Example 3.)
• What percentage of pregnant women aged 15-49 in Eastern Equatoria with at least one ITN slept
under an ITN the night before the survey? There is no number in this cell—only an asterisk. This is
because fewer than 25 pregnant women with more than secondary education in households with
at least one ITN were interviewed in the survey. Results for this group are not reported. The
subgroup is too small, and therefore the data is not reliable.
Note: When parentheses or asterisks are used in a table, the explanation will be noted under the table.
If there are no parentheses or asterisks in a table, you can proceed with confidence that enough cases
were included in all categories that the data is reliable.
Reading and Understanding the 2017 SSMIS ● xv
EXAMPLE 3: UNDERSTANDING SAMPLING WEIGHTS IN 2017 SSMIS TABLES
A sample is a group of people who have
been selected for a survey. In the 2017
SSMIS, the sample was designed to
represent the national population aged 15-
49. In addition to national data, most
countries want to collect and report data on
smaller geographical or administrative
areas. However, doing so requires a
minimum sample size per area. For the
2017 SSMIS, the survey sample is
representative at the national and
statistical area levels, and for urban and
rural areas.
To generate statistics that are
representative of the country as a whole
and the 10 statistical areas, the number of
women surveyed in each statistical area
should contribute to the size of the total
(national) sample in proportion to size of
the statistical area. However, if some
statistical areas have small populations, then a sample allocated in proportion to each statistical area’s
population may not include sufficient women from each statistical area for analysis. To solve this
problem, statistical areas with small populations are oversampled. For example, let’s say that you have
enough money to interview 4,453 women and want to produce results that are representative of South
Sudan as a whole and the statistical areas for the 2017 SSMIS (as in Table 2.3). However, the total
population of South Sudan is not evenly distributed among the statistical areas: some statistical area
are heavily populated while others are not. Thus, statistical areas with less population were
oversampled.
A sampling statistician determines how many women should be interviewed in each statistical area in
order to get reliable statistics. The blue column (1) in the table at the right shows the actual number of
women interviewed in each statistical area.
With this distribution of interviews, some statistical areas are overrepresented, and some statistical
areas are underrepresented. For example, the population in Jonglei statistical area is about 15% of the
population in South Sudan, while Western Equatoria’s population contributes only 7% of the population
in South Sudan. But as the blue column shows, the number of women interviewed in Jonglei accounts
for only about 9% of the total sample of women interviewed (421/4,453) and the number of women
interviewed in Western Equatoria statistical area accounts for 10% of the total sample of women
interviewed (450/4,453). This unweighted distribution of women does not accurately represent the
population.
In order to get statistics that are representative of South Sudan, the distribution of the women in the
sample needs to be weighted (or mathematically adjusted) such that it resembles the true distribution
of the population in the country. Women from a small statistical area, Western Equatoria, should only
contribute a small amount to the national total. Women from a larger statistical area, like Jonglei, should
contribute much more. Therefore, DHS statisticians mathematically calculate a “weight” which is used
to adjust the number of women from each statistical area so that each statistical area’s contribution to
the total is proportional to the actual population of the statistical area.
The numbers in the purple column (2) represent the “weighted” values. The weighted values can be
smaller or larger than the unweighted values at statistical area level. The total national sample size of
Reading and Understanding the 2017 SSMIS ● xvi
4,453 women has not changed after weighting, but the distribution of the women in the statistical areas
has been changed to represent their contribution to the total population size.
How do statisticians weight each category? They consider the probability that a woman was selected
in the sample. If you were to compare the red column (3) to the actual population distribution of South
Sudan, you would see that women in each statistical area are contributing to the total sample with the
same weight that they contribute to the population of the country. The weighted number of women in
the survey now accurately represents the proportion of women who live in Western Equatoria and the
proportion of women who live in Jonglei.
With sampling and weighting, it is possible to interview enough women to provide reliable statistics at
national and statistical levels. In general, only the weighted numbers are shown in each of the 2017
SSMIS tables, so don’t be surprised if these numbers seem low: they may actually represent a larger
number of women interviewed.
Map of South Sudan ● 1
MAP OF SOUTH SUDAN
Introduction ● 2
1 INTRODUCTION
1.1 Country Profile
After decades of conflict between the northern and southern regions, Sudan was engulfed in two phases
of civil war from 1955 to 1972 and 1983 to 2005, which resulted in the loss of 2.5 million lives. A
Comprehensive Peace Agreement was signed in January 2005 between the Sudanese government
and the Sudan People’s Liberation Movement/Army (SPLM/A). One of the key clauses was the
recognition of South Sudan’s right to hold a referendum on whether to remain part of Sudan or secede
to form a new nation. A referendum was held in January 2011 and resulted in a 99% approval of the
option to secede. The Republic of South Sudan was established on July 9th, 2011 and is therefore the
youngest country in Africa.
The renewed conflicts in December 2013 and July 2016 have undermined the development gains
achieved since independence and worsened the humanitarian situation. Hundreds of thousands of
people have been killed, more than 4.2 million people have been displaced both internally and to
neighbouring countries, and about 5.3 million (nearly half the population) face severe food insecurity.
Without conflict resolution and a framework for peace and security, the country’s longer-term
development and prosperity are called into question (World Bank 2018).
1.1.1 Geography
South Sudan is a land-locked country in East Africa, bordering six malaria-endemic countries: Central
African Republic in the west, Democratic Republic of Congo in the southwest, Ethiopia in the east,
Kenya in the southeast, Uganda in the south, and Sudan in the north. The country covers an area of
approximately 650,000 km2 of land mass, between 8° and 18° south latitude and between 20° and 35°
east longitude.
The total population was about 11.9 million in 2017, as projected from the 2008 Population Census. At
independence in 2011, South Sudan had 10 states, while the three regions that were used prior to
independence were used for the design of the 2013 SSMIS. Today South Sudan has 32 states, with
each of the former 10 states having been subdivided. The states are the basic planning levels for health
service delivery.
The climate is tropical with average temperatures ranging between 20°C and 37°C and relative humidity
between 26% and 88%. Annual rainfall ranges between 1,000 mm in the South and 400 mm in the
northern parts. Similarly, the duration of the rainy season varies from 7–8 months in the South to 5–
6 months in the northern region. Malaria is endemic across the entire country with year-round
transmission but peaking towards the end of the rainy season from September to November.
1.1.2 Population
In the 2008 Population and Housing Census, South Sudan’s population stood at 8.3 million. An annual
population growth rate of 3.77% each year during the 2008-2017 period. South Sudan’s population is
characterised as very young. The 2008 population census reports that 53% of the population is under
age 18 and only 4% is age 65 or older (NBS 2012). This is attributed to high fertility and declining
mortality.
Table 1.1 presents trends in basic demographic indicators for South Sudan for selected years from
2008 to 2017. The population was projected to have grown from 8.3 million people in 2008 to 11.9
million people in 2017 according to the National Bureau of Statistics estimates published in 2015.
Because of the length of time since the last census and the conflict in the intervening years, the
population distribution may have shifted.
Introduction ● 3
1.3 Objectives of the 2017 South Sudan Malaria Indicator Survey
The main objective of the 2017 SSMIS was to measure progress achieved in key malaria indicators
since the 2013 SSMIS. The primary objectives as outlined in the study protocol were the following:
1. To assess the coverage of core malaria control interventions (net ownership and use, IRS
coverage, effective treatment of fever within 24 hours of onset in children under 5 years, access
and use of intermittent preventive treatment during pregnancy) targeted in the National Malaria
Strategic Plan 2014/15 – 2020/21 as a follow-up on the 2013 MIS findings.
2. To determine the prevalence and type of malaria parasites in children under 5 years and
pregnant women.
3. To determine the prevalence of anaemia in children under 5 years and pregnant women.
4. To assess knowledge, attitudes, and practices regarding malaria in the general population.
The secondary objective was to strengthen the capacity of the NMCP and partners for future
implementation of the survey.
1.4 Methodology of the South Sudan Malaria Indicator Survey
The 2017 SSMIS is the third survey of its kind carried out in South Sudan. The first Malaria Indicator
Survey was implemented in 2009 (NMCP et al.; 2009) and the second in 2013 (NMCP et al.; 2013). As
with the previous Malaria Indicator Surveys, the 2017 survey was designed to follow the Roll Back
Malaria Monitoring and Evaluation Working Group guidelines. It was also designed to support the
implementation of the South Sudan National Malaria Strategy 2014 – 2021 and the South Sudan Health
Policy Document 2016 – 2022 through the measurement of standardised indicators.
The 2017 SSMIS was carried out from 5th December to 31st December 2017 in all ten statistical areas,
with the exception of only 17 EAs in Unity statistical area where due to security challenges, data
2008 2017
Statistical areas
Upper Nile 964,353 1,385,479
Jonglei 1,358,602 1,873,176
Unity 585,801 877,313
Warrap 972,928 1,379,959
Northern Bahr el-Ghazal 720,898 1,023,383
Western Bahr el-Ghazal 333,431 473,636
Lakes 695,730 1,053,177
Western Equatoria 619,029 803,264
Central Equatoria 1,103,557 1,574,711
Eastern Equatoria 906,161 1,393,765
Total 8,260,490 11,868,209
Population by statistical area from 2008 Southern Sudan Population
and Housing Census and 2017 population projections from the
National Bureau of Statistics
Table 1.1 Distribution of South Sudan population by statistical
areas
Source: Southern Sudan Population and Housing Census (2008),
and Population Projections for South Sudan, 2015-2020 (2015).
Introduction ● 4
collection was interrupted and could only be conducted from 7th to 19th April 2018. In all, there was a
nationally representative sample of 5,190 households. All women aged 15-49 in the selected
households were eligible for individual interviews. They were asked questions about prevention of
malaria during pregnancy and treatment of childhood fever. In addition, the survey included testing for
anaemia and malaria among children aged 6 to 59 months using a finger- or heel-prick blood sample
and testing for anaemia in pregnant women. The results of anaemia and malaria rapid diagnostic testing
were available immediately and were provided to the children’s parents or guardians. Thin and thick
blood smears were collected in the field and transported to the Public Health Reference Laboratory
(PHRL) in Juba where they were tested for the presence of malaria parasites.
1.4.1 Survey organisation
The 2017 SSMIS was implemented by the Ministry of Health, National Malaria Control Programme
(NMCP) department in collaboration with other stakeholders. A Technical Working Group (TWG) was
set up comprising of stakeholders from WHO, National Bureau of Statistics (NBS), Population Services
International (PSI), Malaria Consortium and Interchurches Medical Assistance (IMA). Funding for the
survey came from the Global Fund to fight AIDS, Tuberculosis and Malaria (GFATM). The MOH was
responsible for general administrative management of the survey, including overseeing day-to-day
operations. The Ministry took primary responsibility for organizing the Technical Working Group and
developing the survey protocol, participating along with NBS in recruiting, training, and monitoring field
staff.
The National Bureau of Statistics assisted the MOH in the design of the 2017 SSMIS, especially in
sample design and selection. They provided technical input in recruitment of field staff, data collection,
survey methodology and design, sample size, questionnaire customisation, development of manuals
for supervisors and interviewers, and training of interviewers. The NBS also led the preparation of
adequate enumeration area (EA) maps and statistical area planning maps (soft and hard copies) that
were used during the field work. The 2017 SSMIS was the first nationally representative household
survey to be completed using mobile data collection in South Sudan. NBS programmed the
questionnaires using the Census and Survey Programme (CSPro) data collection software and helped
with training on mobile data collection.
1.4.2 Sample design
The design for the survey was a two-stage representative probability sampling that produced estimates
for the country, for rural and urban settings separately, and for each of the 10 statistical areas.
South Sudan is administratively divided into 32 states and each state is subdivided into Counties,
Payams, and Bomas. Bomas are comprised of one or more enumeration areas (EAs). The primary
sampling units (PSUs) were the EAs, the smallest geographic statistical areas which are census
operational segments identified on maps, with an average of 186 households in the urban areas and
138 households in the rural areas.
To balance a practical sample size with a survey that would be informative for malaria control decision-
making, the 2017 SSMIS was stratified into 10 statistical areas (SAs) which correspond with the 10
former states, rather than the current 32 states. This provides more detailed information than the three
regions into which the 2013 SSMIS was stratified.
For each of the 10 statistical areas, 28 EAs were selected using population proportional to size (PPS)
sampling, for a total of 280 clusters. Of these, 210 were rural and 70 were urban. For the 2017 SSMIS,
these EAs were selected with stratification by urban and rural areas in proportion with the population of
urban and rural EAs in each SA.
The second stage involved selection of a sample of 20 households using systematic sampling from
each of the selected clusters. Prior to household selection, some of the urban clusters were updated
by NBS. This entailed undertaking a household listing in each of the selected clusters to update the list
of residential households within it. As part of the listing, NBS also updated the necessary maps and
Introduction ● 5
recorded the geographic coordinates of each cluster. Only selected households were interviewed, and
replacement of nonresponding households was not allowed. In the data analysis, which included
comparing the GPS coordinates to map files of enumeration areas, some deviations from the intended
sampling were observed. These are described in the limitations section. Further details on the sample
design are provided in Appendix B.
1.4.3 Supplementary sample of Protection of Civilians sites and Internally Displaced populations
To ensure that protection of camps (PoCs) and Internally Displaced Persons (IDPs) populations
including PoCs and IDPs were represented for decision-making, additional samples outside the main
sampling frame were taken and were analysed and presented separately. Two clusters were selected
in each of 5 PoC areas, and 20 households were selected from each cluster. In total,10 PoC clusters
and four IDPs clusters were also selected.
Results from the general population and PoC and IDP populations were not combined in the analysis
and are presented separately in the 2017 SSMIS data tables. To aid comparisons, results from PoC
and IDP populations are presented in the same tables as the general population where space allows.
Where tables are too large with the supplementary samples included, a separate table is included. For
example, Table 2.10 presents literacy of women in the general population, while Table 2.10B presents
the same data on the PoC and IDP samples.
1.4.4 Questionnaires
Three types of questionnaires were used in the 2017 SSMIS: a household questionnaire, a woman’s
questionnaire, and a biomarker questionnaire. Core questionnaires were developed by the Roll Back
Malaria Monitoring and Evaluation Reference Group in collaboration with ICF International. These were
adapted for use in South Sudan by the SSMIS Technical Working Group. The questionnaires were
adapted in English and then translated into Arabic, a language widely spoken across the country. A
team from NBS programmed the questionnaires in CSPro for data collection in tablets. Interviewers
had the option of conducting each survey in either English or Arabic. In a few areas where neither
English nor Arabic was spoken, interviewers from that area used local language for the interviews.
The household questionnaire was used to list all the usual members and visitors in the selected
households. Some basic information was collected on the characteristics of each person listed,
including age, sex, and relationship to the head of the household. Data from the roster in the household
questionnaire was used to identify women aged 15-49 years eligible for the individual interview and
children aged 6 - 59 months eligible for anaemia and malaria testing. The household questionnaire also
collected information on characteristics of the household’s dwelling unit, such as the source of water,
type of toilet facilities, materials used for the floor, roof, and walls of the house, ownership of various
durable goods, and ownership and use of mosquito nets.
The woman’s questionnaire was used to collect information from women aged 15-49 years on
background characteristics, reproductive history for the last 5 years, antenatal care (ANC) and
preventive malaria treatment for the most recent birth, fever prevalence, care-seeking and treatment
among children 6-59 months old.
A biomarker’s questionnaire was used to record haemoglobin measurements and results of malaria
rapid diagnostic testing for children 6-59 months old and pregnant women. The questionnaires used
are provided in Appendix C.
1.4.5 Anaemia and malaria testing
The 2017 SSMIS incorporated three biomarkers. Finger or heel-prick blood samples were collected
from children 6-59 months old and the pregnant women to perform on the spot testing for anaemia and
malaria, and thick and thin blood smears were prepared to be read in the laboratory to determine the
presence of malaria parasitaemia. Each team included two laboratory technicians who were responsible
for implementing the malaria and anaemia testing and for making the blood smears. Health workers
were also responsible for ensuring that children who tested positive for malaria via the rapid diagnostic
Introduction ● 6
test (RDT) but did not show signs of complicated malaria were offered a full course of medicine
according to standard procedures for malaria treatment in South Sudan. Written, informed consent for
testing was sought from the parent/guardian of all children.
Anaemia testing: Because there is a strong correlation between malaria infection and anaemia, the
2017 SSMIS included anaemia testing for children 6-59 months old. After obtaining consent, blood
samples were collected using a single-use, spring-loaded, retractable, sterile lancet to make a finger or
heel-prick. Laboratory technicians then used a microcuvette to collect a drop of blood. Haemoglobin
analysis was carried out on site using a battery-operated portable HemoCue® 301+ analyser, which
produces results in less than a minute, and the results were given to the child’s parent/guardian verbally
and in written form. Children who had a haemoglobin level under 7.0 g/dl (severe anaemia) were given
a referral letter and recommendation to be taken to a health facility for follow up care. Results of the
anaemia test were recorded in the biomarker questionnaire in the tablet as well as in a brochure that
was left in the household to explain the causes and prevention of anaemia.
Malaria rapid diagnostic tests: One of the major objectives of the 2017 SSMIS was to provide
information on the prevalence of malaria infection among children 6-59 months old and pregnant
women. Using the same finger or heel-prick used for anaemia testing, another drop of blood was tested
immediately using CAREStart RDTs, which tests for Plasmodium falciparum only. The results were
provided to the child’s parent/guardian in both oral and written form and were recorded in the biomarker
questionnaire. Children who tested positive for malaria using the RDT were offered a full course of
Artesunate Amodiaquine (ASAQ), in accord with National Guidelines for the Treatment of Malaria in
South Sudan. The drug was provided by NMCP. The health workers provided a referral to a healthcare
facility for children who tested positive and showed signs and symptoms of complicated malaria.
Malaria microscopy using blood smears: In addition to the RDT, both thick and thin blood smears
were taken from all children and pregnant women in the field to be tested later in the laboratory for the
presence of malaria parasites. The tablet automatically generated an eight-digit code including the
statistical area, cluster number, household number and line number of the individual child or woman.
This number was automatically recorded in the tablet, and manually recorded on the slides using a
metal pen/grease lead pencil. The blood smears were dried, and thin smear fixed, and packed carefully
in the field. They were periodically sent to the Public Health Reference Laboratory in Juba for
microscopic examination.
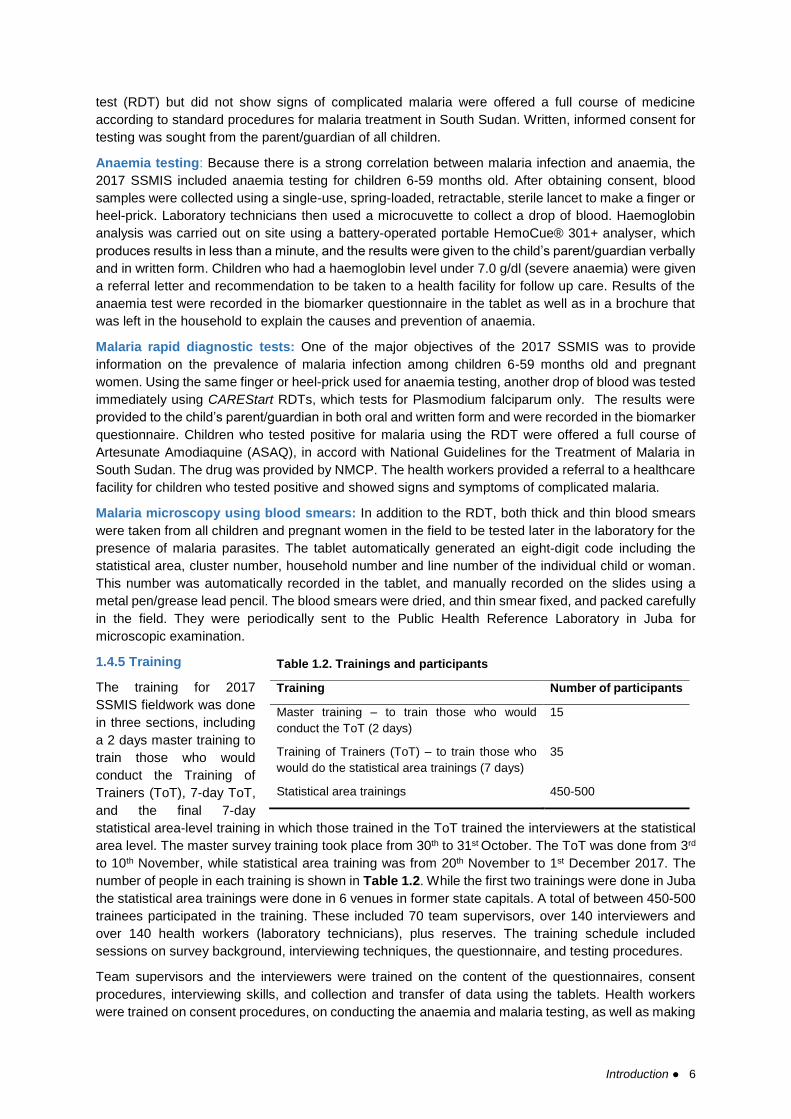
1.4.5 Training
The training for 2017
SSMIS fieldwork was done
in three sections, including
a 2 days master training to
train those who would
conduct the Training of
Trainers (ToT), 7-day ToT,
and the final 7-day
statistical area-level training in which those trained in the ToT trained the interviewers at the statistical
area level. The master survey training took place from 30th to 31st October. The ToT was done from 3rd
to 10th November, while statistical area training was from 20th November to 1st December 2017. The
number of people in each training is shown in Table 1.2. While the first two trainings were done in Juba
the statistical area trainings were done in 6 venues in former state capitals. A total of between 450-500
trainees participated in the training. These included 70 team supervisors, over 140 interviewers and
over 140 health workers (laboratory technicians), plus reserves. The training schedule included
sessions on survey background, interviewing techniques, the questionnaire, and testing procedures.
Team supervisors and the interviewers were trained on the content of the questionnaires, consent
procedures, interviewing skills, and collection and transfer of data using the tablets. Health workers
were trained on consent procedures, on conducting the anaemia and malaria testing, as well as making
Table 1.2. Trainings and participants
Training Number of participants
Master training – to train those who would
conduct the ToT (2 days)
15
Training of Trainers (ToT) – to train those who
would do the statistical area trainings (7 days)
35
Statistical area trainings 450-500
Introduction ● 7
the thick and thin blood smears. The health workers received a practical training at the public reference
laboratory. The health workers were trained on administering Artesunate Amodiaquine (ASAQ) to those
who tested positive for malaria, according to the national guidelines, and how to refer complicated
malaria cases.
As part of the ToT and statistical area-level trainings, there was a day of practice in urban and rural
clusters not included in the sample survey. The NBS Statistical Area Coordinators provided support in
identifying local cluster boundaries. Following the ToT, a pretest was completed to field test the data
collection programme on the tablets, questionnaires, translations, and survey procedures, following
which minor changes in skip patterns were implemented in the CSPro programming. During the
statistical area-level trainings, seventy field teams were trained to conduct the pretest. The pretest
fieldwork took place from 2nd to 3rd December 2017, following which changes were made in the system
of recording blood slide numbers because of the lack of barcoded slides.
A separate training was conducted for the PoC and IDP populations data collection teams, including 5
teams for PoC data collection and 1 team for IDP data collection.
1.4.6 Fieldwork
Primary fieldwork took a period of 4 weeks from 5th to 31st December 2017. Seventy teams, each
comprised of a supervisor, two interviewers, and two laboratory technicians, completed the fieldwork.
Each team was allocated clusters in the different statistical areas and counties according to their local
language competency and logistical feasibility. The teams spent an average of 3 days in a cluster.
Initially the teams conducted a household listing of all the household in the selected EA from which the
systematic sample was drawn by the field supervisor for subsequent data collection. At the end of
December 2017, data collection was finalised in 9 of the 10 statistical areas, and, due to accessibility,
17 out of 28 EAs data had not been collected in the Unity statistical area. Due to insecurity, the
remaining data in the Unity statistical area was collected 7th to 21st April 2018, before which a refresher
training was held.
Details of the assigned clusters and sampled households were provided to field teams to enable them
to properly identify the selected households; in each cluster, field teams were facilitated by the NBS
Statistical Area Coordinators and a village guide. Where eligible respondents were absent from their
home, up to two additional call-back visits were made on different days to facilitate the participation of
the respondents. Taking blood samples can be a sensitive issue in some communities. Therefore,
national and state-level radio broadcasts were made with information about the 2017 SSMIS.
Fieldwork was supervised by a team of national supervisors from NMCP and NBS and statistical area
supervisors who visited the teams in the field to ensure that the survey was conducted according to the
protocol and to provide solutions to any challenges encountered.
1.4.7 Data Processing
The 2017 SSMIS used Samsung tablet computers with data entry programmes developed in CSPro by
NBS. Tablets were Bluetooth-enabled to facilitate the electronic transfer of household assignment
among field team members and the transfer of completed questionnaires to team supervisors for
transfer to the central office. A server developed by NBS was to be used to transfer encrypted data
from the field to the central office in Juba throughout the course of the survey, but there were challenges
in implementation. Each tablet was fitted with a micro-SD card for encrypted data back-up and data
was manually transferred via Bluetooth from the tablets to a central database at the end of fieldwork.
The CSPro databases for the main surveys were exported to Stata format, and additional data cleaning
and analysis were conducted in Stata version 13. Results from the laboratory microscopy reading of
the bloods smears were first entered onto paper forms, then entered into Microsoft Excel spreadsheets.
The laboratory data was also imported from Excel into Stata for data cleaning and analysis.
1.4.8 Ethical considerations
Introduction ● 8
The protocol for the 2017 SSMIS was approved by the Ministry of Health Ethical Review Committee.
All data and other information were maintained confidentially to the greatest extent possible. All data
sets remain the property of the National Malaria Control Programme. The list of the identification
numbers and respondents’ names were stored separately during fieldwork and were removed from the
electronic database during analysis. The blood samples were stored only with code identifiers to protect
the identity of the respondent.
Oral informed consent was sought, during which the risks and benefits of participation in the survey
were explained to potential respondents. The risk of participation was minimal and was limited to
temporary discomfort associated with either discussion of potentially sensitive information or with the
finger or heel-prick blood collection. The benefits of participation in the survey included anaemia and
malaria testing for children and treatment or referral as appropriate. Also, the results will benefit NMCP’s
and MOH’s ability to monitor key health indicators and will provide evidence for decision-making that
will enable NMCP to improve its policies and interventions. There was no compensation to respondents
to participate.
1.5 Challenges and Limitations
During the period of data collection, the MIS team faced substantial challenges due to insecurity and
due to capacity constraints in survey execution. These challenges, strategies to mitigate them, and the
resultant limitations in the quality of the final survey are described transparently below.
1.5.1 Sampling challenges
Insecurity and access to EAs: Insecurity limited accessibility to some enumeration areas. In addition,
insecurity led to population movements that may make the last census (2008) a less than ideal sampling
universe on which to base a nationally representative survey. An initial sample of 280 EAs were selected
with 28 clusters for each of the 10 statistical areas from the list of 10,000 EAs, minus EAs where the
population was known to have moved or evacuated. On review, this sample included many areas that
were inaccessible, so it was discarded.
An exclusion list of 1,939 out of 9,127 EAs (21.2%) that were not accessible due to insecurity, flooding,
or other reasons was removed from the main list of EAs. A fresh random selection of 280 EAs were
made from the list of 7,188 accessible EAs. The number and percentage of EAs that were inaccessible
by statistical area are shown in Table 1.3.
Of the sample of 280, 238 had data collected during the fieldwork in December 2017. Of the 45 EAs
that were not visited in December 2017, 17 were in the Unity statistical area. A replacement sample of
17 EAs was selected for Unity, and data was collected in these EAs in April 2018.
Unauthorised EA replacements: During the household listing process GPS coordinates were
collected, and it was noted in the data analysis stage that in some cases, survey teams substituted one
EA for another due to difficulties in reaching the selected EAs. Details are included in Annex A.
Introduction ● 9
1.5.2 Questionnaire challenges
Net type classification: In the 2017 MIS, the question on the types of nets was modified, with the
intention of increasing recall of net type by survey respondents. Rather than asking about specific
brands of nets, interviewers asked about ‘hard’ vs. ‘soft’ nets, as they are commonly classified in South
Sudan. This required additional calculations to derive the indicators on Insecticide Treated Nets (ITNs);
these calculations are detailed in the nets section in Chapter 3, Malaria Prevention.
ACT question: For children who had received treatment, the type of treatment received was classified
as “Any ACT” vs. a list of specific monotherapies. Due to a questionnaire issue, rates of ACTs may be
overreported in the 2017 MIS. Details are described in Chapter 4.
Data merging and sample sizes: The 2017 SSMIS was the first nationally representative household
survey implemented with mobile/electronic data collection in South Sudan, and some challenges
specific to the data collection method were encountered. Due to limitations with how the questionnaire
was implemented in CSPro, some of the women’s surveys and biomarker surveys for children and
pregnant women could not be merged with the relevant household data. This may lead to apparent
discrepancies in sample sizes in the result tables. Details are described in Annex A.
1.5.3 Other challenges and limitations
Response rates for eligible women and children: Interviewers were trained to interview all eligible
women in a household. Response rates for eligible women are typically close to 100% in Malaria
Indicator Surveys. However, due to challenges in the cascaded training of trainers and difficulties in
oversight due to accessibility, interviewers did not consistently interview all eligible women in the
household. Nationally, 77% of eligible women were interviewed, but these rates varied substantially by
statistical area, ranging from 38% in Unity statistical area to 98% in Lakes statistical area. This is likely
indicative of variable quality of training and supervision by statistical area; as noted above, Unity
statistical area had inaccessibility issues. For similar reasons response rates for eligible children were
lower than expected and varied by statistical area. Overall, 60% of eligible children were interviewed.
Details of response rates are included in Table 1.2 and Annex A.
Statistical area
Number of
EAs
Number of
inaccessible EAs
Percentage of
EAs that were
inaccessible
Upper Nile 839 444 52.9
Jonglei 1,152 399 34.6
Unity 631 152 24.1
Warrap 1,375 164 11.9
Northern Bahr el-Ghazal 1,113 0 0.0
Western Bahr el-Ghazal 402 45 11.2
Lakes 819 0 0.0
Western Equatoria 794 3 0.4
Central Equatoria 1,106 540 48.8
Eastern Equatoria 896 192 21.4
Total 9,127 1,939 21.2
Table 1.3. Enumeration areas and accessibility by statistical area
Number of enumeration areas by statistical area and the number of
percentage of EAs that were inaccessible due to population displacement,
flooding, insecurity, or other reasons, South Sudan 2017
Introduction ● 10
Other limitations: Because the 2017 SSMIS included some children under 59 months who were
attending school, especially in urban areas, and because fieldwork was completed during the school
year, field teams faced challenges with logistics and timing to reach children.
Respondents had to recall from memory the name of any antimalarial medicine given for the last fever
episode in young children, introducing potential recall bias.
Finally, the 2017 SSMIS is a cross-sectional survey, so it is not possible to establish a cause and effect
relationship between measured behaviours and any programme or policy.
1.6 Response Rates
In the 2017 SSMIS, Table 1.4 shows a total of 5,225 households were selected for the survey, out of
which 5,219 were occupied, and 5,190 were interviewed. This gave a 99% household response rate.
The total number of households interviewed in urban settings were 1,552 compared to 3,638
households in rural areas. In the interviewed households, 7,073 eligible women were identified of whom
5,426 were successfully interviewed, yielding a response rate of 77%. The household response rate
between urban and rural areas have a slight difference. This relatively low response rate was due to
challenges in the cascaded training for the 2017 SSMIS; for more details, see the Challenges and
Limitations section.
For the supplementary sample of PoC and IDP households, 221 household were selected, 215 were
occupied, and 211 were interviewed. This gave a 98% response rate. This included 144 PoC
households and 67 IDP households. In the interviewed households, 284 eligible women were identified
of whom 160 were successfully interviewed yielding response rate of 56%. The household response
rate in the POCs was 43% and 86% in IDPs.
Result Urban Rural Total PoC3 IDP4 Total
Household interviews
Households selected 982 4,281 5,263 154 67 221
Households occupied 979 4,278 5,257 149 67 216
Households interviewed 975 4,253 5,228 144 67 211
Household response rate1 99.6 99.4 99.4 96.6 100.0 97.7
Interviews with women age 15-49
Number of eligible women 1,592 5,481 7,073 193 91 284
Number of eligible women interviewed 1,040 3,650 4,690 86 83 169
Eligible women response rate2 65.3 66.7 70.2 44.6 91.2 59.5
1 Households interviewed/households occupied2 Respondents interviewed/eligible respondents
4 Internally Displaced Persons: Households living in IDP settlements administered by various agencies.
3 Protection of Civilians: Households living in PoC sites administered by the UN.
PoC and IDPGeneral population
Number of households, number of interviews, and response rates, according to residence (unweighted), for
the general population and for PoC and IDP populations, South Sudan 2017
Table 1.4 Results of the household and individual interviews
Introduction ● 11
1.7 Recommendations for next SSMIS
As described above, the MIS team faced substantial challenges to capacity constraints and accessibility
of survey areas. To mitigate against the reoccurence of similar issues, the following recommendations
are made for fieldwork for the next SSMIS:
1) Preparations such as procurement of survey materials, recruitment of survey personnel, and
finalisation of the survey questionnaires should begin substantially earlier than with the 2017
SSMIS. The MIS team should allow a minimum of nine months between protocol finalization
and the finalisation of the report to ensure there is sufficient time for robust training of field staff
and high-quality data collection, cleaning, analysis, and report-writing.
2) The MIS team should ensure there are multiple rounds of checks of the final questionnaires
against the standard MIS materials and desired indicators, to ensure that any changes made
to the questionnaire will allow the calculation of all desired indicators.
3) The MIS team should use a modern, user-friendly survey software (such as Open Data Kit or
other commonly available software) to ensure that the electronic implementation of the
questionnaire is reliable (i.e., without crashing). At the same time, the electronic implementation
of the questionnaire should be as easy for enumerators to use as possible, eliminating potential
errors around entering unique IDs or other information multiple times. The final implementation
should be checked through survey pre-testing.
4) The MIS team should use a commerical or nonprofit server for data transmission during data
collection. An external server solution is desirable because of guranteed uptime and robust
backups. The server should use appropriate encryption protocols for protection of the data.
Ownership of the data would remain with NMCP.
5) In combination with the use of a robust server solution described above, real-time data checks
should be implemented to ensure that all survey procedures are being followed and enumerator
training is sufficient.
6) The MIS team should consider laboratory materials that will result in better performance (lower
rates of fixing due to the heat) of blood smears taken in the field. If stronger methods and
materials are not feasible or available, the team may consider not including microscopy in the
next MIS.
7) Overall, the MIS team should consult with stakeholders on how to ensure that capacity is bult
throughout the process of implementing the survey and conducting the data analysis.
If these recommendations are followed many of the challenges and limitations encountered in
implementing the 2017 SSMIS may be avoided.
Characteristics of Households and Women ● 12
2 CHARACTERISTICS OF HOUSEHOLDS AND WOMEN
Information on the socioeconomic characteristics of the household population in the 2017 SSMIS
provides context to interpret demographic and health indicators and can indicate the representativeness
of the survey. This information also sheds light on the living conditions of the population.
This chapter presents information on source of drinking water, sanitation, wealth, ownership of durable
goods, and composition of household population. In addition, the chapter presents characteristics of
the survey respondents such as age, education, and literacy. Socioeconomic characteristics are useful
for understanding the factors that affect use of health services and other health behaviours related to
malaria control.
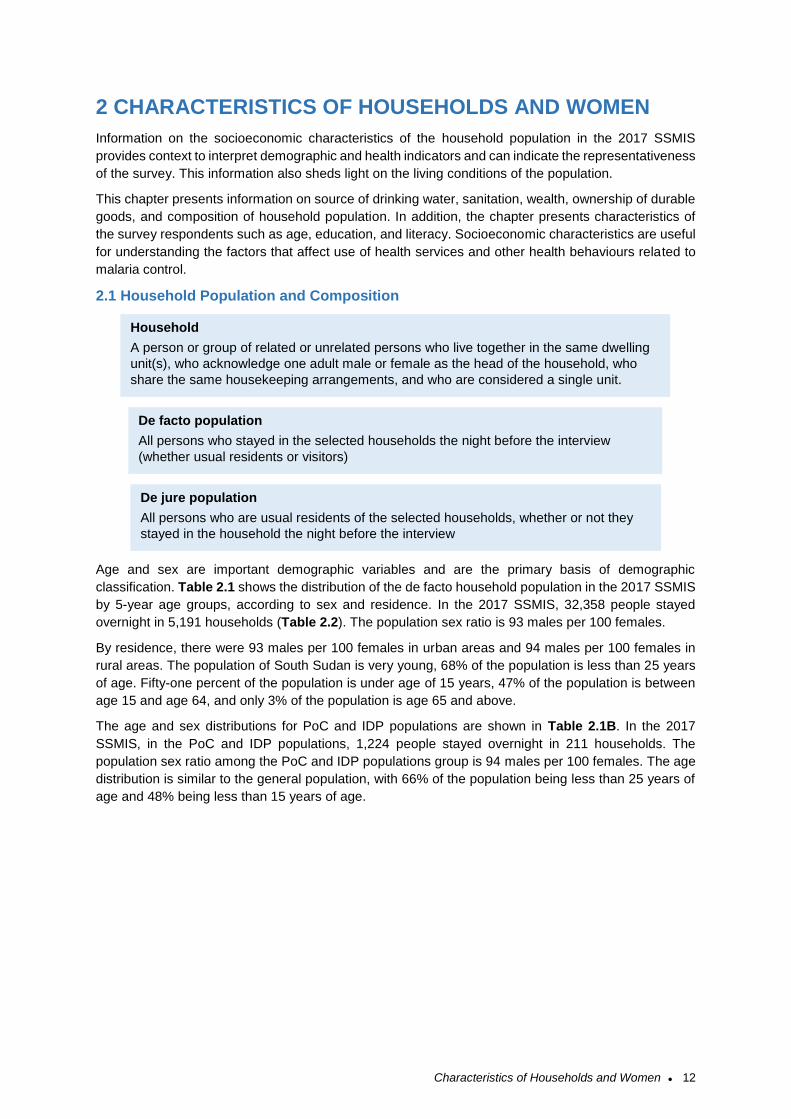
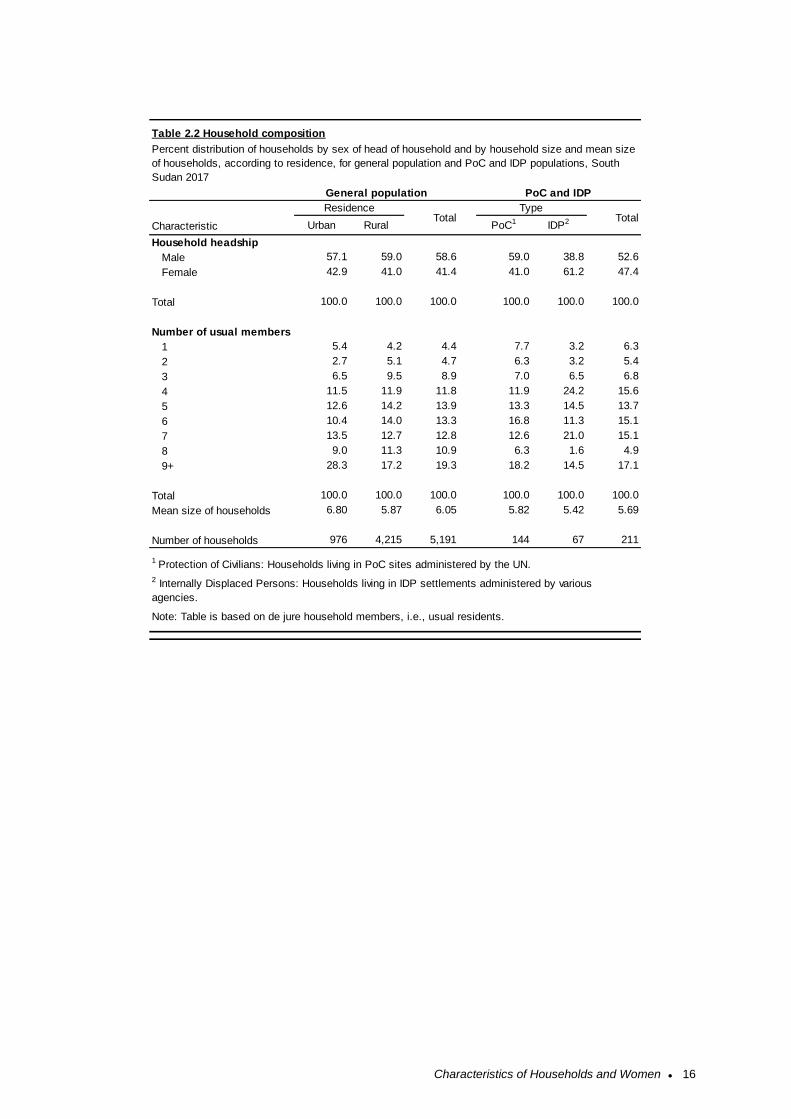
2.1 Household Population and Composition
Age and sex are important demographic variables and are the primary basis of demographic
classification. Table 2.1 shows the distribution of the de facto household population in the 2017 SSMIS
by 5-year age groups, according to sex and residence. In the 2017 SSMIS, 32,358 people stayed
overnight in 5,191 households (Table 2.2). The population sex ratio is 93 males per 100 females.
By residence, there were 93 males per 100 females in urban areas and 94 males per 100 females in
rural areas. The population of South Sudan is very young, 68% of the population is less than 25 years
of age. Fifty-one percent of the population is under age of 15 years, 47% of the population is between
age 15 and age 64, and only 3% of the population is age 65 and above.
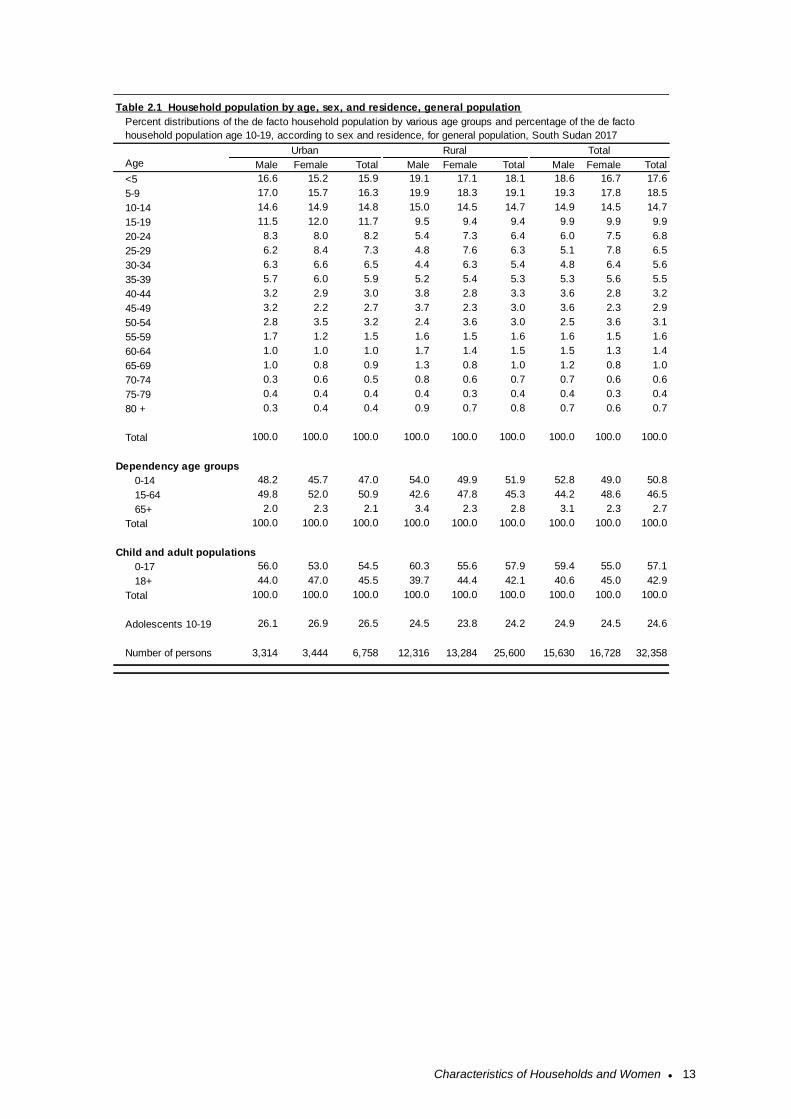
The age and sex distributions for PoC and IDP populations are shown in Table 2.1B. In the 2017
SSMIS, in the PoC and IDP populations, 1,224 people stayed overnight in 211 households. The
population sex ratio among the PoC and IDP populations group is 94 males per 100 females. The age
distribution is similar to the general population, with 66% of the population being less than 25 years of
age and 48% being less than 15 years of age.
Household
A person or group of related or unrelated persons who live together in the same dwelling
unit(s), who acknowledge one adult male or female as the head of the household, who
share the same housekeeping arrangements, and who are considered a single unit.
De facto population
All persons who stayed in the selected households the night before the interview
(whether usual residents or visitors)
De jure population
All persons who are usual residents of the selected households, whether or not they
stayed in the household the night before the interview
Characteristics of Households and Women ● 13
Male Female Total Male Female Total Male Female Total
<5 16.6 15.2 15.9 19.1 17.1 18.1 18.6 16.7 17.6
5-9 17.0 15.7 16.3 19.9 18.3 19.1 19.3 17.8 18.5
10-14 14.6 14.9 14.8 15.0 14.5 14.7 14.9 14.5 14.7
15-19 11.5 12.0 11.7 9.5 9.4 9.4 9.9 9.9 9.9
20-24 8.3 8.0 8.2 5.4 7.3 6.4 6.0 7.5 6.8
25-29 6.2 8.4 7.3 4.8 7.6 6.3 5.1 7.8 6.5
30-34 6.3 6.6 6.5 4.4 6.3 5.4 4.8 6.4 5.6
35-39 5.7 6.0 5.9 5.2 5.4 5.3 5.3 5.6 5.5
40-44 3.2 2.9 3.0 3.8 2.8 3.3 3.6 2.8 3.2
45-49 3.2 2.2 2.7 3.7 2.3 3.0 3.6 2.3 2.9
50-54 2.8 3.5 3.2 2.4 3.6 3.0 2.5 3.6 3.1
55-59 1.7 1.2 1.5 1.6 1.5 1.6 1.6 1.5 1.6
60-64 1.0 1.0 1.0 1.7 1.4 1.5 1.5 1.3 1.4
65-69 1.0 0.8 0.9 1.3 0.8 1.0 1.2 0.8 1.0
70-74 0.3 0.6 0.5 0.8 0.6 0.7 0.7 0.6 0.6
75-79 0.4 0.4 0.4 0.4 0.3 0.4 0.4 0.3 0.4
80 + 0.3 0.4 0.4 0.9 0.7 0.8 0.7 0.6 0.7
Total 100.0 100.0 100.0 100.0 100.0 100.0 100.0 100.0 100.0
Dependency age groups
0-14 48.2 45.7 47.0 54.0 49.9 51.9 52.8 49.0 50.8
15-64 49.8 52.0 50.9 42.6 47.8 45.3 44.2 48.6 46.5
65+ 2.0 2.3 2.1 3.4 2.3 2.8 3.1 2.3 2.7
Total 100.0 100.0 100.0 100.0 100.0 100.0 100.0 100.0 100.0
Child and adult populations
0-17 56.0 53.0 54.5 60.3 55.6 57.9 59.4 55.0 57.1
18+ 44.0 47.0 45.5 39.7 44.4 42.1 40.6 45.0 42.9
Total 100.0 100.0 100.0 100.0 100.0 100.0 100.0 100.0 100.0
Adolescents 10-19 26.1 26.9 26.5 24.5 23.8 24.2 24.9 24.5 24.6
Number of persons 3,314 3,444 6,758 12,316 13,284 25,600 15,630 16,728 32,358
Percent distributions of the de facto household population by various age groups and percentage of the de facto
household population age 10-19, according to sex and residence, for general population, South Sudan 2017
Total
Table 2.1 Household population by age, sex, and residence, general population
Age
Urban Rural
Characteristics of Households and Women ● 14
Male Female Total Male Female Total Male Female Total
<5 15.7 15.2 15.3 12.1 14.9 15.4 14.6 15.1 15.3
5-9 18.8 17.7 17.8 22.7 20.1 20.7 20.0 18.5 18.7
10-14 14.1 14.6 14.7 14.1 14.6 14.9 14.1 14.6 14.7
15-19 11.6 11.1 11.1 11.6 9.9 9.9 11.6 10.7 10.7
20-24 6.3 7.1 7.2 7.1 6.0 6.1 6.5 6.8 6.8
25-29 6.7 6.1 6.1 7.6 5.7 6.1 7.0 6.0 6.1
30-34 7.6 5.8 5.7 7.1 6.5 6.6 7.5 6.0 6.0
35-39 6.3 5.4 5.3 8.6 7.6 8.0 7.0 6.0 6.1
40-44 3.7 3.9 3.9 2.5 3.1 2.8 3.3 3.7 3.6
45-49 2.5 3.4 3.5 1.5 3.9 3.6 2.2 3.6 3.5
50-54 0.9 2.5 2.5 3.5 4.7 3.9 1.7 3.2 2.9
55-59 4.6 4.4 4.4 0.0 0.5 0.6 3.2 3.2 3.2
60-64 0.7 1.0 1.0 0.5 1.8 1.1 0.6 1.2 1.0
65-69 0.0 0.6 0.6 1.0 0.5 0.6 0.0 0.4 0.4
70-74 0.0 0.1 0.1 0.0 0.0 0.0 0.0 0.1 0.1
75-79 0.2 0.4 0.4 0.0 0.0 0.0 0.2 0.2 0.2
80 + 0.2 0.7 0.6 0.0 0.0 0.0 0.5 0.7 0.6
Total 100.0 100.0 100.0 100.0 100.0 100.0 100.0 100.0 100.0
Dependency age groups
0-14 48.6 47.6 47.7 49.0 49.6 51.0 48.7 48.2 48.7
15-64 50.9 50.7 50.6 50.0 49.9 48.5 50.6 50.4 50.0
65+ 0.5 1.8 1.7 1.0 0.5 0.6 0.6 1.4 1.3
Total 100.0 100.0 100.0 100.0 100.0 100.0 100.0 100.0 100.0
Child and adult populations
0-17 56.7 55.8 56.0 55.6 55.6 57.0 56.3 55.7 56.3
18+ 43.3 44.2 44.0 44.4 44.4 43.0 43.7 44.3 43.7
Total 100.0 100.0 100.0 100.0 100.0 100.0 100.0 100.0 100.0
Adolescents 10-19 25.7 25.7 25.8 25.8 24.5 24.8 25.7 25.2 25.5
Number of persons 432 841 838 198 383 363 630 1,224 1,224
2 Internally Displaced Persons: Households living in IDP settlements administered by various agencies.
1 Protection of Civilians: Households living in PoC sites administered by the UN.
Table 2.1B Household population by age, sex, and residence, PoC and IDP
Percent distributions of the de facto household population by various age groups and percentage of the de facto
household population age 10-19, according to sex and residence, for PoC and IDP populations, South Sudan 2017
Age
PoC1 IDP2Total
Characteristics of Households and Women ● 15
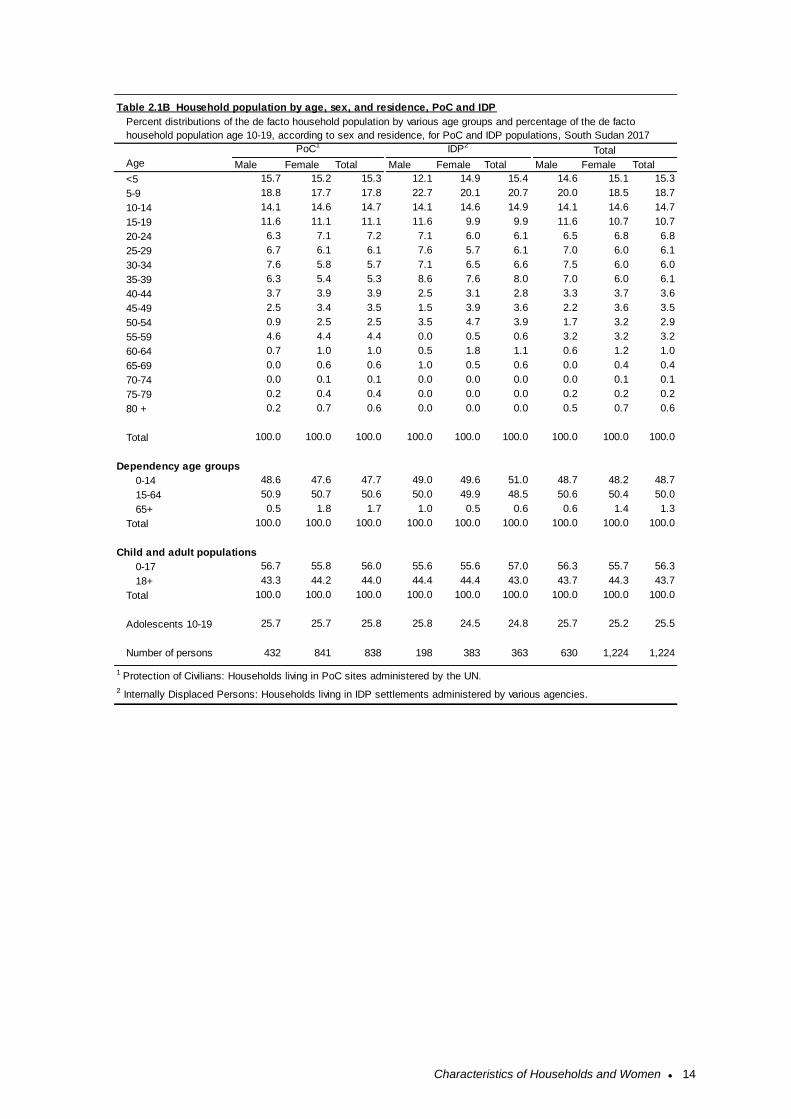
The population pyramid in Figure 2.1 shows the
population distribution by sex and by five-year age
groups for the general population. The broad base of
the pyramid shows that the South Sudan population is
young, which is typical of developing countries with a
high fertility rate and low life expectancy.
Household headship, number of usual members, and
mean size of households are shown in Table 2.2. The
majority of households (59%) in South Sudan are
headed by men, while 59% of PoC and 39% of IDP
households were headed by men. The mean size of
households in the general population is 6.05 members,
with 6.80 members on average in urban households
and 5.87 members on average in rural households. The
mean sizes of PoC and IDP households are 5.82 and
5.42 members, respectively.
Age Male Female Total
<5 18.5 16.7 17.5
5-9 19.2 17.8 18.5
10-14 14.9 14.5 14.7
15-19 9.9 10.0 10.0
20-24 6.1 7.5 6.8
25-29 5.1 7.8 6.5
30-34 4.8 6.4 5.6
35-39 5.3 5.6 5.5
40-44 3.6 2.8 3.2
45-49 3.7 2.3 3.0
50-54 2.6 3.5 3.1
55-59 1.7 1.5 1.6
60-64 1.5 1.3 1.4
65-69 1.2 0.8 1.0
70-74 0.7 0.6 0.6
75-79 0.4 0.3 0.4
80+ 0.7 0.6 0.7
Total 100.0 100.0 100.0
Number 16,224 17,358 33,582
Percent distribution of the de facto household
population by 5-year age groups, according to sex,
for general population, South Sudan 2017
Figure 2.1 Population pyramid, general
population
Characteristics of Households and Women ● 16
Urban Rural PoC1 IDP2
Household headship
Male 57.1 59.0 58.6 59.0 38.8 52.6
Female 42.9 41.0 41.4 41.0 61.2 47.4
Total 100.0 100.0 100.0 100.0 100.0 100.0
Number of usual members
1 5.4 4.2 4.4 7.7 3.2 6.3
2 2.7 5.1 4.7 6.3 3.2 5.4
3 6.5 9.5 8.9 7.0 6.5 6.8
4 11.5 11.9 11.8 11.9 24.2 15.6
5 12.6 14.2 13.9 13.3 14.5 13.7
6 10.4 14.0 13.3 16.8 11.3 15.1
7 13.5 12.7 12.8 12.6 21.0 15.1
8 9.0 11.3 10.9 6.3 1.6 4.9
9+ 28.3 17.2 19.3 18.2 14.5 17.1
Total 100.0 100.0 100.0 100.0 100.0 100.0
Mean size of households 6.80 5.87 6.05 5.82 5.42 5.69
Number of households 976 4,215 5,191 144 67 211
Table 2.2 Household composition
Characteristic
ResidenceTotal
1 Protection of Civilians: Households living in PoC sites administered by the UN.
2 Internally Displaced Persons: Households living in IDP settlements administered by various
agencies.
Note: Table is based on de jure household members, i.e., usual residents.
Percent distribution of households by sex of head of household and by household size and mean size
of households, according to residence, for general population and PoC and IDP populations, South
Sudan 2017
General population
TypeTotal
PoC and IDP
Characteristics of Households and Women ● 17
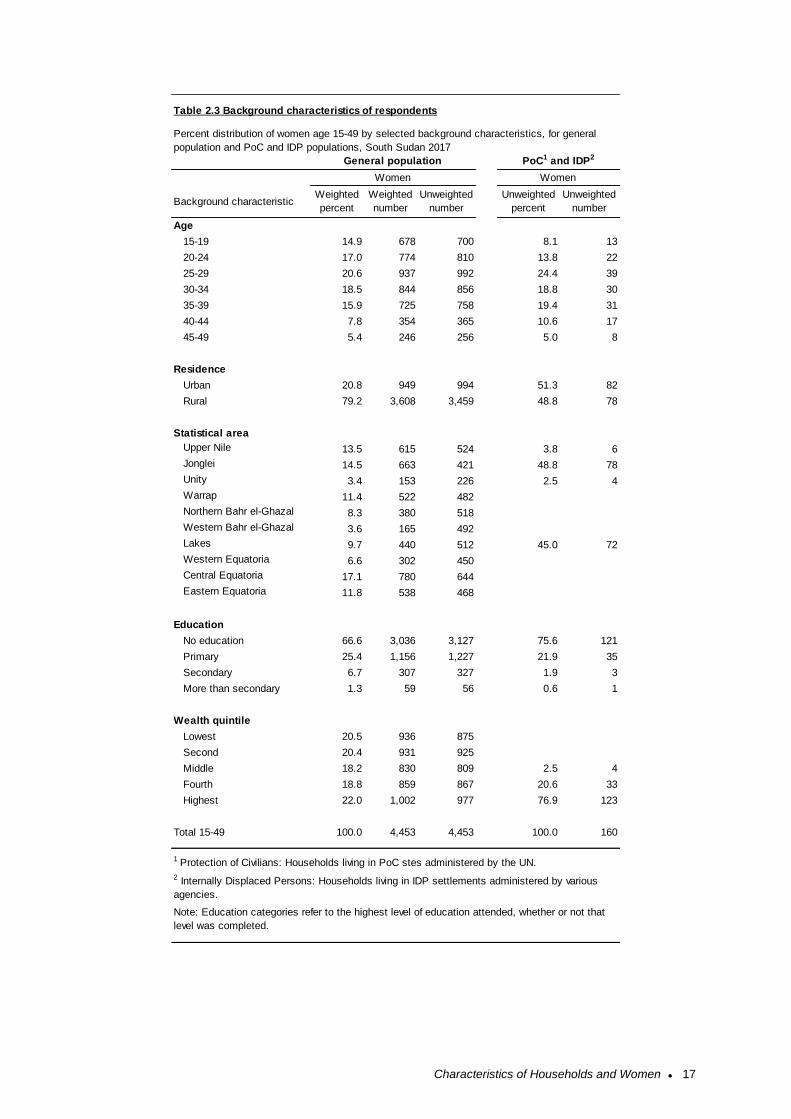
Age
15-19 14.9 678 700 8.1 13
20-24 17.0 774 810 13.8 22
25-29 20.6 937 992 24.4 39
30-34 18.5 844 856 18.8 30
35-39 15.9 725 758 19.4 31
40-44 7.8 354 365 10.6 17
45-49 5.4 246 256 5.0 8
Residence
Urban 20.8 949 994 51.3 82
Rural 79.2 3,608 3,459 48.8 78
Statistical area
Upper Nile 13.5 615 524 3.8 6
Jonglei 14.5 663 421 48.8 78
Unity 3.4 153 226 2.5 4
Warrap 11.4 522 482
Northern Bahr el-Ghazal 8.3 380 518
Western Bahr el-Ghazal 3.6 165 492
Lakes 9.7 440 512 45.0 72
Western Equatoria 6.6 302 450
Central Equatoria 17.1 780 644
Eastern Equatoria 11.8 538 468
Education
No education 66.6 3,036 3,127 75.6 121
Primary 25.4 1,156 1,227 21.9 35
Secondary 6.7 307 327 1.9 3
More than secondary 1.3 59 56 0.6 1
Wealth quintile
Lowest 20.5 936 875
Second 20.4 931 925
Middle 18.2 830 809 2.5 4
Fourth 18.8 859 867 20.6 33
Highest 22.0 1,002 977 76.9 123
Total 15-49 100.0 4,453 4,453 100.0 160
Women
PoC1 and IDP2General population
Table 2.3 Background characteristics of respondents
Women
Percent distribution of women age 15-49 by selected background characteristics, for general
population and PoC and IDP populations, South Sudan 2017
Note: Education categories refer to the highest level of education attended, whether or not that
level was completed.
2 Internally Displaced Persons: Households living in IDP settlements administered by various
agencies.
1 Protection of Civilians: Households living in PoC stes administered by the UN.
Unweighted
percentBackground characteristic
Weighted
percent
Weighted
number
Unweighted
number
Unweighted
number
Characteristics of Households and Women ● 18
2.2 Drinking Water Sources and Treatment
Improved sources of water protect against outside contamination so that water is more likely to be safe
to drink. Table 2.4 shows sources of drinking water for households and the population. 71% of
households and 72% of the population in South Sudan have an improved source of drinking water.
Access to an improved source of drinking water did not vary by residence (urban versus rural). The
most common source of drinking water is tubewells/boreholes, accounting for 60% of households’
Urban Rural Total Urban Rural Total
Source of drinking water
Improved source 71.0 71.1 71.1 70.1 72.7 72.2
Piped into dwelling/yard/plot 1.9 0.9 1.1 1.7 1.1 1.2
Piped to neighbor 1.4 0.2 0.4 1.5 0.2 0.5
Public tap/standpipe 17.6 4.7 7.1 17.0 4.8 7.3
Tubewell/borehole 45.2 63.7 60.2 45.6 65.1 61.0
Protected dug well 4.2 1.0 1.6 3.6 0.9 1.5
Protected spring 0.2 0.5 0.5 0.2 0.6 0.5
Rainwater 0.0 0.0 0.0 0.0 0.0 0.0
Bottled water, improved source for
cooking/handwashing1 0.3 0.0 0.1 0.3 0.0 0.1
Unimproved source 29.0 28.6 28.7 29.9 27.0 27.6
Unprotected dug well 6.8 7.9 7.7 7.8 6.9 7.1
Unprotected spring 0.9 0.6 0.7 0.6 0.6 0.6
Tanker truck/cart with small tank 16.5 1.1 4.0 17.9 1.4 4.8
Surface water 4.8 18.9 16.3 3.7 18.1 15.1
Bottled water, unimproved source for
cooking/handwashing1 0.0 0.0 0.0 0.0 0.0 0.0
Other source 0.0 0.3 0.2 0.0 0.3 0.2
Total 100.0 100.0 100.0 100.0 100.0 100.0
Time to obtain drinking water (round trip)
Water on premises 9.6 7.5 7.9 10.0 7.4 8.0
Less than 30 minutes 62.4 52.3 54.2 60.7 52.7 54.4
30 minutes or longer 28.0 40.2 37.9 29.4 39.8 37.7
Total 100.0 100.0 100.0 100.0 100.0 100.0
Number 975 4,215 5,190 6,758 25,648 32,406
Percent distribution of households and de jure population by source of drinking water and by time to obtain drinking
water, according to residence, for general population, South Sudan 2017
1 Households using bottled water for drinking are classified as using an improved or unimproved source according to
their water source for cooking and handwashing.
Characteristic
Table 2.4 Household drinking water, general population
Households Population
Improved sources of drinking water
Include piped water, public taps, standpipes, tube wells, boreholes,
protected dug wells and springs, and rainwater. Households that use bottled
or sachet water for drinking are classified as using an improved source only
if their water for cooking and handwashing come from an improved source.
Sample: Households
Characteristics of Households and Women ● 19
water sources nationally. 45% of urban households use tubewells/boreholes, while 64% of urban
households use tubewells/boreholes. Unimproved sources provided the drinking water for 29% of
households nationally. The most common unimproved water source for urban households is tanker
trucks/carts with a small tank (17% of urban households), while the most common unimproved source
for rural households is surface water (19% of rural households). Nationally, 38% of households get their
drinking water from a source that is more than 30 minutes round trip away.
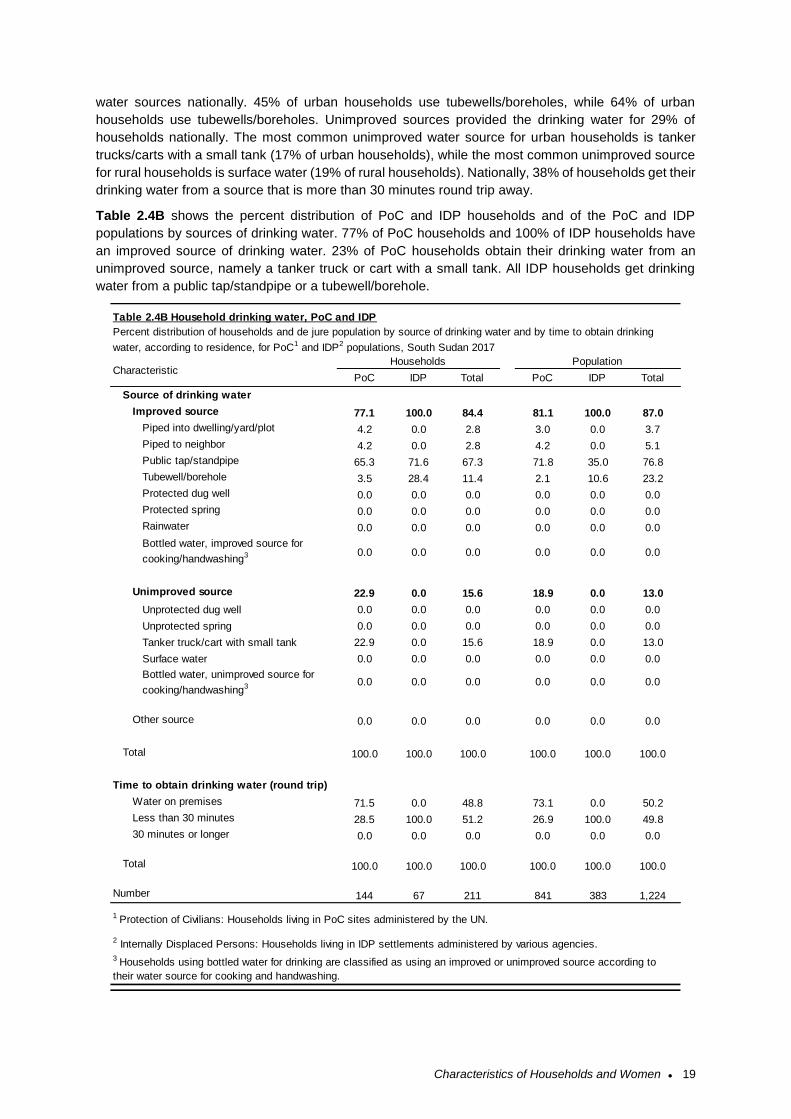
Table 2.4B shows the percent distribution of PoC and IDP households and of the PoC and IDP
populations by sources of drinking water. 77% of PoC households and 100% of IDP households have
an improved source of drinking water. 23% of PoC households obtain their drinking water from an
unimproved source, namely a tanker truck or cart with a small tank. All IDP households get drinking
water from a public tap/standpipe or a tubewell/borehole.
PoC IDP Total PoC IDP Total
Source of drinking water
Improved source 77.1 100.0 84.4 81.1 100.0 87.0
Piped into dwelling/yard/plot 4.2 0.0 2.8 3.0 0.0 3.7
Piped to neighbor 4.2 0.0 2.8 4.2 0.0 5.1
Public tap/standpipe 65.3 71.6 67.3 71.8 35.0 76.8
Tubewell/borehole 3.5 28.4 11.4 2.1 10.6 23.2
Protected dug well 0.0 0.0 0.0 0.0 0.0 0.0
Protected spring 0.0 0.0 0.0 0.0 0.0 0.0
Rainwater 0.0 0.0 0.0 0.0 0.0 0.0
Bottled water, improved source for
cooking/handwashing3 0.0 0.0 0.0 0.0 0.0 0.0
Unimproved source 22.9 0.0 15.6 18.9 0.0 13.0
Unprotected dug well 0.0 0.0 0.0 0.0 0.0 0.0
Unprotected spring 0.0 0.0 0.0 0.0 0.0 0.0
Tanker truck/cart with small tank 22.9 0.0 15.6 18.9 0.0 13.0
Surface water 0.0 0.0 0.0 0.0 0.0 0.0
Bottled water, unimproved source for
cooking/handwashing3 0.0 0.0 0.0 0.0 0.0 0.0
Other source 0.0 0.0 0.0 0.0 0.0 0.0
Total 100.0 100.0 100.0 100.0 100.0 100.0
Time to obtain drinking water (round trip)
Water on premises 71.5 0.0 48.8 73.1 0.0 50.2
Less than 30 minutes 28.5 100.0 51.2 26.9 100.0 49.8
30 minutes or longer 0.0 0.0 0.0 0.0 0.0 0.0
Total 100.0 100.0 100.0 100.0 100.0 100.0
Number 144 67 211 841 383 1,224
Households Population
1 Protection of Civilians: Households living in PoC sites administered by the UN.
2 Internally Displaced Persons: Households living in IDP settlements administered by various agencies.
3 Households using bottled water for drinking are classified as using an improved or unimproved source according to
their water source for cooking and handwashing.
Characteristic
Table 2.4B Household drinking water, PoC and IDP
Percent distribution of households and de jure population by source of drinking water and by time to obtain drinking
water, according to residence, for PoC1 and IDP2 populations, South Sudan 2017
Characteristics of Households and Women ● 20
2.3 Sanitation
Nationally, only 14% of households use an improved toilet facility, defined as a non-shared facility
constructed to prevent contact with human waste and thus reduce the transmission of cholera, typhoid,
and other diseases. Another 8% of households use an improved facility shared with other households
(Table 2.5). Nearly two-thirds (64%) of households use open defecation (no toilet facilities).
The most common facilities for households with improved sanitation were pit latrines with a slab (7% of
households) and ventilated improved pit latrines (4%). Household in urban areas are more likely to use
improved non-shared facilities (27%) compared to rural households with 9%. Open defecation is used
by 30% of urban households and 72% of rural households.
The majority (88%) of households in PoC and IDP areas have unimproved sanitation. Overall 12% of
households in POCs and IDPs have improved sanitation.
Improved toilet facilities
Include any non-shared toilet of the following types: flush/pour, flush toilets
to piped sewer systems, septic tanks, and pit latrines; ventilated improved
pit (VIP) latrines; pit latrines with slabs; and composting toilets.
Sample: Households
Characteristics of Households and Women ● 21
Type a
nd location o
f to
ilet/
latr
ine facili
tyU
rban
Rura
lTota
lU
rban
Rura
lTota
lP
oC
1ID
P2
Tota
lP
oC
1ID
P2
Tota
l
Imp
rove
d s
an
ita
tio
n27.2
9.1
12.5
30.9
8.9
13.5
1.5
(31.5
)10.9
0.2
38.6
12.3
F
lush/p
our
flush t
o p
iped s
ew
er
syste
m0.9
0.2
0.3
1.5
0.2
0.5
0.7
(1.5
)0.9
0.1
1.8
0.7
F
lush/p
our
flush t
o s
eptic t
ank
1.2
0.0
0.3
2.1
0.0
0.5
0.0
(0.0
)0.0
0.0
0.0
0.0
F
lush/p
our
flush t
o a
pit latr
ine
0.9
0.0
0.2
1.3
0.1
0.3
0.0
(0.0
)0.0
0.0
0.0
0.0
V
entila
ted im
pro
ved p
it (
VIP
) la
trin
e11.3
1.9
3.7
12.1
2.1
4.2
0.7
(0.7
)10.0
0.1
36.8
11.6
P
it latr
ine w
ith a
sla
b9.9
6.7
7.3
10.7
6.2
7.1
0.1
(0.1
)0.0
0.0
0.0
0.0
C
om
posting t
oile
t2.9
0.3
0.8
3.1
0.4
1.0
0.0
(0.0
)0.0
0.0
0.0
0.0
Un
imp
rove
d s
an
ita
tio
n72.8
90.9
87.5
69.1
91.1
86.5
98.6
(98.6
)89.1
99.8
61.4
87.7
Sh
are
d f
acil
ity
318.8
6.0
8.4
17.7
5.9
8.3
91.0
(91.0
)71.1
91.6
27.4
71.5
F
lush/p
our
flush t
o p
iped s
ew
er
syste
m0.2
0.1
0.1
0.4
0.1
0.2
0.7
(0.7
)0.9
0.4
0.3
0.3
F
lush/p
our
flush t
o s
eptic t
ank
0.4
0.0
0.1
0.3
0.0
0.1
56.9
(56.9
)47.4
60.5
27.2
50.1
F
lush/p
our
flush t
o a
pit latr
ine
0.2
0.0
0.1
0.1
0.0
0.1
32.6
(32.6
)22.3
30.0
0.0
20.6
V
entila
ted im
pro
ved p
it (
VIP
) la
trin
e6.4
2.5
3.3
6.4
2.5
3.3
0.7
(0.7
)0.5
0.7
0.0
0.5
P
it latr
ine w
ith a
sla
b8.6
3.1
4.2
8.0
3.0
4.0
0.0
(0.0
)0.0
0.0
0.0
0.0
C
om
posting t
oile
t3.0
0.2
0.7
2.3
0.3
0.7
0.0
(0.0
)0.0
0.0
0.0
0.0
Un
imp
rove
d f
acil
ity
23.7
12.5
14.6
22.8
11.6
13.9
6.3
(1.5
)4.7
5.9
1.6
4.6
F
lush/p
our
flush n
ot
to s
ew
er/
septic t
ank/p
it
latr
ine
1.3
0.0
0.3
1.3
0.1
0.3
5.6
(1.5
)4.3
5.8
1.6
4.5
P
it latr
ine w
ithout
sla
b/o
pen p
it21.2
8.5
10.9
20.5
7.8
10.5
0.7
(0.0
)0.5
0.1
0.0
0.1
B
ucket
0.1
0.0
0.0
0.1
0.0
0.0
0.0
(0.0
)0.0
0.0
0.0
0.0
H
angin
g t
oile
t/hangin
g latr
ine
1.0
4.0
3.4
0.9
3.7
3.1
0.0
(0.0
)0.0
0.0
0.0
0.0
O
pe
n d
efe
ca
tio
n (
no
fa
cil
ity/b
ush
/fie
ld)
30.4
72.3
64.4
28.7
73.6
64.2
1.4
(38.8
)13.3
2.3
32.4
11.7
Tota
l 100.0
100.0
100.0
100.0
100.0
100.0
100.1
(100.1
)100.0
100.0
100.0
100.0
679
1,1
67
1,8
46
4,8
18
6,7
68
11,5
86
142
41
183
822
259
1,0
81
Popula
tion
Num
ber
of household
s/p
opula
tion w
ith a
t
oile
t/la
trin
e facili
ty
Ge
ne
ral
po
pu
lati
on
Perc
ent
dis
trib
ution o
f household
s a
nd d
e jure
popula
tion b
y t
ype o
f to
ilet/
latr
ine facili
ties,
accord
ing t
o r
esid
ence,
South
Sudan 2
017
Po
C a
nd
ID
P
3 F
acili
ties t
hat
would
be c
onsid
ere
d im
pro
ved if th
ey w
ere
not
share
d b
y t
wo o
r m
ore
household
s
Ta
ble
2.5
H
ou
seh
old
sa
nit
ati
on
fa
cil
itie
s
Household
sP
opula
tion
1 P
rote
ction o
f C
ivili
ans:
Household
s liv
ing in P
oC
sites a
dm
inis
tere
d b
y t
he U
N.
2 Inte
rnally
Dis
pla
ced P
ers
ons:
Household
s liv
ing in ID
P s
ett
lem
ents
adm
inis
tere
d b
y v
arious a
gencie
s.
Num
bers
in p
are
nth
eses a
re b
ased o
n 2
5-4
9 u
nw
eig
hte
d c
ases.
Household
s
Characteristics of Households and Women ● 22
2.4 Housing Characteristics
The 2017 SSMIS collected data on household features such as access to electricity, flooring material,
number of sleeping rooms, and types of fuel used for cooking. The responses to these questions, along
with information on ownership of household durable goods, contribute to the creation of the household
wealth index and provide information that may be relevant for other health indicators.
Overall, only 4% of households in the general population have electricity (Table 2.6). Households in
urban areas (10%) were more likely to have electricity than in rural areas (3%). Access to electricity is
also limited for PoC and IDP households, with 1% of PoC and 5% of IDP households having electricity
(Table 2.6B).
The most common flooring material in South Sudan is earth/sand (74%), followed by dung (21%).
Flooring material for PoC and IDP households are similar to the general population: 72% of PoC
households and 78% of IDP households have earth/sand floors, followed by dung (16% of PoC and
21% of IDP).
The number of rooms a household uses for sleeping is an indicator of socioeconomic level and of
crowding in the household, which can facilitate the spread of disease. In South Sudan, 77% of
households use either one or two rooms for sleeping.
Exposure to cooking smoke, especially to smoke produced from solid fuels, is potentially harmful to
health. The use of solid fuels for cooking is nearly universal (97%) for households in South Sudan, with
the major sources being wood and charcoal.
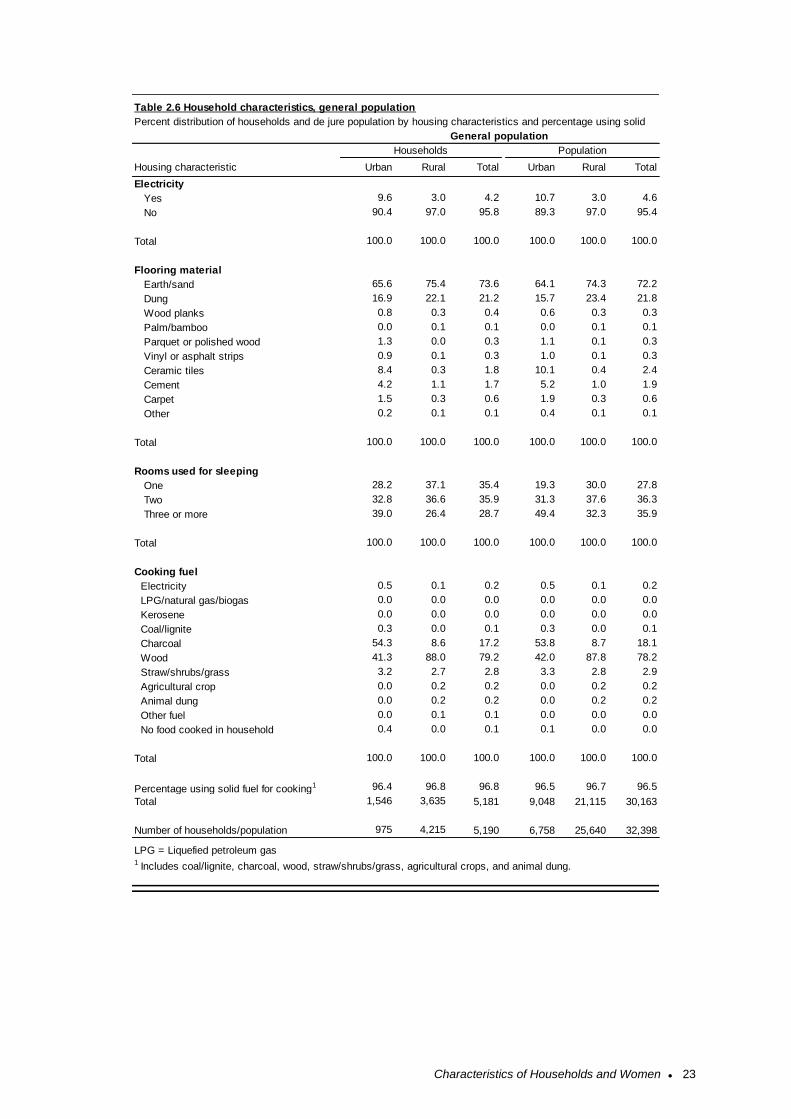
Characteristics of Households and Women ● 23
Housing characteristic Urban Rural Total Urban Rural Total
Electricity
Yes 9.6 3.0 4.2 10.7 3.0 4.6
No 90.4 97.0 95.8 89.3 97.0 95.4
Total 100.0 100.0 100.0 100.0 100.0 100.0
Flooring material
Earth/sand 65.6 75.4 73.6 64.1 74.3 72.2
Dung 16.9 22.1 21.2 15.7 23.4 21.8
Wood planks 0.8 0.3 0.4 0.6 0.3 0.3
Palm/bamboo 0.0 0.1 0.1 0.0 0.1 0.1
Parquet or polished wood 1.3 0.0 0.3 1.1 0.1 0.3
Vinyl or asphalt strips 0.9 0.1 0.3 1.0 0.1 0.3
Ceramic tiles 8.4 0.3 1.8 10.1 0.4 2.4
Cement 4.2 1.1 1.7 5.2 1.0 1.9
Carpet 1.5 0.3 0.6 1.9 0.3 0.6
Other 0.2 0.1 0.1 0.4 0.1 0.1
Total 100.0 100.0 100.0 100.0 100.0 100.0
Rooms used for sleeping
One 28.2 37.1 35.4 19.3 30.0 27.8
Two 32.8 36.6 35.9 31.3 37.6 36.3
Three or more 39.0 26.4 28.7 49.4 32.3 35.9
Total 100.0 100.0 100.0 100.0 100.0 100.0
Cooking fuel
Electricity 0.5 0.1 0.2 0.5 0.1 0.2
LPG/natural gas/biogas 0.0 0.0 0.0 0.0 0.0 0.0
Kerosene 0.0 0.0 0.0 0.0 0.0 0.0
Coal/lignite 0.3 0.0 0.1 0.3 0.0 0.1
Charcoal 54.3 8.6 17.2 53.8 8.7 18.1
Wood 41.3 88.0 79.2 42.0 87.8 78.2
Straw/shrubs/grass 3.2 2.7 2.8 3.3 2.8 2.9
Agricultural crop 0.0 0.2 0.2 0.0 0.2 0.2
Animal dung 0.0 0.2 0.2 0.0 0.2 0.2
Other fuel 0.0 0.1 0.1 0.0 0.0 0.0
No food cooked in household 0.4 0.0 0.1 0.1 0.0 0.0
Total 100.0 100.0 100.0 100.0 100.0 100.0
Percentage using solid fuel for cooking1 96.4 96.8 96.8 96.5 96.7 96.5
Total 1,546 3,635 5,181 9,048 21,115 30,163
Number of households/population 975 4,215 5,190 6,758 25,640 32,398
LPG = Liquefied petroleum gas1 Includes coal/lignite, charcoal, wood, straw/shrubs/grass, agricultural crops, and animal dung.
General population
Table 2.6 Household characteristics, general population
Households Population
Percent distribution of households and de jure population by housing characteristics and percentage using solid
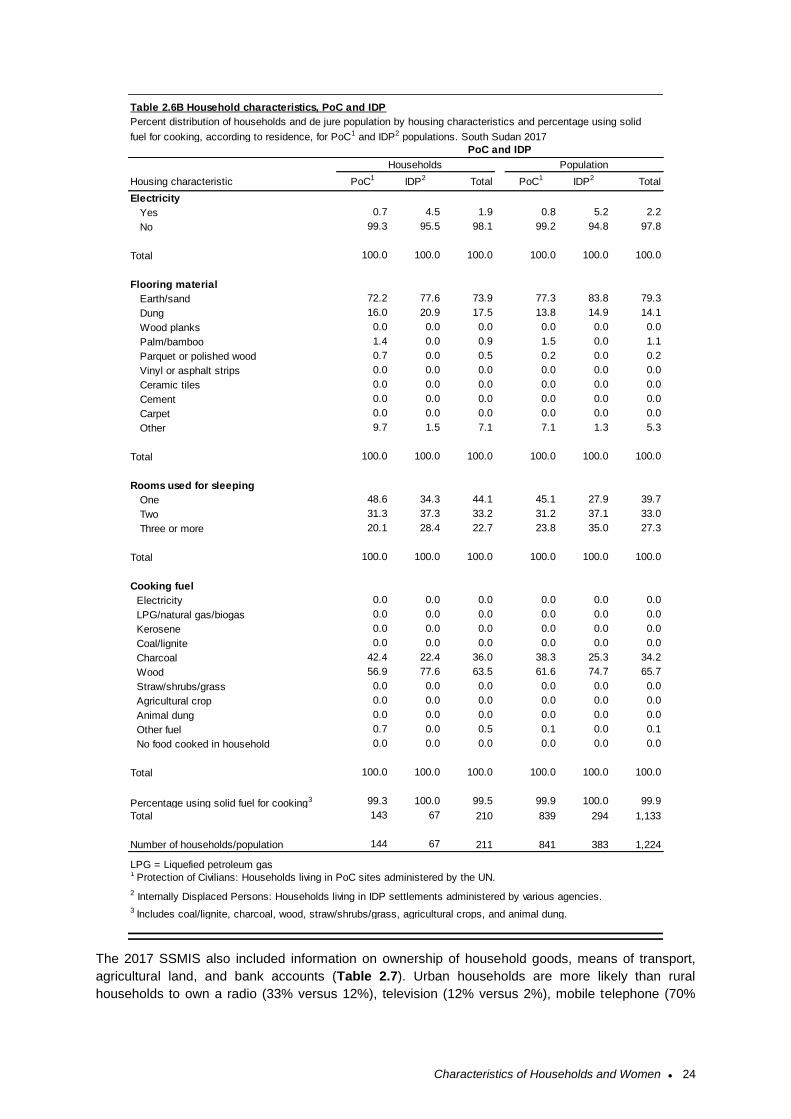
Characteristics of Households and Women ● 24
The 2017 SSMIS also included information on ownership of household goods, means of transport,
agricultural land, and bank accounts (Table 2.7). Urban households are more likely than rural
households to own a radio (33% versus 12%), television (12% versus 2%), mobile telephone (70%
Housing characteristic PoC1 IDP2 Total PoC1 IDP2 Total
Electricity
Yes 0.7 4.5 1.9 0.8 5.2 2.2
No 99.3 95.5 98.1 99.2 94.8 97.8
Total 100.0 100.0 100.0 100.0 100.0 100.0
Flooring material
Earth/sand 72.2 77.6 73.9 77.3 83.8 79.3
Dung 16.0 20.9 17.5 13.8 14.9 14.1
Wood planks 0.0 0.0 0.0 0.0 0.0 0.0
Palm/bamboo 1.4 0.0 0.9 1.5 0.0 1.1
Parquet or polished wood 0.7 0.0 0.5 0.2 0.0 0.2
Vinyl or asphalt strips 0.0 0.0 0.0 0.0 0.0 0.0
Ceramic tiles 0.0 0.0 0.0 0.0 0.0 0.0
Cement 0.0 0.0 0.0 0.0 0.0 0.0
Carpet 0.0 0.0 0.0 0.0 0.0 0.0
Other 9.7 1.5 7.1 7.1 1.3 5.3
Total 100.0 100.0 100.0 100.0 100.0 100.0
Rooms used for sleeping
One 48.6 34.3 44.1 45.1 27.9 39.7
Two 31.3 37.3 33.2 31.2 37.1 33.0
Three or more 20.1 28.4 22.7 23.8 35.0 27.3
Total 100.0 100.0 100.0 100.0 100.0 100.0
Cooking fuel
Electricity 0.0 0.0 0.0 0.0 0.0 0.0
LPG/natural gas/biogas 0.0 0.0 0.0 0.0 0.0 0.0
Kerosene 0.0 0.0 0.0 0.0 0.0 0.0
Coal/lignite 0.0 0.0 0.0 0.0 0.0 0.0
Charcoal 42.4 22.4 36.0 38.3 25.3 34.2
Wood 56.9 77.6 63.5 61.6 74.7 65.7
Straw/shrubs/grass 0.0 0.0 0.0 0.0 0.0 0.0
Agricultural crop 0.0 0.0 0.0 0.0 0.0 0.0
Animal dung 0.0 0.0 0.0 0.0 0.0 0.0
Other fuel 0.7 0.0 0.5 0.1 0.0 0.1
No food cooked in household 0.0 0.0 0.0 0.0 0.0 0.0
Total 100.0 100.0 100.0 100.0 100.0 100.0
Percentage using solid fuel for cooking3 99.3 100.0 99.5 99.9 100.0 99.9
Total 143 67 210 839 294 1,133
Number of households/population 144 67 211 841 383 1,224
LPG = Liquefied petroleum gas1 Protection of Civilians: Households living in PoC sites administered by the UN.
2 Internally Displaced Persons: Households living in IDP settlements administered by various agencies.
3 Includes coal/lignite, charcoal, wood, straw/shrubs/grass, agricultural crops, and animal dung.
Table 2.6B Household characteristics, PoC and IDP
PoC and IDP
Households Population
Percent distribution of households and de jure population by housing characteristics and percentage using solid
fuel for cooking, according to residence, for PoC1 and IDP2 populations. South Sudan 2017
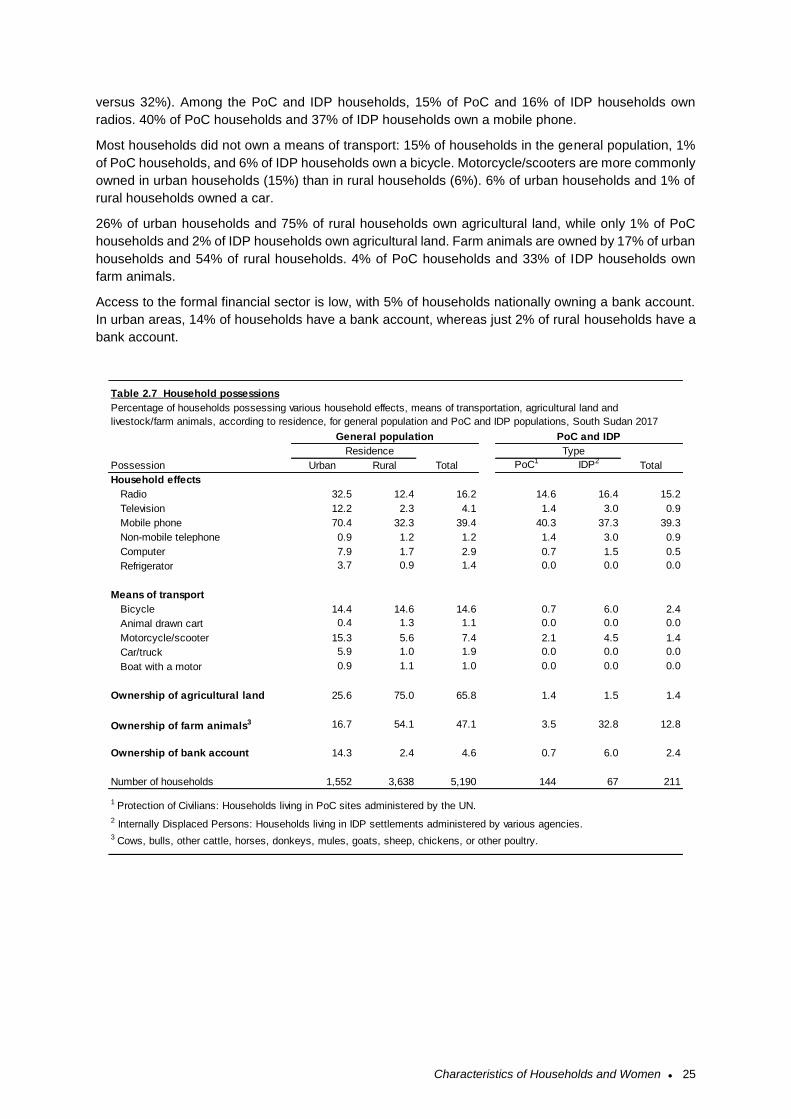
Characteristics of Households and Women ● 25
versus 32%). Among the PoC and IDP households, 15% of PoC and 16% of IDP households own
radios. 40% of PoC households and 37% of IDP households own a mobile phone.
Most households did not own a means of transport: 15% of households in the general population, 1%
of PoC households, and 6% of IDP households own a bicycle. Motorcycle/scooters are more commonly
owned in urban households (15%) than in rural households (6%). 6% of urban households and 1% of
rural households owned a car.
26% of urban households and 75% of rural households own agricultural land, while only 1% of PoC
households and 2% of IDP households own agricultural land. Farm animals are owned by 17% of urban
households and 54% of rural households. 4% of PoC households and 33% of IDP households own
farm animals.
Access to the formal financial sector is low, with 5% of households nationally owning a bank account.
In urban areas, 14% of households have a bank account, whereas just 2% of rural households have a
bank account.
Possession Urban Rural PoC1 IDP2
Household effects
Radio 32.5 12.4 16.2 14.6 16.4 15.2
Television 12.2 2.3 4.1 1.4 3.0 0.9
Mobile phone 70.4 32.3 39.4 40.3 37.3 39.3
Non-mobile telephone 0.9 1.2 1.2 1.4 3.0 0.9
Computer 7.9 1.7 2.9 0.7 1.5 0.5
Refrigerator 3.7 0.9 1.4 0.0 0.0 0.0
Means of transport
Bicycle 14.4 14.6 14.6 0.7 6.0 2.4
Animal drawn cart 0.4 1.3 1.1 0.0 0.0 0.0
Motorcycle/scooter 15.3 5.6 7.4 2.1 4.5 1.4
Car/truck 5.9 1.0 1.9 0.0 0.0 0.0
Boat with a motor 0.9 1.1 1.0 0.0 0.0 0.0
Ownership of agricultural land 25.6 75.0 65.8 1.4 1.5 1.4
Ownership of farm animals3 16.7 54.1 47.1 3.5 32.8 12.8
Ownership of bank account 14.3 2.4 4.6 0.7 6.0 2.4
Number of households 1,552 3,638 5,190 144 67 211
3 Cows, bulls, other cattle, horses, donkeys, mules, goats, sheep, chickens, or other poultry.
Residence
Total
Type
Total
1 Protection of Civilians: Households living in PoC sites administered by the UN.
2 Internally Displaced Persons: Households living in IDP settlements administered by various agencies.
Percentage of households possessing various household effects, means of transportation, agricultural land and
livestock/farm animals, according to residence, for general population and PoC and IDP populations, South Sudan 2017
PoC and IDPGeneral population
Table 2.7 Household possessions
Characteristics of Households and Women ● 26
2.5 Household Wealth
The distribution of households by wealth quintile and residence, and by wealth quintile and statistical
area, is shown in Table 2.8. By definition, 20% of the total household population in the general
population is in each wealth quintile. However, the population distributions are unequal when stratifying
by urban and rural areas. Fifty-eight percent of the population in urban areas is in the highest quintile
compared with only 10% of the population in rural areas being in the highest quintile. On the other hand,
only 1% of the urban population falls in the lowest wealth quintile, compared with 25% of the rural
population.
At the statistical area level, Warrap has the highest percentage of population in the lowest quintile
(43%). Central Equatoria statistical area has the highest percentage of population in the highest wealth
quintile (34%).
The wealth quintiles generated for the general population were also applied to the PoC and IDP
households. For instance, 25% of PoC households were in the top wealth quintile (compared to 20% of
the general population). Just 10% of IDP households were in the top wealth quintile, while 55% of IDP
households were in the lowest quintile.
Wealth Index
Households are given scores based on the number and kinds of consumer goods they
own, ranging from a television to a bicycle or car, plus housing characteristics such as
source of drinking water, toilet facilities, and flooring materials. These scores are derived
using principal component analysis. National wealth quintiles are compiled by assigning
the household score to each usual (de jure) household member, ranking each person in
the household population by their score, and then dividing the distribution into five equal
categories, each with 20% of the population.
Sample: Households
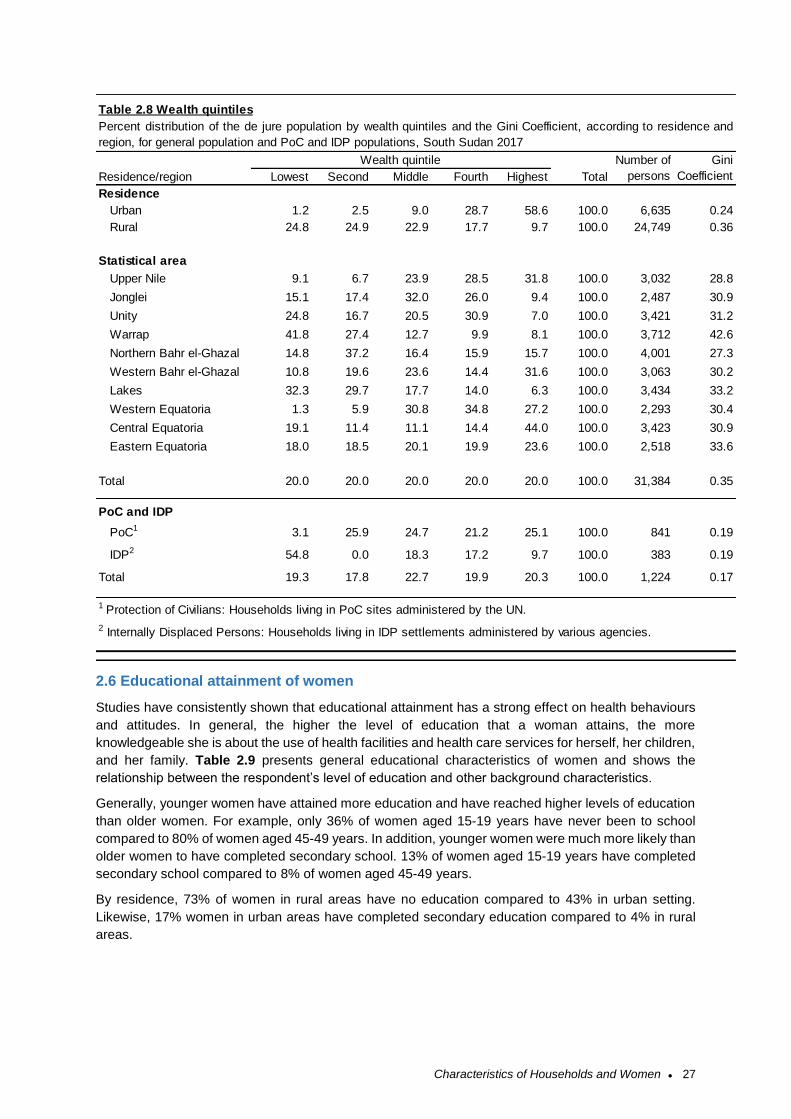
Characteristics of Households and Women ● 27
2.6 Educational attainment of women
Studies have consistently shown that educational attainment has a strong effect on health behaviours
and attitudes. In general, the higher the level of education that a woman attains, the more
knowledgeable she is about the use of health facilities and health care services for herself, her children,
and her family. Table 2.9 presents general educational characteristics of women and shows the
relationship between the respondent’s level of education and other background characteristics.
Generally, younger women have attained more education and have reached higher levels of education
than older women. For example, only 36% of women aged 15-19 years have never been to school
compared to 80% of women aged 45-49 years. In addition, younger women were much more likely than
older women to have completed secondary school. 13% of women aged 15-19 years have completed
secondary school compared to 8% of women aged 45-49 years.
By residence, 73% of women in rural areas have no education compared to 43% in urban setting.
Likewise, 17% women in urban areas have completed secondary education compared to 4% in rural
areas.
Residence/region Lowest Second Middle Fourth Highest Total
Residence
Urban 1.2 2.5 9.0 28.7 58.6 100.0 6,635 0.24
Rural 24.8 24.9 22.9 17.7 9.7 100.0 24,749 0.36
Statistical area
Upper Nile 9.1 6.7 23.9 28.5 31.8 100.0 3,032 28.8
Jonglei 15.1 17.4 32.0 26.0 9.4 100.0 2,487 30.9
Unity 24.8 16.7 20.5 30.9 7.0 100.0 3,421 31.2
Warrap 41.8 27.4 12.7 9.9 8.1 100.0 3,712 42.6
Northern Bahr el-Ghazal 14.8 37.2 16.4 15.9 15.7 100.0 4,001 27.3
Western Bahr el-Ghazal 10.8 19.6 23.6 14.4 31.6 100.0 3,063 30.2
Lakes 32.3 29.7 17.7 14.0 6.3 100.0 3,434 33.2
Western Equatoria 1.3 5.9 30.8 34.8 27.2 100.0 2,293 30.4
Central Equatoria 19.1 11.4 11.1 14.4 44.0 100.0 3,423 30.9
Eastern Equatoria 18.0 18.5 20.1 19.9 23.6 100.0 2,518 33.6
Total 20.0 20.0 20.0 20.0 20.0 100.0 31,384 0.35
PoC and IDP
PoC1 3.1 25.9 24.7 21.2 25.1 100.0 841 0.19
IDP2 54.8 0.0 18.3 17.2 9.7 100.0 383 0.19
Total 19.3 17.8 22.7 19.9 20.3 100.0 1,224 0.17
1 Protection of Civilians: Households living in PoC sites administered by the UN.
2 Internally Displaced Persons: Households living in IDP settlements administered by various agencies.
Table 2.8 Wealth quintiles
Wealth quintile Number of
persons
Percent distribution of the de jure population by wealth quintiles and the Gini Coefficient, according to residence and
region, for general population and PoC and IDP populations, South Sudan 2017
Gini
Coefficient
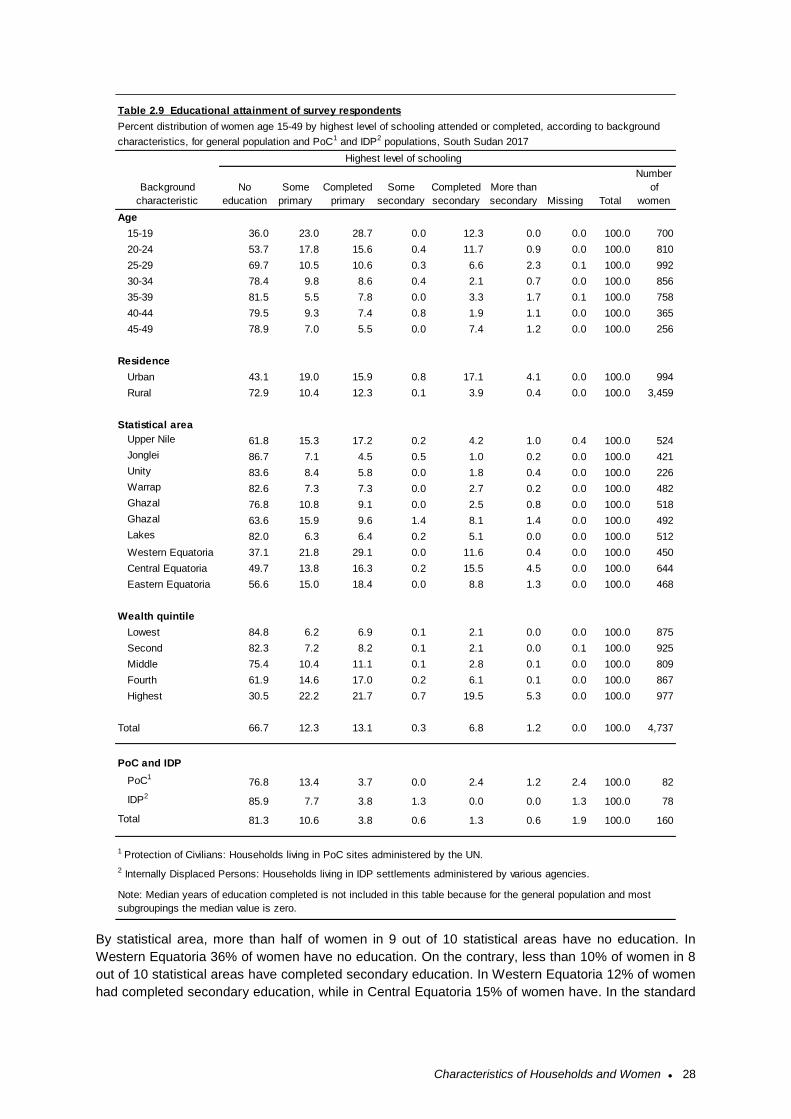
Characteristics of Households and Women ● 28
By statistical area, more than half of women in 9 out of 10 statistical areas have no education. In
Western Equatoria 36% of women have no education. On the contrary, less than 10% of women in 8
out of 10 statistical areas have completed secondary education. In Western Equatoria 12% of women
had completed secondary education, while in Central Equatoria 15% of women have. In the standard
Age
15-19 36.0 23.0 28.7 0.0 12.3 0.0 0.0 100.0 700
20-24 53.7 17.8 15.6 0.4 11.7 0.9 0.0 100.0 810
25-29 69.7 10.5 10.6 0.3 6.6 2.3 0.1 100.0 992
30-34 78.4 9.8 8.6 0.4 2.1 0.7 0.0 100.0 856
35-39 81.5 5.5 7.8 0.0 3.3 1.7 0.1 100.0 758
40-44 79.5 9.3 7.4 0.8 1.9 1.1 0.0 100.0 365
45-49 78.9 7.0 5.5 0.0 7.4 1.2 0.0 100.0 256
Residence
Urban 43.1 19.0 15.9 0.8 17.1 4.1 0.0 100.0 994
Rural 72.9 10.4 12.3 0.1 3.9 0.4 0.0 100.0 3,459
Statistical area
Upper Nile 61.8 15.3 17.2 0.2 4.2 1.0 0.4 100.0 524
Jonglei 86.7 7.1 4.5 0.5 1.0 0.2 0.0 100.0 421
Unity 83.6 8.4 5.8 0.0 1.8 0.4 0.0 100.0 226
Warrap 82.6 7.3 7.3 0.0 2.7 0.2 0.0 100.0 482Northern Bahr el-
Ghazal 76.8 10.8 9.1 0.0 2.5 0.8 0.0 100.0 518Western Bahr el-
Ghazal 63.6 15.9 9.6 1.4 8.1 1.4 0.0 100.0 492
Lakes 82.0 6.3 6.4 0.2 5.1 0.0 0.0 100.0 512
Western Equatoria 37.1 21.8 29.1 0.0 11.6 0.4 0.0 100.0 450
Central Equatoria 49.7 13.8 16.3 0.2 15.5 4.5 0.0 100.0 644
Eastern Equatoria 56.6 15.0 18.4 0.0 8.8 1.3 0.0 100.0 468
Wealth quintile
Lowest 84.8 6.2 6.9 0.1 2.1 0.0 0.0 100.0 875
Second 82.3 7.2 8.2 0.1 2.1 0.0 0.1 100.0 925
Middle 75.4 10.4 11.1 0.1 2.8 0.1 0.0 100.0 809
Fourth 61.9 14.6 17.0 0.2 6.1 0.1 0.0 100.0 867
Highest 30.5 22.2 21.7 0.7 19.5 5.3 0.0 100.0 977
Total 66.7 12.3 13.1 0.3 6.8 1.2 0.0 100.0 4,737
PoC and IDP
PoC176.8 13.4 3.7 0.0 2.4 1.2 2.4 100.0 82
IDP285.9 7.7 3.8 1.3 0.0 0.0 1.3 100.0 78
Total 81.3 10.6 3.8 0.6 1.3 0.6 1.9 100.0 160
1 Protection of Civilians: Households living in PoC sites administered by the UN.
2 Internally Displaced Persons: Households living in IDP settlements administered by various agencies.
Note: Median years of education completed is not included in this table because for the general population and most
subgroupings the median value is zero.
Total
Number
of
women
Table 2.9 Educational attainment of survey respondents
Percent distribution of women age 15-49 by highest level of schooling attended or completed, according to background
characteristics, for general population and PoC1 and IDP2 populations, South Sudan 2017
Highest level of schooling
Background
characteristic
Completed
secondary
More than
secondary Missing
No
education
Some
primary
Completed
primary
Some
secondary
Characteristics of Households and Women ● 29
MIS tables, median years of education is typically included in Table 2.9, but for all of these groups with
more than half of the group having no education, median years completed is zero.
Women in higher wealth quintiles are more likely to have completed some education. In the lowest
wealth quintile, 85% of women have no education, whereas only 31% of women in the top wealth
quintile have no education. The PoC and IDP populations are less educated than the general
population. While 66% of women in the general population have no education, 77% of PoC women and
86% of IDP women have no education
2.7 Literacy of Women
Knowing the level and distribution of literacy among the population is an important factor in the design
and delivery of health messages and interventions. The 2017 SSMIS results show that, overall, 20% of
women aged 15-49 years in South Sudan were literate (Table 2.10).
Literacy is higher in the younger age groups: for women aged 15-19 years of age, 42% are literate,
while only 7% of women aged 45-49 are literate. By residence, 31% of urban women are literate
whereas 17% of rural women were literate. The statistical area with the highest literacy is Central
Equatoria, with 31% literacy for women aged 15-49 years, whereas Jonglei has the lowest literacy rate
at 11%. Literacy also varied by wealth quintile, increasing from 13% in the lowest wealth quintile to 37%
in the highest wealth quintile.
Literacy
Respondents who have attended secondary school or higher are assumed
to be literate. All other respondents were given a sentence to read, and
they were considered literate if they could read all or part of the sentence.
Sample: Women aged 15-49 years
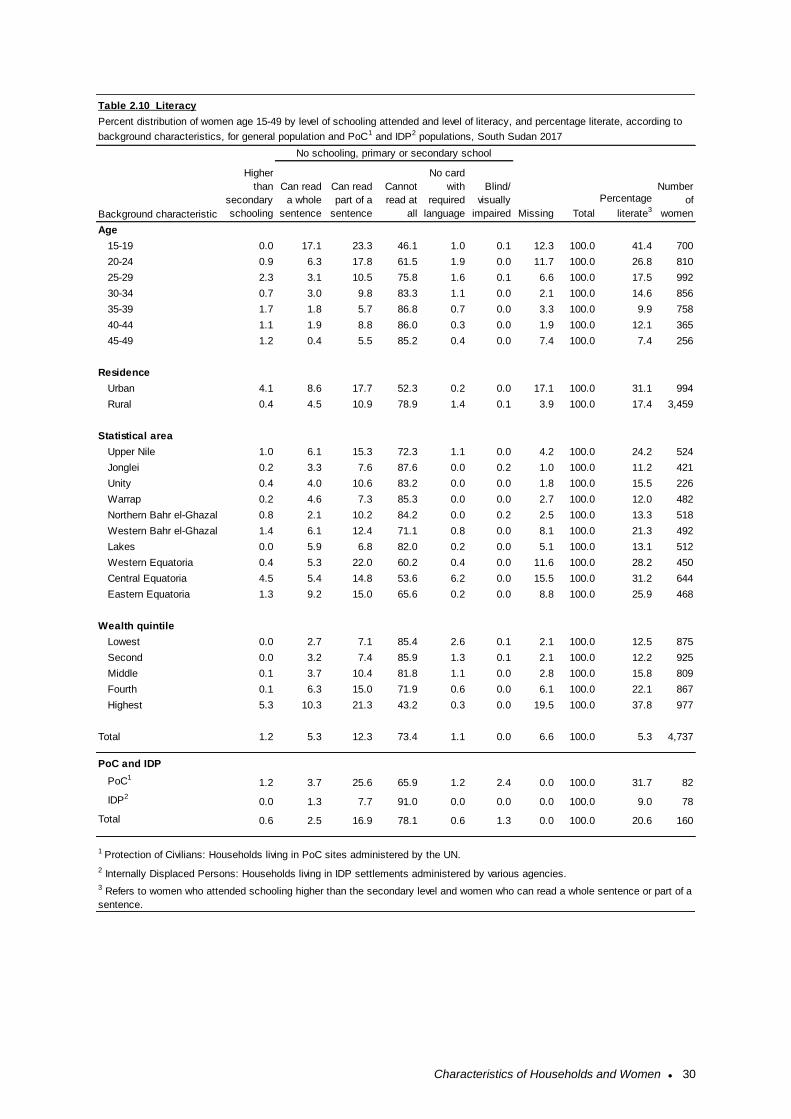
Characteristics of Households and Women ● 30
Age
15-19 0.0 17.1 23.3 46.1 1.0 0.1 12.3 100.0 41.4 700
20-24 0.9 6.3 17.8 61.5 1.9 0.0 11.7 100.0 26.8 810
25-29 2.3 3.1 10.5 75.8 1.6 0.1 6.6 100.0 17.5 992
30-34 0.7 3.0 9.8 83.3 1.1 0.0 2.1 100.0 14.6 856
35-39 1.7 1.8 5.7 86.8 0.7 0.0 3.3 100.0 9.9 758
40-44 1.1 1.9 8.8 86.0 0.3 0.0 1.9 100.0 12.1 365
45-49 1.2 0.4 5.5 85.2 0.4 0.0 7.4 100.0 7.4 256
Residence
Urban 4.1 8.6 17.7 52.3 0.2 0.0 17.1 100.0 31.1 994
Rural 0.4 4.5 10.9 78.9 1.4 0.1 3.9 100.0 17.4 3,459
Statistical area
Upper Nile 1.0 6.1 15.3 72.3 1.1 0.0 4.2 100.0 24.2 524
Jonglei 0.2 3.3 7.6 87.6 0.0 0.2 1.0 100.0 11.2 421
Unity 0.4 4.0 10.6 83.2 0.0 0.0 1.8 100.0 15.5 226
Warrap 0.2 4.6 7.3 85.3 0.0 0.0 2.7 100.0 12.0 482
Northern Bahr el-Ghazal 0.8 2.1 10.2 84.2 0.0 0.2 2.5 100.0 13.3 518
Western Bahr el-Ghazal 1.4 6.1 12.4 71.1 0.8 0.0 8.1 100.0 21.3 492
Lakes 0.0 5.9 6.8 82.0 0.2 0.0 5.1 100.0 13.1 512
Western Equatoria 0.4 5.3 22.0 60.2 0.4 0.0 11.6 100.0 28.2 450
Central Equatoria 4.5 5.4 14.8 53.6 6.2 0.0 15.5 100.0 31.2 644
Eastern Equatoria 1.3 9.2 15.0 65.6 0.2 0.0 8.8 100.0 25.9 468
Wealth quintile
Lowest 0.0 2.7 7.1 85.4 2.6 0.1 2.1 100.0 12.5 875
Second 0.0 3.2 7.4 85.9 1.3 0.1 2.1 100.0 12.2 925
Middle 0.1 3.7 10.4 81.8 1.1 0.0 2.8 100.0 15.8 809
Fourth 0.1 6.3 15.0 71.9 0.6 0.0 6.1 100.0 22.1 867
Highest 5.3 10.3 21.3 43.2 0.3 0.0 19.5 100.0 37.8 977
Total 1.2 5.3 12.3 73.4 1.1 0.0 6.6 100.0 5.3 4,737
PoC and IDP
PoC11.2 3.7 25.6 65.9 1.2 2.4 0.0 100.0 31.7 82
IDP20.0 1.3 7.7 91.0 0.0 0.0 0.0 100.0 9.0 78
Total 0.6 2.5 16.9 78.1 0.6 1.3 0.0 100.0 20.6 160
Table 2.10 Literacy
Percent distribution of women age 15-49 by level of schooling attended and level of literacy, and percentage literate, according to
background characteristics, for general population and PoC1 and IDP2 populations, South Sudan 2017
No schooling, primary or secondary school
Background characteristic
Higher
than
secondary
schooling
3 Refers to women who attended schooling higher than the secondary level and women who can read a whole sentence or part of a
sentence.
Can read
a whole
sentence
Can read
part of a
sentence
Cannot
read at
all
Number
of
women
No card
with
required
language
Blind/
visually
impaired Missing Total
Percentage
literate3
1 Protection of Civilians: Households living in PoC sites administered by the UN.
2 Internally Displaced Persons: Households living in IDP settlements administered by various agencies.
Malaria Prevention ● 31
3 MALARIA PREVENTION
This chapter describes the population coverage rates of some of the key malaria control interventions
in South Sudan, including the ownership and use of insecticide-treated nets (ITNs) and intermittent
preventive treatment in pregnancy (IPTp).
3.1 Background on Malaria Control in South Sudan
Malaria is endemic throughout South Sudan and continues to be a major public health problem.
Transmission of malaria in South Sudan occurs throughout the year and peaks on rainfall, except in
urban cities. South Sudan’s rainy season lasts for about six to eight months (April to November).
Recently, South Sudan experienced an upsurge of malaria cases in the country late in 2015 and the
gradual increase in malaria cases reported in previous years. It is critical that the NMCP updates its
data on malaria prevalence and current intervention coverage and use, to ensure proper planning and
channelling of future interventions and resources.
Estimating the burden of malaria is highly needed for evidence-based planning of malaria control. In
South Sudan, malaria has been the subject of a large amount of epidemiological, entomological and
biomedical research. Malaria surveillance, as part of the general reporting of health events from health
facilities or specific surveillance for epidemic preparedness, provided a wide range of information
(Abdalla 2007).
3.1.1 Health Sector Development Plan
The South Sudan Health Sector Development Plan (HSDP) 2012-2016 provides for the overall vision
and strategic direction for development in the health sector. It is adapted to the South Sudan
Development Plan (SSDP), drawing its vision from the social and human development pillar goal of the
former, which is to promote the well-being and dignity of all people of South Sudan, by progressively
accelerating universal access to basic services. The overall goal of the HSDP is to contribute to the
reduction of maternal and infant mortality and improve the overall health status, as well as the quality
of life of the South Sudanese population” (Ministry of Health 2012).
Malaria control is also emphasised in the Health Policy Document 2016 – 2022. To this end, the Ministry
of Health of the Republic of South Sudan, through the National Malaria Control Programme (NMCP),
has developed a detailed Malaria Strategic Plan 2014/15 – 2020/21 aimed at significantly scaling up
malaria control interventions towards the achievement of two goals:
1. To reduce reported malaria morbidity and mortality by 80% of the 2013 levels, by 2021;
2. To reduce malaria parasite prevalence by 50% of the 2013 levels, by 2021.
The Malaria Strategic Plan 2014/15 – 2020/21 includes these six objectives:
1. To ensure 80% of health facilities routinely report on core malaria indicators, by 2021
2. To strengthen and sustain the management and coordination capacity of the malaria
programme at all levels, by 2021
3. To establish malaria emergency preparedness and ensure timely malaria control responses in
all communities affected by conflict, natural disaster or epidemics, by 2021
4. To ensure that 100% of the population at risk are covered by recommended malaria prevention
methods, by 2021
5. To increase to at least 80%, community and health worker knowledge, attitudes and practices
on malaria prevention and control, by 2019
6. To achieve 100% parasitological diagnosis and treatment of all presented malaria cases
according to the national guidelines, by 2021
Malaria Prevention ● 32
The main interventions in the strategy are vector control (which includes provision of long-lasting
insecticide nets, targeted indoor residual spraying (IRS), and larva source management (LCM));
prevention of malaria in pregnancy by provision of intermittent preventive treatment in pregnancy
(IPTp); malaria case management (diagnosis and treatment); epidemic-preparedness and response;
surveillance, monitoring, evaluation, and operational research; advocacy, communication, and social
mobilisation; and programme management (MOH 2014).
3.2 Ownership of Insecticide-Treated Nets
It is well understood that proper use of ITNs protects households and the entire local community from
malaria. The distribution and use of ITNs is one of the central interventions for preventing malaria
infection in South Sudan.
In the 2017 SSMIS, rather than asking about specific brands of nets, interviewers asked about ‘hard’
vs. ‘soft’ nets, as they are commonly classified in South Sudan. Due to this questionnaire limitation, a
combination of the ‘hard’ vs. ‘soft’ classification, net source, and prior information was used to derive
the ITN indicator as follows: First, all ‘hard’ nets available in South Sudan are ITNs, so they were all
classified as ITNs. Second, all nets obtained from mass distribution campaigns, Expanded Program on
Immunisation (EPI), ANC, health facilities, and Non-governmental Organisation (NGOs) in South Sudan
were also classified as ITNs. Together these two classifications indicated that a minimum of 86% of
nets sampled were ITNs. Third, the remaining nets (14%) were an unknown mixture of ‘soft’ or
other/unknown nets. In the 2013 SSMIS, of nets that were soft (based on classification of the brands in
the 2013 data by material texture) or other/unknown and which were obtained from sources other than
mass distribution, EPI, ANC, health facilities, and NGOs, 86% were ITNs. Based on the assumption
that the mix of ITNs vs. non-ITNs for the subset of nets with these characteristics has remained similar,
85% of the 14% soft or unknown nets from these sources were randomly selected and classified as
ITNs. This results in 98% of the nets in the 2017 SSMIS being classified as ITNs.
In the 2017 SSMIS, the percentage of household with at least one mosquito net (any type) is 64%
(Table 3.1). Sixty-three percent of households have at least one insecticide-treated net (ITN). The
average number of ITNs per household is 1.67. The percentage of household with full household ITN
coverage, i.e. at least one ITN for every two people who stayed in the house the previous night, is 28%.
By background characteristics: Seventy-nine percent of urban household own at least one mosquito
net of any kind, while 61% of rural households have at least one mosquito net of any kind. 78% of urban
households own at least one ITN in the urban areas, while 59% of households in rural areas own at
least one ITN. The average number of nets ITNs per household was 2.49 in urban areas and 1.48 in
rural areas. In urban areas, 41% of households had at least one ITN for every two persons who stayed
in the household the night prior to the survey, while this full household ITN coverage indicator was 25%
in rural areas.
Ownership of insecticide-treated nets
Households that have at least one insecticide-treated net (ITN). An ITN is defined as: (1) a factory-treated net that does not require any further treatment (long-lasting insecticidal net or LLIN) or (2) a net that has been soaked with insecticide within the past 12 months. Sample: Households
Full household ITN coverage Percentage of households with at least one ITN for every two people.
Sample: Households
Malaria Prevention ● 33
The percentage of households with full household ITN coverage was highest in Central Equatoria, with
45% of households having at least one mosquito net for every two persons. Eastern Equatoria (16%)
and Lakes (18%) had the lowest coverage on the full household ITN coverage indicator.
Households in the higher wealth quintiles had higher full ITN coverage. Only 19% of households in the
lowest wealth quintile had full ITN coverage, while 50% of households in the highest wealth quintile had
full ITN coverage.
In the PoC and IDP populations, 84% of PoC households had at least one ITN, while 75% of IDP
households had at least one ITN. The average number of ITNs per household was 1.88 in PoC
households and 2.14 in IDP households. Only 15% of PoC households and 6% of IDP households had
full ITN coverage.
General population
Residence
Urban 79.0 77.5 2.55 2.49 975 41.6 41.0 948
Rural 60.5 59.4 1.51 1.48 4,215 25.0 24.6 3,978
Statistical area
Upper Nile 61.6 61.4 1.98 1.97 500 38.7 38.7 483
Jonglei 46.3 46.1 1.19 1.17 458 22.9 22.6 433
Unity 55.8 54.3 1.34 1.31 541 19.8 19.6 506
Warrap 75.7 71.8 2.14 2.04 547 24.0 22.5 520
Northern Bahr el-Ghazal 79.7 78.1 2.47 2.41 557 31.7 31.1 521
Western Bahr el-Ghazal 46.1 45.5 1.28 1.26 512 21.9 21.3 506
Lakes 73.8 73.4 1.56 1.55 504 17.7 17.7 458
Western Equatoria 66.1 65.5 1.43 1.41 501 42.6 42.6 474
Central Equatoria 86.8 85.9 2.60 2.54 552 45.3 44.7 512
Eastern Equatoria 42.7 41.1 0.85 0.83 518 17.0 16.4 513
Wealth quintile
Lowest 62.7 61.7 1.59 1.56 1,077 19.7 19.3 1,012
Second 56.7 55.6 1.34 1.31 1,079 17.9 17.4 1,012
Middle 52.6 52.0 1.19 1.18 1,076 23.3 23.2 1,016
Fourth 66.8 65.2 1.76 1.73 1,033 32.1 31.6 987
Highest 83.9 82.2 2.78 2.70 925 50.6 49.8 899
Total 63.9 62.8 1.70 1.67 5,190 28.2 27.8 4,926
PoC and IDP
PoC1 86.1 83.5 1.94 1.88 144 37.6 14.9 141
IDP2 77.6 75.3 2.21 2.14 67 46.9 6.3 64
Total 83.4 75.3 1.97 1.18 211 40.5 15.2 205
3An insecticide-treated net (ITN) is a factory-treated net that does not require any further treatment. In the 2013 SSMIS, this was
known as a long-lasting insecticidal net (LLIN).
Insecticide-
treated
mosquito
net (ITN)3
Any
mosquito
net
2 Internally Displaced Persons: Households living in IDP settlements administered by various agencies.
Insecticide-
treated
mosquito
net (ITN)3
Number
of house-
holds
Any mosquito
net
Insecticide-
treated
mosquito net
(ITN)3
1 Protection of Civilians: Households living in PoC sites administered by the UN.
Table 3.1 Household possession of mosquito nets
Percentage of households with at least one mosquito net (treated or untreated) and insecticide-treated net (ITN); average number of
nets and ITNs per household; and percentage of households with at least one net and ITN per two persons who stayed in the
household last night, according to background characteristics, for general population and PoC1 and IDP2 populations. South Sudan
Percentage of
households with at least
one mosquito net
Average number of nets
per household
Percentage of households
with at least one mosquito
net for every two persons
who stayed in the household
last night
Number of
households
with at least
one person
who stayed
in the
household
last nightBackground characteristic
Any
mosquito
net
Malaria Prevention ● 34
Trends: Overall, ownership of at least one ITN by households declined slightly from 66% in 2013
SSMIS to 63% in 2017 SSMIS. The average number of ITNs declined slightly from 1.8 in 2013 SSMIS
to 1.67 in 2017 SSMIS. Notably, average household size declined from 6.5 to 6.05 in the same period.
The average number of ITNs per household in urban areas declined from 2.6 to 2.49. The average
number of ITNs per household in rural areas declined 1.8 to 1.48.
3.2.1 Sources of ITNs
The sources of mosquito nets recorded in the 2017 SSMIS are presented in Table 3.2. Over two-thirds
of ITNs (68%) came from mass distribution campaigns. ANC visits and immunisation visits both
accounted for 4% of ITNs. 22% of ITNs came from shops or markets. Most non-ITN nets came from
markets or shops. Nets sourced from shops/markets were most common in Warrap statistical area
(52% of nets) and Northern Bahr el-Ghazal statistical area (38% of nets). Jonglei and Lakes had the
lowest share of nets obtained from shops/markets, with 8% of nets in both statistical areas being from
that source.
General population
Type of net
ITN3 68.2 4.1 4.3 0.4 0.3 21.5 0.2 0.1 0.8 0.2 100.0 8,651
Other4 0.0 0.0 0.0 0.0 0.0 99.5 0.0 0.0 0.5 0.0 100.0 184
Residence
Urban 65.0 4.2 4.2 0.4 0.5 24.2 0.4 0.1 0.8 0.1 100.0 3,536
Rural 68.0 3.8 4.2 0.3 0.2 22.4 0.1 0.0 0.8 0.2 100.0 5,299
Statistical area
Upper Nile 62.7 4.8 13.7 1.1 2.6 10.8 1.4 0.0 2.2 0.6 100.0 991
Jonglei 88.3 2.9 0.0 0.2 0.6 7.9 0.0 0.0 0.0 0.2 100.0 545
Unity 68.3 1.5 13.8 0.1 0.0 15.9 0.0 0.0 0.1 0.3 100.0 725
Warrap 41.0 4.5 1.3 0.2 0.0 52.1 0.5 0.0 0.3 0.2 100.0 1,169
Northern Bahr el-Ghazal 58.1 2.6 0.8 0.0 0.0 37.8 0.0 0.0 0.7 0.0 100.0 1,376
Western Bahr el-Ghazal 74.8 2.7 6.9 0.3 0.0 15.0 0.0 0.0 0.2 0.2 100.0 655
Lakes 89.3 2.0 0.3 0.1 0.0 7.8 0.0 0.0 0.4 0.1 100.0 784
Western Equatoria 73.5 6.3 4.2 0.0 0.0 14.5 0.0 0.0 1.4 0.1 100.0 716
Central Equatoria 70.7 4.2 1.2 0.8 0.0 22.2 0.0 0.3 0.7 0.0 100.0 1,434
Eastern Equatoria 67.3 10.9 3.0 0.5 0.0 15.7 0.0 0.2 2.3 0.2 100.0 440
Wealth quintile
Lowest 60.0 4.1 5.7 0.5 0.7 27.7 0.2 0.1 0.9 0.1 100.0 2,298
Second 71.7 5.4 6.0 0.4 0.1 15.0 0.7 0.1 0.6 0.0 100.0 1,390
Middle 72.7 3.9 1.7 0.2 0.5 19.0 0.0 0.0 1.8 0.2 100.0 1,481
Fourth 72.6 3.8 2.1 0.1 0.2 20.4 0.0 0.0 0.5 0.3 100.0 1,684
Highest 61.9 3.0 4.7 0.5 0.0 28.9 0.3 0.0 0.4 0.3 100.0 1,982
Total 66.8 4.0 4.2 0.4 0.3 23.1 0.2 0.1 0.8 0.2 100.0 8,835
PoC and IDP
PoC1 82.8 2.2 5.7 0.4 0.7 6.1 1.4 0.7 0.0 0.0 100.0 279
IDP2 98.6 0.0 0.7 0.0 0.0 0.7 0.0 0.0 0.0 0.0 100.0 148
Total 88.3 1.4 4.0 0.2 0.5 4.2 0.9 0.5 0.0 0.0 100.0 427
ANC = Antenatal care
4 Any net that is not an ITN
3 An insecticide-treated net (ITN) is a factory-treated net that does not require any further treatment. In the 2013 SSMIS, this was known as a
long-lasting insecticidal net (LLIN).
Don’t
knowTotal
Number of
mosquito
nets
Table 3.2 Source of mosquito nets
Percent distribution of mosquito nets by source of net, according to background characteristics, for general population and PoC 1 and IDP2
Background characteristic
Mass
distribution
campaign
ANC
visit
Immuni-
zation
visit
Govern-
ment
health
facility
Private
health
facility
Shop/
market
Comm-
unity
health
worker
1 Protection of Civilians: Households living in PoC sites administered by the UN.2 Internally Displaced Persons: Households living in IDP settlements administered by various
Religious
institutionOther
Malaria Prevention ● 35
Shops/markets were a source of nets for all wealth quintiles, including 28% of nets owned by
households in the lowest quintile and 29% of nets in the highest wealth quintile. Sources of nets were
similar between urban and rural households, with 65% of nets in urban areas and 68% of nets in urban
areas sourced from mass campaigns.
For the PoC population, 83% of nets came from mass campaigns and only 6% from shops/markets.
For the IDP population, 99% of nets came from mass campaigns.
Trends: In the 2013 SSMIS, nets were classified slightly differently, make some comparisons difficult.
In the 2013 SSMIS net source options included government health facilities, NGOs, shops, community-
based distributors or outreach, vendors, or others (i.e., mass campaign, ANC, and immunisation visit
were not options). The most direct comparison is with shops/markets, which were the source of 13% of
mosquito nets (any type) in 2013 and 23% of nets in 2017.
3.3 Household Access and Use of ITNs
ITNs act as both a physical and a chemical barrier against mosquitoes. By reducing the vector
population, ITNs may help to reduce malaria risk at the community level as well as to individuals who
use them.
Access to an ITN is measured by the proportion of the population that could sleep under an ITN if each
ITN in the household were used by up to two people. Comparing ITN access and ITN use indicators
can help programmes identify if there is a behavioural gap in which available ITNs are not being used.
If the difference between these indicators is substantial, the programme may need to focus on behaviour
change and how to identify the main drivers or barriers to ITN use to design an appropriate intervention.
This analysis helps ITN programmes determine whether they need to achieve higher ITN coverage,
promote ITN use, or both.
Access to an ITN Percentage of the population that could sleep under an ITN if each ITN in the household were used by up to two people. Sample: De facto household population
Use of ITNs Percentage of population that slept under an ITN the night before the survey. Sample: De facto household population
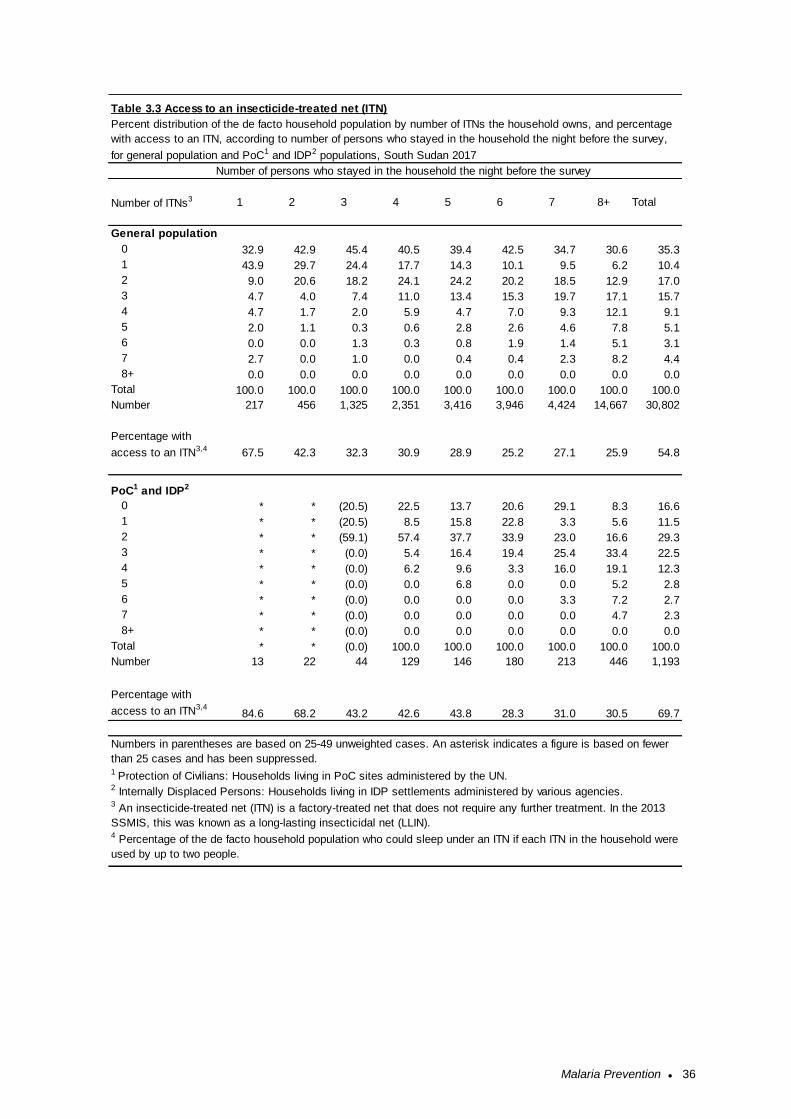
Malaria Prevention ● 36
General population
0 32.9 42.9 45.4 40.5 39.4 42.5 34.7 30.6 35.3
1 43.9 29.7 24.4 17.7 14.3 10.1 9.5 6.2 10.4
2 9.0 20.6 18.2 24.1 24.2 20.2 18.5 12.9 17.0
3 4.7 4.0 7.4 11.0 13.4 15.3 19.7 17.1 15.7
4 4.7 1.7 2.0 5.9 4.7 7.0 9.3 12.1 9.1
5 2.0 1.1 0.3 0.6 2.8 2.6 4.6 7.8 5.1
6 0.0 0.0 1.3 0.3 0.8 1.9 1.4 5.1 3.1
7 2.7 0.0 1.0 0.0 0.4 0.4 2.3 8.2 4.4
8+ 0.0 0.0 0.0 0.0 0.0 0.0 0.0 0.0 0.0
Total 100.0 100.0 100.0 100.0 100.0 100.0 100.0 100.0 100.0
Number 217 456 1,325 2,351 3,416 3,946 4,424 14,667 30,802
Percentage with
access to an ITN3,4 67.5 42.3 32.3 30.9 28.9 25.2 27.1 25.9 54.8
PoC1 and IDP2
0 * * (20.5) 22.5 13.7 20.6 29.1 8.3 16.6
1 * * (20.5) 8.5 15.8 22.8 3.3 5.6 11.5
2 * * (59.1) 57.4 37.7 33.9 23.0 16.6 29.3
3 * * (0.0) 5.4 16.4 19.4 25.4 33.4 22.5
4 * * (0.0) 6.2 9.6 3.3 16.0 19.1 12.3
5 * * (0.0) 0.0 6.8 0.0 0.0 5.2 2.8
6 * * (0.0) 0.0 0.0 0.0 3.3 7.2 2.7
7 * * (0.0) 0.0 0.0 0.0 0.0 4.7 2.3
8+ * * (0.0) 0.0 0.0 0.0 0.0 0.0 0.0
Total * * (0.0) 100.0 100.0 100.0 100.0 100.0 100.0
Number 13 22 44 129 146 180 213 446 1,193
Percentage with
access to an ITN3,484.6 68.2 43.2 42.6 43.8 28.3 31.0 30.5 69.7
2 Internally Displaced Persons: Households living in IDP settlements administered by various agencies.
Numbers in parentheses are based on 25-49 unweighted cases. An asterisk indicates a figure is based on fewer
than 25 cases and has been suppressed.
3 An insecticide-treated net (ITN) is a factory-treated net that does not require any further treatment. In the 2013
SSMIS, this was known as a long-lasting insecticidal net (LLIN).4 Percentage of the de facto household population who could sleep under an ITN if each ITN in the household were
used by up to two people.
5 6 7 8+ TotalNumber of ITNs3
1 Protection of Civilians: Households living in PoC sites administered by the UN.
1 2 3 4
Table 3.3 Access to an insecticide-treated net (ITN)
Percent distribution of the de facto household population by number of ITNs the household owns, and percentage
with access to an ITN, according to number of persons who stayed in the household the night before the survey,
for general population and PoC1 and IDP2 populations, South Sudan 2017
Number of persons who stayed in the household the night before the survey
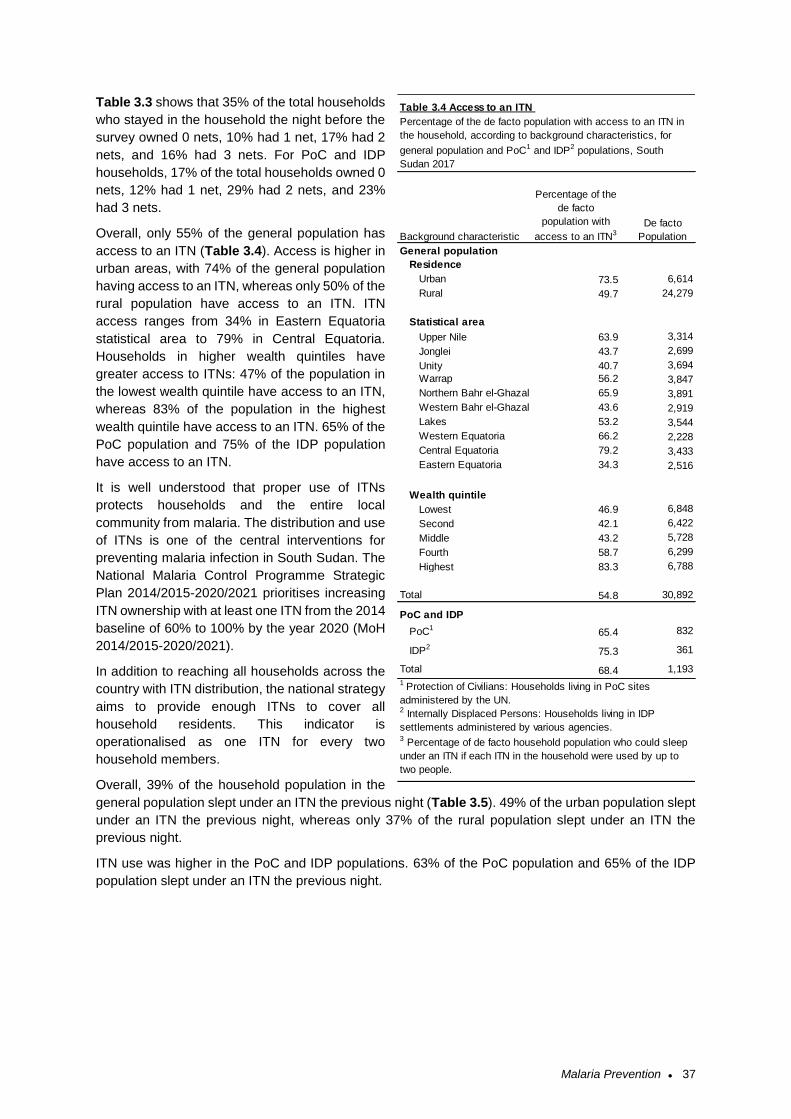
Malaria Prevention ● 37
Table 3.3 shows that 35% of the total households
who stayed in the household the night before the
survey owned 0 nets, 10% had 1 net, 17% had 2
nets, and 16% had 3 nets. For PoC and IDP
households, 17% of the total households owned 0
nets, 12% had 1 net, 29% had 2 nets, and 23%
had 3 nets.
Overall, only 55% of the general population has
access to an ITN (Table 3.4). Access is higher in
urban areas, with 74% of the general population
having access to an ITN, whereas only 50% of the
rural population have access to an ITN. ITN
access ranges from 34% in Eastern Equatoria
statistical area to 79% in Central Equatoria.
Households in higher wealth quintiles have
greater access to ITNs: 47% of the population in
the lowest wealth quintile have access to an ITN,
whereas 83% of the population in the highest
wealth quintile have access to an ITN. 65% of the
PoC population and 75% of the IDP population
have access to an ITN.
It is well understood that proper use of ITNs
protects households and the entire local
community from malaria. The distribution and use
of ITNs is one of the central interventions for
preventing malaria infection in South Sudan. The
National Malaria Control Programme Strategic
Plan 2014/2015-2020/2021 prioritises increasing
ITN ownership with at least one ITN from the 2014
baseline of 60% to 100% by the year 2020 (MoH
2014/2015-2020/2021).
In addition to reaching all households across the
country with ITN distribution, the national strategy
aims to provide enough ITNs to cover all
household residents. This indicator is
operationalised as one ITN for every two
household members.
Overall, 39% of the household population in the
general population slept under an ITN the previous night (Table 3.5). 49% of the urban population slept
under an ITN the previous night, whereas only 37% of the rural population slept under an ITN the
previous night.
ITN use was higher in the PoC and IDP populations. 63% of the PoC population and 65% of the IDP
population slept under an ITN the previous night.
General population
Residence
Urban 73.5 6,614
Rural 49.7 24,279
Statistical area
Upper Nile 63.9 3,314
Jonglei 43.7 2,699
Unity 40.7 3,694
Warrap 56.2 3,847
Northern Bahr el-Ghazal 65.9 3,891
Western Bahr el-Ghazal 43.6 2,919
Lakes 53.2 3,544
Western Equatoria 66.2 2,228
Central Equatoria 79.2 3,433
Eastern Equatoria 34.3 2,516
Wealth quintile
Lowest 46.9 6,848
Second 42.1 6,422
Middle 43.2 5,728
Fourth 58.7 6,299
Highest 83.3 6,788
Total 54.8 30,892
PoC and IDP
PoC165.4 832
IDP275.3 361
Total 68.4 1,193
1 Protection of Civilians: Households living in PoC sites
administered by the UN.2 Internally Displaced Persons: Households living in IDP
settlements administered by various agencies.3 Percentage of de facto household population who could sleep
under an ITN if each ITN in the household were used by up to
two people.
De facto
Population
Table 3.4 Access to an ITN
Background characteristic
Percentage of the
de facto
population with
access to an ITN3
Percentage of the de facto population with access to an ITN in
the household, according to background characteristics, for
general population and PoC1 and IDP2 populations, South
Sudan 2017
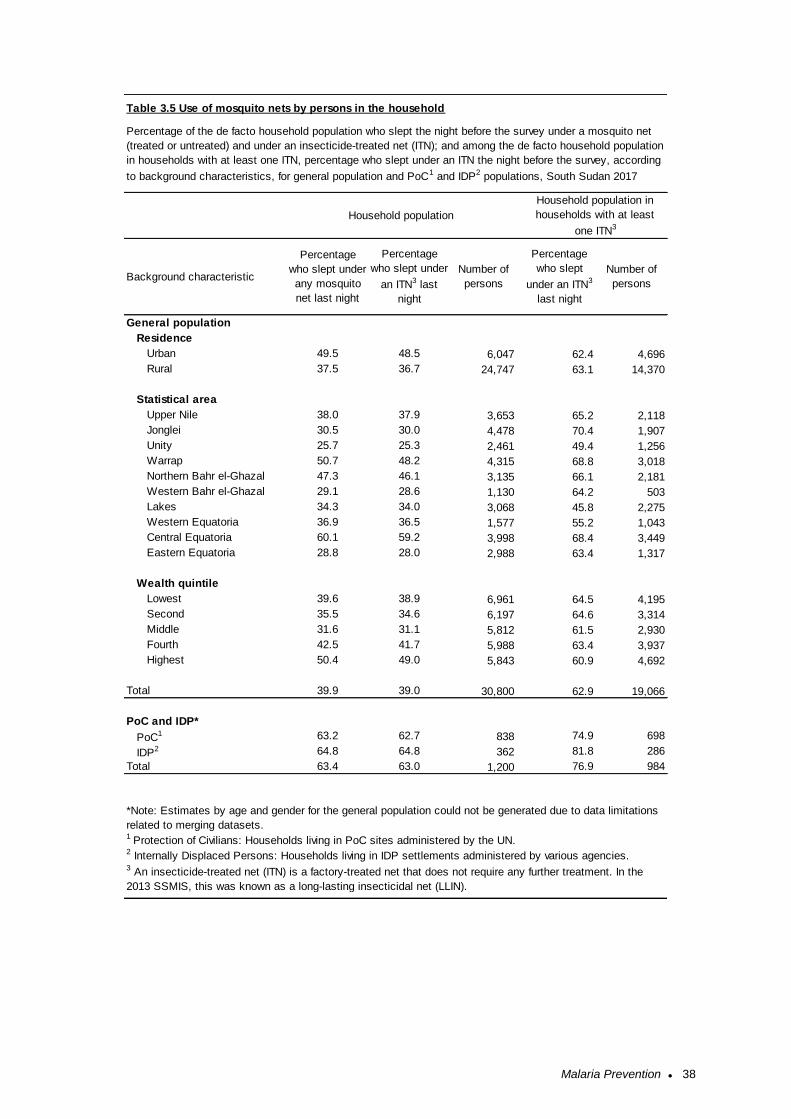
Malaria Prevention ● 38
General population
Residence
Urban 49.5 48.5 6,047 62.4 4,696
Rural 37.5 36.7 24,747 63.1 14,370
Statistical area
Upper Nile 38.0 37.9 3,653 65.2 2,118
Jonglei 30.5 30.0 4,478 70.4 1,907
Unity 25.7 25.3 2,461 49.4 1,256
Warrap 50.7 48.2 4,315 68.8 3,018
Northern Bahr el-Ghazal 47.3 46.1 3,135 66.1 2,181
Western Bahr el-Ghazal 29.1 28.6 1,130 64.2 503
Lakes 34.3 34.0 3,068 45.8 2,275
Western Equatoria 36.9 36.5 1,577 55.2 1,043
Central Equatoria 60.1 59.2 3,998 68.4 3,449
Eastern Equatoria 28.8 28.0 2,988 63.4 1,317
Wealth quintile
Lowest 39.6 38.9 6,961 64.5 4,195
Second 35.5 34.6 6,197 64.6 3,314
Middle 31.6 31.1 5,812 61.5 2,930
Fourth 42.5 41.7 5,988 63.4 3,937
Highest 50.4 49.0 5,843 60.9 4,692
Total 39.9 39.0 30,800 62.9 19,066
PoC and IDP*
PoC1 63.2 62.7 838 74.9 698
IDP2 64.8 64.8 362 81.8 286
Total 63.4 63.0 1,200 76.9 984
3 An insecticide-treated net (ITN) is a factory-treated net that does not require any further treatment. In the
2013 SSMIS, this was known as a long-lasting insecticidal net (LLIN).
Background characteristic
Percentage
who slept under
any mosquito
net last night
Percentage
who slept under
an ITN3 last
night
Number of
persons
Percentage
who slept
under an ITN3
last night
Number of
persons
*Note: Estimates by age and gender for the general population could not be generated due to data limitations
related to merging datasets.1 Protection of Civilians: Households living in PoC sites administered by the UN.2 Internally Displaced Persons: Households living in IDP settlements administered by various agencies.
Table 3.5 Use of mosquito nets by persons in the household
Percentage of the de facto household population who slept the night before the survey under a mosquito net
(treated or untreated) and under an insecticide-treated net (ITN); and among the de facto household population
in households with at least one ITN, percentage who slept under an ITN the night before the survey, according
to background characteristics, for general population and PoC1 and IDP2 populations, South Sudan 2017
Household population
Household population in
households with at least
one ITN3
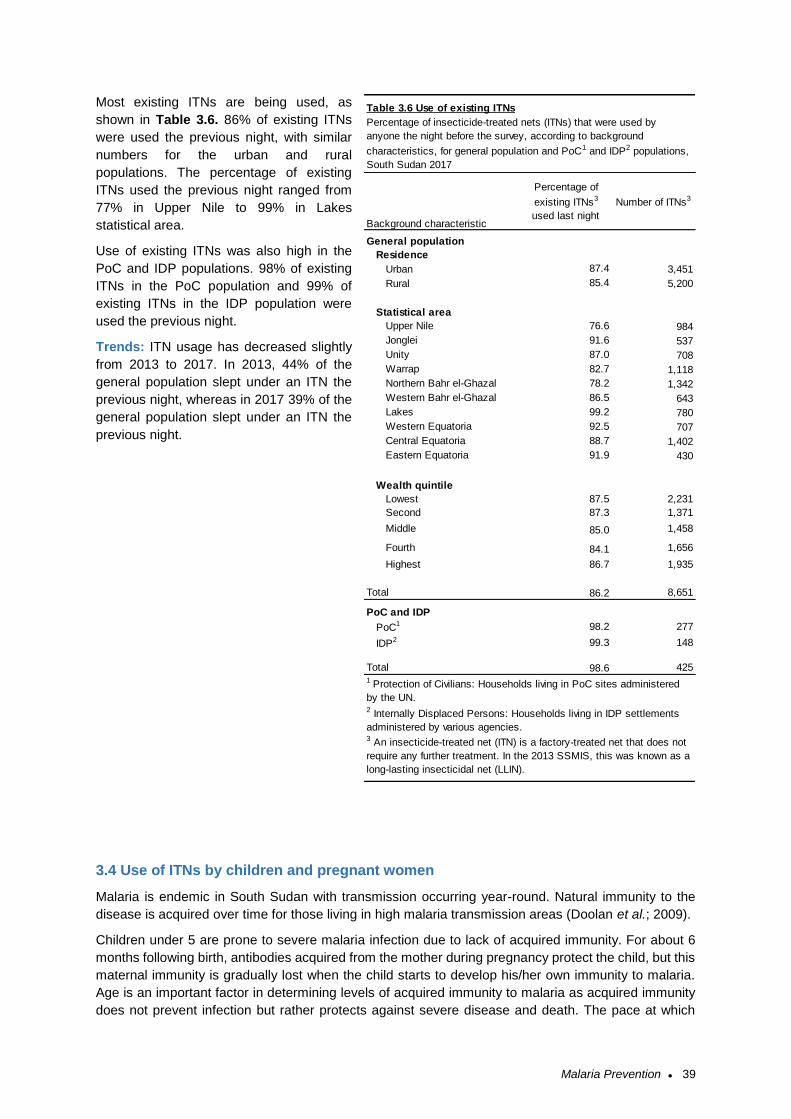
Malaria Prevention ● 39
Most existing ITNs are being used, as
shown in Table 3.6. 86% of existing ITNs
were used the previous night, with similar
numbers for the urban and rural
populations. The percentage of existing
ITNs used the previous night ranged from
77% in Upper Nile to 99% in Lakes
statistical area.
Use of existing ITNs was also high in the
PoC and IDP populations. 98% of existing
ITNs in the PoC population and 99% of
existing ITNs in the IDP population were
used the previous night.
Trends: ITN usage has decreased slightly
from 2013 to 2017. In 2013, 44% of the
general population slept under an ITN the
previous night, whereas in 2017 39% of the
general population slept under an ITN the
previous night.
3.4 Use of ITNs by children and pregnant women
Malaria is endemic in South Sudan with transmission occurring year-round. Natural immunity to the
disease is acquired over time for those living in high malaria transmission areas (Doolan et al.; 2009).
Children under 5 are prone to severe malaria infection due to lack of acquired immunity. For about 6
months following birth, antibodies acquired from the mother during pregnancy protect the child, but this
maternal immunity is gradually lost when the child starts to develop his/her own immunity to malaria.
Age is an important factor in determining levels of acquired immunity to malaria as acquired immunity
does not prevent infection but rather protects against severe disease and death. The pace at which
General population
Residence
Urban 87.4 3,451
Rural 85.4 5,200
Statistical area
Upper Nile 76.6 984
Jonglei 91.6 537
Unity 87.0 708
Warrap 82.7 1,118
Northern Bahr el-Ghazal 78.2 1,342
Western Bahr el-Ghazal 86.5 643
Lakes 99.2 780
Western Equatoria 92.5 707
Central Equatoria 88.7 1,402
Eastern Equatoria 91.9 430
Wealth quintile
Lowest 87.5 2,231
Second 87.3 1,371
Middle 85.0 1,458
Fourth 84.1 1,656
Highest 86.7 1,935
Total 86.2 8,651
PoC and IDP
PoC1 98.2 277
IDP2 99.3 148
Total 98.6 4251 Protection of Civilians: Households living in PoC sites administered
by the UN.2 Internally Displaced Persons: Households living in IDP settlements
administered by various agencies.3 An insecticide-treated net (ITN) is a factory-treated net that does not
require any further treatment. In the 2013 SSMIS, this was known as a
long-lasting insecticidal net (LLIN).
Table 3.6 Use of existing ITNs
Percentage of insecticide-treated nets (ITNs) that were used by
anyone the night before the survey, according to background
characteristics, for general population and PoC1 and IDP2 populations,
South Sudan 2017
Background characteristic
Percentage of
existing ITNs3
used last night
Number of ITNs3
Malaria Prevention ● 40
immunity develops depends on the exposure to malarial infection, and in high malaria-endemic areas,
children are thought to attain a high level of immunity by their fifth birthday. Such children may
experience episodes of malaria illness but usually do not suffer from the severe, life-threatening
conditions.
Malaria transmission in South Sudan is stable and adults usually acquire some degree of immunity;
however, pregnancy suppresses immunity and women in their first pregnancies are at increased risk
for severe malaria. Malaria in pregnancy is frequently associated with the development of anaemia,
which interferes with the maternal-foetus exchange and can lead to low-birth-weight infants, placental
parasitaemia, foetal death, abortion, stillbirth, and prematurity (Shulman and Dorman 2003).
Table 3.7 shows the percentage of children aged 6 - 59 months who slept under an ITN the night before
the survey. Overall, 42% of children aged 6-59 months in South Sudan slept under an ITN the previous
night. 55% of children in PoC areas and 70% of children in IDP areas slept under an ITN the night
before the survey.
Children aged 6-59 months were more likely to have slept under an ITN in urban areas (52%) than in
rural areas (39%). The highest coverage was in Central Equatoria statistical area, with 60% of children
aged 6-59 months sleeping under an ITN the previous night, compared to 22% for Unity. Children aged
6-59 months in the highest wealth quintile were more likely (50%) to sleep under a net the previous
night than children in the lowest wealth quintile (39%).
ITN use by pregnant women in shown in Table 3.8. In the general population, 51% of pregnant women
slept under an ITN the previous night. 69% of urban pregnant women and 46% of rural pregnant women
slept under an ITN the previous night.
Trends: The percentage of children under 5 who slept under an ITN the previous night decreased
slightly from 46% in 2013 to 42% in 2017. The percentage of pregnant women who slept under an ITN
was similar in the two surveys, with 50% in 2013 and 51% in 2017.
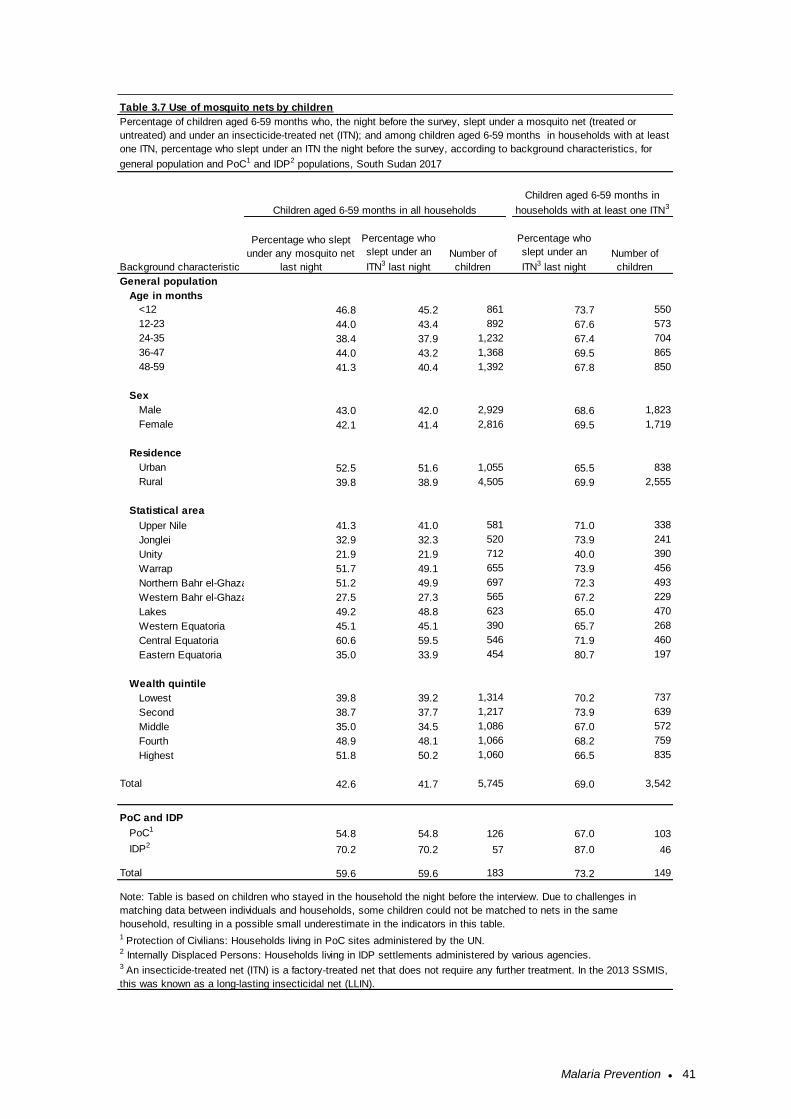
Malaria Prevention ● 41
General population
Age in months
<12 46.8 45.2 861 73.7 550
12-23 44.0 43.4 892 67.6 573
24-35 38.4 37.9 1,232 67.4 704
36-47 44.0 43.2 1,368 69.5 865
48-59 41.3 40.4 1,392 67.8 850
Sex
Male 43.0 42.0 2,929 68.6 1,823
Female 42.1 41.4 2,816 69.5 1,719
Residence
Urban 52.5 51.6 1,055 65.5 838
Rural 39.8 38.9 4,505 69.9 2,555
Statistical area
Upper Nile 41.3 41.0 581 71.0 338
Jonglei 32.9 32.3 520 73.9 241
Unity 21.9 21.9 712 40.0 390
Warrap 51.7 49.1 655 73.9 456
Northern Bahr el-Ghazal 51.2 49.9 697 72.3 493
Western Bahr el-Ghazal 27.5 27.3 565 67.2 229
Lakes 49.2 48.8 623 65.0 470
Western Equatoria 45.1 45.1 390 65.7 268
Central Equatoria 60.6 59.5 546 71.9 460
Eastern Equatoria 35.0 33.9 454 80.7 197
Wealth quintile
Lowest 39.8 39.2 1,314 70.2 737
Second 38.7 37.7 1,217 73.9 639
Middle 35.0 34.5 1,086 67.0 572
Fourth 48.9 48.1 1,066 68.2 759
Highest 51.8 50.2 1,060 66.5 835
Total 42.6 41.7 5,745 69.0 3,542
PoC and IDP
PoC154.8 54.8 126 67.0 103
IDP270.2 70.2 57 87.0 46
Total 59.6 59.6 183 73.2 149
Note: Table is based on children who stayed in the household the night before the interview. Due to challenges in
matching data between individuals and households, some children could not be matched to nets in the same
household, resulting in a possible small underestimate in the indicators in this table.
3 An insecticide-treated net (ITN) is a factory-treated net that does not require any further treatment. In the 2013 SSMIS,
this was known as a long-lasting insecticidal net (LLIN).
Children aged 6-59 months in all households
Children aged 6-59 months in
households with at least one ITN3
Table 3.7 Use of mosquito nets by children
Percentage of children aged 6-59 months who, the night before the survey, slept under a mosquito net (treated or
untreated) and under an insecticide-treated net (ITN); and among children aged 6-59 months in households with at least
one ITN, percentage who slept under an ITN the night before the survey, according to background characteristics, for
general population and PoC1 and IDP2 populations, South Sudan 2017
Background characteristic
1 Protection of Civilians: Households living in PoC sites administered by the UN.2 Internally Displaced Persons: Households living in IDP settlements administered by various agencies.
Percentage who slept
under any mosquito net
last night
Percentage who
slept under an
ITN3 last night
Number of
children
Percentage who
slept under an
ITN3 last night
Number of
children
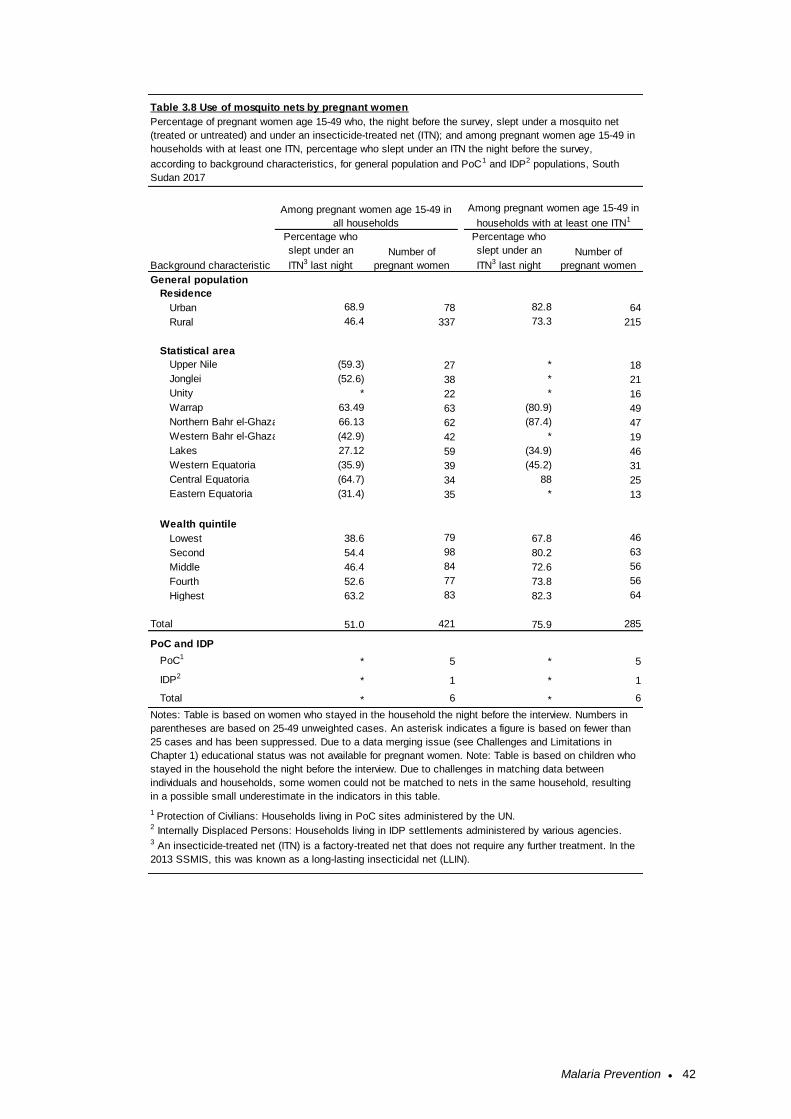
Malaria Prevention ● 42
General population
Residence
Urban 68.9 78 82.8 64
Rural 46.4 337 73.3 215
Statistical area
Upper Nile (59.3) 27 * 18
Jonglei (52.6) 38 * 21
Unity * 22 * 16
Warrap 63.49 63 (80.9) 49
Northern Bahr el-Ghazal 66.13 62 (87.4) 47
Western Bahr el-Ghazal (42.9) 42 * 19
Lakes 27.12 59 (34.9) 46
Western Equatoria (35.9) 39 (45.2) 31
Central Equatoria (64.7) 34 88 25
Eastern Equatoria (31.4) 35 * 13
Wealth quintile
Lowest 38.6 79 67.8 46
Second 54.4 98 80.2 63
Middle 46.4 84 72.6 56
Fourth 52.6 77 73.8 56
Highest 63.2 83 82.3 64
Total 51.0 421 75.9 285
PoC and IDP
PoC1* 5 * 5
IDP2* 1 * 1
Total * 6 * 6
Table 3.8 Use of mosquito nets by pregnant women
Percentage of pregnant women age 15-49 who, the night before the survey, slept under a mosquito net
(treated or untreated) and under an insecticide-treated net (ITN); and among pregnant women age 15-49 in
households with at least one ITN, percentage who slept under an ITN the night before the survey,
according to background characteristics, for general population and PoC1 and IDP2 populations, South
Sudan 2017
Among pregnant women age 15-49 in
households with at least one ITN1
Among pregnant women age 15-49 in
all households
3 An insecticide-treated net (ITN) is a factory-treated net that does not require any further treatment. In the
2013 SSMIS, this was known as a long-lasting insecticidal net (LLIN).
Background characteristic
Percentage who
slept under an
ITN3 last night
Number of
pregnant women
Percentage who
slept under an
ITN3 last night
Number of
pregnant women
1 Protection of Civilians: Households living in PoC sites administered by the UN.2 Internally Displaced Persons: Households living in IDP settlements administered by various agencies.
Notes: Table is based on women who stayed in the household the night before the interview. Numbers in
parentheses are based on 25-49 unweighted cases. An asterisk indicates a figure is based on fewer than
25 cases and has been suppressed. Due to a data merging issue (see Challenges and Limitations in
Chapter 1) educational status was not available for pregnant women. Note: Table is based on children who
stayed in the household the night before the interview. Due to challenges in matching data between
individuals and households, some women could not be matched to nets in the same household, resulting
in a possible small underestimate in the indicators in this table.
Malaria Prevention ● 43
3.5 Malaria in Pregnancy
Malaria infection during pregnancy is a major public health problem in South Sudan, with substantial
risks for the mother, her foetus, and the neonate. Intermittent preventive treatment of malaria in
pregnancy (IPTp) is a full therapeutic course of antimalarial medicine given to pregnant women at
routine antenatal care (ANC) visits to prevent malaria. IPTp helps prevent maternal malaria episodes,
maternal and foetal anaemia, placental parasitaemia, low birth weight, and neonatal mortality. WHO
recommends IPTp for all pregnant women beginning in the second trimester (WHO 2016).
Sulphadoxine-pyrimethamine (SP), also known as Fansidar, is the recommended drug for IPTp in South
Sudan. For over 10 years, the Ministry of Health has been implementing IPTp, defined as provision of
at least two doses of SP/Fansidar to protect the mother and her child from malaria during routine ANC
visits in the second and third trimesters of pregnancy (IPTp2+). In 2014 the National Malaria Control
Programme adopted the 2012 WHO recommendation to administer one dose of SP/Fansidar at each
ANC visit after the first trimester, with at least 1 month between doses (WHO 2012a; WHO 2012b). The
household survey indicator used to measure coverage of this intervention is the percentage of women
with a live birth in the 2 years preceding the survey who received three or more doses of SP/Fansidar
to prevent malaria during her most recent pregnancy (IPTp3+)
Sixty-seven percent of women with a live birth in the 2 years preceding the survey received one or more
doses of SP/Fansidar during an ANC visit to prevent malaria (Table 3.9). Fifty-seven percent of these
women received two or more doses of SP/Fansidar, and 31% received three or more doses of
SP/Fansidar. In the PoC and IDP populations, the sample size of pregnant women was too small to
generate reliable estimates for these indicators.
By residence, the use of IPTp was higher in urban areas (73% received one or more doses of
SP/Fansidar) than in rural areas (64%). 38% of women in urban areas received three or more doses,
compared to 28% in rural areas.
Trends: Coverage of IPTp has generally increased from 2013 to 2017. The percentage of women with
a live birth in the previous 2 years who received one dose of SP/Fansidar increase from 38% to 67%,
while the percentage of women with at least two doses of SP/Fansidar increase from 32% to 57%.
Intermittent preventive treatment (IPTp) during pregnancy (IPTp2+) Percentage of women who took at least two doses of SP/Fansidar with at least one dose received during an antenatal care visit during their last pregnancy. Sample: Women age 15-49 with a live birth in the 2 years before the
survey
Intermittent preventive treatment (IPTp) during pregnancy (IPTp3+) Percentage of women who took at least three doses of SP/Fansidar with at least one dose received during an antenatal care visit during their last pregnancy. Sample: Women age 15-49 with a live birth in the 2 years before the
survey
Malaria Prevention ● 44
3.5 Media exposure
In the general population, 46% of interviewed women reported seeing or hearing a message about
malaria in the 6 months preceding the survey (Table 3.10). When asked the source of malaria
messages seen or heard in the past 6 months, 39% mentioned community health workers, 27%
mentioned health facilities, 24% mentioned community events, and 20% mentioned radio.
General population
Residence
Urban 72.8 61.9 38.3 394
Rural 64.4 54.4 28.1 1,017
Statistical area
Upper Nile 47.5 37.6 23.8 181
Jonglei 70.4 53.1 36.7 98
Unity 70.0 60.0 18.6 70
Warrap 66.9 60.1 47.2 163
Northern Bahr el-Ghazal 66.9 60.0 30.8 130
Western Bahr el-Ghazal 63.9 59.4 23.3 180
Lakes 69.9 48.9 14.2 219
Western Equatoria 78.9 73.4 42.2 128
Central Equatoria 64.9 49.6 24.4 131
Eastern Equatoria 79.3 77.5 62.2 111
Education
No education 61.8 52.1 26.1 1,033
Primary 54.5 54.5 27.3 11
Secondary 80.5 68.8 43.8 308
More than secondary 84.7 69.5 49.2 59
Wealth quintile
Lowest 77.4 65.8 42.4 243
Second 58.5 51.2 28.0 246
Middle 66.7 55.1 27.1 321
Fourth 61.2 51.5 27.1 291
Highest 70.3 59.4 31.9 310
Total 66.8 56.5 31.0 1,411
PoC and IDP
PoC1* * * 17
IDP2* * * 21
Total (57.9) (42.1) (26.3) 38
1 Protection of Civilians: Households living in PoC sites administered by the UN.2 Internally Displaced Persons: Households living in IDP settlements administered by various agencies.
Table 3.9 Use of intermittent preventive treatment (IPTp) by women during pregnancy
Percentage of women age 15-49 with a live birth in the 2 years preceding the survey who, during the
pregnancy that resulted in the last live birth, received one or more doses of SP/Fansidar, received two or
more doses of SP/Fansidar, and received three or more doses of SP/Fansidar, according to background
characteristics, for general population and PoC1 and IDP2 populations, South Sudan 2017
Background characteristic
Percentage who
received one or
more doses of
SP/Fansidar
Percentage who
received two or
more doses of
SP/Fansidar
Percentage who
received three
or more doses
of SP/Fansidar
Number of women with
a live birth in the 2
years preceding the
survey
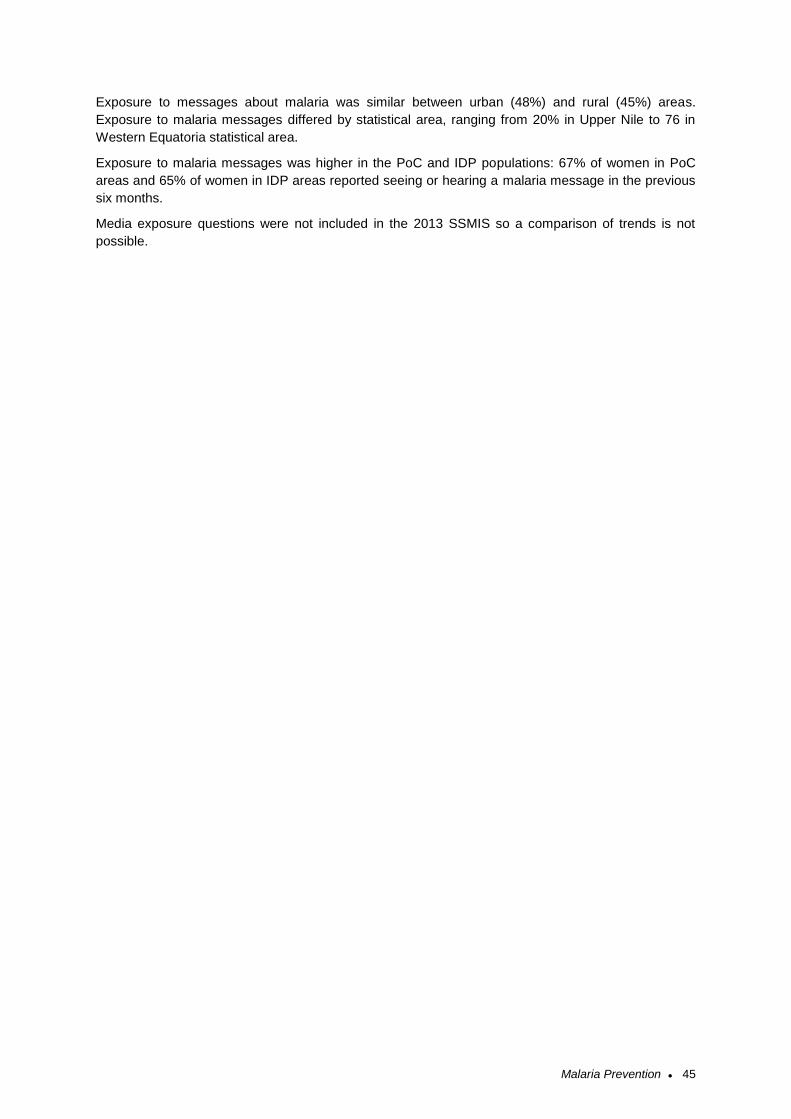
Malaria Prevention ● 45
Exposure to messages about malaria was similar between urban (48%) and rural (45%) areas.
Exposure to malaria messages differed by statistical area, ranging from 20% in Upper Nile to 76 in
Western Equatoria statistical area.
Exposure to malaria messages was higher in the PoC and IDP populations: 67% of women in PoC
areas and 65% of women in IDP areas reported seeing or hearing a malaria message in the previous
six months.
Media exposure questions were not included in the 2013 SSMIS so a comparison of trends is not
possible.
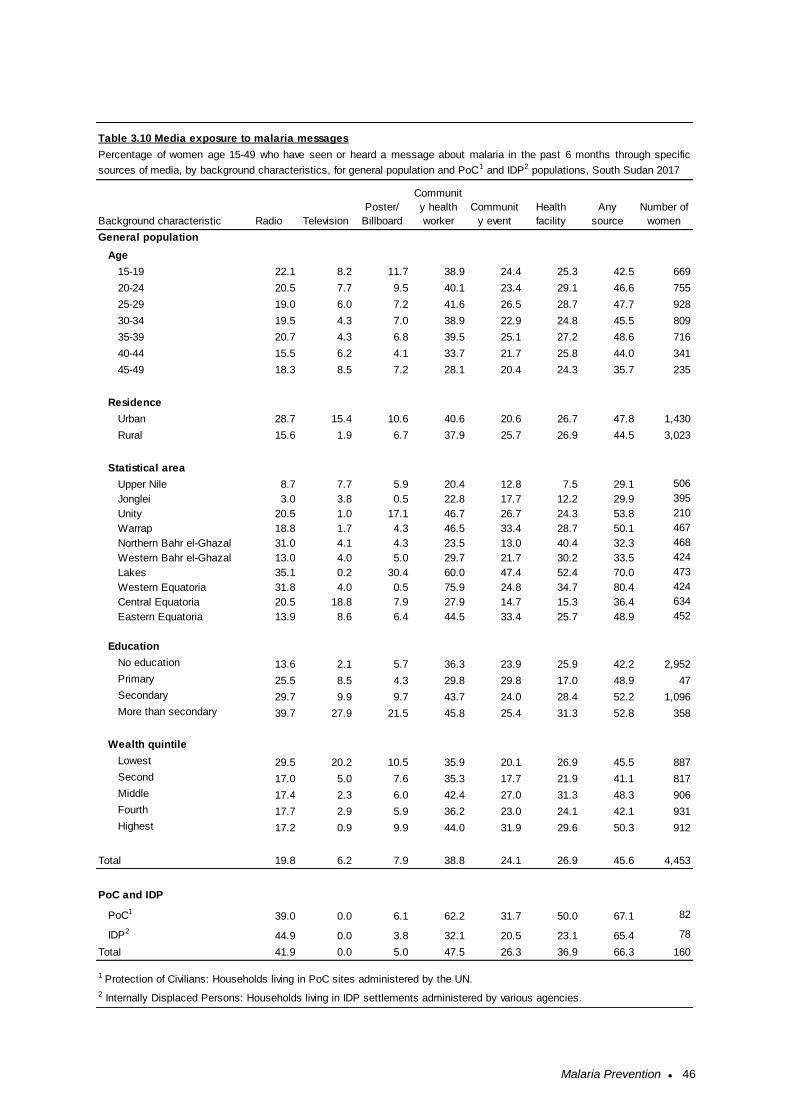
Malaria Prevention ● 46
General population
Age
15-19 22.1 8.2 11.7 38.9 24.4 25.3 42.5 669
20-24 20.5 7.7 9.5 40.1 23.4 29.1 46.6 755
25-29 19.0 6.0 7.2 41.6 26.5 28.7 47.7 928
30-34 19.5 4.3 7.0 38.9 22.9 24.8 45.5 809
35-39 20.7 4.3 6.8 39.5 25.1 27.2 48.6 716
40-44 15.5 6.2 4.1 33.7 21.7 25.8 44.0 341
45-49 18.3 8.5 7.2 28.1 20.4 24.3 35.7 235
Residence
Urban 28.7 15.4 10.6 40.6 20.6 26.7 47.8 1,430
Rural 15.6 1.9 6.7 37.9 25.7 26.9 44.5 3,023
Statistical area
Upper Nile 8.7 7.7 5.9 20.4 12.8 7.5 29.1 506
Jonglei 3.0 3.8 0.5 22.8 17.7 12.2 29.9 395
Unity 20.5 1.0 17.1 46.7 26.7 24.3 53.8 210
Warrap 18.8 1.7 4.3 46.5 33.4 28.7 50.1 467
Northern Bahr el-Ghazal 31.0 4.1 4.3 23.5 13.0 40.4 32.3 468
Western Bahr el-Ghazal 13.0 4.0 5.0 29.7 21.7 30.2 33.5 424
Lakes 35.1 0.2 30.4 60.0 47.4 52.4 70.0 473
Western Equatoria 31.8 4.0 0.5 75.9 24.8 34.7 80.4 424
Central Equatoria 20.5 18.8 7.9 27.9 14.7 15.3 36.4 634
Eastern Equatoria 13.9 8.6 6.4 44.5 33.4 25.7 48.9 452
Education
No education 13.6 2.1 5.7 36.3 23.9 25.9 42.2 2,952
Primary 25.5 8.5 4.3 29.8 29.8 17.0 48.9 47
Secondary 29.7 9.9 9.7 43.7 24.0 28.4 52.2 1,096
More than secondary 39.7 27.9 21.5 45.8 25.4 31.3 52.8 358
Wealth quintile
Lowest 29.5 20.2 10.5 35.9 20.1 26.9 45.5 887
Second 17.0 5.0 7.6 35.3 17.7 21.9 41.1 817
Middle 17.4 2.3 6.0 42.4 27.0 31.3 48.3 906
Fourth 17.7 2.9 5.9 36.2 23.0 24.1 42.1 931
Highest 17.2 0.9 9.9 44.0 31.9 29.6 50.3 912
Total 19.8 6.2 7.9 38.8 24.1 26.9 45.6 4,453
PoC and IDP
PoC139.0 0.0 6.1 62.2 31.7 50.0 67.1 82
IDP244.9 0.0 3.8 32.1 20.5 23.1 65.4 78
Total 41.9 0.0 5.0 47.5 26.3 36.9 66.3 160
1 Protection of Civilians: Households living in PoC sites administered by the UN.
2 Internally Displaced Persons: Households living in IDP settlements administered by various agencies.
Number of
women
Table 3.10 Media exposure to malaria messages
Percentage of women age 15-49 who have seen or heard a message about malaria in the past 6 months through specific
sources of media, by background characteristics, for general population and PoC1 and IDP2 populations, South Sudan 2017
Background characteristic Radio Television
Poster/
Billboard
Communit
y health
worker
Communit
y event
Health
facility
Any
source

Malaria in Children ● 47
4 MALARIA IN CHILDREN
This chapter presents data useful for assessing how well fever management strategies are
implemented. Specific topics include care seeking for febrile children, diagnostic testing of children with
fever, and therapeutic use of antimalarial drugs. Prevalence of anaemia and malaria among children
aged 6-59 months is also assessed.
4.1 Care Seeking for Fever in Children
Fever is a key symptom of malaria and other acute infections in children. Malaria fevers require prompt
and effective treatment to prevent malaria morbidity and mortality. Forty-three percent of children aged
6 to 59 months had fever in the 2 weeks preceding the survey. Advice or treatment was sought for 78%
of the children with fever in the 2 weeks preceding the survey, and timely care seeking (the same or
next day following fever onset) occurred for 24% of the febrile children (Table 4.1).
Among children with recent fever for whom care was sought, most received advice or treatment in the
public sector (89%). Just 11% received advice or treatment in the private sector. Sample sizes for
children with recent fever in PoC and IDP areas were too small to report these indicators (Table 4.2).
Patterns by background characteristics: Care-seeking is higher for urban children (86%) than for
rural children (76%). There are no observed differences between fever prevalence or care seeking by
sex. Timely care (the same day or next day) was sought for 22% of male children and 27% of female
children. The sample size of children for whom care was sought was generally low enough to make
comparisons difficult.
The percentage of children aged 6 to 59 months for whom advice or treatment was sought the same
day or the next day is 24%. Children from households in higher wealth quintiles are more likely to
receive advice or care and to receive it quickly. While care is sought for 71% of children in the lowest
wealth quintile, care is sought for 88% of children in the highest quintile. Timely care was sought for
18% of children in the lowest wealth quintile and 35% of children in the highest quintile.
Trends: Care seeking increased substantially between 2013 and 2017. The percentage of children with
fever in the two weeks preceding the survey was similar between 2013 (45%) and 2017 (42%). The
percentage for whom advice or treatment was sought increased from 57% in 2013 to 78% in 2017.
Care seeking for children aged 6 to 59 months with fever Percentage of children aged 6 to 59 months with a fever in the 2 weeks before the survey for whom advice or treatment was sought from a health provider, a health facility, or a pharmacy. Sample: Children aged 6 to 59 months with a fever in the 2 weeks before
the survey
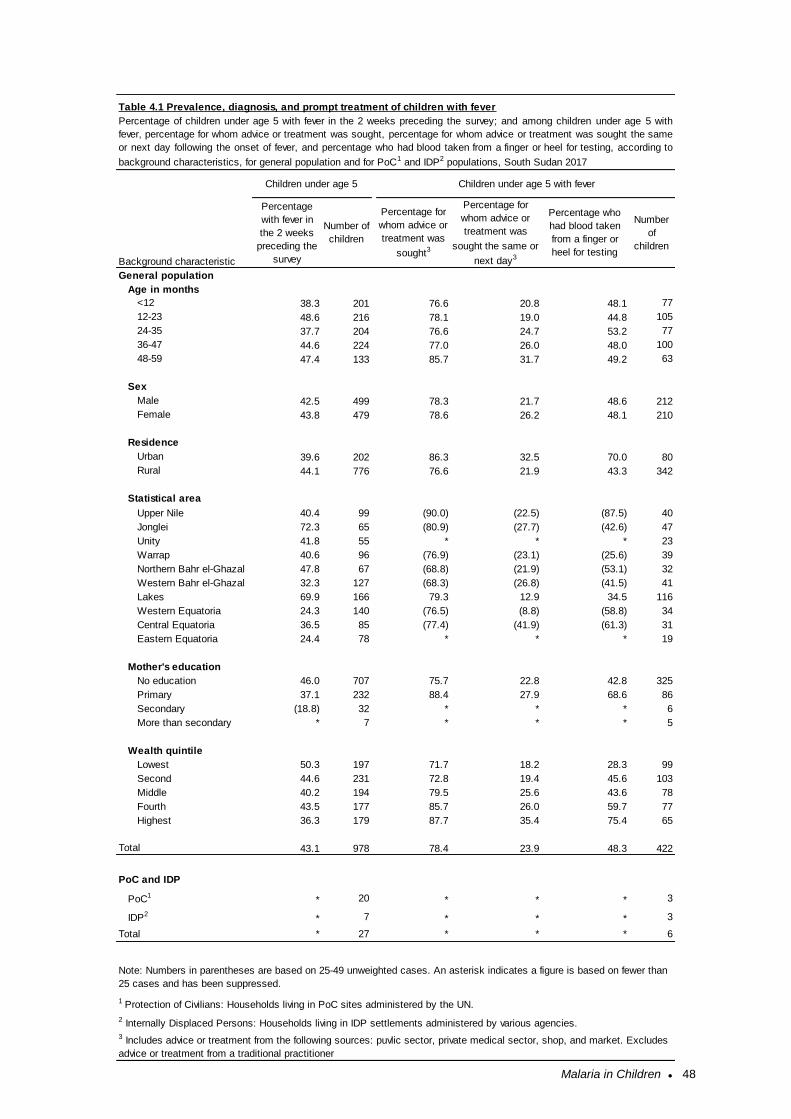
Malaria in Children ● 48
General population
Age in months
<12 38.3 201 76.6 20.8 48.1 77
12-23 48.6 216 78.1 19.0 44.8 105
24-35 37.7 204 76.6 24.7 53.2 77
36-47 44.6 224 77.0 26.0 48.0 100
48-59 47.4 133 85.7 31.7 49.2 63
Sex
Male 42.5 499 78.3 21.7 48.6 212
Female 43.8 479 78.6 26.2 48.1 210
Residence
Urban 39.6 202 86.3 32.5 70.0 80
Rural 44.1 776 76.6 21.9 43.3 342
Statistical area
Upper Nile 40.4 99 (90.0) (22.5) (87.5) 40
Jonglei 72.3 65 (80.9) (27.7) (42.6) 47
Unity 41.8 55 * * * 23
Warrap 40.6 96 (76.9) (23.1) (25.6) 39
Northern Bahr el-Ghazal 47.8 67 (68.8) (21.9) (53.1) 32
Western Bahr el-Ghazal 32.3 127 (68.3) (26.8) (41.5) 41
Lakes 69.9 166 79.3 12.9 34.5 116
Western Equatoria 24.3 140 (76.5) (8.8) (58.8) 34
Central Equatoria 36.5 85 (77.4) (41.9) (61.3) 31
Eastern Equatoria 24.4 78 * * * 19
Mother's education
No education 46.0 707 75.7 22.8 42.8 325
Primary 37.1 232 88.4 27.9 68.6 86
Secondary (18.8) 32 * * * 6
More than secondary * 7 * * * 5
Wealth quintile
Lowest 50.3 197 71.7 18.2 28.3 99
Second 44.6 231 72.8 19.4 45.6 103
Middle 40.2 194 79.5 25.6 43.6 78
Fourth 43.5 177 85.7 26.0 59.7 77
Highest 36.3 179 87.7 35.4 75.4 65
Total 43.1 978 78.4 23.9 48.3 422
PoC and IDP
PoC1* 20 * * * 3
IDP2* 7 * * * 3
Total * 27 * * * 6
2 Internally Displaced Persons: Households living in IDP settlements administered by various agencies.
3 Includes advice or treatment from the following sources: puvlic sector, private medical sector, shop, and market. Excludes
advice or treatment from a traditional practitioner
Note: Numbers in parentheses are based on 25-49 unweighted cases. An asterisk indicates a figure is based on fewer than
25 cases and has been suppressed.
Percentage for
whom advice or
treatment was
sought the same or
next day3
Table 4.1 Prevalence, diagnosis, and prompt treatment of children with fever
Percentage of children under age 5 with fever in the 2 weeks preceding the survey; and among children under age 5 with
fever, percentage for whom advice or treatment was sought, percentage for whom advice or treatment was sought the same
or next day following the onset of fever, and percentage who had blood taken from a finger or heel for testing, according to
background characteristics, for general population and for PoC1 and IDP2 populations, South Sudan 2017
Children under age 5 Children under age 5 with fever
Background characteristic
Percentage
with fever in
the 2 weeks
preceding the
survey
Number of
children
Percentage for
whom advice or
treatment was
sought3
Percentage who
had blood taken
from a finger or
heel for testing
Number
of
children
1 Protection of Civilians: Households living in PoC sites administered by the UN.
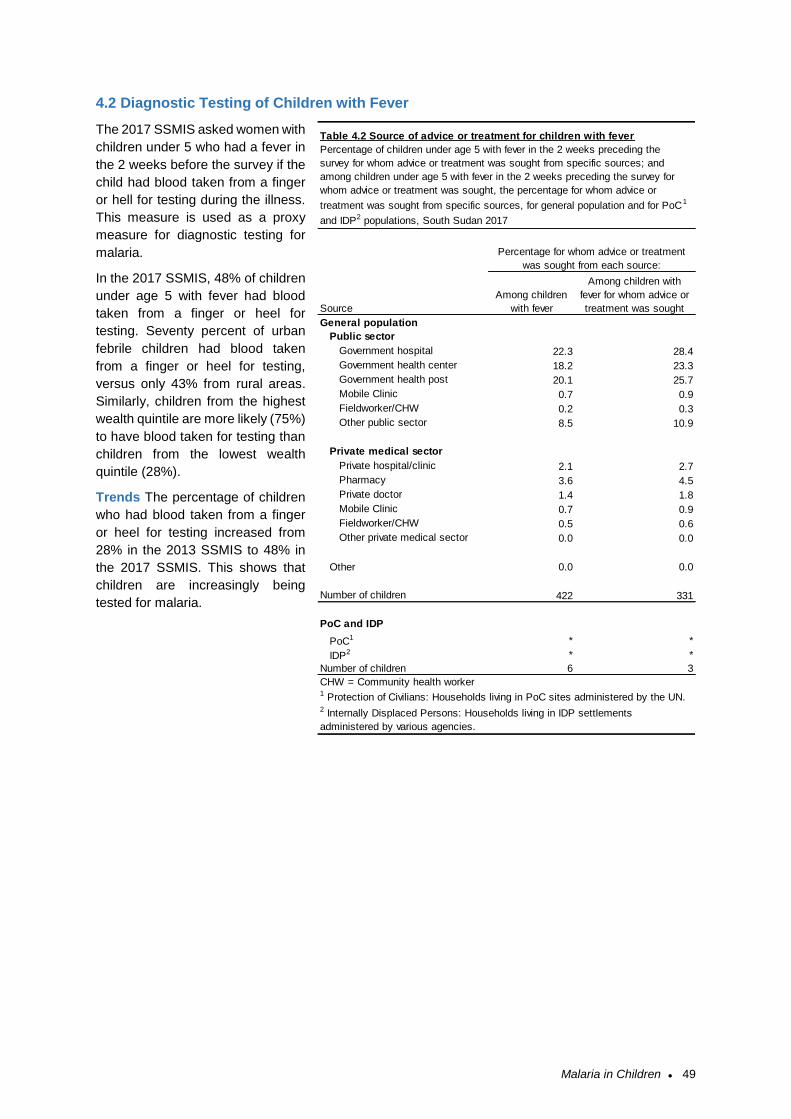
Malaria in Children ● 49
4.2 Diagnostic Testing of Children with Fever
The 2017 SSMIS asked women with
children under 5 who had a fever in
the 2 weeks before the survey if the
child had blood taken from a finger
or hell for testing during the illness.
This measure is used as a proxy
measure for diagnostic testing for
malaria.
In the 2017 SSMIS, 48% of children
under age 5 with fever had blood
taken from a finger or heel for
testing. Seventy percent of urban
febrile children had blood taken
from a finger or heel for testing,
versus only 43% from rural areas.
Similarly, children from the highest
wealth quintile are more likely (75%)
to have blood taken for testing than
children from the lowest wealth
quintile (28%).
Trends The percentage of children
who had blood taken from a finger
or heel for testing increased from
28% in the 2013 SSMIS to 48% in
the 2017 SSMIS. This shows that
children are increasingly being
tested for malaria.
General population
Public sector
Government hospital 22.3 28.4
Government health center 18.2 23.3
Government health post 20.1 25.7
Mobile Clinic 0.7 0.9
Fieldworker/CHW 0.2 0.3
Other public sector 8.5 10.9
Private medical sector
Private hospital/clinic 2.1 2.7
Pharmacy 3.6 4.5
Private doctor 1.4 1.8
Mobile Clinic 0.7 0.9
Fieldworker/CHW 0.5 0.6
Other private medical sector 0.0 0.0
Other 0.0 0.0
Number of children 422 331
PoC and IDP
PoC1 * *
IDP2 * *
Number of children 6 3
CHW = Community health worker1 Protection of Civilians: Households living in PoC sites administered by the UN.2 Internally Displaced Persons: Households living in IDP settlements
administered by various agencies.
Table 4.2 Source of advice or treatment for children with fever
Percentage of children under age 5 with fever in the 2 weeks preceding the
survey for whom advice or treatment was sought from specific sources; and
among children under age 5 with fever in the 2 weeks preceding the survey for
whom advice or treatment was sought, the percentage for whom advice or
treatment was sought from specific sources, for general population and for PoC1
and IDP2 populations, South Sudan 2017
Source
Among children
with fever
Among children with
fever for whom advice or
treatment was sought
Percentage for whom advice or treatment
was sought from each source:
Malaria in Children ● 50
4.3 Use of Recommended Antimalarials
Artemisinin-based combination therapy (ACT) is the recommended first-line antimalarial drug for the
treatment of uncomplicated malaria in South Sudan.
In the 2013 SSMIS a list of ACTs was included to facilitate identification of ACTs, whereas in the 2017
SSMIS interviewers were trained with a list of commonly available ACTs, but this was not included in
the response options on the questionnaire. This led to apparently high misclassification of the most
common ACT, artesunate amodiaquine, as artesunate monotherapy or amodiauqine monotherapy. In
the analysis, amodiaquine and artesunate reported as received from any source other than a hospital
were first reclassified as “any ACT”. Even with this reclassification, rates of artesunate and amodiaquine
monotherapies remained higher than expected, indicating there was likely misclassification for those
who received treatment at hospitals as well. In the final tables, all artesunate and amodiaquine
monotherapies are reclassified as “any ACT”. This likely results in some over-reporting of ACT usage.
According to the results shown in Table 4.3, 61% of children aged 6 to 59 months with recent fever who
received an antimalarial took an ACT.
Trends: The percentage of children receiving any ACT increased strongly between 2013 and 2017. In
the 2013 SSMIS, just 20% of children under age five with a fever received an ACT, compared to 61%
in the 2017 SSMIS. This is attributable to both increased care-seeking, and a higher likelihood that
children for whom care is sought will receive an ACT.
Artemisinin-based combination therapy (ACT) for children aged 6 to 59 months with fever Among children aged 6 to 59 months with a fever in the 2 weeks before the survey who took any antimalarial drugs, the percentage who took an artemisinin-based combination therapy (ACT). Sample: Children aged 6 to 59 months with a fever in the 2 weeks before
the survey who took any antimalarial drug
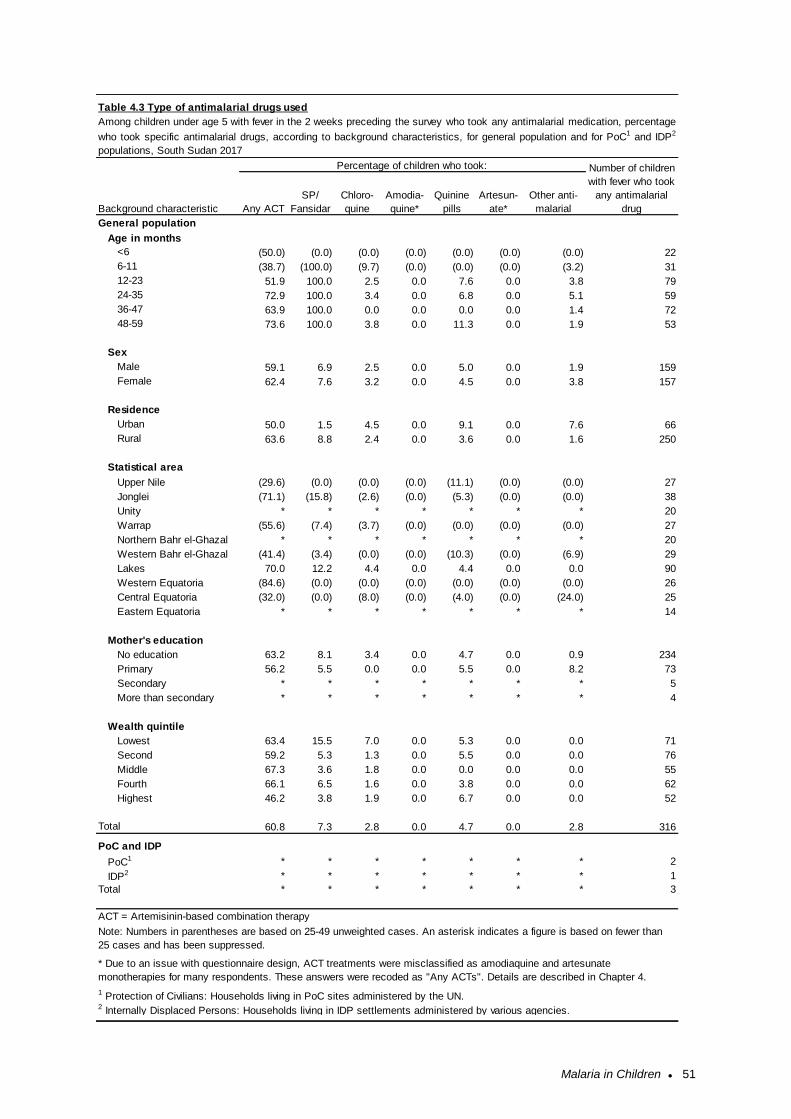
Malaria in Children ● 51
General population
Age in months
<6 (50.0) (0.0) (0.0) (0.0) (0.0) (0.0) (0.0) 22
6-11 (38.7) (100.0) (9.7) (0.0) (0.0) (0.0) (3.2) 31
12-23 51.9 100.0 2.5 0.0 7.6 0.0 3.8 79
24-35 72.9 100.0 3.4 0.0 6.8 0.0 5.1 59
36-47 63.9 100.0 0.0 0.0 0.0 0.0 1.4 72
48-59 73.6 100.0 3.8 0.0 11.3 0.0 1.9 53
Sex
Male 59.1 6.9 2.5 0.0 5.0 0.0 1.9 159
Female 62.4 7.6 3.2 0.0 4.5 0.0 3.8 157
Residence
Urban 50.0 1.5 4.5 0.0 9.1 0.0 7.6 66
Rural 63.6 8.8 2.4 0.0 3.6 0.0 1.6 250
Statistical area
Upper Nile (29.6) (0.0) (0.0) (0.0) (11.1) (0.0) (0.0) 27
Jonglei (71.1) (15.8) (2.6) (0.0) (5.3) (0.0) (0.0) 38
Unity * * * * * * * 20
Warrap (55.6) (7.4) (3.7) (0.0) (0.0) (0.0) (0.0) 27
Northern Bahr el-Ghazal * * * * * * * 20
Western Bahr el-Ghazal (41.4) (3.4) (0.0) (0.0) (10.3) (0.0) (6.9) 29
Lakes 70.0 12.2 4.4 0.0 4.4 0.0 0.0 90
Western Equatoria (84.6) (0.0) (0.0) (0.0) (0.0) (0.0) (0.0) 26
Central Equatoria (32.0) (0.0) (8.0) (0.0) (4.0) (0.0) (24.0) 25
Eastern Equatoria * * * * * * * 14
Mother's education
No education 63.2 8.1 3.4 0.0 4.7 0.0 0.9 234
Primary 56.2 5.5 0.0 0.0 5.5 0.0 8.2 73
Secondary * * * * * * * 5
More than secondary * * * * * * * 4
Wealth quintile
Lowest 63.4 15.5 7.0 0.0 5.3 0.0 0.0 71
Second 59.2 5.3 1.3 0.0 5.5 0.0 0.0 76
Middle 67.3 3.6 1.8 0.0 0.0 0.0 0.0 55
Fourth 66.1 6.5 1.6 0.0 3.8 0.0 0.0 62
Highest 46.2 3.8 1.9 0.0 6.7 0.0 0.0 52
Total 60.8 7.3 2.8 0.0 4.7 0.0 2.8 316
PoC and IDP
PoC1 * * * * * * * 2
IDP2 * * * * * * * 1
Total * * * * * * * 3
ACT = Artemisinin-based combination therapy
Table 4.3 Type of antimalarial drugs used
Among children under age 5 with fever in the 2 weeks preceding the survey who took any antimalarial medication, percentage
who took specific antimalarial drugs, according to background characteristics, for general population and for PoC1 and IDP2
populations, South Sudan 2017
Background characteristic Any ACT
SP/
Fansidar
Chloro-
quine
Amodia-
quine*
Percentage of children who took:
Artesun-
ate*
Other anti-
malarial
2 Internally Displaced Persons: Households living in IDP settlements administered by various agencies.
1 Protection of Civilians: Households living in PoC sites administered by the UN.
Note: Numbers in parentheses are based on 25-49 unweighted cases. An asterisk indicates a figure is based on fewer than
25 cases and has been suppressed.
Number of children
with fever who took
any antimalarial
drug
Quinine
pills
* Due to an issue with questionnaire design, ACT treatments were misclassified as amodiaquine and artesunate
monotherapies for many respondents. These answers were recoded as "Any ACTs". Details are described in Chapter 4.
Malaria in Children ● 52
4.4 Prevalence of Low Haemoglobin in Children
Anaemia, defined as a reduced level of haemoglobin in blood, decreases the amount of oxygen
reaching the tissues and organs of the body and reduces their capacity to function. Anaemia is
associated with impaired motor and cognitive development in children. The main causes of anaemia in
children are malaria and inadequate intake of iron, folate, vitamin B12, or other nutrients. Other causes
of anaemia include intestinal worms, haemoglobinopathy, and sickle cell disease. Although anaemia is
not specific to malaria, trends in anaemia prevalence can reflect malaria morbidity, and they respond
to changes in the coverage of malaria interventions (Korenromp 2004). Malaria interventions have been
associated with a 60% reduction in the risk of anaemia using a cut-off of 8 g/dl (RBM 2003).
Among eligible children age 6-59 months from interviewed households, almost all (97%) consented and
were tested for anaemia (Table 4.4). Table 4.5 presents results of anaemia testing in the 2017 SSMIS,
using a cut-off of <7.0 g/dl. Due to data entry and data cleaning issues, anaemia rates for Lakes and
Western Equatoria statistical areas could not reliably be reported. Results of anaemia testing for these
statistical areas were excluded in Table 4.5 both in the analysis by statistical area and in the other
analyses.
Seven percent of children aged 6-59 months had haemoglobin lower than 7.0 g/dl. Anaemia was
generally more prevalent. Anaemia was higher in urban children (10%) than in rural children (6%). It
did not differ substantially by wealth quintile. By statistical area, anaemia ranged from 3% in Central
Equatoria to 18% in Western Bahr el-Ghazal.
Trends: The percentage of children with severe anaemia stayed roughly similar between 2013 and
2017. In the 2013 SSMIS a threshold of 8.0 g/dl was used for severe anaemia, and 8% of children were
below that threshold. In the 2017 SSMIS, with a more severe cut-off of 7.0 dg/dl, anaemia prevalence
was 7%.
Prevalence of low haemoglobin in children Percentage of children age 6-59 months who had a haemoglobin measurement of less than 7 grams per decilitre (g/dl) of blood. Sample: Children age 6-59 months
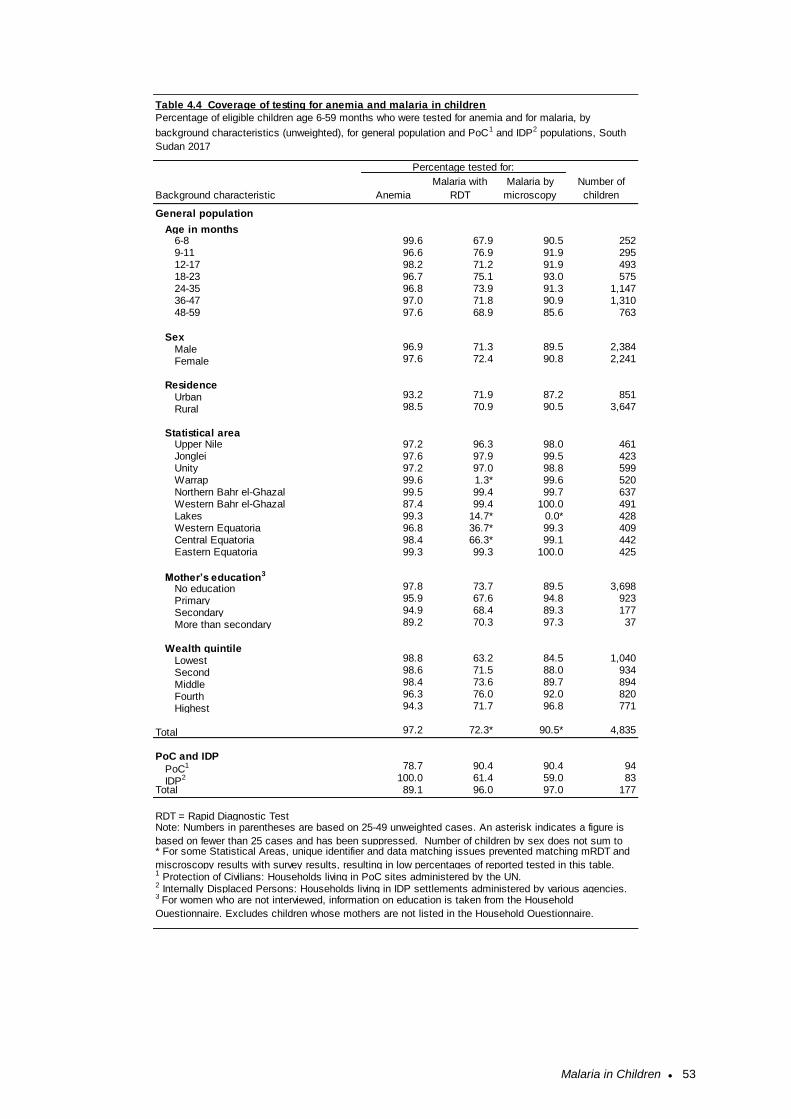
Malaria in Children ● 53
General population
Age in months6-8 99.6 67.9 90.5 2529-11 96.6 76.9 91.9 29512-17 98.2 71.2 91.9 49318-23 96.7 75.1 93.0 57524-35 96.8 73.9 91.3 1,14736-47 97.0 71.8 90.9 1,31048-59 97.6 68.9 85.6 763
SexMale 96.9 71.3 89.5 2,384
Female 97.6 72.4 90.8 2,241
ResidenceUrban 93.2 71.9 87.2 851
Rural 98.5 70.9 90.5 3,647
Statistical areaUpper Nile 97.2 96.3 98.0 461Jonglei 97.6 97.9 99.5 423Unity 97.2 97.0 98.8 599Warrap 99.6 1.3* 99.6 520Northern Bahr el-Ghazal 99.5 99.4 99.7 637Western Bahr el-Ghazal 87.4 99.4 100.0 491Lakes 99.3 14.7* 0.0* 428Western Equatoria 96.8 36.7* 99.3 409Central Equatoria 98.4 66.3* 99.1 442Eastern Equatoria 99.3 99.3 100.0 425
Mother’s education3
No education 97.8 73.7 89.5 3,698
Primary 95.9 67.6 94.8 923
Secondary 94.9 68.4 89.3 177
More than secondary 89.2 70.3 97.3 37
Wealth quintileLowest 98.8 63.2 84.5 1,040
Second 98.6 71.5 88.0 934
Middle 98.4 73.6 89.7 894
Fourth 96.3 76.0 92.0 820
Highest 94.3 71.7 96.8 771
Total 97.2 72.3* 90.5* 4,835
PoC and IDP
PoC1 78.7 90.4 90.4 94
IDP2 100.0 61.4 59.0 83Total 89.1 96.0 97.0 177
* For some Statistical Areas, unique identifier and data matching issues prevented matching mRDT and
miscroscopy results with survey results, resulting in low percentages of reported tested in this table.1 Protection of Civilians: Households living in PoC sites administered by the UN.2 Internally Displaced Persons: Households living in IDP settlements administered by various agencies.3 For women who are not interviewed, information on education is taken from the Household
Questionnaire. Excludes children whose mothers are not listed in the Household Questionnaire.
RDT = Rapid Diagnostic Test Note: Numbers in parentheses are based on 25-49 unweighted cases. An asterisk indicates a figure is
based on fewer than 25 cases and has been suppressed. Number of children by sex does not sum to
Table 4.4 Coverage of testing for anemia and malaria in children
Percentage tested for:
Number of
childrenAnemia
Malaria with
RDT
Percentage of eligible children age 6-59 months who were tested for anemia and for malaria, by
background characteristics (unweighted), for general population and PoC1 and IDP2 populations, South
Sudan 2017
Malaria by
microscopyBackground characteristic
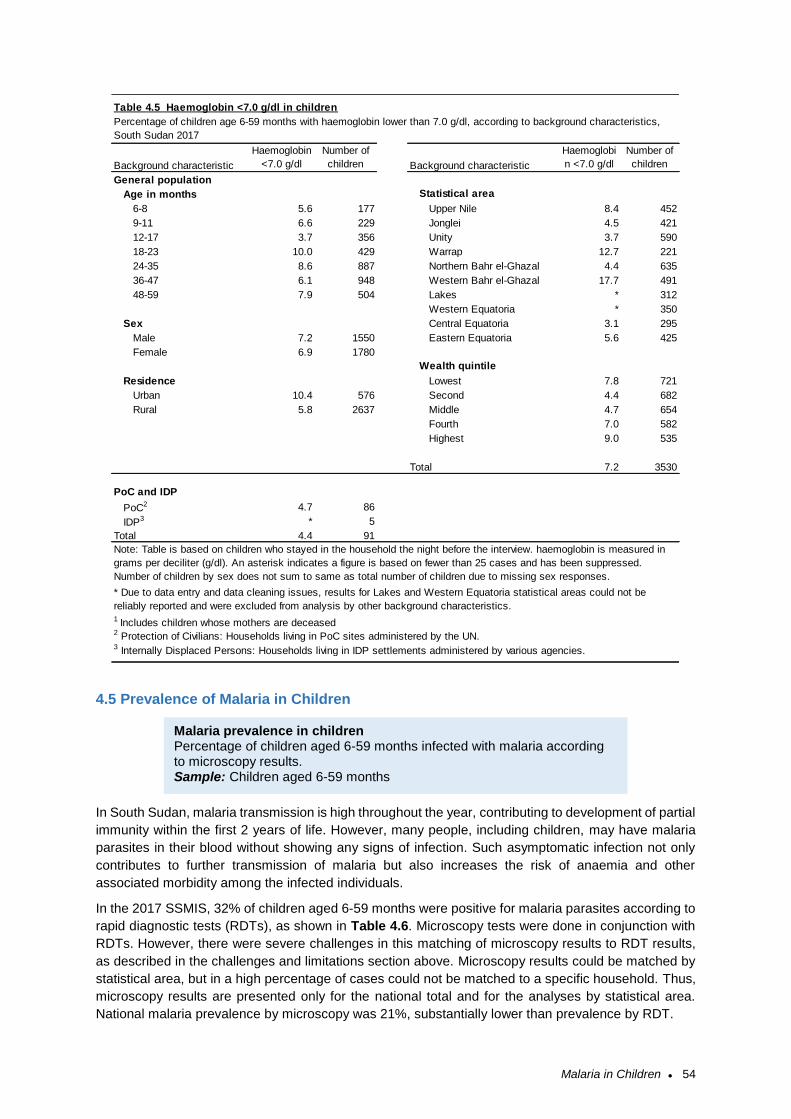
Malaria in Children ● 54
4.5 Prevalence of Malaria in Children
In South Sudan, malaria transmission is high throughout the year, contributing to development of partial
immunity within the first 2 years of life. However, many people, including children, may have malaria
parasites in their blood without showing any signs of infection. Such asymptomatic infection not only
contributes to further transmission of malaria but also increases the risk of anaemia and other
associated morbidity among the infected individuals.
In the 2017 SSMIS, 32% of children aged 6-59 months were positive for malaria parasites according to
rapid diagnostic tests (RDTs), as shown in Table 4.6. Microscopy tests were done in conjunction with
RDTs. However, there were severe challenges in this matching of microscopy results to RDT results,
as described in the challenges and limitations section above. Microscopy results could be matched by
statistical area, but in a high percentage of cases could not be matched to a specific household. Thus,
microscopy results are presented only for the national total and for the analyses by statistical area.
National malaria prevalence by microscopy was 21%, substantially lower than prevalence by RDT.
General population
Age in months Statistical area
6-8 5.6 177 Upper Nile 8.4 452
9-11 6.6 229 Jonglei 4.5 421
12-17 3.7 356 Unity 3.7 590
18-23 10.0 429 Warrap 12.7 221
24-35 8.6 887 Northern Bahr el-Ghazal 4.4 635
36-47 6.1 948 Western Bahr el-Ghazal 17.7 491
48-59 7.9 504 Lakes * 312
Western Equatoria * 350
Sex Central Equatoria 3.1 295
Male 7.2 1550 Eastern Equatoria 5.6 425
Female 6.9 1780
Wealth quintile
Residence Lowest 7.8 721
Urban 10.4 576 Second 4.4 682
Rural 5.8 2637 Middle 4.7 654
Fourth 7.0 582
Highest 9.0 535
Total 7.2 3530
PoC and IDP
PoC2 4.7 86
IDP3 * 5
Total 4.4 91
Note: Table is based on children who stayed in the household the night before the interview. haemoglobin is measured in
grams per deciliter (g/dl). An asterisk indicates a figure is based on fewer than 25 cases and has been suppressed.
Number of children by sex does not sum to same as total number of children due to missing sex responses.
2 Protection of Civilians: Households living in PoC sites administered by the UN.3 Internally Displaced Persons: Households living in IDP settlements administered by various agencies.
Haemoglobi
n <7.0 g/dl
Number of
childrenBackground characteristic
* Due to data entry and data cleaning issues, results for Lakes and Western Equatoria statistical areas could not be
reliably reported and were excluded from analysis by other background characteristics.1 Includes children whose mothers are deceased
Table 4.5 Haemoglobin <7.0 g/dl in children
Background characteristic
Haemoglobin
<7.0 g/dl
Number of
children
Percentage of children age 6-59 months with haemoglobin lower than 7.0 g/dl, according to background characteristics,
South Sudan 2017
Malaria prevalence in children Percentage of children aged 6-59 months infected with malaria according to microscopy results. Sample: Children aged 6-59 months
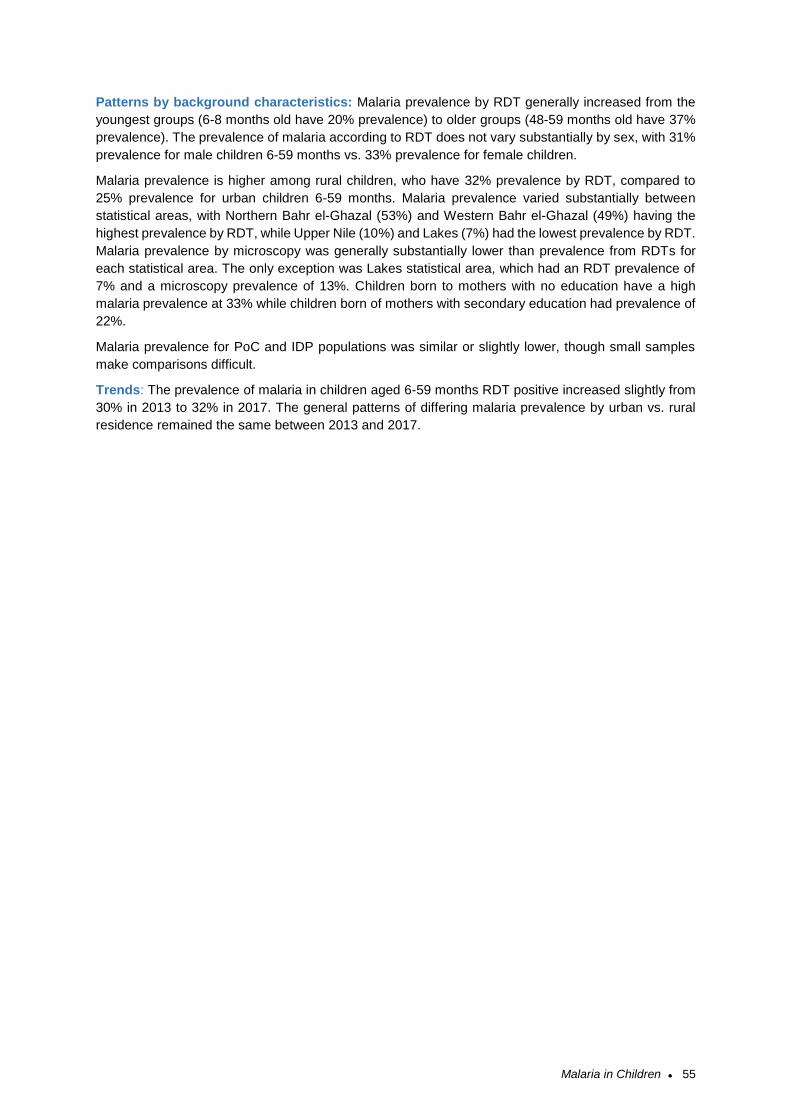
Malaria in Children ● 55
Patterns by background characteristics: Malaria prevalence by RDT generally increased from the
youngest groups (6-8 months old have 20% prevalence) to older groups (48-59 months old have 37%
prevalence). The prevalence of malaria according to RDT does not vary substantially by sex, with 31%
prevalence for male children 6-59 months vs. 33% prevalence for female children.
Malaria prevalence is higher among rural children, who have 32% prevalence by RDT, compared to
25% prevalence for urban children 6-59 months. Malaria prevalence varied substantially between
statistical areas, with Northern Bahr el-Ghazal (53%) and Western Bahr el-Ghazal (49%) having the
highest prevalence by RDT, while Upper Nile (10%) and Lakes (7%) had the lowest prevalence by RDT.
Malaria prevalence by microscopy was generally substantially lower than prevalence from RDTs for
each statistical area. The only exception was Lakes statistical area, which had an RDT prevalence of
7% and a microscopy prevalence of 13%. Children born to mothers with no education have a high
malaria prevalence at 33% while children born of mothers with secondary education had prevalence of
22%.
Malaria prevalence for PoC and IDP populations was similar or slightly lower, though small samples
make comparisons difficult.
Trends: The prevalence of malaria in children aged 6-59 months RDT positive increased slightly from
30% in 2013 to 32% in 2017. The general patterns of differing malaria prevalence by urban vs. rural
residence remained the same between 2013 and 2017.
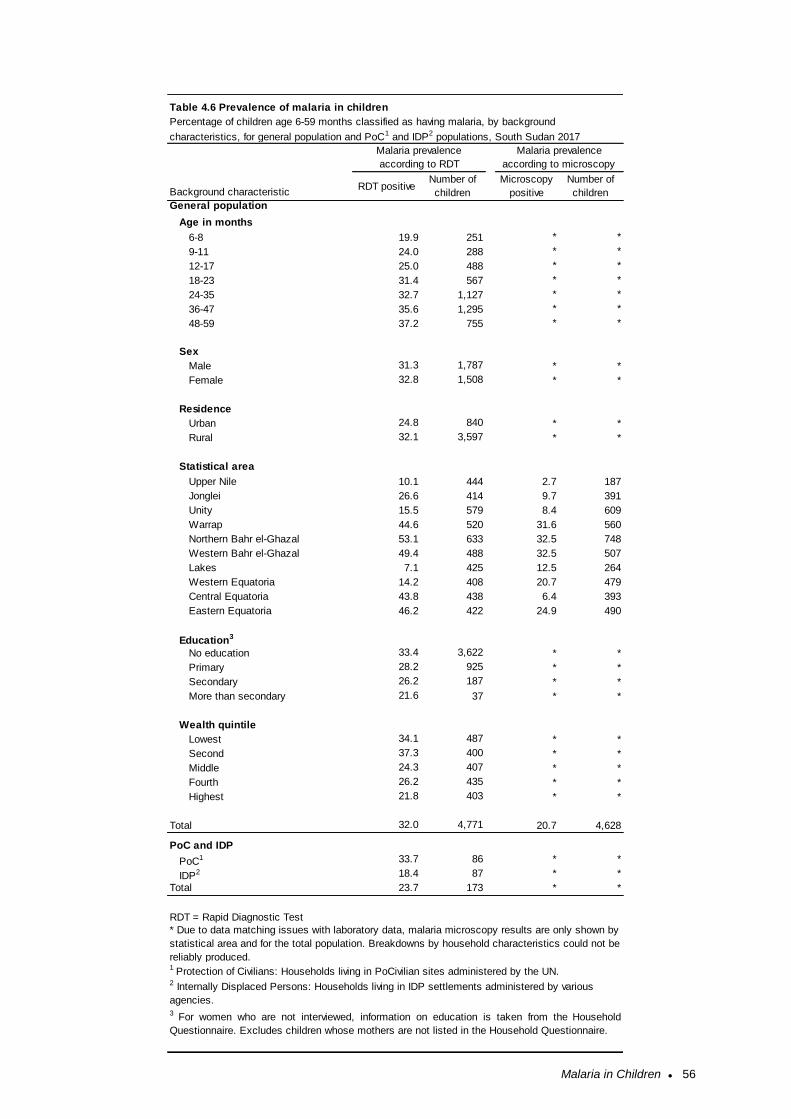
Malaria in Children ● 56
General population
Age in months
6-8 19.9 251 * *
9-11 24.0 288 * *
12-17 25.0 488 * *
18-23 31.4 567 * *
24-35 32.7 1,127 * *
36-47 35.6 1,295 * *
48-59 37.2 755 * *
Sex
Male 31.3 1,787 * *
Female 32.8 1,508 * *
Residence
Urban 24.8 840 * *
Rural 32.1 3,597 * *
Statistical area
Upper Nile 10.1 444 2.7 187
Jonglei 26.6 414 9.7 391
Unity 15.5 579 8.4 609
Warrap 44.6 520 31.6 560
Northern Bahr el-Ghazal 53.1 633 32.5 748
Western Bahr el-Ghazal 49.4 488 32.5 507
Lakes 7.1 425 12.5 264
Western Equatoria 14.2 408 20.7 479
Central Equatoria 43.8 438 6.4 393
Eastern Equatoria 46.2 422 24.9 490
Education3
No education 33.4 3,622 * *
Primary 28.2 925 * *
Secondary 26.2 187 * *
More than secondary 21.6 37 * *
Wealth quintile
Lowest 34.1 487 * *
Second 37.3 400 * *
Middle 24.3 407 * *
Fourth 26.2 435 * *
Highest 21.8 403 * *
Total 32.0 4,771 20.7 4,628
PoC and IDP
PoC1 33.7 86 * *
IDP2 18.4 87 * *
Total 23.7 173 * *
3 For women who are not interviewed, information on education is taken from the Household
Questionnaire. Excludes children whose mothers are not listed in the Household Questionnaire.
* Due to data matching issues with laboratory data, malaria microscopy results are only shown by
statistical area and for the total population. Breakdowns by household characteristics could not be
reliably produced.
2 Internally Displaced Persons: Households living in IDP settlements administered by various
agencies.
RDT = Rapid Diagnostic Test
1 Protection of Civilians: Households living in PoCivilian sites administered by the UN.
Table 4.6 Prevalence of malaria in children
Background characteristic
Number of
children
Microscopy
positive
Number of
children
Percentage of children age 6-59 months classified as having malaria, by background
characteristics, for general population and PoC1 and IDP2 populations, South Sudan 2017
Malaria prevalence
according to RDT
Malaria prevalence
according to microscopy
RDT positive
References ● 57
REFERENCES
Abdalla SI, Malik EM, Ali KM. “The burden of malaria in South Sudan: Incidence, mortality and disability-
adjusted life years.” Malar J 2007 Jul 28;6:97.
Doolan, D. L., C. Dobano, and J. K. Baird. 2009. “Acquired Immunity to Malaria.” Clin Microbio Rev
22:13-36.
Korenromp, E. L., J. Armstrong-Schellenberg, B. Williams, B. Nahlen, R. W. Snow. 2004. “Impact of
Malaria Control on Childhood Anemia in Africa – A Quantitative Review.” Trop Med Int Health 9(10):
1050-1065.
Ministry of Health, Republic of South Sudan, Health Sector Development Plan 2012-2016.
Ministry of Health, Republic of South Sudan, South Sudan Malaria Control Strategic Plan 2014/16-
2021/22. Ministry of Health, Republic of South Sudan, Health Sector Development Plan 2012-2016.
National Bureau of Statistics, 2015. Population Projections for South Sudan 2015-2020.
Roll Back Malaria Partnership. 2003. Monitoring and Evaluation Reference Group Anemia Task Force
Meeting Minutes. Presented at WHO Headquarters. Geneva: 2003 Oct 27-28.
Shulman, C. E., and E. K. Dorman. 2003. “Importance and Prevention of Malaria in Pregnancy.” Trans
R Soc Trop Med Hyg 97(1):30–55.
South Sudan 2013 Malaria Indicator Survey Report.
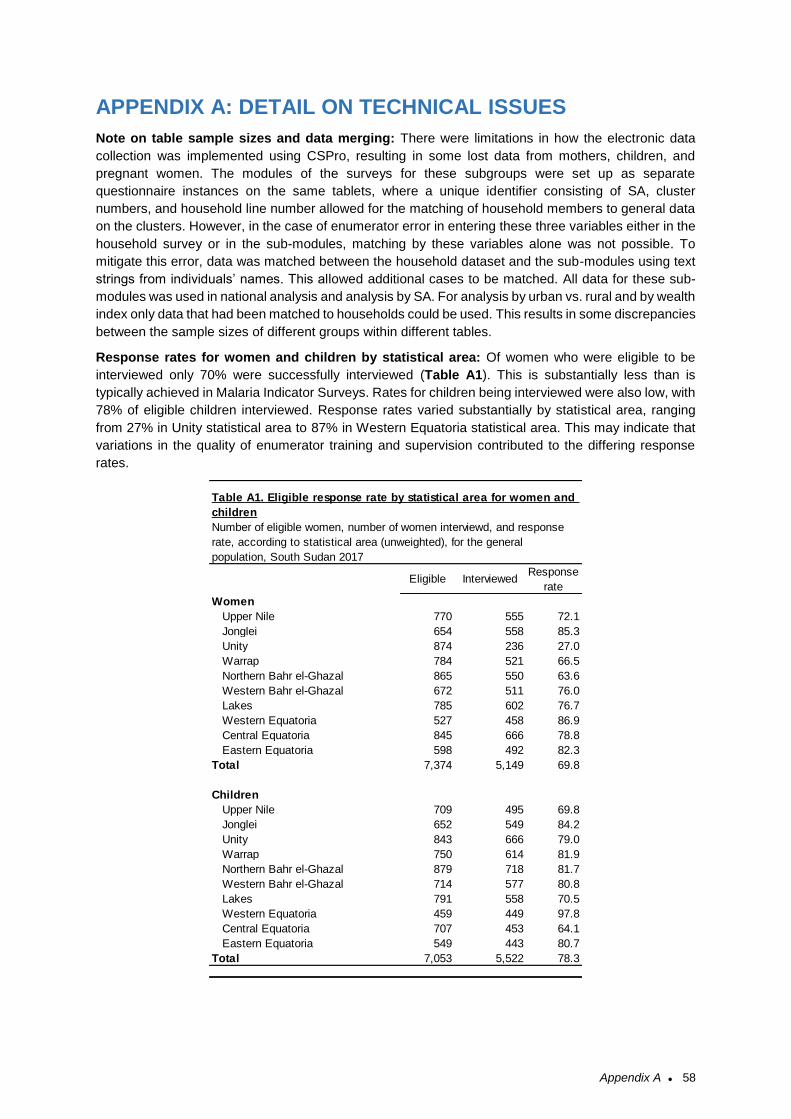
Appendix A ● 58
APPENDIX A: DETAIL ON TECHNICAL ISSUES
Note on table sample sizes and data merging: There were limitations in how the electronic data
collection was implemented using CSPro, resulting in some lost data from mothers, children, and
pregnant women. The modules of the surveys for these subgroups were set up as separate
questionnaire instances on the same tablets, where a unique identifier consisting of SA, cluster
numbers, and household line number allowed for the matching of household members to general data
on the clusters. However, in the case of enumerator error in entering these three variables either in the
household survey or in the sub-modules, matching by these variables alone was not possible. To
mitigate this error, data was matched between the household dataset and the sub-modules using text
strings from individuals’ names. This allowed additional cases to be matched. All data for these sub-
modules was used in national analysis and analysis by SA. For analysis by urban vs. rural and by wealth
index only data that had been matched to households could be used. This results in some discrepancies
between the sample sizes of different groups within different tables.
Response rates for women and children by statistical area: Of women who were eligible to be
interviewed only 70% were successfully interviewed (Table A1). This is substantially less than is
typically achieved in Malaria Indicator Surveys. Rates for children being interviewed were also low, with
78% of eligible children interviewed. Response rates varied substantially by statistical area, ranging
from 27% in Unity statistical area to 87% in Western Equatoria statistical area. This may indicate that
variations in the quality of enumerator training and supervision contributed to the differing response
rates.
Eligible InterviewedResponse
rate
Women
Upper Nile 770 555 72.1
Jonglei 654 558 85.3
Unity 874 236 27.0
Warrap 784 521 66.5
Northern Bahr el-Ghazal 865 550 63.6
Western Bahr el-Ghazal 672 511 76.0
Lakes 785 602 76.7
Western Equatoria 527 458 86.9
Central Equatoria 845 666 78.8
Eastern Equatoria 598 492 82.3
Total 7,374 5,149 69.8
Children
Upper Nile 709 495 69.8
Jonglei 652 549 84.2
Unity 843 666 79.0
Warrap 750 614 81.9
Northern Bahr el-Ghazal 879 718 81.7
Western Bahr el-Ghazal 714 577 80.8
Lakes 791 558 70.5
Western Equatoria 459 449 97.8
Central Equatoria 707 453 64.1
Eastern Equatoria 549 443 80.7
Total 7,053 5,522 78.3
Number of eligible women, number of women interviewd, and response
rate, according to statistical area (unweighted), for the general
population, South Sudan 2017
Table A1. Eligible response rate by statistical area for women and
children
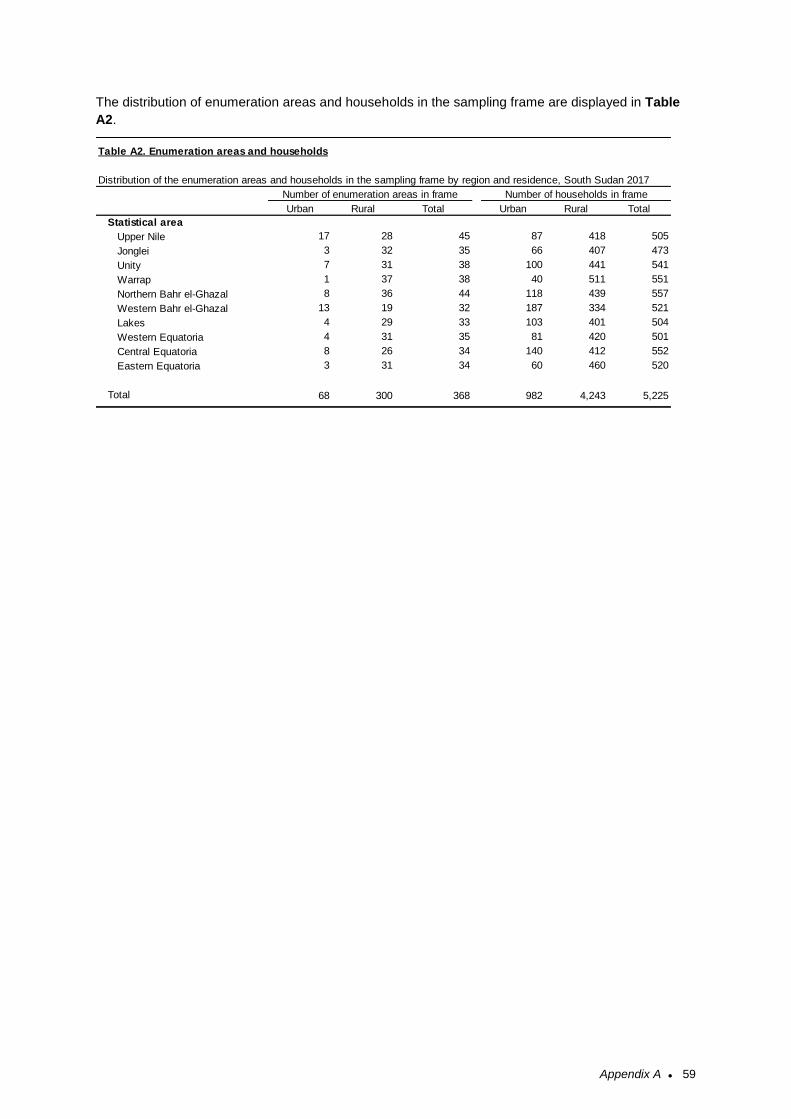
Appendix A ● 59
The distribution of enumeration areas and households in the sampling frame are displayed in Table
A2.
Urban Rural Total Urban Rural Total
Statistical area
Upper Nile 17 28 45 87 418 505
Jonglei 3 32 35 66 407 473
Unity 7 31 38 100 441 541
Warrap 1 37 38 40 511 551
Northern Bahr el-Ghazal 8 36 44 118 439 557
Western Bahr el-Ghazal 13 19 32 187 334 521
Lakes 4 29 33 103 401 504
Western Equatoria 4 31 35 81 420 501
Central Equatoria 8 26 34 140 412 552
Eastern Equatoria 3 31 34 60 460 520
Total 68 300 368 982 4,243 5,225
Table A2. Enumeration areas and households
Distribution of the enumeration areas and households in the sampling frame by region and residence, South Sudan 2017
Number of households in frameNumber of enumeration areas in frame
Appendix B ● 60
APPENDIX B: KEY PARTNERS AND SURVEY PERSONNEL
Partners
Ministry of Health, Republic of South Sudan
National Bureau of Statistics, Republic of South Sudan
Population Services International (PSI)
World Health Organization
Malaria Consortium
Interchurches Medical Assistance (IMA
Survey Personnel
Name Designation and Organisation
Dr. Richard Lako Principal Investigator
Dr. Harriet Pasquale Co-Principal Investigator
Wilson John Sebit Co-Principal Investigator
Adwok Chol Co-Principal Investigator
Dr. Pinyi Nyimol Aupur Director General of Preventive Health Services, MoH
Dr. Thuou Loi Director General of International Health &
Coordination, MoH
Dr. Lul Lojok Director General of Public Health Laboratory, MoH
Margaret Labanya Director General National Bureau of Statistics of
South Sudan
Dr. Kediende Chong Chairman Country Coordinating Mechanism South
Sudan
Isaac Maper NMCP Deputy Director NMCP
Dr. Margaret Betty GHSC (Global Health Supply Chain)
Charles Agono NBS - Director Mapping and GIS
Julius Sebit NBS - Sampling Expert
John Kongor NBS – IT
Jimmy Simon NBS – IT
Mathew Tut PHL
Khoti Gausi WHO IST, Harare regional office, South and Eastern
Africa
Deric Zanera WHO MIS Consultant
Dr. Charimari Lincoln WHO Malaria Representative
Gerishon Gachoki PSI Country Representative
Appendix B ● 61
Brett Keller PSI Regional Researcher, East Africa
Stephen Poyer PSI Research Advisor, Malaria
Dr. Peter Hayombe PSI MIS Coordination Consultant
Herbert Kere PSI PMU M&E Manager
Juliana Bol PSI Data Analysis Consultant
Dr. Martina Jervase NMCP Case Management Specialist
Bakhit Sebit Central Supervisor - Western Bhar el Ghazal
Thon Mayen Central Supervisor - Jonglei
Dhieu Marial Central Supervisor - Lakes
Constantino Dogale Central Supervisor - Warrap
Peter Kon Central Supervisor - Northern Bhar el Ghazal
Victor E. Misaka Central Supervisor - Western Equatoria
Valeriano Lagu Central Supervisor - Eastern Equatoria
Lea Muja Central Supervisor - Central Equatoria
Esther Keji Isaac Central Supervisor - Unity
Mark Y. Lual Central Supervisor - Upper Nile
Charles Stanley Mazinda PHL Parasitologist
Chaplain Monaji PHL Laboratory Technologist/ Technician
Charity Ritti PHL Laboratory Technologist/ Technician
Andrew Lazaro PHL Laboratory Technologist/ Technician
Achan Atem PHL Laboratory Technologist/ Technician
Edema John Mark PHL Laboratory Technologist/ Technician
Bakhita Wani PHL Laboratory Technologist/ Technician
Rebecca Namach PHL Laboratory Technologist/ Technician
Josephine Iteng PHL Laboratory Technologist/ Technician
Poni Grace PHL Laboratory Technologist/ Technician
Rose Achiro Lorim PHL Laboratory Technologist/ Technician
Manasseh Ayawa Justin PHL Laboratory Technologist/ Technician
Clement Koma Dosteo PHL Laboratory Technologist/ Technician
Appendix B ● 62
Interviewers
Abraham Kor Ater Chol Thuch Gai Joseph Dak Deng Moses Ater Nuer
Abraham Mayuom Chol Chuol Duol Kuou Joseph Deng Aguer Moses Chol Ater
Abuoi Maiwak Clement Tong Lual Joseph Deng Akok Moses Dharojok Obongol
Achan Atem Majok Constantino Dogale Joseph Velentino Oliha Moundit Mur
Adhel Deng Wol Daniel Akec Achut Joshua Lony Gatdet Naivasha Kuol
Adut Bosco Kajok Daniel Deng Galuak Julius Sebit Nhiak Apollo Madok
Adwok Chol Awur Daniel John Ojulu Juma Nyagirech Korok Okello Okony Okumo
Agange Nemollo Ochalla Daniel Kuach Atuer Kan Ajak Omot Nyigwo Akway
Agnes Bayoa Aloysioris Daniel Malek Ajok Kepa Simon Lojuan Onyango Johny Ukal
Aguet Elizabeth Daniel Tong Kuel Koma Richard Laku Pandek Deu Deng
Agul Ujieth Nyang David Arop Mabok Kongor Micheal Kiir Peter Aberec Riak
Ahok Santo Garang David Deng Deng Koro Mel Koro Peter Bol Adut
Ajiith Bok David Kur Malieth Kueth Choul Yach Peter Kon Thil
Akech Albeto Makuach De Santos Athian Kuir Garang Atem Peter Mangar Lual
Akech Mangar Akech Deng Ariik Thon Kuol Ajok Alier Peter Mayen Juol
Akol Deng Akol Deng Garang Akechak Kuol Gabriel Manyang Peter Tong Noon
Akot Wol Kuot Deng James Mangaar Lagu Valeriano Philip Kau Manyiel
Akuien Chol Akuien Dhieu Marial Gum Lam Francis Gabriel Philiph Bakhit Layek
Akuoch Albino Chiech Doreen Martha Lazaro Atem Phillip Ezekiel Kutjok
Alich Aluk Alich Duol Biem Lea Muja Rachiel Ajier Akol
Alier Kon Deng Elizabeth Nyaluak Rial Lino Lual Dau Rejoice Opal Adwok
Alue Tom Albert Felix Lobur Wilson Lomude Denis Rumrol Juol
Amin Opiew Nyigwa Fermino Saad Arop Lotila Gain Ngare Salwa Ali Ibrahim
Angelina Adut Agol Gabriel Garang Akoon Luka Lual Chol Samuel Achier Dut
Angelo Goup Thon Kouch Gabriel Mach Garang Luke Loyen Lochul Samuel Maketh Lual
Angoot Chuth Garang Deng Dong Mabior Abraham Reech Santino Kiron Thewa
Angwey Ajang John Garang Deng Kon Mabior Paul Malaak Santino Lual Ngor
Aporomon Doreena Mathya Garang Kuol Mabior Mabok Tong Selwa Ali Ibrahim
Arok Ngong Joseph Gatluak Malual Machar Kunyuk Simon Nyok Mach
Arop Manyang Genaro Joseph Genaro Magok Ayuel Santo Simon Ochalla Wello
Arun Atuer Jok Gordon Pandit Mapuor Majok Diing Wol Susan Akuol Gor
Atap Dhieu Kuel Gumjuer Thii Majur Liok Suzy Agrey Abas
Ather Martin Ather Hakim Idris Ida Makhor Dak Chol Teresa Ajah Ajak
Athieng Cecilia Paul Haya Salam Makop Dak Akucpiir Thon Mayen Thon
Aurwei Maker Malual Hong Wekdit Makuac Akuel Thuch Achol John
Awar Athuai Isaac Majok Manguen Malong Guot Tiar Aliet
Ayom Thiong Akuei Isaiah Nhial Malou Aweer Tito Kuot
Ayuang Kuel Bol Jaach Chol Malual Loch Tong Mayom Chiech
Ayuen Mabut Nyok Jacob Allani Rachu Mangar Ayiei Turuk Koang Nyuel
Bakhit Sebit James Chol Garang Mangok Chol Uyon Chol
Bakhit Sebit Saleh James Lual Garang Mansuk Moses Timon Valentino Garang Deng
Barnabas Bol Apioth James Mabor Majok Mansuk Timon Valentino Makuei
Benjamin Majok Makuei James Rin Agok Manyang Majok Garang Victor E. Miska
Benjamin Makur Gawer James Tiel Madhieu Manyiel Lul Victoria Abua
Benson Anyiec Jeremiah Yel Yel Marial Bai Victoria Cornelious
Benson Bol Bak Jiji Jowang Taktak Marial Moses Mathiang Victoria Reech Kuol
Appendix B ● 63
Bibian John Nyibil Jimi Simon Lako Marial Ngab Wani Paulinho
Bol Adut John Akec Mariano Ngor Atuer Wath Thok
Bol Mawien John Akol Andrew Marina David William Maduok Mayol
Bul Mamer Mabior John Akol Thou Mario Mayen Bol William Wieu Akoon
Cecilia Athieng John Awel Akoi Marko Anyuon Wol Wol Afred Wol
Cecilia Konga John Kongor Majak Marol Buol Wol Alfred
Celerino Peter Ocele John Mading Mangar Martha Peter Koul Wori Moses Kwori
Chacha Oleyo Iboni John Makol Anyieth Mary Akuol Magok Zechariah Malual Mading
Chan Malek John Mangar Agau Mathiang Bol
Charity Riti John Mathieng Atot Mayena Dhot
Charles Agono Mona John Opiti Nyibil Mayiei Makoi
Charles Peter Jok Duot Deu Michael Wiel
Chimel Thii Jok Kelei Moi Alex Lasu
Chol Manyiel Majuot Joseph Bol Kur Monika Nyentoch Marol
Appendix C ● 64
APPENDIX C: QUESTIONNAIRES
The 2017 SSMIS questionnaires are included in the following pages, starting with the Household Questionnaire, followed by the Woman’s Questionnaire, the Biomarker Questionnaire for Children and the Biomarker Questionnaire for Pregnant Women.
FORMATTING DATE:ENGLISH LANGUAGE:
SOUTH SUDAN NATIONAL MINISTRY OF HEALTH
REGION
STATISTICAL STATES _____________________________________________________
STATE
COUNTY
PAYAM
BOMA
CLUSTER 1 RURAL2 URBAN3 POC4 IDPS
EUMERATION AREA (EA) NUMBER . . . . . . . . . . . . . . . . . . . . . . . . . . . . . . . . . . . . . . . . . . . . . . . . . . . . . . . . . . . . . . . . . . . . . . . . . .
HOUSEHOLD NUMBER . . . . . . . . . . . . . . . . . . . . . . . . . . . . . . . . . . . . . . . . . . . . . . . . . . . . . . . . . . . . . . . .
HOUSEHOLD COORDINATES……………………………. . . . . . . . . . . . . . . . . . . . . . . . . . . . . . . . . . . . . . . . . . . . . . . . . . . . . . . . . . . . . . . .
N __ __ . __ __ __ __ __o
E __ __ __ . __ __ __ __ __o
DATE DAY
MONTHTIME _____________
YEARINTERVIEWER'SNAME INT. NO.
RESULT* RESULT*
NEXT VISIT:DATETOTAL NUMBER
TIME OF VISITS
*RESULT CODES: TOTAL PERSONSIN HOUSEHOLD
1 COMPLETED2 NO HOUSEHOLD MEMBER AT HOME OR NO COMPETENT RESPONDENT
AT HOME AT TIME OF VISIT TOTAL ELIGIBLE3 ENTIRE HOUSEHOLD ABSENT FOR EXTENDED PERIOD OF TIME WOMEN4 POSTPONED5 REFUSED6 DWELLING VACANT OR ADDRESS NOT A DWELLING7 DWELLING DESTROYED8 DWELLING NOT FOUND9 OTHER LINE NO. OF
RESPONDENT TO HOUSEHOLDQUESTIONNAIRE
LANGUAGE OFQUESTIONNAIRE**
LANGUAGE OF **LANGUAGE CODES:QUESTIONNAIRE** 01 ENGLISH
02 ARABIC
12 October 201711 October 2017
SUPERVISOR INTERVIEWER
FINAL VISIT
INTERVIEWER VISITS
(SPECIFY)
321
IDENTIFICATION (1)
MALARIA INDICATOR SURVEY HOUSEHOLD QUESTIONNAIRE
………………………………………………………………………………………………
……………………………………………..…………………………………………………..
NAME NUMBER NAME NUMBER
HH-1
SIGNATURE OF INTERVIEWER DATE
RESPONDENT AGREES RESPONDENT DOES NOT AGREETO BE INTERVIEWED . . 1 TO BE INTERVIEWED . . 2 END
##HOURS . . . . . . . . . . . . . . . . . . . . . . .
MINUTES. . . . . . . . . . . . . . . . . . . . . . .
INTRODUCTION AND CONSENT
Hello. My name is _______________________________________. I am working with Ministry of Health. We are conducting a survey about malaria all over South Sudan. The information we collect will help the government to plan health services. Your household was selected for the survey. I would like to ask you some questions about your household. The questions usually take about 35 to 40 minutes. All of the answers you give will be confidential and will not be shared with anyone other than members of our survey team. You don't have to be in the survey, but we hope you will agree to answer the questions since your views are important. If I ask you any question you don't want to answer, just let me know and I will go on to the next question or you can stop the interview at any time. In case you need more information about the survey, you may contact the person listed on this card.
GIVE CARD WITH CONTACT INFORMATION
Do you have any questions?May I begin the interview now?
RECORD THE TIME.
HH-3
LINE RELATIONSHIPNO. TO HEAD OF
HOUSEHOLD
1
CIRCLE CIRCLELINE LINENUMBER NUMBEROF ALL OF ALLWOMEN CHILDRENAGE AGE 6-59 15-49 MONTHS
AFTER LISTING THENAMES AND RECORDINGTHE RELATIONSHIPAND SEX FOR EACHPERSON, ASKQUESTIONS 2A-2CTO BE SURE THAT THELISTING IS COMPLETE.
IF 95THEN ASK APPROPRIATE OR MORE,QUESTIONS IN COLUMNS SEE CODES RECORD5-9 FOR EACH PERSON. BELOW. '95'.
M F Y N Y N
01 1 2 1 2 1 2 01 01
1 2 1 2 1 202 02 02
1 2 1 2 1 203 03 03
1 2 1 2 1 204 04 04
1 2 1 2 1 205 05 05
1 2 1 2 1 206 06 06
1 2 1 2 1 207 07 07
1 2 1 2 1 208 08 08
1 2 1 2 1 209 09 09
1 2 1 2 1 210 10 10
2A) CODES FOR Q. 3: RELATIONSHIP TO HEAD OF HOUSEHOLDADD TOTABLE 01 = HEAD 07 = PARENT-IN-LAW
2B) 02 = WIFE OR HUSBAND 08 = BROTHER OR SISTERADD TO 03 = SON OR DAUGHTER 09 = OTHER RELATIVETABLE 04 = SON-IN-LAW OR 10 = ADOPTED/FOSTER/
2C) DAUGHTER-IN-LAW STEPCHILDADD TO 05 = GRANDCHILD 11 = NOT RELATEDTABLE 06 = PARENT 98 = DON'T KNOW
NO
NO
NO
Just to make sure that I have a complete listing: are there any other people such as small children or infants that we have not listed?Are there any other people who may not be members of your family, such as domestic servants, lodgers, or friends who usually live here?Are there any guests or temporary visitors staying here, or anyone else who stayed here last night, who have not been listed?
YES
YES
YES
Please give me the names of the persons who usually live in your household and guests of the household who stayed here last night, starting with the head of the household.
Does (NAME) usually live here?
What is the relationship of (NAME) to the head of the household?
How old is (NAME)?
Did (NAME) stay here last night?
Is (NAME) male or female?
IN YEARS
HOUSEHOLD SCHEDULE
SEXAND VISITORS
USUAL RESIDENTS
6 7 82 3 4 5 9
ELIGIBILITYAGERESIDENCE
HH-4
M F Y N Y N
11 1 2 1 2 1 2 11 11
1 2 1 2 1 212 12 12
1 2 1 2 1 213 13 13
1 2 1 2 1 214 14 14
1 2 1 2 1 215 15 15
1 2 1 2 1 216 16 16
1 2 1 2 1 217 17 17
1 2 1 2 1 218 18 18
1 2 1 2 1 219 19 19
1 2 1 2 1 220 20 20
ICK HERE IF CONTINUATION SHEET USED
CODES FOR Q. 3: RELATIONSHIP TO HEAD OF HOUSEHOLD
01 = HEAD 07 = PARENT-IN-LAW02 = WIFE OR HUSBAND 08 = BROTHER OR SISTER03 = SON OR DAUGHTER 09 = OTHER RELATIVE04 = SON-IN-LAW OR 10 = ADOPTED/FOSTER/
DAUGHTER-IN-LAW STEPCHILD05 = GRANDCHILD 11 = NOT RELATED06 = PARENT 98 = DON'T KNOW
IN YEARS
HH-5
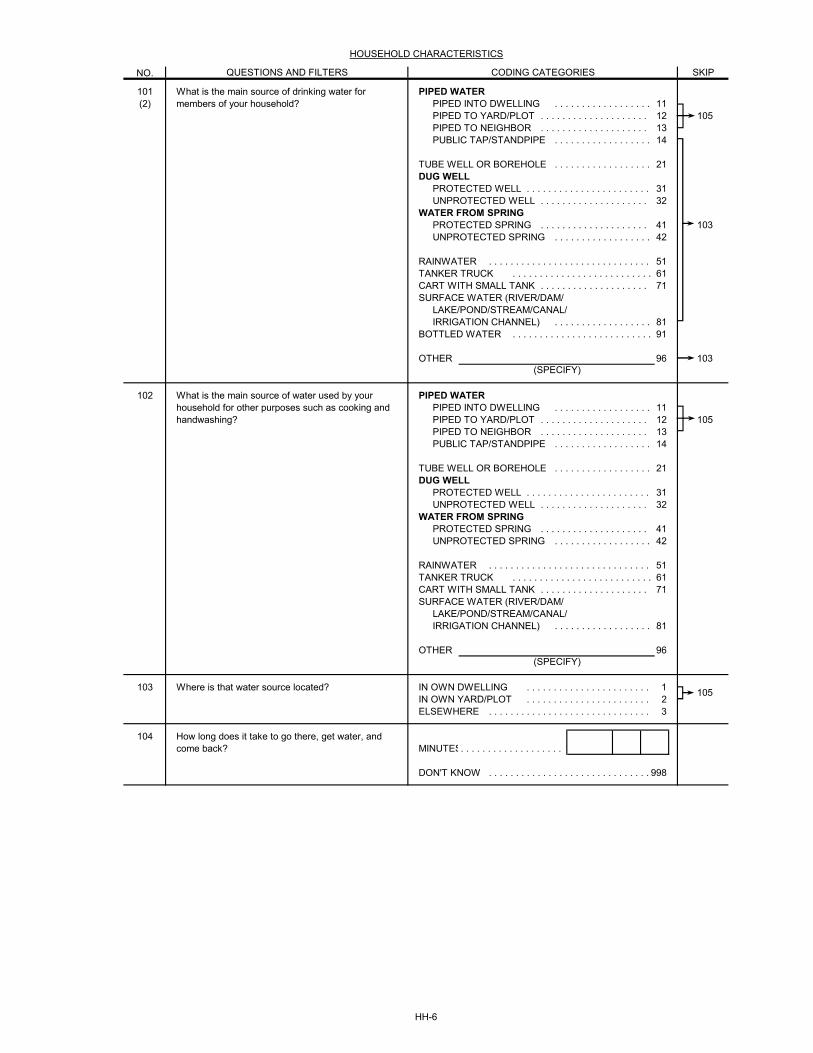
NO.
101 PIPED WATER(2) PIPED INTO DWELLING . . . . . . . . . . . . . . . . . . 11
PIPED TO YARD/PLOT . . . . . . . . . . . . . . . . . . . . 12 105PIPED TO NEIGHBOR . . . . . . . . . . . . . . . . . . . . 13PUBLIC TAP/STANDPIPE . . . . . . . . . . . . . . . . . . 14
TUBE WELL OR BOREHOLE . . . . . . . . . . . . . . . . . . 21DUG WELL
PROTECTED WELL . . . . . . . . . . . . . . . . . . . . . . . 31UNPROTECTED WELL . . . . . . . . . . . . . . . . . . . . 32
WATER FROM SPRINGPROTECTED SPRING . . . . . . . . . . . . . . . . . . . . 41 103UNPROTECTED SPRING . . . . . . . . . . . . . . . . . . 42
RAINWATER . . . . . . . . . . . . . . . . . . . . . . . . . . . . . . 51TANKER TRUCK . . . . . . . . . . . . . . . . . . . . . . . . . . 61CART WITH SMALL TANK . . . . . . . . . . . . . . . . . . . . 71SURFACE WATER (RIVER/DAM/
LAKE/POND/STREAM/CANAL/IRRIGATION CHANNEL) . . . . . . . . . . . . . . . . . . 81
BOTTLED WATER . . . . . . . . . . . . . . . . . . . . . . . . . . 91
OTHER 96 103
102 PIPED WATERPIPED INTO DWELLING . . . . . . . . . . . . . . . . . . 11PIPED TO YARD/PLOT . . . . . . . . . . . . . . . . . . . . 12 105PIPED TO NEIGHBOR . . . . . . . . . . . . . . . . . . . . 13PUBLIC TAP/STANDPIPE . . . . . . . . . . . . . . . . . . 14
TUBE WELL OR BOREHOLE . . . . . . . . . . . . . . . . . . 21DUG WELL
PROTECTED WELL . . . . . . . . . . . . . . . . . . . . . . . 31UNPROTECTED WELL . . . . . . . . . . . . . . . . . . . . 32
WATER FROM SPRINGPROTECTED SPRING . . . . . . . . . . . . . . . . . . . . 41UNPROTECTED SPRING . . . . . . . . . . . . . . . . . . 42
RAINWATER . . . . . . . . . . . . . . . . . . . . . . . . . . . . . . 51TANKER TRUCK . . . . . . . . . . . . . . . . . . . . . . . . . . 61CART WITH SMALL TANK . . . . . . . . . . . . . . . . . . . . 71SURFACE WATER (RIVER/DAM/
LAKE/POND/STREAM/CANAL/IRRIGATION CHANNEL) . . . . . . . . . . . . . . . . . . 81
OTHER 96
103 IN OWN DWELLING . . . . . . . . . . . . . . . . . . . . . . . 1IN OWN YARD/PLOT . . . . . . . . . . . . . . . . . . . . . . . 2ELSEWHERE . . . . . . . . . . . . . . . . . . . . . . . . . . . . . . 3
104MINUTES. . . . . . . . . . . . . . . . . . .
DON'T KNOW . . . . . . . . . . . . . . . . . . . . . . . . . . . . . . 998
Where is that water source located?105
How long does it take to go there, get water, and come back?
(SPECIFY)
What is the main source of water used by your household for other purposes such as cooking and handwashing?
(SPECIFY)
HOUSEHOLD CHARACTERISTICS
CODING CATEGORIESQUESTIONS AND FILTERS
What is the main source of drinking water for members of your household?
SKIP
HH-6
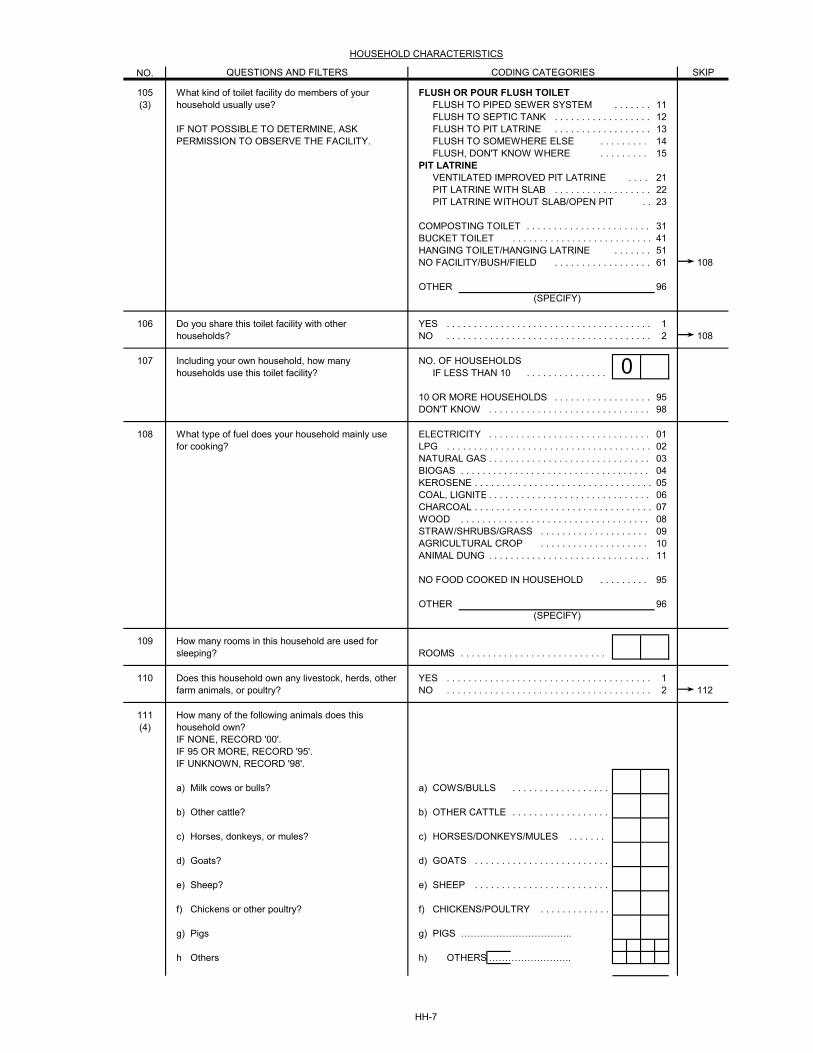
NO.
HOUSEHOLD CHARACTERISTICS
CODING CATEGORIESQUESTIONS AND FILTERS SKIP
105 FLUSH OR POUR FLUSH TOILET(3) FLUSH TO PIPED SEWER SYSTEM . . . . . . . 11
FLUSH TO SEPTIC TANK . . . . . . . . . . . . . . . . . . 12FLUSH TO PIT LATRINE . . . . . . . . . . . . . . . . . . 13FLUSH TO SOMEWHERE ELSE . . . . . . . . . 14FLUSH, DON'T KNOW WHERE . . . . . . . . . 15
PIT LATRINEVENTILATED IMPROVED PIT LATRINE . . . . 21PIT LATRINE WITH SLAB . . . . . . . . . . . . . . . . . . 22PIT LATRINE WITHOUT SLAB/OPEN PIT . . 23
COMPOSTING TOILET . . . . . . . . . . . . . . . . . . . . . . . 31BUCKET TOILET . . . . . . . . . . . . . . . . . . . . . . . . . . 41HANGING TOILET/HANGING LATRINE . . . . . . . 51NO FACILITY/BUSH/FIELD . . . . . . . . . . . . . . . . . . 61 108
OTHER 96
106 YES . . . . . . . . . . . . . . . . . . . . . . . . . . . . . . . . . . . . . . 1NO . . . . . . . . . . . . . . . . . . . . . . . . . . . . . . . . . . . . . . 2 108
107 NO. OF HOUSEHOLDSIF LESS THAN 10 . . . . . . . . . . . . . . .
10 OR MORE HOUSEHOLDS . . . . . . . . . . . . . . . . . . 95DON'T KNOW . . . . . . . . . . . . . . . . . . . . . . . . . . . . . . 98
108 ELECTRICITY . . . . . . . . . . . . . . . . . . . . . . . . . . . . . . 01LPG . . . . . . . . . . . . . . . . . . . . . . . . . . . . . . . . . . . . . . 02NATURAL GAS . . . . . . . . . . . . . . . . . . . . . . . . . . . . . . 03BIOGAS . . . . . . . . . . . . . . . . . . . . . . . . . . . . . . . . . . . 04KEROSENE . . . . . . . . . . . . . . . . . . . . . . . . . . . . . . . . . 05COAL, LIGNITE . . . . . . . . . . . . . . . . . . . . . . . . . . . . . . 06CHARCOAL . . . . . . . . . . . . . . . . . . . . . . . . . . . . . . . . . 07WOOD . . . . . . . . . . . . . . . . . . . . . . . . . . . . . . . . . . . 08STRAW/SHRUBS/GRASS . . . . . . . . . . . . . . . . . . . . 09AGRICULTURAL CROP . . . . . . . . . . . . . . . . . . . . 10ANIMAL DUNG . . . . . . . . . . . . . . . . . . . . . . . . . . . . . . 11
NO FOOD COOKED IN HOUSEHOLD . . . . . . . . . 95
OTHER 96
109ROOMS . . . . . . . . . . . . . . . . . . . . . . . . . . .
110 YES . . . . . . . . . . . . . . . . . . . . . . . . . . . . . . . . . . . . . . 1NO . . . . . . . . . . . . . . . . . . . . . . . . . . . . . . . . . . . . . . 2 112
111(4)
a) a) COWS/BULLS . . . . . . . . . . . . . . . . . .
b) b) OTHER CATTLE . . . . . . . . . . . . . . . . . .
c) c) HORSES/DONKEYS/MULES . . . . . . .
d) d) GOATS . . . . . . . . . . . . . . . . . . . . . . . . .
e) e) SHEEP . . . . . . . . . . . . . . . . . . . . . . . . .
f) f) CHICKENS/POULTRY . . . . . . . . . . . . .
g) g) PIGS ……………………………..
h h) OTHERS ……………………..
What type of fuel does your household mainly use for cooking?
How many rooms in this household are used for sleeping?
(SPECIFY)
Other cattle?
Including your own household, how many households use this toilet facility? 0
IF NOT POSSIBLE TO DETERMINE, ASK PERMISSION TO OBSERVE THE FACILITY.
(SPECIFY)
Do you share this toilet facility with other households?
What kind of toilet facility do members of your household usually use?
Does this household own any livestock, herds, other farm animals, or poultry?
Chickens or other poultry?
Sheep?
Goats?
How many of the following animals does this household own?IF NONE, RECORD '00'.IF 95 OR MORE, RECORD '95'.IF UNKNOWN, RECORD '98'.
Horses, donkeys, or mules?
Milk cows or bulls?
Pigs
Others
HH-7
NO.
HOUSEHOLD CHARACTERISTICS
CODING CATEGORIESQUESTIONS AND FILTERS SKIP
112 YES . . . . . . . . . . . . . . . . . . . . . . . . . . . . . . . . . . . . . . 1NO . . . . . . . . . . . . . . . . . . . . . . . . . . . . . . . . . . . . . . 2 114
113HECTARES . . . . . . . . . . . . . . .95 OR MORE HECTARES . . . . . . . . . . . . . . . . . . 950DON'T KNOW . . . . . . . . . . . . . . . . . . . . . . . . . . . 998
114 YES NO
(5) a) a) ELECTRICITY . . . . . . . . . . . . . . . 1 2b) b) RADIO . . . . . . . . . . . . . . . . . . . . 1 2c) c) TELEVISION . . . . . . . . . . . . . . . 1 2d) d) NON-MOBILE TELEPHONE . . . . . 1 2e) e) COMPUTER . . . . . . . . . . . . . . . 1 2f) f) REFRIGERATOR . . . . . . . . . . . . . 1 2[ADD ADDITIONAL ITEMS. SEE FOOTNOTE 5.]
115 YES NO
a) a) WATCH . . . . . . . . . . . . . . . . . . . . . . 1 2b) b) MOBILE PHONE . . . . . . . . . . . . . . . 1 2c) c) BICYCLE . . . . . . . . . . . . . . . . . . . . . . 1 2d) d) MOTORCYCLE/SCOOTER . . . . . . . 1 2e) f) ANIMAL-DRAWN CART . . . . . . . 1 2f) g) CAR/TRUCK. . . . . . . . . . . . . . . . . . . . 1 2g) h) BOAT WITH MOTOR . . . . . . . . . . 1 2
116 YES . . . . . . . . . . . . . . . . . . . . . . . . . . . . . . . . . . . . . . 1NO . . . . . . . . . . . . . . . . . . . . . . . . . . . . . . . . . . . . . . 2
119 YES . . . . . . . . . . . . . . . . . . . . . . . . . . . . . . . . . . . . . . 1NO . . . . . . . . . . . . . . . . . . . . . . . . . . . . . . . . . . . . . . 2 131
120NUMBER OF NETS . . . . . . . . . . . . . . . . . . . . . . .
Does any member of your household own any agricultural land?
How many hectares of agricultural land do members of this household own?
IF 95 OR MORE, CIRCLE '950'.
A watch?
Does your household have:
A refrigerator?
A non-mobile telephone?A computer?
A television?
IF 7 OR MORE NETS, RECORD '7'.
A motorcycle or motor scooter?A bicycle?
Does any member of this household own:
How many mosquito nets does your household have?
Does your household have any mosquito nets?
Does any member of this household have a bank account?
A boat with a motor?
A mobile phone?
A radio?Electricity?
A car or truck?An animal-drawn cart?
HH-8
121
OBSERVED . . . . . . . . . . 1 OBSERVED . . . . . . . . . . 1 OBSERVED . . . . . . . . . . 1NOT OBSERVED . . . . . 2 NOT OBSERVED . . . . . 2 NOT OBSERVED . . . . . 2
122 MONTHS MONTHS MONTHSAGO . . . . . AGO . . . . . AGO . . . . .
MORE THAN 36 MORE THAN 36 MORE THAN 36MONTHS AGO . . . . . 95 MONTHS AGO . . . . . 95 MONTHS AGO . . . . . 95
NOT SURE . . . . . . . . . . 98 NOT SURE . . . . . . . . . . 98 NOT SURE . . . . . . . . . . 98
123 LONG-LASTING LONG-LASTING LONG-LASTINGINSECTICIDE- INSECTICIDE- INSECTICIDE-TREATED NET (LLIN) TREATED NET (LLIN) TREATED NET (LLIN)
SOFT BRAND . . . . . . . 11 SOFT BRAND . . . . . . . 11 SOFT BRAND . . . . . . . 11HARD BRAND . . . . . . . 12 HARD BRAND . . . . . . . 12 HARD BRAND . . . . . . . 12OTHER/DON'T KNOW OTHER/DON'T KNOW OTHER/DON'T KNOW
BRAND . . . . . . . 16 BRAND . . . . . . . 16 BRAND . . . . . . . 16
OTHER TYPE . . . . . . . 96 OTHER TYPE . . . . . . . 96 OTHER TYPE . . . . . . . 96DON'T KNOW TYPE . . 98 DON'T KNOW TYPE . . 98 DON'T KNOW TYPE . . 98
126 YES, [NMCP/MOH YES, [NMCP/MOH YES, [NMCP/MOH(6) MASS DIST. MASS DIST. MASS DIST.
CAMPAIGN] . . . . . . . 1 CAMPAIGN] . . . . . . . 1 CAMPAIGN] . . . . . . . 1YES, ANC . . . . . . . . . . 2 YES, ANC . . . . . . . . . . 2 YES, ANC . . . . . . . . . . 2YES, IMMUNIZATION YES, IMMUNIZATION YES, IMMUNIZATION
VISIT . . . . . . . . . . 3 VISIT . . . . . . . . . . 3 VISIT . . . . . . . . . . 3(SKIP TO 128) (SKIP TO 128) (SKIP TO 128)
NO . . . . . . . . . . . . . . . . . . . . . . . . . . . . . . . . . . . . 4 NO . . . . . . . . . . . . . . . . . . . . . . . . . . . . . . . . . . . . . 4 NO . . . . . . . . . . . . . . . . . . . . . . . . . . . . . . . . . . . 4
127 GOVERNMENT HEALTH GOVERNMENT HEALTH GOVERNMENT HEALTHFACILITY . . . . . . . 01 FACILITY . . . . . . . 01 FACILITY . . . . . . . 01
PRIVATE HEALTH PRIVATE HEALTH PRIVATE HEALTHFACILITY . . . . . . . 02 FACILITY . . . . . . . 02 FACILITY . . . . . . . 02
PHARMACY . . . . . . . 03 PHARMACY . . . . . . . 03 PHARMACY . . . . . . . 03SHOP/MARKET . . . . . 04 SHOP/MARKET . . . . . 04 SHOP/MARKET . . . . . 04CHW/SOCIAL MOBILISERS . . . . . . . . . . . . . 05 CHW/SOCIAL MOBILISERS . . . . . . . . . . . . . 05 CHW/SOCIAL MOBILISERS . . . . . . . . . . . . . 05RELIGIOUS RELIGIOUS RELIGIOUS
INSTITUTION . . . . . 06 INSTITUTION . . . . . 06 INSTITUTION . . . . . 06SCHOOL . . . . . . . . . . . . . 07 SCHOOL . . . . . . . . . . . . . 07 SCHOOL . . . . . . . . . . . . . 07OTHER . . . . . . . . . . 96 OTHER . . . . . . . . . . 96 OTHER . . . . . . . . . . 96DON’T KNOW . . . . . . . 98 DON’T KNOW . . . . . . . 98 DON’T KNOW . . . . . . . 98
128 YES . . . . . . . . . . . . . . . . . . . . . . . . . . . . . . . . . . . . 1 YES . . . . . . . . . . . . . . . . . . . . . . . . . . . . . . . . . . . . . 1 YES . . . . . . . . . . . . . . . . . . . . . . . . . . . . . . . . . . . 1NO . . . . . . . . . . . . . . . . . . . . . . . . . . . . . . . . . . . . 2 NO . . . . . . . . . . . . . . . . . . . . . . . . . . . . . . . . . . . . . 2 NO . . . . . . . . . . . . . . . . . . . . . . . . . . . . . . . . . . . 2
(SKIP TO 130) (SKIP TO 130) (SKIP TO 130)NOT SURE . . . . . . . . . . 8 NOT SURE . . . . . . . . . . 8 NOT SURE . . . . . . . . . . 8
Did anyone sleep under this mosquito net last night?
Where did you get the net?
Did you get the net through a [NMCP/MOH MASS DISTRIBUTION CAMPAIGN], during an antenatal care visit, or during an immunization visit?
MOSQUITO NETS
NET #3NET #2NET #1
How many months ago did your household get the mosquito net?
OBSERVE OR ASK BRAND/TYPE OF MOSQUITO NET.
IF BRAND IS UNKNOWN AND YOU CANNOT OBSERVE THE NET, SHOW PICTURES OF TYPICAL NET TYPES/BRANDS TO RESPONDENT.
IF LESS THAN ONE MONTH AGO, RECORD '00'.
ASK THE RESPONDENT TO SHOW YOU ALL THE NETS IN THE HOUSEHOLD.
MAKE IT TO CAPTURE UP TO 7 NETS
HH-9
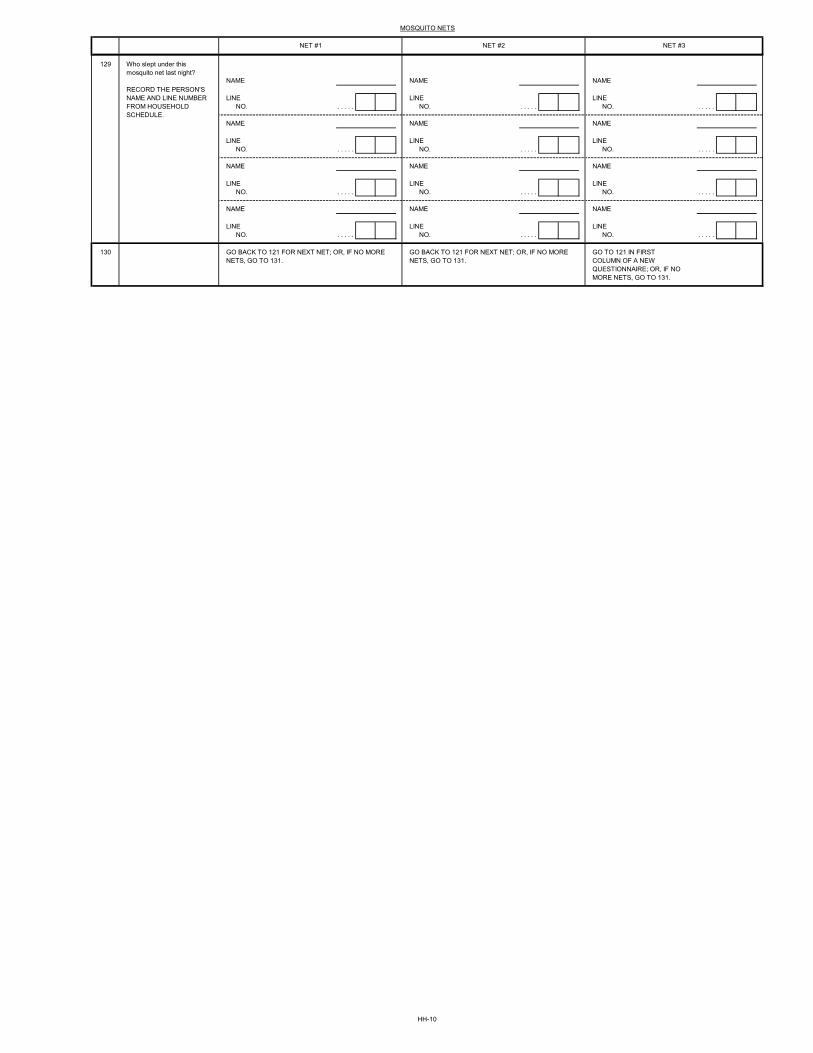
MOSQUITO NETS
NET #3NET #2NET #1
129
LINE LINE LINENO. . . . . . NO. . . . . . NO. . . . . .
LINE LINE LINENO. . . . . . NO. . . . . . NO. . . . . .
LINE LINE LINENO. . . . . . NO. . . . . . NO. . . . . .
LINE LINE LINENO. . . . . . NO. . . . . . NO. . . . . .
130
Who slept under this mosquito net last night?
GO BACK TO 121 FOR NEXT NET; OR, IF NO MORE NETS, GO TO 131.
GO BACK TO 121 FOR NEXT NET; OR, IF NO MORE NETS, GO TO 131.
GO TO 121 IN FIRSTCOLUMN OF A NEWQUESTIONNAIRE; OR, IF NOMORE NETS, GO TO 131.
RECORD THE PERSON'S NAME AND LINE NUMBER FROM HOUSEHOLD SCHEDULE.
NAME NAME NAME
NAME NAME NAME
NAME NAME NAME
NAME NAME NAME
HH-10
NO.
131 NATURAL FLOOR(3) EARTH/SAND . . . . . . . . . . . . . . . . . . . . . . . . . . . . . 11
DUNG . . . . . . . . . . . . . . . . . . . . . . . . . . . . . . . . . . . . . 12RUDIMENTARY FLOOR
WOOD PLANKS . . . . . . . . . . . . . . . . . . . . . . . . . . . . . 21PALM/BAMBOO . . . . . . . . . . . . . . . . . . . . . . . . . . . . . 22
FINISHED FLOORPARQUET OR POLISHED WOOD . . . . . . . 31VINYL OR ASPHALT STRIPS . . . . . . . . . . . . 32CERAMIC TILES . . . . . . . . . . . . . . . . . . . . . . . 33CEMENT . . . . . . . . . . . . . . . . . . . . . . . . . . . . . . . . . . . 34CARPET . . . . . . . . . . . . . . . . . . . . . . . . . . . . . . . . . . . 35
OTHER 96
132 NATURAL ROOFING(3) NO ROOF . . . . . . . . . . . . . . . . . . . . . . . . . . . . . . . . 11
GRASS THATCH/PALM LEAF . . . . . . . . . . . . . . . . . 12SOD . . . . . . . . . . . . . . . . . . . . . . . . . . . . . . . . . . . . . 13
RUDIMENTARY ROOFINGRUSTIC MAT . . . . . . . . . . . . . . . . . . . . . . . . . . . . . 21PALM/BAMBOO . . . . . . . . . . . . . . . . . . . . . . . . . . . . . 22WOOD PLANKS . . . . . . . . . . . . . . . . . . . . . . . . . . . . . 23CARDBOARD . . . . . . . . . . . . . . . . . . . . . . . . . . . . . 24
FINISHED ROOFINGMETAL . . . . . . . . . . . . . . . . . . . . . . . . . . . . . . . . . . . 31WOOD . . . . . . . . . . . . . . . . . . . . . . . . . . . . . . . . . . . 32CALAMINE/CEMENT FIBER . . . . . . . . . . . . 33CERAMIC TILES . . . . . . . . . . . . . . . . . . . . . . . 34CEMENT . . . . . . . . . . . . . . . . . . . . . . . . . . . . . . . . . . . 35ROOFING SHINGLES . . . . . . . . . . . . . . . . . 36
37
OTHER 96
133 NATURAL WALLS(3) NO WALLS . . . . . . . . . . . . . . . . . . . . . . . . . . . . . . . . 11
CANE/PALM/TRUNKS . . . . . . . . . . . . . . . . . 12DIRT . . . . . . . . . . . . . . . . . . . . . . . . . . . . . . . . . . . . . 13
RUDIMENTARY WALLSBAMBOO WITH MUD . . . . . . . . . . . . . . . . . 21STONE WITH MUD . . . . . . . . . . . . . . . . . . . . . . . 22UNCOVERED ADOBE . . . . . . . . . . . . . . . . . 23PLYWOOD . . . . . . . . . . . . . . . . . . . . . . . . . . . . . . . . 24CARDBOARD . . . . . . . . . . . . . . . . . . . . . . . . . . . . . 25REUSED WOOD . . . . . . . . . . . . . . . . . . . . . . . 26
FINISHED WALLSCEMENT . . . . . . . . . . . . . . . . . . . . . . . . . . . . . . . . . . . 31STONE WITH LIME/CEMENT . . . . . . . . . . . . 32BRICKS . . . . . . . . . . . . . . . . . . . . . . . . . . . . . . . . . . . 33CEMENT BLOCKS . . . . . . . . . . . . . . . . . . . . . . . 34COVERED ADOBE . . . . . . . . . . . . . . . . . . . . . . . 35WOOD PLANKS/SHINGLES . . . . . . . . . . . . 36
OTHER 96
134HOURS . . . . . . . . . . . . . . . . . . . . . . . . . . . . .
MINUTES . . . . . . . . . . . . . . . . . . . . . . . . . . . . .
ADDITIONAL HOUSEHOLD CHARACTERISTICS
QUESTIONS AND FILTERS CODING CATEGORIES SKIP
(SPECIFY)
(SPECIFY)
(SPECIFY)
RECORD THE TIME AT THE END OF INTERVIEW.
OBSERVE MAIN MATERIAL OF THE EXTERIOR WALLS OF THE DWELLING.
RECORD OBSERVATION.
OBSERVE MAIN MATERIAL OF THE FLOOR OF THE DWELLING.
RECORD OBSERVATION.
OBSERVE MAIN MATERIAL OF THE ROOF OF THE DWELLING.
RECORD OBSERVATION.
IRON SHEET………………………………
HH-11
COMMENTS ABOUT INTERVIEW:
COMMENTS ON SPECIFIC QUESTIONS:
ANY OTHER COMMENTS:
INTERVIEWER'S OBSERVATIONS
TO BE FILLED IN AFTER COMPLETING INTERVIEW
SUPERVISOR'S OBSERVATIONS
EDITOR'S OBSERVATIONS
HH-12
HOUSEHOLD: FOOTNOTES
(4) Add other country-specific animals, such as oxen, water buffalo, camels, llamas, alpacas, pigs, ducks, geese, or elephants.(5) Each country should add to the list at least five items of furniture (such as a table, chair, sofa, bed, armoire, cupboard, or cabinet). In addition, each country should add at least four additional household appliances so that the list includes at least three items that even a poor household may have, at least three items that a middle income household may have, and at least three items that a high income household may have. Some possible additions are clock, water pump, grain grinder, fan, blender, water heater, generator, washing machine, microwave oven, DVD player, CD player, camera, air conditioner or cooler, and sewing machine.(6) Adapt question locally to use the name of the mass distribution campaign.
(2) Countries that use sachet water (small plastic bags of water) as a source of drinking water should add SACHET WATER as a separate coding category after BOTTLED WATER and with no skip instruction. Similarly, countries that have water kiosks should add WATER KIOSK as a separate coding category with no skip instruction.(3) Coding categories to be developed locally; however, the broad categories must be maintained.
(1) This section should be adapted for country-specific survey design.
HH-13
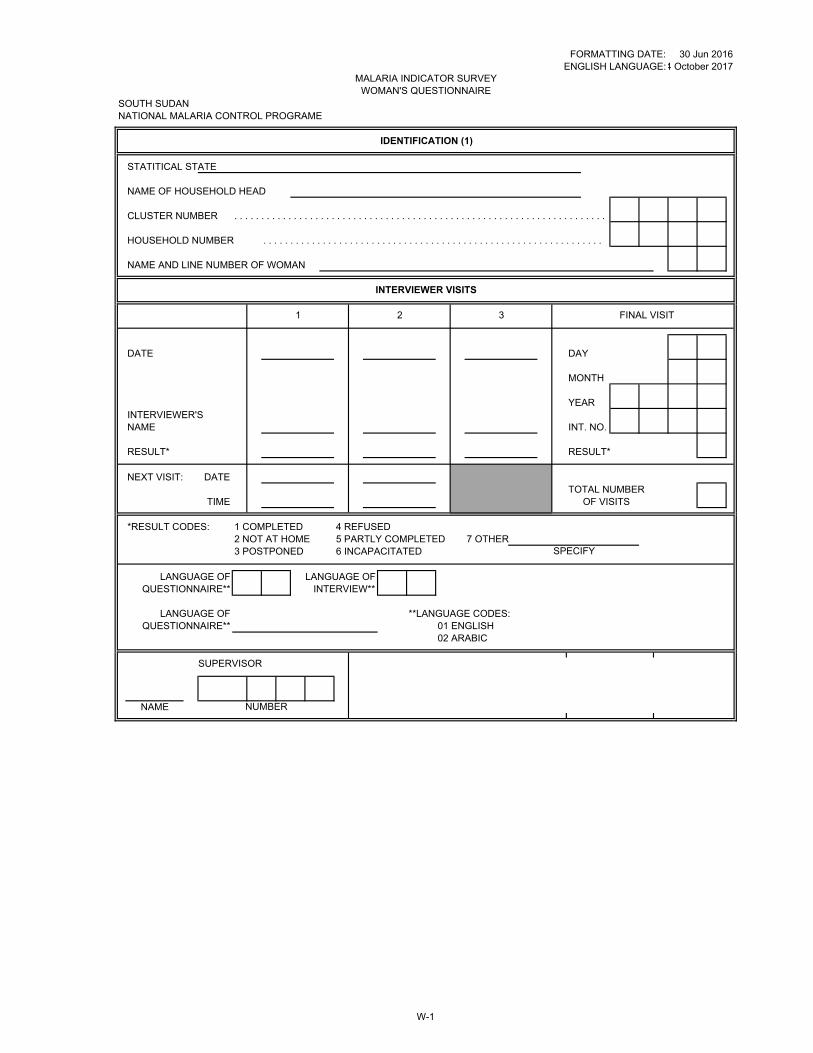
FORMATTING DATE:ENGLISH LANGUAGE:
SOUTH SUDANNATIONAL MALARIA CONTROL PROGRAME
STATITICAL STATE
NAME OF HOUSEHOLD HEAD
CLUSTER NUMBER . . . . . . . . . . . . . . . . . . . . . . . . . . . . . . . . . . . . . . . . . . . . . . . . . . . . . . . . . . . . . . . . . . . . .
HOUSEHOLD NUMBER . . . . . . . . . . . . . . . . . . . . . . . . . . . . . . . . . . . . . . . . . . . . . . . . . . . . . . . . . . . . . . .
NAME AND LINE NUMBER OF WOMAN
DATE DAY
MONTH
YEARINTERVIEWER'SNAME INT. NO.
RESULT* RESULT*
NEXT VISIT: DATETOTAL NUMBER
TIME OF VISITS
*RESULT CODES: 1 COMPLETED 4 REFUSED2 NOT AT HOME 5 PARTLY COMPLETED 7 OTHER3 POSTPONED 6 INCAPACITATED
LANGUAGE OF LANGUAGE OFQUESTIONNAIRE** INTERVIEW**
LANGUAGE OF **LANGUAGE CODES:QUESTIONNAIRE** 01 ENGLISH
02 ARABIC
SPECIFY
30 Jun 20164 October 2017
MALARIA INDICATOR SURVEY WOMAN'S QUESTIONNAIRE
IDENTIFICATION (1)
INTERVIEWER VISITS
1 2 3 FINAL VISIT
SUPERVISOR
NAME NUMBER
W-1

RESPONDENT AGREES RESPONDENT DOES NOT AGREETO BE INTERVIEWED . . 1 TO BE INTERVIEWED . . 2 END
NO.
101HOURS . . . . . . . . . . . . . . . . . . . . . . .
MINUTES. . . . . . . . . . . . . . . . . . . . . . .
102MONTH . . . . . . . . . . . . . . . . . . . . . . .
DON'T KNOW MONTH. . . . . . . . . . . . . . . . . . . . 98
YEAR . . . . . . . . . . . . . . .
DON'T KNOW YEAR . . . . . . . . . . . . . . . . . . . . 9998
103AGE IN COMPLETED YEARS. . . . . . .
104 YES . . . . . . . . . . . . . . . . . . . . . . . . . . . . . . . . . . 1NO . . . . . . . . . . . . . . . . . . . . . . . . . . . . . . . . . . 2 108
105 PRIMARY . . . . . . . . . . . . . . . . . . . . . . . . . . . . 1(2) SECONDARY . . . . . . . . . . . . . . . . . . . . . . . . . . 2
HIGHER . . . . . . . . . . . . . . . . . . . . . . . . . . . . 3
RECORD THE TIME.
SIGNATURE OF INTERVIEWER
In what month and year were you born?
How old were you at your last birthday?
COMPARE AND CORRECT 102 AND/OR 103IF INCONSISTENT.
INTRODUCTION AND CONSENT
SECTION 1. RESPONDENT'S BACKGROUND
QUESTIONS AND FILTERS CODING CATEGORIES SKIP
DATE
Hello. My name is _______________________________________. I am working with [NAME OF ORGANIZATION]. We are conducting a survey about malaria all over [NAME OF COUNTRY]. The information we collect will help the government to plan health services. Your household was selected for the survey. The questions usually take about 35 to 40 minutes. All of the answers you give will be confidential and will not be shared with anyone other than members of our survey team. You don't have to be in the survey, but we hope you will agree to answer the questions since your views are important. If I ask you any question you don't want to answer, just let me know and I will go on to the next question or you can stop the interview at any time.
In case you need more information about the survey, you may contact the person listed on the card that has already been given to your household.
Do you have any questions?May I begin the interview now?
What is the highest level of school you attended: primary, secondary, or higher?
Have you ever attended school?
W-2
NO. QUESTIONS AND FILTERS CODING CATEGORIES SKIP
106(2)
[GRADE/FORM/YEAR]. . . . . . . . . . . .
107
PRIMARY OR HIGHERSECONDARY
108 CANNOT READ AT ALL . . . . . . . . . . . . . . . . . . 1(3) ABLE TO READ ONLY PART OF
THE SENTENCE. . . . . . . . . . . . . . . . . . . . . . . 2ABLE TO READ WHOLE SENTENC. . . . . . . . . . 3
NO CARD WITH REQUIREDLANGUAGE 4
BLIND/VISUALLY IMPAIRED . . . . . . . . . . . . . . . 5
What is the highest [GRADE/FORM/YEAR] you completed at that level?
109
CHECK 105:
IF COMPLETED LESS THAN ONE YEAR AT THAT LEVEL, RECORD '00'.
(SPECIFY LANGUAGE)
Now I would like you to read this sentence to me.
SHOW CARD TO RESPONDENT.
IF RESPONDENT CANNOT READ WHOLE SENTENCE,PROBE: Can you read any part of the sentence to me?
NO.
SECTION 1. RESPONDENT'S BACKGROUND
QUESTIONS AND FILTERS CODING CATEGORIES SKIP
109 YES . . . . . . . . . . . . . . . . . . . . . . . . . . . . . . . . . . 1NO . . . . . . . . . . . . . . . . . . . . . . . . . . . . . . . . . . 2 201
110YES NO
a) RADIO . . . . . . . . . . . . . . . . . . . . . . . . . . 1 2b) TELEVISION. . . . . . . . . . . . . . . . . . . . . . . 1 2c)
POSTER/BILLBOARD . . . . . . . . . . . . . . . 1 2
d)COMMUNITY HEALTH WORKER. . . . . . . 1 2
e)COMMUNITY EVENT . . . . . . . . . . . . . . . 1 2
f) ANYWHERE ELSE . . . . . . . . . . . . . . . . . . 1 2
From a community health worker?
At a community event?
Anywhere else?
In the past six months, have you seen or heard any messages about malaria?
Have you seen or heard these messages:
On the radio?On the television?On a poster or billboard?

NO.
201 YES . . . . . . . . . . . . . . . . . . . . . . . . . . . . . . . . . . 1NO . . . . . . . . . . . . . . . . . . . . . . . . . . . . . . . . . . 2 206
202 YES . . . . . . . . . . . . . . . . . . . . . . . . . . . . . . . . . . 1NO . . . . . . . . . . . . . . . . . . . . . . . . . . . . . . . . . . 2 204
203 a)a) SONS AT HOME. . . . . . . . . . . . . . .
b)b) DAUGHTERS AT HOME . . . . . . .
204 YES . . . . . . . . . . . . . . . . . . . . . . . . . . . . . . . . . . 1NO . . . . . . . . . . . . . . . . . . . . . . . . . . . . . . . . . . 2 206
205 a)a) SONS ELSEWHERE . . . . . . . . . .
b)b) DAUGHTERS ELSEWHERE . . . .
206
YES . . . . . . . . . . . . . . . . . . . . . . . . . . . . . . . . . . 1NO . . . . . . . . . . . . . . . . . . . . . . . . . . . . . . . . . . 2 208
207 a)a) BOYS DEAD . . . . . . . . . . . . . . .
b)b) GIRLS DEAD . . . . . . . . . . . . . . .
208TOTAL BIRTHS . . . . . . . . . . . . . . . . . .
209
YES NO
210
ONE OR MORE NO BIRTHSBIRTHS
211TOTAL IN 2013-2017 . . . . . . . . . .
NONE. . . . . . . . . . . . . . . . . . . . . . . . . . . . . . . . . . 00 225RECORD NUMBER OF LIVE BIRTHS IN 2013-2017
SKIPCODING CATEGORIESQUESTIONS AND FILTERS
SECTION 2. REPRODUCTION
CHECK 208:
SUM ANSWERS TO 203, 205, AND 207, AND ENTER TOTAL. IF NONE, RECORD '00'.
IF NONE, RECORD '00'.
And how many girls have died?
How many boys have died?
Have you ever given birth to a boy or girl who was born alive but later died?
IF NO, PROBE: Any baby who cried, who made any movement, sound, or effort to breathe, or who showed any other signs of life even if for a very short
How many sons live with you?
Do you have any sons or daughters to whom you have given birth who are now living with you?
Now I would like to ask about all the births you have had during your life. Have you ever given birth?
225
Now I’d like to ask you about your more recent births. How many births have you had in 2013-2017?
PROBE AND CORRECT 201-208
AS NECESSARY.
Just to make sure that I have this right: you have had in TOTAL _____ births during your life. Is that correct?
CHECK 208:
And how many daughters live with you?
IF NONE, RECORD '00'.
And how many daughters are alive but do not live with you?
How many sons are alive but do not live with you?
Do you have any sons or daughters to whom you have given birth who are alive but do not live with
IF NONE, RECORD '00'.
W-5
IF ALIVE:
01BOY 1 SING 1 YES 1 YES 1
GIRL 2 MULT 2 NO 2 NO 2
02 YES 1BOY 1 SING 1 YES 1 YES 1
NO 2GIRL 2 MULT 2 NO 2
NO 2
03 YES 1BOY 1 SING 1 YES 1 YES 1
NO 2GIRL 2 MULT 2 NO 2
NO 2
04 YES 1BOY 1 SING 1 YES 1 YES 1
NO 2GIRL 2 MULT 2 NO 2
NO . . . . 2
05 YES 1BOY 1 SING 1 YES 1 YES 1
NO 2GIRL 2 MULT 2 NO 2
NO . . . . 2
HOUSEHOLDLINE NUMBER
HOUSEHOLDLINE NUMBER
HOUSEHOLD
(NEXT BIRTH)MONTHS
MONTHS
(NEXT BIRTH)
AGE IN
AGE INYEARS
(SKIP TO 221)
DAY
MONTH
MONTH
DAYYEARS
HOUSEHOLDLINE NUMBER
218
Is (NAME) still alive?
How old was (NAME) at (NAME)'s last birthday?
Is (NAME) living with you?
What name was given to your (most recent/ previous) baby?
RECORD NAME.
BIRTH HISTORY NUMBER.
On what day, month, and year was (NAME) born?
Is (NAME) a boy or a girl?
Were any of these births twins?
SECTION 2. REPRODUCTION
RECORD AGE IN COMP-LETED YEARS.
RECORD HOUSEHOLD LINE NUMBER OF CHILD. RECORD '00' IF CHILD NOT LISTED IN HOUSEHOLD.
Were there any other live births between (NAME) and (NAME OF PREVIOUS BIRTH), including any children who died after birth?
LINE NUMBERHOUSEHOLD
212
RECORD IN 213 THE NAMES OF ALL THE BIRTHS BORN IN 2013-2017. RECORD TWINS AND TRIPLETS ON SEPARATE ROWS. IF THERE ARE MORE THAN 5 BIRTHS, USE AN ADDITIONAL QUESTIONNAIRE STARTING WITH THE SECOND ROW.
IF ALIVE: IF ALIVE:217216215214213 220
MONTHS
DAYAGE INYEARS
(ADD BIRTH)
MONTH
(SKIP TO 221) (NEXT
BIRTH)MONTHS
DAYAGE INYEARS
LINE NUMBER
(NEXT BIRTH)
(ADD BIRTH)
Now I would like to record the names of all your births in 2013-2017, whether still alive or not, starting with the most recent one you had.
(ADD BIRTH)
MONTH
(SKIP TO 221)
(SKIP TO 221) (NEXT
BIRTH)MONTHS
(NEXT BIRTH)
DAYAGE INYEARS (ADD
BIRTH)MONTH
221219
W-6
NO.
222 YES . . . . . . . . . . . . . . . . . . . . . . . . . . . . . . . . . . 1(RECORD BIRTH(S) IN TABLE)
NO . . . . . . . . . . . . . . . . . . . . . . . . . . . . . . . . . . 2
223
NUMBERS NUMBERS AREARE SAME DIFFERENT
(PROBE AND RECONCILE)
224(4) NUMBER OF BIRTHS . . . . . . . . . . . . . . . . . .
NONE . . . . . . . . . . . . . . . . . . . . . . . . . . . . . . . . . . 0
225 YES . . . . . . . . . . . . . . . . . . . . . . . . . . . . . . . . . . 1NO . . . . . . . . . . . . . . . . . . . . . . . . . . . . . . . . . . 2UNSURE . . . . . . . . . . . . . . . . . . . . . . . . . . . . 8
226MONTHS . . . . . . . . . . . . . . . . . . . .
227
(4)428
(GO TO 301) Q. 224 IS BLANK428
CHECK 224:
227
Are you pregnant now?
RECORD NUMBER OF COMPLETED MONTHS.
ONE OR MORE BIRTHS IN 2013-2017
NO BIRTHS IN 2013-2017
CHECK 216: ENTER THE NUMBER OF BIRTHS IN 2013-2017
How many months pregnant are you?
SECTION 2. REPRODUCTION
CODING CATEGORIESQUESTIONS AND FILTERS SKIP
COMPARE 211 WITH NUMBER OF BIRTHS IN BIRTH HISTORY
Have you had any live births since the birth of (NAME OF MOST RECENT BIRTH)?”
W-7
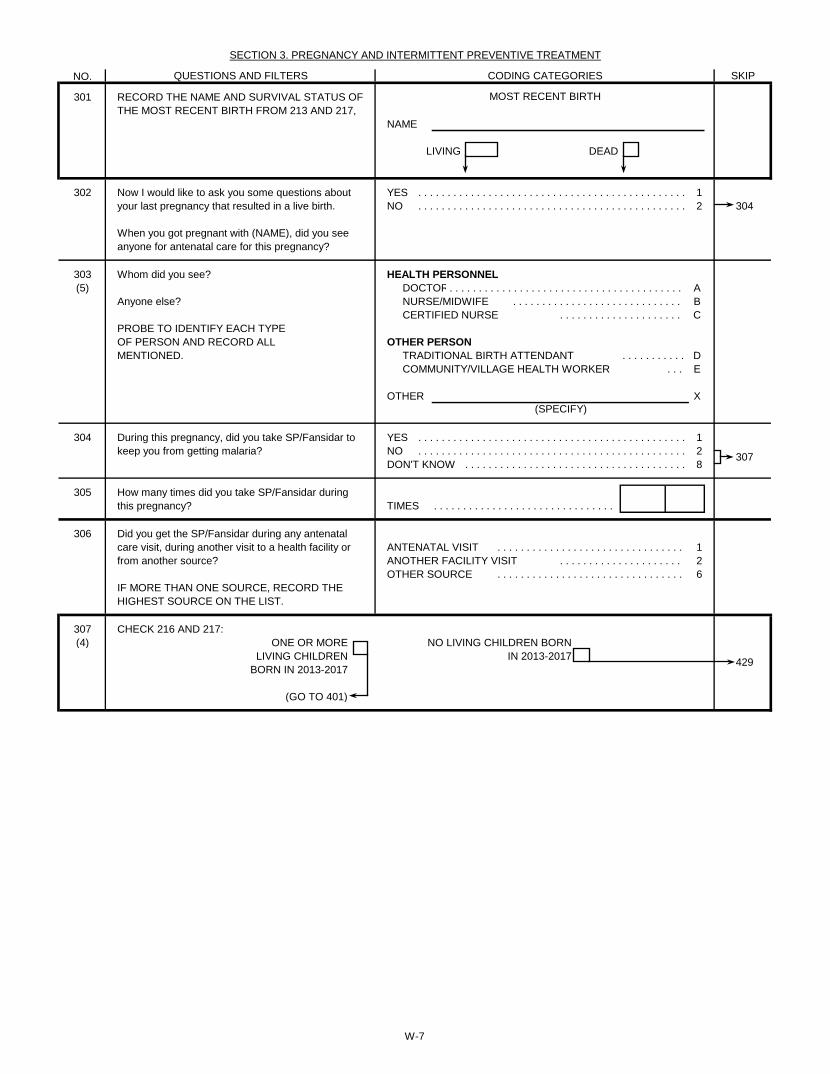
NO.
301
NAME
LIVING DEAD
302 YES . . . . . . . . . . . . . . . . . . . . . . . . . . . . . . . . . . . . . . . . . . . . . . 1NO . . . . . . . . . . . . . . . . . . . . . . . . . . . . . . . . . . . . . . . . . . . . . . 2 304
303 HEALTH PERSONNEL(5) DOCTOR. . . . . . . . . . . . . . . . . . . . . . . . . . . . . . . . . . . . . . . . A
NURSE/MIDWIFE . . . . . . . . . . . . . . . . . . . . . . . . . . . . . BCERTIFIED NURSE . . . . . . . . . . . . . . . . . . . . . C
PROBE TO IDENTIFY EACH TYPEOF PERSON AND RECORD ALL OTHER PERSONMENTIONED. TRADITIONAL BIRTH ATTENDANT . . . . . . . . . . . D
COMMUNITY/VILLAGE HEALTH WORKER . . . E
OTHER X
304 YES . . . . . . . . . . . . . . . . . . . . . . . . . . . . . . . . . . . . . . . . . . . . . . 1NO . . . . . . . . . . . . . . . . . . . . . . . . . . . . . . . . . . . . . . . . . . . . . . 2DON'T KNOW . . . . . . . . . . . . . . . . . . . . . . . . . . . . . . . . . . . . . . 8
305TIMES . . . . . . . . . . . . . . . . . . . . . . . . . . . . . . .
306ANTENATAL VISIT . . . . . . . . . . . . . . . . . . . . . . . . . . . . . . . . 1ANOTHER FACILITY VISIT . . . . . . . . . . . . . . . . . . . . . 2OTHER SOURCE . . . . . . . . . . . . . . . . . . . . . . . . . . . . . . . . 6
307 CHECK 216 AND 217:(4)
(GO TO 401)
Now I would like to ask you some questions about your last pregnancy that resulted in a live birth.
When you got pregnant with (NAME), did you see anyone for antenatal care for this pregnancy?
Whom did you see?
Anyone else?
During this pregnancy, did you take SP/Fansidar to keep you from getting malaria?
How many times did you take SP/Fansidar during this pregnancy?
RECORD THE NAME AND SURVIVAL STATUS OF THE MOST RECENT BIRTH FROM 213 AND 217,
SECTION 3. PREGNANCY AND INTERMITTENT PREVENTIVE TREATMENT
QUESTIONS AND FILTERS CODING CATEGORIES SKIP
MOST RECENT BIRTH
307
(SPECIFY)
429
Did you get the SP/Fansidar during any antenatal care visit, during another visit to a health facility or from another source?
IF MORE THAN ONE SOURCE, RECORD THE HIGHEST SOURCE ON THE LIST.
ONE OR MORE LIVING CHILDREN
BORN IN 2013-2017
NO LIVING CHILDREN BORN IN 2013-2017
W-7
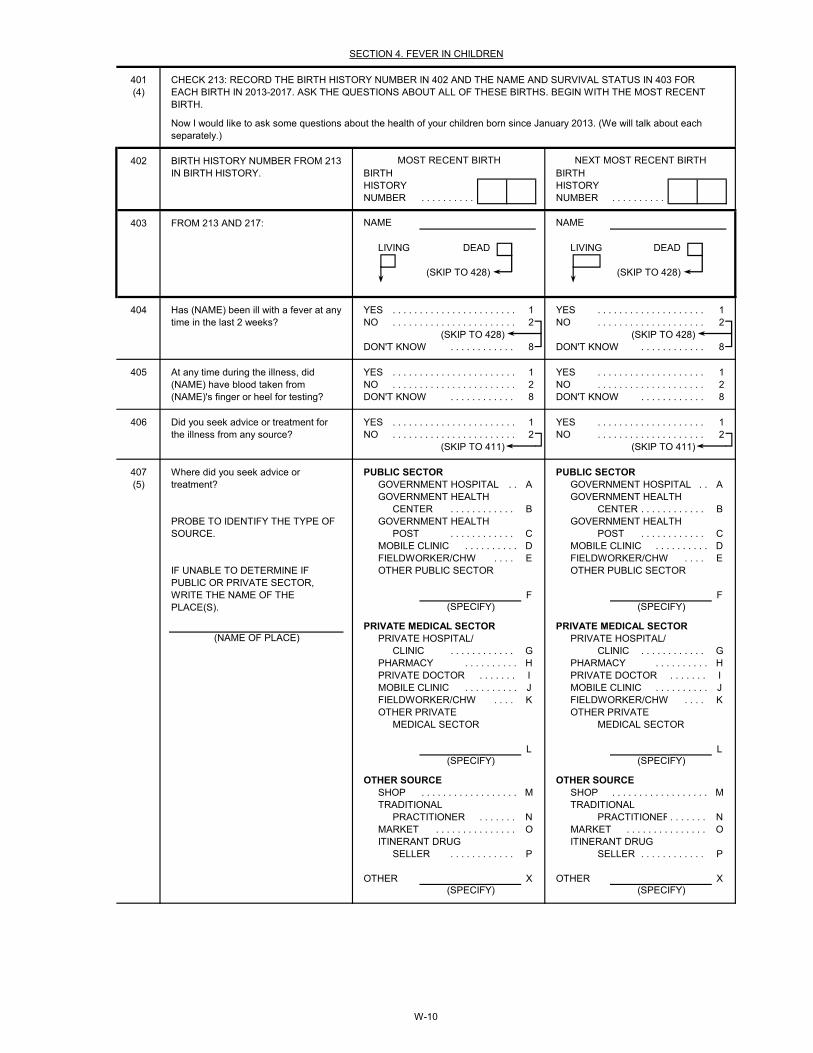
401(4)
402BIRTH BIRTHHISTORY HISTORYNUMBER . . . . . . . . . . NUMBER . . . . . . . . . .
403
LIVING DEAD LIVING DEAD
(SKIP TO 428) (SKIP TO 428)
404 YES . . . . . . . . . . . . . . . . . . . . . . . 1 YES . . . . . . . . . . . . . . . . . . . . 1NO . . . . . . . . . . . . . . . . . . . . . . . 2 NO . . . . . . . . . . . . . . . . . . . . 2
(SKIP TO 428) (SKIP TO 428)DON'T KNOW . . . . . . . . . . . . 8 DON'T KNOW . . . . . . . . . . . . 8
405 YES . . . . . . . . . . . . . . . . . . . . . . . 1 YES . . . . . . . . . . . . . . . . . . . . 1NO . . . . . . . . . . . . . . . . . . . . . . . 2 NO . . . . . . . . . . . . . . . . . . . . 2DON'T KNOW . . . . . . . . . . . . 8 DON'T KNOW . . . . . . . . . . . . 8
406 YES . . . . . . . . . . . . . . . . . . . . . . . 1 YES . . . . . . . . . . . . . . . . . . . . 1NO . . . . . . . . . . . . . . . . . . . . . . . 2 NO . . . . . . . . . . . . . . . . . . . . 2
(SKIP TO 411) (SKIP TO 411)
407 PUBLIC SECTOR PUBLIC SECTOR(5) GOVERNMENT HOSPITAL . . A GOVERNMENT HOSPITAL . . A
GOVERNMENT HEALTH GOVERNMENT HEALTHCENTER . . . . . . . . . . . . B CENTER . . . . . . . . . . . . B
GOVERNMENT HEALTH GOVERNMENT HEALTHPOST . . . . . . . . . . . . C POST . . . . . . . . . . . . C
MOBILE CLINIC . . . . . . . . . . D MOBILE CLINIC . . . . . . . . . . DFIELDWORKER/CHW . . . . E FIELDWORKER/CHW . . . . EOTHER PUBLIC SECTOR OTHER PUBLIC SECTOR
F F
PRIVATE MEDICAL SECTOR PRIVATE MEDICAL SECTORPRIVATE HOSPITAL/ PRIVATE HOSPITAL/
CLINIC . . . . . . . . . . . . G CLINIC . . . . . . . . . . . . GPHARMACY . . . . . . . . . . H PHARMACY . . . . . . . . . . HPRIVATE DOCTOR . . . . . . . I PRIVATE DOCTOR . . . . . . . IMOBILE CLINIC . . . . . . . . . . J MOBILE CLINIC . . . . . . . . . . JFIELDWORKER/CHW . . . . K FIELDWORKER/CHW . . . . KOTHER PRIVATE OTHER PRIVATE
MEDICAL SECTOR MEDICAL SECTOR
L L
OTHER SOURCE OTHER SOURCESHOP . . . . . . . . . . . . . . . . . . M SHOP . . . . . . . . . . . . . . . . . . MTRADITIONAL TRADITIONAL
PRACTITIONER . . . . . . . N PRACTITIONER. . . . . . . NMARKET . . . . . . . . . . . . . . . O MARKET . . . . . . . . . . . . . . . OITINERANT DRUG ITINERANT DRUG
SELLER . . . . . . . . . . . . P SELLER . . . . . . . . . . . . P
OTHER X OTHER X
Where did you seek advice or treatment?
FROM 213 AND 217:
At any time during the illness, did (NAME) have blood taken from (NAME)'s finger or heel for testing?
Did you seek advice or treatment for the illness from any source?
PROBE TO IDENTIFY THE TYPE OF SOURCE.
(SPECIFY)
(SPECIFY) (SPECIFY)
(SPECIFY)
(SPECIFY)
SECTION 4. FEVER IN CHILDREN
Now I would like to ask some questions about the health of your children born since January 2013. (We will talk about each separately.)
Has (NAME) been ill with a fever at any time in the last 2 weeks?
NAME NAME
NEXT MOST RECENT BIRTHMOST RECENT BIRTH
CHECK 213: RECORD THE BIRTH HISTORY NUMBER IN 402 AND THE NAME AND SURVIVAL STATUS IN 403 FOR EACH BIRTH IN 2013-2017. ASK THE QUESTIONS ABOUT ALL OF THESE BIRTHS. BEGIN WITH THE MOST RECENT BIRTH.
BIRTH HISTORY NUMBER FROM 213 IN BIRTH HISTORY.
IF UNABLE TO DETERMINE IF PUBLIC OR PRIVATE SECTOR, WRITE THE NAME OF THE PLACE(S).
(SPECIFY)
(NAME OF PLACE)
W-10
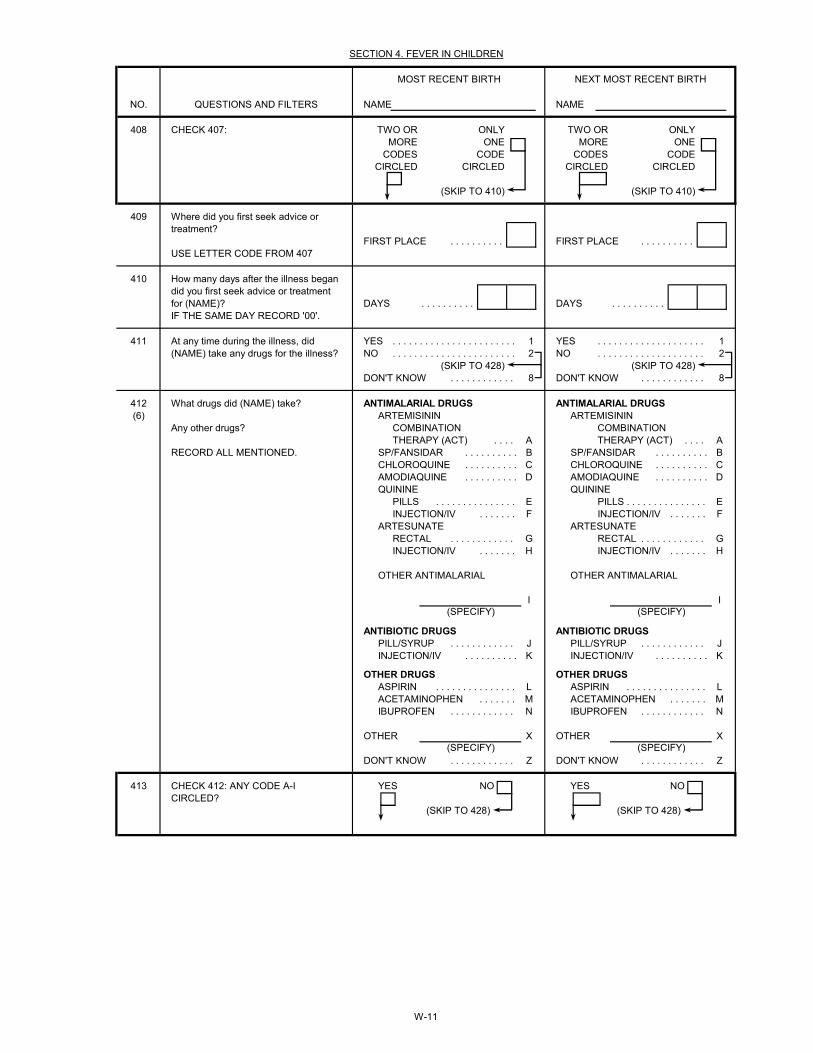
NO. NAME NAME
408 TWO OR ONLY TWO OR ONLYMORE ONE MORE ONE
CODES CODE CODES CODECIRCLED CIRCLED CIRCLED CIRCLED
(SKIP TO 410) (SKIP TO 410)
409
FIRST PLACE . . . . . . . . . . FIRST PLACE . . . . . . . . . . USE LETTER CODE FROM 407
410
DAYS . . . . . . . . . . DAYS . . . . . . . . . . IF THE SAME DAY RECORD '00'.
411 YES . . . . . . . . . . . . . . . . . . . . . . . 1 YES . . . . . . . . . . . . . . . . . . . . 1NO . . . . . . . . . . . . . . . . . . . . . . . 2 NO . . . . . . . . . . . . . . . . . . . . 2
(SKIP TO 428) (SKIP TO 428)DON'T KNOW . . . . . . . . . . . . 8 DON'T KNOW . . . . . . . . . . . . 8
412 ANTIMALARIAL DRUGS ANTIMALARIAL DRUGS(6) ARTEMISININ ARTEMISININ
COMBINATION COMBINATIONTHERAPY (ACT) . . . . A THERAPY (ACT) . . . . A
RECORD ALL MENTIONED. SP/FANSIDAR . . . . . . . . . . B SP/FANSIDAR . . . . . . . . . . BCHLOROQUINE . . . . . . . . . . C CHLOROQUINE . . . . . . . . . . CAMODIAQUINE . . . . . . . . . . D AMODIAQUINE . . . . . . . . . . DQUININE QUININE
PILLS . . . . . . . . . . . . . . . E PILLS . . . . . . . . . . . . . . . EINJECTION/IV . . . . . . . F INJECTION/IV . . . . . . . F
ARTESUNATE ARTESUNATERECTAL . . . . . . . . . . . . G RECTAL . . . . . . . . . . . . GINJECTION/IV . . . . . . . H INJECTION/IV . . . . . . . H
OTHER ANTIMALARIAL OTHER ANTIMALARIAL
I I
ANTIBIOTIC DRUGS ANTIBIOTIC DRUGSPILL/SYRUP . . . . . . . . . . . . J PILL/SYRUP . . . . . . . . . . . . JINJECTION/IV . . . . . . . . . . K INJECTION/IV . . . . . . . . . . K
OTHER DRUGS OTHER DRUGSASPIRIN . . . . . . . . . . . . . . . L ASPIRIN . . . . . . . . . . . . . . . LACETAMINOPHEN . . . . . . . M ACETAMINOPHEN . . . . . . . MIBUPROFEN . . . . . . . . . . . . N IBUPROFEN . . . . . . . . . . . . N
OTHER X OTHER X
DON'T KNOW . . . . . . . . . . . . Z DON'T KNOW . . . . . . . . . . . . Z
413 YES NO YES NO
(SKIP TO 428) (SKIP TO 428)
NEXT MOST RECENT BIRTH
SECTION 4. FEVER IN CHILDREN
CHECK 407:
(SPECIFY)
(SPECIFY)
How many days after the illness began did you first seek advice or treatment for (NAME)?
CHECK 412: ANY CODE A-I CIRCLED?
At any time during the illness, did (NAME) take any drugs for the illness?
What drugs did (NAME) take?
Any other drugs?
(SPECIFY)
(SPECIFY)
Where did you first seek advice or treatment?
QUESTIONS AND FILTERS
MOST RECENT BIRTH
W-11
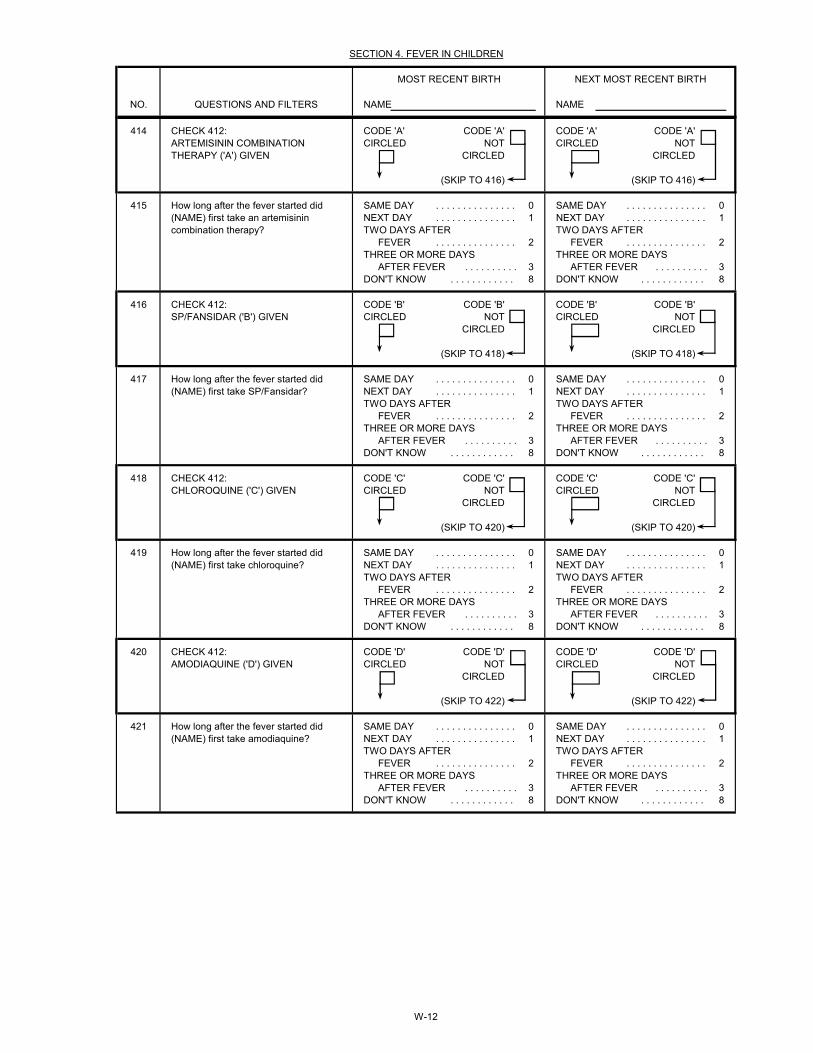
NO. NAME NAME
NEXT MOST RECENT BIRTH
SECTION 4. FEVER IN CHILDREN
QUESTIONS AND FILTERS
MOST RECENT BIRTH
414 CODE 'A' CODE 'A' CODE 'A' CODE 'A'CIRCLED NOT CIRCLED NOT
CIRCLED CIRCLED
(SKIP TO 416) (SKIP TO 416)
415 SAME DAY . . . . . . . . . . . . . . . 0 SAME DAY . . . . . . . . . . . . . . . 0NEXT DAY . . . . . . . . . . . . . . . 1 NEXT DAY . . . . . . . . . . . . . . . 1TWO DAYS AFTER TWO DAYS AFTER
FEVER . . . . . . . . . . . . . . . 2 FEVER . . . . . . . . . . . . . . . 2THREE OR MORE DAYS THREE OR MORE DAYS
AFTER FEVER . . . . . . . . . . 3 AFTER FEVER . . . . . . . . . . 3DON'T KNOW . . . . . . . . . . . . 8 DON'T KNOW . . . . . . . . . . . . 8
416 CODE 'B' CODE 'B' CODE 'B' CODE 'B'CIRCLED NOT CIRCLED NOT
CIRCLED CIRCLED
(SKIP TO 418) (SKIP TO 418)
417 SAME DAY . . . . . . . . . . . . . . . 0 SAME DAY . . . . . . . . . . . . . . . 0NEXT DAY . . . . . . . . . . . . . . . 1 NEXT DAY . . . . . . . . . . . . . . . 1TWO DAYS AFTER TWO DAYS AFTER
FEVER . . . . . . . . . . . . . . . 2 FEVER . . . . . . . . . . . . . . . 2THREE OR MORE DAYS THREE OR MORE DAYS
AFTER FEVER . . . . . . . . . . 3 AFTER FEVER . . . . . . . . . . 3DON'T KNOW . . . . . . . . . . . . 8 DON'T KNOW . . . . . . . . . . . . 8
418 CODE 'C' CODE 'C' CODE 'C' CODE 'C'CIRCLED NOT CIRCLED NOT
CIRCLED CIRCLED
(SKIP TO 420) (SKIP TO 420)
419 SAME DAY . . . . . . . . . . . . . . . 0 SAME DAY . . . . . . . . . . . . . . . 0NEXT DAY . . . . . . . . . . . . . . . 1 NEXT DAY . . . . . . . . . . . . . . . 1TWO DAYS AFTER TWO DAYS AFTER
FEVER . . . . . . . . . . . . . . . 2 FEVER . . . . . . . . . . . . . . . 2THREE OR MORE DAYS THREE OR MORE DAYS
AFTER FEVER . . . . . . . . . . 3 AFTER FEVER . . . . . . . . . . 3DON'T KNOW . . . . . . . . . . . . 8 DON'T KNOW . . . . . . . . . . . . 8
420 CODE 'D' CODE 'D' CODE 'D' CODE 'D'CIRCLED NOT CIRCLED NOT
CIRCLED CIRCLED
(SKIP TO 422) (SKIP TO 422)
421 SAME DAY . . . . . . . . . . . . . . . 0 SAME DAY . . . . . . . . . . . . . . . 0NEXT DAY . . . . . . . . . . . . . . . 1 NEXT DAY . . . . . . . . . . . . . . . 1TWO DAYS AFTER TWO DAYS AFTER
FEVER . . . . . . . . . . . . . . . 2 FEVER . . . . . . . . . . . . . . . 2THREE OR MORE DAYS THREE OR MORE DAYS
AFTER FEVER . . . . . . . . . . 3 AFTER FEVER . . . . . . . . . . 3DON'T KNOW . . . . . . . . . . . . 8 DON'T KNOW . . . . . . . . . . . . 8
CHECK 412:CHLOROQUINE ('C') GIVEN
How long after the fever started did (NAME) first take chloroquine?
CHECK 412:AMODIAQUINE ('D') GIVEN
CHECK 412:ARTEMISININ COMBINATION THERAPY ('A') GIVEN
How long after the fever started did (NAME) first take an artemisinin combination therapy?
CHECK 412:SP/FANSIDAR ('B') GIVEN
How long after the fever started did (NAME) first take SP/Fansidar?
How long after the fever started did (NAME) first take amodiaquine?
W-12
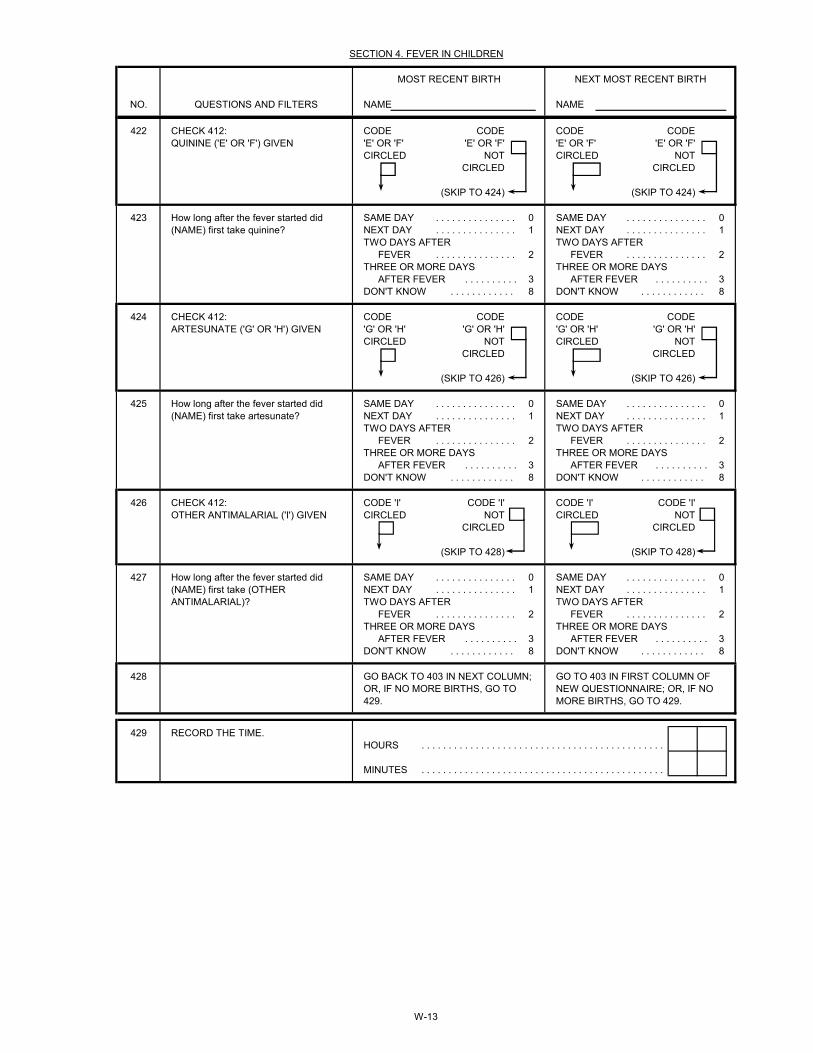
NO. NAME NAME
NEXT MOST RECENT BIRTH
SECTION 4. FEVER IN CHILDREN
QUESTIONS AND FILTERS
MOST RECENT BIRTH
422 CODE CODE CODE CODE'E' OR 'F' 'E' OR 'F' 'E' OR 'F' 'E' OR 'F'CIRCLED NOT CIRCLED NOT
CIRCLED CIRCLED
(SKIP TO 424) (SKIP TO 424)
423 SAME DAY . . . . . . . . . . . . . . . 0 SAME DAY . . . . . . . . . . . . . . . 0NEXT DAY . . . . . . . . . . . . . . . 1 NEXT DAY . . . . . . . . . . . . . . . 1TWO DAYS AFTER TWO DAYS AFTER
FEVER . . . . . . . . . . . . . . . 2 FEVER . . . . . . . . . . . . . . . 2THREE OR MORE DAYS THREE OR MORE DAYS
AFTER FEVER . . . . . . . . . . 3 AFTER FEVER . . . . . . . . . . 3DON'T KNOW . . . . . . . . . . . . 8 DON'T KNOW . . . . . . . . . . . . 8
424 CODE CODE CODE CODE'G' OR 'H' 'G' OR 'H' 'G' OR 'H' 'G' OR 'H'CIRCLED NOT CIRCLED NOT
CIRCLED CIRCLED
(SKIP TO 426) (SKIP TO 426)
425 SAME DAY . . . . . . . . . . . . . . . 0 SAME DAY . . . . . . . . . . . . . . . 0NEXT DAY . . . . . . . . . . . . . . . 1 NEXT DAY . . . . . . . . . . . . . . . 1TWO DAYS AFTER TWO DAYS AFTER
FEVER . . . . . . . . . . . . . . . 2 FEVER . . . . . . . . . . . . . . . 2THREE OR MORE DAYS THREE OR MORE DAYS
AFTER FEVER . . . . . . . . . . 3 AFTER FEVER . . . . . . . . . . 3DON'T KNOW . . . . . . . . . . . . 8 DON'T KNOW . . . . . . . . . . . . 8
426 CODE 'I' CODE 'I' CODE 'I' CODE 'I'CIRCLED NOT CIRCLED NOT
CIRCLED CIRCLED
(SKIP TO 428) (SKIP TO 428)
427 SAME DAY . . . . . . . . . . . . . . . 0 SAME DAY . . . . . . . . . . . . . . . 0NEXT DAY . . . . . . . . . . . . . . . 1 NEXT DAY . . . . . . . . . . . . . . . 1TWO DAYS AFTER TWO DAYS AFTER
FEVER . . . . . . . . . . . . . . . 2 FEVER . . . . . . . . . . . . . . . 2THREE OR MORE DAYS THREE OR MORE DAYS
AFTER FEVER . . . . . . . . . . 3 AFTER FEVER . . . . . . . . . . 3DON'T KNOW . . . . . . . . . . . . 8 DON'T KNOW . . . . . . . . . . . . 8
428
429 RECORD THE TIME.HOURS . . . . . . . . . . . . . . . . . . . . . . . . . . . . . . . . . . . . . . . . . . . . .
MINUTES . . . . . . . . . . . . . . . . . . . . . . . . . . . . . . . . . . . . . . . . . . . . .
CHECK 412:ARTESUNATE ('G' OR 'H') GIVEN
How long after the fever started did (NAME) first take artesunate?
CHECK 412:OTHER ANTIMALARIAL ('I') GIVEN
How long after the fever started did (NAME) first take (OTHER ANTIMALARIAL)?
CHECK 412:QUININE ('E' OR 'F') GIVEN
How long after the fever started did (NAME) first take quinine?
GO TO 403 IN FIRST COLUMN OF NEW QUESTIONNAIRE; OR, IF NO MORE BIRTHS, GO TO 429.
GO BACK TO 403 IN NEXT COLUMN; OR, IF NO MORE BIRTHS, GO TO 429.
W-13

COMMENTS ABOUT INTERVIEW:
COMMENTS ON SPECIFIC QUESTIONS:
ANY OTHER COMMENTS:
INTERVIEWER'S OBSERVATIONS
TO BE FILLED IN AFTER COMPLETING INTERVIEW
SUPERVISOR'S OBSERVATIONS
EDITOR'S OBSERVATIONS
W-14
(6) Coding categories to be developed locally and revised based on the pretest. All antimalarials commonly used in the country should be included in the response categories. Common brand names of drugs, such as Bayer, Tylenol or Paracetamol, should be added to the response categories for aspirin, acetaminophen, or ibuprofen as appropriate.
(2) Revise according to the local education system.(1) This section should be adapted for country-specific survey design.
Women's Questionnaire: NOTES
(3) Each card should have four simple sentences appropriate to the country (e.g., "Parents love their children.", "Farming is hard work.", "The child is reading a book.", "Children work hard at school."). Cards should be prepared for every language in which respondents are likely to be literate.(4) Year of fieldwork is assumed to be 2017. For fieldwork beginning in 2018, all references to calendar years should be increased by one; for example, 2012 should be changed to 2013, 2013 should be changed to 2014, and similarly for all years throughout the (5) Coding categories to be developed locally; however, the broad categories must be maintained. Additions to the codes under the private medical sector heading may include religious affiliated sources and NGO sources.
YEAR OF FIELDWORK: 2017FIVE YEARS BEFORE SURVEY: 2013
CHILD OLDER THAN 5: 2012CHILD UNDER 4: 2015CHILD UNDER 3: 2015
CHILD UNDER 16: 2002
FORMATTING DATE:ENGLISH LANGUAGE:
BIOMARKER QUESTIONNAIRE SOUTH SUDANNATIONAL MALARIA CONTROL PROGRAMME
PLACE NAME
NAME OF HOUSEHOLD HEAD
CLUSTER NUMBER . . . . . . . . . . . . . . . . . . . . . . . . . . . . . . . . . . . . . . . . . . . . . . . . . . . . . . . . . . . . . . . . . .
HOUSEHOLD NUMBER . . . . . . . . . . . . . . . . . . . . . . . . . . . . . . . . . . . . . . . . . . . . . . . . . . . . . . . . . . . . . . .
DATE DAY
FIELDWORKER'S MONTHNAME
YEAR
NEXT VISIT:DATE TOTAL NUMBEROF VISITS
TIME
NOTES:TOTAL ELIGIBLE
CHILDREN
LANGUAGE OF LANGUAGE OF NATIVE LANGUAGE TRANSLATORQUESTIONNAIRE** INTERVIEW** OF RESPONDENT** (YES = 1, NO = 2)
LANGUAGE OF **LANGUAGE CODES:QUESTIONNAIRE** 01 ENGLISH
02 ARABIC
November 2017Nov-17
MALARIA INDICATOR SURVEY
IDENTIFICATION (1)
SUPERVISOR
NAME NUMBER
FIELDWORKER VISITS
1 2 3 FINAL VISIT
BIO-1
101
102 LINE LINE LINENUMBER . . . . . . NUMBER . . . . . . NUMBER . . . . . .
NAME NAME NAME
103
DAY . . . . . . . . . DAY . . . . . . . . . DAY . . . . . . . . .
MONTH. . . . . . . MONTH. . . . . . . MONTH. . . . . . .
YEAR. . YEAR. . YEAR. .
104 YES . . . . . . . . . . . . . . 1 YES . . . . . . . . . . . . . . 1 YES . . . . . . . . . . . . . . 1(2) NO . . . . . . . . . . . . . . 2 NO . . . . . . . . . . . . . . 2 NO . . . . . . . . . . . . . . 2
(SKIP TO 130) (SKIP TO 130) (SKIP TO 130)
105 0-5 MONTHS . . . . . . . 1 0-5 MONTHS . . . . . . . 1 0-5 MONTHS . . . . . . . 1(SKIP TO 130) (SKIP TO 130) (SKIP TO 130)
OLDER . . . . . . . . . . 2 OLDER . . . . . . . . . . 2 OLDER . . . . . . . . . . 2
106 LINE LINE LINENUMBER . . . . . . NUMBER . . . . . . NUMBER . . . . . .
(RECORD '00' IF NOT LISTED (RECORD '00' IF NOT LISTED (RECORD '00' IF NOT LISTED
107(2)
108 GRANTED . . . . . . . . . 1 GRANTED . . . . . . . . . 1 GRANTED . . . . . . . . . 1
REFUSED . . . . . . . . . 2 REFUSED . . . . . . . . . 2 REFUSED . . . . . . . . . 2NOT PRESENT/OTHE. 3 NOT PRESENT/OTHE. 3 NOT PRESENT/OTHE. 3
(SIGN)
CIRCLE THE CODE ANDSIGN YOUR NAME.
LINE NUMBER OF PARENT/OTHER ADULT RESPONSIBLE FOR THE CHILD FROM COLUMN 1 OF
ASK CONSENT FOR ANEMIA TESTFROM PARENT/OTHER ADULT.
CHECK COLUMN 9 IN HOUSEHOLD QUESTIONNAIRE. RECORD THE LINE NUMBER AND NAME FOR ALL ELIGIBLE CHILDREN 6-59 MONTHS IN QUESTION 102; IF MORE THAN SIX CHILDREN, USE ADDITIONAL QUESTIONNAIRE(S).
HEMOGLOBIN MEASUREMENT AND MALARIA TESTING FOR CHILDREN AGE 6-59 MONTHS
CHILD 1
(SIGN) (SIGN)
CHILD 2 CHILD 3
What is (NAME)’s date of birth?
CHECK 103: CHILD BORN IN 2013-2017?
CHECK HOUSEHOLD QUESTIONNAIRE:LINE NUMBER FROM COLUMN 9.
IF MOTHER INTERVIEWED:COPY CHILD’S DATE OF BIRTH (DAY, MONTH, AND YEAR) FROM BIRTH HISTORY. IF MOTHER NOT INTERVIEWED ASK:
As part of this survey, we are asking children all over the country to take an anemia test. Anemia is a serious health problem that usually results from poor nutrition, infection, or chronic disease. This survey will assist the government to develop programs to prevent and treat anemia. We ask that all children born in 2013 or later take part in anemia testing in this survey and give a few drops of blood from a finger or heel. The equipment used to take the blood is clean and completely safe. It has never been used before and will be thrown away after each test.
The blood will be tested for anemia immediately, and the result will be told to you right away. The result will be kept strictly confidential and will not be shared with anyone other than members of our survey team.
Do you have any questions?You can say yes or no. It is up to you to decide.
CHECK 103: CHILD AGE 0-5 MONTHS, I.E., WAS CHILD BORN IN MONTH OF INTERVIEW OR 5 PREVIOUS MONTHS?
BIO-2
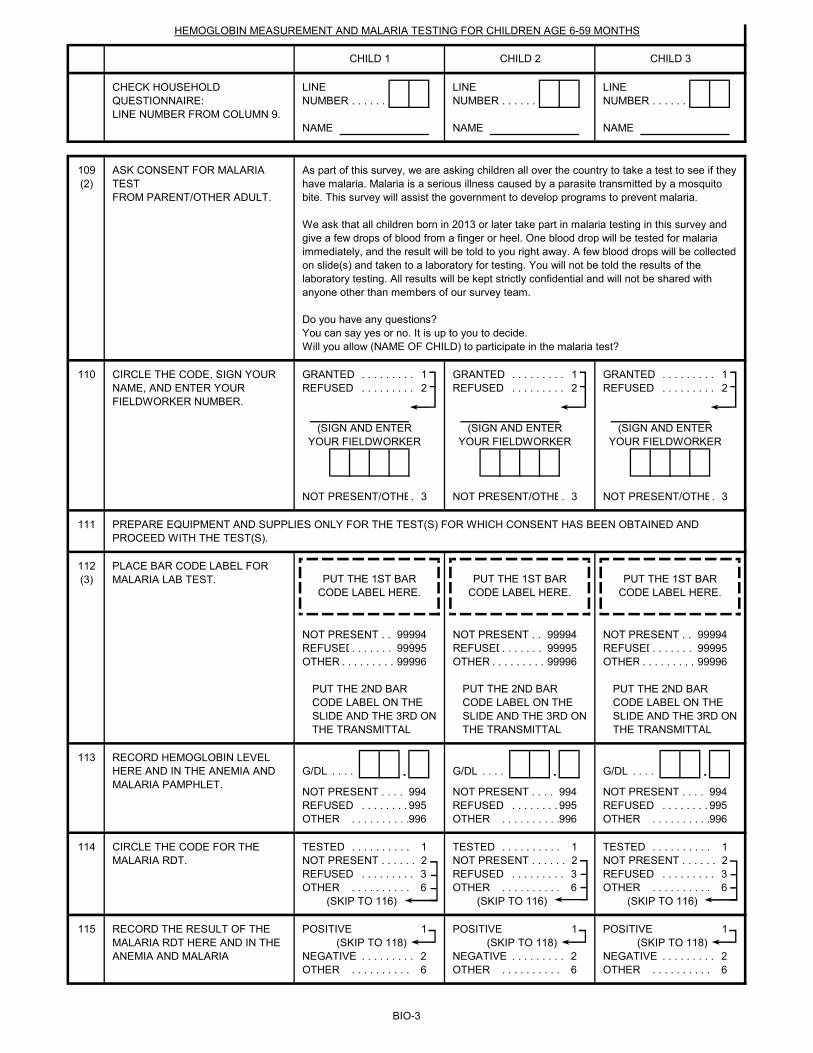
LINE LINE LINENUMBER . . . . . . NUMBER . . . . . . NUMBER . . . . . .
NAME NAME NAME
109(2)
110 GRANTED . . . . . . . . . 1 GRANTED . . . . . . . . . 1 GRANTED . . . . . . . . . 1REFUSED . . . . . . . . . 2 REFUSED . . . . . . . . . 2 REFUSED . . . . . . . . . 2
NOT PRESENT/OTHE. 3 NOT PRESENT/OTHE. 3 NOT PRESENT/OTHE. 3
111
112(3)
NOT PRESENT . . 99994 NOT PRESENT . . 99994 NOT PRESENT . . 99994REFUSED. . . . . . . 99995 REFUSED. . . . . . . 99995 REFUSED. . . . . . . 99995OTHER . . . . . . . . . 99996 OTHER . . . . . . . . . 99996 OTHER . . . . . . . . . 99996
113G/DL . . . . . G/DL . . . . . G/DL . . . . .
NOT PRESENT . . . . 994 NOT PRESENT . . . . 994 NOT PRESENT . . . . 994REFUSED . . . . . . . . . 995 REFUSED . . . . . . . . . 995 REFUSED . . . . . . . . . 995OTHER . . . . . . . . . . 996 OTHER . . . . . . . . . . 996 OTHER . . . . . . . . . . 996
114 TESTED . . . . . . . . . . 1 TESTED . . . . . . . . . . 1 TESTED . . . . . . . . . . 1NOT PRESENT . . . . . . 2 NOT PRESENT . . . . . . 2 NOT PRESENT . . . . . . 2REFUSED . . . . . . . . . 3 REFUSED . . . . . . . . . 3 REFUSED . . . . . . . . . 3OTHER . . . . . . . . . . 6 OTHER . . . . . . . . . . 6 OTHER . . . . . . . . . . 6
(SKIP TO 116) (SKIP TO 116) (SKIP TO 116)
115 POSITIVE 1 POSITIVE 1 POSITIVE 1(SKIP TO 118) (SKIP TO 118) (SKIP TO 118)
NEGATIVE . . . . . . . . . 2 NEGATIVE . . . . . . . . . 2 NEGATIVE . . . . . . . . . 2OTHER . . . . . . . . . . 6 OTHER . . . . . . . . . . 6 OTHER . . . . . . . . . . 6
CHILD 1 CHILD 2 CHILD 3
CHECK HOUSEHOLD QUESTIONNAIRE:LINE NUMBER FROM COLUMN 9.
PLACE BAR CODE LABEL FOR MALARIA LAB TEST.
CIRCLE THE CODE, SIGN YOUR NAME, AND ENTER YOUR FIELDWORKER NUMBER.
PUT THE 1ST BAR CODE LABEL HERE.
PUT THE 1ST BAR CODE LABEL HERE.
PUT THE 1ST BAR CODE LABEL HERE.
(SIGN AND ENTER YOUR FIELDWORKER
(SIGN AND ENTER YOUR FIELDWORKER
(SIGN AND ENTER YOUR FIELDWORKER
ASK CONSENT FOR MALARIA TESTFROM PARENT/OTHER ADULT.
HEMOGLOBIN MEASUREMENT AND MALARIA TESTING FOR CHILDREN AGE 6-59 MONTHS
As part of this survey, we are asking children all over the country to take a test to see if they have malaria. Malaria is a serious illness caused by a parasite transmitted by a mosquito bite. This survey will assist the government to develop programs to prevent malaria.
We ask that all children born in 2013 or later take part in malaria testing in this survey and give a few drops of blood from a finger or heel. One blood drop will be tested for malaria immediately, and the result will be told to you right away. A few blood drops will be collected on slide(s) and taken to a laboratory for testing. You will not be told the results of the laboratory testing. All results will be kept strictly confidential and will not be shared with anyone other than members of our survey team.
Do you have any questions?You can say yes or no. It is up to you to decide.Will you allow (NAME OF CHILD) to participate in the malaria test?
PUT THE 2ND BAR CODE LABEL ON THE SLIDE AND THE 3RD ON THE TRANSMITTAL
PUT THE 2ND BAR CODE LABEL ON THE SLIDE AND THE 3RD ON THE TRANSMITTAL
RECORD HEMOGLOBIN LEVEL HERE AND IN THE ANEMIA AND MALARIA PAMPHLET.
PREPARE EQUIPMENT AND SUPPLIES ONLY FOR THE TEST(S) FOR WHICH CONSENT HAS BEEN OBTAINED AND PROCEED WITH THE TEST(S).
PUT THE 2ND BAR CODE LABEL ON THE SLIDE AND THE 3RD ON THE TRANSMITTAL
CIRCLE THE CODE FOR THE MALARIA RDT.
RECORD THE RESULT OF THE MALARIA RDT HERE AND IN THE ANEMIA AND MALARIA
BIO-3
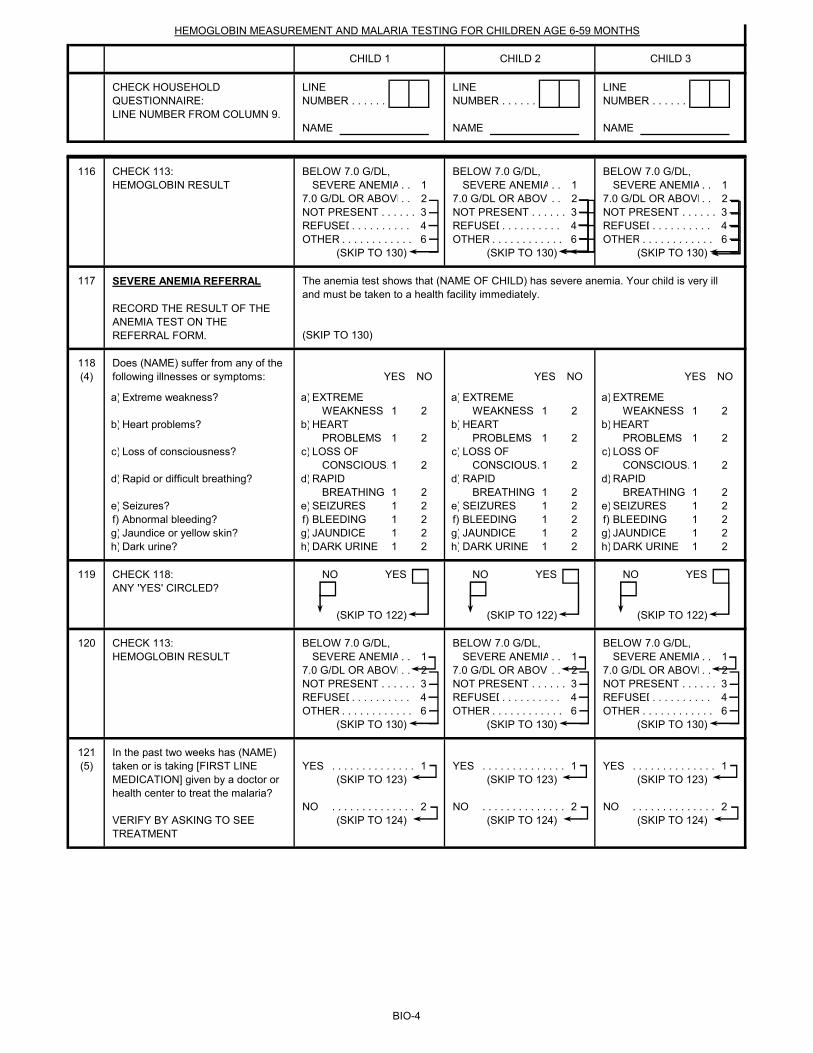
LINE LINE LINENUMBER . . . . . . NUMBER . . . . . . NUMBER . . . . . .
NAME NAME NAME
CHILD 1 CHILD 2 CHILD 3
CHECK HOUSEHOLD QUESTIONNAIRE:LINE NUMBER FROM COLUMN 9.
HEMOGLOBIN MEASUREMENT AND MALARIA TESTING FOR CHILDREN AGE 6-59 MONTHS
116 BELOW 7.0 G/DL, BELOW 7.0 G/DL, BELOW 7.0 G/DL, SEVERE ANEMIA . . 1 SEVERE ANEMIA . . 1 SEVERE ANEMIA . . 1
7.0 G/DL OR ABOVE. . 2 7.0 G/DL OR ABOVE. . 2 7.0 G/DL OR ABOVE. . 2NOT PRESENT . . . . . . 3 NOT PRESENT . . . . . . 3 NOT PRESENT . . . . . . 3REFUSED. . . . . . . . . . 4 REFUSED. . . . . . . . . . 4 REFUSED. . . . . . . . . . 4OTHER . . . . . . . . . . . . 6 OTHER . . . . . . . . . . . . 6 OTHER . . . . . . . . . . . . 6
(SKIP TO 130) (SKIP TO 130) (SKIP TO 130)
117
(SKIP TO 130)
118(4) YES NO YES NO YES NO
a) a) EXTREME a) EXTREME a) EXTREMEWEAKNESS 1 2 WEAKNESS 1 2 WEAKNESS 1 2
b) b) HEART b) HEART b) HEARTPROBLEMS 1 2 PROBLEMS 1 2 PROBLEMS 1 2
c) c) LOSS OF c) LOSS OF c) LOSS OF CONSCIOUS. 1 2 CONSCIOUS. 1 2 CONSCIOUS. 1 2
d) d) RAPID d) RAPID d) RAPIDBREATHING 1 2 BREATHING 1 2 BREATHING 1 2
e) e) SEIZURES 1 2 e) SEIZURES 1 2 e) SEIZURES 1 2f) f) BLEEDING 1 2 f) BLEEDING 1 2 f) BLEEDING 1 2g) g) JAUNDICE 1 2 g) JAUNDICE 1 2 g) JAUNDICE 1 2h) h) DARK URINE 1 2 h) DARK URINE 1 2 h) DARK URINE 1 2
119 NO YES NO YES NO YES
(SKIP TO 122) (SKIP TO 122) (SKIP TO 122)
120 BELOW 7.0 G/DL, BELOW 7.0 G/DL, BELOW 7.0 G/DL, SEVERE ANEMIA . . 1 SEVERE ANEMIA . . 1 SEVERE ANEMIA . . 1
7.0 G/DL OR ABOVE. . 2 7.0 G/DL OR ABOVE. . 2 7.0 G/DL OR ABOVE. . 2NOT PRESENT . . . . . . 3 NOT PRESENT . . . . . . 3 NOT PRESENT . . . . . . 3REFUSED. . . . . . . . . . 4 REFUSED. . . . . . . . . . 4 REFUSED. . . . . . . . . . 4OTHER . . . . . . . . . . . . 6 OTHER . . . . . . . . . . . . 6 OTHER . . . . . . . . . . . . 6
(SKIP TO 130) (SKIP TO 130) (SKIP TO 130)
121(5) YES . . . . . . . . . . . . . . 1 YES . . . . . . . . . . . . . . 1 YES . . . . . . . . . . . . . . 1
(SKIP TO 123) (SKIP TO 123) (SKIP TO 123)
NO . . . . . . . . . . . . . . 2 NO . . . . . . . . . . . . . . 2 NO . . . . . . . . . . . . . . 2(SKIP TO 124) (SKIP TO 124) (SKIP TO 124)
Does (NAME) suffer from any of the following illnesses or symptoms:
Dark urine?Jaundice or yellow skin?Abnormal bleeding?Seizures?
Rapid or difficult breathing?
Loss of consciousness?
Heart problems?
Extreme weakness?
SEVERE ANEMIA REFERRAL RECORD THE RESULT OF THE ANEMIA TEST ON THE REFERRAL FORM.
VERIFY BY ASKING TO SEE TREATMENT
CHECK 113: HEMOGLOBIN RESULT
In the past two weeks has (NAME) taken or is taking [FIRST LINE MEDICATION] given by a doctor or health center to treat the malaria?
The anemia test shows that (NAME OF CHILD) has severe anemia. Your child is very ill and must be taken to a health facility immediately.
CHECK 113: HEMOGLOBIN RESULT
CHECK 118: ANY 'YES' CIRCLED?
BIO-4
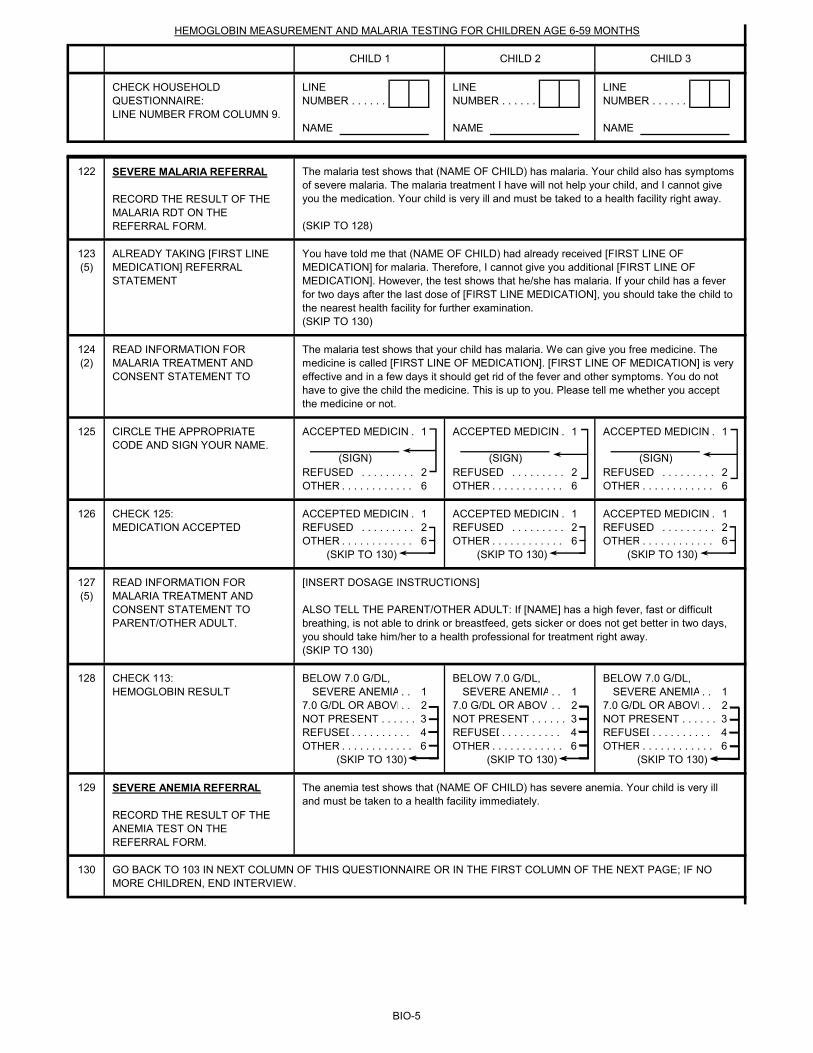
LINE LINE LINENUMBER . . . . . . NUMBER . . . . . . NUMBER . . . . . .
NAME NAME NAME
CHILD 1 CHILD 2 CHILD 3
CHECK HOUSEHOLD QUESTIONNAIRE:LINE NUMBER FROM COLUMN 9.
HEMOGLOBIN MEASUREMENT AND MALARIA TESTING FOR CHILDREN AGE 6-59 MONTHS
122
(SKIP TO 128)
123(5)
(SKIP TO 130)
124(2)
125 ACCEPTED MEDICIN . 1 ACCEPTED MEDICIN . 1 ACCEPTED MEDICIN . 1
REFUSED . . . . . . . . . 2 REFUSED . . . . . . . . . 2 REFUSED . . . . . . . . . 2OTHER . . . . . . . . . . . . 6 OTHER . . . . . . . . . . . . 6 OTHER . . . . . . . . . . . . 6
126 ACCEPTED MEDICIN . 1 ACCEPTED MEDICIN . 1 ACCEPTED MEDICIN . 1REFUSED . . . . . . . . . 2 REFUSED . . . . . . . . . 2 REFUSED . . . . . . . . . 2OTHER . . . . . . . . . . . . 6 OTHER . . . . . . . . . . . . 6 OTHER . . . . . . . . . . . . 6
(SKIP TO 130) (SKIP TO 130) (SKIP TO 130)
127(5)
(SKIP TO 130)
128 BELOW 7.0 G/DL, BELOW 7.0 G/DL, BELOW 7.0 G/DL, SEVERE ANEMIA . . 1 SEVERE ANEMIA . . 1 SEVERE ANEMIA . . 1
7.0 G/DL OR ABOVE. . 2 7.0 G/DL OR ABOVE. . 2 7.0 G/DL OR ABOVE. . 2NOT PRESENT . . . . . . 3 NOT PRESENT . . . . . . 3 NOT PRESENT . . . . . . 3REFUSED. . . . . . . . . . 4 REFUSED. . . . . . . . . . 4 REFUSED. . . . . . . . . . 4OTHER . . . . . . . . . . . . 6 OTHER . . . . . . . . . . . . 6 OTHER . . . . . . . . . . . . 6
(SKIP TO 130) (SKIP TO 130) (SKIP TO 130)
129
130
SEVERE MALARIA REFERRAL RECORD THE RESULT OF THE MALARIA RDT ON THE REFERRAL FORM.
SEVERE ANEMIA REFERRAL RECORD THE RESULT OF THE ANEMIA TEST ON THE REFERRAL FORM.
ALREADY TAKING [FIRST LINE MEDICATION] REFERRAL STATEMENT
CHECK 125:MEDICATION ACCEPTED
GO BACK TO 103 IN NEXT COLUMN OF THIS QUESTIONNAIRE OR IN THE FIRST COLUMN OF THE NEXT PAGE; IF NO MORE CHILDREN, END INTERVIEW.
The anemia test shows that (NAME OF CHILD) has severe anemia. Your child is very ill and must be taken to a health facility immediately.
The malaria test shows that (NAME OF CHILD) has malaria. Your child also has symptoms of severe malaria. The malaria treatment I have will not help your child, and I cannot give you the medication. Your child is very ill and must be taked to a health facility right away.
You have told me that (NAME OF CHILD) had already received [FIRST LINE OF MEDICATION] for malaria. Therefore, I cannot give you additional [FIRST LINE OF MEDICATION]. However, the test shows that he/she has malaria. If your child has a fever for two days after the last dose of [FIRST LINE MEDICATION], you should take the child to the nearest health facility for further examination.
CHECK 113: HEMOGLOBIN RESULT
READ INFORMATION FOR MALARIA TREATMENT AND CONSENT STATEMENT TO
The malaria test shows that your child has malaria. We can give you free medicine. The medicine is called [FIRST LINE OF MEDICATION]. [FIRST LINE OF MEDICATION] is very effective and in a few days it should get rid of the fever and other symptoms. You do not have to give the child the medicine. This is up to you. Please tell me whether you accept the medicine or not.
CIRCLE THE APPROPRIATE CODE AND SIGN YOUR NAME.
(SIGN) (SIGN) (SIGN)
[INSERT DOSAGE INSTRUCTIONS]
ALSO TELL THE PARENT/OTHER ADULT: If [NAME] has a high fever, fast or difficult breathing, is not able to drink or breastfeed, gets sicker or does not get better in two days, you should take him/her to a health professional for treatment right away.
READ INFORMATION FOR MALARIA TREATMENT AND CONSENT STATEMENT TO PARENT/OTHER ADULT.
BIO-5
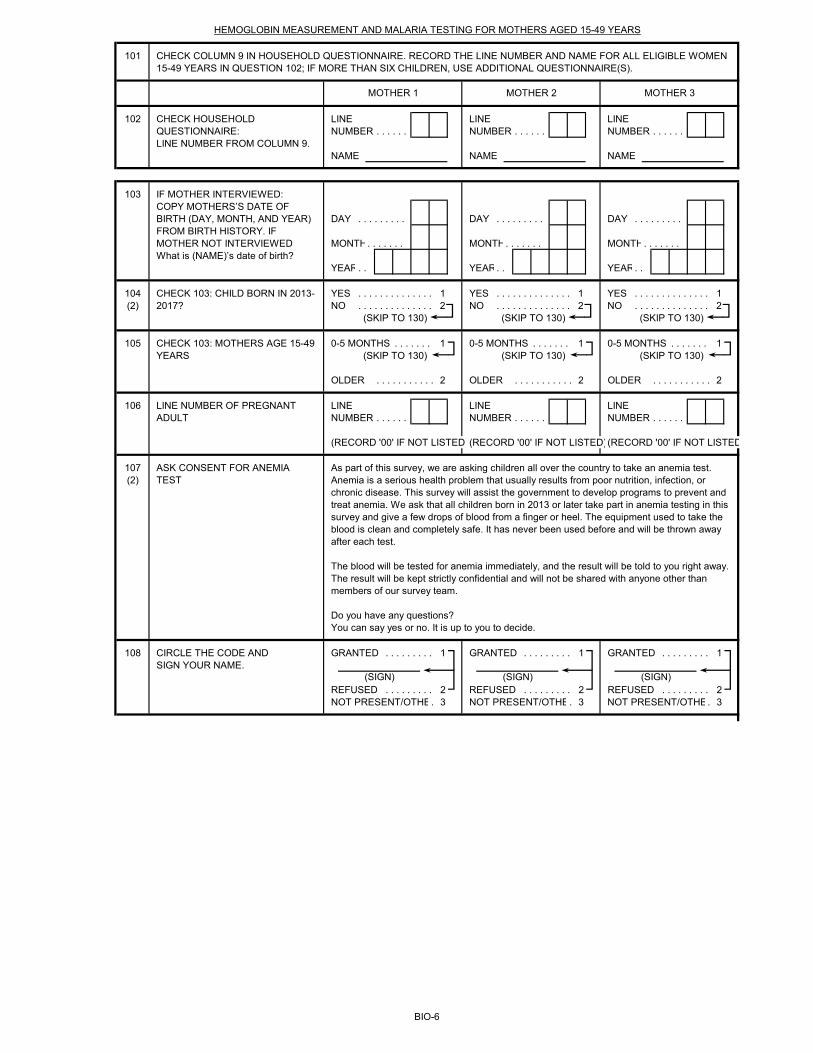
101
102 LINE LINE LINENUMBER . . . . . . NUMBER . . . . . . NUMBER . . . . . .
NAME NAME NAME
103
DAY . . . . . . . . . DAY . . . . . . . . . DAY . . . . . . . . .
MONTH. . . . . . . MONTH. . . . . . . MONTH. . . . . . .
YEAR. . YEAR. . YEAR. .
104 YES . . . . . . . . . . . . . . 1 YES . . . . . . . . . . . . . . 1 YES . . . . . . . . . . . . . . 1(2) NO . . . . . . . . . . . . . . 2 NO . . . . . . . . . . . . . . 2 NO . . . . . . . . . . . . . . 2
(SKIP TO 130) (SKIP TO 130) (SKIP TO 130)
105 0-5 MONTHS . . . . . . . 1 0-5 MONTHS . . . . . . . 1 0-5 MONTHS . . . . . . . 1(SKIP TO 130) (SKIP TO 130) (SKIP TO 130)
OLDER . . . . . . . . . . . 2 OLDER . . . . . . . . . . . 2 OLDER . . . . . . . . . . . 2
106 LINE LINE LINENUMBER . . . . . . NUMBER . . . . . . NUMBER . . . . . .
(RECORD '00' IF NOT LISTED)(RECORD '00' IF NOT LISTED)(RECORD '00' IF NOT LISTED
107(2)
108 GRANTED . . . . . . . . . 1 GRANTED . . . . . . . . . 1 GRANTED . . . . . . . . . 1
REFUSED . . . . . . . . . 2 REFUSED . . . . . . . . . 2 REFUSED . . . . . . . . . 2NOT PRESENT/OTHE. 3 NOT PRESENT/OTHE. 3 NOT PRESENT/OTHE. 3
IF MOTHER INTERVIEWED:COPY MOTHERS’S DATE OF BIRTH (DAY, MONTH, AND YEAR) FROM BIRTH HISTORY. IF MOTHER NOT INTERVIEWED What is (NAME)’s date of birth?
CHECK 103: CHILD BORN IN 2013-2017?
CHECK 103: MOTHERS AGE 15-49 YEARS
LINE NUMBER OF PREGNANT ADULT
ASK CONSENT FOR ANEMIA TEST
As part of this survey, we are asking children all over the country to take an anemia test. Anemia is a serious health problem that usually results from poor nutrition, infection, or chronic disease. This survey will assist the government to develop programs to prevent and treat anemia. We ask that all children born in 2013 or later take part in anemia testing in this survey and give a few drops of blood from a finger or heel. The equipment used to take the blood is clean and completely safe. It has never been used before and will be thrown away after each test.
The blood will be tested for anemia immediately, and the result will be told to you right away. The result will be kept strictly confidential and will not be shared with anyone other than members of our survey team.
Do you have any questions?You can say yes or no. It is up to you to decide.
CIRCLE THE CODE ANDSIGN YOUR NAME.
(SIGN) (SIGN) (SIGN)
CHECK HOUSEHOLD QUESTIONNAIRE:LINE NUMBER FROM COLUMN 9.
HEMOGLOBIN MEASUREMENT AND MALARIA TESTING FOR MOTHERS AGED 15-49 YEARS
CHECK COLUMN 9 IN HOUSEHOLD QUESTIONNAIRE. RECORD THE LINE NUMBER AND NAME FOR ALL ELIGIBLE WOMEN 15-49 YEARS IN QUESTION 102; IF MORE THAN SIX CHILDREN, USE ADDITIONAL QUESTIONNAIRE(S).
MOTHER 1 MOTHER 2 MOTHER 3
BIO-6
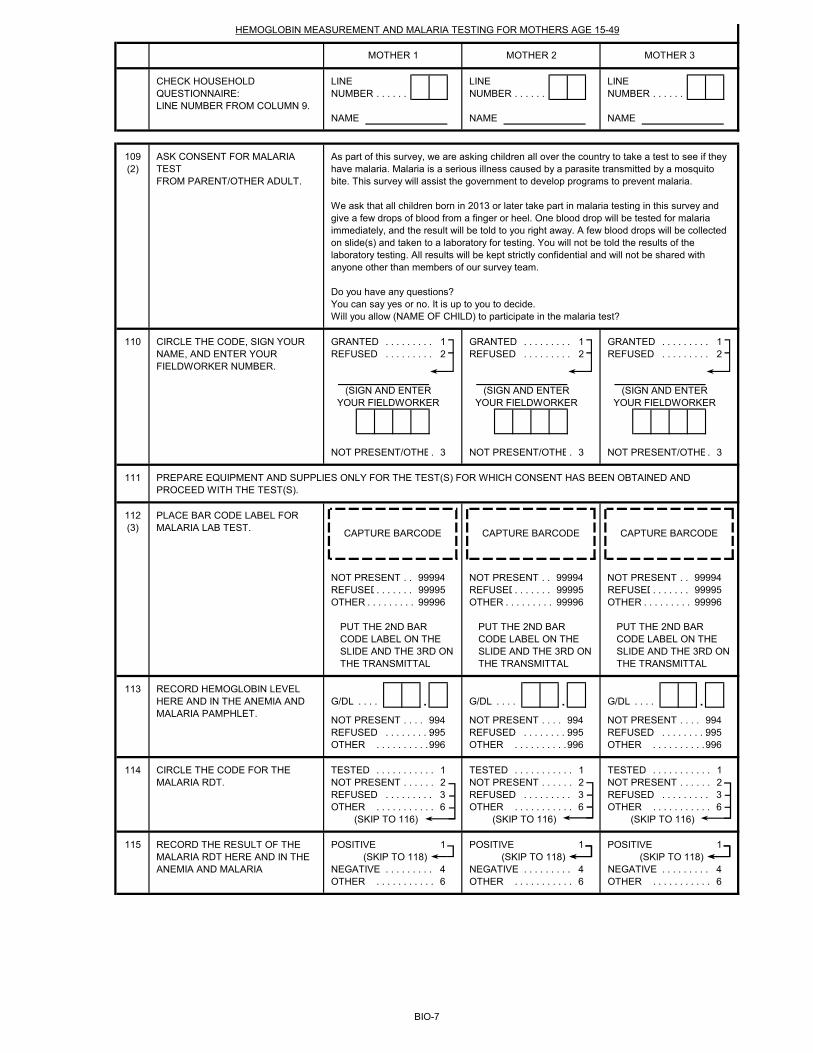
LINE LINE LINENUMBER . . . . . . NUMBER . . . . . . NUMBER . . . . . .
NAME NAME NAME
109(2)
110 GRANTED . . . . . . . . . 1 GRANTED . . . . . . . . . 1 GRANTED . . . . . . . . . 1REFUSED . . . . . . . . . 2 REFUSED . . . . . . . . . 2 REFUSED . . . . . . . . . 2
NOT PRESENT/OTHE. 3 NOT PRESENT/OTHE. 3 NOT PRESENT/OTHE. 3
111
112(3)
NOT PRESENT . . 99994 NOT PRESENT . . 99994 NOT PRESENT . . 99994REFUSED. . . . . . . 99995 REFUSED. . . . . . . 99995 REFUSED. . . . . . . 99995OTHER . . . . . . . . . 99996 OTHER . . . . . . . . . 99996 OTHER . . . . . . . . . 99996
113G/DL . . . . . G/DL . . . . . G/DL . . . . .
NOT PRESENT . . . . 994 NOT PRESENT . . . . 994 NOT PRESENT . . . . 994REFUSED . . . . . . . . . 995 REFUSED . . . . . . . . . 995 REFUSED . . . . . . . . . 995OTHER . . . . . . . . . . . 996 OTHER . . . . . . . . . . . 996 OTHER . . . . . . . . . . . 996
114 TESTED . . . . . . . . . . . 1 TESTED . . . . . . . . . . . 1 TESTED . . . . . . . . . . . 1NOT PRESENT . . . . . . 2 NOT PRESENT . . . . . . 2 NOT PRESENT . . . . . . 2REFUSED . . . . . . . . . 3 REFUSED . . . . . . . . . 3 REFUSED . . . . . . . . . 3OTHER . . . . . . . . . . . 6 OTHER . . . . . . . . . . . 6 OTHER . . . . . . . . . . . 6
(SKIP TO 116) (SKIP TO 116) (SKIP TO 116)
115 POSITIVE 1 POSITIVE 1 POSITIVE 1(SKIP TO 118) (SKIP TO 118) (SKIP TO 118)
NEGATIVE . . . . . . . . . 4 NEGATIVE . . . . . . . . . 4 NEGATIVE . . . . . . . . . 4OTHER . . . . . . . . . . . 6 OTHER . . . . . . . . . . . 6 OTHER . . . . . . . . . . . 6
MOTHER 1 MOTHER 2 MOTHER 3
PREPARE EQUIPMENT AND SUPPLIES ONLY FOR THE TEST(S) FOR WHICH CONSENT HAS BEEN OBTAINED AND PROCEED WITH THE TEST(S).
PLACE BAR CODE LABEL FOR MALARIA LAB TEST.
CAPTURE BARCODE CAPTURE BARCODE CAPTURE BARCODE
PUT THE 2ND BAR CODE LABEL ON THE SLIDE AND THE 3RD ON THE TRANSMITTAL
PUT THE 2ND BAR CODE LABEL ON THE SLIDE AND THE 3RD ON THE TRANSMITTAL
PUT THE 2ND BAR CODE LABEL ON THE SLIDE AND THE 3RD ON THE TRANSMITTAL
RECORD HEMOGLOBIN LEVEL HERE AND IN THE ANEMIA AND MALARIA PAMPHLET.
CIRCLE THE CODE FOR THE MALARIA RDT.
RECORD THE RESULT OF THE MALARIA RDT HERE AND IN THE ANEMIA AND MALARIA
CHECK HOUSEHOLD QUESTIONNAIRE:LINE NUMBER FROM COLUMN 9.
As part of this survey, we are asking children all over the country to take a test to see if they have malaria. Malaria is a serious illness caused by a parasite transmitted by a mosquito bite. This survey will assist the government to develop programs to prevent malaria.
We ask that all children born in 2013 or later take part in malaria testing in this survey and give a few drops of blood from a finger or heel. One blood drop will be tested for malaria immediately, and the result will be told to you right away. A few blood drops will be collected on slide(s) and taken to a laboratory for testing. You will not be told the results of the laboratory testing. All results will be kept strictly confidential and will not be shared with anyone other than members of our survey team.
Do you have any questions?You can say yes or no. It is up to you to decide.Will you allow (NAME OF CHILD) to participate in the malaria test?
CIRCLE THE CODE, SIGN YOUR NAME, AND ENTER YOUR FIELDWORKER NUMBER.
ASK CONSENT FOR MALARIA TESTFROM PARENT/OTHER ADULT.
(SIGN AND ENTER YOUR FIELDWORKER
(SIGN AND ENTER YOUR FIELDWORKER
(SIGN AND ENTER YOUR FIELDWORKER
HEMOGLOBIN MEASUREMENT AND MALARIA TESTING FOR MOTHERS AGE 15-49
BIO-7
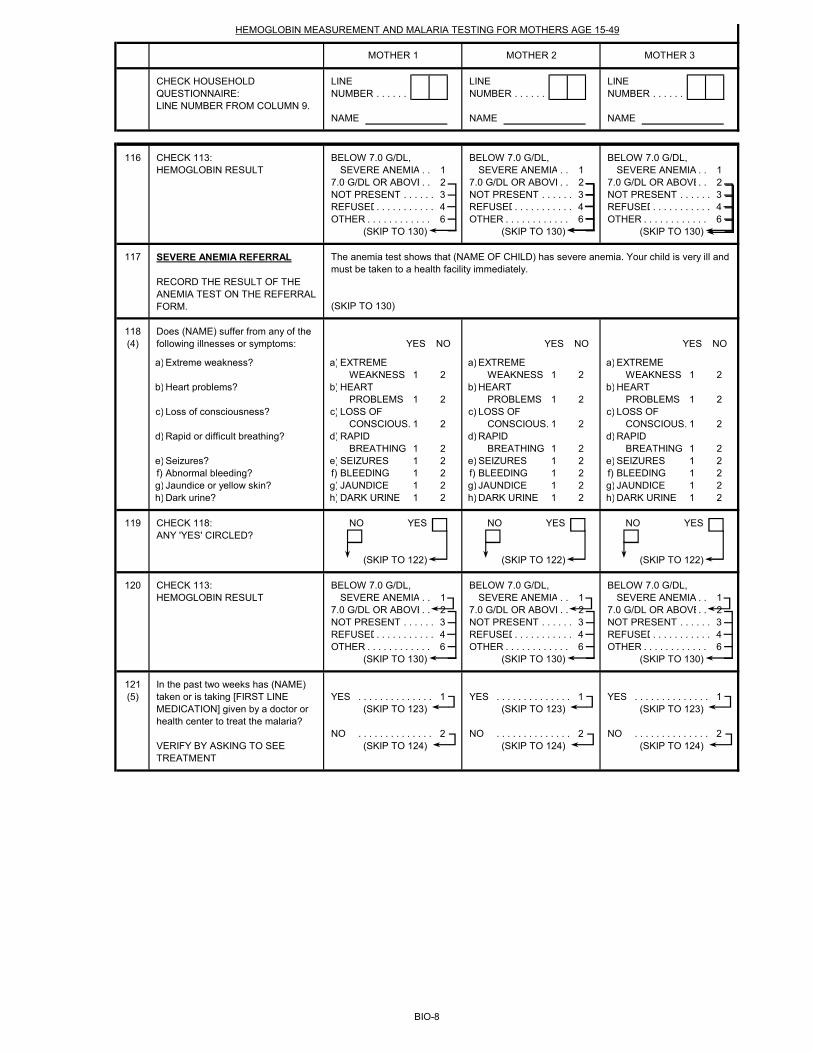
LINE LINE LINENUMBER . . . . . . NUMBER . . . . . . NUMBER . . . . . .
NAME NAME NAME
MOTHER 1 MOTHER 2 MOTHER 3
CHECK HOUSEHOLD QUESTIONNAIRE:LINE NUMBER FROM COLUMN 9.
HEMOGLOBIN MEASUREMENT AND MALARIA TESTING FOR MOTHERS AGE 15-49
116 BELOW 7.0 G/DL, BELOW 7.0 G/DL, BELOW 7.0 G/DL, SEVERE ANEMIA . . 1 SEVERE ANEMIA . . 1 SEVERE ANEMIA . . 1
7.0 G/DL OR ABOVE. . 2 7.0 G/DL OR ABOVE. . 2 7.0 G/DL OR ABOVE. . 2NOT PRESENT . . . . . . 3 NOT PRESENT . . . . . . 3 NOT PRESENT . . . . . . 3REFUSED. . . . . . . . . . . 4 REFUSED. . . . . . . . . . . 4 REFUSED. . . . . . . . . . . 4OTHER . . . . . . . . . . . . 6 OTHER . . . . . . . . . . . . 6 OTHER . . . . . . . . . . . . 6
(SKIP TO 130) (SKIP TO 130) (SKIP TO 130)
117
(SKIP TO 130)
118(4) YES NO YES NO YES NO
a) a) EXTREME a) EXTREME a) EXTREMEWEAKNESS 1 2 WEAKNESS 1 2 WEAKNESS 1 2
b) b) HEART b) HEART b) HEARTPROBLEMS 1 2 PROBLEMS 1 2 PROBLEMS 1 2
c) c) LOSS OF c) LOSS OF c) LOSS OF CONSCIOUS. 1 2 CONSCIOUS. 1 2 CONSCIOUS. 1 2
d) d) RAPID d) RAPID d) RAPIDBREATHING 1 2 BREATHING 1 2 BREATHING 1 2
e) e) SEIZURES 1 2 e) SEIZURES 1 2 e) SEIZURES 1 2f) f) BLEEDING 1 2 f) BLEEDING 1 2 f) BLEEDING 1 2g) g) JAUNDICE 1 2 g) JAUNDICE 1 2 g) JAUNDICE 1 2h) h) DARK URINE 1 2 h) DARK URINE 1 2 h) DARK URINE 1 2
119 NO YES NO YES NO YES
(SKIP TO 122) (SKIP TO 122) (SKIP TO 122)
120 BELOW 7.0 G/DL, BELOW 7.0 G/DL, BELOW 7.0 G/DL, SEVERE ANEMIA . . 1 SEVERE ANEMIA . . 1 SEVERE ANEMIA . . 1
7.0 G/DL OR ABOVE. . 2 7.0 G/DL OR ABOVE. . 2 7.0 G/DL OR ABOVE. . 2NOT PRESENT . . . . . . 3 NOT PRESENT . . . . . . 3 NOT PRESENT . . . . . . 3REFUSED. . . . . . . . . . . 4 REFUSED. . . . . . . . . . . 4 REFUSED. . . . . . . . . . . 4OTHER . . . . . . . . . . . . 6 OTHER . . . . . . . . . . . . 6 OTHER . . . . . . . . . . . . 6
(SKIP TO 130) (SKIP TO 130) (SKIP TO 130)
121(5) YES . . . . . . . . . . . . . . 1 YES . . . . . . . . . . . . . . 1 YES . . . . . . . . . . . . . . 1
(SKIP TO 123) (SKIP TO 123) (SKIP TO 123)
NO . . . . . . . . . . . . . . 2 NO . . . . . . . . . . . . . . 2 NO . . . . . . . . . . . . . . 2(SKIP TO 124) (SKIP TO 124) (SKIP TO 124)
Abnormal bleeding?Jaundice or yellow skin?Dark urine?
Extreme weakness?
Heart problems?
Loss of consciousness?
Rapid or difficult breathing?
Seizures?
VERIFY BY ASKING TO SEE TREATMENT
In the past two weeks has (NAME) taken or is taking [FIRST LINE MEDICATION] given by a doctor or health center to treat the malaria?
Does (NAME) suffer from any of the following illnesses or symptoms:
CHECK 118: ANY 'YES' CIRCLED?
CHECK 113: HEMOGLOBIN RESULT
The anemia test shows that (NAME OF CHILD) has severe anemia. Your child is very ill and must be taken to a health facility immediately.
CHECK 113: HEMOGLOBIN RESULT
SEVERE ANEMIA REFERRAL RECORD THE RESULT OF THE ANEMIA TEST ON THE REFERRAL FORM.
BIO-8
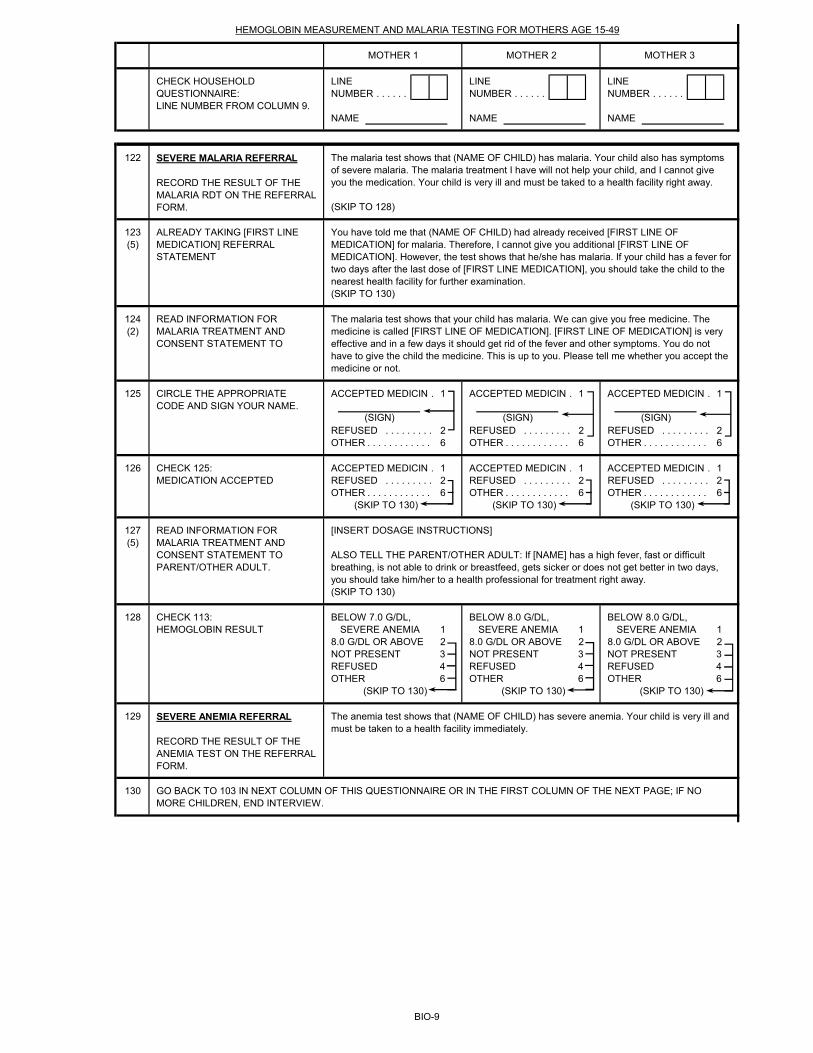
LINE LINE LINENUMBER . . . . . . NUMBER . . . . . . NUMBER . . . . . .
NAME NAME NAME
MOTHER 1 MOTHER 2 MOTHER 3
CHECK HOUSEHOLD QUESTIONNAIRE:LINE NUMBER FROM COLUMN 9.
HEMOGLOBIN MEASUREMENT AND MALARIA TESTING FOR MOTHERS AGE 15-49
122
(SKIP TO 128)
123(5)
(SKIP TO 130)
124(2)
125 ACCEPTED MEDICIN . 1 ACCEPTED MEDICIN . 1 ACCEPTED MEDICIN . 1
REFUSED . . . . . . . . . 2 REFUSED . . . . . . . . . 2 REFUSED . . . . . . . . . 2OTHER . . . . . . . . . . . . 6 OTHER . . . . . . . . . . . . 6 OTHER . . . . . . . . . . . . 6
126 ACCEPTED MEDICIN . 1 ACCEPTED MEDICIN . 1 ACCEPTED MEDICIN . 1REFUSED . . . . . . . . . 2 REFUSED . . . . . . . . . 2 REFUSED . . . . . . . . . 2OTHER . . . . . . . . . . . . 6 OTHER . . . . . . . . . . . . 6 OTHER . . . . . . . . . . . . 6
(SKIP TO 130) (SKIP TO 130) (SKIP TO 130)
127(5)
(SKIP TO 130)
128 BELOW 7.0 G/DL, BELOW 8.0 G/DL, BELOW 8.0 G/DL, SEVERE ANEMIA 1 SEVERE ANEMIA 1 SEVERE ANEMIA 1
8.0 G/DL OR ABOVE 2 8.0 G/DL OR ABOVE 2 8.0 G/DL OR ABOVE 2NOT PRESENT 3 NOT PRESENT 3 NOT PRESENT 3REFUSED 4 REFUSED 4 REFUSED 4OTHER 6 OTHER 6 OTHER 6
(SKIP TO 130) (SKIP TO 130) (SKIP TO 130)
129
130
CHECK 113: HEMOGLOBIN RESULT
SEVERE ANEMIA REFERRAL RECORD THE RESULT OF THE ANEMIA TEST ON THE REFERRAL FORM.
The anemia test shows that (NAME OF CHILD) has severe anemia. Your child is very ill and must be taken to a health facility immediately.
GO BACK TO 103 IN NEXT COLUMN OF THIS QUESTIONNAIRE OR IN THE FIRST COLUMN OF THE NEXT PAGE; IF NO MORE CHILDREN, END INTERVIEW.
CHECK 125:MEDICATION ACCEPTED
READ INFORMATION FOR MALARIA TREATMENT AND CONSENT STATEMENT TO PARENT/OTHER ADULT.
[INSERT DOSAGE INSTRUCTIONS]
ALSO TELL THE PARENT/OTHER ADULT: If [NAME] has a high fever, fast or difficult breathing, is not able to drink or breastfeed, gets sicker or does not get better in two days, you should take him/her to a health professional for treatment right away.
CIRCLE THE APPROPRIATE CODE AND SIGN YOUR NAME.
(SIGN) (SIGN) (SIGN)
SEVERE MALARIA REFERRAL RECORD THE RESULT OF THE MALARIA RDT ON THE REFERRAL FORM.
The malaria test shows that (NAME OF CHILD) has malaria. Your child also has symptoms of severe malaria. The malaria treatment I have will not help your child, and I cannot give you the medication. Your child is very ill and must be taked to a health facility right away.
ALREADY TAKING [FIRST LINE MEDICATION] REFERRAL STATEMENT
You have told me that (NAME OF CHILD) had already received [FIRST LINE OF MEDICATION] for malaria. Therefore, I cannot give you additional [FIRST LINE OF MEDICATION]. However, the test shows that he/she has malaria. If your child has a fever for two days after the last dose of [FIRST LINE MEDICATION], you should take the child to the nearest health facility for further examination.
READ INFORMATION FOR MALARIA TREATMENT AND CONSENT STATEMENT TO
The malaria test shows that your child has malaria. We can give you free medicine. The medicine is called [FIRST LINE OF MEDICATION]. [FIRST LINE OF MEDICATION] is very effective and in a few days it should get rid of the fever and other symptoms. You do not have to give the child the medicine. This is up to you. Please tell me whether you accept the medicine or not.
BIO-9

FIELDWORKER'S OBSERVATIONS
TO BE FILLED IN AFTER COMPLETING BIOMARKERS
SUPERVISOR'S OBSERVATIONS
EDITOR'S OBSERVATIONS
BIO-10
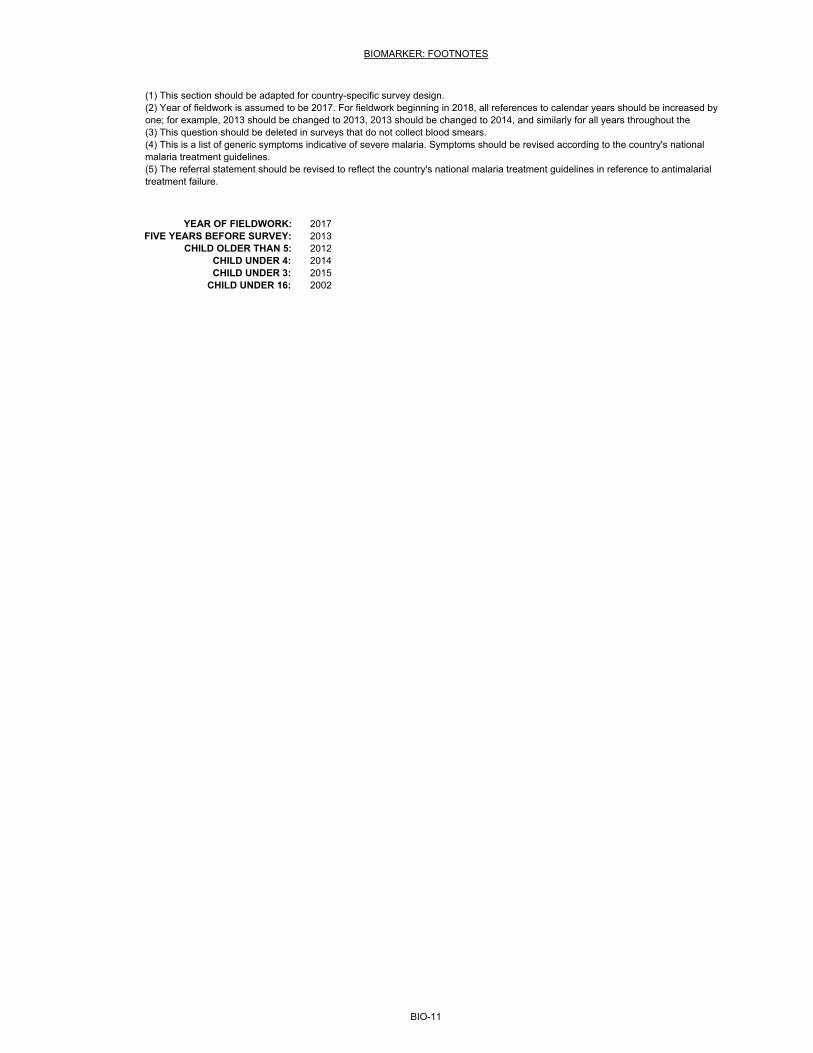
(5) The referral statement should be revised to reflect the country's national malaria treatment guidelines in reference to antimalarial treatment failure.
BIOMARKER: FOOTNOTES
(1) This section should be adapted for country-specific survey design.(2) Year of fieldwork is assumed to be 2017. For fieldwork beginning in 2018, all references to calendar years should be increased by one; for example, 2013 should be changed to 2013, 2013 should be changed to 2014, and similarly for all years throughout the (3) This question should be deleted in surveys that do not collect blood smears. (4) This is a list of generic symptoms indicative of severe malaria. Symptoms should be revised according to the country's national malaria treatment guidelines.
BIO-11
YEAR OF FIELDWORK: 2017FIVE YEARS BEFORE SURVEY: 2013
CHILD OLDER THAN 5: 2012CHILD UNDER 4: 2014CHILD UNDER 3: 2015
CHILD UNDER 16: 2002

FORMATTING DATE:ENGLISH LANGUAGE:
SOUTH SUDAN NATIONAL MALARIA CONTROL PROGRAMME
PLACE NAME
NAME OF HOUSEHOLD HEAD
CLUSTER NUMBER . . . . . . . . . . . . . . . . . . . . . . . . . . . . . . . . . . . . . . . . . . . . . . . . . . . . . . . . . . . . . . . . . .
HOUSEHOLD NUMBER . . . . . . . . . . . . . . . . . . . . . . . . . . . . . . . . . . . . . . . . . . . . . . . . . . . . . . . . . . . . . . .
DATE DAY
FIELDWORKER'S MONTHNAME
YEAR
NEXT VISIT:DATE TOTAL NUMBEROF VISITS
TIME
NOTES:TOTAL ELIGIBLE
CHILDREN
LANGUAGE OF LANGUAGE OF NATIVE LANGUAGE TRANSLATORQUESTIONNAIRE** INTERVIEW** OF RESPONDENT** (YES = 1, NO = 2)
LANGUAGE OF **LANGUAGE CODES:QUESTIONNAIRE** 01 ENGLISH
02 ARABIC
FIELDWORKER VISITS
1 2 3 FINAL VISIT
Note: Brackets [ ] indicate items that should be adapted on a country-specific basis.
SUPERVISOR
NAME NUMBER
November 2017Nov-17
MALARIA INDICATOR SURVEYBIOMARKER QUESTIONNAIRE
IDENTIFICATION (1)
BIO-1
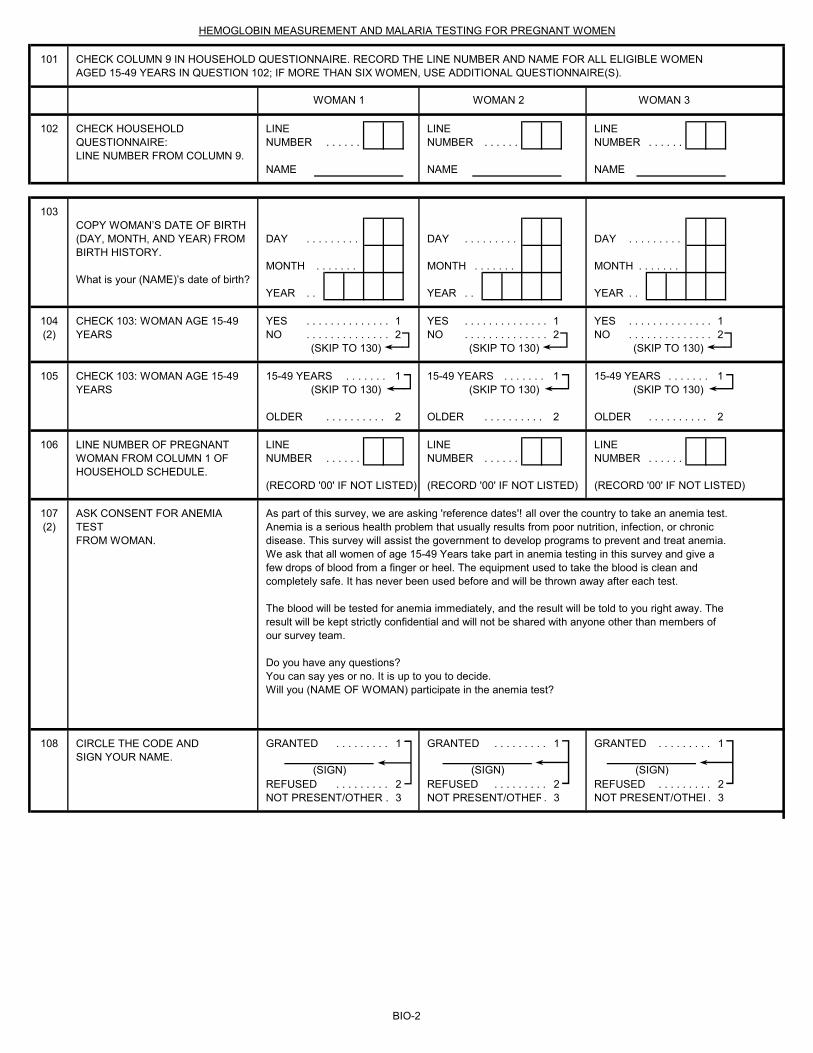
101
102 LINE LINE LINENUMBER . . . . . . NUMBER . . . . . . NUMBER . . . . . .
NAME NAME NAME
103
DAY . . . . . . . . . DAY . . . . . . . . . DAY . . . . . . . . .
MONTH . . . . . . . MONTH . . . . . . . MONTH . . . . . . .
YEAR . . YEAR . . YEAR . .
104 YES . . . . . . . . . . . . . . 1 YES . . . . . . . . . . . . . . 1 YES . . . . . . . . . . . . . . 1(2) NO . . . . . . . . . . . . . . 2 NO . . . . . . . . . . . . . . 2 NO . . . . . . . . . . . . . . 2
(SKIP TO 130) (SKIP TO 130) (SKIP TO 130)
105 15-49 YEARS . . . . . . . 1 15-49 YEARS . . . . . . . 1 15-49 YEARS . . . . . . . 1(SKIP TO 130) (SKIP TO 130) (SKIP TO 130)
OLDER . . . . . . . . . . 2 OLDER . . . . . . . . . . 2 OLDER . . . . . . . . . . 2
106 LINE LINE LINENUMBER . . . . . . NUMBER . . . . . . NUMBER . . . . . .
(RECORD '00' IF NOT LISTED) (RECORD '00' IF NOT LISTED) (RECORD '00' IF NOT LISTED)
107(2)
108 GRANTED . . . . . . . . . 1 GRANTED . . . . . . . . . 1 GRANTED . . . . . . . . . 1
REFUSED . . . . . . . . . 2 REFUSED . . . . . . . . . 2 REFUSED . . . . . . . . . 2NOT PRESENT/OTHER . 3 NOT PRESENT/OTHER. 3 NOT PRESENT/OTHER. 3
CHECK COLUMN 9 IN HOUSEHOLD QUESTIONNAIRE. RECORD THE LINE NUMBER AND NAME FOR ALL ELIGIBLE WOMEN AGED 15-49 YEARS IN QUESTION 102; IF MORE THAN SIX WOMEN, USE ADDITIONAL QUESTIONNAIRE(S).
HEMOGLOBIN MEASUREMENT AND MALARIA TESTING FOR PREGNANT WOMEN
WOMAN 1
(SIGN) (SIGN)
WOMAN 2 WOMAN 3
What is your (NAME)’s date of birth?
CHECK 103: WOMAN AGE 15-49 YEARS
CHECK HOUSEHOLD QUESTIONNAIRE:LINE NUMBER FROM COLUMN 9.
COPY WOMAN’S DATE OF BIRTH (DAY, MONTH, AND YEAR) FROM BIRTH HISTORY.
As part of this survey, we are asking 'reference dates'! all over the country to take an anemia test. Anemia is a serious health problem that usually results from poor nutrition, infection, or chronic disease. This survey will assist the government to develop programs to prevent and treat anemia. We ask that all women of age 15-49 Years take part in anemia testing in this survey and give a few drops of blood from a finger or heel. The equipment used to take the blood is clean and completely safe. It has never been used before and will be thrown away after each test.
The blood will be tested for anemia immediately, and the result will be told to you right away. The result will be kept strictly confidential and will not be shared with anyone other than members of our survey team.
Do you have any questions?You can say yes or no. It is up to you to decide.Will you (NAME OF WOMAN) participate in the anemia test?
CHECK 103: WOMAN AGE 15-49 YEARS
LINE NUMBER OF PREGNANT WOMAN FROM COLUMN 1 OF HOUSEHOLD SCHEDULE.
ASK CONSENT FOR ANEMIA TESTFROM WOMAN.
(SIGN)
CIRCLE THE CODE ANDSIGN YOUR NAME.
BIO-2
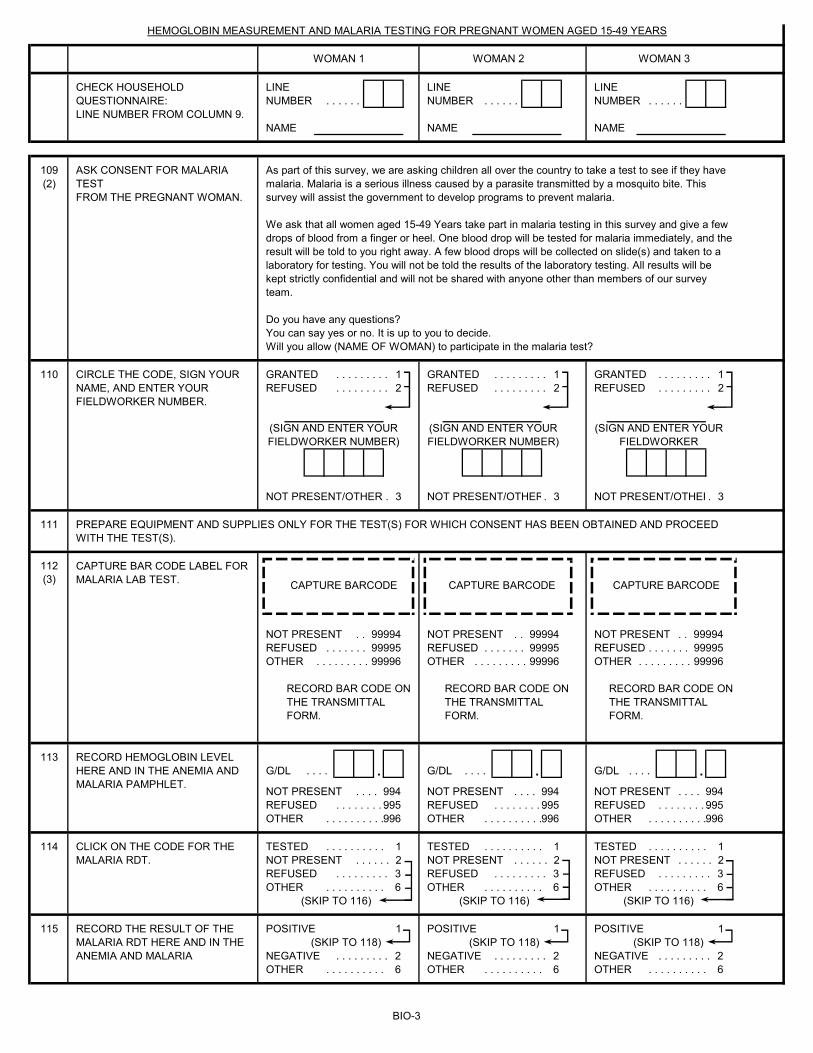
LINE LINE LINENUMBER . . . . . . NUMBER . . . . . . NUMBER . . . . . .
NAME NAME NAME
109(2)
110 GRANTED . . . . . . . . . 1 GRANTED . . . . . . . . . 1 GRANTED . . . . . . . . . 1REFUSED . . . . . . . . . 2 REFUSED . . . . . . . . . 2 REFUSED . . . . . . . . . 2
NOT PRESENT/OTHER . 3 NOT PRESENT/OTHER. 3 NOT PRESENT/OTHER. 3
111
112(3)
NOT PRESENT . . 99994 NOT PRESENT . . 99994 NOT PRESENT . . 99994REFUSED . . . . . . . 99995 REFUSED . . . . . . . 99995 REFUSED . . . . . . . 99995OTHER . . . . . . . . . 99996 OTHER . . . . . . . . . 99996 OTHER . . . . . . . . . 99996
113G/DL . . . . . G/DL . . . . . G/DL . . . . .
NOT PRESENT . . . . 994 NOT PRESENT . . . . 994 NOT PRESENT . . . . 994REFUSED . . . . . . . . . 995 REFUSED . . . . . . . . . 995 REFUSED . . . . . . . . . 995OTHER . . . . . . . . . . 996 OTHER . . . . . . . . . . 996 OTHER . . . . . . . . . . 996
114 TESTED . . . . . . . . . . 1 TESTED . . . . . . . . . . 1 TESTED . . . . . . . . . . 1NOT PRESENT . . . . . . 2 NOT PRESENT . . . . . . 2 NOT PRESENT . . . . . . 2REFUSED . . . . . . . . . 3 REFUSED . . . . . . . . . 3 REFUSED . . . . . . . . . 3OTHER . . . . . . . . . . 6 OTHER . . . . . . . . . . 6 OTHER . . . . . . . . . . 6
(SKIP TO 116) (SKIP TO 116) (SKIP TO 116)
115 POSITIVE 1 POSITIVE 1 POSITIVE 1(SKIP TO 118) (SKIP TO 118) (SKIP TO 118)
NEGATIVE . . . . . . . . . 2 NEGATIVE . . . . . . . . . 2 NEGATIVE . . . . . . . . . 2OTHER . . . . . . . . . . 6 OTHER . . . . . . . . . . 6 OTHER . . . . . . . . . . 6
CLICK ON THE CODE FOR THE MALARIA RDT.
RECORD THE RESULT OF THE MALARIA RDT HERE AND IN THE ANEMIA AND MALARIA
PREPARE EQUIPMENT AND SUPPLIES ONLY FOR THE TEST(S) FOR WHICH CONSENT HAS BEEN OBTAINED AND PROCEED WITH THE TEST(S).
RECORD BAR CODE ON THE TRANSMITTAL FORM.
HEMOGLOBIN MEASUREMENT AND MALARIA TESTING FOR PREGNANT WOMEN AGED 15-49 YEARS
As part of this survey, we are asking children all over the country to take a test to see if they have malaria. Malaria is a serious illness caused by a parasite transmitted by a mosquito bite. This survey will assist the government to develop programs to prevent malaria.
We ask that all women aged 15-49 Years take part in malaria testing in this survey and give a few drops of blood from a finger or heel. One blood drop will be tested for malaria immediately, and the result will be told to you right away. A few blood drops will be collected on slide(s) and taken to a laboratory for testing. You will not be told the results of the laboratory testing. All results will be kept strictly confidential and will not be shared with anyone other than members of our survey team.
Do you have any questions?You can say yes or no. It is up to you to decide.Will you allow (NAME OF WOMAN) to participate in the malaria test?
RECORD BAR CODE ON THE TRANSMITTAL FORM.
RECORD BAR CODE ON THE TRANSMITTAL FORM.
RECORD HEMOGLOBIN LEVEL HERE AND IN THE ANEMIA AND MALARIA PAMPHLET.
CAPTURE BARCODE
(SIGN AND ENTER YOUR FIELDWORKER NUMBER)
(SIGN AND ENTER YOUR FIELDWORKER NUMBER)
(SIGN AND ENTER YOUR FIELDWORKER
ASK CONSENT FOR MALARIA TESTFROM THE PREGNANT WOMAN.
CHECK HOUSEHOLD QUESTIONNAIRE:LINE NUMBER FROM COLUMN 9.
CAPTURE BAR CODE LABEL FOR MALARIA LAB TEST.
CIRCLE THE CODE, SIGN YOUR NAME, AND ENTER YOUR FIELDWORKER NUMBER.
CAPTURE BARCODE CAPTURE BARCODE
WOMAN 1 WOMAN 2 WOMAN 3
BIO-3
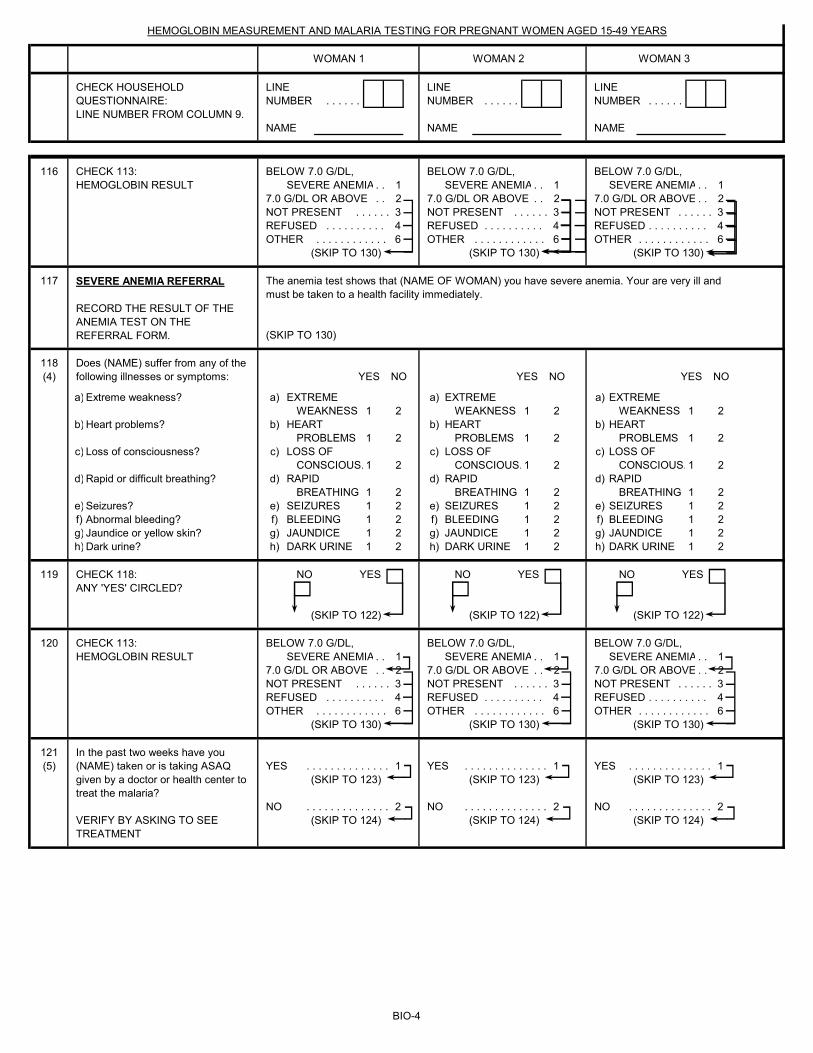
LINE LINE LINENUMBER . . . . . . NUMBER . . . . . . NUMBER . . . . . .
NAME NAME NAME
HEMOGLOBIN MEASUREMENT AND MALARIA TESTING FOR PREGNANT WOMEN AGED 15-49 YEARS
CHECK HOUSEHOLD QUESTIONNAIRE:LINE NUMBER FROM COLUMN 9.
WOMAN 1 WOMAN 2 WOMAN 3
116 BELOW 7.0 G/DL, BELOW 7.0 G/DL, BELOW 7.0 G/DL, SEVERE ANEMIA . . 1 SEVERE ANEMIA . . 1 SEVERE ANEMIA . . 1
7.0 G/DL OR ABOVE . . 2 7.0 G/DL OR ABOVE . . 2 7.0 G/DL OR ABOVE . . 2NOT PRESENT . . . . . . 3 NOT PRESENT . . . . . . 3 NOT PRESENT . . . . . . 3REFUSED . . . . . . . . . . 4 REFUSED . . . . . . . . . . 4 REFUSED . . . . . . . . . . 4OTHER . . . . . . . . . . . . 6 OTHER . . . . . . . . . . . . 6 OTHER . . . . . . . . . . . . 6
(SKIP TO 130) (SKIP TO 130) (SKIP TO 130)
117
(SKIP TO 130)
118(4) YES NO YES NO YES NO
a) a) EXTREME a) EXTREME a) EXTREMEWEAKNESS 1 2 WEAKNESS 1 2 WEAKNESS 1 2
b) b) HEART b) HEART b) HEARTPROBLEMS 1 2 PROBLEMS 1 2 PROBLEMS 1 2
c) c) LOSS OF c) LOSS OF c) LOSS OF CONSCIOUS. 1 2 CONSCIOUS. 1 2 CONSCIOUS. 1 2
d) d) RAPID d) RAPID d) RAPIDBREATHING 1 2 BREATHING 1 2 BREATHING 1 2
e) e) SEIZURES 1 2 e) SEIZURES 1 2 e) SEIZURES 1 2f) f) BLEEDING 1 2 f) BLEEDING 1 2 f) BLEEDING 1 2g) g) JAUNDICE 1 2 g) JAUNDICE 1 2 g) JAUNDICE 1 2h) h) DARK URINE 1 2 h) DARK URINE 1 2 h) DARK URINE 1 2
119 NO YES NO YES NO YES
(SKIP TO 122) (SKIP TO 122) (SKIP TO 122)
120 BELOW 7.0 G/DL, BELOW 7.0 G/DL, BELOW 7.0 G/DL, SEVERE ANEMIA . . 1 SEVERE ANEMIA . . 1 SEVERE ANEMIA . . 1
7.0 G/DL OR ABOVE . . 2 7.0 G/DL OR ABOVE . . 2 7.0 G/DL OR ABOVE . . 2NOT PRESENT . . . . . . 3 NOT PRESENT . . . . . . 3 NOT PRESENT . . . . . . 3REFUSED . . . . . . . . . . 4 REFUSED . . . . . . . . . . 4 REFUSED . . . . . . . . . . 4OTHER . . . . . . . . . . . . 6 OTHER . . . . . . . . . . . . 6 OTHER . . . . . . . . . . . . 6
(SKIP TO 130) (SKIP TO 130) (SKIP TO 130)
121(5) YES . . . . . . . . . . . . . . 1 YES . . . . . . . . . . . . . . 1 YES . . . . . . . . . . . . . . 1
(SKIP TO 123) (SKIP TO 123) (SKIP TO 123)
NO . . . . . . . . . . . . . . 2 NO . . . . . . . . . . . . . . 2 NO . . . . . . . . . . . . . . 2(SKIP TO 124) (SKIP TO 124) (SKIP TO 124)
CHECK 113: HEMOGLOBIN RESULT
CHECK 118: ANY 'YES' CIRCLED?
SEVERE ANEMIA REFERRAL RECORD THE RESULT OF THE ANEMIA TEST ON THE REFERRAL FORM.
VERIFY BY ASKING TO SEE TREATMENT
CHECK 113: HEMOGLOBIN RESULT
In the past two weeks have you (NAME) taken or is taking ASAQ given by a doctor or health center to treat the malaria?
The anemia test shows that (NAME OF WOMAN) you have severe anemia. Your are very ill and must be taken to a health facility immediately.
Does (NAME) suffer from any of the following illnesses or symptoms:
Dark urine?Jaundice or yellow skin?Abnormal bleeding?Seizures?
Rapid or difficult breathing?
Loss of consciousness?
Heart problems?
Extreme weakness?
BIO-4
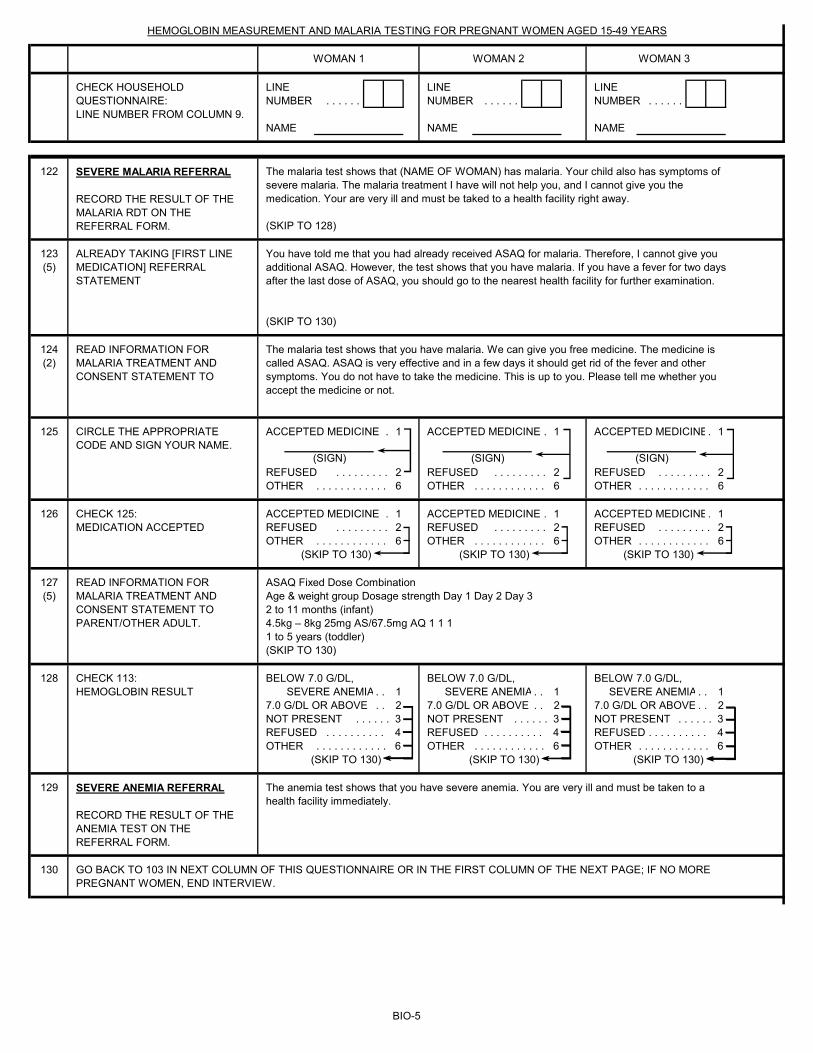
LINE LINE LINENUMBER . . . . . . NUMBER . . . . . . NUMBER . . . . . .
NAME NAME NAME
HEMOGLOBIN MEASUREMENT AND MALARIA TESTING FOR PREGNANT WOMEN AGED 15-49 YEARS
CHECK HOUSEHOLD QUESTIONNAIRE:LINE NUMBER FROM COLUMN 9.
WOMAN 1 WOMAN 2 WOMAN 3
122
(SKIP TO 128)
123(5)
(SKIP TO 130)
124(2)
125 ACCEPTED MEDICINE . 1 ACCEPTED MEDICINE . 1 ACCEPTED MEDICINE. 1
REFUSED . . . . . . . . . 2 REFUSED . . . . . . . . . 2 REFUSED . . . . . . . . . 2OTHER . . . . . . . . . . . . 6 OTHER . . . . . . . . . . . . 6 OTHER . . . . . . . . . . . . 6
126 ACCEPTED MEDICINE . 1 ACCEPTED MEDICINE . 1 ACCEPTED MEDICINE. 1REFUSED . . . . . . . . . 2 REFUSED . . . . . . . . . 2 REFUSED . . . . . . . . . 2OTHER . . . . . . . . . . . . 6 OTHER . . . . . . . . . . . . 6 OTHER . . . . . . . . . . . . 6
(SKIP TO 130) (SKIP TO 130) (SKIP TO 130)
127(5)
(SKIP TO 130)
128 BELOW 7.0 G/DL, BELOW 7.0 G/DL, BELOW 7.0 G/DL, SEVERE ANEMIA . . 1 SEVERE ANEMIA . . 1 SEVERE ANEMIA . . 1
7.0 G/DL OR ABOVE . . 2 7.0 G/DL OR ABOVE . . 2 7.0 G/DL OR ABOVE . . 2NOT PRESENT . . . . . . 3 NOT PRESENT . . . . . . 3 NOT PRESENT . . . . . . 3REFUSED . . . . . . . . . . 4 REFUSED . . . . . . . . . . 4 REFUSED . . . . . . . . . . 4OTHER . . . . . . . . . . . . 6 OTHER . . . . . . . . . . . . 6 OTHER . . . . . . . . . . . . 6
(SKIP TO 130) (SKIP TO 130) (SKIP TO 130)
129
130
The anemia test shows that you have severe anemia. You are very ill and must be taken to a health facility immediately.
The malaria test shows that (NAME OF WOMAN) has malaria. Your child also has symptoms of severe malaria. The malaria treatment I have will not help you, and I cannot give you the medication. Your are very ill and must be taked to a health facility right away.
You have told me that you had already received ASAQ for malaria. Therefore, I cannot give you additional ASAQ. However, the test shows that you have malaria. If you have a fever for two days after the last dose of ASAQ, you should go to the nearest health facility for further examination.
CHECK 113: HEMOGLOBIN RESULT
READ INFORMATION FOR MALARIA TREATMENT AND CONSENT STATEMENT TO
The malaria test shows that you have malaria. We can give you free medicine. The medicine is called ASAQ. ASAQ is very effective and in a few days it should get rid of the fever and other symptoms. You do not have to take the medicine. This is up to you. Please tell me whether you accept the medicine or not.
CIRCLE THE APPROPRIATE CODE AND SIGN YOUR NAME.
(SIGN) (SIGN) (SIGN)
ASAQ Fixed Dose CombinationAge & weight group Dosage strength Day 1 Day 2 Day 32 to 11 months (infant)4.5kg – 8kg 25mg AS/67.5mg AQ 1 1 11 to 5 years (toddler)
READ INFORMATION FOR MALARIA TREATMENT AND CONSENT STATEMENT TO PARENT/OTHER ADULT.
GO BACK TO 103 IN NEXT COLUMN OF THIS QUESTIONNAIRE OR IN THE FIRST COLUMN OF THE NEXT PAGE; IF NO MORE PREGNANT WOMEN, END INTERVIEW.
SEVERE MALARIA REFERRAL RECORD THE RESULT OF THE MALARIA RDT ON THE REFERRAL FORM.
SEVERE ANEMIA REFERRAL RECORD THE RESULT OF THE ANEMIA TEST ON THE REFERRAL FORM.
ALREADY TAKING [FIRST LINE MEDICATION] REFERRAL STATEMENT
CHECK 125:MEDICATION ACCEPTED
BIO-5
101
102 LINE LINE LINENUMBER . . . . . . NUMBER . . . . . . NUMBER . . . . . . . .
NAME NAME NAME
103
DAY . . . . . . . . . DAY . . . . . . . . . . DAY . . . . . . . . . . .
MONTH . . . . . . . MONTH . . . . . . . MONTH . . . . . . . . .
YEAR . . YEAR. . . YEAR . .
104 YES . . . . . . . . . . . . . . . . 1 YES . . . . . . . . . . . . . . . . 1 YES . . . . . . . . . . . . . . . . 1(2) NO . . . . . . . . . . . . . . . . 2 NO . . . . . . . . . . . . . . . . 2 NO . . . . . . . . . . . . . . . . 2
(SKIP TO 130) (SKIP TO 130) (SKIP TO 130)
105 15-49 YEARS . . . . . . . . . . 1 15-49 YEARS . . . . . . . . . 1 15-49 YEARS . . . . . . . . . 1(SKIP TO 130) (SKIP TO 130) (SKIP TO 130)
OLDER . . . . . . . . . . . . . 2 OLDER . . . . . . . . . . . . 2 OLDER . . . . . . . . . . . . . 2
106 LINE LINE LINENUMBER . . . . . . NUMBER . . . . . . NUMBER . . . . . . . .
(RECORD '00' IF NOT LISTED) (RECORD '00' IF NOT LISTED) (RECORD '00' IF NOT LISTED)
107(2)
108 GRANTED . . . . . . . . . . . 1 GRANTED . . . . . . . . . . . 1 GRANTED . . . . . . . . . . . 1
REFUSED . . . . . . . . . . . 2 REFUSED . . . . . . . . . . . 2 REFUSED . . . . . . . . . . . 2NOT PRESENT/OTHER . 3 NOT PRESENT/OTHER . 3 NOT PRESENT/OTHER . 3
CHECK HOUSEHOLD QUESTIONNAIRE:LINE NUMBER FROM COLUMN 9.
HEMOGLOBIN MEASUREMENT AND MALARIA TESTING FOR MOTHERS AGED 15-49 YEARS
CHECK COLUMN 9 IN HOUSEHOLD QUESTIONNAIRE. RECORD THE LINE NUMBER AND NAME FOR ALL ELIGIBLE WOMEN 15-49 YEARS IN QUESTION 102; IF MORE THAN SIX WOMEN, USE ADDITIONAL QUESTIONNAIRE(S).
MOTHER 4 MOTHER 5 MOTHER 6
COPY MOTHERS’S DATE OF BIRTH (DAY, MONTH, AND YEAR) FROM BIRTH HISTORY.
What is your (NAME)’s date of birth?
CHECK 103: MOTHERS AGE 15-49 YEARS
CHECK 103: MOTHERS AGE 15-49 YEARS
LINE NUMBER OF PREGNANT ADULT
ASK CONSENT FOR ANEMIA TEST
As part of this survey, we are asking 'reference dates'! all over the country to take an anemia test. Anemia is a serious health problem that usually results from poor nutrition, infection, or chronic disease. This survey will assist the government to develop programs to prevent and treat anemia. We ask that all women of age 15-49 Years take part in anemia testing in this survey and give a few drops of blood from a finger or heel. The equipment used to take the blood is clean and completely safe. It has never been used before and will be thrown away after each test.
The blood will be tested for anemia immediately, and the result will be told to you right away. The result will be kept strictly confidential and will not be shared with anyone other than members of our survey team.
Do you have any questions?You can say yes or no. It is up to you to decide.Will you (NAME OF WOMAN) participate in the anemia test?
CIRCLE THE CODE ANDSIGN YOUR NAME.
(SIGN) (SIGN) (SIGN)
BIO-6
LINE LINE LINENUMBER . . . . . . NUMBER . . . . . . NUMBER . . . . . . . .
NAME NAME NAME
109(2)
110 GRANTED . . . . . . . . . . . 1 GRANTED . . . . . . . . . . . 1 GRANTED . . . . . . . . . . . 1REFUSED . . . . . . . . . . . 2 REFUSED . . . . . . . . . . . 2 REFUSED . . . . . . . . . . . 2
NOT PRESENT/OTHER . 3 NOT PRESENT/OTHER . 3 NOT PRESENT/OTHER . 3
111
112(3)
NOT PRESENT . . . . . 99994 NOT PRESENT . . 99994 NOT PRESENT . . . . 99994REFUSED . . . . . . . . . . 99995 REFUSED . . . . . . . 99995 REFUSED . . . . . . . . . 99995OTHER . . . . . . . . . . . 99996 OTHER . . . . . . . . . 99996 OTHER . . . . . . . . . . . 99996
113G/DL . . . . . G/DL . . . . . . G/DL . . . . .
NOT PRESENT . . . . . . 994 NOT PRESENT . . . . . . 994 NOT PRESENT . . . . . . 994REFUSED . . . . . . . . . . . 995 REFUSED . . . . . . . . . . . 995 REFUSED . . . . . . . . . . . 995OTHER . . . . . . . . . . . . . 996 OTHER . . . . . . . . . . . . 996 OTHER . . . . . . . . . . . . . 996
114 TESTED . . . . . . . . . . . . . 1 TESTED . . . . . . . . . . . . 1 TESTED . . . . . . . . . . . . . 1NOT PRESENT . . . . . . . . 2 NOT PRESENT . . . . . . . 2 NOT PRESENT . . . . . . . . 2REFUSED . . . . . . . . . . . 3 REFUSED . . . . . . . . . . . 3 REFUSED . . . . . . . . . . . 3OTHER . . . . . . . . . . . . . 6 OTHER . . . . . . . . . . . . 6 OTHER . . . . . . . . . . . . . 6
(SKIP TO 116) (SKIP TO 116) (SKIP TO 116)
115 POSITIVE 1 POSITIVE 1 POSITIVE 1(SKIP TO 118) (SKIP TO 118) (SKIP TO 118)
NEGATIVE . . . . . . . . . . . 4 NEGATIVE . . . . . . . . . . . 4 NEGATIVE . . . . . . . . . . . 4OTHER . . . . . . . . . . . . . 6 OTHER . . . . . . . . . . . . 6 OTHER . . . . . . . . . . . . . 6
HEMOGLOBIN MEASUREMENT AND MALARIA TESTING FOR MOTHERS AGE 15-49
CHECK HOUSEHOLD QUESTIONNAIRE:LINE NUMBER FROM COLUMN 9.
As part of this survey, we are asking children all over the country to take a test to see if they have malaria. Malaria is a serious illness caused by a parasite transmitted by a mosquito bite. This survey will assist the government to develop programs to prevent malaria.
We ask that all women aged 15-49 Years take part in malaria testing in this survey and give a few drops of blood from a finger or heel. One blood drop will be tested for malaria immediately, and the result will be told to you right away. A few blood drops will be collected on slide(s) and taken to a laboratory for testing. You will not be told the results of the laboratory testing. All results will be kept strictly confidential and will not be shared with anyone other than members of our survey team.
Do you have any questions?You can say yes or no. It is up to you to decide.Will you allow (NAME OF WOMAN) to participate in the malaria test?
CIRCLE THE CODE, SIGN YOUR NAME, AND ENTER YOUR FIELDWORKER NUMBER.
ASK CONSENT FOR MALARIA TESTFROM PREGNANT WOMAN.
(ENTER YOUR FIELDWORKER NUMBER)
(ENTER YOUR FIELDWORKER NUMBER)
(ENTER YOUR FIELDWORKER NUMBER)
PREPARE EQUIPMENT AND SUPPLIES ONLY FOR THE TEST(S) FOR WHICH CONSENT HAS BEEN OBTAINED AND PROCEED WITH THE TEST(S).
CAPTURE BAR CODE LABEL FOR MALARIA LAB TEST.
CAPTURE BARCODE CAPTURE BARCODE CAPTURE BARCODE
RECORD BAR CODE ON THE TRANSMITTAL FORM.
RECORD BAR CODE ON THE TRANSMITTAL FORM.
RECORD BAR CODE ON THE TRANSMITTAL FORM.
RECORD HEMOGLOBIN LEVEL HERE AND IN THE ANEMIA AND MALARIA PAMPHLET.
CIRCLE THE CODE FOR THE MALARIA RDT.
CLICK THE RESULT OF THE MALARIA RDT HERE AND IN THE ANEMIA AND MALARIA
MOTHER 1 MOTHER 2 MOTHER 3
BIO-7
LINE LINE LINENUMBER . . . . . . NUMBER . . . . . . NUMBER . . . . . . . .
NAME NAME NAME
HEMOGLOBIN MEASUREMENT AND MALARIA TESTING FOR MOTHERS AGE 15-49
CHECK HOUSEHOLD QUESTIONNAIRE:LINE NUMBER FROM COLUMN 9.
MOTHER 1 MOTHER 2 MOTHER 3
116 BELOW 7.0 G/DL, BELOW 7.0 G/DL, BELOW 7.0 G/DL, SEVERE ANEMIA . . 1 SEVERE ANEMIA . . . . 1 SEVERE ANEMIA . . 1
7.0 G/DL OR ABOVE . . 2 7.0 G/DL OR ABOVE. . . . 2 7.0 G/DL OR ABOVE . . 2NOT PRESENT . . . . . . . . 3 NOT PRESENT . . . . . . . 3 NOT PRESENT . . . . . . . . 3REFUSED . . . . . . . . . . . . . 4 REFUSED . . . . . . . . . . . . 4 REFUSED . . . . . . . . . . . . . 4OTHER . . . . . . . . . . . . . . . 6 OTHER . . . . . . . . . . . . . . 6 OTHER . . . . . . . . . . . . . . 6
(SKIP TO 130) (SKIP TO 130) (SKIP TO 130)
117
(SKIP TO 130)
118(4) YES NO YES NO YES NO
a) a) EXTREME a) EXTREME a) EXTREMEWEAKNESS 1 2 WEAKNESS 1 2 WEAKNESS 1 2
b) b) HEART b) HEART b) HEARTPROBLEMS 1 2 PROBLEMS 1 2 PROBLEMS 1 2
c) c) LOSS OF c) LOSS OF c) LOSS OF CONSCIOUS. 1 2 CONSCIOUS. 1 2 CONSCIOUS. 1 2
d) d) RAPID d) RAPID d) RAPIDBREATHING 1 2 BREATHING 1 2 BREATHING 1 2
e) e) SEIZURES 1 2 e) SEIZURES 1 2 e) SEIZURES 1 2f) f) BLEEDING 1 2 f) BLEEDING 1 2 f) BLEEDING 1 2g) g) JAUNDICE 1 2 g) JAUNDICE 1 2 g) JAUNDICE 1 2h) h) DARK URINE 1 2 h) DARK URINE 1 2 h) DARK URINE 1 2
119 NO YES NO YES NO YES
(SKIP TO 122) (SKIP TO 122) (SKIP TO 122)
120 BELOW 7.0 G/DL, BELOW 7.0 G/DL, BELOW 7.0 G/DL, SEVERE ANEMIA . . 1 SEVERE ANEMIA . . . . 1 SEVERE ANEMIA . . 1
7.0 G/DL OR ABOVE . . 2 7.0 G/DL OR ABOVE. . . . 2 7.0 G/DL OR ABOVE . . 2NOT PRESENT . . . . . . . . 3 NOT PRESENT . . . . . . . 3 NOT PRESENT . . . . . . . . 3REFUSED . . . . . . . . . . . . . 4 REFUSED . . . . . . . . . . . . 4 REFUSED . . . . . . . . . . . . . 4OTHER . . . . . . . . . . . . . . . 6 OTHER . . . . . . . . . . . . . . 6 OTHER . . . . . . . . . . . . . . 6
(SKIP TO 130) (SKIP TO 130) (SKIP TO 130)
121(5) YES . . . . . . . . . . . . . . . . 1 YES . . . . . . . . . . . . . . . . 1 YES . . . . . . . . . . . . . . . . 1
(SKIP TO 123) (SKIP TO 123) (SKIP TO 123)
NO . . . . . . . . . . . . . . . . 2 NO . . . . . . . . . . . . . . . . 2 NO . . . . . . . . . . . . . . . . 2(SKIP TO 124) (SKIP TO 124) (SKIP TO 124)
CHECK 118: ANY 'YES' CLICKED?
CHECK 113: HEMOGLOBIN RESULT
The anemia test shows that (NAME OF WOMAN) you have severe anemia. Your are very ill and must be taken to a health facility immediately.
CHECK 113: HEMOGLOBIN RESULT
SEVERE ANEMIA REFERRAL RECORD THE RESULT OF THE ANEMIA TEST ON THE REFERRAL FORM.
VERIFY BY ASKING TO SEE TREATMENT
In the past two weeks have you (NAME) taken or is taking ASAQ given by a doctor or health center to treat the malaria?
Does (NAME) suffer from any of the following illnesses or symptoms:
Abnormal bleeding?Jaundice or yellow skin?Dark urine?
Extreme weakness?
Heart problems?
Loss of consciousness?
Rapid or difficult breathing?
Seizures?
BIO-8
LINE LINE LINENUMBER . . . . . . NUMBER . . . . . . NUMBER . . . . . . . .
NAME NAME NAME
HEMOGLOBIN MEASUREMENT AND MALARIA TESTING FOR MOTHERS AGE 15-49
CHECK HOUSEHOLD QUESTIONNAIRE:LINE NUMBER FROM COLUMN 9.
MOTHER 1 MOTHER 2 MOTHER 3
122
(SKIP TO 128)
123(5)
(SKIP TO 130)
124(2)
125 ACCEPTED MEDICINE . 1 ACCEPTED MEDICINE . 1 ACCEPTED MEDICINE . 1
REFUSED . . . . . . . . . . . 2 REFUSED . . . . . . . . . . . 2 REFUSED . . . . . . . . . . . 2OTHER . . . . . . . . . . . . . . . 6 OTHER . . . . . . . . . . . . . . 6 OTHER . . . . . . . . . . . . . . 6
126 ACCEPTED MEDICINE . 1 ACCEPTED MEDICINE . 1 ACCEPTED MEDICINE . 1REFUSED . . . . . . . . . . . 2 REFUSED . . . . . . . . . . . 2 REFUSED . . . . . . . . . . . 2OTHER . . . . . . . . . . . . . . . 6 OTHER . . . . . . . . . . . . . . 6 OTHER . . . . . . . . . . . . . . 6
(SKIP TO 130) (SKIP TO 130) (SKIP TO 130)
127(5)
(SKIP TO 130)
128 BELOW 7.0 G/DL, BELOW 8.0 G/DL, BELOW 8.0 G/DL, SEVERE ANEMIA 1 SEVERE ANEMIA 1 SEVERE ANEMIA 1
8.0 G/DL OR ABOVE 2 8.0 G/DL OR ABOVE 2 8.0 G/DL OR ABOVE 2NOT PRESENT 3 NOT PRESENT 3 NOT PRESENT 3REFUSED 4 REFUSED 4 REFUSED 4OTHER 6 OTHER 6 OTHER 6
(SKIP TO 130) (SKIP TO 130) (SKIP TO 130)
129
130
CLICK THE APPROPRIATE CODE AND SIGN YOUR NAME.
(SIGN) (SIGN) (SIGN)
SEVERE MALARIA REFERRAL RECORD THE RESULT OF THE MALARIA RDT ON THE REFERRAL FORM.
The malaria test shows that (NAME OF WOMAN) has malaria. Your child also has symptoms of severe malaria. The malaria treatment I have will not help you, and I cannot give you the medication. Your are very ill and must be taked to a health facility right away.
ALREADY TAKING ASAQ REFERRAL STATEMENT
You have told me that you had already received ASAQ for malaria. Therefore, I cannot give you additional ASAQ. However, the test shows that you have malaria. If you have a fever for two days after the last dose of ASAQ, you should go to the nearest health facility for further examination.
READ INFORMATION FOR MALARIA TREATMENT AND CONSENT STATEMENT TO
The malaria test shows that you have malaria. We can give you free medicine. The medicine is called ASAQ. ASAQ is very effective and in a few days it should get rid of the fever and other symptoms. You do not have to take the medicine. This is up to you. Please tell me whether you accept the medicine or not.
CHECK 113: HEMOGLOBIN RESULT
SEVERE ANEMIA REFERRAL RECORD THE RESULT OF THE ANEMIA TEST ON THE REFERRAL FORM.
The anemia test shows that you have severe anemia. You are very ill and must be taken to a health facility immediately.
GO BACK TO 103 IN NEXT COLUMN OF THIS QUESTIONNAIRE OR IN THE FIRST COLUMN OF THE NEXT PAGE; IF NO MORE PREGNANT WOMEN, END INTERVIEW.
CHECK 125:MEDICATION ACCEPTED
READ INFORMATION FOR MALARIA TREATMENT AND CONSENT STATEMENT TO PREGNANT WOMAN.
ASAQ Fixed Dose CombinationAge & weight group Dosage strength Day 1 Day 2 Day 32 to 11 months (infant)4.5kg – 8kg 25mg AS/67.5mg AQ 1 1 11 to 5 years (toddler)
BIO-9
FIELDWORKER'S OBSERVATIONS
TO BE FILLED IN AFTER COMPLETING BIOMARKERS
SUPERVISOR'S OBSERVATIONS
EDITOR'S OBSERVATIONS
BIO-10
(5) The referral statement should be revised to reflect the country's national malaria treatment guidelines in reference to antimalarial treatment failure.
BIOMARKER: FOOTNOTES
(1) This section should be adapted for country-specific survey design.(2) Year of fieldwork is assumed to be 2017. For fieldwork beginning in 2018, all references to calendar years should be increased by one; for example, 15-49 Years should be changed to 2013, 2013 should be changed to 2014, and similarly for all years throughout (3) This question should be deleted in surveys that do not collect blood smears. (4) This is a list of generic symptoms indicative of severe malaria. Symptoms should be revised according to the country's national malaria treatment guidelines.
BIO-11
YEAR OF FIELDWORK: 2017FIVE YEARS BEFORE SURVEY:49 Years
CHILD OLDER THAN 5: 2012CHILD UNDER 4: 2014CHILD UNDER 3: 2015
CHILD UNDER 16: 2002


