Embed Size (px)
Citation preview
VOL. 3, NO. 1, January 2012 ISSN 2079-8407
Journal of Emerging Trends in Computing and Information Sciences ©2009-2012 CIS Journal. All rights reserved.
http://www.cisjournal.org
21
Requirements Definitions of Robotics Automation and Safety Systems Using the Behavioral Patterns ANALYSIS (PBA) Approach:
The Production Cell System and the Railroad Crossing 1 Assem El-Ansary, 2 David Rine
1 CEO Emergent Technologies USA, Inc. 2 George Mason University
{ 1 [email protected] , 2 [email protected] }
ABSTRACT
Experience is showing some modeling quality problems with the Use Case Modeling Approach. There is a need for another higher quality modeling approach with a sound theoretical basis and a precise definition. This research has developed an alternative, a new event-oriented approach (BPA), and the case studies carried out support the hypothesis that BPA is a more effective alternative to the Use Case Approach (UCA) in modeling and understanding system functional requirements. In BPA, events are considered the primary objects of the world model. The Event defined in BPA is a real-life conceptual entity that is unrelated to any implementation. The BPA Behavioral Patterns are temporally ordered according to the sequence of the real world events.
The major contributions of this research are: The Behavioral Pattern Analysis (BPA) modeling approach. Validation of the research hypothesis that the Behavioral Pattern Analysis (BPA) approach is a more effective alternative
to Use Case Analysis (UCA) in modeling the functional requirements of Human-Machine Safety-Critical Real-time Systems.
The development of an interactive software tool (DECISION), which is based on a combination of the Analytic Hierarchy Process (AHP) and the ELECTRE Multi-Criteria Decision Making (MCDM) methods. The DECISION software tool was used to process the assessment results of the case studies.
Keywords: modeling, software development, use cases, event-oriented modeling, behavioral pattern
1. INTRODUCTION
1.1 The Research Problem
Experience is showing some problems with Use Cases such as Graham [10]: 1. The lack of Use Case formal specification has led to a
proliferation of approaches all calling themselves ‘use case’ based.
2. Lack of atomicity was the reason for generating hundreds of use cases for some simple applications.
3. The lack of formality and atomicity makes the measurement of a project’s task complexity, by counting the use cases, unreal.
4. The absence of the notion of triggering events and business goals in determining the use, is a serious deficiency.
5. There is a problem with the phrase use case itself. A major problem in the use case modeling approach is its
tendency to focus on the solution rather than the problem.
Jacobson defined use case as “a behaviorally related sequence of transactions in a dialogue with the system” [15]. The processing of transactions, or operations, or use cases is what the machine does. It is part of the solution, not part of the problem [14]. The problems in addressing the requirements definition that addresses the problem(s) that the different stakeholders suffer from is addressed by Wiegers [26] and Wohlin [27]. BPA is aimed at capturing the true requirement. The BPA functional requirements development procedure starts by identifying the Mission and the Scoped Problem.
The concluding statement of the “Question Time! About Use Cases” Panel of the OOPSLA’98 Conference by Ian Graham was “There is a need for another approach with a sound theoretical basis and a precise definition.” This need is what this research problem area is about.

VOL. 3, NO. 1, January 2012 ISSN 2079-8407
Journal of Emerging Trends in Computing and Information Sciences ©2009-2012 CIS Journal. All rights reserved.
http://www.cisjournal.org
22
In addition to the problems with the use cases from Fowler, Martin and Cockburn [8], as well as Jackson [14] that were described briefly several additional problems were identified during this dissertation research. The following is an itemization of these problems: The types of interactions are: interactions among users,
interactions between users and the system, and interactions among the different components of the system.
Yet, use cases describe only the users’ interaction with the system. This is just one type of interaction.
Because use cases are used to identify the objects, if use cases do not describe all of the interactions, the resulting object (class) model may be incomplete.
As a result of class model incompleteness there will then be an incomplete description of the interactions, and so the sequence diagram may be incomplete.
Using natural language in use cases description, with the absence of any semantic structure such as alternation or repetition, increases the risks of ambiguity, incompleteness, and inconsistency.
The use case modeling approach, as well as most of the popular modeling approaches such as Booch, OMT, UML, etc., are using the state diagrams to complement the system behavior modeling. One may argue that any missing interaction description may be captured via the state diagrams. However a missing object or interaction is unlikely to be captured and explicitly represented in these diagrams. Also, a state diagram describes an individual object’s response to specific events rather than objects interaction. Hence, objects interaction must be reconstructed from the analysis of groups of diagrams. Such a task is complex and error-prone.
In conclusion, if the analyst misinterpreted or neglected
some structural or behavioral aspects, then the resulting conceptual model will not be a valid representation or understanding of the real world. The resulting software solution system built from the model may not demonstrate the correct behavior or may ungracefully terminate. The end result might be the loss of opportunities in using business systems, serious damages in embedded systems, or the loss of lives in using a safety-critical system. 1.2. Survey of Prior Research
At the OOPSLA 2006 conference, Overgaard and Palmkvist [22] introduced a tutorial “T01: Use-Case Model Refactoring and Improvement “. The tutorial was dedicated to discussing the Use Case problems. It mentioned that there are far too many low-quality use-case models, and surprisingly often the same mistakes reappear. In this tutorial the authors show how to improve a use-case model by re-factoring as well as how to retract from some of the most common errors and mistakes. It also discussed the so-
called use-case anti-patterns to look for and examine sample use-case models.
It was found that teams have difficulty developing use case models in general, and in particular knowing how to use them to capture behavior that will improve reliability from Right, Johnson and Kratschmer [23]. At the 17th IEEE International Symposium on Software Reliability Engineering, Right, Johnson and Kratschmer [23] discussed in their paper “Improve Software Reliability with Use Case Modeling” the specific problems that teams have such as:
1) Identifying alternative behavior 2) Capturing the right level of detail 3) Capturing internal behavior of the system 4) Developing use cases for system actors
Generating discussion on the behavior from a user's perspective.
Use Cases have achieved wide use as specification tool for observable behavior of systems, yet there remains a large gap between behavioral specifications and determination of software components to be built or procured [28]. The “Use Cases in Model-Driven Software Engineering” (the 2005 incarnation of the “Open Issues in Industrial Use Case Modeling” workshop series) brought together use case experts from industry and academia to identify and characterize some problem areas and some promising approaches. The experts conclusion was that the integration of use cases within Model Driven Software Engineering requires a better definition of use case contents, specifically a better definition of use case description of behavior through sequences of action steps, use case pre and post conditions, and relationship between use case model and conceptual model. Even though the UML2 specification allows for several textual and graphical representations of use case behavior, but does not provide any rules for transformations between different representations at the same level of abstraction. It does not provide either any rules for transformations of these representations to other artifacts at levels closer to implementation. The hope was that the Workshop on Use Case Modeling would fill the “requirements gap” in the current research on model-driven methodologies.
Lily, S. published an interesting article “Use case pitfalls: top 10 problems from real projects using use cases” [20]. This article is an extension of the famous articles by Rosenberg [24] about the top 10 Use case problems. The following are the top 10 pitfalls:
1. The system boundary is undefined or inconstant. The undefined or inconsistent system
boundary is probably the most universal problem that was observed in projects trying use cases for the first time [20]. When the system boundary is confused,
VOL. 3, NO. 1, January 2012 ISSN 2079-8407
Journal of Emerging Trends in Computing and Information Sciences ©2009-2012 CIS Journal. All rights reserved.
http://www.cisjournal.org
23
it’s hard to know what’s in and what’s out. 2. The use cases are written from the system's (not the
actors') point of view. 3. The actor names are inconsistent. 4. There are too many use cases. 5. The actor-to-use case relationships resemble a
spider's web. 6. The use-case specifications are too long. 7. The use-case specifications are confusing. 8. The use case doesn't correctly describe functional
entitlement. 9. The customer doesn't understand the use cases. 10. The use cases are never finished.
The problems in discovering the real business requirements for software project success are addressed by Goldsmith [8]. At the very least, a use case specification should answer these basic questions [20]:
Who? (the actors) Why? (the goal and/or context) When? (the triggering event) What? (the normal flow) What else? (alternative and/or exceptional flows)
In addition to the fields to be specified within each use case, it’s also helpful to define a standard for what information is to be specified for a group, or "package," of related use cases. In contrast, BPA is based on Events that
spells out all of these questions. Events used in BPA has strong theoretical background in philosophy [6].
The current paper is concerned with developing BPA, which is a more effective alternative to use cases in modeling and understanding system functional requirements due to El-Ansary [7]. BPA is an event-oriented approach in which events are considered the primary objects of the world model. While the term Event is used in UML, and in almost all of the other modeling approaches, to mean an occurrence of stimulus that can trigger a state transition, the Event defined in BPA is a real-life conceptual entity that is unrelated to any implementation. Event spell out the Who, Why, When, and What [6]. In the BPA approach, the BPA Behavioral Pattern, which is the template that one uses to model and describe an event, takes the place of the Use Case in the UML Use Case View. The BPA Behavioral Patterns are temporally ordered according to the sequence of the real world events. The temporal relationships between events are before, meets, overlaps, starts, during, finishes, and equals [1].
2. Illustrating BPA through the Production Cell Case Study
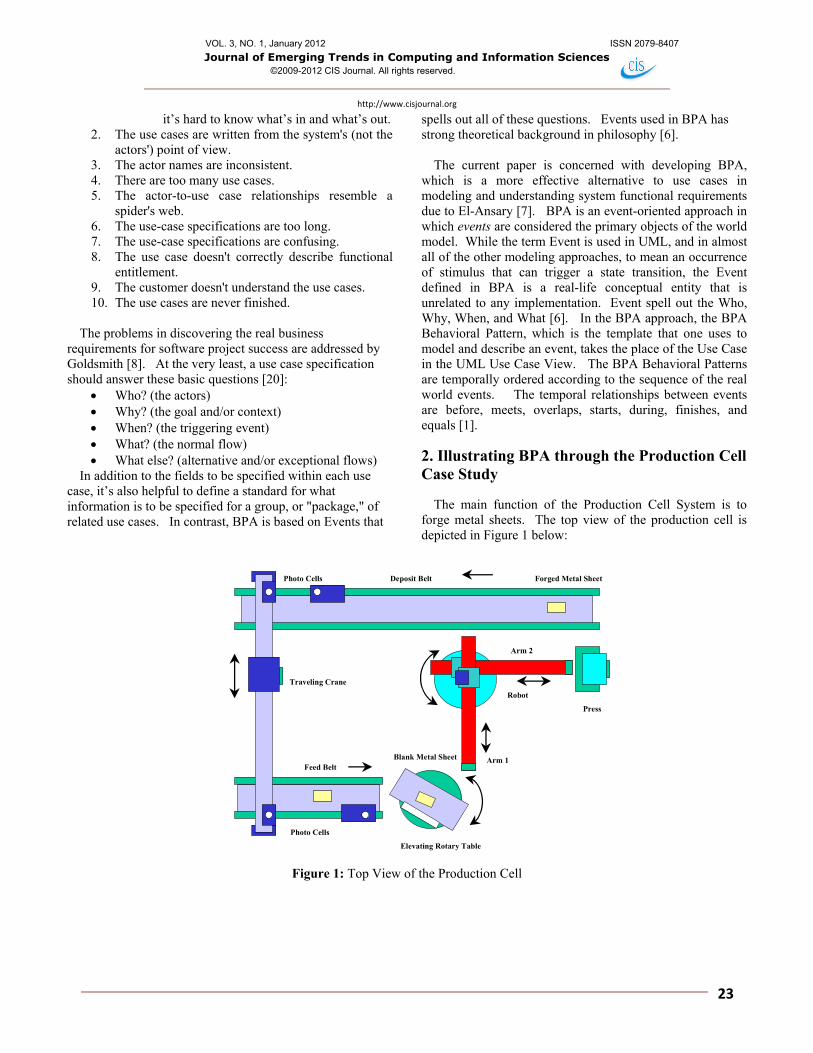
The main function of the Production Cell System is to forge metal sheets. The top view of the production cell is depicted in Figure 1 below:
Traveling Crane
Deposit Belt
Arm 1
Elevating Rotary Table
Feed Belt
Arm 2
Robot
Press
Photo Cells
Photo Cells
Forged Metal Sheet
Blank Metal Sheet
Figure 1: Top View of the Production Cell
VOL. 3, NO. 1, January 2012 ISSN 2079-8407
Journal of Emerging Trends in Computing and Information Sciences ©2009-2012 CIS Journal. All rights reserved.
http://www.cisjournal.org
24
The following steps describe the operation cycle of the
production cell (Figure 1.): 1. The Feed Belt conveys a blank metal sheet to the
Elevating Rotary Table. The Belt is powered by an electric motor that can be
started up or stopped by the control program. 2. The Elevating Rotary Table lifts the blank metal sheet
up and rotates 45 to position the sheet within the Robot’s Arm1 reach. The vertical movement is necessary because the
Robot arms are located at different levels and the Robot does not move vertically.
The 45 rotation is necessary because an arm’s gripper is not rotary and can’t itself position the metal sheets in the press in a straight position.
3. The Robot extends Arm1, picks up the blank metal sheet from the Elevating Rotary Table then retracts Arm1.
4. The Robot rotates counterclockwise to position Arm2 in front of the forging Press.
5. To empty the Press, the Press waits in its lower (unloading) position until Arm2 extends, retrieves the forged metal sheet and retracts away from the Press. Because the Robot arms are located at different
levels, the Press has three positions: - In the lower position, the Press is unloaded by
Arm2 - In the middle position, the Press is loaded by
Arm1 - In the high position, the Press is closed
forging a blank metal sheet 6. The Press moves its lower plate up to its middle
(loading) position and waits for Arm1 to arrive and load the blank sheet.
7. The Robot rotates counterclockwise until Arm2 points towards the deposit belt. Arm2 extends and places the forged metal sheet on the Deposit Belt and retracts away from the Deposit Belt.
8. The Robot rotates counterclockwise to position Arm1 in front of the press, extends Arm1, places the blank sheet in the press, and retracts Arm1 away from the Press
9. The Press closes, forges the blank sheet, and opens again to its lower position.
10. The Robot rotates clockwise towards its initial position.
11. The Crane receives a signal from the photoelectric cell, indicating that the forged metal sheet arrived at the unloading area. The crane’s gripper positions itself over the Deposit Belt and picks up the forged sheet.
12. The Crane moves to the left until positioned over the Forged Sheets Container and then drops the forged sheet.
13. The crane continues moving to the left until positioned over the Blank Sheets Container, moves its electromagnetic gripper down, picks a blank sheet up, moves the gripper up and continue moving to position itself at the Feed Belt.
14. The gripper releases the blank sheet on the loading area of the Feed Belt.
15. The crane travels to the right back to the Deposit Belt. 16. The operation cycle repeats. Safety Requirements 1. The Production Cell System (PCS) must never allow a
metal sheet to be dropped outside the conveyer belts or press to avoid injuring people.
2. The PCS must disallow the pieces of machinery from colliding with each other.
3. The PCS must not allow motion beyond specified ranges of operation.
4. The PCS must guarantee sufficient distance between two consecutive blank sheets to prevent having two blank sheets simultaneously in the press
Utility (Liveness Criteria) Each blank metal sheet must be forged before it is placed on the deposit belt
3. RESEARCH THESIS
The specific thesis is that the proposed Behavioral Pattern Analysis (BPA) Approach is more effective than the Use Case Analysis (UCA) Approach at modeling the functional requirements of Interactive Safety-Critical Real-time Systems.
The following subsection presents a summary of the research approach.
4. THE BPA REQUIREMENTS DEVELOPMENT PROCEDURE
The following is an outline of the BPA functional requirements development procedure:
Identify the Mission and the Scoped Problem Identify the Events at different levels of abstraction –
draw the Event Hierarchy Diagram Identify the Relationships between events – draw the
Event Thread Diagram Group the events by Location / Loci of Control
and Effect Refine and transform the main (high level) events into
their corresponding BPA Behavioral Pattern
VOL. 3, NO. 1, January 2012 ISSN 2079-8407
Journal of Emerging Trends in Computing and Information Sciences ©2009-2012 CIS Journal. All rights reserved.
http://www.cisjournal.org
25
Identify the Temporal and Enable/Causal Constraint relationships between events – draw the Constraints Event Thread Diagram
Identify the Critical Events and possible ways of their failure – draw the Critical Event Analysis Diagram
Identify missing requirements that are necessary to satisfy the critical constraints
Using the identified missing requirements, refine the diagrams as necessary
Using the BPA Behavioral Patterns, identify the candidate classes – draw the Class Diagram
Depict the relationships between Events and World State if a State Model is required in the design phase – draw the Event/State History Chart.
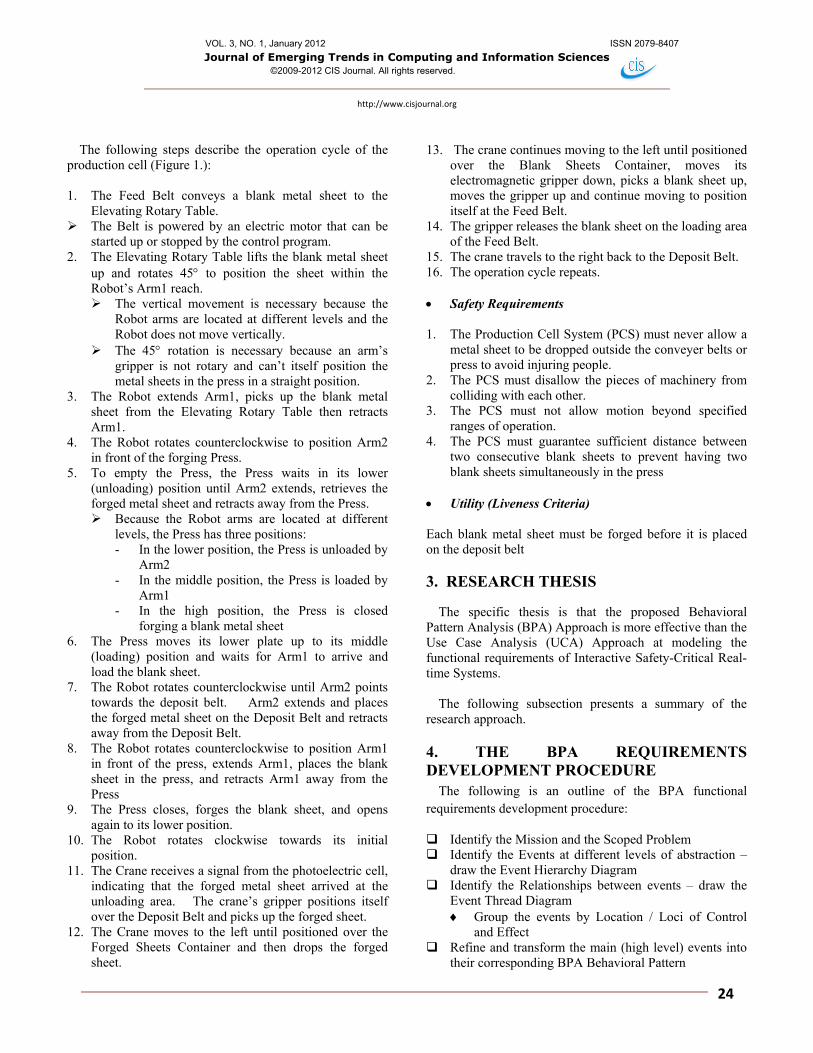
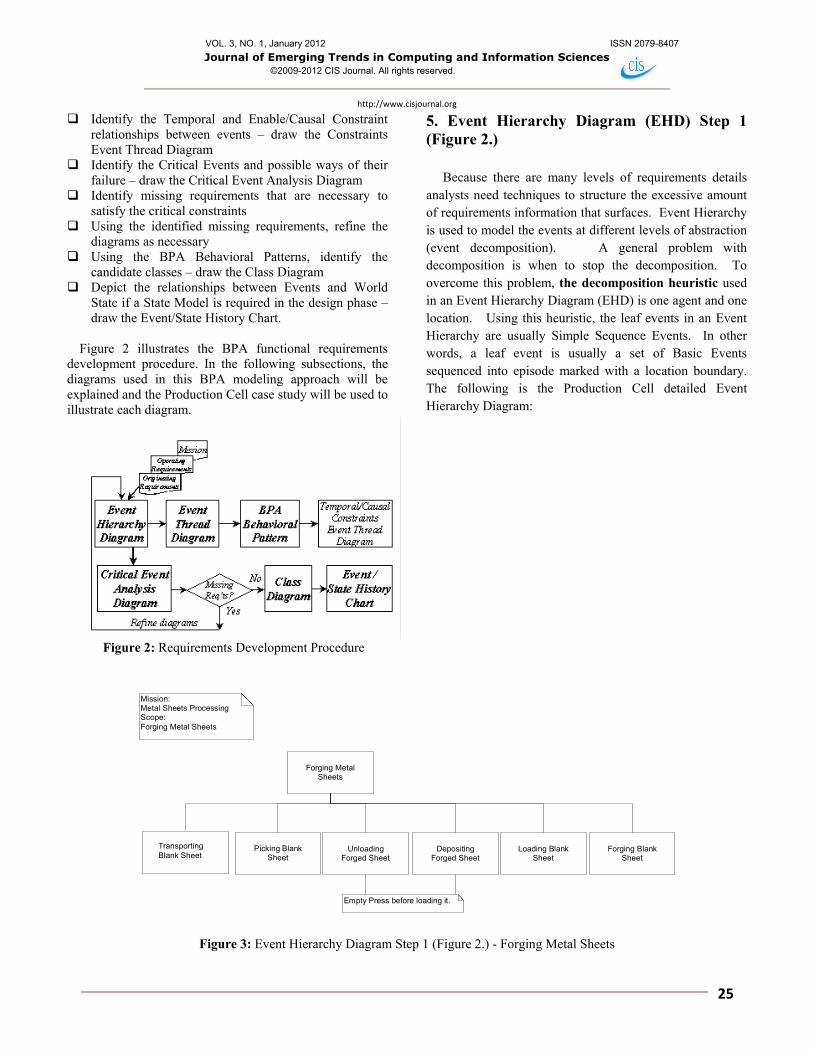
Figure 2 illustrates the BPA functional requirements
development procedure. In the following subsections, the diagrams used in this BPA modeling approach will be explained and the Production Cell case study will be used to illustrate each diagram.
Figure 2: Requirements Development Procedure
5. Event Hierarchy Diagram (EHD) Step 1 (Figure 2.)
Because there are many levels of requirements details analysts need techniques to structure the excessive amount of requirements information that surfaces. Event Hierarchy is used to model the events at different levels of abstraction (event decomposition). A general problem with decomposition is when to stop the decomposition. To overcome this problem, the decomposition heuristic used in an Event Hierarchy Diagram (EHD) is one agent and one location. Using this heuristic, the leaf events in an Event Hierarchy are usually Simple Sequence Events. In other words, a leaf event is usually a set of Basic Events sequenced into episode marked with a location boundary. The following is the Production Cell detailed Event Hierarchy Diagram:
Forging MetalSheets
TransportingBlank Sheet
Loading BlankSheet
Forging BlankSheet
DepositingForged Sheet
UnloadingForged Sheet
Picking BlankSheet
Mission:Metal Sheets ProcessingScope:Forging Metal Sheets
Empty Press before loading it.
Figure 3: Event Hierarchy Diagram Step 1 (Figure 2.) - Forging Metal Sheets
VOL. 3, NO. 1, January 2012 ISSN 2079-8407
Journal of Emerging Trends in Computing and Information Sciences ©2009-2012 CIS Journal. All rights reserved.
http://www.cisjournal.org
26
In order to prevent having two blank sheets simultaneously in the press (Constraint 4), the press should be empty before loading a blank sheet in it. Hence, the ‘Unloading Forged Sheet’ event should precede the ‘Loading Blank Sheet’ event.
Using the identified main events, the high level EHD
diagram (or the first level in a detailed EHD diagram) is drawn. Each main event is then decomposed further until one arrives at leaf events, each of which has one location or one locus of effect and control and one agent.
In order to model the sequence of events (and show the location / loci of control and effect view, or the temporal / causal constraints), one uses the event thread diagrams as shown in the next subsections.
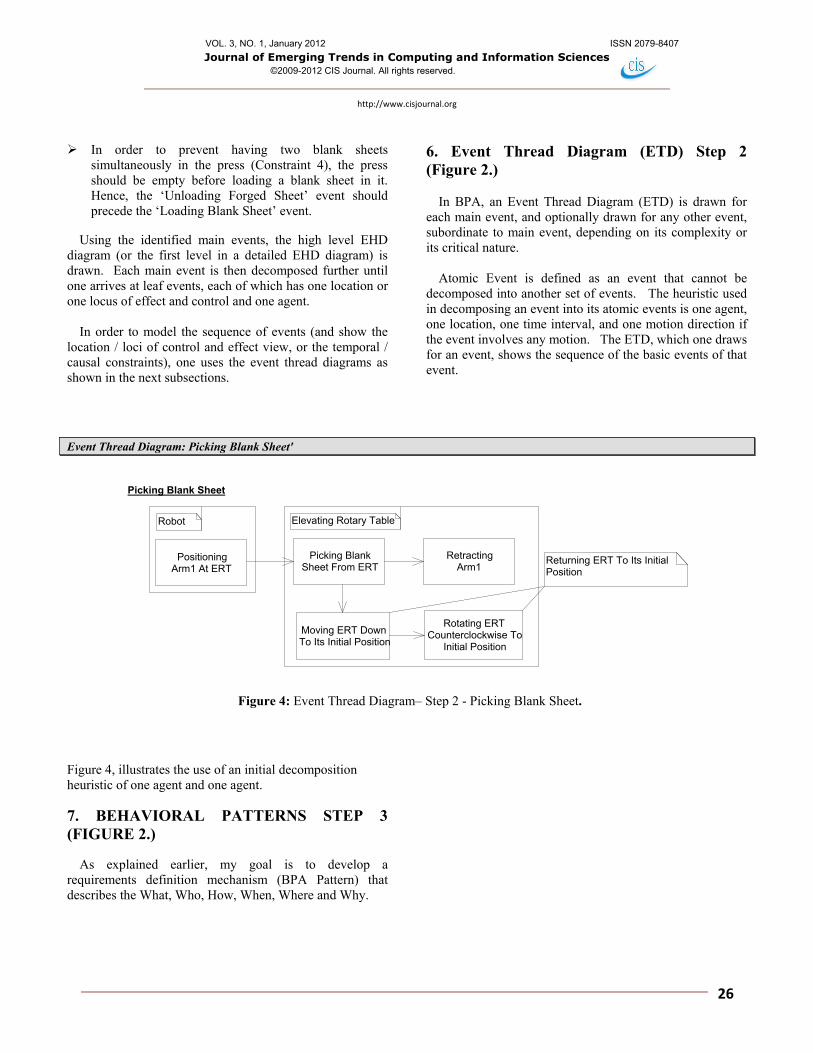
6. Event Thread Diagram (ETD) Step 2 (Figure 2.)
In BPA, an Event Thread Diagram (ETD) is drawn for each main event, and optionally drawn for any other event, subordinate to main event, depending on its complexity or its critical nature.
Atomic Event is defined as an event that cannot be decomposed into another set of events. The heuristic used in decomposing an event into its atomic events is one agent, one location, one time interval, and one motion direction if the event involves any motion. The ETD, which one draws for an event, shows the sequence of the basic events of that event.
Event Thread Diagram: Picking Blank Sheet'
RetractingArm1
PositioningArm1 At ERT
Picking BlankSheet From ERT
Moving ERT DownTo Its Initial Position
Rotating ERTCounterclockwise To
Initial Position
Picking Blank Sheet
Elevating Rotary TableRobot
Returning ERT To Its InitialPosition
Figure 4: Event Thread Diagram– Step 2 - Picking Blank Sheet.
Figure 4, illustrates the use of an initial decomposition heuristic of one agent and one agent.
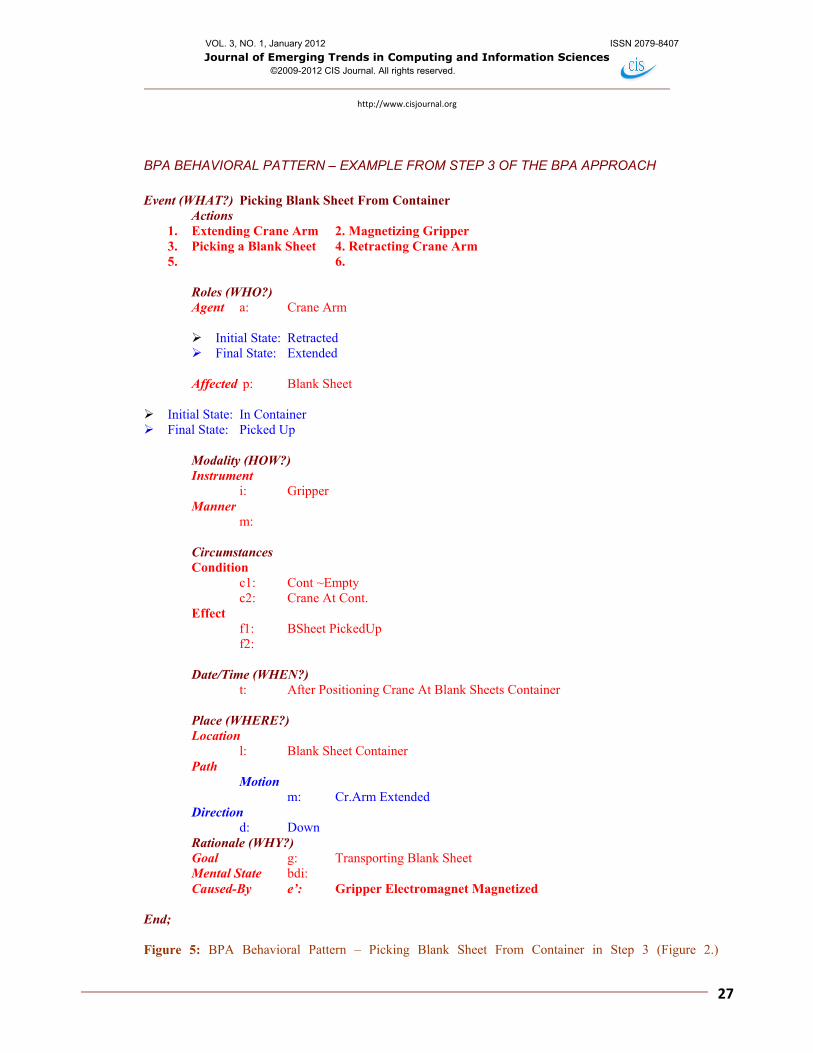
7. BEHAVIORAL PATTERNS STEP 3 (FIGURE 2.)
As explained earlier, my goal is to develop a requirements definition mechanism (BPA Pattern) that describes the What, Who, How, When, Where and Why.
VOL. 3, NO. 1, January 2012 ISSN 2079-8407
Journal of Emerging Trends in Computing and Information Sciences ©2009-2012 CIS Journal. All rights reserved.
http://www.cisjournal.org
27
BPA BEHAVIORAL PATTERN – EXAMPLE FROM STEP 3 OF THE BPA APPROACH
Event (WHAT?) Picking Blank Sheet From Container
Actions 1. Extending Crane Arm 2. Magnetizing Gripper 3. Picking a Blank Sheet 4. Retracting Crane Arm 5. 6.
Roles (WHO?) Agent a: Crane Arm
Initial State: Retracted Final State: Extended
Affected p: Blank Sheet
Initial State: In Container Final State: Picked Up
Modality (HOW?) Instrument
i: Gripper Manner
m: Circumstances Condition
c1: Cont ~Empty c2: Crane At Cont.
Effect f1: BSheet PickedUp f2:
Date/Time (WHEN?)
t: After Positioning Crane At Blank Sheets Container
Place (WHERE?) Location
l: Blank Sheet Container Path
Motion m: Cr.Arm Extended
Direction d: Down
Rationale (WHY?) Goal g: Transporting Blank Sheet Mental State bdi: Caused-By e’: Gripper Electromagnet Magnetized
End; Figure 5: BPA Behavioral Pattern – Picking Blank Sheet From Container in Step 3 (Figure 2.)
VOL. 3, NO. 1, January 2012 ISSN 2079-8407
Journal of Emerging Trends in Computing and Information Sciences ©2009-2012 CIS Journal. All rights reserved.
http://www.cisjournal.org
28
8. INTRODUCING TIME AS A PREREQUISITE TO STEP 4 OF THE BPA APPROACH (FIGURE 2.)
The key intuitions motivating the introduction of time are: Events take time. Yet, in most of the popular Object-
Oriented Approaches such as OMT and UML, time is neglected in the event definition.
Multiple events may occur at the same time, and could be unrelated, cooperating, or interfering with each other.
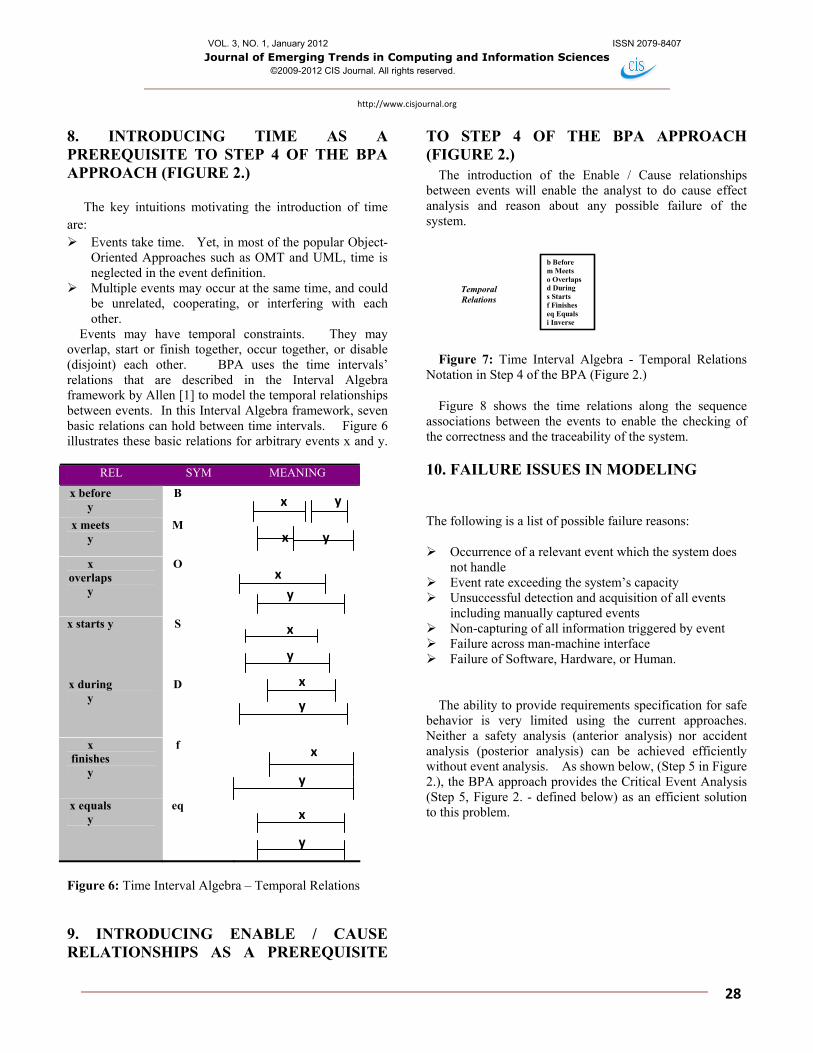
Events may have temporal constraints. They may overlap, start or finish together, occur together, or disable (disjoint) each other. BPA uses the time intervals’ relations that are described in the Interval Algebra framework by Allen [1] to model the temporal relationships between events. In this Interval Algebra framework, seven basic relations can hold between time intervals. Figure 6 illustrates these basic relations for arbitrary events x and y.
REL SYM MEANING
x before y
B
x meets y
M
x overlaps
y
O
x starts y S
x during y
D
x finishes
y
f
x equals y
eq
Figure 6: Time Interval Algebra – Temporal Relations
9. INTRODUCING ENABLE / CAUSE RELATIONSHIPS AS A PREREQUISITE
TO STEP 4 OF THE BPA APPROACH (FIGURE 2.)
The introduction of the Enable / Cause relationships between events will enable the analyst to do cause effect analysis and reason about any possible failure of the system.
b Beforem Meetso Overlapsd Durings Startsf Finisheseq Equalsi Inverse
TemporalRelations
Figure 7: Time Interval Algebra - Temporal Relations
Notation in Step 4 of the BPA (Figure 2.)
Figure 8 shows the time relations along the sequence associations between the events to enable the checking of the correctness and the traceability of the system.
10. FAILURE ISSUES IN MODELING
The following is a list of possible failure reasons:
Occurrence of a relevant event which the system does not handle
Event rate exceeding the system’s capacity Unsuccessful detection and acquisition of all events
including manually captured events Non-capturing of all information triggered by event Failure across man-machine interface Failure of Software, Hardware, or Human.
The ability to provide requirements specification for safe behavior is very limited using the current approaches. Neither a safety analysis (anterior analysis) nor accident analysis (posterior analysis) can be achieved efficiently without event analysis. As shown below, (Step 5 in Figure 2.), the BPA approach provides the Critical Event Analysis (Step 5, Figure 2. - defined below) as an efficient solution to this problem.
x
x
y
x
y
x
y
x
y
x
y
x
y
y
VOL. 3, NO. 1, January 2012 ISSN 2079-8407
Journal of Emerging Trends in Computing and Information Sciences ©2009-2012 CIS Journal. All rights reserved.
http://www.cisjournal.org
29
Conveying BlankSheet to Feed
Belt
Loading BlankSheet on Elevating
Rotary Table
Moving BlankSheet to Elevating
Rotary Table
Moving BlankSheet Up AtARM1 Level
Picking BlankSheet fromContainer
RetractingCrane Arm
Releasing BlankSheet on Feed
Belt
RetractingCrane Arm
Rotating BlankSheet At Arm1
Reach
Waiting ForPickup
{b,m} {b}
{b}
{b,m}
{b,m} {b} {b} {b} {b}
Figure 8: Temporal Constraint Diagram - Transporting Blank Sheet - in Step 4 of the BPA (Figure 2.)
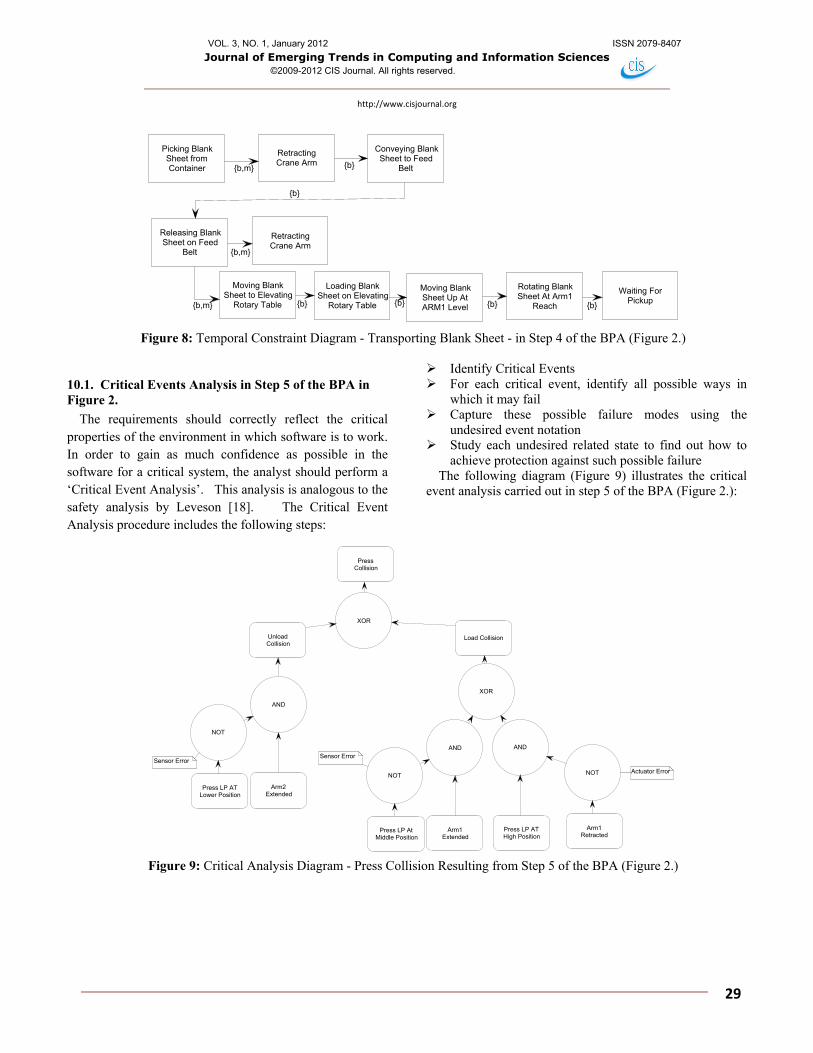
10.1. Critical Events Analysis in Step 5 of the BPA in Figure 2.
The requirements should correctly reflect the critical properties of the environment in which software is to work. In order to gain as much confidence as possible in the software for a critical system, the analyst should perform a ‘Critical Event Analysis’. This analysis is analogous to the safety analysis by Leveson [18]. The Critical Event Analysis procedure includes the following steps:
Identify Critical Events For each critical event, identify all possible ways in
which it may fail Capture these possible failure modes using the
undesired event notation Study each undesired related state to find out how to
achieve protection against such possible failure The following diagram (Figure 9) illustrates the critical
event analysis carried out in step 5 of the BPA (Figure 2.):
PressCollision
Press LP ATLower Position
NOT
Arm2Extended
AND
Press LP ATHigh Position
NOT
Arm1Retracted
AND
Load CollisionUnloadCollision
Press LP AtMiddle Position
NOT
Arm1Extended
AND
XOR
XOR
Sensor ErrorSensor Error
Actuator Error
Figure 9: Critical Analysis Diagram - Press Collision Resulting from Step 5 of the BPA (Figure 2.)

VOL. 3, NO. 1, January 2012 ISSN 2079-8407
Journal of Emerging Trends in Computing and Information Sciences ©2009-2012 CIS Journal. All rights reserved.
http://www.cisjournal.org
30
11. MISSING REQUIREMENTS CHECKING IN STEP 6 OF THE BPA (FIGURE 2.)
There were no missing requirements that required generating a Derived Requirement Document.
However, by reviewing the BPA Behavioral Patterns and the Critical Event Analysis Diagrams, we discovered the following missing events after applying Step 6 of the BPA: 1. Positioning Crane Arm At Blank Sheets Container
This was discovered by reviewing the precondition and time of the ‘Picking Blank Sheet from Container’ Behavioral Pattern. To fix this problem there are two alternatives:
1) Modify the Event Hierarchy Detail for
Transporting Blank Sheet to include ‘Positioning Crane Arm At Blank Sheet Container’ before the ‘Picking Blank Sheet from Container’ event, or
2) Assume that the initial position of the Crane is at the Blank Sheets Container. In this case we need to return the Crane to the Blank Sheet Container (its initial position) after depositing a Forged Sheet.
The second alternative looks more appealing because we need to start any piece of machinery from some initial position. Hence we will choose that alternative. However, we need to add a time constraint to ensure that the Crane will be at the Blank Sheet Container (returned to its initial position) before the ‘Picking Blank Sheet from Container’ event.
2. Positioning Crane At Feed Belt This was discovered by reviewing:
a) The precondition and time of the ‘Releasing Blank Sheet On Feed Belt’ Behavioral Pattern, and
b) The ‘Metal Sheet Misdrop By Crane’ Critical Event Analysis Diagram.
To fix this problem, an Event Thread Diagram for ‘Conveying Blank Sheet To Feed Belt’ Event that includes the ‘Positioning Crane At Feed Belt’ Event was added. Also, to ensure that the Crane will be positioned at the Feed Belt before releasing the Metal Sheet Blank, we added a time constraint in the ‘Transporting Blank Sheet’ Temporal Constraints Diagram between the ‘Positioning Crane At Feed Belt’ Event and the ‘Releasing Blank Sheet On Feed Belt’ Event. 4. Waiting For Forged Sheet Arrival
This was discovered as a result of discovering that
‘Positioning Crane At Deposit Belt’ is missing and by reviewing the Originating Requirement.
To fix the problem of 3 and 4 above:
a) A decision was made to add both of these events to ‘Transporting Blank Sheet’ Event Thread Diagram because it was stated in the Originating Requirements that after the Crane releases a Blank Sheet on the Feed Belt, it should move to the Deposit Belt. The importance of both of these events is that they satisfy the Liveness Criteria because they imply that for every Blank Sheet that is transported, there is a Forged Sheet that should be picked up for depositing.
b) A time constraint has been added in the ‘Depositing Forged Sheet’ Temporal Constraints Diagram between the ‘Waiting For Forged Sheet Arrival’ Event and the ‘Picking up Forged Sheet’ Event. Also, to ensure that the Crane will be positioned at the Deposit Belt before picking up the Forged Sheet, another time constraint was added between the ‘Positioning Crane At Deposit Belt’ Event and the ‘Waiting For Forged Sheet Arrival’ Event in the ‘Transporting Blank Sheet’ Temporal Constraints Diagram.
5. Positioning Crane At Forged Sheets Container
This was discovered by reviewing:
a) The precondition and time of the ‘Releasing Forged Sheet’ Behavioral Pattern, and
b) The ‘Metal Sheet Misdrop By Crane’ Critical Event Analysis Diagram.
To fix this problem, an Event ‘Positioning Crane At Forged Sheets Container’ was added to the Depositing Forged Sheet Thread Diagram. Also, a time constraint was added between the ‘Positioning Crane At Forged Sheets Container ‘ Event and the ‘Releasing Forged Sheet’ Event to ensure that the Crane will be positioned at the Forged Sheets Container before releasing the Forged Metal Sheet.
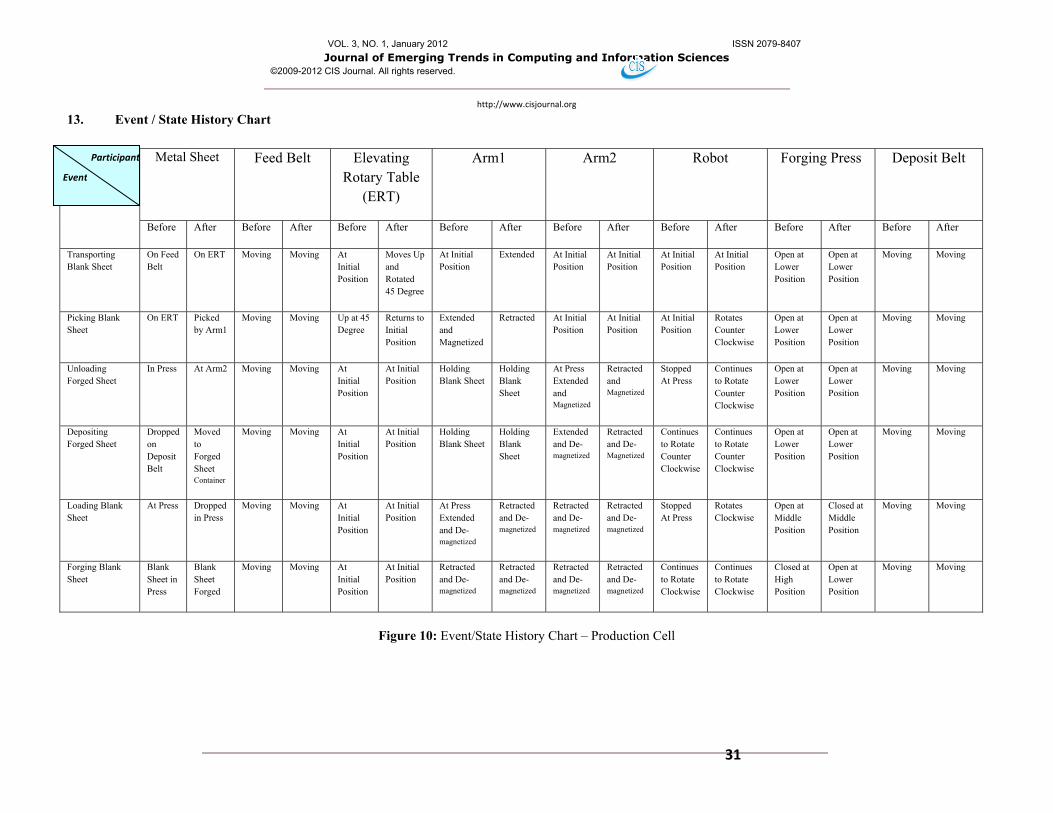
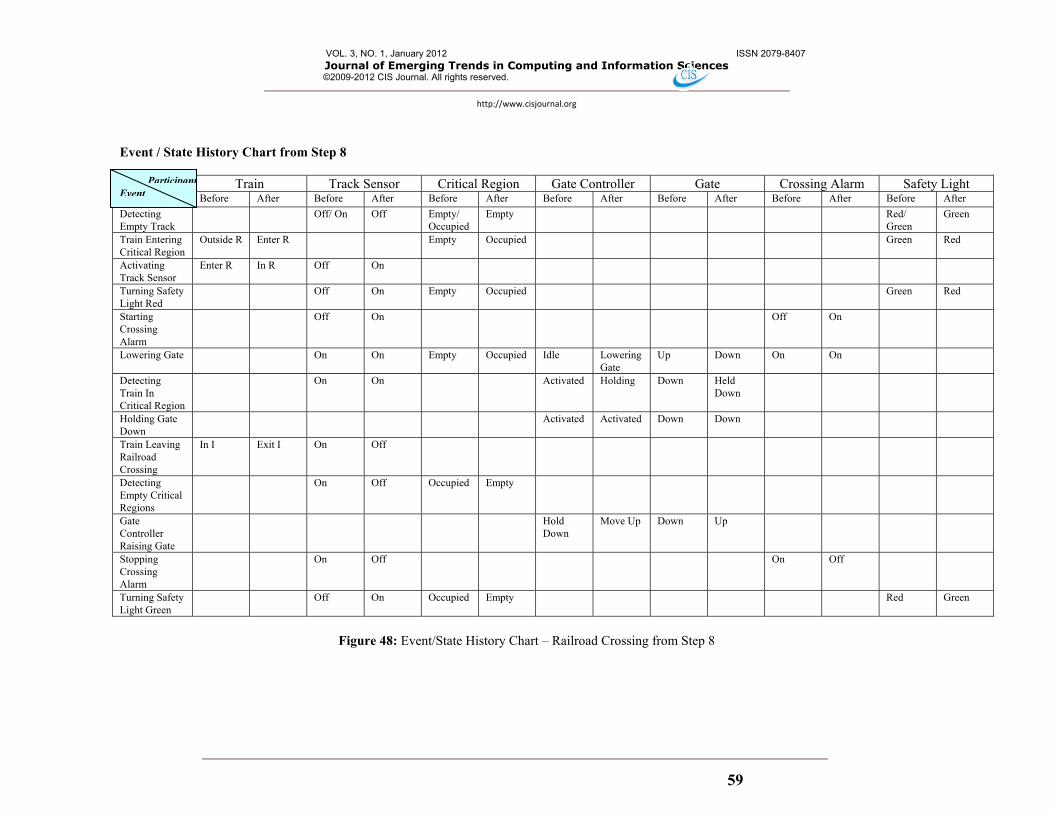
12. Identifying Objects using Behavioral Patterns in Steps 7 and 8 of the BPA (Figure 2.) 12.1. Event / State History Chart in Step 8 of the BPA (Figure 2.)
An event as defined in UML, and all other state-based approaches, describes the object states before and after the event for one object only. In the BPA approach, the Event/State History chart (Step 8, Figure 2.) captures the states of all objects before and after each event The following chart depicts this idea:
VOL. 3, NO. 1, January 2012 ISSN 2079-8407
Journal of Emerging Trends in Computing and Information Sciences ©2009-2012 CIS Journal. All rights reserved.
http://www.cisjournal.org
31
13. Event / State History Chart
Metal Sheet Feed Belt Elevating
Rotary Table (ERT)
Arm1 Arm2 Robot Forging Press Deposit Belt
Before After Before After Before After Before After Before After Before After Before After Before After
Transporting Blank Sheet
On Feed Belt
On ERT Moving Moving At Initial Position
Moves Up and Rotated 45 Degree
At Initial Position
Extended At Initial Position
At Initial Position
At Initial Position
At Initial Position
Open at Lower Position
Open at Lower Position
Moving Moving
Picking Blank Sheet
On ERT Picked by Arm1
Moving Moving Up at 45 Degree
Returns to Initial Position
Extended and Magnetized
Retracted At Initial Position
At Initial Position
At Initial Position
Rotates Counter Clockwise
Open at Lower Position
Open at Lower Position
Moving Moving
Unloading Forged Sheet
In Press At Arm2 Moving Moving At Initial Position
At Initial Position
Holding Blank Sheet
Holding Blank Sheet
At Press Extended and Magnetized
Retracted and Magnetized
Stopped At Press
Continues to Rotate Counter Clockwise
Open at Lower Position
Open at Lower Position
Moving Moving
Depositing Forged Sheet
Dropped on Deposit Belt
Moved to Forged Sheet Container
Moving Moving At Initial Position
At Initial Position
Holding Blank Sheet
Holding Blank Sheet
Extended and De-magnetized
Retracted and De-Magnetized
Continues to Rotate Counter Clockwise
Continues to Rotate Counter Clockwise
Open at Lower Position
Open at Lower Position
Moving Moving
Loading Blank Sheet
At Press Dropped in Press
Moving Moving At Initial Position
At Initial Position
At Press Extended and De-magnetized
Retracted and De-magnetized
Retracted and De-magnetized
Retracted and De-magnetized
Stopped At Press
Rotates Clockwise
Open at Middle Position
Closed at Middle Position
Moving Moving
Forging Blank Sheet
Blank Sheet in Press
Blank Sheet Forged
Moving Moving At Initial Position
At Initial Position
Retracted and De-magnetized
Retracted and De-magnetized
Retracted and De-magnetized
Retracted and De-magnetized
Continues to Rotate Clockwise
Continues to Rotate Clockwise
Closed at High Position
Open at Lower Position
Moving Moving
Figure 10: Event/State History Chart – Production Cell
Participant
Event
VOL. 3, NO. 1, January 2012 ISSN 2079-8407
Journal of Emerging Trends in Computing and Information Sciences ©2009-2012 CIS Journal. All rights reserved.
http://www.cisjournal.org
32
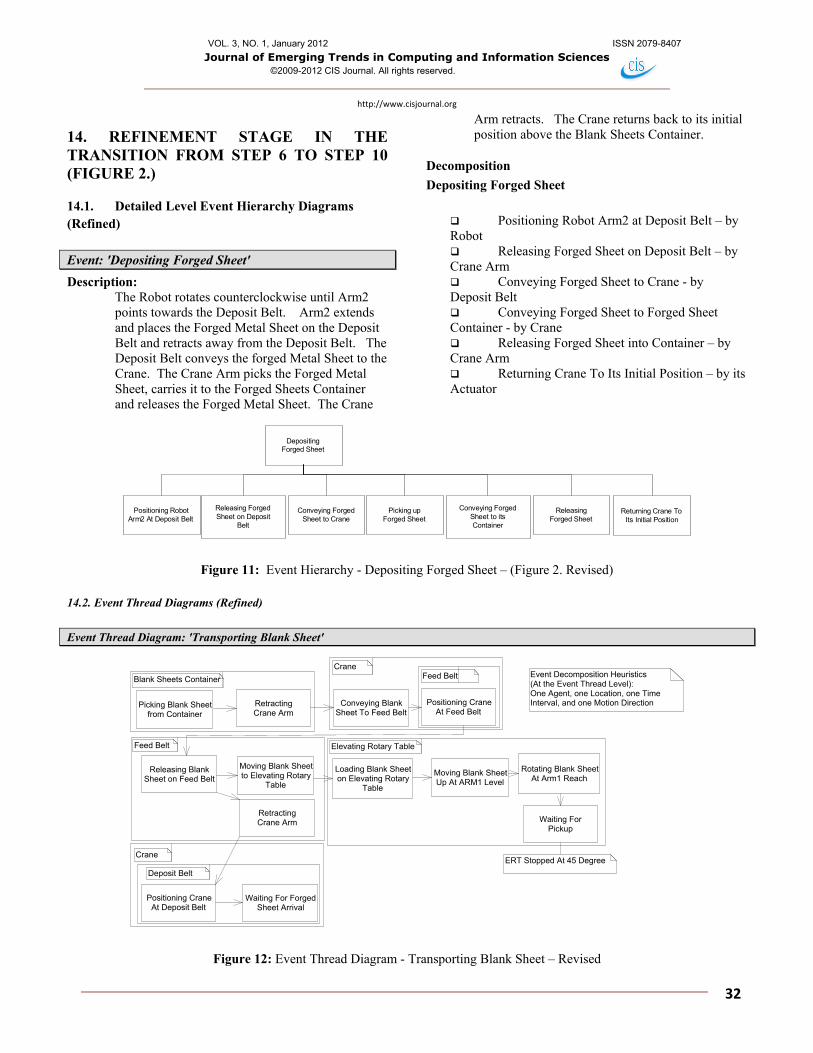
14. REFINEMENT STAGE IN THE TRANSITION FROM STEP 6 TO STEP 10 (FIGURE 2.)
14.1. Detailed Level Event Hierarchy Diagrams (Refined)
Event: 'Depositing Forged Sheet'
Description: The Robot rotates counterclockwise until Arm2 points towards the Deposit Belt. Arm2 extends and places the Forged Metal Sheet on the Deposit Belt and retracts away from the Deposit Belt. The Deposit Belt conveys the forged Metal Sheet to the Crane. The Crane Arm picks the Forged Metal Sheet, carries it to the Forged Sheets Container and releases the Forged Metal Sheet. The Crane
Arm retracts. The Crane returns back to its initial position above the Blank Sheets Container.
Decomposition
Depositing Forged Sheet
Positioning Robot Arm2 at Deposit Belt – by Robot Releasing Forged Sheet on Deposit Belt – by Crane Arm Conveying Forged Sheet to Crane - by Deposit Belt Conveying Forged Sheet to Forged Sheet Container - by Crane Releasing Forged Sheet into Container – by Crane Arm Returning Crane To Its Initial Position – by its Actuator
DepositingForged Sheet
Positioning RobotArm2 At Deposit Belt
Conveying ForgedSheet to Crane
Releasing ForgedSheet on Deposit
Belt
Picking upForged Sheet
Conveying ForgedSheet to itsContainer
ReleasingForged Sheet
Returning Crane ToIts Initial Position
Figure 11: Event Hierarchy - Depositing Forged Sheet – (Figure 2. Revised)
14.2. Event Thread Diagrams (Refined)
Event Thread Diagram: 'Transporting Blank Sheet'
Picking Blank Sheetfrom Container
Releasing BlankSheet on Feed Belt
Moving Blank Sheetto Elevating Rotary
Table
Loading Blank Sheeton Elevating Rotary
Table
Conveying BlankSheet To Feed Belt
RetractingCrane Arm
RetractingCrane Arm
Moving Blank SheetUp At ARM1 Level
Rotating Blank SheetAt Arm1 Reach
Waiting ForPickup
Positioning CraneAt Feed Belt
Positioning CraneAt Deposit Belt
Waiting For ForgedSheet Arrival
Crane
Feed Belt Elevating Rotary Table
Blank Sheets ContainerEvent Decomposition Heuristics(At the Event Thread Level):One Agent, one Location, one TimeInterval, and one Motion Direction
ERT Stopped At 45 Degree
Feed Belt
Crane
Deposit Belt
Figure 12: Event Thread Diagram - Transporting Blank Sheet – Revised
VOL. 3, NO. 1, January 2012 ISSN 2079-8407
Journal of Emerging Trends in Computing and Information Sciences ©2009-2012 CIS Journal. All rights reserved.
http://www.cisjournal.org
33
There is no need to do any more refinement to the Event Hierarchy Diagrams or the Event Thread Diagrams. It is implied that actuator(s) and sensor(s) are responsible for positioning. The details were captured, and clearly identified, in the BPA Behavioral Patterns.
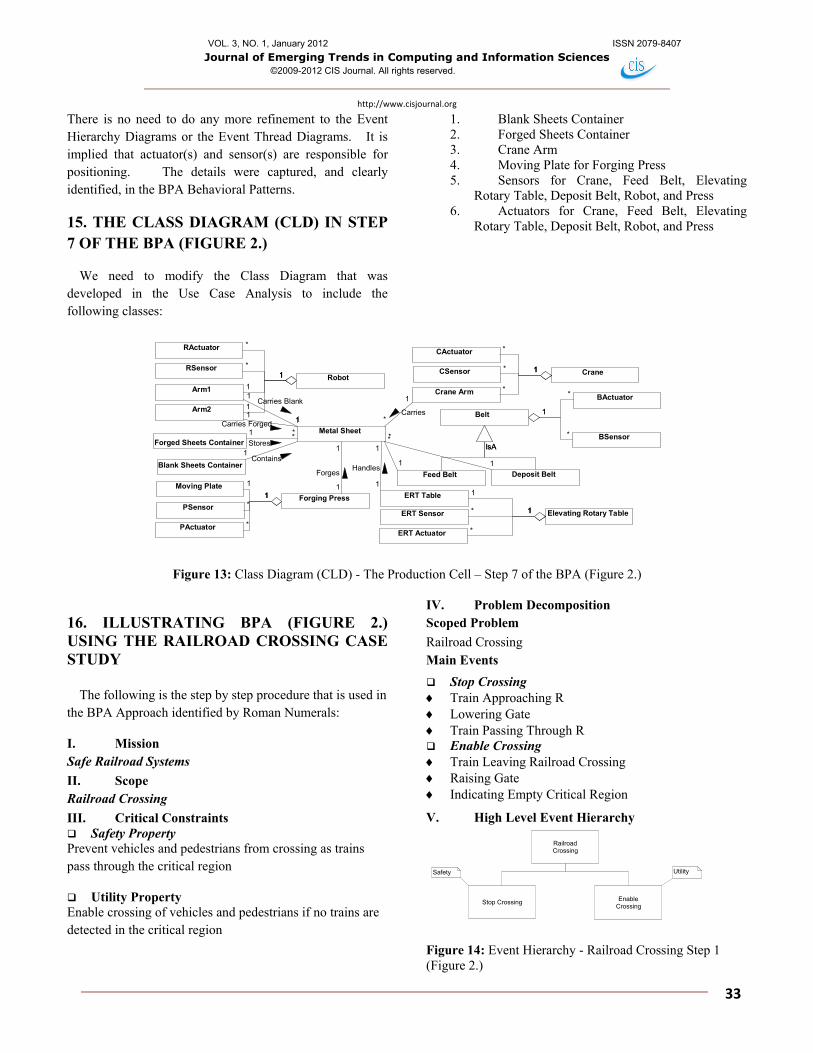
15. THE CLASS DIAGRAM (CLD) IN STEP 7 OF THE BPA (FIGURE 2.)
We need to modify the Class Diagram that was developed in the Use Case Analysis to include the following classes:
1. Blank Sheets Container 2. Forged Sheets Container 3. Crane Arm 4. Moving Plate for Forging Press 5. Sensors for Crane, Feed Belt, Elevating
Rotary Table, Deposit Belt, Robot, and Press 6. Actuators for Crane, Feed Belt, Elevating
Rotary Table, Deposit Belt, Robot, and Press
Metal Sheet
Forging Press
Belt
CraneRobot
ERT Table
Crane Arm
Blank Sheets ContainerFeed Belt Deposit Belt
Arm1
Arm2
Forged Sheets Container
Moving Plate
RActuatorCActuator
BSensor
BActuator
RSensor CSensor
PSensor
PActuator
ERT Sensor
ERT Actuator
Elevating Rotary Table
*
1Contains
*1
Stores
11
Carries Forged1
1Carries Blank
1
1
Handles
1
1
Forges
*
1
*
1
1
1
1
1
*
1*
1* 1
*
1
*
1
1
1*
1
*
1
*
1
*
1 1
1* 1
*
1
*
1
Carries
IsAIsA
Figure 13: Class Diagram (CLD) - The Production Cell – Step 7 of the BPA (Figure 2.)
16. ILLUSTRATING BPA (FIGURE 2.) USING THE RAILROAD CROSSING CASE STUDY
The following is the step by step procedure that is used in the BPA Approach identified by Roman Numerals:
I. Mission Safe Railroad Systems
II. Scope Railroad Crossing
III. Critical Constraints Safety Property Prevent vehicles and pedestrians from crossing as trains pass through the critical region
Utility Property Enable crossing of vehicles and pedestrians if no trains are detected in the critical region
IV. Problem Decomposition Scoped Problem
Railroad Crossing Main Events
Stop Crossing Train Approaching R Lowering Gate Train Passing Through R Enable Crossing Train Leaving Railroad Crossing Raising Gate Indicating Empty Critical Region
V. High Level Event Hierarchy
RailroadCrossing
Stop Crossing EnableCrossing
Safety Utility
Figure 14: Event Hierarchy - Railroad Crossing Step 1 (Figure 2.)
VOL. 3, NO. 1, January 2012 ISSN 2079-8407 Journal of Emerging Trends in Computing and Information Sciences
©2009-2012 CIS Journal. All rights reserved.
http://www.cisjournal.org
34
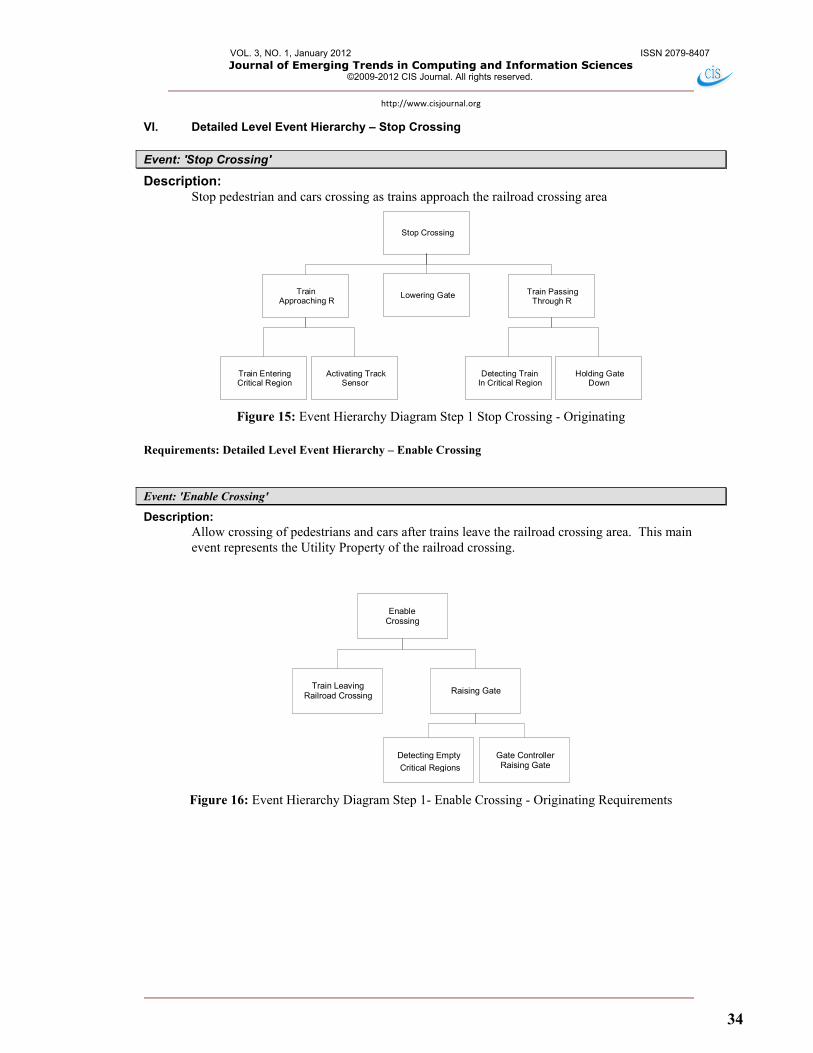
VI. Detailed Level Event Hierarchy – Stop Crossing
Event: 'Stop Crossing'
Description: Stop pedestrian and cars crossing as trains approach the railroad crossing area
Lowering Gate
Detecting TrainIn Critical Region
TrainApproaching R
Stop Crossing
Holding GateDown
Train EnteringCritical Region
Train PassingThrough R
Activating TrackSensor
Figure 15: Event Hierarchy Diagram Step 1 Stop Crossing - Originating
Requirements: Detailed Level Event Hierarchy – Enable Crossing
Event: 'Enable Crossing'
Description: Allow crossing of pedestrians and cars after trains leave the railroad crossing area. This main event represents the Utility Property of the railroad crossing.
EnableCrossing
Train LeavingRailroad Crossing
Raising Gate
Detecting Empty
Critical Regions
Gate ControllerRaising Gate
Figure 16: Event Hierarchy Diagram Step 1- Enable Crossing - Originating Requirements
VOL. 3, NO. 1, January 2012 ISSN 2079-8407 Journal of Emerging Trends in Computing and Information Sciences
©2009-2012 CIS Journal. All rights reserved.
http://www.cisjournal.org
35
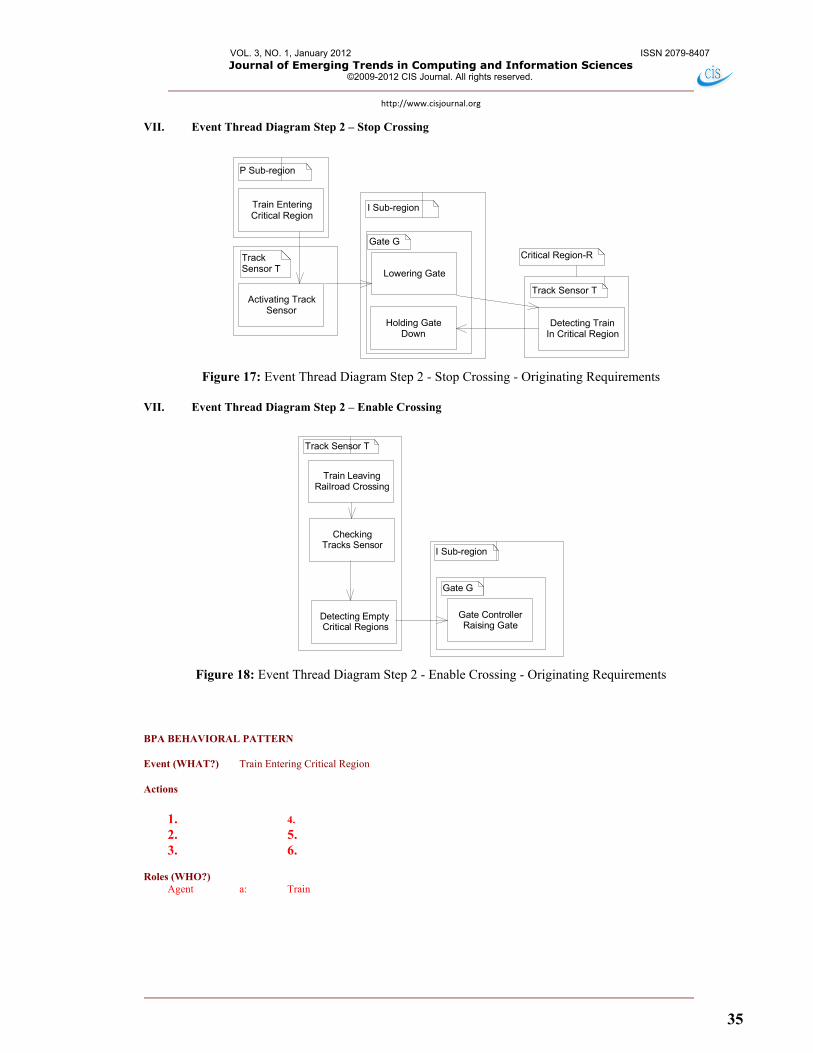
VII. Event Thread Diagram Step 2 – Stop Crossing
Train EnteringCritical Region
Lowering Gate
Holding GateDown
Detecting TrainIn Critical Region
Activating TrackSensor
P Sub-region
Critical Region-R
I Sub-region
Gate G
Track Sensor T
TrackSensor T
Figure 17: Event Thread Diagram Step 2 - Stop Crossing - Originating Requirements
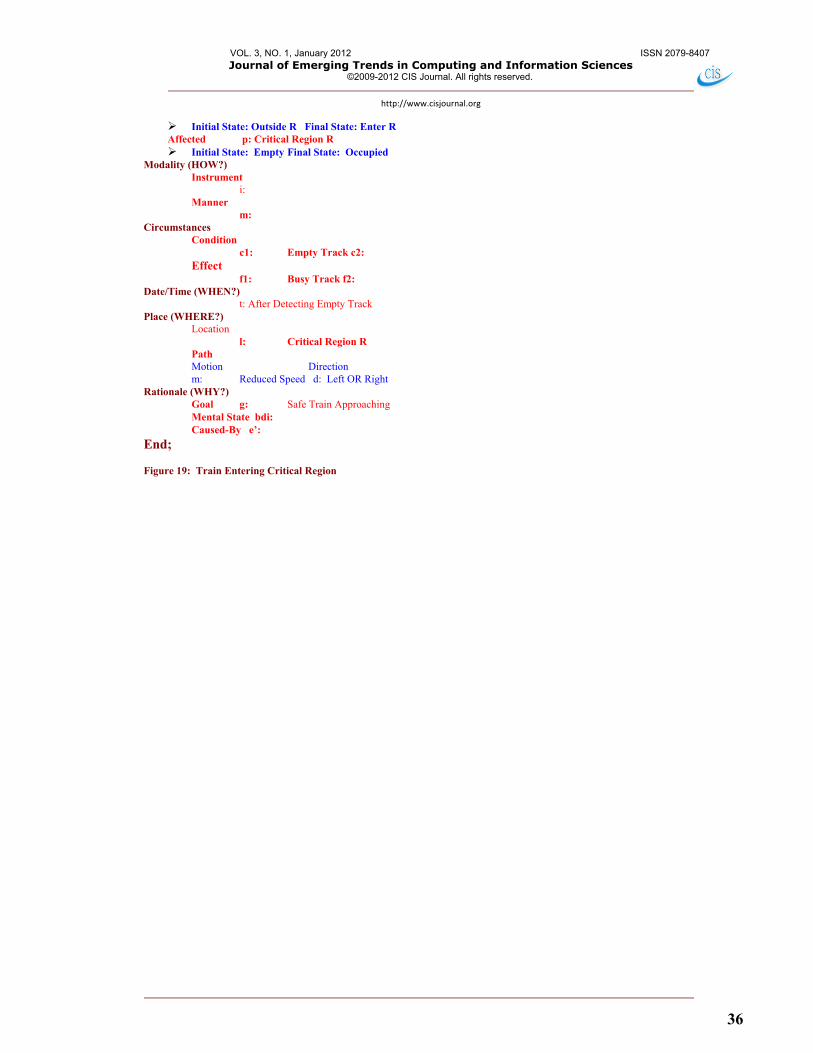
VII. Event Thread Diagram Step 2 – Enable Crossing
Train LeavingRailroad Crossing
Gate ControllerRaising Gate
CheckingTracks Sensor
Detecting EmptyCritical Regions
Track Sensor T
Gate G
I Sub-region
Figure 18: Event Thread Diagram Step 2 - Enable Crossing - Originating Requirements
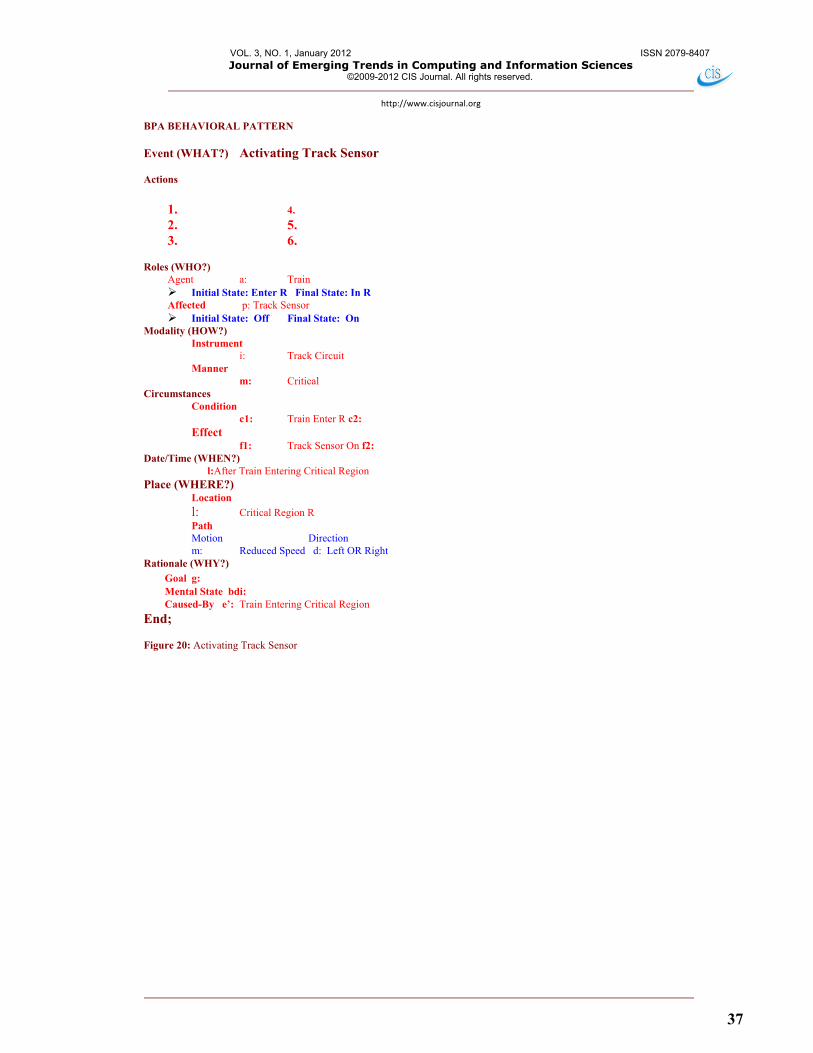
BPA BEHAVIORAL PATTERN Event (WHAT?) Train Entering Critical Region
Actions
1. 4. 2. 5. 3. 6.
Roles (WHO?)
Agent a: Train
VOL. 3, NO. 1, January 2012 ISSN 2079-8407 Journal of Emerging Trends in Computing and Information Sciences
©2009-2012 CIS Journal. All rights reserved.
http://www.cisjournal.org
36
Initial State: Outside R Final State: Enter R Affected p: Critical Region R Initial State: Empty Final State: Occupied
Modality (HOW?) Instrument
i: Manner
m: Circumstances
Condition c1: Empty Track c2:
Effect f1: Busy Track f2:
Date/Time (WHEN?) t: After Detecting Empty Track
Place (WHERE?) Location
l: Critical Region R Path Motion Direction m: Reduced Speed d: Left OR Right
Rationale (WHY?) Goal g: Safe Train Approaching Mental State bdi: Caused-By e’:
End; Figure 19: Train Entering Critical Region
VOL. 3, NO. 1, January 2012 ISSN 2079-8407 Journal of Emerging Trends in Computing and Information Sciences
©2009-2012 CIS Journal. All rights reserved.
http://www.cisjournal.org
37
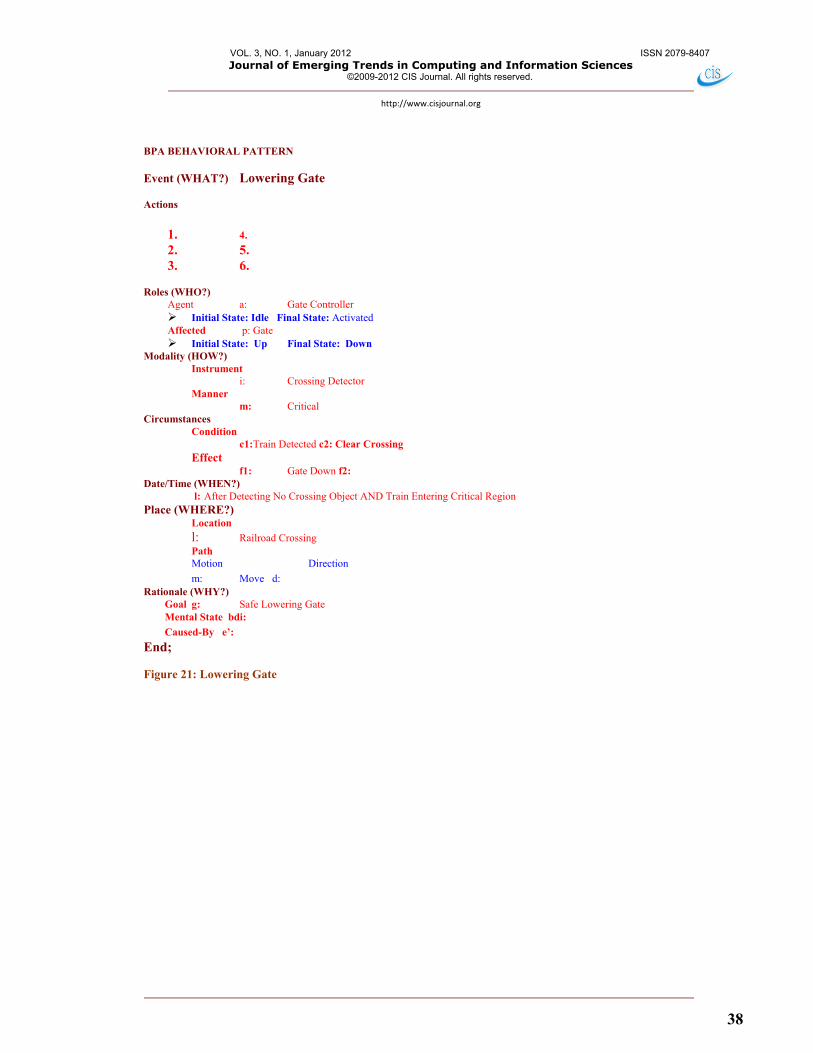
BPA BEHAVIORAL PATTERN
Event (WHAT?) Activating Track Sensor
Actions
1. 4. 2. 5. 3. 6.
Roles (WHO?)
Agent a: Train Initial State: Enter R Final State: In R Affected p: Track Sensor Initial State: Off Final State: On
Modality (HOW?) Instrument
i: Track Circuit Manner
m: Critical Circumstances
Condition c1: Train Enter R c2:
Effect f1: Track Sensor On f2:
Date/Time (WHEN?) l:After Train Entering Critical Region
Place (WHERE?) Location
l: Critical Region R Path Motion Direction m: Reduced Speed d: Left OR Right
Rationale (WHY?)
Goal g: Mental State bdi: Caused-By e’: Train Entering Critical Region
End; Figure 20: Activating Track Sensor
VOL. 3, NO. 1, January 2012 ISSN 2079-8407 Journal of Emerging Trends in Computing and Information Sciences
©2009-2012 CIS Journal. All rights reserved.
http://www.cisjournal.org
38
BPA BEHAVIORAL PATTERN
Event (WHAT?) Lowering Gate
Actions
1. 4. 2. 5. 3. 6.
Roles (WHO?)
Agent a: Gate Controller Initial State: Idle Final State: Activated Affected p: Gate Initial State: Up Final State: Down
Modality (HOW?) Instrument
i: Crossing Detector Manner
m: Critical Circumstances
Condition c1:Train Detected c2: Clear Crossing
Effect f1: Gate Down f2:
Date/Time (WHEN?) l: After Detecting No Crossing Object AND Train Entering Critical Region
Place (WHERE?) Location
l: Railroad Crossing Path Motion Direction
m: Move d: Rationale (WHY?) Goal g: Safe Lowering Gate Mental State bdi:
Caused-By e’:
End; Figure 21: Lowering Gate
VOL. 3, NO. 1, January 2012 ISSN 2079-8407 Journal of Emerging Trends in Computing and Information Sciences
©2009-2012 CIS Journal. All rights reserved.
http://www.cisjournal.org
39
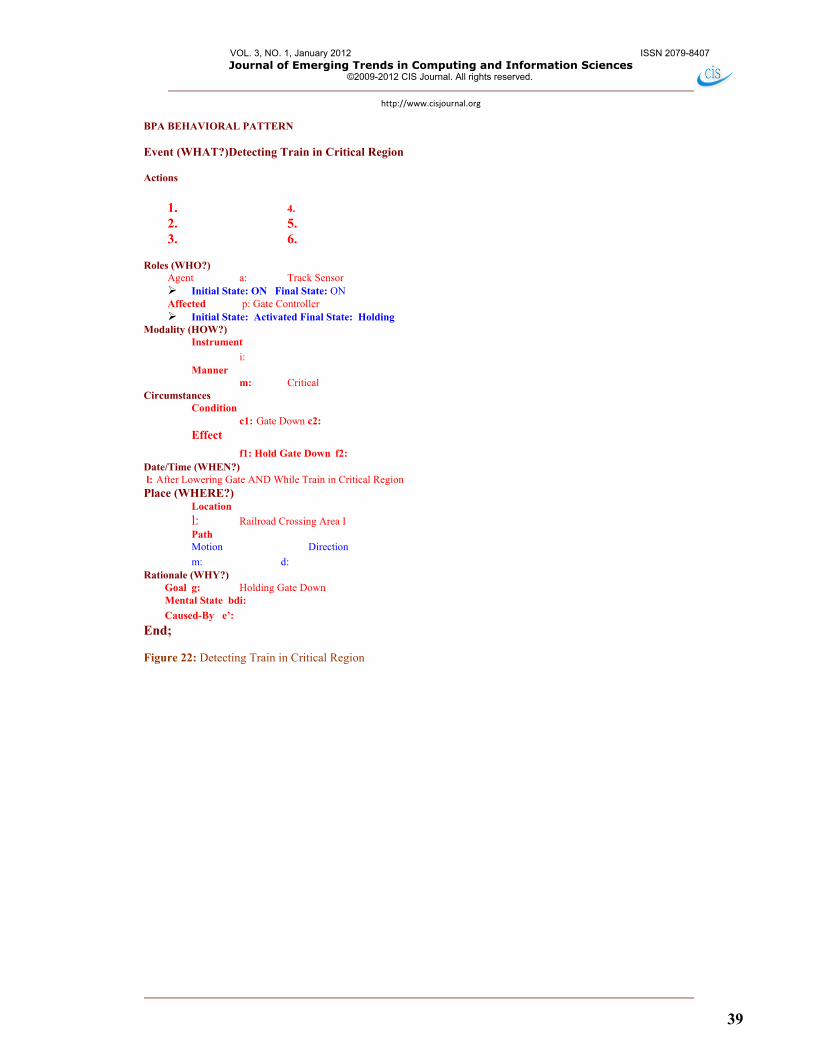
BPA BEHAVIORAL PATTERN Event (WHAT?)Detecting Train in Critical Region
Actions
1. 4. 2. 5. 3. 6.
Roles (WHO?)
Agent a: Track Sensor Initial State: ON Final State: ON Affected p: Gate Controller Initial State: Activated Final State: Holding
Modality (HOW?) Instrument
i: Manner
m: Critical Circumstances
Condition c1: Gate Down c2:
Effect
f1: Hold Gate Down f2: Date/Time (WHEN?) l: After Lowering Gate AND While Train in Critical Region Place (WHERE?)
Location
l: Railroad Crossing Area I Path Motion Direction
m: d: Rationale (WHY?) Goal g: Holding Gate Down Mental State bdi:
Caused-By e’:
End; Figure 22: Detecting Train in Critical Region
VOL. 3, NO. 1, January 2012 ISSN 2079-8407 Journal of Emerging Trends in Computing and Information Sciences
©2009-2012 CIS Journal. All rights reserved.
http://www.cisjournal.org
40
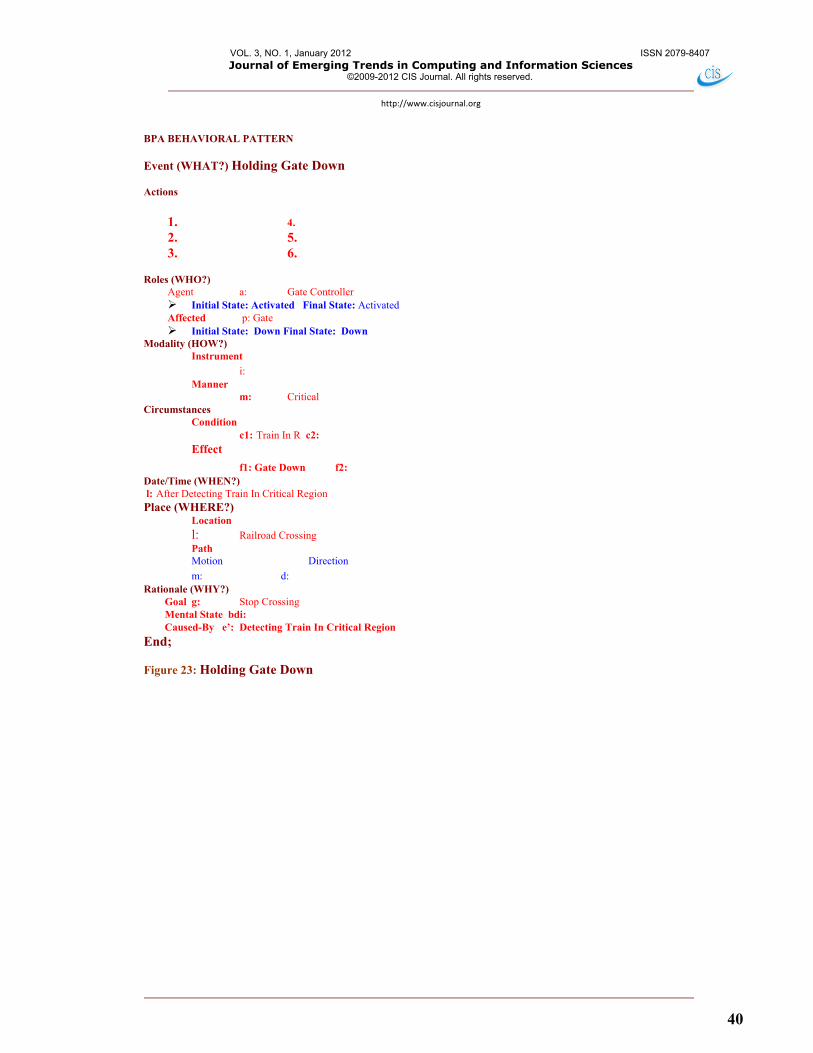
BPA BEHAVIORAL PATTERN
Event (WHAT?) Holding Gate Down
Actions
1. 4. 2. 5. 3. 6.
Roles (WHO?)
Agent a: Gate Controller Initial State: Activated Final State: Activated Affected p: Gate Initial State: Down Final State: Down
Modality (HOW?) Instrument
i: Manner
m: Critical Circumstances
Condition c1: Train In R c2:
Effect
f1: Gate Down f2: Date/Time (WHEN?) l: After Detecting Train In Critical Region Place (WHERE?)
Location
l: Railroad Crossing Path Motion Direction
m: d: Rationale (WHY?) Goal g: Stop Crossing Mental State bdi: Caused-By e’: Detecting Train In Critical Region
End;
Figure 23: Holding Gate Down
VOL. 3, NO. 1, January 2012 ISSN 2079-8407 Journal of Emerging Trends in Computing and Information Sciences
©2009-2012 CIS Journal. All rights reserved.
http://www.cisjournal.org
41
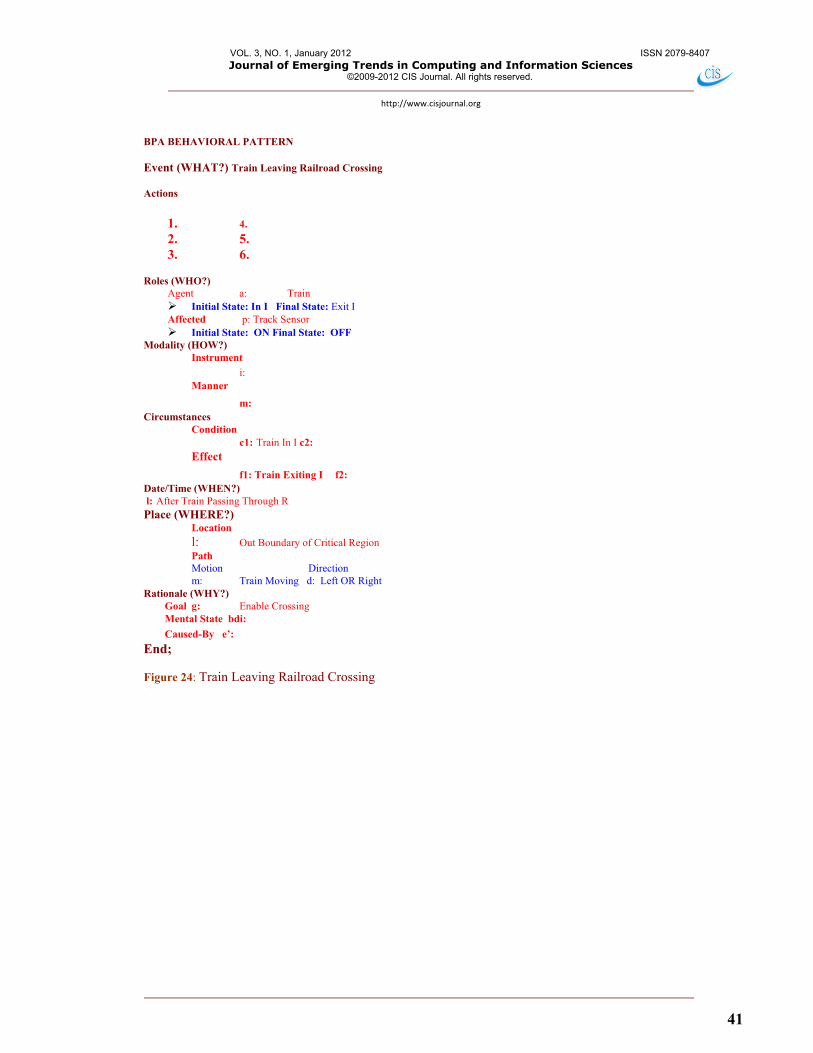
BPA BEHAVIORAL PATTERN Event (WHAT?) Train Leaving Railroad Crossing
Actions
1. 4. 2. 5. 3. 6.
Roles (WHO?)
Agent a: Train Initial State: In I Final State: Exit I Affected p: Track Sensor Initial State: ON Final State: OFF
Modality (HOW?) Instrument
i: Manner
m: Circumstances
Condition c1: Train In I c2:
Effect
f1: Train Exiting I f2: Date/Time (WHEN?) l: After Train Passing Through R Place (WHERE?)
Location
l: Out Boundary of Critical Region Path Motion Direction m: Train Moving d: Left OR Right
Rationale (WHY?) Goal g: Enable Crossing Mental State bdi:
Caused-By e’:
End;
Figure 24: Train Leaving Railroad Crossing
VOL. 3, NO. 1, January 2012 ISSN 2079-8407 Journal of Emerging Trends in Computing and Information Sciences
©2009-2012 CIS Journal. All rights reserved.
http://www.cisjournal.org
42
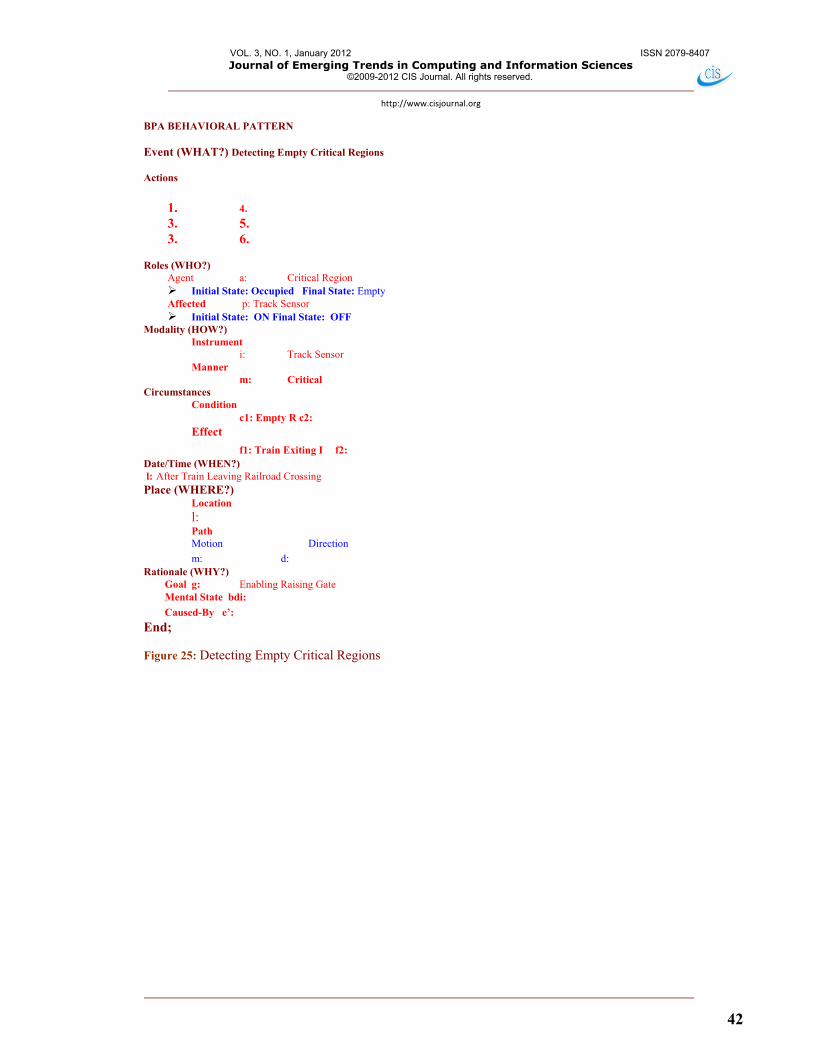
BPA BEHAVIORAL PATTERN Event (WHAT?) Detecting Empty Critical Regions
Actions
1. 4. 3. 5. 3. 6.
Roles (WHO?)
Agent a: Critical Region Initial State: Occupied Final State: Empty Affected p: Track Sensor Initial State: ON Final State: OFF
Modality (HOW?) Instrument
i: Track Sensor Manner
m: Critical Circumstances
Condition c1: Empty R c2:
Effect
f1: Train Exiting I f2: Date/Time (WHEN?) l: After Train Leaving Railroad Crossing Place (WHERE?)
Location
l: Path Motion Direction
m: d: Rationale (WHY?) Goal g: Enabling Raising Gate Mental State bdi:
Caused-By e’:
End;
Figure 25: Detecting Empty Critical Regions
VOL. 3, NO. 1, January 2012 ISSN 2079-8407 Journal of Emerging Trends in Computing and Information Sciences
©2009-2012 CIS Journal. All rights reserved.
http://www.cisjournal.org
43
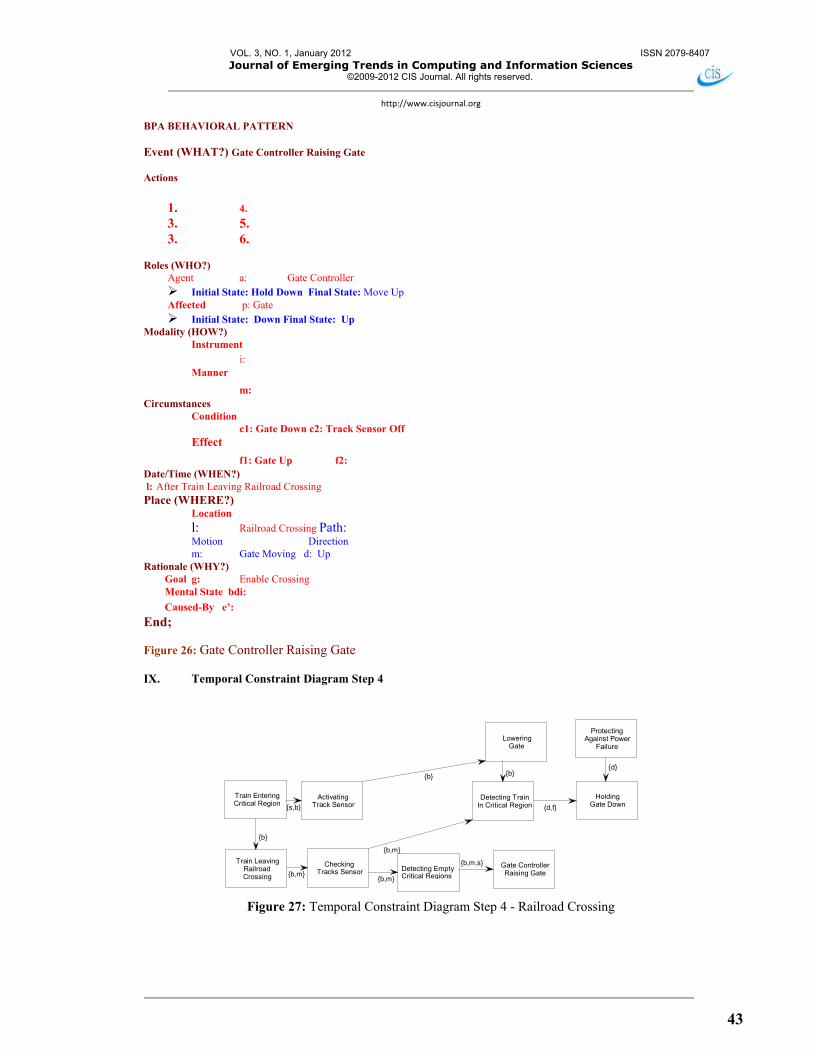
BPA BEHAVIORAL PATTERN Event (WHAT?) Gate Controller Raising Gate
Actions
1. 4. 3. 5. 3. 6.
Roles (WHO?)
Agent a: Gate Controller Initial State: Hold Down Final State: Move Up Affected p: Gate Initial State: Down Final State: Up
Modality (HOW?) Instrument
i: Manner
m: Circumstances
Condition c1: Gate Down c2: Track Sensor Off
Effect
f1: Gate Up f2: Date/Time (WHEN?) l: After Train Leaving Railroad Crossing Place (WHERE?)
Location
l: Railroad Crossing Path: Motion Direction m: Gate Moving d: Up
Rationale (WHY?) Goal g: Enable Crossing Mental State bdi:
Caused-By e’:
End;
Figure 26: Gate Controller Raising Gate IX. Temporal Constraint Diagram Step 4
Train EnteringCritical Region
LoweringGate
Detecting TrainIn Critical Region
ProtectingAgainst Power
Failure
HoldingGate Down
Detecting EmptyCritical Regions
Train LeavingRailroadCrossing
Gate ControllerRaising Gate
ActivatingTrack Sensor
CheckingTracks Sensor
{b}
{d,f}
{d}
{b}
{b,m,s}
{s,b}
{b}
{b,m}{b,m}
{b,m}
Figure 27: Temporal Constraint Diagram Step 4 - Railroad Crossing
VOL. 3, NO. 1, January 2012 ISSN 2079-8407 Journal of Emerging Trends in Computing and Information Sciences
©2009-2012 CIS Journal. All rights reserved.
http://www.cisjournal.org
44
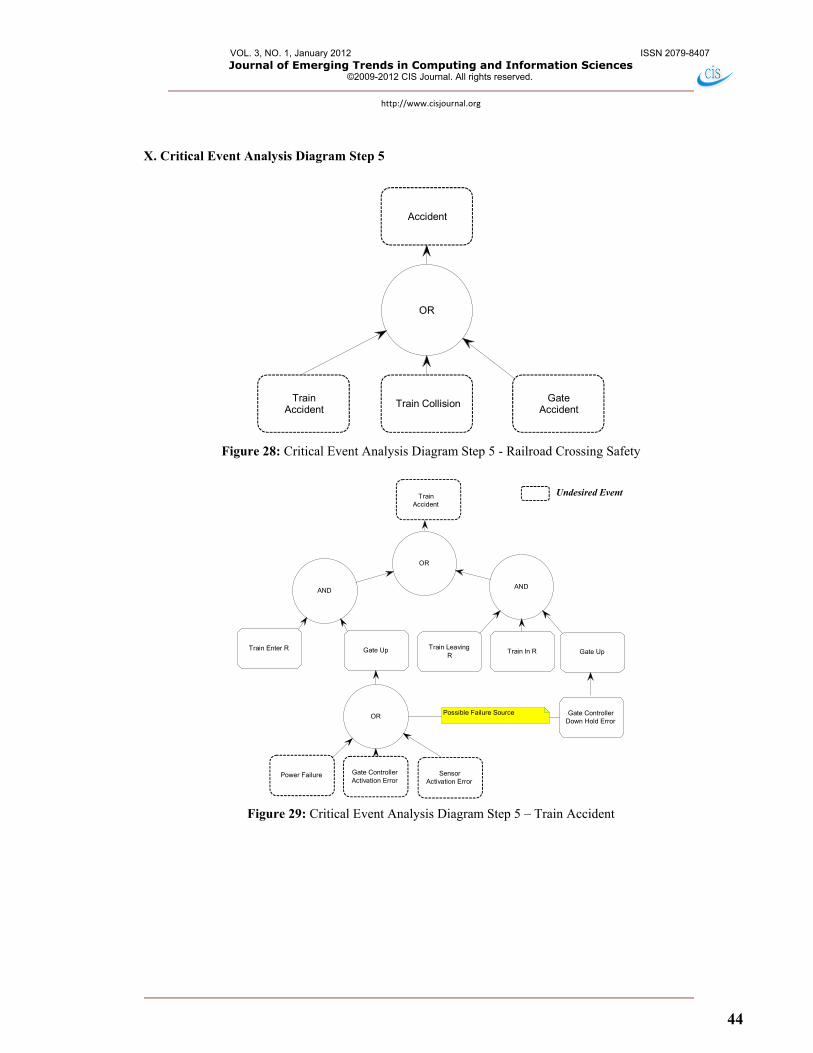
X. Critical Event Analysis Diagram Step 5
GateAccident
Train CollisionTrainAccident
Accident
OR
Figure 28: Critical Event Analysis Diagram Step 5 - Railroad Crossing Safety
TrainAccident
AND
Train LeavingR
Train Enter R
OR
Train In R
AND
Gate ControllerDown Hold Error
SensorActivation Error
Gate Up
Power Failure Gate ControllerActivation Error
OR
Gate Up
Possible Failure Source
Undesired Event
Figure 29: Critical Event Analysis Diagram Step 5 – Train Accident
VOL. 3, NO. 1, January 2012 ISSN 2079-8407 Journal of Emerging Trends in Computing and Information Sciences
©2009-2012 CIS Journal. All rights reserved.
http://www.cisjournal.org
45
TrainApproaching R
DetectingOccupied Track
NOT
AND
Train CollisionGate
Accident
LoweringGate
Vehicles andPassangers
Crossing
AND
Safety Light is required to warnnext train's driver Crossing Alarm Required
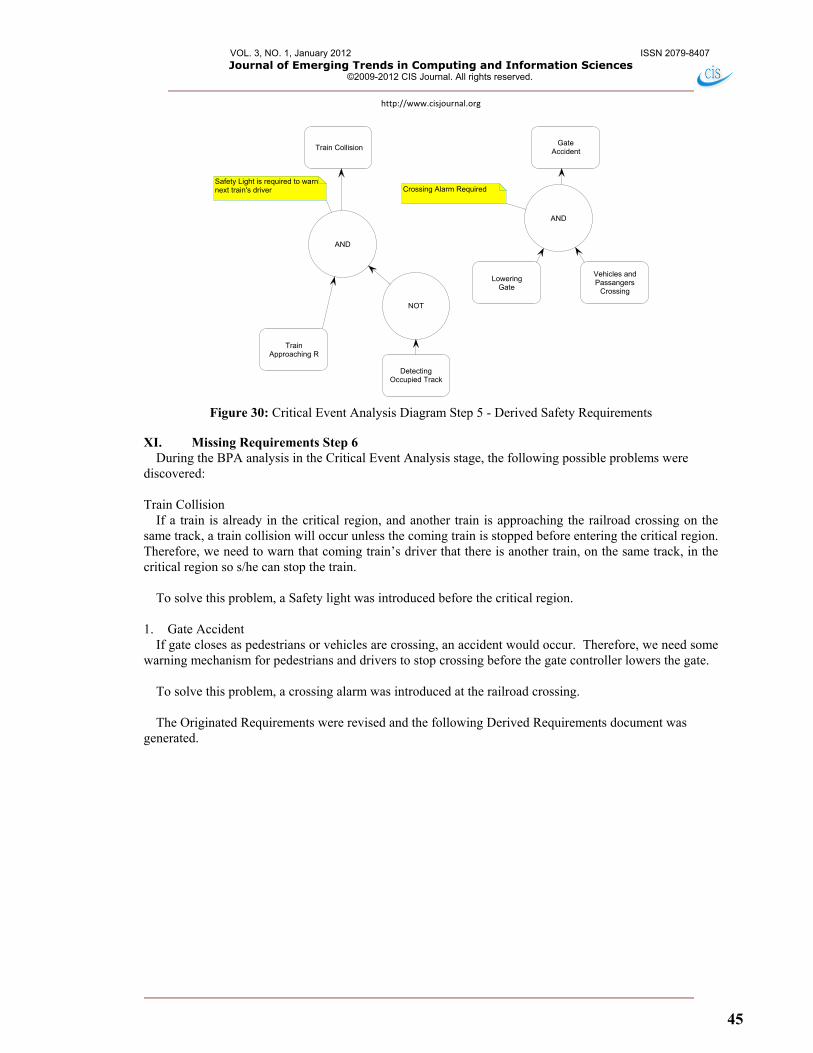
Figure 30: Critical Event Analysis Diagram Step 5 - Derived Safety Requirements
XI. Missing Requirements Step 6
During the BPA analysis in the Critical Event Analysis stage, the following possible problems were discovered: Train Collision
If a train is already in the critical region, and another train is approaching the railroad crossing on the same track, a train collision will occur unless the coming train is stopped before entering the critical region. Therefore, we need to warn that coming train’s driver that there is another train, on the same track, in the critical region so s/he can stop the train.
To solve this problem, a Safety light was introduced before the critical region. 1. Gate Accident
If gate closes as pedestrians or vehicles are crossing, an accident would occur. Therefore, we need some warning mechanism for pedestrians and drivers to stop crossing before the gate controller lowers the gate.
To solve this problem, a crossing alarm was introduced at the railroad crossing.
The Originated Requirements were revised and the following Derived Requirements document was generated.
VOL. 3, NO. 1, January 2012 ISSN 2079-8407 Journal of Emerging Trends in Computing and Information Sciences
©2009-2012 CIS Journal. All rights reserved.
http://www.cisjournal.org
46
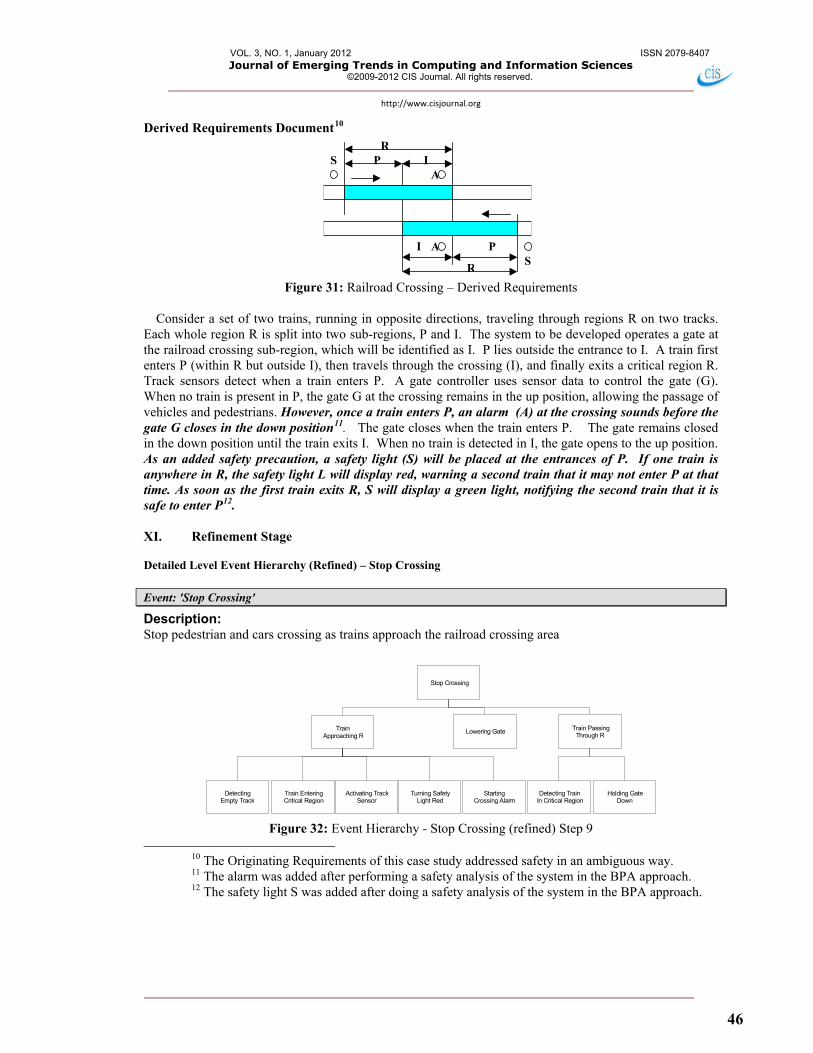
Derived Requirements Document10
P
PI
IR
R
A
AS
S
Figure 31: Railroad Crossing – Derived Requirements
Consider a set of two trains, running in opposite directions, traveling through regions R on two tracks. Each whole region R is split into two sub-regions, P and I. The system to be developed operates a gate at the railroad crossing sub-region, which will be identified as I. P lies outside the entrance to I. A train first enters P (within R but outside I), then travels through the crossing (I), and finally exits a critical region R. Track sensors detect when a train enters P. A gate controller uses sensor data to control the gate (G). When no train is present in P, the gate G at the crossing remains in the up position, allowing the passage of vehicles and pedestrians. However, once a train enters P, an alarm (A) at the crossing sounds before the gate G closes in the down position11. The gate closes when the train enters P. The gate remains closed in the down position until the train exits I. When no train is detected in I, the gate opens to the up position. As an added safety precaution, a safety light (S) will be placed at the entrances of P. If one train is anywhere in R, the safety light L will display red, warning a second train that it may not enter P at that time. As soon as the first train exits R, S will display a green light, notifying the second train that it is safe to enter P12. XI. Refinement Stage Detailed Level Event Hierarchy (Refined) – Stop Crossing
Event: 'Stop Crossing'
Description: Stop pedestrian and cars crossing as trains approach the railroad crossing area
Lowering Gate
Detecting TrainIn Critical Region
TrainApproaching R
StartingCrossing Alarm
Stop Crossing
Holding GateDown
Train EnteringCritical Region
DetectingEmpty Track
Train PassingThrough R
Turning SafetyLight Red
Activating TrackSensor
Figure 32: Event Hierarchy - Stop Crossing (refined) Step 9
10 The Originating Requirements of this case study addressed safety in an ambiguous way. 11 The alarm was added after performing a safety analysis of the system in the BPA approach. 12 The safety light S was added after doing a safety analysis of the system in the BPA approach.
VOL. 3, NO. 1, January 2012 ISSN 2079-8407 Journal of Emerging Trends in Computing and Information Sciences
©2009-2012 CIS Journal. All rights reserved.
http://www.cisjournal.org
47
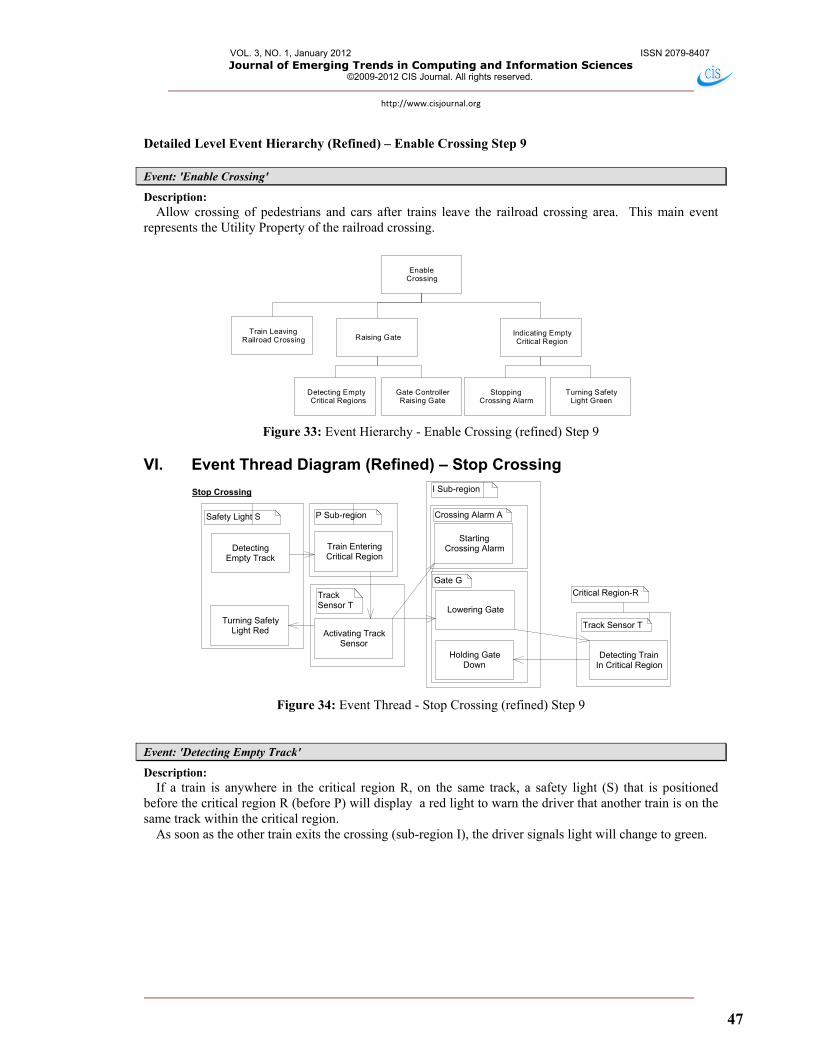
Detailed Level Event Hierarchy (Refined) – Enable Crossing Step 9
Event: 'Enable Crossing'
Description: Allow crossing of pedestrians and cars after trains leave the railroad crossing area. This main event
represents the Utility Property of the railroad crossing.
EnableCrossing
Train LeavingRailroad Crossing Raising Gate
StoppingCrossing Alarm
Detecting EmptyCritical Regions
Gate ControllerRaising Gate
Turning SafetyLight Green
Indicating EmptyCritical Region
Figure 33: Event Hierarchy - Enable Crossing (refined) Step 9
VI. Event Thread Diagram (Refined) – Stop Crossing
Train EnteringCritical Region
StartingCrossing Alarm
Lowering Gate
Holding GateDown
Detecting TrainIn Critical Region
DetectingEmpty Track
Turning SafetyLight Red Activating Track
Sensor
Stop Crossing
Safety Light S P Sub-region
Critical Region-R
I Sub-region
Crossing Alarm A
Gate G
Track Sensor T
TrackSensor T
Figure 34: Event Thread - Stop Crossing (refined) Step 9
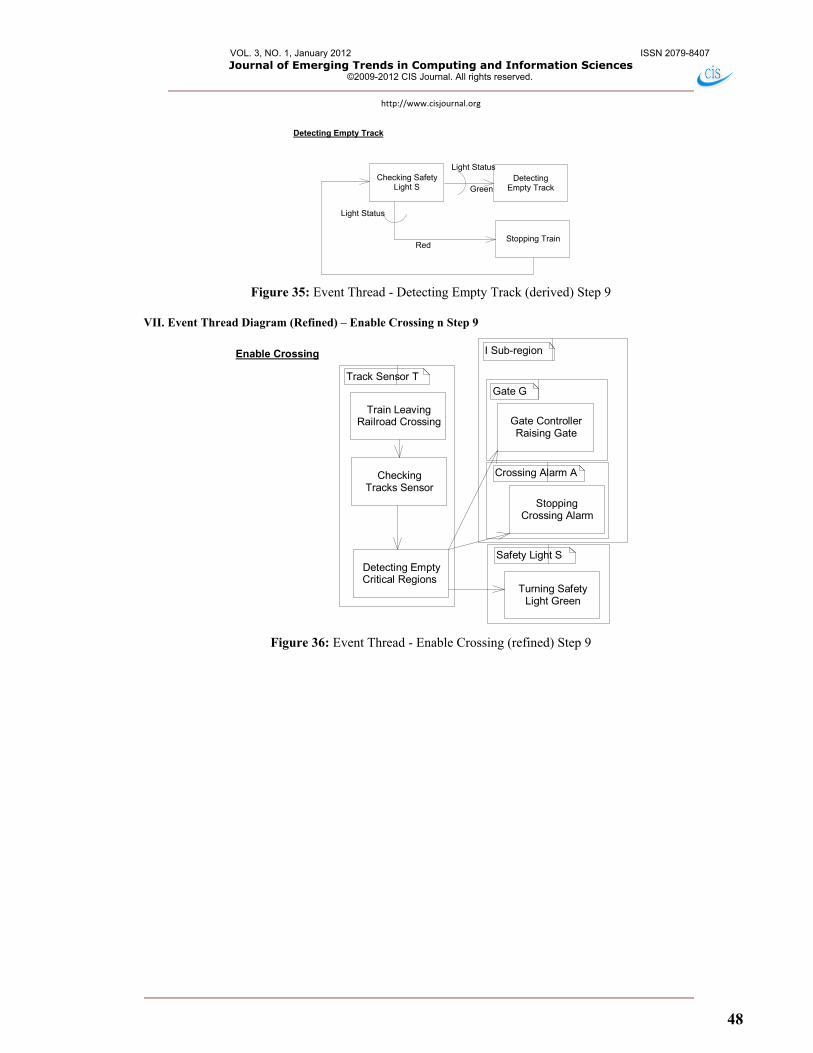
Event: 'Detecting Empty Track'
Description: If a train is anywhere in the critical region R, on the same track, a safety light (S) that is positioned
before the critical region R (before P) will display a red light to warn the driver that another train is on the same track within the critical region.
As soon as the other train exits the crossing (sub-region I), the driver signals light will change to green.
VOL. 3, NO. 1, January 2012 ISSN 2079-8407 Journal of Emerging Trends in Computing and Information Sciences
©2009-2012 CIS Journal. All rights reserved.
http://www.cisjournal.org
48
Stopping Train
Checking SafetyLight S
DetectingEmpty Track
Detecting Empty Track
Light Status
Green
Light Status
Red
Figure 35: Event Thread - Detecting Empty Track (derived) Step 9
VII. Event Thread Diagram (Refined) – Enable Crossing n Step 9
Train LeavingRailroad Crossing Gate Controller
Raising Gate
StoppingCrossing Alarm
Turning SafetyLight Green
CheckingTracks Sensor
Detecting EmptyCritical Regions
Enable Crossing
Track Sensor TGate G
Crossing Alarm A
Safety Light S
I Sub-region
Figure 36: Event Thread - Enable Crossing (refined) Step 9
VOL. 3, NO. 1, January 2012 ISSN 2079-8407 Journal of Emerging Trends in Computing and Information Sciences
©2009-2012 CIS Journal. All rights reserved.
http://www.cisjournal.org
49
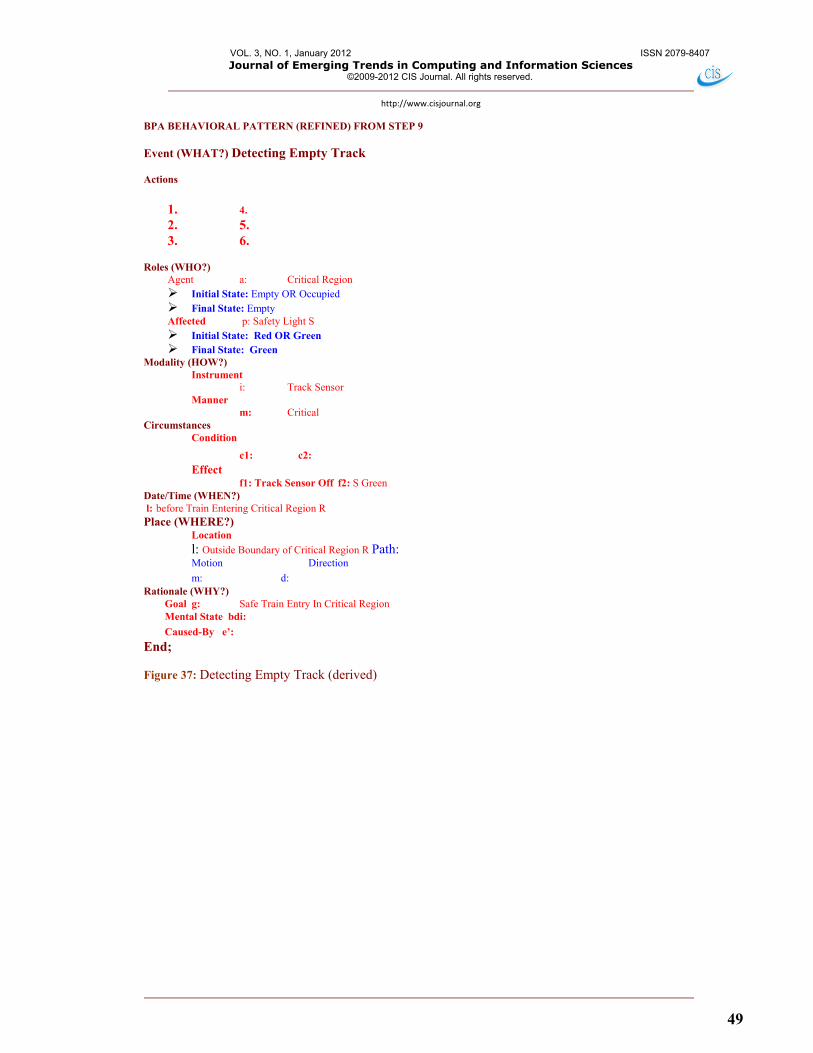
BPA BEHAVIORAL PATTERN (REFINED) FROM STEP 9
Event (WHAT?) Detecting Empty Track
Actions
1. 4. 2. 5. 3. 6.
Roles (WHO?)
Agent a: Critical Region Initial State: Empty OR Occupied Final State: Empty Affected p: Safety Light S Initial State: Red OR Green Final State: Green
Modality (HOW?) Instrument
i: Track Sensor Manner
m: Critical Circumstances
Condition
c1: c2: Effect
f1: Track Sensor Off f2: S Green Date/Time (WHEN?) l: before Train Entering Critical Region R Place (WHERE?)
Location
l: Outside Boundary of Critical Region R Path: Motion Direction
m: d: Rationale (WHY?) Goal g: Safe Train Entry In Critical Region Mental State bdi:
Caused-By e’:
End;
Figure 37: Detecting Empty Track (derived)
VOL. 3, NO. 1, January 2012 ISSN 2079-8407 Journal of Emerging Trends in Computing and Information Sciences
©2009-2012 CIS Journal. All rights reserved.
http://www.cisjournal.org
50
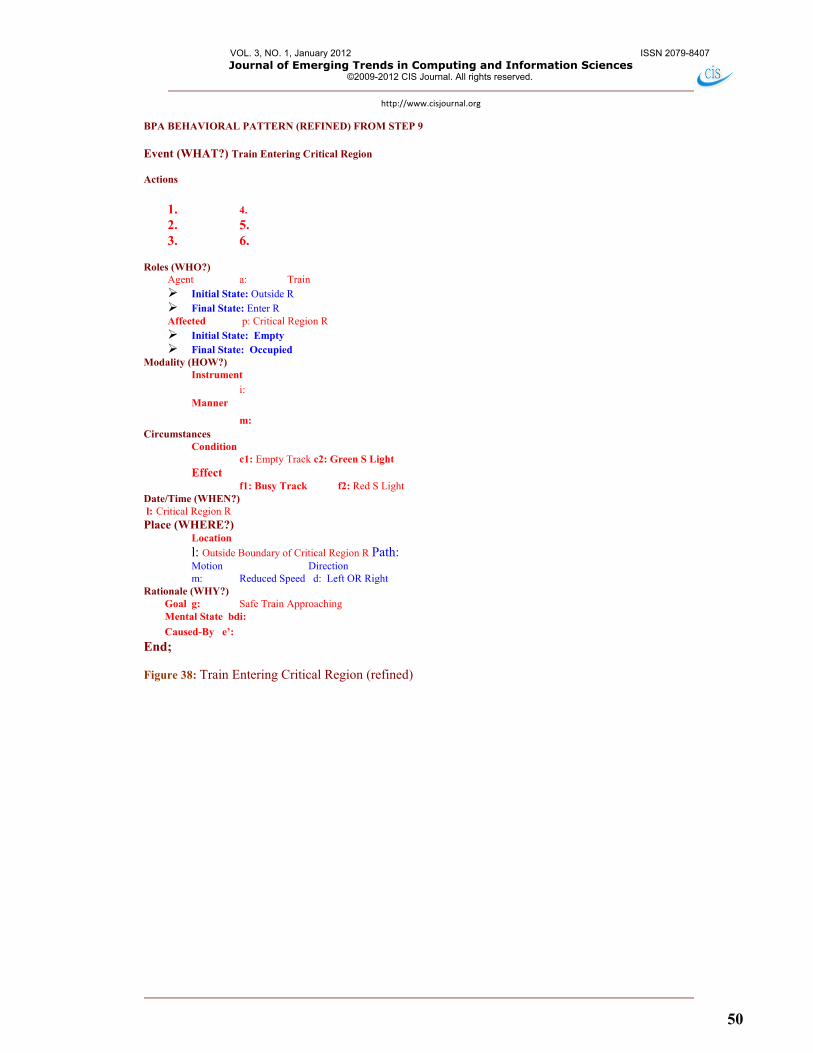
BPA BEHAVIORAL PATTERN (REFINED) FROM STEP 9 Event (WHAT?) Train Entering Critical Region
Actions
1. 4. 2. 5. 3. 6.
Roles (WHO?)
Agent a: Train Initial State: Outside R Final State: Enter R Affected p: Critical Region R Initial State: Empty Final State: Occupied
Modality (HOW?) Instrument
i: Manner
m: Circumstances
Condition c1: Empty Track c2: Green S Light
Effect f1: Busy Track f2: Red S Light
Date/Time (WHEN?) l: Critical Region R Place (WHERE?)
Location
l: Outside Boundary of Critical Region R Path: Motion Direction m: Reduced Speed d: Left OR Right
Rationale (WHY?) Goal g: Safe Train Approaching Mental State bdi:
Caused-By e’:
End;
Figure 38: Train Entering Critical Region (refined)
VOL. 3, NO. 1, January 2012 ISSN 2079-8407 Journal of Emerging Trends in Computing and Information Sciences
©2009-2012 CIS Journal. All rights reserved.
http://www.cisjournal.org
51
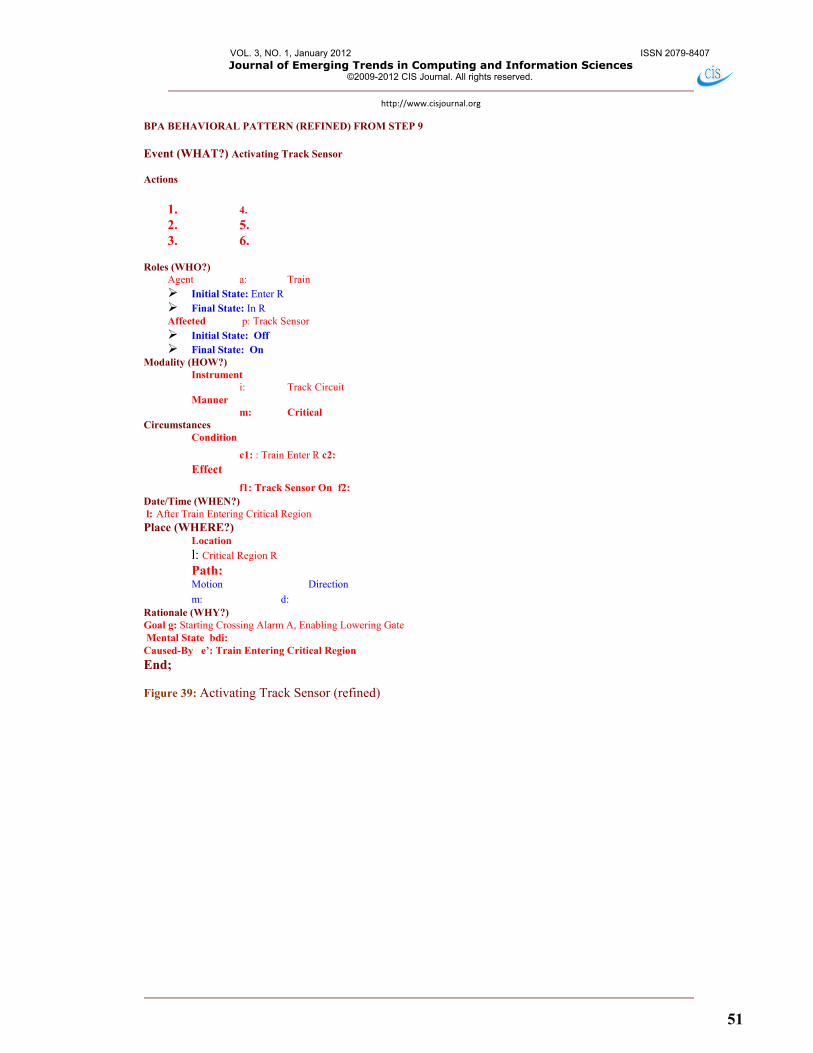
BPA BEHAVIORAL PATTERN (REFINED) FROM STEP 9 Event (WHAT?) Activating Track Sensor
Actions
1. 4. 2. 5. 3. 6.
Roles (WHO?)
Agent a: Train Initial State: Enter R Final State: In R Affected p: Track Sensor Initial State: Off Final State: On
Modality (HOW?) Instrument
i: Track Circuit Manner
m: Critical Circumstances
Condition
c1: : Train Enter R c2: Effect
f1: Track Sensor On f2: Date/Time (WHEN?) l: After Train Entering Critical Region Place (WHERE?)
Location
l: Critical Region R
Path: Motion Direction
m: d: Rationale (WHY?) Goal g: Starting Crossing Alarm A, Enabling Lowering Gate Mental State bdi: Caused-By e’: Train Entering Critical Region
End;
Figure 39: Activating Track Sensor (refined)
VOL. 3, NO. 1, January 2012 ISSN 2079-8407 Journal of Emerging Trends in Computing and Information Sciences
©2009-2012 CIS Journal. All rights reserved.
http://www.cisjournal.org
52
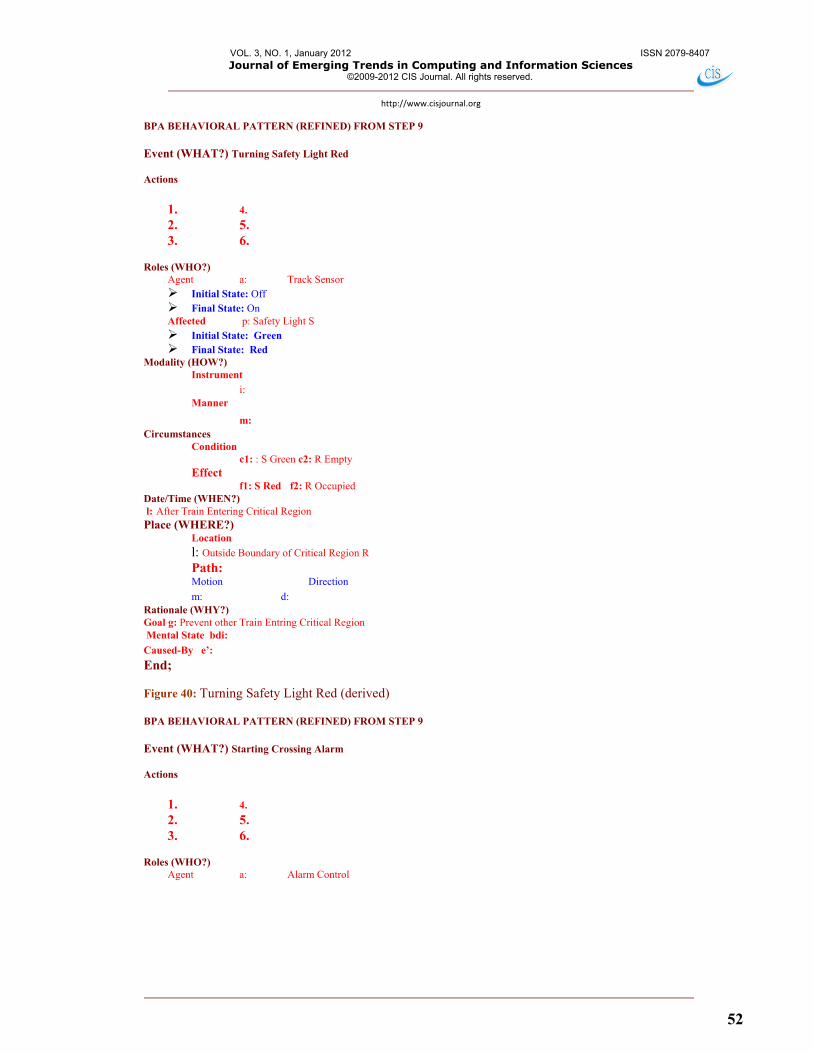
BPA BEHAVIORAL PATTERN (REFINED) FROM STEP 9 Event (WHAT?) Turning Safety Light Red
Actions
1. 4. 2. 5. 3. 6.
Roles (WHO?)
Agent a: Track Sensor Initial State: Off Final State: On Affected p: Safety Light S Initial State: Green Final State: Red
Modality (HOW?) Instrument
i: Manner
m: Circumstances
Condition c1: : S Green c2: R Empty
Effect f1: S Red f2: R Occupied
Date/Time (WHEN?) l: After Train Entering Critical Region Place (WHERE?)
Location
l: Outside Boundary of Critical Region R
Path: Motion Direction
m: d: Rationale (WHY?) Goal g: Prevent other Train Entring Critical Region Mental State bdi:
Caused-By e’:
End;
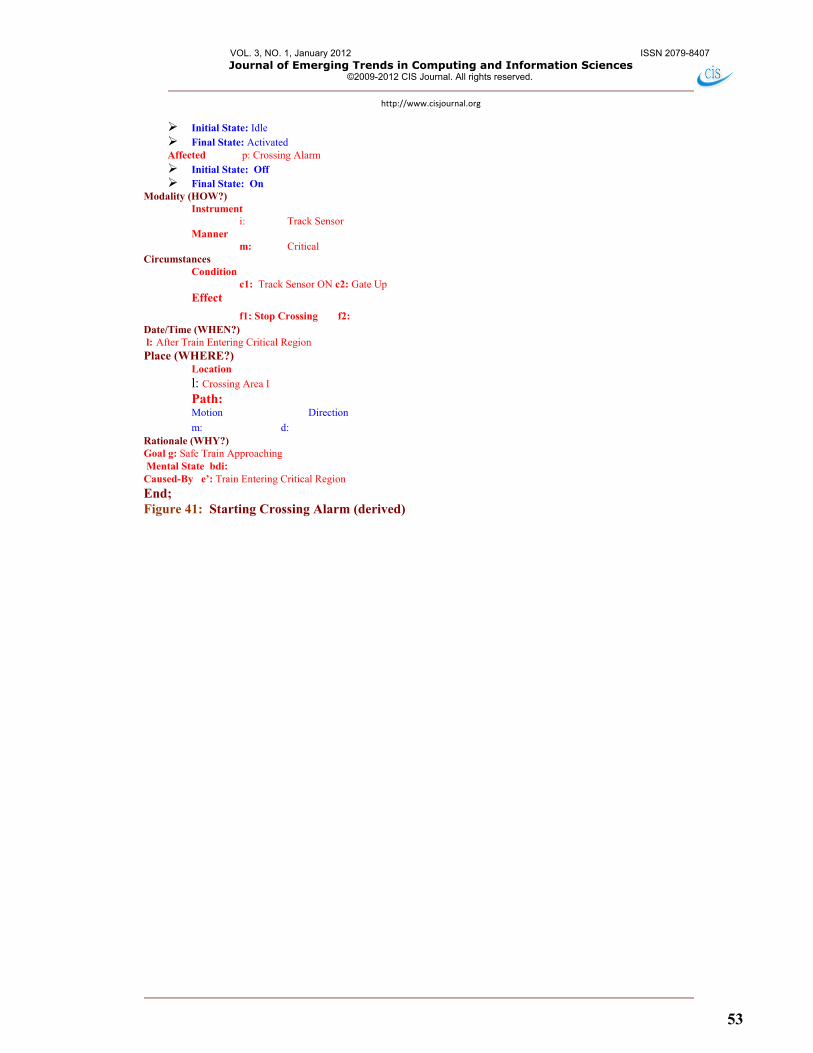
Figure 40: Turning Safety Light Red (derived) BPA BEHAVIORAL PATTERN (REFINED) FROM STEP 9 Event (WHAT?) Starting Crossing Alarm
Actions
1. 4. 2. 5. 3. 6.
Roles (WHO?)
Agent a: Alarm Control
VOL. 3, NO. 1, January 2012 ISSN 2079-8407 Journal of Emerging Trends in Computing and Information Sciences
©2009-2012 CIS Journal. All rights reserved.
http://www.cisjournal.org
53
Initial State: Idle Final State: Activated Affected p: Crossing Alarm Initial State: Off Final State: On
Modality (HOW?) Instrument
i: Track Sensor Manner
m: Critical Circumstances
Condition c1: Track Sensor ON c2: Gate Up
Effect
f1: Stop Crossing f2: Date/Time (WHEN?) l: After Train Entering Critical Region Place (WHERE?)
Location
l: Crossing Area I
Path: Motion Direction
m: d: Rationale (WHY?) Goal g: Safe Train Approaching Mental State bdi: Caused-By e’: Train Entering Critical Region
End; Figure 41: Starting Crossing Alarm (derived)
VOL. 3, NO. 1, January 2012 ISSN 2079-8407 Journal of Emerging Trends in Computing and Information Sciences
©2009-2012 CIS Journal. All rights reserved.
http://www.cisjournal.org
54
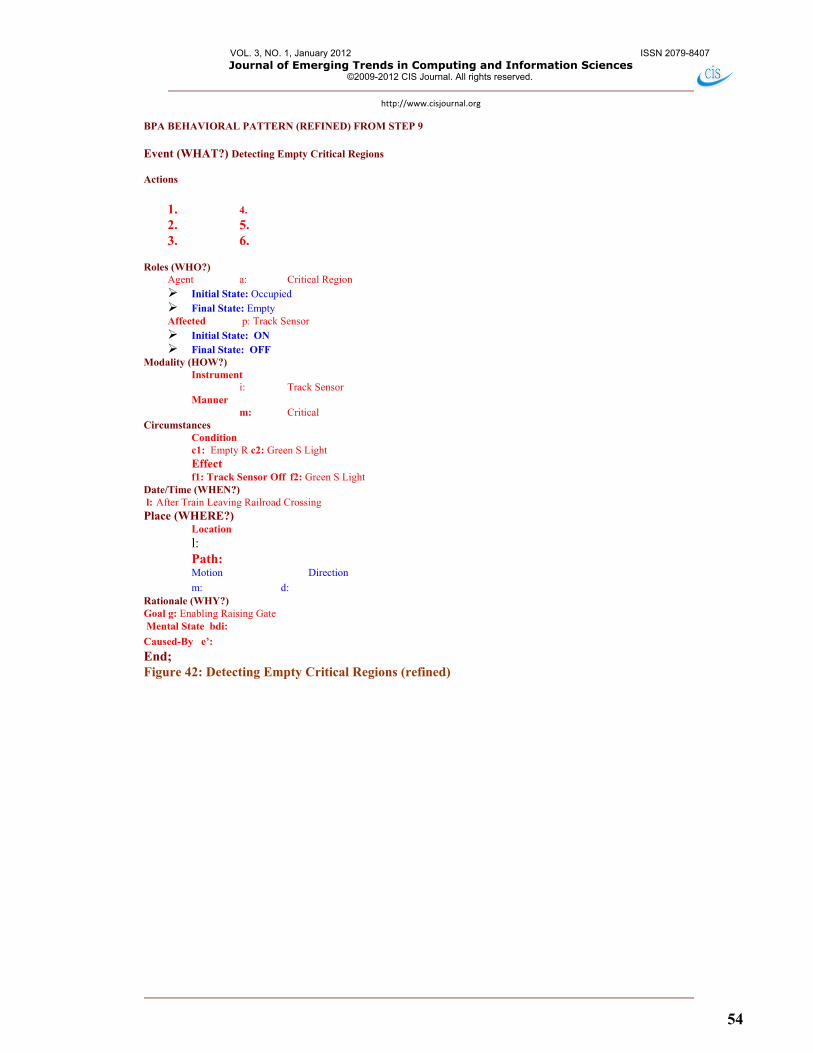
BPA BEHAVIORAL PATTERN (REFINED) FROM STEP 9 Event (WHAT?) Detecting Empty Critical Regions
Actions
1. 4. 2. 5. 3. 6.
Roles (WHO?)
Agent a: Critical Region Initial State: Occupied Final State: Empty Affected p: Track Sensor Initial State: ON Final State: OFF
Modality (HOW?) Instrument
i: Track Sensor Manner
m: Critical Circumstances
Condition c1: Empty R c2: Green S Light Effect f1: Track Sensor Off f2: Green S Light
Date/Time (WHEN?) l: After Train Leaving Railroad Crossing Place (WHERE?)
Location
l:
Path: Motion Direction
m: d: Rationale (WHY?) Goal g: Enabling Raising Gate Mental State bdi:
Caused-By e’:
End; Figure 42: Detecting Empty Critical Regions (refined)
VOL. 3, NO. 1, January 2012 ISSN 2079-8407 Journal of Emerging Trends in Computing and Information Sciences
©2009-2012 CIS Journal. All rights reserved.
http://www.cisjournal.org
55
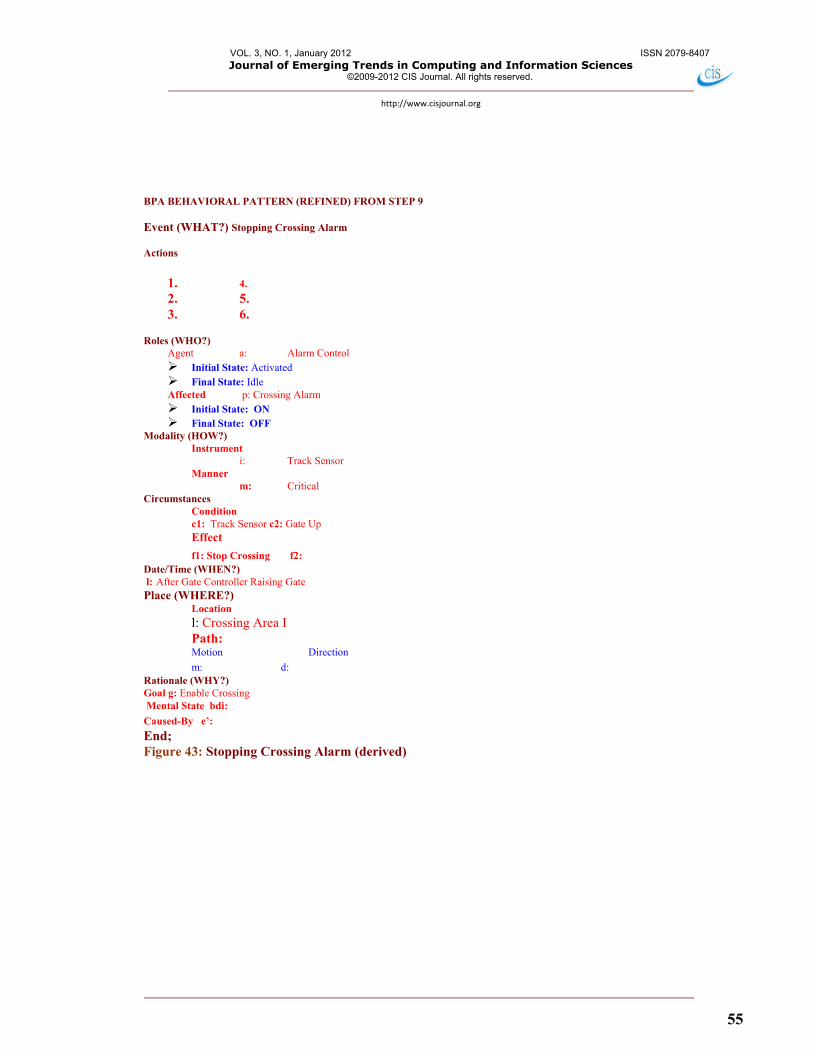
BPA BEHAVIORAL PATTERN (REFINED) FROM STEP 9 Event (WHAT?) Stopping Crossing Alarm Actions
1. 4. 2. 5. 3. 6.
Roles (WHO?)
Agent a: Alarm Control Initial State: Activated Final State: Idle Affected p: Crossing Alarm Initial State: ON Final State: OFF
Modality (HOW?) Instrument
i: Track Sensor Manner
m: Critical Circumstances
Condition c1: Track Sensor c2: Gate Up Effect
f1: Stop Crossing f2: Date/Time (WHEN?) l: After Gate Controller Raising Gate Place (WHERE?)
Location
l: Crossing Area I
Path: Motion Direction
m: d: Rationale (WHY?) Goal g: Enable Crossing Mental State bdi:
Caused-By e’:
End; Figure 43: Stopping Crossing Alarm (derived)
VOL. 3, NO. 1, January 2012 ISSN 2079-8407 Journal of Emerging Trends in Computing and Information Sciences
©2009-2012 CIS Journal. All rights reserved.
http://www.cisjournal.org
56
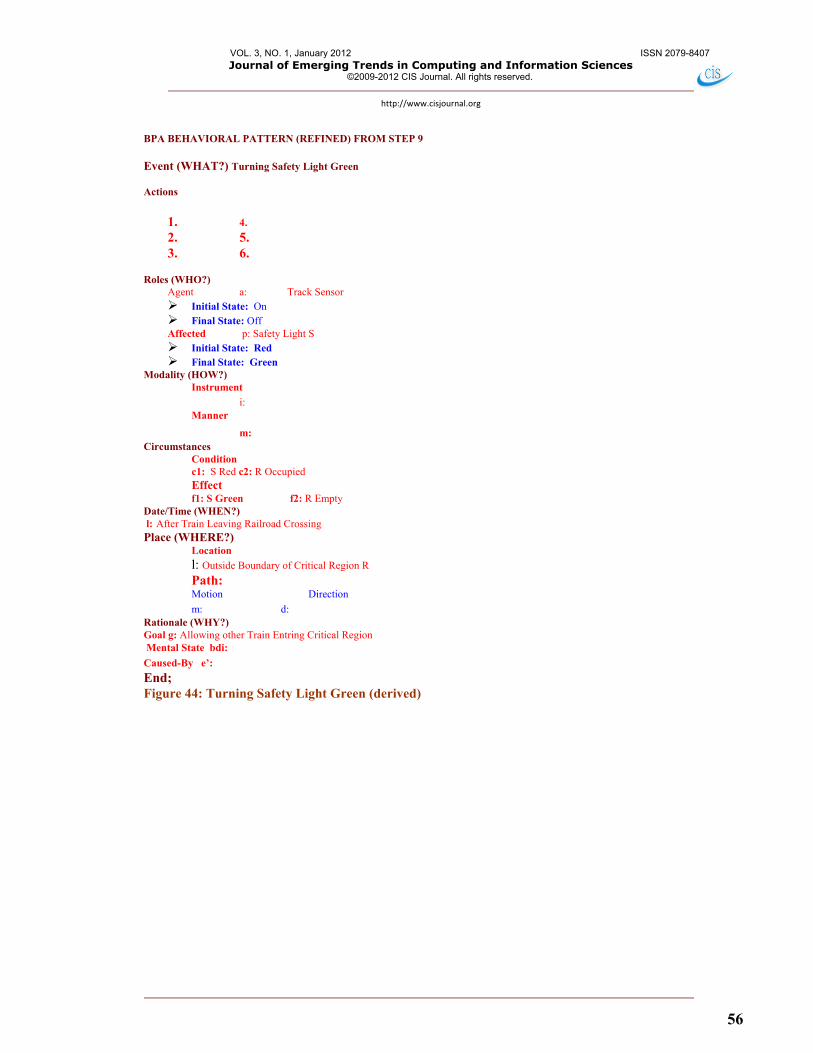
BPA BEHAVIORAL PATTERN (REFINED) FROM STEP 9 Event (WHAT?) Turning Safety Light Green Actions
1. 4. 2. 5. 3. 6.
Roles (WHO?)
Agent a: Track Sensor Initial State: On Final State: Off Affected p: Safety Light S Initial State: Red Final State: Green
Modality (HOW?) Instrument
i: Manner
m: Circumstances
Condition c1: S Red c2: R Occupied Effect f1: S Green f2: R Empty
Date/Time (WHEN?) l: After Train Leaving Railroad Crossing Place (WHERE?)
Location
l: Outside Boundary of Critical Region R
Path: Motion Direction
m: d: Rationale (WHY?) Goal g: Allowing other Train Entring Critical Region Mental State bdi:
Caused-By e’:
End; Figure 44: Turning Safety Light Green (derived)
VOL. 3, NO. 1, January 2012 ISSN 2079-8407 Journal of Emerging Trends in Computing and Information Sciences
©2009-2012 CIS Journal. All rights reserved.
http://www.cisjournal.org
57
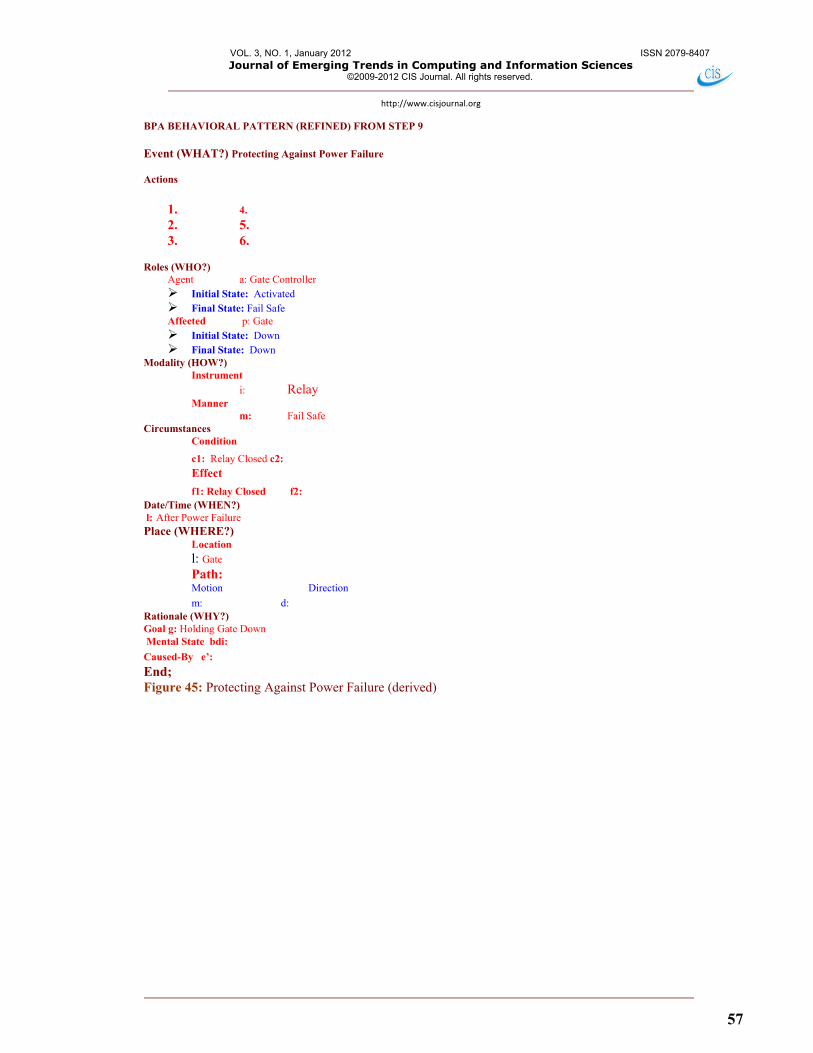
BPA BEHAVIORAL PATTERN (REFINED) FROM STEP 9 Event (WHAT?) Protecting Against Power Failure Actions
1. 4. 2. 5. 3. 6.
Roles (WHO?)
Agent a: Gate Controller Initial State: Activated Final State: Fail Safe Affected p: Gate Initial State: Down Final State: Down
Modality (HOW?) Instrument
i: Relay Manner
m: Fail Safe Circumstances
Condition
c1: Relay Closed c2: Effect
f1: Relay Closed f2: Date/Time (WHEN?) l: After Power Failure Place (WHERE?)
Location
l: Gate
Path: Motion Direction
m: d: Rationale (WHY?) Goal g: Holding Gate Down Mental State bdi:
Caused-By e’:
End; Figure 45: Protecting Against Power Failure (derived)
VOL. 3, NO. 1, January 2012 ISSN 2079-8407 Journal of Emerging Trends in Computing and Information Sciences
©2009-2012 CIS Journal. All rights reserved.
http://www.cisjournal.org
58
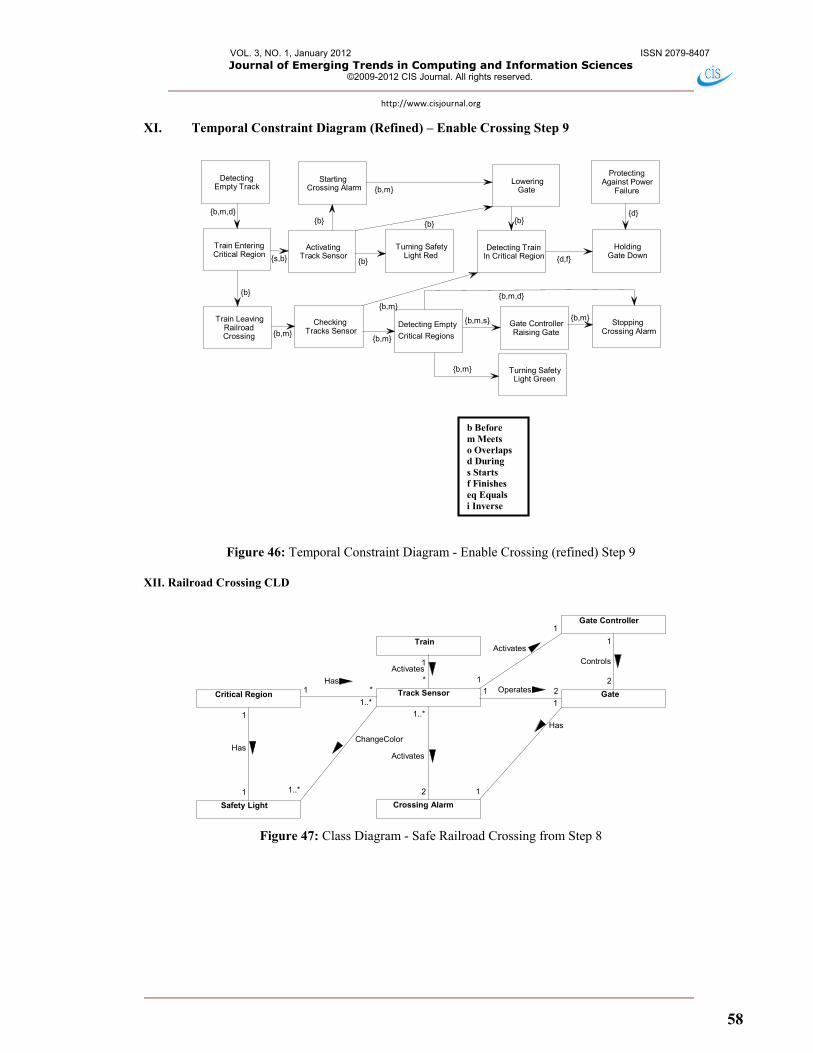
XI. Temporal Constraint Diagram (Refined) – Enable Crossing Step 9
DetectingEmpty Track
Train EnteringCritical Region
StartingCrossing Alarm
LoweringGate
Detecting TrainIn Critical Region
ProtectingAgainst Power
Failure
HoldingGate Down
Detecting Empty
Critical Regions
Train LeavingRailroadCrossing
Gate ControllerRaising Gate
StoppingCrossing Alarm
Turning SafetyLight Red
Turning SafetyLight Green
ActivatingTrack Sensor
CheckingTracks Sensor
{b,m,d}{b}
{d,f}
{d}
{b}
{b,m,s} {b,m}
{b,m}
{b,m}
{b,m,d}
{b}
{b}
{s,b}
{b}
{b,m}{b,m}
{b,m}
b Beforem Meetso Overlapsd Durings Startsf Finisheseq Equalsi Inverse
Figure 46: Temporal Constraint Diagram - Enable Crossing (refined) Step 9
XII. Railroad Crossing CLD
Train
Gate Controller
Track Sensor Gate
Crossing Alarm
Critical Region
Safety Light
*
1Activates
1
1
Activates
2
1
Controls
21 Operates
2
1..*
Activates
1
1
Has
1..*
ChangeColor
*1Has
1
1
Has
1..*
Figure 47: Class Diagram - Safe Railroad Crossing from Step 8
VOL. 3, NO. 1, January 2012 ISSN 2079-8407 Journal of Emerging Trends in Computing and Information Sciences
©2009-2012 CIS Journal. All rights reserved.
http://www.cisjournal.org
59
Event / State History Chart from Step 8
Train Track Sensor Critical Region Gate Controller Gate Crossing Alarm Safety Light Before After Before After Before After Before After Before After Before After Before After Detecting Empty Track
Off/ On Off Empty/ Occupied
Empty Red/ Green
Green
Train Entering Critical Region
Outside R Enter R Empty Occupied Green Red
Activating Track Sensor
Enter R In R Off On
Turning Safety Light Red
Off On Empty Occupied Green Red
Starting Crossing Alarm
Off On Off On
Lowering Gate On On Empty Occupied Idle Lowering Gate
Up Down On On
Detecting Train In Critical Region
On On Activated Holding Down Held Down
Holding Gate Down
Activated Activated Down Down
Train Leaving Railroad Crossing
In I Exit I On Off
Detecting Empty Critical Regions
On Off Occupied Empty
Gate Controller Raising Gate
Hold Down
Move Up Down Up
Stopping Crossing Alarm
On Off On Off
Turning Safety Light Green
Off On Occupied Empty Red Green
Figure 48: Event/State History Chart – Railroad Crossing from Step 8
ParticipantEvent
VOL. 3, NO. 1, January 2012 ISSN 2079-8407 Journal of Emerging Trends in Computing and Information Sciences
©2009-2012 CIS Journal. All rights reserved.
http://www.cisjournal.org
60
18. EVALUATION OF THE EFFECTIVENESS OF THE BPA APPROACH AND THE UCA APPROACH
In this research, three real-life applications were used to illustrate the effectiveness of the new BPA approach in handling safety-critical real-time systems development: (1) The Therac-25 Medical Device System reported by
Leveson [18] (2) The Production Cell System of Lewerentz [ 19] (3) The Railroad Crossing System of Heitmeyer [11].
The UCA and the BPA approaches were used to define the requirements and model these systems. The first application was used, as a proof of concept, in a pilot case study. The last two applications were distributed as part of the case studies material to compare the UCA versus the BPA approaches using the pre-mentioned effectiveness criteria. 19. THE EFFECTIVENESS METRICS
The effectiveness metrics categories used in this research include: 1. System Effectiveness represented by safety 2. Requirements Engineering Process Effectiveness
represented by the CMM and CMMI repeatability 3. Definition of Requirements Effectiveness represented
by the ANSI (NIST) / IEEE standards for systems specifications.
19.1 System Effectiveness
Because the focus of this research is on safety-critical systems, Safety is selected as the measure of system effectiveness. ‘Safety’ is defined in the American Heritage dictionary as the condition of being safe, or as the freedom from danger, risk, or injury.
19.2 Requirements Engineering Process Effectiveness ‘Repeatability’ is defined in the American Heritage dictionary as following the same procedure in doing or expressing something. Repeatability is an indicator of the effectiveness of software development process. It represents the second level of the SEI Capability Maturity Model (CMM) from Humphrey [12]. The Capability Maturity Model (CMM and the new CMMI) is a framework for assessing software process maturity in software development organizations.
19.3 Definition of Requirements Effectiveness
The following is a compiled list, from the ANSI/IEEE Std 830-1984 [13], of the particular defined characteristics that were used to compare the effectiveness of the BPA
approach versus the Use Case Analysis approach: Unambiguous
Requirements definition is unambiguous if – and only if – every requirement stated therein has only one interpretation. To reduce the ambiguity inherent in natural languages, formal requirement specification languages and/or graphical modeling techniques are used to define the requirements.
Complete Requirements definition is complete if it possesses the following qualities: - Inclusion of all significant requirements and
constraints - Specification of responses to valid and
invalid input values. Consistent
Requirements Definition is inconsistent if and only if no set of individual requirements described in it conflict. Likely conflict types are: - Naming - Characteristics specification - Temporal or Logical.
Modifiable Requirements Definition is modifiable if its structure and style enable changes to be made easily, completely, and consistently. Modifiability generally requires: - Ease of use - No redundancy.
Traceable Requirements Definition is traceable if the origin of each requirement is clear and if it facilitates the referencing of each requirement in the next development stages. The forward traceability is especially important when requirements change. It is essential to be able to identify all the requirements that may be affected by these modifications. Unique names or reference numbers are required for this purpose.
Usability Usability means that Requirements Definition is usable during design, implementation, and maintenance phases. However, there is no evidence that Usability is an independent characteristic. It can mean Unambiguous, Complete, or Modifiable. Because we have included all of the pre-mentioned characteristics, Usability was taken out.
20. THE CASE STUDIES
A ‘Case Study’ is defined in the American Heritage Dictionary as an exemplary or cautionary model. Case studies continue to be used extensively in the evaluation
VOL. 3, NO. 1, January 2012 ISSN 2079-8407 Journal of Emerging Trends in Computing and Information Sciences
©2009-2012 CIS Journal. All rights reserved.
http://www.cisjournal.org
61
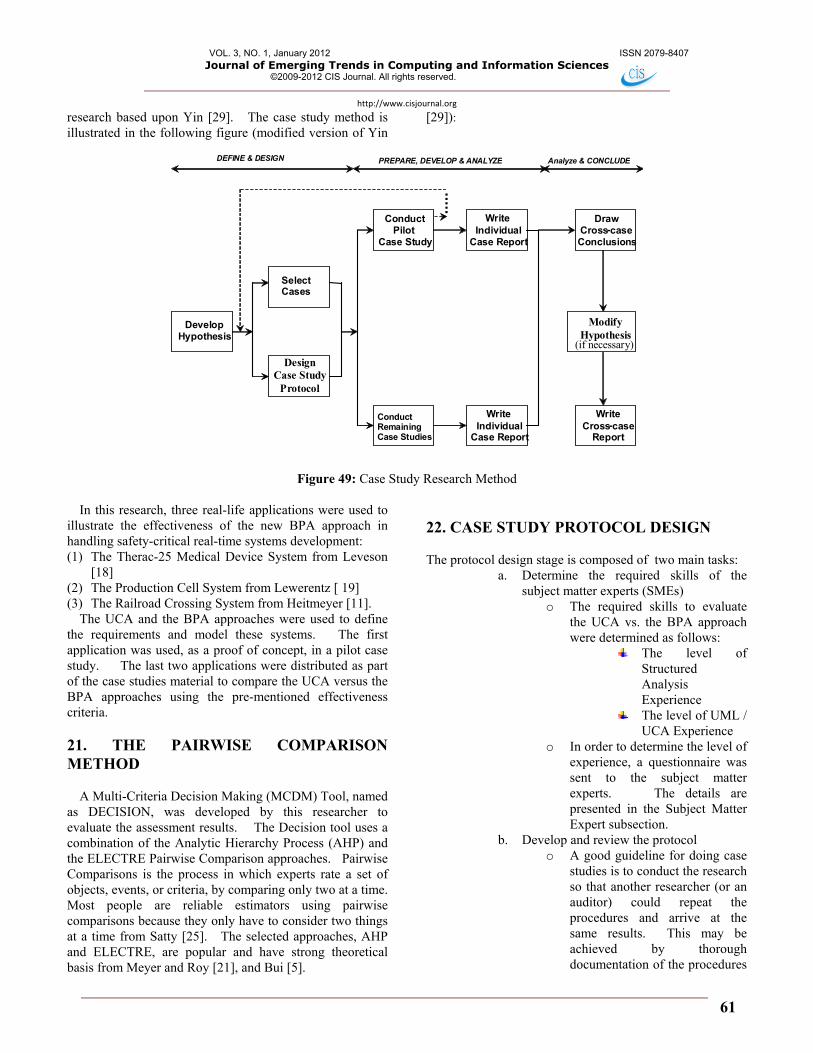
research based upon Yin [29]. The case study method is illustrated in the following figure (modified version of Yin
[29]):
Develop Hypothesis
Select Cases
Design Case Study
Protocol
ConductPilot
Case Study
ConductRemaining Case Studies
WriteIndividual
Case Report
Draw Cross - case Conclusions
Modify Hypothesis
(if necessary)
Write Cross - case
Report Write
IndividualCase Report
DEFINE & DESIGN PREPARE, DEVELOP & ANALYZE Analyze & CONCLUDE
Figure 49: Case Study Research Method
In this research, three real-life applications were used to
illustrate the effectiveness of the new BPA approach in handling safety-critical real-time systems development: (1) The Therac-25 Medical Device System from Leveson
[18] (2) The Production Cell System from Lewerentz [ 19] (3) The Railroad Crossing System from Heitmeyer [11].
The UCA and the BPA approaches were used to define the requirements and model these systems. The first application was used, as a proof of concept, in a pilot case study. The last two applications were distributed as part of the case studies material to compare the UCA versus the BPA approaches using the pre-mentioned effectiveness criteria. 21. THE PAIRWISE COMPARISON METHOD
A Multi-Criteria Decision Making (MCDM) Tool, named as DECISION, was developed by this researcher to evaluate the assessment results. The Decision tool uses a combination of the Analytic Hierarchy Process (AHP) and the ELECTRE Pairwise Comparison approaches. Pairwise Comparisons is the process in which experts rate a set of objects, events, or criteria, by comparing only two at a time. Most people are reliable estimators using pairwise comparisons because they only have to consider two things at a time from Satty [25]. The selected approaches, AHP and ELECTRE, are popular and have strong theoretical basis from Meyer and Roy [21], and Bui [5].
22. CASE STUDY PROTOCOL DESIGN The protocol design stage is composed of two main tasks:
a. Determine the required skills of the subject matter experts (SMEs)
o The required skills to evaluate the UCA vs. the BPA approach were determined as follows:
The level of Structured Analysis Experience
The level of UML / UCA Experience
o In order to determine the level of experience, a questionnaire was sent to the subject matter experts. The details are presented in the Subject Matter Expert subsection.
b. Develop and review the protocol o A good guideline for doing case
studies is to conduct the research so that another researcher (or an auditor) could repeat the procedures and arrive at the same results. This may be achieved by thorough documentation of the procedures
VOL. 3, NO. 1, January 2012 ISSN 2079-8407 Journal of Emerging Trends in Computing and Information Sciences
©2009-2012 CIS Journal. All rights reserved.
http://www.cisjournal.org
62
to be followed and the questions to be asked. The following subsection presents the used case study material in which the documentation guidelines of the case study protocol were followed.
23. THE CASE STUDY MATERIAL
Each SME was provided with a case study kit that contains:
1. A cover letter 2. A consent form 3. The instructions 4. An application 5. A brief overview and a step by step procedure
describing how to analyze and model requirements using the UCA and BPA approaches
6. Two analyses of the given application; one using the UCA modeling approach and the other using the BPA modeling approach
7. Explanation of the evaluation method (Pairwise Comparison) and the effectiveness criteria
The set of questions presented clearly in a table format (Evaluation Forms).
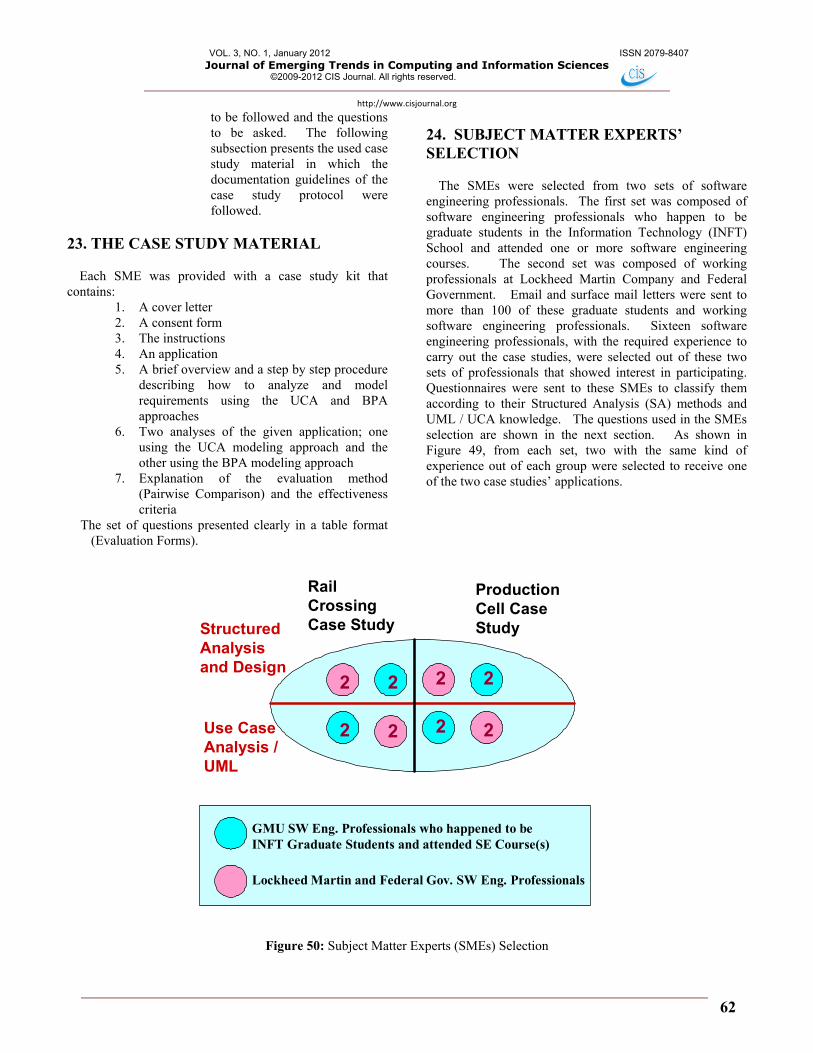
24. SUBJECT MATTER EXPERTS’ SELECTION
The SMEs were selected from two sets of software engineering professionals. The first set was composed of software engineering professionals who happen to be graduate students in the Information Technology (INFT) School and attended one or more software engineering courses. The second set was composed of working professionals at Lockheed Martin Company and Federal Government. Email and surface mail letters were sent to more than 100 of these graduate students and working software engineering professionals. Sixteen software engineering professionals, with the required experience to carry out the case studies, were selected out of these two sets of professionals that showed interest in participating. Questionnaires were sent to these SMEs to classify them according to their Structured Analysis (SA) methods and UML / UCA knowledge. The questions used in the SMEs selection are shown in the next section. As shown in Figure 49, from each set, two with the same kind of experience out of each group were selected to receive one of the two case studies’ applications.
Structured Analysis and Design
Use Case Analysis / UML
Production Cell Case Study
Rail Crossing Case Study
22
2 2 2
2 2
2
Lockheed Martin and Federal Gov. SW Eng. Professionals
GMU SW Eng. Professionals who happened to be INFT Graduate Students and attended SE Course(s)
Figure 50: Subject Matter Experts (SMEs) Selection
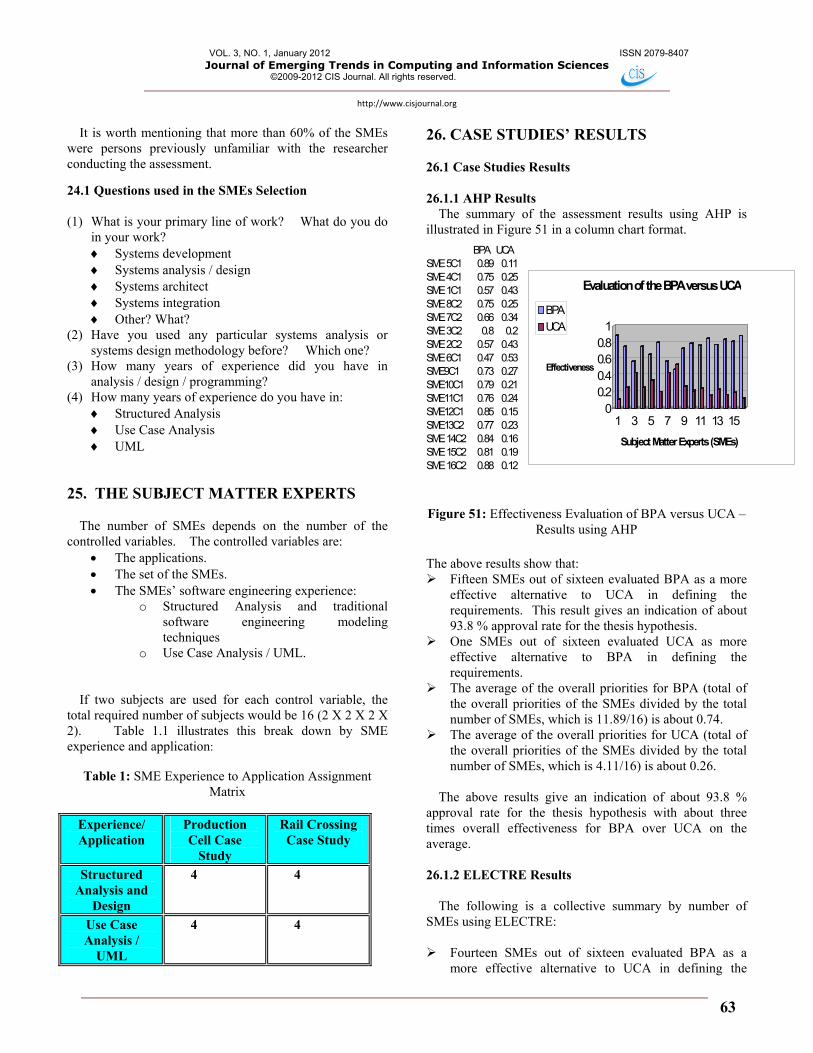
VOL. 3, NO. 1, January 2012 ISSN 2079-8407 Journal of Emerging Trends in Computing and Information Sciences
©2009-2012 CIS Journal. All rights reserved.
http://www.cisjournal.org
63
It is worth mentioning that more than 60% of the SMEs
were persons previously unfamiliar with the researcher conducting the assessment.
24.1 Questions used in the SMEs Selection (1) What is your primary line of work? What do you do
in your work? Systems development Systems analysis / design Systems architect Systems integration Other? What?
(2) Have you used any particular systems analysis or systems design methodology before? Which one?
(3) How many years of experience did you have in analysis / design / programming?
(4) How many years of experience do you have in: Structured Analysis Use Case Analysis UML
25. THE SUBJECT MATTER EXPERTS
The number of SMEs depends on the number of the controlled variables. The controlled variables are:
The applications. The set of the SMEs. The SMEs’ software engineering experience:
o Structured Analysis and traditional software engineering modeling techniques
o Use Case Analysis / UML.
If two subjects are used for each control variable, the total required number of subjects would be 16 (2 X 2 X 2 X 2). Table 1.1 illustrates this break down by SME experience and application:
Table 1: SME Experience to Application Assignment Matrix
Experience/ Application
Production Cell Case
Study
Rail Crossing Case Study
Structured Analysis and
Design
4 4
Use Case Analysis /
UML
4 4
26. CASE STUDIES’ RESULTS 26.1 Case Studies Results 26.1.1 AHP Results
The summary of the assessment results using AHP is illustrated in Figure 51 in a column chart format.
Figure 51: Effectiveness Evaluation of BPA versus UCA –
Results using AHP The above results show that: Fifteen SMEs out of sixteen evaluated BPA as a more
effective alternative to UCA in defining the requirements. This result gives an indication of about 93.8 % approval rate for the thesis hypothesis.
One SMEs out of sixteen evaluated UCA as more effective alternative to BPA in defining the requirements.
The average of the overall priorities for BPA (total of the overall priorities of the SMEs divided by the total number of SMEs, which is 11.89/16) is about 0.74.
The average of the overall priorities for UCA (total of the overall priorities of the SMEs divided by the total number of SMEs, which is 4.11/16) is about 0.26.
The above results give an indication of about 93.8 %
approval rate for the thesis hypothesis with about three times overall effectiveness for BPA over UCA on the average. 26.1.2 ELECTRE Results
The following is a collective summary by number of SMEs using ELECTRE: Fourteen SMEs out of sixteen evaluated BPA as a
more effective alternative to UCA in defining the
BPA UCASME 5C1 0.89 0.11SME 4C1 0.75 0.25SME 1C1 0.57 0.43SME 8C2 0.75 0.25SME 7C2 0.66 0.34SME 3C2 0.8 0.2SME 2C2 0.57 0.43SME 6C1 0.47 0.53SME9C1 0.73 0.27SME10C1 0.79 0.21SME11C1 0.76 0.24SME12C1 0.85 0.15SME13C2 0.77 0.23SME 14C2 0.84 0.16SME 15C2 0.81 0.19SME 16C2 0.88 0.12
00.20.40.60.8
1
Effectiveness
1 3 5 7 9 11 13 15
Subject Matter Experts (SMEs)
Evaluation of the BPA versus UCA
BPA
UCA
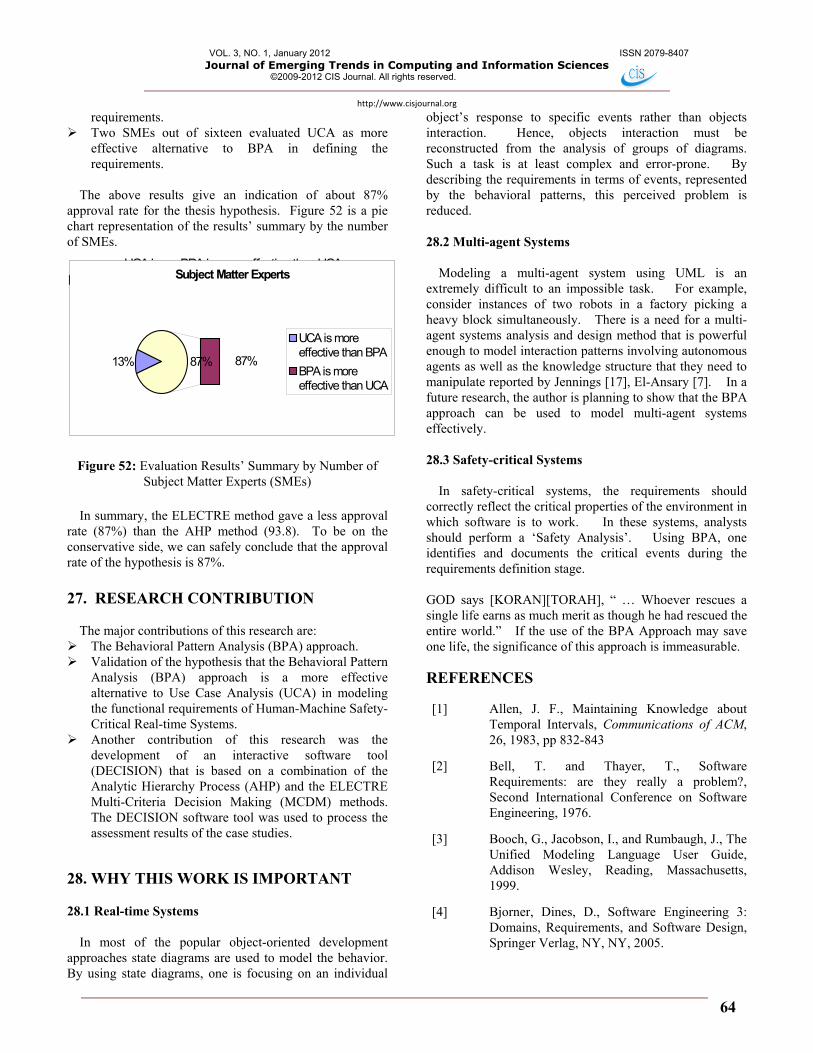
VOL. 3, NO. 1, January 2012 ISSN 2079-8407 Journal of Emerging Trends in Computing and Information Sciences
©2009-2012 CIS Journal. All rights reserved.
http://www.cisjournal.org
64
requirements. Two SMEs out of sixteen evaluated UCA as more
effective alternative to BPA in defining the requirements.
The above results give an indication of about 87%
approval rate for the thesis hypothesis. Figure 52 is a pie chart representation of the results’ summary by the number of SMEs.
Figure 52: Evaluation Results’ Summary by Number of
Subject Matter Experts (SMEs)
In summary, the ELECTRE method gave a less approval rate (87%) than the AHP method (93.8). To be on the conservative side, we can safely conclude that the approval rate of the hypothesis is 87%. 27. RESEARCH CONTRIBUTION
The major contributions of this research are: The Behavioral Pattern Analysis (BPA) approach. Validation of the hypothesis that the Behavioral Pattern
Analysis (BPA) approach is a more effective alternative to Use Case Analysis (UCA) in modeling the functional requirements of Human-Machine Safety-Critical Real-time Systems.
Another contribution of this research was the development of an interactive software tool (DECISION) that is based on a combination of the Analytic Hierarchy Process (AHP) and the ELECTRE Multi-Criteria Decision Making (MCDM) methods. The DECISION software tool was used to process the assessment results of the case studies.
28. WHY THIS WORK IS IMPORTANT 28.1 Real-time Systems
In most of the popular object-oriented development approaches state diagrams are used to model the behavior. By using state diagrams, one is focusing on an individual
object’s response to specific events rather than objects interaction. Hence, objects interaction must be reconstructed from the analysis of groups of diagrams. Such a task is at least complex and error-prone. By describing the requirements in terms of events, represented by the behavioral patterns, this perceived problem is reduced. 28.2 Multi-agent Systems
Modeling a multi-agent system using UML is an extremely difficult to an impossible task. For example, consider instances of two robots in a factory picking a heavy block simultaneously. There is a need for a multi-agent systems analysis and design method that is powerful enough to model interaction patterns involving autonomous agents as well as the knowledge structure that they need to manipulate reported by Jennings [17], El-Ansary [7]. In a future research, the author is planning to show that the BPA approach can be used to model multi-agent systems effectively. 28.3 Safety-critical Systems
In safety-critical systems, the requirements should correctly reflect the critical properties of the environment in which software is to work. In these systems, analysts should perform a ‘Safety Analysis’. Using BPA, one identifies and documents the critical events during the requirements definition stage. GOD says [KORAN][TORAH], “ … Whoever rescues a single life earns as much merit as though he had rescued the entire world.” If the use of the BPA Approach may save one life, the significance of this approach is immeasurable.
REFERENCES [1] Allen, J. F., Maintaining Knowledge about
Temporal Intervals, Communications of ACM, 26, 1983, pp 832-843
[2] Bell, T. and Thayer, T., Software Requirements: are they really a problem?, Second International Conference on Software Engineering, 1976.
[3] Booch, G., Jacobson, I., and Rumbaugh, J., The Unified Modeling Language User Guide, Addison Wesley, Reading, Massachusetts, 1999.
[4] Bjorner, Dines, D., Software Engineering 3: Domains, Requirements, and Software Design, Springer Verlag, NY, NY, 2005.
UCA is moBPA is more effective than UCAParticipant 2 14Subject Matter Experts
13% 87%87%
UCA is moreeffective than BPA
BPA is moreeffective than UCA
VOL. 3, NO. 1, January 2012 ISSN 2079-8407 Journal of Emerging Trends in Computing and Information Sciences
©2009-2012 CIS Journal. All rights reserved.
http://www.cisjournal.org
65
[5] Bui, Tung X., Co-oP, A Group Decision Support System for Cooperative Multiple Criteria Group Decision Making, Springer-Verlag, 1987.
[6] Davidson, D., Essays on Actions and Events, Oxford University Press, New York, 1980.
[7] El-Ansary, Assem I., Behavioral Pattern Analysis: Towards a New Representation of Systems Requirements Based on Actions and Events, in Proceedings of the 2002 ACM Symposium on Applied Computing, ACM, New York, NY, 2002.
[8] Fowler, M. and Cockburn, Question Time! About Use Cases, OOPSLA’98 Proceedings, ACM Press, New York, NY, 1998.
[9] Goldsmith, Robin F., Discovering Real Business Requirements for Software Project Success, Artech House, NY, 2003
[10] Graham, Ian, Migrating to Object Technology, Addison-Wesley, Reading, Massachusetts, 1995.
[11] Heitmeyer, Constance and Mandrioli, Dino, Formal Methods for Real-Time Computing: An Overview, in Formal Methods for Real-Time Computing, John Wiley & Sons, Inc., NY, 1996.
[12] Humphrey, W. Managing the Software Process. Reading, MA: Addison-Wesley, 1989.
[13] ANSI and IEEE, ANSI/IEEE Std 830-1984, IEEE Guide to Software Requirements Specification, in System and Software Requirements Engineering, IEEE Computer Society Press, Los Alamitos, California, 1990, pp 170-192.
[14] Jackson, Michael, Software Requirements & Specification, A Lexicon of Practice, Principles and Prejudices, ACM Press, Addison-Wesley, Reading, Massachusetts, 1995.
[15] Jacobson, I., Christeron, M., and Overgaard, Object-Oriented Software Engineering: A Use Case Driven Approach, Addison-Wesley, Reading, Massachusetts, 1992.
[16] Jacobson, I., The Use Case Construct in Object-Oriented Software Engineering, in Carroll, J., Scenario-Based Design, John Wiley & Sons, Inc., NY, 1995.
[17] Jennings, N. and O’Hare, G. editors, Foundations of Distributed AI, John Wiley & Sons, Inc., NY, 1995.
[18] Leveson, N. An Investigation of the Therac-25 Accidents IEEE Computer Society Press Los Alamitos, CA, USA, 1996.Therac-25 Accidents: An Updated Version of the Original Accident Investigation Paper. http://www.cs.washington.edu/research/projects/safety/www/therac-25.html
[19] Lewerentz, C., and Lindner, T., Formal Development of Reactive Systems, Springer-Verlag, NY, 1995.
[20] Lilly, S., Use case pitfalls: top 10 problems from real projects using use cases, TOOLS30, ACM Press, New York, NY, 1999.
[21] Meyer and Roy, B. The outranking approach and the foundations of Electre methods Journal Theory and Decision Publisher Springer Netherlands ISSN 0040-5833 (Print) 1573-7187 (Online) Issue Volume 31, Number 1 / July, 1991
[22] Overgaard, G., and Palmkvist, K., “T01: Use-Case Model Refactoring and Improvement“, OOPSLA’06 Proceedings, ACM Press, New York, NY, 2006.
[23] Right, D., and Johnson, K., and Kratschmer, T., Improve Software Reliability with Use Case Modeling, IEEE Press, NY, NY, 2005.
[24] Rosenberg, D., and Scott, K., Use Case Driven Object Modeling with UML: A Practical Approach, Addison Wesley, New York, NY, 1999.
[25] Satty, L. 1982 Decision Making for Leaders: The Analytical Hierarchy Process for Decisions in a Complex World, ISBN 0-534-97959-9, Wadsworth. 1988, Paperback, ISBN 0-9620317-0-4, RWS http://en.wikipedia.org/wiki/Thomas_L._Saaty
[26] Wiegers, K., G., Software Requirements, Microsoft Press, 2003.
[27] Wohlin, C. and Aurum, A., Engineering and Managing Software Requirements, Springer Verlag, New York, NY, 2005.
[28] Workshop on Use Cases in Model-Driven Software Engineering'Use Cases in Model-Driven Software Engineering' http://www.i.einf.uc3m.es/wuscam-05 H.

VOL. 3, NO. 1, January 2012 ISSN 2079-8407 Journal of Emerging Trends in Computing and Information Sciences
©2009-2012 CIS Journal. All rights reserved.
http://www.cisjournal.org
66
Astudillo, G. Genova, M. Smialek J. Llorens, P. Metz, R. Prieto-Diaz. Models Workshop, Open Issues in Industrial Use Case Modeling, Montego Bay, Jamaica, IEEE Press, NY, NY, 2005.
[29] Yin, R. Case Study Research: Design and Methods, Third Edition, Applied Social Research Methods Series, Vol 5, Sage Publications, Inc., Thousand Oaks, CA 2003. Second Edition, 1994.