Embed Size (px)
Citation preview

Dr.R.Rathi Devi.,M.B.A.,M.Phil.,Ph.D.,
Department of Business Administration
Arasu College of Arts and Science for Women,Karur.
Research Methods in Management
Unit-I
Meaning Of Research:
Research in simple terms refers to search for knowledge. It is a scientific and systematic
search for information on a particular topic or issue. It is also known as the art of scientific
investigation. Several social scientists have defined research in different ways.
Objectives Of Research
The main aim of research is to find out the truth which is hidden and has not yet been
discovered. Although every research study has its own specific objectives, the research
objectives may be broadly grouped as follows:
1. To gain familiarity with new insights into a phenomenon (i.e., formulative research
studies);
2. To accurately portray the characteristics of a particular individual, group, or a situation
(i.e., descriptive research studies);
3. To analyse the frequency with which something occurs (i.e., diagnostic research studies);
and
4. To examine the hypothesis of a causal relationship between two variables (i.e., hypothesis-
testing research studies).
Research Methods Versus Methodology:
Research methods include all those techniques/methods that are adopted for conducting
research. Thus, research techniques or methods are the methods that the researchers adopt for
conducting the research studies.
On the other hand, research methodology is the way in which research problems are solved
systematically. It is a science of studying how research is conducted scientifically.
Research Approaches:
There are two main approaches to research:
1. Quantitative approach :The quantitative approach involves the collection of
quantitative data. This approach further includes experimental, inferential, and
simulation approaches to research.
2. Qualitative approach: The qualitative approach uses the method of subjective
assessment of opinions, behaviour and attitudes.

Dr.R.Rathi Devi.,M.B.A.,M.Phil.,Ph.D.,
Department of Business Administration
Arasu College of Arts and Science for Women,Karur.
Types Of Research:
1. Descriptive Versus Analytical:
Descriptive research consists of surveys and fact-finding enquiries of different types.
The main objective of descriptive research is describing the state of affairs as it
prevails at the time of study.
In the Analytical research, the researcher has to use the already available facts or
information, and analyse them to make a critical evaluation of the subject.
2. Applied Versus Fundamental:
Research can also be applied or fundamental in nature. An attempt to find a solution
to an immediate problem encountered by a firm, an industry, a business organisation,
or the society is known as applied research. The objective of applied research is to
find a solution to some pressing practical problem.
Fundamental research mainly concerns generalizations and formulation of a theory.
3. Quantitative Versus Qualitative:
Quantitative research relates to aspects that can be quantified or can be expressed in
terms of quantity. It involves the measurement of quantity or amount. Various
available statistical and econometric methods are adopted for analysis in such
research.
Qualitative research is concerned with qualitative phenomena, or more specifically,
the aspects related to or involving quality or kind.
4. Conceptual Versus Empirical:
The research related to some abstract idea or theory is known as Conceptual Research.
Generally, philosophers and thinkers use it for developing new concepts or for
reinterpreting the existing ones.
Empirical Research, on the other hand, exclusively relies on the observation or
experience with hardly any regard for theory and system. Such research is data based,
which often comes up with conclusions that can be verified through experiments or
observation.
Dr.R.Rathi Devi.,M.B.A.,M.Phil.,Ph.D.,
Department of Business Administration
Arasu College of Arts and Science for Women,Karur.
Research Process
Unit-2
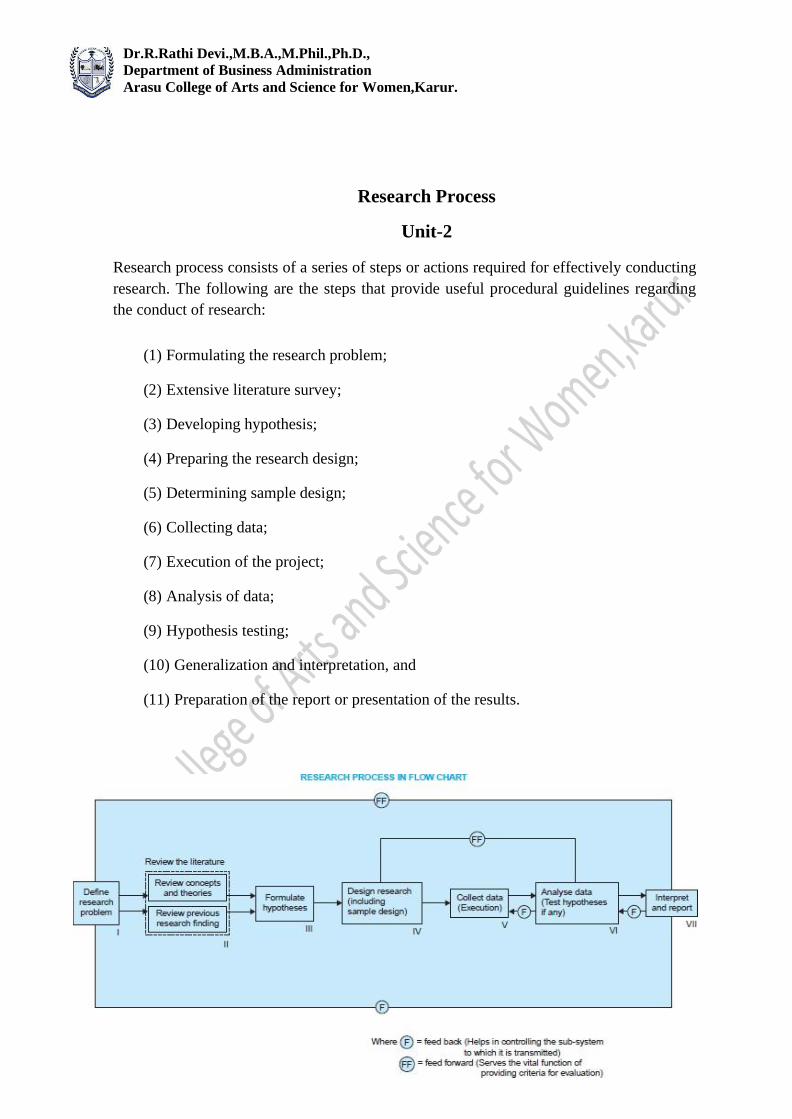
Research process consists of a series of steps or actions required for effectively conducting
research. The following are the steps that provide useful procedural guidelines regarding
the conduct of research:
(1) Formulating the research problem;
(2) Extensive literature survey;
(3) Developing hypothesis;
(4) Preparing the research design;
(5) Determining sample design;
(6) Collecting data;
(7) Execution of the project;
(8) Analysis of data;
(9) Hypothesis testing;
(10) Generalization and interpretation, and
(11) Preparation of the report or presentation of the results.

Dr.R.Rathi Devi.,M.B.A.,M.Phil.,Ph.D.,
Department of Business Administration
Arasu College of Arts and Science for Women,Karur.
Research Problem
A research problem, in general, refers to some difficulty which a researcher experiences in
the context of either a theoretical or practical situation and wants to obtain a solution for the
same.
“A research problem refers to an unanswered question that a researcher might encounter in
the context of either a theoretical or practical situation, which he/she would like to answer or
find a solution to.”
Dr.R.Rathi Devi.,M.B.A.,M.Phil.,Ph.D.,
Department of Business Administration
Arasu College of Arts and Science for Women,Karur.
Formulating the research problem
There are two types of research problems, viz., those which relate to states of nature and
those which relate to relationships between variables. At the very outset the researcher must
single out the problem he wants to study, i.e., he must decide the general area of interest or
aspect of a subject-matter that he would like to inquire into. Essentially two steps are
involved in formulating the research problem, viz., understanding the problem thoroughly,
and rephrasing the same into meaningful terms from an analytical point of view.
The best way of understanding the problem is to discuss it with one’s own colleagues or with
those having some expertise in the matter. In an academic institution the researcher can seek
the help from a guide who is usually an experienced man and has several research problems
in mind.
Research Design:
“A research design is the arrangement of conditions for collection and analysis of data in a
manner that aims to combine relevance to the research purpose with economy in procedure.”
In fact, the research design is the conceptual structure within which research is conducted; it
constitutes the blueprint for the collection, measurement and analysis of data.
As such the design includes an outline of what the researcher will do from writing the
hypothesis and its operational implications to the final analysis of data.
The designing decisions happen to be in respect of:
(i) What is the study about?
(ii) Why is the study being made?
(iii) Where will the study be carried out?
(iv) What type of data is required?
(v) Where can the required data be found?
(vi) What periods of time will the study include?
(vii) What will be the sample design?
(viii) What techniques of data collection will be used?
(ix) How will the data be analysed?
(x) In what style will the report be prepared?

Dr.R.Rathi Devi.,M.B.A.,M.Phil.,Ph.D.,
Department of Business Administration
Arasu College of Arts and Science for Women,Karur.
Features of good Research Design:
The important features of Research Design may be outlined as follows:
(i) the means of obtaining information;
(ii) the availability and skills of the researcher and his staff, if any;
(iii) the objective of the problem to be studied;
(iv) the nature of the problem to be studied; and
(v) the availability of time and money for the research work.
DIFFERENT RESEARCH DESIGNS
(1) Research design in case of exploratory research studies:
Exploratory research studies are also termed as formulative research studies. The main
purpose of such studies is that of formulating a problem for more precise investigation or of
developing the working hypotheses from an operational point of view.
Generally, the following three methods in the context of research design for such studies are
talked about: (a) the survey of concerning literature; (b) the experience survey and (c) the
analysis of ‘insight-stimulating’ examples.
(2) Research design in case of descriptive and diagnostic research studies: Descriptive
research studies are those studies which are concerned with describing the characteristics of a
particular individual, or of a group, whereas diagnostic research studies determine the
frequency with which something occurs or its association with something else.
The design in such studies must be rigid and not flexible and must focus attention on the
following:
(a) Formulating the objective of the study (what the study is about and why is it being made?)
(b) Designing the methods of data collection (what techniques of gathering data will be
adopted?)
(c) Selecting the sample (how much material will be needed?)
(d) Collecting the data (where can the required data be found and with what time period
should the data be related?)
(e) Processing and analysing the data.
(f) Reporting the findings.

Dr.R.Rathi Devi.,M.B.A.,M.Phil.,Ph.D.,
Department of Business Administration
Arasu College of Arts and Science for Women,Karur.
The difference between research designs in respect of the above two types of research studies
can be conveniently summarised in tabular form as under:
3. Research design in case of hypothesis-testing research studies:
Hypothesis-testing research studies (generally known as experimental studies) are those
where the researcher tests the hypotheses of causal relationships between variables. Such
studies require procedures that will not only reduce bias and increase reliability, but will
permit drawing inferences about causality
Research Hypothesis:
When a prediction or a hypothesized relationship is tested by adopting scientific methods, it
is known as research hypothesis. The research hypothesis is a predictive statement which
relates to a dependent variable and an independent variable.
For instance, the following statements may be considered:
i. “Students who take tuitions perform better than the others who do not receive tuitions” or,
ii. “The female students perform as well as the male students”.
Characteristics of Hypothesis:
A hypothesis should have the following characteristic features:-
i. A hypothesis must be precise and clear.
ii. A hypothesis must be capable of being put to test.

Dr.R.Rathi Devi.,M.B.A.,M.Phil.,Ph.D.,
Department of Business Administration
Arasu College of Arts and Science for Women,Karur.
iii. A hypothesis must state relationship between two variables, in the case of relational
hypotheses.
iv. A hypothesis must be specific and limited in scope.
v. A hypothesis must be stated in the simplest language, so as to make it understood by
all concerned.
vi. A hypothesis must be consistent and derived from the most known facts.
MEASUREMENT IN RESEARCH
In our daily life we are said to measure when we use some yardstick to determine
weight, height, or some other feature of a physical object. We also measure when we
judge how well we like a song, a painting or the personalities of our friends.
Measurement is a relatively complex and demanding task, specially so when it
concerns qualitative or abstract phenomena. By measurement we mean the process of
assigning numbers to objects or observations, the level of measurement being a
function of the rules under which the numbers are assigned.
MEASUREMENT SCALES:
The most widely used classification of measurement scales are: (a) nominal scale; (b)
ordinal scale; (c) interval scale; and (d) ratio scale
(a) Nominal scale: Nominal scale is simply a system of assigning number symbols to
events in order to label them. The usual example of this is the assignment of numbers
of basketball players in order to identify them. Nominal scale is the least powerful
level of measurement. It indicates no order or distance relationship and has no
arithmetic origin.
(b) Ordinal scale: The lowest level of the ordered scale that is commonly used is the
ordinal scale. The ordinal scale places events in order, but there is no attempt to make
the intervals of the scale equal in terms of some rule. Rank orders represent ordinal
scales and are frequently used in research relating to qualitative phenomena. A
student’s rank in his graduation class involves the use of an ordinal scale.
(c) Interval scale: In the case of interval scale, the intervals are adjusted in terms of
some rule that has been established as a basis for making the units equal. The units are
equal only in so far as one accepts the assumptions on which the rule is based.

Dr.R.Rathi Devi.,M.B.A.,M.Phil.,Ph.D.,
Department of Business Administration
Arasu College of Arts and Science for Women,Karur.
(d)Ratio scale: Ratio scales have an absolute or true zero of measurement. The term
‘absolute zero’ is not as precise as it was once believed to be. We can conceive of an
absolute zero of length and similarly we can conceive of an absolute zero of time. For
example, the zero point on a centimetre scale indicates the complete absence of length
or height. But an absolute zero of temperature is theoretically unobtainable and it
remains a concept existing only in the scientist’s mind.
Sources of Error in Measurement
Measurement should be precise and unambiguous in an ideal research study. This
objective, however, is often not met with in entirety. As such the researcher must be
aware about the sources of error in measurement. The following are the possible
sources of error in measurement.
(a) Respondent: At times the respondent may be reluctant to express strong negative
feelings or it is just possible that he may have very little knowledge but may not admit
his ignorance. All this reluctance is likely to result in an interview of ‘guesses.’
Transient factors like fatigue, boredom, anxiety, etc. may limit the ability of the
respondent to respond accurately and fully.
(b) Situation: Situational factors may also come in the way of correct measurement.
Any condition which places a strain on interview can have serious effects on the
interviewer-respondent rapport.
For instance, if someone else is present, he can distort responses by joining in or
merely by being present. If the respondent feels that anonymity is not assured, he may
be reluctant to express certain feelings.
(c) Measurer: The interviewer can distort responses by rewording or reordering
questions. His behaviour, style and looks may encourage or discourage certain replies
from respondents. Careless mechanical processing may distort the findings. Errors
may also creep in because of incorrect coding, faulty tabulation and/or statistical
calculations, particularly in the data-analysis stage.
(d) Instrument: Error may arise because of the defective measuring instrument. The
use of complex
words, beyond the comprehension of the respondent, ambiguous meanings, poor
printing, inadequate space for replies, response choice omissions, etc. are a few things
that make the measuring instrument defective and may result in measurement errors.
Another type of instrument deficiency is the poor sampling of the universe of items of
concern.
Researcher must know that correct measurement depends on successfully meeting all
of the problems listed above
Dr.R.Rathi Devi.,M.B.A.,M.Phil.,Ph.D.,
Department of Business Administration
Arasu College of Arts and Science for Women,Karur.
Sampling -Unit-3
Sampling is a process used in statistical analysis in which a predetermined number of
observations are taken from a larger population.
CENSUS AND SAMPLE SURVEY
All items in any field of inquiry constitute a ‘Universe’ or ‘Population.’ A complete
enumeration of all items in the ‘population’ is known as a census inquiry. It can be
presumed that in such an inquiry, when all items are covered, no element of chance is
left and highest accuracy is obtained. But in practice this may not be true. Even the
slightest element of bias in such an inquiry will get larger and larger as the number of
observation increases. Moreover, there is no way of checking the element of bias or its
extent except through a resurvey or use of sample checks. Besides, this type of inquiry
involves a great deal of time, money and energy. Therefore, when the field of inquiry
is large, this method becomes difficult to adopt because of the resources involved. At
times, this method is practically beyond the reach of ordinary researchers. Perhaps,
government is the only institution which can get the complete enumeration carried out.
Even the government adopts this in very rare cases such as population census
conducted once in a decade.
Sample Design
IMPLICATIONS OF A SAMPLE DESIGN A sample design is a definite plan for obtaining a sample from a given population. It refers to
The technique or the procedure the researcher would adopt in selecting items for the sample.
STEPS IN SAMPLE DESIGN
1) Type Of Universe:
The first step involved in developing sample design is to clearly define the number of
cases, technically known as the universe. A universe may be finite or infinite. In a
finite universe the number of items is certain, whereas in the case of an infinite
universe the number of items is infinite (i.e., there is no idea about the total number of
items). For example, while the population of a city or the number of workers in a
factory comprise finite universes, the number of stars in the sky, or throwing of a dice
represent infinite universe.
2) Sampling Unit:
A sampling unit may be a geographical area like a state, district, village, etc., or a
social unit like a family, religious community, school, etc., or it may also be an
individual. At times, the researcher would have to choose one or more of such units
for his/her study.

Dr.R.Rathi Devi.,M.B.A.,M.Phil.,Ph.D.,
Department of Business Administration
Arasu College of Arts and Science for Women,Karur.
3) Source List:
Source list is also known as the ‘sampling frame’, from which the sample is to be
selected. The source list consists of names of all the items of a universe. The source
list must be reliable, comprehensive, correct, and appropriate.
4) Size of Sample:
Size of the sample refers to the number of items to be chosen from the universe to
form a sample. For a researcher, this constitutes a major problem. The size of sample
must be optimum. An optimum sample may be defined as the one that satisfies the
requirements of representativeness, flexibility, efficiency, and reliability.
CHARACTERISTICS OF A GOOD SAMPLE DESIGN
From what has been stated above, we can list down the characteristics of a good
sample design as under:
(a) Sample design must result in a truly representative sample.
(b) Sample design must be such which results in a small sampling error.
(c) Sample design must be viable in the context of funds available for the research
study.
(d) Sample design must be such so that systematic bias can be controlled in a better
way.
(e) Sample should be such that the results of the sample study can be applied, in
general, for the universe with a reasonable level of confidence.
Types Of Sample Designs
1. Non-probability sampling : It is a sampling technique in which the researcher
selects samples based on the subjective judgment of the researcher rather than random
selection.
In non-probability sampling, not all members of the population have a chance of
participating in the study. Non-probability sampling is carried out by methods of
observation and is widely used in qualitative research.
Probability Sampling:
Probability sampling is also known as ‘choice sampling’ or ‘random sampling’. Under
this sampling design, every item of the universe has an equal chance of being
included in the sample. In a way, it is a lottery method under which individual units
are selected from the whole group, not deliberately, but by using some mechanical
process. Therefore, only chance would determine whether an item or the other would
be included in the sample or not. The results obtained from probability or random
sampling would be assured in terms of probability.

Dr.R.Rathi Devi.,M.B.A.,M.Phil.,Ph.D.,
Department of Business Administration
Arasu College of Arts and Science for Women,Karur.
Systematic sampling: In some instances, the most practical way of sampling is to
select every ith item on a list. Sampling of this type is known as systematic sampling.
An element of randomness is introduced into this kind of sampling by using random
numbers to pick up the unit with which to start. For instance, if a 4 per cent sample is
desired, the first item would be selected randomly from the first twenty-five and
thereafter every 25th item would automatically be included in the sample.
Unit-4
Processing and Analysis of Data
The data, after collection, has to be processed and analysed in accordance with the
outline laid down for the purpose at the time of developing the research plan. This is
essential for a scientific study and for ensuring that we have all relevant data for
making contemplated comparisons and analysis.
Technically speaking, processing implies editing, coding, classification and tabulation
of collected data so that they are amenable to analysis. The term analysis refers to the
computation of certain measures along with searching for patterns of relationship that
exist among data-groups.
PROCESSING OPERATIONS
1. Editing: Editing of data is a process of examining the collected raw data (specially
in surveys) to detect errors and omissions and to correct these when possible. As a
matter of fact, editing involves a careful scrutiny of the completed questionnaires
and/or schedules. Editing is done to assure that the data are accurate, consistent with
other facts gathered, uniformly entered, as completed as possible and have been well
arranged to facilitate coding and tabulation.
2. Coding: Coding refers to the process of assigning numerals or other symbols to
answers so that responses can be put into a limited number of categories or classes.
Such classes should be appropriate to the research problem under consideration.
3. Classification: Most research studies result in a large volume of raw data which
must be reduced into homogeneous groups if we are to get meaningful relationships.
This fact necessitates classification of data which happens to be the process of
arranging data in groups or classes on the basis of common characteristics. Data
having a common characteristic are placed in one class and in this way the entire data
get divided into a number of groups or classes.
4. Tabulation: When a mass of data has been assembled, it becomes necessary for the
researcher to arrange the same in some kind of concise and logical order. This
procedure is referred to as tabulation. Thus, tabulation is the process of summarising

Dr.R.Rathi Devi.,M.B.A.,M.Phil.,Ph.D.,
Department of Business Administration
Arasu College of Arts and Science for Women,Karur.
raw data and displaying the same in compact form (i.e., in the form of statistical
tables) for further analysis. In a broader sense, tabulation is an orderly arrangement of
data in columns and rows.
PROBLEMS IN PROCESSING
(a) The problem concerning “Don’t know” (or DK) responses: While processing the
data, the researcher often comes across some responses that are difficult to handle.
One category of such responses may be ‘Don’t Know Response’ or simply DK
response. When the DK response group is small, it is of little significance. But when it is
relatively big, it becomes a matter of major concern in which case the question arises:
Is the question which elicited DK response useless?
The answer depends on two points viz., the respondent actually may not know the
answer or the researcher may fail in obtaining the appropriate information.
How DK responses are to be dealt with by researchers?
The best way is to design better type of questions. Good interviewers with
respondents will result in minimising DK responses. But what about the DK
responses that have already taken place?
One way to tackle this issue is to estimate the allocation of DK answers from other
data in the questionnaire. The other way is to keep DK responses as a separate
category in tabulation where we can consider it as a separate reply category if DK
responses happen to be legitimate, otherwise we should let the reader make his own
decision.
b) Use or percentages: Percentages are often used in data presentation for they
simplify numbers, reducing all of them to a 0 to 100 range. Through the use of
percentages, the data are reduced in the standard form with base equal to 100 which
fact facilitates relative comparisons.
ELEMENTS/TYPES OF ANALYSIS
Analysis, particularly in case of survey or experimental data, involves estimating the
values of unknown parameters of the population and testing of hypotheses for
drawing inferences. Analysis may, therefore, be categorised as descriptive analysis
and inferential analysis (Inferential analysis is often known as statistical analysis).
“Descriptive analysis is largely the study of distributions of one variable. This study
provides us with profiles of companies, work groups, persons and other subjects on
any of a multiple of characteristics such as size, composition, efficiency, preferences,
etc.

Dr.R.Rathi Devi.,M.B.A.,M.Phil.,Ph.D.,
Department of Business Administration
Arasu College of Arts and Science for Women,Karur.
In modern times, with the availability of computer facilities, there has been a rapid
development of multivariate analysis which may be defined as “all statistical methods
which simultaneously analyse more than two variables on a sample of observations”.
Usually the following analyses are involved when we make a reference of
multivariate analysis:
(a) Multiple regression analysis:
This analysis is adopted when the researcher has one dependent variable which is
presumed to be a function of two or more independent variables. The objective of this
analysis is to make a prediction about the dependent variable based on its covariance
with all the concerned independent variables.
For example, you could use multiple regression to understand whether exam
performance can be predicted based on revision time, test anxiety, lecture attendance
and gender.
(b) Multiple discriminant analysis: This analysis is appropriate when the researcher has
a single dependent variable that cannot be measured, but can be classified into two or
more groups on the basis of some attribute. The object of this analysis happens to be
to predict an entity’s possibility of belonging to a particular group based on several
predictor variables.
For example, a research team has been organized to study the outcomes of buildings
on fire when residents are involved. The purpose of the study is to predict what
elements can ensure the safe release of residents even before the fire security team
arrives. The Hypothesis is that many variables may be good predictors of safe
evacuation versus injury to during evacuation of residents. These variables may be:
number of residents, access to fire station, number of floors in a building etc.
(c) Multivariate analysis of variance (or multi-ANOVA): This analysis is an
extension of two way ANOVA, wherein the ratio of among group variance to within
group variance is worked out on a set of variables.
One-way ANOVA between groups: used when you want to test two groups to see if
there’s a difference between them.
(d) Canonical analysis: This analysis can be used in case of both measurable and
non-measurable variables for the purpose of simultaneously predicting a set of
dependent variables from their joint covariance with a set of independent variables.
variables related to exercise and health.
On one hand, you have variables associated with exercise, observations such as the
climbing rate on a stair stepper, how fast you can run a certain distance, the amount of
weight lifted on bench press, the number of push-ups per minute, etc.
On the other hand, you have variables that attempt to measure overall health, such as
blood pressure, cholesterol levels, glucose levels, body mass index, etc. Two types of
variables are measured and the relationships between the exercise variables and the
health variables are of interest.

Dr.R.Rathi Devi.,M.B.A.,M.Phil.,Ph.D.,
Department of Business Administration
Arasu College of Arts and Science for Women,Karur.
Unit-5
Interpretation and Report Writing
After collecting and analysing the data, the researcher has to accomplish the task of
drawing inferences (a conclusion reached) followed by report writing.
MEANING OF INTERPRETATION
Interpretation refers to the task of drawing inferences from the collected facts after an
analytical and/or experimental study.
Thus, interpretation is the device through which the factors that seem to explain what
has been observed by researcher in the course of the study can be better understood
and it also provides a theoretical conception which can serve as a guide for further
researches.
TECHNIQUE OF INTERPRETATION
The task of interpretation is not an easy job, rather it requires a great skill.
Interpretation is an art that one learns through practice and experience. The researcher
may, at times, seek the guidance from experts for accomplishing the task of
interpretation.
The technique of interpretation often involves the following steps:
(i) Researcher must give reasonable explanations of the relations which he has found
and he must interpret the lines of relationship in terms of the underlying processes.
(ii) It is advisable, before embarking upon final interpretation, to consult someone
having insight into the study and who is frank and honest and will not hesitate to point
out omissions and errors in logical argumentation. Such a consultation will result in
correct interpretation and, thus, will enhance the utility of research results.
(iv) Researcher must accomplish the task of interpretation only after considering all
relevant factors affecting the problem to avoid false generalization.
PRECAUTIONS IN INTERPRETATION
One should always remember that even if the data are properly collected and
analysed, wrong interpretation would lead to inaccurate conclusions. It is, therefore,
absolutely essential that the task of interpretation be accomplished(skilled) with
patience in an impartial(unbiased) manner and also in correct perspective(view).
SIGNIFICANCE OF REPORT WRITING
Research report is considered a major component of the research study for the
research task remains incomplete till the report has been presented and/or written. As
a matter of fact even the most brilliant hypothesis, highly well designed and
conducted research study, and the most striking generalizations and findings are of
little value unless they are effectively communicated to others.
Dr.R.Rathi Devi.,M.B.A.,M.Phil.,Ph.D.,
Department of Business Administration
Arasu College of Arts and Science for Women,Karur.
DIFFERENT STEPS IN WRITING REPORT
1. Logical analysis of the subject matter: It is the first step which is primarily concerned
with the development of a subject. There are two ways in which to develop a subject
(a) logically and (b) chronologically. The logical development is made on the basis of
mental connections and associations between the one thing and another by means of
analysis. Chronological development is based on a connection or sequence in time or
occurrence.
2. Preparation of the final outline: It is the next step in writing the research report
“Outlines are the framework upon which long written works are constructed. They are
an aid to the logical organisation of the material and a reminder of the points to be
stressed in the report.”
3. Preparation of the rough draft: This follows the logical analysis of the subject and
the preparation of the final outline. Such a step is of utmost importance for the
researcher now sits to write down what he has done in the context of his research
study. He will write down the procedure adopted by him in collecting the material for
his study along with various limitations faced by him, the technique of analysis
adopted by him, the broad findings and generalizations and the various suggestions he
wants to offer regarding the problem concerned.
4. Rewriting and polishing of the rough draft: This step happens to be most difficult
part of all formal writing. Usually this step requires more time than the writing of the
rough draft. The careful revision makes the difference between a mediocre and a good
piece of writing. While rewriting and polishing, one should check the report for
weaknesses in logical development or presentation. The researcher should also “see
whether or not the material, as it is presented, has unity and cohesion; does the report
stand upright and firm and exhibit a definite pattern, like a marble arch? Or does it
resemble an old wall of mouldering cement and loose brick.”
5. Preparation of the final bibliography: Next in order comes the task of the
preparation of the final bibliography. The bibliography, which is generally appended
to the research report, is a list of books. It should contain all those works which the
researcher has consulted. The bibliography should be arranged alphabetically and may
be divided into two parts; the first part may contain the names of books and
pamphlets, and the second part may contain the names of magazine and newspaper
articles.

Dr.R.Rathi Devi.,M.B.A.,M.Phil.,Ph.D.,
Department of Business Administration
Arasu College of Arts and Science for Women,Karur.
LAYOUT OF THE RESEARCH REPORT
(A) Preliminary Pages
In its preliminary pages the report should carry a title and date, followed by
acknowledgements in the form of ‘Preface’ or ‘Foreword’. Then there should be a
table of contents followed by list of tables and illustrations so that the decision-maker
or anybody interested in reading the report can easily locate the required information
in the report.
(B) Main Text
The main text provides the complete outline of the research report along with all
details. Title of the research study is repeated at the top of the first page of the main
text and then follows the other details on pages numbered consecutively, beginning
with the second page. Each main section of the report should begin on a new page.
The main text of the report should have the following sections:
(i) Introduction; (ii) Statement of findings and recommendations; (iii) The results; (iv)
The implications drawn from the results; and (v) The summary.
(C) End Matter
At the end of the report, appendices should be enlisted in respect of all technical data
such as questionnaires, sample information, mathematical derivations and the like
ones. Bibliography of sources consulted should also be given. Index (an alphabetical
listing of names, places and topics along with the numbers of the pages in a book or
report on which they are mentioned or discussed) should invariably be given at the
end of the report.
TYPES OF REPORTS
Research reports vary greatly in length and type. In each individual case, both the
length and the form are largely dictated by the problems at hand. For instance,
business firms prefer reports in the letter form, just one or two pages in length. Banks,
insurance organisations and financial institutions are generally fond of the short
balance-sheet type of tabulation for their annual reports to their customers and
shareholders.
(A) Technical Report
In the technical report the main emphasis is on (i) the methods employed, (it)
assumptions made in the course of the study, (iii) the detailed presentation of the
findings including their limitations and supporting data.
A general outline of a technical report can be as follows:
Dr.R.Rathi Devi.,M.B.A.,M.Phil.,Ph.D.,
Department of Business Administration
Arasu College of Arts and Science for Women,Karur.
1. Summary of results: A brief review of the main findings just in two or three pages.
2. Nature of the study: Description of the general objectives of study, formulation of
the problem in operational terms, the working hypothesis, the type of analysis and
data required, etc.
3. Methods employed: Specific methods used in the study and their limitations. For
instance, in sampling studies we should give details of sample design viz., sample
size, sample selection, etc.
4. Data: Discussion of data collected, their sources, characteristics and limitations. If
secondary data are used, their suitability to the problem at hand be fully assessed. In
case of a survey, the manner in which data were collected should be fully described.
5. Analysis of data and presentation of findings: The analysis of data and presentation
of the findings of the study with supporting data in the form of tables and charts be
fully narrated. This, in fact, happens to be the main body of the report usually
extending over several chapters.
6. Conclusions: A detailed summary of the findings and the policy implications drawn
from the results be explained.
7. Bibliography: Bibliography of various sources consulted be prepared and attached.
8. Technical appendices: Appendices be given for all technical matters relating to
questionnaire, mathematical derivations, elaboration on particular technique of
analysis and the like ones.
9. Index: Index must be prepared and be given invariably in the report at the end.
B) Popular Report
The popular report is one which gives emphasis on simplicity and attractiveness. The
simplification should be sought through clear writing, minimization of technical,
particularly mathematical, details and liberal use of charts and diagrams.
We give below a general outline of a popular report.
1. The findings and their implications: Emphasis in the report is given on the findings
of most practical interest and on the implications of these findings.
2. Recommendations for action: Recommendations for action on the basis of the
findings of the study is made in this section of the report.
3. Objective of the study: A general review of how the problem arise is presented
along with the specific objectives of the project under study.
4. Methods employed: A brief and non-technical description of the methods and
techniques used, including a short review of the data on which the study is based, is

Dr.R.Rathi Devi.,M.B.A.,M.Phil.,Ph.D.,
Department of Business Administration
Arasu College of Arts and Science for Women,Karur.
given in this part of the report.
5. Results: This section constitutes the main body of the report wherein the results of
the study are presented in clear and non-technical terms with liberal use of all sorts of
illustrations such as charts, diagrams and the like ones.
MECHANICS OF WRITING A RESEARCH REPORT
There are very definite and set rules which should be followed in the actual
preparation of the research report or paper. Once the techniques are finally decided,
they should be scrupulously adhered to, and no deviation permitted. The criteria of
format should be decided as soon as the materials for the research paper have been
assembled. The following points deserve mention so far as the mechanics of writing a
report are concerned:
1. Size and physical design: The manuscript should be written on unruled paper 8 1 2²
× 11² in size. If it is to be written by hand, then black or blue-black ink should be
used. A margin of at least one and one-half inches should be allowed at the left hand
and of at least half an inch at the right hand of the paper. There should also be one-
inch margins, top and bottom. The paper should be neat and legible. If the manuscript
is to be typed, then all typing should be double-spaced on one side of the page only
except for the insertion of the long quotations.
2. Procedure: Various steps in writing the report should be strictly adhered (All such
steps have already been explained earlier in this chapter).
3. Layout: Keeping in view the objective and nature of the problem, the layout of the
report should be thought of and decided and accordingly adopted (The layout of the
research report and various types of reports have been described in this chapter
earlier which should be taken as a guide for report-writing in case of a particular
problem).
4. Treatment of quotations: Quotations should be placed in quotation marks and
double spaced, forming an immediate part of the text. But if a quotation is of a
considerable length (more than four or five type written lines) then it should be single-
spaced and indented at least half an inch to the right of the normal text margin.
5. Documentation style: Regarding documentation, the first footnote reference to any
given work should be complete in its documentation, giving all the essential facts
about the edition used. Such documentary footnotes follow a general sequence.
PRECAUTIONS FOR WRITING RESEARCH REPORTS
Research report is a channel of communicating the research findings to the readers of
the report. A good research report is one which does this task efficiently and
effectively. As such it must be prepared keeping the following precautions in view:
Dr.R.Rathi Devi.,M.B.A.,M.Phil.,Ph.D.,
Department of Business Administration
Arasu College of Arts and Science for Women,Karur.
1. While determining the length of the report (since research reports vary greatly in
length), one should keep in view the fact that it should be long enough to cover the
subject but short enough to maintain interest. In fact, report-writing should not be a
means to learning more and more about less and less.
2. A research report should not, if this can be avoided, be dul; it should be such as to
sustain reader’s interest.
3. Abstract terminology and technical jargon should be avoided in a research report.
The report should be able to convey the matter as simply as possible. This, in other
words, means that report should be written in an objective style in simple language,
avoiding expressions such as “it seems,” “there may be” and the like.
4. Readers are often interested in acquiring a quick knowledge of the main findings
and as such the report must provide a ready availability of the findings. For this
purpose, charts, addition to the summary of important findings.
5. The layout of the report should be well thought out and must be appropriate and in
accordance with the objective of the research problem.
6. The reports should be free from grammatical mistakes and must be prepared strictly
in accordance with the techniques of composition of report-writing such as the use of
quotations, footnotes, documentation, proper punctuation and use of abbreviations in
footnotes and the like.
7. The report must present the logical analysis of the subject matter. It must reflect a
structure wherein the different pieces of analysis relating to the research problem fit
well.
8. A research report should show originality and should necessarily be an attempt to
solvesome intellectual problem. It must contribute to the solution of a problem and
must add to the store of knowledge.


