Embed Size (px)
Citation preview
energies
Article
Research on Initiation of Carbon Dioxide Fracturing Pipe Usingthe Liquid Carbon Dioxide Phase-TransitionBlasting Technology
Jieqin Xia 1,2, Bin Dou 1,2,*, Hong Tian 1,2,* , Jun Zheng 1,2, Guodong Cui 1,2 and Muhammad Kashif 3
�����������������
Citation: Xia, J.; Dou, B.; Tian, H.;
Zheng, J.; Cui, G.; Kashif, M. Research
on Initiation of Carbon Dioxide
Fracturing Pipe Using the Liquid
Carbon Dioxide Phase-Transition
Blasting Technology. Energies 2021, 14,
521. https://doi.org/10.3390/
en14030521
Received: 2 December 2020
Accepted: 13 January 2021
Published: 20 January 2021
Publisher’s Note: MDPI stays neutral
with regard to jurisdictional claims in
published maps and institutional affil-
iations.
Copyright: © 2021 by the authors.
Licensee MDPI, Basel, Switzerland.
This article is an open access article
distributed under the terms and
conditions of the Creative Commons
Attribution (CC BY) license (https://
creativecommons.org/licenses/by/
4.0/).
1 Faculty of Engineering, China University of Geosciences, Wuhan 430074, China; [email protected] (J.X.);[email protected] (J.Z.); [email protected] (G.C.)
2 National Center for International Research on Deep Earth Drilling and Resource Development,Wuhan 430074, China
3 Department of Earth Sciences, University of Sargodha, Sargodha 40100, Pakistan;[email protected]
* Correspondence: [email protected] (B.D.); [email protected] (H.T.); Tel.: +86-189-861-53360 (B.D.);+86-137-2023-8728 (H.T.)
Abstract: Liquid carbon dioxide (L-CO2) phase-transition blasting technology (LCPTB) has causedwide concern in many fields, but there is a lack of research on the initiation of the carbon dioxidefracturing pipe. Studies regarding the carbon dioxide fracturing pipe initiation are critical forcontrolling and optimizing the LCPTB. Therefore, in this article, a series of exploratory experiments ofcarbon dioxide blasting were carried out to investigate the qualitative and quantitative relationshipsbetween the carbon dioxide fracturing pipe initiation and the three key variables (the filling mass ofliquid carbon dioxide (L-CO2) (X1), the amount of chemical heating material (X2) and the thickness ofthe constant-stress shear plate (X3)). The failure mechanisms of three variables on the phase-transitionblasting process of a carbon dioxide fracturing pipe was analyzed qualitatively based on experimenttemperature, strain curve and failure form of constant-stress shear plate. An empirical model betweenthe carbon dioxide fracturing pipe initiation (Y) and the three key variables (X1, X2, X3) was obtainedafter processing experiment result data quantitatively. Based on the phase-transition and blastingprocess of carbon dioxide, two methods, the Viral–Han–Long (VHL) equation of gas state (EOS) andthe strength-failure method were used to calculate the blasting pressure and determine the failuremode of the fracturing pipe. The proposed blasting empirical model can be used to optimize thestructural design of carbon dioxide fracturing pipes, guide on-site carbon dioxide blasting operationsand further achieve the best blasting effect of LCPTB, so this work can enable LCPTB to be betterapplied to practical projects.
Keywords: liquid carbon dioxide; fracturing pipe; initiation; empirical model; failure mode
1. Introduction
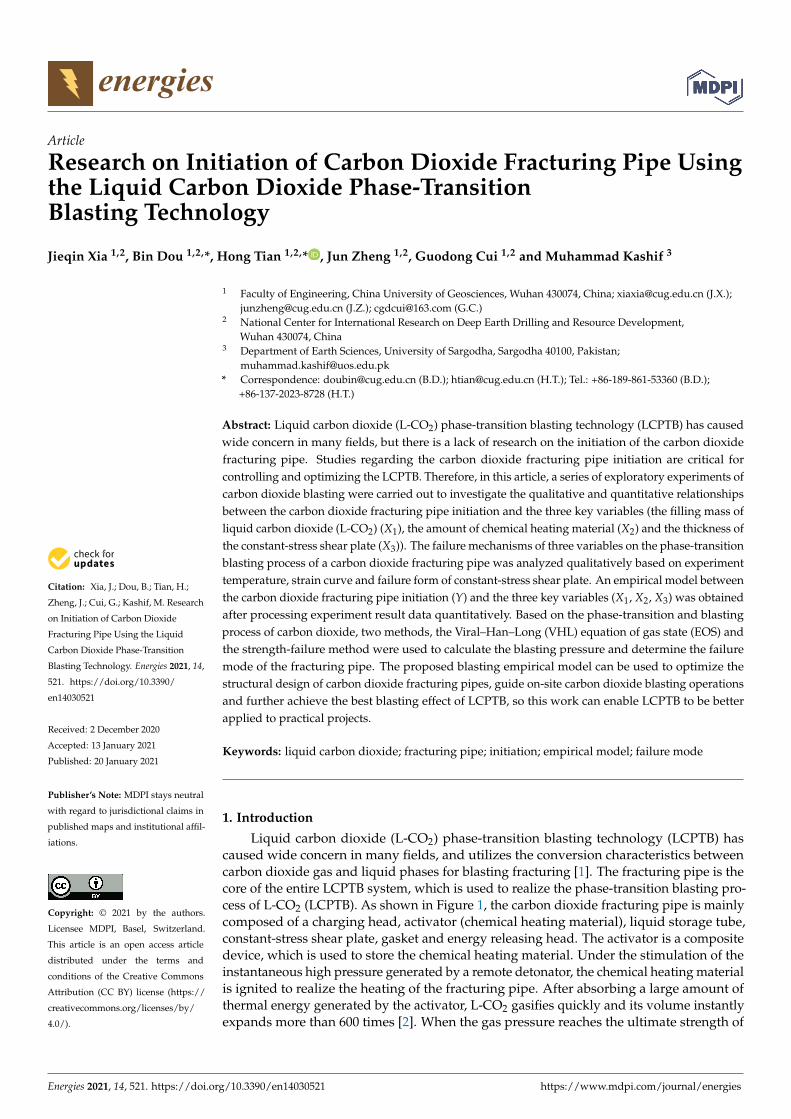
Liquid carbon dioxide (L-CO2) phase-transition blasting technology (LCPTB) hascaused wide concern in many fields, and utilizes the conversion characteristics betweencarbon dioxide gas and liquid phases for blasting fracturing [1]. The fracturing pipe is thecore of the entire LCPTB system, which is used to realize the phase-transition blasting pro-cess of L-CO2 (LCPTB). As shown in Figure 1, the carbon dioxide fracturing pipe is mainlycomposed of a charging head, activator (chemical heating material), liquid storage tube,constant-stress shear plate, gasket and energy releasing head. The activator is a compositedevice, which is used to store the chemical heating material. Under the stimulation of theinstantaneous high pressure generated by a remote detonator, the chemical heating materialis ignited to realize the heating of the fracturing pipe. After absorbing a large amount ofthermal energy generated by the activator, L-CO2 gasifies quickly and its volume instantlyexpands more than 600 times [2]. When the gas pressure reaches the ultimate strength of
Energies 2021, 14, 521. https://doi.org/10.3390/en14030521 https://www.mdpi.com/journal/energies
Energies 2021, 14, 521 2 of 16
the constant-stress shear plate, the constant-stress shear plate will be destroyed. After that,the high-energy carbon dioxide gas is released from the front end of the energy releasinghead, and the blasting occurs and causes the rock mass crack, then the high-pressure gasmigration makes fractures secondary development and expansion. The blasting productsare gaseous CO2 and water vapor, with no sparks or flames, and the releasing pressure andenergy can be controlled and modified easily according to user requirements [3]. Therefore,the LCPTB has the significant advantages in controllable blasting pressure, uniform seamformation, being economical and pollution-free, and having intelligent control. Meanwhile,it overcomes the disadvantages of heavy harm, serious pollution, and high cost in thechemical blasting process. As such, the blasting technology has caused a wide concernin geotechnical engineering [4], municipal transportation [5], geological engineering [6],gaseous industry [7], geothermal engineering [8–11] and other fields [12,13].
Energies 2021, 14, x FOR PEER REVIEW 2 of 16
ing a large amount of thermal energy generated by the activator, L-CO2 gasifies quickly and its volume instantly expands more than 600 times [2]. When the gas pressure reaches the ultimate strength of the constant-stress shear plate, the constant-stress shear plate will be destroyed. After that, the high-energy carbon dioxide gas is released from the front end of the energy releasing head, and the blasting occurs and causes the rock mass crack, then the high-pressure gas migration makes fractures secondary development and expansion. The blasting products are gaseous CO2 and water vapor, with no sparks or flames, and the releasing pressure and energy can be controlled and modified easily ac-cording to user requirements [3]. Therefore, the LCPTB has the significant advantages in controllable blasting pressure, uniform seam formation, being economical and pollu-tion-free, and having intelligent control. Meanwhile, it overcomes the disadvantages of heavy harm, serious pollution, and high cost in the chemical blasting process. As such, the blasting technology has caused a wide concern in geotechnical engineering [4], mu-nicipal transportation [5], geological engineering [6], gaseous industry [7], geothermal engineering [8–11] and other fields [12,13].
Figure 1. The structure of carbon dioxide fracturing pipe.
LCPTB is also known as the cardox tube system, which was proposed by a British company in 1914, and it began to be used during the early 1950s [14–16]. In 1989, it was introduced into licensed coal mines in South Wales and recently was successfully used on a shaft sinking project in granite rock [17]. Patrick [18] and Caldwell, T [19] contrast-ed the advantages of CO2 blasting relative to traditional chemical blasting. Then, in 1998, Singh simply described a rock breaking project with this blasting technology at quarry-ing in Turkey. At the end of the 20th century, LCPTB was introduced to the coal mining industry and has been greatly applied in the enhancement of coal seam permeability [2–4,7,20,21]. Nowadays, with the help of field experiment, laboratory simulation, compar-ative analysis, numerical simulation and other scientific research methods, the blasting fracturing process [22–25], blasting fracturing energy [26–30], blasting fracturing mecha-nism [22,26,31] and blasting phase-transition process of the LCPTB were discussed in detail [23,30–33]. The blasting process of the LCPTB can be accurately controlled by the carbon dioxide fracturing pipe, and many scholars have also focused on this research. Chen et al. [17] designed experimental equipment to monitor shock wave pressure dur-ing the LCPTB, which is convenient for in-depth study of the LCPTB mechanism. Based on in-depth research on gas blasting, Hu et al. [6] proposed a new CO2 static pneumatic fracturing technology. Li et al. [34] proposed novel liquid carbon dioxide rock-breaking technology and designed the relative device. Finally, the technology was successfully applied in rock excavation at a metro station construction site.
In summary, most of the LCPTB research focuses on phase-transition mecha-nism[22,26,31], rock blasting [32,35], blasting antireflection [2–4,7,20,21] and blasting fracture propagation [11,20,36,37]. However, there is a lack of research on the initiation of the fracturing pipe and especially research on the relationship among controllable blasting parameters, blasting pressure and blasting effect in the LCPTB. The filling mass of L-CO2, the amount of chemical heating material and the thickness of the con-stant-stress shear plate are three key variables which directly determine the fracturing
Figure 1. The structure of carbon dioxide fracturing pipe.
LCPTB is also known as the cardox tube system, which was proposed by a Britishcompany in 1914, and it began to be used during the early 1950s [14–16]. In 1989, it wasintroduced into licensed coal mines in South Wales and recently was successfully used ona shaft sinking project in granite rock [17]. Patrick [18] and Caldwell, T [19] contrasted theadvantages of CO2 blasting relative to traditional chemical blasting. Then, in 1998, Singhsimply described a rock breaking project with this blasting technology at quarrying inTurkey. At the end of the 20th century, LCPTB was introduced to the coal mining industryand has been greatly applied in the enhancement of coal seam permeability [2–4,7,20,21].Nowadays, with the help of field experiment, laboratory simulation, comparative analysis,numerical simulation and other scientific research methods, the blasting fracturing pro-cess [22–25], blasting fracturing energy [26–30], blasting fracturing mechanism [22,26,31]and blasting phase-transition process of the LCPTB were discussed in detail [23,30–33]. Theblasting process of the LCPTB can be accurately controlled by the carbon dioxide fracturingpipe, and many scholars have also focused on this research. Chen et al. [17] designedexperimental equipment to monitor shock wave pressure during the LCPTB, which isconvenient for in-depth study of the LCPTB mechanism. Based on in-depth research ongas blasting, Hu et al. [6] proposed a new CO2 static pneumatic fracturing technology.Li et al. [34] proposed novel liquid carbon dioxide rock-breaking technology and designedthe relative device. Finally, the technology was successfully applied in rock excavation at ametro station construction site.
In summary, most of the LCPTB research focuses on phase-transition mechanism [22,26,31],rock blasting [32,35], blasting antireflection [2–4,7,20,21] and blasting fracture propaga-tion [11,20,36,37]. However, there is a lack of research on the initiation of the fracturingpipe and especially research on the relationship among controllable blasting parameters,blasting pressure and blasting effect in the LCPTB. The filling mass of L-CO2, the amountof chemical heating material and the thickness of the constant-stress shear plate are threekey variables which directly determine the fracturing pipe initiation. These three keyvariables have mainly relied on practical experience, which is not completely scientific
Energies 2021, 14, 521 3 of 16
and reliable. Studies regarding the carbon dioxide fracturing pipe initiation are critical forcontrolling and optimizing the LCPTB. Furthermore, the fracturing pipe initiation directlyaffects the effect of blasting and fracturing. The successful blasting of the fracturing pipe isconducive to improving blasting efficiency, saving blasting costs, and achieving optimalblasting benefits. Therefore, it is necessary to study the relationship between the fracturingpipe initiation and the three key variables. Hence, in this article, according to the results ofcarbon dioxide blasting experiments, the quantitative and qualitative relationships amongthe three key variables (X1, X2, X3) and the fracturing pipe initiation (Y) were explored.The calculation models of blasting pressure were used to determine the failure mode ofthe fracturing pipe. The proposed blasting empirical model can be used to optimize thestructural design of carbon dioxide fracturing pipes, guide on-site carbon dioxide blastingoperations, and further achieve the best blasting effect of LCPTB. This will enable theLCPTB to be better applied to practical projects, so this work has great practical guidingsignificance.
2. Experimental Methodology2.1. Experimental Apparatus
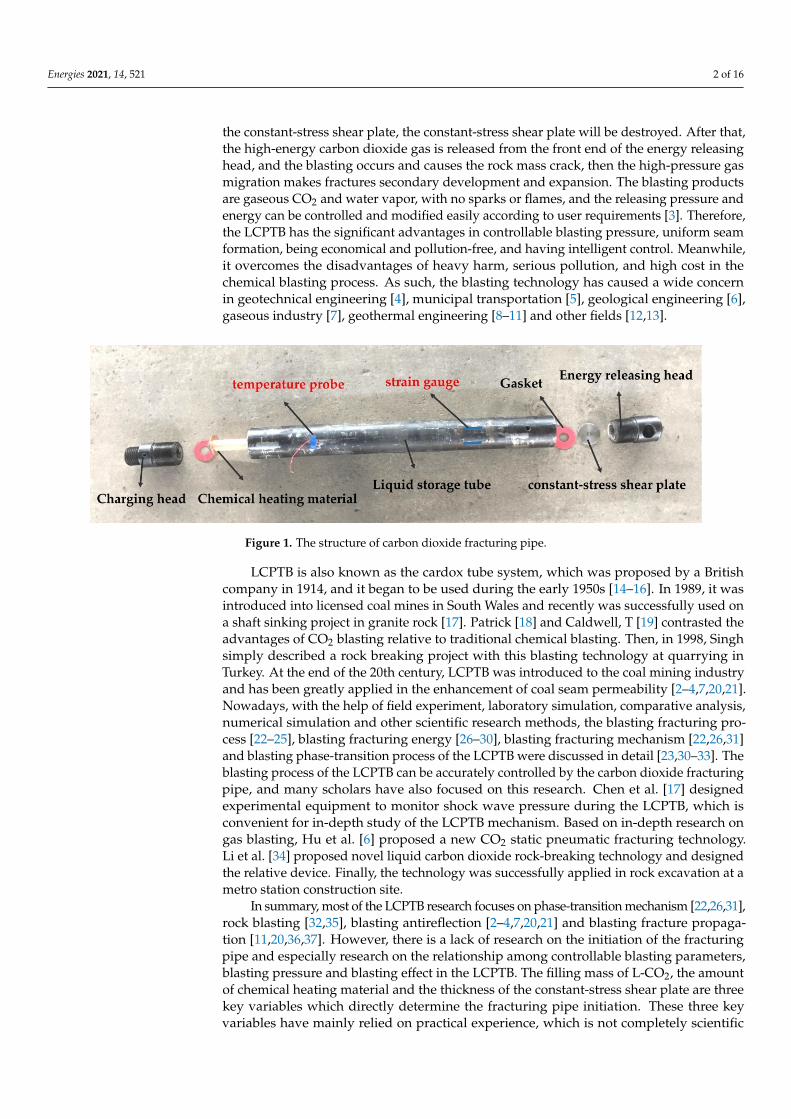
A carbon dioxide blasting experiment system consists of a filling system, blastingsystem and detection system. The filling system is used to complete the transfer of L-CO2from the storage container to the fracturing pipe, and is equipped with a carbon dioxidestorage tank, a filling machine and a fracturing pipe screwing machine. The blasting systemis the key to successful experiment, and it is also the location of the three key variables inthe experiment, including fracturing pipe and high-energy pulse detonator. The detectionsystem plays the role of recording real-time temperature and strain changes during theexperiment, and consists of a 8852K.J.T. thermocouple temperature meter and DH5956strain dynamic measuring instrument. The fracturing pipe-95 was used in the experiment(Figure 1), with a length of 910 mm, an outer diameter of 95 mm, an inner diameter of65 mm and a volume of 1.93 L. The diameter of the constant-stress shear plate used in theexperiment was 42 mm, and the material was 45 steel. The physical diagram of the carbondioxide blasting experiment system is shown in Figure 2.
Energies 2021, 14, x FOR PEER REVIEW 3 of 16
pipe initiation. These three key variables have mainly relied on practical experience, which is not completely scientific and reliable. Studies regarding the carbon dioxide fracturing pipe initiation are critical for controlling and optimizing the LCPTB. Fur-thermore, the fracturing pipe initiation directly affects the effect of blasting and fractur-ing. The successful blasting of the fracturing pipe is conducive to improving blasting ef-ficiency, saving blasting costs, and achieving optimal blasting benefits. Therefore, it is necessary to study the relationship between the fracturing pipe initiation and the three key variables. Hence, in this article, according to the results of carbon dioxide blasting experiments, the quantitative and qualitative relationships among the three key variables (X1, X2, X3) and the fracturing pipe initiation (Y) were explored. The calculation models of blasting pressure were used to determine the failure mode of the fracturing pipe. The proposed blasting empirical model can be used to optimize the structural design of car-bon dioxide fracturing pipes, guide on-site carbon dioxide blasting operations, and fur-ther achieve the best blasting effect of LCPTB. This will enable the LCPTB to be better applied to practical projects, so this work has great practical guiding significance.
2. Experimental Methodology 2.1. Experimental Apparatus
A carbon dioxide blasting experiment system consists of a filling system, blasting system and detection system. The filling system is used to complete the transfer of L-CO2 from the storage container to the fracturing pipe, and is equipped with a carbon dioxide storage tank, a filling machine and a fracturing pipe screwing machine. The blasting system is the key to successful experiment, and it is also the location of the three key variables in the experiment, including fracturing pipe and high-energy pulse detonator. The detection system plays the role of recording real-time temperature and strain changes during the experiment, and consists of a 8852K.J.T. thermocouple temperature meter and DH5956 strain dynamic measuring instrument. The fracturing pipe-95 was used in the experiment (Figure 1), with a length of 910 mm, an outer diameter of 95 mm, an inner diameter of 65 mm and a volume of 1.93 L. The diameter of the constant-stress shear plate used in the experiment was 42 mm, and the material was 45 steel. The phys-ical diagram of the carbon dioxide blasting experiment system is shown in Figure 2.
Figure 2. Carbon dioxide blasting experiment system. Figure 2. Carbon dioxide blasting experiment system.
Energies 2021, 14, 521 4 of 16
2.2. Experimental Setup
In this article, 17 groups of exploratory experiments on carbon dioxide blasting werecarried out in a 10 × 10 m abandoned boiler room. The experimental object was thecarbon dioxide fracturing pipe, which has no action object. The experiments were usedto explore the empirical model between the three key variables and the fracturing pipeinitiation. During the experiment, the thickness of constant-stress shear plate and theamount of chemical heating material are considered as specific variables. The constant-stress shear plate of 4.0 mm, 4.5 mm and 5.0 mm, and the amount of chemical heatingmaterial of 250 g and 300 g were designed, respectively. The filling mass of L-CO2 isan undetermined variable, which needs to be adjusted according to the field experimentsituation. At the same time, considering the experiment cost and sealing requirements,the experiment adopted the method of attaching the temperature measurement probe tothe outside of the liquid storage tube, and used the stress-strain method to measure thepressure value indirectly. The strain gauge and temperature gauge were used to record thestrain and temperature data of the entire experiment, and the remote intelligent control ofthe detonator was adopted in the blasting field to make this experiment safe and operable.
2.3. Experimental Process
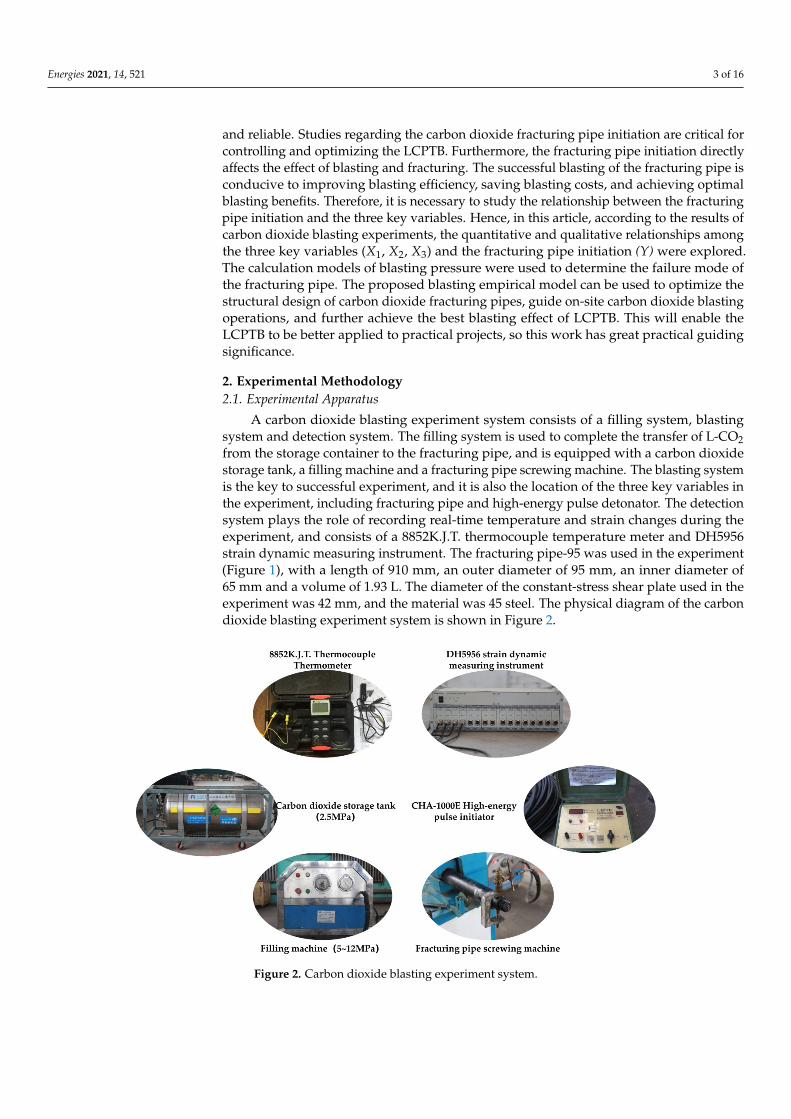
The experimental filling-blasting process is shown in Figure 3. Firstly, the thicknessof constant-stress shear plate and the amount of chemical heating material used in theexperiments were selected, the internal volume V of Fracturing pipe was measured by waterinjection, and the mass (m) of the fracturing pipe before filling was measured. Secondly,the filling mass of L-CO2 (M) in the experiment was measured, and the L-CO2 storage tankand L-CO2 charging machine were used to complete the filling of L-CO2. Furthermore,after meeting the air tightness requirements of a fracturing pipe, the experimental sitewas arranged, and the strain gauge and the temperature probe were fixed as shown inFigure 1. Finally, the detonating wire was connected to high-energy pulse detonator, andthe detonator was switched on to realize blasting.
Energies 2021, 14, x FOR PEER REVIEW 4 of 16
2.2. Experimental Setup In this article, 17 groups of exploratory experiments on carbon dioxide blasting
were carried out in a 10 × 10 m abandoned boiler room. The experimental object was the carbon dioxide fracturing pipe, which has no action object. The experiments were used to explore the empirical model between the three key variables and the fracturing pipe initiation. During the experiment, the thickness of constant-stress shear plate and the amount of chemical heating material are considered as specific variables. The con-stant-stress shear plate of 4.0 mm, 4.5 mm and 5.0 mm, and the amount of chemical heating material of 250 g and 300 g were designed, respectively. The filling mass of L-CO2 is an undetermined variable, which needs to be adjusted according to the field experi-ment situation. At the same time, considering the experiment cost and sealing require-ments, the experiment adopted the method of attaching the temperature measurement probe to the outside of the liquid storage tube, and used the stress-strain method to measure the pressure value indirectly. The strain gauge and temperature gauge were used to record the strain and temperature data of the entire experiment, and the remote intelligent control of the detonator was adopted in the blasting field to make this ex-periment safe and operable.
2.3. Experimental Process The experimental filling-blasting process is shown in Figure 3. Firstly, the thickness
of constant-stress shear plate and the amount of chemical heating material used in the experiments were selected, the internal volume V of Fracturing pipe was measured by water injection, and the mass (m) of the fracturing pipe before filling was measured. Secondly, the filling mass of L-CO2 (M) in the experiment was measured, and the L-CO2 storage tank and L-CO2 charging machine were used to complete the filling of L-CO2. Furthermore, after meeting the air tightness requirements of a fracturing pipe, the ex-perimental site was arranged, and the strain gauge and the temperature probe were fixed as shown in Figure 1. Finally, the detonating wire was connected to high-energy pulse detonator, and the detonator was switched on to realize blasting.
Figure 3. The experimental filling-blasting process.
3. Results and Discussion Among the 17 groups of carbon dioxide blasting experiments, 10 groups were suc-
cessfully blasted, while 7 groups failed, and the specific values of the experiment varia-bles are shown in Table 1. The constant-stress shear plate of the successful blasting frac-turing pipe was broken into fragments and showed different degrees of distortion. However, the failed blasting fracturing pipe did not fracture, and showed a convex shape with different widths.
Figure 3. The experimental filling-blasting process.
3. Results and Discussion
Among the 17 groups of carbon dioxide blasting experiments, 10 groups were success-fully blasted, while 7 groups failed, and the specific values of the experiment variables areshown in Table 1. The constant-stress shear plate of the successful blasting fracturing pipewas broken into fragments and showed different degrees of distortion. However, the failedblasting fracturing pipe did not fracture, and showed a convex shape with different widths.
Energies 2021, 14, 521 5 of 16
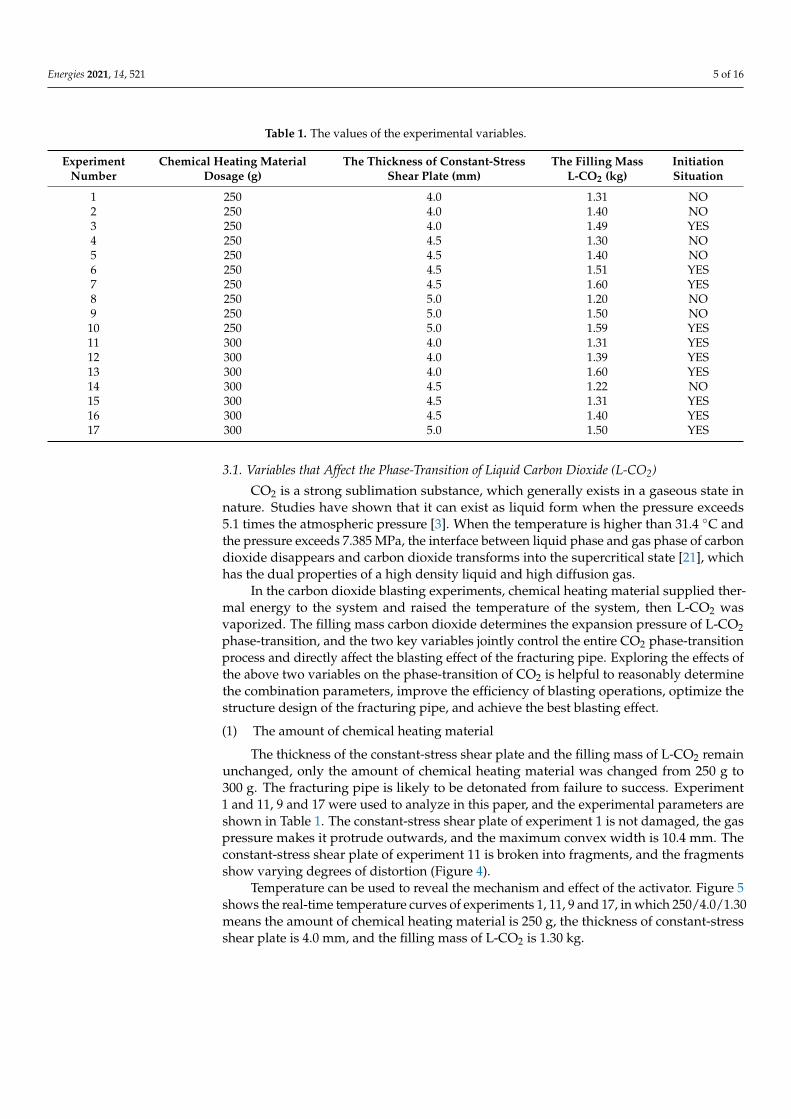
Table 1. The values of the experimental variables.
ExperimentNumber
Chemical Heating MaterialDosage (g)
The Thickness of Constant-StressShear Plate (mm)
The Filling MassL-CO2 (kg)
InitiationSituation
1 250 4.0 1.31 NO2 250 4.0 1.40 NO3 250 4.0 1.49 YES4 250 4.5 1.30 NO5 250 4.5 1.40 NO6 250 4.5 1.51 YES7 250 4.5 1.60 YES8 250 5.0 1.20 NO9 250 5.0 1.50 NO
10 250 5.0 1.59 YES11 300 4.0 1.31 YES12 300 4.0 1.39 YES13 300 4.0 1.60 YES14 300 4.5 1.22 NO15 300 4.5 1.31 YES16 300 4.5 1.40 YES17 300 5.0 1.50 YES
3.1. Variables that Affect the Phase-Transition of Liquid Carbon Dioxide (L-CO2)
CO2 is a strong sublimation substance, which generally exists in a gaseous state innature. Studies have shown that it can exist as liquid form when the pressure exceeds5.1 times the atmospheric pressure [3]. When the temperature is higher than 31.4 ◦C andthe pressure exceeds 7.385 MPa, the interface between liquid phase and gas phase of carbondioxide disappears and carbon dioxide transforms into the supercritical state [21], whichhas the dual properties of a high density liquid and high diffusion gas.
In the carbon dioxide blasting experiments, chemical heating material supplied ther-mal energy to the system and raised the temperature of the system, then L-CO2 wasvaporized. The filling mass carbon dioxide determines the expansion pressure of L-CO2phase-transition, and the two key variables jointly control the entire CO2 phase-transitionprocess and directly affect the blasting effect of the fracturing pipe. Exploring the effects ofthe above two variables on the phase-transition of CO2 is helpful to reasonably determinethe combination parameters, improve the efficiency of blasting operations, optimize thestructure design of the fracturing pipe, and achieve the best blasting effect.
(1) The amount of chemical heating material
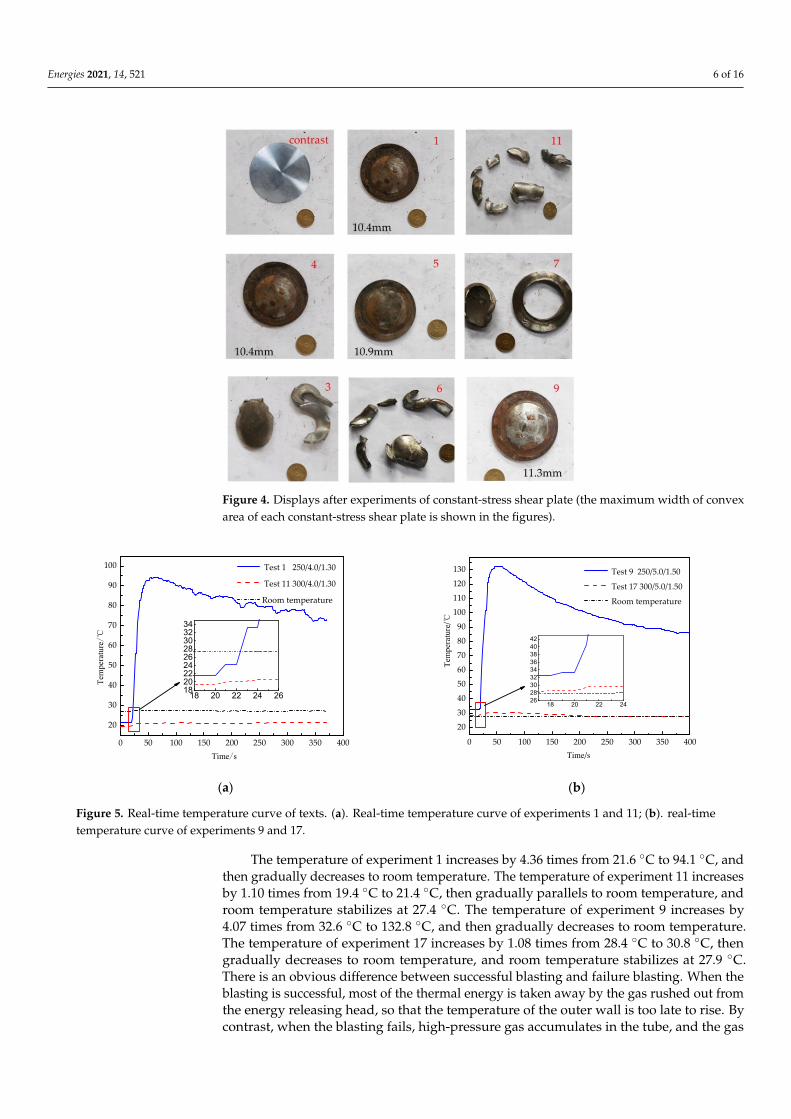
The thickness of the constant-stress shear plate and the filling mass of L-CO2 remainunchanged, only the amount of chemical heating material was changed from 250 g to300 g. The fracturing pipe is likely to be detonated from failure to success. Experiment1 and 11, 9 and 17 were used to analyze in this paper, and the experimental parameters areshown in Table 1. The constant-stress shear plate of experiment 1 is not damaged, the gaspressure makes it protrude outwards, and the maximum convex width is 10.4 mm. Theconstant-stress shear plate of experiment 11 is broken into fragments, and the fragmentsshow varying degrees of distortion (Figure 4).
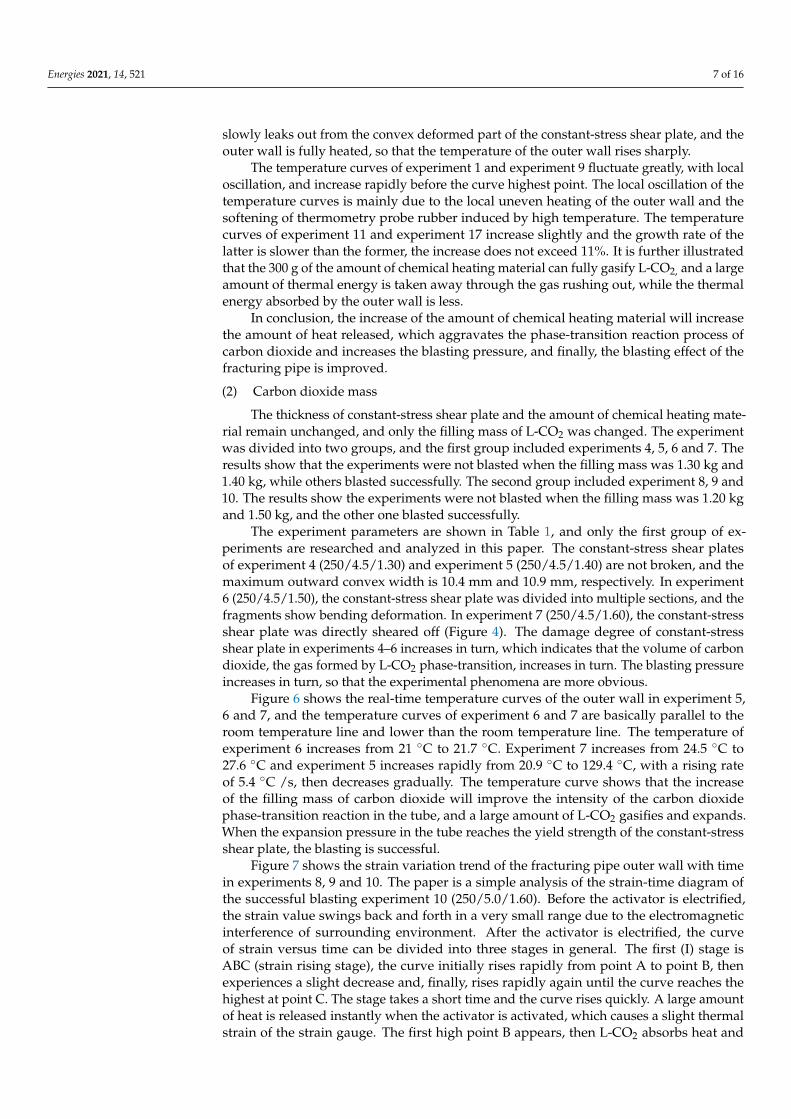
Temperature can be used to reveal the mechanism and effect of the activator. Figure 5shows the real-time temperature curves of experiments 1, 11, 9 and 17, in which 250/4.0/1.30means the amount of chemical heating material is 250 g, the thickness of constant-stressshear plate is 4.0 mm, and the filling mass of L-CO2 is 1.30 kg.
Energies 2021, 14, 521 6 of 16Energies 2021, 14, x FOR PEER REVIEW 6 of 16
Figure 4. Displays after experiments of constant-stress shear plate (the maximum width of convex area of each constant-stress shear plate is shown in the figures).
Temperature can be used to reveal the mechanism and effect of the activator. Figure 5 shows the real-time temperature curves of experiments 1, 11, 9 and 17, in which 250/4.0/1.30 means the amount of chemical heating material is 250 g, the thickness of con-stant-stress shear plate is 4.0 mm, and the filling mass of L-CO2 is 1.30 kg.
0 50 100 150 200 250 300 350 400
20
30
40
50
60
70
80
90
100
18 20 22 24 26182022242628303234
Tem
pera
ture/℃
Time/s
Test 1 250/4.0/1.30
Test 11 300/4.0/1.30
Room temperature
0 50 100 150 200 250 300 350 400
20
30
40
50
60
70
80
90
100
110
120
130
18 20 22 24262830323436384042
Tem
pera
ture
/℃
Time/s
Test 9 250/5.0/1.50
Test 17 300/5.0/1.50
Room temperature
(a) (b)
Figure 5. Real-time temperature curve of texts. (a). Real-time temperature curve of experiments 1 and 11; (b). real-time temperature curve of experiments 9 and 17.
The temperature of experiment 1 increases by 4.36 times from 21.6 °C to 94.1 °C, and then gradually decreases to room temperature. The temperature of experiment 11 in-creases by 1.10 times from 19.4 °C to 21.4 °C, then gradually parallels to room tempera-ture, and room temperature stabilizes at 27.4 °C. The temperature of experiment 9 in-creases by 4.07 times from 32.6 °C to 132.8 °C, and then gradually decreases to room temperature. The temperature of experiment 17 increases by 1.08 times from 28.4 °C to 30.8 °C, then gradually decreases to room temperature, and room temperature stabilizes at 27.9 °C. There is an obvious difference between successful blasting and failure blasting. When the blasting is successful, most of the thermal energy is taken away by the gas
Figure 4. Displays after experiments of constant-stress shear plate (the maximum width of convexarea of each constant-stress shear plate is shown in the figures).
Energies 2021, 14, x FOR PEER REVIEW 6 of 16
Figure 4. Displays after experiments of constant-stress shear plate (the maximum width of convex area of each constant-stress shear plate is shown in the figures).
Temperature can be used to reveal the mechanism and effect of the activator. Figure 5 shows the real-time temperature curves of experiments 1, 11, 9 and 17, in which 250/4.0/1.30 means the amount of chemical heating material is 250 g, the thickness of con-stant-stress shear plate is 4.0 mm, and the filling mass of L-CO2 is 1.30 kg.
0 50 100 150 200 250 300 350 400
20
30
40
50
60
70
80
90
100
18 20 22 24 26182022242628303234
Tem
pera
ture/℃
Time/s
Test 1 250/4.0/1.30
Test 11 300/4.0/1.30
Room temperature
0 50 100 150 200 250 300 350 400
20
30
40
50
60
70
80
90
100
110
120
130
18 20 22 24262830323436384042
Tem
pera
ture
/℃
Time/s
Test 9 250/5.0/1.50
Test 17 300/5.0/1.50
Room temperature
(a) (b)
Figure 5. Real-time temperature curve of texts. (a). Real-time temperature curve of experiments 1 and 11; (b). real-time temperature curve of experiments 9 and 17.
The temperature of experiment 1 increases by 4.36 times from 21.6 °C to 94.1 °C, and then gradually decreases to room temperature. The temperature of experiment 11 in-creases by 1.10 times from 19.4 °C to 21.4 °C, then gradually parallels to room tempera-ture, and room temperature stabilizes at 27.4 °C. The temperature of experiment 9 in-creases by 4.07 times from 32.6 °C to 132.8 °C, and then gradually decreases to room temperature. The temperature of experiment 17 increases by 1.08 times from 28.4 °C to 30.8 °C, then gradually decreases to room temperature, and room temperature stabilizes at 27.9 °C. There is an obvious difference between successful blasting and failure blasting. When the blasting is successful, most of the thermal energy is taken away by the gas
Figure 5. Real-time temperature curve of texts. (a). Real-time temperature curve of experiments 1 and 11; (b). real-timetemperature curve of experiments 9 and 17.
The temperature of experiment 1 increases by 4.36 times from 21.6 ◦C to 94.1 ◦C, andthen gradually decreases to room temperature. The temperature of experiment 11 increasesby 1.10 times from 19.4 ◦C to 21.4 ◦C, then gradually parallels to room temperature, androom temperature stabilizes at 27.4 ◦C. The temperature of experiment 9 increases by4.07 times from 32.6 ◦C to 132.8 ◦C, and then gradually decreases to room temperature.The temperature of experiment 17 increases by 1.08 times from 28.4 ◦C to 30.8 ◦C, thengradually decreases to room temperature, and room temperature stabilizes at 27.9 ◦C.There is an obvious difference between successful blasting and failure blasting. When theblasting is successful, most of the thermal energy is taken away by the gas rushed out fromthe energy releasing head, so that the temperature of the outer wall is too late to rise. Bycontrast, when the blasting fails, high-pressure gas accumulates in the tube, and the gas
Energies 2021, 14, 521 7 of 16
slowly leaks out from the convex deformed part of the constant-stress shear plate, and theouter wall is fully heated, so that the temperature of the outer wall rises sharply.
The temperature curves of experiment 1 and experiment 9 fluctuate greatly, with localoscillation, and increase rapidly before the curve highest point. The local oscillation of thetemperature curves is mainly due to the local uneven heating of the outer wall and thesoftening of thermometry probe rubber induced by high temperature. The temperaturecurves of experiment 11 and experiment 17 increase slightly and the growth rate of thelatter is slower than the former, the increase does not exceed 11%. It is further illustratedthat the 300 g of the amount of chemical heating material can fully gasify L-CO2, and a largeamount of thermal energy is taken away through the gas rushing out, while the thermalenergy absorbed by the outer wall is less.
In conclusion, the increase of the amount of chemical heating material will increasethe amount of heat released, which aggravates the phase-transition reaction process ofcarbon dioxide and increases the blasting pressure, and finally, the blasting effect of thefracturing pipe is improved.
(2) Carbon dioxide mass
The thickness of constant-stress shear plate and the amount of chemical heating mate-rial remain unchanged, and only the filling mass of L-CO2 was changed. The experimentwas divided into two groups, and the first group included experiments 4, 5, 6 and 7. Theresults show that the experiments were not blasted when the filling mass was 1.30 kg and1.40 kg, while others blasted successfully. The second group included experiment 8, 9 and10. The results show the experiments were not blasted when the filling mass was 1.20 kgand 1.50 kg, and the other one blasted successfully.
The experiment parameters are shown in Table 1, and only the first group of ex-periments are researched and analyzed in this paper. The constant-stress shear platesof experiment 4 (250/4.5/1.30) and experiment 5 (250/4.5/1.40) are not broken, and themaximum outward convex width is 10.4 mm and 10.9 mm, respectively. In experiment6 (250/4.5/1.50), the constant-stress shear plate was divided into multiple sections, and thefragments show bending deformation. In experiment 7 (250/4.5/1.60), the constant-stressshear plate was directly sheared off (Figure 4). The damage degree of constant-stressshear plate in experiments 4–6 increases in turn, which indicates that the volume of carbondioxide, the gas formed by L-CO2 phase-transition, increases in turn. The blasting pressureincreases in turn, so that the experimental phenomena are more obvious.
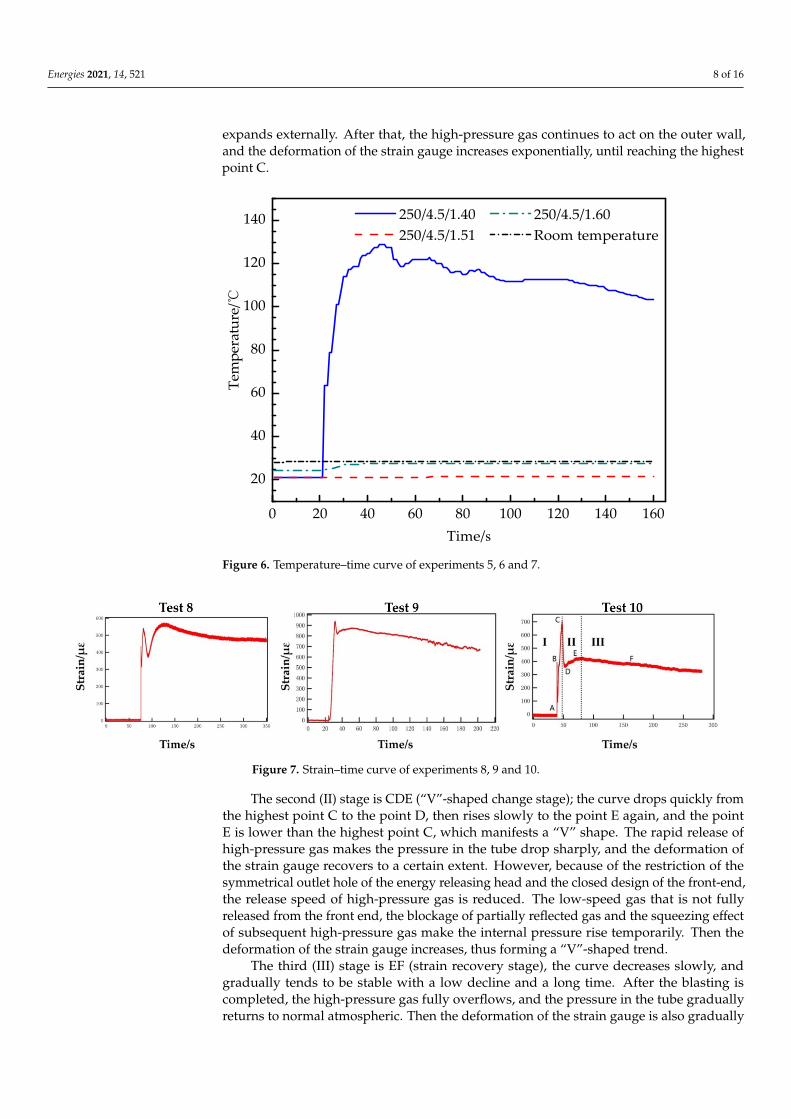
Figure 6 shows the real-time temperature curves of the outer wall in experiment 5,6 and 7, and the temperature curves of experiment 6 and 7 are basically parallel to theroom temperature line and lower than the room temperature line. The temperature ofexperiment 6 increases from 21 ◦C to 21.7 ◦C. Experiment 7 increases from 24.5 ◦C to27.6 ◦C and experiment 5 increases rapidly from 20.9 ◦C to 129.4 ◦C, with a rising rateof 5.4 ◦C /s, then decreases gradually. The temperature curve shows that the increaseof the filling mass of carbon dioxide will improve the intensity of the carbon dioxidephase-transition reaction in the tube, and a large amount of L-CO2 gasifies and expands.When the expansion pressure in the tube reaches the yield strength of the constant-stressshear plate, the blasting is successful.
Figure 7 shows the strain variation trend of the fracturing pipe outer wall with timein experiments 8, 9 and 10. The paper is a simple analysis of the strain-time diagram ofthe successful blasting experiment 10 (250/5.0/1.60). Before the activator is electrified,the strain value swings back and forth in a very small range due to the electromagneticinterference of surrounding environment. After the activator is electrified, the curveof strain versus time can be divided into three stages in general. The first (I) stage isABC (strain rising stage), the curve initially rises rapidly from point A to point B, thenexperiences a slight decrease and, finally, rises rapidly again until the curve reaches thehighest at point C. The stage takes a short time and the curve rises quickly. A large amountof heat is released instantly when the activator is activated, which causes a slight thermalstrain of the strain gauge. The first high point B appears, then L-CO2 absorbs heat and
Energies 2021, 14, 521 8 of 16
expands externally. After that, the high-pressure gas continues to act on the outer wall,and the deformation of the strain gauge increases exponentially, until reaching the highestpoint C.
Energies 2021, 14, x FOR PEER REVIEW 8 of 16
0 20 40 60 80 100 120 140 160
20
40
60
80
100
120
140 250/4.5/1.60 Room temperature
Tem
pera
ture
/℃
Time/s
250/4.5/1.40 250/4.5/1.51
Figure 6. Temperature–time curve of experiments 5, 6 and 7.
Figure 7 shows the strain variation trend of the fracturing pipe outer wall with time in experiments 8, 9 and 10. The paper is a simple analysis of the strain-time diagram of the successful blasting experiment 10 (250/5.0/1.60). Before the activator is electrified, the strain value swings back and forth in a very small range due to the electromagnetic in-terference of surrounding environment. After the activator is electrified, the curve of strain versus time can be divided into three stages in general. The first (I) stage is ABC (strain rising stage), the curve initially rises rapidly from point A to point B, then expe-riences a slight decrease and, finally, rises rapidly again until the curve reaches the highest at point C. The stage takes a short time and the curve rises quickly. A large amount of heat is released instantly when the activator is activated, which causes a slight thermal strain of the strain gauge. The first high point B appears, then L-CO2 absorbs heat and expands externally. After that, the high-pressure gas continues to act on the outer wall, and the deformation of the strain gauge increases exponentially, until reaching the highest point C.
Figure 7. Strain–time curve of experiments 8, 9 and 10.
The second (II) stage is CDE (“V”-shaped change stage); the curve drops quickly from the highest point C to the point D, then rises slowly to the point E again, and the point E is lower than the highest point C, which manifests a “V” shape. The rapid release of high-pressure gas makes the pressure in the tube drop sharply, and the deformation of the strain gauge recovers to a certain extent. However, because of the restriction of the symmetrical outlet hole of the energy releasing head and the closed design of the front-end, the release speed of high-pressure gas is reduced. The low-speed gas that is not fully released from the front end, the blockage of partially reflected gas and the
Figure 6. Temperature–time curve of experiments 5, 6 and 7.
Energies 2021, 14, x FOR PEER REVIEW 8 of 16
0 20 40 60 80 100 120 140 160
20
40
60
80
100
120
140 250/4.5/1.60 Room temperature
Tem
pera
ture
/℃
Time/s
250/4.5/1.40 250/4.5/1.51
Figure 6. Temperature–time curve of experiments 5, 6 and 7.
Figure 7 shows the strain variation trend of the fracturing pipe outer wall with time in experiments 8, 9 and 10. The paper is a simple analysis of the strain-time diagram of the successful blasting experiment 10 (250/5.0/1.60). Before the activator is electrified, the strain value swings back and forth in a very small range due to the electromagnetic in-terference of surrounding environment. After the activator is electrified, the curve of strain versus time can be divided into three stages in general. The first (I) stage is ABC (strain rising stage), the curve initially rises rapidly from point A to point B, then expe-riences a slight decrease and, finally, rises rapidly again until the curve reaches the highest at point C. The stage takes a short time and the curve rises quickly. A large amount of heat is released instantly when the activator is activated, which causes a slight thermal strain of the strain gauge. The first high point B appears, then L-CO2 absorbs heat and expands externally. After that, the high-pressure gas continues to act on the outer wall, and the deformation of the strain gauge increases exponentially, until reaching the highest point C.
Figure 7. Strain–time curve of experiments 8, 9 and 10.
The second (II) stage is CDE (“V”-shaped change stage); the curve drops quickly from the highest point C to the point D, then rises slowly to the point E again, and the point E is lower than the highest point C, which manifests a “V” shape. The rapid release of high-pressure gas makes the pressure in the tube drop sharply, and the deformation of the strain gauge recovers to a certain extent. However, because of the restriction of the symmetrical outlet hole of the energy releasing head and the closed design of the front-end, the release speed of high-pressure gas is reduced. The low-speed gas that is not fully released from the front end, the blockage of partially reflected gas and the
Figure 7. Strain–time curve of experiments 8, 9 and 10.
The second (II) stage is CDE (“V”-shaped change stage); the curve drops quickly fromthe highest point C to the point D, then rises slowly to the point E again, and the pointE is lower than the highest point C, which manifests a “V” shape. The rapid release ofhigh-pressure gas makes the pressure in the tube drop sharply, and the deformation ofthe strain gauge recovers to a certain extent. However, because of the restriction of thesymmetrical outlet hole of the energy releasing head and the closed design of the front-end,the release speed of high-pressure gas is reduced. The low-speed gas that is not fullyreleased from the front end, the blockage of partially reflected gas and the squeezing effectof subsequent high-pressure gas make the internal pressure rise temporarily. Then thedeformation of the strain gauge increases, thus forming a “V”-shaped trend.
The third (III) stage is EF (strain recovery stage), the curve decreases slowly, andgradually tends to be stable with a low decline and a long time. After the blasting iscompleted, the high-pressure gas fully overflows, and the pressure in the tube graduallyreturns to normal atmospheric. Then the deformation of the strain gauge is also gradually
Energies 2021, 14, 521 9 of 16
recovered, but the plastic deformation cannot be recovered, so the curve declines andgradually tends to a stable value.
In conclusion, the increase in the amount of chemical heating material will increasethe amount of heat released, which aggravates the phase-transition reaction process ofcarbon dioxide and increases the blasting pressure, and finally the blasting effect of thefracturing pipe is improved.
3.2. Variables that Affect the Damage of the Fracturing Pipe-Constant-Stress Shear Plate
The constant-stress shear plate is equivalent to the control valve of the blasting energyreleasing channel, and controls whether the whole system is successfully blasted. When thepressure in the tube is greater than the yield strength of the constant-stress shear plate, theconstant-stress shear plate is destroyed, then the high-pressure gas rushes out quickly, andthe blasting is successful. Otherwise, the blasting fails. The thickness of the constant-stressshear plate is directly related to its yield strength, and indirectly determines the blastingpressure released by the whole blasting system. The research on the influence of thethickness of the constant-stress shear plate on the blasting performance of the fracturingpipe has greatly guiding significance, which can optimize the structural design of carbondioxide fracturing pipes, guide on-site carbon dioxide blasting operations and furtherachieve the best blasting effect of LCPTB.
The paper analyzes the experimental phenomena and data of experiment 3.6.9, ex-periment 9 (250/5.0/1.50) fails to blast, the constant-stress shear plate remains intact asa whole, and the maximum convex width of the central part is 11.3 mm (Figure 4). Theconstant-stress shear plates of experiment 6 (250/4.5/1.50) and experiment 3 (250/4.0/1.50)have different degrees of bending and torsion deformation, and the degree of deformationand fracture in experiment 6 is greater than that in experiment 3. The main reasons are asfollows: firstly, L-CO2 gasifies and expands the instant when activator is excited, whichmakes the internal pressure of the fracturing pipe rise sharply, and the blasting occurswhen the yield strength of the constant-stress shear plate is less than the internal pressureof the fracturing pipe. Secondly, at the moment of blasting, the constant-stress shear plateis simultaneously sheared and stretched. Coupled with the special structure of the frontenergy releasing head, the fragments are initially pushed by internal pressure to hit thefront end of the energy releasing head, then pushed out of the tube by carbon dioxideairflow. So this reciprocating process aggravates the distortion of the fragments. Finally,when the amount of chemical heating material and the filling mass of L-CO2 are fixed,the maximum gas released pressure that can be generated inside the tube is determined.Therefore, the lower the failure pressure required for the constant-stress shear plate andthe shorter the blasting time, the lower the degree of distortion of the fragments.
As shown in Figure 8, the temperature of experiments 3 and 6 increase slowly, and thetemperature difference of experiment 6 (∆T1∆T1) is 52.6% larger than that of experiment3 (∆T2∆T2). The temperature of experiment 3 (250/4.0/1.50) increases from 22.9 ◦C to24.8 ◦C, which takes 19 s and the growth rate is 0.10 ◦C/s. The temperature of experiment6 (250/4.5/1.50) increases from 24.5 ◦C to 27.4 ◦C, which takes 17 s and the growth rateis 0.17 ◦C/s. The temperature of experiment 9 (250/5.0/1.50) increases obviously, andthe maximum value is much higher than that in experiments 3 and 6. The temperatureof experiment 9 increases from 32.6 ◦C to 132.8 ◦C, which takes 35 s and the growth rateis 2.86 ◦C/s. The main reasons are as follows: with the increase of the thickness of theconstant-stress shear plate, the constant-stress shear plate needs greater gas pressure tocause damage. The carbon dioxide gas inside the tube continues to absorb heat and heat up,and the continuous process of CO2 phase-transition becomes longer, then the temperaturetransferred to the outer wall becomes higher.
Energies 2021, 14, 521 10 of 16
Energies 2021, 14, x FOR PEER REVIEW 10 of 16
stant-stress shear plate, the constant-stress shear plate needs greater gas pressure to cause damage. The carbon dioxide gas inside the tube continues to absorb heat and heat up, and the continuous process of CO2 phase-transition becomes longer, then the tempera-ture transferred to the outer wall becomes higher.
To sum up, the yield strength of the constant-stress shear plate can be approximately regarded as the actual outlet pressure of the fracturing pipe, and the increase of the thickness of the constant-stress shear plate can significantly improve the blasting pres-sure of the fracturing pipe. The greater the thickness of the constant-stress shear plate, the greater the gas pressure required. However, when the internal gas pressure tends to the maximum, the thickness of the constant-stress shear plate will also limit the progress of the blasting.
0 10 20 30 40 50 60 7020
40
60
80
100
120
140
20 22 24 26 28 30 32 34 3622232425262728
Tem
pera
ture
/℃
Time/s
250/4.0/1.50 250/4.5/1.50 250/5.0/1.50
△T2
△T1
Figure 8. Real-time temperature curve of experiments 3, 6 and 9.
3.3. The Quantitative Relationship between the Variables and Blasting The filling mass of L-CO2 and the amount of chemical heating material jointly con-
trol the internal phase-transition reaction process of the fracturing pipe, and both directly affect the maximum gas pressure that can be released. The thickness of the con-stant-stress shear plate controls the blasting and energy release process of the fracturing pipe, which directly affects the blasting effect of the fracturing pipe. The process of L-CO2 from phase-transition to blasting is controlled by the three key variables. In order to ex-plain the internal relationship between the successful blasting of the fracturing pipe and the three key variables, whether the fracturing pipe is blasted or not is regarded as the logical dependent variable Y (“1” stands for successful blasting and “0” stands for blast-ing failure), and the amount of chemical heating material, the thickness of constant-stress shear plate and the filling mass of L-CO2 are defined as independent variables X1, X2, X3, respectively. Then, Fisher discriminant analysis was used to quantify the experimental results, and the mathematical representation equation between Y and X was obtained.
1 1 2 2 3 3 4Y X X Xω ω ω ω= + + + (1)
1 2 30.043 0.384 9.923 23.839 Y X X X= − + − (2)
Among them, the coefficients in front of the independent variables X1, X2, X3 re-spectively represent their weights ω1, ω2, ω3 for the dependent variable Y, and ω4 repre-sent the weight of unconsidered factors for dependent variable Y.
According to the analysis of the equation, it can be seen that the filling mass of L-CO2 (kg) and the amount of chemical heating material (g) have a positive effect on
Figure 8. Real-time temperature curve of experiments 3, 6 and 9.
To sum up, the yield strength of the constant-stress shear plate can be approximatelyregarded as the actual outlet pressure of the fracturing pipe, and the increase of thethickness of the constant-stress shear plate can significantly improve the blasting pressureof the fracturing pipe. The greater the thickness of the constant-stress shear plate, thegreater the gas pressure required. However, when the internal gas pressure tends to themaximum, the thickness of the constant-stress shear plate will also limit the progress ofthe blasting.
3.3. The Quantitative Relationship between the Variables and Blasting
The filling mass of L-CO2 and the amount of chemical heating material jointly controlthe internal phase-transition reaction process of the fracturing pipe, and both directlyaffect the maximum gas pressure that can be released. The thickness of the constant-stress shear plate controls the blasting and energy release process of the fracturing pipe,which directly affects the blasting effect of the fracturing pipe. The process of L-CO2 fromphase-transition to blasting is controlled by the three key variables. In order to explainthe internal relationship between the successful blasting of the fracturing pipe and thethree key variables, whether the fracturing pipe is blasted or not is regarded as the logicaldependent variable Y (“1” stands for successful blasting and “0” stands for blasting failure),and the amount of chemical heating material, the thickness of constant-stress shear plateand the filling mass of L-CO2 are defined as independent variables X1, X2, X3, respectively.Then, Fisher discriminant analysis was used to quantify the experimental results, and themathematical representation equation between Y and X was obtained.
Y = ω1X1 + ω2X2 + ω3X3 + ω4 (1)
Y = 0.043X1 − 0.384X2 + 9.923X3 − 23.839 (2)
Among them, the coefficients in front of the independent variables X1, X2, X3 respec-tively represent their weightsω1,ω2,ω3 for the dependent variable Y, andω4 representthe weight of unconsidered factors for dependent variable Y.
According to the analysis of the equation, it can be seen that the filling mass of L-CO2 (kg) and the amount of chemical heating material (g) have a positive effect on whetherthe fracturing pipe is blasted. And the influence degree of the filling mass of carbon dioxide
Energies 2021, 14, 521 11 of 16
is about 231 times higher than the amount of chemical heating material. Yet the thickness(mm) of constant-stress shear plate has a negative effect. In the actual blasting operations,the filling mass of L-CO2 is also the most easily controlled variable, so the filling mass ofL-CO2 can be properly increased to ensure the success of blasting. This result is consistentwith the analysis of the previous experimental results and the conclusion of the pressure,volume and temperature (PVT) equation of high-pressure gas. The equation can be furtherexplained that the area above the plane (Y > 0) indicates successful blasting, while the areabelow the plane (Y < 0) represents failed blasting. This result can quantitatively explainthe mathematical relationship between the successful blasting and the three key variables,predict whether carbon dioxide blasting operations can be successfully carried out underthe relevant blasting parameters, guide the actual on-site blasting work, and improve theefficiency of carbon dioxide blasting.
4. Failure Mode of the Fracturing Pipe
In a prior study of this paper, how the filling mass of L-CO2, the amount of chemicalheating material and the thickness of constant-stress shear plate affect the phase-transitionblasting process of the carbon dioxide fracturing pipe have been analyzed qualitatively andquantitatively. It can be found that these three key variables also determine the blastingpressure of the whole carbon dioxide fracturing pipe. From the perspective of the phase-transition of L-CO2, most of the CO2 in the tube exists in a gaseous and supercriticalstate. The comparative state Viral–Han–Long (VHL) equation can be used to quantitativelydescribe the relationships among pressure, temperature and volume of carbon dioxide inthe tube, Then, the theoretical value of internal pressure (P) can be derived as the blastingpressure. From the perspective of the damage of the constant-stress shear plate duringthe blasting of the fracturing pipe, the constant-stress shear plate is subjected to tensionand shear simultaneously, and then the blasting pressure P acting on the constant-stressshear plate is determined by the breaking strength when the constant-stress shear plate isbroken. At the same time, only when the pressure of the high-pressure gas released by thephase-transition of L-CO2 is greater than the ultimate yield strength of the constant-stressshear plate, the fracturing pipe is successfully blasted.
(1) Strength-failure method
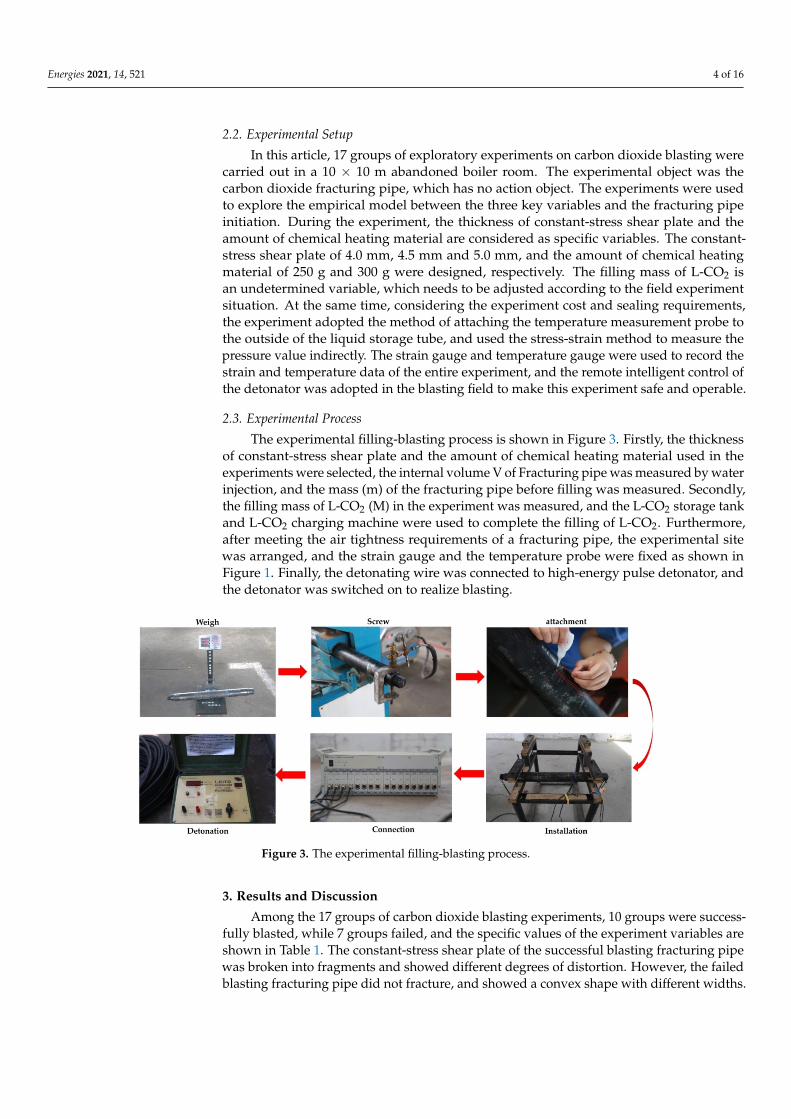
As shown in Figure 9, there are two failure modes of the constant-stress shear plate. (1)Tensile failure with non-surging internal pressure, (2) Punching-shear failure with surginginternal pressure. In this paper, the material of the constant-stress shear plate is 45 steel,which belongs to the flat plate with a diameter of 42 mm, and the diameter of area of thrustsurface on which carbon dioxide gas acts is 32 mm.
Some simplifications and assumptions for these two failure modes:(i) Tensile failure with non-surging internal pressure. Before the force is applied, the
thickness of the constant-stress shear plate is d0, and after being deformed into a sphericalstructure, the thickness is d, the height of the spherical crown is h, the radius of the sphere isR, and the actual diameter of the internal pressure acting surface is D. The blasting pressureequation is expressed as follows [38,39]:
Pb =8d0σb
D
√(√1 + δ− 1
)/(1 + δ) (3)
(ii) Punching-shear failure with surging internal pressure. Due to the surge in internalpressure, the increase of this pressure is greater than the yield strength of the constant-stressshear plate within milliseconds, then the central part of the constant-stress shear plate isdamaged before being deformed, and the whole compressed part of the constant-stressshear plate is sheared off. The blasting pressure equation is expressed as follows [40]:
Pb = 4d0σt/D (4)
Energies 2021, 14, 521 12 of 16
where σb is the tensile strength of the constant-stress shear plate, MPa; δ is the elongationrate in the direction of tensile stress; σt is the shear strength of the constant-stress shearplate, MPa; Pb is the blasting pressure, MPa.
Energies 2021, 14, x FOR PEER REVIEW 12 of 16
(a)Tensile failure (b)Punching-shear failure
Figure 9. Schematic diagram of two different failure mode of constant-stress shear plates.
Some simplifications and assumptions for these two failure modes: (i) Tensile failure with non-surging internal pressure. Before the force is applied, the
thickness of the constant-stress shear plate is d0, and after being deformed into a spherical structure, the thickness is d, the height of the spherical crown is h, the radius of the sphere is R, and the actual diameter of the internal pressure acting surface is D. The blasting pressure equation is expressed as follows [38,39]: 𝑃 = 8𝑑 𝜎𝐷 √1 + 𝛿 − 1 (1 + 𝛿) (3)
(ii) Punching-shear failure with surging internal pressure. Due to the surge in in-ternal pressure, the increase of this pressure is greater than the yield strength of the con-stant-stress shear plate within milliseconds, then the central part of the constant-stress shear plate is damaged before being deformed, and the whole compressed part of the constant-stress shear plate is sheared off. The blasting pressure equation is expressed as follows [40]: 𝑃 = 4𝑑 𝜎 𝐷 (4)
where 𝜎 is the tensile strength of the constant-stress shear plate, MPa; 𝛿 is the elonga-tion rate in the direction of tensile stress; 𝜎 is the shear strength of the constant-stress shear plate, MPa; Pb is the blasting pressure, MPa. (2) Viral–Han–Long Equation of Gas State (VHL-EOS)
At present, the gas state equation under high temperature and high-pressure has the forms of Becker–Kistiakowski–Wilson (BKW), Jones–Wilkins–Lee (JWL) [41], Jacobs–Cowperthwaite–Zwisler (JCZ) [42], etc. The VHL equation based on the L-J potential energy function [43], which has been thoroughly studied the thermodynamic state tran-sition of the gas components in explosive products under high temperature and high-pressure [44,45]. It can effectively describe the thermodynamic relationship of PVT of gas in detonation environment [46–48], so the theoretical value P of the internal pres-sure can be derived by taking the internal temperature of tube and the filling mass of L-CO2 as variables in the gas state VHL equation.
The specific form of the VHL equation of state is expressed as follows [49,50]: 𝑃𝑉𝑛𝑅𝑇 = 1 + 𝜔𝐵 + 𝜔 𝐶 + 𝜔 𝐷 + 𝜔 𝐸 + (𝑎 + 𝑏𝑇 )𝜔 (5)
Figure 9. Schematic diagram of two different failure mode of constant-stress shear plates.
(2) Viral–Han–Long Equation of Gas State (VHL-EOS)
At present, the gas state equation under high temperature and high-pressure hasthe forms of Becker–Kistiakowski–Wilson (BKW), Jones–Wilkins–Lee (JWL) [41], Jacobs–Cowperthwaite–Zwisler (JCZ) [42], etc. The VHL equation based on the L-J potential energyfunction [43], which has been thoroughly studied the thermodynamic state transition of thegas components in explosive products under high temperature and high-pressure [44,45].It can effectively describe the thermodynamic relationship of PVT of gas in detonationenvironment [46–48], so the theoretical value P of the internal pressure can be derived bytaking the internal temperature of tube and the filling mass of L-CO2 as variables in thegas state VHL equation.
The specific form of the VHL equation of state is expressed as follows [49,50]:
PVnRT
= 1 + ωB + ω2C + ω3D + ω4E + (a + bT1)ωf (5)
B =∞
∑j=0
−2j+ 12
4j!Γ(
2j− 14
)T1−2j−1
4 (6)
C = c1T1c2 + c3T1
c4 + c5T1c6 + c7T1
c8 + c9T1c10 (7)
D = d1T1d2 + d3T1
d4 + d5T1d6 + d7T1
d8 + d9T1d10 (8)
E = e1T1e2 + e3T1
e4 (9)
T1 =Tδ
(10)
ω =b0
2nbCH4 V
(11)
Energies 2021, 14, 521 13 of 16
where P, V, T are the actual pressure (GPa), volume (ml), and temperature (K) of the gas.n is the number of molar of carbon dioxide gas filled in a fixed volume, mol. R is themolar gas constant 8.3145 × 10⁻⁵. The second-order dimensionless virial coefficient B isapproximately calculated by the variable step sinbsen quadrature method [49–51]. C, D arethe third-order and fourth-order dimensionless virial coefficients respectively, and c1-c10,d1-d10 are constants. For the dimensionless virial coefficients above the fifth order, theyare represented by a combination function, the values of coefficients e1-e4, a, b and f arethe thermodynamic data of non-polar molecules CH4. bCH4 bCH4 is 67.21. ω.δωδ is the LJpotential parameter, the VHL equation of state realizes the comparison of the equation ofstate of other gases and methane through the parameterω.δωδ.
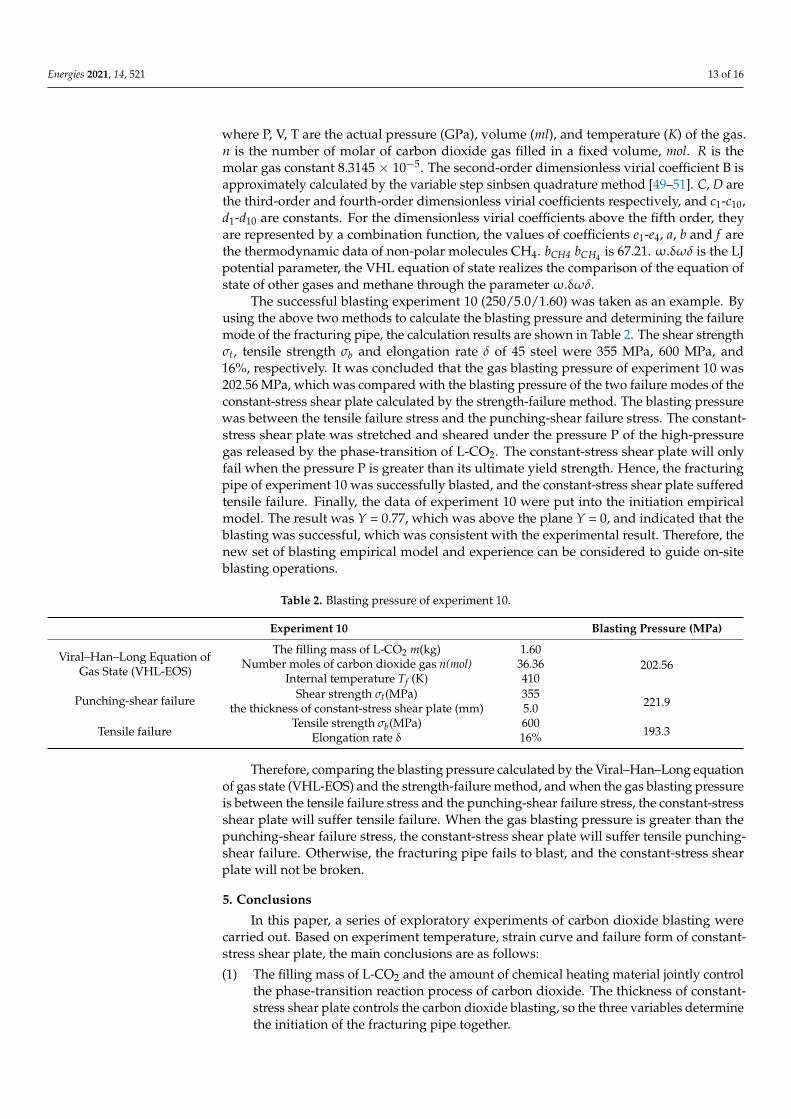
The successful blasting experiment 10 (250/5.0/1.60) was taken as an example. Byusing the above two methods to calculate the blasting pressure and determining the failuremode of the fracturing pipe, the calculation results are shown in Table 2. The shear strengthσt, tensile strength σb and elongation rate δ of 45 steel were 355 MPa, 600 MPa, and16%, respectively. It was concluded that the gas blasting pressure of experiment 10 was202.56 MPa, which was compared with the blasting pressure of the two failure modes of theconstant-stress shear plate calculated by the strength-failure method. The blasting pressurewas between the tensile failure stress and the punching-shear failure stress. The constant-stress shear plate was stretched and sheared under the pressure P of the high-pressuregas released by the phase-transition of L-CO2. The constant-stress shear plate will onlyfail when the pressure P is greater than its ultimate yield strength. Hence, the fracturingpipe of experiment 10 was successfully blasted, and the constant-stress shear plate sufferedtensile failure. Finally, the data of experiment 10 were put into the initiation empiricalmodel. The result was Y = 0.77, which was above the plane Y = 0, and indicated that theblasting was successful, which was consistent with the experimental result. Therefore, thenew set of blasting empirical model and experience can be considered to guide on-siteblasting operations.
Table 2. Blasting pressure of experiment 10.
Experiment 10 Blasting Pressure (MPa)
Viral–Han–Long Equation ofGas State (VHL-EOS)
The filling mass of L-CO2 m(kg) 1.60202.56Number moles of carbon dioxide gas n(mol) 36.36
Internal temperature Tf (K) 410
Punching-shear failure Shear strength σt(MPa) 355221.9the thickness of constant-stress shear plate (mm) 5.0
Tensile failureTensile strength σb(MPa) 600
193.3Elongation rate δ 16%
Therefore, comparing the blasting pressure calculated by the Viral–Han–Long equationof gas state (VHL-EOS) and the strength-failure method, and when the gas blasting pressureis between the tensile failure stress and the punching-shear failure stress, the constant-stressshear plate will suffer tensile failure. When the gas blasting pressure is greater than thepunching-shear failure stress, the constant-stress shear plate will suffer tensile punching-shear failure. Otherwise, the fracturing pipe fails to blast, and the constant-stress shearplate will not be broken.
5. Conclusions
In this paper, a series of exploratory experiments of carbon dioxide blasting werecarried out. Based on experiment temperature, strain curve and failure form of constant-stress shear plate, the main conclusions are as follows:
(1) The filling mass of L-CO2 and the amount of chemical heating material jointly controlthe phase-transition reaction process of carbon dioxide. The thickness of constant-stress shear plate controls the carbon dioxide blasting, so the three variables determinethe initiation of the fracturing pipe together.
Energies 2021, 14, 521 14 of 16
(2) An empirical model between the carbon dioxide fracturing pipe initiation (Y) andthree key variables (the filling mass of liquid carbon dioxide (L-CO2) (X1), the amountof chemical heating material(X2) and the thickness of constant-stress shear plate(X3))is obtained, which can be used to explain, predict and guide on-site carbon dioxideblasting operations.
(3) Two methods for the blasting pressure of the fracturing pipe are summarized. (a) Thecomparative state VHL equation is used to quantitatively describe the relationshipsamong pressure, temperature and volume of carbon dioxide in the tube, and thenthe theoretical value P of the internal pressure is derived as the blasting pressure;(b) the blast stress P acting on the constant-stress shear plate is determined by theyield strength of constant-stress shear plate.
(4) The failure model of the fracturing pipe can be determined by comparing the blastingpressure calculated by the VHL-EOS with the blasting pressure calculated by thestrength-failure method.
Author Contributions: J.X. conceived and designed the experiment; H.T. and J.Z. carried out thecarbon dioxide experiments; J.X. wrote the manuscript; B.D. and G.C. provided advice on the writingof abstract and conclusions; B.D., H.T., J.Z., G.C. and M.K. made a significant contribution to therevision of manuscript. All authors have read and agreed to the published version of the manuscript.
Funding: This research was funded by The National Key Research and Development Programsof China grant number 2019YFB1504201, 2019YFB1504203, and 2019YFB1504204, ExperimentalTechnology Research Project of China University of Geosciences (Wuhan) grant number SKJ2019088,and The Fundamental Research Founds for National University, China University of Geosciences(Wuhan) grant number 1910491A18.
Data Availability Statement: Data sharing not applicable.
Conflicts of Interest: The authors declare that they have no known competing financial interests orpersonal relationships that could have appeared to influence the work reported in this paper.
References1. Sun, W.; Wang, Y. Numerical Simulation of Rock Fracturing by Carbon Dioxide Phase Transition. In Proceedings of the 51st U.S.
Rock Mechanics/Geomechanics Symposium, San Francisco, CA, USA, 28 August 2017; p. 6.2. Chen, H.D.; Wang, Z.F.; Chen, X.E.; Chen, X.J.; Wang, L.G. Increasing permeability of coal seams using the phase energy of liquid
carbon dioxide. J. CO2 Util. 2017, 19, 112–119. [CrossRef]3. Fan, Y.C.; Qin, B.T.; Zhou, Q.; Shi, Q.L.; Wu, J.H. Liquid CO2 phase transition fracturing technology and its application in
enhancing gas drainage of coal mines. Adsorpt. Sci. Technol. 2020, 38, 393–412. [CrossRef]4. Vidanovic, N.; Ognjanovic, S.; Ilincic, N.; Ilic, N.; Tokalic, R. Application of unconventional methods of underground premises
construction in coal mines. Tech. Technol. Educ. Manag. 2011, 6, 861–865.5. Spur, G.; Uhlmann, E.; Elbing, F. Dry-ice blasting for cleaning: Process, optimization and application. Wear 1999, 233–235,
402–411. [CrossRef]6. Hu, S.B.; Pang, S.G.; Yan, Z.Y. A new dynamic fracturing method: Deflagration fracturing technology with carbon dioxide. Int. J.
Fract. 2019, 220, 99–111. [CrossRef]7. Hu, G.Z.; He, W.R.; Sun, M. Enhancing coal seam gas using liquid CO2 phase-transition blasting with cross-measure borehole.
J. Nat. Gas Sci. Eng. 2018, 60, 164–173. [CrossRef]8. Cui, G.D.; Ren, S.R.; Dou, B.; Ning, F.L. Geothermal energy exploitation from depleted high-temperature gas reservoirs by
recycling CO2: The superiority and existing problems. Geosci. Front. 2020. [CrossRef]9. Pruess, K. Enhanced geothermal systems (EGS) using CO2 as working fluid—A novel approach for generating renewable energy
with simultaneous sequestration of carbon. Geothermics 2006, 35, 351–367. [CrossRef]10. Brown, D. A hot dry rock geothermal energy concept utilizing supercritical CO2 instead of water. Proc. Twenty-Fifth Work-
shop Geotherm. Reserv. Eng. 2000. Available online: https://www.researchgate.net/publication/237219291_A_hot_dry_rock_geothermal_energy_concept_utilizing_supercritical_CO2_instead_of_water (accessed on 13 December 2020).
11. Stevens, S.H.; Spector, D.; Riemer, P. Enhanced Coalbed Methane Recovery Using CO2 Injection: Worldwide Resource and CO2Sequestration Potential. In Proceedings of the SPE International Oil and Gas Conference and Exhibition in China, Beijing, China,1 January 1998; p. 13.
12. Cui, G.; Pei, S.; Rui, Z.; Dou, B.; Ning, F.; Wang, J. Whole process analysis of geothermal exploitation and power generation froma depleted high-temperature gas reservoir by recycling CO2. Energy 2021, 217, 119340. [CrossRef]
Energies 2021, 14, 521 15 of 16
13. Gross, D.; Ferguson, N.; Amon, S.; Hanenkamp, N. Theoretical Investigation of the Influence of Different Chamber Geometries onthe Agglomeration Capacity of Carbon Dioxide. Appl. Mech. Mater. 2017, 871, 169–175. [CrossRef]
14. Archibald, L.C. Cryogenic Blasting Using Carbon Dioxide Media for the Removal of Organic Coatings. Trans. IMF 1991, 69,128–132. [CrossRef]
15. Wilson, H.H. Coal augers: Development and application underground. Trans. Inst. Min. Eng. 1954, 113, 524–539.16. Clairet, J. Use of Cardox in coal mining in Sarre. Rev. Ind. Miner. 1952, 33, 846–854.17. Weir, P.; Edwards, J.H. Mechanical loading and Cardox revolutionize an old mine. Coal Age 1928, 33, 288–290.18. Chen, Y.; Zhang, H.; Zhu, Z.; Ren, T.; Cao, C.; Zhu, F.; Li, Y.P. A new shock-wave test apparatus for liquid CO2 blasting and
measurement analysis. Meas. Control 2019, 52, 399–408. [CrossRef]19. Patrick. CO2 blasting in Europe. Nucl. Eng. Int. 1995, 36, 193.20. Caldwell, T. A Comparison of Non-Explosive Rock Breaking Techniques. Bachelor’s Thesis, School of Engineering, The University
of Queensland, Queensland, Australia, 1 January 2004.21. He, W.R.; He, F.L.; Zhang, K.; Zhao, Y.Q.; Zhu, H.Z. Increasing Permeability of Coal Seam and Improving Gas Drainage Using a
Liquid Carbon Dioxide Phase Transition Explosive Technology. Adv. Civ. Eng. 2018, 2018, 15. [CrossRef]22. Vishal, V. Saturation time dependency of liquid and supercritical CO2 permeability of bituminous coals: Implications for carbon
storage. Fuel 2017, 192, 201–207. [CrossRef]23. Gao, F.; Tang, L.; Zhou, K.; Zhang, Y.; Ke, B. Mechanism Analysis of Liquid Carbon Dioxide Phase Transition for Fracturing Rock
Masses. Energies 2018, 11, 2909. [CrossRef]24. Ke, B.; Zhou, K.P.; Ren, G.F.; Shi, J.; Zhang, Y.N. Positive Phase Pressure Function and Pressure Attenuation Characteristic of a
Liquid Carbon Dioxide Blasting System. Energies 2019, 12, 4134. [CrossRef]25. Lak, M.; Fatehi Marji, M.; Yarahmadi Bafghi, A.; Abdollahipour, A. A Coupled Finite Difference-Boundary Element Method for
modeling the propagation of explosion-induced radial cracks around a wellbore. J. Nat. Gas. Sci. Eng. 2019, 64, 41–51. [CrossRef]26. Lak, M.; Fatehi Marji, M.; Yarahamdi Bafghi, A.R.; Abdollahipour, A. Discrete element modeling of explosion-induced fracture
extension in jointed rock masses. J. Min. Environ. 2019, 10, 125–138. [CrossRef]27. Ke, B.; Zhou, K.; Xu, C.; Ren, G.; Jiang, T. Thermodynamic properties and explosion energy analysis of carbon dioxide blasting
systems. Min. Technol. 2018, 128, 39–50. [CrossRef]28. Huang, X.; Li, Q.Y.; Wei, X.A.; Yang, X.X.; Luo, D.Y.; Zeng, H.D.; Wang, H.W. Indoor Test System for Liquid CO2 Phase Change
Shock Wave Pressure with PVDF Sensors. Sensors 2020, 20, 2395. [CrossRef] [PubMed]29. Zhou, K.P.; Ke, B.; Li, J.L.; Zhang, Y.N.; Cheng, L. Pressure dynamic response and explosion energy of liquid carbon dioxide
blasting system. Blasting 2017, 34, 7.30. Wang, Z.F.; Sun, X.M.; Lu, T.K.; Han, Y.B. Experiment research on strengthening gas drainage effect with fracturing technique by
liquid CO2 phase transition. J. Henan Polytech. Univ. Nat. Sci. 2015, 34, 1–5.31. Zhang, Y.; Deng, J.; Deng, H.; Ke, B. Peridynamics simulation of rock fracturing under liquid carbon dioxide blasting. Int. J.
Damage Mech. 2018, 28, 1038–1052. [CrossRef]32. Zhang, Y.N.; Deng, J.R.; Ke, B.; Deng, H.W.; Li, J.L. Experimental Study on Explosion Pressure and Rock Breaking Characteristics
under Liquid Carbon Dioxide Blasting. Adv. Civ. Eng. 2018, 2018, 7840125. [CrossRef]33. Zhou, S.T.; Jiang, N.; He, X.; Luo, X.D. Rock Breaking and Dynamic Response Characteristics of Carbon Dioxide Phase Transition
Fracturing Considering the Gathering Energy Effect. Energies 2020, 13, 1336. [CrossRef]34. Li, Q.Y.; Chen, G.; Luo, D.Y.; Ma, H.P.; Liu, Y. An experimental study of a novel liquid carbon dioxide rock-breaking technology.
Int. J. Rock Mech. Min. Sci. 2020, 128, 104244. [CrossRef]35. Qiduo, Z. Rock Breaking Mechanism and Numerical Simulation Analysis of Liquid Carbon Dioxide Blasting; Hebei University of
Technology: Tianjin, China, 2018.36. Pan, H.Y.; Li, J.W.; Zhang, T.J.; Li, S.G.; Zhang, L. Study on crack propagation of the CO2 presplitting blasting empty hole effect in
coal seam. Energy Sci. Eng. 2020, 8, 3898–3908. [CrossRef]37. Mingyu, W. Study on Crack Propagation Law of Liquid Carbon Dioxide Phase Transition Blasting and its Application. Master’s
Thesis, China University of Mining, Xuzhou, China, 2018.38. Yinming, Z.; Liu, L.; Jun, Y. Analysis of rupture disk bursting pressure of a hybrid inflator. Appl. Sci. Technol. 2014, 41, 73–76.39. Shengchang, L. Discussion on several main formulas for explosion pressure of explosion-proof membrane. Petro-Chem. Equip
Techno 1988, 2, 17–19.40. Zewei, W.; Qingyu, Q.; Xiuxia, Y.; Liqing, C. Calculation of burst pressure of bursting membrane. Chem. Equip. Pip. 1980, 4, 1–9.41. Cowan, R.D.; Fickett, W. Calculation of the Detonation Properties of Solid Explosives with the Kistiakowski-Wilson Equation of
State. J. Chem. Phys. 1956, 24, 932–939. [CrossRef]42. Guidry, R.; Mcguire, R.; Lee, E. Parameterization of the BKW and JCZ Equations of State for Explosives; Frank J. Seiler Research
Laboratory: Alexandria, VA, USA, 1978. [CrossRef]43. Liu, Q.; Han, Y.; Long, X.P.; Duan, Y.L. Prediction of H2O PVT relations at high temperatures by VHL equation of state. AIP Adv.
2019, 9, 8. [CrossRef]44. Maillet, J.B.; Bourasseau, E. Ab initio simulations of thermodynamic and chemical properties of detonation product mixtures.
J. Chem. Phys. 2009, 131, 9. [CrossRef]

Energies 2021, 14, 521 16 of 16
45. Kopyshev, V.P.; Medvedev, A.B.; Khrustalev, V.V. Equation of state of explosion products on the basis of a modified Van der Waalsmodel. Combust. Explos. 2006, 42, 76–87. [CrossRef]
46. Son, E.E. Current investigations of thermophysical properties of substances (based on recent publications in the journal HighTemperature). High. Temp. 2013, 51, 351–368. [CrossRef]
47. Fegley, B., Jr. Practical chemical thermodynamics for geoscientists. Acad. Press 2013, 48, 712–713.48. Al-Jawad, M.S.; Hassan, O.F. Comprehensive Model for Flash Calculations of Heavy Oils Using the Soave—Redlich—Kwong
Equation of State. In Proceedings of the North Africa Technical Conference and Exhibition, Cairo, Egypt, 1 January 2012; p. 14.49. Han, Y.; Guo, X.L.; Long, X.P. High Temperature and High Pressure Equation of State of Carbon Dioxide. Chin. J. Energetic Mater.
2016, 24, 0462–0468. [CrossRef]50. Hirschfelder, J.O.; Curtiss, C.F.; Bird, R.B. Molecular Theory of Gases and Liquids; Wileg: New York, NY, USA, 1954; p. 34.51. Han, Y.; Long, X.P.; Huang, Y.M.; Jiang, Z.H. Effect of L-J or Exp-6 Potential Function on Calcula tion of Reduced Second Viral
Coefficient. Chin. J. Energ. Mater. 2009, 17, 574–577.


