Embed Size (px)
Citation preview
0
RESEARCH PAPER 1
2
Flexural behaviour of concrete slabs reinforced with GFRP bars and hollow 3
composite reinforcing systems 4
(Title contains 14 words) 5
6 Running headline: Flexural behaviour of concrete slabs reinforced with GFRP bars and hollow composite reinforcing systems 7
(90 characters) 8 by 9
10
Mohammed Al-Rubaye1, Allan Manalo2, Omar Alajarmeh3, Wahid Ferdous4*, Weena 11
Lokuge5, Brahim Benmokrane6, and Azam Edoo7 12 13
1Postgraduate student, Centre for Future Materials (CFM) , School of Civil Engineering and 14
Surveying, University of Southern Queensland , QLD 4350, Australia. Email: 15
[email protected], 16 2Professor, Centre for Future Materials (CFM), School of Civil Engineering and Surveying, 17
University of Southern Queensland, QLD 4350, Australia. Email: [email protected] 18 3PhD Student, Centre for Future Materials (CFM), School of Civil Engineering and 19
Surveying, University of Southern Queensland, QLD 4350, Australia. Email: 20
[email protected] 21 4(*Corresponding Author) Research Fellow, Centre for Future Materials (CFM), University 22
of Southern Queensland, QLD 4350, Australia. Email: [email protected] 23 5Senior Lecturer in Civil Engineering, Centre for Future Materials (CFM), School of Civil 24
Engineering and Surveying, University of Southern Queensland, QLD 4350, Australia. Email: 25
[email protected] 26 6Professor of Civil Engineering, University of Sherbrooke, Department of Civil Engineering, 27
Sherbrooke, Quebec, Canada. Email: [email protected] 28 7Manager, Composite Reinforcing Solutions Pty. Ltd., 48 Lucraft Gardens, Winthrop, WA 29
6150, Australia. Email: [email protected] 30
31
Submitted to 32
Composite Structures 33 34
35 36
37
38
39
40
41
42
43
44
45
46
47
48
49
50
*Corresponding Author:
Wahid Ferdous
Research Fellow,
University of Southern Queensland, Centre for Future Materials (CFM),
Toowoomba, QLD 4350, Australia
Tel: +61 7 4631 1331; Email: [email protected]
Manuscript summary:
Total pages 32 (including 1-page cover)
Number of figures 11
Number of tables 5
brought to you by COREView metadata, citation and similar papers at core.ac.uk
provided by University of Southern Queensland ePrints
1
Flexural behaviour of concrete slabs reinforced with GFRP bars and hollow 51
composite reinforcing systems 52
53
Mohammed Al-Rubaye1, Allan Manalo2, Omar Alajarmeh3, Wahid Ferdous4*, Weena 54
Lokuge5, Brahim Benmokrane6, and Azam Edoo7 55
56
1Postgraduate student, Centre for Future Materials (CFM) , School of Civil Engineering and 57
Surveying, University of Southern Queensland , QLD 4350, Australia. Email: 58
60 2Professor, Centre for Future Materials (CFM), School of Civil Engineering and Surveying, 61
University of Southern Queensland, QLD 4350, Australia. Email: [email protected] 62
63 3PhD Student, Centre for Future Materials (CFM), School of Civil Engineering and Surveying, 64
University of Southern Queensland, QLD 4350, Australia. Email: 65
67 4(*Corresponding Author) Research Fellow, Centre for Future Materials (CFM), School of 68
Civil Engineering and Surveying, University of Southern Queensland, QLD 4350, Australia. 69
Email: [email protected] 70
71 5Senior Lecturer in Civil Engineering, Centre for Future Materials (CFM), School of Civil 72
Engineering and Surveying, University of Southern Queensland, QLD 4350, Australia. Email: 73
75 6Professor of Civil Engineering, University of Sherbrooke, Department of Civil Engineering, 76
Sherbrooke, Quebec, Canada. Email: [email protected] 77
78 7Manager, Composite Reinforcing Solutions Pty. Ltd., 48 Lucraft Gardens, Winthrop, WA 79
6150, Australia. Email: [email protected] 80
81
Abstract 82
Glass Fibre Reinforced Polymer (GFRP) bars are now attracting attention as an alternative 83
reinforcement in concrete slabs because of their high resistance to corrosion that is a major 84
problem for steel bars. Recently, hollow concrete slab systems are being used to reduce the 85
amount of concrete in the slab and to minimise the self-weight, but the internal holes makes 86
them prone to shear failure and collapse. A hollow composite reinforcing system (CRS) with 87
four flanges to improve the bond with concrete has recently been developed to stabilise the 88
2
holes in concrete members. This study investigated the flexural behaviour of concrete slabs 89
reinforced with GFRP bars and CRS. Four full-scale concrete slabs (solid slab reinforced with 90
GFRP bars; hollow slab reinforced with GFRP bars; slab reinforced with GFRP bars and CRS; 91
and slab reinforced with steel bars and CRS) were prepared and tested under four-point static 92
bending to understand how this new construction system would perform. CRS is found to 93
enhance the structural performance of hollow concrete slabs because it is more compatible with 94
GFRP bars than steel bars due to their similar modulus of elasticity. A simplified Fibre Model 95
Analysis (FMA) reliably predicted the capacity of hollow concrete slabs. 96
97
Keywords: Flexural behaviour; hollow core concrete slabs; composite reinforcing system; 98
GFRP bars; Modelling. 99
100
1. Introduction 101
Reinforced concrete slabs are important structural members in building structures as they carry 102
loads and transfer them to the beams [1, 2]. Traditionally, steel bars used as internal 103
reinforcement inevitably corrode, which then affects the integrity of concrete slabs by reducing 104
their strength and limiting their serviceability. The corrosion of steel bars is practically critical 105
in structures built close to marine or industrial environments [3]. For example, the million dollar 106
20-storey Iluka high-rise apartment complex in Surfers Paradise, Australia which was built in 107
1972 was demolished in 2013 due to corrosion of the steel reinforcement in the concrete slabs 108
and other structural elements [4]. Moreover, the Australian Corrosion Association (ACA) has 109
reported that more than AU$10 billion is lost every year due to the corrosion of steel 110
reinforcement [5]. Therefore, an alternative reinforcing material that will minimise or eliminate 111
corrosion in concrete structures is deemed necessary. 112
3
Fibre reinforced polymer composites have emerged as a comparatively new 113
construction material that can address many of the weaknesses of traditional construction 114
materials [6]. The non-corrosive Glass Fibre Reinforced Polymer (GFRP) bars are an effective 115
alternative reinforcing solution for concrete structures that has lower maintenance and repair 116
costs [7]. This alternative reinforcement is lighter, non-magnetic and has higher tensile strength 117
than steel [8, 9]. Many studies reported that GFRP bars have been used successfully as internal 118
reinforcement for concrete structures, including beams [10], columns [11], and slabs [12]. Since 119
slabs are the main structural members in a building that consume the largest amount of concrete 120
and contributes significantly to the dead load [13], it should be designed to minimise the amount 121
of materials and to reduce the overall weight. Previous researchers [14, 15] have created holes 122
inside the slab to reduce the amount of concrete and its overall weight. 123
A hollow core slab (HCS) is a common structural form used for precast concrete slabs 124
and wall panels in industrial, commercial and residential applications [16-18]. However, several 125
researchers found that voids can cause early shear failure and significantly reduce the capacity 126
of the slab [19, 20]. Meng [21] suggested that CFRP sheets bonded with epoxy resin and 127
attached inside the voids would increase the shear capacity of HCS. However, this technique is 128
not cost effective and difficult to implement, especially for small diameter voids. Cuenca and 129
Serna [22] studied the HCS with and without fibres and they concluded that the shear capacity 130
and ductility can be improved using fiber reinforcements. There is a need therefore to determine 131
an efficient technology to improve structural performance of lightweight hollow core slabs. An 132
FRP system that will create a hollow inside the slab and stabilise the voids, while fully 133
interacting with the concrete needs to be developed. 134
A new type of hollow composite reinforcing system (CRS) has recently been designed 135
and developed to create voids in reinforced concrete slabs. This CRS system has four flanges 136
that act as shear connectors, similar to the rib shear connector in the FRP decks introduced by 137
4
many researchers to provide a composite action with concrete [23, 24]. This paper investigated 138
for the first time the flexural behaviour of a one-way concrete slab reinforced with GFRP bars 139
and CRS. Four concrete slabs (a solid slab reinforced with GFRP, a hollow slab reinforced with 140
GFRP, a GFRP-reinforced slab with CRS, and a steel-reinforced slab with CRS) were cast and 141
tested under static four-point bending to evaluate the effectiveness of the hollow CRS inside 142
the HCS. The capacity of the hollow concrete slab was also predicted theoretically using fibre 143
model analysis and compared with the experimental results. The results obtained from this study 144
will aim at advancing the understanding on the behaviour of hollow concrete slabs reinforced 145
with GFRP bars and hollow composite systems, and providing new lightweight slabs for civil 146
engineering constructions. 147
148
2. Experimental Program 149
2.1. Materials 150
2.1.1. Hollow composite reinforcing system (CRS) 151
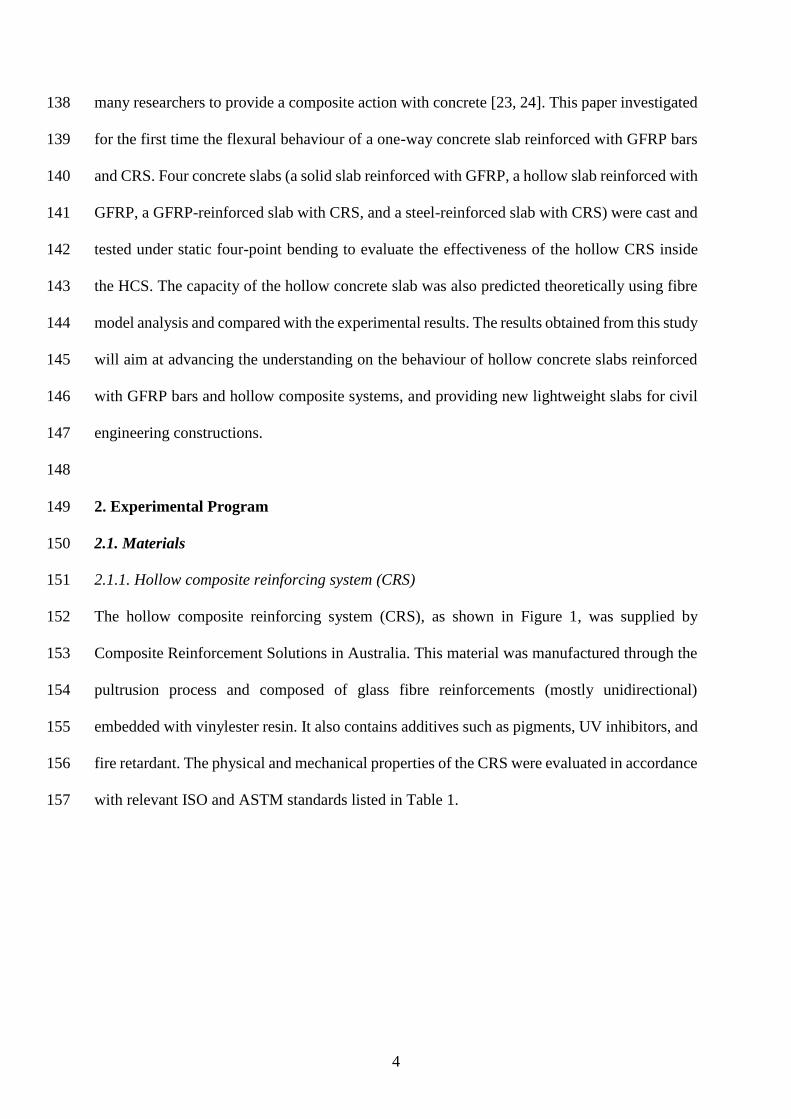
The hollow composite reinforcing system (CRS), as shown in Figure 1, was supplied by 152
Composite Reinforcement Solutions in Australia. This material was manufactured through the 153
pultrusion process and composed of glass fibre reinforcements (mostly unidirectional) 154
embedded with vinylester resin. It also contains additives such as pigments, UV inhibitors, and 155
fire retardant. The physical and mechanical properties of the CRS were evaluated in accordance 156
with relevant ISO and ASTM standards listed in Table 1. 157
5
158
Figure 1: Details of the composite reinforcing systems (CRS) (a) shape, and (b) dimensions 159
Table 1. Physical and mechanical properties of CRS including standard deviation (SD). 160
Properties Test standard Values SD
Density, kg/m3 ASTM D792 [25] 1926 23.4
Fibre content by weight, % ASTM D2584 [26] 73 2.5
Glass transition temperature, oC ASTM E1356 [27] 81 4.2
Axial compression, MPa ASTM D695 [28] 120 7.1
Transverse compression, MPa ISO 14125 [29] 8.8 1.1
Transverse shear strength, MPa ASTM D2344 [30] 7.5 0.7
Inter-laminar shear strength, MPa ASTM D4475 [31] 22 1.5
Flexural strength, MPa ASTM D790 [32] 201 28.7
Flexural modulus, GPa ASTM D790 [32] 42 1.3
161
2.1.2. GFRP bars 162
The concrete slabs were reinforced with 12 mm diameter high-modulus (Grade III) GFRP bars 163
[33]. These bars were fabricated through the pultrusion process by impregnating E-type glass 164
fibres in a thermosetting modified vinyl-ester resin. The external surfaces of the GFRP bars 165
(a) (b)
6
were coated with particles of silica-sand to enhance the bond between the reinforcement and 166
surrounding concrete. The mechanical properties of these bars are reported by Benmokrane et 167
al. [34] and summarised in Table 2. 168
Table 2. Mechanical properties of GFRP bars [34]. 169
Properties Test standard Values SD
Flexural strength, MPa ASTM D4476 [35] 1588 93
Interlaminar shear strength, MPa ASTM D4475 [31] 53 2.1
Longitudinal tensile strength, MPa ASTM D7205 [36] 1281 35
Longitudinal tensile modulus, GPa ACI 440.6M [37] and CSA S807 [33] 61 0.4
Longitudinal tensile strain at failure, % ACI 440.6M [37] and CSA S807 [33] 2.1 0.1
170
2.1.3. Steel bars 171
The steel reinforcing bars were standard grade 500N with a nominal diameter of 12 mm. The 172
characteristic strength and Young’s modulus of the reinforcing steel as supplied by the 173
manufacturer were 500 MPa and 200 GPa, respectively. 174
2.1.4. Concrete 175
The ready mix concrete with a nominal compressive strength of 32 MPa was used. The 176
maximum size of aggregate was 10 mm and the slump value of the concrete was 100 mm in 177
accordance with AS1379 specification [38]. A total of 8 cylinders were prepared and tested as 178
per AS1012 standards [39] at the time of testing the slabs. The average compressive strength of 179
concrete was 31.8 MPa with a standard deviation of 3.54 MPa while the modulus of elasticity 180
was measured as 29.9 GPa. 181
182
7
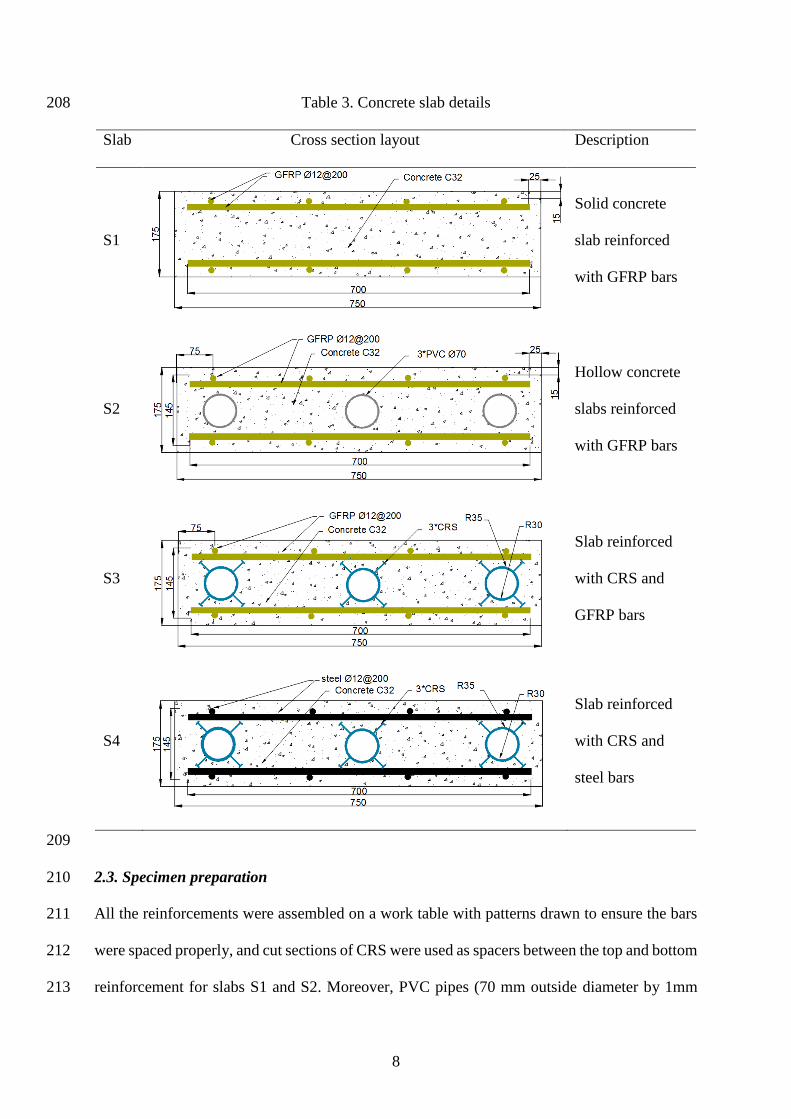
2.2. Slab details 183
Four full-scale slabs, 2400 mm long by 750 mm wide by 175 mm thick were prepared. These 184
dimensions are based on industry practice for precast hollow core slabs. Of these four slabs, 185
one solid slab reinforced with GFRP bars (S1), one hollow slab reinforced with GFRP bars (S2), 186
one GFRP reinforced slab with CRS (S3), and one slab was reinforced with steel bars and CRS 187
(S4). Slabs S1, S2, and S3 were reinforced with 12 mm diameter GFRP bars spaced 200 mm 188
(both longitudinally and transversely) at the top and bottom, while slab S4 was reinforced with 189
12 mm diameter steel bars instead of GFRP but maintained the same reinforcement arrangement 190
for comparison. The reinforcement ratio was = 0.44% for all slabs that resulted in an over-191
reinforced section for slabs S1 to S3 (balanced reinforcement ratio, b = 0.25%) and an under-192
reinforced section for slab S4 (b = 2.1%) as per the CSA S806 [40]. Reinforcement ratio of 193
0.44% for GFRP-reinforced slabs was adopted from the specification provided in ACI-15 code 194
by having at least 1.4 as a ratio between the actual reinforcement-to-balanced conditions. The 195
reinforcement ratio was adopted to achieve a flexural compression failure in concrete and 196
provide high deformation capacity and less brittle failure rather than tensile rupture of the GFRP 197
bars. Slab S2 was fabricated with three holes, 70 mm diameter in each and spaced at 300 mm 198
while slabs S3 and S4 were manufactured with three hollow CRS of equal diameter and spacing. 199
A 15 mm thick cover of concrete was provided at the top and bottom reinforcements, and a 25 200
mm thick cover of concrete was provided at the edges of the slabs. The geometric dimensions 201
and reinforcement arrangements are provided in Table 3. It is noteworthy that one CRS has a 202
cross-sectional area of 1585 mm2, which is 1.63% of the gross sectional area of the slab. 203
Therefore, the three CRS is 4.89% of the total gross sectional area of the concrete. However, 204
the main function of the CRS is to stabilise the holes while the longitudinal GFRP bars provide 205
the longitudinal reinforcement to carry flexural loads. 206
207
8
Table 3. Concrete slab details 208
Slab Cross section layout Description
S1
Solid concrete
slab reinforced
with GFRP bars
S2
Hollow concrete
slabs reinforced
with GFRP bars
S3
Slab reinforced
with CRS and
GFRP bars
S4
Slab reinforced
with CRS and
steel bars
209
2.3. Specimen preparation 210
All the reinforcements were assembled on a work table with patterns drawn to ensure the bars 211
were spaced properly, and cut sections of CRS were used as spacers between the top and bottom 212
reinforcement for slabs S1 and S2. Moreover, PVC pipes (70 mm outside diameter by 1mm 213
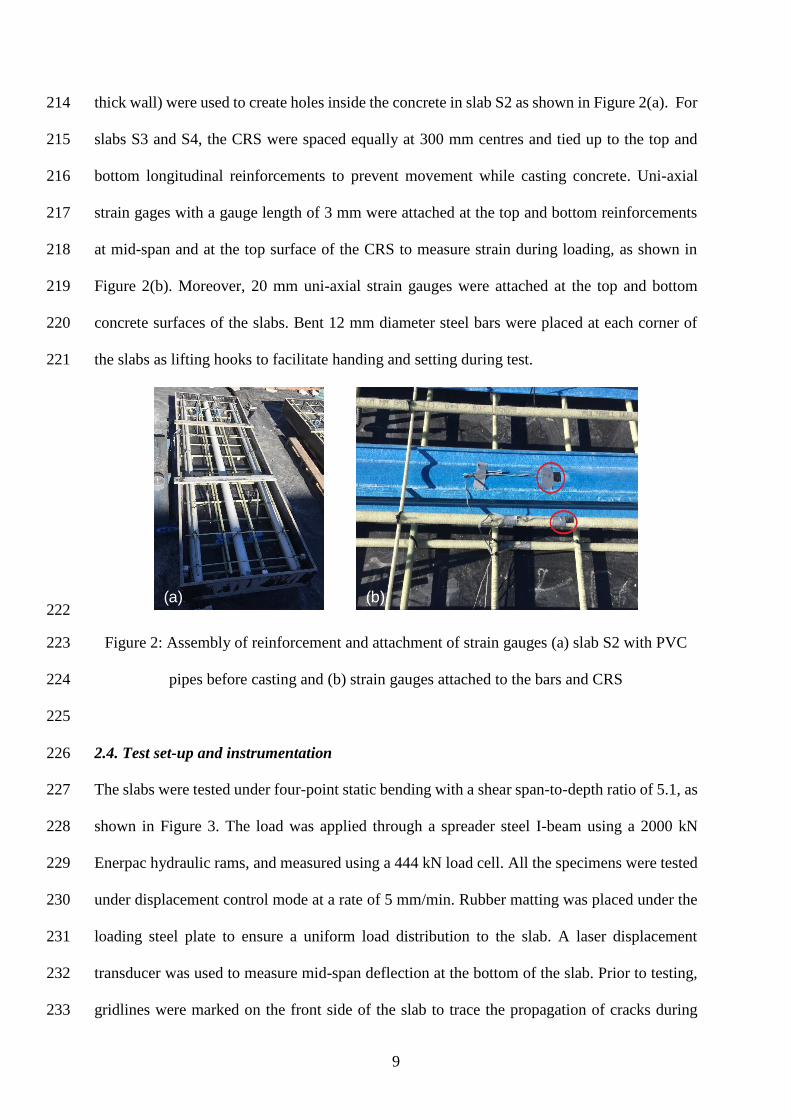
9
thick wall) were used to create holes inside the concrete in slab S2 as shown in Figure 2(a). For 214
slabs S3 and S4, the CRS were spaced equally at 300 mm centres and tied up to the top and 215
bottom longitudinal reinforcements to prevent movement while casting concrete. Uni-axial 216
strain gages with a gauge length of 3 mm were attached at the top and bottom reinforcements 217
at mid-span and at the top surface of the CRS to measure strain during loading, as shown in 218
Figure 2(b). Moreover, 20 mm uni-axial strain gauges were attached at the top and bottom 219
concrete surfaces of the slabs. Bent 12 mm diameter steel bars were placed at each corner of 220
the slabs as lifting hooks to facilitate handing and setting during test. 221
222
Figure 2: Assembly of reinforcement and attachment of strain gauges (a) slab S2 with PVC 223
pipes before casting and (b) strain gauges attached to the bars and CRS 224
225
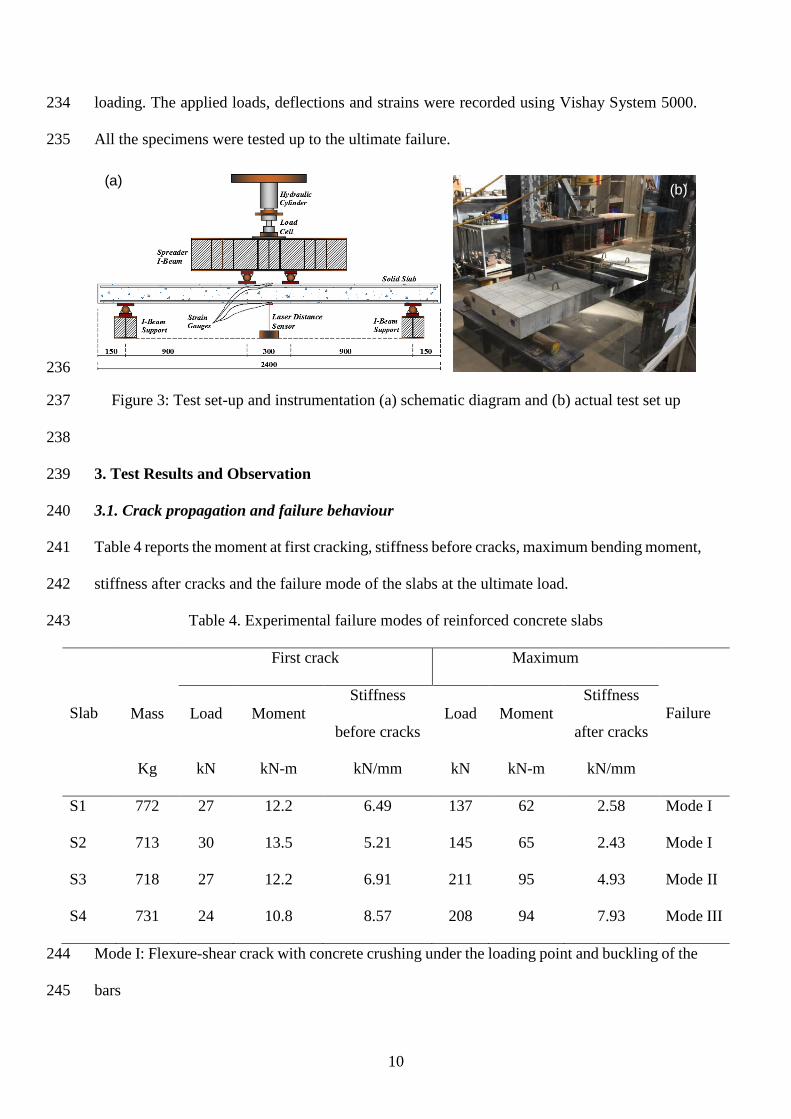
2.4. Test set-up and instrumentation 226
The slabs were tested under four-point static bending with a shear span-to-depth ratio of 5.1, as 227
shown in Figure 3. The load was applied through a spreader steel I-beam using a 2000 kN 228
Enerpac hydraulic rams, and measured using a 444 kN load cell. All the specimens were tested 229
under displacement control mode at a rate of 5 mm/min. Rubber matting was placed under the 230
loading steel plate to ensure a uniform load distribution to the slab. A laser displacement 231
transducer was used to measure mid-span deflection at the bottom of the slab. Prior to testing, 232
gridlines were marked on the front side of the slab to trace the propagation of cracks during 233
(a) (b)
10
loading. The applied loads, deflections and strains were recorded using Vishay System 5000. 234
All the specimens were tested up to the ultimate failure. 235
236
Figure 3: Test set-up and instrumentation (a) schematic diagram and (b) actual test set up 237
238
3. Test Results and Observation 239
3.1. Crack propagation and failure behaviour 240
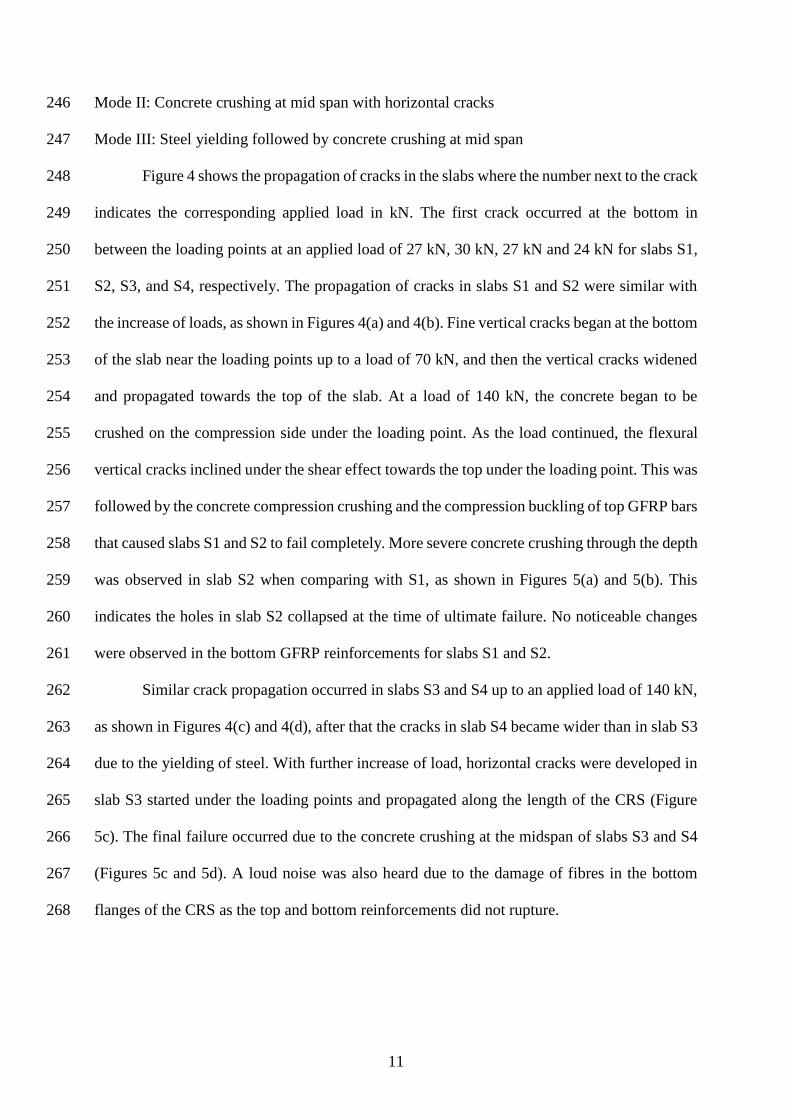
Table 4 reports the moment at first cracking, stiffness before cracks, maximum bending moment, 241
stiffness after cracks and the failure mode of the slabs at the ultimate load. 242
Table 4. Experimental failure modes of reinforced concrete slabs 243
Slab
First crack Maximum
Failure Mass Load Moment
Stiffness
before cracks
Load Moment
Stiffness
after cracks
Kg kN kN-m kN/mm kN kN-m kN/mm
S1 772 27 12.2 6.49 137 62 2.58 Mode I
S2 713 30 13.5 5.21 145 65 2.43 Mode I
S3 718 27 12.2 6.91 211 95 4.93 Mode II
S4 731 24 10.8 8.57 208 94 7.93 Mode III
Mode I: Flexure-shear crack with concrete crushing under the loading point and buckling of the 244
bars 245
(a)(b)
11
Mode II: Concrete crushing at mid span with horizontal cracks 246
Mode III: Steel yielding followed by concrete crushing at mid span 247
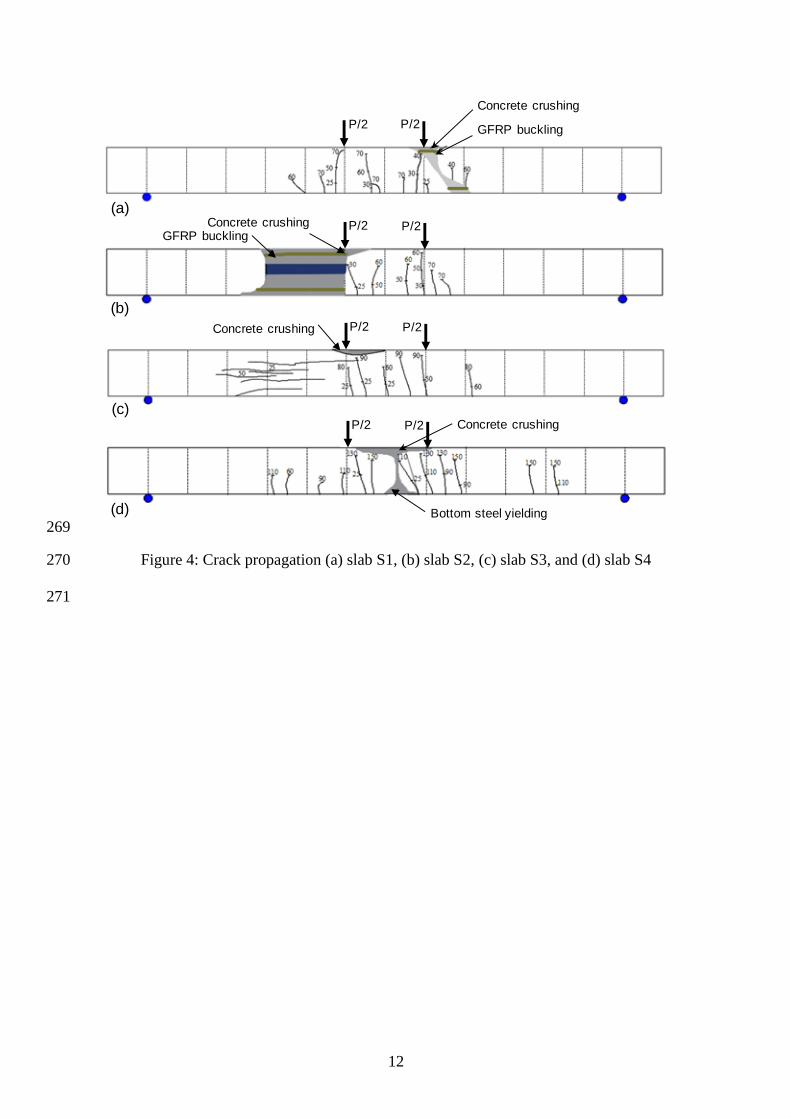
Figure 4 shows the propagation of cracks in the slabs where the number next to the crack 248
indicates the corresponding applied load in kN. The first crack occurred at the bottom in 249
between the loading points at an applied load of 27 kN, 30 kN, 27 kN and 24 kN for slabs S1, 250
S2, S3, and S4, respectively. The propagation of cracks in slabs S1 and S2 were similar with 251
the increase of loads, as shown in Figures 4(a) and 4(b). Fine vertical cracks began at the bottom 252
of the slab near the loading points up to a load of 70 kN, and then the vertical cracks widened 253
and propagated towards the top of the slab. At a load of 140 kN, the concrete began to be 254
crushed on the compression side under the loading point. As the load continued, the flexural 255
vertical cracks inclined under the shear effect towards the top under the loading point. This was 256
followed by the concrete compression crushing and the compression buckling of top GFRP bars 257
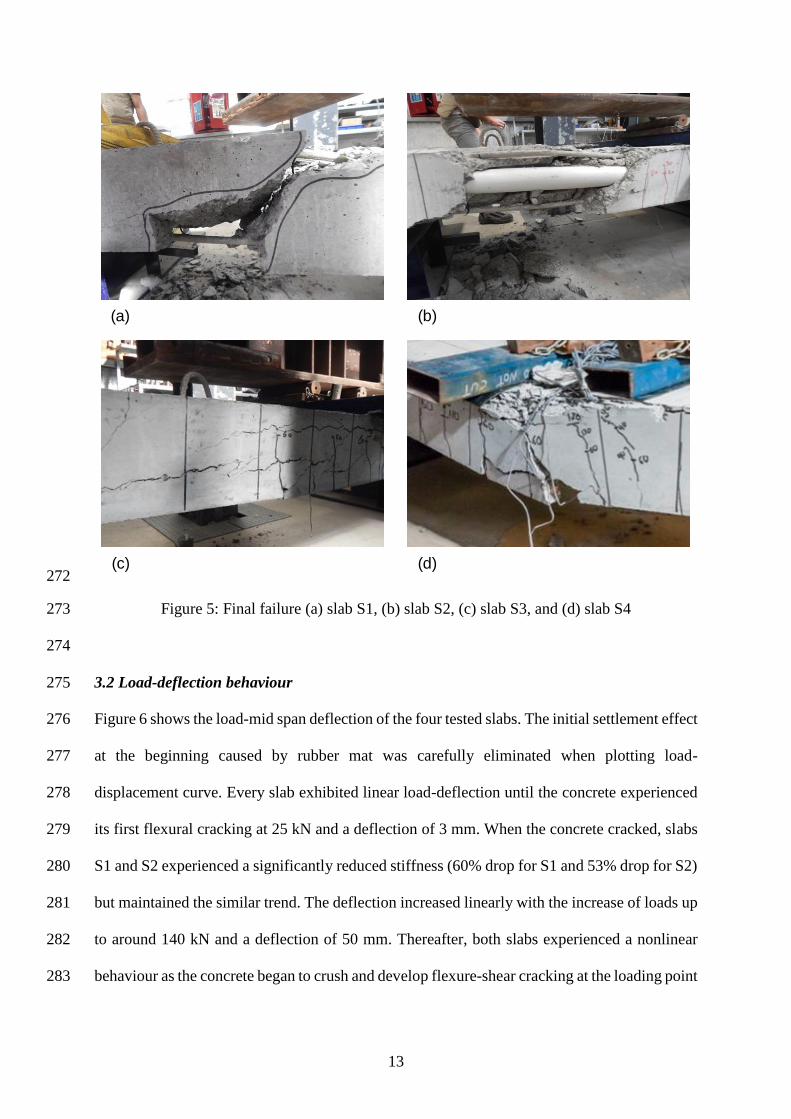
that caused slabs S1 and S2 to fail completely. More severe concrete crushing through the depth 258
was observed in slab S2 when comparing with S1, as shown in Figures 5(a) and 5(b). This 259
indicates the holes in slab S2 collapsed at the time of ultimate failure. No noticeable changes 260
were observed in the bottom GFRP reinforcements for slabs S1 and S2. 261
Similar crack propagation occurred in slabs S3 and S4 up to an applied load of 140 kN, 262
as shown in Figures 4(c) and 4(d), after that the cracks in slab S4 became wider than in slab S3 263
due to the yielding of steel. With further increase of load, horizontal cracks were developed in 264
slab S3 started under the loading points and propagated along the length of the CRS (Figure 265
5c). The final failure occurred due to the concrete crushing at the midspan of slabs S3 and S4 266
(Figures 5c and 5d). A loud noise was also heard due to the damage of fibres in the bottom 267
flanges of the CRS as the top and bottom reinforcements did not rupture. 268
12
269
Figure 4: Crack propagation (a) slab S1, (b) slab S2, (c) slab S3, and (d) slab S4 270
271
P/2 P/2
Concrete crushing
GFRP buckling
Concrete crushingGFRP buckling
Concrete crushing
P/2 P/2
P/2 P/2
P/2 P/2 Concrete crushing
Bottom steel yielding
(a)
(b)
(c)
(d)
13
272
Figure 5: Final failure (a) slab S1, (b) slab S2, (c) slab S3, and (d) slab S4 273
274
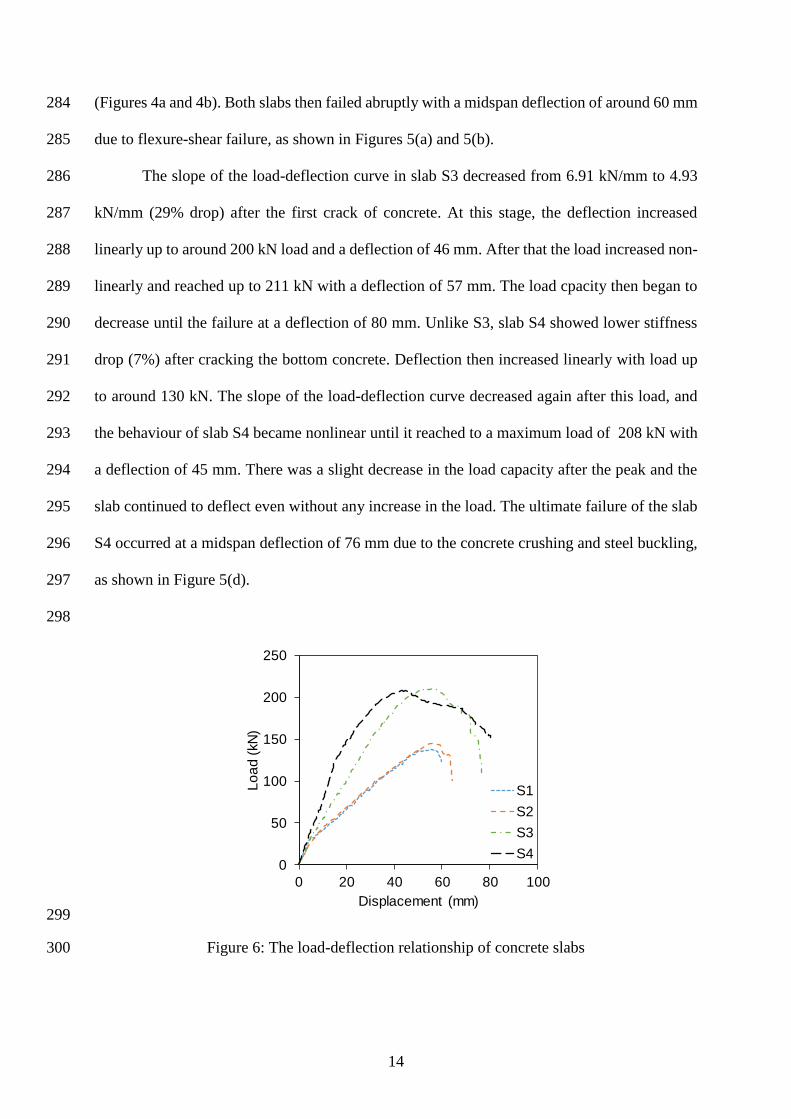
3.2 Load-deflection behaviour 275
Figure 6 shows the load-mid span deflection of the four tested slabs. The initial settlement effect 276
at the beginning caused by rubber mat was carefully eliminated when plotting load-277
displacement curve. Every slab exhibited linear load-deflection until the concrete experienced 278
its first flexural cracking at 25 kN and a deflection of 3 mm. When the concrete cracked, slabs 279
S1 and S2 experienced a significantly reduced stiffness (60% drop for S1 and 53% drop for S2) 280
but maintained the similar trend. The deflection increased linearly with the increase of loads up 281
to around 140 kN and a deflection of 50 mm. Thereafter, both slabs experienced a nonlinear 282
behaviour as the concrete began to crush and develop flexure-shear cracking at the loading point 283
(a) (b)
(c) (d)
14
(Figures 4a and 4b). Both slabs then failed abruptly with a midspan deflection of around 60 mm 284
due to flexure-shear failure, as shown in Figures 5(a) and 5(b). 285
The slope of the load-deflection curve in slab S3 decreased from 6.91 kN/mm to 4.93 286
kN/mm (29% drop) after the first crack of concrete. At this stage, the deflection increased 287
linearly up to around 200 kN load and a deflection of 46 mm. After that the load increased non-288
linearly and reached up to 211 kN with a deflection of 57 mm. The load cpacity then began to 289
decrease until the failure at a deflection of 80 mm. Unlike S3, slab S4 showed lower stiffness 290
drop (7%) after cracking the bottom concrete. Deflection then increased linearly with load up 291
to around 130 kN. The slope of the load-deflection curve decreased again after this load, and 292
the behaviour of slab S4 became nonlinear until it reached to a maximum load of 208 kN with 293
a deflection of 45 mm. There was a slight decrease in the load capacity after the peak and the 294
slab continued to deflect even without any increase in the load. The ultimate failure of the slab 295
S4 occurred at a midspan deflection of 76 mm due to the concrete crushing and steel buckling, 296
as shown in Figure 5(d). 297
298
299
Figure 6: The load-deflection relationship of concrete slabs 300
0
50
100
150
200
250
0 20 40 60 80 100
Lo
ad (
kN
)
Displacement (mm)
S1
S2
S3
S4
15
To verify the reliability of the experimental results, a nonlinear finite element (FE) analysis for 301
slab S3 has been conducted using ANSYS Mechanical APDL [41]. Solid 65 three-dimensional 302
element was used to model concrete that has the capability of capturing nonlinear material 303
properties, plastic deformation, crushing in compression and cracking in tension. The CRS 304
profiles were modelled with a Shell 181 element that is suitable for analysing thin to 305
moderately-thick structural component. A Beam 188 element was used to model FRP bars that 306
is suitable for analysing slender to moderately thick beam structures while the loading and 307
support plates were modelled with a Solid 186 element. Mapped meshing with a maximum 308
element size of 10 mm and approximate aspect ratio of one were used for half slab. The 309
symmetric plane were subjected to symmetric boundary conditions. The concrete crushing and 310
cracking stresses of 32 MPa and 2.26 MPa, respectively, and open and closed shear transferred 311
coefficients of 0.2 and 0.8, respectively were used in the model. Orthotropic properties of CRS 312
fibre composite profiles and isotropic properties of FRP bars as provided in Table 1 and Table 313
2 were used. Loads were applied at top nodes of the loading plate while the supports were 314
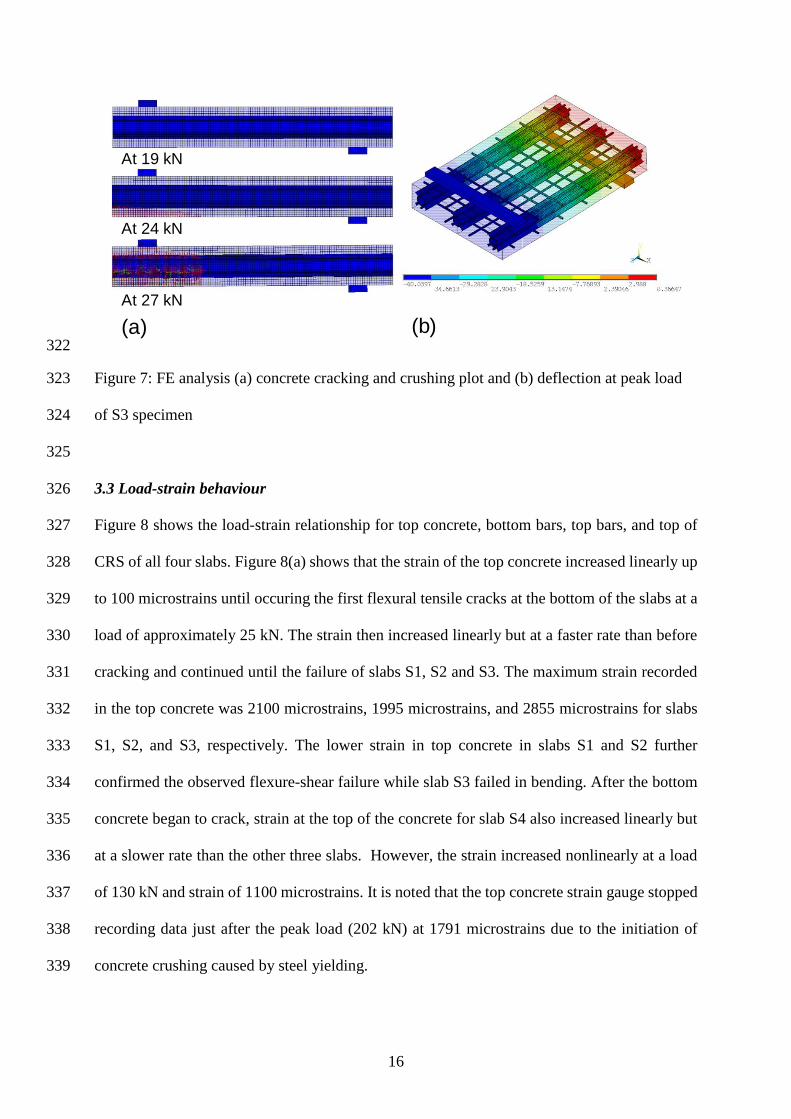
restrained in X and Y directions to simulate the experimental testing conditions. Figure 7(a) 315
shows that the cracking of bottom concrete started at around 24 kN which is to similar the 316
experimental crack observation at 25 kN. The increase of load gradually increase the 317
propagation of cracks. The deflection behaviour of the slab at peak load (220 kN) is shown in 318
Figure 7(b) where it can be seen that the maximum deflection is approximately 40 mm that is 319
close to the experimental deflection at peak load for S3 specimen. This FE result confirmed that 320
the experimental data are reliable and valid. 321
16
322
Figure 7: FE analysis (a) concrete cracking and crushing plot and (b) deflection at peak load 323
of S3 specimen 324
325
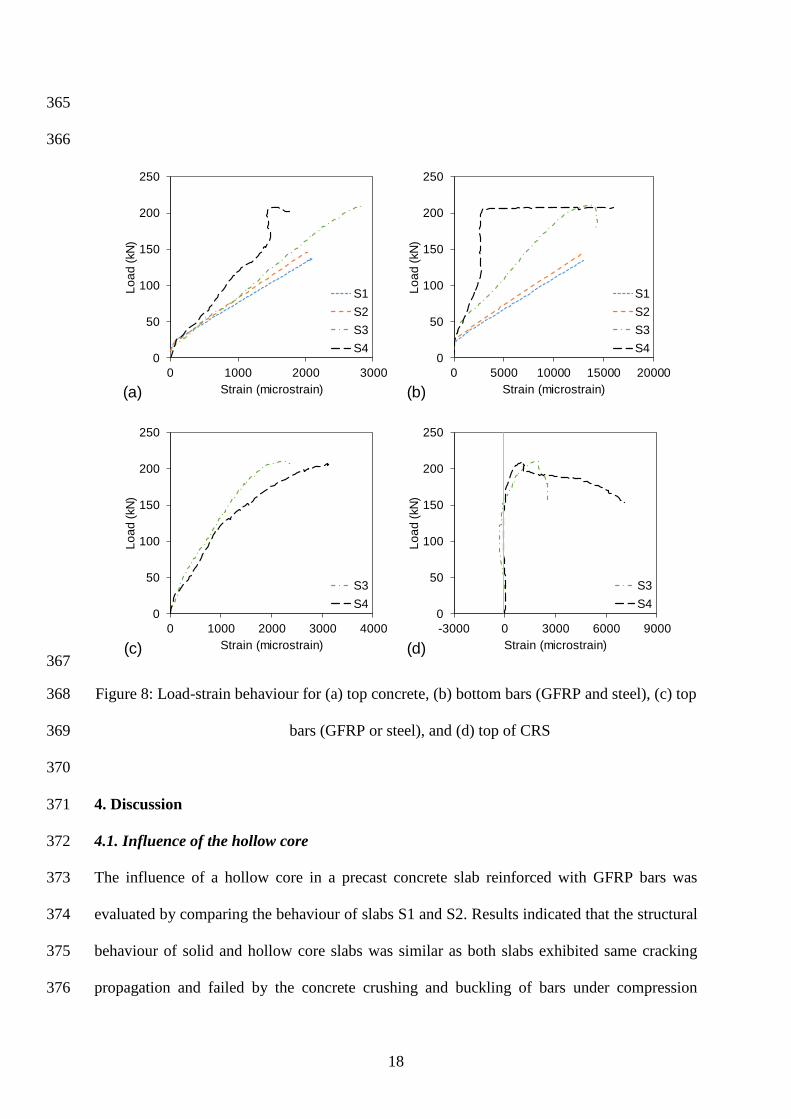
3.3 Load-strain behaviour 326
Figure 8 shows the load-strain relationship for top concrete, bottom bars, top bars, and top of 327
CRS of all four slabs. Figure 8(a) shows that the strain of the top concrete increased linearly up 328
to 100 microstrains until occuring the first flexural tensile cracks at the bottom of the slabs at a 329
load of approximately 25 kN. The strain then increased linearly but at a faster rate than before 330
cracking and continued until the failure of slabs S1, S2 and S3. The maximum strain recorded 331
in the top concrete was 2100 microstrains, 1995 microstrains, and 2855 microstrains for slabs 332
S1, S2, and S3, respectively. The lower strain in top concrete in slabs S1 and S2 further 333
confirmed the observed flexure-shear failure while slab S3 failed in bending. After the bottom 334
concrete began to crack, strain at the top of the concrete for slab S4 also increased linearly but 335
at a slower rate than the other three slabs. However, the strain increased nonlinearly at a load 336
of 130 kN and strain of 1100 microstrains. It is noted that the top concrete strain gauge stopped 337
recording data just after the peak load (202 kN) at 1791 microstrains due to the initiation of 338
concrete crushing caused by steel yielding. 339
At 19 kN
At 24 kN
At 27 kN
(a) (b)

17
Figure 8(b) shows the load-strain relationship of bottom bars for all slabs. There was no 340
noticeable changes of strain in the bottom GFRP bars before the concrete tensile cracking at 341
around 25 kN load while the strain increased rapidly thereafter. The load-strain behaviour in the 342
tensile GFRP bars for slabs S1 and S2 was found similar, and the strain reached to 13,000 343
microstrains at failure. The load-strain behaviour in slab S3 was almost linear after the first 344
flexural tensile crack of the concrete, however, the rate of increase of strain was slower than 345
slabs S1 and S2. The nonlinearity started when the load reached to the peak at around 211 kN. 346
The strain measured at the bottom of GFRP bars when slab S3 finally failed was around 14,000 347
microstrains, which was almost 70% of the failure strain of the GFRP bars in tension. As 348
expected, the strain in the bottom steel bars for slab S4 developed at a slower rate than the GFRP 349
bars in slabs S1 to S3. However, the strain remained constant at around 2700 microstrains from 350
130 kN to 208 kN, which is the level of yield strain for 500 MPa steel bars. This was followed 351
by a large increase in strain even without any further increase in the applied load. 352
Figure 8(c) shows the relationship between load and strain of the compression 353
reinforcement for slabs S3 and S4. The graph shows that the strain in the compressive GFRP 354
bars in slab S3 increased linearly with load even after the bottom concrete began to crack. 355
However, the load-strain behaviour became nonlinear near to the peak at 170 kN. The maximum 356
strain recorded was around 2400 microstrains. On the other hand, the load-strain behaviour in 357
the top steel bars for slab S4 was nonlinear from concrete cracking to the failure. Over 3000 358
microstrains were recorded in the steel bars in compression at failure. Figure 8(d) shows the 359
load-strain relationship at the top surface of the CRS for slab S3 and S4. Both slabs showed 360
very small strain at the top of the CRS up to 150 kN. After that the strain increased nonlinearly 361
until the slab reached to the peak load and observed that the strain in slab S3 was slightly higher 362
than slab S4 at the same level of load. The CRS in slab S4 reached almost 7100 microstrains 363
before it failed whereas the maximum strain recorded in slab S3 was only 2500 microstrains. 364
18
365
366
367
Figure 8: Load-strain behaviour for (a) top concrete, (b) bottom bars (GFRP and steel), (c) top 368
bars (GFRP or steel), and (d) top of CRS 369
370
4. Discussion 371
4.1. Influence of the hollow core 372
The influence of a hollow core in a precast concrete slab reinforced with GFRP bars was 373
evaluated by comparing the behaviour of slabs S1 and S2. Results indicated that the structural 374
behaviour of solid and hollow core slabs was similar as both slabs exhibited same cracking 375
propagation and failed by the concrete crushing and buckling of bars under compression 376
0
50
100
150
200
250
0 1000 2000 3000
Lo
ad (
kN
)
Strain (microstrain)
S1
S2
S3
S40
50
100
150
200
250
0 5000 10000 15000 20000
Lo
ad (
kN
)
Strain (microstrain)
S1
S2
S3
S4
0
50
100
150
200
250
0 1000 2000 3000 4000
Lo
ad (
kN
)
Strain (microstrain)
S3
S40
50
100
150
200
250
-3000 0 3000 6000 9000
Lo
ad (
kN
)
Strain (microstrain)
S3
S4
(a) (b)
(c) (d)
19
followed by a diagonal crack. The diagonal crack observed in slabs S1 and S2 is due to the 377
flexure and shear effect as the crack started from the bottom and propagated diagonally towards 378
the top. This can be further confirmed by shear resistance capacity of the slab estimated using 379
Canadian code [40], Australian code [42], American code [43] and Italian code [44] as 380
expressed in Eq. (1), Eq. (2), Eq. (3) and Eq. (4), respectively. The estimated shear resistance 381
of the solid slab (S1) is 84 kN, 80 kN, 100 kN, and 93 kN, while for the hollow slab (S2) is 382
62kN, 61 kN, 74 kN, and 68 kN based on CSA-S806 [40], AS-3600 [42], ACI-318 [45], and 383
CNR-DT 203 [44] standards, respectively. These results are close to the experimental shear 384
force (half the applied load) developed at failure of slab S1 (68.5 kN) and S2 (72.5 kN). This 385
finding refers to the shear effect in the final failure of S1 and S2. However, the failure of hollow 386
core slab (S2) was more brittle than the solid slab (S1) due to the catastrophic collapse of the 387
holes. Cuenca and Serna [22] stated that this type of failure is expected for hollow core concrete 388
slab because of the reduced width of the web that cannot resist the shear forces. 389
According to CSA-S806 standard [40], 390
𝑉𝑐 = 0.05𝜆𝜙𝑐𝑘𝑚𝑘𝑟(𝑓𝑐′)1/3𝑏𝑣𝑑𝑜 (1) 391
where, 0.11𝜙𝑐(𝑓𝑐′)1/2𝑏𝑣𝑑𝑜 ≤ 𝑉𝑐 ≤ 0.22𝜙𝑐(𝑓𝑐
′)1/2𝑏𝑣𝑑𝑜 392
According to AS-3600 standard [42], 393
𝑉𝑐 = 𝛽𝑏𝑣𝑑𝑜𝑓𝑐𝑣(𝐴𝑓
𝑏𝑣𝑑𝑜)1/3 (2) 394
According to ACI-318 code [45], 395
𝑉𝑐 = 2𝜆√𝑓𝑐′𝑏𝑣𝑑𝑜 (3) 396
According to CNR-DT 203 code [44], 397
𝑉𝑐 = 1.3 (𝐸𝐹
𝐸𝑆)
1
2. 𝜏𝑅𝑑. 𝑘. (1.2 + 40𝜌)𝑏𝑣𝑑𝑜 (4) 398
20
In Eqns. (1 to 3), 𝑉𝑐 is the total shear resistance, 𝛽 = 1.1(1.6 −𝑑𝑜
1000), 𝜆 = 1, and 𝜙𝑐 = 0.6 are 399
factors to account for concrete, 𝑘𝑚 = √𝑉𝑓𝑑𝑜
𝑀𝑓≤ 1 and 𝑘𝑟 = 1 + (𝐸𝐹 . 𝜌)1/3 are the moment and 400
reinforcement coefficients ,respectively, where 𝑀𝑓 and 𝑉𝑓 are the factored moment and shear 401
forces, respectively, 𝐸𝐹 , 𝐸𝑆 and 𝜌𝐹 are the elastic modulus of the GFRP bars and steel, 402
respectively, and the longitudinal reinforcement ratio. The 𝜏𝑅𝑑 = (0.15√𝑓𝑐′) and 𝑘 = 1 are the 403
design shear stress of the concrete and reinforcement coefficient, respectively. The 𝑓𝑐′ and 𝐴𝑓 404
are the concrete strength and area of reinforcement, 𝑏𝑣 and 𝑑𝑜 are the width of the slab and 405
depth of reinforcement, 𝑓𝑐𝑣 = (𝑓𝑐′)1/3 ≤ 4 MPa. It is important to note that Eq. (1), Eq. (2) and 406
Eq. (4) are based on SI unit whereas Eq. (3) is based on FPS unit. 407
Creating holes in the slab that reduced the gross cross-sectional area by 9% has an effect 408
on initial bending stiffness, however, it did not affect significantly on the capacity. The stiffness 409
of the slabs S1 and S2 were measured at 6.49 kN/mm and 5.21 kN/mm while the capacity 410
obtained were 137 kN and 145 kN, respectively (Table 4). The lower stiffness of S2 than S1 is 411
due to the reduced width of the slab at the initial location of neutral axis. However, the bottom 412
concrete started cracking with the increase of loads and the neutral axis gradually shifted 413
upwards. At a maximum load point, the similar behaviour and capacity of slabs S1 and S2 can 414
be attributed to the location of neutral axis that is above the top of the hollow core where the 415
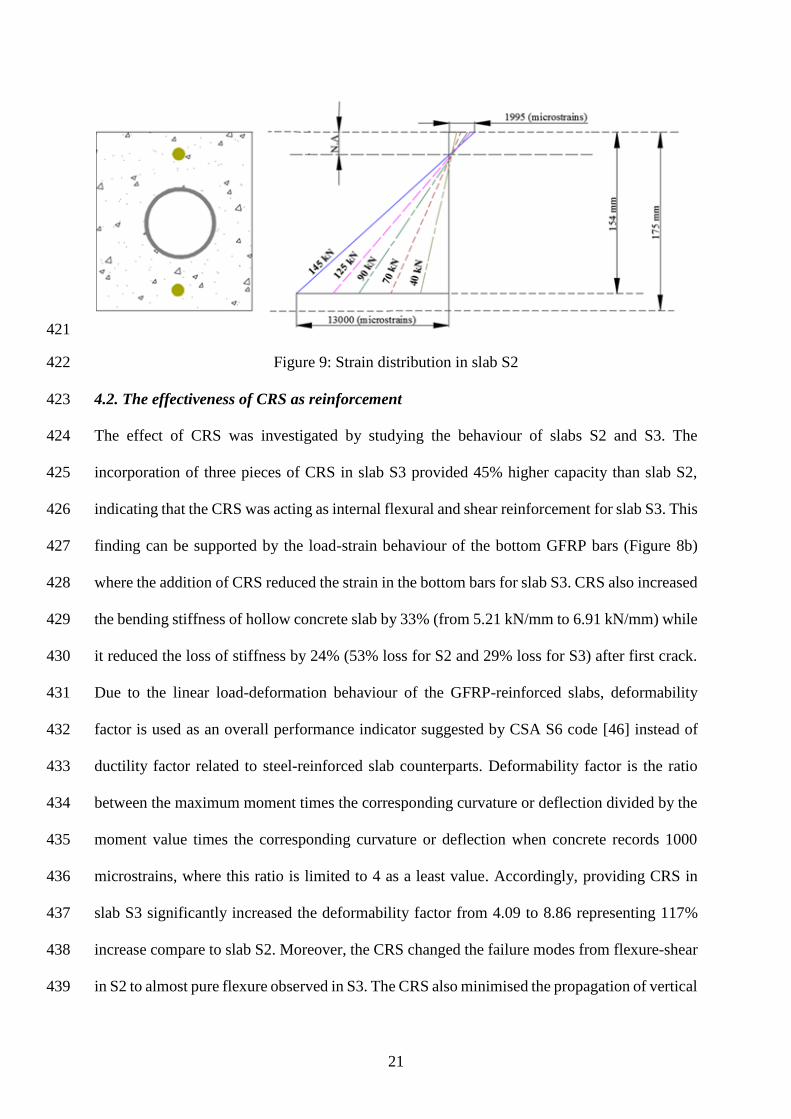
uncracked concrete in compression were behaving same for both slabs. Using the strain 416
measured at the top concrete in Figure 8(a) and bottom reinforcement in Figure 8(b), the neutral 417
axis at the loads of 40 kN, 70 kN, 90 kN, 125 kN and 145 kN was calculated to be 18.48 mm, 418
14.79 mm, 14.36 mm, 13.50 mm and 13.33 mm, respectively, which clearly indicated the 419
neutral axis was above the holes, as shown in Figure 9. 420
21
421
Figure 9: Strain distribution in slab S2 422
4.2. The effectiveness of CRS as reinforcement 423
The effect of CRS was investigated by studying the behaviour of slabs S2 and S3. The 424
incorporation of three pieces of CRS in slab S3 provided 45% higher capacity than slab S2, 425
indicating that the CRS was acting as internal flexural and shear reinforcement for slab S3. This 426
finding can be supported by the load-strain behaviour of the bottom GFRP bars (Figure 8b) 427
where the addition of CRS reduced the strain in the bottom bars for slab S3. CRS also increased 428
the bending stiffness of hollow concrete slab by 33% (from 5.21 kN/mm to 6.91 kN/mm) while 429
it reduced the loss of stiffness by 24% (53% loss for S2 and 29% loss for S3) after first crack. 430
Due to the linear load-deformation behaviour of the GFRP-reinforced slabs, deformability 431
factor is used as an overall performance indicator suggested by CSA S6 code [46] instead of 432
ductility factor related to steel-reinforced slab counterparts. Deformability factor is the ratio 433
between the maximum moment times the corresponding curvature or deflection divided by the 434
moment value times the corresponding curvature or deflection when concrete records 1000 435
microstrains, where this ratio is limited to 4 as a least value. Accordingly, providing CRS in 436
slab S3 significantly increased the deformability factor from 4.09 to 8.86 representing 117% 437
increase compare to slab S2. Moreover, the CRS changed the failure modes from flexure-shear 438
in S2 to almost pure flexure observed in S3. The CRS also minimised the propagation of vertical 439
22
flexural cracks and prevented the massive concrete crushing at the final failure. CRS controlled 440
the direction of cracking and made the crack path longer because they needed to pass through 441
the CRS flanges, thereby enhancing the serviceability performance of slab S3. The hollowness 442
of the CRS increased significantly the stiffness and strength of the slab without increasing the 443
weight. This improvement cannot be achieved with just conventional reinforcement or GFRP 444
bars without the additional weight due to the increase in amount of reinforcement. The 445
enhancement of the performance of hollow core slab using CRS was found better than the 446
carbon fibre reinforced polymer (CFRP) sheets implemented by [21] where the load capacity 447
only increased by 11%. This was because the latter method could not prevent the hollow core 448
from collapsing. It is worth mentioning that no debonding failure was observed in slab S3 as 449
because the four flanges of the CRS interacted effectively with the concrete. On the other hand, 450
the debonding failure seen by [21] for externally bonded CFRP sheets could have been 451
prevented by providing thicker sheets internally and that is how CRS is working. Elgabbas et 452
al. [47] observed improvement in the load carrying capacity of the hollow core concrete slabs 453
reinforced internally with thin CFRP sheets but shear failure still occurred due to the debonding 454
of CFRP sheets from the concrete. More interestingly, the addition of GFRP bars with 455
equivalent area of CRS could not achieve such enhancement in stiffness and strength without 456
increasing the cross-sectional area of the slab due to the significant increase in the ratio between 457
the actual reinforcement-to-balanced condition, wherein El-Nemr et al. [48] indicated that this 458
condition will result in insufficient improvement in carrying loads. This result also indicates 459
that a thinner concrete slab with CRS is possible to achieve the same strength and stiffness of 460
solid and hollow slab resulting in a more lightweight and economical structure. 461
462
4.3. Effect of reinforcing materials 463
23
Finding the influence of using different reinforcing materials in concrete slabs was achieved by 464
testing slabs S3 and S4. The types of reinforcement had a signficant effect on the overall 465
stiffness but none on the load capacity of the hollow concrete slabs. After first crack, slab S4 466
retained almost 93% of its initial and uncracked stiffness while slab S3 retained 71%. Slab S4 467
was stiffer because the modulus of elasticity of steel used in it was higher than the GFRP bars 468
in slab S3, as also observed by many researchers [7, 10, 49, 50]. However, the provision of CRS 469
enabled the GFRP reinforced hollow concrete slab to retain most of its stiffness because it 470
prevented developing wider flexural cracks. For example, El-Gamal et al. [51] found that the 471
steel reinforced slab was almost 72% stiffer than the slabs reinforced with GFRP with a similar 472
reinforcement ratio while in the present study the steel reinforced slab (S4) was only 33% stiffer 473
than slab S3. Moreover, the flexural capacity of slab S3 (211 kN) and S4 (208 kN) were almost 474
same because the failure behaviour of both slabs was governed by compressive crushing of the 475
top concrete followed by failure of the CRS due to the combination of bending and interlaminar 476
shear failure. Figure 8 shows that the addition of CRS reduced the amount of strain experienced 477
by the GFRP bars (slab S3) thus indicating how well it utilises the tensile strength of the bars. 478
Morever, the GFRP bars and CRS were recorded the highest contribution in the final load. 479
Notwithstanding this, all of the stress was transferred to the CRS when the tensile reinforcement 480
in slab S4 yielded at a load of 140 kN. The bottom steel reinforcement stopped recording the 481
strains while the strain in the CRS increased markedly after the steel bars yielded up to their 482
maximum load (Figure 8). Slab S4 then continued to carry the load until the CRS failed, and 483
then the stiffness decreased in the load-deflection behaviour when the steel yields (Figure 6) 484
showing almost similar stiffness to slab S3 until the maximum load capacity. This result 485
contradicts the comparison between the stiffness as slab S4 reinforced with steel was stiffer 486
than S3 from the time the concrete began to crack until the steel yielded. However, a different 487
trend was observed after yielding as S3 slab showed continuous linear stiffness due to the linear 488
24
elastic behaviour of GFRP bars while in S4 the steel stopped resisting. On the other hand, it can 489
be noticed that slab S3 shows a slightly higher area under the load-deformation curve (see 490
Figure 6) compare to slab S4, indicating that the CRS improved the deformability of slab S3 491
and energy absorption. This suggests that the GFRP bars and CRS combination are more 492
compatible than steel bars and CRS combination because the stiffness of GFRP and CRS are 493
almost the same. 494
The presence of CRS prevented the premature compressive failure of concrete but still 495
developed horizontal shear cracks at the level of the hollow reinforcing system. However, there 496
were more and deeper horizontal cracks in slab S3 than in slab S4. Chang and Seo [52] studied 497
GFRP-reinforced and steel-reinforced one way slabs with similar dimensions and 498
reinforcement ratio. They observed wider cracks in GFRP-reinforced slab than in the steel-499
reinforced one because of the low modulus of GFRP bars. The lower stiffness of GFRP bars 500
than steel bars also explains why the deflection in slab S3 was higher than in slab S4. At the 501
maximum load, compressive crushing of the concrete began in slab S3 whereas the bottom steel 502
in slab S4 yielded. 503
5. Theoretical evaluation of the flexural capacity of CRC slabs 504
5.1. Fibre model analysis 505
The behaviour of concrete slabs with hollow composite reinforcing system in flexure was 506
predicted using a simple Fibre Model Analysis (FMA). This layer-by-layer approach was 507
successfully implemented by previous researchers [53-55] in predicting the flexural capacity 508
of composite structures. In this design approach, the capacity of hollow concrete slabs is based 509
on the force equilibrium, strain compatibility, and constitutive behaviour of the materials. The 510
internal force equilibrium principle was applied to determine the flexural capacity based on the 511
properties of the constituent materials. It was assumed that a perfect bond exists between the 512
reinforcement and concrete, and the strain in each layer was directly proportional to their 513
25
distance from the neutral axis. The sectional equilibrium was maintained by balancing the 514
internal compressive and tensile resistance of the section, indicating varying locations of neutral 515
axis with the increase of loads. For simplicity, the four rectangular flanges (Figure 1b) were 516
converted to an equivalent circular area (Figure 10) for slabs with hollow composite reinforcing 517
system. The top CRS bars were located at 42.5 mm from the top concrete layer while the bottom 518
CRS bars were positioned at the same distance from bottom concrete layer. The unit sectional 519
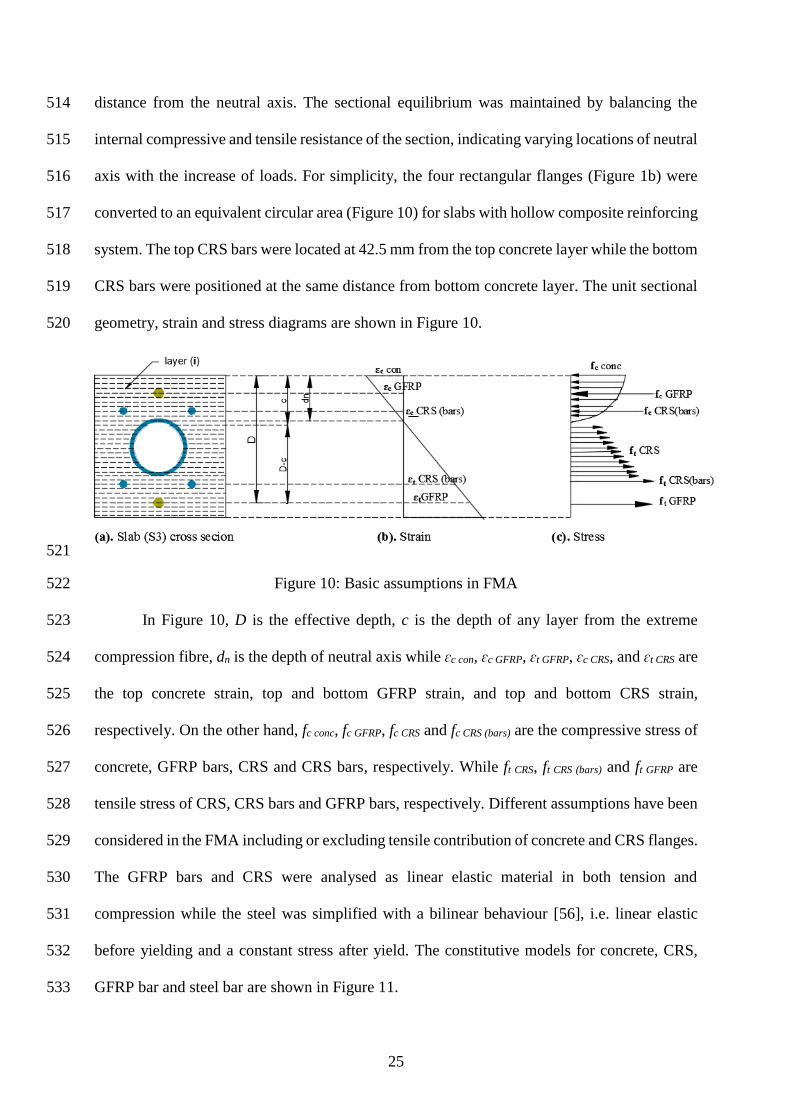
geometry, strain and stress diagrams are shown in Figure 10. 520
521
Figure 10: Basic assumptions in FMA 522
In Figure 10, D is the effective depth, c is the depth of any layer from the extreme 523
compression fibre, dn is the depth of neutral axis while ɛc con, ɛc GFRP, ɛt GFRP, ɛc CRS, and ɛt CRS are 524
the top concrete strain, top and bottom GFRP strain, and top and bottom CRS strain, 525
respectively. On the other hand, fc conc, fc GFRP, fc CRS and fc CRS (bars) are the compressive stress of 526
concrete, GFRP bars, CRS and CRS bars, respectively. While ft CRS, ft CRS (bars) and ft GFRP are 527
tensile stress of CRS, CRS bars and GFRP bars, respectively. Different assumptions have been 528
considered in the FMA including or excluding tensile contribution of concrete and CRS flanges. 529
The GFRP bars and CRS were analysed as linear elastic material in both tension and 530
compression while the steel was simplified with a bilinear behaviour [56], i.e. linear elastic 531
before yielding and a constant stress after yield. The constitutive models for concrete, CRS, 532
GFRP bar and steel bar are shown in Figure 11. 533
26
534
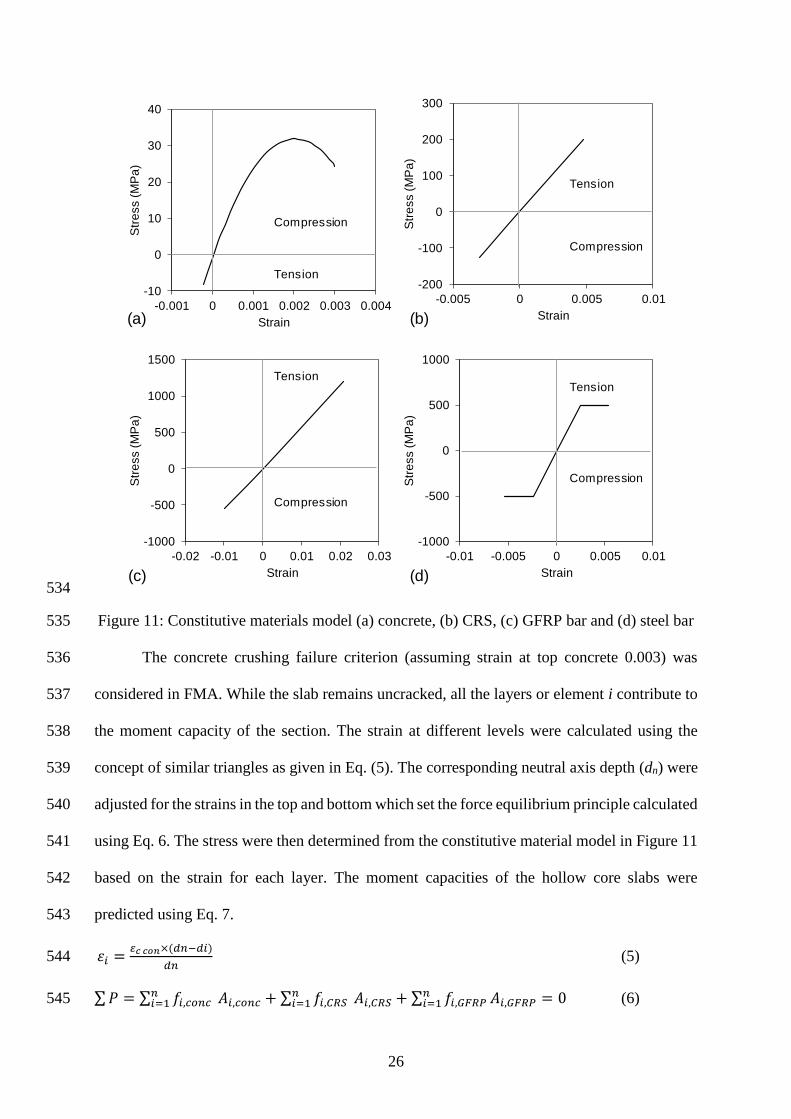
Figure 11: Constitutive materials model (a) concrete, (b) CRS, (c) GFRP bar and (d) steel bar 535
The concrete crushing failure criterion (assuming strain at top concrete 0.003) was 536
considered in FMA. While the slab remains uncracked, all the layers or element i contribute to 537
the moment capacity of the section. The strain at different levels were calculated using the 538
concept of similar triangles as given in Eq. (5). The corresponding neutral axis depth (dn) were 539
adjusted for the strains in the top and bottom which set the force equilibrium principle calculated 540
using Eq. 6. The stress were then determined from the constitutive material model in Figure 11 541
based on the strain for each layer. The moment capacities of the hollow core slabs were 542
predicted using Eq. 7. 543
𝜀𝑖 =𝜀𝑐 𝑐𝑜𝑛×(𝑑𝑛−𝑑𝑖)
𝑑𝑛 (5) 544
∑ 𝑃 = ∑ 𝑓𝑖,𝑐𝑜𝑛𝑐𝑛𝑖=1 𝐴𝑖,𝑐𝑜𝑛𝑐 + ∑ 𝑓𝑖,𝐶𝑅𝑆
𝑛𝑖=1 𝐴𝑖,𝐶𝑅𝑆 + ∑ 𝑓𝑖,𝐺𝐹𝑅𝑃
𝑛𝑖=1 𝐴𝑖,𝐺𝐹𝑅𝑃 = 0 (6) 545
-10
0
10
20
30
40
-0.001 0 0.001 0.002 0.003 0.004
Str
ess (
MP
a)
Strain
-200
-100
0
100
200
300
-0.005 0 0.005 0.01
Str
ess (
MP
a)
Strain
-1000
-500
0
500
1000
1500
-0.02 -0.01 0 0.01 0.02 0.03
Str
ess (
MP
a)
Strain
-1000
-500
0
500
1000
-0.01 -0.005 0 0.005 0.01
Str
ess (
MP
a)
Strain
(a) (b)
(c) (d)
Compression
Tension
Compression
Compression
Compression
Tension
TensionTension
27
546
∑ 𝑀 = ∑ 𝑓𝑖,𝑐𝑜𝑛𝑐𝑛𝑖=1 𝐴𝑖,𝑐𝑜𝑛𝑐𝑑𝑖 + ∑ 𝑓𝑖,𝐶𝑅𝑆
𝑛𝑖=1 𝐴𝑖,𝐶𝑅𝑆 𝑑𝑖 + ∑ 𝑓𝑖,𝐺𝐹𝑅𝑃
𝑛𝑖=1 𝐴𝑖,𝐺𝐹𝑅𝑃 𝑑𝑖 (7) 547
In Eqs. (4-6), Ɛc con and Ɛi are the top concrete strain and concrete strain at depth di. Moreover, 548
P, fi,conc, Ai,conc, fi,GFRP, Ai,GFRP, fi,CRS, Ai,CRS, M and di indicate the load capacity, concrete strength 549
at layer i, concrete area at layer i, strength of GFRP bar, area of main reinforcement at layer i, 550
CRS strength at layer i, CRS area at layer i, bending moment capacity, and layer depth from 551
upper compressive layer. The total number of layers (n) is 175 layers. 552
553
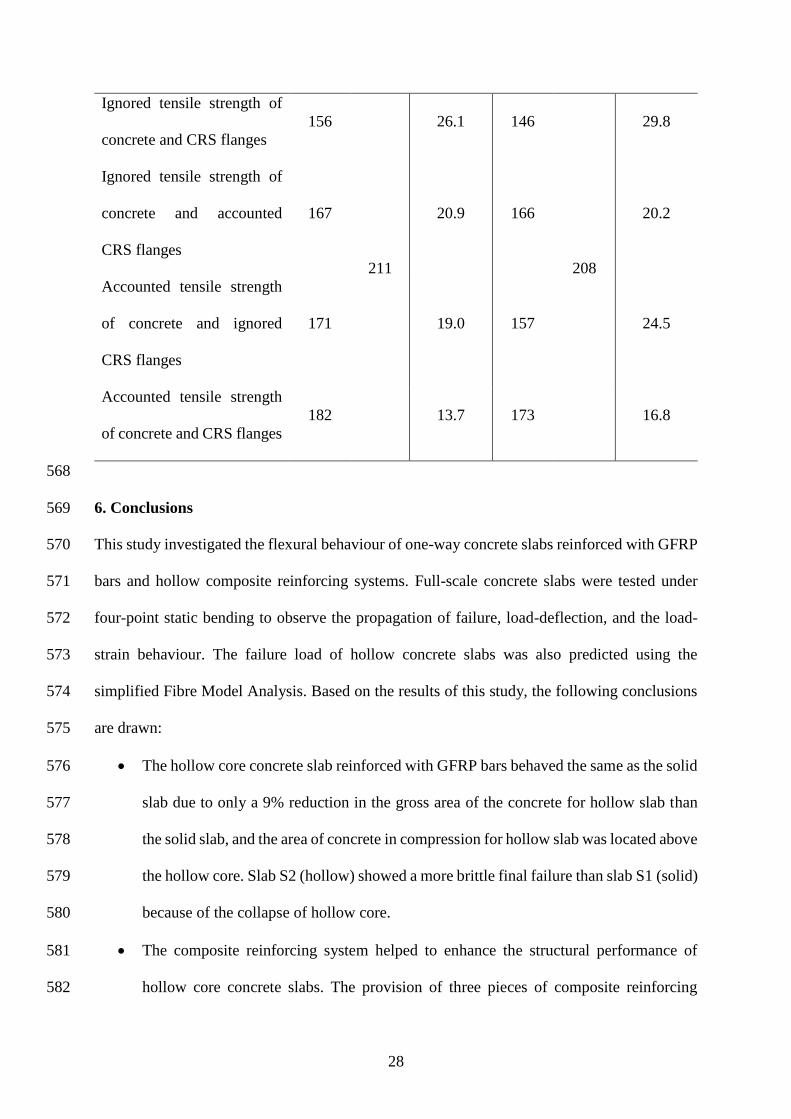
5.2 Predicted failure load and comparison with the experiments 554
The flexural capacity is calculated for S3 and S4 slabs as they are failed in flexure while the 555
other two slabs S1 and S2 were failed in flexure-shear, thus, FMA is not an ideal approach to 556
estimate the failure loads for the latter case. Table 5 presents a summary of the loads predicted 557
under different criteria and compares them with the results from the experiment. It can be seen 558
that the closest prediction was obtained when the contribution of the tensile strength of concrete 559
(Stiffening behaviour) and the flanges of the CRS were accounted. In general, the capacity of 560
the slab with CRS can be predicted as close as 13.8% to the actual load measured from the 561
experiments. The small difference between the predicted load and the actual failure load can be 562
attributed to many reasons including the inherent variability of the compressive strength of 563
concrete, the contribution of the flanges in keeping more concrete intact, and the partial 564
consideration of the CRS (the small web portion perpendicular to flanges did not consider) in 565
the FMA. 566
Table 5. Predicted and actual failure loads 567
Considerations
Capacity of S3
(kN)
Difference
(%)
Capacity of S4
(kN)
Difference
(%)
FMA Exp. FMA Exp.
28
Ignored tensile strength of
concrete and CRS flanges
156
211
26.1 146
208
29.8
Ignored tensile strength of
concrete and accounted
CRS flanges
167 20.9 166 20.2
Accounted tensile strength
of concrete and ignored
CRS flanges
171 19.0 157 24.5
Accounted tensile strength
of concrete and CRS flanges
182 13.7 173 16.8
568
6. Conclusions 569
This study investigated the flexural behaviour of one-way concrete slabs reinforced with GFRP 570
bars and hollow composite reinforcing systems. Full-scale concrete slabs were tested under 571
four-point static bending to observe the propagation of failure, load-deflection, and the load-572
strain behaviour. The failure load of hollow concrete slabs was also predicted using the 573
simplified Fibre Model Analysis. Based on the results of this study, the following conclusions 574
are drawn: 575
The hollow core concrete slab reinforced with GFRP bars behaved the same as the solid 576
slab due to only a 9% reduction in the gross area of the concrete for hollow slab than 577
the solid slab, and the area of concrete in compression for hollow slab was located above 578
the hollow core. Slab S2 (hollow) showed a more brittle final failure than slab S1 (solid) 579
because of the collapse of hollow core. 580
The composite reinforcing system helped to enhance the structural performance of 581
hollow core concrete slabs. The provision of three pieces of composite reinforcing 582
29
system (S3) increased the stiffness of the GFRP reinforced concrete hollow slab by 33%, 583
reduced the loss of stiffness after concrete cracking by 24%, increased the load carrying 584
capacity by 45%, and significantly increased the deformability by 117% than S2. The 585
hollow composite system in slab S3 also prevented vertical flexural cracks starting from 586
bottom and propagating up to the top layer of concrete, this resulted in ductile flexural 587
failure. 588
The hollow composite reinforcing system was more compatible with GFRP bars than 589
steel bars due to their similar modulus of elasticity. The slab reinforced with steel (S4) 590
was stiffer than S3 from the time the concrete began to crack until the steel yielded. 591
However, the GFRP reinforced slab (S3) was stiffer and retained this constant stiffness 592
until the load reached its maximum. Moreover, the GFRP bars and the CRS 593
simultaneously resisted the load up to failure in S3, whereas all the load was transferred 594
to CRS once the steel yielded in steel reinforced slab (S4). 595
The simplified fibre model analysis reliably predicted the maximum flexural strength of 596
hollow concrete slabs with composite reinforcing system. By incorporating the 597
stiffening behaviour of concrete under tension and the flanges of the hollow composite 598
reinforcing system, the predicted failure load was only 13.8% less than the failure load 599
measured experimentally. This result was further verified with complex finite element 600
analysis. 601
The above findings clearly demonstrated the effectiveness of CRS in concrete slabs. This 602
enhancement in overall behaviour cannot be achieved with just conventional reinforcement or 603
GFRP bars without the additional weight due to the increase in amount of reinforcement and 604
the concrete itself. Moreover, a thinner concrete slab with CRS is possible to achieve more 605
strength and stiffness than solid and hollow slab resulting in a more lightweight and efficient 606
structural system. Thus, it is suggested that the effectiveness of CRS with different diameters 607
30
are explored in other types of structures to quantify further its benefit and to develop new light-608
weight and high-strength concrete structures suitable for civil engineering construction. 609
Acknowledgements 610
The authors wish to acknowledge the support from the Australian Research Council through 611
the Discovery scheme (DP180102208). The authors would also like to thank Composite 612
Reinforcement Solutions Pty. Ltd. for providing the hollow composite reinforcing systems, as 613
well as the technical staff and postgraduate students at the Centre for Future Materials (CFM) 614
in the University of Southern Queensland for helping to prepare and testing specimens. 615
References 616
[1] Yardim Y, Waleed A, Jaafar MS, Laseima S. AAC-concrete light weight precast composite 617
floor slab. Construction and Building Materials. 2013;40:405-10. 618
[2] Taylor R, Maher D, Hayes B. Effect of the arrangement of reinforcement on the behaviour 619
of reinforced concrete slabs. Magazine of concrete research. 1966;18:85-94. 620
[3] Smith P. Design and specification of marine concrete structures. Marine Concrete Structures: 621
Design, Durability and Performance. 2016:65. 622
[4] Dalton N. Warning to check for 'concrete cancer' in older unit high rise complexes. Australia: 623
Cairns Post; 2014. 624
[5] Goldston MW. Behaviour of concrete beams reinforced with GFRP bars under static & 625
impact loading. Australia: University of Wollongong, 2016. 626
[6] Ferdous W, Ngo TD, Nguyen KTQ, Ghazlan A, Mendis P, Manalo A. Effect of fire-627
retardant ceram powder on the properties of phenolic-based GFRP composites. Composites Part 628
B: Engineering. 2018;155:414-24. 629
[7] Abdalla H. Evaluation of deflection in concrete members reinforced with fibre reinforced 630
polymer (FRP) bars. Composite structures. 2002;56:63-71. 631
[8] Ferdous W, Manalo A, Aravinthan T. Effect of beam orientation on the static behaviour of 632
phenolic core sandwich composites with different shear span-to-depth ratios. Composite 633
Structures. 2017;168:292–304. 634
[9] Manalo AC. Behaviour of fibre composite sandwich structures under short and 635
asymmetrical beam shear tests. Composite Structures. 2013;99:339–49. 636
[10] Maranan G, Manalo A, Benmokrane B, Karunasena W, Mendis P. Evaluation of the 637
flexural strength and serviceability of geopolymer concrete beams reinforced with glass-fibre-638
reinforced polymer (GFRP) bars. Engineering Structures. 2015;101:529-41. 639
[11] Maranan G, Manalo A, Benmokrane B, Karunasena W, Mendis P. Behavior of 640
concentrically loaded geopolymer-concrete circular columns reinforced longitudinally and 641
transversely with GFRP bars. Engineering Structures. 2016;117:422-36. 642
[12] Bouguerra K, Ahmed E, El-Gamal S, Benmokrane B. Testing of full-scale concrete bridge 643
deck slabs reinforced with fiber-reinforced polymer (FRP) bars. Construction and Building 644
Materials. 2011;25:3956-65. 645
[13] Sacks R, Eastman CM, Lee G. Parametric 3D modeling in building construction with 646
examples from precast concrete. Automation in construction. 2004;13:291-312. 647
31
[14] de Castilho VC, do Carmo Nicoletti M, El Debs MK. An investigation of the use of three 648
selection-based genetic algorithm families when minimizing the production cost of hollow core 649
slabs. Computer methods in applied mechanics and engineering. 2005;194:4651-67. 650
[15] Pajari M. Web shear failure in prestressed hollow core slabs. Journal of Structural 651
Engineering. 2009;42:83-104. 652
[16] Hegger J, Roggendorf T, Kerkeni N. Shear capacity of prestressed hollow core slabs in 653
slim floor constructions. Engineering Structures. 2009;31:551-9. 654
[17] Al-Negheimish AI, El-Sayed AK, Khanbari MO, Alhozaimy AM. Structural behavior of 655
prestressed SCC hollow core slabs. Construction and Building Materials. 2018;182:334-45. 656
[18] Ferdous W, Bai Y, Ngo TD, Manalo A, Mendis P. New advancements, challenges and 657
opportunities of multi-storey modular buildings – A state-of-the-art review. Engineering 658
Structures. 2019;183:883-93. 659
[19] Azad AK, Hakeem IY. Flexural behavior of hybrid hollow-core slab built with ultra high 660
performance concrete faces. Materials and Structures. 2016;49:3801-13. 661
[20] Brunesi E, Bolognini D, Nascimbene R. Evaluation of the shear capacity of precast-662
prestressed hollow core slabs: numerical and experimental comparisons. Materials and 663
Structures. 2015;48:1503-21. 664
[21] Meng X. Shear Strengthening of Prestressed Hollow Core Slabs Using Externally Bonded 665
Carbon Fiber Reinforced Polymer Sheets: University of Windsor (Canada), 2016. 666
[22] Cuenca E, Serna P. Failure modes and shear design of prestressed hollow core slabs made 667
of fiber-reinforced concrete. Composites Part B: Engineering. 2013;45:952-64. 668
[23] Benayoune A, Samad AA, Trikha D, Ali AA, Ellinna S. Flexural behaviour of pre-cast 669
concrete sandwich composite panel–experimental and theoretical investigations. Construction 670
and Building Materials. 2008;22:580-92. 671
[24] Hall J, Mottram J. Combined FRP reinforcement and permanent formwork for concrete 672
members. Journal of Composites for Construction. 1998;2:78-86. 673
[25] ASTM-D792. Standard test methods for density and specific gravity (relative density) of 674
plastics by displacement. West Conshohocken, PA: ASTM International; 2013. 675
[26] ASTM-D2584. Standard test method for ignition loss of cured reinforced resins. West 676
Conshohocken, PA: ASTM International; 2018. 677
[27] ASTM-E1356. Standard test method for assignment of the glass transition temperatures by 678
differential scanning calorimetry. West Conshohocken, PA: ASTM International; 2014. 679
[28] ASTM-D695. Standard test method for compressive properties of rigid plastics. West 680
Conshohocken, PA: ASTM International; 2015. 681
[29] ISO-14125. Fibre-reinforced plastic composites -- Determination of flexural properties. 682
International Organization for Standardization; 1998. 683
[30] ASTM-D2344. Standard test method for short-beam strength of polymer matrix composite 684
materials and their laminates. West Conshohocken, PA: ASTM International; 2016. 685
[31] ASTM-D4475. Standard test method for apparent horizontal shear strength of pultruded 686
reinforced plastic rods by the short-beam method. West Conshohocken, PA: ASTM 687
International; 2016. 688
[32] ASTM-D790. Standard test methods for flexural properties of unreinforced and reinforced 689
plastics and electrical insulating materials. West Conshohocken, PA: ASTM International; 690
2017. 691
[33] CSA-S807. Specification for fibre-reinforced polymers. Canadian Standards Association; 692
2010. 693
[34] Benmokrane B, Manalo A, Bouhet J-C, Mohamed K, Robert M. Effects of Diameter on 694
the Durability of Glass Fiber–Reinforced Polymer Bars Conditioned in Alkaline Solution. 695
Journal of Composites for Construction. 2017;21:04017040. 696
32
[35] ASTM-D4476. Standard test method for flexural properties of fiber reinforced pultruded 697
plastic rods. West Conshohocken, PA: ASTM International; 2014. 698
[36] ASTM-D7205. Standard test method for tensile properties of fiber reinforced polymer 699
matrix composite bars. West Conshohocken, PA: ASTM International; 2016. 700
[37] ACI-440.6M. Specification for carbon and glass fiber-reinforced polymer bar materials for 701
concrete reinforcement. USA: ACI; 2008. 702
[38] Standards Australia. Specification and supply of concrete. AS1379-2007 Australia SIA 703
Global; 2007. 704
[39] Standards Australia. Methods of testing concrete Method 1: Sampling of concrete. AS 705
10121-2014 Australia: Standards Australia; 2014. 706
[40] CSA-S806. Design and construction of building structures with fibre-reinforced polymers. 707
Canadian Standards Association; 2012. 708
[41] ANSYS-Inc. ANSYS mechanical APDL introductory tutorials. 15.0 ed. USA2013. 709
[42] AS-3600. Concrete structures. Sydney, Australia: Standards Australia; 2017. 710
[43] Nilson A, Darwin D, Dolan C. Design of Concrete Structures. Europe: McGraw-Hill 711
Education, 2015. 712
[44] CNR-DT-203. Guide for the design and construction of concrete structures reinforced with 713
fibre-reinforced polymer bars. Rome, Italy: National Research Council (CNR); 2006. 714
[45] ACI-318. Building code requirements for structural concrete (ACI 318-08) and 715
commentary. USA: American Concrete Institute; 2008. 716
[46] S807-10 CC. Specification for fibre reinforced polymers. Rexdale, Ontario, Canada. 2010. 717
[47] Elgabbas F, El-Ghandour A, Abdelrahman A, El-Dieb A. Different CFRP strengthening 718
techniques for prestressed hollow core concrete slabs: Experimental study and analytical 719
investigation. Composite structures. 2010;92:401-11. 720
[48] El-Nemr A, Ahmed EA, El-Safty A, Benmokrane B. Evaluation of the flexural strength 721
and serviceability of concrete beams reinforced with different types of GFRP bars. Engineering 722
Structures. 2018;173:606-19. 723
[49] Ali AH, Afifi MZ, Abdulsalam B, Haggag H, El Hashimy A, El-Sayed T, et al. 724
Performance Evaluation of One-Way Concrete Slabs Reinforced with New Developed GFRP 725
Bars. Materials Sciences and Applications. 2015;6:420. 726
[50] Benmokrane B, Chaallal O, Masmoudi R. Glass fibre reinforced plastic (GFRP) rebars for 727
concrete structures. Construction and Building Materials. 1995;9:353-64. 728
[51] El-Gamal S, AbdulRahman B, Benmokrane B. Deflection Behaviour of Concrete Beams 729
Reinforced with Different Types of GFRP Bars. Advances in FRP Composites in Civil 730
Engineering: Springer; 2011. p. 279-82. 731
[52] Kugkwan C, Daewon S. Behavior of one-way concrete slabs reinforced with GFRP bars. 732
Journal of Asian Architecture and Building Engineering. 2012;11:351-8. 733
[53] Muttashar M, Manalo A, Karunasena W, Lokuge W. Flexural behaviour of multi-celled 734
GFRP composite beams with concrete infill: Experiment and theoretical analysis. Composite 735
Structures. 2017;159:21-33. 736
[54] Manalo A, Surendar S, Van Erp G, Benmokrane B. Flexural behavior of an FRP sandwich 737
system with glass-fiber skins and a phenolic core at elevated in-service temperature. Composite 738
Structures. 2016;152:96-105. 739
[55] Muttashar M, Manalo A, Karunasena W, Lokuge W. Influence of infill concrete strength 740
on the flexural behaviour of pultruded GFRP square beams. Composite Structures. 741
2016;145:58-67. 742
[56] Wolanski AJ. Flexural behavior of reinforced and prestressed concrete beams using finite 743
element analysis. USA: Marquette University, 2004. 744
745
746


