Embed Size (px)
Citation preview
Kirchner and Leiman Maritime Studies 2014, 13:7http://www.maritimestudiesjournal.com/content/13/1/7
RESEARCH Open Access
Resource rents and resource management policiesin Namibia’s post-Independence hake fisheryCarola Kirchner1* and Anthony Leiman2
* Correspondence: [email protected] Scientist, Secretariat ofthe Pacific Community, Noumea,New CaledoniaFull list of author information isavailable at the end of the article
©Am
Abstract
This study reviews the nature and outcomes of policies, incentives and managementprocedures in the Namibian hake industry from independence in 1990 to the present. Itis argued that, although based on individual quotas, Namibia’s post-independencemanagement procedures have conflicted with the State’s commitment to efficiency.Its ‘Namibianization’ policy and its attempt to increase domestic control of the hakeindustry both increased fishing effort and depressed hake stocks below economicallyoptimal levels. Despite current over-capacity, government continues to reward newinvestments. Industry inefficiency has been further compounded by inconsistentrights allocation policies and the fragmentation of quota shares, which have reducedright-holders’ sense of stewardship over the resource. If the resulting loss of rents is tobe reversed, the present policies and the associated perverse incentives will need to bere-evaluated.
Keywords: Resource rent; Hake; Management procedures; Namibianization; Quota;Vessel capacity; Freezer vessel
IntroductionManaging a fishery is a complex process with social, economic and ecological dimensions.
Without regulation, open access and modern technology can cause an economically
excessive effort level and an unwarranted decline in the resource. Increasingly, modern
managers have seen the solution in twin policies: the allocation of property rights, often
in the form of individual tradable quotas (ITQs), and rule-based management of the TAC
(total allowable catch) through operational management procedures (OMPs). This usually
makes a public authority responsible for the sustainable utilization of the resource and its
socio-economic consequences. This paper shows how institutional factors can lead to
poor delivery in a theoretically valid “rights based” management system.
Like many third world countries, Namibia faces competing imperatives. Job creation,
food security, foreign exchange generation and tax revenue collection are only a few.
The job of a politician is to balance these. By contrast, the fisheries scientist often looks
to the long-term sustainability of the stock he or she studies, and measures success by
the growth of that resource. There is no right and wrong in these two approaches; but
behind both of them lies a simple reality: the sustainability of the resource is key to all. If
the stock collapses, with it go the jobs, the foreign exchange and the tax revenues. No
short run imperatives can overide this harsh reality.
2014 Kirchner and Leiman; licensee Springer. This is an open access article distributed under the terms of the Creative Commonsttribution License (http://creativecommons.org/licenses/by/2.0), which permits unrestricted use, distribution, and reproduction in anyedium, provided the original work is properly cited.
Kirchner and Leiman Maritime Studies 2014, 13:7 Page 2 of 23http://www.maritimestudiesjournal.com/content/13/1/7
This paper explores the divergencies between scientific and political management in
Namibia, and their implications. It is structured as follows: the initial portion, sections
one and two, provides background material. The former details the problem of managing
a fishery when the manager has multiple objectives in mind, and the special problems
faced by Namibia’s fisheries managers. Section two addresses the institutional history of
the Namibian hake fishery. The later portion analyses the impacts of these divisions
Section three describes the process of resource management, including the development
of scientific recommendations and their evolution into political decisions. Section four
discusses the implications of these divergences, and section five concludes.
The nature of the problem
It is in the interest of any nation that the its fisheries’ resource rents (i.e. the fishing
industry’s economic profits) be maximized and captured locally. That this is rarely
achieved has been clearly shown (World Bank, 2008), despite the fact that most fisheries
management regimes have long moved from open access policies to various forms of
effort control. Such controls include restrictions of catch, gear, effort, area or season, the
impacts of which are on the resource directly, and also economic interventions including
fishing rights, licence fees and taxes. All aim to reduce economic inefficiencies and to
increase the overall profitability of the industry. However, in their original forms all
proved inefficient. In each there remained a fault line between individually rational
behaviour and the ideal behaviour that would maximize collective profits.
Economic theory suggested that allocating property rights to the resource could solve
the problem. Each right would be issued as an individual quota (IQ) i.e. a fixed proportion
of the annually set total allowable catch (TAC). Such rights remove the incentive to race
for fish before the TAC is fished out. Fish prices stabilize as fishers spread their activities
over longer periods, and the incentive to overcapitalize is removed. At the same time, the
TAC is still operating to ensure the long-term sustainability of the resource (Grafton
1996; Sumaila 2010). If rights can be freely traded as individual transferable quotas
(ITQs) they will in time be held by the fishers best able to profit from them. In this
way sustainability and rent maximization are theoretically achieved simultaneously.
The issue becomes less clear-cut if the state’s objective function also includes job creation.
In theory government can tax away the (maximized) profits of the fishing industry and use
them to create jobs at low cost elsewhere in the economy. Alternatively they can pressure
firms to use uneconomically labour-intensive technologies, thus trading off the number of
fishery-related jobs per tonne of fish captured, against profits. Clearly, if job creation is
important, then the selection of stategy should depend on the state’s (in) ability to create
jobs cheaply elsewhere in the economy.
The second requirement for policy efficiency is the accurate determination of the
TAC which sets the tonnage in each individual quota. This requires credible scientific
stock assessments, and a recognized rule tying the TAC to them. This system increasingly
takes the form of an OMP: a set of rules pre-agreed between the industry, scientists and the
state, based on a statistical catch-at-age model of the fishery which is updated regularly to
provide stock estimates. The model can (and should) be regularly improved, but critical to
the operation of the process is a commitment to follow its prescriptions.
Namibian fisheries are often held up as an example of well-conceived management.
Management plans (OMPs) have been in place for over a decade and the state appears
Kirchner and Leiman Maritime Studies 2014, 13:7 Page 3 of 23http://www.maritimestudiesjournal.com/content/13/1/7
supportive of scientific management. A closer study, however, shows a history of ineffi-
ciency, much of it based on TACs set above the levels originally recommended. In part
this has flowed from the prevailing institutional arrangements, though some can be
traced back to early failures in the model driving the OMP, which reduced the credibil-
ity of the science involved. This paper investigates these inefficiencies and their roots.
Prior to independence in 1990, Namibia was administered by South Africa through a
League of Nations mandate. In consequence, even after the 1982 Convention on the
Law of the Sea, the territory’s waters extended only 3 nautical miles, beyond which
there was effectively open access. Unsurprisingly, the hake resource which the new
Namibian government inherited at independence in 1990 had been seriously depleted
by foreign fleets. Responding to this problem the State imposed a variety of imperatives
on itself: one of these was to establish the fishery as a domestic activity. Another was
to allow the resource to recover to levels that would maximize resource rents. These
two objectives have proven mutually incompatible. Indeed, despite strong constitutional
language mandating sustainable management, the resource has continued to be over-
exploited. This paper explains the policy choices made and their consequences.
It has been argued that key to the sustainable management of a fishery are the in-
stitutional structures and incentives facing its participants (Hilborn et al. 2005).
Since independence, the Ministry of Fisheries and Resource Management of Namibia
has been responsible for the management of the country’s ‘publicly owned’ hake resource.
State policy entitles the industry to a ‘normal profit’, but requires that any further ‘eco-
nomic profits’ should accrue to the people as a whole, the government being responsible
for their collection and distribution.
There is no doubt that the resource was severely depleted at independence and had
to be allowed to recover. This process was, and continues to be, poorly managed and
as a result potential rents were lost. The extent to which Namibia’s post-independence
hake fishery’s resource rents fell short of their potential, and thereby imposed costs on
both the industry and the public, has been estimated by a range of authors (Manning
1998; Oelofsen 1999; Ithindi 2003; Lange 2004). Manning (1998): 270 argued that the
hake industry lost rents of N$260a million in 1996, while we estimate that rents with a
minimum value of N$227 m were lost in 2010.
On the positive side, the State’s objectives were clearly framed from the start. Post-
independence these were formulated as follows (Government of Namibia 1991: 42):
The government’s main objective for the fisheries sector is to utilize the country’s
fisheries resources on a sustainable basis and to develop industries based on them in
a way that ensures their lasting contribution to the country’s economy and overall
development objectives…The government is committed to rebuilding depleted
fishery stocks to their level of full potential…All stocks will otherwise be exploited
on a sustainable basis and at moderate levels, in general below that estimated to give
maximum sustainable yields. (our emphasis)
The statement seems clear. At Namibia’s Independence in 1990 the fish stock had
been seriously depleted by foreign fishing fleets, the domestic fishing industry was
poorly developed, and fisheries provided little employment to Namibians. The depleted
stocks called for conservative management if they were to rebuild to a rent-maximizing
Kirchner and Leiman Maritime Studies 2014, 13:7 Page 4 of 23http://www.maritimestudiesjournal.com/content/13/1/7
level. However, this long term imperative was countered by the immediate need to
develop the local fishing industry and to increase employment.
Twenty years have passed since these objectives were formulated and implemented.
The estimated hake stock was then far below its maximum sustainable yield level
(BMSY), and despite some comments in the literature (e.g. Nichols 2004), the resource
has not recovered since then (Kirchner et al. 2012).
Institutional historyAlthough the system of individual rights used by the Namibian authorities should have
enhanced the efficiency of the hake fishery, lowering costs, reducing effort, and rewarding
the industry for allowing the recovery of the stock, it has signally failed to achieve these
ends. Much of this failure is owing to institutional features of the industry and the state
management system that directed it.
The central institutional driver has been “Namibianization”. The government has
consistently espoused the view that the country’s citizens should share the benefits of
its natural resources. One manifestation was the Namibianization policy of 1992 gave
citizens economic incentives to participate in the fishing industry as owners or as
employees (Armstrong et al. 2004). The policy had two objectives: increasing Namibian
control/ownership, and increasing economic benefits to Namibians. The former
entailed achieving Namibian majority shareholding in fishing companies, while the
latter promoted job creation for Namibians and revenue generation for government
(Erastus 2002: 43).
The policy led to the termination of all pre-existing fishing rights in 1993, and the
allocation of new rights using the degree of Namibian control in applicant firms as the
primary criterion.a Firms with less than 50% Namibian ownership received seven-year
quotas, while those that were at least 90% Namibian-owned, and had 50% Namibian
investment in vessels and onshore processing facilities, received fifteen-year rights.
Namibian right-holders with part shares in larger ventures, and foreign-owned ventures
that had invested significantly or had the potential to do so, also qualified for 15-year
fishing rights. 20-year rights were ostensibly available to ventures that employed at least
5 000 permanent employees in onshore processing facilities and fulfilled the requirements
for 15-year rights (Armstrong et al. 2004), but none has yet been allocated.
Importantly, although these rights were allocated rather than auctioned, they were not
costless. A levy was payable for all rights; however, Namibians paid significantly less than
foreigners, and rebates on quota fees varied with the degree of Namibianization. In 1997
the quota fee for hake was N$800 per tonne (roughly US$175 at the exchange rate of the
time) for foreign freezer vessels, N$680 for Namibian-based freezer vessels, with a rebate
of N$200 if fully Namibian-owned and a further discount of N$200 if the catch was proc-
essed on land (Armstrong et al. 2004).b Quota fees for Namibian wet-fish rights were N
$660 per tonne in 1997, but were lowered to N$300 in 2004, at which level they remain.c
Melber (2003) has claimed that almost all levies were paid at the lowest rate and that
Namibianization was and is illusory, with foreign control maintained through a compli-
cated web of preferential shares, proxy ownership and cross-ownership (Manning 1998;
Melber 2003) that lowers the State’s share of resource rents.
In addition to the quota levies and the standard corporate tax fee of 35%, companies
pay by-catch fees on most non-quota species. Although most fetch lower prices than
Kirchner and Leiman Maritime Studies 2014, 13:7 Page 5 of 23http://www.maritimestudiesjournal.com/content/13/1/7
hake, two species are particularly valuable, Monkfish (Lophius vomerinus) and Kingklip
(Genypterus capensis). The fee is intended to prevent the targeting of these species
without encouraging by-catch dumping. Some by-catch is allowed without payment
since an element of it is unavoidable (Nichols 2004). Namibia prohibits vessel to vessel
transhipment of fish. Consequently, all hake is landed at Walvis Bay or Lüderitz, where
onshore inspectors monitor compliance with quota limits and fee payments (Nichols
2004). All hake vessels also carry onboard compliance monitors.
The final fee is that paid into the Marine Research Fund for every tonne landed. During
the period 1994–1999 the fund collected an annual average of N$37million for research
and training (Wiuum and Uulenga 2003), the hake sector typically contributing 56%-66%
of this (Eide et al. 2003).
Among the causes of rent loss in Namibia’s fisheries was the country’s new ‘empower-
ment’ policy. In 1994–1995 it allocated 25% of the TAC to newcomers: a mix of previously
disadvantaged business people, local fishers and prominent Namibians. The policy had
two key objectives:
to provide the newcomers with enough quota to compete against well established
companies (Erastus 2002).
to increase employment: the quotas were distributed with the proviso that the fish be
processed ashore, as onshore processing is more labour-intensive than that aboard
freezer trawlers (Armstrong et al. 2004).
Unfortunately, the high cost of entry into the industry encouraged some new right-
holders to ‘lease’ their quota to established firms. An average wet-fish vessel at the time
cost roughly N$7.7 million (about N$55 million in 2011 terms) and, while cheaper than
freezer vessels, which then cost about N$26.5 million (roughly N$100 million or US$8
million in 2011 terms), it was still costly enough to make it difficult for newcomers to buy
their own vessels (Japp and Steenkamp 2004).
The Namibian authorities were concerned that new recipients of quota should not
simply sell their quota and pocket the cash. Consequently a feature of the Namibian
hake fishery is that individual rights are technically non-tradable; however, the acceptabil-
ity of leasing arrangements has rendered them de facto ITQs (Armstrong et al. 2004).
Importantly, this official non-tradability precludes the use of quota as collateral when
applying for credit (Sherbourne 2010).
In 2002, the Minister of Fisheries announced that foreign companies wishing further
exploitation rights would need to form joint ventures with previously disadvantaged
Namibians. Although some new right-holders had already bought old vessels (thereby
reinforcing industry over-capacity), some foreign firms objected that Namibian partners
in such joint ventures would be more likely to decamp with their share of the money
than to invest it in maintenance or acquisition of assets (Melber 2003).
While the employment creation aspect of Namibia’s empowerment policy appeared
successful during the period 1991–1998, when fisheries employment increased by 6 000
(Erastus 2002), it was not costless. Armstrong et al. (Armstrong et al. 2004) estimated
that between 1993 and 1998 the policy provided 1000 new jobs a year at an average
annual cost of N$74.5 million in quota fees foregone: a cost to government of N$74 500
per job. Manning (1998) asserted that the funds could have been used more effectively in
Kirchner and Leiman Maritime Studies 2014, 13:7 Page 6 of 23http://www.maritimestudiesjournal.com/content/13/1/7
other sectors, such as health, education and housing. He critiqued the Namibianization
policy on three primary grounds: general loss of resource rent, the capture of resource
rents by a few individuals rather the Namibian people as a whole, and the continuation of
de facto foreign ownership. In a rejoinder, however, Oelofsen (1999) contended that,
compared to other national fisheries, Namibia had captured a relatively large part of the
resource rent. Undoubtedly, Namibian ownership has increased substantially since inde-
pendence, as has participation by Namibian pension and insurance funds.
Fishing rights lie at the heart of Namibian fisheries policy: ‘No person may harvest any
marine resource commercially unless they are the owner of a fishing right’ (MFMR 2000).
Such rights are primarily intended to curtail fishing effort, and protect the resource
(Nichols 2004), however redistribution is an important secondary aim. Sections 16, 17
and 18 of the 1992 Sea Fisheries Act (Government of Namibia 1992) specified that the
applicant should be a Namibian citizen or company, and should be able to exploit the
resource satisfactorily. To this it was added that special criteria such as the advancement of
previously disadvantaged persons and the contribution to regional development in Namibia
would be considered, and that the rights would be non-transferable to ensure that the
Namibianization and empowerment strategies were sustained (Nichols 2004).
Unfortunately, Namibianization further fragmented the TAC. Owners of quotas too
small to warrant vessel purchase either leased them or entered into joint ventures with
larger quota holders. The resulting power asymmetry often meant disadvantageous
commercial relationships (Manning 1998), the rents being captured by the larger firms
with whom they interacted.
Such fragmentation also affects sustainability and rents. In an oligopolistic fishery
with long-term rights, firms have an incentive a) to steward the resource properly and
abide by the quota set (no highgrading etc.) and b) to set up processing plants and estab-
lish markets for processed product, i.e. to add value (Parslow 2010), since the economies
of scale and scope in hake processing and marketing allow vertically integrated firms to
make fuller use of value chains. However, as Sumaila (2010) pointed out, when those who
have long-term quotas are not those doing the fishing, ITQs are no guarantee of good
resource stewardship.
One flaw in the current quota allocation system is that it engenders perverse incentives.
The Ministry of Fisheries expects unfilled quotas to be returned for redistribution to other
companies. Right-holders that do not return uncaught quota are penalized N$800 per
tonne for uncaught quota (no rebates). The Ministry has also warned that unfilled quotas
might affect future rights allocations (Armstrong et al. 2004). This puts pressure on
quota-holders to keep fishing even when catch per unit effort (CPUE) is low.d This is
clearly at odds with the stated primary objectives of Namibian fisheries management and
seems likely to deplete both resource stocks and company profits (BCLME 2006a: 32).
The allocation system not only fails to maximize rents, it fails to appropriate them to
the state. One suggested solution is auctioning the quotas to eligible bidders,
granting the quota to the second highest bidder to disincentivize over-bidding by
new entrants (BCLME 2006b: 90).
The key failing of Namibia’s hake policy has been its inability to restore the resource.
Although the Namibian hake population showed some recovery after 2007, it remains
Kirchner and Leiman Maritime Studies 2014, 13:7 Page 7 of 23http://www.maritimestudiesjournal.com/content/13/1/7
at one-third of the modelled maximum sustainable yield level (BMSY) (Kirchner et al.
2012), a level similar to that in 1990. One reason for this failure is that Namibia’s fisheries
managers are juggling competing economic, social and political imperatives. While high
catches may be politically useful, they only make economic sense if interest rates are very
high, catch per unit effort (CPUE) is unrelated to stocks, or an easily-poached high-value
resource is involved.
This failure has had profound consequences for the fishery’s viability. Ordinarily,
maximizing the present value of fishery profits requires keeping the resource large
enough to provide a high future CPUE, thereby keeping average costs relatively low
(BCLME 2006b). The age distribution of the fish population is also affected by current
catches: overfishing leaves a younger stock of smaller individuals. It also affects product
prices; rebuilding the resource increases the proportion of older and larger fish in the
catch. These command a higher price per kilogram, typically 200 to 300 percent more
than small hake (Leiman and Harris 2009: 42). Since larger fish are also more fecund,
allowing an overfished stock to age will clearly increase sustainable rents.
It is worth re-emphasising that rents in the hake sector increase along a value chain.
They accrue to those processing hake rather than to those harvesting it. Large vertically-
integrated fishing companies enjoy economies of scale and scope. Not only are they more
cost-effective, but their wider spread of processed products reduces their vulnerability to
financial risk and leaves them better prepared for quota and economic fluctuations. Such
firms exist in a world of long-term contracts with international buyers and necessarily
take a longer-term approach to the sustainability of the fish resource (BCLME 2006b).
In evaluations of profitability in the hake sector, an issue that regularly appears is the
“wet-fish/freezer vessel debate”. At its heart is job creation. The hake fishery currently
employs 63% of all fisheries workers. A key determinant of employment levels is the
harvesting method used. Redistributing quota to wet-fish operators lengthens and adds
complexity to the value chain, increasing the range of product options. It also increases
employment of unskilled and female labour (the restricted range of hake products pro-
duced aboard freezer vessels is largely produced by semi-skilled male labour (BCLME
2006a)).e To increase and secure employment in the sector, the Ministry of Fisheries
has therefore given wet-fish trawlers about 70% of the TAC, though the industry has
typically argued that freezer trawlers (the remaining 30%) are more profitable (Japp and
Steenkamp 2004), and that State support of the wet-fish sector is dissipating taxable
resource rents (BCLME 2006b).
Freezer vessels can only make limited use of large (high-value) fish since these are
mechanically filleted and used to produce a limited range of standard products. If
landed from a wet-fish vessel the same fish could be exported fresh, hand filleted, or
processed into a designer product aligned to immediate market demands (BCLME
2006a). On the other hand, Namibia’s wet-fish trawler fleet is very old (over 30 years);
vessel efficiency deteriorates with age, potentially dissipating rents further (BCLME
2006c).
It is politically difficult to reduce overcapacity in a fleet (Oelofsen 1999), even when it
is clear that vessel age and fleet overcapacity directly dissipate rents. Namibia’s problem
has been worsened by a quota allocation process (Government of Namibia 1993) that
encourages investment in vessels and processing plants by tying additional quota
allocation directly to capital investments made.
Kirchner and Leiman Maritime Studies 2014, 13:7 Page 8 of 23http://www.maritimestudiesjournal.com/content/13/1/7
The Namibian government’s 1994 apportionment policy (BCLME 2006c) aimed to
increase employment in the fishery by gradually shifting catch and effort away from the
freezer fleet, which dominated the industry in the early 1990s, and towards wet-fish
vessels. The policy stipulated that the proportion of the total allowable catch (TAC) going
to wet-fish operators would rise from 20% in 1993, to 40% in 1994, 60% in 1995, and the
present 70% of TAC.
The apportionment policy’s impacts on rents have been disputed (Sumaila 2000,
2001; Japp and Steenkamp 2004). Sumaila (2000), assuming a 150 000 tonnes TAC,
assessed the optimal freezer/wet-fish vessel mix in terms of discounted net benefit and
impact on employment. It estimated a present value of N$10.42 billion from the
60:40% policy, this coming from 32 wet-fish and 13 freezer trawlers. Controversially,
however, it found that the total rent would be greater (NPV = N$11.69 billion) if all
the TAC were allocated to 53 wet-fish trawlers, an approach which could provide em-
ployment for 7 800 workers as opposed to the 5 219 employed with the 60:40% policy.
Sumaila’s later bio-economic modelling results (Sumaila 2001) reasserted that resource
rents would be maximized if wet-fish operators received the entire quota. He did con-
cede, however, that other considerations (biological, market, harvesting and processing
constraints) could support the current allocation system.
Sumaila’s results were contested by Japp and Steenkamp’s (2004) study of detailed
revenue data from 13 land-based factories, 20 freezer vessels and 77 wet-fish vessels for
the 2002/3 fishing season. Although some wet-fish operators were profitable, they
found the wet-fish segment of the hake fishery generally unviable. They estimated the
net present value for freezer vessels at N$363.3 million in 2004 while wet-fish operators
showed a loss of N$2 466 million. While revenues per tonne were similar, the combined
fishing and processing costs per tonne on freezer vessels were below those of fishing
with wet-fish trawlers and processing on land. Consequently they recommended a
controlled deregulation of the apportionment over four years.
The relative profitability of wet-fish vessels is clearly affected by fuel prices and the
distance vessels have to travel to their fishing grounds. Freezer trawlers do less travelling,
but have to generate their own power on board. Japp and Steenkamp’s (2004) study was
undertaken after oil prices had begun their rise.f However, Eide et al. (2003) estimated
hake resource rents between 2000 and 2002 (a period of low fuel prices) at N$81-140
million for wet-fish operators and N$171-234 million for freezer vessels, despite their
smaller share of TAC.
Resource managementThe remainder of this paper will evaluate the management of the resource by com-
paring the policy recommendations made to those actually adopted, and their
consequences.
The data evaluated in this study were collected by the Ministry of Fisheries and
Marine Resources. Fishery-dependent data are recorded by skippers on vessels on a
trawl-by-trawl basis, providing a very complete database on the fishing operations
(Van der Westhuizen 2001). Efficiency data come from the fleet analysis conducted
for the year 2008 (the latest complete dataset). This related CPUE to Horse Power
(HP) and vessel age, while comparing total annual catch and the number of days fishing
in the wet-fish and freezer fleets.g
Kirchner and Leiman Maritime Studies 2014, 13:7 Page 9 of 23http://www.maritimestudiesjournal.com/content/13/1/7
The revenues lost through quota fee reductions were calculated and the impacts of
apportionment policy were investigated using a bioeconomic model (Kirchner 2014
forthcoming).
Biological management recommendations: a chronicle
Section 15 of Namibia’s Sea Fisheries Act (Government of Namibia 1992) provides for
the Minister to determine total allowable catches (TACs) after consultation with the
Marine Resources Advisory Council (formerly Sea Fishery Advisory Council). In practice,
the process followed since 1997 has been as follows:-
First a working group that contains industry members, government scientists and
consultants, meets to discuss the available data and the assessments. On the basis of
these discussions government scientists then prepare recommendations for the annual
hake TAC and related issues. These are then presented to the Minister and senior officials.
At this stage they may be changed. The recommendations are next put to the Marine
Resources Advisory Council. They take cognizance of socio-economic considerations and
formulate their own recommendations for the Minister, who receives them and then him-
self makes recommendations to Cabinet, taking into account any other relevant factors.
Immediately following Independence, a hake TAC of 60 000 tonnes was allocated for
both 1990 and 1991. This was a severe drop: catches had been around 300 000 tonnes
in 1989. Between 1992 and 1997, the scientists’ TAC recommendations were based on
swept-area research surveys taken to estimate the hake biomass.
It is important to note at this stage that the Namibian White Paper on a Marine Fisheries
Policy (Government of Namibia 1991) recommended that TAC be restricted to 20% of the
“fishable biomass” (fish larger than 35 cm) until the stocks were considered rebuilt. This
guideline was not always followed, as for example in 1995, when the scientifically recom-
mended TAC was about 35% of the fishable biomass, which was further increased by
Marine Resources Advisory Council (MRAC) to over 40%.
One source of the problem was scientific uncertainty. The pre-1990 data were of
mixed quality, making it difficult to set a baseline. By 1997, the status and trend of the
hake resource remained unclear. While the catch per unit effort (CPUE) index was
declining, the survey index estimate showed no trend at all (Butterworth and Geromont,
2001), implying that the stock was stable. The ambiguity came from the effect of prior
assumptions on the outcomes of the swept-area survey estimates. These estimate the
biomass of fish aged 2 years or more as a proportion of the estimated pristine stock of
such fish (B2+/K2+). If treated as an absolute, (i.e. one was implicitly assuming that the
gear was 100% efficient with a catchability coefficient q = 1, and that the survey estimates
were unbiased), then the surveys suggested that the stock was depleted to B2+/K2+ =
0.104h. But if the survey estimates were treated in relative terms, then the resource could
look very healthy. Thus, if the assessment used a catchability coefficient of q = 0.2 (imply-
ing that only 20% of the fish in the path of the trawl were being caught) then the resource
appeared very healthy (well above BMSY with B2+/K2+ = 0.803, indicating that higher TACs
could be set.
In reaction to this uncertainty Butterworth and Geromont (2001) developed an
“Interim Management Procedure” (IMP). This aimed to prevent the resource being left
unharvested if it was in good condition while allowing the resource managers to react
fairly quickly if subsequent data indicated that the stock was indeed depleted. Although
Kirchner and Leiman Maritime Studies 2014, 13:7 Page 10 of 23http://www.maritimestudiesjournal.com/content/13/1/7
the IMP was in place from 1998 to 2000 its recommendations were never followed,
either because scientists changed the original formula or because the MRAC disputed
its recommendations.
After three years the IMP was thought to have served its purpose as further research
and data from the fishery improved the understanding of the resource and its status.
The catchability factor of the survey vessel was by then believed to be well below q = 1.
The estimated stock size in 2001 (B/K = 0.27) had not shown much recovery (Butterworth
and Rademeyer, 2005) from its depleted state in 1990 (B/K ≈ 0.22). Although the assess-
ment showed that, with future projected catches around 200 000 tonnes, no clear recov-
ery from the low biomass levels in 1990 was expected, the TAC was still set at 200 000
tonnes, of which only 174 000 tonnes were caught in 2001
A new operational management procedure (OMP) was tested and internationally
reviewed (unpublished reports of the BENEFIT stock assessment programme 2000,
2001). It appeared to perform reasonably well provided the carrying capacity of the
hake stock did not decrease, even when the survey estimates were taken as absolute
(the most pessimistic case) (Rademeyer 2003).
The hake OMP had been developed to meet four objectives: to maximize average annual
catch; to minimize annual catch variation; to allow recovery in spawning biomass to at
least the MSY level; and to achieve acceptable risk.
Although these matched the stipulations of the Marine Fisheries Policy, the OMP
was not accepted by Namibian management and MRAC, and a TAC of 195 000 tonnes
was set. Despite the low fuel prices at the time, and the penalties for failure to land
quota, only 156 000 tonnes were landed in 2002. The fish stock had clearly been seriously
depleted.
A routine updated assessment was done to evaluate whether the resource status
remained within the range considered when the OMP was developed (Rademeyer and
Butterworth, unpublished report 2003a). The updated assessment included new data
which changed the results considerably from the OMP reference assessment. Although
the estimated depletion value had fallen to 20% for the reference case, it was still just
within the 95% confidence intervals for the OMP reference case and the OMP was
retained as the basis for recommendations. The recommended TAC for 2003, based on
the OMP and following all the rules, was estimated to be 176 000 tonnes. The decrease
in the TAC should have been larger, but it was limited by the OMP’s constraint rule
which only allowed a 10% year on year decline in TAC. The allocated TAC was 180
000 tonnes, and subsequent reconciliation showed an actual catch of 189 000 tonnes.
In 2004, the routine updated assessment for the Namibian hake resource (Rademeyer
and Butterworth, unpublished report 2003b) showed a completely different picture to
the Reference Case used to test the candidate OMPs in (Rademeyer 2003). It had
moved outside the range tested in the OMP; moreover, a statistically significant incon-
sistency between the survey and CPUE index was detected which had to be addressed
in the assessment and recommendations.
Though the OMP had recommended a TAC of 158 000 tonnes the TAC was increased
from 180 000 to 196 000 tonnes. Yet again the depleted stock prevented the TAC being
caught, and only 174 000 tonnes were landed.
In 2005, the scientists agreed that the resource was seriously depleted, the modellers
(Rademeyer and Butterworth, unpublished report 2005a, 2005b) estimating that the
Kirchner and Leiman Maritime Studies 2014, 13:7 Page 11 of 23http://www.maritimestudiesjournal.com/content/13/1/7
spawning biomass was below 10% of pristine levels (Bsp(2005)/Ksp <0.1). Despite this
agreement, government scientists recommended a TAC of 160 000 tonnes, which was
increased by MRAC to 180 000 tonnes of which only 141 000 tonnes could be landed.
In 2006, it was clear to all that the hake stock was severely depleted. The CPUE was
low and the fish sizes were small, suggesting that the biomass consisted mainly of
recruits from the above-average 2004 and 2005 cohorts. Many companies in the fishing
industry suffered extreme financial strain and some closed.
The assessments indicated that the TAC should be decreased to at most 100 000
tonnes and then kept low for many years for the resource to regain the MSY level. The
industry requested step-wise reduction in the TAC so that members could adapt their
businesses to lower quotas. It was therefore recommended that the TAC be reduced to
140 000 tonnes in 2006 and then cut by 10 000 tonnes annually for four years, to reach
TAC of 100 000 tonnes in 2010, where it would stay until the resource had expanded
to the MSY level. However, the severity of the situation was so clear to management
members and MRAC that TAC was cut by 50 000 tonnes and set at 130 000 tonnes.
There was general concern that large numbers of fish smaller than 36 cm (the official
minimum size) were being landed despite the use of compulsory sorting grids. To address
the problem additional regulations were implemented. Those implemented in or by 2006
included an increase in the minumum mesh size to 110 mm; the closure of the fishery in
October of each year, and a series of geographic restrictions that precluded hake fishing
by wet, freezer and longline vessels within the 200 m waterdepth range along the whole
Namibian coast, and more specifically no trawling in waters shallower that 300 m the area
from 25°S to the Orange River, and no freezer trawlers between 25°S and the Orange
River in waters shallower that 350 m.
Despite the earlier commitment, the TAC was never decreased to 100 000 tonnes. It
remained at 130 000 tonnes until 2008. The resource showed some improvement in
2009 and the TAC was increased to 148 000 tonnes to help the fishing industry through
the worldwide economic downturn. Possibly due to above average recruitment levels in
recent years (Kirchner et al. 2012), the resource showed clear signs of improvement,
therefore the basis of scientific advice was revisited in 2011. The recommended TAC is
now set at 80% of the average replacement yield over the previous five years, with 20% being
left to expand the resource. Despite recent experiences, even though the recommended
TAC for 2011 was 145 000 tonnes, 180 000 tonnes of quota were allocated, with 170 000
tonnes being allocated for the 2012/2013 season.
Fishing capacity
Namibia’s fishing season starts in May and ends in April of the subsequent year. In most
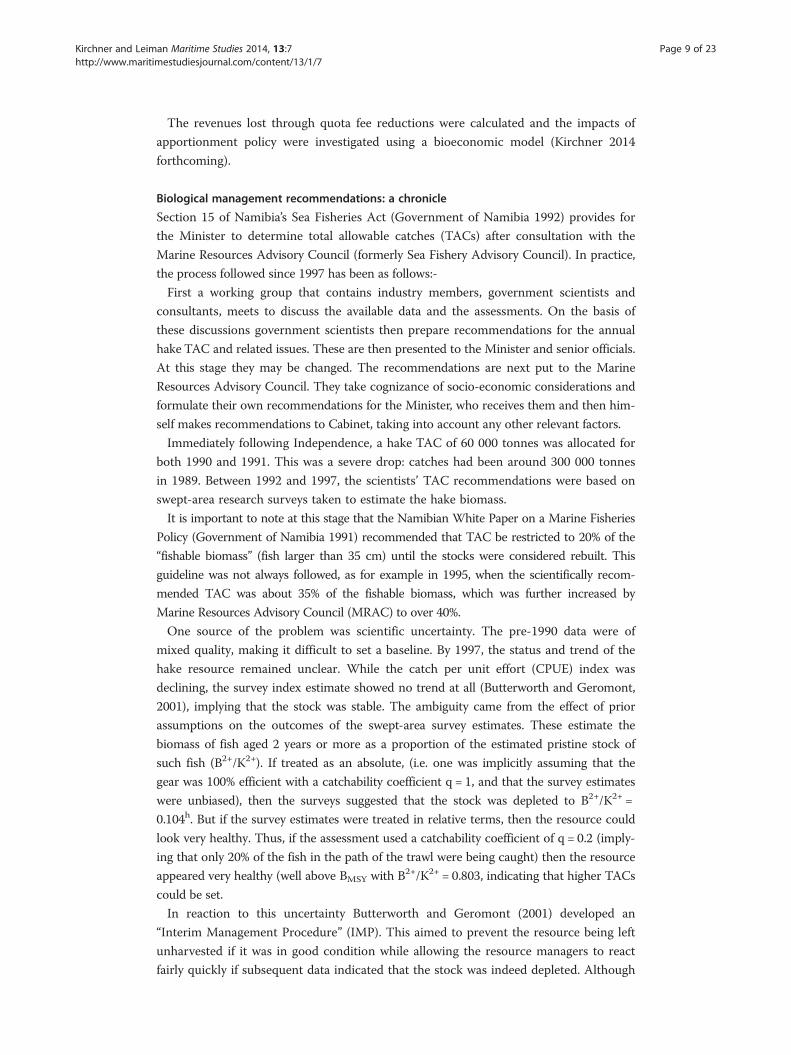
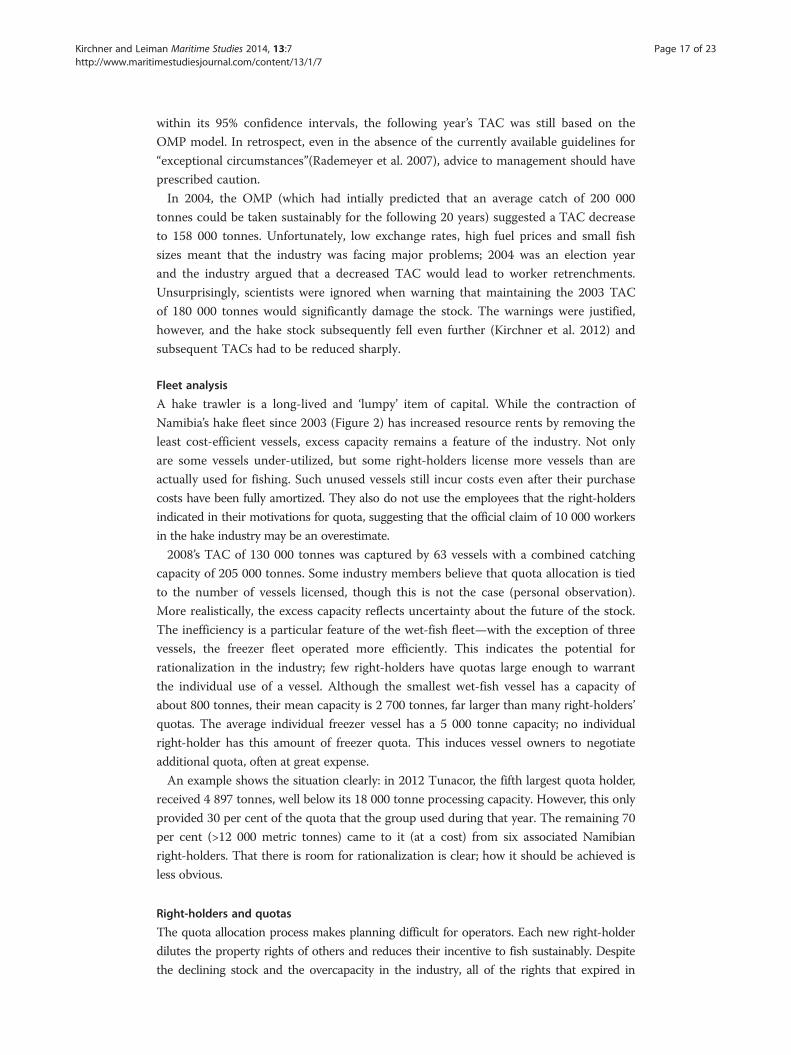
years more vessels were licensed than actually fished, although between 1996 and 2002
unlicensed (or poorly recorded) vessels were fishing, especially in the freezer sector (Figure 1).
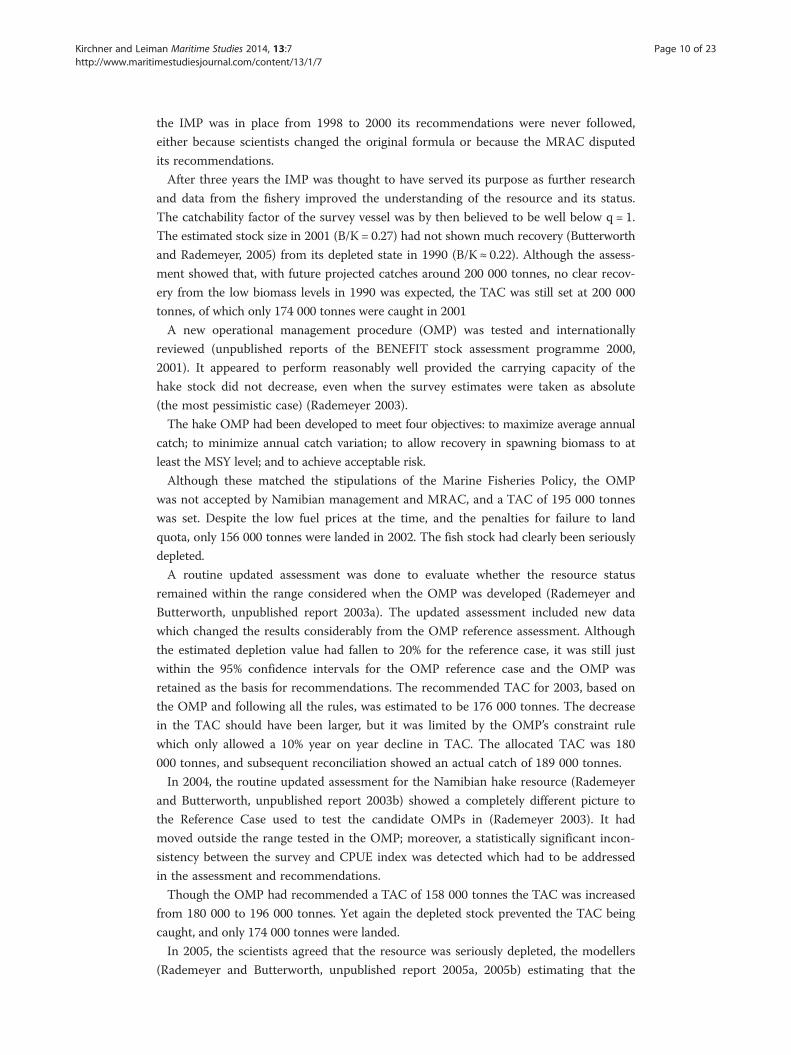
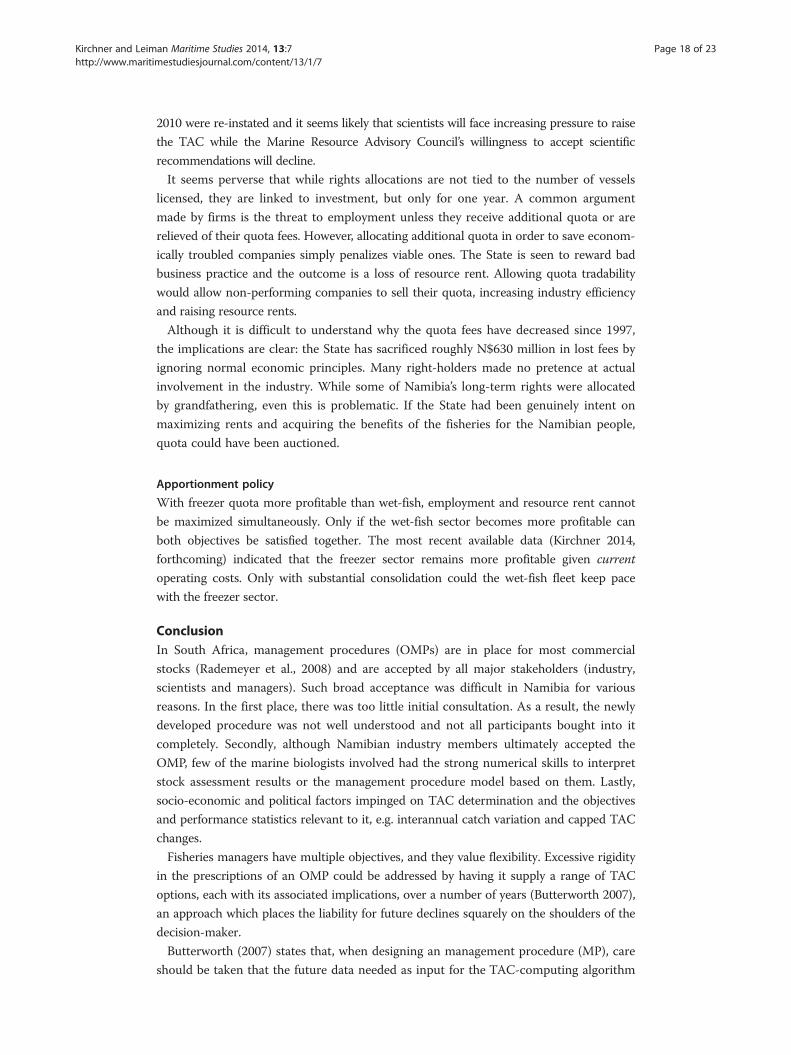
Initially, the number of trawlers was closely tied to the TAC; however, since 2006
vessel numbers have decreased despite an increasing TAC (Figure 2). Two reasons suggest
themselves: a) that, despite the non-tradability of quota, industry members have aligned
themselves through joint ventures etc. allowing more efficient use of capital, and b) that
with rising oil prices only the most efficient vessels are being used.
Excess capacity was clearly a significant issue. The catching capacity of the 63 vessels
actually fishing in the 2008 fishing season (May 2008 - April 2009) was estimated at
0
20
40
60
80
100
120
140
160
1996
1997
1998
1999
2000
2001
2002
2003
2004
2005
2006
2007
2008
2009
2010
Nu
mb
er o
f ve
ssel
s
Total licensed Total fishing
Figure 1 Number of vessels licenced and fishing: 1996–2009.
Kirchner and Leiman Maritime Studies 2014, 13:7 Page 12 of 23http://www.maritimestudiesjournal.com/content/13/1/7
205 000 tonnes, 137 000 tonnes for wet-fish and 68 000 tonnes for freezer vessels.
However, the TAC was only 130 000 tonnes and 31 vessels were not fishing at all. With
October closed for fishing, and allowing a typical fishing trip of 7 days with 3–5 days
in the harbour between trips, an efficient wet-fish vessel could potentially be fishing
195-230 days per year. Only 32% of the wet-fish fleet fished 200 or more days in the
2008 season, while 32% were out for fewer than 150 days. Freezer vessels spent
typically 200–240 days fishing in 2008. The number of hours trawling per day was
estimated at 13 and 16 hours for the wet-fish and freezer fleet respectively.
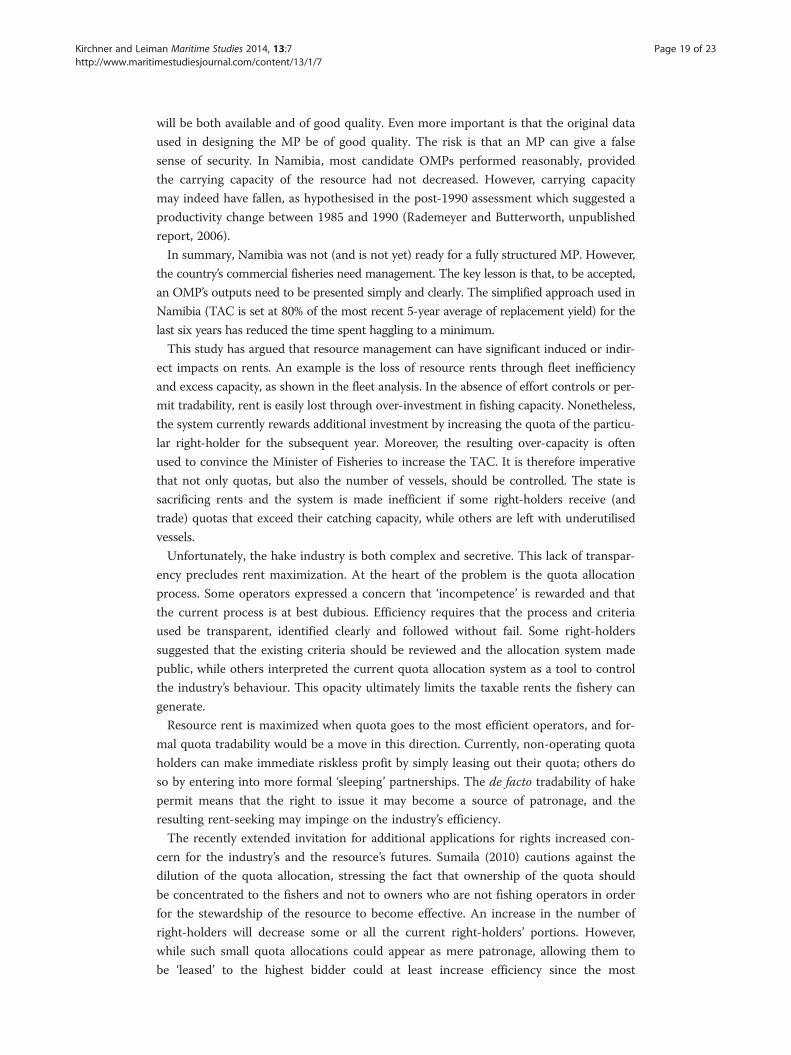
A priori, both vessel efficiency and CPUE are linked to engine power. However, this
appears to explain only 12% of the variation in CPUE (Figure 3a). On the other hand, if
0
50
100
150
200
250
0
20
40
60
80
100
120
140
160
1996
1997
1998
1999
2000
2001
2002
2003
2004
2005
2006
2007
2008
2009
To
tal
allo
wab
le c
atch
in
ton
nes
(x
1000
)
Nu
mb
er o
f b
oat
s fi
shin
g
Number of boats fishingTAC
Figure 2 Number of freezer and wet-fish vessels fishing and total allowable catches (in 000 stonnes): 1996–2009.
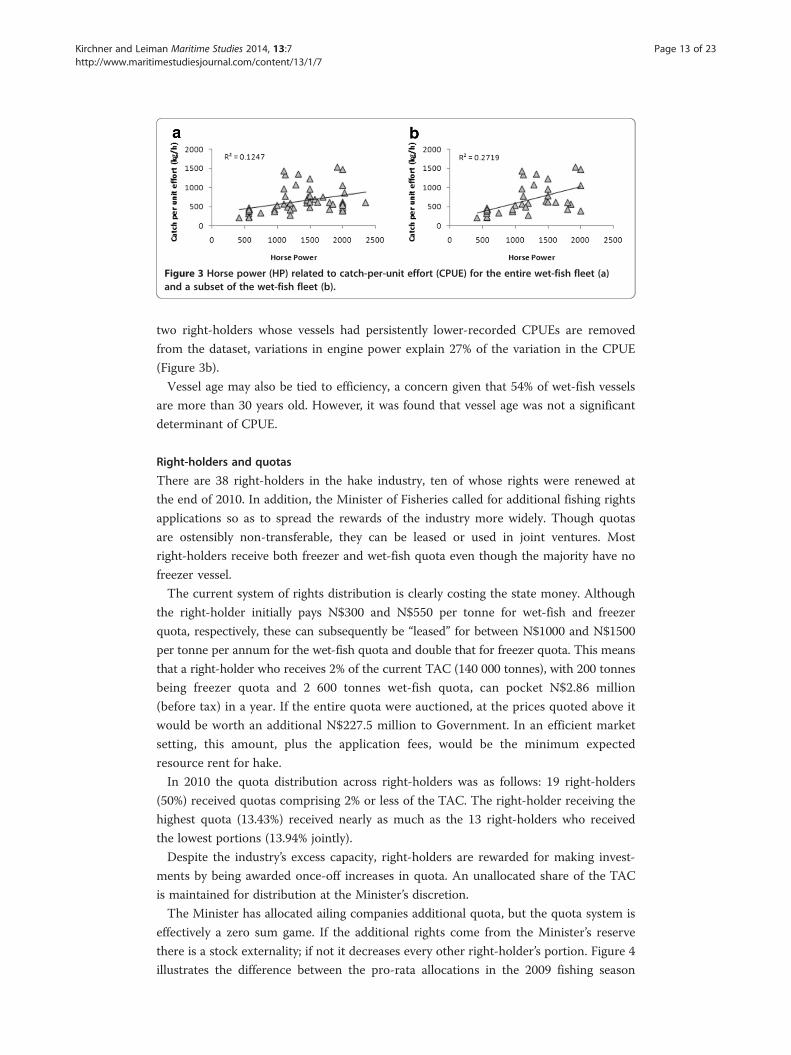
Figure 3 Horse power (HP) related to catch-per-unit effort (CPUE) for the entire wet-fish fleet (a)and a subset of the wet-fish fleet (b).
Kirchner and Leiman Maritime Studies 2014, 13:7 Page 13 of 23http://www.maritimestudiesjournal.com/content/13/1/7
two right-holders whose vessels had persistently lower-recorded CPUEs are removed
from the dataset, variations in engine power explain 27% of the variation in the CPUE
(Figure 3b).
Vessel age may also be tied to efficiency, a concern given that 54% of wet-fish vessels
are more than 30 years old. However, it was found that vessel age was not a significant
determinant of CPUE.
Right-holders and quotas
There are 38 right-holders in the hake industry, ten of whose rights were renewed at
the end of 2010. In addition, the Minister of Fisheries called for additional fishing rights
applications so as to spread the rewards of the industry more widely. Though quotas
are ostensibly non-transferable, they can be leased or used in joint ventures. Most
right-holders receive both freezer and wet-fish quota even though the majority have no
freezer vessel.
The current system of rights distribution is clearly costing the state money. Although
the right-holder initially pays N$300 and N$550 per tonne for wet-fish and freezer
quota, respectively, these can subsequently be “leased” for between N$1000 and N$1500
per tonne per annum for the wet-fish quota and double that for freezer quota. This means
that a right-holder who receives 2% of the current TAC (140 000 tonnes), with 200 tonnes
being freezer quota and 2 600 tonnes wet-fish quota, can pocket N$2.86 million
(before tax) in a year. If the entire quota were auctioned, at the prices quoted above it
would be worth an additional N$227.5 million to Government. In an efficient market
setting, this amount, plus the application fees, would be the minimum expected
resource rent for hake.
In 2010 the quota distribution across right-holders was as follows: 19 right-holders
(50%) received quotas comprising 2% or less of the TAC. The right-holder receiving the
highest quota (13.43%) received nearly as much as the 13 right-holders who received
the lowest portions (13.94% jointly).
Despite the industry’s excess capacity, right-holders are rewarded for making invest-
ments by being awarded once-off increases in quota. An unallocated share of the TAC
is maintained for distribution at the Minister’s discretion.
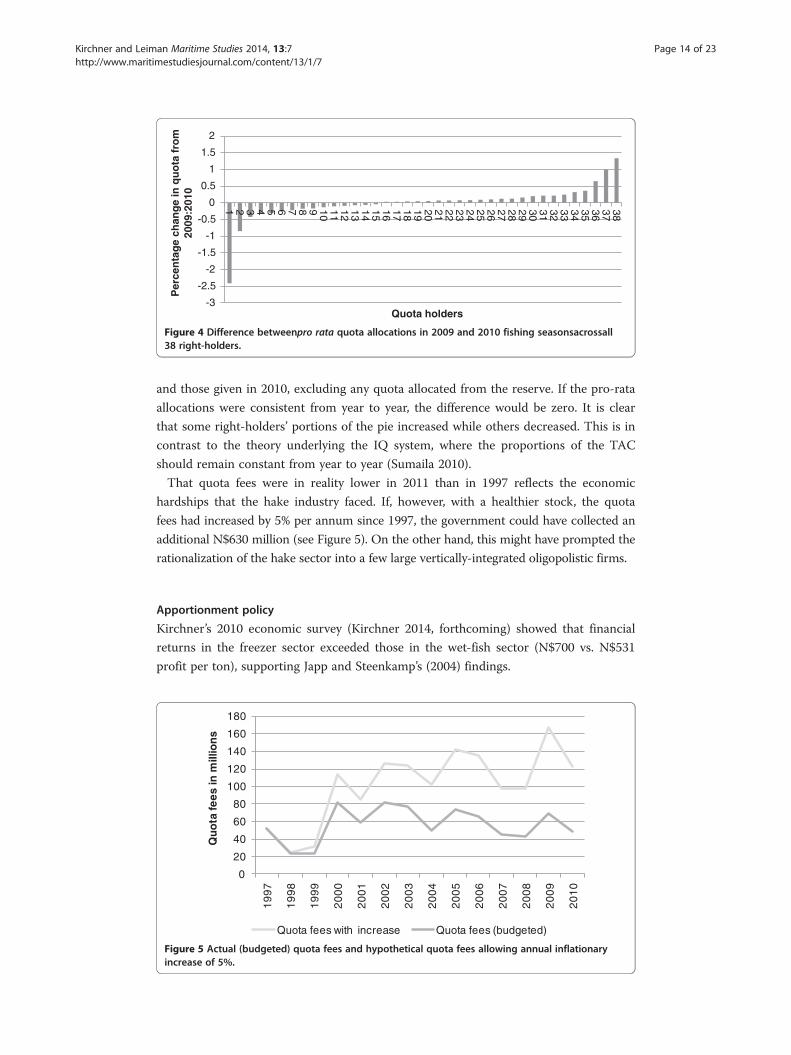
The Minister has allocated ailing companies additional quota, but the quota system is
effectively a zero sum game. If the additional rights come from the Minister’s reserve
there is a stock externality; if not it decreases every other right-holder’s portion. Figure 4
illustrates the difference between the pro-rata allocations in the 2009 fishing season
-3
-2.5
-2
-1.5
-1
-0.5
0
0.5
1
1.5
2
1 2 3 4 5 6 7 8 9 10 11 12 13 14 15 16 17 18 19 20 21 22 23 24 25 26 27 28 29 30 31 32 33 34 35 36 37 38P
erce
nta
ge
chan
ge
in q
uo
ta f
rom
20
09:2
010
Quota holders
Figure 4 Difference betweenpro rata quota allocations in 2009 and 2010 fishing seasonsacrossall38 right-holders.
Kirchner and Leiman Maritime Studies 2014, 13:7 Page 14 of 23http://www.maritimestudiesjournal.com/content/13/1/7
and those given in 2010, excluding any quota allocated from the reserve. If the pro-rata
allocations were consistent from year to year, the difference would be zero. It is clear
that some right-holders’ portions of the pie increased while others decreased. This is in
contrast to the theory underlying the IQ system, where the proportions of the TAC
should remain constant from year to year (Sumaila 2010).
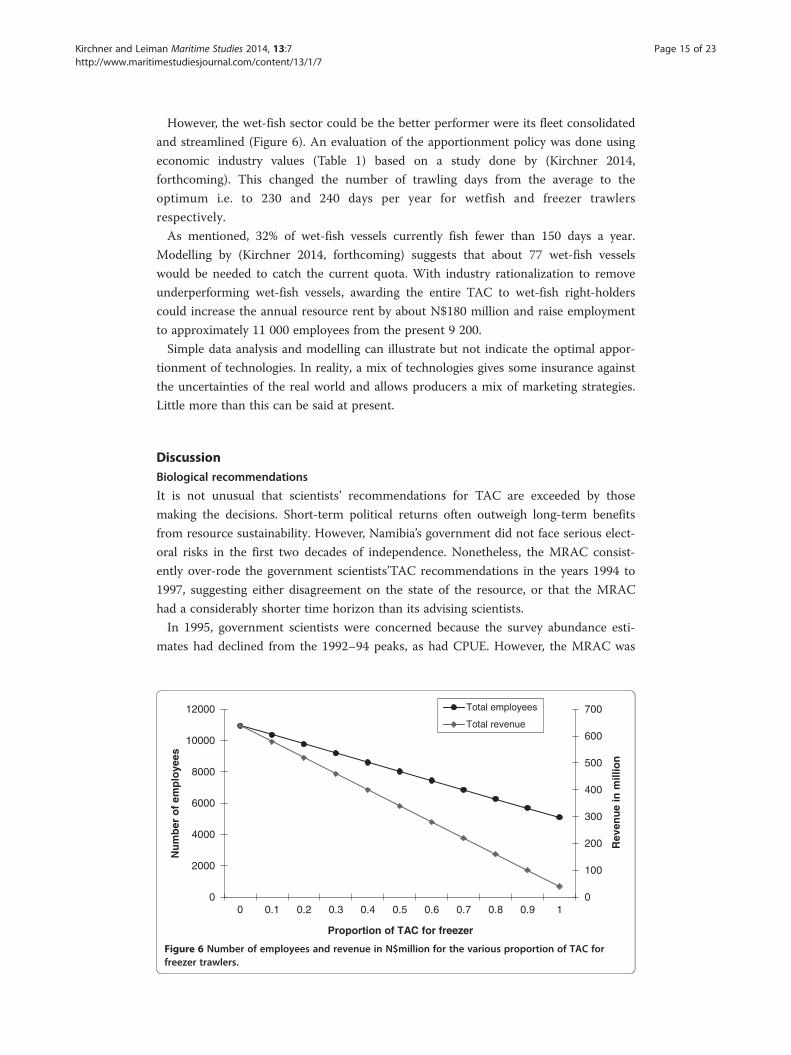
That quota fees were in reality lower in 2011 than in 1997 reflects the economic
hardships that the hake industry faced. If, however, with a healthier stock, the quota
fees had increased by 5% per annum since 1997, the government could have collected an
additional N$630 million (see Figure 5). On the other hand, this might have prompted the
rationalization of the hake sector into a few large vertically-integrated oligopolistic firms.
Apportionment policy
Kirchner’s 2010 economic survey (Kirchner 2014, forthcoming) showed that financial
returns in the freezer sector exceeded those in the wet-fish sector (N$700 vs. N$531
profit per ton), supporting Japp and Steenkamp’s (2004) findings.
0
20
40
60
80
100
120
140
160
180
19
97
19
98
19
99
20
00
20
01
20
02
20
03
20
04
20
05
20
06
20
07
20
08
20
09
20
10
Qu
ota
fee
s in
mill
ion
s
Quota fees with increase Quota fees (budgeted)
Figure 5 Actual (budgeted) quota fees and hypothetical quota fees allowing annual inflationaryincrease of 5%.
Kirchner and Leiman Maritime Studies 2014, 13:7 Page 15 of 23http://www.maritimestudiesjournal.com/content/13/1/7
However, the wet-fish sector could be the better performer were its fleet consolidated
and streamlined (Figure 6). An evaluation of the apportionment policy was done using
economic industry values (Table 1) based on a study done by (Kirchner 2014,
forthcoming). This changed the number of trawling days from the average to the
optimum i.e. to 230 and 240 days per year for wetfish and freezer trawlers
respectively.
As mentioned, 32% of wet-fish vessels currently fish fewer than 150 days a year.
Modelling by (Kirchner 2014, forthcoming) suggests that about 77 wet-fish vessels
would be needed to catch the current quota. With industry rationalization to remove
underperforming wet-fish vessels, awarding the entire TAC to wet-fish right-holders
could increase the annual resource rent by about N$180 million and raise employment
to approximately 11 000 employees from the present 9 200.
Simple data analysis and modelling can illustrate but not indicate the optimal appor-
tionment of technologies. In reality, a mix of technologies gives some insurance against
the uncertainties of the real world and allows producers a mix of marketing strategies.
Little more than this can be said at present.
DiscussionBiological recommendations
It is not unusual that scientists’ recommendations for TAC are exceeded by those
making the decisions. Short-term political returns often outweigh long-term benefits
from resource sustainability. However, Namibia’s government did not face serious elect-
oral risks in the first two decades of independence. Nonetheless, the MRAC consist-
ently over-rode the government scientists’TAC recommendations in the years 1994 to
1997, suggesting either disagreement on the state of the resource, or that the MRAC
had a considerably shorter time horizon than its advising scientists.
In 1995, government scientists were concerned because the survey abundance esti-
mates had declined from the 1992–94 peaks, as had CPUE. However, the MRAC was
0
100
200
300
400
500
600
700
0
2000
4000
6000
8000
10000
12000
0 0.1 0.2 0.3 0.4 0.5 0.6 0.7 0.8 0.9 1
Rev
enu
e in
mill
ion
Nu
mb
er o
f em
plo
yees
Proportion of TAC for freezer
Total employees
Total revenue
Figure 6 Number of employees and revenue in N$million for the various proportion of TAC forfreezer trawlers.
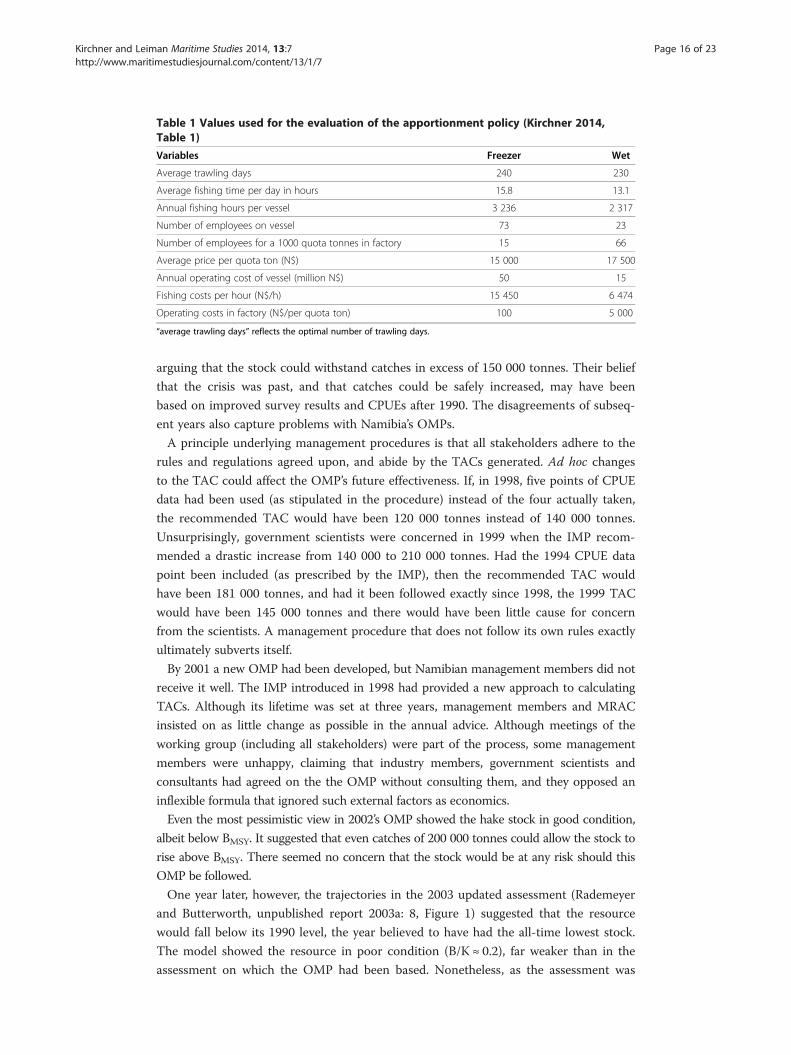
Table 1 Values used for the evaluation of the apportionment policy (Kirchner 2014,Table 1)
Variables Freezer Wet
Average trawling days 240 230
Average fishing time per day in hours 15.8 13.1
Annual fishing hours per vessel 3 236 2 317
Number of employees on vessel 73 23
Number of employees for a 1000 quota tonnes in factory 15 66
Average price per quota ton (N$) 15 000 17 500
Annual operating cost of vessel (million N$) 50 15
Fishing costs per hour (N$/h) 15 450 6 474
Operating costs in factory (N$/per quota ton) 100 5 000
“average trawling days” reflects the optimal number of trawling days.
Kirchner and Leiman Maritime Studies 2014, 13:7 Page 16 of 23http://www.maritimestudiesjournal.com/content/13/1/7
arguing that the stock could withstand catches in excess of 150 000 tonnes. Their belief
that the crisis was past, and that catches could be safely increased, may have been
based on improved survey results and CPUEs after 1990. The disagreements of subseq-
ent years also capture problems with Namibia’s OMPs.
A principle underlying management procedures is that all stakeholders adhere to the
rules and regulations agreed upon, and abide by the TACs generated. Ad hoc changes
to the TAC could affect the OMP’s future effectiveness. If, in 1998, five points of CPUE
data had been used (as stipulated in the procedure) instead of the four actually taken,
the recommended TAC would have been 120 000 tonnes instead of 140 000 tonnes.
Unsurprisingly, government scientists were concerned in 1999 when the IMP recom-
mended a drastic increase from 140 000 to 210 000 tonnes. Had the 1994 CPUE data
point been included (as prescribed by the IMP), then the recommended TAC would
have been 181 000 tonnes, and had it been followed exactly since 1998, the 1999 TAC
would have been 145 000 tonnes and there would have been little cause for concern
from the scientists. A management procedure that does not follow its own rules exactly
ultimately subverts itself.
By 2001 a new OMP had been developed, but Namibian management members did not
receive it well. The IMP introduced in 1998 had provided a new approach to calculating
TACs. Although its lifetime was set at three years, management members and MRAC
insisted on as little change as possible in the annual advice. Although meetings of the
working group (including all stakeholders) were part of the process, some management
members were unhappy, claiming that industry members, government scientists and
consultants had agreed on the the OMP without consulting them, and they opposed an
inflexible formula that ignored such external factors as economics.
Even the most pessimistic view in 2002’s OMP showed the hake stock in good condition,
albeit below BMSY. It suggested that even catches of 200 000 tonnes could allow the stock to
rise above BMSY. There seemed no concern that the stock would be at any risk should this
OMP be followed.
One year later, however, the trajectories in the 2003 updated assessment (Rademeyer
and Butterworth, unpublished report 2003a: 8, Figure 1) suggested that the resource
would fall below its 1990 level, the year believed to have had the all-time lowest stock.
The model showed the resource in poor condition (B/K ≈ 0.2), far weaker than in the
assessment on which the OMP had been based. Nonetheless, as the assessment was
Kirchner and Leiman Maritime Studies 2014, 13:7 Page 17 of 23http://www.maritimestudiesjournal.com/content/13/1/7
within its 95% confidence intervals, the following year’s TAC was still based on the
OMP model. In retrospect, even in the absence of the currently available guidelines for
“exceptional circumstances”(Rademeyer et al. 2007), advice to management should have
prescribed caution.
In 2004, the OMP (which had intially predicted that an average catch of 200 000
tonnes could be taken sustainably for the following 20 years) suggested a TAC decrease
to 158 000 tonnes. Unfortunately, low exchange rates, high fuel prices and small fish
sizes meant that the industry was facing major problems; 2004 was an election year
and the industry argued that a decreased TAC would lead to worker retrenchments.
Unsurprisingly, scientists were ignored when warning that maintaining the 2003 TAC
of 180 000 tonnes would significantly damage the stock. The warnings were justified,
however, and the hake stock subsequently fell even further (Kirchner et al. 2012) and
subsequent TACs had to be reduced sharply.
Fleet analysis
A hake trawler is a long-lived and ‘lumpy’ item of capital. While the contraction of
Namibia’s hake fleet since 2003 (Figure 2) has increased resource rents by removing the
least cost-efficient vessels, excess capacity remains a feature of the industry. Not only
are some vessels under-utilized, but some right-holders license more vessels than are
actually used for fishing. Such unused vessels still incur costs even after their purchase
costs have been fully amortized. They also do not use the employees that the right-holders
indicated in their motivations for quota, suggesting that the official claim of 10 000 workers
in the hake industry may be an overestimate.
2008’s TAC of 130 000 tonnes was captured by 63 vessels with a combined catching
capacity of 205 000 tonnes. Some industry members believe that quota allocation is tied
to the number of vessels licensed, though this is not the case (personal observation).
More realistically, the excess capacity reflects uncertainty about the future of the stock.
The inefficiency is a particular feature of the wet-fish fleet—with the exception of three
vessels, the freezer fleet operated more efficiently. This indicates the potential for
rationalization in the industry; few right-holders have quotas large enough to warrant
the individual use of a vessel. Although the smallest wet-fish vessel has a capacity of
about 800 tonnes, their mean capacity is 2 700 tonnes, far larger than many right-holders’
quotas. The average individual freezer vessel has a 5 000 tonne capacity; no individual
right-holder has this amount of freezer quota. This induces vessel owners to negotiate
additional quota, often at great expense.
An example shows the situation clearly: in 2012 Tunacor, the fifth largest quota holder,
received 4 897 tonnes, well below its 18 000 tonne processing capacity. However, this only
provided 30 per cent of the quota that the group used during that year. The remaining 70
per cent (>12 000 metric tonnes) came to it (at a cost) from six associated Namibian
right-holders. That there is room for rationalization is clear; how it should be achieved is
less obvious.
Right-holders and quotas
The quota allocation process makes planning difficult for operators. Each new right-holder
dilutes the property rights of others and reduces their incentive to fish sustainably. Despite
the declining stock and the overcapacity in the industry, all of the rights that expired in
Kirchner and Leiman Maritime Studies 2014, 13:7 Page 18 of 23http://www.maritimestudiesjournal.com/content/13/1/7
2010 were re-instated and it seems likely that scientists will face increasing pressure to raise
the TAC while the Marine Resource Advisory Council’s willingness to accept scientific
recommendations will decline.
It seems perverse that while rights allocations are not tied to the number of vessels
licensed, they are linked to investment, but only for one year. A common argument
made by firms is the threat to employment unless they receive additional quota or are
relieved of their quota fees. However, allocating additional quota in order to save econom-
ically troubled companies simply penalizes viable ones. The State is seen to reward bad
business practice and the outcome is a loss of resource rent. Allowing quota tradability
would allow non-performing companies to sell their quota, increasing industry efficiency
and raising resource rents.
Although it is difficult to understand why the quota fees have decreased since 1997,
the implications are clear: the State has sacrificed roughly N$630 million in lost fees by
ignoring normal economic principles. Many right-holders made no pretence at actual
involvement in the industry. While some of Namibia’s long-term rights were allocated
by grandfathering, even this is problematic. If the State had been genuinely intent on
maximizing rents and acquiring the benefits of the fisheries for the Namibian people,
quota could have been auctioned.
Apportionment policy
With freezer quota more profitable than wet-fish, employment and resource rent cannot
be maximized simultaneously. Only if the wet-fish sector becomes more profitable can
both objectives be satisfied together. The most recent available data (Kirchner 2014,
forthcoming) indicated that the freezer sector remains more profitable given current
operating costs. Only with substantial consolidation could the wet-fish fleet keep pace
with the freezer sector.
ConclusionIn South Africa, management procedures (OMPs) are in place for most commercial
stocks (Rademeyer et al., 2008) and are accepted by all major stakeholders (industry,
scientists and managers). Such broad acceptance was difficult in Namibia for various
reasons. In the first place, there was too little initial consultation. As a result, the newly
developed procedure was not well understood and not all participants bought into it
completely. Secondly, although Namibian industry members ultimately accepted the
OMP, few of the marine biologists involved had the strong numerical skills to interpret
stock assessment results or the management procedure model based on them. Lastly,
socio-economic and political factors impinged on TAC determination and the objectives
and performance statistics relevant to it, e.g. interannual catch variation and capped TAC
changes.
Fisheries managers have multiple objectives, and they value flexibility. Excessive rigidity
in the prescriptions of an OMP could be addressed by having it supply a range of TAC
options, each with its associated implications, over a number of years (Butterworth 2007),
an approach which places the liability for future declines squarely on the shoulders of the
decision-maker.
Butterworth (2007) states that, when designing an management procedure (MP), care
should be taken that the future data needed as input for the TAC-computing algorithm
Kirchner and Leiman Maritime Studies 2014, 13:7 Page 19 of 23http://www.maritimestudiesjournal.com/content/13/1/7
will be both available and of good quality. Even more important is that the original data
used in designing the MP be of good quality. The risk is that an MP can give a false
sense of security. In Namibia, most candidate OMPs performed reasonably, provided
the carrying capacity of the resource had not decreased. However, carrying capacity
may indeed have fallen, as hypothesised in the post-1990 assessment which suggested a
productivity change between 1985 and 1990 (Rademeyer and Butterworth, unpublished
report, 2006).
In summary, Namibia was not (and is not yet) ready for a fully structured MP. However,
the country’s commercial fisheries need management. The key lesson is that, to be accepted,
an OMP’s outputs need to be presented simply and clearly. The simplified approach used in
Namibia (TAC is set at 80% of the most recent 5-year average of replacement yield) for the
last six years has reduced the time spent haggling to a minimum.
This study has argued that resource management can have significant induced or indir-
ect impacts on rents. An example is the loss of resource rents through fleet inefficiency
and excess capacity, as shown in the fleet analysis. In the absence of effort controls or per-
mit tradability, rent is easily lost through over-investment in fishing capacity. Nonetheless,
the system currently rewards additional investment by increasing the quota of the particu-
lar right-holder for the subsequent year. Moreover, the resulting over-capacity is often
used to convince the Minister of Fisheries to increase the TAC. It is therefore imperative
that not only quotas, but also the number of vessels, should be controlled. The state is
sacrificing rents and the system is made inefficient if some right-holders receive (and
trade) quotas that exceed their catching capacity, while others are left with underutilised
vessels.
Unfortunately, the hake industry is both complex and secretive. This lack of transpar-
ency precludes rent maximization. At the heart of the problem is the quota allocation
process. Some operators expressed a concern that ‘incompetence’ is rewarded and that
the current process is at best dubious. Efficiency requires that the process and criteria
used be transparent, identified clearly and followed without fail. Some right-holders
suggested that the existing criteria should be reviewed and the allocation system made
public, while others interpreted the current quota allocation system as a tool to control
the industry’s behaviour. This opacity ultimately limits the taxable rents the fishery can
generate.
Resource rent is maximized when quota goes to the most efficient operators, and for-
mal quota tradability would be a move in this direction. Currently, non-operating quota
holders can make immediate riskless profit by simply leasing out their quota; others do
so by entering into more formal ‘sleeping’ partnerships. The de facto tradability of hake
permit means that the right to issue it may become a source of patronage, and the
resulting rent-seeking may impinge on the industry’s efficiency.
The recently extended invitation for additional applications for rights increased con-
cern for the industry’s and the resource’s futures. Sumaila (2010) cautions against the
dilution of the quota allocation, stressing the fact that ownership of the quota should
be concentrated to the fishers and not to owners who are not fishing operators in order
for the stewardship of the resource to become effective. An increase in the number of
right-holders will decrease some or all the current right-holders’ portions. However,
while such small quota allocations could appear as mere patronage, allowing them to
be ‘leased’ to the highest bidder could at least increase efficiency since the most
Kirchner and Leiman Maritime Studies 2014, 13:7 Page 20 of 23http://www.maritimestudiesjournal.com/content/13/1/7
profitable processing plants are those able to pay the highest prices. The hake sector
enjoys economies of scale, but requires skills and capital to be profitable. With full
transferability, quota holdings will be aggregated until only a few large and efficient
operators are left, any remaining right-holders being paper quota-holders with no
significant investment in the industry. The counterpoint to this argument is that some
non-quota holders have been paying unaffordable prices for quotas just to stay in busi-
ness, hoping that the industry or the resource will turn around. Their debts have been
increasing, some have failed, and more seem likely to do so. Such failures have imposed
costs on Namibia’s banks, since an operator without formally tradable quota has few
useful assets. Given existing excess capacity in the industry, the demand for vessels and
other large-scale ostensibly ‘high value’ assets from bankrupt enterprises remains limited.
The policy of quota apportionment by vessel type remains contentious, especially as a
large proportion of (apparently more profitable) freezer vessel products are exported
for further value-adding. It can be argued justifiably that such value should be added in
Namibia. While the present study concurred with Sumaila (2000) that the wet-fish sector
could potentially be the more profitable, our concerns about data validity suggest caution
in respect of this view, especially given the opposing empirical observations presented by
Japp and Steenkamp (2004) and Eide et al. (2003). Nonetheless, it is clear that the wet-fish
sector has become more organized, efficient and streamlined since 2003, and some pro-
cessing plants have found innovative ways to increase profitability. It is up to the fishing
industry and MFMR to identify further ways to streamline operations.
The key driver of rent losses in Namibia’s hake fishery is undoubtedly the depressed
resource stock. Less certain is the cause: is it merely excess effort or are there broader
ecosystem causes? Hake is a predator whose primary prey, sardine (Sardinops ocellatus),
is currently severely depleted. This is likely to limit the recovery of the hake stock. A more
nuanced policy question is therefore whether to advocate a temporary closure or TAC
reduction in the sardine/anchovy fishery.
What is the way forward? The hake resource is a public asset, hence such public
concerns as social and ecosystem sustainability should carry weight in its manage-
ment. Bromley (2009) suggested that the economic crash of 2008 showed just how
important it is that a state should not abdicate its responsibilities to a self-interested
private sector. However, in a world of stable politics, secure property rights and natur-
ally monopolistic fisheries, it would be easy to agree with Arnason (2008) that the state
should simply allocate long-term rights and leave quota holders to take over the
complete management of the resource, including the costs of doing research. Such
firms would have a long-term interest in maximizing the present value of the stream
of net income from the resource, and would have an incentive to manage the resource
well. Further, the data used in the economic evaluation would be far more available
and reliable. They would also be responsible for the monitoring and surveillance of the
fishing behaviour. The idea is appealing, but the stability and security it needs may still
be some way off.
EndnotesaThese rights take the form of individual quotas or permit allocated by species.bBetween 1990 and 2012, the N$/USD exchange rate averaged 6.8100 peaking at
11.61 in January 2002.
Kirchner and Leiman Maritime Studies 2014, 13:7 Page 21 of 23http://www.maritimestudiesjournal.com/content/13/1/7
c These levies are far lower than those in, for example, Iceland, which charges 9% of net
landed value.dIn a world of stochastically variable stocks, it is only as a season progresses that decision-
makers can determine whether their anticipations of the resource stock were justified.
(Weitzman 2002) makes the strong point that it is therefore the escapement, not the catch
that one wants to control. When CPUE is low the state should therefore encourage firms
not to land their quota; by contrast the present system penalizes those who do so.eWet-fish quota provides 72.7 jobs per 1000 tonnes, 21.2 persons per 1000 tonnes on
the vessels and 51.5 persons per 1000 tonnes in the processing plants. Freezer vessels
only employ 17.2 people per 1000 tonnes.fWe will argue that since 2004 the wet-fish sector has become increasingly streamlined.gFleet capacity was calculated using the industry’s own rule, by multiplying the Horse
Power by two for wet-fish vessels and by two and a half for freezer vessels.hB/K refers to the biomass of the hake aged 2 and above (corresponding roughly to
lengths greater than 35 cm, i.e. the fishable biomass) expressed as a proportion of the
corresponding pristine (pre-exploitation) level. In a simple Shaefer model the sustain-
able harvest (surplus production) is rBt (1-Bt/K) where r is the population growth rate.
Catchability (q) measures the ‘gear efficiency’ of the survey vessel, i.e. it is the link
between CPUE and the stock of fish.
Competing interestsThe authors declare that they have no competing interests.
Authors’ contributionsCK conducted the initial surveys and compiled the primary analysis, AL contributed to the literature survey and draftedthe manuscript. All authors read and approved the final manuscript.
AcknowledgementWe hereby thank the Ministry of Fisheries in Namibia and the Namibian hake fishing industry members for providingthe data on which this study is based. We also warmly thank the Confederation of the Namibian Fishing Associationfor financially supporting this work.
Government PublicationsMinistry of Fisheries and Marine Resources. 1991. Towards Responsible Development of the Fisheries Sector. WhitePaper of the Ministry of Fisheries and Marine Resources Namibia.Ministry of Fisheries and Marine Resources. 1992. Sea Fisheries Act (14 of 1992). Government Gazette, Republic ofNamibia.Ministry of Fisheries and Marine Resources. 1993. “Announcement of Period during which applications for rights ofexploitation under the Sea Fisheries Act, 1992 may be made.” Government Gazette No 679 (30 July 1993): 1–5.Government of the Republic of Namibia.Ministry of Fisheries and Marine Resources. 1997. Proceedings of an International Workshop on the Research andManagement of Hake in Namibian Waters, Swakopmund, October 1997. Unpublished report, Ministry of Fisheries andMarine Resources, Namibia.Ministry of Fisheries and Marine Resources. 2000. Marine Resources Act 27 of 2000.
Author details1Fisheries Scientist, Secretariat of the Pacific Community, Noumea, New Caledonia. 2School of Economics, University ofCape Town, South Africa.
Received: 3 June 2013 Accepted: 26 March 2014Published: 24 July 2014
References
Armstrong, CM, UR Sumaila, A Erastus, and O Msiska. 2004. Benefits and Costs of the Namibianisation Policy. InNamibia’s Fisheries: Ecological, Economic and Social Aspects, ed. UR Sumaila, D Boyer, MD Skogen, and SISteinshamn, 203–215. Delft, The Netherlands: Eburon.
Arnason, R. 2008. Fisheries self-management under ITQ’s. Marine Resource Econonomics 22: 373–390.Benguela Current Large Marine Ecosystem Programme. 2006a. Recommendations on Beneficiation of Fishing Activities
in the BCLME Region. BCLME project LMR/SE/03/02. http://www.bclme.org.Benguela Current Large Marine Ecosystem Programme. 2006b. Micro-Economic Systems Analysis of the BCLME
Commercial Marine Fisheries. BCLME project LMR/SE/03/03. http://www.bclme.org.
Kirchner and Leiman Maritime Studies 2014, 13:7 Page 22 of 23http://www.maritimestudiesjournal.com/content/13/1/7
Benguela Current Large Marine Ecosystem Programme. 2006c. Commercial Fisheries Rights Holder and Vessel AnalysisBCLME Project LMR/SE/03/03. http://www.bclme.org.
Bromley, DW. 2009. Abdicating responsibility: the deceits of fisheries policy. Fisheries 34(4): 280–302.Butterworth, DS. 2007. Why a management procedure approach? Some positives and negatives. ICES Journal of Marine
Science 64: 613–617.Butterworth, DS, and HF Geromont. 2001. Evaluation of a Range of Possible Simple Interim Management Procedures
for the Namibian Hake Fishery. In A Decade of Namibian Fisheries Science, 23rd ed, ed. AIL Payne, SC Pillar, andRJM Crawford, 357–374. South African: South African Journal of Marine Science.
Butterworth, DS, and RA Rademeyer. 2005. Sustainable management initiatives for the southern African hake fisheriesover recent years. Bulletin of Marine Science 76(2): 287–319.
Eide, A, P Manning, and SI Steinshamn. 2003. Assessment of the economic benefits African countries received fromtheir marine resources: three case studies. Bergen, Norway: Centre for Fisheries Economics. SNF Report No. 05/03.
Erastus, AN. 2002. The Development of the Namibianisation Policy in the Hake Subsector, 1994–1999. Windhoek,Namibia: NEPRU Working Paper No. 82.
Government of Namibia. 1991. Ministry of Fisheries and Marine Resources. Towards Responsible Development of theFisheries Sector, White Paper of the Ministry of Fisheries and Marine Resources Namibia, 42.
Government of Namibia. 1992. Ministry of Fisheries and Marine Resources. Sea Fisheries Act (14 of 1992). GovernmentGazette, Republic of Namibia
Government of Namibia. 1993. Ministry of Fisheries and Marine Resources. “Announcement of Period during whichapplications for rights of exploitation under the Sea Fisheries Act, 1992 may be made.”, 1–5. Government of theRepublic of Namibia: Government Gazette No 679 (30 July 1993).
Grafton, RQ. 1996. Individual tradable quotas: theory and practice. Reviews in Fish Biology and Fisheries 6(1): 5–20.Hilborn, R, JM Orensanz, and AM Parma. 2005. Institutions, incentives and the future of fisheries. Philosophical
Transactions of the Royal Society, B: Biological Sciences 360: 47–57.Ithindi, AP. 2003. Rent Capture in the Namibian Fisheries: the Case of Hake. United Nations University. http://www.
unuftp.is/static/fellows/document/pendaprf.pdf.Japp, D, and S Steenkamp. 2004. Optimum Proportioning of the Hake TAC Between wet-Fish Trawlers and Freezer Fish
Operators in Namibia. Cape Town, South Africa: Available from Fisheries & Oceangraphic Support Services cc.Kirchner, CH. 2014. A bio-economic evaluation of present and future profit streams within the Namibian hake industry.
African Journal of Marine Science 2014: 2014.Kirchner, CH, P Kainge, and J Kathena. 2012. Evaluation of the Status of the Namibian Hake Resource (Merluccius spp.)
Using Statistical Catch-at-age Analysis. RFF Discussion Paper EfD 12–12. Available from http://www.efdinitiative.org/sites/default/files/efd-dp-12-1220evaluation20of20the20status.pdf accessed on 09/07/2014.
Lange, GM. 2004. Economic Value of Fish Stocks and the National Wealth of Namibia. In Namibia’s Fisheries: Ecological,Economic and Social Aspects, ed. UR Sumaila, D Boyer, MD Skogen, and SI Steinshamn, 187–209. Delft, TheNetherlands: Eburon.
Leiman, A, and T Harris. 2009. The Design, Compilation and Interpretation of Satellite Accounts for South AfricanFisheries. Some Critical Thoughts. Environment for Development. Discussion Paper Series. http://www.efdinitiative.org/sites/default/files/efd-dp-09-04.pdf. Accessed on 09/07/2014.
Manning, PR. 1998. Managing Namibia’s Fisheries: Optimal Resource use and National Development Objectives. Ph.D.Thesis. London: LSE.
Melber, H. 2003. Of big fish & small fry: the fishing industry in Namibia. Review of African Political Economy 30(95): 142–149.Ministry of Fisheries and Marine Resources. 2000. Marine Resources Act 27 of 2000.Nichols, P. 2004. Marine Fisheries Management in Namibia: Has it Worked? In Namibia’s Fisheries: Ecological, Economic and Social
Aspects, ed. UR Eburon, UR Sumaila, D Boyer, MD Skogen, and SI Steinshamn, 319–332. Delft, The Netherlands: Eburon.Oelofsen, B. 1999. Fisheries management: the Namibian approach. ICES Journal of Marine Science 56: 999–1004.Parslow, J. 2010. Individual transferable quotas and the “tragedy of the commons”. Canadian Journal of Fisheriesand
Aquatic Sciences 67: 1889–1896.Rademeyer, R. 2003. Assessment of and Management Procedures for the Hake Stocks off Southern Africa. PhD Thesis.
Cape Town, South Africa: The University of Cape Town.Rademeyer, RA, and DS Butterwort. 2006. Updated Assessment and Constant Catch Projections for the Namibian Hake
Resource. Unpublished Report. Namibia: Ministry of Fisheries and Marine Resources. HWG/WkShop/2006/02/07.Rademeyer, RA, and DS Butterworth. 2003a. An Updated Assessment for the Namibian Hake Resource. Namibia: HWG/
WkShop/2003/03. Unpublished report, NatMIRC.Rademeyer, RA, and DS Butterworth. 2003b. Routine Updated Assessment for the Namibian Hake Resource. Stock
assessment workshop. Unpublished report, BENEFIT.Rademeyer, RA, and DS Butterworth. 2005a. 2005 Assessment of the Namibian Hake Resource, Including Both Catch-at-
age and Catch-at-Length Information. Unpublished Report. Namibia: Ministry of Fisheries and Marine Resources.HWG/WkShop/2005/02.
Rademeyer, RA, and DS Butterworth. 2005b. Yet Further Updates of an Assessment of the Namibian Hake Resource,Including Both Catch-at-age and Catch-at-Length Information. Unpublished Report. Namibia: Ministry of Fisheriesand Marine Resources. HWG/WkShop/2005/02/07.
Rademeyer, RA, EE Plagányi, and DS Butterworth. 2007. Tips and tricks in designing management procedures. ICESJournal of Marine Science 64: 618–625.
Rademeyer, RA, DS Butterworth, and EE Plagányi. 2008. Assessment of South African hake resource taking its twospecies nature into account. African Journal of MarineScience 30(2): 263–290.
Sherbourne, R. 2010. Guide to the Namibian Econonomy 2010. Institute for Public Policy Research. Windhoek: John Meinert Printing.Sumaila, UR. 2000. Fish as a vehicle for economic development in Namibia. Forum for Development 2: 295–315.Sumaila, UR. 2001. Biodiversity in a Game Theoretic Model of the Fishery. In Proceedings of the 10th International
Conference of the International Institute of Fisheries Economics & Trade, ed. RS Johnston and AL Shriver. Corvallis,Oregon: (CD-ROM). http://www.oregonstate.edu/dept/IIFET/2000/papers/sumaila2.pdf. Accessed on 9/7/14.
Kirchner and Leiman Maritime Studies 2014, 13:7 Page 23 of 23http://www.maritimestudiesjournal.com/content/13/1/7
Sumaila, UR. 2010. A cautionary note on individual transferable quotas. Ecology and Society 15(3): 36.Van der Westhuizen, A. 2001. A Decade of Exploitation and Management of the Namibian Hake Stocks. In A Decade of
Namibian Fisheries Science, 23rd ed, ed. AIL Payne, SC Pillar, and RJM Crawford, 357–374. South African: SouthAfrican Journal of Marine Science.
Weitzman, ML. 2002. Landing fees vs harvest quotas with uncertain fish stocks. Journal of Environmental Economicsand Management 43: 325–338.
Wiuum, VH, and AS Uulenga. 2003. Fishery Management Costs and Rent Extraction: The Case of Namibia. In The Costof Fisheries Management, ed. WE Schrank, A Ragnar, and R Hannesson, 173–185. Aldershot: Ashgate.
World Bank. 2008. The sunken Billions. The Economic Justification for Fisheries Reform. Washington, DC: Theinternational Bank for Reconstruction and Development.
doi:10.1186/2212-9790-13-7Cite this article as: Kirchner and Leiman: Resource rents and resource management policies in Namibia’s post-Independence hake fishery. Maritime Studies 2014 13:7.
Submit your manuscript to a journal and benefi t from:
7 Convenient online submission
7 Rigorous peer review
7 Immediate publication on acceptance
7 Open access: articles freely available online
7 High visibility within the fi eld
7 Retaining the copyright to your article
Submit your next manuscript at 7 springeropen.com


