Embed Size (px)
Citation preview

Journal of Vegetation Science && (2011)
Responses of riparian guilds to flow alterations in aMediterranean stream
Marıa Dolores Bejarano, Marta Gonzalez del Tanago, Diego Garcıa de Jalon, MiguelMarchamalo, Alvaro Sordo-Ward & Joaquın Solana-Gutierrez
Keywords
Composition; Diversity; Establishment
patterns; Mature forest; Pioneers; Shrubland;
Streamwater declines
Nomenclature
Lopez Gonzalez (2001)
Received 9 May 2011
Accepted 5 October 2011
Co-ordinating Editor: Lindsay Turnbull
Bejarano, M.D. (corresponding author,
[email protected]), Gonzalez
del Tanago, M. ([email protected]) &
de Jalon, D.G. ([email protected]): Grupo
de investigacion en Hidrobiologıa,
Departamento de Ingenierıa Forestal,
Universidad Politecnica de Madrid, ES-28040,
Madrid, Espana
Marchamalo, M. (miguel.marchamalo@upm.
es): Grupo de investigacion en Hidrobiologıa,
Departamento de Ingenierıa y Morfologıa del
Terreno, Universidad Politecnica de Madrid,
ES-28040, Madrid, Espana
Sordo-Ward, A. ([email protected]):
Departamento de Ingenierıa Civil: Hidraulica y
Energetica, Universidad Politecnica deMadrid,
ES-28040, Madrid, Espana
Solana-Gutierrez, J. (joaquin.solana@upm.
es): Grupo de investigacion en Hidrobiologıa,
Departamento de Economıa y Gestion Forestal,
Universidad Politecnica de Madrid, ES- 28040,
Madrid, Espana
Abstract
Questions: DoMediterranean riparian guilds show distinct responses to stream
water declines? If observed, which are themost sensitive and resilient guilds and
their most affected attributes?
Location: Tietar river below the Rosarito dam, central-western Spain.
Methods: We identified riparian guilds based on key woody species features
and species distribution within this Mediterranean river corridor, and evalu-
ated similarity of their responses to long-term flow alteration (i.e. stream
water declines since dam construction in 1959). Hierarchical cluster analysis
was used to group surveyed vegetation bands according to species composi-
tion. The groups were designated as riparian guilds where each vegetation
group comprising a guild: (1) contains species sharing similar features (using
PCA); and (2) shares a similar environment (using DCA). Changes in several
guild attributes (i.e. dominance and species composition, diversity and estab-
lishment patterns) during the regulated period were compared statistically. We
used pre- and post-dam established vegetation bands identified based on old
(1956) and modern (2006) aerial photographs and field measurements of
woody species diameter.
Results: Responses to flow alterations varied between guilds according to eco-
logical requirements of their species. The ability to survive water stress (i.e.
‘Xeric’ guilds) and drag forces caused by floods (‘Torrential’ guilds) allowed cer-
tain pioneer shrub-dominated guilds (e.g. Flueggea tinctoria and Salix salviifolia)
to spread on newly emerged surfaces downward to the main channel after flow
alterations, although new shrubland had less species diversity than pre-dam
shrubland. In contrast, new hydromorphological conditions following damming
limited recruitment of native late-successional tree guilds sensitive to floods (to
drag forces, inundation and anoxia; i.e. ‘Slow-water’ and ‘Flood-sensitive’,
respectively) and those with greater water requirements (i.e. ‘Hydric’) (e.g.
Alnus glutinosa and Celtis australis), although species diversity increased in this
mature forest through co-existence of remaining riparian species and new arri-
val of upland species.
Conclusions: Changes in several riparian attributes after flow alterations
differed between guilds. Stream water declines after damming caused shifts in
species-poor pioneer shrubland downwards to the watered channel, resulting in
severe declines ofmaturenative forest. Understanding vegetation guild responses
provides information about general trends in plant populations and assemblage
structures expected to occur during river development and flow regulation,
increasing our capacity to detect and synthesize complex flow alteration–riparian
ecosystem response relationships, and anticipate irreversible impacts.
Journal of Vegetation ScienceDoi: 10.1111/j.1654-1103.2011.01360.x© 2011 International Association for Vegetation Science 1

Introduction
The effects of altered stream flows vary among species,
depending on their life-history attributes (Nilsson et al.
1991a; Jansson et al. 2000; Merritt & Cooper 2000; Dyne-
sius et al. 2004; Merritt et al. 2010). For example, woody
species from the genera Populus, Salix, Acer and Tamarix
respond differently to flow regime changes (Rood & Ma-
honey 1990; Rood et al. 1999; Polzin & Rood 2000; Lytle &
Merritt 2004; Birken & Cooper 2006; DeWine & Cooper
2007; Hughes et al. 2010; Merritt & Poff 2010). Neverthe-
less, species-based knowledge reveals only part of the
ecological consequences of flow alterations; moreover,
because of the large number of plant species along rivers
around the world, it is impossible to assess the impacts on
all species. In addition, results from research on species are
difficult to extrapolate to other geographical regions. Based
on the ecological guild concept, some authors have studied
the responses of groups of species (functional groups, usu-
ally referred to as guilds), assuming that species tend to
associate according to similar behaviour in response to
environmental conditions (Root 1967; Leonard & Orth
1988; Simberloff & Dayan 1991; Austen et al. 1994). This
guild approach has been widely used to guide the manage-
ment of fisheries (Regier et al. 1989; Welcomme et al.
2005; Kennard et al. 2007; Melcher et al. 2007), but few
studies have used plant guilds to analyse riparian vegeta-
tion responses to changing hydrology and geomorphology
of rivers. The identification of riparian vegetation–flow
response guilds was recently proposed in Merritt et al.
(2010) as a tool for determining environmental flows for
riparian ecosystems. The guild approach is a synecological
assessment that allows generalizations and comparisons
among different fluvial systems (Severinghaus 1981).
Mediterranean rivers are among the most impounded
in the world (Garcıa de Jalon 2003; Grantham et al. 2010);
consequently, there is an increasing demand for scientific
knowledge related to impacts of flow alterations to assure
their sustainable management. In the Iberian Peninsula,
the majority of riverine studies have been designed to
describe and locate riparian vegetation types and assess
their conservation value (Aguiar et al. 2000; Salinas et al.
2000; Garilleti et al. 2008); but few studies on the specific
effects of hydrologic alterations on vegetation have been
conducted (but see e.g. Aguiar & Ferreira 2005; Garofano-
Gomez et al. 2009; Gonzalez et al. 2010a, 2010b). The
great heterogeneity of Mediterranean riparian vegetation
leads to a wide range of responses to hydrologic changes.
In addition, the overlapping effects of other common
human disturbances (e.g. grazing, gravel mining, land
occupation for agriculture, straightening and channelizat-
ion) also directly or indirectly affect riparian plants (Corba-
cho et al. 2003), obscuring the specific consequences of
flow alterations. These factors make it difficult to deepen
our understanding of hydrologic alteration and vegetation
responses inMediterranean regions.
In arid region streams, riparian vegetation is particularly
responsive to the hydrologic regime related to water level,
flooding and hyporheic fluxes (Stromberg 1993; Ferreira &
Moreira 1999; Mitsch & Gosselink 2000; Aguiar et al.
2001). Studies conducted in dry regions show that for pio-
neer species, a reduction of stream flow and groundwater
level affects recruitment and decreases photosynthetic
activity and growth because of limited water availability
(Mahoney & Rood 1992; Stromberg et al. 1996; Horton
et al. 2001; Lite & Stromberg 2005). In addition, flood
magnitude reduction in semi-arid and arid environments
also affects tree growth, regeneration and, ultimately, veg-
etation dynamics due to a lack of hydrogeomorphic distur-
bances that transport propagules and nutrients and
remove or create new habitats for plant establishment
(Stromberg et al. 1997; Corenblit et al. 2007; Dufour &
Piegay 2008). Vegetation sensitivity to stream flow
changes, coupled with increasing urban and agricultural
water demand, is having serious negative impacts onMed-
iterranean riverine ecosystems (Garcıa-Ruiz et al. 1995;
Ibanez et al. 1996; Beguerıa et al. 2003; Pinilla 2006;
Cabezas et al. 2009). Many essential functions of riparian
areas, such as stabilization of fluvial land forms (Gurnell &
Petts 2002, 2006; Corenblit et al. 2007), flood control
(Hughes & Rood 2003), hyporheic filtration and habitat,
and refuge and migration corridor provision for animals
(Naiman et al. 1993; Naiman & Decamps 1997; Salinas
et al. 2000) are at risk of being lost.
In this study, we investigated whether there are Medi-
terranean riparian guilds that show distinct responses to
stream flow declines. If these phenomena were observed,
our final purpose was to detect the most sensitive and resil-
ient guilds and their most affected attributes to develop a
sound scientific basis to redirect flow regime management
and restoration strategies in the Mediterranean region
toward especially threatened plant communities. Thus, we
described the woody riparian vegetation of a 62-km regu-
lated reach of a Mediterranean stream in central-western
Spain, identifying riparian guilds and evaluating and com-
paring each guild’s response to flow alterations in terms of
changes in composition, diversity and distribution within
the riparian corridor.
Methods
Study area and site locations
The Tietar river is a 150-km-long tributary of the Tagus
river in central-western Spain and extends over 4478 km2
(Fig. 1). It originates in the Gredos Mountains at 750 m a.
s.l., flows westward through the Rosarito reservoir, and
Journal of Vegetation Science2 Doi: 10.1111/j.1654-1103.2011.01360.x© 2011 International Association for Vegetation Science
Response of riparian guilds to flow alteration M. D. Bejarano et al.

ends in the Torrejon-Tietar reservoir between the conflu-
ence of the Tietar and Tagus rivers. The Rosarito dam
became operational in Jan 1959 and is used for irrigation
(Spanish Ministry of Environment 2006). The catchment
area upstream from the dam (1736 km2) represents 40%
of the total area of the Tietar river, and the dam has a live
storage capacity of 85 9 106 m3. Water is partially
diverted from the reservoir from May to Oct through two
side channels to meet the water demands of the 14 000 ha
of crops in the lower valley. In addition, another
15 000 ha of crops are supplied directly from the main
channel of the study area of the river through direct pump-
ing, mainly along its lower part (Tagus Basin Authority;
http://chtajo.es; Fig. 1). The floodplain is intensively used
for agriculture and is characterized by numerous settle-
ments. In the past, extensive grazing impacted its riparian
vegetation, and gravel mining affected certain river areas.
Although these pressures are not active at present, they
might still be relevant through their legacy effects. This
study focuses on the 62-km regulated reach of the Tietar
from below the Rosarito dam to (near) the tail of the
downstream Torrejon-Tietar reservoir (Fig. 1).
The selected river reach is a wandering to meandering
channel. It presents a coarser substrate and steeper chan-
nel bed along its first few kilometers and progressively
becomes a low-gradient, sand bed river downstream. The
average annual rainfall exceeds 1000 mm yr�1 in the
mountains and occasionally occurs as snow (Spanish
Meteorological Agency; http://aemet.es). In contrast, rain-
fall is approximately 500 mm yr�1 in the lower valley. The
Tietar’s stream flow is mainly sustained by surface run-off
and contributions from the major tributaries. The natural
total annual run-off entering the Rosarito reservoir is
766 hm3 (1985–2000) (source: simulated natural flow
using the Sacramento model: CEDEX-Spanish Ministry of
Environment and PublicWorks; http://Cedex.es). Ground-
water discharge from the basin which recharges the lower
Tietar valley aquifer also contributes to the flow in this part
of the river (Spanish Geological Institute; http://aguas.
igme.es). Consequently, the Tietar river exhibits pluvial
seasonal flow variability, with winter and spring peak
flows, and naturally, it rarely dries up in summer (Fig. 2).
Seven river segments (RS1–RS7) downstream from the
Rosarito dam were randomly chosen for analysis (Fig. 1),
which included representative riparian forest. They were
assumed to be subject to hydrologic alterations and other
minor impacts that did not significantly differ among
them. The homogeneity of the geomorphic and vegetation
characteristics determined the length of each river seg-
ment, which was 2-km long on average.
Data collection
Fieldwork
In the field, we surveyed each river segment. First, we
established 30-m wide transects perpendicular to the river
channel, from a terrace top or hillslope that contained rela-
tively mature woody vegetation and appeared to be repre-
sentative of the segment to the corresponding form on the
opposite bank. The number of transects per river segment
depended on the length and heterogeneity of each seg-
ment (nine transects per segment on average) and were
randomly distributed. Across each transect, we identified
consecutive bands of vegetation, arranged parallel to the
Fig. 1. The Tietar river basin in central-western Spain. Map shows relief, river network and location of gauging stations, Rosarito reservoir, pumping
stations, and surveyed river segments.
Journal of Vegetation ScienceDoi: 10.1111/j.1654-1103.2011.01360.x© 2011 International Association for Vegetation Science 3
M. D. Bejarano et al. Response of riparian guilds to flow alteration

river flow, from the left to the right bank. A band consisted
of a homogeneous vegetation zone with respect to the
canopy, mid-stratum and ground cover of the dominant
species (according to Friedman et al. 2006; Bornette et al.
2008; Stromberg et al. 2010; Bejarano et al. 2011a).
Finally, bands of vegetation were characterized by deter-
mining biological and physical variables in the field.
Woody species and their relative abundances were deter-
mined by dividing the number of individuals of each spe-
cies by the total number of woody individuals within each
band. The diameter at breast height (DBH) was measured
using calipers for a representative number of individuals of
the different cohorts of tree and shrub species (i.e. 50% of
individuals) visually recognized in the band. The relative
location of each bandwasmeasured according to themaxi-
mum, minimum and mean distance to and height above
the flow level during the survey season (base flow). This
was done using a Suunto level, a measuring tape and a
laser distance-measuring tool. The size class and relative
abundances of riparian surface substrates (first 20 cm of
depth) were determined following the Wentworth scale
and adding bedrock and peat (following Nilsson et al.
1994). The size class and its abundance were assigned
based on visual inspection. Substrates were ranked in
terms of water-holding capacity by weighting the value of
substrate fineness by the percentage composition of the
riverbank substrate, and based on nine Φ (phi) values
(log2 transformation of the size class) for peat (Φ �12),
clay (Φ �9.0), silt (Φ �6.5), sand (Φ �2.0), gravel (Φ 2.0),
pebbles (Φ 4.5), cobbles (Φ 6.5), boulders (Φ 9.0) and bed-
rock (Φ 12) (Wright et al. 1984). The dominant fluvial
land form was noted (i.e. active and high bars, bench,
floodplain and terrace; following Hupp & Osterkamp 1996;
Hupp & Rinaldi 2009). We took qualitative notes about
dominant geomorphic processes based on evidence of inci-
sion (e.g. bare, exposed roots) or aggradation (e.g. buried
stems or fresh sediment on top of vegetated floodplain
deposits) and the absence/presence of woody debris. Can-
opy cover of the bands was obtained from an average of
three readings per band using a spherical densiometer.
Measurements were carried out in Jul 2008. The average
base flow during the surveys ranged between 3.4
and 6.2 m3 s�1 from the first to the last river segment,
respectively.
Office work
We classified the vegetation bands surveyed in the field
into pre-dam established and post-dam established. For
this, we matched the DBH field data for each vegetation
band with information from two series of orthophoto-
graphs taken prior to (spring and summer 1956) and after
(spring 2006) the year in which the dam became operable
(Jan 1959). DBH data provided age estimation of individu-
als, while old and modern orthophotograph comparisons
allowed identification of both the riparian areas that were
vegetated prior to dam operation, and those that were col-
onized during the regulated period. Along the selected
river segments on both series of photographs, we drew
polygons representing the succession phases of vegetation
according to the presence and combination of specific spe-
cies, dominance structure and environmental envelope
(following Egger et al. 2008). We characterized the poly-
gons as water, initial stage (i.e. bare ground), colonization
stage (i.e. annual herbs, pioneer vegetation and seedlings),
transition stage (i.e. reeds, grassland and shrubs or early
successional woodland) and established stage (i.e. mature
riparian forest). Based on these criteria, we defined: (1)
‘novel’ (post-dam) areas, those colonized after damming
that corresponded to areas in transition and established
stages onmodern pictures, but were in water, initial or col-
onization stages in older pictures; and (2) ‘relict’ (pre-dam)
areas, those already in transition and established stages in
older pictures. The 1:30 000 older pre-dam photographs
0
20
40
60
80
100
120
140
Flow
(m3 s–1
)
Altered at dam
Natural at dam
Altered 62km downstream
Natural 62km downstream
Oct Nov Dec Jan Feb Mar Apr May Jun Jul Aug Sep
Fig. 2. Intra-annual flow fluctuations in the Tietar river during the period 1985–2000 at the Rosarito dam site (filled dots) and 62 km downstream (unfilled
dots). Black lines represent the ‘natural’ mean monthly flow reconstructed with models, whereas dashed lines represent the altered mean monthly flow at
gauges #3127 and #3184.
Journal of Vegetation Science4 Doi: 10.1111/j.1654-1103.2011.01360.x© 2011 International Association for Vegetation Science
Response of riparian guilds to flow alteration M. D. Bejarano et al.

(provided by the CECAF: Map and Photo Air Force Center,
Spanish Ministry of Defence) were previously digitized
and orthorectified using the flight’s camera calibration data
and the corresponding 2-m pixel side digital elevation
model (DEM) and ground control points from 1:10 000
scale topographic maps. The 1:25 000 modern post-dam
orthophotographs were downloaded from SIGPAC (Span-
ish Geographic Information System for Farming Lands;
http://sigpac.mapa.es). ArcGis (version 9.2) and ERDAS
Imagine (version 8.5) were used for digitalization and
orthorectification.
To calculate the band inundation frequencies, we used
the HEC-RAS 4.1 (U.S. Army Corps of Engineers; http://
www.hec.usace.army.mil/) step-backwater hydraulic
model. We predicted the water-surface elevation at dis-
charges corresponding to the base flow, annual winter
flow, bankfull discharge (2-yr return period) and 4-, 10-
and 25-yr return period discharges for each river segment,
calculated by fitting a Gumbel distribution to data from the
closest stream gauge. The channel geometry was defined
for each river segment based on the cross-sections per
surveyed transect. Roughness coefficients for the cross-
sections were estimated following Arcement & Schneider
(1989). This model was validated using the observed
water-surface elevations at base flow (during the field sea-
son). A bandwas considered floodedwhenwater exceeded
half of the band’s area.
Hydrologic characterization
We characterized the altered and natural hydrology along
the study river reach using real (altered) and reconstructed
(‘natural’) flow series from 1985 to 2000. A 15-yr period
was chosen to match the available altered and natural
reconstructed series. We assumed non-significant reduc-
tion of floods due to the small size of the reservoir in rela-
tion to the magnitude of floods in the area (source:
Caumax software for flood simulationCEDEX-Spanish
Minsitry of Environment & Public Works 2008). The
altered daily flow data were obtained from a gauging sta-
tion located in the Tietar river at the Rosarito dam (#3127)
and from a station located 62 km downstream before the
river enters the Torrejon-Tietar reservoir (#3184; Fig. 1).
For the altered regime calculations at each river segment,
we added the Tietar river base-flow to run-off contribu-
tions from its tributaries using information from their
gauging stations (Fig. 1). For ungauged tributaries, we
extrapolated the run-off values from a fitted regression to
the gauged data. Direct pumping along the study river
reach was also incorporated according to information pro-
vided by the Tagus Water Authority (i.e. 122 hm3 yr�1 for
irrigation, mainly along the lower part of the reach, and
10 hm3 yr�1 for surrounding villages’ water supplies;
Fig. 1). Because pre-dam flow series were not available,
the ‘natural’ mean monthly flow data for the Tietar river
were obtained from reconstructed flow series provided by
the Tagus Water Authority (Flores-Montoya et al. 2003;
Tagus Basin Authority; http://chtajo.es). They were recon-
structed using the rainfall–run-off model (Sacramento Soil
Moisture Accounting model, SAC-SMA; Burnash et al.
1973), a deterministic, continuous, non-linear, semi-
distributed hydrologic model. For the ‘natural’ flow regime
calculations for each selected river segment, we fitted a
regression to this ‘natural’ reconstructed data for the larger
Tietar river. Based on this flow information, we evaluated
changes in the intra-annual flow fluctuation and quanti-
fied the reduction in the average water discharge as one
minus the altered/natural total annual run-off ratio.
Identification of riparian guilds
Step 1: We examined scientific literature for key attributes
of surveyed riparian species (App. S1) that might condi-
tion their response to changes in flow regime or processes
associated with them. The most relevant species attributes
were determined with a principal components analysis
(PCA) performed with Statgraphics Centurion (version
XVI) on a set of 20 selected variables (Fig. 3; App. S1)
describing species life history and phenology, reproductive
strategy, morphology and ecology (following Merritt et al.
2010). Our purpose in carrying out this step was to deter-
mine whether these attributes varied by species within our
surveyed species set.
Step 2: We subjected our riparian composition data set
(14 woody species and percentage of abundance from the
surveyed vegetation bands) to a detrended correspondence
analysis (DCA) using CANOCO (version 4.5; Leps & Smil-
auer 2003) to evaluate species distribution trends along
the Tietar river. Multiple regressions among DCA axes and
environmental variables were used to assess how mea-
sured environmental variables influenced species spatial
patterns. Categorical environmental variables were chan-
ged to dummy variables and rare species were down-
weighted. To quantify the relationship between the trait
matrix and the community ordination, we used a canoni-
cal correlation analysis (CCA) between the PCA space and
the DCA space (Statgraphics Centurion, version XVI). Step
2 was undertaken to corroborate that the species attributes
determined in step 1 were reflected in the species spatial
distributions within the gradients of environmental condi-
tions in the Tietar river corridor.
Step 3: We grouped surveyed vegetation bands accord-
ing to their species composition using a hierarchical cluster
analysis (see Crome 1978; Landres & MacMahon 1980)
performed with PASW Statistics (version 18) on the
species abundance data from each band, so that resulting
Journal of Vegetation ScienceDoi: 10.1111/j.1654-1103.2011.01360.x© 2011 International Association for Vegetation Science 5
M. D. Bejarano et al. Response of riparian guilds to flow alteration
vegetation groups differed from each other in riparian spe-
cies associations. Each group was named according to the
most important flow-related attributes of its species:
drought resistance (i.e. resistance to water stress: Xeric,
Mesic, Hydric), drag resistance (i.e. resistance to drag forces
caused by floods: ‘Torrential’, ‘Semi-torrential’ and ‘Slow-
water’) and flood resistance (i.e. resistance to inundation
and anoxia: ‘Flood-tolerant’ and ‘Flood-sensitive’). The
between-groups linkage method and the squared Euclid-
ean distance (SED) were used for analysis. The threshold
in the resulting dendrogram was set manually to between
3 and 5 SED to obtain a minimal number of groups that
represent the heterogeneity of the river vegetation. After
comparisons with PCA and DCA results, vegetation groups
were designated as riparian guilds, based on the criteria
that each vegetation group comprising a guild: (1) contains
species that share similar attributes (deduced in step 1);
and (2) shares a similar environment (deduced in step 2).
Responses of riparian guilds to flow alteration
A DCA was also used to investigate plant community com-
position patterns prior to and after dam construction by
locating the pre-dam and post-dam surveyed vegetation
bands within the ordination axis. We carried out within-
guild pre–dam and post–dam comparisons to detect signifi-
cant changes in guild abundance and distribution that
occurred following the construction of the dam and, if
present, whether this took place specifically for certain
guilds. Additionally, we compared diversity changes. Shifts
in the dominance of woody vegetation guilds were
assessed by analysing their pre- and post-dam frequencies.
Changes in guild distribution within the riparian zone
were evaluated by comparing the mean establishment dis-
tance and height with respect to the base flow of each
riparian guild in the pre- and post-dam bands. Woody spe-
cies diversity changes were evaluated by comparing the
Shannon’s index (Shannon 1948) from each riparian guild
in the pre- and post-dam bands. Comparisons were carried
out using t-tests and non-parametric Kolmogorov–Smir-
nov and Kruskal–Wallis tests when normality, indepen-
dence and homoscedasticity assumptions were not met by
the data. They were performed with the PASW Statistics
(version 18) software, and a 0.05 alpha level was used for
all comparison tests.
Results
Changes in flow regime
Annual run-off at the dam location decreased 36.7% after
dam operation began (Table 1). While natural simulated
run-off during the period 1985–2000 was 766 hm3 yr�1,
recorded flows during the same (regulated) period were
485 hm3 yr�1 (Table 1). At the dam site, the greatest flow
declines occurred in summer (post-/pre-mean discharge
ratio of 0.14) when water is diverted for irrigation through
the two artificial side channels; whereas reservoir filling
resulted in a halving of the river discharge in spring (post-/
pre- mean discharge ratio of 0.45; Fig. 2). The differences
between ‘natural’ and altered discharges were lower dur-
ing the autumn and winter seasons at the dam location
(post-/pre-ratio of 0.71; Fig. 2). The reduction in mean
–0.5
–0.4
–0.3
–0.2
–0.1
0.0
0.1
0.2
0.3
0.4
0.5
–0.4 –0.3 –0.2 –0.1 0.0 0.1 0.2 0.3 0.4
Component I
Com
pone
nt II
L
VR
FSR
H
SWSF
DR
LS
LT
LSh
RD
PS
DD
ST
AT
LR
SaT
CSR
(b)
–4
–3
–2
–1
0
1
2
3
4
–6 –4 –2 0 2 4 6
Component I
Com
pone
nt II
(a)
Ag
Ca
FaUm
Ss
FtCm
SAMn
SaSf
Sp
AnRp
Gc
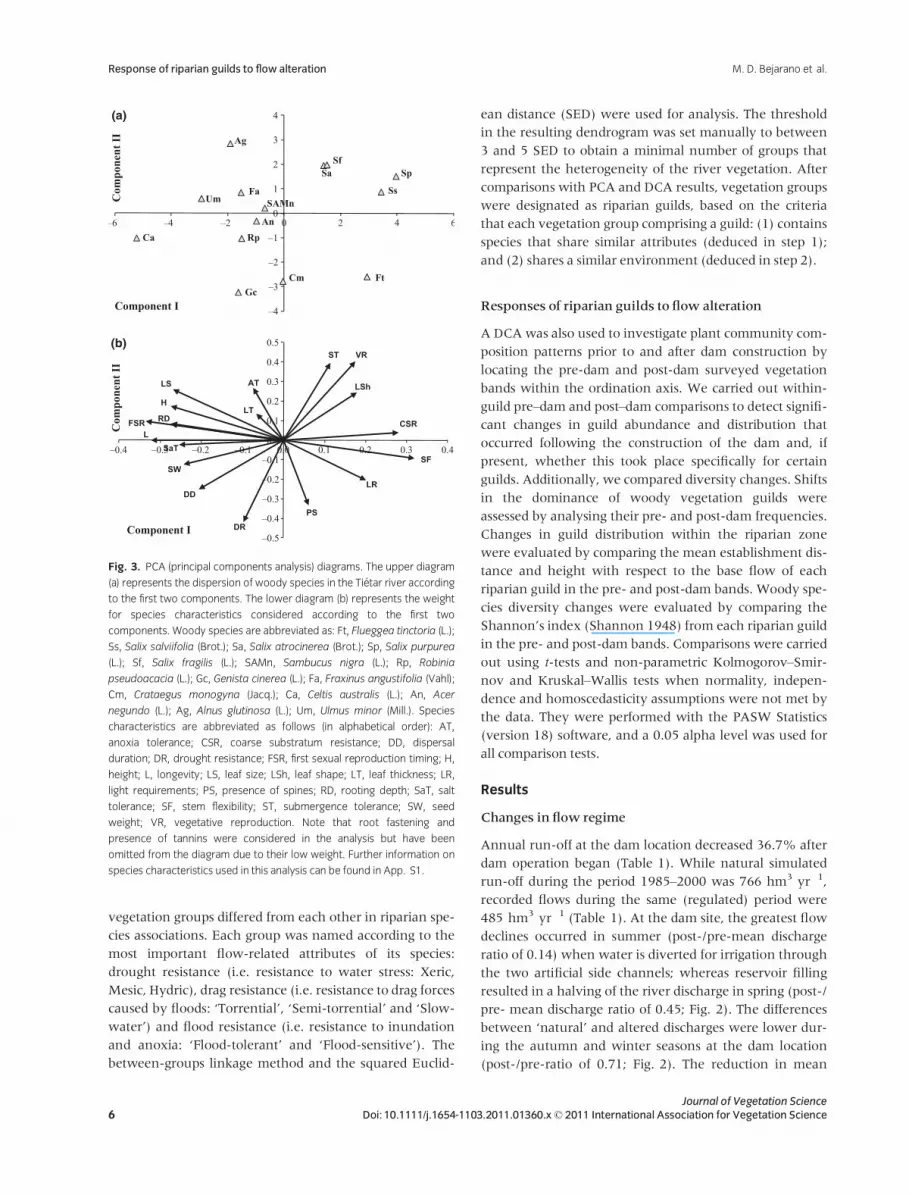
Fig. 3. PCA (principal components analysis) diagrams. The upper diagram
(a) represents the dispersion of woody species in the Tietar river according
to the first two components. The lower diagram (b) represents the weight
for species characteristics considered according to the first two
components. Woody species are abbreviated as: Ft, Flueggea tinctoria (L.);
Ss, Salix salviifolia (Brot.); Sa, Salix atrocinerea (Brot.); Sp, Salix purpurea
(L.); Sf, Salix fragilis (L.); SAMn, Sambucus nigra (L.); Rp, Robinia
pseudoacacia (L.); Gc, Genista cinerea (L.); Fa, Fraxinus angustifolia (Vahl);
Cm, Crataegus monogyna (Jacq.); Ca, Celtis australis (L.); An, Acer
negundo (L.); Ag, Alnus glutinosa (L.); Um, Ulmus minor (Mill.). Species
characteristics are abbreviated as follows (in alphabetical order): AT,
anoxia tolerance; CSR, coarse substratum resistance; DD, dispersal
duration; DR, drought resistance; FSR, first sexual reproduction timing; H,
height; L, longevity; LS, leaf size; LSh, leaf shape; LT, leaf thickness; LR,
light requirements; PS, presence of spines; RD, rooting depth; SaT, salt
tolerance; SF, stem flexibility; ST, submergence tolerance; SW, seed
weight; VR, vegetative reproduction. Note that root fastening and
presence of tannins were considered in the analysis but have been
omitted from the diagram due to their low weight. Further information on
species characteristics used in this analysis can be found in App. S1.
Journal of Vegetation Science6 Doi: 10.1111/j.1654-1103.2011.01360.x© 2011 International Association for Vegetation Science
Response of riparian guilds to flow alteration M. D. Bejarano et al.
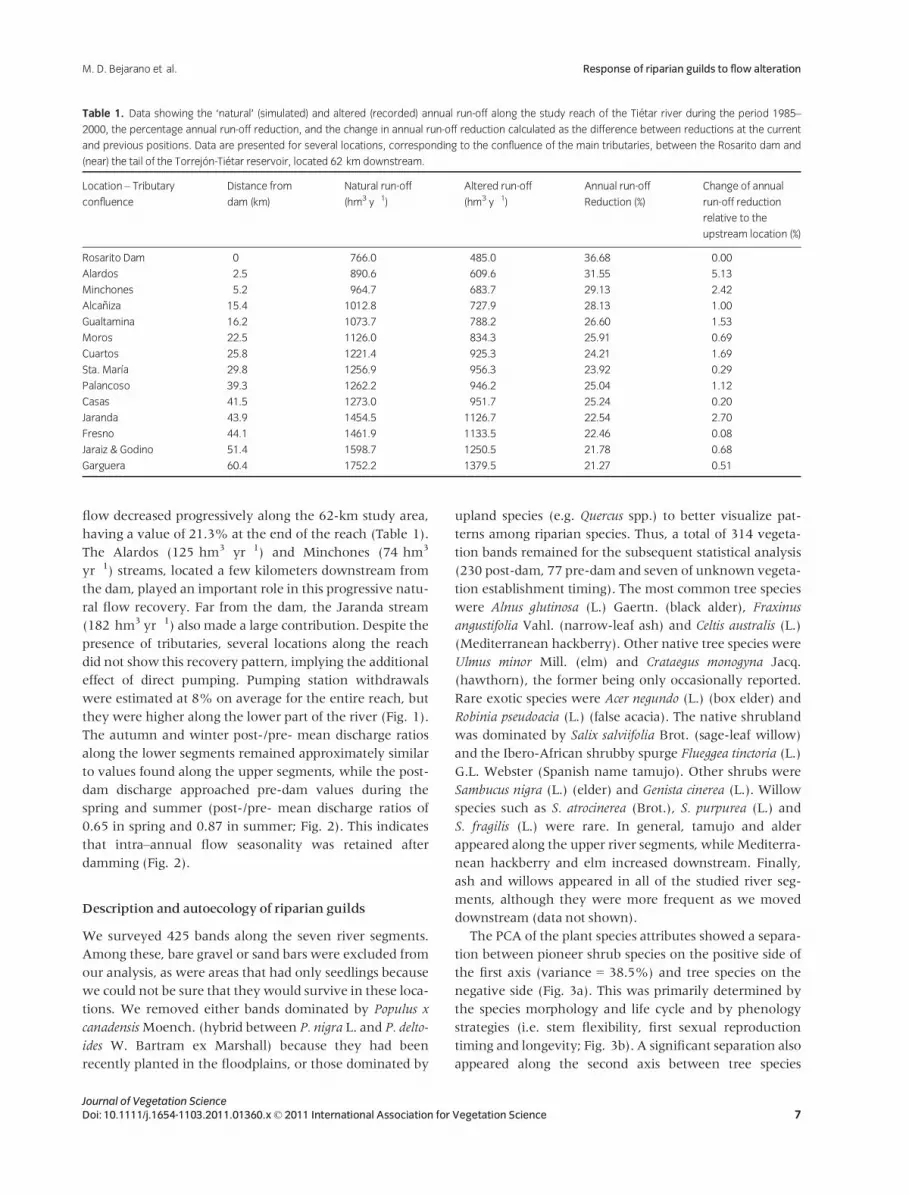
flow decreased progressively along the 62-km study area,
having a value of 21.3% at the end of the reach (Table 1).
The Alardos (125 hm3 yr�1) and Minchones (74 hm3
yr�1) streams, located a few kilometers downstream from
the dam, played an important role in this progressive natu-
ral flow recovery. Far from the dam, the Jaranda stream
(182 hm3 yr�1) also made a large contribution. Despite the
presence of tributaries, several locations along the reach
did not show this recovery pattern, implying the additional
effect of direct pumping. Pumping station withdrawals
were estimated at 8% on average for the entire reach, but
they were higher along the lower part of the river (Fig. 1).
The autumn and winter post-/pre- mean discharge ratios
along the lower segments remained approximately similar
to values found along the upper segments, while the post-
dam discharge approached pre-dam values during the
spring and summer (post-/pre- mean discharge ratios of
0.65 in spring and 0.87 in summer; Fig. 2). This indicates
that intra–annual flow seasonality was retained after
damming (Fig. 2).
Description and autoecology of riparian guilds
We surveyed 425 bands along the seven river segments.
Among these, bare gravel or sand bars were excluded from
our analysis, as were areas that had only seedlings because
we could not be sure that they would survive in these loca-
tions. We removed either bands dominated by Populus x
canadensisMoench. (hybrid between P. nigra L. and P. delto-
ides W. Bartram ex Marshall) because they had been
recently planted in the floodplains, or those dominated by
upland species (e.g. Quercus spp.) to better visualize pat-
terns among riparian species. Thus, a total of 314 vegeta-
tion bands remained for the subsequent statistical analysis
(230 post-dam, 77 pre-dam and seven of unknown vegeta-
tion establishment timing). The most common tree species
were Alnus glutinosa (L.) Gaertn. (black alder), Fraxinus
angustifolia Vahl. (narrow-leaf ash) and Celtis australis (L.)
(Mediterranean hackberry). Other native tree species were
Ulmus minor Mill. (elm) and Crataegus monogyna Jacq.
(hawthorn), the former being only occasionally reported.
Rare exotic species were Acer negundo (L.) (box elder) and
Robinia pseudoacia (L.) (false acacia). The native shrubland
was dominated by Salix salviifolia Brot. (sage-leaf willow)
and the Ibero-African shrubby spurge Flueggea tinctoria (L.)
G.L. Webster (Spanish name tamujo). Other shrubs were
Sambucus nigra (L.) (elder) and Genista cinerea (L.). Willow
species such as S. atrocinerea (Brot.), S. purpurea (L.) and
S. fragilis (L.) were rare. In general, tamujo and alder
appeared along the upper river segments, while Mediterra-
nean hackberry and elm increased downstream. Finally,
ash and willows appeared in all of the studied river seg-
ments, although they were more frequent as we moved
downstream (data not shown).
The PCA of the plant species attributes showed a separa-
tion between pioneer shrub species on the positive side of
the first axis (variance = 38.5%) and tree species on the
negative side (Fig. 3a). This was primarily determined by
the species morphology and life cycle and by phenology
strategies (i.e. stem flexibility, first sexual reproduction
timing and longevity; Fig. 3b). A significant separation also
appeared along the second axis between tree species
Table 1. Data showing the ‘natural’ (simulated) and altered (recorded) annual run-off along the study reach of the Tietar river during the period 1985–
2000, the percentage annual run-off reduction, and the change in annual run-off reduction calculated as the difference between reductions at the current
and previous positions. Data are presented for several locations, corresponding to the confluence of the main tributaries, between the Rosarito dam and
(near) the tail of the Torrejon-Tietar reservoir, located 62 km downstream.
Location – Tributary
confluence
Distance from
dam (km)
Natural run-off
(hm3 y�1)
Altered run-off
(hm3 y�1)
Annual run-off
Reduction (%)
Change of annual
run-off reduction
relative to the
upstream location (%)
Rosarito Dam 0 766.0 485.0 36.68 0.00
Alardos 2.5 890.6 609.6 31.55 �5.13
Minchones 5.2 964.7 683.7 29.13 �2.42
Alcaniza 15.4 1012.8 727.9 28.13 �1.00
Gualtamina 16.2 1073.7 788.2 26.60 �1.53
Moros 22.5 1126.0 834.3 25.91 �0.69
Cuartos 25.8 1221.4 925.3 24.21 �1.69
Sta. Marıa 29.8 1256.9 956.3 23.92 �0.29
Palancoso 39.3 1262.2 946.2 25.04 1.12
Casas 41.5 1273.0 951.7 25.24 0.20
Jaranda 43.9 1454.5 1126.7 22.54 �2.70
Fresno 44.1 1461.9 1133.5 22.46 �0.08
Jaraiz & Godino 51.4 1598.7 1250.5 21.78 �0.68
Garguera 60.4 1752.2 1379.5 21.27 �0.51
Journal of Vegetation ScienceDoi: 10.1111/j.1654-1103.2011.01360.x© 2011 International Association for Vegetation Science 7
M. D. Bejarano et al. Response of riparian guilds to flow alteration

(cumulative variance of axes I and II = 60.2%; Fig. 3a).
Axis II mainly contained the species ecological attributes; it
represented a water balance gradient (i.e. anoxia toler-
ance, drought resistance and submergence tolerance), with
the water stress-resistant tree species on the negative side
(Fig. 3). There were six statistically significant components
(i.e. when eigenvalues < 1), which accounted for 88.2%
of the total data variance.
The DCA on the species composition data set of the Tie-
tar river revealed compositional differences between sur-
veyed bands (Fig. 4a). The first two axes explained 36% of
the total variation of species data and accounted for the
60% of species–environment relations (eigenvalue axis
I = 0.72; axis II = 0.55). Species–environment correlations
were high (Pearson’s correlation coefficient r axis I = 0.76
and r axis II = 0.5). Themost important variables that con-
tributed significantly to inter-band floristic heterogeneity
were tree and shrub establishment timing (i.e. the youn-
gest individuals were found on the right side of the dia-
gram) and height and land form (i.e. banks or terraces),
geomorphic processes (i.e. aggradation or stability) and
canopy cover along the first axis, and the size of substra-
tum particles (i.e. sand or cobbles and pebbles) along the
second axis (Fig. 4b). The first axis can be interpreted as a
transverse gradient from the water to the terrace (from
right to left), implying both water availability and intensity
of flood disturbance lateral gradients, and a light availabil-
ity gradient; whereas the second axis might be related to a
gradient of substrate particle size, which is highly related to
water availability for plants; water-holding capacity
decreases with increasing particle size. Applying a CCA, a
high correlation resulted between the two principal canon-
ical axes from the two spaces (i.e. PCA and DCA spaces;
first principal canonical axis r = 0.91; P < 0.0001 and sec-
ond principal canonical axis r = 0.75; P < 0.01), which
supports the association between the trait matrix and the
community ordination.
Clustering techniques grouped the bands into nine
groups according to species composition and abundances
(see Table 2 for a complete list). The position of the groups
along the DCA axes was overlain by band affiliation,
thereby enabling visualization of the major features of the
vegetation spatial patterns (Fig. 4a). DCA showed that the
above-defined vegetation groups differed significantly,
being distinctly arranged depending on site characteristics
(Fig. 4) and according to the ecological requirements of
the group associates (Table 2, Fig. 3). This result supported
their designations as riparian guilds. Bands characterized
by the ‘Xeric/Torrential’ guild (i.e. dominated by Flueggea
tinctoria), the ‘Mesic/Torrential’ guild (i.e. co-dominated by
F. tinctoria and Salix salviifolia) and the ‘Xeric/Semi-torren-
tial’ guild (i.e. co-dominated by F. tinctoria and Fraxinus
angustifolia) typically colonized the coarsest substrates and
were very often found at river-disturbed sites (Fig. 4).
They appeared on frequently inundated, active and ag-
graded banks that presented the largest deposits of woody
debris. Such sites usually coincided with those that were
lowest with regard to the channel. This was true for rela-
tively pure tamujo (F. tinctoria) communities, whereas site
characteristics of these bands slightly differed from the
aforementioned bands, with increasing abundance of wil-
lows and ash. Bands characterized by the ‘Hydric/Torren-
tial’ guild (i.e. dominated by Salix spp.) shared the highly
disturbed habitat with those described above, with the
0.0
0.5
1.0
1.5
2.0
2.5
3.0
3.5
0.0 0.5 1.0 1.5 2.0 2.5 3.0 3.5
DC
A A
xis I
I
DCA Axis I
SpeciesXeric/TorrentialMesic/TorrentialXeric/Semi-torrentialHydric/TorrentialHydric/Semi-torrentialGeneralistHydric/Slow-water/Flood-tolerantXeric/Slow-water/Flood-tolerantXeric/Slow-water/Flood-sensitive
Sf
An
Ag
SAMn
Fa
CmGc
UmCa
Ft
Ss
Sp
Rs
Sa
–0.8
–0.6
–0.4
–0.2
0
0.2
0.4
–0.8 –0.6 –0.4 –0.2 0 0.2 0.4 0.6 0.8
DC
A A
xis I
I
DCA Axis I
ETR
DW
HW IAB
HB
B
FPT
BSC
BR
Cb
Pb
Gr
Sa
SiCl
WD
Ag
St
Er
(a)
(b)
Fig. 4. DCA (detrended correspondence analysis) diagrams. The upper
diagram (a) represents the species–samples biplot of the DCA of the whole
data set (i.e. species composition in the surveyed vegetation bands along
the Tietar river). Triangles represent woody species, whereas the
remaining symbols represent the sampled bands. Each dash large circle
indicates a riparian guild assigned to the sampled bands it includes,
according to the cluster analysis. The lower diagram (b) shows the
retrospective projection of the environmental variables that characterized
the sampled bands. Environmental variables are abbreviated as follows (in
alphabetical order): AB, active bank; Ag, aggradation; B, bench; BR,
bedrock; BS, bank slope; C, canopy cover; Cb, cobble; Cl, clay; DW,
distance to water edge; Er, erosion; ET, establishment timing; FP,
floodplain; Gr, gravel; HB, high bank; HW, height above the water level; I,
inundation frequency; Pb, pebble; R, degree of regulation; Sa, sand; Si, silt;
St, stability; T, terrace; WD, woody debris. See legend to Fig. 3 for species
abbreviations.
Journal of Vegetation Science8 Doi: 10.1111/j.1654-1103.2011.01360.x© 2011 International Association for Vegetation Science
Response of riparian guilds to flow alteration M. D. Bejarano et al.

exception that they preferred finer substrates and had a
higher water requirement (Fig. 4). Bands characterized by
the ‘Hydric/Semi-torrential’ guild (i.e. co-dominated by
Salix salviifolia and F. angustifolia) and the ‘Generalist’ guild
(i.e. dominated by F. angustifolia) occupied the centre to the
right side of the DCA diagram, implying flexibility for habi-
tat conditions (Fig. 4). In general, they were located rela-
tively high and far from the channel and usually appeared
growing on stable to aggraded floodplains and high banks
that were inundated more or less frequently. The more
dominant the willows, the more disturbed and closer and
lower to the channel were these bands. At the other
extreme, bands characterized by the ‘Xeric/Slow-water/
Flood-sensitive’ guild (i.e. dominated by Celtis australis) and
the ‘Xeric/Slow-water/Flood-tolerant’ guild (i.e. domi-
nated byUlmus minor) were generally found on the highest
and less frequently flooded land forms, although the latter
slightly better tolerated inundation (Fig. 4). Finally, bands
characterized by the ‘Hydric/Slow-water/Flood-tolerant’
guild were located on fine substrate areas, coinciding with
steep and eroded benches. These land forms were rarely
flood-disturbed but presented goodwater access (Fig. 4).
Shifts in guild dominance
The tamujo shrubland, which was mainly represented by
the ‘Xeric andMesic/Torrential and Semi-torrential’ guilds,
appeared only among the established post-dam bands.
Pre-dam established bands characterized by the
willow-dominated shrubland, which was represented by
the ‘Hydric/Torrential and Semi-torrential’ guilds, were
scarce; on average, these guilds established post-dam rep-
resented 85% of the willow-dominated shrubland (Fig. 5).
In contrast, the relative proportion of bands characterized
by the ‘Hydric and Xeric/Slow-water/Flood-tolerant and
Flood-sensitive’ guilds, which established during the pre-
dam period, was significantly higher than that of the post-
dam established bands (Fig. 5). Bands characterized by
these guilds that established during the post-dam period
represented 20% of the alder and hackberry forests.
Among the surveyed bands characterized by the ash forest
(i.e. the ‘Generalist’ guild), half of them were colonized
after damming (Fig. 5). Finally, the relative proportion of
the post-dam established riparian bands presenting the
‘Xeric/Slow-water/Flood-tolerant’ guild represented 71%
of the elm forest (Fig. 5).
Table 2. Riparian guild assignment to sampled vegetation bands in the Tietar river. The Table contains species abundance (%) within the band. Riparian
guilds are named according to the most important flow-related attributes of the species. Woody species are abbreviated as: Ft: Flueggea tinctoria (L.); Ss:
Salix salviifolia (Brot.); Sa: Salix atrocinerea (Brot.); Sp: Salix purpurea (L.); Sf: Salix fragilis (L.); SAMn: Sambucus nigra (L.); Rp: Robinia pseudoacacia (L.); Gc:
Genista cinerea (L.); Fa: Fraxinus angustifolia (Vahl); Cm: Crataegus monogyna (Jacq.); Ca: Celtis australis (L.); An: Acer negundo (L.); Ag: Alnus glutinosa (L.);
Um: Ulmus minor (Mill.). ‘n’ represents the total number of sampled bands belonging to each guild.
Species abundance within the surveyed band (%)
Riparian Guild Ca Um Ag Fa Pc An Rp Cm SAMn Ss Sa Sf Sp Ft Gc
Xeric/Torrential (n = 9) 0 0 0 0.2 0 0 0 0 0 10.5 0 0 0 89.3 0
Mesic/Torrential (n = 8) 0 0 1.1 5.8 1.7 0 0 0 0 59.7 0 0 0 31.8 0
Xeric/Semi-torrential (n = 6) 0 0 0 56.0 0 0 0 0.8 0 9.2 0 0 0 33.9 0
Hydric/Torrential (n = 117) 0.1 0 0.2 0.7 0.3 0 0 0 0.1 97.1 0.4 0.02 0.2 0.02 0
Hydric/Semi-torrential (n = 75) 0.4 0.6 1.5 25.2 0.8 1.2 0.9 0.02 3.0 64.3 0.6 0.2 1.0 0.2 0.1
Generalist (n = 66) 3.1 0.9 0.7 66.3 0 0 0 1.7 0 27.0 0 0 0.3 0 0
Hydric/Slow-water/Flood-tolerant (n = 15) 0 0 67.2 24.4 3.2 0 0 0 0.6 4.7 0 0 0 0 0
Xeric/Slow-water/Flood-tolerant (n = 7) 1.5 74.7 0 17.3 0.6 0 0.4 0 4 1.4 0 0 0 0 0.2
Xeric/Slow-water/Flood-sensitive (n = 11) 84.3 2.0 0 1.8 0.7 0 0 1.8 4.6 0.9 0 0 0 0 2.5
0102030405060708090
100
1 2 3 4 5 6 7 8 9
% V
eget
atio
n ba
nds
Riparian guilds
Pre-damPost-dam Unknown
Fig. 5. Relative proportion of the riparian guilds defined for the Tietar
river that established during the pre-dam and post-dam periods along the
study reach. Dashed bars represent sampled bands whose vegetation
establishment timing is unknown. Bars represent the percentage of
sampled vegetation bands corresponding to each riparian guild and
establishment timing. x-axis contains the riparian guilds: (1) ‘Xeric/
Torrential’; (2) ‘Mesic/Torrential’; (3) ‘Xeric/Semi-torrential’; (4) ‘Hydric/
Torrential’; (5) ‘Hydric/Semi-torrential’; (6) ‘Generalist’; (7) ‘Hydric/Slow-
water/Flood-tolerant’; (8) ‘Xeric/Slow-water/Flood-tolerant’; and (9) ‘Xeric/
Slow-water/Flood-sensitive’.
Journal of Vegetation ScienceDoi: 10.1111/j.1654-1103.2011.01360.x© 2011 International Association for Vegetation Science 9
M. D. Bejarano et al. Response of riparian guilds to flow alteration

Changes in guild establishment patterns
Establishment positions differed significantly between
riparian guilds when considering either pre-dam or post-
dam vegetation bands (P < 0.05 in Kruskal–Wallis test). In
general, the establishment height above the water level
increased from the shrubland to the forest (Figs 4b, 6a, c).
‘Torrential’ guilds (i.e. bands containing F. tinctoria and
Salix spp.) appeared at the lowest surfaces, whereas the
‘Slow-water’ and ‘Flood-sensitive’ guilds (i.e. bands con-
taining A. glutinosa, U. minor and C. australis) were distrib-
uted within the highest land forms with regard to the
water level. Among the ‘Slow-water’ guilds, those desig-
nated as ‘Xeric’ (bands containing U. minor and C. australis)
were located at significantly higher surfaces than the oth-
ers. The ‘Generalist’ guild appeared on intermediate height
areas. On the other hand, there were no clear patterns for
the establishment distance from the water edge among the
riparian guilds (Figs 4b, 6b, d). Comparisons of individual
guilds before and after dam installation showed that there
was a decrease of the height and distance of establishment
with regard to the water channel for all riparian guilds after
the initiation of hydrologic alterations, although only
height changes were statistically significant for all the
guilds considered (P < 0.05 in t-test; Fig. 6). When pre–
post comparisons were broken down by upper–lower river
segments (i.e. RS1–RS3 and RS4–RS7 according to their
differing geomorphic characteristics), the general trends
remained, except for the vegetation establishment distance
to the water along the upper segments, whose pre- and
post-dam values did not differ statistically (P > 0.05 in
Kolmogorov–Smirnov test; Fig. 6a).
Changes inwoody species diversity
Diversity of woody species within each surveyed band
statistically differed when comparing riparian guilds
(P > 0.05 in Kruskal–Wallis test for both pre- and post-
dam bands; Fig. 7). Bands characterized by the ‘Xeric and
Hydric/Torrential’ guilds presented the lowest values for
the Shannon’s index (0.39 on average), whereas the
‘Hydric/Semi-torrential’ guild showed the highest values
(0.82 on average; Fig. 7). Within riparian guilds, pre–post
comparisons of Shannon’s index did not indicate any
statistically significant differences (0.05 significance level
in the t-test) for most of the guilds. In general, post-dam
0
20
40
60
80
100
120
Dis
tanc
e to
wat
er e
dge
(m)
Riparian guilds
Upper segmentsPre-damPost-dam
(b)
0
1
2
3
4
5
6
7
8
9H
eigh
t abo
ve w
ater
leve
l (m
)
Riparian guilds
Upper segmentsPre-damPost-dam
(a)
0
20
40
60
80
100
120
Dis
tanc
e to
wat
er e
dge
(m)
Riparian guilds
Lower segmentsPre-damPost-dam
(d)
0
1
2
3
4
5
6
7
8
9
Hei
ght a
bove
wat
er le
vel (
m)
Riparian guilds
Lower segmentsPre-damPost-dam
(c)
1 2 3 4 5 6 7 8 91 2 3 4* 5* 6* 7* 8 9*
1 2 3 4* 5* 6* 7 8* 9*1 2 3 4* 5* 6* 7* 8* 9*
Fig. 6. Mean ± SE of the establishment height (a, c) and distance (b, d) relative to the water level during the sampling season for riparian guilds assigned
to the surveyed bands. The Figure represents data along the upper segments (RS1–RS3; first 20 km downstream from the dam; (a, b) and lower segments
(RS4–RS7; c, d) sampled along the Tietar river. Pre-dam and post-dam establishment locations are represented. *indicates statistically significant pre–post
differences (P < 0.05 in t-test). x-axis contains the riparian guilds; see legend to Fig. 5 for guild names.
Journal of Vegetation Science10 Doi: 10.1111/j.1654-1103.2011.01360.x© 2011 International Association for Vegetation Science
Response of riparian guilds to flow alteration M. D. Bejarano et al.

established bands characterized by the ‘Torrential’ and
‘Semi-torrential’ guilds exhibited lower diversity values
than those for the pre-dam bands. The reverse was true for
mature riparian forest bands characterized by the ‘Slow-
water’ guilds, where woody species diversity was higher
for the post-dam establishment (Fig. 7). On average,
within-band diversity decreased 31% for pioneer shrubs
and ash-dominated bands and increased 41% for bands
characterized by late-successional forest.
Discussion
In this study, we identified the riparian guilds present
along the Tietar river corridor and evidenced that they
responded to four main environmental gradients: flood
inundation, moisture, canopy and substrate grain size. We
also showed that certain species characteristics – stem
flexibility, stem and root length, longevity, reproductive
strategies, anoxia and submergence tolerance, drought
resistance, and light requirements – control species toler-
ance to drag and drowning, water and light requirements
and substrate preferences. Consequently, the environmen-
tal gradients existing within the Tietar riparian corridor
result in a dynamic mosaic of vegetation patches (Hupp &
Osterkamp 1996), where species with similar characteris-
tics are clustered together and locations are determined by
habitat conditions (Friedman et al. 2006; Hupp & Rinaldi
2007).
Water withdrawals for agriculture have decreased
stream discharge in the Tietar river during the last 50 yr,
significantly reducing water availability for plants. Similar
to many other studies (Johnson et al. 1995; Scott et al.
1996, 1997; Merritt & Cooper 2000; Cooper et al. 2003;
Birken & Cooper 2006; DeWine & Cooper 2007; Bejarano
et al. 2011; Bejarano & Sordo-Ward 2011), we found that
vegetation has progressively encroached downward and
inward towards the active channel in response to this
change, to ensure water access. However, shifts toward the
dominance and decline of particular riparian guilds along
the Tietar river during the post-dam period indicate that
some guilds (i.e. pioneer shrub guilds) can take advantage
of the conditions created by flow regulation, while others
cannot (i.e. native late-successional guilds).
The areas colonized by vegetation correspond to newly
exposed areas, which are lower and closer to the active
channel. They undergo frequent fluvial disturbance events
that redistribute soils and produce bank accretion. This
limits the proliferation of species to those with flexible
stems, rapid reproduction, resistance to burial and
re-sprouting ability, and explains the proliferation of the
‘Torrential’ and ‘Semi-torrential’ guilds in the Tietar river
after damming, which are dominated by F. tinctoria and
Salix spp. (Malanson 1993; Hughes et al. 2001, 2010;
Karrenberg et al. 2002, 2003; Prada & Arizpe 2008). In
addition, the segments closest to the dam contain the
coarsest substrates due to trapping of fine sediment in the
reservoir and scouring processes downstream of the dam.
These coarse substrates contribute to summer water stress
and difficulty of rooting, creating conditions only adequate
for the ‘Xeric/Torrential’ guilds (Gasith & Resh 1999; Agu-
iar & Ferreira 2005). Finer substrates and return flows from
irrigation that recharge the aquifer (Spanish Geological
Institute; http://aguas.igme.es) increase as wemove down-
stream from the dam. Thus, the combined effects of ground
water contributions and the higher water-holding capacity
of substrates result in less water depletion during the dry
season in the lowland segments, allowing the spread of
obligate phreatophytes along these segments (i.e. ‘Hydric/
Torrential’ guilds; Naumburg et al. 2005).
The fact that some F. angustifolia individuals were associ-
ated with Salix spp. individuals and shared similar locations
with them (i.e. the ‘Hydric/Semi-torrential’ guild) reflects
the ability of F. angustifolia to succeed in fluvial-disturbed
areas, behaving as a pioneer in the Tietar river. Addition-
ally, mature individuals of F. angustifolia have also persisted
on more distant and higher land forms with other non-
obligate phreatophyte species, where their long roots and
trunks facilitate access to water and light. Assuming that
all vegetation bands were, or will be, similar in appearance
at the same age (Oliver 1981; Foster & Tilman 2000), our
findings indicate a shift in the composition and structure of
late-successional riparian forests, from being initially domi-
nated by the ‘Slow-water’ guilds mainly represented by
A. glutinosa and C. australis in more humid or drier areas,
respectively (Garilleti et al. 2008), to becoming dominated
by the ‘Generalist’ guild dominated by F. angustifolia.
The significant and low number of post-dam bands
characterized by the ‘Hydric/Slow-water/Flood-tolerant’
0
0.2
0.4
0.6
0.8
1
1.2
Shan
non´
s ind
ex
Pre-damPost-dam
1 2 3 4† 5* 6 7 8 9Riparian guilds
Fig. 7. Average Shannon index and standard error of pre-dam and post-
dam established bands corresponding to each riparian guild in the Tietar
river. *indicates statistically significant pre–post differences (P < 0.05 in
K–S test); †indicates P-values between 0.1 and 0.05. x-axis contains the
riparian guilds; see legend to Fig. 5 for guild names.
Journal of Vegetation ScienceDoi: 10.1111/j.1654-1103.2011.01360.x© 2011 International Association for Vegetation Science 11
M. D. Bejarano et al. Response of riparian guilds to flow alteration

guild indicates a failure at some point during critical steps
in the life cycle of its species under the new hydrogeomor-
phic conditions. High water requirements and low resis-
tance to drag forces caused by floods of dominant species
(i.e. A. glutinosa) of this guild are reported in the literature
(De la Torre 1971, 2006; Costa et al. 1997; Prada & Arizpe
2008; United States Department of Agriculture: USDA;
http://usda.gov). In the Tietar river, the survival of A. glu-
tinosa seedlings on newly emerged river banks, where
water availability is guaranteed, might be hampered by fre-
quent fluvial disturbance events on these surfaces. Similar
arguments may also explain the decrease of the post-dam
‘Xeric/Slow-water/Flood-sensitive’ guild, whose species
cannot survive prolonged submergence during flooding.
Our results are not conclusive on the effect of regulation
on U. minor forests. Surveyed bands characterized by the
‘Xeric/Slow-water/Flood-tolerant’ guild were very few
and mortality of this species could be a consequence of
Dutch elm disease (Dıez & Gil 1999). Exotic species, such
as R. pseudoacacia and A. negundo, were found more fre-
quently on newly emerged areas, associated with Salix spp.
and F. angustifolia. However, although flow alteration
seems to favour their expansion, they are still very rare,
indicating that they are not competitive with other native
species.
Our study revealed slightly higher woody species diver-
sity within the post-dam established vegetation bands
characterized by late-successional ‘Slow-water’ guilds. This
pattern may be explained by the co-existence of riverine
species and upland species, with the former able to survive
drier and shadier conditions and the latter having accessed
and successfully become established on the higher fluvial
forms following stream water declines (Corenblit et al.
2007, 2008; Bejarano et al. 2011a). However, we found
less woody species within the remaining riparian guilds of
the Tietar river in the vegetation bands established post-
dam, similar to results reported in studies downstream
from dams in other areas (Nilsson et al. 1991a, 1991b;
Decamps & Tabacchi 1994; Bush & Smith 1995; Ferreira &
Stohlgren 1999; Jansson et al. 2000; Johnson 2002; Dyne-
sius et al. 2004).
Using a riparian guild approach increased our capacity
to detect and synthesize complex flow alteration–riparian
ecosystem response relationships. As such, our study sug-
gests that riparian guilds function as ‘super-species’ as far
as their responses to stream-flow changes are concerned.
We demonstrated statistically significant changes in several
riparian attributes after flow alterations, as expected
according to the riparian vegetation–flow response guild
theory (Merritt et al. 2010). The ‘Hydric’, ‘Slow-water’
and ‘Flood-sensitive’ guilds in the Tietar river have become
the guilds most threatened by regulation, as a result of the
significant decrease in recruitment of the species due to
the decrease in discharge and maintenance of floods after
damming. In contrast, the most ‘Generalist’ riparian traits,
together with the ‘Xeric’ and ‘Torrential’ traits, have
expanded significantly during the post-dam period. We
support here the use of ‘indicator guilds’ rather than ‘indi-
cator species’ (Verner 1984), suggesting that the effect of
similar stream-flow alterations to those described for the
Tietar river might similarly affect analogous guilds in other
regions.
Conclusions
The guild concept can help in environmental assessment
and management (Hawkins & MacMahon 1989). As
applied here, it provides a more functional evaluation of
the causes and consequences of community change in
response to human-caused alterations in flow regime than
conventional approaches. The advantage of the riparian
guild concept lies in its ability to enable the management
of flow attributes for multiple species, over those pre-
scribed to accommodate few or single species. Specifically,
understanding riparian guild responses to stream-flow
alterations can guide river rehabilitation and restoration
projects, as well as environmental flow design. In addition,
specific negative impacts of flow alterations on particular
associated species can be detected, allowing restoration
strategies to be focused toward especially threatened
guilds.
Acknowledgements
The study was possible thanks to the Marıa Dolores Bejar-
ano FPU contract (AP2005-2680) for the training of uni-
versity staff from the Spanish Ministry of Science and
Innovation. It was also supported by funds from the POT-
ECOL (CGL2007-66412) andMOCHCA (CGL2009-14258)
projects financed by the Spanish Ministry of Science and
Innovation, and from the Coordination Action VIAGUA
(410AC0399) under the CYTED Program (Iberoamerican
Program of Science and Technology for Development). We
would like to thank Lane Butler for assistance with lan-
guage and Daniel Sisı and Eufrasia Aguirre for assistance
during field surveys. Finally, we are also very grateful to
the Stromberg Lab Group (Arizona State University, USA)
and the anonymous reviewers whose comments consider-
ably improved the paper.
References
Aguiar, F. & Ferreira, M.T. 2005. Human-disturbed landscapes:
effects on composition and integrity of riparian woody
vegetation in the Tagus river basin, Portugal. Environmental
Conservation 32: 30–41.
Journal of Vegetation Science12 Doi: 10.1111/j.1654-1103.2011.01360.x© 2011 International Association for Vegetation Science
Response of riparian guilds to flow alteration M. D. Bejarano et al.

Aguiar, F.C., Ferreira, M.T., Moreira, I. & Albuquerque, A. 2000.
Riparian types on a Mediterranean basin. Aspects of Applied
Biology 58: 1–12.
Aguiar, F.C., Ferreira, M.T. &Moreira, I. 2001. Exotic and native
vegetation establishment following channelization of a wes-
tern Iberian river. Regulated Rivers: Research & Management 17:
509–526.
Arcement, G.J. & Schneider, V. 1989. Guide for selecting Man-
ning’s roughness coefficients for natural channels and flood
plains. United States Geological survey Water Supply book
2339. USGPOWashington and Dever, CO. 38 pp.
Austen, D.J., Bayel, P.B. & Menzel, B.W. 1994. Importance of
the guild concept to fisheries research and management.
Fisheries 19: 12–20.
Beguerıa, S., Lopez-Moreno, J.I., Lorente, A., Seeger, M. &
Garcıa- Ruiz, J.M. 2003. Assessing the effect of climate oscil-
lations and land-use changes on streamflow in the central
Spanish pyrenees. Ambio 32: 283–286.
Bejarano, M.D. & Sordo-Ward, A. 2011. Riparian woodland
encroachment following flow regulation: a comparative
study of Boreal and Mediterranean streams. Knowledge and
Management of Aquatic Ecosystems. In press: doi: 10.1051/
kmae/2011059. Volume 1, article number 402.
Bejarano, M.D., Nilsson, C., Gonzalez del Tanago, M. &
Marchamalo, M. 2011. Responses of riparian trees and
shrubs to flow regulation along a boreal stream in northern
Sweden. Freshwater Biology 56: 853–866.
Birken, A.S. & Cooper, D.J. 2006. Processes of Tamarix invasion
and floodplain development along the lower Green river,
Utah. Ecological Applications 16: 1103–1120.
Bornette, G., Tabacchi, E., Hupp, C., Puijalon, S. & Rostan, J.C.
2008. A model of plant strategies in fluvial hydrosystems.
Freshwater Biology 53: 1692–1705.
Burnash, R.J.C., Ferrel, R.L. & McGuire, R.A. 1973. A general
streamflow simulation system–conceptual modeling for digital com-
puters. Report by the Joint Federal State River Forecasting
Center, Sacramento, CA, US.
Bush, D.E. & Smith, S.D. 1995. Mechanisms associated with
decline of woody species in riparian ecosystems of the south-
western U.S. Ecological Monographs 65: 347–370.
Cabezas, A., Comın, F.A., Beguerıa, S. & Trabucchi, M. 2009.
Hydrologic and landscape changes in the middle Ebro river
(NE Spain): implications for restoration and management.
Hydrology and Earth System Sciences 13: 1–12.
Castroviejo, S. (Coord.) 2005. Flora iberica. Real Jardin Botanico.
CSIC. Madrid, ES. Vols. 2, 3, 8.
CEDEX-Spanish Minsitry of Environment and Public Works
2008. Mapa de caudales maximos en la cuenca del Tajo. Centro
de Estudios Hidrograficos del CEDEX. Aplicacion informatica
de uso publico, Ministerio de Fomento,Madrid, Espana.
Cooper, D.J., Andersen, D.C. & Chimner, R.A. 2003. Multiple
pathways for woody plant establishment on floodplains at
local to regional scale. Journal of Ecology 91: 182–196.
Corbacho, C., Sanchez, J.M. & Costillo, E. 2003. Patterns of
structural complexity and human disturbance of riparian
vegetation in agricultural landscapes of a Mediterranean
area. Agriculture, Ecosystems and Environment 95: 495–507.
Corenblit, D., Tabacchi, E., Steiger, J. &Gurnell, A.M. 2007. Reci-
procal interactions and adjustment between fluvial land-
forms and vegetation dynamics in river corridors: a review of
complementary approaches.Earth-Science Reviews 84: 56–86.
Corenblit, D., Gurnell, A.M., Steiger, J. & Tabacchi, E. 2008.
Reciprocal adjustments between landforms and living organ-
isms: extended geomorphic evolutionary insights. Catena 73:
261–273.
Costa, M., Morla, C. & Sainz, H. 1997. Los bosques Ibericos. Una
interpretacion geobotanica. Editorial Planeta, Barcelona, ES.
Crome, F.H.J. 1978. Foraging ecology of an assemblage of birds
in lowland rainforest in northern Queensland. Australian
Journal of Ecology 3: 195–212.
De la Torre, J. 1971. Arboles y arbustos de la Espana Peninsular.
Escuela Tecnica Superior de Ingenieros de Montes, Madrid,
ES. 512 pp.
De la Torre, J. 2006. Flora mayor. DG Biodiversidad, Madrid, ES.
1756 pp.
Decamps, H. & Tabacchi, E. 1994. Species richness in vegetation
along river margins. In Aquatic ecology: scale, pattern and
process. Giller, P.S., Hildrew, A.G. & Raffaelli, D.G. (eds.)
pp. 1–20. Blackwell Scientific, Oxford, UK.
DeWine, J.M. & Cooper, D.J. 2007. Effects of river regulation on
riparian box elder (Acer negundo) forests in canyons of the
upper Colorado river basin, USA.Wetlands 27: 278–289.
Dıez, J. & Gil, L. 1999. Effects of Ophiostoma ulmi and Ophiostoma
novo-ulmi culture filtrates on elm culture from genotypes
with different susceptibility to Dutch Elm Disease. European
Journal for Plant Pathology 28: 399–407.
Dufour, S. & Piegay, H. 2008. Geomorphological controls of
Fraxinus excelsior growth and regeneration in floodplain
forests. Ecology 89: 205–215.
Dynesius, M., Jansson, R., Johansson, M.E. & Nilsson, C. 2004.
Intercontinental similarities in riparian-plant diversity
and sensitivity to river regulation. Ecological Applications 14:
173–191.
Egger, C., Exner, A. & Jorde, K. 2008. Modelling and evaluating
changes of morphology and vegetation due to dam opera-
tion. Technical study for Korea Institute of Construction
Technology, Korea, 196 pp.
Ferreira, M.T. & Moreira, I.S. 1999. River plants from an Iberian
basin and environmental factors influencing their distribu-
tion.Hydrobiologia 415: 101–107.
Ferreira, L.V. & Stohlgren, T.J. 1999. Effects of river level fluctu-
ation on plant species richness, diversity, and distribution in
a floodplain forest in central Amazonia. Oecologia 120:
582–587.
Flores-Montoya, F., Garrote, L. & Martin-Carrasco, F. 2003. The
hydrologic regime of the Tagus Basin in the last 60 years.
In: Varis, O., Tortajada, C., Chevallier, P., Pouyaud, B. &
Servat, E. (eds.) Proceedings of the XI World Water Congress:
water resources management in the 21st century. pp. 22–31.
IWRA.Madrid, ES.
Journal of Vegetation ScienceDoi: 10.1111/j.1654-1103.2011.01360.x© 2011 International Association for Vegetation Science 13
M. D. Bejarano et al. Response of riparian guilds to flow alteration

Foster, B.L. & Tilman, D. 2000. Dynamic and static views of
succession: testing the descriptive power of the chronose-
quence approach. Plant Ecology 146: 1–10.
Friedman, J.M., Auble, G.T., Andrews, E.D., Kittel, G., Madole,
R.F., Griffin, E.R. & Allred, T.M. 2006. Transverse and
longitudinal variation in woody riparian vegetation along a
montane river.Western North American Naturalist 66: 78–91.
Garcıa de Jalon, D. 2003. The spanish experience in determining
minimum flow regimes in regulated streams. Canadian Water
Resources Journal 28: 1–14.
Garcıa-Ruiz, J.M., Lasanta, T., Ortigosa, L., Ruizflano, P., Martı,
C. & Gonzalez, C. 1995. Sediment yield under different
land uses in the spanish pyrenees. Mountain Research and
Development 15: 229–240.
Garilleti, R., Calleja, J.A. & Lara, F. 2008. Sıntesis ecologica y
sectorizacion de la vegetacion de ribera de la mitad sur de Espana.
Informe CEDEX inedito. Madrid. ES. 571 pp.
Garofano-Gomez, V., Martınez-Capel, F. & Frances, F. 2009. Dis-
tribution patterns of riparian species in relation to channel
bed in twoMediterranean rivers. Proceedings of the 7th Interna-
tional Symposium of Ecohydraulics. Int. Association of Hydraulic
Engineering and Research (IAHR) – University of Concepcion
(Chile). Published by ISE 2009 Organizing Committee. ISBN:
978-981-08-2100-5. 9 Pp.
Gasith, A. & Resh, V.H. 1999. Streams in Mediterranean climate
regions: abiotic influences and biotic response to predictable
seasonal events. Annual Review of Ecology and Systematics 30:
51–81.
Gonzalez, E., Gonzalex-Sanchıs, M., Cabezas, A., Comın, F.A. &
Muller, E. 2010a. Recent changes in the riparian forest of
a large regulated Mediterranean river: implications for
management. Environmental Management 45: 669–681.
Gonzalez, E., Gonzalez-Sanchıs, M., Comın, F.A. & Muller, E.
2010b. Hydrologic thresholds for riparian forest conservation
in a regulated large Mediterranean river. River Research and
Applications 26: 1–10.
Grantham, T.E., Merenlender, A.M. & Resh, V.E. 2010. Climatic
influences and anthropogenic stressors: an integrated frame-
work for streamflowmanagement inMediterranean-climate
California, U.S.A. Freshwater Biology 55(Suppl.1): 188–204.
Gurnell, A.M. & Petts, G.E. 2002. Island-dominated landscapes
of large floodplain rivers, a European perspective. Freshwater
Biology 47: 581–600.
Gurnell, A.M. & Petts, G.E. 2006. Trees as riparian engineers: the
Tagliamento river, Italy. Earth Surface Processes and Landforms
31: 1558–1574.
Hawkins, C.P. & MacMahon, JA. 1989. Guilds: the multiple
meanings of a concept. Annual Reviews of Entomology 34:
423–451.
Horton, J.L., Kolb, T.E. & Hart, S.C. 2001. Response of riparian
trees to interannual variation in ground water depth in
a semi-arid river basin. Plant, Cell and Environment 24:
293–304.
Hughes, F.M.R. & Rood, S.B. 2003. Allocation of river flows for
restoration of floodplain forest ecosystems: a review of
approaches and their applicability in Europe. Environmental
Management 32: 12–33.
Hughes, F.M.R., Adams, W.M., Muller, E., Nilsson, C., Richards,
K.S., Barsoum, N., Decamps, H., Foussadier, R., Girel, J.,
Guilloy, H., Hayes, A., Johansson, M., Lambs, L., Pautou, G.,
Peiry, J.L., Perrow, M., Vautier, F. & Winfield, M. 2001. The
importance of different scale processes for the restoration of
floodplain woodlands. Regulated Rivers: Research and Manage-
ment 17: 325–345.
Hughes, F.M.R., Johansson, M., Xiong, S., Carlborg, E.,
Hawkins, D., Svedmark,M., Hayes, A., Goodall, A., Richards,
K.S. & Nilsson, C. 2010. The influence of hydrological
regimes on sex ratios and spatial segregation of the sexes in
two dioecious riparian shrub species in northern Sweden.
Plant Ecology 208: 77–92.
Hupp, C.R. & Osterkamp, W.R. 1996. Riparian vegetation and
fluvial geomorphic processes. Geomorphology 14: 277–295.
Hupp, C.R. & Rinaldi, M. 2009. Riparian vegetation patterns in
relation to fluvial landforms and channel evolution along
selected rivers of Tuscany (central Italy). Annals of the Associa-
tion of American Geographers 97: 12–30.
Ibanez, C., Prat, N. & Canicio, A. 1996. Changes in the hydrology
and sediment transport produced by large dams on the lower
Ebro river and its estuary. Regulated Rivers: Research and
Management 12: 51–62.
Jansson, R., Nilsson, C., Dynesius, M. & Andersson, E. 2000.
Effects of river regulation on river-margin vegetation: a
comparison of eight boreal rivers. Ecological Applications 10:
203–224.
Johnson, W.C. 2002. Riparian vegetation diversity along
regulated rivers: contribution of novel and relict habitats.
Freshwater Biology 47: 749–759.
Johnson, W.C., Dixon, M.D., Simons, R., Jenson, S. & Larson, K.
1995. Mapping the response of riparian vegetation to possi-
ble flow reductions in the Snake River, Idaho. Geomorphology
13: 159–173.
Karrenberg, S., Edwards, P.J. & Kollmann, J. 2002. The life
history of Salicaceae living in the active zone of floodplains.
Freshwater Biology 47: 733–748.
Karrenberg, S., Blaser, S., Kollmann, J., Speck, T. & Edwards, P.
J. 2003. Root anchorage of saplings and cuttings of woody
pioneer species in a riparian environment. Functional Ecology
17: 170–177.
Kennard, M.J., Olden, J.D., Arthington, A.H., Pusey, B.J. & Poff,
N.L. 2007. Multiscale effects of flow regime and habitat and
their interaction on fish assemblage structure in eastern
Australia. Canadian Fisheries Aquatic Science 64: 1346–1359.
Landres, P.B. & MacMahon, J.A. 1980. Guilds and community
organization: analysis of an oak woodland avifauna in
Sonora,Mexico. Auk 97: 351–365.
Leonard, P. & Orth, D. 1988. Use of habitat guilds of fishes to
determine instream flow requirements. North American Jour-
nal of Fisheries Management 8: 399–409.
Leps, J. & Smilauer, P. 2003.Multivariate analysis of ecological data
using CANOCO. Cambridge University Press, Cambridge, UK.
Journal of Vegetation Science14 Doi: 10.1111/j.1654-1103.2011.01360.x© 2011 International Association for Vegetation Science
Response of riparian guilds to flow alteration M. D. Bejarano et al.

Lite, S.J. & Stromberg, J.C. 2005. Surface water and ground-
water thresholds for maintaining Populus–Salix forests, San
Pedro river, Arizona. Biological Conservation 125: 153–167.
Lopez Gonzalez, G.A. 2001. Los arboles y arbustos de la Penınsula
Iberica e islas Baleares. Ediciones Mundiprensa, Madrid,
Espana, 1727 Pp.
Lytle, D.A. & Merritt, D.M. 2004. Hydrologic regimes and ripar-
ian forests: a structured population model for cottonwood.
Ecology 85: 2493–2503.
Mahoney, J.M. & Rood, S.B. 1992. Response of a hybrid poplar
to water table decline in different substrates. Forest Ecology
andManagement 54: 141–156.
Malanson, G.P. 1993. Riparian landscapes. Cambridge University
Press, Cambridge, UK.
Melcher, A., Schmutz, S. & Haidvogl, G. 2007. Spatially based
methods to assess the ecological status of European fish
assemblage types. Fisheries Management and Ecology 14: 453–
463.
Merritt, D.M. & Cooper, D.J. 2000. Riparian vegetation and
channel change in response to river regulation: a compara-
tive study of regulated and unregulated streams in the Green
river basin, USA. Regulated Rivers: Research and Management
16: 543–564.
Merritt, D.M. & Poff, N.L. 2010. Shifting dominance of riparian
Populus and Tamarix along gradients of flow alteration in
western North American rivers. Ecological Applications 20:
135–152.
Merritt, D.M., Scott, M.L., Poff, L.N., Auble, G.T. & Lytle, D.A.
2010. Theory, methods and tools for determining environ-
mental flows for riparian vegetation: riparian vegetation–
flow response guilds. Freshwater Biology 55: 206–225.
Mitsch, W.J. & Gosselink, J.G. 2000. The value of wetlands:
importance of scale and landscape setting. Ecological Econom-
ics 35: 25–33.
Naiman, R.J. & Decamps, H. 1997. The ecology of interfaces:
riparian zones. Annual Review of Ecology and Systematics 28:
621–658.
Naiman, R.J., Decamps, H. & Pollock, M. 1993. The role of ripar-
ian corridors in maintaining regional diversity. Ecological
Applications 3: 209–212.
Naumburg, E., Mata-Gonzalez, R., Hunter, R.G., Mclendon, T. &
Martın, D.W. 2005. Phreatophytic vegetation and ground-
water fluctuations: a review of current research and applica-
tion of ecosystem response modeling with an emphasis on
Great Basin vegetation. Environmental Management 35: 726–
740.
Navarro, R. & Galvez, C. 2002. Manual para la identificacion y
reproduccion de semillas de especies vegetales autoctonas. Junta
de Andalucıa. Cordoba, ES. (2 Vols.).
Nilsson, C., Ekblad, A., Gardfjell, M. & Carlberg, B. 1991a. Long-
term effects of river regulation on river margin vegetation.
Journal of Applied Ecology 28: 963–987.
Nilsson, C., Gardfjell, M. & Grelsson, G. 1991b. Importance of
hydrochory in structuring plant communities along rivers.
Canadian Journal of Botany 69: 2631–2633.
Nilsson, C., Ekblad, A., Dynesius, M., Backe, S., Gardfjell, M.,
Carlberg, B., Hellquist, S. & Jansson, R. 1994. A comparison
of species richness and traits of riparian plants between a
main river channel and its tributaries. Journal of Ecology 82:
281–295.
Oliver, C.D. 1981. Stand development – its uses and methods of study.
In Means, J.E. (ed.), Forests succession and stand development
research in the northwest. pp. 100–112. Forest Research Lab,
Oregon State University, OR, US.
Pinilla, V. 2006. The Development of Irrigated Agriculture in
Twentieth-century Spain: a Case Study of the Ebro Basin.
Agricultural History Review 54: 122–141.
Polzin,M.L. & Rood, S.B. 2000. Effects of damming and flow sta-
bilization on riparian processes and black cottonwoods along
the Kootenay river. Rivers 7: 221–232.
Prada, M.A. & Arizpe, D. 2008. Riparian tree and shrub propagation
handbbook. An aid to riverine restoration in the Mediterranean
region. Generalitat Valenciana, ES. pp. 202. ISBN: 978-84-
482-4965-6.
Regier, H.A., Welcomme, R.L., Steedman, R.J. & Henderson,
H.F. 1989. Rehabilitation of degraded river systems. Cana-
dian Special Publication on Fisheries and Aquatic Science 106:
86–89.
Rood, S.B. & Mahoney, J.M. 1990. Collapse of riparian poplar
forests downstream from dams in western prairies: probable
causes and prospects for mitigation. Environmental Manage-
ment 14: 451–464.
Rood, S.B., Taboulchanas, K., Bradle, y C.E. & Kalischuk, A.R.
1999. Influence of flow regulation on channel dynamics and
riparian cottonwoods along the Bow river, Alberta. Rivers 7:
33–48.
Root, R.B. 1967. The niche exploitation pattern of the blue-gray
gnatcatcher. Ecological Monographs 37: 317–350.
Ruız de la Torre, J. 1971. Arboles y arbustos de la Espana peninsular.
Mundi-Prensa, Madrid, ES. 512 pp.
Ruız de la Torre, J. 2006. Flora mayor. direccion general para la
biodiversidad. Ministerio de Medio Ambiente. Madrid, ES.
1756 pp.
Salinas, M.J., Banca, G. & Romero, T. 2000. Evaluating riparian
vegetation in semi-arid Mediterranean watercourses in the
southeastern Iberian Peninsula. Environmental Conservation
27: 24–35.
Scott, M.L., Friedman, J.M. & Auble, G.T. 1996. Fluvial process
and establishment of bottomland trees. Geomorphology 14:
327–339.
Scott, M.L., Auble, G.T. & Friedman, J.M. 1997. Flood
dependency of cottonwood establishment along the Mis-
souri river, Montana, USA. Ecological Applications 7: 677–
690.
Severinghaus, W.D. 1981. Guild theory development as a mech-
anism for assessing environmental impact. Environmental
Management 5: 187–190.
Shannon, C.E. 1948. A mathematical theory of communication.
Bell System Technical Journal 27: 379–423.
Journal of Vegetation ScienceDoi: 10.1111/j.1654-1103.2011.01360.x© 2011 International Association for Vegetation Science 15
M. D. Bejarano et al. Response of riparian guilds to flow alteration

Simberloff, D. & Dayan, T. 1991. The guild concept and the struc-
ture of ecological communities. Annual Reviews of Ecology and
Systematic 22: 115–143.
SpanishMinistry of Environment. 2006. Inventario de Presas Espa-
nolas. Formato CD. Ministerio de Medio Ambiente, Madrid,
Espana.
Stromberg, J.C. 1993. Fremont cottonwood–Goodding willow
riparian forests: a review of their ecology, threats, and recov-
ery potential. Journal of the Arizona-Nevada Academy of Science
27: 97–110.
Stromberg, J.C., Tiller, R. & Richter, B. 1996. Effects of ground-
water decline on riparian vegetation of semiarid regions: the
San Pedro, Arizona. Ecological Applications 6: 113–131.
Stromberg, J.C., Fry, J. & Patten, D.T. 1997. Marsh development
after large floods in an alluvial, arid-land river. Wetlands 17:
292–300.
Stromberg, J.C., Lite, S.J. & Dixon, M.D. 2010. Effects of stream
flow patterns on riparian vegetation of a semiarid river:
implications for a changing climate. River Research and Appli-
cations 26: 712–729.
Suszka, B, Muller, C. & Bonnet-Mason Beat, M. 1994. Seeds
of forest broadleaves from harvest to sowing. INRA. Paris, FR.
294 pp.
Verner, J. 1984. The guild concept applied to management of
bird populations. Environmental Management 8: 1–14.
Welcomme, R.L., Winemiller, K.O. & Cowx, I.G. 2005.
Fish environmental guilds as a tool for assessment of ecologi-
cal condition of rivers. River Research and Applications 21:
1–20.
Wright, J.F., Moss, D., Armitage, P.D. & Furse, M.T. 1984. A pre-
liminary classification of running-water sites in Great Britain
based on macro-invertebrate species and the prediction of
community type using environmental data. Freshwater
Biology 14: 221–256.
Web References
http://aemet.es. Agencia Estatal deMeteorologıa.
http://aguas.igme.es. Instituto Geologico y Minero de
Espana.
http://cedex.es. Centro de Estudios Hidrograficos.
http://chtajo.es. Confederacion Hidrografica del Tajo.
http://hec.usace.army.mil/software/hec-ras/hecras-
download.html. US Army Corps of Engineers.
http://sigpac.mapa.es. Sistema de Informacion Ge-
ografica de Parcelas Agrıcolas.
http://usda.gov. United States Department of Agricul-
ture.
Supporting Information
Additional supporting information may be found in the
online version of this article:
Appendix S1. Metrics used to define the riparian
species guilds. They were quantified based on species traits
recorded in the literature (Castroviejo 20051; Navarro &
Galvez 20022; Ruız de la Torre 1971, 20063, 4; Suszka et al.
1994; 5), the authors’ field observations and measured
data. Some metrics were evaluated in relative terms by a
ranking of each trait (between 0 and 1).
Please note: Wiley-Blackwell are not responsible for
the content or functionality of any supporting materials
supplied by the authors. Any queries (other than missing
material) should be directed to the corresponding author
for the article.
Journal of Vegetation Science16 Doi: 10.1111/j.1654-1103.2011.01360.x© 2011 International Association for Vegetation Science
Response of riparian guilds to flow alteration M. D. Bejarano et al.

Graphical AbstractThe contents of this page will be used as part of the graphical abstract of html only. It will not be published as part
of main.
This article shows the opposite effects of flow alterations on Mediterranean riparian guilds according to the species flow-
related attributes.Whereas the ability to survive water stress and to drag forces caused by floods favor the expansion of pio-
neer shrub-dominated guilds, the recruitment of native late-successional tree guilds which are sensitive to floods and have
greater water requirements is limited after damming.


