Embed Size (px)
Citation preview
Resting-state brain networks in neonatalhypoxic-ischemic brain damage: a functional
near-infrared spectroscopy study
Shen Zhang ,a Cheng Peng ,b Yang Yang,a Daifa Wang,a,c
Xinlin Hou,b,* and Deyu Li a,c,d,e,*aBeihang University, School of Biological Science and Medical Engineering,
Beijing, ChinabPeking University First Hospital, Department of Neonatal Ward, Beijing, ChinacBeihang University, Advanced Innovation Center for Biomedical Engineering,
Beijing, ChinadBeihang University, State Key Laboratory of Software Development Environment,
Beijing, ChinaeBeihang University, State Key Laboratory of Virtual Reality Technology and System,
Beijing, China
Abstract
Significance: There is an emerging need for convenient and continuous bedside monitoring of full-term newborns with hypoxic-ischemic brain damage (HIBD) to determine whether early interven-tion is required. Functional near-infrared spectroscopy (fNIRS)-based resting-state brain networkanalysis, which could provide an effective evaluation method, remains to be extensively studied.
Aim: Our study aims to verify the feasibility of fNIRS-based resting-state brain networks forevaluating brain function in infants with HIBD to provide a new and effective means for clinicalresearch in neonatal HIBD.
Approach: Thirteen neonates with HIBDwere scanned using fNIRS in the resting state. The brainnetwork properties were explored to attempt to extract effective features as recognition indicators.
Results: Compared with healthy controls, newborns with HIBD showed decreased brain func-tional connectivity. Specifically, there were severe losses of long-range functional connectivityof the contralateral parietal-temporal lobe, contralateral parietal-frontal lobe, and contralateralparietal lobe. The node degree showed a widespread decrease in the left frontal middle gyrus, leftsuperior frontal gyrus dorsal, and right central posterior gyrus. However, newborns with HIBDshowed a significantly higher local network efficiency (*p < 0.05). Subsequently, networkindicators based on small-worldness, local efficiency, modularity, and normalized clusteringcoefficient were extracted for HIBD identification with the accuracy observed as 79.17%.
Conclusions: Our findings indicate that fNIRS-based resting-state brain network analysis couldsupport early HIBD diagnosis.
© The Authors. Published by SPIE under a Creative Commons Attribution 4.0 Unported License.Distribution or reproduction of this work in whole or in part requires full attribution of the original pub-lication, including its DOI. [DOI: 10.1117/1.NPh.8.2.025007]
Keywords: infants; hypoxic-ischemic brain damage; functional near-infrared spectroscopy;brain network; resting state.
Paper 20085R received Nov. 22, 2020; accepted for publication Apr. 28, 2021; published onlineMay 14, 2021.
1 Introduction
Hypoxic-ischemic brain damage (HIBD) is among the leading causes of neonatal death andneurological disorders.1 Persistent brain injury in the neonatal period has been suggested to
*Address all correspondence to Deyu Li, [email protected]; Xinlin Hou, [email protected]
Neurophotonics 025007-1 Apr–Jun 2021 • Vol. 8(2)
Downloaded From: https://www.spiedigitallibrary.org/journals/Neurophotonics on 25 Mar 2022Terms of Use: https://www.spiedigitallibrary.org/terms-of-use
disrupt key structural development, which results in serious consequences such as white matterabnormalities, neuronal necrosis, and intracerebral hemorrhage. Nearly 25% of survivors presentneurological-related sequelae, including mental retardation, paralysis, epilepsy, and otherdiseases.2–4 Typical neurological symptoms of HIBD deteriorate within a few days after birth;therefore, continuous monitoring and effective evaluation of brain function in these childrencould help determine whether targeted intervention is necessary and allow for decisive diseasediagnosis and treatment.5
Currently, the clinical HIBD diagnosis mainly relies on two aspects. These include clinicalcharacterization, which specifically refers to abnormal changes in consciousness, original reflec-tion (there are some congenital reflexes in newborns, which reflect whether the body and nervoussystem function of the newborn is normal), and muscle tension,6 as well as detection of HIBD-induced lesions using ultrasound, computed tomography (CT), magnetic resonance imaging(MRI), and other medical imaging technologies. These classical technologies have their ownadvantages and limitations. Ultrasound has gradually optimized resolution in brain structure scan-ning, but it is insufficient at monitoring capabilities of functional hemodynamics. CT involves acertain radiation degree, with immature brain tissue having an unideal tolerance. MRI has a strongspatial resolution, which can accurately distinguish the perfusion level of regional cerebral bloodflow. However, there is an emerging need for convenient and continuous bedside monitoring ofneonates who are unable to undergo MRI due to clinical instability and/or the medical equipmentrequired for therapeutic interventions. It would be a positive effort to satisfy the need by func-tional near-infrared spectroscopy (fNIRS) resting-state brain network analysis.
fNIRS is a relatively new non-invasive brain imaging technology and has attracted greatattention from brain researchers due to its friendliness to the participants.7,8 More importantly,the main advantage of fNIRS in the diagnosis of HIBD is to support portable and continuousbedside monitoring. fNIRS allows us to obtain neonatal high-quality data sets within a fewminutes. Notably, the data can be collected with the infants in a quiet or sleep state withoutthe need to perform tasks or other auxiliary reagents (tranquilizers). The short preparation anddetection period at the bedside means that pediatricians can record data repeatedly at any criticalpoint. In addition, fNIRS avoids the effects of radiation on newborns compared with CT orpositron emission CT.
Brain network analysis has been widely used in the evaluation of brain function. The humanbrain is a highly complex network system with numerous local or global topological features.9,10
Some synchronous low-frequency fluctuations are associated with neural activity between somebrain regions in the resting state, which indicates that organized activities between different brainregions contribute to maintaining the mechanism of brain activity.11,12 Different from a randomnetwork, the brain functional network is economical, which ensures that the brain can differ-entiate and integrate information efficiently, providing the physiological basis for informationprocessing and mental representations.13 Bullmore and Sporns14 believe that brain networks canbe examined by critical properties of graph theory, such as clustering coefficient, node degree,efficiency, and modularity. These metrics of graph theory provide key information about thenetwork structure and describe the specific organizational style of the network. Over the pastdecade, resting-state brain networks have had great utility in brain function assessment, espe-cially when assessing neurocognitive development in newborns. Relevant fMRI studies haveshown some basic functional networks in healthy newborns;15 moreover, the precursors of someadvanced networks have been identified. Studies have demonstrated the presence of the defaultmode network of the primary motor cortex and sensory cortex.16 Smyser et al.17 used fMRI toexplore the resting-state connectivity of premature infants. The results showed that the mostobvious decrease of functional connectivity was in the area near the injured site. They also con-firmed that abnormal development of periventricular white matter would lead to a decrease ofnetwork connectivity. Tusor18 studied 15 infants with HIBD, and conventional MRI showed thatthere were varying degrees of damage to white matter and gray matter in the cohort. In theseinfants, typical resting-state networks, including auditory, somatomotor, visual, and default pat-tern networks, were identified. In addition, the long-distance connection of the unilateral brain inchildren with HIBD was weakened.
A series of advances has been made in the study of the neonatal fNIRS connectivity. Homaeet al.19 conducted follow-up fNIRS assessments of healthy newborns for 6 months and observed
Zhang et al.: Resting-state brain networks in neonatal hypoxic-ischemic brain damage. . .
Neurophotonics 025007-2 Apr–Jun 2021 • Vol. 8(2)
Downloaded From: https://www.spiedigitallibrary.org/journals/Neurophotonics on 25 Mar 2022Terms of Use: https://www.spiedigitallibrary.org/terms-of-use
gradual complication and enhancement of the functional network in each region of the neonatalcerebral cortex. Makiko et al.20 found that infants with Down’s syndrome had lower connectivityand different local hemodynamics, which demonstrated the potential of fNIRS for clinical use ininfants. Lin et al.21 utilized resting-state fNIRS imaging data to explore topological changes innetwork organization during development from early childhood and early adolescence to adult-hood, and the results showed the developmental maturity of important functional brain organi-zation in early childhood. Kelsey et al.22 explored the link between gut microbiome, brain, andbehavior in 63 newborn infants by resting-state fNIRS. They found that the composition of gutmicrobiota is related to the individual differences of brain network connectivity, which in turnmediates the individual differences of infant behavior temperament. Their findings indicate thatthe gut microbiome plays an important role in human development.
However, as far as we know, the existing studies on the functional connectivity of the neo-natal brain mostly focus on preterm infants (gestational age < 37weeks) and do not deeply deter-mine the changes of their network properties. Full-term infants with HIBD often miss thetreatment window because of their atypical clinical symptoms, until serious complications suchas hydrocephalus are found. The specific network properties have not been extracted as sensitivebiological factors for early auxiliary diagnosis of HIBD. Given the aforementioned findings, thisstudy aims to use fNIRS to record the resting-state data of full-term infants with HIBD for con-structing a functional network that covers the prefrontal, parietal, and temporal lobes, to observethe local or global topological features of HIBD using network analysis, and to extract sensitivebiological factors to achieve effective recognition of HIBD.
2 Methods
In this experiment, fNIRS was applied to record resting-state signals from neonates with HIBD.We constructed a whole-brain functional network based on the between-channel correlation of thesequences of hemoglobin concentration. Functional connections between six early-developingregions of interest (ROIs) were explored. Using comparisons, sensitive network indicators wereextracted as features and used to input support vector machines (SVM) for training and testing.This study was conducted according to the Declaration of Helsinki and approved by the localEthics Committee of Beihang University.
2.1 Participants
This study enrolled participants from the pediatric neonatal ward of the Peking University FirstHospital. The inclusion criteria were as follows: (1) term neonates with a gestational age of 37 to44 weeks; (2) having a HIBD diagnosis (mainly including diffuse white matter abnormalities,periventricular leukomalacia, blood oxygen ischemic encephalopathy, intraventricular hemor-rhage, hemorrhagic ventricular dilatation, hemorrhagic hydrocephalus, and periventricular hem-orrhagic infarction); and (3) having consent from the legal guardian. All relevant assessmentswere obtained within 72 h of the baby’s birth since typical neurological symptoms of HIBDappear within 6 to 12 h after birth and peak at 72 h. The acquisition time was strictly controlledto avoid the effect of our clinical intervention. All infants were monitored after full lactation andnatural sleep. Two infants woke up and cried, so they could not complete the monitoring. Theywere excluded in the follow-up analysis. After early screening and subsequent visits, 13 eligiblenewborns with HIBD and 13 healthy newborns as controls were enrolled in the experiment. Thesocio-demographic information for this study is shown in Table 1.
2.2 Data Acquisition
The fNIRS signals were acquired using a multichannel fNIRS system (NirSmart-2416,HuiChuang, China) with two wavelengths (760 and 850 nm) at a sampling rate of 10 Hz.
An experimental platform dedicated to newborns was established [see Fig. 1(a)]. To reduceinterference from the external environment, the newborns were tested in a room with dim lightand sound insulation effects. Before being tested, the newborn was placed in a supine position in
Zhang et al.: Resting-state brain networks in neonatal hypoxic-ischemic brain damage. . .
Neurophotonics 025007-3 Apr–Jun 2021 • Vol. 8(2)
Downloaded From: https://www.spiedigitallibrary.org/journals/Neurophotonics on 25 Mar 2022Terms of Use: https://www.spiedigitallibrary.org/terms-of-use
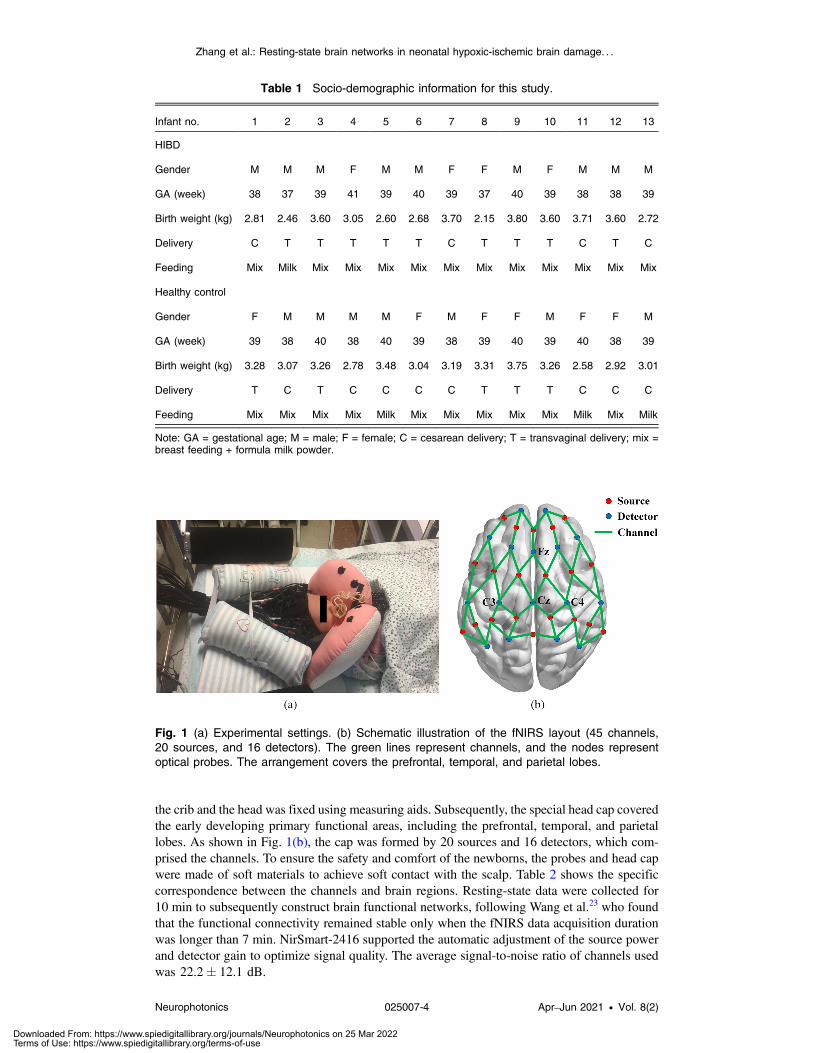
the crib and the head was fixed using measuring aids. Subsequently, the special head cap coveredthe early developing primary functional areas, including the prefrontal, temporal, and parietallobes. As shown in Fig. 1(b), the cap was formed by 20 sources and 16 detectors, which com-prised the channels. To ensure the safety and comfort of the newborns, the probes and head capwere made of soft materials to achieve soft contact with the scalp. Table 2 shows the specificcorrespondence between the channels and brain regions. Resting-state data were collected for10 min to subsequently construct brain functional networks, following Wang et al.23 who foundthat the functional connectivity remained stable only when the fNIRS data acquisition durationwas longer than 7 min. NirSmart-2416 supported the automatic adjustment of the source powerand detector gain to optimize signal quality. The average signal-to-noise ratio of channels usedwas 22.2� 12.1 dB.
Fig. 1 (a) Experimental settings. (b) Schematic illustration of the fNIRS layout (45 channels,20 sources, and 16 detectors). The green lines represent channels, and the nodes representoptical probes. The arrangement covers the prefrontal, temporal, and parietal lobes.
Table 1 Socio-demographic information for this study.
Infant no. 1 2 3 4 5 6 7 8 9 10 11 12 13
HIBD
Gender M M M F M M F F M F M M M
GA (week) 38 37 39 41 39 40 39 37 40 39 38 38 39
Birth weight (kg) 2.81 2.46 3.60 3.05 2.60 2.68 3.70 2.15 3.80 3.60 3.71 3.60 2.72
Delivery C T T T T T C T T T C T C
Feeding Mix Milk Mix Mix Mix Mix Mix Mix Mix Mix Mix Mix Mix
Healthy control
Gender F M M M M F M F F M F F M
GA (week) 39 38 40 38 40 39 38 39 40 39 40 38 39
Birth weight (kg) 3.28 3.07 3.26 2.78 3.48 3.04 3.19 3.31 3.75 3.26 2.58 2.92 3.01
Delivery T C T C C C C T T T C C C
Feeding Mix Mix Mix Mix Milk Mix Mix Mix Mix Mix Milk Mix Milk
Note: GA = gestational age; M = male; F = female; C = cesarean delivery; T = transvaginal delivery; mix =breast feeding + formula milk powder.
Zhang et al.: Resting-state brain networks in neonatal hypoxic-ischemic brain damage. . .
Neurophotonics 025007-4 Apr–Jun 2021 • Vol. 8(2)
Downloaded From: https://www.spiedigitallibrary.org/journals/Neurophotonics on 25 Mar 2022Terms of Use: https://www.spiedigitallibrary.org/terms-of-use
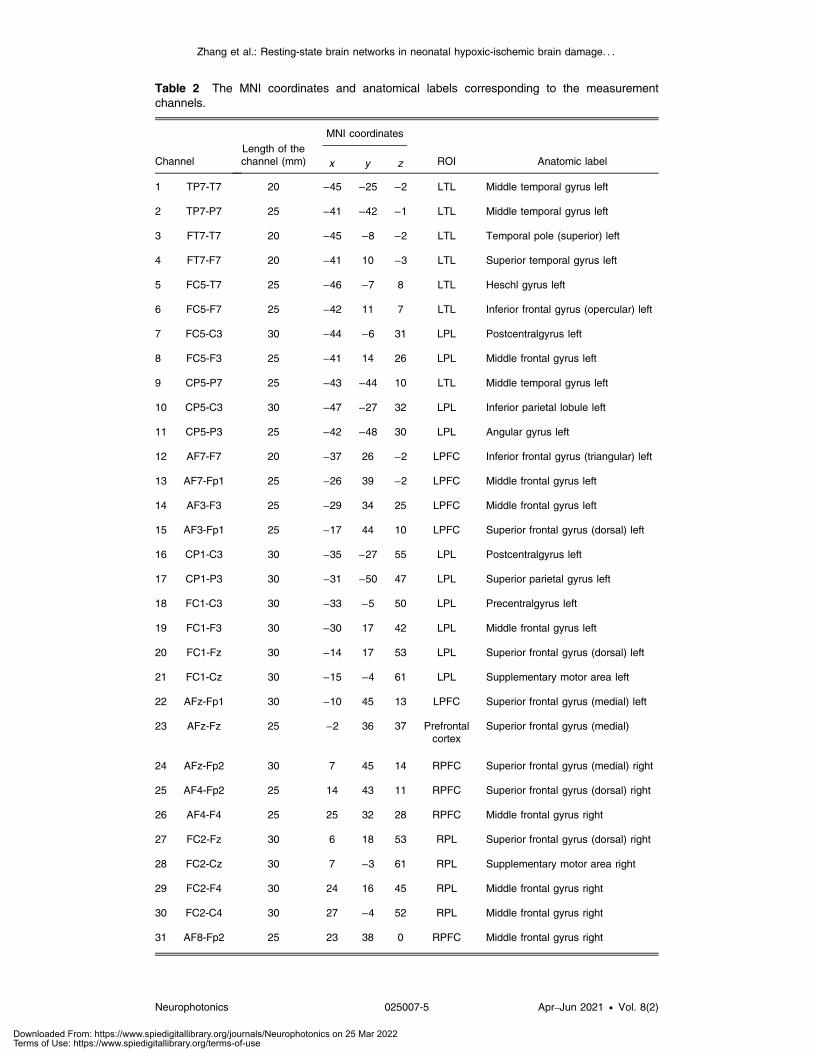
Table 2 The MNI coordinates and anatomical labels corresponding to the measurementchannels.
ChannelLength of thechannel (mm)
MNI coordinates
ROI Anatomic labelx y z
1 TP7-T7 20 −45 −25 −2 LTL Middle temporal gyrus left
2 TP7-P7 25 −41 −42 −1 LTL Middle temporal gyrus left
3 FT7-T7 20 −45 −8 −2 LTL Temporal pole (superior) left
4 FT7-F7 20 −41 10 −3 LTL Superior temporal gyrus left
5 FC5-T7 25 −46 −7 8 LTL Heschl gyrus left
6 FC5-F7 25 −42 11 7 LTL Inferior frontal gyrus (opercular) left
7 FC5-C3 30 −44 −6 31 LPL Postcentralgyrus left
8 FC5-F3 25 −41 14 26 LPL Middle frontal gyrus left
9 CP5-P7 25 −43 −44 10 LTL Middle temporal gyrus left
10 CP5-C3 30 −47 −27 32 LPL Inferior parietal lobule left
11 CP5-P3 25 −42 −48 30 LPL Angular gyrus left
12 AF7-F7 20 −37 26 −2 LPFC Inferior frontal gyrus (triangular) left
13 AF7-Fp1 25 −26 39 −2 LPFC Middle frontal gyrus left
14 AF3-F3 25 −29 34 25 LPFC Middle frontal gyrus left
15 AF3-Fp1 25 −17 44 10 LPFC Superior frontal gyrus (dorsal) left
16 CP1-C3 30 −35 −27 55 LPL Postcentralgyrus left
17 CP1-P3 30 −31 −50 47 LPL Superior parietal gyrus left
18 FC1-C3 30 −33 −5 50 LPL Precentralgyrus left
19 FC1-F3 30 −30 17 42 LPL Middle frontal gyrus left
20 FC1-Fz 30 −14 17 53 LPL Superior frontal gyrus (dorsal) left
21 FC1-Cz 30 −15 −4 61 LPL Supplementary motor area left
22 AFz-Fp1 30 −10 45 13 LPFC Superior frontal gyrus (medial) left
23 AFz-Fz 25 −2 36 37 Prefrontalcortex
Superior frontal gyrus (medial)
24 AFz-Fp2 30 7 45 14 RPFC Superior frontal gyrus (medial) right
25 AF4-Fp2 25 14 43 11 RPFC Superior frontal gyrus (dorsal) right
26 AF4-F4 25 25 32 28 RPFC Middle frontal gyrus right
27 FC2-Fz 30 6 18 53 RPL Superior frontal gyrus (dorsal) right
28 FC2-Cz 30 7 −3 61 RPL Supplementary motor area right
29 FC2-F4 30 24 16 45 RPL Middle frontal gyrus right
30 FC2-C4 30 27 −4 52 RPL Middle frontal gyrus right
31 AF8-Fp2 25 23 38 0 RPFC Middle frontal gyrus right
Zhang et al.: Resting-state brain networks in neonatal hypoxic-ischemic brain damage. . .
Neurophotonics 025007-5 Apr–Jun 2021 • Vol. 8(2)
Downloaded From: https://www.spiedigitallibrary.org/journals/Neurophotonics on 25 Mar 2022Terms of Use: https://www.spiedigitallibrary.org/terms-of-use
2.3 Data Preprocessing
The NirSpark software (HuiChuang, China) package was used to preprocess fNIRS signals.During fNIRS scans, the newborns occasionally had involuntary sudden head movements (evenin sleep). Motion artifacts affect functional connectivity analysis deeply and have attracted muchattention. The commonly used correcting approaches include spline interpolation, wavelet analy-sis, principal component analysis, Kalman filtering, etc. Each method has its own advantages.The positive aspect of spline interpolation is that it only corrects the pre-localized artifacts with-out modifying the other portions of the time series. Therefore, the spline interpolation methodwas used to amend motion artifacts, which were manifested as an impulse or cliff-type jumpscaused by the relative sliding of the scalp and probes.24–26 Subsequently, 0.01- to 0.1-Hz band-pass filtering was performed to remove the noise based on physiological fluctuations such aspulse and respiration.27 Then the modified Beer–Lambert law was used to transform light inten-sity data into the relative change of the concentration of oxygenated (HbO) and deoxygenatedhemoglobin (HbR) as follows:
EQ-TARGET;temp:intralink-;e001;116;207ΔODλi ¼ ðελiHboΔCHbo þ ελiHbRΔCHbRÞ × r × DPFλi ; i ¼ 1;2; (1)
where the variable ε is the wavelength-dependent extinction coefficient for each hemoglobintype. The change in light absorption, which is referred to as the delta optical density, is repre-sented as ΔOD. ΔCHbO and ΔCHbR represent the relative concentration changes of HbO andHbR, respectively. The DPF (differential path-length factor) accounts for the true effective pathlength between the source and detector, while r represents the linear distance between the pairedprobes. The DPF is related to the wavelength of the incident light and the distance betweensources and detectors. Based on a related study by van der Zee et al.,28 DPF ¼ 4 was consideredappropriate for this study.
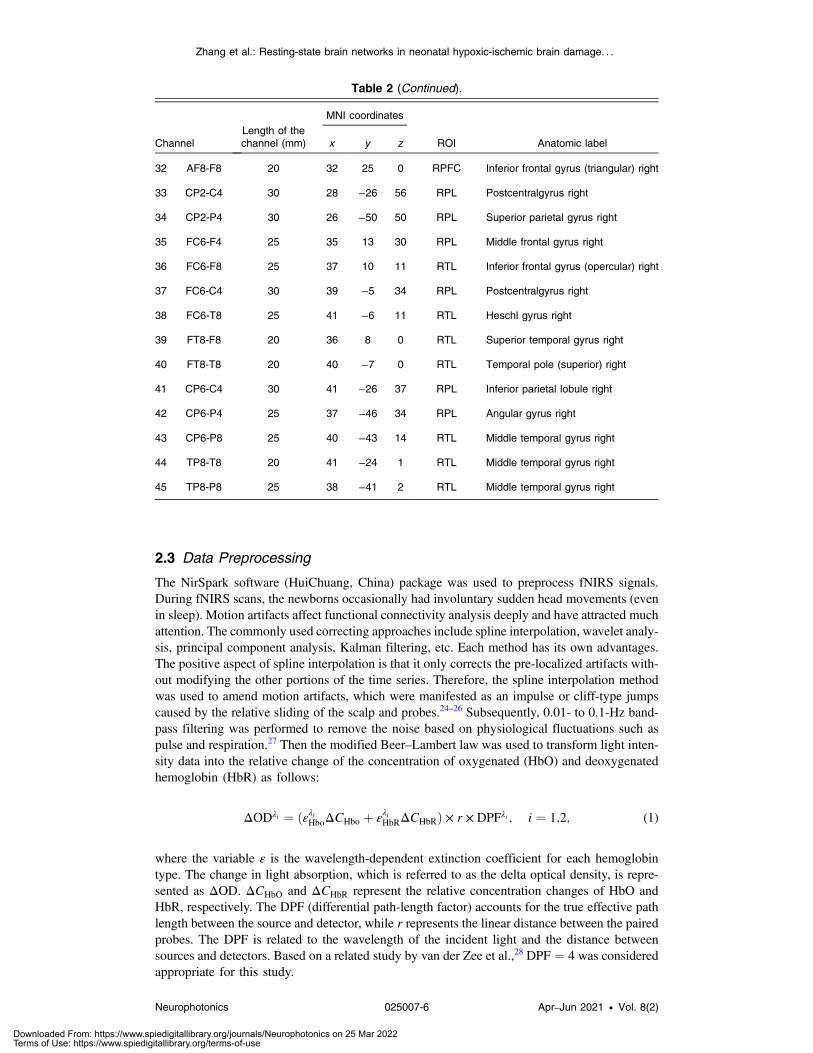
Table 2 (Continued).
ChannelLength of thechannel (mm)
MNI coordinates
ROI Anatomic labelx y z
32 AF8-F8 20 32 25 0 RPFC Inferior frontal gyrus (triangular) right
33 CP2-C4 30 28 −26 56 RPL Postcentralgyrus right
34 CP2-P4 30 26 −50 50 RPL Superior parietal gyrus right
35 FC6-F4 25 35 13 30 RPL Middle frontal gyrus right
36 FC6-F8 25 37 10 11 RTL Inferior frontal gyrus (opercular) right
37 FC6-C4 30 39 −5 34 RPL Postcentralgyrus right
38 FC6-T8 25 41 −6 11 RTL Heschl gyrus right
39 FT8-F8 20 36 8 0 RTL Superior temporal gyrus right
40 FT8-T8 20 40 −7 0 RTL Temporal pole (superior) right
41 CP6-C4 30 41 −26 37 RPL Inferior parietal lobule right
42 CP6-P4 25 37 −46 34 RPL Angular gyrus right
43 CP6-P8 25 40 −43 14 RTL Middle temporal gyrus right
44 TP8-T8 20 41 −24 1 RTL Middle temporal gyrus right
45 TP8-P8 25 38 −41 2 RTL Middle temporal gyrus right
Zhang et al.: Resting-state brain networks in neonatal hypoxic-ischemic brain damage. . .
Neurophotonics 025007-6 Apr–Jun 2021 • Vol. 8(2)
Downloaded From: https://www.spiedigitallibrary.org/journals/Neurophotonics on 25 Mar 2022Terms of Use: https://www.spiedigitallibrary.org/terms-of-use
2.4 Brain Functional Networks Construction
During the past 20 years, brain studies have increasingly applied EEG-, fMRI-, and fNIRS-basedbrain network analysis, as well as other brain imaging techniques. Studies have shown that graphtheory-based brain network theory is an effective tool for analyzing brain structure and function,which reveals numerous potential operating mechanisms and features.29
During advanced cognitive processing, there is cooperation among brain regions with a con-sistent hemoglobin supply. The transformed HbO or HbR sequences were used to constructand evaluate the correlation between 45 channels through Pearson’s correlation coefficient asfollows:
EQ-TARGET;temp:intralink-;e002;116;621r ¼ Σni¼1ðXi − XÞðYi − YÞffiffiffiffiffiffiffiffiffiffiffiffiffiffiffiffiffiffiffiffiffiffiffiffiffiffiffiffi
Σni¼1ðXi − XÞ2
q ffiffiffiffiffiffiffiffiffiffiffiffiffiffiffiffiffiffiffiffiffiffiffiffiffiffiffiΣni¼1ðYi − YÞ2
q ; (2)
where X and Y represent the time series of hemoglobin concentration in the different channels orROIs, respectively, and r is the correlation coefficient. Thus, a 45 × 45 functional connectivitymatrix could be obtained from each participant. Subsequently, Fisher’s r-to-z transformation wasapplied to convert these correlation coefficients to z-scores for improved normality.
Forty-five channels were divided into six ROIs based on their location (see Table 1), includ-ing the left prefrontal cortex (LPFC), left temporal lobe (LTL), left parietal lobe (LPL), rightprefrontal cortex (RPFC), right temporal lobe (RTL), and right parietal lobe (RPL). Moreover,we averaged the time series of all channels in each region and calculated the between-region r toevaluate the between-ROI correlation.
Using threshold sparsity, the correlation matrix was transformed into a binary matrix fol-lowed by the construction of the specific brain network model of HIBD. The thresholds wereselected to ensure network integrity and small-world attributes. The sparsity parameter wasselected to determine the ratio of the number of existing edges to the maximum possible edges,which has a great impact on the topology of the network. Usually, researchers apply multiplethresholds and analyze the topological properties of brain networks. Bassett et al.30 used a spar-sity range (5% < s < 25%, stepsize ¼ 1%) to explore the network properties. Lin et al.21 andWang et al.23 investigated the relationship between function connectivity and fNIRS data lengthwith 10% < s < 50%. This is because the real difference of topological attributes between statesis likely to cover a sparsity interval (called sparsity segment), rather than a few sporadic sparsitylevels. Random noise only has a very low probability to form a statistically significant sparsitysegment. In this study, 36 brain network models were constructed to assess HIBD characteristicsat different scales (5% < s < 40%, stepsize ¼ 1%). Further, we generated random networks withthe same number of nodes, number of edges, and degree distribution as the actual network toverify the reliability of the real network. Several common global network and regional nodemetrics were used to evaluate global and local topological features, including clustering coef-ficient (Cp), small-worldness (σ), modularity (Q), local efficiency (Eloc), and global efficiency(Eglob). The calculation formula is as follows:11,31
EQ-TARGET;temp:intralink-;e003;116;241CP ¼ 1
N
Xi∈G
Ei
DiðDi − 1Þ∕2 ; (3)
whereN represents the number of nodes in the unweighted networkG,Di is the number of edgesconnected to the i’th node, and Ei is the number of edges in the subgraph. The clustering coef-ficient reflects the local interconnectivity of a network,
EQ-TARGET;temp:intralink-;e004;116;159σ ¼ Cp_γ
Lp_λ: (4)
The characteristic path length Lp of graph G is defined as the average of the shortest pathlengths between all node pairs in network G. Specifically, Cp_γ ¼ Creal
p ∕Crandp , where Crand
p
is the average value of the corresponding parameters derived from 1000 matched random net-works with the same number of nodes, edges, and degree distribution as the real brain network.
Zhang et al.: Resting-state brain networks in neonatal hypoxic-ischemic brain damage. . .
Neurophotonics 025007-7 Apr–Jun 2021 • Vol. 8(2)
Downloaded From: https://www.spiedigitallibrary.org/journals/Neurophotonics on 25 Mar 2022Terms of Use: https://www.spiedigitallibrary.org/terms-of-use
Similarly, Lp_λ ¼ Lrealp ∕Lrand
p could be calculated to examine the small-world attributes of thenetworks,
EQ-TARGET;temp:intralink-;e005;116;710QðpÞ ¼Xm−1
M
�lmL
−�dm2L
�2�; (5)
whereM is the number of modules, L is the total number of edges of the network, lm is the totalnumber of edges in module m, and dm represents the sum of the degrees of the nodes in modulem. Modularity is defined as the largest value of modularity measures associated with all pos-sible configurations of modules,
EQ-TARGET;temp:intralink-;e006;116;612Eglob ¼1
NðN − 1ÞXi≠j∈G
1
dij; (6)
EQ-TARGET;temp:intralink-;e007;116;552Eloc ¼1
N
Xi∈G
EglobðiÞ; (7)
where dij is the shortest distance between node i and node j and N is the number of nodes of G.Concretely, Eglob delivers the efficiency of parallel information transfer in the network, whileEloc measures the local efficiency of information transfer in the immediate neighborhood ofeach node. Similar to the normalized clustering coefficient, the normalized local and globalefficiency were also calculated as follows: Eloc_γ ¼ Ereal
loc ∕Erandloc and Eglob_γ ¼ Ereal
glob∕Erandglob,
respectively. More concretely, Erandloc and Erand
glob were the average value of the corresponding
parameters derived from 1000 matched random networks with the same number of nodes,edges, and degree distribution as the real brain network.
2.5 Statistical Analysis
Two-sample t-tests and false discovery rate (FDR) correction were applied to compare thedifferences between the HIBD and healthy control (HC) groups. To examine the small-worldattributes of HIBD networks, we showed the small-worldness, local efficiency, modularity, andnormalized clustering coefficient at a threshold of 0.3, and the statistical difference betweenHIBD and HC was exhibited.
Based on differences in brain networks, we extracted the most recognizable small-worldattributes and operational efficiency as the feature input to the SVM for model training, whichcould provide concise and efficient auxiliary indicators for HIBD clinical diagnosis.
The small-worldness, local efficiency, modularity, and normalized clustering coefficient at athreshold in the range of 0.3 to 0.34 were selected as features. Thus, 4 × 5 ¼ 20 features could beextracted from each sample. We randomly divided the 13 HIBD samples, as well as the HCsamples, into the training group and test group (10:3). Then the SVM was conducted for thebinary classifications of the HIBD and HC. This study selected a linear kernel function andfivefold cross-validation mode.32,33 Cross folding for internal validity and grid search methodswere used to identify the optimal parameters c and g. In addition, the receiver operating char-acteristic (ROC) curve approach was applied to evaluate the sensitivity and specificity of the fourtypes of significant differential features. The area under the ROC curve (AUC) was conducted toquantify the performances of these features in detecting HIBD.
3 Results
We explored the structural characteristics of the resting brain network in infants with HIBD andassessed for differences in the network phenomenon compared with healthy newborns. In thisstudy, we mainly used HbR signals to characterize the topological development of functionalbrain networks since they are generally more reliable for most brain network metrics.
Zhang et al.: Resting-state brain networks in neonatal hypoxic-ischemic brain damage. . .
Neurophotonics 025007-8 Apr–Jun 2021 • Vol. 8(2)
Downloaded From: https://www.spiedigitallibrary.org/journals/Neurophotonics on 25 Mar 2022Terms of Use: https://www.spiedigitallibrary.org/terms-of-use
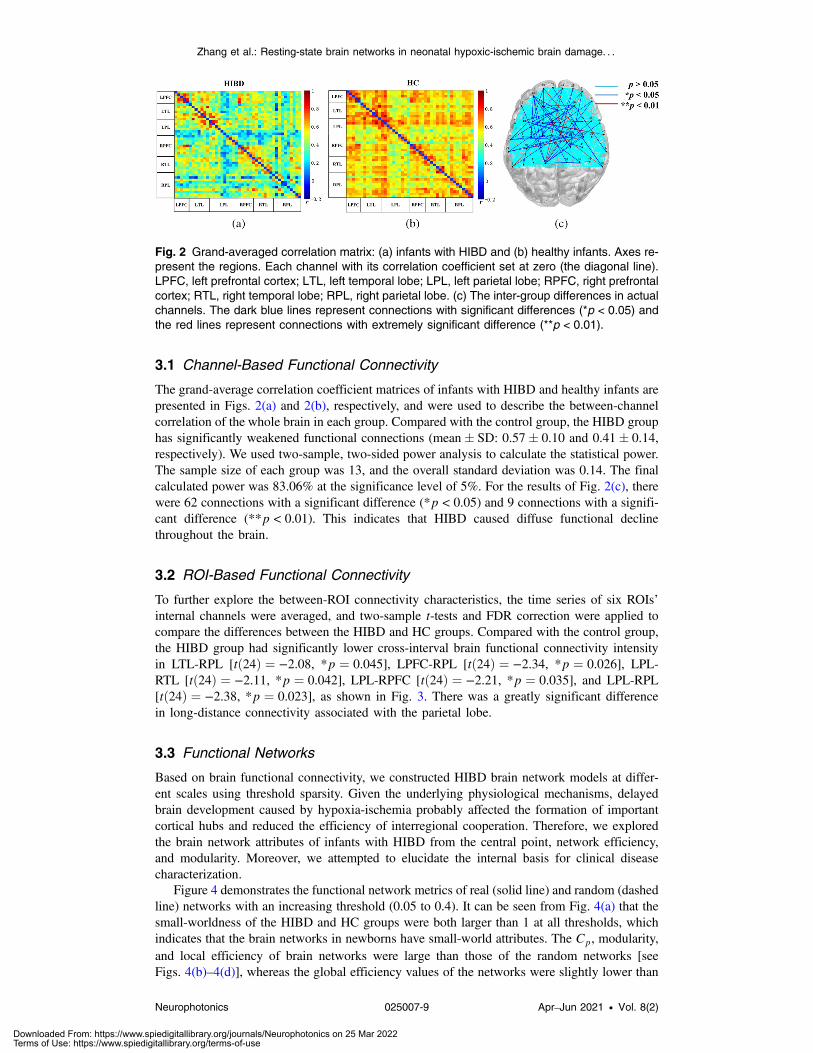
3.1 Channel-Based Functional Connectivity
The grand-average correlation coefficient matrices of infants with HIBD and healthy infants arepresented in Figs. 2(a) and 2(b), respectively, and were used to describe the between-channelcorrelation of the whole brain in each group. Compared with the control group, the HIBD grouphas significantly weakened functional connections (mean� SD: 0.57� 0.10 and 0.41� 0.14,respectively). We used two-sample, two-sided power analysis to calculate the statistical power.The sample size of each group was 13, and the overall standard deviation was 0.14. The finalcalculated power was 83.06% at the significance level of 5%. For the results of Fig. 2(c), therewere 62 connections with a significant difference (*p < 0.05) and 9 connections with a signifi-cant difference (**p < 0.01). This indicates that HIBD caused diffuse functional declinethroughout the brain.
3.2 ROI-Based Functional Connectivity
To further explore the between-ROI connectivity characteristics, the time series of six ROIs’internal channels were averaged, and two-sample t-tests and FDR correction were applied tocompare the differences between the HIBD and HC groups. Compared with the control group,the HIBD group had significantly lower cross-interval brain functional connectivity intensityin LTL-RPL [tð24Þ ¼ −2.08, *p ¼ 0.045], LPFC-RPL [tð24Þ ¼ −2.34, *p ¼ 0.026], LPL-RTL [tð24Þ ¼ −2.11, *p ¼ 0.042], LPL-RPFC [tð24Þ ¼ −2.21, *p ¼ 0.035], and LPL-RPL[tð24Þ ¼ −2.38, *p ¼ 0.023], as shown in Fig. 3. There was a greatly significant differencein long-distance connectivity associated with the parietal lobe.
3.3 Functional Networks
Based on brain functional connectivity, we constructed HIBD brain network models at differ-ent scales using threshold sparsity. Given the underlying physiological mechanisms, delayedbrain development caused by hypoxia-ischemia probably affected the formation of importantcortical hubs and reduced the efficiency of interregional cooperation. Therefore, we exploredthe brain network attributes of infants with HIBD from the central point, network efficiency,and modularity. Moreover, we attempted to elucidate the internal basis for clinical diseasecharacterization.
Figure 4 demonstrates the functional network metrics of real (solid line) and random (dashedline) networks with an increasing threshold (0.05 to 0.4). It can be seen from Fig. 4(a) that thesmall-worldness of the HIBD and HC groups were both larger than 1 at all thresholds, whichindicates that the brain networks in newborns have small-world attributes. The Cp, modularity,and local efficiency of brain networks were large than those of the random networks [seeFigs. 4(b)–4(d)], whereas the global efficiency values of the networks were slightly lower than
Fig. 2 Grand-averaged correlation matrix: (a) infants with HIBD and (b) healthy infants. Axes re-present the regions. Each channel with its correlation coefficient set at zero (the diagonal line).LPFC, left prefrontal cortex; LTL, left temporal lobe; LPL, left parietal lobe; RPFC, right prefrontalcortex; RTL, right temporal lobe; RPL, right parietal lobe. (c) The inter-group differences in actualchannels. The dark blue lines represent connections with significant differences (*p < 0.05) andthe red lines represent connections with extremely significant difference (**p < 0.01).
Zhang et al.: Resting-state brain networks in neonatal hypoxic-ischemic brain damage. . .
Neurophotonics 025007-9 Apr–Jun 2021 • Vol. 8(2)
Downloaded From: https://www.spiedigitallibrary.org/journals/Neurophotonics on 25 Mar 2022Terms of Use: https://www.spiedigitallibrary.org/terms-of-use
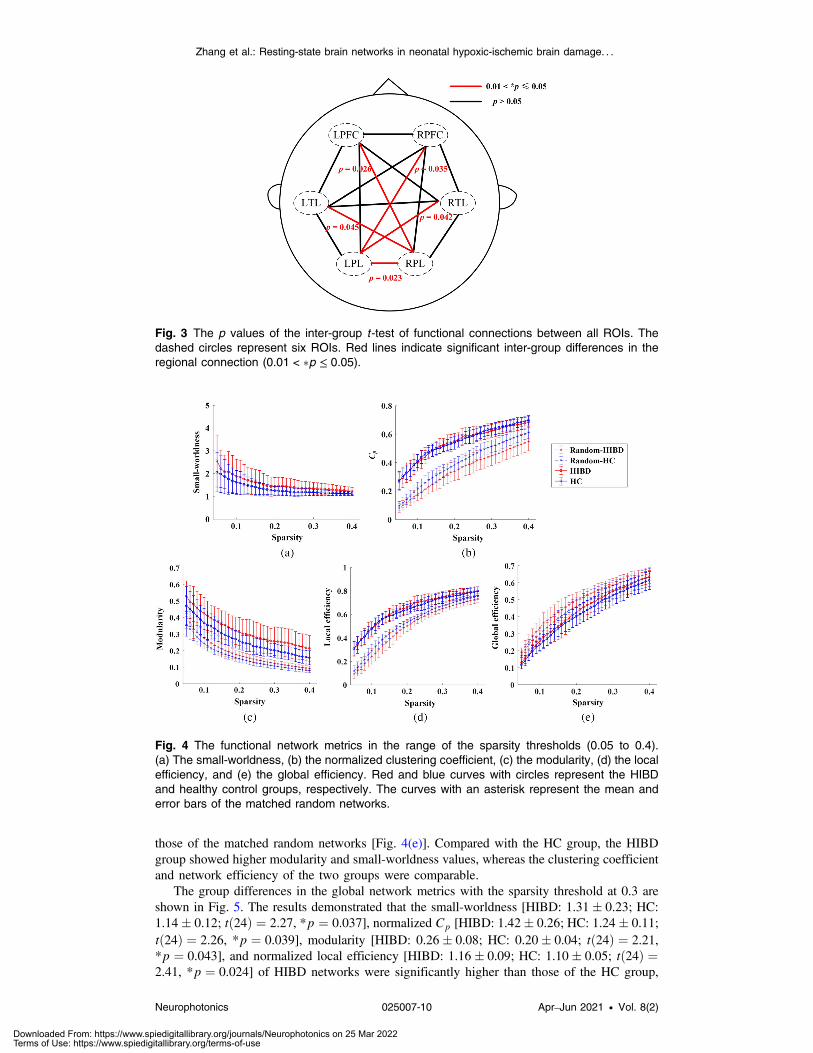
those of the matched random networks [Fig. 4(e)]. Compared with the HC group, the HIBDgroup showed higher modularity and small-worldness values, whereas the clustering coefficientand network efficiency of the two groups were comparable.
The group differences in the global network metrics with the sparsity threshold at 0.3 areshown in Fig. 5. The results demonstrated that the small-worldness [HIBD: 1.31� 0.23; HC:1.14� 0.12; tð24Þ ¼ 2.27, *p ¼ 0.037], normalized Cp [HIBD: 1.42� 0.26; HC: 1.24� 0.11;tð24Þ ¼ 2.26, *p ¼ 0.039], modularity [HIBD: 0.26� 0.08; HC: 0.20� 0.04; tð24Þ ¼ 2.21,*p ¼ 0.043], and normalized local efficiency [HIBD: 1.16� 0.09; HC: 1.10� 0.05; tð24Þ ¼2.41, *p ¼ 0.024] of HIBD networks were significantly higher than those of the HC group,
Fig. 4 The functional network metrics in the range of the sparsity thresholds (0.05 to 0.4).(a) The small-worldness, (b) the normalized clustering coefficient, (c) the modularity, (d) the localefficiency, and (e) the global efficiency. Red and blue curves with circles represent the HIBDand healthy control groups, respectively. The curves with an asterisk represent the mean anderror bars of the matched random networks.
Fig. 3 The p values of the inter-group t -test of functional connections between all ROIs. Thedashed circles represent six ROIs. Red lines indicate significant inter-group differences in theregional connection (0.01 < �p ≤ 0.05).
Zhang et al.: Resting-state brain networks in neonatal hypoxic-ischemic brain damage. . .
Neurophotonics 025007-10 Apr–Jun 2021 • Vol. 8(2)
Downloaded From: https://www.spiedigitallibrary.org/journals/Neurophotonics on 25 Mar 2022Terms of Use: https://www.spiedigitallibrary.org/terms-of-use
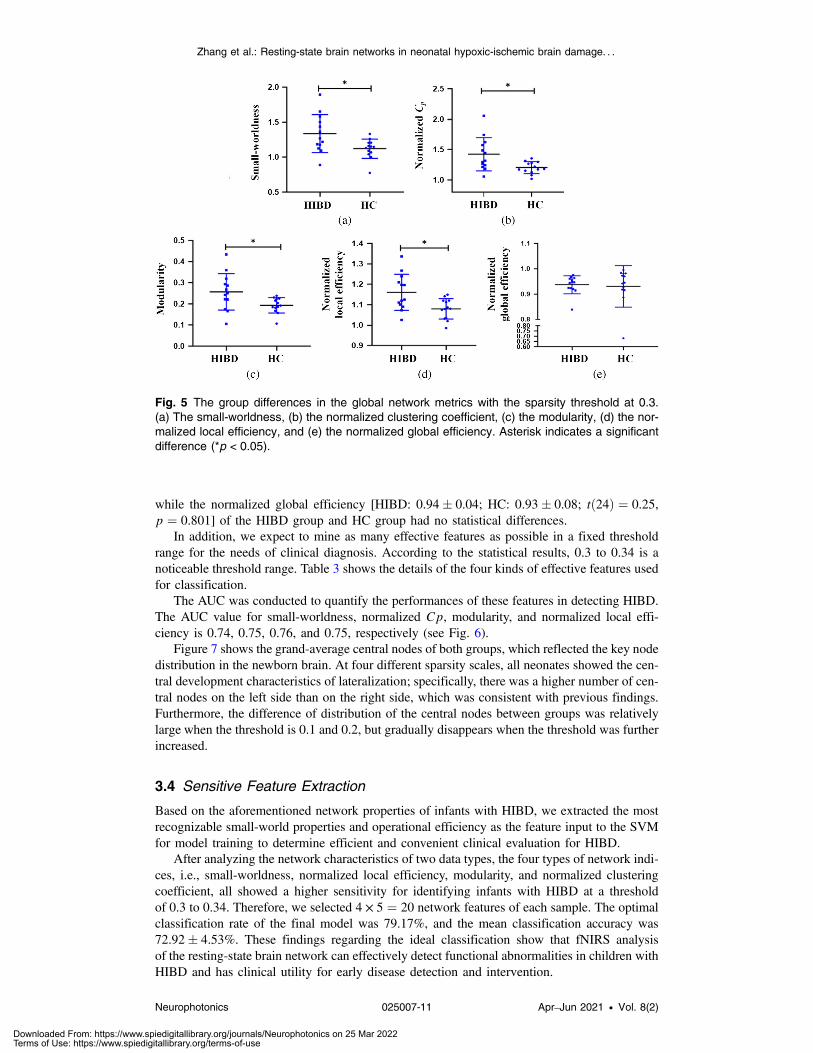
while the normalized global efficiency [HIBD: 0.94� 0.04; HC: 0.93� 0.08; tð24Þ ¼ 0.25,p ¼ 0.801] of the HIBD group and HC group had no statistical differences.
In addition, we expect to mine as many effective features as possible in a fixed thresholdrange for the needs of clinical diagnosis. According to the statistical results, 0.3 to 0.34 is anoticeable threshold range. Table 3 shows the details of the four kinds of effective features usedfor classification.
The AUC was conducted to quantify the performances of these features in detecting HIBD.The AUC value for small-worldness, normalized Cp, modularity, and normalized local effi-ciency is 0.74, 0.75, 0.76, and 0.75, respectively (see Fig. 6).
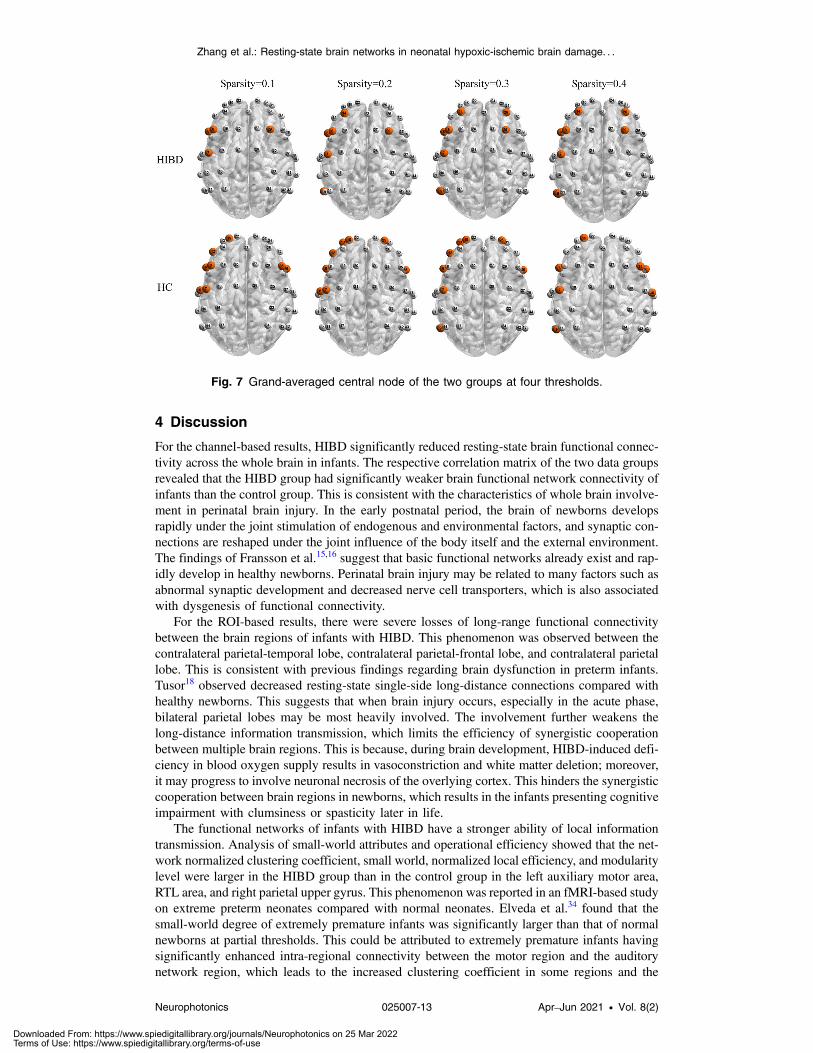
Figure 7 shows the grand-average central nodes of both groups, which reflected the key nodedistribution in the newborn brain. At four different sparsity scales, all neonates showed the cen-tral development characteristics of lateralization; specifically, there was a higher number of cen-tral nodes on the left side than on the right side, which was consistent with previous findings.Furthermore, the difference of distribution of the central nodes between groups was relativelylarge when the threshold is 0.1 and 0.2, but gradually disappears when the threshold was furtherincreased.
3.4 Sensitive Feature Extraction
Based on the aforementioned network properties of infants with HIBD, we extracted the mostrecognizable small-world properties and operational efficiency as the feature input to the SVMfor model training to determine efficient and convenient clinical evaluation for HIBD.
After analyzing the network characteristics of two data types, the four types of network indi-ces, i.e., small-worldness, normalized local efficiency, modularity, and normalized clusteringcoefficient, all showed a higher sensitivity for identifying infants with HIBD at a thresholdof 0.3 to 0.34. Therefore, we selected 4 × 5 ¼ 20 network features of each sample. The optimalclassification rate of the final model was 79.17%, and the mean classification accuracy was72.92� 4.53%. These findings regarding the ideal classification show that fNIRS analysisof the resting-state brain network can effectively detect functional abnormalities in children withHIBD and has clinical utility for early disease detection and intervention.
Fig. 5 The group differences in the global network metrics with the sparsity threshold at 0.3.(a) The small-worldness, (b) the normalized clustering coefficient, (c) the modularity, (d) the nor-malized local efficiency, and (e) the normalized global efficiency. Asterisk indicates a significantdifference (*p < 0.05).
Zhang et al.: Resting-state brain networks in neonatal hypoxic-ischemic brain damage. . .
Neurophotonics 025007-11 Apr–Jun 2021 • Vol. 8(2)
Downloaded From: https://www.spiedigitallibrary.org/journals/Neurophotonics on 25 Mar 2022Terms of Use: https://www.spiedigitallibrary.org/terms-of-use
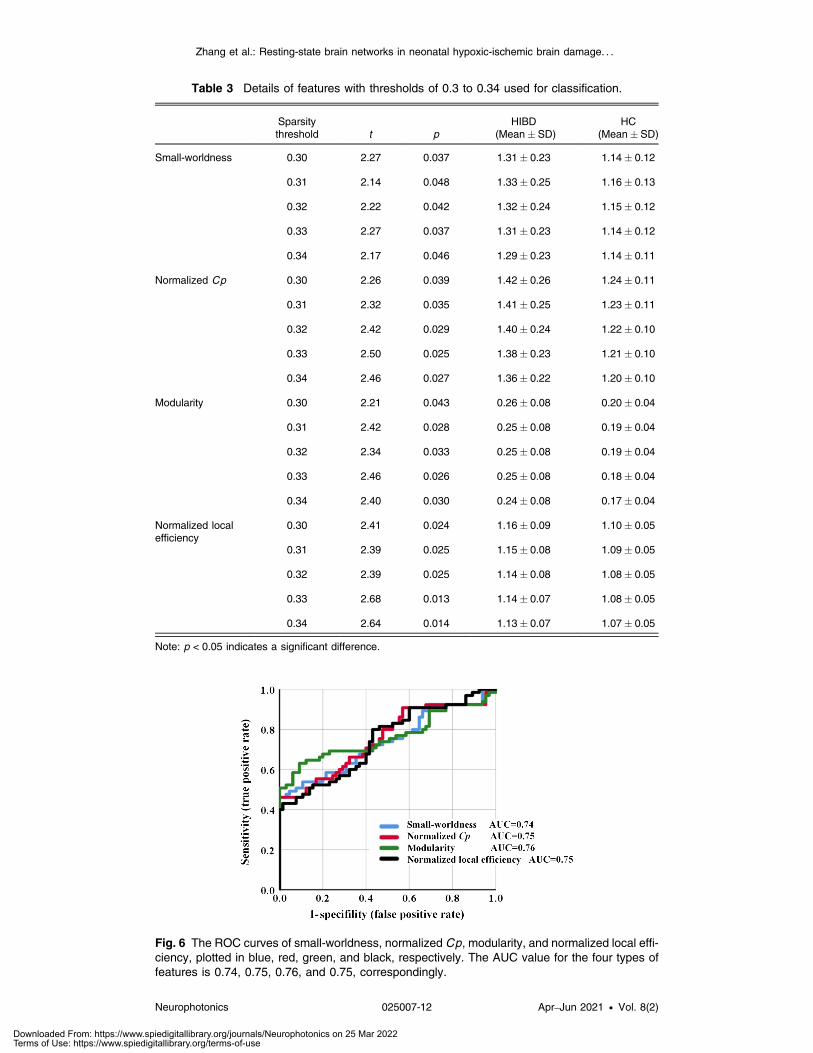
Table 3 Details of features with thresholds of 0.3 to 0.34 used for classification.
Sparsitythreshold t p
HIBD(Mean� SD)
HC(Mean� SD)
Small-worldness 0.30 2.27 0.037 1.31� 0.23 1.14� 0.12
0.31 2.14 0.048 1.33� 0.25 1.16� 0.13
0.32 2.22 0.042 1.32� 0.24 1.15� 0.12
0.33 2.27 0.037 1.31� 0.23 1.14� 0.12
0.34 2.17 0.046 1.29� 0.23 1.14� 0.11
Normalized Cp 0.30 2.26 0.039 1.42� 0.26 1.24� 0.11
0.31 2.32 0.035 1.41� 0.25 1.23� 0.11
0.32 2.42 0.029 1.40� 0.24 1.22� 0.10
0.33 2.50 0.025 1.38� 0.23 1.21� 0.10
0.34 2.46 0.027 1.36� 0.22 1.20� 0.10
Modularity 0.30 2.21 0.043 0.26� 0.08 0.20� 0.04
0.31 2.42 0.028 0.25� 0.08 0.19� 0.04
0.32 2.34 0.033 0.25� 0.08 0.19� 0.04
0.33 2.46 0.026 0.25� 0.08 0.18� 0.04
0.34 2.40 0.030 0.24� 0.08 0.17� 0.04
Normalized localefficiency
0.30 2.41 0.024 1.16� 0.09 1.10� 0.05
0.31 2.39 0.025 1.15� 0.08 1.09� 0.05
0.32 2.39 0.025 1.14� 0.08 1.08� 0.05
0.33 2.68 0.013 1.14� 0.07 1.08� 0.05
0.34 2.64 0.014 1.13� 0.07 1.07� 0.05
Note: p < 0.05 indicates a significant difference.
Fig. 6 The ROC curves of small-worldness, normalized Cp, modularity, and normalized local effi-ciency, plotted in blue, red, green, and black, respectively. The AUC value for the four types offeatures is 0.74, 0.75, 0.76, and 0.75, correspondingly.
Zhang et al.: Resting-state brain networks in neonatal hypoxic-ischemic brain damage. . .
Neurophotonics 025007-12 Apr–Jun 2021 • Vol. 8(2)
Downloaded From: https://www.spiedigitallibrary.org/journals/Neurophotonics on 25 Mar 2022Terms of Use: https://www.spiedigitallibrary.org/terms-of-use
4 Discussion
For the channel-based results, HIBD significantly reduced resting-state brain functional connec-tivity across the whole brain in infants. The respective correlation matrix of the two data groupsrevealed that the HIBD group had significantly weaker brain functional network connectivity ofinfants than the control group. This is consistent with the characteristics of whole brain involve-ment in perinatal brain injury. In the early postnatal period, the brain of newborns developsrapidly under the joint stimulation of endogenous and environmental factors, and synaptic con-nections are reshaped under the joint influence of the body itself and the external environment.The findings of Fransson et al.15,16 suggest that basic functional networks already exist and rap-idly develop in healthy newborns. Perinatal brain injury may be related to many factors such asabnormal synaptic development and decreased nerve cell transporters, which is also associatedwith dysgenesis of functional connectivity.
For the ROI-based results, there were severe losses of long-range functional connectivitybetween the brain regions of infants with HIBD. This phenomenon was observed between thecontralateral parietal-temporal lobe, contralateral parietal-frontal lobe, and contralateral parietallobe. This is consistent with previous findings regarding brain dysfunction in preterm infants.Tusor18 observed decreased resting-state single-side long-distance connections compared withhealthy newborns. This suggests that when brain injury occurs, especially in the acute phase,bilateral parietal lobes may be most heavily involved. The involvement further weakens thelong-distance information transmission, which limits the efficiency of synergistic cooperationbetween multiple brain regions. This is because, during brain development, HIBD-induced defi-ciency in blood oxygen supply results in vasoconstriction and white matter deletion; moreover,it may progress to involve neuronal necrosis of the overlying cortex. This hinders the synergisticcooperation between brain regions in newborns, which results in the infants presenting cognitiveimpairment with clumsiness or spasticity later in life.
The functional networks of infants with HIBD have a stronger ability of local informationtransmission. Analysis of small-world attributes and operational efficiency showed that the net-work normalized clustering coefficient, small world, normalized local efficiency, and modularitylevel were larger in the HIBD group than in the control group in the left auxiliary motor area,RTL area, and right parietal upper gyrus. This phenomenon was reported in an fMRI-based studyon extreme preterm neonates compared with normal neonates. Elveda et al.34 found that thesmall-world degree of extremely premature infants was significantly larger than that of normalnewborns at partial thresholds. This could be attributed to extremely premature infants havingsignificantly enhanced intra-regional connectivity between the motor region and the auditorynetwork region, which leads to the increased clustering coefficient in some regions and the
Fig. 7 Grand-averaged central node of the two groups at four thresholds.
Zhang et al.: Resting-state brain networks in neonatal hypoxic-ischemic brain damage. . .
Neurophotonics 025007-13 Apr–Jun 2021 • Vol. 8(2)
Downloaded From: https://www.spiedigitallibrary.org/journals/Neurophotonics on 25 Mar 2022Terms of Use: https://www.spiedigitallibrary.org/terms-of-use
increase of the small-world degree. This indicates that the functional connections of the infantsalso redistribute after acute brain injury, which is consistent with the redistribution of cerebralhemodynamics. The observed increase in local efficiency and the decline in overall ability couldbe attributed to the compensation effect. The less damaged functional area responsible for basicsurvival needs demonstrates the phenomenon of excessive compensation, which causes internalnetwork overdevelopment. Contrastingly, severely damaged high-level functional hubs showimpeded development. This phenomenon may be involved in the prognosis of patients withmental retardation, cerebral palsy, and other cognitive disorders.
Graph theory analysis based on functional connectivity can derive summary parameters todescribe and quantify aberrant communication patterns associated with brain injury. Afterscreening, network indicators based on small-worldness, local efficiency, modularity, and nor-malized clustering coefficient allowed for efficient HIBD identification. The AUC values dem-onstrated the ability of all of these features in HIBD detection (*p < 0.05). The performance ofthe four types of features was similar, among which modularity was slightly better. These indica-tors highlight the dysfunction of information transmission and integration in the brain and net-work efficiency overdevelopment within the region, which can be significantly distinguishedfrom healthy newborns. This provides a new and concise basis for clinical diagnosis, whichcould increase the general attention of clinicians.
Moreover, central node development in the left side was higher than that in the right side;specifically, there was preferential development of advanced language-related function of thenewborn. The left side of the healthy newborn is usually 4.3% larger than the right side,35 whichis consistent with our findings. Notably, infants with HIBD had missing regional central nodesresponsible for language-related advanced cognitive functions, including channel 8 (left middlefrontal gyrus), 15 (left upper frontal gyrus dorsal), and 30 (right central posterior gyrus). Thecentral nodes are responsible for integrating information from each functional region to completeefficient resource allocation and operation; moreover, their absence could cause delayedcognitive function development in newborns. On the other hand, the sample size limits furtherdiscussion of distribution of the central nodes. Although the central nodes were not selected asfeatures for classification in this study, their low level of development for HIBD infants makesthem still worth collecting for verification, which may build a relationship between HIBD andfunctional networks.
Taken together, sustained brain damage could disrupt the development of key structural andfunctional networks, which leads to neurological development disorders in newborns. fNIRS-based analysis of the resting-state brain network could be applied to identify abnormal featuresregarding brain functional development in infants with HIBD, which contributes to the patho-logical understanding and clinical diagnosis of the disease. There are also some limitations andsuggestions given based on our results. The small sample size restricts the statistical power to acertain extent. We have not made a more in-depth pathological analysis of HIBD. In future stud-ies, fNIRS and clinical manifestations of HIBD will be combined to assess the associationbetween the network of lesions and the core symptoms. Moreover, we expect to mine as manyeffective features as possible in a fixed threshold range for the needs of clinical diagnosis. Thesparsity segment near 0.3 was a recommended threshold range and could be used as a referencefor future research on infant brain functional connectivity.
5 Conclusion
This is the first study to conduct fNIRS analysis of the resting-state brain network for assessingbrain function levels in children with HIBD.
By exploring brain network attributes, we observed significant between-group differences invarious aspects, including functional connectivity intensity, node center, and informationtransmission between brain regions. These findings provide a theoretical basis for the clinicalcharacterization of mental retardation, cerebral palsy, convulsion, and cognitive dysfunction inchildren. Further, according to specific network defects, the extracted sensitivity index based onsmall-world attributes, efficiency, modularity, and node degree could be effectively applied toidentify patients, which indicates that fNIRS-based analysis of the resting-state brain network
Zhang et al.: Resting-state brain networks in neonatal hypoxic-ischemic brain damage. . .
Neurophotonics 025007-14 Apr–Jun 2021 • Vol. 8(2)
Downloaded From: https://www.spiedigitallibrary.org/journals/Neurophotonics on 25 Mar 2022Terms of Use: https://www.spiedigitallibrary.org/terms-of-use
could be an exciting tool for assisting in the early clinical diagnosis of HIBD. Future studiesshould assess the utility of this technology for other types of neonatal brain injury.
Disclosures
The authors declare no conflicts of interest.
Acknowledgments
This work has been supported by the National Major Scientific Research InstrumentDevelopment Project of China (Grant No. 81927804), and the National Key Research andDevelopment Plan (Grant Nos. 20YFC2004200 and 2018YFC2001700).
References
1. J. J. Kurinczuk, M. White-Koning, and N. Badawi, “Epidemiology of neonatal encepha-lopathy and hypoxic-ischaemic encephalopathy,” Early Hum. Dev. 86(6), 329–338 (2010).
2. E. M. Douglas and M. D. Weiss, “Hypoxic ischemic encephalopathy: a review for theclinician,” JAMA Pediatr. 169(4), 397–403 (2015).
3. D. M. Ferriero, “Neonatal brain injury,” N. Engl. J. Med. 351(19), 1985–1995 (2004).4. H. Hagberg, E. A. David, and F. Groenendaal, “Perinatal brain damage: the term infant,”
Neurobiol. Dis. 92(Pt. A), 102–112 (2016).5. E. M. Douglas and M. D. Weiss, “Biomarkers of hypoxic-ischemic encephalopathy in
newborns,” Front. Neurol. 3, 144 (2012).6. J. J. Volpe, “Neonatal encephalopathy: an inadequate term for hypoxic-ischemic encepha-
lopathy,” Ann. Neurol. 72(2), 156–166 (2012).7. M. Ferrari and V. Quaresima, “A brief review on the history of human functional near-
infrared spectroscopy (fNIRS) development and fields of application,” NeuroImage 63,921–935 (2012).
8. D. R. Leff et al., “Assessment of the cerebral cortex during motor task behaviours in adults: asystematic review of functional near infrared spectroscopy (fNIRS) studies,” NeuroImage54, 2922–2936 (2011).
9. M. D. Fox and M. E. Raichle, “Spontaneous fluctuations in brain activity observed withfunctional magnetic resonance imaging,” Nat. Rev. Neurosci. 8(9), 700–711 (2007).
10. H. Den and H. E. Pol, “Exploring the brain network: a review on resting-state fMRI func-tional connectivity,” Eur. Neuropsychopharmacol. 20(8), 519–534 (2010).
11. J. S. Damoiseaux et al., “Consistent resting-state networks across healthy subjects,” Proc.Natl. Acad. Sci. U. S. A. 103(37), 13848–13853 (2006).
12. M. E. Raichle and A. Z. Snyder, “A default mode of brain function: a brief history of anevolving idea,” NeuroImage 37(4), 1083–1090 (2007).
13. K. Friston, “Beyond phrenology: what can neuroimaging tell us about distributed circuitry?”Annu. Rev. Neurosci. 25, 221–250 (2002).
14. E. T. Bullmore and O. Sporns, “Complex brain networks: graph theoretical analysis of struc-tural and functional systems,” Nat. Rev. Neurosci. 10(3), 186–198 (2009).
15. P. Fransson et al., “Spontaneous brain activity in the newborn brain during natural sleep-anfMRI study in infants born at full term,” Pediatr. Res. 66(3), 301–305 (2009).
16. P. Fransson et al., “Resting-state networks in the infant brain,” Proc. Natl. Acad. Sci. U. S. A.104(39), 15531–15536 (2007).
17. C. D. Smyser et al., “Effects of white matter injury on resting state fMRI measures in pre-maturely born infants,” PLoS One 8(7), e68098 (2013).
18. N. Tusor, “Diffusion tensor imaging and resting state functional connectivity as advancedimaging biomarkers of outcome in infants with hypoxic-ischaemic encephalopathy treatedwith hypothermia,” PhD Thesis, Imperial College London, London (2014).
19. F. Homae et al., “Development of global cortical networks in early infancy,” J. Neurosci.30(14), 4877–4882 (2010).
Zhang et al.: Resting-state brain networks in neonatal hypoxic-ischemic brain damage. . .
Neurophotonics 025007-15 Apr–Jun 2021 • Vol. 8(2)
Downloaded From: https://www.spiedigitallibrary.org/journals/Neurophotonics on 25 Mar 2022Terms of Use: https://www.spiedigitallibrary.org/terms-of-use
20. I. Makiko et al., “Functional connectivity of the cortex of term and preterm infants andinfants with Down’s syndrome,” NeuroImage 85, 272–278 (2014).
21. C. Lin, D. Qi, and N. Haijing, “The development of functional network organization in earlychildhood and early adolescence: a resting-state fNIRS study,” Dev. Cognit. Neurosci. 30,223–235 (2018).
22. C. M. Kelsey et al., “Gut microbiota composition is associated with newborn functionalbrain connectivity and behavioral temperament,” Brain Behav. Immun. 91(2), 472–486(2020).
23. J. Wang, Q. Dong, and H. Niu, “The minimum resting-state fNIRS imaging duration foraccurate and stable mapping of brain connectivity network in children,” Sci. Rep. 7(1), 6461(2017).
24. F. Scholkmann et al., “How to detect andreduce movement artifacts in near-infrared imagingusing moving standard deviation and spline interpolation,” Physiol. Meas. 31, 649–662(2010).
25. S. Sutoko et al., “Atypical dynamic-connectivity recruitment in attention-deficit/hyperactivitydisorder children: an insight into task-based dynamic connectivity through an fNIRS study,”Front. Hum. Neurosci. 14, 3 (2020).
26. X. Jingping et al., “FC-NIRS: a functional connectivity analysis tool for near-infrared spec-troscopy data,” Biomed. Res. Int. 2015, 1–11 (2015).
27. Z. Li et al., “Assessment of cerebral oxygenation oscillations in subjects with hypertension,”Microvasc. Res. 88, 32–41 (2013).
28. Z. P. Van der Zee et al., “Experimentally measured optical pathlengths for the adult head,calf and forearm and the head of the newborn infant as a function of inter optode spacing,”Adv. Exp. Med. Biol. 316, 143–153 (1992).
29. S. Achard and E. Bullmore, “Efficiency and cost of economical brain functional networks,”PLoS Comput. Biol. 3(2), e17 (2007).
30. D. S. Bassett et al., “Hierarchical organization of human cortical networks in health andschizophrenia,” J. Neurosci. 28(37), 9239–9248 (2008).
31. D. J. Watts and S. H. Strogatz, “Collective dynamics of ‘small-world’ network,” Nature393(6684), 440–442 (1998).
32. S. Power and T. Chau, “Automatic single-trial classification of prefrontal hemodynamicactivity in an individual with Duchenne muscular dystrophy,” Dev. Neurorehabil. 16,67–72 (2013).
33. B. Xu et al., “Improving classification by feature discretization and optimization for fNIRS-based BCI,” Biomim. Biomater. Tissue Eng. 19, 1000119 (2014).
34. G. Elveda, A. P. Nehal, and L. M. Stephanie, “Altered functional network connectivity inpreterm infants: antecedents of cognitive and motor impairments,” Brain Struct. Funct. 223,3665–3680 (2018).
35. P. Fransson et al., “The functional architecture of the infant brain as revealed by resting-statefMRI,” Cereb. Cortex 21(1), 145–154 (2011).
Shen Zhang received his BS degree in electronic information engineering from BeihangUniversity, where he is currently pursuing his PhD in biomedical engineering. His research inter-ests include the fNIRS-based brain–computer interface and its clinical application.
Cheng Peng graduated from Peking University. He is now a resident at Peking University FirstHospital. He is interested in the application of fNIRS technology on newborns.
Yang Yang received his MS degree from Beihang University. His research interests focus on thefunctional connectivity and brain networks in infants.
Daifa Wang is an associate professor at the Advanced Innovation Center for BiomedicalEngineering of Beihang University. His research interests focus on brain function evaluation,neuromodulation, and optical tomography.
Xinlin Hou is a chief neonatologist at Peking University First Hospital. She had one year ofexperience as a visiting scholar at the University of Duisburg–Essen in Germany. Her research
Zhang et al.: Resting-state brain networks in neonatal hypoxic-ischemic brain damage. . .
Neurophotonics 025007-16 Apr–Jun 2021 • Vol. 8(2)
Downloaded From: https://www.spiedigitallibrary.org/journals/Neurophotonics on 25 Mar 2022Terms of Use: https://www.spiedigitallibrary.org/terms-of-use

interests include non-invasive functional monitoring of the neonatal brain and the pathogenesis,diagnosis, and treatment of perinatal brain injury.
Deyu Li is a professor of the School of Biological Science and Medical Engineering at BeihangUniversity and also works at the Advanced Innovation Center for Biomedical Engineering andState Key Laboratory of Software Development Environment of Beihang University. Hisresearch is focused on investigations of biomedical imaging and image processing, biomedicalsignal processing, and rehabilitation engineering.
Zhang et al.: Resting-state brain networks in neonatal hypoxic-ischemic brain damage. . .
Neurophotonics 025007-17 Apr–Jun 2021 • Vol. 8(2)
Downloaded From: https://www.spiedigitallibrary.org/journals/Neurophotonics on 25 Mar 2022Terms of Use: https://www.spiedigitallibrary.org/terms-of-use


