Embed Size (px)
Citation preview


CONTENTS
Page No. Landscape Fragmentation, Biodiversity Loss, Restoration and Management
4
Ecological Blueprint of Plantation in Mining Sectors:an Implication in Biodiversity Conservation andClimate Change Anshumali
5-19
Sustainable Landscape Restoration for JhariaCoalfield- India Biswajit Paul
20-36
Biodiversity Conservation through Removal ofLantana camara - an Invasive Species in PlantedEcosystem of Rajaji National Park Uttarakhand
H.B.Vasistha, Mridula Negi, S. Rasaily,Suryapal Singh Bhandari and S.K. Kamboj
37- 49
Loss of Habitat of Endangered House-Sparrow(Passer domesticus indicus, Jardine and Selby, 1831)in Saharanpur District of Western U.P. and Suggestionsfor its Conservation S.C. Dhiman, Harender Singh, Salman Ansar
50-62
Analysis of Soil Moisture Variability in Relation toNatural Regeneration in watershed forested with Sal(Shorea robusta) J.V.Tyagi,Rakesh Kumar and R.D.Singh
63-81
Forest Landscape Restoration For Planetary Van ViharProject (PVVP) at Deotsidh in Hamirpur District, Himachal Pradesh Sanjay Sood & Sandeep Bhimta
82-90
Bioengineering Measures for Himalayan LandscapesAffected by Landslide –A Case Study
Ashish Rawat Prafulla Soni & H.B.Vasistha
91-112
Soil Nutrient Status in Age Series of Restored RockPhosphate Mined Sites and Natural Forest - AComparative Study
Shikha Uniyal Gairola and Prafulla Soni
113-120
Soil Mineralogy, Micronutrient Status and Phytoremediation
121
Soil Micronutrient Status under Different ForestEcosystems of Dehradun District, Uttarakhand
C.M.Mathavan andM.K.Gupta
122-130
Microbes and Green Technology: Role of Microbialinoculants Establishment of Plantation and NaturalRegeneration in Limestone Mine Spoils
Anuj Kumar Singh and Jamaluddin
131-151
Pedospheric Distribution of Soil CationicMicronutrients under Various Land Use Systems inUttarakhand. C.M. Mathavan and A.K.Raina
152-161
Environmental Application of Forest Tree Species inPhytoremediation and Reclamation
Preeti Pandey Pant and A.K. Tripathi
162-174
Biotreatment of Textile Wastewater Using Fungi Nutan Gupta, A.K Tripathi and N.S.K Harsh
175-186
Heavy Metal and Chemical Study of Rivers of DoonValley
A. Kumar, B.S. Bisht, V.D. Joshi and A.K. Singh
187-195
Land Use Land Cover Change 196Assessment of Extension of Ganga River Corridor anIndication of Soil Erosion and Biodiversity Loss UsingRemote Sensing and GIS Techniques Parth Sarathi Mahapatra, H.B.Vasistha
197-211
Biodiversity Characterization in Marine NationalPark,Jamnagar, Gujarat using Remote Sensing andGeographic Information System
Ganesh Datt Bhatt
212-227
Seismic Vulnerability Mapping Using GeospatialTechnology Peeyush
228-244
Land Use Practices for Flood Risk Reduction Richa Arya, Mohd. Muzamil Bhat,
A.K. Gupta and M. Yunus
245-258
Combating Desertification Programmes in WesternRajasthan –Issues and Constraints N.K.Bohra ,J.K.Shukla and D.K.Mishra
259-268
Bio-economic analysis of soil and forest degradationprocesses in Arnigad micro watershed of Mussoorie-Dehradun, Uttarakhand (India) Ram Chandra and Prafulla Soni
269-289
Urban Ecotourism for Promoting StakeholderParticipation in Urban Landscape Transformation
Govind Singh, Chirashree Ghosh, Mihir Deb
290-316
Status of Soil and Spoil Properties in Stone MineArea, Haryana, India
Vivek Dwivedi and Prafulla Soni
317-326
Microbial Biomass as Influenced by Restorationmeasures in Rock Phosphate Mined Area atMaldeota, Doon Valley
Richi Yadav, Mridula Negi, H.B.Vasistha
327-334
Agroforestry as a landscape for the management ofcotton pests T.S.Dange,Y.Sridhar and R. Sundraraj
335-342
Carbon Sequestration through Soil Organic Carbon Store estimation under Different Land uses in Lower Altitudinal Regions of Uttarakhand
M.K. Gupta
343-355
Soil Mineralogical Investigations for Sustainable Restoration of Different Land Uses in Uttarakhand
Joystu Dutta
356-369
Tree Inventory-A Management Tool in Landscape Restoration and Management
Ramesh Madav and Gouri Kesar
370-383
Ecological Impact of Forest Fire on UndergrowthDiversity Under Ten Years Old Teak Plantation ofTarai Forest in Haridwar Forest Division, Uttarakhand Nirmal Ram, Pramod Kumar and Lal Singh
383-398
Forest Conservation through Biodiversity Informatics Neelesh Yadav
399-412
Plant Species for Fragmented Landscapes 413Diversity of Medicinal Plant Species in the Thar Desert (Rajasthan), India S. R Baloch, G. Singh and Pramod Kumar
414-432
Establishment of an Arboretum for Conservation ofTemperate Himalayan Flora Vaneet Jishtu and Mohinder Pal
433-446
Sacred Trees with Multiple Uses Anita Tomar
447-458
Nature Based Tourism- A Source of Livelihood forRural People Sweta Priyam, H. B. Vasistha and Mridula Negi
459-469
Contributing Authors 470-478
Landscape Fragmentation, Biodiversity Loss,
Restoration and Management
Ecological Blueprint of Plantation in Mining Sectors: an
Implication in Biodiversity Conservation and Climate Change
Anshumali
Department of Environmental Science and Engineering
Indian School of Mines
Dhnabd-826004, Jharkhand
Abstract
For the sustainable development of Indian economy, large scale
mining activities have been taking place in the tropical deciduous forests
of eastern, central and southern India for last two decades. The
afforestation and reforestation of mined out areas to enhance the secondary
succession, leguminous and exotic species have been selected for the
restoration without considering their in situ relative frequency, density,
dominance and diversity indices. The major problem associated with
leguminous plants is their occurrence (<14 %) in tropical deciduous forests
with poor regeneration capacity. The mountain slopes are dominated by
dicot plants with simple leaves (non-leguminous plants) while the dry flat
surfaces on mountain/plateau (away from seasonal water channels) are
dominated by dicot plants with compound leaves (leguminous/non-
leguminous plants). These are seldom used for restoration of OB dumps.
Not only this, even after accumulation of organic matter and
increased essential nutrients in mine spoils by using leguminous trees,
restoration activities further ignore plantation of dominant native plants as
per their microclimate. In view of these, an Integrated Vegetation Cover
Development Programme (IVCDP) is required to address the following
bottlenecks in the sustainable mining practices:
• Scientific investigation of dominance of dicot plants with simple
leaves (non- leguminous) on the mountain slopes and dicot plants
with compound leaves (leguminous and non-leguminous) on the dry
flat surfaces of mountain/plateau/uplands (away from seasonal water
channels)
• Data generation on diversity loss due to mining industries
• CO2 sequestration by tropical deciduous forests
• Socio-economic viability of current management practices
Keywords: Sustainable Development, Tropical Deciduous Forests, Mine
Spoils.
Introduction
Understanding the diversity of nature in various forms is a
fundamental goal of ecological research (Lubchenco et al.,1991) and is
also essential for understanding the ecosystem function and stability
(Ehrlich & Wilson 1991; Holdgate 1996; Tilman 2000). In India, tropical
forests account for ca. 46% of the total forest land (Singh and Singh,
1988), however, because of high anthropogenic pressures and habitat
destruction in the past several decades, the dry deciduous forest cover in
most parts of central India is being converted into dry deciduous scrub, dry
savanna and dry grasslands which are progressively species poor with
decreased species richness and heterogeneity. Further, in-depth studies of
these forests with respect to classification, mapping, change detection
study of vegetation using satellite images (i.e. deforestation,
fragmentation and degradation), phytosociology of plant communities
(composition, regeneration and diversity patterns), phenology
relationship between leaf traits and vegetation response to a broad
range of environmental factors etc., using large-scale permanent
inventory plots revealed sever impact of anthropogenic activities on
diversity loss particularly tree species.Based on the baseline data generated
and published on various aspects of tropical deciduous forests of Vindhyan
region, this review has been carried out to (i) assess the dominance of dicot
plants with simple leaves (non-leguminous) on the mountain slopes and
dicot plants with compound leaves (leguminous and non- leguminous) on
the dry flat surfaces of mountain/plateau/uplands (away from seasonal
water channels) (ii) assess the leguminous and non-leguminous species
loss due to habitat destruction.
Plant Diversity Assessment
The detailed information about the Vindhyan forests is given
elsewhere (Jha et al., 2005; Sagar and Singh, 2005). Forest fragmentation
and its impact on species diversity using remote sensing and GIS
reveals a substantial portion of the dry tropical landscape are
undergoing simplification or homogenization in terms of species
richness and vegetation cover as a result of increasing large scale
anthropogenic pressure in the form of mining, thermal power generation,
cement industry, sporadic illegal tree felling, widespread lopping and
extraction of non-timber forest resources etc. (Jha et al., 2005; Singh et al.
1991).
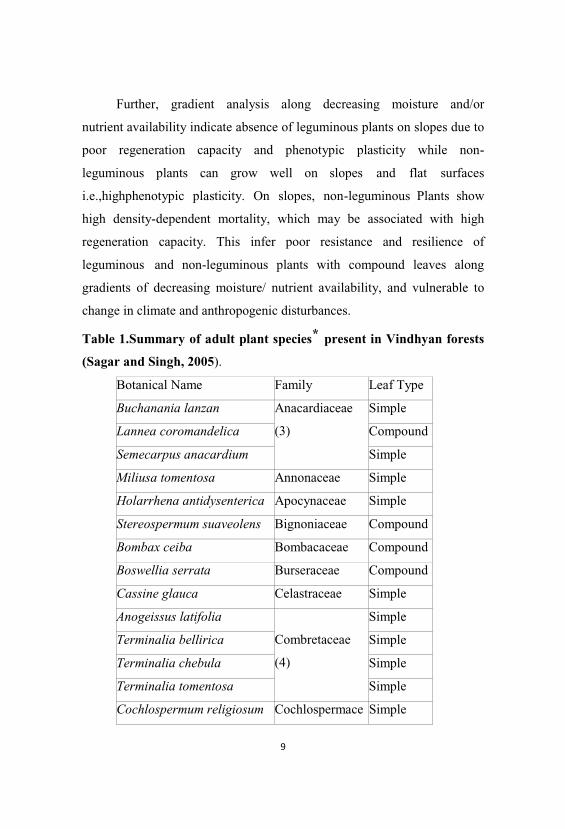
The total number of adult plant species belong to Fabaceae is 17 %
(Table 1). However, the significant regeneration capacity is shown only by
4 % mainly Acacia catechu and Hardwickia binata. The rest 83 % belong
to the non-leguminous trees species. The communities most vulnerable to
alien invasive plants are Acacia- Terminalia, Terminalia-Shorea and
Hardwickia-Acacia (Raghubanshi and Tripathi,2009). Raizada et al.
(2009) studied the response of selected native dry tropical and alien
invasive species to CO2 enrichment and found increased net assimilation
rate (NAR) as well as relative growth rate (RGR) under elevated CO2 in
all species but the magnitude was higher in the case of invasive species.
These indicate that the leguminous trees can be replaced by non-
leguminous invasive plants like Lantana camara, Parthenium
hysterophorus and Ocimum basilicum at a great extent in near future.
Adaptation Strategies
Leaf traits are often cited as the principal traits to relate plant
resource use,biomass and ecosystem functioning (Westoby, 1998;
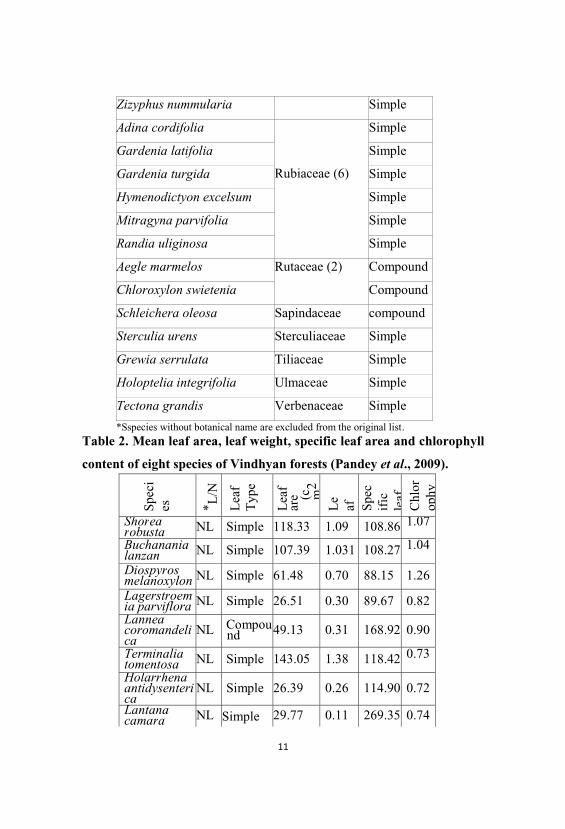
Weiher, 1999; Craine et al.,2001; Vendramini et al., 2002). Pandey et al
(2009) studied the leaf traits of eight common plant species (non-
leguminous) found in Vindhyan dry tropical region to understand their
adaptation strategies (Table 2). The simple leaves of non-leguminous
plants are short-lived but productive due to high leaf area, leaf weight,
specific leaf area (SLA), and chlorophyll content. Sagar and Singh (2003)
showed the percent of species and importance values were larger for
medium or less deciduous trait categories (non-legumes) than for highly
deciduous traits (legumes), representing a trade-off between water loss and
period of dry matter synthesis. The non-legumes are also characterized by
low height:diameter ratio (Table 3) i.e. large investment in diameter
compared to height growth, therefore the H:D ratio is positively correlated
with relative growth rate. Thus non-leguminous plants with simple leaves
growing on moist slopes achieve a greater CO2 sequestration and hence
fast growth in resource- rich environment. Singh et al. (2000) found
similar response to nutrient enrichment for non-leguminous species
planted on mine spoils. Generally, the trees that allocate comparatively less
resources to stem per unit of height growth are assumed to grow taller than
those that allocate more (King, 1981; Lawton, 1984).
Further, gradient analysis along decreasing moisture and/or
nutrient availability indicate absence of leguminous plants on slopes due to
poor regeneration capacity and phenotypic plasticity while non-
leguminous plants can grow well on slopes and flat surfaces
i.e.,highphenotypic plasticity. On slopes, non-leguminous Plants show
high density-dependent mortality, which may be associated with high
regeneration capacity. This infer poor resistance and resilience of
leguminous and non-leguminous plants with compound leaves along
gradients of decreasing moisture/ nutrient availability, and vulnerable to
change in climate and anthropogenic disturbances.
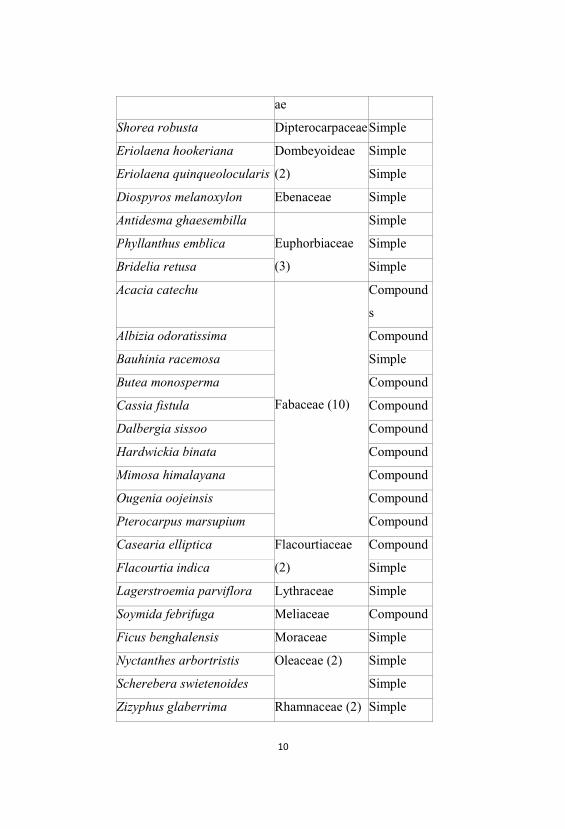
Table 1.Summary of adult plant species* present in Vindhyan forests
(Sagar and Singh, 2005).
Botanical Name Family Leaf Type
Buchanania lanzan Anacardiaceae
(3)
Simple
Lannea coromandelica Compound
Semecarpus anacardium Simple
Miliusa tomentosa Annonaceae Simple
Holarrhena antidysenterica Apocynaceae Simple
Stereospermum suaveolens Bignoniaceae Compound
Bombax ceiba Bombacaceae Compound
Boswellia serrata Burseraceae Compound
Cassine glauca Celastraceae Simple
Anogeissus latifolia
Combretaceae
(4)
Simple
Terminalia bellirica Simple
Terminalia chebula Simple
Terminalia tomentosa Simple
Cochlospermum religiosum Cochlospermace Simple
ae
Shorea robusta DipterocarpaceaeSimple
Eriolaena hookeriana Dombeyoideae
(2)
Simple
Eriolaena quinqueolocularis Simple
Diospyros melanoxylon Ebenaceae Simple
Antidesma ghaesembilla
Euphorbiaceae
(3)
Simple
Phyllanthus emblica Simple
Bridelia retusa Simple
Acacia catechu
Fabaceae (10)
Compound
s
Albizia odoratissima Compound
Bauhinia racemosa Simple
Butea monosperma Compound
Cassia fistula Compound
Dalbergia sissoo Compound
Hardwickia binata Compound
Mimosa himalayana Compound
Ougenia oojeinsis Compound
Pterocarpus marsupium Compound
Casearia elliptica Flacourtiaceae
(2)
Compound
Flacourtia indica Simple
Lagerstroemia parviflora Lythraceae Simple
Soymida febrifuga Meliaceae Compound
Ficus benghalensis Moraceae Simple
Nyctanthes arbortristis Oleaceae (2) Simple
Scherebera swietenoides Simple
Zizyphus glaberrima Rhamnaceae (2) Simple
Spec
ies * L
/N
Lea
f
Typ
e
Lea
far
e (c m2
Le
af Spec
ific
leaf
Chl
orop
hy
Shorearobusta NL Simple 118.33 1.09 108.86 1.07
Buchananialanzan NL Simple 107.39 1.031 108.27 1.04
Diospyrosmelanoxylon NL Simple 61.48 0.70 88.15 1.26
Lagerstroemia parviflora NL Simple 26.51 0.30 89.67 0.82Lanneacoromandelica
NL Compound 49.13 0.31 168.92 0.90
Terminaliatomentosa NL Simple 143.05 1.38 118.42 0.73
Holarrhenaantidysenterica
NL Simple 26.39 0.26 114.90 0.72
Lantanacamara NL Simple 29.77 0.11 269.35 0.74
Zizyphus nummularia Simple
Adina cordifolia
Rubiaceae (6)
Simple
Gardenia latifolia Simple
Gardenia turgida Simple
Hymenodictyon excelsum Simple
Mitragyna parvifolia Simple
Randia uliginosa Simple
Aegle marmelos Rutaceae (2) Compound
Chloroxylon swietenia Compound
Schleichera oleosa Sapindaceae compound
Sterculia urens Sterculiaceae Simple
Grewia serrulata Tiliaceae Simple
Holoptelia integrifolia Ulmaceae Simple
Tectona grandis Verbenaceae Simple
*Sspecies without botanical name are excluded from the original list.
Table 2. Mean leaf area, leaf weight, specific leaf area and chlorophyll
content of eight species of Vindhyan forests (Pandey et al., 2009).
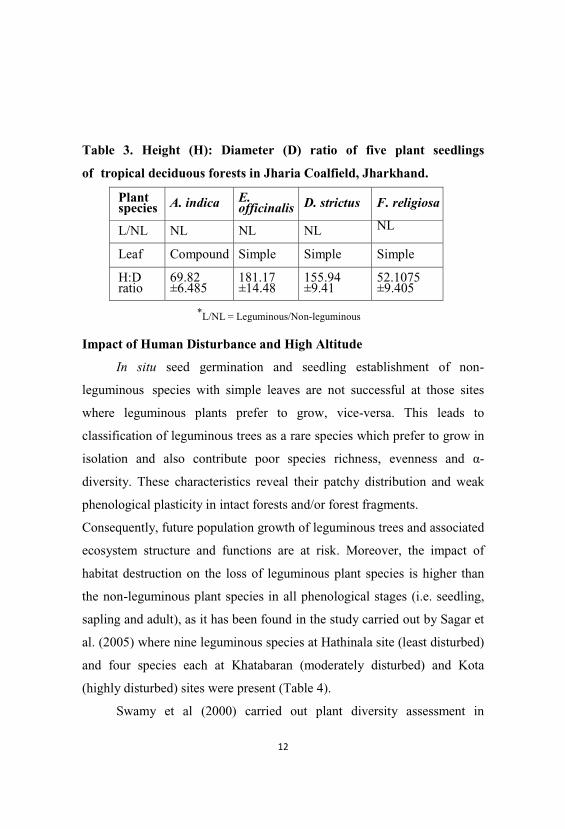
Table 3. Height (H): Diameter (D) ratio of five plant seedlings
of tropical deciduous forests in Jharia Coalfield, Jharkhand.
Impact of Human Disturbance and High Altitude
In situ seed germination and seedling establishment of non-
leguminous species with simple leaves are not successful at those sites
where leguminous plants prefer to grow, vice-versa. This leads to
classification of leguminous trees as a rare species which prefer to grow in
isolation and also contribute poor species richness, evenness and -
diversity. These characteristics reveal their patchy distribution and weak
phenological plasticity in intact forests and/or forest fragments.
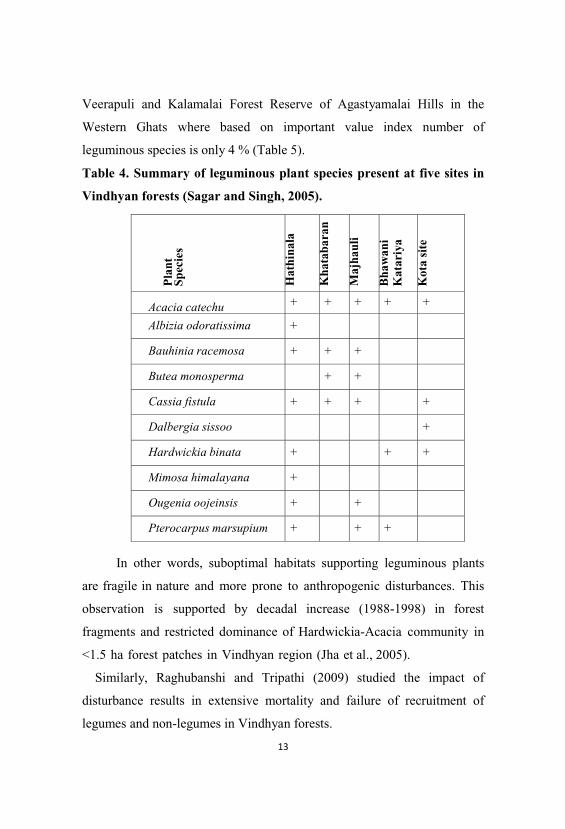
Consequently, future population growth of leguminous trees and associated
ecosystem structure and functions are at risk. Moreover, the impact of
habitat destruction on the loss of leguminous plant species is higher than
the non-leguminous plant species in all phenological stages (i.e. seedling,
sapling and adult), as it has been found in the study carried out by Sagar et
al. (2005) where nine leguminous species at Hathinala site (least disturbed)
and four species each at Khatabaran (moderately disturbed) and Kota
(highly disturbed) sites were present (Table 4).
Swamy et al (2000) carried out plant diversity assessment in
*L/NL = Leguminous/Non-leguminous
Plantspecies A. indica E.
officinalis D. strictus F. religiosa
L/NL NL NL NL NL
Leaf Compound Simple Simple Simple
H:Dratio
69.82±6.485
181.17±14.48
155.94±9.41
52.1075±9.405
Pla
ntSp
ecie
s
Hat
hina
la
Kha
taba
ran
Maj
haul
i
Bha
wan
iK
atar
iya
Kot
asi
te
Acacia catechu + + + + +
Albizia odoratissima +
Bauhinia racemosa + + +
Butea monosperma + +
Cassia fistula + + + +
Dalbergia sissoo +
Hardwickia binata + + +
Mimosa himalayana +
Ougenia oojeinsis + +
Pterocarpus marsupium + + +
Veerapuli and Kalamalai Forest Reserve of Agastyamalai Hills in the
Western Ghats where based on important value index number of
leguminous species is only 4 % (Table 5).
Table 4. Summary of leguminous plant species present at five sites in
Vindhyan forests (Sagar and Singh, 2005).
In other words, suboptimal habitats supporting leguminous plants
are fragile in nature and more prone to anthropogenic disturbances. This
observation is supported by decadal increase (1988-1998) in forest
fragments and restricted dominance of Hardwickia-Acacia community in
<1.5 ha forest patches in Vindhyan region (Jha et al., 2005).
Similarly, Raghubanshi and Tripathi (2009) studied the impact of
disturbance results in extensive mortality and failure of recruitment of
legumes and non-legumes in Vindhyan forests.
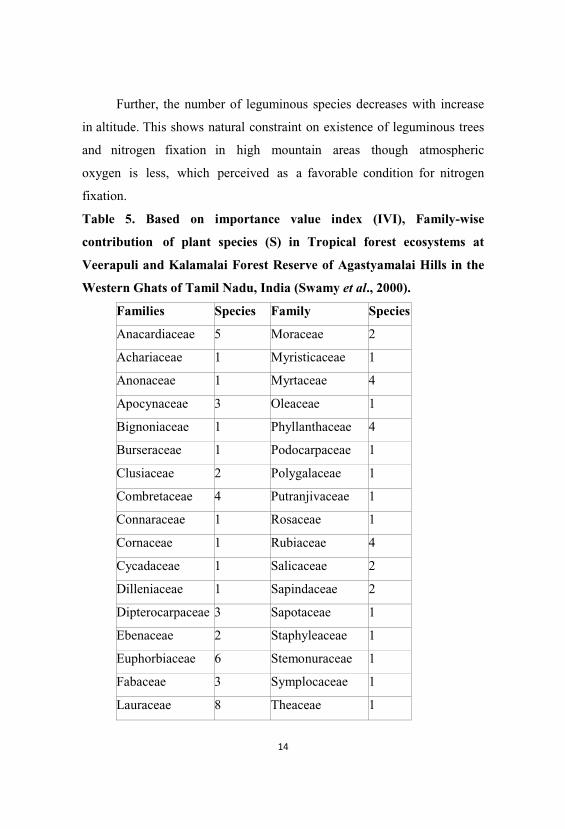
Further, the number of leguminous species decreases with increase
in altitude. This shows natural constraint on existence of leguminous trees
and nitrogen fixation in high mountain areas though atmospheric
oxygen is less, which perceived as a favorable condition for nitrogen
fixation.
Table 5. Based on importance value index (IVI), Family-wise
contribution of plant species (S) in Tropical forest ecosystems at
Veerapuli and Kalamalai Forest Reserve of Agastyamalai Hills in the
Western Ghats of Tamil Nadu, India (Swamy et al., 2000).
Families Species Family Species
Anacardiaceae 5 Moraceae 2
Achariaceae 1 Myristicaceae 1
Anonaceae 1 Myrtaceae 4
Apocynaceae 3 Oleaceae 1
Bignoniaceae 1 Phyllanthaceae 4
Burseraceae 1 Podocarpaceae 1
Clusiaceae 2 Polygalaceae 1
Combretaceae 4 Putranjivaceae 1
Connaraceae 1 Rosaceae 1
Cornaceae 1 Rubiaceae 4
Cycadaceae 1 Salicaceae 2
Dilleniaceae 1 Sapindaceae 2
Dipterocarpaceae 3 Sapotaceae 1
Ebenaceae 2 Staphyleaceae 1
Euphorbiaceae 6 Stemonuraceae 1
Fabaceae 3 Symplocaceae 1
Lauraceae 8 Theaceae 1
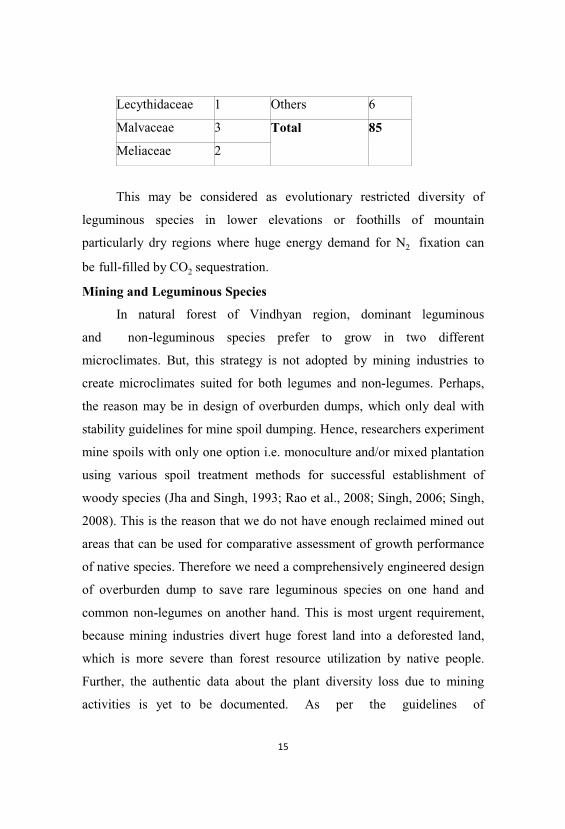
Lecythidaceae 1 Others 6
Malvaceae 3 Total 85
Meliaceae 2
This may be considered as evolutionary restricted diversity of
leguminous species in lower elevations or foothills of mountain
particularly dry regions where huge energy demand for N2 fixation can
be full-filled by CO2 sequestration.
Mining and Leguminous Species
In natural forest of Vindhyan region, dominant leguminous
and non-leguminous species prefer to grow in two different
microclimates. But, this strategy is not adopted by mining industries to
create microclimates suited for both legumes and non-legumes. Perhaps,
the reason may be in design of overburden dumps, which only deal with
stability guidelines for mine spoil dumping. Hence, researchers experiment
mine spoils with only one option i.e. monoculture and/or mixed plantation
using various spoil treatment methods for successful establishment of
woody species (Jha and Singh, 1993; Rao et al., 2008; Singh, 2006; Singh,
2008). This is the reason that we do not have enough reclaimed mined out
areas that can be used for comparative assessment of growth performance
of native species. Therefore we need a comprehensively engineered design
of overburden dump to save rare leguminous species on one hand and
common non-legumes on another hand. This is most urgent requirement,
because mining industries divert huge forest land into a deforested land,
which is more severe than forest resource utilization by native people.
Further, the authentic data about the plant diversity loss due to mining
activities is yet to be documented. As per the guidelines of
Environmental Clearance (EC), mining industries in consultation with
Central and State authorities insure socio-economic viability of restoration
measures adopted for mined out areas. But in reality, all the efforts are
futile due to lack of awareness and inculcated habit of ignorance about the
conservation of natural resources
Thrust Research Areas
In light of above facts, an Integrated Vegetation Cover Development
Programme (IVCDP) is suggested to address the following bottlenecks in
the sustainable mining practices:
• Scientific investigation of dominance of dicot plants with simple
leaves (non- leguminous) on the mountain slopes and dicot plants
with compound leaves (leguminous and non-leguminous) on the dry
flat surfaces of mountain/plateau/uplands (away from seasonal
water channels). This study will help in design of overburden dump
taking into account environmental significance of biotic and abiotic
factors in in-situ/ex-situ plant diversity conservation.
• Establish relationship between carbon and nitrogen cycles
considering natural and anthropogenic constraints in tropical
deciduous forests.
• Data generation on plant diversity loss due to mining industries.
• Socio-economic viability of current management practices.
Conclusions
The diversity pattern of legumes and non-legume species in
Vindhyan region and other parts of Indian subcontinent reveal their
entirely different nature and response to type of disturbance. Generally,
both dominant legumes and non-legumes do not grow in each other’s
habitat due to their unique phenological plasticity and regeneration
capacity. Further, non-legumes carry out CO2 fixation while leguminous
species play dual role in deciduous forests i.e. CO2 fixation and N2
fixation. These characteristics emphasize conservation as per their
requirement in forest region and mined out areas. Hence, the concept of
IVCDP will be useful for the sustainable development of natural resources.
References
Craine, J.M., Frochle, J., Tilman, D.G., Wedin, D.A., Chapin, F.S.,
2001. The relationships among root and leaf traits of 76 grassland
species and relative abundance along fertility and disturbance
gradients. Oikos, 93, 274–285.
Ehrlich, P.R., Wilson E.O.,1991. Biodiversity studies-science and
policy. Science,253: 758-762.
Holdgate M., 1996. The ecological significance of biological diversity.
Ambio, 25:409-416.
Jha A.K., Singh, J.S., 1993. Restoration of degraded land: an overview.
pp. 1-9. In: J.S. Singh (ed.) Restoration of Degraded Land:
Concepts and Strategies. Rastogi Publications, Meerut, India.
Jha C.S., Goparaju L., Tripathi A., Gharai B., Raghubanshi A.S., Singh
J.S., 2005.Forest fragmentation and its impact on species
diversity: an analysis using remote sensing and GIS. Biodiversity
and Conservation, 14: 1681–1698.
King D.A., 1981. Tree dimensions: maximizing the rate of height growth
in dense stands. Oecologia, 51: 351-356.
Lawton, R.O. 1984. Ecological constraints on wood density in a tropical
montane rain forest. American Journal of Botany, 71: 261-267.
Lubchenco, J., Olson A.M., Brubaker L.B., Carpenter S.R., Holland M.M.,
Hubbell S.P., Levin S.A., Macmahon J.A., Matson P.A., Melillo
J.M., Mooney H.A., Peterson C.H., Pulliam H.R., Real L.A., Regal
P.J., Risser P.G.,1991. The sustainable biosphere initiative: an
ecological research agenda. Ecology, 72:371-412.
Pandey S.K., Singh H., Singh J.S., 2009. Species and site effects on leaf
traits of woody vegetation in a dry tropical environment. Current
Science, 96(8): 1109-1114.
Raghubanshi A.S., Tripathi A.,2009. Effect of disturbance, habitat
fragmentation and alien invasive plants on floral diversity in dry
tropical forests of Vindhyan highland: a review. Tropical Ecology,
50(1): 57-69.
Rao P.B., Kaur A., Tewari A., 2008. Drought resistance in seedlings of
five important tree species in Tarai region of Uttarakhand. Tropical
Ecology 49(1): 43-52.
Raizada P., Singh A., Raghubanshi A.S., 2009. Comparative response of
seedlings of selected native dry tropical and alien invasive species
to CO2 enrichment. Journal of Plant Ecology, 2(2): 69–75.
Sagar R., Singh J.S., 2005. Structure, diversity, and regeneration of tropical
dry deciduous forest of northern India. Biodiversity and
Conservation, 14: 935–959.
Singh A., 2006. Growth and leaf nutrient status of companion species as
influenced by neighbouring species in mixed plantations raised on
mine spoil. Tropical Ecology 47(2): 259-269.
Singh A., 2008. Influence of tree canopy on dry matter yield of seedlings
of Leucaena leucocephala on mine spoil in dry tropical
environment. Indian Journal of Forestry, 31(2): 207-208.
Singh K.P., Singh J.S., 1988. Certain structural and functional aspects of
dry tropical forests and savanna. International Journal of Ecology
Environmental Science,14: 31–45.
Singh J.S., Singh K.P., Agrawal M., 1991. Environmental degradation of
the Obra- Renukoot-Singrauli area, India and its impact on natural
and derived ecosystems. Environmentalist, 1:171–180.
Singh A., Jha A.K., Singh J.S.,2000. Effect of nutrient enrichment on
native tropical trees planted on Singrauli Coalfields, India.
Restoration Ecology, 8: 80-86.
Swamy P.S., Sundarapandian S.M., Chandrasekar P., Chandrasekaran
S.,2000. Plant species diversity and tree population structure of a
humid tropical forest in Tamil Nadu, India. Biodiversity and
Conservation, 9: 1643–1669.
Tilman, D., 2000. Causes, consequences and ethics of biodiversity.
Nature, 405: 208-211.
Vendramini, F., Diaz, S., Gurvich, D.E., Wilson, P.J., Thompson, K.,
Hodgson, J.G.,2002. Leaf traits as indicators of resource-use
strategy in floras with succulent species. New Phytol. 154: 147–157.
stoby, M., (1998). A leaf height seed (LHS) plant ecology strategy scheme.
Plant Soil,199: 213–227.
Weiher, E., 1999. The combined effects of scale and productivity on
species richness.Journal of Ecology, 87: 1005–1011.
Sustainable Landscape Restoration for Jharia Coalfield- India
Biswajit Paul
Department of Environmental Science and Engineering,
Indian School of Mines, Dhanbad, Jharkhand, India
Abstract
Mining Industries are considered as an environmentally perilous
development in the area. Mine restoration is planning to reclaim the mines
after it is exhausted of its mineral resources, uneconomical or it is
technically unsuitable for mining. The Jharia coalfield lying in eastern part
of India have 49 overlapping coal seams of various thicknesses,
unapproachable old mine working, devastating mine fire, numerous
environmental problems and highly populated surface along with important
infrastructures was chosen for the study. Here millions of tonnes of good
metallurgical coal get devastated due to ravaging mine fire leading to
uncontrolled high carbon dioxide emissions.
The workings of the Jharia Coalfield being more than two century
old has brought in numerous environmental degradation as mentioned.
More than four hundred private mines were operating to supply coal for
industrial use during the British period in India. The mine planning to
operate the coalfield as a whole was never conducted although Mine
Closure planning or Reclamation Planning is a part of mine plan.
Geological study, seam orientation, geographical boundaries and
method of working was studied by the author to establish a sustainable
mine closure and restoration strategy for different areas/geological
measures of the coalfields to combat the existing fire thus reducing
emissions and safe evacuation of coal. The outcome of this paper will
enable the mine officials to take appropriate steps to achieve sustainable
mine closer and post mining environmental management in the next two
centuries.
Mine Restoration Planning of this coalfield will cover the post
mining land use, safety and favorable environmental condition for the
inhabitants of the coalfield.
Keywords: Coalfield, closure planning, degradation, restoration
Introduction
The Jharia coalfield (JCF) is one of the most important coalfield in
India because of its reserves of prime coking coal. These prime coking
coals are used for making coke for metallurgical purposes. There are some
reserves of non-coking coal also which are used for the nearby power
plants. The river Damodar traverses in the southern portion of the sickle
shaped coalfield. The coal basin covers an area of 456sq.km. There are 49
overlapping coal seams in his coalfield of which 26 seams are local in
nature while 23 seams are regional and found throughout the coalfield
(Sengupta, 1980).
Location of the Coalfield
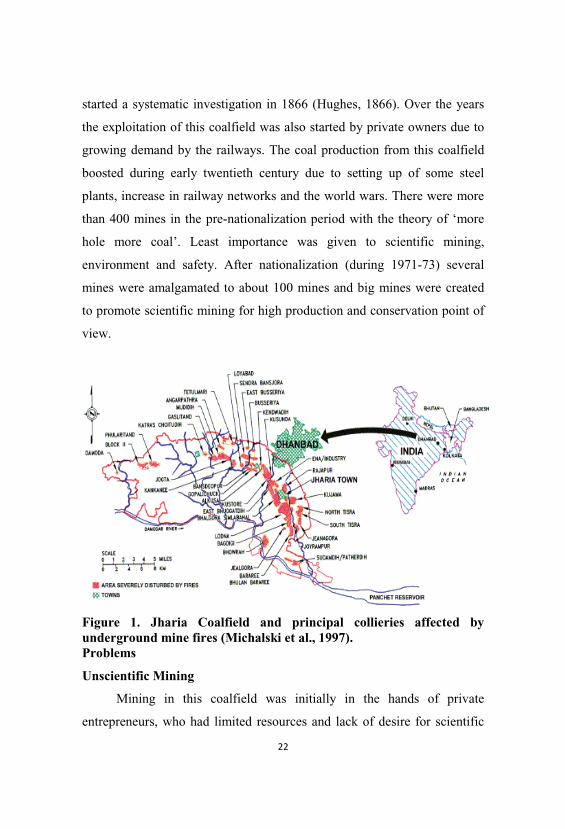
The Jharia Coalfield is situated in the eastern part of India in the
state of Jharkhand. The coalfield is located mostly in Dhanbad district, in
the state of Jharkhand. It is lying between latitude 23° 39' to 23° 48' N and
longitude 86° 11' to 86° 27' E which is about 260km northwest of Kolkata.
Figure 1 shows the location of the coalfield with some of the mines having
problems of fire.
History of Mining
The existence of the coalfield was known from time immemorial.
However (Heatly, 1842) the first reference about the occurrence of coal
was made in 1777. The coalfield was surveyed several times during the
mid-nineteenth century. The Geological Survey of India (GSI) finally in
started a systematic investigation in 1866 (Hughes, 1866). Over the years
the exploitation of this coalfield was also started by private owners due to
growing demand by the railways. The coal production from this coalfield
boosted during early twentieth century due to setting up of some steel
plants, increase in railway networks and the world wars. There were more
than 400 mines in the pre-nationalization period with the theory of ‘more
hole more coal’. Least importance was given to scientific mining,
environment and safety. After nationalization (during 1971-73) several
mines were amalgamated to about 100 mines and big mines were created
to promote scientific mining for high production and conservation point of
view.
Figure 1. Jharia Coalfield and principal collieries affected byunderground mine fires (Michalski et al., 1997). Problems
Unscientific Mining
Mining in this coalfield was initially in the hands of private
entrepreneurs, who had limited resources and lack of desire for scientific
mining. The mining methods were comprised of both opencast as well as
underground. The opencast mining areas were not backfilled, so large
voids are still present in the form of abandoned mining areas. Having small
leases the overburdens had been kept over the coal bearing areas hence
have to be rehandled several times.
Subsidence
The thick seams were extracted by underground caving methods at
shallow depth also. This process has damaged the surface land in the form
of subsidence impacts and formation of pot holes or cracks damaging the
surface infrastructure. Around 34.97 sq. km. area of the JCF is under
subsidence and considered unstable. It is mentioned in JCF reconstruction
program that about 70% of the underground production of coal would
come by caving and balance 30% by stowing and thus about 101 sq. km.
underground mining area would be affected by subsidence.
Mine Fire
Land subsidence has also enhanced spontaneous heating of coal
seams leading to mine fires. This coalfield was engulfed with about 70
mine fires, spread over an area of 17.32 sq. km., blocking more than 636
million tonnes of coking coal and 1238 million tonnes of non-coking coal
(www.envfor.nic.in).
Small Leases
The coal mining leases were distributed in more than 400 small
mines operated by private owners as said earlier. However to promote
scientific mining after nationalization M/s Bharat Coking Coal Limited
(BCCL) the main lessee of JCF has amalgamated these large numbers of
mines into about 100 mines for better administrative purpose, view of coal
conservation and for technological advantages. Still larger mines have to
be created for scientific mining purpose.
Settlements
The greatest hindrance to the scientific mining in JCF is the huge
population settled over the mining blocks, which prevent the mine
operators, to mine in a scientific methodical manner. Presently as per the
Jharia Action Plan BCCL have to rehabilitate about 1,00,000 families away
from the lease hold areas in the northern Metamorphic regions, in order to
protect the coal blocks from raging mine fire, continue mining and close
the exhausted mines in a sustainable manner.
Geological Formations
The general stratigraphic succession is given in Table 1. The plan of
the geological formations of Jharia coalfield is presented in Figure 2.
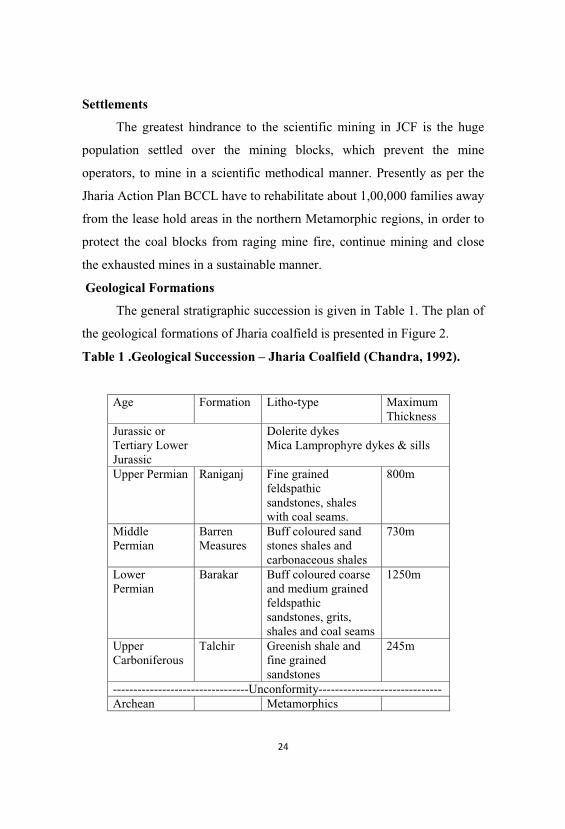
Table 1 .Geological Succession – Jharia Coalfield (Chandra, 1992).
Age Formation Litho-type MaximumThickness
Jurassic orTertiary LowerJurassic
Dolerite dykesMica Lamprophyre dykes & sills
Upper Permian Raniganj Fine grainedfeldspathicsandstones, shaleswith coal seams.
800m
MiddlePermian
BarrenMeasures
Buff coloured sandstones shales andcarbonaceous shales
730m
LowerPermian
Barakar Buff coloured coarseand medium grainedfeldspathicsandstones, grits, shales and coal seams
1250m
UpperCarboniferous
Talchir Greenish shale andfine grainedsandstones
245m
---------------------------------Unconformity------------------------------Archean Metamorphics
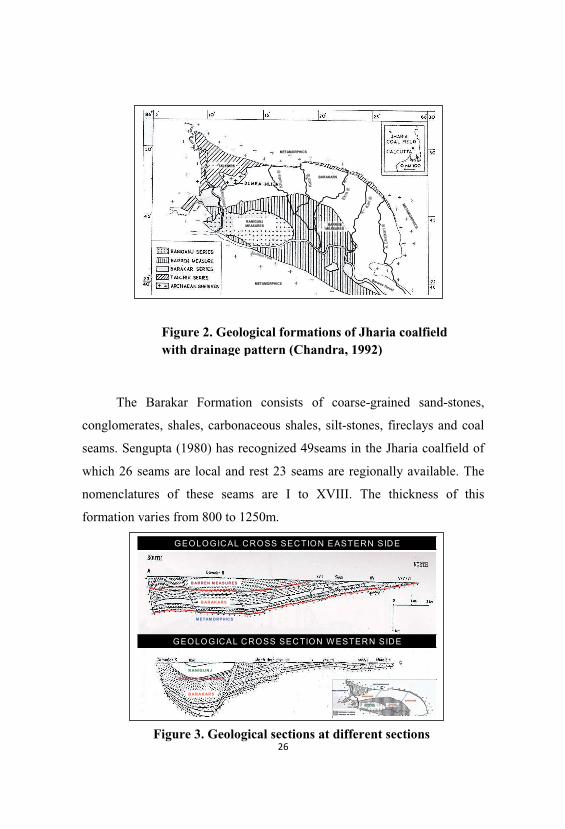
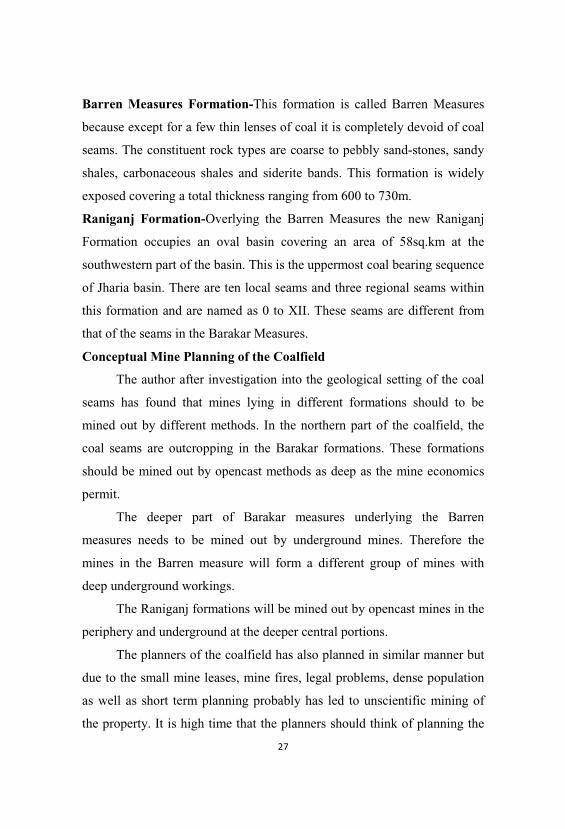
The cross-section of the coalfield at two sections are shown in
Figure 3. The basement metamorphic rocks are overlain by Talchir
Formation followed by the Barakar Formation, which is the main coal-
bearing horizon (Chandra, 1992).This measure extends from extreme north
to extreme south upto the southern fault and then vanishes. It also extends
from extreme east to extreme west. Above the Barakar formation lays the
Barren Measures which is bereft of coal seams except for a few lenses of
coal. Overlying the Barren Measures lies the Raniganj Formation which is
also coal bearing. This measure is placed in the south-west corner of JCF.
This Raniganj measure is a full coalfield with all the features of a coal
basin having different series of coal seams than that of the Barakar
Measures.
Metamorphic Rocks -The coalfield is surrounded by metamorphic rocks
made up of granites, granite-gneisses, quartzites, mica schists and
amphibolites. Gneisses are the dominant rock type. In the north west part
of the coalfield, at Dumra an outlier of metamorphic rock is exposed as
shown in Figure 2. Otherwise the metamorphic rock occurs only at the
base of the basin at different depths.
Talchir Formation-Rocks of Talchir Formation are of fluvio-glacial
origin marked by a basal boulder bed resting on the pre-Cambrian
basement. The formation is exposed almost continuous stretch around the
northern crescent-shaped periphery of the basin. Toward the eastern and
southeastern periphery and also at depth, the formation gradually vanishes
toward the middle.
Barakar Formation-This Formation consisting of fluviatile deposits is the
lowermost member in the Jharia coalfield. This is the most important
formation containing coal seams and covers an area of about 210sq km.
The Barakar Formation consists of coarse-grained sand-stones,
conglomerates, shales, carbonaceous shales, silt-stones, fireclays and coal
seams. Sengupta (1980) has recognized 49seams in the Jharia coalfield of
which 26 seams are local and rest 23 seams are regionally available. The
nomenclatures of these seams are I to XVIII. The thickness of this
formation varies from 800 to 1250m.
Figure 2. Geological formations of Jharia coalfieldwith drainage pattern (Chandra, 1992)
METAMORPHICS
METAM
ORPHICSBARRENMEASURES
RANIGUNJMEASURES
BARAKARS
Southern Fault
Bararee ThrustMETAMORPHICS
TALCHIRS
Jam
unia
®
Khud
ia®
Katri
®
Ekra
®
Kari
®
Cha
tkar
i®
METAMORPHICS
METAM
ORPHICSBARRENMEASURES
RANIGUNJMEASURES
BARAKARS
Southern Fault
Bararee ThrustMETAMORPHICS
TALCHIRS
Jam
unia
®
Khud
ia®
Katri
®
Ekra
®
Kari
®
Cha
tkar
i®
GEOLOGICAL CROSS SECTION EASTERN SIDEGEOLOGICAL CROSS SECTION EASTERN SIDE
GEOLOGICAL CROSS SECTION W ESTERN SIDEGEOLOGICAL CROSS SECTION W ESTERN SIDE
C
R ANIGU NJ
B AR AK ARS
B ARREN M E ASUR ES
M ETAM ORPHICS
BAR AK ARS
B ARREN M EASURES
GEOLOGICAL CROSS SECTION EASTERN SIDEGEOLOGICAL CROSS SECTION EASTERN SIDE
GEOLOGICAL CROSS SECTION W ESTERN SIDEGEOLOGICAL CROSS SECTION W ESTERN SIDE
CC
R ANIGU NJ
B AR AK ARS
B ARREN M E ASUR ES
M ETAM ORPHICS
BAR AK ARS
B ARREN M EASURES
Figure 3. Geological sections at different sections
Barren Measures Formation-This formation is called Barren Measures
because except for a few thin lenses of coal it is completely devoid of coal
seams. The constituent rock types are coarse to pebbly sand-stones, sandy
shales, carbonaceous shales and siderite bands. This formation is widely
exposed covering a total thickness ranging from 600 to 730m.
Raniganj Formation-Overlying the Barren Measures the new Raniganj
Formation occupies an oval basin covering an area of 58sq.km at the
southwestern part of the basin. This is the uppermost coal bearing sequence
of Jharia basin. There are ten local seams and three regional seams within
this formation and are named as 0 to XII. These seams are different from
that of the seams in the Barakar Measures.
Conceptual Mine Planning of the Coalfield
The author after investigation into the geological setting of the coal
seams has found that mines lying in different formations should to be
mined out by different methods. In the northern part of the coalfield, the
coal seams are outcropping in the Barakar formations. These formations
should be mined out by opencast methods as deep as the mine economics
permit.
The deeper part of Barakar measures underlying the Barren
measures needs to be mined out by underground mines. Therefore the
mines in the Barren measure will form a different group of mines with
deep underground workings.
The Raniganj formations will be mined out by opencast mines in the
periphery and underground at the deeper central portions.
The planners of the coalfield has also planned in similar manner but
due to the small mine leases, mine fires, legal problems, dense population
as well as short term planning probably has led to unscientific mining of
the property. It is high time that the planners should think of planning the
mining operation of the entire coalfield instead of individual leases. Big
blocks should be excavated right from the extreme north and should
proceed toward south. The mines should be reclaimed or backfilled after
de-coaling from the northern side only to prevent rehandling of OB dumps.
Mine Boundaries in the Barakar Measures
Large opencast mine have to be created by combining several mines.
Therefore the mine boundaries have to be demarcated for long term plans.
The Jharia coalfield has been traversed by several perennial streams
namely the Jamunia, Khudia, Katri, Ekra, Kari and Chatkari streams.
These streams are the main drainage system of the 456sq.km coalfield and
flow from the north to the south to meet the river Damodar. The mine
waters, washery effluents, domestic wastewaters are directed to these
natural drains. As it is essential to maintain these natural drains, these
streams may form natural boundaries of the big mines. The other
boundaries may be the Metamorphics and the demarcation between the
Barakar, Barren and Raniganj measures. For example the portion between
the Jamunia and Khudia River lying in the Barakar formation only i.e., the
Phularitand and Block II area in Figure 1 may form only one big mine.
Figure 2 shows the streams and different measures to mark the boundaries
of the big mines to be mined in similar methods. As lot of coal will be
blocked under these streams, these may also be diverted through the de-
coaled area temporarily by building artificial drain or canal like structure.
Mining the Barakar Measures
The geological cross section shows as the seams are outcropping in
the northern side of the coalfield we should start the opencast mines from
the extreme north and after de-coaling proceed toward the southern
boundary as per the dip direction of the seams. The overburdens could be
kept initially in the Metamorphic areas lying in the north of the coalfield.
As the mines proceeds toward the dip side backfilling with reclamation can
be started from the northern side. This will minimize the re-handling of the
overburden in different areas and facilitate faster rehabilitation in the de-
coaled areas.
Mining the Barren Measures
The mines lying under the Barren Measure are suitable for
underground only as the coal bearing Barakar measures are underlying it.
Therefore these mines can carry on their operation till the opencast mines
from the rise side (Barakar Measures) approaches these underground
mines. Suitable precautions have to be taken as the opencast mines may get
connected with the underground mines which may disturb the ventilation
and may allow surface water into the mines causing inundation from the
rise side.The connections between the opencast and the underground mines
may also serve as coal transport networks from the deep mines to the
exposed part of the seams in the opencast mines.
Mining the Raniganj Measures
The Raniganj Measures also can be mined out from the periphery as
opencast mines and proceed toward the centre. Later on as these peripheral
opencast mines reaches the un-economics depth towards the centre,
underground mining may continue at the central deep portion. There are
potential for coal bed methane extraction also in the eastern and south-
eastern portion of the Raniganj Measures near the Bhatdih mines.
Closure and Restoration Plan of Jharia Coalfield
The Jharia Closure and restoration plan should be integrated with the
mining plan of the coalfield. With the present rate of extraction of 30Mt
per annum, the coalfield may last for another 200years considering 40%
extraction of roughly 17000Mt of reserve. As the major opencast mines
will be lying in the Barakar measure the restoration of the mines in this
formation will be of utmost importance. The progressive mine closure and
reclamation of this coalfield will also start from the northern boundary of
the coalfield. The following areas need to be addressed in the mine closure
and restoration plan of JCF.
Reclamation and Rehabilitation of the Mined-Out Land
The actual site of the pit will be restored by reclamation and
rehabilitation of mined-out land for future use. The proposals should be
supported with relevant plans and sections depicting the method of land
restoration / reclamation / rehabilitation. Suitable plantation will be done to
stabilize the land. The land will be allowed to consolidate for a few years
before utilization for any infrastructure or construction purposes. The
residual pits will be maintained with water suitable for use like
pisciculture, lakes for tourism, migratory birds, picnic spots, etc. Necessary
care will be taken to prevent any danger of the stored water to the adjacent
underground mines or underneath seams.
The overburden dumps will be suitably terraced for stabilization and
plantation will be done to prevent erosion and air pollution. Garland
drainage and suitable sedimentation tanks will be constructed to
accommodate the storm water. The garland drains and the sedimentation
tanks will be cleaned before onset of every monsoon.
Care will be taken to prevent fire due to presence of carbonaceous
materials in the overburden as well as in the mine fill. The mine opening
will be suitably covered and stowed to prevent any future fire in the un-
recovered coal pillars. The pits shall be suitably fenced, the shafts will be
suitably covered to prevent any danger to man and animals.
The office building shall be used for the society. The railway tracks
used for coal transportation may be used as city rails/metro rails. The
mined out land may be handed over to the original owner, if found or may
be auctioned with suitable planning and plotting.
Air Quality Management
The mining lands if not stabilized by vegetation, will be prone to air
pollution due to presence of air borne materials. The overburden dumps as
well as the backfilled areas should be suitably covered by plantation and
weeding. Care will be taken to prevent fire due to presence of
carbonaceous materials in the overburden as well as in the mine fill. The
carbonaceous materials will be suitably packed and any contact with air
will be prevented by making impermeable layers. Incombustible materials
like ash may be mixed with the carbonaceous materials to prevent
smoldering. The mine opening will be suitably closed, stowed and sealed
to prevent any future fire in the remnant pillars. A regular air quality
monitoring will be done to check the status of air pollution.
Water Quality Management
The existing surface and ground water bodies available in the lease
areas will be protected and the measures for protection against erosion,
sedimentation, siltation will be taken. Water treatment, diversion of water
courses will be done if there are chances of contamination of ground water
from leaching, acid mine drainage etc. Quantity and quality of surface
water bodies should be monitored to meet the water quality conforming to
the permissible limits. Regular hydrological study will be carried out in the
area to monitor the water balance.
The residual mine pits, shafts and workings may be used as water
reservoirs. The mine pumps and the water treatment plants should be
maintained by the lease holders for a few years, to distribute water to the
local people for domestic and agricultural purposes before handing them
over to the local administration.
Waste Management
The type, quality and quantity of overburden, washery reject, pit
head thermal power plant ash etc. available and their disposal practice
should be addressed. If no utilizations of these waste materials are
proposed, the manner in which these waste materials will be stabilized
should be decided. The protective measures should be taken for prevention
of siltation, erosion and airborne dust from these waste materials. If toxic
and hazardous elements are present in the waste material, suitable
protective measures like plantation, weeding and contouring should be
taken to prevent their dispersion in the air environment, surrounding
agricultural land and leaching in the surface and ground water.The mining
wastes may be properly placed in the underground mine voids or surface
exhausted pits after suitable toxicological and physical tests.
Risk Assessment and Disaster Management
The restoration plan should deal with action plan for high risk
accidents like landslides, subsidence, flood, inundation or explosion in
underground mines, fire, subsidence, seismic activities, tailing dam failure
etc. Emergency plan should be proposed for quick evacuation and
ameliorative measures to be taken. The capability of lessee to meet such
eventualities and the assistance to be required from the local authority
should also be described. The rehabilitated peoples over the mined out
land should be well informed and well trained about the anticipated
dangers of the old mining lands, old workings like outbreak of fire or
subsidence.
Safety and Security
The mine shafts should be suitably covered and protected. The
opencast mines connected to the underground mine working should be
filled up properly with sealing of the connections to prevent fire,
inundation as well as illegal mining. The slopes of the mine should be
made stable by terracing, stone pitching and securing by fencing. Suitable
plantation, weeding should be done in the slopes to prevent erosion. The
areas likely to be subsided should be stowed properly. The public should
be made aware about the unanticipated dangers of the area.
Disposal of Mining Machineries
As there will be high utilization of gigantic mining machines suitable
disposal plans should be developed. The old and worn-out machines
should be scheduled to be disposed and recycled. The tyres of the heavy
machineries, belt conveyors etc should be properly recycled and
disposed.The headgears, ropes, weigh bridges, workshops, railway siding
tracks, pit head washeries should be dismantled and sent for useful
purpose. The batteries should be disposed as per the rules enforced in the
country.
Utilization of Office Buildings and Staff Quarters
The office building should be used for societal purpose during the
post mining period and the residential buildings may be auctioned or
donated to the local people. Suitable markets, schools, community centers,
training centers should be developed in the abandoned lands to promote
sustainability.
Economic Repercussions of Closure and Restoration of Mine and
Manpower Retrenchments
Manpower retrenchment, compensation to be given, socio-economic
repercussions and remedial measures, consequent to the closure of mines
should be described, specifically stating the following:
• Number of local residents employed in the mine, status of the
continuation of family occupation and scope of joining the
occupation back in some other mining areas of the company.
• Compensation given or to be given to the employees connecting
with sustenance of himself and their family members.
• Satellite occupations connected to the mining industry - number of
persons engaged therein - continuance of such business after mine
closes.
• Continued engagement of employees in the rehabilitated status of
mining lease area and any other remnant activities.
• Envisaged repercussions on the expectation of the society around
due to closure of mine.
Time Scheduling for Abandonment
The details of time schedule of all abandonment operations as
proposed above should be addressed with time schedule. The manpower
and other resources required for completion of proposed job should be
described. The schedule of such operations should also be supplemented
by PERT ( Programme Evaluation & Review Technique ), Bar chart etc.
Abandonment Cost
The closure and restoration cost has to be estimated based on the
activities required for implementing the protective and rehabilitation
measures including their maintenance and monitoring programme. The
restoration cost should be considered as a part of mining operation rather
than a separate environmental or social budget.
Conclusions
The inventors of the coalfield could not plan the mining methods for
proper conservation, safety and environmental requirements. For this
reason the present operators are facing difficulties due to the small mine
leases, legal problems, dense population, mine fires and unscientific
mining of the property. It is high time that we should think of planning the
mining operation of the entire coalfield instead of individual small leases.
Similarly the restoration of the entire coalfields have to be conceptualized
and implemented along with the current mining operations so that
sustainable development take place making the future generations secured
from the unsafe mining and environmental adversities. The author of the
paper has conceptualized the closure and restoration of the Jharia Coalfield
in his own way of imagination.
Acknowledgements
The views expressed in the paper are personal. The present problems
faced in the mining operations are due to absence of long term planning
during the pre-nationalised period. Hence a closure plan of the entire JCF
is required to be formulated so that the future anticipated problems can be
eliminated and Jharia will be a better place to live. The author is thankful
to Professor Gurdeep Singh, Head of the Department, Centre of Mining
Environment, Environmental Science & Engineering Department, Indian
School of Mines(ISM), Dhanbad for his inspiration and guidance. He also
expresses his sincere gratitude to Professor T. Kumar for his kind
acquiescence for this write-up.
References
Chandra, D. 1992) Jharia Coalfield, Geological Society of India, 1-42.
Heatly Tollemache, S.G.1842. Contributions towards a history of the
development of the Mineral Resources of India, J. Asiat. Soc,
Beng,11,811.
Huges, T.W.H., (1866). Jharia Coalfield, Mem.Geol.Surv.India, 5,334-
336.
Master Plan for dealing with fire, subsidence and rehabilitation in the
leasehold of BCCL, BCCL, 2008.

Michalski, S.R. Custer, E.S. and Munshi, P.L.1997. Investigation of the
Jharia coalfield mine fires – India, Vision 2000, 14th Annual
Meeting of the American Society for Surface Mining and
Reclamation, Austin, Texas, May 10-16,
Sengupta,N.1980. A revision of the geology of Jharia coalfield with
particular reference to distribution of coal seam, Ph.D. thesis, Indian
School of Mines, Dhanbad, 103pp.
Biodiversity Conservation through Removal of Lantana camara-an
Invasive Species in Planted Ecosystem of Rajaji National Park
Uttarakhand
H.B.Vasistha, Mridula Negi, S. Rasaily*,
Suryapal Singh Bhandari and S.K. Kamboj
Division of Ecology and Environment,Forest Research Institute, Dehradun
* Director, Rajaji National Park
Abstract
Invasion of alien species is a growing problem for the world, both
ecological and economically. They can alter ecological relationships
among native species and can affect ecosystem functions, economic value
of ecosystem as well as human health. Biodiversity of different habitats in
our country is largely affected by the invasion of various invasive species,
Lantana camara native to South America is one of them. Rajaji National
Park nestled in Shivalik ranges and extending in the district of Dehradun,
Haridwar and Pauri of Uttarakhand, and characterized by the presence of
distinct natural vegetation communities i.e. sal, mixed broad leaf, chir pine,
scrubland, grassy pastures, riverine and planted ecosystems are largely
invaded by L. camara, resulting in loss of biodiversity and food of wild
animals. Eucalyptus which is planted in certain parts of Kansaro range of
Rajaji National Park in the years 1996 and 1997 is heavily encroached by
L. camara. To manage the plantation ecosystems, Lantana is being
removed from these areas. In order to see the impact of invasion of L.
camara particularly on plant diversity and species composition, a study
has been carried out in Lantana invaded as well as Lantana removal sites
in Eucalyptus plantations.
The present paper describes the species composition and plant
diversity as influenced by the invasion of Lantana camara in Eucalyptus
plantation in Rajaji National Park.
Keywords: Invasion, Alien species, Ecosystem, Riverine, Shivalik Ranges.
Introduction
Invasion of alien species is a growing problem for the world, both
ecological and economically. It is a high priority problem in the field
of environmental management.Invasive species often alter the ecological
relationship among native species and affect the ecosystem functions, their
economic value as well as human health. Biodiversity of different forest
ecosystem whether natural or manmade is largely affected by the various
invasive species. Word wide an estimated 80% of endangered species
could suffer losses due to competition with or predation by invasive
species (Smith and Berg, 1988). Convention on
Biological Diversity (CBD) recognizes biological invasions as the second
most important casual factor for the loss of biological diversity in natural
ecosystem across the world (Love et al., 2009).The problem of invasion of
alien species becomes more serious when it occurs in National Parks,
Sanctuary and Biosphere reserve etc. Since spread of alien species
disturbed the food chain of the ecosystem by reducing the habitat of
wild animals and loss of biodiversity thereof. Rajaji national park which
was established in the year 1983 with the aim to maintain the habitats of
various wild animals such as Asian elephant, tiger, leopard, dear, samber
etc. is facing an accentuated problem of invasion of Lantana camara, an
exotic weed native to South America. The invasion resulted in loss of
habitats and biodiversity, food of herbivores and free movement of wild
animals in both natural and planted ecosystems of the park area. In order
to ascertain the extent of loss of biodiversity and vegetation composition
under planted ecosystems, a study has been carried out under
Eucalyptus plantation in Kansaro Range of Rajaj national park.
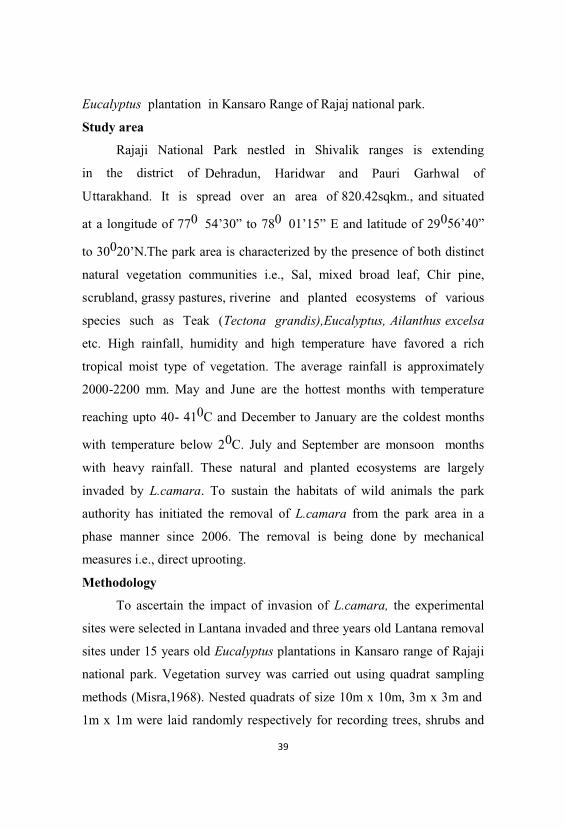
Study area
Rajaji National Park nestled in Shivalik ranges is extending
in the district of Dehradun, Haridwar and Pauri Garhwal of
Uttarakhand. It is spread over an area of 820.42sqkm., and situated
at a longitude of 770 54’30” to 780 01’15” E and latitude of 29056’40”
to 30020’N.The park area is characterized by the presence of both distinct
natural vegetation communities i.e., Sal, mixed broad leaf, Chir pine,
scrubland, grassy pastures, riverine and planted ecosystems of various
species such as Teak (Tectona grandis),Eucalyptus, Ailanthus excelsa
etc. High rainfall, humidity and high temperature have favored a rich
tropical moist type of vegetation. The average rainfall is approximately
2000-2200 mm. May and June are the hottest months with temperature
reaching upto 40- 410C and December to January are the coldest months
with temperature below 20C. July and September are monsoon months
with heavy rainfall. These natural and planted ecosystems are largely
invaded by L.camara. To sustain the habitats of wild animals the park
authority has initiated the removal of L.camara from the park area in a
phase manner since 2006. The removal is being done by mechanical
measures i.e., direct uprooting.
Methodology
To ascertain the impact of invasion of L.camara, the experimental
sites were selected in Lantana invaded and three years old Lantana removal
sites under 15 years old Eucalyptus plantations in Kansaro range of Rajaji
national park. Vegetation survey was carried out using quadrat sampling
methods (Misra,1968). Nested quadrats of size 10m x 10m, 3m x 3m and
1m x 1m were laid randomly respectively for recording trees, shrubs and
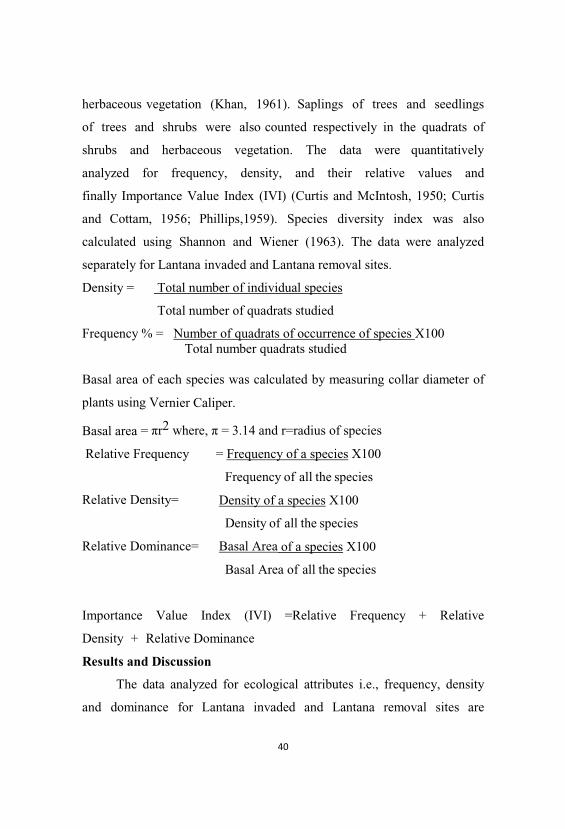
herbaceous vegetation (Khan, 1961). Saplings of trees and seedlings
of trees and shrubs were also counted respectively in the quadrats of
shrubs and herbaceous vegetation. The data were quantitatively
analyzed for frequency, density, and their relative values and
finally Importance Value Index (IVI) (Curtis and McIntosh, 1950; Curtis
and Cottam, 1956; Phillips,1959). Species diversity index was also
calculated using Shannon and Wiener (1963). The data were analyzed
separately for Lantana invaded and Lantana removal sites.
Density = Total number of individual species
Total number of quadrats studied
Frequency % = Number of quadrats of occurrence of species X100 Total number quadrats studied
Basal area of each species was calculated by measuring collar diameter of
plants using Vernier Caliper.
Basal area = r2 where, = 3.14 and r=radius of species
Relative Frequency = Frequency of a species X100
Frequency of all the species
Relative Density= Density of a species X100
Density of all the species
Relative Dominance= Basal Area of a species X100
Basal Area of all the species
Importance Value Index (IVI) =Relative Frequency + Relative
Density + Relative Dominance
Results and Discussion
The data analyzed for ecological attributes i.e., frequency, density
and dominance for Lantana invaded and Lantana removal sites are
presented in Tables 1 and 2.
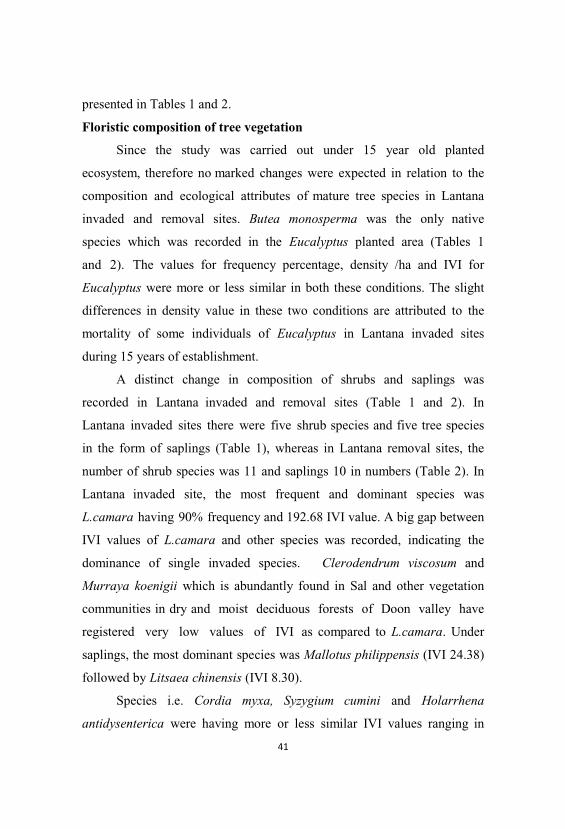
Floristic composition of tree vegetation
Since the study was carried out under 15 year old planted
ecosystem, therefore no marked changes were expected in relation to the
composition and ecological attributes of mature tree species in Lantana
invaded and removal sites. Butea monosperma was the only native
species which was recorded in the Eucalyptus planted area (Tables 1
and 2). The values for frequency percentage, density /ha and IVI for
Eucalyptus were more or less similar in both these conditions. The slight
differences in density value in these two conditions are attributed to the
mortality of some individuals of Eucalyptus in Lantana invaded sites
during 15 years of establishment.
A distinct change in composition of shrubs and saplings was
recorded in Lantana invaded and removal sites (Table 1 and 2). In
Lantana invaded sites there were five shrub species and five tree species
in the form of saplings (Table 1), whereas in Lantana removal sites, the
number of shrub species was 11 and saplings 10 in numbers (Table 2). In
Lantana invaded site, the most frequent and dominant species was
L.camara having 90% frequency and 192.68 IVI value. A big gap between
IVI values of L.camara and other species was recorded, indicating the
dominance of single invaded species. Clerodendrum viscosum and
Murraya koenigii which is abundantly found in Sal and other vegetation
communities in dry and moist deciduous forests of Doon valley have
registered very low values of IVI as compared to L.camara. Under
saplings, the most dominant species was Mallotus philippensis (IVI 24.38)
followed by Litsaea chinensis (IVI 8.30).
Species i.e. Cordia myxa, Syzygium cumini and Holarrhena
antidysenterica were having more or less similar IVI values ranging in
between 4.16 to 4.19
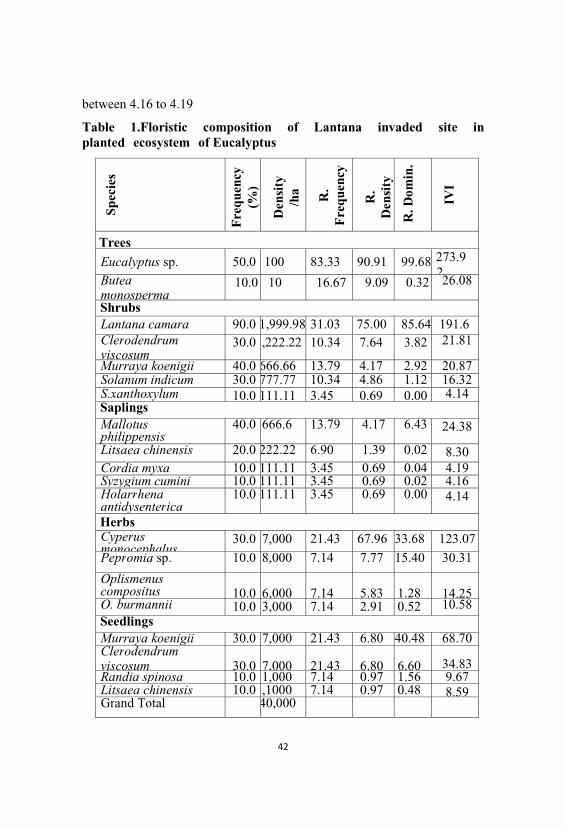
Table 1.Floristic composition of Lantana invaded site in planted ecosystem of Eucalyptus
Spec
ies
Fre
quen
cy(%
)
Den
sity
/ha R.
Fre
quen
cy
R.
Den
sity
R. D
omin
.
IVI
Trees
Eucalyptus sp. 50.0 100 83.33 90.91 99.68 273.92
Buteamonosperma
10.0 10 16.67 9.09 0.32 26.08
ShrubsLantana camara 90.0 1,999.98 31.03 75.00 85.64 191.6Clerodendrumviscosum
30.0 ,222.22 10.34 7.64 3.82 21.81
Murraya koenigii 40.0 666.66 13.79 4.17 2.92 20.87Solanum indicum 30.0 777.77 10.34 4.86 1.12 16.32S.xanthoxylum 10.0 111.11 3.45 0.69 0.00 4.14SaplingsMallotusphilippensis
40.0 666.6 13.79 4.17 6.43 24.38
Litsaea chinensis 20.0 222.22 6.90 1.39 0.02 8.30Cordia myxa 10.0 111.11 3.45 0.69 0.04 4.19Syzygium cumini 10.0 111.11 3.45 0.69 0.02 4.16Holarrhenaantidysenterica
10.0 111.11 3.45 0.69 0.00 4.14
HerbsCyperusmonocephalus
30.0 7,000 21.43 67.96 33.68 123.07
Pepromia sp. 10.0 8,000 7.14 7.77 15.40 30.31
Oplismenuscompositus 10.0 6,000 7.14 5.83 1.28 14.25O. burmannii 10.0 3,000 7.14 2.91 0.52 10.58SeedlingsMurraya koenigii 30.0 7,000 21.43 6.80 40.48 68.70Clerodendrumviscosum 30.0 7,000 21.43 6.80 6.60 34.83Randia spinosa 10.0 1,000 7.14 0.97 1.56 9.67Litsaea chinensis 10.0 ,1000 7.14 0.97 0.48 8.59Grand Total 40,000
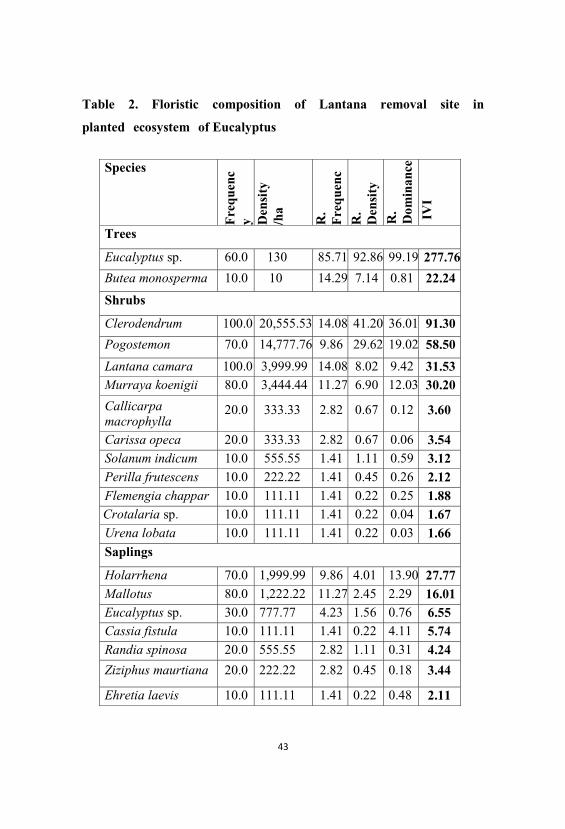
Table 2. Floristic composition of Lantana removal site in
planted ecosystem of Eucalyptus
Species
Fre
quen
cy D
ensi
ty/h
a
R.
Fre
quen
c
R.
Den
sity
R.
Dom
inan
ce
IVI
Trees
Eucalyptus sp. 60.0 130 85.71 92.86 99.19 277.76
Butea monosperma 10.0 10 14.29 7.14 0.81 22.24
Shrubs
Clerodendrum 100.0 20,555.53 14.08 41.20 36.01 91.30
Pogostemon 70.0 14,777.76 9.86 29.62 19.02 58.50
Lantana camara 100.0 3,999.99 14.08 8.02 9.42 31.53Murraya koenigii 80.0 3,444.44 11.27 6.90 12.03 30.20
Callicarpamacrophylla
20.0 333.33 2.82 0.67 0.12 3.60
Carissa opeca 20.0 333.33 2.82 0.67 0.06 3.54Solanum indicum 10.0 555.55 1.41 1.11 0.59 3.12Perilla frutescens 10.0 222.22 1.41 0.45 0.26 2.12Flemengia chappar 10.0 111.11 1.41 0.22 0.25 1.88Crotalaria sp. 10.0 111.11 1.41 0.22 0.04 1.67Urena lobata 10.0 111.11 1.41 0.22 0.03 1.66Saplings
Holarrhena 70.0 1,999.99 9.86 4.01 13.90 27.77Mallotus 80.0 1,222.22 11.27 2.45 2.29 16.01Eucalyptus sp. 30.0 777.77 4.23 1.56 0.76 6.55Cassia fistula 10.0 111.11 1.41 0.22 4.11 5.74Randia spinosa 20.0 555.55 2.82 1.11 0.31 4.24
Ziziphus maurtiana 20.0 222.22 2.82 0.45 0.18 3.44
Ehretia laevis 10.0 111.11 1.41 0.22 0.48 2.11
Wrightia tomentosa 10.0 111.11 1.41 0.22 0.10 1.73
Phyllanthus emblica 10.0 111.11 1.41 0.22 0.02 1.66
Premna latifolia 10.0 111.11 1.41 0.22 0.01 1.65Herbs
Chloris dolichostachya30.0 6,43,000 4.11 67.68 17.39 89.19Impereta cylindrica 20.0 65,000 2.74 6.84 20.32 29.91Ageratum conyzoides 70.0 40,000 9.59 4.21 12.51 26.31Cyperus eria 30.0 40,000 4.11 4.21 15.62 23.94Cassia tora 60.0 44,000 8.22 4.63 9.33 22.18Achyranthes aspera 50.0 7,000 6.85 0.74 0.01 7.59Commelina 20.0 8,000 2.74 0.84 1.70 5.28Capillipedium 10.0 1,000 1.37 1.79 1.49 4.65Rungia pectinata 20.0 4,000 2.74 0.42 0.28 3.44Oxalis corniculata 10.0 2,000 1.37 0.21 0.78 2.36Oplismenus 10.0 3,000 1.37 0.32 0.26 1.95O. compositus 10.0 2,000 1.37 0.21 0.11 1.69
SeedlingsSida cordata 70.0 24,000 9.59 2.53 1.66 13.78Clerodendrum 50.0 8,000 6.85 0.84 4.58 12.27Ichnocarpus frutescens30.0 8,000 4.11 0.84 6.31 11.26Holarrhena 40.0 5,000 5.48 0.53 1.56 7.57Pogostemon 40.0 8,000 5.48 0.84 0.70 7.02Randia spinosa 20.0 3,000 2.74 0.32 1.43 4.49Murraya koenigii 20.0 4,000 2.74 0.42 0.52 3.68Litsaea chinensis 10.0 1,000 1.37 0.11 1.73 3.21Mitragyna parviflora 10.0 1,000 1.37 0.11 0.48 1.95Mimosa sp 10.0 1,000 1.37 0.11 0.31 1.79Lantana camara 10.0 1,000 1.37 0.11 0.13 1.61Wrightia tomentosa 10.0 1,000 1.37 0.11 0.07 1.54Phyllanthus emblica 10.0 1,000 1.37 0.11 0.07 1.54Urena lobata 10.0 1,000 1.37 0.11 0.07 1.54Eucalyptus sp. 10.0 1,000 1.37 0.11 0.05 1.53Asparagas racemosa 10.0 1,000 1.37 0.11 0.04 1.51
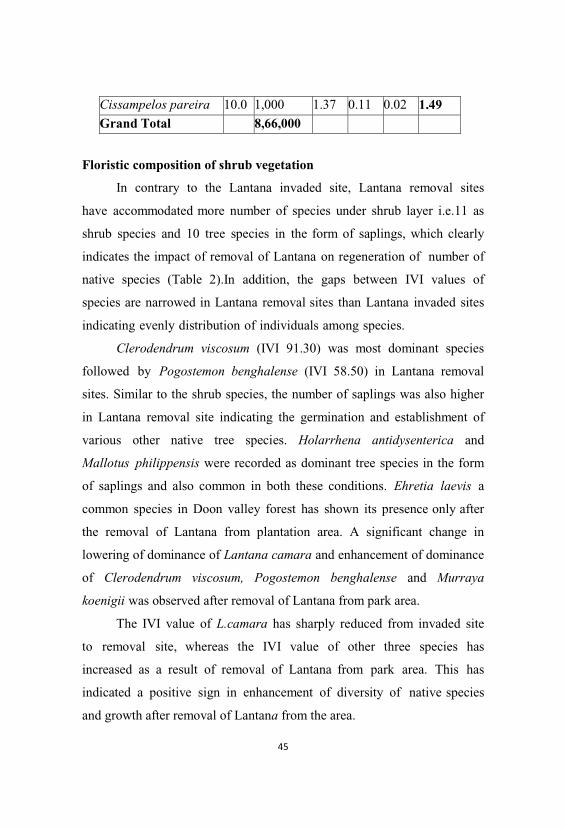
Floristic composition of shrub vegetation
In contrary to the Lantana invaded site, Lantana removal sites
have accommodated more number of species under shrub layer i.e.11 as
shrub species and 10 tree species in the form of saplings, which clearly
indicates the impact of removal of Lantana on regeneration of number of
native species (Table 2).In addition, the gaps between IVI values of
species are narrowed in Lantana removal sites than Lantana invaded sites
indicating evenly distribution of individuals among species.
Clerodendrum viscosum (IVI 91.30) was most dominant species
followed by Pogostemon benghalense (IVI 58.50) in Lantana removal
sites. Similar to the shrub species, the number of saplings was also higher
in Lantana removal site indicating the germination and establishment of
various other native tree species. Holarrhena antidysenterica and
Mallotus philippensis were recorded as dominant tree species in the form
of saplings and also common in both these conditions. Ehretia laevis a
common species in Doon valley forest has shown its presence only after
the removal of Lantana from plantation area. A significant change in
lowering of dominance of Lantana camara and enhancement of dominance
of Clerodendrum viscosum, Pogostemon benghalense and Murraya
koenigii was observed after removal of Lantana from park area.
The IVI value of L.camara has sharply reduced from invaded site
to removal site, whereas the IVI value of other three species has
increased as a result of removal of Lantana from park area. This has
indicated a positive sign in enhancement of diversity of native species
and growth after removal of Lantana from the area.
Cissampelos pareira 10.0 1,000 1.37 0.11 0.02 1.49Grand Total 8,66,000
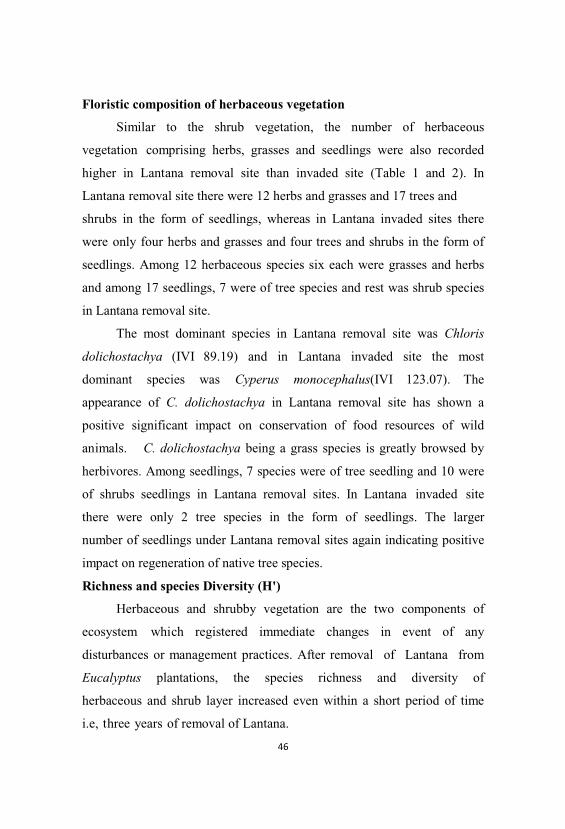
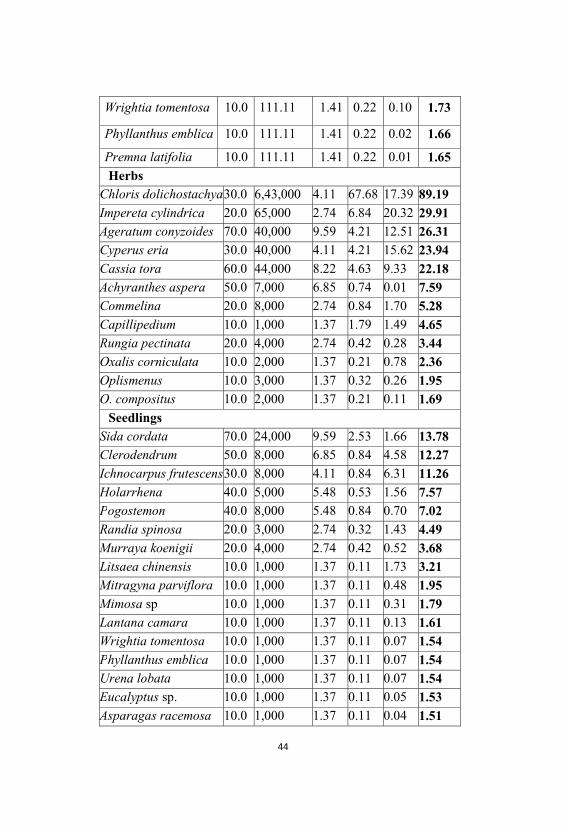
Floristic composition of herbaceous vegetation
Similar to the shrub vegetation, the number of herbaceous
vegetation comprising herbs, grasses and seedlings were also recorded
higher in Lantana removal site than invaded site (Table 1 and 2). In
Lantana removal site there were 12 herbs and grasses and 17 trees and
shrubs in the form of seedlings, whereas in Lantana invaded sites there
were only four herbs and grasses and four trees and shrubs in the form of
seedlings. Among 12 herbaceous species six each were grasses and herbs
and among 17 seedlings, 7 were of tree species and rest was shrub species
in Lantana removal site.
The most dominant species in Lantana removal site was Chloris
dolichostachya (IVI 89.19) and in Lantana invaded site the most
dominant species was Cyperus monocephalus(IVI 123.07). The
appearance of C. dolichostachya in Lantana removal site has shown a
positive significant impact on conservation of food resources of wild
animals. C. dolichostachya being a grass species is greatly browsed by
herbivores. Among seedlings, 7 species were of tree seedling and 10 were
of shrubs seedlings in Lantana removal sites. In Lantana invaded site
there were only 2 tree species in the form of seedlings. The larger
number of seedlings under Lantana removal sites again indicating positive
impact on regeneration of native tree species.
Richness and species Diversity (H')
Herbaceous and shrubby vegetation are the two components of
ecosystem which registered immediate changes in event of any
disturbances or management practices. After removal of Lantana from
Eucalyptus plantations, the species richness and diversity of
herbaceous and shrub layer increased even within a short period of time
i.e, three years of removal of Lantana.
Lantanainvaded site
Lantana removal site
Speciesrichne
DiversityIndex(H')
Speciesrichnes
DiversityIndex(H')
Tree layer 2 0.30 2 0.25
Shrub layer 10
1.02 21 1.72
Herbaceouslayer
8 1.18
29 1.46
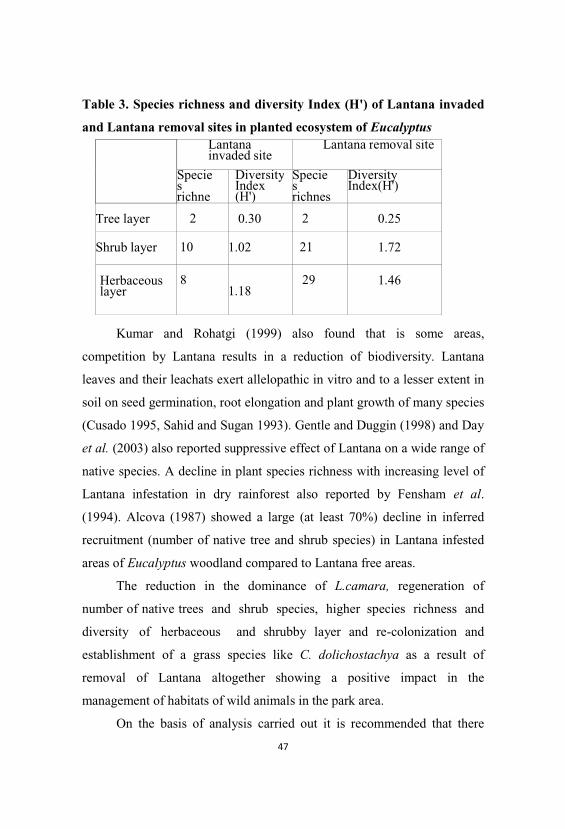
Table 3. Species richness and diversity Index (H') of Lantana invaded
and Lantana removal sites in planted ecosystem of Eucalyptus
Kumar and Rohatgi (1999) also found that is some areas,
competition by Lantana results in a reduction of biodiversity. Lantana
leaves and their leachats exert allelopathic in vitro and to a lesser extent in
soil on seed germination, root elongation and plant growth of many species
(Cusado 1995, Sahid and Sugan 1993). Gentle and Duggin (1998) and Day
et al. (2003) also reported suppressive effect of Lantana on a wide range of
native species. A decline in plant species richness with increasing level of
Lantana infestation in dry rainforest also reported by Fensham et al.
(1994). Alcova (1987) showed a large (at least 70%) decline in inferred
recruitment (number of native tree and shrub species) in Lantana infested
areas of Eucalyptus woodland compared to Lantana free areas.
The reduction in the dominance of L.camara, regeneration of
number of native trees and shrub species, higher species richness and
diversity of herbaceous and shrubby layer and re-colonization and
establishment of a grass species like C. dolichostachya as a result of
removal of Lantana altogether showing a positive impact in the
management of habitats of wild animals in the park area.
On the basis of analysis carried out it is recommended that there
should be total removal of Lantana from the park area.
References
Alcova PA 1987. The effects of the presence of Lantana camara on local
bird populations in Brisbane Forest Park. Project report NO T
(AS) 99. Queensland University of Technology, Brisbane
Curtis J.T. And Cottam G. 1956. Plant Ecology Work Book, Laboratory
Field Reference Manual.Burgess Pub. (Minnesota Co.) 193pp.
Curtis J.T. And McIntosh R.P. 1950. The interrelationship of
certain analytic and synthetic phytosociological characters.
Ecology ,31:434-445.
Cusado, C.M. 1995. Allelopathic effects of Lantana camara
(Verbenaceae) on morning glory (Ipomoea tricolor). Rhodora,
97: 264-274.
Day. M.D., Wiley, C.J., Playford, J., Zalucki, M.P. 2003. Lantana:
Current management status and future protects. Australian
Center for International Agricultural Research: Canberra.
Fensham, R.J., Fairfax R.J, Cannell, R.J. 1994. The invasion of Lantana
camara L. in Forty Mile Scrub National Park, North
Queensland. Australian Journal of Ecology, 19: 297-305.
Gentle C.B. and Duggin, J.A. 1998. Interference of Choricarpia
leptopetala by Lantana camara with nutrient enrichment in
mesic forest on the Central Cost of NSW. Plant Ecology 136:
205-211
Khan, M.A.W. 1961. Method of studying forest types. Proc. X Silva
Conference. F.R.I.
Kumar, S and Rohatgi, N. 1999. The role of invasive weeds in changing
floristic diversity. Annals of Forestry ,7(I): 147-150.
Love A., Babu, S. and Babu, C.R. 2009. Management of Lantana, an
invasive alien weed in forest ecosystem of India. Current
Science ,19(10): 1421-1429.
Misra R. 1968. Ecology Work Book. Oxford and I.B.H. Publishers, New
Delhi
Phillips E.A. 1959. Methods of Vegetation Study. Henry Holt & Co. Inc.
Sahid, I.B. and Sugau, J.B. 1993. Alleopathic effect of Lantana
camara and siam weeds (Chromolaena odorata) on selected
crops. Weed Science, 41(2): 303-308.
Shannon, C.E. and Wiener, W.1963. The Mathematical Theory of
Communication. Univ. Illinois Press, Urbana.
Smith, I.P. and Jr. K. Berg 1988. Inventory of Rare and Endangered
Vascular plants of California.Sacramento, California: California
Native plant Society.
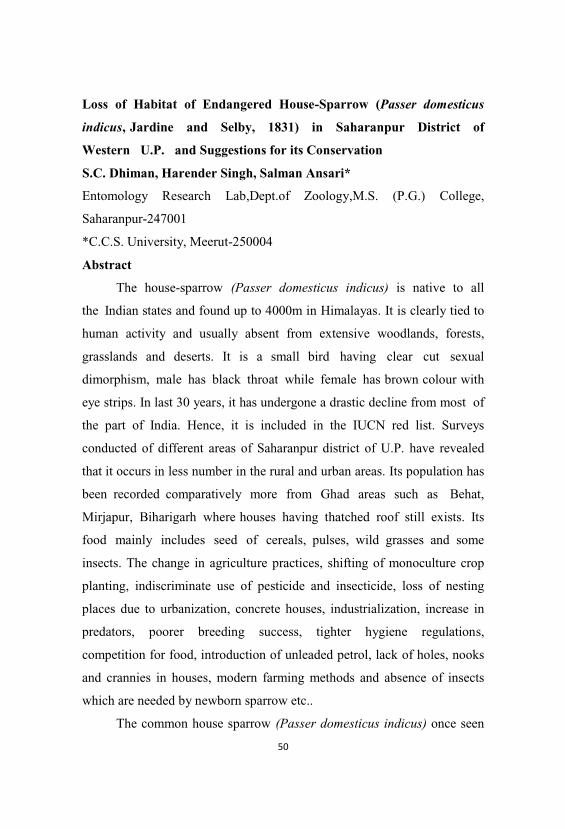
Loss of Habitat of Endangered House-Sparrow (Passer domesticus
indicus, Jardine and Selby, 1831) in Saharanpur District of
Western U.P. and Suggestions for its Conservation
S.C. Dhiman, Harender Singh, Salman Ansari*
Entomology Research Lab,Dept.of Zoology,M.S. (P.G.) College,
Saharanpur-247001
*C.C.S. University, Meerut-250004
Abstract
The house-sparrow (Passer domesticus indicus) is native to all
the Indian states and found up to 4000m in Himalayas. It is clearly tied to
human activity and usually absent from extensive woodlands, forests,
grasslands and deserts. It is a small bird having clear cut sexual
dimorphism, male has black throat while female has brown colour with
eye strips. In last 30 years, it has undergone a drastic decline from most of
the part of India. Hence, it is included in the IUCN red list. Surveys
conducted of different areas of Saharanpur district of U.P. have revealed
that it occurs in less number in the rural and urban areas. Its population has
been recorded comparatively more from Ghad areas such as Behat,
Mirjapur, Biharigarh where houses having thatched roof still exists. Its
food mainly includes seed of cereals, pulses, wild grasses and some
insects. The change in agriculture practices, shifting of monoculture crop
planting, indiscriminate use of pesticide and insecticide, loss of nesting
places due to urbanization, concrete houses, industrialization, increase in
predators, poorer breeding success, tighter hygiene regulations,
competition for food, introduction of unleaded petrol, lack of holes, nooks
and crannies in houses, modern farming methods and absence of insects
which are needed by newborn sparrow etc..
The common house sparrow (Passer domesticus indicus) once seen
widely everywhere in Saharanpur district of U.P. has now shown
remarkable decline in its population in Saharanpur proper, Deoband and
Nakur. However, in adjacent villages of Nakur and Behat, its population
has been seen comparatively more. The present study aims at finding
reasons and consequences of changing and declining in population pattern
of house-sparrow in Saharanpur district of U.P.. To conserve this little and
homely bird to whom most children and adults are aquivanted, some
means are suggested which includes, climate changes, to provide nesting
sites, food resources, plantation of plant bushes and hedgerows within the
ground perimeter, environmental and house-sparrow conservation
programmes in villages, erection of cell-phone towers away from rural
areas as well as urban dwellings and minimize mushrooming of these
towers , formation of sparrow club in metropolitan cities and building of
sparrow shelters in houses, gardens and foam lands, feeding of sparrow by
giving healthy seeds as pious Hindus do far pigeons and control of air-
pollution in big cities.
Keywords: Passer domesticus indicus, loss of habitat, ghad,
disappearance, conservation, IUCN.
Introduction
There are so many different species of birds that have inhabited
the earth before the arrival of Homo sapiens. According to the book of Dr.
Oliver Austen’s “Book of the World”, fossils records reach at a peak of
approx. 11,500 species during the Pleistocene period, about 250,000 years
ago. Since then they are declining to our world countable near about
9,000 living species. Out of all, approx. 100 unique species of birds
have become extinct during the past decades, even today the
threatened comes with 1,000 or above species. The House sparrow, Passer
domesticus indicus, a member of family Passeridae and considered to be
relative to the Weaver Finch Family. These birds are ubiquitous and
sedentary birds and don’t travel more than one or two kilometers in search
of food. But it is a very unfortunate to say that coming generation may
not be able to see the little bird if the present situation is going on.
It is small song bird, males and females can be differentiated
distinctly .The average size is 14-16 cm and 26-32 gm in weight. It is a
small bird, beak thick, short legs, chest unstreaked and always prefer to
stay near human populations . hey prefer to make nest in small holes in
buildings, thatched roofs and even street lamps . The house sparrow,
Passer domesticus indicus has undergone a drastic decline in the past
30-40 years. It is included in the red list of IUCN (International Union for
the Conservation of Nature) and highly concerned of ‘Conservation ICU
(Intensive Care Unit). The Royal Society for Protection of Birds (RSPB)
UK recently added the house sparrow to its Red list due to rapidly
declining bird populations, which pose global conservation concern. India
encompasses almost all the hot and humid evergreen forests, providing
habitats for various species up to about 4000m in the Himalayas. Passer
domesticus indicus is abundant in temperate climate. The house sparrow
survives for around 3 years in the open and upto 13 years in captivity and
eats seeds, live-stock feed, weed and insects (Lowther and Clink, 1992).
The first introduction of the house sparrow was conducted by the Brooklyn
Institute in 1851. House sparrow is a summer visitor (March-October) to
higher elevation in Baluchistan and in the Himalayas, Pakistan,
Bangladesh, Sri-lanka, Andaman Islands and Nepal, Ranges from
Arabia to Burma, South Africa, Zanzibar, Comoro and Mascarene Islands.
Nest is made up of an untidy bulky collection of straw, fibres, cotton
strings, lined with feather. Egg, 3-6 usually 4, pale greenish white blotched
and spotted with brown and ashy grey (Ali and Ripley, 1974 and 1983) . In
Netherlands, this species is even considered an endangered species (BBC
News, 2008) and population has dropped in half since the 1980s. The
British Trust of Ornithology (bto,1982)estimated that the sparrow
population in London had decline by 71% in b/w 1994-2004. A study by a
conservation biologist. In India during last 30 years, dramatic decline of
sparrow populations occurred across, almost all the rural and urban areas of
India.
Hence, present investigation has been taken in Saharanpur city
proper and Ghad areas of West Uttar Pradesh to ascertain the loss of
habitat of the house-sparrow Passer domesticus indicus and measures to be
taken to enhance population of this endangered bird.
Material and Methods
Surveys were conducted of different areas of District Saharanpur
including rural and urban areas for three consequents years 2007-2009.
These surveys were made during different season’s viz., summer, autumn
and winter. Number of Birds in each area was recorded and their feeding
and nesting habit was also observed. A questioner was prepared and given
to the selected villagers and urban peoples to fill up it. The data generated
from the questionnaire were pooled and observations were recorded.
Binocular was also used for careful observations and photographs of the
birds were taken by Sony digital camera.
Results and Discussion
Saharanpur district attained the status as Saharanpur division in
1997 of Uttar Pardesh. The total area is 3860 square Kilometers (Figure
1.).
All seasons are available here and the district is in a rectangular
shape and lies between 29o34' 45" and 30o21'30"north latitude and 77o9'
78o14'45" east longitude.
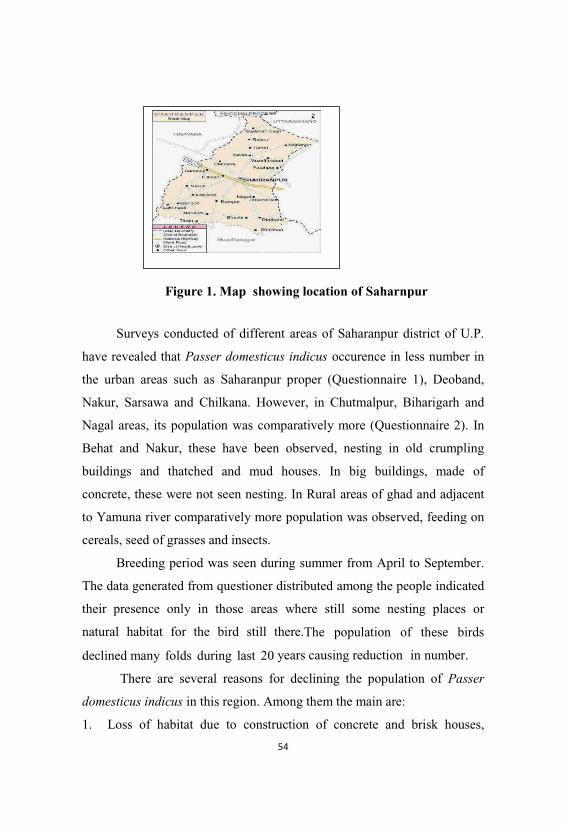
Surveys conduct
have revealed that Pas
the urban areas such a
Nakur, Sarsawa and C
Nagal areas, its popula
Behat and Nakur, the
buildings and thatche
concrete, these were no
to Yamuna river compa
cereals, seed of grasses
Breeding period
The data generated from
their presence only in
natural habitat for the
declined many folds du
There are sever
domesticus indicus in th
1. Loss of habitat d
Figure
ted of different areas of Saharanpur d
sser domesticus indicus occurence in l
as Saharanpur proper (Questionnaire
Chilkana. However, in Chutmalpur, B
ation was comparatively more (Questi
se have been observed, nesting in o
ed and mud houses. In big buildin
ot seen nesting. In Rural areas of ghad
aratively more population was observe
s and insects.
was seen during summer from April
m questioner distributed among the pe
n those areas where still some nest
e bird still there.The population of
uring last 20 years causing reduction
ral reasons for declining the populati
his region. Among them the main are:
due to construction of concrete and
1. Map showing location of Saharnp
district of U.P.
ess number in
1), Deoband,
Biharigarh and
ionnaire 2). In
old crumpling
ngs, made of
d and adjacent
ed, feeding on
to September.
ople indicated
ing places or
f these birds
in number.
ion of Passer
brisk houses,
pur
due to which nesting places, is not available for the bird.
2. In the past time people had the habit to reduce the moisture content of
seed grains (wheat, maize, oat, barley) by spreading in open on the ground
which served easy food for these birds but now a day’s good storing
facilities for grains and flour supply by mills directly to the shops and
consumers.
3. Mushrooming of mobile towers and electrification in almost all areas
which generates electromagnetic radiations affecting the population of
birds.
4. The absence of the kitchen gardens and non-availability of insect
larvae such as Helicorerpa armigera, Agrotes, Chilo etc. usually found in
beans, cereals and legume crops is the possible reasons for the sparrow’s
decline in numbers.
5. An urban air pollutant, which contains nearly 3,000 different elements
and compounds, has a wide ranging toxic effect. The major components of
these fine particles are sulfates, carbonaceous materials, nitrates, and
trace elements. Organic carbon is suspected to be mutagenic and
carcinogenic, while Elemental carbon is linked to a range of
adverse environmental effects, including interference in the lung
clearance mechanism. The presence of these pollutants in the urban
atmosphere is also considered as a limiting factor for the healthy breeding
of sparrows.
6.Organic farming and the increased use of chemical pesticides and
fertilizers to improve yield, are leading the bird to a state of being more
endangered.
7. Reducing areas of badly maintained buildings. The decline is due to
lack of holes for nesting in modern houses and cutting of hedges from
gardens. Old spacious buildings are being replaced by match-box flats.
8. Hedges being replaced by wrought iron fences may be the probable
cause for decline the number of house-sparrow in urban areas.
9. Increased predation by owls and cats and competition of food by
other species, including pigeons, crows and mynahs may be the probable
cause of decline the number of house-sparrow in rural and urban areas of
Saharanpur district.
10. Introduction of unleaded petrol, believed to be eco-friendly,
had harmful byproducts. The fuel uses Methyl Tertiary Butyl Ether
(MTBE) as an anti- knocking agent. Along with byproducts of
combustion, this kills small insects. The insecticidal nature of the
byproducts makes the food for those birds feeding on insects scarce is
may be the probable cause of the disappearance of the house- sparrow in
rural and urban areas of Saharanpur district of western Uttar Pradesh.
11. Indiscriminate use of insecticides or pesticides which kill the insects
and their larvae on large scale as well as acts as toxins for birds.
Suggestions for Management
Following recommendations are being suggested for management of
Passer domesticus indicus population so that these may not entirely
disappear from this region like vulture, white kite, horn-owls etc.:
1. To provide nesting site
2. To provide food resources
3. Plantation of plant bushes and hedge rows within the ground perimeter
4. Environmental and house-sparrow conservation related programmes
in rural and urban areas.
5. Erection of cell-phone towers away from rural and urban areas or
minimize the mushrooming of these towers
6. Formation of sparrow club in metropolitan cities
7. Building of shelters for sparrows in houses, garden and farm lands.
8. Control of air-pollution in the urban areas as well as in rural areas.
9. Provide small pots having water and seed grain to keep up on the roof
top.
10. To give feed to the birds like pious Hindus do for pigeons in
metropolitan cities.
11. Conservation of endangered birds should be made a part of the
syllabus of school and colleges.
The common house-sparrow, Passer domesticus indicus are
ubiquitous in nature (excluding the poles) (Joshi, 2009) . It likes areas that
have been modified by humans, farms, residential and urban areas. It forms
monogamous pairs for each breeding season. It makes nest between
February and May, from dried vegetation, feathers, strings and paper
(Joshi, 2009) . It has been observed nesting in the holes of tree trunks in
some parts of the Saharanpur district. Eggs are laid at many times in the
nesting period. After the eggs are hatched, both males and females feed the
young. House sparrows tend to forage for food on the ground, using a
hopping movement. House-sparrow aggressively protects a small territory
just around their nesting site (Dandapat, 2010). They usually stay in the
same region all year round, but maybe partially migratory in some areas
(Banerjee, 2010). The same has been observed in Saharanpur district.
Hose-sparrows eat various kinds of seed supplemented by some insects.
Rural birds tend to eat more waste seed from animal dung and from fields,
while urban birds tend to eat more commercial bird seed and weed seed
(Chakrobarty,2010). Besides all seeds, it also feed upon insects, terrestrial
non-insect arthropods (Including grasshoppers, spiders, bettles,
caterpillars, butterflies, mothes etc.) (Lowther and Clink, 1992). House-
sparrows are native to Europe. Asia and North Africa and have been
introduced to North America, South America, South Africa, Australia and
New Zealand. They were introduced to North America n 1851, when
100 birds were released in Brokley, New York. Vocalizations are varied,
but loud “cheeps” are most common. The common preys on House-
sparrow are hawks, owls, domestic cats, dogs and black rat snakes
(Dandapat, Banerjee and Chakrobarty,2010).
House-sparrows are monogamous, farming long term pair bonds.
They have multiple broods, but it is rare that more than two of these will
be successful (Gulati,2005). Mating display begin by male selecting a nest
site and remains as it advertisement calling, a quite chirrup, repeat at a rate
of 1 call every 1-2 sec, sometimes accompanied by wing shivering and tail
raising, if female approaches and shows interest in the nest, male
becomes excited, jumping about in stiffly held posture, wing held out
slightly and drooped head held high with black throat feathers erected
(Hatch, 2007) . Its breeding season is chiefly March-June in the northern
area, continuing till September- October in central India and
throughout the year in southern India (Monika, 2005) . House-sparrows
lays 5-6 eggs, profusely dusted, speckled or blotched with black –brown
on a blue tinted or creamy white ground (Monika, 2005). The incubation
period of all the birds varies around 10-12 days (Hatch and Westneat,
2007). Clutch size usually 4-5 eggs and range 1-8. Male and female
incubate the egg for a period of 10-13 days (Walters, 1994). Both adults
feed the young and maintain the nest; on rare occasions other adults will
also assist with chicks (Ali and Repley, 1974) . The young fledge after 14-
17 days, remaining dependent on their parents for an additional 10 days
(Ali and Repley, 1984) .The preliminary analysis of population dynamics
of Passer domesticus indicus have been conducted at Saharanpur proper
and Ghad region of West Uttar Pradesh, which indicated the presence of
bird in those areas more which are having still some habitat for the birds.
Acknowledgements
The Authors are thankful to the people of rural areas of Saharanpur
district, farmers,students and even women who cooperated with full heart
during the period of present study. Thanks are also due to NGOs and
students of M.S. (P.G.) College, Saharanpur who cooperated for
population count of the bird in Saharanpur proper and adjacent areas.
References
Ali, S. 2002. The Book of Indian Birds. 13th edition, revised.
Ali, S. and Ripley, S.D. 1974. Flowerparkers to Buntings in: Handbook of
the birds of India and Pakistan. Vol. 10.. Oxford University Press.
Ali, S. and Ripley, S.D. 1983. 106 plates depicting all the birds by Dick. J.
in: A pictorial guide to the bird of Indian sub continent. The
Bombay Natural History Society. Oxford University Press.
Baker, M. 1995. Environmental Component of Latitudinal Clutch-size
Variation in House-Sparrows (Passer domesticus). The Auk 112 (1):
249-252.
BBC News (2008).Sparrow death mars record attempt. BBC News
Channel.Retrieved July 20, 2008,
http://news.bbc.co.uk/1/hi/world/europe/4450958.stm
Brunn, Bertel, Chandler S.R., and Herbert S.Z. 1983. Birds of North
America: AGuide to field identification. Expanded, Revised
Edition. Golden Press, New York.
BTO Breeding birds in the under countryside (2002)
http://www.bto.org/birdtrends/werhousep.html.
Campbell, R.W., N.K. Dawe, I. McTaggart-Cowan, J.M. Cooper, G.W.
Kaiser, A.C.Stewart and M.C.E. McNall, 2001. The Birds of British
Columbia, Volume 4: Passerines (Wood-Warblers through Old
World Sparrow). UBC Press, Vancouver, BC.
Carson, R. 1962: Silent Spring, pg 100-101.
Chapman, F.M. 1966. Hand Book of Birds of Eastern North
America. Dover Publications, Inc. New York. 581 Pp.
Dandapat A., Dipak Banerjee and Dibyendhu Chakrobarty, 2010.The case
of the Disappearing House Sparrow (Passer domesticus indicus).
Review, National Dairy Research Institute, Karnal, Haryana, India.
Vol.3 (2), 97-100. Veterinary World.
Dongre S.D. and R. G. Verma, 2009. Effect of Cell Phone Radiation on
Gauriya Sparrows Passer Domesticus. Shodh, Samiksha aur
Mulyankan (International Research Journal)-ISSN-0974-2832 Vol.
II, Issue-7, p51-52.
Dr. Bigu J., 1973. National Research Center of Canada. Extract From Ltr-
CS-113. Forbush, E.H. 1955. A Natural History of American
Birds of Eastern and Central North America, Bramhall House,
New York, 554 Pp.
Ford, P. 2002: Europe the case of the missing Sparrows. The
Christian Science Monitor Dec 27, 2002 edition.
Goyal Monika 2005. Preliminary Survey of House sparrow (Passer
domesticus) in three different areas of Haridwar, Uttaranchal. M.sc.
Thesis, Gurukul kangri University, Haridwar, India.
Greenoak, F. 1979. All the Birds of the air. Book Club Associates, London.
Gulati V.2005. House sparrow on verge of extinction. Tribune News
Service. Chandigarh, India.Retrieved September 20, 2005,
http://www.Tribuneindia.com/2005/20050920/cth1.htm#11.
Hatch Marget I. and Westneat David F. 2007.Age related patterns of
reproductive success in house-sparrow Passer domesticus.
Journal of Avian Biology 38:603-611.
Imhof, T.A. 1962. Alabama Birds. State of Alabama, Department of
Conservation, Game and Fish Division, University of Alabama
Press. 591 Pp.
Joris, Everaet, Dirk Banwen, 2007: Electromagnetic Biology and
medicine Pages 63-72.
Lowery, G.H., Jr. 1960. Louisiana Birds. Louisiana Wildlife and
Fisheries Commission, Louisiana State University Press. 567 Pp.
Lowther P E and Clink C L 1992 The Birds of North America (Editor: A
Poole, P Stettenhein, and F Gill). No. 12, The Academy Of Natural
Science, Philadelphia, PA and the American Ornithologists Union,
Washington, DC.
Martin schram, 2008: Scripps Howard News Service.
Menon, M. and R. Mohanraj, 2010. Vanishing Sparrows- Possibly A
Synergistic Effect. Tiger Paper, Vol. 37(1).
Parmar B. 2008. Where are all the sparrows gone? Retrieved June 09,
2008, from http://indiwo.in.com/india/features/harmony-in-
life/where-are-all-the-sparrows- gone/40681/0.
“Passer domesticus” (On-line), Animal Diversity Web. Accessed
October 02, 2007
athttp://animaldiversity.ummz.umich.edu/site/accounts/information/
Passer_d omesticus.html
Royal Society for the Protection of Birds (RSPB).
http://www.rspb.org.uk/birds/guide/h/housesparrow/index.asp.
Scott Weidensaul and R. Robinson. 2004. Natural Inquires.
National Wildlife Federation Vol 42( 3).
Sprunt,A.Jr. and E.B.Chamberlin.1970. South Carolina Bird Life.
University of South Carolina Press, Columbia, 655 Pp.
Tanner,J.A. and Sierra,Romero,1973.Department of Anatomy,Queen
University, Kingston Canada Extract from LTR-CS-89.
Tanner,J.A.,1969.National Research Center of Canada. Extract fom Ltr-
Cs-18. Vijayan, V.S. 2003. Where Have all the Sparrows gone?
Down To Earth. (Cross Currents).
Youth, H. 2003. State of World, Watching Birds Disappear. Word Watch
Institute, pg 15.
Analysis of Soil Moisture Variability in Relation to Natural
Regeneration in watershed forested with Sal (Shorea robusta).
J.V. Tyagi,Rakesh Kumar and R.D.Singh
National Institute of Hydrology
Jal Vigyan Bhawan, Roorkee- 247667, Uttarakhand, India
Abstract
Soil moisture is regarded as one of the important factors that affect
the natural regeneration of Sal (Shorea robusta) species. Both, soil
moisture and natural regeneration vary spatially depending on the
overhead canopy density. The present study was carried out to assess the
soil moisture variation under different micro- environments due to
overhead canopy of varying density and analyze its relationship with the
natural regeneration of sal. Experimental plots of 40m X 40m size were
demarcated under different overhead canopy densities in a small Sal
forested watershed in the foot hills of Himalayas in Nainital District of
Uttarakhand State. The plots were monitored on long term basis for soil
moisture and natural regeneration of Sal. The weekly soil moisture
observations were taken at 25, 50 and 100 cm depths and the
regeneration surveys were conducted on annual basis. The analysis of
regeneration data revealed that the natural regeneration was highest under
C1 (up to 0.30) canopy followed by C2 (0.30-0.50), and C3 (0.50-
0.70) canopies. The C3 canopy rather showed the dying back of Sal
shoots over 4 years of study. The monthly average soil moisture storage
was found highest under C3 canopy and lowest in C1 canopy both at 100
cm and 50 cm depths. It is indicative of higher withdrawal of soil
moisture under C1 canopy. At 25 cm depth, the soil moisture regime in
three canopies was found to interchange with time which is probably
due to the fact that the depletion of soil moisture at 25 cm depth is
affected more by evaporation than transpiration. The highest R2 value
of linear regression between average incremental score of plot
regeneration and average soil moisture content was obtained as 0.156 for
the average soil moisture content at 100 cm depth during the period
November to June. The results of the study indicated that the natural
regeneration in C2 and C3 canopy is not limited by soil moisture.
Keywords: Natural regeneration, Sal, canopy density, soil moisture.
Introduction
Forests are the essence of environment and constitute an essential
life support providing food, fiber, fodder, fuel, and medicines. They also
play a vital role in moderating the climate, altering the seasonal and annual
water yield, checking soil erosion and preserving biodiversity. Shorea
robusta or sal is an important timber- yielding plant known for its heavy,
hard and tough wood, and is one of the major forest types in South Asia.
Its geographic range extends from the southern slopes and lower foothills
of the Himalayas to plains, river slopes and valleys in Nepal, Bangladesh,
India, Bhutan and South China (Gautam & Devoe, 2006; Sapkota, 2009).
In India, sal forest is widely distributed in tropical regions and covers
about 10.57 m ha (Rathore, 2000), which is about 13.3% of the total forest
area in the country. In the Himalayan foothill belt, it extends up to the
Assam valley (including Meghalaya and Tripura) in the east to foothills of
north-west Bengal, Uttar Pradesh, Uttarakhand, and Kangra region of
Himachal Pradesh.
The natural regeneration which generally takes place through seeds
has been the main source of the sustained sal forests. Of late, these forests
have, however, been found to face some problems with the result that their
perpetuity has become a matter of worry to all concerned. Several studies
on regeneration of sal have been carried out in the past and the factors like
biotic (grazing and fire), seeding, canopy density, plant communities,
competition of weeds, climate, nutrient requirements, growth of
seedling along shade and moisture gradients, root growth and its
penetrability have been studied (Champion, 1933; Davis, 1948; Pande,
1956; Soni, 1961; Seth, 1961; Rao and Singh, 1984; Saxena and Singh,
1984; Singh and Singh, 1984; Tewari 1982; Upreti et al., 1985).
However, the information on variation in soil moisture and
regeneration under different micro-environments formed due to
varying overhead canopy density seems to be meager (Dabral, et al.,
1980). Hole (1914, 1921) and Boyce & Bakshi (1959) observed that poor
soil aeration and inadequate soil moisture are mainly responsible for
unsatisfactory sal regeneration. Seth and Bhatnagar (1960) found positive
correlation between soil moisture content and good regeneration.
Srivastava (1972) reported that the maximum height growth, foliage
development and uptake of potassium and phosphorus of sal was at 37%
moisture, i.e at 85% of water holding capacity, but it did not withstand
water logging condition because of bad soil aeration.
Gautam et al. (2007) reported that the correlation of sal with soil
moisture was positive (r = 0.127 and p < 0.01) at seedling stage, positive
but not significant at sapling stage and negative (r = – 0.102 and p < 0.05)
in the mature stage. Chauhan et al. (2008) carried out a multiple
regression between seedling density of sal and six soil parameters (soil
moisture, soil organic carbon, pH, nitrogen, phosphorous and potassium)
and reported the coefficient of determination (R2) as 0.042 and 0.222 in
natural and planted forest respectively. Sapkota (2009) found
that seedling regeneration of sal differed significantly between the gap
and intact vegetation environments. The seedling density was higher in
the gaps than in the intact vegetation. Since the soil moisture varies
under different canopy densities (Jetten,1994; Dam, 2001), there is a
need to study the relationship between natural regeneration and soil
moisture under varying micro-environmental conditions. In the present
work, an attempt has been made to analyze the soil moisture variation
under different canopy densities at 25, 50 and 100 cm depths and correlate
the soil moisture levels with natural regeneration.
Study Area
A sal forested watershed of about 16.40 ha, located between
latitudes 29º 20 29" to 29º 20 57" N and longitudes 79º 18 26" to 79º 18
37" E, was selected in Musabangar village of Kaladhungi Tehsil in
Nainital district, Uttarakhand, India. The watershed was fenced by a
barbed wire to protect it from grazing by villagers’ animals and
browsing by wild animals like pigs, deer and porcupines which cause a
great disturbance to the natural regeneration. The normal annual rainfall of
Nainital district is about 1528 mm, of which about 80% occur in monsoon
months of July to September. The entire study watershed is covered under
sal forest of varying canopy density. The elevation in the watershed varies
from 562 m at the upstream to 526 m at the outlet. The slope of the
watershed though varies from flat to about 72%, the major area (approx.
80%) falls under slope range of 5 to 25%. Soil samples were collected
from 27 locations and analyzed for grain size distribution in the laboratory
using mechanical sieve shakers and laser based particle size analyzer. The
analysis revealed that the watershed chiefly consists of silt loam with
medium to coarse gravel. The canopy density survey of the watershed was
conducted by the Department of Forests of Uttarakhand State under
three canopy density classes of C1, C2 and C3,representing
respectively the areas where canopy density has reduced to (0-0.30), (0.30-
0.50), and (0.50-0.70).
Data Collection and Analysis
In order to study the variation in soil moisture storage and
regeneration response of sal under different canopy densities, a
series of twenty seven experimental plots of 40m X 40m size was
demarcated in the watershed under three density classes of C1,C2 and C3,
with nine experimental plots in each canopy(Figure 1).The watershed
rainfall was measured with an ordinary rain gauge (ORG) located near the
watershed outlet. The soil moisture sensors of ‘Water Mark’ make were
installed at 25, 50 and 100 cm depths in each of the experimental plots to
monitor the soil water potential at different depths.An intensive data
collection programme was initiated in the watershed towards the end of the
year 2005. The soil water potential in all the sensors was monitored at
weekly intervals and converted to volumetric soil moisture content using
the soil-moisture retention curves developed for respective sites and
depths. Few of these sensors were either damaged by wild pigs or
malfunctioned after some time and therefore these were discarded for
further observations.The temporal variation of soil moisture along with
corresponding rainfall was plotted for all the sites as illustrated in Figure 2
for one of the sites. The soil moisture variation was found to respond well
to the rainfall and the evapotranspiration. The soil moisture values at 25
cm depth were found to increase quickly with occurrence of rainfall and
also depleted at a faster rate as compared to those at 50 cm and 100 cm
depths. It is obvious that a longer time is required for percolation of water
to greater depths. Also, the evaporation from soil mostly takes place up to
20-30 cm depth and therefore the soil moisture is depleted quickly in this
layer. Though the soil moisture at all three depths is observed at highest
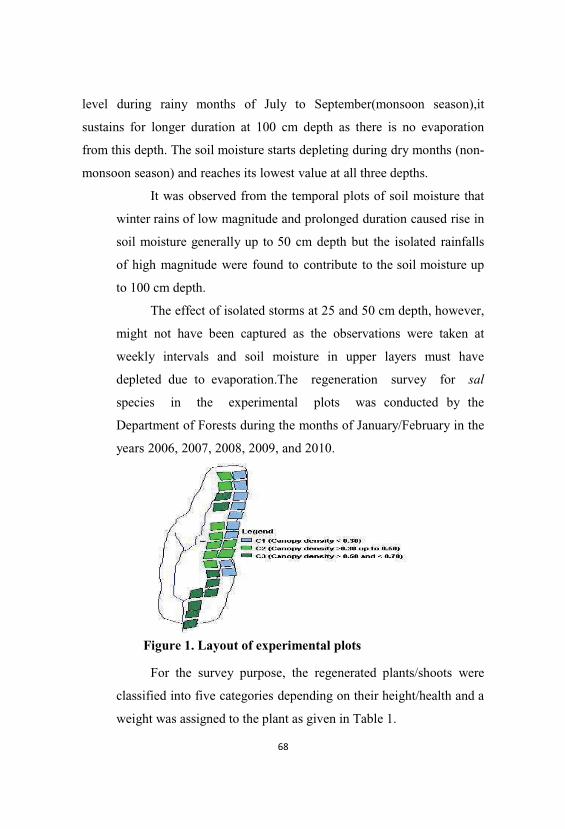
level during rainy months of July to September(monsoon season),it
sustains for longer duration at 100 cm depth as there is no evaporation
from this depth. The soil moisture starts depleting during dry months (non-
monsoon season) and reaches its lowest value at all three depths.
It was observed from the temporal plots of soil moisture that
winter rains of low magnitude and prolonged duration caused rise in
soil moisture generally up to 50 cm depth but the isolated rainfalls
of high magnitude were found to contribute to the soil moisture up
to 100 cm depth.
The effect of isolated storms at 25 and 50 cm depth, however,
might not have been captured as the observations were taken at
weekly intervals and soil moisture in upper layers must have
depleted due to evaporation.The regeneration survey for sal
species in the experimental plots was conducted by the
Department of Forests during the months of January/February in the
years 2006, 2007, 2008, 2009, and 2010.
For the survey purpose, the regenerated plants/shoots were
classified into five categories depending on their height/health and a
weight was assigned to the plant as given in Table 1.
Figure 1. Layout of experimental plots
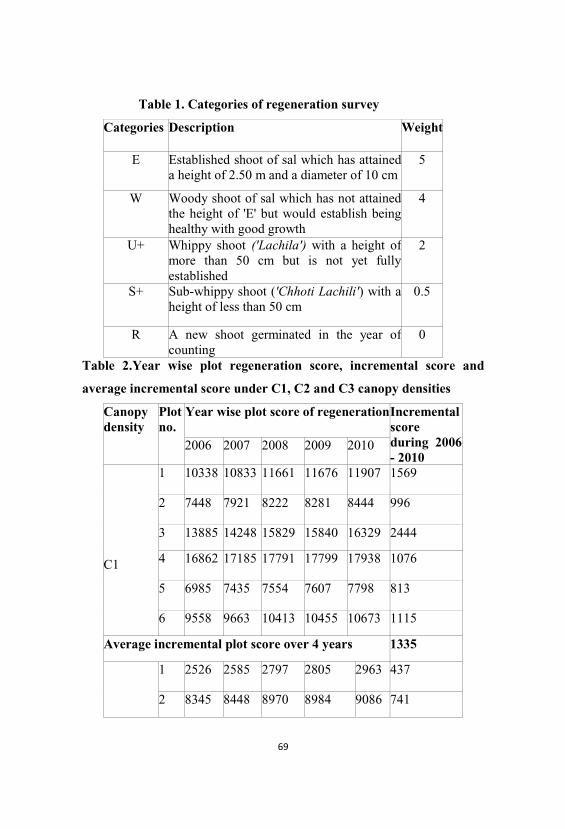
Table 1. Categories of regeneration survey
Categories Description Weight
E Established shoot of sal which has attaineda height of 2.50 m and a diameter of 10 cm
5
W Woody shoot of sal which has not attainedthe height of 'E' but would establish beinghealthy with good growth
4
U+ Whippy shoot ('Lachila') with a height ofmore than 50 cm but is not yet fullyestablished
2
S+ Sub-whippy shoot ('Chhoti Lachili') with aheight of less than 50 cm
0.5
R A new shoot germinated in the year ofcounting
0
Table 2.Year wise plot regeneration score, incremental score and
average incremental score under C1, C2 and C3 canopy densities
Canopydensity
Plotno.
Year wise plot score of regenerationIncrementalscore during 2006- 2010
2006 2007 2008 2009 2010
C1
1 10338 10833 11661 11676 11907 1569
2 7448 7921 8222 8281 8444 996
3 13885 14248 15829 15840 16329 2444
4 16862 17185 17791 17799 17938 1076
5 6985 7435 7554 7607 7798 813
6 9558 9663 10413 10455 10673 1115
Average incremental plot score over 4 years 1335
1 2526 2585 2797 2805 2963 437
2 8345 8448 8970 8984 9086 741
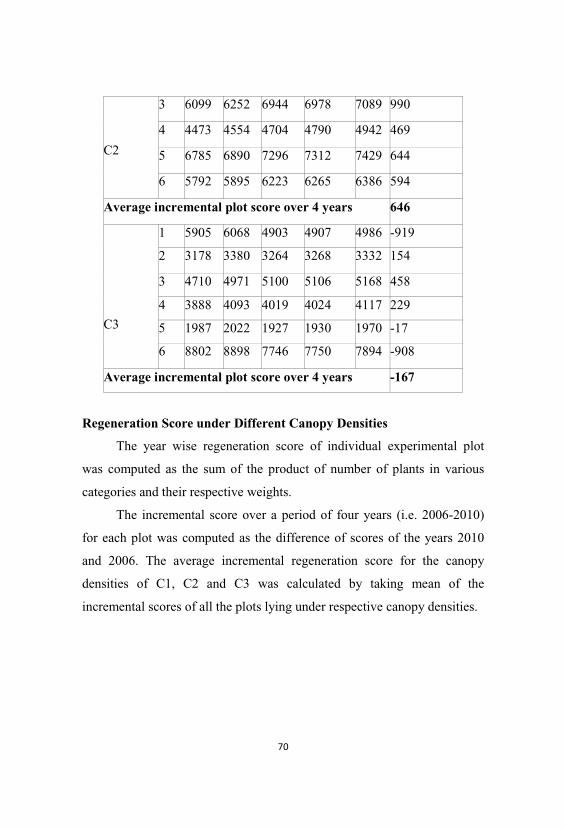
C2
3 6099 6252 6944 6978 7089 990
4 4473 4554 4704 4790 4942 469
5 6785 6890 7296 7312 7429 644
6 5792 5895 6223 6265 6386 594
Average incremental plot score over 4 years 646
C3
1 5905 6068 4903 4907 4986 -919
2 3178 3380 3264 3268 3332 154
3 4710 4971 5100 5106 5168 458
4 3888 4093 4019 4024 4117 229
5 1987 2022 1927 1930 1970 -17
6 8802 8898 7746 7750 7894 -908
Average incremental plot score over 4 years -167
Regeneration Score under Different Canopy Densities
The year wise regeneration score of individual experimental plot
was computed as the sum of the product of number of plants in various
categories and their respective weights.
The incremental score over a period of four years (i.e. 2006-2010)
for each plot was computed as the difference of scores of the years 2010
and 2006. The average incremental regeneration score for the canopy
densities of C1, C2 and C3 was calculated by taking mean of the
incremental scores of all the plots lying under respective canopy densities.
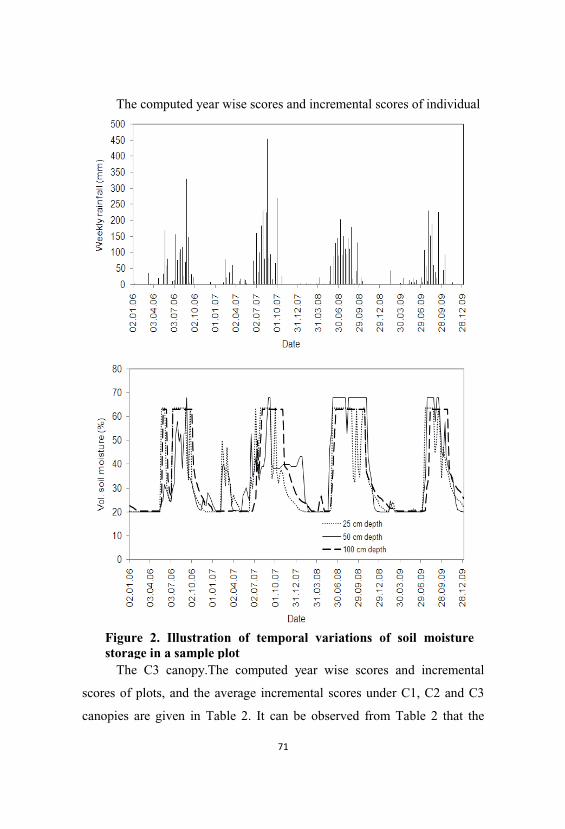
The computed year wise scores and incremental scores of individual
The C3 canopy.The computed year wise scores and incremental
scores of plots, and the average incremental scores under C1, C2 and C3
canopies are given in Table 2. It can be observed from Table 2 that the
Figure 2. Illustration of temporal variations of soil moisturestorage in a sample plot
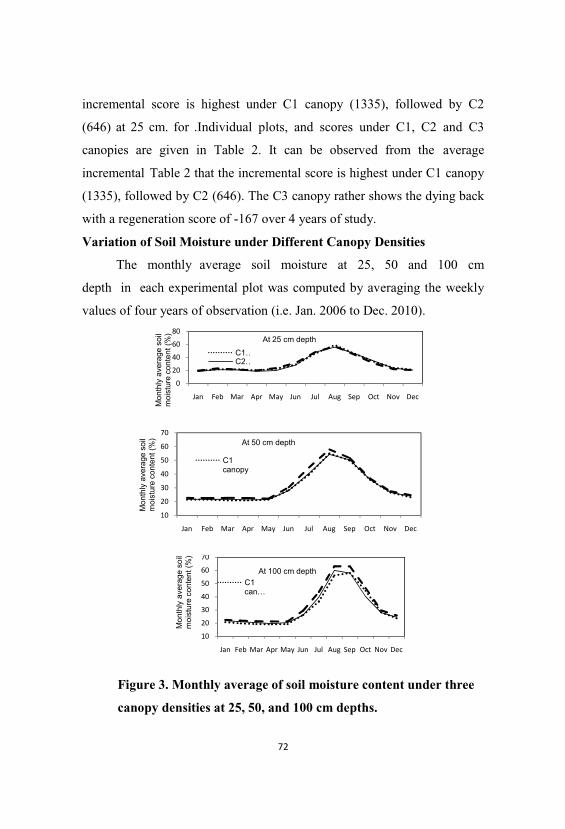
incremental score is highest under C1 canopy (1335), followed by C2
(646) at 25 cm. for .Individual plots, and scores under C1, C2 and C3
canopies are given in Table 2. It can be observed from the average
incremental Table 2 that the incremental score is highest under C1 canopy
(1335), followed by C2 (646). The C3 canopy rather shows the dying back
with a regeneration score of -167 over 4 years of study.
Variation of Soil Moisture under Different Canopy Densities
The monthly average soil moisture at 25, 50 and 100 cm
depth in each experimental plot was computed by averaging the weekly
values of four years of observation (i.e. Jan. 2006 to Dec. 2010).
Mon
thly
aver
age
soil
moi
stur
eco
nten
t (%
)
At 100 cm depthC1can…
Mon
thly
aver
age
soil
moi
stur
eco
nten
t (%
) At 50 cm depth
C1canopy
Mon
thly
aver
age
soil
moi
stur
eco
nten
t (%
)
At 25 cm depth
C1…C2…
Figure 3. Monthly average of soil moisture content under three
canopy densities at 25, 50, and 100 cm depths.
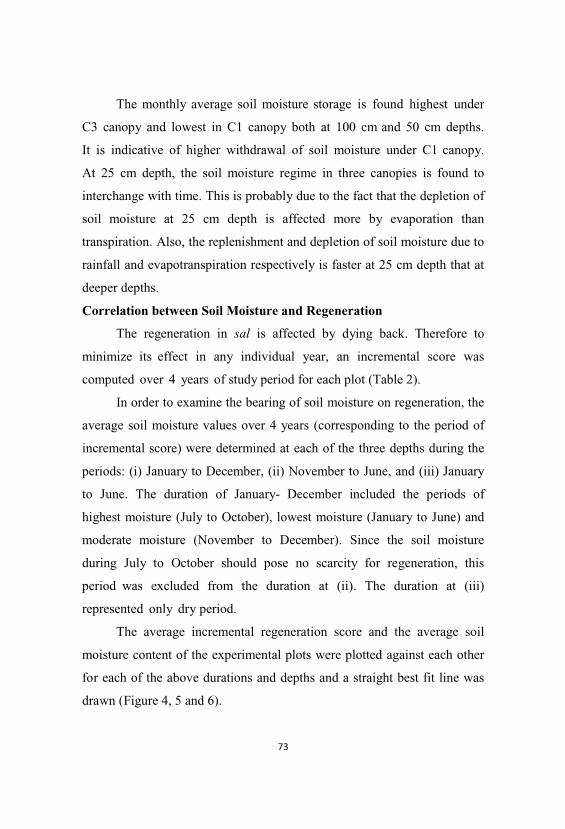
The monthly average soil moisture storage is found highest under
C3 canopy and lowest in C1 canopy both at 100 cm and 50 cm depths.
It is indicative of higher withdrawal of soil moisture under C1 canopy.
At 25 cm depth, the soil moisture regime in three canopies is found to
interchange with time. This is probably due to the fact that the depletion of
soil moisture at 25 cm depth is affected more by evaporation than
transpiration. Also, the replenishment and depletion of soil moisture due to
rainfall and evapotranspiration respectively is faster at 25 cm depth that at
deeper depths.
Correlation between Soil Moisture and Regeneration
The regeneration in sal is affected by dying back. Therefore to
minimize its effect in any individual year, an incremental score was
computed over 4 years of study period for each plot (Table 2).
In order to examine the bearing of soil moisture on regeneration, the
average soil moisture values over 4 years (corresponding to the period of
incremental score) were determined at each of the three depths during the
periods: (i) January to December, (ii) November to June, and (iii) January
to June. The duration of January- December included the periods of
highest moisture (July to October), lowest moisture (January to June) and
moderate moisture (November to December). Since the soil moisture
during July to October should pose no scarcity for regeneration, this
period was excluded from the duration at (ii). The duration at (iii)
represented only dry period.
The average incremental regeneration score and the average soil
moisture content of the experimental plots were plotted against each other
for each of the above durations and depths and a straight best fit line was
drawn (Figure 4, 5 and 6).
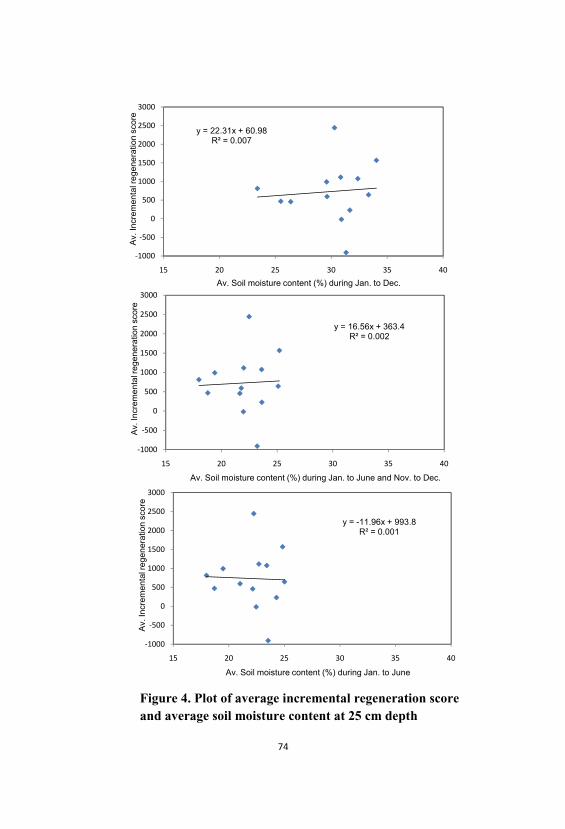
y = -11.96x + 993.8R² = 0.001
Av.
Incr
emen
talr
egen
erat
ion
scor
e
Av. Soil moisture content (%) during Jan. to June
y = 16.56x + 363.4R² = 0.002
Av.
Incr
emen
talr
egen
erat
ion
scor
e
Av. Soil moisture content (%) during Jan. to June and Nov. to Dec.
y = 22.31x + 60.98R² = 0.007
Av.
Incr
emen
talr
egen
erat
ion
scor
e
Av. Soil moisture content (%) during Jan. to Dec.
Figure 4. Plot of average incremental regeneration scoreand average soil moisture content at 25 cm depth
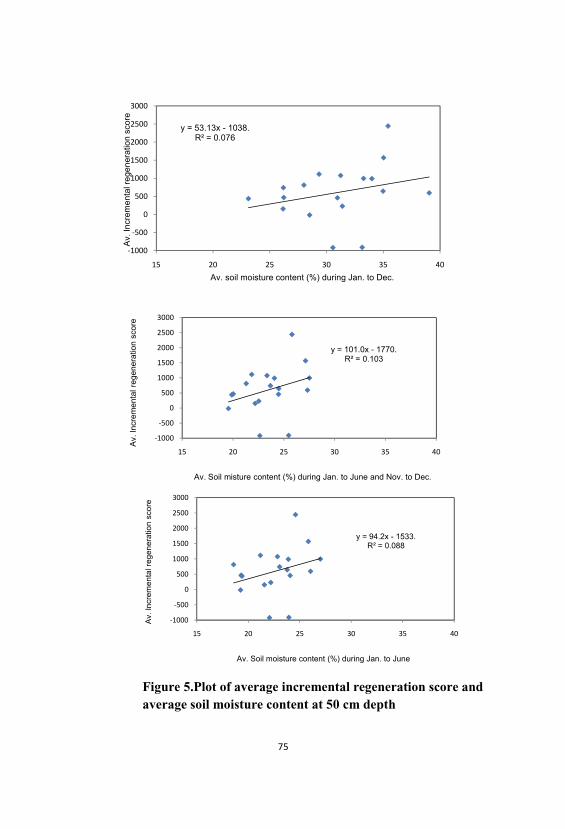
y = 94.2x - 1533.R² = 0.088
Av.
Incr
emen
talr
egen
erat
ion
scor
e
Av. Soil moisture content (%) during Jan. to June
y = 101.0x - 1770.R² = 0.103
Av.
Incr
emen
talr
egen
erat
ion
scor
e
Av. Soil misture content (%) during Jan. to June and Nov. to Dec.
y = 53.13x - 1038.R² = 0.076
Av.
Incr
emen
talr
egen
erat
ion
scor
e
Av. soil moisture content (%) during Jan. to Dec.
Figure 5.Plot of average incremental regeneration score andaverage soil moisture content at 50 cm depth
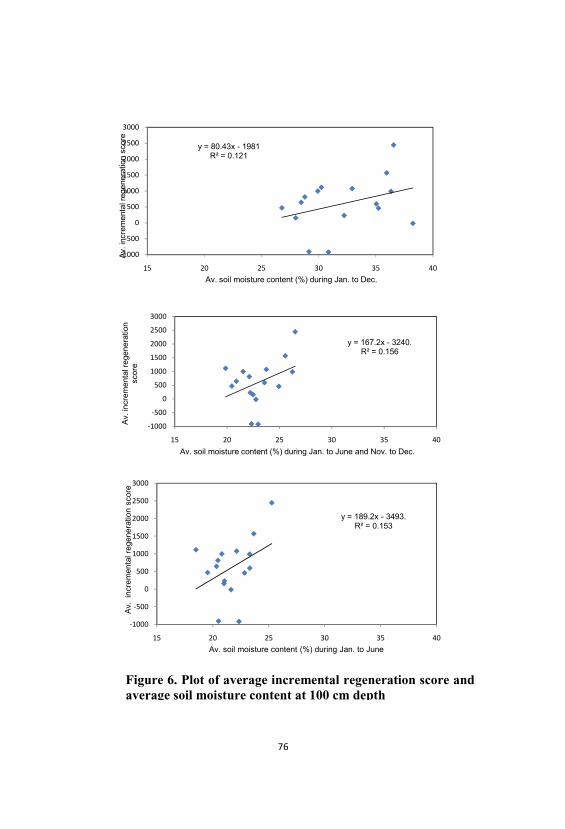
y = 189.2x - 3493.R² = 0.153
Av.
incr
emen
talr
egen
erat
ion
scor
e
Av. soil moisture content (%) during Jan. to June
y = 167.2x - 3240.R² = 0.156
Av. i
ncre
men
talr
egen
erat
ion
scor
e
Av. soil moisture content (%) during Jan. to June and Nov. to Dec.
y = 80.43x - 1981R² = 0.121
Av. i
ncre
men
talr
egen
erat
ion
scor
e
Av. soil moisture content (%) during Jan. to Dec.
Figure 6. Plot of average incremental regeneration score andaverage soil moisture content at 100 cm depth
The regression equation and coefficient of determination (R2) were
also computed for each of these lines. The results of the regression analysis
revealed that a very poor but positive correlation existed between
regeneration and soil moisture at 25 cm depth during the period (Jan. to
Dec.) and almost no correlation existed during the periods (Nov. to June)
and (Jan. to June). The regeneration was found to be positively correlated
with soil moisture both at 50 and 100 cm depths. The value of R2 was
obtained as 0.076, 0.103, and 0.088 for soil moisture at 50 cm depth
during the periods (Jan. to Dec.), (Nov. to June), and (Jan. to June)
respectively; and 0.121, 0.156, and 0.153 for soil moisture at 100 cm
depth during respectively periods. These R2 values are found consistent
with the values reported by others, for example, Gautam et al. (2007)
reported r = 0.127 between sal seedling and soil moisture; Chauhan et
al. (2008) reported multiple regression R2 between sal seedling density
and six soil parameters (soil moisture, soil organic carbon, pH, nitrogen,
phosphorous and potassium) as 0.042 in natural forests, and 0.222 in
planted forests. In the present study, the higher values of R2 as 0.156
and 0.103 at 100 cm and 50 cm depth respectively indicate that the
regeneration is better correlated with soil moisture during dry months
especially at 50 to 100 cm depth than that at 25 cm depth. These results
also indicate that the natural regeneration in C2 and C3 canopy is not
limited by the soil moisture. This inference can be supported by the
Figure 4 which shows that despite lowest levels of monthly average soil
moisture under C1 canopy at 100 cm depth, the incremental regeneration
score is highest under C1 canopy (Table 2).
Conclusions
Following conclusions were drawn from the results of the study:
1. The natural regeneration was found highest under C1 (up to-0.30)
canopy followed by C2 (0.30-0.50), and C3 (0.50-0.70) canopies. The
C3 canopy rather showed dying back with a regeneration score of -167
over 4 years of study.
2. The monthly average soil moisture storage was found highest under
C3 canopy and lowest in C1 canopy both at 100 cm and 50 cm
depths. It is indicative of higher withdrawal of soil moisture under
C1 canopy. At 25 cm depth, the soil moisture regime in three
canopies was found to interchange with time.
3. The R2 values of linear regression between average incremental score
of plot regeneration and average soil moisture content were obtained as
0.156 and 0.103 for the average soil moisture content at 100 cm and 50
cm depth respectively during the period November to June. No
correlation was found with soil moisture at 25 cm depth. This
indicated that the regeneration is affected by the soil moisture content
of dry months especially at 50 to 100 cm depth than that at 25 cm depth.
4. The results also indicated that the natural regeneration in C2 and C3
canopy is not limited by soil moisture.
Acknowledgements
The project team is extremely thankful to the officers and staff of
Department of Forests, Govt. of Uttarakhand, India for providing logistics
during field visits and sparing their valuable time for discussion.
References
Boyce, J.S. and Bakshi, B.K. 1959. Dying of sal. Indian Forester, 85(10):
585-588.
Champion, H.G. 1933. Regeneration and management of sal (shorea
robusta). Indian Forest Records(Old series),Silviculture 19(3).
Manage Publications, Delhi.
Chauhan, D.S., Dhanai, C.S., Singh, B., Chauhan, S.,Todaria, N.P. and
Khalid. M.A.2008. Regeneration and tree diversity in natural and
planted forests in a Terai - Bhabhar forest in Katarniaghat Wildlife
Sanctuary, India. Tropical Ecology,49(1): 53-67, 2008.
Dabral, B.G., Pant, S.P., and Pharasi, S.C. 1980. Microclimate of a
regenerating sal forest in West Dehradun. 2nd Forestry Conference,
Dehradun.
Dam, O.V. 2001. Forest filled with gaps - Effects of gap size on water and
nutrient cycling in tropical rain forest. Tropenbos-Guyana Series 10,
Tropenbos- Guyana Programme, Georgetown, Guyana.
Davis, P.W. 1948. Sal natural regeneration in United provinces. Indian
Forester,74(2).
Gautam, K.H. and Devoe, N.N. 2006. Ecological and anthropogenic niches
of sal (Shorea robusta Gaertn. f.) forest and prospects for multiple-
product forest management - A review. Forestry, 79: 81-101.
Gautam, M.K., Tripathi, A.K., Manhas, R.K. 2007. Indicator species for
the natural regeneration of Shorea robusta Gaertn. f. (sal). Current
Science, 93(10).
Hole, R.S. 1914. Ecology of sal (shorea robusta). Indian Forest.
Records, 5(4): 87-102.
Hole, R.S. 1921. Regeneration of sal (shorea robusta) forests – A study in
economic ecology. Ind. Forest Rec. (Old series), Silviculture, 8(2).
Manager of Publications, Delhi.
Jetten, V.G. 1994. Modelling the effects of logging on the water balance of
a tropical rain forest - A study in Guyana. Ph.D.Thesis. Dept. Of
Physical Geography, University of Utrecht. Tropenbos Series 6, The
Tropenbos Foundation, Wageningen, the Netherlands.
Pande, D.C. 1956. Natural regeneration of sal in Uttar Pradesh – some
recent experimental evidence. Proc. IX Silvi. Conf., Dehradun.
Rao, P.B. and Singh, S.P. 1984. Population dynamics of a foothill sal
(Shorea robusta Gaertn. F.) forests in Kumaon Himalaya. Oecol.
Plantarum, 6:147-152.
Rathore,C.S.2000.Sal borer problem in Indian sal
forests. http://www.iifm.ac.in/databank/problems/salborer.html
Retrieved on 10thAugust, 2009.
Sapkota, I.P. 2009. Species diversity, regeneration and early growth of sal
forests in Nepal: responses to inherent disturbance regimes. Ph.D.
Thesis, Swedish University of Agricultural sciences, Alnarp.
Saxena, A.K. and Singh, J.S. 1984. Tree population structure of certain
Himalayan forest - annotation and implications of concerning future
composition. Vegetation,58: 61-69.
Seth, S.K. and Bhatnagar, H.P. 1960.Inter-relation between mineral
constituents of foliage, soil properties, site quality and regeneration
status in some Shorea robusta forests.Indian forester 86 (10): 590-
601.
Seth, S.K. 1961. The problem of sal regeneration in Uttar Pradesh.
Proc. VIII Silvi.Conf., Dehradun.
Singh, J.S. and Singh, S.P. 1984. An integrated ecological study of eastern
Kumaon Himalaya with emphasis on natural resources. Final
technical report, DST, Govt. of India, New Delhi.
Soni, R.C. 1961. Recent trends in sal natural regeneration techniques with
particular reference to B3 type sal. Proc. X Silvi. Conf., Dehradun.
Srivastava, P.B.L. 1972. Competitive potential of sal seedlings. Indian
Forester,98(8),Dehradun.
Tewari, J.C. 1982. Vegetation analysis along altitudinal gradients
around Nainital. Ph.D. Thesis, Kumaon University, Nainital.
Upreti, N., Tewari, J.C., and Singh, S.P. 1985. The Oak forests of
the Kumaon Himalaya (India): composition, diversity and
regeneration. Mountain Res. Development, 5:163-174.
Forest Landscape Restoration For Planetary Van Vihar
Project(PVVP)at Deotsidh in Hamirpur District, Himachal Pradesh
Sanjay Sood & Sandeep Bhimta
State Forest Department,Hamirpur, H.P.
Abstract
Importance of various trees has been emphasized in our
puranas,Vedas and upnishads. In the past, people preserved. Sacred
groves (Navgrah Vatika, Nakshtra Vatika etc.)considering such trees to
be incarnation of Gods. There is vast scope of planting such tropical
plant species (of religious as well as medicinal significance) over
degraded forest landscapes with the twin objectives of mitigating the
degradation as well as to enhance the aesthetic environment of the
site.Planetary Van Vihar project (PVVP) at Deotsidh ,district Hamirpur,
Himachal Pradesh is an attempt in this direction to plan and design a
model based on our religious texts and beliefs for the purpose of
conservation as well as to cater to the multiple needs of the society.
Keywords : Restoration , tropical , aesthetic, religious
Introduction
The Vedas and Puranas are the words of God which He revealed to
people through sages and through incarnations. There has been a very
intimate and practical relationship between plants and various Nakshatras
and planets. Many plants of astrological importance also have the power
to heal certain ailments.The Planetary Van Vihar Project (PVVP) at
Deotsidh, district Hamirpur, Himachal Pradesh is an attempt in this
direction to plan and design a model based on our religious texts and
beliefs for the purpose of conservation and to cater to the multifarious
needs of the society.
Location
The site is around 300 mtrs from Sh. Baba Balak Nathji’s temple at
Deotsidh, at an altitude of 830 mtrs above MSL in district Hamirpur,
Himachal Pradesh. Soil of the area is sandy loam in nature and neutral in
reaction.
Climate
The climate of the area is tropical characterized by rainfall
(monsoon) from July to September. Droughts are frequent both in the pre
and post monsoon periods and frost of moderate intensity in
December and January is common. The temperatures during May-June
are the highest (36° C ) whereas Dec.-Jan are the coldest months when the
temperatures are as low as 10° C.
Conceptual Plan for restoration
Besides conservation aspects ,attraction and pleasantness are the
other special features of the project.Models like Navgrah vatika
(consonance of nine planets ),Shiv Panchayat Vatika and a sale counter for
sale of plants of astrological species ( as per the Sun & Moon sign) have
been incorporated as a part of multi dimensional approach towards
environmental consciousness.Deciduous plant species intermixed with
evergreens used for the plantation purpose is a sure bet against the impacts
of harsh winters.The summarized conceptual plan is elaborated as under:
A) For Relaxation ,attraction and pleasure
a) The frontal area
b) The sprawling lawn
c) The Navgrah vat d) Shiv Panchayatna
B)For conservation and economic viability
a) Plant Conservation Area (PCA)
1. Provision of Navgrah Vatika plants to ward off evil effects of planets.
2. Provision of Shiv Panchayat Vatika for religious purpose.
3. Topiaries
b) Provision of nursery of medicinal & planetary plants.
c) Availability of Navgrah and medicinal & planetary plants for the
visitors.(sale counter)
d) Provision of Trekking & relaxation measures in the landscape.
Important Features of the Project
The Planetary Van Vihar Project (PVVP) required considerable
planning and thought. It was finally conceived and started in June
2010. Some of the important components of the conceptual plan are as
listed below:
Conservation Measures
a) Planetary contented plants in the landscape by introducing Navgrah
Vatika & Shiv Panchayat Van.
Plant species for Navgrah Vatika: Aak (Calotropis) for
Sun,Plash (Butea monosperma) for Moon, Puthkanda (Achyranthes
aspera) for Mercury , Gular ( Ficus glomerata) for Venus , Shammi
(Prosopis cineraria) for Saturn, Doob grass ( Cynodon dactylon ) for
Rahu, Kusha ( Demostachya bipinnata ) for Ketu , Peepal (Ficus
religiosa) for Jupiter , Khair (Acacia catechu ) for Mars.These plants
species are to be planted in a specific pattern as depicted below:
S.No. Name ofPlanet
Local Name Botanical Name
1 Ketu Kush/Daab Desmostachya bipinnata
2 Guru Peepal Ficus religiosa
3 Budh Apamarg Achyranthes aspera
4 Shani Shami, Khejri Prosopis cineraria
5 Ravi Shweth Aak Calotropis procera
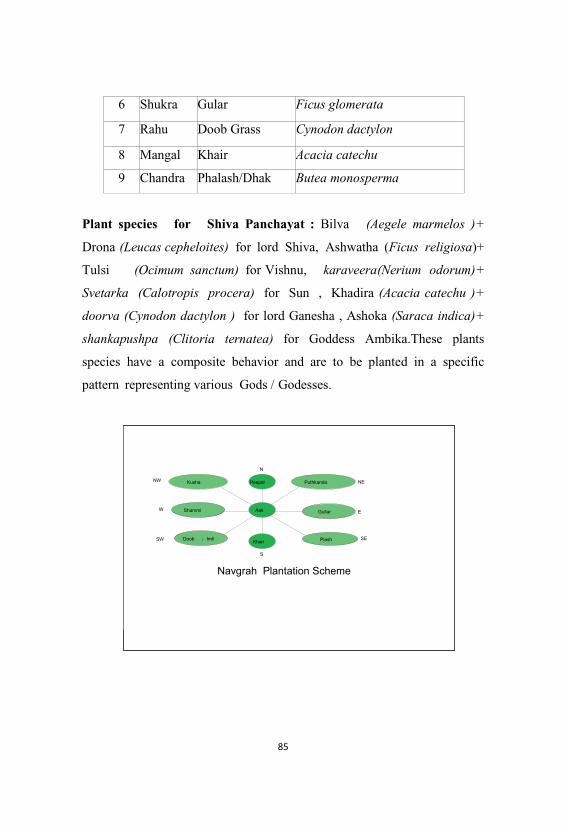
Doob / Imli Khair Plash
Peepal PuthkandaKusha
Shammi GullarAak
N
S
E
SE
NENW
W
SW
Navgrah Plantation Scheme
6 Shukra Gular Ficus glomerata
7 Rahu Doob Grass Cynodon dactylon
8 Mangal Khair Acacia catechu
9 Chandra Phalash/Dhak Butea monosperma
Plant species for Shiva Panchayat : Bilva (Aegele marmelos )+
Drona (Leucas cepheloites) for lord Shiva, Ashwatha (Ficus religiosa)+
Tulsi (Ocimum sanctum) for Vishnu, karaveera(Nerium odorum)+
Svetarka (Calotropis procera) for Sun , Khadira (Acacia catechu )+
doorva (Cynodon dactylon ) for lord Ganesha , Ashoka (Saraca indica)+
shankapushpa (Clitoria ternatea) for Goddess Ambika.These plants
species have a composite behavior and are to be planted in a specific
pattern representing various Gods / Godesses.
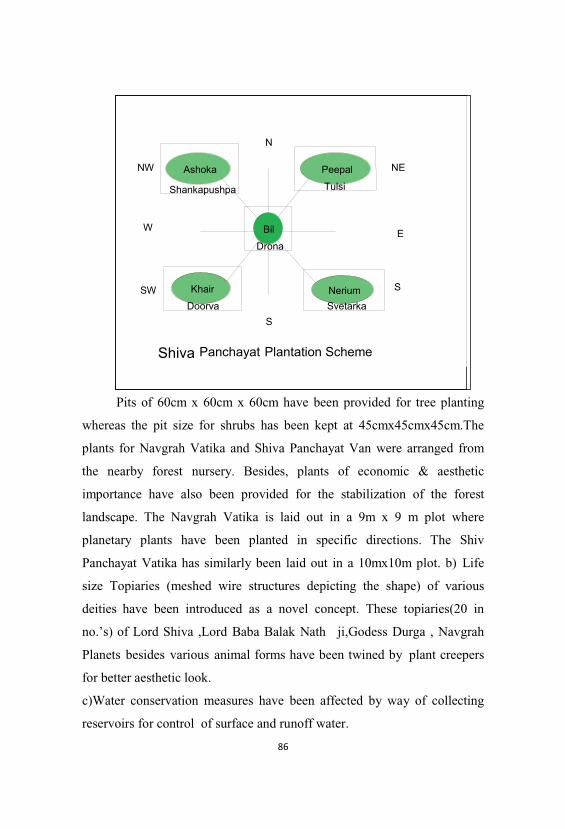
Khair Nerium
PeepalAshoka
Bil
N
S
E
SE
NENW
W
SW
Shiva Panchayat Plantation Scheme
Drona
TulsiShankapushpa
Doorva Svetarka
Pits of 60cm x 60cm x 60cm have been provided for tree planting
whereas the pit size for shrubs has been kept at 45cmx45cmx45cm.The
plants for Navgrah Vatika and Shiva Panchayat Van were arranged from
the nearby forest nursery. Besides, plants of economic & aesthetic
importance have also been provided for the stabilization of the forest
landscape. The Navgrah Vatika is laid out in a 9m x 9 m plot where
planetary plants have been planted in specific directions. The Shiv
Panchayat Vatika has similarly been laid out in a 10mx10m plot. b) Life
size Topiaries (meshed wire structures depicting the shape) of various
deities have been introduced as a novel concept. These topiaries(20 in
no.’s) of Lord Shiva ,Lord Baba Balak Nath ji,Godess Durga , Navgrah
Planets besides various animal forms have been twined by plant creepers
for better aesthetic look.
c)Water conservation measures have been affected by way of collecting
reservoirs for control of surface and runoff water.
Khair Nerium
PeepalAshoka
Bil
N
S
E
S
NENW
W
SW
Shiva Panchayat Plantation Scheme
Drona
TulsiShankapushpa
Doorva Svetarka
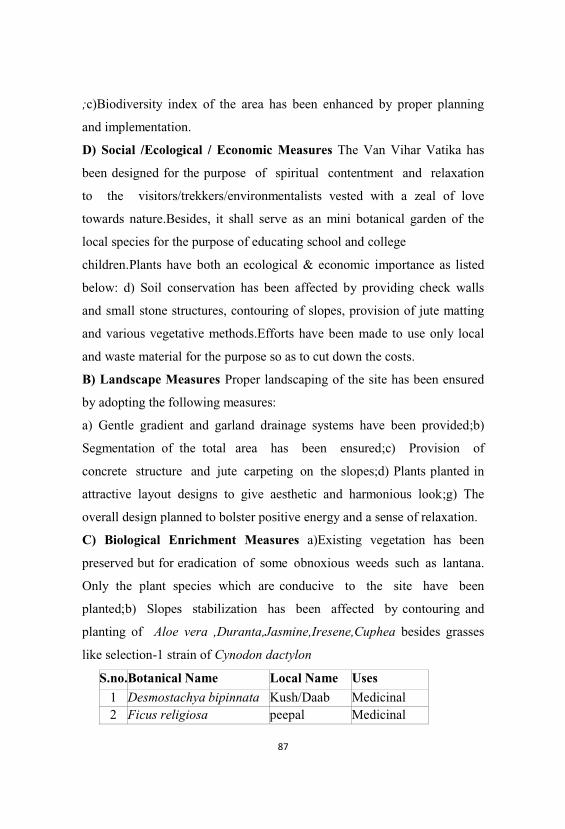
;c)Biodiversity index of the area has been enhanced by proper planning
and implementation.
D) Social /Ecological / Economic Measures The Van Vihar Vatika has
been designed for the purpose of spiritual contentment and relaxation
to the visitors/trekkers/environmentalists vested with a zeal of love
towards nature.Besides, it shall serve as an mini botanical garden of the
local species for the purpose of educating school and college
children.Plants have both an ecological & economic importance as listed
below: d) Soil conservation has been affected by providing check walls
and small stone structures, contouring of slopes, provision of jute matting
and various vegetative methods.Efforts have been made to use only local
and waste material for the purpose so as to cut down the costs.
B) Landscape Measures Proper landscaping of the site has been ensured
by adopting the following measures:
a) Gentle gradient and garland drainage systems have been provided;b)
Segmentation of the total area has been ensured;c) Provision of
concrete structure and jute carpeting on the slopes;d) Plants planted in
attractive layout designs to give aesthetic and harmonious look;g) The
overall design planned to bolster positive energy and a sense of relaxation.
C) Biological Enrichment Measures a)Existing vegetation has been
preserved but for eradication of some obnoxious weeds such as lantana.
Only the plant species which are conducive to the site have been
planted;b) Slopes stabilization has been affected by contouring and
planting of Aloe vera ,Duranta,Jasmine,Iresene,Cuphea besides grasses
like selection-1 strain of Cynodon dactylon
S.no.Botanical Name Local Name Uses
1 Desmostachya bipinnata Kush/Daab Medicinal2 Ficus religiosa peepal Medicinal
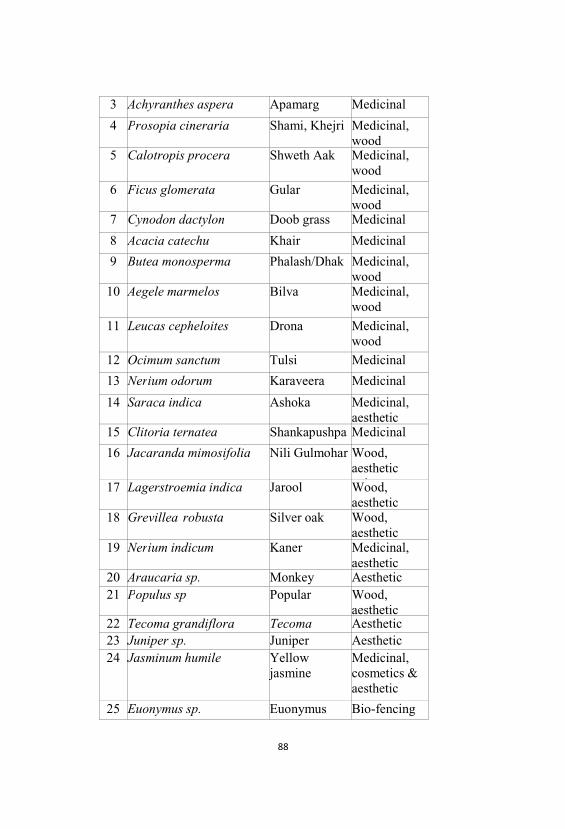
3 Achyranthes aspera Apamarg Medicinal
4 Prosopia cineraria Shami, Khejri Medicinal, wood
5 Calotropis procera Shweth Aak Medicinal, wood
6 Ficus glomerata Gular Medicinal, wood
7 Cynodon dactylon Doob grass Medicinal
8 Acacia catechu Khair Medicinal
9 Butea monosperma Phalash/Dhak Medicinal, wood
10 Aegele marmelos Bilva Medicinal, wood
11 Leucas cepheloites Drona Medicinal, wood
12 Ocimum sanctum Tulsi Medicinal
13 Nerium odorum Karaveera Medicinal
14 Saraca indica Ashoka Medicinal, aesthetic
15 Clitoria ternatea Shankapushpa Medicinal
16 Jacaranda mimosifolia Nili Gulmohar Wood, aesthetic
l17 Lagerstroemia indica Jarool Wood, aesthetic
18 Grevillea robusta Silver oak Wood, aesthetic
19 Nerium indicum Kaner Medicinal, aesthetic
20 Araucaria sp. Monkey Aesthetic21 Populus sp Popular Wood,
aesthetic22 Tecoma grandiflora Tecoma Aesthetic 23 Juniper sp. Juniper Aesthetic24 Jasminum humile Yellow
jasmineMedicinal, cosmetics &aesthetic
25 Euonymus sp. Euonymus Bio-fencing& h i
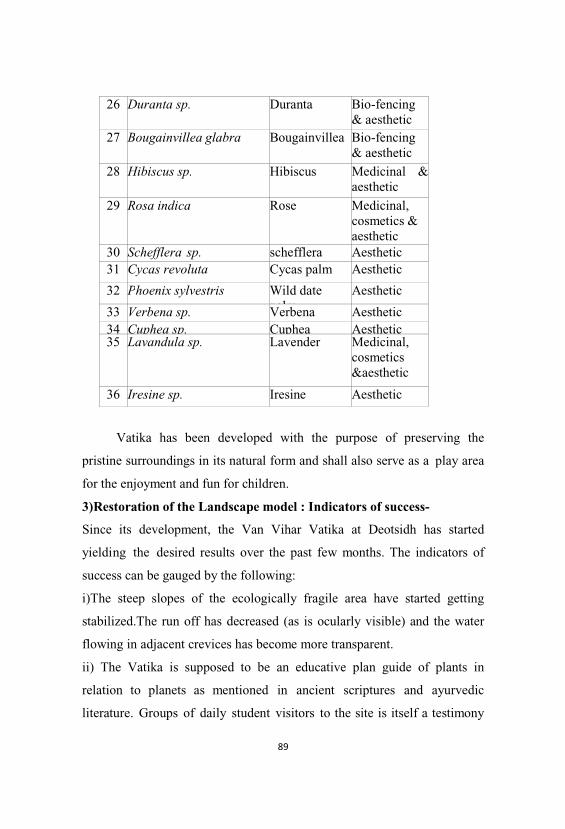
26 Duranta sp. Duranta Bio-fencing& aesthetic
27 Bougainvillea glabra Bougainvillea Bio-fencing& aesthetic
28 Hibiscus sp. Hibiscus Medicinal &aesthetic
29 Rosa indica Rose Medicinal, cosmetics &aesthetic
30 Schefflera sp. schefflera Aesthetic31 Cycas revoluta Cycas palm Aesthetic
32 Phoenix sylvestris Wild datepalm
Aesthetic
33 Verbena sp. Verbena Aesthetic34 Cuphea sp. Cuphea Aesthetic35 Lavandula sp. Lavender Medicinal,
cosmetics&aesthetic
36 Iresine sp. Iresine Aesthetic
Vatika has been developed with the purpose of preserving the
pristine surroundings in its natural form and shall also serve as a play area
for the enjoyment and fun for children.
3)Restoration of the Landscape model : Indicators of success-
Since its development, the Van Vihar Vatika at Deotsidh has started
yielding the desired results over the past few months. The indicators of
success can be gauged by the following:
i)The steep slopes of the ecologically fragile area have started getting
stabilized.The run off has decreased (as is ocularly visible) and the water
flowing in adjacent crevices has become more transparent.
ii) The Vatika is supposed to be an educative plan guide of plants in
relation to planets as mentioned in ancient scriptures and ayurvedic
literature. Groups of daily student visitors to the site is itself a testimony
to the increasing interest of people in this novel concept.
iii) ) The local farming community has started taking keen interest in the
cultivation of available commercial medicinal plants at the site for
the purpose of supporting their livelihood.
iv) The restoration model at Deotsidh shall act as a focus for similar
replicas in many other parts of the state and even beyond. It shall help
encourage people to conserve nature by reviving their concern towards the
religious and medicinal values of our plants.
References
“Miracles of Veda & Purana http://sanatandharma.tripod.com
Negi,S.S.1982 . Environment problems in the Himalayas.
Bioengineering Measures for Himalayan Landscapes Affected by
Landslide –A Case Study
Ashish Rawat, Prafulla Soni* & H.B.Vasistha**
Louisberger,New Delhi
*Advisor Restoration ecology & Biodiversity Conservation
**Ecology & Environment Division
Forest Research Institute, Dehradun
Abstract
The Himalayan range of Garhwal Himalya is undergoing constant
rupture in the thrust belt zone, due to which earthquake and landslide
activity is triggered almost everywhere in the region. Landslides are one
of the indicators of the geomorphological modifications taking place in
this active and fragile terrain. Restoration is difficult on landslide
surfaces because of the high degree of spatial and temporal heterogeneity
in soil stability and fertility. Restoration efforts can be streamlined by
using techniques that promote successional processes.Bioengineering is
one such measure that effectively deal with landslides, hill
slopes failure, and other related problems. It is an integrated
approach that assists stabilization of hill slopes/landslide sites and im
proves the site quality by improving soil nutrient status. The application
of bioengineering is also vital for restoration of biodiversity in landslide
damaged/degraded sites. Furthermore, this technique is a cost-
effective solution, which uses locally available materials and allows
the involvement of the local population in management and maintenance.
The present paper deals with the application of bioengineering and
its importance in addressing landslides and other related problem in the
Himalayan region with special reference to the catastrophic Varunavat
landslide, occurred on September 24, 2003 in Uttarkashi district of
Garhwal Himalaya.
Keywords: Landslides, Bioengineering, Restoration, Varunavat, Himalaya
Introduction
Himalayas, one of the most fascinating, striking and astonishing
mountain range in the world are geologically very weak, fragile and
rugged in nature. The fragility and weak geology of Himalayas attribute
several catastrophic disasters in the region, landslides are one of them.
Landslides are a form of slope failure characterized by the rapid mass
movement of soil and/or rock along a discrete shear surface (Varnes
1978). Landslides are one of the natural hazards that affect at least 15%
of land area of our country exceeding 0.49 million km2 (Sharda, 2008).
The term “landslide” as presented by Varnes (1978) and Cruden and
Varnes (1996) includes all types of gravity-induced mass movements,
ranging from rock falls through slides/slumps, avalanches, and flows, and
it includes both subaerial and submarine mass movements triggered
mainly by precipitation (including snowmelt), seismic activity, and
volcanic eruptions.
The Himalayas experience some of the highest rates of landslides in
the world and the adverse geology, topography and land use are made
more acute by the humid sub-tropical temperature zones. Rapid rock
weathering and heavy rainfall are predominant features of this area and are
responsible for inducing landslides and erosion. Bioengineering can be
used to protect almost all slopes against erosion through slope
protection and stabilization which dramatically reduces landslides and the
devastation they cause.
Natural ecosystems have an inherent characteristic to recover after
natural or man imposed damage. However, in view of frequent damage of
natural ecosystems in various regions of Himalaya, technologies are
required to hasten the process of recovery. Bioengineering is undoubtedly
the most important factor in ameliorating the effects of severe ecological
disturbance such as landslides.
Bioengineering as an Integrated Approach
Bioengineering entails the use of living plants and other auxiliary
materials for stabilization of hill slopes, works as an integrated technique
to protect slope against surface tension, to reduce the risk of planer sliding
and to improve surface draining. Species having colonizing behaviour, fast
growing nature and dense and deep root system with potential of
adventitious root system and fast and simple propagation are needed to be
selected for bioengineering application.
The skill of using vegetation in engineering is to combine it
carefully with civil works to give the best results in terms of cost and
effect. Bioengineering is relatively low in cost and the materials and
skills are all available in rural areas. It takes some time for the materials
to reach their maximum strength, but unlike civil engineering systems,
they tend to become stronger over time.One of the main advantages of
bioengineering approach to slope protection, viz. plants and the mechanical
structures can function together in mutually reinforcing or complementary
roles. The field studies (White, 1979) have shown that in many instances
combined structural-vegetative slope protection systems are more cost-
effective than the use of either vegetation or structure alone. Vegetative
treatments alone are usually much less expensive than earth retaining
structures or other geological protection systems. On the other hand, their
effectiveness in terms of preventing soil loss or arresting slope movement
under severe conditions may also be much lower.
Bioengineering application blend into the landscape, hence this
application is environmentally viable but the geological structures do not
visually intrude upon the landscape as much as the conventional earth
retaining structures. Thus, opportunities arise to incorporate vegetation
into structure itself. This is done by planting either in between structural
members or upon the benches purposely designed into a structure.
Role of Vegetation in Landslide Stabilization
Vegetation is a regulatory factor towards the reconstruction of an
ecosystem and landslide soils, as it improves the physical and biological
diversity of disturbed sites. The role of vegetation is quite significant in
prevention as well as stabilizing the landslides. Plant cover not only
protects the surface from weathering due to direct impact of rain and
winds but its intricate root system works as a cohesive in binding the
loose soil and preventing it from erosion. Vegetation increases the soil
infiltration capacity, helping to reduce the volume of runoff. Plants
transpire considerable quantities of water, reducing soil moisture and
increasing soil suction.
The vegetation acts as a barrier to the rainfall and significantly
reduces the kinetic energy of raindrops and thus, reduces their power of
erosion. The network of surface fibres produces a tensile mat effect and
restrains the underlying strata. Plant roots bind the soil which increases
the shear strength through a matrix of tensile fibres, resulting in
increased resistance to deformation. The roots of plants penetrate deeply
giving anchorage into firm strata, bonding the soil mantle to stable sub-soil
or bedrock; and support to upslope material through buttressing and
arching. The use of vegetation to manage erosion and protect slopes is
relatively inexpensive, does not require heavy machinery on the slope,
establishes wildlife habitat, and can improve the aesthetic quality of the
property. Vegetation also encourages other plants and animals to live on
the slope and therefore, bioengineering helps to improve the environment
as well as providing useful products, such as, firewood and fruit.
Bradshaw (1987) envisaged the importance of achieving a stable and
self- sustaining vegetative cover. Vegetation is a regulatory factor towards
the reconstruction of an ecosystem and landslide soils, as it improves the
physical and biological diversity of disturbed sites. Revegetation is
supposed to be the best tool for stabilization of degraded habitats (Singh et
al., 2002), because vegetation not only provide long-term ecosystem
stabilization and render potential ameliorative effects on soil quality, but
also have potential value (Torbert et al., 1993; Fisher, 1990; Ashby,
1987).
Plant Selection for Bioengineering Application
Selection of vegetation, for bioengineering of landslide sites
depend upon many factors viz. site conditions, soil type, topography,
aspect etc. but the vegetation selected for bioengineering of landslide
habitats must adapt the site condition and fulfill the multitude of needs.
For rehabilitation of any type of wasteland, the choice of species should
be such that the demand for inputs is the least and attention needed is
negligible. They should have deep and large root system and preferably be
hardy, fast-growing and suckering (Sastry and Kavathekar, 1990). The
native vegetation could be used in rehabilitation and restoration
prorammes as they have fewer competitors than other species and the
disturbances permits the germination and development of non-seeded
species (Munshower, 1993). Leguminous species has been recognized
as the suitable species for bioengineering of landslide because these
species has the capability of fixing atmospheric nitrogen which not only
improve the site condition but also make an invaluable contribution to the
reestablishment of nitrogen cycle in the disturbed habitat (Cryderman and
Sheltron, 1976; Biondini and Redente, 1986).
Vegetation can be selected and arranged on the slope to
perform specific engineering functions. A mixture of plants, mainly fast
growing shrubs and herbs should be introduced so as to give a range of
rooting depths which create an irregular structure. This tends to prevent
continuous shear planes from developing in the upper soil layers,
discouraging shearing from taking place. The plants on the site should be a
mixture of ages so that they do not all need to be replaced at the same time
and to ensure that there will always be strong healthy plants protecting the
slopes.
An ideal bioengineering vegetation community should be
primary successional species with fast growing in nature and deep
penetrating root system to bind the loose soil, high survival rate; good
foliage cover, colonizing behaviour, giving the maximum anchorage
effect. Shrubs with strong, woody roots which are shallower than the tree
roots form an intermediate level and large clumping grasses with a dense
network of fibrous roots close to the soil surface; provide a thick surface
cover to prevent erosion.
Lessons of Bioengineering from Varunavat Landslide, Garhwal
Himalaya-A Case Study
September 23rd, 2003 was not less than a doom day for
Uttarkashi because Varunavat Parvat (longitudes 78°26’ E and latitudes
30°44’ N, elevation 1160-1790 m msl) which is sacred for thousands of
local inhabitants, struck late in the night on September 23rd, 2003,
immediately after the rainy season and left behind a classical example of
devastation for scientists, geologists and researchers because at the foot of
the Parvat lies the Uttarkashi township and it was under threat for a
period of one month because of the hysterically debris slide (debris slide
in the crown portion, and rockfall and rockslide in the middle part) from
Varunavat Parvat.
The September, 2003, Varunavat landslide in Uttarkashi has affected
a large area (about 18 ha) of Varunavat Parvat and damaged/uprooted
about 2050 trees of chir pine (Pinus roxburghii), the dominating tree
species of this region. Apart from this, about 450 trees of chir pine were
slashed to transport heavy machinery used for geological treatment of
Varunavat landslide area and about 600 trees were slashed down for
various other purposes. The sum total of chir pine reduction was about
3,100 (Soni et al., 2008).
Due to the catastrophic landslide, there was a huge loss to
vegetation, which removed carbon from vegetation, hence total amount of
carbon removed from vegetation was about 396.4 tonnes for chir pine and
0.25 tonns for shrubs. Regarding loss of biomass the total loss was
assessed about 792.8 tonnes for chir pine and 0.50 tonnes for shrubs, while
soil carbon loss in landslide areas was estimated about 404 tonnes.
Economic loss due to depletion of biomass alone of chir pine has
been assessed as rupees 43, 40 lakhs (Soni et al., 2008).
About 13 species including 5 species of shrubs and 8 species of
herbs and grasses has been disappeared from the Varunavat Landslide
areas. Most of these species were ecologically and ethnobotanically
important (Rawat et al., 2007).
Bioengineering Measures at Varunavat Landslide Damaged Sites
Forest Research Institute, Dehradun and State Forest Department,
Uttarakhand have undertaken a joint venture for the biological stabilization
of Varunavat landslide using bioengineering technique in 2006-2007.
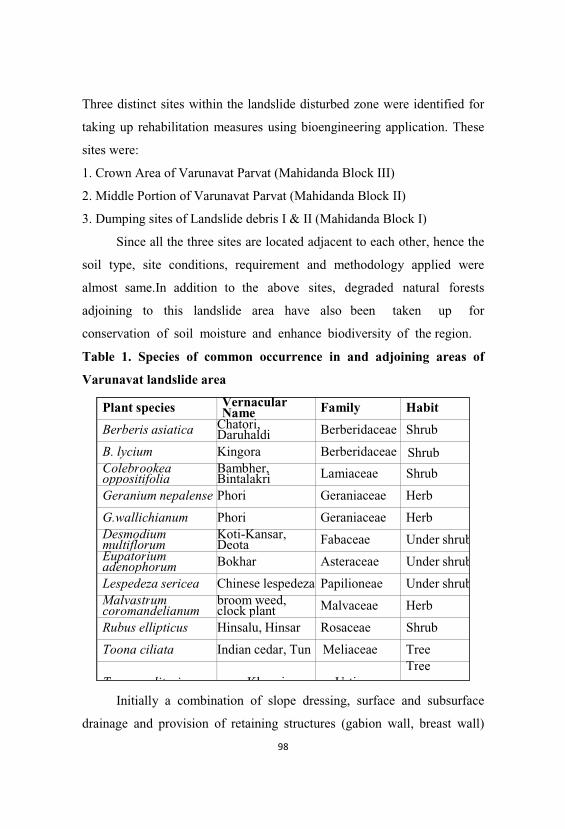
Plant species VernacularName Family Habit
Berberis asiatica Chatori,Daruhaldi Berberidaceae Shrub
B. lycium Kingora Berberidaceae ShrubColebrookeaoppositifolia
Bambher,Bintalakri Lamiaceae Shrub
Geranium nepalense Phori Geraniaceae Herb
G.wallichianum Phori Geraniaceae HerbDesmodiummultiflorum
Koti-Kansar,Deota Fabaceae Under shrub
Eupatoriumadenophorum Bokhar Asteraceae Under shrub
Lespedeza sericea Chinese lespedeza Papilioneae Under shrubMalvastrumcoromandelianum
broom weed,clock plant Malvaceae Herb
Rubus ellipticus Hinsalu, Hinsar Rosaceae Shrub
Toona ciliata Indian cedar, Tun Meliaceae Tree
T lit i Kh i U tiTree
Three distinct sites within the landslide disturbed zone were identified for
taking up rehabilitation measures using bioengineering application. These
sites were:
1. Crown Area of Varunavat Parvat (Mahidanda Block III)
2. Middle Portion of Varunavat Parvat (Mahidanda Block II)
3. Dumping sites of Landslide debris I & II (Mahidanda Block I)
Since all the three sites are located adjacent to each other, hence the
soil type, site conditions, requirement and methodology applied were
almost same.In addition to the above sites, degraded natural forests
adjoining to this landslide area have also been taken up for
conservation of soil moisture and enhance biodiversity of the region.
Table 1. Species of common occurrence in and adjoining areas of
Varunavat landslide area
Initially a combination of slope dressing, surface and subsurface
drainage and provision of retaining structures (gabion wall, breast wall)
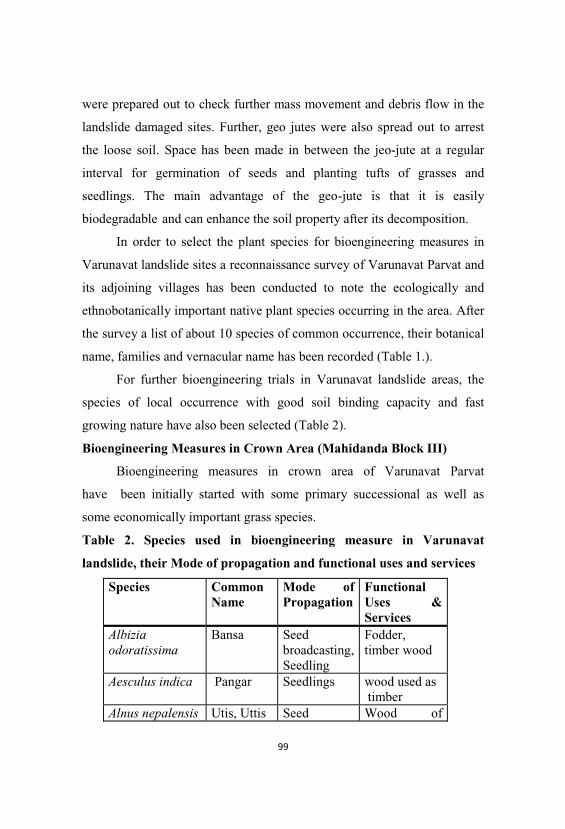
were prepared out to check further mass movement and debris flow in the
landslide damaged sites. Further, geo jutes were also spread out to arrest
the loose soil. Space has been made in between the jeo-jute at a regular
interval for germination of seeds and planting tufts of grasses and
seedlings. The main advantage of the geo-jute is that it is easily
biodegradable and can enhance the soil property after its decomposition.
In order to select the plant species for bioengineering measures in
Varunavat landslide sites a reconnaissance survey of Varunavat Parvat and
its adjoining villages has been conducted to note the ecologically and
ethnobotanically important native plant species occurring in the area. After
the survey a list of about 10 species of common occurrence, their botanical
name, families and vernacular name has been recorded (Table 1.).
For further bioengineering trials in Varunavat landslide areas, the
species of local occurrence with good soil binding capacity and fast
growing nature have also been selected (Table 2).
Bioengineering Measures in Crown Area (Mahidanda Block III)
Bioengineering measures in crown area of Varunavat Parvat
have been initially started with some primary successional as well as
some economically important grass species.
Table 2. Species used in bioengineering measure in Varunavat
landslide, their Mode of propagation and functional uses and services
Species CommonName
Mode ofPropagation
FunctionalUses &Services
Albiziaodoratissima
Bansa Seedbroadcasting, Seedling
Fodder, timber wood
Aesculus indica Pangar Seedlings wood used astimber
Alnus nepalensis Utis, Uttis Seed Wood of
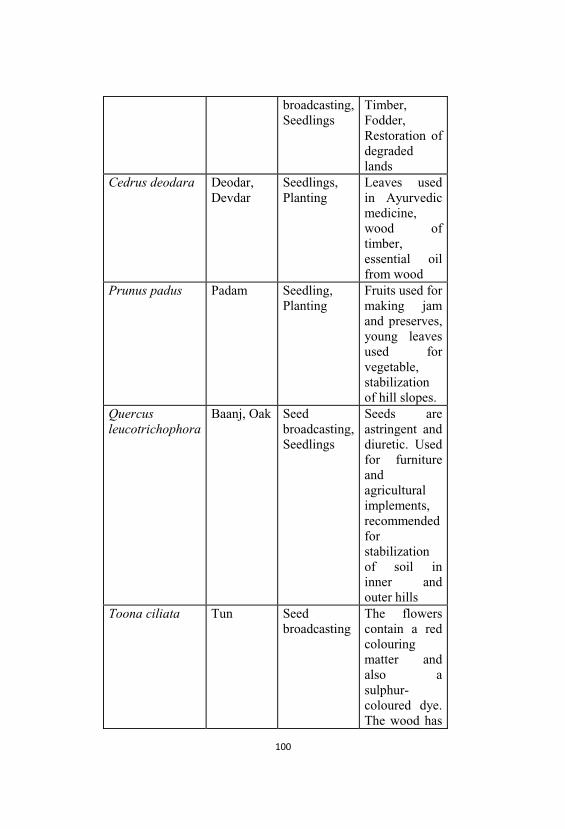
broadcasting, Seedlings
Timber, Fodder, Restoration ofdegradedlands
Cedrus deodara Deodar, Devdar
Seedlings, Planting
Leaves usedin Ayurvedicmedicine, wood oftimber, essential oilfrom wood
Prunus padus Padam Seedling, Planting
Fruits used formaking jamand preserves, young leavesused forvegetable, stabilizationof hill slopes.
Quercusleucotrichophora
Baanj, Oak Seedbroadcasting, Seedlings
Seeds areastringent anddiuretic. Usedfor furnitureandagriculturalimplements, recommendedforstabilizationof soil ininner andouter hills
Toona ciliata Tun Seedbroadcasting
The flowerscontain a redcolouringmatter andalso asulphur-coloured dye. The wood has
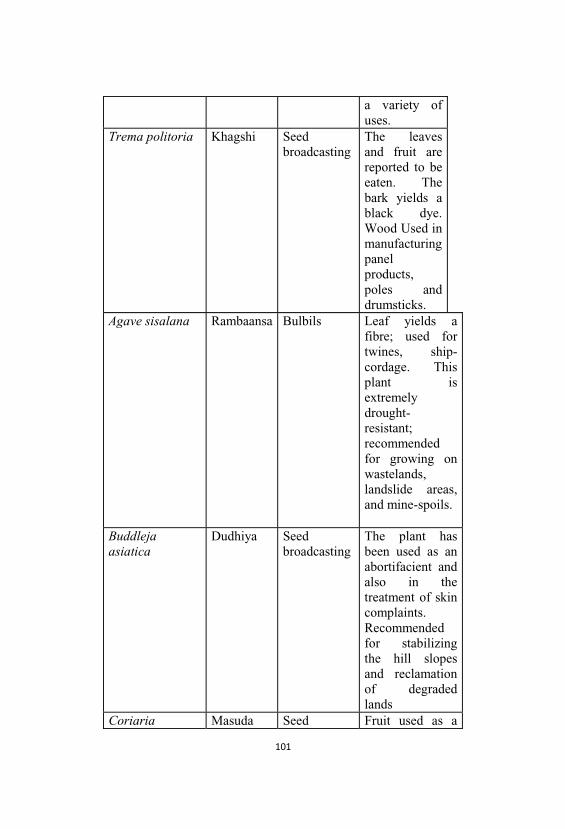
a variety ofuses.
Trema politoria Khagshi Seedbroadcasting
The leavesand fruit arereported to beeaten. Thebark yields ablack dye. Wood Used inmanufacturingpanelproducts, poles anddrumsticks.
Agave sisalana Rambaansa Bulbils Leaf yields afibre; used fortwines, ship-cordage. Thisplant isextremelydrought-resistant;recommendedfor growing onwastelands, landslide areas, and mine-spoils.
Buddlejaasiatica
Dudhiya Seed broadcasting
The plant hasbeen used as anabortifacient andalso in thetreatment of skincomplaints. Recommendedfor stabilizingthe hill slopesand reclamationof degradedlands
Coriaria Masuda Seed Fruit used as a
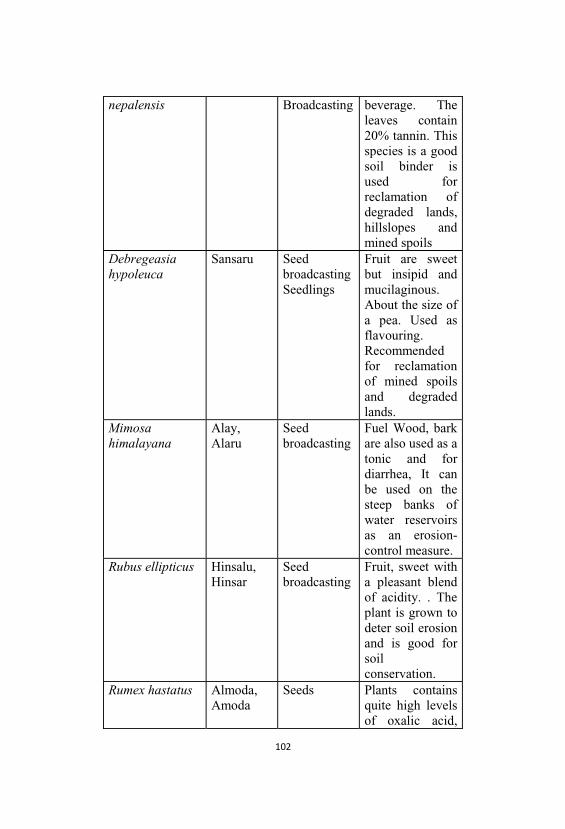
nepalensis Broadcasting beverage. Theleaves contain20% tannin. Thisspecies is a goodsoil binder isused forreclamation ofdegraded lands, hillslopes andmined spoils
Debregeasiahypoleuca
Sansaru SeedbroadcastingSeedlings
Fruit are sweetbut insipid andmucilaginous. About the size ofa pea. Used asflavouring. Recommendedfor reclamationof mined spoilsand degradedlands.
Mimosahimalayana
Alay, Alaru
Seedbroadcasting
Fuel Wood, barkare also used as atonic and fordiarrhea, It canbe used on thesteep banks ofwater reservoirsas an erosion-control measure.
Rubus ellipticus Hinsalu, Hinsar
Seedbroadcasting
Fruit, sweet witha pleasant blendof acidity. . Theplant is grown todeter soil erosionand is good forsoilconservation.
Rumex hastatus Almoda, Amoda
Seeds Plants containsquite high levelsof oxalic acid,
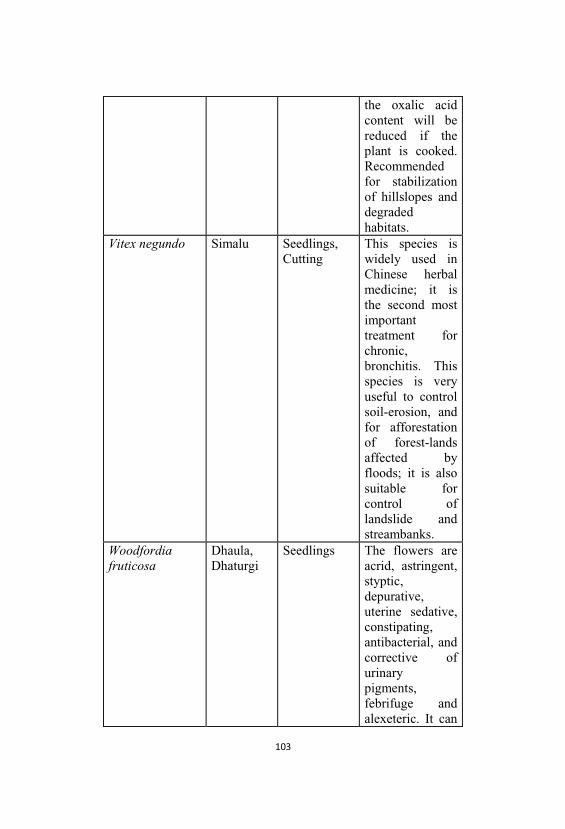
the oxalic acidcontent will bereduced if theplant is cooked. Recommendedfor stabilizationof hillslopes anddegradedhabitats.
Vitex negundo Simalu Seedlings, Cutting
This species iswidely used inChinese herbalmedicine; it isthe second mostimportanttreatment forchronic, bronchitis. Thisspecies is veryuseful to controlsoil-erosion, andfor afforestationof forest-landsaffected byfloods; it is alsosuitable forcontrol oflandslide andstreambanks.
Woodfordiafruticosa
Dhaula, Dhaturgi
Seedlings The flowers areacrid, astringent, styptic, depurative, uterine sedative, constipating, antibacterial, andcorrective ofurinarypigments, febrifuge andalexeteric. It can
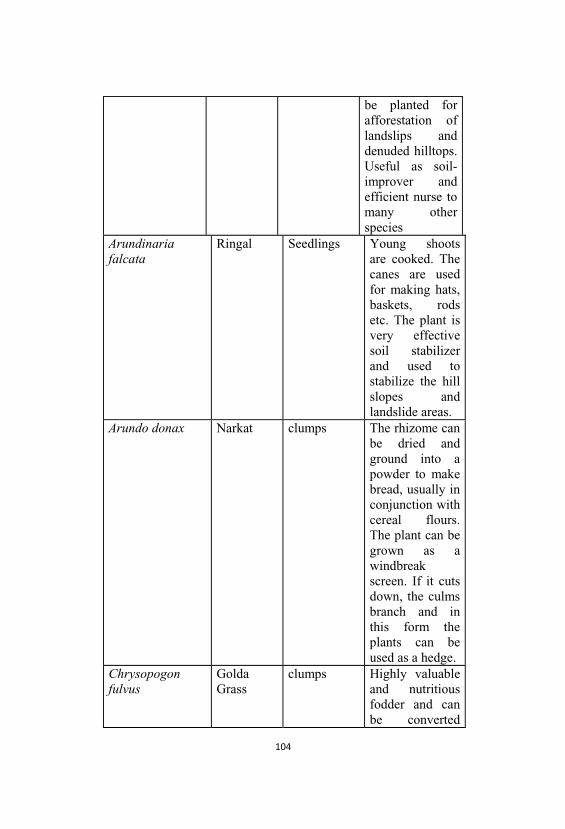
be planted forafforestation oflandslips anddenuded hilltops. Useful as soil-improver andefficient nurse tomany otherspecies
Arundinariafalcata
Ringal Seedlings Young shootsare cooked. Thecanes are usedfor making hats, baskets, rodsetc. The plant isvery effectivesoil stabilizerand used tostabilize the hillslopes andlandslide areas.
Arundo donax Narkat clumps The rhizome canbe dried andground into apowder to makebread, usually inconjunction withcereal flours. The plant can begrown as awindbreakscreen. If it cutsdown, the culmsbranch and inthis form theplants can beused as a hedge.
Chrysopogonfulvus
GoldaGrass
clumps Highly valuableand nutritiousfodder and canbe converted
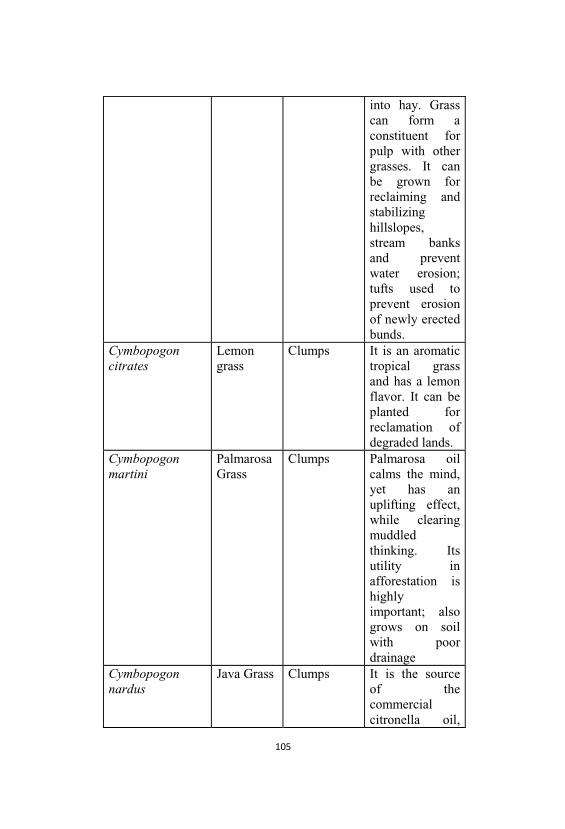
into hay. Grasscan form aconstituent forpulp with othergrasses. It canbe grown forreclaiming andstabilizinghillslopes, stream banksand preventwater erosion;tufts used toprevent erosionof newly erectedbunds.
Cymbopogoncitrates
Lemongrass
Clumps It is an aromatictropical grassand has a lemonflavor. It can beplanted forreclamation ofdegraded lands.
Cymbopogonmartini
PalmarosaGrass
Clumps Palmarosa oilcalms the mind, yet has anuplifting effect, while clearingmuddledthinking. Itsutility inafforestation ishighlyimportant; alsogrows on soilwith poordrainage
Cymbopogonnardus
Java Grass Clumps It is the sourceof thecommercialcitronella oil,
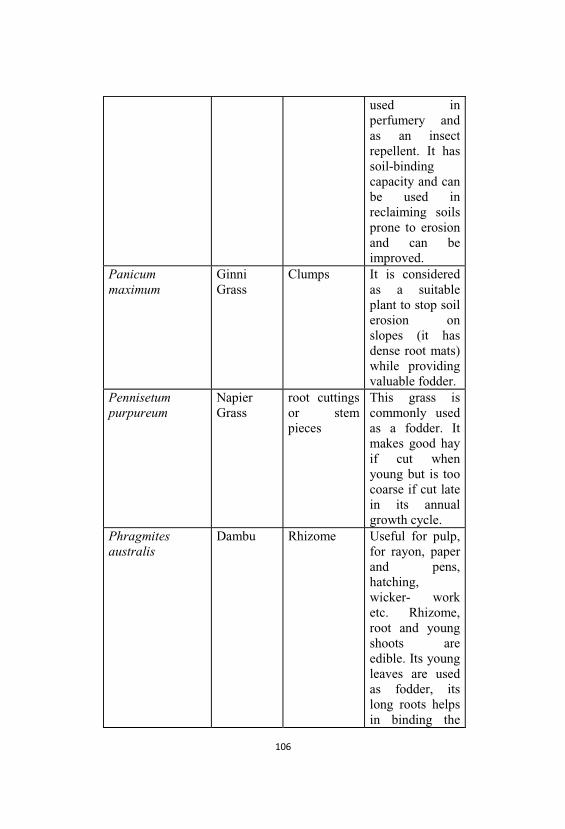
used inperfumery andas an insectrepellent. It hassoil-bindingcapacity and canbe used inreclaiming soilsprone to erosionand can beimproved.
Panicummaximum
GinniGrass
Clumps It is consideredas a suitableplant to stop soilerosion onslopes (it hasdense root mats)while providingvaluable fodder.
Pennisetumpurpureum
NapierGrass
root cuttingsor stempieces
This grass iscommonly usedas a fodder. Itmakes good hayif cut whenyoung but is toocoarse if cut latein its annualgrowth cycle.
Phragmitesaustralis
Dambu Rhizome Useful for pulp, for rayon, paperand pens, hatching, wicker- worketc. Rhizome, root and youngshoots areedible. Its youngleaves are usedas fodder, itslong roots helpsin binding the
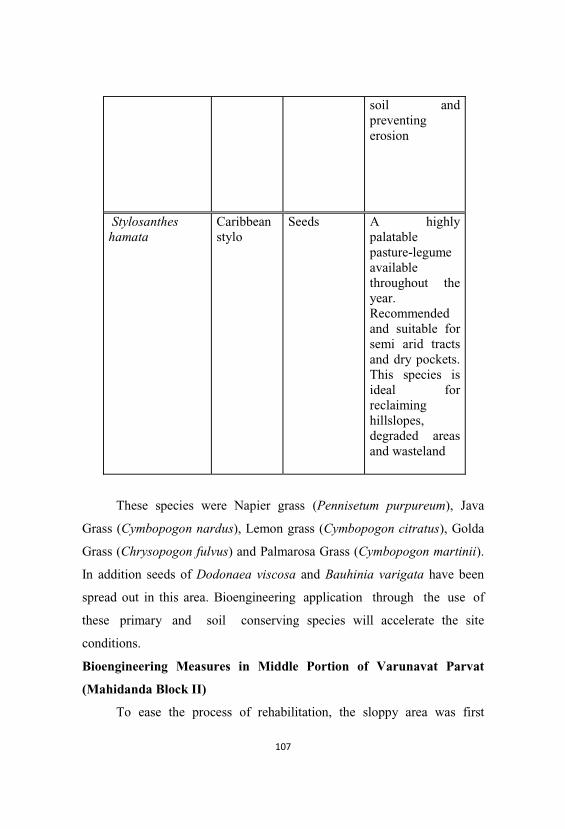
soil andpreventingerosion
Stylosantheshamata
Caribbeanstylo
Seeds A highlypalatablepasture-legumeavailablethroughout theyear. Recommendedand suitable forsemi arid tractsand dry pockets. This species isideal forreclaiminghillslopes, degraded areasand wasteland
These species were Napier grass (Pennisetum purpureum), Java
Grass (Cymbopogon nardus), Lemon grass (Cymbopogon citratus), Golda
Grass (Chrysopogon fulvus) and Palmarosa Grass (Cymbopogon martinii).
In addition seeds of Dodonaea viscosa and Bauhinia varigata have been
spread out in this area. Bioengineering application through the use of
these primary and soil conserving species will accelerate the site
conditions.
Bioengineering Measures in Middle Portion of Varunavat Parvat
(Mahidanda Block II)
To ease the process of rehabilitation, the sloppy area was first
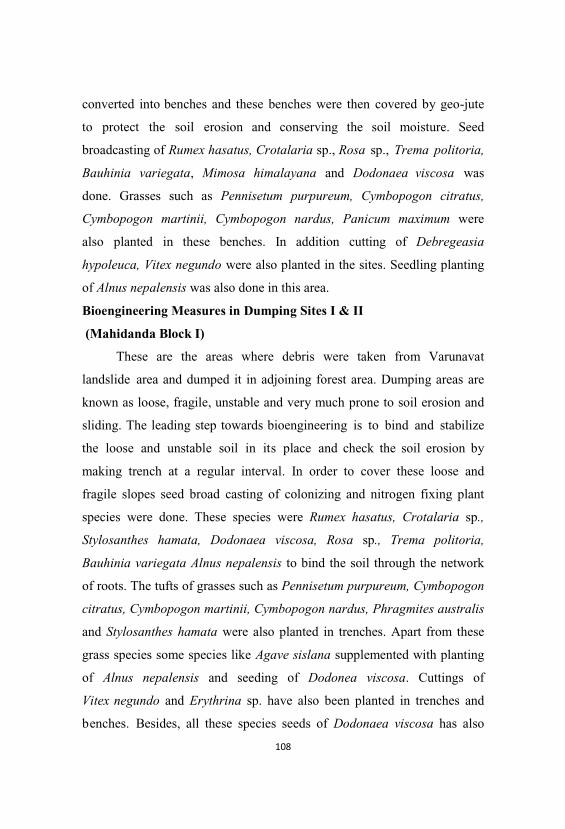
converted into benches and these benches were then covered by geo-jute
to protect the soil erosion and conserving the soil moisture. Seed
broadcasting of Rumex hasatus, Crotalaria sp., Rosa sp., Trema politoria,
Bauhinia variegata, Mimosa himalayana and Dodonaea viscosa was
done. Grasses such as Pennisetum purpureum, Cymbopogon citratus,
Cymbopogon martinii, Cymbopogon nardus, Panicum maximum were
also planted in these benches. In addition cutting of Debregeasia
hypoleuca, Vitex negundo were also planted in the sites. Seedling planting
of Alnus nepalensis was also done in this area.
Bioengineering Measures in Dumping Sites I & II
(Mahidanda Block I)
These are the areas where debris were taken from Varunavat
landslide area and dumped it in adjoining forest area. Dumping areas are
known as loose, fragile, unstable and very much prone to soil erosion and
sliding. The leading step towards bioengineering is to bind and stabilize
the loose and unstable soil in its place and check the soil erosion by
making trench at a regular interval. In order to cover these loose and
fragile slopes seed broad casting of colonizing and nitrogen fixing plant
species were done. These species were Rumex hasatus, Crotalaria sp.,
Stylosanthes hamata, Dodonaea viscosa, Rosa sp., Trema politoria,
Bauhinia variegata Alnus nepalensis to bind the soil through the network
of roots. The tufts of grasses such as Pennisetum purpureum, Cymbopogon
citratus, Cymbopogon martinii, Cymbopogon nardus, Phragmites australis
and Stylosanthes hamata were also planted in trenches. Apart from these
grass species some species like Agave sislana supplemented with planting
of Alnus nepalensis and seeding of Dodonea viscosa. Cuttings of
Vitex negundo and Erythrina sp. have also been planted in trenches and
benches. Besides, all these species seeds of Dodonaea viscosa has also
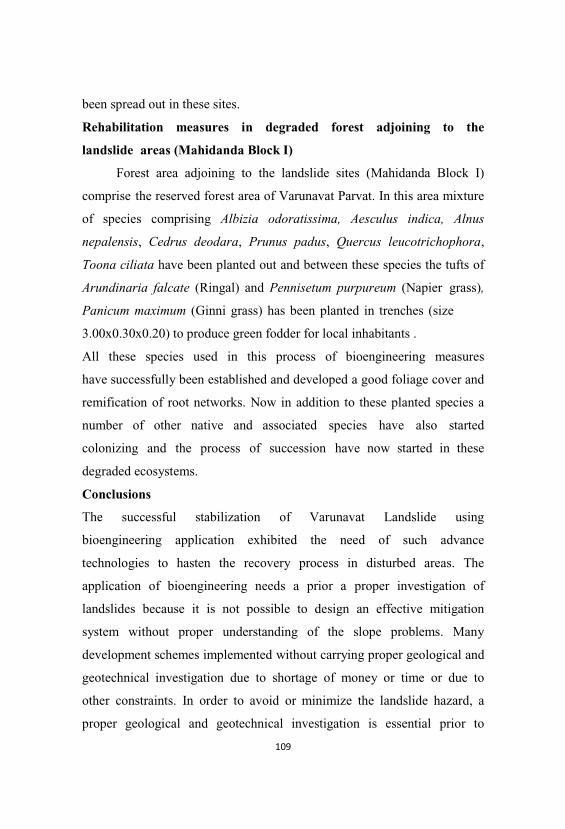
been spread out in these sites.
Rehabilitation measures in degraded forest adjoining to the
landslide areas (Mahidanda Block I)
Forest area adjoining to the landslide sites (Mahidanda Block I)
comprise the reserved forest area of Varunavat Parvat. In this area mixture
of species comprising Albizia odoratissima, Aesculus indica, Alnus
nepalensis, Cedrus deodara, Prunus padus, Quercus leucotrichophora,
Toona ciliata have been planted out and between these species the tufts of
Arundinaria falcate (Ringal) and Pennisetum purpureum (Napier grass),
Panicum maximum (Ginni grass) has been planted in trenches (size
3.00x0.30x0.20) to produce green fodder for local inhabitants .
All these species used in this process of bioengineering measures
have successfully been established and developed a good foliage cover and
remification of root networks. Now in addition to these planted species a
number of other native and associated species have also started
colonizing and the process of succession have now started in these
degraded ecosystems.
Conclusions
The successful stabilization of Varunavat Landslide using
bioengineering application exhibited the need of such advance
technologies to hasten the recovery process in disturbed areas. The
application of bioengineering needs a prior a proper investigation of
landslides because it is not possible to design an effective mitigation
system without proper understanding of the slope problems. Many
development schemes implemented without carrying proper geological and
geotechnical investigation due to shortage of money or time or due to
other constraints. In order to avoid or minimize the landslide hazard, a
proper geological and geotechnical investigation is essential prior to
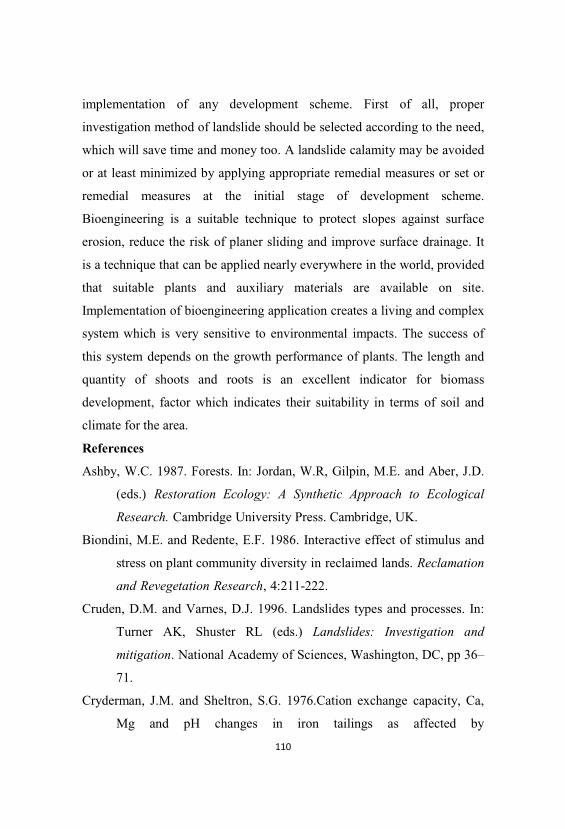
implementation of any development scheme. First of all, proper
investigation method of landslide should be selected according to the need,
which will save time and money too. A landslide calamity may be avoided
or at least minimized by applying appropriate remedial measures or set or
remedial measures at the initial stage of development scheme.
Bioengineering is a suitable technique to protect slopes against surface
erosion, reduce the risk of planer sliding and improve surface drainage. It
is a technique that can be applied nearly everywhere in the world, provided
that suitable plants and auxiliary materials are available on site.
Implementation of bioengineering application creates a living and complex
system which is very sensitive to environmental impacts. The success of
this system depends on the growth performance of plants. The length and
quantity of shoots and roots is an excellent indicator for biomass
development, factor which indicates their suitability in terms of soil and
climate for the area.
References
Ashby, W.C. 1987. Forests. In: Jordan, W.R, Gilpin, M.E. and Aber, J.D.
(eds.) Restoration Ecology: A Synthetic Approach to Ecological
Research. Cambridge University Press. Cambridge, UK.
Biondini, M.E. and Redente, E.F. 1986. Interactive effect of stimulus and
stress on plant community diversity in reclaimed lands. Reclamation
and Revegetation Research, 4:211-222.
Cruden, D.M. and Varnes, D.J. 1996. Landslides types and processes. In:
Turner AK, Shuster RL (eds.) Landslides: Investigation and
mitigation. National Academy of Sciences, Washington, DC, pp 36–
71.
Cryderman, J.M. and Sheltron, S.G. 1976.Cation exchange capacity, Ca,
Mg and pH changes in iron tailings as affected by
vegetation.Research Note no . 20 Ford Forestry Centre, Michigan
Technological University,10 p.
Fisher, R.F. 1990. Amelioration of soils by trees. In: Gessel, S.P, Lacate,
D.S, Weetman, G.F. and Powers, R.F. (eds.), Sustained Productivity
of Forest Soils. Proc. North American For. Soils Conf, 7th
Vancouver, B.C, July, 24-28, 1988, Univ. British
Columbia,Faculty of For. Publ. Vancouver, B.C. 525p.
Munshower, F.F. 1993. In. Practical Handbook of Disturbed Land
Revegetation. Lewis Publishers. London (UK).
Sastry, T. C. S. and Kavathekar, K.Y. 1990. (Ed.). Plants for
Reclamation of Wastelands.Publication and Information
Directorate, Council of Scientific & Industrial Research, Hillside
Road, New Delhi, India.
Sharda, Y.P. 2008. Landslides in India. Glimpses of Geoscience
Research in India. 98-101pp.
Singh, A.N., Raghubanshi, A.S. and Singh, J.S. 2002. Plantation as a tool
for mine spoil restoration. Current Science, 82(12): 1436-1441.
Varnes, D.J. 1978. Slope movement types and processes. In: Schuster, R.L.
and Krizek, R.J. (eds.), Landslides: Analysis and Control, Nat l.
Res. Council, Wash, D.C,Transp. Res. Bd. Spec. Rept.176,11-33
pp.
White, P.S. 1979. Pattern, process, and natural disturbance in vegetation.
Botanical Review,45: 229-299.
Bradshaw, A. D. (1987). The reclamation of derelict land and the ecology
of ecosystem. In W. R. Jordan, M. E. Gilpin, and J. D. Aber (eds.),
Restoratio ecology:A SyntheticAapproach to Ecological Research.
Cambridge, UK: Cambridge University Press.
Torbert, J. L., Burger, J. A. and Daniels, W. L. (1993). Pine growth
variation associated with overburden rock type on a reclaimed
surface mine in Virginia.
Rawat, A., Soni P. and Vasistha, H.B. (2007). Ecological Studies In
Varunavat Landslide of Uttarkashi District of Garhwal Himalaya
And Role of Native Plant Species For Its Biostabilization. In. IInd
Uttarakhand Science Congress 15-17, Nov. Uttarakhand Academy
of Administration, Nainital. Journal of Environmental Quality,
(19): 88–92.
Soni P., Vasistha, H.B. and Rawat, A. (2008). Natural resources depletion
and their ecological and economical valuation in Varunavat
landslide of Uttarkashi district, Garhwal Himalaya. Landslide
Management: Present Scenario & Future Directions, C.B.RI.
Roorkee.278-283 pp.
Soil Nutrient Status in Age Series of Restored Rock Phosphate
Mined Sites and Natural Forest - A Comparative Study
Shikha Uniyal Gairola and Prafulla Soni*
NOIDA,U.P.India
* Advisor Restoration ecology &
Biodiversity Conservation,Panditwari,Phase II-Dehradun
Abstract
Mining of minerals in the Himalayan region is important not only
for the local and national economy but also for the development of
industry as well, but the extraction of these minerals is bringing about
superimposition of natural fertile soil by inactive and infertile materials.
Present study has been carried out in an eco-restored rock phosphate mine
at Maldeota Dehradun where ecorestoration measures were undertaken in
15 hectare mine spoil area in the year 1982. The study shows that after
23 years of restoration the soil nutrients in the restored areas have
exceeded the adjoining natural forest. Total nitrogen, available
phosphorous, exchangeable potassium and organic matter were found
maximum in the restored site in comparison to the natural forest.
Keywords: Eco-restored, Rock phosphate, mine spoil, nutrients, natural
forest
Introduction
Surface mining operations have the potential to destroy the flora
and fauna,and contaminate the soil, air and water in the surrounding areas
(Safaya, 1979; Dhar and Thakur, 1995). In India nearly 7,365 active
mining leases are spread over an area of 7,30,230 hectares and idle mining
leases (which are not operational due to one reason or the other) cover an
area of 2,13,150 hectares. The total leased out area is thus 9, 43,380
hectares (Soni et al., 1995). Mine spoils pose adverse conditions for soil
microbes and plant growth, due to their low organic matter,other
essential nutrients and unfavourable soil chemistry, poor structure - either
coarse or compact, and high isolation from vegetation (Meyer, 1973 and
Harthill and Mckell, 1979). Poor microbial population inhibits nutrient
transformation the establishment of the plant growth and the process of
ecological succession (Singh et al., 1996). Consequently the natural
recovery is a slow process and takes several years for the creation of self-
sustaining ecosystem. The effect of soil disturbances are markedly
adverse because many beneficial soil characteristics may require from
hundreds to tens of thousands of years to develop through pedogenic
processes in order to reach a steady state resulting in maximum
productivity (Jha and Singh, 1992). This is of great concern to both the
public and government agencies because of their local impacts on
ecosystems.
Himalayas are very rich in mineral resources like marble, limestone,
gypsum, dolomite and rock phosphate but the fact that these hills have
very low carrying capacity is generally overlooked. While, mining of these
minerals in the Himalayan region is important not only for the local and
national economy but also for the development of industry as well, but the
extraction of these minerals has resulted in loss of top fertile soil and
inactive and infertile materials have been brought to surface.
Ecological restoration of these derelict mined lands has been taken up
and this has resulted in improvement of soil nutrient status. Present
study describes the soil nutrient status in an age series (23, 22, 21and 20
years) of mined areas. Comparison of the nutrient status of mined areas
has been done with the soil of natural forest in the adjoining areas.
Study Area
The Dun is a characteristic geomorphological entity of the
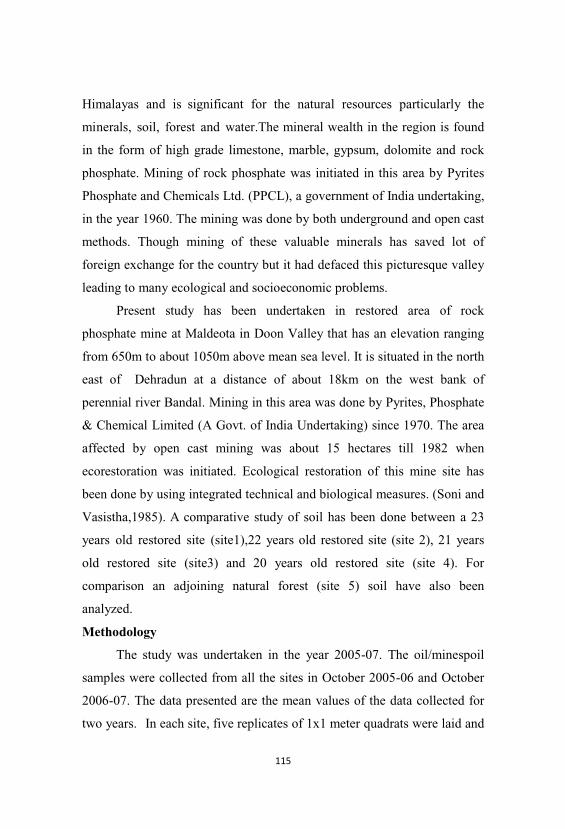
Himalayas and is significant for the natural resources particularly the
minerals, soil, forest and water.The mineral wealth in the region is found
in the form of high grade limestone, marble, gypsum, dolomite and rock
phosphate. Mining of rock phosphate was initiated in this area by Pyrites
Phosphate and Chemicals Ltd. (PPCL), a government of India undertaking,
in the year 1960. The mining was done by both underground and open cast
methods. Though mining of these valuable minerals has saved lot of
foreign exchange for the country but it had defaced this picturesque valley
leading to many ecological and socioeconomic problems.
Present study has been undertaken in restored area of rock
phosphate mine at Maldeota in Doon Valley that has an elevation ranging
from 650m to about 1050m above mean sea level. It is situated in the north
east of Dehradun at a distance of about 18km on the west bank of
perennial river Bandal. Mining in this area was done by Pyrites, Phosphate
& Chemical Limited (A Govt. of India Undertaking) since 1970. The area
affected by open cast mining was about 15 hectares till 1982 when
ecorestoration was initiated. Ecological restoration of this mine site has
been done by using integrated technical and biological measures. (Soni and
Vasistha,1985). A comparative study of soil has been done between a 23
years old restored site (site1),22 years old restored site (site 2), 21 years
old restored site (site3) and 20 years old restored site (site 4). For
comparison an adjoining natural forest (site 5) soil have also been
analyzed.
Methodology
The study was undertaken in the year 2005-07. The oil/minespoil
samples were collected from all the sites in October 2005-06 and October
2006-07. The data presented are the mean values of the data collected for
two years. In each site, five replicates of 1x1 meter quadrats were laid and
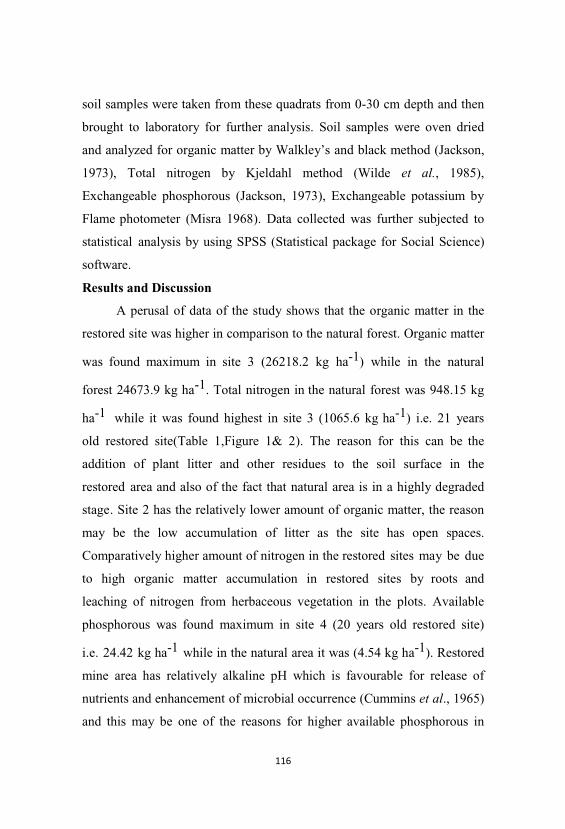
soil samples were taken from these quadrats from 0-30 cm depth and then
brought to laboratory for further analysis. Soil samples were oven dried
and analyzed for organic matter by Walkley’s and black method (Jackson,
1973), Total nitrogen by Kjeldahl method (Wilde et al., 1985),
Exchangeable phosphorous (Jackson, 1973), Exchangeable potassium by
Flame photometer (Misra 1968). Data collected was further subjected to
statistical analysis by using SPSS (Statistical package for Social Science)
software.
Results and Discussion
A perusal of data of the study shows that the organic matter in the
restored site was higher in comparison to the natural forest. Organic matter
was found maximum in site 3 (26218.2 kg ha-1) while in the natural
forest 24673.9 kg ha-1. Total nitrogen in the natural forest was 948.15 kg
ha-1 while it was found highest in site 3 (1065.6 kg ha-1) i.e. 21 years
old restored site(Table 1,Figure 1& 2). The reason for this can be the
addition of plant litter and other residues to the soil surface in the
restored area and also of the fact that natural area is in a highly degraded
stage. Site 2 has the relatively lower amount of organic matter, the reason
may be the low accumulation of litter as the site has open spaces.
Comparatively higher amount of nitrogen in the restored sites may be due
to high organic matter accumulation in restored sites by roots and
leaching of nitrogen from herbaceous vegetation in the plots. Available
phosphorous was found maximum in site 4 (20 years old restored site)
i.e. 24.42 kg ha-1 while in the natural area it was (4.54 kg ha-1). Restored
mine area has relatively alkaline pH which is favourable for release of
nutrients and enhancement of microbial occurrence (Cummins et al., 1965)
and this may be one of the reasons for higher available phosphorous in
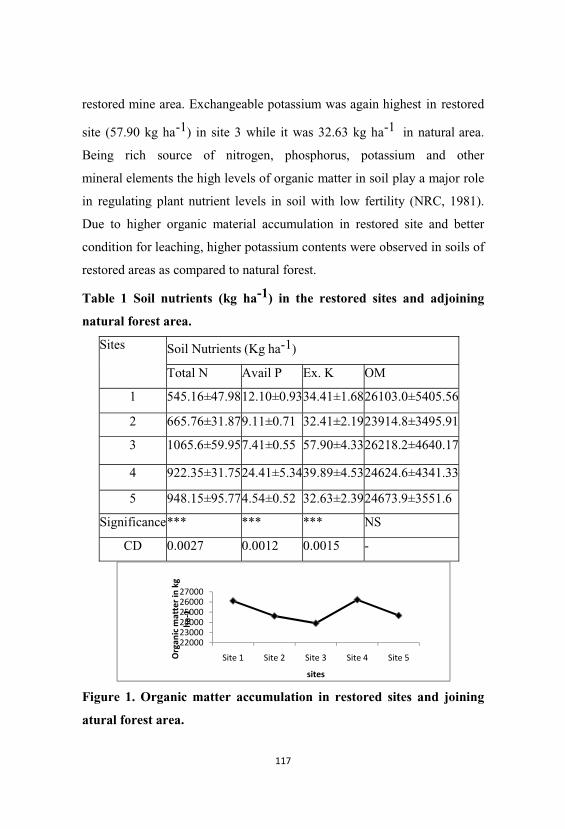
restored mine area. Exchangeable potassium was again highest in restored
site (57.90 kg ha-1) in site 3 while it was 32.63 kg ha-1 in natural area.
Being rich source of nitrogen, phosphorus, potassium and other
mineral elements the high levels of organic matter in soil play a major role
in regulating plant nutrient levels in soil with low fertility (NRC, 1981).
Due to higher organic material accumulation in restored site and better
condition for leaching, higher potassium contents were observed in soils of
restored areas as compared to natural forest.
Table 1 Soil nutrients (kg ha-1) in the restored sites and adjoining
natural forest area.
Sites Soil Nutrients (Kg ha-1)
Total N Avail P Ex. K OM
1 545.16±47.9812.10±0.9334.41±1.6826103.0±5405.56
2 665.76±31.879.11±0.71 32.41±2.1923914.8±3495.91
3 1065.6±59.957.41±0.55 57.90±4.3326218.2±4640.17
4 922.35±31.7524.41±5.3439.89±4.5324624.6±4341.33
5 948.15±95.774.54±0.52 32.63±2.3924673.9±3551.6
Significance*** *** *** NS
CD 0.0027 0.0012 0.0015 -
Figure 1. Organic matter accumulation in restored sites and joining
atural forest area.
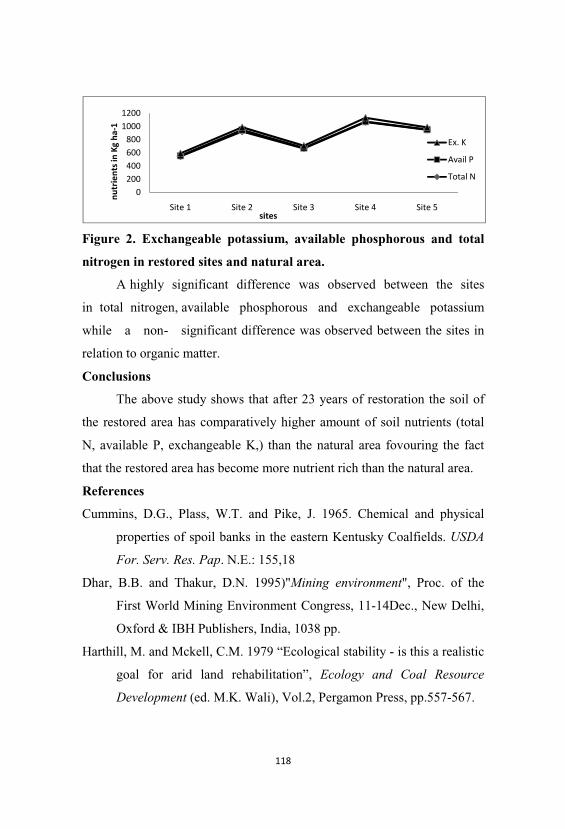
Figure 2. Exchangeable potassium, available phosphorous and total
nitrogen in restored sites and natural area.
A highly significant difference was observed between the sites
in total nitrogen, available phosphorous and exchangeable potassium
while a non- significant difference was observed between the sites in
relation to organic matter.
Conclusions
The above study shows that after 23 years of restoration the soil of
the restored area has comparatively higher amount of soil nutrients (total
N, available P, exchangeable K,) than the natural area fovouring the fact
that the restored area has become more nutrient rich than the natural area.
References
Cummins, D.G., Plass, W.T. and Pike, J. 1965. Chemical and physical
properties of spoil banks in the eastern Kentusky Coalfields. USDA
For. Serv. Res. Pap. N.E.: 155,18
Dhar, B.B. and Thakur, D.N. 1995)"Mining environment", Proc. of the
First World Mining Environment Congress, 11-14Dec., New Delhi,
Oxford & IBH Publishers, India, 1038 pp.
Harthill, M. and Mckell, C.M. 1979 “Ecological stability - is this a realistic
goal for arid land rehabilitation”, Ecology and Coal Resource
Development (ed. M.K. Wali), Vol.2, Pergamon Press, pp.557-567.
Jackson M.L. 1973 Soil Chemical Analysis. Prentice Hall of India Ltd.,
New Delhi.
Jha, A.K. and Singh, J.S. 1992 “Influence of microsites on redevelopment
of vegetation on coalmine spoils in a dry tropical environment”, J of
Environmental Management, 36: 95-116.
Meyer, F.H. 1973 "Distribution of ectomycorrhizae in native and man
made forests", Ectomycorrhizae: Their Ecology and Physiology
(eds. G.C. Marks and T.T. Klozlowski), pp. 79-105. Academic
Press, NY.
Misra, R. 1968. Ecology Work Book, Oxford and IBH Publishing Co. New
Delhi.(pH)
Safaya, N.M. 1979 “Dilineation of mineral stresses in mine spoils and
screening plants for adaptability”, Ecology and Coal Resource
Development (ed. M.K. Wali), pp. 830-849. Pergamon Press, New
York.
Singh, R.S., Chaulya, S.K., Tewary, B.K. and Dhar, B.B. 1996
“Restoration of a coalmine overburden dump - A case study”, Coal
International, March: 88-83.
Soni, P. and Vasistha, H.B. 1985. Reclamation of rock phosphate mine at
Maldeota. In: (Eds) Sharma, M.R. & Gupta, B.K. Proc. Recent
advances in plant science. Bishen Singh and Mahendra Pal Singh,
Dehradun.
Soni, P. 1998. Concept of ecorejuvenation-its application in mined areas.
In (ed) Soni, P., Chandra, V. and Sharma, S.D. 1997. Environmental
Management, Concepts, Strategies and Legislation for Mine
Areas.1-10.

Wilde, S.A., Corey, R.B., Iyer, J.G. and Voigt, G.K. 1985. Soil and Plant
Analysis for tree culture. Oxford and IBH publishing co., New
Delhi.(for nitrogen)
National Research Council 1981. Surface mining, Soil, Coal and society:
National Academy Press, Washington. D. C., 233pp.
Soil Minerlogy,Micronutrient Status
and Phytoremediation
Soil Micronutrient Status under Different Forest Ecosystems of
Dehradun District, Uttarakhand.
C.M. Mathavan and M.K.Gupta
Forest Soil and Land Reclamation Division, Forest Research Institute,
Dehra Dun-248 006, Uttarakhand, India
Abstract
Fertility and productivity of soil not only depend on major soil
nutrients (N, P and K), soil micronutrients also play an important role in
growth and development of plants. An attempt has been made to
generate information regarding the EDTA- extractable Iron (Fe), Zinc
(Zn), Copper (Cu) and Manganese (Mn) status under five different forest
covers of Dehra Dun district. Soil samples (0-30 cm), representing sal,
deodar, quercus, chir pine and miscellaneous forest systems, were
collected. The collected samples were processed and analyzed for pH
and organic carbon by standard procedures. The EDTA extractable Fe,
Zn, Cu and Mn were extracted with 0.05 M ethylene di-amine tetra-
acetic acid (EDTA) solution and analyzed with the help of atomic
absorption spectrophotometer. The soils under sal and deodar forests were
acidic in reaction with average pH values of 5.73 and 5.93, respectively
whereas quercus and chir pine forest soils were near neutral in reaction.
As high as 4.31 per cent of mean organic carbon content observed in
soils of deodar forest system followed by quercus (2.82%),
miscellaneous forest (2.68%), chir pine forest (2.26%) and sal forest
(1.59%). The EDTA-extractable Iron (Fe) content of soil recorded highest
mean value of 24.62 mg kg-1 under miscellaneous forest system, while
the lowest mean content of 11.91 mg kg-1 observed under soils of
deodar forest system. Mean values of soil EDTA-Zinc content varied
from 2.25 mg kg-1in chir pine, 2.80 mg kg-1 in sal, 5.25 mg kg-1 in
miscellaneous, 5.42 mg kg-1 in deodar and 6.33 mg kg-1 in quercus forest
systems. The available copper (Cu) content of soils collected from various
forest systems varied widely from 0.73 to 5.63 mg kg-1 with the highest
mean value of 3.91 mg kg-1 observed under chir pine forest soil.
Compare to other soil cationic micronutrients, manganese content was the
lowest with the mean value varied from 1.03 (quercus) to 1.75 mg kg-1
(deodar). As per the soil micronutrient critical limit concept, on an
average different forest systems of Dehra Dun district have capacity to
maintain sufficient range of micronutrients.
Keywords: Forest soil, EDTA, Iron, Zinc, Copper, Manganese
Introduction
Forests are providing important environmental services such
as carbon sequestration, landscape beauty, biodiversity conservation and
watershed protection. Foresters have always relied on knowledge of
chemical and physical properties of soils to assess capacity of sites to
support productive forests. Fertility and productivity of soil not only
depend on major soil nutrients (N, P and K), soil micronutrients also play
an important role in growth and development of plants. Role of
micronutrients in balanced plant nutrition and their importance in plant
physiological process are well established by essential nutrient concept.
Thus, knowledge of status of micronutrients is helpful in understanding the
inherent capacity of soil to supply these nutrients to plants. Availability of
micronutrients is influenced by their distribution in soil and other physico-
chemical properties of the soil (Sharma and Chaudhary, 2007). Besides
soil characteristics, vegetation type and covers also plays a vital role in
governing the nutrient dynamics and fertility of soils (Venkatesh et.al.,
2003). Soils under different vegetation may vary physico-chemical
properties which may modify extractable micronutrients content and
their availability. So, analysis of these properties along with
micronutrients under different forest systems may have significant
importance. Scanty information is available on status of soil cationic
micronutrients under various forest covers in India especially in the Dehra
Dun district of Uttarakhand. Keeping in this view an attempt has been
made to generate information regarding the available Fe, Zn, Cu and Mn
status and some physico-chemical properties under five different forest
covers viz. sal, deodar, quercus, chir pine and miscellaneous forest systems
of Dehra Dun district, Uttarakhand.
Materials and Methods
Fifty soil samples (0-30 cm), representing sal, deodar, quercus, chir
pine and miscellaneous forest systems (10 in each), were collected from
different locations of Dehra Dun district, Uttarakhand. The collected
samples were processed and sieved through 2mm sieve. Soil samples
were analyzed for pH and organic carbon by standard procedures. The
available fraction of four micronutrients viz. Fe, Zn, Cu and Mn were
analyzed by extracting a portion of 5 g soil with 100 ml of 0.05 M ethylene
di-amine tetra-acetic acid (EDTA) solution as per Quevauviller (1998) and
subsequently analyzed with the help of atomic absorption
spectrophotometer (GBC 904).
Results and Discussion
The data on soil pH and organic carbon status of soils under
various forest systems are presented in table 1. The pH values of soils
showed marked variations under different forest covers.The soils under sal
and deodar forests were acidic in reaction with average pH values of 5.73
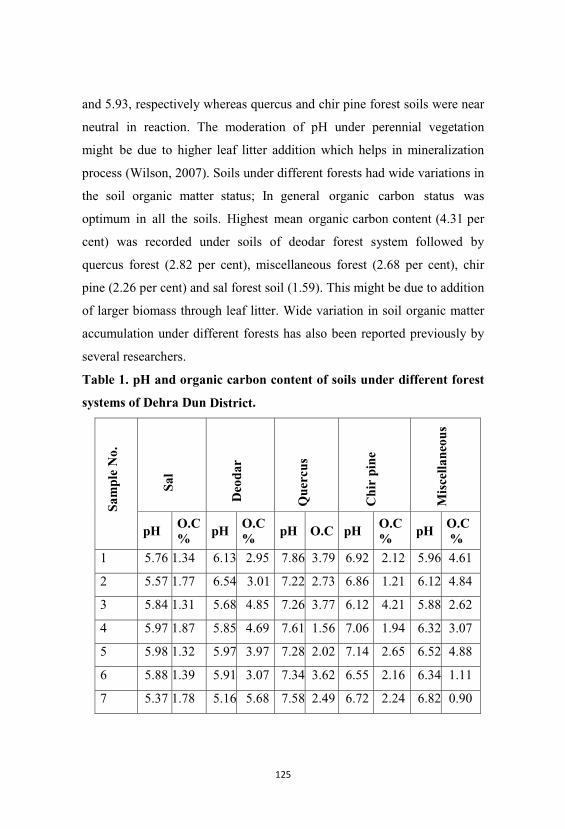
and 5.93, respectively whereas quercus and chir pine forest soils were near
neutral in reaction. The moderation of pH under perennial vegetation
might be due to higher leaf litter addition which helps in mineralization
process (Wilson, 2007). Soils under different forests had wide variations in
the soil organic matter status; In general organic carbon status was
optimum in all the soils. Highest mean organic carbon content (4.31 per
cent) was recorded under soils of deodar forest system followed by
quercus forest (2.82 per cent), miscellaneous forest (2.68 per cent), chir
pine (2.26 per cent) and sal forest soil (1.59). This might be due to addition
of larger biomass through leaf litter. Wide variation in soil organic matter
accumulation under different forests has also been reported previously by
several researchers.
Table 1. pH and organic carbon content of soils under different forest
systems of Dehra Dun District.
Sam
ple
No.
Sal
Deo
dar
Que
rcus
Chi
rpi
ne
Mis
cella
neou
s
pHO.C%
pHO.C%
pH O.C pHO.C%
pHO.C%
1 5.76 1.34 6.13 2.95 7.86 3.79 6.92 2.12 5.96 4.61
2 5.57 1.77 6.54 3.01 7.22 2.73 6.86 1.21 6.12 4.84
3 5.84 1.31 5.68 4.85 7.26 3.77 6.12 4.21 5.88 2.62
4 5.97 1.87 5.85 4.69 7.61 1.56 7.06 1.94 6.32 3.07
5 5.98 1.32 5.97 3.97 7.28 2.02 7.14 2.65 6.52 4.88
6 5.88 1.39 5.91 3.07 7.34 3.62 6.55 2.16 6.34 1.11
7 5.37 1.78 5.16 5.68 7.58 2.49 6.72 2.24 6.82 0.90
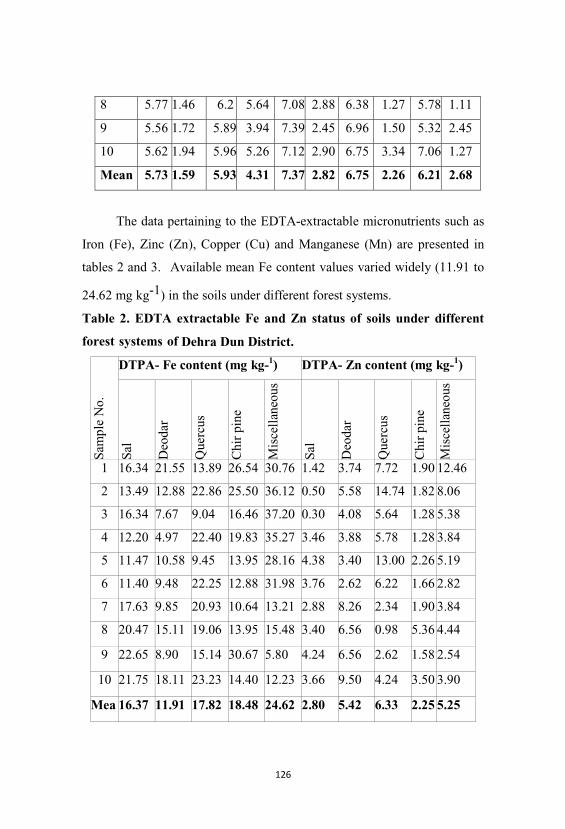
8 5.77 1.46 6.2 5.64 7.08 2.88 6.38 1.27 5.78 1.11
9 5.56 1.72 5.89 3.94 7.39 2.45 6.96 1.50 5.32 2.45
10 5.62 1.94 5.96 5.26 7.12 2.90 6.75 3.34 7.06 1.27
Mean 5.73 1.59 5.93 4.31 7.37 2.82 6.75 2.26 6.21 2.68
The data pertaining to the EDTA-extractable micronutrients such as
Iron (Fe), Zinc (Zn), Copper (Cu) and Manganese (Mn) are presented in
tables 2 and 3. Available mean Fe content values varied widely (11.91 to
24.62 mg kg-1) in the soils under different forest systems.
Table 2. EDTA extractable Fe and Zn status of soils under different
forest systems of Dehra Dun District.
Sam
ple
No.
DTPA- Fe content (mg kg-1) DTPA- Zn content (mg kg-1)
Sal
Deo
dar
Que
rcus
Chi
rpi
ne
Mis
cella
neou
s
Sal
Deo
dar
Que
rcus
Chi
rpi
ne
Mis
cella
neou
s
1 16.34 21.55 13.89 26.54 30.76 1.42 3.74 7.72 1.90 12.46
2 13.49 12.88 22.86 25.50 36.12 0.50 5.58 14.74 1.82 8.06
3 16.34 7.67 9.04 16.46 37.20 0.30 4.08 5.64 1.28 5.38
4 12.20 4.97 22.40 19.83 35.27 3.46 3.88 5.78 1.28 3.84
5 11.47 10.58 9.45 13.95 28.16 4.38 3.40 13.00 2.26 5.19
6 11.40 9.48 22.25 12.88 31.98 3.76 2.62 6.22 1.66 2.82
7 17.63 9.85 20.93 10.64 13.21 2.88 8.26 2.34 1.90 3.84
8 20.47 15.11 19.06 13.95 15.48 3.40 6.56 0.98 5.36 4.44
9 22.65 8.90 15.14 30.67 5.80 4.24 6.56 2.62 1.58 2.54
10 21.75 18.11 23.23 14.40 12.23 3.66 9.50 4.24 3.50 3.90
Mea 16.37 11.91 17.82 18.48 24.62 2.80 5.42 6.33 2.25 5.25
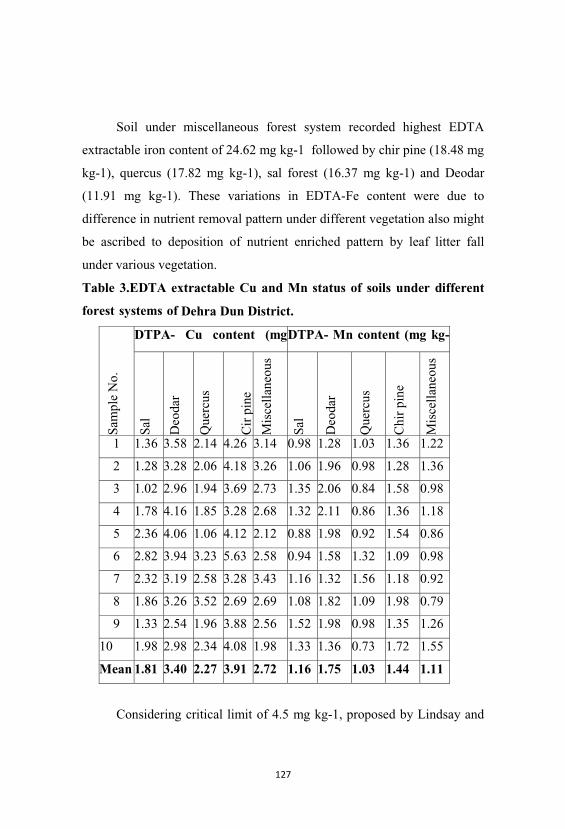
Soil under miscellaneous forest system recorded highest EDTA
extractable iron content of 24.62 mg kg-1 followed by chir pine (18.48 mg
kg-1), quercus (17.82 mg kg-1), sal forest (16.37 mg kg-1) and Deodar
(11.91 mg kg-1). These variations in EDTA-Fe content were due to
difference in nutrient removal pattern under different vegetation also might
be ascribed to deposition of nutrient enriched pattern by leaf litter fall
under various vegetation.
Table 3.EDTA extractable Cu and Mn status of soils under different
forest systems of Dehra Dun District.
Sam
ple
No.
DTPA- Cu content (mgDTPA- Mn content (mg kg-
Sal
Deo
dar
Que
rcus
Ci r
pine
Mis
cella
neou
s
Sal
Deo
dar
Que
rcus
Chi
rpi
ne
Mis
cella
neou
s1 1.36 3.58 2.14 4.26 3.14 0.98 1.28 1.03 1.36 1.22
2 1.28 3.28 2.06 4.18 3.26 1.06 1.96 0.98 1.28 1.36
3 1.02 2.96 1.94 3.69 2.73 1.35 2.06 0.84 1.58 0.98
4 1.78 4.16 1.85 3.28 2.68 1.32 2.11 0.86 1.36 1.18
5 2.36 4.06 1.06 4.12 2.12 0.88 1.98 0.92 1.54 0.86
6 2.82 3.94 3.23 5.63 2.58 0.94 1.58 1.32 1.09 0.98
7 2.32 3.19 2.58 3.28 3.43 1.16 1.32 1.56 1.18 0.92
8 1.86 3.26 3.52 2.69 2.69 1.08 1.82 1.09 1.98 0.79
9 1.33 2.54 1.96 3.88 2.56 1.52 1.98 0.98 1.35 1.26
10 1.98 2.98 2.34 4.08 1.98 1.33 1.36 0.73 1.72 1.55
Mean 1.81 3.40 2.27 3.91 2.72 1.16 1.75 1.03 1.44 1.11
Considering critical limit of 4.5 mg kg-1, proposed by Lindsay and
Norvell (1978), all the soil samples are sufficient in available Fe. These
results suggest that some of the soils under deodar forest system had
marginal level of Fe which indicates that corrective measures would be
required to avoid Fe chlorosis / Fe deficiency in the near future.
Mean values of soil EDTA-Zinc content varied from 2.25 mg kg-1in
chir pine,2.80 mg kg-1 in sal, 5.25 mg kg-1 in miscellaneous, 5.42 mg kg-
1 in deodar and 6.33 mg kg-1 in quercus forest systems. Critical limits for
available Zn identified by Takkar and Mann (1975) are < 0.6, 0.6 to 1.2
and > 1.2 mg kg-1 for deficient, medium and high, respectively.
Accordingly Zn content was found to be sufficient in most of the soils
under different forest systems except two locations under sal forest and one
location under quercus forest. Soils under perennial vegetation and tree
plantation had medium to sufficient range of Zn due to addition of leaf
litter and deposition of eroded material from slope (Katyal and Datta,
2004).
The available copper (Cu) content of soils collected from
various forest systems varied widely from 0.73 to 5.63 mg kg-1 with the
highest mean value of 3.91 mg kg-1 observed under chir pine forest soil.
Critical limits of copper identified by Katyal and Sharma (1991) are < 0.2,
0.2 to 2.0 and > 2 mg kg-1 for deficient, medium and high status.
Accordingly soils under sal forest were found to be medium in mean Cu
content, whereas mean Cu content of soils under other forest systems were
found to be high. This might be due to continuous organic matter addition
through leaf litter fall and acidic to neutral pH increases the solubility and
availability of Cu in soil.
Compare to other soil cationic micronutrients, manganese content
was the lowest with the mean values of EDTA-Mn content ranged from
1.03 to 1.75 mg kg-1 in soils under different forest systems. The highest
value of Mn was recorded in deodar forest soil, while the lowest
content was under quercus forest soil.
Considering 1.0 mg kg-1 as critical limit (Lindsay and Norvell
1978), all the soils are sufficient in available manganese. This sufficient
value might be due to better supply of manganese through parent material
and higher organic carbon may further increase the Mn solubility in soil.
Conclusions
It is apparent from the study that the soils are adequately
supplied with available micronutrient (Fe, Zn, Cu and Mn) contents.
Sufficient level of organic matter addition through leaf litter, parent
material and optimum pH are the main soil characteristics which maintain
adequate supply of micronutrient to soils under different forest
systems. As per the soil micronutrient critical limit concept, on an average
different forest systems of Dehra Dun district have capacity to maintain
sufficient range of micronutrients.
References
Katyal, J.C. and Datta, S.P. 2004. Role of micronutrients in ensuring the
optimum use of macronutrients. IFA International symposium on
micronutrients held at New Delhi, India during February 23-25,
2004
Katyal, J.C. and Sharma, B.D.1991. DTPA extractable and total Zn, Cu,
Mn and Fe in Indian soils and their association with some soil
properties. Geoderma 49,165-179
Lindsay, W.L. and Norvell, W.A. 1978. Development of a DTPA soil test
for zinc, iron, manganese, and copper. Soil Science Society of
America Journal 42: 421-428.
Quevauviller, P.H. 1998. Operationally defined extraction procedures for
soil and sediment analysis. Trends in Analytical Chemistry 17: 289-
298.
Sharma, J.C. and Chaudhary, S.K.2007. Vertical distribution of
micronutrient cations in relation to soil characteristics in lower
Shiwaliks of Solan district in North- West Himalayas. Journal of the
Indian Society of Soil Science 55, 40-44.
Takkar, P.N. and Mann, M.S. 1975. Evaluation of analytical methods of
estimating available zinc and response of maize to applied zinc in
major soil series of Ludhiana, Punajb. Agrochimica 20, 420-430
Venkatesh, M.S., Majumdar, B., Kumar, K and Patiram 2003. Status of
micronutrient cations under various land use systems of Megalaya.
Journal of the Indian Society of Soil Science 51, 6.-64.
Wilson, Brian R.2007. Scattered native trees and soil pattern in grazing
land on Northern Table lands of New South Wales, Australlia.
Australian Journal of Soil Research 45, 199-205.
Microbes and Green Technology: Role of Microbial inoculants on
Establishment of Plantation and Natural Regeneration in Limestone
Mine Spoils
Anuj Kumar Singh and Jamaluddin*
Orissa University of Agriculture & Technology, Bhubaneswar
*Department of Biological Science, Rani Durgavati University, Jabalpur
Abstract
Exploitation of limestone has resulted disturbance of large tract of
land. The fertility status of soil is changed to a considerable extent after
mining. Mining disrupts soil-plant-microbe system and causes alteration of
nutrient dynamics and results into reduction in soil productivity. In such
soil conditions, natural regeneration is a very slow process and may take
many years to develop a full fledged ecosystem. Merely plantation may
not guarantee establishment of plant on mined spoils as there is no
constant supply of essential nutrients due to lack or less population of
under ground microbial flora. Such degraded land which has low
microbial density, low nutrients level with poor nutrient cycling capacity;
inoculation of selected microbes are very helpful in the establishment,
growth and survival of plants. A consortium of beneficial microbes like
plant growth promoting rhizobacteria (PGPRs) along with arbuscular
mycorrhizal fungi may play pivotal role in restoration of such harsh
sites. An important goal of restoration is to accelerate natural successional
processes so as to increase biological productivity, reduce rates of soil
erosion, increase soil fertility and increase biotic control over
biogeochemical fluxes within the recovering ecosystems. Analysis of
different natural successions on natural and artificial substrates suggests
that one of the important factors limiting the rate of development is the
process of immigration of flora. Application of microbial inoculants ensure
the establishment of nutrient supply , soil development which attracts
immigration of surrounding species, accelerates natural regeneration
process and ultimately a self sustained system on mined spoils is
developed.
Keywords: Limestone mine spoils, PGPRs, natural regeneration,
restoration
Introduction
It is universally accepted that the microbes are beneficial in the
activity of important functions performed in the ecosystem. Soil
microbial biomass, living part of the soil organic matter, is an agent of
transformation of organic matter and source of available nutrients.
Activities of soil microbes can change the soil environment much rapidly
and provide key controlling influence on the rate at which nutrient cycling
processes take place and play a very important role in the formation of
macro aggregates. The potential of soil microorganisms has been
recognized widely in improvement of soil quality, soil formation,
aggregation and revegetation through their activities in litter
decomposition, phosphate solubilization, nitrogen fixation, oxidation of
various inorganic components of soil or mineralization of inorganic
components and mycorrhizal symbiosis are major beneficial activities that
play a very important role in soil system functioning. Implications of
plants and their symbionts like mycorrhizal fungi, nitrogen fixing bacteria
and free-living rhizosphere population of bacteria promote plants
establishment and growth. Thus, an active soil microbial biomass is an
essential factor in the long-term fertility of soils. Application of microbial
technology has become an integral element of forestry and agriculture and
has substantially contributed in forest and agricultural productivity.
This article reviews some of the important aspects of microbial
applications in forestry and discusses implications of microbial
inoculation in restoration of limestone mined out lands.
Soil-Plant-Microbe Interaction
Microbial activity in the rhizosphere affects rooting patterns and the
supply of available nutrients to plants thereby modifying the quality and
quantity of root exudates (Bowen and Rovira, 1999; Gryndler, 2000;
Barea, 2000).Carbon fluxes are crucial determinants of rhizosphere
function. The release of root exudates and decaying plant material
provide sources of carbon compound for the heterotrophic soil biota as
either growth substrates or structural material for root associated
microbiota (Werner, 1998). Nitrogen-fixing microbes can exist as free-
living organisms in associations of different degrees of complexity with
other microbes and plants. The most abundant elements in the atmosphere
(N2) are very often the limiting element for the growth of most organisms.
Many soil organisms interact with each other to overcome of the
limitation. Positive effects of Rhizobium sp. inoculation in combination
with Azotobacter sp. or Azospirillum sp. inoculants have been reported
for different forage and grain legumes. The role of microorganisms
in nutrient cycling is unique. An active biomass is an essential factor in
the long-term fertility of restored soil. It is therefore essential that microbes
beneficial for plant growth have to be introduced to the spoils. Among the
different microbes vesicular- arbuscular mycorrhizal fungi, nitrogen fixers
and phosphate solubilizers are very important for any plant. Phosphorus
is an important plant nutrient next to nitrogen for plants growth. The
most important aspect of phosphorus cycle is microbial mineralization,
solubilization and immobilization besides chemical fixation of phosphorus
in the soil. Phosphorus solubilising microorganisms convert insoluble
inorganic phosphate compounds into soluble form. A considerable higher
concentration of phosphate solubilising bacteria is commonly found in
the rhizosphere soil. Also the fungal genera with this capacity are
Penicillium and Aspergillus (Suh et al., 1995; Whitelaw et al.,
1999).Pseudomonas is a typical PGPR and their interactions with AM
fungi mutually enhance each other’s colonization and achieve additive
plant growth enhancement (Singh and Jamaluddin, 2008). Another
mechanism of action of PGPR on plant growth is the production of
siderophores. The siderophores are produced by most fungi and bacteria
including Pseudomonas, Rhizobium and Azotobacter (Meyer and
Linderman, 1986).Arbuscular Mycorrhiza Fungi (AMF) which are an
important group of soil-borne microorganisms; contribute substantially to
the establishment, productivity, and longevity of natural or man-made
ecosystems. These fungi form symbiotic association with most
terrestrial plant families. Due to the extensive network of external
hyphae which function as plant rootlets and increase Phosphorus uptake,
arbuscular mycorrhizal fungi are considered as beneficial
microorganisms. The species of Pseudomonas, Bacillus, Aspergillus,
Penicillium etc. have been reported to be active in the bioconversion of
insoluble phosphorus. These organisms produce organic acids like citric,
glutamic, succinic, lactic and tartaric acids which are responsible for
solubilization of insoluble forms of phosphorus. Phosphorus solubilising
microorganisms synergistically interact with nitrogen fixing
microorganisms. These PGPRs are widely being exploited as biofertilizers
in agriculture, horticulture, forestry, agro-forestry (Gaur, 1990).
Phosphorus Nutrition of Plants on Mined Spoils
Phosphorus is an important plant nutrient next to nitrogen for
plants growth.The most important aspect of phosphorus cycle is microbial
mineralization, solubilization and immobilization besides chemical fixation
of phosphorus in the soil. Phosphorus solubilising microorganisms
convert insoluble inorganic phosphate compounds into soluble form. A
considerable higher concentration of phosphate solubilising bacteria is
commonly found in the rhizosphere soil. A significant amount of
phosphorus is bound in organic forms in the rhizosphere. Phosphatase
enzymes produced by plants and microbes are presumed to convert
organic phosphorus into available phosphate, which is absorbed by plants.
Phosphate availability is one of the major growth limiting factors for
plants in many natural ecosystems (Antibus and Dighton, 1993). Plants
absorb phosphorus from the soil as inorganic phosphate ions, but there
availability is severely restricted by reactions of inorganic and organic
phosphates with soil constituents. Phosphatase enzymes can significantly
import the availability and recycling of phosphorus in and around the
rhizosphere. Mine spoils are infertile strata for the plant growth
(Bradshaw, Dancer, Handley, and Sheldon,1975). Since calcareous mine
spoils present low level of key nutrients like N,P and K and also lack
sufficient level of organic matter. An appropriate level of nutrients and
microbial system is a requisite for the growth and establishment of
plants. Phosphorus is one of the major constituents of the soil nutrients
system, which often becomes inadequate in mine spoils. In such
unfavorable conditions phosphatase enzyme activity of plants may prove
significant in the phosphorus liberation from organically bound
phosphorus to available inorganic form. This liberated and available
form of phosphorus is mineralized by rhizosphere microbes and is made
available for plants uptake. A study on effect of AMF inoculation on
phosphatase enzyme activity conducted by Singh and Jamaluddin (2008)
reported that the inoculation of AM fungi influenced both the phosphatases
(acid and alkaline) activity. By inoculation of AM fungi; activity of both
acid and alkaline phosphatases was found to be increased in the
rhizosphere soil of Jatropha curcas. There was significant variation
(p<0.05) in the acid phosphatase activity in the rhizosphere soil of
inoculated and un-inoculated plants. Alkaline phosphatase activity was
also found enhanced in the rhizosphere soil of inoculated plants. From the
above records, it is clearly evident that arbuscular mycorrhizal fungi
affected the activity of both the phosphatases. Mutualistic association
thus may improve the phosphorus mineralization and its acquisition by
plants. In this study, acid phosphatase activity was found greater than
alkaline phosphatase activity in rhizosphere soil of both inoculated and
uninoculated plants. Acid phosphatases contribute significantly to the
mineralization of organic phosphorus compounds in soil, thus
enhancing the biological availability of released inorganic phosphorus.
Kennedy and Rangarajan (2001) observed significant increase in both the
acid and alkaline phosphatase activity in three varieties of Papaya and
observed comparatively higher acid phosphatase activity than alkaline
phosphatase activity. Mohandas (1992) observed significant
enhancement in the activity of acid and alkaline phosphatase in the root
surface of papaya inoculated with AM fungi, also observed that G.
mosseae inoculation resulted in a higher increase compared to G.
fasciculatum and acid phosphatase activity was higher than the alkaline
phosphatase activity. Tisserant et al. (1993) suggested that alkaline
phosphatase activity was induced by colonization of host roots and
this enzyme could be used for analyzing the symbiotic efficiency of
arbuscular mycorrhizal infection. Thiagarajan and Ahmad (1994) reported
increased acid and alkaline phosphatase activity in AM inoculated cowpea
(Vigna unguiculata) plants as compared to uninoculated plants. Joner
and Johansen (2000) studied comparative effect of different arbuscular
mycorrhizal fungi on phosphatase activity in soil and found that G.
intraradices showed the highest external phosphatases activity in two
experiments and G. claroides had the same activity in one experiment.
Dodd et al. (1987) observed comparatively enhanced acid and alkaline
phosphatase activity in the rhizosphere of AM inoculated pants than
uninoculated ones. Studies conducted at the International Crops Research
Institute for the Semi Arid Tropics (ICRISAT), Andhra Pradesh, India
showed that in sterilized soil, acid and alkaline phosphatase activities in
the rhizospheres of mycorrhizal and non-mycorrhizal plants were higher
than in non- rhizosphere soil. With acid phosphatase, the activity was
highest in the rhizosphere of mycorrhizal plants followed by rhizosphere of
non-mycorrhizal plants and non-mycorrhizal soil (Krishna and Bagyaraj,
1985).These studies reflect significance of microbes in phosphorus
nutrition of the plants.
Microbial Solubilization of Calcite Rocks
Soil microorganisms inhabiting the rhizosphere environment
interact with plant roots and mediate nutrient cycling. Solubilization of
rock materials by microorganisms contribute to a great extent and play
very important role in maintaining supplies of inorganic nutrients for
plants. Limestone mine overburden dumps are composed of large amount
of infertile soil along with waste rocks. These over burden dumps are
deficient in nutrients and are unable to support vegetation on mined dumps.
In such alkaline soil, the activity of calcium and its minerals become high.
As these minerals are rock bound, their release into the soil is very slow.
The solubilization of these rock bound minerals is very important for the
enrichment of the fertility of the mined spoils. The soil microorganisms
play an active role in the solubilization of calcite rocks and the minerals
released into the soil may be utilized by the plants grown in calcite
medium of limestone mined spoils. Singh and Jamaluddin (2010) reported
an increase in the phosphate solubilization efficiency of Pseudomonas
fluorescens and Azospirillum sp. when the isolates of both the bacterial
strains repeatedly exposed in calcium rich medium. The in vitro assay
showed the bacterial inoculation solubilized the added rock power more
efficiently at when they repeatedly inoculated in calcium rich medium.
It may be an indication of development of more tolerant and more
efficient strain of the same bacterial isolates. Such efficient strains may be
developed and multiplied for use in the field poor in nutrients Phosphorus
in particular. Leyval et al. (1990) also reported bacterial solubilization of
Mica mineral which led release of unavailable nutrients to Pine and Beech.
Watteau and Berthelin (1994) emphasized that the organic acids produced
by rock dissolving bacteria enhanced the weathering of primary rock
minerals by chelating cations from minerals. The rhizosphere of the Plant
which is rich in microbial diversity especially of bacteria, contribute
significantly to the supply of nutrients to plants (Hinsinger and
Gilkes,1993).These bacterial population can be developed in more capable
strains and can be multiplied for application in the field. Chang and Li
(1998) demonstrated induced weathering processes by combined effect of
plant root and soil microbes which may be responsible for
transformation of mineral structure, removing cations from the minerals
for rapid uptake by plants. Seshadri et al. (2000) tested three strains of
Azospirillum sp. to study their capability to solubilize inorganic phosphate
in- vitro. Gaur (1990) reported solubilization of tricalcium phosphate in
liquid medium by using bacterial inoculants and demonstrated phosphorus
solubilising bacteria as a significant bacterial biofertilizers. Agnihotri
(1970) tested some fungal isolates for efficiency of solubilization of
insoluble phosphate and observed the solubilization process to a
maximum extent. Similar observations in respect to the activity of
Streptomyces sp. against rock phosphate solubilization were made by
Bardiya and Gaur (1974). The periodic solubilization of ferric and
Aluminium phosphate was investigated in liquid medium by Gaur and
Gaind (1983).Ahmad and Jha (1968) reported the solubilization of rock
phosphate and hydroxyapatite by some bacteria and fungi. Wani et al.
(1979) also confirmed the rock solubilization ability of selected strains of
Pseudomonas striata and Bacillus polymyxa on both solid and liquid
mediums. The investigations carried out in the present study are an
indication of the development of new strains of the test organisms.
These improved strains can be further multiplied in bulk and can be used
for biological solubilization of rock bound minerals in nutrient deficient
soils like limestone mined overburden dumps.
Mycorrhizal Technology and Mines Restoration
Arbuscular Mycorrhizal associations are important in natural and
managed ecosystems due to their nutritional and non- nutritional benefits
to their symbiotic partners. They can alter plant productivity because AMF
acts as biofertilizers, bioprotectant or biodegraders and are known to
improve plant growth and health by improving mineral nutrition or
increasing resistance or tolerance to biotic and abiotic stresses.
Mycorrhizal fungi are species of fungi that intimately associate
with plant roots forming a symbiotic relationship, with the plant
providing ca for the carbohydrate for fungi and the fungi providing
nutrients such as phosphorus, to the plants. Mycorrhizal fungi can absorb,
accumulate and transport large quantities of phosphate within their hyphae
and release to plant cells in root tissue. Mycorrhizal symbiosis is very
important in agriculture and forestry. Plants inoculated with arbuscular
mycorrhiza have been shown to be more resistant to some root diseases. It
is now generally recognized that they improve not only the phosphorus
nutrition of the host plant but also its growth, which may rest in an
increase in resistance to drought stress and some diseases. Therefore, AM
fungi offer a great potential for sustainable agriculture, and the application
of AM fungi to agriculture has been developed.
AM fungi modify the quality and abundance of micro flora and alter
overall microbial activity. Following host root colonization the AMF
induces changes in the host root exudation pattern, which alters the
microbial equilibrium in the rhizosphere (Pfledger and Linderman, 1994).
These interactions enhance plant growth, health and productivity (Paulitz
and Linderman, 1989). Applications of biofertilizers have great potential in
preventing soil degradation and restoring soil fertility of drastically
disturbed lands. Plant succession following drastic disturbance due to
mining is a subject of both practical and ecological interest. Wali and
Freeman (1973) pointed out that an adequate understanding of natural
revegetation processes should be included in all rehabilitation efforts
without which no desired plant cover will be possible. Bradshaw (1983)
reported that natural processes of ecosystem development on derelict lands
are slow and stochastic.In fact, in some countries the AM fungal inocula
have been commercialized. Since it is laborious and cost-consuming for
production of AM fungal inocula because of their obligate biotrophic
nature, the ways to increase the function of the indigenous AM fungi in
soil have also been developed. AM fungal association enhances nitrogen
gain in ecosystems by increasing the nitrogen fixation rates of plant and
nitrogen fixing bacterial associations. In many ecosystems a large fraction
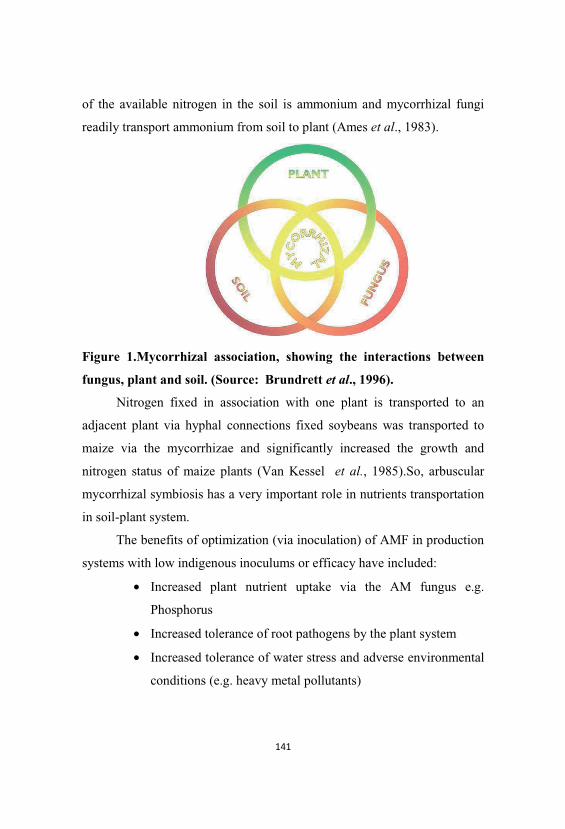
of the available nitrogen in the soil is ammonium and mycorrhizal fungi
readily transport ammonium from soil to plant (Ames et al., 1983).
Figure 1.Mycorrhizal association, showing the interactions between
fungus, plant and soil. (Source: Brundrett et al., 1996).
Nitrogen fixed in association with one plant is transported to an
adjacent plant via hyphal connections fixed soybeans was transported to
maize via the mycorrhizae and significantly increased the growth and
nitrogen status of maize plants (Van Kessel et al., 1985).So, arbuscular
mycorrhizal symbiosis has a very important role in nutrients transportation
in soil-plant system.
The benefits of optimization (via inoculation) of AMF in production
systems with low indigenous inoculums or efficacy have included:
• Increased plant nutrient uptake via the AM fungus e.g.
Phosphorus
• Increased tolerance of root pathogens by the plant system
• Increased tolerance of water stress and adverse environmental
conditions (e.g. heavy metal pollutants)
• Increased efficacy of N-fixation by Rhizobium and other
nitrogen fixing bacteria
• Increased natural succession
• Increased plant biodiversity in restored ecosystems
• Increased stability of soils
Microbes, Mines Restoration and Natural Regeneration
Soil acts as a critical controlling component in the development of
any ecosystem. Mine spoils are not suitable for both plant and microbial
growth because of low organic matter content, unfavorable pH, drought
arising from coarse texture or oxygen deficiency due to compaction. The
other factors for revegetation of mine spoil may be salinity, alkalinity,
poor water holding capacity, inadequate supply of plant nutrients and
accelerated rate of erosion. The soils of disturbed sites are frequently low
in available nutrients and lack the nitrogen-fixing bacteria and mycorrhizal
fungi usually associated with root rhizospheres. As such, land restoration
in semi-arid areas faces a number of constrains related to soil degradation
and water shortage. As mycorrhizae may enhance the ability of the plant to
scope with water stress situations associated to nutrient deficiency and
drought. The use of AMF could reduce the amount of fertilizer needed for
the establishment of vegetation and could also increase the rate at which
the desired vegetation becomes established by stimulating the development
of beneficial microorganisms in the rhizosphere. Degraded soils are
common targets of revegetation efforts in the tropics, but they often exhibit
low densities of AMF fungi . This may limit the degree of mycorrhizal
colonization in transplanted seedlings and consequently hamper their
seedling establishment and growth in those areas. Soil inoculation with
consortium of AMF and PGPRs has significantly enhanced plant growth
and biomass production in limestone mine spoils. Inoculation of native and
well adapted microbial flora may prove a proficient tool for restoration of
heavily degraded limestone mine spoils. Native benefifical microbial
flora like arbuscular mycorrhizal fungi along with Phosphorus solubilising
bacteria(PSB) and nitrogen fixing bacteria were isolated, multiplied and re-
inoculated in different important plant species viz Pongamia pinnata,
Jatropha curcas, Withania somnifera and Ailanthus excelsa. All the
inoculated plants exhibited enhanced growth and development as
compared to uninoculated ones. Moreover, inoculation with beneficial
plant growth promoting rhizobacteria (PGPRs) changed the soil
characteristics and also allowed increased invasion and natural succession
on reclaimed spoil as compared to unreclaimed sites (Singh and
Jamaluddin,2009;Dutta and Agrawal,2002;Singh,2004).
Numerous studies have demonstrated that land restoration benefits
from microbial inoculation in plantations on mines spoil. Plantation allows
jump start succession. The catalytic effects of plantations are due to
changes in under story microclimatic conditions (increased soil moisture,
reduced temperature etc.), increased vegetational structure complexity,
development of litter and humus layers and the soil physical and chemical
environment and accelerating development of diversity on degraded sites.
Plantations have an important role in protecting the soil surface from
erosion and altering the accumulation of fine particles. They can reverse
degradation process by stabilizing soil through development of extensive
root systems. Plantation of suitable species speed up succession that fulfills
revegetation goal. Besides controlling leaching of nutrients through soil
erosion increases plant diversity. Earlier studies indicated that well adapted
plant species could be recommended to establish self-sustaining cover,
which require little maintenance activities. In restoration, emphasis is
given first to build soil organic matter, nutrients and vegetation cover to
accelerate natural recovery process. Plantation can be used as a tool for
mine spoil restoration as well as carbon sequestration. Once plantation is
established, plants increase soil organic matter, lower soil bulk density,
moderate soil pH and bring mineral nutrients to the surface and accumulate
them in available form. The plants accumulate these nutrients and re-
deposit them on the soil surface in organic matter, from which nutrients are
much more readily available for microbial breakdown. Once the soil
characteristics have been restored, it is not difficult to form the full suit of
self sustained plantation on mined lands. Some of the plant species viz.
Jatropha curcas, Pongamia pinnata, Ailanthus excelsa and Withania
somnifera have been successfully experimented on limestone mined out
areas of Madhya Pradesh in India. These important biodiesel and medicinal
plant species ensured their survival and also attracted different other
shrubs, grasses and tree species to grow under planted area. Plantation on
mined spoil created catalytic effects to restore soil fertility and ameliorate
microclimatic conditions.. A number of restoration ecologists have
suggested many approaches for restoration of mined land (Soni et al.,
1989); however they all recommend afforestation approach which is
uniformly accepted. However, the plantation supplemented with beneficial
microbial inoculants has greater influence on the natural regeneration
process on mined spoil (Singh and Jamaluddin, 2009). Consortium of
bacterial inoculants and arbuscular mycorrhizal fungi is supposed to
accelerate nitrogen fixation and phosphatase enzyme activity in the
rhizosphere of plants which ensures the supply of nitrogen and phosphorus
in the soil. More over, plant cover prevents soil from erosion thus
increasing the infiltration rate of the water in the soil. All these changes
and favorable alteration of soil characteristics causes immigration of
surrounding native herb and tree species and results into jump start
succession on mined site.
For reclamation of such problematic mine spoils, microbial
inoculants like phosphate solubilizing microorganisms, Azospirillum,
Rhizobium and Vesicular - Arbuscular Mycorrhiza are recommended to
use. Fixation of atmospheric nitrogen and mobilization of essential
micronutrients make them easily accessible to plants. This approach leads
to achieve the fertility, thus improving the water holding capacity of soil
and creating topsoil to sustain high quality vegetation cover. The
rejuvenation of mine spoil dump and mined land productivity and fertility
through amendment of these microbial inoculants would enable restoration
of the degraded land and creation of a self sustained ecosystem. Thus, the
improvement in the physico-chemical and microbial status of soil through
organic blending, inoculation with biofertilizers, plantation of suitable
plant species and establishment of bio-geochemical cycle in the mine
spoils are, therefore, essential to achieve the objectives of restoration of
land fertility, productivity and biological rejuvenation of limestone mined
spoils.
References
Agnihotri,U.P.1970. Solubilization of insoluble phosphates by some
soil fungi isolated from nursery seedbeds.Canadian J.Microbiology,
16:877-880.
Ahmed, N. and Jha. K.K. 1968. Solubilization of rock phosphate by
microorganisms isolated from Bihar soils. J. Gen. Appl. Microbiol.,
14:89-95.
Ames, R.N., Reic, C.P.P., Proter, L.K. and Cambardella, C. 1983. Hyphal
uptake and transport of nitrogen from two N-labeled Sources by
Glomus mosseae a vesicular arbuscular mycorrhizal fungus. New
Phytologist, 95: 381-396.
Antibus, R.K. and Dighton, J. 1993. Acid phosphatase activities and
oxygen uptake in mycorrhizas of selected deciduous forest trees,
65: Proceedings of the 9th North American Conference on
Mycorrhizae, 8-12 August, 1993,University of Guelph, Guelph,
Ontario, Canada.
Barea, J.M. 2000. Rhizosphere and Mycorrhizae of field crops, In
Biological Resource Management, connecting science and
Policy(OECD),Toutant, P., Balazs, E., Galante, E. (eds.), INRA and
Springer, Berlin, Heidelberg, New York.
Bowen, G.D. and Rovira, AD. 1999. The rhizosphere and its management
to improve plant growth. Advances in Agronomy, 66:1-102.
Bradshaw, A.D., Dancer, W.S., Handley, J.F. and Sheldon, J.C. 1975.
Biology of land revegetation and reclamation of china-clay wastes,
363-384 : In The ecology of Resource degradation and renewal,
Chadwick, M.J. and Goodman, G.T. (eds.), Blackwell Scientific
Publication, Oxford, England.
Brundrett M, Beegher N, Dell B, Groove T, Malajczuk N (1996) Working
with mycorrhizas in Forestry and Agriculture. ACIAR Monograph
32. 374 + xp. ISBN 186320 1815
Chang, T.T. and Li, C.Y. 1998. Weathering of limestone, marble and
calcium phosphate by ectomycorrhizal fungi and associated
microorganisms. Taiwan J. Forestry Sci., 13(2): 85-90.
Chen BD, Li XL, Tao HQ, Christie P, Wong MH (2003). The role of
arbuscular mycorrhiza in zinc uptake by red clover growing in
calcareous soil spiked with various quantities of zinc.
Chemosphere,50(6): 839-846
Cook, C.W., Hyde, R.M. and Sims, P.L. 1974.Guidelines for revegetation
and stabilization of surface mined areas in the western states.
Colorado State University, Range Science Series, 16: 70 pp.
Cumming Jr, Ning J (2003). Arbuscular mycorrhizal fungi enhance
aluminium resistance of broomsedge (Andrpongon
virginicus L). J.Exp. Bot.54(386):1477-1459.
Dancer, W.S., Handley, J.F. and Bradshaw, A.D. 1977. Nitrogen
accumulation in kaolin mining wastes in Cornwall. II. Forage
Legumes. Plant and Soil,48:303-314.
Dodd, J.C., Burton, C.C., Burns, R.G. and Jeffries, P. 1987. Phosphatase
activity associated with the roots and the rhizosphere of plants
infected with vesicular- arbuscular mycorrhizal fungi. New
Phytologist, 107(1): 163-172.
Dutta, R.K. and Agrawal, M. (2002).Effects of tree plantations on the soil
characteristics and microbial activity of coal mine spoil land.
Tropical ecology, 43(2):315-324.
Gaur, A.C. and Gaind, S.1983. Microbial solubilization of phosphates
with particular reference to iron and aluminium phosphate. Sci.
Cult.,49:110-112.
Gaur,A.C.1970.Role of phosphate solubilizing microorganisms and
organic matter in soil productivity,259-268, National symposium on
Soil productivity, National Academy of Sciences.
Gaur,A.C.1990. Phosphate solubilizing bacteria as biofertilizer,160-176:In
Phosphate solubilizing microorganisms as biofertilizers. Omega
Scientific Publishers, New Delhi.
Gonzalez-Chavez, M.C., Carrilo-Gonzalez, R., Wright, SF. and Nichols,
K. 2004. The role of Glomalian, a protein produced by arbuscular
mycorrhizal fungi, in sequestering potentially toxic elements.
Environ.Pollution,130:317-323.
Gryndler, M.2000. Interactions of arbuscular mycorrhizal fungi with
other soil organisms,239-262: In Arbuscular mycorrhizas:
Physiology and function, Kapulnik, Y. and Douds Jr, D.D. (eds.),
Dordrecht Kluwer academic publishers, The Netherlands.
Hinsinger, P. and Gilkes, R.J. 1995. Root-induced dissolution of phosphate
rock in the rhizosphere of lupins grown in alkaline soil. Australian
J. Soil Res. 33: 477-489.
Jamal A, Ayub N, Usman M, Khan AG (2002). Arbuscular
mycorrhizal fungi enhance zinc and nickel uptake from
contaminated soil by soybean and lentil. International Journal of
Phytoremediation, 4(3):203-221.
Joner, E.J. and Johansen, A. 2000. Phosphatase activity of external
hyphae of two arbuscular mycorrhizal fungi. Mycological Research,
104:81-86.
Kennedy,Z.J. and Rangarajan ,M. 2001.Biomass production, root
colonization and phosphatase activity by six mycorrhizal fungi in
papaya. Indian phytopathology, 54 (1):72-77.
Krishna, K.R. and Bagyaraj, D.J. 1985. Phosphatases in the rhizospheres of
mycorrhizal and non-mycorrhizal groundnut. Journal of Soil
Biology and Ecology 5(2): 81-85.
Leyval, C.,Laheurte, F., Belgy, G. and Berthelin, J. 1990. Weathering of
micas in the rhizospheres of maize, pine and beech seedlings
influenced by mycorrhizal and bacterial inoculation. Symbiosis,
9:105-109.
Liao JP, Lin XG, Cao ZH, Shi YQ, Wong MH (2003). Interactions
between arbuscular mycorrhizae and heavy metals under sand
culture experiment. Chemosphere 50 (6) :847-853.
Marin M, Ybarra M, Fe A, Garcia-Ferriz L (2002). Effect of arbuscular
mycorrhizal fungi and pesticides on Cyanara cardunculatus growth.
Agricultural and Food Science in Finland 11 (3): 245-251.
Meyer, R.J. and Linderman, R.G.1986.Response of subterranean clover to
dual inoculation with vesicular arbuscular mycorrhizal fungi and
plant growth promoting rhizobacterium Pseudomonas putida.
Soil Biol.Biochem.,18 (2):185-190.
Mohandas, S.1990. Enhanced phosphatase activity in mycorrhizal Papaya
(Carica papaya cv. Coorg honey dew) roots, 55-56: In Current
Trends in Mycorrhizal Research, Jalali B.L. and Chand, H. (eds.),
Proceedings of the National Conference on Mycorrhiza, Haryana
agriculture University, Hisar, Haryana.
O’Connor, P.J., Smith, S.E. and Smith, F. 2002.Arbuscular Mycorrhizas
influence plant diversity and community structure in a semi arid
herb land. New Phytologist,154 (1):209-218.
Palaniappan,S.P. and Natarajan.1993.Practical aspects of organic mater
maintenance in soils.23-41:In Organics in soil health and crop
production, Thompson, P.K.(eds.),Tree crops development
foundation, Indiaseed.675pp.
Sheshadri, S.,Muthukumarasamy,Lakshminarsimhan, C.and Ignacimuthu,
S. 2000.Solubilization of inorganic phosphates by Azospirillum
halopraeferans.Current Science, 79(5): 565-567.
Rao AV, Tak R (2002). Growth of different tree species and their nutrient
uptake in limestone mine spoil as influenced by arbuscular
mycorrhizal (AM)-fungi in Indian arid zone. J. Arid Environ.
51(1):113-119.
Rufykiri G, Thiry Y, Wang L, Delvaux B, Declerck S (2002). Uranium
uptake and translocation by the arbuscular fungus, Glomus
intraradices, under root-organ culture conditions. New
Phytol.156(2): 275-281.
Singh,A.(2004).Herbaceous biomass yield on an age series of naturally
revegetated mine spoils in a dry tropical environment. Journal of
Indian Institute of Science.84:53-56.
Singh, Anuj Kumar and Jamaluddin (2008). Phosphatase activity in the
rhizosphere of medicinal plants inoculated with Arbuscular
Mycorrhizal Fungi. Mycorrhiza News, 19(3):11-12.
Singh, Anuj Kumar and Jamaluddin (2009). Effect of bio-inoculants and
stone mulch on performance of biodiesel and medicinal plant species
on limestone mined spoil. Mycorrhiza News, 21(3):31-33
Singh, Anuj Kumar and Jamaluddin(2009).Effect of microbial inoculants
on performance of Pongamia pinnata in calcareous mined spoils.
Indian Forestry, March: 1-5.
Singh, Anuj Kumar and Jamaluddin (2010).Synthesis of resistance and
enhanced mineral solubilization capacity of Plant Growth Promoting
Rhizobacteria (PGPRs) native to calcareous soils of limestone
mined spoils. Indian Forester (In press).
Soni, P., Vasistha, H.B., Kumar, O. and Bhatt, V. 1989. Successional
trends in mined ecosystems. J. Nat. Cons., 1:115-122.
Suh, J. S., Lee, S. K., Kim, K.S. and Seong, K. Y. 1995. Solubilization
of Insoluble Phosphates by Pseudomonas putida, Penicillium sp.
and Aspergillus niger isolated from Korean Soils. JKSSF,
28(3):278-286.
Thiagarajan, T.R. and Ahmad, M.H. 1994. Phosphatase activity and
cytokinin content in cowpeas (Vigna unguiculata) inoculated with a
vesicular arbuscular mycorrhizal fungus. Biology and Fertility of
Soils, 17(1):51-56.
Tisserant, B., Gianinazzi-Pearson, V., Gianinazzi, S. and Gollett, A. 1993.
Plants histochemical staining of fungal alkaline phosphatase activity
for analysis of efficient arbuscular mycorrhizal infections.
Mycological Research, 972: 245-250.
Vankessel, C., Singleton, P.W. and Hoben, H.J. 1985.Enhanced nitrogen
transfer from a soybean to maize by vesicular-arbuscular
mycorrhizal fungi. Plant Physiology,79: 562-563.
Wani, P.V.,More, B.B. and Patil, P.L. 1979.Physiological studies on the
activity of phosphorus solubilizing microorganisms. Indian J.
Microbiology, 19:23-25.
Watteau, F. and Berthelin, J. 1994. Microbial dissolution of iron and
aluminium from soil minerals: efficiency and specificity of
hydroxamate siderophores compared to aliphatic acids. European
J. Soil Biol., 30:1-9.
Werner, D. 1998. Organic signals between plants and micro-organisms,
197-222: In The Rhizosphere : Biochemistry and organic substances
at the soil-plant interfaces, Pinton, R.,Varanini, Z. and Nannipieri,
P.(eds.), New York, Marcel Dekker.
Whitelaw, M.A. 2000. Growth promotion of plants inoculated with
phosphate- solubilizing fungi. Advances in Agronomy, 69:99-151.
Whitelaw, M.A., Harden, R.J. and Helyar, K.R. 1999. Phosphate
solubilization in culture by the soil fungus Penicillium radicum.
Advances in Agronomy,31:655-665.
Pedospheric Distribution of Soil Cationic Micronutrients under
Various Land Use Systems in Uttarakhand.
C.M. Mathavan and A.K.Raina
Forest Soil and Land Reclamation Division, Forest Research Institute,
Dehra Dun-248 006, Uttarakhand, India
Abstract
Soils exhibit great spatial variability across any landscape as a
result of morphogenic properties unique to the environment under
which they were formed. The Pedosphere variations due to parent
material, topography, climate etc. lead to spatial variation of
micronutrients in the soil. The present study was undertaken to analyze the
influence of physiography on availability of DTPA extractable
micronutrients (Fe, Zn, Cu and Mn) vis a vis soil characteristics in typical
five soil profiles of Dehra Dun Dist. Uttarakhand developed under
different vegetation. Typical soil profiles representing different land form
units viz. Dhanaulti (Deodar forest), Dhanaulti (Pine forest), Bansiwala
(Sal forest), Mohand (Mixed forest) and Kempty (Oak forest) were
exposed and horizon wise sampling was carried out. The collected samples
were processed and analyzed for pH, texture and organic carbon by
standard procedures. The DTPA extractable Fe, Zn, Cu and Mn were
extracted and subsequently analyzed with the help of atomic absorption
spectrophotometer. The soils were near neutral to acidic in reaction with
pH ranging from 5.45 to 7.00. The soil organic carbon content
prominently decreased from top layer of the profile to down layers in all
five profiles. The surface soils of all the profile had lower DTPA- Zn
content compared to sub surface layers as high as 13.8 mg kg-1 observed
under lower profile layer (150-170 cm depth) of sal forest (Bansiwala)
compared to other profiles. DTPA- Cu content in soils varied from 4.72 to
21.18 mg kg-1 in profiles developed under various land forms. Available
Fe ranged between 7.68 to 26.36 mg kg-1, it was in the order of Pine
forest > Sal forest > Oak forest > Deodar forest > Mixed forest. In general
DTPA – Fe decreased with increasing soil depth as the soil become coarser
Fe content decreased significantly. The available Mn content ranged
between 1.08 to 8.16 mg kg-1 in the soils irrespective of soil depth and
physiography. It is evident from the study that the DTPA extractable
micronutrient status of soil varied widely under different land use systems.
Keywords. Pedosphere, DTPA and micronutrients
Introduction
The soil layer or pedosphere is essentially the skin of the terrestrial
earth,
functioning as earth geomembrane, regulating the biogeochemical and
hydrological cycling of matter and energy with terrestrial surfaces (Huete
2004). The pedosphere is a unique biologically active dynamic layer
forming a continuous interface between the lithosphere, atmosphere,
hydrosphere and biosphere. Soils exhibit great spatial variability across any
landscape as a result of morphogenic properties unique to the environment
under which they were formed. The pedospheric variations due to parent
material, topography, climate etc. lead to spatial variation of
micronutrients in the soils (Sharma et al. 2005). Soil formation process
influenced by water, temperature, soil erosion and microclimate relations
which in turn affects the pedogenic processes producing soils of various
nutrient supplying capacities (Verma et al. 2005). Micronutrients play an
important role in physiological processes of plants which is directly linked
with plant growth and stabilization. Profile distribution of micronutrients
under different forest systems has not been investigated in the state of
Uttarakhand. Keeping in view the close relationship, the present study was
undertaken to analyze the influence of physiography on availability of
DTPA extractable micronutrients (Fe, Zn, Cu and Mn) vis a vis soil
characteristics in typical five soil profiles from various forest Divisions of
Uttarakhand state.
Materials and Method
The study area is located under various forest divisions of Dehra
Dun district,Uttarakhand. Typical soil profiles developed under different
vegetation has been selected for the study. Five soil profiles representing
different land form units viz. Dhanaulti (Deodar forest), Dhanaulti (Pine
forest), Bansiwala (Sal forest), Mohand (Mixed forest) and Kempty (Oak
forest) were exposed and horizon wise sampling was carried out. The soil
samples were air-dried, ground in a wooden plank and roller, passed
through 2mm sieve and analyzed for various chemical characters. Soil pH
was measured in 1.2 soil. water suspension using glass electrode. The
organic carbon was determined by rapid titration method (Walkley and
Black 1934) and particle size analysis by international pipette method
(Day 1965). The available fractions of Fe, Zn, Cu and Mn were extracted
with DTPA-TEA buffer (0.005 M DTPA + 0.01 M CaCl2 + 0.1 M TEA,
pH 7.3) as per the method of Lindsay and Norvell (1978) and the
concentration of Fe, Zn, Cu and Mn in the DTPA extracts was
determined using atomic absorption spectrophotometer (AAS).
Results and Discussion
The data of some important soil properties are presented in table 1.
The profile soils under different vegetation were near neutral to acidic in
reaction with pH values ranging from 6.70 to 7.00 Dhanaulti (Deodar
forest), 6.10 to 6.40 Dhanaulti (Pine forest), 5.90 to 6.20 Bansiwala (Sal
forest), 6.65 to 7.00 Mohand (Mixed forest) and 5.45 to 6.05 Kempty
(Oak forest). The organic matter content of the soils was low to high and
values varied from 0.10 to 5.17 per cent. The soil organic matter content
prominently decreased from top layer of the profile to down layers in all
five profiles. This may be due to accumulation of leaf litters and debris
enriches the organic carbon / organic matter content of top soil. The soils
of the area have developed on almost similar kind of parent material due to
this there is no variations in the texture of these soils depending upon
topographic positions. The texture of the soils was loam to sandy clay
loam in nature, finer and clay content exhibiting increase with depth.
The data pertaining to the DTPA-extractable micronutrients such as
Iron (Fe), Zinc (Zn), Copper (Cu) and Manganese (Mn) are presented in
table 2.The DTPA-Fe content in the surface horizons of all the pedons
ranged between 7.68 to 26.36 mg kg-1.These variations in DTPA-Fe
content were due to difference in nutrient removal pattern under different
vegetation also might be ascribed to deposition of nutrient enriched pattern
by leaf litter fall under various vegetation. In general, available iron
content decreased with increasing soil depth, which may be due to lower
content of organic carbon in the subsurface soil than the surface soils.
Presence of organic matter in the surface layer leads to formation of
organic chelating agents which could have transformed insoluble phase of
Fe into soluble metallic complexes. These results get support from the
findings of Singh et.al. (1990). As high as 26.36 mg kg-1 of DTPA – Fe
recorded under surface layer of (0-10cm) pine forest soil of Dhanaulti
forest division. Considering critical limit of 4.5 mg kg-1, proposed by
Lindsay and Norvell (1978), all the soil samples are sufficient in available
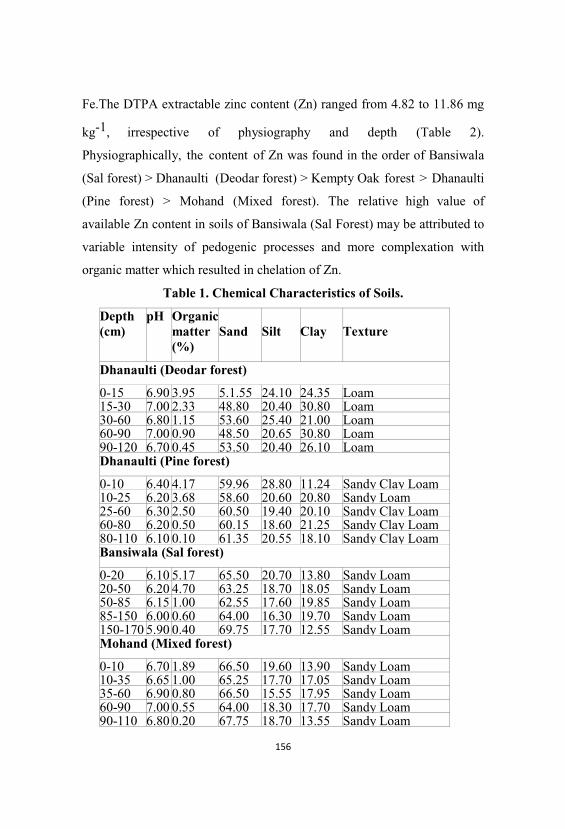
Fe.The DTPA extractable zinc content (Zn) ranged from 4.82 to 11.86 mg
kg-1, irrespective of physiography and depth (Table 2).
Physiographically, the content of Zn was found in the order of Bansiwala
(Sal forest) > Dhanaulti (Deodar forest) > Kempty Oak forest > Dhanaulti
(Pine forest) > Mohand (Mixed forest). The relative high value of
available Zn content in soils of Bansiwala (Sal Forest) may be attributed to
variable intensity of pedogenic processes and more complexation with
organic matter which resulted in chelation of Zn.
Table 1. Chemical Characteristics of Soils.
Depth(cm)
pH Organicmatter(%)
Sand Silt Clay Texture
Dhanaulti (Deodar forest)
0-15 6.90 3.95 5.1.55 24.10 24.35 Loam15-30 7.00 2.33 48.80 20.40 30.80 Loam30-60 6.80 1.15 53.60 25.40 21.00 Loam60-90 7.00 0.90 48.50 20.65 30.80 Loam90-120 6.70 0.45 53.50 20.40 26.10 LoamDhanaulti (Pine forest)
0-10 6.40 4.17 59.96 28.80 11.24 Sandy Clay Loam10-25 6.20 3.68 58.60 20.60 20.80 Sandy Loam25-60 6.30 2.50 60.50 19.40 20.10 Sandy Clay Loam60-80 6.20 0.50 60.15 18.60 21.25 Sandy Clay Loam80-110 6.10 0.10 61.35 20.55 18.10 Sandy Clay LoamBansiwala (Sal forest)
0-20 6.10 5.17 65.50 20.70 13.80 Sandy Loam20-50 6.20 4.70 63.25 18.70 18.05 Sandy Loam50-85 6.15 1.00 62.55 17.60 19.85 Sandy Loam85-150 6.00 0.60 64.00 16.30 19.70 Sandy Loam150-170 5.90 0.40 69.75 17.70 12.55 Sandy LoamMohand (Mixed forest)
0-10 6.70 1.89 66.50 19.60 13.90 Sandy Loam10-35 6.65 1.00 65.25 17.70 17.05 Sandy Loam35-60 6.90 0.80 66.50 15.55 17.95 Sandy Loam60-90 7.00 0.55 64.00 18.30 17.70 Sandy Loam90-110 6.80 0.20 67.75 18.70 13.55 Sandy Loam
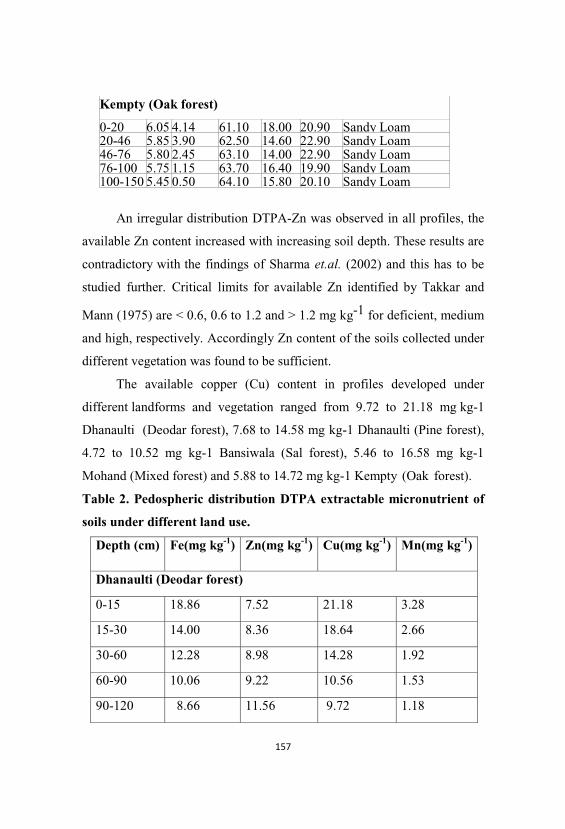
Kempty (Oak forest)
0-20 6.05 4.14 61.10 18.00 20.90 Sandy Loam20-46 5.85 3.90 62.50 14.60 22.90 Sandy Loam46-76 5.80 2.45 63.10 14.00 22.90 Sandy Loam76-100 5.75 1.15 63.70 16.40 19.90 Sandy Loam100-150 5.45 0.50 64.10 15.80 20.10 Sandy Loam
An irregular distribution DTPA-Zn was observed in all profiles, the
available Zn content increased with increasing soil depth. These results are
contradictory with the findings of Sharma et.al. (2002) and this has to be
studied further. Critical limits for available Zn identified by Takkar and
Mann (1975) are < 0.6, 0.6 to 1.2 and > 1.2 mg kg-1 for deficient, medium
and high, respectively. Accordingly Zn content of the soils collected under
different vegetation was found to be sufficient.
The available copper (Cu) content in profiles developed under
different landforms and vegetation ranged from 9.72 to 21.18 mg kg-1
Dhanaulti (Deodar forest), 7.68 to 14.58 mg kg-1 Dhanaulti (Pine forest),
4.72 to 10.52 mg kg-1 Bansiwala (Sal forest), 5.46 to 16.58 mg kg-1
Mohand (Mixed forest) and 5.88 to 14.72 mg kg-1 Kempty (Oak forest).
Table 2. Pedospheric distribution DTPA extractable micronutrient of
soils under different land use.
Depth (cm) Fe(mg kg-1) Zn(mg kg-1) Cu(mg kg-1) Mn(mg kg-1)
Dhanaulti (Deodar forest)
0-15 18.86 7.52 21.18 3.28
15-30 14.00 8.36 18.64 2.66
30-60 12.28 8.98 14.28 1.92
60-90 10.06 9.22 10.56 1.53
90-120 8.66 11.56 9.72 1.18
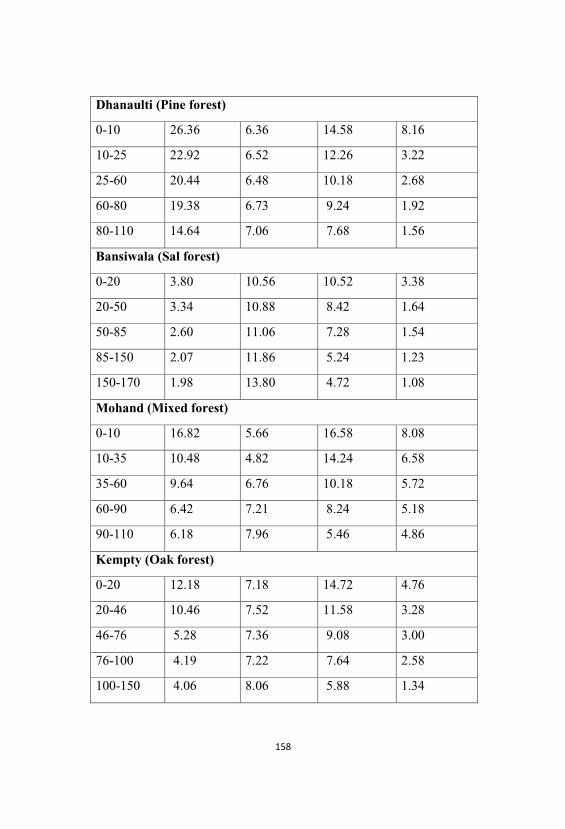
Dhanaulti (Pine forest)
0-10 26.36 6.36 14.58 8.16
10-25 22.92 6.52 12.26 3.22
25-60 20.44 6.48 10.18 2.68
60-80 19.38 6.73 9.24 1.92
80-110 14.64 7.06 7.68 1.56
Bansiwala (Sal forest)
0-20 3.80 10.56 10.52 3.38
20-50 3.34 10.88 8.42 1.64
50-85 2.60 11.06 7.28 1.54
85-150 2.07 11.86 5.24 1.23
150-170 1.98 13.80 4.72 1.08
Mohand (Mixed forest)
0-10 16.82 5.66 16.58 8.08
10-35 10.48 4.82 14.24 6.58
35-60 9.64 6.76 10.18 5.72
60-90 6.42 7.21 8.24 5.18
90-110 6.18 7.96 5.46 4.86
Kempty (Oak forest)
0-20 12.18 7.18 14.72 4.76
20-46 10.46 7.52 11.58 3.28
46-76 5.28 7.36 9.08 3.00
76-100 4.19 7.22 7.64 2.58
100-150 4.06 8.06 5.88 1.34
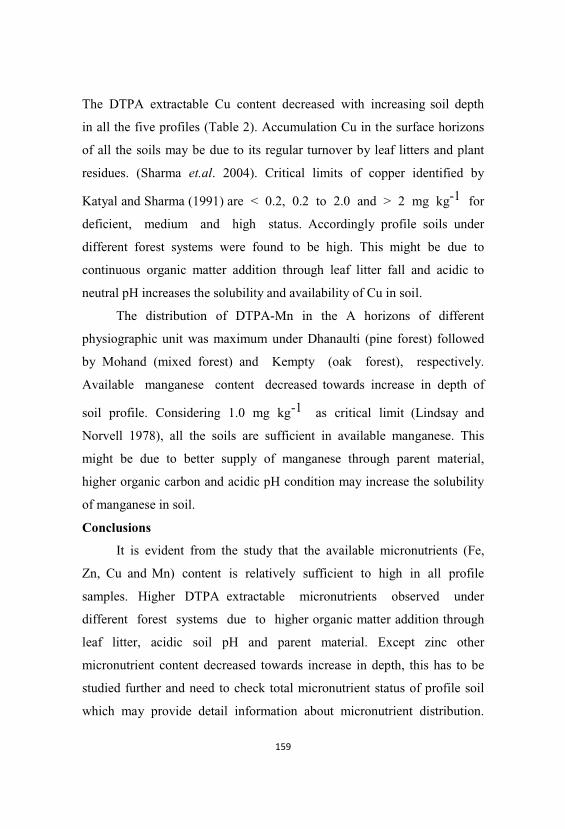
The DTPA extractable Cu content decreased with increasing soil depth
in all the five profiles (Table 2). Accumulation Cu in the surface horizons
of all the soils may be due to its regular turnover by leaf litters and plant
residues. (Sharma et.al. 2004). Critical limits of copper identified by
Katyal and Sharma (1991) are < 0.2, 0.2 to 2.0 and > 2 mg kg-1 for
deficient, medium and high status. Accordingly profile soils under
different forest systems were found to be high. This might be due to
continuous organic matter addition through leaf litter fall and acidic to
neutral pH increases the solubility and availability of Cu in soil.
The distribution of DTPA-Mn in the A horizons of different
physiographic unit was maximum under Dhanaulti (pine forest) followed
by Mohand (mixed forest) and Kempty (oak forest), respectively.
Available manganese content decreased towards increase in depth of
soil profile. Considering 1.0 mg kg-1 as critical limit (Lindsay and
Norvell 1978), all the soils are sufficient in available manganese. This
might be due to better supply of manganese through parent material,
higher organic carbon and acidic pH condition may increase the solubility
of manganese in soil.
Conclusions
It is evident from the study that the available micronutrients (Fe,
Zn, Cu and Mn) content is relatively sufficient to high in all profile
samples. Higher DTPA extractable micronutrients observed under
different forest systems due to higher organic matter addition through
leaf litter, acidic soil pH and parent material. Except zinc other
micronutrient content decreased towards increase in depth, this has to be
studied further and need to check total micronutrient status of profile soil
which may provide detail information about micronutrient distribution.
As per the soil micronutrient critical limit concept, on an average different
forest systems have capacity to maintain sufficient range of micronutrients.
References
Day, P.R. 1965. Particle fractionation and particle size analysis. In
methods of Soil Analysis. Part I (Black, C.A. et.al.) American
Society of Agronomy. Madison, Wisconsin, USA pp 545-546.
Huete, A. 2004. Remote sensing of soils and soil processes. In Remote
Sensing for Natural Resources management and Environmental
Monitoring. Manual of Remote Sensiing Volume 4, John Wiley and
Sons, Inc., New York.
Katyal, J.C. and Sharma, B.D.1991. DTPA extractable and total Zn, Cu,
Mn and Fe in Indian soils and their association with some soil
properties. Geoderma 49, 165-179
Lindsay, W.L. and Norvell, W.A.1978. Development of a DTPA soil test
for zinc, iron, manganese, and copper. Soil Science Society of
America Journal 42.421-428
Sharma, B.D., Aggarwal, V.K., Mukhopadhyay, S.S. and Arora,
H. 2002.Micronutrient distribution and their association with
soil properties in Entisols of Punjab. Indian Journal of Agricultural
Sciences 72, 334-340.
Sharma, B.D., Mukhopadhyay, S.S and Arora, H. 2005. Total and DTPA
extractable micronutrient in relation to pedogenesis in some
Alfisols of Punjab. Soil Science 170, 1-14.
Singh, K., Goyal, V.P and Singh, M 1990. Distribution of micronutrient
cations in semi-arid alluvial soil profiles. Journal of the Indian
Society of Soil Science 38, 736.-737.
Takkar, P.N. and Mann, M.S. 1975. Evaluation of analytical methods of
estimating available zinc and response of maize to applied zinc in
major soil series of Ludhiana, Punajb. Agrochimica 20, 420-430.
Verma, V.K., Setia, R.K., Sharma, P.K and Kumar, Ashok 2005.
Pedospheric variations in distribution and proposed modification of
the chromic acid titration method. Soil Science 37, 29-38.
Walkley, A. and Black, I.A. (1934). An examination of the Degtjareff
method for determining soil organic matter,
Environmental Application of Forest Tree Species n Phytoremediation
and Reclamation
Preeti Pandey Pant & A.K. Tripathi
Ecology and Environment Division,
Forest Research Institute, P.O. New Forest, Dehradun
Abstract
Due to rapid deforestation and depletion of genetic resources
coupled with escalating human needs, there is a great need to
conserve and improve tree ecosystems in general and their biodiversity in
particular. Phytoremediation is an emerging technology for remediating
Brownfield’s, landfills, and other contaminated sites. Many laboratory
and field tests have demonstrated that trees can absorb, transform, or
contain a variety of contaminants, including soft and heavy metals and
volatile organics through hydraulic control, absorption, and mycorrhizal
activity in the root zone. This paper presents a short review about
phytoremediation, its principles, mechanisms and possibilities of
application. The paper also illustrates results of research conducted at
the Forest Research Institute, Dehradun, using six forestry tree species for
phytoremediation. Information collected worldwide shows the great
potential of using trees, in phytoremediation and their potential
contribution for improvement of environment. This paper presents
a short review about phytoremediation, its principles, mechanisms and
possibilities of application.
Keywords: Bio concentration factor, phytoremediation, trees.
Introduction
Groundwater and soils can became contaminated as a consequence
of natural activities; such are geological erosions and salt drainage, by
human activities in industry, agriculture, wastewaters, constructions and
mining. Contaminants can be both of organic and of inorganic origin
(heavy metals, radionuclide’s, nitrates, and phosphates, inorganic and
organic compounds) (Sparks, 1995). Processes of remediation by
mechanically-physically-chemical techniques can be significantly
expensive and, according to Schnoor (1997), their cost may range
between 100 and 1500 US$ per ton of soil, depending upon the selected
technique. Phytoremediation can therefore represent a valid as alternative
to these techniques. In the last decade of 20th century, American scientists
developed research about plant-affection on sites contaminated by heavy
metals, organic and non-organic compounds produced by industry.
Researchers showed plant-affection in decrease of their concentrations
in soil, surface and groundwater. This developed an idea for planting
plants at these sites and the technique is called phytoremediation.
Phytoremediation is an emerging technology that uses various plants to
degrade, extract, contain or immobilize contaminants from soil and water
(EPA, 2000).
Phytoremediation is use of plants and their associated
microorganisms for cleaning up the environment (Salt et.al., 1995; Raskin
et al., 1997). According to Salt (1995), one of the mechanisms of
phytoremediation is phytodegradation, during which plants and their
rhizospheric microorganisms degrade organic contaminants. Some authors
(Arthur et al., 2005; Epa, 2000) consider degradation of contaminants by
rhizosphere microorganisms as a separate mechanism called
rhizodegradation. In the northern hemisphere only a limited number of
wooden species are suitable for phytoremediation. Poplars (Populus sp.)
and Willows (Salix sp.) are the most common tree species used for
phytoremediation because they grow rapidly, have many and deep roots,
and take up large quantities of water (licht and isebrands, 2005). They
were originally bred and grown as a cash crop for use as pulp wood
and as renewable energy source, but because of their rapid growth rates
and high evapotranspiration rates, they can be considered as ideal
candidates for phytoremediation (Chappell, 1997.) Their large root systems
with a high proportion of fine roots (diameter smaller than 1mm) have a
considerable ability of retaining large amounts of water in the vamoose
zone above the groundwater table, thus providing high transpiration rates
(Quinn et al.., 2001). Various researches showed significant potential of
Poplars for phytoremediation from different contaminants with use of
different phytoremediation mechanisms like phytodegradation of voc’s
(volatile organic compounds) (Newman et al..,1997; Xingmao and
Burken, 2004), fertilizers and pesticides (Licht and Schnoor, 1993),
rhizodegradation (Federle and Schwab,1989) and phytoextraction
(Banuelos et al., 1997; Pilipovic et al., 2005). Researchers up to date
defined various different systems of phytoremediation of soils and
groundwater depending upon the way plants affects contaminants.
According to environmental protection agency of United States of
America (epa, 2000), the following mechanisms of phytoremediation
should be considered:
A) phytoextraction is the process of up-taking contaminants by plants roots
and of trans-locating them to upper parts of plants. With plant harvesting,
the contaminants are removed from the contaminated site, which is easier
simpler than excavating and removing soil layers. This technology is used
for phytoremediation of soils, sediments and sludges. In some cases plants
that accumulated metal can be used as a source for food, e.g. plants grown
on soils with high concentration of selenium (se) can be used for feeding of
animals (Banuelos et al.,1997).
B) Phytostabilization is the process of (1) immobilization of contaminants
in soils by adsorption and accumulation in roots of plants or sedimentation
root zone, (2) use of plants and plants roots to prevent migration of
pollutants by wind and water erosion, drainage and dispersion in soils.
Process of phytostabilization is carried out through the root zone, by
microbiological and chemical mechanisms, with change of soil and/or
contaminant chemistry. Due to the production of root exudates and CO2,
changes in pH value of soil are very frequent. Phytostabilization can
change metal solubility, or affect solubility of organic compounds. Plant
affected soils can transfer metals from insoluble to a soluble oxidizing
state (Salt et al., 1995). In some cases, phytostabilisation can result in
phytolignification, in which case organic matter is incorporated in plant
lignin (Cunningham et al., 1995). Soils, sediments and sludges containing
contaminants in the root zone can be treated with this mechanism, where
influence of roots can be extended with transport of exudates to lower
layers. An advantage of this mechanism is in situ treatment, return of
vegetation and unnecessary disposal of dangerous materials.
Disadvantages of phytostabilization are represented by the fact that
contaminants are not removed from site, and by the need for fertilizing in
order to prevent drainage.
C) Rhizodegradation is degradation of organic contaminants with
microorganisms supported by presence of roots. This mechanism is also
called biodegradation. Root exudates contain sugars, aminoacids,
organic and fatty acids, sterols, growth hormones, enzymes and other
compounds that stimulate development of microorganisms (Schnoor et al.,
1995a). Microorganism abundance and activity in the rhizosphere can be
increased by presence of exudates, which can result in increased
biodegradation. Also, the rhizosphere area can be increased by stimulated
biodegradation. Biotransformation processes in the rhizosphere are
the of consequence of secretion of enzymes by microorganisms amongst
which, according to Coats (1991), there are oxidation, reduction,
hydrolysis, conjugation etc.
Interaction of plants and microorganisms also determines a mutual
assistance, because microorganisms create better conditions for
plants through detoxification of phytotoxic compounds, thus increasing
availability of nutrients (Anhalt et al., 2000), and plants supply nutrients
for microbic development through root exudates (Chappell, 1997).
D) Phytodegradation (phytotransformation) is degradation of contaminants
carried out by plants’ metabolism. Main mechanism in this process is
uptake and metabolizing of contaminants by plants. Uptake of
contaminants depends upon their solubility, hydrophobic and polarity.
Moderately hydrophobic compounds are easily up taken, while highly
hydrophobic organic contaminants are most often sediment on root
surface and rarely translocated, together with highly soluble compounds
(Schnoor et al., 1995b). Non polar molecules with mr < 500 will be
bounded to root surface, while polar molecules will be uptaken and
translocated ( Bell, 1992). Advantage of this mechanism is possibility of
application in solis without suitable microflora, while disadvantage is
possibility of presence of toxic metabolites and intermediary products of
metabolism.
E) Phytovolatilization is process of uptake of contaminates by plants and
their transpiration into the atmosphere, unchanged or slightly modified,
where they are then degraded by solar radiation. In concomitance with this
process, rhizo- and phytodegradation can also occur. This method is used
for groundwaters, for soils, sediments and sludge with sufficient hydraulic
conductivity, in which the amount of transpired contaminants is strongly
affected by climatic conditions (temperature, precipitation, insolation and
wind). In case of partial degradation, there is a possibility of
photodegradation by the sun (Chappell, 1997). Disadvantage is that
transpired contaminants such as vinyl-chloride are cancerogenous and is a
product of trichlor- ethene. Another disadvantage can be the potential
accumulation of contaminants in plants and their fruits.
F) Hydraulic control presents system of phytoremediation in which plants
uptake groundwater and control contaminant plume and also called
phytohydraulics. This mechanism is used for phytoremediation of surface
and groundwaters. Advantage is lower costs compared to pumping
systems, but disadvantages reflect in dependence upon season’s changes,
climate conditions and depth of penetration of roots.
G) Vegetative cover is long life sustainable vegetation system that is
used for covering of landfills and dangerous waste disposal sites. Plants
can be either planted in the material and do the phytoremediation, or
planted in soil cover above the material.
Both these two systems should prevent contact of human and animals with
contaminated material and minimize water drainage and circulation
through waste in order to prevent migration of contaminants. Advantage is
erosion prevention and sustainability of these systems (Dwyer, 1997) and
stimulation of microorganism’s development.
This mechanism is mixture of water uptake, contaminant uptake,
plant metabolism, rhizo- and phytodegradation, phytovolatilization and
phytoextraction. Disadvantage of this model is the fact that it can be
applied only for easy assimilating and metabolizing components like
fertilizers and pesticides that are very water soluble. Amongst the various
numbers of contaminants present in the environment, nitrates play a
significant role in ground and surface water contamination.
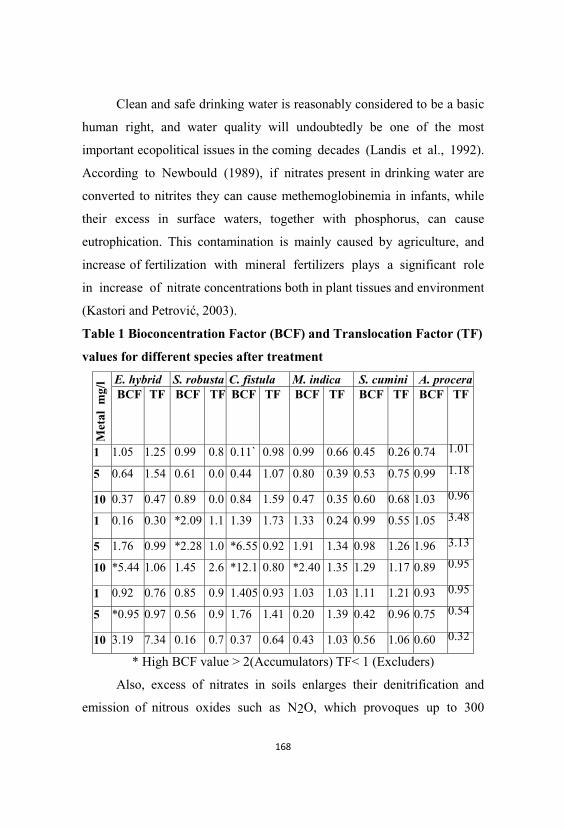
Clean and safe drinking water is reasonably considered to be a basic
human right, and water quality will undoubtedly be one of the most
important ecopolitical issues in the coming decades (Landis et al., 1992).
According to Newbould (1989), if nitrates present in drinking water are
converted to nitrites they can cause methemoglobinemia in infants, while
their excess in surface waters, together with phosphorus, can cause
eutrophication. This contamination is mainly caused by agriculture, and
increase of fertilization with mineral fertilizers plays a significant role
in increase of nitrate concentrations both in plant tissues and environment
(Kastori and Petrovi , 2003).
Table 1 Bioconcentration Factor (BCF) and Translocation Factor (TF)
values for different species after treatment
Met
al m
g/l E. hybrid S. robusta C. fistula M. indica S. cumini A. procera
BCF TF BCF TF BCF TF BCF TF BCF TF BCF TF
1 1.05 1.25 0.99 0.8 0.11` 0.98 0.99 0.66 0.45 0.26 0.74 1.01
5 0.64 1.54 0.61 0.0 0.44 1.07 0.80 0.39 0.53 0.75 0.99 1.18
10 0.37 0.47 0.89 0.0 0.84 1.59 0.47 0.35 0.60 0.68 1.03 0.96
1 0.16 0.30 *2.09 1.1 1.39 1.73 1.33 0.24 0.99 0.55 1.05 3.48
5 1.76 0.99 *2.28 1.0 *6.55 0.92 1.91 1.34 0.98 1.26 1.96 3.13
10 *5.44 1.06 1.45 2.6 *12.1 0.80 *2.40 1.35 1.29 1.17 0.89 0.95
1 0.92 0.76 0.85 0.9 1.405 0.93 1.03 1.03 1.11 1.21 0.93 0.95
5 *0.95 0.97 0.56 0.9 1.76 1.41 0.20 1.39 0.42 0.96 0.75 0.54
10 3.19 7.34 0.16 0.7 0.37 0.64 0.43 1.03 0.56 1.06 0.60 0.32
* High BCF value > 2(Accumulators) TF< 1 (Excluders)
Also, excess of nitrates in soils enlarges their denitrification and
emission of nitrous oxides such as N2O, which provoques up to 300
times more harmful effect than CO2 (Schepers et al.., 2005). The results
of Bio concentration factor (BCF) of six species are given in Table 1; the
experiment was conducted at the Forest Research Institute, Dehradun.
Table summarise that the hyperaccumulating plants are those plants which
have BCF > 2 and TF >1. The species which have Translocation Factor
(TF) < 1 can be termed as metal excluders and the plants with TF ~ 1or >
1can be termed as metal accumulators Mellem, (2005).
Plants have evolved to tolerate the presence of large amounts of metals in
their environment by the following three ways:
1.Excluders, whereby transport of metals is restricted and
constant metal concentrations are maintained in the stalk over a wide
range of soil levels.
2.Inclusion, whereby stalk metal concentrations reflect those in the soil
solution in a linear relationship.
3.Accumulators where by metals are accumulated in the roots and upper
plant parts at both high and low soil concentrations.
Conclusions
The significant role of trees in phytoremediation is illustrated in
this paper both through review of references and through results of
research conducted at the Forest research Institute, Dehradun. Plant roots
can penetrate through deeper soil layers and remediate wider area.
Their higher biomass, compared to herbaceous plants, can extract
greater amounts of contaminants, providing great environmental benefit
such as carbon sequestration, oxygen production and microclimate
improvement. It may be concluded that there is a direct relationship
between the concentration of heavy metals and morphological and
biochemical responses of plants and chemical characteristics of soil.
Metabolically, physiological, biochemical responses of plants to heavy
metal concentration can be viewed as potentially adaptive changes
that decline the operation of metabolic regulatory mechanisms which
favours the functioning of the plants during or after stress. Tolerant
species with high remediation capacities showing least adverse impact
would be proposed for the phytoremediation of industrial waste disposal
sites or soil affected by those particular heavy metals. Therefore, efforts
should be geared towards conservation of the remaining and
establishment of more mangrove plant species including other types of
vegetation in this ecological zone in such a way that will assist in
exploiting this technique of environmental pollution remediation.
References
Anhalt,J.C.,Arthur,E.L., Anderson,T.A., and Coats, J.R.2000. Degradation
of atrazine,metolachlor, and pendimethalin in pesticide-
contaminated soils: effects of aged residues on soil respiration
and plant survival. J. Environ. Sci. Health.35: 417–438.
Arthur,E.L.,Rice P.J.,Anderson, T.A., Baladi, S.M., Henderson, K.L.D.,
Coats, J.R.2005. Phytoremediation-an overwiew. Critical rewiews
in plant science.24: 109-122.
Banuelos, G.S., Ajwa, H.A., Mackey, B., Wu, L. L., Cook, C., Akohoue,
S., Zambrzuski, S. 1997. Evaluation of different plant species used
for phytoremediation of high soil selenium. Journal of
environmental quality, 26:639-646.
Bell, R.M. 1992. Higher plant accumulation of organic pollutants from
soils. Risk reduction engineering laboratory, Cincinnati, Ohio.
EPA/600/r-92/138
Chappell,J.1997.Phytoremediation of tree using populus. Status report
prepared for the US epa technology innovation office under a
national network of environmental management studies fellowship
compiled June - August 1997.
Coats,J.R.1991.Pesticide degradation mechanisms and environmental
activation. In: somasundaram, l., and coats, j. R. (eds.): pesticide
transformation products: fate and significance in the environment.
Pp. 10–29., American Chemical Society Symposium Series 459,
Washington, D.C.
Cunningham, S.D., berti, W.R., Huang, J.W. 1995. Phytoremediation of
contaminated soils. Trends in biotechnology., 13: 393-397.
Dwyer, S.F. 1997. Large-scale field study of landfill covers at sandia
national laboratories. Conference proceedings landfill capping in the
semi-arid west: problems,perspectives, and solutions, May 21-22.
Grand tetonnational park, Pp-87-107.
Epa/600/r-99/107. 2000. Introduction to phytoremediation, u.s.
environmental protection agency, national risk management
research laboratory office of research and development cincinnati,
ohio 45268. February 2000
Federle, T.W., and B.S. Schwab. 1989. Mineralization of surfactants by
microbiota of aquatic plants. Appl. Environ. Microbiol., 55: 2092-
2094.
International poplar comission 1979. poplars and willows in wood
production and land use. 328 pp. Rome, Italy. Food and Agriculture
Organization
Kastori R., Petrovic, N. 2003. Nitrates in vegetables: physiological,
ecological and agrotechnical aspects; naucni institut za ratarstvo i
povrtarstvo - novi sad; verzal, novi sad, jugoslavija (Serbian with
English summary)
Landis, T.D., Campbell, S., Zeusen, F. 1992. Agricultural pollution of
surface water and groundwater in forest nurseries; proceedings,
intermountain forest nursery organization, USDA Forest Service,
gen. Tech. Report 2, August 12-16, 1991, Park City,Utah,USA,1-15.
Licht, L.A., Schnoor, J.L. 1993. Tree buffers protect shallow ground water
at contaminated sites. Epa ground water currents, office of solid
waste and emergency response. Epa/542/n-93/011.
Licht, L.A., Isebrands, J.G. 2005. Linking phytoremediated pollutant
removal to biomass economic opportunities. Biomass and bioenergy,
28: 203-218.
Nanda Kumar, P.B.A., Dushenkov, V., Motto, H., Raskin, I. 1995.
Phytoextraction: the use of plants to remove heavy metals from
soils. Environmental science and technology, 29(5): 1232-1238.
Newbould, P. 1989. The Use of nitrogen fertilizer in agriculture. Where do
we go practically and ecologically. Plant and soil, 115: 297-311
Newman, L.A., Strand, S.E., Domroes, D., Duffy, J. Ekuan, G., Karscig,
G., Muiznieks, I. A., Ruszaj, M., Heilman, P., Gordon, M.P. 1997.
Abstract: Removal of trichloreth-ylene from a simulated aquifer
using poplar. Fourth international in situ and on-site bioremediation
symposium, April 28 - May 1,1997, New Orleans, la. 3: 321.
Pilipovic, A. 2005. The role of poplars (populus sp.) In phytoremediation
of nitrate contaminated waters; m.sc. Thesis; University of Novi
Sad, Faculty of Agriculture, Novi Sad, Serbia
Pilipovic, A., Nikolic, N., Orlovic, S., Petrovic, N., Krstic, B. 2005.
Cadmium phytoextraction potential of polar clones (populus spp.).
Z. Naturforsch. 60c:247-251.
Pilipovic, A., Nikolic, N., Orlovic, S., Krstic, B., Roncevic, S. and
Borisev, M. 2008.The effect of crude oil contaminated soil on
growth of different populus sp. And salix sp. Genotypes. , 2nd
international scientific conference “remediation in environmental
protection – present state and future prospects”, Belgrade, Serbia
May 14-15, 2008, proceedings book, pp 29-37.
Pilipovic, A., Nikolic, N., Orlovic., S. 2006. Rewiew of researches
conducted on heavy metal and nitrate phytoremediation with use of
poplars. Proceedings of scientific gathering implementation of
remediation in environmental improvement with international
participation, belgrade, november 27th2006.(ed. Ljiljana
tanasijevic), ISBN 86-80809-32-2, pp 55-65
Quin, J.J., Negri, M.C., Hinchman, R.R., Moos, L.P. and Wozniak 2001.
Predicting the effect of deep-rooted hybrid poplars on the
groundwater flow system at a large-scale phytoremediation site.
International juornal of phytoremediation,3(1): 41-60.
Raskin, I., Smith, R.D., Salt, D.E. 1997. Phytoremediation of metals: using
plants to remove pollutants from the environment. Curr. Opin.
Biotechnol., 8: 221-226.
Salt, D.E., Blaylock, M., Kumar, N.P.B.A., Dushenkov, V., Ensley,
B.D. 1995.Phytoremediation: a novel strategy for the removal of
toxic metals from the environment using plants. Biotechnology, 13:
468-474.
Salt, D.E., Smith, R.D., Raskin, I. 1998. Phytoremediation. Annu.rev.
Plant physiol.Plant mol. Biol., 49: 643-668.
Schepers, J.S.; Francis, D.D.; Shanahan, J.F. 2005. Relay cropping for
improved air and water quality. A journal of biosciences, zeitschrift
fur naturforschung c, l60 (3/4), 186-190.
Schnoor J.L. 1997. Phytoremediation. Groundwater technology
analysis center:technology evaluation report te-98-01.
Schnoor, J. L., Licht, L. A., Mccutcheon, S.C., Wolfe, N. L., Carreira,
L.H. 1995a.Phytoremediation of organic and nutrient
contaminants. Environmental science and technology, 29: 318-323.
Schnoor, J. L., Licht, L. A., Mccutcheon, S. C., Wolfe, N. L., Carreira,
L.H. 1995b.Phytoremediation of organic and nutrient
contaminants. Environmental science and technology, 29: 318-323.
Sparks, D.L. 1995. Environmental soil chemistry. Academic Press, San
Diego, CA, USA.Vovk Koze, A.; Vrhovsek, D. 2008.
Ecoremediatioan as strategic development approach, 2nd
international scientific conference “Remediation in environmental
protection – present state and future prospects”, Belgrade, Serbia,
May 14-15, 2008, proceedings book, pp 109-119.
Xingmao,M.and Burken,J.2004.Modeling of tce diffusion to the
atmosphere and distribution in plant stems.Environmental sci. and
technology 38:4580-4586.
Biotreatment of Textile Wastewater Using Fungi
Nutan Gupta, A.K Tripathi, and N.S.K Harsh*
Forest Ecology and Environment Division
* Forest Pathology Division, Forest Research Institute, Dehradun
Abstract
Wastewater released from textile and dye industry can
cause serious environmental effects due to the presence of toxic dyes and
dark coloration. Colour from this effluent makes the receiving water bodies
unaesthetic affecting its water transparency and gas solubility. Over the
past decade, the white rot fungi have been studied for their ability to
degrade recalcitrant organo-pollutants such as polycyclic aromatic
hydrocarbons, cholorphenols, and polychlorinated biphenyls. Many
white rot fungi, actinomycetes and bacteria are used for the
development of biological processes for the treatment of textile effluents.
Many physical and chemical methods such as adsorption, coagulation,
precipitation, chemical oxidation, photodegradation and filtration have
been used for colour removal from wastewaters. Unfortunately, due to
high operating costs and operational problems such as development of
toxic intermediates, lower removal efficiency, and higher specificity for a
group of dyes, among others. Apart from this, these methods produce
large quantities of sludge, which again causes a problem in its disposal.
Biological decolorization being simple to use and low in cost have been
the main focus in recent studies, since it results in partial or complete
bioconversion of pollutants to stable nontoxic end products. Most of the
studies have been focused to the decolorization of a single dye or even to a
mixture of dyes. Many white rot fungi e.g. Phanerachaete
chrysosporium, Ganoderma sp., Trametes trogii, Irpex lacteus,
Dichomitus squalens, Pycnoporus strains etc. have been intensively
studied in connection with their ligninolytic enzyme production and their
decolorisation ability. The present study shows the potential of various
fungi for their capacity to decolorize the textile effluent and their
capability for heavy metal removal. Maximum decolorization (92%) was
achieved by Trametes versicolor, whereas maximum concentration of
chromium was removed by Mucor hiemalis.
Keywords : wastewater,heavy metal,fungi,textile
Introduction
Textile industry is one of the oldest and largest industries of India.
Not going far back in the history of textile industry in India, the East India
Company started its business by cotton industry. Now-a-days, India is a
major exporter of textile-finished materials. Textile industry in India is a
fast growing industry (Hussain et al., 2004) and its wastewater is rated as
the most polluting among all industrial sectors considering both volume
and composition of effluent (Vanndevivera et al., 1998). It is a complex
and highly variable mixture of many polluting substances ranging from
inorganic compounds and elements to polymers and organic products
(Banat et al.,1996). It induces persistent color coupled with organic load
leading to disruption of the total ecological/symbiotic balance of the
receiving water stream.
The increasing trend of requirement and production of dye and dye
intermediates is also associated with the anticipated generation of both
liquid and solid wastes (CPCB, 1990). The removal of dyes from
industrial effluents is becoming a major problem for the textile
industry as government legislations are becoming more stringent. The
effluents of wastewater in some industries such as dyestuff, textile, leather,
etc., contain synthetic dyestuff and toxic chemicals (Choiu,2003). About
10-20% of the dye comes in wastewater during textile processing and
enters into different environmental segments (Inbaraj et al., 2002). Dyes
have a tendency to sequester metal ions producing micro toxicity to fish
and other organisms (Mittal and Venkobachar, 1989). According to
Inbaraj et al. (2002), some dyes are also reported to cause allergic
dermatitis, skin irritation, cancer and mutations in humans.
Moreover, the dyes without an appropriate treatment can persist in
the environment for extensive periods of time and are deleterious not only
for the photosynthetic processes of the aquatic plants but also for all the
living organisms since the degradation of these can lead to carcinogenic
substances (Hao et al., 2000; Pinheiro et al., 2004). The release of dyes
into the environment constitutes only a small proportion of water
pollution, but dyes are visible in small quantities due to their brilliance.
Tightening government legislation is forcing textile industries to treat their
waste effluent to an increasingly high standard. Currently, removal of dyes
from effluents is being done by physico-chemical means. Such methods
are often very costly and although the dyes are removed,
accumulation of concentrated sludge creates a disposal problem. There is
a need to find alternative treatments that are effective in removing dyes
from large volumes of effluents and are low in cost, such as biological or
combination systems.
Heavy metals beyond permissible limits cause direct toxicity to
all living beings. Metallic effluents can have ecological impacts on water
bodies leading to increased nutrient load especially if they are
essential metals. These metals in effluents may increase fertility of the
sediment and water column and lead to eutrophication, which leads to
oxygen deficiency, algal bloom and death of aquatic life.
The microorganisms produce both constitutive and inducible
enzymes to bioremediate heavy metals and chemical compounds present in
wastewater. Strains of bacteria, fungi and algae can be used
extensively in bioremediation of textile effluents. The majority of
bioremediation studies have been concentrated upon bacterial cultures,
largely excluding the fungi, even though they represent a major component
of microbial life in the biosphere. For example it has been estimated that
1g of forest litter can contain as much as 1 km of fungal hyphae (Evans
and Bucke,1998).
Microorganisms have been shown to take up heavy metals
from aqueous solutions (Gadd, 1988). There is a need for innovative
treatment technologies for the removal of heavy metal ions from
wastewater. Fungi are recognized for their superior aptitudes to produce a
large variety of extracellular proteins, organic acids and other metabolites,
and for their capacities to adapt to severe environmental constraints.
Besides the production of various relevant metabolites, fungi have been
attracting a growing interest for the bioremediation of wastewater
ingredients such as metals, inorganic nutrients and organic compounds
(Akthar and Mohan, 1995). White rot fungi belong primarily to the
Basidiomycetes, but may also include some Ascomycetes from the
order Sphaeriales (Rayner and Boddy, 1988). Basidiomycetes are usually
recognised by their sexual fruiting bodies (the mushrooms, toadstools and
brackets) but it is the main body of the fungus, the mycelium that is of
interest in bioremediation studies. The present study was
undertaken to the study the biotreatment potential of various fungi in
treating the textile wastewater and heavy metal removal.
Material and Methods
The fungi used were collected from National Type Culture
Collection , Forest Pathology Division, Forest Research Institute. Samples
of the effluents and / the dead organic matter (wood, leaves, etc.) floating/
lying in and around effluent affected localities were brought to the
laboratory for examination and isolation of the fungi. The textile effluent
was collected from Malwa Cotton Spinning Mills Ltd. (Paonta Sahib).
The following fungal cultures were used in this study: Bjerkandera
adusta, Flavodon flavus, Geotrichum candidum, Merulius tremellosus,
Mucor hiemalis, Oxyporus ravidus, Pycnoporus sanguineus, Penicillium
sp., Schizophyllum commune, Trametes hirsuta, Trametes versicolor, and
Trichoderma sp. Of these, Geotrichum candium, Mucor hiemalis,
Penicillium sp., Schizophyllum commune and Trichoderma sp. have been
isolated from effluent and surrounding areas.
As the pH of textile effluent was alkaline pH of the effluent was
adjusted between 5.5-6.0 using buffers and dilute acids to provide
optimum pH for fungal growth. After inoculation of fungus into the flasks
containing effluent they were incubated at required optimum
temperature. Aliquots of culture supernatant were removed at regular
intervals and analyzed for colour removal.
Decolourization was monitored at maximum wavelength and over a range
of wavelengths in culture supernatants using a scanning
spectrophotometer. Distilled water was taken as blank. For each reading, a
few mL liquid was taken from the sample, and then analyzed
instrumentally. The experiment was performed in duplicate and mean
readings were taken. % decolorization was calculated by using the
following equation.
Where Ao = initial absorbance and At = absorbance after time t (Olukanni
% DecolourizationA0-At
A0
x 100
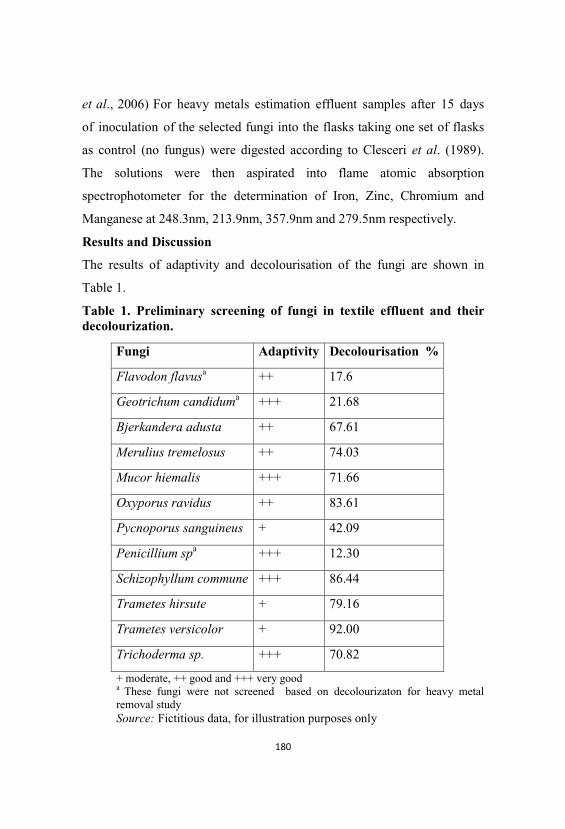
et al., 2006) For heavy metals estimation effluent samples after 15 days
of inoculation of the selected fungi into the flasks taking one set of flasks
as control (no fungus) were digested according to Clesceri et al. (1989).
The solutions were then aspirated into flame atomic absorption
spectrophotometer for the determination of Iron, Zinc, Chromium and
Manganese at 248.3nm, 213.9nm, 357.9nm and 279.5nm respectively.
Results and Discussion
The results of adaptivity and decolourisation of the fungi are shown in
Table 1.
Table 1. Preliminary screening of fungi in textile effluent and theirdecolourization.
Fungi Adaptivity Decolourisation %
Flavodon flavusa ++ 17.6
Geotrichum candiduma +++ 21.68
Bjerkandera adusta ++ 67.61
Merulius tremelosus ++ 74.03
Mucor hiemalis +++ 71.66
Oxyporus ravidus ++ 83.61
Pycnoporus sanguineus + 42.09
Penicillium spa +++ 12.30
Schizophyllum commune +++ 86.44
Trametes hirsute + 79.16
Trametes versicolor + 92.00
Trichoderma sp. +++ 70.82
+ moderate, ++ good and +++ very gooda These fungi were not screened based on decolourizaton for heavy metalremoval studySource: Fictitious data, for illustration purposes only
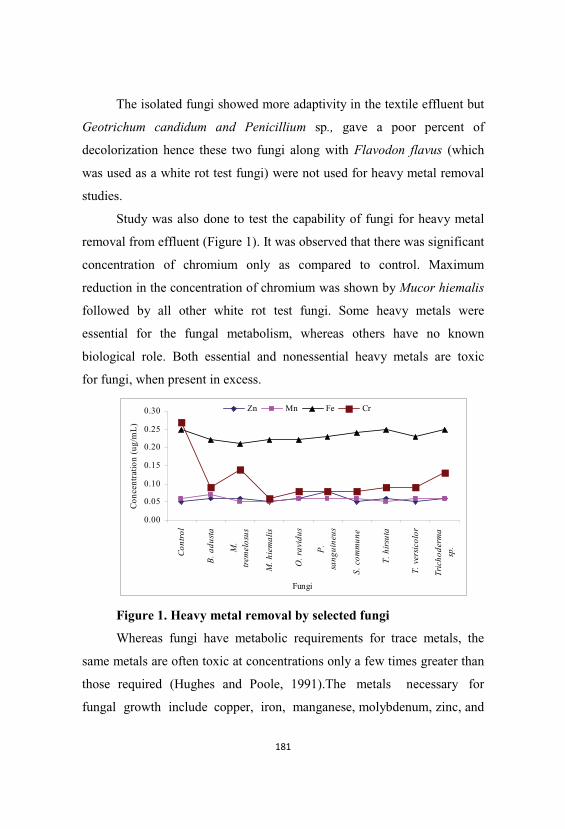
The isolated fungi showed more adaptivity in the textile effluent but
Geotrichum candidum and Penicillium sp., gave a poor percent of
decolorization hence these two fungi along with Flavodon flavus (which
was used as a white rot test fungi) were not used for heavy metal removal
studies.
Study was also done to test the capability of fungi for heavy metal
removal from effluent (Figure 1). It was observed that there was significant
concentration of chromium only as compared to control. Maximum
reduction in the concentration of chromium was shown by Mucor hiemalis
followed by all other white rot test fungi. Some heavy metals were
essential for the fungal metabolism, whereas others have no known
biological role. Both essential and nonessential heavy metals are toxic
for fungi, when present in excess.
Figure 1. Heavy metal removal by selected fungi
Whereas fungi have metabolic requirements for trace metals, the
same metals are often toxic at concentrations only a few times greater than
those required (Hughes and Poole, 1991).The metals necessary for
fungal growth include copper, iron, manganese, molybdenum, zinc, and
0.00
0.05
0.10
0.15
0.20
0.25
0.30
Con
trol
B. a
dust
a
M.
trem
elos
us
M. h
iem
alis
O. r
avid
us
P.
sang
uine
us
S. c
omm
une
T. h
irsu
ta
T. v
ersi
colo
r
Tric
hode
rma
sp.
Fungi
Con
cent
ratio
n(u
g/m
L)
Zn Mn Fe Cr
nickel. Nonessential metals commonly encountered include chromium,
cadmium, lead, mercury and silver (Gadd, 1993). Mullen et al. (1992)
reported on the biosorption of Cd, Cu, Ag and La by two fungi,
Aspergillus niger and Mucor rouxii. Yetis et al. (1998) studied the
adsorptive capacity of Trametes versicolor and found it in the order
of Pb>Ni>Cr>Cd>Cu. Tham et al. (1999) revealed that in Ganoderma
lucidum, toxicity of heavy metals decreased in the order
Hg>Cd>Cu>U>Pb>Mn=Zn. The decrease of fungal growth rate is
sometimes accompanied with the increase of the lag phase. Lengthening of
lag phase was also recorded on media containing Hg in case of
Pycnoporus cinnabarinus (Mandal et al.,1998).
Conclusions
In this study, the biotreatment potential and heavy metal removal
from the textile wastewater using fungi were investiagted. White rot fungi
show considerable promise for the decolourisation. Maximum
decolorization was shown by Trametes versicolor followed by
Schizophyllum commune and Oxyporus ravidus. Maximum reduction in
the concentration of chromium was shown by Mucor hiemalis.
The results of the present study suggest that white rot fungi can be
used for decolourising the textile wastewater. Considering the fact that,
due to high operating costs and operational problems such as development
of toxic intermediates, lower removal efficiency, and higher specificity for
a group of dyes, among others, these methods produce large quantities of
sludge, which again causes a problem in its disposal. Therefore,
bioremediation using fungi can be cost effective for removing heavy metal
and colour from the textile wastewater.
Acknowledgements
The authors are thankful to the Director, Forest Research
Institute for providing necessary facilities for carrying out this
investigation.
References
Akthar, M.N. and Mohan, P.M. 1995. Bioremediation of toxic metal
ions from polluted lake waters and industrial effluents by fungal
biosorbent. Current Science, 69:1028-1030.
Banat, I. M., Nigam, P., Singh, D. and Marchant, R. 1996. Microbial
decolorization of textile dye containing effluents: a review.
Bioresource Technology, 58:217-227.
Choiu,M.S.and Li, H.Y.2003.Adsorption behaviours of reactive dye in
aqueous solution on chemical cross-linked chitosan
beads.Chemosphere,50(8):095-1105.
CPCB. 1990. Minimal National standards-Dye and Dye Intermediate
Industry.Central Pollution Control Board, New Delhi.
Dionmez, G. 2002. Bioaccumulation of the reactive textile dyes by
Candida tropicalis growing in molasses medium. Enzyme and
Microbial Technology, 30:363–366.
Diorio, L., Mercuri, A.A., Nahabedian, D.E. and Forchiassin, F. 2008.
Development of a bioreactor system for the decolorization of dyes
by Coriolus versicolor f. antarcticus. Chemosphere, 72:150–156.
Evans, C.S. and Bucke, C. 1998. Bioremediation by fungi. Chemistry
and Industry,2:134-137.
Gadd, G.M. 1988. Accumulation of metal by micro-organisms and algae,
401-430: In Biotechnology:A Complete Treatise.In Rehm,H. (Ed.),
Special Microbial Processes,vol.4,VCH,Verlagsgesellschaft,
Weinheim. 6B.
Gadd, G.M. 1993. Interactions of fungi with toxic metals. New
Phytologist, 124:25–60.
Hao,O.J.,Kim, H., Chiang and P.C. 2000. Decolorization of wastewater.
Critical Reviews in Environmental Sciences, 30:449-505.
Hatvani, N, and Mlecs, I. 2002 Effect of the nutrient composition on
dye decolorisation and extracellular enzyme production by
Lentinus edodes on solid medium. Enzyme Microbiology and
Technology, 30:381–386.
Hughes, M.N. and Poole, R.K. 1991. Metal speciation and microbial
growth-the hard (and soft) facts. J. Gen. Microbiol. 137:725–734.
Hussain, J. Hussain, I. and Arif, M. 2004. Characterization of textile
wastewater.Journal of Industrial Pollution Control, 20(1):137-144.
Inbaraj, B., Selvarani, B. and Sulochana, N. 2002. Evaluation of a
carbonaceous sorbent prepared from pearl millet husk for its
removal of basic dyes. Journal of Scientific and Industrial Research,
61:971-978.
Jarosz-Wiilkolazka, A., Kochman’nska-Redst, J., Malarczyk. E., Wardas.
W. and Leonowicz, A. 2002. Fungi and their ability to decolourize
azo and antraquinonic dyes. Enzyme Microbiology and Technology,
30:566–572.
Mandal, T.K., Baldrian, P., Gabriel, J., Nerud, F. and Zadra, F. 1998.
Effect of mercury on the growth of wood-rotting basidiomycetes
Pleurotus ostreatus, Pycnoporus cinnabarinus and Serpula
lacrymans. Chemosphere, 36:435–440.
Mittal, A.K. and Venkobachar, C. 1989. Studies on sorption of dyes by
sulfonated coal and Ganoderma lucidum. Indian Journal of
Environmental Health, 31(2):105-111.
Mohorcic, M., Friedrich, J. and Pavko, A. 2004. Decoloration of the
diazo dye reactive black 5 by immobilized Bjerkandera adusta in a
stirred tank bioreactor. Acta Chimica Slovenica, 51:619-628.
Moorthi, S.P.,Selvam,S.P.,Sasikalaveni,,Murugesan, K. and Kalaichelvan,
P.T.2007. Decolorization of textile dyes and their effluents using
white rot fungi.African Journal of Biotechnology, 6(4):424-429.
Murali, S., Narayan, A.E., Vidyavate. and Sriniketan, G. 2000. Studies on
colour removal by microbial means. Journal of Industrial
Pollution Control,16(2):211-215.
Mullen, M.D., Wolf, D.C., Beveridge, T.J. and Bailey, G.W. 1992.
Sorption of heavy metals by the soil fungi Aspergillus niger and
Mucor rouxii. Soil Biology and Biochemistry, 24:129–135.
Olukanni, O.D., Osuntoki, A.A. and Gbenle, G.O. 2006. Textile effluent
biodegradation potentials of textile effluent-adapted and non-adapted
bacteria. African Journal of Biotechnology, 5(20):1980-1984.
Pinheiro, H.M., Touraud, E. and Thomas, O. 2004. Aromatic amines from
azo dye reduction: status review with emphasis on direct UV
spectrophotometric detection in textile industry wastewaters. Dyes
and Pigments, 61:121-139.
Rayner, A.D.M. and Boddy, L. 1988. Fungal decomposition of wood: its
biology and ecology, John Wiley, Chichester. 587pp.
Reddy, A. 1995. The potential for white-rot fungi in the treatment of
pollutants.Current Opinion in Biotechnology, 6:320–328.
Swamy,J.and Ramsay,J.A.1999.The evaluation of white rot fungi in the
decolorization of textile dyes.Enzyme & Microbial
Technology,24:130–137.
Tham, L.X., Matsuhashi, S. and Kume, T. 1999. Responses of Ganoderma
lucidum to heavy metals. Mycoscience, 40: 209–213.
Vanndevivera, P.C., Bianchi, R. and Verstraete, W. 1998. Treatment and
Reuse of Wastewater from the Textile Wet-Processing
Industry:Review of Emerging Technologies.Jr. of Chemical

Technology and Biotechnology,72:289-302.
Yetis,U.Özcengiz,G.,Dilek,F.B.,Ergen,N.and Dölek,A.1998.Heavy metal
biosorption by white-rot fungi. Water Science Techology, 38:323–
330.
Heavy Metal and Chemical Study of Rivers of Doon Valley
A. Kumar, B.S. * V.D. Joshi*And A.K. Singh**
Biotechnology Research Laboratory, Dept of Zoology/Entomology,
H.N.Bahuguna University, SRT Campus Badshahithaul
Tehri-249199 (UK) INDIA
*Dept of Zoology, Govt. PG College Kotdwara Garhwal-246149 (UK)
** Wadia Institute of Himalayan Geology, 33, GMS Road Dehradun-
248001 (UK) INDIA
Abstract
Water is a common chemical substance that is essential for the
survival of all known forms of life. Industrial uses of metals such as metal
plating, tanneries, industrial processes utilizing metal as catalysts, have
generated large amount of aqueous effluents that contain high levels of
heavy metals. Metal polluted industrial effluents discharged into rivers
directly or indirectly. The discharge of waste water in river can change the
chemical parameters of water and show an adverse effect on environment.
Water samples were collected, from five rivers of Doon Valley: river
Ganga, Alaknanda, Mandakini, Bhagirathi and Yamuna, to determine
the heavy metals and other parameters like temperature, pH, TDS,
BOD, COD and chloride. The toxic metals analyzed by ICP-MS. The
temperature ranged between 10 – 27oC, pH ranged between 7.03 – 8.16,
DO ranged 6.3 – 9 mg/l, BOD ranged 1.4 – 4.7 mg/l, COD ranged between
2.9 – 34.2 mg/l, Total hardness ranged between 42 – 820 mg/l, TDS
ranged between 68 – 220 mg/l and chlorides ranged between 7 – 26 mg/l. .
Results showed that maximum pollutants were found in river Ganga at
Missarpur Haridwar and river Yamuna at Dakpathar.
Keywords : metal pollution, heavy metals, Doon valley, ICP- MS.
Introduction
Heavy metals are natural components of the Earth's crust. They
cannot be degraded or destroyed. To a small extent they enter our
bodies via food, drinking water and air. As trace elements, some heavy
metals are essential to maintain the metabolism of the human body.
However, at higher concentrations they can lead to poisoning. The term
heavy metals refer to any metallic element that has a relatively high
density and is toxic or poisonous even at low concentration (Lenntech,
2004). Heavy metal poisoning could result from drinking-water
contamination, high ambient air concentrations near emission sources or
intake via the food chain. Heavy metals occur as natural constituents of
the earth crust, and are persistent environmental contaminants since
they cannot be degraded or destroyed. To a small extent, they enter the
body system through food, air, and water and bioaccumulate over a period
of time (Lenntech, 2004; UNEP/GPA, 2004). Bioaccumulation means an
increase in the concentration of a chemical in a biological organism over
time, compared to the chemical's concentration in the environment.
Compounds accumulate in living things any time they are taken up and
stored faster than they are broken down or excreted. Heavy metals can
enter a water supply by industrial and consumer waste, or even from
acidic rain breaking down soils and releasing heavy metals into streams,
lakes, rivers and groundwater.
Material and MethodS
Water samples were collected from five rivers of Doon valley. The
rivers for this study were: Ganga (G), Alaknanda (A), Mandakini (M),
Bhagirathi (B) and Yamuna (Y). Water samples were collected once in
every month during April- June 2009 from two sites- middle of the
river stretch and discharge point at nine monitoring stations viz.
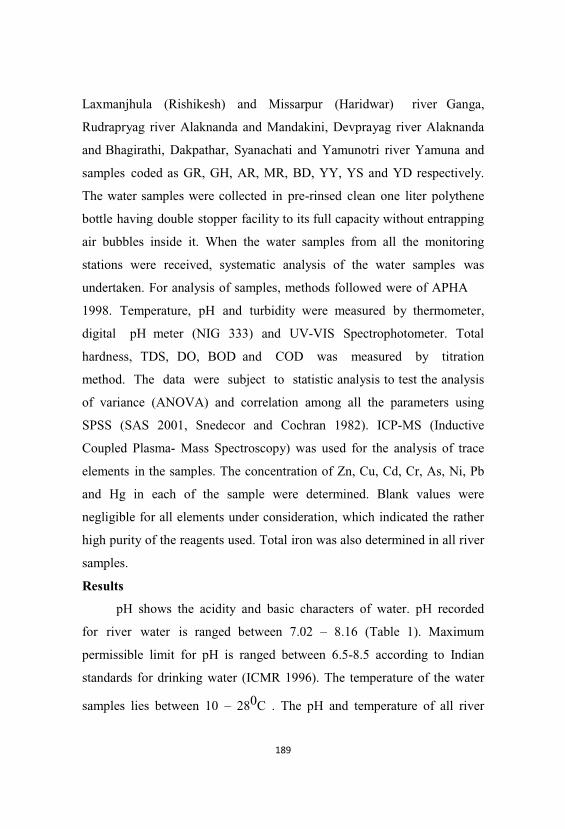
Laxmanjhula (Rishikesh) and Missarpur (Haridwar) river Ganga,
Rudrapryag river Alaknanda and Mandakini, Devprayag river Alaknanda
and Bhagirathi, Dakpathar, Syanachati and Yamunotri river Yamuna and
samples coded as GR, GH, AR, MR, BD, YY, YS and YD respectively.
The water samples were collected in pre-rinsed clean one liter polythene
bottle having double stopper facility to its full capacity without entrapping
air bubbles inside it. When the water samples from all the monitoring
stations were received, systematic analysis of the water samples was
undertaken. For analysis of samples, methods followed were of APHA
1998. Temperature, pH and turbidity were measured by thermometer,
digital pH meter (NIG 333) and UV-VIS Spectrophotometer. Total
hardness, TDS, DO, BOD and COD was measured by titration
method. The data were subject to statistic analysis to test the analysis
of variance (ANOVA) and correlation among all the parameters using
SPSS (SAS 2001, Snedecor and Cochran 1982). ICP-MS (Inductive
Coupled Plasma- Mass Spectroscopy) was used for the analysis of trace
elements in the samples. The concentration of Zn, Cu, Cd, Cr, As, Ni, Pb
and Hg in each of the sample were determined. Blank values were
negligible for all elements under consideration, which indicated the rather
high purity of the reagents used. Total iron was also determined in all river
samples.
Results
pH shows the acidity and basic characters of water. pH recorded
for river water is ranged between 7.02 – 8.16 (Table 1). Maximum
permissible limit for pH is ranged between 6.5-8.5 according to Indian
standards for drinking water (ICMR 1996). The temperature of the water
samples lies between 10 – 280C . The pH and temperature of all river
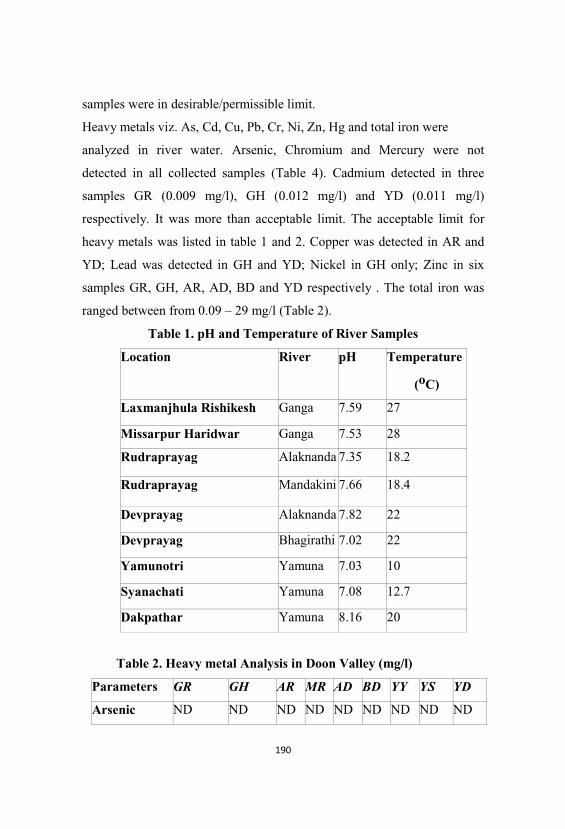
samples were in desirable/permissible limit.
Heavy metals viz. As, Cd, Cu, Pb, Cr, Ni, Zn, Hg and total iron were
analyzed in river water. Arsenic, Chromium and Mercury were not
detected in all collected samples (Table 4). Cadmium detected in three
samples GR (0.009 mg/l), GH (0.012 mg/l) and YD (0.011 mg/l)
respectively. It was more than acceptable limit. The acceptable limit for
heavy metals was listed in table 1 and 2. Copper was detected in AR and
YD; Lead was detected in GH and YD; Nickel in GH only; Zinc in six
samples GR, GH, AR, AD, BD and YD respectively . The total iron was
ranged between from 0.09 – 29 mg/l (Table 2).
Table 1. pH and Temperature of River Samples
Location River pH Temperature
(oC)
Laxmanjhula Rishikesh Ganga 7.59 27
Missarpur Haridwar Ganga 7.53 28
Rudraprayag Alaknanda 7.35 18.2
Rudraprayag Mandakini 7.66 18.4
Devprayag Alaknanda 7.82 22
Devprayag Bhagirathi 7.02 22
Yamunotri Yamuna 7.03 10
Syanachati Yamuna 7.08 12.7
Dakpathar Yamuna 8.16 20
Table 2. Heavy metal Analysis in Doon Valley (mg/l)
Parameters GR GH AR MR AD BD YY YS YD
Arsenic ND ND ND ND ND ND ND ND ND
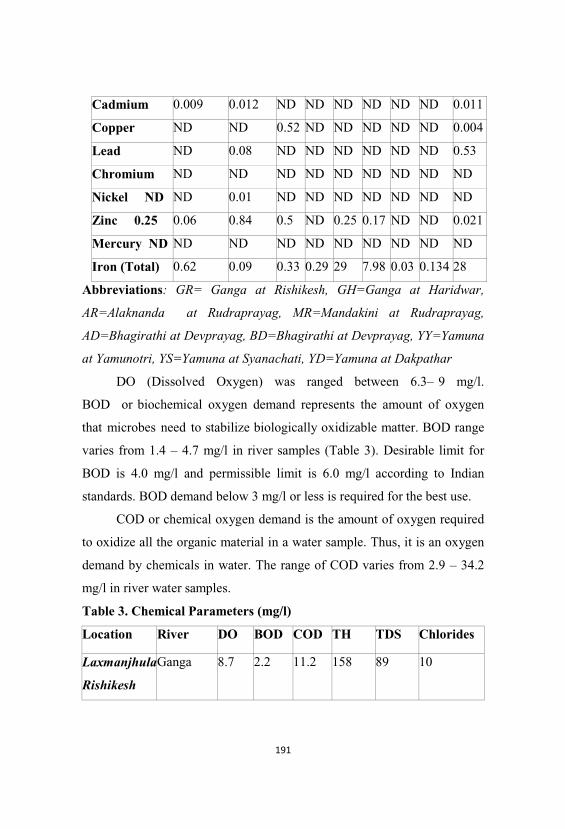
Cadmium 0.009 0.012 ND ND ND ND ND ND 0.011
Copper ND ND 0.52 ND ND ND ND ND 0.004
Lead ND 0.08 ND ND ND ND ND ND 0.53
Chromium ND ND ND ND ND ND ND ND ND
Nickel ND ND 0.01 ND ND ND ND ND ND ND
Zinc 0.25 0.06 0.84 0.5 ND 0.25 0.17 ND ND 0.021
Mercury ND ND ND ND ND ND ND ND ND ND
Iron (Total) 0.62 0.09 0.33 0.29 29 7.98 0.03 0.134 28
Abbreviations: GR= Ganga at Rishikesh, GH=Ganga at Haridwar,
AR=Alaknanda at Rudraprayag, MR=Mandakini at Rudraprayag,
AD=Bhagirathi at Devprayag, BD=Bhagirathi at Devprayag, YY=Yamuna
at Yamunotri, YS=Yamuna at Syanachati, YD=Yamuna at Dakpathar
DO (Dissolved Oxygen) was ranged between 6.3– 9 mg/l.
BOD or biochemical oxygen demand represents the amount of oxygen
that microbes need to stabilize biologically oxidizable matter. BOD range
varies from 1.4 – 4.7 mg/l in river samples (Table 3). Desirable limit for
BOD is 4.0 mg/l and permissible limit is 6.0 mg/l according to Indian
standards. BOD demand below 3 mg/l or less is required for the best use.
COD or chemical oxygen demand is the amount of oxygen required
to oxidize all the organic material in a water sample. Thus, it is an oxygen
demand by chemicals in water. The range of COD varies from 2.9 – 34.2
mg/l in river water samples.
Table 3. Chemical Parameters (mg/l)
Location River DO BOD COD TH TDS Chlorides
Laxmanjhula
Rishikesh
Ganga 8.7 2.2 11.2 158 89 10
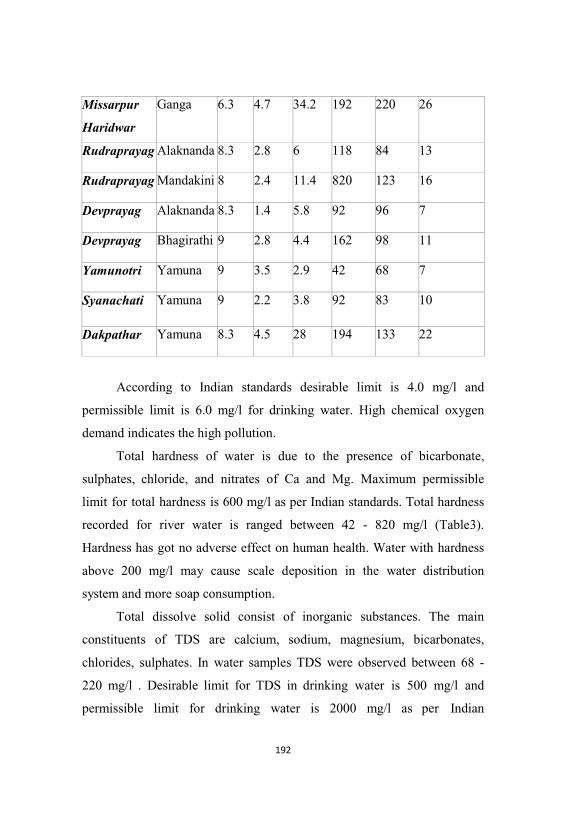
Missarpur
Haridwar
Ganga 6.3 4.7 34.2 192 220 26
Rudraprayag Alaknanda 8.3 2.8 6 118 84 13
Rudraprayag Mandakini 8 2.4 11.4 820 123 16
Devprayag Alaknanda 8.3 1.4 5.8 92 96 7
Devprayag Bhagirathi 9 2.8 4.4 162 98 11
Yamunotri Yamuna 9 3.5 2.9 42 68 7
Syanachati Yamuna 9 2.2 3.8 92 83 10
Dakpathar Yamuna 8.3 4.5 28 194 133 22
According to Indian standards desirable limit is 4.0 mg/l and
permissible limit is 6.0 mg/l for drinking water. High chemical oxygen
demand indicates the high pollution.
Total hardness of water is due to the presence of bicarbonate,
sulphates, chloride, and nitrates of Ca and Mg. Maximum permissible
limit for total hardness is 600 mg/l as per Indian standards. Total hardness
recorded for river water is ranged between 42 - 820 mg/l (Table3).
Hardness has got no adverse effect on human health. Water with hardness
above 200 mg/l may cause scale deposition in the water distribution
system and more soap consumption.
Total dissolve solid consist of inorganic substances. The main
constituents of TDS are calcium, sodium, magnesium, bicarbonates,
chlorides, sulphates. In water samples TDS were observed between 68 -
220 mg/l . Desirable limit for TDS in drinking water is 500 mg/l and
permissible limit for drinking water is 2000 mg/l as per Indian
standards. Beyond desirable limit water becomes unpalatable and may
cause gastrointestinal irritation.
Chloride concentration in water samples recorded is ranged
between 7 – 26 mg/l (Table 3). Maximum permissible limit of chloride
is 1000 mg/l and desirable limit of chloride is 250 mg/l as per
Indian standards. In this study highest concentration of Chloride was
26 mg/l in Ganga River at Missarpur Haridwar.
Discussion
Pollution is the main reason because of which the rivers are getting
polluted.Increased human activities near the river bodies are major factors
contributing to the pollution of these rivers. The presence of heavy metals
in these rivers poses a serious threat because most of these heavy metals
have serious toxic effects on both humans and on plants. Directly or
indirectly the water of these rivers are utilized by human, animals, and
plants thus there is a great risk involved of getting contaminated. In
rocks, they exist as their ores in different chemical forms, from
which they are recovered as minerals. Heavy metal ores include
sulphides, such as iron, arsenic, lead, lead-zinc, cobalt, gold silver and
nickel sulphides; oxides such as aluminium, manganese, gold, selenium
and antimony. Some exist and can be recovered as both sulphide and oxide
ores such as iron, copper and cobalt. Ore minerals tend to occur in families
whereby metals that exist naturally as sulphides would mostly occur
together, likewise for oxides.
Generally, metals are emitted during their mining and processing
activities (Lenntech, 2004). Environmental pollution by heavy metals is
very prominent in areas of mining and old mine sites and pollution
reduces with increasing distance away from mining sites (Peplow, 1999).
These metals are leached out and in sloppy areas are carried by acid
water downstream or run-off to the sea. Through mining activities, water
bodies are most emphatically polluted (Garbarino et al., 1995; INECAR,
2000). Through rivers and streams, the metals are transported as either
dissolved species in water or as an integral part of suspended sediments,
dissolved species in water have the greatest potential of causing the most
deleterious effects.
Most of the chemical parameters were found to be above the
permissible limit as per prescribed standards. The temperature ranged
between 10 – 27oC, pH ranged between 7.03 – 8.16, DO ranged 6.3 – 9
mg/l, BOD ranged 1.4 – 4.7 mg/l, COD ranged between 2.9 – 34.2 mg/l,
Total hardness ranged between 42 – 820 mg/l, TDS ranged between 68 –
220 mg/l and chlorides ranged between 7 – 26 mg/l. . Results showed that
maximum pollutants were found in river Ganga at Missarpur Haridwar and
river Yamuna at Dakpathar.
Acknowledgements
The authors are grateful to Dr. P.P. Khanna, (Scientist F, Wadia
Institute of Himalayan Geology) for providing the facility to estimate the
total heavy metals and Mrs. K.P. Rathoure for their valuable comments
and technical support.
References
American Public Health Association 1995, Standard Methods for the
Examination of Water and Sewage, APHA, Washington, 95 APHA
1998, Standard methods for the examination of water and waste
water, 20th
Ed. American Public Health Association Washington.
Garbarino JR, Hayes H, Roth D, Antweider R, Brinton TI, Taylor H 1995,
Contaminants in the Mississippi River, U. S. Geological Survey
Circular Virginia, U.S.A 1133.
ICMR (Indian Council of Medical Research), Guideline for drinking water
1996, INECAR 2000, (Institute of Environmental Conservation and
Research).
Lenntech Water Treatment and Air Purification 2004, Water Treatment,
Published by Lenntech, Rotterdamseweg, Netherlands
(www.excelwater.com/thp/filters/Water-Purification.htm).
Peplow D 1999, Environmental Impacts of Mining in Eastern Washington,
Center for Water and Watershed Studies Fact Sheet, University of
Washington, Seattle. Snedecor GW, Cochran WG.1982,Statistical
Methods.7th ed.he Iowa State University Press.Ames,IA.Statistical
Analysis Systems 2001, SAS® User's Guide: Statistics, Version 5
Edition Cary, NC.
UNEP/GPA 2004, United Nations Environmental Protection/Global
Program of Action, Why The Marine Environment Needs Protection
From Heavy Metals. WHO 1999, Guidelines for Drinking water
quality, Geneva, 2nd Ed.; 97-100.

Land Use Land Cover Change
Assessment of Extension of Ganga River Corridor an Indication of
Soil Erosion and Biodiversity Loss Using Remote Sensing and GIS
Techniques
Parth Sarathi Mahapatra, H.B.Vasistha
Ecology & environment division
Forest Research Institute,Dehradun-248006, India
Abstract
Biodiversity has become one of the central environmental
issues in the framework of recent policies and international conventions
for the promotion of sustainable development. In context to it the fragile
ecosystem of the Himalayas has been an increasing cause of concern to the
environmentalists. The steep slopes in the Himalayas, sparse forest
cover, as well as high seismicity are the major factors responsible for
soil erosion and sedimentation in Upper Ganges thereby encouraging
habitat loss of many floral and faunal species. This problem is attributed to
various developmental and anthropogenic activities such as construction of
hydroelectric dam, mining, road construction, dredging, deforestation,
grazing and unplanned agricultural practices in the catchments area. In
general, loss of biodiversity diminishes the rate and capacity of
ecosystems to produce ecosystem services; therefore conservation of the
same is quiet essential.
This study was conducted in the river corridor of Ganga in between
Kaudiyala and Rishikesh popularly known as ‘Kaudiyala-Tapovan
Ecotourism Zone’ which is famous for river rafting in Uttarakhand. It is
located in the district Tehri Garhwal, Uttarakhand, between 30°04 23 –
30°07 34 N latitude and 78°30 13 –78°19 48 E longitude and covers a
road distance of 40 km along with a river distance of 36 km from the well
known religious place Rishikesh.
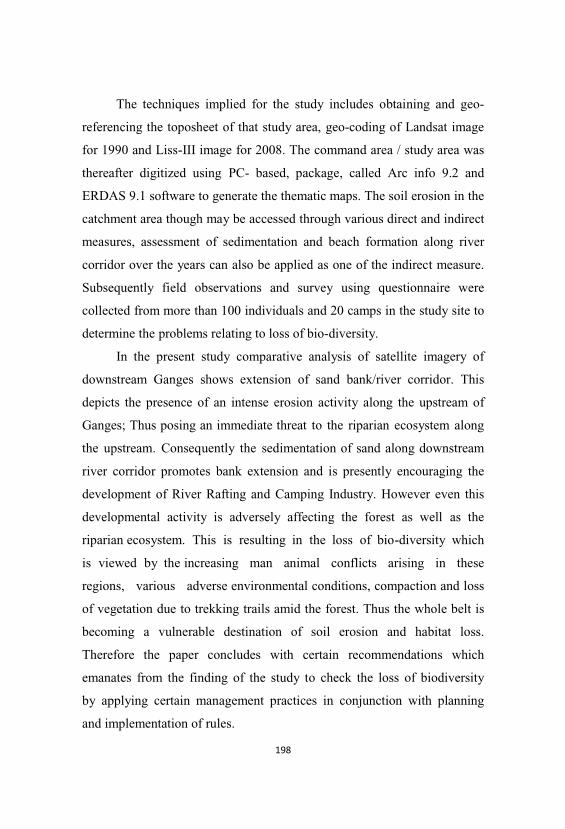
The techniques implied for the study includes obtaining and geo-
referencing the toposheet of that study area, geo-coding of Landsat image
for 1990 and Liss-III image for 2008. The command area / study area was
thereafter digitized using PC- based, package, called Arc info 9.2 and
ERDAS 9.1 software to generate the thematic maps. The soil erosion in the
catchment area though may be accessed through various direct and indirect
measures, assessment of sedimentation and beach formation along river
corridor over the years can also be applied as one of the indirect measure.
Subsequently field observations and survey using questionnaire were
collected from more than 100 individuals and 20 camps in the study site to
determine the problems relating to loss of bio-diversity.
In the present study comparative analysis of satellite imagery of
downstream Ganges shows extension of sand bank/river corridor. This
depicts the presence of an intense erosion activity along the upstream of
Ganges; Thus posing an immediate threat to the riparian ecosystem along
the upstream. Consequently the sedimentation of sand along downstream
river corridor promotes bank extension and is presently encouraging the
development of River Rafting and Camping Industry. However even this
developmental activity is adversely affecting the forest as well as the
riparian ecosystem. This is resulting in the loss of bio-diversity which
is viewed by the increasing man animal conflicts arising in these
regions, various adverse environmental conditions, compaction and loss
of vegetation due to trekking trails amid the forest. Thus the whole belt is
becoming a vulnerable destination of soil erosion and habitat loss.
Therefore the paper concludes with certain recommendations which
emanates from the finding of the study to check the loss of biodiversity
by applying certain management practices in conjunction with planning
and implementation of rules.
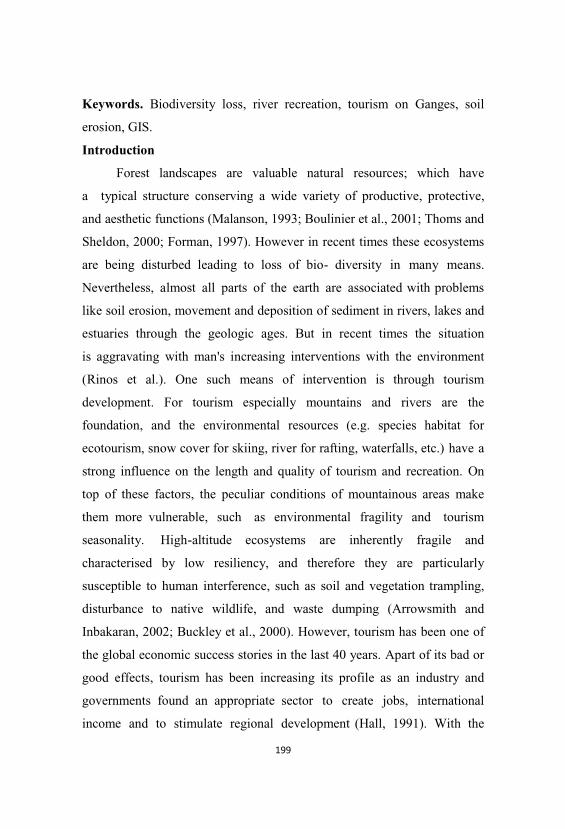
Keywords. Biodiversity loss, river recreation, tourism on Ganges, soil
erosion, GIS.
Introduction
Forest landscapes are valuable natural resources; which have
a typical structure conserving a wide variety of productive, protective,
and aesthetic functions (Malanson, 1993; Boulinier et al., 2001; Thoms and
Sheldon, 2000; Forman, 1997). However in recent times these ecosystems
are being disturbed leading to loss of bio- diversity in many means.
Nevertheless, almost all parts of the earth are associated with problems
like soil erosion, movement and deposition of sediment in rivers, lakes and
estuaries through the geologic ages. But in recent times the situation
is aggravating with man's increasing interventions with the environment
(Rinos et al.). One such means of intervention is through tourism
development. For tourism especially mountains and rivers are the
foundation, and the environmental resources (e.g. species habitat for
ecotourism, snow cover for skiing, river for rafting, waterfalls, etc.) have a
strong influence on the length and quality of tourism and recreation. On
top of these factors, the peculiar conditions of mountainous areas make
them more vulnerable, such as environmental fragility and tourism
seasonality. High-altitude ecosystems are inherently fragile and
characterised by low resiliency, and therefore they are particularly
susceptible to human interference, such as soil and vegetation trampling,
disturbance to native wildlife, and waste dumping (Arrowsmith and
Inbakaran, 2002; Buckley et al., 2000). However, tourism has been one of
the global economic success stories in the last 40 years. Apart of its bad or
good effects, tourism has been increasing its profile as an industry and
governments found an appropriate sector to create jobs, international
income and to stimulate regional development (Hall, 1991). With the
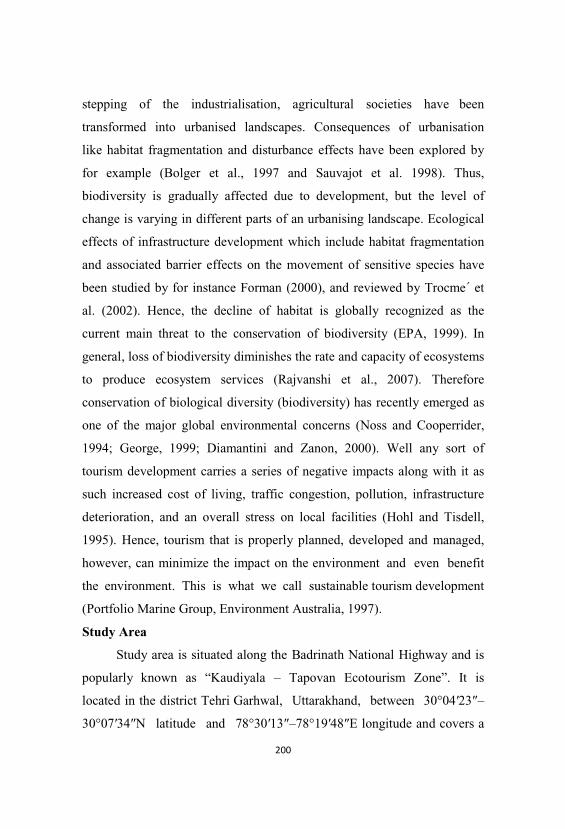
stepping of the industrialisation, agricultural societies have been
transformed into urbanised landscapes. Consequences of urbanisation
like habitat fragmentation and disturbance effects have been explored by
for example (Bolger et al., 1997 and Sauvajot et al. 1998). Thus,
biodiversity is gradually affected due to development, but the level of
change is varying in different parts of an urbanising landscape. Ecological
effects of infrastructure development which include habitat fragmentation
and associated barrier effects on the movement of sensitive species have
been studied by for instance Forman (2000), and reviewed by Trocme´ et
al. (2002). Hence, the decline of habitat is globally recognized as the
current main threat to the conservation of biodiversity (EPA, 1999). In
general, loss of biodiversity diminishes the rate and capacity of ecosystems
to produce ecosystem services (Rajvanshi et al., 2007). Therefore
conservation of biological diversity (biodiversity) has recently emerged as
one of the major global environmental concerns (Noss and Cooperrider,
1994; George, 1999; Diamantini and Zanon, 2000). Well any sort of
tourism development carries a series of negative impacts along with it as
such increased cost of living, traffic congestion, pollution, infrastructure
deterioration, and an overall stress on local facilities (Hohl and Tisdell,
1995). Hence, tourism that is properly planned, developed and managed,
however, can minimize the impact on the environment and even benefit
the environment. This is what we call sustainable tourism development
(Portfolio Marine Group, Environment Australia, 1997).
Study Area
Study area is situated along the Badrinath National Highway and is
popularly known as “Kaudiyala – Tapovan Ecotourism Zone”. It is
located in the district Tehri Garhwal, Uttarakhand, between 30°04 23 –
30°07 34 N latitude and 78°30 13 –78°19 48 E longitude and covers a
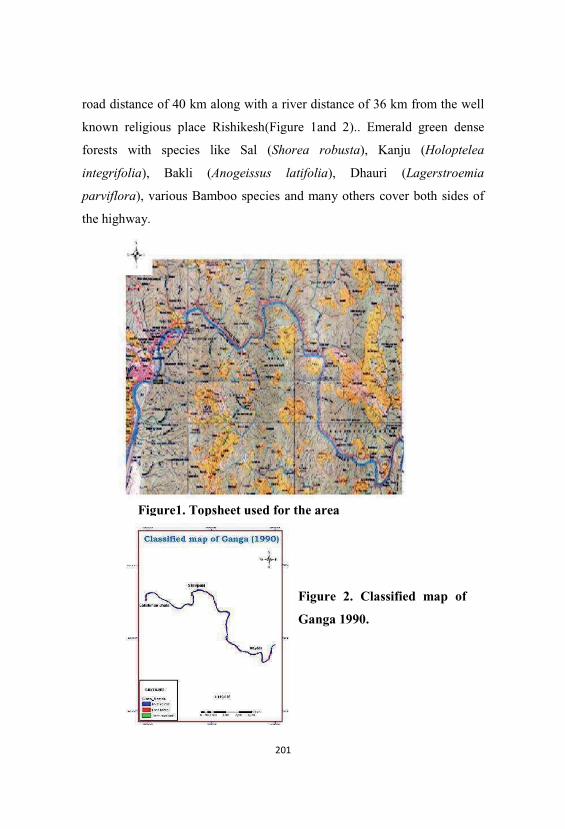
road distance of 40 km along with a river distance of 36 km from the well
known religious place Rishikesh(Figure 1and 2).. Emerald green dense
forests with species like Sal (Shorea robusta), Kanju (Holoptelea
integrifolia), Bakli (Anogeissus latifolia), Dhauri (Lagerstroemia
parviflora), various Bamboo species and many others cover both sides of
the highway.
Figure1. Topsheet used for the area
Figure 2. Classified map of
Ganga 1990.
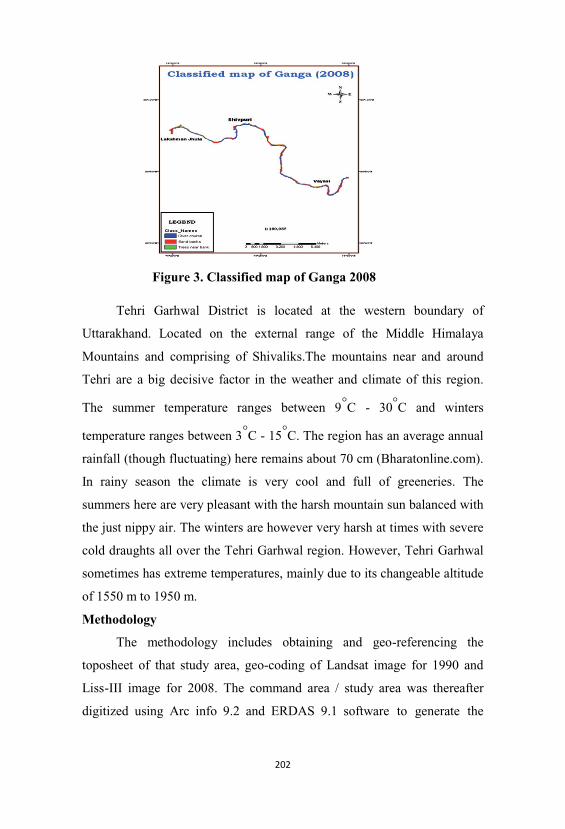
Tehri Garhwal District is located at the western boundary of
Uttarakhand. Located on the external range of the Middle Himalaya
Mountains and comprising of Shivaliks.The mountains near and around
Tehri are a big decisive factor in the weather and climate of this region.
The summer temperature ranges between 9°C - 30°C and winters
temperature ranges between 3°C - 15°C. The region has an average annual
rainfall (though fluctuating) here remains about 70 cm (Bharatonline.com).
In rainy season the climate is very cool and full of greeneries. The
summers here are very pleasant with the harsh mountain sun balanced with
the just nippy air. The winters are however very harsh at times with severe
cold draughts all over the Tehri Garhwal region. However, Tehri Garhwal
sometimes has extreme temperatures, mainly due to its changeable altitude
of 1550 m to 1950 m.
Methodology
The methodology includes obtaining and geo-referencing the
toposheet of that study area, geo-coding of Landsat image for 1990 and
Liss-III image for 2008. The command area / study area was thereafter
digitized using Arc info 9.2 and ERDAS 9.1 software to generate the
Figure 3. Classified map of Ganga 2008
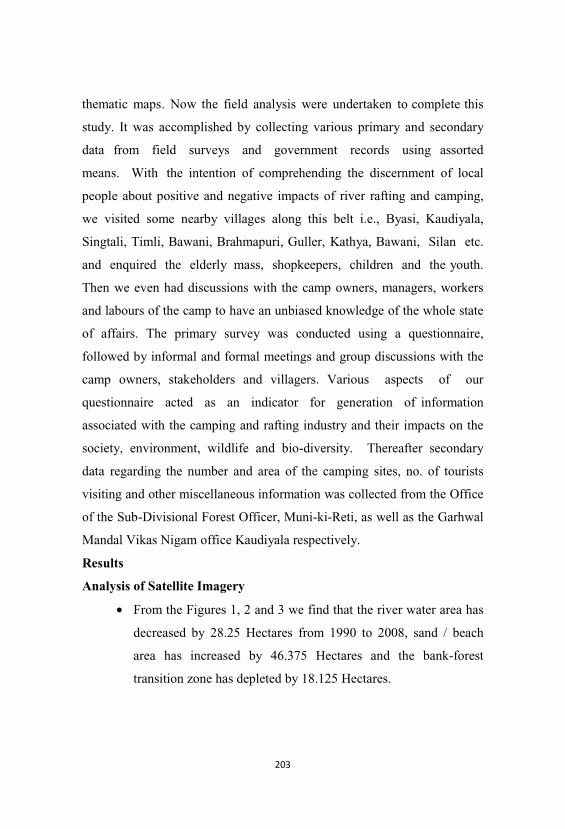
thematic maps. Now the field analysis were undertaken to complete this
study. It was accomplished by collecting various primary and secondary
data from field surveys and government records using assorted
means. With the intention of comprehending the discernment of local
people about positive and negative impacts of river rafting and camping,
we visited some nearby villages along this belt i.e., Byasi, Kaudiyala,
Singtali, Timli, Bawani, Brahmapuri, Guller, Kathya, Bawani, Silan etc.
and enquired the elderly mass, shopkeepers, children and the youth.
Then we even had discussions with the camp owners, managers, workers
and labours of the camp to have an unbiased knowledge of the whole state
of affairs. The primary survey was conducted using a questionnaire,
followed by informal and formal meetings and group discussions with the
camp owners, stakeholders and villagers. Various aspects of our
questionnaire acted as an indicator for generation of information
associated with the camping and rafting industry and their impacts on the
society, environment, wildlife and bio-diversity. Thereafter secondary
data regarding the number and area of the camping sites, no. of tourists
visiting and other miscellaneous information was collected from the Office
of the Sub-Divisional Forest Officer, Muni-ki-Reti, as well as the Garhwal
Mandal Vikas Nigam office Kaudiyala respectively.
Results
Analysis of Satellite Imagery
• From the Figures 1, 2 and 3 we find that the river water area has
decreased by 28.25 Hectares from 1990 to 2008, sand / beach
area has increased by 46.375 Hectares and the bank-forest
transition zone has depleted by 18.125 Hectares.
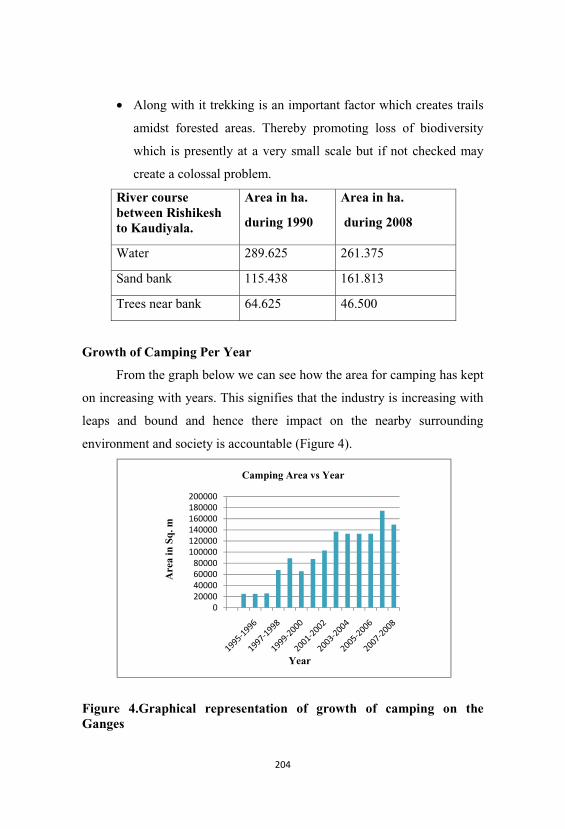
• Along with it trekking is an important factor which creates trails
amidst forested areas. Thereby promoting loss of biodiversity
which is presently at a very small scale but if not checked may
create a colossal problem.
River coursebetween Rishikeshto Kaudiyala.
Area in ha.
during 1990
Area in ha.
during 2008
Water 289.625 261.375
Sand bank 115.438 161.813
Trees near bank 64.625 46.500
Growth of Camping Per Year
From the graph below we can see how the area for camping has kept
on increasing with years. This signifies that the industry is increasing with
leaps and bound and hence there impact on the nearby surrounding
environment and society is accountable (Figure 4).
Figure 4.Graphical representation of growth of camping on theGanges
Are
ain
Sq.
m
Year
Camping Area vs Year
Impacts on Bio-Diversity
From the study it was found that due to increased tourism activity
amidst the forest, trails were created which keep on widening with time
resulting in fragmentation, soil erosion and compaction. Some of the
biological impacts as visualised include vegetation trampling and
degradation (e.g., root exposure), forest thinning (e.g., use of wood for
bonfire by campers), wildlife disturbance and also carry a potential threat
for introduction of exotic species (Figure 5). Waste dumping in campsite
areas or along the trail and even along the river corridors as well as roads
may result in surface and groundwater pollution. Additionally, these
activities determine a number of indirect impacts, such as increase in
traffic, and therefore air and noise pollution, off-road driving, land
occupation, soil loss and deforestation due to the construction of
campsites, and tourism infrastructures in general.
Impacts on Wildlife
With the advent of white water tourism in Uttarakhand, some of the
undisturbed ecosystems in this region were engendered. The wild life in
the forest ecosystem was the first to face trouble with human intervention
in their lands. As per reviews collected from the local people, camp
working staff, Indo Tibetian Boder Police Camps along the river course, it
was found that there was a change from diurnal habitat to nocturnal habitat
in the wild animals of that region. Now these animals that are forced to
move at night find livestock to be an easy prey and even destroy the
agricultural lands of the villagers. Hence, in return the villagers set traps to
kill the wild animals. Along with it close interaction and not exactly
conflicts have been undertaken by 59% of the people in the camps
surveyed (Mahapatra et al. 2010). However, incursions into the camps
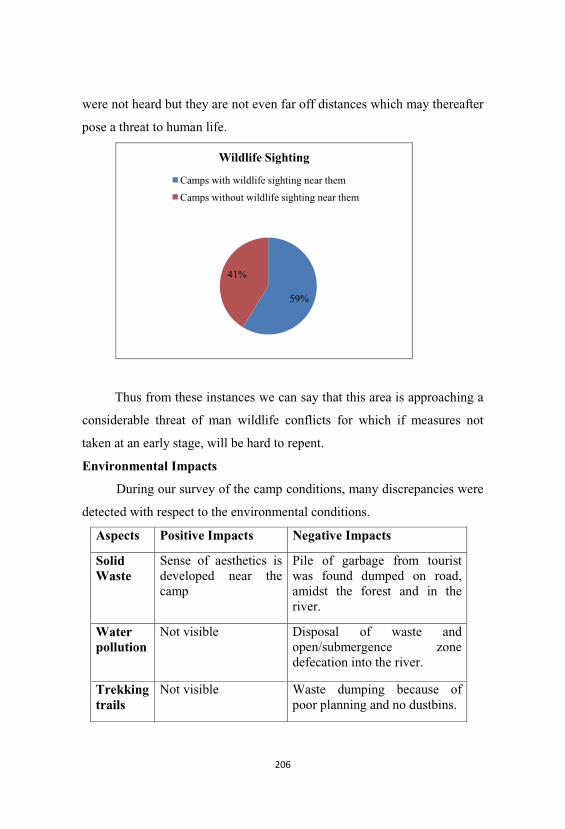
were not heard but they are not even far off distances which may thereafter
pose a threat to human life.
Thus from these instances we can say that this area is approaching a
considerable threat of man wildlife conflicts for which if measures not
taken at an early stage, will be hard to repent.
Environmental Impacts
During our survey of the camp conditions, many discrepancies were
detected with respect to the environmental conditions.
Aspects Positive Impacts Negative Impacts
SolidWaste
Sense of aesthetics isdeveloped near thecamp
Pile of garbage from touristwas found dumped on road, amidst the forest and in theriver.
Waterpollution
Not visible Disposal of waste andopen/submergence zonedefecation into the river.
Trekkingtrails
Not visible Waste dumping because ofpoor planning and no dustbins.
59%
41%
Wildlife Sighting
Camps with wildlife sighting near them
Camps without wildlife sighting near them
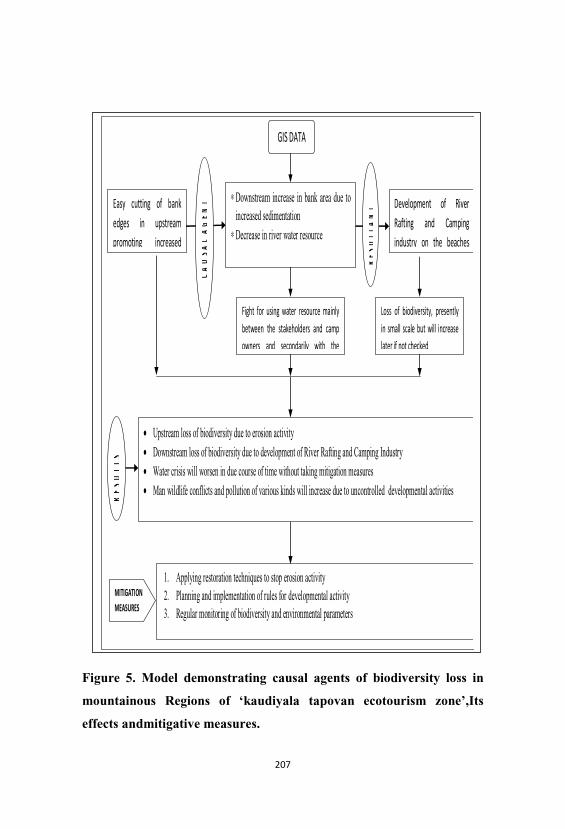
Figure 5. Model demonstrating causal agents of biodiversity loss in
mountainous Regions of ‘kaudiyala tapovan ecotourism zone’,Its
effects andmitigative measures.
• Upstream loss of biodiversity due to erosion activity• Downstream loss of biodiversity due to development of River Rafting and Camping Industry• Water crisis will worsen in due course of time without taking mitigation measures• Man wildlife conflicts and pollution of various kinds will increase due to uncontrolled developmental activities
1. Applying restoration techniques to stop erosion activity2. Planning and implementation of rules for developmental activity3. Regular monitoring of biodiversity and environmental parameters
∗ Downstream increase in bank area due toincreased sedimentation
∗ Decrease in river water resource
Discussion and Conclusions
The study shows that in the upstream of Ganges, there is a
continuous erosion activity which is resulting in enormous amount of sand
deposition along the downstream every year. As a result of which the sand
area is increasing which is indirectly leading for the development of the
River Rafting and Camping industry in the Rishikesh-Kaudiyala Eco-
tourism zone along the downstream of the Ganges. As a consequence,
mountain and river tourism has become an important source of income,
providing a significant contribution to the economic development of the
region. However, tourism development is posing a threat to the
conservation of this serene environment, due to the fragility of its
ecosystems, as well as the lack of adequate infrastructures, policies and
planning tools.
Therefore from the study we could find out that an intense erosion
activity is constantly occurring in the upstream of Ganges which is as such
posing a potential threat to the mountain as well as riparian ecosystem of
that area. However, the subsequent direct and indirect impacts emanating
from this activity include enormous deposition of sand in the downstream
of the river. Consequently, laying a foundation for the development of
“River Rafting and Camping Industry” and on the other hand reducing the
river water resource and putting an adverse impact on the bio-diversity as
well as the wildlife (Figure 5). Hence, a final consideration is that impacts
of bio-diversity loss and tourism as a whole are difficult to estimate
because they comprise a complex network of direct and indirect effects. In
addition to it very little knowledge is present about biodiversity works
being carried out in mountainous regions, as a result of which this work
can provide a baseline for further studies.
References
Arrowsmith, C, and Inbakaran R. 2002. Estimating environmental
resiliency for the Grampians National Park, Victoria, Australia: a
quantitative approach. Tour Manag. 23:295–309.
Bolger, D.T., Scott, T.A. and Rotenberry, J.T. 1997. Breeding bird
abundance in an urbanizing landscape in coastal Southern California.
Conservation Biology; 11: 406–421.
Boulinier, T., Nichols, J.D., Hines, J.E., et al. 2001. Forest fragmentation
and bird community dynamics: inference at regional scale. Ecol. 82
(4):159-169.
Buckley, R.C., Pickering, C.M., and Warnken, J., 2000. Environmental
management for Alpine tourism and resorts in Australia. In: Godde
P.M., Price M.F., Zimmermann F.M., editors. Tourism and
development in mountain regions. Wallingford: CABI Publishing. pp.
27–45.
Diamantini, C. and Zanon, B. 2000. Planning the urban sustainable
development. The case of the plan for the province of Trento, Italy.
Environmental Impact Assessment Review; 20:299–310.
Dover, R.W., Bunce, R.G.H. (Eds.), 1998. Key Concepts in Landscape
Ecology. Proceedings of the 1998 European Congress of the
International Association for Landscape Ecology. pp. 239–244.
EPA (Environmental Protection Agency), 1999. Considering ecological
processes in environmental impact assessments. U.S. Environmental
Protection Agency—Office of Federal Activities.
Forman, R.T.T., 1997. Land Mosaics: The Ecology of Landscapes and
Regions, Cambridge University Press, Cambridge. 213-156.
Forman, R.T.T., 2000. Estimate of the area affected ecologically by the
road system in the United States. Conservation Biology 14, 31–35.
George, C., 1999. Testing for sustainable development through
environmental assessment. Environmental Impact Assessment
Review; 19:175–200.
Hall, C.M., 1991. Introduction to Tourism in Australia: impacts, planning
and development. Melbourne: Longman Cheshire.
Hohl, A.E., and Tisdell, C.A., 1995. Peripheral tourism development and
management. Annals of Tourism Research, 22: 517–533.
http://www.bharatonline.com/uttarakhand/tehri-garhwal/weather.html
(Assessed on 15th May, 2010)
Mahapatra, P.S., Vasistha, H.B. and Sharma, D.K., 2010. Man Wildlife
Conflict: A Case Study of Kaudiyala – Tapovan Ecotourism Zone,
Uttarakhand. Proceedings of 5th Uttarakhand State Science and
Technology Congress. pp. 186
Malanson, G.P., 1993. Riparian Landscapes. Cambridge University Press.
Cambridge.
Noss, R.F., Cooperrider, A.Y., 1994. Saving nature’s legacy. Protecting
and restoring biodiversity. Washington, DC: Island Press.
Portfolio Marine Group, Environment Australia, 1997. Coastal Tourism -
A Manual for Sustainable Development, Based on a draft paper
prepared by Southern Cross University, ISBN 0642271291.
Rajvanshi, A., Mathur, Vinod B., Iftikhar, Usman A., 2007. Best practice
guidance for biodiversity-inclusive impact assessment: A manual for
practitioners and reviewers in South Asia. CBBIA-IAIA Guidance
Series. Capacity Building in Biodiversity and Impact Assessment
(CBBIA) Project, International Association for Impact Assessment
(IAIA), North Dakota, U.S.A.
Rinos. Mohamed. M. H., Aggarwal. S. P., Silva De Ranjith Premalal.,
1997. Application of Remote Sensing and GIS on soil erosion
assessment at Bata River Basin, India. ACRS proceedings.
Sauvajot, R.M., Buechner, M., Kamradt, D.A., Shonewald, C.M., 1998.
Patterns of human disturbance and response by small mammals and
birds in chaparral near urban development. Urban Ecosystems. 2:
279–297.
Thoms, M.C. and Sheldon, F., 2000. Lowland rivers: an Australian
introduction. Regul River. 16:375-383.
Trocme´, M., Cahill, S., de Vries, J.G., Farrall, H., Folkeson, L., Fry, G.,
Hicks, C., Peymen, J. (Eds.), 2002. Habitat fragmentation due to
transportation infrastructure. The European Review. European
Communities, Luxembourg. pp. 253.
Biodiversity Characterization in Marine National Park, Jamnagar,
Gujarat using Remote Sensing and Geographic Information System
Ganesh Datt Bhatt
Global Open University, Nagaland
Abstract
India has a vast extent of coast line of about 8000 km spanning 13
maritime mainland states and Union Territories, which are home to a
diversity of coastal and marine ecosystems, comprising nationally and
globally significant biodiversity (Venkataraman and Wafar, 2005). To
study the phytodiversity is very essential for conservation in a limited time
and less manpower. A comprehensive methodology involving remote
sensing field investigation and the Geographical Information System
(GIS) has been adopted for the present study. Satellite data of MSS 4-5
is used for the present study. Supervised classification, unsupervised
classification and onscreen visual interpation have been done. For
supervised classification the field survey was done to become acquainted
with the general patterns of vegetation of the area. Major vegetation types
and a few prime localities of characteristics types were recorded. In
unsupervised classification (using ISODATA) has been done with 15
classes at a 98% confidence threshold. On screen visual interpretation
(1.50,000 scale) in a polygon mode using arc view has been performed
with the fundamental image characteristics i.e. tone, texture, pattern, size,
shape; shadow coupled with site / location and associated features.
Looking at the data generated from the three classification
attempts side by side, it can easily be seen that differences in land use
classes are present. Furthermore, the data generated with the
unsupervised technique contains additional land use classes. By
simply visually analyzing the images created using the different
classification techniques, the method of onscreen visual interpation
appears to be the better choice in this example. Human error in giving
iterations, lack of knowledge of study area, and other factors all
contribute to inaccurate results in the supervised classification and
unsupervised method. The main task of this study was to identify the
proximate drivers of biodiversity loss through vegetation/forest
distribution status. In the district like MNP, Jamnagar the industrial
activity and infrastructural development have been identified as major
driver of biodiversity loss. The secondary factors which concern the
conservationists is unsustainable high rates of human population
growth, natural resource consumption; inadequate knowledge and
insufficient use of information and economic system and policies that fail
to value the environment and its resource. With the specific needs of
the district of MNP, Jamnagar there is need to build trust between
development activity viz., mining, dam construction, industrialization, land
use conversion and conservation interests.
Keywords. Remote sensing, Biodiversity, Geographical Information
System.
Introduction
India has a vast extent of coast line of about 8000 km spanning 13
maritime mainland states and Union Territories, which are home to a
diversity of coastal and marine ecosystems, comprising nationally and
globally significant biodiversity (Venkataraman and Wafar, 2005). It
also supports almost 30% of its human population being dependent on
the rich exploitable coastal and marine resources. The coastline of Bay of
Bengal and Arabian Sea continues to be a rich fishing ground in the
south Asian region and India is one of the world’s largest marine product
nations.
Marine ecosystems such as estuaries, coral reefs, marshes, lagoon,
sandy and rocky beaches, mangrove forests and sea grass beds are all
known for their high biological productivity, which provide a wide range
of habitat for many aquatic flora and fauna. It also provides important
food resources and critically major services to human beings.
Therefore, sustainability of these fragile ecosystems should be our primary
concern. So far, we have largely looked the marine biodiversity as a source
of commercial products instead of appreciating their ecological values
and services which has resulted in over exploitation and several species
are now in the verge of extinction. Moreover, human activities such as
destructive fishing, shipping, coastal developments, discharge of
untreated effluent from industries have caused considerable damage
and pose a severe threat to the coastal and marine biodiversity. In
addition to that, global warming due to climate change also poses major
challenges to marine biodiversity.
The Gulf of Kutch is an extension of Arabian Sea towards east and
covers southern part of Kutch district and northern portion of
Jamnagar district. Some portion of Rajkot district is located on the closed
end of the Gulf. Total area of Gulf of Kutch is 7350 km2. The coral reef
is found on the southern part of the Gulf in Jamnagar district and it is
one of the 4 major important reefs of the country. It is the northern most
reef of the country located just below the Tropic of Cancer. The reef found
in the Gulf of Kutch seems to be originated in the Cambrian Period thus it
is a very ancient reef and many fossils of molluscs are found on the shore.
The water current is very fast and studies done by NIO suggests that silt
from river Indus which meets the sea near Karachi flows into the Gulf
and it affects the coral reef. Ecologically the reef in the Gulf of
Kutch has great significance as it is having different types of
ecosystems like Coral reef ecosystem; Sea grass and Sea weed ecosystem,
Mangrove ecosystem, Coastal sandy ecosystem, Barren mudflat, Rocky
shore etc. Because of the diversity in ecosystem the biological diversity in
this area is very high. Therefore, in one of the seminars at Sasan Gir in
1980 it was decided to protect and develop this area for preservation of
Marine life.Most importantly, coordination among all
organizations/institutions who works for conservation of coastal and
marine biodiversity and social welfare of coastal communities is required.
Moreover, documentation and data base of research information
on marine biodiversity is also urgently required. It is also important to
develop a specialized higher educational field based programme in
marine ecosystem ecology with an emphasis on rigorous scientific
research, hypothesis testing, taxonomy and conservation. Human resource
development to manage the Marine Protected Areas of India is also
required immediately.
Methodology
A comprehensive methodology involving remote sensing field
investigation and the Geographical Information System (GIS) has been
adopted or the present study (Figure 1). The raw digital data was enhanced
using contrast stretching techniques to facilitate better differentiation
among vegetation types. The field survey was done to become acquainted
with the general patterns of vegetation of the area. Major vegetation types
and a few prime localities of characteristics types were recorded. The
variation and tonal patterns were observed on existing map/images.
The spectral pattern observed on satellite image has been compared with
the ground situation in the field with respect to each forest types under
different phonological appearance.
The first attempt was made to classify the various land uses in erdas
GIS and image processing software using supervised classification
techniques. In supervised classification, spectral signatures are developed
from specified locations in the image.
These specified locations are given the generic name 'training sites'
and are defined by the user generally a vector layer is digitized over the
raster scene. The vector layer consists of various polygons overlaying
different land use types. The image shows the raster image seen earlier
with the addition of several training sites outlined on top of it. The
training sites will help erdas develop spectral signatures for the outlined
areas. The land use categories of interest in this example are water,
agriculture, grassland, and forest. Multiple polygons are created for each
land use category to help ensure that erdas has sufficient information
to create the spectral signatures. Once the training sites are developed
erdas can use this information, along with the various images of different
bandwidths, to create spectral signatures from the specified areas. These
signatures will then be used to classify all pixels in the scene. There are
two basic groups of classifiers that are used in erdas supervised
classification module. They are called hard classifiers and soft classifiers.
Hard classifiers assign each pixel in the scene a discrete value or category
based on the training sites in the vector layer. For example, if four different
land use types were identified with the training sites, each pixel in the
scene will take on the value of one of those four land uses. If soft
classifiers are used, probabilities may be listed as to which category each
pixel may or may not belong to. In other words, definitive decisions about
land categories are not made. The hard classifier called MAXLIKE was
used to re-classify each pixel. MAXLIKE assigns each pixel in the image
to the class that it has the maximum likelihood of belonging to. Other hard
classifiers may use statistics such as pixel location and proximity of other
features to help make classification decisions. The AREA module in
erdas was then used to view the statistics concerning each land cover
group. This information will later be compared to data generated from the
unsupervised classification example. Zooming in on the dam and outlet
area of Perry Reservoir, it is evident that the classification technique used
has some error in classifying. This image identifies areas on the dam of
the reservoir as agricultural areas. This area is most likely made up of
riprap or other non-vegetative materials and fall in the same category as the
bare soil. This is a common problem and is most likely due to the similar
reflectance properties held by non-vegetative surfaces. The spectral
reflectance properties of these surfaces, such as rock and concrete, were
classified in the same category as bare soil (Figure 2).
Unsupervised classification is a method in which the computer
searches for natural groupings of similar pixels called clusters (Jensen
231). Fewer clusters exist; more pixels within each cluster exist and will
vary in terms of spectral signature, and vice versa. In ERDAS
unsupervised classification is performed using an algorithm called the
Iterative Self-Organizing Data Analysis Technique (ISODATA). Using
this algorithm, the analyst input the number of clusters desired and a
confidence threshold. The computer will then build clusters iteratively,
meaning that with each new iteration the clusters become more and more
refined. The iterations stop when the confidence level (or a maximum
number of iterations specified by the user) is reached (Jensen 238). For
example, if the user wants 30 clusters at 95% confidence, the computer
will filter actively build the clusters until it is 95% confident has attained
the best distribution of pixels into 30 clusters. After the clusters are built,
the analyst must select the land cover classes (water, forest, etc.), then
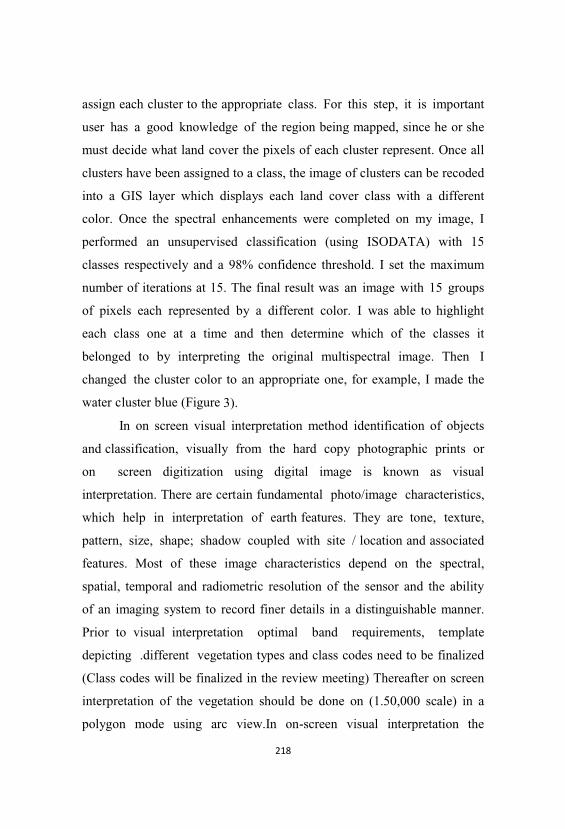
assign each cluster to the appropriate class. For this step, it is important
user has a good knowledge of the region being mapped, since he or she
must decide what land cover the pixels of each cluster represent. Once all
clusters have been assigned to a class, the image of clusters can be recoded
into a GIS layer which displays each land cover class with a different
color. Once the spectral enhancements were completed on my image, I
performed an unsupervised classification (using ISODATA) with 15
classes respectively and a 98% confidence threshold. I set the maximum
number of iterations at 15. The final result was an image with 15 groups
of pixels each represented by a different color. I was able to highlight
each class one at a time and then determine which of the classes it
belonged to by interpreting the original multispectral image. Then I
changed the cluster color to an appropriate one, for example, I made the
water cluster blue (Figure 3).
In on screen visual interpretation method identification of objects
and classification, visually from the hard copy photographic prints or
on screen digitization using digital image is known as visual
interpretation. There are certain fundamental photo/image characteristics,
which help in interpretation of earth features. They are tone, texture,
pattern, size, shape; shadow coupled with site / location and associated
features. Most of these image characteristics depend on the spectral,
spatial, temporal and radiometric resolution of the sensor and the ability
of an imaging system to record finer details in a distinguishable manner.
Prior to visual interpretation optimal band requirements, template
depicting .different vegetation types and class codes need to be finalized
(Class codes will be finalized in the review meeting) Thereafter on screen
interpretation of the vegetation should be done on (1.50,000 scale) in a
polygon mode using arc view.In on-screen visual interpretation the
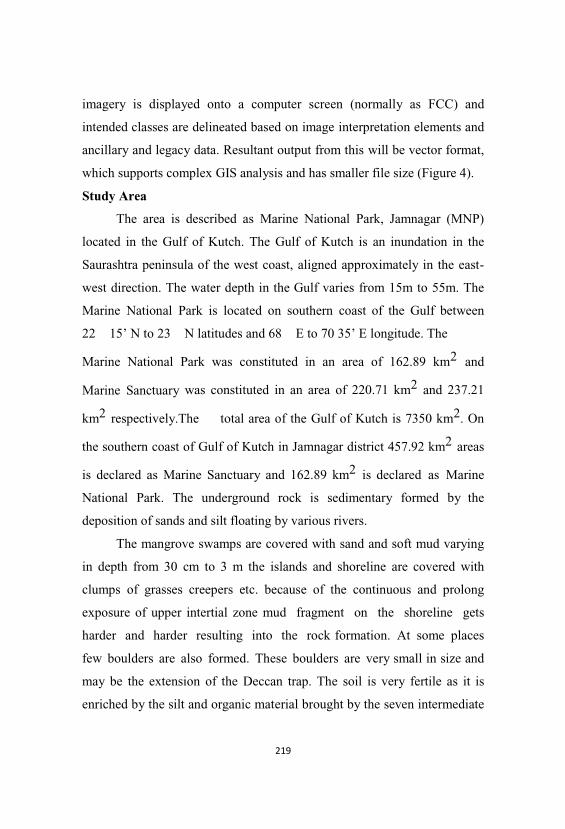
imagery is displayed onto a computer screen (normally as FCC) and
intended classes are delineated based on image interpretation elements and
ancillary and legacy data. Resultant output from this will be vector format,
which supports complex GIS analysis and has smaller file size (Figure 4).
Study Area
The area is described as Marine National Park, Jamnagar (MNP)
located in the Gulf of Kutch. The Gulf of Kutch is an inundation in the
Saurashtra peninsula of the west coast, aligned approximately in the east-
west direction. The water depth in the Gulf varies from 15m to 55m. The
Marine National Park is located on southern coast of the Gulf between
22 15’ N to 23 N latitudes and 68 E to 70 35’ E longitude. The
Marine National Park was constituted in an area of 162.89 km2 and
Marine Sanctuary was constituted in an area of 220.71 km2 and 237.21
km2 respectively.The total area of the Gulf of Kutch is 7350 km2. On
the southern coast of Gulf of Kutch in Jamnagar district 457.92 km2 areas
is declared as Marine Sanctuary and 162.89 km2 is declared as Marine
National Park. The underground rock is sedimentary formed by the
deposition of sands and silt floating by various rivers.
The mangrove swamps are covered with sand and soft mud varying
in depth from 30 cm to 3 m the islands and shoreline are covered with
clumps of grasses creepers etc. because of the continuous and prolong
exposure of upper intertial zone mud fragment on the shoreline gets
harder and harder resulting into the rock formation. At some places
few boulders are also formed. These boulders are very small in size and
may be the extension of the Deccan trap. The soil is very fertile as it is
enriched by the silt and organic material brought by the seven intermediate
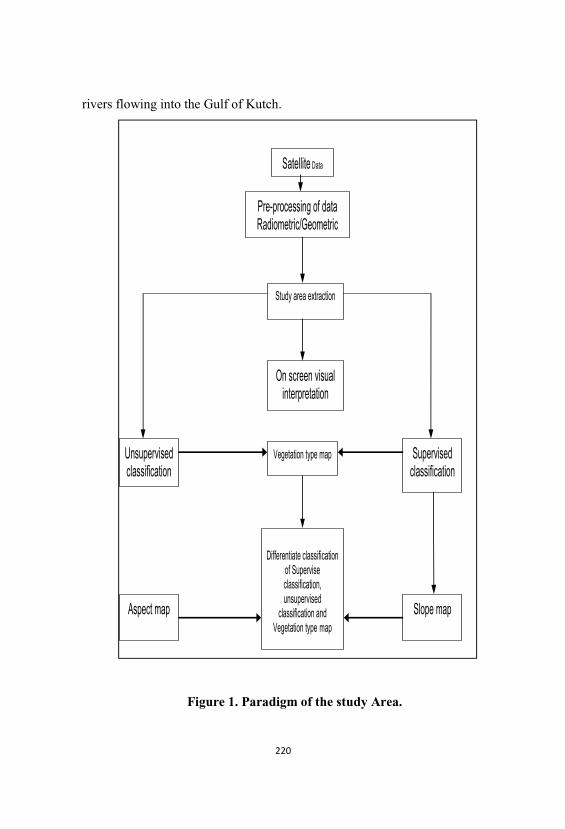
rivers flowing into the Gulf of Kutch.
Satellite Data
Pre-processing of data Radiometric/Geometric
Study area extraction
On screen visualinterpretation
Vegetation type mapUnsupervisedclassification
Supervisedclassification
Aspect map
Differentiate classificationof Superviseclassification,unsupervised
classification andVegetation type map
Slope map
Figure 1. Paradigm of the study Area.
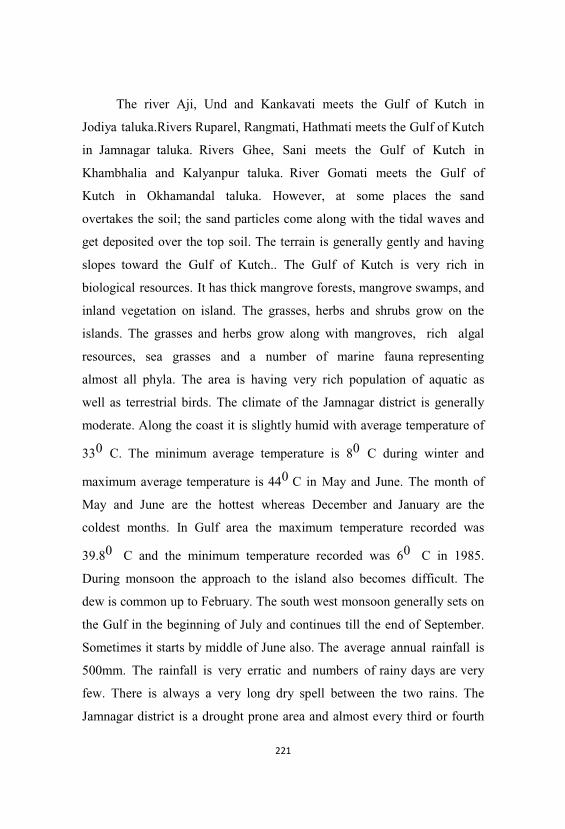
The river Aji, Und and Kankavati meets the Gulf of Kutch in
Jodiya taluka.Rivers Ruparel, Rangmati, Hathmati meets the Gulf of Kutch
in Jamnagar taluka. Rivers Ghee, Sani meets the Gulf of Kutch in
Khambhalia and Kalyanpur taluka. River Gomati meets the Gulf of
Kutch in Okhamandal taluka. However, at some places the sand
overtakes the soil; the sand particles come along with the tidal waves and
get deposited over the top soil. The terrain is generally gently and having
slopes toward the Gulf of Kutch.. The Gulf of Kutch is very rich in
biological resources. It has thick mangrove forests, mangrove swamps, and
inland vegetation on island. The grasses, herbs and shrubs grow on the
islands. The grasses and herbs grow along with mangroves, rich algal
resources, sea grasses and a number of marine fauna representing
almost all phyla. The area is having very rich population of aquatic as
well as terrestrial birds. The climate of the Jamnagar district is generally
moderate. Along the coast it is slightly humid with average temperature of
330 C. The minimum average temperature is 80 C during winter and
maximum average temperature is 440 C in May and June. The month of
May and June are the hottest whereas December and January are the
coldest months. In Gulf area the maximum temperature recorded was
39.80 C and the minimum temperature recorded was 60 C in 1985.
During monsoon the approach to the island also becomes difficult. The
dew is common up to February. The south west monsoon generally sets on
the Gulf in the beginning of July and continues till the end of September.
Sometimes it starts by middle of June also. The average annual rainfall is
500mm. The rainfall is very erratic and numbers of rainy days are very
few. There is always a very long dry spell between the two rains. The
Jamnagar district is a drought prone area and almost every third or fourth
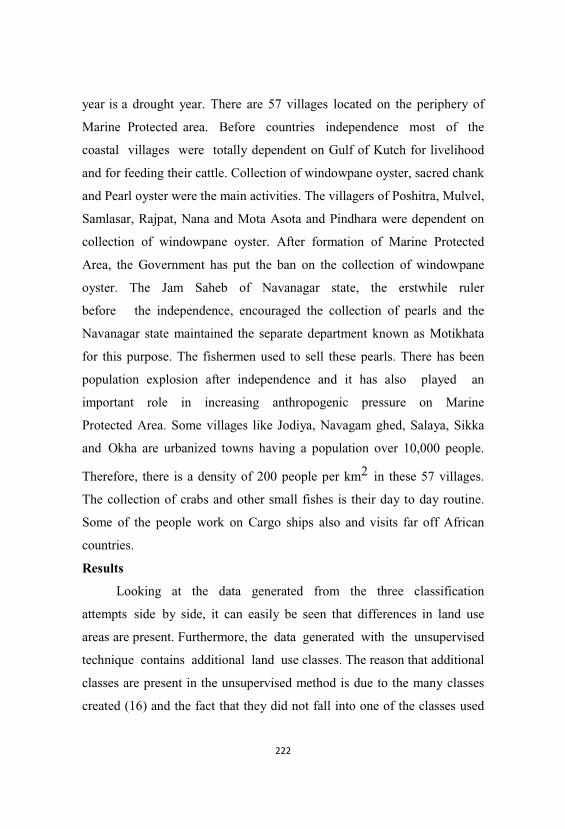
year is a drought year. There are 57 villages located on the periphery of
Marine Protected area. Before countries independence most of the
coastal villages were totally dependent on Gulf of Kutch for livelihood
and for feeding their cattle. Collection of windowpane oyster, sacred chank
and Pearl oyster were the main activities. The villagers of Poshitra, Mulvel,
Samlasar, Rajpat, Nana and Mota Asota and Pindhara were dependent on
collection of windowpane oyster. After formation of Marine Protected
Area, the Government has put the ban on the collection of windowpane
oyster. The Jam Saheb of Navanagar state, the erstwhile ruler
before the independence, encouraged the collection of pearls and the
Navanagar state maintained the separate department known as Motikhata
for this purpose. The fishermen used to sell these pearls. There has been
population explosion after independence and it has also played an
important role in increasing anthropogenic pressure on Marine
Protected Area. Some villages like Jodiya, Navagam ghed, Salaya, Sikka
and Okha are urbanized towns having a population over 10,000 people.
Therefore, there is a density of 200 people per km2 in these 57 villages.
The collection of crabs and other small fishes is their day to day routine.
Some of the people work on Cargo ships also and visits far off African
countries.
Results
Looking at the data generated from the three classification
attempts side by side, it can easily be seen that differences in land use
areas are present. Furthermore, the data generated with the unsupervised
technique contains additional land use classes. The reason that additional
classes are present in the unsupervised method is due to the many classes
created (16) and the fact that they did not fall into one of the classes used
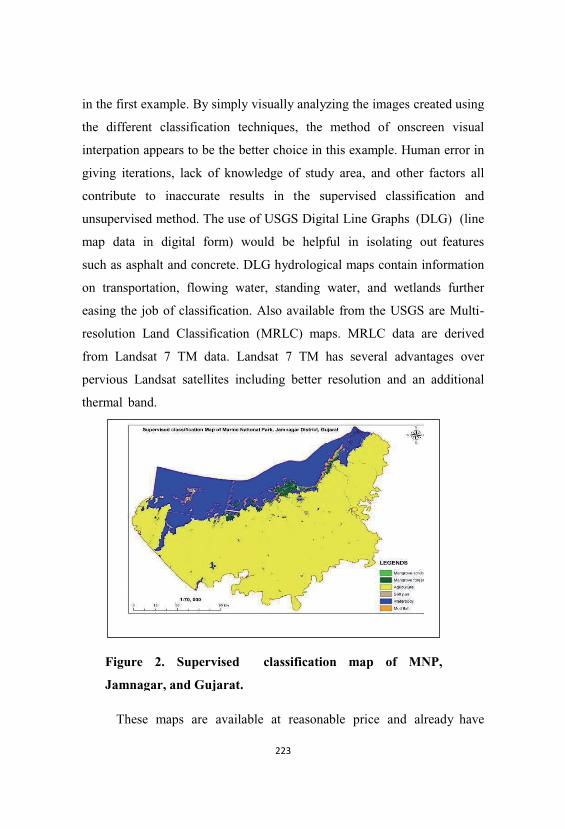
in the first example. By simply visually analyzing the images created using
the different classification techniques, the method of onscreen visual
interpation appears to be the better choice in this example. Human error in
giving iterations, lack of knowledge of study area, and other factors all
contribute to inaccurate results in the supervised classification and
unsupervised method. The use of USGS Digital Line Graphs (DLG) (line
map data in digital form) would be helpful in isolating out features
such as asphalt and concrete. DLG hydrological maps contain information
on transportation, flowing water, standing water, and wetlands further
easing the job of classification. Also available from the USGS are Multi-
resolution Land Classification (MRLC) maps. MRLC data are derived
from Landsat 7 TM data. Landsat 7 TM has several advantages over
pervious Landsat satellites including better resolution and an additional
thermal band.
These maps are available at reasonable price and already have
Figure 2. Supervised classification map of MNP,
Jamnagar, and Gujarat.
land use classified into 21 different land use classes. Deforestation and
subsequent loss in biodiversity has raised concern among
conservationists in the recent past.
The supervised, unsupervised and onscreen visual interpretation
technique has been used to map these features in a consistent scale and
classification scheme incorporating the knowledge base. The use of
biodiversity indices appears to be a viable approach for establishing
environmental thresholds and evaluating ecological impacts of
development. The temporal remote sensing data has been found very
effective to map and monitor the impact of drivers of biodiversity loss
over the natural resource.
Figure 3. Unsupervised classification map of MNP, Jamnagar,
Gujarat.
The economic and social drivers of habitat loss and related
biodiversity threats, the human ecological analysis provides a
most useful complement to the biological analysis of the biodiversity
problem. Although there is ample evidence for the theoretical
background behind the policy, economic and social drivers of
biodiversity loss, experimental evidence for most of the causes of this
loss is fragmented, meager or non-existent.
Although many of these relationships are complex, it is imperative to
enhance research on the causal links between biodiversity losses on the
one hand and economic policy, production and consumption
patterns, culture, internalization of environmental costs, globalization of
the economy and poverty and inequality on the other hand. Theory alone
offers insufficient arguments to tackle the current root drivers of
biodiversity loss. Forest lands with high resource values of regional and
national significance, are under a threat of being utilized for timber and
non-forest purposes. The main task of this study was to identify the
proximate drivers of biodiversity loss through vegetation/forest distribution
status. In the district like MNP, Jamnagar the industrial activity and
infrastructural development have been identified as major driver of
biodiversity loss.
The secondary factors which concern the conservationists is
unsustainable high rates of human population growth, natural resource
consumption; inadequate knowledge and insufficient use of information
and economic system and policies that fail to value the environment and its
resource. Of core importance in this discussion is the question as to
whether conservation policies will be able to compensate for the current
fundamental root causes of biodiversity loss. With the specific needs of
the district of MNP, Jamnagar there is need to build trust between
development activity viz., mining, dam construction, industrialization, land
use conversion and conservation interests.
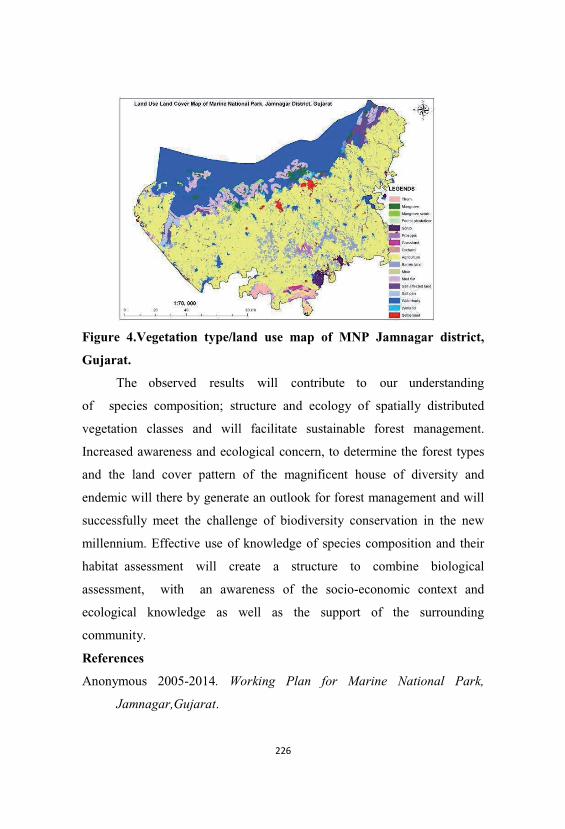
Figure 4.Vegetation type/land use map of MNP Jamnagar district,
Gujarat.
The observed results will contribute to our understanding
of species composition; structure and ecology of spatially distributed
vegetation classes and will facilitate sustainable forest management.
Increased awareness and ecological concern, to determine the forest types
and the land cover pattern of the magnificent house of diversity and
endemic will there by generate an outlook for forest management and will
successfully meet the challenge of biodiversity conservation in the new
millennium. Effective use of knowledge of species composition and their
habitat assessment will create a structure to combine biological
assessment, with an awareness of the socio-economic context and
ecological knowledge as well as the support of the surrounding
community.
References
Anonymous 2005-2014. Working Plan for Marine National Park,
Jamnagar,Gujarat.
Anonymous 2008. State of Forest Report 2005. Forest Survey of India,
Dehradun.
Champion, H.G. and Seth, S.K. 1968. A Revised Survey of the Forest
Types of India, Govt. of India, Publications, New Delhi, 404p.
Morrison, Current Projects. new wcpa. MPA_WCPA India.doc 31/22/02.
Pernetta, J.C. (Ed). 1993. Marine Protected Area Needs in the South Asian
Seas Region. Volume 2. India. A Marine Conservation and
Development Report.Sabins, Floyd F. Remote Sensing. Principles
and Interpretation. 3rd edition.The wildlife protection act, 1972.
(No. 53 of 1972).
Vasanthakumari V; Devaraj S N; Devaraj H.1997. Methacrylonitrile
induced oxidative stress in rat liver. Indian journal of biochemistry
& biophysics.
Venkataraman et., S. al. E. Stringer, B. S. Kandola, D. A. Pye, and J. T.
Gallagher 2003. 537 – 542.
Kannan AT, and Mohan V. 2005 Challenges in diabetes management
with, Ministry of Health and Family Welfare. Government of India;
43-64.
NRSC, 2008. Biodiversity characterization at landscape level using
remote sensing and Geographic information system. Manual,
National Remote Sensing Centre, Hyderabad.
Seismic Vulnerability Mapping Using Geospatial Technology
Peeyush
Disaster Mitigation & Management Center-Dehradun
Abstract
This research presents a framework to integrate several sources of
spatial information to derive a map of seismic vulnerability for the city of
Dehradun which is under Earthquake Zone V. The proposed method is
based on generating a geographical database with different
variables. In this case study, seismic vulnerability assessment of
buildings and population is carried out for one municipal wards of
Dehradun City. Parameters considered for the generation of compatible
building type classifications are roof type, structures, presence of
cracks, maintenance, building shape, number of stories, year of
construction etc. The spatial information will obtained from different
sources, mainly Iknos images, ground truth data collection. The map of
seismic vulnerability will be based on the estimated location of population,
as well as the situation of critical installations and a map of construction
fragility. Since population activity changes through the day, a dynamic
cartography of vulnerability will produce, based on population density
levels for different time periods. Seismic Analysis is a subset of
structural analysis and is the calculation of the response of a building
structure to earthquakes. It is part of the process of structural design,
earthquake engineering or structural assessment and retrofit in regions
where earthquakes are prevalent. Seismic vulnerability analysis of existing
buildings requires basic information of their structural behavior. This
research presents a methodology to predict the seismic vulnerability of
buildings by geostatistical analysis using geoinformatics on a number
of structural parameters determined on the basis of engineering
knowledge and observations. It’s better to evaluate earthquake damage in
a probabilistic way due to the uncertainty in occurrence of
earthquake and respective structural response. In this case study,
seismic vulnerability assessment of buildings and population is carried out
for one municipal wards of Dehradun City. Parameters considered for the
generation of compatible building type classifications are roof type,
structures, presence of cracks, maintenance, building shape, number of
stories, year of construction etc. To estimate risk of population, social
vulnerability parameters like utilities, facilities, day and night time
population, population at various age groups are taken. Finally, amount of
vulnerability related to various buildings are calculated and its impact on
population is shown.
Keywords: Seismic vulnerability, geostatistics, geoinformatics, Seismic
vulnerability.
Introduction
Indian landmass was once a part of the conglomerate of
continental plates located in southern hemisphere, around the South Pole,
and evolutionary history of Himalaya is interwoven intricately with the
separation of these plates and northward drift of the Indian landmass.
Continued subduction of the Indian Plate beneath the Eurasian Plate
consumed the intervening oceanic plate and led to the collision of the alien
landmasses. This caused upliftment, deformation, metamorphism and
shearing of the sediments deposited in the hitherto intervening ocean basin,
along with the rock mass of the two Plates involved in orogeny. This sums
up the evolutionary history of the Himalayan mountain chain which is a
product of continent – continent collision that has rendered the terrain
highly fragile and prone to disasters.
Earthquake hazard potential is evaluated to be particularly high
in the entire Himalayan terrain and in the past the region has been
jolted by four Great Earthquakes, apart from Kumaun Earthquake of
1720 and Garhwal Earthquake of 1803. The peak ground acceleration
(PGA) in Western Assam Earthquake of 1897 is estimated to have
exceeded 1 g (Oldham, 1899), while around 18,000 persons were
reportedly killed in 1905 Kangara Earthquake (Middlemiss, 1910). Arya
(1990) has indicated possibility of around 80,000 persons being killed if
the 1905 event repeats during the daytime. This projection is verified by
the toll of 2005 Muzaffarabad Earthquake. Wyss (2005) carried out
loss estimation simulations for Great Earthquakes in the Himalaya
and has estimated the fatalities to exceed 2,000 in the townships of
Almora, Ranikhet, Chaubatiya, Nainital, Pithoragarh, Champawat,
Kotabag, Lansdowne and Ramnagar in the simulated Garhwal
Earthquake. Entire State of Uttarakhand is categorized as falling in Zone
IV and V of the Earthquake Zoning Map of India (IS 1893 Part 1, 2002)
and is interpreted to have accumulated potential slip for generating future
Great Earthquakes (Khattri, 1987).
Most earthquakes in the State of Uttarakhand are concentrated in
close proximity of the Main Central Thrust (MCT) and not many
earthquakes have their epicenters in the proximity of both Main Boundary
Thrust (MBT) and Himalayan Frontal Fault. This however does not rule
out possibility of a major earthquake along the latter tectonic boundaries
but is certainly indicative of relatively higher risk in the areas around
MCT. It is important to note that a number of urban centres in the State are
located in close proximity of these tectonic discontinuities and this is a
cause of concern.
Seismic risk is a direct function of the state of built environment or
vulnerability of the building stock. Assessment of the building condition is
therefore central to any seismic risk evaluation exercise because it forms
the basis for realistic risk reduction efforts. This exercise is all the more
important for urban areas that have concentration of both infrastructure and
population.
Scenario is really grim in the urban areas in the hilly terrain that are
faced with severe constraints on horizontal expansion and people are
forced to add storeys to the existing structures in order to meet the
growing demand. Due to the lack of suitably qualified technical manpower
in these areas most structures are however constructed without due regard
to seismic safety related features. Lack of awareness regarding seismic
threat in the region, as also on the seismic safety related measures is
often cited as being the main causes of non – compliance of appropriate
seismic safety measures. Inappropriate techno-legal regime, non –
existence of suitable mechanism for their compliance and lack of stern
action against the defaulters are however important issues related to this
important problem.
Objectives
The research aims at precisely ascertaining the population group
prone to high seismic risk in the Chukhuwala ward (Ward No. 13) of
Dehradun city. This would help in highlighting the seriousness of the
issue and is intended to pave way for corrective measures, suggestions for
which would form a part of the research. The research is intended to bring
forth the following that could subsequently be utilized for formulation of
an effective risk reduction strategy:
1. Evaluation of differential seismic vulnerability of the building stock.
2. Risk assessment.
3. Estimation of casualties and direct losses due to seismogenic damage
to the building stock.
Study Area
Though the study focuses on Dehradun city the limitations
imposed by available time do not allow this study to cover the
entire city and one highly vulnerable ward (Chukhuwala) of the city is
therefore covered under the present investigations. Located in the heart of
the city the Chukhuwala ward represents old constructed area of the city.
This area is highly congested, has preponderance of age- old buildings and
has numerous problems relating to access. Bindal River is located to the
northwest of the ward and in the vicinity of the river there is
preponderance of slums and squatters. The residential population of the
Chukhuwala ward is 12000. The study area Dehradun according to
seismic zoning map of India (IS-1893-2002) lies in seismic zone IV,
having expected MSK intensity VIII.
Methodology
Detailed seismic vulnerability evaluation is a technically
complex and expensive procedure and can only be performed on a
limited number of buildings. It is therefore important to use simpler
procedures that help in rapid evaluation of the vulnerability profile of
different type of buildings. More complex evaluation procedures can thus
be limited to the most critical buildings (Sinha and Goyal, 2004).
Rapid Visual Screening (RVS) is one such cost effective tool for
identifying highly vulnerable structures that can subsequently be
surveyed in detail for appropriate mitigative action. RVS was first
proposed in the United States (US) in 1988 and was further modified in
2002 to incorporate latest technological advancements and lessons from
earthquake disasters in the 1990s. Though originally developed for typical
constructions in the US this procedure has been widely used in many other
countries after suitable modifications. The most important feature of this
procedure is that it permits vulnerability assessment based on walk-around
of the building by a trained evaluator. The evaluation procedure and
system is compatible with GIS-based city database and also permits
use of the collected building information for a variety of other planning
and mitigation purposes.
The RVS method is designed to be implemented without
performing any structural calculations and utilises a scoring system that
requires the evaluator to identify the primary structural lateral load-
resisting system together with the building attributes that modify the
seismic performance expected for this lateral load-resisting system. The
inspection, data collection and decision making process typically takes
place at the building site.
Data Collection
Modified version of the FEMA-154/ATC-21 based data collection
form was used for collecting information in the field. Taking note of
seasonal variation in occupancy provision was made for recording the peak
and lean occupancy of the buildings. In order to take the relief of the area
into account provision of broad estimation of the slope into three
categories (<15°, 15° - 30° and >30°) was also included. Some parameters
that include building identification number, ward number, owner’s name,
roof type, accessibility were also added for a broader information spectrum
and to make analysis easier to perform. Provision was also made for
including the subjective remarks of the field surveyor. IKONOS imagery
was utilised for mapping the structures while the database was prepared
using ARC INFO GIS software (version 9.3) that was also used for
analysis and correlation. For assessing the seismic vulnerability of the
structures in the Chukhuwala Ward detailed investigation of the
individual buildings was undertaken in the field. The format utilized
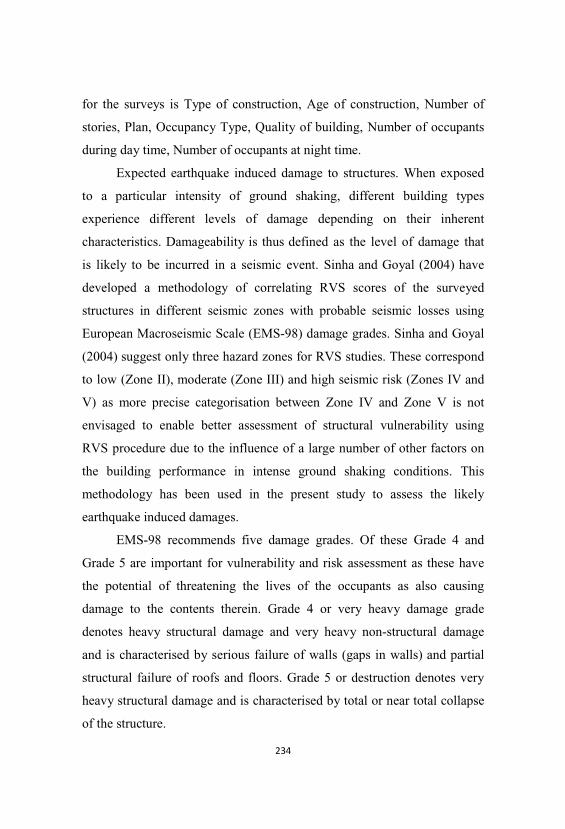
for the surveys is Type of construction, Age of construction, Number of
stories, Plan, Occupancy Type, Quality of building, Number of occupants
during day time, Number of occupants at night time.
Expected earthquake induced damage to structures. When exposed
to a particular intensity of ground shaking, different building types
experience different levels of damage depending on their inherent
characteristics. Damageability is thus defined as the level of damage that
is likely to be incurred in a seismic event. Sinha and Goyal (2004) have
developed a methodology of correlating RVS scores of the surveyed
structures in different seismic zones with probable seismic losses using
European Macroseismic Scale (EMS-98) damage grades. Sinha and Goyal
(2004) suggest only three hazard zones for RVS studies. These correspond
to low (Zone II), moderate (Zone III) and high seismic risk (Zones IV and
V) as more precise categorisation between Zone IV and Zone V is not
envisaged to enable better assessment of structural vulnerability using
RVS procedure due to the influence of a large number of other factors on
the building performance in intense ground shaking conditions. This
methodology has been used in the present study to assess the likely
earthquake induced damages.
EMS-98 recommends five damage grades. Of these Grade 4 and
Grade 5 are important for vulnerability and risk assessment as these have
the potential of threatening the lives of the occupants as also causing
damage to the contents therein. Grade 4 or very heavy damage grade
denotes heavy structural damage and very heavy non-structural damage
and is characterised by serious failure of walls (gaps in walls) and partial
structural failure of roofs and floors. Grade 5 or destruction denotes very
heavy structural damage and is characterised by total or near total collapse
of the structure.
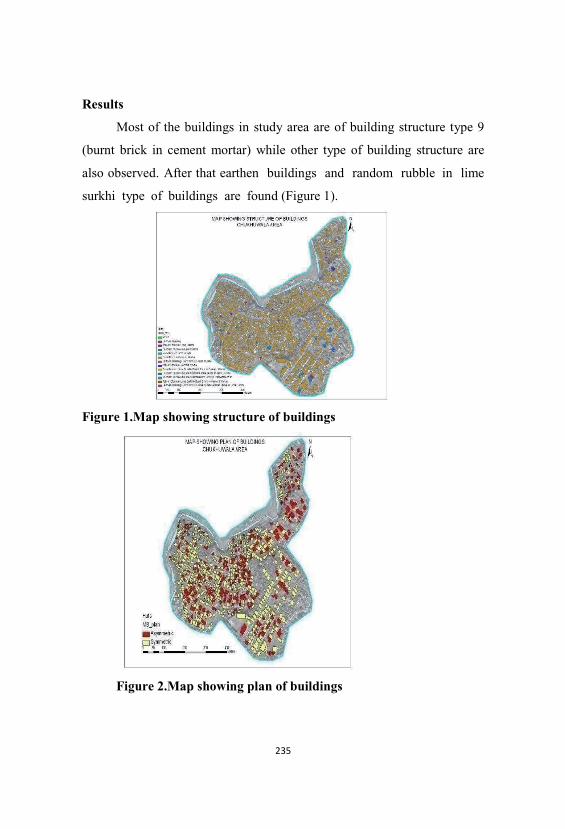
Results
Most of the buildings in study area are of building structure type 9
(burnt brick in cement mortar) while other type of building structure are
also observed. After that earthen buildings and random rubble in lime
surkhi type of buildings are found (Figure 1).
Figure 1.Map showing structure of buildings
Figure 2.Map showing plan of buildings
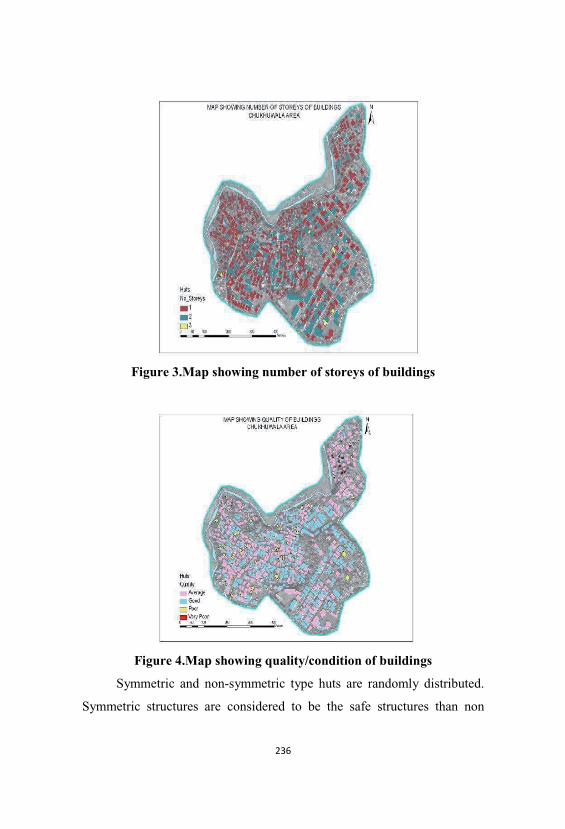
Figure 3.Map showing number of storeys of buildings
Figure 4.Map showing quality/condition of buildings
Symmetric and non-symmetric type huts are randomly distributed.
Symmetric structures are considered to be the safe structures than non
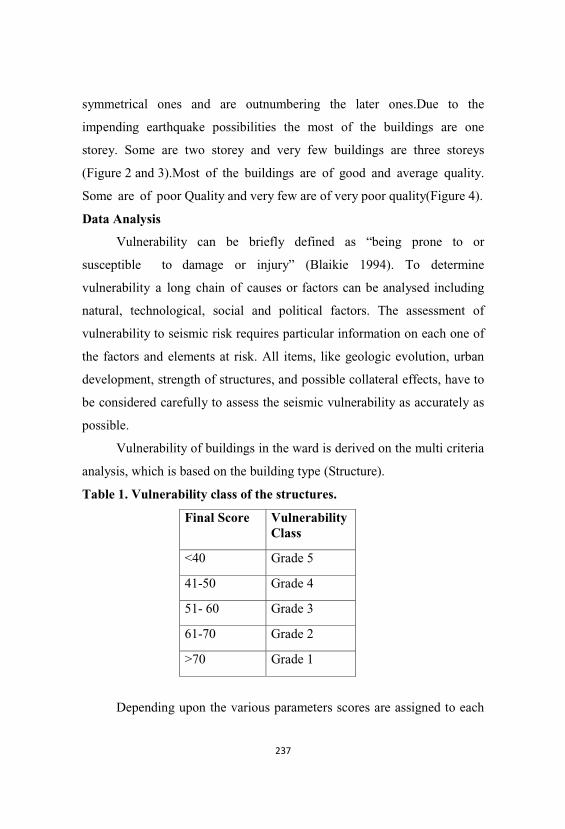
symmetrical ones and are outnumbering the later ones.Due to the
impending earthquake possibilities the most of the buildings are one
storey. Some are two storey and very few buildings are three storeys
(Figure 2 and 3).Most of the buildings are of good and average quality.
Some are of poor Quality and very few are of very poor quality(Figure 4).
Data Analysis
Vulnerability can be briefly defined as “being prone to or
susceptible to damage or injury” (Blaikie 1994). To determine
vulnerability a long chain of causes or factors can be analysed including
natural, technological, social and political factors. The assessment of
vulnerability to seismic risk requires particular information on each one of
the factors and elements at risk. All items, like geologic evolution, urban
development, strength of structures, and possible collateral effects, have to
be considered carefully to assess the seismic vulnerability as accurately as
possible.
Vulnerability of buildings in the ward is derived on the multi criteria
analysis, which is based on the building type (Structure).
Table 1. Vulnerability class of the structures.
Final Score VulnerabilityClass
<40 Grade 5
41-50 Grade 4
51- 60 Grade 3
61-70 Grade 2
>70 Grade 1
Depending upon the various parameters scores are assigned to each
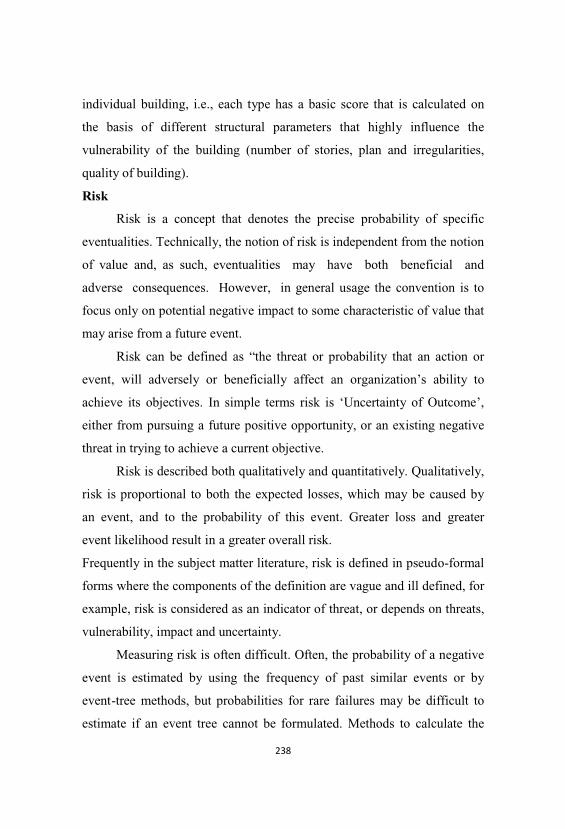
individual building, i.e., each type has a basic score that is calculated on
the basis of different structural parameters that highly influence the
vulnerability of the building (number of stories, plan and irregularities,
quality of building).
Risk
Risk is a concept that denotes the precise probability of specific
eventualities. Technically, the notion of risk is independent from the notion
of value and, as such, eventualities may have both beneficial and
adverse consequences. However, in general usage the convention is to
focus only on potential negative impact to some characteristic of value that
may arise from a future event.
Risk can be defined as “the threat or probability that an action or
event, will adversely or beneficially affect an organization’s ability to
achieve its objectives. In simple terms risk is ‘Uncertainty of Outcome’,
either from pursuing a future positive opportunity, or an existing negative
threat in trying to achieve a current objective.
Risk is described both qualitatively and quantitatively. Qualitatively,
risk is proportional to both the expected losses, which may be caused by
an event, and to the probability of this event. Greater loss and greater
event likelihood result in a greater overall risk.
Frequently in the subject matter literature, risk is defined in pseudo-formal
forms where the components of the definition are vague and ill defined, for
example, risk is considered as an indicator of threat, or depends on threats,
vulnerability, impact and uncertainty.
Measuring risk is often difficult. Often, the probability of a negative
event is estimated by using the frequency of past similar events or by
event-tree methods, but probabilities for rare failures may be difficult to
estimate if an event tree cannot be formulated. Methods to calculate the
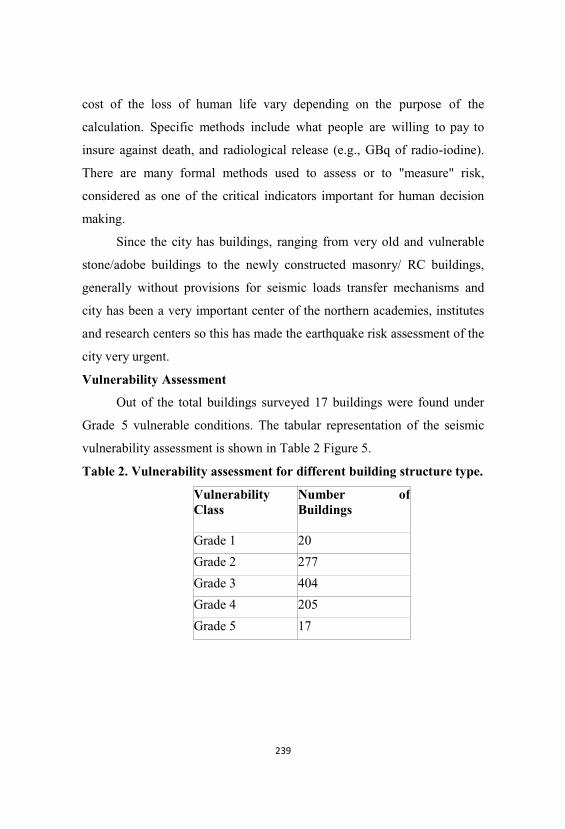
cost of the loss of human life vary depending on the purpose of the
calculation. Specific methods include what people are willing to pay to
insure against death, and radiological release (e.g., GBq of radio-iodine).
There are many formal methods used to assess or to "measure" risk,
considered as one of the critical indicators important for human decision
making.
Since the city has buildings, ranging from very old and vulnerable
stone/adobe buildings to the newly constructed masonry/ RC buildings,
generally without provisions for seismic loads transfer mechanisms and
city has been a very important center of the northern academies, institutes
and research centers so this has made the earthquake risk assessment of the
city very urgent.
Vulnerability Assessment
Out of the total buildings surveyed 17 buildings were found under
Grade 5 vulnerable conditions. The tabular representation of the seismic
vulnerability assessment is shown in Table 2 Figure 5.
Table 2. Vulnerability assessment for different building structure type.
VulnerabilityClass
Number ofBuildings
Grade 1 20
Grade 2 277
Grade 3 404
Grade 4 205
Grade 5 17
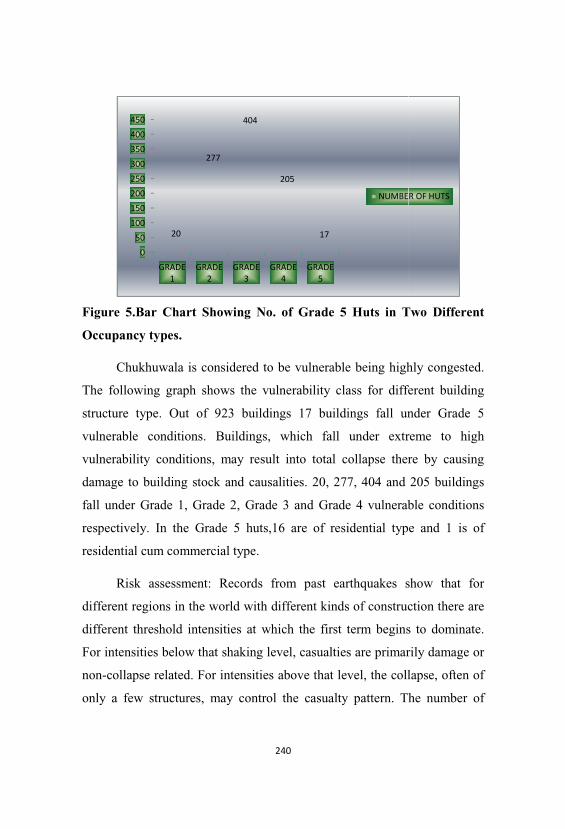
Figure 5.Bar Chart S
Occupancy types.
Chukhuwala is c
The following graph s
structure type. Out of
vulnerable conditions.
vulnerability condition
damage to building sto
fall under Grade 1, Gr
respectively. In the G
residential cum comme
Risk assessment
different regions in the
different threshold inte
For intensities below th
non-collapse related. F
only a few structures,
Showing No. of Grade 5 Huts in T
considered to be vulnerable being high
shows the vulnerability class for diffe
f 923 buildings 17 buildings fall un
. Buildings, which fall under extr
ns, may result into total collapse ther
ock and causalities. 20, 277, 404 and
rade 2, Grade 3 and Grade 4 vulnerab
rade 5 huts,16 are of residential typ
ercial type.
t: Records from past earthquakes s
e world with different kinds of construc
ensities at which the first term begins
hat shaking level, casualties are primar
or intensities above that level, the coll
may control the casualty pattern. Th
Two Different
hly congested.
ferent building
nder Grade 5
reme to high
re by causing
205 buildings
ble conditions
e and 1 is of
show that for
ction there are
s to dominate.
rily damage or
lapse, often of
he number of
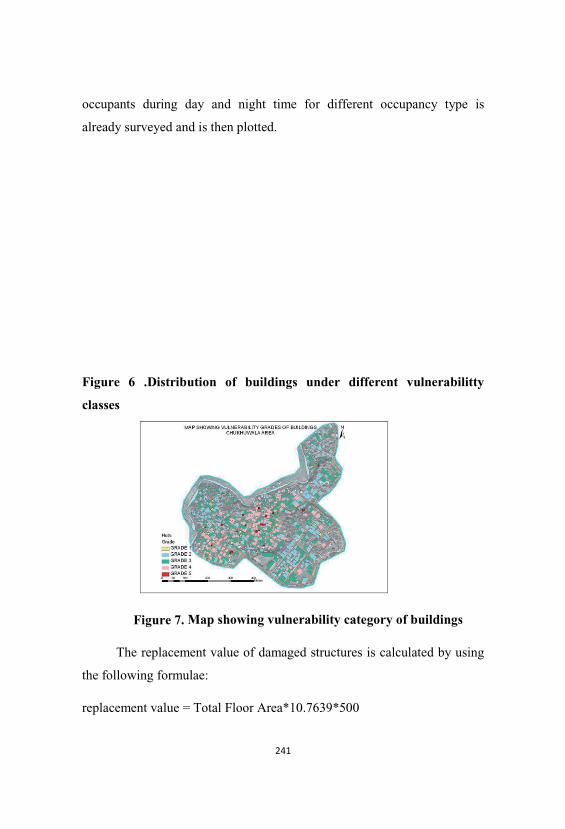
occupants during day
already surveyed and is
Figure 6 .Distributio
classes
Figure 7. Ma
The replacement
the following formulae
replacement value = To
and night time for different occup
s then plotted.
on of buildings under different v
ap showing vulnerability category of
t value of damaged structures is calcul
:
otal Floor Area*10.7639*500
pancy type is
vulnerabilitty
buildings
lated by using
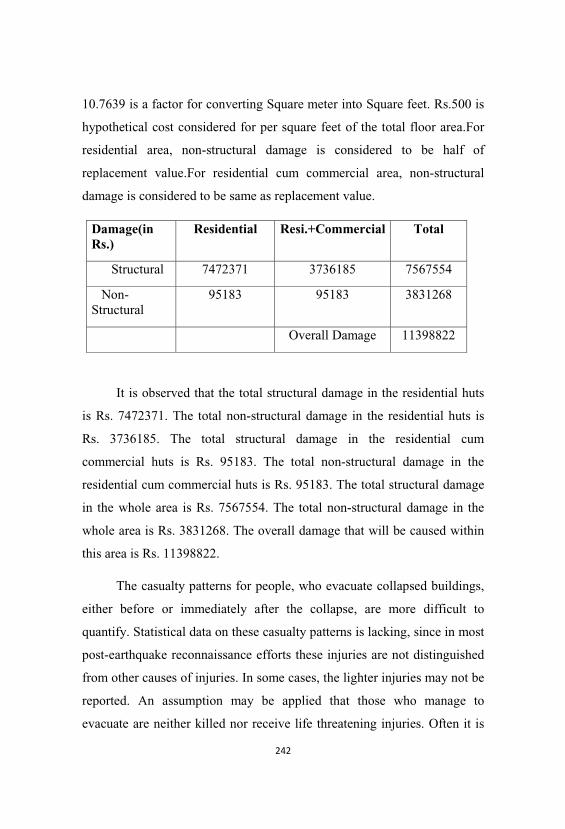
10.7639 is a factor for converting Square meter into Square feet. Rs.500 is
hypothetical cost considered for per square feet of the total floor area.For
residential area, non-structural damage is considered to be half of
replacement value.For residential cum commercial area, non-structural
damage is considered to be same as replacement value.
Damage(inRs.)
Residential Resi.+Commercial Total
Structural 7472371 3736185 7567554
Non-Structural
95183 95183 3831268
Overall Damage 11398822
It is observed that the total structural damage in the residential huts
is Rs. 7472371. The total non-structural damage in the residential huts is
Rs. 3736185. The total structural damage in the residential cum
commercial huts is Rs. 95183. The total non-structural damage in the
residential cum commercial huts is Rs. 95183. The total structural damage
in the whole area is Rs. 7567554. The total non-structural damage in the
whole area is Rs. 3831268. The overall damage that will be caused within
this area is Rs. 11398822.
The casualty patterns for people, who evacuate collapsed buildings,
either before or immediately after the collapse, are more difficult to
quantify. Statistical data on these casualty patterns is lacking, since in most
post-earthquake reconnaissance efforts these injuries are not distinguished
from other causes of injuries. In some cases, the lighter injuries may not be
reported. An assumption may be applied that those who manage to
evacuate are neither killed nor receive life threatening injuries. Often it is
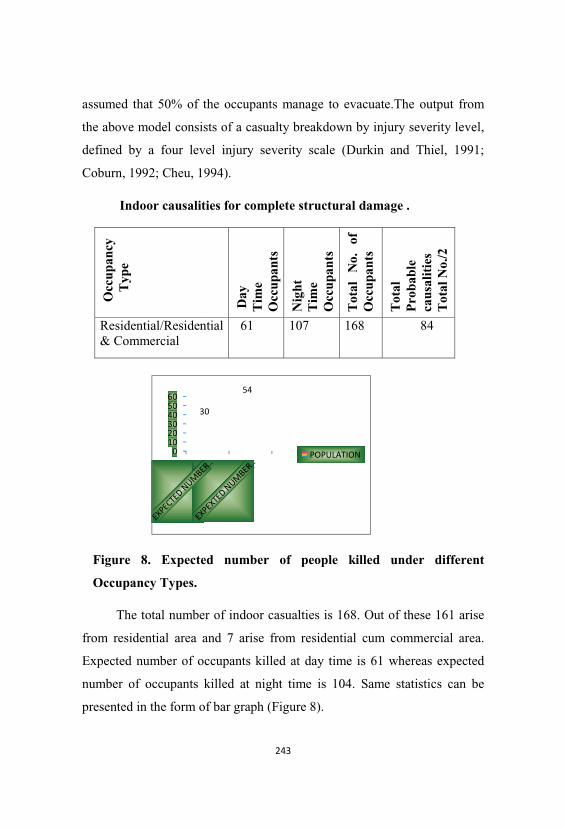
assumed that 50% of t
the above model consis
defined by a four lev
Coburn, 1992; Cheu, 19
Indoor causalit
Figure 8. Expecte
Occupancy Types.
The total numbe
from residential area a
Expected number of o
number of occupants k
presented in the form o
O
ccup
ancy
Typ
e
Residential/Residen& Commercial
the occupants manage to evacuate.Th
sts of a casualty breakdown by injury
vel injury severity scale (Durkin and
994).
ties for complete structural damage .
ed number of people killed und
er of indoor casualties is 168. Out of th
and 7 arise from residential cum com
ccupants killed at day time is 61 whe
killed at night time is 104. Same sta
of bar graph (Figure 8).
Day
Tim
e
O
ccup
ants
Nig
ht
Tim
eO
ccup
ants
Tot
alN
o.
ofO
ccup
ants
Tot
alP
bbl
ntial 61 107 168
e output from
severity level,
d Thiel, 1991;
.
der different
hese 161 arise
mmercial area.
ereas expected
atistics can be
Pro
babl
eca
usal
itie
sT
otal
No.
/2
84
References
Arya, A.S., 1990, Damage scenario of a hypothetical 8.0 magnitude
earthquake in Kangra region of Himachal Pradesh, Bull. Ind. Soc.,
Earthquake Tech. Paper,297 (3), 121 –132.
FEMA 154, Rapid Visual Screening of Buildings for Potential Seismic
Hazards,(ATC, 1988, updated 2002).Indian Standard (IS).1893,
Part 1,2002, Criteria for earthquake Resistant Design of
Structures, Bureau of Indian Standards, New Delhi.
Khattri, K.N., 1987. Great earthquakes, seismicity gaps and potential for
earthquake disaster along the Himalayan plate boundary,
Tectonophysics, 138. 79-92.
Oldham, R.D., 1899. Report on the great earthquake of 12th June, 1897,
Memoirs of the Geological Survey of India, Vol. XXIX, Geological
Survey of India, Calcutta.
Population profiles (India, States and Union Territories), 2004, Office of
the Registrar General, India, New Delhi.
Sinha, R., and Goyal, A., 2004, A National Policy for Seismic
Vulnerability Assessment of Buildings and Procedure for Rapid
Visual Screening of Buildings for Potential Seismic Vulnerability,
Report of the Department of Civil Engineering, Indian Institute of
echnology,Bombay,12pp.,
(http.//www.civil.iitb.ac.in/~rsinha/Vulnerability_Assessment.pdf)
Wyss, M., 2005, Human losses expected in Himalayan earthquakes,
Natural Hazards,34, 305-314.
Land Use Practices for Flood Risk Reduction
Richa Arya, Mohd. Muzamil Bhat, A.K. Gupta*and M. Yunus
Department of Environmental Science,
Babasaheb Bhimrao Ambedkar University, Lucknow (U.P.)
*National Institute of Disaster management (GOI), New Delhi
Abstract
The Indian sub-continent has an area of 3.28 million sq. km
(329 million hectares). It is the second largest country in Asia and the
seventh in the world. Because of its unique geography, India is always
prone to several disasters. Flood is one of them and it has the greatest
potential of all natural disasters and affects the greatest number of people
physically and economically. In India, human interference becomes very
high in the flood plain areas and the land use patterns gradually
changed. Besides, the runoff generation process is changed, especially by
decreasing the infiltration capacity of the soil and the change of soil cover.
High population density increases the risk of flood hazard. The per capita
availability of land has declined from 0.89 hectare in 1951 to 0.37 hectare
in 1991 and is expected to slide down to 0.20 hectare in 2035. Flood risk
can be mitigated by land use planning, which includes many aspects and
is a beneficial tool for all levels (large scale and community based).
Key words. Disaster, flood, land use, population density etc.
Introduction
In India flood problems are occurring to areas on the northern of
Ganga River,eastern of Brahmaputra and Barak rivers. These rivers having
large number of tributaries are the main root cause of flood problem in
our country. The flood plains of the Ganga, Brahmaputra and Barak rivers
in the region have large area used for agriculture. The agricultural
productivity on these flood plains is partly influenced by the supply of
nutrients and minerals during periods of inundation. The physical and
chemical properties of the flood plain soils and the temporary water
storages located on the flood plains change as a result of floods and this
influences crop growth. The Ganga, Brahmaputra and Barak rivers are fed
by water from the Himalayas.
The flood plains of the north-eastern region of India receive
heavy rainfall during the monsoon season. The unplanned land use
increases the flood risk and about 40 mh land is prone to floods in India.
Flooding produces a variety of negative impacts. The magnitude of
adverse impacts depends on the vulnerability of the activities and
population and the frequency, intensity and extent of flooding. The
major impact is loss of lives and property. As communication links and
infrastructure such as power plants, roads and bridges are damaged
and disrupted, economic activities come to a standstill, resulting in
dislocation and the dysfunction of normal life for a period much beyond
the duration of the flooding. Similarly, the direct effect on production
assets be it in agriculture or industry, can inhibit regular activity and
lead to loss of livelihoods. Damage to infrastructure also causes long-term
impacts, such as disruptions to clean water and electricity, transport,
communication, education and health care. The additional cost of
rehabilitation, relocation of people and removal of property from flood-
affected areas can divert the capital required for maintaining production.
Migration to developed urban areas contributes to the
overcrowding in the cities. These migrants swell the ranks of the urban
poor and end up living in marginal lands in cities that are prone to floods
or other risks. Selective out-migration of the workforce sometimes creates
complex social problems. The high cost of relief and recovery may
adversely impact investment in infrastructure and other development
activities in the area and in certain cases may cripple the frail economy of
the region. Recurrent flooding in a region may discourage long-term
investments by the government and private sector alike. Lack of
livelihoods, combined with migration of skilled labour and inflation may
have a negative impact on aregion's economic growth. Loss of resources
can lead to high costs of goods and services.
Flood
Flood is a natural phenomenon, sometimes it is also influenced by
human activity. There were several definitions given by many
workers/organization. Flood is a body of water rises to overflow the land
which is not normally submerged (Ward,1978). Flood is a relatively high
flow which overtakes the natural channel provided for the runoff
(Chow, 1956). According to World Meteorological Organization
(1974), a flood is a rise usually brief, in the water in a river to a peak, from
which the water level recedes at a slower rate. There are various categories
of floods as river flood, single event flood, multiple event flood, flash
flood, urban flood, flood due to dam breakage, Predictable-regular
flooding etc.
Flood risk in India
The problem related to flood in India may be categorized on
regional basis as Brahmaputra river region, Ganga river region, North-
West river region and Central India Deccan rivers regions. Flood risk is
increasing gradually from several decades. Heavy rainfall is the main
reason behind the flood in these regions in India but another most common
reason is unplanned drainage system. The north western parts and southern
parts of west Bengal severely faced the problem of drainage congestion.
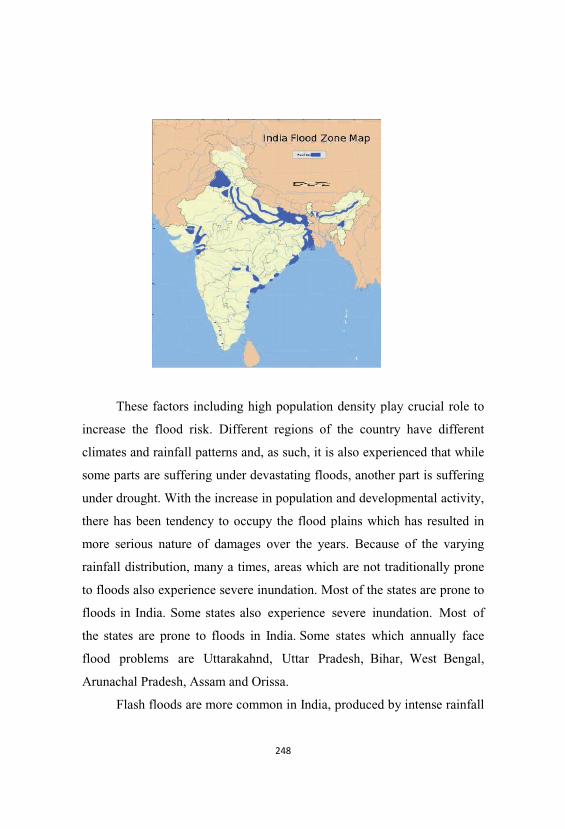
These factors inc
increase the flood risk
climates and rainfall pa
some parts are sufferin
under drought. With th
there has been tendenc
more serious nature o
rainfall distribution, m
to floods also experien
floods in India. Some
the states are prone to
flood problems are U
Arunachal Pradesh, As
Flash floods are
cluding high population density play c
k. Different regions of the country h
atterns and, as such, it is also experien
ng under devastating floods, another pa
he increase in population and developm
cy to occupy the flood plains which h
f damages over the years. Because o
any a times, areas which are not tradi
ce severe inundation. Most of the state
states also experience severe inundat
o floods in India. Some states which
Uttarakahnd, Uttar Pradesh, Bihar,
sam and Orissa.
more common in India, produced by in
crucial role to
have different
ced that while
art is suffering
mental activity,
has resulted in
of the varying
tionally prone
es are prone to
tion. Most of
annually face
West Bengal,
ntense rainfall
over a small area and the infiltration rate is much lower than the rainfall
rate. Flash floods are characterized by very fast rise and recession of flow
of small volume and high discharge, which causes high damages because
of suddenness. This occurs in hilly and not too hilly regions and
slopping lands where heavy rainfall and thunderstorms or cloudbursts are
common. Depression and cyclonic storms in the coastal areas of Orissa,
West Bengal, Andhra Pradesh, Karnataka and Tamil Nadu also cause flash
floods.Arunachal Pradesh, Assam, Orissa, Himachal Pradesh, Uttarakhand,
the Western Ghats in Maharashtra and Kerala are more vulnerable to flash
floods caused by cloud bursts. Sudden release of waters from upstream
reservoirs, breaches in landslide dams and embankments on the banks of
the rivers leads to disastrous floods.
Departmental/Institutional Framework
Both State and Central level organizations are involved in flood
executive schemes.The States have to investigate, plan, construct, maintain
and operate all flood works. Flood Control Boards were concurrently set
up in some of the States, later followed by some others. The functions
of the State Flood Control Boards are to assess the flood problem in the
States, deal with questions of policy and over-see the planning and
implementation of flood schemes. In the discharge of their functions, the
Boards are assisted by Technical Advisory Committee. The role of Central
Government is advisory, catalytic and promotional in nature.
Various Departments and Organizations dealing with Flood
Management at State level are Irrigation & Waterways (I&W) Department,
Water Resources Department, Public Works Department (Water
Resources), Irrigation & Flood Control Department, Agricultural and
Minor Irrigation, Narmada & Water Resources Department and Power &
Irrigation Department. Similarly Central Organizations involved are
Central Water Commission, Ganga Flood Control Commission,
Brahmaputra Board, India Meteorological Department (IMD), National
Centre for Medium Range Weather Forecasting (NCMRWF), National
Disaster Management Division of Ministry of Home Affairs, National
Institute of Disaster Management (NIDM) and National Disaster
Management Authority (NDMA).
Protection against Floods
Safety against floods had received considerable attention during
the last four decades. Different measures have been adopted to reduce
flood losses and protect the flood plains but with limited success.
Absolute flood control and protection to all flood prone areas in the
country for all magnitude of floods of different probability of recurrence is
not possible to be achieved due to various reasons. Nevertheless, flood
management measures to give a reasonable degree of protection form flood
losses at economic costs, would be necessary. As the flood disaster of
varying degree may continue to occur every year in various parts of the
country, an integrated approach to manage flood disaster for its different
phases as given below should be part of the future programme.
1. Pre-disaster Phase
2. Disaster/Impact phase
3. Post-disaster Phase.
The pre disaster phase includes prevention, mitigation and
preparedness activities. These activities involve extensive data
collection, maintaining directories of resources, developing action plans,
capacity building, training and community awareness activities among
others. Government departments, district administration, local authorities
and other relevant agencies will develop plans for prevention and
mitigation of disasters and will build capacity and ensure preparedness in

the event of a flood disaster actually taking place. The disaster phase
includes all measures that are taken immediately aftermath disaster. The
speed and efficiency of the response in this phase will crucially determine
the loss to life and property. The revenue department, in conjunction with
other relevant Government departments would carry out activities in this
phase. In the post-disaster phase, the thrust of Government policy will be
to ensure a speedy return to normalcy and mitigation of long term
consequences of the disaster. The policy objective of the Government in
this phase will be to focus on economic and social consequences of the
disaster and directing efforts to improve the same. The post-disaster phase
will mainly comprise reconstruction and rehabilitation activities. From the
foregoing statement, it can be seen that concerted effort and coordination
amongst different department of Central and State Governments, NGOs
etc., are required to bring about appropriate disaster Management system
into place to reduce the losses and suffering of the people when faced with
such disasters.
Land Use and Flood
Due to increasing human interference and development of the
catchment area,the runoff generation process is changed, especially
through decreasing the infiltration capacity of the soil and the change of
soil cover. Hydrological responses to rainfall strongly depend on local
characteristics of soil, such as water storage capacity and infiltration rates
of that particular area. The types and density of vegetation cover and land-
use characteristics are also important to understand hydrologic response to
rainfall. Environmental degradation is the result of uncontrolled urban
development in high-risk zones. Large-scale constructions within the
floodplain can result in obstruction to flood flows. Such construction can
be undertaken as part of developing new buildings, roads, industrial
and residential areas. For water resources development barrages or
dams may be constructed in the upper reaches of a water course.
Depending on the topography of the area this in case leads to the diversion
of water into a neighbouring catchment and may increase the flood risk in
these regions.
The construction of transport infrastructure such as highways and
railroads ideally requires open flat land. Such conditions can be found on
floodplains and the floodplains are used to develop such infrastructure.
Human activities gradually encroach on the natural environment altering
the dynamic equilibrium of the hydrologic cycle and initiating new
processes during rainfall events. It is now well accepted that there exists
causal links between environmental degradation, land-use and
vulnerability to disaster. In physical terms, for instance, flash floods
are considered to be fast onset disasters, but the root cause may reside in a
historically progressive process of environmental degradation and
unsustainable land-use that affects the hydrological response and the
impact of the flood. Urbanisation disrupts natural drainage patterns.
Natural watercourses are destroyed and the natural retention of runoff by
plants and soil is removed. By changing pervious natural surfaces to less
or non-pervious artificial surfaces, the storm water runoff rates and the
total runoff volumes will increase as a result of a declining natural water
storage capacity of the soil. All these factors are leading to an increased
risk of urban flooding. Change of natural water storage as a consequence
of urbanisation also causes significant changes to the temporal
characteristics of runoff from an urbanised area, such as shortening the
runoff travel time and giving to the event a flashing appearance.
Land use Planning
Flood management plans are developed at different levels as part
of sectoral planning. These include Basin or Catchment Flood
Management Strategy, Basin or Catchment Flood Management Plan, Local
Floodplain Management Plan and Project Plan. The different plans largely
vary on spatial and temporal scales. The first two are prepared for
comparably large areas and partly with substantial time horizons
(reaching up to several decades). The latter two types of flood management
plans are prepared on rather small spatial scales and time scales of
months or a few years. Spatial planning can be seen as one of the means
to prevent and mitigate man-made and natural risks (Burby, 2006; Burby
et al., 2000; Cutter, 1993; Godschalk et al.,1999; Immink, 2005; Mileti,
1999).
All structural flood management interventions need to be
incorporated into the land use planning process to safeguard spatial
requirements of those measures now and in the future. This proves in
practice a challenging task as spatial requirements can be substantial with
limited available land resources e.g., for a dam or reservoir but similarly
for levees and diversion channels. Further our knowledge of the future is
inherently limited. This particularly concerns future economic drivers,
as well as future rainfall patterns and other climatic factors which form
the basis of planning the location and spatial requirements of hydraulic
works in general and structural flood management measures in particular.
Another option under this strategy refers to measures taken over the whole
catchment area (not only the water system) to optimize the functioning of
the catchment for flood management. Another consideration taken refers to
where flooding causes least harm and where it should occur to protect
other crucial areas such as cities and industrial centres with high
potential for damage. Those high risk areas need to be identified and made
part of the land-use planning and regulation process, in order to be kept
free from high risk uses.
Flood Management Planning Processes
Information on land use/land cover in the form of maps and
statistical data is very vital for spatial planning, management and
utilisation of land for agriculture, forestry, pasture, urban-industrial,
environmental studies, economic production etc. Today, with the growing
population pressure, low man-land ratio and increasing land degradation,
the need for optimum utilization of land assumes much greater
relevance. The draft outline on the National Land Use Policy and
strategy on Optimum Land Use Planning and the creation of National
Land Use Conservation Board (NLUCB) in 1985 clearly indicate the
serious concern of the Government in this regard. Flood risk management
involves a suite of management plans which fall into the three categories of
prevention, protection and preparedness. The first category can also be
subdivided into those actions which address the cause and those which
address the effect of flooding. Dealing with the cause is fundamental in a
long term solution to any environmental, social or economic issue. In
terms of flooding it is identifying where the floodwaters originate,
investigating runoff rates in headwater catchments, looking at how river
channels convey floods and dealing with the rivers before they become too
big to be managed. Dealing with the cause of the floods is therefore
looking at the whole catchment and the management technique which can
best address the cause is catchment land use planning.
Land use can be planned on a catchment scale to target the causes of
flooding by distributing certain land uses in key areas within the
catchment. The land uses to be considered include the catchment’s
vegetation cover, soil cover, river channels and related aspects such as
ground drainage, access roads and river morphology. For flood
management these land uses need to be distributed to control the rate of
runoff during storm conditions and the rate of flow down the watercourses.
To plan the distribution of land uses over a catchment the full range of
catchment characteristics need to be linked to the hydrological
characteristics of the land use type. The identification of key flood
control areas within a catchment highlights other areas in the catchment
which will have little control on flood generation. These areas could be a
significant proportion of the catchment enabling land owners and local
communities to use this land for agriculture, forestry, recreation and small
scale infrastructure. This integrated approach on the whole catchment
scale, involving communities, is therefore land use planning on a
sustainable level. Sustainability has to involve the economics of a scheme,
good planning, understanding flood generation processes, protecting
natural environments and working with communities. This has led to the
suggestion that sustainable flood risk management includes the following
components:
1. Floods legislation driven by good policy and planning;
2. Flood monitoring networks and warning systems;
3. Flood data for trend analysis and investigating flood generation
processes;
4. Protecting, benefiting and involving communities;
5. Engineered flood protection schemes
6. Economics including capital costs, maintenance costs
7. Protecting and enhancing the natural environment;
8. Natural flood management in functional flood control areas
involving river restoration and catchment land use planning.
Natural flood management deals with the causes of flooding by slowing
down runoff rates in the upper catchment and reducing flow rates
down watercourses. Fundamental to this is that there are key areas in a
catchment where floods are generated and where flood flows should be
slowed down. In a catchment there are natural systems such as soils and
river meanders which provide this function. If these systems at the key
points have been degraded then there is a high risk of increased runoff
rates and more rapid flow rates in rivers. These areas are therefore keys in
the success of natural flood management and can be termed functional
flood control areas. The techniques which are used in natural flood
management include:
• Reforestation of hill slopes
• Planting dense woodlands in gullies
• Blocking artificial drains
• Restoring wetland features
• Restoring river channel meanders
• Controlling excessive erosion
• Management of large woody debris in watercourses
One approach to the mitigation of the severity of floods is to retard
the rate of run-off from natural watersheds. In rural areas, this can be
accomplished by adopting conservation practices directed towards the
increased infiltration of storm rainfall and the surface detention of flood
run-off. In small urban watersheds, run-off can be retarded by providing
onsite detention storage facilities, using such techniques as the provision
of lot storage and the use of parking areas and sporting fields to detain
storm run-off. Land-use regulations can be used as an effective means of
reducing the damage associated with natural disasters. In the context of
floodplain occupation, land-use regulations attempt to minimize the
effect of flood disasters by balancing land uses with flood risk.
Restrictions are placed on the nature and location of urban and industrial
development and the type and extent of agricultural activity. To be fully
effective, such land-use control measures should be introduced in
combination with other forms of disaster reduction drawn from the
range of available structural and non-structural measures. Although it is
not possible to avoid the occurrence of natural disasters, their physical
impacts can be reduced through appropriate mitigation strategies. In many
circumstances, wise land-use planning and management can be effective in
reducing the adverse consequences of water-related natural disasters. On
the other hand, the vulnerability of land to such hazards as flooding or
landslip can be increased as a consequence of environmental degradation
resulting from unwise land use and the uncontrolled exploitation of natural
resources.
Conclusions
All structural flood management interventions need to be
incorporated into the land use planning process to safeguard spatial
requirements of those measures now and in the future. The assessment of
the influence of human activities on the global environment needs spatially
explicit data sets describing changes in land use and land cover and their
associated biophysical and socioeconomic drivers. One of the most
obvious manifestations of human activity in the terrestrial biosphere is the
extent of land use and land cover change. Flood risks can be reduced and
mitigated by better land use planning and is a beneficial tool for all levels.
References
Burby, R.J.2006. Hurricane Katrina and the paradoxes of government
disaster policy. Bringing about wise governmental decisions for
hazardous areas.Annals of the American Academy of Political and
Social Science 604, 171-191.
Burby, R.J., Deyle, R.E., Godschalk, D.R., and Olshansky, R.B. (2000).
Creating Hazard Resilient Communities through Land-Use
Planning. Natural Hazards Review, 1, 99-106.
Chow, V.T. (1956). Hydrologic studies of floods in the United States,
International Association of Hydrological Sciences, 42,134–170.
Cutter, S.L.1993. Living with risk . the geography of technological
hazards, Arnold, London. 71-73.
Godschalk, D.R., Beatly, T., Berke, P., Brower, D.J., Kaiser, E.J., Bowl,
C.C. and Goebel, R.M.1999. Natural Hazard Mitigation. Recasting
Disaster Policy and Planning, Island Press, Washington D.C. 233-
234.
Immink, I. 005). Established and recent policy arrangements for river
management in The Netherlands. an analysis of discourses. From
Landscape research to Landscape Planning. Aspects of Integration,
Education and Application, B. Tress, G. , G. Tress, G. Fry and P.
Opdam, eds., Springer, Dordrecht. 387-404.
Mileti, D. S. 1999. Disasters by design . a reassessment of natural
hazards in the United States, Joseph Henry Press, Washington, D.C.
133-135.
Ward, R. 1978. Floods. A Gcographirol Perrpccfiuc. London Macmillan
Press Ltd.55-58.
WMO (World Meteorological Organization). (1974). WMO/UNESCO
International Glossary of Hydrology, WMO Publication No. 385,
WMO, Geneva.
WMO (World Meteorological Organization). 2007. The role of land-use
planning in flood management- A tool for integrated flood
management. 10-15.
Combating Desertification Programmes in Western Rajasthan –Issues
and Constraints
N.K.Bohra ,J.K.Shukla and D.K.Mishra
Arid Forest Research Institute, Jodhpur (Rajasthan)
Abstract
In Western Rajasthan the climate is very harsh and rainfall is
irregular .The temperature reaches to 50 degree in summer and drops to 0
degree in winter. The Forest area is very limited and rainfed agriculture is
the only system for their survival. The huge barren land patches along with
moving sand dunes and rocky area are really a challenge for the forester
and researcher. Government of India started a massive programme in
western Rajasthan named as Combating Dsrtification Programme (CDP).
The programme aimed to establish sand dunes, increase in forest area
along with providing fuel wood, fodder, and increase in pasture lands,
employment generation and other local requirements. However during
implementation there are several constraints appear with respect to land
ownership, types of plantation, local factors etc. There is need to find out
solutions well as to modified programme with respect to changing climate
and local demand .During evaluation work of these area several good
things also comes out like increase in forest area ,increase in awareness and
at the same time increase in Biodiversity in the programme area. However
there are some lacunae are also there which should be solved and in
future such programmes can be organized and develop after learning from
these programmes stories. The paper will be presented with respect to
study undertaken in Jodhpur, Sikar, Nagaur and Barmer region of western
Rajasthan.
Keywords: CDP, pasture lands, biodiversity
Introduction
Rajasthan is the largest state of India, having 10.5% area of the
country and covers two-third area of Thar Desert. It Supports 5.5% of
human population, 10% of cattle, with 0.5% Pastureland and 1.15% water
resources of the country. In this region droughts recur almost every year in
one or the other part of the State. The total area affected by sand drift in
India is about 88,000 km2. Thar Desert in Rajasthan is characterized by
low and erratic rainfall, monsoon variability, high air temperatures and
intense solar radiation coupled with high wind velocity. Thus, there is a
random recurrence of drought and famines making local livelihoods highly
vulnerable.
With increase in human and livestock population over the years, the
natural resources in the drought prone and desert areas have been under
great stress resulting in continuous depletion of vegetative cover, increase
in soil erosion and fall in ground water levels due to continuous
exploitation. All these factors contribute to diminishing productivity of
land and loss of natural resources. Department of Land Resources have
been addressing these problems on a regular basis through the highly
focused, specific area development programme i.e., Desert Development
Programme (DDP) in dry regions of India in 1977-78. From 1995-96, the
coverage has been extended to a few more districts. Desert Development
Programme (DPP) was launched as a centrally sponsored scheme in
1977-78 with the prime objective of controlling desertification and
restoration of ecological balance in dry region. In Rajasthan, various
schemes taken-up under this programme are, shelterbelt plantations,
rehabilitation of degraded forests, village fuel wood and fodder plantation,
farm forestry, sand dune stabilization, pasture development and
establishment of nurseries.
In absence of watershed in arid districts of Rajasthan, the
recommendation of Hanumanta Rao committee was relaxed in 10 arid
districts. Fifty percent of funds allocated to a district were suggested for its
use as per the normal guidelines for watershed development and the
remaining 50% of the fund was earmarked for sand dune stabilization,
shelterbelt creation and afforestation. In Rajasthan, various schemes
taken-up under this programme are afforestation, shelterbelt
plantations, sand dune stabilization and plantation. To involve village
communities in the implementation of this project and also involve the
Panchayat Raj Institutions (PRIs) for management of economic
development activities in rural areas, GOI has issued Guidelines called
Guidelines for Naveen Hariyali. These new guidelines under the area
development programmes were implemented in accordance with the
Guidelines for Naveen Hariyali with effect from 1.4.2003.
Comabating Desertificaton Programme
The Combating Desertification Project is a centrally sponsored
project in which project cost is shared by the Central and State
Governments in the ratio of 75.25. The work is carried out in
accordance with project profile by the agency i.e. Forest department
and include objectives such as:
1. Combating desertification
2. Increasing supply of fuel wood, fodder and generating
employment through environmental improvement of degraded
community and forestland by afforestation.
3. Sand dune stabilization work to control shifting of sand dune and to
check further extension of desert.
4. Increasing productivity of existing vegetation through proper
treatment in addition to the planted seedlings.
5. Improvement in climatic condition through afforestation activities.
6. Supply of quality planting stock on local demands.
7. Ensuring people participation in afforestation activities.
Plantation activities covered in the model were defined for growing
tree and grasses under the project and the provision has been made for their
maintenance for five years. In order to protect the plants raised under the
project, provision has been made for the enclosure of the plantation sites
by trench- cum-mound fencing in the areas having hard soil and by 3/4
strand Iron barbed wire fencing in the areas having loose sandy soil. Some
sites have protected by both ditch and barbed wire fencing.
By clubbing together different activities a decrease in demand and
supply gap of fuel wood, fodder and other forest products has been
observed, thereby fulfilling the local needs viz. fuel wood, fodder, NTFP
and timber.
Selection of Place
The decision regarding selection of village panchayats under which
plantation has to be raised is taken in the meeting of Zila Parishad after
thorough discussion. The community organization represented by village
panchayats and VFPMCs were involved in selection of suitable site
and allotment through the approval of Gramsabha, mode of operation &
treatment plan of the proposed area. VLOs were involved in execution
of the afforestation work through fencing, vegetative interlacing,
erection of micro windbreaks, mulching, formation of V-ditches, contour
trenches, planting, seed sowing & its protection. For each plantation site,
forest department has been formally allowed to raise plantation by a
resolution passed by the concerned Gramsabha.
Under this project various models are proposed depending on site
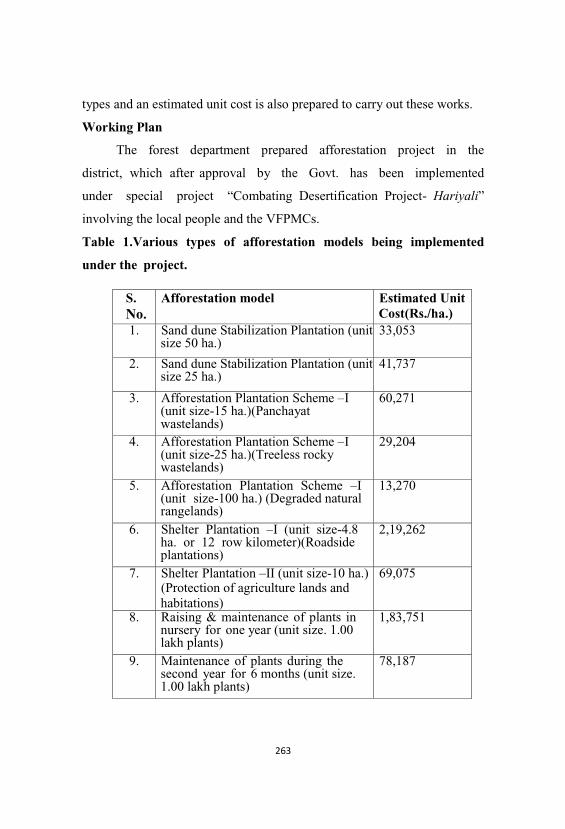
S. No.
Afforestation model Estimated UnitCost(Rs./ha.)
1. Sand dune Stabilization Plantation (unitsize 50 ha.)
33,053
2. Sand dune Stabilization Plantation (unitsize 25 ha.)
41,737
3. Afforestation Plantation Scheme –I(unit size-15 ha.)(Panchayatwastelands)
60,271
4. Afforestation Plantation Scheme –I(unit size-25 ha.)(Treeless rockywastelands)
29,204
5. Afforestation Plantation Scheme –I(unit size-100 ha.) (Degraded naturalrangelands)
13,270
6. Shelter Plantation –I (unit size-4.8ha. or 12 row kilometer)(Roadsideplantations)
2,19,262
7. Shelter Plantation –II (unit size-10 ha.)(Protection of agriculture lands andhabitations)
69,075
8. Raising & maintenance of plants innursery for one year (unit size. 1.00lakh plants)
1,83,751
9. Maintenance of plants during thesecond year for 6 months (unit size. 1.00 lakh plants)
78,187
types and an estimated unit cost is also prepared to carry out these works.
Working Plan
The forest department prepared afforestation project in the
district, which after approval by the Govt. has been implemented
under special project “Combating Desertification Project- Hariyali”
involving the local people and the VFPMCs.
Table 1.Various types of afforestation models being implemented
under the project.
Constitution of Wc/Wa and Related Training
As per the guidelines issued by Ministry of rural development,
Govt. of India, vide letter No.S-11033/3/98-DDP, dated. 10th December,
1998 – Para 5, constitution of village forests protection and Management
Committee (VFPMC) in the form of village level organizations (VLO’s)
have been registered and they are functioning as watershed associations.
Training and entry point activities were clubbed with actual work of sand
dunes stabilization, shelterbelt plantation and afforestation activities,
though some of the activities related to plantation have been demonstrated
by the project implementing agency like :
1. Training on collection, belling and storage of grasses.
2. Training on nursery development and tree planting techniques
through village nurseries.
3. Training on silviculture operations like pruning, weed removal
These training were organized at range levels and the details and
actual dates were not available with them and/or not made available.
Role of Women in the Execution of Project
Major afforestation activities are executed through women as
laborers (varying from 60 to 80 per cent). However, efforts are being made
to give them more representation in VFPMCs and involve them in
decision-making processes. Representation of women in decision making
process has been negligible. This may be because of low literacy and
prevailing traditional Purda system among the women, who generally
avoid coming in the meetings and expressing themselves. Plantations are
being raised on different types of types of wastelands available. Types of
available wasteland are.
1. Degraded Gaucher and Orans
2. Saline –alkaline area
3. Barren rocky slops.
4. Active sand dunes with interdunal spaces.
These include village common land (Oran and Gaucher), bare sand
dunes, panchayats wastelands, treeless rocky wastelands; heavy gully
eroded areas and degraded village rangeland except some portion on forest
land. There is a scarcity of water, shelter, fodder etc.
Compatible Methodology / Technique Used
The methodology adopted for soil and water conservation work is
suitably laid at the site to manage the existing natural resources. Digging of
contour or staggered trenches in the hilly tracts and V-ditches in the
flatland are the measures adopted in the form of earthwork to improve soil
and water status. The methodology adopted for the execution of work is
based on the demand of local people, cost-effective technology and
suitably matching with the topography of land.
On shifting sand dunes, soil conservation works against wind
erosion are done through micro windbreaks of locally available dry
materials of Kheemp (Leptadenia pyrotechnica), Bui (Aerva persica),
Sinia (Crotolaria burhia), termed as mulching and also through live
vegetative means like sowing of seeds of Phog (Calligonum
polygonoides), Kheemp (Laptadenia pyrotechnica), Sewan (Lasiurus
sindicus), Sonamukhi (Cassia angustifolia) etc. along the contour against
the wind direction. Construction of wide trench-cum-bund enclosure (in
hard soil only) is made to protect the plantations from the biotic
interference. Digging of pits for planting of the seedlings and making
of saucer (thavla) around the seedling are the other soil working done
under the CDP. Construction of contour trenches in the areas having
higher slope and hard surface for moisture conservation (wherever
required),Gully plugging and construction of check dams wherever
required, Construction of V–ditches on lands with gentle slopes as a
moisture conservation measure (wherever required) with regular soil
working in the saucer (thavla) are also made mandatory under this project.
For creating awareness among the villagers and to ensure people’s
participation in the project, trainings have been organized both at Range
and Division levels. In all the field offices viz. Range offices, the
plantation records like survey maps, plantation journals, plantation
schedule etc. were prepared and maintained properly.
Usefulness
The project was successful in following ways:
• There is increase in biological diversity after project
implementation and protection of the area. Some indigenous species
sprouted/regenerated after protection of the area even during failure of
monsoon when most of the plantation activities in dry areas ceased.
Some of the species may be endangered and/or of high value either
in the term of gene bank or of medicinal in nature.
• Sand dune stabilization work under the project has benefited some
of the farmers in the area. At sum range areas where earlier roads are
blocked during summer region are now having clear roads due to
stabilization of sand dunes on both sides of roads. Establishment of
shelterbelt will be beneficial in improving microclimate and proving
shade in the vicinity of the habitations. Adoption of different
afforestation models increased the grass productivity particularly
when the grass seed sown after deep plough in between the two rows of
the planted seedlings as well as on the V-ditches.
• The poor villagers got the employment in afforestation works. They
collect the grass free of cost from the plantation areas and their
requirement for cattle stall-feeding is met to some extent.
However there are still some constraints which owing to harsh
conditions cannot be removed, however during execution of new
programme for afforestation in desert, these should be kept in mind.
Constraints
• Because of extreme climatic conditions, raising of successful
plantation is a difficult task in the district. The Scarcity of water
along with uncertainty of employment and poor socio-economic
condition prevailing in the region makes the area very harsh. The
sand storms due to high winds in the summer drift the loose sand
exposing the roots of planted seedlings and depositing the same on
the young seedlings in adjoining areas. Successive droughts further
aggravate the problem.
• Citrullus colocynthis (Tumba) and other cucurbits plants were
found to grow naturally in most of the sites with sandy soils. But it
provided a good shelter to the rodents, whose number multiplied
enormously and have damaged the plantations (peeling Acacia
tortilis as well as other plants shoots).
• The people’s involvement is mainly limited up to execution of
development works in the form of labour and initial planning as
micro plan. Special emphasis needs to be given on involvement of
women in afforestation and soil conservation works.
• The plantations are well protected from cattle through fencing /
social fencing.
• However, three strand barbed wire fencing was not found
effective against Chinkara and Blue bull.
• In some of the sites, the problem of rodent and termite both have
affected the site too much, which have affected the growth and
survival both .The plantation may be better protected with active
involvement of VFPMCs and the villagers.
• The frequency of irrigation was less which may be one of the
causes of mortality in the initial period of one to two year..
• The performance of A.tortilis in the project is found more
satisfactory as compare to other tree species but the composition
of other species specially the indigenous tree species like
T.undulata, P. cineraria and A.senegal etc should be increased.
Presently, the twigs or cutting material is being used for erection of
micro windbreaks; it can be improved through live hedge
windbreaks by seed sowing of Cassia angustifolia, bui/sevan etc
in checkerboard design. The silvipastoral system and live hedge
plantation of Euphorbia species and Acacia Senegal should also be
increased.
Conclusions
The combating desertification programme has improved the desertic
conditionand life .It was also useful in creating awareness and also
generating employment to improve the economic condition of the harsh
region. It is essential to utilize its fruit in sustainable way and by
conserving the plantation so that our future generation can also reap its
fruit.
Bio-economic analysis of soil and forest degradation processes in
Arnigad micro watershed of Mussoorie-Dehradun, Uttarakhand
(India)
Ram Chandra and Prafulla Soni*
Progressive Research Organization for Welfare (PROW),
Vishwakarma Colony,M.B. Road,New Delhi (India) -110044
* Advisor Restoration ecology & Biodiversity Conservation,Dehradun
Abstract
The Himalayas present a storehouse of biodiversity, where flora
and fauna vary extensively with climate diversity from one region to the
other. However, extensive commercial felling of forest for timber has been
reported in the region, especially in the last few decades when urban
centers began to grow in areas near the forests.
One of the big challenges is the natural resource dependence of the
native population of the region, who are primarily agro-pastoral. The bulk
of the region has dependence on livestock. The potential impacts of
excessive grazing include depletion of the scarce forage for wildlife,
habitat degradation and soil and forest degradation. The livestock
population in the region has also increased during the recent past and
problem of grazing in the high altitudes has acquired serious dimension, as
a result the vegetative cover is decreasing which has resulted in the
loss of top soil due to excessive erosion. Fuel wood and fodder
constitutes the dominant source of energy and feed for livestock
respectively in the region and population growth has contributed to
increased exploitation of forests for meeting growing energy demands.To
see the effects of human, livestock, grazing, fuel wood and fodder
collection activities on absolute change in selected land use categories of
forest i.e. dense forest, scrub forest and degraded forest during 1985-86 to
2005-06, a study was conducted in Arnigad micro watershed of Mussorie-
Dehradun, Uttarakhand and hypotheses were developed; collected primary
data was processed and analyzed through the linear and multiple regression
models to predict the directional results of research indicating the impacts
of demographic activities on the soil and forest ecosystems leading to their
degradation.
Results of the study showed that at the difference of 20 years
period from 1985-86 to 2005-06 developed hypotheses were found true in
case of scrub and degraded forest. As the activities of grazing, fuel wood
and fodder collection got increased then increase in forest degradation of
the category degraded forest and scrub forest took place in Arnigad
watershed. Increase in human as well as livestock population caused
change in the land use categories and the forest degradation increased
when the human and livestock population went on increasing. Increase in
income from different sources of fodder, crop and animal husbandry
caused the continuation of the use of resources and ultimately led to forest
degradation. Soil degradation is aggravated by increased demographic
pressure as well as grazing, fuel wood and fodder collection activities. It is
inferred that when livestock population increases the extent of area
under soil erosion also increases with the degree of increase in
livestock population.
Keywords: Regression models, hypotheses, soil,forest degradation, micro
watershed.
Introduction
The Himalayas present a storehouse of biodiversity, where flora
and fauna vary extensively with climate diversity from one region to the
other. If an attempt is made to divide the forests types based on the

standard classification of tropical, sub-tropical, temperate and alpine, it
becomes difficult to describe the rich diversity of the Himalayan forests.
One-tenth of the world's known species of higher altitude plants and
animals occur in the Himalayas (IPCC, 2001). However the rich diversity
of Himalayas is now severely threatened and many species have become
endangered on account of a variety of physical, biotic and strategic factors
unique to the region. The loss in biodiversity has been largely on account
of habitat losses, which in turn have happened due to deforestation, over-
exploitation of resources, wetland drainage and filling, human
settlements/encroachments, population growth, and species introduction.
The rich endemic flora of the Himalayan region faces the threat of
extinction due to degradation of forests and natural habitats for expansion
of agriculture, river valley projects, industrial and urban development
(MoEF, 1999).
The Himalayan region is characterized not only by ecological
fragility but also by a deep and historical geopolitical sensitivity (Stone,
1992). An ecosystem based natural resource management approach is
difficult to achieve as many countries share the resources of this
mountain system. One of the big challenges is the natural resource
dependence of the native population of the region, who are primarily agro-
pastoral. The bulk of the region has dependence on livestock. The potential
impacts of excessive grazing include depletion of the scarce forage for
wildlife, habitat degradation, disease transfer and reduction in the breeding
performance of both wildlife and domestic stock. This leads to livestock
depredation by wild carnivores, which is a serious conservation issue in
the Himalayan region. Land degradation in the Himalayas has also been
caused by instabilities arising from the large-scale expansion of new roads
and open cast mining (Stone, 1992). Soil erosion, especially the loss of
fertile topsoil either by gully, rill or sheet erosion, formation of hardpans
and the exposure to indurated horizons has led to large-scale deterioration
of the resource base of mountain agriculture. This is manifested in the
decline in the per capita availability of cropland, reduced availability of
village commons (also called support land), fall in soil fertility and a
decline in the carrying capacity of these areas. Large portions of arable
land in the northern Himalayan states of Jammu & Kashmir and Himachal
Pradesh have been rendered infertile and are in need of contingent soil and
water conservation measures like contour farming, terracing, strip
cropping, mulching, crop rotations, organic manuring, shallow ploughing
etc. (Gupta and Banerjee, 1991). The prime cause for these can be
attributed to the rate of exploitation of land resources, which has been
higher than the rate of replenishment.
Forest areas in the proximity of population centres and villages are
reported to be degrading faster due to collection of fuel wood and cattle
grazing, as compared to forests away from population centres and located
in inaccessible areas (FSI, 2000). Deforestation and degradation has been
caused by commercial logging; clearing of forestland for settlements and
agriculture; excessive exploitation of forests for fuel wood and food; and
overgrazing. The denudation of fir and spruce forests in Himachal
Pradesh and Jammu and Kashmir for making package cartons for apples is
an example of the commercial exploitation of forests taking place in the
region (TERI,1992). Fuel wood constitutes the dominant source of energy
in the region and population growth has contributed to increased
exploitation of forests for meeting growing energy demands.
Degradation of natural forests is a global problem (Guppy, 1984;
Sayer and Whitmore, 1991). Mankind has been destroying forest for
millennia ever since agriculture was discovered (William, 1989). In the
Himalaya too, deforestation is argued to be not a recent phenomenon, it
has a long history, being well established in late eighteenth century at
least (Mahat et al., 1986). In Himalaya, degradation of forest cover is a
primary problem, which gives way to a variety of problems. With
deforestation of slopes many environmental degradation processes like soil
erosion, slope failures, depletion of soil fertility, scarcity of fuel wood and
fodder, increased overland flows, reduced ground water recharge, loss of
biological diversity are accelerated.
Study Area
Present study was undertaken to assess soil and forest
degradation in the Arnigad watershed located in Uttarakhand, indicating
towards the current status of the Arnigad watershed. The Arnigad
watershed is situated in Dehra Dun district in the Mussoorie hills
(Mussoorie Forest Division) of Uttarakhand state in India. Total area of
the watershed is 13.39 km2 and the elevation ranges between 836 meters
and 2175 meters above MSL. This is a typical Himalayan watershed and
lies between 300 23 25 to 300 27 50 North latitude and 780 05 05 to 780
07 08 East longitude.
The climate of the area is typically monsoonic with three distinct
seasons, viz., summer, monsoon and winter. The watershed lies in
sub-tropical zone with an average annual rainfall of 2150 mm. Monsoon
normally breaks in the middle of June and lasts till middle of September.
About 75% of the total annual rainfall is received from June to September.
Winter rains are generally intermittent and mild. May and June are the
hottest months with average maximum temperature of 380C. Minimum
temperature recorded during December and January was 1-30C. Frost
occurs during these months and sometimes causes damage to tender
seedlings and vegetation.Land use pattern of the Arnigad watershed has
been influenced by terrain, climate and biotic influence. Four land covers
were founding the area, viz., well stock forest, degraded forest and scrub
forest. Lower western Himalayan Temperate Banj Oak forest (12/C1a)
and Northern Dry Mixed Deciduous Forest (5B/C2) are the forest types
occurring in this watershed (Champion and Seth, 1968). In general the
Quercus (Quercus leucotrichophora) forests were dense and well stocked
occurring in upper most portions. The degraded forest land was
predominantly occupied by Lantana camara and occupied an area of 85
ha. This species covered more than 90% of land in degraded forest and left
little scope for other species to survive or establish. However, small
number of Murraya koengii bushes was seen in this area. About 251 ha of
the watershed area constituted scrub vegetation, representing degraded
stage of the original forest that had been overexploited for fodder, fuel
wood and timber. Scrub forests had a few highly lopped trees.
To see the effects of human, livestock, grazing, fuel wood and
fodder collection activities on absolute change in selected land use
categories of forest i.e. dense forest, scrub forest and degraded forest
during 1985-86 to 2005-06, a study was conducted in Arnigad micro
watershed of Mussorie-Dehradun, Uttarakhand and hypotheses were
developed; collected primary data was processed and analyzed through the
linear and multiple regression models to predict the directional results of
research indicating the impacts of demographic activities on the soil and
forest ecosystems leading to their degradation.
Methods
The study is based on the primary data collected through the
Participatory Rural Appraisal (Mukherjee, 1993) approach by approaching
the various representing different age groups and gender. This study is
based on the statements and facts collected during 1985-86 and 2005-06
about the soil and forest degradation processes in the selected Arnigad
microwatershed.
Bio-economic Analysis Based on Regression Models.
For bio-economic analysis of soil and forest degradation
linear and multiple regression models were used.Regression equations
were obtained to find out the significance of relationships of:
• Absolute change in forest land use categories with grazing, fuel
wood and fodder.
• Absolute change in scrub land use categories with grazing, fuel
wood and fodder.
• Absolute change in degraded land use categories with grazing,
fuel wood and fodder.
• Land use categories with absolute change during 1985-86 and 2005-
06.
• Land use categories with absolute change in livestock
population between 1985-86 and 2005-06.
• Income with fodder, crop quantity and animal husbandry
(milk selling).
• Absolute change in soil erosion area with grazing.
• Absolute change in soil erosion area with increasing
livestock population between 1985-86 and 2005-06.
Hypotheses tested
In relation to the soil and forest degradation processes in the study
area the following four main hypotheses were formulated for testing.
Hypothesis 1. Forest degradation is aggravated by grazing, fuel wood
and fodder collection activities
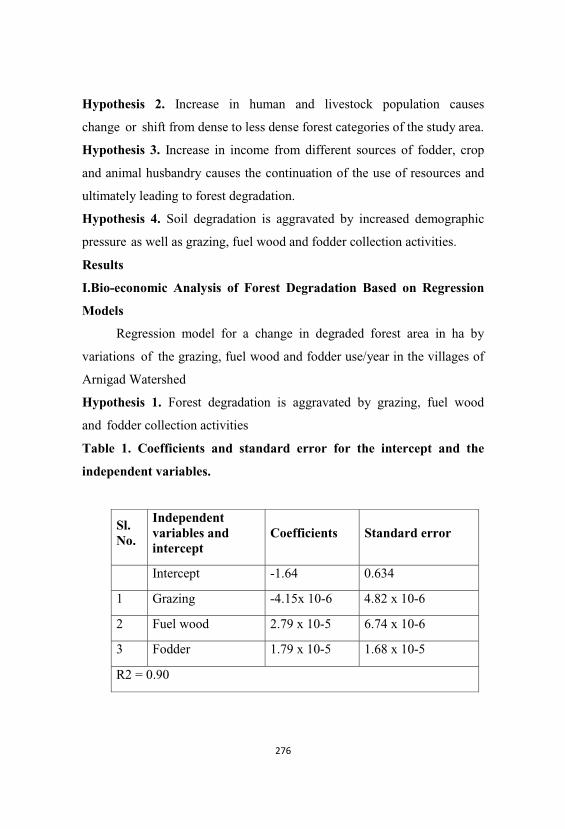
Hypothesis 2. Increase in human and livestock population causes
change or shift from dense to less dense forest categories of the study area.
Hypothesis 3. Increase in income from different sources of fodder, crop
and animal husbandry causes the continuation of the use of resources and
ultimately leading to forest degradation.
Hypothesis 4. Soil degradation is aggravated by increased demographic
pressure as well as grazing, fuel wood and fodder collection activities.
Results
I.Bio-economic Analysis of Forest Degradation Based on Regression
Models
Regression model for a change in degraded forest area in ha by
variations of the grazing, fuel wood and fodder use/year in the villages of
Arnigad Watershed
Hypothesis 1. Forest degradation is aggravated by grazing, fuel wood
and fodder collection activities
Table 1. Coefficients and standard error for the intercept and the
independent variables.
Sl. No.
Independentvariables andintercept
Coefficients Standard error
Intercept -1.64 0.634
1 Grazing -4.15x 10⁻⁶ 4.82 x 10⁻⁶
2 Fuel wood 2.79 x 10⁻⁵ 6.74 x 10⁻⁶
3 Fodder 1.79 x 10⁻⁵ 1.68 x 10⁻⁵
R2 = 0.90
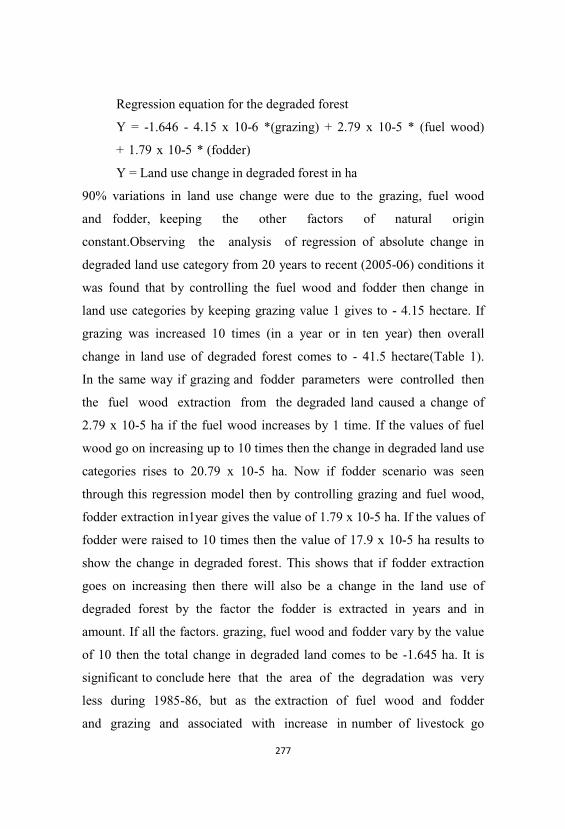
Regression equation for the degraded forest
Y = -1.646 - 4.15 x 10⁻⁶ *(grazing) + 2.79 x 10⁻⁵ * (fuel wood)
+ 1.79 x 10⁻⁵ * (fodder)
Y = Land use change in degraded forest in ha
90% variations in land use change were due to the grazing, fuel wood
and fodder, keeping the other factors of natural origin
constant.Observing the analysis of regression of absolute change in
degraded land use category from 20 years to recent (2005-06) conditions it
was found that by controlling the fuel wood and fodder then change in
land use categories by keeping grazing value 1 gives to - 4.15 hectare. If
grazing was increased 10 times (in a year or in ten year) then overall
change in land use of degraded forest comes to - 41.5 hectare(Table 1).
In the same way if grazing and fodder parameters were controlled then
the fuel wood extraction from the degraded land caused a change of
2.79 x 10⁻⁵ ha if the fuel wood increases by 1 time. If the values of fuel
wood go on increasing up to 10 times then the change in degraded land use
categories rises to 20.79 x 10⁻⁵ ha. Now if fodder scenario was seen
through this regression model then by controlling grazing and fuel wood,
fodder extraction in1year gives the value of 1.79 x 10⁻⁵ ha. If the values of
fodder were raised to 10 times then the value of 17.9 x 10⁻⁵ ha results to
show the change in degraded forest. This shows that if fodder extraction
goes on increasing then there will also be a change in the land use of
degraded forest by the factor the fodder is extracted in years and in
amount. If all the factors. grazing, fuel wood and fodder vary by the value
of 10 then the total change in degraded land comes to be -1.645 ha. It is
significant to conclude here that the area of the degradation was very
less during 1985-86, but as the extraction of fuel wood and fodder
and grazing and associated with increase in number of livestock go
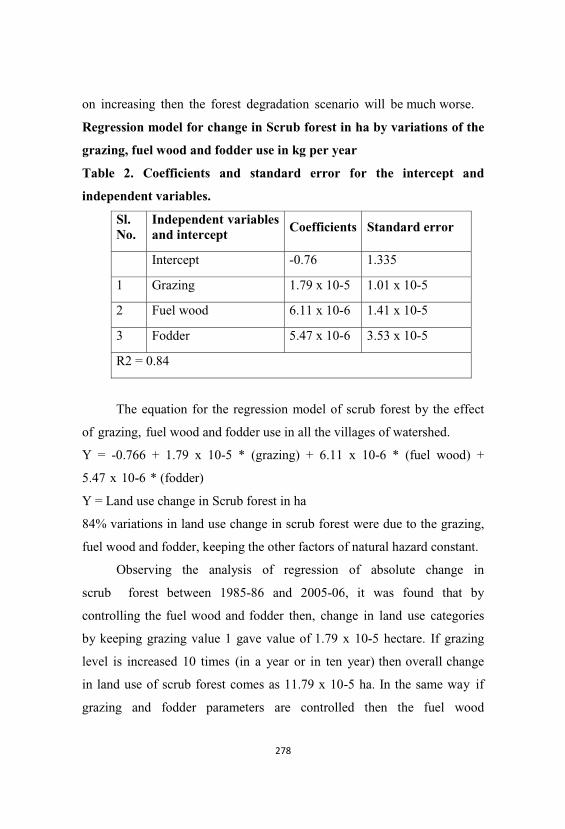
on increasing then the forest degradation scenario will be much worse.
Regression model for change in Scrub forest in ha by variations of the
grazing, fuel wood and fodder use in kg per year
Table 2. Coefficients and standard error for the intercept and
independent variables.
Sl. No.
Independent variablesand intercept
Coefficients Standard error
Intercept -0.76 1.335
1 Grazing 1.79 x 10⁻⁵ 1.01 x 10⁻⁵
2 Fuel wood 6.11 x 10⁻⁶ 1.41 x 10⁻⁵
3 Fodder 5.47 x 10⁻⁶ 3.53 x 10⁻⁵
R2 = 0.84
The equation for the regression model of scrub forest by the effect
of grazing, fuel wood and fodder use in all the villages of watershed.
Y = -0.766 + 1.79 x 10⁻⁵ * (grazing) + 6.11 x 10⁻⁶ * (fuel wood) +
5.47 x 10⁻⁶ * (fodder)
Y = Land use change in Scrub forest in ha
84% variations in land use change in scrub forest were due to the grazing,
fuel wood and fodder, keeping the other factors of natural hazard constant.
Observing the analysis of regression of absolute change in
scrub forest between 1985-86 and 2005-06, it was found that by
controlling the fuel wood and fodder then, change in land use categories
by keeping grazing value 1 gave value of 1.79 x 10⁻⁵ hectare. If grazing
level is increased 10 times (in a year or in ten year) then overall change
in land use of scrub forest comes as 11.79 x 10⁻⁵ ha. In the same way if
grazing and fodder parameters are controlled then the fuel wood
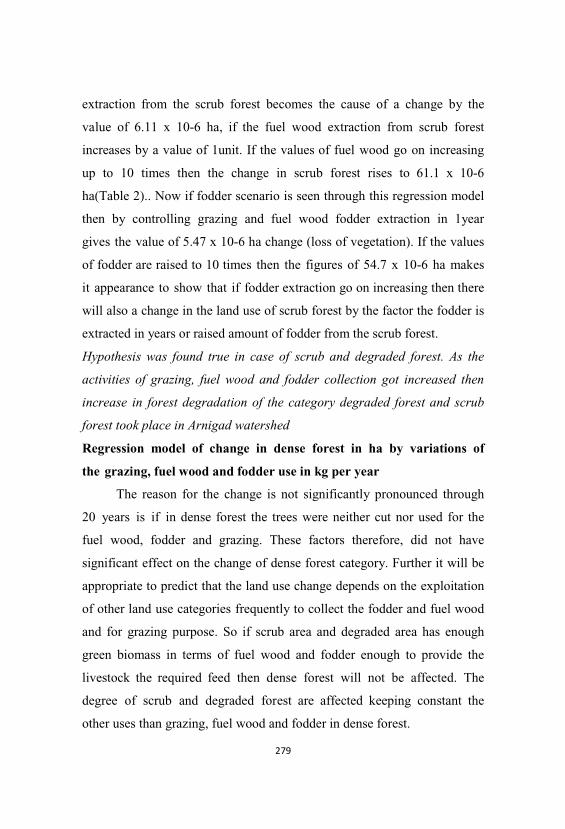
extraction from the scrub forest becomes the cause of a change by the
value of 6.11 x 10⁻⁶ ha, if the fuel wood extraction from scrub forest
increases by a value of 1unit. If the values of fuel wood go on increasing
up to 10 times then the change in scrub forest rises to 61.1 x 10⁻⁶
ha(Table 2).. Now if fodder scenario is seen through this regression model
then by controlling grazing and fuel wood fodder extraction in 1year
gives the value of 5.47 x 10⁻⁶ ha change (loss of vegetation). If the values
of fodder are raised to 10 times then the figures of 54.7 x 10⁻⁶ ha makes
it appearance to show that if fodder extraction go on increasing then there
will also a change in the land use of scrub forest by the factor the fodder is
extracted in years or raised amount of fodder from the scrub forest.
Hypothesis was found true in case of scrub and degraded forest. As the
activities of grazing, fuel wood and fodder collection got increased then
increase in forest degradation of the category degraded forest and scrub
forest took place in Arnigad watershed
Regression model of change in dense forest in ha by variations of
the grazing, fuel wood and fodder use in kg per year
The reason for the change is not significantly pronounced through
20 years is if in dense forest the trees were neither cut nor used for the
fuel wood, fodder and grazing. These factors therefore, did not have
significant effect on the change of dense forest category. Further it will be
appropriate to predict that the land use change depends on the exploitation
of other land use categories frequently to collect the fodder and fuel wood
and for grazing purpose. So if scrub area and degraded area has enough
green biomass in terms of fuel wood and fodder enough to provide the
livestock the required feed then dense forest will not be affected. The
degree of scrub and degraded forest are affected keeping constant the
other uses than grazing, fuel wood and fodder in dense forest.
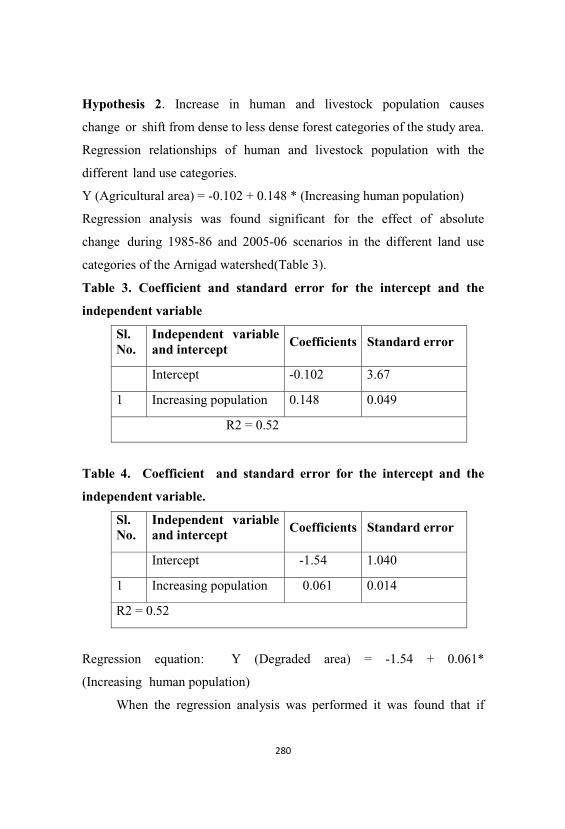
Hypothesis 2. Increase in human and livestock population causes
change or shift from dense to less dense forest categories of the study area.
Regression relationships of human and livestock population with the
different land use categories.
Y (Agricultural area) = -0.102 + 0.148 * (Increasing human population)
Regression analysis was found significant for the effect of absolute
change during 1985-86 and 2005-06 scenarios in the different land use
categories of the Arnigad watershed(Table 3).
Table 3. Coefficient and standard error for the intercept and the
independent variable
Sl. No.
Independent variableand intercept
Coefficients Standard error
Intercept -0.102 3.67
1 Increasing population 0.148 0.049
R2 = 0.52
Table 4. Coefficient and standard error for the intercept and the
independent variable.
Sl. No.
Independent variableand intercept
Coefficients Standard error
Intercept -1.54 1.040
1 Increasing population 0.061 0.014
R2 = 0.52
Regression equation: Y (Degraded area) = -1.54 + 0.061*
(Increasing human population)
When the regression analysis was performed it was found that if
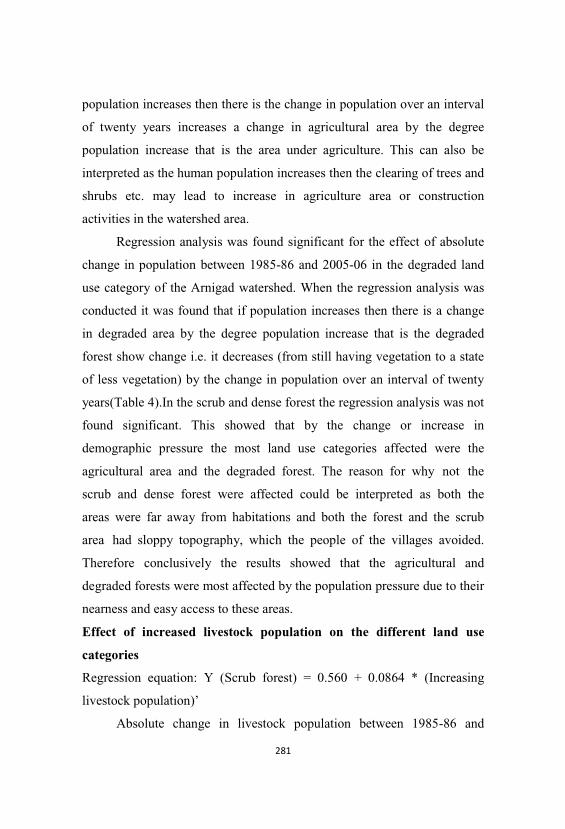
population increases then there is the change in population over an interval
of twenty years increases a change in agricultural area by the degree
population increase that is the area under agriculture. This can also be
interpreted as the human population increases then the clearing of trees and
shrubs etc. may lead to increase in agriculture area or construction
activities in the watershed area.
Regression analysis was found significant for the effect of absolute
change in population between 1985-86 and 2005-06 in the degraded land
use category of the Arnigad watershed. When the regression analysis was
conducted it was found that if population increases then there is a change
in degraded area by the degree population increase that is the degraded
forest show change i.e. it decreases (from still having vegetation to a state
of less vegetation) by the change in population over an interval of twenty
years(Table 4).In the scrub and dense forest the regression analysis was not
found significant. This showed that by the change or increase in
demographic pressure the most land use categories affected were the
agricultural area and the degraded forest. The reason for why not the
scrub and dense forest were affected could be interpreted as both the
areas were far away from habitations and both the forest and the scrub
area had sloppy topography, which the people of the villages avoided.
Therefore conclusively the results showed that the agricultural and
degraded forests were most affected by the population pressure due to their
nearness and easy access to these areas.
Effect of increased livestock population on the different land use
categories
Regression equation: Y (Scrub forest) = 0.560 + 0.0864 * (Increasing
livestock population)’
Absolute change in livestock population between 1985-86 and
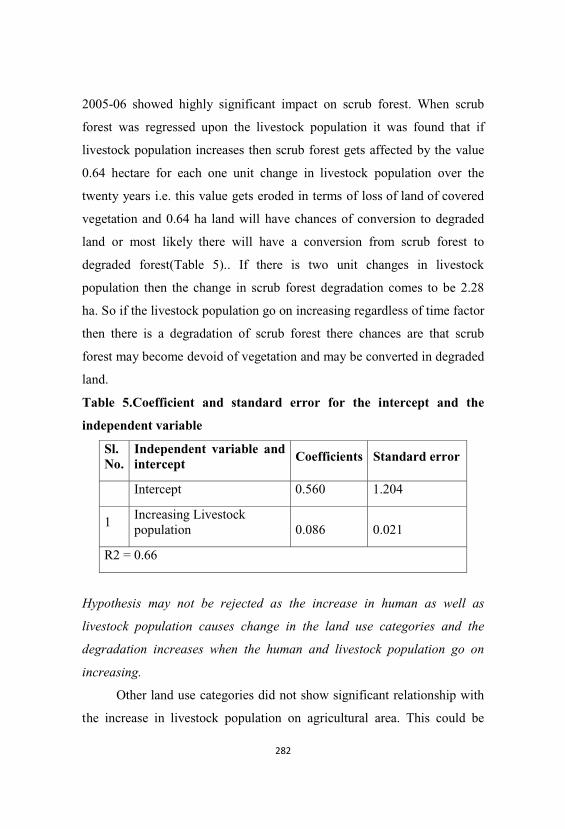
2005-06 showed highly significant impact on scrub forest. When scrub
forest was regressed upon the livestock population it was found that if
livestock population increases then scrub forest gets affected by the value
0.64 hectare for each one unit change in livestock population over the
twenty years i.e. this value gets eroded in terms of loss of land of covered
vegetation and 0.64 ha land will have chances of conversion to degraded
land or most likely there will have a conversion from scrub forest to
degraded forest(Table 5).. If there is two unit changes in livestock
population then the change in scrub forest degradation comes to be 2.28
ha. So if the livestock population go on increasing regardless of time factor
then there is a degradation of scrub forest there chances are that scrub
forest may become devoid of vegetation and may be converted in degraded
land.
Table 5.Coefficient and standard error for the intercept and the
independent variable
Sl. No.
Independent variable andintercept
Coefficients Standard error
Intercept 0.560 1.204
1Increasing Livestockpopulation 0.086 0.021
R2 = 0.66
Hypothesis may not be rejected as the increase in human as well as
livestock population causes change in the land use categories and the
degradation increases when the human and livestock population go on
increasing.
Other land use categories did not show significant relationship with
the increase in livestock population on agricultural area. This could be
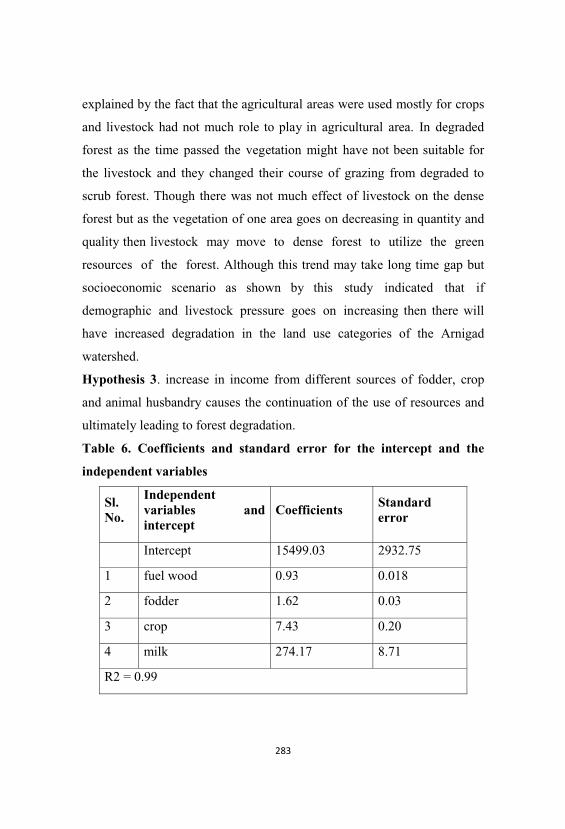
explained by the fact that the agricultural areas were used mostly for crops
and livestock had not much role to play in agricultural area. In degraded
forest as the time passed the vegetation might have not been suitable for
the livestock and they changed their course of grazing from degraded to
scrub forest. Though there was not much effect of livestock on the dense
forest but as the vegetation of one area goes on decreasing in quantity and
quality then livestock may move to dense forest to utilize the green
resources of the forest. Although this trend may take long time gap but
socioeconomic scenario as shown by this study indicated that if
demographic and livestock pressure goes on increasing then there will
have increased degradation in the land use categories of the Arnigad
watershed.
Hypothesis 3. increase in income from different sources of fodder, crop
and animal husbandry causes the continuation of the use of resources and
ultimately leading to forest degradation.
Table 6. Coefficients and standard error for the intercept and the
independent variables
Sl. No.
Independentvariables andintercept
CoefficientsStandarderror
Intercept 15499.03 2932.75
1 fuel wood 0.93 0.018
2 fodder 1.62 0.03
3 crop 7.43 0.20
4 milk 274.17 8.71
R2 = 0.99
Regression equation for total income from fuel wood, fodder, crop and
milk;
Y (Total income) = 15499.03 +0.93 * (Fuel wood) + 1.62 * (fodder) +
7.43 *(crop) +274.17* (Milk)
When income was regressed on fuel wood, fodder, crop and milk as
independent variables then the regression equation came as above and was
highly significant in favour of total income from fuel wood, fodder, crop
and milk sources. So if all the sources’ value being 1 then the total income
in Rs. results as 15,783.18 on annual basis. If fodder, crop and milk are
controlled then the total income from fuel wood will come as Rs.
15,499.96. In the same way if fuel wood, milk and crop are controlled then
one unit rise in fodder gives an output of Rs. 15500.65/annum and as
fodder quantity/year changes then the output amount also gets
changed(Table 6).. Now if fuel wood, fodder and milk are controlled then
one unit rise in crop gives Rs.15506.46/annum. Finally if fuel wood,
fodder and crop are controlled then total income from crop will give
Rs. 15773.2. And fuel wood and fodder quantity in favour of livestock
provides income in kind, as fodder is free for them, which is collected from
forests of the region concerned.
This hypothesis can also be accepted as the overall results give the
impression that as the income increases then there are also the usual
activities of using fuel wood and fodder and keeping animals for
generating income by regular exploitation or use of the forest resources.
While keeping and using the animals like goat, sheep and
mules etc. income is generated through production of milk, meat and
their use as means of transportation in the hilly areas of this watershed,
collection of fuel wood, fodder and grazing gives them extra income in the
form of kind (indirect income). As by collection of fodder, the cattle and
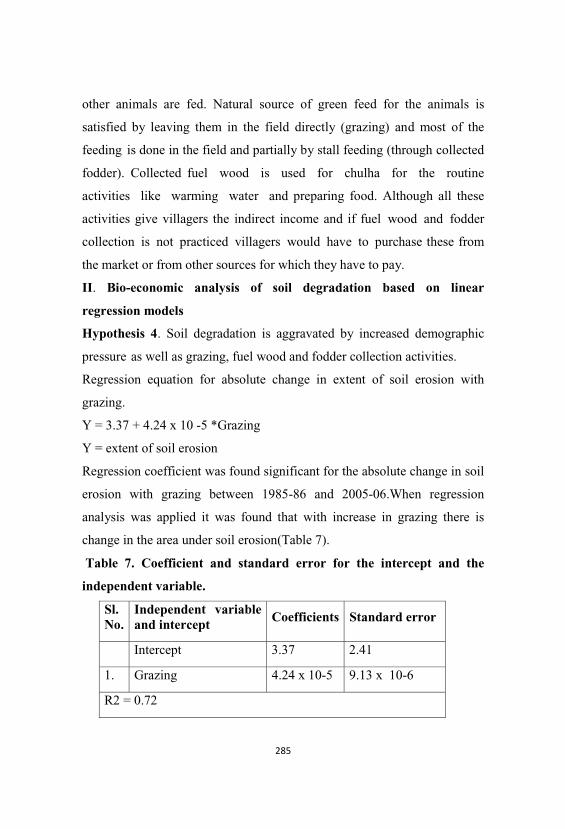
other animals are fed. Natural source of green feed for the animals is
satisfied by leaving them in the field directly (grazing) and most of the
feeding is done in the field and partially by stall feeding (through collected
fodder). Collected fuel wood is used for chulha for the routine
activities like warming water and preparing food. Although all these
activities give villagers the indirect income and if fuel wood and fodder
collection is not practiced villagers would have to purchase these from
the market or from other sources for which they have to pay.
II. Bio-economic analysis of soil degradation based on linear
regression models
Hypothesis 4. Soil degradation is aggravated by increased demographic
pressure as well as grazing, fuel wood and fodder collection activities.
Regression equation for absolute change in extent of soil erosion with
grazing.
Y = 3.37 + 4.24 x 10 -5 *Grazing
Y = extent of soil erosion
Regression coefficient was found significant for the absolute change in soil
erosion with grazing between 1985-86 and 2005-06.When regression
analysis was applied it was found that with increase in grazing there is
change in the area under soil erosion(Table 7).
Table 7. Coefficient and standard error for the intercept and the
independent variable.
Sl. No.
Independent variableand intercept
Coefficients Standard error
Intercept 3.37 2.41
1. Grazing 4.24 x 10⁻⁵ 9.13 x 10⁻⁶
R2 = 0.72
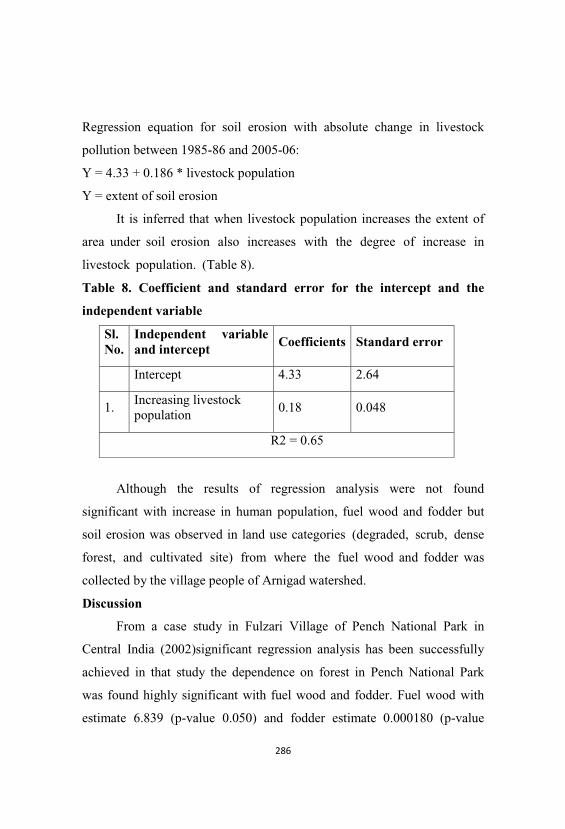
Regression equation for soil erosion with absolute change in livestock
pollution between 1985-86 and 2005-06:
Y = 4.33 + 0.186 * livestock population
Y = extent of soil erosion
It is inferred that when livestock population increases the extent of
area under soil erosion also increases with the degree of increase in
livestock population. (Table 8).
Table 8. Coefficient and standard error for the intercept and the
independent variable
Sl. No.
Independent variableand intercept
Coefficients Standard error
Intercept 4.33 2.64
1. Increasing livestockpopulation
0.18 0.048
R2 = 0.65
Although the results of regression analysis were not found
significant with increase in human population, fuel wood and fodder but
soil erosion was observed in land use categories (degraded, scrub, dense
forest, and cultivated site) from where the fuel wood and fodder was
collected by the village people of Arnigad watershed.
Discussion
From a case study in Fulzari Village of Pench National Park in
Central India (2002)significant regression analysis has been successfully
achieved in that study the dependence on forest in Pench National Park
was found highly significant with fuel wood and fodder. Fuel wood with
estimate 6.839 (p-value 0.050) and fodder estimate 0.000180 (p-value
0.615). From the same study in Pench National Park the livestock was
found dependable on forest and for this regression equation also showed
significant results with estimate 0.219 (p-value 0.559).
In the current study fuel wood estimate 6.11 x 10⁻⁶ (SE-1.41 x 10⁻⁵)
and fodder estimate 5.47 x 10⁻⁶ (SE-3.53 x 10⁻⁵) being significant in
favour of fuel wood and fodder dependence on forestThe livestock
dependence on forest is very high with estimate 0.0864 (SE - 0.021)
In the current study the linear regression model for human population on
agriculture and multiple regression model of total income from the fuel
wood, fodder, crop and milk (animal husbandry) had shown positive
impact on the forests of the study area depicting the dependence on forest
areas of the Arnigad microwatershed.
On the basis of the present investigation it can be concluded that the
area has high potential in terms of number of species and communities.
The occurrence of high number of herbs and shrubs replace the gaps
created by felling /removal of trees in the area.
Following alternatives may prove to be significant in judicious
management of such kind of watersheds:
• For maintaining the continuous supply of the quantity as well as
quality of the fuelwood and fodder produce on sustainable basis,
assisted natural regeneration of native species may be encouraged.
• Stall-feeding of livestock be promoted among the villagers.
• Optimum exploitation of natural resources based on scientific
methods.
• For reducing the soil and forest degradation processes
awareness regarding protection and conservation of natural
resources is required.
Conclusions
The data and facts collected from the village population of Arnigad
watershed during the years 1985-86 and 2005-06, gave a clear cut picture
of the usage and consumption of fuelwood, fodder and livestock grazing
and in addition the increase in human and livestock population and
consequently increase in agriculture area. Usage of natural resource since
a long time led to the increase in extent of area under soil and forest
degradation.
Bioeconomic analysis of soil and forest degradation processes based
on regression models in the selected watershed led to conclude that if
increasing human and livestock population and grazing fuelwood and
fodder collection activities continued then as the reqression models predict
directionally that the area under soil and forest will degrade and will
increase in extent. However, if proper education and scientific methods are
applied to the rural communities then such situation can be controlled
gradually.
References
Champion, H.G. and Seth, S.K. 1968. General Silviculture of India.
Manager of Publications, Delhi
Guppy, N. 1984. Tropical deforestation. a global review. Foreign Affairs.
62407. 928-965.
Gupta, R. D. and Banerjee, S. K. 1991. Problems and management of soil
and forest resources of north-west Himalayas. Mahajan Book
Center and Publishers, Jammu. 162p.
IPCC, 2001. Impacts, Adaptation and Vulnerability. Contribution of
Working Group II to the Third Assessment Report of the
Intergovernmental Panel on Climate Change. James J McCarthy,
Osvaldo F Canziani, Neil A Leary, David J Dokken, Kasey S White;
editors. Cambridge University Press. United Kingdom. 533-590 pp.
Kulkarni Anjali and Vaidya, V. M. (edit) 2002, Economics of protected
area – a case study of Pench National park, Nagpur University,
Nagpur
Mahat, T.B.S., Griffin, D.M. and Shepherd, K.R. 1986. Human impact on
some forest of the middle hills of Nepal. I. Forestry in the
context of the traditional resources of the State. Mountain Research
and Development. 6. 223-232.
MoEF, 1999. National Forestry Action Programme - India. Volume
1. Status of Forestry in India. Ministry of Environment and Forests,
Government of India. New Delhi. 177 pp.
Mukherjee, Neela. 1993.Participatory rural appraisal. Methodology
and applications. Concepts Publishing Company, New Delhi.
Sayer, J.A. and Whitmore, T.C.1991. Tropical moist forests. destruction
and species extinction. Biological Conservation. 55, 119-124.
State of forest report, 2000, Forest Survey of India, Dehradun
Stone, Peter B, 1992. State of the World's Mountains - A Global Report.
Mountain Agenda. Peter B Stone, editor. 391 pp.
TERI, 1992. Energy, environment and sustainable development in the
Himalayas.Proceedings of the National Workshop on Energy and
Environmental issues in Mountain development. Held on 24-25
September 1991 in Shimla, India. Pradeep Monga and P. Venkata
Ramana, editors. New Delhi. 202 pp.
William, M. 1989. Deforestation. past and present. In. Progress in Human
Geography. pp. 176-208.
Urban Ecotourism for Promoting Stakeholder Participation in
Urban Landscape Transformation
Govind Singh, Chirashree Ghosh, Mihir Deb*
Department of Environmental Biology, University of Delhi
Department of Geology, University of Delhi
Abstract
The world today is experiencing an unprecedented rate of urban
population growth over the past century. Towns are being converted into
cities and cities into mega cities and conurbations. The world population
became more urban than rural on May 23rd, 2007 (NCSU, 2007).
Consequently, cities are being reshaped and urban landscapes
transformed to address economic globalization, handle intercity
competition and to meet the requirements of post modernity (Gospodini,
2006). Effective landscape transformation and management requires
adequate stakeholder participation. There is evidence that stakeholder
participation in environment management can lead to more effective and
durable decision making (Reed et al.2009). When this is applied to
planning of urban landscapes especially in developing countries, one of the
first issues faced is that of pseudo stakeholdership. This paper investigates
the ownership crisis faced by the National Capital Territory (NCT) of
Delhi and highlights the city’s non-inclusive development as its
consequence. The role of landscape is investigated from the point of view
of Delhi being the capital-of- choice since recorded history. The landscape
of Delhi consists of a broad spectrum of environments ranging from the
city forests to highly modified artificial landscapes in certain parks (Khera
et al, 2009). An attempt is made to correlate landscape management with
enhanced ecosystem services in the urban setting of the NCT. To address
the stakeholdership crisis which is characteristic in today’s cities, and is
felt more in Delhi due to its ‘capital’ nature, the technique of ‘urban
ecotourism’ is explored. We present an experimental ‘urban ecotourism’
approach of linking natural heritage of Delhi with the citizens, after
identifying stakeholders. We show how, with the use of suitable
ecotourism tools, the lifelines of Delhi – Delhi Ridge and River Yamuna –
have much more to offer and how such an intervention could be a win
situation for all.
Keywords: Urban Landscape, Ecosystem Services, Delhi, Urban
Ecotourism
Introduction
Urban ecotourism is a now evolving form of ecotourism which
advocates the transition from simple enjoyment and satisfaction to stages
of greater understanding, attitude change and more environmentally
responsible behaviour (Orams, 1995) while living in a city. Although
urban ecotourism is an emerging concept, its contents still cannot be
clearly laid out. The significance of urban ecotourism in the rapidly
urbanizing world order has been highlighted by several authors (Gibson, et
al 2003; Higham & Luck, 2002; Kastelein, 2004; Wu & Wang, 2007). The
objective of urban ecotourism can be defined very simply as nature travel
and conservation in a city environment. Its consequences, on the other
hand, can be drastic and very impactful. Sustainable tourism in Singapore
city has transformed the garbage-strewn polluted waters of the Singapore
River into a zone of recreation and entertainment in a little over three
decade period (Savage et al, 2004). Urban environments have long been
ignored by ecologists, so much so that ecological knowledge has
contributed little to solving urban environmental problems (Grimm et al,
2008). In the rapidly urbanizing nations of Asia and sub-Saharan Africa,
cities face another challenge of lacking stakeholders and an ownership
crisis of varying intensity. Migration rate is high in these countries
which lead to intensification of economic competition thus keeping
citizens thoroughly involved in meeting their personal goals. Eventually,
decisions of citizens become more and more governed by concerns related
to securing household livelihood rather than with a landscape
sustainability view. Consequently, landscape users in a city lose sight of
important landscape properties such as water flows, soil organic matter
movements and landscape diversity. Those who move in to a city from a
village or town, do so with hope and aspiration of a more prosperous
future. This section of the urban society, which includes all economic
strata, may have even lesser appreciation for urban landscape components,
especially if these are of no direct benefit to them. However, it is not
just ‘pure economic gains’ mindset but also ignorance about the city
and its environment which creates such pseudo stakeholders in the
evolving cities of today.
The European Landscape Convention (Déjeant-Pons, 2006) defines
landscape as “an area of land, as perceived by people”. This lays a greater
emphasis on identifying and adequately involving stakeholders for
landscape modification and governance. Studies indicate that the views of
specialists, as reflected in planning policies and documents presently in
force, may not necessarily match up with those of the population at large
(Reed, 2008). Consequently, stakeholder participation is increasingly
sought and embedded into environmental decision-making processes,
from local to international scales (Stringer et al., 2007). For example
proponents proposing large projects that may have considerable
environmental impact need to carry out a comprehensive Environmental
Impact Assessment (EIA) under the Ministry of Environment & Forests,
Government of India’s guidelines. These guidelines have considerable
room for public hearing as is elaborated in the modified EIA Notification
(Paliwal, 2006). In India, participating in environmental decision- making
is increasingly becoming regarded as a democratic right. The proliferating
environmental interest groups are exercising this right in the form of
Public Interest Litigations (PIL) and filing Right to Information (RTI)
applications. However, participation is a process where individuals,
groups and organisations choose to take an active role in making
decisions that may or may not affect them. Such individuals, groups and
organisations may or may not have a say in the decision making process
when it comes to specific landscape transformation. For the purpose of
efficiency, this paper understands the stakeholder as those who are affected
by and can affect a decision. This definition of the stakeholder, as against
engaging with the wider public in meaningful dialogue, is more result
oriented (Wandersman, 1981).
The lack of suitable participation by stakeholders is making the
urbanization process less inclusive and unsustainable. In India, where the
urbanization process is more intense and prominent, unsustainable urban
development is closely linked with inequity and deteriorating quality of
life. Delhi, the capital of the world’s largest democracy and the second
most populated country is also grappling with the urbanization challenge.
The annual growth rate of the population of Delhi during 1991-2001
was 3.85% (Annonymous, 2007-08), which is double the national average.
The increase in the population of Delhi from 4 lakhs in 1911 to 137 lakhs
in 2001 exerted understandable pressure on the urban landscape and has
transformed it immensely. Landscape components like the Delhi Ridge
and River Yamuna, which are also the lifelines of Delhi, are being
consumed rapidly. The heritage trees and green spaces are being replaced
by high-rises. The transformation is largely facilitated by government
policy of zoning and master planning owing to lack of stakeholder
identification and challenges discussed above.
This paper discusses an innovative experiment of using urban
ecotourism for addressing the ownership crisis in Delhi city. Through
guided tours of Delhi’s landscape hotspots, citizens’ rendezvous with sites
of ecological significance is used to create better informed and more
responsible citizens. Through four urban eco-bus tours, carefully selected
citizens were invited to explore the natural heritage of Delhi and reconnect
them to the city’s landscape. Two natural landscape features, Delhi Ridge
and Yamuna River remained central to these urban ecotours. Landscape
transformation with respect to other urban environmental parameters such
as waste, transport, energy, and the larger realm of urban planning was
also included in the urban ecotour. As citizens witnessed hitherto
unknown urban landscape features and transformations, environmental
problems became more real to them and solutions began to surface from
within the group. Cities are the future of the world and only those nations
who can sustain their urban growth, will grow and prosper in a sustainable
manner. This requires respecting the natural landscape of the region
especially while making decisions that may impact landscape features
irreversibly. This in turn requires a civil society comprising better
informed and more responsible citizens, creating which is the primary
objective of urban ecotourism.
Stakeholder Crisis in Urban Landscape Transformation
Cities are the greatest of human inventions and grow in complex
ways due to their sheer size, social structures, economic systems,
geopolitical settings and the evolution of technology (Kennedy et al,
2007). The process of urbanization has occurred unevenly across the globe
with North America, Europe and Australia already having most of its
population living in urban areas. Latin America, North Africa and parts of
the Pacific Rim such as Japan are also quite urbanized. These countries
have a relatively slow rate of urban population growth today (McDonald et
al, 2009). In contrast, Asian and sub-Saharan African countries are
currently mostly rural, and are on the steady path of urban growth.
Urbanization, which is the longest lasting impact of the industrial
revolution, has now become its driving force in the developing
economies of Asia and Africa. This has made urban areas hotspots that are
driving global environmental change (Grimm et al., 2008). Urban
metabolism, defined as the sum total of the technical and socio-economic
processes that occur in cities, resulting in growth, production of energy,
and elimination of waste, is steadily increasing (Kennedy et al., 2007).
Urban landscapes today are being transformed to accommodate the
needs of rapid urbanization and increasing urban metabolism. Urban
landscapes affect multiple actors and agencies and are typically complex,
which makes their transformation uncertain. This demands transparent
decision-making that is flexible to changing circumstances, and
embraces a diversity of knowledge systems and values (Reed,2008).
Urban landscape management for sustainable urban development is
therefore a key contemporary challenge.
Cities and Sustainability
“We cannot confine ourselves to the so-called “natural” entities and
ignore the processes and expressions of vegetation now so abundantly
provided by man. Such a course is not scientifically sound, because
scientific analysis must penetrate beneath the forms of the “natural”
entities, and ecology must be applied to conditions brought about by
human activity.” - A. Tansley (1935)
Cities have been the cradle of human civilization, the birth place of
ideas, innovation and the creative class. Urban centers have been the
drivers of economic growth especially since the industrial revolution. The
economies of scale work with the large population inviting synergy
which facilitates the growth process. Since urban sustainability is
complex and desired state, understanding urban ecology is crucial to
sustaining the growth of our cities. The challenge is to develop a highly
interdisciplinary approach which can bring together various skill sets in
the mighty task of making our cities work (Mcintyre et al, 2000).
For most of the twentieth century, ecologists shunned urban areas
with the result that ecological knowledge has contributed little to solving
urban environmental problems (Grimm et al, 2008). Two major reasons for
this are lack of interdisciplinary interest and ecologists’ pre-occupation
with conventional ecological practices. This is no longer the case and a
shifting trend is apparent since the last decade. Simultaneously, the world
is witnessing a need based interest in carrying interdisciplinary research.
As a result of this shift, ecologists are now exploring unexploited
opportunities for research (McDonnell and Picket, 1990), discussing
special features of urban ecosystems (Rebele, 1994), asking whether there
is a need for a theory of urban ecology (Niemela, 1999), laying down
integrated approaches to long term studies of urban ecological systems
(Grimm et al, 2000) and even asking if it’s time to include marine realm in
urban ecology (Bulleri, 2006). However, there is still uncertainty on the
difference (or for that matter similarity) between urban and human ecology
which stems from the fact that the urban environment is human
dominated (Mcintyre et al,2000). The larger fact remains that urban
ecological research has begun and answers to some ecological
challenges like biodiversity conservation, water quality monitoring,
ecosystem management and other biotic and abiotic interactions can now
be expected.
Every city and urban region is not standalone and depends for its
existence and growth on a globally diffuse productive hinterland several
times its size (Rees,1997). At the same time, phenomena such as
“sprawl”, “endless city”, “edge effect” are all pushing cities beyond their
limit and transforming large metropolis into mega cities, conurbations and
mega regions. This global trend towards urbanization and a simultaneous
threat of climate change is destabilizing national, regional and local
environmental security and posing difficult challenges in sustaining cities
and making them work.
Stakeholder participation
Stakeholder participation in urban setting has three fundamental
issues that interfere in the decision making process. 1) It is only recently
that urban ecological studies have gained momentum. We do not fully
understand ‘nature in the city’ and the ecosystem services that urban
landscape provide (Grimm et al, 2008), 2) Because of the rapid pace of
urban life due to the sheer size, structure and working of modern day
cities, citizens become short sighted and oriented towards achieving their
personal goals. They have little time for participating in anything other
than daily chores as cut-throat competition in every aspect of city life
keeps citizens entirely self- consumed, and 3) World over, there is a
consistent phenomenon of shifting to urban region in search of better
livelihood opportunities and ‘unlimited’ resource availability. The
city is, of course, an illusion for many who move in with hope and
aspiration for a more prosperous future. Their attitude is that of demanding
and few, if any, realize that they also have to give to the city, in some form
or the other. Such migrant citizens become pseudo-stakeholders and also
reduce the probability of participation of other citizens as immigration
intensifies competition.
The concept of landscape is characterized by the importance of
individual interaction with place, incorporating both physical and
metaphysical aspects, with social, cultural and artistic associations
(Phillips, 2000). Cities are a unique platform where people from various
culture, communities, economic strata and educational backgrounds come
together. Different people may perceive a place in different ways at such
a confluence thus making formulation of landscape policy difficult. In
spite of this, decision-makers need to formulate strategies, plans and
policies that will apply to one and all. The best way to ensure inclusive
planning is a participatory policy formulation. A process is needed which
rationally seeks to focus on addressing such difficulties by building
consensus and addressing conflicts (Conrad et al, 2009). Stakeholder
involvement in cities is, however, easier said than done. The process faces
difficulty in every step, from identifying stakeholders to involving them in
an appropriate manner. The scope of this paper does not make it possible to
examine the development and application of stakeholder theory in urban
settings. What can be said for now is that measures are required to
understand the expansion of cities with respect to biological as well
demographic change. And it needs to be ensured that urban change is
conducive, productive and in the best interest of all the stakeholders.
Urban Ecotourism as an Ecotourism Sub-set
Ecotourism or ecologically sound tourism is defined as ‘‘small-scale
travel to natural areas that conserves the environment and improves the
well-being of local people’’ (Annonymous, 1990). As is the case with most
definitions, multiple debates exist over the most accurate definition of
‘ecotourism’. However, the basic principles of conserving nature and
benefiting local communities are the central focus of all existing
definitions. The term ecotourism (or ‘eco-tourism’) first began to appear in
English academic literature only as late as the 1980s (Weaver and Lawton,
2007). The year 2002 was declared as the International Year of Ecotourism
(IYE) by the United Nations and a specialised peer-reviewed Journal of
Ecotourism was established in that year. Ecotourism as a field of academic
enquiry has now come of age in the little over three decades of its
existence. The field is interdisciplinary and will therefore take time and
efforts before it can begin to deliver. Ecotourism is now being viewed as
effective for promoting the conservation of endangered species and
habitats in developing countries (Bookbinder et al, 2008). Ecological
economics tools such as contingent valuation and cost-benefit analysis
indicate that ecotourism can contribute to safeguarding biodiversity and
ecosystem functions (Gossling, 1999). According to Grenier et al (1993),
the simultaneous growth of environmentalism as reflected in the high level
of international participation at the 1992 Earth Summit and of the $2.75
trillion world tourism industry in that period focused attention on the ideals
of sustainable development and ecotourism and created a niche for
landscape architecture and planning.
Urban ecotourism is the extension of ecotourism concepts to urban
settings. While the fundamental principles of ecotourism apply to urban
ecotourism, there is a key difference between the two. Ecotourism usually
brings a set of new individuals to a region of ecological interest, and in
the process adds another set of stakeholders. Such individuals become
better aware of the issues and challenges of respective ecological spots and
help raise awareness in places where they originally reside. Some of these
individuals may actively engage with the communities and
ecosystems. Urban ecotourism, of the kind being presented in this paper, is
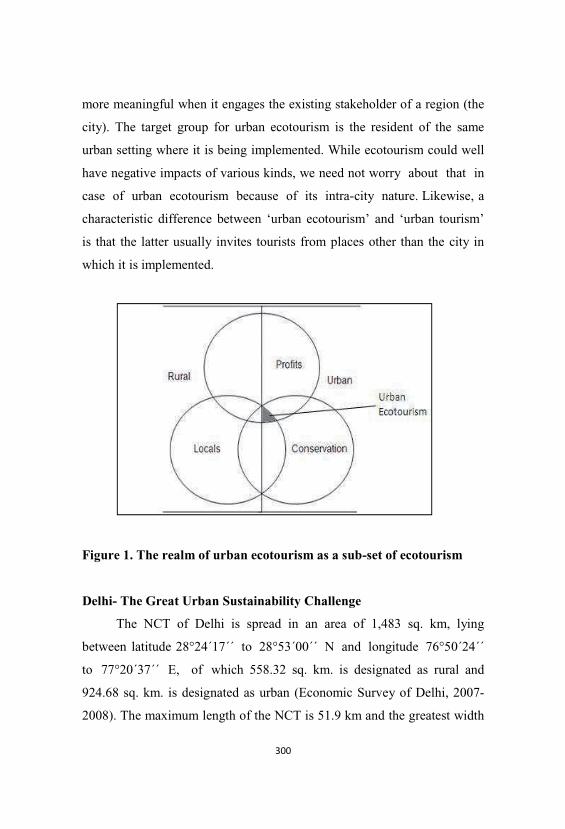
more meaningful when
city). The target group
urban setting where it
have negative impacts
case of urban ecotou
characteristic differenc
is that the latter usuall
which it is implemented
Figure 1. The realm o
Delhi- The Great Urb
The NCT of D
between latitude 28°24
to 77°20 37 E, of
924.68 sq. km. is desig
2008). The maximum l
n it engages the existing stakeholder of
p for urban ecotourism is the residen
is being implemented. While ecotouris
of various kinds, we need not worry a
urism because of its intra-city natur
ce between ‘urban ecotourism’ and ‘u
ly invites tourists from places other th
d.
of urban ecotourism as a sub-set of ec
ban Sustainability Challenge
elhi is spread in an area of 1,483 s
4 17 to 28°53 00 N and longitud
which 558.32 sq. km. is designated
gnated as urban (Economic Survey of
length of the NCT is 51.9 km and the
f a region (the
nt of the same
sm could well
about that in
re. Likewise, a
urban tourism’
han the city in
cotourism
sq. km, lying
de 76°50 24
d as rural and
f Delhi, 2007-
greatest width
is 48.5 km. It shares its border with Haryana and Uttar Pradesh and the
Yamuna River and terminal part of the Aravalli hill range are the two main
geographical features of the city. The Aravalli hill range is covered with
forest and is called the Ridge while the Yamuna is Delhi’s main source of
drinking water and a sacred river for most of its inhabitants. Also known as
the lifelines of Delhi, the Ridge provides natural protection while the river
is a perennial source of water right at the gateway to the vast Indo-
Gangetic plains. The historical seven cities of Delhi have been cradled
by these two features which made Delhi the capital of choice for many a
rulers. Present day Delhi has grown beyond and above these features even
as these remain the source of meeting the city’s basic need of fresh air and
water.
According to the Census of India 2001, Delhi was the third most
populated city in the country followed by Mumbai and Kolkata. However,
due to the spatial advantage not available to Mumbai and Kolkata, Delhi is
expanding on all sides with much pace. The city had already overtaken
Kolkata and if it continues to grow with the current pace, it will soon
enjoy the status of India’s most populated city. In order to better manage
the National Capital Territory (NCT) of Delhi, a Gazette notification in
1996 divided it administratively into 9 districts and 27 sub-divisions. The
NCT of Delhi is most urbanized among all states and union territories in
India with 93 percent urban population. The national percentage urban
population figure stands at 27.8 (Census of India, 2001).
Cities of today, especially in the developing economies, are
acquiring an economic, cultural and literary identity of their own; at times
even independent of the identity of the country in which they are located.
Delhi, being the National Capital, enjoys a more affluent status in the
country which it has also come to exploit. The population of Delhi has
grown from 137 lakhs in 2001 to estimated 166 lakhs in 2007
(Annonymous, 2007-08). The now urbanising city has a greater resource
demand which is no longer proportional to the increasing population alone.
Urbanisation is slowly yet surely accompanied by an increase in per
capital demand levels. Delhi’resource demand today is a measure of the
affluence of the city. An improvement in living standards and providing of
urban-styled basic needs such as all time water supply, access to more
units of energy, better transport facilities and greater access to sanitation
facilities, etc. all adds greater pressure on the urban landscape. Access to
better health facilities has increased life expectancy in Delhi, which,
along with the net in-migration to the city has led to a tremendous
increase in the city’s population. Skewed overall development of the
country is another factor which forces migration to Delhi. Sustaining the
urban development of Delhi has therefore become a great challenge today,
one that needs to be addressed in a role model manner for sustaining our
national urban growth.
Since the independence of India in 1947, the now 100 year old
capital city of Delhi has formulated three Master Plans aiming at
sustainable urban development. The Planning Department of GNCT
defines a Master Plan as a long term perspective plan for guiding the
sustainable planned development of the city. This document lays down
planning guidelines, policies and development code and space
requirements for various socio-economic activities during the plan period.
It is also the basis for all infrastructure requirements. There is, however,
a need for making the process of Master Plan formulation more
inclusive to avoid problems encountered in the administration of the Plan
(Datta and Jha, 1983). It may be noted here that the Government of
NCT of Delhi has now begun to use its affluence and political
influence to source resources such as water from as far as the Giri River
(MPD 2021,2007). A crucial aspect of sustaining urban growth is to
ensure that it is equitable and for all sections of the society. The natural
landscape of the city must be respected after appreciating the ecosystem
services it provides. At the same time, the use of landscape by all
sections of the society must be understood and analyzed for sound urban
planning and policy formulation. Stakeholder identification and
involvement needs to move beyond just placing an urban modification
notice in a national daily. Changes will have to be made both at the policy
maker as well as stakeholder level.
Urban Ecotourism in Delhi
Four urban ecotourism trips were organised in Delhi from
December, 2008 to March 2009 time period. Each tour covered a
respective geographical area that spread over one or two districts. The
districts covered included. North/North-west (North city ecotour),
East/Central (Central city ecotour), South/South-west (South city
ecotour). A fourth city ecotour was organised on World Water Day to
explore the relationship between water and urbanization with respect to
urban metabolism of River Yamuna.
Methodology
A month long detailed reconnaissance was made of the
urban landscape of Delhi to identify sites of ecological significance.
Research on the ecosystem services provided by the selected landscape
features was carried out. A standard public transport (Delhi Transport
Corporation) bus was hired for the urban ecotours, with an objective of
promoting the use of public transport with the citizens. The total number of
selected sites was analyzed for the time required to spend on each of these
sites and the travel distance between them. Based on this analysis, the
ecotour was distributed over a period of three days and into three zones.
North, Central and South. An additional ecotour was organised on the
theme of water and urbanization, based on popular request after the
conclusion of the first three ecotours.
Outreach work was carried out to promote the urban ecotours with
the target stakeholder group in mind. Various forms of media were used
to involve the section of society which has access to them. The
Department of Environment, Govt. of NCT of Delhi was approached to
provide a half page advertisement of the ecotour in city wide newspaper.
Media houses and radio channels were contacted to list and
announce the urban ecotours.
Table 1. Description of pioneering urban ecotours.
S. Ecotour Urban ecotour sites
1. North city
ecotour
(1)Vishwavidyalaya Metro Station –
(2)Kamala Nehru (North
2. Central city
ecotour
Max Mueller Bhawan - Agrasen ki Baoli -
Yamuna River - Ghazipur Landfill - Sanjay
3. South city
ecotour
Max Mueller Bhawan - Agrasen ki Baoli -
Bhuli Bhatiyari Park4. Water and
urbanisatio
Vishwavidyalaya Metro Station – Jheel inside
Kamala Nehru
An announcement of the ecotours was made in the active
online groups comprising members who discuss city’s issues and
problems. The registration for the urban ecotours was done online and at
certain strategic public places in the city. A total of 960 registrations
were made for the ecotours, and 50*3, 150 people were randomly selected
from this. An additional 50 individuals were later selected for the fourth
urban ecotour in a similar manner.
Delhi Landscape and Ecosystem Services
A comprehensive research was carried out for identifying
landscape features in Delhi that provide useful ecosystem services. Table 1
illustrates the different sites selected for the three pioneer urban ecotours.
A detailed profile of the North city ecotour is provided to better explain it
from the landscape – ecosystem services – ecotourism perspective.
For the North city tour, the Vishwavidyalaya Metro Station (1) was
the site for initial gathering and boarding the bus. The significance of
Delhi Metro as a mass transport system was highlighted at the gathering
point (Siemiatycki, 2006). The Metro versus road transport debate was put
forward in the Delhi context. The number of cars taken off the road by the
introduction of the Metro was showcased along with the cycle hiring
facility at the Metro station. The Kamala Nehru Ridge (2), the Northern
extension of the Aravalli hills in Delhi, was chosen as the next destination.
The Delhi Ridge was afforested between the time period of 1883 and 1913,
receiving stimulus in 1911 with the decision of the transfer of the British
capital to Delhi (Mann and Sehrawat, 2008). The more apparent role of the
Ridge in regulating air quality was discussed. The role of the Delhi Ridge
as a water manager was explained particularly in the light of urbanization
impacting ground water quality and quantity in Delhi (Trivedi et al,
2001). Focused work on studying the relationship of urban
environments and ground water quality has now begun (Deb, 2009). The
North Delhi (Kamala Nehru) Ridge is located adjacent to the University
of Delhi and was the site of action for the 1857 revolt against the
British rule in India. It therefore has a historical significance
characterized with the presence of structures like the Flagstaff Tower and
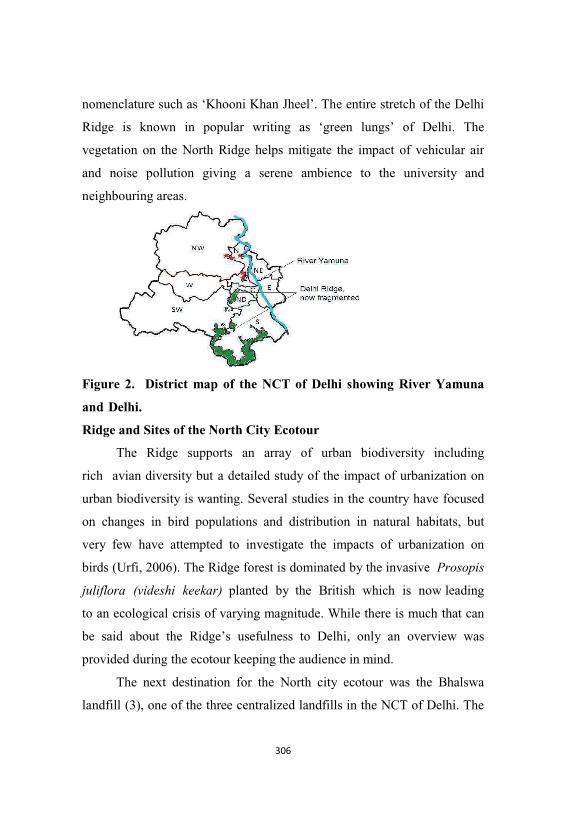
nomenclature such as ‘Khooni Khan Jheel’. The entire stretch of the Delhi
Ridge is known in popular writing as ‘green lungs’ of Delhi. The
vegetation on the North Ridge helps mitigate the impact of vehicular air
and noise pollution giving a serene ambience to the university and
neighbouring areas.
Figure 2. District map of the NCT of Delhi showing River Yamuna
and Delhi.
Ridge and Sites of the North City Ecotour
The Ridge supports an array of urban biodiversity including
rich avian diversity but a detailed study of the impact of urbanization on
urban biodiversity is wanting. Several studies in the country have focused
on changes in bird populations and distribution in natural habitats, but
very few have attempted to investigate the impacts of urbanization on
birds (Urfi, 2006). The Ridge forest is dominated by the invasive Prosopis
juliflora (videshi keekar) planted by the British which is now leading
to an ecological crisis of varying magnitude. While there is much that can
be said about the Ridge’s usefulness to Delhi, only an overview was
provided during the ecotour keeping the audience in mind.
The next destination for the North city ecotour was the Bhalswa
landfill (3), one of the three centralized landfills in the NCT of Delhi. The
landfill is now overflowing and the leachates from the waste have also
contaminated the regions’ ground water (Jhamnani and Singh, 2009). The
focus of the urban ecotour here was to let the citizens witness the
consequence of the waste generated at the household level. While
emptying our dustbins at the local municipal collection center, it is
important to realize that out of sight does not mean out of mind in this
case. Bhalswa landfill, located at by-pass to the main city, has become a
landmark for many who frequent the neighbouring state of Haryana North
of Delhi. The stench from the landfill is a sign for many roadways
commuters that they are now entering Delhi. Thus, the importance of
effective waste management and the success of interventions such as
segregation and reduction at source were highlighted at this site. The
contribution of Landfill gas, a mix of primarily CO2 and CH4, emitted
during the decomposition of organic waste, to global climate change was
also discussed (Talyan, 2007), along with the difficulty in its inclusion in
city based GHG inventory preparation and management (Ghosh,2009).
Adjacent to the Bhalswa landfill, along the Supplementary drain, is
the centuries old Bhalswa lake and an Acacia woodland (4). This became
the next site on the North city ecotour. The landscape view of the lake
with the hill in the vicinity is interesting but not attractive since the hill
comprises waste and the lake sewage fed. Bhalswa lake is a Delhi Tourism
water sports site but the quality of water in which kayaking and boating
has been allowed is concerning. The close by Acacia woodlands is
inhabited by a herd of Boselaphus tragocamelus (Nilgai), the biggest
Asian antelope. Participants were informed about how the name ‘Nilgai’
(Blue cow) has helped in the conservation of this wild animal as farmers
consider it holy and do not harm it.
The final destination for the North city ecotour was selected to be
the Yamuna Biodiversity Park (5), a joint venture of the Delhi
Development Authority and the University of Delhi. The Yamuna
Biodiversity Park (YBP) is spread over an area of approximately 457 acres
near Wazirabad village on the flat alluvial plains of River Yamuna. The
Park acts as a natural conservation site for specific group of endangered
plants and comprises locally extinct native flora and fauna of Delhi. It is
an open environmental laboratory and an excellent demonstration of
landscape reclamation. The region has high soil salinity which is being
addressed using phytoremediation and landscape management measures.
YBP has two zones, the visitor zone and the nature reserve zone. The
landscape of the Park is so designed that rain water is diverted to any of
the two wetlands that host a diversity of migratory birds. A Nature
Interpretation Center (NIC) and presence of field biologists at the Park
makes it an excellent venue to observe nature in the city (YBP, DDA).
YBP gives an interesting insight into the ‘web of life’ demonstrating
different trophic levels and showcasing nature in action. The importance
of wetlands, trees, birds, insects, water, air, soil can all be understood
through strategically designed walks in the YBP.
Discussion
The Urban Ecotourism project in Delhi received considerable
attention and participation from the target section of the society.
Participants on the urban ecotour showed good interest in exploring the
natural landscape of Delhi and understanding the ecological significance
of landscape diversity. Most of the selected sites were visited by the
participants for the first time through the medium of the urban ecotour.
This category of participants also included those who had been living in
the city for more than a decade. During information dissemination and
consequent discussions, it became evident that a greater percentage of the
participants were familiar with environmental problems and challenges.
However, not all of them understood their relationship with the landscape
features, especially in the case of waste and water pollution.
An interesting observation was made during the visit to the Bhalswa
and Ghazipur landfill sites. While the participants walked towards these
sites, and even before they were briefed, it was observed that they
discussed the issue of waste among themselves, highlighting all relevant
aspects. While returning from the landfill, and after the briefing, the
discussion was oriented towards finding and implementing solutions in
their respective households and Resident Welfare Associations (RWAs).
It was felt that though urbanized, citizens will be able to work better in
case of managing common property resources like water, clean air and
surroundings if they are brought together. The latter is, however,
challenging. Keenness of participants towards understanding solutions and
wanting to know more about available options for reducing pollution
was developed during the urban ecotour. This showed how, with greater
information dissemination, good difference can be made in the city.
To elaborate more on this, many of the participants volunteered
active participation in environmental initiatives towards the conclusion of
the tour. The experience of exploring the local landscape motivated some
to sketch, photograph, plan future excursions and video-document the
urban landscape diversity. The creative class in the city, that also had
representation among the participants got considerable food for thought
during the urban ecotours. This is noteworthy as it is now believed that a
creative city is actually a more productive one. Local, national and
international media also showed interest in covering the first ever urban
ecotour experiment in Delhi (Express News Service; Dastidar, HT; Sinha,
N. (IE); Shoba, V. (IE).
The urban ecotours presented in this paper were organised free-of-
cost, with support from the Delhi Greens organisation. However, an on the
spot willingness-to- pay (WTP) and willingness-to-accept (WTA) survey,
along with tour feedback indicated that organising such tours could be a
profitable venture. 85% of the participants agreed to pay reasonable fees
for taking similar urban ecotours in Delhi. The remaining 15%
participants mostly comprised students. Participants also suggested that
such urban ecotours could be organised with schools, colleges,
corporate houses and even government agencies at nominal fees. It can
therefore be concluded that an urban ecotourism model, as discussed in this
paper, can help generate considerable environmental awareness among
people living in the city. At the same time, it could also be a profitable
venture and has scope for generating green jobs in the process.
Conclusions
Cities are the future of human civilization making it imperative to
ensure their health and sustainability. Rapid urbanization is exerting
tremendous pressure on urban landscapes of existing and emerging cities,
especially in the developing world. Delhi is no exception and is witnessing
urban landscape transformation in order to accommodate the needs of an
ever growing population with increasing consumption patterns. The
struggle to survive and prosper in the fast pace of city life is resulting in
cities facing severe ownership crisis. Urban ecotourism could be a
useful tool to generate awareness, imbibe ownership in citizens and earn
revenue while ensuring the conservation of urban ecosystem components
that provide critical ecosystem services.
Ecotourism is a fast maturing field whose capacity to meet its
ascribed objectives is increasingly being enhanced. Urban landscape
transformation is both an apparent and irreversible trend. It takes place
in cities which are known more as regions of social than ecological
interactions. While urban ecotourism is a burgeoning subject in the
research of ecotourism, more attempts are needed to interpret its
contents. However, it is certainly a promising field that provides a useful
tool for creating more effective and empowered stakeholders which is
absolutely essential in sustainable landscape decision making. Advances in
the field of urban ecotourism could well shift the focus from only urban
areas to suburbs or surrounding rural areas proportionate to individual
city’s ecological footprint.
Acknowledgement
The authors acknowledge the support of the Delhi Greens
organisation and involvement of the Department of Environment,
Government of NCT of Delhi in providing logistics and extending
promotional support respectively.
References
Annonymous 1990 The International Ecotourism Society
http.//ecotourism.org/ Accessed on 01 Jan. 2011.
Annonymous 2007-08. Department of Planning., Government of NCT of
Delhi-8.
Bookbinder, M.P., Dinerstein,E., Rijal,A., Cauley, H.,Rajouria,A.
1998.Ecotourism’s Support of Biodiversity Conservation.
Conservation Biology 12(6). 1399-1404.
Bulleri, F. 2006. Is it time for urban ecology to include the marine
realm? Trends Ecol. Evol. 21, 658–659.
Census of India, 2001. Ministry of Home Affairs, Government of India.
Conrad, E., Christie, M., Fazey, I. 2009. Incorporating people’s
perception into landscape planning. Ethical challenges in dealing
with diversity of opinion within a community. Retrieved on.
28th December, 2010, Retrieved from. http.//www.inter-
disciplinary.net/Dastidar, A. “Delhi’s Saturday Greens” Hindustan
Times (11 Dec. 2008)
Datta, A., and Jha, G.1983. Delhi. Two decades of plan
implementation. Habitat International. 7(1-2). 37-45.
Deb, M. 2009 Report. Spatial distribution of PTE and other pollutant
ions in the ground water in varied urban environments of NCT,
Delhi. School of Environmental Studies, University of Delhi.
Supported by Department of Environment, GNCT of Delhi
Déjeant-Pons, M. "The European Landscape Convention" Landscape
Research (31.Apr. 2006. 02 Jan. 2011). Retrieved from.
http.//www.informaworld.com/10.1080/01426390601004343
Express News Service. “Hop onto bus, connect with environment” (12
Dec. 2008). Express News Service. How green was my city. eco-
tourism on wheels shows impact of pollution” Indian Express. (14
Dec. 2008).
Cuddihy G, C., , J.,Engel-Yan, J. 2007. The changing metabolism of cities.
Journal of Industrial Ecology. 11(2). 43-59.
Ghosh, C. 2009 Report. Inventorization of Greenhouse gases – sources &
sinks in Delhi. School of Environmental Studies, University of
Delhi. Supported by Department of Environment, GNCT of Delhi
Gibson, A., Dodd, R., Joppe, M., & Jamieson, B. 2003. Ecotourism in
the city?Toronto’s green tourism association. International Journal
of Contemporary Hospitality Management, 15(6), 324–327.
Gospodini, A. 2006 Portraying, classifying and understanding the
emerging landscapes in the post-industrial cities. Cities. 5. 311-330.
Gossling, S. 1999. Ecotourism. a means to safeguard biodiversity and
ecosystem functions? Ecological Economics. 29(2). 303-320.
Grenier, D., Kaae, B.C., Miller, M.L., Mobley , R.W. 1993. Ecotourism,
landscape architecture and urban planning. Landscape and Urban
Planning 25(1-2). 1-16.
Grimm, N.B., Grove, J.M., Pickett, S.T.A., Redman, C.L.2000. Integrated
approaches to long-term studies of urban ecological systems.
BioScience. 50(7). 571-584.
Higham, J., & Lu¨ ck, M. 2002. Urban ecotourism. a contradiction in
terms. Journal of Ecotourism. 1(1), 36–51.
Jhamnani, B. and Singh, S.K. 2009. Groundwater Contamination due to
Bhalaswa Landfill Site in New Delhi. International Journal of
Environmental Science & Engineering. 1(3). 121-125.
Kastelein, B. 2004. Urban ecotourism. impossible conundrum. Business
Mexico. 10.36–42.
Khera, N., Mehta, V., Sabata, B.C.2009. Interrelationship of birds and
habitat features in urban green spaces in Delhi, India. Urban
Forestry & Urban Greening. 8.187–196.
Mann, M. and Sehrawat, S.2008. A City With a View. The Afforestation
of the Delhi Ridge, 1883–1913. In. Modem Asian Studies. 1-28.
Cambridge University Press
Master Plan of Delhi (MPD) 2021, 2007. Notified by the Ministry
of Urban Development, Government of India (Delhi Division).
Vide S.O. 141. Mcdonald, R.I., Formanb, R.T.T., Kareivac, P.,
Neugartena, R., Salzerd, D., Fishera,J.2009. Urban effects,
distance, and protected areas in an urbanizing world. Landscape
and Urban Planning. 93. 63-75.
McDonnell, M.J. and Picket, S.T.A. 1990. Ecosystem structure and
function along urban–rural gradients. an unexploited opportunity
for ecology. Ecology 71,1232–1237
Mcintyre, N.E., Knowles-Y Anez, K., Hope, D. 2000. Urban ecology as an
interdisciplinary field. differences in the use of "urban" between the
social and natural sciences. Urban Ecosystems. 4. 5-24
NCSU, North Carolina State University 2007. World population becomes
more urban than rural. ScienceDaily, Retrieved. August, 28, 2010,
from http.//sciencedaily.com-/releases/2007/05/070525000642
Neimela, J. 1999. Is there a need for a theory of urban ecology? Urban
Ecosystems. 3.57-65.
Orams, M. B. 1995. Toward a more desirable form of ecotourism.
Tourism Management 16(1). 3–8.
Paliwal, R.2006. EIA practice in India and its evaluation using SWOT
analysis.Environmental Impact Assessment Review. 26(5). 492-510.
Phillips, A. ‘International policies and landscape protection’ in Landscape
and Sustainability. J.F. Benson and M.H. Roe (eds.), Spon Press,
London, 2000, pp. 78-96.
Rebele, F. 1994 Urban ecology and special features of urban ecosystems.
Global Ecol.Biogeogr. Lett. 4, 173-187.
Reed, M.S. 2008. Stakeholder participation for environmental
management. A literature review. Biological Conservation. 2417-
2431.
Reed, M.S., Dougill, A.J., Baker, T., 2008. Participatory indicator
development. what can ecologists and local communities learn from
each other? Ecological Applications 18. 1253-1269.
Rees, W.E.1997. Urban ecosystems. the human dimension. Urban
Ecosystems. 1. 63-75.
Savage, V.R., Huang, S., Chang, T.C.2004. The Singapore River thematic
zone. sustainable tourism in an urban context. The Geographical
Journal. 170(3).212-225.
Shoba, V. “Dilli Darshan with a difference” Indian Express (21 Dec.
2008). Siemiatycki, M.2006. Message in a Metro. Building Urban
Rail Infrastructure and Image in Delhi, India. International Journal
of Urban and Regional Research.30(2). 277–292.
Sinha, N. “Eco tour takes Delhiites back to city waterbodies” (23 Marc.
2009).
Stringer, L.C., Reed, M.S., Dougill, A.J., Rokitzki, M., Seely, M., 2007.
Enhancing participation in the implementation of the United
Nations Convention to Combat Desertification. Natural Resources
Forum. 31. 198–211.
Talyan, V., Dahiya, R.P., Anand, S., Sreekrishnan, T.R. 2007.
Quantification of methane emission from municipal solid waste
disposal in Delhi. Resource Conservation & Recycling. 50. 240-259.
Tansley, A.G.1935. The use and abuse of vegetational concepts and
terms. Ecology.16. 284–307.
Trivedi, S.M, Yadav, B.R., Gupta, N., Chandrasekhran, H.2001. Effects of
urbanization on changes in groundwater quantity and quality in
Delhi State, India. IAHS Publ. no. 269, 2001.
Urfi, A.J.2006. Biodiversity conservation in an urban landscape. a case
study of some important bird areas on the river Yamuna in Delhi
(India). In. Conservation Biology in Asia McNeely, J.A., T. M.
McCarthy, A. Smith, L. Olsvig- Whittaker, and E.D.
Wikramanayake (editors). Published by the Society for
Conservation Biology Asia Section and Resources Himalaya,
Kathmandu, Nepal. 303-317.
Wandersman, A., 1981. A framework of participation in community
organisations.Journal of Applied Behavioural Science. 17, 27–58.
Weaver, D.B.and Lawton.L.J.2007.Twenty years on.The state of
contemporary ecotourism research.Tourism Management.28. 1168-
1179.
Wu, Y. Y., & Wang, H. L. 2007. Urban ecotourism, a contradiction?
International Ecotourism Monthly. 90, 8–9.
Yamuna Biodiversity Park (YBP), Delhi Development Authority website.
Retrieved from. http.//www.dda.org.in/greens/biodiv/yamuna-
biodiversity-park.html Accessed on 02 Jan. 2011.
Status of Soil and Spoil Properties in Stone Mine Area, Haryana, India
Vivek Dwivedi and Prafulla Soni*
CEDAR,Vasant Vihar,Dehradun
*Advisor Restoration ecology & Biodiversity
Conservation,Dehradun
Abstract
Present study includes analysis of some salient soil attributes of
restored mine spoils, active mining area and undisturbed areas in the
vicinity of stone mine in district Faridabad, Haryana. Study was
conducted in a total of six sites that is two sites of two age series each,
one active mine site and adjacent undisturbed area. Soil samples were
collected for the analysis of soil pH, bulk density, soil moisture, electrical
conductivity (EC), soil organic carbon (SOC), available nitrogen (N),
available phosphorous (P), exchangeable potassium (K). pH ranges from
6.24 to 7.49, electrical conductivity (EC) from 0.009 to 0.098 ds/ m, soil
moisture between 1.56 to 7.31, bulk density 0.91 and 1.22, soil organic
carbon (SOC) between 37.4 to 9.2 t/ha, available nitrogen in a range of
0.21 to 0.66 t/ha, available phosphorous between 0.0018t/ha and 0.023
t/ha and exchangeable potassium between 0.018 and 0.146 t/ha. Data has
been discussed in the in the light of restoration age.
Keywords: Mine spoils, soil organic carbon, restoration age
Introduction
Stone mines of Aravali falls under villages of Ballabgarh Taluk in
the district Faridabad of Haryana state namely the Khori Jamalpur and
Sirohi stone mines. The area lies in the Survey of India toposheet No. 53H
/3 (1.50,000). The two mines lie between latitudes 280 18’ 59” to 280
19’47” N and Longitudes 770 10’ 07” and 770 10’ 47”E. The altitude
varies between 232 m to 300 m above the sea level. The topography of the
core mining area is hilly while in the buffer area it is flat and undulated.
Khori Jamalpur having lease area of 131.05 ha and Sirohi having leased
area of 86.6 ha. Haryana Govt. leases the mines to Faridabad Gurgaon
Minerals for seven years. The minor minerals being mined from these
mines are road metal and masonry stone, used in building, road
construction and railways. Therefore, the exact working area available
for mining is 68.21 ha in Khori Jamalpur and 47.83 ha in Sirohi mines.
Mining is being done in these areas since November 2001 by open cast
mining method. The waste product containing soil, sand and small
size stone generated during mining operation is dumped in the area and it
is also used in back filling of excavated pits. The assessment of
rehabilitation works has been carried out in two mines. The climate over
most of the year is of a pronounced continental character. It is very hot in
summer and markedly cold in winter. The area experiences three distinct
seasons i.e. winter (November to mid of March), summer (end of March to
end of June) and rainy (end of June to September). The area
experiences severe cold during the month of December to February. The
temperature varies from 6.10 C to 410 C. Similarly May and June
experiences very hot conditions. The monthly maximum temperature
may often go up to 460 C.
Mining is an essential activity. Indiscriminate and unplanned mining
causes irreversible damage and deterioration of natural resources. Mining
activities affect the surrounding i.e. air, water, soil, land, biological
diversity etc. and leads to environmental problems like land degradation
particularly in opencast mining, land subsidence in underground mining,
deforestation, atmospheric pollution, pollution of aquatic bodies, disposal
of solid wastes, etc. affecting the ecological balance of the area. Ecosystem
approach to restore the productive potential of disturbed mined land is the
measure requisite for a sustainable development. Once the target material
is excavated, the process of mining consequently leads to the heap of mine
spoil. The objective of this study to assess the spoil of mine and soil
quality of adjoining natural areas, furthermore to assess that up to what
extant one should work on the spoil quality to reach the restoration at
a satisfactory level? We can say if we could develop a soil quality
index for such degraded mine land than it would help researchers to
think beyond that. In the process of restoration it is very essential to make
spoil able to support the plantation over it. This paper will discuss the
quality of mine spoil and soil quality of the unmined areas.
Material and methods
Study was conducted during 2008 at Forest Research Institute,
Dehradun. Soil and spoil samples were collected from 0-30 cm depth from
a total of six sites vis-à-vis two sites of two age series, mine site and
adjacent undisturbed area, namely; Undisturbed (Site- 1), Four year old
plantation at Khori (Site-2), One year old plantation at Khori (Site-3),
Mine site (Site-4) Four year old plantation at Sirohi (Site-5) and One year
old plantation at Sirohi (Site- 6). Five replicates were taken to conduct
the present study. Soil and spoil samples were collected and immediately
samples were firstly undergone to measure the moisture content of the
samples. Soil moisture content was measured by means of moisture meter
No-50. Soil pH was measured by Electrical conductivity was measured
with the help of soil conductivity meter. Soil organic carbon (SOC)
content was estimated by Walkley and Black (1934) titration method.
Core sampler method was used for estimation of Bulk density (Jackson
1967). Available nitrogen (N) was estimated by the alkaline permagnete
method using Kjeldahl apparatus. Available phosphorous (P) was
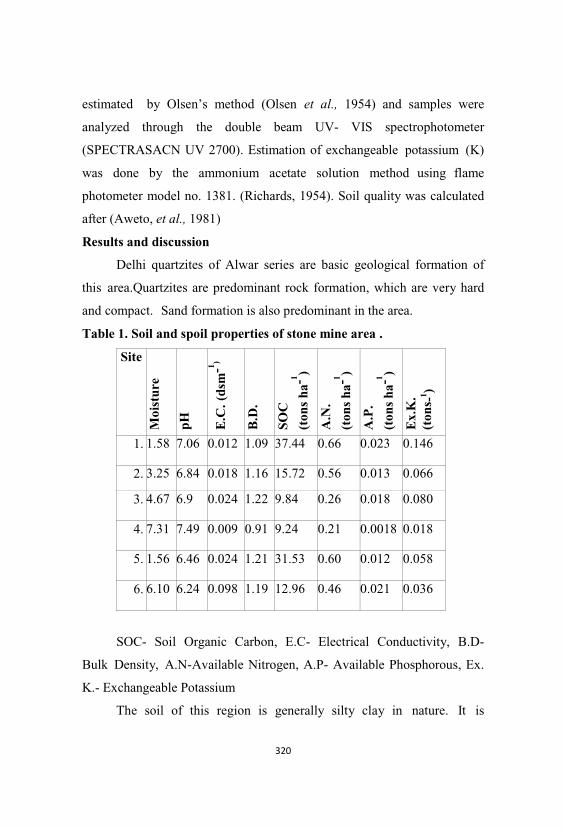
estimated by Olsen’s method (Olsen et al., 1954) and samples were
analyzed through the double beam UV- VIS spectrophotometer
(SPECTRASACN UV 2700). Estimation of exchangeable potassium (K)
was done by the ammonium acetate solution method using flame
photometer model no. 1381. (Richards, 1954). Soil quality was calculated
after (Aweto, et al., 1981)
Results and discussion
Delhi quartzites of Alwar series are basic geological formation of
this area.Quartzites are predominant rock formation, which are very hard
and compact. Sand formation is also predominant in the area.
Table 1. Soil and spoil properties of stone mine area .
Site
Moi
stur
e
pH E.C
. (ds
m-1 )
B.D
.
SOC
(ton
sha
-1 )
A.N
.
(ton
sha
-1 )
A.P
.
(ton
sha
-1 )
Ex.
K.
(t
ons -
1 )1. 1.58 7.06 0.012 1.09 37.44 0.66 0.023 0.146
2. 3.25 6.84 0.018 1.16 15.72 0.56 0.013 0.066
3. 4.67 6.9 0.024 1.22 9.84 0.26 0.018 0.080
4. 7.31 7.49 0.009 0.91 9.24 0.21 0.0018 0.018
5. 1.56 6.46 0.024 1.21 31.53 0.60 0.012 0.058
6. 6.10 6.24 0.098 1.19 12.96 0.46 0.021 0.036
SOC- Soil Organic Carbon, E.C- Electrical Conductivity, B.D-
Bulk Density, A.N-Available Nitrogen, A.P- Available Phosphorous, Ex.
K.- Exchangeable Potassium
The soil of this region is generally silty clay in nature. It is
brownish in colour and generally deficient in nitrogen and organic
matter content.Present study of stone mine area shows a range of pH
between 6.24 and 7.49, site-6 shows the lowest pH value 6.24 while the
highest value was observed from the mine site i.e. site site-4.
The pH value between 5.5 to 6.5 means, soil is lime free and
satisfactory for of the plantation and pH between 6.5 –7.5 is ideal for the
same (Chaudhary, et al., 2008). The pH range of the study area is between
6.24 and 7.49. It is, therefore, can be said that pH ranges between 6.16 and
7.8 are in safe range. High pH value 7.49 was observed in the mine area,
hence the lowest available phosphorous value 0.0018 tons ha-1 was
estimated from the mine spoil samples, and this value shows a
relationship between the high pH value and lowest availability of the
phosphorous. Chaudhary, et al., 2008, also find out at high Ph > 8.0,
availability of phosphorous is very low. Although almost soil and spoil
samples were near neutral.
Soil and spoil moisture content was in a range between 1.56
to 7.31% minimum moisture i.e. was measured from site-1, while
maximum moisture content was estimated from mine area i.e. site-4, it is
because while in the process of mining, machinist use water to lose the soil
for excavation of the target material. Second highest value of moisture
content was recorded from the site-6 followed by the site-3 and site-2,
lowest moisture content was recorded from site-1 and site-5, except these
two sites plantation was supported with the proper watering so as to
enhance the plantation in these reas. The values of electrical conductivity
(EC) reveal a range from 0.009 to 0.098 ds/ m. Mine site shows EC 0.009
ds/ m while highest EC value 0.098 ds/ m was recorded from the site- 6.
For agricultural practice electrical conductivity between 0 to 2 ds/ m is safe
for all the crops. Bu
ecosystem is not fixed
can say that all the EC
Figure 1. Soil an
Figure 2. Soil an
For agricultural p
ut the suggested EC value for a de
so far. If we use the suggested range o
values for the study site are in a safe ra
nd spoil physical parameters among
nd spoil chemical attributes among th
practice electrical conductivity betwee
egraded mine
of EC then we
ange.
the sites.
he sites.
en 0 to 2 ds/ m
is safe for all the crops. But the suggested EC value for a degraded mine
ecosystem is not fixed so far. If we use the suggested range of EC then we
can say that all the EC values for the study site are in a safe range.
Soil organic carbon (SOC) values were between 9.24 tons ha-1 and
37.44 tons ha-1. Mine site i.e. site -4 has the lowest 9.24 tons ha-1 soil
organic carbon value while the highest soil organic carbon i.e. 37.44 tons
ha-1 was estimated from the natural area (Site- 1) followed by the site-5,
which has 31.53 tons ha-1 soil organic carbon. It has been suggested that
the soil organic carbon (SOC %) was lowest 0.31% in the mine area while
the highest value 1.25% soil organic carbon (SOC) was estimated from the
site- 1. Site- 4 is totally devoid of soil organic carbon and is not suitable
for plantation because the soil organic carbon required for plantation
must be in a range between 0.5- 0.75%. site-3, site-4 and site-6 reflecting
the very low soil organic carbon values, hence need some additives to
strengthen the restoration of mine spoils. Available nitrogen was in a
range of 0.21 to 0.66 tons ha-1. the lowest available nitrogen was estimated
from the site- 4 while the highest available nitrogen was estimated from
the site-1, because the natural or unmined area is dominated with
trees of Prosopis julifora which is a leguminous species having nitrogen
fixing bacteria in its root nodules, which helps in the mineralization of the
total nitrogen and made available to the plants. In case of available
phosphorous (P) we got a range between 0.0018 tons ha-1 and 0.023 tons
ha-1. Site-4 has the lowest availability of phosphorous while site-1 has the
highest phosphorous followed by the site -6. However there is very low
availability of the phosphorous among the sites. So here we can suggest
that there must be plantation of those species that can hold a good
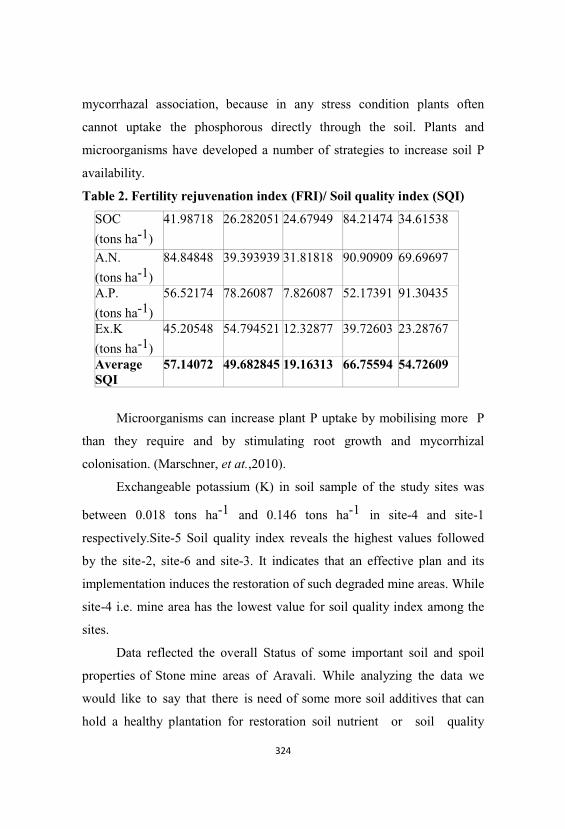
mycorrhazal association, because in any stress condition plants often
cannot uptake the phosphorous directly through the soil. Plants and
microorganisms have developed a number of strategies to increase soil P
availability.
Table 2. Fertility rejuvenation index (FRI)/ Soil quality index (SQI)
SOC
(tons ha-1)
41.98718 26.282051 24.67949 84.21474 34.61538
A.N.
(tons ha-1)
84.84848 39.393939 31.81818 90.90909 69.69697
A.P.
(tons ha-1)
56.52174 78.26087 7.826087 52.17391 91.30435
Ex.K
(tons ha-1)
45.20548 54.794521 12.32877 39.72603 23.28767
Average SQI
57.14072 49.682845 19.16313 66.75594 54.72609
Microorganisms can increase plant P uptake by mobilising more P
than they require and by stimulating root growth and mycorrhizal
colonisation. (Marschner, et at.,2010).
Exchangeable potassium (K) in soil sample of the study sites was
between 0.018 tons ha-1 and 0.146 tons ha-1 in site-4 and site-1
respectively.Site-5 Soil quality index reveals the highest values followed
by the site-2, site-6 and site-3. It indicates that an effective plan and its
implementation induces the restoration of such degraded mine areas. While
site-4 i.e. mine area has the lowest value for soil quality index among the
sites.
Data reflected the overall Status of some important soil and spoil
properties of Stone mine areas of Aravali. While analyzing the data we
would like to say that there is need of some more soil additives that can
hold a healthy plantation for restoration soil nutrient or soil quality
index for such degraded ecosystems, in this series of restoration
studies we must think to improve the soil microbial properties. Second
thing we feel strongly that like agricultural soil, scientists and researchers
developed some soil quality index in context to the important soil nutrients
and soil properties. Here we researchers from the field of ecological
restoration, we are trying to develop some soil quality index in reference to
the country like India.
Acknowledgments
Authors are thankful to Shri Mr. S.P Sethi, Chairman Sethi Group
of Companies and Shri Surinder Sharma Director M/S Faridabad Gurgaon
Minerals, New Delhi and Dr. S.S. Negi, Director Forest Research Institute,
Dehradun, for providing support for the present study.
References
Aweto,A.O.1981. Secondary succession and soil fertility restoration in
south Nigeria. 1. Succession, Journal of Ecology 69. 601- 607.
Better Crops 1998. Functions of Potassium in Plants. Vol. 82 No. 3
Better Crops 1999 Functions of Phosphorus in Plants. Vol. 83 No. 1
Chaudhary, B.L. and Bhatia, S. 2008. Salient soil properties of Sagwara
Tehsil of Durgapur District. The Ecoscan 2 (1) . 73- 76.
Marschner, P., Crowley, D., R. Zed, 2010.Interactions between rhizosphere
microorganisms and plants governing iron and phosphorus
availability. In 19th World Congress of Soil Science, Soil Solutions
for a Changing World,1–6,August 2010, Brisbane, Australia.
Published on DVD.
Olsen, S.R., Cole, C.V., Wantanabe, F.S. and Dean, L.A. 1954.
Estimation of available phosphorous in soils by extraction with
sodium bicarbonate. U.S. Dep. Agric. Circ. No. 939. USA.
Richards, L.A. 1954. Diagnosis and improvement of saline and alkali
soils. USDA Agric. Handbook. No. 60. Washington, D.C.
Walkley, A. 1947. A critical examination of rapid method for determining
organic carbon in soils. Effect of variations in digestion conditions
and of organic soil constituent. Soil. Sci., 63. 251- 263
Walkley,A.and Black,I.A.1934.An examination of the Dejtareff method
of determining soil organic matter and a proposed modification of
chromic acid titration method. Soil Science 37. 29-37.
Microbial Biomass as Influenced by Restoration measures in Rock
Phosphate Mined Area at Maldeota, Doon Valley
Richi Yadav, Mridula Negi, H.B. Vasistha
Forest Ecology and Environment Division,
Forest Research Institute, Dehradun-248006, India
Abstract
Microbial properties have been reported to be useful indicators of
soil quality and could possibly serve as assessment criteria of successful
rehabilitation of ecologically disturbed areas. Soil microbial biomass is
considered as an important early indicator of changes that may occur in
the long term with regard to soil fertility and constitutes an important
source and sink of nutrients. To assess the impact of restoration on
microbial biomass in rock phosphate mined area a study has been
conducted at Maldeota, located about 18 km towards NE of Doon Valley;
lies in between longitude 770 38’ to 780 20’ E and latitude 290 35’ to
300 30’ N and is about 750 to 1050 m above mean sea level. Climate of
Maldeota has well demarcated summer, rainy and winter seasons. The soil
texture of Maldeota varies from sandy loam to loamy sand. The natural
vegetation of the site is represented by tropical dry mixed deciduous forest
type. Rock phosphate was being mined at Maldeota through open cast as
well as underground mining methods. The area was restored way back in
1982. The study sites were 26 year old restored area having plantation of
Acacia catechu and Dalbergia sissoo and Natural forest containing
dominant tree species of Cassia fistula, Nycthanthes arbor-tristis, Bauhinia
vareigata, Flacourtia cataphracta respectively. Results indicated that the
microbial biomass in the restored area was found to be greater as
compared to the natural forest area indicating recovery of soil quality after
restoration.
Key words: Soil microbial biomass, restored area, soil fertility
Introduction
Little is known about the impact of restoration practices on soil
microbial communities. Ecological restoration is defined by the Society for
Ecological Restoration (2002) as ‘The process of assisting the recovery of
an ecosystem that has been degraded, damaged, or destroyed’.
Microorganisms play an important role in the functioning of any soil
ecosystem as they are actively involved in litter breakdown, cycling of
nutrients, formation of stable microaggregates, and structural development.
In many restoration projects, the main focus has been on the establishment
of native plant species and creation of plant communities that closely
resemble those of undisturbed native vegetation (Zedler 2001; Walker and
del Moral 2003).
Ecological impacts of restoration procedures on soils can directly
affect plant community composition or system-level functions such
as nutrient cycling. Monitoring periodical changes not only in
vegetation but also in soils portrays the overall success of the restoration
process more accurately. Soil microbiological properties such as microbial
biomass may be used as early and sensitive indicators of soil quality
(Bending et al. 2004), for comparisons of soils under different
managements (Kieft 1994) and that high levels of microbial activity are
fundamental in maintaining soil quality (Garcia et al. 2002). Soil microbial
biomass is a potential source of plant nutrients, and a higher level of soil
microbial biomass is an indicator of soil fertility. The microbial biomass
of soil is defined as the part of the organic matter in the soil that constitutes
living smaller microorganisms.
Typical microbial biomass carbon ranges from 1 to 5% of soil
organic matter. The changes in soil can be easily monitored by
following changes in the soil microbial biomass. The soil microbial
biomass carbon is an important component of soil organic matter and
comprises 1–3% of total organic carbon in soil (Jenkinson and Ladd
1981), but it has a rapid turnover rate and represents a labile
reservoir of nutrients (Marumoto 1984). Due to its dynamic character,
microbial biomass responds to management practices (cultivation,
residue management, amendments, and fertiliser application) and other
environmental variables and its effects are often measurable (Batra et al.
1997). The soil microflora and the vegetation of an ecosystem are
closely interrelated. Plants influence soil biotic processes by delivering
organic compounds, whereas soil microbes have a positive impact on plant
growth by the decomposition and mineralization of plant material.
Materials and Methods
Study Site
Maldeota, the study area where field observations were undertaken
is located in Doon valley. Geographically Doon valley is situated in
Northern part of Uttarakhand between longitude 770 38’ to 780 20’ E
and latitude 290 35’ to 300 30’ N stretching in NW-NE direction
following the main Himalayan range. It is about 18 km towards NE of
Dehradun between 750 to 1050 m above mean sea level. Climate of
Maldeota has well demarcated summer, rainy and winter seasons.
Because of elevation of this site and its location in Doon Valley, summer
is not very hot. Summer is followed by pre-monsoon and local showers.
Monsoon breaks towards the end of June and continues up to September.
The soil texture of Maldeota varies from sandy loam to loamy sand. Sal
forests are the climax type of forests in Dun valley. As per Champion and
Seth’s classification (1968) natural vegetation of the experimental site is
represented by tropical dry mixed deciduous forest type (5B/C2).
Predominant species of the natural area are Mallotus phillipensis,
Nycthanthes arbor-tristis, Bombax ceiba, Flacourtia cataphracta, Cassia
fistula and Acacia catechu and Dalbergia sissoo in riverine ecosystem.
Undergrowth mainly consists of Murraya koenigii, Woodfordia fruticosa,
Adhatoda zeylanica, Lantana camara and Eupatorium glandulosum.
Rock phosphate commonly known as Mussoorie Phos was being
mined through open cast as well as underground mining methods. The
waste product or overburden generated during mining contained major
portions of shale, chert and limestone. The area was restored way back in
1982 using native plant species like Acacia catechu, Wendlandia exserta,
Dalbergia sissoo etc. The adjacent Natural forest was taken as a
reference site to the restored area.
Soil Sampling
Soil samples were collected from 26 year old restored site and
from adjacent natural forest. A composite soil sample was prepared by
mixing soil samples taken from each site. Replicates were taken from the
composite sample to avoid the spatial heterogeneity among the soil
microbes. Microbial biomass carbon (MBC) was estimated by using
modified liquid chloroform fumigation incubation technique (Brookes et
al. 1987) and Soil organic carbon was determined by Walkley and Black
method (Walkley 1947).The statistical analysis of data was done using
Statistical Package for Social Sciences (SPSS) 17.0.
Results and Discussion
The data from Table 1 infers that soil microbial biomass (µg g -1)
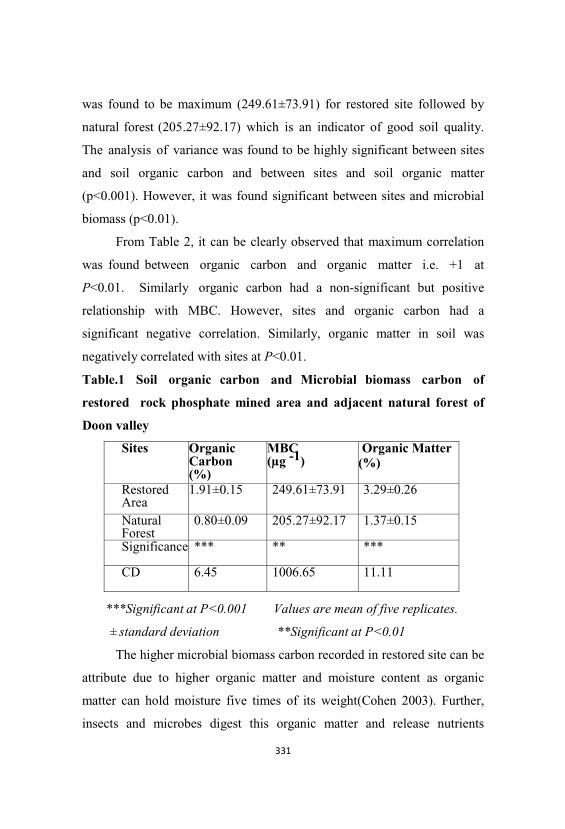
Sites OrganicCarbon(%)
MBC(µg -1)
Organic Matter(%)
RestoredArea
1.91±0.15 249.61±73.91 3.29±0.26
NaturalForest
0.80±0.09 205.27±92.17 1.37±0.15
Significance *** ** ***
CD 6.45 1006.65 11.11
was found to be maximum (249.61±73.91) for restored site followed by
natural forest (205.27±92.17) which is an indicator of good soil quality.
The analysis of variance was found to be highly significant between sites
and soil organic carbon and between sites and soil organic matter
(p<0.001). However, it was found significant between sites and microbial
biomass (p<0.01).
From Table 2, it can be clearly observed that maximum correlation
was found between organic carbon and organic matter i.e. +1 at
P<0.01. Similarly organic carbon had a non-significant but positive
relationship with MBC. However, sites and organic carbon had a
significant negative correlation. Similarly, organic matter in soil was
negatively correlated with sites at P<0.01.
Table.1 Soil organic carbon and Microbial biomass carbon of
restored rock phosphate mined area and adjacent natural forest of
Doon valley
***Significant at P<0.001 Values are mean of five replicates.
± standard deviation **Significant at P<0.01
The higher microbial biomass carbon recorded in restored site can be
attribute due to higher organic matter and moisture content as organic
matter can hold moisture five times of its weight(Cohen 2003). Further,
insects and microbes digest this organic matter and release nutrients
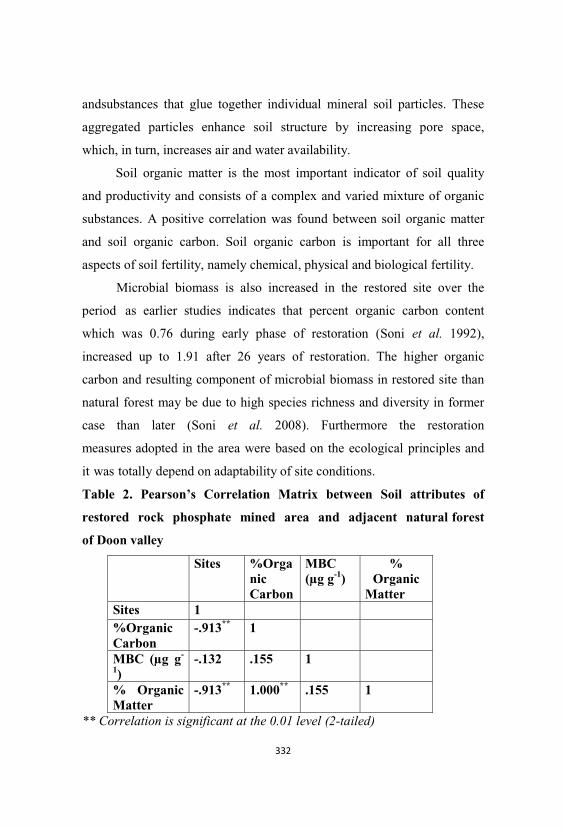
andsubstances that glue together individual mineral soil particles. These
aggregated particles enhance soil structure by increasing pore space,
which, in turn, increases air and water availability.
Soil organic matter is the most important indicator of soil quality
and productivity and consists of a complex and varied mixture of organic
substances. A positive correlation was found between soil organic matter
and soil organic carbon. Soil organic carbon is important for all three
aspects of soil fertility, namely chemical, physical and biological fertility.
Microbial biomass is also increased in the restored site over the
period as earlier studies indicates that percent organic carbon content
which was 0.76 during early phase of restoration (Soni et al. 1992),
increased up to 1.91 after 26 years of restoration. The higher organic
carbon and resulting component of microbial biomass in restored site than
natural forest may be due to high species richness and diversity in former
case than later (Soni et al. 2008). Furthermore the restoration
measures adopted in the area were based on the ecological principles and
it was totally depend on adaptability of site conditions.
Table 2. Pearson’s Correlation Matrix between Soil attributes of
restored rock phosphate mined area and adjacent natural forest
of Doon valley
Sites %OrganicCarbon
MBC (µg g-1)
%Organic
MatterSites 1 %OrganicCarbon
-.913** 1
MBC (µg g-
1)-.132 .155 1
% OrganicMatter
-.913** 1.000** .155 1
** Correlation is significant at the 0.01 level (2-tailed)
It was observed during the restoration chronosequence, soil
organic carbon and microbial biomass increased in the restored site.
Results indicated that restored site is having higher microbial biomass and
soil organic carbon value than Natural forest area which is an indicator of
good soil quality and recovery. Thus, we can conclude that over the years
of restoration, the soil was trying to come back to its original state as
observed indicating the fertility status of the soil.
Acknowledgements
We thank Dr. (Mrs.) Prafulla Soni, Head of Division, Forest
Ecology and Environment Division, Forest Research Institute, for
providing the facilities and Dr. Ashish Rawat for his help in statistical
analysis.
References
Batra, L, Kumari, A, Manna, M.C, Chhabra, R. 1997. Microbiological
and chemical amelioration of alkaline soil by growing Karnal grass
and gypsum application.Experimental Agriculture, 33: 389–397.
Bending, G.D., Turner, M.K., Rayns, F., Marx, M.C. and Wood, M. 2004.
Microbial and biochemical soil quality indicators and their potential
for differentiating areas under contrasting agricultural management
regimes. Soil Biology and Biochemistry, 36: 1785- 1792.
Brookes, P., Vance, E. and Jekinson, D.J. 1987. An extraction method for
measuring soil microbial biomass C. Soil Biology and Biochemistry,
19:703-707.
Champion, H.G. and Seth, S.K. 1968. Revised Survey of Forest Types in
India. Govt. of India Publication, New Delhi.
COHEN, J. 2003. The Impacts of fire on ecosystems. Available online at
http://www.micro.utexas.edu/courses/mcmurry/spring98/10/jerry.ht
ml.
Garcia, C., Hernandez, T., Roldan, A. and Martin, A. 2002. Effect of plant
cover decline on chemical and microbiological parameters under
Mediterranean climate. Soil Biology and Biochemistry, 34: 635-642.
Jenkinson, D.S. and Ladd, J.N. 1981. Microbial biomass in soil,
measurement and turnover. In: Paul, W.A. and Ladd, J.N. (eds.),
Marcel Dekker, New York, Soil Biochemistry, 5: 415–471.
Kieft, T.L. 1994. Grazing and plant canopy effects on semi-arid soil
microbial biomass and respiration. Biology and Fertility of Soils, 18:
155-182
Marumoto, K. 1984. Mineralization of C and N from microbial
biomass in paddy soils. Plant and Soil, 76: 165-173.
Society for Ecological Restoration 2002. The SER Primer on Ecological
Restoration.http://www.ser.org/.
Soni, P., Vasistha, H.B. and Om Kumar, 1992. Surface Mined Lands-
Problems and Prospects: A report on Eco Restoration of Rock
Phosphate Mined area.ICFRE-18, ICFRE, Dehradun.
Soni, P., Negi, M. and Uniyal, S. 2008. To Study Ecological Succession in
Restored Mined Areas. Project Report, Division of Ecology and
Environment, Forest Research Institute, Dehradun.
Walkley, A. 1947. An examination of methods for determining organic
carbon and nitrogen in soils. J. Agri.Sci., 25:598-609.
Walker, L. R., and del Moral, R. 2003. Primary Succession and Ecosystem
Rehabilitation.Cambridge University Press, Cambridge,United
Kingdom.
Zedler, J. B. 2001. Handbook for Restoring Tidal Wetlands. CRC Press,
LLC., Boca Raton, Florida.
Agroforestry as a landscape for the management of cotton pests
T. S. Dange, Y. Sridhar* and R. Sundraraj**
Forest Research Centre, (ICFRE), Hyderabad, India-50014
*National Research Centre for Soybean – Indore, India
** Institute of Wood Science and Technology, (ICFRE), Bangalore, India
Abstract
The key challenge of the 21st century pest managers is to translate
ecological principles into practical alternative system to suit the specific
needs of farming communities in different agroecological regions of the
world. A major strategy to design a more sustainable agriculture is to
restore agricultural diversity by following key agroecological guidelines
by increasing biodiversity in time and space through multiple cropping and
agroforestry designs and enhancing landscape diversity with biological
corridors. The present study is aimed to know the insect pests management
of cotton under different agroforestry systems in Andhra Pradesh to see the
effects of various tree combinations on insect pest and natural enemy fauna
of cotton. For this purpose agroforestry systems were developed wherein
Cotton was grown as an intercrop with Neem, Bamboo, Custard apple,
Eucalypts, Aonla, and Moringa. Seasonal incidence and population
dynamics of major pests and natural enemies were observed. Treatment
combinations of custard apple + cotton, bamboo + cotton and bamboo +
cotton were found highly effective to support less density of sucking pests
and more of natural enemies. Correspondingly increase in yield of
cotton was observed in these combinations. The study clearly indicated
that the insect pest problems associated with monoculture of cotton can be
minimized with habitat fragmentation and landscape restoration which
demonstrated the potential of developing multifunctional pest stable
agroforestry models for cotton production in small holdings with low
inputs for ecological reasons (sustainability, stability, equity and
productivity) in the long run.
Keywords: Agroforestry, landscape, pest management, natural enemies
Introduction
The spread of modern agriculture has resulted in tremendous
changes in landscape diversity. There has been a consistent trend towards
simplification of field due to monoculture and intensive cultivation
practices leading to decrease in inter-and intra-specific diversity within the
planted field. Although these trends appear to exist worldwide, they are
more apparent, and certainly best documented, in industrialized countries.
Increasingly, evidence suggests that these changes in landscape diversity
have led to more insect outbreaks due to the expansion of monocultures at
the expense of natural vegetation, through decreasing habitat diversity.
One of the main characteristics of the modern agricultural landscape is the
large size and homogeneity of crop monocultures, which fragment the
natural landscape. Massive expansion and increases in production of crops
such as rice, wheat, maize, cotton and soybean, in various regions of the
developing world led to major environmental degradation and loss of
biodiversity, especially in bird populations (Donald, 2004). Such
agricultural intensification can also directly affect the abundance and
diversity of natural enemies, as the larger the area under monoculture the
lower the viability of a given population of beneficial fauna. At hand is
also the issue of colonization of crop “islands” by insects. In the case of
annual crops, insects must colonize from the borders each season, and the
larger the field, the greater is the distance that must be covered. The
increased monoculture leads to more frequent insect outbreaks. Many
ecologists have conducted experiments testing the theory that decreased
plant diversity in agro-eco- systems allows greater chance for invasive
species to colonize, subsequently leading to enhanced herbivorous insect
abundance, many of these experiments have shown that mixing certain
plant species with the primary host of a specialized herbivore gives a
fairly consistent result. specialized species usually exhibit higher
abundance in monocultures than in diversified crop systems (Andow,
1983). Several reviews have been published documenting the effects of
within habitat diversity on insects (Altieri and Letourneau, 1984; Risch
et al., 1983). Two main ecological hypotheses (the natural enemy
hypothesis and the resource concentration hypothesis), have been offered
to explain why insect populations tend to explode in monocultures and
how in agroecosystems insect populations can be stabilized by
constructing vegetational architectures that support natural enemies and/or
that directly exert inhibitory effects on pest attacks (Root, 1973).
Agroforestry systems create landscape structure that is important for
the biological pest control. In structurally complex landscapes, parasitism
is higher and crop damage lower than in simple landscapes with a high
percentage of agricultural use. When carefully designed, woody and
herbaceous corridors such as hedgerows, windbreaks, shelterbelts,
wooded alleys and forest edges, can be needed to protect soil, conserve
moisture and improve dry land crops. Corridors provide habitat that
benefit wildlife within agricultural landscapes and provide diversity
that supports natural enemies of crop pests. Benefits to wildlife include
protection from wind and adverse weather, escape or refuge cover, food
and foraging sites, reproductive habitat and travel areas. Birds living in
a wooded corridor forage in the crop field and consume insect pests
blown or attracted to the edge. Diversity in habitat and fauna through the
application of agroforestry principles appears to bring stability to
agricultural landscapes.
Material and Methods
The Experiment was carried out during 2005-08 at Forest Research
Centre, Hyderabad (17o 20´ N latitude and 78o 30´ E longitude with
an altitude of 536m. MSL). Cotton (Gossypium hirsutum) was grown as
an intercrop with different trees viz; Neem (Azadirachta indica), Custard
apple (Annona squamosa), Eucalyptus (Eucalyptus tereticornis), Aonla
(Emblica officinalis) and Moringa (Moringa oleifera)and Bamboo
(Dendrocalamus strictus). The experiment was conducted in completely
randomized block design with three replications. Each plot was measuring
28 m X 20 m. along northern and southern edges and in median of each
plot three rows of trees at 2 m X 2 m spacing were planted. Cotton was
cultivated in eight meters wide area available between the two strips of
three tree rows each with an espacement 90x60cms. An isolation
distance of four meters was maintained between two treatment plots.
Spacing between tree crops was narrowed (2 m X 2 m) as compared to
conventional practices in tune with the study objectives to get the desired
impact. Insect pests and the natural enemies like parasites, predators, and
spiders of cotton, trees and bamboos, were recorded during the early hours
of the day at fortnightly interval during the experimental period. Yield
of cotton and trees were recorded accordingly. Data were subjected to
ANOVA. Means were separated by Duncan’s Multiple Range Test
(Duncan, 1955). Correlations between the abiotic factors and incidence of
major insect pests were correlated. Data was analyzed using SPSS
software.
Results and Discussion
Extent of damage was expressed in terms of percentage change in
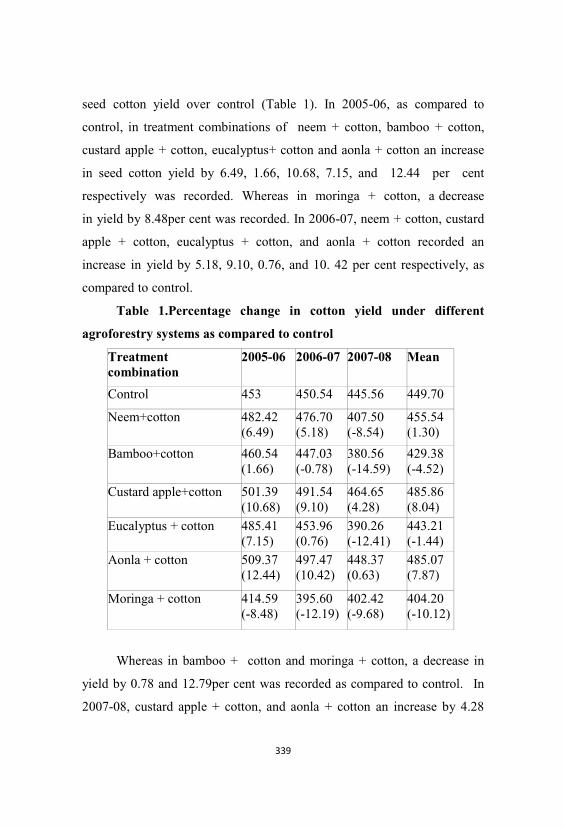
seed cotton yield over control (Table 1). In 2005-06, as compared to
control, in treatment combinations of neem + cotton, bamboo + cotton,
custard apple + cotton, eucalyptus+ cotton and aonla + cotton an increase
in seed cotton yield by 6.49, 1.66, 10.68, 7.15, and 12.44 per cent
respectively was recorded. Whereas in moringa + cotton, a decrease
in yield by 8.48per cent was recorded. In 2006-07, neem + cotton, custard
apple + cotton, eucalyptus + cotton, and aonla + cotton recorded an
increase in yield by 5.18, 9.10, 0.76, and 10. 42 per cent respectively, as
compared to control.
Table 1.Percentage change in cotton yield under different
agroforestry systems as compared to control
Treatmentcombination
2005-06 2006-07 2007-08 Mean
Control 453 450.54 445.56 449.70
Neem+cotton 482.42(6.49)
476.70(5.18)
407.50(-8.54)
455.54(1.30)
Bamboo+cotton 460.54(1.66)
447.03(-0.78)
380.56(-14.59)
429.38(-4.52)
Custard apple+cotton 501.39(10.68)
491.54(9.10)
464.65(4.28)
485.86(8.04)
Eucalyptus + cotton 485.41(7.15)
453.96(0.76)
390.26(-12.41)
443.21(-1.44)
Aonla + cotton 509.37(12.44)
497.47(10.42)
448.37(0.63)
485.07(7.87)
Moringa + cotton 414.59(-8.48)
395.60(-12.19)
402.42(-9.68)
404.20(-10.12)
Whereas in bamboo + cotton and moringa + cotton, a decrease in
yield by 0.78 and 12.79per cent was recorded as compared to control. In
2007-08, custard apple + cotton, and aonla + cotton an increase by 4.28
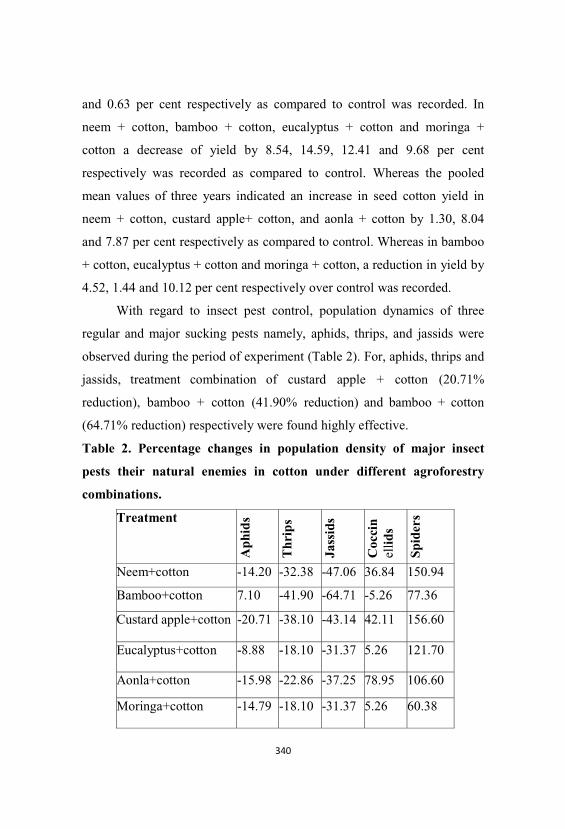
and 0.63 per cent respectively as compared to control was recorded. In
neem + cotton, bamboo + cotton, eucalyptus + cotton and moringa +
cotton a decrease of yield by 8.54, 14.59, 12.41 and 9.68 per cent
respectively was recorded as compared to control. Whereas the pooled
mean values of three years indicated an increase in seed cotton yield in
neem + cotton, custard apple+ cotton, and aonla + cotton by 1.30, 8.04
and 7.87 per cent respectively as compared to control. Whereas in bamboo
+ cotton, eucalyptus + cotton and moringa + cotton, a reduction in yield by
4.52, 1.44 and 10.12 per cent respectively over control was recorded.
With regard to insect pest control, population dynamics of three
regular and major sucking pests namely, aphids, thrips, and jassids were
observed during the period of experiment (Table 2). For, aphids, thrips and
jassids, treatment combination of custard apple + cotton (20.71%
reduction), bamboo + cotton (41.90% reduction) and bamboo + cotton
(64.71% reduction) respectively were found highly effective.
Table 2. Percentage changes in population density of major insect
pests their natural enemies in cotton under different agroforestry
combinations.
Treatment
Aph
ids
Thr
ips
Jass
ids
Coc
cin
ellid
s
Spid
ers
Neem+cotton -14.20 -32.38 -47.06 36.84 150.94
Bamboo+cotton 7.10 -41.90 -64.71 -5.26 77.36
Custard apple+cotton -20.71 -38.10 -43.14 42.11 156.60
Eucalyptus+cotton -8.88 -18.10 -31.37 5.26 121.70
Aonla+cotton -15.98 -22.86 -37.25 78.95 106.60
Moringa+cotton -14.79 -18.10 -31.37 5.26 60.38
In a nutshell, data engendered during the study revealed clearly that
cotton, combined with trees supported significantly lower aphid,
thrips, and jassid populations and higher coccinellid and spider
populations as compared to cotton sole crop, suggesting suppression of
aphids, thrips and jassids populations due to increased abundance of
generalist predators namely coccinellids and spiders in agroforestry
systems.
This is a clear demonstration of diluting monoculture effects by crop
diversification. These results are in harmony with van Emden and
Williams, 1974; Goodman, 1975; Cromartie, 1981; Altieri et al., 1990.
References
Altieri, M.A. and Letourneau, D.K. 1984. Vegetation diversity and
insect pest outbreaks. CRC Critical Reviews in Plant Sciences, 2.
131-169.
Altieri, M. A., Glaser, D.L. and Schmidt, L.L. 1990. Diversification of
agro- ecosystems for insect pest regulation. Experiments
with collards. In. Gliessman, S.R ed. Agro ecology. Researching
the ecological basis for sustainable agriculture. Berlin. Springer
Verlag.
Andow, D.1983. Plant diversity and insect populations in experimental
agroecosystems. interactions among beans, insects and weeds. Ph.D.
dissertation. Cornell University.
Cromartie, W.J. 1981. The environmental control of insects using crop
diversity. In.Pimentel D. Ed. CRC handbook of pest management
in agriculture. Florida. CRC Press.
Donald, P.F. 2004.Biodiversity impacts of some agricultural commodity
production systems. Conservation Biology, 18, 17-37.
Duncan, D. B. 1955. A significant test for differences between ranked
treatments in analysis of variance. Virginia Journal of Science, 2.
171-181.
Goodman, D. 1975. The theory of diversity-stability relationships
in ecology.Quarterly Review of Biology, 50. 237-266.
Price, P.W.1976. Colonization of crops by arthropods. non-equibrium
communitiesin Soyabean field. Environmental entomology,5,605-12.
Risch, S.J., Andow, D. and Altieri, M.A. 1983. Agroecosystem diversity
and pest control. data, tentative conclusions and new research
directions. Environmental Entomology, 12 (3). 625-629.
Root, R.B. 1973. Organization of a plant-arthropod association in simple
and diverse habitats. the fauna of collards (Brassica oleracea).
Ecology Monographs, 43.95-124.
Van Emden, H.F. and Williams, G.F. 1974. Insect stability and diversity in
agro ecosystems. Annual Review of Entomology, 19. 455-475.
Carbon Sequestration through Soil Organic Carbon Store Estimation
under Different Land uses in Lower Altitudinal Region of
Uttarakhand
M.K. Gupta
Forest Soil & Land Reclamation Division
Forest Research Institute, Dehra Dun
Abstract
Soil carbon has much longer residence mean times than the carbon
in the vegetation that the soils support. Storage of organic carbon in the
long residence time, pool is referred to as Carbon sequestration.
Intergovernmental Panel on Climate Change has recognized soil organic
carbon pool as one of the five major carbon pools for the Land Use, Land
Use Change in Forestry sector. Land use and soil management practices
can significantly influence soil organic carbon dynamics and carbon flux
from the soil. No systematic study has been undertaken to estimate the soil
organic carbon pool in forests, as well as in other land uses in this area. A
study was conducted in three land uses viz. Forests, Horticulture and
plantations occurring below 1000 m altitude in Uttarakhand to estimate
SOC pool. Soil samples were collected from Dehra Dun, Haridwar,
Pauri, Nainital, Tehri, Champawat, Pithoragarh, Chamoli, Bageshwer,
Udham Singh Nagar, Uttarkashi and Rudrapryag districts. Under
forests land use, Soil Organic Carbon pool was estimated in Sal
(Shorea robusta), Chir (Pinus roxburghii) and Miscellaneous forests.
Under horticulture land use SOC was estimated in Mango, Litchi and
Guava orchards while under plantation land use SOC pool was estimated
under Teak, Chir, Eucalyptus, Shisham and Poplar. Maximum SOC pool
was estimated in the soils under forest (64.40 t ha-1) followed by
horticulture (49.12 t ha-1), and the least was under plantations (37.21 t ha-
1). Differences in the SOC pool under these land uses were
statistically significant. Forests have 30.33 % higher SOC pool as
compared to Horticulture and 72.05 % higher as compared to plantations.
Horticulture has 32.01 % higher SOC pool as compared to plantation land
use. Share occupied by individual land use, out of total SOC pool has been
worked out and observed that forests has occupied the maximum share
(42.58 %) followed by Horticulture (32.76 %). Plantations occupied the
least share (24.81 %) in this low altitudinal region of Uttarakhand state.
Keywords : Soil carbon, land use change, carbon pool, plantation.
Introduction
Soil Carbon has much longer residence mean times than the
Carbon in the vegetation that the soils support. Storage of organic
Carbon in this long residence time, pool is referred to as Carbon
sequestration. The concern about increasing atmospheric CO2 and its role
in future global climate change has lead Soil scientists to quantify soil
organic carbon content (also referred as stocks or storage) (Lacelle et
al.,2001). Accurate quantification of soil carbon is necessary for detection
and prediction of changes in response to changing global climate.
Concentration of atmospheric CO2 can be lowered either by
reducing emissions or by taking CO2 out from the atmosphere and stored
in the terrestrial, oceanic or aquatic ecosystems. Tree growth serves as an
important means to capture and store atmospheric carbon dioxide in
vegetation, soils and biomass products (Makundi and Sathaye, 2004). Most
of the carbon enters the ecosystem through the process of photosynthesis in
the leaves. After the litter fall, the detritus is decomposed and forms soil
organic carbon by microbial process. Eventually, after the death of
animals, the detritus decomposed in to the soil organic carbon by
microbial activities.
Soils and vegetation, therefore, represent potential sinks for this
additional carbon and several authors have suggested afforestation as a
possible means of mitigating global climate change (Shivanna et al., 2006
and Ramachandran et al., 2007). Intergovernmental Panel on Climate
Change has recognized soil organic carbon pool as one of the five major
carbon pools for the Land Use, Land Use Change in Forestry sector. It is
mandatory for all nations to provide soil organic carbon pool and changes
from LULUCF sector of the forests under National Communications to the
UNFCCC.
Land use and soil management practices can significantly
influence soil organic carbon dynamics and carbon flux from the soil
(Batjes, 1996;Tian et al.,2002). Some reports indicate, up to 87 %
decrease in soil organic carbon due to deforestation. There is intense
anthropogenic pressure on the forests. From 1951 to 1980, about 4.3 m
ha forest was diverted to non - forest use mainly for agriculture (62 %)
and river valley project (hydro - electric and irrigation) (12 %) industrial
purpose (4%) and other purpose (22%) (Ravindranath, 2002).
No systematic study has been undertaken to estimate the soil
organic carbon pool in forests, as well as in other land uses in this area.
Therefore, a study was conducted in Uttarakhand State, to estimate SOC
pool under different land uses by ground truthing. The results of this study
have provided the authentic and comprehensive estimates of the SOC pool
under different vegetation covers.
Materials and Methods
Because the input of organic matter is largely from aboveground
litter, forest soil organic matter tends to concentrate in the upper soil
horizons, with roughly half of the soil organic carbon of the top 100 cm of
mineral soil being held in the upper 30 cm layer. The carbon held in the
upper profile is often the most chemically decomposable, and the most
directly exposed to natural and anthropogenic disturbances (IPCC,
2003). Therefore, soil organic carbon pool was estimated up to the depth
of 30 cm in this study.
Study was conducted in three land uses viz. forests,
horticulture and plantations occurring below 1000 m altitude in
Uttarakhand. Under forests land use, Soil Organic Carbon pool was
estimated in all available forest covers below 1000 m altitude i.e. Sal
(Shorea robusta), Chir (Pinus roxburghii) and Miscellaneous forests.
Under horticulture land use SOC was estimated in Mango, Guava and
Litchi orchards, which was available at this altitudinal region. Poplar,
Eucalyptus, Shisham, Teak and Chir plantations were available in this
region, therefore SOC pool under these plantations were also estimated.
360 soil samples from all these land uses were collected. Soil samples
were collected for organic carbon estimation, bulk density and coarse
fragment estimation from different forest covers and horticulture.
In Uttarakhand, below the altitude of 1000 m, sampling sites were
selected in all the districts in which these forest covers, plantations and
orchards were available. Sampling points have been selected randomly and
at each sampling point, an area of about ½ km were covered and collect
five soil samples from this area for soil organic carbon estimation and two
separate samples were collected for bulk density and coarse fragment
estimation. It was ensured that sampling points typically represent the
study area. Variation in the number of samples was due to difference in
area available under particular forest stand. Details of the sites from where
soil samples were collected in different ranges and numbers of sample
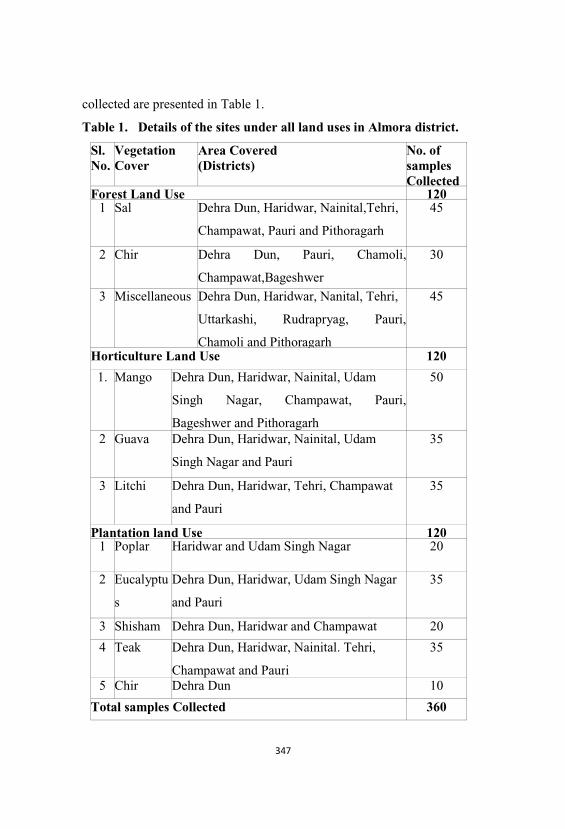
collected are presented in Table 1.
Table 1. Details of the sites under all land uses in Almora district.
Sl. No.
VegetationCover
Area Covered(Districts)
No. ofsamplesCollected
Forest Land Use 1201 Sal Dehra Dun, Haridwar, Nainital,Tehri,
Champawat, Pauri and Pithoragarh
45
2 Chir Dehra Dun, Pauri, Chamoli,
Champawat,Bageshwer
30
3 Miscellaneous Dehra Dun, Haridwar, Nanital, Tehri,
Uttarkashi, Rudrapryag, Pauri,
Chamoli and Pithoragarh
45
Horticulture Land Use 120
1. Mango Dehra Dun, Haridwar, Nainital, Udam
Singh Nagar, Champawat, Pauri,
Bageshwer and Pithoragarh
50
2 Guava Dehra Dun, Haridwar, Nainital, Udam
Singh Nagar and Pauri
35
3 Litchi Dehra Dun, Haridwar, Tehri, Champawat
and Pauri
35
Plantation land Use 1201 Poplar Haridwar and Udam Singh Nagar 20
2 Eucalyptu
s
Dehra Dun, Haridwar, Udam Singh Nagar
and Pauri
35
3 Shisham Dehra Dun, Haridwar and Champawat 20
4 Teak Dehra Dun, Haridwar, Nainital. Tehri,
Champawat and Pauri
35
5 Chir Dehra Dun 10
Total samples Collected 360
Latitude, Longitude and altitude of each sampling site were recorded
by GPS and depicted the sampling sites in Figure 1. Forest floor litter of an
area of 0.5m x 0.5 m, at each sampling point was removed and a pit of 30
cm wide, 30 cm deep and 50 cm in length was dug out. Soil from 0 to 30
cm depth, from three sides of the pit, scraped with the help of Kurpee. This
soil mixed thoroughly and removed gravels. Keep in a polythene bag and
tightly closed with thread with proper labeling. In the laboratory, samples
were air dried and after drying the samples, grind it and sieve it through
100 mesh sieve (2 mm sieve). This sieved sample used for soil
organic carbon estimation. Soil organic carbon was estimated by standard
Walkley & Black (1934) method. Amount of coarse fragments were
estimated in each sample collected from different forests and deducted
from the soil weight to get an accurate soil weight per ha basis and soil
organic carbon estimation. Bulk density of every site was estimated by
standard core method (Wilde et al., 1964). All the methods used in this
study are in accordance to Ravindranath, and Ostwald, (2008).
The data for SOC pool was calculated by using the following
equation as suggested by IPCC Good Practice Guidance for LULUCF
(IPCC, 2003).
Equation for SOC.
Horizon = n Horizon = n
SOC = SOC horizon = ([SOC] * Bulk density * depth * (1 – C frag)
* 10) horizon
Horizon = 1 Horizon = 1
Where,
SOC = Representative soil organic carbon content for the forest type and
soil of interest, tones C ha.-1
SOC horizon = Soil organic carbon content for a constituent soil horizon,
tones C ha –1 [SOC] = Concentration of SOC in a given soil mass
obtained from analysis, g C (kg soil)–1
Bulk density = Soil mass per sample volume, tones soil m-3 (equivalent to
Mg m-3) Depth = Horizon depth or thickness of soil layer, m
C Fragment = % volume of coarse fragments / 100, dimensionless
Results and Discussion
Soils under different forests covers occurring below 1000 m above
mean sea level, were collected from Sal, Chir and Miscellneous forests
from Dehra Dun, Haridwar, Pauri, Nainital, Tehri, Champawat,
Pithoragarh, Chamoli, Bageshwer, Uttarkashi and Rudrapryag districts.
Forests occurring below 1000 m altitude having on an average 64.40 t ha-
1 SOC pool. Among these forest covers Miscellaneous forests have
maximum SOC pool (71.50 t ha-1) followed by Sal (62.76 t ha-1) and the
least SOC pool was in the soils under Chir (56.21 t ha-1). Subset for =
0.05 indicate that Miscellaneous and Sal stands separately (a) while Sal is
also with Chir (b) (Table 2). Soils under Miscellaneous forests have 13.92
% higher SOC pool as compared to Sal while 27.20 % higher in
comparison to Chir. SOC pool under Sal was 11.65 % higher as compared
to Chir forests.
Mitigation potential for different forests covers was worked out
against Chir forests which has the least SOC pool and observed that
Miscellaneous have maximum mitigation potential (1.27) followed by Sal
(1.11). Standard Error of SOC pool, in all the forest covers is varied from
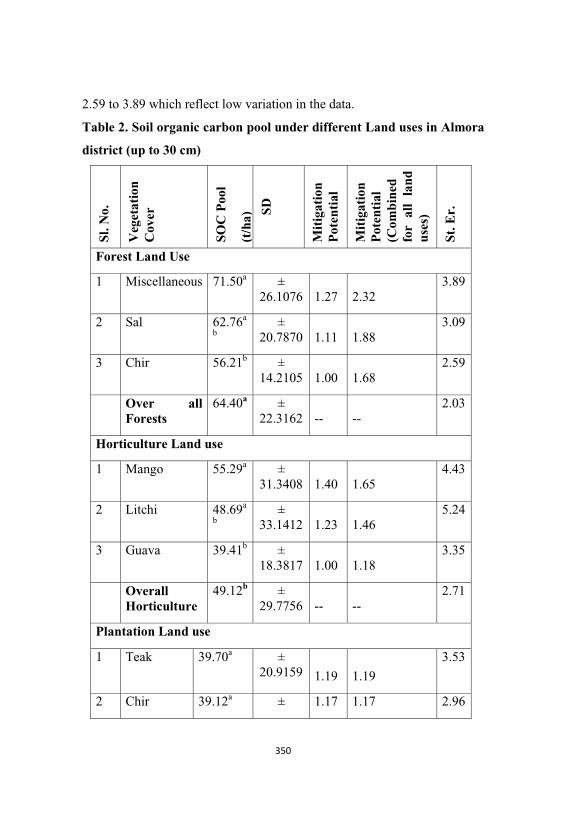
2.59 to 3.89 which reflect low variation in the data.
Table 2. Soil organic carbon pool under different Land uses in Almora
district (up to 30 cm)
Sl. N
o.
Veg
etat
ion
C
over
SOC
Poo
l
(t/h
a) SD
Mit
igat
ion
Pot
enti
al
Mit
igat
ion
Pot
enti
al(C
ombi
ned
for
all
land
uses
)
St. E
r.
Forest Land Use
1 Miscellaneous 71.50a ±26.1076 1.27 2.32
3.89
2 Sal 62.76a
b±
20.7870 1.11 1.883.09
3 Chir 56.21b ±14.2105 1.00 1.68
2.59
Over allForests
64.40a ±22.3162 -- --
2.03
Horticulture Land use
1 Mango 55.29a ±31.3408 1.40 1.65
4.43
2 Litchi 48.69a
b±
33.1412 1.23 1.465.24
3 Guava 39.41b ±18.3817 1.00 1.18
3.35
OverallHorticulture
49.12b ±29.7756 -- --
2.71
Plantation Land use
1 Teak 39.70a ±20.9159 1.19 1.19
3.53
2 Chir 39.12a ± 1.17 1.17 2.96
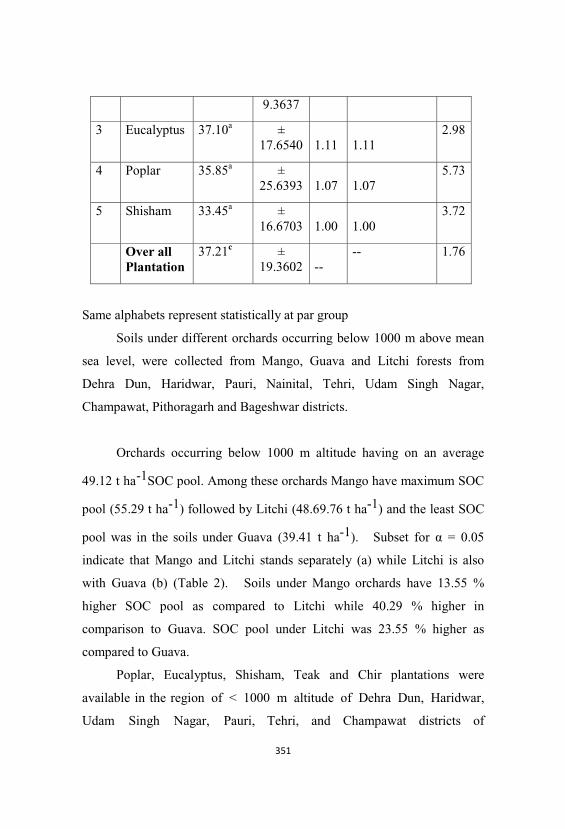
9.3637
3 Eucalyptus 37.10a ±17.6540 1.11 1.11
2.98
4 Poplar 35.85a ±25.6393 1.07 1.07
5.73
5 Shisham 33.45a ±16.6703 1.00 1.00
3.72
Over allPlantation
37.21c ±19.3602 --
-- 1.76
Same alphabets represent statistically at par group
Soils under different orchards occurring below 1000 m above mean
sea level, were collected from Mango, Guava and Litchi forests from
Dehra Dun, Haridwar, Pauri, Nainital, Tehri, Udam Singh Nagar,
Champawat, Pithoragarh and Bageshwar districts.
Orchards occurring below 1000 m altitude having on an average
49.12 t ha-1SOC pool. Among these orchards Mango have maximum SOC
pool (55.29 t ha-1) followed by Litchi (48.69.76 t ha-1) and the least SOC
pool was in the soils under Guava (39.41 t ha-1). Subset for = 0.05
indicate that Mango and Litchi stands separately (a) while Litchi is also
with Guava (b) (Table 2). Soils under Mango orchards have 13.55 %
higher SOC pool as compared to Litchi while 40.29 % higher in
comparison to Guava. SOC pool under Litchi was 23.55 % higher as
compared to Guava.
Poplar, Eucalyptus, Shisham, Teak and Chir plantations were
available in the region of < 1000 m altitude of Dehra Dun, Haridwar,
Udam Singh Nagar, Pauri, Tehri, and Champawat districts of
Uttarakhand. On an average these plantations have
37.21 t ha-1 Soc pool in this region. Out of these plantations, Teak has the
maximum SOC pool (39.70 t ha-1), followed by Chir (39.11 t ha-1),
Eucalyptus (37.10 t ha-1), poplar (35.85 t ha-1) and the least pool was
under Shisham (33.45 t ha-1). SOC pool under Teak and Chir has
marginal differences while under teak it was 7.03 % higher as compared
to Eucalyptus, 10.73 % as compared to poplar and 18.68 as compared to
Shisham. SOC pool under Eucalyptus was 3.45 % higher as compared to
Poplar and
10.88 % as compared to Shisham. Subset for = 0.05 indicate that SOC
pool under all the plantations were not statistically significant and can be
placed all together (a) (Table 2). Standard error varied from 2.96 to 5.73
which are considerably low and indicate not much variation in the sites.
When all the forest covers, plantations and orchards were integrated
in their land uses and over all SOC pool under these three land uses viz.
forests, horticulture and plantation were compared, it was observed that
maximum SOC pool was in the soils under forests (64.40 t ha-1) followed
by horticulture (49.12 t ha-1) and the least was under plantation (37.21 t
ha-1). ). Subset for = 0.05 indicate that forests stands separately (a)
while Horticulture is also stand seperately (b) and plantation (c) (Table
2). Forests have 30.33 % higher SOC pool as compared to Horticulture
and 72.05 % higher as compared to plantations. Horticulture has 32.01 %
higher SOC pool as compared to plantation land use.
The effect of land use change on soil carbon stock is of concern in
the context of international policy agendas on GHG emission mitigation.
Gua and Gifford (2002) reported that soil C stocks decline after land
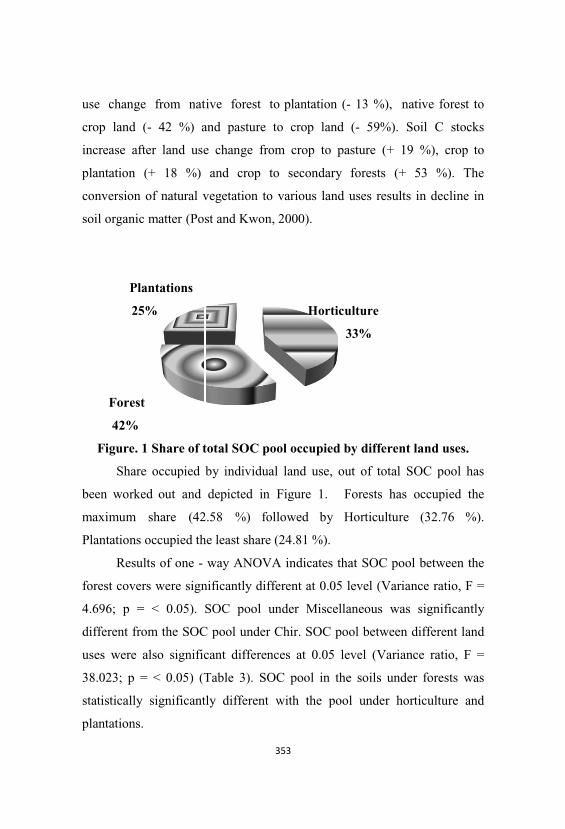
use change from native forest to plantation (- 13 %), native forest to
crop land (- 42 %) and pasture to crop land (- 59%). Soil C stocks
increase after land use change from crop to pasture (+ 19 %), crop to
plantation (+ 18 %) and crop to secondary forests (+ 53 %). The
conversion of natural vegetation to various land uses results in decline in
soil organic matter (Post and Kwon, 2000).
Plantations
25% Horticulture
33%
Forest
42%
Figure. 1 Share of total SOC pool occupied by different land uses.
Share occupied by individual land use, out of total SOC pool has
been worked out and depicted in Figure 1. Forests has occupied the
maximum share (42.58 %) followed by Horticulture (32.76 %).
Plantations occupied the least share (24.81 %).
Results of one - way ANOVA indicates that SOC pool between the
forest covers were significantly different at 0.05 level (Variance ratio, F =
4.696; p = < 0.05). SOC pool under Miscellaneous was significantly
different from the SOC pool under Chir. SOC pool between different land
uses were also significant differences at 0.05 level (Variance ratio, F =
38.023; p = < 0.05) (Table 3). SOC pool in the soils under forests was
statistically significantly different with the pool under horticulture and
plantations.
Table 3. Statistically significant mean differences on the basis of CD
(LSD).
Sl. No.
Vegetation Mean Difference P value
1 Miscellaneous Vs Chir 15.2937* 0.058
2 Forests Vs Horticulture 15.2807* 0.000
3 Forests Vs Plantations 27.1945* 0.000
4 Horticulture Vs Plantation 11.9137* 0.000
References
Batjes, N.H. 1996. Total carbon and nitrogen in he soils of the world.
Euro. J. SoilSci., 47. 151-163.
Guo, L.B. and Gifford, R.M. 2002. Soil Carbon stocks and land use
change. a meta analysis. Global Change Biology 8 (4). 345 - 360
IPCC 2003. Good Practice Guidance for Land Use, Land Use Change
and Forestry.Published by the Institute for Global Environmental
Strategies (IGES) for the IPCC. Publishers Institute for Global
Environmental Strategies, Japan
Lacelle, B.; Waltman, S.; Bliss, N. and Orozco, C.F.2001. Methods used
to create the North American soil organic carbon digital data
base.485– 494 pp
Makundi, Willy R. and Sathaye, Jayant, A.2004. GHG mitigation potential
and cost in tropical forestry – relative role for agroforestry.
Environment, Development and Sustainability 6. 235-260
Post, W.M.and Kwon,K.C.2000.Soil carbon sequestration and land use
change.Process and potential. Global Change Biology 6 . 317–327.
Ramachandran, A., S. Jayakumar, R.M. Haroon, A. Bhaskaran and D.I.
Arockiasamy.2007. Carbon sequestration. estimation of carbon
stock in natural forests using geospatial technology in the
Eastern Ghats of Tamil Nadu, India. Current Science, 92 (3).
323-331.
Ravindranath, N.H. 2002. Climate change forests and India CO2
emission, impact, mitigation and global negotiations in climate
change and India. Issues, concerns and opportunities (eds.)
P.R.Shukla, S.K.Sharma and P. Venkata Ramana. Tata Mc Graw –
Hill Publishing Co. Ltd. New Delhi.
Ravindranath, N.H. and Ostwald, M.2008. Carbon Inventory Methods.
Handbook for Greenhouse Gas Inventory, Carbon Mitigation
and Round wood Production Projects. Springer
Shivanna, H., P. Janagiri, H.C. balachandra and S. Kyatappanvar 2006.
Potential of Pongamia pinnata in carbon sequestration – An
important bio-diesel plant. My Forest, 42 (1). 5-11.
Tian, H., J.M. Melillo and D.W. Kicklighter. 2002. Regional carbon
dynamics in monsoon Asia and implications for the global
carbon cycle. Global and Planetary Change, 37. 201-217.
Walkley, A. and I. A. Black. 1934. An Examination of Degtjareff Method
for Determining Soil Organic Matter and a Proposed Modification
of the Chromic Acid Titration Method. Soil Sci. 37.29-37.
Wilde, S.A., Voigt, G.K. and Iyer, J.G.1964. Soil and Plant Analysis for
Tree Culture.Oxford Publishing House, Calcutta, India.
Soil Mineralogical Investigations for Sustainable Restoration of
Different Land Uses in Uttarakhand
Joystu Dutta
Forest Soil and Land Reclamation Division,
Forest Research Institute, Dehradun
Abstract
Soil mineralogical studies helps in evaluating the petrographic origin
of soils, the stage of weathering, their nutrient reserve and many other
physical and chemical properties, thereby, rendering it an adequate or
an inadequate medium for plant growth. Forest have a much longer
period of growth, therefore, fertile soil should able to supply adequate
amount of nutrients over the entire growth period so that increased
production on a sustained basis can be ensured. The plant nutrients
are chiefly derived from the weathering of minerals, the reserve and
availability of nutrients depends largely on the mineralogical composition
of soil and their parent material. The importance of soil-mineralogical
research is mainly due to intimate relationship between the mineral content
and soil fertility. The loss of nutrients through felling, subterranean
drainage, run off etc. should easily be replenished by the constant release
of nutrients resulting from weathering under favourable conditions in the
soils developed from parent material rich in nutrient bearing minerals.
The paramount importance of mineralogical studies in forestry is thus
quite obvious and merits greater attention in the soil investigation.
In view of the relatively long period of tree growth, the nature and
amount of minerals present in the soil and parent material are of vital
significance in forestry. Mineralogical studies have not only been of
fundamental value in correlating the regional relationship of different soils
and in understanding other pedological aspects but also of great utilitarian
significance in evaluating the soil fertility status and in managing the soil
for higher productivity. Mineralogical studies have also been helpful
in understanding the successional status of forest and in investigating the
various problems like reduction of growth, quality, vigour, and incidence
of mortality, diseases and pests etc.
To establish the contribution of soil mineralogy for sustainable
restoration of different land uses, studies were carried out in the natural
forests of Cedrus deodara at Barkot (Upper Yamuna Forest Division,
Uttarkashi), barren lands of Raipur Range (Mussoorie Forest Division)
and sodic land of eastern Uttar Pradesh respectively. Geologically , the
rocks in Barkot and Raipur range are of pre-cambrian to early paleozoic
age with recent and subrecent deposits. Sodic lands forms a part of Indo-
Gangetic alluvial plain which owes its origin to a depression probably
formed contemporaneously with the uplift of Himalayas (Krishnan,
1982). The plains are built up of layers of sands, clays and occasional
organic debris of geologically very recent date (Pleistocene and Recent)
filling up a deep depression between two other units. Soils belong to Typic
Paleudoll, Typic Argiudoll, Typic Paleudult and Humic Hapludult in
Upper Yamuna Forest division and Typic Argiudolls, Typic Argiustolls,
Typic Dystrochrept and Ruptic-Alfic Eutrochrepts in Mussoorie Forest
Division. From the field, micromorphological and mineralogical
observations were carried out. In sodic lands it has been observed that
sedimentation and pedogenesis have been closely interrelated in the study
area. The study further revealed that relief and age acting on geology
govern the existing soil whereas effect of altitude and climate on geology
gives rise to natural vegetation. Climate and aspect on a particular site has
given rise to existing floristic composition. Suitable strategies
based on soil mineralogy for restoration of different land uses have been
tested and reported in the paper.
Keywords: Petrography, Pedology, Land uses, Soil mineralogy,
Sustainable restoration, Strategies
Introduction
Uttarakhand forests of Garhwal are a most fascinating
segment of the Himalayas in many ways. These are quite unique in
their geological setting. Mussoorie Forest Division of Garhwal Himalayas
has been attracting the attention of soil scientists, geologists,
environmentalists, ecologists etc. from all over the world for
conservation and sustainable use of forest products because it is a store of
all the rock formations resulting in different soil and vegetation
types (Raina & Jha,2005).The Garhwal Himalayas are a mass of
intricate folding & faulting and composed of igneous, sedimentary and
metamorphic rocks (Valdiya, 1980).
Soil is one of the most important factors for tree growth which is
mainly governed by weathering and climatic conditions.
Fields of study
Soil occupies the pedosphere, one of Earth's spheres that the
geosciences use to organize the Earth conceptually. This is
the conceptual perspective of pedology and edaphology, the two main
branches of soil science. Pedology is the study of soil in its natural
setting. Edaphology is the study of soil in relation to soil- dependent uses.
Both branches apply a combination of soil physics, soil-chemistry, and
soil-biology. Due to the numerous interactions between the
biosphere, atmosphere and hydrosphere that are hosted within the
pedosphere, more integrated, less soil-centric concepts are also valuable.
Many concepts essential to understanding of soil come from individuals
not recognised strictly as soil scientists. This highlights the
interdisciplinary nature of soil concepts.
Research
Dependence on and curiosity about soil, exploring the diversity
and dynamic of this resource continues to yield fresh discoveries and
insights. New avenues of soil research are compelled by a need to
understand soil in the context of climate change, greenhouse gases, and
carbon sequestration. Interest in maintaining the planet's biodiversity
and in exploring past cultures has also stimulated renewed interest in
achieving a more refined understanding of soil.
The rate of growth and type of species depend upon the mineral
composition of soil and parent rock. Plant nutrients are chiefly derived
from the weathering of minerals. The reserve and availability of
nutrients depends largely on the mineralogical composition of soils
and their parent material.
Geologically the rocks of the study area are of Pre-Cambrian
to early Paleozoic in age with recent and sub recent deposits.
The forest types of the areas are Himalayan moist temperate forests
as per Champion & Seth (1968) with Quercus leucotrichophora,
Pinus roxburghii, Dalbergia sisoo, Acacia catechu, Cassia fistula, Shorea
robusta, Cedrus deodora, Lannea coromandelica, Terminalia belerica,
Miscellaneous (Bauhinia variegata) etc. as the dominant species.
Kempty Range of Mussoorie Forest Division covers an area of about
2,500 ha, but information on forest soil in relation to vegetation and
parent rock is meager (Raina et al. 2001; Raina and Jha, 2005). A few
studies on morphology, mineralogy, genesis and classification of
Himalayan soils and their correlation with vegetation have been carried
out (Yadav, 1963; Singh et al., 1989, Singhal et al., 1989 Minhas et al.,
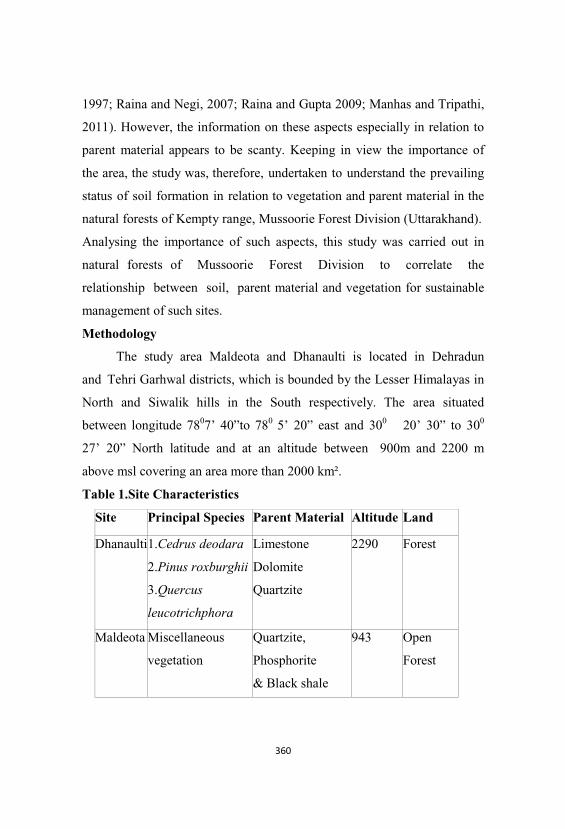
1997; Raina and Negi, 2007; Raina and Gupta 2009; Manhas and Tripathi,
2011). However, the information on these aspects especially in relation to
parent material appears to be scanty. Keeping in view the importance of
the area, the study was, therefore, undertaken to understand the prevailing
status of soil formation in relation to vegetation and parent material in the
natural forests of Kempty range, Mussoorie Forest Division (Uttarakhand).
Analysing the importance of such aspects, this study was carried out in
natural forests of Mussoorie Forest Division to correlate the
relationship between soil, parent material and vegetation for sustainable
management of such sites.
Methodology
The study area Maldeota and Dhanaulti is located in Dehradun
and Tehri Garhwal districts, which is bounded by the Lesser Himalayas in
North and Siwalik hills in the South respectively. The area situated
between longitude 7807’ 40”to 780 5’ 20” east and 300 20’ 30” to 300
27’ 20” North latitude and at an altitude between 900m and 2200 m
above msl covering an area more than 2000 km².
Table 1.Site Characteristics
Site Principal Species Parent Material Altitude
( )
Land
Dhanaulti1.Cedrus deodara
2.Pinus roxburghii
3.Quercus
leucotrichphora
Limestone
Dolomite
Quartzite
2290 Forest
Maldeota Miscellaneous
vegetation
Quartzite,
Phosphorite
& Black shale
943 Open
Forest
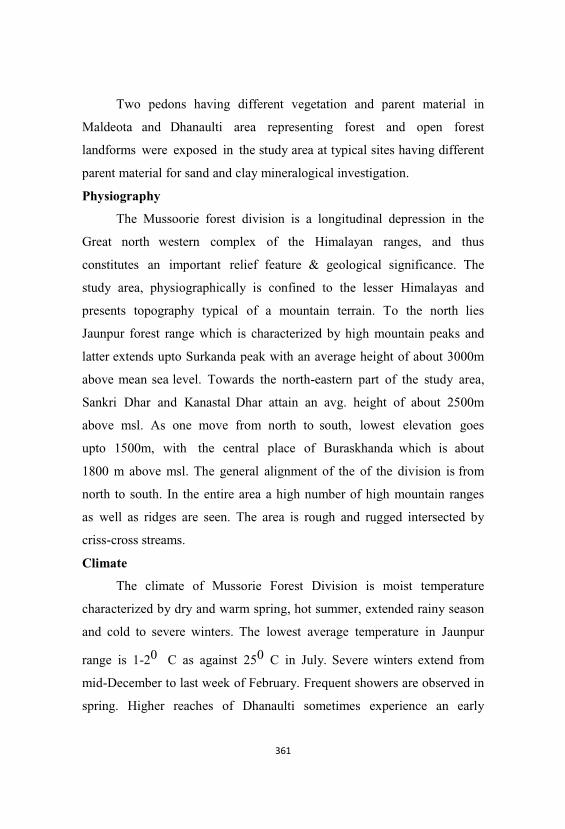
Two pedons having different vegetation and parent material in
Maldeota and Dhanaulti area representing forest and open forest
landforms were exposed in the study area at typical sites having different
parent material for sand and clay mineralogical investigation.
Physiography
The Mussoorie forest division is a longitudinal depression in the
Great north western complex of the Himalayan ranges, and thus
constitutes an important relief feature & geological significance. The
study area, physiographically is confined to the lesser Himalayas and
presents topography typical of a mountain terrain. To the north lies
Jaunpur forest range which is characterized by high mountain peaks and
latter extends upto Surkanda peak with an average height of about 3000m
above mean sea level. Towards the north-eastern part of the study area,
Sankri Dhar and Kanastal Dhar attain an avg. height of about 2500m
above msl. As one move from north to south, lowest elevation goes
upto 1500m, with the central place of Buraskhanda which is about
1800 m above msl. The general alignment of the of the division is from
north to south. In the entire area a high number of high mountain ranges
as well as ridges are seen. The area is rough and rugged intersected by
criss-cross streams.
Climate
The climate of Mussorie Forest Division is moist temperature
characterized by dry and warm spring, hot summer, extended rainy season
and cold to severe winters. The lowest average temperature in Jaunpur
range is 1-20 C as against 250 C in July. Severe winters extend from
mid-December to last week of February. Frequent showers are observed in
spring. Higher reaches of Dhanaulti sometimes experience an early
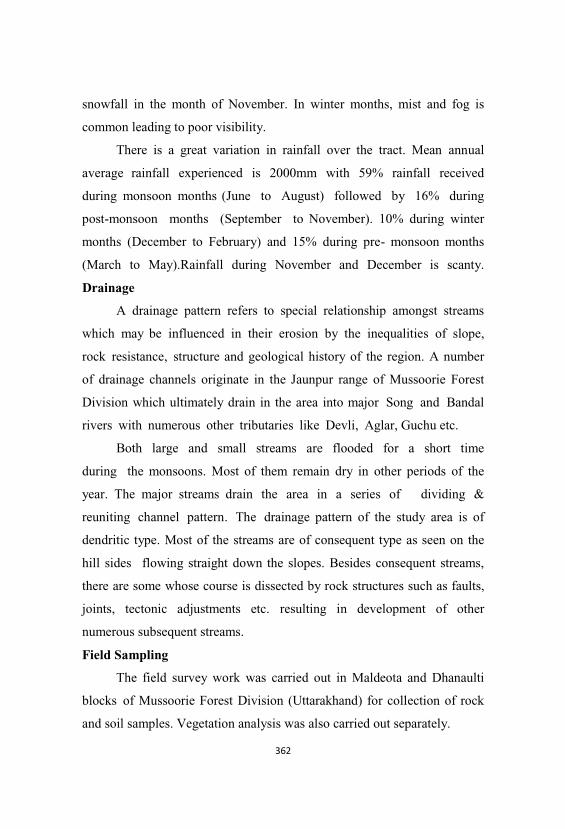
snowfall in the month of November. In winter months, mist and fog is
common leading to poor visibility.
There is a great variation in rainfall over the tract. Mean annual
average rainfall experienced is 2000mm with 59% rainfall received
during monsoon months (June to August) followed by 16% during
post-monsoon months (September to November). 10% during winter
months (December to February) and 15% during pre- monsoon months
(March to May).Rainfall during November and December is scanty.
Drainage
A drainage pattern refers to special relationship amongst streams
which may be influenced in their erosion by the inequalities of slope,
rock resistance, structure and geological history of the region. A number
of drainage channels originate in the Jaunpur range of Mussoorie Forest
Division which ultimately drain in the area into major Song and Bandal
rivers with numerous other tributaries like Devli, Aglar, Guchu etc.
Both large and small streams are flooded for a short time
during the monsoons. Most of them remain dry in other periods of the
year. The major streams drain the area in a series of dividing &
reuniting channel pattern. The drainage pattern of the study area is of
dendritic type. Most of the streams are of consequent type as seen on the
hill sides flowing straight down the slopes. Besides consequent streams,
there are some whose course is dissected by rock structures such as faults,
joints, tectonic adjustments etc. resulting in development of other
numerous subsequent streams.
Field Sampling
The field survey work was carried out in Maldeota and Dhanaulti
blocks of Mussoorie Forest Division (Uttarakhand) for collection of rock
and soil samples. Vegetation analysis was also carried out separately.
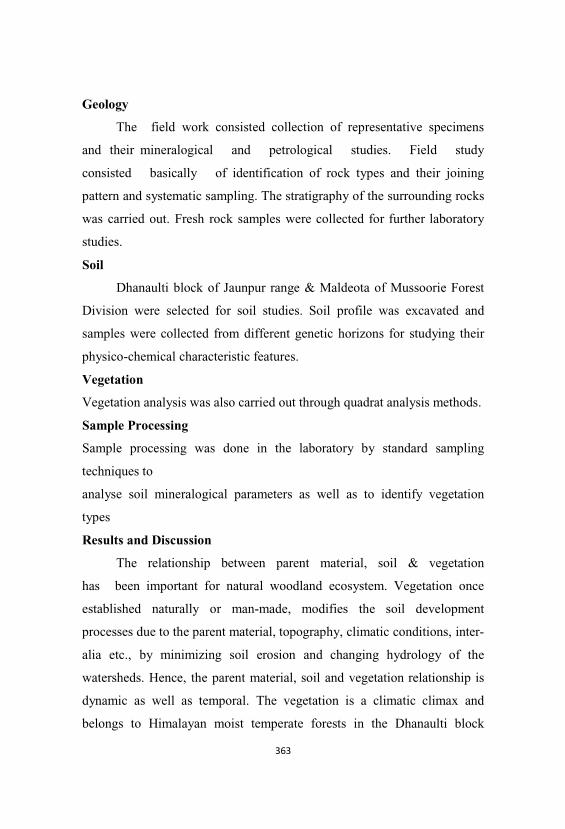
Geology
The field work consisted collection of representative specimens
and their mineralogical and petrological studies. Field study
consisted basically of identification of rock types and their joining
pattern and systematic sampling. The stratigraphy of the surrounding rocks
was carried out. Fresh rock samples were collected for further laboratory
studies.
Soil
Dhanaulti block of Jaunpur range & Maldeota of Mussoorie Forest
Division were selected for soil studies. Soil profile was excavated and
samples were collected from different genetic horizons for studying their
physico-chemical characteristic features.
Vegetation
Vegetation analysis was also carried out through quadrat analysis methods.
Sample Processing
Sample processing was done in the laboratory by standard sampling
techniques to
analyse soil mineralogical parameters as well as to identify vegetation
types
Results and Discussion
The relationship between parent material, soil & vegetation
has been important for natural woodland ecosystem. Vegetation once
established naturally or man-made, modifies the soil development
processes due to the parent material, topography, climatic conditions, inter-
alia etc., by minimizing soil erosion and changing hydrology of the
watersheds. Hence, the parent material, soil and vegetation relationship is
dynamic as well as temporal. The vegetation is a climatic climax and
belongs to Himalayan moist temperate forests in the Dhanaulti block
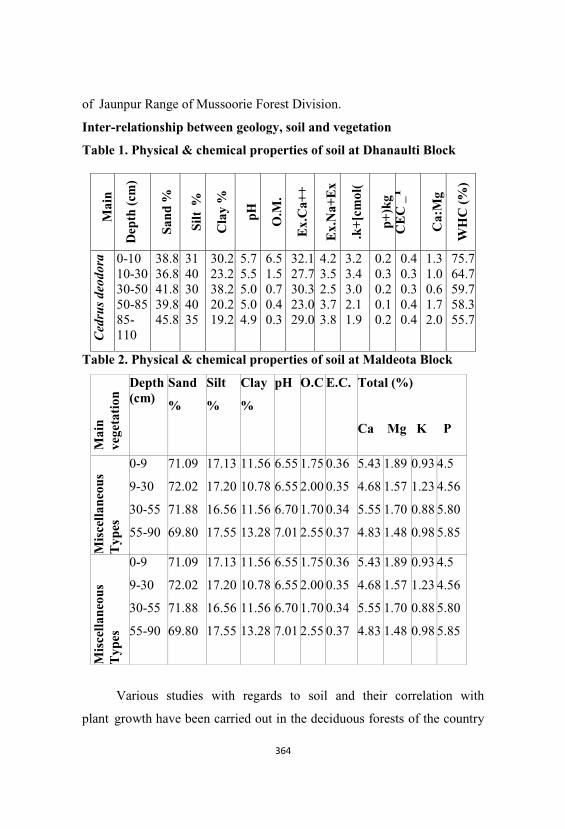
of Jaunpur Range of Mussoorie Forest Division.
Inter-relationship between geology, soil and vegetation
Table 1. Physical & chemical properties of soil at Dhanaulti Block
Table 2. Physical & chemical properties of soil at Maldeota Block
Mai
nve
geta
tion
Depth(cm)
Sand
%
Silt
%
Clay
%
pH O.C E.C. Total (%)
Ca Mg K P
Mis
cella
neou
sT
ypes
0-9
9-30
30-55
55-90
71.09
72.02
71.88
69.80
17.13
17.20
16.56
17.55
11.56
10.78
11.56
13.28
6.55
6.55
6.70
7.01
1.75
2.00
1.70
2.55
0.36
0.35
0.34
0.37
5.43
4.68
5.55
4.83
1.89
1.57
1.70
1.48
0.93
1.23
0.88
0.98
4.5
4.56
5.80
5.85
Mis
cella
neou
sT
ypes
0-9
9-30
30-55
55-90
71.09
72.02
71.88
69.80
17.13
17.20
16.56
17.55
11.56
10.78
11.56
13.28
6.55
6.55
6.70
7.01
1.75
2.00
1.70
2.55
0.36
0.35
0.34
0.37
5.43
4.68
5.55
4.83
1.89
1.57
1.70
1.48
0.93
1.23
0.88
0.98
4.5
4.56
5.80
5.85
Various studies with regards to soil and their correlation with
plant growth have been carried out in the deciduous forests of the country
Mai
n iD
epth
(cm
)
Sand
%
Silt
%
Cla
y%
pH O.M
.
Ex.
Ca+
+
Ex.
Na+
Ex
.k+[
cmol
(
p+)k
gC
EC
_1
Ca:
Mg
WH
C(%
)
Ced
rus
deod
ora 0-10
10-3030-5050-8585-110
38.836.841.839.845.8
3140304035
30.223.238.220.219.2
5.75.55.05.04.9
6.51.50.70.40.3
32.127.730.323.029.0
4.23.52.53.73.8
3.23.43.02.11.9
0.20.30.20.10.2
0.40.30.30.40.4
1.31.00.61.72.0
75.764.759.758.355.7
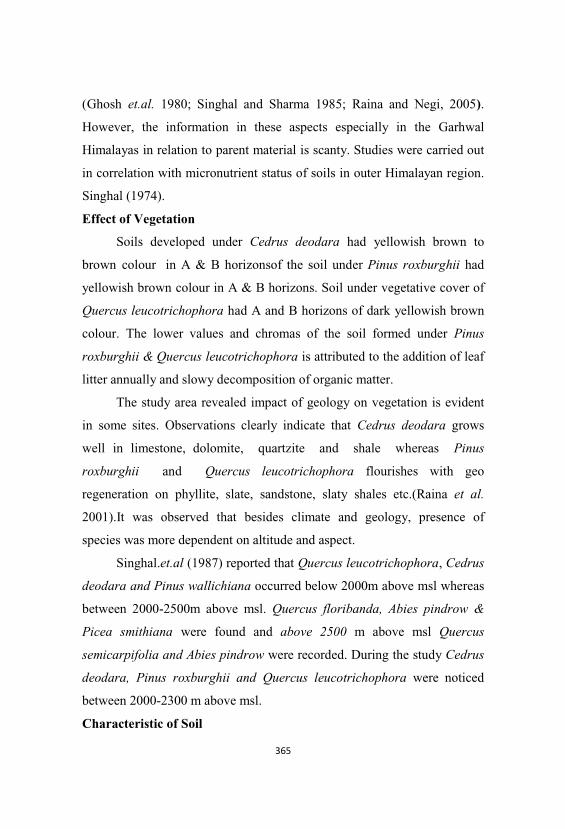
(Ghosh et.al. 1980; Singhal and Sharma 1985; Raina and Negi, 2005).
However, the information in these aspects especially in the Garhwal
Himalayas in relation to parent material is scanty. Studies were carried out
in correlation with micronutrient status of soils in outer Himalayan region.
Singhal (1974).
Effect of Vegetation
Soils developed under Cedrus deodara had yellowish brown to
brown colour in A & B horizonsof the soil under Pinus roxburghii had
yellowish brown colour in A & B horizons. Soil under vegetative cover of
Quercus leucotrichophora had A and B horizons of dark yellowish brown
colour. The lower values and chromas of the soil formed under Pinus
roxburghii & Quercus leucotrichophora is attributed to the addition of leaf
litter annually and slowy decomposition of organic matter.
The study area revealed impact of geology on vegetation is evident
in some sites. Observations clearly indicate that Cedrus deodara grows
well in limestone, dolomite, quartzite and shale whereas Pinus
roxburghii and Quercus leucotrichophora flourishes with geo
regeneration on phyllite, slate, sandstone, slaty shales etc.(Raina et al.
2001).It was observed that besides climate and geology, presence of
species was more dependent on altitude and aspect.
Singhal.et.al (1987) reported that Quercus leucotrichophora, Cedrus
deodara and Pinus wallichiana occurred below 2000m above msl whereas
between 2000-2500m above msl. Quercus floribanda, Abies pindrow &
Picea smithiana were found and above 2500 m above msl Quercus
semicarpifolia and Abies pindrow were recorded. During the study Cedrus
deodara, Pinus roxburghii and Quercus leucotrichophora were noticed
between 2000-2300 m above msl.
Characteristic of Soil
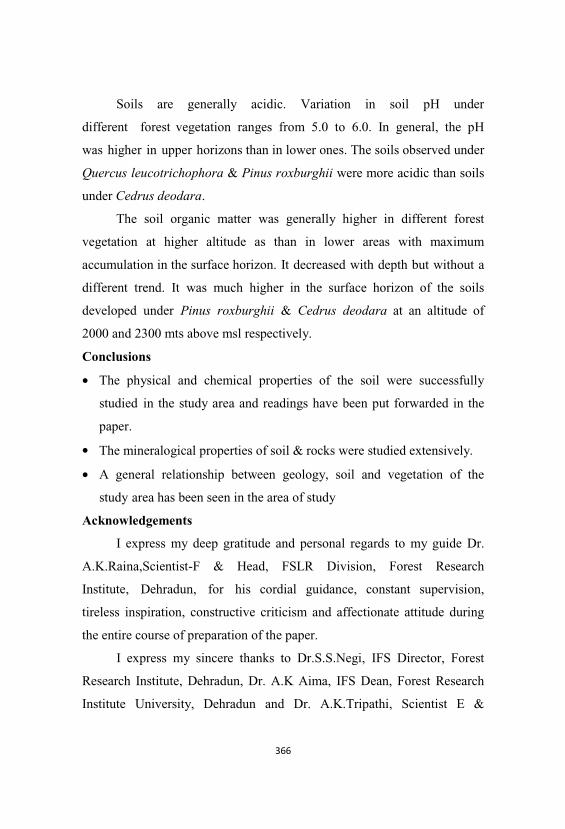
Soils are generally acidic. Variation in soil pH under
different forest vegetation ranges from 5.0 to 6.0. In general, the pH
was higher in upper horizons than in lower ones. The soils observed under
Quercus leucotrichophora & Pinus roxburghii were more acidic than soils
under Cedrus deodara.
The soil organic matter was generally higher in different forest
vegetation at higher altitude as than in lower areas with maximum
accumulation in the surface horizon. It decreased with depth but without a
different trend. It was much higher in the surface horizon of the soils
developed under Pinus roxburghii & Cedrus deodara at an altitude of
2000 and 2300 mts above msl respectively.
Conclusions
• The physical and chemical properties of the soil were successfully
studied in the study area and readings have been put forwarded in the
paper.
• The mineralogical properties of soil & rocks were studied extensively.
• A general relationship between geology, soil and vegetation of the
study area has been seen in the area of study
Acknowledgements
I express my deep gratitude and personal regards to my guide Dr.
A.K.Raina,Scientist-F & Head, FSLR Division, Forest Research
Institute, Dehradun, for his cordial guidance, constant supervision,
tireless inspiration, constructive criticism and affectionate attitude during
the entire course of preparation of the paper.
I express my sincere thanks to Dr.S.S.Negi, IFS Director, Forest
Research Institute, Dehradun, Dr. A.K Aima, IFS Dean, Forest Research
Institute University, Dehradun and Dr. A.K.Tripathi, Scientist E &
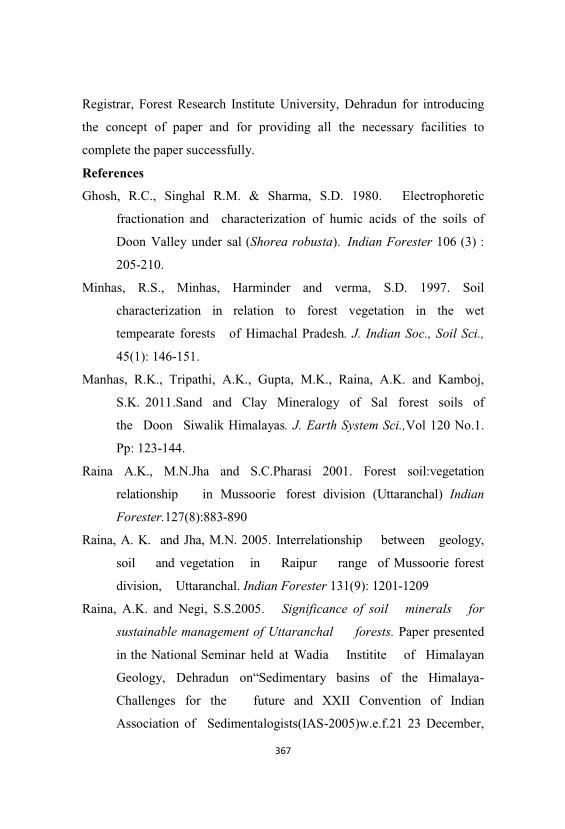
Registrar, Forest Research Institute University, Dehradun for introducing
the concept of paper and for providing all the necessary facilities to
complete the paper successfully.
References
Ghosh, R.C., Singhal R.M. & Sharma, S.D. 1980. Electrophoretic
fractionation and characterization of humic acids of the soils of
Doon Valley under sal (Shorea robusta). Indian Forester 106 (3) :
205-210.
Minhas, R.S., Minhas, Harminder and verma, S.D. 1997. Soil
characterization in relation to forest vegetation in the wet
tempearate forests of Himachal Pradesh. J. Indian Soc., Soil Sci.,
45(1): 146-151.
Manhas, R.K., Tripathi, A.K., Gupta, M.K., Raina, A.K. and Kamboj,
S.K. 2011.Sand and Clay Mineralogy of Sal forest soils of
the Doon Siwalik Himalayas. J. Earth System Sci.,Vol 120 No.1.
Pp: 123-144.
Raina A.K., M.N.Jha and S.C.Pharasi 2001. Forest soil:vegetation
relationship in Mussoorie forest division (Uttaranchal) Indian
Forester.127(8):883-890
Raina, A. K. and Jha, M.N. 2005. Interrelationship between geology,
soil and vegetation in Raipur range of Mussoorie forest
division, Uttaranchal. Indian Forester 131(9): 1201-1209
Raina, A.K. and Negi, S.S.2005. Significance of soil minerals for
sustainable management of Uttaranchal forests. Paper presented
in the National Seminar held at Wadia Institite of Himalayan
Geology, Dehradun on“Sedimentary basins of the Himalaya-
Challenges for the future and XXII Convention of Indian
Association of Sedimentalogists(IAS-2005)w.e.f.21 23 December,
2005.
Raina, A. K. and Negi S.S.2007. Soil mineral relationship with different
forest types in Mussoorie forest division of Uttaranchal, India
Himalayn Geology 28(1):79-86
Raina, A.K and Gupta, M.K.2009. Soil and vegetation studies in
relation to parent material of Garhwal Himalaya, Uttarakhand,
India”. Ann. For. 17 (1) : 71 – 82
Raina, A.K. and Gupta, M.K. 2009. Soil characteristics in relation to
vegetation and parent material under different forest covers in
Kempty forest range, Uttarakhand forests. Indian Forester 135 (3):
331 -341
Singh, R.P., Gupta, M.K. and Singhal, R. M. 1989. Seasonal moisture
variation under high altitude coniferous forests of Himachal
Pradesh. J. Nat. Con.1 (2): 143-153.
Singhal, R.M. (1974). Micro-nutrient status of some forest soils
of outer Himalayas. Forestry Conference, Dehra Dun.
Singhal, R.M. and Sharma, S.D.1987. Biochemical and elemental
composition of sal (Shorea robusta) litter of Dehra Dun forests
(Uttar Pradesh). Indian J. Forestery 10 (2) : 111-113.
Singhal, R.M., Kumar, P. and Sharma, S.D.1987. Study of the humus
forms in some ecosystems of Chakrata Forest, (Dehradun) U.P.,
Indian Forester 113 (2): 117-126.
Singhal, R.M. and Sharma, S.D. 1985. Study of the soils of Doon Valley
forests.J. Indian Soc. Soil Sci. 33 : 627-634.
Singhal, R.M. and Sharma, S.D. 1985. Nature and properties of soil
humus substances of Doon Valley forests. J. Indian Soc. Soil Sci.
33 : 896-898.
Singhal, R.M., Soni, S. and Sharma, S.D. 1989. Study of the soils of

Mussoorie area (Gharwal Himalyas). Indian Forester 15 (12) : 924-
933.
Yadav, J.S.P. 1963. Studies on soil profiles in Chakrata Forest Division
of U.P.Indian Forester. 89 (1): 18 – 38.
Valdiya, K.S. 1980. Geology of Kumaon lesser Himalaya. Wadia
Institute of Himalayan Geology. Dehradun.
Tree Inventory-A Management Tool in Landscape Restoration and
Management
Ramesh Madav and Gouri Keskar
Terracon Ecotech Pvt. Ltd., 6th Floor, ‘Swagat’
Shraddhanand Road,
Vile Parle (East), Mumbai- 400 057, India,
Abstract
Landscape alteration for essential development is major
environmental problem across the globe.Forests, which have provided
the human race with wide range of products and services, have often
been used extravagantly and thereby either becoming fragmented or
diverted to non forestry uses. Landscape changes due to growing need of
infrastructure and development in developing regions lead to damage in
the natural vegetation cover. This necessitates restoration and
management of landscapes. Although restoration should be a key element,
this does not mean simply getting as much forest cover back as possible. A
more comprehensive approach to restoration should emphasize the
importance of both the quality and quantity of tree cover. Qualitative and
quantitative assessment of tree cover is a step towards landscape
restoration, which can be made easy with the help of ‘Tree Inventory’.
Tree inventory is used to create and use baseline information on trees
which facilitates better provision of trees in proposed development areas.
It regulates adequate number of new trees in those areas; growing need and
importance of preserving biodiversity that we already have. For e.g., the
tree inventory of proposed Bangalore Chennai expressway predicts the
impact of development of highway and the need of qualitative and
quantitative plantation post completion of the project. With the available
baseline data one can analyze the need of plantation and can better select
the tree species according to the native trees present pre project. Tree
inventory has capacity to enhance and regenerate the urban landscapes
with natural benefits and services provided by ecosystems in their natural
state.
Keywords: Tree inventory, landscape restoration, habitat fragmentation
Introduction
Human activities can leave landscape features that are present for a
long time.These can impact the natural environment in many ways.
Features such as roads, power transmission lines, seismic lines and
pipelines create new corridors that influence human and animal
movement patterns. Land use activities impact the natural environment
in many ways. Some activities remove vegetation and add to the
fragmentation of the natural landscape for many generations.
Vegetation plays a significant role in the ecosystem and is considered as a
major factor which is affected due to infrastructure activities.
The fact is that tree cover no longer dominates many forest
landscapes. In some areas, the current land-use configuration has led to a
dramatic and detrimental decline in the availability of forest goods and
services. In such degraded landscapes, agricultural production tends to
suffer, local shortages of timber and fuel wood prevail, household
income falls, and biological diversity declines. Often, the effects of
landscape degradation are felt further ownstream – siltation loads increase
and water quality declines. Forest landscape restoration can help reverse
some of the more severe impacts of forest loss and degradation.
The foremost step towards restoration of fragmentation caused by
building new infrastructure and reconstruction is assessing the total
vegetation cover before any development activity takes place. Restoration
in this generation not only means restoring the habitats which have already
been destroyed but also taking care that the development activities will
not impact the forest patches. Tree inventory is not only essential for
assessing the present forest cover for bringing back the forest cover after
completion of the project but also for better planning of the project. This
highlights maintaining the eco-sensitive patches of the forest, maintaining
the significant habitats at the site and taking care that the wildlife is least
affected. This paper focuses on tree inventory which assesses the forest
cover or urban vegetation cover to restore the vegetation in accordance
with current infrastructural developments. Moreover tree inventory
facilitates to study the landscape ecology of the site. It is the study of the
interaction between abiotic and biotic landscape components in space and
time and the related flora and fauna (Vink,1980; Naveh and Lieberman,
1984; Forman and Godron, 1986). As flora forms the fundamental factor of
the ecosystem, it is essential to assess and restore it in a form which will be
beneficial for mutual relationship of human and nature.
Overview of Current Situation
Infrastructure in India is described as vast land of construction
opportunity.The physical presence of roads and railways in the
landscape creates new habitat edges, alters hydrological dynamics, and
disrupts natural processes and habitats. Maintenance and operational
activities contaminate the surrounding environment with a variety of
chemical pollutants and noise. In addition, infrastructure and traffic impose
movement barriers to most terrestrial animals and cause the death of
millions of individual animals per year. The various biotic and abiotic
impacts operate in a synergetic way locally as well as at a broader scale.
Transportation infrastructure causes not only the loss and isolation of
wildlife habitat, but leads to a fragmentation of the landscape in a literal
sense.
Vegetation provides habitat to wildlife and ecosystem services
such as food and fuel and many other products to humans. Vegetation
defines landscapes in people’s minds, and is an essential component of
any biome or environment. The movement of organisms is a fundamental
property of life. Plants ‘move’ passively via natural (e.g. wind, water, and
animals) or human (e.g. vehicles) vectors that transport their pollen or
seeds (Verkaar 1988; Wace 1977). Few studies have been carried out to
investigate the effect of infrastructure on plant movements, but there is
evidence that weeds and many exotic plant species spread along
infrastructure verges into adjacent habitats. Animals are more directly
affected by infrastructure barriers.
With over 33 lakh kilometers of roadways, India has the second
largest road network in the world. It includes all types of roads - paved
roads, unpaved roads , national highways, state highways, major district
roads, minor district roads, village roads, link roads etc. The national
highways with a length of over 70, 548 kilometers, account for 2% of the
total road network but carry 40% of the movement of goods and
passengers. State Highways have a total length of 1, 31,899 km, major
district roads-4,67,763 km; rural and other roads 26,50,000 km. The Indian
Government, via the National Highway Development Program (NHDP),
is planning more than 200 projects in NHDP Phase III and V to be bid
out, representing around 13,000 km of roads. In order to foster the
economic and social growth of the developing nation, central government
of India has initiated various road construction projects to increase the
road connectivity network across the nation. National Highways
Authority of India (NHAI) has decided to take up about 1000 km of
expressways under Phase-VI of the National Highways Development
Project (NHDP).The paper covers one of the case studies of the
infrastructure project under NHDP and highlights the need of tree
inventory and its importance in landscape restoration strategy.
Tree Inventory in Development Projects
Restoring urban landscapes requires development of green belt
along the verges of the developing road structures. It serves as habitat as
well as a corridor for many species, restoring and reserving the native
potential of the habitat. Tree inventory facilitates establishment of such
structures with vegetation along the verges.
Numerous inventories indicate the great potential of verges to
support a diverse range of plant and animal species (e.g. Hansen and
Jensen 1972; Hansen 1982; Mader et al. 1983; Van der Sluijs and Van
Bohemen 1991; Sjölund et al. 1999). In areas, where much of the native
vegetation has been destroyed due to agriculture, forestry or urban
development, verges can serve as a last resort for wildlife (Loney and
Hobbs 1991). Shrubs and trees can provide valuable nesting sites for birds
and small mammals (Adams and Geis 1973; Laursen 1981; Havlin 1987;
Meunier et al. 1999) and also offer food and shelter for larger species
(Klein 1971; Rost and Bailey 1979). Other elements of the
infrastructure itself can also provide attractive, yet sometimes hazardous,
habitat for wildlife. Careful design, management and maintenance of these
structures are required in order to minimize the potentially negative
impacts on the wildlife. It is not surprising that species, which regularly
visit road corridors to forage or nest, feature frequently in traffic mortality
statistics. In this respect,infrastructure corridors may act as an ecological
trap, outwardly offering favourable habitat conditions but with the hidden
high risk of mortality. When designing and managing verges, it is
therefore advisable to consider the risk of creating an ecological trap
that may kill more species than it sustains.
It is clear that infrastructure verges can facilitate animal movement
and enable the spread of plants and other sessile species. It may therefore
seem feasible to integrate infrastructure corridors into the existing (natural)
ecological network. Considering the unavoidable need of development
of infrastructure for human progress, the solution of establishing green
cover in the modern landscapes is of current interest. The vegetation
along the verges of the modern infrastructure has its own pros and cons
but tree inventory of the patches under development can help infrastructure
planners to layout a vegetation plan which will least affect the native
habitat of the project site and offer least disturbing habitat to biotic
components.
To minimize the conflicts between the developmental activities in
forest patches and wildlife, a more comprehensive approach to restoration
should emphasize the importance of both the quality and quantity of tree
cover. Such integrated assessment is possible through tree inventory.
Tree Inventory / Tree Census.
In dealing with habitat fragmentation, a distinction has to be made
by between fragmentation caused by the existing infrastructure network
and the fragmentation caused by building new infrastructure and
reconstruction. Tree inventory is a tool to assess vegetation of both the
types of infrastructure networks as well as of any development
project.
The collection of a database that characterizes trees and their
locations which is then used to achieve management objectives is called
Tree Inventory. On the same lines of Human Census, the concept of tree
inventory is introduced to measure the area under green cover and
number of trees in the jurisdiction / project area. Various ratios can be
derived from this data such as tree to human population, concentration of
species as also percentage of area covered under green cover etc.
Importance of Tree Inventory
Tree inventory helps to manage & analyze information related to
trees and take decisions effectively and efficiently for further plantation or
removal of trees in particular areas. Due to rapid industrialization and
urbanization, corporations and organizations are required to take steps for
tree plantation, protection of existing trees and preparation of proposal of
compensatory afforestation.Tree inventory is largely carried out by
municipal corporations, large institutions, development agencies and
industries for plans for development of tree cover.
While it is mandatory for corporations and industries to develop and
maintain green belts, tree inventory is the first step to collect base line data
that can be utilized for other green initiatives.Calculations of Carbon
credits and carbon sequestration mechanism will also need proper and
authentic tree inventory data for validations and assessment. Similarly
development of infrastructure needs quantitative and qualitative
assessments of the tree cover which helps in better planning and
management for restoring the vegetation cover of the site. Tree inventory
is useful in effective landscape tree management; it creates a baseline data
for setting management objectives; used as resource for creating plan to
meet management objectives; it provides information to educate and
persuade customers and constituents and also provides data to justify
maintenance recommendations and contract estimates.
Process of Tree Inventory
Tree Inventory means counting of trees which have woody stem or
trunk with a minimum girth of 10 cm and height of more than 4 ft from the
ground level. Tree inventory help us identify species composition, tree size
distribution, tree condition, prevalent defects and disorders, maintenance
needs. It also helps inventory-facilitated management activities like - tree
risk management, tree health management, species diversity management,
maintenance need assessment and prioritization,tree planting and removal
planning and prioritization. It allows us to measure inventory-based
management outcomes like improved communication, improved efficiency
and effectiveness in management activities, healthier, less-hazardous trees,
improved service and satisfaction to citizensof the locality.
Terracon Ecotech Pvt. Ltd. (Terracon) has pioneered the
activity of Tree Inventory in India. With a team of qualified experts in the
field of GIS, GPS, Botany, Taxonomy, Environment science
etc,Terracon has developed a systematic & organized process for tree
inventory.Terracon has qualified botanists and competent field officers
supported with industry’s most modern technology & gadgets for tree
inventory. Field officers are equipped with GPS devices which map
exact tree location with latitude and longitude values. Field assistant then
enters information of other observations of tree. All this information is
then transferred to server and then to VrukshSharad software.
VrukshSharad is Terracon’s proprietary software that allows users to
monitor & analyze tree inventory information with various analytical tools
and tree knowledge bank.
Terracon uses various equipments and accessories like PDA or GPS
device, Desktop PC / Laptops,Server City, Server Master, Tree inventory
Software viz. VrukshSharad, maps, measuring tapes etc.Before going to
field, Inventory Planning is carried out in order to determine the purpose of
the tree inventory, the data needed to meet that purpose & the resources
needed to collect the data.Accordingly, procedure is developed for how to
collect baseline data from the field.
Terracon has a knowledge bank of more than 600 plant species.
Each and every plant species is identified, counted & recorded with
Latitude / Longitude value of that plant. If field officer finds new species,
he brings back taxonomically identifiable parts of that plant (viz. leaves,
flowers, fruits, etc) to office and confirms it with senior taxonomists and /
or books and journals. The knowledge is also updated in our knowledge
bank. Counting of trees is done area wise. Tree Location & ownership of
land is classified as i.e. government, private, industry, road side, or any
other premises; health status of tree is classified as. healthy, infested,
dangerous and dead.
For every tree inventory activity, Senior Plant Taxonomist is
monitoring over all process technically,and Coordinator, team leader,
experienced Field officers (B. Sc. or M. Sc. with Specialization in Plant
Taxonomy), Field assistants, admin support as programmers, data entry
operators, data analysts. Tree Inventory report is then prepared with count
of trees. Tabular representation of each and every tree is drafted with
following 15 observations –
1. Latitude and Longitude reading
2. Tree Number
3. Common name
4. Girth
5. Approximate height
6. Approximate age
7. Approximate canopy cover
8. Tree ownership classified as Government, Private, Industry, Road
side or
Other
9. Information on Importance of fruit, aesthetic, cultural, economic
and ecological aspects of tree species
10. Condition of the tree
11. Botanical name
12. Family name
13. Colour photograph of a few peculiar / rare species
14. Total trees and types found in the location
15. Remarks or Recommendations for plantation
Such assessment of the project area makes restoration activities easy
and is a ready handed tool which can be used for any development project
in accordance with the need of the native habitat.
Case Study
Project: Inventory of Trees on the Proposed Bangalore Chennai
National Expressway under NHDP
NHAI awarded work of development of an expressway
corridor between Bangalore and Chennai to facilitate high speed travel in
this corridor. The existing National Highway which is running parallel to
the proposed expressway carries one of the highest traffic carrying
corridors in India.
As a part of ecological study of the area, Terracon carried out tree
inventory for a stretch of 259 km belt going through 3 states viz;
Karnataka, Andhra Pradesh and Tamil Nadu. Elaborative study on the
tree species observed was carried out during the survey. The report
contains list of the trees with respect to chainages, species wise count of
the trees with their common & scientific names, list of trees along with
their multilingual names, list of rare and endangered species, list of
medicinal tree species and list of dominant species in surveyed area. The
report is also supported with photographs of some of the key species
observed in the field.
Location- Bangalore-Chennai Expressway Project in the States of
Karnataka, Andhra Pradesh and Tamil Nadu.
Distance- Bangalore (Haskote) – Chennai (Shriperumbudur) 260 km
Spur- Bhangarpeth – Betmangla to Bangalore-Chennai Expressway (52
km chinage) 2 km
Forest patch- 13 -14 km length, 120 m width
Width- 120 m
Inventory period- 18th October 2010 to 29th October 2010
The detailed study of the trees of project site enables to summarize
ecological health of the ecosystem as trees form the major link between the
biotic factors of the environment. The study site included agricultural
lands, residential areas, villages and 2 reserve forests viz., 8 km in to
Palamner Reserve Forest (RF) and 1 km in to Bodabanda RF in the state of
Andhra Pradesh. The survey yielded 2, 04,442 tree individuals of 124
species. The road chainage will severely impact the status of these 2 lakh
trees counted during the survey. The amount of damage will still be
restricted to commercial and cultivable trees as top 5 species comprise of
common trees like Nilgiri, Mango,Coconut, Toddy and Neem. The table
below gives the number of each tree species which will be suffered.
Composition of trees in the area subjected to suffer due to project
activity.
Eucalyptus globulus Labill. 1,52,886
Mangifera indica L. 20,541
Cocos nucifera Linn. 6,867
Borassus flabellifer L. 3,999
Azadirachta indica A. Juss 2,503
.
The study suggests that the flora of this 260 km long stretch is
monotonous as it is dominated by Eucalyptus which amounts to be 75 %
of the total trees counted during the survey. Thus as the area is
monotonous, the impact can be reduced by restoration.
In the survey, the 8 km of chainage that passes through Palamner
reserve should be treated as critical as it holds up about 5,567
individuals of 31 species of trees. This area shows unique diversity and
has a presence of 338 individuals of Chloroxylon swietenia DC which is
classified as vulnerable by International Union for Conservation of Nature
(IUCN) standards. Necessary steps should be taken to mitigate and reduce
the impacts. Restoration of the same number may be an ideal option. The
tree inventory report also notes it with concern that, the tree specific
survey is still not covering the status of the reserve forest when
considered with shrubs, climbers and other vegetation that may not
be fitted in definition of trees. Such vegetation that doesn’t amount to be
the trees can still play critical role in ecosystems. In concern with the
palamner RF this comment shall be considered critically.
During the overall survey, 2 species were found to be vulnerable
(Chloroxylon swietenia DC and Santalum album Linn.) and 1 species
which is critically endangered (Nothopegia castanaefolia Roth.) was
found.
To summarize, the impact as analyzed by the survey can be
mitigated by restoration and plantation of critically endangered
individuals. The tree inventory survey also suggests the mitigation
measures for the Highways and Expressways as per the Environmental
Impact Assessment Guidance Manual,MoEF.
• Tree plantation plan to compensate the trees cut can be prepared
as per the government Norms
• Possibility of tree transplantation should be examined
• Identification of sensitive natural environments in the early planning
stage so that alternative routes, changes in width of the road can be
examined
• Compensate the loss of forest coverage by appropriate
plantation programme.
• Survival rate of plants must be included in the contract specifications so
as to ensure that the compensatory plantation achieves its objective
• Development of green belt on either side of the highway consisting
of a variety of trees would help to enrich ecology of the area and add to
aesthetics.
• Regeneration of rare plants of economic importance including
medicinal plants
• Conservation plan for conservation and protection of flora, rare species
and medicinal plants
• The location for roadside green belt can be finalized keeping in view
of future expansion of the highway
Thus the intensive tree inventory survey not only assesses the
present forest cover but also gives the mitigation measures according to the
need of the project and helps conserve the natural status of the
environment.
Conclusions
Transportation infrastructure, notably roads and railways, strongly
contribute to the fragmentation of habitats. However, the long-term
consequences to nature are difficult to quantify and evaluate. Trees form
the major factor of the ecosystem and are directly and indirectly
responsible for maintaining the health of the ecosystem. The knowledge
of trees is essential to integrate ecological assessment and infrastructure or
development project planning processes. This need is fulfilled with the
help of tree inventory which is a ready hand tool for assessing the health
of the ecosystem and determining the impact of the development
project on the environment. Tree inventory helps to regain ecological
integrity and enhance human well-being in degraded landscapes. Thus it
helps in restoration activities with consideration of developments in
developing countries.
References
COST 341national state of art report Sweden Terracon Ecotech Pvt. Ltd,
October 2010, Inventory of trees on the proposed Bangalore Chennai
National Expressway under NHDP.
Elizabeth Montgomery, 2008, PricewaterhouseCoopers, Infrastructure in
India – A vast land of construction opportunityRuth Wenger,
Rosmarie Sommer, Susanne Wymann von Dach, Info Resources
Focus, Forest Landscape Restoration (FLR).
Seiler, Andreas and Folkeson, Lennart (eds.), 2006, Habitat Fragmentation
due to Transport Infrastructure,World wide fund for Nature’s
(WWF)/ International Union for Conservation of Nature’s (IUCN),
Forest Landscape Restoration
Web Sites referred:
http.//www.enr.gov.nt.ca/_live/pages/wpPages/soe_human_activities.aspx
http.//www.tnhighways.org/nh.htm.
Ecological Impact of Forest Fire on Undergrowth Diversity Under Ten
Years Old Teak Plantation of Tarai Forest in Haridwar Forest
Division, Uttarakhand
Nirmal Ram, Pramod Kumar and Lal Singh
Forest Ecology & Environment Division, Forest Research Institute,
Dehradun
Abstract
Nearly all countries, in every stage of economic development and in
every ecological zone are suffering with environmental, social and
economic consequences of forest fires. The frequency and intensity of
forest fires around the globe in recent years have become alarming. The
forest fire result in loss of vegetation, forest floor, destruction of soil, soil
and water erosion, wild animals, birds which tender the entire ecosystem
in-effective, resulting ecological imbalance. Forest undergrowth are first
victim of forest fire. Forest undergrowths play major ecological role for
providing shelter to fauna, protecting soil and water erosion, improving
soil fertility. In Uttarakhand forest fires are common phenomenon during
summer in every forest types. To assess the ecological impact of forest
fire on undergrowth diversity, under 10 years old teak plantation, a study
has been carried out in Chiriyapur forest range of Haridwar Forest
Division. Total density (ha-1) and basal area (m2ha-1) of the teak trees
were 600 and 18.28, respectively. Shrubs richness, density (ha-1),
diversity and evenness were 13, 1217, 1.84 and 0.50, respectively.
Herbaceous ecological status under unburnt and burnt forest floors during
rainy season did not show any changes in species richness but recorded
changes in species density, diversity and evenness than winter season.
Further herbaceous species richness, density, diversity and evenness during
winter and rainy season was recorded more under unburnt forest floor than
burnt forest floor. Similarity in herbaceous vegetation between unburnt
and burnt forest floor during winter season was 80% whereas it was 30%
during rainy season. Ageratum conyzoides and Parthenium hysterophorus
an alien species was found be invaded in the burnt forest floor. Besides in
burnt forest floor during rainy season the biomass production of grass was
487.5 kg ha-1 and biomass production of Parthenium was 300 kg ha-1
whereas in unburnt forest floor grass biomass production was merely
14.7 kg ha-1. Results indicate that fire invites invasion of weeds and
boosting the productivity of herbaceous and grass vegetation.
Keywords: Forest fire, diversity, similarity, biomass, invasion.
Introduction
Nearly all countries, in every stage of economic development and
in every ecological zone are suffering with environmental, social and
economic consequences of forest fires. The frequency and intensity of
forest fires around the globe in recent years have become alarming. The
forest fire result in loss of vegetation, forest floor, destruction of soil, soil
and water erosion, wild animals, birds which tender the entire ecosystem
in-effective, resulting ecological imbalance. Forest undergrowth is first
victim of forest fire. Forest undergrowths play major ecological role for
providing shelter to fauna, protecting soil and water erosion, improving
soil fertility. Ground flora diversity and biomass production from
plantations of different trees species of different agro-climatic zones varies
to a great extent (Sharma, et al, 1978; Mathur, et al, 1980; Mathur and
Soni, 1983; Singh et al, 1986; Prasad and Jalil, 1987; Chaudhery et
al. (1988); Prasad, 1992; Chakravarty and Mathur, 1992; Ram and Jana,
1997; Shadangi and Nath, 2005; Ram,2006;; Upadhyay et al., 2006;
Zonner et al.,2006; Kern et al., 2006; Mcdonald and Treena, 2007;
Gachet et al., 2007; Amin-Al et al., 2007) and have influences on
earthworms (Campan, et al, 2002). Fire impact on undergrowth diversity
and soil attributes have been studied by Srivastava (2006) and Ram
(2006). In Uttarakhand forest fires are common phenomenon during
summer in every forest types. To assess the ecological impact of forest fire
on undergrowth diversity, under 10 years old teak plantation, a study
has been carried out in Chiriyapur forest range of Haridwar Forest
Division.
Study Sites
Study sites in Chiriyapur Forests were located within
29047’472’’ to29048’905’’ N. to 78013’ 875’’ to 78015’616’’ E and
elevation range 266.7 to 286m msl. Maximum and minimum temperatures
are being experiences by area during May to June and December to
January. Average rainfall was 1171 mm. Maximum rainfall occurs during
July and August. Although monsoonal rainfall starts with effect from June
and lasted up to September, October – December experiences dry season.
Materials and Methods
For determination of phytosociological attributes of trees, shrubs
and herbs several quadrats of 10X10 m 5X5 m and 1X1 m size
respectively were laid out (Misra, 1968) under 10 years teak plantation.
Several 1X1 m sizes quadrats were laid out during winter and rainy
season to assess its phytosociological structure change season wise.
Following formula was used to determined structure of the species.
Diversity Index was calculated ( Shanon and Wiener (1963):
H' = (n1x N) log (n1x N) Where H= Diversity Index of Species
n1= Total number of individual of a species
N= Total number of individuals of all species in the stand
Richness of the species was counted as per encountered in study
plots. Similarly Index of the species between two stands was calculated
(Sorenson, 1948) as per following:
Similarity index = 2 C ------ X100 (A+B)
Where,C= Number of common species in both the stand. A= Total number
of species in one stand.;B= Total number of species in another stand.
Equitability/ Evenness was calculated as per Pielou (1975):
Evenness (E) = H'/Hmax= H logs
Where H'= Diversity Index Value of all species. Hmax= Number of
species in the stand. (S).For determination of undergrowth biomass five
harvest method (Ram & Jana, 1997) was used.
Results and Discussion
Total density and basal area of teak plantation 1997 was 600ha-1
and 18.28 m2 ha-1 respectively(Table 1). It can be seen from table 1 that
ecological status of shrubs under unburnt teak forest floor. Adhatoda
zeylanica shows maximum frequency (100%),density (514 ha-1), and
dominance (IVI 76.83). Total density of the shrubs was 1217 ha-1.
Diversity index of shrubs was 1.84.
Ecological status of herbs under unburnt forest floor during winter
and rainy season are given in table 2 and 3. It was found that during winter
season Aerva lanata shows 100% frequency followed by Sida acuta (80%)
whereas during rainy season Imperata cylindrica shows 100% distribution.
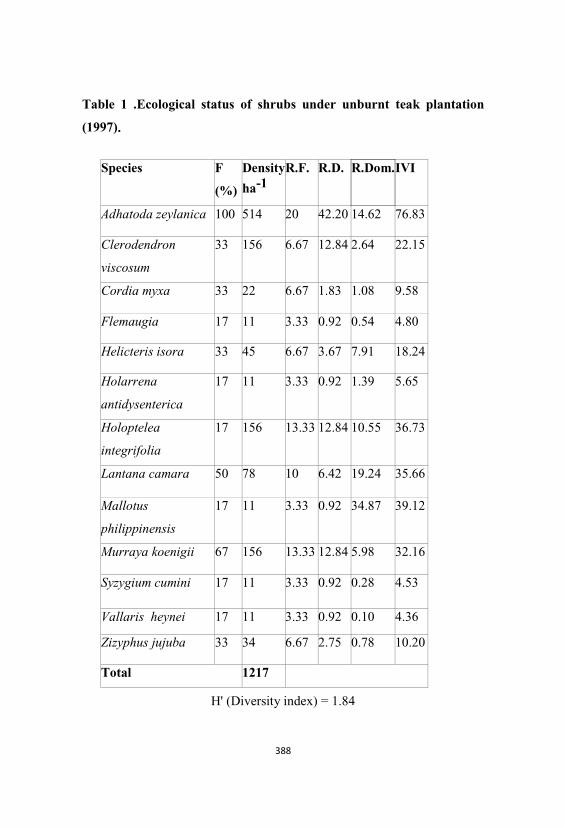
Table 1 .Ecological status of shrubs under unburnt teak plantation
(1997).
H' (Diversity index) = 1.84
Species F
(%)
Density
ha-1R.F. R.D. R.Dom.IVI
Adhatoda zeylanica 100 514 20 42.20 14.62 76.83
Clerodendron
viscosum
33 156 6.67 12.84 2.64 22.15
Cordia myxa 33 22 6.67 1.83 1.08 9.58
Flemaugia 17 11 3.33 0.92 0.54 4.80
Helicteris isora 33 45 6.67 3.67 7.91 18.24
Holarrena
antidysenterica
17 11 3.33 0.92 1.39 5.65
Holoptelea
integrifolia
17 156 13.33 12.84 10.55 36.73
Lantana camara 50 78 10 6.42 19.24 35.66
Mallotus
philippinensis
17 11 3.33 0.92 34.87 39.12
Murraya koenigii 67 156 13.33 12.84 5.98 32.16
Syzygium cumini 17 11 3.33 0.92 0.28 4.53
Vallaris heynei 17 11 3.33 0.92 0.10 4.36
Zizyphus jujuba 33 34 6.67 2.75 0.78 10.20
Total 1217
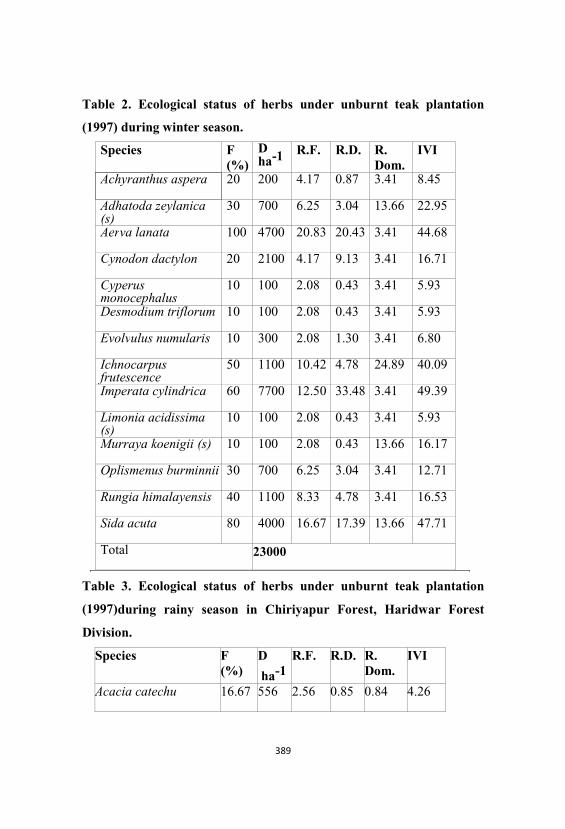
Species F (%)
Dha-1 R.F. R.D. R.
Dom.IVI
Achyranthus aspera 20 200 4.17 0.87 3.41 8.45
Adhatoda zeylanica(s)
30 700 6.25 3.04 13.66 22.95
Aerva lanata 100 4700 20.83 20.43 3.41 44.68
Cynodon dactylon 20 2100 4.17 9.13 3.41 16.71
Cyperusmonocephalus
10 100 2.08 0.43 3.41 5.93
Desmodium triflorum 10 100 2.08 0.43 3.41 5.93
Evolvulus numularis 10 300 2.08 1.30 3.41 6.80
Ichnocarpusfrutescence
50 1100 10.42 4.78 24.89 40.09
Imperata cylindrica 60 7700 12.50 33.48 3.41 49.39
Limonia acidissima(s)
10 100 2.08 0.43 3.41 5.93
Murraya koenigii (s) 10 100 2.08 0.43 13.66 16.17
Oplismenus burminnii 30 700 6.25 3.04 3.41 12.71
Rungia himalayensis 40 1100 8.33 4.78 3.41 16.53
Sida acuta 80 4000 16.67 17.39 13.66 47.71
Total 23000
Table 2. Ecological status of herbs under unburnt teak plantation
(1997) during winter season.
Table 3. Ecological status of herbs under unburnt teak plantation
(1997)during rainy season in Chiriyapur Forest, Haridwar Forest
Division.
Species F (%)
D
ha-1R.F. R.D. R.
Dom.IVI
Acacia catechu 16.67 556 2.56 0.85 0.84 4.26
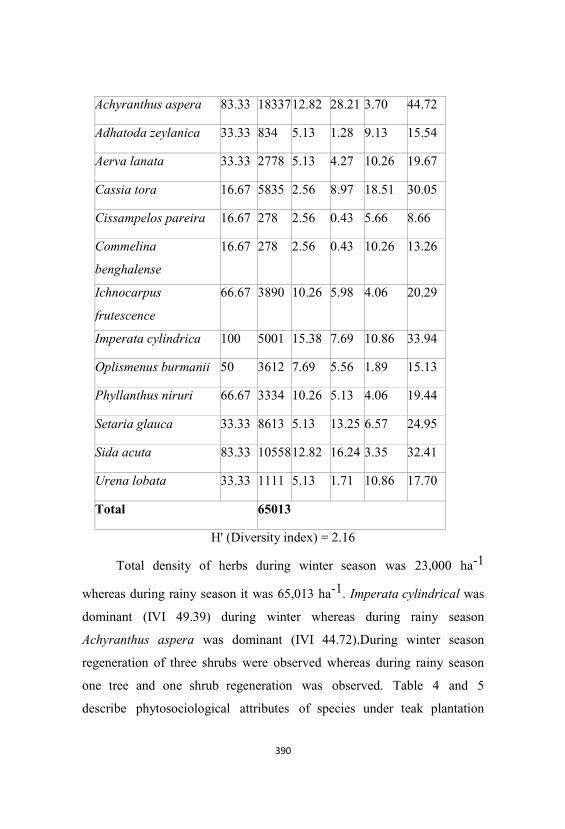
Achyranthus aspera 83.33 1833712.82 28.21 3.70 44.72
Adhatoda zeylanica 33.33 834 5.13 1.28 9.13 15.54
Aerva lanata 33.33 2778 5.13 4.27 10.26 19.67
Cassia tora 16.67 5835 2.56 8.97 18.51 30.05
Cissampelos pareira 16.67 278 2.56 0.43 5.66 8.66
Commelina
benghalense
16.67 278 2.56 0.43 10.26 13.26
Ichnocarpus
frutescence
66.67 3890 10.26 5.98 4.06 20.29
Imperata cylindrica 100 5001 15.38 7.69 10.86 33.94
Oplismenus burmanii 50 3612 7.69 5.56 1.89 15.13
Phyllanthus niruri 66.67 3334 10.26 5.13 4.06 19.44
Setaria glauca 33.33 8613 5.13 13.25 6.57 24.95
Sida acuta 83.33 1055812.82 16.24 3.35 32.41
Urena lobata 33.33 1111 5.13 1.71 10.86 17.70
Total 65013
H' (Diversity index) = 2.16
Total density of herbs during winter season was 23,000 ha-1
whereas during rainy season it was 65,013 ha-1. Imperata cylindrical was
dominant (IVI 49.39) during winter whereas during rainy season
Achyranthus aspera was dominant (IVI 44.72).During winter season
regeneration of three shrubs were observed whereas during rainy season
one tree and one shrub regeneration was observed. Table 4 and 5
describe phytosociological attributes of species under teak plantation
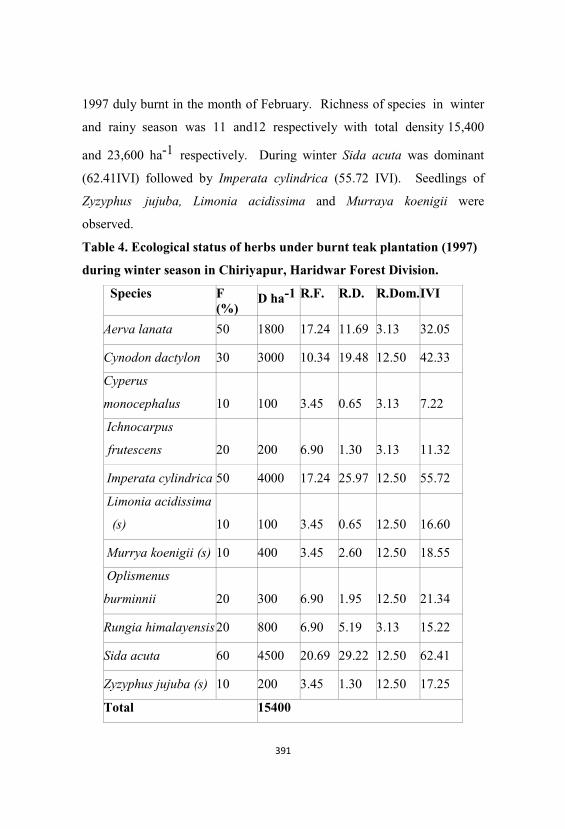
1997 duly burnt in the month of February. Richness of species in winter
and rainy season was 11 and12 respectively with total density 15,400
and 23,600 ha-1 respectively. During winter Sida acuta was dominant
(62.41IVI) followed by Imperata cylindrica (55.72 IVI). Seedlings of
Zyzyphus jujuba, Limonia acidissima and Murraya koenigii were
observed.
Table 4. Ecological status of herbs under burnt teak plantation (1997)
during winter season in Chiriyapur, Haridwar Forest Division.
Species F(%)
D ha-1 R.F. R.D. R.Dom.IVI
Aerva lanata 50 1800 17.24 11.69 3.13 32.05
Cynodon dactylon 30 3000 10.34 19.48 12.50 42.33
Cyperus
monocephalus 10 100 3.45 0.65 3.13 7.22
Ichnocarpus
frutescens 20 200 6.90 1.30 3.13 11.32
Imperata cylindrica 50 4000 17.24 25.97 12.50 55.72
Limonia acidissima
(s) 10 100 3.45 0.65 12.50 16.60
Murrya koenigii (s) 10 400 3.45 2.60 12.50 18.55
Oplismenus
burminnii 20 300 6.90 1.95 12.50 21.34
Rungia himalayensis20 800 6.90 5.19 3.13 15.22
Sida acuta 60 4500 20.69 29.22 12.50 62.41
Zyzyphus jujuba (s) 10 200 3.45 1.30 12.50 17.25
Total 15400
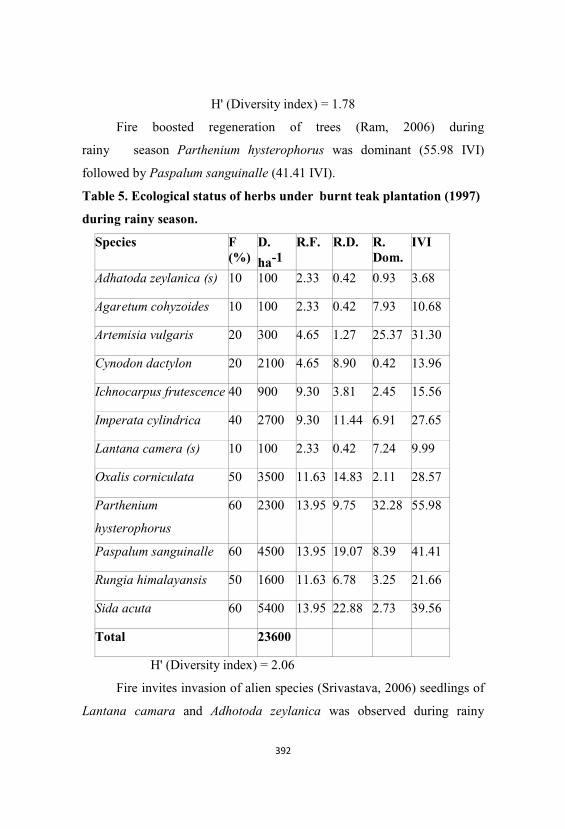
H' (Diversity index) = 1.78
Fire boosted regeneration of trees (Ram, 2006) during
rainy season Parthenium hysterophorus was dominant (55.98 IVI)
followed by Paspalum sanguinalle (41.41 IVI).
Table 5. Ecological status of herbs under burnt teak plantation (1997)
during rainy season.
Species F (%)
D.
ha-1R.F. R.D. R.
Dom.IVI
Adhatoda zeylanica (s) 10 100 2.33 0.42 0.93 3.68
Agaretum cohyzoides 10 100 2.33 0.42 7.93 10.68
Artemisia vulgaris 20 300 4.65 1.27 25.37 31.30
Cynodon dactylon 20 2100 4.65 8.90 0.42 13.96
Ichnocarpus frutescence 40 900 9.30 3.81 2.45 15.56
Imperata cylindrica 40 2700 9.30 11.44 6.91 27.65
Lantana camera (s) 10 100 2.33 0.42 7.24 9.99
Oxalis corniculata 50 3500 11.63 14.83 2.11 28.57
Parthenium
hysterophorus
60 2300 13.95 9.75 32.28 55.98
Paspalum sanguinalle 60 4500 13.95 19.07 8.39 41.41
Rungia himalayansis 50 1600 11.63 6.78 3.25 21.66
Sida acuta 60 5400 13.95 22.88 2.73 39.56
Total 23600
H' (Diversity index) = 2.06
Fire invites invasion of alien species (Srivastava, 2006) seedlings of
Lantana camara and Adhotoda zeylanica was observed during rainy
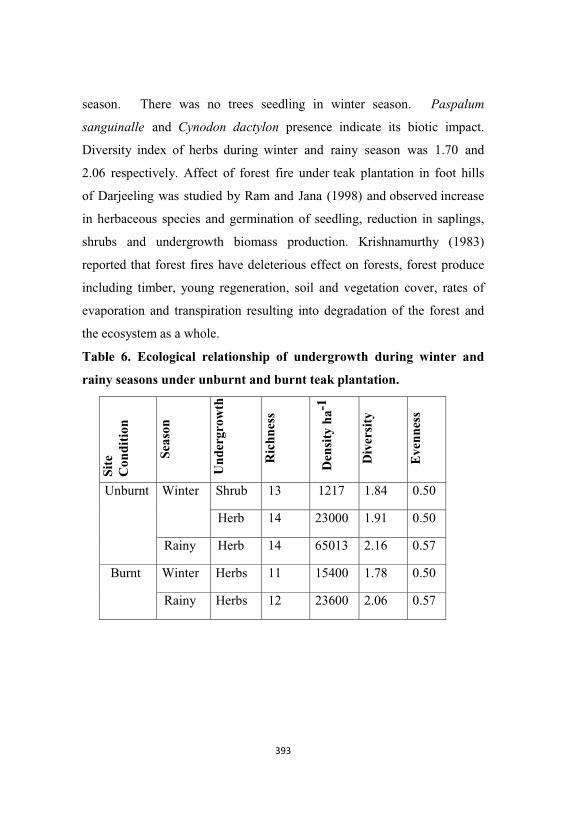
season. There was no trees seedling in winter season. Paspalum
sanguinalle and Cynodon dactylon presence indicate its biotic impact.
Diversity index of herbs during winter and rainy season was 1.70 and
2.06 respectively. Affect of forest fire under teak plantation in foot hills
of Darjeeling was studied by Ram and Jana (1998) and observed increase
in herbaceous species and germination of seedling, reduction in saplings,
shrubs and undergrowth biomass production. Krishnamurthy (1983)
reported that forest fires have deleterious effect on forests, forest produce
including timber, young regeneration, soil and vegetation cover, rates of
evaporation and transpiration resulting into degradation of the forest and
the ecosystem as a whole.
Table 6. Ecological relationship of undergrowth during winter and
rainy seasons under unburnt and burnt teak plantation.
Site
Con
diti
on
Seas
on
Und
ergr
owth
Ric
hnes
s
Den
sity
ha-1
Div
ersi
ty
Eve
nnes
s
Unburnt Winter Shrub 13 1217 1.84 0.50
Herb 14 23000 1.91 0.50
Rainy Herb 14 65013 2.16 0.57
Burnt Winter Herbs 11 15400 1.78 0.50
Rainy Herbs 12 23600 2.06 0.57
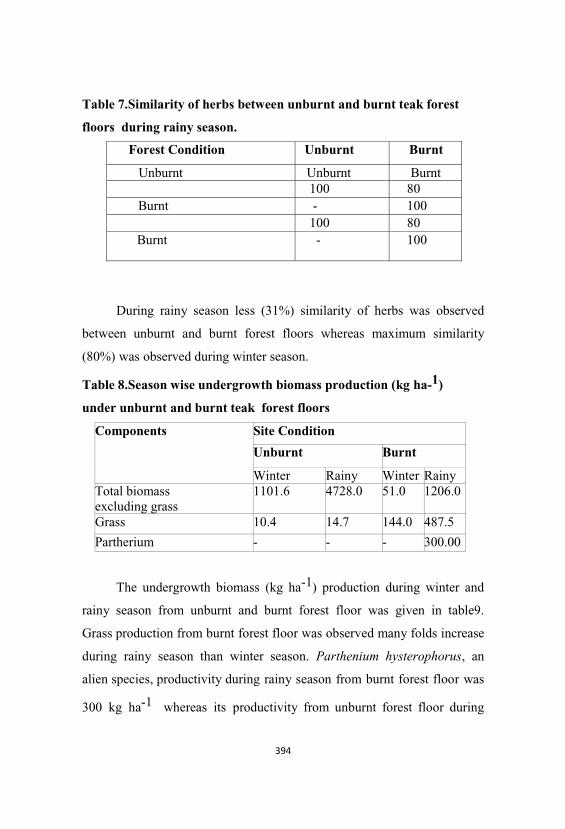
Forest Condition Unburnt Burnt
Unburnt Unburnt Burnt 100 80
Burnt - 100 100 80 Burnt - 100
Table 7.Similarity of herbs between unburnt and burnt teak forest
floors during rainy season.
During rainy season less (31%) similarity of herbs was observed
between unburnt and burnt forest floors whereas maximum similarity
(80%) was observed during winter season.
Table 8.Season wise undergrowth biomass production (kg ha-1)
under unburnt and burnt teak forest floors
Components Site Condition
Unburnt Burnt
Winter Rainy Winter RainyTotal biomass excluding grass
1101.6 4728.0 51.0 1206.0
Grass 10.4 14.7 144.0 487.5
Partherium - - - 300.00
The undergrowth biomass (kg ha-1) production during winter and
rainy season from unburnt and burnt forest floor was given in table9.
Grass production from burnt forest floor was observed many folds increase
during rainy season than winter season. Parthenium hysterophorus, an
alien species, productivity during rainy season from burnt forest floor was
300 kg ha-1 whereas its productivity from unburnt forest floor during
winter and rainy season and burnt forest floor during winter season were
nil. The undergrowth biomass production from brunt floor was less (
Ram, 2006).The result indicates that fire favour luxuriant herbs appearance
during rainy season as reported by Srivastava (2006).
It can be concluded from the study that fire to the forests invites
invasion of weeds and boosting of the productivity of herbaceous and grass
vegetation.
References
Campana, C; Gavom, S and J.F Pange 2002.Influence of ground
cover on earthwork communities in a unmanged beach forest
linear gradient studies.European Journal of soil, 38(2): 213-224
Chakravarty, D and H.N, Mathur 1992. Camparative iundergrowthj studies
and bioomass estimation in ecucalyptus plantation in Tripura Effects
of Growing Eucalyuts(Edt. Singhal, R.M. & Rawat, J.K,F.R.I.,
Dehradun.)
Chaudhery, O.P., Mishra, G.P. and Ram Prasad 1988. Phytosociological
studies of teak plantation and mixed natural forests in Madhya
Pradesh. II Disturbed; species diversity; productivity and some
quantitative parameters of ground flora.Journal of Tropical
Forestry,4(11):177-187.
Gachet, S., Leduc, A., Bergeron, Y., Nguyen-Xuan, T. and Francine
Tremblay 2007. Under story vegetation of boreal tree plantation:
Differences in relation to previous land use and natural forests.
Forest Ecology and Management, 242: 49-57.
Kern,C.C.,Brain,J.P.and Terry F.Strong 2006. Ground layer plant
community responses to even –age and uneven age. Silviculture
treatments in Wisconsin northern hardwood forests. Forest Ecology
and Management, 230: 162-170.
Krishnamurthy, A.V.R.G. 1983. Forest and Wildlife in India.Committee
on Science Technology in Developing Countries, IIT.
Madras.Mathur H.N; Naveem ,Jain and S.S. Sajwan 1980. Ground
cover and undergrowth in eucalyptus, brush wood and sal forest.
An ecological asssement .Van Vigyan 18 (3&4) : 56-61,
Mathur,H.N. and P. Son 1983. Comparative account of undergrowth under
ecualyptus and sal in three different localities of doon valley. Indian
forester 109 (9):882-890
Mcdonald, S.E. and E.F. Treena 2007. Under story plant community of
Boreal mixed wood forests and response to variable retention
harvesting. Forest Ecology and Management, 242: 34-48.
Mishra, R. 1968. Ecological Work Book. Oxford and IBH Publishing CO.
New Delhi.
Pielou, E.C. 1975. Ecological Diversity. John Willey and Sons, New York.
Prasad, Ram 1992. Ground floor diversity and grass production under
plant- aiton of eucalpyputs and other species Effects of growing
eucalyputs (edt. Singhal,R.M. and Rawat, J.K, FRI Dehradun).
Prasad, Ram and P. Jalil 1987. Grass production from man-made forests.
A paper presented in the seminar on Plantation Strategy held at
SFRI Jabalpur (June 27-28, 1987
Ram, Nirmal and M.M. Jana 1997. Ecological impact of compaction
under Teak plantation in the foot hill of Darjeeling Himalyan ,
Indian Forester 123 (7): 623-630.
Ram, Nirmal and M.M. Jana 1998. Ecological impact of forest fire under
teak plantation in the foot hill of Darjeeling Himalaya. The National
Seminar on Environment And Sustainable Development November
19-21, 1998, Dept. of Geography, North Bengal University
Daljeeling West Bengal, India.
Ram, Nirmal 2006. Ecological impact of forest fire under Cryptomeria
japonica plantation in wet temperate zone of Balason catchment of
Darjeeling hills. Proceedings of the XIIth Silvicultural Conference
(1-3rd Feb, 2006). Pp. 159- 166. Ed. Negi, S.S. et al. FRI,
Dehradun.
Shadangi, D.K. and V. Nath 2005. Impact of seasons on ground flora,
under plantation and natural forest in Amarkantak. Indian Forester,
131 (2). 240-250.
Shanon, C.E. and W.E. Wiener 1963. The Mathemetical Theory pf
Communication University of Illinois Press. Urbana, USA. Pp 117.
Sharma S.K, Verma C.M. and L.D.,Ahuja 1978. Production of Ground
Story (grass components) in afforested area in arid regions of India.
Sympo on Arid Zone Research And Development (AZRI) Jodhpur,
Feb, 14-15, 1978
Singh, Bakshish, Mathur H.N. and P. Joshi 1986. Effect of shade on
grassland production in the moist -subtropical region of Northern
India. Indian Journals of Forestry 13 (4)345-348.
Singh, Sanjay, 1998. Vegetational studies under noth and south aspects on
the temperate zone of Tirthan Valley of Western Himalaya, Indian
Journal of Forestry, 21 (3): 217-223
Sorenson, T. 1948. A method of establishment group of equal
amplitude in plant society based on similarity of species. K. Danske
Videnst Selsk, 5:1-34.
Srivastava, R.K. 2006. Impact of forest fire on Indian Biodiversity.
Proceedings of the XIIth Silvicuture Conference (1-3rd. Feb, 2006).
Pp 143-145, Ed. Negi, S.S. et al. FRI, Dehradun.
Upadhyay, K., Pandey, H.N. and R.S. Tripathi 2006. Understory plant
diversity in sub- tropical humid forest of Mrghalaya. International
Journal of Ecology and Environmental Science, 32: 207-219.
Zonner, K., Eric , Kebrick, J.M., Jensen, R.G., Peck, J.E. and J.K.
Grabner, 2006. Responses of ground flora to a gradient of harvest
intensity in the Missouri Ozarks. Ecology and Management, 222:
326-334.
Forest Conservation through Biodiversity Informatics
Neelesh Yadav
Forest Informatics Division
Forest Research Institute, Dehradun-248006
Abstract
The fundamental basis of all efforts to effectively conserve
biodiversity and natural ecosystems lies in efficient access to
knowledgebase on biodiversity and ecosystems resources and
processes. While, enormous amount of biodiversity knowledge is
available and generated daily, data / information is scattered and not
digitized. This hampers the sustainable development, especially in
developing and under-developed part of the globe. Authors elaborate the
role of digital libraries in collating information from various sources and
develop interoperability mechanism for better exchange / sharing of
information. Digital Library Initiatives (DLI) in biodiversity would lead
to creating virtual research space for evaluating hypothesis. The Forest
Research Institute, Dehradun has established a Bioinformatics centre to
achieve the objectives of digital library conservation for its historical
biological collections. Land managers researchers and the public
currently often are unable to obtain useful biodiversity information of
forests because the subject represents such a large component of biology,
ecology, forestry and systems to compile and organize this information
do not exist. Information on vascular plant taxonomy, trees
information, ecosystem database etc. are the key factors of forest
biodiversity. The biodiversity informatics will lead to conserve the forests
because it will provide the all kind of information via digital and
electronic medium to the common people and create an understanding
of climate change and global warming, so its importance is must for
adoption at all research level. The forest ecosystem covers biggest amount
of biodiversity, so the development of biodiversity informatics is the
need of time. Biodiversity Informatics is the application of informatics
to recorded and yet-to-be discovered information specifically about
biodiversity, and the linking of this information with genomic,
geospatial and other biological and non-biological datasets.
Biodiversity Informatics is the application of information technology
(IT) tools and approaches to biodiversity information, principally at the
organismic level. It thus deals with information capture, storage
provision, retrieval, and analysis, focused on individual organisms,
populations, and species, and their interactions. The use of Information
and communication technology will provide one platform for the forest
biodiversity conservation. The Forest Research Institute, Dehradun
(India) is working for biodiversity informatics for forest conservation. All
museums specimens and forestry information is going to become digital
through biodiversity informatics.
Keywords: Biodiversity informatics, digital library, forest biodiversity
Introduction
Biodiversity informatics is an interdisciplinary research and
infrastructure development activity. It thrives on collaborations among
environmental biologists, computer scientists, and network and software
engineers. The field brings together leading information processing
technologies such as semantic frameworks, information models, data
integration engines, network communications protocols, standards,
software applications and web services, to enable wholly new kinds of
analytical and synthetic research in environmental biology.
Biodiversity research is inherently a global enterprise.
Systematists and ecologists in the western hemisphere for over a century
have collaborated across political borders to document the distribution of
species and of biological diversity. And in recent decades much work has
been focused on understanding the dynamics of ecological processes
responsible for the creation and maintenance of diverse systems.
Biodiversity informatics attempts to accurately acquire, represent,
communicate, integrate, analyze and apply information extracted from
natural systems. The field can be modeled as a process or ‘value
chain’ of activities beginning with the methods and activities associated
data collection, and ending in the application of derived knowledge for
science and society.(Source Global Biodiveristy Information facility,
www.gbif.org).
Biological Diversity
Earth is the only planet in solar system known to inhibit the life. E.
O. Wilson,who first coined the word “Biodiversity” project that there
are about 10 million species, of which 1.5 to 1.7 million are known to us
(Wilson, 2000). Biodiversity, refers to the variety and variability among
living organisms within ecological systems in which they occur; as well as
the way they interact with each other in their environment. Hence, it
encompasses all levels of natural variations from molecular and genetic
levels to the species level. A responsible use of the earth’s natural
resources requires in-depth knowledge of the size and quality of stocks
and its locations, a conscious exploitation plan and monitoring of
consequences of the use of these resources. Since our fate and economic
prosperity are so completely linked to the natural world, information
about biodiversity and ecosystems – as well as the infrastructure that
surrounds it – is vital to wide range of scientific, educational, commercial
and governmental uses (Schnase et.al., 1997). Hence, information about
biodiversity forms the basis of our most important knowledge domains
(Schnase,2000).
Biodiversity Information- Availability, Content and Quality
The major characteristics of the biodiversity information is its
diverse,distributed sources as well as diverse discipline, types and formats
in which it is available. From traditional paper based libraries to scattered
databases of varying size and physical specimens preserved in natural
history collections throughout the world, record on biodiversity is
uncoordinated and poorly integrated, and large parts of it are isolated from
general use. No guide exists to what data are available, access is often on
an ad hoc basis, and scales and content of data sets are not consistent
(Schalk,1997, 1998). Hence, though abundant biodiversity data
and information are incomplete and dispersed among organizations,
government agencies and individuals. Complicating this picture further, the
quality of data and information available if often unknown. Thus, a
common language and system for information exchange and management
is needed urgently. It is like having data without information system.
Information and Communication Technology (ICT) may provide an
answer to this challenging problem.
Biodiversity Informatics
Currently, the biological informatics activity is synonymous with
the molecular and genetic informatics, popularly known as bioinformatics.
However, the complete value of molecular or genetic information cannot
be realized until it is possible to correlate genetic information with data on
(for example) the native habitat, neurobiology, physiology, or genealogical
relationships of the species from which the genes are derived.
At the end of the last millennium we witnessed the birth of a new field
of science. biodiversity informatics. This is a broad field of applying
ICT to all kinds of biological sciences. Worldwide there are several

measures being initiated to develop tools, techniques and standards for
collection, collation, storage, analysis, modeling, simulation and
dissemination of the diverse and distributed information about the vast
biotic resources and their environs (Schalk, 1992; Schalk and Los, 1995;
Sugden and Pennisi, 2000). This has given birth to many information
systems and networks dedicated to cater information needs of specific bio-
geographic areas and ecosystems. This first wave of biodiversity
informatics resulted into massive information sources (Bisby, 2000),
however, second wave aims at pulling together these sources, bringing
coherence and organization in information collated. There are several
international treaties calling for comprehensive, high quality information
on the status of biodiversity.
Digital Library Initiatives (DLI)
Digital Library Initiative (DLI), is coordinated set of
heterogeneous actors /organizations interact through an electronic and
communication network to develop, add-value, disseminate, and achieve
electronic information and related specialist services. Digital libraries are
not just limited to information warehousing. Current breed of digital
library activities include data mining, indexing and classification, linking,
filtering and ranking as well as interoperability across multiple platforms
to access and retrieve many digital representations for text and multimedia
object. Some even offer intelligent agents, while others reach towards the
goal of video searching. Site neutrality, open access, variety and
granularity of information, information sharing, up-to-date and round the
clock availability are distinguishing characteristics of DLI. This helps
transcend language barriers reaching across continents and languages. DLI
offers collaborations amongst laboratories where information and data is
raw material, forming digital collaboratory laboratory.
DLI in Biodiversity Informatics
Major objectives of the DLI in biodiversity are to increase the
amount of useful information available to decision-makers, scientists, and
the public. This can be achieved by providing open, worldwide access to
existing biodiversity information, achieving compatibility through
standardization and interoperability and track information needs,
priorities and best practices, and also by prioritizing and promoting
expansion in content.
The digital library, which serves as a clearinghouse for scientific
data, maps, metadata, documents and GIS data, can characterize the
ecology of the given region. DLI efforts in biodiversity should first aim at
becoming clearinghouse of knowledge by developing meta-databases.
This calls for co-operation within and amongst agencies. Development of
metadatabases, electronic catalogues, electronic data archival leading to
clearinghouse mechanism would be the assured way to ensure the wider
dissemination of wealth of information that is available in our libraries.
The first step in this direction would be to make our catalogue available on
the Net, followed by the step wise electronic archival of legacy literature
and development of data retrieval interfaces to make them available on the
web.
Ram.,et.al. (2000), state that DLI initiatives in the area of
biodiversity should support dynamic resources that can be updated by
users or an information provider at any time. This would result in, -reduced
cost of obtaining updated information, -direct communication with the end
users, -creation of cooperative atmosphere to encourage information
exchange, -improved cost effectiveness of research efforts by expediting
and increasing information flow, and –mechanism for direct public
participation in the information gathering process.
Biodiversity DLI in Third World – Status
By collecting data, recording the information and disseminating this
knowledge, using the latest technologies available, Third World
countries will be better able to manage their biodiversity and help
maintain nature’s fragile balance. However, given the fact that –
information infrastructure is just beginning to span its way, it is not
surprising that biodiversity information within many developing and
under-developed nations are dispersed, distributed, not in exchangeable
form. However, the negative attitude towards information management
initiative is what worries us the most. Many a times authorities as well as
data generators escape with the argument that the data is classified and
hence can’t be shared, even restrictively within the nation. Further, those
interested in information management activities are discouraged, as it is
not treated as scientific activities. This prevent domain expert from
taking active part in scientific information management. This is
further worsened by the widening gap between the data managers and data
producers, mostly due to lack of trust. Since the ecological, economical
and social value of data are not realized, millions of dollars worth of
information never sees the light of the day.
This is particularly true for the discipline like biodiversity
where several socio-political forces wish not to have efficient, accurate,
authenticate and quality information disseminated. Hence, DLI in
Biodiversity in Third World is imperative for sustainable utilization of
their natural resources. This would not only aid better research, but would
also reduce the cost of doing research – which often is issue when funding
ideas and concepts. It would also prevent duplication of doing same things
by different groups, involving waste of intellectual ability, time,
money and infrastructure. Thus, knowledge management mechanism and
its implementation are essential for the developing countries, especially in
today’s competitive world of intellectual property rights.
Major Application Areas and Challenges
We see great potential for DLI in biodiversity within the
developing and under-developed nations. Major application areas can be
categorized as:
• Information Collection, Collation
• Processing / Organization of information
• Information Analysis and Discovery
• Access / Interaction leading to collaboration
• Policy and Procedure
• Human Resource Development
This is very much within the reach as current breed of digital
libraries include data mining, indexing and classification, linking, filtering
and ranking; as well as interoperability across multiple access and
retrieve many digital representations for text and multimedia objects.
Thus, the chief structural characteristic of a digital library is a high
degree of data integration across formal boundaries. Some offer intelligent
agents, while other digital library systems reach toward the goal of video
searching.
In addition to knowing what’s where and who’s who in the field of
biodiversity; and access to formal ways of publications; digital libraries
should be able to develop the mechanism to tap the informal intellectual
discussions and exchange / sharing activities such as email or even
informal notices. We should be able to analyze and forecast based on this
tapped information.
Some of the technologies and standards, which have been evolved
during past few years as part of the global research in the field of digital
library, are bound to play significant role in biodiversity knowledge
management. Notable amongst them are metadata creation, information
harvesting, and interoperability between datasets. In subsequent part of this
paper we shall discuss them in detail.
Information Harvesting and Archiving
One of the major characteristics of biodiversity information is
its content diversity and distributed sources. Since, information is
available in patches and owned by individuals / institutions, it becomes
difficult to arrive at efficient decisions based on accurate, precise,
authenticate, up-to-date information. Single biggest challenge for
information managers and biodiversity domain experts is to collate this
dispersed information in single repository or achieve cross-linking
between these multivariate and multi-standard datasets. Since, it is
impossible to develop a single repository, an approach of easily accessible,
distributed data network to collate and disseminate information on
biodiversity would be viable and working solution. With the help of
information extractors or robots or harvesters, data /information can
be pulled together and made available to end-user as one single query
result. These “Agents” or “Robots” uses pull technology to retrieve data
from distributed sources and conglomerate information into common
accessible format. Hence, information residing in various electronic
databases linked on the net can be virtually pulled together.
However, in developing and under-developed nations not all the
biodiversity information procedures are online, hence offline information
acquisition can be practiced. Since many of these organizations are in
beginning stages of data/information digitization, efforts could be made to
develop common-formats for similar type of data such as
taxonomy, biology. Biogeography, ecology, environmental stress and
pollution etc This would pave way for easy-to-handle information
integration. This calls for collaborative and joint action on behalf of
digital libraries and domain experts.
Much of the information in the Third World is still on non-
electronic media and non-exchangeable format. Much of the information is
available in print media, card-files, biological specimens and field notes of
individual workers. Archiving this information in digitized form and
making it available online would be significant contribution in building
“digital biodiversity knowledge library” ollation of these individual
repositories would form full proof and integrated “national natural history
management information facility”.
We are of the opinion that, DLI in our environments should reach
beyond the development of factual databases - data sets, which collate
actual scientific data that is generated through our R&D and environmental
surveillance programs. Mechanism to acquire data as and when generated
is imperative. However, there is a need to evolve ways to provide security
to data until objectives are accomplished. This would bring significant
change for developing and under-developed regions of this planet earth,
where much of the information / data on biodiversity remains scattered and
unplanned to the date.
Interoperability amongst databases
Modern electronic biodiversity databases are highly
diverse and heterogeneous, ranging from genomic databases, to
specimen databases, to ecological and ecosystem databases. To understand
and manage biodiversity, the different varieties of data must be combined
and analyzed together. It is because of this biological and information
complexity (Schnase at. al., 1997), in biodiversity research people act as
sophisticated filters and query processors. Though this process of
extracting higher-order understanding from dispersed datasets is
intellectual in nature; yet it breaks down quickly as the volume and
dimensionality of the data increase.
Means to manage this complexity are must. DLI can promote
interoperability dispersed biodiversity knowledge.
The interoperability issues of the biodiversity information
community are both technical and organizational in nature.
Organizations have evolved their own systems, legacy databases, and
applications to serve internal needs. This has resulted in data models and
applications uniquely tailored to meet specific internal requirements.
However, as the importance of sharing information across
organizational computing environments is recognized, data interoperability
becomes paramount.
The interoperability of biodiversity information across systems and
platforms is also an organizational issue. There is an urgent need to access
distributed information from many organizations to address boundary-
spanning problems such as; disaster relief, environmental monitoring,
interagency coordination, joint force deployment, and provision of
integrated geospatial mapping services over the Internet. The need
to access information resources across bureaucratic and hierarchical
boundaries calls for new organizational processes that permit open network
exchanges.
Digital libraries can play an instrumental role in overcoming current
impediments to interoperability by harmonizing the transfer of open
biodiversity data. Open data models can reduce transaction costs, stimulate
component generation, and provide a standard platform for new
components and applications. Using ANSI/NISO Z39.50, a standard for
information interchange and retrieval that has proven successful in the
bibliographic and geospatial domains, it is now possible to search and
retrieve biodiversity information from multiple databases connected
by the Internet (Soberon, 1999). Common Object Request Broker
Architecture (CORBA) can be used to provide access to biological
databases bringing their content together. Further, Extensible Markup
Language (XML) is being used increasingly to describe cross-discipline
data (e.g. taxonomy, natural history, botany, weather, geospatial as well as
cellular and molecular biology information). Authors group has
recently developed BCML(Biological Collections Markup Language)
(http.//www.ncbi.org.in/bcml/) to help describing biological specimen
repositories. Use of these protocols and standards by developing and
under-developed nations in setting up distributed national CHM would
achieve interoperability amongst data sources maintained by different
data custodians.
Conclusions
The foregoing discussion reveals that there is great potential
at the same time challenges that lies before the DLI in Biodiversity
for the Third World. If the standards, tools and techniques and
experiences of similar efforts in the other part of the globe is used
wisely, digital library would play vital role in archiving and
digitizing biodiversity information storehouse unexplored in Third World.
This would result in development of “Open and Distributed” virtual
biodiversity knowledge facility and would greatly aid the sustainable
usage and conservation of our biotic diversity. The forests hve largest
amount of biodiversity information so the application of biodiversity
informatics in forestry data may be a right and correct beginning.
Biodiversity informatics is very significant tool for forest conservation.
References
Schalk, P. H.1898. Management of marine natural resources through
biodiversity informatics. Marine Policy, 22(3).269-280.
Helly, John, T Case, F. Davis, S. Levin and W Michener (l995). The state
of Computational ecology. Available at
http.//www.sdsc.edu/compeco_workshop/report/report.html
Schnase, J. L. 2000. Research directions in Biodiversity Informatics.
Proc. 26th Int.Conf. Very Large Databases, Cairo, Egypt, 2000.
Bowker, G. C. 2000. Work and information in the sciences of
biodiversity. Proc. 26thInt. Conf. Very Large Databases, Cairo,
Egypt, 2000.
Cotter, G. A. and B. T. Bauldock 2000. Biodiversity Informatics
Infrastructure. An information commons for the biodiversity
community. Proc. 26th Int. Conf. Vary Large Databases, Cairo,
Egypt, 2000.
Lane, M.A., J. L. Edwards and E. S. Nielson. 2000. Biodiversity
Informatics. The challenges of rapid development, large databases
and complex data. Proc. 26th Int. Conf. Very Large Databases,
Cairo, Egypt, 2000.
Sugden, A. and E. Pennisi. 2000. Diversity Digitized. Science, 289 (5488).
2305.
Wilson, E. 0. 2000. A global biodiversity map. Science, 289 (5488). 2279.
Bisby, F. A. 2000. The quiet revolution. biodiverrity informatics and
the Internet.Science, 289 (5488). 2309-2312.
Edwards, J. L., M. A. Lane and E. S. Nielson. 2000. Interoperability of
biodiversity databases. biodiversity information on every desktop.
Science, 289 (5488).2312-2314.
GBIF Business Plan, Draft 5 2000. Global Biodiversity Information
Facility Business Plan, Draft 5,September, 2000., pp. 38.
Ram. Sudha., M. R. Kunzmann, J. Kim and J. Abbruzzi. (2000). A Digital
“Living” Library – Prototype for Harvesting Ecological Data over
the Internet.
Schnase, J. L., M. A. Lane, G. C. Bowker, S. L. Star and A.
Silberscgatz 1997.Building the next generation biological
information infrastructure. Proc. Natl. Acad. Sci., Forum on Nature
and Human Society. The Ouest for a sustainable World, October 27-
30, 1997. Washington DC, USA.
Plant Species for Fragmented
Landscapes
Diversity of Medicinal Plant Species in the Thar Desert (Rajasthan),
India
S. R Baloch, G. Singh* and Pramod Kumar
Forest.Research.Institut. Dehradun
Arid Forest Research Institute, Jodhpur*
Abstract
With the advent of human civilization, many systems of therapy
have been developed primarily based on plants i.e. Ayurveda,
Homeopathy, Sidda, Unani, etc. The plant-based traditional medical
systems continue to provide the primary health care to more than three-
quarters of the world’s populace. Thus, it is necessary that we should have
full knowledge regarding the occurrence, frequency and distribution of
these plants for their proper utilization. Thar Desert of Rajasthan has great
potentiality both from the economic and botanical points of view.
Therefore, a study was undertaken in Forest land, Community land and
Agriculture land of Barmer, Jaisalmer, Bikaner and Pali districts of Thar
Desert of Rajasthan. The study aimed to look into the diversity of plant
resources that are used by local people for curing various ailments. The
study revealed that the 57 plant species belonging to 37 families were
recorded in the study area. Out of this, 14 tree species, 18 shrub species, 25
herb species, have been recorded. Mimoceae and Caesalpiniaceae were
found to be the most dominant family in tree species; Amaranthaceae and
Asclepiadaceae in shrub species and Poaceae and Febaceae, Asteraceae,
Malvaceae, Euphorbiaceous, Solanaceae herb species, respectively.
Keywords: Thar Desert. plant species, diversity.
Introduction
Traditional utilization of plants for medicinal purposes in India
has been documented long back in ancient literature (Tulsidas, 1631;
Charak , Drdhbala, 1996) Indian Systems of Medicine (ISM), which is
one of the most ancient medicine practices known to the world, and
derives maximum formulations from plants and plant extracts that exist in
the forests has always played a key role in the health systems. However,
organized studies in this direction were initiated in 1956 (Rao,1996)
and off late such studies are gaining recognition and popularity due to
fading of traditional knowledge and reducing plant population. Right from
its beginning, the documentation of traditional knowledge especially on
the medicinal uses of plants, has provided many important drugs of the
modern day (Anon., 1994; Cox and Ballick,1994; Fabricant and
Farnsworth, 2001). Even today this area holds much more hidden treasure,
as almost 80% of the human population in developing countries is
dependent on plant resources for healthcare (Farnsworth et al., 1985). In
India the native people are exploiting a variety of herbals for effective
curing of various ailments. But, in the rural areas of Thar Desert districts,
plants are the major source of local medicine for their well being.
Information on folk medicinal uses of the plants has recently become of
renewed interest in search for new therapeutic agent. A vast
knowledge on medicinal plants exists as oral among the folklore and
primitive societies of India, where a large number of potent medicinal
herbs are found growing wild. The plant parts used, preparation, and
administration of drugs vary from one place to other. However, the
knowledge of herbal medicines is gradually perishing, although some of
the traditional herbal men are still practicing the art of herbal healing
effectively. These plants are frequently used by the local inhabitants of the
area for treatment of various diseases. Some modern drugs have been
deducted from folklore and traditional medicines. Living close to
nature, traditional societies have acquired unique knowledge about the
use of wild flora and fauna, most of which are unknown to the people who
live away from such natural ecosystem as forests. Such knowledge and
practices/experience were subjected to further modification or enriched
with new knowledge of practice by succeeding generations and become a
part of the tradition, culture, art, belief, folklore and knowledge base of
these traditional communities. The traditional knowledge, skill and
practices thus developed are freely exchanged cared for and nourished as a
common property of the communities (Pushpangadan and Kumar,
2005).The value and importance of traditional knowledge are now being
increasingly all over the world (Posey and Dutfield, 1996). The Indian
Thar desert supports a number of plant species of which a few are used as
medicinal purposes despite of adverse climatic conditions and high biotic
pressure (Singh, 1985; Bhandari and Shringi, 1987; Mertia, 1990). The
plants of the arid region have been well documented for their medicinal
values (Atal et al., 1975; Bhandari, 1997; Joshi et. al,1998; Katewa and
Guria, 1997; Mertia and Nagarajan, 1997). However, information on the
uses of plants as traditional medicines has not been documented and
there is still need for proper documentation of these plants because
such type of study basically lies in finding out the usage of plants or its
parts for betterment of the forest dwellers to achieve their socio-economic
development. Keeping this in view, the present study was initiated, with
an aim to document the knowledge of rural people and folklore on the
utilization of medicinal plants in remote areas of Barmer, Jaisalmer,
Bikaner, and Pali districts of Thar Desert, Rajasthan
Survey Data Collection
The survey was conducted in these districts during the evaluation
of Combat Desertification Project & Study on biological diversity in
Mangala, Sarswati and Rageshwari areas of Rajasthan Hydro carbon
project. The population of the study area is predominantly rural. The main
occupation of these communities is farming and livestock rearing. During
survey interactions were made with villagers and local communities of
the respective areas for collecting information’s on various plant drugs
used by them to treat different ailments and their mode of administration.
With the help of the information provided by them regarding plant species
was then compared and confirmed with authentic literature.
Results and Discussion
In the modern age, people are very alert about their health and
health hazards caused by allopathic drugs due to their side effects. After
recognition of the World Health Organization Assembly (1977), day by
day herbal medicines are become popular all over the world. Now a
day's, it is estimated that about 80 percent of the world population relies
on herbal medicines for primary health care. The present study reveals
that there is a great wealth of knowledge and practice regarding use of
plant for therapeutic purpose in different parts of state because the
efficacious of these plants have been tried and tested by various
communities since a long time.
Plants medicines deserve detailed studies. The traditional
knowledge of rural is valuable not merely as an indicator of plant to
be screened but also equally important to evolve new methodological
approach and strategies towards treatment and research. The information
presented can prove to be invaluable as a starting point to provide for
screening plants for therapeutic use and furthering the research on
traditional medicinal plants for improving their quality and efficacy. No
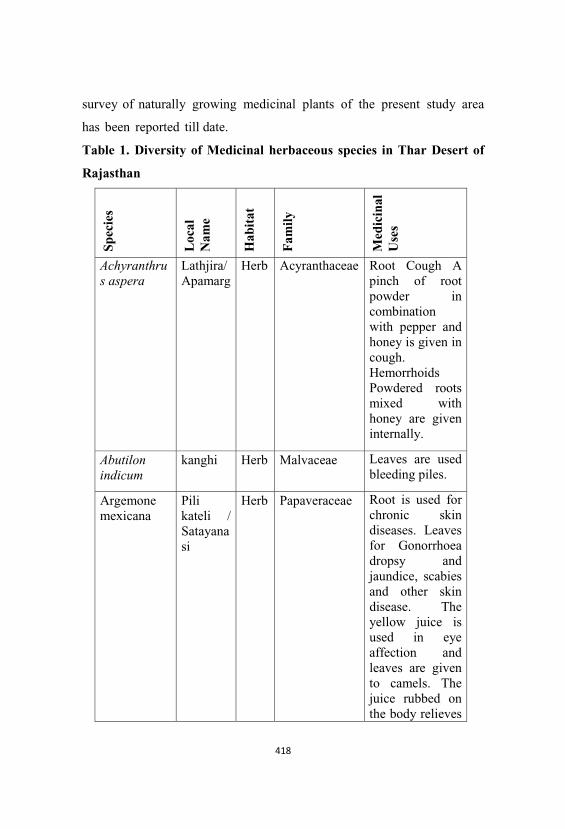
survey of naturally growing medicinal plants of the present study area
has been reported till date.
Table 1. Diversity of Medicinal herbaceous species in Thar Desert of
Rajasthan
Spec
ies
Loc
alN
ame
Hab
itat
Fam
ily
Med
icin
alU
ses
Achyranthrus aspera
Lathjira/Apamarg
Herb Acyranthaceae Root Cough Apinch of rootpowder incombinationwith pepper andhoney is given incough. HemorrhoidsPowdered rootsmixed withhoney are giveninternally.
Abutilonindicum
kanghi Herb Malvaceae Leaves are usedbleeding piles.
Argemonemexicana
Pilikateli /Satayanasi
Herb Papaveraceae Root is used forchronic skindiseases. Leavesfor Gonorrhoeadropsy andjaundice, scabiesand other skindisease. Theyellow juice isused in eyeaffection andleaves are givento camels. Thejuice rubbed onthe body relieves
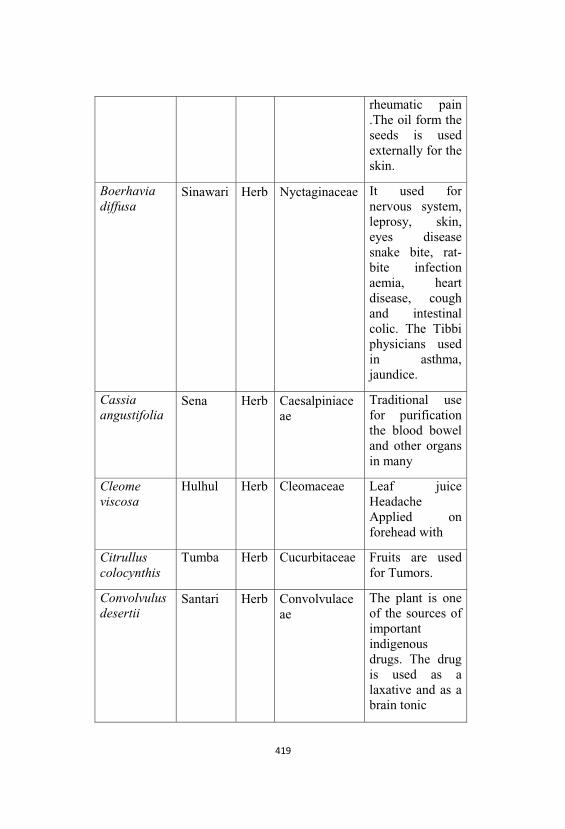
rheumatic pain.The oil form theseeds is usedexternally for theskin.
Boerhaviadiffusa
Sinawari Herb Nyctaginaceae It used fornervous system, leprosy, skin, eyes diseasesnake bite, rat-bite infectionaemia, heartdisease, coughand intestinalcolic. The Tibbiphysicians usedin asthma, jaundice.
Cassiaangustifolia
Sena Herb Caesalpiniaceae
Traditional usefor purificationthe blood boweland other organsin many
Cleomeviscosa
Hulhul Herb Cleomaceae Leaf juiceHeadacheApplied onforehead with
Citrulluscolocynthis
Tumba Herb Cucurbitaceae Fruits are usedfor Tumors.
Convolvulusdesertii
Santari Herb Convolvulaceae
The plant is oneof the sources ofimportantindigenousdrugs. The drugis used as alaxative and as abrain tonic
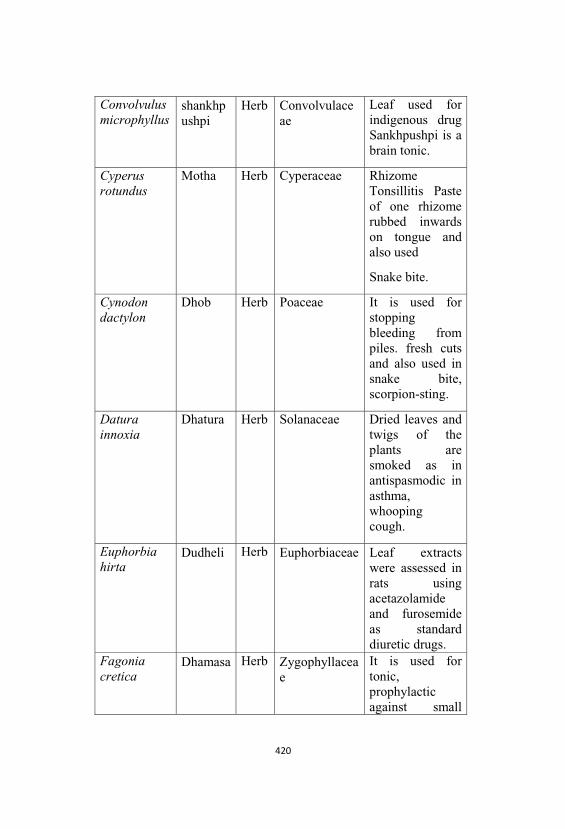
Convolvulusmicrophyllus
shankhpushpi
Herb Convolvulaceae
Leaf used forindigenous drugSankhpushpi is abrain tonic.
Cyperusrotundus
Motha Herb Cyperaceae RhizomeTonsillitis Pasteof one rhizomerubbed inwardson tongue andalso used
Snake bite.
Cynodondactylon
Dhob Herb Poaceae It is used forstoppingbleeding frompiles. fresh cutsand also used insnake bite, scorpion-sting.
Daturainnoxia
Dhatura Herb Solanaceae Dried leaves andtwigs of theplants aresmoked as inantispasmodic inasthma, whoopingcough.
Euphorbiahirta
Dudheli Herb Euphorbiaceae Leaf extractswere assessed inrats usingacetazolamideand furosemideas standarddiuretic drugs.
Fagoniacretica
Dhamasa Herb Zygophyllaceae
It is used fortonic, prophylacticagainst small
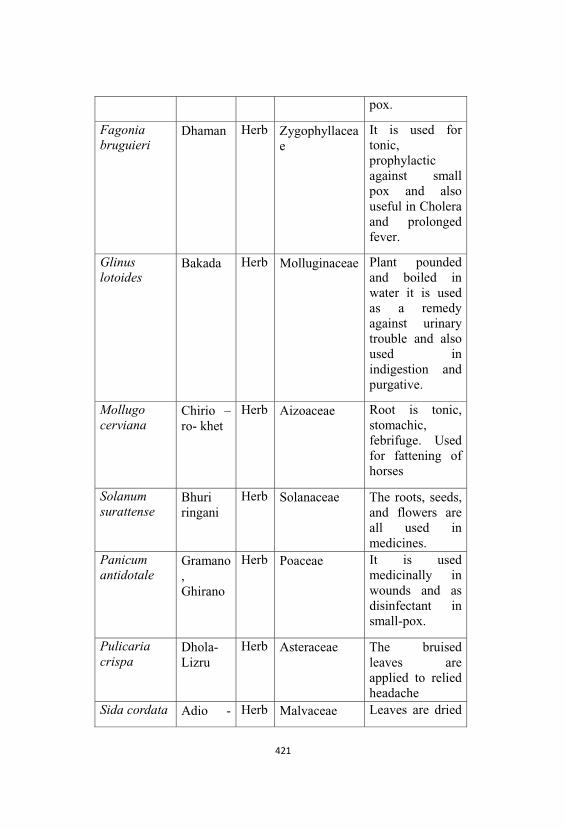
pox.
Fagoniabruguieri
Dhaman Herb Zygophyllaceae
It is used fortonic, prophylacticagainst smallpox and alsouseful in Choleraand prolongedfever.
Glinuslotoides
Bakada Herb Molluginaceae Plant poundedand boiled inwater it is usedas a remedyagainst urinarytrouble and alsoused inindigestion andpurgative.
Mollugocerviana
Chirio –ro- khet
Herb Aizoaceae Root is tonic, stomachic, febrifuge. Usedfor fattening ofhorses
Solanumsurattense
Bhuriringani
Herb Solanaceae The roots, seeds, and flowers areall used inmedicines.
Panicum antidotale
Gramano, Ghirano
Herb Poaceae It is usedmedicinally inwounds and asdisinfectant insmall-pox.
Pulicariacrispa
Dhola-Lizru
Herb Asteraceae The bruisedleaves areapplied to reliedheadache
Sida cordata Adio - Herb Malvaceae Leaves are dried
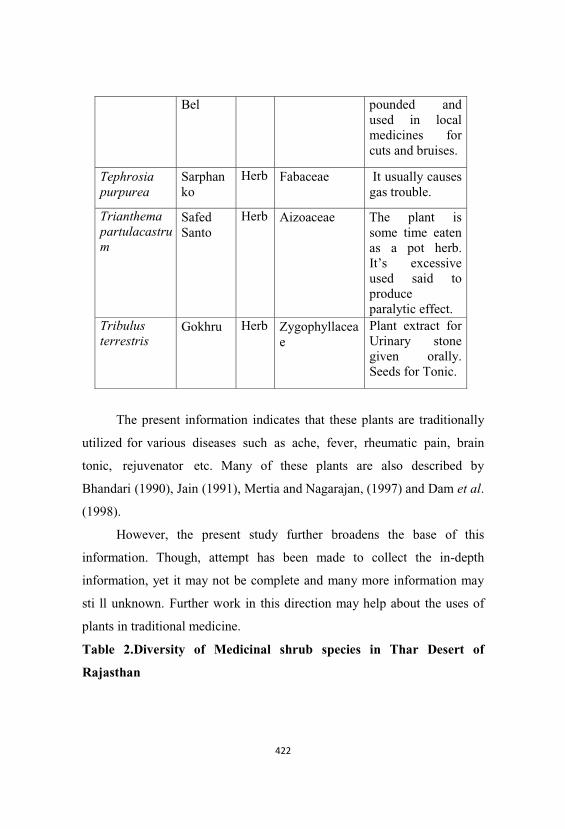
Bel pounded andused in localmedicines forcuts and bruises.
Tephrosiapurpurea
Sarphanko
Herb Fabaceae It usually causesgas trouble.
Trianthemapartulacastrum
SafedSanto
Herb Aizoaceae The plant issome time eatenas a pot herb. It’s excessiveused said toproduceparalytic effect.
Tribulusterrestris
Gokhru Herb Zygophyllaceae
Plant extract forUrinary stonegiven orally. Seeds for Tonic.
The present information indicates that these plants are traditionally
utilized for various diseases such as ache, fever, rheumatic pain, brain
tonic, rejuvenator etc. Many of these plants are also described by
Bhandari (1990), Jain (1991), Mertia and Nagarajan, (1997) and Dam et al.
(1998).
However, the present study further broadens the base of this
information. Though, attempt has been made to collect the in-depth
information, yet it may not be complete and many more information may
sti ll unknown. Further work in this direction may help about the uses of
plants in traditional medicine.
Table 2.Diversity of Medicinal shrub species in Thar Desert of
Rajasthan
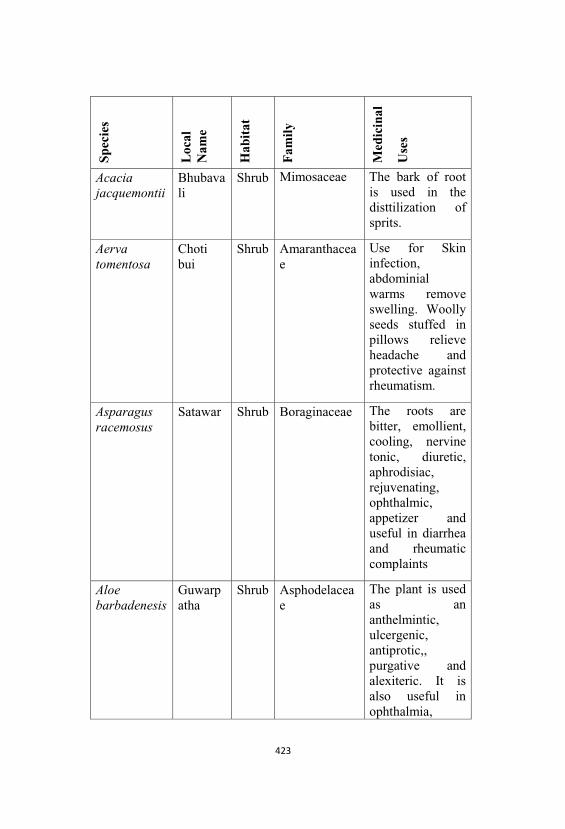
Spec
ies
Loc
alN
ame
Hab
itat
Fam
ily
Med
icin
al
Use
s
Acacia jacquemontii
Bhubavali
Shrub Mimosaceae The bark of rootis used in thedisttilization ofsprits.
Aervatomentosa
Chotibui
Shrub Amaranthaceae
Use for Skininfection, abdominialwarms removeswelling. Woollyseeds stuffed inpillows relieveheadache andprotective againstrheumatism.
Asparagusracemosus
Satawar Shrub Boraginaceae The roots arebitter, emollient, cooling, nervinetonic, diuretic, aphrodisiac, rejuvenating, ophthalmic, appetizer anduseful in diarrheaand rheumaticcomplaints
Aloebarbadenesis
Guwarpatha
Shrub Asphodelaceae
The plant is usedas ananthelmintic, ulcergenic, antiprotic,, purgative andalexiteric. It isalso useful inophthalmia,
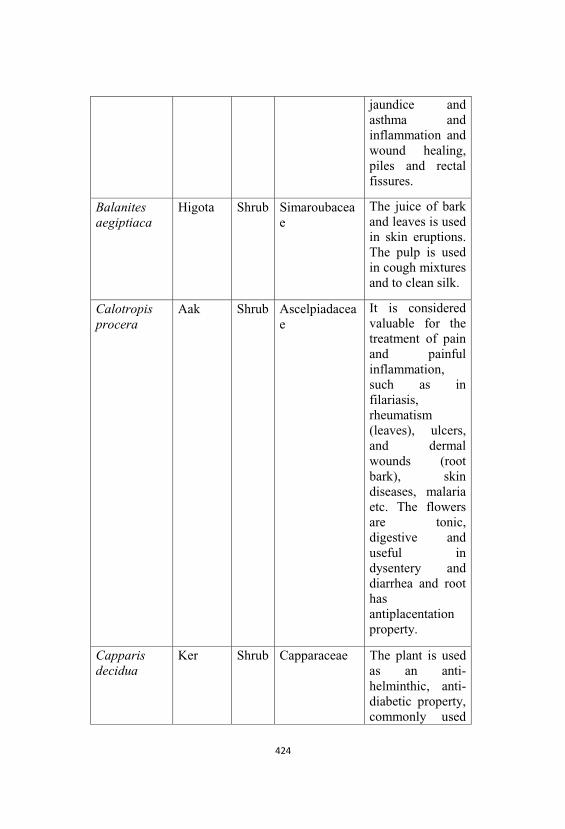
jaundice andasthma andinflammation andwound healing, piles and rectalfissures.
Balanitesaegiptiaca
Higota Shrub Simaroubaceae
The juice of barkand leaves is usedin skin eruptions. The pulp is usedin cough mixturesand to clean silk.
Calotropisprocera
Aak Shrub Ascelpiadaceae
It is consideredvaluable for thetreatment of painand painfulinflammation, such as infilariasis, rheumatism(leaves), ulcers, and dermalwounds (rootbark), skindiseases, malariaetc. The flowersare tonic, digestive anduseful indysentery anddiarrhea and roothasantiplacentationproperty.
Capparisdecidua
Ker Shrub Capparaceae The plant is usedas an anti-helminthic, anti-diabetic property, commonly used
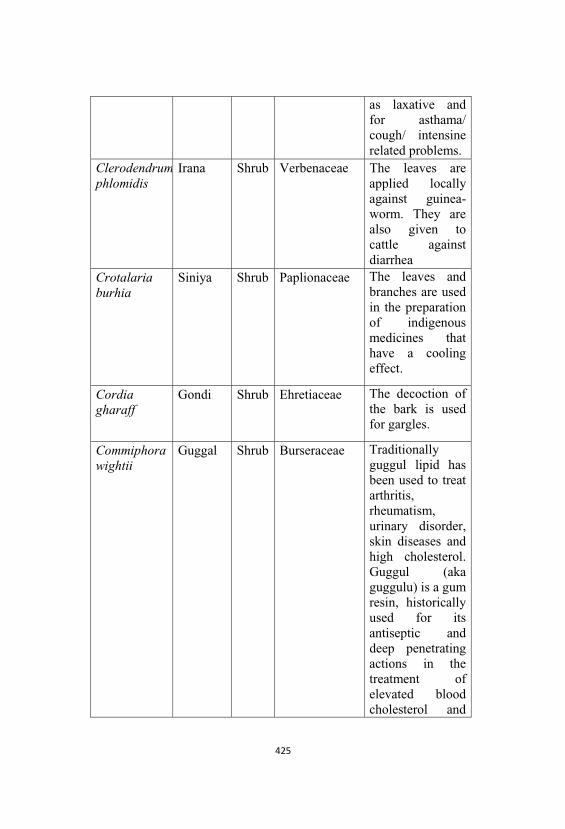
as laxative andfor asthama/cough/ intensinerelated problems.
Clerodendrumphlomidis
Irana Shrub Verbenaceae The leaves areapplied locallyagainst guinea-worm. They arealso given tocattle againstdiarrhea
Crotalariaburhia
Siniya Shrub Paplionaceae The leaves andbranches are usedin the preparationof indigenousmedicines thathave a coolingeffect.
Cordiagharaff
Gondi Shrub Ehretiaceae The decoction ofthe bark is usedfor gargles.
Commiphorawightii
Guggal Shrub Burseraceae Traditionallyguggul lipid hasbeen used to treatarthritis, rheumatism, urinary disorder, skin diseases andhigh cholesterol. Guggul (akaguggulu) is a gumresin, historicallyused for itsantiseptic anddeep penetratingactions in thetreatment ofelevated bloodcholesterol and
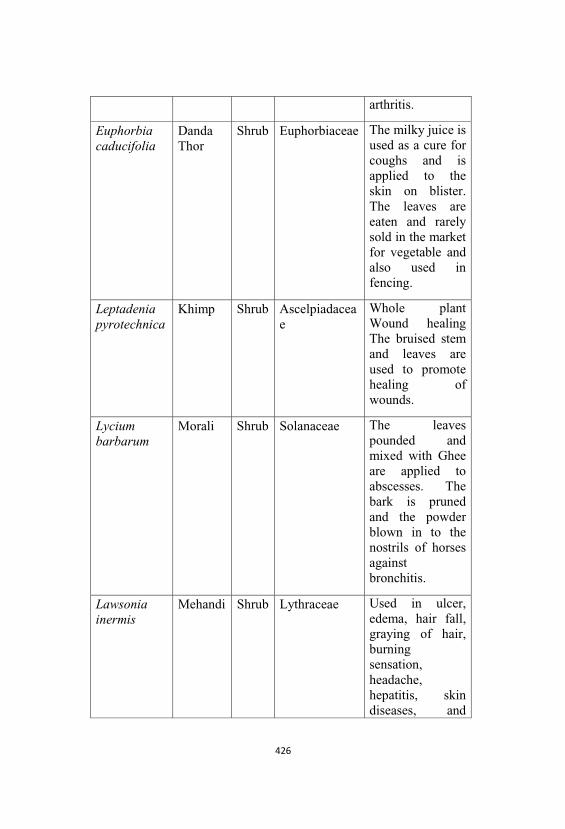
arthritis.
Euphorbiacaducifolia
DandaThor
Shrub Euphorbiaceae The milky juice isused as a cure forcoughs and isapplied to theskin on blister. The leaves areeaten and rarelysold in the marketfor vegetable andalso used infencing.
Leptadeniapyrotechnica
Khimp Shrub Ascelpiadaceae
Whole plantWound healingThe bruised stemand leaves areused to promotehealing ofwounds.
Lyciumbarbarum
Morali Shrub Solanaceae The leavespounded andmixed with Gheeare applied toabscesses. Thebark is prunedand the powderblown in to thenostrils of horsesagainstbronchitis.
Lawsoniainermis
Mehandi Shrub Lythraceae Used in ulcer, edema, hair fall, graying of hair, burningsensation, headache, hepatitis, skindiseases, and
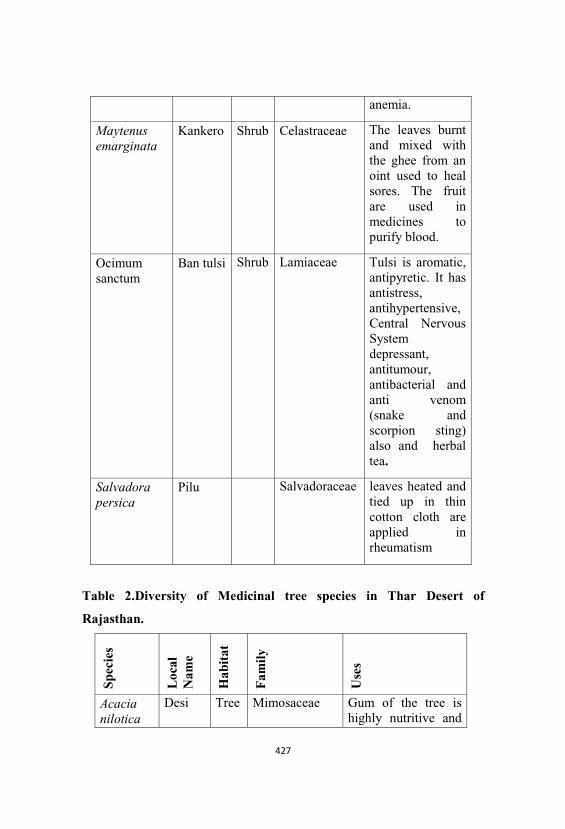
anemia.
Maytenusemarginata
Kankero Shrub Celastraceae The leaves burntand mixed withthe ghee from anoint used to healsores. The fruitare used inmedicines topurify blood.
Ocimumsanctum
Ban tulsi Shrub Lamiaceae Tulsi is aromatic, antipyretic. It hasantistress, antihypertensive, Central NervousSystemdepressant, antitumour, antibacterial andanti venom(snake andscorpion sting)also and herbaltea.
Salvadorapersica
Pilu Salvadoraceae leaves heated andtied up in thincotton cloth areapplied inrheumatism
Table 2.Diversity of Medicinal tree species in Thar Desert of
Rajasthan.
Spec
ies
Loc
alN
ame
Hab
itat
Fam
ily
Use
s
Acacianilotica
Desi Tree Mimosaceae Gum of the tree ishighly nutritive and
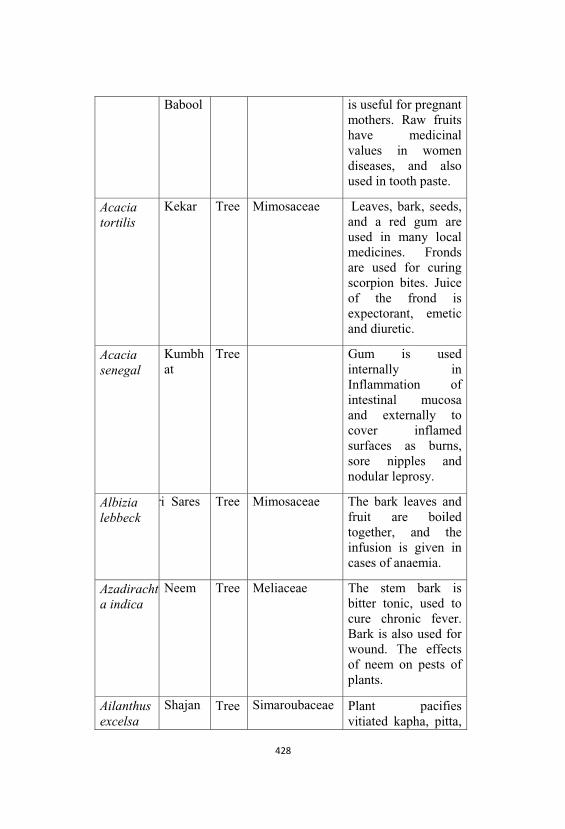
Babool is useful for pregnantmothers. Raw fruitshave medicinalvalues in womendiseases, and alsoused in tooth paste.
Acaciatortilis
Kekar Tree Mimosaceae Leaves, bark, seeds, and a red gum areused in many localmedicines. Frondsare used for curingscorpion bites. Juiceof the frond isexpectorant, emeticand diuretic.
Acaciasenegal
Kumbhat
Tree Gum is usedinternally inInflammation ofintestinal mucosaand externally tocover inflamedsurfaces as burns, sore nipples andnodular leprosy.
Albizialebbeck
ri Sares Tree Mimosaceae The bark leaves andfruit are boiledtogether, and theinfusion is given incases of anaemia.
Azadirachta indica
Neem Tree Meliaceae The stem bark isbitter tonic, used tocure chronic fever. Bark is also used forwound. The effectsof neem on pests ofplants.
Ailanthusexcelsa
Shajan Tree Simaroubaceae Plant pacifiesvitiated kapha, pitta,
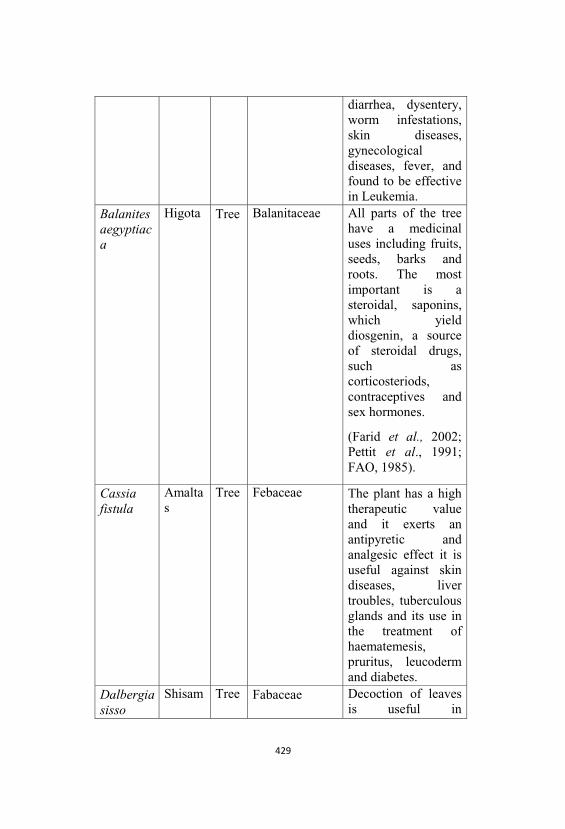
diarrhea, dysentery, worm infestations, skin diseases, gynecologicaldiseases, fever, andfound to be effectivein Leukemia.
Balanitesaegyptiaca
Higota Tree Balanitaceae All parts of the treehave a medicinaluses including fruits, seeds, barks androots. The mostimportant is asteroidal, saponins, which yielddiosgenin, a sourceof steroidal drugs, such ascorticosteriods, contraceptives andsex hormones.
(Farid et al., 2002;Pettit et al., 1991;FAO, 1985).
Cassiafistula
Amaltas
Tree Febaceae The plant has a hightherapeutic valueand it exerts anantipyretic andanalgesic effect it isuseful against skindiseases, livertroubles, tuberculousglands and its use inthe treatment ofhaematemesis, pruritus, leucodermand diabetes.
Dalbergiasisso
Shisam Tree Fabaceae Decoction of leavesis useful in
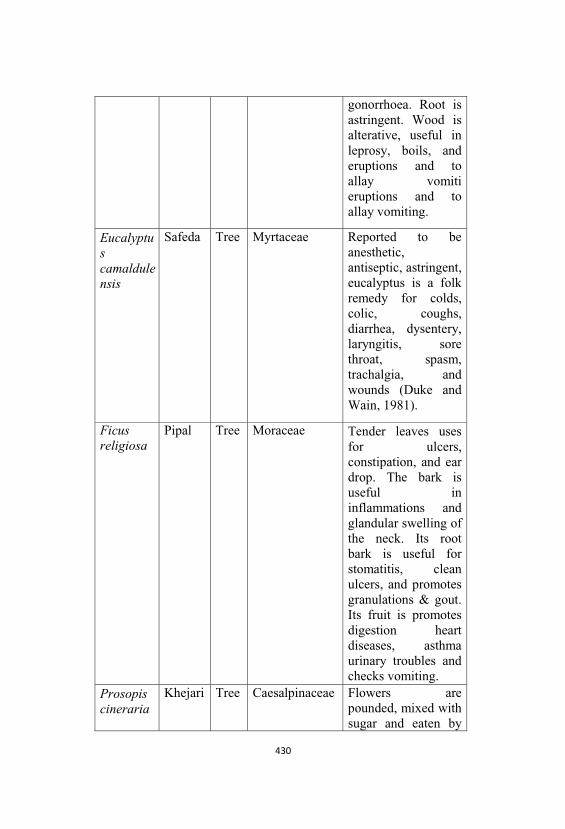
gonorrhoea. Root isastringent. Wood isalterative, useful inleprosy, boils, anderuptions and toallay vomitieruptions and toallay vomiting.
Eucalyptuscamaldulensis
Safeda Tree Myrtaceae Reported to beanesthetic, antiseptic, astringent, eucalyptus is a folkremedy for colds, colic, coughs, diarrhea, dysentery, laryngitis, sorethroat, spasm, trachalgia, andwounds (Duke andWain, 1981).
Ficusreligiosa
Pipal Tree Moraceae Tender leaves usesfor ulcers, constipation, and eardrop. The bark isuseful ininflammations andglandular swelling ofthe neck. Its rootbark is useful forstomatitis, cleanulcers, and promotesgranulations & gout. Its fruit is promotesdigestion heartdiseases, asthmaurinary troubles andchecks vomiting.
Prosopiscineraria
Khejari Tree Caesalpinaceae Flowers arepounded, mixed withsugar and eaten by
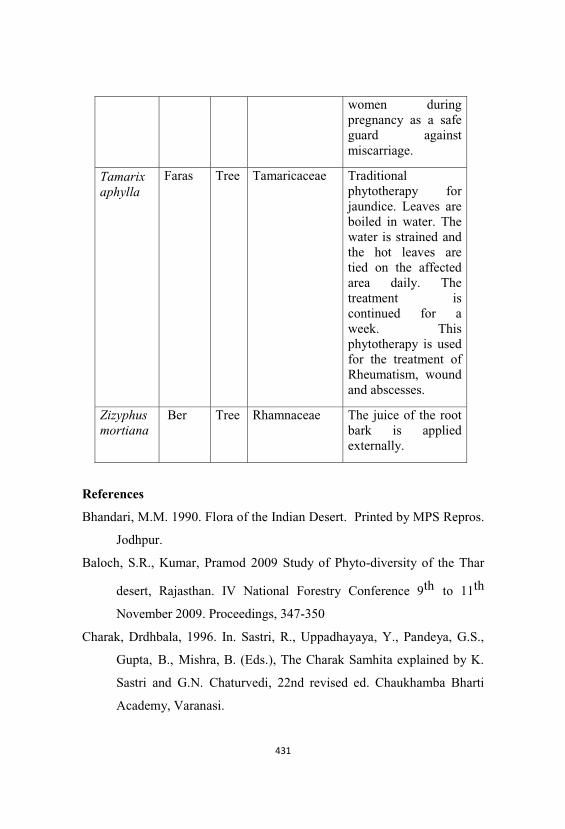
women duringpregnancy as a safeguard againstmiscarriage.
Tamarixaphylla
Faras Tree Tamaricaceae Traditionalphytotherapy forjaundice. Leaves areboiled in water. Thewater is strained andthe hot leaves aretied on the affectedarea daily. Thetreatment iscontinued for aweek. Thisphytotherapy is usedfor the treatment ofRheumatism, woundand abscesses.
Zizyphusmortiana
Ber Tree Rhamnaceae The juice of the rootbark is appliedexternally.
References
Bhandari, M.M. 1990. Flora of the Indian Desert. Printed by MPS Repros.
Jodhpur.
Baloch, S.R., Kumar, Pramod 2009 Study of Phyto-diversity of the Thar
desert, Rajasthan. IV National Forestry Conference 9th to 11th
November 2009. Proceedings, 347-350
Charak, Drdhbala, 1996. In. Sastri, R., Uppadhayaya, Y., Pandeya, G.S.,
Gupta, B., Mishra, B. (Eds.), The Charak Samhita explained by K.
Sastri and G.N. Chaturvedi, 22nd revised ed. Chaukhamba Bharti
Academy, Varanasi.
Fabricant, D.S., Farnsworth, N.R., 2001. The value of plants used in
Traditional medicine for Drug Discovery. Environment Health
Perspectives 109, 69–75.
Jain, A., Katewa, S.S., Galav, P.K., Sharma, P., 2005. Medicinal plant
diversity of Sitamata wildlife sanctuary, Rajasthan, India. Journal of
Ethnopharmacology. 102, 143–157.
Khan, T.I. and Frost, S.2001. Floral biodiversity. a question of survival
in the Indian Thar Desert. The Environmentalist, 21(3). 231-236.
Katewa, S.S., Choudhari, B.L., Jain, A., 2004. Folk herbal medicines
from tribal areas of Rajasthan, India. Journal of
Ethnopharmacology 92, 41–46.
Mishra, A., Kumar, A., 2000. Medicinally important trees of Rajasthan.
International Journal of Mendel 1–8, 37-38.
Mertia RS, Nagarajan M., 2003. Towards conservation of medicinal plant
lore of Indian arid zone. (The) Indian Forester, 129(2), 268-274 [11
Ref].
Parveen B. Upadhyay, Shikha Roy and Ashwani Kumar Traditional uses
of medicinal plants among the rural communities of Churu district in
the Thar Desert, India Journal of EthnopharmacologyVolume 113,
Issue 3, 25 September 2007, Pages 387-399
Singh, G. 2005. Ecological and environmental assessment in the on-
shore area of RJ-ON-90/2 block’. Technical Report AFRI,
Jodhpur. Submitted to M/S Cairn Energy Pvt. Ltd, Chennai.
Shetty, B.V. and Singh, V.1993. Flora of Rajasthan. Vol I – III. Boatanical
Survey of India, Calcutta.
Singh, V., Pandey, R.P., 1983. Economic and medicinal plants of Indian
Desert. Tulsidas. Ramcharitmanas (1631 samvat).
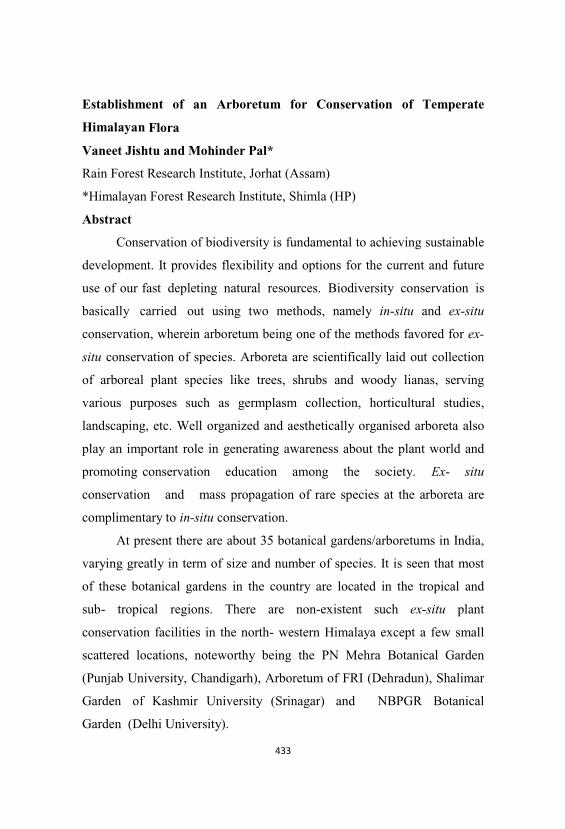
Establishment of an Arboretum for Conservation of Temperate
Himalayan Flora
Vaneet Jishtu and Mohinder Pal*
Rain Forest Research Institute, Jorhat (Assam)
*Himalayan Forest Research Institute, Shimla (HP)
Abstract
Conservation of biodiversity is fundamental to achieving sustainable
development. It provides flexibility and options for the current and future
use of our fast depleting natural resources. Biodiversity conservation is
basically carried out using two methods, namely in-situ and ex-situ
conservation, wherein arboretum being one of the methods favored for ex-
situ conservation of species. Arboreta are scientifically laid out collection
of arboreal plant species like trees, shrubs and woody lianas, serving
various purposes such as germplasm collection, horticultural studies,
landscaping, etc. Well organized and aesthetically organised arboreta also
play an important role in generating awareness about the plant world and
promoting conservation education among the society. Ex- situ
conservation and mass propagation of rare species at the arboreta are
complimentary to in-situ conservation.
At present there are about 35 botanical gardens/arboretums in India,
varying greatly in term of size and number of species. It is seen that most
of these botanical gardens in the country are located in the tropical and
sub- tropical regions. There are non-existent such ex-situ plant
conservation facilities in the north- western Himalaya except a few small
scattered locations, noteworthy being the PN Mehra Botanical Garden
(Punjab University, Chandigarh), Arboretum of FRI (Dehradun), Shalimar
Garden of Kashmir University (Srinagar) and NBPGR Botanical
Garden (Delhi University).
The Wildlife Wing, Himachal Pradesh Forest Department (HPFD),
consequent upon diversion of some forest land due to Parvati Stage-II
Hydroelectricity Project, has stipulated both in- situ and ex- situ projects
for the state in consultation with the Wildlife Institute of India (WII). Ex-
situ component of the project includes exploring the prospects for setting
up a Temperate Arboretum for display, education and propagation of tree
flora and their subsequent reintroduction in the wild. With the aim of ex
situ conservation of temperate Himalayan tree flora including endemic and
endangered species, an arboretum is being established near Shimla. The
project is being implemented by the Wildlife Wing of the State Forest
Department, with the technical assistance from the Himalayan Forest
Research Institute, Shimla. The basic purpose of this arboretum will be to
conserve the gene pool and it will have a vital role in the rehabilitation of
species affected by the numerous developmental/hydro- projects,
mushrooming in the state.
Keywords: Biodiversity, Temperate Arboretum, sustainable development,
Himalayan tree flora.
Introduction
Biodiversity conservation is basically carried out using two
methods, namely in-situ and ex-situ conservation, wherein arboreta being
one of the methods favored for ex-situ conservation of tree species.
Arboreta are scientifically laid out collection of arboreal plant species like
trees, shrubs and woody lianas, serving various purposes such as
germplasm collection, horticultural studies, landscaping, etc. Well
organized and aesthetically laid out arboreta also play an important role in
generating awareness about the plant world and promoting conservation
education among the society. Ex-situ conservation and mass propagation
of rare species at the arboreta are complimentary to in-situ conservation.
At present there are about 35 botanical gardens/arboretums in India,
varying greatly in term of size and number of species. It is seen that most
of these botanical gardens in the country are located in the tropical and
sub-tropical regions. There are very few botanical gardens and ex-situ
plant conservation facilities in the western and north- western Himalaya
except a few localities, (Samant et al., 1998). Noteworthy being the PN
Mehra Botanical Garden at Punjab University campus, Chandigarh,
Arboretum of Forest Research Institute (FRI), Dehradun, Shalimar
Garden of Kashmir University, Srinagar and the NBPGR Botanical
Garden at Delhi University.
The Wildlife Wing, HP Forest Department (now on HPFD),
consequent upon diversion of some forest land due to Parvati Stage-II
Hydroelectricity Project (HEP), has stipulated both in- situ and ex- situ
projects for the state in consultation with the Wildlife Institute of India
(WII). Ex- situ component of the project includes exploring the prospects
for setting up a Temperate Arboretum for display, education and
propagation of tree flora and their subsequent reintroduction in the wild.
With the aim of ex situ conservation of temperate Himalayan tree
flora including endemic and endangered species, the temperate arboretum
is being established near Shimla. The project is being implemented by
the Wildlife Wing of the State Forest Department, with the technical
assistance from the Himalayan Forest Research Institute (now on HFRI),
Shimla. The basic purpose of this arboretum will be to conserve the
gene pool and it will have a vital role in the rehabilitation of species
affected by the numerous developmental/hydro-projects, mushrooming in
the state.
Site Selection
A standard arboretum should have the following infrastructure
and natural setting. (a) adequate area, (b) permanent source of water, (c)
aesthetically appealing landscape, (d) altitudinal and topographic variation,
(e) space for interpretation and visitor centre, (f) facilities for glass house,
mist chamber, polyhouse and nurseries, (g) space for taxonomical and
botanical themes such as medicinal plants, germplasm collection centre,
pinetum, etc.
Keeping these points in view, a few candidate sites around Shimla
were surveyed, viz., (i) Kufri, adjacent to High Altitude Zoological Park,
(ii) Naldehra near Golf Course, (iii) Mashobra and (iv) Potter Hill, near
Shimla town, which was finally selected. In addition, some provision will
be made to extend this programme for a part of Kufri Zoological Park, near
Shimla, so that additional germplasm and species of aesthetic value could
be retained at the latter site, which experiences an influx of tourists
throughout the year.
Potters Hill is located at about seven kilometers west of
Shimla town at altitudes ranging between 1750 and 2250 amsl and is an
ideal site due to its moderate climate and location. This site spreads over a
100 ha area and lies adjacent to the HP University Campus.
Administratively, the area falls under Totu Block in Taradevi Range,
Shimla Forest Division. The area is naturally rich in temperate flora
and a rapid survey of the site during July-September revealed that this site
harbours more than 360 species of flowering plants (Rawat and Jishtu,
2005 [WII Report, Annexure-5.6]. It supports temperate conifer forests
(Cedrus deodara - Pinus roxburghii), broadleaf forest (mainly Quercus
leucotrichophora –Rhododendron arboreum), secondary scrub and grassy
glades in addition to other prominent arboreal species like Pieris
ovalifolia, Benthamidia macrophylla, B. capitata, Pyrus pashia,
Populus ciliata, Prunus cerasoides, etc. In addition, the very popular
‘Chadwik Falls’, a major attraction for the tourists who visit Shimla, falls
in easy access of the selected site of Potters Hill.
Arboretum and its Role in Plant Conservation
For the foreseeable future, increasing demands for natural
resources will continue to degrade habitats and push an increasing number
of plants toward extinction. A critical and fundamental role of ex situ
institutions is to combat extinctions (Maunder and Byers 2005). One such
institution is the arboretum, which by definition, is an outdoor collection
of trees, shrubs and other woody plants systematically and aesthetically
arranged for the purposes of demonstration, research, and education. It is
a “living museum” where visitors are welcome throughout the year, to
walk about, enjoy and learn more about trees. The design and landscaping
of the arboretum at Potter Hill would be such that it would aesthetically
merge with the landscape and generate awareness about the native tree
species among the visitors. The ultimate goal is to encourage the planting
and conservation of trees for a greener, healthier, and more beautiful
tomorrow.
Plants in the Arboretum will be grouped into separate habitats
(providing the near best conditions to their natural habitat). These will be
marked with clear wooden signs. The information (natural habitat, local
use, ecological importance, threat status, morphology, and other attributes)
on the species planted will be documented in all respect at the time of
planting. The arboretum would house almost all the representative tree
species of temperate region (over 160 species belonging to 50 families) in
a phased manner. Initially, focus will be on the rare and lesser known tree
species and the conifers of the state. The seedlings will be collected from
the various nurseries, spread over the state and where possible to collect
few seedling specimens from the wild. Rare and uncommon species can be
raised in the nursery developed at the site, or through some research
organizations. For rarer tree species at least five individuals would be
planted. To begin with, ‘Flora Simlensis’ (Collet, 1902) would be taken
to select the species for plantation. ‘The woody elements largely
predominate in the Flora of Simla with one hundred and thirty seven
species belonging to eighty three genera and thirty six orders. All earlier
travelers, including Lady Dalhousie, were struck by the variety of trees of
the different altitudinal zones of vegetation’ (Botting Hemsley,
Introduction to ‘Flora Simlensis’ in Collet, 1902). The ‘Flora of Himachal
Pradesh’ (Chowdhery and Wadhwa, 1984) will be consulted to locate
regions of occurrence in other temperate areas of the state. The main role
of the arboretum in general would be to:
• Establish a living repository of temperate Himalayan tree flora.
• Set up a facility for ex- situ conservation of rare and threatened
tree taxa.
• Exchange of plant propagules within the Himalayan States and to
promote conservation education among the school children and
common public.
• Create opportunities for recreation and aesthetics, and
• Create a database on the individual plant species, and establish
international and national affiliation for further research.
However, with the successful setting up of the arboretum, certain
other functions will indirectly benefit plant conservation in the region.
These beneficial functions would include habitat protection, conservation
of associated herbaceous flora, research, etc.
Habitat Protection
No significant areas have been designated as parks and special
areas which provide statutory protection for the habitats of our diverse
flora and fauna in the north western part of the country. By designating
and landscaping such special areas, it compels the general public to
recognize the scientific importance of these sites and to ensure that due
consideration to plant conservation is given. The major part of the forest
land at the Arboretum site is to be maintained in its natural state. Only,
where ever possible, crucial management decisions regarding constructions
and landscaping will be made to maintain the region, which will be
an added plus for habitat protection. As a result of habitat protection the
diversity of insects, butterflies, birds and even some smaller mammals will
increase.
Conservation of Herbaceous Flora
The flora of the temperate Himalayas is diverse in character with
numerous species of the European flora being seen here at the limit of their
northern distribution range. ‘Simla district has a smaller area than the
country of Sussex, in which about 1000 species of flowering plants grow’
(Collet, 1902). Many species of plants are noteworthy for their
contributions to the medicinal and aromatic industry.
Research at the Arboretum
Seed collected from rare, threatened and endangered trees will be
germinated at the arboretum and grown for eventual planting in the nearby
appropriate recovery habitat. This program will be developed under a
program, involving school children and other members of the community.
This will be a regular educational program designed to bring students,
teachers, conservation groups and private nurseries together to grow
native trees for community projects. In addition to creating awareness,
these ‘hands on’ activities, will also teach the children how to germinate,
grow and plant trees.
Landscape Management
Since, the lower part of the forest is dominated by Chir
Pine (Pinus roxburghii), the forest floor during the drier months of April
– June is littered with the dried pine needles. These pine needles when dry
pose a fire hazard since it is highly flammable. Thus, forest fire will be a
major hazard to the arboretum, as it bedevils the management for about
three months each summer. Here comes the involvement of villagers who
are engaged to collect the dried needles for use as a cushion for the cattle,
which on an average, is replaced once in a week. The removal of the Chir
Pine needles reduces the risk of fire during the summer season and also
helps the growth of many useful herbaceous species.
Another important aspect in the management of the landscape would
be to avoid invasive introductions, since the invasive species have been
recognized as a serious threat to biodiversity, second only to habitat loss
(Wilcove et al., 1998). At present the proposed site has several exotic
species which will be gradually replaced by the native species.
Garbage is another problem and one of the major tasks of the
management is to collect litter left by the visitors which is mainly in the
form of plastic and glass. With such problems in mind, the management
has planned to put up eco-friendly garbage collection units and also place
litter bins located strategically throughout the arboretum.
Administration
As proposed the arboretum is being managed by the Wildlife Wing
of the HP Forest Department. An Advisory Committee, under the
chairmanship of the Chief Wildlife Warden, HP has been set up. The
Advisory Committee includes, the Director of HRFI, Shimla, the Director
of GB Pant Institute at Mohal, Kullu, the Conservator of Forests, Shimla
Circle, Head of Department of Botany, HP University, the Head of
Department of Forestry, Dr YS Parmar University of Horticulture &
Forestry, Nauni, Solan, and the Director of National Bureau of Plant
Genetics and Research (NBPGR), Shimla. Non official members include
two prominent citizens of Shimla, with interest in the conservation of
Shimla’s native flora. Director HFRI, Shimla serves as the Secretary to the
Advisory Committee.
The development, implementation, monitoring and database is being
undertaken by HFRI, which is functioning as the institutional anchor
of the arboretum. HFRI is also responsible for commissioning and
supervision of various studies/researches connected with the arboretum.
Local inhabitants from adjacent villages are being hired as skilled
labourers, daily wage workers, Malis and guides, etc. The Wildlife Wing
has entered into a Memorandum of Agreement (MOA) with the HFRI,
for smooth functioning of the project.
Funding
The Government of HP has approved the Strategic Plan for
Conservation of Endangered Wildlife in Himachal Pradesh by the
Wildlife Institute of India (WII), Dehradun. This entire plan, developed
by the WII, is to be funded to the tune of rupees twenty crores by
National Hydro Power Corporation (NHPC) (HEP Parvati Stage-II) over a
period of ten years. The Temperate Arboretum at Potter’s Hill is an
approved item of activity under this plan, (WII HPFD Consultancy
Report, 2005; pp.235 -247). It is therefore proposed that the establishment
and maintenance of the TABG would be steered by the Wildlife Wing of
HPFD and executed by the HFRI, Shimla. For the various items of work
as proposed hereunder, the Wildlife Wing would place at the disposal of
HFRI, adequate funds on a year to year basis. Further, because the
proposed TABG would is proposed to be notified as a conservation
reserve under the Wildlife Protection Act, 1972, it would become eligible
for Government of India (GoI) funding under the Centrally Sponsored
Scheme for Conservation of Protected Areas.
The critical concern here will be to ensure the future financing of the
arboretum, once established. Firstly, the role of the home unit or HPFD
(Wildlife Wing) in this case will be the key to the future functioning of the
arboretum. Later upon when it will look to move from the governmental
control and/or support will need to replace that segment of their financial
support by increasing the memberships, donations, trusts or other similar
financial management. Collaborative efforts may be encouraged with sister
institutions and with organizations both within and if possible, outside the
country.
Secondly, the charitable donations need to be increased as such
projects have a few advantages. Aesthetically laid arboreta are places of
beauty and education and supporting them makes life better for everyone,
a goal most people generally understand. Earned income is another critical
component of most arboreta. Since most efforts to earn funds depend on
people visiting the garden, the weather and other externalities can disrupt
income flow (sometimes dramatically, like during the wet monsoons).
Diversification is therefore the key to success and initiatives have been
set up for developing a garden's business operations, which may be critical
to success in earned income areas. The initiatives may be in the form of
gift shops, souvenirs, posters and live plants sale, guided tours, etc.
With the belief that gardens are essential, relevant institutions for an
advanced society, all efforts need to be made to adequately fund their
operations. The fact that critical work conserving the world's plants
has fallen by default to arboreta and botanic gardens only adds to the
importance of their mission (Olin, 1995).
Conclusions
Plants are arguably the single most important group of organisms
in shaping the habitats and determining the physical environments that all
other species require for survival, and as such significantly influence total
biodiversity richness. Recent studies predicting that climate change could
result in the extinction of up to half the world’s plant species by the end of
the century. Such mass extinctions will have catastrophic effects for
humanity (Belinda et al., 2008).
If ex situ conservation is to play an effective role in conserving wild
plant diversity and supporting habitat conservation, appropriate levels of
infrastructure and capacity need to be established (Maunder et al., 2004).
Moreover, an integrated plant conservation advocates for the protection of
plants in their native habitats with an ex situ conservation program to
provide a safety net against extinction in the wild. The botanic gardens and
arboreta of the world are now unmatched ex situ collections of plant
biodiversity (Janice et al, 2010). They provide the tools, resources, and
research for better management of wild populations (Kayri, et al., 2006).
The arboretum at Shimla, once established, would be the first ex-situ
plant conservation facility in the region, and one of the few conservatory –
type gardens in the north western Himalaya. It will provide a homeport,
research and propagation facility for the amateur as well a professional
gardening community in the region. Establishing an arboretum is a great
step towards looking after our forests and other forms of natural
vegetation. Besides conservation, it is the understanding and explanation
of our plant diversity which is aesthetically undertaken by such ex-situ
plant conservation facilities.
Protecting threatened plants is not just a research and forestry issue.
As administrators, it is important to present a balanced assessment of
the costs and benefits involved, yet still find room to guarantee plant
conservation. Here, biodiversity conservation tools like the arboretums
can help quash the often misguided hysteria associated with the more
strident opponents of the conservation programmes. We must convince
others, including our leaders, that having a diverse and healthy gene pool
from which horticulture, agriculture, and the environment can benefit is
good for everyone, especially our future generations.
To summarize, the arboretum mission attempts to delicately make
the point that ex situ conservation can make a big difference in improving
native tree species survival of the temperate region. All of these efforts
require help from a dedicated team of researchers, core of volunteers,
commitment of the administrators and a strong will of the leaders,
without which we would fail to meet our conservation goals.
“When we plant trees, we plant the seeds of peace and seeds of hope.”
(Wangari Maathai, Nobel Peace Laureate. 2004).
References.
Belinda Hawkins, Suzanne Sharrock and Kay Havens 2008. Plants
and Climate Change. Which Future? Botanic Gardens
Conservation International, Surrey, UK.
Bramwell, D 2007. The Response of Botanic Gardens to Climate Change.
BG Journal 4 (2). 3-8.
Chowdhery, H.J. and Wadhwa, B.M 1984. Flora of Himachal
Pradesh. Vol.1-3.Botanical Survey of India, Calcutta.
Collet, H 1921. Flora Simlensis - A Handbook of the Flowering Plants of
Simla, Revised Thacker Spink and Co., Calcutta.
Janice Golding, Sabine Güsewell, Holger Kreft, Victor Y. Kuzevanov,
Susanna Lehvävirta, Ingrid Parmentier and Marco Pautasso 2010.
Species-richness patterns of the living collections of the world's
botanic gardens. a matter of socio-economics? Ann. Bot., March,
2010.
Kayri Havens, Pati Vitt, Mike Maunder, Edward O. Guerrant Jr and
Kingsley Dixon 2006. Ex Situ Plant Conservation and Beyond.
Bioscience, 56(6).525-531.
Maunder. M, Guerrant EO, Havens K, Dixon KW 2004. Realizing the full
potential of ex situ contributions to global plant conservation. Pages
389–418 in Guerrant EO, Havens K, Maunder M, eds. Ex Situ
Plant Conservation. Supporting Species Survival in the Wild.
Washington (DC). Island Press.
Maunder.M,Byers.O.2005.The IUCN technical guidelines on the
management of ex situ populations for conservation.Reflecting
major changes in the application of ex situ conservation.Oryx 39.1-4.
Peter, J. Olin 1995. Funding Botanic Gardens and Arboreta in the
21st Century.Botanic Gardens Conservation, International. Vol. 2;
No. 5.
Rawat, G. S and Jishtu Vaneet 2005. Establishment of Temperate
Arboretum and Botanical Garden (TABG) in Himachal Pradesh.
Challenges and Strategies for Future. In Strategic Plan Project – II.
Conservation of Endangered Wildlife in H.P. pp 238.
Raven, P. H. 1987. The scope of the plant conservation problem world-
wide. In Botanic Gardens and the World Conservation Strategy (eds.
D. Bramwell, O. Hamann, V. Heywood, and H. Synge), Academic
Press, London, pp. 19-29.
Samant S. S., U. Dhar and L. M. S. Palni 1998. Medicinal Plants of Indian
Himalaya.Diversity Distribution Potential Values, Gyanodaya
Prakashan, Nainitial.
Thomas, C., Cameron, A., Green, R., Bakkenes, M., Beaumont, L.,
Collingham, Y.,Erasmus, B., Ferreira de Siqueira, M., Grainger, A.,
Hannah, L., Hughes, L., Huntley, B., van Jaarsveld, A., Midgley, G.,
Miles, L., Ortega-Huerta, M., Townsend Peterson, A., Phillips, O.
and Williams, S’2004. Extinction Risk from Climate Change.
Nature, 427. 145-148.
Warren, D. M 1992. Indigenous knowledge, biodiversity conservation and
development. Keynote address at the International Conference
on Conservation of Biodiversity in Africa. Local Initiatives and
Institutional Roles, 30 August - 3 September 1992, Nairobi, Kenya.
WII-HPFD Consultancy Report 2005. Strategic Plan Project – II.
Conservation of Endangered Wildlife in H.P.
Wilcove, D. S, Rothstein D, Dubow J, Phillips A, Losos E. 1998.
Quantifying threats to imperiled species in the United States. Bio
Science 48. 607–615.
Wilson, E. O 1988. The Current State of Biological Diversity. In E. O.
Wilson [ed.].Biodiversity. National Academy Press. Washington, D.
C. Pp. 3-18.
Sacred Trees with Multiple Uses
Anita Tomar
Silviculture Division,Forest Research Institute
Dehradun. Uttarakhand, India
Abstract
Tree worship is an age old practice in India as seen from the seals of
Mohenjodaro and Harrapa that have impressions of sacred Peepal and
willow trees. Trees are prominent in the Bhagvad Gita, the Bible and
the holy Koran. During ancient times tree are associated with certain
deities and are said to be abode of Gods and Goddesses. Old Buddhist and
Hindu sculptures display prominently Baniyan, Peepal, Siras, Sal, Mango,
Ashok, Nag Kesher, Champa, Kadamb etc . For example, Mangifera
indica has traditionally been used for various religious functions .Its
leaves are used to cover the pitcher used in pooja as an auspicious
omen. Mango wood and branches are preferred in all the sacrificial fires.
Ficus religiosa is held sacred to Hindus and Buddhists. Ficus bengalensis
is known as Akshay vat i.e long lasting or immortal. It is said to be
dwelling places of the souls of ‘pitter’ our ancestors. Aegle marmelos
leaves are offered to God Shiva.
As it was noticed that the species related directly or indirectly with
deities or mythological figures are having multiple uses so to explore the
better utilization of sacred trees present check list of sacred trees having
multiple uses has been compiled from the observation made by the author
as well as reports in literature. Some of the striking examples are,
Mangifera indica, Saraca asoca, Ficus religiosa, Ficus bengalensis, Aegle
marmelos, Azadirachta indica, Santalum album, etc.
In the present paper 7 sacred trees with multiple uses belonging to
different families are dealt with. A new approach can be adopted in
fostering love for trees. These trees will not only provide much needed
fuel, food, fodder, timber, medicine etc but will also contribute towards
improvement of environment. Their planting and conservation is thus
recommended.
Keywords: Tree worship, deities, mythological figures, multiple uses
Introduction
Trees have become part of our lives. They are represented in
legends and myths, both from our culture and from others. Trees have also
become deeply integrated in symbolism and are used in a variety of ways
to convey messages related to the qualities that certain trees possess. The
tree also appears in religion, where it is worshipped directly or used as a
place around which to worship.
It is mentioned of the Kalpavriksha and Chaityavriksha in the
ancient scriptures indicating that the worship of the tree is indeed an
ancient Indian practice. The Ancient Aryans worshiped nature. Plants, trees
and the other elements were always revered and several rituals were
connected to them. Tree worship continues to be an element of modern
Indian traditions. It is also evident from our ancient scripture that tree
worship was widely practiced in India as seen from the seals of
Mohenjodaro and Harrapa that have impressions of stylized Peepal and
Willow trees. There are many trees which are considered sacred. A few
are highlighted here.
Asoka Tree
Systematic position
Kingdom: Plantae Division: Magnoliophyta
Class: Magnoliopsida Order: Fabales
Family: Caesalpiniaceae Genus: Saraca
Species: asoca
Asoka is a sanskrit word meaning without grief or that which gives
no grief. Asoka is one of the most legendary and sacred trees of India, and
one of the most fascinating flowers in the Indian range of flower essences.
The tree has many other names in local languages as well. One such
name means the tree of love blossoms. The Hindus regard it as sacred,
being dedicated to Kama Deva, God of Love. The tree is a symbol of love.
Its beautiful, delicately perfumed flowers are used in temple decoration.
There are also festivals associated with this flower. The asok tree is
considered sacred throughout the Indian subcontinent. It is often found at
gates of Buddhist and Hindu temples. Ramayana also mentions this tree as
the Asok vatika where Hanuman first meets Goddess Sita. Lord Mahavira,
too, renounced the world under the Asoka tree in Vaishali.
The Asoka tree has a symbolic importance in Buddhism. Queen
Maya of Sakya is said to have given birth to the Buddha under an Asoka
tree in a garden in Lumbini. According to tradition, the queen walked in
the garden until she came to an Asoka tree to take a rest. Then the tree
magically bent down for her and she grasped a branch. At that moment
the Buddha emerged from her right side.
The juice obtained from boiling the bark of Asoka tree is used to
cure some ailments of women, and a pulp of the blossoms is one of the
remedies used for dysentery. Bark used in uterine infections, as an
astringent and in excessive menstruation. Flowers are uterine tonic and
are used in “Pitta”, leaves juice mixed with cumin seeds are used in
stomachalgia.
Banyan Tree
Systematic position
Kingdom: Plantae Division: Magnoliophyta
Class: Magnoliopsida Order: Urticales Family: Moraceae
Genus: Ficus Species: benghalensis
The name was originally given to F. benghalensis and comes
from India where early travellers observed that the shade of the tree was
frequented by banias or Indian traders. In Hinduism, the leaf of banyan
tree is said to be the resting place for the God Krishna, who, after
consuming all the universe during the time of destruction, absorbs
everything created and turns himself to a child as small as he could fit into
the tiny leaf of the banyan tree and keeps floating in the void space, until
he himself decides to recreate everything back out from him. Also in
Hindu culture, the banyan tree is also called kalpavriksha meaning 'wish
fulfilling divine tree' Like Peepal tree, the Banyan tree also symbolizes the
Trimurti-Lord Vishnu, Lord Shiva and Lord Brahma. The tree also
symbolizes life and fertility in many Hindu cultures. That is the reason,
banyan tree is worshiped by those who are childless and this tree should
never be cut. The tree can grow into a giant tree covering several
hectares. The Great Banyan in the Indian Botanic Garden, Howrah, is
considered to be the largest tree in the world. Lord Dakshinamurthy, who
is worshiped as the "ultimate guru", is usually depicted beneath a banyan
tree. He symbolizes Lord Shiva and is seen as the destroyer of
ignorance and embodiment of knowledge.
Banyan trees have been used or investigated for a wide variety of
uses, from paper and rubber to hair conditioners and ornaments. The
banyan yields an inferior rubber, and the sticky milk is used to make bird
lime. The wood of banyan is suitable for the paper pulp, and in Assam and
Madras, paper has been prepared using the bark. Fiber is also made from
its bark and aerial roots of banyan in India are used to make rope for
tying bundles of wood. Lac is sometimes collected on the tree. The fruit is
eaten in times of scarcity and is greedily devoured by birds and monkeys.
The leaves and twigs are a favourite fodder for cattle and elephants.
Bael Tree
Systematic position
Kingdom: Plantae Division: Magnoliophyta
Class: Magnoliopsida Order: Sapindales Family: Rutaceaec
Genus: Aegle Species: marmelos
In Hinduism, the Bael (Bilwa) tree is very sacred. It is today
mainly used in the worship of Shiva. Hindus believe that Lord Shiva
will be pleased with Bilwa (Bael) Pattra (leaf) Puja (worship). The
importance of this tree in worship of Lord Shiva is mentioned in several
sacred books. Prior to wide availability of South Indian coconuts in North
India, Bael fruits were also used in other deities puja rituals and crushed or
offered in the same way as coconuts are today.
In the Hindu religion, the Tri-foliate leaves typical of the Bael are
seen as the 3-pronged Trident (Trisula) that Lord Shiva holds in his right
hand. The Trident symbolizes his three fundamental powers of will, action
and knowledge. The Trident also symbolizes the past, the present and the
future and also symbolizes the three functions of the Lord-the creation,
preservation and destruction as well as his three eyes. Planting these trees
around home or temple is sanctifying and is equivalent to worshiping a
Linga with bilwa leaves and water. The offering of the leaves is a
compulsory ritual while worshipping Lord Shiva all over India.
Almost every Hindu temple in India would have one or more
Bael trees in their courtyards. The Skanda Purana interprets the
significance of Bael tree and mentions that Goddess Parvati`s perspiration,
which fell to the ground while she performed penance, gave birth to this
tree. Hindu mythology also says that various incarnations of Parvati reside
in each part of the Bael tree.
Beal tree is also sacred to the Jains. It is said the 23rd Tirthankara,
Bhagwan Parasnathji attained "Nirvana" enlightenment under a Bael tree.
Besides religious significance, almost all parts of the tree have medicinal
qualities. Bael is an ingredient in many Ayurvedic and Siddha
formulations. Moreover, it may be related Vishwakarma, as mucous
that surround seed is put to use in building construction, varnishing etc.
Wood of Bael is used in construction. The pulp of the ripe fruit is
a laxative and mixed with a little milk and sugar makes a very agreeable
cooling sherbet. The unripe fruit, either boiled or roasted, is used as a
specific for diarrhea and dysentery. The pulp is also used to strengthen
mortar. The mucus with which the cells of the fruit are filled is used for
adhesive purposes, and is often mixed with water-paints to add to their
strength and brilliancy. Snuff-boxes are made of the shell of the fruit. The
leaves are very bitter and are used as a febrifuge, they are also lopped for
cattle fodder. Root and stem bark is used in fever. Root is one of the
ingredients of Dasmula (ten roots).
Mango Tree
Systematic position
Kingdom: Plantae Division: Magnoliophyta
Class: Magnoliopsida Order: Sapindales Family: Anacardiaceae
Genus: Mangifera Species: indica
In Hindu religion, mango tree has a lot of religious importance. To
the Hindus, it is an alteration of the God Prajapati, the Lord of all
creatures. Further, the rooms in which marriage ceremonies are held are
festooned with Mango leaves. The wood is also considered as sacred
because it is included in funeral pyres. The Hindus also dedicate the
flowers of the tree to the Moon on the second day of the Bengali month.
The significance of this finds mention in the Ramayana,
Mahabharata and the Puranas. The mango as a fruit is a symbol of love and
fertility. The leaf of the tree is used during most religious and social
ceremonies of the Hindus. A "Purnakumbha" is a pot filled with water and
topped with fresh mango leaves and a coconut and considered to be the
"staphna" of the puja. The pot symbolizes mother earth, water is the life
giver, coconut the divine consciousness and the mango leaves symbolizes
life. The whole "Purnakumbha" is symbolizes Goddess Lakshmi and good
fortune. On various auspicious occasions, mango leaves are used to adorn
entrances at home to signify good fortune. Mango blossoms are used on
Basant Panchami day to worship Goddess Saraswasti. The tree is also
sacred to the Buddhists because it is believed that Lord Buddha
performed during his lifetime the instantaneous creation of a large mango
tree from the seed at a place called Shravasti.
The mango is the most popular and choicest fruit of India and
occupies a prominent place among the best fruits of the world. Amchoor
and pickles are prepared from unripe fruits. The green fruit is pickled, and
is dried as an article of trade in Bengal. The pulp of the ripe fruit is dried in
thin plates, which can be kept for months without losing flavor. Timber is
used in building construction and as a fuel. Wood is made into planks, and
is sometimes used for tea-boxes also. Doors and windows and sometimes
cheap furniture are made of it. The bark is also styptic and is also use to
stop vomiting and also used for diarrhea, dysentery.
Neem Tree
Systematic position
Kingdom: Plantae Division: Magnoliophyta
Class: Magnoliopsida Order: Sapindales Family: Meliaceae
Genus: Azadirachta Species: indica
It is said that on the first day of Chaitra, after Amavasya, it is very
essential to worship the neem and eat its leaves, mixed with pepper and
sugar, as a safeguard from fever. The neem tree besides having various
medicinal benefits is a highly revered tree among the Hindus because it is
a manifestation of "Goddess Durga" or "Maa Kali". That is why the tree is
sometimes referred to as Neemari Devi. The Tree is worshiped very
intensely. Tamil Ladies, while worshiping Maa kali dress in red, carry
branches of the Neem tree, and dance in public places swishing the
branches as an act of exorcism and to purify the world. The multi-
headed occult goddess Yellamma (a highly revered goddess in south
India) sometimes assumes the appearance of a young neem tree. Young
maidens worship this Goddess by cladding themselves all over in neem
branches. In Bengal, neem is considered to be the tree which is the abode
of "Sitala" (the great Pox-mother who can cause or cure disease). The
customary treatment of pox is therefore to rub the body with neem leaves
while making prayers to Sitala. It is also said that the smoke of burning
neem protects both the living and the dead from evil spirits.
Being an evergreen shady tree, it is planted by the road side, in the
courtyards and assembly places in the rural areas. It is well suited for the
afforestation in arid regions and is a common avenue tree. Almost every
part of the tree is bitter and is used in indigenous medicine. The wood is
suitable for carving .The timber is used in house building and for making
boards, panels, toys, ploughs etc.Wood is used in construction and for
furniture, and makes good sonorous drums. The bark, leaves and fruit are
used in medicine. The fruit gives oil which is considered very well for
small-pox sores and is also used for burning. The leaves are much lopped
for goat and camel fodder. Aroma of leaves has insecticidal properties
therefore dried leaves are used to preserve clothes and books.
Peepal Tree
Systematic position
Kingdom: Plantae Division: Magnoliophyta
Class: Magnoliopsida Order: Urticales Family: Moraceae
Genus: Ficus Species: religiosa
Peepal tree also known as "Ashvattha" in Sanskrit is a very large tree
and the first-known depicted tree in India. A seal discovered at
Mohenjodaro, one of the cities of the Indus Valley Civilisation depicts the
peepal being worshiped. According to the Brahma Purana and the Padma
Purana, when the demons defeated the gods, Lord Vishnu hid himself in
the Peepal tree and that is why it is believed that the Peepal tree is a
symbol of Vishnu and is worshiped since past. There is another belief that
the tree represents the Trimurti-the roots being Brahma, the trunk
Vishnu and the leaves Shiva. Some says that Lord Krishna is believed
to have died under this tree, after which the present Kali Yuga started.
According to another belief, Goddess Lakshmi also inhabited the tree,
especially on saturday and hence it is considered auspicious to worship it.
Infact women worship the tree to bless them with a son tying red thread or
red cloth around its trunk or on its branches. According to the Skanda
Purana, to cut down a Peepal tree is considered a sin. Even Buddha is
believed to have attained enlightenment under the Peepal tree and the
Peepal is also sacred to Buddhist. Hence it is also called the Bodhi tree or
"tree of enlightenment".
It is said that peepal tree protects mankind from the evil eye and
also keeps away dreadful dreams. Mentions have been made about the
holiness of Peepal tree in Vedas. Well, apart from its religious
significance, Peepal tree is also known for its medicinal value.
Its leaves serve as a wonderful laxative as well as tonic for the body.
It is especially useful for patients suffering from Jaundice. It helps to
control the excessive amount of urine released during jaundice. The leaves
of Peepal are highly effective in treating heart disorders. It helps to control
the palpitation of heart and thereby combat the cardiac weakness.
Ayurveda makes an extensive use of the leaves of Peepal due to the
numerous benefits it provides. The leaves and branches are good for
elephant fodder. The milky juice hardens into a substance resembling
guttapercha. Peepal leaves are of great use in getting rid of mumps
Chandan Tree
Systematic position
Kingdom: Plantae Division: Magnoliophyta
Class: Magnoliopsida Order: Santalales Family: Santalaceae
Genus: Santalum Species: album
Besides being used in fragrance industry, fine woodworking
and aromatherapy, Sandalwood is commonly used for incense and
religious ceremonies. The red sandalwood tree is considered to be a
very sacred tree and is like a sage among many people. It is said that all
other trees are considered ordinary trees and are like ignorant men in front
of a red sandalwood, Popularly known as Chandan, Sandalwood has an
extraordinary fragrance. Sandalwood paste is used in all religious rituals.
The paste is smeared on the foreheads of devotees of Vishnu and Shiva
and it is said that the sandalwood paste is meant to cool and protect the
"Agna chakra" present between the eyebrows. In India, the death pyre is
made using sandalwood branches for centuries. According to legend, Lord
Ganesha was created by Goddess Parvati out of sandalwood paste that she
used for her bath and breathed life into the figure. According to Indian
mythology, sandalwood tree is depicted as being entwined with serpents.
Sandalwood remains cool and aromatic even when the poisonous
serpent coils around it. This also has another meaning that the basic nature
of an individual cannot change because of outer effects.
Sandal wood, its paste and oil are important in worship of gods.
The Sandal tree is highly regarded in the Vedic texts, and the
heartwood is considered to be sacred. It is said that chandana, or
Indra's Sandalwood tree, scents the whole of paradise with its fragrance.
Sandalwood is considered the epitome of excellence, imparting fragrance
even to the axe that cuts it. For this reason anything that is excellent is
referred to as Chandana.
Its oil from heartwood used in the symptomatic treatment of
dysuria, in gonorrheal urethritis and cystitis. The oil from sandalwood is
widely used in the cosmetic industry and is expensive. Paste of wood
used as a cooling application to the skin for allaying heat.
Conclusions
One of the most significant ways in which trees are regarded is
through their association with religion. Several races exist that revere trees,
and there are some that use them as icons. Others used them to make
representations of gods that they worshiped.
Vonmahotsava, farm forestry. social forestry and such other
programmes have been launched to motivate farmers to plant trees.
However, these programmes have not been fully successful. May be, if
sacred tree worship as a ritual is indicated, the planting programmes can
be successful. As highlighted above, all these sacred trees species are
multiple uses. These trees will not only provide much needed fuel, food,
fodder, timber, medicine, wood etc. but will also contribute towards
improvement of environment. Adoption of such an approach will go a
long way in fostering love for trees, their maintenance, conservation,
protection and planting is thus recommended.
References
Aima, R., 2009.A Pictorial Guide to the Plants of the Indian sub-
continent. Natraj publishers, Dehradun.. pp.555
Chopra, R. N., Nayar, S. L. and Chopra, I. C., Glossary of Indian
Medicinal Plants.,Publication and Information Directorate. CSIR,
New Delhi.1956.pp.318
Davies, D., The Iconography of Landscape – Cambridge University
Press.1988
Kanjilal, U.N., Forest Flora of the Chakrata, Dehradun and
Saharanpur Forest Divisions, Natraj Publishers, Dehradun. 2004.
pp.593
Negi, S. S., Srivastava R. K. and Bisht, N.S., Medicinal and Aromatic
Plants. Indian Forester, Dehradun.2007.pp.607.
Shah, R., Nature’s Medicinal Plants of Uttaranchal (Trees, shrubs and
climbers) Revised Volume-I . Gyanodaya Prakashan, Nainital. 2003.
pp.527 www.http://en.wikipedia.org/wiki/.
Nature Based Tourism- A Source of Livelihood for Rural People
Sweta Priyam, H. B. Vasistha and Mridula Negi
Forest Ecology and Environment Division Forest Research Institute,
Dehradun-248006
Abstract
Nature based tourism is a developing niche within the larger travel
industry, with the potential of livelihood generation and sustainable
development including protection and conservation of nature. This leads to
an incentive for sustaining natural resources which in turn pave way for
conserving biodiversity at local or regional level.
This paper revolves around the impact analysis of nature based
tourism on livelihood of villages in and around Kunjapuri temple in district
Tehri Garhwal, Uttarakhand, situated at 1676m above msl, 35 km on
Rishikesh- Gangotri National Highway. Four villages namely Badera,
Pater, Kheragoan and Sonigoan are located in the vicinity of the temple
and depend on adjoining forest around the temple for forest based
resources. The invigorating environment, aesthetic beauty, serine
atmosphere, diversity of avifauna, mountains clad with snow and
telescopic display of panoramic view of Himalayas catch the attention of
visitors. At the same time it offers attractive destination for trekking and
adventure tourism like paragliding. The nature based tourism is becoming
a major source of livelihood of villagers by selling of local goods,
establishing small and medium shops of tea, grocery shops. To
conserve biodiversity and developing perspective of nature based
tourism which in turn sustains the livelihood of villagers, departments
like Forest Research Institute and State Forest Department has initiated
the activities like planting of aesthetic and multipurpose plant species.
The present paper discusses in detail the impact of nature based
tourism on livelihood of villagers located in and around Kunjapuri,
Uttarakhand.
Keywords. Nature-based tourism, livelihood, Kunjapuri, Rural people,
Introduction
Travel and tourism are among the world’s fastest growing
industries and are the major source of foreign exchange earnings for many
developing countries. Nature- based tourism or ecotourism is a growing
niche market within the larger travel industry, with the potential of being
an important sustainable development tool. It is defined by its sustainable
development results. conserving natural areas, educating visitors about
sustainability, and benefiting local people. Yet while ecotourism has the
potential to create positive environmental and social impacts, it can
unfortunately be damaging as mass tourism if not done properly. Typically
located in pristine, fragile ecosystem, ecotourism projects run the risk of
destroying the very environmental assets on which they depend. The
loss of biodiversity and wildlife habitats, the production of waste and
polluted effluent in areas that have little or no capacity to absorb them are
just some of the worries.
Recognizing the global importance of the issue, United Nations
designated 2002 as the International Year of Ecotourism, and the
Commission on Sustainable Development (CSD) mandated the United
Nations Environment Programme (UNEP) and the World Tourism
Organization to carry out activities for the year. Its goal was to review
the lessons learned in implementing ecotourism, and to identify and
promote forms of ecotourism that lead to the protection of critically
endangered ecosystems, sharing the benefits of the activity with local
communities and respecting local cultures.
Ecotourism has been defined as a form of nature-based tourism in
the market place. The term ecotourism, therefore, refers on one hand to a
concept under a set of principles, and on the other hand to a specific
market segment. The International Ecotourism Society (TIES) (previously
known as The Ecotourism Society (TES)) in 1991 produced one of the
earliest definitions “Ecotourism is responsible travel to natural areas that
conserves the environment and sustains the well being of the people”.
Ecotourism as defined by IUCN (now called the World
Conservation Union) states in 1996 that ecotourism “is, environmentally
responsible travel and visitation to relatively undisturbed natural areas, to
enjoy, study and appreciate nature (and accompanying cultural features
both past and present), that promotes conservation, has lower visitor
impact, and provides for beneficially active socio-economic involvement
of local populations”.
'Ecotourism' (also known as ecological tourism) is responsible travel
to fragile, pristine, and usually protected areas that strives to be low impact
and (often) small scale. Its purpose is to educate the travelers; provide
funds for conservation; directly benefit the economic development and
political empowerment of local communities; and foster respect for
different cultures and for human rights. It is held as important by those
who participate in it so that future generations may experience aspects of
the environment relatively untouched by human intervention.
Ecotourism typically involves travel to destinations where flora,
fauna, and cultural heritage are the primary attractions. One of the goals of
ecotourism is to offer tourists insight into the impact of human beings on
the environment, and to foster a greater appreciation of our natural habitats.
Responsible ecotourism includes programs that minimize the
negative aspects of conventional tourism on the environment and enhance
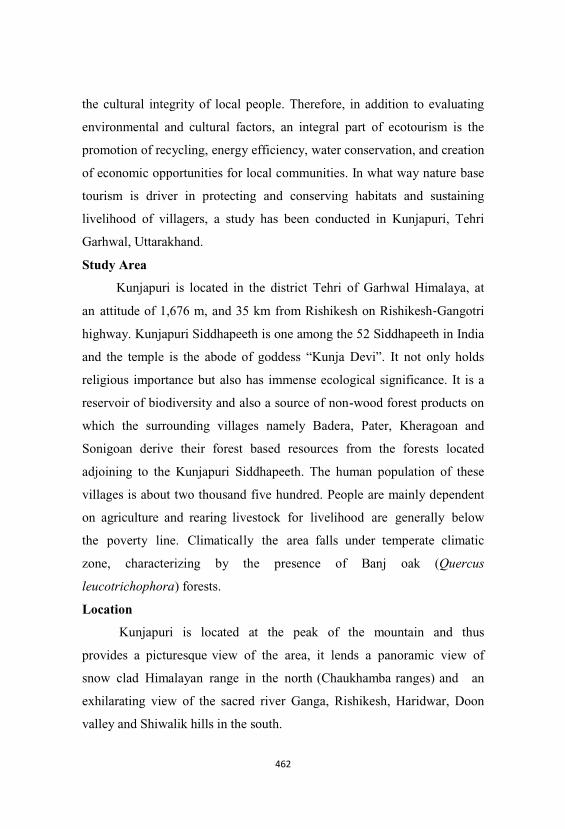
the cultural integrity of local people. Therefore, in addition to evaluating
environmental and cultural factors, an integral part of ecotourism is the
promotion of recycling, energy efficiency, water conservation, and creation
of economic opportunities for local communities. In what way nature base
tourism is driver in protecting and conserving habitats and sustaining
livelihood of villagers, a study has been conducted in Kunjapuri, Tehri
Garhwal, Uttarakhand.
Study Area
Kunjapuri is located in the district Tehri of Garhwal Himalaya, at
an attitude of 1,676 m, and 35 km from Rishikesh on Rishikesh Gangotri
highway. Kunjapuri Siddhapeeth is one among the 52 Siddhapeeth in India
and the temple is the abode of goddess “Kunja Devi”. It not only holds
religious importance but also has immense ecological significance. It is a
reservoir of biodiversity and also a source of non-wood forest products on
which the surrounding villages namely Badera, Pater, Kheragoan and
Sonigoan derive their forest based resources from the forests located
adjoining to the Kunjapuri Siddhapeeth. The human population of these
villages is about two thousand five hundred. People are mainly dependent
on agriculture and rearing livestock for livelihood are generally below
the poverty line. Climatically the area falls under temperate climatic
zone, characterizing by the presence of Banj oak (Quercus
leucotrichophora) forests.
Location
Kunjapuri is located at the peak of the mountain and thus
provides a picturesque view of the area, it lends a panoramic view of
snow clad Himalayan range in the north (Chaukhamba ranges) and an
exhilarating view of the sacred river Ganga, Rishikesh, Haridwar, Doon
valley and Shiwalik hills in the south.
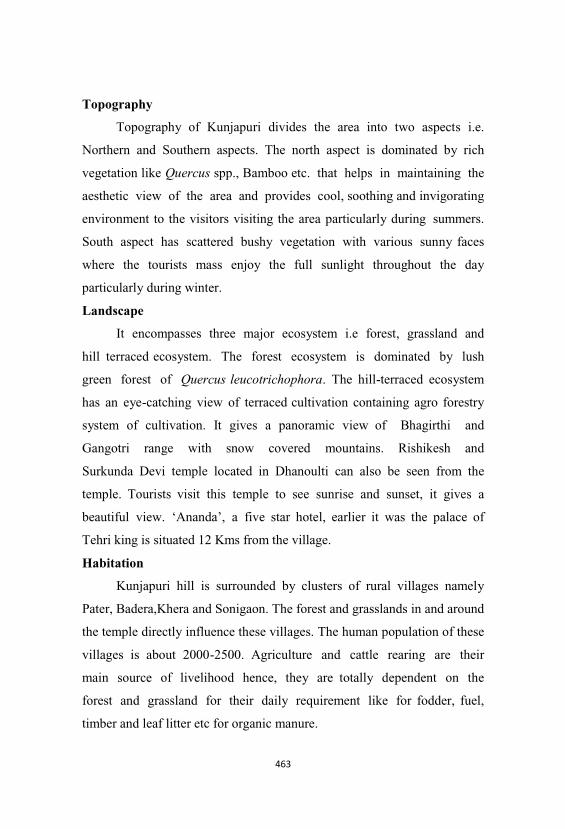
Topography
Topography of Kunjapuri divides the area into two aspects i.e.
Northern and Southern aspects. The north aspect is dominated by rich
vegetation like Quercus spp., Bamboo etc. that helps in maintaining the
aesthetic view of the area and provides cool, soothing and invigorating
environment to the visitors visiting the area particularly during summers.
South aspect has scattered bushy vegetation with various sunny faces
where the tourists mass enjoy the full sunlight throughout the day
particularly during winter.
Landscape
It encompasses three major ecosystem i.e forest, grassland and
hill terraced ecosystem. The forest ecosystem is dominated by lush
green forest of Quercus leucotrichophora. The hill-terraced ecosystem
has an eye-catching view of terraced cultivation containing agro forestry
system of cultivation. It gives a panoramic view of Bhagirthi and
Gangotri range with snow covered mountains. Rishikesh and
Surkunda Devi temple located in Dhanoulti can also be seen from the
temple. Tourists visit this temple to see sunrise and sunset, it gives a
beautiful view. ‘Ananda’, a five star hotel, earlier it was the palace of
Tehri king is situated 12 Kms from the village.
Habitation
Kunjapuri hill is surrounded by clusters of rural villages namely
Pater, Badera,Khera and Sonigaon. The forest and grasslands in and around
the temple directly influence these villages. The human population of these
villages is about 2000-2500. Agriculture and cattle rearing are their
main source of livelihood hence, they are totally dependent on the
forest and grassland for their daily requirement like for fodder, fuel,
timber and leaf litter etc for organic manure.
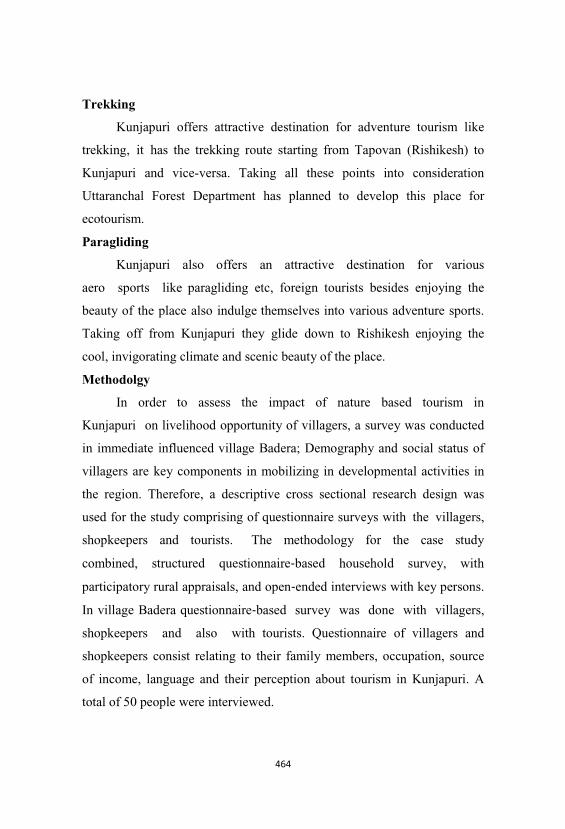
Trekking
Kunjapuri offers attractive destination for adventure tourism like
trekking, it has the trekking route starting from Tapovan (Rishikesh) to
Kunjapuri and vice-versa. Taking all these points into consideration
Uttaranchal Forest Department has planned to develop this place for
ecotourism.
Paragliding
Kunjapuri also offers an attractive destination for various
aero sports like paragliding etc, foreign tourists besides enjoying the
beauty of the place also indulge themselves into various adventure sports.
Taking off from Kunjapuri they glide down to Rishikesh enjoying the
cool, invigorating climate and scenic beauty of the place.
Methodolgy
In order to assess the impact of nature based tourism in
Kunjapuri on livelihood opportunity of villagers, a survey was conducted
in immediate influenced village Badera; Demography and social status of
villagers are key components in mobilizing in developmental activities in
the region. Therefore, a descriptive cross sectional research design was
used for the study comprising of questionnaire surveys with the villagers,
shopkeepers and tourists. The methodology for the case study
combined, structured questionnaire based household survey, with
participatory rural appraisals, and open ended interviews with key persons.
In village Badera questionnaire based survey was done with villagers,
shopkeepers and also with tourists. Questionnaire of villagers and
shopkeepers consist relating to their family members, occupation, source
of income, language and their perception about tourism in Kunjapuri. A
total of 50 people were interviewed.
Results
The village is dominated by female population with agriculture as
the major source of income with 3-4 ha of land, beside rearing cattle.
Figure 1. Percentage distribution population in village Badera.
Figure 2. Percentage distribution of Income in village
Badera.
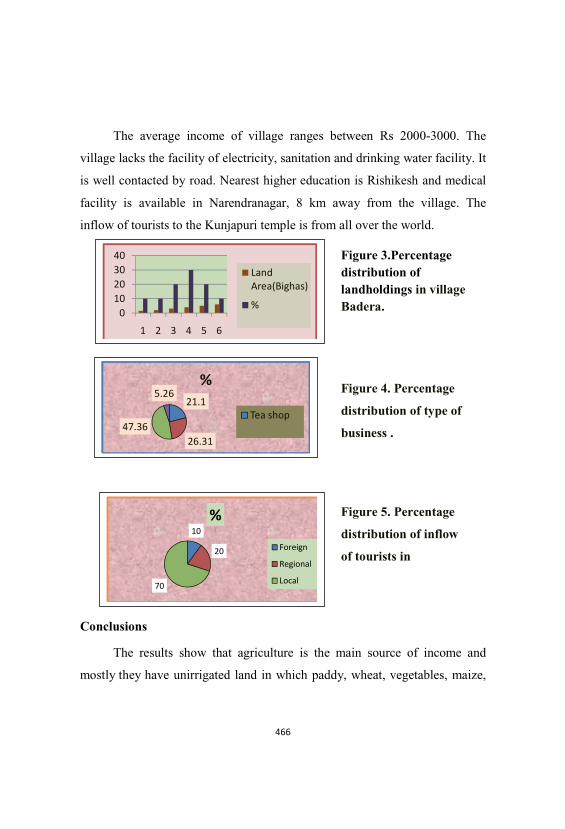
The average income of village ranges between Rs 2000-3000. The
village lacks the facility of electricity, sanitation and drinking water facility. It
is well contacted by road. Nearest higher education is Rishikesh and medical
facility is available in Narendranagar, 8 km away from the village. The
inflow of tourists to the Kunjapuri temple is from all over the world.
Conclusions
The results show that agriculture is the main source of income and
mostly they have unirrigated land in which paddy, wheat, vegetables, maize,
Figure 3.Percentagedistribution oflandholdings in villageBadera.
Figure 4. Percentage
distribution of type of
business .
Figure 5. Percentage
distribution of inflow
of tourists in
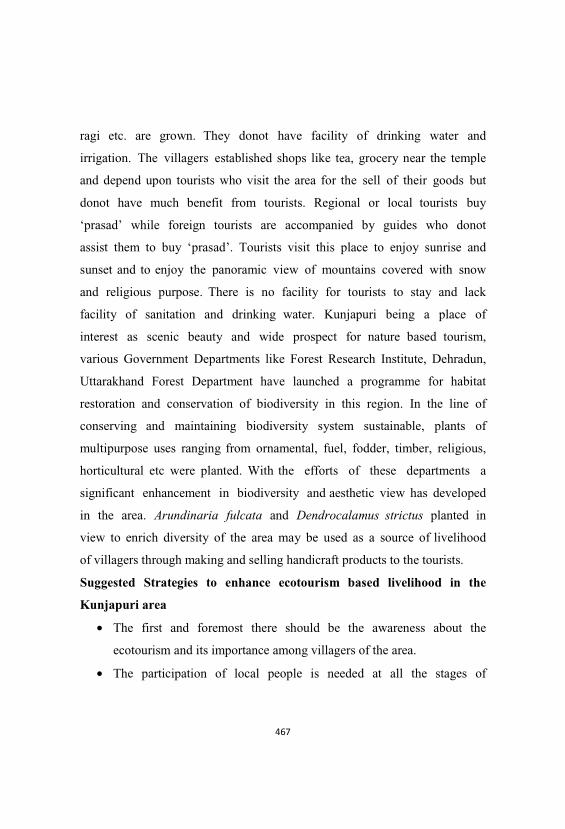
ragi etc. are grown. They donot have facility of drinking water and
irrigation. The villagers established shops like tea, grocery near the temple
and depend upon tourists who visit the area for the sell of their goods but
donot have much benefit from tourists. Regional or local tourists buy
‘prasad’ while foreign tourists are accompanied by guides who donot
assist them to buy ‘prasad’. Tourists visit this place to enjoy sunrise and
sunset and to enjoy the panoramic view of mountains covered with snow
and religious purpose. There is no facility for tourists to stay and lack
facility of sanitation and drinking water. Kunjapuri being a place of
interest as scenic beauty and wide prospect for nature based tourism,
various Government Departments like Forest Research Institute, Dehradun,
Uttarakhand Forest Department have launched a programme for habitat
restoration and conservation of biodiversity in this region. In the line of
conserving and maintaining biodiversity system sustainable, plants of
multipurpose uses ranging from ornamental, fuel, fodder, timber, religious,
horticultural etc were planted. With the efforts of these departments a
significant enhancement in biodiversity and aesthetic view has developed
in the area. Arundinaria fulcata and Dendrocalamus strictus planted in
view to enrich diversity of the area may be used as a source of livelihood
of villagers through making and selling handicraft products to the tourists.
Suggested Strategies to enhance ecotourism based livelihood in the
Kunjapuri area
• The first and foremost there should be the awareness about the
ecotourism and its importance among villagers of the area.
• The participation of local people is needed at all the stages of
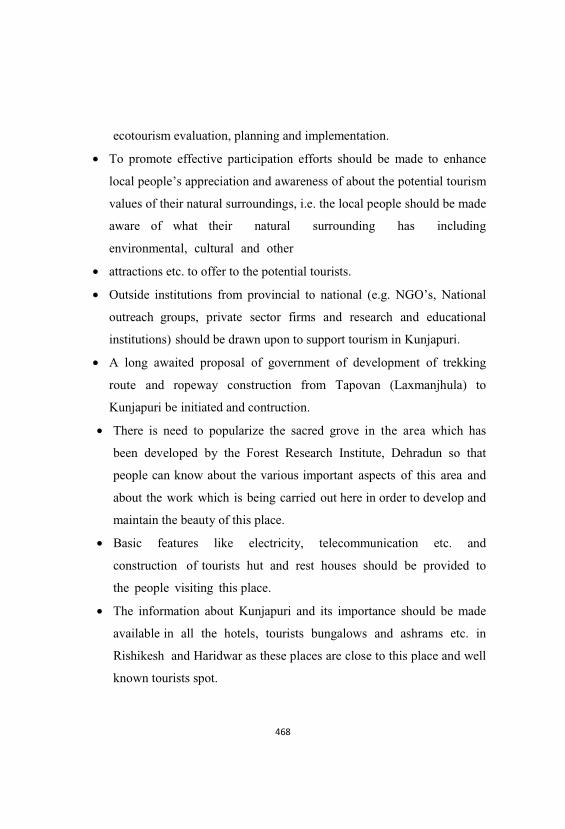
ecotourism evaluation, planning and implementation.
• To promote effective participation efforts should be made to enhance
local people’s appreciation and awareness of about the potential tourism
values of their natural surroundings, i.e. the local people should be made
aware of what their natural surrounding has including
environmental, cultural and other
• attractions etc. to offer to the potential tourists.
• Outside institutions from provincial to national (e.g. NGO’s, National
outreach groups, private sector firms and research and educational
institutions) should be drawn upon to support tourism in Kunjapuri.
• A long awaited proposal of government of development of trekking
route and ropeway construction from Tapovan (Laxmanjhula) to
Kunjapuri be initiated and contruction.
• There is need to popularize the sacred grove in the area which has
been developed by the Forest Research Institute, Dehradun so that
people can know about the various important aspects of this area and
about the work which is being carried out here in order to develop and
maintain the beauty of this place.
• Basic features like electricity, telecommunication etc. and
construction of tourists hut and rest houses should be provided to
the people visiting this place.
• The information about Kunjapuri and its importance should be made
available in all the hotels, tourists bungalows and ashrams etc. in
Rishikesh and Haridwar as these places are close to this place and well
known tourists spot.
• Incorporate Kunjapuri in the tourist map of Garhwal Himalaya.
These strategies would go a long way to promote Kunjapuri as a
potential site for the ecotourism. To be viable, ecotourism should be
community based and the needs of the community, their ideas of conservation
be given prime importance. Local structures must receive patronage and
promotion, so that ecotourism becomes a dynamic facet of economic
development.
Refrences
Barkin, D. 2002. Eco tourism for sustainable regional development. Current
Issues inTourism. 5(3–4).245–253.
Buckley, R. 1994. Research Note, a framework for ecotourism. Annals of
TourismResearch. 21(3).661–669.
Ceballos-Lascurain, Hector. 1996.Tourism, Ecotourism and Protected Areas.
IUCN.
Choudhary Manjula, Kamra K. K, Boora, Bhushan Ravi, Chand Mohinder
and Taxak R. H 2007.Tourism Development Impact and Strategies.
Department of Torism and Hotel Management, K. U. pp- 61
Rawat M, Vasistha H. B, Negi M2010, People’s Perception on the Impact of
Climate Change in Garhwal Himalayan Region. A Case Study from
Kunjapuri Hills, in edition (Bhawana Luthra, Vijay Pratap Singh,
Debajit Barkataki, Tara Mann, Rahul Singh) Reflections of Climate
Change Leaders from the Himalayas.
Conributing Authors
Prafulla Soni
Retd.Scientist- G & Head
Ecology & Environment Division
Forest Research Institute,Dehradun
Presently Advisor Restoration ecology & Biodiversity Conservation
Lal Singh
Forest Soil & Land reclamation Division
Forest Research Institute, Dehradun
Anshumali
Department of Environmental Science and Engineering
Indian School of Mines Dhnabd-826004, Jharkhand
J.V. Tyagi
National Institute of Hydrology,Jal Vigyan Bhawan
Roorkee- 247667, Uttarakhand, India
[email protected]; [email protected]
Rakesh Kumar
National Institute of Hydrology,Jal Vigyan Bhawan,
Roorkee- 247667, Uttarakhand, India
R.D.Singh
National Institute of Hydrology,Jal Vigyan Bhawan, Roorkee- 247667,
Uttarakhand, India
Harender Singh
Entomology Research Lab,Department of Zoology,
M.S. (P.G.) College, Saharanpur; 247001
S.C. Dhiman
Entomology Research Lab,Department of Zoology,
M.S. (P.G.) College, Saharanpur; 247001
Salman Ansari
C.C.S. University, Meerut-250004
Biswajit Paul
Department of Environmental Science and Engineering,
Indian School of Mines, Dhanbad, Jharkhand, India
C.M. Mathavan
Regional Fertilizer Quality Control Laboratory
Ministry of Agriculture
Madhavaram Milk Colony, Chennai-51
Anuj Kumar Singh
Orissa University of Agriculture & Technology, Bhubaneswar
[email protected],[email protected]
Jamaluddin
Department of Biological Science, Rani Durgavati University, Jabalpur
Ashish Rawat
The Louis Berger Group, Inc
Plot No. B-3-6, Sector 32, Gurgaon - 122001, INDIA
Shikha Uniyal Gairola NOIDA, U.P.(India)
Sanjay Sood & Sandeep Bhimta
CF Hamirpur, H.P.
Preeti Pandey Pant
Wildlife Division
Ministry of Environment and Forests
Government of India
Paryavaran Bhawan, C G O Complex, Lodhi Road, New Delhi.
A.K. Tripathi
Ecology and Environment Division,
Forest Research Institute, P.O. New Forest, Dehradun
Nutan Gupta
Forest Research Institute, P.O. New Forest, Dehradun
N.S.K Harsh
Forest Pathology Division, Forest Research Institute, Dehradun
Ashok Kumar
Department of Biotechnology, HNBGU (A Central University),
Srinagar-Garhwal-246174 (UK) INDIA
B.S. Bisht
Badshahithaul Tehri-249199 (UK) INDIA
V.D. Joshi
Dept of Zoology, Govt. PG College Kotdwara Garhwal (UK) INDIA
Parth Sarathi Mahapatra
Ecology & environment division
Forest Research Institute,Dehradun-248006, India
+917377487707/ +919438300732
Ganesh Datt Bhatt
Global Open University, Nagaland
Richa Arya
Department of Environmental Science,
Babasaheb Bhimrao Ambedkar University, Lucknow (U.P.)
Mohd. Muzamil
Department of Environmental Science,
Babasaheb Bhimrao Ambedkar University, Lucknow (U.P.)
M. Yunus
Department of Environmental Science,
Babasaheb Bhimrao Ambedkar University, Lucknow (U.P.)
A.K. Gupta
National Institute of Disaster management (GOI), New Delhi
[email protected], [email protected],
Peeyush
Disaster Mitigation & Management Center-Dehradun
N.K.Bohra
Arid Forest Research Institute, Jodhpur (Rajasthan)
J.K.Shukla
Arid Forest Research Institute, Jodhpur (Rajasthan)
D.K.Mishra
Arid Forest Research Institute, Jodhpur (Rajasthan)
Ram Chandra
Progressive Research Organization for Welfare (PROW),
B-28-29, Flat No. 203, Vishwakarma Colony,
M.B. Road, New Delhi (India) -110044
Govind Singh
Department of Environmental Biology, University of Delhi
Mihir Deb
Department of Geology, University of Delhi
Chirashree Ghosh
Department of Geology, University of Delhi
Vivek Dwivedi CEDAR, Dehradun
T. S. Dange
Forest Research Centre, (ICFRE), Hyderabad, India-50014
Y. Sridhar
National Research Centre for Soybean – Indore, India
R. Sundraraj
Institute of Wood Science and Technology, (ICFRE), Bangalore, India
M.K. Gupta
Forest Soil & Land Reclamation Division
Forest Research Institute, Dehra Dun
Joystu Dutta
Forest Soil and Land Reclamation Division,
Forest Research Institute, Dehradun
Ramesh Madav
Terracon Ecotech Pvt. Ltd., 6th Floor, ‘Swagat’, Shraddhanand Road,
Vile Parle (East), Mumbai- 400 057, India,
Gouri Keskar
Terracon Ecotech Pvt. Ltd., 6th Floor, ‘Swagat’, Shraddhanand Road,
Vile Parle (East), Mumbai- 400 057, India
Nirmal Ram
Forest Ecology & Environment Division
Forest Research Institute, Dehradun
Pramod Kumar
Forest Ecology & Environment Division
Forest Research Institute, Dehradun
Neelesh Yadav
Forest Informatics Division
Forest Research Institute, Dehradun-248006
A.K.Raina
Forest Soil and Land Reclamation Division, Forest Research Institute,
Dehra Dun-248 006, Uttarakhand, India
S. R Baloch
Forest.Research.Institute. Dehradun
G. Singh
Forest Ecology Division AFRI, Jodhpur.
Arid Forest Research Institute, Jodhpur
Vaneet Jishtu
Rain Forest Research Institute, Jorhat (Assam)
Mohinder Pal
Himalayan Forest Research Institute, Shimla (HP)
Anita Tomar
CSFER, Allahabad
Richi Yadav
Forest Ecology and Environment Division
Forest Research Institute,
Dehradun-248006, India
Mridula Negi
Forest Ecology and Environment Division, Forest Research
Institute,
Dehradun-248006, India
H.B. Vasistha
Forest Ecology and Environment Division, Forest
Dehradun-248006, India
S. Rasaily
Director
Rajaji National Park
Dehradun
Suryapal Singh Bhandari
Forest Ecology and Environment Division,
Forest Dehradun-248006, India
S.K. Kamboj
Forest Ecology and Environment Division,Forest
Dehradun-248006, India
Sweta Priyam
Forest Ecology and Environment Division
Forest Research Institute, Dehradun-248006


Buy your books fast and straightforward online - at one of world’s
fastest growing online book stores! Environmentally sound due to
Print-on-Demand technologies.
Buy your books online at
www.get-morebooks.com
Kaufen Sie Ihre Bücher schnell und unkompliziert online – auf einer
der am schnellsten wachsenden Buchhandelsplattformen weltweit!
Dank Print-On-Demand umwelt- und ressourcenschonend produzi-
ert.
Bücher schneller online kaufen
www.morebooks.deVDM Verlagsservicegesellschaft mbH
Heinrich-Böcking-Str. 6-8 Telefon: +49 681 3720 174 [email protected] - 66121 Saarbrücken Telefax: +49 681 3720 1749 www.vdm-vsg.de


