Embed Size (px)
Citation preview
This article was downloaded by: [INASP - Kenya]On: 08 March 2015, At: 04:42Publisher: Taylor & FrancisInforma Ltd Registered in England and Wales Registered Number: 1072954 Registered office: MortimerHouse, 37-41 Mortimer Street, London W1T 3JH, UK
Click for updates
Forest Science and TechnologyPublication details, including instructions for authors and subscription information:http://www.tandfonline.com/loi/tfst20
Restoring aboveground carbon and biodiversity: acase study from the Nile basin, EthiopiaWolde Mekuriaa, Simon Langana, Robyn Johnstonb, Beyene Belayc, Dagninet Amarec,Tadesse Gashawc, Gizaw Destac, Andrew Nobleb & Abeyou Waled
a International Water Management Institute (IWMI), PO Box 5689, Addis Ababa, Ethiopiab International Water Management Institute (IWMI), 127 Sunil Mawatha, Pelawatte,Battaramulla, Colombo, Sri Lankac Amhara Regional Agricultural Research Institute, Bahir Dar, Ethiopiad Bahir Dar University, School of Civil and Water Resources Engineering, Bahir Dar,EthiopiaPublished online: 05 Mar 2015.
To cite this article: Wolde Mekuria, Simon Langan, Robyn Johnston, Beyene Belay, Dagninet Amare, Tadesse Gashaw,Gizaw Desta, Andrew Noble & Abeyou Wale (2015): Restoring aboveground carbon and biodiversity: a case study from theNile basin, Ethiopia, Forest Science and Technology, DOI: 10.1080/21580103.2014.966862
To link to this article: http://dx.doi.org/10.1080/21580103.2014.966862
PLEASE SCROLL DOWN FOR ARTICLE
Taylor & Francis makes every effort to ensure the accuracy of all the information (the “Content”) containedin the publications on our platform. However, Taylor & Francis, our agents, and our licensors make norepresentations or warranties whatsoever as to the accuracy, completeness, or suitability for any purpose ofthe Content. Any opinions and views expressed in this publication are the opinions and views of the authors,and are not the views of or endorsed by Taylor & Francis. The accuracy of the Content should not be reliedupon and should be independently verified with primary sources of information. Taylor and Francis shallnot be liable for any losses, actions, claims, proceedings, demands, costs, expenses, damages, and otherliabilities whatsoever or howsoever caused arising directly or indirectly in connection with, in relation to orarising out of the use of the Content.
This article may be used for research, teaching, and private study purposes. Any substantial or systematicreproduction, redistribution, reselling, loan, sub-licensing, systematic supply, or distribution in anyform to anyone is expressly forbidden. Terms & Conditions of access and use can be found at http://www.tandfonline.com/page/terms-and-conditions

Restoring aboveground carbon and biodiversity: a case study from the Nile basin, Ethiopia
Wolde Mekuriaa*, Simon Langana, Robyn Johnstonb, Beyene Belayc, Dagninet Amarec, Tadesse Gashawc, Gizaw Destac,
Andrew Nobleb and Abeyou Waled
aInternational Water Management Institute (IWMI), PO Box 5689, Addis Ababa, Ethiopia; bInternational Water Management Institute(IWMI), 127 Sunil Mawatha, Pelawatte, Battaramulla, Colombo, Sri Lanka; cAmhara Regional Agricultural Research Institute, BahirDar, Ethiopia; dBahir Dar University, School of Civil and Water Resources Engineering, Bahir Dar, Ethiopia
(Received 1 April 2014; Accepted 19 August 2014)
In Ethiopia, exclosures in landscapes have become increasingly important to improving ecosystem services and reversingbiodiversity losses. The present study was conducted in Gomit watershed, northern Ethiopia, to: (i) investigate the changesin vegetation composition, diversity and aboveground biomass and carbon following the establishment of exclosures; and(ii) analyse the economic returns of aboveground carbon sequestration and assess the perception of local communities onland degradation and exclosures. A space-for-time substitution approach was used to detect the changes in abovegroundcarbon, species composition, and diversity. Exclosures of 1-, 2-, 3-, 4-, 5-, and 7-years-old and a communal grazing landwere selected. Household surveys, key informant interviews, and a financial analysis were used to assess the perception oflocal communities and the value of exclosure impacts, respectively. Significant (P D 0.049) differences in species diversityand considerable increases in aboveground carbon (ranged from 0.6 to 4.2 t C ha¡1), CO2 storage (varied between 2.1 and15.3 t CO2 ha¡1), woody species composition, and richness (ranged from five to 28) were observed following theestablishment of exclosures. Exclosures generated temporary certified emission reductions (tCER) of 3.4, 2.1, 7.5, 12.6,12.5, and 15.3 Mg CO2 ha
¡1 after 1, 2, 3, 4, 5, and 7 years, respectively. The net present value (NPV) of the abovegroundcarbon sequestered in exclosures ranged from US$6.6 to US$37.0 per hectare and increased with exclosure duration. At awatershed level, 51.4 Mg C ha¡1 can be sequestered, which represents 188.6 Mg CO2 ha
¡1, resulting in tCER of 139.4 MgCO2 ha¡1 and NPV of US$478.3 per hectare. This result would suggest that exclosures can potentially improve localcommunities’ livelihoods beyond rehabilitating degraded lands if carbon stored in exclosures is traded. Communities in thewatershed demonstrated that exclosures are effective in restoring degraded lands and they are benefiting from increasedfodder production and reduced impacts of soil erosion. However, the respondents are also concerned over the sustainabilityof exclosure land management, as further expansion of exclosures aggravates degradation of remaining communal grazinglands and causes fuel wood shortages. This suggests that the sustainability of exclosure land management can be attainedonly if these critical concerns are addressed by a joint effort among government agencies, nongovernmental organizations,and communities.
Keywords: aboveground carbon; carbon trading; ecosystems degradation; exclosures; plant species richness; plant diver-sity; tCER
Introduction
Human exploitation and the widespread loss of biodiver-
sity has resulted in a dramatic reduction in the provision-
ing of ecosystem services (MEA 2005; Chazdon 2008;
Guariguata and Balvanera 2009; Butchart et al. 2010;
Hector et al. 2011). In Ethiopia, land resources are facing
intense degradation as a consequence of deforestation,
agricultural land expansion, and overgrazing that results
in significant environmental degradation, loss of forest
biodiversity, and ecosystem services (Lemenih et al.
2005; Mengistu et al. 2005). For example, the rate of
deforestation in the Ethiopian highlands was estimated at
62,000 ha yr¡1 (World Bank 2001), average rate of soil
erosion for all land uses was estimated at 35 Mg ha¡1
yr¡1 (Keyser and Sonneveld 2001), and nutrient depletion
was reported as 30 kg ha¡1 of nitrogen and 15�20 kg
ha¡1 of phosphorus (UNDP 2002). Ecological restoration,
which aims to restore disturbed ecosystems, has been an
important approach to mitigate human pressures on
natural ecosystems (Holl et al. 2003) and improve ecosys-
tem services (Doren et al. 2009; Bullock et al. 2011), as
well as reversing biodiversity losses (Bullock et al. 2011).
Consequently, restoration of degraded watersheds through
establishing exclosures has become increasingly impor-
tant in Amhara regional state, in the northern highlands of
Ethiopia (Waesberghe and Mezemir 2010).
Exclosures are areas closed off or protected from inter-
ference from people and domestic animals, with the goal
of promoting natural regeneration of plants and reducing
land degradation of formerly degraded communal grazing
lands (Mekuria et al. 2011). The inception of exclosure
land management at a watershed level started in 2005
when 25 watersheds were selected and supported within
the framework of the Sustainable Utilization of Natural
Resources for Improved Food Security (SUN) program
(Waesberghe and Mezemir 2010). As part of the SUN pro-
gram, communities in the Gomit watershed established
exclosures on communal grazing lands in 2006. Priority
*Corresponding author. Email: [email protected] or [email protected]
ISSN 2158-0103 print/ISSN 2158-0715 online
� 2015 Korean Forest Society
http://dx.doi.org/10.1080/21580103.2014.966862
http://www.tandfonline.com
Forest Science and Technology
2015, 1�11
Dow
nloa
ded
by [
INA
SP -
Ken
ya]
at 0
4:42
08
Mar
ch 2
015

areas for establishing exclosures were identified as a joint
initiative of local communities, a community watershed
team (CWT), government agencies, and nongovernmental
organizations (NGOs). The management and use of the
exclosures in the Gomit watershed is managed by CWT,
which represents the watershed community. The CWT is
actively involved in the planning and implementation of
the watershed development activities such as exclosure
establishment and protection, and construction of soil and
water conservation (SWC) structures.
Case studies conducted in the highlands of Ethiopia
have shown that exclosures can be effective in restoring
degraded ecosystems (e.g., Girmay et al. 2009; Yayneshet
et al. 2009; Mekuria and Veldkamp 2012; Mekuria 2013;
Yami et al. 2013) and in providing economic benefits
(Tilahun et al. 2007; Babulo et al. 2009; Mekuria et al.
2011). However, all of these studies have been conducted
in only two or three villages and so cannot adequately rep-
resent the diversity in soil, slope, exclosure management,
climate, and topography in the Ethiopian highlands. In
addition, the changes in aboveground biomass and carbon
and biodiversity following the establishment of exclosures
have not been inventoried systematically at a watershed or
landscape level. Although exclosures have been estab-
lished since 2006 in Gomit watershed, empirical data on
the effectiveness of these protected areas in improving
aboveground carbon, the economic returns of improved
aboveground carbon, and the impacts of exclosures on
livelihoods are lacking. Further, members of different cul-
tures or cultural groups may value forest biodiversity and
ecosystem services differently and, as a consequence,
may or may not support conservation goals set by gover-
nance bodies (Deng et al. 2006; Lindemann-Matthies
et al. 2014). There is a need to understand the perception
of local communities on the effectiveness of exclosures in
restoring degraded ecosystems and improving livelihoods.
A comprehensive study to investigate the biophysical
and socioeconomic changes following the establishment
of exclosures at a watershed level is critical for evaluation
of existing exclosures, designing ways of increasing
incomes of rural communities through exclosure estab-
lishment, and for deciding whether additional exclosures
should be established. Such understanding would help
maximize benefits for smallholders from existing exclo-
sures, which in turn will improve the livelihoods of the
local communities. The present study was conducted in
Gomit watershed, northern Ethiopia, to: (i) investigate the
changes in vegetation composition, diversity, and above-
ground carbon following the establishment of exclosures
on communal grazing lands over different time periods;
(ii) analyse the economic returns of sequestered above-
ground carbon; and (iii) assess the perception of local
communities on the effectiveness of exclosures in restor-
ing degraded landscapes and their contribution to improv-
ing the livelihoods of watershed communities. We
hypothesized that exclosures can be effective in restoring
degraded ecosystems, improving the livelihoods of water-
shed communities, and generating potential household
income through aboveground carbon sequestration.
Materials and method
Study area
The study was conducted in Gomit watershed located in
Libo Kemkem Wereda, South Gondar administrative
zone of Amhara region in northwestern Ethiopia
(Figure 1). Gomit watershed covers an area of 1483 ha
(Waesberghe and Mezemir 2010). The total beneficiary
population consists of 360 households. As in other parts
of the Amhara region, agriculture is the predominant sec-
tor of the economy in the Gomit watershed. The agricul-
tural sector is primarily dependent on smallholder
farming. The average farm size is 0.82 hectare per house-
hold. Smallholders cultivating fragmented microholdings
produce more than 95% of the annual agricultural output
(Waesberghe and Mezemir 2010).
The annual income of the very poor, poor, middle, and
better off communities in the Gomit watershed varies
between US$68 and US$89, US$121�132,
US$132�142, and US$168�195, respectively (USAID
2007). Our recent data from the household survey
reported here indicates that the average annual income of
the communities in the Gomit watershed is US$88.
Despite a long rainy season and moderately fertile clay
loam soils, the study site faces a food deficit every year.
Major problems that contribute to this food deficit include
population density, lack of income to buy agricultural
inputs such as fertilizers, and natural resource degradation
(USAID 2007; Waesberghe and Mezemir 2010).
In response to natural resource degradation problems,
the communities in the Gomit watershed are organized as
an association and started land rehabilitation efforts
through exclosure establishment and the construction of
soil water conservation (SWC) structures since 2006. The
association is given legal power over the use and manage-
ment of the natural resources. Accordingly, the Gomit
watershed association is formally registered under procla-
mation No. 1965 of 1960 of the civil code 1990. The
Gomit watershed association elected the CWT, which is
responsible for the management, protection, and use of
exclosures and other land rehabilitation efforts. The CWT
consists of nine members (seven men and two women).
Five of the nine members act as chair, deputy chair, secre-
tary, finance administration, and monitoring and evalua-
tion, while the remaining four are ordinary members.
To ensure the sustainable management of exclosures
and protection of the SWC structures, the Gomit watershed
association, together with CWT, drafted a bylaw based on
a model provided by the SUN program. The draft agree-
ment was presented to all watershed members for discus-
sion and approval. After discussion and approval from all
members, the draft agreement was legalized at zonal level,
which in turn enabled the communities to enforce their
bylaws and protect their resources from “free riders.”
In the Gomit watershed, the first exclosures were
established in 2006, and accordingly we selected 1-, 2-, 3-
4-, 5-, and 7-year-old exclosures as well as a communal
grazing land as a control treatment. We assumed that,
before establishment, exclosures and the communal
2 W. Mekuria et al.
Dow
nloa
ded
by [
INA
SP -
Ken
ya]
at 0
4:42
08
Mar
ch 2
015

grazing lands were in similar condition because the exclo-
sures were established on the same communal grazing
lands that were used for livestock grazing. The area of the
exclosures ranged from 2.4 to 14.0 ha while the commu-
nal grazing land covers an area of 3.6 ha (Table 1).
In exclosures, grass harvesting (using a cut and carry
system) is the only activity allowed, and is conducted
once a year. On the communal grazing land, unlimited
access for grazing is practiced. In exclosures, SWC struc-
tures such as hillside terraces, stone bunds, and microba-
sins have been constructed. The purpose of constructing
SWC structures in exclosures is to enhance biological
regeneration of degraded indigenous trees and shrubs, and
promote grass production through increasing the avail-
ability of water in the root zone.
According to the Ethiopian climate classification,
Gomit watershed has a woina dega tropical continental
climate.1 The mean annual rainfall (for the years
1992�2006) was 1148 mm yr¡1. The mean minimum
temperature was 11.8 �C, while the mean maximum tem-
perature was 27.0 �C. The altitude of the study sites range
from 1963 to 2056 m above sea level. The rainy season
usually occurs between June and September in which
87% of annual rainfall occurs (Figure 2). Major land uses
in the watershed include cultivated lands (23% of the
area), degraded secondary forest lands (53%), communal
grazing lands (18%), and other uses (6%). Mixed
crop�livestock farming is the backbone of household
livelihoods at the study sites.
Soils of the study sites were classified into three major
groups: chromic luvisols; eutric fluvisols; and eutric lepto-
sols (Table 1). The most common indigenous woody veg-
etation species in exclosures and communal grazing land
include Euclea racemosa subsp. schimperi (A.DC.)
Table 1. Basic characteristics of the exclosures and grazing land.
% coverage of soil types
Study sites Exclosure age (years) Area (ha) Eutric leptosols Chromic luvisols Eutric fluvisols
Grazing land NA 3.6 � 100 �Atikuwarit 1 2.4 � 100 �Markos 2 3.2 � 85 15
Kikibe 3 3.6 � 100 �Enkuro-fej 4 4.7 20 80 �Tinkish 5 12.7 35 65 �Deldalit 7 14.0 � � 100
Figure 1. Study area with the location of the study sites indicated in the right hand figure.
Forest Science and Technology 3
Dow
nloa
ded
by [
INA
SP -
Ken
ya]
at 0
4:42
08
Mar
ch 2
015

Dandy, Calpurnia aurea (Alt.) Benth., and Dodonaea
angustifolia (L.f.). Understory vegetation of the exclo-
sures and communal grazing land were dominated by
grass species such as Hyparrhenia hirta (L.) Stapf and
Delphinium dasycaulon.
Vegetation inventory and analysis
A space-for-time substitution approach (Mekuria et al.
2011) was used to detect changes in plant species rich-
ness, diversity, and aboveground standing biomass and
carbon after conversion of communal grazing lands to
exclosures with ages of 1, 2, 3, 4, 5 and 7 years. In each
exclosure and grazing land, three transects spaced at a
minimum distance ranged from 50 to 75 m were estab-
lished. Transects were laid parallel to the topography. We
decided to delineate three transects per site because the
spatial heterogeneity of vegetation within a site was less.
Along each transect, three landscape positions (upper
slope, mid-slope, and foot slope) were delineated. At each
landscape position, a sampling plot of 20 m £ 20 m was
established (i.e., three plots per landscape position and
nine plots per site).
In each 20 m £ 20 m plot, individual plant variables
such as diameter at breast height (DBH) or, for smaller
and multi-stemmed shrubs, diameter at stump height or at
a height of 30 cm (d30) from the ground, crown diameter,
and total height were measured. DBH and d30 were mea-
sured using calipers. Crown diameter and total height
were measured using a measuring tape. The species of
plants encountered in each plot were also identified. In the
entire study, we studied 63 sample plots, of which 54
were in exclosures and nine in communal grazing land.
The average total density of plant species per hectare
was derived from the total number of individuals recorded
in the sample plots at each exclosure age (nine samples
per plot or 0.36 ha) and the communal grazing land.
Sorensen’s similarity index (Sorensen 1948) was used to
determine the species similarities among the studied sites.
The Shannon-Wiener index of diversity (H0; Shannon
1948) was used to determine native plant species diversity
in exclosures and grazing land, and to conduct compari-
sons in species diversity among the studied sites. To
determine the similarity in abundance of different species
within a community, we used the Shannon-Wiener index
of evenness (J). The types of plant species found in the
studied sites were also described in terms of richness,
plant family, and habit. Data were collected from Septem-
ber to November 2013.
Aboveground biomass and carbon estimation
To estimate aboveground biomass, dominant woody spe-
cies using our inventory data were identified (Table 2).
The dominant woody species were determined based on
the relative importance value (Mekuria et al. 2011). The
number of woody species selected for biomass estimation
varied between two and seven (Table 2). The methods of
Hoff et al. (2002) and Snowdon et al. (2002) for above-
ground woody biomass measurement were used. The
dominant woody species were grouped into three diameter
classes in order to minimize errors that can arise from var-
iable sizes of individuals (Table 2). In exclosures and the
communal grazing lands, selected individuals represent-
ing the dominant species were harvested and weighed.
Altogether we harvested 87 trees and shrubs. Fresh mass
of aboveground vegetation was adjusted to dry mass using
the measured moisture content, determined by oven dry-
ing samples at 65 �C until constant mass was attained (c.
72�78 h). Carbon stocks in aboveground biomass were
estimated by multiplying the oven-dried biomass by a fac-
tor of 0.5 (Snowdon et al. 2002).
Economic valuation
The enhancement of aboveground carbon is considered an
indirect benefit of exclosures and communal grazing land.
Necessary input factors are land and labor. As certified
emission reductions (CER) are traded as CO2 units
(UNFCCC 2003), carbon storage was converted into CO2
quantities (Mg CO2 ha¡1) multiplying carbon storage (Mg
C ha¡1) by the molar conversion factor of 3.67 (Olschew-
ski and Benitez 2005). For determining carbon revenues,
permanent carbon prices were transformed into prices for
temporary credits in accordance with Olschewski et al.
(2005) and Mekuria et al. (2011). Assuming a temporary
CER (tCER) expiring time of 5 years, an average price of
US$25 per permanent credit and a discount rate for Annex
I countries of 3%, results in a price of US$3.43 per tCER.
The labor cost of guards to protect exclosures from inter-
ference by humans and livestock was calculated as wage
per hectare based on monthly salary and the area of exclo-
sure assigned for each guard. Data on monthly salary was
obtained from the CWT. Key informant interviews was
used to gather data on major crops cultivated, crop pro-
duction, production costs, and market prices of major
crops.
A financial analysis of costs and benefits using market
prices for valuing project impacts was conducted. Given
the long-term project horizon, costs and benefits occurring
at different points of time were discounted to make them
comparable. For this purpose, real discount rate (r) was
Figure 2. Mean monthly rainfall (mm yr¡1) of the study sitesfor the years 1992 to 2006.
4 W. Mekuria et al.
Dow
nloa
ded
by [
INA
SP -
Ken
ya]
at 0
4:42
08
Mar
ch 2
015

determined based on price index and interest rate informa-
tion of recent 8 consecutive years (i.e., 2004�2011)
obtained from the National Bank of Ethiopia (Table 3).
We estimated the real interest rate and inflation rate using
the equation and procedures described in Mekuria et al.
(2013). We determined a nominal interest rate of 16.5%
and an average inflation rate of 14.9% based on the infor-
mation in Table 3. Consequently, the real interest rate of
(r) 5.1% was applied when discounting the monetary
values of the respective years. Net present value (NPV)
was used as a decision criterion. NPV was calculated
using the equation described in Mekuria et al. (2013).
Assessment of local community perception on exclosures
Individual household survey and key informant interviews
were conducted from September to November 2013 using
a structured survey questionnaire. Using systematic
Table 2. Dominant woody species used for aboveground biomass estimation.
Diameter class (cm)
SitesExclosureage (year) Dominant woody species
Diameterclass 1
Diameterclass 2
Diameterclass 3
Grazing land NA Croton macrostachyus Del. 2.5-13.6 13.6-24.7 24.7-35.8
Senna singueana (Del.) Lock 2.0-3.3 3.3-4.6 4.6-6.0
Calpurnia aurea (Alt.) Benth. 2.0-2.7 2.7-3.4 3.4-4.2
Atikuwarit 1 Euclea racemosa subsp. schimperi (A.DC.) Dandy 2.0-4.1 4.1-6.3 6.3-84
Calpurnia aurea (Alt.) Benth 2.0-2.9 2.9-3.9 3.9-4.8
Markos 2 Leucaena spp. 2.1-2.8 2.8-3.5 3.5-4.3
Maytenus senegalensis (Lam.) Exell 2.2-2.8 � �Calpurnia aurea (Alt.) Benth. 1.8-4.5 4.5-7.2 7.2-10
Euclea racemosa subsp. schimperi (A.DC.) Dandy 1.8-3.7 3.7-5.6 5.6-7.5
Dodonaea angustifolia (L.f.) 2.0-3.6 � �Kikibe 3 Leucaena spp. 2.0-5.3 5.3-8.6 8.6-12.0
Euclea racemosa subsp. schimperi (A.DC.) Dandy 1.0-3.3 3.3-5.6 5.6-7.9
Calpurnia aurea (Alt.) Benth. 2.0-3.4 3.4-4.8 4.8-6.2
Dodonaea angustifolia (L.f.) 2.0-3.4 3.4-4.8 4.8-6.2
Enkuro-fej 4 Leucaena spp. 2.0-5.3 5.3-8.6 8.6-12.0
Dodonaea angustifolia (L.f.) 2.0-3.0 3.0-4.0 4.0-5.0
Calpurnia aurea (Alt.) Benth. 2.0-3.7 3.7-5.4 5.4-7.2
Tinkish 5 Leucaena spp. 2.0-2.7 2.7-3.4 3.4-4.2
Euclea racemosa subsp. schimperi (A.DC.) Dandy 2.0-4.0 4.0-6.0 6.0-8.1
Dodonaea angustifolia (L.f.) 1.6-3.8 3.8-6.0 6.0-8.2
Acokanthra schimperi (A.DC.) Benth. 2.0-3.0 3.0-4.0 4.0-5.0
Calpurnia aurea (Alt.) Benth. 2.1-2.3 � �Acacia abyssinica Hochst.ex Benth. 3.2-8.2 8.2-13.2 13.2-18.2
Mytenus undata (A.DC.) f.whea 2.2-3.2 3.2-4.2 4.2-5.2
Deldalit 7 Carissa spinarum L. 2.0-2.7 2.7-3.4 3.4-4.2
Maytenus senegalensis (Lam.) Exell 2.0-3.4 3.4-4.8 4.8-6.3
Euclea racemosa subsp. schimperi (A.DC.) Dandy 2.0-3.7 3.7-5.4 5.4-7.2
Dodonaea angustifolia (L.f.) 2.0-3.1 3.1-4.2 4.2-5.6
Acokanthra schimperi (A.DC.) Benth. 2.0-4.7 4.7-7.4 7.4-10.2
Calpurnia aurea (Alt.) Benth 2.0-4.1 4.1-6.1 6.1-8.2
Leucaena spp. 2.0-3.5 3.5-5.0 5.0-6.5
Table 3. Price index and interest rates for the years 2004�2011.
Jan 04 Jan 05 Jan 06 Jan 07 Jan 08 Jan 09 Jan 10 Jan 11
General price index 89.6 100.0 112.31 131.67 190.12 206.22 223.0 297.09
Lending rate (%)
Min 7.0 7.0 7.0 8.0 8.0 8.0 7.5 7.5
Max 14.0 14.0 14.0 15.0 16.5 16.5 16.25 16.25
Mean 10.5 10.5 10.5 11.5 12.25 12.25 11.88 11.88
General price index of 2005 was used as a reference and set to 100.
Forest Science and Technology 5
Dow
nloa
ded
by [
INA
SP -
Ken
ya]
at 0
4:42
08
Mar
ch 2
015

random sampling, 58 households (i.e., 16% of the water-
shed community) were selected, while 25 key informants
were selected using purposeful sampling. The key inform-
ants comprise watershed management committees, devel-
opment agents, SWC and forest use and management
experts at the district agricultural office, administration
bodies, women association committees, agricultural pro-
duction cadres, and German Development Cooperation
(GDC) focal persons. The survey questions and key infor-
mant interviews focused on the following main topics: (i)
extent, causes and consequences of land degradation as
well as the rehabilitation efforts or works in the water-
shed; (ii) exclosure establishment processes; (iii) the role
of exclosures in restoring degraded ecosystems; (iv) man-
agement, use, and protection of exclosures; and (v) infor-
mal institutions for the management, use, and protection
of exclosures.
Data analyses
We first conducted tests for normality (Kolmogorov�Smir-
nov D statistic) and equality of variance (Levene statistic)
of the variables tested. The differences among exclosures
and between an exclosure and grazing land in vegetation
parameters such as species richness, diversity, similarity in
species composition, and aboveground biomass and carbon
were assessed using one-way analysis of variance
(ANOVA). Significance of differences between treatment
means was tested using the least significant difference test
(LSD) with P < 0.05. Mean comparisons were conducted
for the variables that showed significant difference during
the analysis of variance. The qualitative data from individ-
ual interviews and key informant interviews were analyzed
using content analysis (Bernard 2006), that is, who says
what, to whom, why, to what extent, and with what effect.
Descriptive statistics was used to summarize and compare
the quantitative data from the individual interviews.
Results
Vegetation composition as affected by exclosure land
management
In exclosures, between nine and 32 plant species repre-
senting five to 21 families were recorded, whereas four
plant species representing three families were recorded in
the communal grazing land (Table 4). In all exclosures,
Fabaceae contributed the greatest number of species.
Exclosures contained more shrub, shrub/tree, and tree spe-
cies than the communal grazing land (Table 4). The num-
ber of shrub/tree and tree species increased with exclosure
duration. Except for the relatively oldest exclosures, shrub
species dominate the species composition when compared
to shrub/tree or tree species.
The similarity of vegetation composition between an
exclosure and the communal grazing land varied between
22.2% and 46.2% and decreased with exclosure age
(Table 5). In addition, the similarity of vegetation compo-
sition between the oldest exclosure and the remaining
exclosures displayed an increasing trend with exclosure
age (Table 5).
Table 4. Total number of plant species recorded in the entire sampled plots in exclosures and grazing land.
Exclosure age (year)
Variables Grazing One Two Three Four Five Seven
Total number of species recorded 4 9 9 18 14 19 32
Plant families (number) 3 6 5 12 10 14 21
Families represented by two or more species (number) 1 1 1 5 1 1 6
Climber species (number) 0 0 0 0 0 0 6
Shrub species (number) 1 2 2 4 1 1 6
Shrub/tree species (number) 1 5 5 6 4 5 9
Tree species (number) 2 2 2 8 9 13 11
Table 5. Similarities in species composition among the studied sites.
Species similarity (%)
CGL 1-yr-Exc 2-yr-Exc 3-yr-Exc 4-yr-Exc 5-yr-Exc 7-yr-Exc
CGL 46.2 30.8 36.4 33.3 34.8 22.2
1-yr-Exc 55.6 51.9 43.5 42.9 34.1
2-yr-Exc 66.7 60.9 50.0 39.0
3-yr-Exc 50.0 59.5 47.1
4-yr-Exc 60.6 39.1
5-yr-Exc 47.1
7-yr-Exc
CGL, communal grazing land; Exc, exclosure.
6 W. Mekuria et al.
Dow
nloa
ded
by [
INA
SP -
Ken
ya]
at 0
4:42
08
Mar
ch 2
015
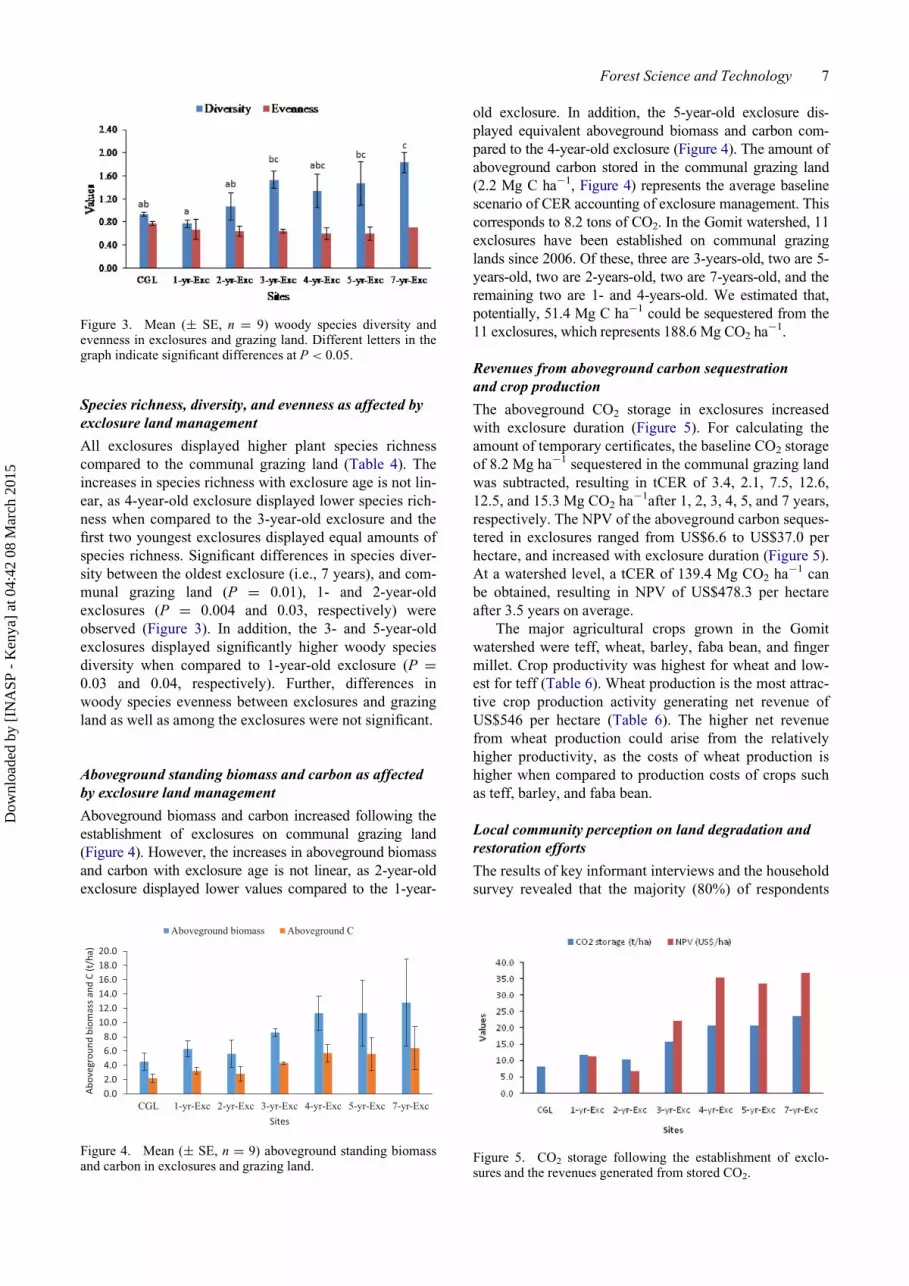
Species richness, diversity, and evenness as affected by
exclosure land management
All exclosures displayed higher plant species richness
compared to the communal grazing land (Table 4). The
increases in species richness with exclosure age is not lin-
ear, as 4-year-old exclosure displayed lower species rich-
ness when compared to the 3-year-old exclosure and the
first two youngest exclosures displayed equal amounts of
species richness. Significant differences in species diver-
sity between the oldest exclosure (i.e., 7 years), and com-
munal grazing land (P D 0.01), 1- and 2-year-old
exclosures (P D 0.004 and 0.03, respectively) were
observed (Figure 3). In addition, the 3- and 5-year-old
exclosures displayed significantly higher woody species
diversity when compared to 1-year-old exclosure (P D0.03 and 0.04, respectively). Further, differences in
woody species evenness between exclosures and grazing
land as well as among the exclosures were not significant.
Aboveground standing biomass and carbon as affected
by exclosure land management
Aboveground biomass and carbon increased following the
establishment of exclosures on communal grazing land
(Figure 4). However, the increases in aboveground biomass
and carbon with exclosure age is not linear, as 2-year-old
exclosure displayed lower values compared to the 1-year-
old exclosure. In addition, the 5-year-old exclosure dis-
played equivalent aboveground biomass and carbon com-
pared to the 4-year-old exclosure (Figure 4). The amount of
aboveground carbon stored in the communal grazing land
(2.2 Mg C ha¡1, Figure 4) represents the average baseline
scenario of CER accounting of exclosure management. This
corresponds to 8.2 tons of CO2. In the Gomit watershed, 11
exclosures have been established on communal grazing
lands since 2006. Of these, three are 3-years-old, two are 5-
years-old, two are 2-years-old, two are 7-years-old, and the
remaining two are 1- and 4-years-old. We estimated that,
potentially, 51.4 Mg C ha¡1 could be sequestered from the
11 exclosures, which represents 188.6 Mg CO2 ha¡1.
Revenues from aboveground carbon sequestration
and crop production
The aboveground CO2 storage in exclosures increased
with exclosure duration (Figure 5). For calculating the
amount of temporary certificates, the baseline CO2 storage
of 8.2 Mg ha¡1 sequestered in the communal grazing land
was subtracted, resulting in tCER of 3.4, 2.1, 7.5, 12.6,
12.5, and 15.3 Mg CO2 ha¡1after 1, 2, 3, 4, 5, and 7 years,
respectively. The NPV of the aboveground carbon seques-
tered in exclosures ranged from US$6.6 to US$37.0 per
hectare, and increased with exclosure duration (Figure 5).
At a watershed level, a tCER of 139.4 Mg CO2 ha¡1 can
be obtained, resulting in NPV of US$478.3 per hectare
after 3.5 years on average.
The major agricultural crops grown in the Gomit
watershed were teff, wheat, barley, faba bean, and finger
millet. Crop productivity was highest for wheat and low-
est for teff (Table 6). Wheat production is the most attrac-
tive crop production activity generating net revenue of
US$546 per hectare (Table 6). The higher net revenue
from wheat production could arise from the relatively
higher productivity, as the costs of wheat production is
higher when compared to production costs of crops such
as teff, barley, and faba bean.
Local community perception on land degradation and
restoration efforts
The results of key informant interviews and the household
survey revealed that the majority (80%) of respondents
Figure 3. Mean (§ SE, n D 9) woody species diversity andevenness in exclosures and grazing land. Different letters in thegraph indicate significant differences at P < 0.05.
0.02.04.06.08.0
10.012.014.016.018.020.0
CGL 1-yr-Exc 2-yr-Exc 3-yr-Exc 4-yr-Exc 5-yr-Exc 7-yr-Exc
Abov
egro
und
biom
ass
and
C (t
/ha)
Sites
Aboveground biomass Aboveground C
Figure 4. Mean (§ SE, n D 9) aboveground standing biomassand carbon in exclosures and grazing land.
Figure 5. CO2 storage following the establishment of exclo-sures and the revenues generated from stored CO2.
Forest Science and Technology 7
Dow
nloa
ded
by [
INA
SP -
Ken
ya]
at 0
4:42
08
Mar
ch 2
015

perceive land degradation as a problem. The most com-
mon forms of land degradation mentioned by these
respondents include soil erosion, vegetation degradation,
and decline of soil fertility in crop land. The most impor-
tant causes of land degradation mentioned by the respond-
ents include deforestation for expansion of farm land and
fuel wood, free grazing, population growth, recurrent
drought, and rainfall variability. Loss of crop land due to
gully formation, flooding in the downstream areas, and
declining crop productivity are among the consequences
of land degradation. However, few (20%) of the respond-
ents mentioned that land degradation problems are
decreasing at the moment compared to 2 to 3 years ago
due to the rehabilitation efforts undertaken in the water-
shed since 2006. Although the opinion of the respondents
over the severity of land degradation is different, all the
respondents agree on the fruitfulness of restoration efforts.
All the respondents elaborated that the restoration efforts
increased vegetation cover, rehabilitated large gullies, and
reduced loss of crops and grazing lands. The results of the
present study revealed that joint efforts among govern-
ment agencies, NGOs, and communities is crucial to
strengthen the rehabilitation efforts and further reduce the
negative consequences of land degradation.
Local community perception on exclosure land
management
Respondents elaborated that exclosures are established
with close consultations and discussion among the com-
munity, district agricultural offices, and NGOs. All of the
respondents elaborated that the decision processes in
demarcating communal grazing lands and establishing
exclosures are participatory, as the community are
involved from planning stage to monitoring and evalua-
tion of exclosure land management. However, women’s
participation in decision making is limited. Exclosures are
jointly managed by the community, CWT, and govern-
ment. The community, together with the CWT, usually
assigns guards to protect exclosures from free riders. The
exclosures are managed by the bylaws, initiated by gov-
ernment and the SUN program, and approved by the com-
munity following a discussion. The bylaw describes the
rules and regulations pertaining to the management, pro-
tection, use, and benefit sharing among the communities.
The CWT, together with government legal institution,
enforces the bylaws. All of the respondents believe that
the established bylaw is key for the sustainable manage-
ment of exclosures, as it is established through participa-
tion of the community and sets out the legal base to
impose fines on free riders. In general, the respondents
believe that CWT is effective in enforcing the bylaw.
However, some members of the CWT are reluctant to
enforce the bylaw. By failing to do so they threaten the
sustainable protection of the exclosures.
The respondents indicated that exclosures are effec-
tive in restoring degraded ecosystems, as indigenous tree
species are regenerated, vegetation cover is increased, soil
erosion and sedimentation is reduced, and gullies are reha-
bilitated following the establishment of exclosures. Fod-
der production, mainly from grasses and fodder trees such
as Sesbania have also increased following the establish-
ment of exclosures. Further, according to the respondents,
expanding exclosure establishment in the watershed bene-
fits the neighboring areas by reducing soil erosion, gully
formation, flooding, and sedimentation in the downstream
areas. With respect to the effects of exclosures on crop
production, the respondents forwarded three different
opinions: (i) the majority (82%) of the respondents men-
tioned that they had not noticed the effects of exclosures
on crop production; (ii) a few (10%) respondents men-
tioned that crop production for households having farm
plots near exclosures was reduced due to a reduction in
the size of farm plots following exclosure establishment;
and (iii) a few (8%) respondents elaborated that exclo-
sures resulted in increased crop production by reducing
soil erosion and sedimentation.
Respondents stressed that exclosure land management
reduced the availability of fuel wood, as fuel wood collec-
tion from exclosures is not permitted, and aggravated soil
and vegetation degradation in the remaining communal
grazing lands due to increased grazing and human pres-
sure. In addition, exclosure land management forced
households to reduce livestock numbers. For example,
one of the key informants observed:
Following the establishment of exclosures, I have soldthree heads and now planning to sell two heads.
However, reducing livestock numbers does not reduce
livestock productivity, as farmers are practicing stall feed-
ing of improved livestock varieties, which provide
increased milk and other livestock products.
Table 6. Major crop cultivated, crop productivity, and revenues from crop production.
Crop typeProduction
cost (ETH birr ha-1)�Production(Qt ha-1)
Output price(Birr Qt-1)
Revenue(Birr ha-1)
Net revenue(Birr ha-1)
Net revenue(US$ ha-1)
Teff 6,200 7.2 1,075 7,740 1,540 81
Wheat 7,000 25.6 679 17,382 10,382 546
Barley 3,252 20 473 9,460 6,208 327
Faba bean 1,270 13.6 606 8,241 6,972 367
Finger millet 9,800 24 763 18,312 8,512 448
�Production cost refers to the sum of the costs for ploughing, weeding, harvesting, trashing, and inputs used such as fertilizer and herbicides. Exchangerate used: 1 ETH birr D 0.0526 US$.
8 W. Mekuria et al.
Dow
nloa
ded
by [
INA
SP -
Ken
ya]
at 0
4:42
08
Mar
ch 2
015

The beneficiaries of a particular exclosure are house-
holds who have been using the land as communal grazing
lands. In some cases, a particular exclosure is distributed
to landless youths who are members of the watershed
community. The majority of respondents believe that
there is equal benefit sharing among the beneficiaries, as
the land area of exclosures is proportionally distributed
among the beneficiaries to harvest grasses and other prod-
ucts. However, some respondents mentioned that house-
holds without adequate labour may benefit less from grass
products compared to households who do have adequate
labour. In general, the respondents observe livelihood
changes in some households following the establishment
of exclosures through bee keeping, livestock fattening,
and increased crop production.
Discussion
The enhancement of species richness (Table 4), above-
ground biomass and carbon (Figure 4), and the significant
increase in plant species diversity (Figure 3) following the
establishment of exclosures on communal grazing lands
demonstrate that exclosures can be effective in restoring
degraded lands and ecosystem services in a relatively
short period of time. Provided that the soil types (Table 1)
and land management practices in the study sites are simi-
lar, we assumed that exclosures and communal grazing
land were comparable and that differences in the mea-
sured variables among the studied sites were caused by
land use change (i.e., exclosure establishment) and not by
inherent site variability. Such differences between exclo-
sures and grazing land can be explained in two ways. On
the one hand, increased grazing pressure in the reduced
area of communal grazing land after establishment of
exclosures and susceptibility to deforestation for fuel
wood collection would cause further vegetation degrada-
tion and decreases in aboveground biomass and carbon in
grazing land. On the other hand, the protection of exclo-
sures from human and livestock interference, and the posi-
tive consequences of increased soil moisture content due
to the construction of SWC structures would improve veg-
etation cover, composition, richness, diversity, and above-
ground biomass and carbon.
Other case studies conducted in the central and north-
ern highlands of Ethiopia have also shown that exclosures
provide favorable microhabitats for plants, which can be
an effective method to improve aboveground biomass,
density, composition, and diversity of naturally regener-
ated plant species (Mengistu et al. 2005; Abebe et al.
2006; Yami et al. 2006; Birhane et al. 2007; Mekuria and
Veldkamp 2012). In semi-arid Kenya, Mureithi (2012)
and, in China, Park et al. (2013) also reported that exclo-
sures increased woody and herbaceous species richness,
diversity, and aboveground biomass. Further, in China,
Yong-Zhong et al. (2005) demonstrated that excluding
livestock grazing enhances vegetation recovery, litter
accumulation, and development of annual and perennial
grasses. The lack of difference in species diversity
between the 1- and 2-year-old exclosures and the
communal grazing land as well as the similar species rich-
ness in the 1- and 2-year-old exclosures could indicate
that vegetation restoration through exclosure establish-
ment needs more that 2 years. The insignificant difference
in species diversity between the communal grazing land
and 4-year-old exclosures may be the result of higher
evenness of species distribution in the communal grazing
land (Figure 3), which increased the value of the Shan-
non-Wiener diversity index.
Vegetation composition, richness, diversity, and
aboveground biomass and carbon were also influenced by
exclosure age. This influence of exclosure age was sup-
ported by increased number of shrub/tree and tree species
with exclosure duration when compared to shrub species.
In addition, decreasing plant species similarity between
an exclosure and grazing land with exclosure age (Table 5)
strengthen our argument that restoration of degraded veg-
etation is influenced by exclosure duration. Further, the
observed similarities in species composition among exclo-
sures support the importance of exclosure duration in
restoring degraded vegetation through exclosure establish-
ment. The results of the present study demonstrate that all
exclosures are at early succession stage, as the vegetation
composition is dominated by shrub species. In line with
this, Park et al. (2013) demonstrated that vegetation suc-
cession following exclosure establishment proceeds via
three stages: annual plant communities; herbs; and shrubs
and trees, which illustrates the influence of exclosure
duration on woody species restoration.
The tCER net benefits from aboveground carbon
sequestration of exclosures does not provide sufficient
incentive to initiate the participation of land managers and
local communities in establishing further exclosures in
the future. However, if all ecosystem services from exclo-
sures such as soil carbon sequestration, soil nutrient resto-
ration, and honey and grass production are accounted for,
exclosures can be a competitive form of land use manage-
ment when compared to crop production. Mekuria et al.
(2011) have reported a similar result in which tCER net
benefits of exclosure only cover 44% of the benefits from
the best alternative land use. However, this study further
demonstrates that exclosures can be a competitive form of
land use if all ecosystem services are considered and
traded, and could generate a 28% higher NPV when com-
pared to the best alternative land use over a 30 year
period.
Although our results clearly show that exclosures as
carbon sink projects are economically unattractive at an
average price of US$25 per permanent credit, they could
be viable alternatives if the price per permanent credit
increases to US$80. Using a price of US$80 per perma-
nent credit (US$10.99 per temporary credit), the NPV
from aboveground carbon storage of the relatively older
exclosures (i.e., 4- to 7-year-old) ranged from US$117 to
US$118.5 per hectare, which is higher than the net reve-
nues from teff production (Table 6). Thus, prices that are
equal or greater than US$80 per permanent credit would
make the relatively older exclosures profitable when com-
pared to teff production without considering payments for
Forest Science and Technology 9
Dow
nloa
ded
by [
INA
SP -
Ken
ya]
at 0
4:42
08
Mar
ch 2
015

other ecosystem services obtained from exclosures
establishment.
Compared to the average annual income of the com-
munities in the Gomit watershed (i.e., ETB 1671), the
contribution of the potential income that can be generated
from carbon trading is considerable (i.e., 42.1% of the
annual income). This in turn suggests that establishing
exclosures on communal grazing lands could help achieve
increases in annual household income and improve the
livelihoods of the smallholders. This is also consistent
with communities’ perception of the importance of exclo-
sures in improving livelihoods.
The use of participatory decision-making processes in
the rehabilitation of degraded ecosystems through exclo-
sures establishment, legalizing the watershed community
on the use, protection and management of natural resour-
ces, developing agreed bylaws, and establishing a strong
CWT facilitated the sustainable management of exclo-
sures in the watershed. In addition, the positive attitudes
of the community toward the effectiveness of exclosures
in restoring degraded ecosystems provide incentives to
maximize the benefits. Although the respondents agree
with the importance of exclosures in enhancing fodder
production and other services, they put forward three dif-
ferent opinions on the influence of exclosures on crop pro-
duction. This difference could arise from the location of
farm lands, and level of awareness and understanding of
the ongoing rehabilitation efforts.
The limited participation of women in decision-mak-
ing in exclosure land management can be attributed to
poor representation of women in the CWT (just two out of
nine CWT members were women). In addition, local cul-
tural perceptions that precluded women’s participation in
watershed management decisions and that do not allow
women to express their opinions in a public situation
could contribute to their limited participation in decision-
making. This suggests that greater inclusion of women
and marginal groups is needed to understand the different
priorities, concerns, preferences, and interests of men and
women farmers in order to achieve sustainable exclosure
land management.
Sustainable watershed management such as establish-
ing exclosures and enhancing natural regeneration of
woody species through constructing SWC structures in
exclosures can be used to reverse land degradation, lower
environmental impacts, and diversify household income
sources. Exclosures help achieve sustainable intensifica-
tion of agricultural production by reducing soil erosion,
improving vegetation cover, and sequestering CO2 and
are therefore an adaptive strategy to climate change or
variability. Exclosures can also generate up to 42% of the
current annual income of the communities in the study
sites if carbon stored in aboveground biomass is traded.
This in turn opens up possibilities to expand exclosures in
the watershed for the restoration of degraded lands and
diversify household income sources. The positive opin-
ions of watershed communities on exclosure land manage-
ment could be used as an asset for the expansion of
exclosures in the watershed.
However, the concerns of the local communities,
particularly the negative effects of exclosures in fuel
wood availability and the severe degradation of useful
tree and shrub species in the remaining communal graz-
ing lands is critical, as more than 90% of local communi-
ties depend on bioenergy sources (wood, dung) to meet
their household energy demands (Zenebe 2007). This
illustrates that the sustainability of exclosure land man-
agement can be attained only if these critical concerns
are addressed by a joint effort among government agen-
cies, NGOs, and communities. In addition, government
authorities (i.e., Bureau of Agriculture, district agricul-
tural offices and district administrative bodies) can help
strengthen participatory decision-making in exclosure
land management to include the voices of women and
other marginal groups.
Conclusions
The results of this study confirm that the establishment of
exclosures on degraded communal grazing lands in the
Gomit watershed can effectively restore degraded ecosys-
tems, diversify household income, and contribute to improv-
ing the livelihood of smallholders. However, the decision to
establish additional exclosures should include a comprehen-
sive socioeconomic analysis that incorporates all services
provided by exclosures. In addition, local communities’
concerns on the expansion of exclosures should be
addressed. In order to address local communities’ concerns,
the government could exert efforts toward enhancing the
awareness of communities on the importance of sustainable
land management, while NGOs could provide credit to
expand bee keeping and livestock fattening programs, and
introduce solar panels in the watershed. Communities could
contribute local knowledge of land management, labor, and
locally available materials.
Acknowledgements
We are grateful to the Amhara Regional Agricultural ResearchInstitute (ARARI) for their cooperation and facilitation of theresearch work. We are also very grateful to the local communi-ties in the study area and the CWT for their support during thefieldwork.
Note
1. Woina dega (subtropical zone) includes the highlands areasof 1830�2440 m above sea level with a mean annual tem-perature of c. 22 �C and annual rainfall between 510 and1530 mm.
References
Abebe MH, Oba G, Angassa A, Weladji RB. 2006. The role ofarea enclosures and fallow age in the restoration of plantdiversity in northern Ethiopia. Afr J Ecol. 44:507�514.
Babulo B, Muys B, Fredu N, Tollens E, Nyssen J, Deckers J,Mathijs E. 2009. The economic contribution of forestresource use to rural livelihoods in Tigray, Northern Ethio-pia. Forest Policy Econ. 11:109�117.
10 W. Mekuria et al.
Dow
nloa
ded
by [
INA
SP -
Ken
ya]
at 0
4:42
08
Mar
ch 2
015

Bernard R. 2006. Research methods in anthropology: qualitativeand quantitative approaches. 4th ed. USA: AltaMira Press;p. 463�522.
Birhane E, Teketay D, Barklund P. 2007. Enclosures to enhancewoody species diversity in the drylands of Tigray, Ethiopia.East Afr J Sci. 1:136�147.
Butchart SHM, Walpole M, Collen B, van Strien A, Scharle-mann JPW, et al. 2010. Global biodiversity: indicators ofrecent declines. Sci. 328:1164�1168.
Bullock JM, Aronson J, Newton AC, Pywell RF, Rey-Benayas J.2011. Restoration of ecosystem services and biodiversity:conflicts and opportunities. Trends Ecol Evol. 26:541�549.
Chazdon RL. 2008. Beyond deforestation: restoring forests andecosystem services on degraded lands. Sci. 320:1458�1459.
Deng J, Walker GJ, Swinnerton G. 2006. A comparison of envi-ronmental values and attitudes between Chinese in Canadaand Anglo-Canadians. Environ Behav. 38: 22�47.
Doren RF, Trexler JC, Gottlieb AD, Harwell MC. 2009. Ecologi-cal indicators for system-wide assessment of the greater ever-glades ecosystem restoration program. Ecol Indic. 9s:s2�s16.
Girmay G, Singh BR, Nyssen J, Borrosen T. 2009. Runoff andsediment-associated nutrient losses under different land usesin Tigray, northern Ethiopia. J Hydrol. 376:70�80.
Guariguata MR, Balvanera P. 2009. Tropical forest serviceflows: improving our understanding of the biophysicaldimension of ecosystem services. Forest Ecol Manag.258:1825�1829.
Hector A, Philipson C, Saner P, Chamagne J, Dzulkifli D,O’Brien M, Snaddon JK, Ulok P, Weilenmann M, ReynoldsG, Godfray HCJ. 2011. The Sabah Biodiversity Experiment:a long-term test of the role of tree diversity in restoring tropi-cal forest structure and functioning. Phil Trans R Soc B.366:3303�3315.
Hoff C, Rambal S, Joffre R. 2002. Simulating carbon and waterflows and growth in a Mediterranean evergreen Quercus ilexcoppice using the FOREST-BGC model. Forest Ecol Manag.164:121�136.
Holl KD, Crone EE, Schultz CB. 2013. Landscape Restoration:Moving from Generalities to Methodologies. BioScience.53:491�502.
Keyzer MA, Sonneveld BGJS. 2001. The effect of soil degradationon agricultural productivity in Ethiopia: a Non-ParametricRegional Analysis. In: Heerink N, Van Keulen H, Kurpios M,editors. Economic policy reforms and sustainable land use inLDCs. Heidelberg: Physica Verlag; p. 269�292.
Lemenih M, Karltun E, Olsson M. 2005. Soil organic matterdynamics after deforestation along a farm field chronose-quence in southern highlands of Ethiopia. Agric EcosystEnviron. 109:9�19.
Lindemann-Matthies P, Keller D, Li X, Schmid B. 2014. Atti-tudes toward forest diversity and forest ecosystem serv-ices—a cross-cultural comparison between China andSwitzerland. J Plant Ecol. 7:1�9.
MEA (Millennium Ecosystem Assessment). 2005. Ecosystemsand human well-being: desertification synthesis. Washing-ton, D.C: World Resources Institute.
Mekuria W, Veldkamp E. 2012. Restoration of native vegetationfollowing exclosure establishment on communal grazinglands in Tigray, Ethiopia. Appl Veg Sci. 15:71�83.
Mekuria W, Veldkamp E, Corre MD, Mitiku H. 2011. Restora-tion of ecosystem carbon stocks following exclosure estab-lishment in communal grazing lands in Tigray, Ethiopia.Soil Sci Soc Am J. 75:246�256.
Mekuria W. 2013. Conversion of communal grazing lands intoexclosures restored soil properties in the semi-arid lowlandsof Northern Ethiopia. Arid Land Res Mange. 27:153�166.
Mekuria W, Getnet K, Noble A, Hoanh CT, McCartney M, Lan-gan S. 2013. Economic valuation of organic and clay-based
soil amendments in small-scale agriculture in Lao PDR.Field Crop Res. 149:379�389.
Mengistu M, Teketay D, H�akan H, Yemshaw Y. 2005. The roleof enclosures in the recovery of woody vegetation indegraded dryland hillsides of central and northern Ethiopia.J. Arid Environ. 60:259�281.
Mureithi SM. 2012. Effects of enclosures and land zoning on therestoration of degraded semi-arid rangeland in Kenya. PhDthesis. Ghent University Press. pp. 210. ISBN 978-9-4619708-4-8.
Olschewski R, Benı´tez P. 2005. Secondary forests as temporarycarbon sinks? The economic impact of accounting methodson reforestation projects in the tropics. Ecol Econ.55:380�394.
Olschewski R, Benı´tez P, de Koning GHJ, Schlichter T. 2005.How attractive are forest carbon sinks? Economic insightsinto supply and demand of certified emission reductions.J Forest Econ. 11:77�94.
Park KH, Qu ZQ, Wan QQ, Ding GD, Wu B. 2013. Effects ofenclosures on vegetation recovery and succession in Hulun-beier steppe, China. Forest Sci Tech. 9:25�32.
Shannon CE. 1948. A mathematical theory of communication.Bell Syst Tech. J. 27:379�423.
Snowdon P, Raison J, Keith H, Ritson P, Grierson P, Admas M,Montagu K, Huiquan BB, Eamus D. 2002. Protocol forsampling tree and stand biomass. National carbon accountingsystem technical report, Australian greenhouse office. No. 31.
Sorensen T. 1948. A method of establishing groups of equalamplitude in plant sociology based on similarity of speciescontent. Det Kong. Danske Videnskabernes Selskab, Biolo-giske Skrifter (Copenhagen) 5:1�34.
Tilahun M, Olschewski R, Kleinn C, Gebrehiwot K. 2007. Eco-nomic analysis of closing degraded Bosewellia papyriferadry forest from human intervention: A study from Tigray,Northern Ethiopia. Forest Policy Econ. 9:996�1005. UNDP(United Nations Development Program). 2002. World devel-opment report. Oxford University Press.
UNFCCC. 2003. Development and transfer of technologies.Report of the UNFCCC workshop on enabling environmentsfor technology transfer, Ghent, 9�10 April 2003.
USAID 2007. Libo Kemkem Wereda, Livlihood Zone Informa-tion. Addis Ababa, Ethiopia: USAID.
Waesberghe VV, Mezemir M. 2010. Ethio-German Programmeon “Sustainable Utilization of Natural Resources forImproved Food Security” SUN Watershed Assessment of theAmhara SUN-assisted watersheds. GFA Consulting GroupGmbH, Eulenkrug straße 82, D-22359 Hamburg, Germany.
World Bank. 2001. African development indicators. WashingtonD.C.: The World Bank.
Yami M, Gebrehiwot K, Stein M, Mekuria W. 2006. Impact ofarea enclosures on density, diversity, and population struc-ture of woody species: the case of May Ba’ati-Douga Tem-bien, Tigray, Ethiopia. Eth J Nat Res. 8:99�121.
Yami M, Mekuria W, Hauser M. 2013. The effectiveness of vil-lage bylaws in sustainable management of community man-aged exclosures in Northern Ethiopia. Sustainability Sci.8:73�86.
Yayneshet T, Eik LO, Moe SR. 2009. The effects of exclosuresin restoring degraded semi-arid vegetation in communalgrazing lands in northern Ethiopia. J Arid Environ.73:542�549.
Young-Zhong S, Yu-Lin L, Jian-Yaun C, Wen-Zhi Z. 2005.Influences of continuous grazing and livestock exclusion onsoil properties in a degraded sandy grassland, Inner Mongo-lia, northern China. Catena. 59:267�278.
Zenebe G. 2007. Household fuel consumption and resource usein rural-urban Ethiopia. PhD Thesis, Wageningen Univer-sity. ISBN: 978-90-8504-745-2.
Forest Science and Technology 11
Dow
nloa
ded
by [
INA
SP -
Ken
ya]
at 0
4:42
08
Mar
ch 2
015


