Embed Size (px)
Citation preview

RETAIL-COMMERCIAL DISTRICT
SMALL BUSINESS STUDYChange and Drivers of Change in Vancouver’s Local Shopping Areas
Liveable CITY
Planning Ltd.
Andrew Yan
Consulting
Prepared for: City of Vancouver
Planning, Sustainability and Urban Design
Economic Development Planning Group /
BIA Program

LIVEABLE CITY
PLANNING LTD.
Andrew Yan
Consulting2
City of Vancouver: Retail-Commercial District Small Business Study, 2020
Planning, Sustainability and Urban Design, City-Wide & Regional PlanningEconomic Development Planning Group / BIA Program
• Chris Robertson
• Matthew Bourke
• Peter Vaisbord
• Paul Siggers
Internal Advisory Team
• Community Planning – Wes Regan, Andrew Pask, Jose Fernandez-Garcia
• Development Planning – Paul Cheng
• Finance & Revenue Services – Grace Cheng, Rob Evans
• Vancouver Economic Commission – Meg O’Shea
Business Planning and Project Support
• Eleena Marley
• Kaidra Mitchell
Consultants
• Urban Systems – Justin Barer
• Commercial Marketing Inc. – Lewis Silberberg
• Andrew Yan Consulting – Andy Yan
• Liveable City Planning Ltd. – Michael Mortensen
• Lee & Associates – Don Mussenden
2
Source: weddingmapper.com

LIVEABLE CITY
PLANNING LTD.
Andrew Yan
Consulting3
Table of Contents
1.0 Project Introduction 4
2.0 Definitions and Commercial Area Typologies 14
3.0 Context and Trends Review 38
4.0 Methodology and Data Sources 53
5.0 Local Shopping Areas Change Over Time 58
6.0 Engagement With Business Community 153
7.0 Assessing Health and Vitality Over Time 179
8.0 Synopsis: Challenges and Change Drivers 223
9.0 Conclusions and Next Steps 231
10.0 Appendices 243
Appendix A: Assumptions and Limiting Conditions
Appendix B: Classification of Commercial Storefronts
Appendix C: Summary Drivers of Change and Key Takeaways for Each Study Area
Appendix D: Historical Commercial Inventories
Appendix E: 2019 Commercial Inventories
Appendix F: Survey of Business Owners and Operators
Appendix G: Survey of Landlords and Brokers
3
Source: weddingmapper.com

1.0 PROJECT INTRODUCTION
LIVEABLE CITY
PLANNING LTD.
Andrew Yan
Consulting5
1.1 PROJECT INTRODUCTION
In late 2018, the City of Vancouver commissioned a study to determine the changes and drivers of
change being experienced by small, independent businesses in the City’s local shopping areas. There
is growing concern that local shopping areas in the City are declining, and that independent
businesses in particular are being displaced due to an unprecedented confluence of circumstances.
Using six case study areas across the City, this study attempts to answer to the following questions:
1. What changes have occurred in the last 10+ years in six case study areas in terms of:
• Predominant tenant types (counts and floor area)
• Vacancies
• Chain businesses and independent businesses
• Property values and property taxes
• Property ownership
• Basic and additional commercial rents
• Business revenues and profitability
• The context of change (spatial, demographic, and macro-economic)
2. What are the key issues and ‘drivers’ of change (positive and negative) in each area, including the
relative importance of different factors, and the interrelationships between factors?
3. What makes a healthy local shopping area*, and what are some of the indicators of failing
health?
4. How might the City best monitor neighbourhood retail health and vitality going forward, and
how might it support independent business and business area vitality more broadly?
Source: weddingmapper.com
* Most of Vancouver’s local shopping areas (LSAs) evolved along the City’s historic streetcar routes. They are street-oriented neighbourhood and local-serving areas typically zoned “C-1”, “C-2” or “C-3A”.

LIVEABLE CITY
PLANNING LTD.
Andrew Yan
Consulting6
1.1 PROJECT INTRODUCTION
• Across North America and in markets overseas, a variety of forces are threatening the viability
and vibrancy of neighbourhood retail. These include: the competition of online retail; rising
property taxes and lease rates; shifting demographics and consumer preferences; and the
pressures of redevelopment, to name a few.
• Vancouver’s local shopping areas have evolved over the City’s 134-year history. The first LSAs
emerged at the intersections of streetcar lines in the early 1900s, shaped by the dual logic of
electric mass transit and pedestrian mobility. They expanded somewhat with the subsequent
adoption of automobiles but still remain walkable and connected to the neighbourhoods that
provide their customer base. Today, Vancouver’s LSAs contribute to social, economic and
environmental sustainability by offering convenient local access to goods and services, places to
meet and socialize, and places to create and support unique neighbourhood character.
• The evolution and renewal of the city’s LSAs involves many actors including property owners;
small and large business tenants and their Business Improvement Associations (BIAs); local and
regional customers; and all levels of government including the City which controls land use,
property taxation, policing, local investments and maintenance of the public realm. The health
and vitality of the small, independent businesses that give our local retail streets their unique
flavour is also a function of our land economy, Federal and Provincial tax policies, City policy
decisions, neighbourhood vitality and the spending power and decisions of local customers, as
well as the self-organizing efforts of local BIAs.
• This study is a first step in providing baseline information on the dimensions and drivers of
change that are affecting local retail and services today. This information is necessary in order to
understand and respond to demographic change, competition, and wider market forces. There
are many opportunities to improve neighbourhood retail streets across this City. Through careful
planning and support, new roles can be found for retail streets to better serve changing
neighbourhoods. In our conclusions we provide some ideas on what roles the City might play to
support positive change going forward.
• The project Assumptions and Limiting Conditions are detailed in Appendix A.
Source: weddingmapper.com

LIVEABLE CITY
PLANNING LTD.
Andrew Yan
Consulting7
1.2 STUDY AREA SELECTION
7
Source: weddingmapper.com
• Six BIA Study areas were selected through an iterative process with City staffin January - February 2019, and approved by the BIA partnership.* Theintent was to get a representative mix of Local Shopping Areas so that theinsights of the Study would be generally applicable across the City.
• In selecting Study areas, the general guiding principles were:
o Achieving north-south representation.
o Achieving east-west representation.
o Selecting at least four areas that appear to be evidencing change orinstability.
o Selecting at least 2 Study areas in ‘Community Plan’ Areas.
o Selecting at least 2 Study areas that are in areas commonly perceived as‘stable’ or ‘healthy.’
o Confining selection to areas with C-2 or similar zoning.
• The BIAs selected according to these filters were:
1. South Granville BIA
2. West Broadway BIA
3. Marpole BIA
4. Collingwood BIA
5. Hastings North BIA
6. Commercial Drive BIA
West Broadway
South Granville
Marpole
Collingwood
Commercial Drive
Hastings North
Study BIA
Non-Study BIA
Broadway
41st Ave
Dunbar
Gra
ndvil
le S
tree
t
Mai
n S
tree
t
Vic
tori
a D
rive
*The Vancouver BIA Partnership (Partnership) is a coalition representing
all of the City’s 22 BIAs.

LIVEABLE CITY
PLANNING LTD.
Andrew Yan
Consulting8
1.3 STUDY AREAS: SOUTH GRANVILLE
• The South Granville BIA Study area encompasses the entirety of thecurrently-defined BIA, extending from West 5th Avenue to West 15thAvenue along Granville Street, plus the west side of Granville between West15th and 16th Avenues.
• The Study area also includes all ground floor retail and service commercialuses on the south side of West Broadway between Fir Street and thelaneway east of Granville Street.
• This area does not have a recent community plan, or vision.
• Portions of this area may be influenced by speculation due to the BroadwaySubway extension. The entrance for the South Granville Station will be onthe northeast corner of Broadway and Granville, currently occupied by afour-storey commercial building.
8
Source: weddingmapper.com
South Granville BIA
Number of Blocks 11
Linear Metres 1,100
Total Commercial Floor Area (sq.ft.) 540,392
Total Commercial Storefront Count 199
Recent Plan? No
Zoning C-3A
Year of Baseline Inventory 2006
South Granville BIA Study Area
Source: City of Vancouver Open Data Catalogue
South Granville BIA Snapshot
West 5th Ave
Gra
nvi
lle S
tree
t
West 15th Ave
Broadway
West 10th Ave
Fir
Stre
et

LIVEABLE CITY
PLANNING LTD.
Andrew Yan
Consulting9
1.4 STUDY AREAS: WEST BROADWAY
• The West Broadway BIA encompasses the entirety of the BIA area, a 10-block stretch from Collingwood Street in the west to Larch Street in the east.It operates under the “Kits on Broadway” brand.
• The BIA includes three blocks east of Macdonald Street, which contains thenearly 50,000 square foot Safeway store plus a stretch of small businesses.
• The area does not have a recent community plan or vision statement.
Source: weddingmapper.com
West Broadway BIA
Number of Blocks 10
Linear Metres 1,420
Total Commercial Floor Area (sq.ft.) 488,528
Total Commercial Storefront Count 255
Recent Plan? No
Zoning C-2C / C-2C1
Year of Baseline Inventory 2010
West Broadway BIA Study Area
Source: City of Vancouver Open Data Catalogue
West Broadway BIA Snapshot
West Broadway
Co
llin
gwo
od
Str
eet
Larc
h S
tree
t
West 8th Ave

LIVEABLE CITY
PLANNING LTD.
Andrew Yan
Consulting10
1.5 STUDY AREAS: MARPOLE
• The Marpole BIA encompasses the 7900 through 8700 blocks of Granville Street(from West 71st Avenue to just north of West 63rd Avenue).
• The Marpole BIA is part of the area covered by the 2014 Marpole Community Plan.
10
Source: weddingmapper.com
Marpole BIA
Number of Blocks 8
Linear Metres 600
Total Commercial Floor Area (sq.ft.) 246,827
Total Commercial Storefront Count 141
Recent Plan? Yes
Zoning C-2 / C-1 / C-2C
Year of Baseline Inventory 2011
Marpole BIA Snapshot
Marpole Neighbourhood Boundaries
Source: Marpole Community Plan
Marpole BIA Study Area
Source: City of Vancouver Open Data Catalogue
Gra
nvi
lle S
tree
t
West 70th Ave
West 63rd Ave
Co
rnis
h S
tree
t

LIVEABLE CITY
PLANNING LTD.
Andrew Yan
Consulting11
1.6 STUDY AREAS: COLLINGWOOD
• The Collingwood BIA runs along Kingsway, from Rupert Street in the westto Boundary Road in the east.
• Note that the boundary line between two Community Vision Areas(Renfrew Collingwood and Killarney) runs along the centre line ofKingsway between Joyce Street and Boundary Road.
• The Study area encompasses the entirety of the currently-defined BIA.
• From a zoning standpoint, the Study area is entirely C-2 (north and southof Kingsway), with the exception of CD-1 sites.
• Barring any future rezoning policy, there are no significant differences indevelopment potential between the two Community Vision areas.
11
Source: weddingmapper.com
Collingwood BIA
Number of Blocks 15
Linear Metres 1,450
Total Commercial Floor Area (sq.ft.) 411,300
Total Commercial Storefront Count 203
Recent Plan? No
Zoning C-2
Year of Baseline Inventory 2005
Collingwood BIA Snapshot
Collingwood BIA Study Area
Source: City of Vancouver Open Data Catalogue
Bo
un
dar
y R
oad
.

LIVEABLE CITY
PLANNING LTD.
Andrew Yan
Consulting12
12
Hastings North BIA Study Area
Hastings StV
icto
ria
Dri
ve.
Cla
rk D
rive
.
• While the Hastings North (East Village) BIA extends along Hastings St. from Renfrew in the east nearly to Clark Drive in the west, the analysis for this study looks
at only the portion of the BIA between Renfrew and Victoria (as depicted above).
• The decision to truncate the Study area at Victoria was taken primarily based on a zoning rationale: zoning is C-2C1 from Renfrew to Slocan, C-2C from Slocan
to Garden, C-2C1 from Garden to Victoria, and MC-1 / MC-2 west of Victoria. Industrial properties are excluded.
• Nanaimo St. marks the boundary between the Hastings Sunrise Community Vision and the Grandview-Woodland Community Plan area. In consultation with
City of Vancouver staff and the BIA board, it was determined that there was not sufficient difference in zoned potential between the two sections of Hastings
to affect study findings.
Hastings North*
Number of Blocks 10
Linear Metres 1,550
Total Commercial Floor Area (sq.ft.) 484,414
Total Commercial Storefront Count 257
Recent Plan? Yes (west of Nanaimo)
Zoning C-2C1 / C-2C / C-2C1
Year of Baseline Inventory 2002
*area between Victoria and Renfrew
Hastings North BIA Snapshot (Study Area Only)
1.7 STUDY AREAS: HASTINGS NORTH (EAST VILLAGE)
Study Area
Re
nfr
ew S
t.
East Pender St
Hastings North BIA Study Area

LIVEABLE CITY
PLANNING LTD.
Andrew Yan
Consulting13
• The Commercial Drive BIA encompasses a 2-km section of Commercial Drive from 13th Ave in the south to Venables Streetin the north.
• Initially, consideration was given to restricting the Study area to the portion of the BIA located north of the Grandview Cut,as the area south of Broadway crosses community plan / vision area boundaries (from Grandview-Woodland CommunityPlan to Kensington Cedar Cottage Community Vision).
• Ultimately a decision was taken to include the entirety of the BIA for the following reasons:
o After input from City of Vancouver staff, and an initial round of consultations with the BIA board, it was determined thatthere was insufficient difference in zoned development potential between the Community Vision and Community Planareas.
▪ C-2C1 Venables to Charles
▪ C-2C from Charles to 3rd Avenue
▪ C-2C1 from 3rd to 6th Avenues
▪ C-2 from 6th Avenue to the Cut (with some CD-1)
▪ C-2C and C-3A from the Cut to 12th Avenue
▪ C-2C1 from 12th to 13th Avenue
o There is street-oriented retail south of the Cut, including the Safeway store (which is a future redevelopment site).
o Historical data sets prepared by Commercial Marketing Inc (CMI) that are used in this study (discussed in detail insubsequent sections of this document) cover the entirety of the BIA.
o This rationale for inclusion of the entire BIA was presented to the BIA Board in February, 2019 and all were inagreement.
13
Source: weddingmapper.com
Venables St
E 13th Ave
Co
mm
erci
al D
rive
Commercial Dr. BIA Study Area
1.6 STUDY AREAS: COMMERCIAL DRIVE
Commercial Drive BIA
Number of Blocks 20
Linear Metres 2,000
Total Commercial Floor Area (sq.ft.) 802,341
Total Commercial Storefront Count 352
Recent Plan? Yes
Zoning C-2C1 / C-2C / C-2 / C-2C / C-3A
Year of Baseline Inventory 2005
Commercial Drive BIA Snapshot
Co
tto
n D
r

2.0 DEFINITIONS and COMMERCIAL AREA TYPOLOGIES

LIVEABLE CITY
PLANNING LTD.
Andrew Yan
Consulting15
Anchor Uses Anchors are retail and non-retail businesses / uses with a significant draw of customers which also support other nearby
businesses. They can include grocery stores, retail clusters, community centres, libraries, and schools.
BIAs Vancouver has 22 Business Improvement Areas (BIAs) funded through a commercial property tax levy, and managed by
non-profit associations of property owners and business tenants whose goal is to promote and improve their business
district.
Chain Business Defined by Statistics Canada as an organization operating four or more outlets in the same industry class under the same
legal ownership at any time during the survey year.
Community Shopping Street A broad typology of street-oriented commercial districts comprised of 30 to 400 shops. For this report, three types of
community shopping streets have been identified: small, medium and large. Community Shopping Streets do not include
neighbourhood clusters or nodes of <30 shops, or ‘shopping districts’, which are higher density (and often multi-level)
agglomerations such as those found downtown.
Independent Business An organization operating three or fewer outlets in the same industry class under the same legal ownership at any time
during the survey year.
Small Business Statistics Canada defines a small business is one with 99 employees or fewer. BC Stats classifies a small business as one
with less than 50 employees. As employment data was not available for this report, the term ‘small business’ is used
interchangeably with ‘independent business.’
Retail Hierarchy & Commercial
Area Typologies
Retail
Land use economists classify commercial areas by their size (floor area) and function (local serving, city serving, sub-
regional and regional). Traditional concepts of retail hierarchy hold that smaller centres serve local areas, while larger retail
centres serve a wider (regional) trade area. These classifications have become increasingly blurred as malls try to imitate
streets (“lifestyle centres”) and as street-oriented retail hosts many stores found in malls.
Used as a shorthand for a wide range of retail-commercial business categories found in the Study areas, many of which are
not strictly engaged in retail sales. These include restaurants and bars, and personal and professional service providers.
2.1 SUMMARY DEFINITIONS*
*Presented here for ease of reference. Additional definitions, and additional detail on the above definitions, are provided throughout Section 2.0.

LIVEABLE CITY
PLANNING LTD.
Andrew Yan
Consulting16
Statistics Canada
Statistics Canada defines chain and independent retail as follows:
• “Retail Store Chain” is defined as an organization operating four or more outlets in thesame industry class under the same legal ownership at any time during the survey year.
• A “Franchise” is defined as a person, group of persons, partnership or incorporatedcompany granted a contractual privilege permitting the sale of a product, use of a tradename or provision of a service within a specific territory and/or in a specified manner.
• An “independent Store” consists of stores with less than four locations in the same industryclass under the same legal ownership at any time during the survey year.
-----------------------------------------
There are in fact a variety of other working definitions in North America for what constitutes a‘chain’ or ‘formula’ retailer, and similarly there are a variety of approaches to regulation andoversight. Broadly speaking, chain businesses are those that have multiple locations (above agiven threshold), and standardized retail or service offers, features or a recognizableappearance.
As a detailed review of beneficial ownership of businesses is beyond the capacity of theanalysis in the present study, businesses that would typically be considered “franchises”through a visual assessment are amalgamated into the ‘chain store’ category.
Chain and Independents
Chain stores are sometimes called “formula retailers”, recognizing the repetition or ‘sameness’ of characteristics across establishments
WORKING DEFINITION FOR THIS STUDY
This study adopts Statistics Canada’s definition of chain retail
(with the inclusion of franchise businesses) to allow for
consistency with Statistics Canada and to allow for future
comparability across other Canadian municipalities. All
historical and current inventory data in the six Study areas is
classified using this definition.
Notably, the City of Toronto recently undertook a study on
chain retail, driven by research concerns and questions similar
to those raised by the City of Vancouver. Prior to the
commencement of that study, Toronto city staff had in-depth
discussions around working definitions of ‘chain’ and
‘independent’ business, as well as what constituted ‘small
business’. Ultimately, Toronto elected to adopt Statistics
Canada’s definitions of Chain Retail vs. Independent Retail.
2.1 DEFINITIONS

LIVEABLE CITY
PLANNING LTD.
Andrew Yan
Consulting17
The Statistics Canada definition of chain stores dates to 1931, from the Seventh Census of
Canada, Volume X: Merchandising and Service Establishments, Part 1. In that document, the
following definition was established:
Definition of a chain – a chain is defined as a group of stores of the same or similar kind of
business, centrally owned and operated, and stocked with merchandise placed through a
central buying office. It is not necessary that a warehouse be owned and operated by the
company itself in order that it be classified as a chain, but some form of central buying is a
fundamental feature of chain store operation for without this feature the advantage to be
gained from bulk purchasing would not be obtained. The information received regarding the
method followed in supplying the different stores of a given organization was usually
inadequate to indicate when it should be considered a chain, so that it has been necessary to
make an arbitrary division in this field. For this census, all groups of four stores or more under
the same ownership are classified as chains provided that they are engaged in similar lines of
activity, irrespective of the method by which they are stocked.
A similar reference can be found in the American Economic Review (1937).
For a variety of reasons, Statistics Canada is considering discontinuing the chain / non chain
distinction in its publication of the Annual Retail Trade Survey. The following pages provide
other working examples of chain / formula retail definitions currently used in some other North
American municipalities.
Chain and Independents
2.1 DEFINITIONS

LIVEABLE CITY
PLANNING LTD.
Andrew Yan
Consulting18
Chain and Independents
SAN FRANCISCO
• Under section 303.1 of the San Francisco Planning Code, “formula retailers” have been defined as “a type of
retail sales activity or retail sales establishment that has eleven or more other retail sales establishments in
operation…located anywhere in the world,” and has two or more of the following features:
o A standardized array of merchandise
o A standardized façade
o A standardized décor and colour scheme
o A uniform product mix across all stores
o Standardized signage
o A trademark or a service mark
• In the mid-2000s, San Francisco adopted policies to limit formula retail in all neighbourhood commercial
districts (NCDs). Today it has arguably the most comprehensive formula retail use restrictions in North
America. Rules around formula retail vary by neighbourhood.
o Formula retail in all NCDs must obtain a conditional use authorization to open.
o In a few NCDs, formula retail is ostensibly banned outright (although there are instances where chains have
been granted conditional use exceptions nonetheless).
o Conditional Use Application evaluations consider many factors, including the existing retail landscape, vacancies,
and compatibility with ‘neighbourhood character.’
o An economic impact study is required for uses greater than 20,000 square feet.
2.1 DEFINITIONS

LIVEABLE CITY
PLANNING LTD.
Andrew Yan
Consulting19
NEW YORK
• New York has adopted the same working definition of formula retail as San Francisco.
• A 2017 City report entitled Planning for Retail Diversity recommended that staff should “work with stakeholders
to examine the potential for zoning restrictions on chain stores and restaurants” in response to growing concerns
about preserving neighbourhood character and diversity of local independent businesses.
• The 2017 report built upon a 2015 study released by New York City’s East Village (Preserving Local, Independent
Retail) which proposed limitations on chain stores in that neighbourhood. The East Village already has restrictions
on store frontage sizes and certain changes of store use.
NANTUCKET, MASSACHUSETTS
• In 2006, the Town of Nantucket (population: 11,327) banned chain stores from its downtown.
• The town defines chain stores and restaurants as companies with 14 or more identical outlets and more than
three standardized features.
• The regulation was driven not by large format chain retail influx, but by the arrival of smaller chain retail in the
apparel category.
JERSEY CITY, NEW JERSEY
• In 2015, Jersey City began restricting chain stores to 30% of ground-floor commercial space in downtown
buildings (with some exceptions).
• The city defines chain stores as those having multiple locations within the region, and which exhibit standardized
characteristics such as logos, menus and store décor.
• The ordinance does not apply to grocery stores.
Chain and Independents
2.1 DEFINITIONS

LIVEABLE CITY
PLANNING LTD.
Andrew Yan
Consulting20
• For the purpose of collecting and reporting national statistics, Innovation,
Science and Economic Development Canada (ISED) classifies businesses
according to the number of paid employees. Its publication Key Small
Business Statistics (most recently released in January, 2019) uses the
following classifications:
o Small Business : 1 to 99 employees
o Medium Business: 100 to 499 employees
o Large Business: 500+ employees
• Within the small business category, data are publicly available at the
provincial level, by North American Industry Classification System (NAICS)
code, for the following employment clusters:
o 1 to 4 employees
o 5 to 9 employees
o 10 to 19 employees
o 20 to 49 employees
o 50 to 99 employees
• In British Columbia, 98% of ‘retail trade’ businesses (NAICS 44-45) have 99
or fewer employees, and 85% have 20 or fewer employees.
• 35% of BC retail businesses can be classified as ‘nano enterprises (4 or
fewer employees).
• Amongst full-service and limited-service eating establishments,
respectively 99.6% and 97.4% are classified as ‘small’ with 50% and 65%
having fewer than 20 employees.
Category ClusterEmployees
1 to 4 5 to 9 10 to 19 20 to 49 50 to 99
Retail Trade 35.0% 29.0% 20.7% 9.6% 3.7%
Drinking Places 11.2% 15.0% 24.1% 41.4% 7.9%
Full-Service Restaurants 16.2% 23.3% 25.0% 24.5% 8.3%
Limited Service Restaurants 17.5% 22.6% 33.9% 20.0% 4.9%
Personal, Professional,
Household Services55.2% 28.8% 11.8% 3.6% 0.5%
Table 1: Number of Employees within Small Business Classification, by Category, British Columbia, December 2017
Source: Statistics Canada, Table 33-10-0037-01 – Canadian Business Counts, with employees, December 2017
WORKING DEFINITION FOR THIS STUDY
The term ‘Small Business” should be read as “independent business” in this study.
While there are undoubtedly instances where a business considered ‘small’ from an
employment standpoint is also a chain, professional experience tells us that a majority of
independent businesses (3 or fewer locations) are likely to have under 100 employees.
Similarly, a majority of chain businesses are likely to have over 100 employees.
Small Business
2.1 DEFINITIONS

LIVEABLE CITY
PLANNING LTD.
Andrew Yan
Consulting21
Employees vs. Floor Areas
While the number of employees is a common and useful metric for
conceptualizing and analysing business size, another metric that is used in the
retail and service commercial sectors is gross leasable or saleable floor area.
Sales volumes are typically tracked and reported on a per-square-foot basis,
and rent-to-sales ratios are often tracked on a floor-area basis.
What constitutes ‘small ‘or ‘large’ floor areas (or numbers of employees) in
the retail world varies by category. For instance, consider the typical size
thresholds for grocery stores and how those may compare to other
categories:
• A corner store or green grocer is typically under 5,000 square feet, and may
be under 1,000 square feet (e.g. Nada, 675 E. Broadway; Be Fresh, 1900 W.
1st Avenue).
• A neighbourhood supermarket may be 8,000 to 20,000 square feet, and
typically includes a small café (e.g. Choices Market at W. 57th Avenue;
Strong’s Market on Dunbar).
• A typical destination or medium supermarket is 25,000 to 45,000 square
feet, and often includes full-sized cafes and specialty food stations (e.g.
Urban Fare).
• A large supermarket is over 50,000 square feet, and may be part of a much
larger extra-large general merchandiser (e.g. Wal Mart Supercentre of
180,000 square feet with 50,000+ square feet of retail grocery area). In
some of these larger general merchandisers, the grocery component may
be 80,000 to 150,000 square feet.
*Employment data for businesses in the Study areas was not available. Employment estimates have been made based on an estimate of 350 square feet per employee on
average, based on professional experience.
• Compare the concept of ‘small’ or micro’ grocery to the concept of
‘small’ for other categories:
o A ‘small’ pharmacy may be under 1,500 square feet.
o A ‘small’ restaurant is under 1,000 square feet.
o A ‘small’ liquor store may be under 2,500 square feet.
Small Business and Independent Business
Another item to consider is the extent of overlap between ‘small’ and
‘independent’ business categories. These terms are often used
interchangeably in planning-related discussions. However, if ‘small’ is
conceived using the Statistics Canada employment threshold of ‘under
100’ and a chain store is a business with 4 or more locations, then there
will be instances of small, chain businesses. Some examples of such in two
of the Study areas are: Turnabout Luxury Resale (5 locations); Trees
Coffee (6 locations), Thai Basil (4 locations), Banana Leaf (5 locations),
Purebread Bakery (5 locations). All are local or regional chains which likely
have under 100 employees.*
Small Business
2.1 DEFINITIONS

LIVEABLE CITY
PLANNING LTD.
Andrew Yan
Consulting22
• The consulting team acknowledges that the term ‘small business’ may
have political connotations, and is a term that is often used
interchangeably with independent business.
• As discussed above, what classifies as ‘small’ will differ depending on the
metric used (employees vs. floor area), and what is physically small for
one category may be large for another. Further there are instances where
businesses that are considered ‘small’ from an employment standpoint
are also chains.
• Unfortunately, the City of Vancouver does not possess a reliable database
of employment data by business. While data provided by the City’s BIA
Program does contain a field showing number of employees, there are
data veracity concerns which make this field problematic (and ultimately
not useful) for this study.
• By contrast, the City of Toronto “Retail Main Streets Study” (prepared by
ThreeSixty Collective for the City of Toronto Economic Development and
Culture Division) has the advantage of access to high-quality longitudinal
employment data by location and business type. This data has been
gathered and updated annually as part of the city-wide survey of
businesses since 1983.*
Small Business
2.1 DEFINITIONS
*See: https://www.toronto.ca/city-government/data-research-maps/research-reports/planning-development/toronto-employment-survey/

LIVEABLE CITY
PLANNING LTD.
Andrew Yan
Consulting23
An anchor use, alternately a ‘major attractor’ or ‘activity generator’, is defined
as a retail or non-retail use (or uses) that drive foot traffic and business to
other nearby uses in a commercial area. They are often critical for sustaining
the smaller, more specialized shops and services in an area. While anchors are
typically retail uses, there are other uses that can be effective drivers of traffic
such as community centres, libraries, or schools.
Examples of anchors within the context of street-oriented commercial
precincts are as follows:
• Grocery stores and General Merchandisers: a full-line grocery store such as
a Save-On Foods or Safeway, a general merchandiser such as a London
Drugs, or even a pharmacy with sizeable retail grocery and general
merchandise components such as Shoppers Drugs Mart, will draw regular
foot traffic as customers return on a regular basis to buy day-to-day
convenience goods. Often these businesses benefit from greater brand
recognition and advertising resources, which positively impacts their ability
to draw customers. If these businesses are well-placed in a retail area, they
will both draw customers into an area and provide foot traffic to other
stores. The loss of a grocery or general merchandise anchor can have
knock-on impacts for local shopping areas. A recent example is the loss of
the Safeway grocery store in Point Grey Village (West 10th Avenue), and the
subsequent (negative) impact on foot traffic and business closures.
Anchor Uses or Attractors
• Clusters of Stores in same merchandise category: the concentration of many
storefronts in a single category (e.g. fashion, furniture stores, restaurants)
can also act as an anchoring use in a retail precinct. Customers are drawn
to these clusters, knowing that they will have many options within a short
distance. Examples of such ‘comparison goods’ clusters include furniture
and homewares stores on South Granville, apparel boutiques on Main
Street, or the ‘polar fleece’ district that emerged around Mountain
Equipment Co-op on Broadway.
• Cultural, Civic, Institutional and Entertainment uses: the presence of a busy
community centre, a library, or a cultural venue like a theatre can act as
either primary or complementary activity drivers, and can make an area a
destination. The Stanley Theatre on South Granville, for instance, attracts
evening patronage to the precinct, and was found in a 2004 study to
positively benefit local businesses.* The loss of an institution can have
negative effects for an area. For instance, it was noted during interviews
conducted for this study that the closure of Sir Guy Carleton Elementary
School on Kingsway led to a noticeable drop in sales volumes for some
nearby businesses.
2.1 DEFINITIONS
*Jones, Ken, Ryerson University Centre for the Study of Commercial Activity. (2004) Spillover Effects of Investments in Cultural Facilities.

LIVEABLE CITY
PLANNING LTD.
Andrew Yan
Consulting24
• A common distinction made within the classification and hierarchy of retail districts is Convenience Goods and
Services vs. Shoppers (or ‘Comparison’) Goods and Services.
• Convenience Goods and Services:
o Are lower order goods and services which are purchased frequently.
o Are often the predominant businesses in most neighbourhood-oriented local shopping areas, and tend to decrease
as a proportion of total as one moves up the retail hierarchy.
o Typically include grocery stores, convenience stores, pharmacies, banks, personal services (e.g. barber, dry cleaner),
general services, and some professional offices.
• Comparison Goods and Services
o Higher order goods and services which are purchased less frequently than convenience goods and services, and for
which consumers are likely to do comparison shopping.
o Comparison goods include apparel, appliances, electronics books, hobbies, toys, music, homewares, and jewellery.
o Comparison services may include medical services, financial and legal services, and other professional services.
o The proportion of higher order goods and services in a shopping area will increase at higher levels of the retail
hierarchy. The hierarchy typologies as its applies to the City of Vancouver is discussed in more detail in Section 2.2.
For the purposes of Study area retail classifications in this document, Comparison and Convenience Service commercial
has been grouped under the single heading “Service Commercial.” Convenience Goods and Comparison Goods are kept
separate.
In addition, we use the category “Food & Beverage” to classify all types of restaurants / eating places / drinking places.
We use “Entertainment / Fitness / Recreation” for any entertainment or recreation venues including theatres, gyms, and
yoga studios. We use “Automotive Goods and Services” for all types of business that sell or service vehicles or vehicle
parts.
Convenience and Comparison Goods and Services
2.1 DEFINITIONS

LIVEABLE CITY
PLANNING LTD.
Andrew Yan
Consulting25
Convenience and Comparison Goods and Services
2.1 DEFINITIONS
Category What is included?
Convenience Goods Grocery stores; specialty food stores (e.g. bakeries, fish markets; green grocers); convenience stores; liquor stores; personal service stores and pharmacies; florists
Service Commercial Personal services, professional services, health services, financial services, legal services.
Comparison Goods Art, books, clothes, luggage, accessories, electronics, appliances, furniture, gifts, hobbies, toys, jeweler, lawn/garden/hardware, office supplies, optical goods, pet store, shoe store, sporting goods, general merchandisers
Food and Beverage Full-service restaurants; limited service eating places; drinking places.
Automotive Goods and Services Parts and accessories stores; repair and maintenance; auto, boat dealers.
Entertainment / Fitness / Recreation
Theatres, gyms, fitness, yoga, billiards, bowling, martial arts.
Vacant Unoccupied storefronts, regardless of lease / permitting status.

LIVEABLE CITY
PLANNING LTD.
Andrew Yan
Consulting26
• Vacancy can be, and often is, defined in different ways.
o The International Council of Shopping Centers (ICSC) defines vacancy in their Dictionary of
Shopping Terms (2005) as: “the square footage that is unoccupied even if leases are signed and
rents are being collected, expressed as a percentage of the total occupancy area of each store
category.”
o The shopping centre industry typically follows the ICSC definition of vacancy. However, a 2013
article published by Ryerson University’s Centre for the Study of Commercial Activity noted that
few companies report vacancy by store category (as per ICSC definition). Instead, vacancy is
reported as a function of total floor area, with the following variations:
▪ Shopping centre owners and developers report vacancy on a square footage basis for
unoccupied space (including vacant space that is still subject to lease payments and is
technically non-leasable) and reported against gross leasable area (GLA).
▪ Leasing industry professionals usually report vacancy as unoccupied space that is leasable,
and reported against total GLA.
o When collecting or reviewing vacancy rate data, there must be clarity on what definition is being
used. From the perspective of the resident and shopper, an empty storefront looks and feels the
same, and has the same overall negative impact on the neighbourhood, regardless of whether it
is vacant and leasable or vacant and encumbered in some way from a new occupancy.
o From the perspective of business area health, however, the difference between vacant and
leasable vs. vacant and encumbered could be important. If, for instance, half of vacancies are
encumbered from new occupancies, this could have much more serious impacts on the ability for
a struggling area to recover quickly.
Vacancy Rates
2.1 DEFINITIONS
WORKING VACANCY DEFINITION FOR THIS STUDY
• The data collected for this Study reports as
“vacant” any storefront in the Study areas that
is unoccupied, regardless of lease status or
permitting status, based on field observations.
• Vacancy percentages are reported as
proportions of total floor area and total store
count within each Study area.
• Significant variations in vacancy percentages
between floor area and store counts are a
function of differences in store sizes. For
instance, a large space formerly occupied by a
grocery store is counted as only one storefront,
but it may significantly increase the vacancy
rate of an area on a floor area basis. Its loss is
also likely to have a significant impact on the
health and vitality of the shopping areas.

LIVEABLE CITY
PLANNING LTD.
Andrew Yan
Consulting27
Vacancy Typologies
The ideal situation for a local shopping area is not to achieve 100% occupancy. Some commercial vacancy is a
necessary attribute of healthy property markets. This is often referred to as “Natural” market vacancy.
• The efficient operation of commercial markets, reflected in churn and filtering of businesses up and down the
property ladder, cannot occur without some degree of vacancy. This type of vacancy is often referred to as
“Frictional” or “Cyclical” vacancy.
• This can be differentiated from “structural” vacancy, referring to properties that are perpetually vacant for a
number of reasons. Such properties are a problem for commercial landlords, nearby small businesses, and
overall health and vitality of commercial precincts.
• Natural market vacancy can be split into two tiers: Premium Vacancy and Auxiliary Vacancy
o Premium vacancy: represents the best properties, typically close to anchor tenants and the core of a local
shopping area, and are part of the typical cyclical / frictional vacancy cycle.
o Auxiliary vacancy: describes vacant secondary properties that still play a role in an area but are lower-grade
building stock. Often these buildings are critical for small, independent businesses.
• A common rule of thumb in the commercial brokerage industry is that a frictional vacancy rate around 5-7% is
healthy, and up to 10% is acceptable, as it allows for business churn and filtering without unduly impacting the overall
health and vitality of a precinct.
2.1 DEFINITIONS

LIVEABLE CITY
PLANNING LTD.
Andrew Yan
Consulting28
• Commercial rents are a significant operating cost. Businesses typically think about rent in terms of rent-to-sales ratios.
• Each business category has different abilities to pay rent, but a rule of thumb in the retail leasing industry is that if a
business is paying more than 15% to 20% of gross sales in combined rents (Basic + Additional), it is unlikely to survive
long-term.
• Within a standard commercial lease, particularly for a retail space, there are typically two components of rent:
1. Basic Rent (sometimes termed ‘minimum rent’), which is the per-square-foot per annum calculation that is the
negotiated rent paid to the property owner, not including tenant inducements; and
2. Additional Rent, which can comprise any of the following items: taxes, insurance, utilities and operating
expenses.
• Tenant inducements are a form of consideration given by a landlord to a tenant in order to incent them to sign a lease.
Inducements can be used to achieve a higher basic rent (i.e. the rate that goes into the lease) for the purposes of
resale or financing.
o Common types of inducements include any of the following, or combinations therein:
▪ Free rent periods
▪ Leasehold improvements provided by the landlord
▪ Cash allowance paid to the tenant
o Different inducement types result in different accounting and tax treatments.
Commercial Rents and Inducements
2.1 DEFINITIONS

LIVEABLE CITY
PLANNING LTD.
Andrew Yan
Consulting29
Local shopping areas are not all created equal; the ingredients for their success
inevitably vary by size and context.
Historical City of Vancouver Commercial Area Definitions and Hierarchy
Historically, City of Vancouver policy recognized a hierarchy of five levels of
commercial districts, of which the first and third levels are primarily
neighbourhood-serving. Their descriptions, originally from a 1987 Review of
Commercial Zoning Districts, and summarized by Vanessa Kay in a Professional
Project Report at the UBC School of Community and Regional Planning in 2010*,
are listed below:
1. Local Centres – provide convenience goods and services required by nearby
residents on a day-to-day basis. The major components are usually a grocery
store or medium-sized supermarket, a drug store, beauty or barber shop,
drycleaners and a service station. Over 75% of a local centre’s floor area is
devoted to the sale of convenience goods and services (food, drugs, beauty
needs etc.), and the remainder to shopping goods (apparel, appliances etc.)
2. General Business Areas – auto-oriented mix of retail, service, office and
general commercial components along major arterials
3. District Centres – offer a large variety of goods and services, in addition to
those provided in local centres, and function as the retail and service centre of
a whole residential district. The major components are usually a large
supermarket, large variety or discount store, other apparel and appliance
stores, and some professional offices. In addition, district centres are usually
the recreational, cultural and civic centres for the City’s residential districts.
Most district centres tend to contain a post office, library, community centre,
arena or theatre. Approximately 50% of the floor area is devoted to shopping
(comparison) goods and 50% to convenience goods and services.
4. Regional Centres – focal points of specialized shopping, usually
containing a large department store
5. Central Business District – the regional downtown; the principal office,
financial and entertainment centre for the metropolitan area
Embedded within the categories above are distinctions between retail
function, which themselves are indicators of an area’s placement within
the retail hierarchy. For instance, a local centre or district centre is likely to
have a greater weighting toward convenience goods and services, whereas
a regional centre will likely be more heavily weighted to comparison goods.
Other Typology / Hierarchy Definitions
Note that there are other City of Vancouver spatial / typological definitions
that have been used in discussions of the City’s neighbourhood retail
landscape over the years. For example:
• “Neighbourhood Shopping Areas,” or neighbourhood-serving shopping
areas are both frequently-used terms to describe local shopping streets
/ areas in City plans and reports.
• “Neighbourhood Centres” were designated for nineteen
neighbourhoods through the City’s extensive neighbourhood visioning
processes, in years following the adoption of City Plan in 1995.
There are also other classification schemas that are in use (formally and
informally) in various City planning groups.. One of the notable challenges
in reconciling different classification schemas is that different approaches
to definition and classification have been used for different purposes at
different times.
2.2 SHOPPING AREA TYPOLOGIES
*Kay, Vanessa (2010). Neighbourhood Retail Change: The Evolution of Local Shopping Areas in Vancouver, BC. UBC School of Community and Regional Planning.

LIVEABLE CITY
PLANNING LTD.
Andrew Yan
Consulting30
Emerging Trends Shaping Nature of Commercial Districts
While most elements of the commercial area typologies and hierarchy
presented on the previous page remain valid, there have been changes in the
retail landscape in recent years which may alter the characteristics of our
commercial districts. Further, the “Local Centres” level of the hierarchy could be
further broken down into sub-categories to better capture significant
differences in district size, mix and trade area. To set the context for a modified
commercial hierarchy, we present here a snapshot of some trends that are likely
to re-shape commercial districts in the coming decade and beyond. These are
discussed in more detail in Section 3.1.
• Online: Many comparison shopping goods (e.g. electronics, appliances,
books, sporting goods, fashion, homewares etc.), can now be easily browsed
and ordered online through multiple platforms, and delivered to homes,
offices or other locations for pickup. As this trend grows and expands to
more retail categories, more businesses will likely curate smaller storefronts
for display, limited on-site product sales, customer interface and virtual
browsing. These stores will also double as points for distribution / pickup of
orders at the curb. The outcome may not necessarily be a decrease in the
total floor area required (or the desire of a business to have a physical
presence in commercial districts), but rather a change to the way space is
demised between warehousing / logistics and retail / service.
• Artisanal & Online: People are seeking out more authentic, local experiences
and goods. For a local artisanal producer, this may translate into demand for
space with a small retail/service presence, back-of-house areas for
production and storage, while the bulk of sales are made through online
platforms.
• Convenience Shopping Online: Customers are browsing and purchasing
convenience shopping goods (e.g. grocery, pharmacy, day-to-day home
products etc.) online through multiple platforms. People now order
everything from shampoo and paper towels to dry goods and fresh
vegetables online. Some orders are made through online retail giants like
Amazon; others are through online platforms of grocery chains like
Save-On Foods and Loblaws. Others still are ordered through online
platforms of smaller local businesses (independents and chains), who are
able to build robust sales platforms and business practices with the help of
groups like Shopify. As online shopping increases in convenience categories,
traditional grocery stores may increasingly reorganize their space to dedicate
more floor area to sorting and preparing online orders for delivery or pick-
up.
• Restaurants Online: Web platforms are driving the expansion of third-party
home delivery companies. More restaurant floor area will be dedicated to
expediting deliveries. It will also mean more restaurants converting into, or
operating separate delivery-only ‘ghost kitchens’ that will not need
prominent commercial space so long as they are within quick-delivery range
of a major consumer trade area. The growth of start-up brands is likely to
accelerate through expansion of ghost kitchens, as this will provide a lower
cost point of entry to the restaurant business.
• Combination Stores: Demand is likely to increase for combination production
/ consumption (or sales) / meeting spaces that are local and unique. This
could include local cafes / bakeries, micro breweries / distilleries, artisan
manufacturing with other social functions (e.g. an artisan manufacturer that
also offers services to customers and a café) Flexibility and adaptability of
physical space, along with flexible and adaptable policies controlling use and
building upgrades in LSAs, will be critical in effectively responding to
emerging trends and ensuring that commercial districts can adapt effectively.
2.2 SHOPPING AREA TYPOLOGIES

LIVEABLE CITY
PLANNING LTD.
Andrew Yan
Consulting31
• The commercial district hierarchy – per City of Vancouver – discussed previously will
continue to apply, but the nature of the business mix within that hierarchy is likely to
evolve as some of the trends discussed above become more prominent.
• For the purposes of this report, as well as to present a starting point for the City’s
evolving conversation on commercial hierarchy leading up to the City Wide Plan process,
we propose the following hierarchy of commercial precincts organized from the smallest
to largest scale.
Proposed Commercial Hierarchy
1 / Convenience Commercial Nodes or Clusters
2 / Neighbourhood Clusters [ >1 to <3 blocks ]
3 / Community Commercial Precincts
a) Small Neighbourhood / Community Commercial Precincts [ 3 to 5 blocks ]
b) Medium Length Community Commercial Precincts [ 5 to 9 blocks ]
c) Large / Extended Community Commercial Precincts [ 9 or more blocks ]
4 / Regional Centres / Central Business Districts
Note that this hierarchy is broken out primarily by size of cluster (i.e. number of stores). As a
result some of these categories will fit into more than one of the categories in the historical
hierarchy.
2.2 SHOPPING AREA TYPOLOGIES
Proposed Commercial Hierarchy
Case Study Areas

LIVEABLE CITY
PLANNING LTD.
Andrew Yan
Consulting32
Proposed Commercial Hierarchy
1. Convenience Commercial Nodes or Clusters
[ as small as 1 storefront, up to 1 block ]
• Includes small street-oriented ‘local centres’ (providing convenience commercial
and social function for immediate neighbourhood). May also include small ‘general
business areas’ along major arterials, serving both local neighbourhood needs and
the travelling public.
• At times comprised of a single store, but may extend up to 1 block (with some
partial spill over to an adjacent block) with retail, service, office and general
commercial.
• Main mode of access is dependent on physical location and design (e.g. within a
neighbourhood vs. at intersection of major arterials).
• Often situated around either a food production / consumption use (e.g. bakery /
café), or a convenience store. Note that many small neighbourhood nodes serve
multiple functions.
• Convenience Commercial Nodes or Clusters are inclusive of active isolated C-zone
retail sites, active non-conforming retail sites, and active neighbourhood grocery
store sites.*
Le Marche St. George at E. 28th Ave. & St. George Street
The Brick Yard at W. 16th Ave & Macdonald Street
2.2 SHOPPING AREA TYPOLOGIES
*For a detailed inventory of neighbourhood retail sites (active and deactivated / demolished) throughout the City, see Hunter, Jacqueline (2019) “Small-scale neighbourhood retail in
Vancouver: An inventory of stores and an assessment of opportunities.” Prepared as part of the Greenest City or Healthy City Scholars Program, a partnership between the City of
Vancouver and the University of British Columbia.

LIVEABLE CITY
PLANNING LTD.
Andrew Yan
Consulting33
Proposed Commercial Hierarchy
2. Neighbourhood Clusters [ >1 to <3 blocks ]
• Includes slightly larger ‘local centres’, and may include slightly larger
‘general business areas’.
• Small, usually unanchored agglomerations of convenience retail,
service commercial, and restaurants, serving the immediate
neighbourhood.
• May contain a unique destination draw (e.g. a popular bakery or
restaurant).
• Typically these extend 1-2 blocks from an intersection, but may be up
to 3 blocks in length.
• Land uses are often less mixed in these clusters (historically), but that is
likely to evolve.
• Some examples include: W. 33rd & Mackenzie; W. 24th & Macdonald.
W. 33rd Avenue & Mackenzie Street
Macdonald Street, W. 24th Ave to W. King Edward Ave.
2.2 SHOPPING AREA TYPOLOGIES

LIVEABLE CITY
PLANNING LTD.
Andrew Yan
Consulting34
Proposed Commercial Hierarchy
3. Community Commercial Precincts
• This category generally encompasses both the ‘District Centres’ and ‘Local Centres’ from the historical
commercial district hierarchy.
• These areas are typically anchored by one or more grocery stores, depending on the size of the commercial
precinct.
• The grocery stores are typically complemented by specialty food retailers, one or more drug stores /
pharmacies, a variety of personal and professional services (including banks), restaurants, and some
comparison goods and services.
• Some community shopping streets have larger proportions of comparison goods and services. This is a function
an area’s historical evolution and placement within the city more than a function of its size.
• Following are sub-sets of Community Commercial Precincts:
A. Small Neighbourhood / Community Commercial Precincts [ 3 to 5 blocks ]
o Typically contains a defined ‘core’ area and grocery store anchor, and ancillary convenience retail / service.
o Likely to have at least 75%, and possibly over 85%, of floor area in convenience goods and service, although
this could vary.
o Examples: West Point Grey BIA; Dunbar Village BIA (core area between W. 26th and W. 30th Ave); 1st &
Renfrew.
B. Medium Length Community Commercial Precinct [5 to 9 blocks]
o At least 5 blocks, and up to 9 blocks in length.
o May contain one or more ‘core’ areas serving different (but overlapping) trade areas.
o Typically at least 200,000 square feet of combined retail and service commercial floor area.
o Likely to contain a higher proportion of convenience goods and services vs. comparison goods and services
than the large / extended shopping streets.
o Also likely to include one or more non-retail anchors, such as a library and/or a community centre.
2.2 SHOPPING AREA TYPOLOGIES
Marpole BIA
Storefront Count (including vacant)
141
Combined Floor Area (sq.ft.)
246,827
Convenience Goods / Services + Food & Beverage as % of Occupied Floor Area
92%
Comparison Goods as % of OccupiedFloor Area
8%
Example of Medium Length Community Commercial Precinct: Marple BIA

LIVEABLE CITY
PLANNING LTD.
Andrew Yan
Consulting35
Proposed Commercial Hierarchy
3. Community Commercial Precincts
C. Large / Extended Community Commercial Precincts [ 9 or more blocks ]
o May contain multiple anchored ‘core’ areas serving different (but overlapping) neighbourhood trade areas.
o Typically comprised of at least 400,000 square feet of combined retail and service commercial floor area, and up to 450 storefronts.
o Convenience goods and services comprise at least 60% of total floor area.
5 of the 6 Study areas examined in this report fall into this portion of the hierarchy. The table below provides examples using four of the Study
areas. Note the business mix in South Granville reflects its historical role as a destination shopping precinct, while also serving neighbourhood
convenience needs.
West Broadway Commercial Drive Hastings North South Granville
Storefront Count (including vacant) 255 352 257 199
Combined Floor Area (sq.ft.) 488,528 802,341 484,414 540,392
Convenience Goods + Services + Automotive + Food & Beverage as % of Occupied Floor Area
73% 83% 83% 44%
Comparison Goods + Entertainment as % of Occupied Floor Area
28% 17% 17% 56%
2.2 SHOPPING AREA TYPOLOGIES
Examples of Large/Extended Community Commercial Precinct:

LIVEABLE CITY
PLANNING LTD.
Andrew Yan
Consulting36
Proposed Commercial Hierarchy
4. Regional Centres / Central Business Districts
• This is an amalgamation of the top two tiers in the historical hierarchy (Regional Centres + Central
Business District).
• As per the historical hierarchy, this area (or areas) would comprise the focal points for specialized
shopping, along with major office, financial and entertainment.
• These areas are comprised of a network of multiple commercial streets / districts intersecting one
another, and would also include a region-serving mall like Oakridge Centre.
• Unlike the other areas in the hierarchy, there is more likely to be a significant amount of retail /
service commercial activity above and below the ground floor.
• These areas are often defined by high density residential and a mixture of land uses, or are
undergoing transformations to mixed use (e.g. Oakridge Centre).
• These areas will often include one or more regional transportation hubs.
This hierarchy should be taken as a starting point for further discussions around how the City may best
conceptualize different types of retail districts and precincts going forward. The discussion around the
hierarchical framework, and how it aligns with land use planning policy (including zoning), should be the
subject of further deliberation as the City moves forward into future phases of work on supports for
neighbourhood shopping areas.
2.2 SHOPPING AREA TYPOLOGIES

LIVEABLE CITY
PLANNING LTD.
Andrew Yan
Consulting37
Population Density Thresholds
Another way to conceptualize shopping area typologies may be to think about them in terms of surrounding area population
densities that comprise their trade areas. Based on a high-level review of population densities within 1 kilometre radii around
each of the City’s 22 BIAs using data from the 2016 Census, we found:
• Areas with more than 100 residents per hectare in the 1 Km radius around the BIA are also those that fall within the
“Regional Centre / Central Business District” typology (with the exception of Oakridge Centre). With the combination
of high population density, multi-modal access, and large daytime working populations, certain types of activities
and destination / specialty retailers can thrive.
o BIA catchment areas that meet or exceed the 100 residents/Ha thresholds include: West End, Robson Street,
Downtown and Yaletown.
o Assessing the health and vitality of these areas would likely require additional quantitative and qualitative
considerations that are beyond the scope of this study. In other words, the health and vitality “report card” that is
presented in later sections of this document would not necessarily apply to these areas.
• Areas with less than 100 residents per hectare in the 1 Km radius around the BIA fall into the various Community
Commercial Precinct typologies, which are themselves the ‘top’ of a hierarchy that includes neighbourhood clusters
and convenience clusters.
o In these types of precincts, retail activity is mostly on the ground level, and is often more oriented towards
convenience goods and services (although, as noted in the case of South Granville, there are exceptions to this
depending on the historical role played by a neighbourhood commercial street).
• A population density of less than 40 residents per hectare in the surrounding trade area may be a threshold indicator
below which a local shopping area begins to struggle, particularly if inflow spending from areas beyond the
immediate trade area is insufficient. Point Grey Village on West 10th Avenue is a case-in-point. With just over 30
residents per hectare, the Village has historically depended on significant inflow spending from UBC’s Point Grey
campus and the University Endowment Lands (UEL). The growth of local retail and service at UBC in recent years –
including a grocery store anchor at Wesbrook Village – has reduced inflow spending for Point Grey Village
businesses. Given these conditions, and an insufficient local trade area population density, the Village has
experienced increasing retail vacancies, exacerbated by the loss of the major anchor grocery store (related to a lease
expiry).
> 100/ Ha
< 100 / Ha
< 40/ Ha
2.2 SHOPPING AREA TYPOLOGIES

3.0 CONTEXT AND TRENDS REVIEW

LIVEABLE CITY
PLANNING LTD.
Andrew Yan
Consulting39
3.1 RETAIL SALES TRENDS
This section provides an overview of the macro-context within
which Vancouver's local shopping areas are operating, and
challenges they are facing.
Retail Sales Growth – BC and Vancouver
Retail sales in British Columbia have grown at an average annual rate of
4.1% since 2008, while sales in the Vancouver Census Metropolitan
Area (CMA) have increased at an average annual rate of 4.5%. In 2018,
retail sales in B.C. totaled just under $86 billion, of which approximately
47% ($40.3 billion) occurred in the Vancouver CMA.
Retail sales growth slowed considerably in 2018, with virtually zero
growth in the Vancouver CMA year-over-year despite 1.5% growth in
the region’s population. Sales at the provincial level through the first
seven months of 2019 were up over the same period the previous year
(+0.5%) but were down in Vancouver (-1.1%). This is a strong indicator
that Vancouver will see a decrease in annual retail spending for the first
time since the 2008-09 financial crisis. This is likely a function in part of
a reverse ‘wealth effect’ taking hold in the Lower Mainland, with
stagnating home price growth translating to decreased consumer
confidence, increased consumer debt, and reduced willingness or
ability to spend on retail goods. Notably, this decline in Vancouver area
retail sales compares with strong gains in Canada’s other large cities.
Toronto’s retail sales from January through July 2019 were up 4.5%
from the same months in 2018, while Montreal saw a 5.9% gain.
The main drags on BC retail sales were motor vehicles and parts, and
building materials, garden equipment and supplies.
-8%
-6%
-4%
-2%
0%
2%
4%
6%
8%
10%
12%
14%
0
10,000,000
20,000,000
30,000,000
40,000,000
50,000,000
60,000,000
70,000,000
80,000,000
90,000,000
100,000,000
2008 2009 2010 2011 2012 2013 2014 2015 2016 2017 2018
Cu
rren
t D
olla
rs
VancouverBCVancouver Growth Rate
British Columbia and Vancouver Retail Sales, 2008 to 2018
Source (data in narrative, and figure above): Statistics Canada Table 20-10-0008-01
Purpose of this Section

LIVEABLE CITY
PLANNING LTD.
Andrew Yan
Consulting40
Growth by Category, Vancouver CMA
The figure at right shows retail sales growth and change by
category in the Vancouver CMA in 2016/17 and 2017/18.
Some sectors which performed strongly in 2016/17 slowed or
reversed course the following year, most notably:
• Building materials / garden supplies (still positive
growth, but significantly moderated).
• Jewelry, luggage and leather goods (from strong
growth to year-over-year drop).
• Vehicle sales and parts (from 9% growth to 7%
decline).
Other sectors showed turnarounds from the previous year,
notably:
• Specialty foods (+12%, vs. -13% previous year).
• Clothing (+16%, vs. 2.6% previous year).
• Electronics and Appliances (+2.7%, vs. -0.9% previous
year).
Vancouver CMA Sales Change by Category, 2016/17 and 2017/18
Source: Statistics Canada Table 20-10-0008-01
8.7%
-6.3%
-0.9%
29.7%
6.8%
-13.4%
21.6%
10.3%
15.5%
2.6%
4.2%
18.2%
-2.5%
3.4%
3.6%
-7.2%
-1.4%
2.7%
2.8%
0.8%
12.0%
-2.0%
-2.9%
8.4%
16.3%
1.9%
-2.9%
-1.3%
2.6%
0.5%
Vehicles & Parts
Furniture / Furnishings
Electronics / Appliances
Building Materials / Garden
Grocery Stores
Specialty Food Stores
Beer, Wine, Liquor Stores
Health and Personal Care Stores
Gas Stations
Clothing
Shoes
Jewellery, Luggage, Leather
Sporting Goods, Hobbies, Books, Music
General Merchandise
Miscellaneous
2017/18 2016/17
3.1 RETAIL SALES TRENDS

LIVEABLE CITY
PLANNING LTD.
Andrew Yan
Consulting41
Growth by Category, Vancouver CMA vs. BC
The figure at right compares sales growth in the 2017/18 period
between the Vancouver CMA and the province overall.
Sector-specific growth in the province has generally been
greater than in Vancouver, with the exception of clothing and
specialty food retailers.
Vancouver CMA and British Columbia Sales Change by Category, 2017/18
Source: Statistics Canada Table 20-10-0008-01
8.7%
-6.3%
-0.9%
29.7%
6.8%
-13.4%
21.6%
10.3%
15.5%
2.6%
4.2%
18.2%
-2.5%
3.4%
3.6%
-7.2%
-1.4%
2.7%
2.8%
0.8%
12.0%
-2.0%
-2.9%
8.4%
16.3%
1.9%
-2.9%
-1.3%
2.6%
0.5%
Vehicles & Parts
Furniture / Furnishings
Electronics / Appliances
Building Materials / Garden
Grocery Stores
Specialty Food Stores
Beer, Wine, Liquor Stores
Health and Personal Care Stores
Gas Stations
Clothing
Shoes
Jewellery, Luggage, Leather
Sporting Goods, Hobbies, Books, Music
General Merchandise
Miscellaneous
2017/18 2016/17
-1.9%
0.2%
-0.6%
4.9%
-0.3%
6.0%
5.5%
-2.0%
9.0%
13.7%
2.9%
-2.3%
0.0%
2.9%
2.2%
-7.2%
-1.4%
2.7%
2.8%
0.8%
12.0%
-2.0%
-2.9%
8.4%
16.3%
1.9%
-2.9%
-1.3%
2.6%
0.5%
Vehicles & Parts
Furniture / Furnishings
Electronics / Appliances
Building Materials / Garden
Grocery Stores
Specialty Food Stores
Beer, Wine, Liquor Stores
Health and Personal Care Stores
Gas Stations
Clothing
Shoes
Jewellery, Luggage, Leather
Sporting Goods, Hobbies, Books, Music
General Merchandise
Miscellaneous
Vancouver 2017/18 BC 2017/18
3.1 RETAIL SALES TRENDS

LIVEABLE CITY
PLANNING LTD.
Andrew Yan
Consulting42
Sales by Store Type
Independent businesses in British Columbia last captured a majority of
total market sales in 2003.*
In the period between 2012 and 2017, annual sales growth amongst
independent retailers averaged 7.5%, compared with 4.0% for chain
retailers. The result has been an increasing proportion of retail sales
attributable to independents year-over-year, growing from 44% in 2012
to 48% in 2017. A goal of this Study is to determine the health and
viability of independent businesses in Vancouver specifically.
Total Retail Sales by Year, British Columbia
*CUPE and Civic Economics, 2013: “Independent BC: Small Business and the British Columbia Economy”
$-
$5,000,000
$10,000,000
$15,000,000
$20,000,000
$25,000,000
$30,000,000
$35,000,000
$40,000,000
$45,000,000
2012 2013 2014 2015 2016 2017
Sale
s (x
$1,0
00)
Chains Independents
Source: Statistics Canada, Table 20-10-0066-01
Market Share Captured by Independents
Looking at sales by sector, independents are most prominent in the categories
of health and personal care, furniture and home furnishings, and miscellaneous
goods retail. In each of these sectors, independents accounted for more than
50% of sales in BC.
Other prominent categories for independents in BC, from a proportion-of-
total-sales standpoint, are building materials and garden stores (48%), sporting
goods, hobbies, books and music (46%), and food and beverage stores (33%).
53.6%
23.5%
48.0%
32.7%
61.8%
33.0%24.0%
46.3%
18.1%
58.2%
44.5%
29.8%
47.6%43.5%
74.3%
34.9%
23.0%
42.0%
21.6%
60.3%
0.0%
10.0%
20.0%
30.0%
40.0%
50.0%
60.0%
70.0%
80.0%
British Columbia Canada
Proportion of Retail Market Captured by Independents, BC and Canada, 2017
3.1 RETAIL SALES TRENDS
Source: Statistics Canada, Table 20-10-0066-01

LIVEABLE CITY
PLANNING LTD.
Andrew Yan
Consulting43
Gross and Operating Profit Margins by Store Type
The charts opposite show both the gross margin and the operating
profit margin reported by chain and non-chain retail businesses
operating in British Columbia between 2012 and 2017.
• Definitions:
o Gross Margin is calculated by subtracting the cost of goods
sold from the total operating revenues. The ratio is expressed
as a percentage of the total operating revenues.
o Operating Profit is calculated by subtracting total operating
expenses* and the cost of goods sold from total operating
revenues. The ratio is expressed as a percentage of the total
operating revenues.
• Gross margins for all retailers as a share of operating revenue
narrowed over the 2012 to 2017 period; this narrowing was
greater amongst independent businesses.
• Operating profits as a share of operating revenues decreased
for chain retailers but increased for independent retailers over
this period in British Columbia. Operating profits are still
considerably lower amongst independent retailers.
Chain vs. Independent Margins, 2012 to 2017
Source: Statistics Canada, Table 20-10-0066-01
*Note that operating expenses include property taxes, insurance and utilities. They do not include loan payments, depreciation and income taxes
31.7 31.2 30.5 31.3 31.6 31.5
27.3 25.9 25.9 26.3 26.1 25.1
0.0
5.0
10.0
15.0
20.0
25.0
30.0
35.0
2012 2013 2014 2015 2016 2017
%
Chain vs. Independent Retailer Gross Margins, British Columbia
Chain Independent
8.57.9 7.6 7.9 7.7
6.9
1.82.7
3.4 3.5 3.53.9
0.0
1.0
2.0
3.0
4.0
5.0
6.0
7.0
8.0
9.0
2012 2013 2014 2015 2016 2017
%
Chain vs. Independent Retailer Operating Profit Margins, British Columbia
Chain Independent
3.1 RETAIL SALES TRENDS

LIVEABLE CITY
PLANNING LTD.
Andrew Yan
Consulting44
E-Commerce Expanding Across Sectors
E-commerce is quickly growing as a proportion of total sales in
Canada. According to Statistics Canada it accounted for 1.6% of total
sales in 2012, 2% in 2015, 2.7% in 2017, 3.0% in 2018 and nearly 4%
in 2019. November 2019 e-sales were 7% higher than in 2018. Note
that this data excludes online purchases made by Canadian
consumers from foreign-based retailers.
The volume of e-commerce transactions from January through
November 2019 was up 21% over the same period in 2018. E-
commerce sales totaled $18.05 billion in 2018, up from $16.8 billion
in 2017, $11.6 billion in 2015 and $8.3 billion in 2012. They are
likely to exceed $21.6 billion in 2019.
The prominence of e-commerce varies considerably by sector. Note
that sectoral breakdown was only available to the end of 2017 at
time of writing.
• Electronics and appliances, and clothing and accessories, arethe sectors with the greatest proportion of sales occurringonline (4.8% and 4.4% respectively in 2017).
• These are followed by miscellaneous store retailers (3.3%),
furniture and home furnishings (1.8%) and building materials /
garden equipment supplies stores (1.2%).
The pace of e-commerce growth is likely to accelerate rapidly in
Canada in the next decade, if the experience of the US and UK is any
guide (per eMarketer.com, November 2018):
• UK: 18% of retail sales occurred online in 2018
• US: 10% of retail sales occurred online in 2018
Monthly Retail E-Commerce Sales in Canada, Monthly, January 2017 to November 2019
Source: Statistics Canada Table 20-10-0072-01
E-Commerce as a percentage of total sales - Canada
Category 2012 2013 2014 2015 2016 2017
Furniture and home furnishings
stores [442]0.6 1.2 1.3 1.7 1.7 1.8
Electronics and appliance stores
[443]3.4 3.5 3.6 4.1 4.7 4.8
Building material and garden
equipment and supplies dealers
[444]
0.3 0.7 0.7 0.8 1 1.2
Food and beverage stores [445]0.1 0.1 x 0.2 x 0.4
Health and personal care stores
[446]0.2 0.4 x x x 0.8
Clothing and clothing
accessories stores [448]1.2 2.1 2.3 3 3.8 4.4
Sporting goods, hobby, book
and music stores [451]1.8 3.5 3.8 4.3 4.7 x
General merchandise stores
[452]x x 0.3 x 0.2 0.3
Miscellaneous store retailers
[453]2.3 2.4 2.2 x 2.8 3.3
Source: Statistics Canada, Table 20-10-0065-01
-
500,000
1,000,000
1,500,000
2,000,000
2,500,000
3,000,000
Jan
-17
Mar
-17
May
-17
Jul-
17
Sep
-17
No
v-17
Jan
-18
Mar
-18
May
-18
Jul-
18
Sep
-18
No
v-18
Jan
-19
Mar
-19
May
-19
Jul-
19
Sep
-19
No
v-19
Ret
ail E
-Co
mm
erc
e Sa
les,
$
un
adju
sted
(x1
,00
0)
3.1 RETAIL SALES TRENDS
Source: Statistics Canada, Table 20-10-0072-01

LIVEABLE CITY
PLANNING LTD.
Andrew Yan
Consulting45
E-Commerce Sales for Independents
• Independent businesses in Canada recorded $2.3 billion in e-commerce
sales in 2017, compared with $3.5 billion in e-commerce sales amongst
chains.
• E-commerce accounted for 0.7% and 1.3% of total sales achieved by
independents and chains in Canada that year, respectively.
• E-commerce sales by independents have been growing at an average
annual rate of 10.5% since 2013, and the pace of growth has increased in
recent years (15.5% between 2016 and 2017).
Independent Business Sales Methods, 2017
Source: Statistics Canada Table 20-10-0064-01
Method 2013 2014 2015 2016 2017
In-Store 268,276,275$ 282,226,271$ 291,782,182$ 303,771,644$ 326,905,054$
E-Commerce 1,565,278$ 1,646,880$ 1,802,378$ 2,016,961$ 2,329,379$
Catalogue / mail order / phone 3,821,319$ 3,750,451$ 3,798,277$ 4,202,010$ 4,225,850$
All other 2,439,660$ 2,628,862$ 2,797,383$ 2,846,523$ 2,030,900$
TOTAL 276,102,532$ 290,252,464$ 300,180,220$ 312,837,138$ 335,491,183$
E-Commerce as % of Total 0.6% 0.6% 0.6% 0.6% 0.7%
Annual growth of E-Commerce 5.2% 9.4% 11.9% 15.5%
Independent Business Sales Methods (x,1000)
Implications of E-Commerce for Vancouver Small Business:
• Through roundtables and discussions with brokers, it is reported
that many traditional retailers are seeing increased competition
from online portals. The range of competition is expanding across
nearly all product categories.
• The range of product that customers are buying online is
increasing.
• Savvy small businesses, including restaurants and food stores, are
using online platforms to increase their profile and sales.
3.1 RETAIL SALES TRENDS
LIVEABLE CITY
PLANNING LTD.
Andrew Yan
Consulting46
Omni-Channel Sales Strategies
Omni-channel refers to the multi-channel approach to marketing, selling and serving
customers in a way that creates an integrated, cohesive customer experience
regardless of how or where a customer reaches out. A customer can shop online, by
phone, or in a physical store (or through a combination), and the experience should
be seamless.
Omni-channel is differentiated from multi-channel by the depth of integration.
Simply, all omni-channel experiences use multiple channels, but not all multi-
channel experiences are omni-channel. A business may have excellent mobile
marketing, engaging social media, and a compelling website. But if they do not work
together well, they have not achieved an omni-channel experience.
At its core, omni-channel retailing is about creating complementary experiences for
consumers. For most small, independent businesses, the bricks-and-mortar retail
experience remains paramount. However, building a robust online channel to
complement in store sales can help convert and retain customers.
Micro-Warehousing / Click and Collect
As more shopping occurs online, more retailers are trying to create
smaller urban distribution points to fulfill online orders. Retailers can
reduce the costs and problems in their distribution chain by adding
small warehouses into urban areas. These micro-warehouses do not
have to be stand-alone entities, nor do they have to be warehouses
in the traditional sense. A micro-fulfilment centre could be co-
housed in a small format urban store on a main street.
Autonomous Delivery
While still in the experimental phase, autonomous delivery could
become a major piece in the broader retail puzzle, working alongside
micro-warehousing and e-commerce to further disrupt the retail
landscape. Going forward, we are likely to see small format stores in
urban locations use their locational advantage to aid with online
order fulfillment and delivery. Many will partner with micro-
fulfilment start-ups and autonomous mobility companies to reduce
costs and increase speed of the ‘last mile’ delivery to consumers.
Currently, last-mile logistics have an outsized impact on thin margin
businesses. Autonomous vehicles could change the math.
Restaurant Market Share Captured by Independents
• A study prepared by Civic Economics in 2013 indicated that independents make
up a minority of limited-service restaurants in BC (and Canada), but make up a
substantial majority of full-service restaurants.*
o Independents accounted for 17.8% of limited-service restaurants in BC, 18.5% in
Canada.
o Independents accounted for 72.5% of full-service restaurants in BC and 65.5% in
Canada.
3.2 RETAIL CONCEPT TRENDS
*Civic Economics, 2013: Independent BC: Small Business and the British Columbia Economy.

LIVEABLE CITY
PLANNING LTD.
Andrew Yan
Consulting47
3.2 RETAIL CONCEPT TRENDS
Checkout-Free Retail
Amazon Go – Amazon’s convenience retail experiment with stores in Seattle,
San Francisco and Chicago – may have been the first to bring the concept of
checkout-free retail to reality (in January 2018), but others are quickly
following. Check-out free retail relies on sophisticated image recognition
software and artificial intelligence to eliminate the need for a traditional
check-out line. In an Amazon Go store (a convenience concept of up to 2,300
square feet with groceries and prepared foods), cameras track customer
movement throughout the store and keep tabs on the goods being collected.
Software reads the codes on each product as the customer shops, with the
ability to differentiate between nearly identical products. Weight sensors on
each shelf know when an item has been removed, or returned. Nothing is
charged until the shopping trip is over and the customer has departed
through the automated gates.
Some speculate that checkout-free technology will become the norm in 10 to
15 years, significantly disrupting bricks-and-mortar retail across sectors.
• A poll taken in the United States found that 43% of respondents would
rather scan-and-go than wait in a checkout line (GPShopper, May 2018).
• Checkout-free technology may accelerate the demise of large-
format stores, whose business models are already struggling
against e-commerce, replaced by small stores supported by
just-in-time distribution and logistics networks.
• As technology improves and costs are reduced, small chains
and independent retailers could use this technology, just as
independents previously began to use Amazon Marketplace for
direct-to-consumer selling and distribution.
• Amazon Go-type technology could accelerate the retail
landscape’s shift away from large-format stores back to small-
box and local merchants.
Amazon intends to open 3,000 Amazon Go stores across North
America and the UK by 2021, and is looking to expand the concept to
airports, university campuses, transit stations and office lobbies.
Others are experimenting with similar technology, including Tesco in
the UK and Walmart in partnership with Microsoft in the US.

LIVEABLE CITY
PLANNING LTD.
Andrew Yan
Consulting48
Large Format Retail Decline
The combination of e-commerce, micro-warehousing, checkout-free retail
and reduced-cost / highly flexible delivery will all work together to
accelerate the demise of the large format retail store. As these larger
format stores ‘right size’ into smaller footprints that are more conducive to
street retail environments, small business may face growing barriers to
entry (in hot areas) as costs of entry are further bid up.
Pop-Up Retail
Pop-up retail is not in itself an emerging trend. Pop-ups have had regular
presence in many settings for the last 20 years, including at festivals, sales
events, and through creative work of business associations and
neighbourhood groups temporarily activating vacant stores. The emerging
trend in pop-up retail is its use as a way for established (or establishing)
retailers to experiment with new products or approaches.
One example of this is the pop-up retail stores by previously online-only
retailers. Pop-ups are being used to test concepts and gauge levels of
consumer interest in bricks-and-mortar presence of previously virtual
retailers. This can lead to some electing for permanent street locations,
such as Indochino on Homer Street, or Clearly on Robson Street.
Pop-up retail is also being used by developers as part of the process
of creating a compelling tenant mix in some of their new, mixed-use
projects. A recent example of this is the Atrium project at 595 Bay
Street in Toronto. The developer’s pop-up initiative is making several
spaces in the retail podium available for temporary activation, with
the goal of attracting a more diverse clientele and providing a boost
for adjacent retail tenants. For the pop-up brands, this helps create
publicity and test their concepts. Atrium partnered with a firm
specializing in temporary retail activation, which works with
landlords and brands across North America to bring pop-ups into
new projects and established street districts.
Pop-up retail is likely to become more prominent in the business mix
of Vancouver’s local shopping areas, particularly at sites which are
awaiting redevelopment.
3.2 RETAIL CONCEPT TRENDS

LIVEABLE CITY
PLANNING LTD.
Andrew Yan
Consulting49
Ghost Kitchens
The recent closure of Dixie’s Barbecue – Vancouver’s only Central Texas-style
barbecue restaurant – at 337 East Hastings, may at first blush be worthy of a
notation in the City’s records of annual restaurant churn. However, unlike
other restaurant closures, Dixie’s has not truly closed. Instead, it has closed
its dine-in function and reinvented itself to take advantage of a growing
trend in the restaurant industry: ghost kitchens. Its focus is now on food
delivery (via third-party delivery services), a business segment which already
accounts for over 50% of that restaurant’s sales (and growing). Its kitchen
will also serve its growing catering function, and as a commissary space to
allow for expansion of another successful nearby eatery under the same
ownership (Gringo). It will also be available for rent to culinary start-ups or
restaurants in need of extra production space.
Dixie’s is a current, local example of a growing trend in the restaurant
industry, one which could change the nature of many shopping areas in the
next 10+ years. The ghost kitchen, or virtual kitchen phenomenon has been
made possible by the rise of delivery apps, and they are bolstered by growing
consumer demand for convenience when it comes to food. One of the most
prominent examples of this phenomenon is in Toronto, where the Globe and
Mail recently highlighted an example of a local restauranteur with 15
restaurants, almost none of which have a dining room or take-out counter.*
All these restaurants operate by way of delivery services exclusively.
This phenomenon allows restaurateurs to save on staff costs and the
rent required to have full dining rooms and allows for
experimentation with new concepts. As this trend grows, it will likely
mean that restaurants will make up a shrinking proportion of
business counts and floor space in local shopping areas.
Combination Stores / Uses
Small-scale manufacturing, with ancillary retail and/or service space,
is a phenomenon that is on the rise, and is generating demand for
more flexible zoning regulations to accommodate it. In some cities,
this is taking the form of ‘craft districts’ where products are made
and exported, but also sold on site. This can include high-end
apparel, homewares, musical instruments, recreational goods, and
food & beverage (e.g. microbreweries and micro distilleries). This
type of small-scale manufacturing / retail is growing in demand,
building upon changing consumer sentiment against homogeneous
production and products and a desire for locally, ethically and
sustainably-sourced products.
With demand on the rise, zoning bylaws are under pressure to
accommodate artisanal producers that blur the lines between light
industry, retail and service commercial. Many artisanal businesses
would benefit from ‘performance-based’ zoning that judges
appropriateness based on impact rather than use.
3.2 RETAIL CONCEPT TRENDS
*Deschamps, Tara. “Ghost Kitchens begin to pop up in Canada as food delivery grows in popularity.” The Globe and Mail July 19, 2018.
LIVEABLE CITY
PLANNING LTD.
Andrew Yan
Consulting50
3.3 CITY OF VANCOUVER BUSINESS SUPPORTS
The City of Vancouver already has a number of initiatives in place to support business activity in the City’s local shopping areas and beyond, and isworking with the Province on additional initiatives. This section provides an overview of some of these efforts.
Commercial Tax Ratio Shifting
High and increasing property taxes can cause financial burdens for
business owners and operators across the City.
The City has made efforts to use levers available to it to reduce the
business property tax burden:
• According to a recent staff report, the City’s commercial-to-
residential tax ratio is significantly improved in the last 18 years
(3.82:1 in 2018, down from 4.93:1 in 2001). The ratio has been
further reduced in 2019 to 3.17:1.
• In 2019 the City reduced the business tax rate to $4.08 per $1,000 of
property value (from $4.61 per $1,000 in 2018).
• In April of 2019, council approved a 2% “tax shift” from non-
residential to residential property classes, phased in over 3 years.
The effect of this will be to increase the residential tax share to
55.9% and reduce the non-residential share to 44.1%.
Targeted Land Averaging
There are many instances across the City where commercial
properties experienced large year-over-year property tax increases.
A City staff report indicated that approximately 3,000 commercial
properties in Vancouver (or 21% of total properties) are deemed
“under-developed”, whereby their highest and best use is greater
than their existing use.* Their assessed values reflect that highest
and best use, and taxes are levied on that higher value (at the
commercial rate).
• Three-year targeted tax averaging was introduced by the City in
2015 and transitioned to 5 years in 2019. This program is aimed
at providing short-term, multi-year relief to businesses to mitigate
instances of significant tax increases.
• Targeted averaging allows tax payments to be spread out and
gives owners relief by phasing in tax increases due to changes in
land values set by BC Assessment.
• Only ‘hot’ properties are eligible for averaging. A ‘hot’ property is
defined as: “a property that experienced unanticipated, year-over-
year increases in total net assessed value, before averaging, which
exceeds the average assessment increase for the same property
class by more than 10%.”
*City of Vancouver (April 8, 2019) Property Taxation: Distribution of Property Tax Levy. Administrative Report prepared for Standing Committee on City Finance and Services.

LIVEABLE CITY
PLANNING LTD.
Andrew Yan
Consulting51
Support for Split Assessment through Commercial Sub-Class
In February of 2018, Vancouver City Council submitted a formal
request to the Province of B.C. to initiate a province-led
intergovernmental working group to assess the options previously
put forward by the City to address the impact of property
assessments on independent small business tenants. This request
was supported by a formal motion of the Union of BC Municipalities
(UBCM) in September 2018. An intergovernmental working group
was formed near the end of 2018, and has made the following
recommendations for 2020:
• Split “development potential” from “existing use” in the
property assessments.
• Capture “development potential” taxation in a new commercial
sub-class (vs. current method of capturing all under Class 6 –
Business).
The City of Vancouver is now studying how best to enact a split
assessment system if the Province adopts the working group’s
recommendations. This includes:
• Establishing well-defined eligibility requirements,
• Defining the duration of tax relief for the development
potential portion of property value.
• Setting an appropriate tax rate for the development potential
(ranging from x% below Class 6 to $0).
The City believes that splitting development potential from existing
use is the most appropriate means to provide tax relief to small
businesses for the following reasons:
• Provides the most targeted and time-limited approach to
address taxation impacts arising from development potential.
• Shifts the tax to other commercial properties.
• Upholds the Highest-and-Best-Use (HBU) methodology as
stipulated in the Assessment Act while enabling municipalities
to tax “existing use” vs. “development potential” differently.
• Offers a common platform for municipalities while allowing for
flexibility, scalability and customization.
• It is scalable and less administratively burdensome than a
revitalization tax exemption tool.
In October 2019, a private members’ bill was introduced in the BC
Legislature seeking to create a new property tax class to allow for
differential taxation between actual use versus potential future use.
3.3 CITY OF VANCOUVER BUSINESS SUPPORTS

LIVEABLE CITY
PLANNING LTD.
Andrew Yan
Consulting52
BIAs
• The City plays an ongoing role in facilitating annual funding of 22
Business Improvement Associations (BIAs) and remitting money
annually to fund their work supporting local shopping areas through
marketing, safety, research and beautification. The City’s BIAs
represent over 20,000 businesses on nearly 7,200 properties, and
over $39 billion in taxable property value.
• In the 2018-19 fiscal year, the City levied and remitted $12.5 million
to the City’s BIAs, representing a year-over-year increase of 7%.
• The Vancouver BIA Partnership, an umbrella organization of the City’s
BIAs, offers a conduit for local businesses to voice their concerns to
City officials.
Zoning and Development Standards
• The City has a long history of enacting development standards
designed, in part, to promote pedestrian-oriented streets and foot
traffic for business.
• There are approximately 120 street retail clusters in Vancouver;
most fall under C-2 and C-3A district zoning schedules and must
follow development guidelines which encourage particular
‘pedestrian friendly’ streetscape elements.
• Some C-2 districts guidelines (e.g. Commercial Broadway)
recommend that storefronts have a maximum frontage of 25 feet.
Other C-2 schedules require a maximum frontage of 50 feet (with
negotiability).
Small Business Commercial Renovation Centre
• The City established a Small Business Commercial Renovation
Centre, which offers support to small businesses who are
moving or starting new locations. The program offers hands-on
support to reduce difficulties in what can be an onerous and
expensive permitting process, especially for novice applicants.
3.3 CITY OF VANCOUVER BUSINESS SUPPORTS

4.0 METHODOLOGY AND DATA SOURCES

LIVEABLE CITY
PLANNING LTD.
Andrew Yan
Consulting54
This study uses a combination of data sets to analyse change over time in six local shopping areas. These data sets include:
• City of Vancouver BIA Administrative Data on commercial property taxes, total property values, and ownership records.
• City of Vancouver Open Data.
• Commercial Marketing Inc. (CMI) historical street inventory data for each area, at varying points in time back to 2002.
• Updated CMI street inventory data for the six case Study areas, prepared in collaboration with BIA Executive Directors (EDs) between February and April, 2019.*
• Statistics Canada data from the 2006 and 2016 Census.
CMI Data Sets as Basis for Business Mix Change Analysis
After extensive review of data provided by and retrieved from the City, the study team determined that only the CMI data sets were useful for analysing the current andhistorical mix of businesses in each Study area (and thus change over time). This was despite the following limitations to these data sets:
1. Not offering consistent historical time points across areas.
2. Only providing one historical data point for each area.
3. Being limited to businesses with a ground-floor address.
The CMI data sets, including the 2019 updates, provide consistent and reliable snapshots of each Study area in terms of:
• Business counts
• Business floor areas (for some of the Study areas historically)
• Business categories (coded using both CMI’s ‘ground codes’ and North American Industry Classification System (NAICS) categories)
• Chain vs. independent (based on Statistics Canada’s definition)
• Vacant storefronts
• Civic addresses
• Business names
The data was collected and coded consistently, and verified for accuracy by the respective BIA Executive Directors. In each case, the collection, coding and verificationprocess was a collaborative effort between the study team and BIAs. Through this process of inventory vetting and co-creation, inventory accuracy was considerablyincreased and a high level of trust and collaboration was established between the study team and the respective BIA directors.
4.1 APPROACH TO ANALYSIS OF “CHANGE OVER TIME”
*Note that 2020 updates of CMI inventories for each Study area are presented in the accompanying Appendices, along with 2019 and historical inventories. The 2020 inventories are presented for information purposes only; they have not been used in the ‘change over time’ analysis presented in Section 5.

LIVEABLE CITY
PLANNING LTD.
Andrew Yan
Consulting55
City of Vancouver BIA Data
The City of Vancouver provided the study team with the following data:
• Total property values in each BIA, by parcel, back to 2012
• Commercial property taxes in each BIA, by parcel, back to 2012
• Property ownership records in each BIA, by parcel, back to 2012
• Business license information
The property value and property tax information was used to present two snapshots in time for each parcel: 2012 and 2019. Additional disaggregation of the data forpresentation of information for intervening years was not possible within the scope of this study. The two snapshots in time paint a picture of how total property values,and commercial property taxes, have changed in each Study area between two points in time over 7 years.
2012 was selected as a baseline year as it was the oldest year that property data for all the current BIA districts in their current configurations were consistently available.
With the nature of “triple net leases” and “additional rents”, an examination of commercial property tax trends allowed for an insight on the changing financial pressuresfaced by retail and commercial service tenants. An analysis on total property values provided a view into development pressures faced by property owners to sell orredevelop which can, in turn, not only have direct financial implications for the business, but also affect the leasing terms in reference to early lease termination/demolitionclauses to storefront spaces.
Please note that changes in commercial property taxes are independent of changes in total property values. Commercial property taxes and overall property tax assessment rates are set annually by the municipal government whereas property values are determined annually by BC Assessment.
The figures in total property values and commercial property taxes analysis may not be exactly reproduceable. Incomplete tota l property value and commercial property tax records and value outliers were removed to maintain a consistent 2012 to 2019 comparability. The reasons behind the incompleteness of property records between these two timeframes can stem from various factors such as the re-development of a new property in 2019 on a previous site in 2012 or administrative miscodes in records.
City of Vancouver Open Data
The City of Vancouver’s Open Data Catalogue provided key geospatial datasets such as parcel data, BIA boundaries, and citywide air photos.
Statistics Canada Census Data, 2006 and 2016
Statistics Canada provided a key source of demographic information for the areas surrounding each BIA. This study specifically looks at the population densities for theCensus dissemination areas within a one kilometre distance from each BIA.
4.1 APPROACH TO ANALYSIS OF “CHANGE OVER TIME”

LIVEABLE CITY
PLANNING LTD.
Andrew Yan
Consulting56
Beyond measuring what has changed in each Study area over time, this study
also examines reasons for and drivers of change. To do this, the team engaged
with each BIA and its membership, alongside industry experts and property
owners, using a combination of surveys, roundtables and one-on-one
discussions.
This study came together in an iterative manner rather than in a linear
progression. For instance, most of the introductory meetings with BIA leadership
(noted as “Stage 1” below) occurred near the beginning of the process, either
before or during the initial gathering of data and analysis of change in business
mix and other metrics over time. These early meetings were critical for
establishing communication and trust between the study team and BIA
leadership, and to engage each BIA in an active process of co-creation and data
review. This was critical for ensuring accuracy of storefront inventories, as well
as for organizing roundtables, following up with membership regarding survey
completion, and vetting the veracity of some conclusions and indicators.
Stage 1: Introductory Meetings with BIA Leadership
Stage 1 of the engagement protocol involved one-on-one, in-person meetings
between members of the consulting team, the City’s BIA Coordinator, each BIA’s
Executive Director, and in some cases, members of their BIA Boards. The
purpose of these meetings was to introduce the study and consulting team to
each BIA, establish open lines of communication, and to convey the need for
ongoing participation from BIA leadership throughout the process. The study
team explained that BIA Directors would be involved in vetting the updated
business inventories, and that each study BIA would be expected to assist in
convening a roundtable event with their respective membership.
4.2 APPROACH TO ANALYSIS OF “DRIVERS OF CHANGE”
Stage 2: Roundtable Pilot (South Granville)
The study team and City staff agreed that roundtable sessions with BIA
membership and property owners would be one of the key forums for
gathering input on the drivers of change. One-on-one meetings with
representative samples of local businesses in each Study area (focusing on
dominant categories) was another method discussed, but it was ultimately
determined that the resources available for this project would not allow for
this approach to be done effectively.
The study team worked with City staff to design a standardized two-hour
roundtable session. South Granville BIA was jointly selected as the pilot area to
test the roundtable approach.
The pilot roundtable proceeded as follows:
• Arrival and check-in of participants.
• Introductory remarks from City and consulting team (15 minutes).
• Presentation from consultant on specific local shopping area trends,
based on preliminary analysis (25 minutes).
• Creative planning session / open discussion of causal links (40 minutes): a
facilitated table discussion amongst invitees to discuss drivers of change,
including a “Top 10 Drivers of Change” exercise whereby each participant
ranked their own issues from 1 to 10 on cue cards (one issue per card).
• A review of “Top 3 Drivers” (5 minutes): sharing the sentiments in the
room by reading out the cue cards for each of the top 3 issues.
• Concluding remarks and call for surveys (5 minutes): the team thanked
attendees for their participation and asked them to complete the more
detailed printed surveys (discussed below).

LIVEABLE CITY
PLANNING LTD.
Andrew Yan
Consulting57
Stage 3a: Surveys of Business Owners, Landlords, Brokers
The study team developed two surveys – one for business owners /
operators, one for landlords and brokers – as a second means to gather
information from stakeholders. The surveys were designed to identify, at a
greater level of detail, some of the critical issues and change drivers faced
by business owners and landlords in the subject LSAs.
At the time of the South Granville pilot roundtable, surveys were
administered in hard-copy only. Surveys were distributed to attendees as
they entered the venue, and they were asked to return completed surveys
either at the end of the roundtable, or within 1-2 weeks to the BIA
director.
Following completion of this pilot event, subsequent surveys were
digitized using an online platform (Voxco) and links were emailed to BIA
membership by respective BIA Executive Directors.
BIA directors were tasked with following up with their respective
membership to remind them to take the time to fill in the surveys. Survey
results were collated and analyzed by the consulting team.
4.2 APPROACH TO ENGAGEMENT FOR “DRIVERS OF CHANGE” ANALYSIS
Stage 3b: Additional Roundtables and Industry Expert Integration
Following completion of the pilot roundtable in South Granville, the
following ‘tweaks’ were made for each of the five subsequent roundtable
sessions:
• It was determined that at least three members of the consulting
team would be required at each roundtable event to act as
facilitators and presenters.
• At least three City staff members would be required at each
subsequent roundtable to act as both notetakers and facilitators.
• The study team determined (and City staff agreed) that the best
means to gain the benefit of leasing and commercial real estate
industry expertise and input through this process was to seek out
industry experts and actively embed them into the roundtables. This
was done by way of personal outreach by members of the consulting
team to an array of people from the following industries:
o Commercial leasing
o Property development
o Property management
o Small business finance
o Former small business and chain business owners
Approximately 30 industry experts were included in the roundtable
events. Some attended multiple events. Additional industry experts were
consulted by phone outside of the roundtable format.

5.0 LOCAL SHOPPING AREAS CHANGE OVER TIME

LIVEABLE CITY
PLANNING LTD.
Andrew Yan
Consulting59
5.1 OVERVIEW
Introduction and Section Structure
Retail is dynamic and changing. One given is that retail will continue to change, and that the nature of change will vary by category. Some categories will
experience serious shake-ups as a result of the trends and factors discussed in Section 3 (and others not noted), leading to long-term decline or outright
reinvention. Other categories will grow and thrive in this new environment.
A significant data gap affecting the current discussion around small businesses and the nature of Vancouver’s local shopping areas is the extent to which change
has occurred, and what the nature of that change has been. The exploration of this change is a central thrust of this study, and is the focus of this report section.
Section 5 documents the consulting team’s review of the following factors for each of the 6 Study areas, and all Study areas in aggregate, using the data sources
noted below:
Additionally, some potentially important and informative relationships between data sets are explored, pointing to possible areas for future research. Note that
some figures will not necessary add up to 100% with the effects of rounding.
Factor of Change Source(s) of Data
Change in vacancy between one historical point in time and 2019 CMI field surveys, verified by respective BIA Executive Directors
Change in business mix between one historical point in time and 2019. Including analysis by floor area. Baseline Years are:
• South Granville – 2006• West Broadway – 2010• Marpole – 2011• Hastings North – 2002• Collingwood – 2005• Commercial Drive – 2005
CMI field surveys, coded by consulting team using NAICS categories, verified by respective BIA Executive Directors
Change in number of businesses (storefronts) by business type (independent vs. chain) between historical time point and 2019. Including analysis by floor area.
CMI field surveys, coded independent vs. chain, verified by respective BIA Executive Directors; City of Vancouver spatial data (for mapping)
Change in total assessed values and commercial property taxes, 2012 vs. 2019 City of Vancouver Property Tax Office data archived by BIA Program Office
Change in building / land ownership patterns between 2012 and 2019 City of Vancouver, categorized by consulting team
Change in base and additional rent (as available) Review of brokerage reports; engagement with brokers during Roundtable events; phone calls with commercial brokers
Change in population growth and density in each Study area, 2006 to 2016 Statistics Canada
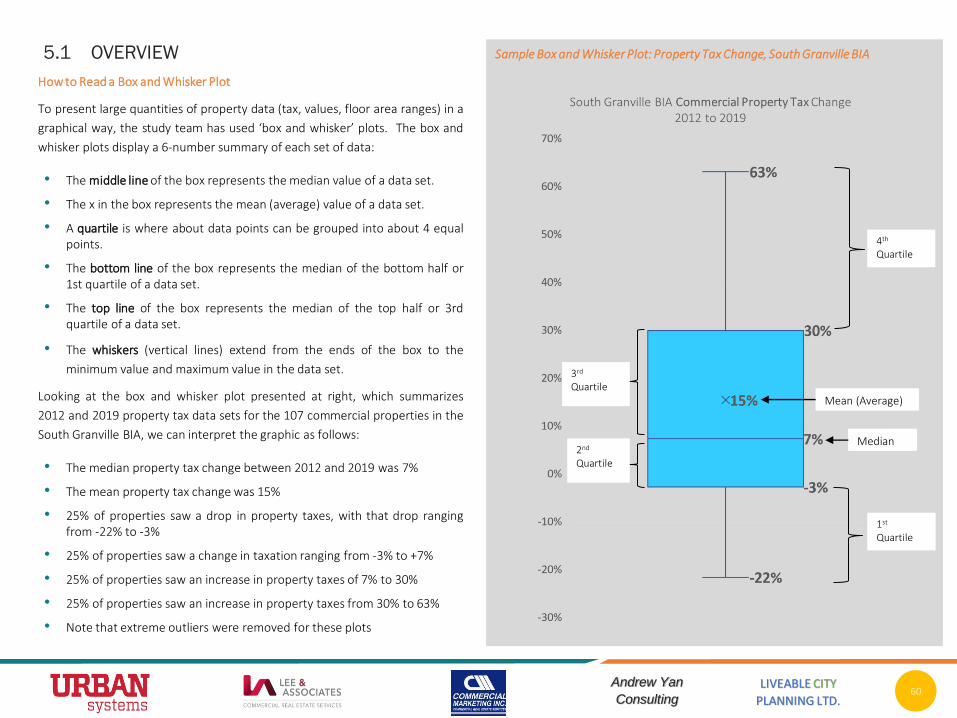
LIVEABLE CITY
PLANNING LTD.
Andrew Yan
Consulting60
How to Read a Box and Whisker Plot
To present large quantities of property data (tax, values, floor area ranges) in a
graphical way, the study team has used ‘box and whisker’ plots. The box and
whisker plots display a 6-number summary of each set of data:
• The middle line of the box represents the median value of a data set.
• The x in the box represents the mean (average) value of a data set.
• A quartile is where about data points can be grouped into about 4 equalpoints.
• The bottom line of the box represents the median of the bottom half or1st quartile of a data set.
• The top line of the box represents the median of the top half or 3rdquartile of a data set.
• The whiskers (vertical lines) extend from the ends of the box to the
minimum value and maximum value in the data set.
Looking at the box and whisker plot presented at right, which summarizes
2012 and 2019 property tax data sets for the 107 commercial properties in the
South Granville BIA, we can interpret the graphic as follows:
• The median property tax change between 2012 and 2019 was 7%
• The mean property tax change was 15%
• 25% of properties saw a drop in property taxes, with that drop rangingfrom -22% to -3%
• 25% of properties saw a change in taxation ranging from -3% to +7%
• 25% of properties saw an increase in property taxes of 7% to 30%
• 25% of properties saw an increase in property taxes from 30% to 63%
• Note that extreme outliers were removed for these plots
Sample Box and Whisker Plot: Property Tax Change, South Granville BIA
Median
Mean (Average)
1st
Quartile
2nd
Quartile
3rd
Quartile
4th
Quartile
5.1 OVERVIEW

LIVEABLE CITY
PLANNING LTD.
Andrew Yan
Consulting61
Notes on the complexity of tracking Commercial Lease Rates
Tracking commercial historical lease rates is complicated for a number of reasons:
• Tenant inducements make it difficult to compare and analyse lease rate data. These are typically not
disclosed in the lease rate data.
• Rent comparables are dependent on source reliability, which makes it difficult to verify rent data
provided.
• Rental rates vary by location within commercial precincts, and their use or category. If rental data for
change-over-time are not from the same block/location, and if possible from the same building, then
the data will be more variable, and its longitudinal comparability will be suspect.
• Even when looking at change-over-time for the same building, variability can occur due to ownership
change, renovations, or significant upgrades.
Our approach to tracking commercial lease rates over time relied on tracking same-building change over
time with input from long-term landlords and property managers in each Study area.
• To collect historical rent data by building, the consulting team contacted landlords and property
managers within the Study area precincts who were deemed to be the most accessible sources for this
information.
• The consulting team contacted other possible sources for this type of data, who were reluctant to
participate due to both the time and cost required to assemble this type of historic information.
• This exercise in trying to collect historical rental information proved to be time consuming for both the
consulting team and property owners / managers.
• Some property owners were reluctant to share data for a variety of reasons.
• Ultimately the study team’s approach generates reasonably reliable measures of change for the
subject properties but the trade-off is a relatively limited sample size.
5.1 OVERVIEW

LIVEABLE CITY
PLANNING LTD.
Andrew Yan
Consulting62
5.2 CHANGE OVER TIME: SOUTH GRANVILLE
Vacancies – 2006 vs 2019
•
• As of April 2019 there were 25 vacancies in the entirety of the South
Granville BIA, accounting for 13% of the total storefront count.
• Most vacant storefronts were located along the west side of
Granville Street (21 of 25).
• Note that this area appears to be in a period of transition.
o Since the inventory was completed in April 2019, additional
businesses have indicated pending closures or relocations. Some of
these pending closures are noted in the table below.
o The vacancy rate is expected to spike to 16% in early 2020, unless
vacancies are backfilled.
Broadway
West 12th Ave
West 14th Ave
West 15th Ave
West 13th Ave
West 11th Ave
West 8th Ave
West 10th Ave
West 5th Ave
Business Name Category Address Location Description
Ramin and Sons Antiques (furniture)
2250 Granville East side, between 6th
and 7th Ave
Plum Women’s Apparel 2799 Granville West side, between 11th and 12th Ave.
West Full-Service Restaurant
2881 Granville West side, between 12th and 13th Ave.
Ouisi Bistro Full-Service Restaurant
3014 Granville East side, between 14th
and 15th Ave.
Williams-Sonoma Home Furnishings 2903 Granville West side, between 13th and 14th Ave.
La Vie en Rose Women’s Apparel 3003 Granville West side, between 14th and 15th Ave
Pending Expected Closures in South Granville BIA in 2020
Source: Correspondence with SGBIA Executive Director, October 2019
Vacancies in the South Granville BIA, April 2019
4%
13%
16%
2006 2019 Early 2020 (Expected)
Vacancy Rates in the South Granville BIA, 2006 - 2019 -Early 2020 (Expected)
West 16th Ave
West 7th Ave
West 6th Ave
BIA Boundaries
Vacancy
Fir
St

LIVEABLE CITY
PLANNING LTD.
Andrew Yan
Consulting63
Vacancies by Floor Area – 2006 vs 2019
•
• Vacancy rates by floor area were slightly different than vacancy
rates by number of storefronts from 2006 to 2019.
o In 2006, the vacancy rate in South Granville by storefront count
was lower than the vacancy rate by floor area.
o In 2019, the vacancy rates by storefront count was higher than
the vacancy rate by floor area.
• The number of vacancies by raw number increased from 7 out
of 199 in 2006 to 25 out of 199 in 2019.
• Over time, the character of vacant storefronts in South
Granville has changed as floor area sizes of vacancies became
smaller.
o The median floor area size for vacancies decreased from 2,094
square feet in 2006 to 1,629 in 2019.
o The average vacant floor area size also decreased from 3,770
square feet in 2006 to 2,599 square feet in 2019.
5.2 CHANGE OVER TIME: SOUTH GRANVILLE

LIVEABLE CITY
PLANNING LTD.
Andrew Yan
Consulting64
Occupied and Vacant Space in South Granville by Floor Area, April 2019
•
• There are 199 storefronts in the South
Granville BIA from 5th Avenue to 16th
Avenue, encompassing 540,392 square
feet.
• There are 25 vacant storefronts (as of
April 2019), accounting for 13% of total
storefronts.
• There are 57,169 square feet of vacant
floor area, accounting for 11% of total
floor area.
• Of the 25 noted vacancies, 24 are
vacant and available for lease, and one
is vacant under construction.
• The figure at right shows the
distribution of occupied and vacant
storefronts by floor area.
0
5
10
15
20
25
400
450
500
563
650
674
750
780
800
850
867
972
1,0
00
1,0
40
1,1
00
1,1
44
1,2
00
1,2
50
1,2
56
1,2
88
1,3
00
1,3
13
1,4
00
1,5
00
1,5
29
1,5
60
1,6
00
1,6
20
1,6
38
1,7
00
1,7
14
1,7
50
2,0
00
2,1
00
2,1
06
2,1
32
2,2
10
2,3
76
2,4
00
2,5
00
2,6
00
2,6
40
2,7
00
2,8
00
2,9
00
2,9
64
3,0
00
3,1
32
3,2
00
3,2
76
3,3
00
3,4
00
3,5
00
3,8
00
4,0
00
4,3
00
4,5
00
4,8
98
5,0
00
5,2
47
5,3
60
5,5
00
5,7
00
6,0
00
6,1
00
6,4
13
6,4
80
6,5
00
7,5
00
8,0
00
9,5
00
10,4
00
11,0
00
11,7
13
12,4
00
13,0
00
17,5
00
29,9
17
Nu
mb
er o
f Sto
refr
on
ts
Floor Area (in Square Feet)
Occupied Vacant
5.2 CHANGE OVER TIME: SOUTH GRANVILLE

LIVEABLE CITY
PLANNING LTD.
Andrew Yan
Consulting65
Business Mix “Top 5”, 2006 and 2019 – Number of Stores
• Vacancy is much more prominent in 2019 vs. 2006.
• Women’s clothing stores, while still a prominent
cluster, have decreased in dominance.
• Furniture stores have increased their overall
presence.
• There are more restaurants (limited, full-serve and
drinking places) in 2019.
• Art dealers are no longer prominent along Granville
south of Broadway.
• Cosmetics, beauty supplies and perfume stores have
fallen out of the top 12.
13%
12%
10%
8%
6%
52%
Vacant Store
Limited service eating places
Women's clothing stores
Furniture stores
Other home furnishings stores
All Other Business Types
Top 5 Dominant Categories in South Granville BIA - 2019% of Total Businesses
5.2 CHANGE OVER TIME: SOUTH GRANVILLE
Rank Type of Business Category Number of Business % of Total Businesses Floor Area (in Sq Ft) % Total Floor Area
1 Vacant Store 25 13% 57,169 11%
2 Limited service eating places 23 12% 42,309 8%
3 Women's clothing stores 20 10% 42,722 8%
4 Furniture stores 16 8% 86,023 16%
5 Other home furnishings stores 11 6% 26,040 5%
Other Types of Businesses 104 52% 286,130 53%
Total 199 100% 540,392 100%
2019
Rank Type of Business Category Number of Businesses % of Total Businesses Floor Area (in Sq Ft) % of Total Floor Area
1 Limited Service Eating Places 25 13% 46,681 9%
2 Women's Clothing Stores 24 12% 53,477 11%
3 Art Dealers 17 9% 33,871 7%
4 Furniture Stores 16 8% 50,213 10%
4* Hair Care And Esthetic Services 16 8% 21,162 4%
5 Used Merchandise Stores 9 5% 13,027 3%
Other Types of Businesses 92 46% 280,645 56%
Total 199 100% 499,075 100%
* Tie in Number of Businesses
2006

LIVEABLE CITY
PLANNING LTD.
Andrew Yan
Consulting66
Business Mix “Top 5”, 2006 and 2019 – Floor Areas
• There have been shifts in business mix in the area,
moving away from limited service eating places and
women’s clothing stores in 2006, to home furniture
stores and other home furnishing stores in 2019.
• If “Furniture stores” and “Other home furnishing stores”
categories were combined, they would become the
largest business type category in the area at 14% of total
businesses and occupy 21% of all retail floor space in the
area.
• The decline of art dealers in the area reflects a major
change as South Granville was once renowned for its
concentration of art dealers and galleries.
5.2 CHANGE OVER TIME: SOUTH GRANVILLE

LIVEABLE CITY
PLANNING LTD.
Andrew Yan
Consulting67
Chain vs Independent Businesses, 2006 and 2019
• In the 13 years between inventories, the total number of ground
floor storefronts remained flat at 199.
• Independent Businesses:
o There was a loss of 48 independent ground floor businesses from
2006 to 2019.
o Independents decreased as a proportion of total ground floor
storefronts, from 70% to 46%.
o Independents decreased as a proportion of total floor area, from
55% to 35%.
• Chain Businesses:
o There was an increase of 30 chain ground floor businesses in the
Study area.
o Chains increased as a proportion of total ground floor storefronts
from 27% to 42% of the total business mix.
o Chains increased as a proportion to floor area, from 40% to 54%.
• Vacancy
o The vacancy rate (on a storefront count basis) increased from 4% to
12% (from 7 to 24 storefronts) with 1 unit in 2019 being under
construction.
5.2 CHANGE OVER TIME: SOUTH GRANVILLE
Note: Vacancy rates in this section will differ from the vacancy rates in the previous section for the BIA as the vacancy rate used here disaggregates “Vacant” storefronts into separate “Under Construction” and “Vacant” categories. Furthermore, vacancy numbers may slightly differ due to numbers rounding.

LIVEABLE CITY
PLANNING LTD.
Andrew Yan
Consulting68
Chain vs. Independent vs. Vacant by Floor Space, 2019
•
• Independent businesses tend to cluster toward
small floor plates.
• The median floor plate for a chain storefront was
2,000 square feet, for an independent storefront
was 1,500 square feet, and 1,638 square feet for a
vacant storefront.
• Chain businesses are found across the floor space
size range, but have a greater tendency to be
present in the larger floor plates than
independents.
5.2 CHANGE OVER TIME: SOUTH GRANVILLE
1,500
Note: Significant outliers were removed from these distribution of floor area charts

LIVEABLE CITY
PLANNING LTD.
Andrew Yan
Consulting69
Change in Property Values and Property Taxes
•
Total Property Values
• Between 2012 and 2019, SGBIA properties increased in
aggregate value by $456.2 million, from $642.5 million to
nearly $1.1 billion.
• 75% of the total property assessments in the SGBIA went
up between 39% and 212%.
• The top 25% of properties increased in value by at least
115%.
• The average total assessment increase was 78%.
• The median total assessment increase was 57%.
Commercial Property Taxes
• Over the same time period, commercial property taxes in
the SGBIA increased from $8.9 million to $10.4 million.
• Average commercial property tax increases in South
Granville were 15%.
• The highest commercial property tax increase was 63%,
except for 3 outliers which increased by 82%, 86% and
119% (not shown in the box and whisker plot).
• 25% of all properties in the SGBIA faced commercial
property tax increases from 30% to 63%.
• Average commercial property tax increase was 15%.
5.2 CHANGE OVER TIME: SOUTH GRANVILLE

LIVEABLE CITY
PLANNING LTD.
Andrew Yan
Consulting70
Change in Basic and Additional Rent
•
• Current and historical basic rent information for South
Granville was obtained for a sample of 10 commercial units
through conversations with industry contacts.
• All premises for which longitudinal data was available saw
either very modest increases, or very modest decreases, in
basic rent between 2011 and 2019.
• Additional rent, on the other hand, increased quite
substantially in nearly all cases, ranging from a low of 5.69%
to a high of 11.76%.
• This data is consistent with anecdotal information from
brokers and landowners, who have indicated a need to help
offset increases in additional rents (mostly property taxes) by
minimizing increases in basic rent, and in some cases
decreasing the basic rent amount.
Year Street Area of Premises
(square feet)
Base Rent (per sq. ft. per annum)
Annual Average
Basic Rent Increases
Additional Rent (per sq. ft. per
annum)
Average Annual
Additional Rent Increase
South Granville
2011Granville
600 $47.92 $22.84
2019 600 $25.00 -5.98% $37.81 8.19%
2011Granville
1300 $65.00 $27.58
2019 1300 $60.00 -0.96% $40.14 5.69%
2011Granville
1350 $65.00 $27.58
2019 1350 $60.00 -0.96% $40.14 5.69%
2011Granville
850 $43.00 $22.84
2019 850 $45.00 0.58% $34.45 6.35%
2011
Granville
1500 $18.00 $17.51
2019 1500 $23.10 3.54% $33.98 11.76%
2011
Granville
2580 $27.32 $22.84
2019 2580 $27.02 -0.14% $34.45 6.35%
2011Granville
1124 $74.73 $22.84
2019 1124 $69.75 -0.83% $34.45 6.35%
2011Granville
867 $69.20 $22.84
2019 867 $70.00 0.14% $34.45 6.35%
2011
Granville
849 $63.60 $22.84
2019 849 $65.00 0.44% $34.45 6.35%
5.2 CHANGE OVER TIME: SOUTH GRANVILLE

LIVEABLE CITY
PLANNING LTD.
Andrew Yan
Consulting71
Change in Commercial Property Ownership, 2012 vs 2019
•
• Over the last 8 years the proportion of commercial properties in the
SGBIA owned by development firms, numbered corporations and
holding companies has increased.
• In 2012, 11% of commercial properties were owned by developers.
This increased to 15% by 2019.
• The transition away from ownership in the name of individuals or
business names is offset by increase in numbered corporations and
holding companies. These changes do not necessarily reflect
fundamental shifts in the beneficial ownership of properties, but
rather changes made to better manage business finances and tax
obligations.
• There seems to be a relationship between the pace of property
ownership change and the uptick in vacancy in the area where
changes in property ownership and ownership type has also come at
the same time as an increase in developer ownership. Further analysis
and investigation of changes in property ownership and vacancy rates
for this BIA as well as others should be further pursued in future
studies.
5.2 CHANGE OVER TIME: SOUTH GRANVILLE
Types of Ownership
2012 2019% Change in
Ownership Type
Business 5 5 0%
Developers 13 17 24%
Financial Institutions
3 1 -200%
Holding Company
54 57 5%
Individual 17 11 -55%
Numbered Corporation
12 16 25%
Owner Occupied
8 3 -167%
Public 3 3 0%
Total 115 113
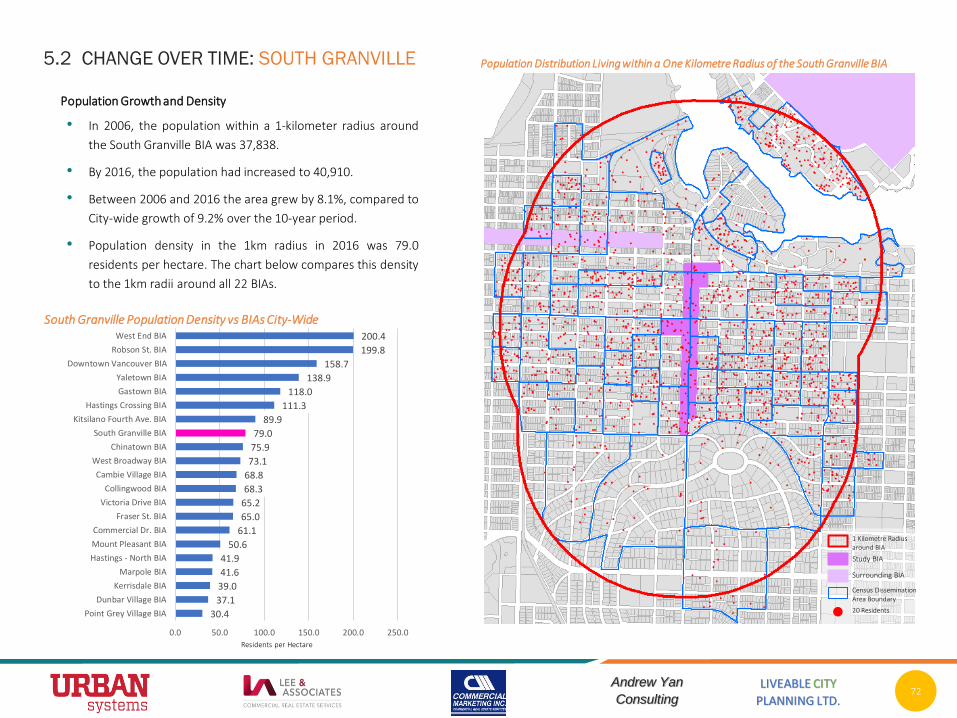
LIVEABLE CITY
PLANNING LTD.
Andrew Yan
Consulting72
Population Growth and Density
•
• In 2006, the population within a 1-kilometer radius around
the South Granville BIA was 37,838.
• By 2016, the population had increased to 40,910.
• Between 2006 and 2016 the area grew by 8.1%, compared to
City-wide growth of 9.2% over the 10-year period.
• Population density in the 1km radius in 2016 was 79.0
residents per hectare. The chart below compares this density
to the 1km radii around all 22 BIAs.
30.4
37.1
39.0
41.6
41.9
50.6
61.1
65.0
65.2
68.3
68.8
73.1
75.9
79.0
89.9
111.3
118.0
138.9
158.7
199.8
200.4
0.0 50.0 100.0 150.0 200.0 250.0
Point Grey Village BIA
Dunbar Village BIA
Kerrisdale BIA
Marpole BIA
Hastings - North BIA
Mount Pleasant BIA
Commercial Dr. BIA
Fraser St. BIA
Victoria Drive BIA
Collingwood BIA
Cambie Village BIA
West Broadway BIA
Chinatown BIA
South Granville BIA
Kitsilano Fourth Ave. BIA
Hastings Crossing BIA
Gastown BIA
Yaletown BIA
Downtown Vancouver BIA
Robson St. BIA
West End BIA
5.2 CHANGE OVER TIME: SOUTH GRANVILLE
South Granville Population Density vs BIAs City-Wide
Residents per Hectare
Population Distribution Living within a One Kilometre Radius of the South Granville BIA
20 Residents
Census DisseminationArea Boundary
1 Kilometre Radius around BIA
Surrounding BIA
Study BIA

LIVEABLE CITY
PLANNING LTD.
Andrew Yan
Consulting73
Household Income and Spending
•
• The median and average household incomes within this
Study area in 2019 are estimated at $80,485 and
$126,167, respectively.
• The aggregate household income in the 1-kilometer
buffer area was approximately $3.21 billion.
• The average household retail and food/beverage
expenditure in 2019 was just over $58,000. In aggregate,
this figure was $1.48 billion.
Metric (2019) South Granville
City of Vancouver
% Over/Under City
Average Annual Household Income
$126,167 $109,914 +15%
Median Annual Household Income
$80,485 $74,312 +8%
Aggregate Annual Household Income
$3.21 billion
$33.0 billion
Average Annual Retail + F&B Spend
$58,117
Aggregate Annual Retail + F&B Spend
$1.48 billion
Source: Environics Analytics
5.2 CHANGE OVER TIME: SOUTH GRANVILLE
South Granville Income and Spending vs. City-Wide
20 Residents
Census DisseminationArea Boundary
1 Kilometre Radius around BIA
Surrounding BIA
Study BIA
Population Distribution Living within a One Kilometre Radius of the South Granville BIA

LIVEABLE CITY
PLANNING LTD.
Andrew Yan
Consulting74
• As of February 2019 there were 39 vacancies in the entirety of the BIA
(including units under construction), accounting for 15% of the total
storefront count. This is higher than the area’s 2010 baseline year vacancy
rate of 7%.
• This figure can be further broken out as:
o Vacant leasable storefronts: 10% (27 storefront).
o Vacant and under construction: 5% (12 storefronts) are under
construction.
• Many of the vacancies in the area are concentrated in the newer
buildings and are under construction.
Larc
h S
t
Tra
falg
ar
St
Ste
phens S
t
Macdonald
St
Baysw
ate
r S
t
Bala
cla
va S
t
Tru
tch S
t
Ble
nheim
St
Wate
rloo S
t
Colli
ngw
ood S
t
West Broadway
5.3 CHANGE OVER TIME: WEST BROADWAY
Vacancies in the West Broadway BIA, February 2019
BIA Boundaries
Vacancy

LIVEABLE CITY
PLANNING LTD.
Andrew Yan
Consulting75
Vacancies by Floor Area – 2010 vs 2019
•
• Vacancy rates by both storefront and floor area grew significantly
from 2010 to 2019 in the West Broadway BIA.
• The number of vacancies by raw number increased by 20 units from
19 in 2010 to 39 in 2019.
• The characteristics of vacant storefronts in the West Broadway BIA
changed to include vacancies that had larger floor areas.
o The median floor space size for vacancies increased from 1,000
square feet in 2010 to 1,235 square feet in 2019 and the average
vacant floor space size also increased from 1,541 square feet in 2010
to 2,077 square feet in 2019.
5.3 CHANGE OVER TIME: WEST BROADWAY

LIVEABLE CITY
PLANNING LTD.
Andrew Yan
Consulting76
Occupied and Vacant Space in West Broadway by Floor Area, April 2019
•
• There are a total of 255 storefronts in the West Broadway BIA from Collingwood St to Larch St, encompassing 488,528 square feet
• In 2019 there were 38 vacant storefronts, accounting for 15% of total storefronts.
• The vacancy rate by floor area also stood at 15%.
• Of the 38 noted vacancies, 26 were vacant and available for lease, and 12 were vacant under construction.
• The figure below shows the distribution of occupied and vacant storefronts by floor area.
0
2
4
6
8
10
12
14
16
18
20
Nu
mb
er o
f St
ore
fro
nts
Floor Area (in Square Feet)
Occupied Under Construction Vacant
5.3 CHANGE OVER TIME: WEST BROADWAY

LIVEABLE CITY
PLANNING LTD.
Andrew Yan
Consulting77
Business Mix “Top 5”, Number of Stores , 2010 and 2019
• While the dominant business categories were
relatively stable between the two snapshot years,
vacancies moved from second place to first place
as the most dominant category on a storefront
count basis. Note that this vacancy figure includes
the space classified as ‘under construction’ on the
previous page.
• The major categories in the area are focused on
consumption in the form of restaurants and
limited service eating places (cafes) and services.
• There is a decline in merchandise retail in the
form of woman’s clothing stores as they were
once in the top 5 of business categories, but are
below the top 10 business category in 2019.
5.3 CHANGE OVER TIME: WEST BROADWAY
Rank Type of Business Category Number of Businesses % of Total Businesses Floor Area (in Sq Ft) % of Total Floor Area
1 Limited Service Eating Places 51 20% 91,784 20%
2 Vacant Store 19 7% 29,284 6%
3 Offices Of Other Health Practitioners 15 6% 16,475 4%
4 Hair Care And Esthetic Services 13 5% 8,580 2%
5 Full Service Restaurants 11 4% 14,685 3%
5* Women's Clothing Stores 11 4% 11,640 3%
Other Types of Businesses 135 53% 278,479 62%
Total 255 100% 450,928 100%
2010
*Tie in Number of Businesses
Rank Type of Business Category Number of Business % of Total Businesses Floor Area (in Sq Ft) % Total Floor Area
1 Vacant Store 38 15% 91,784 19%
2 Limited Service Eating Places 37 15% 29,284 6%
3 Offices Of Other Health Practitioners 26 10% 16,475 3%
4 Full Service Restaurants 22 9% 8,580 2%
5 Hair Care And Esthetic Services 13 5% 14,685 3%
Other Types of Businesses 119 46% 327,720 67%
Total 255 100% 488,528 100%
2019

LIVEABLE CITY
PLANNING LTD.
Andrew Yan
Consulting78
Business Mix “Top 5”, Floor Area, 2010 and 2019
• While vacancies in 2019 represent 15% of total
number of businesses, it is important to note that
many of these vacant spaces are in new
developments and in process of occupation.
• Overall, while there were changes in business
floor area, the business mix in the West Broadway
BIA was relatively stable. Some exceptions were:
• Decrease in women’s clothing stores and
increase in hair care and esthetic services.
• Decrease in limited service eating places.
• Increase in proportion of ‘other health
practitioners.’
• Increased proportion of full-service
restaurants.
5.3 CHANGE OVER TIME: WEST BROADWAY

LIVEABLE CITY
PLANNING LTD.
Andrew Yan
Consulting79
Chain vs. Independent Businesses, 2010 - 2019
• CMI ground-floor business inventory data is available for two points in
time: 2010 and 2019. The latter was last updated in February 2019 with
the assistance of the BIA Executive Director.
• In the 9 years between inventories, the total number of ground floor
storefronts remained flat.
• Independent Businesses:
o Loss of 20 independent ground floor businesses.
o Decrease as a proportion of total ground floor storefronts from 74% to
66%.
o Decreased as a proportion of floor area from 58% to 50%.
• Chain Businesses:
o A slight change in number of chain businesses – growth from 47 to 48.
o Increased as a proportion of total ground floor storefronts from 18% to
19%.
o Remained stable as a proportion of floor area, at 35%.
• Vacancy
o Increased from 8% to 11% based on storefront count (from 20 to 27),
and from 6% to 12% based on floor area.
o 12 vacant storefronts in 2019 were under construction and represent 5
percent of ground floor businesses.
5.3 CHANGE OVER TIME: WEST BROADWAY
Note: Vacancy rates in this section will differ from the vacancy rates in the previous section for the BIA as the vacancy rate used here disaggregates “Vacant” storefronts into separate “Under Construction” and “Vacant” categories. Furthermore, vacancy numbers may slightly differ due to numbers rounding.

LIVEABLE CITY
PLANNING LTD.
Andrew Yan
Consulting80
Chain vs. Independent by Floor Area, 2019
•
• Independent businesses tend to cluster toward
small floor areas.
o Median floor areas for chain stores were 2,260
square feet versus 1,045 square feet for
independent stores.
• The median vacant storefront floor area was
1,296 square feet.
5.3 CHANGE OVER TIME: WEST BROADWAY

LIVEABLE CITY
PLANNING LTD.
Andrew Yan
Consulting81
Change in Total Property Values and Commercial Property Taxes
•
Total Property Values
• Between 2012 and 2019, West Broadway BIA properties
increased in aggregate value by $736.7 million, from $411.2
million to nearly $1.2 billion.
• 75% of the total property assessments in the West Broadway
BIA went up between 82% and 276%.
• The top 25% of properties increased in value by at least
195%.
• The average total assessment increase was 142%.
• The median total assessment increase was 109%.
Commercial Property Taxes
• Over the same time period, commercial property taxes in the
West Broadway BIA increased from $5.65 million to $8.23
million.
• The highest commercial property tax increase was 114%, at
3396 West Broadway (TD Canada Trust).
• 25% of all properties in the West Broadway BIA faced
commercial property tax increases from 56% to 114%.
• Average commercial property tax increase was 29%.
5.3 CHANGE OVER TIME: WEST BROADWAY

LIVEABLE CITY
PLANNING LTD.
Andrew Yan
Consulting82
Change in Basic and Additional Rent
•
• Current and historical basic rent information for West Broadway was obtained for a sample of 3 commercial units through conversations with
industry contacts.
• Base rent increases were relatively modest, ranging from under 1% to just over 2% per year.
• Additional rent increases were higher, ranging from 2.5% to nearly 7% per year.
West Broadway Base and Additional Rent Sample
Year LocationArea of
Premises (sq.ft.)
Base Rent (per sq.ft. per annum)
Annual Average Basic Rent Increase
Additional Rent (per sq.ft. per annum)
Average Annual Additional Rent Increase
2011W. Broadway 988
$38.00 $15.00
2019 $40.00 0.7% $18.00 2.5%
2011
W. Broadway750
$33.00 $16.00
2019 $39.00 2.3% $20.00 3.1%
2011
W. Broadway1469
$30.00 $14.25
2019 $35.00 2.1% $22.00 6.8%
5.3 CHANGE OVER TIME: WEST BROADWAY
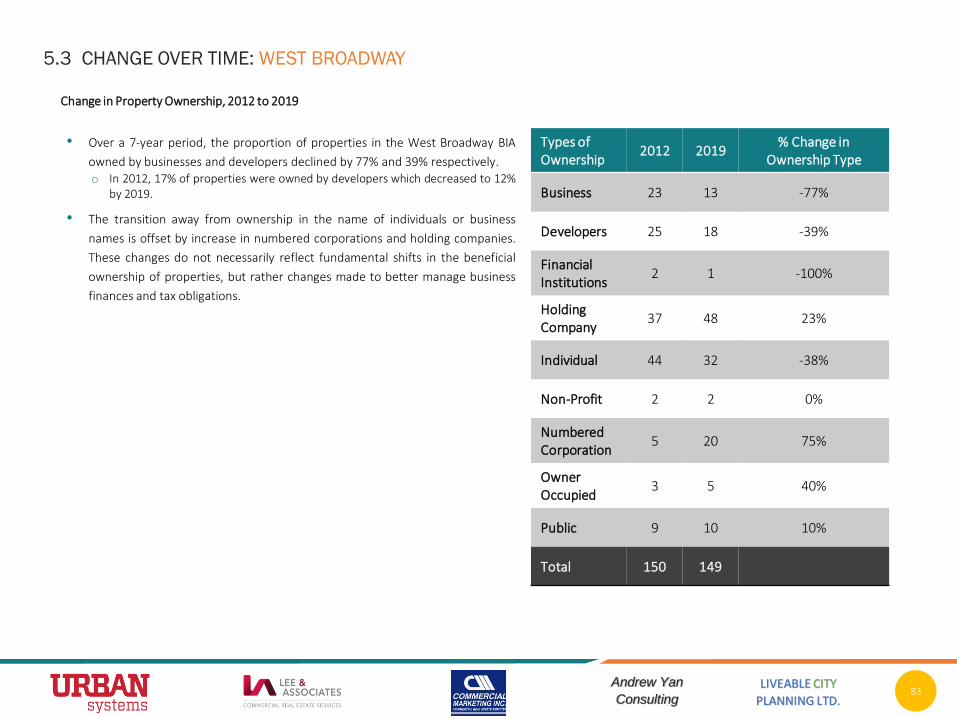
LIVEABLE CITY
PLANNING LTD.
Andrew Yan
Consulting83
Change in Property Ownership, 2012 to 2019
•
• Over a 7-year period, the proportion of properties in the West Broadway BIA
owned by businesses and developers declined by 77% and 39% respectively.o In 2012, 17% of properties were owned by developers which decreased to 12%
by 2019.
• The transition away from ownership in the name of individuals or business
names is offset by increase in numbered corporations and holding companies.
These changes do not necessarily reflect fundamental shifts in the beneficial
ownership of properties, but rather changes made to better manage business
finances and tax obligations.
5.3 CHANGE OVER TIME: WEST BROADWAY
Types of Ownership
2012 2019% Change in
Ownership Type
Business 23 13 -77%
Developers 25 18 -39%
Financial Institutions
2 1 -100%
Holding Company
37 48 23%
Individual 44 32 -38%
Non-Profit 2 2 0%
Numbered Corporation
5 20 75%
Owner Occupied
3 5 40%
Public 9 10 10%
Total 150 149

LIVEABLE CITY
PLANNING LTD.
Andrew Yan
Consulting84
Population Growth and Density
•
• In 2006, the population within a 1-kilometer radius around
the West Broadway BIA was 38,253.
• By 2016, the population had increased to 41,085.
• The area growth rate of 7.4% compares to City-wide growth
of 9.2% over the 10-year period.
• Population density in the 1km radius in 2016 was 73.1
residents per hectare. The chart below compares this density
to the 1km radii around all 22 BIAs.
30.4
37.1
39.0
41.6
41.9
50.6
61.1
65.0
65.2
68.3
68.8
73.1
75.9
79.0
89.9
111.3
118.0
138.9
158.7
199.8
200.4
0.0 50.0 100.0 150.0 200.0 250.0
Point Grey Village BIA
Dunbar Village BIA
Kerrisdale BIA
Marpole BIA
Hastings - North BIA
Mount Pleasant BIA
Commercial Dr. BIA
Fraser St. BIA
Victoria Drive BIA
Collingwood BIA
Cambie Village BIA
West Broadway BIA
Chinatown BIA
South Granville BIA
Kitsilano Fourth Ave. BIA
Hastings Crossing BIA
Gastown BIA
Yaletown BIA
Downtown Vancouver BIA
Robson St. BIA
West End BIA
5.3 CHANGE OVER TIME: WEST BROADWAY
West Broadway Population Density vs BIAs City-Wide
Residents per Hectare
Population Distribution Living within a One Kilometre Radius of the West Broadway BIA
20 Residents
Census DisseminationArea Boundary
1 Kilometre Radius around BIA
Surrounding BIA
Study BIA

LIVEABLE CITY
PLANNING LTD.
Andrew Yan
Consulting85
Household Income and Spending
•
• The median and average household incomes within this
Study area in 2019 are estimated at $83,032 and $124,747
respectively.
• The aggregate household income in the 1-kilometer buffer
area was approximately $2.99 billion.
• The average household retail and food/beverage
expenditure in 2019 was just over $57,000. In aggregate,
this figure was $1.28 billion.
Metric (2019) West Broadway
City of Vancouver
% Over / Under City
Average Annual Household Income
$124,747 $109,914 +13%
Median Annual Household Income
$83,032 $74,312 +12%
Aggregate Annual Household Income
$2.99 billion $33.0 billion
Average Annual Retail + F&B Spend
$57,190
Aggregate Annual Retail + F&B Spend
$1.28 billion
5.3 CHANGE OVER TIME: WEST BROADWAY
Source: Environics Analytics
West Broadway Income and Spending vs. City-Wide
20 Residents
Census DisseminationArea Boundary
1 Kilometre Radius around BIA
Surrounding BIA
Study BIA
Population Distribution Living within a One Kilometre Radius of the West Broadway BIA

LIVEABLE CITY
PLANNING LTD.
Andrew Yan
Consulting86
Vacancies – 2011 and 2019
• As of January 2019 there were 16 vacancies in the entirety of the Marpole BIA, accounting
for 11% of at the total storefront count.
o This is higher than the area’s 2011 baseline year vacancy rate of 9 percent.
• Vacancies are fairly evenly distributed on the east and west sides of Granville Street,
however their north-south distribution is more variable on the east side of the street.
o On the west side of the street, vacancies are clustered around 68th Avenue, with additional
one-off vacancies in the south and north ends.
o On the east side of the street, vacancies are distributed throughout each block.
5.4 CHANGE OVER TIME: MARPOLE
Vacancies in the Marpole BIA, January 2019
BIA Boundaries
Vacancy
Gra
nville
St
W 63rd Ave
W 64rd Ave
W 65rd Ave
W 66rd Ave
W 68rd Ave
SW Marine Dr
Avery Ave
W 71rd Ave

LIVEABLE CITY
PLANNING LTD.
Andrew Yan
Consulting87
Vacancies by Floor Area – 2011 vs 2019
• While vacancy rates in the Marpole BIA were high, vacancies were
characterized by smaller floor areas.
• From 2011 to 2019, the average floor space size that is vacant has
not changed, but the median vacant floor space unit has grown from
1,053 square feet to 1,200 square feet.
5.4 CHANGE OVER TIME: MARPOLE

LIVEABLE CITY
PLANNING LTD.
Andrew Yan
Consulting88
Occupied and Vacant Space in Marpole by Floor Area, April 2019
•
• There are a total of 141 storefronts
in the Marpole BIA from West 63rd
Avenue to West 71st Avenue,
encompassing 246,827 square feet.
• There are 16 vacant storefronts,
accounting for 11% of total
storefronts.
• There are 20,332 square feet of
vacant floor area, accounting for
8% of total floor area.
• Of the 16 noted vacancies, 11 are
available for lease.
• The figure at right shows the
distribution of occupied and vacant
storefronts by floor area.
0
1
2
3
4
5
6
7
8
9
10
Dat
a U
nav
alia
ble
52
8
54
0
60
0
70
0
75
6
78
4
79
6
80
0
90
0
90
7
91
2
91
7
92
0
93
1
1,0
00
1,0
18
1,0
18
1,0
36
1,0
50
1,0
53
1,0
56
1,0
71
1,0
85
1,1
27
1,2
00
1,2
09
1,2
47
1,3
34
1,3
46
1,3
50
1,4
10
1,5
75
1,5
84
1,6
65
1,7
16
1,7
55
1,8
00
1,8
54
1,9
78
2,0
00
2,0
15
2,0
37
2,0
40
2,0
72
2,0
79
2,1
12
2,1
40
2,2
00
2,2
20
2,4
00
2,5
74
2,6
46
2,9
14
2,9
25
3,0
00
3,1
26
3,1
50
3,2
48
3,5
00
3,8
50
3,9
60
4,0
50
4,1
87
4,2
70
4,3
20
4,7
00
4,9
95
5,0
00
5,0
40
5,4
00
33
,07
5
Nu
mb
er o
f St
ore
fro
nts
Floor Area (in Square Feet)
Occupied Vacant
5.4 CHANGE OVER TIME: MARPOLE

LIVEABLE CITY
PLANNING LTD.
Andrew Yan
Consulting89
Business Mix “Top 5”, 2011 and 2019, - business count
• The predominant category in Marpole is Offices of
Other Health Practitioners. However if all
restaurant types are amalgamated, they together
form the predominant category at 26% of total
storefronts.
• Vacancies were the 3rd place most prominent
business category in both 2011 and 2019.
5.4 CHANGE OVER TIME: MARPOLE
* Denotes tie in number of businesses in category
Rank Type of Business Category Number of Businesses % of Total Businesses Floor Area (in Sq Ft) % Total Floor Area
1 Offices of Other Health Practitioners 26 18% 32,216 13%
2 Full service restaurants 21 15% 33,089 13%
3 Vacant Store 16 11% 20,332 8%
3* Limited service eating places 16 11% 23,008 9%
4 Banking 9 6% 29,456 12%
4* Hair care and esthetic services 9 6% 8,697 4%
5 Insurance agencies and brokerages 6 4% 7,869 3%
Other Types of Businesses 39 28% 92,160 37%
Total 141 100% 246,827 100%
2019
Rank Type of Business Category Number of Businesses % of Total Businesses Floor Area (in Sq Ft) % of Total Floor Area
1 Offices Of Other Health Practitioners 22 15% 28,132 12%
2 Limited Service Eating Places 19 13% 23,442 10%
3 Full Service Restaurants 13 9% 22,075 9%
3* Vacant Store 13 9% 15,153 6%
4 Hair Care And Esthetic Services 10 7% 9,666 4%
5 Banking 7 5% 26,893 11%
Other Types of Businesses 59 41% 112,194 47%
Total 143 100% 237,553 100%
2011

LIVEABLE CITY
PLANNING LTD.
Andrew Yan
Consulting90
Business Mix “Top 5”, 2011 and 2019, -Floor Area
• The business mixes in the Marpole BIA remain
similar from 2011 to 2019.
o In 2019, the largest category of businesses in the
Marpole BIA was “Offices of Other Health
practitioners.”
o Restaurants in the form of “Full Service
Restaurants” and “Limited Service Eating Places”
remain the largest combined form of business in
the area as they form 26% of the total number of
businesses and 20% of floor area in the BIA.
5.4 CHANGE OVER TIME: MARPOLE
* Denotes tie in number of businesses in category

LIVEABLE CITY
PLANNING LTD.
Andrew Yan
Consulting91
Chain vs. Independent Businesses, 2011 - 2019
• CMI ground-floor business inventory data is available for two points in
time: 2011 and 2019. The latter was last updated in April with the
assistance of the BIA Executive Director.
• In the 8 years between inventories, the total number of ground floor
storefronts largely remained flat with the loss of two storefronts.
• Independent Businesses:
o Independent ground floor businesses have remained relatively steady, at
96 businesses in 2011 and 97 in 2019.
o Independents increased as a proportion of total ground floor storefronts
from 67% to 68%.
o At the same time, independent businesses decreased as a proportion of
total floor area, from 53% to 48%.
• Chain Businesses:
o The number of ground floor chain businesses decreased from 34 to 28
between 2011 and 2019.
o As a proportion of ground floor storefronts, chain businesses decreased
24% to 20%.
o As a proportion of ground floor business floor area, chain businesses
increased from 41% to 45%.
• Vacancy
o On a ground-floor storefront basis, Increased from 9% to 11% (from 13 to
16 storefronts).
o As a proportion of floor area, increased from 6% to 7%.
5.4 CHANGE OVER TIME: MARPOLE
24%
67%
0%
9%
20%
68%
0%
11%
0%
10%
20%
30%
40%
50%
60%
70%
80%
Chains Independents UnderConstruction
Vacant
Percentage Change in Chains vs. Independent Businesses in the Marpole BIA, 2011-2019
20
11
20
19
Note: Vacancy rates in this section will be differ from the vacancy rates in the previous section for the BIA as the vacancy rate used here disaggregates “Vacant” storefronts into separate “Under Construction” and “Vacant” categories. Furthermore, vacancy numbers may slightly differ due to numbers rounding.

LIVEABLE CITY
PLANNING LTD.
Andrew Yan
Consulting92
Chain vs. Independent by Floor Area, 2019
•
• Like the other study BIAs, independent
businesses tend to cluster toward small
floor plates compared to chain
businesses.
o Median floor areas for chain stores
were 2,037 square feet versus 1,036
square feet for independent stores
• The median vacant storefront floor area
was 1,200 square feet.
5.4 CHANGE OVER TIME: MARPOLE

LIVEABLE CITY
PLANNING LTD.
Andrew Yan
Consulting93
Change in Total Property Values and Commercial Property Taxes
•
Total Property Values
• Between 2012 and 2019, Marpole BIA properties increased
in aggregate value by $368.7 million, from $139.52 million to
$508.27 million.
• 75% of the total property assessments in the Marpole BIA
went up between 89% and 428%.
• The top 25% of properties increased in value by at least
324%.
• The average total assessment increase was 203%.
• The median total assessment increase was 178%.
Commercial Property Taxes
• Over the same time period, commercial property taxes in
Marpole BIA increased from $2.10 million to $3.12 million.
• The highest commercial property tax increase was 151%, at
8655 Granville Street (C2 development lot). This is followed
by 126%, at 8697 Granville (1-storey commercial building).
• 25% of all properties in the Marpole BIA faced commercial
property tax increases from 80% to 151%.
• Average commercial property tax increase was 47%.
5.4 CHANGE OVER TIME: MARPOLE

LIVEABLE CITY
PLANNING LTD.
Andrew Yan
Consulting94
Change in Basic and Additional Rent
Our research returned very limited results on the question of current
basic and additional rent (and trends in rent) in the Marpole area.
Through discussions with brokers and the landlord survey, we were
able to gather information for 3 units.
• The landlord interview found that one property, measuring 4,115
square feet, had a base rate of $43 per square foot in 2014, and
$45 per square foot in 2019, for a 0.93% annual increase over 5
years. Over that same period, the additional rent (primarily
comprising property tax) increased from $16.40 to $25.70 per
square foot – an 11.4% increase in 5 years.
• The leasing information obtained from survey data – pertaining to
2 units measuring 4,200 and 2,700 square feet respectively –
revealed the following per square foot rates for base rents:
o 2011: $21.00
o 2015: $24.00
o 2019: $35.00
This represents an average annual basic rent increase of 8.3%.
5.4 CHANGE OVER TIME: MARPOLE
Property Size 4,115 sq.ft.
Base Rent, 2014 $43 per sq.ft.
Base Rent, 2019 $45 per sq.ft.
Additional Rent, 2014 $16.40 per sq.ft.
Additional Rent, 2019 $25.70 per sq.ft.
Sample Property Base and Additional Rent Change

LIVEABLE CITY
PLANNING LTD.
Andrew Yan
Consulting95
Change in Property Ownership, 2012 to 2019
•
• Individuals remain the dominant forms of ownership type in the Marpole
BIA.
• Ownership type change has been stable with the exception of a large
increase of developers entering the area since 2012.
5.4 CHANGE OVER TIME: MARPOLE
Types of Ownership
2012 2019% Change in
Ownership Type
Bank 1 1 0%
Business 13 13 0%
Developers 0 7 700%
Holding Company
20 15 -25%
Individual 36 30 -17%
Numbered Corporation
3 6 100%
Owner Occupied
12 13 8%
Public 0 2 200%
Total 86 87 1%

LIVEABLE CITY
PLANNING LTD.
Andrew Yan
Consulting96
Population Growth and Density
•
• In 2006, the population within a 1-kilometer radius around
the Marpole BIA was 18,902.
• The population remained nearly flat over 10 years, reaching
18,903 in 2016.
• Population density in the 1km radius in 2016 was 41.6
residents per hectare. The chart below compares this density
to the 1km radii around all 22 BIAs.
30.4
37.1
39.0
41.6
41.9
50.6
61.1
65.0
65.2
68.3
68.8
73.1
75.9
79.0
89.9
111.3
118.0
138.9
158.7
199.8
200.4
0.0 50.0 100.0 150.0 200.0 250.0
Point Grey Village BIA
Dunbar Village BIA
Kerrisdale BIA
Marpole BIA
Hastings - North BIA
Mount Pleasant BIA
Commercial Dr. BIA
Fraser St. BIA
Victoria Drive BIA
Collingwood BIA
Cambie Village BIA
West Broadway BIA
Chinatown BIA
South Granville BIA
Kitsilano Fourth Ave. BIA
Hastings Crossing BIA
Gastown BIA
Yaletown BIA
Downtown Vancouver BIA
Robson St. BIA
West End BIA
5.4 CHANGE OVER TIME: MARPOLE
Marpole Population Density vs BIAs City-Wide
Residents per Hectare
Population Distribution Living within a One Kilometre Radius of the Marpole BIA
20 Residents
Census DisseminationArea Boundary
1 Kilometre Radius around BIA
Surrounding BIA
Study BIA

LIVEABLE CITY
PLANNING LTD.
Andrew Yan
Consulting97
Household Income and Spending
• The median and average household incomes within the 1-
kilometer Study area in 2019 are estimated at $62,557 and
$100,133, respectively.
• The aggregate household income in the 1-kilometer buffer
area was approximately $1.07 billion.
• The average household retail and food/beverage
expenditure in 2019 was just over $48,000. In aggregate, this
figure was $441.75 million.
Metric (2019) Marpole City of Vancouver
% Over/Under City
Average Annual Household Income
$100,133 $109,914 -9%
Median Annual Household Income
$62,557 $74,312 -16%
Aggregate Annual Household Income
$1.07 billion $33.0 billion
Average Annual Retail + F&B Spend
$48,205
Aggregate Annual Retail + F&B Spend
$441.75 million
Source: Environics Analytics
5.4 CHANGE OVER TIME: MARPOLE
Marpole Income and Spending vs. City-Wide
20 Residents
Census DisseminationArea Boundary
1 Kilometre Radius around BIA
Surrounding BIA
Study BIA
Population Distribution Living within a One Kilometre Radius of the Marpole BIA

LIVEABLE CITY
PLANNING LTD.
Andrew Yan
Consulting98
• As of March 2019 there were 31 vacancies in the entirety of the Hastings
North BIA, accounting for 12% of the total storefront count. However this can
be broken out as follows:
o Vacant and Available for Lease: 11% (28 storefronts).
o Vacant and Under Construction: 1% (3 storefronts).
o Vacant storefronts are located along both the North and South side of
Hastings Street.
E Hastings St
Renfr
ew
St
Vic
toria D
r
Kaslo
St
Slo
can S
t
Penticto
n S
t
Kam
loops S
t
Nanaim
o
St
Sem
lin S
t
Lakew
ood D
r
Tem
ple
ton D
r
5.5 CHANGE OVER TIME: HASTINGS NORTH
Vacancies in the Hastings North BIA, March 2019
BIA Boundaries
Vacancy
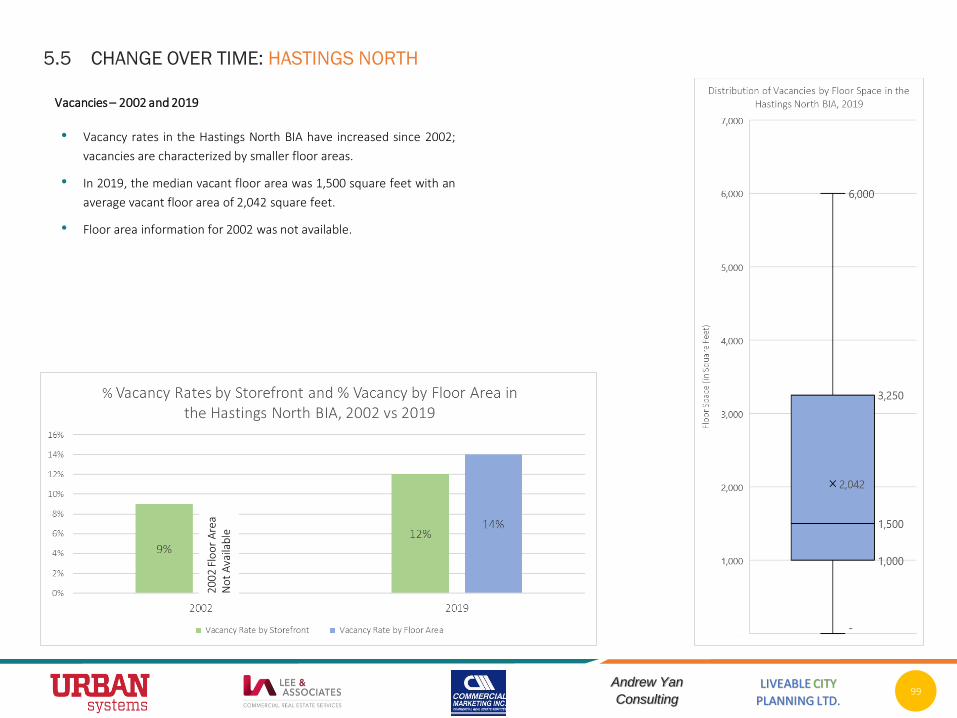
LIVEABLE CITY
PLANNING LTD.
Andrew Yan
Consulting99
Vacancies – 2002 and 2019
•
• Vacancy rates in the Hastings North BIA have increased since 2002;
vacancies are characterized by smaller floor areas.
• In 2019, the median vacant floor area was 1,500 square feet with an
average vacant floor area of 2,042 square feet.
• Floor area information for 2002 was not available.
5.5 CHANGE OVER TIME: HASTINGS NORTH
2002
Flo
or
Are
a N
ot
Ava
ilab
le

LIVEABLE CITY
PLANNING LTD.
Andrew Yan
Consulting100
Occupied and Vacant Space in Hastings North by Floor Area, April 2019
•
• There are a total of 257 storefronts in
the Hastings North BIA from Victoria
Drive to Renfrew St, encompassing
484,414 square feet.
• There were 31 vacancies in 2019,
accounting for 12% of total
storefronts.
• There were 67,731 square feet of
vacant floor area in 2019, accounting
for 14% of total floor area.
• Of the 31 noted vacancies, 28 were
vacant and available for lease, and 3
were vacant under construction.
• The figure at right shows the
distribution of occupied and vacant
storefronts by floor area.
0
10
20
30
40
50
60
70
10
0
40
0
50
0
53
0
55
2
60
0
65
0
74
2
75
0
75
2
80
0
81
4
82
3
90
0
91
2
95
7
96
7
1,0
00
1,0
21
1,0
46
1,0
57
1,0
79
1,0
91
1,1
00
1,1
66
1,2
00
1,2
12
1,2
16
1,2
50
1,3
00
1,4
00
1,5
00
1,6
00
1,6
42
1,7
15
1,8
00
1,8
09
2,0
00
2,0
85
2,3
26
2,4
00
2,5
00
2,7
50
2,8
00
3,0
00
3,2
00
3,5
00
3,6
00
4,0
00
4,5
00
5,0
00
5,5
00
6,0
00
6,2
50
7,0
00
8,0
00
10
,000
12
,000
22
,000
Dat
a U
nav
liabl
e
Nu
mb
er o
f St
ore
fro
nts
Floor Space (in Square Space)
Occupied Vacant
5.5 CHANGE OVER TIME: HASTINGS NORTH

LIVEABLE CITY
PLANNING LTD.
Andrew Yan
Consulting101
Business Mix “Top 5”, 2002 and 2019, Number of Stores
• Vacancy is much more prominent in 2019,
accounting for 31 total storefronts (#1), vs.
21 total storefronts (#2) in 2002.
• There is a remarkably broad range of services
and food consumption establishments in the
BIA.
• While there is a 12 percent vacancy rate in
the BIA, the street remains quite vibrant.
5.5 CHANGE OVER TIME: HASTINGS NORTH
12%
11%
11%
9%
8%
49%
Vacant Store
Limited service eating places
Full service restaurants
General professional offices
Hair care and esthetic services
Other Types of Businesses
Top 5 Dominant Categories in Hastings North BIA - 2019% of Total Businesses
Rank Type of Business Category Number of Business % of Total Businesses Floor Area (in Sq Ft) % Total Floor Area
1 Vacant Store 31 12% 67,731 14%
2 Limited service eating places 29 11% 36,319 7%
3 Full service restaurants 28 11% 51,313 11%
4 General professional offices 24 9% 48,112 10%
5 Hair care and esthetic services 20 8% 18,759 4%
Other Types of Businesses 125 49% 262,180 54%
Total 257 100% 484,414 100%
2019
Rank Type of Business Category Number of Businesses % of Total Businesses Floor Area (in Sq Ft) % of Total Floor Area
1 General Professional Offices 24 10%
1* Limited Service Eating Places 24 10%
2 Vacant Store 21 9%
3 Full Service Restaurants 17 7%
4 Hair Care And Esthetic Services 13 5%
5 Offices Of Other Health Practitioners 11 5%
Other Types of Businesses 128 54%
Total 238 100%
* Tie in Number of Businesses
2002
Data Not Avaliable

LIVEABLE CITY
PLANNING LTD.
Andrew Yan
Consulting102
Business Mix “Top 5, 2002 and 2019, Floor Area
• The business mixes in the Hastings North BIA have
shifted, but have largely remained similar
between their reference periods of 2002 and
2019.
o Eating establishments in the form of “Full Service
Restaurants” and “Limited Service Eating Places”
remain the largest combined form of business in
the area as they form 22% of the total number of
businesses and 18% of floor area in the BIA.
o General professional office were once the
predominant business type (2002), but shifted to
the 4th place by 2019.
5.5 CHANGE OVER TIME: HASTINGS NORTH
20
02
Flo
or
Are
a N
ot
Ava
ilab
le
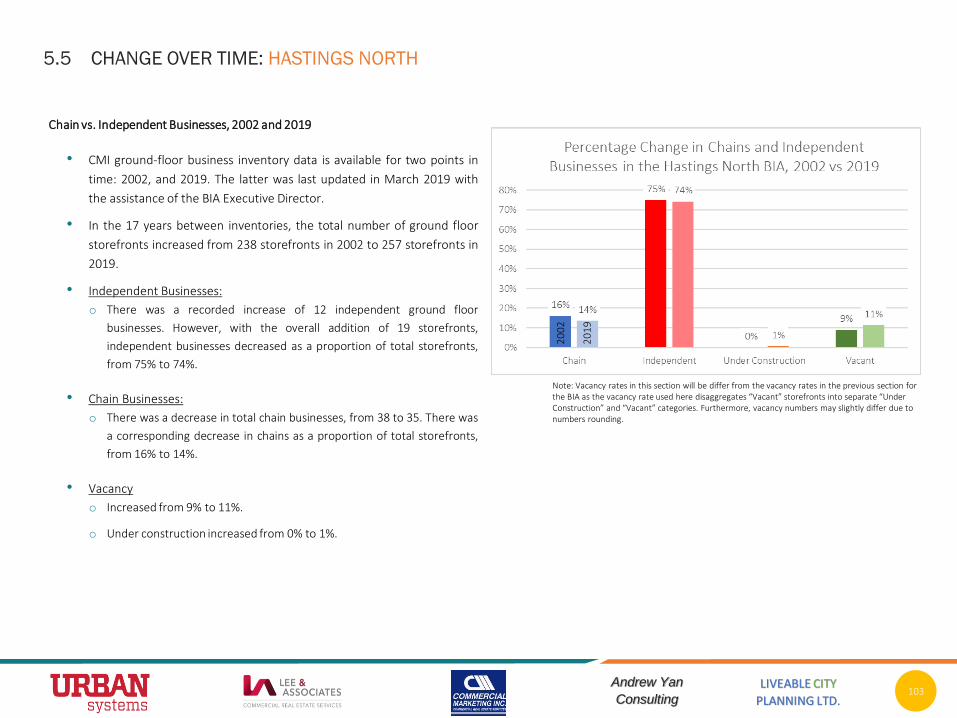
LIVEABLE CITY
PLANNING LTD.
Andrew Yan
Consulting103
Chain vs. Independent Businesses, 2002 and 2019
• CMI ground-floor business inventory data is available for two points in
time: 2002, and 2019. The latter was last updated in March 2019 with
the assistance of the BIA Executive Director.
• In the 17 years between inventories, the total number of ground floor
storefronts increased from 238 storefronts in 2002 to 257 storefronts in
2019.
• Independent Businesses:
o There was a recorded increase of 12 independent ground floor
businesses. However, with the overall addition of 19 storefronts,
independent businesses decreased as a proportion of total storefronts,
from 75% to 74%.
• Chain Businesses:
o There was a decrease in total chain businesses, from 38 to 35. There was
a corresponding decrease in chains as a proportion of total storefronts,
from 16% to 14%.
• Vacancy
o Increased from 9% to 11%.
o Under construction increased from 0% to 1%.
5.5 CHANGE OVER TIME: HASTINGS NORTH
20
02
20
19
Note: Vacancy rates in this section will be differ from the vacancy rates in the previous section for the BIA as the vacancy rate used here disaggregates “Vacant” storefronts into separate “Under Construction” and “Vacant” categories. Furthermore, vacancy numbers may slightly differ due to numbers rounding.

LIVEABLE CITY
PLANNING LTD.
Andrew Yan
Consulting104
Chain vs. Independent by Floor Area, 2019
•
• Independent businesses tend to cluster
toward small floor plates.
• Chain businesses can be found at all
floor area sizes, but then cluster at large
sized floor plates.
0
10
20
30
40
50
60
70
Nu
mb
er o
f St
ore
fro
nts
Floor Area (in Square Space)
Chain Independent Under Construction Vacant
5.5 CHANGE OVER TIME: HASTINGS NORTH

LIVEABLE CITY
PLANNING LTD.
Andrew Yan
Consulting105
Change in Property Values and Property Taxes
•
Total Property Values
• Between 2012 and 2019, Hastings North BIA (East Village)
properties within the Study area increased in aggregate
value by $1,151.96 million, from $407.25 million to $
1,559.21 million.
• 75% of the total property assessments in the Study area
went up between 131% and 541%. This excludes 5 outliers
ranging from 574% to 972%.
• The top 25% of properties increased in total value by at least
305%.
• The average total assessment increase was 250%.
• The median total assessment increase was 214%.
Commercial Property Taxes
• Over the same time period, commercial property taxes in
the Study area increased from $5.68 million to $8.85 million.
• The highest commercial property tax increase was 291%.
• 25% of all properties (excluding outliers) in the Study area
faced commercial property tax increases from 77% to 154%.
• Average commercial property tax increase was 59%.
5.5 CHANGE OVER TIME: HASTINGS NORTH

LIVEABLE CITY
PLANNING LTD.
Andrew Yan
Consulting106
Change in Basic and Additional Rent
•
• Data on changes in basic and additional rent
in Hastings North were sourced through calls
with brokers, plus information gathered from
landlords through the online survey.
• Telephone interviews provided input on 4
properties with an average floor plate of
1,400 square feet; for each, base lease rates
were provided for 2011 and 2019
• Survey data provided base rent information
for an additional 6 properties. Additional rent
information was not provided
• Average annual base rent increases vary from
a low of 0% to a high of 13.5%. The latter
property also saw a nearly 10% increase in
additional rent over the 2011-2019 period
Hastings North Base and Additional Rent Sample Data
Property YearBase Rent (per sf per
annum)
Avg. Annual Change in Base Rent (2019 vs. first
year)
Additional Rent (per sf per annum)
Avg. Annual Change in Additional Rent
12011 $ 24.55 $ 12.75
2019 $ 31.00 3.3% $ 16.85 4.0%
22011 $ 18.43 $ 8.30
2019 $ 18.36 -0.05% $ 14.62 9.52%
32011 $ 19.26 $ 12.03
2019 $ 29.50 6.65% $ 21.34 9.67%
42011 $ 12.00 $ 8.30
2019 $ 25.00 13.54% $ 14.62 9.52%
5
2011 $ 17.83
2015 $ 17.83
2019 $22.59 3.34%
6
2011 $ 13.20
2015 $ 13.20
2019 $ 20.00 6.44%
7
2011 $ 21.00
2015 $ 24.00
2019 $ 24.00 1.56%
8
2011 $ 23.00
2015 $ 23.00
2019 $ 24.00 0.54%
9
2011 $ -
2015 $ 20.16 -
2019 $ 24.00 2.38%
10
2011 $ 15.89
2015 $ 17.75
2019 $ 18.66 1.95%
5.5 CHANGE OVER TIME: HASTINGS NORTH

LIVEABLE CITY
PLANNING LTD.
Andrew Yan
Consulting107
Change in Property Ownership, 2012 to 2019
•
• Over the 8-year period from 2012 to 2019, the proportion of properties in the
Hastings North BIA owned by developers and holding companies increased.
• In 2012, 12 properties were owned by developers while, by 2019, 15
properties were owned by developers.
• Ownership changes and increases in certain ownership types such as holding
companies may not necessarily reflect fundamental shifts in the beneficial
ownership of properties, but rather changes made to better manage business
finances and tax obligations.
5.5 CHANGE OVER TIME: HASTINGS NORTH
Types of Ownership
2012 2019% Change in
Ownership Type
Bank 1 0 -100%
Business 15 13 -13%
Developers 12 15 25%
Government 0 1 100%
Holding Company
48 50 4%
Individual 48 55 15%
Non-Profit 1 2 100%
Numbered Corporation
23 23 0%
Owner Occupied
23 17 -26%
Union 1 0 -100%
Utility 1 0 -100%
Total 173 176

LIVEABLE CITY
PLANNING LTD.
Andrew Yan
Consulting108
Population Growth and Density
•
• In 2006, the population within a 1-kilometer radius around
the Hastings North BIA was 35,250.
• The population grew slightly over 10 years, reaching 36,206
by 2016.
• Population density in the 1km radius around the entire BIA in
2016 was 41.9 residents per hectare.
• The chart at right compares this density to the 1km radii
around all 22 BIAs.
30.4
37.1
39.0
41.6
41.9
50.6
61.1
65.0
65.2
68.3
68.8
73.1
75.9
79.0
89.9
111.3
118.0
138.9
158.7
199.8
200.4
0.0 50.0 100.0 150.0 200.0 250.0
Point Grey Village BIA
Dunbar Village BIA
Kerrisdale BIA
Marpole BIA
Hastings - North BIA
Mount Pleasant BIA
Commercial Dr. BIA
Fraser St. BIA
Victoria Drive BIA
Collingwood BIA
Cambie Village BIA
West Broadway BIA
Chinatown BIA
South Granville BIA
Kitsilano Fourth Ave. BIA
Hastings Crossing BIA
Gastown BIA
Yaletown BIA
Downtown Vancouver BIA
Robson St. BIA
West End BIA
5.5 CHANGE OVER TIME: HASTINGS NORTH
Hastings North Population Density vs BIAs City-Wide
Residents per Hectare
Population Distribution Living within a One Kilometre Radius of the Hastings North BIA
20 Residents
Census DisseminationArea Boundary
1 Kilometre Radius around BIA
Surrounding BIA
Study BIA

LIVEABLE CITY
PLANNING LTD.
Andrew Yan
Consulting109
Household Income and Spending
•
• The median and average household incomes within this
Study area in 2019 are estimated at $62,320 and $85,393,
respectively.
• The aggregate household income in the 1-kilometer buffer
area was approximately $1.47 billion.
• The average household retail and food/beverage
expenditure in 2019 was just over $42,000. In aggregate, the
figure was $718.67 million.
Metric (2019) Hastings North City of Vancouver
% Over/Under City
Average Annual Household Income
$85,393 $109,914 -22%
Median Annual Household Income
$62,320 $74,312 -16%
Aggregate Annual Household Income
$1.47 billion $33.0 billion
Average Annual Retail + F&B Spend
$42,047
Aggregate Annual Retail + F&B Spend
$718.67 million
Source: Environics Analytics
5.5 CHANGE OVER TIME: HASTINGS NORTH
20 Residents
Census DisseminationArea Boundary
1 Kilometre Radius around BIA
Surrounding BIA
Study BIA
Population Distribution Living within a One Kilometre Radius of the Hastings North BIA

LIVEABLE CITY
PLANNING LTD.
Andrew Yan
Consulting110
Vacancies – 2005 vs 2019
• As of March 2019 there were vacancies
distributed through the entirety of the BIA,
accounting for 6% of the total storefront
count.
• Most vacant storefronts are located along the
north side of Kingsway (9 of 12).
• The area has a healthy vacancy rate for a
commercial/retail area.
5.6 CHANGE OVER TIME: COLLINGWOOD
BIA Boundaries
Vacancy

LIVEABLE CITY
PLANNING LTD.
Andrew Yan
Consulting111
Vacancies – 2005 vs. 2019
• At a 6 percent vacancy rate, the Collingwood BIA has the healthiest
vacancy rate out of the six Study areas.
• In 2019, the median vacant floor area was 1,200 square feet with an
average vacant floor area of 1,467 square feet.
• Floor area information for 2005 was not available.
5.6 CHANGE OVER TIME: COLLINGWOOD

LIVEABLE CITY
PLANNING LTD.
Andrew Yan
Consulting112
Occupied and Vacant Space in Collingwood by Floor Area, April 2019
•
• There are a total of 203 storefronts
in the Collingwood BIA from Rupert
St to Boundary Road, encompassing
411,300 square feet.
• In 2019 there were 12 vacant
storefronts, accounting for 6% of
total storefronts.
• There were 17,600 square feet of
vacant floor area, accounting for 4%
of total floor area.
• Of the 12 noted vacancies, all were
vacant and available for lease.
• The figure at right shows the
distribution of occupied and vacant
storefronts by floor area.
5.6 CHANGE OVER TIME: COLLINGWOOD
0
5
10
15
20
25
30
35
Nu
mb
er o
f Sto
refr
on
ts
Floor Area (in Square Feet)
Occupied Vacant

LIVEABLE CITY
PLANNING LTD.
Andrew Yan
Consulting113
Business Mix “Top 5” 2005 and 2019 – Business Counts
• This area of the city is a notable destination for
Chinese and other ethnocultural restaurants. Full
service restaurants are the predominant business
category, accounting for 17% of storefronts and
18% of floor area in 2019.
• If restaurants (limited and full serve) are grouped
together, they account for 27% of storefronts and
27% of floor area.
• The number of ground floor general professional
offices has decreased since 2005, as have the
number of ground floor vacant units. Both
represent positive change.
5.6 CHANGE OVER TIME: COLLINGWOOD
Rank Type of Business Category Number of Business % of Total Businesses Floor Area (in Sq Ft) % Total Floor Area
1 Full Service Restaurants 35 17% 72,400 18%
2 Offices Of Other Health Practitioners 25 12% 38,300 9%
3 Limited Service Eating Places 20 10% 38,700 9%
4 Hair Care And Esthetic Services 17 8% 19,900 5%
5 General Professional Offices 15 7% 24,800 6%
Other Types of Businesses 91 45% 217,200 53%
Total 203 100% 411,300 100%
2019
Rank Type of Business Category Number of Businesses % of Total Businesses Floor Area (in Sq Ft) % of Total Floor Area
1 Full Service Restaurants 27 12%
2 General Professional Offices 25 11%
3 Hair Care And Esthetic Services 20 9%
4 Limited Service Eating Places 14 6%
5 Vacant Store 13 6%
Other Types of Businesses 130 57%
Total 229 100%
2005
Data Not Avaliable

LIVEABLE CITY
PLANNING LTD.
Andrew Yan
Consulting114
Business Mix “Top 5” 2005 and 2019 – Floor Areas
• The business mixes in the Collingwood BIA have slightly shifted, but
have largely remained similar between the reference periods of
2005 and 2019.
• Eating Establishments and Personal Services clusters are major
anchors for the local shopping area.
o Eating establishments in the form of “Full Service Restaurants”
and “Limited Service Eating Places” remain the largest combined
form of business in the area as they form 27% of the total
number of businesses and 27% of floor area in the BIA.
o Personal Services in the form of Office of Other Health
Practitioners, Hair care and esthetic services, and general
professional offices, when combined, form 27% of all businesses
and 20% of floor space.
5.6 CHANGE OVER TIME: COLLINGWOOD
20
05
To
tal F
loo
r A
rea
No
t A
vaila
ble

LIVEABLE CITY
PLANNING LTD.
Andrew Yan
Consulting115
Chain vs. Independent Businesses, 2005 and 2019
• Between 2005 and 2019, the number of recorded storefronts in the
Collingwood BIA decreased, from 229 to 203.
• Independent Businesses:
o There was a recorded decrease in independent businesses, from 193 to
156. As a proportion of total, the decrease was from 84% to 77%.
• Chain Businesses:
o There was an increase in chain businesses, from 24 to 35.
o As a proportion to total storefronts, chains grew from 10% to 17%.
• Vacancy
o Vacant storefronts slightly increased from 5% to 6%
5.6 CHANGE OVER TIME: COLLINGWOOD
Note: Vacancy rates in this section will differ from the vacancy rates in the previous section for the BIA as the vacancy rate used here disaggregates “Vacant” storefronts into separate “Under Construction” and “Vacant” categories. Furthermore, vacancy numbers may slightly differ due to numbers rounding.
20
05
20
19

LIVEABLE CITY
PLANNING LTD.
Andrew Yan
Consulting116
Chain vs. Independent by Floor Space, 2019
•
• Independent businesses tend to cluster toward small
floor areas.
o Median floor areas for chain stores were 2,500
square feet versus 1,200 square feet for independent
stores.
• The median vacant storefront square footage was
1,200 square feet.
0
5
10
15
20
25
30
Nu
mb
er o
f St
ore
fro
nts
Floor Area (in Square Feet)
ChainIndependentVacant
5.6 CHANGE OVER TIME: COLLINGWOOD

LIVEABLE CITY
PLANNING LTD.
Andrew Yan
Consulting117
Change in Property Values and Property Taxes
•
Total Property Values
• Between 2012 and 2019, Collingwood BIA
properties increased in aggregate value by $327.6
million, from $225.79 million to $553.40 million.
• 75% of the total property assessments in
Collingwood went up between 87% and 283%
• The top 25% of total properties increased in value
by at least 178%.
• The average total assessment increase was 128%
• The median total assessment increase was 128%
Commercial Property Taxes
• Over the same time period, commercial property
taxes in Collingwood increased from $2.93 million
to $4.09 million.
• The highest commercial property tax increase was
123%, at 3055 Kingsway (Big O Tires).
• 25% of all properties (excluding outliers) in the
Collingwood BIA faced commercial property tax
increases from 42% to 91%.
• Average commercial property tax increase was
27%.
5.6 CHANGE OVER TIME: COLLINGWOOD

LIVEABLE CITY
PLANNING LTD.
Andrew Yan
Consulting118
Change in Basic and Additional Rent
•
• Data on changes to basic and additional rent in Collingwood was sourced
through broker interviews.
• Survey responses from brokers / landlords were limited (3 surveys completed),
and none of these completed surveys provided information on base or
additional rents.
• Information gathered through interviews is provided in the table below.
Collingwood Base and Additional Rent Sample Data
Property YearBase Rent (per sf per
annum)
Avg. Annual Change in Base Rent (2019 vs. first
year)
Additional Rent (per sf per annum)
Avg. Annual Change in Additional Rent
12014 $ 22.25 $ 12.01
2019 $ 25.00 1.5% $ 16.82 5.0%
22011 $ 25.00 $ 7.00
2019 $ 28.00 1.5% $ 8.50 2.7%
5.6 CHANGE OVER TIME: COLLINGWOOD

LIVEABLE CITY
PLANNING LTD.
Andrew Yan
Consulting119
Change in Property Ownership, 2012 to 2019
• Alongside sizeable increases in property values, the Collingwood area has
seen a substantial increase in the proportion of properties held by
developers – increasing from 11 in 2012 to 40 in 2019.
• There has also been a slight increase in the number of properties held by
holding companies.
5.6 CHANGE OVER TIME: COLLINGWOOD
Types of Ownership
2012 2019% Change in
Ownership Type
Bank 2 1 -100%
Business 17 10 -70%
Developers 11 40 73%
Holding Company
27 32 16%
Individual 57 50 -14%
Numbered Corporation
8 8 0%
Owner Occupied
9 9 0%
Union 23 0 N/A
Total 154 150
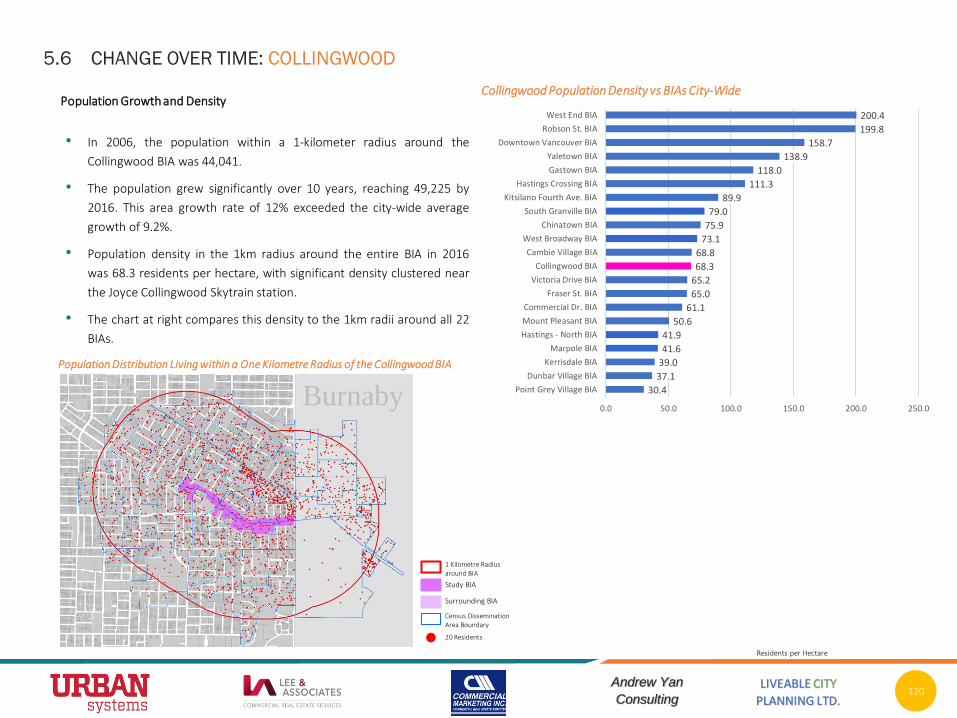
LIVEABLE CITY
PLANNING LTD.
Andrew Yan
Consulting120
Population Growth and Density
• In 2006, the population within a 1-kilometer radius around the
Collingwood BIA was 44,041.
• The population grew significantly over 10 years, reaching 49,225 by
2016. This area growth rate of 12% exceeded the city-wide average
growth of 9.2%.
• Population density in the 1km radius around the entire BIA in 2016
was 68.3 residents per hectare, with significant density clustered near
the Joyce Collingwood Skytrain station.
• The chart at right compares this density to the 1km radii around all 22
BIAs.
30.4
37.1
39.0
41.6
41.9
50.6
61.1
65.0
65.2
68.3
68.8
73.1
75.9
79.0
89.9
111.3
118.0
138.9
158.7
199.8
200.4
0.0 50.0 100.0 150.0 200.0 250.0
Point Grey Village BIA
Dunbar Village BIA
Kerrisdale BIA
Marpole BIA
Hastings - North BIA
Mount Pleasant BIA
Commercial Dr. BIA
Fraser St. BIA
Victoria Drive BIA
Collingwood BIA
Cambie Village BIA
West Broadway BIA
Chinatown BIA
South Granville BIA
Kitsilano Fourth Ave. BIA
Hastings Crossing BIA
Gastown BIA
Yaletown BIA
Downtown Vancouver BIA
Robson St. BIA
West End BIA
5.6 CHANGE OVER TIME: COLLINGWOOD
Collingwood Population Density vs BIAs City-Wide
Residents per Hectare
Population Distribution Living within a One Kilometre Radius of the Collingwood BIA
20 Residents
Census DisseminationArea Boundary
1 Kilometre Radius around BIA
Surrounding BIA
Study BIA
Burnaby

LIVEABLE CITY
PLANNING LTD.
Andrew Yan
Consulting121
Household Income and Spending
•
• The median and average household incomes within this Study area
in 2019 are estimated at $69,145 and $87,781, respectively.
• The aggregate household income in the 1-kilometer buffer area was
approximately $1.51 billion.
• The average household retail and food/beverage expenditure in
2019 was just under $45,000. The aggregate annual retail / food
and beverage spend was nearly $835 million.
Metric (2019) Collingwood City of Vancouver
% Over/Under City
Average Annual Household Income
$87,781 $109,914 -20%
Median Annual Household Income
$69,145 $74,312 -7%
Aggregate Annual Household Income
$1.51 billion $33.0 billion
Average Annual Retail + F&B Spend
$44,991
Aggregate Annual Retail + F&B Spend
$834.9 million
5.6 CHANGE OVER TIME: COLLINGWOOD
Population Distribution Living within a One Kilometre Radius of the Collingwood BIA
20 Residents
Census DisseminationArea Boundary
1 Kilometre Radius around BIA
Surrounding BIA
Study BIA
Burnaby

LIVEABLE CITY
PLANNING LTD.
Andrew Yan
Consulting122
Vacancies - 2019
• As of April 2019 there were 15 vacancies in the entirety of the Commercial
Drive BIA, accounting for 5% of the total storefront count.
• The area had a fairly healthy vacancy rate for a commercial/retail area.
5.7 CHANGE OVER TIME: COMMERCIAL DRIVE
Vacancies in the Commercial Drive BIA, April 2019
Venables St
Parker St
Napier St
William St
Charles St
Kitchener St
Grant St
Graveley St
E 1st Ave
E 2nd Ave
E 3rd Ave
E 4th Ave
McSpadden Ave
E 6th Ave
E 7th Ave
E 8th Ave
E Broadway
E 11th Ave
E 10th Ave
E 12th Ave
E 13thAve
Co
mm
erc
ial D
r
E 5th Ave
BIA Boundaries
Vacancy

LIVEABLE CITY
PLANNING LTD.
Andrew Yan
Consulting123
Vacancies – Base vs. 2019
• While increasing 1 percent, vacancy rates have remained largely stable from
2005 to 2019.
5.7 CHANGE OVER TIME: COMMERCIAL DRIVE

LIVEABLE CITY
PLANNING LTD.
Andrew Yan
Consulting124
Occupied and Vacant Space in Commercial Drive by Floor Area, April 2019
•
• There are a total of 352 storefronts in the
Commercial Drive BIA from Venables St to East
13th Ave, encompassing 802,341 square feet.
• There are 16 vacant storefronts, accounting for
5% of total storefronts.
• There are 28,315 square feet of vacant floor
area, accounting for 4% of total floor area.
• The figure at right shows the distribution of
occupied and vacant storefronts by floor area.0
10
20
30
40
50
60
50
0
80
0
92
5
1,0
00
1,0
04
1,0
09
1,0
36
1,0
50
1,0
86
1,1
69
1,2
00
1,2
28
1,2
40
1,2
65
1,5
00
1,6
72
1,7
09
1,7
83
1,8
00
2,0
00
2,0
61
2,2
00
2,5
00
2,8
00
3,0
00
3,2
00
3,5
00
3,6
00
4,0
00
4,5
00
5,0
00
5,3
00
5,5
00
6,0
00
6,5
00
7,5
00
8,0
00
10
,000
12
,000
14
,826
15
,000
38
,000
Nu
mb
er o
f St
ore
fro
nts
Floor Area (in Square Feet)
Occupied Vacant
5.7 CHANGE OVER TIME: COMMERCIAL DRIVE

LIVEABLE CITY
PLANNING LTD.
Andrew Yan
Consulting125
Dominant Categories and Themes, 2005 and 2019
• Commercial Drive is a major restaurant
destination for local residents and across the City.
The combination of limited and full-service eating
places (the 1st and 2nd categories for total
number of businesses respectively) account for
29% of store counts and 23% of floor area.
• The total number of businesses in Commercial
Drive has decreased over 14 years.
• There is considerable business diversity
throughout this extensive BIA.
5.7 CHANGE OVER TIME: COMMERCIAL DRIVE
Rank Type of Business Category Number of Businesses % of Total Businesses Floor Area (in Sq Ft) % of Total Floor Area
1 Limited Service Eating Places 61 16%
2 Full Service Restaurants 33 9%
3 Offices Of Other Health Practitioners 30 8%
4 General Professional Offices 27 7%
5 Hair Care And Esthetic Services 23 6%
Other Types of Businesses 207 54%
Total 381 100%
2005
Data Not Avaliable
Rank Type of Business Category Number of Business % of Total Businesses Floor Area (in Sq Ft) % Total Floor Area
1 Limited Service Eating Places 67 19% 116,862 15%
2 Full Service Restaurants 36 10% 67,140 8%
3 Offices Of Other Health Practitioners 31 9% 58,236 7%
4 General Professional Offices 20 6% 55,200 7%
5 Hair Care And Esthetic Services 17 5% 22,000 3%
Other Types of Businesses 181 51% 482,903 60%
Total 352 100% 802,341 100%
2019

LIVEABLE CITY
PLANNING LTD.
Andrew Yan
Consulting126
Business Mix “Top 5”, 2005 and 2019, Floor Area
• The business mixes in the Commercial Drive BIA
remain very stable as the top 5 business types in
2005.
• Eating establishments in the form of “Full Service
Restaurants” and “Limited Service Eating Places”
remain the largest combined form of business in
the area as they form 29% of the total number of
businesses and 23% of floor area in the BIA.
• Services in the form of Office of Other Health
Practitioners, General professional offices and
Hair care and esthetic services combined to form
20% of all businesses and 17% of floor space
which illustrates this importance of these business
types to neighbourhood vitality.
5.7 CHANGE OVER TIME: COMMERCIAL DRIVE
20
05
To
tal F
loo
r A
rea
Dat
a N
ot
Ava
ilab
le

LIVEABLE CITY
PLANNING LTD.
Andrew Yan
Consulting127
Chain vs. Independent Businesses, 2005 - 2019
• In the 14 years between inventories, the total number
of ground floor storefronts declined by 6.5%,
dropping from 381 to 352.
• Independent Businesses:
o Independent ground floor businesses have decreased
from 332 to 280 businesses, equating to a decrease in
proportion from 87% to 80%.
• Chain Businesses:
o There was an increase in ground floor chain
businesses, from 34 in 2005 to 56 in 2019 – a gain of
22. This equates to an increase in proportion from 9%
to 16%.
• Vacancy
o Vacant storefronts increased from 13 to 16, but the
rate remained relatively low with an increase from 3%
to 5%. This is partly due to the decrease in total
storefronts. Note that there were 2 storefronts under
construction in 2005.
5.7 CHANGE OVER TIME: COMMERCIAL DRIVE
Note: Vacancy rates in this section will differ from the vacancy rates in the previous section for the BIA as the vacancy rate used here disaggregates “Vacant” storefronts into separate “Under Construction” and “Vacant” categories. Furthermore, vacancy numbers may slightly differ due to numbers rounding.

LIVEABLE CITY
PLANNING LTD.
Andrew Yan
Consulting128
Chain vs. Independent by Floor Space
•
• Independent businesses tend to cluster toward small
floor areas.
o Median floor areas for chain stores were 2,000 square
feet versus 1,500 square feet for independent stores.
• The median vacant storefront square footage was
1,500 square feet.
0
10
20
30
40
50
60
50
0
80
0 9
25
1,0
00
1,0
04
1,0
09
1,0
36
1,0
50
1,0
86
1,1
69
1,2
00
1,2
28
1,2
40
1,2
65
1,5
00
1,6
72
1,7
09
1,7
83
1,8
00
2,0
00
2,0
61
2,2
00
2,5
00
2,8
00
3,0
00
3,2
00
3,5
00
3,6
00
4,0
00
4,5
00
5,0
00
5,3
00
5,5
00
6,0
00
6,5
00
7,5
00
8,0
00
10
,00
0 1
2,0
00
14
,82
6 1
5,0
00
38
,00
0
Nu
mb
er o
f St
ore
fro
nts
Floor Area (in Square Feet)
Chain Independent Vacant
5.7 CHANGE OVER TIME: COMMERCIAL DRIVE
Chain vs. Independent vs. Vacant, 2019
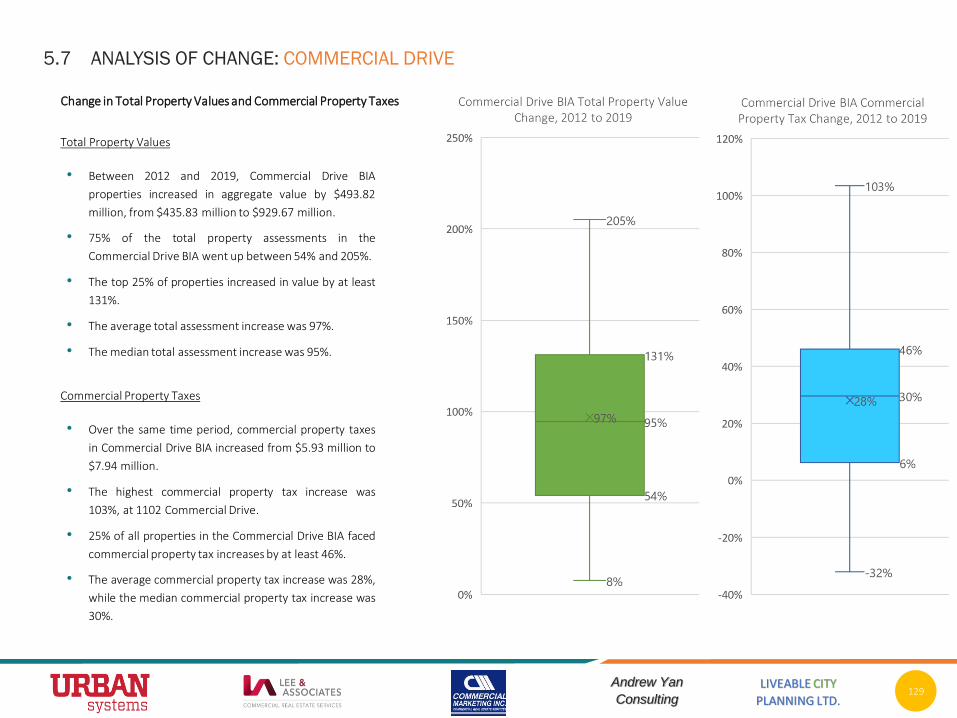
LIVEABLE CITY
PLANNING LTD.
Andrew Yan
Consulting129
Change in Total Property Values and Commercial Property Taxes
•
Total Property Values
• Between 2012 and 2019, Commercial Drive BIA
properties increased in aggregate value by $493.82
million, from $435.83 million to $929.67 million.
• 75% of the total property assessments in the
Commercial Drive BIA went up between 54% and 205%.
• The top 25% of properties increased in value by at least
131%.
• The average total assessment increase was 97%.
• The median total assessment increase was 95%.
Commercial Property Taxes
• Over the same time period, commercial property taxes
in Commercial Drive BIA increased from $5.93 million to
$7.94 million.
• The highest commercial property tax increase was
103%, at 1102 Commercial Drive.
• 25% of all properties in the Commercial Drive BIA faced
commercial property tax increases by at least 46%.
• The average commercial property tax increase was 28%,
while the median commercial property tax increase was
30%.
5.7 ANALYSIS OF CHANGE: COMMERCIAL DRIVE
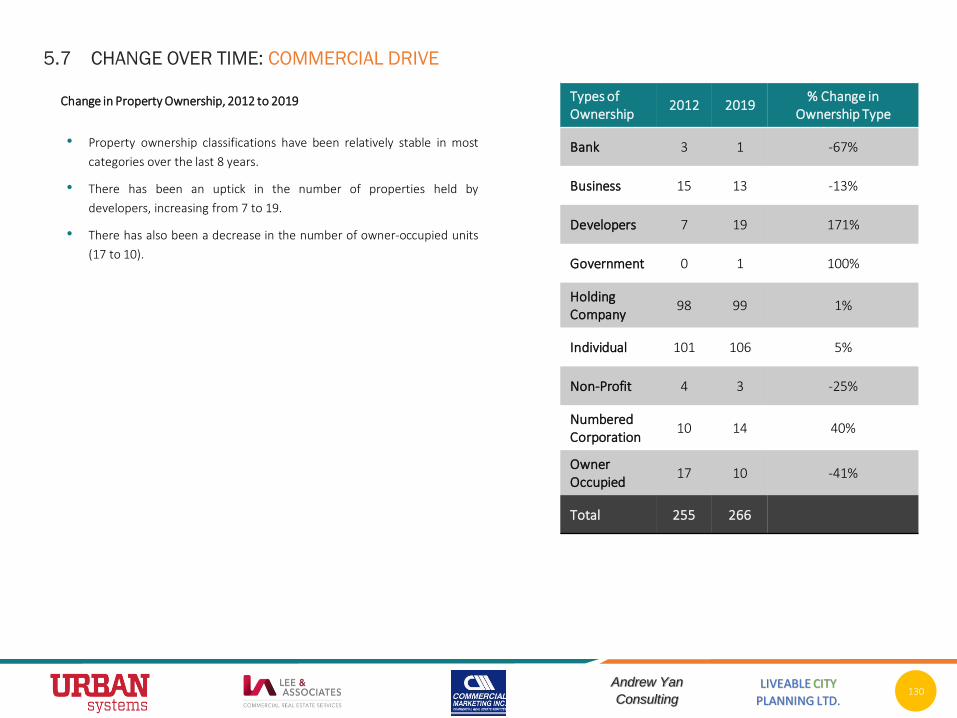
LIVEABLE CITY
PLANNING LTD.
Andrew Yan
Consulting130
Change in Property Ownership, 2012 to 2019
• Property ownership classifications have been relatively stable in most
categories over the last 8 years.
• There has been an uptick in the number of properties held by
developers, increasing from 7 to 19.
• There has also been a decrease in the number of owner-occupied units
(17 to 10).
5.7 CHANGE OVER TIME: COMMERCIAL DRIVE
Types of Ownership
2012 2019% Change in
Ownership Type
Bank 3 1 -67%
Business 15 13 -13%
Developers 7 19 171%
Government 0 1 100%
Holding Company
98 99 1%
Individual 101 106 5%
Non-Profit 4 3 -25%
Numbered Corporation
10 14 40%
Owner Occupied
17 10 -41%
Total 255 266

LIVEABLE CITY
PLANNING LTD.
Andrew Yan
Consulting131
Population Growth and Density
• In 2006, the population within a 1-kilometer radius around the Commercial Drive
BIA was 42,971.
• The population grew over 10 years, reaching 45,399 by 2016 for an area growth
rate of 5.7%.
• Population density in the 1km radius around the entire BIA in 2016 was 61.1
residents per hectare.
• The chart compares this density to the 1km radii around all 22 BIAs.
30.4
37.1
39.0
41.6
41.9
50.6
61.1
65.0
65.2
68.3
68.8
73.1
75.9
79.0
89.9
111.3
118.0
138.9
158.7
199.8
200.4
0.0 50.0 100.0 150.0 200.0 250.0
Point Grey Village BIA
Dunbar Village BIA
Kerrisdale BIA
Marpole BIA
Hastings - North BIA
Mount Pleasant BIA
Commercial Dr. BIA
Fraser St. BIA
Victoria Drive BIA
Collingwood BIA
Cambie Village BIA
West Broadway BIA
Chinatown BIA
South Granville BIA
Kitsilano Fourth Ave. BIA
Hastings Crossing BIA
Gastown BIA
Yaletown BIA
Downtown Vancouver BIA
Robson St. BIA
West End BIA
5.7 CHANGE OVER TIME: COMMERCIAL DRIVE Population Distribution Living within a One Kilometre Radius of the Commercial Drive BIA
Commercial Drive BIA Population Density vs BIAs City-Wide
Residents per Hectare
20 Residents
Census DisseminationArea Boundary
1 Kilometre Radius around BIA
Surrounding BIA
Study BIA

LIVEABLE CITY
PLANNING LTD.
Andrew Yan
Consulting132
5.7 CHANGE OVER TIME: COMMERCIAL DRIVE
Household Income and Spending
• The average and median household incomes within this Study area
in 2019 are estimated at $91,597 and $67,483, respectively.
• The aggregate household income in the 1-kilometer buffer area
was approximately $2.06 billion.
• The average household retail and food/beverage expenditure in
2019 was $44,845. In aggregate, this figure was $991.5 million.
Metric (2019) Commercial Dr. City of Vancouver
% Over/Under City
Average Annual Household Income
$91,597 $109,914 -17%
Median Annual Household Income
$67,483 $74,312 -9%
Aggregate Annual Household Income
$2.06 billion $33.0 billion
Average Annual Retail + F&B Spend
$44,845
Aggregate Annual Retail + F&B Spend
$991.5 million
20 Residents
Census DisseminationArea Boundary
1 Kilometre Radius around BIA
Surrounding BIA
Study BIA
Distribution of Population Living within a One Kilometre Radius of the Commercial Drive BIA
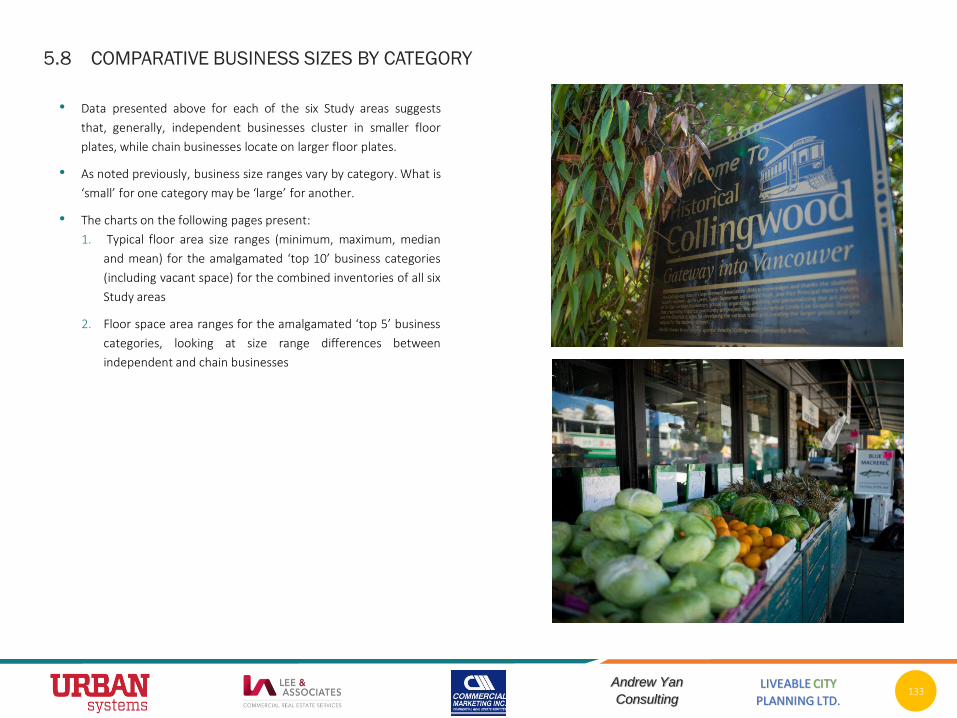
LIVEABLE CITY
PLANNING LTD.
Andrew Yan
Consulting133
• Data presented above for each of the six Study areas suggests
that, generally, independent businesses cluster in smaller floor
plates, while chain businesses locate on larger floor plates.
• As noted previously, business size ranges vary by category. What is
‘small’ for one category may be ‘large’ for another.
• The charts on the following pages present:
1. Typical floor area size ranges (minimum, maximum, median
and mean) for the amalgamated ‘top 10’ business categories
(including vacant space) for the combined inventories of all six
Study areas
2. Floor space area ranges for the amalgamated ‘top 5’ business
categories, looking at size range differences between
independent and chain businesses
5.8 COMPARATIVE BUSINESS SIZES BY CATEGORY

LIVEABLE CITY
PLANNING LTD.
Andrew Yan
Consulting134
Top 10 Business Types by Floor Area (in square feet)
• The box / whisker plots below show the range of business sizes for the amalgamated ‘top 10’ categories of all six Study areas.
5.8 COMPARATIVE BUSINESS SIZES BY CATEGORY
4,028

LIVEABLE CITY
PLANNING LTD.
Andrew Yan
Consulting135
Limited Service Food and Beverage – Chain vs. Independent
• There are 116 independents and 76 chains in the Limited Service Food and
Beverage category across the six combined Study areas.
• The median floor area size of an independent in this category is under 1,300
square feet, whereas the median size of a chain is 1,500 square feet.
• The average floor area size of an independent is just over 1,600 square feet,
compared to nearly 1,800 square feet for chains.
5.8 COMPARATIVE BUSINESS SIZES BY CATEGORY

LIVEABLE CITY
PLANNING LTD.
Andrew Yan
Consulting136
Full-Service Food and Beverage – Chain vs. Independent
• There are 136 independents and 12 chains in the Full-Service Food and
Beverage category across the six combined Study areas.
• The median floor area size of an independent is nearly 1,400 square feet, while
the median size of a chain is 1,600 square feet.
• The average floor area size of an independent is just over 1,800 square feet,
compared to 2,200 square feet for chains.
5.8 COMPARATIVE BUSINESS SIZES BY CATEGORY

LIVEABLE CITY
PLANNING LTD.
Andrew Yan
Consulting137
Pharmacies and Drug Stores – Chain vs. Independent
• There are 13 independents and 13 chains in the Pharmacies and Drug Stores category
across the six combined Study areas.
• The median floor area size of an independent is 1,000 square feet, compared to 2,000 for
a chain.
• The average floor area size of an independent is very close to the median (just under
1,100); average chain size is over 7,500 square feet.
• There is significant floor area size range in this category amongst chain businesses.
5.8 COMPARATIVE BUSINESS SIZES BY CATEGORY
X
1,500
1,5001,200
1,000
675
1,089
Expanded Chart

LIVEABLE CITY
PLANNING LTD.
Andrew Yan
Consulting138
Apparel (Women’s Clothing) – Chain vs. Independent
• There are 26 independents and 7 chains in the Women’s Clothing category
across the six combined Study areas.
• The median floor area size of an independent is 1,200 square feet, compared to
2,500 for a chain.
• The average floor area size of an independent is nearly 1,600 square feet,
compared to 2,400 for chains.
5.8 COMPARATIVE BUSINESS SIZES BY CATEGORY

LIVEABLE CITY
PLANNING LTD.
Andrew Yan
Consulting139
5.8 COMPARATIVE BUSINESS SIZES BY CATEGORY
Beer, Wine, Liquor and Cannabis Stores – Chain vs. Independent
• There are 25 independents and 8 chains in the Beer, Wine, Liquor and Cannabis
category across the six combined Study areas.
• The median floor area size of an independent is 1,000 square feet, compared to
nearly 4,300 square feet for a chain.
• The average floor area size of an independent is nearly 1,600 square feet,
compared to 4,100 for a chain.
893

LIVEABLE CITY
PLANNING LTD.
Andrew Yan
Consulting140
5.8 COMPARATIVE BUSINESS SIZES BY CATEGORY
Synopsis
• Independents smaller than chains: Across the top 5 categories, we find that across all Study areas,
independent businesses operate in smaller floor plates than chain businesses.
• Size range greater for chains: The ranges of floor plate size variability is greater amongst chain businesses in
all the top 5 categories.
• Pharmacies large and small: The most dramatic variance between independent and chain floor plate sizes
amongst the top 5 categories is in the pharmacy category, where the largest independent is only 1,500
square feet while the largest chain is 22,000 square feet.
• Smaller, Independent Restaurants: Restaurants (limited, and full serve), while showing less difference
between chains and independents than other categories, still show a distinct difference in average, median
and max sizes between chains and independents
• Smaller areas, fewer people: The smaller floorplates also most likely reflect smaller businesses in terms of
number of employees.

LIVEABLE CITY
PLANNING LTD.
Andrew Yan
Consulting141
5.9 TOTAL PROPERTY VALUE CHANGE COMPARISON ACROSS ALL STUDY AREAS, 2012 TO 2019

LIVEABLE CITY
PLANNING LTD.
Andrew Yan
Consulting142
5.10 COMMERCIAL PROPERTY TAX CHANGE COMPARISON FOR ALL STUDY AREAS, 2012 TO 2019
The three study areas which have had
recent community plans (Commercial Drive
(Grandview Woodlands), Marpole and
Hastings North (Grandview Woodlands)
have seen the most substantial increases in
property taxes.

LIVEABLE CITY
PLANNING LTD.
Andrew Yan
Consulting143
4%
7%
9%
6%
9%
4%
13%
15%
11%
6%
12%
5%
Collingwood
Commercial Drive
Marpole
Hastings North
West Broadway
South Granville
Vacancy
• Generally speaking, vacancy rates above 10% are a signal of possible health / vitality challenges in a local shopping area.
• In their respective baseline years, all six Study areas were within the ‘healthy’ (<7%) or ‘acceptable’ (7-10%) vacancy ranges, with the
lowest vacancy being seen in South Granville and Commercial Drive (4% and 4% on a storefront basis).
• In 2019, four of the six Study areas had vacancy rates at or above 10%.
Healthy Acceptable Unhealthy
5.11 AMALGAMATED SUMMARY: CHANGE OVER TIME, ALL STUDY AREAS
Vacancy Rate as proportion of total storefronts, base year vs. 2019
Base Year
2019

LIVEABLE CITY
PLANNING LTD.
Andrew Yan
Consulting144
Chains vs. Independents
• There is not a single story across the six Study
areas around chain vs. independent business
trends.
• South Granville exhibited the clearest example
of independent business decrease and chain
business increase; however, this area also saw
a substantial increase in vacancy.
• Collingwood and Commercial Drive both saw
increases in chain business and a
corresponding decrease in independent
business.
• Marpole and Hastings North saw a decrease in
the proportion of chains; Hastings North also
saw a decrease in the proportion of
independents, while Marpole saw a slight
increase in proportion of independents.
• In five of the six areas, the percentage of
independent businesses decreased.
• Independents are not necessarily being
replaced by chains, but in some areas by
vacancies.
5.11 AMALGAMATED SUMMARY: CHANGE OVER TIME, ALL STUDY AREAS
Proportion of Storefronts by Chain Status, Base Year vs. 2019
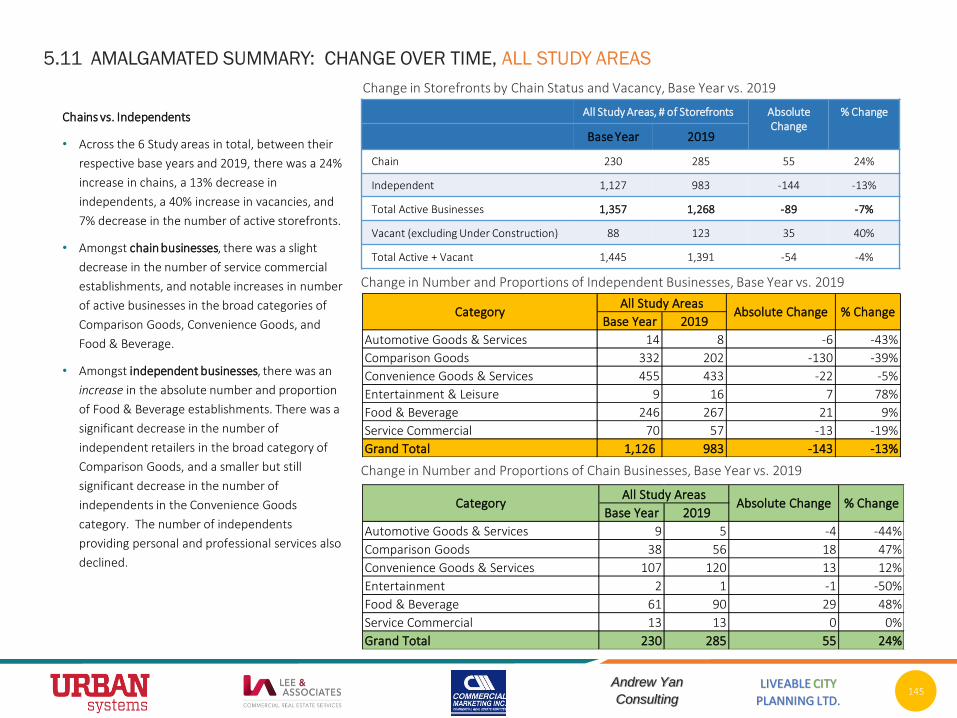
LIVEABLE CITY
PLANNING LTD.
Andrew Yan
Consulting145
Chains vs. Independents
• Across the 6 Study areas in total, between their
respective base years and 2019, there was a 24%
increase in chains, a 13% decrease in
independents, a 40% increase in vacancies, and
7% decrease in the number of active storefronts.
• Amongst chain businesses, there was a slight
decrease in the number of service commercial
establishments, and notable increases in number
of active businesses in the broad categories of
Comparison Goods, Convenience Goods, and
Food & Beverage.
• Amongst independent businesses, there was an
increase in the absolute number and proportion
of Food & Beverage establishments. There was a
significant decrease in the number of
independent retailers in the broad category of
Comparison Goods, and a smaller but still
significant decrease in the number of
independents in the Convenience Goods
category. The number of independents
providing personal and professional services also
declined.
5.11 AMALGAMATED SUMMARY: CHANGE OVER TIME, ALL STUDY AREAS
Change in Storefronts by Chain Status and Vacancy, Base Year vs. 2019
Change in Number and Proportions of Independent Businesses, Base Year vs. 2019
Change in Number and Proportions of Chain Businesses, Base Year vs. 2019
Base Year 2019
Automotive Goods & Services 9 5 -4 -44%
Comparison Goods 38 56 18 47%
Convenience Goods & Services 107 120 13 12%
Entertainment 2 1 -1 -50%
Food & Beverage 61 90 29 48%
Service Commercial 13 13 0 0%
Grand Total 230 285 55 24%
CategoryAll Study Areas
Absolute Change % Change
Base Year 2019
Automotive Goods & Services 14 8 -6 -43%
Comparison Goods 332 202 -130 -39%
Convenience Goods & Services 455 433 -22 -5%
Entertainment & Leisure 9 16 7 78%
Food & Beverage 246 267 21 9%
Service Commercial 70 57 -13 -19%
Grand Total 1,126 983 -143 -13%
% ChangeCategoryAll Study Areas
Absolute Change
All Study Areas, # of Storefronts Absolute Change
% Change
Base Year 2019
Chain 230 285 55 24%
Independent 1,127 983 -144 -13%
Total Active Businesses 1,357 1,268 -89 -7%
Vacant (excluding Under Construction) 88 123 35 40%
Total Active + Vacant 1,445 1,391 -54 -4%

LIVEABLE CITY
PLANNING LTD.
Andrew Yan
Consulting146
Active Business Categories and Vacancies
• Looking at high-level business categorization
for both chains and independents, the
following changes could be observed between
baseline survey years and 2019:
o Notable decrease in the proportion of
active businesses in Comparison Goods
categories
o Significant increase in proportion of active
Food & Beverage businesses
o Relative stability in the proportion of
Service Commercial businesses
o A decrease in Automotive Goods and
Services businesses
o An increase in vacant storefronts (includes
ones under construction)
5.11 AMALGAMATED SUMMARY: CHANGE OVER TIME, ALL STUDY AREAS
Change in Proportions of Storefronts by Category and Vacancy, Base Year vs. 2019

LIVEABLE CITY
PLANNING LTD.
Andrew Yan
Consulting147
Property Ownership, 2012 to 2019
• Across the six Study areas there has been a general
decrease in the number of properties owned by
individuals (-6%) and occupier business ownership (-
25%), compared to properties owned by development
companies (+71%) and numbered corporations
(+45%).
• Increases in ownership by numbered corporations and
decreases in owner-occupied or individual ownership
can be a sign of changing ownership models amongst
business owners for a variety of reasons (e.g. taxation,
estate planning).
• The increase in ownership by development companies
and holding companies may be a signal of future
redevelopment of existing buildings.
5.11 AMALGAMATED SUMMARY: CHANGE OVER TIME, ALL STUDY AREAS
Property Ownership
All Study Areas % Change in Ownership Type2012 2019
Business 95 67 -29%
Developers 68 116 71%
Financial Institution
13 5 -62%
Holding Company
275 301 9%
Individual 301 284 -6%
Non-Profit 7 7 0%
Numbered Corporation
60 87 45%
Owner Occupied
76 57 -25%
Public 35 17 -51%
Definitions: A property is categorized as being owned by “individual” when the ownership record list a person’s name as a property’s owner, “business” owned occurs when a business name is listed as the owner. In both cases, when the assessment title is not being sent to the assessed address, it is assumed that the property is not being owner occupied. An owner occupied property is assumed to occur when the assessment is being sent to the same address as the assessed property and lists an individual or business as its owner.

LIVEABLE CITY
PLANNING LTD.
Andrew Yan
Consulting148
5.11 AMALGAMATED SUMMARY: CHANGE OVER TIME, ALL STUDY AREAS
2019 Snapshots
• Retail and Commercial activities are highly localized, and one
model does not fit all.
• Some BIAs are thriving, but other areas are struggling for a
number of localized and overall market reasons.
• Each BIA has its own mix of independent and chain stores,
but it is important to note the deeper diversity within each
BIA in terms of entrepreneur, family owned, and new
immigrant businesses.
• Vacancy is a concern in four of the six Study areas.
LIVEABLE CITY
PLANNING LTD.
Andrew Yan
Consulting149
Displacement of Independents by Chains is Not Universal
• There has not been a universal ‘surge’ of chains replacing
independents.
o Two areas (Marpole and Hastings North) have a lower proportion of
chain businesses today (by storefront count) than in the
comparative base years.
o West Broadway saw the chain business ratio increase slightly
between base year and 2019, increasing from 18% to 19%.
o South Granville saw the proportion of chain businesses increase
most significantly (with a corresponding decrease in independent
businesses), from 27% to 41%.
o Commercial Drive and Collingwood saw increases in chains from 9%
to 16% and 11% to 17% respectively
Independent Business Counts have Decreased in Most Areas
• Despite variability across Study areas around the trend of chains
(less dominant in two areas, slightly more dominant in three areas,
and more notably dominant in one area), independent businesses
saw a decrease in their proportion of storefronts in five of the six
Study areas
• In Collingwood and Commercial Drive, the loss of independents has
been largely offset by an increase in chains, with vacancy remaining
relatively low.
• In Hastings North, the slight decline in independents has paralleled
a slight decline in chains, and an increase in vacancy.
• In South Granville the story is one of both significant loss of
independents and increase in chains, and a significant increase in
vacancies.
• In West Broadway, an 8% decline in independents has
corresponded with a 1% increase in chains, a 3% increase in
vacancy, and a 5% increase in space under construction.
Vacancy has become More Significant• In all but one area (Collingwood), vacancy rates have increased
between the base year and 2019
• For 3 of the 5 Study areas, vacancy rates have crossed into potentially‘unhealthy’ territory (>10%)
5.12 SYNOPSIS OF KEY FINDINGS: CHANGE OVER TIME, AND CURRENT CONDITIONS

LIVEABLE CITY
PLANNING LTD.
Andrew Yan
Consulting150
Independents Operate in Smaller Spaces
• Across the ‘top 5’ categories in each of the six Study areas,
independent businesses were found to operate in smaller floor
plates than chain businesses.
• Additionally, the variability in the range of floor plate sizes appeared
much greater amongst chain businesses. They also varied
considerably by category.
Property Values Increased Substantially
• Looking at data points from 2012 and 2019, values for commercial
properties increased by an average of between 78% (South Granville)
and 250% (Hastings North).
Additional Rents, Including Property Taxes, Have Increased
• Property taxes typically comprise a significant component of
“additional rent”, but its proportion varies area to area and business
to business.
• Within the sample rental data, additional rent increases were much
higher in single-storey commercial buildings with unused
development potential.
• Looking at data points from 2012 and 2019, average property taxes
increased between 15% (South Granville) and 47% (Marpole).
Average tax increases were highest in 2 areas subject to recent
community plans (Marpole and a portion of Hastings North).
Base Rents in Sample Buildings have Increased, but More Modestly
• While sourced from a small data set (based on lease information
sourced from landlords and brokers for a sample of properties), it
was found that base rents did not go up universally, and where they
did go up, their rate of increase was typically modest.
• Anecdotal evidence suggests that many landlords are moderating
rent increases, and in some cases are decreasing base rents, as
businesses struggle to manage the burden of substantial increases
to additional rents.
5.12 SYNOPSIS OF KEY FINDINGS: CHANGE OVER TIME, AND CURRENT CONDITIONS

LIVEABLE CITY
PLANNING LTD.
Andrew Yan
Consulting151
Property Ownership is Changing
• The nature of ownership of commercial properties is shifting in the
six Study areas, with more properties owned today by development
companies and numbered corporations, and fewer owned by
owner-occupied businesses or individuals
• Some of the observed change in property ownership, such as the
decrease of individual ownership and increase of numbered
companies, may be a reflection more of the nature of business
taxation and the sophistication of the owner/operators, rather than
a substantial structural change.
• However, the increase in ownership by development companies
and holding companies is likely a signal of future redevelopment
intent.
• The analysis of available data suggests a correlation between the rate
of property turnover and the preponderance of vacant storefronts.
This relationship requires further exploration.
Businesses are Facing Increasing Competition from E-Commerce and Other
Sources
• Business owners in many sectors are facing more competition from
online sales. Restaurants are facing a shift in the proportion of their
business tied to food delivery. As these trends advance, they are
likely to lead to greater shifts in how retailers and service providers
use their space and may impact the general tenant mix in retail
areas.
• Some of the emerging implications of e-commerce, omni-channel
retailing and other major trends will likely include:
o Demand for more distribution and logistics space to facilitate
delivery of both retail goods and food
o Greater demand for retail spaces that can be combined with
production, distribution and repair
o Greater demand for floor area related to online order and delivery
preparation
o Ability to accommodate pop-up shops in vacant space, and for
businesses to respond quickly to changing market demand
o Increasing importance of entertainment, personal services, unique
restaurants and non-retail uses such as libraries, community centres
and the like, in local shopping areas, both as anchor uses drawing
foot traffic to other businesses, and in providing places to gather as
a community.
• E-Commerce and omni-channel sales may benefit some small
businesses. Third-party delivery allows restaurants to increase their
effective trade areas. For specialized retailers and boutique
manufacturers, online sales can be a major benefit, particularly if an
area is experiencing declining foot traffic or a stagnant trade area
population.
5.12 SYNOPSIS OF KEY FINDINGS: CHANGE OVER TIME, AND CURRENT CONDITIONS

LIVEABLE CITY
PLANNING LTD.
Andrew Yan
Consulting152
5.12 SYNOPSIS OF KEY FINDINGS: CHANGE OVER TIME, AND CURRENT CONDITIONS
Chains and Independents can form parts of a Healthy Retail Ecosystem
• “Chain” or “independent” can be a function of time. What is a chain
today may once have been an independent (e.g. Starbucks).
Similarly, businesses that grow to become chains may also shrink
and become independents once more (e.g. Strong’s Market). A
healthy retail ecosystem allows businesses to scale, grow, contract,
and test the possibilities of the marketplace.
• Chain businesses, by virtue of their size or the segments they
operate in, can act as anchor tenants for commercial areas.
Common examples are chain supermarkets, pharmacies, and
financial institutions. Chains are also more likely to be able to lease
larger storefronts, which many independents are financially unable
to occupy. Chains do, however, tend to have lower local economic
multiplier benefits. However, this may miss nuance within the
‘chain’ category. A local chain of 7-8 businesses for instance will
likely be quite different in how it interacts with the local community
than a national or global chain.
• A retail ecosystem that allows all businesses to thrive is one of
stable and predictable costs, reasonable permitting requirements
and timelines, a welcoming and safe public realm, flexible building
design, and a strong local customer base. In such an environment,
all businesses with sound operating fundamentals should be able to
compete effectively for space and customers.
• Chain businesses are often more resilient than independents due to
their ability to pay higher rents, weather long permitting processes,
and offset unpredictable cost increases through their economies of
scale and ability to access financing.
• A ‘displacement’ of independents by chains in a local area, which
has been seen in some of the Study areas, is a multi-faceted issue,
likely a function of:
o Chains’ generally greater ability to withstand sudden escalation
to their operating costs in the form of rents (including
commercial property taxes).
o Chains’ ability to offset losses associated with lengthy
permitting processes.
o Chains' ability to pre-lease new space under development.

6.0 ENGAGEMENT WITH BUSINESS COMMUNITY

LIVEABLE CITY
PLANNING LTD.
Andrew Yan
Consulting154
6.1 OVERVIEW OF APPROACH: SURVEYS AND ROUNDTABLES
Building upon the analysis of change over time in the six Study areas presented in
Section 5, we conducted primary research with business owners, operators,
brokers and landlords to understand their perceptions of the challenges and
change drivers in their respective shopping areas. Two parallel approaches were
undertaken in each of the six case Study areas:
1. Surveys of local business owners, operators, landlords, brokers and property
managers; and
2. Roundtable meetings with BIA members, BIA Executive Directors (EDs)
embedded industry experts, and City staff.
This information was supplemented with one-on-one conversations with industry
experts and follow-up discussions with BIA EDs. It is worth noting that these
surveys were completed in advance of COVID-19 measures which have had
significant and ongoing negative impacts on local shops and services.
Surveys Received and Completed
Survey Type Responses* Completed**
Landlords / Brokers/ Property Owners
17 16
Retailers / business owners
102 85
*Responses: number of surveys received with some useful data (i.e. more than name and contact info), but not marked “complete” by Voxco**Completed: number of surveys marked “complete” by Voxco
Retailer / Business Surveys Received by Area and Business Type
BIA Food & Beverage
Personal Service
Destination Retail
Other Retail
Health / Fitness
Other TOTAL
South Granville 0 2 1 0 0 0 3
West Broadway 13 7 2 4 2 2 30
Marpole 0 1 0 1 0 1 3
Hastings North 4 8 1 3 0 3 19
Collingwood 0 3 0 0 0 1 4
Commercial Drive
14 9 5 10 1 4 43
Surveys Overview
• The objective of the direct surveys was to collect detailed information
from local business owners/operators, landlords, brokers and
property managers on the state of retail and service businesses in the
Study areas.
• For the South Granville BIA ‘pilot’ study, surveys were distributed first
in hard copy and only later via electronic mailout. For the other Study
areas, surveys were developed on an online platform (Voxco.com);
BIA Directors emailed survey URL links directly to their membership.
• Responsibility to complete the surveys was left with survey recipients.
BIA leaders were asked to follow up with members to encourage
survey completion.
• Figures on surveys received and completed, along with geographic
and business sector survey sources, are presented below.
LIVEABLE CITY
PLANNING LTD.
Andrew Yan
Consulting155
Surveys Limitations
• Response rates varied considerably from BIA to BIA.
• Small sample sizes for landlord / broker surveys, and relatively small
sample sizes for retailer surveys from 3 of the 6 Study areas, ultimately
preclude the ability to compare results across BIAs, or across business
categories.
• Survey results are, however, useful in aggregate for identifying general
trends, indicators and drivers of change.
• Survey results are presented in their entirety in Appendices F and G.
Roundtables Overview
• A 2-hour roundtable event was held in each of the 6 Study areas,
between 9:30 and 11:30am on a weekday.
• The roundtables were organized by BIA leaders and the consulting team,
and attended by BIA leadership, BIA members, industry experts,
consultants, and City staff.
• A pilot roundtable was held in South Granville on June 19th 2019, and
the final roundtable was held in Hastings North on September 5th, 2019.
• Invited industry experts were embedded into the roundtable events, in
lieu of a formal advisory committee.
• The core objectives of the roundtables were to discuss challenges and
drivers of change, and identify the top issues that had the most relevance
for each particular business or sector.
• By embedding industry experts directly into the roundtable events
(versus having a stand-alone committee), there was greater sharing of
information and more extensive participation.
• Roundtable attendance figures (excluding City staff, consultants and BIA
leadership) were as follows:
o South Granville: 24
o West Broadway: 13
o Marpole: 10
o Hastings North: 12
o Collingwood: 15
o Commercial Drive: 32
• Dates for the roundtable events were as follows:
o South Granville (pilot): June 19th 2019
o West Broadway: July 12th 2019
o Marpole: August 15th 2019
o Collingwood: August 21st 2019
o Commercial Drive: August 30th 2019
o Hastings North: September 5th 2019
• The consulting team had hoped to achieve coverage from dominant
business categories at each roundtable. This was not achieved in some
areas, most notably in Marpole, Collingwood and Hastings North where
there was limited or no representation from multicultural restaurants or
personal services providers. This underscored a key limitation of this
roundtable format, namely that many small, family-operated businesses
who do not typically engage with BIA initiatives were unable or unwilling
to attend the event. To engage effectively with these communities, one-
on-one interviews would be required with the services of a translator.
This was not possible within the study scope.
6.1 OVERVIEW OF APPROACH: SURVEYS AND ROUNDTABLES

LIVEABLE CITY
PLANNING LTD.
Andrew Yan
Consulting156
As noted in the overview, survey response rates and variability
of response by Study area (and business category) negates the
ability to cross-compare. Survey results are thus presented
here in aggregate to tell a more general story on drivers of
change and key issues faced by businesses in the case Study
areas. Survey results are presented in further detail in the
study appendices.
Business Longevity, Locations and Employees
• Amongst business operator respondents (n=102), over
50% identified having been operating their business in its
present location for at least 10 years. 28% indicated they
had operated in the same location for over 20 years.
• 43% of respondents indicated they had been in business
(not necessarily in its current location) at least 20 years.
• 51% of respondents indicated that they had less than 5
full-time employees. 73% had less than 10.
• 85% of respondents do not operate businesses outside of
Vancouver.
2721
1411
29
0
10
20
30
40
<5 5 to 9 10 to 14 15 to 19 >=20
Nu
mb
er o
f P
arti
cip
ants
Number of Years
How many years has your business been operating in THIS location?
8
16 1512
38
0
10
20
30
40
<5 5 to 9 10 to 14 15 to 19 >=20
Nu
mb
er o
f P
arti
cip
ants
Number of Years
How many years has your business been operating in ANY location?
50
2213
211
0102030405060
<5 5 to 9 10 to 14 15 to 19 >=20
Nu
mb
er o
f P
arti
cip
ants
Number of Employees
How many full-time employees are at this business?
6.2 BUSINESS SURVEY RESULTS

LIVEABLE CITY
PLANNING LTD.
Andrew Yan
Consulting157
Unit Tenure and Lease Terms
• Amongst business owner / operators who responded to
questions on unit tenure (n = 100) 86% lease the unit
where they operate their business. 9% own their unit / lot
freehold, and 3% own a strata unit.
• Amongst those who responded to the question of lease
type (n = 85), 73% have a ‘triple net’ lease, 12% pay a
gross rate, and 15% were unsure of lease terms.
o 58% of those who have a lease indicated that they are
concerned that some aspect of their lease is affecting the
viability of their business. The three primary concerns are:
▪ Increasing basic rent (32%)
▪ Increasing property taxes (32%)
▪ Fear of redevelopment(14%)
• Amongst those who know whether they have a
demolition clause in their lease (n = 53), 40% indicated
that their lease included such a clause.
• Amongst those who know whether their lease provides an
option to renew their lease at the existing location (n =
70), 93% indicated that their lease did not provide such an
option.
62
10 13
0
20
40
60
80
I pay Base Rate + Property
Tax + Maintenance (“Triple
Net”)
I pay a Gross Rate
(landlord pays property tax
and repairs)
I don’t knowNu
mb
er o
f Pa
rtic
ipan
ts
What type of lease do you have?
83
3 9 3 20
20
40
60
80
100
We RENT the
property
(Freehold)
We RENT the
property
(Condominium
Strata)
We OWN the
property
(Freehold)
We OWN the
property
(Condominium
Strata)
I Don’t KnowNu
mb
er o
f Pa
rtic
ipan
ts
Does the company rent or own the location of this business?
22
31
25
0
10
20
30
40
Yes No I don’t know
Nu
mbe
r of P
arti
cipa
nts
Does your lease have a Demolition Clause allowing the landlord to terminate your lease for redevelopment?
6.2 BUSINESS SURVEY RESULTS

LIVEABLE CITY
PLANNING LTD.
Andrew Yan
Consulting158
Revenues, Costs and Profits – Last 2 Years
• Business Revenues (n = 92)
o 53% said sales had increased and 22% indicated that sales
had remained the same.
o Only 5% indicated that sales had decreased a lot.
• Lease Costs (n = 89)
o 66% said lease costs have increased a little or a lot. This
includes both basic rent and additional rent (the latter
including property taxes).
o 13% indicated stable lease costs.
o 2% indicated decreased lease costs.
o The balance did not know or did not answer.
• Goods and Services Costs (n = 92)
o 73% said their costs of goods and services required to run
their business had increased a little or a lot.
• Profitability (n = 91)
o 38% said their profitability had increased.
o 29% said their profitability had decreased.
o 25% said their profitability had remained the same.
15
34
20
125
15
0
10
20
30
40
Increased a
Lot
Increased a
Little
Stayed Same Decreased a
little
Decreased a
lot
I Don’t Know N/A
Nu
mb
er o
f Pa
rtic
ipan
ts
Describe how your revenue has changed over the past 2 years?
2633
12
1 18 8
0
20
40
Increased aLot
Increased aLittle
Stayed Same Decreased alittle
Decreased alot
I Don’t Know N/A
Nu
mb
er o
f Pa
rtic
ipan
ts
Describe how the property / lease costs related to your location have changed over the past 2 years?
2938
121 2 3 7
0
20
40
Increased a
Lot
Increased a
Little
Stayed
Same
Decreased
a little
Decreased
a lotDon’t Know N/A
Nu
mb
er o
f Pa
rtic
ipan
ts
Describe how the cost to you of the goods / services that you sell has changed over the past 2 years?
9
17
28
7
23
7
0
10
20
30
Decreased a
lot
Decreased a
little
Increased a
Little
Increased a
Lot
Stayed Same N/A
Nu
mb
er o
f Pa
rtic
ipan
ts
Describe how the profitability of your business has changed over the past 2 years?
6.2 BUSINESS SURVEY RESULTS

LIVEABLE CITY
PLANNING LTD.
Andrew Yan
Consulting159
Basic Rents: 2011, 2015, 2019
• Businesses were asked to share information on the
amount of basic rent paid per square foot in 2019, and
how it compares to basic rent paid in 2015 and 2011.
• The number of respondents varied for each year of data:
o 2011 n = 15
o 2015 n = 21
o 2019 n = 25
2 2 2
5 5
4
3 3
7
2
4 4
1
4 4
1
3
4
0
1
2
3
4
5
6
7
8
2011 2015 2019
Nu
mb
er o
f P
arti
cip
ants
Could you share your Basic Rent (per square foot) for the years below?
$0 to $9
$10 to $19
$20 to $29
$30 to $39
$40 to $49
$50 to $60

LIVEABLE CITY
PLANNING LTD.
Andrew Yan
Consulting160
Challenges to Business Viability
• Retailers were asked to rate, on a scale of 1 to 5 (not significant to
extremely significant), the level of significance of 9 factors as
“challenges to business viability” in their local shopping area.
• They were also asked to describe other factors not listed.
• Response levels varied by question, with a high of 73 and a low of
37.
• The ‘top 3’ challenges to business activity, based on proportion of
respondents ranking them as ‘significant’ or ‘very significant’ were:
o City permitting (87%)
o Rent (75%)
o Overhead costs (75%)
• Beyond the list of 9 issues provided, participants were asked to
identify any “other” issues they perceive as challenges to business
viability. There were 51 responses.
o The most commonly identified ‘other’ concern (n=19) was related
to ‘social issues.’ These include: homelessness, crime, and presence
of low barrier shelters (37%).
o The second-most common ‘other’ issue (n=6) was quality of public
realm (11%).
o This was followed by a 3-way tie between ‘increased competition,’
‘lease uncertainty / redevelopment threat, and ‘cost of goods and
labour’ (8%).
Challenges to Business Viability (Factors)
% Indicating “significant or very significant”
(4 or 5)
Number of respondents (n)
City Permitting 87% 52
Rent / Lease Costs (including taxes) 75% 69
Overhead Costs 75% 73
Labour issues 68% 71
Cash flow / financing 68% 71
Parking / Transportation 53% 64
Ability to Expand 48% 52
Marketing 30% 63
Logistics 21% 37
Level of Significance as Challenges to Business Viability
6.2 BUSINESS SURVEY RESULTS
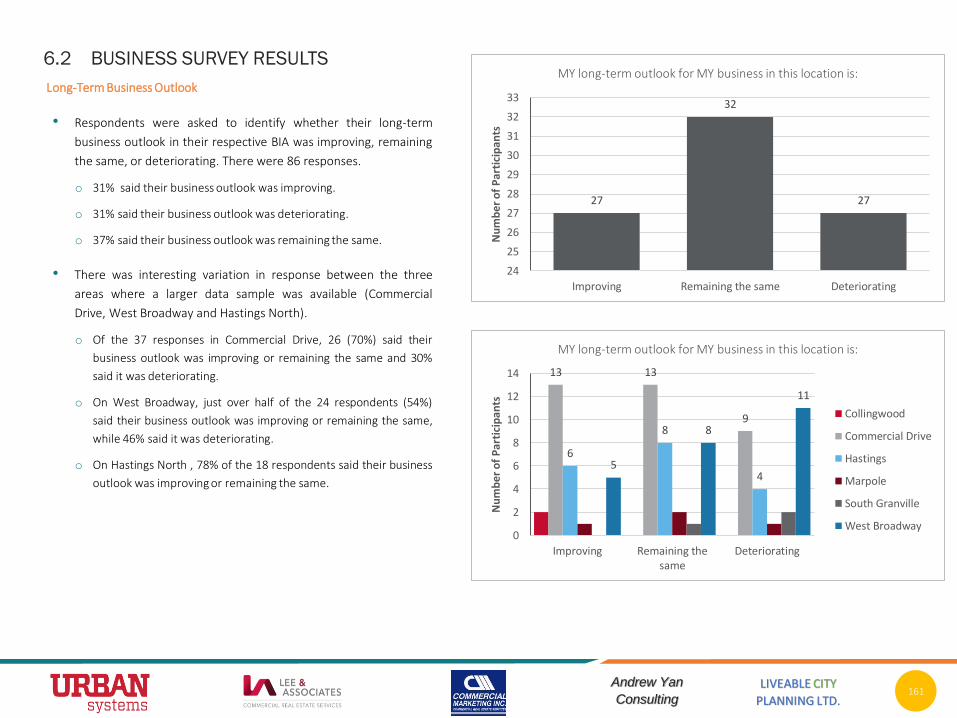
LIVEABLE CITY
PLANNING LTD.
Andrew Yan
Consulting161
Long-Term Business Outlook
• Respondents were asked to identify whether their long-term
business outlook in their respective BIA was improving, remaining
the same, or deteriorating. There were 86 responses.
o 31% said their business outlook was improving.
o 31% said their business outlook was deteriorating.
o 37% said their business outlook was remaining the same.
• There was interesting variation in response between the three
areas where a larger data sample was available (Commercial
Drive, West Broadway and Hastings North).
o Of the 37 responses in Commercial Drive, 26 (70%) said their
business outlook was improving or remaining the same and 30%
said it was deteriorating.
o On West Broadway, just over half of the 24 respondents (54%)
said their business outlook was improving or remaining the same,
while 46% said it was deteriorating.
o On Hastings North , 78% of the 18 respondents said their business
outlook was improving or remaining the same.
27
32
27
24
25
26
27
28
29
30
31
32
33
Improving Remaining the same Deteriorating
Nu
mb
er o
f P
arti
cip
ants
MY long-term outlook for MY business in this location is:
13 13
9
6
8
45
8
11
0
2
4
6
8
10
12
14
Improving Remaining thesame
Deteriorating
Nu
mb
er o
f P
arti
cip
ants
MY long-term outlook for MY business in this location is:
Collingwood
Commercial Drive
Hastings
Marpole
South Granville
West Broadway
6.2 BUSINESS SURVEY RESULTS
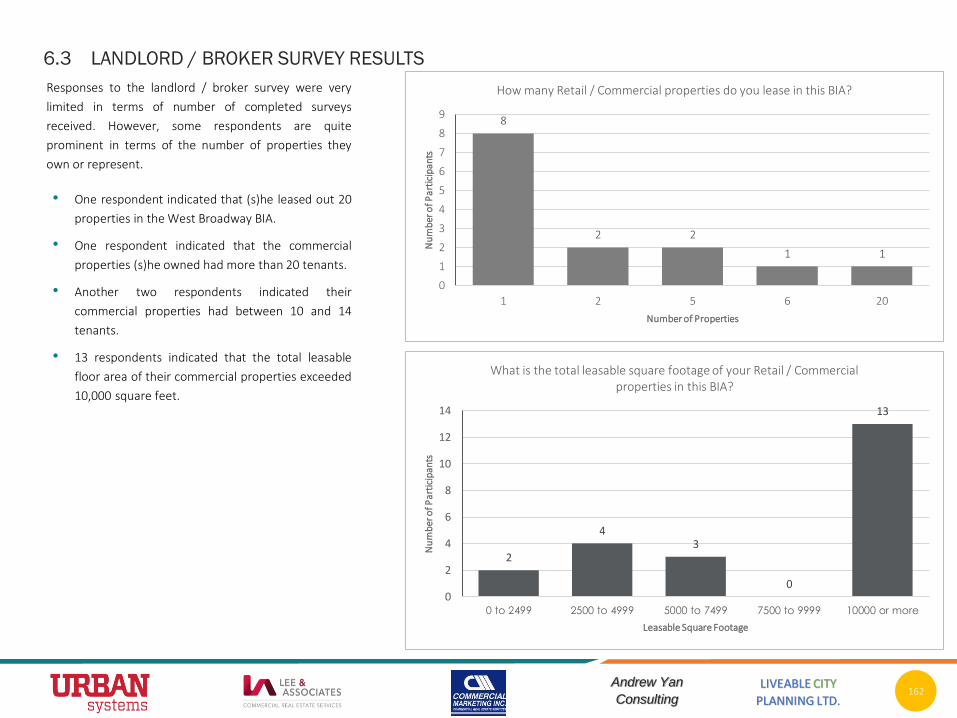
LIVEABLE CITY
PLANNING LTD.
Andrew Yan
Consulting162
6.3 LANDLORD / BROKER SURVEY RESULTS
Responses to the landlord / broker survey were very
limited in terms of number of completed surveys
received. However, some respondents are quite
prominent in terms of the number of properties they
own or represent.
• One respondent indicated that (s)he leased out 20
properties in the West Broadway BIA.
• One respondent indicated that the commercial
properties (s)he owned had more than 20 tenants.
• Another two respondents indicated their
commercial properties had between 10 and 14
tenants.
• 13 respondents indicated that the total leasable
floor area of their commercial properties exceeded
10,000 square feet.
2
43
0
13
0
2
4
6
8
10
12
14
0 to 2499 2500 to 4999 5000 to 7499 7500 to 9999 10000 or more
Nu
mb
er o
f Pa
rtic
ipan
ts
Leasable Square Footage
What is the total leasable square footage of your Retail / Commercial properties in this BIA?
8
2 2
1 1
0
1
2
3
4
5
6
7
8
9
1 2 5 6 20
Nu
mb
er o
f Pa
rtic
ipan
ts
Number of Properties
How many Retail / Commercial properties do you lease in this BIA?

LIVEABLE CITY
PLANNING LTD.
Andrew Yan
Consulting163
Challenges for Business Viability
• Landlords and leasing professionals were asked to rate a
series of issues on a 5-point scale (not significant to very
significant) for their level of significance as challenges to
business viability.
• The predominant issue identified was property taxes, shown
to be significant or very significant to 87% of respondents
(n=15).
• 85% of respondents identified city permitting processing as a
significant or very significant challenge (n=13).
• 82% of respondents identified parking / transportation as a
significant or very significant challenge (n=11).
• 80% of respondents identified overhead costs as a significant
or very significant challenge (n=15).
• 75% of respondents identified rent as a key challenge (n=12).
• 50% of respondents identified labour issues as a significant
or very significant challenge (n=12).
Challenges to Business Viability (Factors)
% Indicating “significant or very significant” (4 or 5)
Number of respondents (n)
Property Taxes 87% 15
City Permitting 85% 13
Parking / Transportation 82% 11
Overhead Costs 80% 15
Rent 75% 9
Regulation 60% 10
Labour Issues 50% 12
Logistics 50% 10
Ability to Expand 50% 8
Marketing 44% 9
Financing / Cash Flow 30% 10
6.3 LANDLORD / BROKER SURVEY RESULTS
Level of Significance as Challenges to Business Viability

LIVEABLE CITY
PLANNING LTD.
Andrew Yan
Consulting164
Permitting Challenges
• On the topic of city permitting challenges, the
responses discussed issues related to:
o Time to have permits issued (too slow).
o Costs of permitting process (direct, and indirect tied to
timing).
o General difficulty of permitting process.
Parking, Transit and Public Realm Challenges
• Respondents were asked to identify the extent to which
quality or management of the following were impacting
the viability of their commercial properties:
o Parking
o Transit
o Sidewalks
o Loading
o Streets
o Laneways
• Of the 12 respondents who provided an answer to this
question, the most common answer was ‘parking’ (8),
followed by ‘streets’ (7) and ‘sidewalks’ (6).
8
3
6
4
7
1
0
2
4
6
8
10
Parking Transit Sidewalks Loading Streets Lane Access
Nu
mb
er o
f P
arti
cip
ants
Does the quality or management of any of these impact the viability of your Retail / Commercial properties?
2
3
1
2
1 1
0
0.5
1
1.5
2
2.5
3
3.5
Lane Access Slow Permitting
Process
Costly
Permitting
Process
Generally
Difficult
Permitting
Process
Parking Bylaws Other
Nu
mb
er o
f P
arti
cip
ants
Are there City Permitting practices that impact the viability of your Retail / Commercial properties?
6.3 LANDLORD / BROKER SURVEY RESULTS

LIVEABLE CITY
PLANNING LTD.
Andrew Yan
Consulting165
Lease Rate Trends
Landlords were asked to indicate the direction of their
commercial lease rate (base rates) over the past 2 years and 5
years.
Reporting on change over the last 2 years:
• 7 indicated that rates had increased a little or a lot
• 6 indicated that rates had stayed the same
• 1 indicated that rates had decreased
Across the Study areas, many landlords and brokers reported
that they have had to maintain low or no commercial lease
rates increases because their tenants have experienced
significant increases in additional rent (primarily due to rising
property taxes).
1
6 6
1 1
0
1
2
3
4
5
6
7
Increased a Lot Increased a Little Stayed Same Decreased a little Don’t Know
Nu
mb
er o
f P
arti
cip
ants
Describe how your retail commercial lease rate has changed
over the past 2 years?
3
8
2
1
0
1
2
3
4
5
6
7
8
9
Increased a Lot Increased a Little Decreased a little Don’t Know
Nu
mb
er
of
Pa
rtic
ipa
nts
Q14b: Describe how your retail commercial lease rate has changed
over the past 5 years?
6.3 LANDLORD / BROKER SURVEY RESULTS

LIVEABLE CITY
PLANNING LTD.
Andrew Yan
Consulting166
Operating Expense Trends
• Landlords were asked to indicate how the
operating expenses for their retail / commercial
spaces have changed in the past 2 years and 5
years.
• The vast majority indicated significant increases in
operating expenses over both periods.
11
3
1
0
2
4
6
8
10
12
Increased a Lot Increased a Little Don’t Know
Nu
mbe
r of P
arti
cipa
nts
Describe how your operating expenses have changed over the past 5 years?
13
1 1
0
2
4
6
8
10
12
14
Increased a Lot Increased a Little Don’t Know
Nu
mbe
r of P
arti
cipa
nts
Describe how your operating expenses have changed over the past 2 years?
6.3 LANDLORD / BROKER SURVEY RESULTS
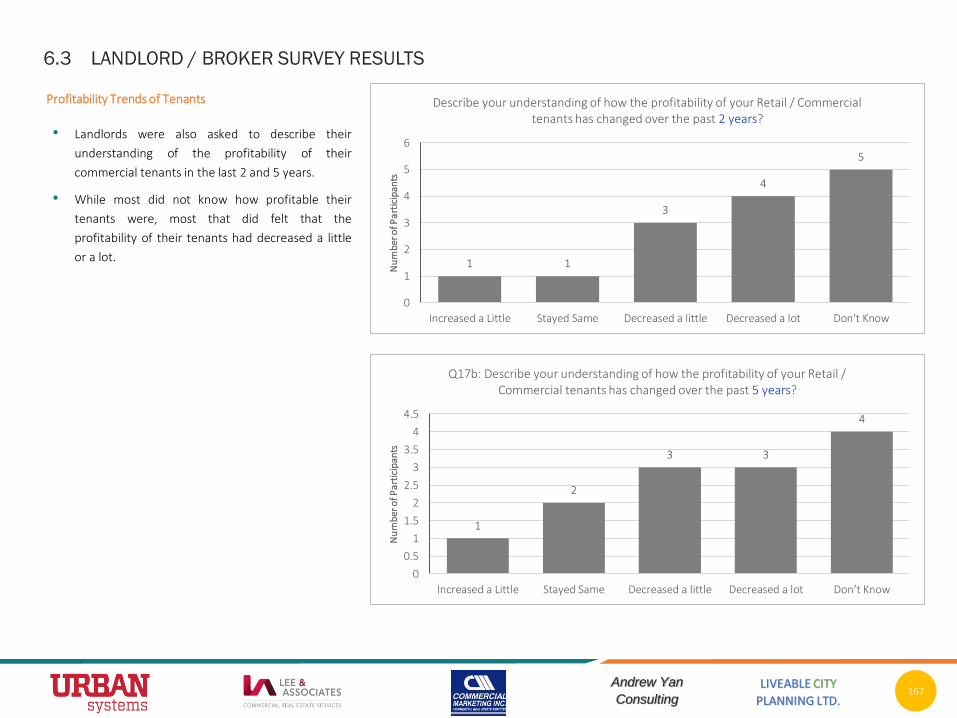
LIVEABLE CITY
PLANNING LTD.
Andrew Yan
Consulting167
Profitability Trends of Tenants
• Landlords were also asked to describe their
understanding of the profitability of their
commercial tenants in the last 2 and 5 years.
• While most did not know how profitable their
tenants were, most that did felt that the
profitability of their tenants had decreased a little
or a lot. 1 1
3
4
5
0
1
2
3
4
5
6
Increased a Little Stayed Same Decreased a little Decreased a lot Don't Know
Nu
mb
er o
f Pa
rtic
ipan
ts
Describe your understanding of how the profitability of your Retail / Commercial tenants has changed over the past 2 years?
1
2
3 3
4
0
0.5
1
1.5
2
2.5
3
3.5
4
4.5
Increased a Little Stayed Same Decreased a little Decreased a lot Don’t Know
Nu
mb
er o
f Pa
rtic
ipan
ts
Q17b: Describe your understanding of how the profitability of your Retail / Commercial tenants has changed over the past 5 years?
6.3 LANDLORD / BROKER SURVEY RESULTS

LIVEABLE CITY
PLANNING LTD.
Andrew Yan
Consulting168
Outlook
Landlords and leasing professionals were asked what their outlook is for retail / commercial uses in each given BIA.
• Of the 15 respondents to this question, only 2 said their outlook was improving.
• 6 respondents indicated that their outlook remained the same.
• 7 respondents indicated that their outlook was deteriorating.
• Respondents identified a number of critical issues that the City must tackle to better support businesses in the City’s local shopping areas:
1. Work with the province to lower property tax on business.
2. Provide more support for small business, including faster permitting.
3. Improve the cleanliness and appeal of the public realm.
4. Overhaul commercial zoning regulations; less emphasis on use, greater flexibility.
5. Accelerate rezoning to allow for faster growth of housing near local shopping areas.
6.3 LANDLORD / BROKER SURVEY RESULTS

LIVEABLE CITY
PLANNING LTD.
Andrew Yan
Consulting169
6.4 ROUNDTABLE RESULTS: SOUTH GRANVILLE ISSUES AND DRIVERS OF CHANGE
South Granville Top 101 2 3 4 5 6 7 8 9 10
Property Taxes Taxes Parking Vacancies On Street Parking Supply Vancancy (N Broadway) Traffic Congestion Placemaking: Lack of Community FeelBike Share Rack Blocks my business City Land Use Bylaws
Property Taxes Property Tax & Rent Parking: On Street Parking Supply Regeneration of the Neighbourhood Traffic Congestion Vacancies: make area look desolate; landlords too greedyImprove Crosswalks Placemaking: Lack of Identity On Street Parking: falling supply; we need moreCity Regulation Overload
Property Taxes Property Taxes Parking: On Street Parking Supply Poor Store Fronts (SG Lacks Interesting "Draws")Parking Inadequate Draw: nothing to draw young millennials (yoga, juice, lifestyle brands) Traffic Artery to YVR/Downtown Development Disruption Vacant Storefronts Lease: Landlords Inflexible
Property Taxes Taxes Parking: On Street Parking Supply Loss of Small Business impacting shopping demographics on the RiseTransit Frequency BIA Macro Marketiing for the Area Traffic Congestion Mix: $ Restaurants Needed Online Competition On Street Loading vs Bus Lane
Property Tax Increases TaxModel - LL should absorb some costsParking: on Street Restricted > 3pm Tenancy Mix Changing (Large Furniture Frontages)Bridge & Foot Traffic Homeless People Need Outdoor Café/Bar Transit Lease: CAM Costs City Public Realm Maintenance
Property Taxes Tax (City, Province, Federal) 5th Ave Needs to be normalized - Excessive Traffic Speed Diminishing Ambience (homelessness, sidewalk width, cleanliness, cafes)Too Many Big Chains Staffing: Cost BIA's Identity Transit Improvements Needed Renovation Costs Property Taxes
Property Tax & Rent Tax: BCAA Speculative Value Traffic Congestion Homelessness No Like-Minded Retailers to create atmosphere Staffing: Attraction & Retention Need Daytime Anchor Competition (too much) Demographics: Need+ Population
Cost of Business Taxes & Wages Increasing Property Tax + Rent drives out interesting businesses that can't drive revenue to support same. Big Boxes came in …Movement: missing Shuttle from/to Cruise ShipsBase Rent Costs Rising BIA's recruitment of interesting businessesPermit: Approval Timelines Housing Availability Competition (too much) in other BIAs. SG is not competitive
Parking Parking: No On-Street Parking > 3pm West Side GranvilleTenant Mix (Missing Grocery, Hardware)Lease: Extension & Rents Retail Mix Permit: Approval Timelines Staffing: Cost & Available Demographics: Aging Population
Parking Parking: Limited Availability Reduces Shopping TimeNeed Cool Vibrant "Botique" Response to Online RetailingRent Total Rent Costs (Base, Tax, CAM) Changing Social Values (identity, environment, health, food)City Regulations (Washrooms) Lease: Maintenance Cost
Parking Parking & Transportation Vacancy (driven by increasing costs) Lack of Street Parking Cost of Rent Forces Small Businesses out Online Competition Cash Flow Interest Rates
Pedestrian Traffic Parking: Lack of OnStreet Parking Degredation of Neighbourhood Lack of Parking Staffing Supply Chain Demographic Change in N'hood
Too much focus on Bicycles Parking Homelessness City Quick to Tax but no services Wages Property Taxes (Falling) Disposable Income
Lease Related Costs Topography Challenges Walking Small Business Taxation Land use Bylaws Bureaucracy Transit Finance: Low Canadian Dollar
Base Rent Costs Rent & Tax Increases Property Tax Escalation (very high) Housing Costs Changing Demographics
Rent Rent Increases Rent Increases Affordable Housing Construction
Increasing Cost of Doing Business; sales flat; reinvesting in business difficultRents General Cost of Doing Business Decrease in Foot Traffic Competition: Downtown / BIA's
Population Density Increasing Rent, Staff, Supplies Labour: Wage Costs Low Walk By Traffic Demographics: Younger; less $
Bringing in New Customers Labour Availability Labour: Wage Costs New Development
Staff Retention Cost of Labour Retail Trends - Online Shopping Competition
Labour / Staffing Availability Wages Competition (too many salons) Online Competition
City Permits/Licences & Oppressive VBBLStaff Challenged by Commute From SuburbsDemographics: Aging Population Data Capture
Online Shopping (Negative) Vacant Storefronts Demographics: Aging Population
Diminishing Vibrancy: Locals & TouristsProv. Govt \Business Confidence Recycling
Top 10 LegendProperty Tax
Lease Issues
Placemaking Issues
Parking / Movement
Labour Issues
City Permits/Licences
Competition
Demographics / Other
1. Property Tax: Increasing Value Assessments and rising property taxes top
the list of business concerns for South Granville. Businesses report this burden
against the backdrop of other tax increases and rising basic rents, all of which
drive up the cost of doing business.
2. Parking / Access: The second most common interest reported by roundtable
participants was the extent and availability of on-street parking. South
Granville retailers benefit from the role of Granville Street as a major arterial
corridor through the city. However, many retailers believe that the elimination
of on-street parking for rush hour bus access reduces customer foot traffic to
their shops.
3. Leases: Retailers report that rent as percentage of sales has risen over last
20 years. Triple net (NNN) leases are almost exclusively the rule in retail. “If a
prospective tenant asks for a gross lease, landlords will choose a different
tenant willing to pay NNN”. Most leases have termination clauses which
presents risk of a forced move and inhibits new investments in their leased
property. Some retailers believe that landlords need to share in burden of
taxes and building operating costs. Some retailers report problems competing
with national tenants (lower cost base allows better capitalized ‘nationals’ to
pay higher rents).

LIVEABLE CITY
PLANNING LTD.
Andrew Yan
Consulting170
Top 10 LegendProperty Tax
Lease Issues
Placemaking Issues
Parking / Movement
Labour Issues
City Permits/Licences
Competition
Demographics / Other
4. Labour: Rising labour costs, commute times, and employee retention are
challenges for many businesses, particularly with the high costs of living in
local neighbourhoods. One business leased a car for an employee who moved
away rather than lose the employee.
5. Placemaking – Vacancy, Mix, Ambience, Homelessness: Businesses are
generally concerned with the ambiance and interest of the street, and the
negative impact of vacant storefronts. Turnover of stores is impacting the mix
and attraction of business. South Granville is “losing small business - losing the
scene” one participant noted.
Homelessness and public disorder is a major problem and many business
owners have to deal with people defecating / urinating around properties and
sleeping rough behind buildings and in doorways. Panhandling is also seen as
a problem.
6. City Permits & Licences: The complexity of city regulations and the speed of
city permitting is seen as a business challenge.
7. Changing Demographics: Businesses report impacts of decreased consumer
spending with an aging population and rising costs of living. Some businesses
see a need for population growth to sustain their local trade area.
8. Competition: Online shopping, the draw of downtown retail and same-
category retail within the BIA are challenges for South Granville Businesses.
Many see a role for the BIA to advocate for a better mix of retail and services.
Other Interests
• Low Canadian Dollar
• Financing Costs
6.4 ROUNDTABLE RESULTS: SOUTH GRANVILLE ISSUES AND DRIVERS OF CHANGE

LIVEABLE CITY
PLANNING LTD.
Andrew Yan
Consulting171
6.5 ROUNDTABLE RESULTS: WEST BROADWAY ISSUES AND DRIVERS OF CHANGE
Top 10 LegendProperty Tax
Lease Issues
Placemaking Issues
Parking / Movement
Labour Issues
City Permits/Licences
Competition
Demographics / Other
1. Property Tax: Increasing Value Assessments and rising property taxes top
the list of business concerns for West Broadway. A common perception is that
BC Assessment property valuation at (unrealized) highest and best use (mixed-
use with upper floor residential strata) is the root of the taxation issue.
2. Leases & Rents: There is a perception that some land owners are driving up
lease rates to justify the high value they paid for sites, with little regard for the
mix/feel for the neighbourhood. Most leases have demolition clauses; tenants
don’t want the uncertainties.
3. Demographics: West Broadway has not had a substantial increase in density
like some other areas have experienced. Participants observe lower levels of
walk-by traffic. Some retailers suggest more local population would help
sustain a more vital local shopping area.
4. City Permits & Licences: Parking requirements make it difficult to change
uses. One participant suggested the City set up a “Small Business Help Centre”
to help new small business owners negotiate leases and navigate permit,
licences and other issues at the City.
5. Placemaking: Participants feel West Broadway lacks a clear identity and a
well-known brand. Businesses would like to see more diversity of supportive
uses like food and retail. Vacancy is an issue. Retailers link high property tax
costs to higher vacancies. Owners are willing to sit vacant to wait for the right
lease. Knock-on effects of vacancies affect the attractiveness of other
businesses. Some businesses suggest new uses like marijuana retail are
negative for the overall vitality of the BIA.
6. Access: Participants suggested more transit stops, improved service and
improvements to walking routes would help foot traffic. Some businesses are
impacted by the use of frontage or curb space for bicycle docking stations.
Uncertainties regarding the development of the Broadway subway line is a
concern for West Broadway retailers. There is some fear the experience will
be like the Canada Line along Cambie where lengthy cut and cover
construction interfered with local business operation.
7. Labour: Costs are increasing with the rising minimum wage and cost of
living, particularly the cost of local housing for employees.
Other Issues
• Limited space to grow businesses within the BIA
West Broadway Top 101 2 3 4 5 6 7 8 9 10
Property Taxes Lack of Density Lack of Retail Anchors Too Many Similar Businesses BIA Stagnant. Lacks Identity Neighbourhood Accessibility - transit, city traffic congestionAffordability Land Use Transit Frequency Poor Zoning Flexibility
Property Taxes & Land Values Neighbourhood Population - Need DensityVacant Storefronts Marijuana Negative to All NeighbourhoodsLack of Brand for BIA Lack of Active Space (bike lanes, running routes)Base Rent Zone for + Families Lack of B-Line Stops Creates a CorridorParking & Code frustrate Expansion
Property Taxes Neighbourhood Population Too much retail - we need less today in 2019 - should rezone some areas or ground floor to residentialCity Permits & Licences Need Beautified Public Space Time: Planning, Permits, Licences Lack of Neighbourhood Identity: no unique destination restaurants, cafes, botiques, Transit - Uncertainties of Skytrain No Space To Grow Business Vacant Storefronts
Property Values Walk by Traffic Possible Subway Impacts Sidewalk Cafes (allowed space) Increasing Homelessness Not Enough Events No Incentive from the City Cost of Labour City Policies Availability of Labour
Property Taxes Walk by Traffic Possible Subway Impacts On Street Parking Supply Local Labour Availability & Cost
Property Taxes Building Codes and Permit Process Traffic & Parking - low foot traffic; congestion makes people avoid certain areas; parking adds to occupancy costNew Transit Affecting Broadway Employee Health Tax
Taxes Permits - Time & Complexity Neighbourhood Unaffordabiltiy for younger demographicTax, fees, rent Land Use Bylaws / Zoning
Rent, Taxes, Parking Vacancy (High Rents) Labour Labour Cost
Maintenance - Landlord Bike Lanes, Docking, Skytrain Lease - Demo Clause
Permits - Time & Complexity Housing Affordability for Staff City Permits & Licences

LIVEABLE CITY
PLANNING LTD.
Andrew Yan
Consulting172
Top 10 LegendProperty Tax
Lease Issues
Placemaking Issues
Parking / Movement
Labour Issues
City Permits/Licences
Competition
Demographics / Other
Marpole Top Ten1 2 3 4 5 6 7 8 9 10
Property Tax Distorted Property Values Parking Access Traffic Congestion City Permits & Licencing City Permits Take Too Long Demo Clauses Result in Short Term TenantsHomelessness & Mental Illness Demographic Change Labour Availability
Property Tax Taxes Maintain On Street Parking Street Parking (we need more) Labour Availability (people cant afford to live in n hood)Parking No Improvement in Transit Population Change & Densification Drug Addicts in ATM rooms
Tax Burden and Redevelopment Pressure sets lease conditions and demo clauses that are not attractive to good businessesCrime & Security Traffic Worsening Safety of Tenants Street Cleaning Development Pressure and Demo ClausesSafety Construction Traffic
Property Tax Homelessness & Negative Impacts on CustomersCapital Funding. High Cost of Living Tenant Quality Demographics: Low pop and high seniors with little disposable incomeZoning Plan and Land Use
Property Taxes & Highest and Best Use AssessmentsFewer People Starting Businesses Labour Retention
Property Taxes Healthy Business Supports Local Redevelopment
Property Taxes too High Supply Demo Clauses
Demo Clauses Tenant Mix
Population Growth
1. Property Tax: Increasing value assessments and rising property taxes top the
list of business concerns for the Marpole BIA. A common perception is that BC
Assessment property valuation at (unrealized) highest and best use (mixed-use
with upper floor strata residential) is the root of the taxation issue. One local
property owner explains: ‘Taxation is the biggest issue. Increasing taxes forces
owners to sell. It’s hard to make existing retail work without moving to highest
and best use. Landlords can’t waive demolition clauses or give tenants long
lease terms if taxes will force sale of the property in the near term. Taxes
should reflect what’s there now, and not “the highest and best use” of what
could be there in the future.’
2. Leases & Rents: While the cost of basic rents does not emerge as a key issue
in Marpole, demolition clauses in leases present business owners with the
prospect of uncertain tenure over the long term. Some retailers feel that
property owners who are looking to lease properties are driven to accept the
highest rent vs. selecting the right tenant for the local mix.
3. Placemaking: Maintenance of the public realm; addressing street social
issues and their impacts; and improving the real and perceived safety of
customers are key issues for local business.
The local Safeway is seen as a key anchor drawing daily and weekly shoppers
to the area. Future large-scale developments should include some smaller
storefronts to allow for complementary tenants to be added to the mix
around the anchor use.
4. Demographics: There is a sense that local population growth is needed for
long term business viability. However there is a negative relationship in terms
of short-term business uncertainty due to rate of change and demolition
clauses in leases.
5. Access: Maintaining on-street parking, managing traffic congestion and
improving transit are key interests of Marpole businesses.
6. City Permits & Licences: There is a general sentiment that Permits and
Licences are complex and take too long. A property owner suggested that
Vancouver follow the lead of New Westminster, where they hired a
commercial business liaison to facilitate business development in the City.
7. Labour: Costs are increasing with the rising minimum wage and cost of
living, particularly the cost of local housing for employees.
Other Issues / Interests
• Limited space to grow businesses within the BIA.
6.6 ROUNDTABLE RESULTS: MARPOLE ISSUES AND DRIVERS OF CHANGE

LIVEABLE CITY
PLANNING LTD.
Andrew Yan
Consulting173
Top 10 LegendProperty Tax
Lease Issues
Placemaking Issues
Parking / Movement
Labour Issues
City Permits/Licences
Competition
Demographics / Other
1. Demographics – Foot Traffic: Hastings North businesses’ top interest was
finding ways to increase foot traffic including the addition of more residential
density to the neighbourhood.
2. Placemaking – Public Realm & Public Order: Addressing vacancies, attracting
and retaining key anchor tenants, and improving the appearance and
cleanliness of the public realm were the next most important concerns for
local businesses. Most notable across Top 10 concerns are the impacts of
homelessness and drug addiction which seem to be spilling outside of the
City’s Downtown East Side (DTES). Rough sleeping, panhandling, and
shoplifting were widely viewed as key issues that need to be addressed to
make the local shopping area more attractive to customers and to improve
real and perceived security.
3. Labour: The cost, accessibility and availability of labour were interests tied
for second spot in the top 10 concerns for Hastings North.
4. Property Tax: Similar to other BIA’s studied, the impact of BCAA assessments
on highest use and rising property taxes were raised as key concerns amidst
the backdrop of other tax increases.
5. Permits & Licences: The complexity, flexibility and time needed to process
permits and licences were cited as key business concerns.
6. Parking / Access: Businesses also ranked highly the need to maintain on-
street parking as Translink expands transit service and the City dedicates more
space to cycling. Transit service is seen as important, but participants noted
that transit riders have to negotiate the DTES Hastings Corridor in order to
arrive in the Hastings North local shopping area.
6. Competition: General business competition and online retail were noted as
a key concern for local businesses, reinforcing the need for improved public
realm and safety.
Other Issues
• Some business owners noted limited ability to purchase their own
commercial property.
Hastings North Top 101 2 3 4 5 6 7 8 9 10
Demographics: falling foot traffic Permit & Licences: inspections and permitsPublic Realm: dirty alleys leads to rodent problemsLabour: increasing business costs makes it hard to pay competitive wages Vacancies: Stores Closing Public Order: Homelessness City Services: City should provide commercial compost bins and pickupVacant Corners (favour chain stores)Public Disorder: safety City Process & Communication (ie. Parking Lot Sale)
Demographic Change: inclusiveness Permit & Licences: flex max height to ensure 14 ft retail floorsCity Issues: homeless, safety Labour: recruitment and retention of staffSocial Issues: dramatically increasedPublic Disorder Public Disorder: theft Placemaking: Need City Vision Unique neighbourhoods
Demographics: need density, youth Permits & Licences: too long, time shifted to preapplication process Safety at night Property Tax Public Order: Homelessness, NeedlesNoxious Uses (slaughterhouse must go)Traffic Congestion Demographics: decreasing families
Demographics: need to increase densityParking: reduced hour access impacts businessIncrease in homelessness Property Tax on Potential Density Lease: rent costs vs affordability Amenity Spaces Demographics: Need + Population
London Drugs Anchor Needed Parking: reduced hour access impacts businessIncrease in homelessness Lease: CAM costs increasing dramatically Labour: availability Permits & Licences: take too long
Public Order, Security, Cleanliness Vacancies: Closed Businesses Parking, Transit, Bike Infrastructure Development favours large chains Permits Inflexible on Use, Parking
Vacant Storefronts: gaps and fragmentation create less cohesionCleanliness (leads to insect/rodent problems)Lack of Parking Density
Labour: staff living further in Surrey/Langley. Hard to retain staff in neighbourhoodIncreasing property taxes and base rents are driving shrinking commercial footprintsParking for Seniors Vacancy in Area
Labour Recruiting Property Tax: increases are not sustainableP. Tax, Permits, Wages increasing Professional qualification criteria
Labour: long commutes; low retentionLeases: increasing cost, uncertainty Property Tax too high Online Retail
Property Taxes Operating Costs (plus labour, security, facilities maintenance)City Review: better "ground plane"
Property Taxes: especially for low density propertiesLabour: local staff scarce No Opportunity to Purchase
Permits & Licences: time/complexityLabour: cost and staff retention
Permits & Licences: time/complexity
Parking: Off street
Parking: reduced times impair business
Competition
6.7 ROUNDTABLE RESULTS: HASTINGS NORTH ISSUES AND DRIVERS OF CHANGE

LIVEABLE CITY
PLANNING LTD.
Andrew Yan
Consulting174
Top 10 LegendProperty Tax
Lease Issues
Placemaking Issues
Parking / Movement
Labour Issues
City Permits/Licences
Competition
Demographics / Other
1. Placemaking – Public Realm & Public Order: Collingwood businesses want to
see improved street appeal and maintenance. A strong message from
participants was the need to address the impacts of homelessness, mental
illness and drug addiction. Rough sleeping, public order, vandalism and
shoplifting permeate most of the Top 10 categories. With respect to retail and
service mix, some businesses want to see a greater mix of retail and services.
Some businesses reported impacts from the closure of Sir Guy Carleton
Elementary School – illustrating the importance of non-retail anchor uses
which can drive significant daily customer traffic.
2. Labour: The cost and availability of local labour was a top concern for
Collingwood businesses given low unemployment rates and high costs of
living.
3. Property Tax: Increasing value assessments and rising property taxes also
rank in the “Top 1” concerns of local business, against other taxation and cost
of business increases.
4. Parking / Access: Local businesses reported some competing interests with
respect to the management of streets and parking: they want to retain on-
street parking for customers; to improve transit; to permit on-street loading,
and reduce traffic congestion.
5. Demographic Change: Businesses see the need for more population and
more affordable housing and the role of such growth in supporting the
viability of the local shopping area.
6. Competition: Online shopping and direct competition from large enclosed
retail centres like Metrotown was a top 10 concern for many businesses.
7. Permits & Licences: The complexity and time needed to process permits and
licences were cited as key business concerns.
Other Issues / Interests
• Some business owners noted that many older single level retail buildings
in Collingwood were not adaptable for new uses.
Collingwood Top 101 2 3 4 5 6 7 8 9 10
Kingsway Street Appeal Low City Maintenance of Lanes Labour Cost Permits & Licences: costs More cleaning needed Curb appeal / Street Cleaning Vandalism Demographics: + families moving here (positive)Homelessness, Mental Illness Existing buildings not efficient
Placemaking: Community Events NeededCultural Niche Strength Labour: training / investment Permits & Licences: $$ /Complexity Need Neighbourhood ImprovementsVacancy looks bad Homelessness Changing Business Owners - DemolitionsLoss of Elementary School Demographics: Shrinking Families
Public Disorder: vandalism, homelessness, drug usersPlacemaking: Mix needed Labour: Low Unemployment Permits & Licences: $$ /Complexity More mix needed Need Clean and safe streets Homelessness Public Order: community policing and block watch needed to address increasing crime and decreasing sense of public safetyNeighbourhood Population Traffic Congestion
Homelessness Shoplifting Problem Residential taxes impact labour Loss Of Schol Traffic Congestion Need Multipurpose NonRetail AnchorLoss of Carelton Elementary Property Tax increases Communication Taxes
Labour Availability Traffic Congestion and Speed Demographic change in N'hood Loss of School On Streeet Loading needed Loss of Carelton Elementary On Street Parking Access reduced while vehicular traffic increasesFinance: Low Canadian $ Labour: Untapped Immigrants Communication: Face to Face
Labour & Affordable Housing On Street Parking Development brings newcomers Street and Lane cleandliness More support for family business New condos +++ population BIA should expand to Joyce/MacKinnonGood Transit
Labour: Education On Street Parking Residential rents too high Taxation on small business Demographics: need + customers Housing Affordability Demographic: + growth + density
Taxes too high Demographic Change Taxes on small business Increasing Cost of Doing Business (MSP, min wage, taxesDemographics: need + customers Labour Availability Demographic Change
Property Tax Demographic Change Permits & Licences: costs and time Transit Service (supports labour) Competition: Online
Access: business parking limited Shrinking Families Permits & Licences Family run stability Competition: Online/social media
Access: Central GVRD location > Affordable housing needed Grafitti: "Art Wall" Needed Construction in N'hood Lease Rates and Property Tax
Lease and Tax costs are barrier to entry> Affordable housing needed Parking Rapid Densification Labour Cost
Demographics: Growth Needed Property Tax Competition - Local / Metrotown Lease Rates too high
Online Competition reduces foot trafficProperty Tax Increases (last 5 years)
6.8 ROUNDTABLE RESULTS: COLLINGWOOD ISSUES AND DRIVERS OF CHANGE

LIVEABLE CITY
PLANNING LTD.
Andrew Yan
Consulting175
Commercial Drive top 101 2 3 4 5 6 7 8 9 10
Placemaking: walkability Property Tax / Future Value Public Realm Cleanliness Strength: Business Diversity City maintenance Need Flex Permits & Bylaws Promote Eclectic N'hood Identity Demographic Growth Needed City Maintenance Political will to help small business
Public Realm Maintenance Property Tax on Future Density Public Realm Cleanliness Homelessness Placemaking: Need Positive Vibe Lack of Regulation City Services: more frequency neededFoot Traffic Public Realm Cleaning COV Offloading Services to Biz
COV Park Maintenance LL's should pay Triple Net Tax Street & Alley Cleaning Public Order on Sidewalks Encourage more street festivals City Permits - Processing Times Homelessness: Public Disorder Cost of Labour Homelessness Cost of Labour
Public Order: Panhandling Rent & Property Tax Increase Suppprt Local Biz Diversity Public Disorder: Drugs /Alcohol Homelessness Public Realm Maintenance Safety Labour: availability of skilled labour Bylaw Officers Need VPD
Security (Homelessness). Increased Property Taxes Safety & Security Transit Frequency #20 Bus Lack of Police Enforcement Community Police Needed Corporation Tax Parking Availability Rent Costs
Shelter Issues Property Tax and Lease Increases Policing Loss Parking (Bike Lanes) On Street Parking Supply Traffic Congestion Business Property Tax Burden Parking Supply Government Small Biz Assistance
Policing Property Taxes Homelessness Parking Access Traffic congestion on 1st Ave Transit On Street Parking Supply Cost of Doing Business
Safety & Security Park Cleanliness & Safety Security and Safety - Homelessness City Permits & Licences Parking supply Property Tax Lease - Demo Clause Business Insurance Cost
City Permits & Licences Public Realm: Cleanliness Shelter Issues Competition Land use bylaws Property Tax - Speculative Tax Permit Delays
Permits: Need More Signage Graffiti Community Police Service More Tourist Outreach Permits & Licences Lease - Demo Clause OnLine Shopping
Licencing & Permits Public Disorder Crime & Homelessness BIA Needs to Market Better Cost/Availibility of Credit Strength of Local Community
COV Services Illegal Vendors Safety & Security Demographics - Local Population Insurance Costs
COV/Business Partnership Public Disorder Safety & Security - outreach Cost of Living = Less Spending BIA not inclusive/representative
Taxes Parking: Lack of Permits & Licencing Reduced Consumer Spending Labour Shortage
Property Taxes On Street Loading: more needed Land Use Bylaws Value of Canadian $
Costs Downloaded to Business + Public Transit /Accessibility Parking - Not enough Labour Shortage & Cost
Security - Hidden Costs Land Use Bylaws Labour Cost & No Offset
Parking Access Labour: Cost of Living Wage
Labour Shortage & Cost Competition
Top 10 LegendProperty Tax
Lease Issues
Placemaking Issues
Parking / Movement
Labour Issues
City Permits/Licences
Competition
Demographics / Other1. Placemaking – Public Realm & Public Order: Commercial Drive’s diverse mix
of retail and services creates a strong identity that the BIA can reinforce and
brand through street festivals and events. However, public street disorder and
the maintenance of sidewalks, streets, parks and lanes feature quite heavily in
the Top 10 issues reported by Commercial Drive businesses. They are very
sensitive to the complex forces driving the homelessness, drug addiction and
public disorder which affect the area. There is a sense that the VPD does not
have the capacity to adequately address shoplifting and public order issues.
Many businesses seek positive approaches such as Community Policing or an
“Ambassadors” program with teams who can address real and perceived
security while helping people access social services or other supports.
2. Permits & Licences: Similar to other BIAs, Commercial Drive businesses are
concerned about the complexity, specialist costs and time needed to complete
and process City permits and licences, and the inflexibility of land use
regulations to accommodate a wide range of businesses. Businesses lose
money while waiting for permits and licenses to be processed. One business
can have to deal with multiple City staff on a permit, creating many
opportunities for inconsistent advice, or for an application to ‘disappear
through the cracks’
Participants supported a streamlined “case management” approach to
permitting and licensing – i.e. calling the City and being able to deal with one
person for all issues. As a general principle, “a business owner should be able
to easily deal with forms, etc. on his/her own.” Even simple things like having a
publicly available printer in the permit office waiting area would allow
applicants to print a form on-site, complete it, and submit it, rather than
having to leave and come back later.
3. Property Tax: Rising property taxes rank next in the range of top business
concerns. Highest-and-best-use property valuation drives up property taxes
that are passed on to commercial tenants though triple net commercial leases.
As one business owner stated, “property taxes are not being borne equally by
lessees vs the property owner”.
6.9 ROUNDTABLE RESULTS: COMMERCIAL DRIVE ISSUES AND DRIVERS OF CHANGE

LIVEABLE CITY
PLANNING LTD.
Andrew Yan
Consulting176
Property Tax cont’d: Against the backdrop of public realm maintenance and
public order deficiencies, there is a perception that businesses are not getting
value for their tax dollars. As one merchant observed, “as a [residential]
property owner, I get lots for property tax. This is totally different than
property tax paid as a business lessee – where all the residential services
(recycling, street beautification) either cost extra, or are not available.”
4. Parking / Access: The availability of on-street parking is also a strong
interest across the list of Top 10 issues. Businesses are wary of the
erosion/limitation of street parking. Traffic congestion on the Drive is seen as
a negative issue.
5. Labour: Rising wages, payroll taxes, and the general unavailability of skilled
labour has been a huge challenge for business. “Employing people at a fair
wage is one thing – but on top of that employers are facing rising CPP and EI
taxes and new MSP fees”, reported one business owner. Another stated
“Employees struggling with high housing and living costs are working double-
shifts just to live here. That can’t work. It impacts staff. They’re stretched.
They show up to work tired and over-extended. This impacts well-being and
customer service”.
6. Demographic Change: Increasing population and local spending power in
the Commercial Drive trade area was noted as an interest by some
participants who see the need for additional population and foot traffic to
support the health of local businesses.
7. Competition: Online shopping and direct competition from other retail
centres was noted as a top 10 issue.
8. Leases: Demolition clauses were identified as major concerns for a number
of businesses because these introduce risk and disincentivize new investment
in their stores.
Other Issues / Interests
• The weakness of the Canadian dollar.
• Rising insurance costs.
6.9 ROUNDTABLE RESULTS: COMMERCIAL DRIVE ISSUES AND DRIVERS OF CHANGE

LIVEABLE CITY
PLANNING LTD.
Andrew Yan
Consulting177
6.10 TOP 10 AMALGAMATED BY FREQUENCY TOP 10 AMALGAMATED (n=92)
1 2 3 4 5 6 7 8 9 10Taxes too high Property Tax / Future Value Vacancy (driven by increasing costs) Vacancies Vacancies: Stores Closing Vancancy (N Broadway) Loss of Carelton Elementary Transit Vacant Storefronts City Land Use Bylaws
Property Tax Property Tax on Future Density Vacant Storefronts Vacancy in Area Placemaking: Need Positive Vibe Vacancies: make area look desolate; landlords too greedyNeed Outdoor Café/Bar Transit Improvements Needed Loss of Elementary School City Regulation Overload
Property Tax LL's should pay Triple Net Tax Tenant Mix (Missing Grocery, Hardware)Loss Of Schol Encourage more street festivals Vacancy looks bad BIA's Identity Parking Availability Bylaw Officers Need VPD City Process & Communication (ie. Parking Lot Sale)
Property Tax Rent & Property Tax Increase Need Cool Vibrant "Botique" Response to Online RetailingLoss of School City maintenance Need Multipurpose NonRetail AnchorNeed Daytime Anchor Parking Supply City Maintenance Poor Zoning Flexibility
Property Tax Increased Property Taxes Lack of Retail Anchors Diminishing Ambience (homelessness, sidewalk width, cleanliness, cafes)Need Beautified Public Space Loss of Carelton Elementary Lack of Neighbourhood Identity: no unique destination restaurants, cafes, botiques, Good Transit Public Realm Cleaning Parking & Code frustrate Expansion
Property Taxes Property Tax and Lease Increases Too much retail - we need less today in 2019 - should rezone some areas or ground floor to residentialToo Many Similar Businesses More cleaning needed Public Realm Maintenance Promote Eclectic N'hood Identity Transit - Uncertainties of Skytrain Homelessness, Mental Illness Property Taxes
Property Taxes Property Taxes Suppprt Local Biz Diversity Strength: Business Diversity Need Neighbourhood ImprovementsNeed Clean and safe streets City Services: more frequency neededConstruction Adds to Congestion Homelessness Taxes
Property Taxes: especially for low density propertiesProperty Tax Street & Alley Cleaning Street and Lane cleanliness More mix needed Curb appeal / Street Cleaning City Services: City should provide commercial compost bins and pickupPlacemaking: Lack of Community FeelPublic Disorder: safety COV Offloading Services to Biz
Property Taxes Property Tax Increases (last 5 years)Public Realm: dirty alleys leads to rodent problemsRegeneration of the Neighbourhood (an interest)Too Many Big Chains Not Enough Events Vandalism Placemaking: Lack of Identity Drug Addicts in ATM rooms Availability of Labour
Property Taxes & Land Values Taxes Public Realm Cleanliness Poor Store Fronts (SG Lacks Interesting "Draws")No Like-Minded Retailers to create atmosphere Noxious Uses (slaughterhouse must go)Safety Development Disruption Transit Frequency Availability of Labour
Property Taxes Property Tax & Rent Public Realm Cleanliness Loss of Small Business impacting shopping demographics on the RiseBIA's recruitment of interesting businessesInadequate Draw: nothing to draw young millennials (yoga, juice, lifestyle brands) Safety Vacant Corners (favour chain stores)Lack of B-Line Stops Creates a CorridorCost of Labour
Property Values Property Taxes Grafitti: "Art Wall" Needed Tenancy Mix Changing (Large Furniture Frontages)Retail Mix BIA Macro Marketiing for the Area Public Disorder: theft Placemaking: No vision from City re: unique neighbourhoodsBike Share Rack Blocks My Business City Public Realm Maintenance
Property Taxes Taxes Community Police Service Marijuana Negative to All NeighbourhoodsBIA Stagnant. Lacks Identity Homeless People Homelessness Public Order: community policing On Street Parking: falling supply Vacant Storefronts
Property Taxes TaxModel - LL should absorb some costsSafety & Security Safety of Tenants Lack of Brand for BIA Public Disorder Homelessness Homelessness & Mental Illness Rent Costs Traffic Congestion
Property Taxes Tax (City, Province, Federal) Safety & Security Public Order on Sidewalks Construction Public Order: Homelessness Homelessness: Public Disorder Cost of Labour Lease: CAM Costs On Street Loading vs Bus Lane
Property Taxes Tax: BCAA Speculative Value Safety & Security - outreach Public Disorder: Drugs /Alcohol Public Order: Homelessness, NeedlesCommunity Police Needed Traffic Congestion Labour: availability of skilled labour No Space To Grow Business Existing buildings not efficient
Property Taxes Increasing property taxes and base rents are driving shrinking commercial footprintsSafety at night Homelessness Increasing Homelessness Need Flex Permits & Bylaws Falling On-Street Parking; Increasing TrafficCost of Labour Labour: Untapped Immigrants Demographics: Shrinking Families
Property Taxes Property Tax: increases are not sustainableSecurity and Safety - Homelessness Homelessness Homelessness Lack of Regulation Traffic Congestion Property Tax increases City Policies Political will to help small business
Property Tax Increases Distorted Property Values Policing Transit Frequency #20 Bus Lack of Police Enforcement City Permits - Processing Times Improve Crosswalks Cost of Doing Business Online Competition Communication: Face to Face
Property Taxes Taxes Degredation of Neighbourhood Loss Parking (Bike Lanes) Street Cleaning Time: Planning, Permits, Licences Traffic Artery toYVR/Downtown Land Use Demographic Change Lease: Landlords Inflexible
Property Taxes Vacancy (High Rents) City Issues: homeless, safety Parking Access Social Issues: dramatically increasedPermits & Licences: take too long Traffic Congestion Zone for + Families Demographics: Need+ Population
Tax Burden and Redevelopment Pressure sets lease conditions and demo clauses that are not attractive to good businessesVacancies: businesses don't look openCrime & Homelessness Transit Service (supports labour) On Street Parking Supply Permit: Approval Timelines On Street Parking Supply Lease: Maintenance Cost Neighbourhood Population
Taxes Vacant Storefronts Increase in homelessness On Street Parking Supply Traffic congestion on 1st Ave Permit: Approval Timelines No Improvement in Transit Demographics: decreasing families Communication
Taxes Public Realm: Cleanliness Increase in homelessness New Transit Affecting Broadway Parking supply City Permits Too Long Housing Availability Population Change & Densification Government Small Biz Assistance
Property Taxes too High City Maintenance of Lanes Homelessness Lack of Street Parking Traffic Congestion Parking Staffing: Cost & Available Demographics: Aging Population Renovation Costs
Property Tax & Rent Cleanliness (leads to insect/rodent problems)Homelessness Lack of Parking On Streeet Loading needed Traffic Congestion Affordability Demographics: + families moving here (positive)
Property Taxes & Highest and Best Use AssessmentsCultural Niche Strength Shelter Issues Traffic Congestion On Street Parking Supply Transit City Regulations (Washrooms) Demographic Growth Needed
Cost of Business Taxes & Wages Placemaking: Mix needed Parking Street Parking (we need more) Traffic Congestion Neighbourhood Accessibility - transit, city traffic congestionPermit Delays Competition (too much)
Costs Downloaded to Business Tenant Mix Parking: On Street Parking Supply City Permits & Licences Parking Lack of Active Space (bike lanes, running routes)Zoning Plan and Land Use Competition in other BIAs
Security - Hidden Costs Graffiti Parking: On Street Parking Supply Permits & Licences: costs Transit Frequency Transit Lease - Demo Clause Mix: $ Restaurants Needed
Diminishing Vibrancy for Locals & TouristsPublic Disorder Parking: On Street Parking Supply Permits & Licences: $$ /Complexity Bridge & Foot Traffic Property Tax Base Rent Finance: low Canadian $
London Drugs Anchor Needed Illegal Vendors Parking: on Street Restricted > 3pm Permits & Licences: $$ /Complexity Labour Cost Property Tax - Speculative Tax Demo Clauses Result in Short Term TenantsBusiness Insurance Cost
Vacant Storefronts: gaps and fragmentation create less cohesionPublic Disorder Property Tax Escalation (very high) City Quick to Tax but no services Staffing Property Taxes Corporation Tax Changing Business Owners - Demolitions
Kingsway Street Appeal Low Park Cleanliness & Safety 5th Ave Needs to be normalized - Excessive Traffic Speed Land use Bylaws Wages Labour Availability Business Property Tax Burden Foot Traffic
Placemaking: Community Events NeededShoplifting Problem Traffic Congestion City Permits & Licences Local Labour Availability & Cost Staffing: Cost OnLine Shopping Interest Rates
Placemaking: walkability Crime & Security Movement: missing Shuttle from/to Cruise ShipsSidewalk Cafes (allowed space) Employee Health Tax Staffing: Attraction & Retention Demographics: lack of population growth
Public Realm Maintenance Homelessness & Negative Impacts on CustomersParking Development favours large chains Labour Availability (people cant afford to live in n hood)Lease - Demo Clause Demographic Change
COV Park Maintenance Pedestrian Traffic Challenged by Topography)Possible Subway Impacts Lease Rates too high Labour: availability Lease - Demo Clause Demographic: + growth + density
Policing Parking: Lack of Possible Subway Impacts Base Rent Costs Rising Labour Shortage Online Competition Demographic Change in N'hood
Safety & Security On Street Loading: more needed Traffic & Parking - low foot traffic; congestion makes people avoid certain areas; parking adds to occupancy costLease: Extension & Rents Permits Inflexible on Use, Parking Supply Chain BIA should expand to Joyce/MacKinnon
Public Order, Security, Cleanliness + Public Transit /Accessibility Parking - Not enough Rent City Permits & Licencing Strength of Local Community Cash Flow
Public Disorder: vandalism, homelessness, drug usersParking: No On-Street Parking > 3pm West Side GranvilleParking, Transit, Bike Infrastructure Lease: CAM costs increasing dramatically Land Use Bylaws / Zoning Housing Affordability (Falling) Disposable Income
Public Order: Panhandling Parking: Limited Availability Reduces Shopping TimeLack of Parking Labour Shortage & Cost Bureaucracy Aging Society; Falling Disposable IncomeFinance: Low Canadian Dollar
Homelessness Parking & Transportation Decrease in parking does not align with increase in senior demographicsHousing Costs Land use bylaws Changing Social Values No Incentive from the City
Security (Homelessness) Parking : Lack of On Street Parknig Parking Access Affordable Housing Permits & Licences New condos +++ population
Shelter Issues Parking Maintain On Street Parking Labour: increasing business costs makes it hard to pay competitive wages Total Rent Costs (Base, Tax, CAM)
Parking Access Traffic Congestion and Speed Traffic Worsening Labour: recruitment and retention of staffCost of Rent Forces Small Businesses out
Access: business parking limited On Street Parking Labour Cost & No Offset Labour Cost Lease: rent costs vs affordability
Access: Central GVRD location On Street Parking Labour Cost Taxation on small business Lease Rates and Property Tax
Parking: Off street Bike Lanes, Docking, Skytrain Labour: training / investment Increasing Cost of Doing Business (MSP, min wage, taxesDemographics: Younger; less $
Parking: reduced times impair businessParking: reduced hour access impacts businessLabour: Low Unemployment Tax, fees, rent Demographics: need + customers
Parking Parking: reduced hour access impacts businessLabour Property Tax Demographics: need + customers
Parking Labour Availability Labour: Wage Costs Property Tax on Potential Density Changing Demographics
Parking Cost of Labour Labour: Wage Costs Competition Competition: Online
Pedestrian Traffic Wages Labour: cost and staff retention Competition Competition: Online/social media
Too much focus on Bicycles Labour: local staff scarce Labour Retention Online Competition Competition: Downtown / BIA's
City Permits & Licences Staff Challenged by Commute From SuburbsPermits & Licencing Online Retail Cost/Availibility of Credit
Permits: Need More Signage Labour: Cost of Living Wage Land Use Bylaws Cost of Living = Less Spending Insurance Costs
Licencing & Permits Housing Affordability for Staff Permits & Licences: costs and time Reduced Consumer Spending BIA not inclusive/representative
COV Services Increasing Property Tax + Rent drives out interesting businesses that can't drive revenue to support same. Big Boxes came in …Permits & Licences Decrease in Foot Traffic More support for family business
COV/Business Partnership Rent Increases City Permits & Licences Low Walk By Traffic
Permits & Licences: time/complexityRent & Tax Increases - LL too greedyRecycling New Development
Permits & Licences: time/complexityRents City Review: better "ground plane" Rapid Densification
Permits - Time & Complexity Increasing Costs of Business (cumulative: staff, rent, supplies, Operating Costs)P. Tax, Permits, Wages increasing Demographics - Local Population
City Permits/Licences & Oppressive VBBLLeases: increasing cost, uncertainty Property Tax too high Density
Labour Availability Operating Costs (labour, extra expenses of security and facilities maintenance)Residential taxes impact labour Value of Canadian $
Labour & Affordable Housing Land Use Bylaws Taxes on small business Family run stability
Labour: Education Building Codes and Permit Process Small Business Taxation Construction in N'hood
Labour Shortage & Cost Permits - Time & Complexity Lease - Demo Clause More Tourist Outreach
Staff Retention Permit & Licences: inspections and permitsResidential rents too high BIA Needs to Market Better
Labour / Staffing Availability Permit & Licences: flex max height to ensure 14 ft retail floorsRent Increases Data Capture
Labour: staff living further in Surrey/Langley. Hard to retain staff in neighbourhoodPermits & Licences: too long, time shifted to preapplication process General Cost of Doing Business Professional qualification criteria
Labour Recruiting Competition Demo Clauses Tenant Quality
Labour: long commutes; low retention> Affordable housing needed Change in Retail Trends - Online Shopping
Lease and Tax costs are barrier to entryShrinking Families Demographics: Aging Population
Demo Clauses Demographic Change Demographics: Aging Population
Occupancy Costs (Taxes, Parking Cost, Base Rent)Demographic Change Demographic change in N'hood
Maintenance - Landlord Lack of Density Development brings newcomers
Lease Related Costs Neighbourhood Population - Need DensityCompetition (too many salons)
Base Rent Costs Neighbourhood Population Competition - Local / Metrotown
Rent Walk by Traffic Neighbourhood Unaffordabiltiy for younger demographic
Increasing Cost of Doing Business; sales flat; reinvesting in business difficultWalk by Traffic No Opportunity to Purchase
Population Growth Prov. Govt \Business Confidence Local Redevelopment
Population Density Fewer People Starting Businesses Capital Funding. High Cost of Living
Bringing in New Customers Healthy Business Supports
Demographics: Growth Needed Supply
Demographics: falling foot traffic
Demographic Change: inclusiveness
Demographics: need density, youth
Demographics: need population
Competition
Online Shopping (Negative)
Property Taxes #1
Placemaking, Public Realm #2
Parking,Streets,Transit #3
Permits &Licences
Labour
Leases
Demographics& Other
Competition
Top 10 LegendProperty Tax
Lease Issues
Placemaking Issues
Parking / Movement
Labour Issues
City Permits/Licences
Competition
Demographics / Other
Top 1 %
Property Taxes 30 33%
Public Realm 16 17%
Parking, Streets, Transit 10 11%
Permits & Licences 9 10%
Labour 9 10%
Leases 8 9%
Demographics 8 9%
Competition 2 2%
Other 0 0%
Totals 92 100%
Top 1 Top 2 Top 3 Total %
Public Realm 16 17 27 60 23%
Property Taxes 30 20 5 55 21%
Parking, Streets, Transit 10 15 20 45 17%
Labour 9 7 9 25 10%
Permits & Licences 9 6 7 22 8%
Leases 8 7 5 20 8%
Demographics 8 8 5 21 8%
Other 0 5 4 9 3%
Competition 2 1 2 5 2%
Totals 92 86 84 262 100%
Top 1
Top 3
Top 10Top 1 Top 2 Top 3 Top 4 Top 5 Top 6 Top 7 Top 8 Top 9 Top 10 Total %
Public Realm 16 17 27 18 21 16 15 7 9 2 148 26%
Parking, Streets, Transit 10 15 20 10 10 6 8 7 4 2 92 16%
Permits & Licences 9 6 7 8 6 8 3 2 1 5 55 10%
Property Taxes 30 20 5 5 0 3 2 2 0 3 70 12%
Labour 9 7 9 6 8 3 3 3 1 3 52 9%
Demographics 8 8 5 8 4 5 4 5 3 1 51 9%
Leases 8 7 5 6 4 2 3 1 3 1 40 7%
Other 0 5 4 8 4 1 5 6 3 3 39 7%
Competition 2 1 2 4 3 1 1 2 1 0 17 3%
Totals 92 86 84 73 60 45 44 35 25 20 564 100%

LIVEABLE CITY
PLANNING LTD.
Andrew Yan
Consulting178
6.11 TOP 10 WORD CLOUD

7.0 ASSESSING HEALTH AND VITALITY OVER TIME

LIVEABLE CITY
PLANNING LTD.
Andrew Yan
Consulting180
7.1 WHY MONITOR LOCAL SHOPPING AREA HEALTH AND VITALITY?
Vancouver is distinct amongst North American cities for the degree to which it is
served by local retail streets vs. shopping centres. To maintain a healthy network
of LSAs that provide groceries, goods and services within walking distance of
home, the City should monitor LSA health, maintain and enhance what is
working, and attend to issues large and small that weaken these areas.
• Neighbourhood Sustainability & Liveability: Local shopping areas offer
groceries, goods and services within walking distance of home, and anchor
vibrant, healthy and resilient neighbourhoods.
• Character: Commercial streets provide local character and livability, a sense
of community, identity, diversity, and quality of public life. The presence of
unique businesses and other attractors in neighbourhoods contribute to
character, livability and attractiveness.
City Initiative / Objective Local Shopping Area Health and Vitality Relevance
Climate Emergency Response Big Move #1 – Walkable City
• More complete neighbourhoods that have daily destinations (shops, services, jobs, parks, schools, community centres, libraries) within walking / rolling distance of where people live
Healthy City Strategy Goals • Healthy, just and sustainable food systems • Adequate income and access to broad range of healthy employment opportunities • Connected and engaged in places and spaces that matter to us • Equitable access to high quality social, community and health services
Greenest City 2020 Action Plan • Strong local economy • Vibrant and inclusive neighbourhoods
Vancouver Food Strategy • Building and maintaining strong food systems
Employment Lands and Economy Review: What We’re Hearing
• Ensure an economy that is prosperous, resilient, equitable and inclusive • Plan for a city with a wide range of jobs, income-levels and workers
• Culture: Local shopping areas provide opportunity for residents to
access specialized, culturally appropriate goods and services.
• Business Multiplier Effect: Local businesses tend to purchase goods and
services from other local businesses (the business multiplier effect).
Local direct and indirect multipliers tend to be more robust amongst
independent businesses (and smaller locally-based chain businesses),
versus national or international chains.
• City Objectives: Local shopping area health and vitality is directly
connected to existing City of Vancouver objectives outlined in the table
below.

LIVEABLE CITY
PLANNING LTD.
Andrew Yan
Consulting181
7.2 METRICS FOR MEASURING COMMERCIAL HEALTH AND VITALITY
There are many potential measures of local shopping area health (and
indicators of failing health): some are clear-cut quantitative metrics and
easy to measure; others are much more subjective and will likely require
further consultation to determine appropriate “metrics”. What constitutes
a ‘healthy’ local shopping area can vary given each area’s distinct context,
role, and history.
Quantitative Metrics
Some of the more important quantitative metrics that can be used to
assess health and vitality, as well as the possible trajectory of a
commercial precinct, include:
• Vacancy Rate .
• Presence of Anchor / Attractor Uses.
• Property Value Change (vs City average).
• Property Tax change (vs Inflation or Consumer Price Index).
• Population Density and Local Trade Area Growth.
An excellent quantitative metric of success would be the net revenue of
local businesses. Within the Canadian context, such data is not readily
available. Outside of the shopping centre environment (where sales data
are often reported to the property operator) there is no available data
from which a shopping area’s sales performance can be estimated, unless
the City were to obtain third-party customer spending information from
point-of-sale payment processors (e.g. Moneris Solutions Corp.).
Many US cities (San Francisco for example) publish data on State Sales Tax
revenues at the scale of neighbourhood shopping areas (“Neighbourhood
Commercial Districts”). This primary data provides more readily available
information on business performance. There remain limitations however,
such as exclusion of non-taxable goods, issues around how stores with
multiple locations report total sales, and levels of aggregation.
Qualitative Metrics
There are many qualitative attributes that make local shopping areas unique,
attractive and viable. These include:
• A complementary business mix that meets needs of residents, visitors and
workers.
• Appealing buildings, vibrant street life, and perception of safety.
• Cultural preservation and enhancement.
• Opportunities for social interaction, gathering.
• Opportunities for presence of unique, independent businesses.
There are a variety of metrics that could be applied to ‘score’ shopping areas
on these (and other) qualitative attributes. In Section 7.4 we propose some
such metrics; these metrics are applied to the six Study areas in Section 7.5.
Each of these metrics is tied back to one or more of the core Principles for
Successful Commercial Precincts, which are presented in Section 7.3.
Different neighbourhoods have different visions for success, and the role of
each street is context-specific. As such, certain metrics will be more important
in some areas and less in others. For instance, some neighbourhoods may
place greater value on preservation of cultural assets or may have concerns
about displacement of businesses that appeal to certain income or ethnic
groups. Other areas may be more concerned about their long-term ability to
be a destination for shopping in one or more categories. Some may cater
primarily to local trade areas, while others have historically attracted a
customer base from a broader area. Even within a neighbourhood there can
be various opinions on what constitutes “health”, and there are likely
variations in health / success within different sub-areas. The key point is that
metrics for measuring health and vitality must, to some extent, be customized,
reflecting current conditions and neighbourhood plans.

LIVEABLE CITY
PLANNING LTD.
Andrew Yan
Consulting182
This study is fundamentally about setting the stage for monitoring and supporting the health and vitality of Vancouver’s local shopping areas. An
understanding of core principles for successful neighbourhood shopping districts is helpful.
This section describes principles for healthy community commercial areas, and some of the factors that support success. Note that some of the “success
factors” are also indicators of success. These principles and factors set the stage for discussion of associated attributes and measurement metrics to assess
health and vitality, presented in Section 7.4. The broad principle categories, and some of the broad factors / indicators, are listed in the table bellow.
7.3 PRINCIPLES FOR SUCCESSFUL COMMUNITY COMMERCIAL PRECINCTS
Principle Category Example Factors and Indicators of Shopping Area Success
1. Fair and Predictable Rents • Stable additional rents• Basic rent, appropriate by category
2. Occupied, Contiguous Storefronts • Vacancy rates under 10% (on a storefront count basis)
3. Cooperation and Coordination • BIA Capacity and Tenure of executive director (ED)• Frequent communication between BIA and anchors / landlords• Engagement of BIA board• Clarity of BIA mandate • Support from City to overcome BIA capacity variability
4. Anchor Uses and Tenant Mix • Anchor or anchor cluster(s), retail and non-retail• Healthy supportive mix of retail and non-retail uses
5. Experience of Place • Cleanliness, safety of street environment• Public realm programming • Compact layout with good store concentration• Appealing and permeable storefronts
6. Transportation and Access • Convenient access by foot, bicycle, transit and car• Available on and off-street parking
7. Local Trade Area Characteristics • Sufficient local population and household density • Household income and spending power • Presence of daytime workers and visitors
8. Supportive Government Policies • Supportive municipal policy around zoning, permitting, building code. • Small business support mechanisms

LIVEABLE CITY
PLANNING LTD.
Andrew Yan
Consulting183
7.3 PRINCIPLES FOR SUCCESSFUL COMMUNITY COMMERCIAL PRECINCTS
Principle #1: Fair and Predictable Rents
Being able to anticipate and plan for overhead costs is a critical component of business
health and vitality. Stable and relatively predictable staffing, product and rent costs are
critical to business health.
Basic Rent
Typically, rental leasing agreements with commercial property owners are negotiated on a
specific term, with a prescribed rent schedule within the lease term. This creates certainty
around basic rents for the initial term of the lease. Commercial leases may include
prescribed or negotiated rent increases where there are lease renewal or extension
clauses in place.
Additional Rent: Common Area Charges + Property Tax
Additional rent in the form of common area maintenance and property tax can present
businesses with the most uncertainty - particularly the property tax component which is
typically borne 100% by the tenant in ‘triple net’ leases (see Principle 8 for discussion on
property taxes).
Basic Rent+ Common Area Charges+ Property Tax= Gross Rent

LIVEABLE CITY
PLANNING LTD.
Andrew Yan
Consulting184
7.3 PRINCIPLES FOR SUCCESSFUL COMMUNITY COMMERCIAL PRECINCTS
Principle #2: Occupied Storefronts
Occupancy is both a principle and an outcome of success in a local shopping area.
High vacancy detracts from success and high occupancy enhances it. Occupied retail streets offer a diversity of shops and services for local, city-wide and
regional customers, and the cumulative draw of the businesses reinforces their success and viability. If an area has persistent, pervasive vacancy at the street
level, this is not a healthy phenomenon. Vacant units do not serve community needs; they reduce the range and diversity of local shops and services, and they
detract from the attractiveness and usefulness of local shopping streets.
Significant vacancy (>10% of storefronts) can negatively affect other occupied businesses because it may reduce the overall draw of a shopping area.
Combatting Vacancy Problems
• BIAs, with City support, can work with property owners to assist with proactive tenant recruitment and selection based on an overall merchandising strategy
• BIAs can assess health / vitality of existing tenants, and work collaboratively to help businesses stay relevant and competitive. Each business will have its
own unique challenges, and the types of assistance required will vary business-to-business.
• City planning departments can create flexible zoning and land use regulations to allow a wider range of temporary and permanent businesses to fill vacant
space.
• City building departments can relax / grandfather building code requirements to enable adaptive re-use of older buildings without triggering costly full-
building upgrades.
• Permit complexity and processing times exacerbate and extend vacancy problems. The degree to which commercial use permits can be simplified and
expedited will help property owners and BIAs combat vacancy.

LIVEABLE CITY
PLANNING LTD.
Andrew Yan
Consulting185
7.3 PRINCIPLES FOR SUCCESSFUL COMMUNITY COMMERCIAL PRECINCTS
Principle #3: Cooperation and Coordination
BIAs and the Vancouver Charter
Sections 455 and 456 of the Vancouver Charter allow City Council to
recognize and grant money to non-profit Business Improvement Associations
(BIAs) which plan and implement a variety of business promotion schemes
including:
• Carrying out business studies.
• Improvement, beautification or maintenance of streets, sidewalks or
city-owned land, buildings or structures.
• Graffiti removal.
• Heritage conservation.
• Encouragement of business.
The Charter requires the City to recover all BIA grants through a special tax
levy on Class 5 and 6 commercial properties in the BIA area based on their
proportionate Class 5 and/or Class 6 assessed value. To initially establish and
periodically renew their status, BIAs typically engage their membership and
plan a strategy to improve their LSA prior to a legislated approval process.
BIA Leadership Sets the Course
In a rapidly evolving retail environment, Vancouver’s local shopping areas
must have engaged and consistent leaders or champions who are
committed, responsible stakeholders that quickly recognize problems, have a
clear vision and mission and are able to overcome obstacles to achieve
results. Without this type of leadership, efforts at creating and maintaining
street retail vitality may get lost amongst competing needs and priorities.
Business and Property Owner Representation
It is important that local businesses and commercial property owners be
properly represented in the BIA and shape its long-term strategies around new
construction, merchandising, research and promotion. This can be a challenge
where landlords are absent or where the membership is changing quickly.
Consider the spectrum of members, from property owners and independent
businesses, to franchises and chains, and anchor businesses.
Proactive Leasing – Property Owners
Local shopping areas can remain competitive and attract customers by
providing goods and services tailored to the specific needs of the
neighbourhood, in an environment that is convenient, service-oriented,
pedestrian-scaled, and connected to the lifestyles of the neighbourhood
residents. This requires the fragmented group of property owners to:
• Buy into a compelling BIA vision around merchandising and positioning.
• Track the evolution of customer needs and desires.
• Understand complementary business types.
• Engage proactive leasing agents to target desired tenants / categories.
• Match lease opportunities with retail categories (considering the ability
of different businesses to carry lease payments).
• Maintain buildings .
Doing this in a comprehensive way requires consistent and engaged leaders.

LIVEABLE CITY
PLANNING LTD.
Andrew Yan
Consulting186
7.3 PRINCIPLES FOR SUCCESSFUL COMMUNITY COMMERCIAL PRECINCTS
Principle #3: Cooperation and Coordination
Proactive Tenant Retention
Tenant retention and improvement is critical to the success of a local shopping area, particularly
the retention of critical anchor tenants. A tenant retention strategy should be a collaborative
effort between the BIAs, property owners, business owners, and requires consistent and engaged
leadership. Critical elements of proactive tenant retention include:
• Frequent check-ins with business owners and property owners to identify critical issues for
business health and vitality, and how it might be changing.
• Active tracking of changes to the competitive retail landscape, and possible impact on local
businesses.
• Communication to businesses about local area progress and opportunities, including
projected changes to the local market and ways to adapt.
Public Private Partnerships
Long-term success requires both public and private partnerships that link planning, coordination,
infrastructure investments and other public sector supports with private sector business savvy,
development and operational expertise, leasing knowledge, and private financing / access to
capital. The champion(s) of an area can be from the public sector, private sector, or both.
Regardless, that person or persons must make sure that all stakeholders are included and
engaged.
Given the significant variability in capacity of Vancouver BIAs, ongoing and active support from the
City is critical.

LIVEABLE CITY
PLANNING LTD.
Andrew Yan
Consulting187
7.3 PRINCIPLES FOR SUCCESSFUL COMMUNITY COMMERCIAL PRECINCTS
Principle #4: Anchor Uses and Tenant Mix
Local Shopping Areas need Anchors
Anchor stores and non-retail anchor uses provide important community
benefits and draw daily customer traffic which in turn supports other
complementary businesses. Typical retail anchor uses usually require more
floor space at grade and therefore require larger assemblies of property.
Common commercial anchors for community shopping precincts, and their
average store sizes across the 6 Study areas (based on 2019 CMI surveys) are:
• Grocery Stores (avg. size: 25,000 sq.ft.)
• Drug Stores (avg. size: 7,500 sq.ft.)
• General Merchandisers (avg. size: 6,400 sq.ft.)
• Clusters of related stores or restaurants
Commercial districts which lose key anchor uses face challenges with the
attendant loss of footfall generated by these uses.
• Recent examples include the loss of the Safeway Store in Point Grey
Village (West 10th Avenue), and the temporary loss of the Strong’s
grocery store in Dunbar Village while it was being redeveloped at a new
location 3 blocks away.
Community centres, schools, libraries and other non-retail uses can provide
powerful anchor effects in commercial areas by ensuring daily traffic. Loss of
these anchors can have similar impacts as the loss of a retail anchor.
Participants in the Collingwood BIA Roundtable reported that many local
businesses saw a noticeable reduction in their sales following the fire-related
closure of Sir Guy Carleton Elementary School (3250 Kingsway) in 2016.
Anchor Design is Critical
The design of anchor facilities (retail and non-retail) is critical. They can add
to the attractiveness of the street if they integrate into the urban block and
provide retail street continuity. Non-retail anchors like community centres
may include some retail / service uses (e.g. cafes with outdoor seating) that
further help to generate street activity. Blank walls should be avoided, along
with surface parking along retail street frontages.
An example of a non-retail anchor that has created transparency and
integrated activity-generating uses is the Creekside Community Recreation
Centre in the Olympic Village. In contrast, an example of a recent anchor
store that does not interface with the street as well as it could is the Safeway
store in Marpole (long unbroken frontage with blank walls.)
Changing Nature of Anchors
The growth of e-commerce amongst other industry trends (see Section 3)
may change the types or physical scale of businesses that serve as anchors.
In Canada, many traditional department stores and general merchandisers
that anchored community and regional malls have disappeared (e.g. Sears,
Eaton’s, Zellers) and other large businesses are having to reinvent their
business model to survive. At the same time, most day-to-day convenience
needs like groceries, pharmaceuticals, health / bath /beauty products and
convenience services – i.e. the basket of uses that anchor most local
shopping areas – are more resilient in the face of e-commerce. This is a
function of the value of convenience, immediacy, and familiarity. Many
bricks-and-mortar stores are also serving increasingly as hubs for delivery
and pick-up of online orders.

LIVEABLE CITY
PLANNING LTD.
Andrew Yan
Consulting188
7.3 PRINCIPLES FOR SUCCESSFUL COMMUNITY COMMERCIAL PRECINCTS
A Healthy Complementary Tenant Mix
Successful commercial streets develop an appropriate mix of complementary shops and services with quality
merchandising / services. A resilient street should provide enough variety to attract shoppers, facilitating one-stop
shopping for essential goods and services, and provide other reasons to come and linger in the area. While every
commercial area has its own character and client base, in general a healthy mix should include:
• A mix of retailers and services offering convenience goods to meet the daily needs of residents and
workers, and a mix of opportunities for comparison goods shopping. Most successful areas offer a mix
of both types of retail, with varying balances depending on the role the area plays within the broader
retail hierarchy of the city (as discussed in Section 2).
• Convenience goods, personal services, food & beverage (F&B) are other essential elements for creating
viable and sustainable community shopping precincts. These uses are likely to become even more
prevalent and critical to the success of shopping streets as traditional retail uses see further erosion of
market share to e-commerce, and consumers place greater value on experience, value-added
customer service and social connections (many of which cannot be replicated online).
While the “right mix” is highly dependent on the role of the street and the nature of the competitive environment,
generally, a street that is primarily “neighbourhood serving” has at least 60% of its storefronts in the convenience
goods / services / F&B categories (combined). In five of the six Study areas, the proportion in these categories
ranges from 63% to 83%. In South Granville, which has historically attracted its customer base from beyond the
local area, the proportion is 41%.
• A mix of chains and independent businesses can contribute to health, vitality and resiliency of shopping
areas. Chains can play an important role, at times serving as anchors, and through provision of more
affordable goods. Independents are critical as they contribute to the unique character of each
neighbourhood and tend to have stronger local economic multiplier effects than chains (although this
would differ depending on the scale of the chain). San Francisco places restrictions on chain retail in
the city’s neighbourhood commercial districts (NCDs). The impacts of these controls are the subject of
much discussion, as there remains a prominent issue of vacant storefronts in many of the city’s NCDs.
There are emerging calls for a re-think on the City’s formula retail restrictions.
Price of Goods at Chains vs. Independents
San Francisco prepared a study in 2014 on pricedifferences between formula (chain) and non-formula (independent) retailers by surveying pricesfor a standardized basket of commodities at over 30formula and non-formula retailers in the city. Pricesof goods were weighted by frequency of purchase,using guidelines from the Bureau of Labor Statistics.The research focused on branded, commoncommodities found in both formula and non-formulastores
• On average, prices were 17% higher at the non-formula retailers (independents) than at theformula (chains) retailers.
Ref: City and County of San Francisco Office of Economic Analysis(2014): “Expanding Formula Retail Controls: Economic Impact Report
Multiplier Effects of Chains vs. Independents
A study on economic impacts of chains andindependents in BC (2013) found that retailers andrestaurants together recirculate more than 2.6x asmuch revenue in the local economy as chaincompetitors.
• Local retailers recirculate 45%, (vs. 17% forchains)
• Local restaurants recirculate 65% (vs. 30% forchains)
Ref: Civic Economics (2013) “Small Business and the British ColumbiaEconomy.
Principle #4: Anchor Uses and Tenant Mix

LIVEABLE CITY
PLANNING LTD.
Andrew Yan
Consulting189
7.3 PRINCIPLES FOR SUCCESSFUL COMMUNITY COMMERCIAL PRECINCTS
A Healthy Complementary Tenant Mix
• Uses Reflecting Unique Local Attributes. The mix of retail and service
commercial uses in a shopping precinct are what differentiate one precinct
from another and make each neighborhood interesting and memorable. The
combination of businesses reflects the character and makeup of the
surrounding area’s culture and history, which in turn makes an area attractive
as a destination. For example, Commercial Drive’s cultural richness and
authenticity stems in part from its reflection of the area’s Italian heritage. This
is embodied in the street’s mix of restaurants, cafes, specialty stores, and
entertainment venues, as well as annual events like Italian Day. West
Broadway was historically the enclave of the City’s Greek community, and that
history is still reflected to some degree in the makeup of the restaurants,
specialty food stores, and the annual Greek Day festival.
• A Mix of Local-Serving Goods and Services at Varying Price Points. Affordability
is top-of-mind for many Vancouver residents today. Having local access to a
range of affordable goods and services is critical as households grapple with
high costs for housing, child-care, and other necessities.
• Healthy Vacancy Rates. As noted in Principle #2, vacancy rates under 10% are
generally considered low enough to support a vibrant retail precinct, while not
being so low as to negate the ability for movement or tenant turnover.
Typically the 4 or 5-7% range is considered ‘healthy’, while the >7% to <10%
range is considered ‘acceptable’. Vacancy rates above 10% begin to raise some
red flags. These are rules of thumb, which may vary depending on local market
conditions.
Category Proportion of Storefronts
Convenience Goods 13%
Service Commercial 26%
Comparison Goods 18%
Food & Beverage 24%
Automotive 1%
Entertainment & Leisure 4%
Vacant (including under construction)
15%
Vacant (excluding under construction)
11%
Tenant Mix Example, West Broadway BIA, Spring 2019
Principle #4: Anchor Uses and Tenant Mix

LIVEABLE CITY
PLANNING LTD.
Andrew Yan
Consulting190
7.3 PRINCIPLES FOR SUCCESSFUL COMMUNITY COMMERCIAL PRECINCTS
Principle #5: Experience of Place
Clean, Safe and Friendly Public Realm
Clean, safe and friendly streets are a prerequisite for successful shopping
areas. Public realm cleanliness, safety and friendliness requires coordinated
efforts from multiple parties, including the City, local businesses and
property owners, and the BIAs.
Goals:
• Clean, level sidewalks and alleyways that promote walking and ‘rolling’(strollers, wheelchairs, shopping buggies etc.)
• Seamless interface between the street and the building
• Safe crossings to connect both sides of the street
• Street trees to mitigate climate and provide beauty
• Good lighting to extend shopping hours
• Generous pedestrian weather protection
• Good wayfinding
• Public art, bike racks and street furniture
• Flexible use of streets and on-street parking to temporarilyaccommodate seasonal events
• Flexibility for seasonal patios and merchandising.
Key Coordinating Agencies
• City Engineering – Street Works
• City Engineering – Waste Management & Recycling
• BC Hydro, Fortis, Telecom Utilities
Special Challenges: Mental Health, Addiction, Homelessness
Roundtable discussions and surveys of retailers conducted for this study
indicated that in many areas the viability of their businesses is being
challenged by the related trio of mental health, addiction and homelessness.
The growing impacts of these challenges on our shopping streets are visible in
the forms of rough sleeping in storefronts, alleys and parkades, shoplifting, the
erosion of public order, property crime as well as perceived and real threats to
personal safety.
As ‘third spaces’ between home and work, local businesses are public and
permeable and particularly exposed to these social issues. The local business
owners, property owners and BIA representatives we engaged in our study
told us that they felt that they were on the ‘front lines’ of these social issues
which are intensifying and widening across more areas. Many business owners
report daily struggles just to open their stores and to maintain hygienic
storefronts and service areas. Many report that their staff and customers often
feel threatened, and many deal with frequent shoplifting.
Key Coordinating Agencies
• City: Vancouver Police Department, Arts, Culture and CommunityServices
• Province: Vancouver Coastal Health & BC Housing• Federal

LIVEABLE CITY
PLANNING LTD.
Andrew Yan
Consulting191
7.3 PRINCIPLES FOR SUCCESSFUL COMMUNITY COMMERCIAL PRECINCTS
Compact, Walkable Precincts
• Areas with a higher concentration of stores, with a synergistic tenant mix, are more appealing places to walk and
linger. In such areas there is sufficient vitality and visual interest to keep people engaged, and multiple types of stores
and services can be accessed within a reasonable walking distance. Large commercial areas of 15+ blocks (e.g.
Commercial Drive) can still be considered ‘compact’ and walkable if the street is comprised of many distinct (and
anchored) sub-areas, each with its own balanced mix of shops and services, and each serving different (but
overlapping) trade areas.
Appealing and Flexible Building Design
• Shoppers will be drawn to, and linger in, areas with appealing design and storefronts. New tenants are more likely to
be attracted to areas which have an attractive built environment, and pleasant public realm.
• A 2014 study of three major metropolitan areas in the United States found that neighbourhoods with a mix of building
styles and sizes often performed well from an economic and retail perspective. The mix of styles creates visual
diversity, while the mix of storefront sizes allows for a range of business types.*
• Following are some key elements related specifically to building massing and geometry**:
o Emphasize primary entrances to each retail tenant through recessing of entrances.
o Use canopies and other forms of weather protection along the building façade, being careful to balance weather protection
needs with visibility of individual storefronts.
o Avoid designing irregular shaped units. Rectangular spaces with good sightlines to the entrance are best for most tenants.
o Units with storefront to depth ratios of 1:3 work for most tenants.
• Different retail tenant types require different unit sizes and configurations. It is important to assess market conditions
and determine a desirable tenant mix before designing the ground floor of a new space. As tenant mix is likely to
change over the lifespan of a building, adaptability and convertibility of space is critical.
A 2016 retail study in San Francisco
revealed how different built forms can
promote or inhibit different types of
businesses.
• One shopping street, with an
average store size of 2,600 square
feet, was (anecdotally) relatively
easy for brokers to lease, as the
spaces were more affordable and
thus more feasible for a range of
independent businesses across
multiple categories.
• Another shopping street, with larger
storefronts and an average store
size of nearly 3,500 square feet was
more attractive to retailers and
restaurants needing larger spaces,
including some chain retailers. The
largest spaces were challenging to
lease because they appeal to limited
numbers of tenant categories, were
not appealing to independents (due
to price) and were difficult to sub-
divide.
Ref: Strategic Economics, “Calle 24 Retail
Study, Final Background Report, August
2016.
Principle #5: Experience of Place
*National Trust for Historic Preservation, “Older, Smaller, Better: Measuring How the Character of Buildings and Blocks Influences Urban Vitality.”
**Adapted from Toronto Retail Design Manual (2019) and informed by CMI and Lee & Associates’ professional experience.

LIVEABLE CITY
PLANNING LTD.
Andrew Yan
Consulting192
7.3 PRINCIPLES FOR SUCCESSFUL COMMUNITY COMMERCIAL PRECINCTS
Interface between the Street and Retail Frontage
Successful neighbourhood shopping streets have a variety of retail, civic uses
and a vibrant public realm. Critical is the way that the storefronts interface
with the street, and how the buildings work together with the public realm to
create a welcoming environment where people are drawn, and where they
want to linger.
• Provide generous sidewalk widths, with flexible space for programming,
seating, walking, rolling and queuing.
• Ensure that people walking along the sidewalk can easily see into stores.
• Avoid unanimated blank walls on all streetscapes. Also avoid fully glazed
storefronts, or windows showing the back of display shelves.
• Avoid blank walls. Wrap long store frontages (for instance, a large-format
retailer) with smaller retail storefronts on the primary retail façade.
• Design the transition from sidewalk to retail space without any visual or
physical obstacles and meet accessibility requirements.
• Ensure each individual storefront on a frontage can be easily identified
through vertical articulation and /or through use of materials, detailing,
canopies etc.
Adaptability and Convertibility
As Vancouver intensifies and increasingly accommodates retail spaces within
mixed-use structures, the importance of designing adaptable structures that
can accommodate future changes increases. Key considerations are:
• Enabling a diversity of commercial uses and mixes.
• Enabling incorporation of new technologies.
• Accommodating future intensification.
A variety of retail unit widths, depths, heights and transparency treatments
should be possible to meet the needs of different tenants over time.
Principle #5: Experience of Place

LIVEABLE CITY
PLANNING LTD.
Andrew Yan
Consulting193
7.3 PRINCIPLES FOR SUCCESSFUL COMMUNITY COMMERCIAL PRECINCTS
Principle #6: Transportation and Access
Access by All Modes
Historically, Vancouver’s local shopping areas emerged with the dual logic of
electric mass transit and walking. These areas today must be accessible by all
forms of transportation including walking, cycling, transit, cars, and goods
movement.
Walking (28.5% of trips)*
Every visit to a shopping area begins and ends with a walk (or roll) so sidewalks
and street crossings need to be well-finished, well-drained, level and free of
clutter to ensure a clear, accessible path for pedestrians. The City’s investment
in these facilities is critical since streets help to define LSA character.
Transit (17.0% of trips)
The quality, distribution and frequency of transit service is important for the
success of shopping areas. This requires coordination between the City and
Translink.
Cycling (7.3% of trips)
Cycle trips have more than doubled over the last decade and the city is
investing in new cycling facilities, including safer ‘all ages and abilities’ lanes,
racks and bike share stations. These facilities need to be properly and directly
integrated into the shopping areas, noting that design and installation require
thoughtful placement so they do not impair business visibility and operations.
Goods Movement and Loading
Retailers and service providers need to efficiently move goods in and
recycling/waste out. City lanes and on-site loading are key facilities for local
businesses. On-street loading needs to be carefully located and planned so as
not to conflict with other street uses.
Cars and On-Street Parking (47.2% of trips)
Almost half of Vancouver trips are made by car, so access and parking for
vehicles still remains an important priority. The allocation of road and parking
space involves tradeoffs with other modes and interests. People frequently
drive to shop or stop mid-trip on the way to or from work, school or
recreation. There must be sufficient parking, both on and off the main street.
The loss of parking presents many local businesses, and destination
businesses, with significant challenges.
City of Vancouver Trip Survey (2013-2018)
*Mode share data as per “2018 Vancouver Panel Survey Report”, McElhanney and Mustel. “Cars and On-Street Parking is sum of Auto Driver + Auto Passenger.

LIVEABLE CITY
PLANNING LTD.
Andrew Yan
Consulting194
7.3 PRINCIPLES FOR SUCCESSFUL COMMUNITY COMMERCIAL PRECINCTS
The geographic trade area that supplies the customer base for a shopping area
will vary based on the tenant mix, the local population density, the competitive
landscape, and other geographic or psychological barriers (e.g. bridges, major
roads, water bodies, topography etc.). While analysis of the current trade area
extent for each of the six Study areas was not conducted in this study, we note
here a number of key local trade area characteristics that are supportive of
strong shopping precincts:
Population Density
Neighbourhoods with a growing population will have a greater chance of
supporting a thriving and resilient local shopping area. As of 2016, the population
density within one kilometer of each of the City’s non-downtown BIAs ranged
from a high of 89.9 residents per hectares (Kitsilano Fourth Avenue) to a low of
only 30.4 residents per hectare (Point Grey Village).* As noted, areas with
population densities above 40 residents per hectare, and with a strong growth
trajectory, have a greater likelihood of sustaining a resilient local shopping
area.**
Of the six BIAs studied, South Granville had the most people (79/Hectare) and
Marpole the lowest (41.6/Ha) within 1 km. Statistics Canada Census shows that
the City of Vancouver’s population grew by 9.2% between 2006 and 2016. In the
same period, population growth varied considerably across the 1 km catchment
areas for each Study area, ranging from a high of 12.0% in Collingwood, to a low
of 0% in Marpole.
Principle #7: Local Trade Area Population & Spending Power
*Based on GIS analysis using 2016 population data**Based on analysis of population densities around each of the City’s BIAs, and professional knowledge of business challenges in the City’s 3 BIA areas falling below this threshold.

LIVEABLE CITY
PLANNING LTD.
Andrew Yan
Consulting195
7.3 PRINCIPLES FOR SUCCESSFUL COMMUNITY COMMERCIAL PRECINCTS
Income and Spending Power
Many retailers, particularly national chain retailers, will examine local area
household incomes, aggregate income, and aggregate disposable income,
within the primary catchment areas, when selecting store locations.
Typically, retailers look at a variety of criteria, including:
• Average and median household incomes
• Population and household density
• Aggregate income and spending power
Within the 1-kilometre zones around each of the 6 Study areas examined in
this analysis, we see the following rankings in terms of average household
incomes, median household incomes, and aggregate household income. All
data is per 2019 estimates, as per Environics Analytics’ “DemoStats” database.
Area Avg. HHLD Income
Median HHLD Income
Aggregate HHLD Income
S. Granville 1 2 1
W. Broadway 2 1 2
Marpole 3 5 6
Hastings N. 6 6 5
Collingwood 5 3 4
Commercial Dr. 4 4 3
Household Income Rankings (2019)
Principle #7: Local Trade Area Population & Spending Power
Source: Environics Analytics’ “DemoStats” database (2019)

LIVEABLE CITY
PLANNING LTD.
Andrew Yan
Consulting196
7.3 PRINCIPLES FOR SUCCESSFUL COMMUNITY COMMERCIAL PRECINCTS
Principle #7: Local Trade Area Population & Spending Power
Other Drivers of Demand
In addition to local resident population and its spending potential, other sources
of demand in a community shopping precinct may include:
• Daytime workers: retailers and restaurants in particular categories may
benefit from workers who travel into the trade area to eat and shop during
their lunch hours, or before / after work. Vancouver’s local shopping areas
and surrounding areas host a diverse array of employers across many
sectors.
• Visitors to local service providers and institutions: medical and dental offices,
schools and other public or private sector institutions (e.g. government
offices, libraries, community centres etc.) draw people who may also stop to
dine or shop.
• Regional visitors: some community shopping precincts are regional
destinations. South Granville has historically been such a destination for
comparison shopping in the apparel, shoes, homewares, and furniture
categories. Commercial Drive is a regional food & beverage / entertainment
destination.
• Tourists: some of Vancouver’s shopping areas are draws for tourism.
Commercial Drive for instance is highlighted as a notable tourism
destination by travel publications (e.g. Lonely Planet) and is marketed based
on its Italian and ‘counterculture’ influences, and its mix of independent
stores, cafes and restaurants. That said, tourism is not the major driver of
business on the Drive, and tourism alone is insufficient to support any
vibrant shopping precinct.
Resident
Population
Employees
TouristsRegional
Visitors
Visitors to Local
Service
Providers /
Institutions

LIVEABLE CITY
PLANNING LTD.
Andrew Yan
Consulting197
7.3 PRINCIPLES FOR SUCCESSFUL COMMUNITY COMMERCIAL PRECINCTS
Principle #8: Supportive Government Policies
Zoning to Support Healthy and Vibrant Local Shopping Areas
Throughout the roundtable events held as part of this study, stakeholders identified flexible, “fluid”
zoning as a critical element for supporting small business and local shopping, particularly in this
period of fast-paced business change and evolution.
Supportive zoning for small business should include:
• Flexible definitions of use and allowances for businesses that do multiple things, including
production, on-site consumption (e.g. brewery tasting room) retail, and storage/distribution.
• Facilitation of pop-up stores to combat the impacts of vacancy.
• Zoning for safety and form, rather than use.
• Allowance for flexible, temporary zoning for properties being rezoned undergoing
redevelopment.
Permits and Licensing
Complex permit processes and application requirements force many business owners to engage a
variety of professionals at great expense. The City (and others’) growing focus on energy and
sustainability adds new analysis, process and timeline requirements, and mandatory upgrades to
often simple tenant improvements.
Long permitting times are a major disincentive for business opening, and often can lead to financial
hardships for small business as they are typically paying rent, common area maintenance charges
and property taxes through these periods where they cannot operate and generate revenue.

LIVEABLE CITY
PLANNING LTD.
Andrew Yan
Consulting198
7.3 PRINCIPLES FOR SUCCESSFUL COMMUNITY COMMERCIAL PRECINCTS
Six Government Agencies set Property Taxes
A common misconception is that the City alone sets property tax when in fact
there are six independent actors involved. BC Assessment (BCA) appraises the
value of land and buildings annually and these valuations form the basis for
the application of a number of property taxes including:
• City Mill Rate (set by the City) x Property Value by Class
• School Mill Rate (Set by the Province) x Property Value by Class
• TransLink Mill Rate (set by TransLink) x Property Value by Class
• BC Assessment Mill Rate (set by the Province) x Property Value by Class
• Metro Vancouver Mill Rate (Set by Metro) x Property Value by Class
• Municipal Finance Mill Rate (Set by Metro) x Property Value by Class
Under typical Triple Net (NNN) Leases, property owners pass the responsibility for
Property Tax payments on to the commercial tenants through their lease terms.
Reasonable and predictable property taxes are key to the stability of local businesses.
In contrast, rising and unpredictable property taxes create significant financial
challenges for all businesses - particularly for smaller businesses that have inelastic
demand and greater dependence on local trade.
Principle #8: Supportive Government Policies
The Interplay of Property Value Assessments & Commercial Property Taxation
A key issue for many businesses is the challenge of rising property taxes.
While the City does not generate higher property tax revenue as a result of
rising property values, the combination of property value increases and
unused development density on many sites with active commercial uses can
result in increased property taxation for commercial tenants.
• Through the structure of ‘triple net’ commercial leases, commercial
tenants are required to pay a basic rent plus an ‘additional’ rent. The
latter includes the property taxes levied on the unit they occupy.
• When there is unused development potential on a site, the property’s
value is still assessed on the basis of its highest and best use, even if the
current use is significantly different (e.g. a single-level commercial
building, with potential to build 6-storeys of mixed-use space).
• As property taxes are levied on the basis of highest and best use, and as
those taxes are often passed on to tenants through triple net leases, the
tenant can be faced with a situation where property taxes increase at a
greater-than-anticipated rate.
• Recognizing the impact of commercial property taxation and highest-and-
best-use assessment on businesses, Vancouver City Council voted on April
29, 2019 to shift 2% of the “City” tax portion of the property taxes from
Commercial property classes to Residential.
• The City continues to work with other Metro Vancouver municipalities
and the Province in proposing a solution in the form of a split property
assessment.

LIVEABLE CITY
PLANNING LTD.
Andrew Yan
Consulting199
7.3 PRINCIPLES FOR SUCCESSFUL COMMUNITY COMMERCIAL PRECINCTS
Provincial Minimum Wage Regulation
Fair and predictable labour costs are important to the vitality of local businesses
and to employees. Wages represent a significant portion of overhead and all
businesses must adapt to rising local wage conditions and minimum wage
increases set by the Province of BC.
On June 1, 2019, the general minimum wage in British Columbia increased to
$13.85 per hour and is anticipated to increase over the next two years to $15.20
by June 1, 2021.
Based on this forecast, the increases in minimum wages will represent an
average compounded rate of c. 3.5% per year.
Provincial Health Tax Increases
Related to Labour Costs, in January 2020, Businesses in BC will pay 100% of
Provincial Medical Service Plan costs. The move will shift c. $800M in costs to BC
businesses with payrolls over $500,000. These costs have historically been shared
50% between businesses and employees. The shift will disproportionately affect
businesses with larger payrolls.
$7.60
$9.60
$11.60
$13.60
$15.60
No
v-0
0
Feb
-02
May
-03
Au
g-04
No
v-0
5
Feb
-07
May
-08
Au
g-0
9
No
v-1
0
Feb
-12
May
-13
Au
g-1
4
No
v-1
5
Feb
-17
May
-18
Au
g-19
No
v-2
0
BC Minimum Wage/Hr, 2000-2021
Principle #8: Supportive Government Policies
Source: Employment and Social Development Canada, Open Data
LIVEABLE CITY
PLANNING LTD.
Andrew Yan
Consulting200
7.3 PRINCIPLES FOR SUCCESSFUL COMMUNITY COMMERCIAL PRECINCTS
Sales Taxes
According to the Business Council of BC, the 2013 elimination of the HST
and return of the provincial sales tax required businesses to pay an
estimated $3 billion in sales tax on inputs used in their operations*
Businesses pay approximately 40% of the PST collected by the Province.
The Province recently eliminated PST on electricity used by businesses,
which has provided local business with a small tax break.
Parking Taxes
Businesses that charge for parking at monthly or hourly rates are subject
to a 5% GST applied to the parking fee and 24% Metro Vancouver
Parking Tax.
Federal Businesses Taxes
Over the past three years, the Federal Government implemented significantchanges limiting how small businesses can manage retained earnings andshare income amongst owners. For Canadian-controlled private corporationsclaiming the small business deduction, the net tax rate on business profit hasbeen cut as follows:
• 9% effective January 1, 2019
• 10% effective January 1, 2018
• 10.5% before 2018
Provincial Businesses Taxes
British Columbia increased its general corporate income tax rate from11.00% to 12.00%, effective 1 January 2018.
Principle #8: Supportive Government Policies
*Business Council of British Columbia. Vol 26, Issue 2, July 2019. It’s Becoming More Costly and Complex to do Business in B.C.
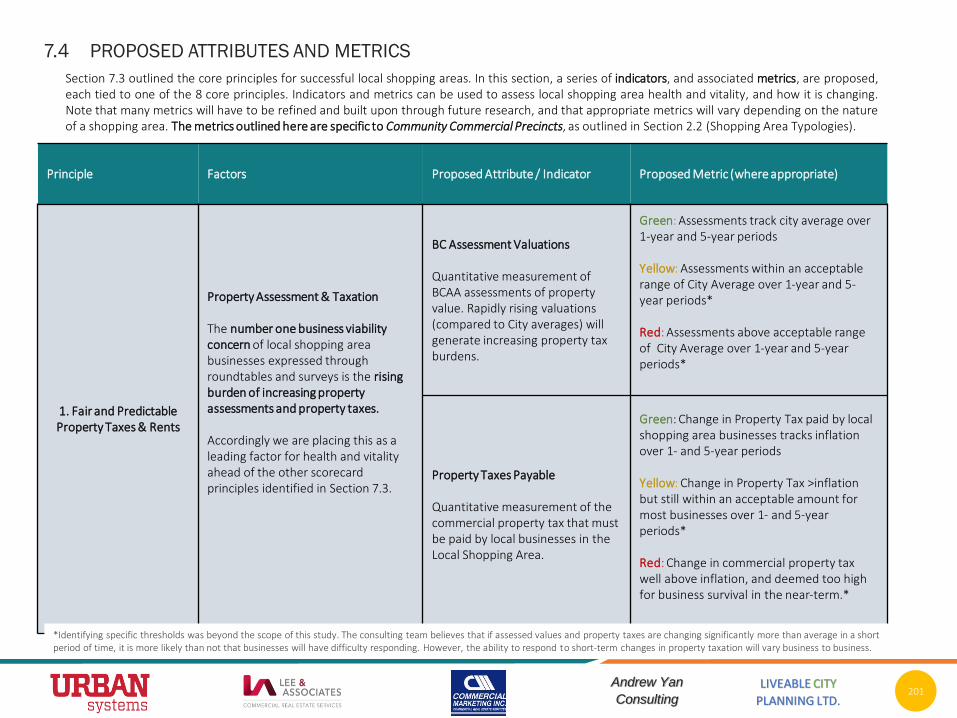
LIVEABLE CITY
PLANNING LTD.
Andrew Yan
Consulting201
7.4 PROPOSED ATTRIBUTES AND METRICS
Principle Factors Proposed Attribute / Indicator Proposed Metric (where appropriate)
1. Fair and Predictable Property Taxes & Rents
Property Assessment & Taxation
The number one business viability concern of local shopping area businesses expressed through roundtables and surveys is the rising burden of increasing property assessments and property taxes.
Accordingly we are placing this as a leading factor for health and vitality ahead of the other scorecard principles identified in Section 7.3.
BC Assessment Valuations
Quantitative measurement of BCAA assessments of property value. Rapidly rising valuations (compared to City averages) will generate increasing property tax burdens.
Green: Assessments track city average over 1-year and 5-year periods
Yellow: Assessments within an acceptable range of City Average over 1-year and 5-year periods*
Red: Assessments above acceptable range of City Average over 1-year and 5-year periods*
Property Taxes Payable
Quantitative measurement of the commercial property tax that must be paid by local businesses in the Local Shopping Area.
Green: Change in Property Tax paid by local shopping area businesses tracks inflation over 1- and 5-year periods
Yellow: Change in Property Tax >inflation but still within an acceptable amount for most businesses over 1- and 5-year periods*
Red: Change in commercial property tax well above inflation, and deemed too high for business survival in the near-term.*
Section 7.3 outlined the core principles for successful local shopping areas. In this section, a series of indicators, and associated metrics, are proposed,each tied to one of the 8 core principles. Indicators and metrics can be used to assess local shopping area health and vitality, and how it is changing.Note that many metrics will have to be refined and built upon through future research, and that appropriate metrics will vary depending on the natureof a shopping area. The metrics outlined here are specific to Community Commercial Precincts, as outlined in Section 2.2 (Shopping Area Typologies).
*Identifying specific thresholds was beyond the scope of this study. The consulting team believes that if assessed values and property taxes are changing significantly more than average in a short period of time, it is more likely than not that businesses will have difficulty responding. However, the ability to respond to short-term changes in property taxation will vary business to business.

LIVEABLE CITY
PLANNING LTD.
Andrew Yan
Consulting202
Principle Factors Proposed Attribute / IndicatorProposed Metric (where appropriate)*
2. Occupied Storefronts
High levels of occupancy are a clear sign of local retail area success and provide a clear-cut quantitative metric for tracking year-to-year.
Measurements of vacancy on a store count and floor area basis.
Track length of vacancy (year-over-year) to differentiate between frictional and structural vacancy.
Consider differentiating vacancies (available for lease, under construction, pending permit)
Green: Vacancy <7% (but above at 4%)Yellow: Vacancy >7%, <10%Red: Vacancy 10%+
7.4 PROPOSED ATTRIBUTES AND METRICS
*Vacancy rate ranges based on industry experience of the consulting team.
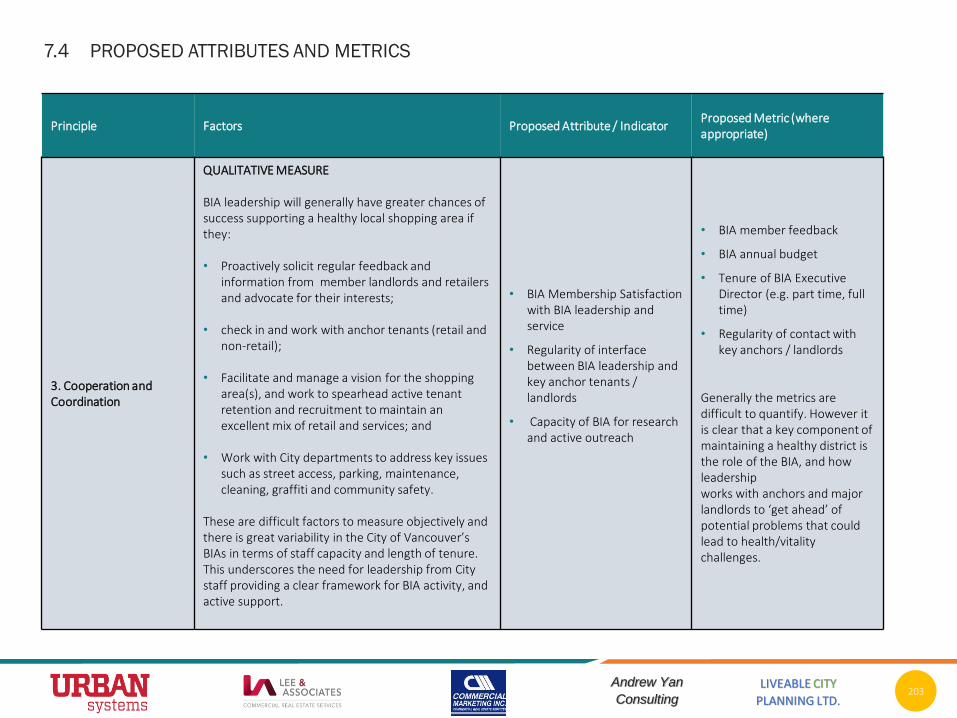
LIVEABLE CITY
PLANNING LTD.
Andrew Yan
Consulting203
Principle Factors Proposed Attribute / IndicatorProposed Metric (where appropriate)
3. Cooperation and Coordination
QUALITATIVE MEASURE
BIA leadership will generally have greater chances of success supporting a healthy local shopping area if they:
• Proactively solicit regular feedback and information from member landlords and retailers and advocate for their interests;
• check in and work with anchor tenants (retail and non-retail);
• Facilitate and manage a vision for the shopping area(s), and work to spearhead active tenant retention and recruitment to maintain an excellent mix of retail and services; and
• Work with City departments to address key issues such as street access, parking, maintenance, cleaning, graffiti and community safety.
These are difficult factors to measure objectively and there is great variability in the City of Vancouver’s BIAs in terms of staff capacity and length of tenure. This underscores the need for leadership from City staff providing a clear framework for BIA activity, and active support.
• BIA Membership Satisfaction with BIA leadership and service
• Regularity of interface between BIA leadership and key anchor tenants / landlords
• Capacity of BIA for research and active outreach
• BIA member feedback
• BIA annual budget
• Tenure of BIA Executive Director (e.g. part time, full time)
• Regularity of contact with key anchors / landlords
Generally the metrics are difficult to quantify. However it is clear that a key component of maintaining a healthy district is the role of the BIA, and how leadership works with anchors and major landlords to ‘get ahead’ of potential problems that could lead to health/vitality challenges.
7.4 PROPOSED ATTRIBUTES AND METRICS

LIVEABLE CITY
PLANNING LTD.
Andrew Yan
Consulting204
Principle Factors Proposed Attribute / Indicator Proposed Metrics* (where appropriate)
4. Anchor Uses & Tenant Mix
Healthy commercial precincts need commercial and non-commercial anchors, and a healthy mix of complementary uses.
• Presence of Grocery Store(s)And / Or
• Cluster of a business category (e.g. clothing stores, destination restaurants, etc.)
Green: at least 1 grocery store (or equivalent) per precinct, and multiple grocery stores, appropriately spaced to serve multiple trade areas, in larger precincts (e.g. Commercial Drive).Yellow: at least 1 grocery anchor, but either not optimally located and/or undersized. Red: Absence of anchor(s), particularly recent loss of anchor.
• Presence of non-commercial anchor(s)
Green: presence of multiple non-retail anchors (institutional, recreational) in precinctYellow: Presence of at least 1 non-retail anchor in precinct. Recent loss of a non-commercial anchor.Red: absence of non-commercial anchors.
• Complementary Tenant Mix
Subjective: Generally, areas that are primarily neighbourhood-serving have 60+% of storefronts as convenience retail/service/food & bev. Complementarity of tenant mix can best be assessed through discussions w/reps from dominant categories. Often a ‘deeper dive’ into the nature of the tenants is required.
• Distinctive Character
Subjective: Ask: does the tenant mix embody some degree of local character? Is it unique, or distinctive? Is the area’s programming supportive of distinctive local culture?
Also consider whether there has been change in the proportion of chains vs. independent businesses.
7.4 PROPOSED ATTRIBUTES AND METRICS
*Anchor tenant metrics based primarily on CMI commercial planning and leasing experience. Complementary tenant mix threshold based on
CMI experience, and reflected by tenant mix data for 6 Study areas.

LIVEABLE CITY
PLANNING LTD.
Andrew Yan
Consulting205
Principle Factors Proposed Attributes / IndicatorsProposed Metrics (where appropriate)
5. Experience of Place
A clean, safe and friendly public realm is essential for the success of a local shopping area.
Clear, clean sidewalks, well maintained buildings with pedestrian weather protection, and appealing storefront designs are elements of successful placemaking.
The impacts of mental health, addiction and homelessness need to be addressed in a humane way to promote real and perceived safety in local shopping areas and to reduce property crime and theft.
BIAs have an important responsibility in liaising with numerous City departments to address many of these issues.
Clean / Safe / Friendly Indicators:• Absence of Graffiti (City data)• Sidewalk condition • Street trees• Wayfinding • Public art • Street furniture • Patios / storefronts
Scoring dependent on what metrics are selected and availability of data.
Concentration of Stores / Compactness Indicators:• Anchored 400-800m areas• Storefronts 8-12m apart on avg.• High intersection density /
pedestrian crossing presence
Storefront density and intersection density thresholds to be determined.
Appealing / Flexible Building Design:• Mix of styles • Mix of building ages • Mix of store sizes
Likely a subjective metric.
Public realm programming: • Permanent programming • Seasonal events / programs
Likely subjective, and area-specific
7.4 PROPOSED ATTRIBUTES AND METRICS

LIVEABLE CITY
PLANNING LTD.
Andrew Yan
Consulting206
Principle Factors Proposed Attributes / IndicatorsProposed Metrics (where appropriate)
6. Accessibility by All Modes
Parking supply is important for providing access for customers, many of whom need to move goods with vehicles.
Presence of bike lanes intersecting with the shopping area, or present on parallel streets, for safe all ages and abilities access.
Comfortable sidewalks – all trips begin and end with a walk.
Good and regular access by transit
• Extent of active on and off-street parking management using time and/or pricing strategies.
Would require parking studies in each area. Further, importance of parking may vary area to area.
• Number of bike lanes to and through the precinct.
Appropriate thresholds to be determined and may vary area to area.
• Width and comfort of sidewalks. Appropriate thresholds to be determined.
• Number of transit routes serving the precinct.
Appropriate thresholds to be determined
7.4 PROPOSED ATTRIBUTES AND METRICS

LIVEABLE CITY
PLANNING LTD.
Andrew Yan
Consulting207
7.4 PROPOSED ATTRIBUTES AND METRICS
Principle Factors Proposed Attributes / IndicatorsProposed Metrics* (where appropriate)
7. Local Trade Area Characteristics
The size of the population within walking distance of the local shopping area is a critical demand factor for local shopping areas. Local spending power and demographic characteristics are also important.
• 1-kilometer radius trade area population density
Green: >60 ppha
Yellow: 41-59 ppha
Red: <40 ppha
• 1-kilometer radius medianhousehold income
Note that this is one proposed attribute. Another attribute may be the aggregate income / spending power of an area. Areas with lower household incomes may collectively have higher spending power than areas with higher median incomes.
Appropriate metrics / thresholds to be determined.
*population density thresholds based on analysis presented on observed thresholds in Section 2.2.

LIVEABLE CITY
PLANNING LTD.
Andrew Yan
Consulting208
Principle Factors Proposed Attributes / IndicatorsProposed Metrics (where appropriate)
8. Supportive RegulatoryEnvironment
Permit & Licensing TimelinesLandlords and Businesses need to comply with City requirements for tenant improvement permits and licensing. City timelines for processing applications is a key factor in business success.
• Permitting & Licensing time
Green: < 1 month for Tenant Improvement Permits & Business Licenses
Yellow: 1 to 2 months for Tenant Improvement Permits & Business Licenses
Red: >2 months for Tenant Improvement Permits & Business Licenses
Zoning CapacityBusinesses need flexible zoning to enable a wide variety of uses.
• Zoning to support flexibility / adaptability / convertibility
Appropriate metrics to be determined following detailed review of current zoning.
7.4 PROPOSED ATTRIBUTES AND METRICS

LIVEABLE CITY
PLANNING LTD.
Andrew Yan
Consulting209
7.5 HEALTH / VITALITY SNAPSHOTS: INTRODUCTION
The following 6 pages contain preliminary health / vitality snapshots for each of the 6 Study areas.
As we have noted throughout section 7.4, many of the proposed metrics / thresholds are yet to be determined and will require further research and internal deliberation by City staff before they can be determined. With that said, the consulting team has provided preliminary scoring for all attributes in the scorecards to follow.
For metrics where no scoring or rating schema / thresholds have been presented in Section 7.4, any scores or ratings shown in Section 7.5 should be interpreted as the subjective opinions of the consulting team only. These opinions are based upon a combination of:
1. Information received during the roundtable engagement events from business operators, brokers, and landlords
2. Information conveyed to the consulting team by BIA leadership over the course of the study
3. Observations of the consulting team members in each commercial area during the course of study, and collective professional experience.
Further snapshots of area-specific health, vitality, key issues and priorities for intervention, are outlined in Appendix C.

LIVEABLE CITY
PLANNING LTD.
Andrew Yan
Consulting210
7.5 HEALTH / VITALITY SNAPSHOT: SOUTH GRANVILLE
Based on consulting team’s assessment through available data and subjective interpretation / experience.
Principle Attribute ⚫⚫⚫ Notes
1. Fair and Predictable Rents BC Assessment ValuationProperty Tax
⚫
⚫
2. Occupied, Contiguous Storefronts Vacancy Rate ⚫
3. Cooperation and Coordination BIA Budget Tenure of BIA ED Contact w/anchors / landlords
⚫
⚫
⚫
SteadySteadySteady
4. Anchor Uses and Tenant Mix Grocery Stores or anchor clustersNon-Retail anchorsComplementary MixDistinctive Character
⚫ / ⚫⚫
⚫
⚫
Becoming less concentrated; grocery store undersized Stanley, major office clusters, firehall / library nearbyLosing local business supporting immediate catchment Steady
5. Experience of Place Cleanliness / Safety Concentration / CompactnessAppealing / Flexible DesignPublic Realm Programming
⚫
⚫
⚫
⚫
Subjective observation / info received from roundtable Subjective observationSubjective observationSubjective observation
6. Accessibility by All Modes Parking AvailabilityBike Lanes / Access / Parking Sidewalks Transit
⚫
⚫
⚫
⚫
Side street parking in resident zones problematic Subjective observationSubjective observationSubjective, based on review of transit routes
7. Local Trade Area Characteristics Population Density Median Household Income
⚫
⚫
SteadySteady
8. Supportive Regulatory Environment
Permitting / Licensing Zoning
⚫
⚫
Long wait times reportedFlexibility could be increased (based on info received during roundtables)

LIVEABLE CITY
PLANNING LTD.
Andrew Yan
Consulting211
Principle Attribute ⚫⚫⚫ Notes
1. Fair and Predictable Rents BC Assessment ValuationProperty Tax
⚫
⚫
2. Occupied, Contiguous Storefronts Vacancy Rate ⚫ / ⚫ Pending deals that will bring vacancy rate down. Positive trajectory.
3. Cooperation and Coordination BIA Budget Tenure of BIA ED Contact w/anchors / landlords
⚫
⚫
⚫
SteadySteadySteady
4. Anchor Uses and Tenant Mix Grocery Stores or anchor clustersNon-Retail anchorsComplementary MixDistinctive Character
⚫
⚫
⚫
⚫
Steady, including food & beverage clustersLibrarySteadyBased on feedback during roundtable + consultant observation
5. Experience of Place Cleanliness / Safety Concentration / CompactnessAppealing / Flexible DesignPublic Realm Programming
⚫
⚫
⚫
⚫
Subjective observations / info received from roundtableSubjective observationSubjective observationSubjective observation
6. Accessibility by All Modes Parking AvailabilityBike Lanes / Access / Parking Sidewalks Transit
⚫
⚫
⚫/ ⚫⚫
Subjective observation Subjective observationExcellent in parts of the precinct, too narrow in others.Subjective, based on review of transit routes
7. Local Trade Area Characteristics Population Density Median Household Income
⚫
⚫
SteadySteady
8. Supportive Regulatory Environment
Permitting / Licensing Zoning
⚫
⚫
Long wait times reported Steady
7.5 HEALTH / VITALITY SNAPSHOT: WEST BROADWAY
Based on consulting team’s assessment through available data and subjective interpretation / experience.

LIVEABLE CITY
PLANNING LTD.
Andrew Yan
Consulting212
Principle Attribute ⚫⚫⚫ Notes
1. Fair and Predictable Rents BC Assessment ValuationProperty Tax
⚫
⚫
2. Occupied, Contiguous Storefronts Vacancy Rate ⚫
3. Cooperation and Coordination BIA Budget Tenure of BIA ED Contact w/anchors / landlords
⚫
⚫
⚫
SteadySteadySteady
4. Anchor Uses and Tenant Mix Grocery Stores or anchor clustersNon-Retail anchorsComplementary MixDistinctive Character
⚫
⚫
⚫
⚫
Steady; grocery store and restaurant clusterLibraryOver-representation of some personal service categories Steady
5. Experience of Place Cleanliness / Safety Concentration / CompactnessAppealing / Flexible DesignPublic Realm Programming
⚫
⚫
⚫
⚫
Subjective observation / info received from roundtable Subjective observationSubjective observation Subjective observation
6. Accessibility by All Modes Parking AvailabilityBike Lanes / Access / Parking Sidewalks Transit
⚫
⚫
⚫
⚫
Subjective observationSubjective observationSubjective observationSubjective, based on review of transit routes
7. Local Trade Area Characteristics Population Density Median Household Income
⚫
⚫
SteadySteady
8. Supportive Regulatory Environment
Permitting / Licensing Zoning
⚫
⚫
Long wait times reported Steady
7.5 HEALTH / VITALITY SNAPSHOT: MARPOLE
Based on consulting team’s assessment through available data and subjective interpretation / experience.

LIVEABLE CITY
PLANNING LTD.
Andrew Yan
Consulting213
Principle Attribute ⚫⚫⚫ Notes
1. Fair and Predictable Rents BC Assessment ValuationProperty Tax
⚫
⚫
2. Occupied, Contiguous Storefronts Vacancy Rate ⚫ Concentrated in particular sub-areas
3. Cooperation and Coordination BIA Budget Tenure of BIA ED Contact w/anchors / landlords
⚫
⚫
⚫
SteadySteadySteady
4. Anchor Uses and Tenant Mix Grocery Stores or anchor clustersNon-Retail anchorsComplementary MixDistinctive Character
⚫
⚫
⚫
⚫
Grocery store, Shoppers, London DrugsLibrarySteadySteady
5. Experience of Place Cleanliness / Safety Concentration / CompactnessAppealing / Flexible DesignPublic Realm Programming
⚫
⚫
⚫
⚫
Subjective observation / info received from roundtable Subjective observationSubjective observationSubjective observation
6. Accessibility by All Modes Parking AvailabilityBike Lanes / Access / Parking Sidewalks Transit
⚫
⚫
⚫
⚫
Subjective observation / info from roundtable Subjective observationSubjective observationProblematic north/south connections based on review of transit routes
7. Local Trade Area Characteristics Population Density Median Household Income
⚫
⚫
SteadySteady
8. Supportive Regulatory Environment
Permitting / Licensing Zoning
⚫
⚫
Long wait times reportedSteady
7.5 HEALTH / VITALITY SNAPSHOT: HASTINGS NORTH
Based on consulting team’s assessment through available data and subjective interpretation / experience.

LIVEABLE CITY
PLANNING LTD.
Andrew Yan
Consulting214
Principle Attribute ⚫⚫⚫ Notes
1. Fair and Predictable Rents BC Assessment ValuationProperty Tax
⚫
⚫
2. Occupied, Contiguous Storefronts Vacancy Rate ⚫ Steady
3. Cooperation and Coordination BIA Budget Tenure of BIA ED Contact w/anchors / landlords
⚫
⚫
⚫
SteadySteadySteady
4. Anchor Uses and Tenant Mix Grocery Stores or anchor clustersNon-Retail anchorsComplementary MixDistinctive Character
⚫
⚫
⚫
⚫
Safeway, London DrugsLibrary; school closureSteadySteady
5. Experience of Place Cleanliness / Safety Concentration / CompactnessAppealing / Flexible DesignPublic Realm Programming
⚫
⚫
⚫
⚫
Subjective observation / info received from roundtable Subjective observation Subjective observation Subjective observation
6. Accessibility by All Modes Parking AvailabilityBike Lanes / Access / Parking Sidewalks Transit
⚫
⚫
⚫
⚫
Problematic parking on Kingsway and side streetsSubjective observationSubjective observationSubjective, based on review of transit routes
7. Local Trade Area Characteristics Population Density Median Household Income
⚫
⚫
SteadySteady
8. Supportive Regulatory Environment
Permitting / Licensing Zoning
⚫
⚫
Wait times not as prominent a reported issueSteady
7.5 HEALTH / VITALITY SNAPSHOT: COLLINGWOOD
Based on consulting team’s assessment through available data and subjective interpretation / experience.

LIVEABLE CITY
PLANNING LTD.
Andrew Yan
Consulting215
Principle Attribute ⚫⚫⚫ Notes
1. Fair and Predictable Rents BC Assessment ValuationProperty Tax
⚫
⚫
2. Occupied, Contiguous Storefronts Vacancy Rate ⚫ 5%
3. Cooperation and Coordination BIA Budget Tenure of BIA ED Contact w/anchors / landlords
⚫
⚫
⚫
SteadySteadySteady
4. Anchor Uses and Tenant Mix Grocery Stores or anchor clustersNon-Retail anchorsComplementary MixDistinctive Character
⚫
⚫
⚫
⚫
Multiple grocery anchors, restaurantsCinema (Rio), Britannia Community CentreSteadySteady
5. Experience of Place Cleanliness / Safety Concentration / CompactnessAppealing / Flexible DesignPublic Realm Programming
⚫
⚫
⚫
⚫
Subjective observation / info received from roundtable Subjective observationSubjective observationSubjective observation
6. Accessibility by All Modes Parking AvailabilityBike Lanes / Access / Parking Sidewalks Transit
⚫
⚫
⚫
⚫
Subjective observation / info received from roundtable Subjective observationSubjective observation Only 1 bus line; Broadway/Commercial SkyTrain
7. Local Trade Area Characteristics Population Density Median Household Income
⚫
⚫
SteadySteady
8. Supportive Regulatory Environment
Permitting / Licensing Zoning
⚫
⚫
Long wait times reportedSteady
7.5 HEALTH / VITALITY SNAPSHOT: COMMERCIAL DRIVE
Based on consulting team’s assessment through available data and subjective interpretation / experience.

LIVEABLE CITY
PLANNING LTD.
Andrew Yan
Consulting216
7.6 APPLYING THE REPORT CARD AND TRACKING CHANGE
The proposed health and vitality metrics and scoring, and their application to
each of the 6 Study areas on the previous pages, shows both snapshots in time,
and potential trajectory of change.
• The snapshots of area health are important indicators, as they may flag
areas of concern that warrant further exploration.
• From the standpoint of problem identification for intervention in a timely
manner, it is the trajectory of change that is more significant. The
trajectory of change in some key categories (e.g. vacancy) is not
altogether clear given the relatively large time gap between data points.
In order to successfully apply this (or a similar) report card tool going forward,
the following initiatives will be required:
1. Create and regularly update a database of key metrics through annual field
surveys.
• A database tracking key indicators of the health of commercial precincts
is an essential prerequisite for both monitoring health and planning
timely interventions.
• Some questions that will need to be discussed further are:
o The geographic extent of data collection (i.e. which areas to include and
exclude)?
o Inclusion or exclusion of non-commercial categories in the field survey?
o Ground floor only or multi-floor? And does this vary by area?
2. BIA Leadership with City Support
• There are many roles that the BIAs, with varying degrees of City support,
can and should play to assist with maintaining and enhancing health of
shopping precincts over time.
• What can be expected of the BIAs themselves will need to be scaled to
accommodate for variability in capacity. The role of the City will therefore
be critical in ensuring that certain core tasks are undertaken around
visioning, tracking, communicating and reporting.
• Regardless of capacity variability, BIA directors and members are on the
front-line in their respective local shopping areas. Each has critical
information, collected formally or informally, that is valuable in
identifying health/vitality concerns, and potentially intervening at an
early stage before problems emerge.
3. Leverage other City databases to access useful metrics for tracking area
health and vitality
• As noted previously, many of the health and vitality attributes are
qualitative in nature and vary area to area.
• Preliminary metrics have been proposed for some of these qualitative
variables. Further discussion will be needed around how and where to
refine these metrics, to make them as widely applicable as possible.
• There are many available data sets that the City already tracks which
could prove useful in putting scores to some of the qualitative elements.
Each of these three initiatives are discussed further in Sections 7.7, 7.8 and 7.9
to follow.

LIVEABLE CITY
PLANNING LTD.
Andrew Yan
Consulting217
7.7 COLLECTING BUSINESS INVENTORY DATA
Core Data to Collect
If the City’s goal is to be able to track the nature of change in the City’s commercial
landscape, understand the trajectory of change, and be positioned to provide
intervention and support in a timely manner, then a database of the City’s
commercial areas will need to be created and annually updated to track the
following data:
1. Vacancies, by storefront count and floor area
Understanding vacancy rates and changing vacancy rates by both store count
and floor area over time, are important and relatively clear-cut quantitative
metrics that can be indicative of health, vitality and change.
Vacancy can be an indicator of many issues, including problems related to
taxation or rent, competition, safety, redevelopment, and other factors.
Vacancy should be tracked and ideally ‘tagged’ by different sub-types,
including:
• Vacant and available (unencumbered by an existing lease, listed for
sale or rent).
• Vacant, or under construction and not yet committed.
• Vacant and pending permit.
• Vacant lots.
Different types of vacancies can tell us different things about an area. For
instance, if a space is vacant and is available for lease, this space may require
significant upgrades but the lease terms being offered may not be conducive
to that level of re-investment. Perhaps a use that would like to go into the
space cannot do so because of either building upgrade requirements or zoning
encumbrances such as allowable use(s) and parking. Or perhaps there are
other issues related to permitting, special lease conditions, problematic
adjacencies, non-market asking rents and the like.
If a space is vacant and available for lease but is not being leased, this is
more problematic than if a vacancy is there because the space is not yet
ready for occupancy. A long-term vacancy can make the space harder to
lease due to a perceived ‘stigma’.
Tracking vacancy data annually can provide other insights into the
changing nature of an area, as a long-term vacancy can be quite different
from a short-term vacancy. If a space is vacant for 12+ months, the ability
or ease with which that space can be leased diminishes. The outcome will
either be that the space remains vacant, or that the use that goes into
that space is not the best complementary or generative use for the area.
Long-term vacancies may tell a story about a structural change in the
marketplace that requires investigation. Short-term vacancies may simply
be part of the typical cycle of business openings and closures.

LIVEABLE CITY
PLANNING LTD.
Andrew Yan
Consulting218
2. Business Counts, Floor Areas, and Categories
Tenant mix by category (e.g. predominant NAICS category), size of each
storefront, and how the mix is changing year-to-year, can tell us many
things about a commercial area, how it serves the neighborhood, how
the needs of a neighbourhood may be changing, and how the
competitive business landscape is changing. This data should be
updated annually through field surveys.
The presence and type of non-retail / service commercial anchors
should also be tracked. These include locations / sizes of:
• Libraries
• Community centres
• Schools
• Daycares
• Cultural spaces
Some of the critical category-related trajectory data that will be
important to keep track of is:
• Loss of commercial anchors, particularly grocery stores. This can
have serious knock-on effects for the viability of other
businesses.
• If the anchor (or one of the anchors) of an area is a cluster of
goods in one category (e.g. apparel), then a loss of multiple
stores may indicate that this use is diminishing in its anchoring
potential for the area.
• Loss of non-commercial anchors such as a library, school, or
other community activity generator.
3. Independent vs. Chain
This can be an interesting metric to track, despite the difficulty around
identifying what is truly an independent or a chain given many layers of
complexity around ownership and control. The City may consider sub-
dividing the ‘chain’ category further than what has been done for this study,
given that a small local chain is likely to have very different impacts on the
local economy than a national or international chain. One possible means of
categorization:
• Local chain (only in Vancouver, or Metro Vancouver)
• Provincial chain (only in BC)
• National chain (only in Canada)
• International chain (multiple countries)
This type of segmentation may require further refinement if this is a metric
that the City wishes to track. For instance, the proposed 4-tier segmentation
noted above would categorize a global fast-food restaurant like McDonalds in
the same category as a largely local restaurant like Meat & Bread, which has
four locations in Vancouver, one in Calgary, and one in Seattle. Further, there
is the ongoing issue of how to deal with franchise ownership, whereby a
global standardized brand is operated on a franchise basis by a local business
owner.
Note: The City’s development and building permit system may be used to ‘flag’ where changes have occurred year-to-year, once a base data set is established. However, permits would not be useful for flagging where a tenant has moved out and a space has become vacant.
7.7 COLLECTING BUSINESS INVENTORY DATA

LIVEABLE CITY
PLANNING LTD.
Andrew Yan
Consulting219
Questions and Methods
The question of “how” to collect and maintain a new dataset of this nature, and
the extent of coverage, is one that will require further discussion in a future
phase of work. It may also require partnership with other organizations,
depending on alignment of interests and required resources.
Our preliminary research suggests that the following will be important
considerations when planning the “how” around data collection and data
management:
1. Clarity of Critical Questions: what questions does the city want to
answer using this new database? What questions might it want to
answer in the future? What are the “must haves” vs. “nice to haves”,
and what resources will be required?
• Having clarity on the questions, and the potential initiatives the
data can support, is a critical first step as this will inform both the
“what” and the “how” for collection and data management.
• For example: should the dataset be limited to the changing nature
of commercial / retail /food and beverage mix? Or, must the data be
able to answer broader questions pertaining to changing activities
in neighbourhood commercial precincts more broadly? This type of
question will determine what variables should be included or
excluded in the inventory, and the extent of resources required to
both build and maintain the datasets.
• Is ‘independent vs. chain’ as defined in this document a data set
that is still desirable for long-term tracking? Is there additional
nuance to the definition that should be applied for it to be
meaningful (e.g. separation of ‘one-off’ businesses in to their own
category of ‘micro-scale’ independents)?
2. Method for Collection: a data set designed to track business counts, floor
areas, vacancies, and business categories across the city over time will
require an annual field survey. The details of how such a survey is carried
out (including by whom, how often, with what supports etc.) and how the
data is updated and maintained, will need to be explored and agreed
upon. Key topics for further exploration include:
• Precise variables to collect.
• Dedicated staff requirements.
• Seasonal staff requirements.
• Timing for hiring, training, data collection, coding, reporting.
• Training protocols for both collecting and maintaining the data.
• Outside assistance requirements / partnerships (if any).
• Comparability and compatibility between regulatory and permitting
needs of the City and standardized economic measurement schemas
like the North American Industry Classification System (NAICS).
• Budgetary commitments.
In considering these questions, note that the collection of the data is only one
piece of the puzzle (although it will require significant annual resources). To
maintain an accurate longitudinal data set will also require ‘back-end’
resources pertaining to database management, data cleaning/maintenance,
and linking the database to other city data sets.
7.7 COLLECTING BUSINESS INVENTORY DATA

LIVEABLE CITY
PLANNING LTD.
Andrew Yan
Consulting220
7.8 BIA LEADERSHIP AND CITY SUPPORT
Engaged leadership from BIAs (both the executive team and the board), with a
high-degree of support from the City, can make a difference in the health and
trajectory of a commercial precinct. Depending on financial and staff capacity,
BIA leadership can fulfill the following roles:
• Vision: creating unity and shared vision amongst businesses, property
owners and leasing agents, and coordinating efforts to meet that vision. This
may include coordinated operating hours, targeted leasing programs, or
other means to promote cross-shopping. A part of building buy-in for a
vision is ensuring that major landlords and anchors are on-side. This
requires open lines of communication, which may require City support.
• Advocacy: advocate on behalf of business owners and operators.
• Partnerships: build partnership between the local businesses, community
groups, customers, and landlords to gain buy-in around vision, and to
collectively advocate on critical issues.
• Targeted Leasing: the BIA, with support from outside experts, can work with
local landlords and brokers to shape the business mix and reduce leasing
risk by building a collective understanding of target business categories, or
specific businesses, that will work well in the area.
• Business Education: the BIA can work with the City and outside expertise to
assist small businesses improve their business plans and business
operations.
• Public Realm: BIAs coordinate public realm improvements such as cleaning,
landscaping and other measures that improve the look and feel of the area.
• Knowledge Collection: BIA leadership is on the front lines, and must
maintain open and frequent lines of communication with the major
activity generators and landlords in a business district. Taking the pulse of
the area is critical to understanding vision, goals, plans, and for crafting
opportunities for partnerships. Depending on capacity, BIA leadership
may require City support in this knowledge collection.
• Knowledge Transfer: on-the-ground knowledge should be conveyed back
to City staff, and between BIAs, in a standard and consistent manner. This
may involve an annual survey filled out and returned by each BIA to the
City BIA liaison. This would ensure that critical on-the-ground knowledge
is transferred to the City in a consistent manner.
• Governance and Transparency: transparency in BIA goals, governance and
operations are instrumental in building trust amongst BIA members.
Consideration should be given by BIA leadership and City staff to jointly
hosting additional (and possibly regular) community roundtables. Done
well, a roundtable is a useful means to gain insights into issues faced by
each area.
Future roundtables should:
• Be held outside of normal business hours.
• Include provision for translation services.
• Involve active recruitment to ensure business and cultural
representativeness and diversity.
• Include embedded expertise from commercial leasing and
property management.

LIVEABLE CITY
PLANNING LTD.
Andrew Yan
Consulting221
7.9 LEVERAGE OTHER CITY DATA SETS
There are many qualitative indicators of health and vitality, the relative
importance of which will inevitably vary from area to area. Further, there are a
range of metrics that could be attached to many of these indicators, which will
require further exploration.
For instance, evaluation of the ‘experience of place’ may leverage existing city
data sets such as:
• Street trees
• Density of street intersections
• Graffiti
• Right-of-way widths
• Bikeways
• Public Art
There will also be opportunities to utilize other city data that is currently
collected and tracked to evaluate year-over-year changes in property valuation
and property taxation.
Other data sources, such as BC Assessment, will be able to provide insights
around building age, and potential linkages between age of building and
different tenant types.
Census data will be able to provide insights on the changing nature of the
surrounding neighbourhoods in terms of population, households, and income
levels.
Between these City and non-City datasets, a number of further advanced
techniques in analysis could be insightful. These may include:
• Retail diversity measures
• Correlation and regression analysis
• Further geospatial analytics

LIVEABLE CITY
PLANNING LTD.
Andrew Yan
Consulting222
7.10 KEY TAKE-AWAYS FOR TRACKING CHANGE AND MONITORING HEALTH / VITALITY
• Local shopping area health and vitality is a critical issue for the future of the
City’s livability, character, culture and other objectives.
• As presented earlier in this document, research suggests that independent
businesses tend to have greater local economic multipliers (direct and
indirect) than larger chain business.
• Monitoring LSA health and vitality requires tracking of many attributes on an
annual basis. The core quantitative attributes to track annually are:
o Vacancy, change in tenant mix, change to anchor tenant status.
o Property value change (compared to City average).
o Property tax change (compared to inflation).
• Tracking changes to ownership may also be useful, as this could provide early
indications of intent to redevelop, which will have implications for building re-
investment and lease terms for current / prospective tenants.
• Metrics for measuring health and vitality must, to some extent, be customized
or weighted to reflect the current conditions and specific neighbourhood
roles and goals.
• Tracking the nature of change long-term will require that the City create a
database to track vacancy, tenant mix, business counts / sizes and business
categories. The geographic extent of the database, and the specifics around
what to collect and how to collect it, will need to be finalized in a future work
phase.
• When designing the protocols for setting up a new data collection /
maintenance process, be clear on the questions before designing a new
database collection protocol.
• Identify partnership agencies (e.g. post-secondary institutions).
• Budget for both data collection and management.
• Engaged leadership from both the BIAs and the City will be
important for both monitoring and supporting long-term health
and vitality of precincts.
• BIA leadership, with support from the City, can support in many
ways including:
o Creating a shared vision for the areas.
o Advocating on behalf of businesses.
o Establishing partnerships between businesses, the community,
customers, and landlords.
o Targeted leasing programs.
o Business education.
o Public realm enhancement.
o Knowledge collection and transfer.
o Partnerships with the City to have input on the built form of new
developments.
• BIAs take the pulse of the local shopping areas. Having each BIA
complete an annual questionnaire is one way to ensure that on-
the-ground knowledge is communicated back to the City in a
consistent manner.
• The opportunity to continue with community roundtables should
be explored. Any future roundtables will need to find ways to
overcome barriers to attendance, such as time of day and
language.
• Multilingual and ethnoculturally sensitive qualitative and
quantitative data collection is also highly recommended.

8.0 SYNOPSIS: CHALLENGES AND CHANGE DRIVERS

LIVEABLE CITY
PLANNING LTD.
Andrew Yan
Consulting224
Vancouver’s local shopping areas are facing a variety of challenges, as
identified through both the data analysis and the engagement undertaken
through both surveys and roundtable events. Those challenges and ‘change
drivers’ can be organized and summarized in the following categories:
1. Increasing Property Tax Load
2. Deteriorating Experience of Place
3. Land Use Regulations and Permitting Requirements
4. Employment Recruitment, Retention and Labour Costs
5. Real Estate Conditions and Lease Terms
6. New Competition and Changing Trade Areas
7. Variable Capacity and Expertise
8. Other Challenges
8.1 CHALLENGES AND CHANGE DRIVERS
1. Increasing Property Tax Load
• Escalating property taxes based on unrealized highest and best use
presents small businesses with significant financial challenges. While the
City is addressing the property tax burden through shifts in the mill rate
from Commercial to Residential land uses, the BC Assessment basis for
property valuation has ultimately driven unsustainable property tax
increases on local businesses in the face of rising land and potential
property development values.
• Triple net leases are the industry norm across Canada, and these
contracts place the responsibility of paying property taxes (plus
insurance and maintenance) on the business owner. While this is not
necessarily a problem in many cases, it can (and has) proven problematic
for businesses when property tax increases outpace business’ ability to
grow sales or otherwise respond.
• Throughout the roundtables, many business owners expressed concern
with the combination of rising property taxes and a perceived decrease
in ‘value for money’ for City services. Many members report fewer City
services and a downloading of costs such as waste collection and
security, all in the face of rising tax bills.
• Commercial property taxes operate within the context of a wider
universe of business taxation. While property taxes escalate for many,
there have also been significant increases in taxation and policy cost
from other sources including:
o Federal small business tax changes..
o BC minimum wage increases.
o Downloading of MSP premiums to employers with payrolls exceeding
$500,000.
o Rising Metro Vancouver regional DCCs and parking taxes.
• Many business owners have described this situation as “death by a
thousand cuts.” Some owners report that gains in sales are outpaced by
the rising costs of operating their businesses.
• The City has a role in engaging senior government to educate policy
makers on the impacts of taxation and the interest of local shopping and
services which support walkable neighbourhoods. At the time of writing,
the BC Government had not yet responded regarding the UBCM motion
to create a commercial sub-class for unbuilt development potential.

LIVEABLE CITY
PLANNING LTD.
Andrew Yan
Consulting225
2. Deteriorating Experience of Place
• A clean, attractive and safe public realm is critical for supporting a
successful retail environment. This can help to attract locals to shop and
recreate in the area (versus leaving to another area). It can also help
position a commercial district as a destination for those beyond the
neighbourhood.
• The great advantage of local shopping streets over the rising tide of
online shopping is direct contact with the customer and the attraction of
a pleasant walk along a tree-lined street with a variety of goods and
services. The City’s primary role in shopping areas is to keep streets,
sidewalks and alleys (i.e. the public realm) in the best condition possible.
• Vancouver has particular challenges with maintaining a high-quality
experience of place. Our society’s mental health, addiction and
homelessness crises are complex, multi-faceted issues that affect people
across the city and region, and they play out and generate profound
impacts on storefront retail and services. When the front door of one’s
shop is blocked by somebody sleeping rough, is littered with needles and
drug paraphernalia, or is contaminated by human waste, there is an
undeniable impact on the curb appeal of one’s business and the cost of
opening one’s doors daily. Many business owners and operators report
additional cost burdens of private security, shoplifting and vandalism. In
some BIAs, business operators and customers experience real and
perceived threats to their personal safety.
• While senior government has a role in addressing these crises (notably
housing and mental health response), the City can, on a practical level,
focus on daily maintenance and cleaning of the public realm as a way to
create and enforce reasonable norms around use of public space, while
maintaining everyone’s basic rights.
• Many businesses seek some form of pragmatic, integrated local
shopping area service from the City that could partner on daily street
maintenance, policing and social services. A coordinated approach
focused on the city’s most important public space – the local shopping
streets – could hold some promise.
8.1 CHALLENGES AND CHANGE DRIVERS

LIVEABLE CITY
PLANNING LTD.
Andrew Yan
Consulting226
3. Land Use Regulations and Permitting
The impact of land use regulations and permitting processes were noted in
each roundtable event as significant challenges for starting businesses in the
City of Vancouver. These issues were also noted as “significant” or “very
significant” challenges to business viability by 85% of survey respondents.
Some of the specific challenges related to land use regulations and permitting
include:
• Time, Cost, and Complexity of Opening a Business: the time, cost (in
dollars spent and foregone dollars earned) and expertise required to
open a business in Vancouver were cited as being significant problems for
small business. In some cases, a tenant will be required to pay rent during
the permitting process, while earning no income. Brokers and other
roundtable attendees noted cases where the permitting process led to
applicants being financially unable to open their business, or put them in
a situation where their ability to absorb early year business ‘growing
pains’ was severely constrained. Some roundtable attendees suggested
the need for a “small business liaison”, or a “case management” approach
to small business, whereby one City staff member shepherds all aspects
of a business’ opening requirements through municipal process. It was
further suggested that a streamlining and prioritizing of permits for small
business should be a top priority.
• Change of Use: protocols around changing an approved land use and
/or building occupancy class was noted as a significant problem, and a
potential cause of long-term vacancy. Costly building upgrades can, at
times, prevent businesses from occupying older commercial space. This
creates a barrier to adaptive re-use and at times it could force property
owners into contemplating an earlier redevelopment of the property
than originally intended. Parking ratio requirements also make it
difficult, and at times impossible, for some uses (which may otherwise
be appropriate from a tenant mix standpoint) to enter unused spaces.
• Zoning limiting flexibility to changing commercial environment: in an
environment where the nature of retail and service is changing quickly,
zoning must become more flexible to allow for businesses to experiment
with new strategies. These may include co-location, use combinations
(e.g. manufacturing, sales and entertainment), or offering new and
varied customer experiences. Current commercial zoning and building
code requirements can place restrictions on businesses’ abilities to
experiment and test the market.
8.1 CHALLENGES AND CHANGE DRIVERS

LIVEABLE CITY
PLANNING LTD.
Andrew Yan
Consulting227
4. Employment Recruitment, Retention and Labour Costs
Issues around rising labour costs, commute times for employees and the
inability of employees to live near work, were consistently noted across the
roundtables and in the surveys. Trends with attracting and retaining quality
employees appear to be a growing problem. There are multiple factors driving
the issues with attracting and retaining labour:
• Low and falling unemployment rates: the City of Vancouver, and Metro
Vancouver region, has a broad-based and growing economy, driven by
sectors such as technology, digital entertainment and tourism. The
seasonally adjusted unemployment rate in the region has been steadily
trending downward since 2010, and was at 4.6% as of December 2019
(per Statistics Canada). This can create labour shortages, particularly in
the retail and service sector where compensation levels are typically
lower than other sectors.
• Competition from higher wage industries: in the context of a strong
economy and low unemployment, retail and service industries have
challenges competing for labour. Some roundtable attendees noted the
need to offer higher pay or other perks (e.g a car lease) to retain valuable
employees, this despite its impacts on operating margins.
• High cost of living: high and rising rents in the City of Vancouver are
forcing many lower wage earners to live further afield. This is making it
difficult to retain people over the long-term. Many business owners
reported workers commuting long distances, with long-term retention
prospects diminishing. Businesses that employ only (or predominantly)
family members are more insulated from such turnover.
• Rising minimum wage: while rising wages may be beneficial to employees
who are struggling with the cost of living, this is another cost for small
business operators in a long line of costs. Research conducted on the
implications of rising minimum wage on workers, business, consumers and
employment levels, generally finds that increases to minimum wage are
most often passed on or absorbed in the form of higher prices or lower
profits. Much of the literature has focused on the restaurant industry.
8.1 CHALLENGES AND CHANGE DRIVERS

LIVEABLE CITY
PLANNING LTD.
Andrew Yan
Consulting228
5. Real Estate Conditions and Lease Terms
There are a number of typical commercial lease terms and clauses that, while a
longstanding part of Canadian commercial leases, can become a challenge to
local shopping areas during periods of significant property appreciation and
redevelopment pressure. This can impact the ability to attract quality tenants
to an area, and may incent business closure or relocation.
Some of the clauses of note are:
• Assignment and Subletting: a clause such as this would either permit or
limit the opportunity for a tenant to sub-let or sell the lease to a new
tenant.
• Option to Renew/Lease Extension: lease renewal clauses typically provide
that a tenant must give notice to renew prior to the negotiation of the
renewal rate for the lease term. During periods of market appreciation in
lease rates, established businesses may be forced to renew at rents that
are unsustainable. This can be particularly onerous where a tenant has
financed improvements, and relocating may force that tenant into a
choice of either spending money to fit out a new space in a more
affordable location, or to renew at the higher rent. Both options may be
financially unsustainable for the business.
• Use Clauses: use clauses may be sufficiently restrictive as to prevent a
tenant from adapting their business in terms of changing trends.
• Demolition Clauses: Demolition clauses have long been a standard feature
in North American lease agreements. In an environment of rising property
values, and with potential for redevelopment to “higher and better use”,
landlords are unlikely to waive demolition clauses in leases. In recent
years with the accelerated rate of change, property owners in some areas
have been given an incentive to enforce early termination and demolition
clauses and draft leases with shorter notice periods for early termination,
which makes the tenants’ term uncertain and discourages longer term
tenant prospects. An incentive for enforcement is the presence of new
community plans or visions that have changed the highest and best use of
the commercial properties.
Beyond lease clauses, there are a variety of factors that can lead to a space
being vacant for a long period, and potentially limit the ability for a desired
tenant category from occupying the space. These include:
• Problematic adjacent tenancies.
• Restrictions around change in use.
• Building upgrade requirements.
• Deferred maintenance.
• Unrealistic landlord expectations on basic rent.
• Poor space design / configuration.
• History of poor landlord / tenant relations.
• Insufficient marketing expertise and leasing exposure.
• Parking and access challenges.
8.1 CHALLENGES AND CHANGE DRIVERS

LIVEABLE CITY
PLANNING LTD.
Andrew Yan
Consulting229
6. New Competitionand Changing Trade Areas
As the competitive landscape shifts, certain categories will grow and thrive
while other categories will struggle. However, if the underlying fundamentals
of an area are strong, an area will be well-positioned to adjust. Street retail has
always been dynamic and subject to category-specific change driven by natural
business lifecycles. For many categories, the pace of change is now
accelerating. Retail properties and precincts that find themselves over-exposed
to one or more categories that are ‘hit’ by changes to the competitive
landscape – such as a shift to e-commerce and ‘click-and-collect’ shopping –
may find themselves going through more intense periods of adjustment in
which vacancies spike.
Fundamentals to keep in mind are:
o A supportive regulatory framework, including fair and predictable taxation.
o A healthy and growing trade area.
o A high quality of place.
o Desirable building stock.
o Easily accessible.
o Compelling and shared vision.
o Cooperative landlords.
o Engaged and proactive leadership.
• If, however, the shift in the competitive landscape has more to do with a
change to core fundamentals, then an area may find itself struggling for a
longer period. The main example of this is the emergence or expansion of
a competitive retail area, which draws customers away.
8.1 CHALLENGES AND CHANGE DRIVERS

LIVEABLE CITY
PLANNING LTD.
Andrew Yan
Consulting230
7. Variable Capacity and Expertise
• BIAs have varying capacity in terms of funds and staffing, and thus varying ability to conduct research and engage actively with the business owners,
operators and landlords in their respective shopping areas (see section 7.9).
• A multi-year coordinated effort is needed to build databases of valuable information (taxes, rents, vacancies, tenant mix, turnover, trade area dynamics etc.),
and to build a coordinated, responsive vision and merchandising strategy.
8. Other Challenges and Change Drivers
• Technological changes pose both challenges and opportunities. While much has been made of the disruptive nature of online retailing and its implications in
the bricks-and-mortar retail sphere, online technologies for food delivery are in many cases extending the trade areas, and in some cases the business
viability, of restaurants. This has long-term implications for restaurant space needs, as well as locational criteria.
• With Vancouver’s status as a “gateway” city, immigrant entrepreneurship in the form of small business can be a powerful vehicle for upward economic
mobility and integration. However, barriers to learning about financing, local business practices, and navigating through the various regulatory regimes can
be obstacles for starting, maintaining and growing a small business in the city.
8.1 CHALLENGES AND CHANGE DRIVERS

9.0 CONCLUSION AND NEXT STEPS

LIVEABLE CITY
PLANNING LTD.
Andrew Yan
Consulting232
9.1 CONCLUSIONS
Conclusions (Section 9.1) and Next Steps (9.2) are grouped into the following broad
categories, generally aligning with the central questions presented in the Introduction:
1. Changes: What has the analysis of available data revealed around key changes that
have occurred in the last 10+ years in six Study areas?
2. Challenges: What are key challenges (i.e. identified issues and change drivers),
both overall and by Study area, including interrelationships between factors?
3. Ingredients: What are the fundamental ingredients for LSA health and vitality, and
how might the City both monitor and support business vitality and resiliency going
forward?
Changes: Common Patterns of Change, All Study Areas
Chains, Independents and Change by Category
• Across all six Study areas and combining all retail categories, we see that change
between base year(s) and 2019 showed a decline in the number of independent
businesses, an increase in the number of chain businesses, and an increase in
vacancy.
• The story of change is not one-to-one replacement of independents by chains. For
each additional chain business between base year(s) and 2019, there was a
decrease of 2.6 independent businesses.
• Across all Study areas (individually and combined) there was an increase in
vacancy. There are 51 more vacant units (+58%) in 2019 than in the respective
base years.
• To fully understand change over time in business counts and vacancy, these must
be considered by retail category.
o The analysis looked at retail by detailed category (see Appendix B),
amalgamated into six category ‘clusters’ (see Section 2.1, and 5.11).
o Amidst an overall 7% decrease in the number of active businesses,
there was an increase in the absolute number of Food & Beverage
establishments (+50, or 16% increase).
o There was relative stability in the Convenience Goods category
cluster (-9 businesses, or 2% decrease).
o There was a more substantial decrease in the Comparison Goods
category cluster (-112 businesses, or 30% decrease).
o There was a significant increase in vacant storefronts, including units
under construction (+51, or 58% increase).
Ownership
• Between 2012 and 2019 there was a notable increase in the number
of properties owned by development groups and numbered
corporations, and a decrease in the number of properties owned by
individuals. This may be a signal of future redevelopment, as well as
an increase in the sophistication of commercial property ownership.
Commercial Property Taxes
• There were increases in commercial property taxes for all Study areas
between 2012 and 2019; however, the average annualized increase
varied considerably area to area, from a low of 2% in South Granville,
to a high of nearly 9% in Marpole.
• Note that South Granville rents and property assessments are
historically higher compared to other LSAs.
Rents
• Data on actual rents paid by commercial tenants (versus asking rents
for vacant space) proved difficult to collect, and only small samples
were obtained through interviews and surveys.

LIVEABLE CITY
PLANNING LTD.
Andrew Yan
Consulting233
9.1 CONCLUSIONS
o One notable item is that multiple survey respondents indicated that basic
rents charged to tenants have not moved much in recent years due to
significant increases in additional rent burdens (including property taxes). In
some cases, property owners have reportedly reduced basic rents to retain
tenants. Again, this information is based on limited and small sample sizes
and anecdotal evidence.
Changes: Differences between Study Areas
Chains, Independents and Vacancies
• In 5 of the 6 Study areas (all but Marpole), there was a decrease in the proportion
of independent businesses between base survey year(s) and 2019.
• In 4 of the 6 Study areas (all but Marpole and Hastings North) there was an
increase in the proportion of chain businesses between base survey year(s) and
2019.
• In 1 of the 6 Study areas (Marpole) there was in increase in the proportion of
independents and a decrease in the proportion of chains between the base survey
year and 2019.
• In 1 of the 6 Study areas (Hastings North) there was a slight decrease in
independents, but also a slight decrease in chains between base survey year and
2019.
• In all Study areas, there were increases in vacancies.
• The area with a decrease of both chains and independents as proportions of
total saw vacancy increase from 9% to 12%.
• The area that saw the most significant drop in independents and most
substantial increase in chains (S. Granville) also saw the largest spike in
vacancy (4% to 13%).
• Increasing vacancy is an issue of varying significance area to area. It is a
complex phenomenon driven by many factors, and there should be
acknowledgment of the difference between cyclical vacancy (a function
of business cycles and churn) and structural vacancy (which may signal
more pervasive issues). As we only have two points in time in the
available data, and an inconsistent base year area-to-area, it is not
possible for this Study to conclude which types of vacancies are
documented from one area to the next.
• Tracking vacancy, and the length of time spaces are vacant, will be an
important metric going forward, and should be updated annually.
Commercial Property Taxes
• All Study areas saw increases in commercial property taxes, but this
was more prominent in some areas than others.
• The median commercial property tax increases between 2012
and 2019 were highest in Hastings North and Marpole (32% and
31%), and lowest in South Granville and West Broadway (7% and
16%).

LIVEABLE CITY
PLANNING LTD.
Andrew Yan
Consulting234
9.1 CONCLUSIONS
Challenges and Change Drivers
Business Roundtables
Through the roundtable discussions, commonalities were identified around
“drivers of change” and challenges for businesses. The ‘top issues” were as
follows:
• Issue #1: the ‘number one’ Roundtable discussion issue (cited by 33% of
participants) was the increasing commercial property tax burden.
• Issue #2: the second most important issue (top issue for 17% of
participants) related to public order and the public realm. Participants
shared significant concerns about real and perceived safety for
customers and staff, and cleanliness and upkeep of the public realm –
much of which is related to growing issues of homelessness and
addiction that continue to challenge the City of Vancouver.
• Issue #3: looking at ‘top 3’ issues cited by roundtable participants,
concerns around safety, cleanliness and maintenance of the public realm
rise to the top (i.e. 23% of respondents identified these as “Top 1, 2 or 3”
issues). This was followed by property taxes (21%) and access / parking
(17%).
Business Surveys
• Business surveys did not generate sufficient response rates from
individual study areas to draw meaningful area-specific conclusions, but
taken together they provide good directional indicators.
• The ‘significant’ or ‘very significant’ challenges to business viability that
were cited most often were (1) City permitting and length of process
(87%); (2) Overhead costs including property taxes (75%); and (3) Rent
(75%).
Landlord / Broker Surveys
• Landlord and broker surveys cited property taxes (87%), permitting (85%) and
transportation / parking (82%) as the ‘top 3’ issues for LSA viability.
• Most landlords with knowledge of tenant profits reported a decrease in profits
in the last 2-5 years.
• Landlords identified the following key issues that the City must address to
better support LSAs:
• Continue advocating for split assessment and a commercial rate sub-
class.
• Provide more direct support to small business, including faster
permitting.
• Improve the cleanliness and appeal of the public realm.
• Overhaul commercial zoning, with less emphasis on use regulations, and
introduction of more flexibility.
• Accelerate rezoning and approvals process to allow faster growth of
housing near shopping areas.

LIVEABLE CITY
PLANNING LTD.
Andrew Yan
Consulting235
9.1 CONCLUSIONS
Key Observations
• Drivers of change, and how they impact LSAs, need to be considered by business
category.
o Businesses in different categories each have their own unique locational, space
and layout requirements, and different abilities to pay rent. Some categories like
personal services, grocery stores and cafes, will likely be more resilient amidst
broader trends in the retail landscape such as an accelerating shift to e-commerce.
o Convenience-type retailers and restaurants that largely draw on neighbourhood
traffic (i.e. grocery stores, pharmacies, liquor stores, cafes, bars) may be more
resilient, provided they are adaptable to trends such as takeout/delivery and
curbside pickup.
o Comparison goods retailers, particularly those in sectors most exposed to e-
commerce such as electronics, homewares, furniture and apparel, face challenges
in adapting their business models in the face of e-commerce and repositioning
their bricks-and-mortar stores to operate as part of omni-channel customer
fulfillment ecosystems.
• Those LSAs that are most nimble and adaptable, and which have strong fundamentals in
place like a growing local trade area, convenience retail anchors (particularly grocery),
and proactive local business leadership (amongst others as discussed in Section 7) will
be the ones most resilient and adaptable in a fast-changing retail landscape.
• Independent businesses across nearly all categories may be declining in absolute
numbers and as a proportion of total active storefronts (except Food & Beverage), but
there is a future for independent business in the City’s LSAs. As with any business,
independents that are focused on providing an omni-channel experience, building
strong connections with their customers – in person and online – and which are in LSAs
that are generally proactive in their approach to merchandising strategy, will be more
likely to succeed.
• Overall, the differences and commonalities in terms of change over
time by area, and the main issues reported by business owners and
landlords (per roundtables and surveys), tell us that:
o There is a common ‘basket’ of issues, but rankings of
importance differ by area.
o Business fundamentals, and responses to change, vary by
category, and the key is to create preconditions for private
sector adaptability in the face of macro changes. These include:
• Strong local trade areas from which to draw customers.
• Supports to help businesses adopt digital platforms for
sales and distribution.
• Streamlined, transparent and nimble City regulations and
processes for business start-up, changes of use, and
adapting business models to respond to changing
customer demands.
• Predictable costs, most importantly basic and additional
rents, but also staffing and merchandising.
• City investments in the public realm – cleanliness, design,
placemaking, safety.
• Strong local level leadership to help existing tenants
navigate change, and to attract new tenants.
While this report did not explore the demographics of each LSA
trade area and their possible relationship to LSA health / vitality and
change, we speculate that there are relationships worth further
exploration.

LIVEABLE CITY
PLANNING LTD.
Andrew Yan
Consulting236
9.1 CONCLUSIONS
Ingredients for Local Shopping Area Health and Vitality
Based on the data gathered and analysed in this Study, combined with the
collective experience of the consulting team, the following fundamental
ingredients for creating preconditions for healthy, resilient LSAs were
identified:
Fair and Predictable Rents and Taxes
• Basic rents vary by use and location, and are also related to other factors
like visibility, proximity to anchor tenants and types of space. Achievable
rents will vary substantially.
• Predictable property taxes and overhead costs are fundamental to any
business plan. An environment where major components of rent shift
considerably over short periods of time can be highly problematic for
business sustainability, or for the ability to attract new businesses to a
shopping area.
Strong Leadership, with Cooperation and Coordination
• LSAs are challenged to manage the mix of tenants and their respective
merchandising strategies due to the fragmented nature of property
ownership and many separate (and not always aligned) interest groups,
including property owners, tenants / leasing agents, and the City’s
numerous departments and political leadership. Such fragmentation can
be a barrier to creating an aligned vision and approach for an area.
• Self-organization and proactive coordination are required for long-term
area success. A cornerstone of success for LSAs is the ability of all parties
with vested interests to find means to cooperate and coordinate their
activities to the benefit of the overall area.
• A strong foundation for collaboration exists through the BIA Partnership, the
umbrella organization of Vancouver’s BIAs. This collaboration could be
expanded in a number of ways, and will vary by area:
• Keeping up-to-date on the status and plans of major anchor uses (retail
and non-retail).
• Keeping in frequent contact with key landlords.
• Defining roles for stakeholders
• Tracking reasons for business closures / relocations
These and other discussions can help to achieve a coherent and shared
vision and strategy for merchandising and overall viability. It may also
include further (and regular) consultation with business owners, and
consistent reporting of emerging issues back to the City.
Strong, Well-Located Anchors and Complementary Tenant Mix
• Local Shopping Areas work best when they are well-anchored by strong
businesses, business clusters and / or non-commercial uses that have a large
and consistent customer draw.
• Grocery stores are the most common and most important anchor tenant for
LSAs. Other important anchors are clusters of related stores or restaurants,
larger general merchandisers, and non-commercial uses like community
centres, libraries and schools.
• Successful neighbourhood commercial areas have complementary tenant
mixes of shops and services that are aligned with the local customer base.
Resilient LSAs provide variety to attract local patrons, facilitate one-stop
shopping for day-to-day needs, provide gathering opportunities, and adapt
as areas change.

LIVEABLE CITY
PLANNING LTD.
Andrew Yan
Consulting237
9.1 CONCLUSIONS
• Each commercial area has its own dynamics and unique character. In
general, a healthy mix will include (a) retailers and services aligned with
resident and local area worker needs, and (b) personal services, food &
beverage and recreation / entertainment options.
• Both chain and independent businesses can form part of a healthy mix.
Oftentimes, chains can perform an anchoring role.
• The loss of an anchor, or anchor relocations to another sub-area within an
LSA, can have significant impacts on the success of other businesses in the
shopping area. Best practices suggest that self-organizing LSAs must pay
close attention to health, performance and longer-term strategy discussions
of local anchors, and to move quickly to find new anchors if one moves (or
indicates pending intent to move).
Consistent and Robust Investments in Public Order, Cleanliness and Safety
• A clean, safe and friendly public realm is a critical prerequisite for the
success of LSAs. Achieving this requires coordinated efforts between the
City, businesses, property owners and BIAs.
• Vancouver grapples with serious challenges around mental health, addiction
and homelessness. In all of the roundtable discussions, these issues were
identified as growing concerns (in some areas more than others) which
collectively impact local streets and local retail.
• The manifestation of these social issues emerge in a variety of ways
including public disorder, shoplifting and property crime, and real and
perceived threats to the safety of patrons and staff. Local retail is on the
front lines of many of these challenges.
Strong Guidelines on Retail Design and Programming
• In terms of retail design and area programming, successful LSAs have:
o A concentration of storefronts in a compact, contiguous layout.
o A mix of smaller and larger stores, catering to different business types.
o Buildings designed for adaptability and convertibility, in a mix of styles
and sizes.
o Buildings designed with transparency and accessibility to the public
realm.
o Permanent and seasonal public realm programming, helping to both
draw and retain patrons.
Multi-Modal Transportation Investments and Access
• Shopping areas that offer ease of access for multiple modes will have
greater long-term success and resiliency. This includes: walking / rolling,
transit, cycling, goods movement (including curb management for pickups
and drop-offs), cars and parking (both on and off-street).

LIVEABLE CITY
PLANNING LTD.
Andrew Yan
Consulting238
9.1 CONCLUSIONS
Growing and Dynamic Neighbourhoods
• Preliminary observations were made in this study that LSAs with <40
residents per hectare in the approximately 15-minute walkshed (or 1
kilometre around the LSAs) were more likely to have ‘red flags’ for health
and vitality. This population threshold, and its relationship to other variables
such as employment, incomes and ethnocultural factors, will need to be
explored in more detail.
• Generally speaking, neighbourhood infill and densification can bring new
people to neighbourhoods, which will inevitably benefit local retail viability
and help to achieve other short and long-term City objectives.
Supportive Policy Framework
• To achieve long-term LSA success, there must be a supportive local and
provincial policy framework in place.
• Commercial Property Taxes: fair and predictable for commercial
businesses, in which they are not carrying the burden of property tax
on unrealized development potential.
• Zoning: supportive zoning and land use regulations that allow a wide
range of permanent and temporary uses. This will become increasingly
important as retail / commercial environments evolve and the need to
constantly adapt and experiment with new concepts becomes even
more fundamental to survival. Use regulation to encourage desired
changes, as well as to discourage unwanted uses.
• Building Code: the VBBL has complicated small business re-use and change
of occupancy requirements for older (i.e. more affordable) buildings.
Relatively modest proposed changes can trigger bylaw requirements for
upgrades since the bylaw has expanded its focus over time. A “test of
reasonableness” in the application of code upgrades on changes of use
could go a long way to assisting with short-term reuse of buildings, and to
the viability of start-ups.
• Permitting: a simplified and expedited permitting process is needed. Small
business support mechanisms, allowing for a one-stop centralized point of
information and assistance related to all matters of business opening,
expansion or relocation, would be very helpful.
Final Take-Aways
The consulting team has prepared brief snapshots of key take-aways on the
drivers of change, key issues, and high-level recommendations for each of the
six Study areas. These are presented in Appendix C.

LIVEABLE CITY
PLANNING LTD.
Andrew Yan
Consulting239
Following are the consulting team’s recommended next steps for the City to
consider.
Continue Work on Fair Property Taxation
• Continue work with the Province to pass legislation creating split property
assessments for calculating commercial property taxes.
• Institute a new commercial sub-class (when available) for application to the
development potential portion of the split assessment.
• Work with stakeholders to ensure a new commercial sub-class is fair and
effective in terms of: (a) eligibility requirements; (b) duration of tax relief;
and (c) tax rate
Develop Clear Data Collection Protocols
• Work across departments to create a refined, effective and useful
framework for the city’s commercial precinct hierarchy / typologies.
• Using this report as a starting point, continue the work of identifying what
key data the City wishes to collect and track over time, noting that effective
problem / question definition will directly inform data collection and
tracking protocols. At a minimum, core quantitative attributes that should
be tracked at a consistent frequency are: (1) vacancy; (2) commercial
property taxes; (3) presence / loss of anchors (retail and non-retail).
• Tracking changes to property ownership and developing a better
understanding of relationships between ownership change and vacancy,
will also be important.
• Other attributes of health and vitality may also be monitored but will likely
require more dialogue and collaboration for effective assessment. This may
not be feasible on an annual basis.
• A custom built-to-purpose (and regularly updated) retail inventory
database is critical. The City should not rely on third-party ‘black box’
‘databases for this purpose. The City may consider building upon CMI data
collection protocols.
• Clarity should be established on what data to include as the inventory is
built, whether data collection should be phased (i.e. select areas updated
on a staggered basis), and how the data should be coded (e.g. CMI coding,
NAICS coding, combinations, and other categories or groupings).
• Be clear about the requirements (staff, costs, time) for not only collecting
data, but keeping it updated and integrating it with other data.
Further Engagement and Health Tracking
• Explore opportunities for more regular check-ins with the local business
community in each precinct, possibly through additional roundtables.
Ensure that these include dominant business categories and all key
stakeholders.
• Gauge the pulse of each commercial precinct regularly through
questionnaires of both active businesses, and those about to close (see
‘exit interviews’ on page 238 for further detail).
• Track the health and vitality of each commercial precinct, using a report
card tool like the one presented in this report. Due to the subjectivity of
some of the measures, this will likely require further collaboration across
departments to set appropriate metrics / thresholds.
• Liaise with BIAs, tenants and landlords. Given the variability of capacity
across BIAs, the City’s role here will be important. Key issues will change
over time, and issues will vary by area. This should inform how data
collection evolves.
9.2 NEXT STEPS

LIVEABLE CITY
PLANNING LTD.
Andrew Yan
Consulting240
Clear and Consistent Tracking of Local Area Health by BIA Leadership
With the acknowledgement that BIA capacity can vary significantly between
areas, each BIA’s leadership should be coordinating closely with the City’s BIA
Program team to engage in the following tasks as part of their core work
programs:
• Maintain ongoing communication with the retail grocery anchor(s)
or equivalent within their respective areas.
• Maintain ongoing communication / engagement with landlords /
property owners within their respective areas.*
• Monitor vacancy and regularly evaluate the business mix within
their respective areas.
• Keep up-to-date on the dominant categories in respective shopping
areas, both in terms of store counts and floor areas.
• Assess the BIA Board composition to identify which businesses /
business categories are represented, which are not represented,
and how that representation aligns with the dominant categories in
the area.
o If dominant categories are not sufficiently represented, ensure
that there are outreach protocols in place to obtain insights /
feedback from those unrepresented or underrepresented
categories.
• When businesses close, or are about to close, each BIA’s leadership
should conduct ‘exit interviews’ with those businesses. Information
gathered on the reasons for closure may shed light on areas for BIA
or City intervention.
9.2 NEXT STEPS
o With input from the BIAs, the City should prepare a
standardized list of questions to guide the exit interviews. This
will ensure that there is consistency in the type and format of
data collected from area to area.
• Each BIA should ensure that it has up-to-date contact information
for both businesses and property owners in their jurisdiction. This
must include names and email addresses.
• BIA leadership must keep up-to-date on: (a) new proposed
development projects and land transactions in their area; (b) city-
wide planning; (c) relevant neighbourhood-level planning work; and
(d) the active uses and vacancies in their respective areas.
*Note that presently there are significant gaps in contact information (i.e. emails, phone numbers) for property owners in the BIAs.

LIVEABLE CITY
PLANNING LTD.
Andrew Yan
Consulting241
Examine Building Code Requirements
• A test of reasonableness in the application of code upgrades would assist short-
term application of existing retail stock for buildings nearing end of their life.
• Based on conversations between consulting team members and senior City
planning staff over the past decade, it has been suggested that in years past,
the chief building official had more discretion on approving changes of use and
re-use for older buildings. A political decision would be needed to amend the
VBBL to create codified discretion.
Streamline Approvals
• An improved permitting process should be a top City priority.
• Provide a simplified route for small business to navigate City processes and
requirements. This could include:
o A small business ombudsperson within Development Services to help resolve
issues and facilitate application review and approval.
o Some form of small business administration that is explicitly designed to help
small business.
Zoning Flexibility
• Zoning in local shopping areas must be made more flexible to accommodate the
rapidly changing nature of retail and service commercial uses.
• Provision must be made for combination businesses, co-location and non-
traditional uses. The principal use may not always be retail, and may not be a
single tenant. Flexibility will be critical for leasing space, meeting changing
consumer needs, and ensuring that areas remain viable and competitive.
• Provisions must also be made to support short-term use by various entities (e.g.
pop-up businesses, art/cultural space), particularly in older structures before
they are demolished for new projects.
Safety and Placemaking
• Continue work to address homelessness and drug crises, which have a
profound impact on storefront retail and services.
• Increase municipal investment in maintenance and cleanliness of roads,
alleyways, medians and sidewalks, including management of litter in the
public realm.
• Explore opportunities for an integrated local shopping area service point
person that can coordinate effective responses around issues of public
realm cleanliness, maintenance and social services.
• Placemaking is a key toolkit available to the City and its BIAs, and needs to
be used effectively to support business, community and the experiential
economy. Collaborative efforts are needed to provide effective, year-
round programing and infrastructure.
Design for Adaptability and Convertibility
• There is an extensive literature on successful design principles for street
retail environments, including design of building facades, design / layout
of building interiors, and the interface between buildings and the public
realm. The City of Toronto’s recently released “Retail Design Manual,”
drawn upon by the consulting team in this report, is an excellent resource.
This resource should be reviewed by City staff, and the City should
determine if these types of guidelines are appropriate for Vancouver. A
similar document for Vancouver, or as a collaborative undertaking of
Vancouver and its neighbouring municipalities, may be warranted.
• New commercial units must be designed to allow for the unique
requirements of different types of businesses, and to be responsive to the
inevitability of business turnover and changing needs. Spaces should be
designed such that they are conducive to occupancy by independent
businesses. This includes the ability to demise spaces into smaller units.
9.2 NEXT STEPS

LIVEABLE CITY
PLANNING LTD.
Andrew Yan
Consulting242
Improve Cooperation, Collaboration and BIA Strategy Development
• There are shared roles and responsibilities for many parties in ensuring
long-term health and resiliency of local shopping areas. These include
roles for the City, BIA leadership, local businesses, landlords, and leasing
agents.
• Local businesses and commercial property owners should be well-
represented on each BIA board, and active in BIA deliberations around
shared interests and strategy for tenant retention and recruitment.
Additional outreach needs to be made to those who are not active BIA
participants.
• Each shopping precinct should have a coherent, shared vision for what it
wants to be, and an actionable merchandising strategy to pursue this
vision, with buy-in from all parties including property owners.
Development of this type of strategy requires:
o Research to understand both limitations and opportunities as they relate
to merchandising mix. This will require City support given variable BIA
capacity. Support may include funding for consulting services, owner
outreach, strategy development, and other initiatives at BIA discretion.
o Data on vacancies, merchandise mix, trade area growth / spending, lease
rates, foot traffic, and other data sought by prospective tenants.
o Buy-in from all parties on the vision and merchandising strategy, allowing
for active tenant attraction and retention programs / strategies.
o Open communication between BIAs (with City support as required) and
major property owners + anchor tenants (commercial and non-
commercial).
Frequent check-ins on area health and vitality, including potential emerging
issues, must be conducted by the City in collaboration with the BIAs. Part of
this process should involve an annual questionnaire for BIA leadership,
documenting the key issues / observations in a consistent manner, and
conveying this information to the City. This may help flag early warning signs
of trouble before they fully emerge, allowing for interventions to be
developed. This also gives BIA leadership (and membership) opportunities to
have more open lines of communication, both within the BIA (i.e. with
landlords, anchor tenants), and with the City, and over time to build BIA
capacity where needed.
Explore Small Business Supports
• Establish better coordination and understanding of outside resources
that can be deployed to assist small businesses. This may include the
Province, post-secondary institutions, business support organizations,
and consultants.
• Explore the idea of a small business ombudsperson, or some other one-
stop point of contact to assist small businesses navigate City process. This
may take the form of a small business administration entity that is
designed to help business through the process. Examples of such an
entity exist in other cities, including New York and San Francisco.
• A small business support centre may also help businesses around issues
like financing, by connecting businesses with lenders.
• Explore the idea of business relocation assistance.
• Explore the viability and applicability of something like the Toronto
Innovation Fund, a city grant program that provides funding to BIAs to
test “innovative and creative solutions to BIA issues.”
9.2 NEXT STEPS

10.0 APPENDICES

APPENDIX A – ASSUMPTIONS AND LIMITING CONDITIONS

APPENDIX A: ASSUMPTIONS & LIMITING CONDITIONS
1. Municipal and Other Data Limitations
• Currently there is no source of comprehensive municipal data that accurately tracks the number of ground floor storefronts, vacancies, vacant frontage, or
floor areas by business category.
• Commercial Marketing Inc. (CMI) Inventories: Fortunately, over the last two decades Commercial Marketing Inc. (CMI) has prepared and maintained detailed
inventories of ground floor retail and service uses in many of Vancouver’s local shopping areas. The inventories include street address, business name,
business category, floor space area (for some areas), and vacancy information for commercial space at grade. The data are the primary source for
longitudinal (change over time) analysis of tenant mix. Each CMI data set has been reviewed for accuracy by the Executive Directors of the respective
Business Improvement Areas (BIAs) in this study. It is worth noting the following regarding the CMI inventories:
o As the inventories were conducted at different times, the data do not provide a consistent baseline across Study areas; and
o The inventories are limited to ground-floor premises.
• City Business License data was reviewed extensively by the consulting team, but was ultimately not used for this study for the following reasons:
o Vacancy and Under Construction data is not captured in this data set.
o Business license categories are not necessarily business categories but reflect the licensing parameters as listed in the City of Vancouver Licence Bylaw
4450. There are many cases where multiple business licenses are associated with a single storefront location. Due to licensing requirements, uses like
“Apartment House” are also present, as rental apartment operators are required to have business licenses.
o There are discrepancies over time in classification of business licenses for the same business. For example, Starbucks’ business license classification
changed from “limited eating establishment” to “Class 1 eatery” between years, but there was no change to the actual business. There were limited
resources to rectify data coding and consistency issues within project scope.
o Business license ‘employee count’ data was ultimately not useful for this study, as the definition of “employee” is not specific (e.g. full-time, part-time,
contract, family member), and the level of reporting (and updating) is inconsistent. As a result, no employee/employment data is presented in this report,
and employment counts are not used in the classification of “small” vs. other business types.
o Business licence ‘date of business inception’ information represented the number of years since inception at that location, not necessarily the date of
inception of the business itself. Date of inception was therefore not useful for this analysis.
Source: weddingmapper.com

APPENDIX A: ASSUMPTIONS & LIMITING CONDITIONS
1. Municipal Data Limitations
• City property value and property tax data was extensively reviewed by the consulting team.
• Data provided by the City was taken, analysed and summarized largely on an as-is basis, with minimal editing / cleaning to account for extreme data outliers.
• The timeframe of study were for the years 2012 and 2019.
• The “property value” and “property tax” data sets were used in this analysis, but were subject to the following limitations:
o “Property values” are defined as the total assessment amount for both land and improvements (buildings) for the years 2012 and 2019.
o “Property tax” is the total property taxes paid for each parcel in each of the above years.
o The 2012 and 2019 timeframes were selected as those were the first and last years of data available from the City which had comparable andcomprehensive property value and property tax data for each of the study BIAs.
o Property values are extracted from BC Assessment, which represents the “fair market value” for the land and the improvements as of July of theprevious year. For instance, a 2019 property assessment value would reflect the value as of July 1 2018.
246
Source: weddingmapper.com

APPENDIX A: ASSUMPTIONS & LIMITING CONDITIONS
2. Methodological Limitations
A detailed discussion of the methodologies used in this study is provided in Section 4. Presented here is a synopsis of some key methodological limitations:
Roundtables & Surveys: This study was conducted in two phases (1) quantitative and (2) qualitative. The qualitative phase of this study relies heavily on
information gathered through ‘roundtable’ events held in each of the six BIA Study areas. Each roundtable was attended by local business owners, landlords,
leasing agents and other stakeholders. BIA members were also invited to complete surveys on “drivers of change” for their shopping area and for their
businesses. These primary research approaches provided valuable first-hand information but they are subject to variety of limitations typical of these
methods.
Three particular limitations of the roundtables and surveys are worth noting are:
• Response data veracity – the attendees and their participation in the roundtable were limited to what participants felt comfortable sharing in that
environment at that moment in time, and to who was able to attend on the given day and time. Within current time and response constraints, there is
no way of independently validating the responses that were provided. Individual revenues and profit information as well as experiences in public safety
and disorder are taken as accurate to what the respondents have or are experiencing. While new “big data” methodologies that respect confidentiality
and privacy are possible to provide a level of transparency and accuracy on the quantitative state of neighbourhoods, this project did not have the
resources to utilize these methods.
• Survey and roundtable response bias – there is an inherent response bias for survey returns and roundtable attendees / participation. Responses
biased toward those who were most able and comfortable responding, attending and verbally articulating and writing in English. Non-English
translation services were not available for this study. Some participants were able to bring their own translators. Feedback from the BIA Executive
Directors, and from roundtable participants, indicates that a suitable sampling of each BIA membership’s diversity was not achieved.
• Deeper culturally accessible and in-language outreach and research amongst stakeholders who were unable to attend roundtables or respond to the
surveys is highly recommended for future projects.
These limitations do not necessarily invalidate the responses received. However the reader should be aware that these responses are not necessarily
representative of overall sentiment in any of the Study areas. Roundtable and survey responses remain useful however, in that they provide a direction and
framing of the issues affecting local businesses. They do not necessarily completely represent the unique and tremendous linguistic and cultural diversity that
can be found in the Study areas, but are a useful starting point for understanding local business sentiment.
247
Source: weddingmapper.com

APPENDIX A: ASSUMPTIONS & LIMITING CONDITIONS
3. BIA Capacity & Engagement
• There is substantial variation across the City’s BIAs in terms of level of staffing resources. This has an impact on the amount of time any given BIA has to
dedicate to any single initiative.
• This project relied heavily on BIA member engagement and follow-up (particularly to increase online survey responses). Some BIAs delivered strong turnouts
to the Round Tables and higher survey response rates; others delivered relatively fewer attendees and survey responses which impacts the degree to which
the data can be seen to be representative.
• Due to variability in survey responses, data from the surveys is presented largely in an amalgamated format (for all Study areas).
4. General Limitations
• The following general limitations should be kept in mind when reading this document and interpreting the results:
o The number of Study areas was limited to six BIA retail commercial districts (of 22 BIAs City-wide, plus other non-BIA street retail precincts)
o There was a lack of comprehensive longitudinal data on vacancies, business counts, and business sizes. For each Study area, data is compared between two years
(one historical, and a snapshot from 2019). As discussed above, with the exception of property ownership and assessment data, City of Vancouver data for the
intervening periods was not usable for the purposes of this study. For some areas, the period between survey years is substantial (e.g. 2006 to 2019 – 13 years)
o While some one-on-one interviews with BIA membership were conducted in the course of study (including start-up meetings with all 6 BIA Executive Directors and
sometimes board members), extensive one-on-one interviews (with translation services) were not possible. Therefore, BIA membership engagement was largely
limited to one roundtable event per BIA (held during a weekday morning in each Study area) and an online survey, with some follow-up interviews with attendees.
o Methods of BIA member follow-up regarding the survey were at the discretion of the BIA Executive Directors and subject to resource limitations
o All roundtables and surveys were administered in English only
o In-depth cleaning / re-coding of City-provided data sets was beyond the scope. These data were used as best as possible within the limitations of the project
scope.
o Analytics around causation and correlation were ultimately deemed problematic due to data limitations. This report presents snapshots of what has changed, and
information gleaned from surveys and roundtables on the reasons for change. This is supplemented by insights from members of the consulting team based on
professional experience and more informal gathering of information. Where possible, early insights on correlation / interesting relationships that are emerging
from the data are discussed, and flagged as possible areas for further research.
248

APPENDIX B – CLASSIFICATION OF COMMERCIAL STOREFRONTS

APPENDIX B: CLASSIFICATIONS OF COMMERCIAL STOREFRONTS
250
Source: weddingmapper.com
Historical commercial inventories for ground-floor businesses in each of the 6 Studyareas were prepared by CMI. Each storefront was assigned a CMI ‘Ground Code’ (aretail coding system developed by CMI), with associated descriptors. The 2019 and2020 inventories were also assigned CMI Ground Codes and descriptors.
For this study, each storefront inventory record (historical, 2019 and 2020) wasadditionally re-coded from CMI to NAICS*. This process was done collaboratively withCity staff. The conversion from CMI to NAICS required some judgement calls, as attimes CMI coding provided a greater amount of business category detail than NAICScould offer, while at other times CMI codes were ‘coarser’ and therefore could only beassigned a higher-level NAICS code (e.g. subsector level, rather than industry group orindustry level). As a result, there are instances where the NAICS equivalents for CMIcodes are at the 3, 4, 5 or 6-digit NAICS level. Additionally, In certain cases, a CMI codecorresponded to an amalgam of multiple NAICS codes. In those instances, a singlecorresponding NAICS code has been assigned, but with it has been paired a customcategory description. These instances are noted in the pages to follow.
Beyond the CMI and NAICS classifications, additional classifications have beenassigned to each record, allowing for other data retrieval and analysis options. Theseadditional classification levels are shown in the table below:
*What are NAICS Codes?
• NAICS (North American Industry Classification System) is a common industry classification system spanning Canada, the United States and Mexico. NAICS is revised every 5 years to keep the classification system current with changes to economic activities. The most recent update occurred in 2017.
• NAICS divides the economy into 22 sectors. Industries within these sectors are grouped according to the production criterion. Four sectors are largely goods-producing, and sixteen are entirely service-producing industries.
• NAICS uses a hierarchical structure, as follows:
• Sector (2-digit code)
• Subsector (3-digit code)
• Industry group (4-digit code
• NAICS industry (5-digit code)
• National Industry (6-digit code)
• Three sectors are represented by a range of 2-digit codes. These include Manufacturing (31-33), Retail Trade (44-45) and Transportation and Warehousing (48-49).
• Example:
Level NAICS Code Title
Sector 44-45 Retail Trade
Subsector 441 Motor Vehicle and Parts Dealer
Industry Group 4412 Other Motor Vehicle Dealer
NAICS Industry 44122 Motorcycle, Boat and Other Motor Vehicle Dealers
National Industry 441221 Motorcycle, ATV, and Personal Watercraft Dealers
Additional Classification 1 Additional Classification 2
Convenience Goods and Services Food Retail
Health and Personal Care
Food Services
Personal Services
Professional Services
Other Services
Comparison Goods Clothing / Accessories Retail
Other Non-Auto Retail
Food & Beverage Food Services
Automotive Goods & Services Auto Retail
Auto Services
Entertainment Amusement, Gaming, Recreation
Vacant Vacant

APPENDIX B: CLASSIFICATIONS OF COMMERCIAL STOREFRONTS
251
Source: weddingmapper.com
*Custom category description
CMI Code CMI Category CMI Land Use Description NAICS Code NAICS Category Additional Category 1
1 FOOD AND DRUG RETAIL SUPERMARKET 44511Supermarkets and other grocery (except convenience) stores Convenience Goods & Services
2 FOOD AND DRUG RETAIL GROCER/PRODUCE 44523 Fruit and Vegetable Markets Convenience Goods & Services
3 FOOD AND DRUG RETAIL GROCER SPECIALTY/ETHNIC/CANDY 44529 Other Specialty Food Stores Convenience Goods & Services
4 FOOD AND DRUG RETAIL CONVENIENCE STORE 44512 Convenience Stores Convenience Goods & Services
5 FOOD AND DRUG RETAIL FISH MARKET 44522 Fish and seafood markets Convenience Goods & Services
6 FOOD AND DRUG RETAIL MEAT MARKET 44521 Meat markets Convenience Goods & Services
7 FOOD AND DRUG RETAIL BAKERY 445291 Baked Goods Store Convenience Goods & Services
8 FOOD AND DRUG RETAIL PHARMACY 44611 Pharmacies and drug stores Convenience Goods & Services
9 FOOD AND DRUG RETAIL DRUGSTORE 44611 Pharmacies and drug stores Convenience Goods & Services
10 FOOD SERVICE LICENSED RESTAURANT/PUBS/BAR 72241 Drinking places Food & Beverage
11 FOOD SERVICE FAST FOOD 722512 Limited service eating places Food & Beverage
12 FOOD SERVICE RESTAURANT / CAFÉ 722512 Limited service eating places Food & Beverage
13 FOOD SERVICE RESTAURANT ETHNIC 722511 Full service restaurants Food & Beverage
14 FOOD SERVICE SPECIALTY COFFEE/TEA 722512 Limited service eating places Food & Beverage
15 FOOD SERVICE OTHER FOOD RETAIL/CHOCOLATES 44529 Other Specialty Food Stores Convenience Goods & Services
16 SERVICE BARBER + BEAUTY SALON 81211 Hair care and esthetic services Convenience Goods & Services
17 SERVICE TRAVEL AGENCY 56151 Travel agencies Convenience Goods & Services
18 SERVICE VIDEO RENTAL & SALES 53228 All other consumer goods rental Convenience Goods & Services
19 SERVICE SHOE REPAIR 81143 Footwear and leather goods repair Convenience Goods & Services
20 SERVICE DRY CLEANER/LAUNDRAMAT/TAILOR 81232 Dry cleaning and laundry services Convenience Goods & Services
21 SERVICE PRINTING / COPY 32311 Printing Convenience Goods & Services22 SERVICE ENTERTAINMENT/THEATRE 711 Entertainment and Theatre Convenience Goods & Services
23 SERVICE FITNESS CENTRE/YOGA/MARTIAL ARTS 71394 Fitness and recreational sports centres Entertainment
24SERVICE
VETERINARIAN/PET GROOMING81291 Pet Care (including Vet)* Convenience Goods & Services
25 SERVICE OTHER/PHYSIO/MASSAGE/LAB/SCHOOL 621 Offices of Other Health Practitioners Convenience Goods & Services26 OFFICE/FINANCIAL STREETFRONT MEDICAL/DENTAL/CHIRO. 621 Offices of Other Health Practitioners Convenience Goods & Services
27 OFFICE/FINANCIAL INSURANCE/REALTOR/INVEST. BROKER 52421 Insurance agencies and brokerages Convenience Goods & Services
28 OFFICE/FINANCIAL FINANCIAL/BANK/CREDIT UNION 52211 Banking Convenience Goods & Services29 OFFICE/FINANCIAL ACCOUNTING/LEGAL/NOTARY 541 Professional, Scientific and Technical Services Convenience Goods & Services
30 OFFICE/FINANCIAL BUSINESS SERVICES 5614 Business Support Services Convenience Goods & Services
31 OFFICE/FINANCIAL OPTOMETRIST 62132 Offices of optometrists Convenience Goods & Services
32 OFFICE/FINANCIAL OTHER 541 General professional offices* n/a
33 GENERAL MERCHANDISE JUNIOR DEPARTMENT STORE 45211 Department stores Comparison Goods
34 GENERAL MERCHANDISE GENERAL STORE 45299 Other general merchandise stores Comparison Goods
35 GENERAL MERCHANDISE GENERAL STORE ETHNIC 45299 Other general merchandise stores Comparison Goods
36 GENERAL MERCHANDISE VARIETY/DOLLAR STORE 45299 Other general merchandise stores Comparison Goods
37 GENERAL MERCHANDISE OTHER 45291 Warehouse clubs Comparison Goods
38 APPAREL AND ACCESSORIES MEN'S APPAREL 44811 Men's clothing stores Comparison Goods
39 APPAREL AND ACCESSORIES MEN'S APPAREL HIGH END 44811 Men's clothing stores Comparison Goods
40 APPAREL AND ACCESSORIES MEN'S APPAREL ETHNIC 44811 Men's clothing stores Comparison Goods

APPENDIX B: CLASSIFICATIONS OF COMMERCIAL STOREFRONTS
252
Source: weddingmapper.com
CMI Code CMI Category CMI Land Use Description NAICS Code NAICS Category Additional Category 1
40 APPAREL AND ACCESSORIES MEN'S APPAREL ETHNIC 44811Men's clothing stores Comparison Goods
41 APPAREL AND ACCESSORIES LADY'S APPAREL 44812Women's clothing stores Comparison Goods
42 APPAREL AND ACCESSORIES LADY'S APPAREL HIGH END 44812Women's clothing stores Comparison Goods
43 APPAREL AND ACCESSORIES LADY'S APPAREL ETHNIC 44812Women's clothing stores Comparison Goods
44 APPAREL AND ACCESSORIES UNISEX 44814Family clothing stores Comparison Goods
45 APPAREL AND ACCESSORIES UNISEX ETHNIC 44814Family clothing stores Comparison Goods
46 APPAREL AND ACCESSORIES CHILDRENS" APPAREL 44813Children's and infants' clothing stores Comparison Goods
47 APPAREL AND ACCESSORIES CHILDREN'S APPAREL ETHNIC 44813Children's and infants' clothing stores Comparison Goods
48 APPAREL AND ACCESSORIES FABRIC (SPECIALTY RETAIL) 45113Sewing, needlework and piece goods stores Comparison Goods
49 APPAREL AND ACCESSORIES BRIDAL 44819Other clothing stores Comparison Goods
50 APPAREL AND ACCESSORIES MATERNITY 44819Other clothing stores Comparison Goods
51 APPAREL AND ACCESSORIES THRIFT/SECOND-HAND MERCHANDISE 45331Used merchandise stores Comparison Goods
52 APPAREL AND ACCESSORIES UNIFORMS 44819Other clothing stores Comparison Goods
53 APPAREL AND ACCESSORIES OTHER APPAREL 44832Luggage and leather goods stores Comparison Goods
54 APPAREL AND ACCESSORIES JEWELLERY 44831Jewellery stores Comparison Goods
55 APPAREL AND ACCESSORIES SHOES 44821Shoe stores Comparison Goods
56 HOME FURNISHINGS HOUSEWARES 44229Other home furnishings stores Comparison Goods
57 HOME FURNISHINGS SMALL APPLIANCES 44314Electronics and appliance stores Comparison Goods
58 HOME FURNISHINGS LARGE APPLIANCES 44314Electronics and appliance stores Comparison Goods
59 HOME FURNISHINGS HARDWARE STORES 44413Hardware Stores Comparison Goods
60 HOME FURNISHINGS GARDEN SUPPLIES (SPECIALTY RETAIL) 4442 Lawn and Garden Equipment and Supplies Stores Comparison Goods
61 HOME FURNISHINGS ELECTRONICS / HOME ENT./COMPUTERS 44314Electronics and appliance stores Comparison Goods
62 HOME FURNISHINGS FURNITURE / HOME FURNISHINGS 44211Furniture stores Comparison Goods
63 HOME FURNISHINGS DURABLE GOODS/PAINT & WALLPAPER 44229Other home furnishings stores Comparison Goods
64 AUTOMOTIVE GAS STATION 44711Gas stations with convenience stores Automotive Goods & Services
65 AUTOMOTIVE TIRES/PARTS/ACCESSORIES 44131Automotive parts and accessories stores Automotive Goods & Services
66 AUTOMOTIVE SERVICE 8111 Automotive repair and maintenance Automotive Goods & Services
67 AUTOMOTIVE AUTO / MOTORCYCLE SALES 44122Motorcycle, boat and other MV dealers Automotive Goods & Services
68 SPECIALTY RETAIL SPORTING GOODS 45111Sporting goods stores Comparison Goods
69 SPECIALTY RETAIL BICYCLE SHOPS 45111Sporting goods stores Comparison Goods
70 SPECIALTY RETAIL BOOKSTORE/MAGAZINES/NEWSPAPERS 45131Book stores and news dealers Comparison Goods
71 SPECIALTY RETAIL TOYS/HOBBIES 45112Hobby, toy and game stores Comparison Goods
72 SPECIALTY RETAIL OFFICE SUPPLIES 45321Office supplies and stationery stores Comparison Goods
73 SPECIALTY RETAIL HEALTH & BEAUTY ITEMS 44612Cosmetics, beauty supplies and perfume stores Convenience Goods & Services
74 SPECIALTY RETAIL CARDS & STATIONARY 45321Office supplies and stationery stores Comparison Goods
75 SPECIALTY RETAIL BEDDING & LINEN (HOME FURNISHING) 44229Other home furnishings stores Comparison Goods
76 SPECIALTY RETAIL ART GALLERY/FRAMING 45392Art dealers Comparison Goods
77 SPECIALTY RETAIL CAMERAS / FILM / PHOTO 44314Electronics and appliance stores Comparison Goods
78 SPECIALTY RETAIL ANTIQUES 45331Used merchandise stores Comparison Goods
79 SPECIALTY RETAIL GIFTS 45322Gift, novelty and souvenir stores Comparison Goods
80 SPECIALTY RETAIL OPTICAL 44613Optical goods stores Comparison Goods
81 SPECIALTY RETAIL PETS & PET SUPPLIES 45391Pet and pet supplies stores Comparison Goods
82 SPECIALTY RETAIL LIQUOR STORE / BEER AND WINE 44531Beer, wine and liquor stores Convenience Goods & Services
83 SPECIALTY RETAIL FLORIST 45311Florists Convenience Goods & Services
84 SPECIALTY RETAIL RECORDS/ TAPES/CDs 45114Musical instrument and supplies stores Comparison Goods
85 SPECIALTY RETAIL MUSICAL INSTRUMENTS 45114Musical instrument and supplies stores Comparison Goods
86 SPECIALTY RETAIL CELLULAR TELEPHONES 51721Wireless telecommunications carriers Convenience Goods & Services
87 VACANCY VACANT STORE 0 Vacant Store Vacant
APPENDIX C – SUMMARY DRIVERS OF CHANGE AND
KEY TAKE-AWAYS FOR EACH STUDY AREA

LIVEABLE CITY
PLANNING LTD.
Andrew Yan
Consulting254
AREA SPECIFIC DRIVERS OF CHANGE
• Property Assessments & Commercial Property Taxes.
• Significant property ownership turnover leading to higher rents.
• Parking and access challenges with transit transfer location change has negatively impacted foot traffic.
• Leasing uncertainty with pending Broadway Subway design and construction.
• Dominant categories in direct competition with other destinations and online retail.
• Aging population in local trade area.
• Insufficient population growth and densities in local trade area.
• Chain-heavy shopping area more exposed to decisions driven by changing national /international priorities such as shifts to online retail.
OUR VIEW
Empirical and anecdotal evidence and professional experience suggests the following factors are driving retail / commercial change in South Granville:
• Commercial Property Tax: Increasing property assessments and taxes are stressing tight profit margins.
• Eroding Access & On-Street Parking: South Granville relies on local shoppers and citywide (or regional) customers who ‘comparison shop’ and is therefore more reliant on convenient transit and car access. Destination businesses are challenged by: (1) increasing congestion and (2) decreasing on-street parking availability (especially on the west side of Granville). Underground and other off-street parking is typically underutilized because it is either not known to many people, or they are unwilling to park there for other reasons (e.g. safety, comfort).
• Demographics: The population in the neighbourhood trade area is aging, and the pace of population growth is insufficient to offset the loss of destination spending driven by increasing competition.
• High Basic and Secondary Rents: South Granville south of Broadway has the highest rents of any of the six Study areas. This, in conjunction with rising property taxes, creates another significant challenge for many businesses. The increasing pace of property purchases is resulting in more rent-seeking behavior (i.e. new owners have less flexibility for lower rents). Tenants are increasingly unwilling or unable to pay these higher required rents, leading to higher vacancies.
• Growth of Chain Retailers and Loss of Local Independent Retailers: The increase in chain businesses and decrease in independents is a function of higher rents, higher commercial property taxes, increased competition in dominant categories, and City processes that are not conducive to easy changes of use. The loss of the art gallery cluster at the north end of the BIA has also led to declining pedestrian traffic.
MACRO DRIVERS OF CHANGE
• Commercial property tax increases
• Permitting delays and restrictive zoning
• Staff costs and retention
• Employer health tax increases
• Low unemployment
• High cost of housing
• Online Retail
SOUTH GRANVILLE
RECOMMENDATIONS FOR SOUTH GRANVILLE
• Split class property tax relief.
• Review on-street parking supply and create better wayfinding for off-street parking.
• BIA Role in promoting retail mix to landlords and developers to preserve key clusters of retail and services.
(79.0 pp/ hectare 13% Vacancy (2019) ◆ Women's’ Apparel & Home Decor

LIVEABLE CITY
PLANNING LTD.
Andrew Yan
Consulting255
AREA SPECIFIC DRIVERS OF CHANGE
• West Broadway continues to be a neighbourhood-oriented shopping precinct, primarily serving the local population.
• This LSA has an evolving identity.
• There is a strong local-serving tenant mix, which is attracting many new independent and chain businesses.
• Some of the vacancies are due to redevelopment and are only temporarily unoccupied in the short term as the spaces are built out.
• There are concerns about the impacts of Broadway Subway construction, and the movement of ridership underground.
OUR VIEW
Empirical and anecdotal evidence and professional experience suggests the following factors are driving retail / commercial change in West Broadway:
• Taxes and Lease Terms: The greatest challenges facing retail and service commercial business in the West Broadway BIA are the combination of rapidly increasing commercial property taxes, increasing basic rents, and leases that are not conducive to long-term stability.
• Grocery Anchor Location: The location of the 50,640 square foot Safeway at the far east end of the shopping area generates traffic for the east end of the precinct but does not anchor the western half of the area.
• Critical Activity Drivers : The area benefits from many other activity drivers and clusters including specialty foods, the redeveloped Hollywood Theatre, and unique restaurants.
• Ingredients for Health: The most recent retail inventory was completed in February 2019; there are indicators that some of the vacant spaces are being filled. The area has many of the ingredients we look for in a healthy local serving precinct: grocery stores, library, specialty foods, pharmacy, strong restaurant mix, many local-serving businesses across categories.
• Food Traffic: The area benefits from transit access and enjoys a large amount of neighborhood foot traffic.
MACRO DRIVERS OF CHANGE
• Commercial property tax increases
• Permitting delays and restrictive zoning
• Staff costs and retention
• Employer health tax increases
• Low unemployment
• High cost of housing
• Online Retail
WEST BROADWAY
RECOMMENDATIONS FOR WEST BROADWAY
• Split class property tax relief.
• More local residents within walking distance to increase foot traffic.
• Ease permitting and licensing process, including change of use requirements.
• Further build BIA / City partnership around improving public realm.
(73.1 pp/ hectare 15% Vacancy (2019) ◆ Restaurants (QSR and FS)

LIVEABLE CITY
PLANNING LTD.
Andrew Yan
Consulting256
AREA SPECIFIC DRIVERS OF CHANGE
• Increasing vacancy.
• Loss of apparel category.
• The BIA was part of the Marpole Community Plan approved in 2014.
• Increasing property transactions and assembly – more properties are turning over.
• Significant property assessment and commercial property tax increases in recent years.
• Trend to shorter notice periods in leases for typical demolition clauses.
• Permitting and licensing delays.
OUR VIEW
Empirical and anecdotal evidence and professional experience suggests the following factors are driving retail / commercial change in Marpole:
• Dominant Categories: Limited and full-service eating places represent 26% of total businesses. Approximately a quarter of restaurants are open and busy evenings and weekends but are not driving footfall during the weekdays. The other important categories are Health and Personal Service-related businesses.
• Local Serving Precinct: Marpole is almost exclusively local-serving, apart from a handful of destination draws such as Ragnar Jewelers and some of the personal or professional service providers. As older buildings are replaced by new buildings over time, the area is likely to become more local-serving.
• Taxes are a Fundamental Issue: Businesses that have been operating with very tight margins are now facing profitability challenges due to the increased commercial property taxes.
• Land Assembly and Lease Clauses: Property purchases and land assemblies are likely to be a major driver of change in this area in the near term. While most leases have demolition clauses, the probability that these will be activated are higher, resulting in conditions that are not conducive to many businesses leasing and undertaking extensive leasehold improvements in older spaces where the term lease term will be uncertain..
• Transit: The area benefits from transit access but does not have a significant amount of foot traffic
MACRO DRIVERS OF CHANGE
• Commercial property tax increases
• Permitting delays and restrictive zoning
• Staff costs and retention
• Employer health tax increases
• Low unemployment
• High cost of housing
• Online Retail
MARPOLE
RECOMMENDATIONS FOR MARPOLE
• Split class property tax relief.
• Continue working with BIA on Community Plan implementation.
(46.1 pp/ hectare 11% Vacancy (2019) ◆ Professional Services & Restaurants
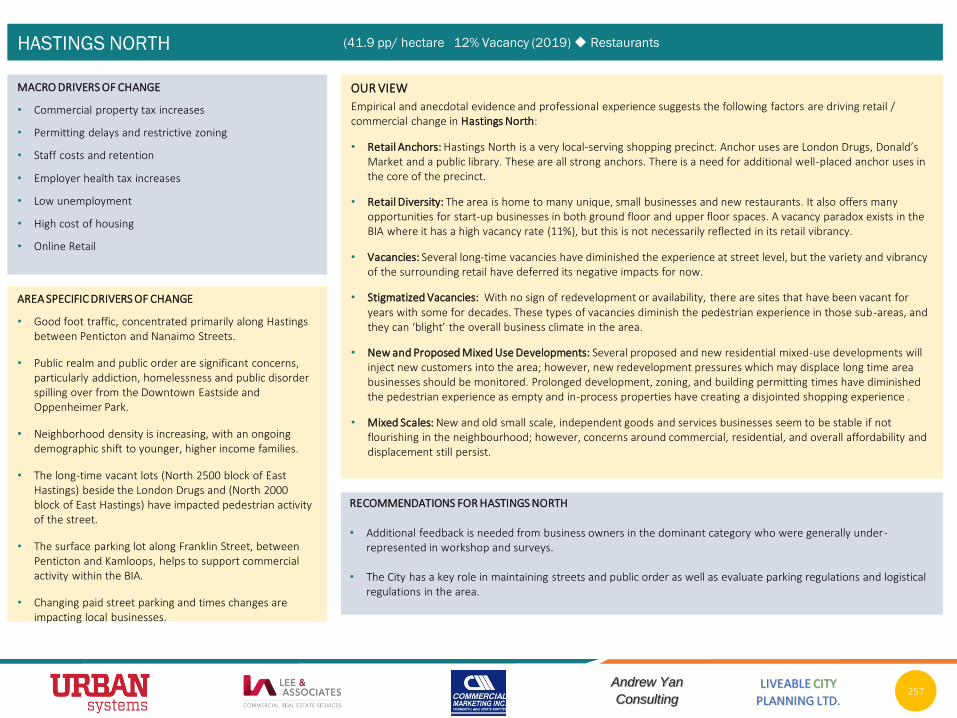
LIVEABLE CITY
PLANNING LTD.
Andrew Yan
Consulting257
AREA SPECIFIC DRIVERS OF CHANGE
• Good foot traffic, concentrated primarily along Hastings between Penticton and Nanaimo Streets.
• Public realm and public order are significant concerns, particularly addiction, homelessness and public disorder spilling over from the Downtown Eastside and Oppenheimer Park.
• Neighborhood density is increasing, with an ongoing demographic shift to younger, higher income families.
• The long-time vacant lots (North 2500 block of East Hastings) beside the London Drugs and (North 2000 block of East Hastings) have impacted pedestrian activity of the street.
• The surface parking lot along Franklin Street, between Penticton and Kamloops, helps to support commercial activity within the BIA.
• Changing paid street parking and times changes are impacting local businesses.
OUR VIEW
Empirical and anecdotal evidence and professional experience suggests the following factors are driving retail / commercial change in Hastings North:
• Retail Anchors: Hastings North is a very local-serving shopping precinct. Anchor uses are London Drugs, Donald’s Market and a public library. These are all strong anchors. There is a need for additional well-placed anchor uses in the core of the precinct.
• Retail Diversity: The area is home to many unique, small businesses and new restaurants. It also offers many opportunities for start-up businesses in both ground floor and upper floor spaces. A vacancy paradox exists in the BIA where it has a high vacancy rate (11%), but this is not necessarily reflected in its retail vibrancy.
• Vacancies: Several long-time vacancies have diminished the experience at street level, but the variety and vibrancy of the surrounding retail have deferred its negative impacts for now.
• Stigmatized Vacancies: With no sign of redevelopment or availability, there are sites that have been vacant for years with some for decades. These types of vacancies diminish the pedestrian experience in those sub-areas, and they can ‘blight’ the overall business climate in the area.
• New and Proposed Mixed Use Developments: Several proposed and new residential mixed-use developments will inject new customers into the area; however, new redevelopment pressures which may displace long time area businesses should be monitored. Prolonged development, zoning, and building permitting times have diminished the pedestrian experience as empty and in-process properties have creating a disjointed shopping experience .
• Mixed Scales: New and old small scale, independent goods and services businesses seem to be stable if not flourishing in the neighbourhood; however, concerns around commercial, residential, and overall affordability and displacement still persist.
MACRO DRIVERS OF CHANGE
• Commercial property tax increases
• Permitting delays and restrictive zoning
• Staff costs and retention
• Employer health tax increases
• Low unemployment
• High cost of housing
• Online Retail
HASTINGS NORTH
RECOMMENDATIONS FOR HASTINGS NORTH
• Additional feedback is needed from business owners in the dominant category who were generally under-represented in workshop and surveys.
• The City has a key role in maintaining streets and public order as well as evaluate parking regulations and logistical regulations in the area.
(41.9 pp/ hectare 12% Vacancy (2019) ◆ Restaurants

LIVEABLE CITY
PLANNING LTD.
Andrew Yan
Consulting258
AREA SPECIFIC DRIVERS OF CHANGE
• Public realm and public order / disorder.
• Property and other taxes.
• Cost and availability of labour.
• Permitting time and flexibility.
• Housing affordability and need for more local population.
• Positive impact of residential density around the Joyce-Collingwood Station.
• Parking and loading policies.
OUR VIEW
Empirical and anecdotal evidence and professional experience suggests the following factors are driving retail / commercial change in Collingwood:
• Family Owned and Operated Businesses: Collingwood is home to many family owned and operated businesses with many small, family owned, niche restaurants. These businesses appear much more resilient to macro changes than other small businesses that are reliant on outside labour. This remains a relatively affordable area to live in Vancouver, and the area is culturally diverse.
• Restaurants as Anchors: In 2005, the dominant category was Limited & Full-service restaurants comprising 18% of total businesses. The area has become significantly more reliant on these categories since then, with combined restaurant categories accounting for 27% of total businesses in 2019. With the advent of food delivery pickup platforms, vehicle parking and stopping / pickup policies may need to revised.
• Public Order and Street Maintenance: Public order and street maintenance were cited in roundtable discussions as the predominant challenges to local business in this area. Vandalism and shoplifting are major and increasing issues.
• Healthy Local Ecosystem: There is a healthy local ecosystem of small business interdependence (e.g. local restaurants buying produce from local green grocers). Vacancy has remained low and relatively stable.
• Role of Non-retail Anchors: Businesses noted the importance of non-retail anchors (i.e. elementary school) in supporting the health and vitality of a local shopping area. Closure of of Sir Guy Carleton Elementary has been negative for local businesses.
MACRO DRIVERS OF CHANGE
• Commercial property tax increases
• Permitting delays and restrictive zoning
• Staff costs and retention
• Employer health tax increases
• Low unemployment
• High cost of housing
• Online Retail
RECOMMENDATIONS FOR COLLINGWOOD
• Maintain Collingwood Community Policing program to deal with public disorder, graffiti etc.
• Explore placemaking and alternative community meeting spaces in the local shopping area to replace lost activity from closure of Sir Guy Carleton Elementary.
• Split assessment property tax relief.
COLLINGWOOD (68.3 pp/ hectare 6% Vacancy (2019) ◆ Restaurants

LIVEABLE CITY
PLANNING LTD.
Andrew Yan
Consulting259
AREA SPECIFIC DRIVERS OF CHANGE
• High foot traffic.
• Excellent access via transit.
• Public disorder and public realm maintenance is eroding.
• Complexity, cost, time of permitting and licensing.
• Increasing Base rents for commercial space.
• The BIA was part of the Grandview-Woodland community plan which was approved in 2016.
OUR VIEW
Empirical and anecdotal evidence and professional experience suggests the following factors are driving retail / commercial change in Commercial Drive:
• Public Realm: The maintenance of the public realm is a critical issue for business in Commercial Drive. There is a general perception that the quality of basic service being received from the City is deteriorating at the same time that property taxes and other costs are dramatically rising.
• Public Order and Safety: To support foot traffic and promote the area as a family destination, businesses want more public order, safety (real and perceived) and better maintenance of the public realm. Many suggest a return to “Community Ambassadors” to enforce bylaws to these ends (and bylaw flexibility where it results in better legitimate use of City sidewalks).
• Mass Transit Access: The area benefits from excellent mass transit access and enjoys a large amount of foot traffic.
• Retail Anchors: The Drive benefits from strong retail anchors (more retail grocery anchors than any other study area) and non-retail anchors (community centre, library, high school, elementary school), as well as an eclectic mix of stores and older businesses established by the historic Italian community.
• Diversity of Retail and Commercial Activities: The diversity of small-scale retail and commercial activities provides a sense of place and character for the area.
MACRO DRIVERS OF CHANGE
• Commercial property tax increases
• Permitting delays and restrictive zoning
• Staff costs and retention
• Employer health tax increases
• Low unemployment
• High cost of housing
• Online Retail
RECOMMENDATIONS FOR COMMERCIAL DRIVE
• The City has purview in the policing and maintenance of streets and lanes for public safety and curb appeal and enforcing bylaws (illegal vending, panhandling). Enhanced resources could improve the attractiveness of the Drive. The BIA also has a role in promoting and shaping the mix and identity / brand of the Drive.
• The City could dedicate more resources and reduce the complexity and time for Permits & Licenses.
• Split assessment property tax relief.
COMMERCIAL DRIVE (61.1 pp/ hectare 5% Vacancy (2019) ◆ Restaurants

APPENDIX D – HISTORICAL COMMERCIAL INVENTORIES
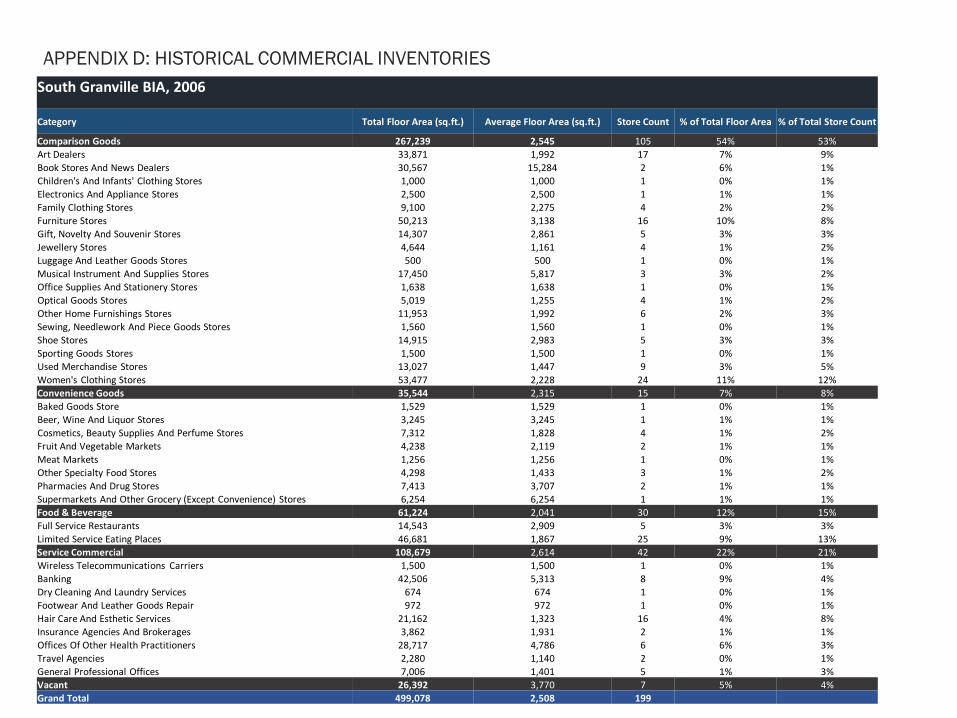
APPENDIX D: HISTORICAL COMMERCIAL INVENTORIES
261
Source: weddingmapper.com
South Granville BIA, 2006
Category Total Floor Area (sq.ft.) Average Floor Area (sq.ft.) Store Count % of Total Floor Area % of Total Store Count
Comparison Goods 267,239 2,545 105 54% 53%
Art Dealers 33,871 1,992 17 7% 9%
Book Stores And News Dealers 30,567 15,284 2 6% 1%
Children's And Infants' Clothing Stores 1,000 1,000 1 0% 1%
Electronics And Appliance Stores 2,500 2,500 1 1% 1%
Family Clothing Stores 9,100 2,275 4 2% 2%
Furniture Stores 50,213 3,138 16 10% 8%
Gift, Novelty And Souvenir Stores 14,307 2,861 5 3% 3%
Jewellery Stores 4,644 1,161 4 1% 2%
Luggage And Leather Goods Stores 500 500 1 0% 1%
Musical Instrument And Supplies Stores 17,450 5,817 3 3% 2%
Office Supplies And Stationery Stores 1,638 1,638 1 0% 1%
Optical Goods Stores 5,019 1,255 4 1% 2%
Other Home Furnishings Stores 11,953 1,992 6 2% 3%
Sewing, Needlework And Piece Goods Stores 1,560 1,560 1 0% 1%
Shoe Stores 14,915 2,983 5 3% 3%
Sporting Goods Stores 1,500 1,500 1 0% 1%
Used Merchandise Stores 13,027 1,447 9 3% 5%
Women's Clothing Stores 53,477 2,228 24 11% 12%
Convenience Goods 35,544 2,315 15 7% 8%
Baked Goods Store 1,529 1,529 1 0% 1%
Beer, Wine And Liquor Stores 3,245 3,245 1 1% 1%
Cosmetics, Beauty Supplies And Perfume Stores 7,312 1,828 4 1% 2%
Fruit And Vegetable Markets 4,238 2,119 2 1% 1%
Meat Markets 1,256 1,256 1 0% 1%
Other Specialty Food Stores 4,298 1,433 3 1% 2%
Pharmacies And Drug Stores 7,413 3,707 2 1% 1%
Supermarkets And Other Grocery (Except Convenience) Stores 6,254 6,254 1 1% 1%
Food & Beverage 61,224 2,041 30 12% 15%
Full Service Restaurants 14,543 2,909 5 3% 3%
Limited Service Eating Places 46,681 1,867 25 9% 13%
Service Commercial 108,679 2,614 42 22% 21%
Wireless Telecommunications Carriers 1,500 1,500 1 0% 1%
Banking 42,506 5,313 8 9% 4%
Dry Cleaning And Laundry Services 674 674 1 0% 1%
Footwear And Leather Goods Repair 972 972 1 0% 1%
Hair Care And Esthetic Services 21,162 1,323 16 4% 8%
Insurance Agencies And Brokerages 3,862 1,931 2 1% 1%
Offices Of Other Health Practitioners 28,717 4,786 6 6% 3%
Travel Agencies 2,280 1,140 2 0% 1%
General Professional Offices 7,006 1,401 5 1% 3%
Vacant 26,392 3,770 7 5% 4%
Grand Total 499,078 2,508 199

APPENDIX D: HISTORICAL COMMERCIAL INVENTORIES
262
Source: weddingmapper.com
West Broadway, 2010Category Total Floor Area (sq.ft.) Average Floor Area (sq.ft.) Store Count
% of Total Floor Area
% of Total Store Count
2010 450927.971 1768.344984 255
Automotive Goods & Services 0 0 1 0% 0%
Gas Stations With Convenience Stores 0 0 1 0% 0%Comparison Goods 128,979 1,720 75 29% 29%
Art Dealers 2,036 1,018 2 0% 1%Book Stores And News Dealers 10,144 1,449 7 2% 3%Children's And Infants' Clothing Stores 3,488 1,163 3 1% 1%Electronics And Appliance Stores 17,322 2,887 6 4% 2%Family Clothing Stores 6,387 1,597 4 1% 2%Furniture Stores 5,662 1,415 4 1% 2%Gift, Novelty And Souvenir Stores 4,881 976 5 1% 2%Hobby, Toy And Game Stores 5,875 2,938 2 1% 1%Jewellery Stores 2,408 803 3 1% 1%Men's Clothing Stores 10,579 5,290 2 2% 1%Optical Goods Stores 1,437 1,437 1 0% 0%
Other General Merchandise Stores 8,236 1,647 5 2% 2%Other Home Furnishings Stores 17,888 2,981 6 4% 2%Pet And Pet Supplies Stores 1,026 1,026 1 0% 0%Shoe Stores 8,739 1,748 5 2% 2%
Sporting Goods Stores 3,737 1,246 3 1% 1%Used Merchandise Stores 6,492 1,623 4 1% 2%Warehouse Clubs 1,000 1,000 1 0% 0%Women's Clothing Stores 11,640 1,058 11 3% 4%
Convenience Goods 109,232 3,121 35 24% 14%Baked Goods Store 7,475 1,246 6 2% 2%Beer, Wine And Liquor Stores 2,009 1,004 2 0% 1%Convenience Stores 3,738 935 4 1% 2%Cosmetics, Beauty Supplies And Perfume Stores 5,532 790 7 1% 3%Florists 3,268 817 4 1% 2%Fruit And Vegetable Markets 18,157 3,026 6 4% 2%Other Specialty Food Stores 10,885 2,721 4 2% 2%Pharmacies And Drug Stores 7,528 7,528 1 2% 0%
Supermarkets And Other Grocery (Except Convenience) Stores 50,640 50,640 1 11% 0%Entertainment and Leisure 6,028 1,507 4 1% 2%
Entertainment And Theatre 0 0 1 0% 0%Fitness And Recreational Sports Centres 6,028 2,009 3 1% 1%
Food & Beverage 106,469 1,717 62 24% 24%Full Service Restaurants 14,685 1,335 11 3% 4%Limited Service Eating Places 91,784 1,800 51 20% 20%
Service Commercial 70,936 1,202 59 16% 23%All Other Consumer Goods Rental 5,369 5,369 1 1% 0%Banking 18,584 3,097 6 4% 2%Dry Cleaning And Laundry Services 2,651 884 3 1% 1%General Professional Offices 1,184 592 2 0% 1%Hair Care And Esthetic Services 8,580 660 13 2% 5%Insurance Agencies And Brokerages 4,421 1,105 4 1% 2%Offices Of Optometrists 2,240 1,120 2 0% 1%Offices Of Other Health Practitioners 16,475 1,098 15 4% 6%Pet Care (Including Vet) 1,477 739 2 0% 1%
Printing 2,214 1,107 2 0% 1%Professional, Scientific And Technical Services 3,059 1,020 3 1% 1%Travel Agencies 3,359 840 4 1% 2%Wireless Telecommunications Carriers 1,322 661 2 0% 1%
Vacant 29,284 1,541 19 6% 7%Vacant Store 29,284 1,541 19 6% 7%
Grand Total 450,928 1,768 255
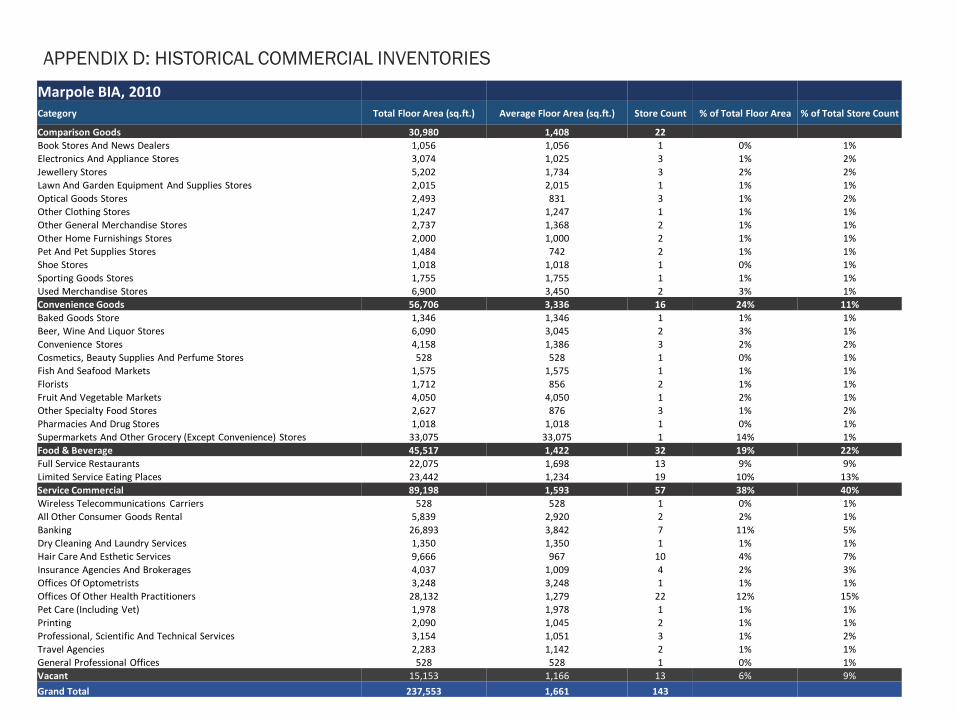
APPENDIX D: HISTORICAL COMMERCIAL INVENTORIES
263
Source: weddingmapper.com
Marpole BIA, 2010Category Total Floor Area (sq.ft.) Average Floor Area (sq.ft.) Store Count % of Total Floor Area % of Total Store Count
Comparison Goods 30,980 1,408 22
Book Stores And News Dealers 1,056 1,056 1 0% 1%
Electronics And Appliance Stores 3,074 1,025 3 1% 2%
Jewellery Stores 5,202 1,734 3 2% 2%
Lawn And Garden Equipment And Supplies Stores 2,015 2,015 1 1% 1%
Optical Goods Stores 2,493 831 3 1% 2%
Other Clothing Stores 1,247 1,247 1 1% 1%
Other General Merchandise Stores 2,737 1,368 2 1% 1%
Other Home Furnishings Stores 2,000 1,000 2 1% 1%
Pet And Pet Supplies Stores 1,484 742 2 1% 1%
Shoe Stores 1,018 1,018 1 0% 1%
Sporting Goods Stores 1,755 1,755 1 1% 1%
Used Merchandise Stores 6,900 3,450 2 3% 1%
Convenience Goods 56,706 3,336 16 24% 11%
Baked Goods Store 1,346 1,346 1 1% 1%
Beer, Wine And Liquor Stores 6,090 3,045 2 3% 1%
Convenience Stores 4,158 1,386 3 2% 2%
Cosmetics, Beauty Supplies And Perfume Stores 528 528 1 0% 1%
Fish And Seafood Markets 1,575 1,575 1 1% 1%
Florists 1,712 856 2 1% 1%
Fruit And Vegetable Markets 4,050 4,050 1 2% 1%
Other Specialty Food Stores 2,627 876 3 1% 2%
Pharmacies And Drug Stores 1,018 1,018 1 0% 1%
Supermarkets And Other Grocery (Except Convenience) Stores 33,075 33,075 1 14% 1%
Food & Beverage 45,517 1,422 32 19% 22%
Full Service Restaurants 22,075 1,698 13 9% 9%
Limited Service Eating Places 23,442 1,234 19 10% 13%
Service Commercial 89,198 1,593 57 38% 40%
Wireless Telecommunications Carriers 528 528 1 0% 1%
All Other Consumer Goods Rental 5,839 2,920 2 2% 1%
Banking 26,893 3,842 7 11% 5%
Dry Cleaning And Laundry Services 1,350 1,350 1 1% 1%
Hair Care And Esthetic Services 9,666 967 10 4% 7%
Insurance Agencies And Brokerages 4,037 1,009 4 2% 3%
Offices Of Optometrists 3,248 3,248 1 1% 1%
Offices Of Other Health Practitioners 28,132 1,279 22 12% 15%
Pet Care (Including Vet) 1,978 1,978 1 1% 1%
Printing 2,090 1,045 2 1% 1%
Professional, Scientific And Technical Services 3,154 1,051 3 1% 2%
Travel Agencies 2,283 1,142 2 1% 1%
General Professional Offices 528 528 1 0% 1%
Vacant 15,153 1,166 13 6% 9%
Grand Total 237,553 1,661 143

APPENDIX D: HISTORICAL COMMERCIAL INVENTORIES
264
Source: weddingmapper.com
*No floor area data available
Collingwood BIA, 2005*Category Store Count % of Total Store Count
Comparison Goods 47
Art Dealers 2 1%
Book Stores And News Dealers 4 2%
Electronics And Appliance Stores 11 5%
Family Clothing Stores 3 1%
Furniture Stores 8 4%
Gift, Novelty And Souvenir Stores 1 0%
Hobby, Toy And Game Stores 1 0%
Musical Instrument And Supplies Stores 1 0%
Optical Goods Stores 3 1%
Other Clothing Stores 1 0%
Other General Merchandise Stores 2 1%
Other Home Furnishings Stores 1 0%
Pet And Pet Supplies Stores 2 1%
Sporting Goods Stores 4 2%
Warehouse Clubs 1 0%
Women's Clothing Stores 2 1%
Convenience Good 27 12%
Baked Goods Store 3 1%
Beer, Wine And Liquor Stores 1 0%
Convenience Stores 4 2%
Cosmetics, Beauty Supplies And Perfume Stores 5 2%
Florists 2 1%
Fruit And Vegetable Markets 4 2%
Meat Markets 1 0%
Other Specialty Food Stores 3 1%
Pharmacies And Drug Stores 3 1%
Supermarkets And Other Grocery (Except Convenience) Stores 1 0%
Food & Beverage 41 18%
Full Service Restaurants 27 12%
Limited Service Eating Places 14 6%
Service Commercial 73 32%
Wireless Telecommunications Carriers 4 2%
All Other Consumer Goods Rental 7 3%
Banking 5 2%
Business Support Services 2 1%
Dry Cleaning And Laundry Services 2 1%
Entertainment And Theatre 2 1%
Hair Care And Esthetic Services 20 9%
Insurance Agencies And Brokerages 5 2%
Offices Of Other Health Practitioners 10 4%
Pet Care (Including Vet) 1 0%
Printing 1 0%
Professional, Scientific And Technical Services 6 3%
Travel Agencies 5 2%
General Professional Offices 3 1%
Entertainment / Fitness / Recreation 3 1%
Fitness And Recreational Sports Centres 3 1%
Vacant 10 4%
Grand Total 226

APPENDIX D: HISTORICAL COMMERCIAL INVENTORIES
265
Source: weddingmapper.com
*No floor area data available
Hastings North, 2002*Category Store Count % of Total
Automotive Goods & Services 10 4%
Automotive Parts And Accessories Stores 3 1%
Automotive Repair And Maintenance 5 2%
Gas Stations With Convenience Stores 1 0%
Motorcycle, Boat And Other Mv Dealers 1 0%
Comparison Goods 45 19%
Art Dealers 2 1%
Children's And Infants' Clothing Stores 1 0%
Electronics And Appliance Stores 8 3%
Furniture Stores 2 1%
Gift, Novelty And Souvenir Stores 2 1%
Hardware Stores 1 0%
Hobby, Toy And Game Stores 1 0%
Jewellery Stores 3 1%
Lawn And Garden Equipment And Supplies Stores 1 0%
Luggage And Leather Goods Stores 2 1%
Men's Clothing Stores 1 0%
Office Supplies And Stationery Stores 1 0%
Optical Goods Stores 3 1%
Other General Merchandise Stores 5 2%
Other Home Furnishings Stores 1 0%
Pet And Pet Supplies Stores 3 1%
Shoe Stores 1 0%
Sporting Goods Stores 2 1%
Used Merchandise Stores 3 1%
Women's Clothing Stores 2 1%
Convenience Goods 39 17%
Baked Goods Store 7 3%
Beer, Wine And Liquor Stores 1 0%
Convenience Stores 7 3%
Cosmetics, Beauty Supplies And Perfume Stores 3 1%
Fish And Seafood Markets 1 0%
Florists 1 0%
Fruit And Vegetable Markets 6 3%
Meat Markets 4 2%
Other Specialty Food Stores 6 3%
Pharmacies And Drug Stores 3 1%
Entertainment and Leisure 2 1%
Entertainment And Theatre 2 1%
Food & Beverage 41 18%
Full Service Restaurants 17 7%
Limited Service Eating Places 24 10%
Service Commercial 80 34%
All Other Consumer Goods Rental 2 1%
Banking 7 3%
Business Support Services 1 0%
Dry Cleaning And Laundry Services 8 3%
Footwear And Leather Goods Repair 1 0%
General Professional Offices 24 10%
Hair Care And Esthetic Services 13 6%
Insurance Agencies And Brokerages 5 2%
Offices Of Other Health Practitioners 11 5%
Pet Care (Including Vet) 1 0%
Printing 4 2%
Professional, Scientific And Technical Services 1 0%
Travel Agencies 2 1%
Vacant 16 7%
Vacant Store 16 7%
Grand Total 233

APPENDIX D: HISTORICAL COMMERCIAL INVENTORIES
266
Source: weddingmapper.com
*No floor area data available
Commercial Drive BIA, 2005*Category Store Count % of Total Store Count
Comparison Goods 76 20%Art Dealers 3 1%Book Stores And News Dealers 6 2%Children's And Infants' Clothing Stores 1 0%Electronics And Appliance Stores 7 2%Family Clothing Stores 7 2%Furniture Stores 3 1%Gift, Novelty And Souvenir Stores 9 2%Hardware Stores 1 0%Jewellery Stores 1 0%Lawn And Garden Equipment And Supplies Stores 1 0%Luggage And Leather Goods Stores 1 0%Men's Clothing Stores 2 1%Musical Instrument And Supplies Stores 2 1%Office Supplies And Stationery Stores 1 0%Optical Goods Stores 2 1%Other General Merchandise Stores 6 2%Other Home Furnishings Stores 3 1%Pet And Pet Supplies Stores 3 1%Shoe Stores 1 0%Sporting Goods Stores 1 0%Used Merchandise Stores 10 3%Warehouse Clubs 1 0%Women's Clothing Stores 4 1%Convenience Goods 63 17%Baked Goods Store 8 2%Beer, Wine And Liquor Stores 2 1%Convenience Stores 17 5%Cosmetics, Beauty Supplies And Perfume Stores 2 1%Florists 2 1%Fruit And Vegetable Markets 10 3%Meat Markets 3 1%Other Specialty Food Stores 10 3%Pharmacies And Drug Stores 7 2%Supermarkets And Other Grocery (Except Convenience) Stores 2 1%Food & Beverage 101 27%Drinking Places 7 2%Full Service Restaurants 33 9%Limited Service Eating Places 61 16%Service Commercial 115 31%All Other Consumer Goods Rental 5 1%Banking 7 2%Business Support Services 1 0%Dry Cleaning And Laundry Services 8 2%Entertainment And Theatre 3 1%Hair Care And Esthetic Services 23 6%Insurance Agencies And Brokerages 3 1%Offices Of Optometrists 1 0%Offices Of Other Health Practitioners 30 8%Printing 2 1%Professional, Scientific And Technical Services 1 0%Travel Agencies 4 1%General Professional Offices 27 7%Entertainment / Fitness / Recreation 5 1%Fitness And Recreational Sports Centres 5 1%Automotive Goods & Services 6 2%Automotive Parts And Accessories Stores 1 0%Automotive Repair And Maintenance 4 1%Motorcycle, Boat And Other Mv Dealers 1 0%Vacant 9 2%Grand Total 375

APPENDIX E – 2019 COMMERCIAL INVENTORIES

APPENDIX E: 2019 COMMERCIAL INVENTORIES
268
Source: weddingmapper.com
South Granville BIA, 2019
Category Total Floor Area (sq.ft.) Average Floor Area (sq.ft.) Store Count% of Total Floor
Area% of Total Store
Count
Comparison Goods 270,066 3,001 90 50% 45%
Art dealers 19,250 2,139 9 4% 5%
Book stores and news dealers 29,917 29,917 1 6% 1%
Children's and infants' clothing stores 6,980 1,745 4 1% 2%
Department stores 12,400 12,400 1 2% 1%
Family clothing stores 8,092 2,023 4 1% 2%
Furniture stores 86,023 5,376 16 16% 8%
Gift, novelty and souvenir stores 1,500 1,500 1 0% 1%
Hobby, toy and game stores 2,500 2,500 1 0% 1%
Jewellery stores 4,244 1,415 3 1% 2%
Men's clothing stores 2,106 1,053 2 0% 1%
Optical goods stores 2,374 1,187 2 0% 1%
Other clothing stores 1,000 1,000 1 0% 1%
Other home furnishings stores 26,040 2,367 11 5% 6%
Shoe stores 13,659 1,951 7 3% 4%
Used merchandise stores 11,260 1,609 7 2% 4%
Women's clothing stores 42,722 2,136 20 8% 10%
Convenience Goods 40,860 2,801 13 8% 7%
Beer, wine and liquor stores 7,150 2,383 3 1% 2%
Cosmetics, beauty supplies and perfume stores 3,988 1,329 3 1% 2%
Florists 2,750 1,375 2 1% 1%
Other Specialty Food Stores 1,000 1,000 1 0% 1%
Pharmacies and drug stores 19,472 6,491 3 4% 2%
Supermarkets and other grocery (except convenience) stores 6,500 6,500 1 1% 1%
Food & Beverage 63,856 1,935 33 12% 17%
Drinking places 7,647 1,912 4 1% 2%
Full service restaurants 13,900 2,317 6 3% 3%
Limited service eating places 42,309 1,840 23 8% 12%
Service Commercial 108,442 2,985 38 20% 19%
Wireless telecommunications carriers 3,964 1,321 3 1% 2%
Banking 43,178 5,397 8 8% 4%
Dry cleaning and laundry services 850 850 1 0% 1%
Entertainment and Theatre 13,000 13,000 1 2% 1%
Footwear and leather goods repair 1,500 1,500 1 0% 1%
Hair care and esthetic services 11,600 1,160 10 2% 5%
Insurance agencies and brokerages 1,000 1,000 1 0% 1%
Offices of Other Health Practitioners 14,950 1,869 8 3% 4%
Travel agencies 1,500 1,500 1 0% 1%
General professional offices 16,900 4,225 4 3% 2%
Vacant 57,169 2,287 25 11% 13%
Grand Total 540,392 2,716 199

APPENDIX E: 2019 COMMERCIAL INVENTORIES
269
Source: weddingmapper.com
West Broadway BIA, 2019Category Total Floor Area (sq.ft.) Average Floor Area (sq.ft.) Store Count % of Total Floor Area % of Total Store Count
Comparison Goods 100,428 2,232 45 21% 18%Book stores and news dealers 4,733 2,366 2 1% 1%Children's and infants' clothing stores 4,057 1,014 4 1% 2%Electronics and appliance stores 4,354 2,177 2 1% 1%Family clothing stores 3,624 1,812 2 1% 1%Furniture stores 8,629 2,876 3 2% 1%Gift, novelty and souvenir stores 1,800 1,800 1 0% 0%Hobby, toy and game stores 5,000 2,500 2 1% 1%Jewellery stores 1,000 1,000 1 0% 0%Lawn and Garden Equipment and Supplies Stores 2,160 2,160 1 0% 0%Men's clothing stores 3,017 3,017 1 1% 0%Office supplies and stationery stores 500 500 1 0% 0%Optical goods stores 4,053 1,013 4 1% 2%Other clothing stores 2,592 2,592 1 1% 0%Other general merchandise stores 14,784 4,928 3 3% 1%Other home furnishings stores 13,691 3,423 4 3% 2%Pet and pet supplies stores 5,183 1,728 3 1% 1%Shoe stores 3,474 1,737 2 1% 1%Sporting goods stores 1,500 1,500 1 0% 0%Used merchandise stores 9,010 4,505 2 2% 1%Women's clothing stores 7,266 1,453 5 1% 2%Convenience Goods 107,896 3,119 33 22% 13%Baked Goods Store 8,585 1,431 6 2% 2%Beer, wine and liquor stores 9,918 1,417 7 2% 3%Convenience Stores 544 544 1 0% 0%Cosmetics, beauty supplies and perfume stores 2,779 926 3 1% 1%Fish and seafood markets 629 629 1 0% 0%Florists 2,229 1,115 2 0% 1%Fruit and Vegetable Markets 6,065 3,032 2 1% 1%Other Specialty Food Stores 12,357 1,765 7 3% 3%Pharmacies and drug stores 14,149 4,716 3 3% 1%
Supermarkets and other grocery (except convenience) stores 50,640 50,640 1 10% 0%Food & Beverage 102,878 1,715 60 21% 24%Drinking places 1,000 1,000 1 0% 0%Full service restaurants 34,393 1,563 22 7% 9%Limited service eating places 67,485 1,824 37 14% 15%Service Commercial 89,035 1,382 66 18% 26%Wireless telecommunications carriers 1,253 626 2 0% 1%Banking 22,511 3,752 6 5% 2%Business Support Services 0 0 0 0% 0%Dry cleaning and laundry services 2,944 981 3 1% 1%Hair care and esthetic services 10,516 809 13 2% 5%Insurance agencies and brokerages 2,824 941 3 1% 1%Offices of optometrists 1,130 1,130 1 0% 0%Offices of Other Health Practitioners 35,096 1,350 26 7% 10%Pet Care (including Vet) 1,477 739 2 0% 1%Printing 1,134 1,134 1 0% 0%Professional, Scientific and Technical Services 786 786 1 0% 0%Travel agencies 3,625 1,208 3 1% 1%General professional offices 5,739 1,148 5 1% 2%Entertainment / Fitness / Recreation 13,080 1,453 9 3% 4%Fitness and recreational sports centres 13,080 1,453 9 3% 4%Automotive Goods & Services 2,500 1,250 2 1% 1%Automotive parts and accessories stores 2,500 2,500 1 1% 0%Gas stations with convenience stores 0 0 1 0% 0%Vacant 72,711 1,864 39 15% 15%Grand Total 488,528 1,923 254

APPENDIX E: 2019 COMMERCIAL INVENTORIES
270
Source: weddingmapper.com
Marpole BIA, 2019
Category Total Floor Area (sq.ft.) Average Floor Area (sq.ft.) Store Count% of Total Floor
Area% of Total Store
Count
Comparison Goods 17,895 1,627 11 7% 8%
Children's and infants' clothing stores 1,575 1,575 1 1% 1%
Gift, novelty and souvenir stores 1,000 1,000 1 0% 1%
Jewellery stores 4,290 2,145 2 2% 1%
Optical goods stores 1,968 656 3 1% 2%
Sporting goods stores 1,755 1,755 1 1% 1%
Used merchandise stores 6,387 3,194 2 3% 1%
Women's clothing stores 920 920 1 0% 1%
Convenience Goods 55,361 5,033 11 22% 8%
Beer, wine and liquor stores 11,923 2,981 4 5% 3%
Cosmetics, beauty supplies and perfume stores 528 528 1 0% 1%
Florists 700 700 1 0% 1%
Fruit and Vegetable Markets 7,200 3,600 2 3% 1%
Pharmacies and drug stores 1,936 968 2 1% 1%
Supermarkets and other grocery (except convenience) stores 33,075 33,075 1 13% 1%
Food and Beverage 56,097 1,516 37 23% 26%
Full service restaurants 33,089 1,576 21 13% 15%
Limited service eating places 23,008 1,438 16 9% 11%
Service Commercial 97,142 1,123 64 39% 45%
Banking 29,456 3,273 9 12% 6%
Dry cleaning and laundry services 2,000 2,000 1 1% 1%
Hair care and esthetic services 8,697 966 9 4% 6%
Insurance agencies and brokerages 7,869 1,311 6 3% 4%
Offices of optometrists 3,248 3,248 1 1% 1%
Offices of Other Health Practitioners 32,216 1,239 26 13% 18%
Pet Care (including Vet) 1,978 1,978 1 1% 1%
Printing 1,334 1,334 1 1% 1%
Professional, Scientific and Technical Services 4,399 1,100 4 2% 3%
Travel agencies 3,700 925 4 1% 3%
General professional offices 2,246 1,123 2 1% 1%
Automotive Goods & Services 0 0 2 0% 1%
Gas stations with convenience stores 0 0 2 0% 1%
Vacant 20,332 1,271 16 8% 11%
Grand Total 246,827 1,751 141

APPENDIX E: 2019 COMMERCIAL INVENTORIES
271
Source: weddingmapper.com
Collingwood BIA, 2019
Category Total Floor Area (sq.ft.) Average Floor Area (sq.ft.) Store Count % of Total Floor Area % of Total Store Count
Comparison Goods 36,800 2,044 18 9% 9%
Art dealers 500 500 1 0% 0%
Electronics and appliance stores 6,900 1,725 4 2% 2%
Furniture stores 4,500 4,500 1 1% 0%
Gift, novelty and souvenir stores 3,500 1,167 3 1% 1%
Hobby, toy and game stores 3,000 3,000 1 1% 0%
Musical instrument and supplies stores 3,000 3,000 1 1% 0%
Optical goods stores 6,200 2,067 3 2% 1%
Other clothing stores 2,500 2,500 1 1% 0%
Other general merchandise stores 3,700 1,850 2 1% 1%
Sporting goods stores 3,000 3,000 1 1% 0%
Convenience Goods 91,900 3,090 29 22% 14%
Baked Goods Store 4,000 1,333 3 1% 1%
Beer, wine and liquor stores 10,200 2,550 4 2% 2%
Convenience Stores 3,000 1,500 2 1% 1%
Cosmetics, beauty supplies and perfume stores 9,900 1,980 5 2% 2%
Florists 1,000 1,000 1 0% 0%
Fruit and Vegetable Markets 9,000 4,500 2 2% 1%
Meat markets 1,500 1,500 1 0% 0%
Other Specialty Food Stores 6,800 1,133 6 2% 3%
Pharmacies and drug stores 14,500 3,625 4 4% 2%
Supermarkets and other grocery (except convenience) stores 32,000 32,000 1 8% 0%
Food & Beverage 111,100 2,020 55 27% 27%
Full service restaurants 72,400 2,069 35 18% 17%
Limited service eating places 38,700 1,935 20 9% 10%
Service Commercial 142,700 1,745 83 35% 41%
Wireless telecommunications carriers 800 800 1 0% 0%
Banking 26,000 4,333 6 6% 3%
Business Support Services 1,200 1,200 1 0% 0%
Dry cleaning and laundry services 4,800 960 5 1% 2%
Footwear and leather goods repair 500 500 1 0% 0%
Hair care and esthetic services 19,900 1,171 17 5% 8%
Insurance agencies and brokerages 15,500 3,100 5 4% 2%
Offices of Other Health Practitioners 38,300 1,596 24 9% 12%
Pet Care (including Vet) 2,400 1,200 2 1% 1%
Printing 1,200 1,200 1 0% 0%
Professional, Scientific and Technical Services 5,500 1,833 3 1% 1%
Travel agencies 1,800 900 2 0% 1%
General professional offices 24,800 1,653 15 6% 7%
Entertainment / Fitness / Recreation 8,200 2,050 4 2% 2%
Fitness and recreational sports centres 8,200 2,050 4 2% 2%
Automotive Goods & Services 3,000 3,000 1 1% 0%
Automotive parts and accessories stores 3,000 3,000 1 1% 0%
Vacant 17,600 1,467 12 4% 6%
Grand Total 411,300 2,036 202
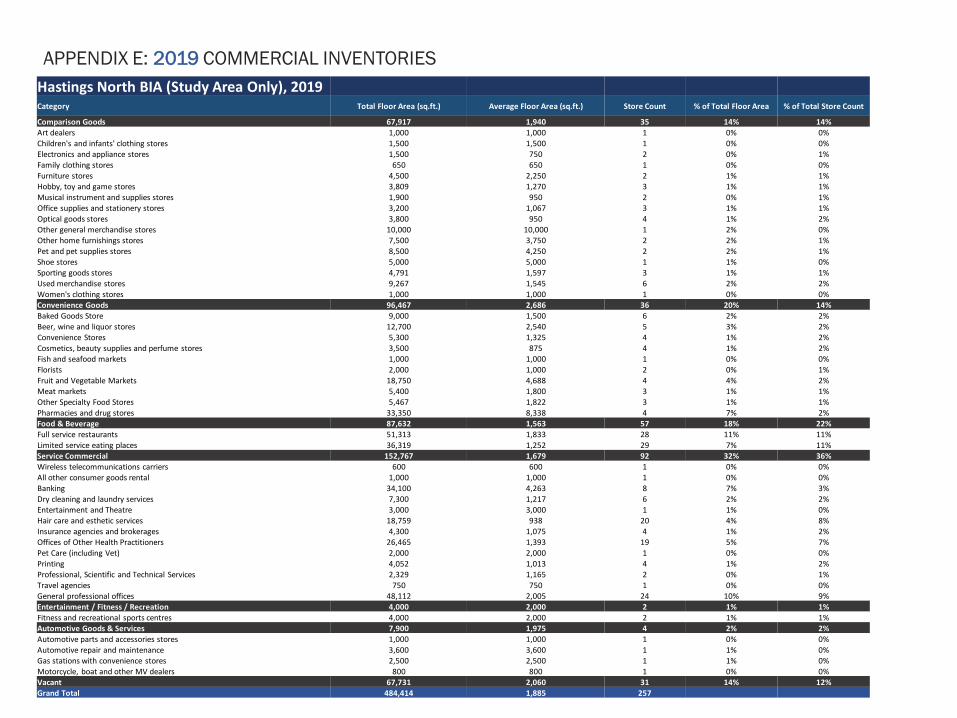
APPENDIX E: 2019 COMMERCIAL INVENTORIES
272
Source: weddingmapper.com
Hastings North BIA (Study Area Only), 2019Category Total Floor Area (sq.ft.) Average Floor Area (sq.ft.) Store Count % of Total Floor Area % of Total Store Count
Comparison Goods 67,917 1,940 35 14% 14%Art dealers 1,000 1,000 1 0% 0%
Children's and infants' clothing stores 1,500 1,500 1 0% 0%Electronics and appliance stores 1,500 750 2 0% 1%
Family clothing stores 650 650 1 0% 0%
Furniture stores 4,500 2,250 2 1% 1%Hobby, toy and game stores 3,809 1,270 3 1% 1%
Musical instrument and supplies stores 1,900 950 2 0% 1%
Office supplies and stationery stores 3,200 1,067 3 1% 1%Optical goods stores 3,800 950 4 1% 2%
Other general merchandise stores 10,000 10,000 1 2% 0%Other home furnishings stores 7,500 3,750 2 2% 1%Pet and pet supplies stores 8,500 4,250 2 2% 1%
Shoe stores 5,000 5,000 1 1% 0%Sporting goods stores 4,791 1,597 3 1% 1%
Used merchandise stores 9,267 1,545 6 2% 2%
Women's clothing stores 1,000 1,000 1 0% 0%Convenience Goods 96,467 2,686 36 20% 14%
Baked Goods Store 9,000 1,500 6 2% 2%
Beer, wine and liquor stores 12,700 2,540 5 3% 2%Convenience Stores 5,300 1,325 4 1% 2%
Cosmetics, beauty supplies and perfume stores 3,500 875 4 1% 2%Fish and seafood markets 1,000 1,000 1 0% 0%Florists 2,000 1,000 2 0% 1%
Fruit and Vegetable Markets 18,750 4,688 4 4% 2%Meat markets 5,400 1,800 3 1% 1%
Other Specialty Food Stores 5,467 1,822 3 1% 1%
Pharmacies and drug stores 33,350 8,338 4 7% 2%Food & Beverage 87,632 1,563 57 18% 22%
Full service restaurants 51,313 1,833 28 11% 11%
Limited service eating places 36,319 1,252 29 7% 11%Service Commercial 152,767 1,679 92 32% 36%
Wireless telecommunications carriers 600 600 1 0% 0%All other consumer goods rental 1,000 1,000 1 0% 0%Banking 34,100 4,263 8 7% 3%
Dry cleaning and laundry services 7,300 1,217 6 2% 2%Entertainment and Theatre 3,000 3,000 1 1% 0%Hair care and esthetic services 18,759 938 20 4% 8%
Insurance agencies and brokerages 4,300 1,075 4 1% 2%Offices of Other Health Practitioners 26,465 1,393 19 5% 7%
Pet Care (including Vet) 2,000 2,000 1 0% 0%
Printing 4,052 1,013 4 1% 2%Professional, Scientific and Technical Services 2,329 1,165 2 0% 1%
Travel agencies 750 750 1 0% 0%General professional offices 48,112 2,005 24 10% 9%Entertainment / Fitness / Recreation 4,000 2,000 2 1% 1%
Fitness and recreational sports centres 4,000 2,000 2 1% 1%Automotive Goods & Services 7,900 1,975 4 2% 2%Automotive parts and accessories stores 1,000 1,000 1 0% 0%
Automotive repair and maintenance 3,600 3,600 1 1% 0%Gas stations with convenience stores 2,500 2,500 1 1% 0%
Motorcycle, boat and other MV dealers 800 800 1 0% 0%
Vacant 67,731 2,060 31 14% 12%Grand Total 484,414 1,885 257

APPENDIX E: 2019 COMMERCIAL INVENTORIES
273
Source: weddingmapper.com
Commercial Drive BIA, 2019Category Total Floor Area (sq.ft.) Average Floor Area (sq.ft.) Store Count % of Total Floor Area % of Total Store Count
Comparison Goods 115,044 1,950 59 14% 17%Art dealers 5,500 1,833 3 1% 1%Book stores and news dealers 5,500 1,375 4 1% 1%Children's and infants' clothing stores 5,200 1,733 3 1% 1%Electronics and appliance stores 3,800 1,900 2 0% 1%Family clothing stores 2,583 1,292 2 0% 1%Furniture stores 7,800 2,600 3 1% 1%Gift, novelty and souvenir stores 4,500 2,250 2 1% 1%Hardware Stores 3,000 3,000 1 0% 0%Hobby, toy and game stores 1,500 1,500 1 0% 0%Jewellery stores 2,000 1,000 2 0% 1%Luggage and leather goods stores 500 500 1 0% 0%Musical instrument and supplies stores 10,200 2,550 4 1% 1%Optical goods stores 4,000 1,333 3 0% 1%Other general merchandise stores 8,300 2,767 3 1% 1%Other home furnishings stores 3,000 3,000 1 0% 0%Pet and pet supplies stores 6,661 2,220 3 1% 1%Shoe stores 6,000 6,000 1 1% 0%Sporting goods stores 4,200 2,100 2 1% 1%Used merchandise stores 16,900 1,878 9 2% 3%Women's clothing stores 13,900 1,544 9 2% 3%Convenience Goods 211,044 3,420 60 26% 17%Baked Goods Store 11,009 2,202 5 1% 1%Beer, wine and liquor stores 21,100 2,110 10 3% 3%Convenience Stores 23,040 2,095 11 3% 3%Cosmetics, beauty supplies and perfume stores 6,500 2,167 3 1% 1%Fish and seafood markets 1,500 1,500 1 0% 0%Florists 1,000 1,000 1 0% 0%Fruit and Vegetable Markets 14,500 4,833 3 2% 1%Meat markets 2,000 2,000 1 0% 0%Other Specialty Food Stores 28,200 2,564 11 4% 3%Pharmacies and drug stores 27,369 2,737 10 3% 3%
Supermarkets and other grocery (except convenience) stores 74,826 18,707 4 9% 1%Food & Beverage 224,502 1,952 115 28% 33%Drinking places 40,500 3,375 12 5% 3%Full service restaurants 67,140 1,865 36 8% 10%Limited service eating places 116,862 1,744 67 15% 19%Service Commercial 194,936 2,161 96 24% 27%Wireless telecommunications carriers 1,000 500 2 0% 1%All other consumer goods rental 2,500 2,500 1 0% 0%Banking 26,000 3,250 8 3% 2%Business Support Services 1,500 1,500 1 0% 0%Dry cleaning and laundry services 7,000 1,400 5 1% 1%Entertainment and Theatre 6,000 6,000 1 1% 0%Hair care and esthetic services 22,000 1,294 17 3% 5%Insurance agencies and brokerages 5,500 1,833 3 1% 1%Offices of Other Health Practitioners 58,236 1,879 31 7% 9%Printing 1,500 1,500 1 0% 0%Professional, Scientific and Technical Services 3,500 1,750 2 0% 1%Travel agencies 5,000 1,250 4 1% 1%General professional offices 55,200 2,760 20 7% 6%Entertainment / Fitness / Recreation 13,500 6,750 2 2% 1%Fitness and recreational sports centres 13,500 6,750 2 2% 1%Automotive Goods & Services 15,000 3,750 4 2% 1%Automotive parts and accessories stores 6,000 6,000 1 1% 0%Automotive repair and maintenance 6,000 3,000 2 1% 1%Motorcycle, boat and other MV dealers 3,000 3,000 1 0% 0%Vacant 28,315 1,770 16 4% 5%Grand Total 802,341 2,279 352

APPENDIX F – SURVEY OF BUSINESS OWNERS AND OPERATORS

APPENDIX F: SURVEY OF BUSINESS OWNERS AND OPERATORS
4A: What is your type of business?
Response CollingwoodSouth
GranvilleWest
BroadwayCommercial
DriveMarpole Hastings
Chain / Franchise
1 1 6 2 3
Independent 1 22 41 5 15
Other 3 1 1 2 1 1
Total 4 3 29 45 6 19
Response CollingwoodSouth
GranvilleWest
BroadwayCommercial
DriveMarpole Hastings
Food and Beverage
13 14 4
Personal Service
3 2 7 9 1 9
Destination Retail
2 5 1
Clothing Retail
1
Other Retail 4 10 1 3
Health and Fitness
2 1
Business to Business
1 2
Other 2 2 1 3
Total 4 3 30 43 3 19
4B: What business sector do you operate in?

APPENDIX F: SURVEY OF BUSINESS OWNERS AND OPERATORS
5: What is your role within the business in this location? 8: What is your business ownership model?
Response CollingwoodSouth
GranvilleWest
BroadwayCommercial
DriveMarpole Hastings
Business Manager
2 1 9 10 3 4
Landlord / Property Owner
3 1 3 1
Business Owner 24 36 4 14
Employee 1 1 1 5 1
Other 1 3 1 1 1
Total 4 2 40 53 11 21
Response CollingwoodSouth
GranvilleWest
BroadwayCommercial
DriveMarpole Hastings
Corporation (For Profit)
2 2 17 31 4 16
Sole Proprietorship
8 12 2
Partnership4 1
Social Enterprise / Non-Profit
1 1 1
Other1 1
Total 3 2 30 44 6 19

APPENDIX F: SURVEY OF BUSINESS OWNERS AND OPERATORS
9A: How many years has your business been operating in THIS location?
Years CollingwoodSouth
GranvilleWest
BroadwayCommercial
DriveMarpole Hastings
<5 14 7 1 5
5 to 9 6 10 5
10 to 14 6 6 2
15 to 19 2 5 3
>=20 2 1 1 15 5 4
Total 2 1 29 43 6 19
9B: How many years has your business been operating in ANY location?
Years CollingwoodSouth
GranvilleWest
BroadwayCommercial
DriveMarpole Hastings
<5 2 3 3
5 to 9 7 6 3
10 to 14 6 6 3
15 to 19 5 3 1 3
>=20 3 1 3 22 4 5
Total 3 1 23 40 5 17
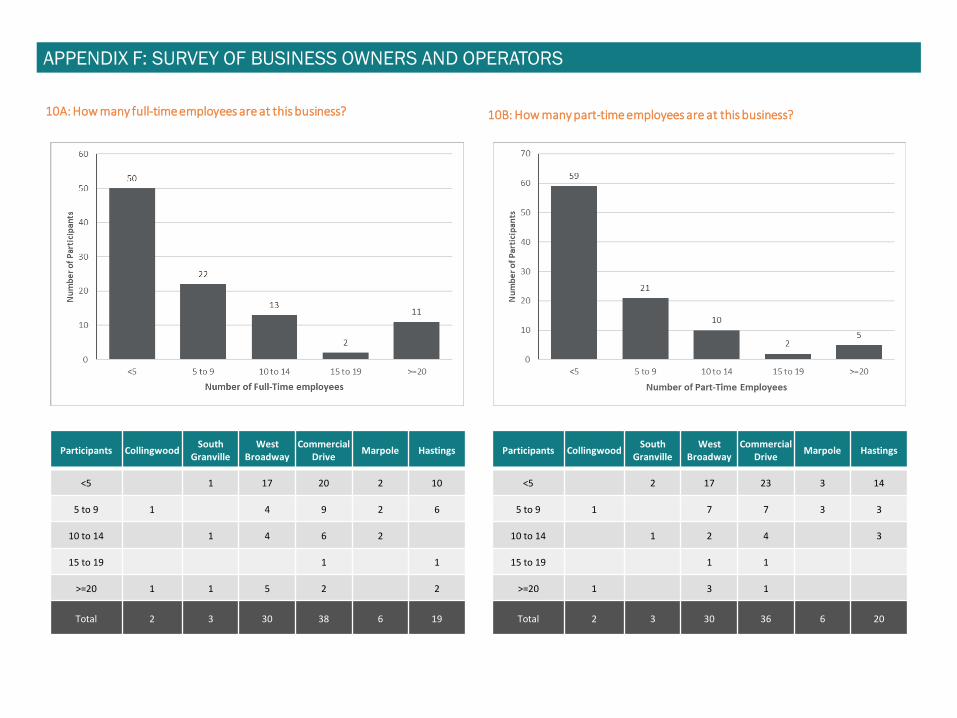
APPENDIX F: SURVEY OF BUSINESS OWNERS AND OPERATORS
10A: How many full-time employees are at this business?
Participants CollingwoodSouth
GranvilleWest
BroadwayCommercial
DriveMarpole Hastings
<5 1 17 20 2 10
5 to 9 1 4 9 2 6
10 to 14 1 4 6 2
15 to 19 1 1
>=20 1 1 5 2 2
Total 2 3 30 38 6 19
Participants CollingwoodSouth
GranvilleWest
BroadwayCommercial
DriveMarpole Hastings
<5 2 17 23 3 14
5 to 9 1 7 7 3 3
10 to 14 1 2 4 3
15 to 19 1 1
>=20 1 3 1
Total 2 3 30 36 6 20
10B: How many part-time employees are at this business?

APPENDIX F: SURVEY OF BUSINESS OWNERS AND OPERATORS
10C: How many casual employees are at this business?
Participants CollingwoodSouth
GranvilleWest
BroadwayCommercial
DriveMarpole Hastings
<5 1 24 16 2 10
5 to 9 2 1
10 to 14 2
15 to 19
>=20 1 2 1
Total

APPENDIX F: SURVEY OF BUSINESS OWNERS AND OPERATORS
11A: Do you have locations outside of Vancouver?
Rating CollingwoodSouth
GranvilleWest
BroadwayCommercial
DriveMarpole Hastings
Yes 1 28 6 2 1
No 2 3 2 38 4 18
Total 3 3 30 44 6 19
11B: Where?
Collingwood
• All across
South Granville• South Surrey / West Vancouver
• owners are across Canada with chains
• Toronto, Montreal, Calgary etc.
West Broadway• North Vancouver
Commercial Drive• Whistler
• Surrey, White Rock, Abbotsford
• Toronto
• Alberta
• Guildford, Abbotsford, White Rock, Regina and Fort Quapelle
• Kamloops, Victoria, Nelson, Balfour, Kelowna
• Kamloops, Kelowna, Nelson, Balfour, Victoria
Marpole• Surrey
• Richmond, Delta, Tsawwassen, Langley, Surrey, Victoria, Nanaimo,
New Westminster, Cormorant Island, Squamish
Hastings• All over Canada

APPENDIX F: SURVEY OF BUSINESS OWNERS AND OPERATORS
12A: Please describe your primary customer base.
Customer Base CollingwoodSouth
GranvilleWest
BroadwayCommercial
DriveMarpole Hastings
Local 9 18 2 2
City-Wide 4 8
Metro-Vancouver 2 4
Outside Metro Vancouver 1 2
General Population 1 2 3 2
Younger Adults 5 9 1
Middle Aged Adults 1 5 10 2 1
Older Adults 2 5 6 1 1
Business-to-Business 1 6 4
Students 6 2
Parents/Families 2 3 1
Males 1 3
Females 2 3 3 1
Affluent 1 1
Middle Class 1 2 1
Low Income 1
Other 4 2 1 1
Total 2 7 50 82 8 13

APPENDIX F: SURVEY OF BUSINESS OWNERS AND OPERATORS
12B: Where does most of your customer base come from?

APPENDIX F: SURVEY OF BUSINESS OWNERS AND OPERATORS
12B: Where does most of your customer base come from?
Collingwood South Granville
West Broadway Commercial Drive
Marpole Hastings

APPENDIX F: SURVEY OF BUSINESS OWNERS AND OPERATORS
12C: Has your customer base changed significantly over the past 5 – 10 years?
Response CollingwoodSouth
GranvilleWest
BroadwayCommercial
DriveMarpole Hastings
Yes 1 2 7 12 1 4
No 2 1 22 27 4 15
Total 3 3 29 39 5 19
Response CollingwoodSouth
GranvilleWest
BroadwayCommercial
DriveMarpole Hastings
Fewer local customers/more
non-local customers
3 1 1
Younger Customers
2 1
Less Affluent Customers
1 1 1
General Decrease in Customers
1 1
Changes Resulting from
Product/Service Changes
4
Other 2 1
Total 1 4 0 12 2 2
12D: How was your customer base changed over the past 5 – 10 years?

APPENDIX F: SURVEY OF BUSINESS OWNERS AND OPERATORS
13: Does the company rent or own the location of this business?
Response CollingwoodSouth
GranvilleWest
BroadwayCommercial
DriveMarpole Hastings
We RENT the property
(Freehold)2 3 25 36 2 15
We RENT the property
(Condominium Strata)
2 1
We OWN the property
(Freehold)3 2 4
We OWN the property
(Condominium Strata)
1 1 1
I Don’t know 1 1
Total 3 3 29 41 5 19

APPENDIX F: SURVEY OF BUSINESS OWNERS AND OPERATORS
14A: Do you have a lease?
Response CollingwoodSouth
GranvilleWest
BroadwayCommercial
DriveMarpole Hastings
Yes – I have a lease for my
Retail/Commercial Space
2 3 22 31 2 13
Yes, I have a lease from the main
Retail/Commercial tenant
1 2 1
No – I don not have a lease
1 1 3 4
I don’t know 1
Total 3 3 25 36 2 18
Response CollingwoodSouth
GranvilleWest
BroadwayCommercial
DriveMarpole Hastings
High/Increasing Rent
4 12 5
High/Increasing Property Taxes
5 11 2 3
High/Increasing Maintenance
3 3 2
Fear of Redevelopment or
Landlord Selling1
General Affordability
1 2
Poor Landlord/Fear of Redevelopment
1 4 4
Other 1 1 1
Total 1 2 16 31 2 14
14B: If you have a lease, do you have concerns that your lease is affecting the
viability of your business?

APPENDIX F: SURVEY OF BUSINESS OWNERS AND OPERATORS
14C: What type of lease do you have? 14D: Could you share your Basic Rent (per square foot) for the years below?
Response CollingwoodSouth
GranvilleWest
BroadwayCommercial
DriveMarpole Hastings
Base Rate + Property Tax + Maintenance
2 19 27 2 12
Gross Rate (Landlord pays
property tax and repairs)
1 4 3 2
I don’t know 2 1 2 5 3
Total 3 3 25 35 2 17
Basic Rent 2011 2015 2019
$0 to $9 2 2 2
$10 to $19 5 5 4
$20 to $29 3 3 7
$30 to $39 2 4 4
$40 to $49 1 4 4
$50 to $59 1 3 4

APPENDIX F: SURVEY OF BUSINESS OWNERS AND OPERATORS
14D: Could you share your Basic Rent (per square foot) for the years below?
Basic Rent2011 2015 2019
C SG WB CD M H C SG WB CD M H C SG WB CD M H
$0 to $9 1 2 1 2 1 1 1
$10 to $19 1 2 3 2 2 3 2 1 3
$20 to $29 1 2 2 1 2 3 4
$30 to $39 2 2 3 3 4 3 1
$40 to $49 1 1 1 3 3 1 6 2
$50 to $59 1 4 4
Total Responses 1 1 5 8 0 5 1 1 8 13 0 7 1 1 12 14 0 9

APPENDIX F: SURVEY OF BUSINESS OWNERS AND OPERATORS
14E: How many years remain on your lease?
Years CollingwoodSouth
GranvilleWest
BroadwayCommercial
DriveMarpole Hastings
0 1 1
1 1 6 3
2 1 1 6 2
3 8 5 2 1
4 4 2
5 1 3 1
7 2
8 1
9 2
10 1 2
20 1
Total 1 1 17 27 2 10
14F: Do you have a renewal clause? If so, how many years?
Years CollingwoodSouth
GranvilleWest
BroadwayCommercial
DriveMarpole Hastings
No 1 7 6 5
1 1
2 1
3 3 3
4 1 1
5 11 14 2 4
6 1
7 1
10 1 2
30 1
I don’t know 2 1 2 5
Other 2
Total 3 2 23 34 2 14

APPENDIX F: SURVEY OF BUSINESS OWNERS AND OPERATORS
14G: Does your lease have a Demolition Clause allowing the landlord to
terminate your lease for redevelopment?
Response CollingwoodSouth
GranvilleWest
BroadwayCommercial
DriveMarpole Hastings
Yes 1 5 11 1 4
No 1 11 12 1 6
I don’t Know 2 1 6 12 4
Total 3 2 22 35 2 14
14H: Do you have options to expand or contract the size of your business at this
location?
Response CollingwoodSouth
GranvilleWest
BroadwayCommercial
DriveMarpole Hastings
Yes 3 1 1
No 1 1 20 28 2 13
I don’t Know 2 1 1 7 2
Total 3 2 24 36 2 16

APPENDIX F: SURVEY OF BUSINESS OWNERS AND OPERATORS
15: If you do not own your locations and do not have a lease, what best
described your situation?
Response CollingwoodSouth
GranvilleWest
BroadwayCommercial
DriveMarpole Hastings
Rent Month to Month
2 5 5
Temporary Rent
1 1 1
I Don’t know 2 7 7 2
Total 2 10 13 8
16A: Describe how your sales / revenue experience has changed in the past 2
years:
Response CollingwoodSouth
GranvilleWest
BroadwayCommercial
DriveMarpole Hastings
Increased a lot
1 3 6 1 4
Increased a little
1 12 14 1 6
Stayed Same 1 2 2 8 2 5
Decreased a little
7 3 2
Decreased a lot
2 3
I don’t know 1
N/A 3 1 1
Total 3 3 26 37 5 18

APPENDIX F: SURVEY OF BUSINESS OWNERS AND OPERATORS
16B: Describe how your sales / revenue experience has changed in the past 5
years:
Response CollingwoodSouth
GranvilleWest
BroadwayCommercial
DriveMarpole Hastings
Increased a lot
1 1 7 8
Increased a little
2 6 11 2 4
Stayed Same 1 5 3 4
Decreased a little
3 5 1 1
Decreased a lot
1 5 2
I don’t know 1
N/A 3 8 2 2
Total 3 3 23 36 5 19
16C: Describe how your sales / revenue experience has changed in the past 10
years:
Response CollingwoodSouth
GranvilleWest
BroadwayCommercial
DriveMarpole Hastings
Increased a lot
1 2 6 1 9
Increased a little
1 4 9 1 4
Stayed Same 1 4 3 2
Decreased a little
1 1 3
Decreased a lot
5 1 1
I don’t know 1 1 1
N/A 6 13 2 4
Total 3 3 22 36 5 19

APPENDIX F: SURVEY OF BUSINESS OWNERS AND OPERATORS
17A: Describe how property / lease costs related to your location have changed
in the past 2 years:
Response CollingwoodSouth
GranvilleWest
BroadwayCommercial
DriveMarpole Hastings
Increased a lot
1 9 8 2 6
Increased a little
1 8 16 8
Stayed Same 1 6 3 2
Decreased a little
1
Decreased a lot
1
I don’t know 2 5 1
N/A 1 4 1 2
Total 3 3 24 37 3 19
Response CollingwoodSouth
GranvilleWest
BroadwayCommercial
DriveMarpole Hastings
Increased a lot
2 9 8 2 5
Increased a little
1 10 14 8
Stayed Same 1 2 2 2
Decreased a little
1 1
Decreased a lot
I don’t know 2 4 1
N/A 3 7 1 3
Total 3 3 25 36 3 19
17B: Describe how property / lease costs related to your location have changed
in the past 5 years:

APPENDIX F: SURVEY OF BUSINESS OWNERS AND OPERATORS
17C: Describe how property / lease costs related to your location have changed
in the past 10 years:
Response CollingwoodSouth
GranvilleWest
BroadwayCommercial
DriveMarpole Hastings
Increased a lot
2 8 10 1 5
Increased a little
1 7 8 1 5
Stayed Same 1 1 2 2
Decreased a little
1 1 1
Decreased a lot
I don’t know 2 5 2
N/A 5 10 1 4
Total 3 3 22 36 3 19
18A: Describe how the cost to you for the goods/services that you sell has
changed over the past 2 years.
Response CollingwoodSouth
GranvilleWest
BroadwayCommercial
DriveMarpole Hastings
Increased a lot
10 12 1 6
Increased a little
2 1 9 16 2 8
Stayed Same 1 4 5 2
Decreased a little
1
Decreased a lot
1 1
I don’t know 2 1
N/A 1 3 1 2
Total 3 3 26 37 4 19

APPENDIX F: SURVEY OF BUSINESS OWNERS AND OPERATORS
18B: Describe how the cost to you for the goods/services that you sell has
changed over the past 5 years.
Response CollingwoodSouth
GranvilleWest
BroadwayCommercial
DriveMarpole Hastings
Increased a lot
1 5 11 1 5
Increased a little
1 2 12 14 1 8
Stayed Same 1 2 3 1 2
Decreased a little
1
Decreased a lot
I don’t know 2 1 1
N/A 1 3 7 1 3
Total 3 3 25 36 4 19
18C: Describe how the cost to you for the goods/services that you sell has
changed over the past 3 years.
Response CollingwoodSouth
GranvilleWest
BroadwayCommercial
DriveMarpole Hastings
Increased a lot
2 1 5 10 1 5
Increased a little
1 9 9 1 5
Stayed Same 1 2 4 1 2
Decreased a little
1
Decreased a lot
1
I don’t know 2 2
N/A 1 5 11 1 4
Total 3 3 22 36 4 19
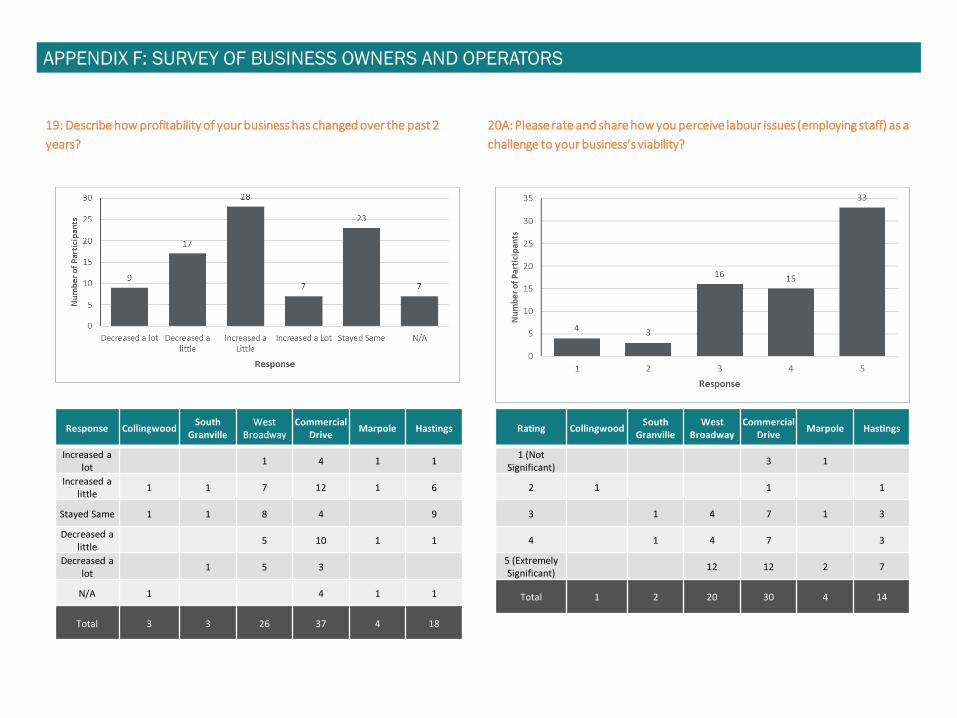
APPENDIX F: SURVEY OF BUSINESS OWNERS AND OPERATORS
19: Describe how profitability of your business has changed over the past 2
years?
Response CollingwoodSouth
GranvilleWest
BroadwayCommercial
DriveMarpole Hastings
Increased a lot
1 4 1 1
Increased a little
1 1 7 12 1 6
Stayed Same 1 1 8 4 9
Decreased a little
5 10 1 1
Decreased a lot
1 5 3
N/A 1 4 1 1
Total 3 3 26 37 4 18
Rating CollingwoodSouth
GranvilleWest
BroadwayCommercial
DriveMarpole Hastings
1 (Not Significant)
3 1
2 1 1 1
3 1 4 7 1 3
4 1 4 7 3
5 (Extremely Significant)
12 12 2 7
Total 1 2 20 30 4 14
20A: Please rate and share how you perceive labour issues (employing staff) as a
challenge to your business’s viability?

APPENDIX F: SURVEY OF BUSINESS OWNERS AND OPERATORS
Rating CollingwoodSouth
GranvilleWest
BroadwayCommercial
DriveMarpole Hastings
1 (Not Significant)
1 4 4
2 5 5 2
3 1 1 4 3 4
4 1 4
5 (Extremely Significant)
4 6 1 7
Total 1 1 15 22 5 13
Rating CollingwoodSouth
GranvilleWest
BroadwayCommercial
DriveMarpole Hastings
1 (Not Significant)
4 5 3 1
2 4 3
3 1 4 1 3
4 1 1
5 (Extremely Significant)
1 4 1
Total 0 1 10 15 3 8
20B: Please rate and share how you perceive acquiring finance / cash flow as a
challenge to your business’s viability?
20C: Please rate and share how you perceive logistics (goods pick up and drop
off) as a challenge to your business’s viability?

APPENDIX F: SURVEY OF BUSINESS OWNERS AND OPERATORS
Rating CollingwoodSouth
GranvilleWest
BroadwayCommercial
DriveMarpole Hastings
1 (Not Significant)
2 1
2 4 4 2
3 7 6 1 3
4 1 1 3 1 5
5 (Extremely Significant)
1 6 10 2 4
Total 0 2 18 25 5 14
20D: Please rate and share how you perceive parking / transportation as a
challenge to your business’s viability?
20E: Please rate and share how you perceive marketing as a challenge to your
business’s viability?
Rating CollingwoodSouth
GranvilleWest
BroadwayCommercial
DriveMarpole Hastings
1 (Not Significant)
2 2 2 3
2 1 1 4 3
3 8 12 1 5
4 1 4 4
5 (Extremely Significant)
1 2 4 1 2
Total 1 2 17 26 4 13

APPENDIX F: SURVEY OF BUSINESS OWNERS AND OPERATORS
20F: Please rate and share how you perceive city permit processing as a
challenge to your business’s viability?
Rating CollingwoodSouth
GranvilleWest
BroadwayCommercial
DriveMarpole Hastings
1 (Not Significant)
3 3
2 1 1 1 1 6
3 1 3 6 1
4 1 4 2 1
5 (Extremely Significant)
7 7 3
Total 1 2 15 19 4 11
20G: Please rate and share how you perceive ability to expand as a challenge to
your business’s viability?
Rating CollingwoodSouth
GranvilleWest
BroadwayCommercial
DriveMarpole Hastings
1 (Not Significant)
4 4 3
2 1 2 3 3
3 1 1 3 1 2
4 3 5 3
5 (Extremely Significant)
4 5 4
Total 0 2 14 20 4 12

APPENDIX F: SURVEY OF BUSINESS OWNERS AND OPERATORS
20H: Please rate and share how you perceive overhead costs as a challenge to
your business’s viability?
20I: Please rate and share how you perceive rent as a challenge to your
business’s viability?
Rating CollingwoodSouth
GranvilleWest
BroadwayCommercial
DriveMarpole Hastings
1 (Not Significant)
1 1
2 1 2 3 1 1
3 2 2 1 3
4 2 4 8 6
5 (Extremely Significant)
1 1 13 13 1 6
Total 2 3 21 27 4 16
Rating CollingwoodSouth
GranvilleWest
BroadwayCommercial
DriveMarpole Hastings
1 (Not Significant)
1 2 2
2 2
3 3 6 3
4 1 6 8 4
5 (Extremely Significant)
2 13 10 1 8
Total 0 3 23 26 3 17

20J: Please rate and share what you perceive as challenges to your business
viability.
APPENDIX F: SURVEY OF BUSINESS OWNERS AND OPERATORS

20J: Please rate and share what you perceive as challenges to your business
viability.
Response CollingwoodSouth
GranvilleWest
BroadwayCommercial
DriveMarpole Hastings
Competitors 4
High Residential Rent
2 1
Lack of Foot Traffic / Negative
Population Growth
2
Accessibility concerns
(parking, transit, etc)
1 1 1
Social Issues (Homelessness,
crime, etc)15
High Rent and Taxes
1 2
Declining Retail Environment
1 2
Cost of Goods / Labour
2 1 1
Low Barrier Shelter
4
Street Appeal 3
Lease Uncertainty /
Threat of Redevelopment
1 1 2
Other 1 1 1
Total 0 5 11 29 2 4
APPENDIX F: SURVEY OF BUSINESS OWNERS AND OPERATORS
Response CollingwoodSouth
GranvilleWest
BroadwayCommercial
DriveMarpole Hastings
Streets 3 8 22 1 9
Transit 1 1 12 12 2 9
Loading 1 6 6
Sidewalks 9 20 1 12
Parking 1 14 21 4 16
Other 3 2 3 1
Total 1 8 46 84 8 53
21: Does the quality or management of any of these impact the viability of your
business?

APPENDIX F: SURVEY OF BUSINESS OWNERS AND OPERATORS
Response CollingwoodSouth
GranvilleWest
BroadwayCommercial
DriveMarpole Hastings
Deliver Goods / Services Direct to
Customers1 9 9 2 7
Sublet or Share Space within
your location to another business
1
Host Events / Shows off site
1 3 3 2 3
Sell goods / services in other
Stores3 2 1 1
Operate “PopUp” Temporary locations
1 2
Sell goods / services directly
online1 3 4
Sell goods / services in Public
Markets2 3 2
Sublet or Share Space within
your location to another business
3 3 1 3
Operate Mobile Sales Vehicles
2 1 1
Sell goods / services on third-
party channels (i.e. Amazon /
eBay)
1
Other 1 1 2
Total 1 2 24 26 7 25
22: Does your business (check any that apply):

APPENDIX F: SURVEY OF BUSINESS OWNERS AND OPERATORS
Response CollingwoodSouth
GranvilleWest
BroadwayCommercial
DriveMarpole Hastings
Deliver Goods / Services Direct to Customers
1 9 9 2 7
Sublet or Share Space within your location to another
business1
Host Events / Shows off site 1 3 3 2 3
Sell goods / services in other Stores
3 2 1 1
Operate “PopUp” Temporary locations
1 2
Sell goods / services directly online
1 3 4
Sell goods / services in Public Markets
2 3 2
Sublet or Share Space within your location to another
business3 3 1 3
Operate Mobile Sales Vehicles 2 1 1
Sell goods / services on third-party channels (i.e. Amazon /
eBay)1
Other 1 1 2
Total 1 2 24 26 7 25
22: Does your business (check any that apply):

APPENDIX F: SURVEY OF BUSINESS OWNERS AND OPERATORS
23: MY long-term outlook for MY business in this location is:
Response CollingwoodSouth
GranvilleWest
BroadwayCommercial
DriveMarpole Hastings
Improving 2 5 13 1 6
Remaining the same
1 8 13 2 8
Deteriorating 2 11 9 1 4
Total 2 3 24 35 4 18

APPENDIX F: SURVEY OF BUSINESS OWNERS AND OPERATORS
24: Within the next 5 years, I will:

APPENDIX F: SURVEY OF BUSINESS OWNERS AND OPERATORS
25: What is WORKING to support your business in its current location?

APPENDIX F: SURVEY OF BUSINESS OWNERS AND OPERATORS
24: Within the next 5 years, I will:
Response CollingwoodSouth
GranvilleWest
BroadwayCommercial
DriveMarpole Hastings
Close the business
1 3
Contract existing
business in this location
(reduce size or hours)
1 1 1
Expand existing business in this location (add
space or operating
hours)
1 2 2 1 5
Relocate the business to
another location
1 8 2 1
Retain the business in this
location and add more locations
1 1 7 11 1 5
Sell the business / pass
it down to family
1 4 16 1 3
Total 2 3 23 35 3 15
25: What is WORKING to support your business in its current location?
Response CollingwoodSouth
GranvilleWest
BroadwayCommercial
DriveMarpole Hastings
BIA Work 1 1 3
Foot Traffic 1 4 2
Stable/Decreasing Costs (Property
Taxes, etc)
2
Supportive Landlord
2
Accessible for Pedestrians
1 1
Accessible Transit
1 2 2 2
Parking 1 3 1
Community Spirit / Events
3 6 4
Proximity to Residential
Developments2 5 1 1
Popular Retail Area
4 5 1
Business Efforts (good customer
service, operational efficiencies)
9 3 1 2
Other 5 1 1
Total 2 1 22 34 3 22

APPENDIX F: SURVEY OF BUSINESS OWNERS AND OPERATORS
26: What is NOT WORKING to support your business in its current location?
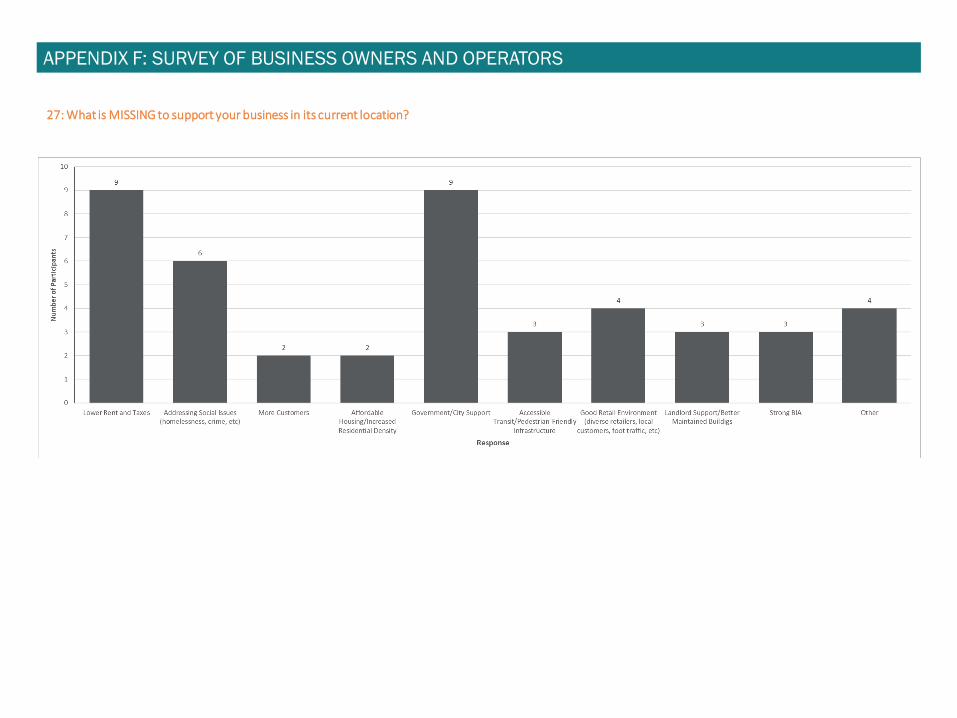
APPENDIX F: SURVEY OF BUSINESS OWNERS AND OPERATORS
27: What is MISSING to support your business in its current location?

APPENDIX F: SURVEY OF BUSINESS OWNERS AND OPERATORS
26: What is NOT WORKING to support your business in its current location?
Response CollingwoodSouth
GranvilleWest
BroadwayCommercial
DriveMarpole Hastings
Social Issues (homelessness,
crime, etc)1 7 4
Lack of Parking 2 2 2 6
Increasing Rent, Property Tax, And Utilities
1 5 7 1
Poor Building Maintenance/L
andscaping2 2
Building Location (not
visible, too small,
accessibility, etc)
2 2
Lack of Traffic/Quiet
Neighbourhood4 1
Competition 1 1
General Lack of Government
Support1 1 1 2
Labour Challenges
1 1 3
Changing Community
Demographics1 1
Fear of Redevelopment
1 3
Other 1 2 2 1
Total 1 3 21 27 4 19
27: What is MISSING to support your business in its current location?
Response CollingwoodSouth
GranvilleWest
BroadwayCommercial
DriveMarpole Hastings
Lower Rent and Taxes
2 5 2
Addressing Social Issues
(homelessness, crime, etc)
1 4 1
More customers 2
Affordable Housing/Increase
d Residential Density
2
Government/City Support
1 1 3 1 3
Accessible Transit/Pedestrian
-Friendly Infrastructure
2 1
Good Retail Environment
(diverse retailers, local customers, foot traffic, etc)
3 1
Landlord Support/Better
Maintained Buildigs
3
Strong BIA 1 2
Other 2 2
Total 1 1 16 19 2 6

APPENDIX F: SURVEY OF BUSINESS OWNERS AND OPERATORS
28: Do you have any comments or suggestions for the study team?
Response CollingwoodSouth
GranvilleWest
BroadwayCommercial
DriveMarpole Hastings
Appreciation for Doing Study
2 2 3
Willing to be Contacted for
Further Discussion
1 2
Comment on High Taxes and
Rent1 2 1 2
Plea to Save Neighborhood/
Listen to Merchants
2 3
Encouraging Study
Team/City to Talk Directly to
Merchants
1 2
Suggesting Increased Pedestrian Facilities
1 2
Feedback for Community Engagement
Session
1
Other 1 2
Total 0 3 9 10 4 5
Other comment details:
West Broadway
• Street patrol
Commercial Drive
• Go sit and watch government employees sitting around collecting their
paycheck
• Some questions are impossible to answer.ie the ones dealing % of. It
requires pulling out records which I lack the time to do in order to
answering correctly.

APPENDIX G – SURVEY OF LANDLORDS AND BROKERS

APPENDIX G: SURVEY OF LANDLORDS AND BROKERS
6: How many years have you been leasing in this BIA?
Number of Years
CollingwoodSouth
GranvilleCommercial
DriveWest
BroadwayMarpole Hastings
0 to 9 0 0 2 2 0 0
10 to 19 0 0 1 0 1 0
20 to 29 1 1 1 1 1 0
30 to 39 2 1 0 0 0 1
40 to 49 0 1 0 0 0 0
50 to 59 0 0 1 0 0 1
60 to 69 0 0 0 0 0 0
70 to 79 0 0 0 0 0 0
80 to 89 0 0 0 0 0 0
90 to 99 0 0 0 0 0 0
100 or more 0 0 1 1 0 0
Total 3 3 6 4 2 2
8A: How many Retail / Commercial properties do you lease in this BIA?
Number of Properties
CollingwoodSouth
GranvilleWest
BroadwayCommercial
DriveMarpole Hastings
1 3 1 4
2 1 1
5 1 1
6 1 1
20
Total 1 3 3 4 2 1

APPENDIX G: SURVEY OF LANDLORDS AND BROKERS
8C: What is the leasable square footage of your Retail / Commercial properties
in this BIA?
Leaseable Squarefootage
CollingwoodSouth
GranvilleWest
BroadwayCommercial
DriveMarpole Hastings
0 to 2499 0 1 1 0 0 0
2500 to 4999 0 1 1 2 0 0
5000 to 7499 1 0 0 1 1 0
7500 to 9999 0 0 0 0 0 0
10000 or more 1 3 3 4 1 1
Total 2 5 5 7 2 1
8B: How many tenants do your Retail / Commercial properties have in this BIA?
Number of Tenants
CollingwoodSouth
GranvilleWest
BroadwayCommercial
DriveMarpole Hastings
0 to 4 0 1 3 3 1 0
5 to 9 1 0 0 0 1 1
10 to 14 0 2 0 0 0 0
15 to 19 0 0 0 0 0 0
20 or more 0 0 0 1 0 0
Total 1 3 3 4 2 1

APPENDIX G: SURVEY OF LANDLORDS AND BROKERS
9A: Please rate and share how you perceive labour issues (employing staff) as a
challenge to your business’s viability?
Rating CollingwoodSouth
GranvilleWest
BroadwayCommercial
DriveMarpole Hastings
1 (Not Significant)
1 1 1 1
2 1 1
3 1
4 1 1
5 (Extremely Significant)
2 1
Total 0 3 3 3 1 2
Rating CollingwoodSouth
GranvilleWest
BroadwayCommercial
DriveMarpole Hastings
1 (Not Significant)
2 2 1
2 1
3 1
4 1
5 (Extremely Significant)
1 1
Total 0 3 1 2 2 2
9B: Please rate and share how you perceive acquiring finance / cash flow as a
challenge to your business’s viability?
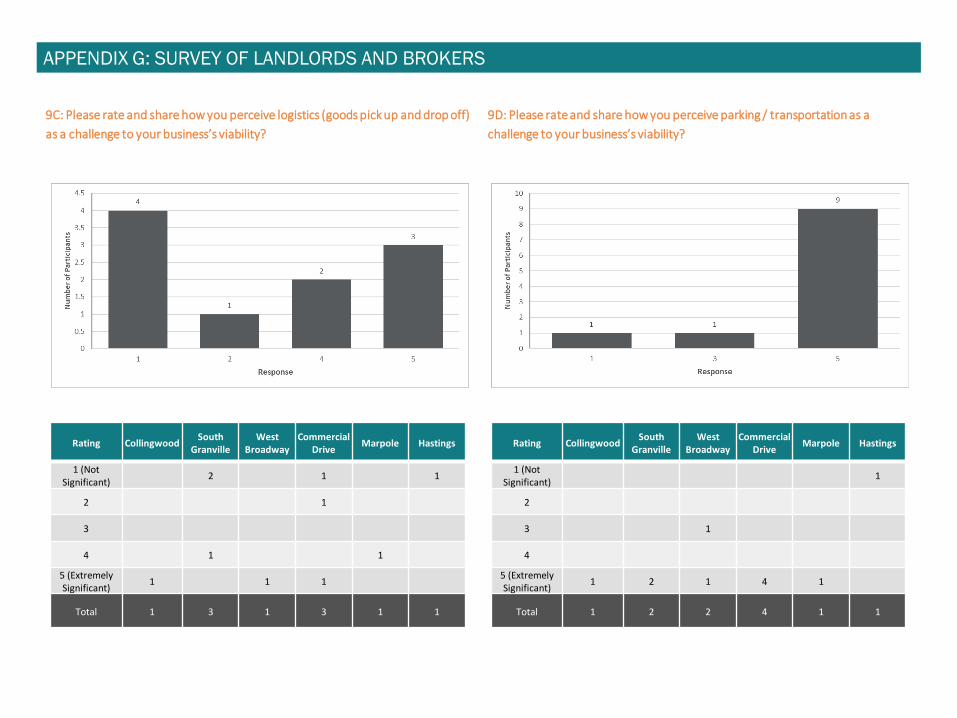
APPENDIX G: SURVEY OF LANDLORDS AND BROKERS
9C: Please rate and share how you perceive logistics (goods pick up and drop off)
as a challenge to your business’s viability?
9D: Please rate and share how you perceive parking / transportation as a
challenge to your business’s viability?
Rating CollingwoodSouth
GranvilleWest
BroadwayCommercial
DriveMarpole Hastings
1 (Not Significant)
2 1 1
2 1
3
4 1 1
5 (Extremely Significant)
1 1 1
Total 1 3 1 3 1 1
Rating CollingwoodSouth
GranvilleWest
BroadwayCommercial
DriveMarpole Hastings
1 (Not Significant)
1
2
3 1
4
5 (Extremely Significant)
1 2 1 4 1
Total 1 2 2 4 1 1

APPENDIX G: SURVEY OF LANDLORDS AND BROKERS
9E: Please rate and share how you perceive marketing as a challenge to your
business’s viability?
Rating CollingwoodSouth
GranvilleWest
BroadwayCommercial
DriveMarpole Hastings
1 (Not Significant)
2 1
2 1 1
3
4 1
5 (Extremely Significant)
1 1 1
Total 0 3 1 2 1 2
Rating CollingwoodSouth
GranvilleWest
BroadwayCommercial
DriveMarpole Hastings
1 (Not Significant)
2 1
2
3 1
4
5 (Extremely Significant)
1 2 2 1
Total 0 3 3 3 1
9F: Please rate and share how you perceive regulations as a challenge to your
business’s viability?

APPENDIX G: SURVEY OF LANDLORDS AND BROKERS
9G: Please rate and share how you perceive city permit processing as a
challenge to your business’s viability?
9H: Please rate and share how you perceive ability to expand as a challenge to
your business’s viability?
Rating CollingwoodSouth
GranvilleWest
BroadwayCommercial
DriveMarpole Hastings
1 (Not Significant)
1 1
2
3
4 1 1 1 1
5 (Extremely Significant)
1 1 2 2 1
Total 1 3 4 2 2 1
Rating CollingwoodSouth
GranvilleWest
BroadwayCommercial
DriveMarpole Hastings
1 (Not Significant)
2 1
2 1
3
4 1
5 (Extremely Significant)
1 1 1
Total 0 2 2 1 2 1

APPENDIX G: SURVEY OF LANDLORDS AND BROKERS
9I: Please rate and share how you perceive overhead costs as a challenge to
your business’s viability?
Rating CollingwoodSouth
GranvilleWest
BroadwayCommercial
DriveMarpole Hastings
1 (Not Significant)
2 1
2
3
4 1 2
5 (Extremely Significant)
2 1 3 2 1
Total 2 3 4 3 1 2
Rating CollingwoodSouth
GranvilleWest
BroadwayCommercial
DriveMarpole Hastings
1 (Not Significant)
1 1
2
3
4 1
5 (Extremely Significant)
2 2 2 3 2 1
Total 2 3 3 3 2 2
9J: Please rate and share how you perceive property taxes as a challenge to your
business’s viability?

APPENDIX G: SURVEY OF LANDLORDS AND BROKERS
9K: Please rate and share how you perceive rent as a challenge to your
business’s viability?
9L: Please rate and share what you perceive as challenges to your business
viability.
Rating CollingwoodSouth
GranvilleWest
BroadwayCommercial
DriveMarpole Hastings
1 (Not Significant)
1 1
2 1
3
4 1 2
5 (Extremely Significant)
2 1 2 1
Total 2 3 3 1 1 2
RatingStreet Appeal /
Building Maintenance
Lane Access
City Processes (business licenses,
zoning/density)
Expensive Utilities
Security/Crime
High Taxes/Lack of Support
for Business Owners
1 (Not Significant)
1 2
2
3
4
5 (Extremely Significant)
1 2 2 2 2 2
Total 2 2 2 2 4 2

APPENDIX G: SURVEY OF LANDLORDS AND BROKERS
10: Are there City Permitting practices that impact the viability of your Retail /
Commercial properties?
Response CollingwoodSouth
GranvilleWest
BroadwayCommercial
DriveMarpole Hastings
Lane Access 2
Slow Permitting Process
2 1
Costly Permitting
Process1
Generally Difficult
Permitting Process
1 1
Parking Bylaws 1
Other 1
Total 2 0 2 4 0 2

APPENDIX G: SURVEY OF LANDLORDS AND BROKERS
11A: Does the quality or management of any of these impact the viability of your
Retail / Commercial properties?
Response CollingwoodSouth
GranvilleWest
BroadwayCommercial
DriveMarpole Hastings
Parking 2 1 1 2 1 1
Transit 1 1 1
Sidewalks 1 2 3
Loading 2 1 1
Streets 1 2 3 1
Lane Access 1
Total 2 5 8 10 3 1
11B: Neighbourhood Details
South Granville• we are a retail storefront and need a neat, tidy, safe and easy to
access area with lots of parking
• No after 3 parking on west side
West Broadway• Sky train will help bring more prospective employees to the area
• And street with closing businesses has no traffic
• There is no sidewalk on Collingwood between W10th and W
Broadway. Extra parking along this corridor is a great help
Marpole• Parking is a big issue in the Marpole Area. Patrons park illegally in spots
that are not designated. Marpole should build a free parking lot, same as Kerrisdale so patrons can park in the area. This will cause less frustrations to the tenants and landlords do not need to issue parking tickets. Free parking can also promote patrons to do more shopping in the area.
Hastings• The parking meters are an inconvenience to customers who must then use
side streets for parking or use the parking lot that is further away from Hastings and Nanaimo which is a challenge for older, disabled, or parents with young children. Paying for parking is just another added expense for people who may be on limited budgets.

APPENDIX G: SURVEY OF LANDLORDS AND BROKERS
12: Are there City Policies that impact the viability of your properties? Please
provide details.
South Granville• Too much focus on bicycles
West Broadway• Yes archaic parking law and buildable height restrictions
• Business Signage limitations, advertisement limitations
• There is a structure at 3474 W Broadway that needs to be updated or
developed. It is a eye sore on W. Broadway and at the back.• Property taxation on phantom density is a major issue for the viability of
our retail tenant's businesses in single level retail buildings
Commercial Drive• The city doesn’t care about our neighborhood, Grandview Park, garbage,
cleanliness of the alleyways
13: Please assist by providing us with your Historical Lease Rates (Base Rate /sf
Net Floor Area) for properties in this BIA
Basic Rent 2011 2015 2019
$0 to $19 4 3 1
$20 to $29 4 5 5
$30 to $39 3 3 5
$40 to $49 0 1 2
$50 or more 1 1 0

APPENDIX G: SURVEY OF LANDLORDS AND BROKERS
14A: Describe how your retail commercial lease rate has changed over the past
2 years?
Rating CollingwoodSouth
GranvilleWest
BroadwayCommercial
DriveMarpole Hastings
Increased a Lot 1
Increased a Little
1 2 2 1
Stayed Same 2 1 2 1
Decreased a little
1
Decreased a lot
Don’t Know 1
Total 2 2 4 3 2 2
Rating CollingwoodSouth
GranvilleWest
BroadwayCommercial
DriveMarpole Hastings
Increased a Lot 1 2
Increased a Little
2 1 1 2 2
Stayed Same
Decreased a little
1 1
Decreased a lot
Don’t Know 1
Total 2 2 3 3 2 2
14B: Describe how your retail commercial lease rate has changed over the past
5 years?

Rating CollingwoodSouth
GranvilleWest
BroadwayCommercial
DriveMarpole Hastings
Increased a Lot 1
Increased a Little
1 2
Stayed Same 2 2 1
Decreased a little
Decreased a lot 1
Don’t Know 1 1 1
N/A 1
Total 2 2 3 3 2 2
APPENDIX G: SURVEY OF LANDLORDS AND BROKERS
15A: Describe how your retail commercial leasing vacancy has changed over the
past 2 years?
14C: Describe how your retail commercial lease rate has changed over the past
10 years?
Rating CollingwoodSouth
GranvilleWest
BroadwayCommercial
DriveMarpole Hastings
Increased a Lot 1 2
Increased a Little
2 1 1 2 2
Stayed Same 1 1
Decreased a little
Decreased a lot
Don’t Know 1
Total 2 2 3 3 2 2

APPENDIX G: SURVEY OF LANDLORDS AND BROKERS
15B: Describe how your retail commercial leasing vacancy has changed over the
past 5 years?
Rating CollingwoodSouth
GranvilleWest
BroadwayCommercial
DriveMarpole Hastings
Increased a Lot
Increased a Little
1 2 1
Stayed Same 1 1 2 1
Decreased a little
Decreased a lot
Don’t Know 1 1 1
N/A 1
Total 1 2 3 3 2 2
15C: Describe how your retail commercial leasing vacancy has changed over the
past 10 years?
Rating CollingwoodSouth
GranvilleWest
BroadwayCommercial
DriveMarpole Hastings
Increased a Lot 1
Increased a Little
3
Stayed Same 2 1
Decreased a little
1
Decreased a lot
Don’t Know 1 1 1
N/A 1
Total 1 1 3 3 2 2

APPENDIX G: SURVEY OF LANDLORDS AND BROKERS
16A: Describe how your operating expenses have changed over the past 2
years?
Rating CollingwoodSouth
GranvilleWest
BroadwayCommercial
DriveMarpole Hastings
Increased a Lot 2 1 4 2 2 2
Increased a Little
1
Stayed Same
Decreased a little
Decreased a lot
Don’t Know 1
N/A
Total 2 2 4 3 2 2
Rating CollingwoodSouth
GranvilleWest
BroadwayCommercial
DriveMarpole Hastings
Increased a Lot 2 4 2 1 2
Increased a Little
2 1
Stayed Same
Decreased a little
Decreased a lot
Don’t Know 1
N/A
Total 2 2 4 3 2 2
16B: Describe how your operating expenses have changed over the past 5
years?

APPENDIX G: SURVEY OF LANDLORDS AND BROKERS
16C: Describe how your operating expenses have changed over the past 10
years?
Rating CollingwoodSouth
GranvilleWest
BroadwayCommercial
DriveMarpole Hastings
Increased a Lot
Increased a Little
1
Stayed Same 1
Decreased a little
1 1
Decreased a lot 2 1 1
Don’t Know 1 1 2 1
N/A
Total 1 2 4 3 2 1
17A: Describe your understanding of how the profitability of your Retail /
Commercial tenants has changed over the past 2 years?
Rating CollingwoodSouth
GranvilleWest
BroadwayCommercial
DriveMarpole Hastings
Increased a Lot 3 2 2
Increased a Little
1 2 2
Stayed Same
Decreased a little
Decreased a lot
Don’t Know 1
N/A
Total 1 2 3 3 2 2

APPENDIX G: SURVEY OF LANDLORDS AND BROKERS
17C: Describe your understanding of how the profitability of your Retail /
Commercial tenants has changed over the past 10 years?
Rating CollingwoodSouth
GranvilleWest
BroadwayCommercial
DriveMarpole Hastings
Increased a Lot
Increased a Little
1 1 1
Stayed Same 1
Decreased a little
1 1
Decreased a lot 1 1
Don’t Know 1 1 2 1
N/A
Total 1 2 3 3 2 2
17B: Describe your understanding of how the profitability of your Retail /
Commercial tenants has changed over the past 5 years?
Rating CollingwoodSouth
GranvilleWest
BroadwayCommercial
DriveMarpole Hastings
Increased a Lot
Increased a Little
1
Stayed Same 1 1
Decreased a little
1 2
Decreased a lot 2 1
Don’t Know 1 2 1
N/A
Total 0 2 4 3 2 2

APPENDIX G: SURVEY OF LANDLORDS AND BROKERS
18: My long term outlook for retail/commercial uses in the BIA is:
Rating CollingwoodSouth
GranvilleWest
BroadwayCommercial
DriveMarpole Hastings
Improving 1 1
Remaining the same
1 1 1 1 1 1
Deteriorating 1 1 3 2
Total 2 2 4 3 2 2
19: Within the next 5 years, my retail / commercial leasing business in the BIA
will:
Rating CollingwoodSouth
GranvilleWest
BroadwayCommercial
DriveMarpole Hastings
Expand 1
Stay the Same 2 1 1 2 2 1
Contract 1 2
Total 2 2 3 2 2 2

APPENDIX G: SURVEY OF LANDLORDS AND BROKERS
21: What is NOT WORKING to support Retail / Commercial uses in this BIA?
Response CollingwoodSouth
GranvilleWest
BroadwayCommercial
DriveMarpole Hastings
Maintaining low lease rates
1
Lack of City Support for
Small Businesses
1 1
Lack of Street Appeal
Response1
High Property Taxes
1 1
Other 1
Total 1 0 2 2 1 1
20: What is WORKING to support Retail / Commercial uses in this BIA?
Response CollingwoodSouth
GranvilleWest
BroadwayCommercial
DriveMarpole Hastings
BIA Work 1 1 1
Good Business Practices or
Choices2 1
Suggestion to Reduce
Property Taxes1 1
Other 1
Total 2 0 2 2 1 2

APPENDIX G: SURVEY OF LANDLORDS AND BROKERS
22: What is MISSING to support Retail / Commercial uses in the BIA?
Response CollingwoodSouth
GranvilleWest
BroadwayCommercial
DriveMarpole Hastings
Lower Property Taxes
1 1
Zoning and Parking Bylaw
Changes2
Improved Street Appeal/Attractio
ns1 1
Expressing General
Dissatisfaction with City
2
Improved Business
Permitting Process
1
Total 2 0 3 2 1 1
23: Do you have any comments or suggestions for the study team?
West Broadway• Dear both, I am not sure what is the purpose of this survey, please send
our voice to legislations. Our expenses is very high. There is no staff to be and minimum wage is $30 for a dental receptionists due to lack of affordable housings. Thanks.
Commercial Drive• Either listen to the resident of the city or stop wasting the taxpayers
money.• Remember who you work for. If you are employed by the city ask yourself
who you work for? If you don't have the right answer, of which there is only one, then you should resign or be fired.
Hastings• Thank you!


