Embed Size (px)
Citation preview

(August 27, 2007)
RETURN MIGRANT STATUS AND EMPLOYMENT:
FINDINGS FROM LONGITUDINAL POPULATION REGISTER DATA*
Jan Saarela** & Fjalar Finnäs***
Abstract. Return migration is very common an event and has therefore emerged as a critical
element of many governments’ migration policy. A comprehensive picture of return migrants’
employment situation is still missing, however. The fundamental reason is that, in most
countries there are no population registers that allow researchers to distinguish people who
have lived abroad. This paper attempts to fill this gap of knowledge by using longitudinal
population register data from Finland. We find that Finnish return migrants, both men and
women, have odds of employment that are only about half those of non-migrants, even when
factors such as age, education, mother tongue and place of residence are accounted for. Also
within higher-educated people, return migrants are in a worse employment position than
observably similar non-migrants. Employment opportunities tend to deteriorate with
migration duration and improve with time subsequent to return migration. This suggests that
there could be an effect of lost contact with the home country labour market when being
abroad, which may override any premium that accrues through human capital of foreign work
experience or other practices gained abroad. Also return migrants with short stays abroad and
long periods at home are in a poor relative position, however. Our findings therefore illustrate
that the return migrants are highly selected with regard to some latent personal characteristics
with severe negative effects on the job finding probability, and that this non-negligible group
in the labour market should be given more policy attention.
Keywords: Return migrants, Employment, Duration, Register data, Finland
* Comments from anonymous persons are gratefully acknowledged. ** Corresponding author. Åbo Akademi University, PO Box 311, FIN-65100 Vasa, Finland. Phone +358-6-3247476, fax, +358-6-3247457, e-mail [email protected] *** Åbo Akademi University, Finland
1

RETURN MIGRANT STATUS AND EMPLOYMENT:
FINDINGS FROM LONGITUDINAL POPULATION REGISTER DATA
1. Introduction
Contemporary migration has a strong temporary element. Approximate numbers for the
United States say that at least 20 per cent of all legal immigrants subsequently return migrate,
and for many European countries the proportion is even larger (Dustmann, 1996; Constant
and Massey, 2003). Finland, which is the country under study here, is no exception in this
context. Over 50 per cent of the more than 0.5 million Finns who have moved abroad since
the 1950s, mainly in the direction of Sweden, have also returned home (Figure 1). This
implies that at least every twentieth person in the country’s current population has lived
abroad, and over three quarters of these return migrants had been in Sweden.
(Figure 1 here)
The lion’s share of all migration to Finland has consequently been undertaken by Finns
who return to their home country from Sweden (Institute of Migration, 2006; Statistics
Finland, 2006a). Sweden attracted Finnish migrants primarily due to the need for labour in the
industry. From an international perspective, circumstances that promoted migration between
the two countries highly correspond with those influencing migration between Puerto Rico
and the United States (cf. Ramos, 1992; Rooth and Saarela, 2007). Finland and Sweden have
many institutional similarities and a common history until 1809. Since 1954 there has also
been free mobility of labour. Sweden’s highly dominant position as source country for
Finnish migrants was partly lost in the beginning of the 1990s, as Finland became member of
the European Union. Since then there has also been an increased inflow of asylum seekers to
Finland.
2

In recent decades, return migration has emerged as a critical element of many
governments’ migration policy (IOM, 2006). A comprehensive picture of the situation of this
large group of people is still missing, however, because in most countries there are no
population registers that allow researchers to distinguish people who have lived abroad (in
any other way than by undertaking surveys).
The present paper attempts to fill this gap of knowledge by using Finnish data. Finland has
a population register that covers the total population, in which each person can be observed in
concurrent censuses. All information is based on existing population files, so there are no
missing observations and no individual recall bias. The population files can be linked to other
existing registers, such as those containing labour force statistics. In this paper, we make use
of this possibility in order to compare return migrants and non-migrants with regard to
employment levels. A person who is employed subsequent to having return migrated is
considered to be successfully reintegrated in the home country, similar to the common way of
treating employed immigrants in any given host country as successfully integrated (Arowolo,
2000; OECD, 2001).
Previous analyses that use census data for studying return migrants’ relative employment
opportunities are consequently very scarce. The contribution that comes closest to ours in
spirit is a study by Muschkin (1993), which was based on data from the 1970 and 1980
population censuses of Puerto Rico. Unlike ours, however, the censuses were not linked, so it
was not possible to observe the same individuals over time. Sample sizes were also small or
in total less than 5,000 persons, of which less than 20 per cent were categorised as return
migrants.
Besides the census data used here, which cover the total population in certain birth cohorts
at the end of every fifth year from 1970 until 1995, complementary data that contain annual
information for the time period 1987-1999 are also analysed. That data set is also based on the
3

population register. Due to confidentiality reasons it is in the form of a random sample. Data
from the censuses consequently give a comprehensive picture for a long period of time,
whereas the annual data facilitate more detailed analyses for shorter periods of time, focusing
on duration abroad and time spent at home subsequent to return migration. We have no
explicit information about the country from which the migrants had returned, but since we are
primarily concerned with the period prior to the mid-1990s, return migrants as discussed here
should be understood as Finns who have return migrated from Sweden.
Muschkin (1993) found that Puerto Ricans who had returned to their home country from
the United States had notably lower adjusted employment rates than non-migrants. The results
were explained by the changing context in which the return migrants were seeking
employment, which was argued to override any potential gain that may accrue through the
migration process, i.e. any premium due to human capital of foreign work experience and
other practices gained abroad. Lost contact with the home country labour market
consequently seemed to have made the return migrants particularly vulnerable to
discontinuities in employment.
In case low relative employment rates of return migrants are due to lost contact, we believe
that they should manifest in two ways. First, if network ties to the home country labour
market weaken abroad, one might expect a negative impact of time spent abroad on
employment opportunities when having returned. The results of Muschkin provided some
support for this argumentation. Second, there should be a “catching-up effect”. This means
that any gap in employment rates of return migrants as compared with non-migrants decrease
with time spent in the home country, as the return migrants become increasingly more
reintegrated. This argumentation is in line with the traditional view of how migrants who
enter a new destination perform in the labour market (Chiswick, 1978; Lichter, 1983;
Maxwell, 1988; Borjas et al., 1992).
4

There are strong reasons to expect that return migrants in the Finnish labour market have
lower employment rates than non-migrants. Migration rates from Finland, and return
migration rates from Sweden, have been found higher among non-employed than among
employed persons (Finnäs, 2003; Saarela and Finnäs, 2006). This may partly be due to
inadequate skills, as Finnish migrants in general have relatively low educational levels
(Finnäs, 2003; Rooth and Saarela, 2007). Recent findings still say that the migrants’
employment probabilities correlate heavily across countries and time (Saarela and Finnäs,
2007). Some other, unobservable, factors might therefore also be important.
No previous study has been explicitly concerned with how Finnish migrants succeed in
finding employment subsequent to having return migrated. That is the issue under analysis
here. In particular, we aim at exploring how any failures in this context as compared with
non-migrants interrelate with structural confounders such as educational levels, and with time
spent abroad and time spent in the home country subsequent to having return migrated.
2. Data and settings for analysis
The census data come from the Finnish longitudinal census data file compiled by Statistics
Finland. They consist of linked individual information from the censuses at the end of the
years 1970, 1975, 1980, 1985, 1990 and 1995 (Statistics Finland, 2006b). Data take the form
of a multidimensional matrix that includes all individuals and information about their year of
birth, sex, educational level, mother tongue, region of residence and employment status.
The observation plan is illustrated by the Lexis diagram in Figure 2. Under analysis are
people born 1951-1970, subject to that they were living in Finland at ages 15-19 years. These
are persons who can be assumed to have made their own migration decision (not governed by
the parents). To include somewhat higher ages into the analysis, people aged 20-34 years in
1970 (i.e. born 1936-1950) are also studied, subject to that they were living in Finland at the
5

time of the 1970 census. Some of them may have been abroad before that census, but they
were born in Finland. Given these conditions, we define return migrants as people who were
living abroad at one or more of the subsequent censuses, and had returned to Finland by the
1995 census at the latest. Consider for instance people born 1951-1955, i.e. those aged 15-19
years in 1970 and living in Finland at that time. In this birth cohort, a person defined as a
return migrant had emigrated abroad by the 1975, 1980, 1985 or 1990 census, and had stayed
abroad for any number of subsequent censuses until being observed again in Finland (in the
1995 census at the latest).
(Figure 2 here)
For all birth cohorts under study, the number of return migrants is given in Table 1
according to which census(es) the return migrants had been abroad and the number of census
they thereafter are observed at home. The illustration is for men and women separately. For
simplicity sake, we consistently focus on the first return migration. Repeated migrants and
people who die are consequently treated as right-censored observations at the time they
cannot be observed in a census. This is the reason to why the number of return migrants, for
any given census abroad, diminishes over censuses subsequent to return migration. The large
number of return migrants who had been abroad at the time of the 1980 census
(approximately three times as many as at the time of any of the other three censuses) is due to
the large migration flows from Finland to Sweden in the late 1970s and from Sweden to
Finland in the early 1980s (cf. Figure 1). The right-most column for each sex refers to the
number of non-migrants in the same birth cohorts. Non-migrants are defined as persons who
were living in Finland at the time of all of the censuses, so the number of people in this group
is constant over time (i.e., over censuses after the migrants had returned). In total, we observe
40,304 return migrants and 2,394,181 non-migrants.
(Table 1 here)
6

The taxonomy of the data means that all persons categorised as return migrants with
certainty had been living abroad. Within the group of non-migrants, there are persons who
also have been living abroad (approximately five per cent of all in the non-migrant category).
These people have both migrated and return migrated between two consecutive censuses, and
had thus stayed abroad for a maximum of five years.
Return migration rates to Finland tend to be very high during the first few years after
migration, so that almost every second migrant returns within three years (Finnäs, 2003). In
correspondence with these earlier findings, approximations undertaken here say that persons
classified as return migrants in the census data amount to one quarter of all return migrants.
Analyses of the census data are therefore by definition concerned with return migrants with
relatively long stays abroad, and thus probably exclude many persons with planned return
migration intentions.
The annual complementary data is an extract from Statistics Finland’s longitudinal
population register file Työssäkäyntitilasto (Statistics Finland, 2006c). It is very similar in
nature to, and partly based on, the census file described above. In contrast with the census
data, it gives all information on a yearly basis for the years 1987 to 1999, so it is possible to
undertake more detailed analyses, albeit for fewer individuals and somewhat shorter periods
of time. The extract consists of a random sample, comprising 5 per cent of all Finnish
speakers and 20 per cent of all Swedish speakers. It focuses on the Southern and Western
parts of Finland, which cover a fourth of the total population of the country. For each
individual and year, there is information about whether the person was living in the country,
was living abroad, or had died. In addition to year of birth, sex and mother tongue, variables
that measure each person’s level and field of education, municipality of residence, and
employment status at the end of each year are also included. Since the data are annual we
7

observe all return migrants who had stayed abroad over the turn of the year, and can thus
measure time abroad and time in the home country with reasonably good accuracy.
The observation plan for these annual data corresponds highly with that used for analysing
the census data. Under study are people born 1973-1982, subject to that they were living in
Finland at 15 years of age. Also included are persons born 1940-1972 (i.e. aged 16-48 years
in 1987), if they were living in Finland at end-1987. Return migrants are defined as persons
who were living abroad at one or more of the years subsequent to having been observed in
Finland, and had returned to Finland by end-1999 at the latest. They amount to 1,238
individuals. Non-migrants are defined as persons in the same birth cohorts, who had been
living in Finland at the end of all of the years 1987 to 1999. They amount to 88,564
individuals.
3. Results
3.1 Relative employment of return migrants
Analyses of the census data clearly revealed that, in line with the findings of Muschkin, return
migrants have notably lower employment levels than non-migrants. This is illustrated in
Table 2, which give aggregate employment rates of return migrants by the specific census(es)
the persons were abroad and the subsequent census(es) after having return migrated.
Employment rates of non-migrants in the same birth cohorts are also provided.
(Table 2 here)
To improve readability, these numbers were transformed into relative differences in
employment levels between return migrants and non-migrants, in terms of odds ratios (Table
3). For instance, in 1980 male return migrants had an employment rate of 65.2 per cent,
whereas the corresponding number for non-migrants was 88.6 per cent. This corresponds to
8

an odds ratio of 0.241 [(0.652/(1-0.652)]/[0.886/(1-0.886)], which says that return migrants
had 76 per cent lower odds of being employed than non-migrants.
(Table 3 here)
For this specific migrant group, the odds ratio gradually increased with time spent in
Finland, to 0.298 in 1985, 0.382 in 1990 and 0.494 in 1995. A similar pattern applies to
people who had been living abroad at other censuses, and to women. Hence as suggested by
the argumentation of lost contact, relative outcomes of return migrants tend to improve with
time spent in the home country, but they remain poorer than those of non-migrants.
There is also some evidence for an inverse relationship between migration duration and
reintegration opportunities. As compared with male non-migrants in 1995, the odds ratio for
employment of men who return migrated during the early 1990s was 0.361 for those with
only one census abroad, 0.220 for those with two censuses abroad, 0.229 for those with three
censuses abroad, and 0.147 for those with all four censuses abroad. A similar negative
association cannot be observed in the other censuses, however. For women there is still a
quite clear level difference, specifically when return migrants with only one census abroad are
compared with those with more than one census abroad.
3.2 The role of structural factors
To account for characteristics differences between return migrants and non-migrants, we
estimated logistic regression models that include age, educational level, mother tongue and
region of residence. Results of these estimations are in Table 3 included as odds ratios within
parentheses, in par with the unadjusted odds ratios outside parentheses. The above conclusion
largely remains. The employment differential cannot evidently be attributed to structural
factors, because in very many instances it even becomes more pronounced when these
variables are accounted for. In spite that Swedish-speaking Finns have higher migration rates
9

and lower return migration rates than Finnish-speaking Finns (Finnäs, 1986; 2003), patterns
for the estimated parameters turned out to be very similar across language groups (not
shown). Mother tongue was therefore here included to account for a level difference in
employment rates that generally is in favour of the Swedish-speaking Finns (Saarela and
Finnäs, 2003).
The data further showed that people who return migrated during economic recessions have
poorer relative performance than those who return migrated during economic upswings,
probably because job competition is then stronger and contacts with the home country labour
market more important for employment opportunities. Between 1976 and 1978,
unemployment rates in Finland tripled from two and a half to over seven per cent, but by the
end of 1980 they had fallen back to just below five per cent. In correspondence, and as
illustrated in the table, the employment rates of male non-migrants in 1980 were almost 90
per cent. Return migrants were much more vulnerable to changes in the economic
environment, as men who return migrated during the second part of the 1970s had an
employment rate in 1980 that was only 65 per cent. A similar pattern can be observed for
women, and for people who return migrated in the early 1990s when overall unemployment
rates in Finland increased from below seven to over 15 per cent. The best relative
performance can be found for people who return migrated when unemployment rates were
low in the 1980s.
Employment opportunities of higher-educated return migrants were substantially better
than those of lower-educated ones, but still worse than those of higher-educated non-migrants.
Male non-migrants with basic education had an employment rate of 59.7 per cent in 1995,
those with vocational education 73.5 per cent, and those with undergraduate or higher
education 87.2 per cent. Corresponding numbers for male return migrants who had been only
the 1990 census abroad, say, were 27.4, 48.9 and 81.8 per cent, respectively (not shown in
10

table). To study if there is variation in the rate of improvement over time across educational
levels, we estimated separate regressions for people with (1) basic education, (2) vocational
education, and (3) undergraduate or higher education. Heterogeneity in the return-migrant
group was reduced by focusing on people who had been only one census abroad. The results,
which are summarised in Table 4, reveal that not even highly-educated return migrants over
time manage to come close to employment levels of non-migrants. Behavioural variation
across differently educated return migrants does not consequently confound the earlier results.
(Table 4 here)
3.3 Migration duration and duration subsequent to return migration
The annual data make it possible to utilise fairly precise duration measures. Here we
categorised return migrants into subgroups according to the number of years they had spent
abroad, and according to the number of years they had spent in Finland subsequent to return
migration. Results of logistic regression models that estimated adjusted odds ratios for
employment of return migrants in relation to that of non-migrants are summarised in Figure 3
to Figure 6. The two former give, for men and women, respectively, odds ratios by time spent
at home and the two latter by time spent abroad. The nature of the data implies that
observations are fairly few, and confidence intervals consequently wide, for longer durations.
In the figures we therefore depict the situation only up to seven years at home and six years
abroad.
(Figure 3 here)
(Figure 4 here)
(Figure 5 here)
(Figure 6 here)
11
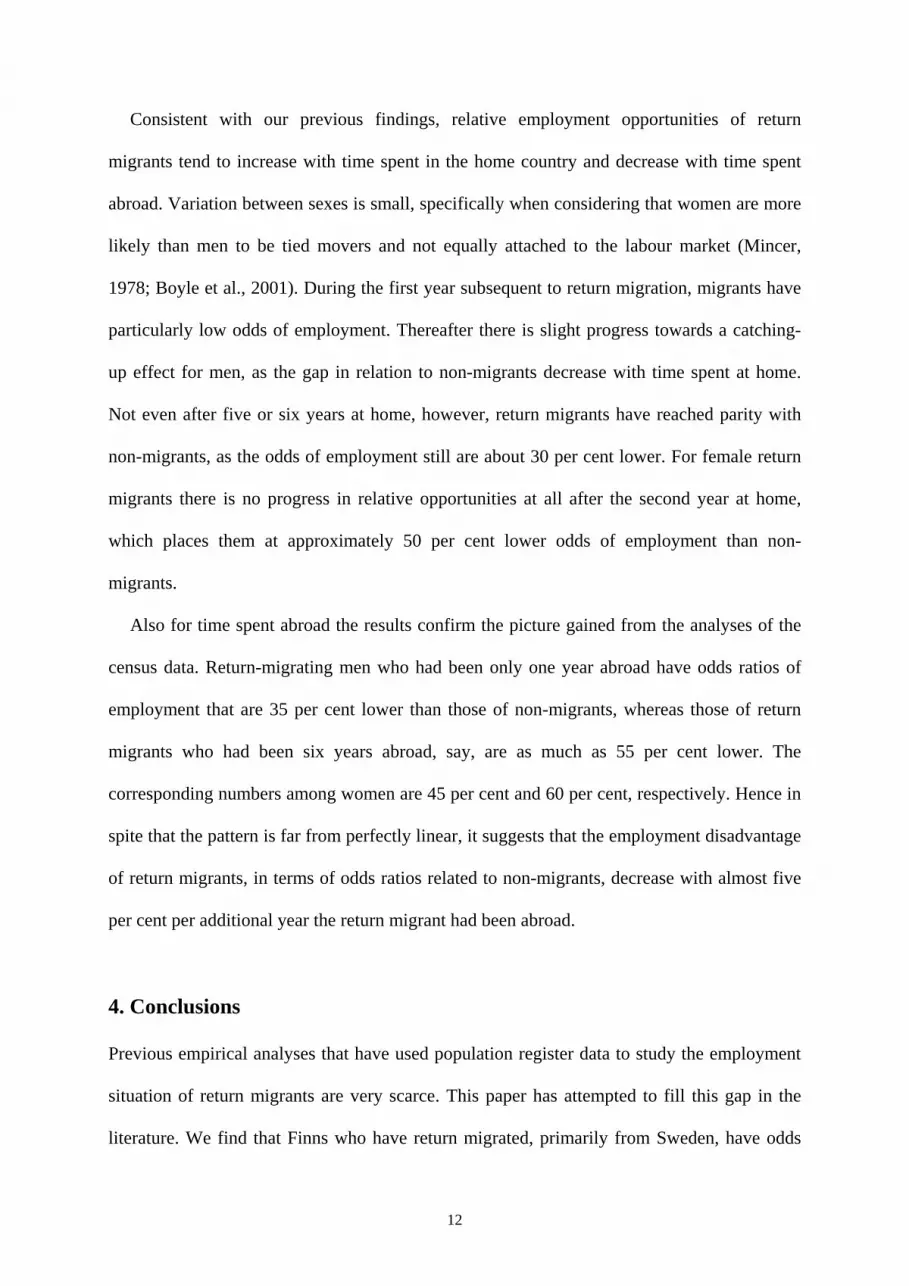
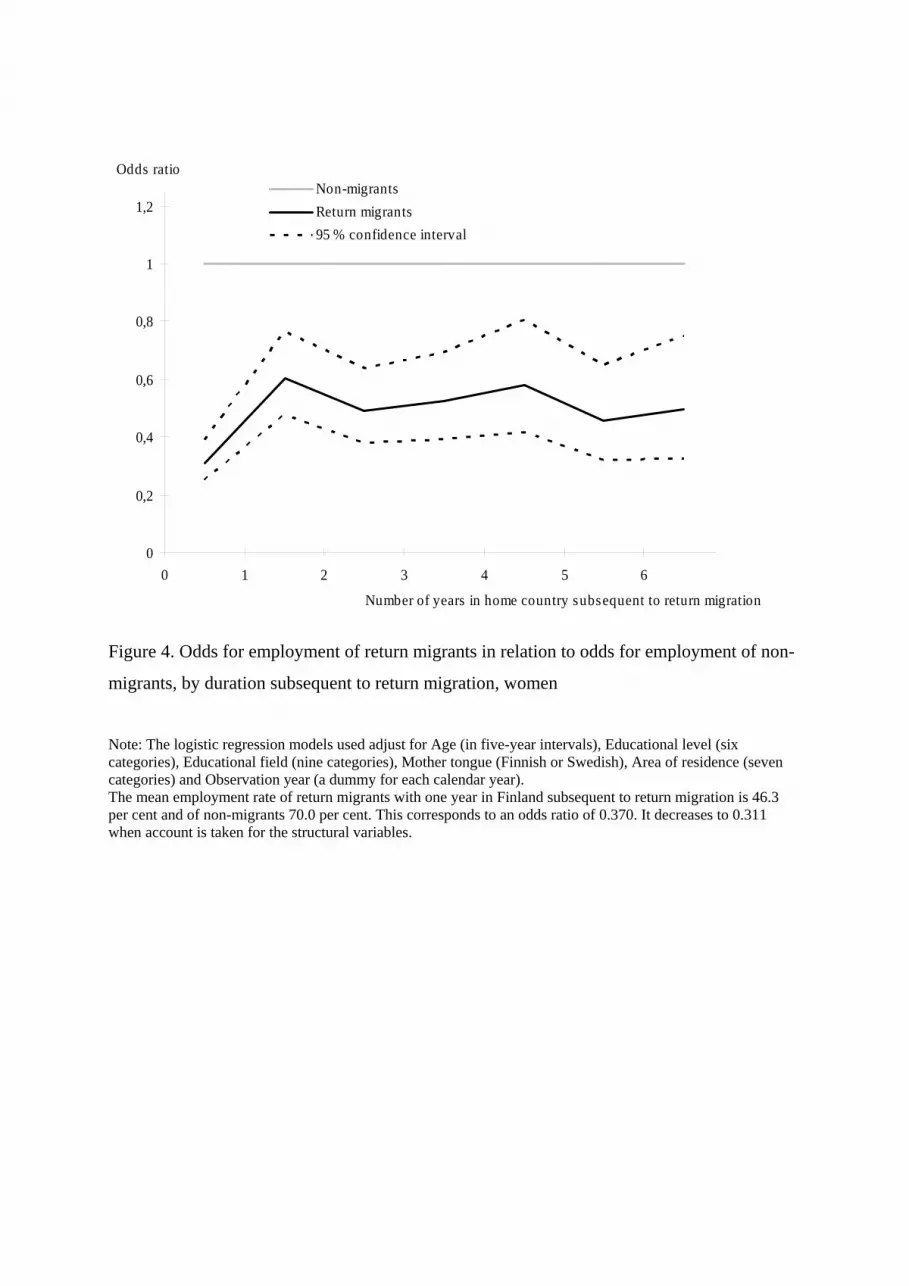
Consistent with our previous findings, relative employment opportunities of return
migrants tend to increase with time spent in the home country and decrease with time spent
abroad. Variation between sexes is small, specifically when considering that women are more
likely than men to be tied movers and not equally attached to the labour market (Mincer,
1978; Boyle et al., 2001). During the first year subsequent to return migration, migrants have
particularly low odds of employment. Thereafter there is slight progress towards a catching-
up effect for men, as the gap in relation to non-migrants decrease with time spent at home.
Not even after five or six years at home, however, return migrants have reached parity with
non-migrants, as the odds of employment still are about 30 per cent lower. For female return
migrants there is no progress in relative opportunities at all after the second year at home,
which places them at approximately 50 per cent lower odds of employment than non-
migrants.
Also for time spent abroad the results confirm the picture gained from the analyses of the
census data. Return-migrating men who had been only one year abroad have odds ratios of
employment that are 35 per cent lower than those of non-migrants, whereas those of return
migrants who had been six years abroad, say, are as much as 55 per cent lower. The
corresponding numbers among women are 45 per cent and 60 per cent, respectively. Hence in
spite that the pattern is far from perfectly linear, it suggests that the employment disadvantage
of return migrants, in terms of odds ratios related to non-migrants, decrease with almost five
per cent per additional year the return migrant had been abroad.
4. Conclusions
Previous empirical analyses that have used population register data to study the employment
situation of return migrants are very scarce. This paper has attempted to fill this gap in the
literature. We find that Finns who have return migrated, primarily from Sweden, have odds
12

ratios of employment that are only about half those of non-migrants. The overall pattern is
also very similar across sexes. The poor relative performance of return migrants cannot be
attributed to structural factors such as age, education, mother tongue, or place of residence,
and is very much in line with earlier findings for Puerto Rican return migrants. Even within
the group of highly educated Finns, return migrants are in a poorer position than non-
migrants.
Return migrants’ employment levels are further found to correlate negatively with duration
abroad and positively with time spent at home subsequent to return migration. This indicates
that lost contact with the home country when being abroad may have negative impact on
labour market opportunities when having returned home. This effect may potentially also
override any gain that accrues through the migration process in the form of human capital of
foreign work experience or other practices gained abroad.
There is a substantial employment gap in relation to non-migrants also for migrants with
short stays abroad and long stays at home, however. The difficulties of return migrants are
therefore obviously associated with some latent personal characteristics that we cannot
observe explicitly. Whatever these factors are, our findings clearly illustrate the complexity
involved when studying migrant populations, and that there are obvious reasons for
attempting to implement policies that facilitate the labour market situation of people who had
lived abroad.
Present results also highlight the well-known fact that migrants constitute a highly selected
group of the population (Borjas and Bratsberg, 1996; Rooth and Saarela, 2007). This is
specifically the case with return migrants, as they are the result of two selection processes:
one at migration and another at return migration. Explicit analyses of selection (cf. Co et al.,
2000; Barrett and O’Connell, 2001; Coulon and Piracha, 2005), which have been beyond the
scope of this paper, are essential for a more detailed understanding of the labour market
13

situation of return migrants. Future research in this area might therefore, tentatively, attempt
to make use of even more informative population register data than those we have had access
to here.
14

References
Arowolo, O. O. (2000). Return Migration and the Problem of Reintegration. International Migration, 38, 59-82. Barrett, A. & O’Connell, P. J. (2001). Is There a Wage Premium for Returning Irish Migrants? Economic and Social Review, 32, 1-21. Borjas, G. J. & Bratsberg, B. (1996). Who Leaves? The Outmigration of the Foreign-born. Review of Economics and Statistics, 78, 165-176. Borjas, G. J., Bronars, S. G. & Trejo, S. J. (1992). Self-selection and Internal Migration in the United States. Journal of Urban Economics, 32, 159-185. Boyle, P., Cooke, T. J., Halfacree, K. & Smith, D. (2001). A Cross-national Comparison of the Impact of Family Migration on Women’s Employment Status. Demography, 38, 201-213. Chiswick, B. (1978). The Effect of Americanization on the Earnings of Foreign-born Men. Journal of Political Economy, 86, 897-921. Co, C. Y., Gang, I. N. & Yun, M.-S. (2000). Returns to Returning. Journal of Population Economics, 13, 57-79. Constant, A. & Massey, D. (2003). Self-selection, Earnings, and Out-migration: A Longitudinal Study of Immigrants to Germany. Journal of Population Economics, 16, 631-653. Coulon, A. de & Piracha, M. (2005). Self-selection and the Performance of Return Migrants: The Source Country Perspective. Journal of Population Economics, 18, 779-807. Dustmann, C. (1996). Return Migration: The European Experience. Economic Policy, 22, 213-250. Finnäs, F. (1986). Den finlandssvenska befolkningsutvecklingen 1950-1980. En analys av en språkgrupps demografiska utveckling och effekten av blandäktenskap. Doctoral Dissertation, Åbo Akademi University, Finland. Finnäs, F. (2003). Migration and Return-migration among Swedish-speaking Finns. In Höglund, R., Jäntti, M. & Rosenqvist, G. (eds.), Statistics, Econometrics and Society: Essays in Honour of Leif Nordberg, Research Reports, No. 238. Statistics Finland, Helsinki, 41-54. Institute of Migration (2006). Tilastot. http://www.migrationinstitute.fi/db/stat/fin/ IOM (2006). Return Migration: Policies and Practices in Europe. International Organization for Migration, Geneva. Lichter, D. T. (1983). Socioeconomic Returns to Migration among Married Women. Social Forces, 62, 487-503.
15

Maxwell, N. L. (1988). Economic Returns to Migration: Marital Status and Gender Differences. Social Science Quarterly, 69, 108-121. Mincer, J. (1978). Family Migration Decisions. Journal of Political Economy, 86, 749-773. Muschkin, C. G. (1993). Consequences of Return Migrant Status for Employment in Puerto Rico. International Migration Review, 27, 79-102. OECD (2001). The Employment of Foreigners: Outlook and Issues in OECD Countries. In OECD Employment Outlook 2001. OECD, Paris, 167-206. Ramos, F. (1992). Out-migration and Return Migration of Puerto Ricans. In Borjas, G. & Freeman, R. (eds.), Immigration and the Work Force: Economic Consequences for the United States and Source Areas. University of Chicago Press, Chicago, 49-66. Rooth, D.-O. & Saarela, J. (2007). Selection in Migration and Return Migration: Evidence from Micro Data. Economics Letters, 94, 90-95. Saarela, J. & Finnäs, F. (2003). Unemployment and Native Language: The Finnish Case. Journal of Socio-Economics, 32, 59-80. Saarela, J. & Finnäs, F. (2006). Adjustment Failures in an Immigrant Population: Finns in Sweden. Social Indicators Research, 82, 545-563. Saarela, J. & Finnäs, F.(2007). Cross-country Employment Propensity of Finnish Migrants: Evidence from Linked Register Data. Migration Letters, forthcoming. Statistics Finland (2006a). Taulukot aihealueella Muuttoliike. http://pxweb2.stat.fi/database/V%E4est%F6/Muuttoliike/Muuttoliike.asp Statistics Finland (2006b). Rekisteriseloste: Väestölaskentojen pitkittäistiedosto 1970-1995. http://www.stat.fi/meta/rekisteriselosteet/rekisteriseloste_vaestolaskenta70-95.html Statistics Finland (2006c). Työssäkäynti. http://www.stat.fi/til/tyokay/index.html
16

Table 1. Number of return migrants by the census(es) they were abroad and the census(es) they were observedin Finland subsequent to return migration, and the number of non-migrants in the same birth cohorts
Non- Non-1980 1985 1990 1995 migrants 1980 1985 1990 1995 migrants
1975 2,788 2,594 2,441 2,317 667,247 1,886 1,766 1,709 1,671 664,0311980 8,560 7,943 7,563 852,704 6,443 6,055 5,913 841,953
1985 2,872 2,626 1,038,618 2,309 2,126 1,020,0641990 2,817 1,209,725 1,884 1,184,456
1975 1980 1,536 1,391 1,336 667,247 1,392 1,301 1,284 664,0311980 1985 2,168 1,963 852,704 2,006 1,848 841,953
1985 1990 544 1,038,618 531 1,020,064
1975 1980 1985 495 453 667,247 493 463 664,0311980 1985 1990 640 852,704 605 841,953
1975 1980 1985 1990 151 667,247 184 664,031
MEN WOMEN
Census abroadCensus after return migratio
n Census after return migration

Table 2. Employment rate of return migrants by the census(es) they were abroad and the census(es) they were observed in Finland subsequentto return migration, and of non-migrants in the same birth cohorts (%)
1980 1985 1990 1995 1980 1985 1990 1995 1980 1985 1990 1995 1980 1985 1990 19951975 65.2 73.8 71.5 52.8 88.6 90.5 86.6 68.8 54.0 70.3 76.1 65.0 76.8 84.8 85.2 70.7
1980 73.4 75.8 59.2 89.0 86.9 70.6 66.6 75.9 66.9 83.0 84.3 71.31985 68.5 51.3 86.2 71.4 66.5 56.3 82.9 70.6
1990 46.5 70.6 43.5 68.8
1975 1980 76.2 78.9 60.6 90.5 86.6 68.8 67.5 79.4 66.4 84.8 85.2 70.71980 1985 69.2 57.5 86.9 70.6 68.0 60.5 84.3 71.3
1985 1990 35.5 71.4 33.1 70.6
1975 1980 1985 69.3 53.9 86.6 68.8 63.1 56.2 85.2 70.71980 1985 1990 35.5 70.6 34.5 71.3
1975 1980 1985 1990 24.5 68.8 38.0 70.7
Census of observationNon-migrantsReturn migrants
MEN WOMENReturn migrants Non-migrants
Census abroadCensus after return Census of observation Census after return

Table 3. Odds for employment of return migrants in relation to odds for employment of non-migrants
1975 0.241 (0.265) 0.298 (0.317) 0.382 (0.377) 0.494 (0.438) 0.354 (0.399) 0.426 (0.446) 0.549 (0.499) 0.755 (0.543)1980 0.340 (0.362) 0.471 (0.419) 0.592 (0.469) 0.408 (0.473) 0.586 (0.576) 0.802 (0.602)
1985 0.347 (0.298) 0.421 (0.327) 0.410 (0.403) 0.536 (0.424)1990 0.361 (0.298) 0.349 (0.307)
1975 1980 0.337 (0.407) 0.578 (0.636) 0.686 (0.632) 0.373 (0.452) 0.670 (0.715) 0.803 (0.647)1980 1985 0.338 (0.311) 0.563 (0.467) 0.397 (0.405) 0.616 (0.495)
1985 1990 0.220 (0.187) 0.206 (0.156)
1975 1980 1985 0.349 (0.397) 0.529 (0.512) 0.297 (0.315) 0.532 (0.430)1980 1985 1990 0.229 (0.199) 0.212 (0.166)
1975 1980 1985 1990 0.147 (0.148) 0.255 (0.209)
Numbers outside parentheses refer to unadjusted odds ratios.Numbers within parentheses refer to odds ratios adjusted for Age, Educational level, Mother tongue and Region of residence.Age is measured in five-year intervals. Educational level consists of the categories (1) Basic, (2) Lower vocational, lower level, (3) Lowervocational, upper level, (4) Upper vocational, (5) Undergraduate and (6) Graduate. Mother tongue is Finnish or Swedish. Region of residence has 13 categories with one separate for the Helsinki metropolitan area.
MEN WOMEN
1980 1985 1990 1995Census after return migration
Census abroad 1980 1985Census after return migration
1990 1995

Table 4. Odds for employment of return migrants in relation to odds for employment of non-migrants, by educational level
Census Educ.abroad level 1980 1985 1990 1995 1980 1985 1990 19951975 Low 0.227 0.328 0.369 0.423 0.374 0.409 0.443 0.520
Semi 0.320 0.272 0.347 0.413 0.422 0.509 0.525 0.575High 0.446 0.552 0.617 0.641 0.407 0.352 0.753 0.486
1980 Low 0.314 0.410 0.451 0.434 0.508 0.538Semi 0.376 0.410 0.473 0.490 0.639 0.660High 0.530 0.473 0.477 0.522 0.523 0.561
1985 Low 0.261 0.258 0.343 0.327Semi 0.310 0.345 0.444 0.476High 0.418 0.510 0.503 0.505
1990 Low 0.232 0.253Semi 0.304 0.318High 0.568 0.381
The odds ratios are adjusted for Age, Mother tongue and Region of residence.Data on return migrants are restricted to those who had been one census abroad.The results are based on regressions estimated separately across sexes, censuses, andeducational levels.Low refers to people with basic education only, Semi to those with vocationaleducation, and High to those with undergraduate or higher education.
MEN WOMENCensus after return migration Census after return migration

0
10000
20000
30000
40000
1945 1950 1955 1960 1965 1970 1975 1980 1985 1990 1995 2000Year
Number of migrants
From Finland to Sweden
From Sweden to Finland
From Finland to other countries thanSwedenFrom other countries than Sweden toFinland
Figure 1. Migration from and to Finland 1945-2001 Source: Institute of Migration (2006)

20
30
40
50
1970 1980 1990 1995
Age
Census year
19851975
25
35
45
55
Figure 2. Lexis diagram of the observation plan for the census data
Notes: The thin bars represent the target population in the sense that persons under study were living in Finland at these ages and points of time. The thick bars represent the period and age in which each person may be analysed with regard to employment.

0
0,2
0,4
0,6
0,8
1
1,2
0 1 2 3 4 5 6Number of years in home country subsequent to return migration
Odds ratioNon-migrantsReturn migrants95 % confidence interval
Figure 3. Odds for employment of return migrants in relation to odds for employment of non-
migrants, by duration subsequent to return migration, men
Notes: The logistic regression models used adjust for Age (in five-year intervals), Educational level (six categories), Educational field (nine categories), Mother tongue (Finnish or Swedish), Area of residence (seven categories) and Observation year (a dummy for each calendar year). The mean employment rate of return migrants with one year in Finland subsequent to return migration is 55.4 per cent and of non-migrants 71.1 per cent. This corresponds to an odds ratio of 0.505. It decreases to 0.364 when account is taken for the structural variables.
0
0,2
0,4
0,6
0,8
1
1,2
0 1 2 3 4 5 6
Number of years in home country subsequent to return migration
Odds ratioNon-migrantsReturn migrants95 % confidence interval
Figure 4. Odds for employment of return migrants in relation to odds for employment of non-
migrants, by duration subsequent to return migration, women
Note: The logistic regression models used adjust for Age (in five-year intervals), Educational level (six categories), Educational field (nine categories), Mother tongue (Finnish or Swedish), Area of residence (seven categories) and Observation year (a dummy for each calendar year). The mean employment rate of return migrants with one year in Finland subsequent to return migration is 46.3 per cent and of non-migrants 70.0 per cent. This corresponds to an odds ratio of 0.370. It decreases to 0.311 when account is taken for the structural variables.

0
0,2
0,4
0,6
0,8
1
1,2
0 1 2 3 4 5 6
Number of years abroad
Odds ratioNon-migrantsReturn migrants
95 % confidence interval
Figure 5. Odds for employment of return migrants in relation to odds for employment of non-
migrants, by migration duration, men
Note: The logistic regression models used adjust for Age (in five-year intervals), Educational level (six categories), Educational field (nine categories), Mother tongue (Finnish or Swedish), Area of residence (seven categories) and Observation year (a dummy for each calendar year). The mean employment rate of return migrants with one year abroad is 65.7 per cent and of non-migrants 71.1 per cent. This corresponds to an odds ratio of 0.777. It decreases to 0.628 when account is taken for the structural variables.

0
0,2
0,4
0,6
0,8
1
1,2
0 1 2 3 4 5 6
Number of years abroad
Odds ratioNon-migrantsReturn migrants95 % confidence interval
Figure 6. Odds for employment of return migrants in relation to odds for employment of non-
migrants, by migration duration, women
Note: The logistic regression models used adjust for Age (in five-year intervals), Educational level (six categories), Educational field (nine categories), Mother tongue (Finnish or Swedish), Area of residence (seven categories) and Observation year (a dummy for each calendar year). The mean employment rate of return migrants with one year abroad is 58.6 per cent and of non-migrants 70.0 per cent. This corresponds to an odds ratio of 0.608. It decreases to 0.549 when account is taken for the structural variables.