Embed Size (px)
Citation preview
Review of Human Development Indices Pierre Biscaye, Jordan Clarke EPAR Request No. 309 Eugenia Ho, Kiran Javaid
C. Leigh Anderson & Travis Reynolds
Prepared for the Development Policy & Finance (DPAF) Team of the Bill & Melinda Gates Foundation
Professor C. Leigh Anderson, Principal Investigator September 17, 2015
EPAR’s innovative student-faculty team model is the first University of Washington partnership to provide rigorous, applied research and analysis to the Bill & Melinda Gates Foundation. Established in 2008, the EPAR model has since been emulated by other UW Schools and
programs to further support the foundation and enhance student learning.
NOTE: The findings and conclusions contained within this material are those of the authors and do not necessarily reflect positions or policies of the Bill & Melinda Gates Foundation.
EVAN S S CHOOL POLI CY ANAL YSI S A ND RESEA RC H (EPA R) | 1
Abstract
This report is intended to support the Development Policy and Finance (DPAF) team’s work on using holistic measurements
of human development. We review the current body of literature exploring the theories behind holistic human development
measurements and the tradeoffs of different methodologies for the construction of human development indices. Through a
review of published and grey literature in the fields of human, international, and economic development we identify 22
current indices that aggregate measures from multiple components of human development. We analyze these indices to
identify tradeoffs related to their unique characteristics and construction methodologies. We evaluate how index
calculation might influence their relevance to different user groups, considering methodology, ease of calculation, ease of
interpretation, coverage of different measures of human development, and comparability. Finally, we assess evidence of
index traction, based on the number of countries for which they are measured, the frequency of their calculation, and
measures of use and recognition by academics, the media, and development organizations and practitioners. The report is
accompanied by an appendix of summary tables for each index with further details regarding background information,
methodology, index components, and evaluation criteria addressed within the report.
Introduction
Human development refers to the measurement of a country’s progress by analyzing citizen well-being (Sen, 1984; Alkire,
2010). Definitions of human development are often vague, and may be tailored to reflect the missions of international
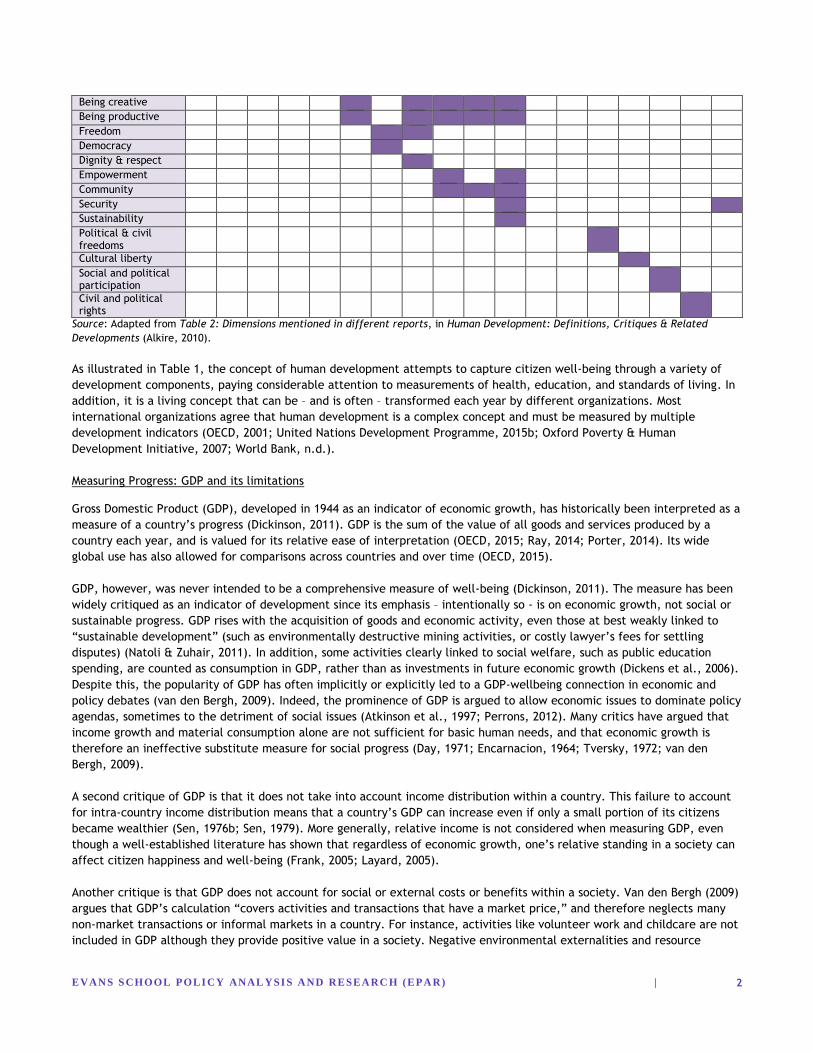
organizations. For example, Table 1 charts the many dimensions of development that the United Nations Development
Programme (UNDP) has included in its definition of human development over the last two decades (Alkire, 2010).
Table 1. Changes in components of the UNDP’s definition of human development over time
Dimensions mentioned by year
‘90 ‘91 ‘92 ‘93 ‘94 ‘95 ‘96 ‘97 ‘98 ‘99 ‘00 ‘01 ‘02 ‘03 ‘04 ‘05 ‘07 ‘09
Long healthy life Knowledge Standard of living Political freedom Human rights Self-respect Physical environment
Freedom of action & expression
Participation Human security Political, social, and economic freedoms
EVAN S S CHOOL POLI CY ANAL YSI S A ND RESEA RC H (EPA R) |
2
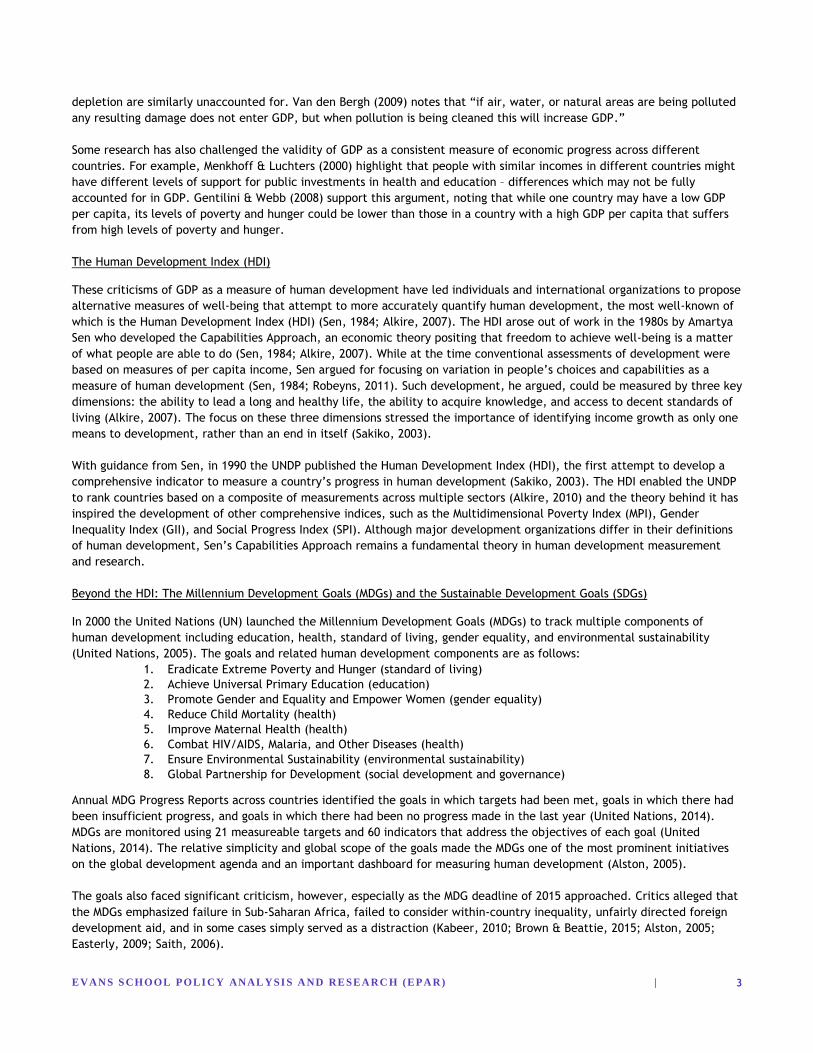
Being creative Being productive Freedom Democracy Dignity & respect Empowerment Community Security Sustainability Political & civil freedoms
Cultural liberty Social and political participation
Civil and political rights
Source: Adapted from Table 2: Dimensions mentioned in different reports, in Human Development: Definitions, Critiques & Related
Developments (Alkire, 2010).
As illustrated in Table 1, the concept of human development attempts to capture citizen well-being through a variety of
development components, paying considerable attention to measurements of health, education, and standards of living. In
addition, it is a living concept that can be – and is often – transformed each year by different organizations. Most
international organizations agree that human development is a complex concept and must be measured by multiple
development indicators (OECD, 2001; United Nations Development Programme, 2015b; Oxford Poverty & Human
Development Initiative, 2007; World Bank, n.d.).
Measuring Progress: GDP and its limitations
Gross Domestic Product (GDP), developed in 1944 as an indicator of economic growth, has historically been interpreted as a
measure of a country’s progress (Dickinson, 2011). GDP is the sum of the value of all goods and services produced by a
country each year, and is valued for its relative ease of interpretation (OECD, 2015; Ray, 2014; Porter, 2014). Its wide
global use has also allowed for comparisons across countries and over time (OECD, 2015).
GDP, however, was never intended to be a comprehensive measure of well-being (Dickinson, 2011). The measure has been
widely critiqued as an indicator of development since its emphasis – intentionally so - is on economic growth, not social or
sustainable progress. GDP rises with the acquisition of goods and economic activity, even those at best weakly linked to
“sustainable development” (such as environmentally destructive mining activities, or costly lawyer’s fees for settling
disputes) (Natoli & Zuhair, 2011). In addition, some activities clearly linked to social welfare, such as public education
spending, are counted as consumption in GDP, rather than as investments in future economic growth (Dickens et al., 2006).
Despite this, the popularity of GDP has often implicitly or explicitly led to a GDP-wellbeing connection in economic and
policy debates (van den Bergh, 2009). Indeed, the prominence of GDP is argued to allow economic issues to dominate policy
agendas, sometimes to the detriment of social issues (Atkinson et al., 1997; Perrons, 2012). Many critics have argued that
income growth and material consumption alone are not sufficient for basic human needs, and that economic growth is
therefore an ineffective substitute measure for social progress (Day, 1971; Encarnacion, 1964; Tversky, 1972; van den
Bergh, 2009).
A second critique of GDP is that it does not take into account income distribution within a country. This failure to account
for intra-country income distribution means that a country’s GDP can increase even if only a small portion of its citizens
became wealthier (Sen, 1976b; Sen, 1979). More generally, relative income is not considered when measuring GDP, even
though a well-established literature has shown that regardless of economic growth, one’s relative standing in a society can
affect citizen happiness and well-being (Frank, 2005; Layard, 2005).
Another critique is that GDP does not account for social or external costs or benefits within a society. Van den Bergh (2009)
argues that GDP’s calculation “covers activities and transactions that have a market price,” and therefore neglects many
non-market transactions or informal markets in a country. For instance, activities like volunteer work and childcare are not
included in GDP although they provide positive value in a society. Negative environmental externalities and resource
EVAN S S CHOOL POLI CY ANAL YSI S A ND RESEA RC H (EPA R) |
3
depletion are similarly unaccounted for. Van den Bergh (2009) notes that “if air, water, or natural areas are being polluted
any resulting damage does not enter GDP, but when pollution is being cleaned this will increase GDP.”
Some research has also challenged the validity of GDP as a consistent measure of economic progress across different
countries. For example, Menkhoff & Luchters (2000) highlight that people with similar incomes in different countries might
have different levels of support for public investments in health and education – differences which may not be fully
accounted for in GDP. Gentilini & Webb (2008) support this argument, noting that while one country may have a low GDP
per capita, its levels of poverty and hunger could be lower than those in a country with a high GDP per capita that suffers
from high levels of poverty and hunger.
The Human Development Index (HDI)
These criticisms of GDP as a measure of human development have led individuals and international organizations to propose
alternative measures of well-being that attempt to more accurately quantify human development, the most well-known of
which is the Human Development Index (HDI) (Sen, 1984; Alkire, 2007). The HDI arose out of work in the 1980s by Amartya
Sen who developed the Capabilities Approach, an economic theory positing that freedom to achieve well-being is a matter
of what people are able to do (Sen, 1984; Alkire, 2007). While at the time conventional assessments of development were
based on measures of per capita income, Sen argued for focusing on variation in people’s choices and capabilities as a
measure of human development (Sen, 1984; Robeyns, 2011). Such development, he argued, could be measured by three key
dimensions: the ability to lead a long and healthy life, the ability to acquire knowledge, and access to decent standards of
living (Alkire, 2007). The focus on these three dimensions stressed the importance of identifying income growth as only one
means to development, rather than an end in itself (Sakiko, 2003).
With guidance from Sen, in 1990 the UNDP published the Human Development Index (HDI), the first attempt to develop a
comprehensive indicator to measure a country’s progress in human development (Sakiko, 2003). The HDI enabled the UNDP
to rank countries based on a composite of measurements across multiple sectors (Alkire, 2010) and the theory behind it has
inspired the development of other comprehensive indices, such as the Multidimensional Poverty Index (MPI), Gender
Inequality Index (GII), and Social Progress Index (SPI). Although major development organizations differ in their definitions
of human development, Sen’s Capabilities Approach remains a fundamental theory in human development measurement
and research.
Beyond the HDI: The Millennium Development Goals (MDGs) and the Sustainable Development Goals (SDGs)
In 2000 the United Nations (UN) launched the Millennium Development Goals (MDGs) to track multiple components of
human development including education, health, standard of living, gender equality, and environmental sustainability
(United Nations, 2005). The goals and related human development components are as follows:
1. Eradicate Extreme Poverty and Hunger (standard of living)
2. Achieve Universal Primary Education (education)
3. Promote Gender and Equality and Empower Women (gender equality)
4. Reduce Child Mortality (health)
5. Improve Maternal Health (health)
6. Combat HIV/AIDS, Malaria, and Other Diseases (health)
7. Ensure Environmental Sustainability (environmental sustainability)
8. Global Partnership for Development (social development and governance)
Annual MDG Progress Reports across countries identified the goals in which targets had been met, goals in which there had
been insufficient progress, and goals in which there had been no progress made in the last year (United Nations, 2014).
MDGs are monitored using 21 measureable targets and 60 indicators that address the objectives of each goal (United
Nations, 2014). The relative simplicity and global scope of the goals made the MDGs one of the most prominent initiatives
on the global development agenda and an important dashboard for measuring human development (Alston, 2005).
The goals also faced significant criticism, however, especially as the MDG deadline of 2015 approached. Critics alleged that
the MDGs emphasized failure in Sub-Saharan Africa, failed to consider within-country inequality, unfairly directed foreign
development aid, and in some cases simply served as a distraction (Kabeer, 2010; Brown & Beattie, 2015; Alston, 2005;
Easterly, 2009; Saith, 2006).
EVAN S S CHOOL POLI CY ANAL YSI S A ND RESEA RC H (EPA R) |
4
To address these criticisms and to motivate progress towards global development, the UN is proposing a new set of goals,
the Sustainable Development Goals (SDGs), that will use the foundation of the MDGs to create a post-2015 global
development agenda (United Nations, 2015). The UN has indicated that the proposed SDGs must be action-oriented,
concise, easy to communicate, limited in number, aspirational, global, and universally applicable in all countries (United
Nations, 2015). The Secretary-General has also noted that key populations – especially women and children – were left
behind in the “unfinished work” of the MDGs (United Nations, 2014). Based on the most recent draft of the 17 proposed
SDGs, key differences between the MDGs and the SDGs include:
1. Focusing on the poorest and hardest to reach; empowering developing countries by including them in the SDG
creation process;
2. Using data to monitor and evaluate countries to increase accountability; and
3. Increasing country autonomy by decreasing reliance on foreign aid and increasing own-revenue sources (Coonrod,
2014).
Until the SDGs are released, however, the MDGs remain a key focal point, and most indices of human development include
measures related to at least one of the MDGs.
Alternative Indices of Human Development
The remainder of this report reviews a range of indices that are currently used to measure human development (HD) and
country progress. We do not focus on assessments of country progress or indices that are not composites or do not have an
explicit HD component (e.g., Corruption Perception Index, Doing Business Survey, etc.), although the analysis includes
indices and tools that combine human development components and measures such as corruption and political openness.
The analysis focuses on the following research questions:
1. What measures or indices have been developed to measure HD progress?
2. What is the methodology of each measure or index, and what are the associated tradeoffs?
We assess characteristics of the selected indices, including their methodologies and components. Next, we evaluate
tradeoffs across of these indices in terms of methodology, ease of calculation, ease of interpretation, coverage of different
components of human development, and comparability. Finally, we consider evidence of traction for the 22 selected
indices to evaluate which indices are most commonly reviewed and used. Appendix A gives a brief overview of each of the
indices reviewed.
Methodology
To identify existing indices that aim to measure country progress on human development, we conducted searches on
Scopus, Google, and Google Scholar. Following the initial screening, 291 relevant sources were shortlisted which discussed
120 different measures. We compiled a final list of 22 relevant human development composite indices1, based on the
criteria that the measure must be:
1. an index including indicators from multiple components of human development (e.g. health and education), rather
than measuring multiple aspects within a single component of human development;2 2. a composite index using a method or methods of aggregation (as opposed to a dashboard measure which showcases
individual indicators separately at a glance); 3. current (continues to be updated with empirical data and not specifically being replaced by another index); and 4. a calculated measure that is not merely a proposal (as reflected by discussion or adoption by organizations).
We conducted supplemental searches on each of the 22 indices to find information on strengths and weaknesses and
evidence of traction (defined as the degree to which indices are broadly used to measure human development across
multiple countries). In addition to these 22 human development indices, we also review GDP as an example of a measure
that is not focused on human development but is nevertheless commonly used as a proxy. Table 2 summarizes key
characteristics of the selected indices, including the year the index was introduced, who developed each index, the number
1 Appendix D provides a table of 20 other indices that measure human development in some manner, including a brief description of those indices and an explanation of the reason for exclusion from the final list of indices included in this review. 2 For instance, an index that considers only health – even if it measures health in multiple aspects like child mortality, life expectancy, etc. – would not be included in this review. However, an index that measures both health and education would be included because of its focus on multiple components.
EVAN S S CHOOL POLI CY ANAL YSI S A ND RESEA RC H (EPA R) |
5
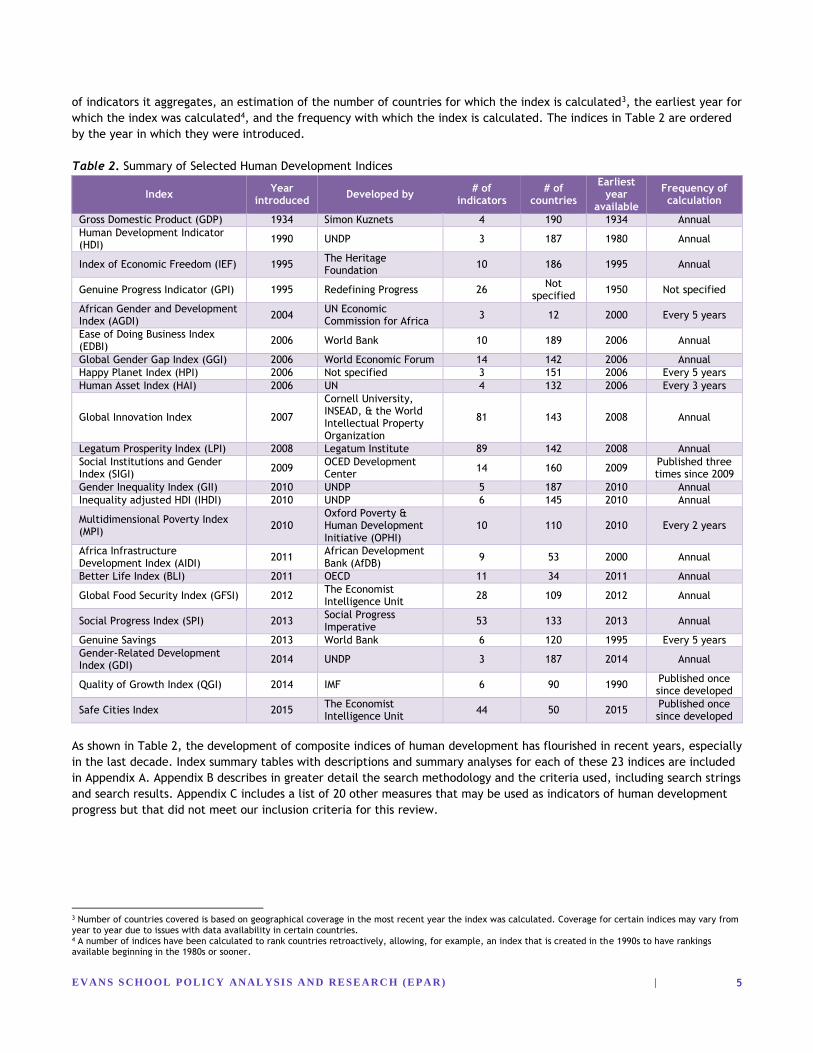
of indicators it aggregates, an estimation of the number of countries for which the index is calculated3, the earliest year for
which the index was calculated4, and the frequency with which the index is calculated. The indices in Table 2 are ordered
by the year in which they were introduced.
Table 2. Summary of Selected Human Development Indices
Index Year
introduced Developed by
# of indicators
# of countries
Earliest year
available
Frequency of calculation
Gross Domestic Product (GDP) 1934 Simon Kuznets 4 190 1934 Annual
Human Development Indicator (HDI)
1990 UNDP 3 187 1980 Annual
Index of Economic Freedom (IEF) 1995 The Heritage Foundation
10 186 1995 Annual
Genuine Progress Indicator (GPI) 1995 Redefining Progress 26 Not
specified 1950 Not specified
African Gender and Development Index (AGDI)
2004 UN Economic Commission for Africa
3 12 2000 Every 5 years
Ease of Doing Business Index (EDBI)
2006 World Bank 10 189 2006 Annual
Global Gender Gap Index (GGI) 2006 World Economic Forum 14 142 2006 Annual
Happy Planet Index (HPI) 2006 Not specified 3 151 2006 Every 5 years
Human Asset Index (HAI) 2006 UN 4 132 2006 Every 3 years
Global Innovation Index 2007
Cornell University, INSEAD, & the World Intellectual Property Organization
81 143 2008 Annual
Legatum Prosperity Index (LPI) 2008 Legatum Institute 89 142 2008 Annual
Social Institutions and Gender Index (SIGI)
2009 OCED Development Center
14 160 2009 Published three times since 2009
Gender Inequality Index (GII) 2010 UNDP 5 187 2010 Annual
Inequality adjusted HDI (IHDI) 2010 UNDP 6 145 2010 Annual
Multidimensional Poverty Index (MPI)
2010 Oxford Poverty & Human Development Initiative (OPHI)
10 110 2010 Every 2 years
Africa Infrastructure Development Index (AIDI)
2011 African Development Bank (AfDB)
9 53 2000 Annual
Better Life Index (BLI) 2011 OECD 11 34 2011 Annual
Global Food Security Index (GFSI) 2012 The Economist Intelligence Unit
28 109 2012 Annual
Social Progress Index (SPI) 2013 Social Progress Imperative
53 133 2013 Annual
Genuine Savings 2013 World Bank 6 120 1995 Every 5 years
Gender-Related Development Index (GDI)
2014 UNDP 3 187 2014 Annual
Quality of Growth Index (QGI) 2014 IMF 6 90 1990 Published once since developed
Safe Cities Index 2015 The Economist Intelligence Unit
44 50 2015 Published once since developed
As shown in Table 2, the development of composite indices of human development has flourished in recent years, especially
in the last decade. Index summary tables with descriptions and summary analyses for each of these 23 indices are included
in Appendix A. Appendix B describes in greater detail the search methodology and the criteria used, including search strings
and search results. Appendix C includes a list of 20 other measures that may be used as indicators of human development
progress but that did not meet our inclusion criteria for this review.
3 Number of countries covered is based on geographical coverage in the most recent year the index was calculated. Coverage for certain indices may vary from year to year due to issues with data availability in certain countries. 4 A number of indices have been calculated to rank countries retroactively, allowing, for example, an index that is created in the 1990s to have rankings available beginning in the 1980s or sooner.
EVAN S S CHOOL POLI CY ANAL YSI S A ND RESEA RC H (EPA R) |
6
Approaches to Index Calculation
While all selected HD measures are composite indices that include indicators from multiple components of human
development, each measure has a different approach to index calculation. Appendix A tables provide greater detail on the
methodologies.
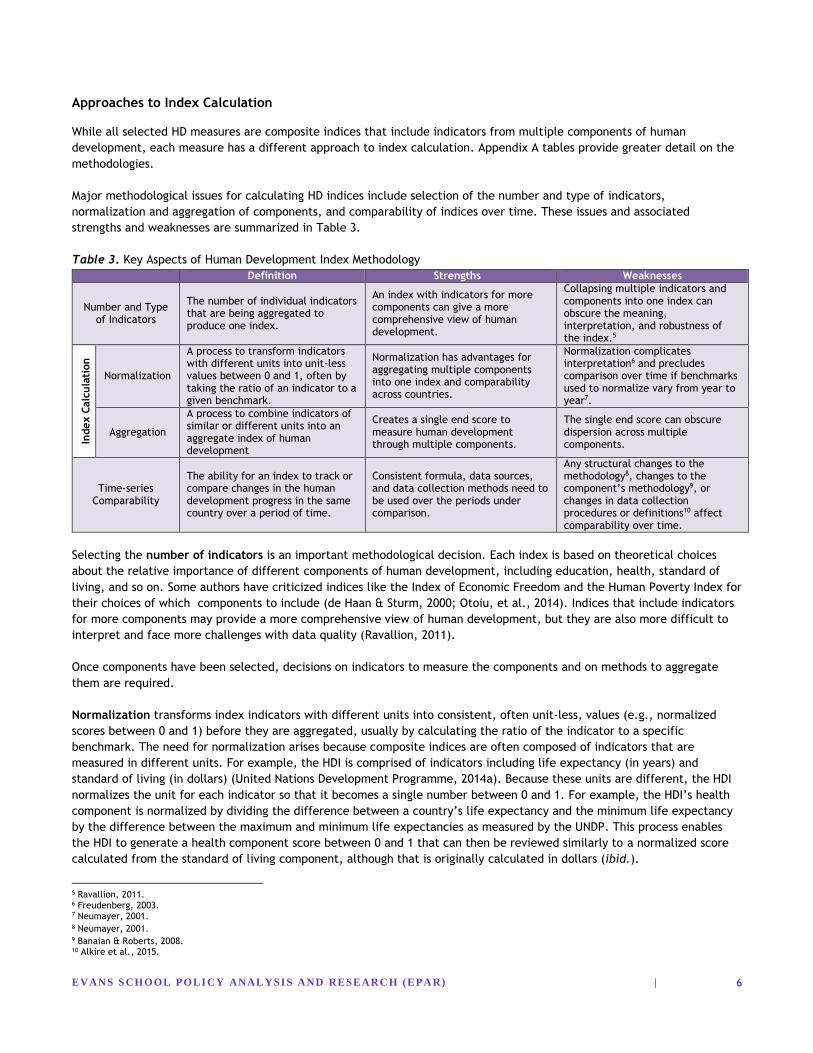
Major methodological issues for calculating HD indices include selection of the number and type of indicators,
normalization and aggregation of components, and comparability of indices over time. These issues and associated
strengths and weaknesses are summarized in Table 3.
Table 3. Key Aspects of Human Development Index Methodology
Definition Strengths Weaknesses
Number and Type of Indicators
The number of individual indicators that are being aggregated to produce one index.
An index with indicators for more components can give a more comprehensive view of human development.
Collapsing multiple indicators and components into one index can obscure the meaning, interpretation, and robustness of the index.5
Index C
alc
ula
tion
Normalization
A process to transform indicators with different units into unit-less values between 0 and 1, often by taking the ratio of an indicator to a given benchmark.
Normalization has advantages for aggregating multiple components into one index and comparability across countries.
Normalization complicates interpretation6 and precludes comparison over time if benchmarks used to normalize vary from year to year7.
Aggregation
A process to combine indicators of similar or different units into an aggregate index of human development
Creates a single end score to measure human development through multiple components.
The single end score can obscure dispersion across multiple components.
Time-series Comparability
The ability for an index to track or compare changes in the human development progress in the same country over a period of time.
Consistent formula, data sources, and data collection methods need to be used over the periods under comparison.
Any structural changes to the methodology8, changes to the component’s methodology9, or changes in data collection procedures or definitions10 affect comparability over time.
Selecting the number of indicators is an important methodological decision. Each index is based on theoretical choices
about the relative importance of different components of human development, including education, health, standard of
living, and so on. Some authors have criticized indices like the Index of Economic Freedom and the Human Poverty Index for
their choices of which components to include (de Haan & Sturm, 2000; Otoiu, et al., 2014). Indices that include indicators
for more components may provide a more comprehensive view of human development, but they are also more difficult to
interpret and face more challenges with data quality (Ravallion, 2011).
Once components have been selected, decisions on indicators to measure the components and on methods to aggregate
them are required.
Normalization transforms index indicators with different units into consistent, often unit-less, values (e.g., normalized
scores between 0 and 1) before they are aggregated, usually by calculating the ratio of the indicator to a specific
benchmark. The need for normalization arises because composite indices are often composed of indicators that are
measured in different units. For example, the HDI is comprised of indicators including life expectancy (in years) and
standard of living (in dollars) (United Nations Development Programme, 2014a). Because these units are different, the HDI
normalizes the unit for each indicator so that it becomes a single number between 0 and 1. For example, the HDI’s health
component is normalized by dividing the difference between a country’s life expectancy and the minimum life expectancy
by the difference between the maximum and minimum life expectancies as measured by the UNDP. This process enables
the HDI to generate a health component score between 0 and 1 that can then be reviewed similarly to a normalized score
calculated from the standard of living component, although that is originally calculated in dollars (ibid.).
5 Ravallion, 2011. 6 Freudenberg, 2003. 7 Neumayer, 2001. 8 Neumayer, 2001. 9 Banaian & Roberts, 2008. 10 Alkire et al., 2015.
EVAN S S CHOOL POLI CY ANAL YSI S A ND RESEA RC H (EPA R) |
7
While normalization has advantages for comparability across countries and aggregating components, it also creates
difficulties in interpretation, as it is not as easy to connect a normalized measure to performance in particular facets of
human development (Freudenberg, 2003). Moreover, as described further below, normalization based on benchmarks that
change from year to year may lead to challenges for making comparisons in index values over time (Mazziotta & Pareto,
2012).
Components can be aggregated linearly or non-linearly: A linear index11 is calculated using a simple summation or a simple
arithmetic mean (i.e. linear average). Linear indices have the advantage of being simple to calculate and easy to interpret,
making them popular among development indices (De Muro, Mazziotta, & Pareto, 2011). A simple summation is the
simplest approach to index calculation, with all indicator values added together to arrive at a composite score.
For the calculation of simple means, the indicators can be weighted equally or differently (ibid.). An equally-weighted
mean implies that all the indicators are perfectly substitutable (De Muro, Mazziotta, & Pareto, 2011; Mishra & Nathan,
2013). Mishra & Nathan (2013) explain that “the perfect substitutability assumption means that a differential improvement
(or increment) in one indicator at any value can be substituted or neutralized by an equal differential decline (or
decrement) in another indicator at any other value.” In other words, indices using an equally-weighted mean value all
indicators in the index equally, thus making the index “indifferent to swapping of values” across indicators (ibid.). On the
surface this approach appears to be neutral (bias-free), though equal weights may be theoretically inconsistent (Foster,
Lopez‐Calva, & Szekely, 2005). The alternative approach is to use weighted means, which assign different values to
different indicators based on theoretical assumptions about the importance of the components. De Muro, Mazziotta, &
Pareto (2011) and others argue that although a weighted mean may be more theoretically consistent because it does not
assume perfect substitutability between indicators, this approach can still be criticized for arbitrary assignment of weights
(Eren et al. 2014; Permanver, 2013; Pinar et al., 2013; Natoli et al., 2011; Korsakiene et al., 2011; Tokuyama & Pillarisetti,
2009; Ray, 2008; Legatum Institute, 2013).
Despite their simplicity and ease of interpretation, linear aggregation methods do not capture dispersion or variability
among index indicators. As a result, these indices do not differentiate between countries with moderate ratings on all
indicators and countries with a mixture of high and low ratings. Many authors have pointed to this limitation as a weakness
of linear measures (Pinar, et al., 2013; Permanver, 2013; Legatum Institute, 2013; Ray, 2008; van Staveren, 2013; IMF,
2015). On the other hand, non-linear aggregation methods are designed to take into account dispersion or variability.
Countries with wide variation across index indicators are therefore rated lower than countries that do equally well in each
indicator. Advocates of nonlinear methods argue that accounting for variability across indicators is a useful and desirable
characteristic for building composite indices of poverty and development, where it may be considered important to capture
the depth and areas of poverty12 (De Muro, Mazziotta, & Pareto, 2011). For instance, a country that performs moderately
well in all HDI indicators could have a higher HDI score than a country that performs very well on two indicators and poorly
on the third, if the ratings are calculated to account for severity of deprivation.
The most common non-linear approach is the exponent-based geometric mean. Geometric means do not allow for perfect
substitutability of indicators, more heavily weighting index indicators with lower scores and penalizing uneven development
(De Muro, Mazziotta, & Pareto, 2011; Mishra & Nathan, 2013). As summarized by De Muro, Mazziotta, & Pareto (2011), a
geometric mean of order greater than one places greater weight on index indicators with larger deprivation, and is
therefore useful for aggregating indices when deprivation on any one indicator is considered detrimental for overall
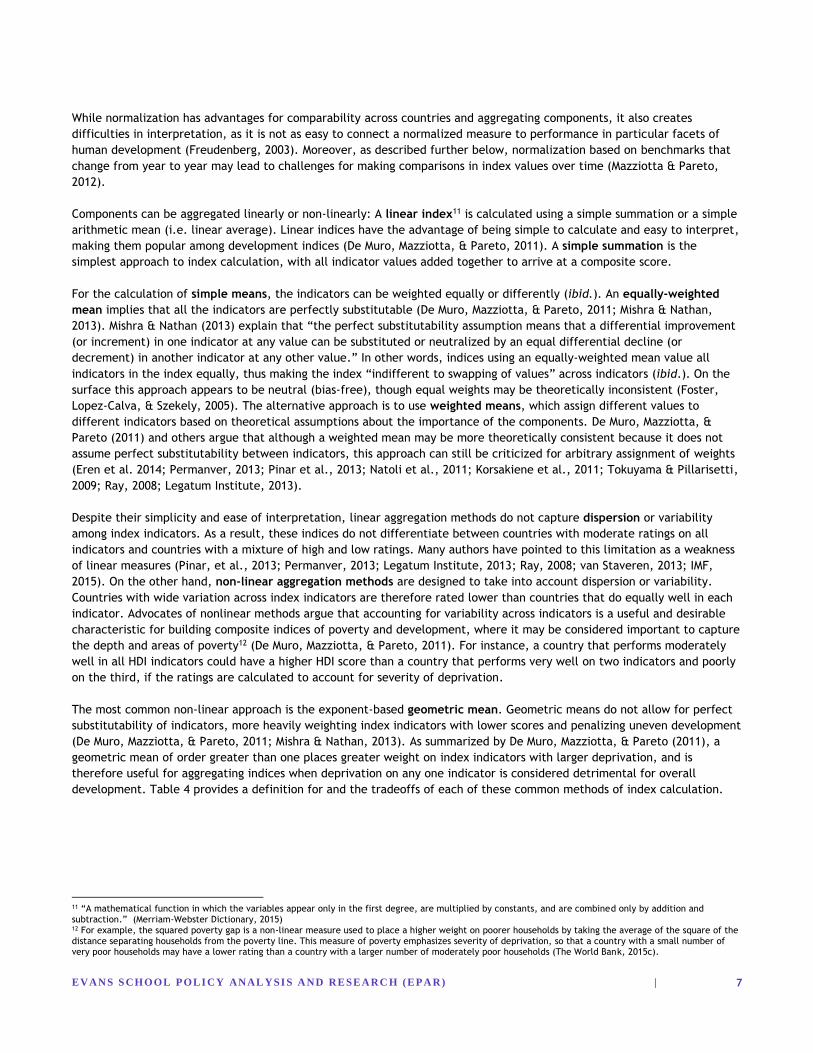
development. Table 4 provides a definition for and the tradeoffs of each of these common methods of index calculation.
11 “A mathematical function in which the variables appear only in the first degree, are multiplied by constants, and are combined only by addition and subtraction.” (Merriam-Webster Dictionary, 2015) 12 For example, the squared poverty gap is a non-linear measure used to place a higher weight on poorer households by taking the average of the square of the distance separating households from the poverty line. This measure of poverty emphasizes severity of deprivation, so that a country with a small number of very poor households may have a lower rating than a country with a larger number of moderately poor households (The World Bank, 2015c).
EVAN S S CHOOL POLI CY ANAL YSI S A ND RESEA RC H (EPA R) |
8
Table 4. Approaches to Index Calculation
Definition Strengths Weaknesses Example13
Linear
Simple Summation
This method of calculation sums the indicators together and reports the summation as the final index result.
Ease of calculation and of interpretation.
Does not capture dispersion or depth of deprivation.14
𝐼𝑛𝑑𝑒𝑥 = 𝐼1 + 𝐼2 + 𝐼3
Simple Mean / Linear Average (Equal
Weighting)
This approach equally weights and sums up the indicators and divides the sum by the number of indicators.
Weighting each indicator equally allows for easy calculation and interpretation. Valuing all indicators equally seems to be a neutral approach.
Often criticized for its simplicity and its arbitrary weighting.15,16,17
𝐼𝑛𝑑𝑒𝑥 =𝐼1 + 𝐼2 + 𝐼3
3
Note: in this simple mean, all components are equally weighted.
Weighted Mean
(Unequal weighting)
Similar to the simple mean, in this approach each indicator is weighted differently in order to denote importance or magnitude of different indicators.
Ability to account for the relative importance of indicators.18
Decision of how to weight indicators in a non-arbitrary way is often debated.19
𝐼𝑛𝑑𝑒𝑥 =2𝐼1 + 𝐼2 + 𝐼
4
Note: In this weighted mean, I1 is weighted twice as much as I2 and I3.
Non Linear
Geometric Mean
This method multiplies the indicator scores together and finds the n-root of that product.
Geometric or power means of order greater than one account for dispersion by placing greater weight on the indicators with larger deprivations.20
More complex to calculate than a simple summation or linear average.
𝐼𝑛𝑑𝑒𝑥 = √𝐼1 ∗ 𝐼2 ∗ 𝐼33
Dispersion example:
𝐶𝑜𝑢𝑛𝑡𝑟𝑦 1 = √4 ∗ 4 ∗ 43
= 4
𝐶𝑜𝑢𝑛𝑡𝑟𝑦 2 = √2 ∗ 4 ∗ 63
= 3.6 Although both countries have an average indicator score of 4, the dispersion in Country 2 decreases its score.
Index calculation methodologies may affect its comparability over time. Time-series comparability requires that an index
uses consistent formula, data sources, and data collection methods over the periods under comparison. Any structural
changes to the methodology (Neumayer, 2001), changes to an indicator’s methodology (Banaian & Roberts, 2008), or
changes in data collection procedures or definitions (Alkire et al., 2015) may threaten an indice’s comparability over time.
A good example is the HDI. Since its creation in 1990, there have been several revisions to its methodology. The biggest
change happened in 2010 when the HDI’s aggregation method was changed to a geometric mean from arithmetic mean. The
HDI has since been recalculated for previous years to reestablish time-series comparability.
Normalized indices can also preclude comparisons over time if the methods used to normalize different indicators vary from
year to year (Neumayer, 2001; Klasen & Schuler, 2011; Mazziotta & Pareto, 2012). For example, the HDI relies on maximum
and minimum values when normalizing its indicators (United Nations Development Programme, 2013), according to:
𝐼𝑛𝑑𝑖𝑐𝑎𝑡𝑜𝑟 𝑆𝑐𝑜𝑟𝑒 = 𝑎𝑐𝑡𝑢𝑎𝑙 𝑣𝑎𝑙𝑢𝑒 − 𝑚𝑖𝑛𝑖𝑚𝑢𝑚 𝑣𝑎𝑙𝑢𝑒
𝑚𝑎𝑥𝑖𝑚𝑢𝑚 𝑣𝑎𝑙𝑢𝑒 − 𝑚𝑖𝑛𝑖𝑚𝑢𝑚 𝑣𝑎𝑙𝑢𝑒
Prior to 1994, the minimum and maximum values used were actual country data for that year (Neumayer, 2001). A
country’s index thus became a relative measure against realized data from a specific year, so that indices from different
13 I = Indicator used in index calculation 14 Pinar, et al., 2013; Permanver, 2013; Legatum Institute, 2013: Ray, 2008 15 Eren, et al., 2014; Permanver, 2013; Pinar, et al., 2013; de Muro, Mazziotta, & Pareto, 2011; Natoli, et al., 2011; Korsakiene, et al., 2011; Tokuyama & Pillarisetti, 2009; Ray, 2008; Legatum Institute, 2013 16 For example, McGillivray and White (1993) analyze the HDI and determine that it is possible to exclude any of the HDI sub-dimensions and still achieve a score that is highly correlated (0.95) to the original HDI. 17 Mcgillivray and Noorbakhsh (2004) note the following: “The three components of the HDI, for example, are assigned weights of one-third each. This in principle is almost certainly incorrect, as it implies that each component is equally important, in terms of well-being achievement, at all points of time and levels of achievement, and in all regions, countries, cultures, levels of development, and so on. The UNDP recognizes this but justifies the HDI weighting scheme on the basis of Occam’s razor; that is, since it is probably impossible to achieve agreement on what the weights should be, the simplest response is the best, that being to assign an equal weight to each component.” 18 de Haan & Sturm, 2000 19 Otoiu, et al., 2014 20 De Muro, Mazziotta, & Pareto, 2011
EVAN S S CHOOL POLI CY ANAL YSI S A ND RESEA RC H (EPA R) |
9
years could not be meaningfully compared with each other (Neumayer, 2001). HDI calculations now use the highest values
observed in the current time series (1980-2014) for the maximum value. Minimum values are set at “subsistence values”
defined by the UNDP (United Nations Development Programme, 2013). But even with these revisions there remains
potential for incomparability in measures over time: for example, if a new maximum score is reached on any indicator
(e.g., if the average life expectancy in the top-performing country grows to over 85) or if the minimum values are changed
by the UNDP, the HDI would need to be recalculated for all years in the time series in order to compare scores over time.
Characteristics of the Selected Human Development Indices
In the following sections, we review and compare the methodologies of the 22 selected indices along with GDP, and assess
tradeoffs among the index’s methodology, calculation, interpretation, comparability, and coverage of HD components.
Index Calculation
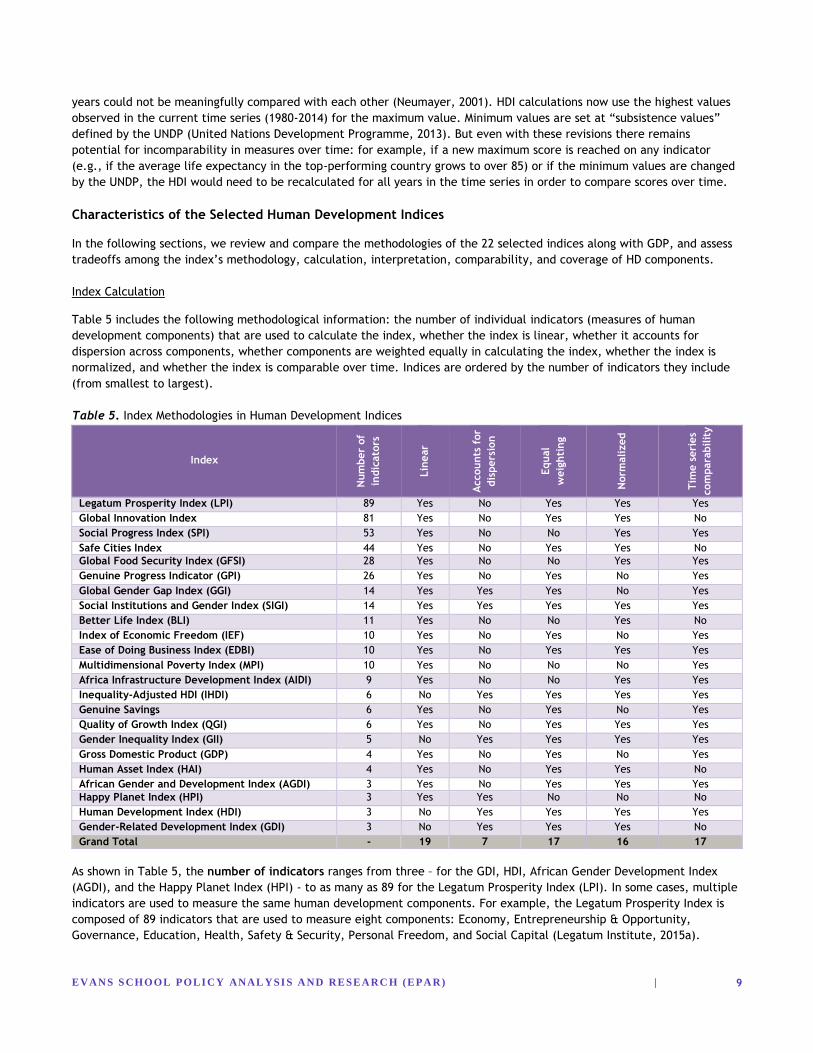
Table 5 includes the following methodological information: the number of individual indicators (measures of human
development components) that are used to calculate the index, whether the index is linear, whether it accounts for
dispersion across components, whether components are weighted equally in calculating the index, whether the index is
normalized, and whether the index is comparable over time. Indices are ordered by the number of indicators they include
(from smallest to largest).
Table 5. Index Methodologies in Human Development Indices
Index
Num
ber
of
indic
ato
rs
Lin
ear
Accounts
for
dis
pers
ion
Equal
weig
hti
ng
Norm
alized
Tim
e s
eri
es
com
para
bilit
y
Legatum Prosperity Index (LPI) 89 Yes No Yes Yes Yes
Global Innovation Index 81 Yes No Yes Yes No
Social Progress Index (SPI) 53 Yes No No Yes Yes
Safe Cities Index 44 Yes No Yes Yes No
Global Food Security Index (GFSI) 28 Yes No No Yes Yes
Genuine Progress Indicator (GPI) 26 Yes No Yes No Yes
Global Gender Gap Index (GGI) 14 Yes Yes Yes No Yes
Social Institutions and Gender Index (SIGI) 14 Yes Yes Yes Yes Yes
Better Life Index (BLI) 11 Yes No No Yes No
Index of Economic Freedom (IEF) 10 Yes No Yes No Yes
Ease of Doing Business Index (EDBI) 10 Yes No Yes Yes Yes
Multidimensional Poverty Index (MPI) 10 Yes No No No Yes
Africa Infrastructure Development Index (AIDI) 9 Yes No No Yes Yes
Inequality-Adjusted HDI (IHDI) 6 No Yes Yes Yes Yes
Genuine Savings 6 Yes No Yes No Yes
Quality of Growth Index (QGI) 6 Yes No Yes Yes Yes
Gender Inequality Index (GII) 5 No Yes Yes Yes Yes
Gross Domestic Product (GDP) 4 Yes No Yes No Yes
Human Asset Index (HAI) 4 Yes No Yes Yes No
African Gender and Development Index (AGDI) 3 Yes No Yes Yes Yes
Happy Planet Index (HPI) 3 Yes Yes No No No
Human Development Index (HDI) 3 No Yes Yes Yes Yes
Gender-Related Development Index (GDI) 3 No Yes Yes Yes No
Grand Total - 19 7 17 16 17
As shown in Table 5, the number of indicators ranges from three – for the GDI, HDI, African Gender Development Index
(AGDI), and the Happy Planet Index (HPI) - to as many as 89 for the Legatum Prosperity Index (LPI). In some cases, multiple
indicators are used to measure the same human development components. For example, the Legatum Prosperity Index is
composed of 89 indicators that are used to measure eight components: Economy, Entrepreneurship & Opportunity,
Governance, Education, Health, Safety & Security, Personal Freedom, and Social Capital (Legatum Institute, 2015a).
EVAN S S CHOOL POLI CY ANAL YSI S A ND RESEA RC H (EPA R) |
10
Although an index with more indicators is often more comprehensive in terms of coverage of HD components, the meaning,
interpretation, and robustness of the index often becomes ambiguous (Ravallion, 2011). Sixteen of the 23 indices normalize
components, further complicating interpretation of any given result.
Nineteen out of the 23 measures are linear. Three of the 19 (GDP, Genuine Progress Indicator (GPI), Genuine Savings) use
the simple summation method, summing the components together and reporting the total as the final index result. In
general, this method is associated with greater ease of calculation and of interpretation. However, the GPI and Genuine
Savings indices are sums of normalized components, resulting in numerical scores that are more difficult to interpret.
Ten other linear indices use simple, equally-weighted means. The remaining six linear indices (MPI, GGI, AIDI, GFSI, BLI,
HPI) use a weighted mean to denote the relative importance of different components. For example, the default model of
the Global Food Security Index (GFSI) averages the suggested weights from an expert panel for each component to reflect
judgments about their relative importance.
Only four of the 23 indices (HDI, GII, GDI, and IHDI) use non-linear approaches involving geometric or power means, and all
four use relatively few indicators (six or fewer). These four indices are the most prevalent measures of HD published by the
UNDP. Their calculation approach favors countries that are doing relatively well in all aspects of human development, and
magnifies the weaknesses of countries that perform poorly on any given subcategory.
Lastly, time series comparability, indicating whether indices can be used to compare performance over time, is possible
for nearly three quarters of the indices (17 out of 23). In some cases, comparison over time is not possible because indices
are new, or because indices changed their formulas at some point and have not been recalculated for previous years,
limiting the period of comparability (e.g., Gender Inequality Index, Gender-Related Development Index, Human Asset
Index). These indices could be compared over time if consistent time series data were used. Some indices, however, such
as the Global Food Security Index, are calculated using benchmarks that change each year, making comparison over time
impossible.
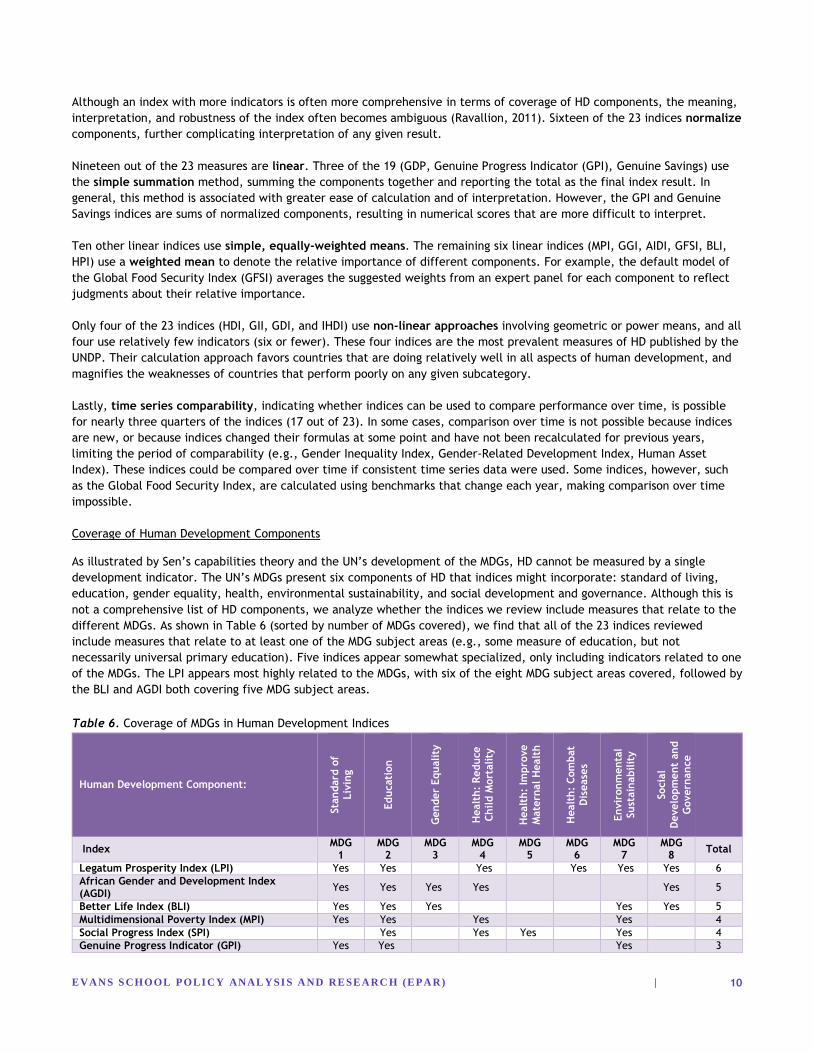
Coverage of Human Development Components
As illustrated by Sen’s capabilities theory and the UN’s development of the MDGs, HD cannot be measured by a single
development indicator. The UN’s MDGs present six components of HD that indices might incorporate: standard of living,
education, gender equality, health, environmental sustainability, and social development and governance. Although this is
not a comprehensive list of HD components, we analyze whether the indices we review include measures that relate to the
different MDGs. As shown in Table 6 (sorted by number of MDGs covered), we find that all of the 23 indices reviewed
include measures that relate to at least one of the MDG subject areas (e.g., some measure of education, but not
necessarily universal primary education). Five indices appear somewhat specialized, only including indicators related to one
of the MDGs. The LPI appears most highly related to the MDGs, with six of the eight MDG subject areas covered, followed by
the BLI and AGDI both covering five MDG subject areas.
Table 6. Coverage of MDGs in Human Development Indices
Human Development Component:
Sta
ndard
of
Liv
ing
Educati
on
Gender
Equality
Healt
h:
Reduce
Child M
ort
ality
Healt
h:
Impro
ve
Mate
rnal H
ealt
h
Healt
h:
Com
bat
Dis
ease
s
Envir
onm
enta
l
Sust
ain
abilit
y
Socia
l
Develo
pm
ent
and
Govern
ance
Index MDG
1 MDG
2 MDG
3 MDG
4 MDG
5 MDG
6 MDG
7 MDG
8 Total
Legatum Prosperity Index (LPI) Yes Yes Yes Yes Yes Yes 6
African Gender and Development Index (AGDI)
Yes Yes Yes Yes Yes 5
Better Life Index (BLI) Yes Yes Yes Yes Yes 5
Multidimensional Poverty Index (MPI) Yes Yes Yes Yes 4
Social Progress Index (SPI) Yes Yes Yes Yes 4
Genuine Progress Indicator (GPI) Yes Yes Yes 3
EVAN S S CHOOL POLI CY ANAL YSI S A ND RESEA RC H (EPA R) |
11
Global Gender Gap Index (GGI) Yes Yes Yes 3
Human Asset Index (HAI) Yes Yes Yes 3
Global Innovation Index Yes Yes Yes 3
Gender Inequality Index (GII) Yes Yes Yes 3
Genuine Savings Yes Yes Yes 3
Gender-Related Development Index (GDI) Yes Yes Yes 3
Quality of Growth Index (QGI) Yes Yes Yes 3
Safe Cities Index Yes Yes Yes 3
Human Development Index (HDI) Yes Yes 2
Inequality-Adjusted HDI (IHDI) Yes Yes 2
Global Food Security Index (GFSI) Yes Yes 2
Gross Domestic Product (GDP) Yes 1
Index of Economic Freedom (IEF) Yes 1
Ease of Doing Business Index (EDBI) Yes 1
Happy Planet Index (HPI) Yes 1
Social Institutions and Gender Index (SIGI) Yes 1
Africa Infrastructure Development Index (AIDI)
Yes 1
Grand Total 13 15 6 7 3 2 9 8
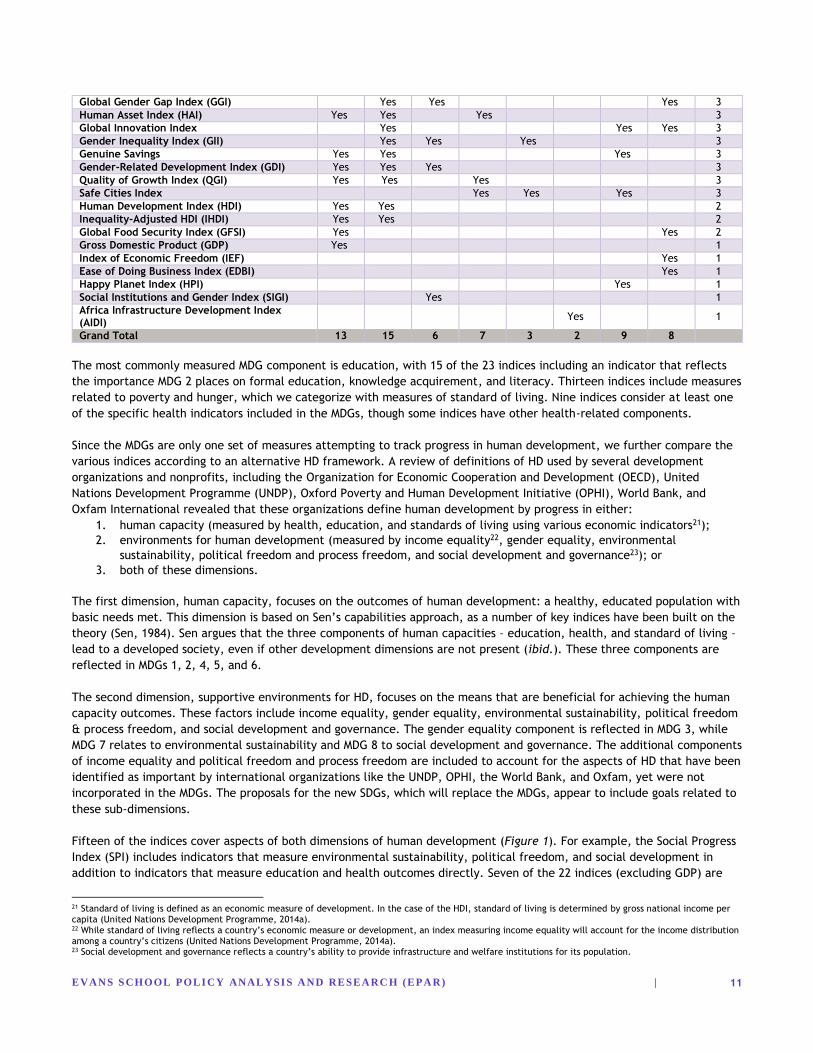
The most commonly measured MDG component is education, with 15 of the 23 indices including an indicator that reflects
the importance MDG 2 places on formal education, knowledge acquirement, and literacy. Thirteen indices include measures
related to poverty and hunger, which we categorize with measures of standard of living. Nine indices consider at least one
of the specific health indicators included in the MDGs, though some indices have other health-related components.
Since the MDGs are only one set of measures attempting to track progress in human development, we further compare the
various indices according to an alternative HD framework. A review of definitions of HD used by several development
organizations and nonprofits, including the Organization for Economic Cooperation and Development (OECD), United
Nations Development Programme (UNDP), Oxford Poverty and Human Development Initiative (OPHI), World Bank, and
Oxfam International revealed that these organizations define human development by progress in either:
1. human capacity (measured by health, education, and standards of living using various economic indicators21);
2. environments for human development (measured by income equality22, gender equality, environmental
sustainability, political freedom and process freedom, and social development and governance23); or
3. both of these dimensions.
The first dimension, human capacity, focuses on the outcomes of human development: a healthy, educated population with
basic needs met. This dimension is based on Sen’s capabilities approach, as a number of key indices have been built on the
theory (Sen, 1984). Sen argues that the three components of human capacities – education, health, and standard of living –
lead to a developed society, even if other development dimensions are not present (ibid.). These three components are
reflected in MDGs 1, 2, 4, 5, and 6.
The second dimension, supportive environments for HD, focuses on the means that are beneficial for achieving the human
capacity outcomes. These factors include income equality, gender equality, environmental sustainability, political freedom
& process freedom, and social development and governance. The gender equality component is reflected in MDG 3, while
MDG 7 relates to environmental sustainability and MDG 8 to social development and governance. The additional components
of income equality and political freedom and process freedom are included to account for the aspects of HD that have been
identified as important by international organizations like the UNDP, OPHI, the World Bank, and Oxfam, yet were not
incorporated in the MDGs. The proposals for the new SDGs, which will replace the MDGs, appear to include goals related to
these sub-dimensions.
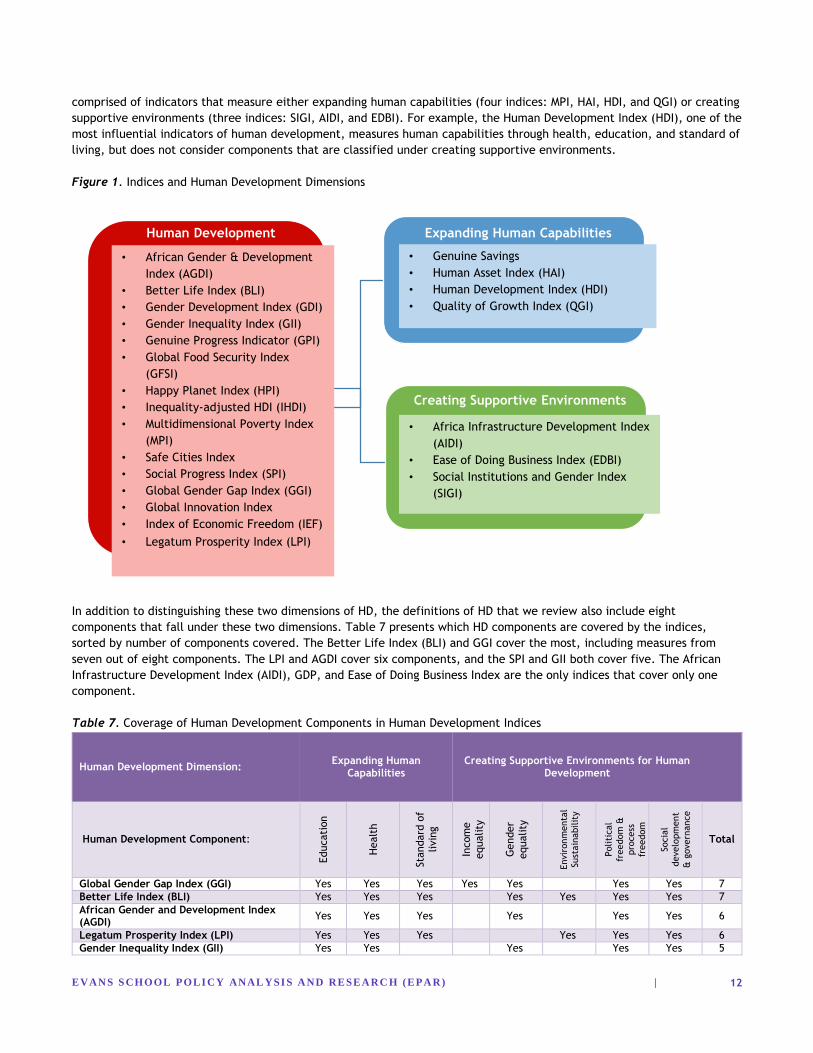
Fifteen of the indices cover aspects of both dimensions of human development (Figure 1). For example, the Social Progress
Index (SPI) includes indicators that measure environmental sustainability, political freedom, and social development in
addition to indicators that measure education and health outcomes directly. Seven of the 22 indices (excluding GDP) are
21 Standard of living is defined as an economic measure of development. In the case of the HDI, standard of living is determined by gross national income per capita (United Nations Development Programme, 2014a). 22 While standard of living reflects a country’s economic measure or development, an index measuring income equality will account for the income distribution among a country’s citizens (United Nations Development Programme, 2014a). 23 Social development and governance reflects a country’s ability to provide infrastructure and welfare institutions for its population.
EVAN S S CHOOL POLI CY ANAL YSI S A ND RESEA RC H (EPA R) |
12
comprised of indicators that measure either expanding human capabilities (four indices: MPI, HAI, HDI, and QGI) or creating
supportive environments (three indices: SIGI, AIDI, and EDBI). For example, the Human Development Index (HDI), one of the
most influential indicators of human development, measures human capabilities through health, education, and standard of
living, but does not consider components that are classified under creating supportive environments.
Figure 1. Indices and Human Development Dimensions
In addition to distinguishing these two dimensions of HD, the definitions of HD that we review also include eight
components that fall under these two dimensions. Table 7 presents which HD components are covered by the indices,
sorted by number of components covered. The Better Life Index (BLI) and GGI cover the most, including measures from
seven out of eight components. The LPI and AGDI cover six components, and the SPI and GII both cover five. The African
Infrastructure Development Index (AIDI), GDP, and Ease of Doing Business Index are the only indices that cover only one
component.
Table 7. Coverage of Human Development Components in Human Development Indices
Human Development Dimension: Expanding Human
Capabilities Creating Supportive Environments for Human
Development
Human Development Component:
Educati
on
Healt
h
Sta
ndard
of
livin
g
Incom
e
equality
Gender
equality
Envir
onm
enta
l
Sust
ain
abilit
y
Politi
cal
freedom
&
pro
cess
freedom
Socia
l
develo
pm
ent
& g
overn
ance
Total
Global Gender Gap Index (GGI) Yes Yes Yes Yes Yes Yes Yes 7
Better Life Index (BLI) Yes Yes Yes Yes Yes Yes Yes 7
African Gender and Development Index (AGDI)
Yes Yes Yes Yes Yes Yes 6
Legatum Prosperity Index (LPI) Yes Yes Yes Yes Yes Yes 6
Gender Inequality Index (GII) Yes Yes Yes Yes Yes 5
Human Development Expanding Human Capabilities
Creating Supportive Environments
• Africa Infrastructure Development Index
(AIDI)
• Ease of Doing Business Index (EDBI)
• Social Institutions and Gender Index
(SIGI)
• Genuine Savings
• Human Asset Index (HAI)
• Human Development Index (HDI)
• Quality of Growth Index (QGI)
• African Gender & Development
Index (AGDI)
• Better Life Index (BLI)
• Gender Development Index (GDI)
• Gender Inequality Index (GII)
• Genuine Progress Indicator (GPI)
• Global Food Security Index
(GFSI)
• Happy Planet Index (HPI)
• Inequality-adjusted HDI (IHDI)
• Multidimensional Poverty Index
(MPI)
• Safe Cities Index
• Social Progress Index (SPI)
• Global Gender Gap Index (GGI)
• Global Innovation Index
• Index of Economic Freedom (IEF)
• Legatum Prosperity Index (LPI)
EVAN S S CHOOL POLI CY ANAL YSI S A ND RESEA RC H (EPA R) |
13
Social Progress Index (SPI) Yes Yes Yes Yes Yes 5
Global Innovation Index Yes Yes Yes Yes 4
Inequality-Adjusted HDI (IHDI) Yes Yes Yes Yes 4
Global Food Security Index (GFSI) Yes Yes Yes Yes 4
Gender-Related Development Index (GDI) Yes Yes Yes Yes 4
Human Development Index (HDI) Yes Yes Yes 3
Genuine Progress Indicator (GPI) Yes Yes Yes 3
Index of Economic Freedom (IEF) Yes Yes Yes 3
Multidimensional Poverty Index (MPI) Yes Yes Yes 3
Genuine Savings Yes Yes Yes 3
Quality of Growth Index (QGI) Yes Yes Yes 3
Safe Cities Index Yes Yes Yes 3
Happy Planet Index (HPI) Yes Yes 2
Human Asset Index (HAI) Yes Yes 2
Social Institutions and Gender Index (SIGI) Yes Yes 2
Gross Domestic Product (GDP) Yes 1
Ease of Doing Business Index (EDBI) Yes 1
Africa Infrastructure Development Index (AIDI)
Yes 1
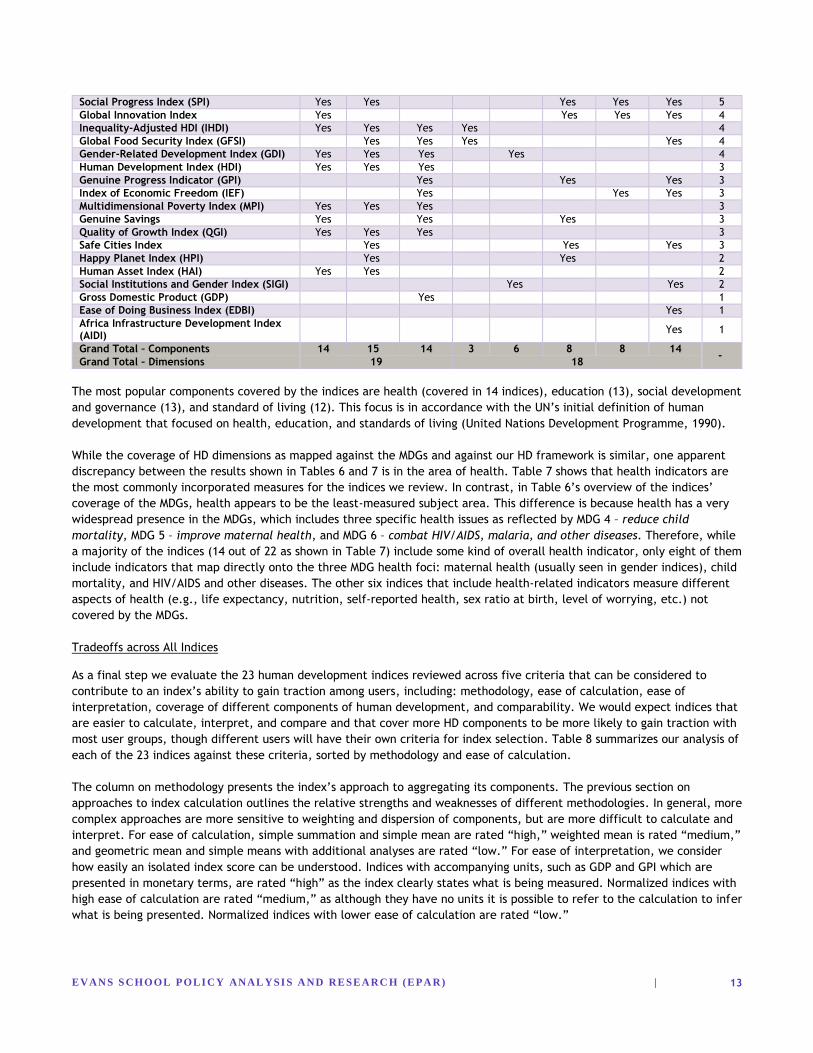
Grand Total – Components 14 15 14 3 6 8 8 14 -
Grand Total – Dimensions 19 18
The most popular components covered by the indices are health (covered in 14 indices), education (13), social development
and governance (13), and standard of living (12). This focus is in accordance with the UN’s initial definition of human
development that focused on health, education, and standards of living (United Nations Development Programme, 1990).
While the coverage of HD dimensions as mapped against the MDGs and against our HD framework is similar, one apparent
discrepancy between the results shown in Tables 6 and 7 is in the area of health. Table 7 shows that health indicators are
the most commonly incorporated measures for the indices we review. In contrast, in Table 6’s overview of the indices’
coverage of the MDGs, health appears to be the least-measured subject area. This difference is because health has a very
widespread presence in the MDGs, which includes three specific health issues as reflected by MDG 4 – reduce child
mortality, MDG 5 – improve maternal health, and MDG 6 – combat HIV/AIDS, malaria, and other diseases. Therefore, while
a majority of the indices (14 out of 22 as shown in Table 7) include some kind of overall health indicator, only eight of them
include indicators that map directly onto the three MDG health foci: maternal health (usually seen in gender indices), child
mortality, and HIV/AIDS and other diseases. The other six indices that include health-related indicators measure different
aspects of health (e.g., life expectancy, nutrition, self-reported health, sex ratio at birth, level of worrying, etc.) not
covered by the MDGs.
Tradeoffs across All Indices
As a final step we evaluate the 23 human development indices reviewed across five criteria that can be considered to
contribute to an index’s ability to gain traction among users, including: methodology, ease of calculation, ease of
interpretation, coverage of different components of human development, and comparability. We would expect indices that
are easier to calculate, interpret, and compare and that cover more HD components to be more likely to gain traction with
most user groups, though different users will have their own criteria for index selection. Table 8 summarizes our analysis of
each of the 23 indices against these criteria, sorted by methodology and ease of calculation.
The column on methodology presents the index’s approach to aggregating its components. The previous section on
approaches to index calculation outlines the relative strengths and weaknesses of different methodologies. In general, more
complex approaches are more sensitive to weighting and dispersion of components, but are more difficult to calculate and
interpret. For ease of calculation, simple summation and simple mean are rated “high,” weighted mean is rated “medium,”
and geometric mean and simple means with additional analyses are rated “low.” For ease of interpretation, we consider
how easily an isolated index score can be understood. Indices with accompanying units, such as GDP and GPI which are
presented in monetary terms, are rated “high” as the index clearly states what is being measured. Normalized indices with
high ease of calculation are rated “medium,” as although they have no units it is possible to refer to the calculation to infer
what is being presented. Normalized indices with lower ease of calculation are rated “low.”
EVAN S S CHOOL POLI CY ANAL YSI S A ND RESEA RC H (EPA R) |
14
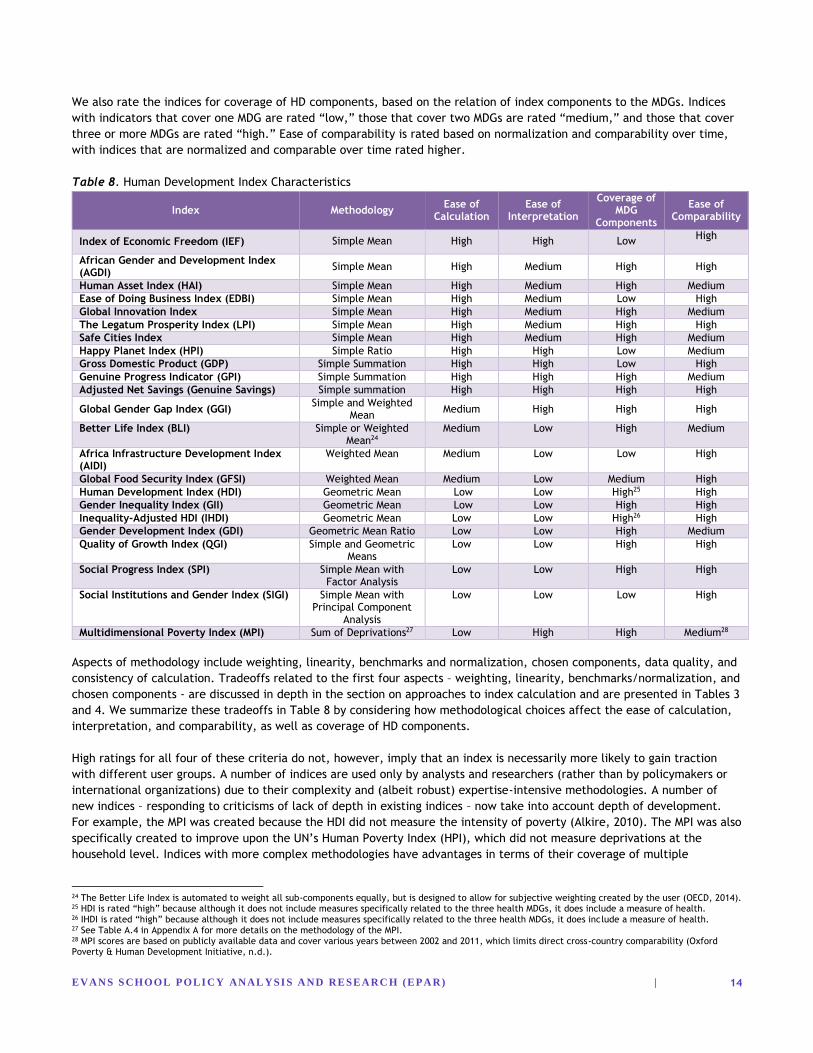
We also rate the indices for coverage of HD components, based on the relation of index components to the MDGs. Indices
with indicators that cover one MDG are rated “low,” those that cover two MDGs are rated “medium,” and those that cover
three or more MDGs are rated “high.” Ease of comparability is rated based on normalization and comparability over time,
with indices that are normalized and comparable over time rated higher.
Table 8. Human Development Index Characteristics
Index Methodology Ease of
Calculation Ease of
Interpretation
Coverage of MDG
Components
Ease of Comparability
Index of Economic Freedom (IEF) Simple Mean High High Low High
African Gender and Development Index (AGDI)
Simple Mean High Medium High High
Human Asset Index (HAI) Simple Mean High Medium High Medium
Ease of Doing Business Index (EDBI) Simple Mean High Medium Low High
Global Innovation Index Simple Mean High Medium High Medium
The Legatum Prosperity Index (LPI) Simple Mean High Medium High High
Safe Cities Index Simple Mean High Medium High Medium
Happy Planet Index (HPI) Simple Ratio High High Low Medium
Gross Domestic Product (GDP) Simple Summation High High Low High
Genuine Progress Indicator (GPI) Simple Summation High High High Medium
Adjusted Net Savings (Genuine Savings) Simple summation High High High High
Global Gender Gap Index (GGI) Simple and Weighted
Mean Medium High High High
Better Life Index (BLI) Simple or Weighted Mean24
Medium Low High Medium
Africa Infrastructure Development Index (AIDI)
Weighted Mean Medium Low Low High
Global Food Security Index (GFSI) Weighted Mean Medium Low Medium High
Human Development Index (HDI) Geometric Mean Low Low High25 High
Gender Inequality Index (GII) Geometric Mean Low Low High High
Inequality-Adjusted HDI (IHDI) Geometric Mean Low Low High26 High
Gender Development Index (GDI) Geometric Mean Ratio Low Low High Medium
Quality of Growth Index (QGI) Simple and Geometric Means
Low Low High High
Social Progress Index (SPI) Simple Mean with Factor Analysis
Low Low High High
Social Institutions and Gender Index (SIGI) Simple Mean with Principal Component
Analysis
Low Low Low High
Multidimensional Poverty Index (MPI) Sum of Deprivations27 Low High High Medium28
Aspects of methodology include weighting, linearity, benchmarks and normalization, chosen components, data quality, and
consistency of calculation. Tradeoffs related to the first four aspects – weighting, linearity, benchmarks/normalization, and
chosen components - are discussed in depth in the section on approaches to index calculation and are presented in Tables 3
and 4. We summarize these tradeoffs in Table 8 by considering how methodological choices affect the ease of calculation,
interpretation, and comparability, as well as coverage of HD components.
High ratings for all four of these criteria do not, however, imply that an index is necessarily more likely to gain traction
with different user groups. A number of indices are used only by analysts and researchers (rather than by policymakers or
international organizations) due to their complexity and (albeit robust) expertise-intensive methodologies. A number of
new indices – responding to criticisms of lack of depth in existing indices – now take into account depth of development.
For example, the MPI was created because the HDI did not measure the intensity of poverty (Alkire, 2010). The MPI was also
specifically created to improve upon the UN’s Human Poverty Index (HPI), which did not measure deprivations at the
household level. Indices with more complex methodologies have advantages in terms of their coverage of multiple
24 The Better Life Index is automated to weight all sub-components equally, but is designed to allow for subjective weighting created by the user (OECD, 2014). 25 HDI is rated “high” because although it does not include measures specifically related to the three health MDGs, it does include a measure of health. 26 IHDI is rated “high” because although it does not include measures specifically related to the three health MDGs, it does include a measure of health. 27 See Table A.4 in Appendix A for more details on the methodology of the MPI. 28 MPI scores are based on publicly available data and cover various years between 2002 and 2011, which limits direct cross-country comparability (Oxford Poverty & Human Development Initiative, n.d.).
EVAN S S CHOOL POLI CY ANAL YSI S A ND RESEA RC H (EPA R) |
15
components of human development and their attention to weighting and dispersion of index components, but this also
makes them more difficult to compute and interpret. As a result, while many analysts and researchers may find these
indices useful, they may be less helpful for politicians, NGOs, and government officials. Some authors therefore argue that
complex indices like the Gender Inequality Index and the Global Food Security Index are not especially useful (Branisa et
al., 2014; Pangaribowo et al., 2013). Further, even those indices specifically designed to improve on existing indices may
not gain traction until enough time has passed for them to be evaluated and to build a consistent data series.
Beyond ease of calculation, interpretation, and comparability, users may also evaluate indices according to their coverage
of HD components. While global development is entering a new era of post-2015 agenda, the MDGs continue to be an
important set of HD measures. They will be the foundation of the development of the new SDGs, which are intended as
global targets for achieving human development (United Nations, 2015). The components of HD represented by the MDGs
are therefore a useful basis for comparing the coverage of composite HD indices. Composite indices are valuable
communication and political tools due to their ability to integrate large amounts of information into relatively, easily
understood formats (Freudenberg, 2003). Human development composite indices that include indicators that are related to
the MDGs may therefore be more helpful in informing development progress in a concise and easy to communicate manner.
As previously highlighted in Table 6, not all indices map closely onto the MDGs. For instance, while eight out of the MPI’s
ten indicators relate directly to MDG targets, other indices like the Ease of Doing Business Index only relate to one MDG.
These indices may be criticized for having too narrow a focus within human development. Broad coverage of different
components of human development is, however, less important than coverage of specific components of interest to the
particular audiences using each index.
As a result of these tradeoffs, human development indices may be most effective and useful when complemented by other
indices rather than considered independently. For instance, the Human Asset Index focuses on the outputs of a country,
and therefore often complements the MPI or HDI well, which are both focused on inputs (Markova, 2013). The Social
Progress Index, a new index, was created in order to complement GDP over time (Porter, et al., 2015). Users may choose to
review multiple indices that consider different components of human development, or may consider indices that measure
similar components but with different methodologies.
Three other aspects of index calculation are not presented in Table 8: data quality, calculation consistency, and
geographical focus. Because of the nature of international data, all indices face issues with data quality and reliability.
Data for governments and for development organizations are gathered locally and then aggregated to measure country-
wide growth. Several authors have noted that national data are often political, and may contain errors due to data
updating, formula revisions, and country thresholds that change each year (Jervon, 2013; Wolff, et al., 2011; Tokuyama &
Pillarisetti, 2009; Stanton, 2007). The lack of validity and reliability of state-level data therefore weakens the validity and
reliability of the national and international data presented in composite indices (Jerven, 2013). Appendix D on data
availability and quality provides an illustration of how data quality issues can lead to differences in measures or rankings
using the example of GDP.
Indices may also be evaluated according to whether they are calculated consistently from year to year. The Better Life
Index allows anyone interested to personalize its methodology by applying different indicator weights. This personalization
allows individual users to make their own decisions about the relative importance of difference dimensions of human
development, but creates challenges for comparing across time or countries. While this index is popular among the media
and citizens, it is not used by governments or international organizations for this reason (OECD, 2014). Other indices,
notably the HDI, also change how they are calculated over time (United Nations Development Programme, 2014a). Indices
whose methodology changes over time are more difficult to interpret and less useful for comparison, unless they are
recalculated for previous years after each methodology change.
Another feature of indices that may affect their relevance to different users is focus on certain geographic areas. This
criterion is discussed in the specific index summary tables in Appendix A. For example, the African Infrastructure and
Development Index and the African Gender and Development Index are Africa-centric, allowing for better measurement
within Africa but not accounting for other developing nations. On the other hand, the Better Life Index only measures
human development across the 34 OECD member nations, and therefore ignores developing countries altogether (OECD,
2014). Indices that measured human development in only one country, such as Gross National Happiness in Bhutan, were
EVAN S S CHOOL POLI CY ANAL YSI S A ND RESEA RC H (EPA R) |
16
not included in this report due to their inability to make cross-country comparisons, but may also be used to measure
human development.
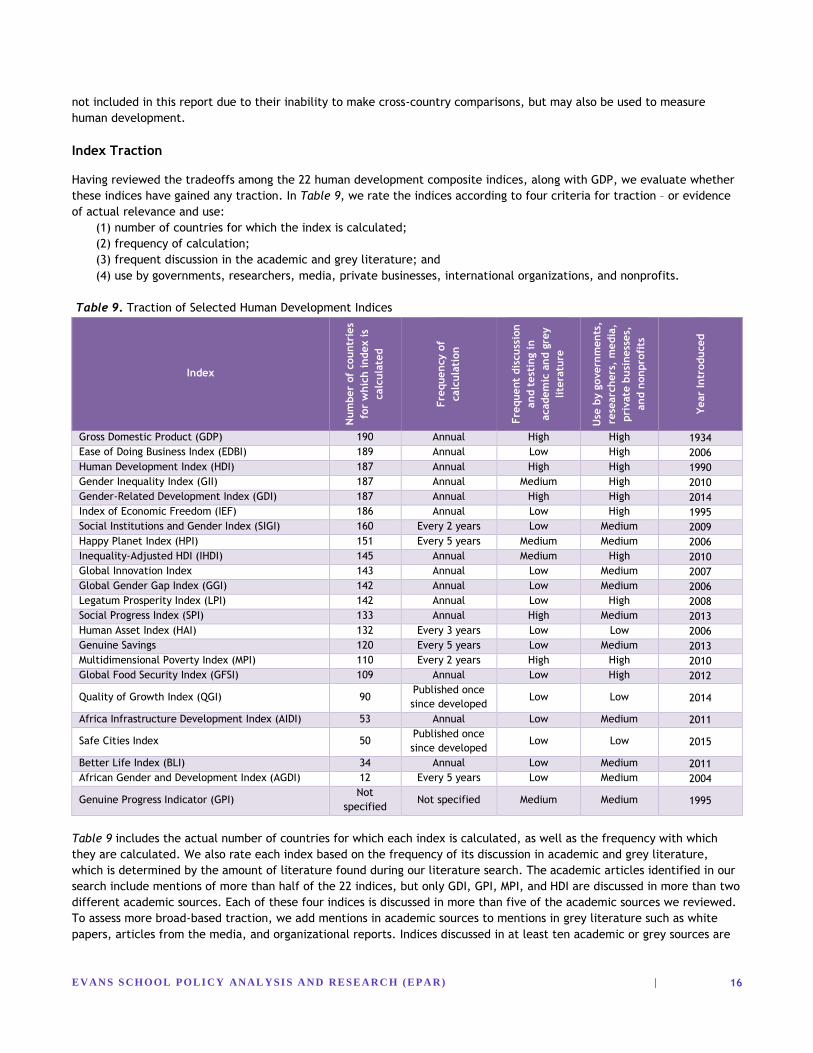
Index Traction
Having reviewed the tradeoffs among the 22 human development composite indices, along with GDP, we evaluate whether
these indices have gained any traction. In Table 9, we rate the indices according to four criteria for traction – or evidence
of actual relevance and use:
(1) number of countries for which the index is calculated;
(2) frequency of calculation;
(3) frequent discussion in the academic and grey literature; and
(4) use by governments, researchers, media, private businesses, international organizations, and nonprofits.
Table 9. Traction of Selected Human Development Indices
Index
Num
ber
of
countr
ies
for
whic
h index is
calc
ula
ted
Fre
quency o
f
calc
ula
tion
Fre
quent
dis
cuss
ion
and t
est
ing in
academ
ic a
nd g
rey
lite
ratu
re
Use
by g
overn
ments
,
rese
arc
hers
, m
edia
,
pri
vate
busi
ness
es,
and n
onpro
fits
Year
Intr
oduced
Gross Domestic Product (GDP) 190 Annual High High 1934
Ease of Doing Business Index (EDBI) 189 Annual Low High 2006
Human Development Index (HDI) 187 Annual High High 1990
Gender Inequality Index (GII) 187 Annual Medium High 2010
Gender-Related Development Index (GDI) 187 Annual High High 2014
Index of Economic Freedom (IEF) 186 Annual Low High 1995
Social Institutions and Gender Index (SIGI) 160 Every 2 years Low Medium 2009
Happy Planet Index (HPI) 151 Every 5 years Medium Medium 2006
Inequality-Adjusted HDI (IHDI) 145 Annual Medium High 2010
Global Innovation Index 143 Annual Low Medium 2007
Global Gender Gap Index (GGI) 142 Annual Low Medium 2006
Legatum Prosperity Index (LPI) 142 Annual Low High 2008
Social Progress Index (SPI) 133 Annual High Medium 2013
Human Asset Index (HAI) 132 Every 3 years Low Low 2006
Genuine Savings 120 Every 5 years Low Medium 2013
Multidimensional Poverty Index (MPI) 110 Every 2 years High High 2010
Global Food Security Index (GFSI) 109 Annual Low High 2012
Quality of Growth Index (QGI) 90 Published once
since developed Low Low 2014
Africa Infrastructure Development Index (AIDI) 53 Annual Low Medium 2011
Safe Cities Index 50 Published once
since developed Low Low 2015
Better Life Index (BLI) 34 Annual Low Medium 2011
African Gender and Development Index (AGDI) 12 Every 5 years Low Medium 2004
Genuine Progress Indicator (GPI) Not
specified Not specified Medium Medium 1995
Table 9 includes the actual number of countries for which each index is calculated, as well as the frequency with which
they are calculated. We also rate each index based on the frequency of its discussion in academic and grey literature,
which is determined by the amount of literature found during our literature search. The academic articles identified in our
search include mentions of more than half of the 22 indices, but only GDI, GPI, MPI, and HDI are discussed in more than two
different academic sources. Each of these four indices is discussed in more than five of the academic sources we reviewed.
To assess more broad-based traction, we add mentions in academic sources to mentions in grey literature such as white
papers, articles from the media, and organizational reports. Indices discussed in at least ten academic or grey sources are
EVAN S S CHOOL POLI CY ANAL YSI S A ND RESEA RC H (EPA R) |
17
rated as “high,” indices discussed in between five and nine pieces of literature are rated as “medium,” and indices
discussed in fewer than five articles are rated as “low.” Finally, we rate the indices on use by governments, researchers,
media, private businesses, international organizations, and nonprofits as identified during the initial literature search.
Indices used by only one field of users (for instance: researchers, or nonprofits) are rated “low,” those that are used by two
fields of users are rated “medium,” and those used by users from at least three different fields are rated “high.”
According to our criteria, GDP, the HDI, the Multidimensional Poverty Index (MPI), and the Gender Development Index (GDI)
are the only indices with high levels of discussion and testing as well as use by different groups. If we also consider
frequency of measurement and number of countries included, GDP and the HDI stand out as the indices with the highest
traction. This finding is not surprising as these were the first indices introduced, but the GDI has gained significant traction
in spite of its recent introduction. Other indices which have gained traction in terms of discussion, testing, and use include
the Genuine Progress Indicator (GPI), Happy Planet Index (HPI), Gender Inequality Index (GII), Inequality-adjusted HDI
(IHDI), Better Life Index (BLI), and Social Progress Index (SPI). Of these ten indices that appear more widely discussed and
used, five (HDI, MPI, GDI, GII, and IHDI) are published by the United Nations Development Programme (UNDP).
In many cases, such as the African Gender and Development Index (AGDI), Ease of Doing Business Index (EDBI), Global
Gender Gap Index (GGI), Global Innovation Index, Legatum Prosperity Index (LPI), African Infrastructure Development Index
(AIDI), Global Food Security Index (GFSI), and Genuine Savings, indices have gained traction in terms of use by different
groups, but have been subjected to less academic discussion and testing.
The novelty of an index can be a weakness in terms of traction. Since the development of the HDI in 1990, there have been
a number of new indices created. While the selected human development indices were all developed after 1990, 11 of the
22 indices were developed in 2010 or later, suggesting that there is increasing interest in measuring human development.
The novelty of these indices by definition indicates that they have not had as much time to receive attention and to garner
support or receive criticism, or to establish a data series for comparisons over time. The increasing number of indices,
however, provides a larger sampling for development organizations and researchers to determine strengths and weaknesses
that may improve current and future indices, and to understand what characteristics are most relevant to different user
groups.
Conclusion
Since the creation of the HDI in 1990 based on Sen’s Capabilities Approach, numerous other composite indices have
emerged in an attempt to replace or supplement GDP in measuring human development. We identified 22 composite
development indices that meet the following criteria: 1) incorporating measures of multiple components of human
development; 2) aggregating multiple components into a single composite index; 3) continued use; and 4) discussion or
adoption by organizations or people beyond the author.
We review the indicators used to calculate each index and map them against components of human development included
in the definitions of major international development organizations. We find that the most common components of human
development covered by the indices are health (covered in 14 indices), education (13), social development and governance
(13), and standard of living (12). Components relating to creating a supporting environment, such as income equality,
gender equality, and environmental sustainability, are less common overall, but are increasingly used in more recent
indices.
As a result of their unique characteristics and construction methodologies, each human development index has its own
strengths and weaknesses that affect their relevance to users. Indices with more complex methodologies can be more
difficult to calculate and interpret, but may have value for development researchers looking for more nuanced measures.
Indices that include a greater number of indicators may be more difficult to compare but may be useful as quick multi-
faceted measure of human development. Indices with simpler methodological approaches appear to benefit from greater
ease of calculation, interpretation, and comparison, but might be criticized for aggregating diverse indicators or for
arbitrary weighting of components.
Some critics of composite indices argue that individual index scores may be insufficient measures to guide policy (Ravallion,
2011) as they may mask information about progress or gaps in specific aspects of human development. Using a combination
EVAN S S CHOOL POLI CY ANAL YSI S A ND RESEA RC H (EPA R) |
18
of indices provides a more comprehensive view of human development. A dashboard approach showcasing individual
indicators separately can also be an alternative which can fill this gap (Ibid.). For example, while the HDI, HAI and MPI all
include education indicators, the HDI measures education attainment through mean and expected years of schooling, the
HAI looks at school enrolment ratios and the MPI measures both (Markova, 2013). In addition, the three indices also
measure health differently. The HDI looks at life expectancy at birth, but the MPI and HAI both include infant mortality
rates (Ibid.). These three indices also have different methodological approaches, as the MPI is calculated as the sum of
deprivations across its sub-components while the HAI is a simple mean and the HDI is a geometric mean. Reviewing these
indices together can therefore provide a more nuanced view of human development progress.
Currently, only GDP, the HDI, the Multidimensional Poverty Index (MPI), and the Gender Development Index (GDI) stand out
as indices with high levels traction. These four indices are frequently discussed and tested and are used by many different
groups, including governments, the media, and development researchers and practitioners. However, several other indices
have achieved some traction, including the Genuine Progress Indicator (GPI), Happy Planet Index (HPI), Gender Inequality
Index (GII), Inequality-adjusted HDI (IHDI), Better Life Index (BLI), and Social Progress Index (SPI). As many of the indices
we review were developed in the last five years, we might expect to see several of them gain traction over time.
Because of the multidimensionality of the concept of human well-being, measuring a country’s progress of human
development can be a complex task. Composite indices of human development represent useful supplements to the
income-based development indicators that are often used to measure human development progress (Booysen, 2002).
Furthermore, their ability to simplify complex measurement constructs is also helpful for catching the eye and focusing
attention (Ibid.), making composite indices potentially useful communication and political tools.
Please direct comments or questions about this research to Principal Investigator Leigh Anderson at [email protected].
EVAN S S CHOOL POLI CY ANAL YSI S A ND RESEA RC H (EPA R) |
19
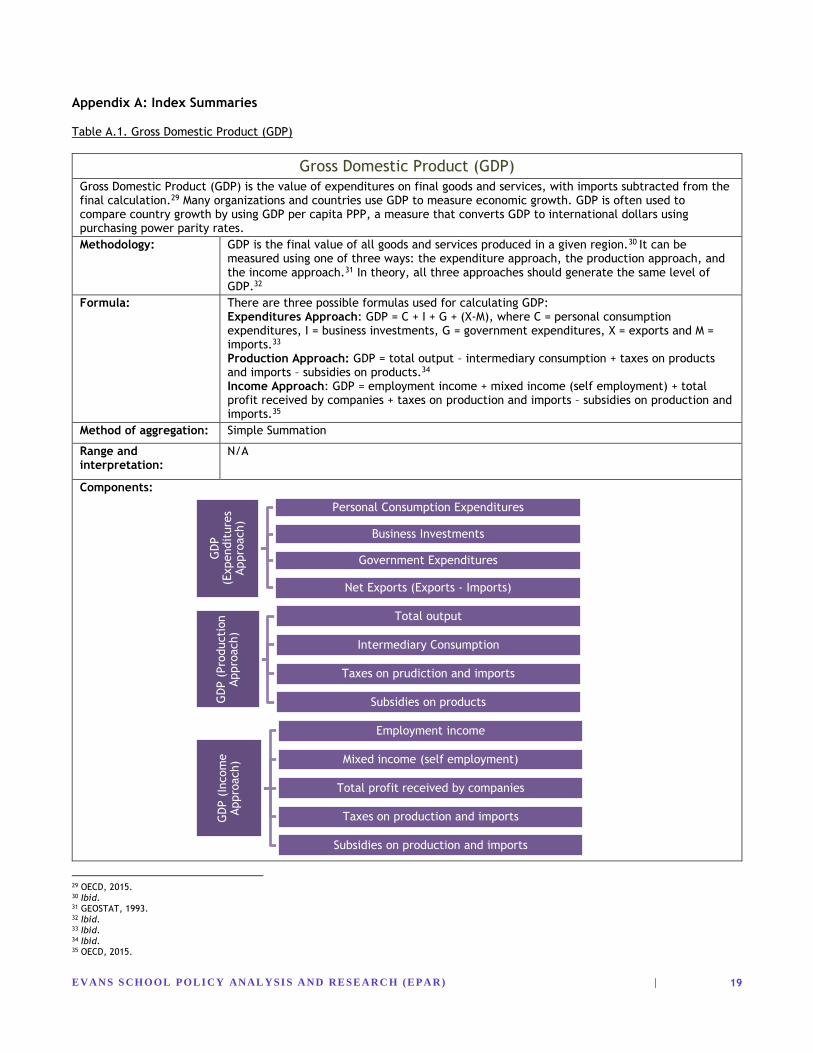
Appendix A: Index Summaries
Table A.1. Gross Domestic Product (GDP)
Gross Domestic Product (GDP)
Gross Domestic Product (GDP) is the value of expenditures on final goods and services, with imports subtracted from the final calculation.29 Many organizations and countries use GDP to measure economic growth. GDP is often used to compare country growth by using GDP per capita PPP, a measure that converts GDP to international dollars using purchasing power parity rates.
Methodology: GDP is the final value of all goods and services produced in a given region.30 It can be measured using one of three ways: the expenditure approach, the production approach, and the income approach.31 In theory, all three approaches should generate the same level of GDP.32
Formula: There are three possible formulas used for calculating GDP: Expenditures Approach: GDP = C + I + G + (X-M), where C = personal consumption expenditures, I = business investments, G = government expenditures, X = exports and M = imports.33 Production Approach: GDP = total output – intermediary consumption + taxes on products and imports – subsidies on products.34 Income Approach: GDP = employment income + mixed income (self employment) + total profit received by companies + taxes on production and imports – subsidies on production and imports.35
Method of aggregation: Simple Summation
Range and interpretation:
N/A
Components:
29 OECD, 2015. 30 Ibid. 31 GEOSTAT, 1993. 32 Ibid. 33 Ibid. 34 Ibid. 35 OECD, 2015.
GD
P
(Expendit
ure
s Appro
ach)
Personal Consumption Expenditures
Business Investments
Government Expenditures
Net Exports (Exports - Imports)
GD
P (
Pro
ducti
on
Appro
ach)
Total output
Intermediary Consumption
Taxes on prudiction and imports
Subsidies on products
GD
P (
Incom
e
Appro
ach)
Employment income
Mixed income (self employment)
Total profit received by companies
Taxes on production and imports
Subsidies on production and imports
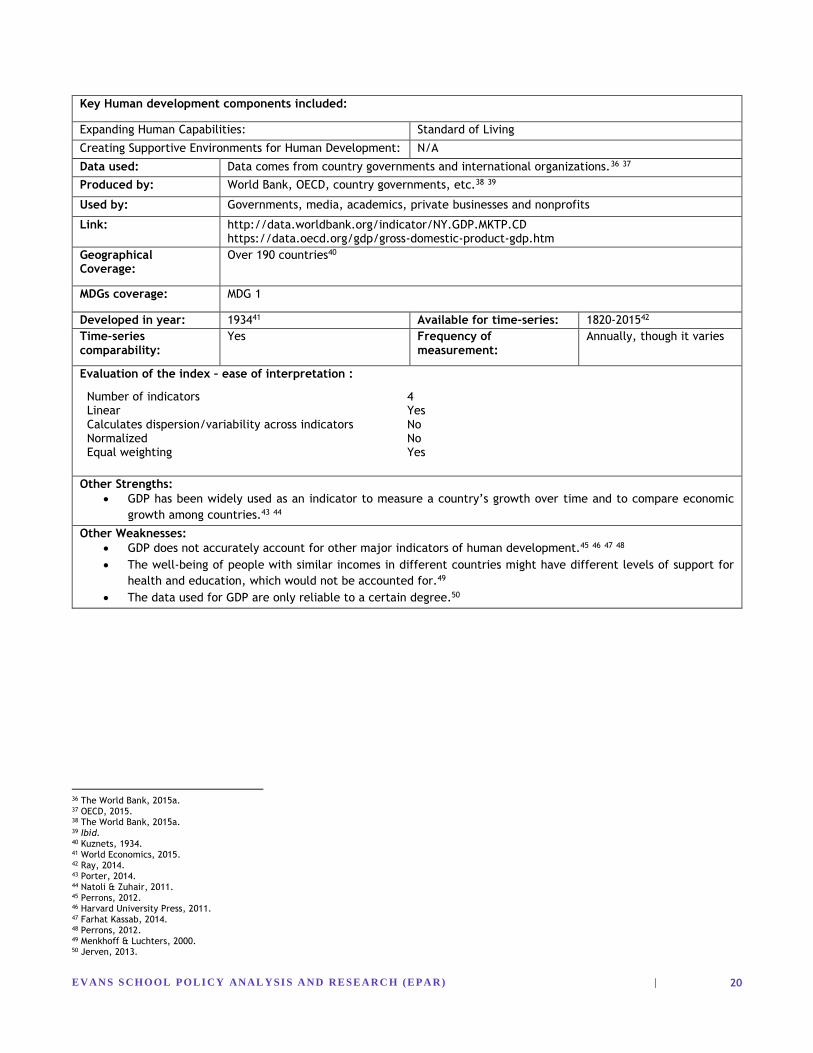
EVAN S S CHOOL POLI CY ANAL YSI S A ND RESEA RC H (EPA R) |
20
Key Human development components included:
Expanding Human Capabilities: Standard of Living
Creating Supportive Environments for Human Development: N/A
Data used: Data comes from country governments and international organizations.36 37
Produced by: World Bank, OECD, country governments, etc.38 39
Used by: Governments, media, academics, private businesses and nonprofits
Link: http://data.worldbank.org/indicator/NY.GDP.MKTP.CD https://data.oecd.org/gdp/gross-domestic-product-gdp.htm
Geographical Coverage:
Over 190 countries40
MDGs coverage: MDG 1
Developed in year: 193441 Available for time-series: 1820-201542
Time-series comparability:
Yes Frequency of measurement:
Annually, though it varies
Evaluation of the index – ease of interpretation :
Number of indicators 4 Linear Yes Calculates dispersion/variability across indicators No Normalized No Equal weighting Yes
Other Strengths:
GDP has been widely used as an indicator to measure a country’s growth over time and to compare economic
growth among countries.43 44
Other Weaknesses:
GDP does not accurately account for other major indicators of human development.45 46 47 48
The well-being of people with similar incomes in different countries might have different levels of support for
health and education, which would not be accounted for.49
The data used for GDP are only reliable to a certain degree.50
36 The World Bank, 2015a. 37 OECD, 2015. 38 The World Bank, 2015a. 39 Ibid. 40 Kuznets, 1934. 41 World Economics, 2015. 42 Ray, 2014. 43 Porter, 2014. 44 Natoli & Zuhair, 2011. 45 Perrons, 2012. 46 Harvard University Press, 2011. 47 Farhat Kassab, 2014. 48 Perrons, 2012. 49 Menkhoff & Luchters, 2000. 50 Jerven, 2013.
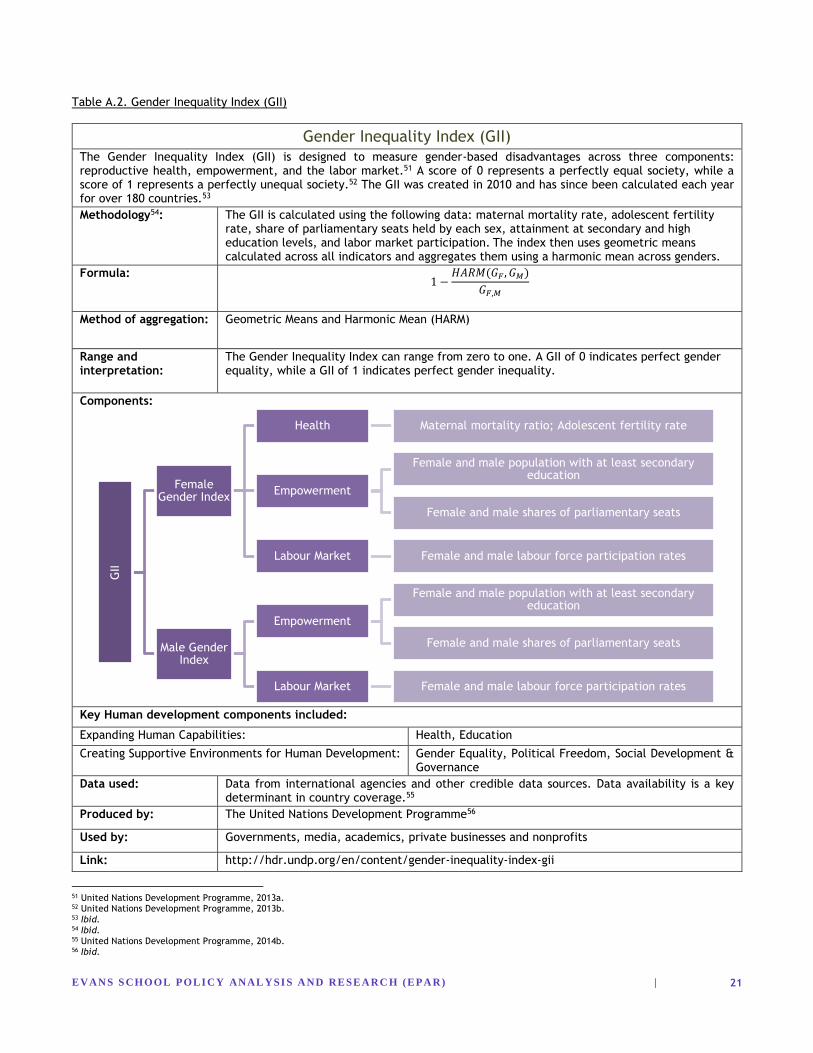
EVAN S S CHOOL POLI CY ANAL YSI S A ND RESEA RC H (EPA R) |
21
Table A.2. Gender Inequality Index (GII)
Gender Inequality Index (GII)
The Gender Inequality Index (GII) is designed to measure gender-based disadvantages across three components: reproductive health, empowerment, and the labor market.51 A score of 0 represents a perfectly equal society, while a score of 1 represents a perfectly unequal society.52 The GII was created in 2010 and has since been calculated each year for over 180 countries.53
Methodology54: The GII is calculated using the following data: maternal mortality rate, adolescent fertility rate, share of parliamentary seats held by each sex, attainment at secondary and high education levels, and labor market participation. The index then uses geometric means calculated across all indicators and aggregates them using a harmonic mean across genders.
Formula: 1 −
𝐻𝐴𝑅𝑀(𝐺𝐹 , 𝐺𝑀)
𝐺𝐹,𝑀
Method of aggregation: Geometric Means and Harmonic Mean (HARM)
Range and interpretation:
The Gender Inequality Index can range from zero to one. A GII of 0 indicates perfect gender equality, while a GII of 1 indicates perfect gender inequality.
Components:
Key Human development components included:
Expanding Human Capabilities: Health, Education
Creating Supportive Environments for Human Development: Gender Equality, Political Freedom, Social Development & Governance
Data used: Data from international agencies and other credible data sources. Data availability is a key determinant in country coverage.55
Produced by: The United Nations Development Programme56
Used by: Governments, media, academics, private businesses and nonprofits
Link: http://hdr.undp.org/en/content/gender-inequality-index-gii
51 United Nations Development Programme, 2013a. 52 United Nations Development Programme, 2013b. 53 Ibid. 54 Ibid. 55 United Nations Development Programme, 2014b. 56 Ibid.
GII
Female Gender Index
Health Maternal mortality ratio; Adolescent fertility rate
Empowerment
Female and male population with at least secondary education
Female and male shares of parliamentary seats
Labour Market Female and male labour force participation rates
Male Gender Index
Empowerment
Female and male population with at least secondary education
Female and male shares of parliamentary seats
Labour Market Female and male labour force participation rates
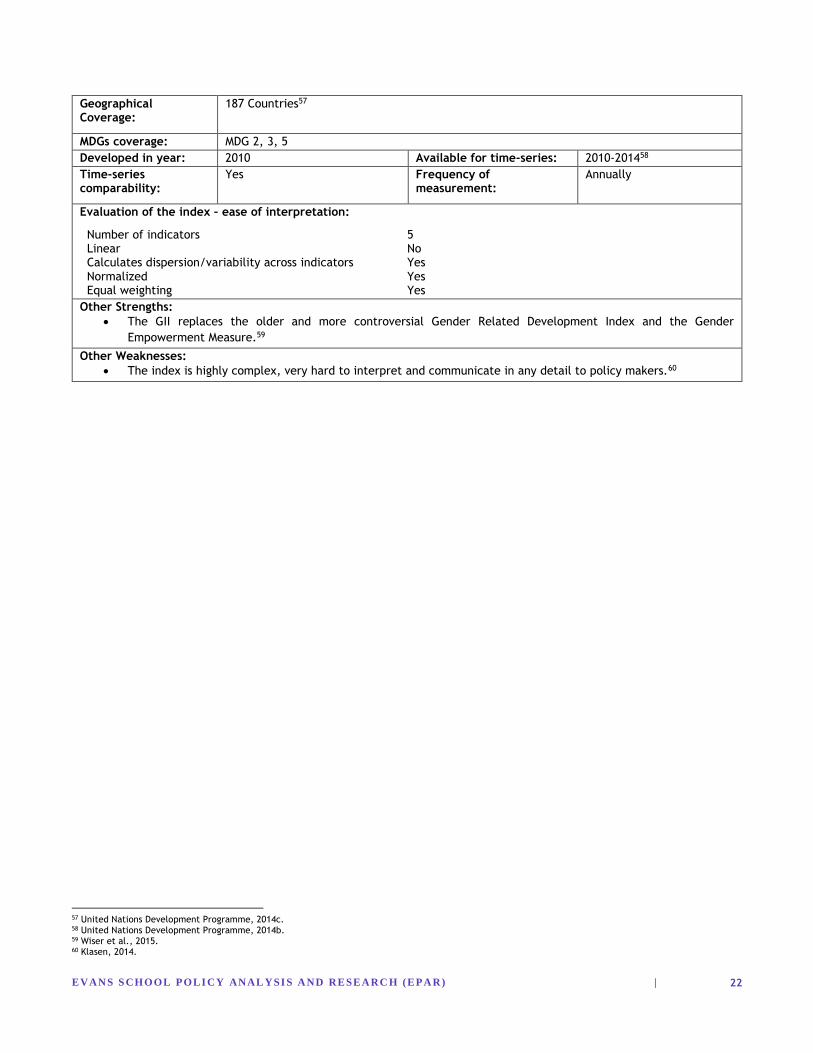
EVAN S S CHOOL POLI CY ANAL YSI S A ND RESEA RC H (EPA R) |
22
Geographical Coverage:
187 Countries57
MDGs coverage: MDG 2, 3, 5
Developed in year: 2010 Available for time-series: 2010-201458
Time-series comparability:
Yes Frequency of measurement:
Annually
Evaluation of the index – ease of interpretation:
Number of indicators 5 Linear No Calculates dispersion/variability across indicators Yes Normalized Yes Equal weighting Yes
Other Strengths:
The GII replaces the older and more controversial Gender Related Development Index and the Gender
Empowerment Measure.59
Other Weaknesses:
The index is highly complex, very hard to interpret and communicate in any detail to policy makers.60
57 United Nations Development Programme, 2014c. 58 United Nations Development Programme, 2014b. 59 Wiser et al., 2015. 60 Klasen, 2014.
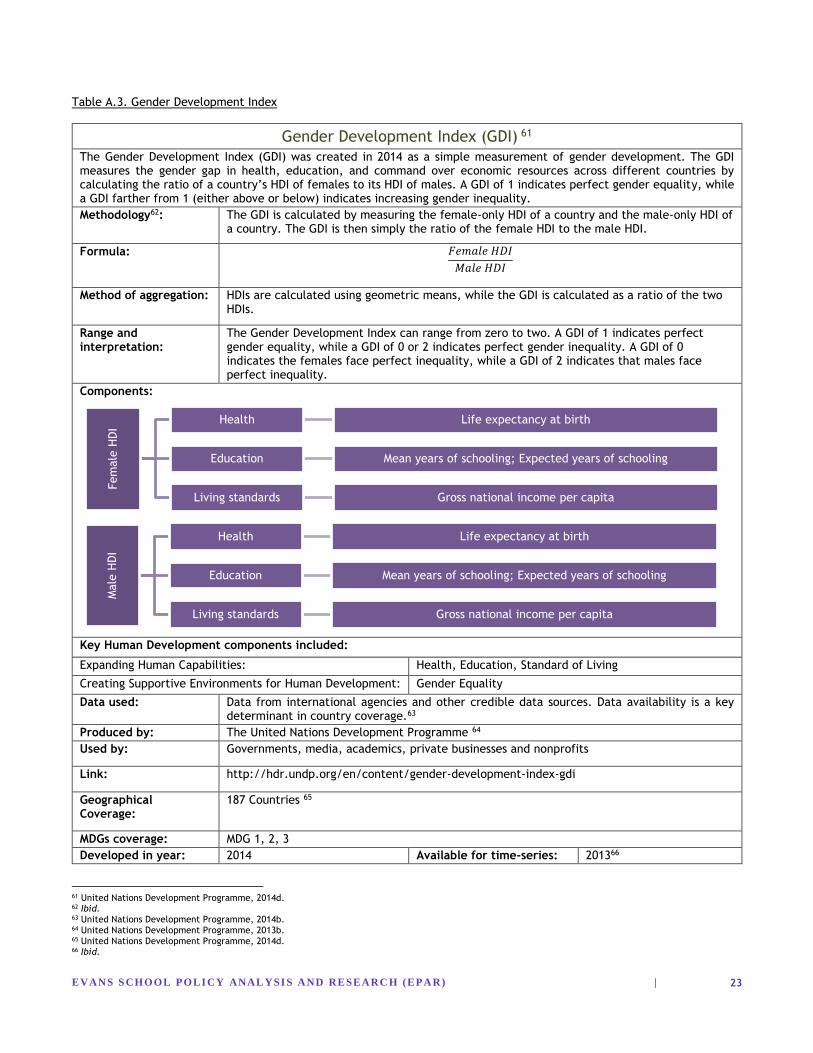
EVAN S S CHOOL POLI CY ANAL YSI S A ND RESEA RC H (EPA R) |
23
Table A.3. Gender Development Index
Gender Development Index (GDI) 61
The Gender Development Index (GDI) was created in 2014 as a simple measurement of gender development. The GDI measures the gender gap in health, education, and command over economic resources across different countries by calculating the ratio of a country’s HDI of females to its HDI of males. A GDI of 1 indicates perfect gender equality, while a GDI farther from 1 (either above or below) indicates increasing gender inequality.
Methodology62: The GDI is calculated by measuring the female-only HDI of a country and the male-only HDI of a country. The GDI is then simply the ratio of the female HDI to the male HDI.
Formula: 𝐹𝑒𝑚𝑎𝑙𝑒 𝐻𝐷𝐼
𝑀𝑎𝑙𝑒 𝐻𝐷𝐼
Method of aggregation: HDIs are calculated using geometric means, while the GDI is calculated as a ratio of the two HDIs.
Range and interpretation:
The Gender Development Index can range from zero to two. A GDI of 1 indicates perfect gender equality, while a GDI of 0 or 2 indicates perfect gender inequality. A GDI of 0 indicates the females face perfect inequality, while a GDI of 2 indicates that males face perfect inequality.
Components:
Key Human Development components included:
Expanding Human Capabilities: Health, Education, Standard of Living
Creating Supportive Environments for Human Development: Gender Equality
Data used: Data from international agencies and other credible data sources. Data availability is a key determinant in country coverage.63
Produced by: The United Nations Development Programme 64
Used by: Governments, media, academics, private businesses and nonprofits
Link: http://hdr.undp.org/en/content/gender-development-index-gdi
Geographical Coverage:
187 Countries 65
MDGs coverage: MDG 1, 2, 3
Developed in year: 2014 Available for time-series: 201366
61 United Nations Development Programme, 2014d. 62 Ibid. 63 United Nations Development Programme, 2014b. 64 United Nations Development Programme, 2013b. 65 United Nations Development Programme, 2014d. 66 Ibid.
Fem
ale
HD
I
Health Life expectancy at birth
Education Mean years of schooling; Expected years of schooling
Living standards Gross national income per capita
Male
HD
I
Health Life expectancy at birth
Education Mean years of schooling; Expected years of schooling
Living standards Gross national income per capita
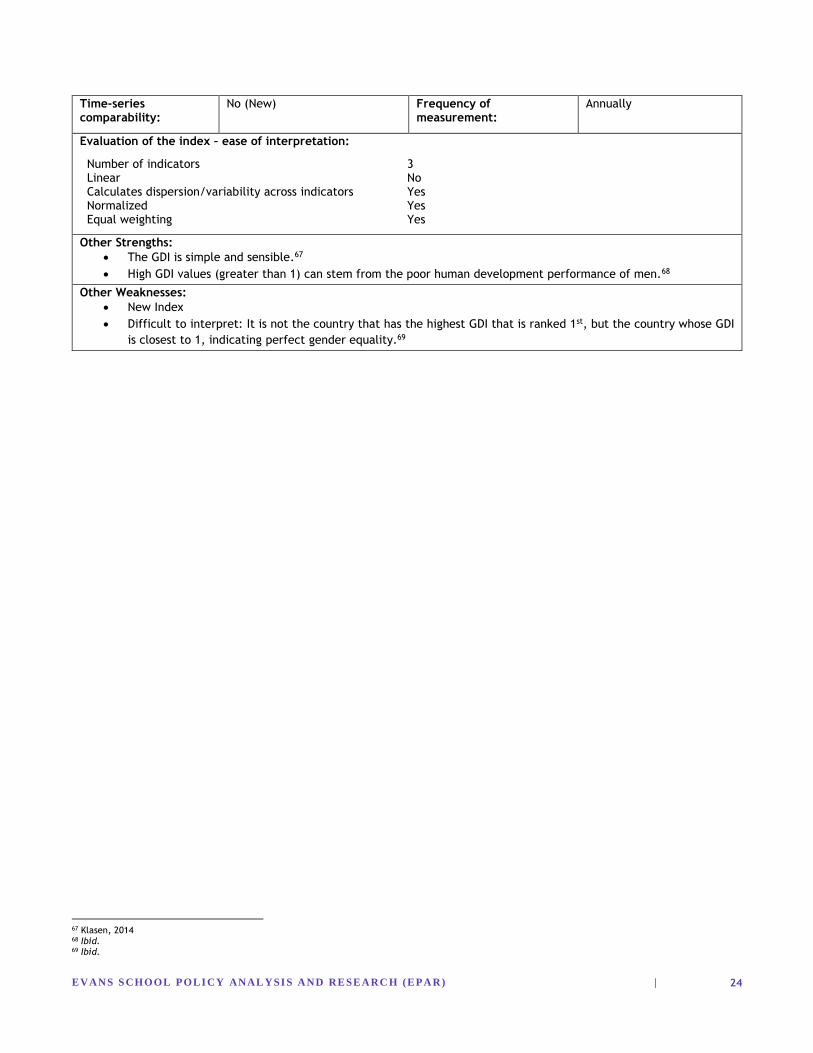
EVAN S S CHOOL POLI CY ANAL YSI S A ND RESEA RC H (EPA R) |
24
Time-series comparability:
No (New) Frequency of measurement:
Annually
Evaluation of the index – ease of interpretation:
Number of indicators 3 Linear No Calculates dispersion/variability across indicators Yes Normalized Yes Equal weighting Yes
Other Strengths:
The GDI is simple and sensible.67
High GDI values (greater than 1) can stem from the poor human development performance of men.68
Other Weaknesses:
New Index
Difficult to interpret: It is not the country that has the highest GDI that is ranked 1st, but the country whose GDI
is closest to 1, indicating perfect gender equality.69
67 Klasen, 2014 68 Ibid. 69 Ibid.
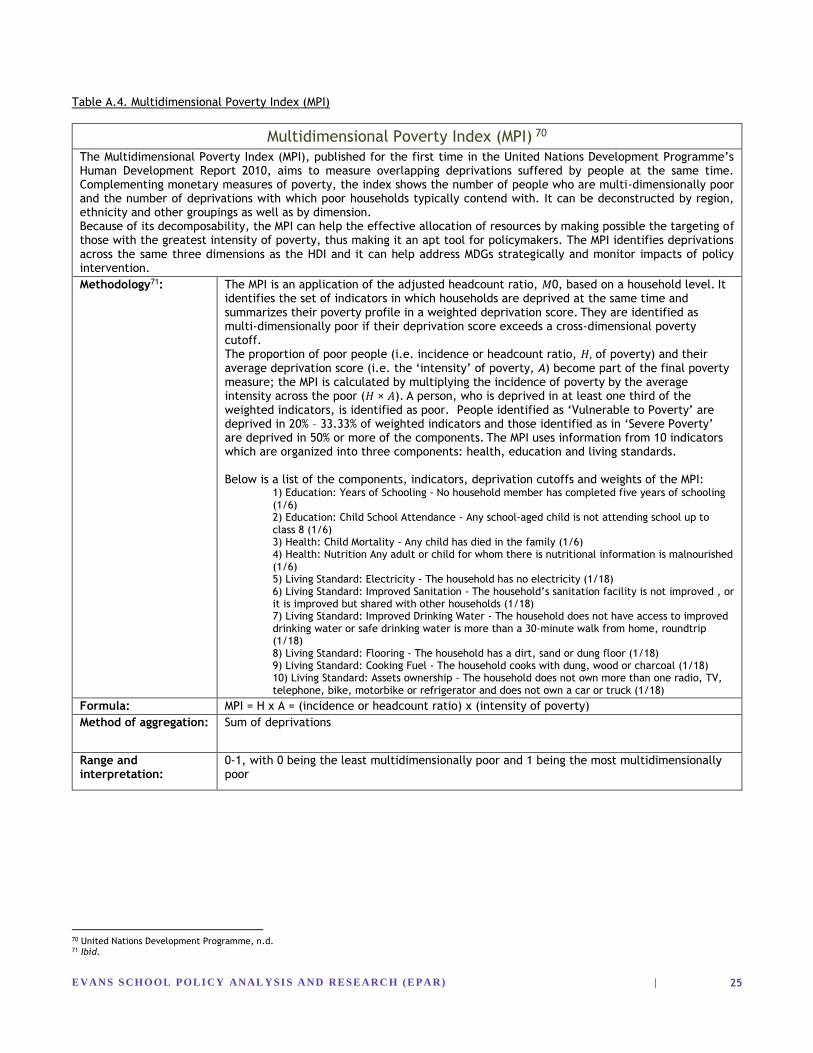
EVAN S S CHOOL POLI CY ANAL YSI S A ND RESEA RC H (EPA R) |
25
Table A.4. Multidimensional Poverty Index (MPI)
Multidimensional Poverty Index (MPI) 70
The Multidimensional Poverty Index (MPI), published for the first time in the United Nations Development Programme’s Human Development Report 2010, aims to measure overlapping deprivations suffered by people at the same time. Complementing monetary measures of poverty, the index shows the number of people who are multi-dimensionally poor and the number of deprivations with which poor households typically contend with. It can be deconstructed by region, ethnicity and other groupings as well as by dimension. Because of its decomposability, the MPI can help the effective allocation of resources by making possible the targeting of those with the greatest intensity of poverty, thus making it an apt tool for policymakers. The MPI identifies deprivations across the same three dimensions as the HDI and it can help address MDGs strategically and monitor impacts of policy intervention.
Methodology71: The MPI is an application of the adjusted headcount ratio, 𝑀0, based on a household level. It identifies the set of indicators in which households are deprived at the same time and summarizes their poverty profile in a weighted deprivation score. They are identified as multi-dimensionally poor if their deprivation score exceeds a cross-dimensional poverty cutoff. The proportion of poor people (i.e. incidence or headcount ratio, 𝐻, of poverty) and their average deprivation score (i.e. the ‘intensity’ of poverty, A) become part of the final poverty measure; the MPI is calculated by multiplying the incidence of poverty by the average intensity across the poor (𝐻 × 𝐴). A person, who is deprived in at least one third of the weighted indicators, is identified as poor. People identified as ‘Vulnerable to Poverty’ are deprived in 20% – 33.33% of weighted indicators and those identified as in ‘Severe Poverty’ are deprived in 50% or more of the components. The MPI uses information from 10 indicators which are organized into three components: health, education and living standards. Below is a list of the components, indicators, deprivation cutoffs and weights of the MPI:
1) Education: Years of Schooling - No household member has completed five years of schooling (1/6) 2) Education: Child School Attendance - Any school-aged child is not attending school up to class 8 (1/6) 3) Health: Child Mortality - Any child has died in the family (1/6) 4) Health: Nutrition Any adult or child for whom there is nutritional information is malnourished (1/6) 5) Living Standard: Electricity - The household has no electricity (1/18) 6) Living Standard: Improved Sanitation - The household’s sanitation facility is not improved , or it is improved but shared with other households (1/18) 7) Living Standard: Improved Drinking Water - The household does not have access to improved drinking water or safe drinking water is more than a 30-minute walk from home, roundtrip (1/18) 8) Living Standard: Flooring - The household has a dirt, sand or dung floor (1/18) 9) Living Standard: Cooking Fuel - The household cooks with dung, wood or charcoal (1/18) 10) Living Standard: Assets ownership - The household does not own more than one radio, TV, telephone, bike, motorbike or refrigerator and does not own a car or truck (1/18)
Formula: MPI = H x A = (incidence or headcount ratio) x (intensity of poverty)
Method of aggregation: Sum of deprivations
Range and interpretation:
0-1, with 0 being the least multidimensionally poor and 1 being the most multidimensionally poor
70 United Nations Development Programme, n.d. 71 Ibid.
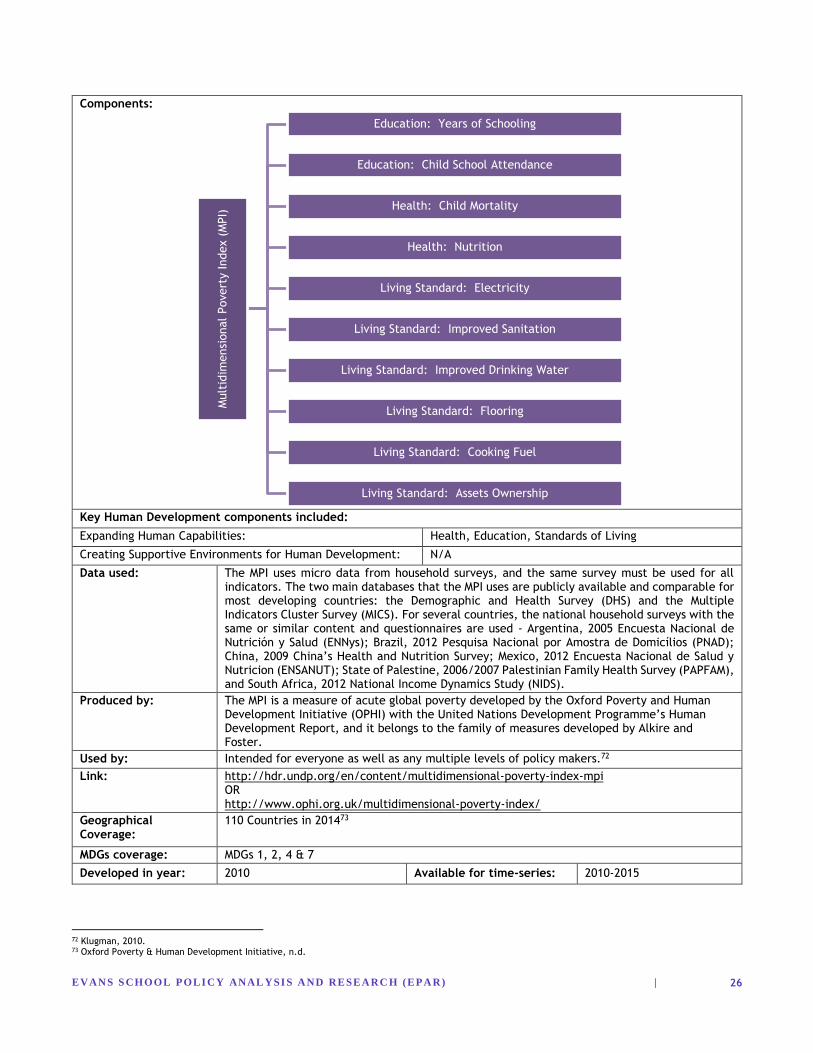
EVAN S S CHOOL POLI CY ANAL YSI S A ND RESEA RC H (EPA R) |
26
Components:
Key Human Development components included:
Expanding Human Capabilities: Health, Education, Standards of Living
Creating Supportive Environments for Human Development: N/A
Data used: The MPI uses micro data from household surveys, and the same survey must be used for all indicators. The two main databases that the MPI uses are publicly available and comparable for most developing countries: the Demographic and Health Survey (DHS) and the Multiple Indicators Cluster Survey (MICS). For several countries, the national household surveys with the same or similar content and questionnaires are used - Argentina, 2005 Encuesta Nacional de Nutrición y Salud (ENNys); Brazil, 2012 Pesquisa Nacional por Amostra de Domicílios (PNAD); China, 2009 China’s Health and Nutrition Survey; Mexico, 2012 Encuesta Nacional de Salud y Nutricion (ENSANUT); State of Palestine, 2006/2007 Palestinian Family Health Survey (PAPFAM), and South Africa, 2012 National Income Dynamics Study (NIDS).
Produced by: The MPI is a measure of acute global poverty developed by the Oxford Poverty and Human Development Initiative (OPHI) with the United Nations Development Programme’s Human Development Report, and it belongs to the family of measures developed by Alkire and Foster.
Used by: Intended for everyone as well as any multiple levels of policy makers.72
Link: http://hdr.undp.org/en/content/multidimensional-poverty-index-mpi OR http://www.ophi.org.uk/multidimensional-poverty-index/
Geographical Coverage:
110 Countries in 201473
MDGs coverage: MDGs 1, 2, 4 & 7
Developed in year: 2010 Available for time-series: 2010-2015
72 Klugman, 2010. 73 Oxford Poverty & Human Development Initiative, n.d.
Mult
idim
ensi
onal
Povert
y Index (
MPI)
Education: Years of Schooling
Education: Child School Attendance
Health: Child Mortality
Health: Nutrition
Living Standard: Electricity
Living Standard: Improved Sanitation
Living Standard: Improved Drinking Water
Living Standard: Flooring
Living Standard: Cooking Fuel
Living Standard: Assets Ownership
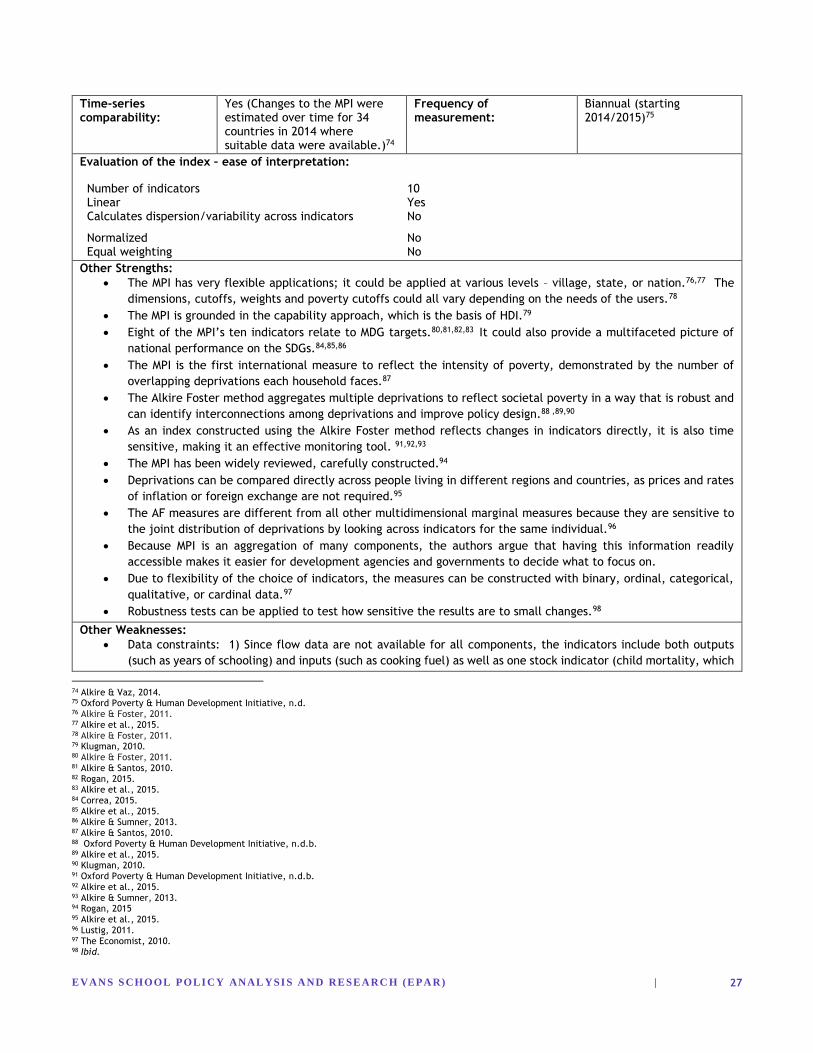
EVAN S S CHOOL POLI CY ANAL YSI S A ND RESEA RC H (EPA R) |
27
Time-series comparability:
Yes (Changes to the MPI were estimated over time for 34 countries in 2014 where suitable data were available.)74
Frequency of measurement:
Biannual (starting 2014/2015)75
Evaluation of the index – ease of interpretation:
Number of indicators 10 Linear Yes Calculates dispersion/variability across indicators No
Normalized No Equal weighting No
Other Strengths:
The MPI has very flexible applications; it could be applied at various levels – village, state, or nation.76,77 The
dimensions, cutoffs, weights and poverty cutoffs could all vary depending on the needs of the users.78
The MPI is grounded in the capability approach, which is the basis of HDI.79
Eight of the MPI’s ten indicators relate to MDG targets.80,81,82,83 It could also provide a multifaceted picture of
national performance on the SDGs.84,85,86
The MPI is the first international measure to reflect the intensity of poverty, demonstrated by the number of
overlapping deprivations each household faces.87
The Alkire Foster method aggregates multiple deprivations to reflect societal poverty in a way that is robust and
can identify interconnections among deprivations and improve policy design.88 ,89,90
As an index constructed using the Alkire Foster method reflects changes in indicators directly, it is also time
sensitive, making it an effective monitoring tool. 91,92,93
The MPI has been widely reviewed, carefully constructed.94
Deprivations can be compared directly across people living in different regions and countries, as prices and rates
of inflation or foreign exchange are not required.95
The AF measures are different from all other multidimensional marginal measures because they are sensitive to
the joint distribution of deprivations by looking across indicators for the same individual.96
Because MPI is an aggregation of many components, the authors argue that having this information readily
accessible makes it easier for development agencies and governments to decide what to focus on.
Due to flexibility of the choice of indicators, the measures can be constructed with binary, ordinal, categorical,
qualitative, or cardinal data.97
Robustness tests can be applied to test how sensitive the results are to small changes.98
Other Weaknesses:
Data constraints: 1) Since flow data are not available for all components, the indicators include both outputs
(such as years of schooling) and inputs (such as cooking fuel) as well as one stock indicator (child mortality, which
74 Alkire & Vaz, 2014. 75 Oxford Poverty & Human Development Initiative, n.d. 76 Alkire & Foster, 2011. 77 Alkire et al., 2015. 78 Alkire & Foster, 2011. 79 Klugman, 2010. 80 Alkire & Foster, 2011. 81 Alkire & Santos, 2010. 82 Rogan, 2015. 83 Alkire et al., 2015. 84 Correa, 2015. 85 Alkire et al., 2015. 86 Alkire & Sumner, 2013. 87 Alkire & Santos, 2010. 88 Oxford Poverty & Human Development Initiative, n.d.b. 89 Alkire et al., 2015. 90 Klugman, 2010. 91 Oxford Poverty & Human Development Initiative, n.d.b. 92 Alkire et al., 2015. 93 Alkire & Sumner, 2013. 94 Rogan, 2015 95 Alkire et al., 2015. 96 Lustig, 2011. 97 The Economist, 2010. 98 Ibid.
EVAN S S CHOOL POLI CY ANAL YSI S A ND RESEA RC H (EPA R) |
28
could reflect a death that was recent or long ago); 2) the health data are relatively weak and overlook some
groups’ deprivations especially for nutrition; 3) subjective judgements were involved in handling missing data; 4)
intra-household inequalities may be severe, but these could not be reflected99; 5) it does not measure inequality
among the poor, although decompositions by group can be used to reveal group-based inequalities; 6) the MPI
estimates are based on publicly available data, which limits direct cross-country comparability; and 7) the MPI
could not include the component of gender differences100 and empowerment. 101,102
Same set of indicators are used in rural and urban areas; deprivations in rural areas are different than those
facing the urban populations.103 It is also not useful for middle-income countries.104
The MPI index rarely covers poverty caused by migration due to war or climate.105
Individuals living in households with no children (or no history of children) are identified as non-deprived in school
attendance and child mortality (as are households with no women), thus the MPI is biased towards households
with children and women of reproductive age (although Santos and Alkire (2011) report preliminary evidence
suggesting that this bias is not significant).106
Ravallion’s main criticisms of the MPI are that:
- any aggregate index can be problematic or misleading because of its implicit marginal rate of substitution
across indicators;107
- due to data constraints, the MPI ended up with fewer components included than the typical consumption-based
unidimensional indices;108,109,110,111,112
- prices are missing in the MPI (i.e., not all goods are market goods) or not reliable (i.e., market prices are
distorted and do not reflect true social valuations; they are not shadow prices).113
- the six “living standard” indicators are likely to be correlated with consumption or income, but they are unlikely
to be very responsive to economic fluctuations;114
- the MPI is not supported by economic theories or practice115 because the MPI aggregates “apples and oranges”
and that there is no consensus exists on how the multiple components should be weighted to form the composite
index.116
The MPI assumes that no correlation exists between the various types of deprivations.117
It is insensitive to deprivations both above and below the first cut-off118
The selection of the MPI components is not grounded in participation of poor men and women. 119
99 Rippin, 2011. 100 International Women's Development Agency, n.d. 101 Oxford Poverty & Human Development Initiative, n.d. 102 Klugman, 2010. 103 Satterthwaite, 2014. 104 The Economist, 2010. 105 Correa, 2015 106 Rogan, 2015. 107 Lustig, 2011. 108 Ibid. 109 Ravallion, 2010, July 28. 110 International Women's Development Agency, n.d. 111 Ravallion, 2010, October 14. 112 Ravallion, 2011. 113 Lustig, 2011. 114 Ravallion, 2010, July 28. 115 Ravallion, 2010, October 14. 116 Ravallion, 2010, July 28. 117 Rippin, 2011. 118 International Women's Development Agency, n.d. 119 Ibid.
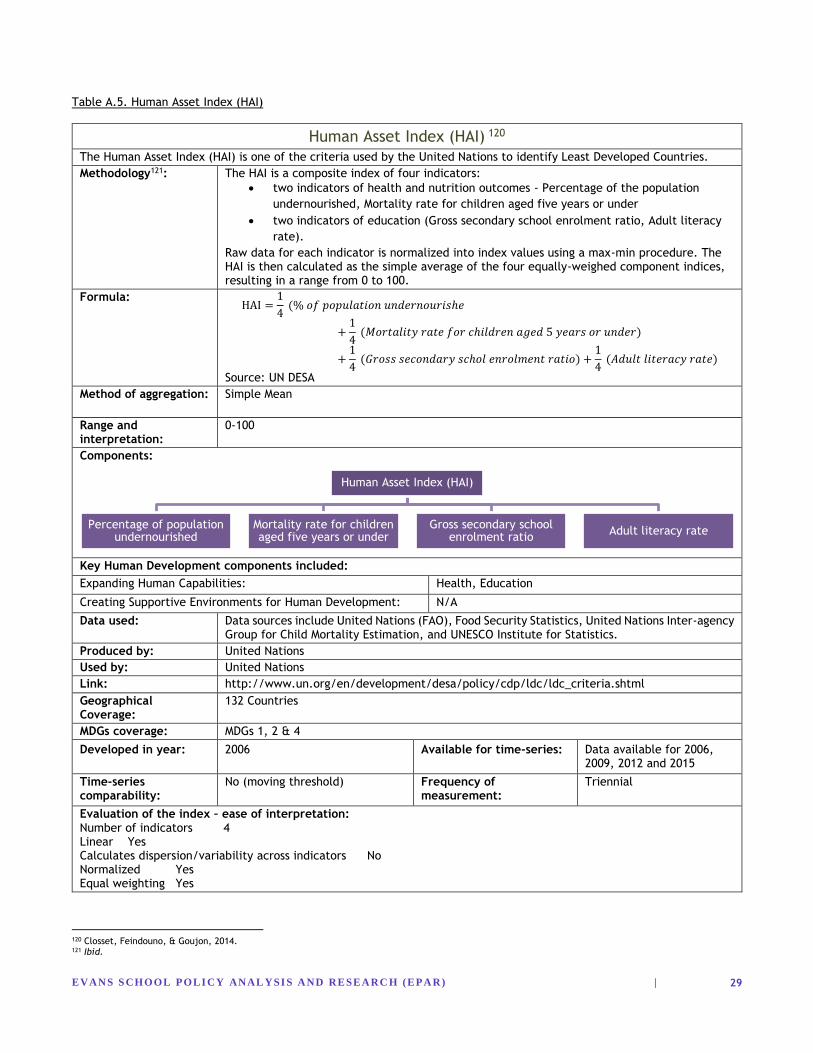
EVAN S S CHOOL POLI CY ANAL YSI S A ND RESEA RC H (EPA R) |
29
Table A.5. Human Asset Index (HAI)
Human Asset Index (HAI) 120
The Human Asset Index (HAI) is one of the criteria used by the United Nations to identify Least Developed Countries.
Methodology121: The HAI is a composite index of four indicators:
two indicators of health and nutrition outcomes - Percentage of the population
undernourished, Mortality rate for children aged five years or under
two indicators of education (Gross secondary school enrolment ratio, Adult literacy
rate).
Raw data for each indicator is normalized into index values using a max-min procedure. The HAI is then calculated as the simple average of the four equally-weighed component indices, resulting in a range from 0 to 100.
Formula: HAI =
1
4 (% 𝑜𝑓 𝑝𝑜𝑝𝑢𝑙𝑎𝑡𝑖𝑜𝑛 𝑢𝑛𝑑𝑒𝑟𝑛𝑜𝑢𝑟𝑖𝑠ℎ𝑒
+1
4 (𝑀𝑜𝑟𝑡𝑎𝑙𝑖𝑡𝑦 𝑟𝑎𝑡𝑒 𝑓𝑜𝑟 𝑐ℎ𝑖𝑙𝑑𝑟𝑒𝑛 𝑎𝑔𝑒𝑑 5 𝑦𝑒𝑎𝑟𝑠 𝑜𝑟 𝑢𝑛𝑑𝑒𝑟)
+1
4 (𝐺𝑟𝑜𝑠𝑠 𝑠𝑒𝑐𝑜𝑛𝑑𝑎𝑟𝑦 𝑠𝑐ℎ𝑜𝑙 𝑒𝑛𝑟𝑜𝑙𝑚𝑒𝑛𝑡 𝑟𝑎𝑡𝑖𝑜) +
1
4 (𝐴𝑑𝑢𝑙𝑡 𝑙𝑖𝑡𝑒𝑟𝑎𝑐𝑦 𝑟𝑎𝑡𝑒)
Source: UN DESA
Method of aggregation: Simple Mean
Range and interpretation:
0-100
Components:
Key Human Development components included:
Expanding Human Capabilities: Health, Education
Creating Supportive Environments for Human Development: N/A
Data used: Data sources include United Nations (FAO), Food Security Statistics, United Nations Inter-agency Group for Child Mortality Estimation, and UNESCO Institute for Statistics.
Produced by: United Nations
Used by: United Nations
Link: http://www.un.org/en/development/desa/policy/cdp/ldc/ldc_criteria.shtml
Geographical Coverage:
132 Countries
MDGs coverage: MDGs 1, 2 & 4
Developed in year: 2006 Available for time-series: Data available for 2006, 2009, 2012 and 2015
Time-series comparability:
No (moving threshold) Frequency of measurement:
Triennial
Evaluation of the index – ease of interpretation: Number of indicators 4 Linear Yes Calculates dispersion/variability across indicators No Normalized Yes Equal weighting Yes
120 Closset, Feindouno, & Goujon, 2014. 121 Ibid.
Human Asset Index (HAI)
Percentage of population undernourished
Mortality rate for children aged five years or under
Gross secondary school enrolment ratio
Adult literacy rate
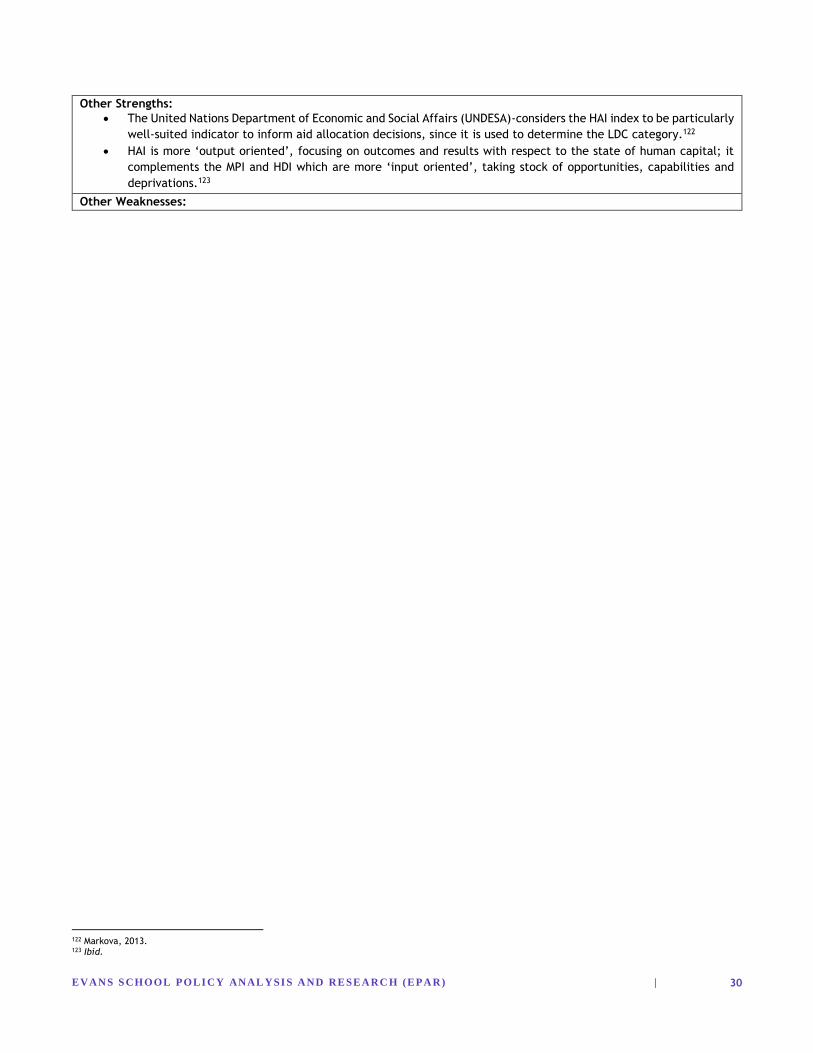
EVAN S S CHOOL POLI CY ANAL YSI S A ND RESEA RC H (EPA R) |
30
Other Strengths:
The United Nations Department of Economic and Social Affairs (UNDESA)-considers the HAI index to be particularly
well-suited indicator to inform aid allocation decisions, since it is used to determine the LDC category.122
HAI is more ‘output oriented’, focusing on outcomes and results with respect to the state of human capital; it
complements the MPI and HDI which are more ‘input oriented’, taking stock of opportunities, capabilities and
deprivations.123
Other Weaknesses:
122 Markova, 2013. 123 Ibid.
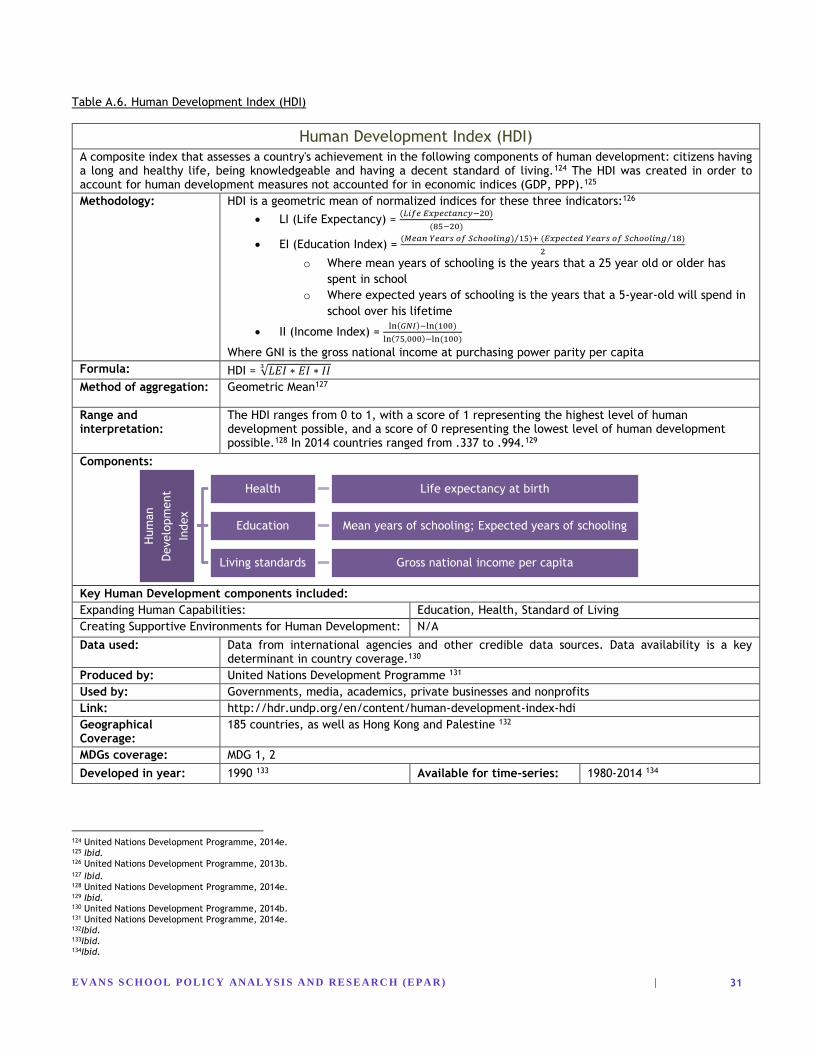
EVAN S S CHOOL POLI CY ANAL YSI S A ND RESEA RC H (EPA R) |
31
Table A.6. Human Development Index (HDI)
Human Development Index (HDI)
A composite index that assesses a country's achievement in the following components of human development: citizens having a long and healthy life, being knowledgeable and having a decent standard of living.124 The HDI was created in order to account for human development measures not accounted for in economic indices (GDP, PPP).125
Methodology: HDI is a geometric mean of normalized indices for these three indicators:126
LI (Life Expectancy) = (𝐿𝑖𝑓𝑒 𝐸𝑥𝑝𝑒𝑐𝑡𝑎𝑛𝑐𝑦−20)
(85−20)
EI (Education Index) = (𝑀𝑒𝑎𝑛 𝑌𝑒𝑎𝑟𝑠 𝑜𝑓 𝑆𝑐ℎ𝑜𝑜𝑙𝑖𝑛𝑔) 15)+ (𝐸𝑥𝑝𝑒𝑐𝑡𝑒𝑑 𝑌𝑒𝑎𝑟𝑠 𝑜𝑓 𝑆𝑐ℎ𝑜𝑜𝑙𝑖𝑛𝑔 18)⁄⁄
2
o Where mean years of schooling is the years that a 25 year old or older has
spent in school
o Where expected years of schooling is the years that a 5-year-old will spend in
school over his lifetime
II (Income Index) = ln(𝐺𝑁𝐼)−ln (100)
ln(75,000)−ln (100)
Where GNI is the gross national income at purchasing power parity per capita
Formula: HDI = √𝐿𝐸𝐼 ∗ 𝐸𝐼 ∗ 𝐼𝐼3
Method of aggregation: Geometric Mean127
Range and interpretation:
The HDI ranges from 0 to 1, with a score of 1 representing the highest level of human development possible, and a score of 0 representing the lowest level of human development possible.128 In 2014 countries ranged from .337 to .994.129
Components:
Key Human Development components included:
Expanding Human Capabilities: Education, Health, Standard of Living
Creating Supportive Environments for Human Development: N/A
Data used: Data from international agencies and other credible data sources. Data availability is a key determinant in country coverage.130
Produced by: United Nations Development Programme 131
Used by: Governments, media, academics, private businesses and nonprofits
Link: http://hdr.undp.org/en/content/human-development-index-hdi
Geographical Coverage:
185 countries, as well as Hong Kong and Palestine 132
MDGs coverage: MDG 1, 2
Developed in year: 1990 133 Available for time-series: 1980-2014 134
124 United Nations Development Programme, 2014e. 125 Ibid. 126 United Nations Development Programme, 2013b. 127 Ibid. 128 United Nations Development Programme, 2014e. 129 Ibid. 130 United Nations Development Programme, 2014b. 131 United Nations Development Programme, 2014e. 132Ibid. 133Ibid. 134Ibid.
Hum
an
Develo
pm
ent
Index
Health Life expectancy at birth
Education Mean years of schooling; Expected years of schooling
Living standards Gross national income per capita
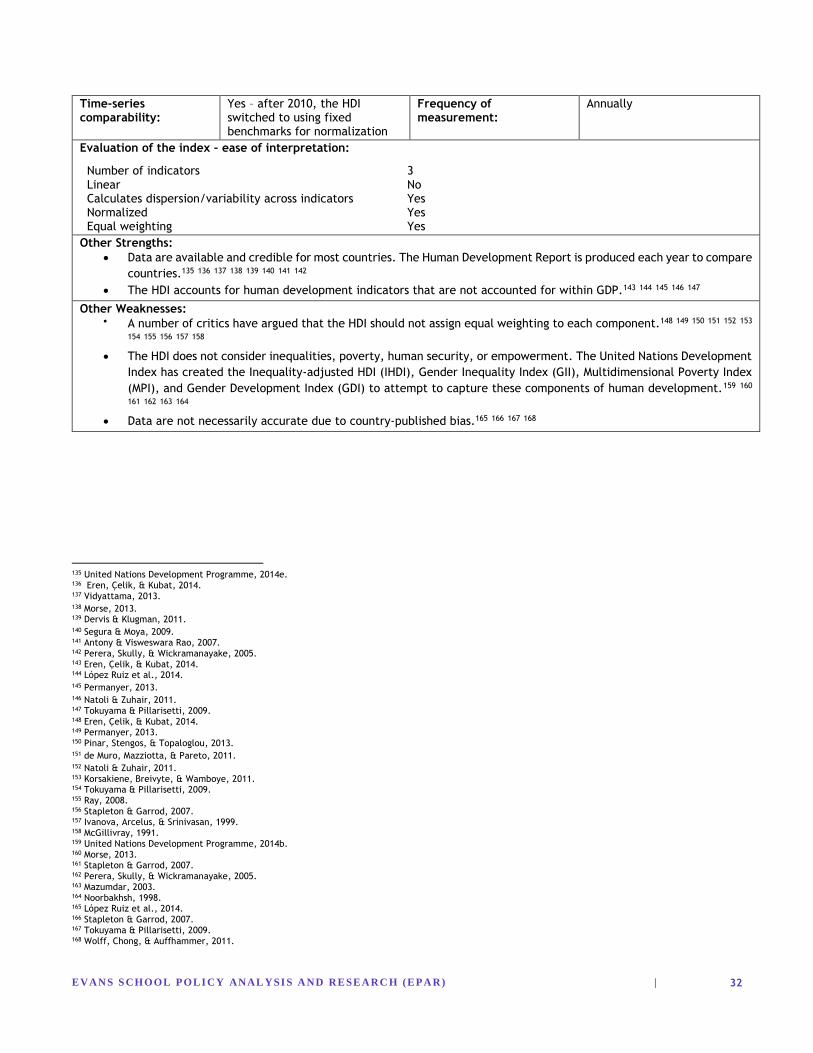
EVAN S S CHOOL POLI CY ANAL YSI S A ND RESEA RC H (EPA R) |
32
Time-series comparability:
Yes – after 2010, the HDI switched to using fixed benchmarks for normalization
Frequency of measurement:
Annually
Evaluation of the index – ease of interpretation:
Number of indicators 3 Linear No Calculates dispersion/variability across indicators Yes Normalized Yes Equal weighting Yes
Other Strengths:
Data are available and credible for most countries. The Human Development Report is produced each year to compare
countries.135 136 137 138 139 140 141 142
The HDI accounts for human development indicators that are not accounted for within GDP.143 144 145 146 147
Other Weaknesses: A number of critics have argued that the HDI should not assign equal weighting to each component.148 149 150 151 152 153
154 155 156 157 158
The HDI does not consider inequalities, poverty, human security, or empowerment. The United Nations Development
Index has created the Inequality-adjusted HDI (IHDI), Gender Inequality Index (GII), Multidimensional Poverty Index
(MPI), and Gender Development Index (GDI) to attempt to capture these components of human development.159 160 161 162 163 164
Data are not necessarily accurate due to country-published bias.165 166 167 168
135 United Nations Development Programme, 2014e. 136 Eren, Çelik, & Kubat, 2014. 137 Vidyattama, 2013. 138 Morse, 2013. 139 Dervis & Klugman, 2011.
140 Segura & Moya, 2009. 141 Antony & Visweswara Rao, 2007. 142 Perera, Skully, & Wickramanayake, 2005. 143 Eren, Çelik, & Kubat, 2014. 144 López Ruiz et al., 2014. 145 Permanyer, 2013. 146 Natoli & Zuhair, 2011. 147 Tokuyama & Pillarisetti, 2009. 148 Eren, Çelik, & Kubat, 2014. 149 Permanyer, 2013. 150 Pinar, Stengos, & Topaloglou, 2013.
151 de Muro, Mazziotta, & Pareto, 2011.
152 Natoli & Zuhair, 2011. 153 Korsakiene, Breivyte, & Wamboye, 2011. 154 Tokuyama & Pillarisetti, 2009. 155 Ray, 2008.
156 Stapleton & Garrod, 2007.
157 Ivanova, Arcelus, & Srinivasan, 1999. 158 McGillivray, 1991.
159 United Nations Development Programme, 2014b. 160 Morse, 2013. 161 Stapleton & Garrod, 2007. 162 Perera, Skully, & Wickramanayake, 2005. 163 Mazumdar, 2003. 164 Noorbakhsh, 1998. 165 López Ruiz et al., 2014. 166 Stapleton & Garrod, 2007. 167 Tokuyama & Pillarisetti, 2009. 168 Wolff, Chong, & Auffhammer, 2011.
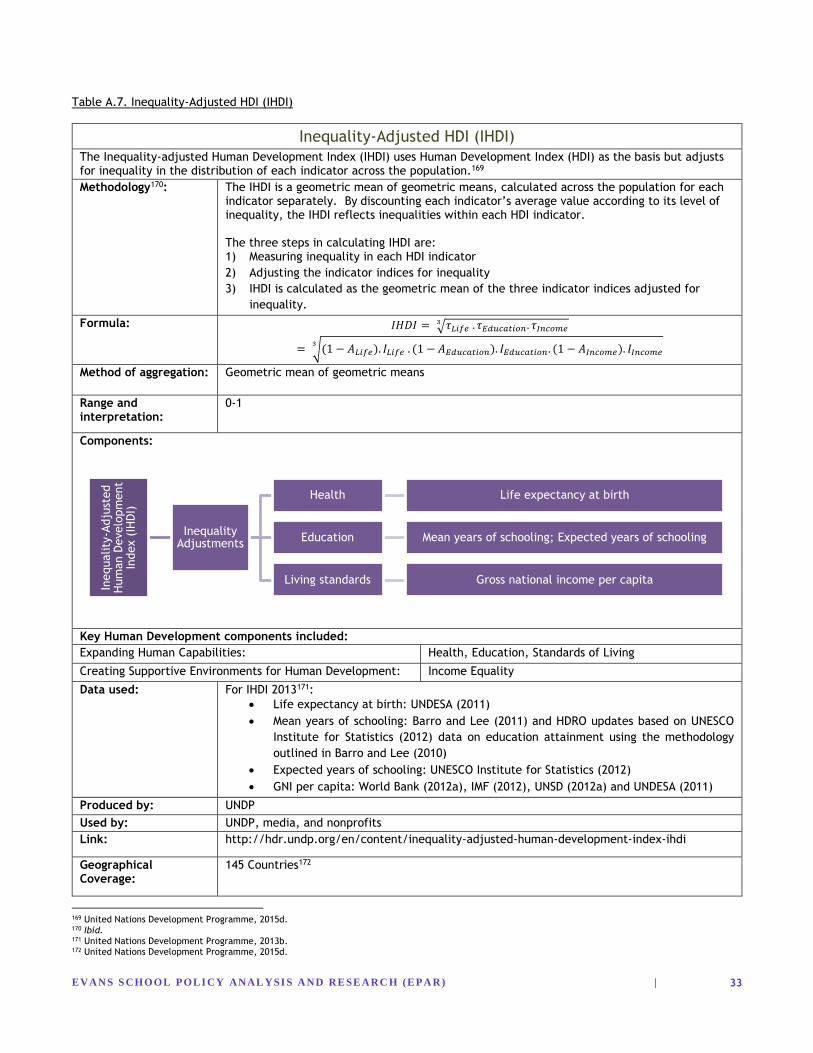
EVAN S S CHOOL POLI CY ANAL YSI S A ND RESEA RC H (EPA R) |
33
Table A.7. Inequality-Adjusted HDI (IHDI)
Inequality-Adjusted HDI (IHDI)
The Inequality-adjusted Human Development Index (IHDI) uses Human Development Index (HDI) as the basis but adjusts for inequality in the distribution of each indicator across the population.169
Methodology170: The IHDI is a geometric mean of geometric means, calculated across the population for each indicator separately. By discounting each indicator’s average value according to its level of inequality, the IHDI reflects inequalities within each HDI indicator. The three steps in calculating IHDI are: 1) Measuring inequality in each HDI indicator
2) Adjusting the indicator indices for inequality
3) IHDI is calculated as the geometric mean of the three indicator indices adjusted for
inequality.
Formula: 𝐼𝐻𝐷𝐼 = √𝜏𝐿𝑖𝑓𝑒 . 𝜏𝐸𝑑𝑢𝑐𝑎𝑡𝑖𝑜𝑛. 𝜏𝐼𝑛𝑐𝑜𝑚𝑒3
= √(1 − 𝐴𝐿𝑖𝑓𝑒). 𝐼𝐿𝑖𝑓𝑒 . (1 − 𝐴𝐸𝑑𝑢𝑐𝑎𝑡𝑖𝑜𝑛). 𝐼𝐸𝑑𝑢𝑐𝑎𝑡𝑖𝑜𝑛. (1 − 𝐴𝐼𝑛𝑐𝑜𝑚𝑒). 𝐼𝐼𝑛𝑐𝑜𝑚𝑒3
Method of aggregation: Geometric mean of geometric means
Range and interpretation:
0-1
Components:
Key Human Development components included:
Expanding Human Capabilities: Health, Education, Standards of Living
Creating Supportive Environments for Human Development: Income Equality
Data used: For IHDI 2013171:
Life expectancy at birth: UNDESA (2011)
Mean years of schooling: Barro and Lee (2011) and HDRO updates based on UNESCO
Institute for Statistics (2012) data on education attainment using the methodology
outlined in Barro and Lee (2010)
Expected years of schooling: UNESCO Institute for Statistics (2012)
GNI per capita: World Bank (2012a), IMF (2012), UNSD (2012a) and UNDESA (2011)
Produced by: UNDP
Used by: UNDP, media, and nonprofits
Link: http://hdr.undp.org/en/content/inequality-adjusted-human-development-index-ihdi
Geographical Coverage:
145 Countries172
169 United Nations Development Programme, 2015d. 170 Ibid. 171 United Nations Development Programme, 2013b. 172 United Nations Development Programme, 2015d.
Inequality
-Adju
sted
Hum
an D
evelo
pm
ent
Index (
IHD
I)
Inequality Adjustments
Health Life expectancy at birth
Education Mean years of schooling; Expected years of schooling
Living standards Gross national income per capita
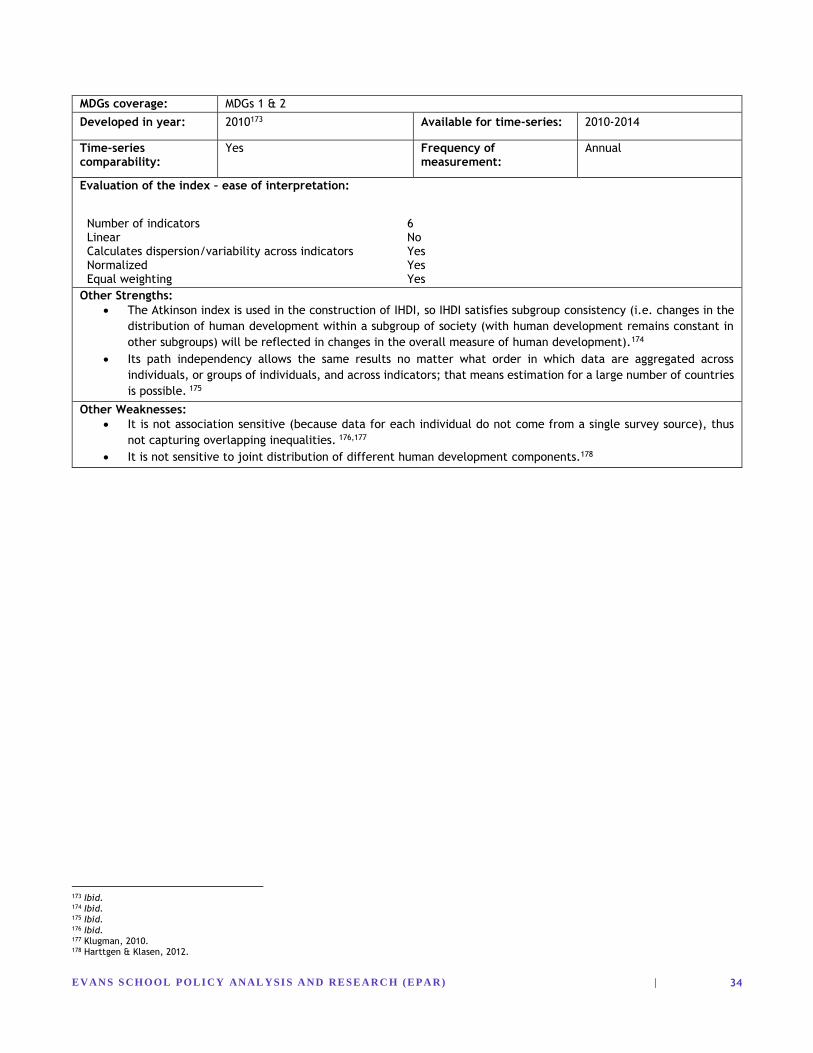
EVAN S S CHOOL POLI CY ANAL YSI S A ND RESEA RC H (EPA R) |
34
MDGs coverage: MDGs 1 & 2
Developed in year: 2010173 Available for time-series: 2010-2014
Time-series comparability:
Yes Frequency of measurement:
Annual
Evaluation of the index – ease of interpretation:
Number of indicators 6 Linear No Calculates dispersion/variability across indicators Yes Normalized Yes Equal weighting Yes
Other Strengths:
The Atkinson index is used in the construction of IHDI, so IHDI satisfies subgroup consistency (i.e. changes in the
distribution of human development within a subgroup of society (with human development remains constant in
other subgroups) will be reflected in changes in the overall measure of human development).174
Its path independency allows the same results no matter what order in which data are aggregated across
individuals, or groups of individuals, and across indicators; that means estimation for a large number of countries
is possible. 175
Other Weaknesses:
It is not association sensitive (because data for each individual do not come from a single survey source), thus
not capturing overlapping inequalities. 176,177
It is not sensitive to joint distribution of different human development components.178
173 Ibid. 174 Ibid. 175 Ibid. 176 Ibid. 177 Klugman, 2010. 178 Harttgen & Klasen, 2012.
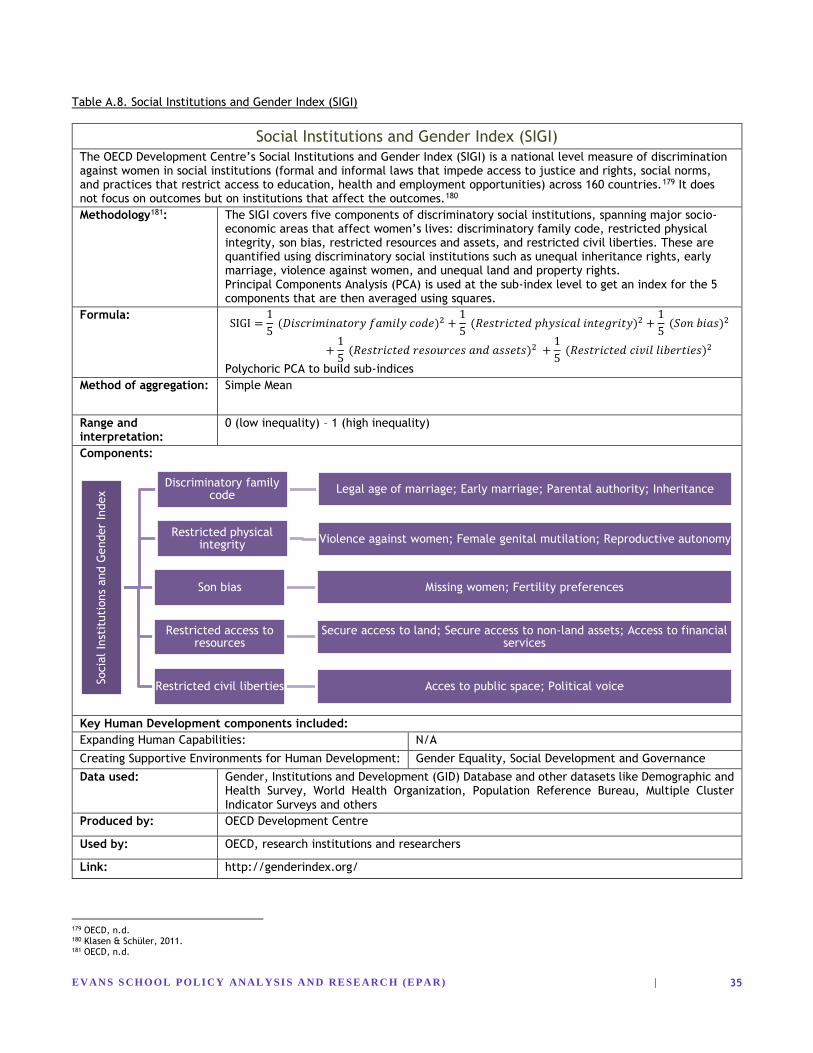
EVAN S S CHOOL POLI CY ANAL YSI S A ND RESEA RC H (EPA R) |
35
Table A.8. Social Institutions and Gender Index (SIGI)
Social Institutions and Gender Index (SIGI)
The OECD Development Centre’s Social Institutions and Gender Index (SIGI) is a national level measure of discrimination against women in social institutions (formal and informal laws that impede access to justice and rights, social norms, and practices that restrict access to education, health and employment opportunities) across 160 countries.179 It does not focus on outcomes but on institutions that affect the outcomes.180
Methodology181: The SIGI covers five components of discriminatory social institutions, spanning major socio-economic areas that affect women’s lives: discriminatory family code, restricted physical integrity, son bias, restricted resources and assets, and restricted civil liberties. These are quantified using discriminatory social institutions such as unequal inheritance rights, early marriage, violence against women, and unequal land and property rights. Principal Components Analysis (PCA) is used at the sub-index level to get an index for the 5 components that are then averaged using squares.
Formula: SIGI =
1
5 (𝐷𝑖𝑠𝑐𝑟𝑖𝑚𝑖𝑛𝑎𝑡𝑜𝑟𝑦 𝑓𝑎𝑚𝑖𝑙𝑦 𝑐𝑜𝑑𝑒)2 +
1
5 (𝑅𝑒𝑠𝑡𝑟𝑖𝑐𝑡𝑒𝑑 𝑝ℎ𝑦𝑠𝑖𝑐𝑎𝑙 𝑖𝑛𝑡𝑒𝑔𝑟𝑖𝑡𝑦)2 +
1
5 (𝑆𝑜𝑛 𝑏𝑖𝑎𝑠)2
+1
5 (𝑅𝑒𝑠𝑡𝑟𝑖𝑐𝑡𝑒𝑑 𝑟𝑒𝑠𝑜𝑢𝑟𝑐𝑒𝑠 𝑎𝑛𝑑 𝑎𝑠𝑠𝑒𝑡𝑠)2 +
1
5 (𝑅𝑒𝑠𝑡𝑟𝑖𝑐𝑡𝑒𝑑 𝑐𝑖𝑣𝑖𝑙 𝑙𝑖𝑏𝑒𝑟𝑡𝑖𝑒𝑠)2
Polychoric PCA to build sub-indices
Method of aggregation: Simple Mean
Range and interpretation:
0 (low inequality) – 1 (high inequality)
Components:
Key Human Development components included:
Expanding Human Capabilities: N/A
Creating Supportive Environments for Human Development: Gender Equality, Social Development and Governance
Data used: Gender, Institutions and Development (GID) Database and other datasets like Demographic and Health Survey, World Health Organization, Population Reference Bureau, Multiple Cluster Indicator Surveys and others
Produced by: OECD Development Centre
Used by: OECD, research institutions and researchers
Link: http://genderindex.org/
179 OECD, n.d. 180 Klasen & Schüler, 2011. 181 OECD, n.d.
Socia
l In
stit
uti
ons
and G
ender
Index
Discriminatory family code
Legal age of marriage; Early marriage; Parental authority; Inheritance
Restricted physical integrity
Violence against women; Female genital mutilation; Reproductive autonomy
Son bias Missing women; Fertility preferences
Restricted access to resources
Secure access to land; Secure access to non-land assets; Access to financial services
Restricted civil liberties Acces to public space; Political voice
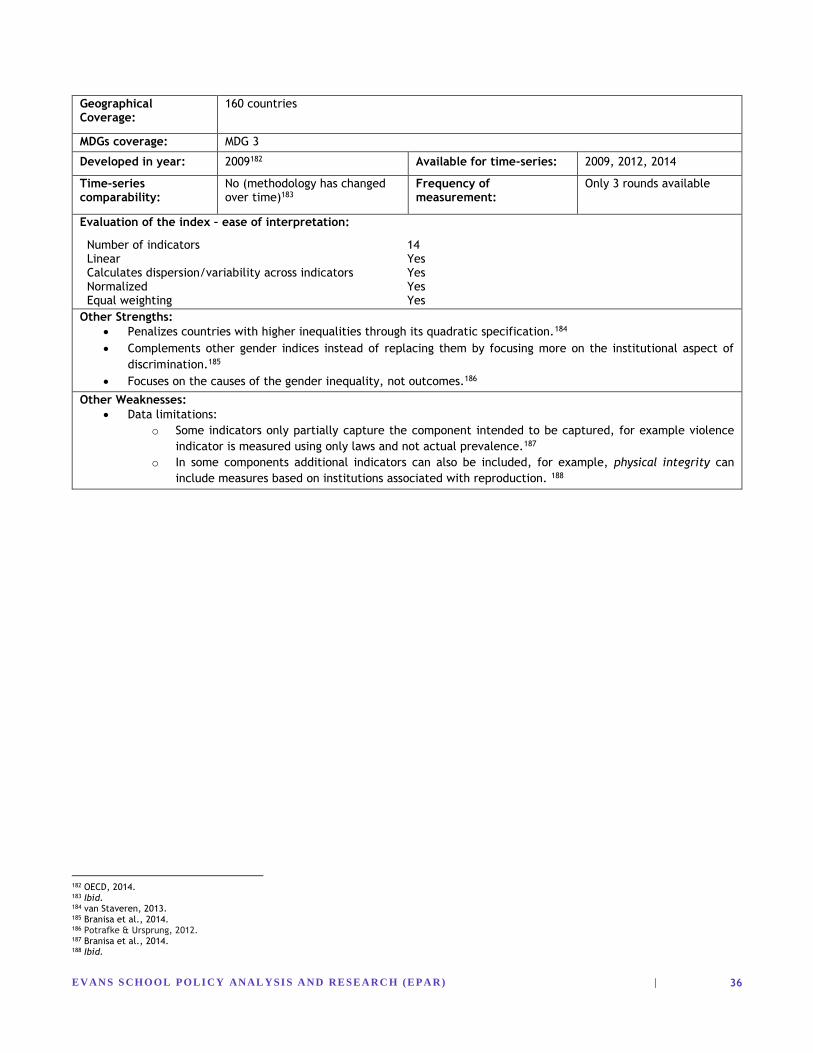
EVAN S S CHOOL POLI CY ANAL YSI S A ND RESEA RC H (EPA R) |
36
Geographical Coverage:
160 countries
MDGs coverage: MDG 3
Developed in year: 2009182 Available for time-series: 2009, 2012, 2014
Time-series comparability:
No (methodology has changed over time)183
Frequency of measurement:
Only 3 rounds available
Evaluation of the index – ease of interpretation:
Number of indicators 14 Linear Yes Calculates dispersion/variability across indicators Yes Normalized Yes Equal weighting Yes
Other Strengths:
Penalizes countries with higher inequalities through its quadratic specification.184
Complements other gender indices instead of replacing them by focusing more on the institutional aspect of
discrimination.185
Focuses on the causes of the gender inequality, not outcomes.186
Other Weaknesses:
Data limitations:
o Some indicators only partially capture the component intended to be captured, for example violence
indicator is measured using only laws and not actual prevalence.187
o In some components additional indicators can also be included, for example, physical integrity can
include measures based on institutions associated with reproduction. 188
182 OECD, 2014. 183 Ibid. 184 van Staveren, 2013. 185 Branisa et al., 2014. 186 Potrafke & Ursprung, 2012. 187 Branisa et al., 2014. 188 Ibid.
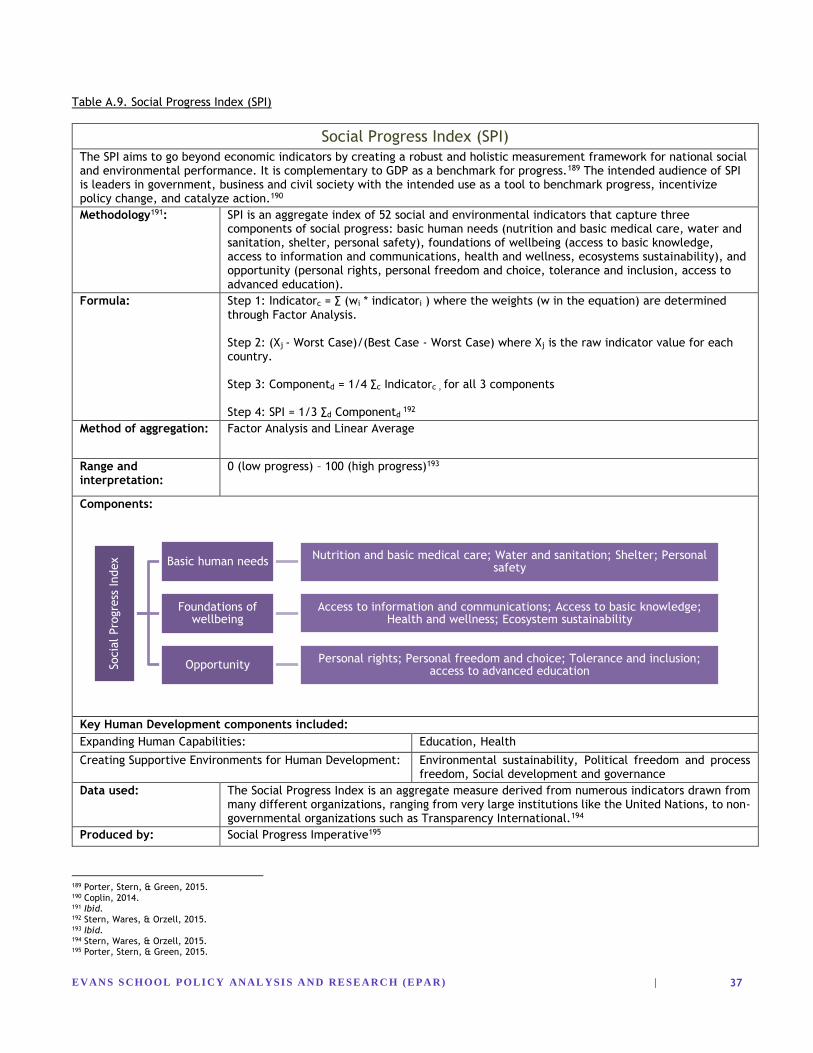
EVAN S S CHOOL POLI CY ANAL YSI S A ND RESEA RC H (EPA R) |
37
Table A.9. Social Progress Index (SPI)
Social Progress Index (SPI)
The SPI aims to go beyond economic indicators by creating a robust and holistic measurement framework for national social and environmental performance. It is complementary to GDP as a benchmark for progress.189 The intended audience of SPI is leaders in government, business and civil society with the intended use as a tool to benchmark progress, incentivize policy change, and catalyze action.190
Methodology191: SPI is an aggregate index of 52 social and environmental indicators that capture three components of social progress: basic human needs (nutrition and basic medical care, water and sanitation, shelter, personal safety), foundations of wellbeing (access to basic knowledge, access to information and communications, health and wellness, ecosystems sustainability), and opportunity (personal rights, personal freedom and choice, tolerance and inclusion, access to advanced education).
Formula: Step 1: Indicatorc = ∑ (wi * indicatori ) where the weights (w in the equation) are determined through Factor Analysis. Step 2: (Xj - Worst Case)/(Best Case - Worst Case) where Xj is the raw indicator value for each country. Step 3: Componentd = 1/4 ∑c Indicatorc , for all 3 components Step 4: SPI = 1/3 ∑d Componentd
192
Method of aggregation: Factor Analysis and Linear Average
Range and interpretation:
0 (low progress) – 100 (high progress)193
Components:
Key Human Development components included:
Expanding Human Capabilities: Education, Health
Creating Supportive Environments for Human Development: Environmental sustainability, Political freedom and process freedom, Social development and governance
Data used: The Social Progress Index is an aggregate measure derived from numerous indicators drawn from many different organizations, ranging from very large institutions like the United Nations, to non-governmental organizations such as Transparency International.194
Produced by: Social Progress Imperative195
189 Porter, Stern, & Green, 2015. 190 Coplin, 2014. 191 Ibid. 192 Stern, Wares, & Orzell, 2015. 193 Ibid. 194 Stern, Wares, & Orzell, 2015. 195 Porter, Stern, & Green, 2015.
Socia
l Pro
gre
ss Index Basic human needs
Nutrition and basic medical care; Water and sanitation; Shelter; Personal safety
Foundations of wellbeing
Access to information and communications; Access to basic knowledge; Health and wellness; Ecosystem sustainability
OpportunityPersonal rights; Personal freedom and choice; Tolerance and inclusion;
access to advanced education
EVAN S S CHOOL POLI CY ANAL YSI S A ND RESEA RC H (EPA R) |
38
Used by: Online newspapers and blogs, research institutions and some researchers (in decreasing order of importance)
Link: http://www.socialprogressimperative.org/data/spi
Geographical Coverage:
133 (plus 28 countries with partial data) for 2015 rankings196
MDGs coverage: MDG 2, 4, 5 & 7
Developed in year: 2013197 Available for time-series: 2013-2015
Time-series comparability:
Yes (methodology different for 2015 but also calculate using 2014 methodology for comparability
Frequency of measurement: Annual
Evaluation of the index – ease of interpretation :
Number of indicators 53 Linear Yes Calculates dispersion/variability across indicators No Normalized Yes Equal weighting No
Other Strengths:
Less volatile than GDP over time198
Complements GDP per capita and does not replace it. Provides additional information. Allows examination of the
two-way relationship of GDP/capita with social progress199 200 201
Other Weaknesses:
196 Ibid. 197 Ibid. 198 Green, 2015. 199 D’Urso, 2015. 200 Porter, 2014. 201 Reddy, 2014.
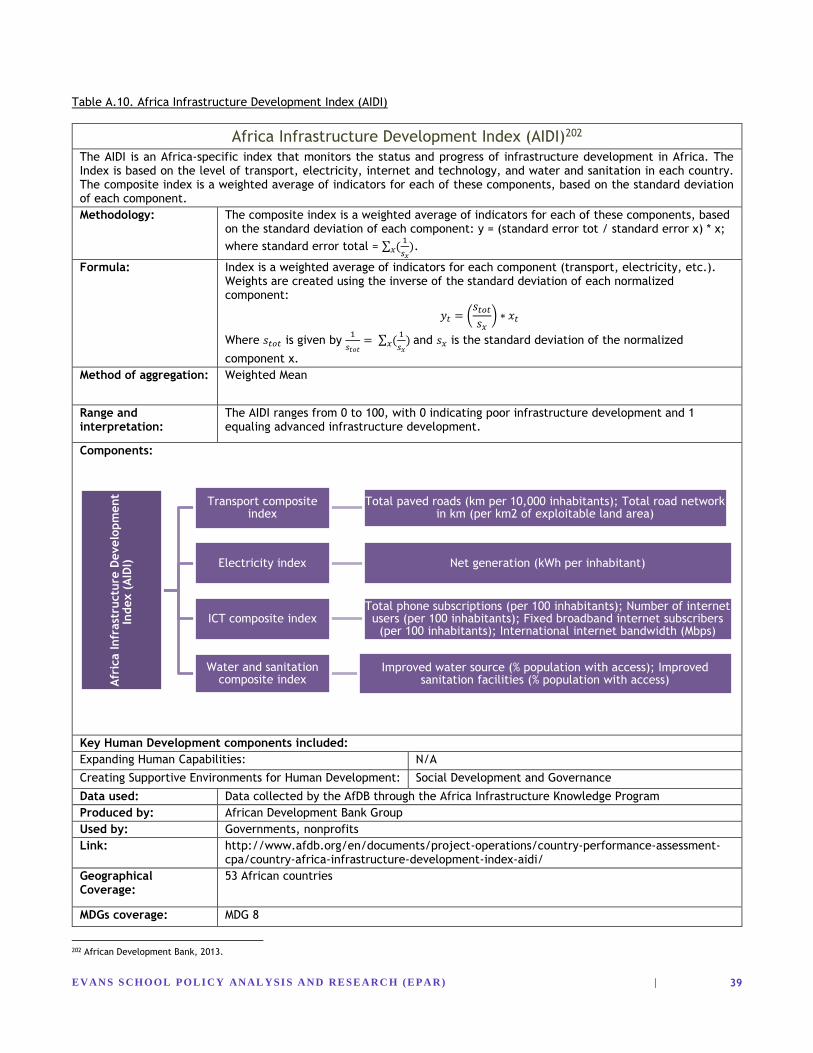
EVAN S S CHOOL POLI CY ANAL YSI S A ND RESEA RC H (EPA R) |
39
Table A.10. Africa Infrastructure Development Index (AIDI)
Africa Infrastructure Development Index (AIDI)202
The AIDI is an Africa-specific index that monitors the status and progress of infrastructure development in Africa. The Index is based on the level of transport, electricity, internet and technology, and water and sanitation in each country. The composite index is a weighted average of indicators for each of these components, based on the standard deviation of each component.
Methodology: The composite index is a weighted average of indicators for each of these components, based on the standard deviation of each component: y = (standard error tot / standard error x) * x;
where standard error total = ∑ (1
𝑠𝑥)𝑥 .
Formula: Index is a weighted average of indicators for each component (transport, electricity, etc.). Weights are created using the inverse of the standard deviation of each normalized component:
𝑦𝑡 = (𝑠𝑡𝑜𝑡
𝑠𝑥) ∗ 𝑥𝑡
Where 𝑠𝑡𝑜𝑡 is given by 1
𝑠𝑡𝑜𝑡= ∑ (
1
𝑠𝑥)𝑥 and 𝑠𝑥 is the standard deviation of the normalized
component x.
Method of aggregation: Weighted Mean
Range and interpretation:
The AIDI ranges from 0 to 100, with 0 indicating poor infrastructure development and 1 equaling advanced infrastructure development.
Components:
Key Human Development components included:
Expanding Human Capabilities: N/A
Creating Supportive Environments for Human Development: Social Development and Governance
Data used: Data collected by the AfDB through the Africa Infrastructure Knowledge Program
Produced by: African Development Bank Group
Used by: Governments, nonprofits
Link: http://www.afdb.org/en/documents/project-operations/country-performance-assessment-cpa/country-africa-infrastructure-development-index-aidi/
Geographical Coverage:
53 African countries
MDGs coverage: MDG 8
202 African Development Bank, 2013.
Afr
ica Infr
ast
ructu
re D
evelo
pm
ent
Index (
AID
I)
Transport composite index
Total paved roads (km per 10,000 inhabitants); Total road network in km (per km2 of exploitable land area)
Electricity index Net generation (kWh per inhabitant)
ICT composite indexTotal phone subscriptions (per 100 inhabitants); Number of internet users (per 100 inhabitants); Fixed broadband internet subscribers
(per 100 inhabitants); International internet bandwidth (Mbps)
Water and sanitation composite index
Improved water source (% population with access); Improved sanitation facilities (% population with access)
EVAN S S CHOOL POLI CY ANAL YSI S A ND RESEA RC H (EPA R) |
40
Developed in year: 2011 Available for time-series: 2000-2011203
Time-series comparability:
Yes Frequency of measurement:
Annually until 2011
Evaluation of the index – ease of interpretation:
Number of indicators 4 Linear Yes Calculates dispersion/variability across indicators Yes Normalized Yes Equal weighting No
Other Strengths:
Africa-specific index created by a well-known development group204
Other Weaknesses:
Relatively recent with no additional literature on the index
Africa-focused
203 African Development Bank, 2014. 204 African Development Bank, 2013.
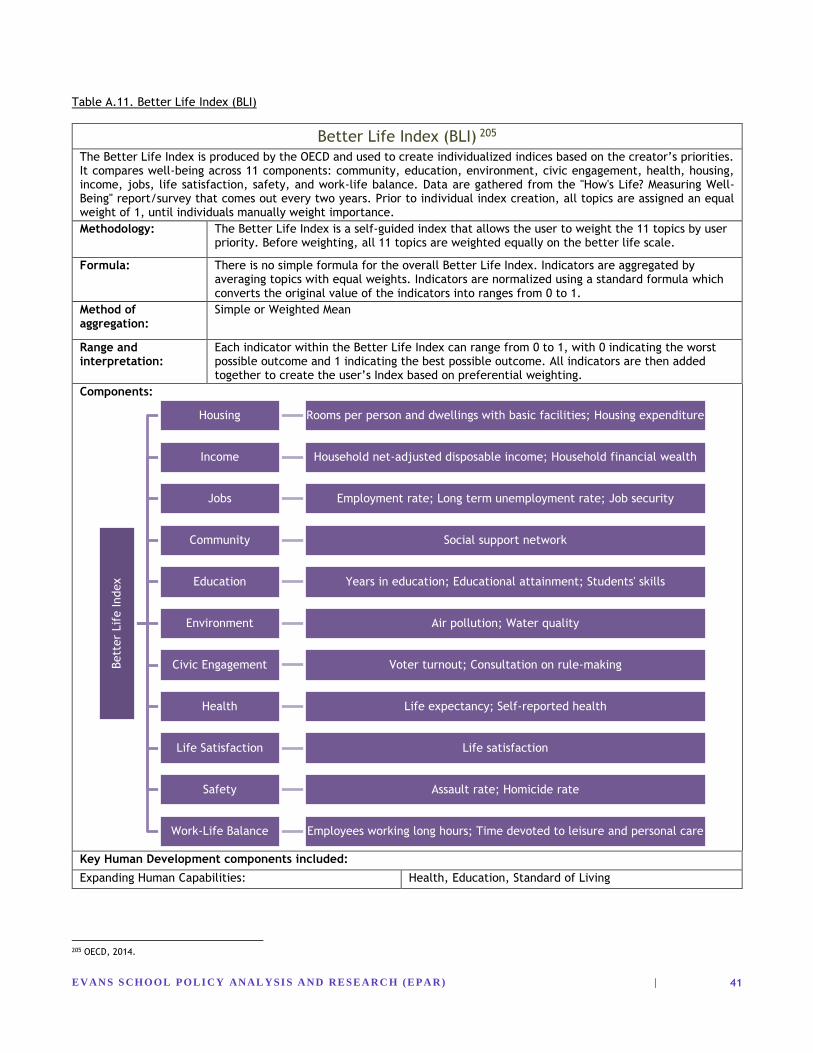
EVAN S S CHOOL POLI CY ANAL YSI S A ND RESEA RC H (EPA R) |
41
Table A.11. Better Life Index (BLI)
Better Life Index (BLI) 205
The Better Life Index is produced by the OECD and used to create individualized indices based on the creator’s priorities. It compares well-being across 11 components: community, education, environment, civic engagement, health, housing, income, jobs, life satisfaction, safety, and work-life balance. Data are gathered from the "How's Life? Measuring Well-Being" report/survey that comes out every two years. Prior to individual index creation, all topics are assigned an equal weight of 1, until individuals manually weight importance.
Methodology: The Better Life Index is a self-guided index that allows the user to weight the 11 topics by user priority. Before weighting, all 11 topics are weighted equally on the better life scale.
Formula: There is no simple formula for the overall Better Life Index. Indicators are aggregated by averaging topics with equal weights. Indicators are normalized using a standard formula which converts the original value of the indicators into ranges from 0 to 1.
Method of aggregation:
Simple or Weighted Mean
Range and interpretation:
Each indicator within the Better Life Index can range from 0 to 1, with 0 indicating the worst possible outcome and 1 indicating the best possible outcome. All indicators are then added together to create the user’s Index based on preferential weighting.
Components:
Key Human Development components included:
Expanding Human Capabilities: Health, Education, Standard of Living
205 OECD, 2014.
Bett
er
Lif
e Index
Housing Rooms per person and dwellings with basic facilities; Housing expenditure
Income Household net-adjusted disposable income; Household financial wealth
Jobs Employment rate; Long term unemployment rate; Job security
Community Social support network
Education Years in education; Educational attainment; Students' skills
Environment Air pollution; Water quality
Civic Engagement Voter turnout; Consultation on rule-making
Health Life expectancy; Self-reported health
Life Satisfaction Life satisfaction
Safety Assault rate; Homicide rate
Work-Life Balance Employees working long hours; Time devoted to leisure and personal care
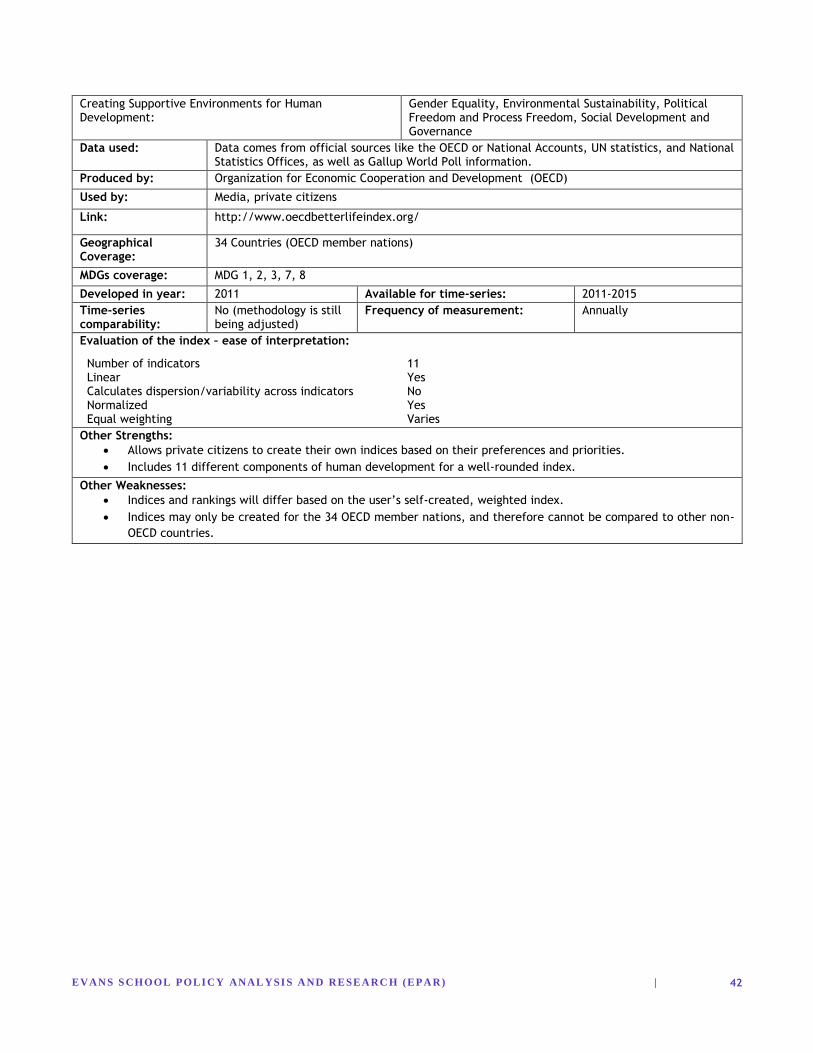
EVAN S S CHOOL POLI CY ANAL YSI S A ND RESEA RC H (EPA R) |
42
Creating Supportive Environments for Human Development:
Gender Equality, Environmental Sustainability, Political Freedom and Process Freedom, Social Development and Governance
Data used: Data comes from official sources like the OECD or National Accounts, UN statistics, and National Statistics Offices, as well as Gallup World Poll information.
Produced by: Organization for Economic Cooperation and Development (OECD)
Used by: Media, private citizens
Link: http://www.oecdbetterlifeindex.org/
Geographical Coverage:
34 Countries (OECD member nations)
MDGs coverage: MDG 1, 2, 3, 7, 8
Developed in year: 2011 Available for time-series: 2011-2015
Time-series comparability:
No (methodology is still being adjusted)
Frequency of measurement: Annually
Evaluation of the index – ease of interpretation:
Number of indicators 11 Linear Yes Calculates dispersion/variability across indicators No Normalized Yes Equal weighting Varies
Other Strengths:
Allows private citizens to create their own indices based on their preferences and priorities.
Includes 11 different components of human development for a well-rounded index.
Other Weaknesses:
Indices and rankings will differ based on the user’s self-created, weighted index.
Indices may only be created for the 34 OECD member nations, and therefore cannot be compared to other non-
OECD countries.
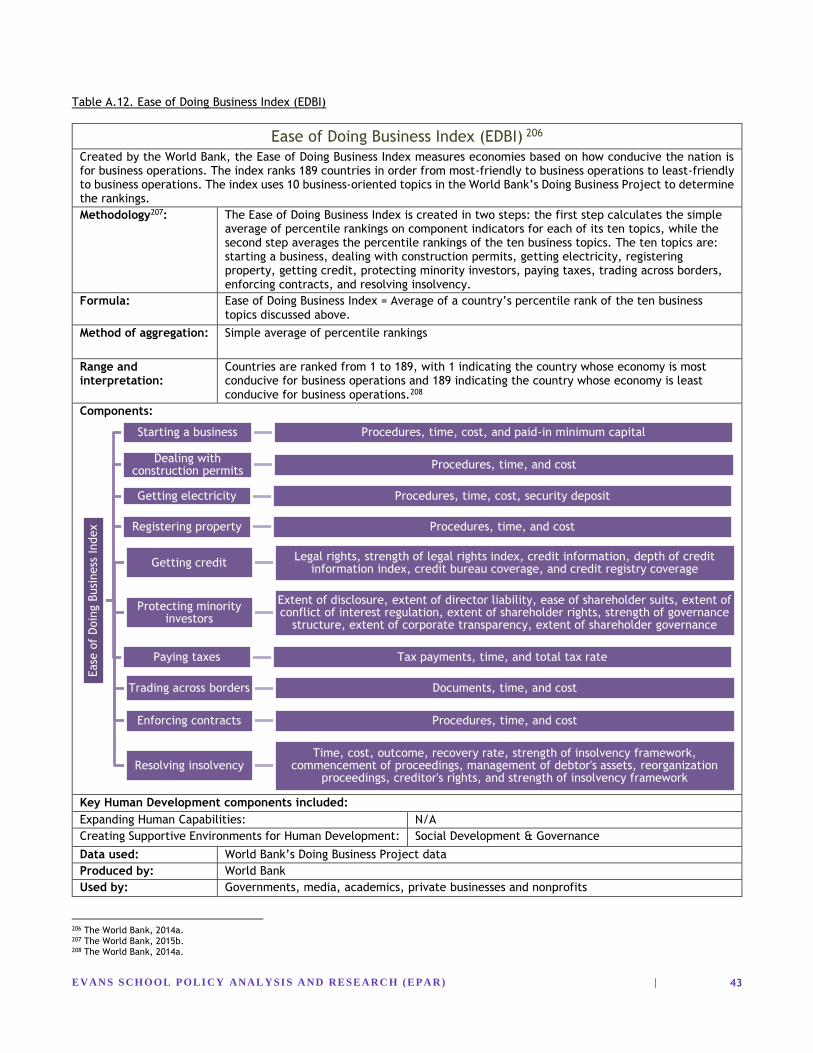
EVAN S S CHOOL POLI CY ANAL YSI S A ND RESEA RC H (EPA R) |
43
Table A.12. Ease of Doing Business Index (EDBI)
Ease of Doing Business Index (EDBI) 206
Created by the World Bank, the Ease of Doing Business Index measures economies based on how conducive the nation is for business operations. The index ranks 189 countries in order from most-friendly to business operations to least-friendly to business operations. The index uses 10 business-oriented topics in the World Bank’s Doing Business Project to determine the rankings.
Methodology207: The Ease of Doing Business Index is created in two steps: the first step calculates the simple average of percentile rankings on component indicators for each of its ten topics, while the second step averages the percentile rankings of the ten business topics. The ten topics are: starting a business, dealing with construction permits, getting electricity, registering property, getting credit, protecting minority investors, paying taxes, trading across borders, enforcing contracts, and resolving insolvency.
Formula: Ease of Doing Business Index = Average of a country’s percentile rank of the ten business topics discussed above.
Method of aggregation: Simple average of percentile rankings
Range and interpretation:
Countries are ranked from 1 to 189, with 1 indicating the country whose economy is most conducive for business operations and 189 indicating the country whose economy is least conducive for business operations.208
Components:
Key Human Development components included:
Expanding Human Capabilities: N/A
Creating Supportive Environments for Human Development: Social Development & Governance
Data used: World Bank’s Doing Business Project data
Produced by: World Bank
Used by: Governments, media, academics, private businesses and nonprofits
206 The World Bank, 2014a. 207 The World Bank, 2015b. 208 The World Bank, 2014a.
Ease
of
Doin
g B
usi
ness
Index
Starting a business Procedures, time, cost, and paid-in minimum capital
Dealing with construction permits
Procedures, time, and cost
Getting electricity Procedures, time, cost, security deposit
Registering property Procedures, time, and cost
Getting creditLegal rights, strength of legal rights index, credit information, depth of credit
information index, credit bureau coverage, and credit registry coverage
Protecting minority investors
Extent of disclosure, extent of director liability, ease of shareholder suits, extent of conflict of interest regulation, extent of shareholder rights, strength of governance
structure, extent of corporate transparency, extent of shareholder governance
Paying taxes Tax payments, time, and total tax rate
Trading across borders Documents, time, and cost
Enforcing contracts Procedures, time, and cost
Resolving insolvencyTime, cost, outcome, recovery rate, strength of insolvency framework,
commencement of proceedings, management of debtor's assets, reorganization proceedings, creditor's rights, and strength of insolvency framework
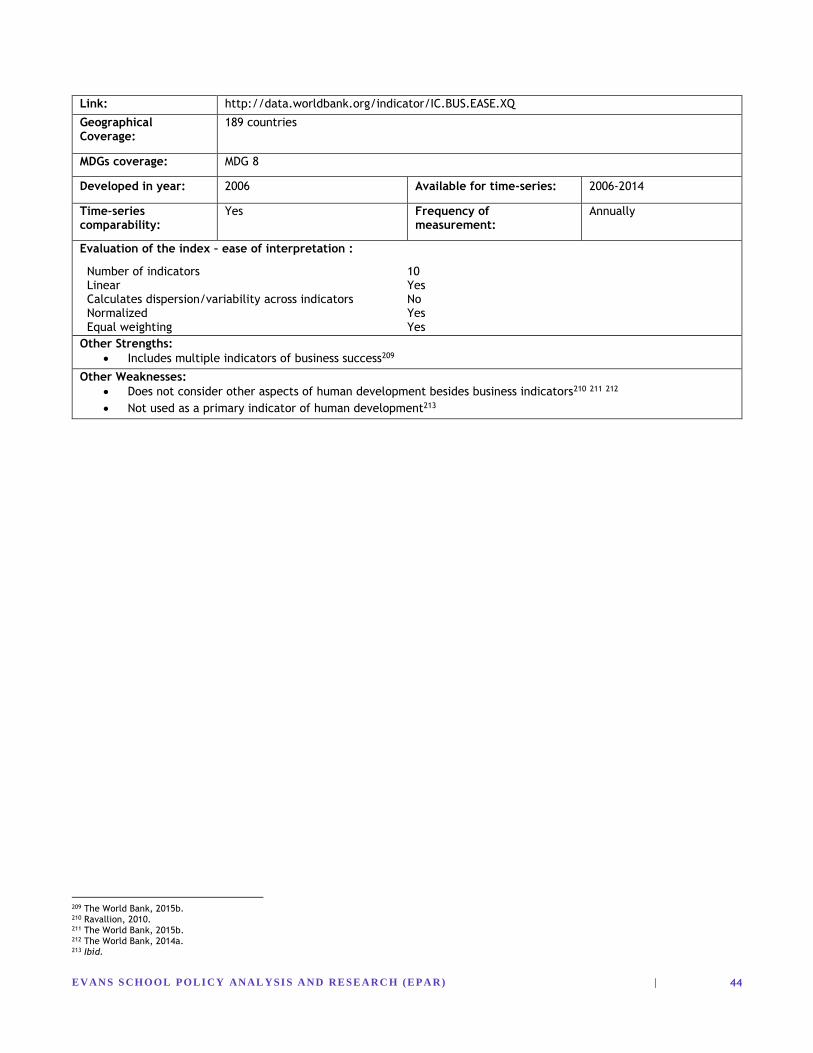
EVAN S S CHOOL POLI CY ANAL YSI S A ND RESEA RC H (EPA R) |
44
Link: http://data.worldbank.org/indicator/IC.BUS.EASE.XQ
Geographical Coverage:
189 countries
MDGs coverage: MDG 8
Developed in year: 2006 Available for time-series: 2006-2014
Time-series comparability:
Yes Frequency of measurement:
Annually
Evaluation of the index – ease of interpretation :
Number of indicators 10 Linear Yes Calculates dispersion/variability across indicators No Normalized Yes Equal weighting Yes
Other Strengths:
Includes multiple indicators of business success209
Other Weaknesses:
Does not consider other aspects of human development besides business indicators210 211 212
Not used as a primary indicator of human development213
209 The World Bank, 2015b. 210 Ravallion, 2010. 211 The World Bank, 2015b. 212 The World Bank, 2014a. 213 Ibid.
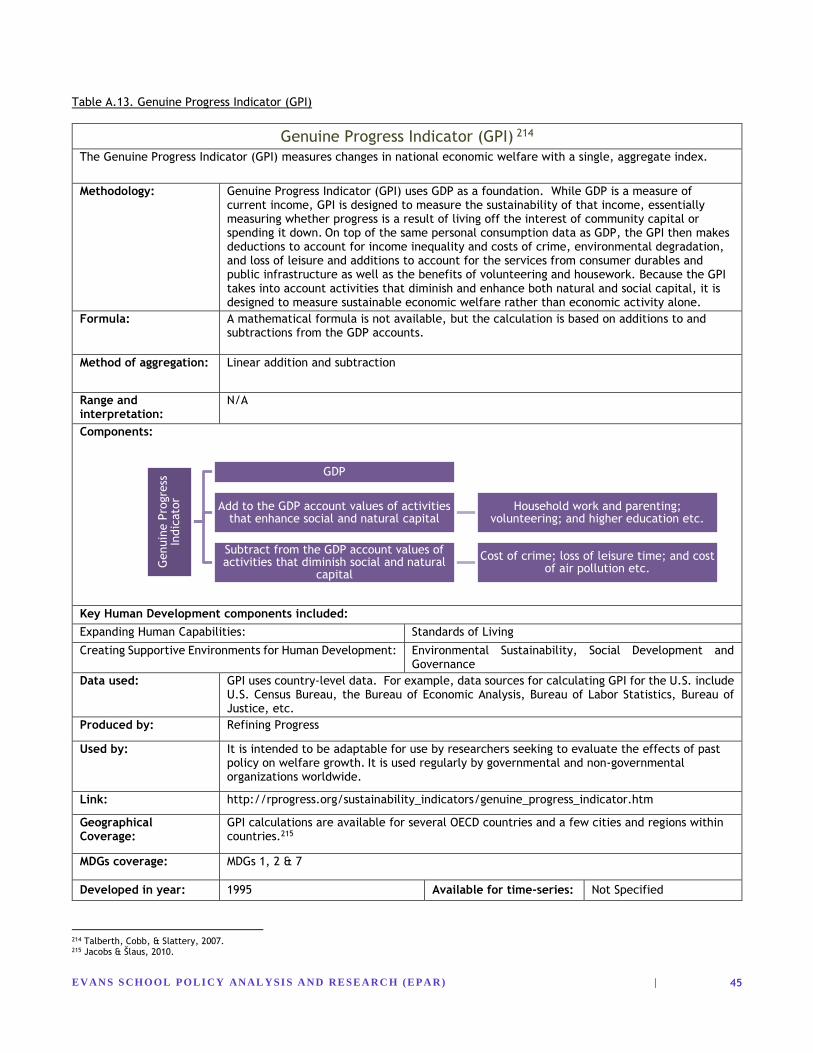
EVAN S S CHOOL POLI CY ANAL YSI S A ND RESEA RC H (EPA R) |
45
Table A.13. Genuine Progress Indicator (GPI)
Genuine Progress Indicator (GPI) 214
The Genuine Progress Indicator (GPI) measures changes in national economic welfare with a single, aggregate index.
Methodology: Genuine Progress Indicator (GPI) uses GDP as a foundation. While GDP is a measure of current income, GPI is designed to measure the sustainability of that income, essentially measuring whether progress is a result of living off the interest of community capital or spending it down. On top of the same personal consumption data as GDP, the GPI then makes deductions to account for income inequality and costs of crime, environmental degradation, and loss of leisure and additions to account for the services from consumer durables and public infrastructure as well as the benefits of volunteering and housework. Because the GPI takes into account activities that diminish and enhance both natural and social capital, it is designed to measure sustainable economic welfare rather than economic activity alone.
Formula: A mathematical formula is not available, but the calculation is based on additions to and subtractions from the GDP accounts.
Method of aggregation: Linear addition and subtraction
Range and interpretation:
N/A
Components:
Key Human Development components included:
Expanding Human Capabilities: Standards of Living
Creating Supportive Environments for Human Development: Environmental Sustainability, Social Development and Governance
Data used: GPI uses country-level data. For example, data sources for calculating GPI for the U.S. include U.S. Census Bureau, the Bureau of Economic Analysis, Bureau of Labor Statistics, Bureau of Justice, etc.
Produced by: Refining Progress
Used by: It is intended to be adaptable for use by researchers seeking to evaluate the effects of past policy on welfare growth. It is used regularly by governmental and non-governmental organizations worldwide.
Link: http://rprogress.org/sustainability_indicators/genuine_progress_indicator.htm
Geographical Coverage:
GPI calculations are available for several OECD countries and a few cities and regions within countries.215
MDGs coverage: MDGs 1, 2 & 7
Developed in year: 1995 Available for time-series: Not Specified
214 Talberth, Cobb, & Slattery, 2007. 215 Jacobs & Šlaus, 2010.
Genuin
e P
rogre
ss
Indic
ato
r
GDP
Add to the GDP account values of activities that enhance social and natural capital
Household work and parenting; volunteering; and higher education etc.
Subtract from the GDP account values of activities that diminish social and natural
capital
Cost of crime; loss of leisure time; and cost of air pollution etc.

EVAN S S CHOOL POLI CY ANAL YSI S A ND RESEA RC H (EPA R) |
46
Time-series comparability:
Yes Frequency of measurement:
Not Specified
Evaluation of the index – ease of interpretation:
Number of indicators 26 Linear Yes Calculates dispersion/variability across indicators No Normalized No Equal weighting Yes
Other Strengths:
The GPI is a more meaningful indicator of the well-being of the nation’s households than GDP because it takes
into account the value of services derived from real wealth and assets.216
Like GDP, it is a currency denominated index and bases itself on GDP consumption data.217
It is a better measure of economic welfare than GDP because of its addition/deduction methodology which
reflects net contributions to natural and social capital stocks.218
Other Weaknesses:
Some question the GPI’s ability to measure sustainable welfare or its methodological soundness (e.g. it fails to
fully account for changes in human-health capital219).220
216 Talberth, Cobb, & Slattery, 2007. 217 Jacobs & Šlaus, 2010. 218 Kubiszewski et al., 2013. 219 Lawn, 2013. 220 Talberth, Cobb, & Slattery, 2007.
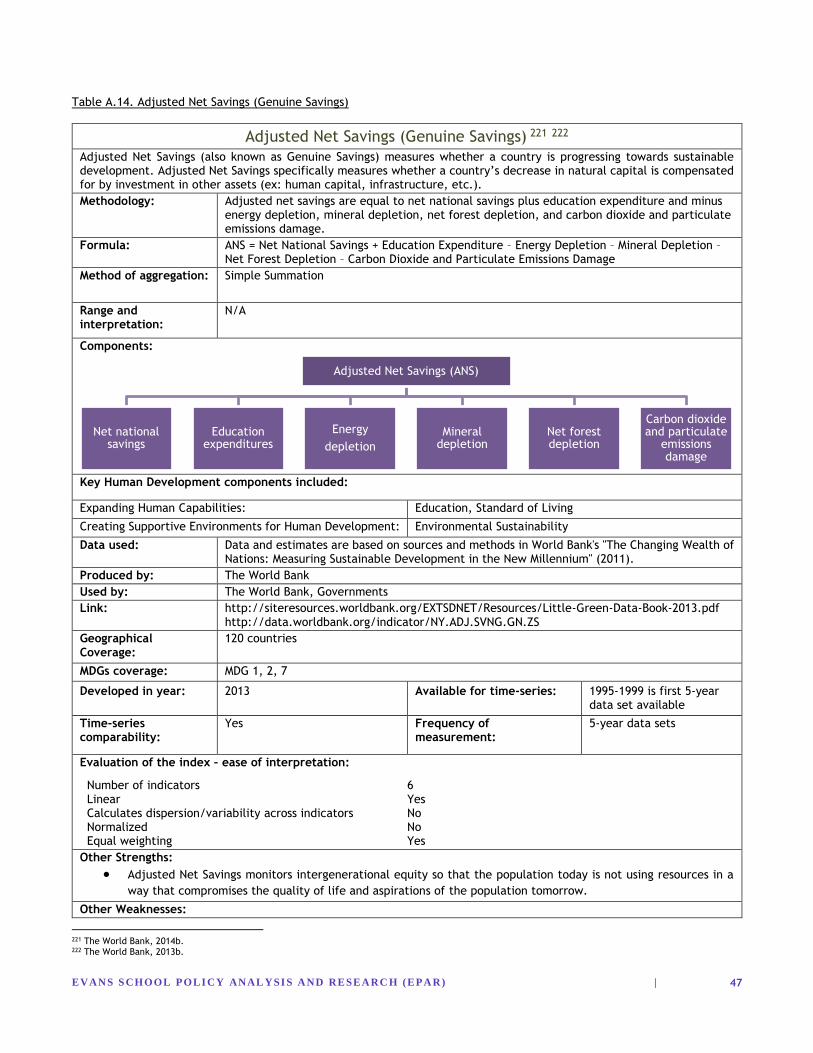
EVAN S S CHOOL POLI CY ANAL YSI S A ND RESEA RC H (EPA R) |
47
Table A.14. Adjusted Net Savings (Genuine Savings)
Adjusted Net Savings (Genuine Savings) 221 222
Adjusted Net Savings (also known as Genuine Savings) measures whether a country is progressing towards sustainable development. Adjusted Net Savings specifically measures whether a country’s decrease in natural capital is compensated for by investment in other assets (ex: human capital, infrastructure, etc.).
Methodology: Adjusted net savings are equal to net national savings plus education expenditure and minus energy depletion, mineral depletion, net forest depletion, and carbon dioxide and particulate emissions damage.
Formula: ANS = Net National Savings + Education Expenditure – Energy Depletion – Mineral Depletion – Net Forest Depletion – Carbon Dioxide and Particulate Emissions Damage
Method of aggregation: Simple Summation
Range and interpretation:
N/A
Components:
Key Human Development components included:
Expanding Human Capabilities: Education, Standard of Living
Creating Supportive Environments for Human Development: Environmental Sustainability
Data used: Data and estimates are based on sources and methods in World Bank's "The Changing Wealth of Nations: Measuring Sustainable Development in the New Millennium" (2011).
Produced by: The World Bank
Used by: The World Bank, Governments
Link: http://siteresources.worldbank.org/EXTSDNET/Resources/Little-Green-Data-Book-2013.pdf http://data.worldbank.org/indicator/NY.ADJ.SVNG.GN.ZS
Geographical Coverage:
120 countries
MDGs coverage: MDG 1, 2, 7
Developed in year: 2013 Available for time-series: 1995-1999 is first 5-year data set available
Time-series comparability:
Yes Frequency of measurement:
5-year data sets
Evaluation of the index – ease of interpretation:
Number of indicators 6 Linear Yes Calculates dispersion/variability across indicators No Normalized No Equal weighting Yes
Other Strengths:
Adjusted Net Savings monitors intergenerational equity so that the population today is not using resources in a
way that compromises the quality of life and aspirations of the population tomorrow.
Other Weaknesses:
221 The World Bank, 2014b. 222 The World Bank, 2013b.
Adjusted Net Savings (ANS)
Net national savings
Education expenditures
Energy
depletion
Mineral depletion
Net forest depletion
Carbon dioxide and particulate
emissions damage
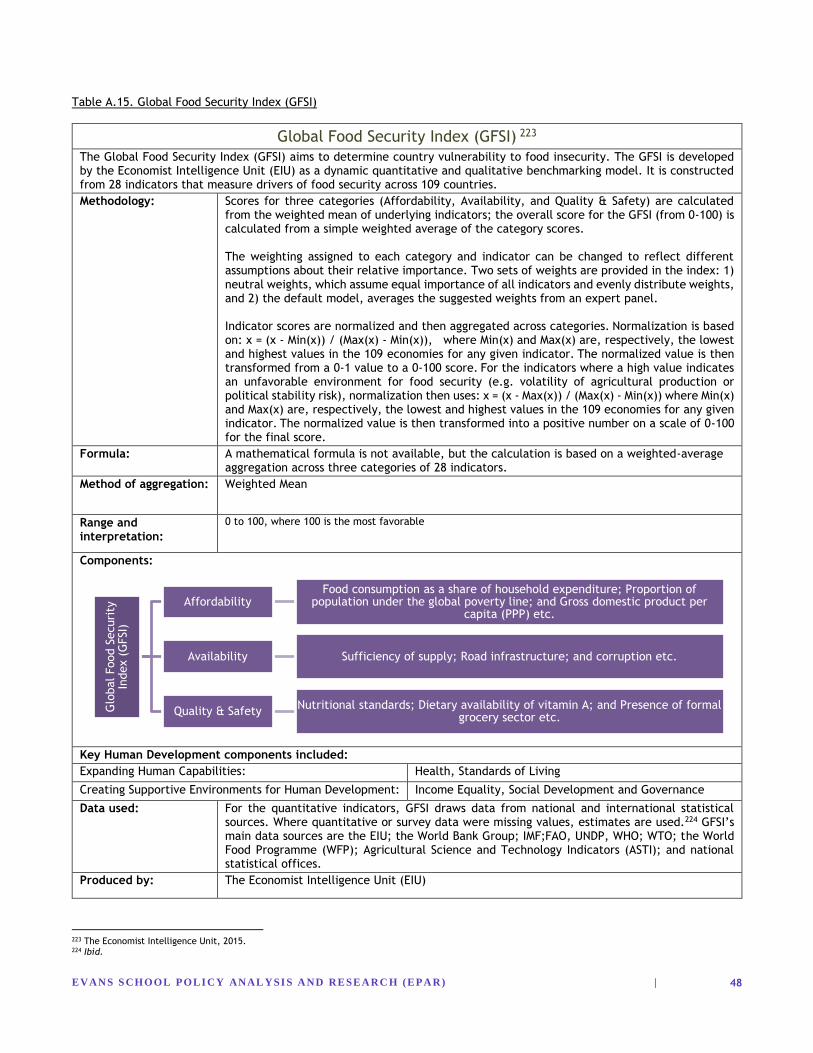
EVAN S S CHOOL POLI CY ANAL YSI S A ND RESEA RC H (EPA R) |
48
Table A.15. Global Food Security Index (GFSI)
Global Food Security Index (GFSI) 223
The Global Food Security Index (GFSI) aims to determine country vulnerability to food insecurity. The GFSI is developed by the Economist Intelligence Unit (EIU) as a dynamic quantitative and qualitative benchmarking model. It is constructed from 28 indicators that measure drivers of food security across 109 countries.
Methodology: Scores for three categories (Affordability, Availability, and Quality & Safety) are calculated from the weighted mean of underlying indicators; the overall score for the GFSI (from 0-100) is calculated from a simple weighted average of the category scores. The weighting assigned to each category and indicator can be changed to reflect different assumptions about their relative importance. Two sets of weights are provided in the index: 1) neutral weights, which assume equal importance of all indicators and evenly distribute weights, and 2) the default model, averages the suggested weights from an expert panel. Indicator scores are normalized and then aggregated across categories. Normalization is based on: x = (x - Min(x)) / (Max(x) - Min(x)), where Min(x) and Max(x) are, respectively, the lowest and highest values in the 109 economies for any given indicator. The normalized value is then transformed from a 0-1 value to a 0-100 score. For the indicators where a high value indicates an unfavorable environment for food security (e.g. volatility of agricultural production or political stability risk), normalization then uses: x = (x - Max(x)) / (Max(x) - Min(x)) where Min(x) and Max(x) are, respectively, the lowest and highest values in the 109 economies for any given indicator. The normalized value is then transformed into a positive number on a scale of 0-100 for the final score.
Formula: A mathematical formula is not available, but the calculation is based on a weighted-average aggregation across three categories of 28 indicators.
Method of aggregation: Weighted Mean
Range and interpretation:
0 to 100, where 100 is the most favorable
Components:
Key Human Development components included:
Expanding Human Capabilities: Health, Standards of Living
Creating Supportive Environments for Human Development: Income Equality, Social Development and Governance
Data used: For the quantitative indicators, GFSI draws data from national and international statistical sources. Where quantitative or survey data were missing values, estimates are used.224 GFSI’s main data sources are the EIU; the World Bank Group; IMF;FAO, UNDP, WHO; WTO; the World Food Programme (WFP); Agricultural Science and Technology Indicators (ASTI); and national statistical offices.
Produced by: The Economist Intelligence Unit (EIU)
223 The Economist Intelligence Unit, 2015. 224 Ibid.
Glo
bal Food S
ecuri
ty
Index (
GFSI)
AffordabilityFood consumption as a share of household expenditure; Proportion of
population under the global poverty line; and Gross domestic product per capita (PPP) etc.
Availability Sufficiency of supply; Road infrastructure; and corruption etc.
Quality & SafetyNutritional standards; Dietary availability of vitamin A; and Presence of formal
grocery sector etc.
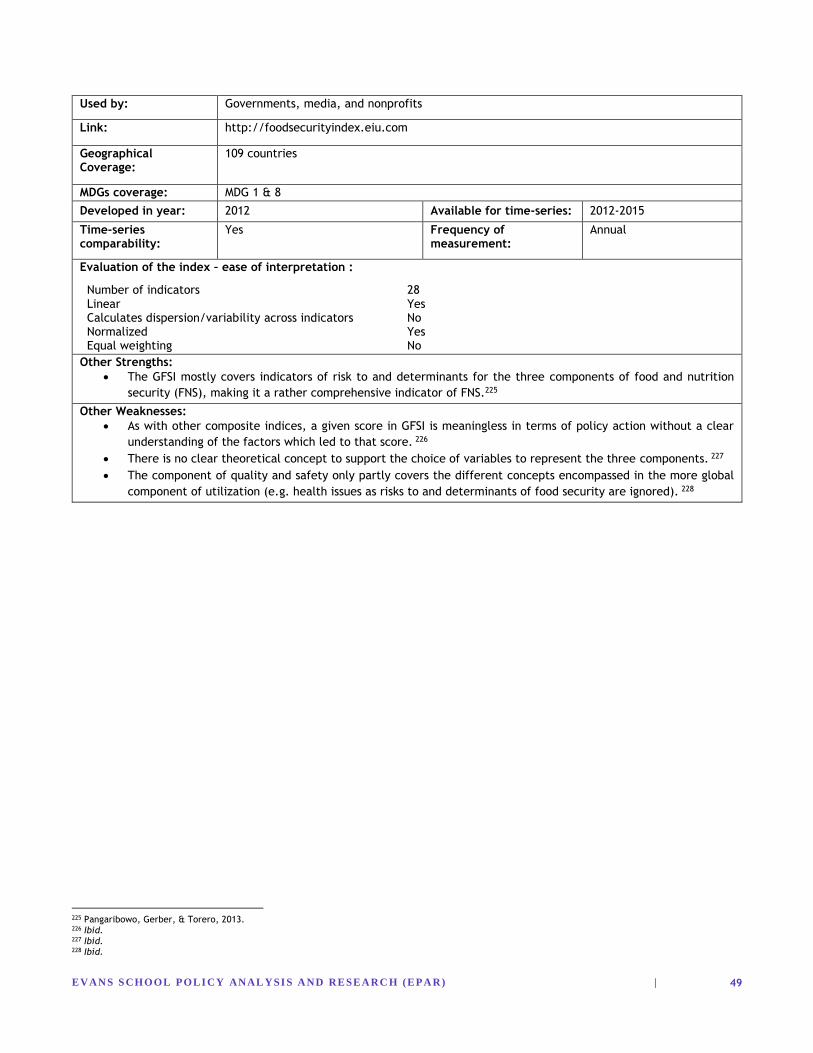
EVAN S S CHOOL POLI CY ANAL YSI S A ND RESEA RC H (EPA R) |
49
Used by: Governments, media, and nonprofits
Link: http://foodsecurityindex.eiu.com
Geographical Coverage:
109 countries
MDGs coverage: MDG 1 & 8
Developed in year: 2012 Available for time-series: 2012-2015
Time-series comparability:
Yes Frequency of measurement:
Annual
Evaluation of the index – ease of interpretation :
Number of indicators 28 Linear Yes Calculates dispersion/variability across indicators No Normalized Yes Equal weighting No
Other Strengths:
The GFSI mostly covers indicators of risk to and determinants for the three components of food and nutrition
security (FNS), making it a rather comprehensive indicator of FNS.225
Other Weaknesses:
As with other composite indices, a given score in GFSI is meaningless in terms of policy action without a clear
understanding of the factors which led to that score. 226
There is no clear theoretical concept to support the choice of variables to represent the three components. 227
The component of quality and safety only partly covers the different concepts encompassed in the more global
component of utilization (e.g. health issues as risks to and determinants of food security are ignored). 228
225 Pangaribowo, Gerber, & Torero, 2013. 226 Ibid. 227 Ibid. 228 Ibid.
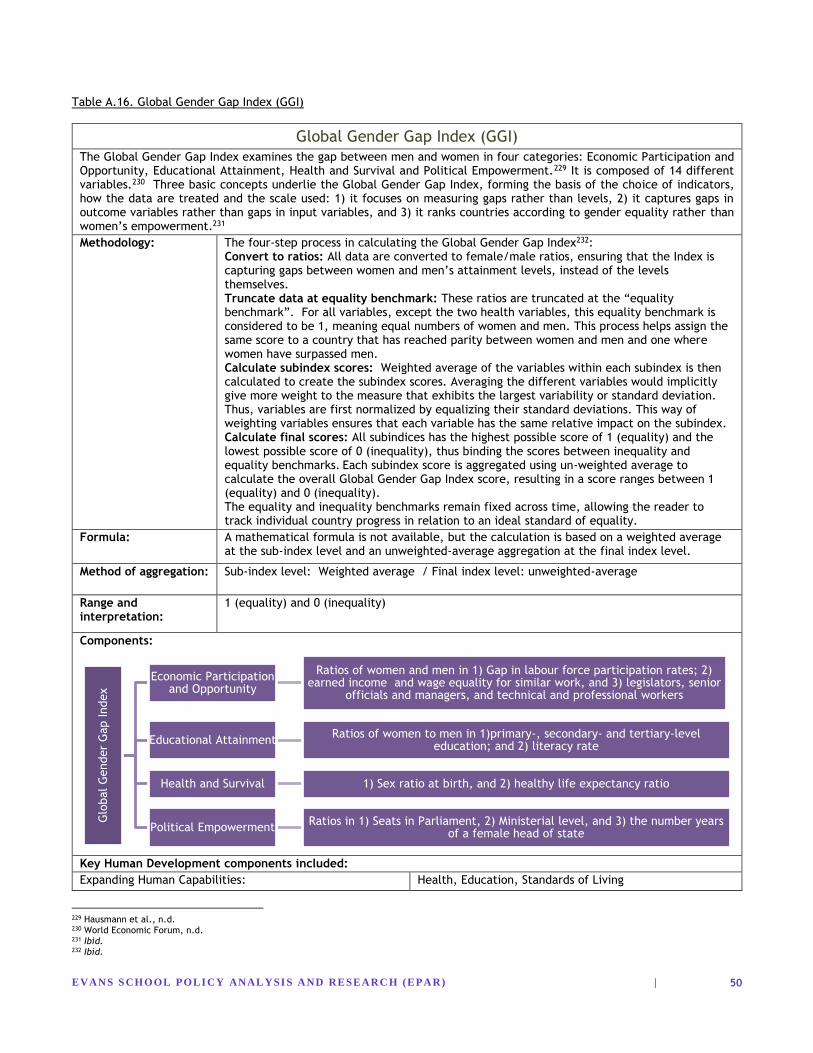
EVAN S S CHOOL POLI CY ANAL YSI S A ND RESEA RC H (EPA R) |
50
Table A.16. Global Gender Gap Index (GGI)
Global Gender Gap Index (GGI)
The Global Gender Gap Index examines the gap between men and women in four categories: Economic Participation and Opportunity, Educational Attainment, Health and Survival and Political Empowerment.229 It is composed of 14 different variables.230 Three basic concepts underlie the Global Gender Gap Index, forming the basis of the choice of indicators, how the data are treated and the scale used: 1) it focuses on measuring gaps rather than levels, 2) it captures gaps in outcome variables rather than gaps in input variables, and 3) it ranks countries according to gender equality rather than women’s empowerment.231
Methodology: The four-step process in calculating the Global Gender Gap Index232: Convert to ratios: All data are converted to female/male ratios, ensuring that the Index is capturing gaps between women and men’s attainment levels, instead of the levels themselves. Truncate data at equality benchmark: These ratios are truncated at the “equality benchmark”. For all variables, except the two health variables, this equality benchmark is considered to be 1, meaning equal numbers of women and men. This process helps assign the same score to a country that has reached parity between women and men and one where women have surpassed men. Calculate subindex scores: Weighted average of the variables within each subindex is then calculated to create the subindex scores. Averaging the different variables would implicitly give more weight to the measure that exhibits the largest variability or standard deviation.
Thus, variables are first normalized by equalizing their standard deviations. This way of weighting variables ensures that each variable has the same relative impact on the subindex. Calculate final scores: All subindices has the highest possible score of 1 (equality) and the lowest possible score of 0 (inequality), thus binding the scores between inequality and equality benchmarks. Each subindex score is aggregated using un-weighted average to calculate the overall Global Gender Gap Index score, resulting in a score ranges between 1 (equality) and 0 (inequality). The equality and inequality benchmarks remain fixed across time, allowing the reader to track individual country progress in relation to an ideal standard of equality.
Formula: A mathematical formula is not available, but the calculation is based on a weighted average at the sub-index level and an unweighted-average aggregation at the final index level.
Method of aggregation: Sub-index level: Weighted average / Final index level: unweighted-average
Range and interpretation:
1 (equality) and 0 (inequality)
Components:
Key Human Development components included:
Expanding Human Capabilities: Health, Education, Standards of Living
229 Hausmann et al., n.d. 230 World Economic Forum, n.d. 231 Ibid. 232 Ibid.
Glo
bal G
ender
Gap Index
Economic Participation and Opportunity
Ratios of women and men in 1) Gap in labour force participation rates; 2) earned income and wage equality for similar work, and 3) legislators, senior
officials and managers, and technical and professional workers
Educational AttainmentRatios of women to men in 1)primary-, secondary- and tertiary-level
education; and 2) literacy rate
Health and Survival 1) Sex ratio at birth, and 2) healthy life expectancy ratio
Political EmpowermentRatios in 1) Seats in Parliament, 2) Ministerial level, and 3) the number years
of a female head of state
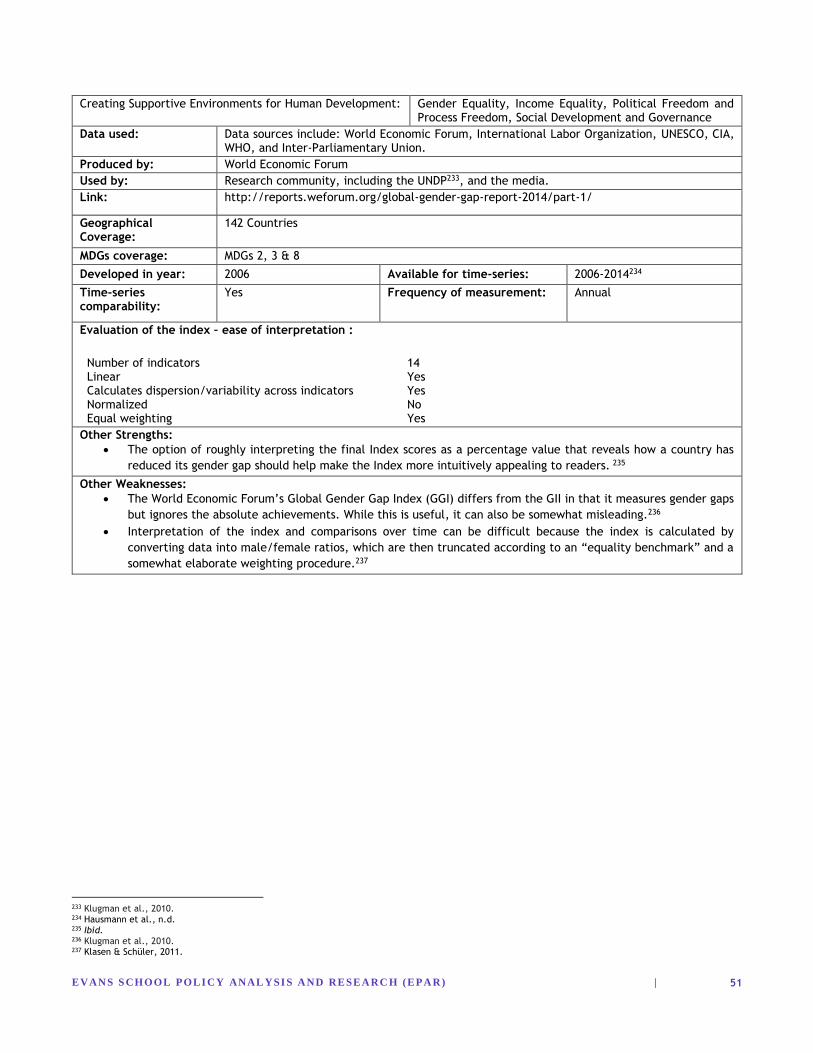
EVAN S S CHOOL POLI CY ANAL YSI S A ND RESEA RC H (EPA R) |
51
Creating Supportive Environments for Human Development: Gender Equality, Income Equality, Political Freedom and Process Freedom, Social Development and Governance
Data used: Data sources include: World Economic Forum, International Labor Organization, UNESCO, CIA, WHO, and Inter-Parliamentary Union.
Produced by: World Economic Forum
Used by: Research community, including the UNDP233, and the media.
Link: http://reports.weforum.org/global-gender-gap-report-2014/part-1/
Geographical Coverage:
142 Countries
MDGs coverage: MDGs 2, 3 & 8
Developed in year: 2006 Available for time-series: 2006-2014234
Time-series comparability:
Yes Frequency of measurement: Annual
Evaluation of the index – ease of interpretation :
Number of indicators 14 Linear Yes Calculates dispersion/variability across indicators Yes Normalized No Equal weighting Yes
Other Strengths:
The option of roughly interpreting the final Index scores as a percentage value that reveals how a country has
reduced its gender gap should help make the Index more intuitively appealing to readers. 235
Other Weaknesses:
The World Economic Forum’s Global Gender Gap Index (GGI) differs from the GII in that it measures gender gaps
but ignores the absolute achievements. While this is useful, it can also be somewhat misleading.236
Interpretation of the index and comparisons over time can be difficult because the index is calculated by
converting data into male/female ratios, which are then truncated according to an “equality benchmark” and a
somewhat elaborate weighting procedure.237
233 Klugman et al., 2010. 234 Hausmann et al., n.d. 235 Ibid. 236 Klugman et al., 2010. 237 Klasen & Schüler, 2011.
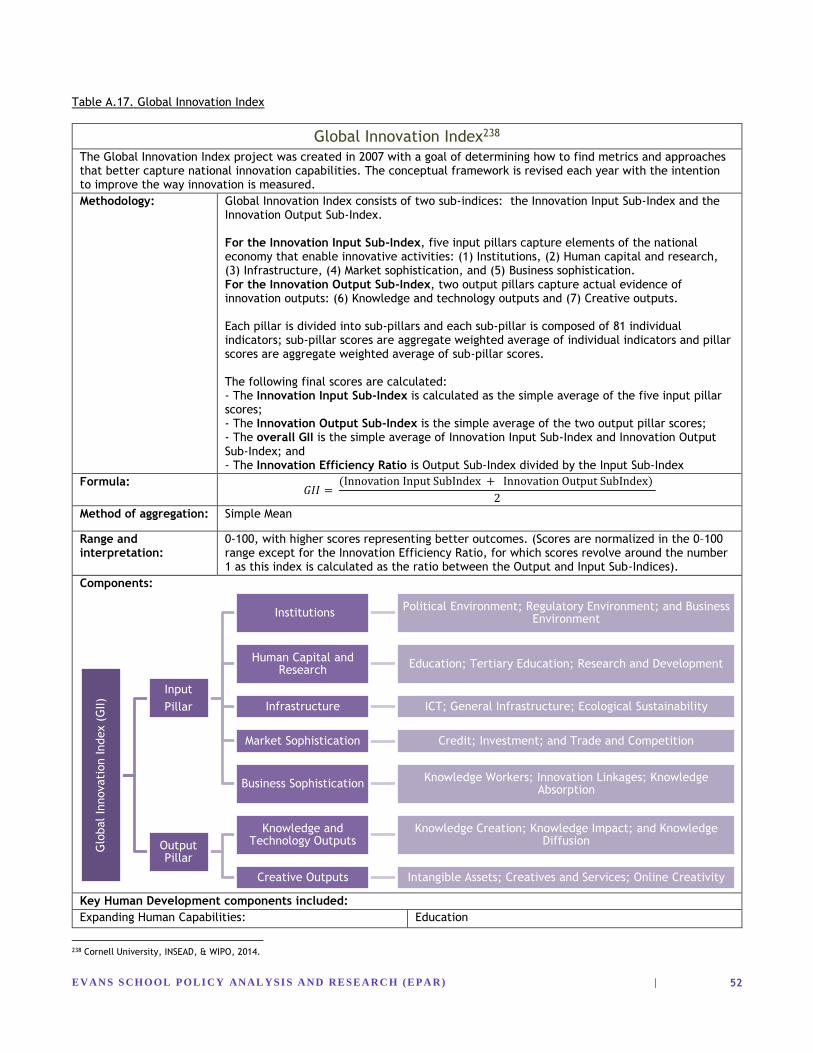
EVAN S S CHOOL POLI CY ANAL YSI S A ND RESEA RC H (EPA R) |
52
Table A.17. Global Innovation Index
Global Innovation Index238
The Global Innovation Index project was created in 2007 with a goal of determining how to find metrics and approaches that better capture national innovation capabilities. The conceptual framework is revised each year with the intention to improve the way innovation is measured.
Methodology: Global Innovation Index consists of two sub-indices: the Innovation Input Sub-Index and the Innovation Output Sub-Index. For the Innovation Input Sub-Index, five input pillars capture elements of the national economy that enable innovative activities: (1) Institutions, (2) Human capital and research, (3) Infrastructure, (4) Market sophistication, and (5) Business sophistication. For the Innovation Output Sub-Index, two output pillars capture actual evidence of innovation outputs: (6) Knowledge and technology outputs and (7) Creative outputs. Each pillar is divided into sub-pillars and each sub-pillar is composed of 81 individual indicators; sub-pillar scores are aggregate weighted average of individual indicators and pillar scores are aggregate weighted average of sub-pillar scores. The following final scores are calculated: - The Innovation Input Sub-Index is calculated as the simple average of the five input pillar scores; - The Innovation Output Sub-Index is the simple average of the two output pillar scores; - The overall GII is the simple average of Innovation Input Sub-Index and Innovation Output Sub-Index; and - The Innovation Efficiency Ratio is Output Sub-Index divided by the Input Sub-Index
Formula: 𝐺𝐼𝐼 =
(Innovation Input SubIndex + Innovation Output SubIndex)
2
Method of aggregation: Simple Mean
Range and interpretation:
0-100, with higher scores representing better outcomes. (Scores are normalized in the 0–100 range except for the Innovation Efficiency Ratio, for which scores revolve around the number 1 as this index is calculated as the ratio between the Output and Input Sub-Indices).
Components:
Key Human Development components included:
Expanding Human Capabilities: Education
238 Cornell University, INSEAD, & WIPO, 2014.
Glo
bal In
novati
on Index (
GII)
Input
Pillar
InstitutionsPolitical Environment; Regulatory Environment; and Business
Environment
Human Capital and Research
Education; Tertiary Education; Research and Development
Infrastructure ICT; General Infrastructure; Ecological Sustainability
Market Sophistication Credit; Investment; and Trade and Competition
Business SophisticationKnowledge Workers; Innovation Linkages; Knowledge
Absorption
Output Pillar
Knowledge and Technology Outputs
Knowledge Creation; Knowledge Impact; and Knowledge Diffusion
Creative Outputs Intangible Assets; Creatives and Services; Online Creativity
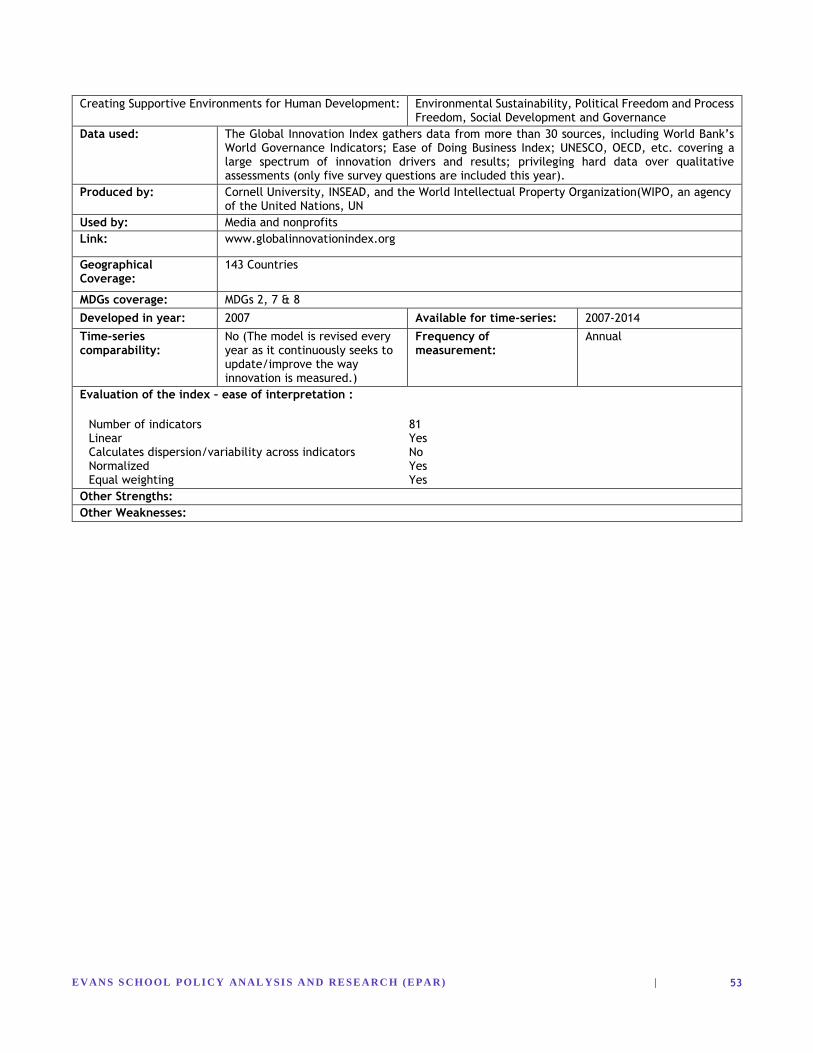
EVAN S S CHOOL POLI CY ANAL YSI S A ND RESEA RC H (EPA R) |
53
Creating Supportive Environments for Human Development: Environmental Sustainability, Political Freedom and Process Freedom, Social Development and Governance
Data used: The Global Innovation Index gathers data from more than 30 sources, including World Bank’s World Governance Indicators; Ease of Doing Business Index; UNESCO, OECD, etc. covering a large spectrum of innovation drivers and results; privileging hard data over qualitative assessments (only five survey questions are included this year).
Produced by: Cornell University, INSEAD, and the World Intellectual Property Organization(WIPO, an agency of the United Nations, UN
Used by: Media and nonprofits
Link: www.globalinnovationindex.org
Geographical Coverage:
143 Countries
MDGs coverage: MDGs 2, 7 & 8
Developed in year: 2007 Available for time-series: 2007-2014
Time-series comparability:
No (The model is revised every year as it continuously seeks to update/improve the way innovation is measured.)
Frequency of measurement:
Annual
Evaluation of the index – ease of interpretation :
Number of indicators 81 Linear Yes Calculates dispersion/variability across indicators No Normalized Yes Equal weighting Yes
Other Strengths:
Other Weaknesses:
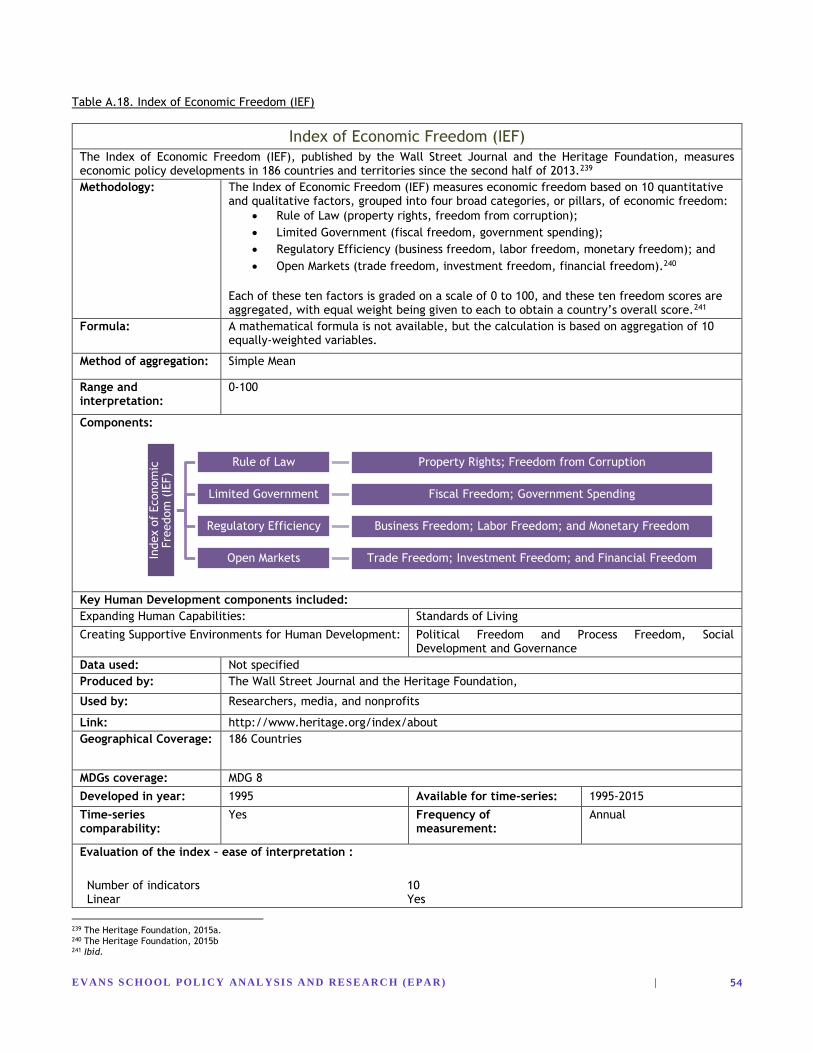
EVAN S S CHOOL POLI CY ANAL YSI S A ND RESEA RC H (EPA R) |
54
Table A.18. Index of Economic Freedom (IEF)
Index of Economic Freedom (IEF)
The Index of Economic Freedom (IEF), published by the Wall Street Journal and the Heritage Foundation, measures economic policy developments in 186 countries and territories since the second half of 2013.239
Methodology: The Index of Economic Freedom (IEF) measures economic freedom based on 10 quantitative and qualitative factors, grouped into four broad categories, or pillars, of economic freedom:
Rule of Law (property rights, freedom from corruption);
Limited Government (fiscal freedom, government spending);
Regulatory Efficiency (business freedom, labor freedom, monetary freedom); and
Open Markets (trade freedom, investment freedom, financial freedom).240
Each of these ten factors is graded on a scale of 0 to 100, and these ten freedom scores are aggregated, with equal weight being given to each to obtain a country’s overall score.241
Formula: A mathematical formula is not available, but the calculation is based on aggregation of 10 equally-weighted variables.
Method of aggregation: Simple Mean
Range and interpretation:
0-100
Components:
Key Human Development components included:
Expanding Human Capabilities: Standards of Living
Creating Supportive Environments for Human Development: Political Freedom and Process Freedom, Social Development and Governance
Data used: Not specified
Produced by: The Wall Street Journal and the Heritage Foundation,
Used by: Researchers, media, and nonprofits
Link: http://www.heritage.org/index/about
Geographical Coverage: 186 Countries
MDGs coverage: MDG 8
Developed in year: 1995 Available for time-series: 1995-2015
Time-series comparability:
Yes Frequency of measurement:
Annual
Evaluation of the index – ease of interpretation :
Number of indicators 10 Linear Yes
239 The Heritage Foundation, 2015a. 240 The Heritage Foundation, 2015b 241 Ibid.
Index o
f Econom
ic
Fre
edom
(IE
F)
Rule of Law Property Rights; Freedom from Corruption
Limited Government Fiscal Freedom; Government Spending
Regulatory Efficiency Business Freedom; Labor Freedom; and Monetary Freedom
Open Markets Trade Freedom; Investment Freedom; and Financial Freedom
EVAN S S CHOOL POLI CY ANAL YSI S A ND RESEA RC H (EPA R) |
55
Calculates dispersion/variability across indicators No Normalized No Equal weighting Yes
Other Strengths:
The correlation between the economic freedom variables of the IEF and indicators of growth has proved to be
positive and significant in the study by De Hann and Sturm.242
Other Weaknesses:
Some of the underlying theories that supports their choice of indicators are questionable, especially the way
government spending and taxes are taken up (the underlying theory about taxation is a deterrent of economic
freedom). 243
242 de Haan & Sturm, 2000. 243 Ibid.
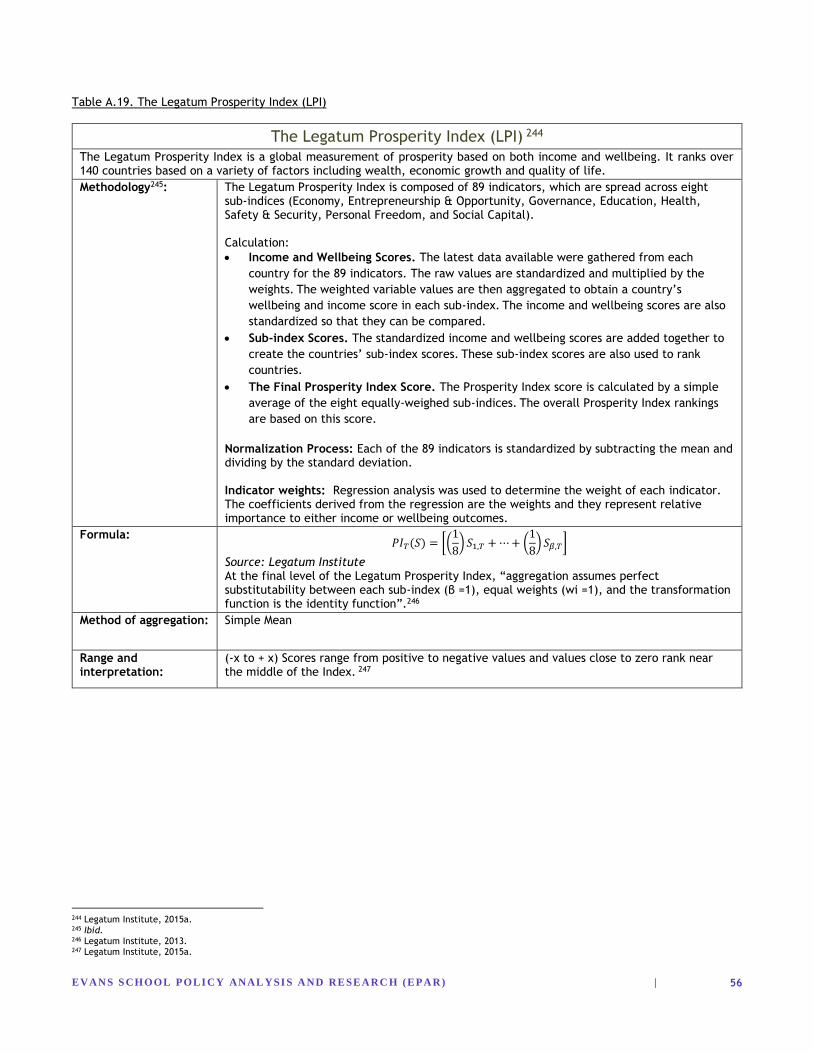
EVAN S S CHOOL POLI CY ANAL YSI S A ND RESEA RC H (EPA R) |
56
Table A.19. The Legatum Prosperity Index (LPI)
The Legatum Prosperity Index (LPI) 244
The Legatum Prosperity Index is a global measurement of prosperity based on both income and wellbeing. It ranks over 140 countries based on a variety of factors including wealth, economic growth and quality of life.
Methodology245: The Legatum Prosperity Index is composed of 89 indicators, which are spread across eight sub-indices (Economy, Entrepreneurship & Opportunity, Governance, Education, Health, Safety & Security, Personal Freedom, and Social Capital). Calculation:
Income and Wellbeing Scores. The latest data available were gathered from each
country for the 89 indicators. The raw values are standardized and multiplied by the
weights. The weighted variable values are then aggregated to obtain a country’s
wellbeing and income score in each sub-index. The income and wellbeing scores are also
standardized so that they can be compared.
Sub-index Scores. The standardized income and wellbeing scores are added together to
create the countries’ sub-index scores. These sub-index scores are also used to rank
countries.
The Final Prosperity Index Score. The Prosperity Index score is calculated by a simple
average of the eight equally-weighed sub-indices. The overall Prosperity Index rankings
are based on this score.
Normalization Process: Each of the 89 indicators is standardized by subtracting the mean and dividing by the standard deviation. Indicator weights: Regression analysis was used to determine the weight of each indicator.
The coefficients derived from the regression are the weights and they represent relative importance to either income or wellbeing outcomes.
Formula: 𝑃𝐼𝑇(𝑆) = [(
1
8) 𝑆1,𝑇 + ⋯ + (
1
8) 𝑆𝛽,𝑇]
Source: Legatum Institute At the final level of the Legatum Prosperity Index, “aggregation assumes perfect substitutability between each sub-index (β =1), equal weights (wi =1), and the transformation function is the identity function”.246
Method of aggregation: Simple Mean
Range and interpretation:
(-x to + x) Scores range from positive to negative values and values close to zero rank near the middle of the Index. 247
244 Legatum Institute, 2015a. 245 Ibid. 246 Legatum Institute, 2013. 247 Legatum Institute, 2015a.
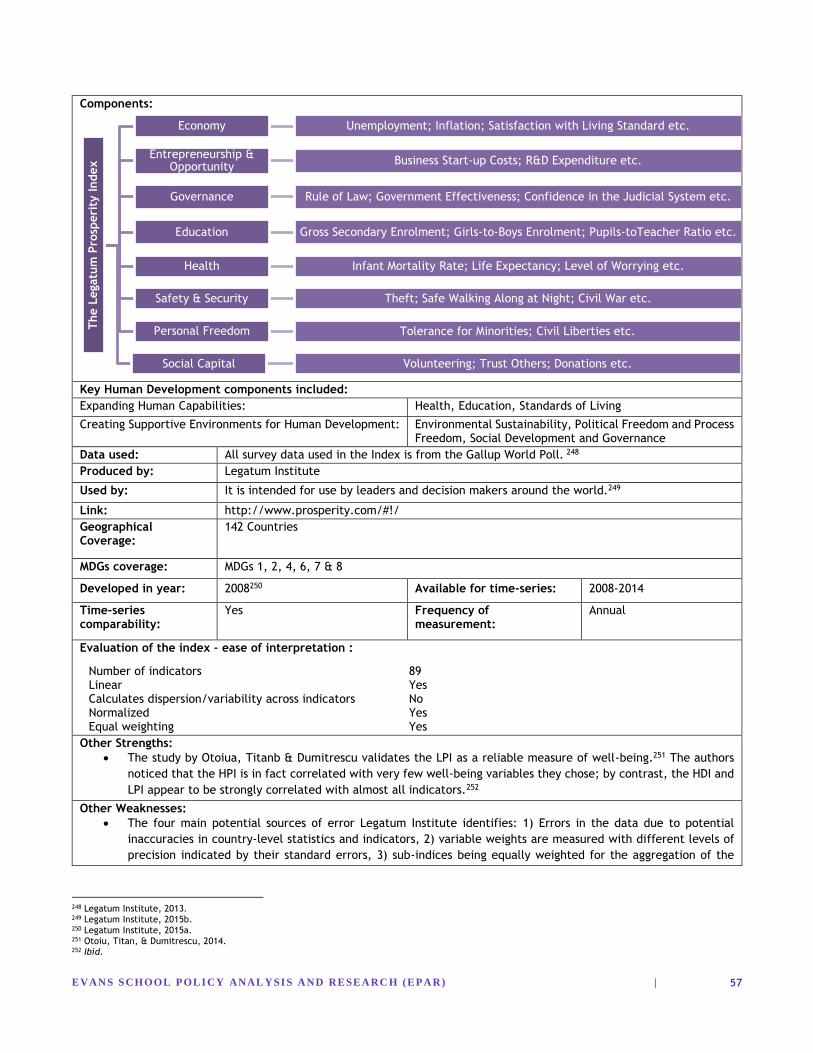
EVAN S S CHOOL POLI CY ANAL YSI S A ND RESEA RC H (EPA R) |
57
Components:
Key Human Development components included:
Expanding Human Capabilities: Health, Education, Standards of Living
Creating Supportive Environments for Human Development: Environmental Sustainability, Political Freedom and Process Freedom, Social Development and Governance
Data used: All survey data used in the Index is from the Gallup World Poll. 248
Produced by: Legatum Institute
Used by: It is intended for use by leaders and decision makers around the world.249
Link: http://www.prosperity.com/#!/
Geographical Coverage:
142 Countries
MDGs coverage: MDGs 1, 2, 4, 6, 7 & 8
Developed in year: 2008250 Available for time-series: 2008-2014
Time-series comparability:
Yes Frequency of measurement:
Annual
Evaluation of the index – ease of interpretation :
Number of indicators 89 Linear Yes Calculates dispersion/variability across indicators No Normalized Yes Equal weighting Yes
Other Strengths:
The study by Otoiua, Titanb & Dumitrescu validates the LPI as a reliable measure of well-being.251 The authors
noticed that the HPI is in fact correlated with very few well-being variables they chose; by contrast, the HDI and
LPI appear to be strongly correlated with almost all indicators.252
Other Weaknesses:
The four main potential sources of error Legatum Institute identifies: 1) Errors in the data due to potential
inaccuracies in country-level statistics and indicators, 2) variable weights are measured with different levels of
precision indicated by their standard errors, 3) sub-indices being equally weighted for the aggregation of the
248 Legatum Institute, 2013. 249 Legatum Institute, 2015b. 250 Legatum Institute, 2015a. 251 Otoiu, Titan, & Dumitrescu, 2014. 252 Ibid.
The L
egatu
m P
rosp
eri
ty Index
Economy Unemployment; Inflation; Satisfaction with Living Standard etc.
Entrepreneurship & Opportunity
Business Start-up Costs; R&D Expenditure etc.
Governance Rule of Law; Government Effectiveness; Confidence in the Judicial System etc.
Education Gross Secondary Enrolment; Girls-to-Boys Enrolment; Pupils-toTeacher Ratio etc.
Health Infant Mortality Rate; Life Expectancy; Level of Worrying etc.
Safety & Security Theft; Safe Walking Along at Night; Civil War etc.
Personal Freedom Tolerance for Minorities; Civil Liberties etc.
Social Capital Volunteering; Trust Others; Donations etc.
EVAN S S CHOOL POLI CY ANAL YSI S A ND RESEA RC H (EPA R) |
58
income and wellbeing components thus may generate a degree of uncertainty, and 4) potential misspecifications
in the modelling can produce errors that affect the Prosperity Index scores.253
253 Legatum Institute, 2013.
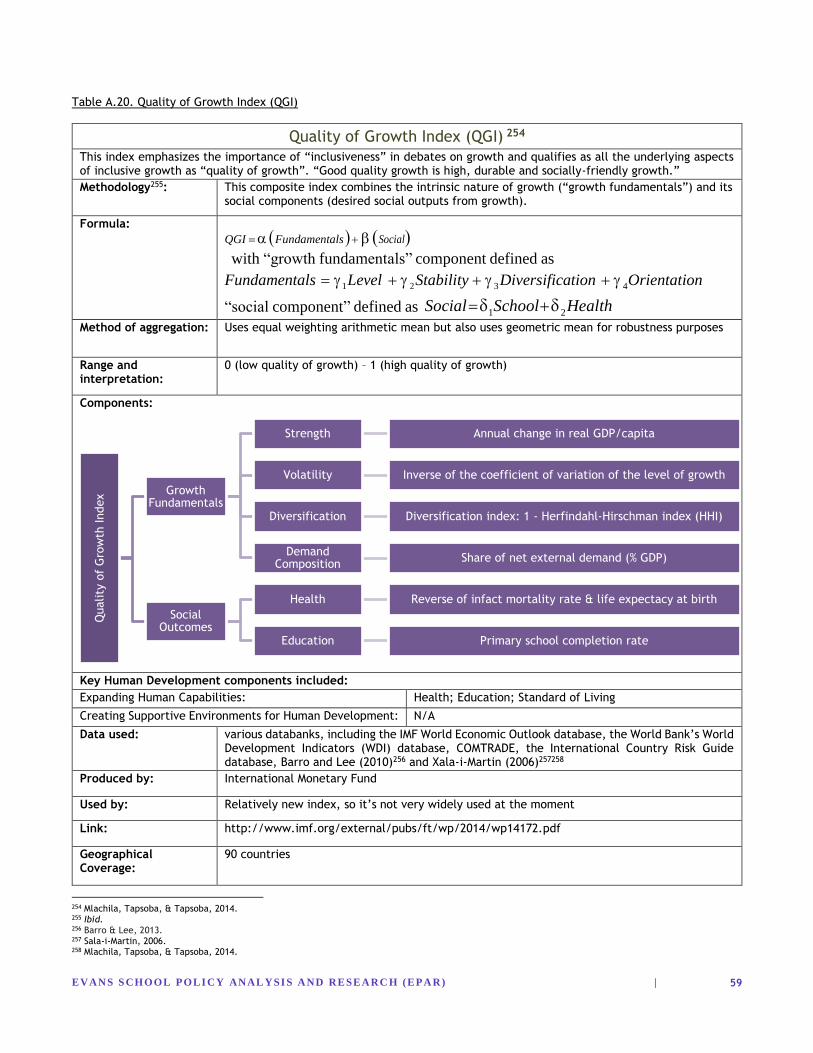
EVAN S S CHOOL POLI CY ANAL YSI S A ND RESEA RC H (EPA R) |
59
Table A.20. Quality of Growth Index (QGI)
Quality of Growth Index (QGI) 254
This index emphasizes the importance of “inclusiveness” in debates on growth and qualifies as all the underlying aspects of inclusive growth as “quality of growth”. “Good quality growth is high, durable and socially-friendly growth.”
Methodology255: This composite index combines the intrinsic nature of growth (“growth fundamentals”) and its social components (desired social outputs from growth).
Formula:
QGI Fundamentals Socialwith “growth fundamentals” component defined as
Fundamentals 1 Level 2 Stability 3 Diversification 4Orientation
“social component” defined as Social 1School
2 Health
Method of aggregation: Uses equal weighting arithmetic mean but also uses geometric mean for robustness purposes
Range and interpretation:
0 (low quality of growth) – 1 (high quality of growth)
Components:
Key Human Development components included:
Expanding Human Capabilities: Health; Education; Standard of Living
Creating Supportive Environments for Human Development: N/A
Data used: various databanks, including the IMF World Economic Outlook database, the World Bank’s World Development Indicators (WDI) database, COMTRADE, the International Country Risk Guide database, Barro and Lee (2010)256 and Xala-i-Martin (2006)257258
Produced by: International Monetary Fund
Used by: Relatively new index, so it’s not very widely used at the moment
Link: http://www.imf.org/external/pubs/ft/wp/2014/wp14172.pdf
Geographical Coverage:
90 countries
254 Mlachila, Tapsoba, & Tapsoba, 2014. 255 Ibid. 256 Barro & Lee, 2013. 257 Sala-i-Martin, 2006. 258 Mlachila, Tapsoba, & Tapsoba, 2014.
Quality
of
Gro
wth
Index Growth
Fundamentals
Strength Annual change in real GDP/capita
Volatility Inverse of the coefficient of variation of the level of growth
Diversification Diversification index: 1 - Herfindahl-Hirschman index (HHI)
Demand Composition
Share of net external demand (% GDP)
Social Outcomes
Health Reverse of infact mortality rate & life expectacy at birth
Education Primary school completion rate
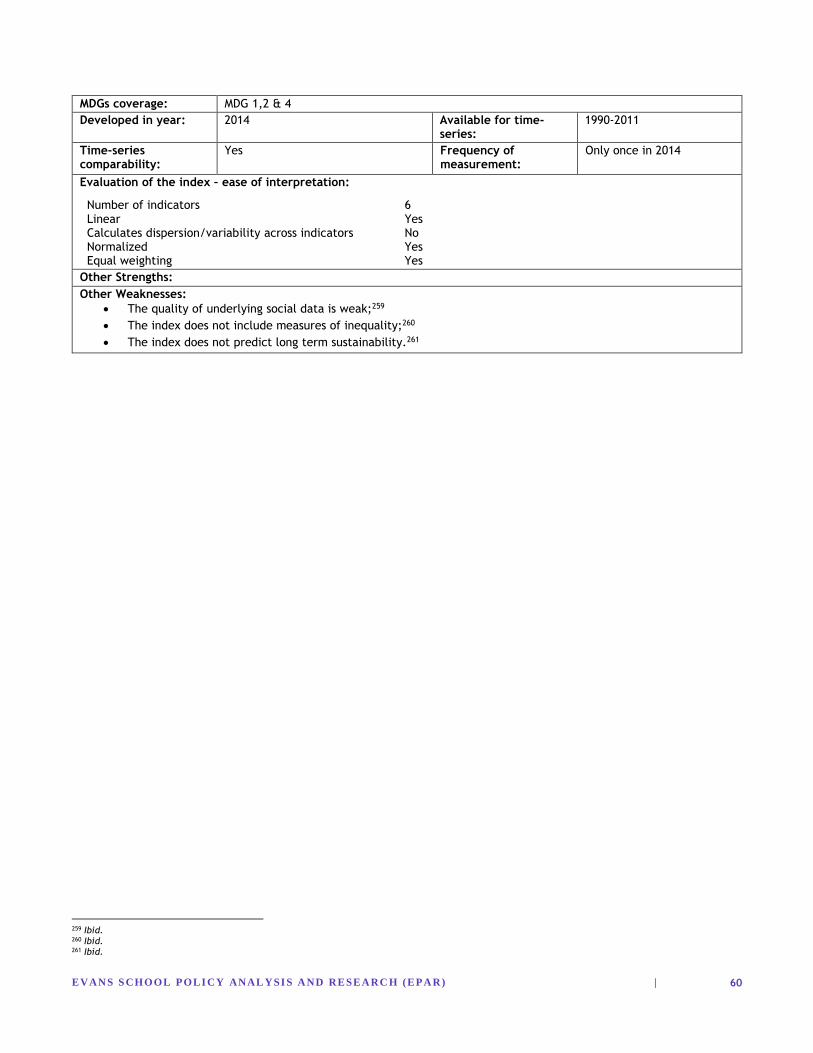
EVAN S S CHOOL POLI CY ANAL YSI S A ND RESEA RC H (EPA R) |
60
MDGs coverage: MDG 1,2 & 4
Developed in year: 2014 Available for time-series:
1990-2011
Time-series comparability:
Yes Frequency of measurement:
Only once in 2014
Evaluation of the index – ease of interpretation:
Number of indicators 6 Linear Yes Calculates dispersion/variability across indicators No Normalized Yes Equal weighting Yes
Other Strengths:
Other Weaknesses:
The quality of underlying social data is weak;259
The index does not include measures of inequality;260
The index does not predict long term sustainability.261
259 Ibid. 260 Ibid. 261 Ibid.
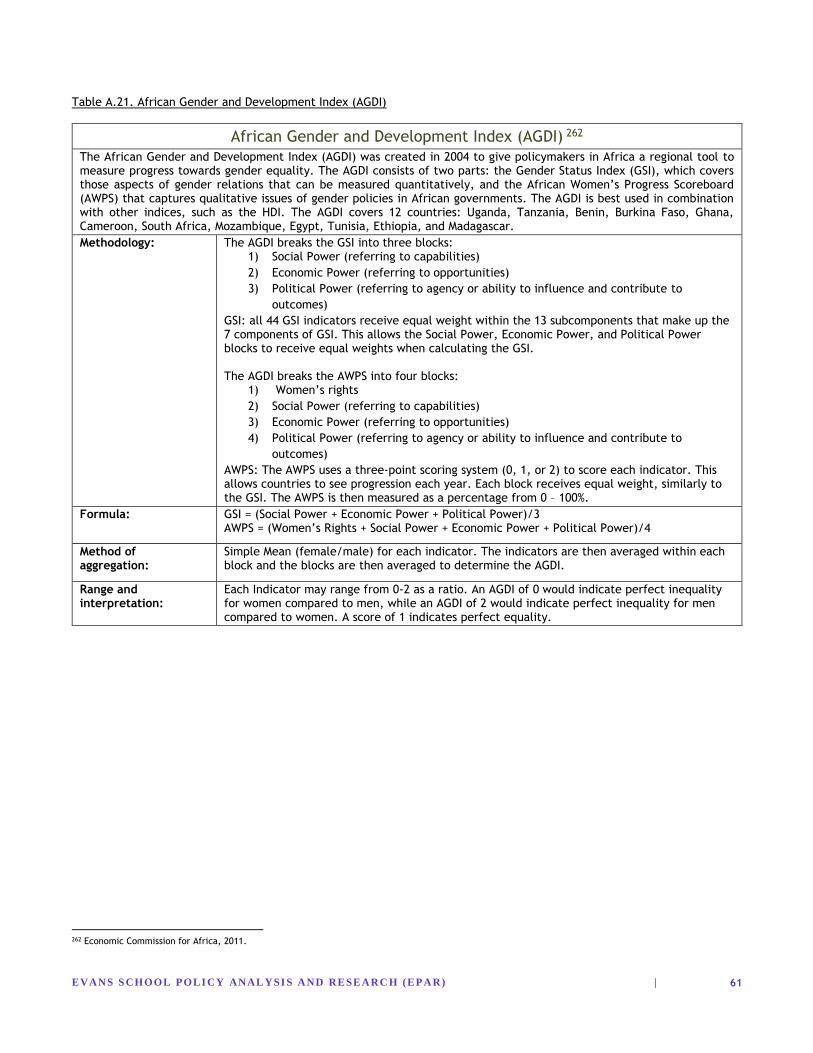
EVAN S S CHOOL POLI CY ANAL YSI S A ND RESEA RC H (EPA R) |
61
Table A.21. African Gender and Development Index (AGDI)
African Gender and Development Index (AGDI) 262
The African Gender and Development Index (AGDI) was created in 2004 to give policymakers in Africa a regional tool to measure progress towards gender equality. The AGDI consists of two parts: the Gender Status Index (GSI), which covers those aspects of gender relations that can be measured quantitatively, and the African Women’s Progress Scoreboard (AWPS) that captures qualitative issues of gender policies in African governments. The AGDI is best used in combination with other indices, such as the HDI. The AGDI covers 12 countries: Uganda, Tanzania, Benin, Burkina Faso, Ghana, Cameroon, South Africa, Mozambique, Egypt, Tunisia, Ethiopia, and Madagascar.
Methodology: The AGDI breaks the GSI into three blocks: 1) Social Power (referring to capabilities)
2) Economic Power (referring to opportunities)
3) Political Power (referring to agency or ability to influence and contribute to
outcomes)
GSI: all 44 GSI indicators receive equal weight within the 13 subcomponents that make up the 7 components of GSI. This allows the Social Power, Economic Power, and Political Power blocks to receive equal weights when calculating the GSI. The AGDI breaks the AWPS into four blocks:
1) Women’s rights
2) Social Power (referring to capabilities)
3) Economic Power (referring to opportunities)
4) Political Power (referring to agency or ability to influence and contribute to
outcomes)
AWPS: The AWPS uses a three-point scoring system (0, 1, or 2) to score each indicator. This allows countries to see progression each year. Each block receives equal weight, similarly to the GSI. The AWPS is then measured as a percentage from 0 – 100%.
Formula: GSI = (Social Power + Economic Power + Political Power)/3 AWPS = (Women’s Rights + Social Power + Economic Power + Political Power)/4
Method of aggregation:
Simple Mean (female/male) for each indicator. The indicators are then averaged within each block and the blocks are then averaged to determine the AGDI.
Range and interpretation:
Each Indicator may range from 0-2 as a ratio. An AGDI of 0 would indicate perfect inequality for women compared to men, while an AGDI of 2 would indicate perfect inequality for men compared to women. A score of 1 indicates perfect equality.
262 Economic Commission for Africa, 2011.
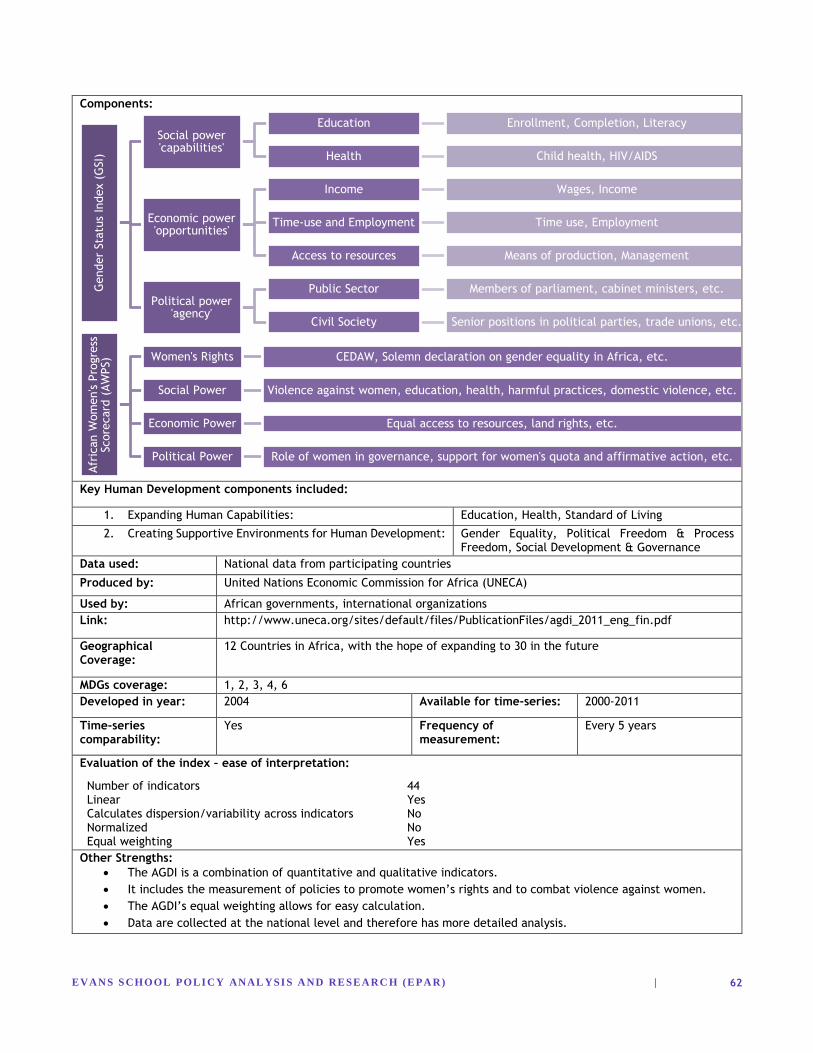
EVAN S S CHOOL POLI CY ANAL YSI S A ND RESEA RC H (EPA R) |
62
Components:
Key Human Development components included:
1. Expanding Human Capabilities: Education, Health, Standard of Living
2. Creating Supportive Environments for Human Development: Gender Equality, Political Freedom & Process Freedom, Social Development & Governance
Data used: National data from participating countries
Produced by: United Nations Economic Commission for Africa (UNECA)
Used by: African governments, international organizations
Link: http://www.uneca.org/sites/default/files/PublicationFiles/agdi_2011_eng_fin.pdf
Geographical Coverage:
12 Countries in Africa, with the hope of expanding to 30 in the future
MDGs coverage: 1, 2, 3, 4, 6
Developed in year: 2004 Available for time-series: 2000-2011
Time-series comparability:
Yes Frequency of measurement:
Every 5 years
Evaluation of the index – ease of interpretation:
Number of indicators 44 Linear Yes Calculates dispersion/variability across indicators No Normalized No Equal weighting Yes
Other Strengths:
The AGDI is a combination of quantitative and qualitative indicators.
It includes the measurement of policies to promote women’s rights and to combat violence against women.
The AGDI’s equal weighting allows for easy calculation.
Data are collected at the national level and therefore has more detailed analysis.
Gender
Sta
tus
Index (
GSI)
Social power 'capabilities'
Education Enrollment, Completion, Literacy
Health Child health, HIV/AIDS
Economic power 'opportunities'
Income Wages, Income
Time-use and Employment Time use, Employment
Access to resources Means of production, Management
Political power 'agency'
Public Sector Members of parliament, cabinet ministers, etc.
Civil Society Senior positions in political parties, trade unions, etc.
Afr
ican W
om
en's P
rogre
ss
Score
card
(AW
PS) Women's Rights CEDAW, Solemn declaration on gender equality in Africa, etc.
Social Power Violence against women, education, health, harmful practices, domestic violence, etc.
Economic Power Equal access to resources, land rights, etc.
Political Power Role of women in governance, support for women's quota and affirmative action, etc.
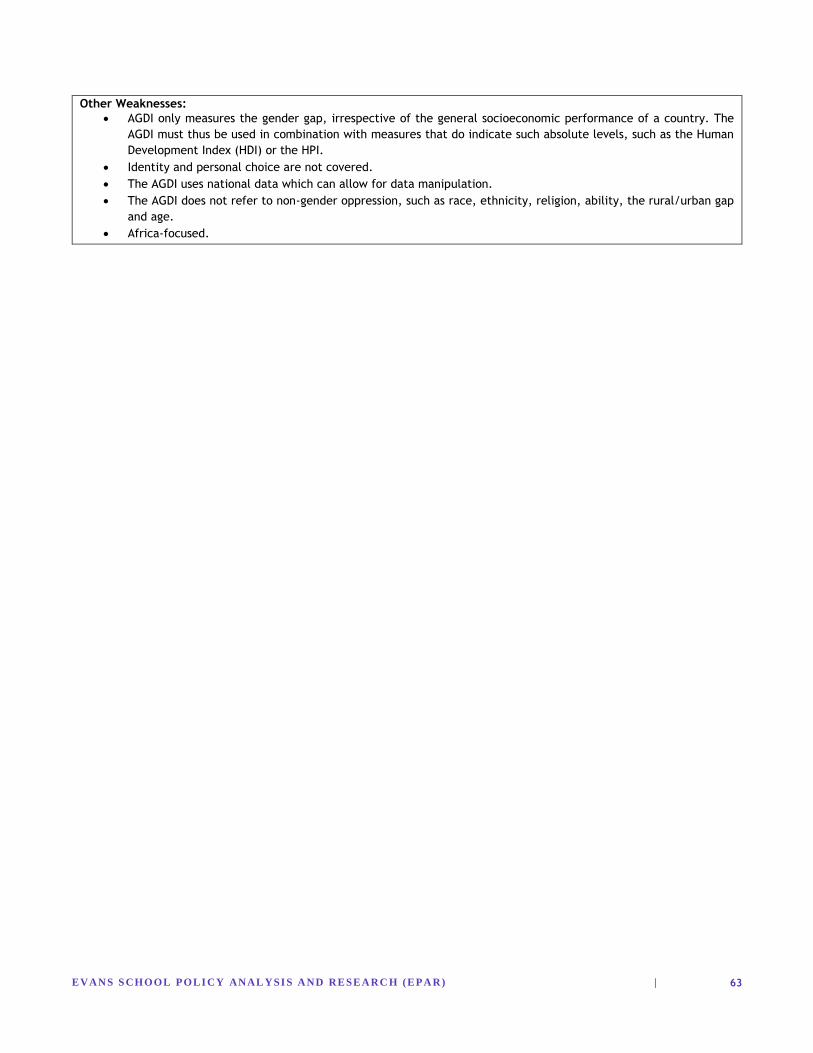
EVAN S S CHOOL POLI CY ANAL YSI S A ND RESEA RC H (EPA R) |
63
Other Weaknesses:
AGDI only measures the gender gap, irrespective of the general socioeconomic performance of a country. The
AGDI must thus be used in combination with measures that do indicate such absolute levels, such as the Human
Development Index (HDI) or the HPI.
Identity and personal choice are not covered.
The AGDI uses national data which can allow for data manipulation.
The AGDI does not refer to non-gender oppression, such as race, ethnicity, religion, ability, the rural/urban gap
and age.
Africa-focused.
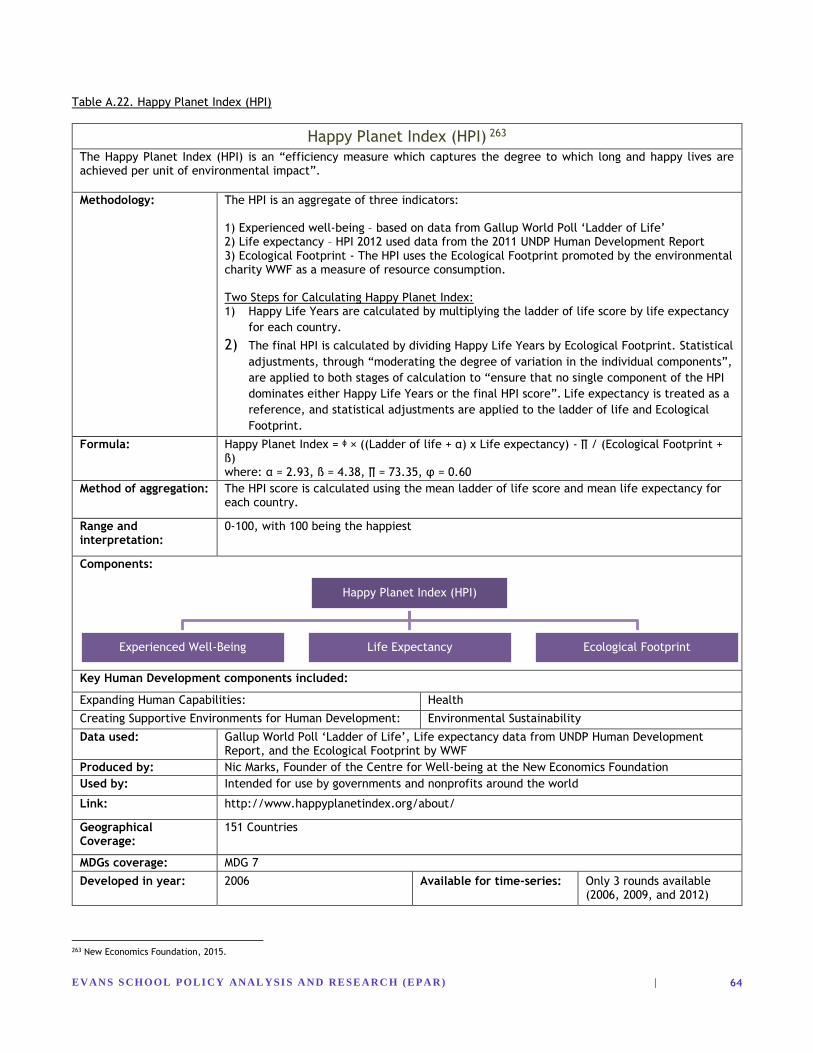
EVAN S S CHOOL POLI CY ANAL YSI S A ND RESEA RC H (EPA R) |
64
Table A.22. Happy Planet Index (HPI)
Happy Planet Index (HPI) 263
The Happy Planet Index (HPI) is an “efficiency measure which captures the degree to which long and happy lives are achieved per unit of environmental impact”.
Methodology: The HPI is an aggregate of three indicators: 1) Experienced well-being – based on data from Gallup World Poll ‘Ladder of Life’ 2) Life expectancy – HPI 2012 used data from the 2011 UNDP Human Development Report 3) Ecological Footprint - The HPI uses the Ecological Footprint promoted by the environmental charity WWF as a measure of resource consumption. Two Steps for Calculating Happy Planet Index: 1) Happy Life Years are calculated by multiplying the ladder of life score by life expectancy
for each country.
2) The final HPI is calculated by dividing Happy Life Years by Ecological Footprint. Statistical
adjustments, through “moderating the degree of variation in the individual components”,
are applied to both stages of calculation to “ensure that no single component of the HPI
dominates either Happy Life Years or the final HPI score”. Life expectancy is treated as a
reference, and statistical adjustments are applied to the ladder of life and Ecological
Footprint.
Formula: Happy Planet Index = ᶲ × ((Ladder of life + α) x Life expectancy) - ∏ / (Ecological Footprint + ß) where: α = 2.93, ß = 4.38, ∏ = 73.35, φ = 0.60
Method of aggregation: The HPI score is calculated using the mean ladder of life score and mean life expectancy for each country.
Range and interpretation:
0-100, with 100 being the happiest
Components:
Key Human Development components included:
Expanding Human Capabilities: Health
Creating Supportive Environments for Human Development: Environmental Sustainability
Data used: Gallup World Poll ‘Ladder of Life’, Life expectancy data from UNDP Human Development Report, and the Ecological Footprint by WWF
Produced by: Nic Marks, Founder of the Centre for Well-being at the New Economics Foundation
Used by: Intended for use by governments and nonprofits around the world
Link: http://www.happyplanetindex.org/about/
Geographical Coverage:
151 Countries
MDGs coverage: MDG 7
Developed in year: 2006 Available for time-series: Only 3 rounds available (2006, 2009, and 2012)
263 New Economics Foundation, 2015.
Happy Planet Index (HPI)
Experienced Well-Being Life Expectancy Ecological Footprint
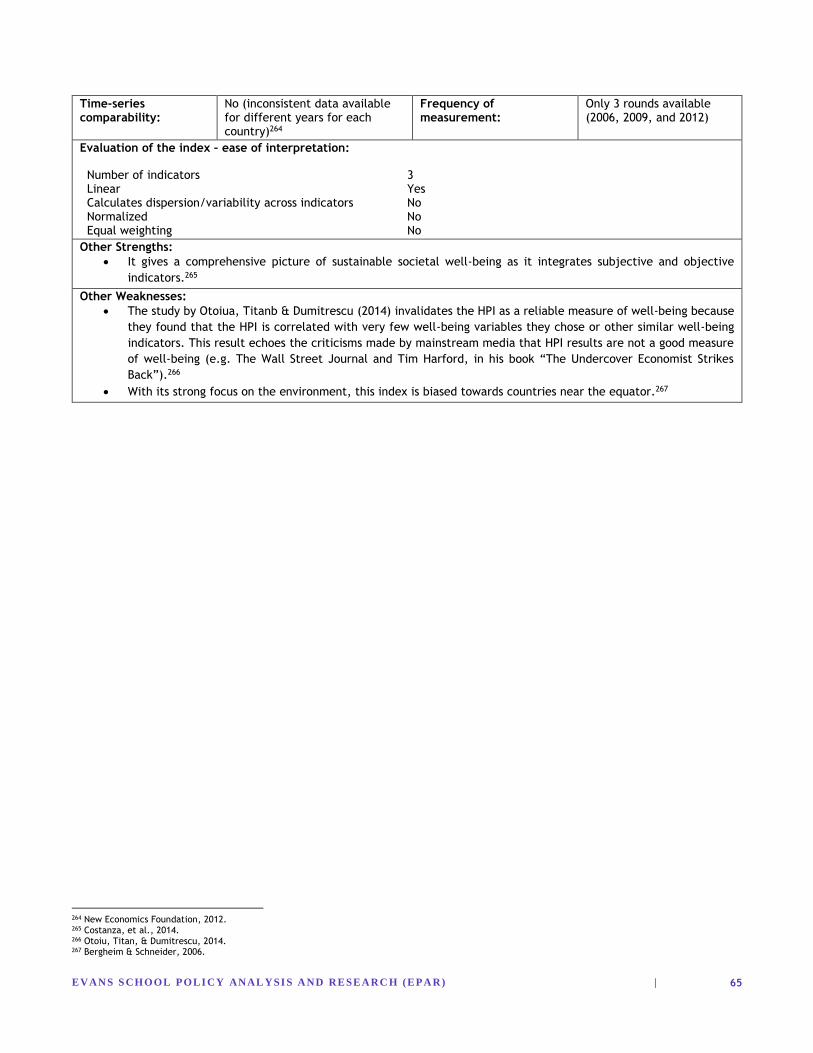
EVAN S S CHOOL POLI CY ANAL YSI S A ND RESEA RC H (EPA R) |
65
Time-series comparability:
No (inconsistent data available for different years for each country)264
Frequency of measurement:
Only 3 rounds available (2006, 2009, and 2012)
Evaluation of the index – ease of interpretation:
Number of indicators 3 Linear Yes Calculates dispersion/variability across indicators No Normalized No Equal weighting No
Other Strengths:
It gives a comprehensive picture of sustainable societal well-being as it integrates subjective and objective
indicators.265
Other Weaknesses:
The study by Otoiua, Titanb & Dumitrescu (2014) invalidates the HPI as a reliable measure of well-being because
they found that the HPI is correlated with very few well-being variables they chose or other similar well-being
indicators. This result echoes the criticisms made by mainstream media that HPI results are not a good measure
of well-being (e.g. The Wall Street Journal and Tim Harford, in his book “The Undercover Economist Strikes
Back”).266
With its strong focus on the environment, this index is biased towards countries near the equator.267
264 New Economics Foundation, 2012. 265 Costanza, et al., 2014. 266 Otoiu, Titan, & Dumitrescu, 2014. 267 Bergheim & Schneider, 2006.

EVAN S S CHOOL POLI CY ANAL YSI S A ND RESEA RC H (EPA R) |
66
Table A.23. Safe Cities Index
Safe Cities Index268
In 2015 The Economist Intelligence Unit (sponsored by NEC) launched a new index, The Safe Cities Index that measures urban safety and security.
Methodology: This index measures the relative level of safety of a diverse mix of the world’s leading cities using four main classifications of safety: digital security, health security, infrastructure safety and personal safety.
Formula: (digital security) + (health security) + (infrastructure safety) + (personal safety)
4
Method of aggregation:
Simple Mean – all indicators weighted equally to measure category scores, and equal weighting of the four categories to get Safe Cities Index.
Range and interpretation:
0 (best city) -100 (worst city)
Components:
Key Human Development components included:
Expanding Human Capabilities: Health
Creating Supportive Environments for Human Development:
Environment Sustainability, Social Development and Governance
Data used: Data collected by in-house researchers; data from similar Economist Intelligence Unit indices that measure city competitiveness, livability, etc.; publicly available information from official sources.
Produced by: The Economist Intelligence Unit
Used by: The Economist
Link: http://safecities.economist.com/
Geographical Coverage:
50 cities across 5 continents
MDGs coverage: MDG 4, 5 & 7
Developed in year: 2015 Available for time-series: Just one year 2015
Time-series comparability:
No (New) Frequency of measurement: Measured once
Evaluation of the index – ease of interpretation:
Number of indicators 44 Linear Yes Calculates dispersion/variability across indicators No Normalized Yes Equal weighting Yes
Other Strengths:
Other Weaknesses:
268 The Economist, 2015.
Safe
Cit
ies
Index
Digital Security Dedicated cyber security teams (input) and the frequency of identity theft (output)
Health security Ratio of hosiptal beds (input) and life expectancy (output)
Infrastructure safety Quality of roads (input) and the number of natural disasters (output)
Personal safety Level of police engagement (input) and the prevalence of violent crime (output)
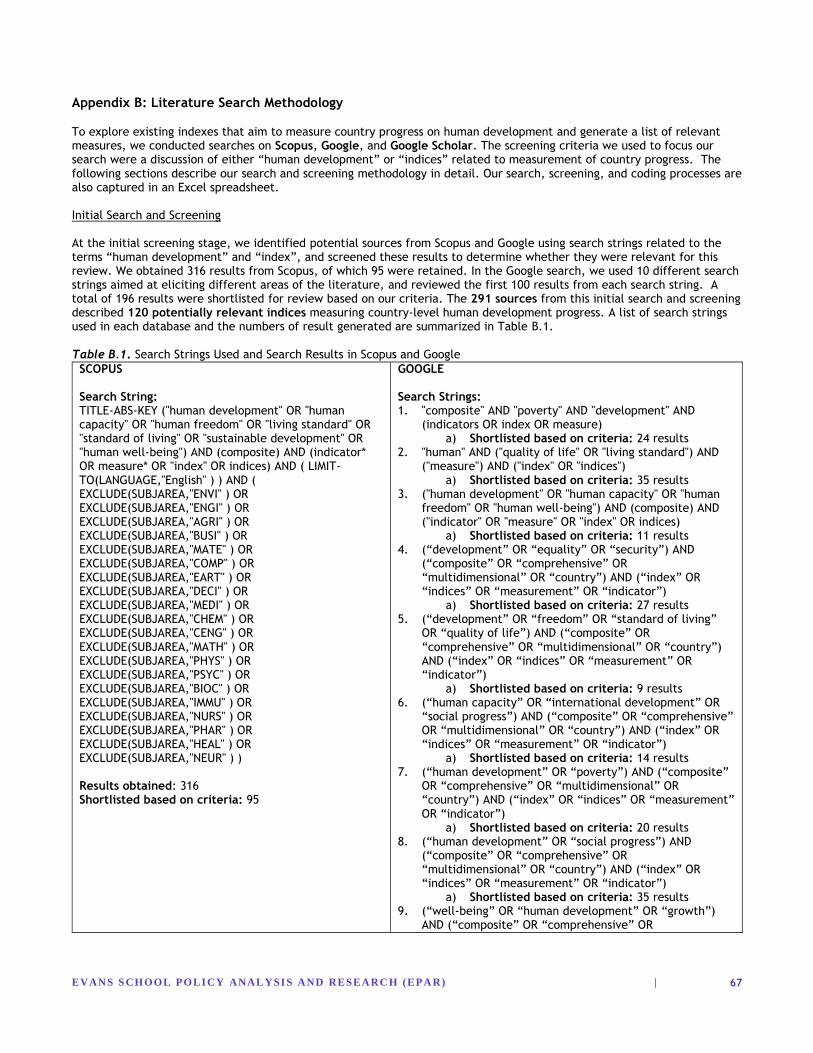
EVAN S S CHOOL POLI CY ANAL YSI S A ND RESEA RC H (EPA R) |
67
Appendix B: Literature Search Methodology
To explore existing indexes that aim to measure country progress on human development and generate a list of relevant measures, we conducted searches on Scopus, Google, and Google Scholar. The screening criteria we used to focus our search were a discussion of either “human development” or “indices” related to measurement of country progress. The following sections describe our search and screening methodology in detail. Our search, screening, and coding processes are also captured in an Excel spreadsheet. Initial Search and Screening
At the initial screening stage, we identified potential sources from Scopus and Google using search strings related to the terms “human development” and “index”, and screened these results to determine whether they were relevant for this review. We obtained 316 results from Scopus, of which 95 were retained. In the Google search, we used 10 different search strings aimed at eliciting different areas of the literature, and reviewed the first 100 results from each search string. A total of 196 results were shortlisted for review based on our criteria. The 291 sources from this initial search and screening described 120 potentially relevant indices measuring country-level human development progress. A list of search strings used in each database and the numbers of result generated are summarized in Table B.1. Table B.1. Search Strings Used and Search Results in Scopus and Google
SCOPUS Search String: TITLE-ABS-KEY ("human development" OR "human capacity" OR "human freedom" OR "living standard" OR "standard of living" OR "sustainable development" OR "human well-being") AND (composite) AND (indicator* OR measure* OR "index" OR indices) AND ( LIMIT-TO(LANGUAGE,"English" ) ) AND ( EXCLUDE(SUBJAREA,"ENVI" ) OR EXCLUDE(SUBJAREA,"ENGI" ) OR EXCLUDE(SUBJAREA,"AGRI" ) OR EXCLUDE(SUBJAREA,"BUSI" ) OR EXCLUDE(SUBJAREA,"MATE" ) OR EXCLUDE(SUBJAREA,"COMP" ) OR EXCLUDE(SUBJAREA,"EART" ) OR EXCLUDE(SUBJAREA,"DECI" ) OR EXCLUDE(SUBJAREA,"MEDI" ) OR EXCLUDE(SUBJAREA,"CHEM" ) OR EXCLUDE(SUBJAREA,"CENG" ) OR EXCLUDE(SUBJAREA,"MATH" ) OR EXCLUDE(SUBJAREA,"PHYS" ) OR EXCLUDE(SUBJAREA,"PSYC" ) OR EXCLUDE(SUBJAREA,"BIOC" ) OR EXCLUDE(SUBJAREA,"IMMU" ) OR EXCLUDE(SUBJAREA,"NURS" ) OR EXCLUDE(SUBJAREA,"PHAR" ) OR EXCLUDE(SUBJAREA,"HEAL" ) OR EXCLUDE(SUBJAREA,"NEUR" ) ) Results obtained: 316 Shortlisted based on criteria: 95
GOOGLE Search Strings: 1. "composite" AND "poverty" AND "development" AND
(indicators OR index OR measure) a) Shortlisted based on criteria: 24 results
2. "human" AND ("quality of life" OR "living standard") AND ("measure") AND ("index" OR "indices")
a) Shortlisted based on criteria: 35 results 3. ("human development" OR "human capacity" OR "human
freedom" OR "human well-being") AND (composite) AND ("indicator" OR "measure" OR "index" OR indices)
a) Shortlisted based on criteria: 11 results 4. (“development” OR “equality” OR “security”) AND
(“composite” OR “comprehensive” OR “multidimensional” OR “country”) AND (“index” OR “indices” OR “measurement” OR “indicator”)
a) Shortlisted based on criteria: 27 results 5. (“development” OR “freedom” OR “standard of living”
OR “quality of life”) AND (“composite” OR “comprehensive” OR “multidimensional” OR “country”) AND (“index” OR “indices” OR “measurement” OR “indicator”)
a) Shortlisted based on criteria: 9 results 6. (“human capacity” OR “international development” OR
“social progress”) AND (“composite” OR “comprehensive” OR “multidimensional” OR “country”) AND (“index” OR “indices” OR “measurement” OR “indicator”)
a) Shortlisted based on criteria: 14 results 7. (“human development” OR “poverty”) AND (“composite”
OR “comprehensive” OR “multidimensional” OR “country”) AND (“index” OR “indices” OR “measurement” OR “indicator”)
a) Shortlisted based on criteria: 20 results 8. (“human development” OR “social progress”) AND
(“composite” OR “comprehensive” OR “multidimensional” OR “country”) AND (“index” OR “indices” OR “measurement” OR “indicator”)
a) Shortlisted based on criteria: 35 results 9. (“well-being” OR “human development” OR “growth”)
AND (“composite” OR “comprehensive” OR
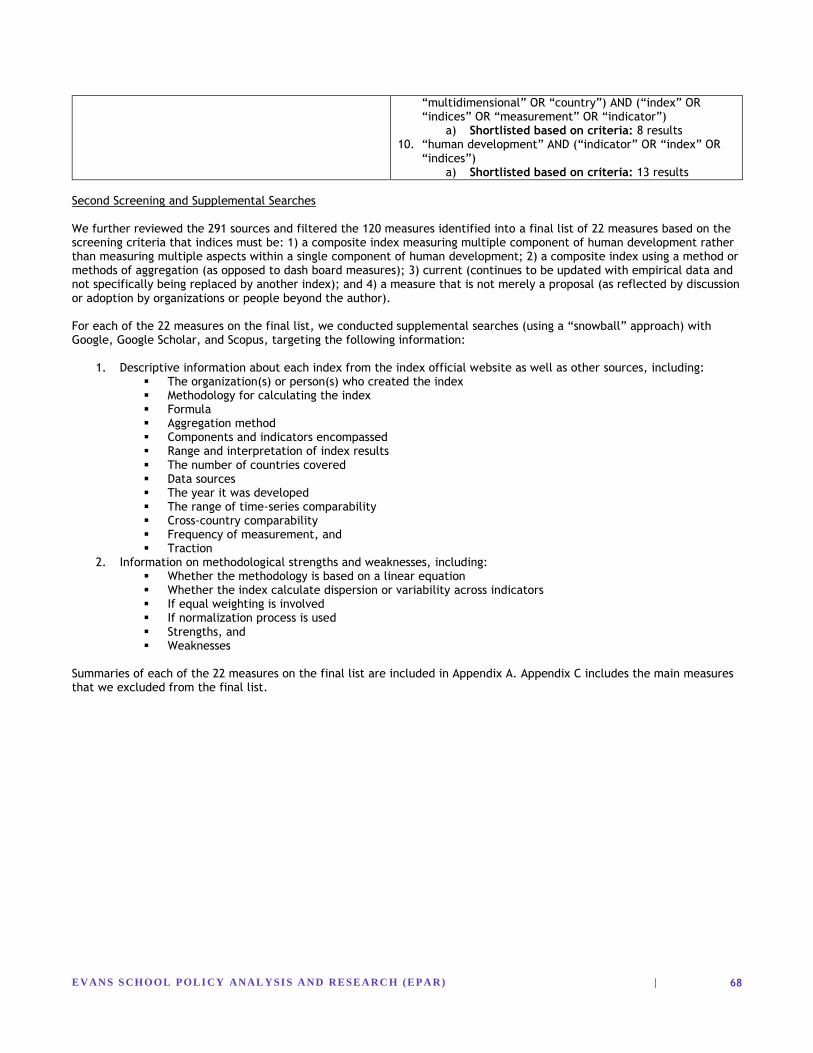
EVAN S S CHOOL POLI CY ANAL YSI S A ND RESEA RC H (EPA R) |
68
“multidimensional” OR “country”) AND (“index” OR “indices” OR “measurement” OR “indicator”)
a) Shortlisted based on criteria: 8 results 10. “human development” AND (“indicator” OR “index” OR
“indices”) a) Shortlisted based on criteria: 13 results
Second Screening and Supplemental Searches
We further reviewed the 291 sources and filtered the 120 measures identified into a final list of 22 measures based on the screening criteria that indices must be: 1) a composite index measuring multiple component of human development rather than measuring multiple aspects within a single component of human development; 2) a composite index using a method or methods of aggregation (as opposed to dash board measures); 3) current (continues to be updated with empirical data and not specifically being replaced by another index); and 4) a measure that is not merely a proposal (as reflected by discussion or adoption by organizations or people beyond the author). For each of the 22 measures on the final list, we conducted supplemental searches (using a “snowball” approach) with Google, Google Scholar, and Scopus, targeting the following information:
1. Descriptive information about each index from the index official website as well as other sources, including: The organization(s) or person(s) who created the index Methodology for calculating the index Formula Aggregation method Components and indicators encompassed Range and interpretation of index results The number of countries covered Data sources The year it was developed The range of time-series comparability Cross-country comparability Frequency of measurement, and Traction
2. Information on methodological strengths and weaknesses, including: Whether the methodology is based on a linear equation Whether the index calculate dispersion or variability across indicators If equal weighting is involved If normalization process is used Strengths, and Weaknesses
Summaries of each of the 22 measures on the final list are included in Appendix A. Appendix C includes the main measures that we excluded from the final list.
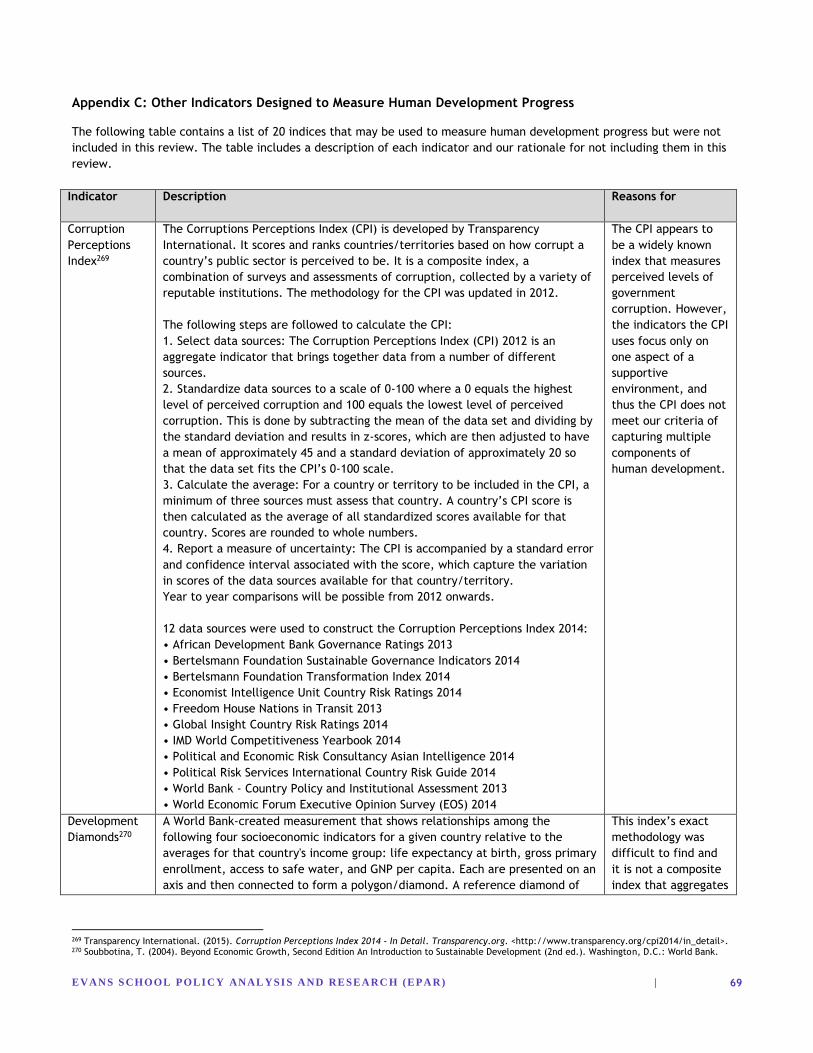
EVAN S S CHOOL POLI CY ANAL YSI S A ND RESEA RC H (EPA R) |
69
Appendix C: Other Indicators Designed to Measure Human Development Progress
The following table contains a list of 20 indices that may be used to measure human development progress but were not
included in this review. The table includes a description of each indicator and our rationale for not including them in this
review.
Indicator Description Reasons for
Exclusion
Corruption
Perceptions
Index269
The Corruptions Perceptions Index (CPI) is developed by Transparency
International. It scores and ranks countries/territories based on how corrupt a
country’s public sector is perceived to be. It is a composite index, a
combination of surveys and assessments of corruption, collected by a variety of
reputable institutions. The methodology for the CPI was updated in 2012.
The following steps are followed to calculate the CPI:
1. Select data sources: The Corruption Perceptions Index (CPI) 2012 is an
aggregate indicator that brings together data from a number of different
sources.
2. Standardize data sources to a scale of 0-100 where a 0 equals the highest
level of perceived corruption and 100 equals the lowest level of perceived
corruption. This is done by subtracting the mean of the data set and dividing by
the standard deviation and results in z-scores, which are then adjusted to have
a mean of approximately 45 and a standard deviation of approximately 20 so
that the data set fits the CPI’s 0-100 scale.
3. Calculate the average: For a country or territory to be included in the CPI, a
minimum of three sources must assess that country. A country’s CPI score is
then calculated as the average of all standardized scores available for that
country. Scores are rounded to whole numbers.
4. Report a measure of uncertainty: The CPI is accompanied by a standard error
and confidence interval associated with the score, which capture the variation
in scores of the data sources available for that country/territory.
Year to year comparisons will be possible from 2012 onwards.
12 data sources were used to construct the Corruption Perceptions Index 2014:
• African Development Bank Governance Ratings 2013
• Bertelsmann Foundation Sustainable Governance Indicators 2014
• Bertelsmann Foundation Transformation Index 2014
• Economist Intelligence Unit Country Risk Ratings 2014
• Freedom House Nations in Transit 2013
• Global Insight Country Risk Ratings 2014
• IMD World Competitiveness Yearbook 2014
• Political and Economic Risk Consultancy Asian Intelligence 2014
• Political Risk Services International Country Risk Guide 2014
• World Bank - Country Policy and Institutional Assessment 2013
• World Economic Forum Executive Opinion Survey (EOS) 2014
The CPI appears to
be a widely known
index that measures
perceived levels of
government
corruption. However,
the indicators the CPI
uses focus only on
one aspect of a
supportive
environment, and
thus the CPI does not
meet our criteria of
capturing multiple
components of
human development.
Development
Diamonds270
A World Bank-created measurement that shows relationships among the
following four socioeconomic indicators for a given country relative to the
averages for that country's income group: life expectancy at birth, gross primary
enrollment, access to safe water, and GNP per capita. Each are presented on an
axis and then connected to form a polygon/diamond. A reference diamond of
This index’s exact
methodology was
difficult to find and
it is not a composite
index that aggregates
269 Transparency International. (2015). Corruption Perceptions Index 2014 - In Detail. Transparency.org. <http://www.transparency.org/cpi2014/in_detail>. 270 Soubbotina, T. (2004). Beyond Economic Growth, Second Edition An Introduction to Sustainable Development (2nd ed.). Washington, D.C.: World Bank.
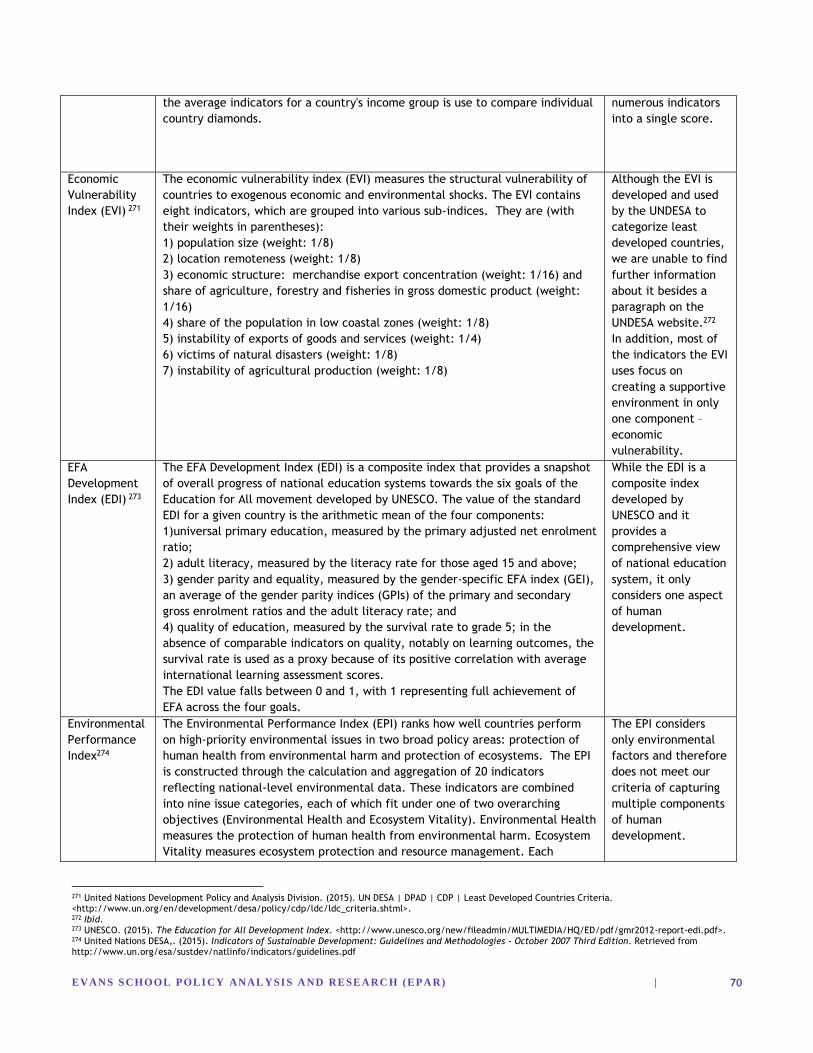
EVAN S S CHOOL POLI CY ANAL YSI S A ND RESEA RC H (EPA R) |
70
the average indicators for a country's income group is use to compare individual
country diamonds.
numerous indicators
into a single score.
Economic
Vulnerability
Index (EVI) 271
The economic vulnerability index (EVI) measures the structural vulnerability of
countries to exogenous economic and environmental shocks. The EVI contains
eight indicators, which are grouped into various sub-indices. They are (with
their weights in parentheses):
1) population size (weight: 1/8)
2) location remoteness (weight: 1/8)
3) economic structure: merchandise export concentration (weight: 1/16) and
share of agriculture, forestry and fisheries in gross domestic product (weight:
1/16)
4) share of the population in low coastal zones (weight: 1/8)
5) instability of exports of goods and services (weight: 1/4)
6) victims of natural disasters (weight: 1/8)
7) instability of agricultural production (weight: 1/8)
Although the EVI is
developed and used
by the UNDESA to
categorize least
developed countries,
we are unable to find
further information
about it besides a
paragraph on the
UNDESA website.272
In addition, most of
the indicators the EVI
uses focus on
creating a supportive
environment in only
one component –
economic
vulnerability.
EFA
Development
Index (EDI) 273
The EFA Development Index (EDI) is a composite index that provides a snapshot
of overall progress of national education systems towards the six goals of the
Education for All movement developed by UNESCO. The value of the standard
EDI for a given country is the arithmetic mean of the four components:
1)universal primary education, measured by the primary adjusted net enrolment
ratio;
2) adult literacy, measured by the literacy rate for those aged 15 and above;
3) gender parity and equality, measured by the gender-specific EFA index (GEI),
an average of the gender parity indices (GPIs) of the primary and secondary
gross enrolment ratios and the adult literacy rate; and
4) quality of education, measured by the survival rate to grade 5; in the
absence of comparable indicators on quality, notably on learning outcomes, the
survival rate is used as a proxy because of its positive correlation with average
international learning assessment scores.
The EDI value falls between 0 and 1, with 1 representing full achievement of
EFA across the four goals.
While the EDI is a
composite index
developed by
UNESCO and it
provides a
comprehensive view
of national education
system, it only
considers one aspect
of human
development.
Environmental
Performance
Index274
The Environmental Performance Index (EPI) ranks how well countries perform
on high-priority environmental issues in two broad policy areas: protection of
human health from environmental harm and protection of ecosystems. The EPI
is constructed through the calculation and aggregation of 20 indicators
reflecting national-level environmental data. These indicators are combined
into nine issue categories, each of which fit under one of two overarching
objectives (Environmental Health and Ecosystem Vitality). Environmental Health
measures the protection of human health from environmental harm. Ecosystem
Vitality measures ecosystem protection and resource management. Each
The EPI considers
only environmental
factors and therefore
does not meet our
criteria of capturing
multiple components
of human
development.
271 United Nations Development Policy and Analysis Division. (2015). UN DESA | DPAD | CDP | Least Developed Countries Criteria. <http://www.un.org/en/development/desa/policy/cdp/ldc/ldc_criteria.shtml>. 272 Ibid. 273 UNESCO. (2015). The Education for All Development Index. <http://www.unesco.org/new/fileadmin/MULTIMEDIA/HQ/ED/pdf/gmr2012-report-edi.pdf>. 274 United Nations DESA,. (2015). Indicators of Sustainable Development: Guidelines and Methodologies - October 2007 Third Edition. Retrieved from http://www.un.org/esa/sustdev/natlinfo/indicators/guidelines.pdf
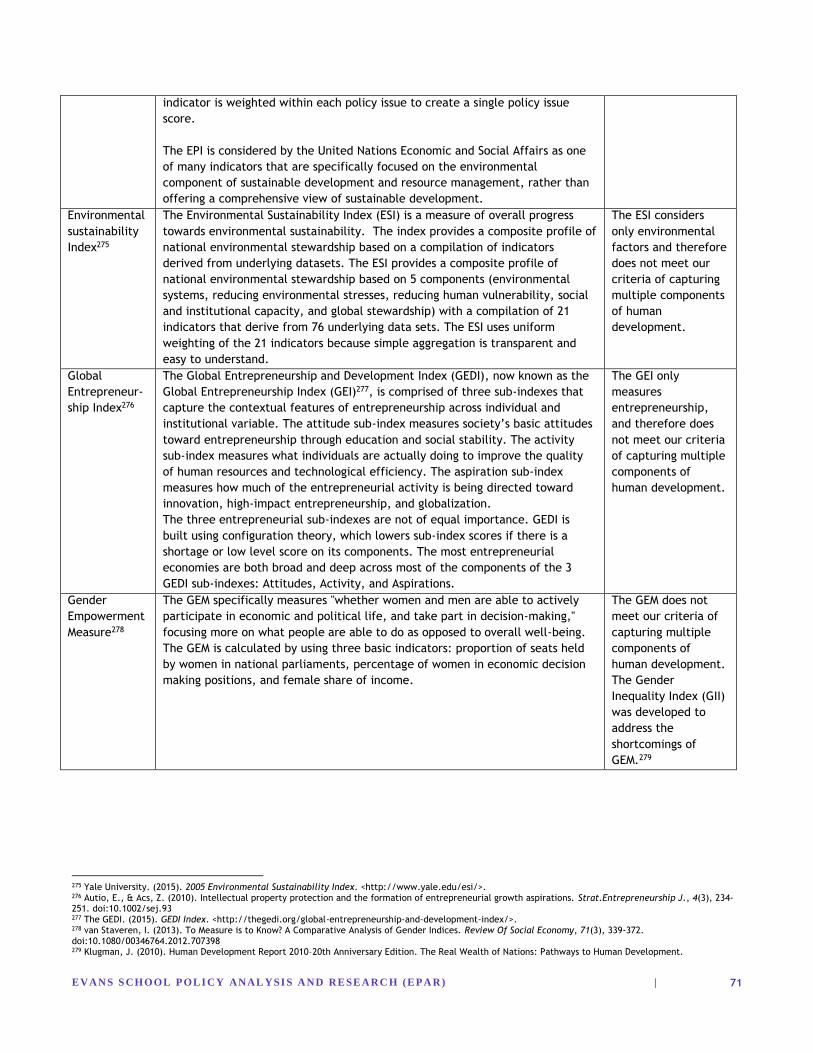
EVAN S S CHOOL POLI CY ANAL YSI S A ND RESEA RC H (EPA R) |
71
indicator is weighted within each policy issue to create a single policy issue
score.
The EPI is considered by the United Nations Economic and Social Affairs as one
of many indicators that are specifically focused on the environmental
component of sustainable development and resource management, rather than
offering a comprehensive view of sustainable development.
Environmental
sustainability
Index275
The Environmental Sustainability Index (ESI) is a measure of overall progress
towards environmental sustainability. The index provides a composite profile of
national environmental stewardship based on a compilation of indicators
derived from underlying datasets. The ESI provides a composite profile of
national environmental stewardship based on 5 components (environmental
systems, reducing environmental stresses, reducing human vulnerability, social
and institutional capacity, and global stewardship) with a compilation of 21
indicators that derive from 76 underlying data sets. The ESI uses uniform
weighting of the 21 indicators because simple aggregation is transparent and
easy to understand.
The ESI considers
only environmental
factors and therefore
does not meet our
criteria of capturing
multiple components
of human
development.
Global
Entrepreneur-
ship Index276
The Global Entrepreneurship and Development Index (GEDI), now known as the
Global Entrepreneurship Index (GEI)277, is comprised of three sub-indexes that
capture the contextual features of entrepreneurship across individual and
institutional variable. The attitude sub-index measures society’s basic attitudes
toward entrepreneurship through education and social stability. The activity
sub-index measures what individuals are actually doing to improve the quality
of human resources and technological efficiency. The aspiration sub-index
measures how much of the entrepreneurial activity is being directed toward
innovation, high-impact entrepreneurship, and globalization.
The three entrepreneurial sub-indexes are not of equal importance. GEDI is
built using configuration theory, which lowers sub-index scores if there is a
shortage or low level score on its components. The most entrepreneurial
economies are both broad and deep across most of the components of the 3
GEDI sub-indexes: Attitudes, Activity, and Aspirations.
The GEI only
measures
entrepreneurship,
and therefore does
not meet our criteria
of capturing multiple
components of
human development.
Gender
Empowerment
Measure278
The GEM specifically measures "whether women and men are able to actively
participate in economic and political life, and take part in decision-making,"
focusing more on what people are able to do as opposed to overall well-being.
The GEM is calculated by using three basic indicators: proportion of seats held
by women in national parliaments, percentage of women in economic decision
making positions, and female share of income.
The GEM does not
meet our criteria of
capturing multiple
components of
human development.
The Gender
Inequality Index (GII)
was developed to
address the
shortcomings of
GEM.279
275 Yale University. (2015). 2005 Environmental Sustainability Index. <http://www.yale.edu/esi/>. 276 Autio, E., & Acs, Z. (2010). Intellectual property protection and the formation of entrepreneurial growth aspirations. Strat.Entrepreneurship J., 4(3), 234-251. doi:10.1002/sej.93 277 The GEDI. (2015). GEDI Index. <http://thegedi.org/global-entrepreneurship-and-development-index/>. 278 van Staveren, I. (2013). To Measure is to Know? A Comparative Analysis of Gender Indices. Review Of Social Economy, 71(3), 339-372. doi:10.1080/00346764.2012.707398 279 Klugman, J. (2010). Human Development Report 2010–20th Anniversary Edition. The Real Wealth of Nations: Pathways to Human Development.
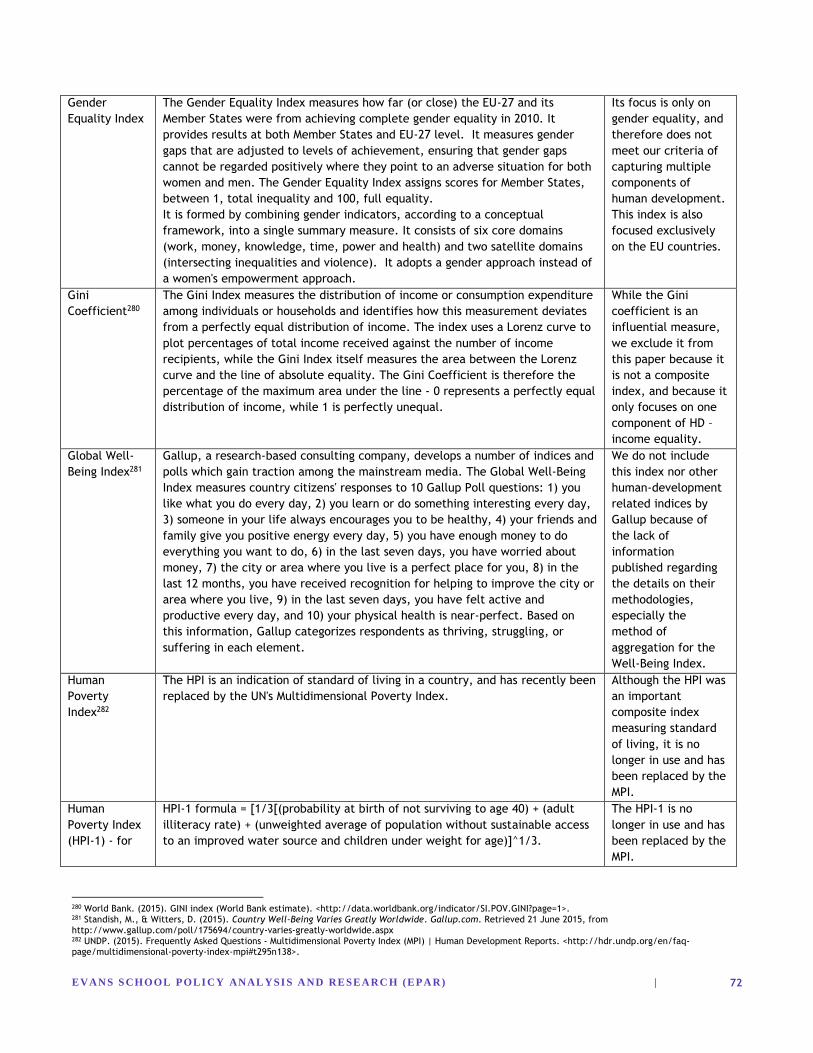
EVAN S S CHOOL POLI CY ANAL YSI S A ND RESEA RC H (EPA R) |
72
Gender
Equality Index
The Gender Equality Index measures how far (or close) the EU-27 and its
Member States were from achieving complete gender equality in 2010. It
provides results at both Member States and EU-27 level. It measures gender
gaps that are adjusted to levels of achievement, ensuring that gender gaps
cannot be regarded positively where they point to an adverse situation for both
women and men. The Gender Equality Index assigns scores for Member States,
between 1, total inequality and 100, full equality.
It is formed by combining gender indicators, according to a conceptual
framework, into a single summary measure. It consists of six core domains
(work, money, knowledge, time, power and health) and two satellite domains
(intersecting inequalities and violence). It adopts a gender approach instead of
a women's empowerment approach.
Its focus is only on
gender equality, and
therefore does not
meet our criteria of
capturing multiple
components of
human development.
This index is also
focused exclusively
on the EU countries.
Gini
Coefficient280
The Gini Index measures the distribution of income or consumption expenditure
among individuals or households and identifies how this measurement deviates
from a perfectly equal distribution of income. The index uses a Lorenz curve to
plot percentages of total income received against the number of income
recipients, while the Gini Index itself measures the area between the Lorenz
curve and the line of absolute equality. The Gini Coefficient is therefore the
percentage of the maximum area under the line - 0 represents a perfectly equal
distribution of income, while 1 is perfectly unequal.
While the Gini
coefficient is an
influential measure,
we exclude it from
this paper because it
is not a composite
index, and because it
only focuses on one
component of HD –
income equality.
Global Well-
Being Index281
Gallup, a research-based consulting company, develops a number of indices and
polls which gain traction among the mainstream media. The Global Well-Being
Index measures country citizens' responses to 10 Gallup Poll questions: 1) you
like what you do every day, 2) you learn or do something interesting every day,
3) someone in your life always encourages you to be healthy, 4) your friends and
family give you positive energy every day, 5) you have enough money to do
everything you want to do, 6) in the last seven days, you have worried about
money, 7) the city or area where you live is a perfect place for you, 8) in the
last 12 months, you have received recognition for helping to improve the city or
area where you live, 9) in the last seven days, you have felt active and
productive every day, and 10) your physical health is near-perfect. Based on
this information, Gallup categorizes respondents as thriving, struggling, or
suffering in each element.
We do not include
this index nor other
human-development
related indices by
Gallup because of
the lack of
information
published regarding
the details on their
methodologies,
especially the
method of
aggregation for the
Well-Being Index.
Human
Poverty
Index282
The HPI is an indication of standard of living in a country, and has recently been
replaced by the UN's Multidimensional Poverty Index.
Although the HPI was
an important
composite index
measuring standard
of living, it is no
longer in use and has
been replaced by the
MPI.
Human
Poverty Index
(HPI-1) - for
HPI-1 formula = [1/3[(probability at birth of not surviving to age 40) + (adult
illiteracy rate) + (unweighted average of population without sustainable access
to an improved water source and children under weight for age)]^1/3.
The HPI-1 is no
longer in use and has
been replaced by the
MPI.
280 World Bank. (2015). GINI index (World Bank estimate). <http://data.worldbank.org/indicator/SI.POV.GINI?page=1>. 281 Standish, M., & Witters, D. (2015). Country Well-Being Varies Greatly Worldwide. Gallup.com. Retrieved 21 June 2015, from http://www.gallup.com/poll/175694/country-varies-greatly-worldwide.aspx 282 UNDP. (2015). Frequently Asked Questions - Multidimensional Poverty Index (MPI) | Human Development Reports. <http://hdr.undp.org/en/faq-page/multidimensional-poverty-index-mpi#t295n138>.
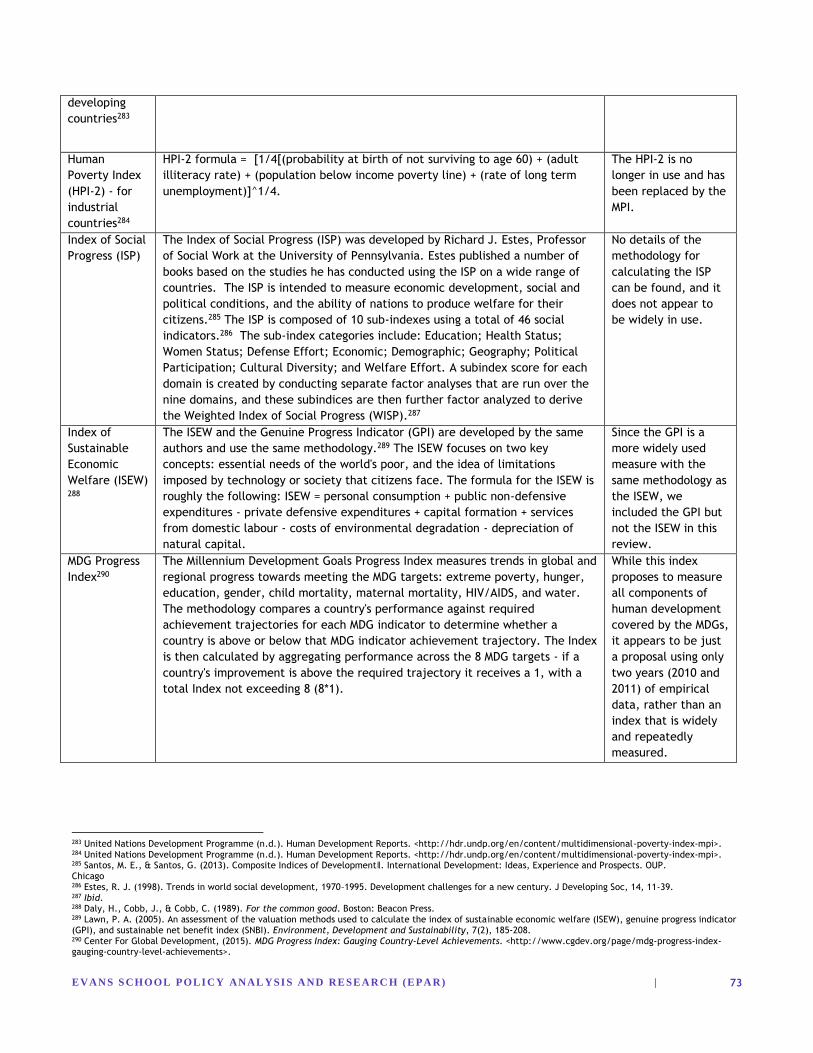
EVAN S S CHOOL POLI CY ANAL YSI S A ND RESEA RC H (EPA R) |
73
developing
countries283
Human
Poverty Index
(HPI-2) - for
industrial
countries284
HPI-2 formula = [1/4[(probability at birth of not surviving to age 60) + (adult
illiteracy rate) + (population below income poverty line) + (rate of long term
unemployment)]^1/4.
The HPI-2 is no
longer in use and has
been replaced by the
MPI.
Index of Social
Progress (ISP)
The Index of Social Progress (ISP) was developed by Richard J. Estes, Professor
of Social Work at the University of Pennsylvania. Estes published a number of
books based on the studies he has conducted using the ISP on a wide range of
countries. The ISP is intended to measure economic development, social and
political conditions, and the ability of nations to produce welfare for their
citizens.285 The ISP is composed of 10 sub-indexes using a total of 46 social
indicators.286 The sub-index categories include: Education; Health Status;
Women Status; Defense Effort; Economic; Demographic; Geography; Political
Participation; Cultural Diversity; and Welfare Effort. A subindex score for each
domain is created by conducting separate factor analyses that are run over the
nine domains, and these subindices are then further factor analyzed to derive
the Weighted Index of Social Progress (WISP).287
No details of the
methodology for
calculating the ISP
can be found, and it
does not appear to
be widely in use.
Index of
Sustainable
Economic
Welfare (ISEW)
288
The ISEW and the Genuine Progress Indicator (GPI) are developed by the same
authors and use the same methodology.289 The ISEW focuses on two key
concepts: essential needs of the world's poor, and the idea of limitations
imposed by technology or society that citizens face. The formula for the ISEW is
roughly the following: ISEW = personal consumption + public non-defensive
expenditures - private defensive expenditures + capital formation + services
from domestic labour - costs of environmental degradation - depreciation of
natural capital.
Since the GPI is a
more widely used
measure with the
same methodology as
the ISEW, we
included the GPI but
not the ISEW in this
review.
MDG Progress
Index290
The Millennium Development Goals Progress Index measures trends in global and
regional progress towards meeting the MDG targets: extreme poverty, hunger,
education, gender, child mortality, maternal mortality, HIV/AIDS, and water.
The methodology compares a country's performance against required
achievement trajectories for each MDG indicator to determine whether a
country is above or below that MDG indicator achievement trajectory. The Index
is then calculated by aggregating performance across the 8 MDG targets - if a
country's improvement is above the required trajectory it receives a 1, with a
total Index not exceeding 8 (8*1).
While this index
proposes to measure
all components of
human development
covered by the MDGs,
it appears to be just
a proposal using only
two years (2010 and
2011) of empirical
data, rather than an
index that is widely
and repeatedly
measured.
283 United Nations Development Programme (n.d.). Human Development Reports. <http://hdr.undp.org/en/content/multidimensional-poverty-index-mpi>. 284 United Nations Development Programme (n.d.). Human Development Reports. <http://hdr.undp.org/en/content/multidimensional-poverty-index-mpi>. 285 Santos, M. E., & Santos, G. (2013). Composite Indices of Development‖. International Development: Ideas, Experience and Prospects. OUP. Chicago 286 Estes, R. J. (1998). Trends in world social development, 1970–1995. Development challenges for a new century. J Developing Soc, 14, 11-39. 287 Ibid. 288 Daly, H., Cobb, J., & Cobb, C. (1989). For the common good. Boston: Beacon Press. 289 Lawn, P. A. (2005). An assessment of the valuation methods used to calculate the index of sustainable economic welfare (ISEW), genuine progress indicator (GPI), and sustainable net benefit index (SNBI). Environment, Development and Sustainability, 7(2), 185-208. 290 Center For Global Development, (2015). MDG Progress Index: Gauging Country-Level Achievements. <http://www.cgdev.org/page/mdg-progress-index-gauging-country-level-achievements>.
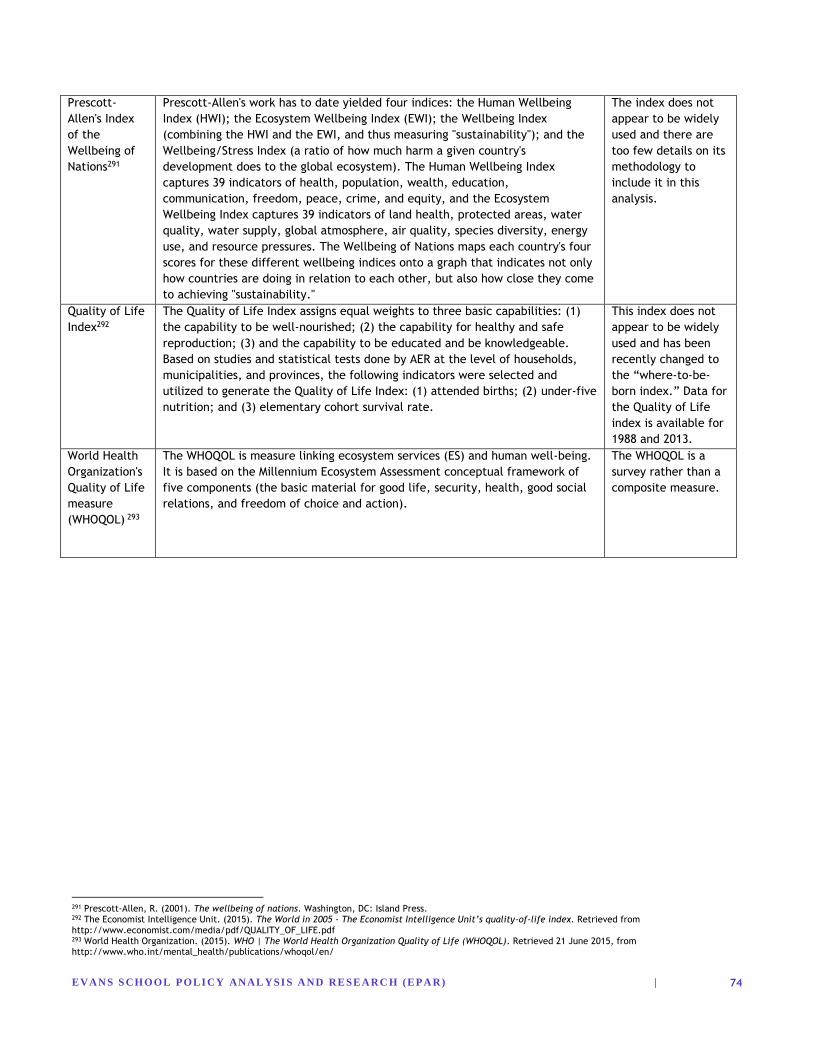
EVAN S S CHOOL POLI CY ANAL YSI S A ND RESEA RC H (EPA R) |
74
Prescott-
Allen's Index
of the
Wellbeing of
Nations291
Prescott-Allen's work has to date yielded four indices: the Human Wellbeing
Index (HWI); the Ecosystem Wellbeing Index (EWI); the Wellbeing Index
(combining the HWI and the EWI, and thus measuring "sustainability"); and the
Wellbeing/Stress Index (a ratio of how much harm a given country's
development does to the global ecosystem). The Human Wellbeing Index
captures 39 indicators of health, population, wealth, education,
communication, freedom, peace, crime, and equity, and the Ecosystem
Wellbeing Index captures 39 indicators of land health, protected areas, water
quality, water supply, global atmosphere, air quality, species diversity, energy
use, and resource pressures. The Wellbeing of Nations maps each country's four
scores for these different wellbeing indices onto a graph that indicates not only
how countries are doing in relation to each other, but also how close they come
to achieving "sustainability."
The index does not
appear to be widely
used and there are
too few details on its
methodology to
include it in this
analysis.
Quality of Life
Index292
The Quality of Life Index assigns equal weights to three basic capabilities: (1)
the capability to be well-nourished; (2) the capability for healthy and safe
reproduction; (3) and the capability to be educated and be knowledgeable.
Based on studies and statistical tests done by AER at the level of households,
municipalities, and provinces, the following indicators were selected and
utilized to generate the Quality of Life Index: (1) attended births; (2) under-five
nutrition; and (3) elementary cohort survival rate.
This index does not
appear to be widely
used and has been
recently changed to
the “where-to-be-
born index.” Data for
the Quality of Life
index is available for
1988 and 2013.
World Health
Organization's
Quality of Life
measure
(WHOQOL) 293
The WHOQOL is measure linking ecosystem services (ES) and human well-being.
It is based on the Millennium Ecosystem Assessment conceptual framework of
five components (the basic material for good life, security, health, good social
relations, and freedom of choice and action).
The WHOQOL is a
survey rather than a
composite measure.
291 Prescott-Allen, R. (2001). The wellbeing of nations. Washington, DC: Island Press. 292 The Economist Intelligence Unit. (2015). The World in 2005 - The Economist Intelligence Unit’s quality-of-life index. Retrieved from http://www.economist.com/media/pdf/QUALITY_OF_LIFE.pdf 293 World Health Organization. (2015). WHO | The World Health Organization Quality of Life (WHOQOL). Retrieved 21 June 2015, from http://www.who.int/mental_health/publications/whoqol/en/
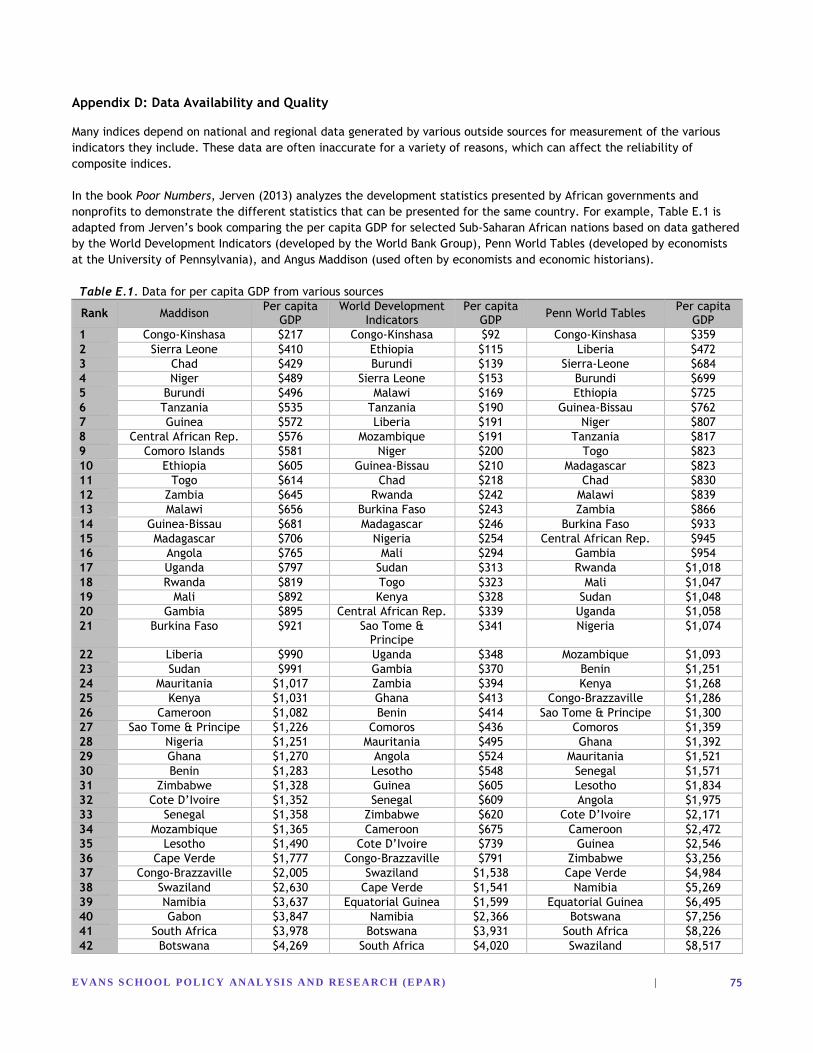
EVAN S S CHOOL POLI CY ANAL YSI S A ND RESEA RC H (EPA R) |
75
Appendix D: Data Availability and Quality
Many indices depend on national and regional data generated by various outside sources for measurement of the various
indicators they include. These data are often inaccurate for a variety of reasons, which can affect the reliability of
composite indices.
In the book Poor Numbers, Jerven (2013) analyzes the development statistics presented by African governments and
nonprofits to demonstrate the different statistics that can be presented for the same country. For example, Table E.1 is
adapted from Jerven’s book comparing the per capita GDP for selected Sub-Saharan African nations based on data gathered
by the World Development Indicators (developed by the World Bank Group), Penn World Tables (developed by economists
at the University of Pennsylvania), and Angus Maddison (used often by economists and economic historians).
Table E.1. Data for per capita GDP from various sources
Rank Maddison Per capita
GDP World Development
Indicators Per capita
GDP Penn World Tables
Per capita GDP
1 Congo-Kinshasa $217 Congo-Kinshasa $92 Congo-Kinshasa $359
2 Sierra Leone $410 Ethiopia $115 Liberia $472
3 Chad $429 Burundi $139 Sierra-Leone $684
4 Niger $489 Sierra Leone $153 Burundi $699
5 Burundi $496 Malawi $169 Ethiopia $725
6 Tanzania $535 Tanzania $190 Guinea-Bissau $762
7 Guinea $572 Liberia $191 Niger $807
8 Central African Rep. $576 Mozambique $191 Tanzania $817
9 Comoro Islands $581 Niger $200 Togo $823
10 Ethiopia $605 Guinea-Bissau $210 Madagascar $823
11 Togo $614 Chad $218 Chad $830
12 Zambia $645 Rwanda $242 Malawi $839
13 Malawi $656 Burkina Faso $243 Zambia $866
14 Guinea-Bissau $681 Madagascar $246 Burkina Faso $933
15 Madagascar $706 Nigeria $254 Central African Rep. $945
16 Angola $765 Mali $294 Gambia $954
17 Uganda $797 Sudan $313 Rwanda $1,018
18 Rwanda $819 Togo $323 Mali $1,047
19 Mali $892 Kenya $328 Sudan $1,048
20 Gambia $895 Central African Rep. $339 Uganda $1,058
21 Burkina Faso $921 Sao Tome & Principe
$341 Nigeria $1,074
22 Liberia $990 Uganda $348 Mozambique $1,093
23 Sudan $991 Gambia $370 Benin $1,251
24 Mauritania $1,017 Zambia $394 Kenya $1,268
25 Kenya $1,031 Ghana $413 Congo-Brazzaville $1,286
26 Cameroon $1,082 Benin $414 Sao Tome & Principe $1,300
27 Sao Tome & Principe $1,226 Comoros $436 Comoros $1,359
28 Nigeria $1,251 Mauritania $495 Ghana $1,392
29 Ghana $1,270 Angola $524 Mauritania $1,521
30 Benin $1,283 Lesotho $548 Senegal $1,571
31 Zimbabwe $1,328 Guinea $605 Lesotho $1,834
32 Cote D’Ivoire $1,352 Senegal $609 Angola $1,975
33 Senegal $1,358 Zimbabwe $620 Cote D’Ivoire $2,171
34 Mozambique $1,365 Cameroon $675 Cameroon $2,472
35 Lesotho $1,490 Cote D’Ivoire $739 Guinea $2,546
36 Cape Verde $1,777 Congo-Brazzaville $791 Zimbabwe $3,256
37 Congo-Brazzaville $2,005 Swaziland $1,538 Cape Verde $4,984
38 Swaziland $2,630 Cape Verde $1,541 Namibia $5,269
39 Namibia $3,637 Equatorial Guinea $1,599 Equatorial Guinea $6,495
40 Gabon $3,847 Namibia $2,366 Botswana $7,256
41 South Africa $3,978 Botswana $3,931 South Africa $8,226
42 Botswana $4,269 South Africa $4,020 Swaziland $8,517
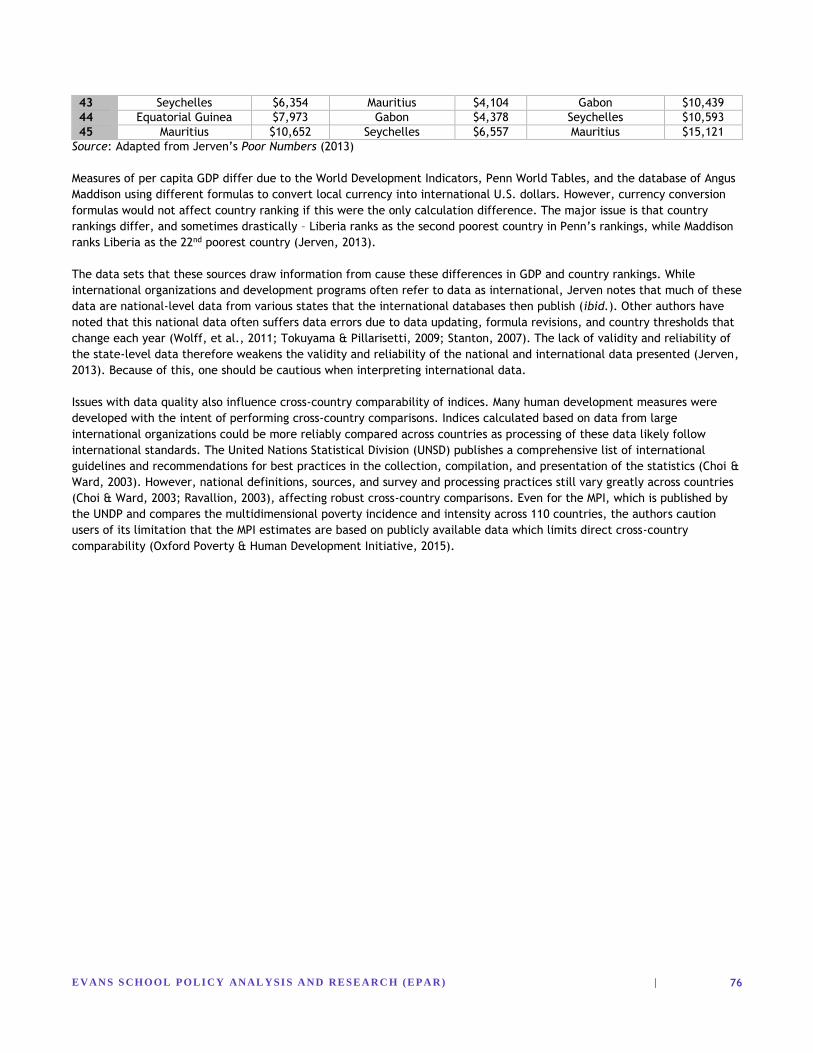
EVAN S S CHOOL POLI CY ANAL YSI S A ND RESEA RC H (EPA R) |
76
43 Seychelles $6,354 Mauritius $4,104 Gabon $10,439
44 Equatorial Guinea $7,973 Gabon $4,378 Seychelles $10,593
45 Mauritius $10,652 Seychelles $6,557 Mauritius $15,121
Source: Adapted from Jerven’s Poor Numbers (2013)
Measures of per capita GDP differ due to the World Development Indicators, Penn World Tables, and the database of Angus
Maddison using different formulas to convert local currency into international U.S. dollars. However, currency conversion
formulas would not affect country ranking if this were the only calculation difference. The major issue is that country
rankings differ, and sometimes drastically – Liberia ranks as the second poorest country in Penn’s rankings, while Maddison
ranks Liberia as the 22nd poorest country (Jerven, 2013).
The data sets that these sources draw information from cause these differences in GDP and country rankings. While
international organizations and development programs often refer to data as international, Jerven notes that much of these
data are national-level data from various states that the international databases then publish (ibid.). Other authors have
noted that this national data often suffers data errors due to data updating, formula revisions, and country thresholds that
change each year (Wolff, et al., 2011; Tokuyama & Pillarisetti, 2009; Stanton, 2007). The lack of validity and reliability of
the state-level data therefore weakens the validity and reliability of the national and international data presented (Jerven,
2013). Because of this, one should be cautious when interpreting international data.
Issues with data quality also influence cross-country comparability of indices. Many human development measures were
developed with the intent of performing cross-country comparisons. Indices calculated based on data from large
international organizations could be more reliably compared across countries as processing of these data likely follow
international standards. The United Nations Statistical Division (UNSD) publishes a comprehensive list of international
guidelines and recommendations for best practices in the collection, compilation, and presentation of the statistics (Choi &
Ward, 2003). However, national definitions, sources, and survey and processing practices still vary greatly across countries
(Choi & Ward, 2003; Ravallion, 2003), affecting robust cross-country comparisons. Even for the MPI, which is published by
the UNDP and compares the multidimensional poverty incidence and intensity across 110 countries, the authors caution
users of its limitation that the MPI estimates are based on publicly available data which limits direct cross-country
comparability (Oxford Poverty & Human Development Initiative, 2015).

EVAN S S CHOOL POLI CY ANAL YSI S A ND RESEA RC H (EPA R) |
77
References
African Development Bank. (2013). Africa Infrastructure Development Index. African Development Bank.
<http://www.afdb.org/fileadmin/uploads/afdb/Documents/Publications/Economic_Brief_-
The_Africa_Infrastructure_Development_Index.pdf>.
African Development Bank. (2014). Country Africa Infrastructure Development Index.
<http://www.afdb.org/en/documents/project-operations/country-performance-assessment-cpa/country-africa-
infrastructure-development-index-aidi/>.
Alkire, S., et al. (2015). Multidimensional Poverty Measurement and Analysis. Oxford University Press, USA.
Alkire, S. (2007). Choosing dimensions: The capability approach and multidimensional poverty. Chronic Poverty Research
Centre Working Paper, (88).
Alkire, S. (2002). The capability approach and human development. In Wadham College and Queen Elizabeth House
Seminar (Vol. 9).
Alkire, S. (2010). Human Development: Definitions, Critiques & Related Developments. OPHI Working Papers. No. 36.
<http://www.ophi.org.uk/wp-content/uploads/OPHI_WP36.pdf>.
Alkire, S., & Foster, J. (2011). Understandings and misunderstandings of multidimensional poverty measurement. The
Journal of Economic Inequality, 9(2), 289-314.
Alkire, S., & Santos, M. E. (2010). "Multidimensional poverty index: research brief." OPHI.
Alkire, S., & Sumner, A. (2013). Multidimensional poverty and the post-2015 MDGs. Development, 56(1), 46-51.
Alkire, S. & Vaz, A. (2014). Reducing Multidimensional Poverty and Destitution: Pace and Patterns.
<http://www.ophi.org.uk/wp-content/uploads/ReducingMultidimensionalPovertyandDestitution-
PaceandPatterns.pdf?d4a512>.
Alkire, S., et al. (2015). Identifying the Poorest People and Groups: Strategies Using the Global Multidimensional Poverty
Index. Journal of International Development, 27(3), 362-387.
Alston, P. (2005). Ships passing in the night: the current state of the human rights and development debate seen through
the lens of the Millennium Development Goals. Human Rights Quarterly, 27(3), 755-829.
Antony, G. M., & Visweswara Rao, K. (2007). A composite index to explain variations in poverty, health, nutritional status
and standard of living: Use of multivariate statistical methods. Public Health, 121(8), 578-587.
Atkinson, G., et al. (1997). Measuring sustainable development macroeconomic and the environment (No. P01 105). IICA,
Lima (Perú). Centro Regional Andino.
Banaian, K., & Roberts, B. (2008). The design and use of political economy indicators. New York: Palgrave Macmillan.
Barro, R. J., & Lee, J. W. (2013). A new data set of educational attainment in the world, 1950–2010. Journal of
Development Economics, 104, 184-198.
Bergheim, S., & Schneider, S. (2006). Measures of well-being. There is more to it than GDP. Deutsche Bank Research,
Frankfurt.
Booysen, F. (2002). An overview and evaluation of composite indices of development. Social Indicators Research, 59(2),
115-151.
Branisa, B., et al. (2014). The institutional basis of gender inequality: The Social Institutions and Gender Index
(SIGI). Feminist Economics, 20(2), 29-64.
Brown, N. J., & Beattie, R. M. (2015). The Millennium Development Goals: taking stock as the first phase ends. Archives of
Disease in Childhood, 100(2), 117-118.
Chakravarty, S. R. (2006). An axiomatic approach to multidimensional poverty measurement via fuzzy sets. In Fuzzy Set
Approach to Multidimensional Poverty Measurement (pp. 49-72). Springer US.
Choi, B. H., & Ward, D. (2003). Main economic indicators: comparative methodological analysis. Wage Related Statistics,
2002(3). OECD Publishing.
Closset, M., Feindouno, S., & Goujon, M. (2014). Human Assets Index retrospective series: 2013 update. Development, 110.
Coonrad, John. (2014). MDGs to SDGs: Top 10 Differences. The Hunger Project: Global Advocacy.
<http://advocacy.thp.org/2014/08/08/mdgs-to-sdgs/>.
Coplin, K. (2014). Indicators in Practice: Social Progress Index. <http://www.epi.yale.edu/indicators-in-practice/social-
progress-index>.
Cornell University, INSEAD, & WIPO. (2014). The Global Innovation Index 2014: The Human Factor In innovation.
Fontainebleau, Ithaca, and Geneva
Correa, P. (2015). Existing poverty index ‘ideal for assessing the SDGs’.
<http://www.scidev.net/global/education/news/global-multidimensional-poverty-index-sdgs-goals.html>.
EVAN S S CHOOL POLI CY ANAL YSI S A ND RESEA RC H (EPA R) |
78
Costanza, R., et al. (2009). Beyond GDP: The Need for New Measures of Progress. Boston: Pardee Center For The Study Of
The Longer-Range Future, Pardee Paper No. 4.
Costanza, et al. (2014). Development: Time to leave GDP behind. Nature, 283-285.
D’Urso, J. (2015). Africa: Major Economies Trail Norway in Social Progress Index.
<http://allafrica.com/stories/201504091080.html>.
Day, R. H. (1971). Rational choice and economic behavior. Theory and Decision, 1(3), 229-251.
de Haan, J., & Sturm, J. (2000). On the relationship between economic freedom and economic growth. European Journal
Of Political Economy, 16(2), 215-241.
de Muro, P., Mazziotta, M., & Pareto, A. (2011). Composite indices of development and poverty: An application to MDGs.
Social Indicators Research, 104(1), 1-18.
Dervis, K., & Klugman, J. (2011). Measuring human progress: The contribution of the human development index and related
indices. Revue d'Economie Politique, 121(1), 73-92.
Dickens, W. T., Sawhill, I. V., & Tebbs, J. (2006). The Effects of Investing in Early Education on Economic Growth.
Brookings Institution.
Dickinson, E. (2011). GDP: a brief history. Foreign Policy. < http://foreignpolicy.com/2011/01/03/gdp-a-brief-history/>.
Easterly, W. (2009). How the millennium development goals are unfair to Africa.World Development, 37(1), 26-35.
Economic Commission for Africa. (2011). The African Gender and Development Index 2011. United Nations Economic
Commission for Africa (UNECA).
<http://www.uneca.org/sites/default/files/PublicationFiles/agdi_2011_eng_fin.pdf.>.
The Economist. (2010). A wealth of data: A useful new way to capture the many aspects of poverty.
The Economist. (2015). Safe Cities Index 2015: Assessing urban security in the digital age.
The Economist Intelligence Unit. (2015). Global Food Security Index 2015.
<http://foodsecurityindex.eiu.com/Home/DownloadResource?fileName=EIU%20Global%20Food%20Security%20Index
%20-%202015%20Findings%20%26%20Methodology.pdf>.
Encarnacion Jr, J. (1964). A note on lexicographical preferences. Econometrica, 215-217.
Eren, M., Çelik, A. K., & Kubat, A. (2014). Determinants of the levels of development based on the human development
index: A comparison of regression models for limited dependent variables. Review of European Studies, 6(1), 10-
22.
Farhat Kassab, S. (2014). Economic growth does “not automatically” lead to social advancement: new social progress index.
Skoll Foundation. <http://www.skollfoundation.org/economic-growth-does-not-automatically-lead-to-social-
advancement-new-social-progress-index/>.
Foster, J. E., Lopez‐Calva, L. F., & Szekely, M. (2005). Measuring the distribution of human development: methodology and
an application to Mexico. Journal of Human Development, 6(1), 5-25.
Frank, R. H. (2005). Positional externalities cause large and preventable welfare losses. American Economic Review, 137-
141.
Eren, M., Çelik, A. K., & Kubat, A. (2014). Determinants of the levels of development based on the human development
index. Review of European Studies, 6(1), 10-22.
Freudenberg, M. (2003), “Composite Indicators of Country Performance: A Critical Assessment”, OECD Science, Technology
and Industry Working Papers, 2003/16, OECD Publishing.
Fukuda-Parr, S. (2003). The human development paradigm: operationalizing Sen's ideas on capabilities. Feminist
Economics, 9(2-3), 301-317.
Gentilini, U., & Webb, P. (2008). How are we doing on poverty and hunger reduction? A new measure of country
performance. Food Policy, 33(6), 521-532.
GEOSTAT. (1993). Standard Methodology of 1993 National Accounts System recommended by the United Nations, OECD,
World Bank, and the IMF.
<http://www.geostat.ge/cms/site_images/_files/english/methodology/GDP%20Brief%20Methodology%20ENG.pdf>.
Green, M. (2015). Why We Shouldn’t Judge a Country by Its GDP. <http://ideas.ted.com/why-we-shouldnt-judge-a-country-
by-its-gdp/>.
Harttgen, K., & Klasen, S. (2012). A Household-Based Human Development Index. World Development, 40, 5, 878-899.
Harvard University Press. (2011). Martha Nussbaum on the Capabilities Approach to Human Development. Harvard
University. <http://harvardpress.typepad.com/hup_publicity/2011/05/martha-nussbaum-creating-capabilities-
human-development.html>.
Hausmann, R., et al. (n.d.). The Global Gender Gap Index 2014. <http://reports.weforum.org/global-gender-gap-report-
2014/part-1/>.
EVAN S S CHOOL POLI CY ANAL YSI S A ND RESEA RC H (EPA R) |
79
Heritage Foundation. (2015a). Executive Highlights | 2015 Index of Economic Freedom Book.
<http://www.heritage.org/index/book/executive-highlights>.
Heritage Foundation. (2015b). 2015 Index of Economic Freedom | The Heritage Foundation.
<http://www.heritage.org/index/about>.
International Women's Development Agency. (n.d.). The Individual Deprivation Measure.
<http://www.yale.edu/macmillan/globaljustice/The-IDM-Report1.pdf>.
Ivanova, I., Arcelus, F. J., & Srinivasan, G. (1999). An assessment of the measurement properties of the human
development index. Social Indicators Research, 46(2), 157-179.
Jacobs, G., & Šlaus, I. (2010). Indicators of economic progress: the power of measurement and human welfare. Cadmus J,
1, 53-113.
Jerven, M. (2013). Poor numbers: how we are misled by African development statistics and what to do about it. Cornell
University Press.
Kabeer, N. (2010). Can the MDGs provide a pathway to social justice? The challenge of intersecting inequalities. Child
Poverty and Inequality: New Perspectives, 57.
Ki-moon, Ban. (2014). Synthesis Report of the Secretary-General on the Post-2015 Agenda. The United Nations.
<https://sustainabledevelopment.un.org/majorgroups/post2015/synthesisreport>.
Klasen, S. (2014). New measures, new insights: the 2014 Human Development Report. Development Progress.
<http://www.developmentprogress.org/blog/2014/07/23/2014-human-development-report-multidimensional-
poverty-inequality-gender>.
Klasen, S., & Schüler, D. (2011). Reforming the gender-related development index and the gender empowerment measure:
Implementing some specific proposals. Feminist Economics, 17(1), 1-30.
Klugman, J. (2010). Human Development Report 2010–20th Anniversary Edition. The Real Wealth of Nations: Pathways to
Human Development. UNDP.
Klugman, J., et al. (2010). Measuring key disparities in human development: The gender inequality index. UNDP.
Korsakiene, R., Breivyte, I., & Wamboye, E. (2011). Sustainable development and human development index. Journal of
Security and Sustainability Issues, 1(2), 103-112.
Kubiszewski, I., et al. (2013). Beyond GDP: Measuring and achieving global genuine progress. Ecological Economics, 93, 57-
68.
Kuznets, S. (1934). "National Income, 1929–1932". 73rd US Congress, 2d session, Senate document no. 124, pages 5-7
<https://fraser.stlouisfed.org/scribd/?title_id=971&filepath=/docs/publications/natincome_1934/19340104_natio
nalinc.pdf>.
Lawn, P. (2013). The failure of the ISEW and GPI to fully account for changes in human-health capital—A methodological
shortcoming not a theoretical weakness. Ecological Economics, 88, 167-177.
Layard, R. (2005). Happiness: lessons form a New Science. London: Allen Lane.
Legatum Institute (2013). The 2013 Legatum Prosperity Index - Methodology.
<http://media.prosperity.com/2013/pdf/publications/methodology_2013_finalweb.pdf>.
Legatum Institute. (2015a). The 2014 Legatum Prosperity Index - Methodology.
<http://www.prosperity.com/#!/methodology>.
Legatum Institute. (2015b). The 2014 Legatum Prosperity Index: FAQs. <http://www.prosperity.com/#!/faqs>.
López Ruiz, V. R., Nevado Peña, D., Alfaro Navarro, J. L., & Grigorescu, A. (2014). Human development european city
index: Methodology and results. Romanian Journal of Economic Forecasting, 17(3), 72-87.
Lustig, N. (2011). Multidimensional indices of achievements and poverty: what do we gain and what do we lose? An
introduction to JOEI Forum on multidimensional poverty. Journal of Economic Inequality, 9(2), 227-234.
Markova, M. (2013). Scientific or political?. <http://www.odi.org/sites/odi.org.uk/files/odi-assets/publications-opinion-
files/8450.pdf>.
Mazumdar, K. (2003). A new approach to human development index. Review of Social Economy, 61(4), 535-549.
Mazziotta, M., & Pareto, A. (2012, May). A well-being index based on the weighted product method. In Proceedings of the
46th scientific meeting of the Italian statistical society, June (pp. 20-22).
Merriam-Webster Dictionary. (2015). Linear Function. <http://www.merriam-webster.com/dictionary/linear%20function>.
McGillivray, M., & White, H. (1993). Measuring development? The UNDP's human development index. Journal of
International Development, 5(2), 183-192.
McGillivray, M., & Noorbakhsh, F. (2004). Composite indices of human well-being: past, present, and future (No. 2004/63).
Research Paper, UNU-WIDER, United Nations University (UNU).
EVAN S S CHOOL POLI CY ANAL YSI S A ND RESEA RC H (EPA R) |
80
Menkhoff, L., & Luchters, G. (2000). The implicit equidistributional bias of human development. Journal of International
Development, 12, 613–623.
Mishra, S., & Nathan, H. S. K. (2013). Measuring human development index: The old, the new and the elegant (No. 2013-
020). Indira Gandhi Institute of Development Research, Mumbai, India.
Mlachila, M. M., Tapsoba, R., & Tapsoba, M. S. J. A. (2014). A Quality of Growth Index for Developing Countries: A
Proposal (No. 14-172). International Monetary Fund.
Morse, S. (2013). Out of sight, out of mind: Reporting of three indices in the UK national press between 1990 and 2009.
Sustainable Development, 21(4), 242-259.
Natoli, R., & Zuhair, S. (2011). Measuring progress: A comparison of the GDP, HDI, GS and the RIE. Social Indicators
Research, 103(1), 33-56.
Neumayer, E. (2001). The human development index and sustainability—a constructive proposal. Ecological Economics,
39(1), 101-114.
New Economics Foundation. (2012). The Happy Planet Index: 2012 Report.
<http://www.happyplanetindex.org/assets/happy-planet-index-report.pdf>.
New Economics Foundation. (2015). Happy Planet Index. <http://www.happyplanetindex.org/about/>.
Noorbakhsh, F. (1998). A modified human development index. World Development, 26(3), 517-528.
OECD. (n.d.). Social Institutions & Gender Index. <http://genderindex.org/>.
OECD. (2001). OECD Glossary of Statistical Terms: Human Development.
<https://stats.oecd.org/glossary/detail.asp?ID=1265>.
OECD. (2008). Handbook on constructing composite indicators. Paris: Organisation for Economic Co-operation and
Development.
OECD. (2014). The Better Life Index. <http://www.oecdbetterlifeindex.org/>.
OECD. (2015). Domestic Product. Gross Domestic Product (GDP). < https://data.oecd.org/gdp/gross-domestic-product-
gdp.htm>.
OECD Development Centre. (2014). Social Institutions and Gender Index 2014: Synthesis Report. OECD Development
Centre’s Social Cohesion Unit.
Otoiu, A., Titan, E., & Dumitrescu, R. (2014). Are the variables used in building composite indicators of well-being relevant?
Validating composite indexes of well-being. Ecological Indicators, 46, 575-585.
Oxfam International. (2015). ‘Our Purpose and Beliefs.’ About Us. <http://oxf.am/2Lj>.
Oxford Poverty & Human Development Initiative. (2007). About OPHI: What does the Oxford Poverty and Human
Development Initiative (OPHI) do? <http://www.ophi.org.uk/about/>.
Oxford Poverty & Human Development Initiative. (2014). Global Multidimensional Poverty Index: What is the Global MPI?
<http://www.ophi.org.uk/multidimensional-poverty-index/>.
Oxford Poverty & Human Development Initiative. (n.d.). Multidimensional Poverty Index (MPI).
<http://www.ophi.org.uk/multidimensional-poverty-index/>.
Oxford Poverty & Human Development Initiative. (n.d.b). Multidimensional poverty measures using the Alkire Foster
method. <http://www.cooperacionespanola.es/sites/default/files/archivo-jornadas-y-
seminarios/multidimensional_poverty_measures_using_the_alkire_foster_method.pdf>.
Pangaribowo, E.H., Gerber, N. & Torero, M. (2013). Food and Nutrition Security Indicators: A Review (No. 147911).
FOODSECURE working paper No. 5.
Perera, S., Skully, M., & Wickramanayake, J. (2005). Human progress in South Asia: A multifaceted analysis. South Asia:
Journal of South Asia Studies, 28(3), 437-456.
Permanyer, I. (2013). Using census data to explore the spatial distribution of human development. World Development, 46,
1-13.
Perrons, D. (2012). Regional performance and inequality: Linking economic and social development through a capabilities
approach. Cambridge Journal of Regions, Economy and Society, 5(1), 15-29.
Pinar, M., Stengos, T., & Topaloglou, N. (2013). Measuring human development: A stochastic dominance approach. Journal
of Economic Growth, 18(1), 69-108.
Porter, M. E. (2014). Better measuring a country – GDP is not the best way to quantify national success. The Boston Globe.
<http://www.bostonglobe.com/opinion/2014/01/11/porter/XQHHPo1gDtuOjgNDOtzDMP/story.html>.
Porter, M. E., Stern, S., & Green, M. (2015). Social Progress Index 2014. London: Social Progress Imperative.
Potrafke, N., & Ursprung, H. W. (2012). Globalization and gender equality in the course of development. European Journal
of Political Economy, 28(4), 399-413.
EVAN S S CHOOL POLI CY ANAL YSI S A ND RESEA RC H (EPA R) |
81
Ravallion, M. (2010, July 28). Guest Blog: World Bank research director critiques the new UN poverty index.
<http://oxfamblogs.org/fp2p/guest-blog-world-bank-research-director-critiques-the-new-un-poverty-index/>.
Ravallion, M. (2010, October 14). Your new composite index has arrived: Please handle with care.
<http://www.voxeu.org/article/your-new-composite-index-has-arrived-please-handle-care>.
Ravallion, M. (2011). On multidimensional indices of poverty. The Journal of Economic Inequality, 9(2), 235-248.
Ravallion, M. (2011). Mashup indices of development. The World Bank Research Observer, lkr009.
Ray, A. K. (2008). Measurement of social development: An international comparison. Social Indicators Research, 86(1), 1-
46.
Ray, M. (2014). Redefining the human development index to account for sustainability. Atlantic Economic Journal, 42(3),
305-316.
Reddy, K.S. (2014). A New Index to Measure Social Progress. <http://www.thehindu.com/opinion/op-ed/a-new-index-to-
measure-social-progress/article6231204.ece>.
Rippin, N. (2011). A Response to the Weaknesses of the Multidimensional Poverty Index (MPI): The Correlation Sensitive
Poverty Index (CSPI). German Development Institute - Briefing Paper. <https://www.die-
gdi.de/uploads/media/BP_19.2011.pdf>.
Robeyns, I. (2011). ‘The Capability Approach’. In Stanford Encyclopedia of Philosophy.
<http://plato.stanford.edu/entries/capability-approach/>.
Rogan, M. (2015). Gender and Multidimensional Poverty in South Africa: Applying the Global Multidimensional Poverty Index
(MPI). Social Indicators Research, 1-20.
Saith, A. (2006). From universal values to Millennium Development Goals: lost in translation. Development and
Change, 37(6), 1167-1199.
Sakiko Fukuda-Parr (2003) The Human Development Paradigm: Operationalizing Sen’s Ideas on Capabilities, Feminist
Economics, 9:2-3, 301-317.
Sala-i-Martin, X. (2006). The world distribution of income: falling poverty and... convergence, period. The Quarterly
Journal of Economics, 351-397.
Santos, M. E., & Santos, G. (2013). Composite Indices of Development ‖. International Development: Ideas, Experience and
Prospects. OUP.
Satterthwaite, D. (2014). The Multidimensional Poverty Index: Another underestimate of urban poverty.
<http://www.iied.org/multidimensional-poverty-index-another-underestimate-urban-poverty>.
Segura, S. L., & Moya, E. G. (2009). Human development index: A non-compensatory assessment. Cuadernos De Economia,
28(50), 223-235.
Sen, A. (1976a). Poverty: an ordinal approach to measurement. Econometrica, 219-231.
Sen, A. (1976b). Real national income. The Review of Economic Studies, 19-39.
Sen, A. (1979). The welfare basis of real income comparisons: A survey. Journal of Economic Literature, 1-45.
Sen, A. (1984) ‘Rights and capabilities.’ In Resources, Values and Development, Harvard University Press, Cambridge, MA.
Stanton, E. A. (2007). The human development index: A history.
Stapleton, L. M., & Garrod, G. D. (2007). Keeping things simple: Why the human development index should not diverge
from its equal weights assumption. Social Indicators Research, 84(2), 179-188.
Stern, S., Wares, A., & Orzell, S. (2015). Social Progress Index 2014 Methodological Report. London: Social Progress
Imperative.
Talberth, J., Cobb, C., & Slattery, N. (2007). The Genuine Progress Indicator 2006 - A Tool for Sustainable Development.
<http://rprogress.org/publications/2007/GPI 2006.pdf>.
Tokuyama, C., & Pillarisetti, R. J. (2009). Measuring and monitoring human welfare: How credible are the data in the
UNDP's human development reports? Journal of Economic and Social Measurement, 34(1), 35-50.
Tversky, A. (1972). Elimination by aspects: A theory of choice. Psychological Review, 79(4), 281.
United Nations. (2005). Millennium Development Goals Report 2005.
<http://www.un.org/millenniumgoals/pdf/mdg2005progresschart.pdf>.
United Nations. (2014). Millennium Development Goals Report 2014.
<http://www.un.org/millenniumgoals/2014%20MDG%20report/MDG%202014%20English%20web.pdf>.
United Nations. (2015). Millennium Development Goals Report 2015.
<http://www.un.org/millenniumgoals/2015_MDG_Report/pdf/MDG%202015%20rev%20(July%201).pdf>.
United Nations Development Programme (n.d.). Human Development Reports.
<http://hdr.undp.org/en/content/multidimensional-poverty-index-mpi>.
United Nations Development Programme. (1990). Human Development Report 1990.
EVAN S S CHOOL POLI CY ANAL YSI S A ND RESEA RC H (EPA R) |
82
<http://hdr.undp.org/en/reports/global/hdr1990>.
United Nations Development Programme. (2013a). The Gender Inequality Index. <http://hdr.undp.org/en/content/gender-
inequality-index-gii>.
United Nations Development Programme. (2013b). Human Development Technical Notes.
<http://hdr.undp.org/sites/default/files/hdr_2013_en_technotes.pdf>.
United Nations Development Programme. (2014a). Human Development Index. Human Development Reports.
<http://hdr.undp.org/en/content/human-development-index-hdi>.
United Nations Development Programme. (2014b). Composite Indices – HDI and Beyond.
<http://hdr.undp.org/en/statistics/understanding/indices>.
United Nations Development Programme. (2014c). Table 4: Gender Inequality Index.
<http://hdr.undp.org/en/content/table-4-gender-inequality-index>.
United Nations Development Programme. (2014d). The Gender Development Index.
<http://hdr.undp.org/en/content/gender-development-index-gdi>.
United Nations Development Programme. (2014e). Human Development Report. <http://hdr.undp.org/en/2014-report>.
United Nations Development Programme. (2015a). About Us: A World of Development Experience.
<http://www.undp.org/content/undp/en/home/operations/about_us.html>.
United Nations Development Programme. (2015b). Human Development Reports: About Human Development.
<http://hdr.undp.org/en/humandev>.
United Nations Development Programme. (2015c). Why is the MPI better than the Human Poverty Index (HPI) which was
previously used in the Human Development Reports? | Human Development Reports.
<http://hdr.undp.org/en/content/why-mpi-better-human-poverty-index-hpi-which-was-previously-used-human-
development-reports>.
United Nations Development Programme. (2015d). Inequality-adjusted Human Development Index (IHDI) | Human
Development Reports. <http://hdr.undp.org/en/content/inequality-adjusted-human-development-index-ihdi>.
UNESCO. (2015). About Us: Introducing UNESCO. <http://en.unesco.org/about-us/introducing-unesco>.
UNICEF. (2015). Who We Are: About UNICEF. <http://www.unicef.org/about/>.
Van den Bergh, J. C. (2009). The GDP paradox. Journal of Economic Psychology, 30(2), 117-135.
van Staveren, I. (2013). To measure is to know? A comparative analysis of gender indices. Review of Social Economy, 71(3),
339-372.
Vidyattama, Y. (2013). Regional convergence and the role of the neighbourhood effect in decentralised Indonesia. Bulletin
of Indonesian Economic Studies, 49(2), 193-211.
Wiser, S., et al. (2015). The Individual Deprivation Measure: A Gender-Sensitive Approach to Poverty Measurement.
International Women’s Development Agency. <http://www.yale.edu/macmillan/globaljustice/The-IDM-
Report1.pdf>.
Wolff, H., Chong, H., & Auffhammer, M. (2011). Classification, detection and consequences of data error: Evidence from
the human development index. Economic Journal, 121(553), 843-870.
World Bank. (n.d.) About the Human Development Network. <http://go.worldbank.org/8TJ7JTJWJ0>.
World Bank. (2013a). The World Bank Group Goals: End Extreme Poverty and Promote Shared Prosperity.
<http://www.worldbank.org/en/about and http://www.worldbank.org/content/dam/Worldbank/document/WB-
goals2013.pdf>.
World Bank. (2013b). The Little Green Data Book. <http://siteresources.worldbank.org/EXTSDNET/Resources/Little-Green-
Data-Book-2013.pdf>.
World Bank. (2014a). Ease of Doing Business Index. <http://data.worldbank.org/indicator/IC.BUS.EASE.XQ>.
World Bank. (2014b). Adjusted Net Savings. <http://data.worldbank.org/indicator/NY.ADJ.SVNG.GN.ZS>.
World Bank. (2015a). GDP (current US dollars). World Bank Data. <http://data.worldbank.org/indicator/NY.GDP.MKTP.CD>.
World Bank. (2015b). Doing Business Project Methodology. <http://www.doingbusiness.org/methodology>.
World Bank. (2015c). Choosing and Estimating Poverty Indicators.
<http://web.worldbank.org/WBSITE/EXTERNAL/TOPICS/EXTPOVERTY/EXTPA/0,,contentMDK:20242881~menuPK:49
2138~pagePK:148956~piPK:216618~theSitePK:430367,00.html>
World Economic Forum. (n.d.). Measuring the Global Gender Gap. <http://reports.weforum.org/global-gender-gap-report-
2014/part-1/the-global-gender-gap-index-2014/>.
World Economics. (2015). Maddison Historical GDP Data.
<http://www.worldeconomics.com/Data/MadisonHistoricalGDP/Madison%20Historical%20GDP%20Data.efp>.


