Embed Size (px)
Citation preview

1
DOI: 10.1002/ ((please add manuscript number)) Article type: Full Paper Attenuated Glial Reactivity on Topographically Functionalized Poly(3,4-
Ethylenedioxythiophene):P-Toluene Sulfonate (PEDOT:PTS) Neuroelectrodes
Fabricated by Microimprint Lithography Catalina Vallejo-Giraldo*, Katarzyna Krukiewicz, Ivo Calaresu, Jingyuan Zhu, Matteo Palma,
Marc Fernandez, Benjamin G, Nathalia Peixoto, Nazar Farid, Gerard O'Connor, Laura
Ballerini, Abhay Pandit, and Manus Jonathan Paul Biggs
Dr Catalina Vallejo-Giraldo, +Dr Katarzyna Krukiewicz, MSc Marc Fernandez, Prof. Abhay Pandit, Dr Manus Jonathan Paul Biggs CÚRAM - Centre for Research in Medical Devices – Galway, Biosciences Research Building, 118 Corrib Village, Newcastle, Galway, Ireland E-mail: [email protected] + Department of Physical Chemistry and Technology of Polymers Silesian University of Technology, Gliwice, Poland Dr Matteo Palma, MSc Jingyuan Zhu School of Biological and Chemical Sciences, Queen Mary University of London, Mile End Road, London E14NS, UK Dr Nathalia Peixoto, MSc Benjamin G Department of Electrical and Computer Engineering, George Mason University, 4400 University Drive MS-1G5 Dr Nazar Farid, Dr Gerard O'Connor School of Physics, National University of Ireland, Galway, University Road, Galway, Ireland MSc Ivo Calaresu, Prof. Laura Ballerini Scuola Internazionale Superiore di Studi Avanzati (SISSA), Via Bonomea, 265, 34136,Trieste, Italy Keywords: neural interfaces, functionalization, topographies, astrogliosis, inflammation Following implantation, neuroelectrode functionality is susceptible to deterioration via reactive
host cell response and glial scar-induced encapsulation. Within the neuroengineering
community there is a consensus that the induction of selective adhesion and regulated cellular
interaction at the tissue-electrode interface can significantly enhance device interfacing and
functionality in vivo. In particular, topographical modification holds promise for the
development of functionalized neural interfaces to mediate initial cell adhesion and the
subsequent evolution of gliosis, minimizing the onset of a pro-inflammatory glial phenotype,
to provide long-term stability. Herein, a novel low-temperature microimprint-lithography
1
2
3
4
5
6
7
8
9
10
11
12
13
14
15
16
17
18
19
20
21
22
23
24
25
26
27
28
29
30
31
32
33
34
35
36
37
38
39
40
41
42
43
44
45
46
47
48
49
50
51
52
53
54
55
56
57
58
59
60
61
62
63
64
65
2
technique for the development of micro-topographically functionalized neuroelectrode
interfaces in electrodeposited PEDOT:PTS is described and assessed in vitro.
Platinum (Pt) microelectrodes were subjected to electrodeposition of a PEDOT:PTS
microcoating which was subsequently topographically functionalized with an ordered array of
micro-pits, inducing a significant reduction in electrode electrical impedance and an increase
in charge storage capacity. Furthermore, topographical functionalized electrodes reduced the
adhesion of reactive astrocytes in vitro, evident from morphological changes in cell area, focal
adhesion formation, and the synthesis of pro-inflammatory cytokines and chemokine factors.
This study contributes to the understanding of gliosis in complex primary mixed cell cultures,
and describes the role of micro-topographically modified neural interfaces in the development
of stable microelectrode interfaces.
1. Introduction
Implantable stimulation and recording devices have received significant attention in biomedical
engineering and have brought great success in the treatment of central nervous system disorders
including paralysis, [1] epilepsy [2] and Parkinson’s disease. [3, 4] In order to achieve chronic
functionality and integration with surrounding tissue, material functionalization strategies have
been employed to provide chemical and physicomechanical properties analogous to neural
tissues, with an ultimate goal of mitigating electrode deterioration via reactive host cell response
and glial scar-induced encapsulation.[3, 5-8]
From this perspective the field of neuroelectrode engineering has encouraged the use of
alternative electroactive materials over conventional metallic strategies such as gold and
platinum [9, 10] as an approach to provide an electrochemical platform for the immobilization of
biological molecules [11, 12] or in order to promote physicomechanical mimicry through soft or
topographically rough interfaces. [13, 14] Specifically, semiconducting polymers,[6, 15-20]
including polypyrrole (PPy) [21-23] and poly(3,4-ethylenedioxythiophene) (PEDOT), [24-26] and
1
2
3
4
5
6
7
8
9
10
11
12
13
14
15
16
17
18
19
20
21
22
23
24
25
26
27
28
29
30
31
32
33
34
35
36
37
38
39
40
41
42
43
44
45
46
47
48
49
50
51
52
53
54
55
56
57
58
59
60
61
62
63
64
65
3
their hybrids [27, 28] have been employed widely in neural engineering because of their versatility
as electrode coatings through electrodeposition processes, [29, 30] and have been employed to
enhance the neuroelectrode electrochemical profile, [26, 31] and provide a platform for chemical,
[32-34] and morphological [35-38] functionalization to meet particular requirements. [39-42]
Ongoing studies into topographical functionalization strategies of the neural interface have
explored the micro [43-45] to the nanoscale [46, 47] and have shown promise, in promoting a low
impedance profile of implantable electrodes through effects on electrode surface area. [46, 48, 49]
Recent studies indicate the cytocompatibility of conducting and semiconducting polymers in
vitro and in vivo and the realization that electrodeposited conducting coatings present a nano-
rough surface has led to speculation that topography may play a role in directing the cellular
functional response to implanted electrodes by modulating cell function through altering
integrin distribution,[50] and differential cell adhesion. [51, 52] In particular nanotopographically
functionalized materials have been shown to influence the activation of intrinsic cellular
processes that lead to more quiescent or reactive cell phenotypes in the onset of a pro-
inflammatory response [46, 50-53] and glial scar formation. [54, 55]
Ordered arrays of lithography fabricated nanopit substrates have been consistently shown in
previous work to disrupt cell adhesion in vitro by direct or indirect modulation of focal adhesion
formation. [51, 52] Recent in vitro studies exploring topographical modification have been
successful in controlling astrocyte adhesion while promoting high neuron integration as
strategies to reduce gliosis, [14, 56, 57] with microscale isotropic pit topographies of 1 µm in depth
reported to modulate astrocytes adhesion in vitro. [61]
Although neural cells are reported to produce sparse and small focal adhesions, [58] it has been
shown that astrocytes are adhesion dependent,[59] and will form a monolayer in culture,
providing neurons with physicochemical cues, to modulate neural processes extension.[57]
Consequently, the ability to control astrocyte adhesion and promote a reduction of the reactive
1
2
3
4
5
6
7
8
9
10
11
12
13
14
15
16
17
18
19
20
21
22
23
24
25
26
27
28
29
30
31
32
33
34
35
36
37
38
39
40
41
42
43
44
45
46
47
48
49
50
51
52
53
54
55
56
57
58
59
60
61
62
63
64
65
4
astrocyte phenotype at the electrode interface is critical to support neuronal outgrowth,[60] and
reduce glial scar formation.[54]
In this study, PEDOT:PTS coated microelectrodes were topographically functionalized with
ordered micro-pit arrays using a novel low-temperature three-step die imprinting lithography
process, as a strategy to enhance electrode functionality, cytocompatibility and promote
selective adhesion, minimizing the onset of a pro-inflammatory glial phenotype, in neural
applications. The physical, electrochemical and cytocompatibility effects of topographically
functionalized microelectrodes were subsequently explored in vitro. Our results elucidate
important topographical effects with regard to microelectrode functionality, cytocompatibility
and astrogliosis towards the generation of neural interfaces with superior electrical and
biological properties.
2. Results and Discussion
2.1. Physical Characterization
A range of techniques have been explored to create defined microstructures on electrode
surfaces, [62] including laser ablation, [63, 64] focused ion beam, [65, 66] sputter etching, [67, 68]
reactive ion etching, [69, 70] deep reactive ion etching, [71, 72] hot embossing, [73, 74] and electron
beam lithography.[75,76] Complementary to these techniques, imprint lithography is an
especially attractive approach due to its simplicity, non-destructive character and feasibility of
patterning large areas with features down to 10 nm using elevated temperature and/or pressure
processes to transfer a pattern into typically thermoplastic materials.[77-80] Regarding the
variation of imprinting methods, direct die imprinting is of particular interest as patterns are
transferred via a stamp/die in a single imprint process. [81] However, the quality of the pattern
transfer depends on relatively high temperatures and pressures [81, 82] and silanization steps are
also required to facilitate the separation of the die and imprinted material. [83-86]
A study by Tan et al. [87] shows the imprinting process of non-thermoplastic materials such as
PEDOT and chitosan using plasticizers. Imprinting of PEDOT and chitosan films from the
1
2
3
4
5
6
7
8
9
10
11
12
13
14
15
16
17
18
19
20
21
22
23
24
25
26
27
28
29
30
31
32
33
34
35
36
37
38
39
40
41
42
43
44
45
46
47
48
49
50
51
52
53
54
55
56
57
58
59
60
61
62
63
64
65
5
poly(dimethylsiloxane) mold was achieved at a pressure of 10 kPa and 25 °C by controlled
addition of glycerol as a plasticizer. In this case, the added glycerol was used to increase the
chain mobility of the polymers, resulting in lower imprinting temperature and low pressures.
Further, a room temperature nanoimprint lithography process was shown by Pisignano and
colleagues [88] with the nanoimprinting of patterns in organic semiconductors with poor
thermoplastic properties.
A focus of this study was to develop a low-temperature, simple imprinting method to reproduce
lithographically fabricated well-defined and ordered topographies into PEDOT:PTS
electrodeposited electrode coatings. Critically this approach preserves the ability to introduce
coupled biochemical functionalization – an approach which has been explored extensively with
PEDOT functionalized microelectrodes. [89-92] Arrays of pits possessing a diameter of ~1 µm a
pitch of ~2 µm and depth of ~ 1 µm were initially fabricated via photolithography which was
used as a mask for a Ni (Nickel) electroforming process as described previously.[51] Fabricated
negative Ni masters were used as hard stamps to replicate the original topography into
electrodeposited PEDOT:PTS coatings via an imprint process applying 1.9 metric tons per cm2
for fifteen minutes to achieve high quality pattern transfer conducted at room temperature. To
facilitate substrate separation, a dehydration-assisted process was employed to enhance the
cohesion of PEDOT:PTS and prevent topography disruption during the separation step,
ensuring high pattern transfer as first described by Yang et al. [83] who also used the dehydration-
assisted method for the imprinting of spin-coated PEDOT:PSS nanogratings for photovoltaic
applications. In this way, silanization steps were avoided as they caused neural cell death to our
cultures due to insufficient evaporation of fluorides. [93, 94]
Experimentally, the micro-imprinting process is outlined in Figure 1. Representative SEM
micrographs of the nickel die used in the imprinting process and the resulting well-ordered
arrays of micro-pits in the micro-topographically functionalized PEDOT:PTS coated
1
2
3
4
5
6
7
8
9
10
11
12
13
14
15
16
17
18
19
20
21
22
23
24
25
26
27
28
29
30
31
32
33
34
35
36
37
38
39
40
41
42
43
44
45
46
47
48
49
50
51
52
53
54
55
56
57
58
59
60
61
62
63
64
65
6
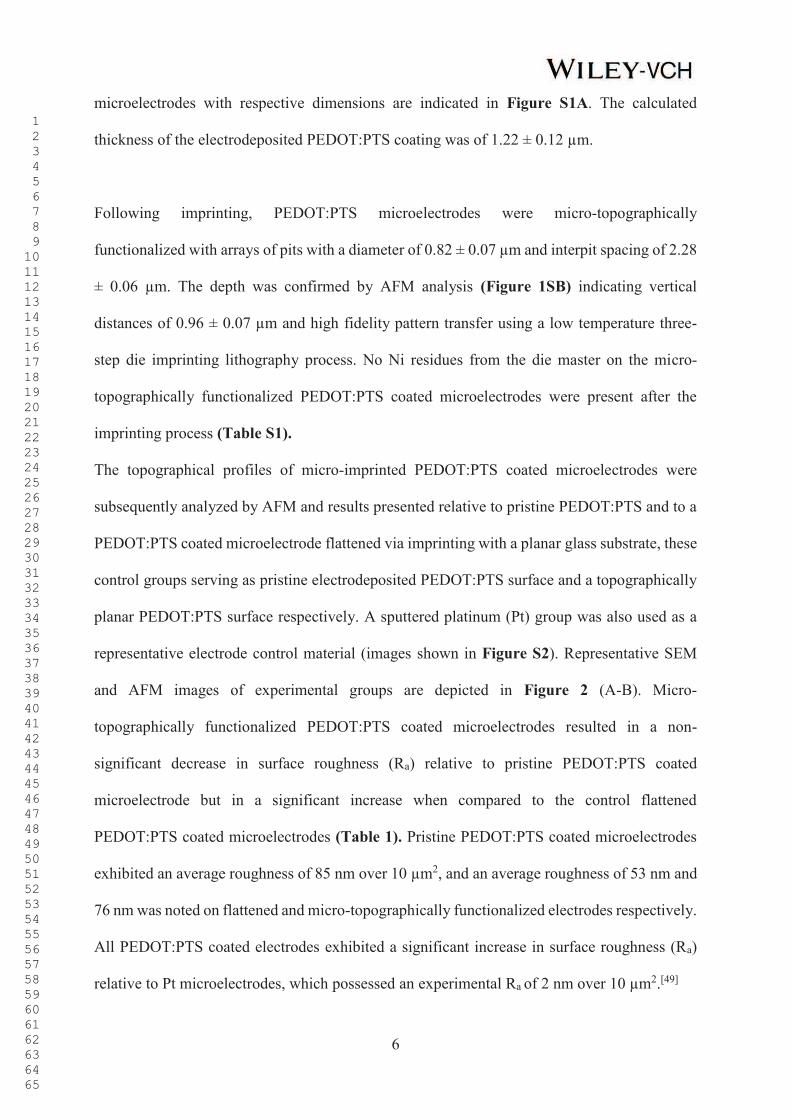
microelectrodes with respective dimensions are indicated in Figure S1A. The calculated
thickness of the electrodeposited PEDOT:PTS coating was of 1.22 ± 0.12 µm.
Following imprinting, PEDOT:PTS microelectrodes were micro-topographically
functionalized with arrays of pits with a diameter of 0.82 ± 0.07 µm and interpit spacing of 2.28
± 0.06 µm. The depth was confirmed by AFM analysis (Figure 1SB) indicating vertical
distances of 0.96 ± 0.07 µm and high fidelity pattern transfer using a low temperature three-
step die imprinting lithography process. No Ni residues from the die master on the micro-
topographically functionalized PEDOT:PTS coated microelectrodes were present after the
imprinting process (Table S1).
The topographical profiles of micro-imprinted PEDOT:PTS coated microelectrodes were
subsequently analyzed by AFM and results presented relative to pristine PEDOT:PTS and to a
PEDOT:PTS coated microelectrode flattened via imprinting with a planar glass substrate, these
control groups serving as pristine electrodeposited PEDOT:PTS surface and a topographically
planar PEDOT:PTS surface respectively. A sputtered platinum (Pt) group was also used as a
representative electrode control material (images shown in Figure S2). Representative SEM
and AFM images of experimental groups are depicted in Figure 2 (A-B). Micro-
topographically functionalized PEDOT:PTS coated microelectrodes resulted in a non-
significant decrease in surface roughness (Ra) relative to pristine PEDOT:PTS coated
microelectrode but in a significant increase when compared to the control flattened
PEDOT:PTS coated microelectrodes (Table 1). Pristine PEDOT:PTS coated microelectrodes
exhibited an average roughness of 85 nm over 10 µm2, and an average roughness of 53 nm and
76 nm was noted on flattened and micro-topographically functionalized electrodes respectively.
All PEDOT:PTS coated electrodes exhibited a significant increase in surface roughness (Ra)
relative to Pt microelectrodes, which possessed an experimental Ra of 2 nm over 10 µm2.[49]
1
2
3
4
5
6
7
8
9
10
11
12
13
14
15
16
17
18
19
20
21
22
23
24
25
26
27
28
29
30
31
32
33
34
35
36
37
38
39
40
41
42
43
44
45
46
47
48
49
50
51
52
53
54
55
56
57
58
59
60
61
62
63
64
65
7
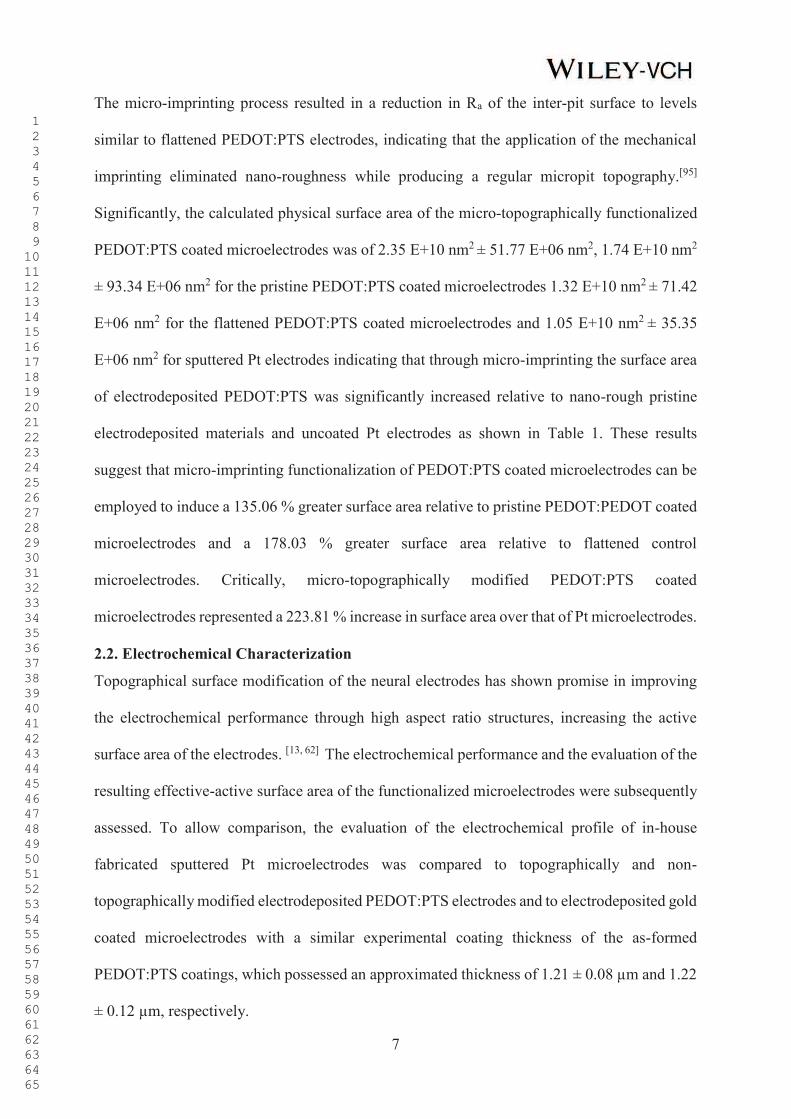
The micro-imprinting process resulted in a reduction in Ra of the inter-pit surface to levels
similar to flattened PEDOT:PTS electrodes, indicating that the application of the mechanical
imprinting eliminated nano-roughness while producing a regular micropit topography.[95]
Significantly, the calculated physical surface area of the micro-topographically functionalized
PEDOT:PTS coated microelectrodes was of 2.35 E+10 nm2 ± 51.77 E+06 nm2, 1.74 E+10 nm2
± 93.34 E+06 nm2 for the pristine PEDOT:PTS coated microelectrodes 1.32 E+10 nm2 ± 71.42
E+06 nm2 for the flattened PEDOT:PTS coated microelectrodes and 1.05 E+10 nm2 ± 35.35
E+06 nm2 for sputtered Pt electrodes indicating that through micro-imprinting the surface area
of electrodeposited PEDOT:PTS was significantly increased relative to nano-rough pristine
electrodeposited materials and uncoated Pt electrodes as shown in Table 1. These results
suggest that micro-imprinting functionalization of PEDOT:PTS coated microelectrodes can be
employed to induce a 135.06 % greater surface area relative to pristine PEDOT:PEDOT coated
microelectrodes and a 178.03 % greater surface area relative to flattened control
microelectrodes. Critically, micro-topographically modified PEDOT:PTS coated
microelectrodes represented a 223.81 % increase in surface area over that of Pt microelectrodes.
2.2. Electrochemical Characterization
Topographical surface modification of the neural electrodes has shown promise in improving
the electrochemical performance through high aspect ratio structures, increasing the active
surface area of the electrodes. [13, 62] The electrochemical performance and the evaluation of the
resulting effective-active surface area of the functionalized microelectrodes were subsequently
assessed. To allow comparison, the evaluation of the electrochemical profile of in-house
fabricated sputtered Pt microelectrodes was compared to topographically and non-
topographically modified electrodeposited PEDOT:PTS electrodes and to electrodeposited gold
coated microelectrodes with a similar experimental coating thickness of the as-formed
PEDOT:PTS coatings, which possessed an approximated thickness of 1.21 ± 0.08 µm and 1.22
± 0.12 µm, respectively.
1
2
3
4
5
6
7
8
9
10
11
12
13
14
15
16
17
18
19
20
21
22
23
24
25
26
27
28
29
30
31
32
33
34
35
36
37
38
39
40
41
42
43
44
45
46
47
48
49
50
51
52
53
54
55
56
57
58
59
60
61
62
63
64
65
8
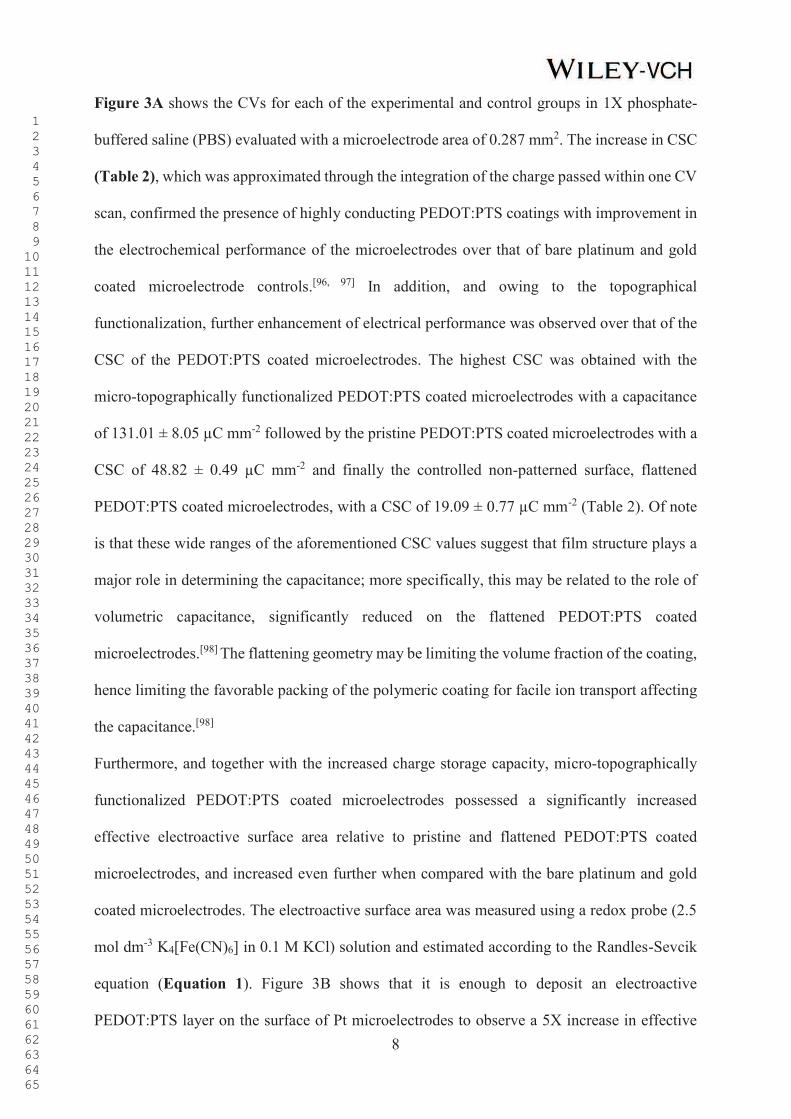
Figure 3A shows the CVs for each of the experimental and control groups in 1X phosphate-
buffered saline (PBS) evaluated with a microelectrode area of 0.287 mm2. The increase in CSC
(Table 2), which was approximated through the integration of the charge passed within one CV
scan, confirmed the presence of highly conducting PEDOT:PTS coatings with improvement in
the electrochemical performance of the microelectrodes over that of bare platinum and gold
coated microelectrode controls.[96, 97] In addition, and owing to the topographical
functionalization, further enhancement of electrical performance was observed over that of the
CSC of the PEDOT:PTS coated microelectrodes. The highest CSC was obtained with the
micro-topographically functionalized PEDOT:PTS coated microelectrodes with a capacitance
of 131.01 ± 8.05 µC mm-2 followed by the pristine PEDOT:PTS coated microelectrodes with a
CSC of 48.82 ± 0.49 µC mm-2 and finally the controlled non-patterned surface, flattened
PEDOT:PTS coated microelectrodes, with a CSC of 19.09 ± 0.77 µC mm-2 (Table 2). Of note
is that these wide ranges of the aforementioned CSC values suggest that film structure plays a
major role in determining the capacitance; more specifically, this may be related to the role of
volumetric capacitance, significantly reduced on the flattened PEDOT:PTS coated
microelectrodes.[98] The flattening geometry may be limiting the volume fraction of the coating,
hence limiting the favorable packing of the polymeric coating for facile ion transport affecting
the capacitance.[98]
Furthermore, and together with the increased charge storage capacity, micro-topographically
functionalized PEDOT:PTS coated microelectrodes possessed a significantly increased
effective electroactive surface area relative to pristine and flattened PEDOT:PTS coated
microelectrodes, and increased even further when compared with the bare platinum and gold
coated microelectrodes. The electroactive surface area was measured using a redox probe (2.5
mol dm-3 K4[Fe(CN)6] in 0.1 M KCl) solution and estimated according to the Randles-Sevcik
equation (Equation 1). Figure 3B shows that it is enough to deposit an electroactive
PEDOT:PTS layer on the surface of Pt microelectrodes to observe a 5X increase in effective
1
2
3
4
5
6
7
8
9
10
11
12
13
14
15
16
17
18
19
20
21
22
23
24
25
26
27
28
29
30
31
32
33
34
35
36
37
38
39
40
41
42
43
44
45
46
47
48
49
50
51
52
53
54
55
56
57
58
59
60
61
62
63
64
65
9
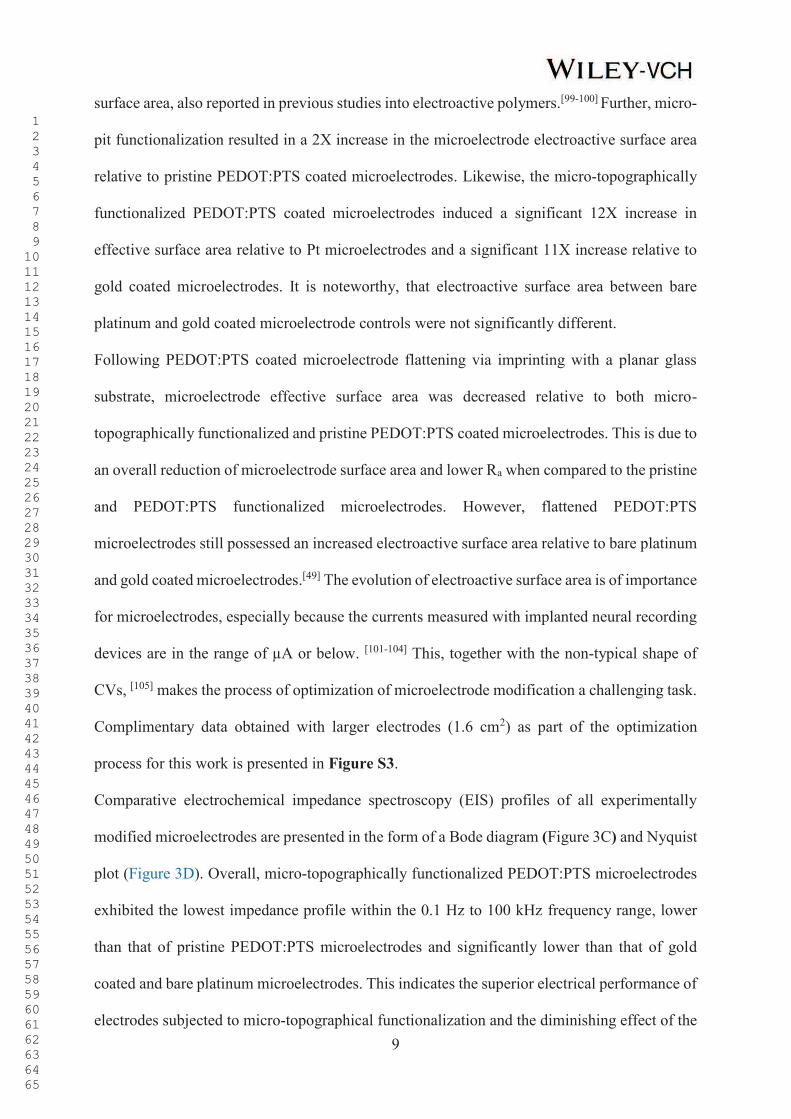
surface area, also reported in previous studies into electroactive polymers.[99-100] Further, micro-
pit functionalization resulted in a 2X increase in the microelectrode electroactive surface area
relative to pristine PEDOT:PTS coated microelectrodes. Likewise, the micro-topographically
functionalized PEDOT:PTS coated microelectrodes induced a significant 12X increase in
effective surface area relative to Pt microelectrodes and a significant 11X increase relative to
gold coated microelectrodes. It is noteworthy, that electroactive surface area between bare
platinum and gold coated microelectrode controls were not significantly different.
Following PEDOT:PTS coated microelectrode flattening via imprinting with a planar glass
substrate, microelectrode effective surface area was decreased relative to both micro-
topographically functionalized and pristine PEDOT:PTS coated microelectrodes. This is due to
an overall reduction of microelectrode surface area and lower Ra when compared to the pristine
and PEDOT:PTS functionalized microelectrodes. However, flattened PEDOT:PTS
microelectrodes still possessed an increased electroactive surface area relative to bare platinum
and gold coated microelectrodes.[49] The evolution of electroactive surface area is of importance
for microelectrodes, especially because the currents measured with implanted neural recording
devices are in the range of µA or below. [101-104] This, together with the non-typical shape of
CVs, [105] makes the process of optimization of microelectrode modification a challenging task.
Complimentary data obtained with larger electrodes (1.6 cm2) as part of the optimization
process for this work is presented in Figure S3.
Comparative electrochemical impedance spectroscopy (EIS) profiles of all experimentally
modified microelectrodes are presented in the form of a Bode diagram (Figure 3C) and Nyquist
plot (Figure 3D). Overall, micro-topographically functionalized PEDOT:PTS microelectrodes
exhibited the lowest impedance profile within the 0.1 Hz to 100 kHz frequency range, lower
than that of pristine PEDOT:PTS microelectrodes and significantly lower than that of gold
coated and bare platinum microelectrodes. This indicates the superior electrical performance of
electrodes subjected to micro-topographical functionalization and the diminishing effect of the
1
2
3
4
5
6
7
8
9
10
11
12
13
14
15
16
17
18
19
20
21
22
23
24
25
26
27
28
29
30
31
32
33
34
35
36
37
38
39
40
41
42
43
44
45
46
47
48
49
50
51
52
53
54
55
56
57
58
59
60
61
62
63
64
65
10
process of PEDOT:PTS flattening on the electrochemical properties of microelectrodes, due to
the impact of the former on volumetric changes of the coating. [98]
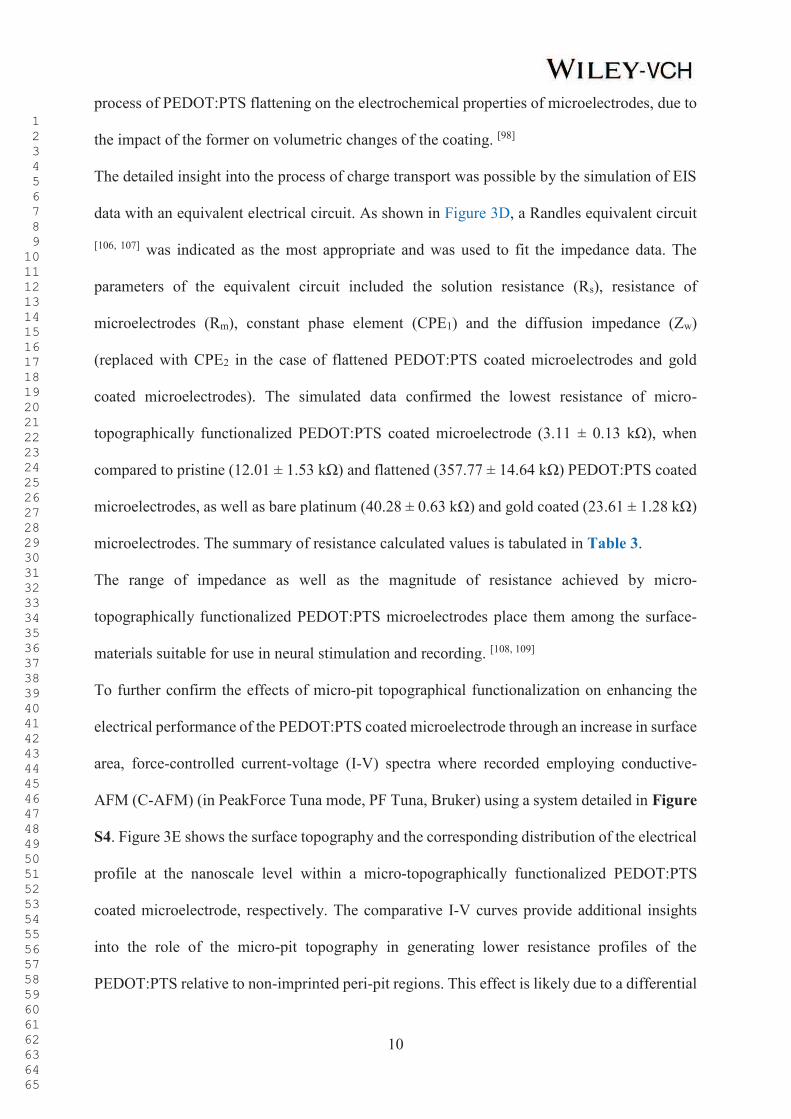
The detailed insight into the process of charge transport was possible by the simulation of EIS
data with an equivalent electrical circuit. As shown in Figure 3D, a Randles equivalent circuit
[106, 107] was indicated as the most appropriate and was used to fit the impedance data. The
parameters of the equivalent circuit included the solution resistance (Rs), resistance of
microelectrodes (Rm), constant phase element (CPE1) and the diffusion impedance (Zw)
(replaced with CPE2 in the case of flattened PEDOT:PTS coated microelectrodes and gold
coated microelectrodes). The simulated data confirmed the lowest resistance of micro-
topographically functionalized PEDOT:PTS coated microelectrode (3.11 ± 0.13 kΩ), when
compared to pristine (12.01 ± 1.53 kΩ) and flattened (357.77 ± 14.64 kΩ) PEDOT:PTS coated
microelectrodes, as well as bare platinum (40.28 ± 0.63 kΩ) and gold coated (23.61 ± 1.28 kΩ)
microelectrodes. The summary of resistance calculated values is tabulated in Table 3.
The range of impedance as well as the magnitude of resistance achieved by micro-
topographically functionalized PEDOT:PTS microelectrodes place them among the surface-
materials suitable for use in neural stimulation and recording. [108, 109]
To further confirm the effects of micro-pit topographical functionalization on enhancing the
electrical performance of the PEDOT:PTS coated microelectrode through an increase in surface
area, force-controlled current-voltage (I-V) spectra where recorded employing conductive-
AFM (C-AFM) (in PeakForce Tuna mode, PF Tuna, Bruker) using a system detailed in Figure
S4. Figure 3E shows the surface topography and the corresponding distribution of the electrical
profile at the nanoscale level within a micro-topographically functionalized PEDOT:PTS
coated microelectrode, respectively. The comparative I-V curves provide additional insights
into the role of the micro-pit topography in generating lower resistance profiles of the
PEDOT:PTS relative to non-imprinted peri-pit regions. This effect is likely due to a differential
1
2
3
4
5
6
7
8
9
10
11
12
13
14
15
16
17
18
19
20
21
22
23
24
25
26
27
28
29
30
31
32
33
34
35
36
37
38
39
40
41
42
43
44
45
46
47
48
49
50
51
52
53
54
55
56
57
58
59
60
61
62
63
64
65
11
response in potential across the pit, resulting in a linear increase in current compared to a steady
response seen on the I-V relationship from the non-patterned region.
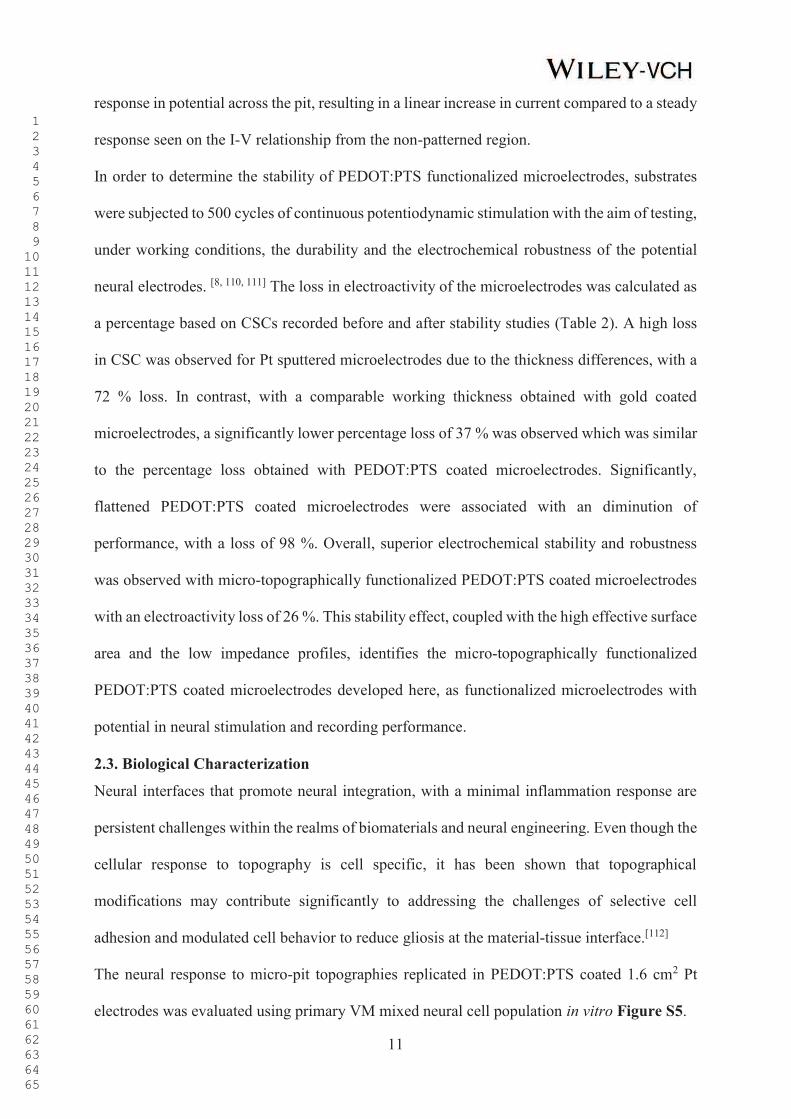
In order to determine the stability of PEDOT:PTS functionalized microelectrodes, substrates
were subjected to 500 cycles of continuous potentiodynamic stimulation with the aim of testing,
under working conditions, the durability and the electrochemical robustness of the potential
neural electrodes. [8, 110, 111] The loss in electroactivity of the microelectrodes was calculated as
a percentage based on CSCs recorded before and after stability studies (Table 2). A high loss
in CSC was observed for Pt sputtered microelectrodes due to the thickness differences, with a
72 % loss. In contrast, with a comparable working thickness obtained with gold coated
microelectrodes, a significantly lower percentage loss of 37 % was observed which was similar
to the percentage loss obtained with PEDOT:PTS coated microelectrodes. Significantly,
flattened PEDOT:PTS coated microelectrodes were associated with an diminution of
performance, with a loss of 98 %. Overall, superior electrochemical stability and robustness
was observed with micro-topographically functionalized PEDOT:PTS coated microelectrodes
with an electroactivity loss of 26 %. This stability effect, coupled with the high effective surface
area and the low impedance profiles, identifies the micro-topographically functionalized
PEDOT:PTS coated microelectrodes developed here, as functionalized microelectrodes with
potential in neural stimulation and recording performance.
2.3. Biological Characterization
Neural interfaces that promote neural integration, with a minimal inflammation response are
persistent challenges within the realms of biomaterials and neural engineering. Even though the
cellular response to topography is cell specific, it has been shown that topographical
modifications may contribute significantly to addressing the challenges of selective cell
adhesion and modulated cell behavior to reduce gliosis at the material-tissue interface.[112]
The neural response to micro-pit topographies replicated in PEDOT:PTS coated 1.6 cm2 Pt
electrodes was evaluated using primary VM mixed neural cell population in vitro Figure S5.
1
2
3
4
5
6
7
8
9
10
11
12
13
14
15
16
17
18
19
20
21
22
23
24
25
26
27
28
29
30
31
32
33
34
35
36
37
38
39
40
41
42
43
44
45
46
47
48
49
50
51
52
53
54
55
56
57
58
59
60
61
62
63
64
65
12
Topographical functionalization to modulate differential cell adhesion and the observation that
flat or non-structured electrodes surfaces favor astrocyte adhesion has been reported previously.
[14, 56, 113] A recent study by Seker and colleagues[56] demonstrated the efficacy of
nanotopographical modification of the electrode surface in reducing focal adhesion formation
in astrocytes while maintaining neural integration on np-Au surfaces. Conversely, Qi et al.[114]
showed that micro-patterned topographies, with dimensions ranging from 2 µm - 10 µm,
influence the differentiation of adult neural stem cells (ANSCs) into neurons, and may
discourage the differentiation of astrocytes.
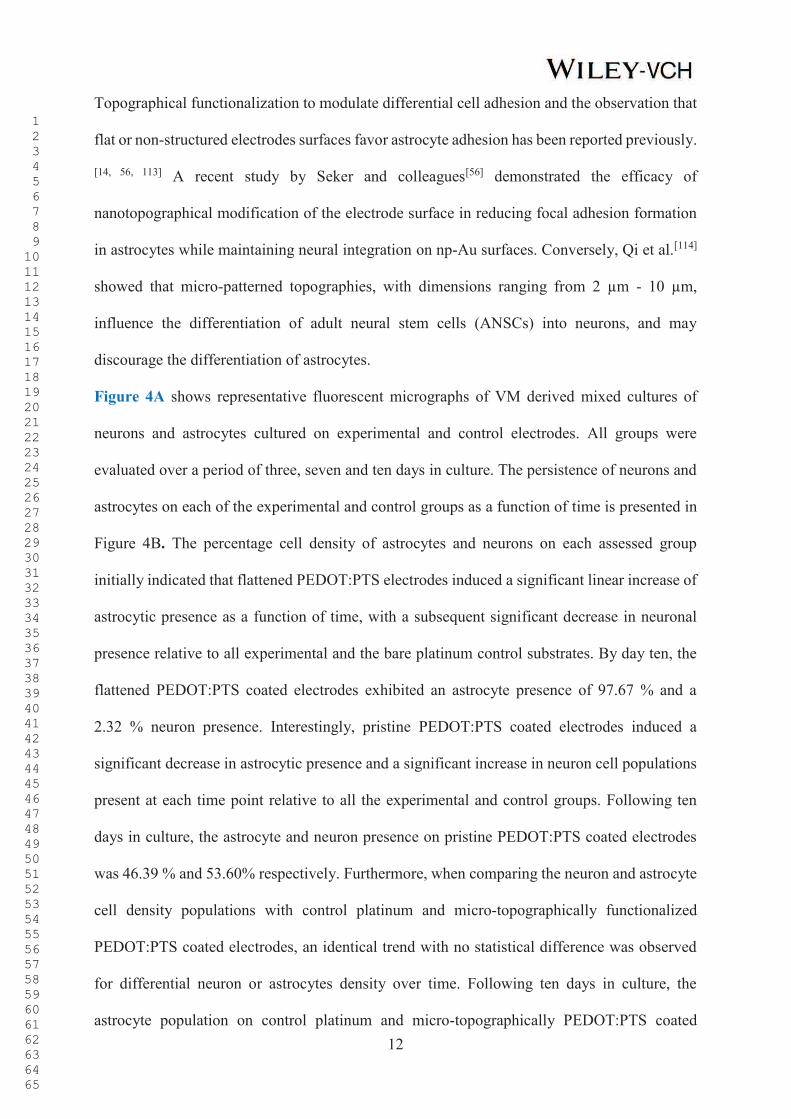
Figure 4A shows representative fluorescent micrographs of VM derived mixed cultures of
neurons and astrocytes cultured on experimental and control electrodes. All groups were
evaluated over a period of three, seven and ten days in culture. The persistence of neurons and
astrocytes on each of the experimental and control groups as a function of time is presented in
Figure 4B. The percentage cell density of astrocytes and neurons on each assessed group
initially indicated that flattened PEDOT:PTS electrodes induced a significant linear increase of
astrocytic presence as a function of time, with a subsequent significant decrease in neuronal
presence relative to all experimental and the bare platinum control substrates. By day ten, the
flattened PEDOT:PTS coated electrodes exhibited an astrocyte presence of 97.67 % and a
2.32 % neuron presence. Interestingly, pristine PEDOT:PTS coated electrodes induced a
significant decrease in astrocytic presence and a significant increase in neuron cell populations
present at each time point relative to all the experimental and control groups. Following ten
days in culture, the astrocyte and neuron presence on pristine PEDOT:PTS coated electrodes
was 46.39 % and 53.60% respectively. Furthermore, when comparing the neuron and astrocyte
cell density populations with control platinum and micro-topographically functionalized
PEDOT:PTS coated electrodes, an identical trend with no statistical difference was observed
for differential neuron or astrocytes density over time. Following ten days in culture, the
astrocyte population on control platinum and micro-topographically PEDOT:PTS coated
1
2
3
4
5
6
7
8
9
10
11
12
13
14
15
16
17
18
19
20
21
22
23
24
25
26
27
28
29
30
31
32
33
34
35
36
37
38
39
40
41
42
43
44
45
46
47
48
49
50
51
52
53
54
55
56
57
58
59
60
61
62
63
64
65
13
electrodes was recorded at 61.97 % and 62.46 % respectively, 16% greater than that on pristine
PEDOT:PTS coated electrodes.
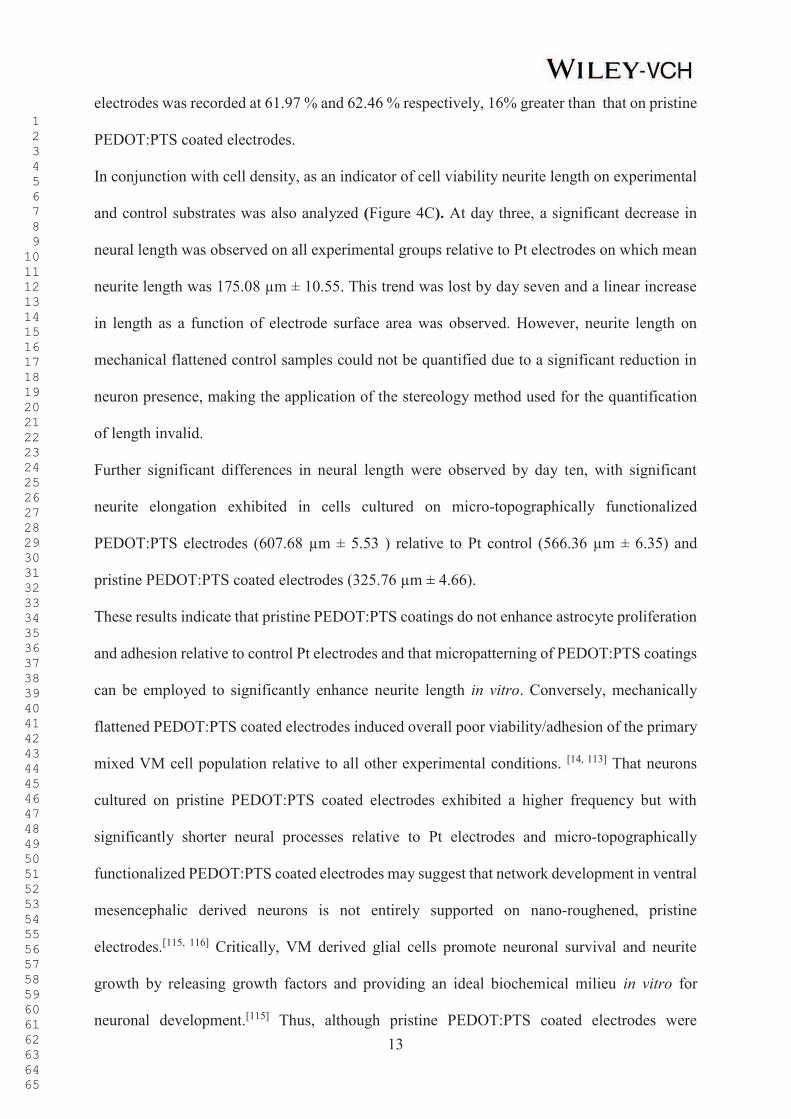
In conjunction with cell density, as an indicator of cell viability neurite length on experimental
and control substrates was also analyzed (Figure 4C). At day three, a significant decrease in
neural length was observed on all experimental groups relative to Pt electrodes on which mean
neurite length was 175.08 µm ± 10.55. This trend was lost by day seven and a linear increase
in length as a function of electrode surface area was observed. However, neurite length on
mechanical flattened control samples could not be quantified due to a significant reduction in
neuron presence, making the application of the stereology method used for the quantification
of length invalid.
Further significant differences in neural length were observed by day ten, with significant
neurite elongation exhibited in cells cultured on micro-topographically functionalized
PEDOT:PTS electrodes (607.68 µm ± 5.53 ) relative to Pt control (566.36 µm ± 6.35) and
pristine PEDOT:PTS coated electrodes (325.76 µm ± 4.66).
These results indicate that pristine PEDOT:PTS coatings do not enhance astrocyte proliferation
and adhesion relative to control Pt electrodes and that micropatterning of PEDOT:PTS coatings
can be employed to significantly enhance neurite length in vitro. Conversely, mechanically
flattened PEDOT:PTS coated electrodes induced overall poor viability/adhesion of the primary
mixed VM cell population relative to all other experimental conditions. [14, 113] That neurons
cultured on pristine PEDOT:PTS coated electrodes exhibited a higher frequency but with
significantly shorter neural processes relative to Pt electrodes and micro-topographically
functionalized PEDOT:PTS coated electrodes may suggest that network development in ventral
mesencephalic derived neurons is not entirely supported on nano-roughened, pristine
electrodes.[115, 116] Critically, VM derived glial cells promote neuronal survival and neurite
growth by releasing growth factors and providing an ideal biochemical milieu in vitro for
neuronal development.[115] Thus, although pristine PEDOT:PTS coated electrodes were
1
2
3
4
5
6
7
8
9
10
11
12
13
14
15
16
17
18
19
20
21
22
23
24
25
26
27
28
29
30
31
32
33
34
35
36
37
38
39
40
41
42
43
44
45
46
47
48
49
50
51
52
53
54
55
56
57
58
59
60
61
62
63
64
65
14
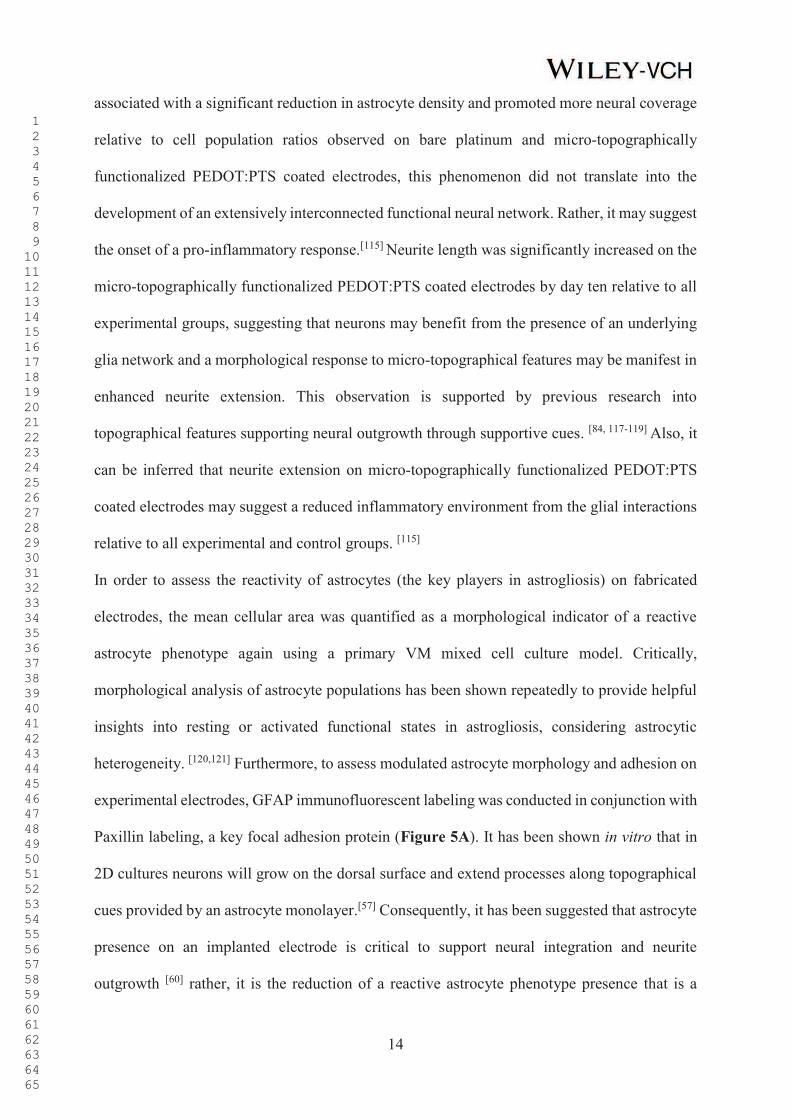
associated with a significant reduction in astrocyte density and promoted more neural coverage
relative to cell population ratios observed on bare platinum and micro-topographically
functionalized PEDOT:PTS coated electrodes, this phenomenon did not translate into the
development of an extensively interconnected functional neural network. Rather, it may suggest
the onset of a pro-inflammatory response.[115] Neurite length was significantly increased on the
micro-topographically functionalized PEDOT:PTS coated electrodes by day ten relative to all
experimental groups, suggesting that neurons may benefit from the presence of an underlying
glia network and a morphological response to micro-topographical features may be manifest in
enhanced neurite extension. This observation is supported by previous research into
topographical features supporting neural outgrowth through supportive cues. [84, 117-119] Also, it
can be inferred that neurite extension on micro-topographically functionalized PEDOT:PTS
coated electrodes may suggest a reduced inflammatory environment from the glial interactions
relative to all experimental and control groups. [115]
In order to assess the reactivity of astrocytes (the key players in astrogliosis) on fabricated
electrodes, the mean cellular area was quantified as a morphological indicator of a reactive
astrocyte phenotype again using a primary VM mixed cell culture model. Critically,
morphological analysis of astrocyte populations has been shown repeatedly to provide helpful
insights into resting or activated functional states in astrogliosis, considering astrocytic
heterogeneity. [120,121] Furthermore, to assess modulated astrocyte morphology and adhesion on
experimental electrodes, GFAP immunofluorescent labeling was conducted in conjunction with
Paxillin labeling, a key focal adhesion protein (Figure 5A). It has been shown in vitro that in
2D cultures neurons will grow on the dorsal surface and extend processes along topographical
cues provided by an astrocyte monolayer.[57] Consequently, it has been suggested that astrocyte
presence on an implanted electrode is critical to support neural integration and neurite
outgrowth [60] rather, it is the reduction of a reactive astrocyte phenotype presence that is a
1
2
3
4
5
6
7
8
9
10
11
12
13
14
15
16
17
18
19
20
21
22
23
24
25
26
27
28
29
30
31
32
33
34
35
36
37
38
39
40
41
42
43
44
45
46
47
48
49
50
51
52
53
54
55
56
57
58
59
60
61
62
63
64
65
15
potential functionalization strategy in minimizing astrogliosis in peri-electrode glial scar
formation.[54]
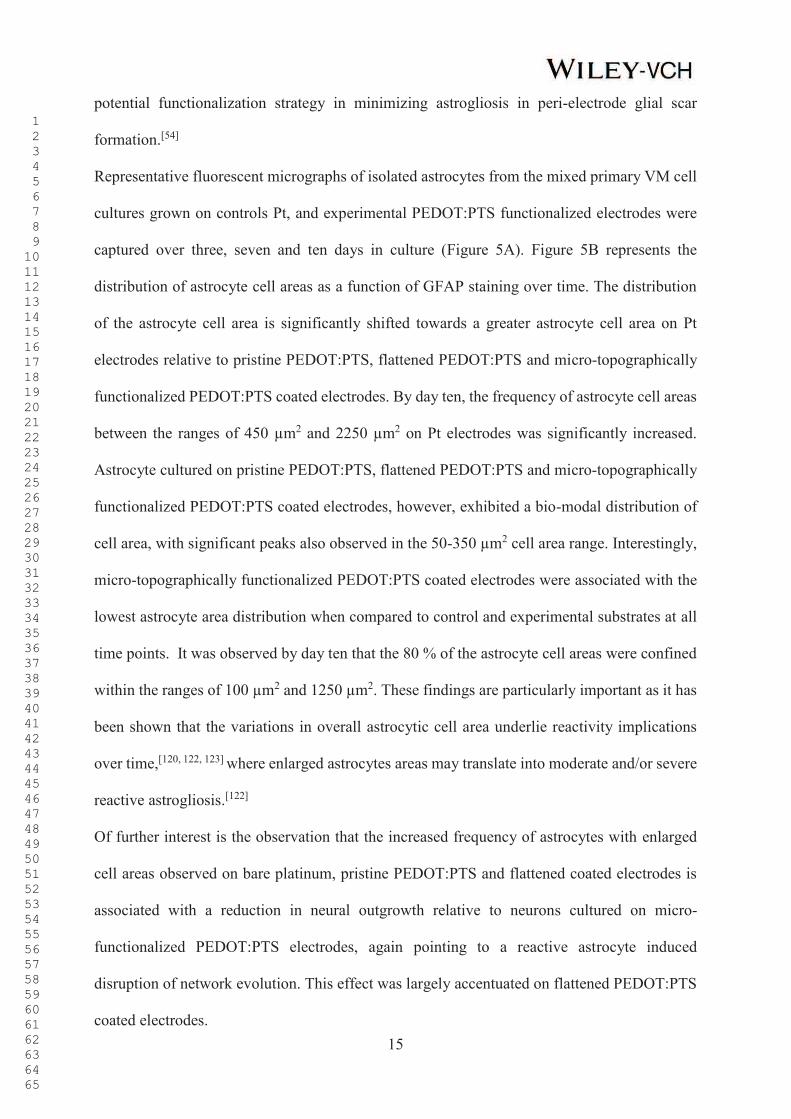
Representative fluorescent micrographs of isolated astrocytes from the mixed primary VM cell
cultures grown on controls Pt, and experimental PEDOT:PTS functionalized electrodes were
captured over three, seven and ten days in culture (Figure 5A). Figure 5B represents the
distribution of astrocyte cell areas as a function of GFAP staining over time. The distribution
of the astrocyte cell area is significantly shifted towards a greater astrocyte cell area on Pt
electrodes relative to pristine PEDOT:PTS, flattened PEDOT:PTS and micro-topographically
functionalized PEDOT:PTS coated electrodes. By day ten, the frequency of astrocyte cell areas
between the ranges of 450 µm2 and 2250 µm2 on Pt electrodes was significantly increased.
Astrocyte cultured on pristine PEDOT:PTS, flattened PEDOT:PTS and micro-topographically
functionalized PEDOT:PTS coated electrodes, however, exhibited a bio-modal distribution of
cell area, with significant peaks also observed in the 50-350 µm2 cell area range. Interestingly,
micro-topographically functionalized PEDOT:PTS coated electrodes were associated with the
lowest astrocyte area distribution when compared to control and experimental substrates at all
time points. It was observed by day ten that the 80 % of the astrocyte cell areas were confined
within the ranges of 100 µm2 and 1250 µm2. These findings are particularly important as it has
been shown that the variations in overall astrocytic cell area underlie reactivity implications
over time,[120, 122, 123] where enlarged astrocytes areas may translate into moderate and/or severe
reactive astrogliosis.[122]
Of further interest is the observation that the increased frequency of astrocytes with enlarged
cell areas observed on bare platinum, pristine PEDOT:PTS and flattened coated electrodes is
associated with a reduction in neural outgrowth relative to neurons cultured on micro-
functionalized PEDOT:PTS electrodes, again pointing to a reactive astrocyte induced
disruption of network evolution. This effect was largely accentuated on flattened PEDOT:PTS
coated electrodes.
1
2
3
4
5
6
7
8
9
10
11
12
13
14
15
16
17
18
19
20
21
22
23
24
25
26
27
28
29
30
31
32
33
34
35
36
37
38
39
40
41
42
43
44
45
46
47
48
49
50
51
52
53
54
55
56
57
58
59
60
61
62
63
64
65
16
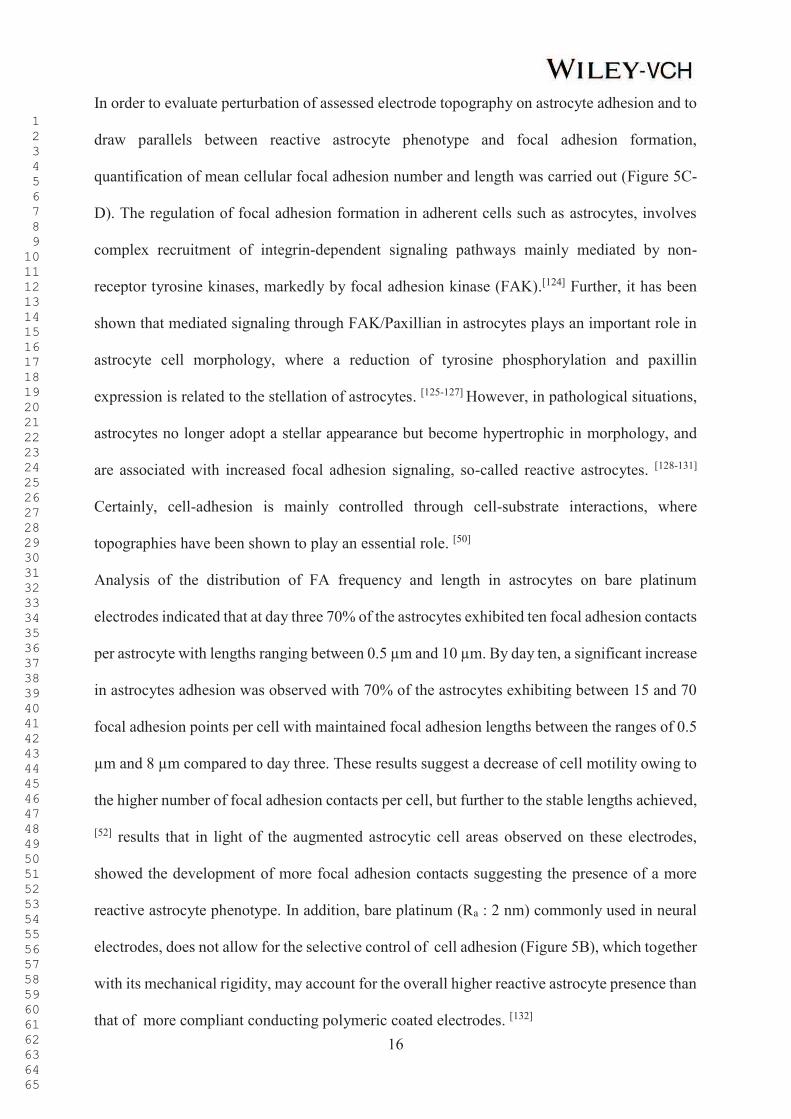
In order to evaluate perturbation of assessed electrode topography on astrocyte adhesion and to
draw parallels between reactive astrocyte phenotype and focal adhesion formation,
quantification of mean cellular focal adhesion number and length was carried out (Figure 5C-
D). The regulation of focal adhesion formation in adherent cells such as astrocytes, involves
complex recruitment of integrin-dependent signaling pathways mainly mediated by non-
receptor tyrosine kinases, markedly by focal adhesion kinase (FAK).[124] Further, it has been
shown that mediated signaling through FAK/Paxillian in astrocytes plays an important role in
astrocyte cell morphology, where a reduction of tyrosine phosphorylation and paxillin
expression is related to the stellation of astrocytes. [125-127] However, in pathological situations,
astrocytes no longer adopt a stellar appearance but become hypertrophic in morphology, and
are associated with increased focal adhesion signaling, so-called reactive astrocytes. [128-131]
Certainly, cell-adhesion is mainly controlled through cell-substrate interactions, where
topographies have been shown to play an essential role. [50]
Analysis of the distribution of FA frequency and length in astrocytes on bare platinum
electrodes indicated that at day three 70% of the astrocytes exhibited ten focal adhesion contacts
per astrocyte with lengths ranging between 0.5 µm and 10 µm. By day ten, a significant increase
in astrocytes adhesion was observed with 70% of the astrocytes exhibiting between 15 and 70
focal adhesion points per cell with maintained focal adhesion lengths between the ranges of 0.5
µm and 8 µm compared to day three. These results suggest a decrease of cell motility owing to
the higher number of focal adhesion contacts per cell, but further to the stable lengths achieved,
[52] results that in light of the augmented astrocytic cell areas observed on these electrodes,
showed the development of more focal adhesion contacts suggesting the presence of a more
reactive astrocyte phenotype. In addition, bare platinum (Ra : 2 nm) commonly used in neural
electrodes, does not allow for the selective control of cell adhesion (Figure 5B), which together
with its mechanical rigidity, may account for the overall higher reactive astrocyte presence than
that of more compliant conducting polymeric coated electrodes. [132]
1
2
3
4
5
6
7
8
9
10
11
12
13
14
15
16
17
18
19
20
21
22
23
24
25
26
27
28
29
30
31
32
33
34
35
36
37
38
39
40
41
42
43
44
45
46
47
48
49
50
51
52
53
54
55
56
57
58
59
60
61
62
63
64
65
17
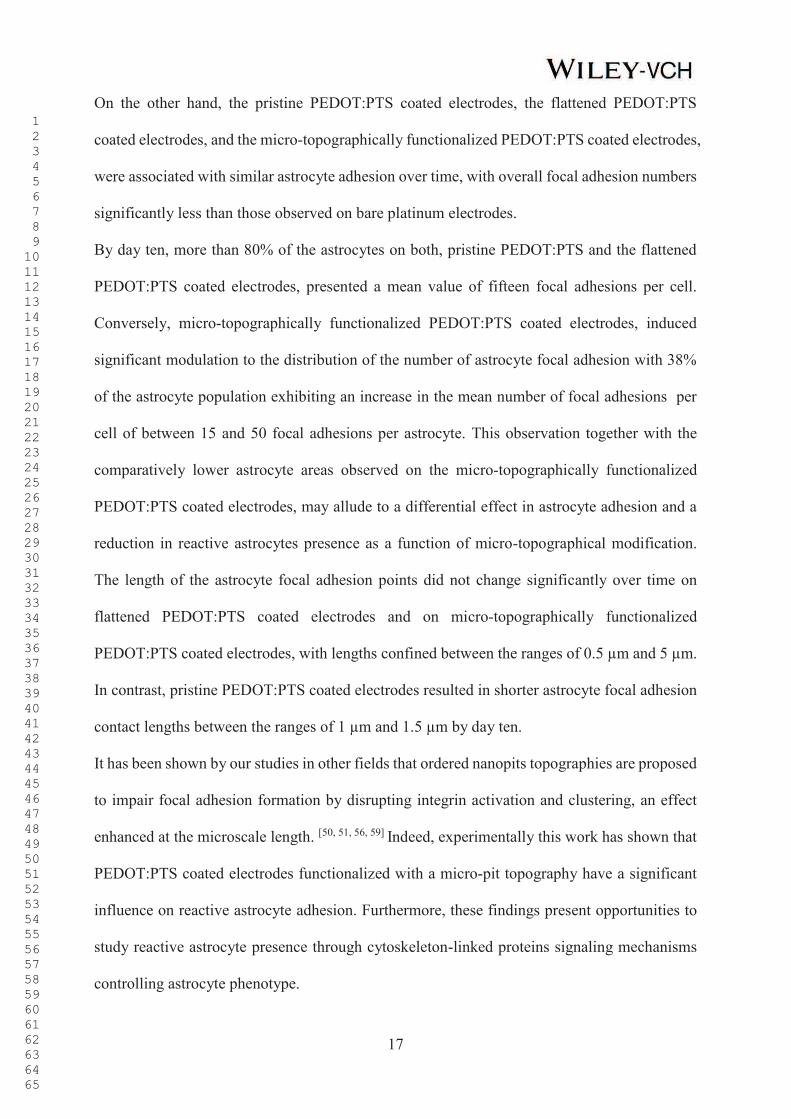
On the other hand, the pristine PEDOT:PTS coated electrodes, the flattened PEDOT:PTS
coated electrodes, and the micro-topographically functionalized PEDOT:PTS coated electrodes,
were associated with similar astrocyte adhesion over time, with overall focal adhesion numbers
significantly less than those observed on bare platinum electrodes.
By day ten, more than 80% of the astrocytes on both, pristine PEDOT:PTS and the flattened
PEDOT:PTS coated electrodes, presented a mean value of fifteen focal adhesions per cell.
Conversely, micro-topographically functionalized PEDOT:PTS coated electrodes, induced
significant modulation to the distribution of the number of astrocyte focal adhesion with 38%
of the astrocyte population exhibiting an increase in the mean number of focal adhesions per
cell of between 15 and 50 focal adhesions per astrocyte. This observation together with the
comparatively lower astrocyte areas observed on the micro-topographically functionalized
PEDOT:PTS coated electrodes, may allude to a differential effect in astrocyte adhesion and a
reduction in reactive astrocytes presence as a function of micro-topographical modification.
The length of the astrocyte focal adhesion points did not change significantly over time on
flattened PEDOT:PTS coated electrodes and on micro-topographically functionalized
PEDOT:PTS coated electrodes, with lengths confined between the ranges of 0.5 µm and 5 µm.
In contrast, pristine PEDOT:PTS coated electrodes resulted in shorter astrocyte focal adhesion
contact lengths between the ranges of 1 µm and 1.5 µm by day ten.
It has been shown by our studies in other fields that ordered nanopits topographies are proposed
to impair focal adhesion formation by disrupting integrin activation and clustering, an effect
enhanced at the microscale length. [50, 51, 56, 59] Indeed, experimentally this work has shown that
PEDOT:PTS coated electrodes functionalized with a micro-pit topography have a significant
influence on reactive astrocyte adhesion. Furthermore, these findings present opportunities to
study reactive astrocyte presence through cytoskeleton-linked proteins signaling mechanisms
controlling astrocyte phenotype.
1
2
3
4
5
6
7
8
9
10
11
12
13
14
15
16
17
18
19
20
21
22
23
24
25
26
27
28
29
30
31
32
33
34
35
36
37
38
39
40
41
42
43
44
45
46
47
48
49
50
51
52
53
54
55
56
57
58
59
60
61
62
63
64
65
18
Understanding the glia interactions as key contributors in the glial scar formation is essential
[54] and in addition to influencing cytoskeleton-linked proteins, substrate topography has been
previously shown to affect cellular function and the synthesis of cytokines and signaling
molecules in neural cells.[133, 134] To elucidate further the roles of topographical
functionalization on the neural response in vitro, changes in the expression of pro-inflammatory
cytokines and chemokine factors were assessed via multiplex ELISA analysis. Currently, few
studies have examined the effect of topographical functionalization on the glial cell functional
response in complex mixed cell cultures. [75] With this in mind, glial-derived cytokines and
chemokine factors such as IFN-g, TNF-α, IL-6, IL-5, and KC/GRO, involved in mediating
neuronal-glial interactions and modulation of reactive astrogliosis were selected for analysis.
[135-140] The release profiles were compared between each of the experimental groups, controls
and with an additional inflammatory control group, VM cells cultured on Thermanox® Plastic
Coverslips (tissue culture plastic) which received a stimulus of interleukin-1beta (IL-1β) at a
dose of 10 ng ml-1. Complementary data for the optimization of the different concentrations of
IL-1β as inflammatory stimuli on VM cells cultures is shown in Figure S6 with the analysis of
the production of reactive oxygen species (ROS), CellROX® and in Figure S7 with the
quantification of activated microglia using methods for morpho-functional analysis described
in, [141] respectively.
The secretion of pro-inflammatory cytokines and chemokine factors in mixed cell populations
cultured on all experimental and control groups is presented in Figure 6. It is interesting to note
that even though there is a linear increase in the release profile of IFN-g in mixed cultures
exposed to inflamed control conditions and when cultured on flattened PEDOT:PTS coated
electrodes over time, Pt electrodes and pristine PEDOT:PTS coated electrodes followed a trend
over time that was similar and constant, with no statistical differences noted between the
expression profile of IFN-g at day three and day ten respectively (Figure 6A). Importantly, the
1
2
3
4
5
6
7
8
9
10
11
12
13
14
15
16
17
18
19
20
21
22
23
24
25
26
27
28
29
30
31
32
33
34
35
36
37
38
39
40
41
42
43
44
45
46
47
48
49
50
51
52
53
54
55
56
57
58
59
60
61
62
63
64
65
19
lowest release profile of IFN-g was observed with the micro-topographically functionalized
PEDOT:PTS coated electrodes, with a maintained overall low and statistically significant
release of this cytokine relative to all experimental and control groups by day ten. This cytokine
is reportedly a crucial immunological player as it regulates relevant genes for cell function and
cell programming. [141] Studies have shown that IFN-g has a unique action on astrocytes,
inducing pro-inflammatory activities and enhancing astrocyte-immunoreactivity. [139, 142] In a
similar manner, TNF-α cytokine is known to act in synergy with IFN-g, [143] showing a similar
release trend on day seven and day ten respectively relative to the release profiles of IFN-g on
these days (Figure 6B). Over time, a linear decrease in TNF-α release was observed in all groups
and controls, except for on the inflamed control group that presented a consistently high release
profile of TNF-α. By day ten, a significantly higher release profile of TNF-α was observed in
the inflamed control group which was comparable to that observed in VM cells cultured on
flattened PEDOT:PTS coated electrodes. Control Pt, pristine PEDOT:PTS and micro-
topographically functionalized PEDOT:PTS groups, were associated with a significant
reduction in TNF-α synthesis and cells cultured on topographically functionalized PEDOT:PTS
coated electrodes produced significantly less TNF-α than Pt control and other PEDOT:PTS
experimental groups. These results indicate an activated response from astrocytes and microglia
respectively, with their coordinated involvement in the host response at the material interface.
[139, 143] Furthermore, the micro-pit topography utilized here also induced a reduced glial cell
inflammatory response via CXCL-1, also known as KC/GRO (Figure 6C). CXCL-1 is
associated with neutrophil recruitment, to a site of inflammation, [144] and a study by Rubio and
colleagues [145] showed that astrocytes, as an early cell component of the neuro-immune
response, produced CXCL-1 in the chemoattraction of the neutrophils and monocytes in neuro-
inflammatory diseases. In this work, it was observed that by day ten, in contrast to a relatively
high release profile of CXCL-1 from the inflammatory control conditions, an overall
1
2
3
4
5
6
7
8
9
10
11
12
13
14
15
16
17
18
19
20
21
22
23
24
25
26
27
28
29
30
31
32
33
34
35
36
37
38
39
40
41
42
43
44
45
46
47
48
49
50
51
52
53
54
55
56
57
58
59
60
61
62
63
64
65

20
significantly lower release response of CXCL-1 was exhibited by VM populations cultured on
the micro-topographically PEDOT:PTS functionalized electrodes, a response maintained up
to day ten in culture.
In primary mixed cultures, such as in the VM cells used in this research, as a consequence of
the orchestrated release of cytokines and growth factors in neuronal-glial interactions, [139] there
is a synergistic effect that allows them to work as co-stimulatory molecules to potentiate
immune interactions, in this case at the local neuron-glial unit, with a resulting increase of
specific cytokines response such as IL-6. [138, 139, 145]
At day three (Figure 6D), IL-6, which plays a vital role in immune regulation and is produced
by astrocytes, microglia and neurons in injury-inflamed milieu, [146-150] showed a significantly
potentiated release profile in the inflammatory control group, relative to an observed significant
linear decrease in the release profile in VM cells cultured on all control and experimental
electrode substrates. On day seven, comparatively significant increases in the release levels of
IL-6 were observed on pristine and micro-topographically functionalized PEDOT:PTS
electrodes relative to day three on bare platinum electrodes, flattened PEDOT:PTS coated
electrodes and on the inflamed control, with significantly lower levels of IL-6 released VM
cells cultured on micro-topographically functionalized PEDOT:PTS electrodes, maintained up
to day ten.
Similar trends in the expression levels of IL-5 were also observed (Figure 6E), an important
and often overlooked pro-inflammatory cytokine that has been shown to be produced by
astrocytes and microglia in vitro. [138, 149] Further, IL-5 has been shown to induce nerve growth
factor (NGF) secretion by astrocytes. [151-153] Again, the released IL-5 concentrations from
micro-topographically functionalized PEDOT:PTS coated electrodes showed significant lower
release profiles when compared to all groups, controls and inflamed control respectively at all
time points.
1
2
3
4
5
6
7
8
9
10
11
12
13
14
15
16
17
18
19
20
21
22
23
24
25
26
27
28
29
30
31
32
33
34
35
36
37
38
39
40
41
42
43
44
45
46
47
48
49
50
51
52
53
54
55
56
57
58
59
60
61
62
63
64
65
21
Cytokines protein interactions adopting a confidence score >0.7 as the threshold to assess
associations was performed and are detailed in Figure S8. These results suggest that the
cytokine expression profiles observed from VM cells cultured on micro-topographically
functionalized electrodes supports an overall neural-glial interaction at the electrode, associated
with minimized reactive gliosis over time. [154] Indeed, this work has shown experimentally that
the micro-topographically functionalized PEDOT:PTS coated electrodes here developed
reduced the cytokine mechanisms of astrogliosis in vitro. This response was accentuated
relative to bare platinum electrodes and pristine PEDOT:PTS coated electrodes, but further
stressed when compared to flattened PEDOT:PTS coated electrodes, which resulted in the
promotion of a more pro-inflammatory cytokine release and chemokine factors, reflected in the
poor VM cell viability and outgrowth.
To evaluate the neuronal network activity and functionality of the neuronal population
interfaced on topographically functionalized electrodes, further studies were conducted with
mature explanted primary rat hippocampal neurons, which unlike embryonic VM populations,
present functional neuronal network after seven to ten days in culture offering an important
advantage to embryonic cells in terms of culture times.[155] Rat hippocampal cells were seeded
on bare platinum electrodes, pristine PEDOT:PTS and on the micro-topographically
functionalized PEDOT:PTS coated electrodes. Flattened PEDOT:PTS coated electrodes were
not further evaluated due to the significant decrease in neuronal presence observed throughout
the study.
Rat hippocampal cells successfully adhered and matured in all substrates and were analyzed
after eight to ten days in vitro (three series of different cultures each), shown previously to be
sufficient time to facilitate functional synaptic network development in vitro with matured
explants. [156–158]
1
2
3
4
5
6
7
8
9
10
11
12
13
14
15
16
17
18
19
20
21
22
23
24
25
26
27
28
29
30
31
32
33
34
35
36
37
38
39
40
41
42
43
44
45
46
47
48
49
50
51
52
53
54
55
56
57
58
59
60
61
62
63
64
65
22
The formation of active synaptic networks was investigated by simultaneously imaging the
intracellular calcium activity of living neurons (ten days in vitro) on representative regions of
660 x 660 µm. Neurons stained with the membrane permeable Ca2+ dye Oregon Green 488
BAPTA-1 were visualized within the sampled area and 8 ± 2 fluorescent cells were selected
(regions of interest, ROIs) in each field (n = 25 fields) as in Figure S9A. At ten days in vitro
matured neurons are synaptically connected and display spontaneous activity including bursts
which manifest as irregular synchronized firing epochs.[159] This can be appreciated in Figure
S9B, where two representative traces from region of interest (ROIs) in the same field are shown
for each condition. The spontaneous bursting activity was fully blocked by TTX (1 µM; not
shown) application, thus confirming the neuronal nature of the recorded signal. [159] The
occurrence of spontaneous Ca2+ episodes in active cells was measured by quantifying the inter-
event-interval (IEI). IEIs distribution was found to be different in the PEDOT:PTS-interfaced
neuronal cultures (pristine and micro-patterned electrodes) when compared to those grown onto
bare platinum electrodes (**p < 0.01; box plot in Figure S9C) suggesting a different coupling
of the network with the substrate. However, median IEI values were comparable, being nine
seconds and ten seconds for pristine PEDOT:PTS and micro-topographically functionalized
PEDOT:PTS, respectively, and nine seconds for platinum (Figure S9C). The tested electrodes
demonstrated a good cytocompatibility promoting functional hippocampal neurons
development and allowing synaptogenesis and active network formation. In the presence of
PEDOT:PTS coatings, neuronal activity appeared to be more organized into regular bursts and
it may suggest that these might be related to the generation of a more favorable environment
for neuronal activity. In turn, it was evident by the neuronal and astrocyte phenotypes visualized
by immunofluorescence image of the specific cytoskeletal component, β-tubulin III, to visualize
neurons, and glial fibrillary acidic protein (GFAP) to visualize astrocytes (Figure S10A) that a
higher neuronal density was present on micro-topographically functionalized PEDOT:PTS
coated electrodes. In addition, a decrease in the astrocyte-to-neuron ratio, was observed on
1
2
3
4
5
6
7
8
9
10
11
12
13
14
15
16
17
18
19
20
21
22
23
24
25
26
27
28
29
30
31
32
33
34
35
36
37
38
39
40
41
42
43
44
45
46
47
48
49
50
51
52
53
54
55
56
57
58
59
60
61
62
63
64
65
23
functionalized electrodes relative to bare platinum or pristine PEDOT:PTS electrodes (0.47 ±
0.16 versus 0.73 ± 0.34 and 0.68 ± 0.26 for bare platinum and pristine PEDOT:PTS controls
respectively, ***p < 0.001 and **p < 0.01). These findings indicate that micro-topographically
functionalized PEDOT:PTS coated electrodes promote the development of a non-reactive
adherent glia network which promotes neuron-electrode interaction. Therefore, the possibility
to exploit micro-topographically engineered PEDOT:PTS electrodes for neural interfacing and
astrogliosis modulation is here strengthened.
3. Conclusion
The paradigm of neuroelectrode functionalization is the maintenance of electrode functionality
and a controlled inflammatory response.[160, 161] Micro-pit topographical functionalized
PEDOT:PTS coated electrodes were assessed for the first time as a methodology for the design
of functionalized neural interface materials with a focus on reduced astrocyte reactive
phenotype, enhanced neural integration and functional capacity.
Topographical functionalized PEDOT:PTS electrodes induced a significant reduction in
electrical impedance and an increase in charge storage capacity and effective surface area, while
maintaining electrode stability. Furthermore, the role of the micro-topographically modified
PEDOT:PTS coated electrodes in reducing the characteristic phenotype associated with
astrogliosis in complex primary mixed cell cultures was assessed from the evident
morphological changes in cell area, the functional promotion of neural network activity, focal
adhesion formation, and the release of pro-inflammatory cytokines and chemokine factors.
A low temperature imprint-lithography technique developed in this study for the micro-
topographically functionalized neuroelectrode interfaces provides a useful bench-mark for
subsequent studies with neural microelectrodes, and the development of dual functionalization
with biological molecules on as-formed conducting polymer coatings. Furthermore, this work
could shift the focus on current efforts in the field to attract astrocytes onto the electrode surface,
but potentially blocking the negative components found in the glial cell response, in vitro.
1
2
3
4
5
6
7
8
9
10
11
12
13
14
15
16
17
18
19
20
21
22
23
24
25
26
27
28
29
30
31
32
33
34
35
36
37
38
39
40
41
42
43
44
45
46
47
48
49
50
51
52
53
54
55
56
57
58
59
60
61
62
63
64
65
24
4. Experimental section
4.1. Fabrication of Microelectrode Arrays
Ultra-short laser operating at 10 kHz and 1030 nm wavelength with 500 fs pulses duration was
used to generate a microelectrode shadow mask in a Polyimide film of 0.05 mm thickness.
Polyimide samples were placed on a 3D computer controlled stage (Aerotech) which enabled
changes in the sample position with micrometer accuracy. The laser was focused on the sample
with a 100 mm focal length lens and the scanning system was coupled to the machining stage
through combination of different reflectors and mirrors. The laser spot diameter was found to
be 25 µm and ablation threshold 0.56 Jcm-2. To avoid the melting of Polyimide, a laser fluence
of 0.6 Jcm-2 just above the threshold and 200 laser scans were used in drawing the electrode
circuit design through the Polyimide film.
Through-mask sputtering of platinum was achieved with a EMSCOPE SC500 at 25 mA for
twenty minutes. Resulting platinum electrode thickness was measured to be 69.27 nm ± 0.01
and resulted in an electrode size of 287.67 ± 0.08 µm in width.
4.2. Imprinting and Die Fabrication
Micro-topographically functionalized PEDOT:PTS coated electrode were made in a three-step
process of photo-lithography, nickel die fabrication, and temperature low imprinting process.
4.2.1 Photo Lithography
100 mm diameter silicon-wafers were first cleaned using the [ozone / DI-water / dilute-HF acid]
cleaning process on a Semitool SAT spray-acid cleaning-tool. The wafers were then coated
with photoresist (Fujifilm HiPR6512) and the mask pattern exposed on an Ultratech 1500
stepper, after which the photoresist was developed using Fujifilm OPD5262 developer. A
number of different masks were used to give various diameter patterns. The wafers were then
dry-etched to the required depth for each pattern using a [SF6 / C4F8] plasma on an STS-ASE
dry-etch tool. After dry-etching, the photoresist was removed by a combination of O2 plasma
ashing plus Piranha (H2SO4 / H2O2] wet-strip.
4.2.2 Nickel Die
1
2
3
4
5
6
7
8
9
10
11
12
13
14
15
16
17
18
19
20
21
22
23
24
25
26
27
28
29
30
31
32
33
34
35
36
37
38
39
40
41
42
43
44
45
46
47
48
49
50
51
52
53
54
55
56
57
58
59
60
61
62
63
64
65

25
This technique has been described previously. [51, 52] Briefly, nickel dies were made directly
from the patterned resist samples. A thin (50-nm) layer of Ni-V was sputter coated on the
samples. That layer acted as an electrode in the subsequent electroplating process. The dies
were plated to a thickness of ca. 300 nm. For more information about the procedure, see
reference [163]
4.2.3 Imprinting Process
PEDOT:PTS coated electrodes were imprinted by a low temperature imprinting process. Before
the imprinting, the processed nickel die master was cut into 1 cm × 1 cm pieces, each piece
acting as an individual stamp. The polymeric PEDOT:PTS coated electrodes were placed in a
desiccator 24 hours prior to the imprinting process and then taken one by one to be processed.
Using a hydraulic press machine (Carver, Inc), the nickel die stamp was then pressed against
the PEDOT:PTS coated electrode, previously placed on pressing paralleled plates, using a
compressive force of 1.9 metric tons cm-2 for fifteen minutes at room temperature.
Flattened controlled non-patterned PEDOT:PTS coated electrodes were processed by pressing
a thick mirror glass stamps against the PEDOT:PTS coated electrode, applying a compressive
force of 1.9 metric tons cm-2 for fifteen minutes at room temperature.
4.3. Physical Characterization
4.3.1 Surface Morphology
Scanning electron microscopy (SEM) was carried out using a Hitachi S-4700 Cold Field
Emission Gun Scanning Electron Microscope (CFE-SEM). The SEM images were taken using
an accelerating voltage of 15 kV and spot current of 10 µA. No gold sputtering was used on the
conducting PEDOT:PTS coated electrodes.
Scanning electron microscopy for biological samples was carried out using a Hitachi S-4700
Cold Field Emission Gun Scanning Electron Microscope (CFE-SEM). Cells on experimental
electrodes were stabilized in 4% paraformaldehyde with 1% sucrose in 0.1 M piperazine-N,N
-bis(2-ethanesulfonic acid) (PIPES) buffer at pH 7.4 for five minutes. Further, samples were
1
2
3
4
5
6
7
8
9
10
11
12
13
14
15
16
17
18
19
20
21
22
23
24
25
26
27
28
29
30
31
32
33
34
35
36
37
38
39
40
41
42
43
44
45
46
47
48
49
50
51
52
53
54
55
56
57
58
59
60
61
62
63
64
65
26
fixed permanently in 2.5% glutaraldehyde for five minutes in PIPES buffer and rinsed three
times for two minutes in PIPES buffer. Additional contrasting of the cell was accomplished by
staining with 1% osmium tetroxide in PIPES for one hour at 22°C and then rinsed in distilled
water for one minute. After this, cells on experimental electrodes were dehydrated through an
ethanol/distilled water series (50, 60, 70, 80, 90, 96 and 100%) followed by a
hexamethyldisilazane (HDMS) or Acetone/Ethanol series (25, 50, 75 and 100 %). The samples
were then left to dry fully and mounted on aluminium stubs, and coated with 10nm layer of
gold (Au).
For surface 3D plots and roughness analysis, Atomic Force Microscopy (AFM) was performed
as detailed in [7] All measurements were taken on a Vico Dimension 3100 AFM using TESPA
Tips (NanoWorld) (Si <8 nm tip radius, 42 N/m spring constant, 320 kHz nominal resonance
frequency), in tapping mode over an area of 10 µm2 with a 0.5 - 1 Hz scan rate.
4.3.2 Thickness Measurements
The thickness of the polymeric PEDOT:PTS coating was measured using a Zygo Newview 100
surface profilometer controlled by MicroPlus software as detailed in [7] Briefly, a pattern of
bright and dark lines - fringes was created as incoming light was split from the limited region
between the sample film and the bare platinum electrode. This pattern difference was translated
to calculate the height information, resulting in the thickness of the polymeric coatings.
4.4. Chemical Characterization
X-ray photoelectron spectroscopy (XPS) spectra were acquired on a Kratos AXIS 165
spectrometer XPS system with X-Ray Gun mono Al Kα 1486.58 eV; 150 W (10 mA, 15kV),
for all scans with the following parameters: sample temperature in a range of 20-30 °C with a
pass energy of 160 eV for survey spectra and 20 eV for narrow regions and steps of 1 eV for
survey and 0.05 eV for regions with dwell times of 50 ms and 100 ms for regions and sweeps
for survey of ~35, and for narrow regions of 6-40. The C1s line at 284.8 eV was used as charge
reference. Spectra were collected in the normal way to the surface direction with an analysis
1
2
3
4
5
6
7
8
9
10
11
12
13
14
15
16
17
18
19
20
21
22
23
24
25
26
27
28
29
30
31
32
33
34
35
36
37
38
39
40
41
42
43
44
45
46
47
48
49
50
51
52
53
54
55
56
57
58
59
60
61
62
63
64
65
27
area of 60 microns. XPS detection limit is estimated to be ~0.1 at%. For the data processing,
the construction and peak fitting of synthetic peaks in narrow region spectra was done using a
Shirely type background and the synthetic peaks were of a mixed Gaussian-Lorenzian type.
Relative sensitivity factors used are from CasaXPS library containing Scofield cross-sections.
4.5. Electrochemical Characterization
4.5.1 Preparation of PEDOT:PTS Samples
The electrodeposition of PEDOT:PTS coatings was conducted under ambient conditions
according to methods described previously[164] Briefly, a solution of 0.05M EDOT (Sigma
Aldrich, Ireland) and 0.1 M PTS (Sigma Aldrich, Ireland, 70,000 g/mol MW) was prepared in
a 50/50 vol.% mixture of acetonitrile and water. The electrolyte solution was placed in an in-
house fabricated electrochemical cell, connected to a Princeton Applied Research
Potentiostat/Galvanostat model 2273 controlled with Power Suite software. An in- house-
fabricated platinum microelectrode probe array and a platinum foil (Goodfellow) were used as
the working electrode (WE) and counter-electrode (CE) respectively. A saturated 3 M KCl
Ag/AgCl reference electrode (RE) (Bioanalytical Systems) was employed. Galvanostatic
electrodeposition was performed and the efficiency of coating, i.e. the amount of polymer
deposited on the electrodes, was controlled by the total charge passing during the
electrodeposition. When the deposition was finalized, the coated electrodes were soaked in
deionized water for 24 hours to remove excess of electrolyte and subsequently dried for use.
For cell studies, PEDOT:PTS was electrodeposited on electrodes with areas of 1.6 cm2 to
facilitate in vitro manipulations.
4.5.2 Electrochemical Measurements
Cyclic voltammetry was performed as previously described in [7] using a Princeton Applied
Research Potentiostat/Galvanostat model 2273 running with Power Suite software.
Measurements were recorded in a custom-made electrochemical cell containing the
microelectrode as working electrode, an Ag/AgCl reference electrode (3 M KCl) (Bioanalytical
1
2
3
4
5
6
7
8
9
10
11
12
13
14
15
16
17
18
19
20
21
22
23
24
25
26
27
28
29
30
31
32
33
34
35
36
37
38
39
40
41
42
43
44
45
46
47
48
49
50
51
52
53
54
55
56
57
58
59
60
61
62
63
64
65

28
Systems) and a platinum foil counter electrode (Goodfellow) in 1X phosphate-buffered saline
(PBS). Cyclic voltammograms (CVs) were run in the potential range from -1.0 V to 0.4 V at a
scan rate of 0.1 V s-1. The charge storage capacity (CSC) was calculated by integrating the area
enclosed by the voltammogram.
Electrical impedance spectroscopy (EIS) was performed using a Princeton Applied Research
Potentiostat/Galvanostat model 2273 running with Power Suite software with a three-electrode
set-up. The measurements were carried out in a frequency range of 0.1 Hz to 100 kHz with an
AC sine wave of 40 mV amplitude applied with 0 V DC offset. The results were presented on
Bode and Nyquist plots and compared to those of bare platinum microelectrodes and coated
gold microelectrodes, to exclude the effect of electrode thickness when compared to
PEDOT:PTS coated microelectrodes. The data fitting analysis was performed using EIS
Spectrum Analyzer 1.0 software with the application of the Powell algorithm.
Electroactive surface area (ESA) measurements for each microelectrode were done through
cyclic voltammetry scans performed in 2.5 mol cm-3 K4[Fe(CN)6] 0.1 M KCl solution, in the
potential range from -1.0 V to 0.4 V at a scan rate of 0.1 V s-1. ESA was estimated according
to the Randles-Sevcik equation:[165, 166]
�� = 2.69 ∙ 10"#$%/&'(/&)%/&* Equation 1
where ip is the reduction/oxidation peak current (A), n is the number of electrons contributing
to the redox reaction, A is the area of the electrode (cm-2), D is the diffusion coefficient of
Fe(CN)64- in KCl solution (6.3�10-6 cm2 s-1), [167] C is the concentration of the Fe(CN)6
4- in the
bulk solution (mol cm-3) and υ is the scan rate (V s-1). The measurements were performed in
triplicate; the results were expressed as a mean ± standard deviation.
The electrochemical stability of microelectrodes was determined as described previously in [8]
Briefly, cyclic voltammetry was performed before and after electrical stability measurements
and used to calculate the percentage of loss in charge storage capacity by comparing the CSC
1
2
3
4
5
6
7
8
9
10
11
12
13
14
15
16
17
18
19
20
21
22
23
24
25
26
27
28
29
30
31
32
33
34
35
36
37
38
39
40
41
42
43
44
45
46
47
48
49
50
51
52
53
54
55
56
57
58
59
60
61
62
63
64
65
29
of the 1st and 500th cycles. The measurements were performed in triplicate; the results were
expressed as a mean ± standard deviation.
Force-controlled current-voltage (I-V) characteristics were recorded employing conductive-
AFM (C-AFM) (in PeakForce Tuna mode, PF Tuna, Bruker). Samples were imaged under
ambient conditions with a Bruker Dimension Icon microscope, with a NanoScope IV control
unit and PF-TUNA add-on module. One sapphire substrate with gold contact was used to
connect samples to form the electric circuit. I-V curves were recorded at selective positions on
the sample surface. C-AFM tips (coated with Platinum/Iridium) were used as the mobile counter
electrode to contact the single-walled carbon nanotubes – (SWCNTs) PeakForce-TUNA tips,
Bruker. For a schematic of the set-up, see Figure S4. The voltage bias was ramped between -
500mV and 500mV. The data was then analyzed by NanoScope Analysis (version 1.5, Bruker)
and Matlab (version 2016 a).
4.6. Biological Characterization
4.6.1 Cell Culture
Primary cultures of ventral mesencephalic neurons (VM) were obtained from the
mesencephalon of embryonic Sprague–Dawley rats according to methods previously described
by Vallejo-Giraldo et al. [7] Briefly, the ventral mesencephalon were dissected from embryonic
fourteen-day rat brains and then mechanically dissociated with a pipette until the tissue was
dispersed. Cells were grown in a humidified atmosphere of 5% CO2 at 37°C and culture in
media (Dulbecco’s modified Eagle’s medium/F12, 33 mM D-glucose, 1 % L-glutamine, 1%
penicillin-streptomycin (PS), 1 % fetal calf serum (FCS), supplemented with 2 % B27).
Controls and experimental groups were cultured for three, seven and ten days in six well culture
plates and sterilized in 70% ethanol for two hours, and subsequently washed repeatedly with
hank’s balanced salt solution (HBSS) and/or molecular biology grade water (Sigma). Prior to
plating, samples and controls were coated with poly-lysine (PLL) (Sigma). They were then
rinsed three times with molecular biology grade water and left to dry overnight. 50,000 cells
1
2
3
4
5
6
7
8
9
10
11
12
13
14
15
16
17
18
19
20
21
22
23
24
25
26
27
28
29
30
31
32
33
34
35
36
37
38
39
40
41
42
43
44
45
46
47
48
49
50
51
52
53
54
55
56
57
58
59
60
61
62
63
64
65
30
cm-2 were plated on each electrode, and then 3 ml of the culture medium was added to each
well and half of the volume was replaced with fresh media every two days for a period of ten
days.
For the inflammatory control, primary VM cells were cultured on sterile Thermanox® Plastic
Coverslips with 13 mm diameter (NUNCTM brand products). 50,000 cells cm-2 were plated on
each coverslip, and grown in a humidified atmosphere of 5% CO2 at 37°C and culture in media
(Dulbecco’s modified Eagle’s medium/F12, 33 mM D-glucose, 1 % L-glutamine, 1% PS, 1 %
FCS, supplemented with 2 % B27). 3 ml of the culture medium was added to each well and,
after two days in culture, the cells were stimulated with IL-1β (10 ng mL-1) prepared in plating
media to a final volume of 3 ml and half of the volume was changed every two days for a period
of ten days. Data for the optimization of the different concentration of IL-1β as inflammatory
stimuli on VM cells cultures is shown in Figure S6 with the analysis of the production of
reactive oxygen species (ROS), CellROX® and in Figure S7 with the quantification of
activated microglia using methods for morpho-functional analysis described in [141] respectively.
Dissociated hippocampal neurons were obtained from P1 to P4-old Wistar rats as previously
reported.[156] Prior to plating, samples of pristine PEDOT:PTS and micro-topographically
functionalized PEDOT:PTS coated electrodes and control bare platinum were sterilized by
repeated (three) ten minutes-long washes with ethanol followed by five minutes-long washes
in molecular biology grade water, both solutions were previously filtered with 0.22 µm cutoff
filter (Merck Millipore). Cultured cells were incubated at 37 °C, 5 % CO2 in culture medium
composed of Neurobasal-A (Thermo Fischer) containing B27 2 % (Gibco) Glutamax 10 mM
and Gentamycin 0.5 μM (Gibco), and used for experiments at eight–ten days in vitro by
renewing half of the medium once in this period.
Ethical Statement (Primary hippocampal cultures)
All experiments were performed in accordance with the EU guidelines (2010/63/UE) and Italian
law (decree 26/14) and were approved by the local authority veterinary service and by our
1
2
3
4
5
6
7
8
9
10
11
12
13
14
15
16
17
18
19
20
21
22
23
24
25
26
27
28
29
30
31
32
33
34
35
36
37
38
39
40
41
42
43
44
45
46
47
48
49
50
51
52
53
54
55
56
57
58
59
60
61
62
63
64
65
31
institution (SISSA-ISAS) ethical committee. Every effort was made to minimize animal
suffering and to reduce the number of animals used. Animal use was approved by the Italian
Ministry of Health, in accordance with the EU Recommendation 2007/526/CE.
4.6.2 Immunofluorescent Labeling
Indirect double-immunofluorescent labeling was performed to visualize neurons and astrocyte
cell populations as described by Vallejo-Giraldo et al. [8] Briefly, VM cells on experimental and
control substrates were fixed with 4% paraformaldehyde and 1% of sucrose for twenty minutes
at room temperature at the time point. Once fixed, the samples were washed with PBS and
permeabilized with buffered 0.5% Triton X-100 within a buffered isotonic solution (10.3 g
sucrose, 0.292 g NaCl, 0.06 g MgCl2, 0.476 g HEPES buffer, 0.5 ml Triton X-100, in 100 ml
water, pH 7.2) at 4ºC for five minutes. Non-specific binding sites were blocked with 1% bovine
serum albumin (BSA) in PBS at 37ºC for 30 minutes and subsequently incubated for two hours
with a 1:200 concentration anti-glial fibrillary acidic protein (GFAP) antibody produced in
mouse (Sigma, 1:200) and 1:500 concentration anti-β-Tubulin III antibody produced in rabbit
(Sigma, 1:500). Samples were washed three times with 0.05% Tween 20/PBS and then
incubated for one hour in the secondary antibody Alexa Fluor® 488 goat anti-Mouse IgG / IgA
/ IgM (H+L) (Molecular probes 1:500) combined with the secondary antibody Alexa Fluor®
594 goat anti-Rabbit IgG (H+L) (Molecular probes, 1:500). Samples were washed with PBS
(five minutes ×3) and mounted on microscope cover slides and counterstained with slowfadeR
gold antifade reagent with DAPI for nuclear staining.
Indirect double-immunofluorescent labeling was performed to visualize focal adhesion sites
and astrocytes following the fixation and permeabilization processes detailed above. In this case
the samples were incubated for two hours with a 1:200 concentration anti-Paxillian (Rb mAb
to Paxillin (Y113) (Life Technologies, 1:200) and with a 1:200 concentration GFAP antibody
produced in mouse (Sigma, 1:200). Samples were washed three times with 0.05% Tween
20/PBS and then incubated for one hour in the secondary antibody Alexa Fluor® 488 goat anti-
1
2
3
4
5
6
7
8
9
10
11
12
13
14
15
16
17
18
19
20
21
22
23
24
25
26
27
28
29
30
31
32
33
34
35
36
37
38
39
40
41
42
43
44
45
46
47
48
49
50
51
52
53
54
55
56
57
58
59
60
61
62
63
64
65
32
Mouse IgG / IgA / IgM (H+L) (Molecular probes 1:500) combined with the secondary antibody
Alexa Fluor® 594 goat anti-Rabbit IgG (H+L) (Molecular probes, 1:100). Samples were
washed with PBS (five minutes ×3) and mounted on microscope cover slides and counterstained
with slowfadeR gold antifade reagent with DAPI for nuclear staining.
Indirect double-immunofluorescent labeling for microglia and astrocytes on inflamed controls
was performed using the same methods detailed above. Samples were incubated for two hours
with GFAP antibody produced in mouse (Sigma, 1:200) at a concentration of 1:200 and with
anti-rabbit Iba1 (Wako, 1:1000) with a concentration of 1:1000. Samples were washed three
times with 0.05% Tween 20/PBS and then incubated for one hour in the secondary antibody
Alexa Fluor® 488 goat anti-Mouse IgG / IgA / IgM (H+L) (Molecular probes 1:500) combined
with the secondary antibody Alexa Fluor® 594 goat anti-Rabbit IgG (H+L) (Molecular probes,
1:1000). Samples were washed with PBS (five minutes ×3) and mounted on microscope cover
slides and counterstained with slowfadeR gold antifade reagent with DAPI for nuclear staining.
Hippocampal dissociated cultures were fixed in 4% formaldehyde (prepared from fresh
paraformaldehyde) in PBS and permeabilized for twenty min with 0.3% Triton-X-100 (Carlo
Erba) in PBS added with 5% FCS (Gibco) and 4% BSA (Sigma-Aldrich) to prevent non-
specific binding of primary antibodies. Samples were subsequently incubated with primary
antibodies for 30 minutes at room temperature and, after being washed with PBS, with
secondary antibodies for 45 minutes. Mounting was performed with anti-fade medium
Vectashield (Vector Laboratories) on 1 mm thick microscope glass slides. Neurons were
labeled through anti-β-tubulin III primary antibody (Sigma-Aldrich T2200, 1:300) and
visualized with Alexa 594 anti-rabbit in goat as secondary antibody (Invitrogen, 1:500).
Astrocytes were stained with mouse anti-GFAP primary antibodies (Sigma-Aldrich G3893,
1:300) and visualized with Alexa 488 anti-mouse in goat as secondary antibody (Invitrogen
1:500). Nuclei were stained with 4’,6-diamidino-2-phenylindole (DAPI, Invitrogen, 1:500).
1
2
3
4
5
6
7
8
9
10
11
12
13
14
15
16
17
18
19
20
21
22
23
24
25
26
27
28
29
30
31
32
33
34
35
36
37
38
39
40
41
42
43
44
45
46
47
48
49
50
51
52
53
54
55
56
57
58
59
60
61
62
63
64
65
33
The production of reactive oxygen species (ROS) on inflamed controls was visualized using an
assay kit, CellROX® Green Reagent, for oxidative stress detection (2.5 mM; Thermo Fisher
Scientific - C10444). CellROX® Green Reagent was diluted in HBSS for a final concentration
of 5 µM (working solution) that was prepared fresh every time used. During use, this working
solution was kept in the dark at 37 °C. After removing cell media, CellROX® Green Reagent
was added on each sample and incubated at 37 °C for 30 minutes. After incubation, each sample
was fixed and permeabilized using methods described aboved. One hour incubation in
rhodamine-conjugated phalloidin (Life Techologies, 1:100) prepared in 1% BSA in PBS was
followed next for F-actin staining. After being washed with PBS (five minutes ×3), samples
were mounted with slowfadeR gold antifade reagent with DAPI for nuclear staining and image
within 24 hours. CellROX® Green was visualized using FTIC channel.
4.6.3 Microscopy and Image Analysis
After immunostaining, samples were viewed with an Olympus Fluoview 1000 Confocal
Microscope at a fixed scan size of 1024 by 1024 at a ratio 1:1. Cell analysis was performed as
described in [8] At least twenty images at 60× magnification were taken at random from each
experimental group and controls. Cell density was analyzed by counting the total number of
labeled nuclei corresponding to neurons and astrocytes in an area of 212 µm * 212 µm. Neurite
length was quantified by analyzing nine random fields of view of three different technical
replicas from three different samples using established stereological methods. [69] The formula
used was: neurite length = n*T *π/2, where n is the number of times neurites intersect grid lines
and T = distance between gridlines (taking magnification into account) as described in [168] Cell
area of astrocytes was recorded from the green channel using the threshold function to generate
particles that were manually dispersed across the image until good coverage was achieved. The
total number of focal adhesion points per cell and their length were quantified by direct scoring
with a four pixel-wide line on the FITC channel as previously described in [7] using ImageJ
software (National Institutes of Health, USA).
1
2
3
4
5
6
7
8
9
10
11
12
13
14
15
16
17
18
19
20
21
22
23
24
25
26
27
28
29
30
31
32
33
34
35
36
37
38
39
40
41
42
43
44
45
46
47
48
49
50
51
52
53
54
55
56
57
58
59
60
61
62
63
64
65
34
Images of immunolabeled hippocampal dissociated cultures were acquired using a Leica
DM6000 Epifluorescence Microscope either at 10× or 20× magnification (dry objectives, and
0.5 NA respectively). Eight fields per culture from three different culture series were collected.
In addition, a Nikon C2 confocal microscope was used to acquire higher quality images at 40×
magnification (dry objective) to obtain a morphological insight of stained cells. Analysis and
images reconstruction were accomplished using NIS-Elements AR (Nikon), Velocity
(PerkinElmer) and ImageJ (NIH) software.
4.6.4 Cytokine Inflammatory Panel
The cytokine multiplex assay was performed on primary VM cell mixed population
supernatants collected at three, seven and ten days in culture grown on all experimental groups,
controls and inflamed control. ELISA pro-inflammatory panel 2 (Rat) (Meso Scale Discovery,
UK) cytokine (IL-6, IL-1β, TNF-α, IFN-Υ, KC/GRO, IL-4, IL-5, IL-13, IL-10) assays were
performed according to the manufacturer’s instructions, using six replicas and without
adjustments to the recommended standard curve, and sample dilutions. Briefly, 150 µL of
blocker H was added on each well of ELISA pro-inflammatory plate and incubated at room
temperature with fast shaking for one hour. In parallel, in a separate provided plate, an initial
1:2 dilution of samples and culture media was prepared and put under shaking for fifteen
minutes. The ELISA pro-inflammatory plate was then washed three times with at least 150 µL
of wash buffer (PBS with 0.05% Tween20) and subsequently, the diluted sample mixed from
the additional plate provided was transferred to the ELISA pro-inflammatory plate with the
addition of 25 µl of diluent 40. Incubation at room temperature with shaking for two hours was
then carried out. The ELISA pro-inflammatory plate was further washed three times with PBS-
tween20, and 25 µL of 1X detection antibody solution was added in each well and incubated at
room temperature with shaking for two hours. The ELISA pro-inflammatory plate was washed
three times and further added 150 µL of 2X read buffer T in each well for plate reading using
the QuickPlex SQ 120 multiplexing instrument from MSD.
1
2
3
4
5
6
7
8
9
10
11
12
13
14
15
16
17
18
19
20
21
22
23
24
25
26
27
28
29
30
31
32
33
34
35
36
37
38
39
40
41
42
43
44
45
46
47
48
49
50
51
52
53
54
55
56
57
58
59
60
61
62
63
64
65
35
The STRING (search Tool for the Retrieval of Interacting Genes) database http://string-db.org
search was performed for known protein interactions adopting a confidence score >0.7 as the
threshold to assess associations.
4.7. Calcium Imaging
Hippocampal dissociated cultures were loaded with cell permeable Ca2+ dye Oregon Green 488
BAPTA-1 AM (Molecular Probes); 10 µL DMSO (Sigma-Aldrich) was added to the stock 50
µg of the dye and cultures were incubated with a final concentration of 4 µM for 30 minutes at
37 °C, 5% CO2, as detailed previously in [7] Samples were thereafter placed in a recording
chamber mounted on an inverted microscope (Nikon Eclipse Ti-U). Cultures were continuously
perfused at 5 mL min-1 rate and at room temperature with extracellular solution of composition
(mM): 150 NaCl, 4 KCl, 2 CaCl2, 1 MgCl2, 10 HEPES, 10 glucose (pH adjusted to 7.4 with
NaOH; osmolarity 300 mOsm). Ca2+ dye was excited at 488 nm with a mercury lamp; excitation
light was separated from the light emitted from the sample using a 395 nm dichroic mirror and
ND filter (1/32). Oregon loaded cultures were observed with a 20× objective (0.45 NA
PlanFluor) and images were continuously acquired (exposure time 150 ms) using an ORCA-
Flash4.0 V2 sCMOS camera (Hamamatsu). The imaging system was controlled by an
integrated imaging software (HCImage Live) and the camera was set to operate on 2048 × 2048
pixels at binning four. After eight minutes of spontaneous activity recording, 1 µM TTX (a
voltage-gated, fast Na+ channel blocker; Latoxan) was added to confirm the neuronal nature of
the recorded signals. Three fields from each sample (two samples per condition) were recorded
and 8 ± 2 cells from each recording were selected by drawing regions of interest (ROIs) around
cell bodies as depicted in Figure S9A. Images were analyzed with both ImageJ software (NIH)
and Clampfit software (pClamp suite, 10.4 version; Axon Instruments) in off-line mode. [169]
The difference between peaks consecutive onset times were computed, to obtain the inter-event
interval (IEI). Intracellular Ca2+ transients were expressed as fractional amplitude increase
(ΔF/F0, where F0 is the baseline fluorescence level and ΔF is the rise over baseline); the onset
1
2
3
4
5
6
7
8
9
10
11
12
13
14
15
16
17
18
19
20
21
22
23
24
25
26
27
28
29
30
31
32
33
34
35
36
37
38
39
40
41
42
43
44
45
46
47
48
49
50
51
52
53
54
55
56
57
58
59
60
61
62
63
64
65
36
time of neuronal activation was determined by detecting those events in the fluorescence signal
that exceed at least five times the standard deviation of the noise.
4.8. Statistical Analysis
All data presented here was confirmed using at least three replicates for each of the test groups
and control groups. The results are expressed as the mean of the values ± standard error of the
mean. One-way ANOVA followed by a Bonferroni test were performed to determine the
statistical significance (p<0.05), unless otherwise stated.
Supporting Information Supporting Information is available from the Wiley Online Library or from the author. Acknowledgements M.J. Biggs is also an SFI, Starting Investigator SIRG COFUND fellow, grant no. 11/SIRG/B2135. This grant was the principal funder of the research. This publication has also emanated from research supported in part by a research grant from Science Foundation Ireland (SFI) and is co-funded under the European Regional Development Fund under Grant Number 13/RC/2073. The authors would like to thank the following people: Ms Nuala Campbell and Ms Eugenia Pugliese for their help in cell quantification, Dr. Karrina McNamara and Dr. Tofail Syed for their help in XPS analysis. The authors are grateful to the facilities and technical assistance of the NCBES Electron Microscopy unit within the Centre for Microscopy & Imaging at the National University of Ireland Galway, a facility that is funded by NUIG and the Irish Government’s
Programme for Research in Third Level Institutions, Cycles 4 and 5, National Development Plan 2007-2013 and also to the Genomics & Screening Core at the National University of Ireland Galway. The authors would like to acknowledge the Tyndall National Institute and the National Access Programme Grant Number NAP428 for preparation of nickel shims emanated from research conducted with the financial support of Science Foundation Ireland under Grant Number [SFI/04/CE/I590a7].
Received: ((will be filled in by the editorial staff)) Revised: ((will be filled in by the editorial staff))
Published online: ((will be filled in by the editorial staff))
1
2
3
4
5
6
7
8
9
10
11
12
13
14
15
16
17
18
19
20
21
22
23
24
25
26
27
28
29
30
31
32
33
34
35
36
37
38
39
40
41
42
43
44
45
46
47
48
49
50
51
52
53
54
55
56
57
58
59
60
61
62
63
64
65

37
References
[1] Lahr, J.; Schwartz, C.; Heimbach, B.; Aertsen, A.; Rickert, J.; Ball, T., J. Neural Eng.
2015, 12 (4), 043001.
[2] Vanleer, A. C.; Blanco, J. A.; Wagenaar, J. B.; Viventi, J.; Contreras, D.; Litt, B., J.
Neural Eng. 2016, 13 (2), 026015.
[3] Fattahi, P.; Yang, G.; Kim, G.; Abidian, M. R., Adv Mater 2014, 26 (12), 1846-1885.
[4] Durand, D. M.; Ghovanloo, M.; Krames, E., J. Neural Eng. 2014, 11 (2), 020201.
[5] Zhou, Z.; Yu, P.; Geller, H. M.; Ober, C. K., Biomacromolecules 2013, 14 (2), 529-537.
[6] Aregueta-Robles, U. A.; Woolley, A. J.; Poole-Warren, L. A.; Lovell, N. H.; Green, R.
A., Frontiers in Neuroengineering 2014, 7 (15).
[7] Vallejo-Giraldo, C.; N. P. P., Anuradha R. Pallipurath, John; O’Connell, J. D. H.,
Parvaneh Mokarian-Tabari, Alexandre Trotier, Katarzyna; Krukiewicz, G. O.-A., Eugenia
Pugliese, Laura Ballerini, Michelle Kilcoyne,; Eilís Dowd, L. R. Q., Abhay Pandit, Paul
Kavanagh and Manus Jonathan Paul; Biggs, Adv Funct Mater 2017.
DOI:10.1002/adfm.201605035
[8] Vallejo-Giraldo, C.; Pugliese, E.; Larranaga, A.; Fernandez-Yague, M. A.; Britton, J.
J.; Trotier, A.; Tadayyon, G.; Kelly, A.; Rago, I.; Sarasua, J. R.; Dowd, E.; Quinlan, L. R.;
Pandit, A.; Biggs, M. J., Nanomedicine (Lond) 2016, 11 (19), 2547-63.
[9] Agnew, W. F.; McCreery, D. B., Neural Prostheses: Fundamental Studies. Prentice
Hall: 1990.
[10] Cogan, S. F., Annu. Rev. Biomed. Eng. 2008, 10, 275-309.
[11] Rousche, P. J.; Pellinen, D. S.; Pivin, D. P., Jr.; Williams, J. C.; Vetter, R. J.; Kipke, D.
R., IEEE Trans Biomed Eng 2001, 48 (3), 361-71.
[12] Mantione, D.; Del Agua, I.; Schaafsma, W.; Diez-Garcia, J.; Castro, B.; Sardon, H.;
Mecerreyes, D., Macromol Biosci 2016, 16 (8), 1227-38.
[13] Boehler, C.; Stieglitz, T.; Asplund, M., Biomaterials 2015, 67, 346-353.
1
2
3
4
5
6
7
8
9
10
11
12
13
14
15
16
17
18
19
20
21
22
23
24
25
26
27
28
29
30
31
32
33
34
35
36
37
38
39
40
41
42
43
44
45
46
47
48
49
50
51
52
53
54
55
56
57
58
59
60
61
62
63
64
65
38
[14] Chapman, C. A. R.; Chen, H.; Stamou, M.; Biener, J.; Biener, M. M.; Lein, P. J.; Seker,
E., ACS Appl Mater Interfaces 2015, 7 (13), 7093-7100.
[15] Asplund, M.; Nyberg, T.; Inganas, O., Polym Chem-Uk 2010, 1 (9), 1374-1391.
[16] Green, R. A.; Baek, S.; Poole-Warren, L. A.; Martens, P. J., Sci Technol Adv Mat 2010,
11 (1), 014107.
[17] Green, R. A.; Lovell, N. H.; Wallace, G. G.; Poole-Warren, L. A., Biomaterials 2008,
29 (24), 3393-3399.
[18] Balint, R.; Cassidy, N. J.; Cartmell, S. H., Acta Biomater 2014, 10 (6), 2341-2353.
[19] Mario Cheong, G. L.; Lim, K. S.; Jakubowicz, A.; Martens, P. J.; Poole-Warren, L. A.;
Green, R. A., Acta Biomater 2014, 10 (3), 1216-1226.
[20] Vallejo-Giraldo, C.; Kelly, A.; Biggs, M. J. P., Drug Discov. Today 2014, 19 (1), 88-94.
[21] Shi, Y.; Pan, L.; Liu, B.; Wang, Y.; Cui, Y.; Bao, Z.; Yu, G., Journal of Materials
Chemistry A 2014, 2 (17), 6086-6091.
[22] Zhang, W.; Yang, F. K.; Pan, Z.; Zhang, J.; Zhao, B., Macromol Rapid Commun 2014,
35 (3), 350-354.
[23] Xu, H.; Holzwarth, J. M.; Yan, Y.; Xu, P.; Zheng, H.; Yin, Y.; Li, S.; Ma, P. X.,
Biomaterials 2014, 35 (1), 225-235.
[24] King, Z. A.; Shaw, C. M.; Spanninga, S. A.; Martin, D. C., Polymer (Guildf) 2011, 52
(5), 1302-1308.
[25] Martin, D. C.; Wu, J.; Shaw, C. M.; King, Z.; Spanninga, S. A.; Richardson-Burns, S.;
Hendricks, J.; Yang, J., Polym. Rev. (Philadelphia, PA, U. S.) 2010, 50 (3), 340-384.
[26] Castagnola, V.; Descamps, E.; Lecestre, A.; Dahan, L.; Remaud, J.; Nowak, L. G.;
Bergaud, C., Biosens. Bioelectron. 2015, 67, 450-457.
[27] Wu, F.; Sun, M.; Jiang, W.; Zhang, K.; Xie, A.; Wang, Y.; Wang, M., Journal of
Materials Chemistry C 2016, 4 (1), 82-88.
1
2
3
4
5
6
7
8
9
10
11
12
13
14
15
16
17
18
19
20
21
22
23
24
25
26
27
28
29
30
31
32
33
34
35
36
37
38
39
40
41
42
43
44
45
46
47
48
49
50
51
52
53
54
55
56
57
58
59
60
61
62
63
64
65
39
[28] Xiao, H.; Zhang, M.; Xiao, Y.; Che, J., Colloids and Surfaces B: Biointerfaces 2015,
126, 138-145.
[29] Fonner, J. M.; Forciniti, L.; Nguyen, H.; Byrne, J. D.; Kou, Y. F.; Syeda-Nawaz, J.;
Schmidt, C. E., Biomed Mater 2008, 3 (3), 034124.
[30] Cui, X.; Lee, V. A.; Raphael, Y.; Wiler, J. A.; Hetke, J. F.; Anderson, D. J.; Martin, D.
C., J Biomed Mater Res 2001, 56 (2), 261-72.
[31] Abidian, M. R.; Corey, J. M.; Kipke, D. R.; Martin, D. C., Small 2010, 6 (3), 421-9.
[32] Wolfs, M.; Darmanin, T.; Guittard, F., Surf. Coat. Technol. 2014, 259, 594-598.
[33] Culebras, M.; Gomez, C.; Cantarero, A., Journal of Materials Chemistry A 2014, 2 (26),
10109-10115.
[34] Oyman, G.; Geyik, C.; Ayranci, R.; Ak, M.; Demirkol, D. O.; Timur, S.; Coskunol, H.,
Rsc Adv 2014, 4 (96), 53411-53418.
[35] Zhu, Z.; Mankowski, T.; Balakrishnan, K.; Shikoh, A. S.; Touati, F.; Benammar, M. A.;
Mansuripur, M.; Falco, C. M., ACS Appl Mater Interfaces 2015, 7 (30), 16223-16230.
[36] Wei, B.; Liu, J.; Ouyang, L.; Kuo, C.-C.; Martin, D. C., ACS Appl Mater Interfaces 2015,
7 (28), 15388-15394.
[37] Deng, H.; Lin, L.; Ji, M.; Zhang, S.; Yang, M.; Fu, Q., Prog Polym Sci 2014, 39 (4),
627-655.
[38] Uppalapati, D.; Boyd, B. J.; Garg, S.; Travas-Sejdic, J.; Svirskis, D., Biomaterials 2016,
111, 149-162.
[39] Vara, H.; Collazos-Castro, J. E., ACS Appl Mater Interfaces 2015, 7 (48), 27016-27026.
[40] Kim, D. H.; Wiler, J. A.; Anderson, D. J.; Kipke, D. R.; Martin, D. C., Acta Biomater
2010, 6 (1), 57-62.
[41] Asplund, M.; Thaning, E.; Lundberg, J.; Sandberg-Nordqvist, A. C.; Kostyszyn, B.;
Inganas, O.; von Holst, H., Biomed Mater 2009, 4 (4), 045009.
1
2
3
4
5
6
7
8
9
10
11
12
13
14
15
16
17
18
19
20
21
22
23
24
25
26
27
28
29
30
31
32
33
34
35
36
37
38
39
40
41
42
43
44
45
46
47
48
49
50
51
52
53
54
55
56
57
58
59
60
61
62
63
64
65
40
[42] George, P. M.; Lyckman, A. W.; LaVan, D. A.; Hegde, A.; Leung, Y.; Avasare, R.;
Testa, C.; Alexander, P. M.; Langer, R.; Sur, M., Biomaterials 2005, 26 (17), 3511-9.
[43] Pearce, T. M.; Williams, J. C., Lab Chip 2007, 7 (1), 30-40.
[44] HajjHassan, M.; Chodavarapu, V.; Musallam, S., Sensors 2008, 8 (10), 6704-6726.
[45] Donoghue, J. P., Nat Neurosci 2002, 5, 1085-1088.
[46] Kotov, N. A.; Winter, J. O.; Clements, I. P.; Jan, E.; Timko, B. P.; Campidelli, S.; Pathak,
S.; Mazzatenta, A.; Lieber, C. M.; Prato, M., Adv Mater 2009, 21 (40), 3970-4004.
[47] Brüggemann, D.; Michael, K. E.; Wolfrum, B.; Offenhäusser, A., International Journal
of Nano and Biomaterials 17 2012, 4 (2), 108-127.
[48] Cui, X.; Hetke, J. F.; Wiler, J. A.; Anderson, D. J.; Martin, D. C., Sensors and Actuators
A: Physical 2001, 93 (1), 8-18.
[49] Asplund, M.; Nyberg, T.; Inganäs, O., Polym Chem-Uk 2010, 1 (9), 1374-1391.
[50] Biggs, M. J. P.; Richards, R. G.; Dalby, M. J., Nanomedicine: Nanotechnology, Biology
and Medicine 2010, 6 (5), 619-633.
[51] Biggs, M. J.; Richards, R. G.; Gadegaard, N.; McMurray, R. J.; Affrossman, S.;
Wilkinson, C. D.; Oreffo, R. O.; Dalby, M. J., J Biomed Mater Res A 2009, 91 (1), 195-208.
[52] Biggs, M. J.; Richards, R.; Gadegaard, N.; Wilkinson, C.; Dalby, M., J. Orthop. Res.
2007, 25 (2), 273-282.
[53] Morgan, J. T.; Murphy, C. J.; Russell, P., Exp. Eye Res. 2013, 115, 1-12.
[54] Sofroniew, M. V., Trends Neurosci. 2009, 32 (12), 638-647.
[55] Polikov, V. S.; Tresco, P. A.; Reichert, W. M., J Neurosci Methods 2005, 148 (1), 1-18.
[56] Chapman, C. A.; Wang, L.; Chen, H.; Garrison, J.; Lein, P. J.; Seker, E., Adv Funct
Mater 2016.
[57] Ereifej, E. S.; Matthew, H. W.; Newaz, G.; Mukhopadhyay, A.; Auner, G.;
Salakhutdinov, I.; VandeVord, P. J., Journal of Biomedical Materials Research Part A 2013,
101 (6), 1743-1757.
1
2
3
4
5
6
7
8
9
10
11
12
13
14
15
16
17
18
19
20
21
22
23
24
25
26
27
28
29
30
31
32
33
34
35
36
37
38
39
40
41
42
43
44
45
46
47
48
49
50
51
52
53
54
55
56
57
58
59
60
61
62
63
64
65
41
[58] Tawil, N.; Wilson, P.; Carbonetto, S., The Journal of Cell Biology 1993, 120 (1), 261-
271.
[59] Biggs, M. J. P.; Dalby, M. J., Proc Inst Mech Eng H 2010, 224 (12), 1441-1453.
[60] Turner, D. A.; Adamson, D. C., J. Neuropathol. Exp. Neurol. 2011, 70 (3), 167-176.
[61] Turner, A. M.; Dowell, N.; Turner, S. W.; Kam, L.; Isaacson, M.; Turner, J. N.;
Craighead, H. G.; Shain, W., J Biomed Mater Res 2000, 51 (3), 430-41.
[62] Leber, M.; Shandhi, M.; Hogan, A.; Solzbacher, F.; Bhandari, R.; Negi, S., Appl. Surf.
Sci. 2016, 365, 180-190.
[63] Corey, J.; Wheeler, B.; Brewer, G., IEEE Trans. Biomed. Eng. 1996, 43 (9), 944-955.
[64] Chung, C.-K.; Tseng, S.-F.; Hsiao, W.-T.; Chiang, D.; Lin, W.-C., Journal of Laser
Micro Nanoengineering 2016, 11 (3), 395-399.
[65] Thakar, R.; Weber, A. E.; Morris, C. A.; Baker, L. A., Analyst 2013, 138 (20), 5973-82.
[66] Bass, R. B.; Clark, W. W.; Zhang, J. Z.; Lichtenberger, A. W., IEEE Transactions on
Applied Superconductivity 2001, 11 (1), 92-94.
[67] Moulin, E.; Bittkau, K.; Ghosh, M.; Bugnon, G.; Stuckelberger, M.; Meier, M.; Haug,
F.-J.; Hüpkes, J.; Ballif, C., Sol. Energy Mater. Sol. Cells 2016, 145, 185-192.
[68] Herth, E.; Algré, E.; Rauch, J. Y.; Gerbedoen, J. C.; Defrance, N.; Delobelle, P., physica
status solidi (a) 2016, 213 (1), 114-121.
[69] Khaldi, A.; Maziz, A.; Plesse, C.; Soyer, C.; Vidal, F.; Cattan, E., Sensors and Actuators
B: Chemical 2016, 229, 635-645.
[70] Li, Z.; Chen, Y.; Zhu, X.; Zheng, M.; Dong, F.; Chen, P.; Xu, L.; Chu, W.; Duan, H.,
Nanotechnology 2016, 27 (36), 365302.
[71] Ma, S.; Xia, Y.; Wang, Y.; Ren, K.; Luo, R.; Song, L.; Chen, X.; Chen, J.; Jin, Y.,
Journal of Vacuum Science & Technology B, Nanotechnology and Microelectronics: Materials,
Processing, Measurement, and Phenomena 2016, 34 (5), 052002.
1
2
3
4
5
6
7
8
9
10
11
12
13
14
15
16
17
18
19
20
21
22
23
24
25
26
27
28
29
30
31
32
33
34
35
36
37
38
39
40
41
42
43
44
45
46
47
48
49
50
51
52
53
54
55
56
57
58
59
60
61
62
63
64
65
42
[72] Wulz, T.; Canfield, B. K.; Davis, L. M.; Spanier, S.; Lukosi, E., Diamond Relat. Mater.
2017, 74, 108-113.
[73] Hof, L. A.; Guo, X.; Seo, M.; Wüthrich, R.; Greener, J., Micromachines 2017, 8 (1), 29.
[74] Ereifej, E. S.; Cheng, M. M.-C.; Mao, G.; VandeVord, P. J., J Neurosci Methods 2013,
217 (1), 17-25.
[75] Gomez, N.; Lee, J. Y.; Nickels, J. D.; Schmidt, C. E., Adv Funct Mater 2007, 17 (10),
1645-1653.
[76] Hoshino, T.; Miyazako, H.; Nakayama, A.; Wagatsuma, A.; Mabuchi, K., Sensors and
Actuators B: Chemical 2016, 236, 659-667.
[77] Zhang, L.; Ducharme, S.; Li, J., Appl. Phys. Lett. 2007, 91 (17), 172906.
[78] Chen, Y.; Ohlberg, D. A.; Li, X.; Stewart, D. R.; Stanley Williams, R.; Jeppesen, J. O.;
Nielsen, K. A.; Stoddart, J. F.; Olynick, D. L.; Anderson, E., Appl. Phys. Lett. 2003, 82 (10),
1610-1612.
[79] Jingfeng, S.; Haidong, L.; Shumin, L.; Li, T.; Alexei, G.; Stephen, D., Nanotechnology
2016, 27 (1), 015302.
[80] Yang, Y.; Lee, K.; Mielczarek, K.; Hu, W.; Zakhidov, A., Nanotechnology 2011, 22
(48), 485301.
[81] Hourdakis, E.; Nassiopoulou, A. G., IEEE Trans. Electron Devices 2016, 63 (2), 746-
750.
[82] Kim, J.; Wubs, K.; Bae, B.-S.; Kim, W. S., Sci Technol Adv Mat 2012, 13 (3), 035004.
[83] Ferrari, A.; Cecchini, M.; Dhawan, A.; Micera, S.; Tonazzini, I.; Stabile, R.; Pisignano,
D.; Beltram, F., Nano Lett. 2011, 11 (2), 505-511.
[84] Franco, D.; Milde, F.; Klingauf, M.; Orsenigo, F.; Dejana, E.; Poulikakos, D.; Cecchini,
M.; Koumoutsakos, P.; Ferrari, A.; Kurtcuoglu, V., Biomaterials 2013, 34 (5), 1488-1497.
[85] Franco, D.; Klingauf, M.; Bednarzik, M.; Cecchini, M.; Kurtcuoglu, V.; Gobrecht, J.;
Poulikakos, D.; Ferrari, A., Soft Matter 2011, 7 (16), 7313-7324.
1
2
3
4
5
6
7
8
9
10
11
12
13
14
15
16
17
18
19
20
21
22
23
24
25
26
27
28
29
30
31
32
33
34
35
36
37
38
39
40
41
42
43
44
45
46
47
48
49
50
51
52
53
54
55
56
57
58
59
60
61
62
63
64
65
43
[86] Schift, H.; Saxer, S.; Park, S.; Padeste, C.; Pieles, U.; Gobrecht, J., Nanotechnology
2005, 16 (5), S171.
[87] Tan, L.; Kong, Y.; Pang, S.; Yee, A., Journal of Vacuum Science & Technology B:
Microelectronics and Nanometer Structures Processing, Measurement, and Phenomena 2004,
22 (5), 2486-2492.
[88] Pisignano, D.; Persano, L.; Raganato, M. F.; Visconti, P.; Cingolani, R.; Barbarella, G.;
Favaretto, L.; Gigli, G., Adv Mater 2004, 16 (6), 525-529. 98.
[89] Collazos-Castro, J. E.; Hernández-Labrado, G. R.; Polo, J. L.; García-Rama, C.,
Biomaterials 2013, 34 (14), 3603-3617.
[90] Bhagwat, N.; Murray, R. E.; Shah, S. I.; Kiick, K. L.; Martin, D. C., Acta Biomater 2016,
41, 235-246.
[91] Alves-Sampaio, A.; García-Rama, C.; Collazos-Castro, J. E., Biomaterials 2016, 89, 98-
113.
[92] Kim, D. H.; Richardson-Burns, S. M.; Hendricks, J. L.; Sequera, C.; Martin, D. C., Adv
Funct Mater 2007, 17 (1), 79-86.
[93] Shuhua, X.; Ziyou, L.; Ling, Y.; Fei, W.; Sun, G., Mediat. Inflamm. 2012, 2012, 102954.
DOI 10.1155/2012/102954.
[94] Strunecka, A.; Blaylock, R. L.; Strunecky, O., Journal of Applied Biomedicine 2016, 14
(3), 171-176.
[95] Donoso, M.; Méndez-Vilas, A.; Bruque, J.; González-Martin, M., Int. Biodeterior.
Biodegrad. 2007, 59 (3), 245-251.
[96] Krukiewicz, K.; Zak, J. K., J. Mater. Sci. 2014, 49 (16), 5738-5745.
[97] Krukiewicz, K.; Jarosz, T.; Zak, J. K.; Lapkowski, M.; Ruszkowski, P.; Bobkiewicz-
Kozlowska, T.; Bednarczyk-Cwynar, B., Acta Biomater 2015, 19, 158-65.
1
2
3
4
5
6
7
8
9
10
11
12
13
14
15
16
17
18
19
20
21
22
23
24
25
26
27
28
29
30
31
32
33
34
35
36
37
38
39
40
41
42
43
44
45
46
47
48
49
50
51
52
53
54
55
56
57
58
59
60
61
62
63
64
65
44
[98] Rivnay, J., Leleux, P., Ferro, M., Sessolo, M., Williamson, A., Koutsouras, D.A.,
Khodagholy, D., Ramuz, M., Strakosas, X., Owens, R.M. and Benar, C., Science advances,
2015, 1(4), e1400251.
[99] Ludwig, K. A.; Langhals, N. B.; Joseph, M. D.; Richardson-Burns, S. M.; Hendricks, J.
L.; Kipke, D. R., J. Neural Eng. 2011, 8 (1), 014001.
[100] Abidian, M. R.; Martin, D. C., Biomaterials 2008, 29 (9), 1273-1283.
[101] Abidian, M. R.; Ludwig, K. A.; Marzullo, T. C.; Martin, D. C.; Kipke, D. R., Adv Mater
2009, 21 (37), 3764-3770.
[102] Molina, A.; González, J.; Laborda, E.; Wang, Y.; Compton, R. G., Phys Chem Chem
Phys 2011, 13 (32), 14694-14704.
[103] Rehacek, V.; Hotovy, I.; Vojs, M.; Mika, F., Microsystem Technologies 2008, 14 (4-5),
491-498.
[104] Lin, Z.; Ino, K.; Shiku, H.; Matsue, T., Chem. Commun. 2010, 46 (4), 559-561.
[105] Orozco, J.; Fernández-Sánchez, C.; Jiménez-Jorquera, C., Sensors 2010, 10 (1), 475-
490.
[106] Olowu, R. A.; Arotiba, O.; Mailu, S. N.; Waryo, T. T.; Baker, P.; Iwuoha, E., Sensors
2010, 10 (11), 9872-9890.
[107] Ma, X.; Yue, G.; Wu, J.; Lan, Z.; Lin, J.-Y., Rsc Adv 2015, 5 (54), 43639-43647.
[108] Wei, W.; Song, Y.; Wang, L.; Zhang, S.; Luo, J.; Xu, S.; Cai, X., Microsystems &
Nanoengineering 2015, 1.
[109] Arcot Desai, S.; Gutekunst, C.-A.; Potter, S. M.; Gross, R. E., Front. Neuroengineering
2014, 7, 16.
[110] Zhang, H.; Shih, J.; Zhu, J.; Kotov, N. A., Nano Lett. 2012, 12 (7), 3391-3398.
[111] Mandal, H. S.; Knaack, G. L.; Charkhkar, H.; McHail, D. G.; Kastee, J. S.; Dumas, T.
C.; Peixoto, N.; Rubinson, J. F.; Pancrazio, J. J., Acta Biomater 2014, 10 (6), 2446-2454.
1
2
3
4
5
6
7
8
9
10
11
12
13
14
15
16
17
18
19
20
21
22
23
24
25
26
27
28
29
30
31
32
33
34
35
36
37
38
39
40
41
42
43
44
45
46
47
48
49
50
51
52
53
54
55
56
57
58
59
60
61
62
63
64
65
45
[112] Nikkhah, M.; Edalat, F.; Manoucheri, S.; Khademhosseini, A., Biomaterials 2012, 33
(21), 5230-46.
[113] Cesca, F.; Limongi, T.; Accardo, A.; Rocchi, A.; Orlando, M.; Shalabaeva, V.; Di
Fabrizio, E.; Benfenati, F., Rsc Adv 2014, 4 (86), 45696-45702.
[114] Qi, L.; Li, N.; Huang, R.; Song, Q.; Wang, L.; Zhang, Q.; Su, R.; Kong, T.; Tang, M.;
Cheng, G., PLoS One 2013, 8 (3), e59022.
[115] Fan, C.; Wang, H.; Chen, D.; Cheng, X.; Xiong, K.; Luo, X.; Cao, Q., Neural
regeneration research 2014, 9 (2), 119.
[116] Sun, W.; Incitti, T.; Migliaresi, C.; Quattrone, A.; Casarosa, S.; Motta, A., J Tissue Eng
Regen Med 2015.
[117] Runge, M. B.; Dadsetan, M.; Baltrusaitis, J.; Ruesink, T.; Lu, L.; Windebank, A. J.;
Yaszemski, M. J., Biomacromolecules 2010, 11 (11), 2845-2853.
[118] Kang, G.; Borgens, R. B.; Cho, Y., Langmuir 2011, 27 (10), 6179-6184.
[119] Shi, X.; Xiao, Y.; Xiao, H.; Harris, G.; Wang, T.; Che, J., Colloids and Surfaces B:
Biointerfaces 2016, 145, 768-776.
[120] Gottipati, M. K.; Kalinina, I.; Bekyarova, E.; Haddon, R. C.; Parpura, V., Nano Lett.
2012, 12 (9), 4742-4747.
[121] Ben Haim, L.; Rowitch, D. H., Nat Rev Neurosci 2017, 18 (1), 31-41.
[122] Sofroniew, M. V.; Vinters, H. V., Acta Neuropathol. 2010, 119 (1), 7-35.
[123] Oberheim, N. A.; Goldman, S. A.; Nedergaard, M., Astrocytes: Methods and Protocols
2012, 23-45.
[124] Beggs, H. E.; Schahin-Reed, D.; Zang, K.; Goebbels, S.; Nave, K. A.; Gorski, J.;
Jones, K. R.; Sretavan, D.; Reichardt, L. F., Neuron 2003, 40 (3), 501-14.
[125] Ramakers, G. J.; Moolenaar, W. H., Exp Cell Res 1998, 245 (2), 252-62.
[126] Koyama, Y.; Yoshioka, Y.; Matsuda, T.; Baba, A., Glia 2003, 43 (2), 185-9.
[127] Padmanabhan, J.; Clayton, D.; Shelanski, M. L., J. Neurobiol. 1999, 39 (3), 407-22.
1
2
3
4
5
6
7
8
9
10
11
12
13
14
15
16
17
18
19
20
21
22
23
24
25
26
27
28
29
30
31
32
33
34
35
36
37
38
39
40
41
42
43
44
45
46
47
48
49
50
51
52
53
54
55
56
57
58
59
60
61
62
63
64
65
46
[128] Paco, S.; Hummel, M.; Plá, V.; Sumoy, L.; Aguado, F., BMC Genomics 2016, 17 (1),
304.
[129] Montgomery, D. L., Vet. Pathol. 1994, 31 (2), 145-67.
[130] Cregg, J. M.; DePaul, M. A.; Filous, A. R.; Lang, B. T.; Tran, A.; Silver, J., Exp. Neurol.
2014, 0, 197-207.
[131] Gilmour, A. D.; Goding, J.; Poole-Warren, L. A.; Thomson, C. E.; Green, R.A. In In
vitro biological assessment of electrode materials for neural interfaces, 2015 7th International
IEEE/EMBS Conference on Neural Engineering (NER), 22-24 April 2015; 2015; pp 450-453.
[132] Baek, S., Green, R. A., & Poole-Warren, L. A., Journal of Biomedical Materials
Research Part A, 2014, 102(8), 2743-2754.
[133] Kriparamanan, R.; Aswath, P.; Zhou, A.; Tang, L.; Nguyen, K. T., J Nanosci
Nanotechnol 2006, 6 (7), 1905-1919.
[134] Sonam, S.; Sathe, S. R.; Yim, E. K.; Sheetz, M. P.; Lim, C. T., Sci Rep-Uk 2016, 6,
20415.
[135] John, G. R.; Lee, S. C.; Brosnan, C. F., The Neuroscientist 2003, 9 (1), 10-22.
[136] Farina, C.; Aloisi, F.; Meinl, E., Trends Immunol. 2007, 28 (3), 138-45.
[137] Streit, W. J.; Hurley, S. D.; McGraw, T. S.; Semple-Rowland, S. L., J Neurosci Res
2000, 61 (1), 10-20.
[138] Brück, D.; Wenning, G. K.; Stefanova, N.; Fellner, L., Neurobiol. Dis. 2016, 85, 262-
274.
[139] Aloisi, F.; Borsellino, G.; Caré, A.; Testa, U.; Gallo, P.; Russo, G.; Peschle, C.; Levi,
G., Int. J. Dev. Neurosci. 1995, 13 (3), 265-274.
[140] Lins, C.; Borojevic, R., Growth Factors 2001, 19 (3), 145-152.
[141] Torres-Platas, S. G.; Comeau, S.; Rachalski, A.; Dal Bo, G.; Cruceanu, C.; Turecki, G.;
Giros, B.; Mechawar, N., J Neuroinflammation 2014, 11 (1), 12.
1
2
3
4
5
6
7
8
9
10
11
12
13
14
15
16
17
18
19
20
21
22
23
24
25
26
27
28
29
30
31
32
33
34
35
36
37
38
39
40
41
42
43
44
45
46
47
48
49
50
51
52
53
54
55
56
57
58
59
60
61
62
63
64
65

47
[142] Schroder, K.; Hertzog, P. J.; Ravasi, T.; Hume, D. A., J. Leukoc. Biol. 2004, 75 (2), 163-
189.
[143] Miljkovic, D.; Momcilovic, M.; Stojanovic, I.; Stosic-Grujicic, S.; Ramic, Z.;
Mostarica-Stojkovic, M., J Neurosci Res 2007, 85 (16), 3598-606.
[144] Cavalcanti, Y. V. N.; Brelaz, M. C. A.; Neves, J. K. d. A. L.; Ferraz, J. C.; Pereira, V.
R. A., Pulmonary medicine 2012, 2012.
[145] Rubio, N.; Sanz-Rodriguez, F., Virology 2007, 358 (1), 98-108.
[146] Roy, M.; Richard, J.-F.; Dumas, A.; Vallières, L., J Neuroinflammation 2012, 9 (1), 18.
[147] Erta, M.; Quintana, A.; Hidalgo, J., Int J Biol Sci 2012, 8 (9), 1254-1266.
[148] Hariri, R. J.; Chang, V. A.; Barie, P. S.; Wang, R. S.; Sharif, S. F.; Ghajar, J. B., Brain
Res 1994, 636 (1), 139-142.
[149] Ma, X.; Reynolds, S. L.; Baker, B. J.; Li, X.; Benveniste, E. N.; Qin, H., The Journal of
Immunology 2010, 184 (9), 4898-4906.
[150] Chiang, C.-S.; Stalder, A.; Samimi, A.; Campbell, I., Dev. Neurosci. 1994, 16 (3-4),
212-221.
[151] Fattori, E.; Lazzaro, D.; Musiani, P.; Modesti, A.; Alonzi, T.; Ciliberto, G., Eur. J.
Neurosci. 1995, 7 (12), 2441-2449.
[152] Sawada, M.; Suzumura, A.; Itoh, Y.; Marunouchi, T., Neurosci Lett 1993, 155 (2), 175-
178.
[153] Awatsuji, H.; Furukawa, Y.; Hirota, M.; Murakami, Y.; Nii, S.; Furukawa, S.; Hayashi,
K., J Neurosci Res 1993, 34 (5), 539-545.
[154] Brodie, C., FEBS Lett 1996, 394 (2), 117-120.
[155] Telias, M; Segal, M; Ben-Yosef, D. F1000Research. 2014, 3:196. DOI
10.12688/f1000research.4943.2.
[156] Lovat, V.; Pantarotto, D.; Lagostena, L.; Cacciari, B.; Grandolfo, M.; Righi, M.;
Spalluto, G.; Prato, M.; Ballerini, L., Nano Lett 2005, 5 (6), 1107-1110.
1
2
3
4
5
6
7
8
9
10
11
12
13
14
15
16
17
18
19
20
21
22
23
24
25
26
27
28
29
30
31
32
33
34
35
36
37
38
39
40
41
42
43
44
45
46
47
48
49
50
51
52
53
54
55
56
57
58
59
60
61
62
63
64
65
48
[157] Mazzatenta, A.; Giugliano, M.; Campidelli, S.; Gambazzi, L.; Businaro, L.; Markram,
H.; Prato, M.; Ballerini, L., J Neurosci 2007, 27 (26), 6931-6936.
[158] Cellot, G.; Toma, F. M.; Varley, Z. K.; Laishram, J.; Villari, A.; Quintana, M.; Cipollone,
S.; Prato, M.; Ballerini, L., J Neurosci 2011, 31 (36), 12945-12953.
[159] Bosi, S.; Rauti, R.; Laishram, J.; Turco, A.; Lonardoni, D.; Nieus, T.; Prato, M.; Scaini,
D.; Ballerini, L., Scientific Reports (Nature Publisher Group) 2015, 5, 9562.
[160] Scarisbrick, I. A.; Radulovic, M.; Burda, J. E.; Larson, N.; Blaber, S. I.; Giannini, C.;
Blaber, M.; Vandell, A. G., K., Biological Chemistry 2012, 393 (5), 355-367.
[161] Padmanabhan, J.; Kyriakides, T. R., Wiley Interdisciplinary Reviews: Nanomedicine
and Nanobiotechnology 2015, 7 (3), 355-370.
[163] Gadegaard, N.; Mosler, S.; Larsen, N. B., Macromol. Mater. Eng. 2003, 288 (1), 76-83.
[164] Baek, S.; Green, R. A.; Poole-Warren, L. A., Acta Biomater 2014, 10 (7), 3048-3058.
[165] Wen, M.; Liu, H.; Zhang, F.; Zhu, Y.; Liu, D.; Tian, Y.; Wu, Q., Chem. Commun. 2009,
(30), 4530-4532.
[166] Bard, A. J.; Faulkner, L. R.; Leddy, J.; Zoski, C. G., Electrochemical methods:
fundamentals and applications. Wiley New York: 1980; Vol. 2.
[167] Stevens, N.; Rooney, M.; Bond, A.; Feldberg, S., The Journal of Physical Chemistry A
2001, 105 (40), 9085-9093
[168] Kavanagh, E. T.; Loughlin, J. P.; Herbert, K. R.; Dockery, P.; Samall, A.; Doyle, K. M.;
Gorman, A. M., Biochem Biophys Res Commun 2006, 351 (4), 890-895.
[169] Rauti, R.; Lozano, N.; León, V.; Scaini, D.; Musto, M.; Rago, I.; Ulloa Severino, F. P.;
Fabbro, A.; Casalis, L.; Vázquez, E., Acs Nano 2016, 10 (4), 4459-4471.
1
2
3
4
5
6
7
8
9
10
11
12
13
14
15
16
17
18
19
20
21
22
23
24
25
26
27
28
29
30
31
32
33
34
35
36
37
38
39
40
41
42
43
44
45
46
47
48
49
50
51
52
53
54
55
56
57
58
59
60
61
62
63
64
65
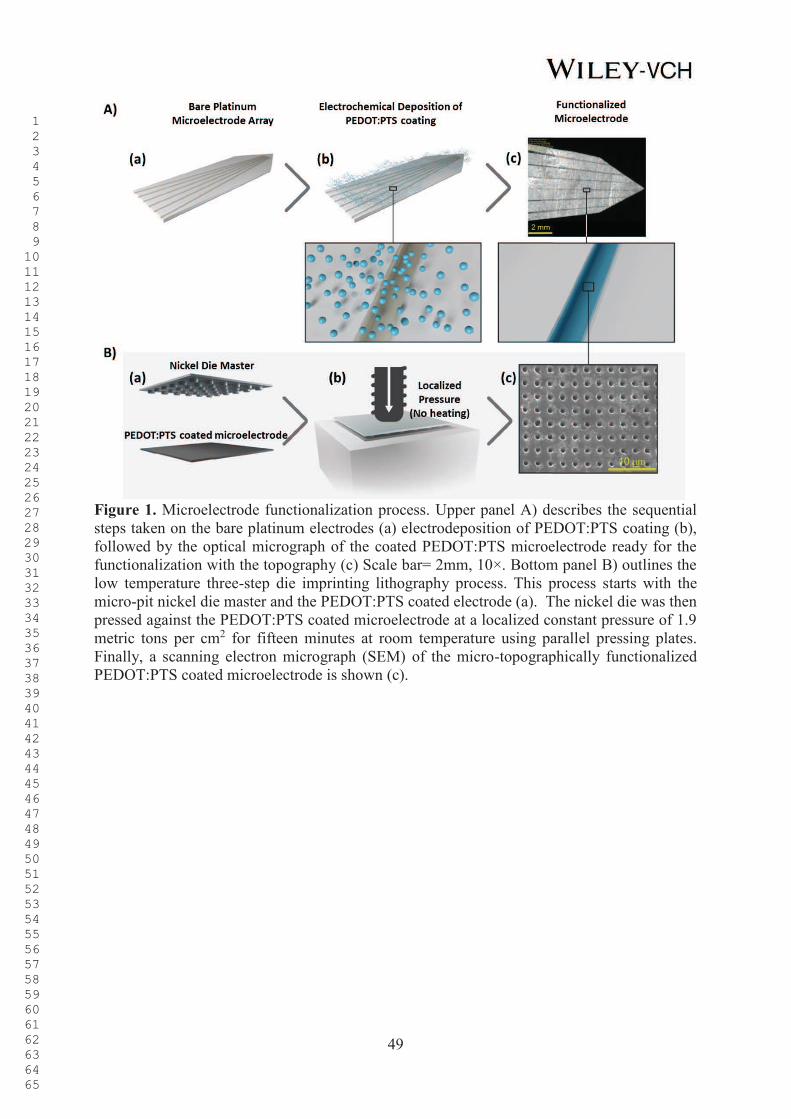
49
Figure 1. Microelectrode functionalization process. Upper panel A) describes the sequential steps taken on the bare platinum electrodes (a) electrodeposition of PEDOT:PTS coating (b), followed by the optical micrograph of the coated PEDOT:PTS microelectrode ready for the functionalization with the topography (c) Scale bar= 2mm, 10×. Bottom panel B) outlines the low temperature three-step die imprinting lithography process. This process starts with the micro-pit nickel die master and the PEDOT:PTS coated electrode (a). The nickel die was then pressed against the PEDOT:PTS coated microelectrode at a localized constant pressure of 1.9 metric tons per cm2 for fifteen minutes at room temperature using parallel pressing plates. Finally, a scanning electron micrograph (SEM) of the micro-topographically functionalized PEDOT:PTS coated microelectrode is shown (c).
1
2
3
4
5
6
7
8
9
10
11
12
13
14
15
16
17
18
19
20
21
22
23
24
25
26
27
28
29
30
31
32
33
34
35
36
37
38
39
40
41
42
43
44
45
46
47
48
49
50
51
52
53
54
55
56
57
58
59
60
61
62
63
64
65
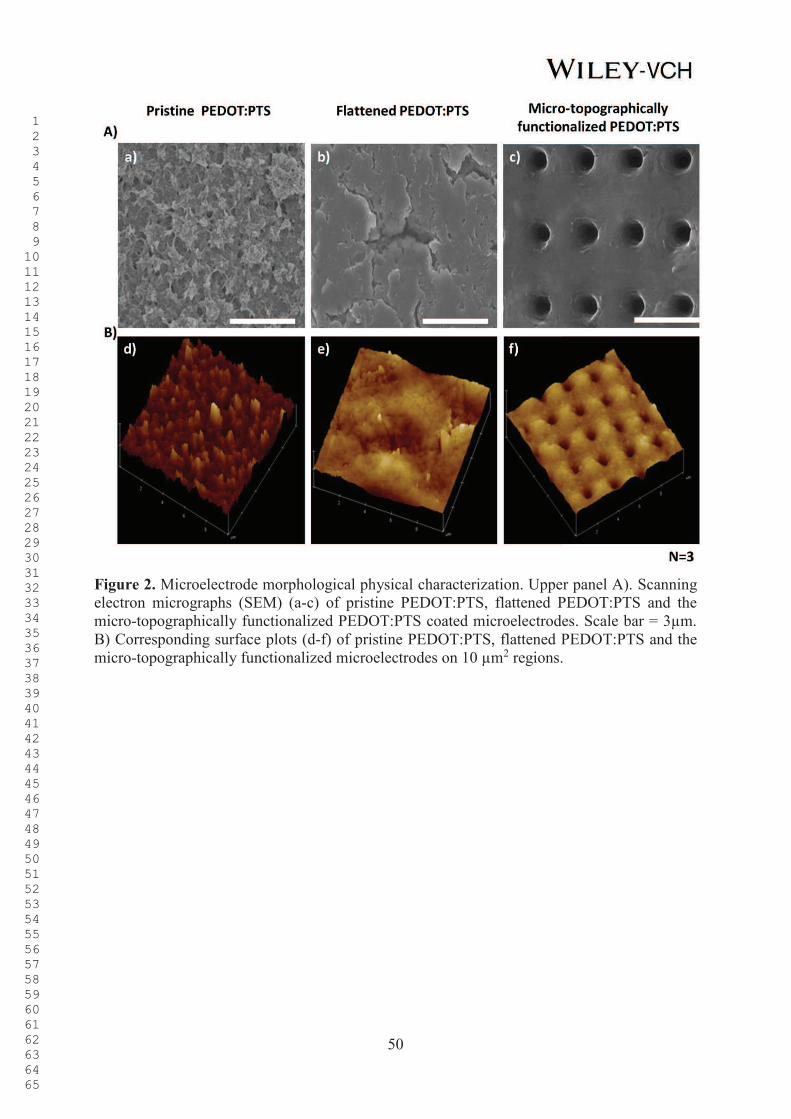
50
Figure 2. Microelectrode morphological physical characterization. Upper panel A). Scanning electron micrographs (SEM) (a-c) of pristine PEDOT:PTS, flattened PEDOT:PTS and the micro-topographically functionalized PEDOT:PTS coated microelectrodes. Scale bar = 3µm. B) Corresponding surface plots (d-f) of pristine PEDOT:PTS, flattened PEDOT:PTS and the micro-topographically functionalized microelectrodes on 10 µm2 regions.
1
2
3
4
5
6
7
8
9
10
11
12
13
14
15
16
17
18
19
20
21
22
23
24
25
26
27
28
29
30
31
32
33
34
35
36
37
38
39
40
41
42
43
44
45
46
47
48
49
50
51
52
53
54
55
56
57
58
59
60
61
62
63
64
65
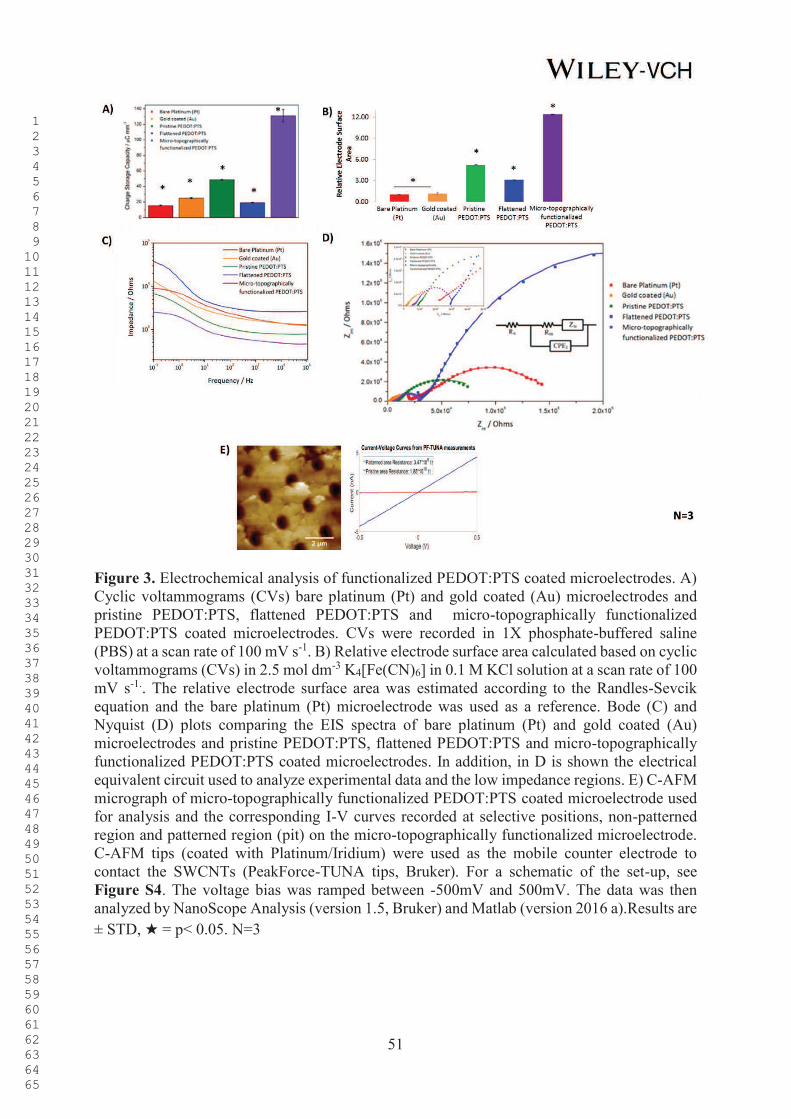
51
Figure 3. Electrochemical analysis of functionalized PEDOT:PTS coated microelectrodes. A) Cyclic voltammograms (CVs) bare platinum (Pt) and gold coated (Au) microelectrodes and pristine PEDOT:PTS, flattened PEDOT:PTS and micro-topographically functionalized PEDOT:PTS coated microelectrodes. CVs were recorded in 1X phosphate-buffered saline (PBS) at a scan rate of 100 mV s-1. B) Relative electrode surface area calculated based on cyclic voltammograms (CVs) in 2.5 mol dm-3 K4[Fe(CN)6] in 0.1 M KCl solution at a scan rate of 100 mV s-1.. The relative electrode surface area was estimated according to the Randles-Sevcik equation and the bare platinum (Pt) microelectrode was used as a reference. Bode (C) and Nyquist (D) plots comparing the EIS spectra of bare platinum (Pt) and gold coated (Au) microelectrodes and pristine PEDOT:PTS, flattened PEDOT:PTS and micro-topographically functionalized PEDOT:PTS coated microelectrodes. In addition, in D is shown the electrical equivalent circuit used to analyze experimental data and the low impedance regions. E) C-AFM micrograph of micro-topographically functionalized PEDOT:PTS coated microelectrode used for analysis and the corresponding I-V curves recorded at selective positions, non-patterned region and patterned region (pit) on the micro-topographically functionalized microelectrode. C-AFM tips (coated with Platinum/Iridium) were used as the mobile counter electrode to contact the SWCNTs (PeakForce-TUNA tips, Bruker). For a schematic of the set-up, see Figure S4. The voltage bias was ramped between -500mV and 500mV. The data was then analyzed by NanoScope Analysis (version 1.5, Bruker) and Matlab (version 2016 a).Results are ± STD, ★ = p< 0.05. N=3
1
2
3
4
5
6
7
8
9
10
11
12
13
14
15
16
17
18
19
20
21
22
23
24
25
26
27
28
29
30
31
32
33
34
35
36
37
38
39
40
41
42
43
44
45
46
47
48
49
50
51
52
53
54
55
56
57
58
59
60
61
62
63
64
65
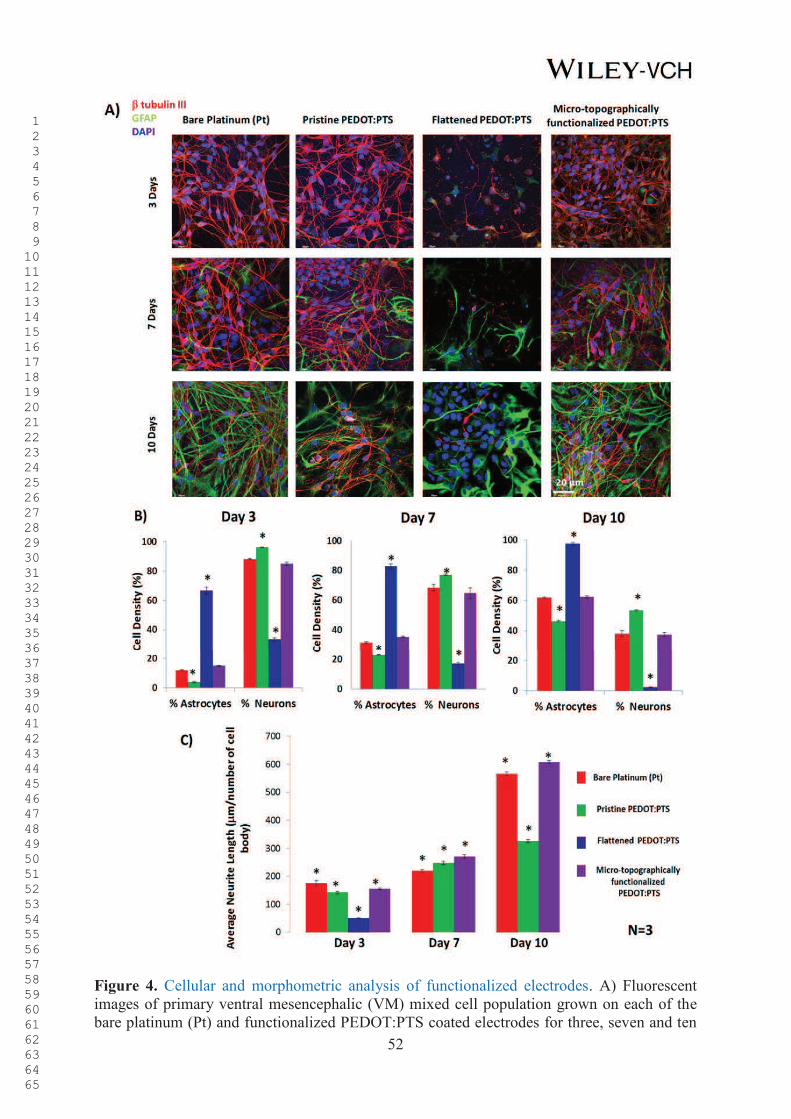
52
Figure 4. Cellular and morphometric analysis of functionalized electrodes. A) Fluorescent images of primary ventral mesencephalic (VM) mixed cell population grown on each of the bare platinum (Pt) and functionalized PEDOT:PTS coated electrodes for three, seven and ten
1
2
3
4
5
6
7
8
9
10
11
12
13
14
15
16
17
18
19
20
21
22
23
24
25
26
27
28
29
30
31
32
33
34
35
36
37
38
39
40
41
42
43
44
45
46
47
48
49
50
51
52
53
54
55
56
57
58
59
60
61
62
63
64
65
53
days in culture. Neurons are visualized by anti β-tubulin III, in red, astrocyte cells by anti-GFAP, in green and nuclei are visualized by DAPI, in blue. Bar = 20 µm, objective 60× magnification. Cell density (%) analysis of astrocytes and neurons presence on each of the electrodes is presented in B). An overall significant (p < 0.05) decrease in viability of neurons and astrocytes density was observed in flattened PEDOT:PTS coated electrodes. Neural length analysis of electrodes presented in C) showed with significant (p < 0.05) longer neurite lengths the neurons grown on micro-topographically functionalized PEDOT:PTS coated electrodes. = p< 0.05.
1
2
3
4
5
6
7
8
9
10
11
12
13
14
15
16
17
18
19
20
21
22
23
24
25
26
27
28
29
30
31
32
33
34
35
36
37
38
39
40
41
42
43
44
45
46
47
48
49
50
51
52
53
54
55
56
57
58
59
60
61
62
63
64
65

54
Figure 5. Morpho-adhesion characteristics of astrocyte presence in the functionalized electrodes towards astrocyte reactivity indication. A) Selective fluorescent images of astrocytes from primary ventral mesencephalic (VM) mixed cell population grown on each of the bare platinum (Pt) and functionalized PEDOT:PTS coated electrodes for three, seven and ten days in culture. Astrocytes are visualized by anti-GFAP, in green, formation of focal adhesion
1
2
3
4
5
6
7
8
9
10
11
12
13
14
15
16
17
18
19
20
21
22
23
24
25
26
27
28
29
30
31
32
33
34
35
36
37
38
39
40
41
42
43
44
45
46
47
48
49
50
51
52
53
54
55
56
57
58
59
60
61
62
63
64
65

55
contacts by anti-Paxillian, in red and nuclei are visualized by DAPI, in blue. Bar = 20 µm, objective 60× magnification. Frequency distribution in time (three, seven, and ten days) of cytoplasm astrocyte areas (µm2) on bare platinum (Pt) and functionalized PEDOT:PTS coated electrodes is presented in B). The frequency distribution of astrocyte areas on micro-topographically functionalized PEDOT:PTS coated electrodes showed the lowest frequencies over time. C) represents the frequency distribution of the astrocyte focal adhesion contact numbers per cell and their corresponding length frequency distribution over time in D).
Figure 6. Comparative gliosis derived cytokines and chemokine factor profiling for interferon-γ (IFN-γ;A), tumor necrosis factor- α (TNF-α;B), chemokine factor CXCL-1 (KC/GRO;C), interleukin-6 (IL-6;D) and interleukin-5 (IL-5;E). The release expression of each of the signaling molecules is analyzed from primary ventral mesencephalic (VM) mixed cell population supernatants collected at day three, seven and ten days on bare platinum (Pt) and functionalized PEDOT:PTS coated electrodes. An important effect is seen on the micro-topographically functionalized PEDOT:PTS coated electrodes, which presented significantly and consistently low release profiles for each cytokine and chemokine factor analyzed. Results are STD, = p< 0.05.
1
2
3
4
5
6
7
8
9
10
11
12
13
14
15
16
17
18
19
20
21
22
23
24
25
26
27
28
29
30
31
32
33
34
35
36
37
38
39
40
41
42
43
44
45
46
47
48
49
50
51
52
53
54
55
56
57
58
59
60
61
62
63
64
65
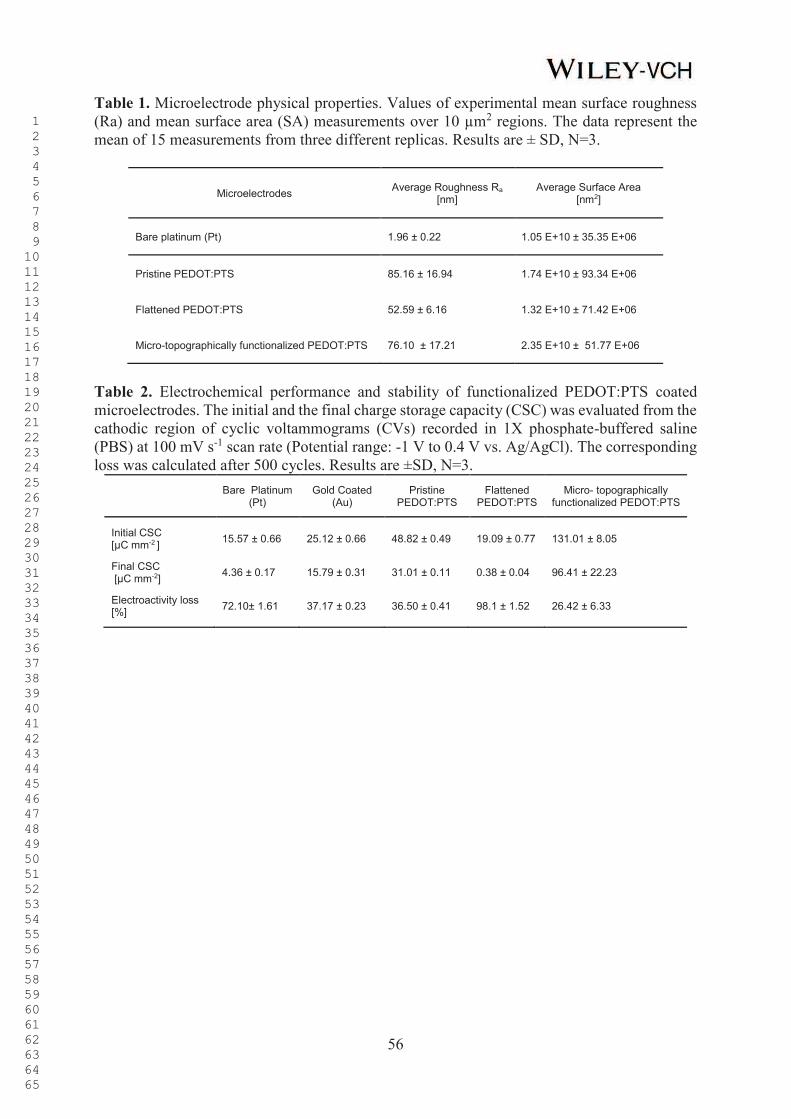
56
Table 1. Microelectrode physical properties. Values of experimental mean surface roughness (Ra) and mean surface area (SA) measurements over 10 µm2 regions. The data represent the mean of 15 measurements from three different replicas. Results are ± SD, N=3.
Microelectrodes Average Roughness Ra
[nm] Average Surface Area
[nm2]
Bare platinum (Pt) 1.96 ± 0.22 1.05 E+10 ± 35.35 E+06
Pristine PEDOT:PTS 85.16 ± 16.94 1.74 E+10 ± 93.34 E+06
Flattened PEDOT:PTS 52.59 ± 6.16 1.32 E+10 ± 71.42 E+06
Micro-topographically functionalized PEDOT:PTS 76.10 ± 17.21 2.35 E+10 ± 51.77 E+06
Table 2. Electrochemical performance and stability of functionalized PEDOT:PTS coated microelectrodes. The initial and the final charge storage capacity (CSC) was evaluated from the cathodic region of cyclic voltammograms (CVs) recorded in 1X phosphate-buffered saline (PBS) at 100 mV s-1 scan rate (Potential range: -1 V to 0.4 V vs. Ag/AgCl). The corresponding loss was calculated after 500 cycles. Results are ±SD, N=3.
Bare Platinum
(Pt) Gold Coated
(Au) Pristine
PEDOT:PTS Flattened
PEDOT:PTS Micro- topographically
functionalized PEDOT:PTS
Initial CSC [µC mm-2 ]
15.57 ± 0.66 25.12 ± 0.66 48.82 ± 0.49 19.09 ± 0.77 131.01 ± 8.05
Final CSC [µC mm-2]
4.36 ± 0.17 15.79 ± 0.31 31.01 ± 0.11 0.38 ± 0.04 96.41 ± 22.23
Electroactivity loss [%]
72.10± 1.61 37.17 ± 0.23 36.50 ± 0.41 98.1 ± 1.52 26.42 ± 6.33
1
2
3
4
5
6
7
8
9
10
11
12
13
14
15
16
17
18
19
20
21
22
23
24
25
26
27
28
29
30
31
32
33
34
35
36
37
38
39
40
41
42
43
44
45
46
47
48
49
50
51
52
53
54
55
56
57
58
59
60
61
62
63
64
65
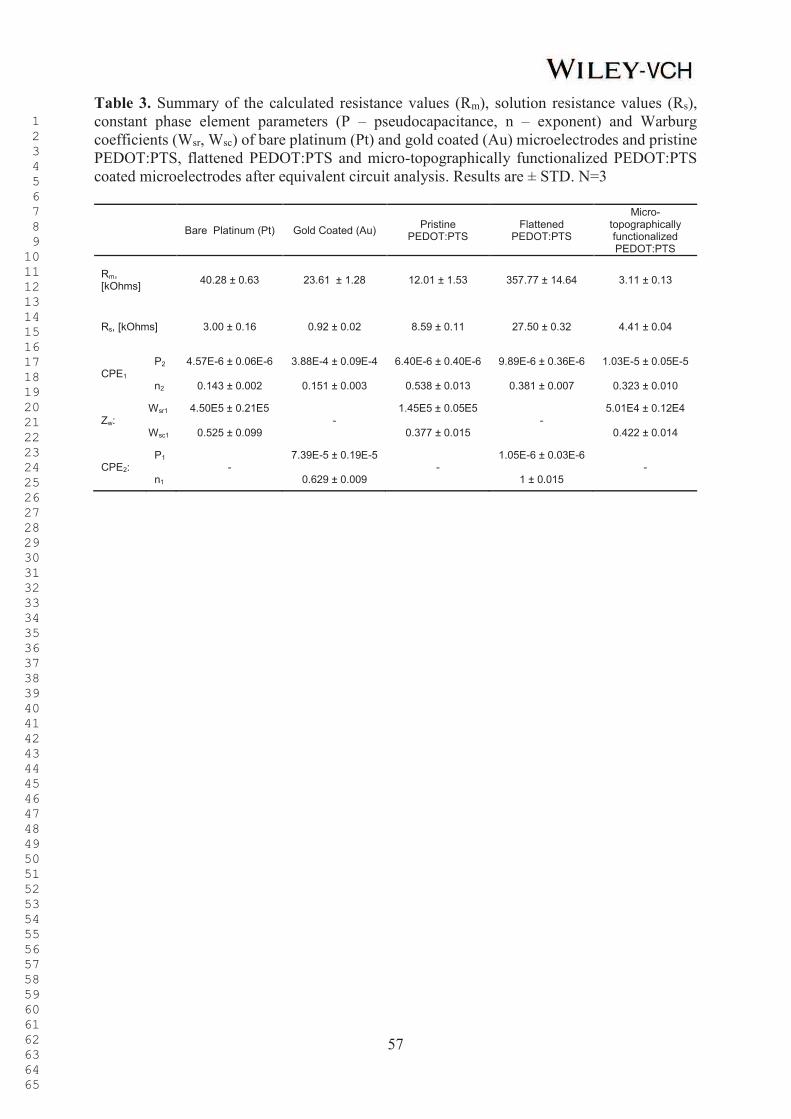
57
Table 3. Summary of the calculated resistance values (Rm), solution resistance values (Rs), constant phase element parameters (P – pseudocapacitance, n – exponent) and Warburg coefficients (Wsr, Wsc) of bare platinum (Pt) and gold coated (Au) microelectrodes and pristine PEDOT:PTS, flattened PEDOT:PTS and micro-topographically functionalized PEDOT:PTS coated microelectrodes after equivalent circuit analysis. Results are ± STD. N=3
Bare Platinum (Pt) Gold Coated (Au) Pristine
PEDOT:PTS Flattened
PEDOT:PTS
Micro-topographically functionalized PEDOT:PTS
Rm, [kOhms]
40.28 ± 0.63 23.61 ± 1.28 12.01 ± 1.53 357.77 ± 14.64 3.11 ± 0.13
Rs, [kOhms] 3.00 ± 0.16 0.92 ± 0.02 8.59 ± 0.11 27.50 ± 0.32 4.41 ± 0.04
CPE1 P2
n2
4.57E-6 ± 0.06E-6
0.143 ± 0.002
3.88E-4 ± 0.09E-4
0.151 ± 0.003
6.40E-6 ± 0.40E-6
0.538 ± 0.013
9.89E-6 ± 0.36E-6
0.381 ± 0.007
1.03E-5 ± 0.05E-5
0.323 ± 0.010
Zw: Wsr1
Wsc1
4.50E5 ± 0.21E5
0.525 ± 0.099 -
1.45E5 ± 0.05E5
0.377 ± 0.015 -
5.01E4 ± 0.12E4
0.422 ± 0.014
CPE2: P1
n1
- 7.39E-5 ± 0.19E-5
0.629 ± 0.009
- 1.05E-6 ± 0.03E-6
1 ± 0.015
-
1
2
3
4
5
6
7
8
9
10
11
12
13
14
15
16
17
18
19
20
21
22
23
24
25
26
27
28
29
30
31
32
33
34
35
36
37
38
39
40
41
42
43
44
45
46
47
48
49
50
51
52
53
54
55
56
57
58
59
60
61
62
63
64
65
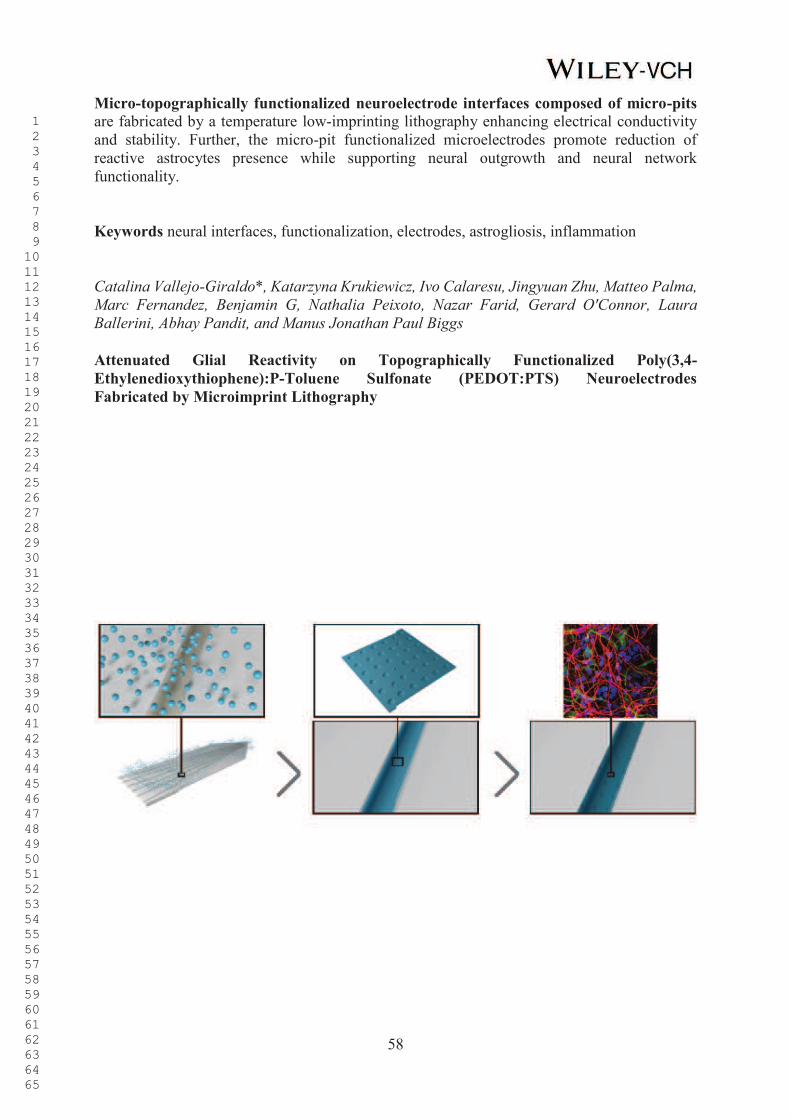
58
Micro-topographically functionalized neuroelectrode interfaces composed of micro-pits are fabricated by a temperature low-imprinting lithography enhancing electrical conductivity and stability. Further, the micro-pit functionalized microelectrodes promote reduction of reactive astrocytes presence while supporting neural outgrowth and neural network functionality. Keywords neural interfaces, functionalization, electrodes, astrogliosis, inflammation Catalina Vallejo-Giraldo*, Katarzyna Krukiewicz, Ivo Calaresu, Jingyuan Zhu, Matteo Palma,
Marc Fernandez, Benjamin G, Nathalia Peixoto, Nazar Farid, Gerard O'Connor, Laura
Ballerini, Abhay Pandit, and Manus Jonathan Paul Biggs
Attenuated Glial Reactivity on Topographically Functionalized Poly(3,4-
Ethylenedioxythiophene):P-Toluene Sulfonate (PEDOT:PTS) Neuroelectrodes
Fabricated by Microimprint Lithography
1
2
3
4
5
6
7
8
9
10
11
12
13
14
15
16
17
18
19
20
21
22
23
24
25
26
27
28
29
30
31
32
33
34
35
36
37
38
39
40
41
42
43
44
45
46
47
48
49
50
51
52
53
54
55
56
57
58
59
60
61
62
63
64
65
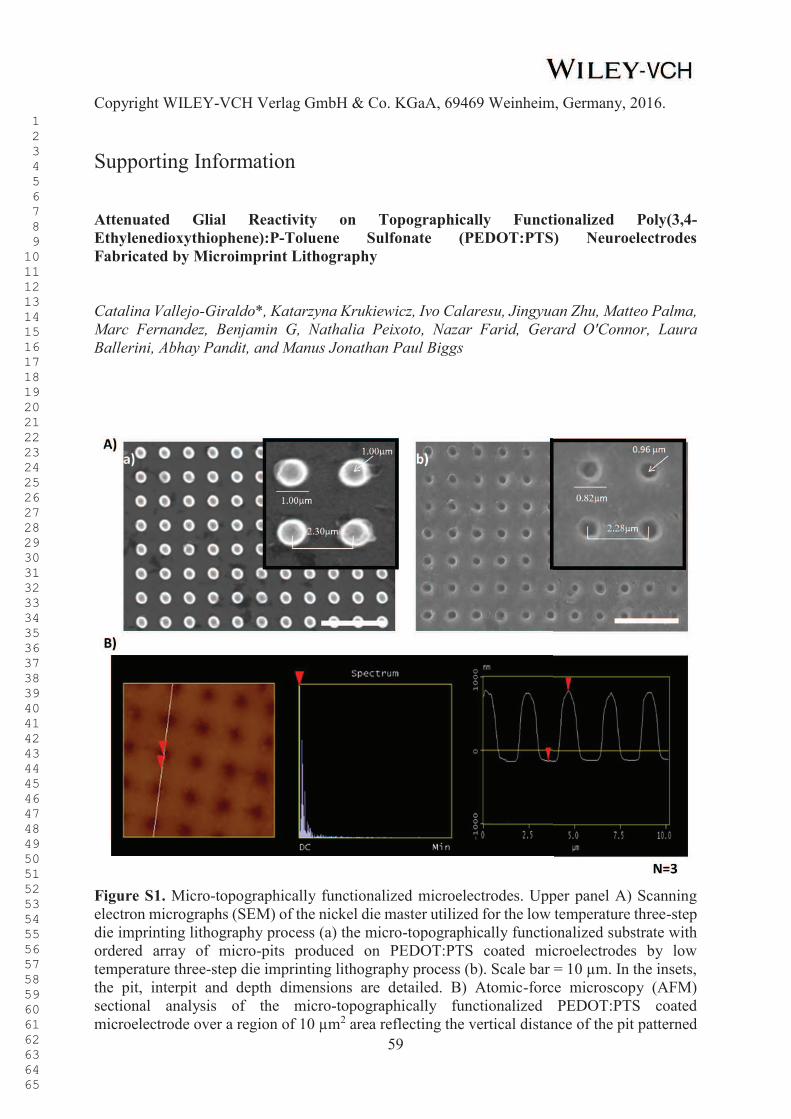
59
Copyright WILEY-VCH Verlag GmbH & Co. KGaA, 69469 Weinheim, Germany, 2016.
Supporting Information Attenuated Glial Reactivity on Topographically Functionalized Poly(3,4-
Ethylenedioxythiophene):P-Toluene Sulfonate (PEDOT:PTS) Neuroelectrodes
Fabricated by Microimprint Lithography Catalina Vallejo-Giraldo*, Katarzyna Krukiewicz, Ivo Calaresu, Jingyuan Zhu, Matteo Palma,
Marc Fernandez, Benjamin G, Nathalia Peixoto, Nazar Farid, Gerard O'Connor, Laura
Ballerini, Abhay Pandit, and Manus Jonathan Paul Biggs
Figure S1. Micro-topographically functionalized microelectrodes. Upper panel A) Scanning electron micrographs (SEM) of the nickel die master utilized for the low temperature three-step die imprinting lithography process (a) the micro-topographically functionalized substrate with ordered array of micro-pits produced on PEDOT:PTS coated microelectrodes by low temperature three-step die imprinting lithography process (b). Scale bar = 10 µm. In the insets, the pit, interpit and depth dimensions are detailed. B) Atomic-force microscopy (AFM) sectional analysis of the micro-topographically functionalized PEDOT:PTS coated microelectrode over a region of 10 µm2 area reflecting the vertical distance of the pit patterned
1
2
3
4
5
6
7
8
9
10
11
12
13
14
15
16
17
18
19
20
21
22
23
24
25
26
27
28
29
30
31
32
33
34
35
36
37
38
39
40
41
42
43
44
45
46
47
48
49
50
51
52
53
54
55
56
57
58
59
60
61
62
63
64
65
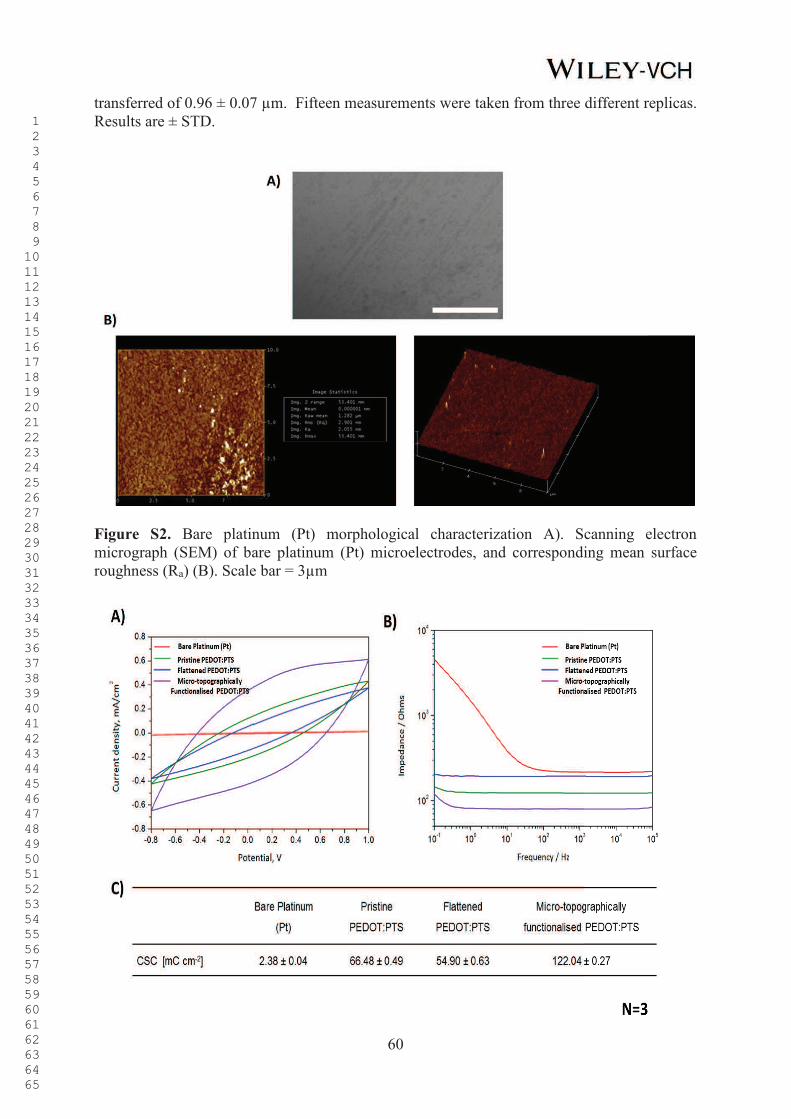
60
transferred of 0.96 ± 0.07 µm. Fifteen measurements were taken from three different replicas. Results are ± STD.
Figure S2. Bare platinum (Pt) morphological characterization A). Scanning electron micrograph (SEM) of bare platinum (Pt) microelectrodes, and corresponding mean surface roughness (Ra) (B). Scale bar = 3µm
1
2
3
4
5
6
7
8
9
10
11
12
13
14
15
16
17
18
19
20
21
22
23
24
25
26
27
28
29
30
31
32
33
34
35
36
37
38
39
40
41
42
43
44
45
46
47
48
49
50
51
52
53
54
55
56
57
58
59
60
61
62
63
64
65
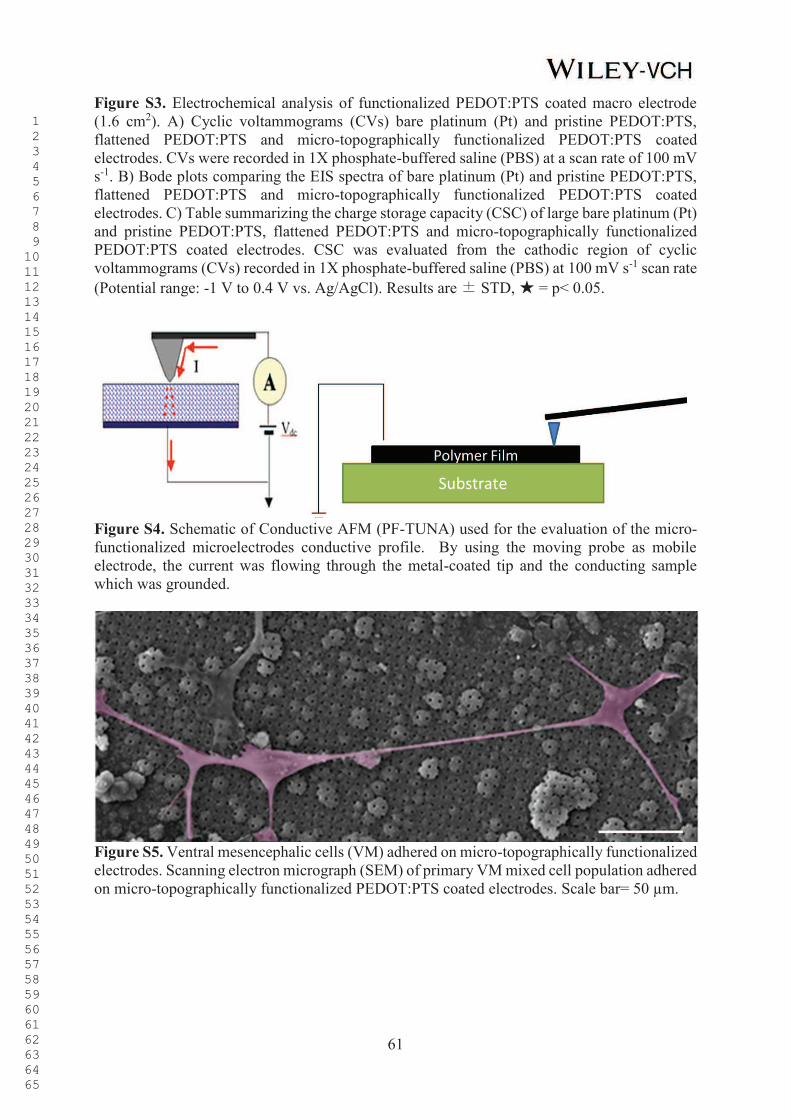
61
Figure S3. Electrochemical analysis of functionalized PEDOT:PTS coated macro electrode (1.6 cm2). A) Cyclic voltammograms (CVs) bare platinum (Pt) and pristine PEDOT:PTS, flattened PEDOT:PTS and micro-topographically functionalized PEDOT:PTS coated electrodes. CVs were recorded in 1X phosphate-buffered saline (PBS) at a scan rate of 100 mV s-1. B) Bode plots comparing the EIS spectra of bare platinum (Pt) and pristine PEDOT:PTS, flattened PEDOT:PTS and micro-topographically functionalized PEDOT:PTS coated electrodes. C) Table summarizing the charge storage capacity (CSC) of large bare platinum (Pt) and pristine PEDOT:PTS, flattened PEDOT:PTS and micro-topographically functionalized PEDOT:PTS coated electrodes. CSC was evaluated from the cathodic region of cyclic voltammograms (CVs) recorded in 1X phosphate-buffered saline (PBS) at 100 mV s-1 scan rate (Potential range: -1 V to 0.4 V vs. Ag/AgCl). Results are STD, = p< 0.05.
Figure S4. Schematic of Conductive AFM (PF-TUNA) used for the evaluation of the micro-functionalized microelectrodes conductive profile. By using the moving probe as mobile electrode, the current was flowing through the metal-coated tip and the conducting sample which was grounded.
Figure S5. Ventral mesencephalic cells (VM) adhered on micro-topographically functionalized electrodes. Scanning electron micrograph (SEM) of primary VM mixed cell population adhered on micro-topographically functionalized PEDOT:PTS coated electrodes. Scale bar= 50 µm.
1
2
3
4
5
6
7
8
9
10
11
12
13
14
15
16
17
18
19
20
21
22
23
24
25
26
27
28
29
30
31
32
33
34
35
36
37
38
39
40
41
42
43
44
45
46
47
48
49
50
51
52
53
54
55
56
57
58
59
60
61
62
63
64
65

62
Figure S6. CellROX® expression on primary ventral mesencephalic (VM) mixed cell population grown on sterile Thermanox® Plastic Coverslips with 13 mm diameter (NUNCTM brand products). Cultures were stimulated with interleukin- 1β (IL-1β) at 1, 10 and 50 ng ml-1 and control. A) Fluorescent images of VM mixed cell population grown on sterile Thermanox® Plastic Coverslip over a period of three, seven and ten days showing CellROX® expression in green, actin in red rhodamine-conjugated phalloidin and nuclei in blue, DAPI. Bar = 20 µm, objective 60× magnification. (B-D) show the percentage of CellROX® nuclei colocalization quantified after stimulus with interleukin-1β (IL-1β) at 1, 10 and 50 ng ml-1 and control. Elevated levels of CellROX® on VM mixed cell population were seen after a stimulus of 10 ng ml-1 of IL-1 and 50 ng ml-1 over ten days in culture, resulting in an increase of oxidative stress species presence as a response of inflammation. = p< 0.05.
1
2
3
4
5
6
7
8
9
10
11
12
13
14
15
16
17
18
19
20
21
22
23
24
25
26
27
28
29
30
31
32
33
34
35
36
37
38
39
40
41
42
43
44
45
46
47
48
49
50
51
52
53
54
55
56
57
58
59
60
61
62
63
64
65
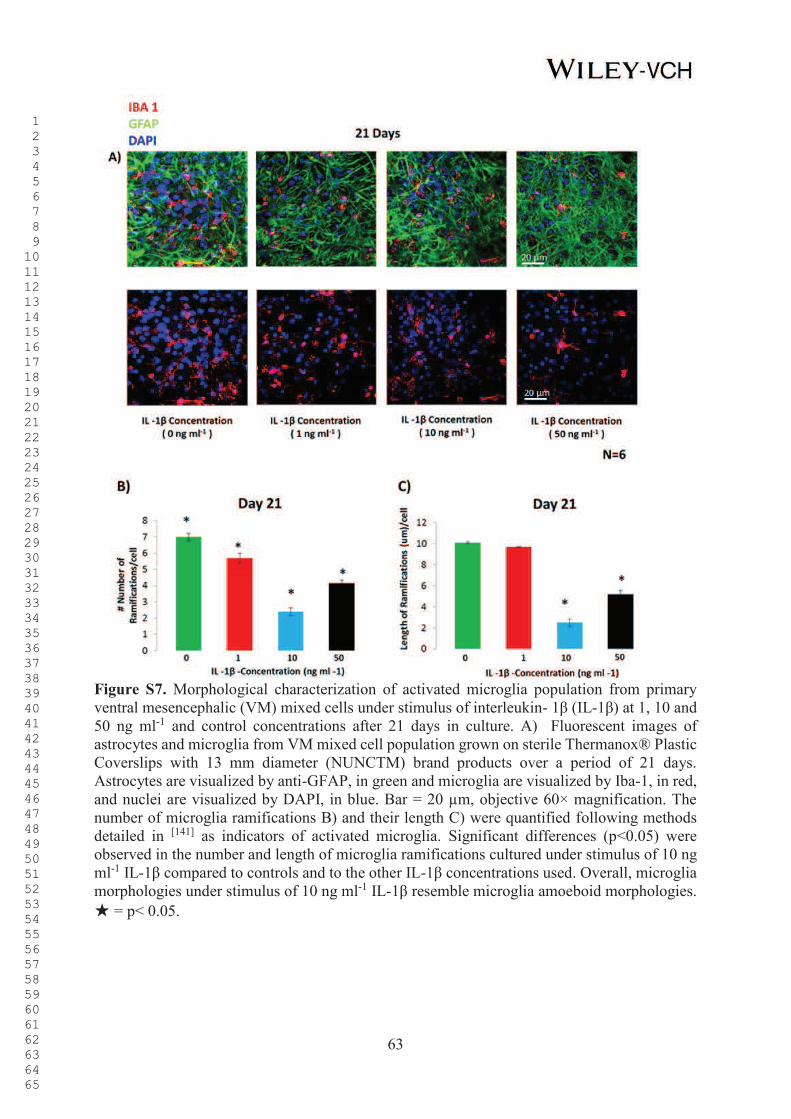
63
Figure S7. Morphological characterization of activated microglia population from primary ventral mesencephalic (VM) mixed cells under stimulus of interleukin- 1β (IL-1β) at 1, 10 and 50 ng ml-1 and control concentrations after 21 days in culture. A) Fluorescent images of astrocytes and microglia from VM mixed cell population grown on sterile Thermanox® Plastic Coverslips with 13 mm diameter (NUNCTM) brand products over a period of 21 days. Astrocytes are visualized by anti-GFAP, in green and microglia are visualized by Iba-1, in red, and nuclei are visualized by DAPI, in blue. Bar = 20 µm, objective 60× magnification. The number of microglia ramifications B) and their length C) were quantified following methods detailed in [141] as indicators of activated microglia. Significant differences (p<0.05) were observed in the number and length of microglia ramifications cultured under stimulus of 10 ng ml-1 IL-1β compared to controls and to the other IL-1β concentrations used. Overall, microglia morphologies under stimulus of 10 ng ml-1 IL-1β resemble microglia amoeboid morphologies.
= p< 0.05.
1
2
3
4
5
6
7
8
9
10
11
12
13
14
15
16
17
18
19
20
21
22
23
24
25
26
27
28
29
30
31
32
33
34
35
36
37
38
39
40
41
42
43
44
45
46
47
48
49
50
51
52
53
54
55
56
57
58
59
60
61
62
63
64
65
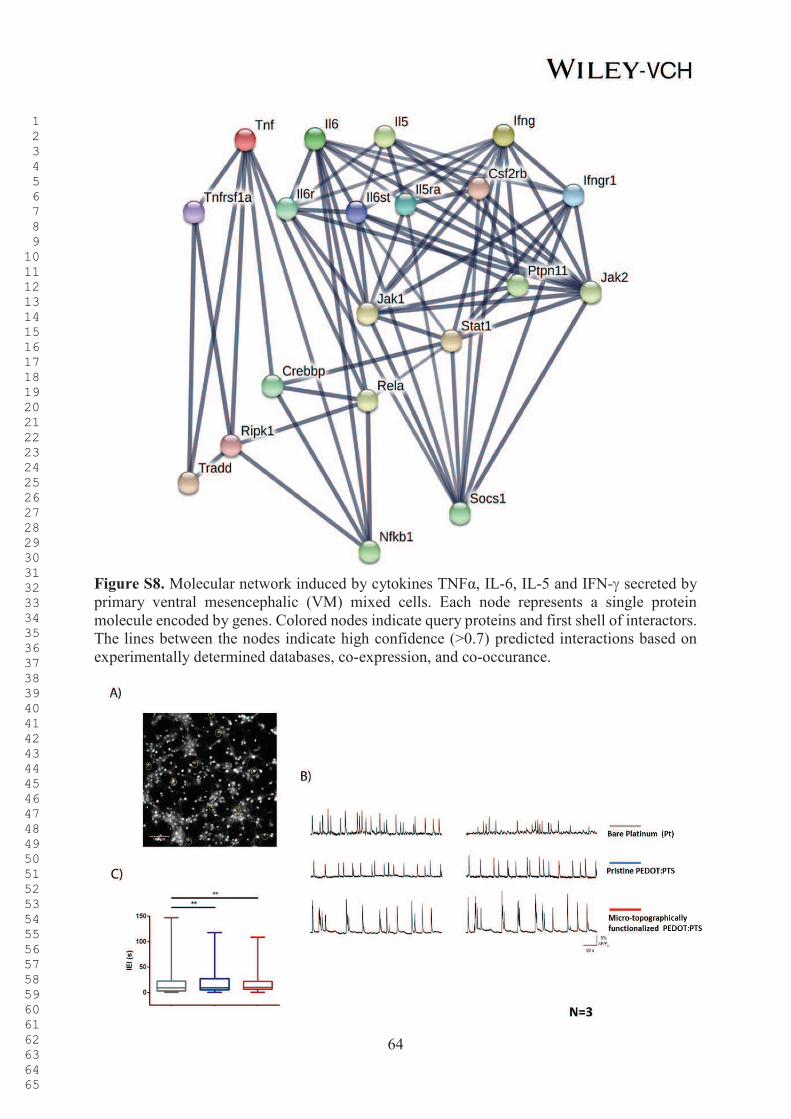
64
Figure S8. Molecular network induced by cytokines TNFα, IL-6, IL-5 and IFN-g secreted by primary ventral mesencephalic (VM) mixed cells. Each node represents a single protein molecule encoded by genes. Colored nodes indicate query proteins and first shell of interactors. The lines between the nodes indicate high confidence (>0.7) predicted interactions based on experimentally determined databases, co-expression, and co-occurance.
1
2
3
4
5
6
7
8
9
10
11
12
13
14
15
16
17
18
19
20
21
22
23
24
25
26
27
28
29
30
31
32
33
34
35
36
37
38
39
40
41
42
43
44
45
46
47
48
49
50
51
52
53
54
55
56
57
58
59
60
61
62
63
64
65
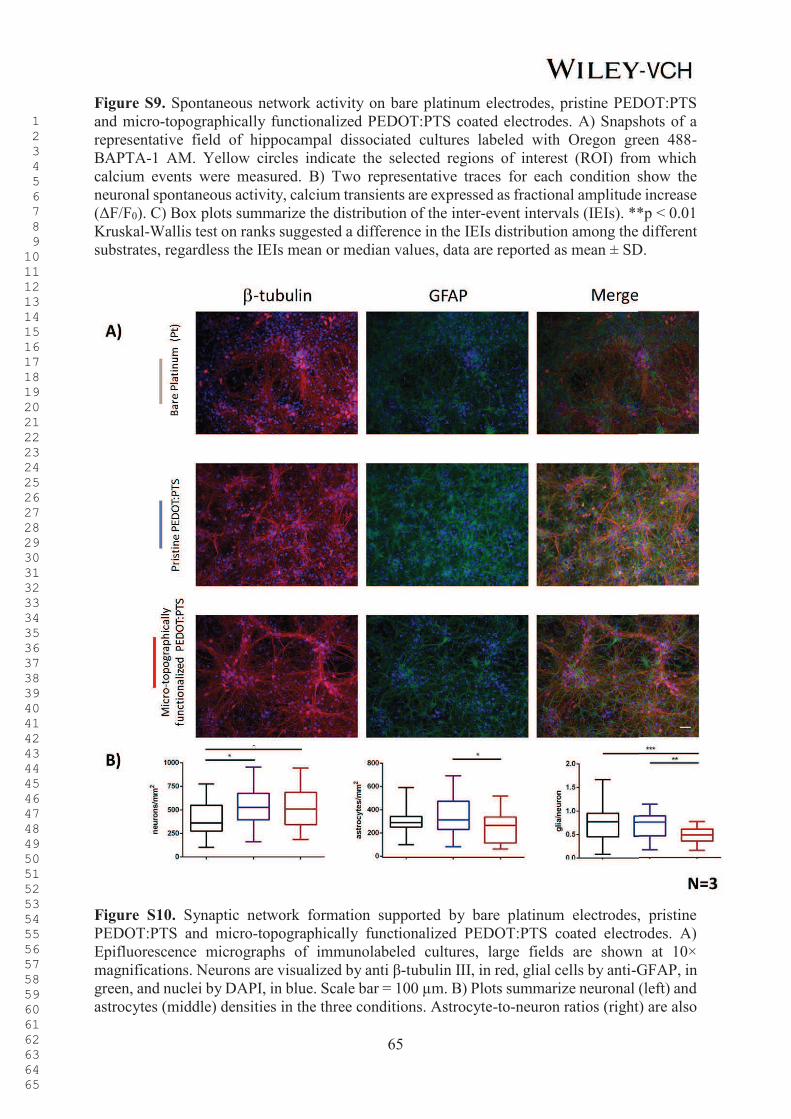
65
Figure S9. Spontaneous network activity on bare platinum electrodes, pristine PEDOT:PTS and micro-topographically functionalized PEDOT:PTS coated electrodes. A) Snapshots of a representative field of hippocampal dissociated cultures labeled with Oregon green 488-BAPTA-1 AM. Yellow circles indicate the selected regions of interest (ROI) from which calcium events were measured. B) Two representative traces for each condition show the neuronal spontaneous activity, calcium transients are expressed as fractional amplitude increase (ΔF/F0). C) Box plots summarize the distribution of the inter-event intervals (IEIs). **p < 0.01 Kruskal-Wallis test on ranks suggested a difference in the IEIs distribution among the different substrates, regardless the IEIs mean or median values, data are reported as mean ± SD.
Figure S10. Synaptic network formation supported by bare platinum electrodes, pristine PEDOT:PTS and micro-topographically functionalized PEDOT:PTS coated electrodes. A) Epifluorescence micrographs of immunolabeled cultures, large fields are shown at 10× magnifications. Neurons are visualized by anti β-tubulin III, in red, glial cells by anti-GFAP, in green, and nuclei by DAPI, in blue. Scale bar = 100 µm. B) Plots summarize neuronal (left) and astrocytes (middle) densities in the three conditions. Astrocyte-to-neuron ratios (right) are also
1
2
3
4
5
6
7
8
9
10
11
12
13
14
15
16
17
18
19
20
21
22
23
24
25
26
27
28
29
30
31
32
33
34
35
36
37
38
39
40
41
42
43
44
45
46
47
48
49
50
51
52
53
54
55
56
57
58
59
60
61
62
63
64
65
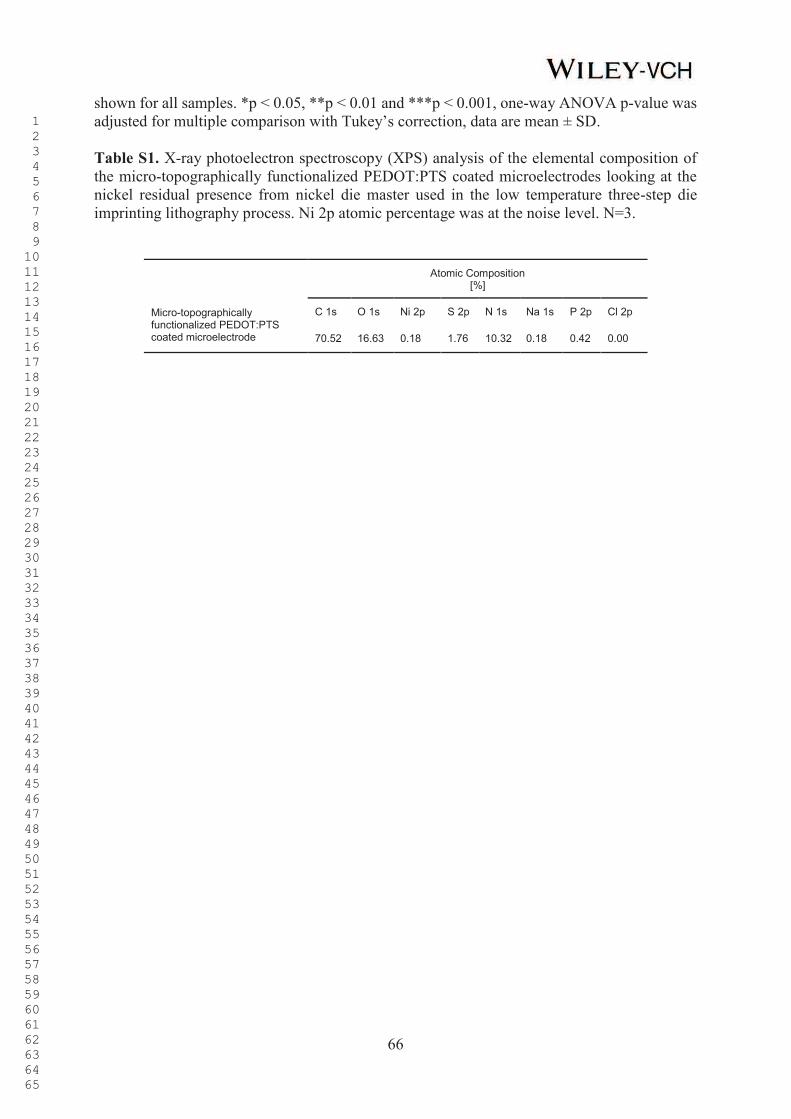
66
shown for all samples. *p < 0.05, **p < 0.01 and ***p < 0.001, one-way ANOVA p-value was adjusted for multiple comparison with Tukey’s correction, data are mean ± SD. Table S1. X-ray photoelectron spectroscopy (XPS) analysis of the elemental composition of the micro-topographically functionalized PEDOT:PTS coated microelectrodes looking at the nickel residual presence from nickel die master used in the low temperature three-step die imprinting lithography process. Ni 2p atomic percentage was at the noise level. N=3.
Micro-topographically functionalized PEDOT:PTS coated microelectrode
Atomic Composition [%]
C 1s O 1s Ni 2p S 2p N 1s Na 1s P 2p Cl 2p
70.52 16.63 0.18 1.76 10.32 0.18 0.42 0.00
1
2
3
4
5
6
7
8
9
10
11
12
13
14
15
16
17
18
19
20
21
22
23
24
25
26
27
28
29
30
31
32
33
34
35
36
37
38
39
40
41
42
43
44
45
46
47
48
49
50
51
52
53
54
55
56
57
58
59
60
61
62
63
64
65