Embed Size (px)
Citation preview
Revisited relationship between tropical and North Pacific seasurface temperature variations
Jong-Yeon Park,1 Sang-Wook Yeh,2 and Jong-Seong Kug1
Received 13 October 2011; revised 12 December 2011; accepted 16 December 2011; published 19 January 2012.
[1] The relationship between the tropical and North Pacificsea surface temperature (SST) variations is reexaminedfollowing the results of Deser and Blackmon (1995, DB95)based on a much longer period of data (1949–2010). As inDB95, the two leading SST modes, the El Niño-SouthernOscillation (ENSO) mode and the North Pacific mode,represent the SST variations in the Pacific domain before1992. Considering the period after 1992, however, one needsto consider a new mode of SST variation along with the twomodes mentioned to understand the relationship between thetropical and North Pacific SST variations. A new SST mode,known as the Warm Pool mode, exhibits a strong variancein the warm pool region and undergoes a phase shift afterthe mid-1990s, reflecting a warming in the warm pool regionand a cooling in the central and eastern equatorial Pacific. Itis found that the Warm Pool mode accompanies the NorthPacific Oscillation-like atmospheric variability over theNorth Pacific. Through this teleconnection, the Warm Poolmode mostly shows a relationship between the warm poolSST and the associated North Pacific SST component andwhich has some similarities with the North Pacific GyreOscillation. Citation: Park, J.-Y., S.-W. Yeh, and J.-S. Kug(2012), Revisited relationship between tropical and North Pacificsea surface temperature variations, Geophys. Res. Lett., 39, L02703,doi:10.1029/2011GL050005.
1. Introduction
[2] It is important to understand the teleconnectionsbetween tropical and extratropical sea surface temperatures(SST) because their relationship can modify the weather andclimate in the mid-latitudes in response to the tropical SSTforcings [Alexander et al., 2002; Lau et al., 2004; Ceballoset al., 2009; Lie and Lee, 2010; Yoon and Yeh, 2010].Such SST teleconnection within the Pacific basin involvesvarious physical processes and intrinsic climatic vari-abilities, including North Pacific Oscillation (NPO), PacificDecadal Oscillation (PDO), El Niño-Southern Oscillation(ENSO) teleconnection, and SST-wind coupling [Vimont et al.,2003; Linkin and Nigam, 2008; Di Lorenzo et al., 2010]. Forexample, Vimont et al. [2003] showed a possible linkagebetween NPO and ENSO with focusing on the importanceof footprinting SST in the subtropics. Moreover, Di Lorenzoet al. [2010] suggested central Pacific Warming may derivechanges in North Pacific Gyre Oscillation (NPGO) through
extra-tropical atmospheric teleconnection and wind-drivenSST modulation.[3] Among the studies examining the SST teleconnec-
tions, Deser and Blackmon [1995] (hereafter, DB95) pro-vided an interesting view of the relationship between thetropical and North Pacific SST anomalies during the borealwinter (November–March). Using an Empirical OrthogonalFunction (EOF) analysis, DB95 identified the two modesof SST variability over the Pacific Ocean spanning thelatitudes of 20oS to 60oN during winter. The two modes arethe El Niño-Southern Oscillation (ENSO) mode and NorthPacific mode. The ENSO mode explains 43% of the varianceover the Pacific Ocean and is highly correlated with theeastern tropical Pacific SST variability, as well as having aconnection to the eastern North Pacific. On the other hand,the North Pacific mode is linearly independent of the ENSOmode and exhibits maximum amplitude and explained vari-ance along �40°N, west of �170°W. The timescale forthe North Pacific mode is longer than that for the ENSOmode. Furthermore, DB95 identified the gross features ofthe 500 hPa patterns associated with the ENSO mode andthe North Pacific mode, respectively, and found that theyare similar, although the North Pacific mode is more asso-ciated with the Pacific/North American (PNA) pattern.[4] So far, the results in DB95 have been widely
referenced and become the conventional view in terms of therelationship between tropical and North Pacific SST varia-tions. However, changes in the Pacific SST have been quitedramatic during recent decades, possibly due to both thenatural forcing and anthropogenic forcing. Therefore, it isnecessary to revisit the relationship between these variations.The purpose of this study is to update the results of DB95and reexamine the relationship between the tropical andNorth Pacific SST variations.
2. Data and Methods
[5] The SST data used in this study are obtained fromdifferent products, including the extended reconstructed SSTversion 3 (ERSST v3) [Smith et al., 2008], the HadleyCenter Sea Surface Temperature data (HadISST) [Rayneret al., 2003], the Kaplan Extended SST version 2 (KaplanSST v2) [Kaplan et al., 1998], and the ComprehensiveOcean–Atmosphere Data Set (COADS) [Woodruff et al.,1998]. The primary dataset is the ERSST, while the otherdatasets provide supplementary data to demonstrate furtherconfidence in the presented results. Atmospheric variables,such as geopotential heights and surface winds, are obtainedfrom the National Centers for Environmental Prediction-National Center for Atmospheric Research (NCEP-NCAR)reanalysis 1 [Kalnay et al., 1996]. The analysis period spansfrom 1949 to the most available recent data.
1Korean Ocean Research Development and Institute, Ansan, SouthKorea.
2Department of Environmental Marine Science, Hanyang University,Ansan, South Korea.
Copyright 2012 by the American Geophysical Union.0094-8276/12/2011GL050005
GEOPHYSICAL RESEARCH LETTERS, VOL. 39, L02703, doi:10.1029/2011GL050005, 2012
L02703 1 of 6
[6] This study uses the seasonal mean data during winter(November-December-January-February-March, hereafter,NDJFM). As in DB95, most analysis is based on statisticalmethods including Empirical Orthogonal Function (EOF)analysis and linear regression analysis. The EOF is based onthe covariance matrix and is shown in normalized form (i.e.,correlation coefficients between the time series of the EOFand the original data), which is the same as in DB95. For thesignificance of the regression analysis, the effective degreeof freedom is obtained using the methodology of Livezeyand Chen [1983].
3. Results
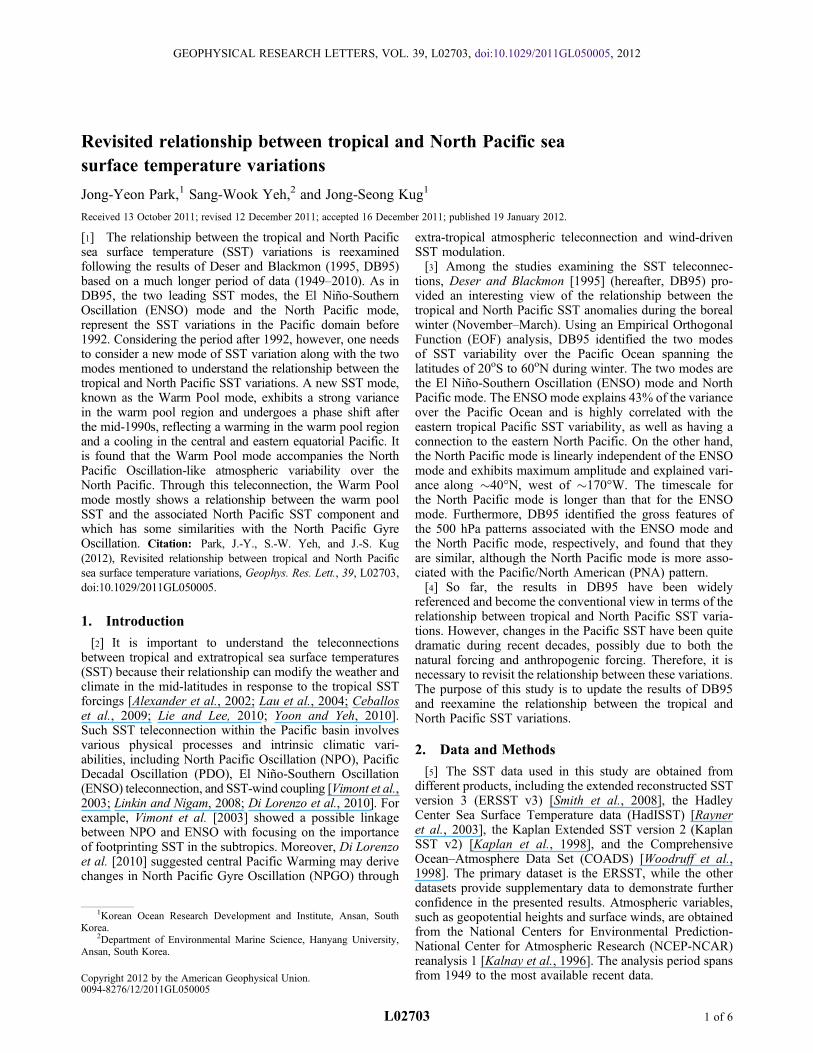
[7] Figures 1a and 1b show the first two EOFs of thewinter SST anomalies for the period of 1949–1992, which isthe same period as used in DB95. Similar to DB95 (Figure 1in DB95), the first two leading EOFs before 1992 representthe ENSO mode (Figure 1a) and the North Pacific mode(Figure 1b), respectively. The ENSO mode explains 46%of the variance over the Pacific domain. The strongest cor-relation appears in the equatorial Pacific, and its oppositesign is found in the western and central North Pacific basin.In contrast, the North Pacific mode is characterized by astrong correlation from the western to the central NorthPacific, and its sign is the same in the central and easterntropical Pacific. Table 1 indicates simultaneous correlationcoefficients between the NINO3 SST index and the principalcomponent (PC) time series of each mode, indicating that theNorth Pacific mode is linearly independent of ENSO. Asshown in DB95, in addition, the timescale of the PC time
series for the North Pacific mode is noticeably longer thanthat of the ENSO mode, which is dominant on an interannualtimescale (not shown). Overall, the ENSO mode and theNorth Pacific mode appear in the first two leadings modes torepresent the SST variability in the Pacific domain for theperiod of 1949–1992, which is consistent with the results ofDB95. It is noteworthy that we also obtain the same resultsusing three different SST datasets (i.e., HadISST, Kaplanversion 2, and COADS) over the period of 1949–1992 (notshown).[8] Figures 1c–1e represent the same EOFs of the winter
SST anomalies but instead use data through 2010 (i.e.,1949–2010). Compared with DB95, the most striking dif-ference is that a new EOF SST mode (Figure 1d) appears inthe second EOF mode that was not found in DB95. On theother hand, the ENSO mode and the North Pacific modeappear in the first and the third EOF modes, as shown inFigures 1c and 1e, respectively. Note that the EOFs from1992 to 2010 are almost similar to those in Figures 1c–1e. Inaddition, the second mode for the period of 1949–2010
Figure 1. (a) EOF 1 and (b) EOF 2 of the Pacific SST during the period 1949–1992. (c–e) EOF 1, 2, and 3, respectively, forthe period 1949–2010. Patterns are shown in normalized form, as they were in DB95.
Table 1. Correlations Between the PC Time Series and the Nino3Index for the Time Periods 1949–1992 and 1949–2010
PC1 PC2 PC3
Nino3 Index 1949–19920.95a 0.20
Nino3 Index 1949–20100.89a 0.17 0.19
aValues indicate the 95% statistical significance.
PARK ET AL.: SST RELATIONSHIP L02703L02703
2 of 6
does not appear in the high-order EOFs for the period of1949–1992. The North Pacific mode is linearly independentof ENSO (Table 1), and the timescale of its PC time series islonger than that of the ENSO mode (see Figure 2), which issimilar to the results before 1992.[9] The second EOF mode shows the largest correlation in
the warm pool region and a zonal contrast of SST anomaliesacross the tropical Pacific basin. In addition, SST anomaliesabove 20oN are characterized by a north-south dipole-likestructure with a strong meridional gradient along �40°N,which have some similarities with the spatial pattern of theNPGO [Di Lorenzo et al., 2008]. Hereafter, we refer to thesecond EOF mode as the so-called Warm Pool modebecause the maximum correlation is found in the warm poolregion. It is noteworthy that such changes in the EOF modesbetween the two periods (1949–92 versus 1949–2010) arealso found when we use three additional different SSTdatasets (i.e., the HadISST, the Kaplan SST, and theCOADS) (not shown). In other words, four different SSTdatasets consistently indicate that the Warm Pool modeappears in the second EOF mode of SST variability in thePacific domain during the period of 1949–2010, although itdoes not appear before 1992. Therefore, one needs to con-sider a new relationship between the tropical and NorthPacific SST variations in the Pacific domain along with theENSO mode and the North Pacific mode when includingdata after 1992. In addition, this result indicates that the SSTvariability, which is represented by the Warm Pool mode, issignificantly enhanced during recent decades; therefore,DB95 could not capture this Warm Pool mode of SST var-iability before 1992.
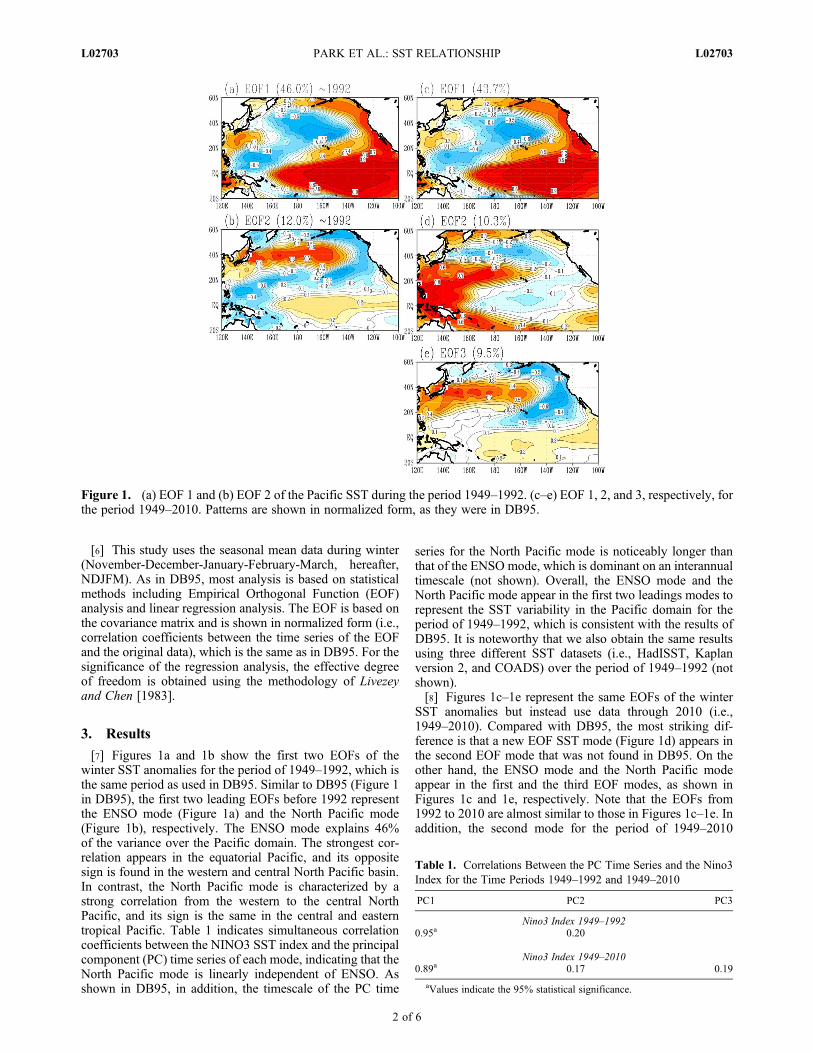
[10] In order to further verify the consistencies of the dif-ferent SST datasets, we display the PC time series of theENSO mode, the Warm Pool mode, and the North Pacificmode, respectively, for the period of 1949–2010 in fourdifferent SST datasets (Figure 2). The PC time series of themodes are well-correlated among the four different SSTdatasets. In particular, the PC time series of the Warm Poolmode are characterized by a shift from a negative sign to apositive sign around the mid-1990s, reflecting a warming inthe warm pool region and a cooling in the central and easternequatorial Pacific during recent decades. Of course, there aresome disagreements between the different datasets for PC2and PC3. These partial disagreements are may be causedfrom the characteristics of each SST dataset related to theaddition of satellite data.[11] Due to poor data coverage in the equatorial western
Pacific in the pre-satellite era, the same analysis has beencarried out just using data before 1975. The result shows thatthe two leading modes are almost the same as the two modesbefore 1992 (not shown). Moreover, these dominant patternsshow the consistency among four different SST datasets,indicating that the results do not significantly change in preand post satellite era.[12] Lastly, we tested the above result by using different
methods of EOFs. Given that EOF analysis is not alwaysstable and sometime is ambiguous, the same analyses usingcorrelation-based matrix and rotated EOFs have been con-ducted. Moreover, EOF analyses in different regions (usingPacific basin SST and tropical Pacific SST) have been alsotested due to a possible dependence of basin-scale EOFson the relatively strong trend in the mid-latitude. It is foundthat There is little change in terms of the spatial patternand corresponding the PC time series (not shown), which isindicative of to some extent the robustness of current result.[13] To obtain large-scale atmospheric patterns associated
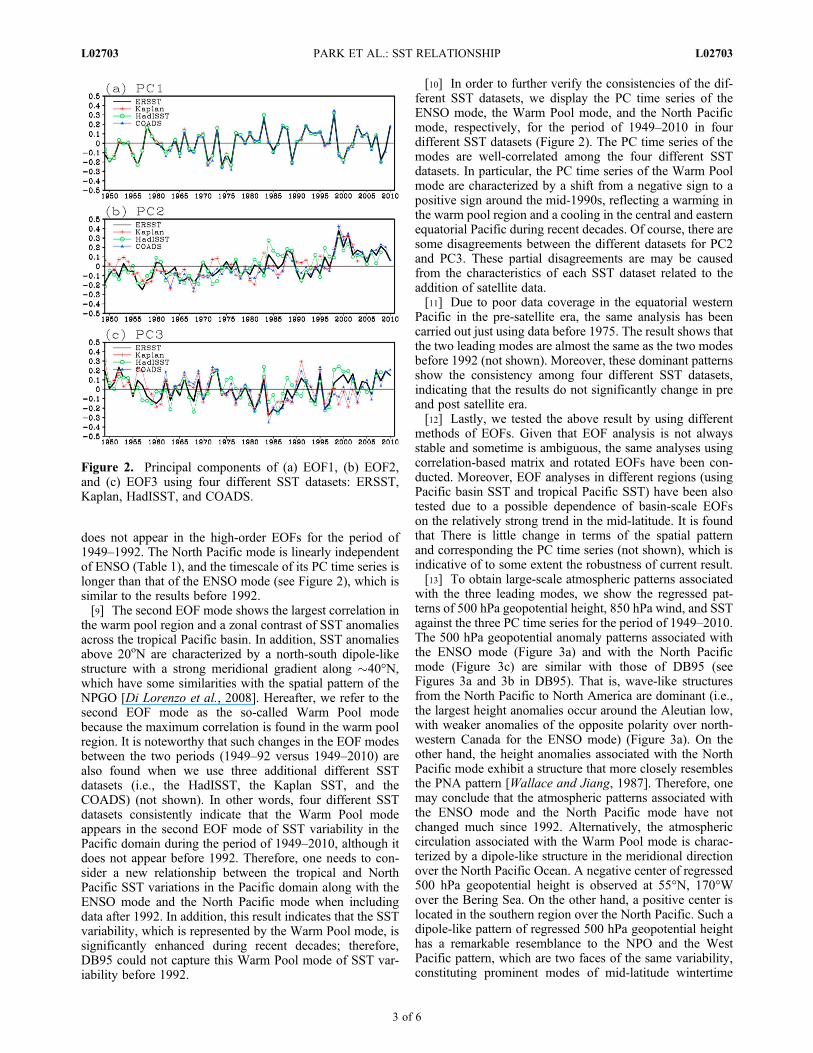
with the three leading modes, we show the regressed pat-terns of 500 hPa geopotential height, 850 hPa wind, and SSTagainst the three PC time series for the period of 1949–2010.The 500 hPa geopotential anomaly patterns associated withthe ENSO mode (Figure 3a) and with the North Pacificmode (Figure 3c) are similar with those of DB95 (seeFigures 3a and 3b in DB95). That is, wave-like structuresfrom the North Pacific to North America are dominant (i.e.,the largest height anomalies occur around the Aleutian low,with weaker anomalies of the opposite polarity over north-western Canada for the ENSO mode) (Figure 3a). On theother hand, the height anomalies associated with the NorthPacific mode exhibit a structure that more closely resemblesthe PNA pattern [Wallace and Jiang, 1987]. Therefore, onemay conclude that the atmospheric patterns associated withthe ENSO mode and the North Pacific mode have notchanged much since 1992. Alternatively, the atmosphericcirculation associated with the Warm Pool mode is charac-terized by a dipole-like structure in the meridional directionover the North Pacific Ocean. A negative center of regressed500 hPa geopotential height is observed at 55°N, 170°Wover the Bering Sea. On the other hand, a positive center islocated in the southern region over the North Pacific. Such adipole-like pattern of regressed 500 hPa geopotential heighthas a remarkable resemblance to the NPO and the WestPacific pattern, which are two faces of the same variability,constituting prominent modes of mid-latitude wintertime
Figure 2. Principal components of (a) EOF1, (b) EOF2,and (c) EOF3 using four different SST datasets: ERSST,Kaplan, HadISST, and COADS.
PARK ET AL.: SST RELATIONSHIP L02703L02703
3 of 6
atmospheric variability, the so-called NPO/WP pattern[Wallace and Gutzler, 1981; Linkin and Nigam, 2008].[14] Figures 3d–3f show that the North Pacific components
of the three SST modes underlie the zonal and meridionalsurface wind anomalies, such that when the westerlies arestronger, the SSTs are cooler and vice versa. Surface fluxesmay be important in forcing the SST anomalies over theNorth Pacific, as stated in DB95. The surface wind anomaliesassociated with the three modes are reasonably consistentwith the SST-wind relationship in the mid-latitudes [Lau andNath, 1994]. Westerly wind anomalies enhance the totalwind speed, cooling the ocean mixed layer by enhancing thefluxes of sensible and latent heat, strengthening entrainmentand cold advection due to Ekman currents. In detail, thespatial pattern of the North Pacific SST anomalies associatedwith the ENSO mode and the North Pacific mode is charac-terized by anomalous elliptical shaped regions of cold orwarm temperatures in the western and central North Pacific,accompanied by an opposite temperature to the east, northand south. On the other hand, the pattern associated withthe Warm Pool mode is characterized by changes in SST
anomalies in the meridional direction, which is in contrastto the ENSO mode and the North Pacific mode. However,one may conclude that the North Pacific SST componentis forced in relation to the three modes, at least in part bychanges in the atmospheric circulation.
4. Discussion and Concluding Remarks
[15] Using a longer period of data, the relationshipbetween the tropical and North Pacific SST variations duringwinter has been reexamined. In addition to the two dominantmodes in the Pacific Ocean (the ENSO mode and the NorthPacific mode), the Warm Pool mode appears when the recentperiod of data is included. The previous two dominantmodes, which have been identified by DB95, are ranked asthe first and the third modes in the period of 1949–2010 andexhibit similar large-scale patterns in comparison with thosebefore the early 1990s.[16] The Warm Pool mode accompanies the NPO-like
atmospheric pattern and the NPGO-like SST pattern in theNorth Pacific. According to previous studies, the NPGO isdominantly forced by the atmospheric forcing associated
Figure 3. (a–c) The 500 hPa geopotential height anomalies, and (d–f) surface wind anomalies regressed onto the PC timeseries 1 (Figures 3a and 3d), PC time series 2 (Figures 3b and 3e), and PC time series 3 (Figures 3c and 3f). Shaded arearepresents the 95% confidence region.
PARK ET AL.: SST RELATIONSHIP L02703L02703
4 of 6
with the NPO-like variability. Furthermore, the amplificationof the NPGO variance is found in observations during therecent decades [Douglass et al., 2006; Di Lorenzo et al.,2008; Ceballos et al., 2009]. Considering the linear trend intheWarm Pool mode and the result from previous studies, weargue that the Warm Pool mode contributes to the change inthe NPGO-like mean SST field through the atmospheric tel-econnections. In fact, we obtained the NPO-like dipolestructure, which is similar to Figure 3b, by subtracting themean filed during Warm Pool cooling period (1949–1996)from that during Warm Pool warming period (1997–2010).Since the SST in the warm pool exhibits a simple thermo-dynamic energy balance between evaporative heat loss andradiative energy input with little ocean dynamics [Newellet al., 1978], the warm pool SST is associated with anom-alous radiative forcing, including the forcing associated withanthropogenic greenhouse gas concentration increases.[17] One may argue that the ability of the observational
products to estimate the effects of global climate change inthe tropics is not so reliable because SST trends in thetropical Pacific are known to be inconsistent among differentSST datasets [Vecchi et al., 2008]. However, our supple-mentary analysis shows that SST trends during the period1949–2010 are similar in all SST datasets (not shown).Thus, we believe that the warm pool mode is a quite robustfeature in the Pacific basin during the last 60 years.[18] Based on these results, the synthesis of a possible
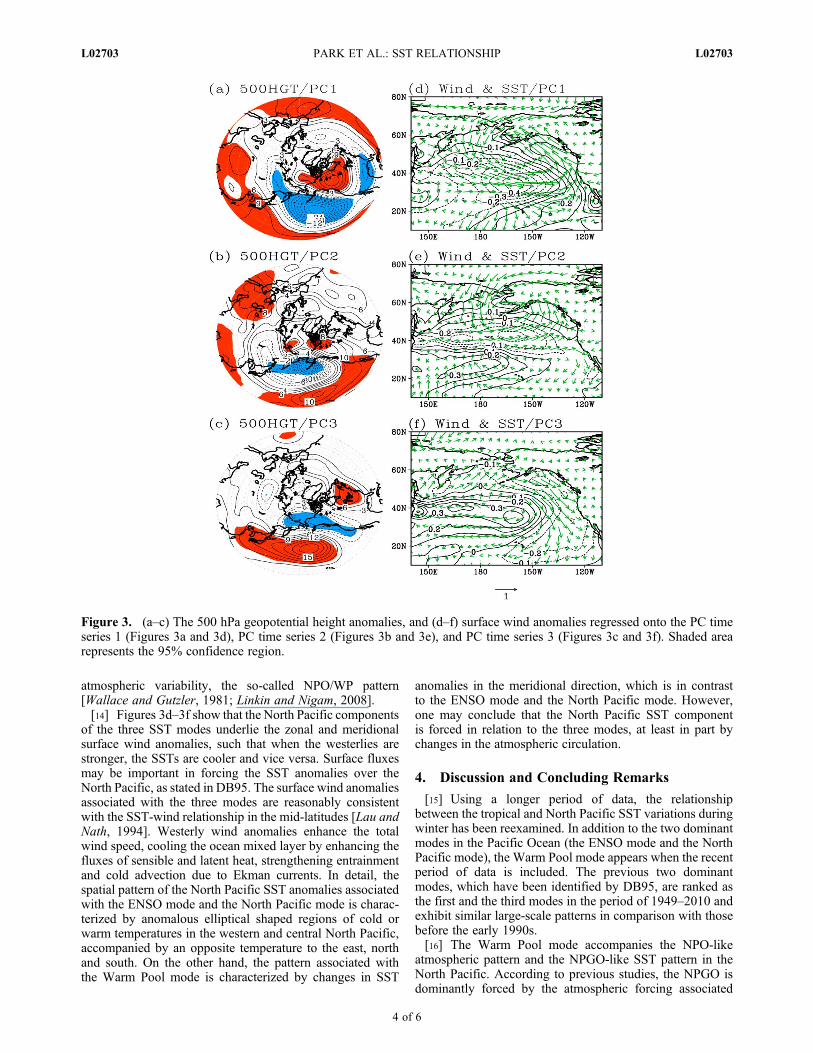
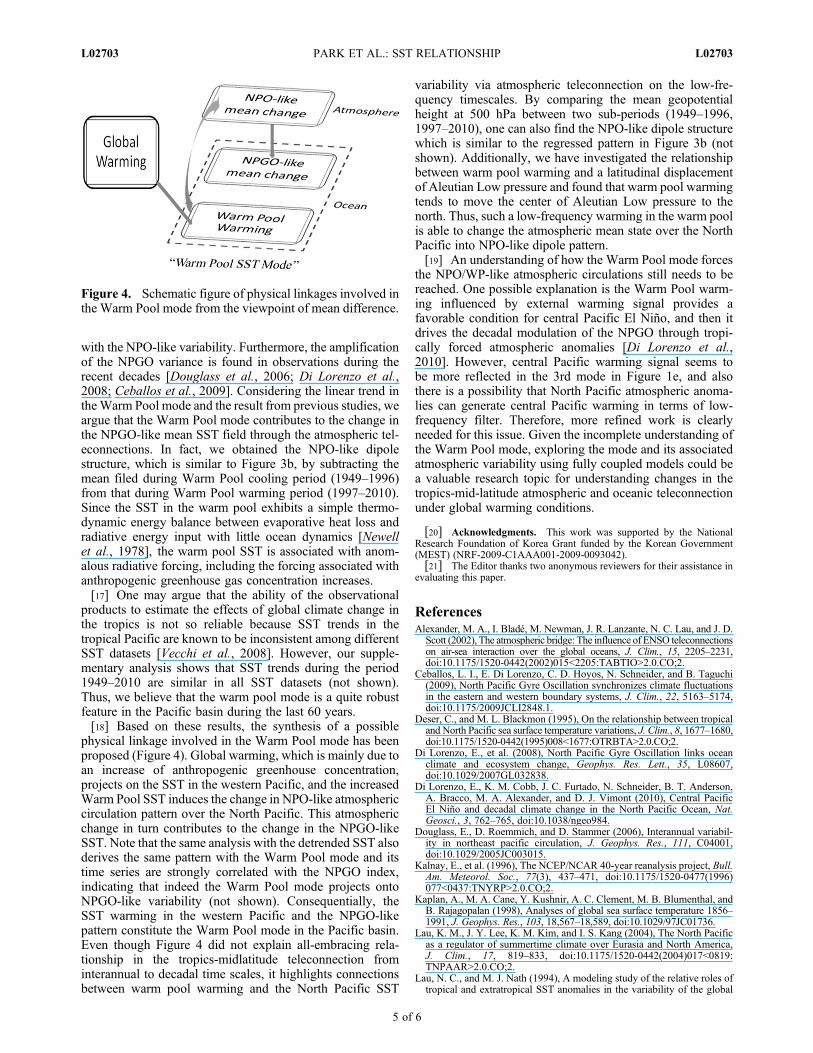
physical linkage involved in the Warm Pool mode has beenproposed (Figure 4). Global warming, which is mainly due toan increase of anthropogenic greenhouse concentration,projects on the SST in the western Pacific, and the increasedWarm Pool SST induces the change in NPO-like atmosphericcirculation pattern over the North Pacific. This atmosphericchange in turn contributes to the change in the NPGO-likeSST. Note that the same analysis with the detrended SST alsoderives the same pattern with the Warm Pool mode and itstime series are strongly correlated with the NPGO index,indicating that indeed the Warm Pool mode projects ontoNPGO-like variability (not shown). Consequentially, theSST warming in the western Pacific and the NPGO-likepattern constitute the Warm Pool mode in the Pacific basin.Even though Figure 4 did not explain all-embracing rela-tionship in the tropics-midlatitude teleconnection frominterannual to decadal time scales, it highlights connectionsbetween warm pool warming and the North Pacific SST
variability via atmospheric teleconnection on the low-fre-quency timescales. By comparing the mean geopotentialheight at 500 hPa between two sub-periods (1949–1996,1997–2010), one can also find the NPO-like dipole structurewhich is similar to the regressed pattern in Figure 3b (notshown). Additionally, we have investigated the relationshipbetween warm pool warming and a latitudinal displacementof Aleutian Low pressure and found that warm pool warmingtends to move the center of Aleutian Low pressure to thenorth. Thus, such a low-frequency warming in the warm poolis able to change the atmospheric mean state over the NorthPacific into NPO-like dipole pattern.[19] An understanding of how the Warm Pool mode forces
the NPO/WP-like atmospheric circulations still needs to bereached. One possible explanation is the Warm Pool warm-ing influenced by external warming signal provides afavorable condition for central Pacific El Niño, and then itdrives the decadal modulation of the NPGO through tropi-cally forced atmospheric anomalies [Di Lorenzo et al.,2010]. However, central Pacific warming signal seems tobe more reflected in the 3rd mode in Figure 1e, and alsothere is a possibility that North Pacific atmospheric anoma-lies can generate central Pacific warming in terms of low-frequency filter. Therefore, more refined work is clearlyneeded for this issue. Given the incomplete understanding ofthe Warm Pool mode, exploring the mode and its associatedatmospheric variability using fully coupled models could bea valuable research topic for understanding changes in thetropics-mid-latitude atmospheric and oceanic teleconnectionunder global warming conditions.
[20] Acknowledgments. This work was supported by the NationalResearch Foundation of Korea Grant funded by the Korean Government(MEST) (NRF-2009-C1AAA001-2009-0093042).[21] The Editor thanks two anonymous reviewers for their assistance in
evaluating this paper.
ReferencesAlexander, M. A., I. Bladé, M. Newman, J. R. Lanzante, N. C. Lau, and J. D.
Scott (2002), The atmospheric bridge: The influence of ENSO teleconnectionson air-sea interaction over the global oceans, J. Clim., 15, 2205–2231,doi:10.1175/1520-0442(2002)015<2205:TABTIO>2.0.CO;2.
Ceballos, L. I., E. Di Lorenzo, C. D. Hoyos, N. Schneider, and B. Taguchi(2009), North Pacific Gyre Oscillation synchronizes climate fluctuationsin the eastern and western boundary systems, J. Clim., 22, 5163–5174,doi:10.1175/2009JCLI2848.1.
Deser, C., and M. L. Blackmon (1995), On the relationship between tropicaland North Pacific sea surface temperature variations, J. Clim., 8, 1677–1680,doi:10.1175/1520-0442(1995)008<1677:OTRBTA>2.0.CO;2.
Di Lorenzo, E., et al. (2008), North Pacific Gyre Oscillation links oceanclimate and ecosystem change, Geophys. Res. Lett., 35, L08607,doi:10.1029/2007GL032838.
Di Lorenzo, E., K. M. Cobb, J. C. Furtado, N. Schneider, B. T. Anderson,A. Bracco, M. A. Alexander, and D. J. Vimont (2010), Central PacificEl Niño and decadal climate change in the North Pacific Ocean, Nat.Geosci., 3, 762–765, doi:10.1038/ngeo984.
Douglass, E., D. Roemmich, and D. Stammer (2006), Interannual variabil-ity in northeast pacific circulation, J. Geophys. Res., 111, C04001,doi:10.1029/2005JC003015.
Kalnay, E., et al. (1996), The NCEP/NCAR 40-year reanalysis project, Bull.Am. Meteorol. Soc., 77(3), 437–471, doi:10.1175/1520-0477(1996)077<0437:TNYRP>2.0.CO;2.
Kaplan, A., M. A. Cane, Y. Kushnir, A. C. Clement, M. B. Blumenthal, andB. Rajagopalan (1998), Analyses of global sea surface temperature 1856–1991, J. Geophys. Res., 103, 18,567–18,589, doi:10.1029/97JC01736.
Lau, K. M., J. Y. Lee, K. M. Kim, and I. S. Kang (2004), The North Pacificas a regulator of summertime climate over Eurasia and North America,J. Clim., 17, 819–833, doi:10.1175/1520-0442(2004)017<0819:TNPAAR>2.0.CO;2.
Lau, N. C., and M. J. Nath (1994), A modeling study of the relative roles oftropical and extratropical SST anomalies in the variability of the global
Figure 4. Schematic figure of physical linkages involved inthe Warm Pool mode from the viewpoint of mean difference.
PARK ET AL.: SST RELATIONSHIP L02703L02703
5 of 6
atmosphere-ocean system, J. Clim., 7, 1184–1207, doi:10.1175/1520-0442(1994)007<1184:AMSOTR>2.0.CO;2.
Lie, H.-J., and S. Lee (2010), Reconstruction of regular time series from bi-monthly temperature data in the Yellow Sea and the northwestern EastChina Sea, Ocean Sci. J., 45, 139–149, doi:10.1007/s12601-010-0012-5.
Linkin, M. E., and S. Nigam (2008), The North Pacific Oscillation-WestPacific Teleconnection pattern: Mature-phase structure and winterimpact, J. Clim., 21, 1979–1997, doi:10.1175/2007JCLI2048.1.
Livezey, R. E., and W. Chen (1983), Statistical field significance and itsdetermination byMonte Carlo techniques(in meteorology),Mon. WeatherRev., 111, 46–59, doi:10.1175/1520-0493(1983)111<0046:SFSAID>2.0.CO;2.
Newell, R. E., A. R. Navato, and J. Hsiung (1978), Long-term global sea sur-face temperature fluctuations and their possible influence on atmosphericCO2 concentrations, Pure Appl. Geophys., 116, 351–371, doi:10.1007/BF01636891.
Rayner, N. A., D. E. Parker, E. B. Horton, C. K. Folland, L. V. Alexander,D. P. Rowell, E. C. Kent, and A. Kaplan (2003), Global analyses of seasurface temperature, sea ice, and night marine air temperature since thelate nineteenth century, J. Geophys. Res., 108(D14), 4407, doi:10.1029/2002JD002670.
Smith, T. M., R. W. Reynolds, T. C. Peterson, and J. Lawrimore (2008),Improvements to NOAA’s historical merged land-ocean surface temper-ature analysis (1880–2006), J. Clim., 21, 2283–2296, doi:10.1175/2007JCLI2100.1.
Vecchi, G., A. Clement, and B. Soden (2008), Examining the tropical Pacific’sresponse to global warming, Eos Trans. AGU, 89(9), 81, doi:10.1029/2008EO090002.
Vimont, D. J., J. M. Wallace, and D. S. Battisti (2003), The seasonal foot-printing mechanism in the Pacific: Implication for ENSO, J. Clim., 16,2668–2675.
Wallace, J. M., and D. S. Gutzler (1981), Teleconnections in the geopoten-tial height field during the Northern Hemisphere winter, Mon. WeatherRev., 109, 784–812.
Wallace, J. M., and Q. Jiang (1987), On the observed structure ofthe interannual variability of the atmosphere-ocean climate system, inAtmospheric and Oceanic Variability, edited by H. Cattle, RoyalMeteorology Society, Reading, U. K., pp. 17–43.
Woodruff, S., H. Diaz, J. Elms, and S. Worley (1998), COADS Release 2data and metadata enhancements for improvements of marine surfaceflux fields, Phys. Chem. Earth, 23(5–6), 517–526, doi:10.1016/S0079-1946(98)00064-0.
Yoon, J., and S. W. Yeh (2010), Influence of the Pacific Decadal Oscilla-tion on the relationship between El Niño and the northeast Asian summermonsoon, J. Clim., 23, 4525–4537, doi:10.1175/2010JCLI3352.1.
J.-S. Kug and J.-Y. Park, Korean Ocean Research Development andInstitute, 1270 Sa-2-dong, Ansan, 426-744, South Korea.S.-W. Yeh, Department of Environmental Marine Science, Hanyang
University, 1271 Sa-3-dong, Ansan, 426-791, South Korea. ([email protected])
PARK ET AL.: SST RELATIONSHIP L02703L02703
6 of 6