Embed Size (px)
Citation preview
1
A REVIEW OF THE SCIENTIFIC LITERATUREON RIPARIAN BUFFER
WIDTH, EXTENT AND VEGETATION
Seth Wenger
for the
Office of Public Service & OutreachInstitute of Ecology
University of Georgia
Revised Version • March 5, 1999
In s t i t u t e o f E co l o g y, Un i v e r s i t y o f Geo rg i a , A t h en s , Geo rg i a , 30602 -2202706 .542 .3948 l f ow l e r@ arches. u g a . edu

2
The Office of Public Service and Outreach at theInstitute of Ecology provides scientific and legal ex-pertise to the citizens of Georgia in the developmentof policies and practices to protect our natural heri-tage. The goals of the office are to:
• Develop and implement a research agenda to meetcommunity needs;
• Provide an opportunity for students, faculty andstaff to work with other disciplines in integratedenvironmental decisionmaking and problem-solving to improve their ability to understand,communicate with, and influence otherdisciplines;
• Build capacity for service learning in the sciencesby providing students an opportunity to applyskills learned in the traditional classroom settingto pressing community concerns and problems;
• Support high quality science education in K-12schools by providing programs for students andinstructional support and training for teachers;
• Increase awareness of the importance ofaddressing environmental issues proactivelywithin the university community and the greatercommunity.The publication of this paper was made possible
by support from the Turner Foundation, R.E.M./Athens, L.L.C., and the University of Georgia Officeof the Vice President for Public Service and Outreach.
For more information about the Office of PublicService and Outreach at the Institute of Ecology, pleasecontact Laurie Fowler at 706-542-3948.

3
EXECUTIVE SUMMARY
Many local governments in Georgia aredeveloping riparian buffer protection plans andordinances without the benefit of scientifically-based guidelines. To address this problem, over140 articles and books were reviewed to establisha legally-defensible basis for determining riparianbuffer width, extent and vegetation. This docu-ment presents the results of this review andproposes several simple formulae for bufferdelineation that can be applied on a municipal orcounty-wide scale.
Sediment is the worst pollutant in manystreams and rivers. Scientific research has shownthat vegetative buffers are effective at trappingsediment from runoff and at reducing channelerosion. Studies have yielded a range of recom-mendations for buffer widths; buffers as narrowas 4.6 m (15 ft) have proven fairly effective in theshort term, although wider buffers providegreater sediment control, especially on steeperslopes. Long-term studies suggest the need formuch wider buffers. It appears that a 30 m (100ft) buffer is sufficiently wide to trap sedimentsunder most circumstances, although buffersshould be extended for steeper slopes. Anabsolute minimum width would be 9 m (30 ft).To be most effective, buffers must extend along allstreams, including intermittent and ephemeralchannels. Buffers must be augmented by limits onimpervious surfaces and strictly enforced on-sitesediment controls. Both grassed and forestedbuffers are effective at trapping sediment, al-though forested buffers provide other benefits aswell.
Buffers are short-term sinks for phosphorus,but over the long term their effectiveness islimited. In many cases phosphorus is attached tosediment or organic matter, so buffers sufficientlywide to control sediment should also provideadequate short-term phosphorus control. How-ever, long-term management of phosphorusrequires effective on-site management of itssources. Buffers can provide very good control ofnitrogen, include nitrate. The widths necessaryfor reducing nitrate concentrations vary based onlocal hydrology, soil factors, slope and othervariables. In most cases 30 m (100 ft) buffersshould provide good control, and 15 m (50 ft)
buffers should be sufficient under many condi-tions. It is especially important to preservewetlands, which are sites of high denitrificationactivity.
To maintain aquatic habitat, the literatureindicates that 10-30 m (35-100 ft) native forestedriparian buffers should be preserved or restoredalong all streams. This will provide streamtemperature control and inputs of large woodydebris and other organic matter necessary foraquatic organisms. While narrow buffers offerconsiderable habitat benefits to many species,protecting diverse terrestrial riparian wildlifecommunities requires some buffers of at least 100meters (300 feet). To provide optimal habitat,native forest vegetation should be maintained orrestored in all buffers.
A review of existing models for buffer widthand effectiveness showed that none are appropri-ate for county-level buffer protection. Modelswere found to be either too data-intensive to bepractical or else lacked verification and calibra-tion. Potential variables for use in a buffer widthformula were considered. Buffer slope and thepresence of wetlands were determined to be themost important and useful factors in determiningbuffer width.
Three options for buffer guidelines wereproposed. All are defensible given the scientificliterature. The first provides the greatest level ofprotection for stream corridors, including goodcontrol of sediment and other contaminants,maintenance of quality aquatic habitat, and someminimal terrestrial wildlife habitat. The secondoption should also provide good protection undermost circumstances, although severe storms,floods, or poor management of contaminantsources could more easily overwhelm the buffer.
Option One:
• Base width: 100 ft (30.5 m) plus 2 ft (0.61 m)per 1% of slope.
• Extend to edge of floodplain.
• Include adjacent wetlands. The buffer widthis extended by the width of the wetlands,which guarantees that the entire wetland andan additional buffer are protected.
4
• Existing impervious surfaces in the riparianzone do not count toward buffer width (i.e.,the width is extended by the width of theimpervious surface, just as for wetlands).
• Slopes over 25% do not count toward thewidth.
• The buffer applies to all perennial,intermittent and ephemeral streams.
Option Two:
The same as Option One, except:
• Base width is 50 ft (15.2 m) plus 2 ft (0.61 m)per 1% of slope.
• Entire floodplain is not necessarily includedin buffer, although potential sources of severecontamination should be excluded from thefloodplain.
• Ephemeral streams are not included; affectedstreams are those that appear on USGeological Survey 1:24,000 topographicquadrangles. Alternatively, buffer can beapplied to all perennial streams plus allintermittent streams of second order or larger
Option Three:
• Fixed buffer width of 100 ft.
• The buffer applies to all streams that appearon US Geological Survey 1:24,000topographic quadrangles or, alternatively, allperennial streams plus all intermittent streamsof second order or larger (as for OptionTwo).
For all options, buffer vegetation shouldconsist of native forest. Restoration should beconducted when necessary and possible.
All major sources of contamination should beexcluded from the buffer. These include con-struction resulting in major land disturbance,impervious surfaces, logging roads, miningactivities, septic tank drain fields, agriculturalfields, waste disposal sites, livestock, and clearcutting of forests. Application of pesticides andfertilizer should also be prohibited, except as maybe needed for buffer restoration.
All of the buffer options described above willprovide some habitat for many terrestrial wildlifespecies. To provide habitat for forest interiorspecies, at least some riparian tracts of at least300 ft width should also be preserved. Identifica-tion of these areas should be part of an overall,county-wide wildlife protection plan.
For riparian buffers to be most effective,some related issues must also be addressed. Theseinclude reducing impervious surfaces, managingpollutants on-site, and minimizing buffer gaps.

5
Contents
EXECUTIVE SUMMARY .............................................................................................................................3I. BACKGROUND AND INTRODUCTION ................................................................................................6
Acknowledgments ..................................................................................................................................8Scope of Review .....................................................................................................................................8Why Another Literature Review?............................................................................................................9Background on Riparian Zones ..............................................................................................................9
II. SEDIMENT............................................................................................................................................11Effects ..................................................................................................................................................11Sources .................................................................................................................................................11Literature Review .................................................................................................................................13Sediment in Surface Runoff ..................................................................................................................14Channel Erosion ...................................................................................................................................18Summary and Recommendations ..........................................................................................................20
III. NUTRIENTS AND OTHER CONTAMINANTS ..................................................................................21A. PHOSPHORUS................................................................................................................................21
Effects ............................................................................................................................................21Sources ..........................................................................................................................................21Literature Review ...........................................................................................................................21Vegetation ......................................................................................................................................23Summary and Recommendations ...................................................................................................24
B. NITROGEN.....................................................................................................................................24Effects ............................................................................................................................................24Sources ..........................................................................................................................................24Literature Review ...........................................................................................................................25Summary and Recommendations ...................................................................................................32
C. OTHER CONTAMINANTS ............................................................................................................32Organic Matter and Biological Contaminants.................................................................................30Pesticides and Metals......................................................................................................................31Summary and Recommendations ...................................................................................................31
IV. OTHER FACTORS INFLUENCING AQUATIC HABITAT ...................................................................32Woody Debris and Litter Inputs ............................................................................................................32Temperature and Light Control ............................................................................................................33Summary and Recommendations ..........................................................................................................34
V. TERRESTRIAL WILDLIFE HABITAT ....................................................................................................35Literature Review .................................................................................................................................35Summary and Recommendations ..........................................................................................................38Flood Control and Other Riparian Buffer Functions .............................................................................38
VI. DEVELOPMENT OF RIPARIAN BUFFER GUIDELINES ....................................................................39A. Review of Models to Determine Buffer Width and Effectiveness ......................................................39B. Factors Influencing Buffer Width ......................................................................................................41C. Buffer Guidelines for Water Quality Protection ................................................................................45D. Other Considerations ......................................................................................................................47
REFERENCES ............................................................................................................................................50

6
Riparian buffers have gained wide acceptanceas tools for protecting water quality, maintainingwildlife habitat and providing other benefits topeople and the environment (Lowrance 1998,USEPA 1998). Today in Georgia, as in manyother states, local governments are developingprograms to protect riparian buffers. Laws suchas the Georgia Planning Act and the Mountainand River Corridor Protection Act give countiesand municipalities strong incentives to incorpo-rate aquatic resource protection into their plansand ordinances. However, scientifically-basedguidelines for local riparian buffer ordinances arenot readily available. The minimum standardsissued by the Department of Natural Resources’Environmental Protection Division (EPD) are notbased on current scientific research and do notprovide a strong level of resource protection.Many local governments are interested in devel-oping effective, comprehensive riparian bufferregulations, but fear that without solid scientificsupport, such ordinances would not be legallydefensible.
The purpose of this document is to provide ascientific foundation for riparian buffer ordi-nances established by local governments inGeorgia. To achieve this goal more than 140articles and books were reviewed with an eyetoward determining the optimal width, extent(i.e., which streams are protected) and vegetation(e.g., forest or grass) of riparian buffers. Thistask is challenging due to the lack of research incertain geographic regions. Although a largenumber of riparian buffer studies have beenconducted in the Georgia Coastal Plain (seeFigure 1), there has been very little researchspecific to the physiographic provinces of NorthGeorgia (Piedmont, Blue Ridge, Valley andRidge) or to urban and suburban areas. Never-theless, it is apparent in reviewing the literaturethat there are general trends which cut acrossgeographic boundaries. Based on current re-search, it is possible to develop defensibleguidelines for determining riparian buffer width,extent and vegetation that are applicable to muchof Georgia and beyond. Naturally, these recom-mendations will not be as accurate as thosesupplied by data-intensive models applied on asite-by-site basis (such as the REMM model
I. Background and Introduction
developed by Richard Lowrance and colleagues).However, these guidelines have the virtue ofbeing simple enough to be incorporated into acounty or municipal ordinance.
The guidelines proposed in this documentshould be viewed as a reasonable interpretation ofthe best available scientific research. If additionalriparian buffer studies are conducted in NorthGeorgia, urban areas, and other neglected regions,it may be possible to refine the recommendations.However, this in no way means that the currentstate of our knowledge is insufficient to developgood policy guidelines and implement effectivebuffer ordinances. As Lowrance et al noted in1997:
“Research is sometimes applied to broad-scaleenvironmental issues with inadequate knowl-edge or incomplete understanding. Publicpolicies to encourage or require landscapemanagement techniques such as riparian(streamside) management will often need toproceed with best professional judgmentdecisions based on incomplete understanding.”
Local officials and natural resource managersare making decisions on riparian buffers today.The scientific community would be remiss if itfailed to provide these decision makers with thebest available information.
To ensure that this review has covered themost relevant research and has made reasonableconclusions, other members of the scientificcommunity were asked to review its findings.These reviewers included:
• Richard Lowrance, Ph.D., USDA-AgriculturalResearch Service
• David Correll, Ph.D., SmithsonianEnvironmental Research Center
• Cathy Pringle, Ph.D., University of Georgia
• Laurie Fowler, J.D., L.L.M., University ofGeorgia
• Judy Meyer, Ph.D., University of Georgia
• Ronald Bjorkland, University of Georgia
• Michael Paul, University of Georgia
Background and Introduction

7
Figure 1. Physiographic Provinces of Georgia.
Although there has been a signficant amount of riparian buffer research in the Georgia Coastal Plain,there has been much less research conducted in the other physiographic provinces (Keys et al 1995, asmodified by J. P. Schmidt)
Background and Introduction
(Map of physiographic provinces)

8
The corrections, additions and changes madeby these reviewers, as well as the comments andsuggestions other people have made on an earlierdraft of this document, have been incorporatedinto this revised version.
Acknowledgments
This review would have been impossiblewithout the assistance and support of numerouspeople, and much of the credit for this project lieswith these individuals. Laurie Fowler suggestedthe idea of the project and helped to guide itsprogress, while Cathy Pringle made certain itremained focused and manageable. RonaldBjorkland made extremely thorough and thought-ful comments on a draft version of this document.Richard Lowrance and David Correll, two of theleading researchers on riparian buffers, weregenerous enough to provide expert criticism andmade important corrections. Many others havelent their expertise and have patiently taken timeto answer my questions. Some of their personalcomments and expert opinions are included inthis review.
• Katherine Baer, Sally Bethea and AliceChampagne, Upper Chattahoochee RiverKeeper
• Jimmy Bramblett, Natural ResourcesConservation Service
• Miguel Cabrera, University of Georgia
• Robert Cooper, University of Georgia
• Gail Cowie, Institute for Community andArea Development
• Bruce Ferguson, University of Georgia
• Christa Frangiamore, University of Georgia
• Charlie Frear, Limestone Valley ResourceConservation and Development
• Byron J. “Bud” Freeman, University ofGeorgia
• Mary Freeman, University of Georgia
• Robin Goodloe, U.S. Fish and WildlifeService
• Gene Helfman, University of Georgia
• Tara Hottenstein, University of Georgia
• Rhett Jackson , University of Georgia
• Bob James, Gently Down the River
• Carl Jordan, University of Georgia
• Elizabeth Kramer, University of Georgia
• James Kundell, University of Georgia/CarlVinson Institute of Government
• Steve Lawrence, Natural ResourcesConservation Service
• Judy Meyer, University of Georgia
• Ken Patton, Manager, Cherokee CountyPlanning and Zoning Office
• Michael Paul, University of Georgia
• Scott Pohlman, University of Georgia
• Todd Rasmussen, University of Georgia
• Rebecca Sharitz, University of Georgia
• Chris Skelton, Georgia Department ofNatural Resources
• Brian Toth, J.P. Schmidt and Karen Payne,NARSAL, University of Georgia
• David Walters, University of Georgia
• The rest of the Pringle and Fowler Labs andmy other colleagues at the Institute ofEcology
Scope of Review
There are literally hundreds of articles anddozens of books written on the subject of riparianbuffer zones. The 1997 version of DavidCorrell’s riparian bibliography (Correll 1997),which is limited to works on nutrients, sedimentsand toxic contaminants, lists 522 citations. JohnVan Deventer published a bibliography in 1992 ofan astounding 3252 articles that relate to riparianresearch and management, though most of theliterature cited does not directly address bufferzones (Deventer 1992). Given the volume ofliterature available, it was apparent from thebeginning that this review would have to belimited in some ways. Priority was given to:
• articles which specifically deal with the issuesof riparian buffer width, extent andvegetation
• previous literature reviews
• articles focused on Georgia and the Piedmont
• seminal articles in the field
Background and Introduction

9
• recent articles (1990-1998) especially thosenot included in prior literature reviews
• articles from refereed journals (althoughseveral good government documents andother works from the “grey literature” areincluded)
Over 140 sources are included in this review.
Why Another Literature Review?As of this writing there exist several excellent
literature reviews on riparian buffer zones. TheU.S. Army Corps of Engineers New EnglandDivision conducted a 1991 literature review forthe State of Vermont called Buffer Strips forRiparian Zone Management that is similar inscope and purpose to this document. It differsfrom most other reviews in that it covers virtuallyall of the functions of riparian buffers, includinginstream and riparian wildlife habitat as well aswater quality functions. It also shares thisdocument’s focus on buffer width, although itultimately makes no width recommendations.Another thorough and useful review is Desbonnetet al’s 1994 Vegetated Buffers in the Coastal Zone:A Summary Review and Bibliography. Despite itstitle, this work reviews research from manyregions, not just the coastal zone. The review israther weak on wildlife habitat studies, however,since it predates much of the best literature.Lowrance and a team of riparian buffer research-ers collaborated on a 1997 paper that synthesizesresearch on sediment and nutrient retention andpresents guidelines for buffers in the ChesapeakeBay watershed. Other useful reviews includeClinnick et al 1985, Muscutt et al 1993, Osborneand Kovacic 1993, Castelle et al 1994, Fennesyand Cronk 1997 and Bjorkland (unpublished).
As useful as these previous works were, a newreview was necessary to include recent studies, toconsider the full range of buffer functions (nutri-ent reduction, wildlife habitat, etc.), and toaddress the primary issue of concern: determiningthe optimal width, extent and vegetation forbuffer zones in Georgia. This works relies heavilyon previous reviews, although in most cases theoriginal research articles were consulted as well.
Background on Riparian ZonesDefinitions
Before proceeding it will be helpful toestablish definitions for some key concepts. Theword riparian is especially subject to confusion,and currently there appears to be no universallyaccepted definition of the term. One of the betterdefinitions comes from Lowrance et al (1985):“‘Riparian ecosystems’ are the complex assem-blage of organisms and their environment existingadjacent to and near flowing water.” Malanson(1991) offers an attractively simple definition:“the ecosystems adjacent to the river.” Bjorkland(unpublished) provides a thorough review ofpublished definitions for the term. Some of thesedefinitions even use “riparian” to refer to theedges of bodies of water other than streams andrivers. This broader usage reflects the original,legal definition of the term, which referred toland adjoining any water body (David Correll,pers. com.). In this review the term is used in twoways: (1) to refer to the “natural” riparian area(Figure 2), the zone along streams and rivers thatin its undisturbed state has a floral and faunalcommunity distinct from surrounding uplandareas, and (2) in the most general sense to refer tothe zone along streams and rivers which mightbenefit from some type of protection. Streamcorridor and river corridor will sometimes beused synonymously with riparian zone.
A riparian zone that is afforded some degreeof protection is a riparian buffer zone. The word“buffer” is used because one of the functions ofthe protected area is to buffer the stream from theimpact of human land use activities, such asfarming and construction. Numerous other termsare also used to refer to this protected zone, bothin this document and in the scientific literature:riparian management zone, riparian forestedbuffer strip, stream buffer zone and protectedstream corridor are all taken to be synonymouswith riparian buffer zone for the purposes of thisreview. Within this document the term is alsofrequently shortened to buffer zone, riparianbuffer or simply buffer. Note that in some fields,especially agricultural research, the term buffer isapplied in a more general sense to a variety ofconservation practices. The terms vegetatedbuffer strip and vegetated filter strip (VFS) areoften used to refer to strips of grass or otherplants installed between or below agricultural
Background and Introduction
10
fields to reduce erosion and trap contaminants.For the sake of clarity, these terms are not used inthis review.
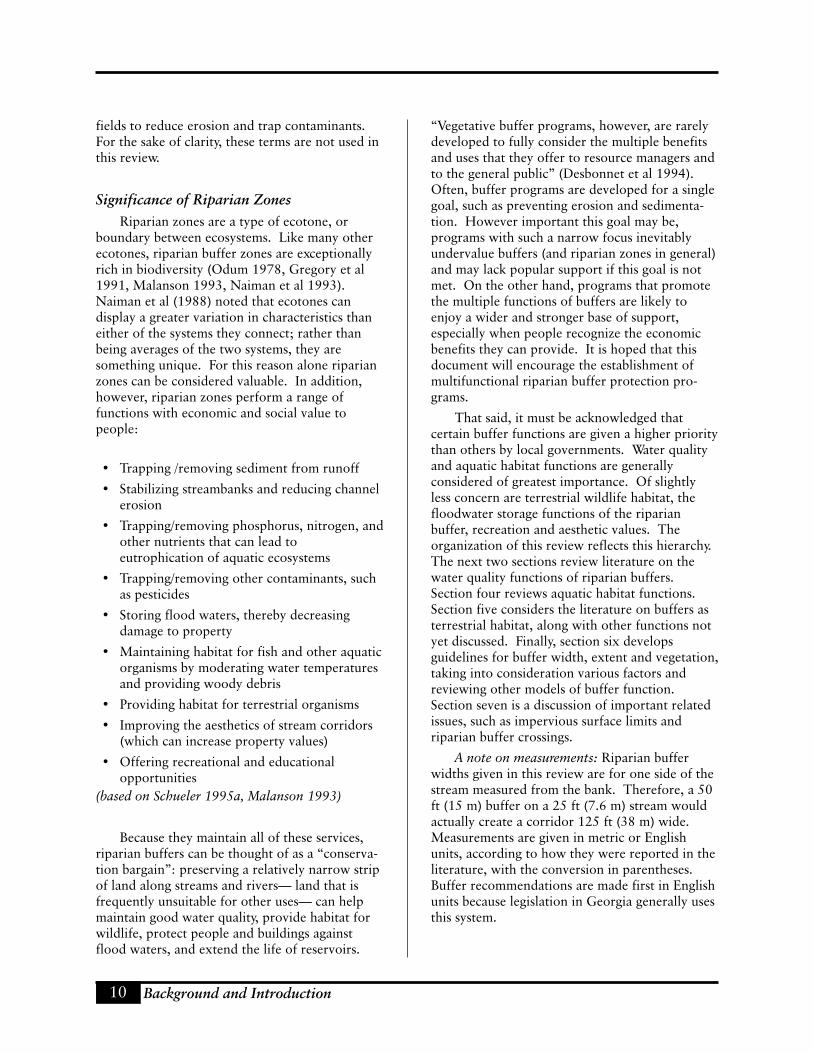
Significance of Riparian ZonesRiparian zones are a type of ecotone, or
boundary between ecosystems. Like many otherecotones, riparian buffer zones are exceptionallyrich in biodiversity (Odum 1978, Gregory et al1991, Malanson 1993, Naiman et al 1993).Naiman et al (1988) noted that ecotones candisplay a greater variation in characteristics thaneither of the systems they connect; rather thanbeing averages of the two systems, they aresomething unique. For this reason alone riparianzones can be considered valuable. In addition,however, riparian zones perform a range offunctions with economic and social value topeople:
• Trapping /removing sediment from runoff
• Stabilizing streambanks and reducing channelerosion
• Trapping/removing phosphorus, nitrogen, andother nutrients that can lead toeutrophication of aquatic ecosystems
• Trapping/removing other contaminants, suchas pesticides
• Storing flood waters, thereby decreasingdamage to property
• Maintaining habitat for fish and other aquaticorganisms by moderating water temperaturesand providing woody debris
• Providing habitat for terrestrial organisms
• Improving the aesthetics of stream corridors(which can increase property values)
• Offering recreational and educationalopportunities
(based on Schueler 1995a, Malanson 1993)
Because they maintain all of these services,riparian buffers can be thought of as a “conserva-tion bargain”: preserving a relatively narrow stripof land along streams and rivers— land that isfrequently unsuitable for other uses— can helpmaintain good water quality, provide habitat forwildlife, protect people and buildings againstflood waters, and extend the life of reservoirs.
“Vegetative buffer programs, however, are rarelydeveloped to fully consider the multiple benefitsand uses that they offer to resource managers andto the general public” (Desbonnet et al 1994).Often, buffer programs are developed for a singlegoal, such as preventing erosion and sedimenta-tion. However important this goal may be,programs with such a narrow focus inevitablyundervalue buffers (and riparian zones in general)and may lack popular support if this goal is notmet. On the other hand, programs that promotethe multiple functions of buffers are likely toenjoy a wider and stronger base of support,especially when people recognize the economicbenefits they can provide. It is hoped that thisdocument will encourage the establishment ofmultifunctional riparian buffer protection pro-grams.
That said, it must be acknowledged thatcertain buffer functions are given a higher prioritythan others by local governments. Water qualityand aquatic habitat functions are generallyconsidered of greatest importance. Of slightlyless concern are terrestrial wildlife habitat, thefloodwater storage functions of the riparianbuffer, recreation and aesthetic values. Theorganization of this review reflects this hierarchy.The next two sections review literature on thewater quality functions of riparian buffers.Section four reviews aquatic habitat functions.Section five considers the literature on buffers asterrestrial habitat, along with other functions notyet discussed. Finally, section six developsguidelines for buffer width, extent and vegetation,taking into consideration various factors andreviewing other models of buffer function.Section seven is a discussion of important relatedissues, such as impervious surface limits andriparian buffer crossings.
A note on measurements: Riparian bufferwidths given in this review are for one side of thestream measured from the bank. Therefore, a 50ft (15 m) buffer on a 25 ft (7.6 m) stream wouldactually create a corridor 125 ft (38 m) wide.Measurements are given in metric or Englishunits, according to how they were reported in theliterature, with the conversion in parentheses.Buffer recommendations are made first in Englishunits because legislation in Georgia generally usesthis system.
Background and Introduction

11
Figure 2. View of a River with an IntactRiparian Zone.
This is the Etowah River in Cherokee County, GA.
In terms of volume, sediment is the largestpollutant of streams and rivers (Cooper 1993). Inmuch of Georgia, sediment levels in streams havehistorically been high due to agricultural activi-ties. The decline in row crop acreage and im-provements in erosion control practices have ledto decreased agricultural sedimentation, but inurbanizing parts of the state these gains have beenoffset by sedimentation from construction(Kundell and Rasmussen 1995).
EffectsExcess amounts of sediment can have numer-
ous deleterious effects on water quality andstream biota. For a full discussion of this topic,refer to Waters 1995 and Wood and Armitage1997. The following brief list summarizes themajor sediment effects.
• Sediment in municipal water is harmful tohumans and to industrial processes.
• Sediment deposited on stream beds reduceshabitat for fish and for the invertebrates thatmany fish consume.
• Suspended sediment reduces lighttransmittance, decreasing algal production.
• High concentrations of fine suspendedsediments cause direct mortality for manyfish.
• Suspended sediments reduce the abundanceof filter-feeding organisms, includingmollusks and some arthropods.
• Sedimentation reduces the capacity and theuseful life of reservoirs.
Sediment must be filtered from municipalwater supplies at considerable cost. The greaterthe turbidity levels in water, the higher the priceof treatment (Kundell and Rasmussen 1995).Note that both suspended sediment (sometimesapproximated by turbidity measurements) andbenthic sediment have detrimental biologicaleffects, and that benthic sediment can becomeresuspended during high flows. Certain fish aremore responsive to sediments than others.
II. Sediment
Although many species of fish found in Georgia’swaters are sediment tolerant, many of the threat-ened and endangered species, such as darters,tend to be very sensitive to siltation (Kundell andRasmussen 1995, Freeman and Barnes 1996,Barnes et al 1997, Burkhead et al 1997). Themany endangered species of native mussels maybe the most sensitive organisms of all (Morris andCorkum 1996).
SourcesSediment in streams either comes from runoff
from upland sources or from the channel itself.Upland sources include row crop agricultural
Sediment

12
fields, exposed earth at construction sites, andlogging roads, for example. Channel-derivedsediment may result from the erosion of poorlystabilized banks and from scouring of the streambed. Livestock watering in streams can contributesignificantly to bank destabilization and erosion(Waters 1992). Note that much channel-derivedsediment may originally have been uplandsediment that is temporarily stored in the stre-ambed or riparian zone (Trimble 1970, Wood andArmitage 1997).
Construction SitesIn urban and urbanizing areas, construction is
likely to be the major source of sediment (seeFigure 3). Streams draining urban areas oftenhave higher sediment loads than those in agricul-tural watersheds (Crawford and Lenat 1989) andcertainly have higher rates than forested areas(Wahl et al 1997). A recent report by the U.S.Geological Survey found that urban streams inGeorgia are the most degraded (Frick et al 1998).
MiningVarious forms of mining can produce severe
sedimentation (Waters 1992, Burkhead et al1997). Gravel dredging can be considered a formof mining which is especially harmful because ittakes place within the river itself. This has directnegative effects on stream organ-isms and increases downstreamturbidity, as local residents andcanoeists have observed (BobJames, pers. com.). In addition,dredging may release sediment-bound contaminants (BurrussInstitute 1998) and contributes tostream downcutting, both at thesite and upstream (Pringle 1997).
Agricultural SourcesAccording to Waters (1992),
row-crop agriculture and livestockare the top two sources of sedimentnationwide. Row crop agricultureis no longer widely practiced inmuch of North Georgia, and inSouth Georgia row-crop agricul-ture tends to be concentrated in
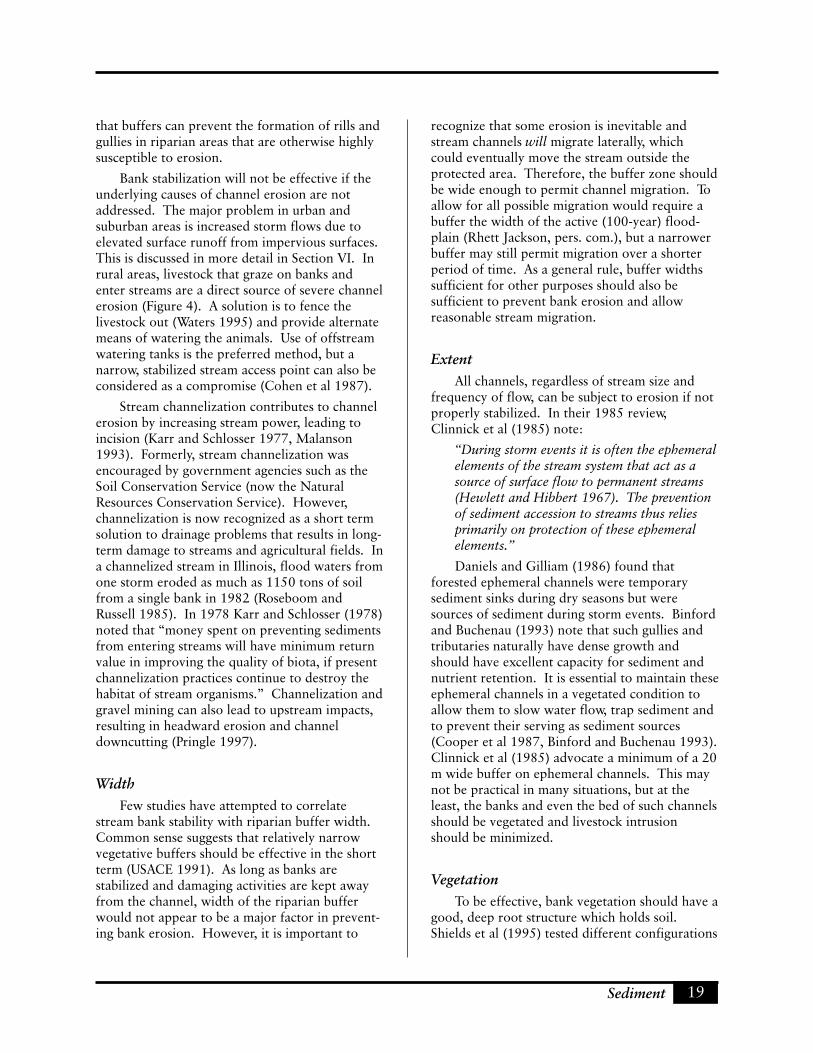
upland areas (Frick et al 1998). However, cattleare raised throughout Georgia (GA Departmentof Agriculture 1997) and frequently are permitteddirect access to streams and rivers, resulting inbank erosion (pers. obs.; see Figure 4).
ForestryStreams in forested areas are not necessarily
pristine. Improperly stabilized logging roads canyield over 350 tons of sediment per acre per year(Kundell and Rasmussen 1995). Some of the firstresearch on riparian buffers was initiated todetermine logging road setbacks (e.g., Trimbleand Sartz 1957). The Georgia Forestry Commis-sion advocates Best Management Practices (BMPs)for logging operations, but compliance is volun-tary. The most recent BMPs have placed limits onlogging in “streamside management zones”(buffers), which vary in width from 20-100 ft (6-30 m) depending on slope and stream type(Georgia Forestry Commission 1999).
Historic SedimentationMany streams and rivers in Georgia have
experienced a long history of sedimentation.Throughout the 1800s and up until the 1940s,massive soil erosion from cotton farming andother forms of row crop agriculture led to severesedimentation of streams all across the Georgia
Figure 3. Impacts of Development.This riparian zone has been stripped of vegetation in prepara-tion for the construction of subdivisions. A properly enforcedriparian buffer ordinance could prevent this type of problem.
Sediment

13
Piedmont (Trimble 1970, Kundelland Rasmussen 1995). Someareas, such as the upper Chatta-hoochee and Etowah Rivers, werealso impacted by hydraulic goldmining, when “entire hillsides”were washed into streams (Glenn1911), leading to rapid sedimen-tation and aggradation of riversand floodplains (Leigh 1994).The channels of many streamswere entirely filled with sedimentover time. For example, the bedof the Etowah River at Canton,GA, rose 4.8 ft (1.46 m) between1890 and 1949 (Walters unpub-lished). With the decline of goldmining and agriculture in theregion, as well as the adoption ofbetter soil conservation practices,sedimentation rates decreased andmany Piedmont streams experi-enced downcutting, as channelscarved deeper and wider into theloose beds of sand (Trimble 1970,Burke 1996). There is evidence,however, that as of the 1980s sedimentation isagain increasing in some Piedmont rivers, perhapsas a result of construction (Burruss Institute 1998,Walters unpublished).
It appears likely that sediment now stored instream channels continues to cause high turbidityduring storms (Trimble 1970; Rhett Jackson, pers.com.). Sediment in the larger Piedmont streamsand rivers may also increase as sand from tributar-ies migrates downstream. Riparian buffers willprobably little effect on this sediment source(except as they contribute to bank stability), butthey are essential in preventing additional degra-dation to water quality, especially in smallertributaries.
Literature ReviewRiparian buffers can reduce stream sedimen-
tation in six ways:
1) by displacing sediment-producing activitiesaway from flowing water (setbacks)
2) by trapping terrestrial sediments in surfacerunoff
Figure 4. Bank Erosion from Livestock Intrusion.
Livestock intrusion into the riparian zone results in stream bankerosion and water contamination.
3) by reducing the velocity of sediment-bearingstorm flows, allowing sediments to settle outof water and be deposited on land (thisincludes sediments previously suspended inthe river that are borne into the riparianbuffer during floods)
4) by stabilizing streambanks, preventing channelerosion
5) by moderating stream flow during floods,reducing bed scour, and
6) by contributing large woody debris (snags) tostreams; these can trap considerable sediment,at least temporarily
(adapted in part from US ACE 1991)
Functions one, two and three are primarilyconcerned with preventing terrestrial sedimentfrom reaching the water. Functions four and fiveinvolve reducing channel erosion. This review ofsediment-related literature is divided into twosubsections corresponding to these two majortopics. The literature on large woody debris isreviewed separately in the section regarding in-stream habitat protection.
Sediment

14
Sediment in Surface RunoffNumerous studies have documented the
effectiveness of buffers in trapping sedimenttransported by surface runoff. The challenge liesin determining the necessary width of the buffer.
WidthOne of the greatest challenges in trying to
develop buffer width recommendations is thatmost studies only examined one or a few bufferwidths. Fennesy and Cronk (1997) noted thisproblem:
“One problem in assessing minimum widthsnecessary to protect adjacent surface water isthat many studies that make recommenda-tions regarding the minimum width necessaryhave arrived at the figure as a byproduct ofsampling design rather than deriving itexperimentally.”
Nevertheless, from the research that exists it isevident that there is a positive correlation be-
tween a buffer’s width and its ability to trapsediments. In their 1994 review, Desbonnet et aldetermined that increasing buffer width by afactor of 3.5 provides a 10% improvement insediment removal. According to the reviewers,the most efficient width of vegetated buffers forsediment removal is 25 m (82 ft). For totalsuspended solids, buffer widths need to increaseby a factor of 3.0 for a 10% increase in removalefficiency, and 60 m (197 ft) wide buffers providethe greatest efficiency. It is important to note thatDesbonnet et al based this relationship on acomposite of data from studies conducted withvarious methods at different location. It may notbe appropriate to compare such study results. Itis more illuminating to examine data from studiesthat compared multiple width buffers in the samelocation under the same study conditions. Sixstudies (Young et al 1980; Peterjohn and Correll1984; Magette et al 1987, 1989; Dillaha et al1988, 1989) have examined the effectiveness ofbuffers of two widths in trapping total suspendedsolids (TSS). In every case, buffer effectiveness
Table 1. Riparian Buffer Width, Slope and TSS Removal Rates.
The ability of riparian buffers to trap suspended solids is positively correlated withwidth and negatively correlated with slope.
Author Width (m) % Slope % Removal of TSS
Dillaha et al (1988) 4.6 11 87
Dillaha et al (1988) 4.6 16 76
Dillaha et al (1988) 9.1 11 95
Dillaha et al (1988) 9.1 16 88
Dillaha et al (1989) 4.6 11 86
Dillaha et al (1989) 4.6 16 53
Dillaha et al (1989) 9.1 11 98
Dillaha et al (1989) 9.1 16 70
Magette et al (1989) 4.6 3.5 66
Magette et al (1989) 9.1 3.5 82
Peterjohn & Correll (1984) 19 5 90
Peterjohn & Correll (1984) 60 5 94
Young et al (1980) 21.3 4 75-81
Young et al (1980) 27.4 4 66-93
Sediment

15
increased with buffer width, although the rela-tionship varied. Table 1 and Figure 5 summarizethe results of these studies [Data from Magette etal (1987) which appear in Figure 5 were takenfrom Desbonnet et al (1993) because the originaldocument was not readily available].
In a series of studies using orchardgrassbuffers downslope from a simulated feedlot,Dillaha et al (1988) reported average TSS reduc-tions of 81% for a 4.6 m (15 ft) buffer and 91%for a 9.1 m (30 ft) buffer. Dillaha et al (1989)later repeated the study using buffers of the samewidth and vegetation below fertilized barecropland. This time they found average sedimentreductions of 70% and 84% for buffers of 4.6 mand 9.1 m width, respectively. Magette et al(1989) conducted a similar study with grassedbuffers of 4.6 m and 9.1 m downslope from plotsto which they added liquid nitrogen or chickenwaste. They found average sediment reductionsof 66% and 82%, respectively.
Coyne et al (1994) also conducted a study ofsimilar design, although they only used strips of 9m (30 ft) width and conducted only one rainfallsimulation rather than a series. The researchersadded poultry waste to a test plot and found thatthe grass buffers trapped 99% of sediment. Younget al (1980) tested the efficiency of buffer strips ofcorn, orchard grass, oats and sorghum/sudangrassat reducing surface runoff from feedlots. Theyfound that buffers of 21.34 m (70 ft) reducedtotal suspended solids by an average of 78%,while 27.43 m (90 ft) wide buffers reduced TSSby an average of 93%. Buffer slope averaged fourpercent.
Peterjohn and Correll (1984) found that a 50m (164 ft) riparian buffer in an agriculturalcatchment in the Mid-Atlantic Coastal Plaintrapped 94% of suspended sediment that entered.Ninety percent was trapped in the first 19 m (62ft). Average slope of the buffer was about fivepercent.
0
10
20
30
40
50
60
70
80
90
100
0 10 20 30 40 50 60Buffer Width
Per
cent
R
emov
al
of
TS
S
Dillaha(88)Dillaha (89)Magette et al (87)Young et al (80)Peterjohn & Correll (84)Magette et al (89)
Figure 5. Removal of TSS by Buffers of Different Widths.The ability of a riparian buffer to remove total suspended solids (TSS) from runoff is a function ofthe buffer's width. Note that with the exception of Peterjohn and Correll (1984) these are short-term studies; long-term studies have suggested that much wider buffers are necessary. This figureis only intended to convey the consistent relationship of buffer width and effectiveness.
Sediment

16
Only a few researchers have found bufferwidth to be unimportant. Daniels and Gilliam(1996) found that 6 m (20 ft) wide grassed buffersand 13 m (43 ft) or 18 m (59 ft) wide combina-tion forest/grassed buffers all reduced sedimentsby about 80%. However, the wider buffersincluded a farm vehicle access road which pro-vided an additional source of sediment, socomparisons are not valid. Gilliam (1994)mentions that a “narrow” buffer in the Piedmontwas found to trap 90% of sediment. Rabeni andSmale (1996) suggest that width of buffer may notbe as important as other, qualitative characteris-tics, such as whether or not the topography canmaintain sheet flow.
Most of the studies described above wereshort-term. There is significant evidence fromlong-term analyses that wider buffers are neces-sary to maintain sediment control. Lowrance et al(1986) used sediment budgets to calculate that alow-gradient riparian buffer ecosystem in theGeorgia Coastal Plain trapped large amounts ofsediment (35-52 Mg/ha per year) between 1880and 1979. Later studies by Lowrance et al (1988)based on cesium-137 concentrations yielded amuch higher reduction rate of 256 Mg/ha peryear for the period between 1964 and 1985. Theresearchers found that sediments from agricul-tural fields were deposited throughout theriparian forest. The greatest amount (depth) oftransported sediment was found 30 m (98 ft)inside the forest and the greatest cesium signaloccurred 80 m (262 ft) into the forest. Theresults are confounded slightly by the higheraffinity of cesium-137 to clay particles, which aretransported farther than sand and silt (possiblyleading to a higher signal deeper in the buffer),and deposition of sediment within the riparianzone by floodwaters from the stream. A similarCs-137 study by Cooper et al (1988) in the NorthCarolina Coastal Plain reached similar conclu-sions. The riparian buffer trapped 84-90% of thesediment eroded from agricultural fields, althoughnearly 50% was transported more than 100 m(328 ft) into the buffer. Slopes ranged from 0-20%. These two studies suggest that althoughriparian zones are efficient sediment traps, thewidth required for long-term retention may besubstantially more than is indicated by short-termexperiments. Buffers of 30-100 m (98-328 ft) ormore might be necessary.
Davies and Nelson (1994) found that bufferscan be highly effective in reducing sedimentationto streams in logged forests, and buffer width isthe determining factor. “All effects of loggingwere dependent on buffer strip width and werenot significantly affected by [buffer] slope, soilerodibility or time (over one to five years) sincelogging.” The authors found that a 30 m (98 ft)buffer was necessary to prevent impacts. Theserecommendations are in agreement with a 1985review of the use of riparian buffers to mitigatethe impacts of logging on forest streams (Clinnick1985). One study cited in that review found that“streams with buffers of at least 30 m widthexhibited similar channel stability and biologicaldiversity to unlogged streams, whereas streamswith buffers less than 30 m showed a range ofeffects similar to those found where no streamprotection was provided” (Erman et al 1977, ascited in Clinnick 1985).
The sediment trapping efficiency of bufferscan be expected to vary based on slope, soilinfiltration rate, and other factors. Slope may bethe best studied of these relationships. Dillaha etal (1988, 1989) found that as buffer slope in-creased from 11% to 16%, sediment removalefficiency declined by 7-38% (See Figure 6). Themost thorough investigations of the relationshipbetween buffer width and slope have beenconducted by forestry researchers. Trimble andSartz (1957) examined erosion of logging roads inthe Hubbard Brook Experimental Forest in NewHampshire to determine how far roads should beset back from streams. They suggested a simpleformula:
25 ft + (2.0 ft)(% slope).
For municipal watersheds where water quality isof very high importance, the setback should bedoubled. Trimble and Sartz’ formula was thebasis of a Forest Service standard for many years.Swift (1986) proposed an alternative formulabased on work in the Nantahala National Forestin western North Carolina. He found that whenbrush barriers are employed below a road, erosionis reduced dramatically. He proposed a bufferwidth formula of
32 ft + (0.40 ft)(% slope).
If barriers are not used the buffer width should beincreased to:
43 ft + (1.39 ft)(% slope) (Swift 1986).
Sediment

17
Swift only measured coarse sediment in his study,not silt and clay, which are transported muchfurther through a buffer. This suggests that hisbuffer recommendations are insufficiently wide.
Lowrance et al (1997) made some generaliza-tions about buffer effectiveness in differentphysiographic provinces. They noted that buffereffectiveness has been well established in theCoastal Plain, where much research has beenconducted. For the Piedmont and Valley andRidge provinces, they predicted sediment reduc-tions of 50-90%, although they did not discusswidths necessary to achieve this reduction. TheBlue Ridge province was not discussed in theirreview. Daniels and Gilliam (1996) suggested thatthe high level of runoff from Piedmont fieldsmakes buffers valuable. They also pointed out,however, that steeper slopes and lower soilinfiltration rates may make Piedmont buffers lesseffective in terms of trapping efficiency thanbuffers in the Coastal Plain.
ExtentIt is very important that buffers be continuous
along streams (Rabeni and Smale 1996). Gaps,crossings or other breaks in the riparian bufferallow direct access of surface flow to the stream,compromising the effectiveness of the system.The problem of buffer gaps is discussed further inSection VI.
Riparian buffers are especially importantalong the smaller headwater streams which makeup the majority of stream miles in any basin(Osborne and Kovavic 1993, Binford andBuchenau 1993, Hubbard and Lowrance 1994,Lowrance et al 1997). These streams have themost land-water interaction and have the mostopportunities to accept and transport sediment.“Protecting greenways along low-order streamsmay offer the greatest benefits for the streamnetwork as a whole” (Binford and Buchenau1993).
Ideally, therefore, a system of riparian buffersshould protect all streams and rivers, regardless of
0
1 0
2 0
3 0
4 0
5 0
6 0
7 0
8 0
9 0
100
0 5 1 0 1 5 2 0Percent slope
Per
cent
re
mov
al
of
TS
S
4.6 m wide (88)9.1 m wide (88)4.6 m wide (89)9.1 m wide (89)
Figure 4. Removal of TSS by Buffers of Different Slopes.
Studies by Dillaha et al revealed an inverse relationship between buffer slope and reduction oftotal suspended solids (TSS). Slope is an important variable to use in determining riparianbuffer width.
Sediment

18
size. Even ephemeral streams should be pro-tected, since these waterways can carry appre-ciable flow and sediment during storms. Al-though such universal protection will generallynot be feasible, buffer ordinances should bewritten to protect as many stream miles aspossible— at least all perennial streams, as well asintermittent streams of second order or larger.
VegetationThe studies reviewed above have found that
for purposes of trapping sediment, both grass andforested buffers are effective. Grass buffers,although more likely to be inundated by excep-tionally high levels of sediment, are useful formaintaining sheet flow and preventing rill andgully erosion. In sum, however, forested buffershave other advantages (discussed in later sections)which recommend them over grass in most cases.A combination of grass and forested buffers hasbeen advocated by many researchers (e.g. Welsch1991, Lowrance et al 1997) and represents areasonable compromise.
LimitationsBuffers are most effective when uniform,
sheet flow through the buffer is maintained; theyare less effective in stopping sediment transportedby concentrated or channelized flow (Karr andSchlosser 1977, Dillaha et al 1989, Osborne andKovacic 1993, Daniels and Gilliam 1996). Whenthese conditions occur, riparian buffers cannotslow the flow sufficiently to allow infiltration ofwater into the soil, although some sediment maystill be trapped by vegetation. Clay particles areunlikely to be trapped because they form colloidsin solution. Jordan et al (1993) reported thatsediment increased across a 60 m (197 ft) wideriparian buffer in the Delmarva Peninsula becauseof rill erosion. Daniels and Gilliam (1996) notedthat ephemeral channels in the North CarolinaPiedmont were ineffective sediment traps duringhigh-flow events. They recommended dispersingthe flow from these channels through a riparianarea rather than allowing them to empty directlyinto a perennial stream. Sheet flow can beencouraged by the use of level spreaders andother structural techniques. Welsch (1991)recommended planting a strip of grass 20 ft (6.1m) wide at the outer edge of a riparian buffer to
help convert concentrated flow to dispersed sheetflow.
It is possible for buffer vegetation to beinundated with sediments and decline in effective-ness, although under normal conditions vegeta-tion should be able to grow through the sediment(Dillaha et al 1989). Sediment can also accumu-late to the point where it forms a levee that blocksthe flow of water from the slope to the stream(Dillaha et al 1989). Flow then runs parallel tothis berm until it reaches a low spot, at whichtime it crosses into the stream in concentratedflow. Buffers on agricultural land with very higherosion may require regular maintenance toremain effective and should always be used inconjunction with other erosion control methods(Barling 1994). The importance of on-sitesediment control is discussed further in a latersection.
Channel ErosionIn a long-term study between 1983 and 1993,
Stanley Trimble found that in San Diego Creek insuburban Los Angeles, two thirds of streamsediment resulted from channel erosion. Heconcluded that “stream channel erosion can bethe major source of sediment in urbanizingwatersheds, with deleterious downstream effects”(Trimble 1997). Clinnick’s 1994 review alsonoted the importance of channel erosion, citing a1990 study by Grissinger et al that suggested that“better than 80% of the total sediment yield forGoodwin Creek in northern Mississippi originatesas channel and gully erosion.” Likewise, Rabeniand Smale (1995), Cooper et al (1993) andLowrance et al (1985) found that the channel canbe a significant source of sediment.
One of the most important roles of protectedriparian buffers is to stabilize banks. A study(Beeson and Doyle 1995) of 748 stream bendsfound that 67% of bends without vegetationsuffered erosion during a storm, while only 14%of bends with vegetation were eroded. Non-vegetated bends were more than 30 times as likelyto suffer exceptionally severe erosion as fullyvegetated bends. The authors concluded,unsurprisingly, that “the denser and more com-plete the vegetation around a bend, generally themore effective it is in reducing erosion” (Beesonand Doyle 1995). Barling and Moore (1994) note
Sediment
19
that buffers can prevent the formation of rills andgullies in riparian areas that are otherwise highlysusceptible to erosion.
Bank stabilization will not be effective if theunderlying causes of channel erosion are notaddressed. The major problem in urban andsuburban areas is increased storm flows due toelevated surface runoff from impervious surfaces.This is discussed in more detail in Section VI. Inrural areas, livestock that graze on banks andenter streams are a direct source of severe channelerosion (Figure 4). A solution is to fence thelivestock out (Waters 1995) and provide alternatemeans of watering the animals. Use of offstreamwatering tanks is the preferred method, but anarrow, stabilized stream access point can also beconsidered as a compromise (Cohen et al 1987).
Stream channelization contributes to channelerosion by increasing stream power, leading toincision (Karr and Schlosser 1977, Malanson1993). Formerly, stream channelization wasencouraged by government agencies such as theSoil Conservation Service (now the NaturalResources Conservation Service). However,channelization is now recognized as a short termsolution to drainage problems that results in long-term damage to streams and agricultural fields. Ina channelized stream in Illinois, flood waters fromone storm eroded as much as 1150 tons of soilfrom a single bank in 1982 (Roseboom andRussell 1985). In 1978 Karr and Schlosser (1978)noted that “money spent on preventing sedimentsfrom entering streams will have minimum returnvalue in improving the quality of biota, if presentchannelization practices continue to destroy thehabitat of stream organisms.” Channelization andgravel mining can also lead to upstream impacts,resulting in headward erosion and channeldowncutting (Pringle 1997).
WidthFew studies have attempted to correlate
stream bank stability with riparian buffer width.Common sense suggests that relatively narrowvegetative buffers should be effective in the shortterm (USACE 1991). As long as banks arestabilized and damaging activities are kept awayfrom the channel, width of the riparian bufferwould not appear to be a major factor in prevent-ing bank erosion. However, it is important to
recognize that some erosion is inevitable andstream channels will migrate laterally, whichcould eventually move the stream outside theprotected area. Therefore, the buffer zone shouldbe wide enough to permit channel migration. Toallow for all possible migration would require abuffer the width of the active (100-year) flood-plain (Rhett Jackson, pers. com.), but a narrowerbuffer may still permit migration over a shorterperiod of time. As a general rule, buffer widthssufficient for other purposes should also besufficient to prevent bank erosion and allowreasonable stream migration.
ExtentAll channels, regardless of stream size and
frequency of flow, can be subject to erosion if notproperly stabilized. In their 1985 review,Clinnick et al (1985) note:
“During storm events it is often the ephemeralelements of the stream system that act as asource of surface flow to permanent streams(Hewlett and Hibbert 1967). The preventionof sediment accession to streams thus reliesprimarily on protection of these ephemeralelements.”
Daniels and Gilliam (1986) found thatforested ephemeral channels were temporarysediment sinks during dry seasons but weresources of sediment during storm events. Binfordand Buchenau (1993) note that such gullies andtributaries naturally have dense growth andshould have excellent capacity for sediment andnutrient retention. It is essential to maintain theseephemeral channels in a vegetated condition toallow them to slow water flow, trap sediment andto prevent their serving as sediment sources(Cooper et al 1987, Binford and Buchenau 1993).Clinnick et al (1985) advocate a minimum of a 20m wide buffer on ephemeral channels. This maynot be practical in many situations, but at theleast, the banks and even the bed of such channelsshould be vegetated and livestock intrusionshould be minimized.
VegetationTo be effective, bank vegetation should have a
good, deep root structure which holds soil.Shields et al (1995) tested different configurations
Sediment

20
of vegetation and structural controls in stabilizingbanks. They found that native woody species,especially willow, are best adapted to recolonizingand stabilizing banks. The authors noted that thepersistent exotic vine kudzu may be the mostserious barrier to vegetation restoration because itcan outcompete native vegetation. Other restora-tion ecologists believe that kudzu and certainother exotics may still have a role in streambankrestoration because they can provide good rootstructure (Carl Jordan, pers. com.).
Artificial methods of streambank stabilization,such as applying riprap or encasing the channel incement, may be effective in reducing bank erosionon site but will increase erosion downstream andhave negative impacts on other stream functions.Artificially stabilized banks lack the habitatbenefits of forested banks and can be expensive tobuild and maintain. Overall, the negative conse-quences of artificial bank stabilization generallyoutweigh the benefits.
Summary and RecommendationsRiparian buffers are generally very effective at
trapping sediment in surface runoff and atreducing channel erosion. Studies have yielded arange of recommendations for buffer widths;buffers as narrow as 4.6 m (15 ft) have provenfairly effective in the short term, although widerbuffers provide greater sediment control, espe-cially on steeper slopes. Long-term studiessuggest the need for wider buffers. It appears thata 30 m (100 ft) buffer is sufficiently wide to trap
sediments under most circumstances. This isconsistent with the review of Castelle et al (1993),which found that buffers must be 30 m wide tomaintain a healthy biota. This width may beextended to account for factors such as steepslopes and land uses that yield excessive erosion.It is possible to also make the case for a narrowerwidth, although the long-term effectiveness ofsuch a buffer would be questionable. An absoluteminimum width would be 9 m (30 ft). Formaximum effectiveness, buffers must extendalong all streams, including intermittent andephemeral segments. The effectiveness of anetwork of buffers is directly related to its extent;governments that do not apply buffers to certainclasses of streams should be aware that suchexemptions reduce benefits substantially. Buffersneed to be augmented by limits on impervioussurfaces and strictly enforced on-site sedimentcontrols (discussed in Section VI).
Riparian buffers should be viewed as anessential component of a comprehensive, perfor-mance-based approach to sediment reduction.Periodic testing of instream turbidity should beconducted to assess the effectiveness of sedimentcontrol measures. Kundell and Rasmussen (1995)recommend a maximum instream standard of 25NTU (nephelometric turbidity units), measured atthe end of a designated segment (not below site ofimpact). Regular monitoring and enforcement ofthis standard will help ensure the effectiveness ofriparian buffers and other sediment-controlpractices.
Sediment

21
A. Phosphorus
EffectsPhosphorus has long been implicated in the
eutrophication (overfertilization) of lakes.Eutrophication unbalances an aquatic ecosystem,leading to massive blooms of some types of algae.When these algae die off and decay, oxygen isconsumed, sometimes to the point where fish andother animals cannot survive. Eutrophication canlead to other harmful effects, such as the bloomsof the dinoflagellate Pfiesteria documented in EastCoast estuaries in recent years. Pfiesteria has beenlinked to massive fish kills and releases toxins thatare poisonous to humans (Burkholder 1998). Inat least some Georgia lakes and reservoirs, such asLake Allatoona, phosphorus is the most problem-atic nutrient and possibly the greatest pollutantoverall (Burruss Institute 1998).
SourcesPotential nonpoint sources of phosphorus
include:
• Fertilizers applied to agricultural fields
• Animal wastes from concentrated animalfeeding operations (CAFOs) spread ontofields
• Septic drain fields
• Leaking sewer pipes
• Fertilizers applied to lawns
The relative impact of each of these sources willvary across the state. Cropland fertilization isprobably not a major problem in most of northGeorgia, but land-applied chicken waste fromCAFOs is likely to be a significant source ofpollution in some watersheds (Burruss Institute1998, Frick et al 1998). There are hundreds ofmillions of chickens raised in North Georgia(Bachtel and Boatright 1996). In suburban areasseptic drain fields are probably more significant,and sewer lines, especially those that run through
stream valleys, can also be important phosphorussources. The impact of lawn fertilization isunclear but potentially quite high. In 1984, theEPA estimated that Americans apply nearly amillion tons of chemical fertilizers to their lawnsper year. According to surveys, about 70% oflawn acreage is fertilized regularly whether or notadditional nutrients are required (Barth 1995).The 1998 USGS report on the Appalachicola-Chattahoochee-Flint basin reported the highestphosphorus levels in streams draining urban,suburban and poultry-producing regions (Frick etal 1998).
Literature ReviewWidth
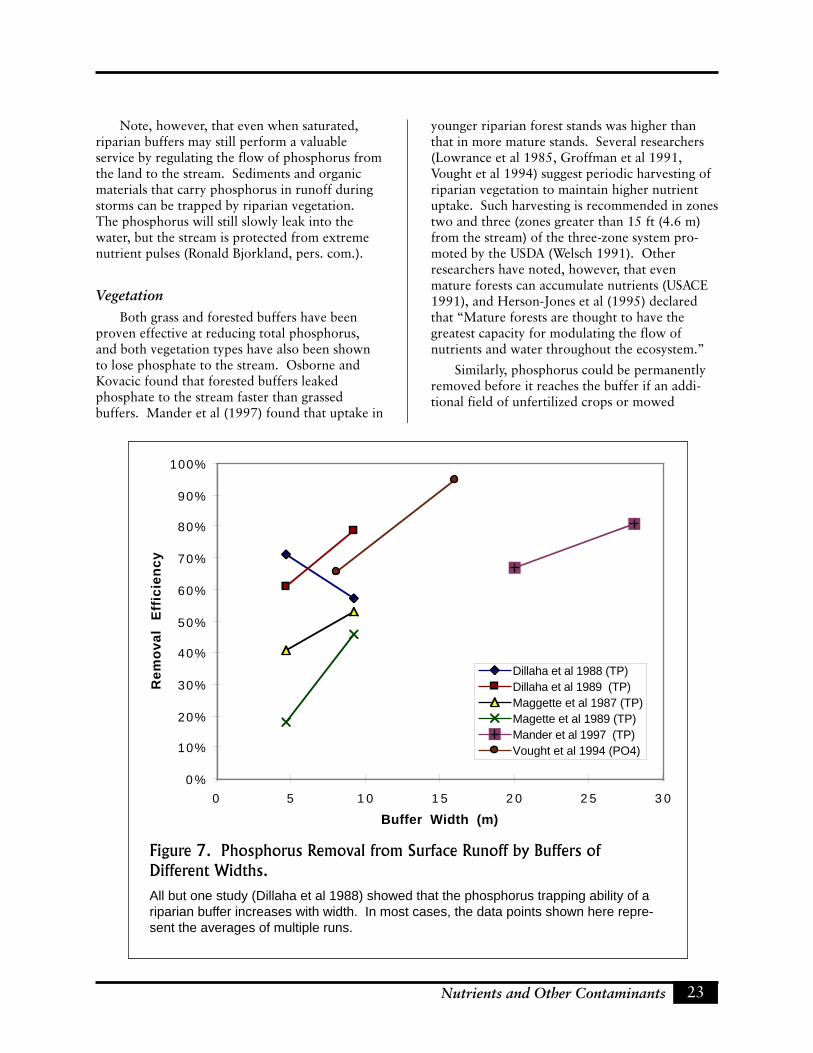
Since most phosphorus arrives in the bufferattached to sediment (Karr and Schlosser 1977,Peterjohn and Correll 1985, Osborne and Kovacic1993) or organic matter (Miguel Cabrera, pers.com.), buffer widths sufficient to remove sedi-ment from runoff should also trap phosphorus.In the short term researchers have found riparianbuffers retain the majority of total phosphorusthat enters, and retention increases with bufferwidth. Studies in Sweden by Vought et al (1994)determined that after 8 m (26.2 ft), grassedbuffers retained 66% of phosphate in surfacerunoff while after 16 m (52.5 ft) 95% wasretained. Mander et al (1997) in Estonia foundtotal phosphorus trapping efficiencies of 67% and81% for riparian buffer widths of 20 m (65.6 ft)and 28 m (91.9 ft), respectively.
A number of studies (Dillaha et al 1988 and1989, Magette 1987 and 1989) have documentedthe performance of grass buffer strips in reducingtotal phosphorus levels (the design of thesestudies was briefly described in the previoussection on sediment). The results are summarizedin Table 2. These authors all noted that effective-ness of the buffers declined over time (the data inTable 2 represent averages of several trials), andthat soluble phosphate reductions were lowerthan total phosphorus reductions. In one case,Dillaha et al (1988) noted that the buffer releasedmore phosphorus than entered. Presumably thisincrease represented previously trapped phospho-
III. Nutrients and Other Contaminants
Nutrients and Other Contaminants

22
rus that was remobilized. With the excep-tion of Dillaha et al 1988, these studies showthat increasing buffer width reduces theconcentration of phosphorus in runoff.Desbonnet et al also observed this correla-tion in their 1993 review. Based on datafrom a number of studies, they reported thatbuffer width must increase by a factor of 2.5to achieve a 10 percent increase in phospho-rus removal. Figure 7 displays the resultsshown in Table 2 along with results fromVought et al (1994) and Mander et al(1997).
LimitationsThe long-term effectiveness of riparian
buffers in retaining available phosphate isquestionable. Whereas nitrate can bedenitrified and released into the atmosphere,phosphorus is either taken up by vegetation,adsorbed onto soil or organic matter,precipitated with metals, or released into thestream or groundwater (Lowrance 1998). It ispossible for a buffer to become “saturated” withphosphorus when all soil binding sites are filled;any additional phosphorus inputs will then beoffset by export of soluble phosphate (Daniel andMoore 1997; Miguel Cabrera, pers. com.; DaveCorrell, pers. com.). Soils become saturated atdifferent rates, depending on factors such ascation exchange capacity and redox potential.Harvesting vegetation may be the only reasonablemanagement technique that permanently removesphosphorus from the system. Such harvesting candestabilize the riparian area and lead to erosion,however (USACE 1991), and so should berestricted to areas well away from the streambank. Welsch (1991) recommends 15 ft (4.6 m),although 25-50 ft (7.6 -15.2 m) would provide agreater margin of safety.
Riparian buffers are typically effective atshort-term control of sediment-bound phosphorusbut have low net dissolved phosphorus retention(Lowrance et al 1997). For example, Daniels andGilliam (1986) found that riparian buffers ofunspecified width reduced total phosphorus by50%, while soluble phosphate declined by only20%. Peterjohn and Correll (1984) found that84% of total phosphorus and 73% of solublephosphate were removed from surface runoffpassing across a 50-m (164 ft) riparian buffer in
the Maryland Coastal Plain. On the other hand,Young et al (1980) reported little difference in thereductions of soluble phosphate and total phos-phorus across a 21 m (68.9 ft) wide buffer ofcorn. Total phosphorus declined by 67%, whilesoluble phosphate was reduced by 69%.
The sediment-bound phosphorus trapped bybuffers may slowly be leached into the stream,especially once the buffer is saturated (Omernik etal 1981, Osborne and Kovacic 1993, Mander1997). A number of studies have shown either nonet reduction or a net increase in groundwaterphosphate as it crosses the riparian buffer.Studies in which swine waste was applied to 30 m(98.4 ft) buffer strips in South Georgia showed noreduction of phosphate in shallow groundwater(Hubbard 1997). In fact, phosphate levelsincreased from 0.5 mg/L to 1.0 mg/L over thecourse of the study, although whether this repre-sented a trend or an anomaly was unclear.Peterjohn and Correll (1984) likewise found thattotal phosphorus concentrations in shallowgroundwater rose at their 50-m (164 ft) riparianbuffer study site. In one transect, phosphorusconcentrations doubled and in another theyquadrupled. A study by Osborne and Kovacic(1993) found that neither a 16 m (52.5 ft) wideforested buffer nor a 39 m (128 ft) wide grassbuffer reduced subsurface phosphate loads fromcrop land.
Table 2. Removal of Total Phosphorus byGrass Buffers.
With one exception, studies by Dillaha et al andMagette et al found a positive correlation betweenthe width of grass riparian buffers and the ability totrap total phosphorus in surface runoff.
StudyTotal P Removal
4.6 m buffer 9.1 m buffer
Dillaha et al 1988 71.5% 57.5%
Dillaha et al 1989 61% 79%
Magette et al 198741% 53%
Magette et al 1989 18% 46%
Nutrients and Other Contaminants
23
Note, however, that even when saturated,riparian buffers may still perform a valuableservice by regulating the flow of phosphorus fromthe land to the stream. Sediments and organicmaterials that carry phosphorus in runoff duringstorms can be trapped by riparian vegetation.The phosphorus will still slowly leak into thewater, but the stream is protected from extremenutrient pulses (Ronald Bjorkland, pers. com.).
VegetationBoth grass and forested buffers have been
proven effective at reducing total phosphorus,and both vegetation types have also been shownto lose phosphate to the stream. Osborne andKovacic found that forested buffers leakedphosphate to the stream faster than grassedbuffers. Mander et al (1997) found that uptake in
younger riparian forest stands was higher thanthat in more mature stands. Several researchers(Lowrance et al 1985, Groffman et al 1991,Vought et al 1994) suggest periodic harvesting ofriparian vegetation to maintain higher nutrientuptake. Such harvesting is recommended in zonestwo and three (zones greater than 15 ft (4.6 m)from the stream) of the three-zone system pro-moted by the USDA (Welsch 1991). Otherresearchers have noted, however, that evenmature forests can accumulate nutrients (USACE1991), and Herson-Jones et al (1995) declaredthat “Mature forests are thought to have thegreatest capacity for modulating the flow ofnutrients and water throughout the ecosystem.”
Similarly, phosphorus could be permanentlyremoved before it reaches the buffer if an addi-tional field of unfertilized crops or mowed
0 %
10%
20%
30%
40%
50%
60%
70%
80%
90%
100%
0 5 1 0 1 5 2 0 2 5 3 0
Buffer Width (m)
Re
mo
val
Eff
icie
ncy
Dillaha et al 1988 (TP)Dillaha et al 1989 (TP)Maggette et al 1987 (TP)Magette et al 1989 (TP)Mander et al 1997 (TP)Vought et al 1994 (PO4)
Figure 7. Phosphorus Removal from Surface Runoff by Buffers ofDifferent Widths.All but one study (Dillaha et al 1988) showed that the phosphorus trapping ability of ariparian buffer increases with width. In most cases, the data points shown here repre-sent the averages of multiple runs.
Nutrients and Other Contaminants
24
hayfields were planted between the phosphorussource and the riparian buffer. Young et al (1980)found average total phosphorus reductions of83% in 27 m (89 ft) and 21 m (69 ft) widecropped buffers. Cropping allows for productiveuse of land and permanent removal of muchphosphorus before runoff reaches the riparianbuffer.
ExtentAs for sediment control, effective nutrient
control requires continuous buffers on all streams.Gilliam (1994) has noted that for purposes ofnutrient reduction, “there should be a strongeffort to preserve a wet, vegetated buffer next toephemeral and intermittent channels or streams.”Despite their limitations, riparian buffers are stillvery important because they separate phosphorus-producing activities from streams. Every unpro-tected stream segment or gap in the streamrepresents a point at which pollution can havedirect access to the water. In areas withoutbuffers, phosphorus-laden sediments and solublephosphate can run directly into waterways withvery little chance of removal. Sorrano et al(1996) predicted that in an agricultural watershedin Wisconsin, converting all riparian (within 100m (328 ft) of a stream) agricultural land to forestwould reduce phosphorus loading by 55% duringa high runoff year, even assuming no net retentionof phosphorus by the riparian zone.
Summary and RecommendationsAlthough riparian buffers can effectively trap
phosphorus in runoff, they do not provide long-term storage and are not effective at filteringsoluble phosphate. Phosphorus trapped in abuffer may gradually leak into the stream, espe-cially once the buffer becomes P-saturated.Harvesting of riparian vegetation does provide amethod of permanently removing some phospho-rus from the system.
Riparian zones wide enough to providesediment control (15-30 m, increasing with slope)should provide short-term control of sediment-bound phosphorus. Wider setbacks should beconsidered for application of animal waste,fertilization, and other activities that yield largeamounts of nutrients. Buffer zones should beplaced on all streams. For phosphorus removal,
both forested and grassed buffers are equallyuseful.
Due to their limitations, riparian buffersshould not be viewed as a primary tool forreducing phosphorus loading of streams. Everyeffort should be made to reduce phosphorusinputs at their sources. This can be accomplishedthrough effective erosion control methods;judicious application of fertilizers; proper place-ment, inspection and maintenance of sewer lines;and restrictions on the land application of wastefrom concentrated animal feeding operations(CAFOs). If phosphorus is managed responsiblyon-site, buffers can store significant amounts ofthe excess; but if phosphorus is uncontrolled,buffers can quickly become saturated and over-whelmed. Even with their limits, buffers stillperform a valuable service by displacing phospho-rus-producing activities away from streams andregulating the flow of phosphorus.
B. Nitrogen
EffectsLike phosphorus, nitrogen contributes to the
eutrophication of waters. Nitrogen occurs innumerous organic and inorganic forms which areinterconvertible under suitable circumstances.Nitrate (NO3
-) has been the target of many bufferprograms because it is potentially toxic to humansand animals at concentrations greater than 10 mg/L. Ammonium (NH4
+) is another common formof nitrogen that is toxic to many aquatic organ-isms and is readily taken up by plants and algae.Removal of nitrate and ammonium from drinkingwater can be a significant water treatment ex-pense (Welsch 1991).
SourcesNonpoint sources of nitrogen are similar to
those of phosphorus: fertilizers applied to agricul-tural fields; waste from concentrated animalfeeding operations (CAFOs); septic drain fields;leaking sewer pipes; and fertilizers applied tolawns. The relative significance of these sourceswill vary from region to region.
Nutrients and Other Contaminants

25
Literature ReviewIn their 1994 literature review, Desbonnet et
al concluded that total nitrogen removal rates forbuffers are good, but nitrate reductions arevariable and low. There is significant evidencethat this is not a valid conclusion. A number ofstudies either not included in the Desbonnet et alreview or published more recently show signifi-cant nitrate reductions. Fennesy and Cronk(1997) reviewed riparian buffer literature with afocus on nitrogen reduction and concluded thatriparian buffers of 20-30 m (66-98 ft) can removenearly 100% of nitrate. Gilliam (1994) declaresthat,
“Even though our understanding of theprocesses causing the losses of NO3
- areincomplete, all who have worked in thisresearch area agree that riparian zones can betremendously effective in NO3
- removal.”
On a landscape level, channelized tributaries withlittle or no riparian buffer zones may have two tothree times the annual nitrate concentration ofnatural stream reaches with wetland or riparianbuffers (Cooper et al 1994).
There are two major ways in which a riparianbuffer strip can remove nitrogen passing throughit, both of which can be significant:
• Uptake by vegetation
• DenitrificationDenitrification is the conversion of nitrate intonitrogen gas by anaerobic microorganisms. Itrepresents a permanent removal of nitrogenfrom the riparian ecosystem and may be thedominant mechanism of nitrogen reduction inmany riparian systems. Denitrification alsooccurs within stream channels themselves,though at rates much lower than in riparianareas, especially wetlands (Fennessy andCronk 1997).
Unlike phosphorus, nitrate is quite solubleand readily moves into shallow groundwater(Lowrance et al 1985). In many areas, mostnitrate enters the riparian zone via subsurfacepathways (Lowrance et al 1984, 1985,Haycock and Pinay 1993, Muscutt et al 1993,Fennesy and Cronk 1997; but see Dillaha et al1988). The amount of nitrogen reductiondepends a great deal on the nature of thesepathways: if the flow is shallow and passes
through the root zone of riparian vegetation,vegetative uptake and denitrification can besignificant. If the flow bypasses the riparian zoneand recharges an aquifer or contributes to baseflow of a stream, nitrogen loss may be much less(see Figure 9). This review first looks at thebuffer width necessary to remove nitrogen fromsurface runoff, then considers nitrogen removalfrom subsurface flow. Denitrification is thenexamined in greater detail.
WidthReduction of various forms of nitrogen in
surface runoff is reasonably well correlated withbuffer width. Dillaha et al (1988) found that 4.6m (15 ft) and 9.1 m (30 ft) grassed filter stripswere moderately effective in removing totalnitrogen from surface runoff from a simulatedfeed lot, but ineffective in removing nitrate.Other studies of similar design by Dillaha et al(1989) and Magette et al (1987, 1989) yieldedsimilar results. Total nitrogen removal efficienciesin all studies increased with buffer width (Table 3).
In their feedlot studies, Young et al (1980)found that 21.34 m (70 ft) buffers of croppedcorn reduced total Kjeldahl nitrogen by 67% andammonium by 71%, though nitrate increasedacross the buffer. Extrapolating from the data,Young et al suggested that 36 m (118 ft) widebuffers are sufficient to protect water quality.
Table 3. Removal of Total Nitrogen by GrassBuffers.
Studies by Dillaha et al and Magette et al found apositive correlation between the width of grassriparian buffers and the ability to trap total nitrogenin surface runoff.
StudyTotal N Removal
4.6 m buffer 9.1 m buffer
Dillaha et al 1988 67% 74%
Dillaha et al 198954% 73%
Magette et al 1987 17% 51%
Magette et al 19890% 48%
Nutrients and Other Contaminants

26
Vought et al (1994) reported surface nitratereductions of 20% after 8 m (26.2 ft) and 50%after 16 m (52.5 ft) for grass buffers in Sweden.They concluded that “a buffer strip of 10-20 mwill, in most cases, retain the major part of thenitrogen and phosphorus carried by surfacerunoff.” Jacobs and Gilliam (1985) found that inbuffers downslope from Coastal Plain fieldswithout artificial drainage, the nitrate concentra-tion in surface runoff was reduced from 7.9 mg/lto 0.1 mg/l (99%). Though they did not reportwidth of buffer strips used, the authors said thatbuffer strips of 16 m (52.5 ft) were effective.
A study by Daniels and Gilliam (1996) in theNorth Carolina Piedmont determined that grassedbuffers of 6 m (20 ft) width and combinationgrass-forested buffers of 13 m (42.7 ft) and 18 m(59.1 ft) width retained 20-50% of ammoniumand 50% of both total nitrogen and nitrate.Because sites had different characteristics it is notpossible to determine whether width was a factor.In addition, like the Dillaha (1988, 1989) andMagette (1987, 1989) studies summarized above,Daniels and Gilliam only studied surface flow, notsubsurface flow. Since in many cases most nitratepasses through buffers in the interflow, studiesthat ignore it may greatly underestimate (or, insome cases, overestimate) nitrate reduction.
In their studies inthe Mid-AtlanticCoastal Plain,Peterjohn and Correll(1985) found that a 50m (164 ft) bufferreduced all forms ofnitrogen in surfacerunoff. Nitrate inshallow groundwaterwas reduced consider-ably across the buffer,but other forms ofnitrogen increased inthe subsurface flow.These results aresummarized in Table 4.
Like Peterjohn andCorrell, many otherresearchers have foundthat nitrate reductionin subsurface flow ishigh, although the
optimal buffer width depends on factors such asthe hydrologic pathway and denitrificationpotential. Hanson et al (1994) reported that a 31m (102 ft) wide riparian buffer downslope from aseptic tank drain field reduced shallow groundwa-ter nitrate concentrations by 94%, from 8 mg/L to0.5 mg/L. Jordan et al (1993) found that a 60 m(197 ft) wide riparian buffer adjacent to croplandin the Delmarva Peninsula reduced subsurfacenitrate levels from 8 mg/L to less than 0.4 mg/l(95%). Most of the change occurred abruptlywithin the riparian forest at the edge of thefloodplain, where conditions were optimal fordenitrification. Mander et al (1997) found totalgroundwater nitrogen removal efficiencies of 81%and 80% for riparian buffer sites of 20 m (65.7 ft)and 28 m (91.9 ft) width, respectively.
Researchers at the USDA Agricultural Stationin Tifton, Georgia applied swine waste to 30 m(98.4 ft) riparian buffer strips of various types.Preliminary results from 1996 showed thatshallow groundwater nitrate levels were reducedfrom 40 mg/L at the top of the plots to 9 mg/L atthe lower end of the plots, a reduction of 78%(Hubbard 1997). Previous research in the regionhad determined that buffers less than 15 m (49.2ft) wide can remove significant amounts of nitratein surface and subsurface flow (Hubbard and
Table 4. Nitrogen Reductions Reported by Peterjohn andCorrell (1985).Values show initial concentration of nutrients entering the 50-m buffer andfinal concentrations after passing through the buffer. Values in parenthe-ses are the percent reductions across the buffer.
Nitrate (mg/L) ExchangeableNH4+ (mg/L)
ParticulateOrg. N (mg/L)
Surface RunoffInitial: 4.45 0.402 19.5
Final: 0.91 (79%) 0.087 (78%) 2.67 (86%)
SubsurfaceTransect 1
Initial: 7.40 0.075 0.207
Final: 0.764 (90%)0.274(increase)
0.267(increase)
SubsurfaceTransect 2
Initial: 6.76 0.074 0.146
Final: 0.101 (99%) 0.441(increase)
0.243(increase)
Nutrients and Other Contaminants

27
0
1 0
2 0
3 0
4 0
5 0
6 0
7 0
8 0
9 0
100
0 1 0 2 0 3 0 4 0 5 0 6 0
Buffer Width
Pe
rce
nt
Re
mo
val
Osborne and Kovacic (1993)Mander et al (1997)Mander et al (1997)Hubbard (1997)Hanson et al (1994)Osborne and Kovacic (1993)Jordan et al (1993)Lowrance (1992)Haycock and Pinay (1993)Haycock and Pinay (1993)
Figure 8. Subsurface Nitrate Removal in Several Studies.
Numerous studies of riparian buffers have reported high rates (>75%) of nitrate removal fromshallow groundwater. There is not a clear correlation between nitrate removal rate andriparian buffer width, however.
Lowrance 1994). Another study in the Tiftonarea (Lowrance 1992) had determined that a 50-60 m (~160-200 ft) wide riparian buffer reducedgroundwater nitrate levels from 13.52 mg/L to0.81 mg/L (94%) at depths of 1-2 m (3.3 - 6.6 ft).The greatest reduction occurred in the first 10 m(33 ft). Still another study using a mass balanceapproach (Lowrance 1984) found that a buffer ofunspecified width removed 68% of total nitrogen.
Osborne and Kovacic (1993) reported that a16 m (52.5 ft) wide forested buffer in Illinoisreduced shallow groundwater nitrate levels of 10-25 mg/L to less than 1.0 mg/L (a maximum 96%reduction). A 39 m (128 ft) wide grassed bufferin the same area reduced nitrate levels of 15-44mg/L to about 2.4 mg/L (a maximum 95%reduction).
In reviewing other studies, Vought et al(1994) concluded that nitrate reduction insubsurface flow approaches 100% between 10 m(33 ft) and 20 m (66 ft) into the buffer; increasingthe riparian width beyond 20-25 m (62-82 ft) hadno further effect. Pinay and Descamps, asreferenced by Muscutt et al (1993), concludedthat 30 m (98 ft) buffers are sufficient for remov-ing nitrogen. Results from these studies aresummarized in Table 5 and Figure 8.
DenitrificationThere is an ongoing debate as to which is the
dominant mechanism for nitrogen removal:denitrification or vegetative uptake. Fennessy andCronk (1997) claim that denitrification is themost significant, and there is some evidence to
Nutrients and Other Contaminants

28
support this view (e.g., Jacobs and Gilliam 1985,Peterjohn and Correll 1985). Lowrance (1992)has made the case for vegetative uptake and hasemphasized that, whichever method is dominant,vegetation is necessary for nitrogen removal.Lowrance (1992) and Hanson et al (1994) havereported significant nitrate reductions in shallowgroundwater one to two meters deep that appearto be correlated with high denitrification rates atthe surface. It appears that vegetation takes upthe nitrate and transfers it to the surface layer,where it is denitrified. In the end, local condi-tions will likely determine which mechanismdominates (Gilliam 1994).
Denitrification is one of a number of coupledprocesses which are best described by thermody-namic theory (Hedin 1998). Interestingly, there isa significant inverse relationship between denitri-fication and phosphorus removal. Highly reduc-ing conditions that are suitable for denitrificationalso favor reduction of iron oxyhydroxides, whichcan release bound phosphorus and increase thephosphate that is exported from the buffer(Jordan et al 1993).
Soil microorganisms have the capacity toprocess nitrate at much higher concentrationsthan they normally experience (Duff and Triska1990, Groffman et al 1991a, b, Lowrance 1992,Hanson et al 1994, Schnabel 1997). Denitrifica-tion rates can increase quite rapidly in response tonitrate increases. In some cases, microorganismscan denitrify all of the available nitrate, butammonium and organic N pass through the bufferbecause they are not processed (nitrified) quicklyenough (Lowrance 1992). Many soils are alsocarbon limited or become carbon limited at highnitrate levels (Groffman et al 1991a, b; Hedin etal 1998). Hedin et al (1998) reported on acarbon-limited site with very high nitrate levelsclose to the stream; when sufficient carbon wasadded, denitrification levels were exceedinglyhigh (equivalent to 6600 kg N/ha per year). Topromote more carbon availability, Hedin et alrecommended maintaining organically richriparian wetlands. Duff and Triska (1990)observed denitrification in the hyporheic zone ofa small headwater stream. In their study site,groundwater had a high concentration of dis-solved organic carbon (DOC) which was reduced
Table 5. Nitrate Removal in Shallow Groundwater.Studies have demonstrated consistently high removal rates for nitrate fromshallow groundwater passing through riparian buffers. “Final Conc.” is theconcentration of nitrate in groundwater leaving the riparian buffer. Concentra-tions over 10 mg/L (ppm) are considered potentially harmful.
Width (m) % Reduction Final Conc. (mg/L)
Osborne and Kovacic (1993) 16 96 <1.0
Haycock and Pinay (1994) 16 84 N.R.
Haycock and Pinay (1994) 20 99 N.R.
Mander et al (1997) 20 81 N.R.
Mander et al (1997) 28 80 N.R.
Hubbard (1997) 30 78 9
Hanson et al (1994) 31 94 0.5
Osborne and Kovacic (1993) 39 95 <1.0
Jordan et al (1993) 60 95 0.4
Lowrance (1992) 60 94 0.81
Nutrients and Other Contaminants

29
as it passed through the riparian zone. Denitrifi-cation was greatest farther from the stream wherenitrate was in greatest supply. Rhodes et al(1985) reported 99% nitrate removal in riparianforests and wetlands at a high-altitude undis-turbed watershed in Nevada.
Denitrification takes place under conditionsof reduced oxygen availability and is correlatedwith soil moisture. Rates are typically very highin wetlands (Groffman et al 1991a, b; Hanson etal 1994; Collier et al 1995b). In field studies inRhode Island Groffman et al reported thatvariability in nitrate reduction in subsurface flows(ranging from 14% to 97%) was almost entirelyexplained by soil moisture. Wetland soils hadconsistently high nitrate removal, while betterdrained upland soils had lower and more variablenitrate removal efficiencies. Since denitrificationis the most permanent method for removingnitrogen, good management practices call forpreservation of areas of high denitrificationactivity, such as wetlands (Collier et al 1995b,Hedin et al 1998). Note, however, that denitrifi-cation has also been observed under well oxygen-ated soil conditions, presumably indicating thatthere can be sites of local anoxia (Duff and Triska1990).
Nitrate loss does not appear to be limited towarm months. In a study during the winterseason in Britain, Haycock and Pinay (1993)reported that a 20 m (65.6 ft) wide poplarforested site retained 99% of the nitrate thatentered, no matter how high the load level. A 16m (52.5 ft) wide grass riparian zone retainednearly 100% of nitrate at lower concentrationsbut only 84% at high concentrations. All flowwas subsurface. In the poplar site nitrate reduc-tion was essentially complete after the first 5 m(16 ft) of flow. Bacterial denitrification wasassumed to be the mechanism for nitrate loss,since the vegetation was dormant and uptake rateswould be low. The variation between the sitesmay have been due to the larger amounts ofcarbon contributed by the poplars (Haycock andPinay 1993). Lowrance (1992) and Osborne andKovacic (1993) also reported nitrate removalrates that were independent of season. Lowrancenoted that dormant season nitrate removal is notjust due to denitrification but can result fromuptake by trees as well. Groffman et al (1991b)conducted analyses of denitrification in surface
soils at sites in Rhode Island. They reported totalnitrogen removal efficiencies of 40% to 99% foroverland flow during the summer, but rates of lessthan 30% in the winter. Additional field studiesconducted by the same team failed to find aninfluence of seasonality on nitrate removal. Theytheorized that elevated water tables in winter mayhave brought denitrifying bacteria into contactwith more nitrate-laden water, compensating forthe lack of vegetative uptake (Groffman et al1991b).
The characteristics of groundwater flow willdetermine where within the riparian bufferdenitrification will occur. Lowrance (1992)found that most nitrate loss occurred at thebuffer-field interface. Hedin et al (1998) andSchnabel et al (1997) studied systems in whichshallow groundwater with very high nitrateconcentrations entered the buffer very close to thestream. Some studies (e.g. Jordan et al 1993)have shown that denitrification rates are greatestat the edge of the floodplain. In all cases, nitrateremoval occurred at locations where the watertable was near the surface and both carbon andnitrate were in good supply. Determining allthese factors in the field is not easy and thehydrology of many riparian areas is still poorlyunderstood, making accurate predictions ofnitrogen removal difficult (Gilliam 1994).
It appears that few researchers have docu-mented nitrate reductions in subsurface flow inthe Piedmont or Blue Ridge physiographicprovinces. Lowrance et al (1997) cited data fromstudies by Daniels and Gilliam that show largereductions in groundwater nitrate levels in NorthCarolina Piedmont locations. The study siteswere characterized by high water tables andshallow groundwater flow through the root zoneof riparian vegetation (see Figure 9-a). Whenthese conditions are present, as in areas of thinsoils, high rates of nitrate reduction should occur(Lowrance et al 1997). However, in Piedmontsoils underlain by schist/gneiss bedrock, anappreciable amount of flow may move intoregional aquifers in the saprolite, bypassing theriparian root zone and contributing to the baseflow of streams (Figure 9-b). A moderate level ofdenitrification is expected under these conditions(Lowrance et al 1997). In Piedmont soils under-lain by marble bedrock, most flow may enterregional aquifers and nitrate loss in riparian areas
Nutrients and Other Contaminants

30
Figure 9. Different Possible Groundwater Flow Paths.
Based in part of Lowrance et al (1997).
Figure 8c. Groundwater flow paths across a riparian buffer in a wide, flat floodplain with a high water table. Area of greatest nutrient removal will likely be the edge of the floodplain.
Figure 8a. Groundwater flow paths across a riparian buffer with shallow soils or an aquitard (semi-impervious layer). Flow should pass through root zone, allowing significant removal of nutrients and contaminants.
Figure 8b. Groundwater flow paths across a riparian buffer with moderately deep soils. Some flow passes through root zone, but some bypasses the riparian area The area of greatest nutrient removal may be very close to stream.
Figure 9a. Groundwater flow paths across a riparian buffer with shallow soils or an aquitard(semi-impervious layer). Flow should pass through the root zone, allowing significant re-moval of nutrients and contaminants.
Figure 9b. Groundwater flow paths across a riparian buffer with moderately deep soils. Someflow should passes through the root zone, but some bypasses the riparian area. The area ofgreatest nutrient removal may be very close to the stream.
Figure 9c. Groundwater flow paths across a riparian buffer across a wide, flat floodplain witha high water table. Area of greatest nutrient removal will likely be the edge of the floodplain.
Nutrients and Other Contaminants

31
is probably much less significant (Lowrance et al1997) (Figure 9-d). However, in their study ofriparian sites in the Valley and Ridge physi-ographic province, Schnabel et al (1997) foundsignificant denitrification rates where nitrate-richgroundwater emerged close to the stream bank.These sites had flow-restrictive layers 8-10 m(26.2 - 32.8 ft) below the surface, as wouldPiedmont soils with marble bedrock. The deeperflow paths changed the location of denitrificationactivity but did not prevent nitrate reduction.Hedin (1997) also observed a similar phenom-enon at a site in Michigan with deep glacial soils.
Even within the Coastal Plain hydrology canvary significantly, affecting how nutrient reduc-tion takes place. Human modifications also alterthese patterns. Jacobs and Gilliam (1985) foundthat at a site in the Middle Coastal Plain of NorthCarolina most transport was via subsurfacepathways. In a Lower Coastal Plain site, on theother hand, most movement was by surface flow.Fields in this area were drained by ditches, and adense clay B layer prevented deeper subsurfaceflow.
Rates of nutrient reduction are influenced bythe length of time water is retained in the buffer(Fennessy and Cronk 1997), which in turn isdetermined by slope, rainfall, soil characteristics,hydrologic flow path, and the width of buffer(Phillips 1989a,b). Retention time may actuallybe longer than would be indicated by thesefactors, because some researchers have shown thatthe flow of water is not perpendicular to thechannel but oblique to the channel. Residencetimes in a 27 m wide buffer along a Thames,
England headwater stream ranged from 12 daysto over three years (Fennessy and Cronk 1997).Research on the Georgia Coastal Plain showedthat it can take several seasons for nutrients andcontaminants to pass through a 50-m wideriparian buffer where shallow lateral flow is thedominant pathway (Hubbard and Lowrance1996). On the other hand, when overland flowoccurs, water can pass through the buffer in amatter of minutes. Models have been developedto predict buffer effectiveness based on detentiontime (Phillips 1989a, b), but their accuracy isunproven.
ExtentAs discussed in previous sections, protection
of water quality requires preservation of bufferson as many streams as possible.
VegetationBoth grass and forested buffers have been
shown to reduce nitrogen effectively. In studies inRhode Island, Groffman et al (1991a) found thatwhen nitrate was added to soil cores, soils fromgrass plots exhibited denitrification rates an orderof magnitude higher than those from forestedplots. Schnabel et al (1997) also reported higherdenitrification rates for grassed buffer sites.Haycock and Pinay (1993) and Osborne andKovacic (1993), on the other hand, found higherrates of nitrate retention in forested buffers.Lowrance has concluded that overall, grassbuffers are not effective at removing nutrientsfrom shallow groundwater (Lowrance 1998).
Figure 8d. Groundwater flow paths across a riparian buffer with very deep soils or fractured bedrock. Much groundwater bypasses the riparian buffer, and nutrient removal may be lower than in other systems.
Figure 9d. Groundwater flow paths across a riparian buffer with very deep soils or fracturedbedrock. Much groundwater bypasses the riparian buffer, and nutrient removal may be lowerthan in other systems.
Nutrients and Other Contaminants

32
Both grass and forested buffers have proveneffective in removing surface nutrients fromsurface runoff, although grass buffers have beenmore heavily studied.
Summary and RecommendationsThe nitrogen removal capacity of riparian
buffers has been well established. Nitrogenremoval in surface runoff has been correlatedwith buffer width, but rates appear to be lowerthan for subsurface reduction. Studies havedocumented high levels of nitrate removal fromshallow groundwater, which is the dominantmode of nitrate transport through many buffers.Nitrate may be removed by both vegetativeuptake and denitrification. The buffer widthnecessary for nitrate reduction depends greatly onthe hydrologic flow paths, and numerous studieswould be required to fully characterize thepathways of shallow groundwater flow in all areasof Georgia. However, based on existing research,most areas of Georgia should generally supportsignificant nitrogen removal in the riparian buffer.
Because the distribution of denitrificationsites vary spatially, wider buffers will on averageinclude more denitrification sites than narrowerbuffers. A minimal width of 15 m (50 ft) isprobably necessary for most buffers to reducenitrogen levels. Wider buffers of 30 m (100 ft) orgreater would be more likely to include otherareas of denitrification activity and provide morenitrogen removal. Buffers should be preservedalong as many streams as possible, and it isespecially important to preserve riparian wet-lands, which are sites of high nitrogen removal.
C. Other Contaminants
Organic Matter and BiologicalContaminants
Human and animal waste contribute toaquatic degradation in ways other than nutrientcontamination. First, these wastes carry withthem an array of pathogenic microorganisms.Secondly, when organic matter is broken down by
aerobic bacteria in water, oxygen is consumedrapidly. High levels of organic matter with highbiological oxygen demand (BOD) can use up allof the available oxygen in a stream, river or lake,killing fish and other organisms. Whereas surfacewaters naturally have a BOD of 0.5 to 7 mg/L,chicken wastes may have a BOD of 24,000 to67,000 mg/L (Cooper et al 1993).
Fecal coliform is used as an indicator ofpathogenic microorganisms. The levels of fecalcoliform can vary temporally at a single site andcan be quite high, even in areas of Georgiaconsidered less impacted. At a monitoring stationin Lake Allatoona near where the Etowah Riverenters the reservoir, fecal coliform levels rangingfrom 1.8 colonies (in May) to 24,000 colonies (inNovember) per 100 ml were recorded. Forreference, the recommended limit for water thatpeople directly contact (i.e., the “primary contactstandard”) is 200 colonies / 100 ml.
Sources of organic matter and biologicalcontaminants include leaking sewer pipes, im-properly functioning septic systems, animal wastesprayed onto fields and animal waste lagoons.Burkholder et al (1998) documented a large fishkill in deoxygenated water after a swine lagoonruptured into the Neuse River in North Carolina.
Riparian buffers can trap waste transported insurface runoff in the same way that they trapsediments and associated nutrients. In the face ofvery high waste levels, however, trapping effi-ciency may not be adequate to reduce contami-nants to a safe level. Coyne et al (1995) appliedpoultry manure to two test plots and measuredfecal coliform reduction across 9 m (30 ft) widegrass filter strips. After artificial rain was applied,researchers found that fecal coliform concentra-tions were reduced by 74% and 34% in the twostrips. Nevertheless, runoff exceeded the primarycontact standard in every sample. A 1973 studyby Young et al found that a 60 m (197 ft) longgrass filter strip reduced fecal coliform by 87%,total coliform by 84% and BOD by 62% (Karrand Schlosser 1977). Cooper et al (1993) foundthat constructed wetlands removed 76% of BODwhen coupled behind an anaerobic lagoon. Theredo not appear to be other studies which haveaddressed this issue.
Nutrients and Other Contaminants

33
Pesticides and MetalsPesticides are intended to be toxic. When
these chemicals are introduced into aquaticsystems they can cause both direct mortality toorganisms and various sublethal effects (Cooper etal 1993). Although a number of the most persis-tent and toxic pesticides have been banned in theU.S., many that are currently applied are stillquite dangerous. According to Cooper et al(1993), “Some insecticides in current use not onlyaccumulate, they can be as toxic as and oftenmore toxic than banned organochlorines.”
Besides their use in row crop agriculture,pesticides are gaining favor in forestry in theSoutheast (Neary et al 1993) and are commonlyused on lawns and plantings in urban areas. TheEPA estimates that nearly 70 million pounds ofactive pesticide ingredients are applied to urbanlawns each year. One survey of 500 homes foundthat 50 different pesticides were used (Schueler1995a, b). Even long-banned insecticides likeDDT and chlordane are commonly found inurban streams. Chlorpyrifos also appears inrunoff at levels toxic to a range of wildlifeincluding geese, songbirds and amphibians(Schueler 1995b). A recent study by the U.S.Geological Survey found that urban and suburbanstreams in the Atlanta region had levels ofdiazinon and carbaryl that exceeded aquatic lifecriteria (Frick et al 1998). Heavy metals areusually associated with industrial activities, andconcentrations tend to be highest in streamsdraining urban areas (Crawford and Lenat 1989).
Buffers are very important in displacingpesticide application away from streams, prevent-ing direct contamination and reducing the dangerof drift. Many pesticides are broken down withinbuffer soils, while metals may bind to soil par-ticles. Greater buffer width increases the reten-tion time for chemicals (allowing more opportuni-ties for contaminants to decompose) and providesmore sites for binding metals. Frick et al (1998)attribute the unexpectedly low pesticide levels inagricultural Coastal Plain streams to the largelyintact forested wetlands and floodplains.
The mechanisms of pesticide transport arenot well understood (Muscutt et al 1993).Lowrance et al (1997) examined changes inpesticide concentrations crossing a 50-m (164 ft)wide buffer in the Georgia Coastal Plain. Atra-zine and Alachlor were reduced from 34 µg/L and
9.1 µg/L, respectively, to less than 1 µg/L. Thechemicals took three years to enter groundwater,and it appeared that they first moved laterallyacross the buffer before infiltrating deeply.Hatfield et al (1995) found that grassed filterstrips of 40 ft (12.2 m) and 60 ft (24.4 m) re-moved 10-40% of the atrazine, cyanazine andmetolachlor passing across them. Arora et al(1996) found that 20.12 m (66 ft) wide riparianbuffers of 3% slope retained 8-100% of theherbicides (atrazine, metolachlor and cyanazine)that entered during storm events. The variationwas related to the amount of runoff that occurredduring the storms. None of these studies exam-ined the long-term fate of pesticides or theirdegradation products.
Neary et al (1993) reviewed recent studies inthe Southeast on the use of buffers in reducingpesticide contamination of water. They foundthat cases of high concentrations of pesticides inwater only occurred when no buffer was used orwhen they were applied within the buffer (i.e., thebuffer was violated). Regular use of buffer stripskept pesticide residue concentrations withinwater-quality standards. Neary concluded that“Generally speaking, buffer strips of 15 m (49 ft)or larger are effective in minimizing pesticideresidue contamination of stream flow.”
Herson-Jones et al (1995) concluded thaturban buffers have shown a moderate to highability to remove or retain hydrocarbons andmetals from surface runoff. They cited data froma 1992 study by the Metropolitan Seattle WaterPollution Control Department which foundremoval rates exceeding 40% for lead, 60% forcopper, zinc and iron, and 70% for oil and grease.Studies in Rhode Island (Groffman et al 1991b)also found high metal retention rates. Theauthors reported that riparian buffers retained allthe copper that was added to them. This reten-tion depends on cation exchange capacity (CEC)of the soil, however, and it is possible for bufferCEC to become saturated, just as it can underhigh phosphorus loads.
Summary and RecommendationsBased on the limited studies available,
riparian buffers are useful for reducing levels ofbiological contaminants and organic matter, butby themselves may not be sufficient to protect
Nutrients and Other Contaminants

34
water quality. Buffers at least 9 m (~30 ft) wideand probably much wider are needed; widthshould be extended for steeper slopes that wouldreduce buffer contact time. Every effort shouldbe made to reduce these contaminants at theirsource, and it is wisest to prohibit sources withinthe floodplain, regardless of buffer width.
Buffers can remove pesticides and heavymetals, but the width necessary is unclear fromthe existing research. Neary’s (1993) recommen-dation of 15 m (49 ft) should be viewed as aminimum width, since the studies by Hatfield etal (1995) and Lowrance et al (1997) suggest thatsignificantly wider buffers may be required.
Aquatic habitat quality is very important inthe Southeast, which has a high level of fish andmussel diversity. Probably the most importantfactor affecting the habitat of aquatic organisms issediment, discussed in detail in Section II. Thissection will discuss other factors that influence thehabitat of stream organisms and the characteris-tics of buffers required to support high qualityhabitat.
Woody Debris and Litter InputsLarge woody debris (LWD) deposited into the
stream from the riparian zone provides essentialhabitat for many fish. According to May et al(1996), LWD is the most important factor indetermining habitat for salmonids (salmon, troutand related fish). Leaf litter and other organicmatter from riparian forests, including terrestrialinvertebrates that drop into the water, are animportant source of food and energy to streamsystems.
In studies in Alaska, researchers found thatduring the winter, salmonid survival dependedupon the amount of debris in streams (Murphy etal 1986). Stream reaches that were protected by15-130 m (49-427 ft) wide riparian buffers werefound to be similar in habitat quality to oldgrowth reaches. Clear cutting led to short-termincreases in summer salmonid populationsbecause overall stream production increased, butin the winter there was insufficient debris toprovide shelter for fish. Forested stream corridorsare necessary to provide regular inputs of LWDand removal of riparian forest can have long-termnegative effects. Gregory and Ashkenas note that
“of all the ecological functions of riparian areas,the process of woody debris loading into chan-nels, lakes and floodplains requires the longesttime for recovery after harvest” (Gregory andAshkenas 1990). Collier et al (1995a) recom-mend a buffer width of at least one tree height tomaintain inputs of LWD, although for stabilitypurposes (i.e., to prevent windthrow) they suggestthat a width equal to three tree heights may benecessary.
The type and amount of riparian vegetation iscorrelated with different fish communities (Baltzand Moyle 1984), and studies indicate that nativevegetation is important for proper stream func-tioning (Abelho and Graça 1996, Karr andSchlosser 1978). Stream organisms may not beadapted to the leaf fall patterns or the chemicalcharacteristics of leaves from nonnative trees,suggesting that management schemes shouldinclude the maintenance and restoration of nativevegetation (Abelho and Graça 1996).
Removal of riparian forests can cause afundamental shift in stream energy dynamics,moving the system from heterotrophy (whereproduction is based on inputs of leaves and otherterrestrial matter) to autotrophy (where produc-tion is based on algae) (Allan 1995). This shiftalso alters the seasonal dynamics of the stream(Schlosser and Karr 1981). Streams with riparianvegetation experience a peak in organic matter inthe fall, but streams without riparian vegetationexperience peaks in the summer.
Aquatic invertebrates are important compo-nents of the stream system, so much so that theyare commonly used as indicators of stream health.
IV. Other Factors Influencing Aquatic Habitat
Aquatic Habitat

35
Aquatic invertebrates are the major food sourcefor many, if not most freshwater fish. Riparianvegetation, in turn, provides leaves and otherforms of litter that feed these invertebrates.Additionally, most aquatic invertebrates emergefrom the stream as adults and use the riparianzone for reproduction (Erman 1984). Riparianvegetation also influences the amount and type ofterrestrial invertebrates that fall into streams.Some fish, such as brown trout, may rely onterrestrial invertebrates for most of their food(Dahl 1998). A study in New Zealand found thatpasture streams had a much lower biomass (1/6thto 1/12th) of terrestrial invertebrates than eitherungrazed grassland or forest streams (Edwardsand Huryn 1996). Other factors, such as altitudeand stream width, were not found to be signifi-cant in the study. Of course, the importance ofterrestrial organisms as a food source is mostimportant in headwater streams and less signifi-cant in larger streams and rivers that have higheralgal production (Vannote et al 1980).
Temperature and Light ControlIn Georgia, like most of the U.S., the native
vegetation in riparian zones is hardwood forest.These forests keep headwater streams cool byproviding shade for the surface water and reduc-ing the temperature of the shallow groundwaterthat feeds the stream. Removing these riparianforests will increase stream temperatures, andeven minor changes in temperature can causemajor changes in the fish community (Baltz andMoyle 1984).
Although increases in temperature and lightcan generate increased aquatic production insome cases, many aquatic organisms can onlysurvive within a relative narrow temperaturerange (Allen 1995). Trout are a well-known andcommercially important example of a fish thatcannot tolerate high temperatures. Thermalfluctuations can have a range of direct effects onmussels, including reproductive problems anddeath (Morris and Corkum 1996). Higher watertemperatures also decreases oxygen solubility,which harms many organisms and also reducesthe water’s capacity to assimilate organic materi-als and increases the rate at which nutrientssolubilize and become readily available (Karr andSchlosser 1978).
Factors other than shading affect streamtemperature, however. Dams can cause profoundchanges to the stream thermal regime thatoverride the influence of riparian forests. Im-poundments that release water from the topincrease downstream water temperature, whilebottom-release dams decrease downstream watertemperature. Additionally, discharges of coolingwater from power plants can greatly increasewater temperature.
On small streams, however, shading is likelyto be the most important factor. A study byBarton et al (1985) found that most of thevariation in the maximum water temperature wasrelated to the fraction of forested bank within 2.5km upstream of the study site, while maximumweekly temperature was correlated with bufferlength and width. This regression accounted for90% of temperature variability. The authorsreported that water temperature was the onlyimportant factor determining the presence oftrout. For these fish to be present, 80% of bankswithin 2.5 km upstream had to have forests of atleast 10 m (33 ft) wide, or sufficient to shade thestream (Barton et al 1985). In Georgia, Gregoryet al (in press) found that mean water tempera-tures in some Coastal Plain streams with noriparian cover approached 37° C in the summer,while nearby streams with forested riparian zoneswere 15° cooler. Temperature in the streamsvaried by as much as 20° C in the winter andspring. The authors suggested that the thermalvariability was likely to be a factor in the variabil-ity in aquatic invertebrate communities theyfound in the streams.
A study of mussels in Ontario found dramaticdifferences between mussel communities inforested and agricultural catchments (Morris andCorkum 1996). Agricultural streams weredominated by one species of tolerant mussel(Pyganodon grandis), which represented 62.5% ofindividuals in those rivers (and only 1% inforested basins). The authors identified tempera-ture as an important variable influencing the shift,although nutrients may also have been a factor.
In a review of several articles on the subject,Osborne and Kovacic (1993) concluded thatbuffer widths of 10-30 m (33-98 ft) can effec-tively maintain stream temperatures. Shading hasthe greatest impact on smaller streams. Collier etal (1995b) note that “generally, protecting or
Aquatic Habitat

36
planting small headwater streams achieves thegreatest temperature reduction per unit length ofriparian shade.” This again indicates the need toestablish buffers on even the smallest streamswhen possible.
Summary and RecommendationsRemoval of riparian forests has a profoundly
negative effect on stream biota. Davies andNelson (1994) summarized the range of effectsclearcutting can have on stream communities:“Logging significantly increased riffle sediment,length of open stream, periphytic algal cover,water temperature and snag volume. Loggingalso significantly decreased riffle macroinverte-brate abundance, particularly of stoneflies andleptophlebiid mayflies, and brown trout abun-
dance.” The researchers recommended a 30 m(98 ft) buffer to mitigate these effects. At aminimum, a 50 ft (15 m) buffer appears necessaryto provide woody debris inputs to the stream. Notree harvesting should occur within 25 ft (12 m)of the stream (50 ft/15 m is preferable), andharvesting in the remainder of the buffer shouldleave some mature and senescent trees. Nativevegetation should be preserved whenever pos-sible. To maintain stream temperatures, riparianbuffers must be at least 10 m (30 ft) wide, for-ested, and be continuous along all stream chan-nels to maintain proper stream temperatures. It isimportant to note that while some other riparianfunctions (e.g., sediment and nutrient retention)can be performed adequately by grassed buffers,forested buffers of native vegetation are vital tothe health of stream biota.
Article Widths Studied (m) Min. WidthRecommendation (m)
Hodges and Krementz (1996) 36-2088 100
Keller et al (1993) 25-800 100
Kilgo et al (1998) 25-500 both narrow and wide
Kinley & Newhouse (1997) 14-70 70
Smith & Schaefer (1992) 20-150 no recommendation
Spackman and Hughes (1995) 25-200 150-175
Thurmond et al (1995) 15-50 15
Triquet et al (1990) 15-23 no recommendation
Table 6. Riparian Buffer Recommendations from Avian Studies.The recommendations of the literature on riparian corridor widths for birds aresummarized here. The second column shows the range of buffer widthsstudied by the authors. The third column shows the authors’ recommenda-tions for the minimum corridor widths necessary to support bird populations.
Aquatic Habitat

37
Riparian corridors support an exceptionallevel of biodiversity, due to natural disturbanceregimes, a diversity of habitats and small-scaleclimatic variation (Naiman et al 1993). Gregoryand Ashkenas (1990) found that riparian forestsin the Willamette National Forest support ap-proximately twice the number of species than arefound in upland forests. Riparian zones alsosupport many rare species (Naiman et al 1993).Riparian areas are a declining habitat, however.Malanson (1993) estimates that 70% of naturalriparian communities have been lost; in someareas losses may be as high as 98%. Naiman et al(1993) put the loss at an average 80% for NorthAmerica and Europe.
Literature ReviewGregory and Ashkenas (1990) have noted that
riparian buffers established for water quality andfisheries needs may not meet the habitat require-ments of terrestrial wildlife. The ability of astream corridor to support wildlife is usuallydirectly related to its width (Schaefer and Brown1992). Narrow buffers may support a limitednumber of species, but wide buffers will berequired to maintain populations of riparian-dependent interior species. Generally, mostresearchers advocate preserving as wide a bufferas possible. Schaefer and Brown (1992) havesuggested that a protected river corridor shouldcover the floodplain and an additional uplandarea on at least on one side. Other researchershave attempted to quantify the necessary widthaccording to the needs of various riparian-dependent species.
BirdsOver the last decade there has been an
abundance of research on the use of ripariancorridors by birds. The recommendations ofmany of these studies are summarized in Table 6.
Triquet et al (1990) examined bird popula-tions in mature forest, clearcut forest, andclearcuts with a 15-23 m (49-76 ft) wide riparianbuffer. They found that retaining the bufferprovides habitat for some species of mature-forestand edge-dwelling songbirds that otherwise would
be absent. Birds associated with mature forestsvirtually disappeared from the clearcut site,though at the buffer strip site the decline wasmuch less (Triquet et al 1990).
Keller et al (1993) assessed bird species at 117riparian corridors of 25 m (82.0 ft) to 800 m(2624 ft) width in Maryland and Delaware. Theyfound that the total number of neotropicalmigrant species increased with forest width, andten species increased in abundance as widthincreased. Keller et al recommended preservingriparian corridors at least 100 m (328 ft) wide,and even wider corridors when possible. Whereintact riparian areas exist, they suggested givingpriority to the widest corridors available. How-ever, they said efforts to create or increaseriparian forest width should focus first on streamswith no vegetation and then on narrow (<50 m /164 ft) forests: “The presence of even a narrowriparian forest dramatically enhances an area’sability to support songbirds compared to a streamsurrounded only by agricultural fields or herba-ceous riparian habitats” (Keller et al 1993).
In surveys in Vermont forests, Spackman andHughes (1995) found that 90% of bird species areincluded within 150-175 m (492-574 ft) buffersalong most streams. At two streams the distancewas less. For most sites, 90% of plant species arerepresented within 15 m (49 ft) of the stream.Because Spackman and Hughes studied riparianareas that were part of intact mature forests,however, their findings are not completelyrelevant to riparian buffers bounded by openfields or urban development.
Kilgo et al (1998) studied bird richness andabundance in bottomland hardwood forests inSouthern South Carolina. Widths of forestsranged from less than 50 m (164 ft) to over 1000m (3280 ft), measured on both sides of the stream(except on the Savannah River, where forest ononly one side was measured because the river wasa flight barrier). Uphill land cover was eitherclosed-canopy pine or field-scrub. The authorsreported that species richness showed a strongpositive correlation with bottomland forest width,even though the adjacent habitat was also for-ested. They did not find a significant bufferingeffect of the pine habitat. That is, sites with field-
V. Terrestrial Wildlife Habitat
Terrestrial Habitat

38
scrub habitat uphill rather than pine forestshowed no decrease in bird abundance andrichness. This may be due to the great width ofmost of the buffers the researchers studied. Kilgoet al (1998) recommend protecting both narrowand wide riparian buffers, although they point outthe importance of preserving the few remainingareas of wide bottomland hardwood forest.
In a study in the Altamaha basin of theGeorgia Coastal Plain, Hodges and Krementz(1996) measured densities of neotropical migrantbirds in narrow (36-330 m/118-1082 ft), medium(440660 m/1443-2165 ft) and wide (1520 - 2088m/~0.95-1.3 mi) riparian corridors. They founda significant increase in bird densities for severalspecies between 50 m (164 ft) and 100 m (328 ft).Beyond 100 m, there was little increase associatedwith wider corridors. The researchers suggestedthat “forest corridors of about 100 m should besufficient to maintain functional assemblages ofthe six most common species of breedingneotropical migratory birds.”
Thurmond et al (1995) examined birdpopulations in narrower riparian corridors in theOgeechee River basin in the Upper Coastal Plainof Georgia. Riparian buffers of 50 ft (15.2 m),100 ft (31 m) and 164 ft (50 m) adjoining pineplantations of less than five years age werecompared to mature riparian areas. The authorsfound that breeding forest interior species werevirtually absent from all buffer strips, althoughoverall abundance and densities in these stripswere higher than in the adjacent pine plantations.They concluded that narrow protected streamcorridors are important in maintaining greaterbird diversity even though they are insufficent forprotecting interior species.
Smith and Schaefer (1992) found smalldifferences between bird populations in narrow(20-60 m/ 66-197 ft) and wide (75-150 m/246-492 ft) naturally vegetated buffers in an urbanizedNorth Florida watershed. Area-sensitive speciessuch as Acadian Flycatchers and Hooded Warblerswere not found in the narrow buffers. SummerTanagers were not recorded anywhere in theurbanized area, but they were found in a nearbyundisturbed riparian forest. The researchersfound that during spring, bird species diversityand evenness were less in Hogtown Creek, butaverage density was greater. During winter, bird
density and richness were greater in HogtownCreek.
Kinley and Newhouse (1997) studied breed-ing bird populations in riparian buffers of 14 m(46.0 ft), 37 m (121 ft) and 70 m (230 ft) inBritish Columbia. They found that densities ofall birds increased as buffer width increased, andthey concluded that “narrower riparian reservezones are of less value than wider reserve zones.”
Researchers have frequently reported birddensities and richness that are equal or greater innarrow buffers or clearcut areas. Afterclearcutting, bird diversity and abundance mayincrease because of the influx of open-habitat andedge-habitat birds (e.g., Triquet et al 1990). Thisis an example of the edge effect: boundaries likeforest edges (and riparian zones) tend to beespecially rich in biodiversity. It is a managementproblem in some ecosystems to maximize bothedge habitat and interior habitat. In addition,many species require more than one ecologicalsystem in which to complete their life cycles(Naiman et al 1988). However, generally speak-ing, animals that exploit impacted areas and edgesare more likely to be habitat generalists that areless in need of protection. Measurements ofspecies richness and population density are lessuseful than indices of similarity between devel-oped and undeveloped sites. Management on thelocal scale for maximum richness and density willalmost certainly result in the loss of habitatspecialists.
MammalsFew studies have explicitly addressed the
issue of how wide riparian buffers need to be tosupport mammal populations. Cross (1985)found that riparian zones in mixed conifer forestsites in southwest Oregon supported a higherdiversity and density of small mammal speciesthan upland habitat. Diversity and speciescomposition in a 67 m (220 ft) wide riparianbuffer bordered by a clearcut were found to becomparable to undisturbed sites.
Large mammals, as well as large reptiles suchas alligators, are also important for the role theyplay in determining the structure of streams andriparian zones (Naiman and Rogers 1997). Forexample, beavers create wetlands in areas wherethey would otherwise not exist, increasing the
Terrestrial Habitat

39
overall diversity of the aquatic community inthose regions (Snodgrass and Meffe 1998).Removal of large animals leads to simplificationof the ecosystem and loss of diversity (Naimanand Rogers 1997).
Reptiles and AmphibiansRiparian zones are often rich in both diversity
and abundance of reptiles and amphibians. Insome mountainous areas the number and biomassof salamanders can exceed that of birds andmammals (Brode and Bury 1984).
Reptiles and amphibians vary in their depen-dence upon riparian areas. Many amphibiansspend their entire lives within the stream andriparian zone, while other species use it forbreeding or as part of a larger range (Brode andBury 1984). In Western Oregon reptiles andamphibians that are dependent upon riparianareas may require buffers of 75-100 m (246-328ft) (Gomez and Anthony 1996). The authorsnoted that many species may also require preser-vation of large areas of old growth and uplandhabitat as well. Likewise, in a study of CarolinaBays, Burke and Gibbons (1995) found that a 275m (902 ft) upland buffer is required to protect allnest and hibernation sites for certain freshwaterturtles. Beyond a certain width, however, habitatheterogeneity is probably more important thanhabitat width. Burbrink et al (1998) found that100 m (328 ft) naturally vegetated riparian zonessupported reptile and amphibian diversities thatwere as high as 1 km (0.62 mi) wide naturallyvegetated riparian zones.
VegetationRelatively few riparian studies have focused
on the needs of native terrestrial vegetation.Gregory et al (1992) observed that “riparianzones are commonly recognized as corridors formovement of animals within drainages, but theyalso play an important role within landscapes ascorridors for dispersal of plants.” Riparian zonesprovide areas of habitat heterogeneity and cansupport high plant diversity. In the VermontAppalachians, Spackman and Hughes (1995)found that 90% of plant species surveyed wererepresented within 15 m (49 ft) of the stream.
Many floodplain plants require regular cyclesof flooding for seed dispersal and germination.Dam regulation of the Savannah River hasdesynchronized the conditions necessary forgermination of tupelo and cypress seeds(Schneider et al 1989; Sharitz et al 1990). As aresult, these once-dominant species are no longerreproducing effectively, which may ultimately leadto a shift in the forest composition. Similarly,dam-altered flow regimes have prevented regen-eration of cottonwood trees in areas of thewestern United States (Poff et al 1997).
In terms of vegetation required for terrestrialwildlife, it is almost axiomatic that native plantsare necessary to support healthy populations ofnative species. Studies have shown that pineplantations and other monoculture or nonnativevegetation tend to support a lower abundance anddiversity of wildlife (e.g., Dickson 1978). Nativeriparian vegetation should always be protectedand restored when necessary. Preserving thenatural hydrology of the stream system will alsohelp preserve native plants.
Riparian Buffers as Movement CorridorsOne of the incidental benefits frequently
ascribed to riparian buffers is their use as move-ment corridors for terrestrial wildlife. Ripariancorridors may be more suitable in this role thanother types of corridors because they tend to beenvironmentally diverse (Cross 1985). However,there has been considerable debate concerningwhether animals actually use corridors andwhether corridors should be a conservationpriority. Reed Noss (1983, 1987) has been astrong advocate of movement corridors forconnecting preserves and maintaining geneticexchange between animal populations. Simberloffand Cox (1987) and Simberloff et al (1992) havepointed out that corridors have some potentialnegative consequences and are not always thewisest use of conservation funds. A lack ofempirical research on both sides of the issue hasprevented resolution of the debate.
Harrison (1992) suggested minimum corridorwidths for migration of large mammals, but thescale of his recommendations (0.6 to 22 km wide)is not appropriate for most riparian corridors.Machtans et al (1996) examined songbird abun-dance in 100 m (328 ft) wide buffer strips adja-
Terrestrial Habitat

40
cent to clearcut forest to determine whether birdsused them as movement corridors. They foundthat juveniles do use the corridors for dispersal,but that the adults in the buffer are probablyresidents. Given the lack of consensus andresearch on the use of riparian buffers as move-ment corridors, it is more defensible to basebuffer width on habitat requirements of terrestrialorganisms. Because there is general agreementthat riparian buffers offer important high-qualityhabitat, there is little need to debate their meritsas movement corridors at this time.
Summary and RecommendationsWhile narrow buffers offer considerable
habitat benefits to many species, protectingdiverse terrestrial riparian wildlife communitiesrequires some buffers of at least 100 m (~300 ft).Bird abundance and diversity may be high inimpacted areas, but sensitive interior-dwellingspecies will be lost unless some wide ripariantracts are preserved. To provide optimal habitat,native forest vegetation should be maintained orrestored in all buffers. Riparian buffers may alsoserve as movement corridors, but considering thecontentiousness of this issue it is most defensibleto base buffer width on habitat requirements.
However desirable they might be, however,300 ft wide buffers are not practical on allstreams in most areas. Therefore, minimumriparian buffer width should be based on waterquality and aquatic habitat functions. This shouldresult in an abundance of narrow riparian corri-dors that will offer good habitat for many terres-trial species. In addition, at least a few wide (300-1000 ft/~90300 m) riparian corridors and largeblocks of upland forest should be identified andtargeted for preservation. This will providehabitat for those species that rely on areas ofinterior forest. Protection of these wide ripariancorridors for terrestrial wildlife should be a partof an overall habitat-protection plan for thecounty or region.
Flood Control and Other Riparian BufferFunctions
Flooding is a natural feature of aquatic andriparian ecosystems. The frequency, duration andmagnitude of floods helps to determine both the
physical and biological characteristics of theriparian zone (Junk et al 1989). As discussedabove, many riparian plants rely on cycles offlooding for seed dispersal and recruitment, whilemany fish species use riparian zones as nurseries,spawning grounds or feeding areas during highflows. A healthy riparian zone and a healthystream system requires the maintenance of thenatural flow regime (Poff et al 1997).
Of course, while floods are good for thestream and the riparian zone, they can be verydamaging to human structures and activities.Removal of riparian vegetation, drainage ofwetlands and development of floodplains leads tolarger magnitude floods that cause greater damageto property (Poff et al 1997, FIFMTF 1996).Michener et al (1998) reported that flooding inSouth Georgia in 1994 and 1997 was greatlyameliorated by the largely intact natural riparianareas. Riparian wetlands are especially valuablefor flood water storage.
Other factors can exacerbate flooding andneed to be considered. Channelization, althoughin many cases conducted for flood controlpurposes, can actually increase the magnitude offlooding downstream (Roseboom and Russell1985, Poff et al 1997). The Federal InteragencyFloodplain Management Task Force now discour-ages such structural controls on flooding andpromotes the preservation of floodplains in anatural state (FIFMTF 1996). Impervioussurfaces also greatly increase stream storm flows,as discussed in Section VID.
To provide maximum protection from floodsand maximum storage of flood waters, a buffershould include the entire floodplain. Short ofthis, the buffer should be as wide as possible andinclude all adjacent wetlands.
As outlined in the introduction, riparianbuffers perform a number of other importantfunctions, such as providing recreational andaesthetic benefits. These are beyond the scope ofthis document, although some of the economicbenefits of buffers are discussed in a separatepaper.
Terrestrial Habitat

41
From the literature discussed above, it isrelatively easy to recommend guidelines for bufferextent and vegetation:
Extent: Buffers should be placed on allperennial, intermittent and ephemeral streams tothe maximum extent feasible. The overalleffectiveness of the buffer is a function of howmany stream miles are included. A good practicalgoal is to protect all perennial streams as well asall intermittent streams of second order andhigher.
Vegetation: Buffers should consist of nativeforest along the stream to maintain aquatichabitat. Further from the stream (at least 25-50ft), some harvesting of trees may be permissibleand an outer belt of mowed grass can be usefulfor retaining nutrients and dissipating the energyof runoff.
Width, however, is somewhat more problem-atic. Although some buffer functions do notdemand great width, others (especially removal ofsediment) require significant width under someconditions. Current regulations in Georgiamandate fixed width buffers, regardless oftopographic conditions or other factors. How-ever, it is evident from the discussion so far thatnumerous variables influence buffer function.The question is, which of these variables are themost important? Is it possible to incorporate themost significant factors into a variable-widthformula? To help answer these questions, severalpreviously developed models and formulae fordescribing buffer function or determining bufferwidth are reviewed.
A. Review of Models to Determine BufferWidth and Effectiveness
Phillips (1989a, 1989b) derived two equa-tions to describe buffer performance, both ofwhich compare a given buffer with a referencebuffer. The first (the Hydraulic Model) focusesexclusively on overland flow of sediments andsediment-bound contaminants:
Bb/Br= (Kb/Kr)(Lb/Lr)0.4(sb/sr)-1.3(nb/nr)0.6
Where B=buffer effectiveness, K=saturatedhydraulic conductivity, L=width of buffer,s=slope, and n=Manning’s roughness coefficient.Subscripts b and r denote the buffer in questionand the reference buffer, respectively.
The second formula, the Detention Model,considers both overland flow and subsurface flow.
Bb/Br= (nb/nr)0.6(Lb/Lr)2(Kb/Kr)0.4(sb/sr)-0.7(Cb/Cr)
Where C= soil moisture storage capacity andthe other variables are the same as in the aboveequation.
As noted by Muscutt et al (1993), Phillips didnot verify his models experimentally, nor werethey field-tested or calibrated. It is also importantto note that the equations are only as good as thereference buffer selected for comparison. Theparameters for reference buffers in Phillips’studies were not based on real reference sites, butrather were based on typical recorded values fromthe regions under study. Phillips admits hischoices are “somewhat arbitrary” (Phillips1989b). Although his second model is designedto address nitrogen removal, many factorsinfluencing denitrification and vegetative uptakeof nutrients (the two major mechanisms fornitrogen reduction) are ignored. Thus, accordingto the model, wetland areas are poor riparianbuffers, a prediction that runs counter to bothscientific research and common sense. Neverthe-less, Phillips’ model may represent a good startingpoint and could prove somewhat useful if experi-mentally verified and calibrated.
Despite the limitations of Phillips’ model,Xiang (1993, 1996) and Xiang and Stratton(1996) used Phillips’ detention model as a basisfor a series of studies using a Geographic Informa-tion System (GIS) to delineate buffers in NorthCarolina. Although these studies provide anexcellent example of the utility of GIS for large-scale delineation and study of buffers, they arestill based on an untested formula.
VI. Development of Riparian Buffer Guidelines
Riparian Buffer Guidelines

42
The Riparian Ecosystem Management Modelsimulates the daily processing of water, sediment,carbon, and nutrients in a three-zone buffersystem (Lowrance 1998). It is a computersimulation that allows buffer managers to deter-mine the water quality impacts of buffer systemsof different widths, slopes, soils, and vegetation.So far it has been tested and calibrated at sitesnear Tifton, Georgia, in the Coastal Plain, andadditional verification is planned for other sitesaround the country. Initial testing revealed thatREMM is accurate at predicting buffer functionunder many conditions, but at times appreciableerror was observed (Lowrance 1998).
REMM is probably the most detailed andrealistic model of riparian buffer function devel-oped so far. Once it has been tested and cali-brated for different regions, it should be a veryuseful tool for determining buffer characteristicson a site-by-site basis. Sensitivity analyses mayalso reveal which environmental factors are themost significant in different areas, and thisinformation could be used to develop a simplermodel that could be applied county- or municipal-ity-wide. At this point, however, REMM is toodata-intensive to be useful for policy purposes.
Williams and Nicks (1988) used the Chemi-cal, Runoff, and Erosion from AgriculturalManagement Systems (CREAMS) model toevaluate grass filter strips of widths of 3-15 m,slopes of 2.4-10% and various roughness coeffi-cients on a 1.6 ha wheat site. They concludedthat CREAMS “can be a useful tool for evaluatingfilter strip effectiveness in reducing sedimentyield.” The authors only conducted one experi-mental verification, however, which showedmoderately close correlation (erosion was overes-timated by 38%). Flannagan et al (1989) foundthat under ideal conditions, CREAMS caneffectively predict sediment deposition in grassfilter strips. The authors developed a simplifiedversion of the model with extremely goodcorrelation (r2= 0.99) to the original. In a laterstudy, Williams and Nicks (1993) used CREAMSand WEPP (Water Erosion Prediction Project) toevaluate the effectiveness of riparian buffers of20-30 m at 200 Conservation Reserve Programsites in Central and Eastern U.S. Only selectedresults were reported. Predictions from WEPPand CREAMS varied, sometimes greatly: in one
case, WEPP predicted an 85% reduction in soilloss while CREAMS predicted a 10% reduction.No attempt was made to verify predictions withfield observations.
Mander (1997) also developed a model forbuffer width:
P=(tqfi1/2)/(mKin)
Where P= buffer width, t= a conversion constant(0.00069), q= the mean intensity of overlandflow, f= either the distance between stream andwatershed boundary or the ratio of catchmentarea to stream segment length, i= slope, m=roughness coefficient (not Manning’s), Ki= waterinfiltration rate and n= soil adsorption capacity.
At this time, there does not appear to be anypublished verification of Mander’s model.
Nieswand et al (1990) determined that slopeand width were the main factors influencing theeffectiveness of buffers in trapping sediment andassociated pollutants. They developed a simpleformula for determining width based on a modi-fied Manning’s equation:
W= k(s1/2)
Where W= width of buffer in feet
k = 50 ft (constant)
s = percent slope expressed as a wholenumber (e.g., 5% slope=5)
The constant “50 ft” is somewhat arbitrary; itwas chosen based on common buffer recommen-dations, with the assumption that a 50 ft buffer atone percent slope provides adequate protection tostreams. The authors also recommend that slopesgreater than 15% and impervious surfaces areineffective and should not be credited in bufferwidth calculations (Nieswand et al 1990).
An unusual system of determining bufferwidth was developed by Budd et al (1988) for acounty east of Seattle, Washington. While not aformula or model as such, it is worth mentioningbecause it purports to consider various streamcorridor variables. The method for width deter-
Riparian Buffer Guidelines

43
mination involves a subjective evaluation ofstream buffer characteristics, such as erosionpotential, wildlife habitat quality, etc., along withthe threats to the stream segment. Based on thesefactors, the assessor recommends a width forprotected buffers, much as a doctor recommendsa prescription for a patient. It is unclear, how-ever, how the assessor actually determines thewidth. No rules or guidelines are supplied.When Budd et al (1988) applied this method toBear-Evans Creek in Washington, they almostinvariably recommended a width of 50 feet,regardless of local conditions. Clearly the resultsof such a survey will reflect the biases of theassessor, and without guidelines such a protocol isof little practical use.
It is evident that none of these models areappropriate for delineating riparian buffers at thecounty scale. Some are too data-intensive to beeasily applied on large scale, some have not beenproperly field-tested or calibrated, some do notaccount for factors influencing significant pro-cesses, and some yield inconsistent results withone another. A new, simple formula is needed.The next section considers what variables shouldbe incorporated into this formula.
B. Factors Influencing Buffer WidthIt is evident from the preceding sections that
there are a range of variables that influence theeffectiveness of buffers. These include:
• slope of banks and areas contributing flow tothe stream segment
• rainfall
• soil infiltration rate (saturated hydraulicconductivity) and other soil factors (redoxpotential, pH, temperature)
• soil moisture content
• floodplain width
• catchment size
• land use
• impervious surfaces
• vegetation, including litter and other surfacecover characteristics (often quantified as aroughness coefficient such as Manning’s N)
Clinnick (1985) identified soil type, slope andcover factors as important variables. Binford andBuchenau (1993) thought the most importantfactors were catchment size, slope, and land use.Fennessy and Cronk (1997) identified detentiontime as the most important variable; this isactually an aggregate of several variables, includ-ing slope, soil factors, surface cover characteris-tics, hydrological factors, and others. Osborneand Kovacic (1993) suggested that factors influ-encing nutrient removal efficiency of buffersinclude sedimentation rates, drainage characteris-tics, soil characteristics (i.e. redox potential),organic matter content and type, temperature,successional status and nutrient loading rates.
The following is a discussion of each of thesefactors and considerations on the practicality ofincorporating them into a variable-width bufferformula that can readily be applied county-wide.As will be seen below, in many cases it is clear thatsome factors are important, but practical consid-erations make it difficult to incorporate them on alarge scale. The purpose of this paper is todevelop guidelines that are not only scientificallydefensible and reasonably accurate, but that canalso be readily applied to any property withminimal effort and data collection. When it ispossible to conduct a detailed analysis of on-siteconditions to determine the optimal buffer for aspecific tract of land, additional variables shouldbe considered. In that case, a more accuratemodel, such as REMM, should be used.
SlopeThe slope of the land on either side of the
stream may be the most significant variable indetermining effectiveness of the buffer in trappingsediment and retaining nutrients. The steeper theslope, the higher the velocity of overland flowand the less time it takes nutrients and othercontaminants to pass through the buffer, whetherattached to sediments or moving in subsurfaceflow. Slope is a variable in virtually all models ofbuffer effectiveness and should definitely beincluded in a formula for buffer width.
Although Nieswand et al (1990) make a casefor a width that varies exponentially with slope,research by Trimble and Sartz (1957) and Swift(1986) found a linear relationship in their fieldstudies. Trimble and Sartz suggested that widthshould increase by either two or four feet for each
Riparian Buffer Guidelines

44
percent increase in slope; Swift suggested thatwidth should increase either 0.40 or 1.39 feet foreach percent increase in slope. Since Swiftignored small silt and clay particles, his variablesare apt to be low. Therefore, this review followsTrimble and Sartz’ recommendation of increasingthe buffer by 2 ft per 1% increase in slope.
Many researchers have noted that very steepslopes cannot effectively remove contaminants,though there is debate over what constitutes asteep slope. Among the recommendations are:
• 40% slope (Cohen et al 1987)
• 25% slope (Schueler 1995a)
• 15% slope (Nieswand et al 1990)
• 10% slope (Herson-Jones et al 1995)
Georgia’s minimum standards for MountainSlope Protection apply to certain slopes over25%. Soil surveys typically do not recommendagriculture on slopes over 10% because of theerosion hazard. On the other hand, Swift foundthat riparian buffers on logging roads were able totrap sediment even on extremely steep (80%)slopes, though again small particles are notconsidered. There appear to be no other studieswhich evaluate buffer effectiveness at greater thanmoderate slopes. Any cutoff will be somewhatarbitrary, but 25% appears to be reasonable giventhe range shown above, until further research canclarify the issue. Therefore, the buffer widthshould increase by two feet for each slope percentup to 25%. Slopes steeper than this are notcredited toward the buffer width.
RainfallThe pattern and intensity of rainfall are
important factors in determining the effectivenessof buffers. Daniels and Gilliam (1996) found thatmost of the sediment that passed through ariparian buffer did so during a single storm. Onestudy cited by Karr and Schlosser (1976) foundthat 75% of agricultural erosion occurs duringfour storms a year, but another study they citefound that smaller rain events caused at least 50%of erosion and there was significant regionalvariability. It would be expected that in regionswhere rainfall is uniform and light, narrowerbuffers may effectively manage most of the
sediment and nutrients that enter them. In areasthat experience seasonal storms of high intensity,wider buffers may be necessary. However, theredo not appear to be any studies that quantify therelationship between rainfall and buffer effective-ness. Several studies (e.g. Dillaha et al 1988,1989; Magette et al 1987, 1989) described in thisreview simulated heavy rainfall conditions on testplots, but the studies were short-term and rainfallintensity comparisons were not made. Magette(1987) reported that buffer effectiveness declinedas rainfall events increased. Others (Cooper et al1987, Lowrance et al 1988) have examined theeffectiveness of buffers over a sufficiently longtime frame to include large storms. These long-term studies indicated the need for wider buffersthan were recommended by most short-termstudies. Groffman et al (1991b) suggested thatdenitrification rates are lower during stormsbecause buffer residence times are decreased, butno empirical evidence was available. Hanson et al(1994) reported increases in denitrification ratesin response to storms. Precipitation is incorpo-rated into the “R” factor of the Universal Soil LossEquation, which provides a rough estimate oferosion from agricultural fields or other plots. Itmay be possible to use this factor in a formula forbuffer width; this warrants further investigation.
Buffers should be designed to effectivelyhandle runoff and subsurface flow-rates from aone-year storm event. Just as for otherstormwater best management practices, allow-ances should be made for exceptional (10-year or25-year) events. In the absence of hard data,however, it is not possible to draw a valid rela-tionship between rainfall patterns and bufferwidth. When possible, buffer effectiveness shouldbe assessed through stream water quality measure-ments during or after storms. When buffers arefound to be ineffective they should be widened oradditional on-site controls should be imple-mented.
Catchment Size/Hydraulic LoadingIt is logical that an increase in catchment size
will demand an increase in buffer width. That is,a stream segment that drains five acres will collectmore pollutants than one draining two acres, anda larger buffer will be required. The relationshipmay not be so simple, however. Sorrano et al(1996) argue that sediment/nutrient loading
Riparian Buffer Guidelines

45
models that directly correlate loading rate withcatchment area ignore the fact that as distancefrom the stream increases, sediments and nutri-ents are less likely to actually enter surface water.In other words, the areas closest to streamchannels are far more important than more distalareas, and an increase in contributing area doesnot necessarily correspond to an increase incontaminant loading. Hatfield et al (1995)reported that catchment size had little influenceon pesticide removal by buffer strips.
Additionally, denitrification rates usuallyincrease to accommodate increased nitrateloading rates, as long as carbon does not becomelimiting. Haycock and Pinay (1993) reported99% nitrate reductions in 20 m (66 ft) widewooded riparian buffers regardless of the level ofnitrate loading. Mander et al (1997) found thatnutrient retention bears a strong log-log relation-ship with nutrient load; i.e., as load increases,retention increases (They also make a ratherunconvincing case that retention efficiencydeclines slightly with higher loads). It appearsthat increased nutrient and/or hydraulic load doesnot necessarily require a wider buffer. In anycase, the relationship is sufficiently complex thatcatchment size is not a reasonable variable toinclude in a simple buffer model.
Soil FactorsSoil characteristics determine in large part
whether or not overland flow occurs, how fastwater and contaminants move to the stream, andother factors relevant to the effectiveness of theriparian buffer. Denitrification rates are stronglyinfluenced by soil moisture and soil pH(Groffman et al 1991a,b).
However, determining soil characteristics ona county-wide scale is somewhat problematic.According to Steve Lawrence of the NaturalResources Conservation Service, soil survey mapsmay not be sufficiently accurate for application ina model for buffer width (pers. com.). Theminimum mapping unit is 3-4 acres, and inevita-bly some “inclusions” occur: these are small areasof different soil type lumped in with the dominantsoil type. Mapping accuracy is even lower forsoils that have been disturbed by construction orother activities (Elizabeth Kramer, pers. com.).Therefore, without detailed and potentiallyexpensive on-site soil analyses, it is unlikely that
including soil factors as variables would addgreatly to the accuracy of a model. Of course, itmay be reasonable to consider very general soilcharacteristics, such whether a soil is hydric(frequently flooded) and the overall hydrology ofthe area. In cases where on-site analysis ispossible, it may be reasonable to adjust bufferwidth accordingly.
Soil Moisture & WetlandsDenitrification rates show a positive correla-
tion with soil moisture content (e.g. Groffman etal 1991a, b, Hanson et al 1994, Schnabel et al1997). Wetlands, those soils with the highestmoisture levels, have long been recognized fortheir value in trapping sediment and nutrients.They are also recognized as important animalhabitat and are valuable in reducing flood im-pacts.
Riparian wetlands are significant enough tomerit automatic inclusion in a buffer system. Thewidth of the buffer should be extended by thewidth of all adjacent wetlands. For example, if asite that would otherwise have a 75 ft (22.9 m)wide buffer is found to include part of a 50 ft(15.2 m) wide area of riparian wetlands, totalbuffer width should be extended to 125 ft (38 m).Constructed wetlands are becoming more com-mon as a component in human and animal wastetreatment systems. However, natural wetlandsrequire buffers of their own and should never beused to process untreated waste (Lowrance1997b, Hubbard 1997).
FloodplainThe floodplain represents the region of
material interchange between land and stream, aswell as the limits of stream channel migration.Studies reviewed above have shown that theentire floodplain can be a site of significantcontaminant removal. For this reason, it makessense to extend the buffer to the edge of thefloodplain whenever possible. In their bufferguidelines for Willamette National Forest, Gre-gory and Ashkenas (1990) declare that “theriparian management zone should include theentire [100 year] floodplain. Failure to do so willseriously jeopardize the riparian managementobjectives during major floods.” Schueler (1995)also recommends including the floodplain.
Riparian Buffer Guidelines

46
Including the entire floodplain is, naturally, alsothe best way to minimize damage from floods.
Therefore, whenever feasible, the riparianbuffer should be extended to the edge of the 100-year floodplain. Even when this is not possible,certain activities and structures should be ex-cluded from the floodplain because of the riskthey pose to the stream. These include animalwaste lagoons, animal waste spray fields, hazard-ous and municipal waste disposal facilities, andother potential sources of severe contamination.
Land UseUrban and agricultural watersheds experience
greater sedimentation and eutrophication thanforested watersheds (Crawford and Lenat 1989).A study in coastal South Carolina found that astream draining an 11 ha urbanized watershedhad a 66% greater sediment load than a streamdraining a 37 ha forested watershed, despite itssmaller catchment area (Wahl et al 1997). Studiesby Crawford and Lenat (1989) clearly showedthat for all indicators (sediment, nutrients, metals,fish, invertebrates), urban streams are moreheavily impacted than either forested or agricul-tural streams. Agricultural watersheds alsodisplay serious impacts, although they can stillretain a healthy (if altered) biota (Crawford andLenat 1989). A recent study by the U.S. Geologi-cal Survey found that Piedmont, Georgia streamsdraining watersheds that are mostly forestedmaintain the healthiest fish communities. Agricul-tural and suburban streams are worse, and urbanstreams tend to be the most degraded.
Incorporating land use into a formula forriparian buffer width presents some practicaldifficulties, however, because the relationship isquite complex. For example, even though urbanstreams tend to suffer greater impacts than otherstreams, urban buffers also tend to be less effec-tive because storm drains deliver a large propor-tion of runoff directly to the channel. Therefore,widening a buffer in an urban area may have lessof an effect on water quality than widening abuffer in an agricultural area. In a similar vein,does a pristine stream running through a forestneed a smaller or larger buffer than an agricul-tural stream? Although the stream may notappear to be threatened, the absence of a suffi-
ciently wide buffer might allow a logging road tobe built too close, damaging the stream withsediment. Furthermore, land uses of the samegeneral category (e.g., farming) could have verydifferent effects on a stream. For example, oneproperty zoned agricultural might be planted tocotton and produce massive sediment loads, whileanother might be planted to unmanaged pinetrees. Administration of such a program would bedifficult and subject to frequent challenges.
A more practical approach is to establishriparian buffer widths that are sufficiently wide tomitigate the great majority of land use impacts.Specific activities that are especially damagingshould be subject to additional setbacks. Inaddition, pollution should be managed on-site,impervious surfaces should be limited and ripar-ian buffer bypasses should be minimized (seebelow). These controls may do more to improvestream water quality and habitat than additionalincreases in the riparian buffer width.
Impervious surfacesBecause impervious surface area is so closely
correlated with stream water quality, it may beconsidered as a variable for determining bufferwidth. It is far more effective, however, to treatimpervious surface as a controllable variable andimplement impervious surface limits and controls.This is discussed in more detail in a later section.In any case, however, preexisting impervioussurfaces near the stream will not effectivelyperform buffer functions and should not counttoward buffer width. For example, if a 30 ft wideroad parallels a stream, the riparian buffer shouldbe increased by 30 ft on the road side.
VegetationVegetation characteristics may influence
buffer effectiveness and therefore necessarywidth. However, in this report vegetation isconsidered a factor under management and not awidth variable.
Riparian Buffer Guidelines

47
C. Buffer Guidelines for Water QualityProtection
In the previous section it was established thatbuffer width should vary based on slope andshould include wetlands. One final task remainsbefore buffer guidelines are presented: to deter-mine the minimum width of the buffer. Withoutconsidering terrestrial habitat, most recommenda-tions for minimum buffer widths range from 15 m(~50 ft) to 30 m (~100 ft). It might be possibleto determine the correct width from within thisrange by conducting additional research in theregion of interest. In the absence of this, how-ever, the choice of minimum width amounts to achoice regarding margin of safety or, conversely,acceptable risk. The greater the minimum bufferwidth, the greater the margin of safety in terms ofwater quality and habitat preservation. Accord-ingly, several options are proposed: The first twoare variable-width options, one with a 100 ft basewidth, and one with a 50 ft base width. The firstcan be considered the “conservative” option: itmeets or exceeds many buffer width recommen-dations, and therefore should ensure high waterquality and support good habitat for nativeaquatic organisms. The second is the “riskier”option: it should, under most conditions, providegood protection to the stream and good habitatpreservation, although heavy rain, floods, or poormanagement of contaminant sources could moreeasily overwhelm the buffer. All of these optionsare defensible given the literature reviewed here.As a third option, a 100 ft fixed-width riparianbuffer is recommended for local governments thatfind it impractical to administer a variable-widthbuffer.
Option One:
• Base width: 100 ft (30.5 m) plus 2 ft (0.61 m)per 1% of slope.
• Extend to edge of floodplain.
• Include adjacent wetlands. The buffer widthis extended by the width of the wetlands,which guarantees that the entire wetland andan additional buffer are protected.
• Existing impervious surfaces in the riparianzone do not count toward buffer width (i.e.,the width is extended by the width of theimpervious surface, just as for wetlands).
• Slopes over 25% do not count toward thewidth.
• The buffer applies to all perennial,intermittent and ephemeral streams.
Option Two:The same as Option One, except:
• Base width is 50 ft (15.2 m) plus 2 ft (0.61 m)per 1% of slope.
• Entire floodplain is not necessarily includedin buffer, although potential sources of severecontamination be excluded from thefloodplain.
• Ephemeral streams are not included; affectedstreams are those that appear on USGeological Survey 1:24,000 topographicquadrangles. Alternatively, the buffer can beapplied to all perennial streams plus allintermittent streams of second order orlarger.
Figure 9 shows an example of how OptionTwo can be applied to a theoretical riparianlandscape.
Option Three:
• Fixed buffer width of 100 ft.
• The buffer applies to all streams that appearon US Geological Survey 1:24,000topographic quadrangles or, alternatively, allperennial streams plus all intermittent streamsof second order or larger (as for OptionTwo).
All of the buffer options described willprovide habitat for many terrestrial wildlifespecies. However, significantly wider buffers arenecessary to provide habitat for forest interiorspecies, many of which are species of specialconcern. The most common recommendation inthe literature on wildlife (most of which focuseson birds) is for a 100 m (300 ft) riparian buffer.Although this is not practical in many cases, localgovernments should preserve at least someriparian tracts of 300 foot width or greater.Identification of these areas should be part of anoverall, county-wide wildlife protection plan.
Riparian Buffer Guidelines

48
Activities Prohibited in the BufferAs a general rule, all sources of contamination
should be excluded from the buffer. Theseinclude:
• land disturbing activities
• impervious surfaces
• logging roads
• mining
• septic tank drain fields
• agricultural fields
• waste disposal sites
• application of pesticides and fertilizer (exceptas necessary for buffer restoration)
• livestock
One exemption to this list that local govern-ments may wish to consider is construction of asingle family home. Minimum standards for rivercorridor protection issued by the EnvironmentalProtection Division cannot by law prohibit thebuilding of a single-family dwelling within thebuffer for protected River Corridors (OCGA 12-2-8). Local governments that develop ordinances
more stringent than the minimum standards mayalso wish to make this exemption.
The Three-Zone Buffer SystemA three-zone riparian buffer system has been
suggested for agricultural areas to allow somelimited use of riparian land while preservingbuffer functionality (Welsch 1991). Zone one,which extends from the bank to 15 ft (4.6 m)within the buffer, is undisturbed forest. Zone twois a managed forest, beginning 15 ft (4.6 m) fromthe bank and extending to 75 ft (22.9 m). Peri-odic harvesting and some disturbance is accept-able within this zone. Zone 3 is a grassed strip,beginning 75 ft (22.9 m) from the bank andextending to the buffer’s edge at 95 ft (29.0 m).Controlled grazing and mowing may be permittedin this zone.
While the three-zone system represents agood compromise for buffers on agricultural land,it introduces an added level of complexity to abuffer ordinance that may not be warranted,especially if a variable-width system is used.Local governments may want to encourage thethree-zone system as a voluntary practice on
25 ft
Wetland 10% slope
30% slope
Impervioussurface
10% slope
Channel
Average slope: 12%. Base width: 74 ft.Total width: 126 ft.
25 ft 40 ft 10 ft 17 ft 9 ft
limit of buffer
not counted not counted
Figure 9. Example of the Application of BufferGuidelines to a Hypothetical Riparian Landscape.Base distance is calculated as 50 ft (for "Option 2") plus 2 ftper 1% of slope. Wetlands, slopes over 25%, andimpervious surfaces do not count toward the buffer width.
Figure 10. Example of the Application of Buffer Guidelines to a Hypothetical RiparianLandscape.Base distance is calculated as 50 ft (for “Option 2”) plus 2 ft per 1% slope. Wetlands, slopes over 25%,and impervious surfaces do not count toward the buffer width.
Average slope: 12%Base width: 74 ftTotal width: 126 ft
Riparian Buffer Guidelines

49
agricultural lands. Additional information isavailable from the Natural Resources Conserva-tion Service.
Is This Possible?An ordinance that establishes 100 ft or wider
buffers on all perennial streams may soundunrealistic or too heavy-handed for most localgovernments. But such an ordinance is not asdraconian as it first sounds. It is important tobear in mind that in most areas, such land uselaws must of necessity exempt existing land uses:no local government is going to tell a smallproperty owner that he must move his house orconvert his lawn to forest (although he could beactively encouraged to do the latter). The peoplewho are most affected are developers, who mustnow incorporate buffers into their designs. Thiswill not necessarily have a negative economicimpact. Several studies have shown that peoplewill pay a premium to live or work neargreenways or other protected areas, and thisallows the developer to recoup at least some ofthe costs of not developing up to the stream bank.Finally, any buffer ordinance should alwaysinclude clear, fair rules for variances, which willinsure that anyone who is unfairly impacted bythe law can obtain relief. More information onhow local governments can develop and imple-ment riparian buffer ordinances is included in aseparate “Guidebook for Developing LocalRiparian Buffer Ordinances,” available from theUniversity of Georgia Institute of Ecology Officeof Public Service and Outreach. The documentdiscusses various tools for protecting buffers, casestudies of existing buffer protection programs,important issues of concerns such as “takings,”and includes model riparian buffer ordinances.
D. Other ConsiderationsEstablishing a system of protected riparian
buffers is an important step in preserving healthystreams. However, a number of other steps mustbe taken if buffers are to be truly effective.
Reducing Impervious Surfaces
In a natural forested watershed, overlandflow is quite rare, occurring only during the most
severe rainstorms. Impervious surfaces, on theother hand, transfer most precipitation intorunoff, leading to increased surface erosion,higher and faster storm flows in streams, andincreased channel erosion. As a consequence,urban streams characteristically have greatlyelevated sediment levels (Wahl et al 1997, Frick etal 1998). Flow from impervious surfaces alsocarries pollutants directly to streams, bypassingthe natural filtration that would occur by passagethrough soil. Impervious surfaces are so closelycorrelated with urban water pollution that theyare commonly used as an indicator of overallstream quality (Arnold and Gibbons 1996). Mayet al (1997) note that impervious surfaces are the“major contributor to changes in watershedhydrology that drive many of the physical changesaffecting urban streams.” Trimble (1997) ascribedthe cause of large-scale channel erosion in SanDiego Creek to increased impervious surfaces inthe watershed. Impervious surfaces also decreasegroundwater recharge and stream base flow levels(Ferguson and Suckling 1990). In a study ofPeachtree Creek in Atlanta, Ferguson and Suck-ling (1990) also linked impervious surfaces to anincrease in evapotranspiration; water evaporatesquickly from impervious surfaces, creating awarm microclimate which increases transpirationrates in trees and plants. This further reducesstream flows, except during rainstorms. In short,impervious surfaces cause “flashy” streams withlow base flows and very high storm flows.
Riparian buffers cannot protect a stream fromchannel erosion if the stream is constantly scouredby high storm flows caused by runoff fromimpervious surfaces. All municipalities andcounties experiencing urban and suburban growthshould consider enacting impervious surfacecontrols in addition to riparian buffer ordinances.These limits can range from 10-12%, the point atwhich streams are considered impacted, to 30%,the point at which streams can be considereddegraded (Klein 1979). If existing technologieswere vigorously applied, impervious surfacescould be nearly eliminated (Bruce Ferguson, pers.com.). Further information on reducing impervi-ous surfaces is available in the publication LandDevelopment Provisions to Protect Georgia WaterQuality (UGASED 1997) and in a recent publica-tion of the Etowah Initiative (Miller andSutherland 1999).
Riparian Buffer Guidelines

50
On-Site Management of Pollutants
Riparian buffers alone are not enough tomitigate the effects of otherwise uncontrolledupland activities (Binford and Buchenau 1993).As Barling (1994) notes, “buffer strips shouldonly be considered as a secondary conservationpractice after controlling the generation ofpollutants at their source.” In many cases it maybe easier, cheaper and preferable to preventpollutants from moving off site in the first place.
SedimentIn the case of agricultural regions, erosion
reduction efforts should focus on keeping soil infields, where it is usable, rather than trapping it inthe riparian zone, where it is much more difficultto salvage. The Natural Resources ConservationService, the Georgia Soil and Water ConservationCommission, extension agencies and othergovernmental and non-governmental organiza-tions can provide detailed information on effec-tive best management practices to reduce erosion.It is essential to follow these BMPs in addition toprotecting functioning riparian buffer strips.Local governments need to take a coordinatingrole in ensuring that the various agencies and theagricultural community cooperate to reach waterquality goals for the basin.
Likewise, BMPs must be faithfully imple-mented and enforced in construction projects. Areview by Brown and Caraco (1997) found that inmany cases, half of all practices specified inerosion and sediment control (ESC) plans werenot implemented correctly and were not working.Contractors habitually saved money by cuttingESC installation and maintenance. Surveys alsofound that ESC practices rated as “most effective”by experts were seldom applied while those rated“ineffective” are still widely used. The authorsalso report that a field assessment of silt fencesfound that 42% were improperly installed and66% were inadequately maintained. Theyconclude that while a substantial amount ofmoney is now spent on ESC practices, “much ofthis money is not being well spent— practices arepoorly or inappropriately installed, and very littleis spent on maintaining them” (Brown and Caraco1997). Kundell and Rasmussen (1995) havenoted the importance of inspections and enforce-ment of BMPs in Georgia.
NutrientsBecause riparian zones can become saturated
with phosphorus, it is very important to managesources of this nutrient. Septic drain fields andsewer pipes can leak soluble phosphorus andshould be located as far from streams as possible.Frequently, however, sewer pipes are routedthrough stream corridors, creating an extremehazard if they should leak. Although a review ofsetback recommendations for septic tank drainfields and sewer pipes is beyond the scope of thisdocument, a minimum distance of 100 ft (~30m)appears prudent considering the magnitude of therisk. Sewer pipes should only cross streams whenabsolutely necessary.
Concentrated Animal Feeding Operations(CAFOs) typically dispose of large amounts ofnutrient-rich waste by holding it in waste lagoonsand applying it to fields either as fertilizer orsimply as a disposal method (Linville 1997).Large CAFOs may be considered point sourcepolluters and can be required to obtain a federalpermit (issued in Georgia by the EPD), butnationally only 12% of CAFOs are actuallypermitted (Linville 1997). Waste lagoon spills canbe devastating to rivers (Burkholder 1997,Linville 1997), and placement of such lagoonsshould be carefully regulated. It is probably bestto determine placement on a site-by-site basis toensure that if a spill occurs, its effect on thestream system will be minimized. At the least,lagoons should be located outside of riparianbuffers and the 100-year floodplain.
Because riparian buffers are generally effec-tive at removing nitrogen from animal waste(Groffman et al 1991a), manure applicationstrategies should be based on phosphorus, espe-cially in watersheds where it is a limiting nutrient(Daniel and Moore 1997, Miguel Cabrera, pers.com.). Studies by Miguel Cabrera have shownthat the concentration of phosphorus in runoff isproportional to the amount applied to the field,and that current application rates are many timeshigher than they should be to maintain phospho-rus at acceptable levels (pers. com.). New ap-proaches to phosphorus management are gainingacceptance and hold some promise for reducingthe amount of phosphorus that can reach thestream. However, even with the best availablecontrols, manure application rates likely will need
Riparian Buffer Guidelines
51
to be reduced substantially to prevent phosphoruspollution of streams (Miguel Cabrera, pers. com.).
Riparian Buffer Crossings/Bypasses
Road crossings and other breaks in theriparian buffer effectively reduce buffer width tozero and allow sediment and other contaminantsto pass directly into the stream (Swift 1986).Buffer crossings, or even just narrow points in thebuffer, may be the locations of the majority ofcontaminant transport to the stream (Weller et al1998). All buffer crossings should be minimized,but when they are necessary, Schueler (1995)suggests the following guidelines:
• Crossing width should be minimized
• Direct (90 degree) crossing angles arepreferable to oblique crossing angles
• Construction should be capable of surviving100-year floods
• Free-span bridges are preferable toculvertizing or piping the stream
Special care must be taken to stabilize banksaround the buffer crossing. Crossings should beregularly monitored, especially after severe stormsand floods, to determine if excessive sedimenta-tion is occurring. Sewer lines which cross streamsshould also be inspected to ensure they are notleaking or damaged in any way.
It is also essential to minimize practices whichcause water flow to bypass the riparian zone.Drain tiles used to improve drainage fromagricultural fields discharge flow directly into thestream (Fennessy and Cronk 1997, Osborne andKovacic 1993, Vought et al 1994). Jacobs andGilliam (1985) compared fields drained by a
riparian buffer with fields drained by ditches anddrain tile. They observed high nitrate reductionin the riparian buffer, but much lower nitrate lossin drainage ditches and very little nitrate removalfor fields drained by tile. Nitrate levels in tiledrains in Georgia agricultural fields have beenfound to be several times higher than the levels inthe shallow aquifer (Frick et al 1998). Construct-ing riparian wetlands at the outfall of the draintile would help to slow the transport of pollutantsinto the stream and permit nutrient uptake andremoval (Osborne and Kovacic 1993).
Similarly, in urban areas, storm drains carrycontaminant-laden water from impervioussurfaces directly into streams. This practiceshould be discontinued. Ideally, runoff should beallowed to infiltrate into the soil as close aspossible to the source. If some drainage isrequired, outflow should either be directed in theform of sheet flow across a suitably wide riparianbuffer or into a storm water detention ponds orconstructed wetlands. When necessary, con-structed wetlands may be incorporated into theriparian buffer if they are properly located and donot harm existing wetlands or other criticalriparian features (Schueler 1995a).
For More Information
For additional information on how localgovernments can develop riparian buffer ordi-nances, a “Guidebook for Developing LocalRiparian Buffer Ordinances,” is available from theUniversity of Georgia Institute of Ecology Officeof Public Service and Outreach (phone: 706-542-3948; email: [email protected]). Foradditional scientific information on riparianbuffers, all of the sources cited in this review arelisted in the References section which follows.
Riparian Buffer Guidelines
52
Allan, J. D., 1995. Stream Ecology: Structureand Function of Running Waters. London, UK:Chapman and Hall.
Abelho, M. and M. A. S. Graça. 1996. Effectsof eucalyptus afforestation on leaf litter dynamicsand macroinvertebrate community structure ofstreams in Central Portugal. Hydrobiologia 324:195-204.
Anderson, K. , B. R. Dubrow, S. Paladino, M.Paul and T. Schofield. Date unknown. IntercountyCooperation on the Upper Etowah: A Window ofOpportunity. Atlanta, GA: Georgia Institute ofTechnology.
Arnold, C. L., Jr. and C. J. Gibbons. 1996.Impervious Surface Coverage: The emergence ofa key environmental indicator. APA Journal62(2):243-258.
Arora, K., S. K. Mickelson, J. L. Baker, D. P.Tierney, C. J. Peters. 1996. Herbicide retention byvegetative buffer strips from runoff under naturalrainfall. Transactions of the ASAE 2155-2162.
Baltz, D. M. and P. B. Moyle. 1984. Theinfluence of riparian vegetation on stream fishcommunities of California. Pp 183-187 in R. E.Warner and K. M. Hendrix (eds), CaliforniaRiparian Systems: Ecology, Conservation andManagement. Berkeley, CA: University of Califor-nia Press.
Barling, R. D. and I. D. Moore. 1994. Role ofbuffer strips in management of waterway pollu-tion: A review. Environmental Management18(4):543-558.
Barnes, K. H., J. L. Meyer and B. J. Freeman.1997. Sedimentation and Georgia’s fishes: Ananalysis of existing information and futureresearch. In: Hatcher, K. J., ed., Proceedings of the1997 Georgia Water Resources Conference.Athens, GA: University of Georgia.
Barth, C. A. 1995. Nutrient movement fromthe lawn to the stream? Watershed ProtectionTechniques 2(1): 239-246.
Barton, D. R., W. D. Taylor and R. M. Biette.1985. Dimensions of riparian buffer stripsrequired to maintain trout habitat in southern
Ontario streams. North American Journal ofFisheries Management 5: 364-378.
Beeson, C. E. and P. E. Doyle. 1995. Com-parison of bank erosion at vegetated and non-vegetated channel bends. Water Resources Bulletin31(6):983-990.
Binford, M. W. and M. J. Buchenau. 1993.Riparian greenways and water resources. In:Smith, D. S. and P. Cawood, eds. Ecology ofGreenways. Minneapolis, MN: University ofMinnesota Press.
Bjorkland, R. J. Unpublished. Riparian Zones:The Multiple Use Ecosystems— A Review.
Black, S., P. Broadhurst, J. Hightower and S.Schauman. 1985. The value of riparian habitatand wildlife to the residents of a rapidly urbaniz-ing community. In: Riparian Ecosystems and theirManagement: Reconciling Conflicting Uses (FirstNorth American Riparian Conference). Ft. Collins,CO: Rocky Mountain Forest and Range Experi-ment Station (Gen. Tech. Report RM-120).
Brode, J. M. and R. B. Bury, 1984. Theimportance of riparian systems to amphibians andreptiles. Pp 30-36 in R.E. Warner and K.M.Hendrix (eds.), California Riparian Systems:Ecology, Conservation and Management. Berkeley,CA: University of California.
Brown, W. E. and D. S. Caraco. 1997. MuddyWater In— Muddy Water Out? Watershed Protec-tion Techniques 2(3):393-403.
Budd, W. W., P. L. Cohen, P. R. Saunders andF. R. Steiner. 1987. Stream corridor managementin the Pacific Northwest: I. Determination ofstream-corridor widths. Environmental Manage-ment 11(5): 587597.
Burbrink, F. T., C. A. Phillips and E. J. Heske.1998. A riparian zone in southern Illinois as apotential dispersal corridor for reptiles andamphibians. Biological Conservation 86: 107-115.
Burke, M. A. 1996. Historic Evolution ofChannel Morphology and Riverine WetlandHydrologic Functions in the Piedmont of Georgia(Master’s Thesis). Athens, GA: University ofGeorgia.
References
References

53
Burke, V. J. and J. W. Gibbons. 1995. Terres-trial buffer zones and wetland conservation: Acase study of freshwater turtles in a Carolina Bay.Conservation Biology 9(6):1365-1369.
Burkhead, N. M., S. J. Walsh, B. J. Freemanand J. D. Williams. 1997. Status and restorationof the Etowah River, an imperiled SouthernAppalachian Ecosystem. In: Benz, G. W. and D. E.Collins, eds., Aquatic Fauna in Peril: The SouthernPerspective. Decatur, GA: Southeast AquaticResearch Institute (Special Publication 1).
Burkholder, J. M., M. A. Mallin, H. B.Glasgow, Jr., L. M. Larsen, M. R. McIver, G. C.Shank, N. Deamer-Melia, D. S. Briley, J. Springer,B. W. Touchette, and E. K. Hannon. 1997.Impacts to a coastal river and estuary fromrupture of a large swine waste holding lagoon.Journal of Environmental Quality 26:1451-1466.
A. L. Burruss Institute of Public Service(Burruss Institute), Kennesaw State University.1998. Lake Allatoona Phase I Diagnostic-Feasibil-ity Study Report for 1992-1997. Kennesaw, GA:A. L. Burruss Institute of Public Service,Kennesaw State University.
Castelle, A. J., A. W. Johnson and C. Conolly.1994. Wetland and stream buffer requirements—A review. Journal of Environmental Quality23:878-882.
Clinnick, P. F. 1985. Buffer strip managementin forest operations: A review. Australian Forestry48(1): 34-45.
Cohen, P., P. R. Saunders, W. W. Budd and F.R. Steiner. 1987. Stream corridor management inthe Pacific Northwest: II. Management strategies.Environmental Management 11(5): 599-605.
Collier, K. J., A. B. Cooper, R. J. Davies-Colley, J. C. Rutherford, C. M. Smith, R. B.Williamson. 1995a. Managing Riparian Zones: AContribution to Protecting New Zealand’s Riversand Streams. Vol. 1: Concepts. Wellington, NZ:Department of Conservation.
Collier, K. J., A. B. Cooper, R. J. Davies-Colley, J. C. Rutherford, C. M. Smith, R. B.Williamson. 1995a. Managing Riparian Zones: AContribution to Protecting New Zealand’s Riversand Streams. Vol. 2: Guidelines. Wellington, NZ:Department of Conservation.
Cooper, C. M. 1993. Biological effects ofagriculturally derived surface water pollutants onaquatic systems— a review. Journal of Environ-mental Quality 22:402-408.
Cooper, J. R., J. W. Gilliam, R. B. Daniels andW. P. Robarge. 1987. Riparian areas as filters foragricultural sediment. Soil Science Society ofAmerica Journal 51:416-420.
Correll, D. S. 1997. Vegetated Stream Ripar-ian Zones: Their Effects on Stream Nutrients,Sediments, and Toxic Substances (An Annotatedand Indexed Bibliography). [http://www.serc.si.edu/documents/ ripzone.html].Accessed 9/25/98.
Coyne, M. S., R. A. Gilfillen, R. W. Rhodesand R. L., Blevins. 1995. Soil and fecal coliformtrapping by grass filter strips during simulatedrain. Journal of Soil and Water Conservation50(4): 405-408.
Crawford, J. K. and D. R. Lenat. 1989.Effects of land use on the water quality and biotaof three streams in the Piedmont Province ofNorth Carolina. In: Water Resources InvestigationReport 89-4007. Raleigh, NC: US GeologicalSurvey.
Cross, S. P. 1985. Responses of small mam-mals to forest riparian perturbations. In: RiparianEcosystems and Their Management: ReconcilingConflicting Uses (First North American RiparianConference). Ft. Collins, CO: Rocky MountainForest and Range Experiment Station (Gen. Tech.Report RM-120).
Dahl, J. 1998. The impact of vertebrate andinvertebrate predators on a benthic streamassemblage. Oecologia 117: 217-226.
Daniel, T. C. and P. A. Moore. 1997. Manag-ing Phosphorus in Manure: Causes, Concerns andBMPs. In: Proceedings of the Southeastern Sus-tainable Animal Waste Workshop. Athens, GA:University of Georgia.
Daniels, R. B. and J. W. Gilliam. 1996.Sediment and chemical load reduction by grassand riparian filters. Soil Science Society ofAmerica Journal 60:246-251.
Davies, P. E. and M. Nelson. 1994. Relation-ships between riparian buffer widths and theeffects of logging on stream habitat, invertebrate
References

54
community composition and fish abundance.Australian Journal of Marine and FreshwaterResources 45: 1289-1305.
Desbonnet, A., P. Pogue, V. Lee and N. Wolf.1994. Vegetated Buffers in the Coastal Zone: ASummary Review and Bibliography. Providence,RI: University of Rhode Island.
Dickson, J. G. 1978. Forest bird communi-ties of the bottomland hardwoods. Pages 66-73in: R. M. DeGraaf, tech. coord., Proceedings ofthe Workshop Management of Southern Forests forNongame Birds. Asheville, NC: SoutheasternForest Experimental Station (U. S. Forest ServiceGeneral Technical Report SE-14).
Dillaha, T. A., J. H. Sherrard, D. Lee, S.Mostaghimi, V.O. Shanholtz. 1988. Evaluation ofvegetative filter strips as a best managementpractice for feed lots. Journal of the Water Pollu-tion Control Federation 60(7):1231-1238.
Dillaha, T. A., R. B. Reneau, S. Mostaghimi,D. Lee. 1989. Vegetative Filter Strips for Agricul-tural Nonpoint Source Pollution Control. Transac-tions of the ASAE 32(2):513-519.
Duff, J. H. and F. J. Triska. 1990. Denitrifica-tion in sediments from the hyporheic zoneadjacent to a small forested stream. CanadianJournal of Fisheries and Aquatic Science 47:1140-1147.
Edwards, E. D. and A. D. Huryn. 1996.Effect of riparian land use on contributions ofterrestrial invertebrates to streams. Hydrobiologia337: 151-159.
Erman, N. A. 1984. The use of ripariansystems by aquatic insects. Pp 177-182 in R.E.Warner and K.M. Hendrix (eds), CaliforniaRiparian Systems: Ecology, Conservation andManagement. Berkeley, CA: University of Califor-nia Press.
Federal Interagency Floodplain ManagementTask Force (FIFMTF). 1996. Protecting Flood-plain Resources: A Guidebook for Communities.Federal Emergency Management Agency (FEMA268/June 1996).
Fennessy, M. S. and J. K. Cronk. 1997. Theeffectiveness and restoration potential of riparianecotones for the management of nonpoint sourcepollution, particularly nitrate. Critical Reviews in
Environmental Science and Technology 27(4):285-317.
Ferguson, B. K. and P. W. Suckling. 1990.Changing rainfall-runoff relationships in theurbanizing Peachtree Creek Watershed, Atlanta,Georgia. Water Resources Bulletin 26(2):313-322.
Flanagan, D. C., G. R. Foster, W. H. Neibling,and J. P. Burt. 1989. Simplified equations for filterstrip design. Transactions of the ASAE 22:2001-2007.
Freeman, B. J. and K. H. Barnes. 1996.Identification and Mapping of Critical Habitats inthe Etowah River Corridor of Northern Georgia(Annual Report). Athens, GA: University ofGeorgia.
Frick, E. A., D. J. Hippe, G. R. Buell, C. A.Couch, E. H. Hopkins, D. J. Wangsness, J. W.Garrett. 1998. Water Quality in the Apalachicola-Chattahoochee- Flint Basin, Georgia, Alabama,and Florida, 1992-1995. U.S. Geological SurveyCircular 1164.
Georgia Department of Agriculture. 1997.Georgia Agricultural Facts. Athens, GA: GeorgiaAgricultural Statistics Service.
Georgia Forestry Commission. 1999.Georgia’s Best Management Practices for Forestry.Macon, GA: Georgia Forestry Commission.
Gilliam, J. W. 1994. Riparian wetlands andwater quality. Journal of Environmental Quality23: 896900.
Glenn, L. C. 1911. Denudation and Erosionin the Southern Appalachians. USGS ProfessionalPaper Number 72.
Gomez, D. M. and R. G. Anthony. 1996.Amphibian and reptile abundance in riparian andupslope areas of five forest types in westernOregon. Northwest Science 79(2): 109-119.
Gregory, B., C. M. Pringle, G. Vellidis and R.R. Lowrance. In Press. Using benthic macroinver-tebrate assemblages to assess the effectiveness ofriparian forest buffer zones in intermittentSoutheastern Coastal Plain streams.
Gregory, S. and L. Ashkenas. 1990. FieldGuide for Riparian Management. USDA ForestService.
References

55
Gregory, S. V., F. J. Swanson, A. McKee andK. W. Cummins. 1991. An Ecosystem Perspectiveof Riparian Zones: Focus on links between landand water. Bioscience 41(8): 540-551.
Groffman, P. M., E. A. Axelrod, J. L.Lemonyon and W. M. Sullivan. 1991a. Denitrifi-cation in grass and forest vegetated filter strips.Journal of Environmental Quality 20: 671-674.
Groffman, P. M., A. J. Gold, T. P. Husband,R. C. Simmons, W. R. Eddleman. 1991b. AnInvestigation Into Multiple Uses of VegetatedBuffer Strips. Kingston, RI: University of RhodeIsland.
Hanson, G. C., P. M. Groffman and A. J.Gold. 1994. Denitrification in riparian wetlandsreceiving high and low groundwater nitrateinputs. Journal of Environmental Quality 23:917-922.
Harrison, R. L. 1992. Toward a theory ofinter-refuge corridor design. Conservation Biology6(2): 293-295.
Hatfield, J. L., S. K. Mickelson, J. L. Baker,K. Arora, D. P. Tierney, and C. J. Peter. 1995.Buffer strips: Landscape modification to reduceoff-site herbicide movement. In: Clean Water,Clean Environment, 21st Century : Team Agricul-ture, Working to Protect Water Resources, Vol. 1.St. Joseph, MI: American Society of AgriculturalEngineers.
Haycock, N. E. and G. Pinay. 1993. Ground-water nitrate dynamics in grass and poplarvegetated riparian buffer strips during winter.Journal of Environmental Quality 22:273-278.
Hedin, L. O., J. C. von Fischer, N. E. Ostrum,B. P. Kennedy, M. G. Brown and G. P. Robertson.1998. Thermodynamic constraints on nitrogentransformations and other biogeochemicalprocesses at soil-stream interfaces. Ecology79(2):684-703.
Herson-Jones, L. M., M. Heraty and B.Jordan. 1995. Riparian Buffer Strategies forUrban Watersheds. Washington, DC: Metropoli-tan Washington Council of Governments.
Hodges, M. F. Jr. and D. G. Krementz. 1996.Neotropical migratory breeding bird communitiesin riparian forests of different widths along the
Altamaha River, Georgia. Wilson Bulletin 108(3):495-506.
Hubbard, R. K. 1997. Riparian buffer systemsfor managing animal waste. Proceedings of theSoutheastern Sustainable Animal Waste Workshop.Athens, GA: University of Georgia.
Hubbard, R. K. and R. R. Lowrance. 1994.Riparian forest buffer system research at theCoastal Plain Experimental Station, Tifton,Georgia. Water, Air and Soil Pollution 77: 409-432.
Hubbard, R. K. and R. R. Lowrance. 1996.Solute transport and filtering through a riparianforest. Transactions of the ASAE 39(2): 477-488.
Jacobs, T. C. and J. W. Gilliam. 1985. Ripar-ian losses of nitrate from agricultural drainagewaters. Journal of Environmental Quality 14(4):472-478.
Jordan, T. E., D. L. Correll and D. E. Weller.1993. Nutrient interception by a riparian forestreceiving inputs from adjacent cropland. Journalof Environmental Quality 22:467-473.
Junk, W. J., P. B. Bayley and R. E. Sparks.1989. The flood pulse concept in river-floodplainsystems. Pp 110-127 in D. P. Dodge (ed.) Proceed-ings of the International Large River Symposium.Canadian Special Publication in Fisheries andAquatic Science 106.
Karr, J. R. and I. J. Schlosser. 1977. Impact ofNearstream Vegetation and Stream Morphology onWater Quality and Stream Biota. Athens, GA: U.S.EPA Ecological Research Series (EPA-600/3-77/097).
Karr, J. R. and I. J. Schlosser. 1978. Waterresources and the land-water interface. Science201: 229-234.
Keller, C. E., C. S. Robbins and J. S. Hatfield.1993. Avian communities in riparian forests ofdifferent widths in Maryland and Delaware.Wetlands 13(2):137-144.
Keys, Jr., J., C. Carpenter, S. Hooks, F.Koenig, W. H. McNab, W. Russel and M. L.Smith. 1995. Ecological Units of the EasternUnited States-- First Approximation. Atlanta, GA:U.S.D.A. Forest Service.
References

56
Kilgo, J. C., R. A. Sargent, B. R. Chapman, K.V. Miller. 1998. Effect of stand width and adja-cent habitat on breeding bird communities inbottomland hardwoods. Journal of WildlifeManagement 62(1):72-83.
Kinley, T. A. and N. J. Newhouse. 1997.Relationship of riparian reserve zone width tobird density and diversity in Southeastern BritishColumbia. Northwest Science 71(2):75-86.
Klein, R. D. 1979. Urbanization and streamquality impairment. Water Resources Bulletin15(4):948-963.
Kundell, J. E. and T. C. Rasmussen. 1995.Erosion and Sedimentation: Scientific and Regula-tory Issues. Athens, GA: University of Georgia.
Leigh, D. S. 1994. Gold mining’s impact onNorth Georgia floodplains: Mercury contamina-tion and floodplain sedimentation. Pp 215-224in: Marston, R. A. and V. R. Hasfurther (eds.),Effects of Human-Induced Changes on HydrologicSystems. American Water Resources TechnicalPublication Series TPS94-3.
Linville, I. H. 1997. Animal waste manage-ment issues: A federal perspective. In: Proceedingsof the Southeastern Sustainable Animal WasteWorkshop. Athens, GA: University of Georgia.
Lowrance, R. R. 1992. Groundwater nitrateand denitrification in a Coastal Plain riparianforest. Journal of Environmental Quality 21:401-405.
Lowrance, R. R. 1997. Wetland processes andmanure management. In: Proceedings of theSoutheastern Sustainable Animal Waste Workshop.Athens, GA: University of Georgia.
Lowrance, R. R. 1998. Riparian forestecosystems as filters for nonpoint-source pollu-tion. Pp. 113-141 in: M. L. Pace and P. M.Groffman (eds.), Successes, Limitations andFrontiers in Ecosystem Science. Springer Verlag.
Lowrance, R., R. Todd, J. Fail, Jr., O.Hendrickson, Jr., R. Leonard, and L. Asmussen.1984. Riparian forests as nutrient filters inagricultural watersheds. BioScience 34(6):374-377.
Lowrance, R., R. Leonard and J. Sheridan.1985. Managing riparian ecosystems to control
nonpoint pollution. Journal of Soil and WaterConservation 40(1): 87-91.
Lowrance, R., J. K. Sharpe and J. M.Sheridan. 1986. Long-term sediment depositionin the riparian zone of a Coastal Plain watershed.Journal of Soil and Water Conservation 41(4):266-271.
Lowrance, R. R., S. McIntyre and C. Lance.1988. Erosion and deposition in a field/forestsystem estimated using cesium-137 activity.Journal of Soil and Water Conservation 43: 195-99.
Lowrance, R., G. Vellidis, R. D. Wauchope, P.Gay and D. D. Bosch. 1997. Herbicide transportin a managed riparian forest buffer system.Transactions of the ASAE 40 (4): 1047-1057.
Lowrance, R., and 12 others. 1997. Waterquality functions of riparian forest buffers inChesapeake Bay watersheds. EnvironmentalManagement 21(5):687-712.
Lowrance, R., L. S. Altier, R. G. Williams, S.P. Imadar, D. D. Bosch, J. M. Sheridan, D. L.Thomas, R. K. Hubbard. 1998. The RiparianEcosystem Management Model: Simulator forecological processes in riparian zones. Proceedingsof the First Federal Interagency HydrologicModeling Conference.
Machtans, C. S., M-A Villard and S. J.Hannon. 1996. Use of riparian buffer strips asmovement corridors by forest birds. ConservationBiology 10(5):1366-1379
Magette, W. L., R. B. Brinsfield, R. E. Palmerand J. D. Wood. 1989. Nutrient and sedimentremoval by vegetated filter strips. Transactions ofthe ASAE 32(2): 663-667.
Malanson, G. P. 1993. Riparian Landscapes.Cambridge, UK: Cambridge University Press.
Mander, Ü., V. Kuusemets, K. Lohmus, T.Mauring. 1997. Efficiency and dimensioning ofriparian buffer zones in agricultural catchments.Ecological Engineering 8: 299-324.
May, C. W., R. R. Horner, J. R. Karr, B. W.May, and E. B. Welch. 1997. Effects of urbaniza-tion on small streams in the Puget Sound LowlandEcoregion. Watershed Protection Techniques2(4):483-494.
References

57
Meador, M. R. and A. O. Layher. 1998.Instream sand and gravel mining: Environmentalissues and regulatory process in the United States.Fisheries 23(11): 6-13.
Michener, W. K., E. R. Blood, J. B. Box, C. A.Couch, S. W. Golladay, D. J. Hippe, R. J. Mitchelland B. J. Palik. 1998. Tropical storm flooding of acoastal plain landscape. Bioscience 48(9): 696-705.
Miller, A. E. And A. Sutherland. 1999.Reducing the Impacts of Stormwater RunoffThrough Alternative Development Practices.Athens, GA: University of Georgia.
Morris, T. J. and L. D. Corkum. 1996.Assemblage structure of freshwater mussels(Bivalvia: Unionidae) in rivers with grassy andforested riparian zones. Journal of the NorthAmerican Benthological Society 15(4):576-586.
Murphy, M. L., J. Heifetz, S. W. Johnson, K.V. Koski and J. F. Thedinga. 1986. Effects ofclear-cut logging with and without buffer strips onjuvenile salmonids in Alaskan streams. CanadianJournal of Fisheries and Aquatic Science 43: 1521-1533.
Muscutt, A. D., G. L. Harris, S.W. Bailey andD. B. Davies. 1993. Buffer zones to improvewater quality: A review of their potential use inUK agriculture. Agriculture, Ecosystems andEnvironment 45: 59-77.
Naiman, R. J., H. Décamps, J. Pastor and C.A. Johnston. 1988. The potential importance ofboundaries to fluvial ecosystems. Journal of theNorth American Benthological Society 7(4): 289-306.
Naiman, R. J., H. Décamps and M. Pollock.1993. The role of riparian corridors in maintain-ing regional biodiversity. Ecological Applications3(2): 209-212.
Naiman, R. J. and K. H. Rogers. 1997. Largeanimals and system-level characteristics in rivercorridors: Implications for river management.Bioscience 47(8): 521-529.
Neary, D. G., P. B. Bush and J. L. Michael.1993. Fate, dissipation and environmental effectsof pesticides in southern forests: A review of adecade of research progress. EnvironmentalToxicology and Chemistry 12: 411-428.
Nieswand, G. H., R. M. Hordon, T. B.Shelton, B. B. Chavooshian and S. Blarr. 1990.Buffer strips to protect water supply reservoirs: Amodel and recommendations. Water ResourcesBulletin 26(6):959-966.
Noss, R. F. 1983. A regional landscapeapproach to maintain diversity. Bioscience33(11):700-706.
Noss, R. F. 1987. Corridors in real land-scapes: A reply to Simberloff and Cox. Conserva-tion Biology 1(2): 159-164.
Odum, E. P. 1978. Ecological importance ofthe riparian zone. Pp 2-4 in: Johnson andMcCormick (tech. coords.), Strategies for Protec-tion and Management of Floodplain Wetlands andOther Riparian Ecosystems. U.S. Dept. of Agricul-ture Forest Service Gen. Tech. Report WO-12.
Omernik, J. M., A. R. Abernathy and L. M.Male. 1981. Stream nutrient levels and proximityof agriculture and forest land to streams: Somerelationships. Journal of Soil and Water Conserva-tion 36(4): 227-231.
Osborne, L. L. and D. A. Kovacic. 1993.Riparian vegetated buffer strips in water-qualityrestoration and stream management. FreshwaterBiology 29: 243-258.
Peterjohn, W. T. and D. L. Correll. 1984.Nutrient dynamics in an agricultural watershed:Observations on the role of a riparian forest.Ecology 65(5): 1466-1475.
Phillips, J. D. 1989. Nonpoint source pollu-tion control effectiveness of riparian forests alonga Coastal Plain river. Journal of Hydrology 110:221-237.
Phillips, J. D. 1989. An evaluation of thefactors determining the effectiveness of waterquality buffer zones. Journal of Hydrology 107:133-145.
Poff, N. L., J. D. Allan, M. B. Bain, J. R. Karr,K. L. Prestegaard, B. D. Richter, R. E. Sparks andJ. C. Stromberg. 1997. The natural flow regime:A paradigm for river conservation and restora-tion. Bioscience 47(11): 769-784.
Pringle, C. P. 1997. Exploring how distur-bance is transmitted upstream: Going against the
References

58
flow. Journal of the North American Benthologi-cal Society 16(2): 425-438.
Rabeni, C. F. and M. A. Smale. 1995. Effectsof siltation on stream fishes and the potentialmitigating role of the buffering riparian zone.Microbiologia 303: 211-219.
Rhodes, J., C. M. Skau, D. Greenlee and D.L. Brown. 1985. Quantification of nitrate uptakeby riparian forests and wetlands in an undisturbedheadwaters watershed. In: Riparian Ecosystemsand their Management: Reconciling ConflictingUses (First North American Riparian Conference).Ft. Collins, CO: Rocky Mountain Forest andRange Experiment Station (Gen. Tech. ReportRM-120).
Roseboom, D. and K. Russell. 1985. Riparianvegetation reduces stream bank and row cropflood damages. In: Riparian Ecosystems and theirManagement: Reconciling Conflicting Uses (FirstNorth American Riparian Conference). Ft. Collins,CO: Rocky Mountain Forest and Range Experi-ment Station (Gen. Tech. Report RM-120).
Schaefer, J. M. and M. T. Brown. 1992.Designing and Protecting Riparian Corridors forWildlife. Rivers 3(1):14-26.
Schlosser, I. J. and J. R. Karr. 1981. Waterquality in agricultural watersheds: Impact ofriparian vegetation during base flow. WaterResources Bulletin 17(2):233-240.
Schnaebel, R. R., J. A. Shaffer, W. L. Stoutand L. F. Cornish. 1997. Denitrification distribu-tions in four Valley and Ridge riparian ecosys-tems. Environmental Management 21(2):283-290.
Schneider, R. L., N. E. Martin and R. R.Sharitz. 1989. Impact of dam operations onhydrology and associated floodplain forests ofSoutheastern rivers. Pp 1113-1122 in: Sharitz andGibbons (eds), Freshwater Wetlands and Wildlife.Oak Ridge, TN: USDOE Office of Scientific andTechnical Information (CONF-8603101).
Schueler, T. 1995a. The architecture of urbanstream buffers. Watershed Protection Techniques1(4).
Schueler, T. 1995b. Urban pesticides: Fromthe lawn to the stream. Watershed ProtectionTechniques 2(1):247-253.
Sharitz, R. R., R. L. Schneider and L. C. Lee.1990. Composition and regeneration of a dis-turbed river floodplain forest in South Carolina.Pp 195-218 in Gosselink, Lee and Muir (eds.),Ecological Processes and Cumulative Impacts:Illustrated by Bottomland Hardwood WetlandEcosystems. Chelsea, MI: Lewis Publishers.
Shields, F. D., Jr., A. J. Bowie and C. M.Cooper. 1995. Control of streambank erosion dueto bed degradation with vegetation and structure.Water Resources Bulletin 31(3):475-490.
Simberloff, D. and J. Cox. 1987. Conse-quences and costs of conservation corridors.Conservation Biology 1(1):63-71.
Simberloff, D., J. A. Farr, J. Cox, and D. W.Mehlman. 1992. Movement corridors: Conserva-tion bargains or poor investments? ConservationBiology 6(4):493-504.
Smith, R. J. and J. M. Schaefer. 1992. Aviancharacteristics of an urban riparian strip corridor.Wilson Bulletin 104(4):732-738.
Snodgrass, J. W. And G. K. Meffe. 1998.Influence of beavers on stream fish assemblages:Effects of pond age and watershed position.Ecology 79: 928-942.
Sorrano, P. A., S. L. Hubler, S. R. Carpenterand R. C. Lathrop. 1996. Phosphorus loads tosurface waters: A simple model to account forspatial pattern of land use. Ecological Applications6(3): 865-878.
Spackman, S. C. and J. W. Hughes. 1995.Assessment of minimum corridor width forbiological conservation: Species richness anddistribution along mid-order streams in Vermont,USA. Biological Conservation 71: 325-332.
Swift, L. W. Jr. 1986. Filter strip width forforest roads in the Southern Appalachians.Southern Journal of Applied Forestry 10:27-34.
Thurmond, D. P., K. V. Miller and T. G.Harris. 1995. Effect of streamside managementzone width on avifauna communities. SouthernJournal of Applied Forestry 19(4): 166-169.
Trimble, G. R. and R. S. Sartz. 1957. How farfrom a stream should a logging road be located?Journal of Forestry 55: 339-341.
References

59
Trimble, S. 1970. Culturally AcceleratedSedimentation the Middle Georgia Piedmont(Master’s Thesis). Athens, GA: University ofGeorgia.
Trimble, S. W. 1997. Contribution of streamchannel erosion to sediment yield from anurbanizing watershed. Science 278:1442-1444.
Triquet, A. M., G. A. McPeek, and W. C.McComb. 1990. Songbird diversity in clearcutswith and without a riparian buffer strip. Journalof Soil and Water Conservation July-Aug: 500-503.
University of Georgia School of Environmen-tal Design (UGASED). 1997. Land DevelopmentProvisions to Protect Georgia Water Quality.Athens, GA: Georgia Department of NaturalResources.
United States Environmental ProtectionAgency (USEPA). 1998. Clean Water Action Plan:Restoring and Protecting America’s Waters.Washington, DC: USEPA (EPA-840-R-98-001).
U.S. Army Corps of Engineers (USACE).1991. Buffer Strips for Riparian Zone Manage-ment. Waltham, MA: USACE.
Van Deventer, J. S. 1992. A Bibliography ofRiparian Research and Management: Fish, Wild-life, Vegetation, and Hydrologic Responses toLivestock Grazing and Other Land Use Activities.Moscow, Idaho: Idaho Riparian Cooperative,University of Idaho.
Vannote, R. L., G. W. Minshall, K. W.Cummins, J. R. Sedell, and C. E. Cushing. 1980.The river continuum concept. Canadian Journalof Fisheries and Aquatic Science 37:130-137.
Vought, L. B.-M., J. Dahl, C. L. Pedersen andJ. O. Lacoursière. 1994. Nutrient retention inriparian ecotones. Ambio 23(6): 343-348.
Wahl, M. H., H. M. McKellar, T. M. Will-iams. 1997. Patterns of nutrient loading inforested and urbanized coastal streams. Journal ofExperimental Marine Biology and Ecology213:111-131.
Walters, D. M. (unpublished). Fluctuation ofchannel elevation of an upper Piedmont river inresponse to human disturbance of the watershed.
Weller, D. E., T. E. Jordan and D. L. Correll.1998. Heuristic models for material dischargefrom landscapes with riparian buffers. EcologicalApplications 8(4): 1156-1169.
Welsch, D. J. 1991. Riparian Forest Buffers:Function and Design for Protection and Enhance-ment of Water Resources. Radnor, PA: USDAForest Service.
Williams, R. D. and A. D. Nicks. 1993. Amodeling approach to evaluate best managementpractices. Water Science and Technology 28(3-5):675-678).
Williams, R. D. and A. D. Nicks. 1988. UsingCREAMS to simulate filter strip effectiveness inerosion control. Journal of Soil and Water Conser-vation Jan-Feb:108-112.
Wood, P. J. and P. D. Armitage. 1997. Biologi-cal effects of fine sediment in the lotic environ-ment. Environmental Management 21(2):203-217.
Xiang, W-N. 1996. GIS-based riparian bufferanalysis: injecting geographic information intolandscape planning. Landscape and Urban Plan-ning 34: 1-10.
Xiang, W-N. 1993. A GIS method forriparian water quality buffer generation. Interna-tional Journal of Geographical InformationSystems 7(1): 57-70.
Xiang, W-N and W. L. Stratton. 1996. The b-function and variable stream buffer mapping: anote on ‘A GIS method for riparian water qualitybuffer generation.’ International Journal ofGeographical Information Systems 10(4): 499-510.
Young, R. A., T. Huntrods and W. Anderson.1980. Effectiveness of vegetated buffer strips incontrolling pollution from feedlot runoff. Journalof Environmental Quality 9(3):483-487.
References


