Embed Size (px)
Citation preview
Riprap Requirements for Overflow Embankments THOMAS E. MURPHY and JOHN L . GRACE, JR., U.S. Army Engineer Waterways
Experiment Station
•OVERFLOW embankments will be integral parts of navigation dams presently being designed and constructed on the Arkansas River. These embankments will be provided across low overbank areas and chutes where necessary to maintain the normal upper pools. In some cases, to provide access to the lock, the embankments will support roadways.
A typical dam will consist of a gated spillway and navigation lock within the main channel of the river and flanking embankments on the overbank. The structures are designed to provide adequate depths for navigation during low flow periods and to offer minimum resistance to flood flows. The capacity of the gated spillways will be such that it will be possible to maintain normal pools until tailwater levels are within about 3 ft of the pool elevation. Thus, when pools rise above normal elevations and overtop the embankments, the differential between headwater and tailwater will not exceed about 3 ft and in most cases will be less than 2 ft.
There will be a total of about 7 miles of these overflow embankments in dams 2-9 and at least some of the embankments can be expected to be overtopped yearly. With this frequency of use, design engineers considered that the embankment sections should be so constructed that extensive repair or maintenance would not be required following each overflow. Several methods of protecting these embankments against scour, including use of asphalt, soil cement, articulated concrete mat, grouted riprap, and dumped stone, were considered. An adequate thickness of protection stone with sizes established on the basis of expected wave heights and velocity of overflow on both the upstream and downstream slopes of the embankments was judged to offer the most satisfactory and economical overflow protection.
Fill slopes for the embankments are being designed in accordance with soils mechanfcs principles based on the shear strengths of the fill and foundation soils. However, consideration is being given to use of a relatively flat downstream slope to support safely protection stone of the required size and gradation to resist the attack of flowing water. Slopes of 1 on 3 for the upstream face and 1 on 4 for the downstream face are believed to be about optimum from a consideration of all factors.
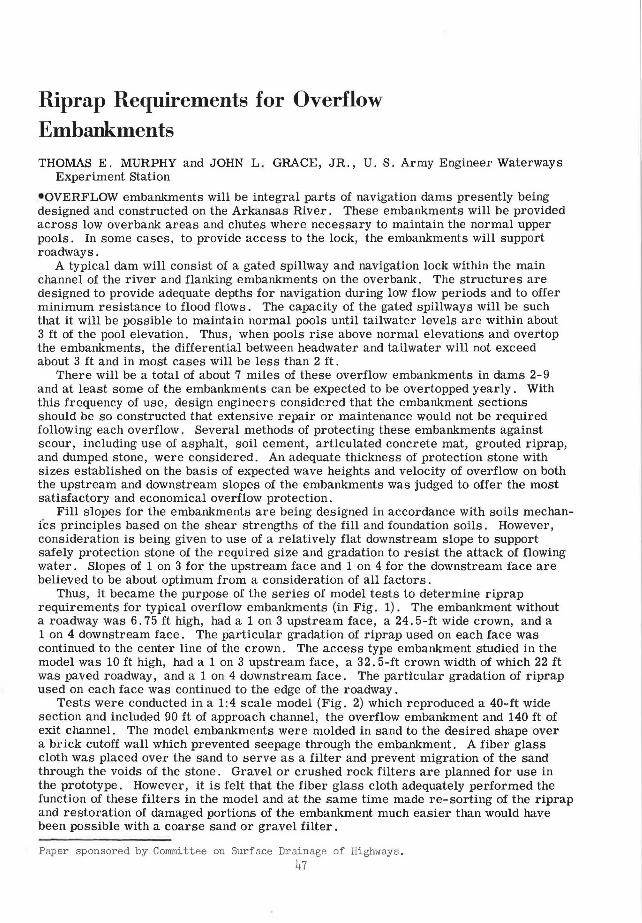
Thus, it became the purpose of the series of model tests to determine riprap requirements for typical overflow embankments (in Fig. 1) . The embankment without a roadway was 6. 75 ft high, had a 1 on 3 upstream face, a 24. 5-ft wide crown, and a 1 on 4 downstream face. The particular gradation of riprap used on each face was continued to the center line of the crown. The access type embankment studied in the model was 10 ft high, had a 1 on 3 upstream face, a 32. 5-ft crown width of which 22 ft was paved roadway, and a 1 on 4 downstream face. The particular gradation of riprap used on each face was continued to the edge of the roadway .
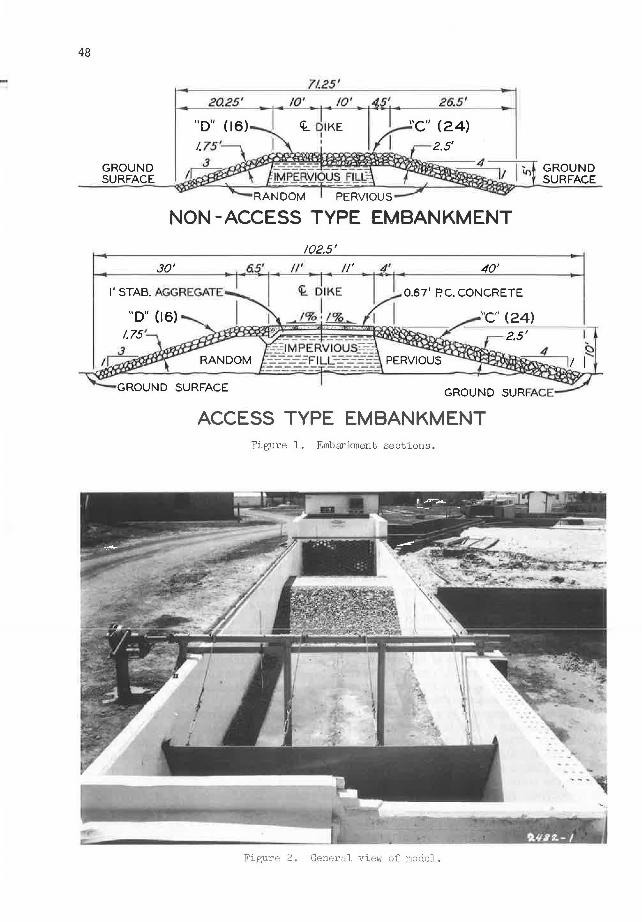
Tests were conducted in a 1: 4 scale model (Fig. 2) which reproduced a 40-ft wide section and included 90 ft of approach channel, the overflow embankment and 140 ft of exit channel. The model embankments were molded in sand to the desired shape over a brick cutoff wall which prevented seepage through the embankment. A fiber glass cloth was placed over the sand to serve as a filter and prevent migration of the sand through the voids of the stone. Gravel or crushed rock filters are planned for use in the prototype. However, it is felt that the fiber glass cloth adequately performed the function of these filters in the model and at the same time made re-sorting of the riprap and restoration of damaged portions of the embankment much easier than would have been possible with a coarse sand or gravel filter.
Paper sponsored by Committee on Surface Drainage of Highways. 47
48
GROUND SURFACE
2Q25'
"D" (16)
11.25'
10' 10'
~ DIKE I I
- -----IMPERVIOUS FIL~-
26.5'
GROUND SURFACE
NON-ACCESS TYPE EMBANKMENT
/02.5'
.JO' II' II' 40'
0.67' P.C. CONCRETE
ACCESS TYPE EMBANKMENT Figure 1. Embankment sections.
..:,. • ' ,.4l'"~ '. : I "," . ·._ J~~Z:t.- I
Figure 2. General view of model.
49
Water used in operation of the model was supplied by a pumping system with a capacity of 100 cfs. Discharges entering the model were measured by a calibrated Cole pitometer installed in a 36-in. pipe. Water-surface elevations were measured by point gages supported on steel rails set to grade along the sides of the flume. Tailwater elevations were regulated by a flap gate at the end of the flume.
The accepted equations of hydraulic similitude, based on gravity as the dominant force, were used to express mathematical relations between dimensions and hydraulic quantities of the model and prototype. Scale relations, model to prototype, were as follows:
Dimension Ratio Numerical
Length Lr 1:4 Area Ar -= Lr2 1:16 Weight Wr = Lr3 1:64 Velocity Vr = LrJ/2 1:2 Discharge Qr = Ls/2 1:32
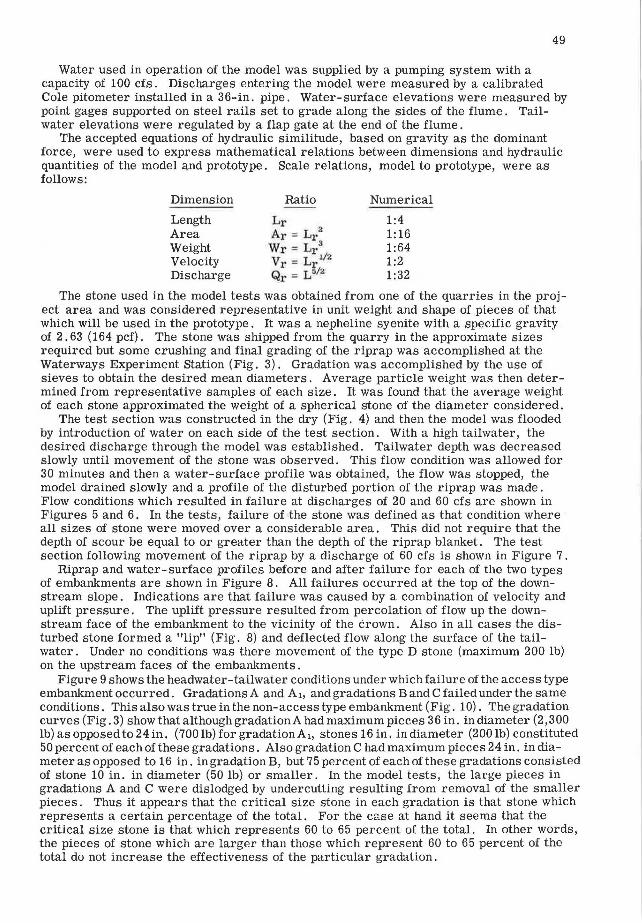
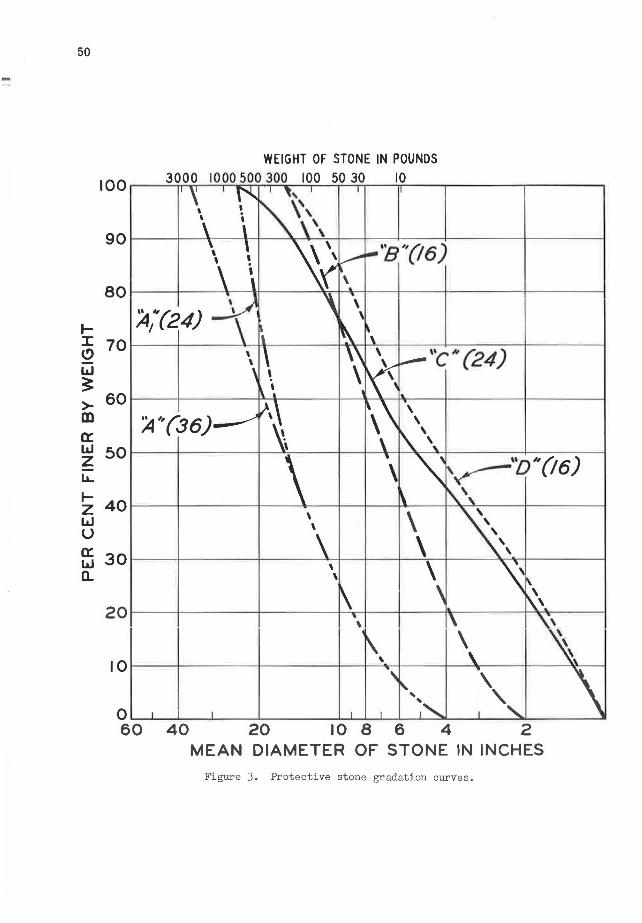
The stone used in the model tests was obtained from one of the quarries in the project area and was considered representative in unit weight and shape of pieces of that which will be used in the prototype. It was a nepheline syenite with a specific gravity of 2. 63 (164 pcf). The stone was shipped from the quarry in the approximate sizes required but some crushing and final grading of the riprap was accomplished at the Waterways Experiment Station (Fig. 3) . Gradation was accomplished by the use of sieves to obtain the desired mean diameters. Average particle weight was then determined from representative samples of each size. It was found that the average weight of each stone approximated the weight of a spherical stone of the diameter considered.
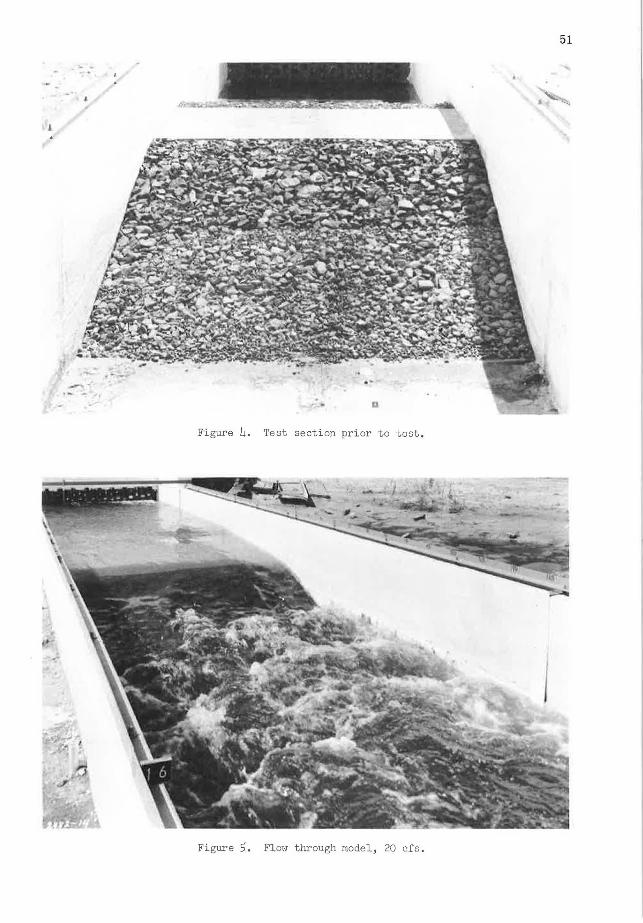
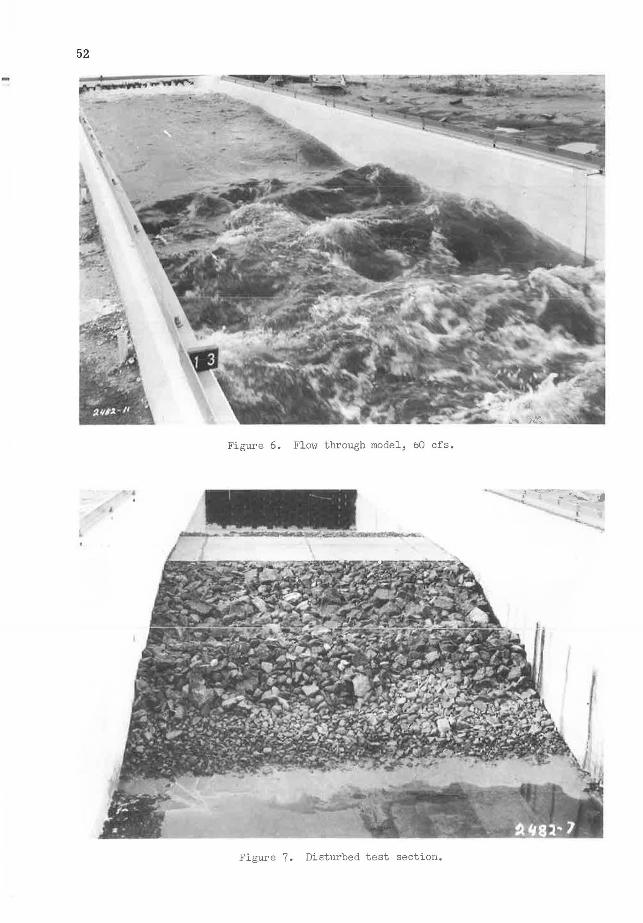
The test section was constructed in the dry (Fig. 4) and then the model was flooded by introduction of water on each side of the test section. With a high tailwater, the desired discharge through the model was established. Tailwater depth was decreased slowly until movement of the stone was observed. This flow condition was allowed for 30 minutes and then a water-surface profile was obtained, the flow was stopped, the model drained slowly and a profile of the disturbed portion of the riprap was made. Flow conditions which resulted in failure at discharges of 20 and 60 cfs are shown in Figures 5 and 6. In the tests, failure of the stone was defined as that condition where all sizes of stone were moved over a considerable area. This did not require that the depth of scour be equal to or greater than the depth of the riprap blanket. The test section following movement of the riprap by a discharge of 60 cfs is shown in Figure 7.
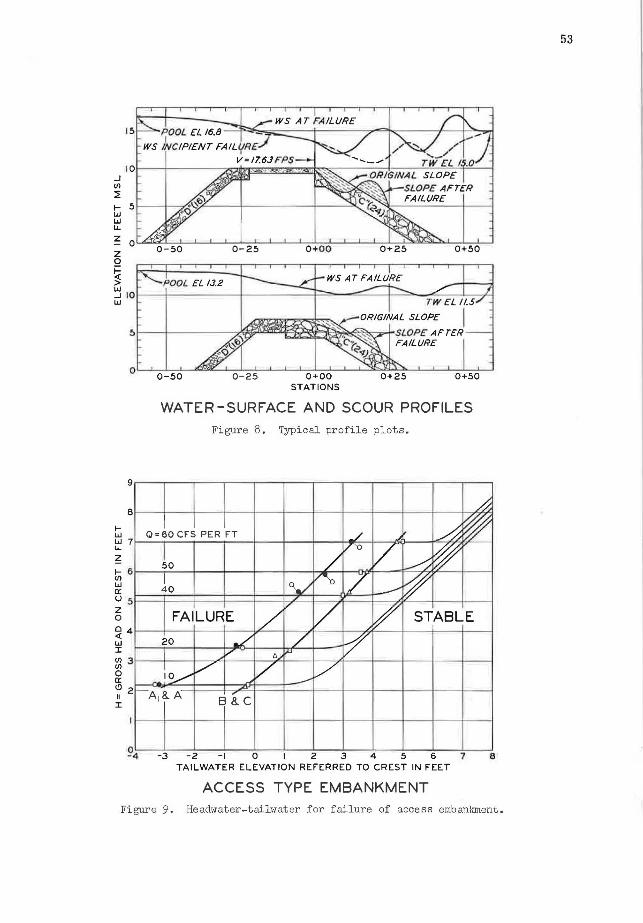
Riprap and water-surface profiles before and after failure for each of the two types of embankments are shown in Figure 8. All failures occurred at the top of the downstream slope . Indications are that failure was caused by a combination of velocity and uplift pressure. The uplift pressure resulted from percolation of flow up the downstream face of the embankment to the vicinity of the crown. Also in all cases the disturbed stone formed a "lip" (Fig. 8) and deflected flow along the surface of the tailwater. Under no conditions was there movement of the type D stone (maximum 200 lb) on the upstream faces of the embankments.
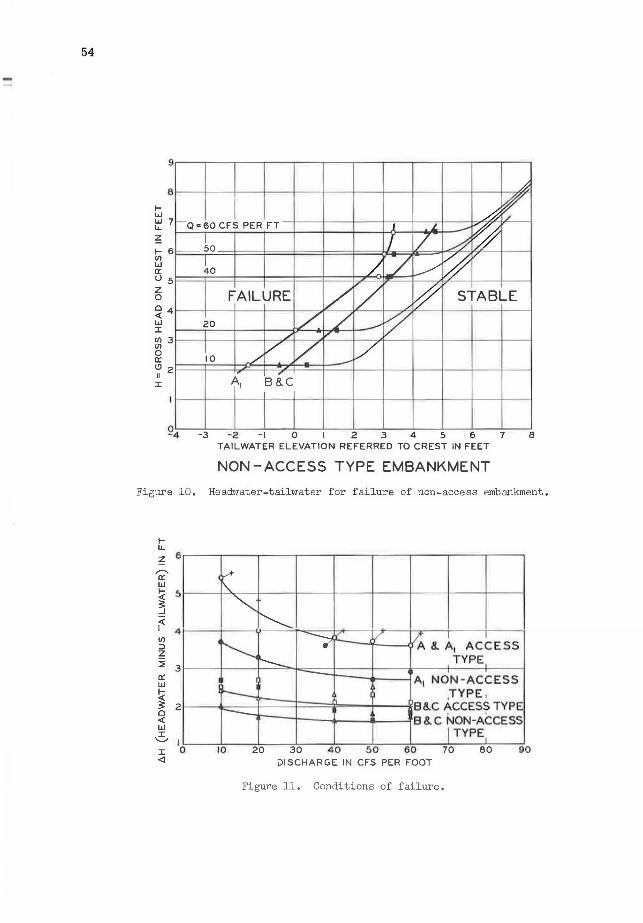
Figure 9 shows the headwater-tailwater conditions under which failure of the access type embankment occurred. Gradations A and A1, and gradations Band C failed under the same conditions. This also was true in the non-access type embankment (Fig. 10). The gradation curves (Fig. 3) show that although gradation A had maximum pieces 3 6 in. in diameter (2,300 lb) as opposed to 24 in. (700 lb) for gradation Ai, stones 16 in. in diameter (200 lb) constituted 50 percent of each of these gradations. Also gradation Chad maximum pieces 24 in. in diameter as opposed to 16 in. in gradation B, but 75 percent of each of these gradations consisted of stone 10 in. in diameter (50 lb) or smaller. In the model tests, the large pieces in gradations A and C were dislodged by undercutting resulting from removal of the smaller pieces. Thus it appears that the critical size stone in each gradation is that stone which represents a certain percentage of the total. For the c2.se at hand it seems that the critical size stone is that which represents 60 to 65 percent of the total. In other words, the pieces of stone which are larger than those which represent 60 to 65 percent of the total do not increase the effectiveness of the particular gradation.
50
t-:I: <!)
w ~ >-m a:: w z LL
t-z w u a:: w a..
80
A;'(24) 70
60
50
40
30
20
\ \
' ..
~''D"(/6)
'
0 1.-....__-1-_1-_ _.__ ___ ....L....L__.__.__.,L_.,L_~-.l------=----.ll
60 40 20 10 a e 4 2 MEAN DIAMETER OF STONE IN INCHES
Figure 3. Protective stone gradation curves.
51
-- -I:>
Figure 4. Test section prior to test.
Figure 5. Flow through model, 20 cfs.
52
Figure 6. Flow through model, 60 cfs.
Figure 7. Disturbed test section.
_J 10 t-----t~~~"':,{;i~JS!iii'.:Z::!!f~:::3!i~~---=:::"i:>,Q/~;;;;;,~!;//~:-'j'"''---j
VJ ~ I- 5 r---1----;~ , .... ~--+------------ -w w u. z o L&::!l:;2L_J__J_..L._..L...L-'-__.t_--L_L-L-l.----1._1.__t_JL_~:l.lSl!Cb.-'--.L..J___j z 0-50 0-25 0+25 0+50 0
~ > POOL El I.J.2 ~ IO l-----l------l------l-::=~-c::==---1--=-~.L__-..L-,,~ w
O L-Lo- -L5_0-'--""""~..Lo-'--2-'5'---'---'--L-o .L.+-OO..L--'--'--""""'o""'+w2...:,5"--L-L--'--o..l+_5 _,_0 ___,
STATIONS
9
e 1-w w 7 u. z I- 6 VJ w a:: u 5 z 0
~4 w I VJ 3 VJ 0 a: \!) 2 II I
WATER-SURFACE AND SCOUR PROFILES Figure 8. Typical profile plots.
/%
0=60 CFS PER FT ../ ,J; ., A w lo /
v-o / ~ _// I
a./ ro / ~ 4 0 _./ I
FAILURE /v V ~/ STABLE
20 ../ / V' V 11,..i-u
I / ... V V _ IO_/ --A1 &. A B &.C
94 -3 -2 -I O I 2 3 4 5 6 7 e TAILWATER ELEVATION REFERRED TO CREST IN FEET
ACCESS TYPE EMBANKMENT Figure 9. Headwater-tailwater for failure of access embankment.
53
54
9
8
1-w w 7 u.. ~ I- 6 UI w a:: u 5 z 0
~4 w J: UI 3 UI 0 a:: I!) 2 II J:
-Q~60 CFS PER FT
I 50
I /._ 40
FAILURE I/ '/ 20 / / _,,
/ -v-I V V ~/ 10 _/
, ,- I
A1 B&.C I I
~
A ~ 1 ~ .--
~ I / A
/ ./ ~v
J ~ STABLE
~
!\ -3 -2 -I O I 2 3 4 5 6 7 TAILWATER ELEVATION REFERRED TO CREST IN FEET
NON -ACCESS TYPE EMBANKMENT
B
Figure 10. Headwater-tailwater for failure of non-access embankment.
I-u..
~ r--, a:: w
~ fi UI ::::, z ~ a:: w ~
6
5
4
3
3: 2 Cl <{ w 0 :i:: lo <l
C
'\.
~ ~
,--.~ / v; &. A1 ACCESS ~ • ~ TYPE - A, NON-ACCESS -- ,TYPE 1
-- 88..C ACCESS TYPE B&.C NON-ACCESS
I TYPE, 10 20 30 40 50 60 70 80 90
DISCHARGE IN CFS PER FOOT
Figure 11. Conditions of failure.

55
Figure 11 plots the head differentials at which failure occurred. At the high discharges, 40, 50, and 60 cfs per ft, this differential was found to be essentially constant for a particular set of embankment conditions. However, failure of a particular gradation of riprap occurred at a lower differential on the non-access type embankment than it did on the access type. The reason for this must be due either to the difference in crown widths, 32. 5 ft for access type and 24. 5 ft for non-access type, or to flow percolating from the headwater through the upper layers of rock in the non-access type embankment and exerting added uplift pressures on the rock in the failure zone.
Various means of plotting the data in a dimensionless form in order to make its application more general have been attempted without success. However, fortunately, or maybe unfortunately for the profession in general, the prime requirements of the designers of the Arkansas River overflow embankments have been satisfied.


