Embed Size (px)
Citation preview

Risk of Recidivism Facing Offenders upon their Return to the Community 2013
Michigan Justice Statistics Center
Page i
Risk of Recidivism Facing Offenders upon their Return to the Community
Michigan Justice Statistics Center School of Criminal Justice Michigan State University
June 2013

Risk of Recidivism Facing Offenders upon their Return to the Community 2013
Michigan Justice Statistics Center
Risk of Recidivism Facing Offenders upon their Return to the Community
(2011-BJS-2831)
Prepared by
Jason Rydberg, M.S. Eric Grommon, Ph.D.
Timothy S. Bynum, Ph.D.
Michigan Justice Statistics Center School of Criminal Justice Michigan State University
June, 2013
Submitted in fulfillment of funding from Bureau of Justice Statistics (2011-BJS-2831) awarded to the Michigan Justice Statistics Center. Any points of view or opinions expressed within this document are those of the authors and do not necessarily represent the position or policies of the Bureau of Justice Statistics or the Michigan Department of Corrections.

Risk of Recidivism Facing Offenders upon their Return to the Community 2013
Michigan Justice Statistics Center
TABLE OF CONTENTS
ACKNOWLEDGEMENTS ………………………………………………………… i INTRODUCTION…………………………………………………………………… 1 METHODOLOGY………………………………………………………………….. 4 Prospective longitudinal interviews……………………………………………….. 4 Recidivism and supervision data…………………………………………………. 5 Study site profile: Lansing………………………………………………………… 6 FINDINGS…………………………………………………………………………… 11 Sample description………………………………………………………………… 11 Nature of recidivism outcomes…………………………………………………… 15 Timing of recidivism events………………………………………………………. 29 Recidivism and reentry dimensions………………………………………………. 40 Pathways to reincarceration and discharge……………………………………… … 52 The cost of non-compliance……………………………………………………… 63 DISCUSSION AND POLICY IMPLICATIONS………………………………….. 66 CONCLUSIONS…………………………………………………………………….. 73 APPENDICES Appendix A: Interview instrument from Understanding the Challenges………….. … 74 Appendix B: Timing of interviews and attrition……………………………………. 79 REFERENCES…………………………………………………………………… … 81

Risk of Recidivism Facing Offenders upon their Return to the Community 2013
Michigan Justice Statistics Center
Page i
ACKNOWLEDGEMENTS We would like to thank the following individuals for their contribution to this project. Michigan Department of Corrections Central Office Le’Ann Duran Gary Stockman Michael Glynn Brenda Hurless R. Douglas Kosinski Area Manager Warren Wilson Lansing Parole Office Supervisors Stephanie Musser Greg Straub Lansing Parole Agents Clinton Auer Daryn Cobb Aaron Hudechek Jamee Babbitt Katrina Coleman Shanna Kuslikis John Bennett Phil Cutts John O’Connell Michelle Boucha Kellie Doerr Eric Rose Michael Bowker Richard Gallagher Matt Walker NayattCastelein Nancy Hamilton Kyle Williams Michael Clapp Lansing Parole Support Staff Kimberly Weber Michigan State Police Nicholas Romanov Michigan Justice Statistics Center Christina Campbell Miriam Northcutt-Bohmert Melissa Christle Eyitayo Onifade Karie Gregory Jodi Petersen Randy Hackenberg Jaemia Pratt Ryan Hackenberg
We would especially like to thank all of the men who gave their time share their experiences and participate in this study.
Michigan Justice Statistics Center
Page 1
Risk of Recidivism Facing Offenders upon their Return to the Community 2013
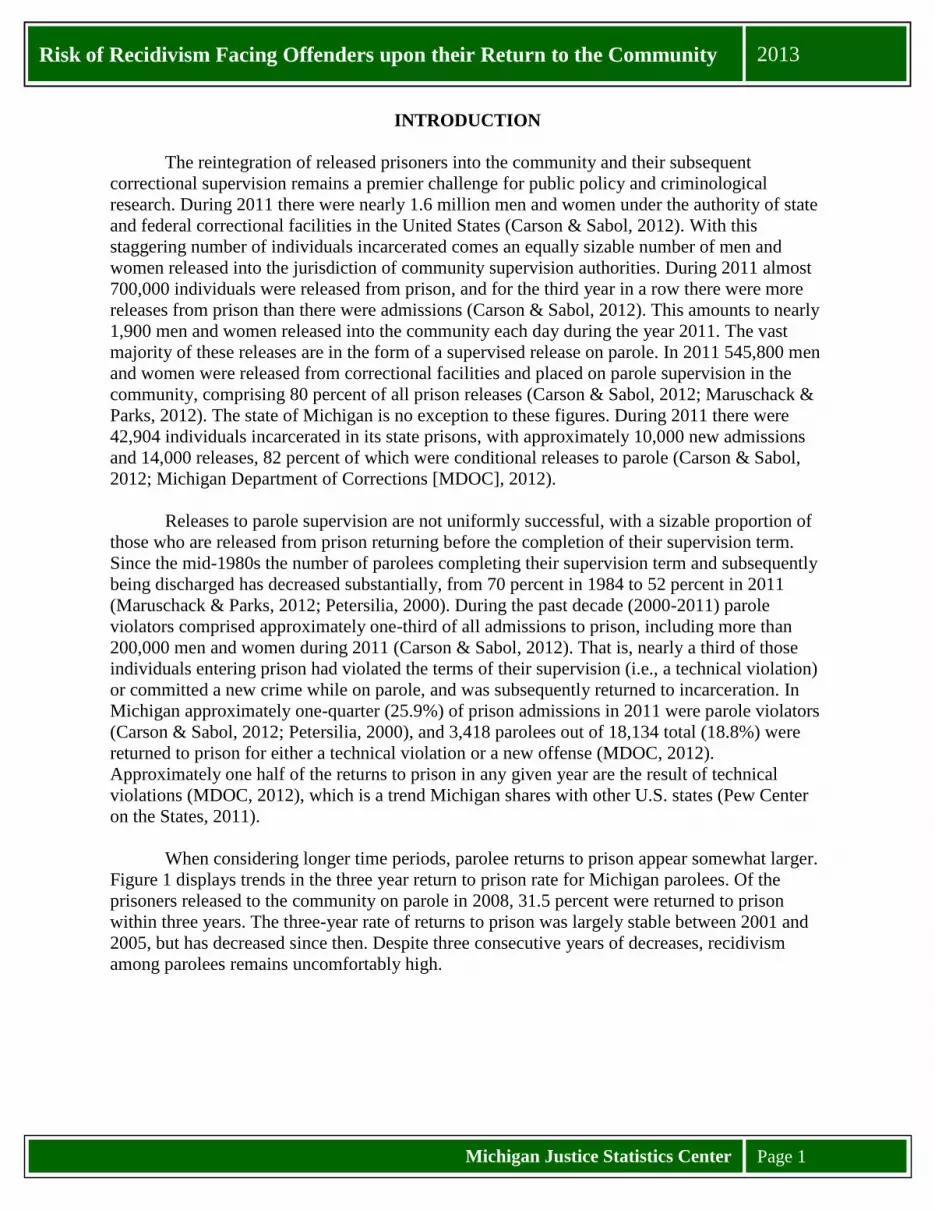
INTRODUCTION The reintegration of released prisoners into the community and their subsequent correctional supervision remains a premier challenge for public policy and criminological research. During 2011 there were nearly 1.6 million men and women under the authority of state and federal correctional facilities in the United States (Carson & Sabol, 2012). With this staggering number of individuals incarcerated comes an equally sizable number of men and women released into the jurisdiction of community supervision authorities. During 2011 almost 700,000 individuals were released from prison, and for the third year in a row there were more releases from prison than there were admissions (Carson & Sabol, 2012). This amounts to nearly 1,900 men and women released into the community each day during the year 2011. The vast majority of these releases are in the form of a supervised release on parole. In 2011 545,800 men and women were released from correctional facilities and placed on parole supervision in the community, comprising 80 percent of all prison releases (Carson & Sabol, 2012; Maruschack & Parks, 2012). The state of Michigan is no exception to these figures. During 2011 there were 42,904 individuals incarcerated in its state prisons, with approximately 10,000 new admissions and 14,000 releases, 82 percent of which were conditional releases to parole (Carson & Sabol, 2012; Michigan Department of Corrections [MDOC], 2012). Releases to parole supervision are not uniformly successful, with a sizable proportion of those who are released from prison returning before the completion of their supervision term. Since the mid-1980s the number of parolees completing their supervision term and subsequently being discharged has decreased substantially, from 70 percent in 1984 to 52 percent in 2011 (Maruschack & Parks, 2012; Petersilia, 2000). During the past decade (2000-2011) parole violators comprised approximately one-third of all admissions to prison, including more than 200,000 men and women during 2011 (Carson & Sabol, 2012). That is, nearly a third of those individuals entering prison had violated the terms of their supervision (i.e., a technical violation) or committed a new crime while on parole, and was subsequently returned to incarceration. In Michigan approximately one-quarter (25.9%) of prison admissions in 2011 were parole violators (Carson & Sabol, 2012; Petersilia, 2000), and 3,418 parolees out of 18,134 total (18.8%) were returned to prison for either a technical violation or a new offense (MDOC, 2012). Approximately one half of the returns to prison in any given year are the result of technical violations (MDOC, 2012), which is a trend Michigan shares with other U.S. states (Pew Center on the States, 2011). When considering longer time periods, parolee returns to prison appear somewhat larger. Figure 1 displays trends in the three year return to prison rate for Michigan parolees. Of the prisoners released to the community on parole in 2008, 31.5 percent were returned to prison within three years. The three-year rate of returns to prison was largely stable between 2001 and 2005, but has decreased since then. Despite three consecutive years of decreases, recidivism among parolees remains uncomfortably high.

Michigan Justice Statistics Center
Page 2
Risk of Recidivism Facing Offenders upon their Return to the Community 2013
Source: Michigan Department of Corrections, Annual Statistical Report.
Figure 1. Percentage of Parolees Returning to Prison within Three Years, 2001-2008. Recidivism by parolees comes at an enormous cost to correctional authorities and tax-payers (Henrichson & Delaney, 2012). The amount of money states are spending on corrections has increased dramatically over the past few decades (Grattet, Petersilia, & Lin, 2008). In 1987 states spent $12 billion dollars on corrections, and by 2007 they were spending $49 billion (Pew Center on the States, 2008). In 2011 Michigan allocated $212 million dollars for field operations alone, including field supervision (i.e., probation and parole), community reentry centers, and electronic monitoring (MDOC, 2012). If the 3,418 returns to prison from parole for that year remained incarcerated for an entire year, at an average cost of $34,423 per person per year, they would incur the state of Michigan a cost of $117,658,326 dollars.1 This figure stands in stark contrast to the estimated cost of $7,895,850 had they remained under parole supervision for the entire year, at a rate of $2,130 per parolee (Michigan Bureau of Fiscal Management, 2013; PolicyOptions.org, 2013).2 These recidivism trends have not been lost on policymakers. States have made a concerted effort to better prepare parolees for the process of reentry, or transitioning from prison back into the community (Lynch & Sabol, 2001). Reentry efforts have attempted to foster systematic preparation of offenders for their return home by addressing the critical areas that research has demonstrated are related to successful community reintegration. Among these critical areas are housing, employment, substance abuse, and familial, peer, and community
1 There are multiple ways to calculate the cost of imprisonment. This particular figure ($34,423) was calculated by multiplying the average daily cost of incarceration per prisoner ($94.31) provided by the Bureau of Fiscal Management and multiplying it by 365. This is an upper-bound figure because it includes employee salaries and benefits, prisoner health and mental health care, food, educational and vocational programming, transportation and utilities. A lower figure was provided by the Vera Institute of Justice (2012) when they divided the total taxpayer cost of Michigan prisons ($1.27 billion dollars) and dividing by the average daily prison population in 2010, arriving at a cost of $28,117 per inmate per year. If this lower figure is plugged into the recidivism cost calculation above, the cost of recidivism would be $96,103,906. 2 The cost of reincarceration figure does not include the costs of minor forms of recidivism, such as those requiring brief stays in county jails. The cost to house a Michigan parolee in per day jail is roughly 10 times the cost to keep them on parole supervision ($57.92 per day for jail versus $5.83 per day for parole).
41.90%39.30% 39.10% 40.80% 40.60%
36.50%33.20% 31.50%
0.00%
10.00%
20.00%
30.00%
40.00%
50.00%
2001 2002 2003 2004 2005 2006 2007 2008
Year of Release

Michigan Justice Statistics Center
Page 3
Risk of Recidivism Facing Offenders upon their Return to the Community 2013
social support (LaVigne & Cowan, 2005). In 2011, Michigan allocated $56 million dollars to its Michigan Prisoner Reentry Initiative (MPRI), which attempts to streamline pre-release planning and continuity of care in the community through the collaboration of MDOC and local community partners. Recidivism is a key focus of MPRI, as the program’s explicit goal in providing its services is to “significantly reduce crime and enhance public safety” (MDOC, 2013). Understanding recidivism is thus a key concern for criminologists, policymakers, and citizens alike. Criminological research has accumulated a body of literature detailing the correlates of recidivism, and more recently attention has shifted to exploring the dynamics of recidivism – including the nature, timing, and contexts of recidivism events. This research study adds to this growing body of literature by providing an in-depth, multi-method exploration of the recidivism process as it was experienced by a small sample of male parolees to Lansing, Michigan during calendar year 2009. Using a combination of longitudinal prospective interviews and secondary case notes we pursued the following research goals: Understand the nature of recidivism among the sample, from minor forms of non-
compliance to more serious incidents resulting in returns to prison. Examine the dynamics of recidivism, including the timing of when recidivism occurred during the process of reentry, and the relation between timing and offense seriousness. Explore the relation between recidivism and other aspects of the reentry process, particularly employment and housing. Investigate the pathways to reincarceration and successful discharge from parole, considering the multiple paths individuals traversed to complete their parole supervision terms. Consider the financial ramifications of recidivism and non-compliance.
Our data contain complete information from the parolee’s release into the community up until their discharge or censoring point. This feature allows us to capture multiple instances of non-compliance and recidivism as they occurred during a parolee’s time in the community. This is unlike analyses of recidivism which stop following sample members at the first instance of reoffending (i.e., the first re-arrest). Exploiting these data allow an in-depth look at the non-linear aspects of reentry and recidivism as processes (Maruna, 2001), rather than singular outcomes.

Michigan Justice Statistics Center
Page 4
Risk of Recidivism Facing Offenders upon their Return to the Community 2013
METHODOLOGY The current inquiry utilizes a multi-methodological design, incorporating data of both qualitative and quantitative varieties. The project is a follow-up and outgrowth of a previous study, Understanding the Challenges Facing Offenders upon their Return to the Community (Grommon, Rydberg, & Bynum, 2012) [henceforth Understanding the Challenges] in which longitudinal prospective interviews were conducted with 39 men paroled to the city of Lansing, Michigan during calendar year 2009.3 Following the completion of that study, extensive and detailed data official record data covering the recidivism and supervision of these individuals was obtained which makes up the bulk of the analyses presented here. The following section will describe relevant information concerning the methodology of Understanding the Challenges, and thus draws heavily on the report by Grommon and colleagues (2012). Because this previous study structured the sampling for the current inquiry, the interview data are discussed first. After that point the unique features of the current inquiry which go over and above the previous study will be described.4 PROSPECTIVE LONGITUDINAL INTERVIEWS Understanding the Challenges (Grommon et al., 2012) sought to gain a thorough understanding of the process of reentry to the community by conducting a series of semi-structured interviews with a sample of moderate to high supervision risk parolees. The project was conducted in the context of the implementation of MPRI, which is a collaborative initiative between MDOC and the departments of Community Health, Labor, and Economic Growth, human services, and local community partners (MDOC, 2012). In 2006, MDOC began to fund and implement reentry programming at several pilot locations throughout the state. The Lansing Parole Office was one of the pilot locations which received the most intensive implementation of MPRI. This office served as the study site for Understanding the Challenges. The reasons for this are because of the convenient location of the Lansing Office relative to the Michigan Statistical Analysis Center, and that the office averaged 20 new parole entries per month, which ensured a sufficient number of parolees who met the selection criteria for the study. For participation in the study, the research team sought 40 moderate to high supervision risk parolees who were about to be released to Lansing for supervision. Parolees at this heightened risk level were sought for several reasons. First, given the focus of Understanding the Challenges on reentry issues, parolees at moderate to high risk would face the most acute risks during their reentry, allowing for a better documentation of the issues faced by individuals returning to the community, and would also be receiving the bulk of reentry programming, giving more insight into the nature of services being provided. Second, parolees at this risk level were required to report to their parole agents more frequently, which facilitated the scheduling of
3 Understanding the Challenges was supported by the Bureau of Justice Statistics (2007-BJS-CX-K036) and the research design and protocol of both that study and current inquiry were approved by the Institutional Review Board at Michigan State University. 4 See Grommon et al. (2012) for a more extensive discussion of the Understanding the Challenges methodology and findings concerning the experience of reentry, including employment, housing, social support, substance abuse, and views of the future. See Grommon and Rydberg (2013) for an analysis and discussion specifically related to managing substance abuse during reentry.

Michigan Justice Statistics Center
Page 5
Risk of Recidivism Facing Offenders upon their Return to the Community 2013
interviews. Research team members worked directly with parole agents to identify parolees who met the sampling criteria. Parole agents were given a project script describing the study and parolees were approached with this information during the pre-parole process. The research team made efforts to contact eligible parolees either at the day of their release from prison or within their first week in the community. All initial interviews took place during calendar year 2009. As part of Understanding the Challenges, research team members planned to conduct four interviews with each parolee over the course of their first year on parole. Topics for each interview included open-ended discussions of pre-release planning, employment, housing, substance abuse history and treatment, and outlooks towards the future (See Appendix A for the complete interview instrument). Participants were compensated with a sum of $20 for each completed interview. Given that parolees are a transient population some degree of attrition was expected. Attrition proved to be problematic. Because of this, we were only able to complete the full-slate of four interviews with a handful of parolees. Most of the prospective interview data consisted of an initial interview at release and a follow-up at some point during the first year on parole (see Appendix B for more information on interview timing and attrition). Each interview was digitally recorded with the permission of the participant, and then manually transcribed. In all, at least one interview was secured with 39 male parolees.5 Relevant to the current inquiry, recidivism by the participants was a significant source of attrition. In several cases follow-up interviews were secured after the participant had been taken into custody, or after they had been released from custody and had resumed their parole. These interviews provided an opportunity to learn about the occurrence and context of recidivism from the perspective of the parolees themselves. Research team members versed in qualitative analysis performed targeted thematic coding surrounding recidivism events. The qualitative analysis provided in the current inquiry fall within the phenomenological tradition, paying specific attention to the lived-experience of reentry and recidivism risks by the participants (Creswell, 2007). RECIDIVISM AND SUPERVISION DATA The majority of analyses for the current inquiry stem from detailed secondary data concerning recidivism and supervision for each of the 39 Understanding the Challenges participants. These data came from two sources and cover multiple measures of recidivism and supervision. First, rearrest data were obtained from the management information system of the Michigan State Police. These data capture instances of a participant being arrested and taken into custody for ordinance, misdemeanor, and felony offenses, but do not necessarily correspond to prosecution or conviction for those offenses. The data contain information on all such incidents between the participants’ parole release date and a censoring point.6 In addition to containing information on rearrests during the participants parole supervision term, these data also have the potential to capture any rearrests occurring after their discharge from supervision.
5 One participant had to be removed from the sample due to technical difficulties which prohibited the transcription of their interview. 6 The censoring point represents the date that the rearrest data were received, which was in May of 2012.

Michigan Justice Statistics Center
Page 6
Risk of Recidivism Facing Offenders upon their Return to the Community 2013
The other source of secondary data was case notes from the data management system of the MDOC. The case notes are official records providing dated information such as updates on housing changes, employment verification, any contacts made with the parolee (i.e., in-person, telephone, or collateral contacts with persons who know the participant), and more importantly, non-compliance and recidivism incidents. These include positive substance abuse tests, absconding, police contacts, parole violations, rearrests, jail stays, and returns to prison. These secondary records covered the same time period as the criminal rearrest data obtained, with the exception that these correctional data end at discharge from supervision, meaning that they do not capture information on any incidents taking place following supervision termination. Recidivism measures and their definitions are presented as they are discussed in the findings section. Utilizing secondary data brings about its associated limitations. Official records of recidivism represent a combination of actual offending behaviors and the behavior of those maintaining the records (Kitsuse & Cicourel, 1963). Parole violation data are no exception, as official records of such violations will represent the behavior of parolees, the capacity of supervision agents to detect deviance, and their response to such deviance (McCleary, 1977, 1978; Grattet, Lin, & Petersilia, 2011). Whether a rearrest takes place is conditional on whether the offending behavior is reported to the police (Maltz, 1984). With these caveats in mind, we utilize multiple measures to attempt to triangulate recidivism. For instance, while the criminal rearrest data do not capture police contacts which do not result in arrest, the correctional data do cover such events, as long as they came to the attention of the corrections authorities. STUDY SITE PROFILE: LANSING To better understand the risk of recidivism that the Understanding the Challenges participants faced during their time in the community, it is important to discuss the context in which they served their parole. This discussion is meant to serve as a historical backdrop structuring the experiences of the men we followed (Young, 2011). All of the 39 participants were paroled to the city of Lansing, Michigan during calendar year 2009. Historical context
Lansing is a small, industrialized, Midwestern-city located in the center of the state of Michigan. It has served as the state capital and seat of the state government since its founding in 1847 (State Journal Company, 1930). Beginning as an agricultural economy based on forestry, Lansing’s industrial growth was spurred by the founding of Michigan State College in nearby East Lansing in 1855 (later to become Michigan State University), and as a major site of Michigan’s automotive industry beginning in the early twentieth century (Lansing State Journal, 2008; Teaford, 1993). In the latter-half of the twentieth century Lansing began to experience tumultuous changes to its social and economic structure. In 1970 Lansing reached its peak population of over 130,000 residents (U.S. Census Bureau, 2005). Since that point, the total population of the city has declined every decade. The population loss has been restricted to whites, with the white population decreasing each decade since 1970, and minority residents in every census category have been increasing in number (U.S. Census Bureau, 2005). Concurrent with the population

Michigan Justice Statistics Center
Page 7
Risk of Recidivism Facing Offenders upon their Return to the Community 2013
decrease were shifts in global trade that were having impacts at the local level. The 1973 Arab Oil Embargo placed heavy strain on the U.S. economy, but particularly the automotive industry, which to date had been producing large, high volume fuel consuming vehicles. This situation suddenly made smaller, more fuel efficient Japanese-made vehicles far more attractive than the cars produced in Lansing (Lansing State Journal, 2008; Zafonte & Sabatier, 2004). Additionally, the Michigan auto industry was receiving fewer defense contracts (Niemark, 1992), and as a consequence, GM began to scale back its operations in the Lansing area, and unemployment in Michigan as a whole began to rise precipitously. However, because Lansing’s economy was relatively diversified, it did not experience similar economic declines and crime rate shifts as other industrialized Michigan cities (e.g., Flint, Saginaw) (Matthews, 1997). More recently Lansing has undergone additional social and economic changes. Unlike other major cities in Michigan which lost substantial proportions of their population between 2000 and 2010, the Lansing tri-county area actually gained residents in this time period (Ahern, 2011). According to the Lansing State Journal, this population growth was induced by Lansing’s growing financial and insurance industries, and the continued success of nearby Michigan State University (Ahern, 2011). As such, the growing employment opportunities in the city have been concentrated among highly-skilled, affluent young professionals. The unskilled population has other industries which can absorb shocks in the economy, such as the state government, but these positions may not be available to individuals on parole, or those with criminal records in general (Pager, 2003; Wilson, 1996). Lansing at the time of the study
Table 1 displays selected demographic characteristics for the city of Lansing, Ingham County (in which Lansing is located), and the state of Michigan around the time of the study participants being released on parole. These features were selected based on their relevance to the process of community reentry. In 2010 Lansing was a city of approximately 114,000 residents. Relative to Ingham county and the state of Michigan, it contained a larger proportion of racial minority residents, lower homeownership rates, higher residential mobility, lower per-capita income, and higher rates of poverty and public assistance income. These figures indicate that study participants were paroling to an area with higher indicators of socioeconomic disadvantage, relative to the state of Michigan as a whole.

Michigan Justice Statistics Center
Page 8
Risk of Recidivism Facing Offenders upon their Return to the Community 2013
Table 1. Selected Demographic Characteristics of Lansing, Ingham County, and State of Michigan, 2010 Lansing Ingham County Michigan Population Total Population 114,297 280,895 9,883,640 Malea 48.4% 48.6% 49.1% Under age 25a 33.2% 34.4% 30.5% Non-whitea 38.8% 23.8% 21.1% Housing Renter-occupied housingb 41.4% 37.4% 23.8% Vacant housingb 10.6% 8.3% 14.6% Vacant housing for rent 45.1% 43.1% 21.4% Lived in same house 1 year agoa 78.5% 76.2% 85.4% Median Gross Rent $689 $737 $742 Earnings and Income Per capita income $19,766 $24,322 $25,482 Median earnings for full-time workers $22,785 $21,895 $24,478 Persons under povertya 25.2% 20.4% 15.7% Households receiving SSIb 6.2% 3.9% 4.6% Households receiving public assistanceb 5.2% 3.2% 3.7% Households receiving food stampsb 25.0% 15.6% 14.3% Occupations Management, business, science, artsc 32.0% 39.5% 34.0% Servicec 22.5% 19.0% 18.2% Sales and officec 25.0% 25.1% 24.9% Natural resourcesc 5.8% 5.3% 8.1% Production, transportation, movingc 14.7% 11.1% 14.8% Source: U.S. Census Bureau Note: SSI = supplemental security income; a = percentage of total population; b = percentage of total housing units; c = percentage of civilian employed population Unemployment rates and employment opportunities are key concerns for individuals attempting to reenter society after a term of incarceration (Bellair & Kowalski, 2011; Kachnowski, 2005). Persons with criminal records face difficulties in securing employment, relative to those without such records (Holzer, Raphael, & Stoll, 2004; Pager, 2007; Western, 2006). These challenges can become exacerbated during labor market declines, leading to increased rates of recidivism during these periods, particularly among African-Americans (Mears, Wang, & Bales, 2012). The 39 men participating in the current study were released into the context of Lansing’s labor market. When the men were released during calendar year 2009, Lansing was experiencing its highest unemployment rates stemming from the 2007 recession (also called “The Great Recession” or the “Economic Downturn”). While many of the participants were serving their prison terms, the National Bureau of Economic Research (2010) documented an 18 month

Michigan Justice Statistics Center
Page 9
Risk of Recidivism Facing Offenders upon their Return to the Community 2013
recession between December 2007 and June 2009. The recession produced particularly severe effects for the national labor market, which peaked at 10.1 percent in October of 2009. Consistent with previous recessions (e.g., 1981-82, 1990-91, 2001) the shocks to the unemployment rate affected particular groups more than others. More specifically, loss of employment was more substantial for males, young persons (i.e., age 16-24), those with lower educational attainment, and racial and ethnic minorities (Elsby, Hobijn, & Sahin, 2010). Unemployment rates in the Lansing area during the recession were higher than the national average. Figure 2 displays the local and national unemployment rates for the duration of 2008 to May of 2012, or one year prior to the beginning of the current study through the end of recidivism follow-up. The Lansing unemployment rate peaked at 16.9 percent in July of 2009 and remained in excess of 15 percent through the following year. By the time the study period ended in May of 2012, the unemployment rate had fallen to 9.9 percent, or roughly two percentage points higher than the national rate.
Source: Bureau of Labor Statistics Figure 2. Unemployment rates in Lansing and the United States during the study period.
A closer look at data from the Bureau of Labor Statistics indicated that most of the employment loss in the Lansing area was concentrated in the manufacturing and service industries, where the combined number of individuals employed in each area declined by roughly 10,000 positions between 2007 and 2009. This is an important trend because these industries represent many of the low-skill employment opportunities relied on by returning offenders (Bellair & Kowalski, 2011). On the other hand, government and education/health services remained at stable levels of employment. Figure 3 shows changes in levels of
0.0
2.0
4.0
6.0
8.0
10.0
12.0
14.0
16.0
18.0
Jan-
08
Mar
-08
May
-08
Jul-
08
Sep-
08
Nov
-08
Jan-
09
Mar
-09
May
-09
Jul-
09
Sep-
09
Nov
-09
Jan-
10
Mar
-10
May
-10
Jul-
10
Sep-
10
Nov
-10
Jan-
11
Mar
-11
May
-11
Jul-
11
Sep-
11
Nov
-11
Jan-
12
Mar
-12
May
-12
Une
mpl
oym
ent
Rat
e
Lansing Unemployment Rate National Unemployment Rate
Study Period Begins

Michigan Justice Statistics Center
Page 10
Risk of Recidivism Facing Offenders upon their Return to the Community 2013
employment by industry in the Lansing/East Lansing metropolitan statistical area between 1990 and 2012. The trends demonstrate changes in the employment structure of the Lansing area, in which industries valued by returning offenders – manufacturing and goods producing – decreased, while high-skill/high-wage positions in science and finance increased. The opportunities left were in low-skills, low wage service positions.
Source: Michigan Department of Technology, Management, and Budget Figure 3. Employment by Industry in Lansing/East Lansing, 1990-2012 Figure 4 displays the same relative trends in employment levels in the Lansing metropolitan statistical area, but only during the study period of 2008 to 2012. The trends suggest that following a general employment crash in 2009, every industry with the exception of government experienced some rebound. The two industries with the largest rebounds were high-skill, high-wage information positions, and low-skill, low-wage service positions.
Source: Michigan Department of Technology, Management, and Budget Figure 4. Employment by Industry in Lansing/East Lansing, 2008-2012
-3-2.5
-2-1.5
-1-0.5
00.5
11.5
2
1990
1991
1992
1993
1994
1995
1996
1997
1998
1999
2000
2001
2002
2003
2004
2005
2006
2007
2008
2009
2010
2011
2012
Stan
dard
Sco
re
Professional Scientific FinancialInformation ManufacturingService Goods ProducingGovernment
-2-1.5
-1-0.5
00.5
11.5
2
2008 2009 2010 2011 2012
Stan
dard
Sco
re
Professional Scientific Financial Information
Manufacturing Service Goods Producing
Government

Michigan Justice Statistics Center
Page 11
Risk of Recidivism Facing Offenders upon their Return to the Community 2013
FINDINGS SAMPLE DESCRIPTION The participants in the current study were 39 male parolees. Distributions of demographic and criminal history variables are displayed in Table 2. On average, the participants were approximately 37 years old. Two-thirds of the sample (n=26) were African-American, and an equal proportion had children (n=27, 69.2%). For their current parole, the majority of the men were released on a persons (n=16, 41.0%) or property (n=14, 35.9%) offense. More than half of the participants had been incarcerated in the past (n=24, 61.5%), meaning that 15 members of the sample (38.5%) were attempting the transition from prison to the community for the first time. On average, the men had served 5 years in prison prior to their current parole. The majority of the participants were released under an initial high risk (n=18, 46.2%) or medium risk (43.6%) supervision. Risk levels were determined using the Correctional Offender Management Profiling for Alternative Sanctions (COMPAS) risk assessment instrument. The COMPAS is a dynamic risk assessment tool, meaning that risk scores are based on factors which can change over time.7 For the current study we did not have access to changes in COMPAS scores, so only the initial risk level is presented. Table 2. Participant Demographic and Criminal History Characteristics (N=39) Variables N (Percent) Mean (S.D.) Range Age at Release 36.6 (8.7) 21 - 56 African-American 26 (66.7%) Has Children 27 (69.2%) Persons Offense Term 16 (41.0%) Property Offense Term 14 (35.9%) Drug Offense Term 5 (12.8%) Sex Offense Term 4 (10.3%) Previous Incarceration 24 (61.5%) Years Incarcerated Prior to Parole 4.9 (3.8) 1 - 14 High Risk Supervision 18 (46.2%) Medium Risk Supervision 17 (43.6%) Low Risk Supervision 4 (10.3%)
7 The COMPAS incorporates a broad selection of criminogenic risk and needs scales, including previous histories of criminal involvement, non-compliance, and violent behavior. Dynamic risk measures include current violent behavior, association with criminals, substance abuse, financial problems, residential instability, and criminal attitudes, among others. The predictive validity of the COMPAS scales was assessed by Brennan, Dieterich, and Ehret (2009) using a validation sample of 2,328 parolees. They found that COMPAS scales registered area under the receiver operating characteristic curve (AUC) values in excess of .70, but scores were slightly higher for the prediction of person offenses (relative to any felony), as well as offenses by female and white parolees. AUC values represent the probability that a randomly selected recidivist would have scored higher on the risk assessment instrument than a randomly selected non-recidivist. An AUC value of .50 means that the instrument was no more effective at predicting recidivism than flipping a coin. AUC values higher than .71 indicate a relatively high predictive accuracy (Rice & Harris, 2005).

Michigan Justice Statistics Center
Page 12
Risk of Recidivism Facing Offenders upon their Return to the Community 2013
Because of the non-random nature of the sampling procedure, we make no claims regarding the representativeness of the current sample. We were able to compare the 39 members of the current sample of 2009 parolees to Lansing to a sample of 166 parolees to Ingham County between 2008 and 2009.8 The current sample was approximately the same age (36.6 years versus 35.7 years, t=-.55, p=.585), had spent approximately the same amount of time in prison for their most recent sentence (4.9 years versus 4.6 years, t=-.45, p=.651), but had a larger proportion of African Americans (66.7% versus 52.0%, χ2=-2.60, 2-sided Exact p=.152), a significantly higher proportion with a previous incarceration (61.5% versus 32.0%, χ2=11.81, 2-sided Exact p=.001).9 The reason for these differences may be accounted for by the high/moderate risk nature of the current sample, while the comparison contained low-risk parolees as well.
Table 3 breaks down the sample by their level of supervision risk. The highest
supervision risk offenders in the sample tended to be slightly younger, whiter, and had served a longer prison term, relative to lower risk members of the sample. None of the observed differences were statistically significant. Because of the nature of sex offender community supervision in Michigan, all of the sex offenders were automatically placed on the highest supervision risk level. Table 3. Demographic and Criminal History Characteristics by Initial Risk Level (N=39) Variables Total High Risk Medium Risk Low Risk N = 39 n = 18 n = 17 n = 4 Age at release 36.6 (8.7) 35.3 (9.7) 37.7 (8.3) 38.5 (5.5) African-American 26 (66.7%) 11 (61.1%) 12 (70.6%) 3 (75.0%) Has Children 27 (69.2%) 10 (55.6%) 13 (76.5%) 4 (100.0%) Persons Offense Term 16 (41.0%) 6 (33.3%) 8 (47.1%) 2 (50.0%) Property Offense Term 14 (35.9%) 5 (27.8%) 7 (41.2%) 2 (50.0%) Drug Offense Term 5 (12.8%) 3 (16.7%) 2 (11.8%) 0 (0.0%) Sex Offense Term 4 (10.3%) 4 (22.2%) 0 (0.0%) 0 (0.0%) Previous Incarceration 24 (61.5%) 10 (55.6%) 10 (58.8%) 4 (100.0%) Years Incarcerated prior to Parole 4.9 (3.8) 5.4 (4.3) 4.8 (3.5) 3.3 (2.1) Note: Bolded differences are statistically significant (p < .05). Whether an individual has a previous criminal record is an important predictor of future of future criminal behavior (Brame, Bushway, & Paternoster, 2003; Huebner & Berg, 2011; Kurlychek, Brame, & Bushway, 2006). Table 4 compares the demographic characteristics of the 15 participants with no prior incarcerations with the 24 that had at least one previous prison term. The sample members who had at least one previous incarceration were older, significantly more
8 These 1,094 Ingham County parolees were gleaned from the comparison group for a larger, quasi-experimental evaluation of sex offender residency restrictions in Michigan and Missouri (Huebner et al., 2012). 9 Due to the relatively small sample sizes, statistical significance tests should be interpreted cautiously. Small samples lack power to detect statistically significant effects, increasing the probability of Type-II error. Additionally, small samples are also unlikely to conform to the assumptions of common significance tests, such as being normally distributed (Allen, 1997). As such, statistical significance tests are presented where appropriate, but should be interpreted conservatively.

Michigan Justice Statistics Center
Page 13
Risk of Recidivism Facing Offenders upon their Return to the Community 2013
likely to be African-American (t=-2.06, p=.050), and were more likely to be serving their parole for a property offense (χ2 = 12.14, p = .007), relative to those with no prior incarcerations. Those with a prior record had also spent less time in prison for their most recent incarceration, but this may be because of the proportion of persons and sex offenders in the group with no previous incarcerations. Additionally, all five of the drug offenders in the current sample had a previous incarceration, while none of the sex offenders did. Table 4. Participant Demographic and Criminal History Characteristics (N=39) Variables Total No Prior
Incarcerations At least one Prior
Incarceration N = 39 n = 15 n = 24 Age at release 36.6 (8.7) 33.5 (8.0) 38.6 (8.7) African-American 26 (66.7%) 7 (46.7%) 19 (79.2%) Has Children 27 (69.2%) 10 (66.7%) 17 (70.8%) Persons Offense Term 16 (41.0%) 8 (53.3%) 8 (33.3%) Property Offense Term 14 (35.9%) 3 (20.0%) 11 (45.8%) Drug Offense Term 5 (12.8%) 0 (0.0%) 5 (20.8%) Sex Offense Term 4 (10.3%) 4 (26.7%) 0 (0.0%) Years Incarcerated prior to Parole 4.9 (3.8) 6.3 (4.2) 4.0 (3.2) High Risk Supervision 18 (46.2%) 8 (53.3%) 10 (41.7%) Medium Risk Supervision 17 (43.6%) 7 (46.7%) 10 (41.7%) Low Risk Supervision 4 (10.3%) 0 (0.0%) 4 (16.7%) Note: Bolded differences are statistically significant (p < .05). This study relies on a combination of secondary correctional record data and semi-structured interviews for an in-depth analysis of recidivism. Table 5 displays the amount and timing of interview administration. As noted, the original goal of the Understanding the Challenges study was to conduct four interviews with each parolee, each occurring approximately three months apart. Because of recidivism and attrition we were only able to achieve this ideal with a handful of parolees (see Appendix B for a more detailed description of attrition). On average, the initial interview was completed after the parolee had spent just over a week in the community (10.2 days). We were able to interview 15 members of the sample (38.5%) on either the day of or the day after their release. A second interview was completed with 30 members of the sample (76.9%), after an average of 265 days (about 8.8 months) in the community. Because of the transience of the sample, it was difficult to complete a second interview within the three months (90-120 days) that were originally planned. Only 10 of the second interviews occurred within three months. Less than half of the parolees that were interviewed twice were able to be reached for a third interview (n=12, 30.8% of the overall sample). The third interview took place after 295 days in the community, and 171 days after the second interview. All four interviews were completed with 7 members of the sample (17.9%). The fourth interview took place after an average of 432 days in the community, and 179 days after the third interview.10
10 We were only able to complete all four interviews within the original plan of nine months with a single parolee (Samuel).

Michigan Justice Statistics Center
Page 14
Risk of Recidivism Facing Offenders upon their Return to the Community 2013
Table 5. Amount and Timing of Interview Administration Interview Days after Release Mean (S.D.) Median Range Interview 1 (N=39) 10.2 (12.8) 6.0 0 - 56 Interview 2 (n=30) 265.7 (168.5) 206.5 89 - 548 Interview 3 (n=12) 294.6 (115.8) 255.0 194 - 542 Interview 4 (n=7) 431.7 (99.4) 429.0 292 - 576 Time between Interviews 1 and 2 255.7 (167.9) 178.5 83 - 548 Time between Interviews 2 and 3 170.9 (123.6) 122.0 68 - 442 Time between Interviews 3 and 4 179.14 (88.0) 147.0 76 - 303 The transience and fluidity of the sample is displayed in Figure 5. This figure visualizes the flow of the men in the current sample over the course of the study period, which extended from January of 2009 to May of 2012. The study duration is broken down into 7 six month intervals. Figure 5 shows that as time passed the number of parolees remaining under supervision decreased, with exits occurring due to absconding, new crimes, parole revocations, and discharges. Several members of the sample experienced these forms of attrition within the first six months. The number of parolees still under active supervision at any given point overestimates the number available for interviews, because some may have been spending brief periods of time in jail during that time frame. Sample members also moved between categories over time, as many of those who were still on active supervision at the conclusion of the study duration had been incarcerated and thus received an extension of their parole term.
Note: Adapted with modification from Grattet, Petersilia, and Lin (2008). Figure 5. Parole Status during the Study Period (N=39)
0
5
10
15
20
25
30
35
January toJune 2009
July toDecember
2009
January toJune 2010
July toDecember
2010
January toJune 2011
July toDecember
2011
January toMay 2012
Num
ber
of P
arol
ees
On Parole, Not Absconded On Parole, AbscondedIncarcerated, New Sentence Incarcerated, RevocationDischarged from Corrections Not yet ParoledDeceased

Michigan Justice Statistics Center
Page 15
Risk of Recidivism Facing Offenders upon their Return to the Community 2013
NATURE OF RECIDIVISM OUTCOMES Recidivism Measures
In the current study we utilize numerous recidivism indicators, ranging from minor forms of supervision non-compliance, resulting in a warning, to serious reoffending, resulting in a return to prison. This section of the report details the recidivism measures we created, their definitions, and their frequency and prevalence among the members of the Understanding the Challenges sample. Unless indicated otherwise, each of the measures is captured using a dichotomous measure.
Rearrests represent the most practical measure of recidivism because their relatively short
distance from offending events allows researchers to capture a broader degree of deviant behavior (i.e., relative to prosecutions, convictions, or returns to prison) (Sellin, 1931; Maltz, 1984). Maltz (1984) suggests that for parole cohorts, such as the one examined in the current study, parole violation data may be useful indicators of recidivism as well. Each of these becomes more valid measures of recidivism if they are subsequently followed up with the filing of charges or a conviction (Maltz, 1984). Our data allowed us to make these determinations. Through our combination of secondary data sources we were able to construct the following recidivism measures, consistent with the definitions and notation proposed by Maltz (1984) (see Table 6). While each measure represents an official response to parolee behavior, each subsequent measure is increasingly dependent on the response of the criminal justice system to the violation behavior. Rv – Parole violation. This measure represents the occurrence and timing of a parolee receiving a parole violation. Parole violations are incurred when the parolee breaches the conditions of their release. They can be given for non-criminal (technical violation) and criminal behaviors. This is the least restrictive definition of recidivism under Maltz’s (1984) scheme. Rvc – Parole violation and jail time. The parolee received a parole violation and time in jail as a result. If the parolee received a violation but did not serve any time in jail as a result, the event was recorded as an Rv. This definition of recidivism includes Rv. Ra – Arrest. This measure captures the occurrence and timing of any rearrest of the parolee. This includes instances where the parolee was arrested by law enforcement or the absconder recovery unit. Because parolees receive violations for arrests, Ra includes Rv, but not necessarily Rvc. The distinction is that a parolee may be arrested and violated but still may not spend any time in jail as a result. Rap – Arrest and prosecution. This measure captures whether prosecutorial action is taken against the parolee following an arrest (e.g., charges filed, indictment, trial, etc.). The timing of the variable represents the date of arrest, not the filing of charges. It includes Ra, Rvc, and Rv. Rac – Arrest and conviction. This measure of recidivism is triggered if the arrest and prosecution of a parolee results in a successful conviction. The timing reflects the date of arrest, not the date of conviction. This definition includes Rap, Ra, Rvc, and Rv. Rexj – Extended jail sentence. This measure applies to recidivism events where the parolee was convicted and sentenced to an extended jail term (e.g., 180-365 days in jail), but not a return to prison. This definition includes Rac, Rap, Ra, Rvc, and Rv.

Michigan Justice Statistics Center
Page 16
Risk of Recidivism Facing Offenders upon their Return to the Community 2013
Rpris – Return to prison. This measure of recidivism is the most restrictive available and represents any recidivism events resulting in the revocation of the subject’s parole and their subsequent return to prison. It necessarily includes Ra, Rvc, and Rv in its definition. It may not include Rac, Rap because a parolee can be returned to prison as a result of violations alone. Table 6. Recidivism Measures Available Recidivism measures Rv Rvc Ra Rap Rac Rexj Rpris Rv – Parole violation X - - - - - - Rvc – Parole violation and jail X X - - - - - Ra – Arrest X x X - - - - Rap – Arrest and prosecution X X X X - - - Rac – Arrest and conviction X X X X X - - Rexj – Extended jail sentence X X X X X X - Rpris – Return to prison X X X x x - X Note: Adapted with modification from Maltz (1984). X = Measure includes this definition; x = Measure may include this definition, but not necessarily. Within the parole violations there were gradations of seriousness. Whenever parole violations were incurred by the parolee, multiple violation behaviors may have been registered. Because of the nature of the secondary data we collected, the exact nature of all of the violations at a given time was not always clear. To correct for this, in each case we coded the most serious violation behavior committed by the parolee, since that information was the most reliably recorded. The seriousness parole violations were categorized in a fashion adapted from Grattet and colleagues (2008), and definitions are displayed in Table 7. Each parole violation type was assigned a value on an ordinal scale, ranging from 1 to 5. Table 7. Parole Violation Seriousness Types Violation Measure Definition/Behaviors Included Seriousness Value Number of Parole Violations
Total count of technical and criminal parole violations
--
Technical Violation Non-criminal behaviors which breach the conditions
of parole
Technical I Positive substance abuse tests, Failure to report 1 (Least) Technical II Absconding from supervision; Electronic monitoring
violations; Special conditions (e.g., no contact orders); Weapon access
2
Criminal Violation Behaviors violating the Michigan Penal Code Criminal I Drug use/possession, minor motor vehicle offenses
(e.g., driving with license suspended) 3
Criminal II Forgery, Drug sales, Burglaries, Batteries without injury, Driving while intoxicated
4
Criminal III Major assaults, Major drugs, Robberies, Criminal Sexual Conduct, Homicides
5 (Most)
Note: Adapted with modification from Grattet, Petersilia, and Lin (2008).

Michigan Justice Statistics Center
Page 17
Risk of Recidivism Facing Offenders upon their Return to the Community 2013
Arrests and parole violations represent the primary recidivism measures for the current study. Through secondary records we were able to construct several other recidivism measures, primarily in the form of non-compliance with parole. Each of these additional measures are listed and defined in Table 8. There are several qualifiers to these definitions. Most parolees were required to submit to substance abuse tests on a weekly, bi-weekly, or monthly basis. The frequency of substance abuse tests could vary throughout the supervision term, depending on levels of compliance or non-compliance.11 On each occurrence of a substance abuse test, the parolee was typically subject to multiple tests (e.g., breathalyzer, urine sample). If any of the multiple tests on a single occasion resulted in a positive reading, that substance abuse test was counted as being positive. Several indicators for measuring parole absences are listed in Table 8. A parolee received a failure to report (FTR) if they did not show up for a scheduled reporting date with their parole agent and did not take any measures to inform their parole agent in the process. Typically a parole agent would reach the parolee via phone following a FTR, and scheduled a next reporting date. Multiple FTRs may be met with a parole violation. Parole absconding was a more serious indicator of parole absences. Absconding was operationally defined as when a parole officer filed an absconder warrant for the parolees’ arrest. An absconder warrant was typically filed after a FTR and subsequent attempts to contact the parolee failed (e.g., phone call, home visit). This definition is consistent with the absconding indicator used by several previous inquiries (Maltz, 1984; Mayzer, Gray, & Maxwell, 2004; Pyrooz, 2012), but is more conservative than the one used by Williams, McShane, and Dolny (2000), who defined absconding in the same way that the current study defines FTR. A measure was also included for police contacts, which parolees are required to inform their parole agents of. A police contact was defined as an incident in which the parolee came into contact with law enforcement pursuant to their own behavior. For instance if a parolee was stopped by the police and given a traffic ticket for speeding, this counted as a police contact. If the same scenario the parolee was the passenger of the vehicle, this did not count as a police contact. Additionally, if the parolee spoke to the police after calling them because their neighbor was playing loud music, this did not count as a police contact. These definitions were adopted so that the variable provided a more valid measure of parole deviance, as opposed to a combined measure of deviance and willingness to contact law enforcement on their own behalf. 11 One major exception to the frequency of substance abuse tests was whether the parolee was placed on a SCRAM tether (Hawethorn et al., 2008), which is a remote blood-alcohol electronic monitoring device. The device takes periodic samples of perspiration, tests them for alcohol content, and records the readings. Parolees may be placed on a SCRAM tether for chronic non-compliance, particularly if the violations involve substance abuse. While on a SCRAM tether the parolee was required to report several times per week so that their parole agent could download the alcohol content readings. Each time the parolee reported to the office for a SCRAM download, the visit was counted as an in-person contact with their parole agent, and a substance abuse test.

Michigan Justice Statistics Center
Page 18
Risk of Recidivism Facing Offenders upon their Return to the Community 2013
Table 8. Additional Recidivism/Non-Compliance Measures Recidivism Measure Definition/Behaviors Included Substance Abuse Relapse Positive substance abuse test Parolee ever had a positive substance abuse test Relapse extent Ratio of number of positive substance abuse tests to total
number of tests Parole Absences Failure to report (FTR) Parolee ever failed to show for a scheduled reporting date Number of FTRs Total number of times a parolee had an FTR Abscond Parolee ever absconded from supervision Absconding duration Number of days parolee was under absconder status Police Contacts Police contact Parolee ever experienced contact with police Number of police contacts Total number of police contacts Jail Stays Jailed Parolee ever spent at least a day in jail Number of jail stays Total number of jail stay events Jail duration Total number of days parolee spent in jail Recidivism outcomes
This section describes the prevalence and frequency of recidivism among the Understanding the Challenges sample of 39 male parolees to Lansing. These figures reflect events over the entire duration of the study. The typical parole supervision term in Michigan is two years (730 days). Parolees can be discharged early, or may have their supervision term extended for incidents of recidivism or chronic non-compliance. The average follow-up time for the 39 members of the sample (i.e., the duration from the participant’s parole date to either their discharge, return to prison, or censoring) was 2.2 years (SD = 0.7 years). This figure was adjusted for time spent incarcerated, resulting in an average time at risk of 1.6 years (SD = 0.6 years) for each participant. The next section on the timing of recidivism will breakdown incidents by when they occurred in the course of parole. Among the 39 men followed during the Understanding the Challenges study, recidivism was the norm, rather than the exception. Figure 6 presents the recidivism rates for each of the recidivism measures adapted from Maltz (1984). These measures indicate whether the participant ever recidivated during their parole. Nearly the entire sample (n=37, 94.9%) received a parole violation (Rv) of some type while under community supervision (The specific types of parole violations are analyzed below). This was the least restrictive recidivism definition utilized. As the definitions become more restrictive, the recidivism rate decreased.

Michigan Justice Statistics Center
Page 19
Risk of Recidivism Facing Offenders upon their Return to the Community 2013
Note: Rv = Parole violation; Rvc = Parole violation and jail; Ra = Arrest; Rap = Arrest and prosecution; Rac = Arrest and conviction; Rexj = Extended jail sentence; Rpris = Return to prison. Figure 6. Recidivism Rate over Entire Duration of Parole (N=39). An equal proportion of participants (n=34, 87.2%) received a parole violation and were subsequently jailed (Rvc), or were rearrested (Ra).12 As some researchers have observed, while an arrest is a good indicator of recidivism because of how close it is to the offending behavior, a person can still be arrested without committing a new crime (Maltz, 1984; Soothill, 2010). This makes arrests a more valid indicator of law enforcement contacts than recidivism. Maltz (1984) suggests that if follow-up prosecution or conviction data are available, we can be more confident in the validity of arrest as a recidivism measure. For the current sample of 39 parolees, approximately two-thirds were arrested and subsequently prosecuted (n=25, 64.1%), and the same proportion were arrested subsequently convicted (n=24, 61.5%). The final columns in Figure 6 represent participants receiving extended jail sentences (Rexj) or returns to prison (Rpris). Because of all of the criminal justice processing which had to take place prior to their occurrence, these were the least prevalent recidivism indicators, with 23 percent (n=9) receiving a lengthy jail sentence and 21 percent (n=8) returning to prison. Because the extended jail sentences represent temporary suspensions of parole supervision, they may be meaningfully combined with returns to prison into a single measure of parole failure. If this is done, just less than half of the sample (n=17, 43.6%) experienced such a recidivism event. The results suggest that the recidivism rate in the current sample of 39 parolees varied greatly according to the restrictiveness of the measure used. We broke the respondents down by some of the available demographic and criminal history variables to examine variation in recidivism prevalence. These results are displayed in
12 The rearrest measure includes incidents where a participant was apprehended and arrested by the parole office’s absconder recovery unit. When considering only rearrests for new crimes, 71.8 percent (n=28) of participants were rearrested.
94.9%87.2% 87.2%
64.1% 61.5%
23.1% 20.5%
0.0%
10.0%
20.0%
30.0%
40.0%
50.0%
60.0%
70.0%
80.0%
90.0%
100.0%
Rv Rvc Ra Rap Rac Rexj Rpris
Per
cent
of
Sam
ple
Rec
idiv
atin
g
Recidivism Measure

Michigan Justice Statistics Center
Page 20
Risk of Recidivism Facing Offenders upon their Return to the Community 2013
Tables 9 and 10. The first comparison is between white and African-American participants. When considering the first three recidivism measures (parole violations, violations and jail time, and rearrests) equal proportions of white and African-American participants recidivated. As recidivism measures became more restrictive and involved an increasing amount of criminal justice processing the white and African-American recidivism rates within the sample began to diverge. Larger proportions of African-Americans were prosecuted (t = -3.43, p = .001), convicted (t = -3.04, p = .004), and given an extended jail sentence, relative to whites. Within this limited sample, this finding is consistent with previous literature showing increased racial disparities at later points of criminal justice system processing (Steen, Engen, & Gainey, 2005; Steffensmeier & Demuth, 2000; Steffensmeier, Ulmer, & Kramer, 1998; cf. Engen & Steen, 2000) but not at earlier ones (Alpert, Macdonald, & Dunham, 2005; D’Alessio & Stolzenberg, 2003; cf. Engel & Calnon, 2004; Kowalski & Lundman, 2007). Similar proportions of African-Americans and whites were returned to prison. Table 9 also includes a comparison of participants with and without children. Similar proportions of parolees in the sample with and without children received a parole violation (96.3% vs. 91.7%), but higher proportions of parolees with at least one child were arrested (n=25, 92.6%), received an extended jail sentence (n=7, 25.9%), or returned to prison (n=7, 25.9%), but no differences were statistically significant. Table 9. Prevalence of Recidivism by Participant Demographics (N=39) Measure Total White African- American No Children At Least One Child N=39 N=13 N=26 N=12 N=27 n (%) n (%) n (%) n (%) n (%) Rv 37 (94.9) 12 (92.3) 25 (96.2) 11 (91.7) 26 (96.3) Rvc 34 (87.2) 11 (84.6) 23 (88.5) 9 (75.0) 25 (92.6) Ra 34 (87.2) 11 (84.6) 23 (88.5) 9 (75.0) 25 (92.6) Rap 25 (64.1) 4 (30.8) 21 (80.8) 8 (66.7) 17 (63.0) Rac 24 (61.5) 4 (30.8) 20 (76.9) 8 (66.7) 16 (59.3) Rexj 9 (23.1) 1 (7.7) 8 (30.8) 2 (16.7) 7 (25.9) Rpris 8 (20.5) 3 (23.1) 5 (19.2) 1 (8.3) 7 (25.9) Note: Bolded differences are statistically significant (p < .05); Rv = Parole violation; Rvc = Parole violation and jail; Ra = Arrest; Rap = Arrest and prosecution; Rac = Arrest and conviction; Rexj = Extended jail sentence; Rpris = Return to prison. Adapted with modification from Maltz (1984).
The next set of comparisons is by the participant’s parole offense, comparing those paroled on persons, property, drug, and sex offenses. Across each offense type, the majority of participants received a parole violation, violation and jail time, or an arrest. While similar proportions of each offense group received a parole violation, significantly different proportions between groups received violations with jail time (F=3.13, p =.038), were arrested (F=3.13, p=.038), arrested and prosecuted (F=4.56, p=.008), or arrested and convicted (F=4.05, p=.014). More specifically, relative to persons offenses or sex offenses, those paroled on property offenses and drug offenses were more likely to have their arrests followed up with prosecution or conviction (n=12, 85.7%). On the other hand, those paroled on persons offenses had a higher proportion of participants returning to prison (n=5, 31.2%). Overall, the four sex offenders avoided the major recidivism indicators, although all had received a parole violation at some

Michigan Justice Statistics Center
Page 21
Risk of Recidivism Facing Offenders upon their Return to the Community 2013
point. The lone sex offender returning to prison did so because their supervision was revoked following a technical violation. Table 10. Prevalence of Recidivism by Participant Race and Current Parole Offense (N=39) Measure Total Persons Offense Property Offense Drug Offense Sex Offense N=39 N=16 N=14 N=5 N=4 n (%) n (%) n (%) n (%) n (%) Rv 37 (94.9) 14 (87.5) 14 (100.0) 5 (100.0) 4 (100.0) Rvc 34 (87.2) 13 (81.2) 14 (100.0) 5 (100.0) 2 (50.0) Ra 34 (87.2) 13 (81.2) 14 (100.0) 5 (100.0) 2 (50.0) Rap 25 (64.1) 9 (56.2) 12 (85.7) 4 (80.0) 0 (0.0) Rac 24 (61.5) 9 (56.2) 12 (85.7) 3 (60.0) 0 (0.0) Rexj 9 (23.1) 2 (12.5) 6 (42.9) 1 (20.0) 0 (0.0) Rpris 8 (20.5) 5 (31.2) 2 (14.3) 0 (0.0) 1 (25.0) Note: Bolded differences are statistically significant (p < .05); Rv = Parole violation; Rvc = Parole violation and jail; Ra = Arrest; Rap = Arrest and prosecution; Rac = Arrest and conviction; Rexj = Extended jail sentence; Rpris = Return to prison. Adapted with modification from Maltz (1984). Table 11 incorporates additional comparisons between prior incarcerations and risk-level at release. Overall, relative to participants who were being paroled for the first time, a slightly larger but non-significant proportion of the participants with a prior incarceration recidivated. The only exception to this was between the responses to recidivism. A larger proportion of participants without a previous incarceration were returned to prison (n=5, 33.3%), while those with a prior prison term received a larger number of extended jail sentences (n=7, 29.2). Considering initial COMPAS risk designations, roughly equal proportions of high and medium risk participants received a parole violation, violation and jail time, or were arrested. However, the high risk sample members had a higher proportion of their arrests followed up with prosecutions or convictions (n=13, 72.2% for each). Considering the return outcomes, high risk parolees had a larger proportion of participants receiving extended jail terms (n=6, 33.3%), and medium risk sample members had a higher number of returns to prison (n=5, 29.4%). However, none of the recidivism indicators varied significantly across initial risk designations. When combining these variables into a general indicator of “returns”, nearly equal proportions of high (n=9, 50.0%) and medium risk (n=7, 41.2%) participants experienced such outcomes.
Michigan Justice Statistics Center
Page 22
Risk of Recidivism Facing Offenders upon their Return to the Community 2013
Table 11. Prevalence of Recidivism by Prior Incarceration and Initial Risk Level (N=39) Measure Total No Prior
Prison Prior Prison
Term High Risk Medium Risk Low Risk
N=39 N=15 N=24 N=18 N=17 N=4 n (%) n (%) n (%) n (%) n (%) n (%) Rv 37 (94.9) 13 (86.7) 24 (100.0) 18 (100.0) 15 (88.2) 4 (100.0) Rvc 34 (87.2) 11 (73.3) 23 (95.8) 16 (88.9) 14 (82.4) 4 (100.0) Ra 34 (87.2) 11 (73.3) 23 (95.8) 16 (88.9) 14 (82.4) 4 (100.0) Rap 25 (64.1) 8 (53.3) 17 (70.8) 13 (72.2) 10 (58.8) 2 (50.0) Rac 24 (61.5) 8 (53.3) 16 (66.7) 13 (72.2) 9 (52.9) 2 (50.0) Rexj 9 (23.1) 2 (13.3) 7 (29.2) 6 (33.3) 2 (11.8) 1 (25.0) Rpris 8 (20.5) 5 (33.3) 3 (12.5) 3 (16.7) 5 (29.4) 0 (0.0) Note: Bolded differences are statistically significant (p < .05); Rv = Parole violation; Rvc = Parole violation and jail; Ra = Arrest; Rap = Arrest and prosecution; Rac = Arrest and conviction; Rexj = Extended jail sentence; Rpris = Return to prison. Adapted with modification from Maltz (1984).
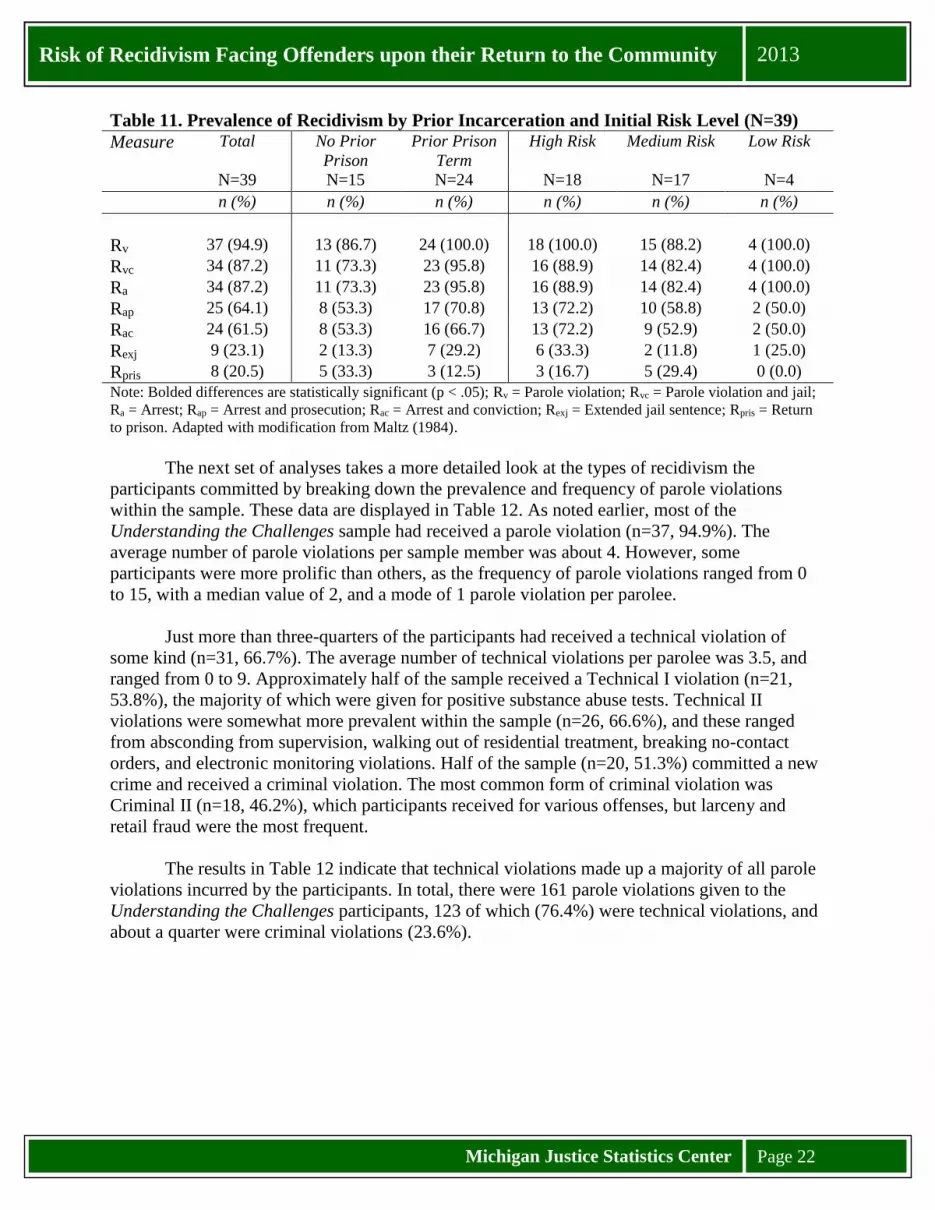
The next set of analyses takes a more detailed look at the types of recidivism the participants committed by breaking down the prevalence and frequency of parole violations within the sample. These data are displayed in Table 12. As noted earlier, most of the Understanding the Challenges sample had received a parole violation (n=37, 94.9%). The average number of parole violations per sample member was about 4. However, some participants were more prolific than others, as the frequency of parole violations ranged from 0 to 15, with a median value of 2, and a mode of 1 parole violation per parolee.
Just more than three-quarters of the participants had received a technical violation of some kind (n=31, 66.7%). The average number of technical violations per parolee was 3.5, and ranged from 0 to 9. Approximately half of the sample received a Technical I violation (n=21, 53.8%), the majority of which were given for positive substance abuse tests. Technical II violations were somewhat more prevalent within the sample (n=26, 66.6%), and these ranged from absconding from supervision, walking out of residential treatment, breaking no-contact orders, and electronic monitoring violations. Half of the sample (n=20, 51.3%) committed a new crime and received a criminal violation. The most common form of criminal violation was Criminal II (n=18, 46.2%), which participants received for various offenses, but larceny and retail fraud were the most frequent.
The results in Table 12 indicate that technical violations made up a majority of all parole violations incurred by the participants. In total, there were 161 parole violations given to the Understanding the Challenges participants, 123 of which (76.4%) were technical violations, and about a quarter were criminal violations (23.6%).

Michigan Justice Statistics Center
Page 23
Risk of Recidivism Facing Offenders upon their Return to the Community 2013
Table 12. Prevalence and Frequency of Parole Violation Types (N=39) Violation Type Prevalence Frequency n (%) Total (%) Mean (S.D.) Range Any Parole Violation 37 (94.9) 161 (100.0) 4.1 (3.7) 0 - 15 Technical Violation 31 (79.5) 123 (76.4) 3.5 (3.1) 0 - 9 Technical I 21 (53.8) 57 (35.4) 1.5 (2.0) 0 - 8 Technical II 26 (66.7) 66 (41.0) 1.7 (2.0) 0 - 6 Criminal Violation 20 (51.3) 38 (23.6) 1.0 (1.2) 0 - 6 Criminal I 5 (12.8) 9 (5.6) 0.2 (0.7) 0 - 3 Criminal II 18 (46.2) 25 (15.5) 0.6 (0.9) 0 - 3 Criminal III 4 (10.3) 4 (2.5) 0.1 (0.3) 0 - 1 The average number of parole violations is compared across demographic and criminal history variables in Tables 13 through 16. In Table 13 the average number of parole violations is compared across race and whether the participant had any children. The African American participants received an average of 4.8 parole violations during their follow-up, compared to 2.8 for the white participants. Statistically significant differences emerged concerning criminal violations, where African American participants averaged 1.4, compared to 0.2 for the white participants (t=-3.96, p<.001). Significant differences were also observed for the number of criminal II (t=-3.42, p=.002).and criminal III (t=-2.13, p=.043) violations between white and African-American participants. Parolees with an without children demonstrated similar levels of parole violation for all parole violation measures. Table 13. Average Number of Parole Violations by Participant Demographics (N=39) Measure Total White African-
American No Children At Least
One Child N=39 N=13 N=26 N=12 N=27 Mean (S.D.) Mean (S.D.) Mean (S.D.) Mean (S.D.) Mean (S.D.) Any Parole Violation 4.1 (3.7) 2.8 (3.0) 4.8 (3.9) 4.2 (3.4) 4.1 (3.9) Technical Violation 3.2 (3.1) 2.5 (3.0) 3.5 (3.2) 3.3 (3.0) 3.1 (3.2) Technical I 1.5 (2.0) 1.0 (2.3) 1.7 (1.9) 1.7 (1.9) 1.4 (2.1) Technical II 1.7 (2.0) 1.5 (1.7) 1.8 (2.2) 1.6 (1.9) 1.7 (2.1) Criminal Violation 1.0 (1.2) 0.2 (0.4) 1.4 (1.3) 0.9 (0.9) 1.0 (1.3) Criminal I 0.2 (0.7) 0.1 (0.3) 0.3 (0.8) 0.1 (0.3) 0.3 (0.8) Criminal II 0.6 (0.9) 0.2 (0.4) 0.9 (0.9) 0.7 (0.9) 0.6 (0.9 ) Criminal III 0.1 (0.3) 0.0 (0.0) 0.2 (0.4) 0.2 (0.4) 0.1 (0.3) Note: Bolded differences are statistically significant (p < .05). Table 14 considers the average number of parole violations as broken down by the sample member’s current parole offense. The number of overall parole violations varied significantly across the groups (F=3.84, p=.018) as the sample members with persons offenses averaged the fewest (2.3) while drug offenders averaged the most (7.2). Many of the drug offender parole violations were driven by positive substance abuse tests. The small number of sex offenders had the highest average of Technical II violations, partially attributable to GPS
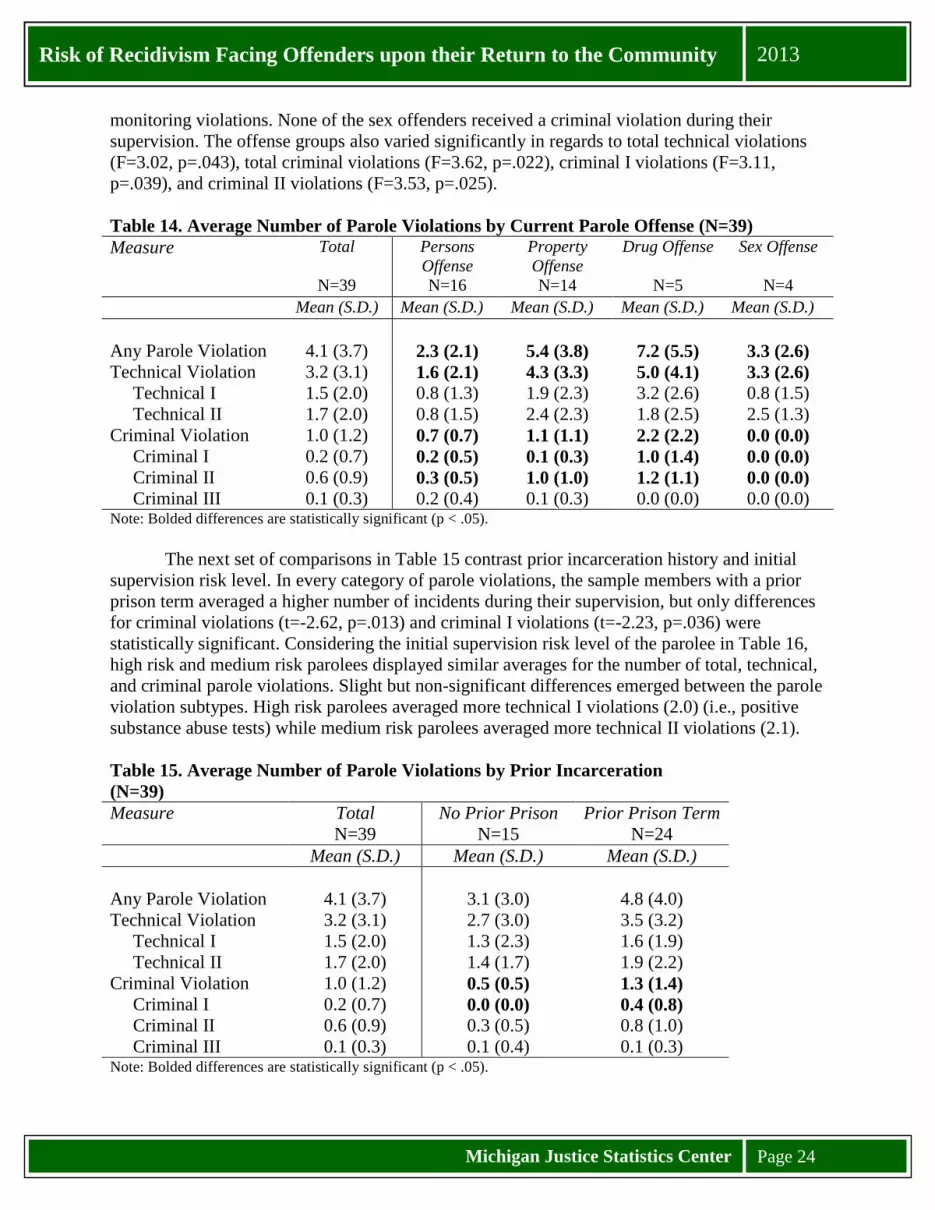
Michigan Justice Statistics Center
Page 24
Risk of Recidivism Facing Offenders upon their Return to the Community 2013
monitoring violations. None of the sex offenders received a criminal violation during their supervision. The offense groups also varied significantly in regards to total technical violations (F=3.02, p=.043), total criminal violations (F=3.62, p=.022), criminal I violations (F=3.11, p=.039), and criminal II violations (F=3.53, p=.025). Table 14. Average Number of Parole Violations by Current Parole Offense (N=39) Measure Total Persons
Offense Property Offense
Drug Offense Sex Offense
N=39 N=16 N=14 N=5 N=4 Mean (S.D.) Mean (S.D.) Mean (S.D.) Mean (S.D.) Mean (S.D.) Any Parole Violation 4.1 (3.7) 2.3 (2.1) 5.4 (3.8) 7.2 (5.5) 3.3 (2.6) Technical Violation 3.2 (3.1) 1.6 (2.1) 4.3 (3.3) 5.0 (4.1) 3.3 (2.6) Technical I 1.5 (2.0) 0.8 (1.3) 1.9 (2.3) 3.2 (2.6) 0.8 (1.5) Technical II 1.7 (2.0) 0.8 (1.5) 2.4 (2.3) 1.8 (2.5) 2.5 (1.3) Criminal Violation 1.0 (1.2) 0.7 (0.7) 1.1 (1.1) 2.2 (2.2) 0.0 (0.0) Criminal I 0.2 (0.7) 0.2 (0.5) 0.1 (0.3) 1.0 (1.4) 0.0 (0.0)
Criminal II 0.6 (0.9) 0.3 (0.5) 1.0 (1.0) 1.2 (1.1) 0.0 (0.0)
Criminal III 0.1 (0.3) 0.2 (0.4) 0.1 (0.3) 0.0 (0.0) 0.0 (0.0)
Note: Bolded differences are statistically significant (p < .05). The next set of comparisons in Table 15 contrast prior incarceration history and initial supervision risk level. In every category of parole violations, the sample members with a prior prison term averaged a higher number of incidents during their supervision, but only differences for criminal violations (t=-2.62, p=.013) and criminal I violations (t=-2.23, p=.036) were statistically significant. Considering the initial supervision risk level of the parolee in Table 16, high risk and medium risk parolees displayed similar averages for the number of total, technical, and criminal parole violations. Slight but non-significant differences emerged between the parole violation subtypes. High risk parolees averaged more technical I violations (2.0) (i.e., positive substance abuse tests) while medium risk parolees averaged more technical II violations (2.1). Table 15. Average Number of Parole Violations by Prior Incarceration (N=39) Measure Total No Prior Prison Prior Prison Term N=39 N=15 N=24 Mean (S.D.) Mean (S.D.) Mean (S.D.) Any Parole Violation 4.1 (3.7) 3.1 (3.0) 4.8 (4.0) Technical Violation 3.2 (3.1) 2.7 (3.0) 3.5 (3.2) Technical I 1.5 (2.0) 1.3 (2.3) 1.6 (1.9) Technical II 1.7 (2.0) 1.4 (1.7) 1.9 (2.2) Criminal Violation 1.0 (1.2) 0.5 (0.5) 1.3 (1.4) Criminal I 0.2 (0.7) 0.0 (0.0) 0.4 (0.8) Criminal II 0.6 (0.9) 0.3 (0.5) 0.8 (1.0) Criminal III 0.1 (0.3) 0.1 (0.4) 0.1 (0.3) Note: Bolded differences are statistically significant (p < .05).

Michigan Justice Statistics Center
Page 25
Risk of Recidivism Facing Offenders upon their Return to the Community 2013
Table 16. Average Number of Parole Violations by Initial Risk Level (N=39) Measure Total High Risk Medium Risk Low Risk N=39 N=18 N=17 N=4 Mean (S.D.) Mean (S.D.) Mean (S.D.) Mean (S.D.) Any Parole Violation 4.1 (3.7) 4.6 (3.9) 4.2 (3.9) 1.8 (0.5) Technical Violation 3.2 (3.1) 3.5 (2.9) 3.4 (3.5) 0.8 (1.0) Technical I 1.5 (2.0) 2.0 (2.3) 1.2 (1.8) 0.0 (0.0) Technical II 1.7 (2.0) 1.5 (1.5) 2.1 (2.6) 0.8 (1.0) Criminal Violation 1.0 (1.2) 1.1 (1.5) 0.8 (1.0) 1.0 (1.2) Criminal I 0.2 (0.7) 0.2 (0.7) 0.2 (0.6) 0.5 (1.0) Criminal II 0.6 (0.9) 0.9 (0.9) 0.4 (0.8) 0.5 (1.0) Criminal III 0.1 (0.3) 0.1 (0.3) 0.8 (0.4) 0.0 (0.0) Note: Bolded differences are statistically significant (p < .05). Variation in average parole violations committed was examined across the age and years incarcerated for the participants. The results of these analyses are displayed in Figures 7 and 8. Different patters emerge between age and time incarcerated. Figure 7 suggests that older sample members (in the age 44-56 quartile) had the highest number of parole violations during their supervision, and those in the 31-37 quartile had the lowest average. Technical violations followed a similar pattern, and average criminal violations was invariant across age groups. None of the parole violation measures varied significantly by parolee age category.
Figure 7. Average Parole Violations by Participant Age (N=39). Figure 8 displays the average number of parole violations by the amount of time that the sample member spent in prison on their most recent incarceration. Significant variation in overall parole violations (F=4.67, p=.008) and technical violations (F=3.96, p=.016) by years incarcerated. The pattern suggests that parolees who spent less time in prison (i.e., 1 year, or 2-3
0
1
2
3
4
5
6
7
8
21 - 30 31 - 37 38 - 43 44 - 56Ave
rage
Num
ber
of P
arol
e V
iola
tion
s
Age Category (Quartiles)
Average Parole Violations Average Technical Violations Average Criminal Violations
N=10 N=10 N=10 N=9

Michigan Justice Statistics Center
Page 26
Risk of Recidivism Facing Offenders upon their Return to the Community 2013
years) committed a higher number of parole violations over the course of their supervision. On the other hand, those who spent longer periods of time incarcerated committed a relatively lower average number of parole violations.
Figure 8. Average Parole Violations by Time Spent Incarcerated (N=39). Additional recidivism and non-compliance measures are displayed in Table 17. Considering substance abuse relapse, the results suggest that the sample struggled with substance use during their supervision. The majority of the sample (n=25, 64.1%) had at least one positive substance use test during their supervision. Some sample members were tested more frequently than others, so relapse extent refers to the ratio of positive tests to total substance abuse tests. On average, one-fifth of all substance abuse tests were positive, but this figure ranged from zero percent to 80 percent. Parole absences refers to minor forms of non-compliance, such as failing to report, and more serious forms, such as absconding. More than half of the sample (n=22, 56.4%) had at least one failure to report, and sample members averaged 1.3 FTRs during their supervision term. Less than half of the sample (n=16, 41.0%) of the sample absconded from supervision at one point. The average duration of each absconding period was just under three months (80.5 days), but ranged from 3 days after the issuing of the absconding warrant, to nearly 10 months. The majority of the sample experienced at least one police contact (n=35, 89.7%) and averaged nearly 3 police contacts over the course of their supervision. Jail stays captured whether the parolee ever spent at least one night in jail. The majority of the sample (n=35. 89.7%) had at least one jail stay. The sample members averaged roughly 3 jail stay events during their supervision, although some experienced as little as zero and as many as 11. The average time spent in jail varied greatly, as the average jail stay was 223 days (median of 108 days). There were some extreme values among the sample members, as these figures include extended jail sentences as a result of a conviction for a new offense.
0
1
2
3
4
5
6
7
8
1 year 2 to 3 years 4 to 7 years 8 or more years
Ave
rage
Num
ber
of P
arol
e V
iola
tion
s
Years Incarcerated
Average Parole Violations Average Technical Violations Average Criminal Violations
N=6 N=14 N=11 N=8

Michigan Justice Statistics Center
Page 27
Risk of Recidivism Facing Offenders upon their Return to the Community 2013
Table 17. Additional Recidivism/Non-Compliance Descriptive Statistics (N=39) Measure N (Percent) Mean (S.D.) Range Substance Abuse Relapse Positive substance abuse test 25 (64.1%) Relapse extent 0.2 (0.2) 0.0 – 0.8 Parole Absences Failure to report (FTR) 22 (56.4%) Number of FTRs 1.3 (1.8) 0 - 7 Abscond 16 (41.0%) Absconding duration (days) 80.5 (94.7) 3 - 296 Police Contact Had a police contact 35 (89.7%) Number of police contacts 2.9 (2.6) 0 - 10 Jail Stays Jailed 35 (89.7%) Number of jail stays 2.9 (2.9) 0 - 11 Jail duration 223.4 (257.4) 0 - 909 Note: Relapse extent is measured as ratio of positive substance abuse tests to total substance abuse tests.
The final analysis of recidivism outcomes in this section further considers the distribution of recidivism events across the parolees in the sample. In their classic research on the Philadelphia Birth Cohort, Wolfgang, Figlio, and Sellin (1972) observed that just 6 percent of their sample was responsible for 52 percent of police contacts incurred by the entire cohort of 9,945 males. Since then there has been the recognition that a small proportion of chronic offenders may account for a disproportionate amount of crimes committed. Over the course of their supervision the 39 men we followed incurred 161 parole violations, 63 arrests, 114 police contacts, and 133 positive substance abuse tests. Figure 9 examines the extent to which some members of the Understanding the Challenges sample accounted for a disproportionate amount of these recidivism/non-compliance events. Figure 9 plots the cumulative proportion of recidivism events by the proportion of parolees. Figure 9 is interpreted as follows. The thick black line represents what we would expect to see if recidivism events were evenly distributed across the sample (i.e., 20% of the parolees accounted for 20% of the recidivism, 30% for 30%, 50% for 50%, etc.). Any deviation above the diagonal black line means that a relatively smaller proportion of parolees is responsible for a larger proportion of recidivism. For instance, an inspection of Figure 9 reveals that 20 percent of the sample parolees (about 8 individuals out of the 39) were responsible for 36% of the police contacts, 50% of the parole violations, 52% of the positive substance abuse tests, and 56% of the arrests. Police contacts were more evenly distributed across the sample, while arrests were the most concentrated among a smaller proportion of sample parolees.

Michigan Justice Statistics Center
Page 28
Risk of Recidivism Facing Offenders upon their Return to the Community 2013
Figure 9. Cumulative Proportions of Recidivism Events by Parolees (N=39)
0.00
10.00
20.00
30.00
40.00
50.00
60.00
70.00
80.00
90.00
100.00
0.00 10.00 20.00 30.00 40.00 50.00 60.00 70.00 80.00 90.00 100.00
Cum
ulat
ive
Per
cent
age
of R
ecid
ivis
m E
vent
s
Cumulative Percentage of Parolees
Parole Violations Arrests Police Contacts Positive SATs Even Comparison

Michigan Justice Statistics Center
Page 29
Risk of Recidivism Facing Offenders upon their Return to the Community 2013
TIMING OF RECIDIVISM EVENTS This section describes the dynamics of recidivism events within the Understanding the Challenges sample by focusing on the timing of recidivism events. Previous research has observed that the majority of recidivism events among parolees occur within the first six months of parole (Grattet, Petersilia, & Lin, 2008; Huebner & Berg, 2011; Langan & Levin, 2002). Unfortunately, many recidivism studies treat recidivism events as terminal events and stop following the parolee after that point. In the current inquiry we had the opportunity to continue to follow sample members following their first recidivism events, allowing us to document the timing of a variety of first recidivism events, as well as the timing of any events occurring after that. This section will first describe the timing of original recidivism events, followed by the dynamic timing of subsequent recidivism. In all cases, unless specified otherwise, the timing of the recidivism event is measured as the length of time between the subject’s parole date and the date of the parole violation/arrest. In the case of follow-up prosecutions and convictions, the timing is still measured as the date of the arrest/violation, not the prosecution or conviction. Time until First Recidivism Event The first set of analyses examine when the first recidivism event occurred in the sample member’s supervision term. Using the recidivism measures adapted from Maltz (1984), we indicated where there first recidivism event occurred using an ordinal scale (see Table 18). We observed that for parole violations (Rv), violations with jail time (Rvc), and arrests (Ra), the first event most often occurred in the first six months of parole. Recidivism events resulting in prosecution (Rap) or conviction (Rac) were somewhat more likely to occur after the first six months of parole, but only by a small margin. Considering the average number of days until the first event, the first parole violation occurred much sooner than the first instance of any of the other recidivism indicators. On average, the recidivism events resulting in a conviction first occurred after 8 months in the community. Table 18. Timing of First Recidivism Event (N=39) Time until first event Rv Rvc Ra Rap Rac n (%) n (%) n (%) n (%) n (%)
Did not recidivate 2 (5.1) 5 (12.8) 5 (12.8) 14 (35.9) 15 (38.5) 0 to 5.9 months 26 (66.7) 16 (41.0) 16 (41.0) 10 (25.6) 8 (20.5) 6 to 11.9 months 7 (17.9) 13 (33.3) 14 (35.9) 12 (30.8) 9 (23.1) 1 yr to 1.9 years 4 (10.3) 5 (12.8) 4 (10.3) 2 (5.1) 6 (15.4) More than 2 years 0 (0.0) 0 (0.0) 0 (0.0) 1 (2.6) 1 (2.6) Mean (S.D) Mean (S.D) Mean (S.D) Mean (S.D) Mean (S.D)
Average days until recidivism*
158.2 (155.9)
206.2 (145.7)
198.2 (134.2)
221.0 (175.4)
260.1 (189.0)
Note: Rv = Parole violation; Rvc = Parole violation and jail; Ra = Arrest; Rap = Arrest and prosecution; Rac = Arrest and conviction. Adapted with modification from Maltz (1984). *Time until recidivism presented is for recidivists on each measure only.

Michigan Justice Statistics Center
Page 30
Risk of Recidivism Facing Offenders upon their Return to the Community 2013
The cumulative hazard for each of the recidivism measures above are plotted in Figure 10. Each line represents the combined proportion of the sample who had committed the given recidivism event as a function of time. For instance, following the parole violation line (Rv), at 180 days on parole approximately 65 percent of the sample had received a parole violation. By 365 days on parole this proportion had increased to 85 percent. This analysis shows that for the Understanding the Challenges sample of parolees, the men accrued their first parole violations more quickly than the more restrictive recidivism measures, and hazard rates level off for all measures after approximately 480 days (16 months) in the community.
Note: Rv = Parole violation; Rvc = Parole violation and jail; Ra = Arrest; Rap = Arrest and prosecution; Rac = Arrest and conviction. Adapted with modification from Maltz (1984). Figure 10. Cumulative Hazard Plot for Recidivism Measures (N=39) The next series of analyses examine differences in the average time until the first recidivism event across participant demographic, supervision, and criminal history variables. Table 19 considers participant race and whether they had any children. On average, African American participants recidivated more quickly than white participants – this was particularly the case for parole violations (t=2.07, p=.045) and arrests leading to prosecutions (t=2.79, p=.008), where white participants were in the community for nearly twice as long before recidivating. In general, those with no children recidivated more quickly than those with at least one child, as measured by parole violations, violations and jail time, and arrests. However, with the more restrictive recidivism measures, those without children took longer to recidivate. None of the observed differences were statistically significant.
.00
.10
.20
.30
.40
.50
.60
.70
.80
.90
1.00
0 30 60 90 120
150
180
210
240
270
300
330
360
390
420
450
480
510
540
570
600
630
660
690
720
Pro
port
ion
Rec
idiv
atin
g (C
umul
ativ
e H
azar
d)
Days Since Parole Release
Rac Rap Ra Rvc Rv
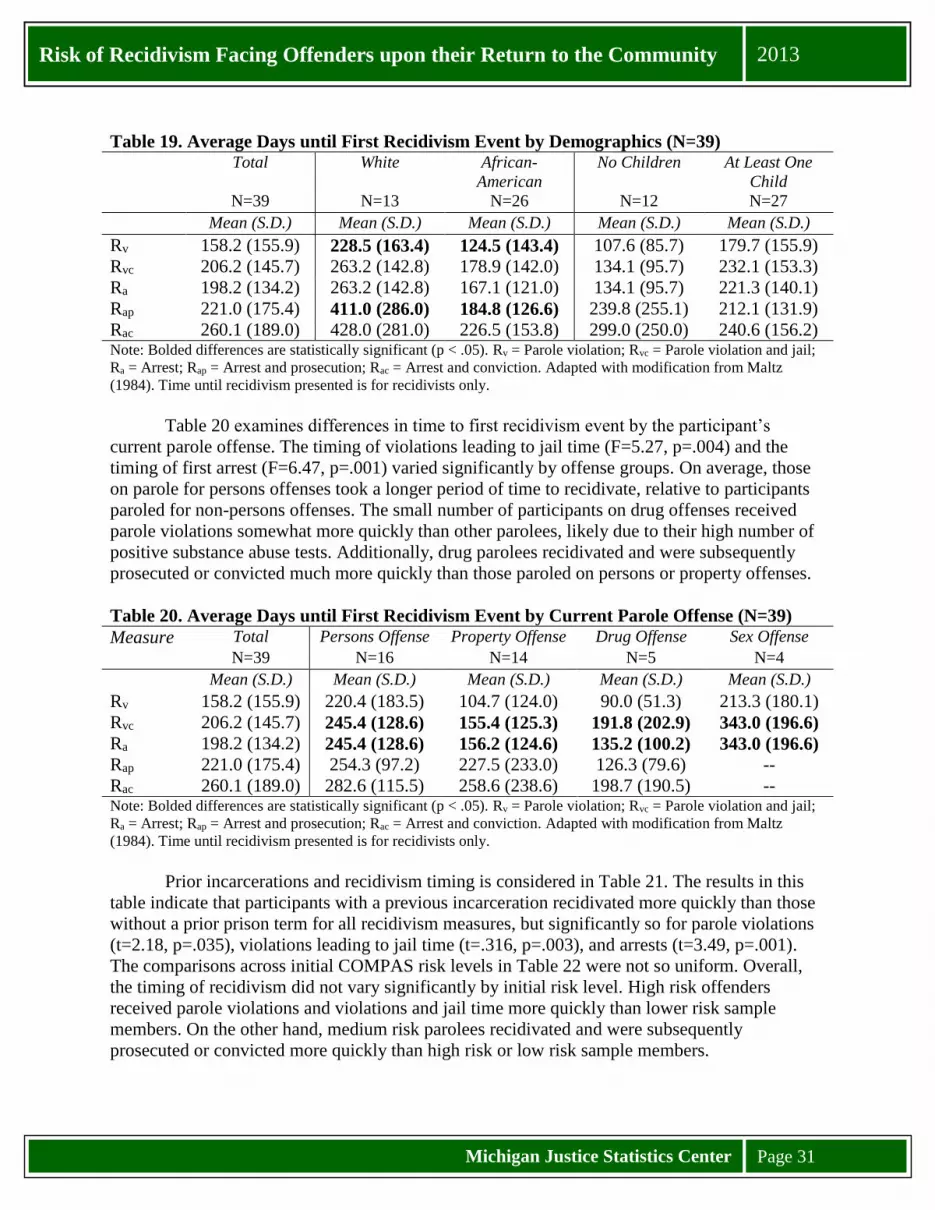
Michigan Justice Statistics Center
Page 31
Risk of Recidivism Facing Offenders upon their Return to the Community 2013
Table 19. Average Days until First Recidivism Event by Demographics (N=39) Total White African-
American No Children At Least One
Child N=39 N=13 N=26 N=12 N=27 Mean (S.D.) Mean (S.D.) Mean (S.D.) Mean (S.D.) Mean (S.D.) Rv 158.2 (155.9) 228.5 (163.4) 124.5 (143.4) 107.6 (85.7) 179.7 (155.9) Rvc 206.2 (145.7) 263.2 (142.8) 178.9 (142.0) 134.1 (95.7) 232.1 (153.3) Ra 198.2 (134.2) 263.2 (142.8) 167.1 (121.0) 134.1 (95.7) 221.3 (140.1) Rap 221.0 (175.4) 411.0 (286.0) 184.8 (126.6) 239.8 (255.1) 212.1 (131.9) Rac 260.1 (189.0) 428.0 (281.0) 226.5 (153.8) 299.0 (250.0) 240.6 (156.2) Note: Bolded differences are statistically significant (p < .05). Rv = Parole violation; Rvc = Parole violation and jail; Ra = Arrest; Rap = Arrest and prosecution; Rac = Arrest and conviction. Adapted with modification from Maltz (1984). Time until recidivism presented is for recidivists only. Table 20 examines differences in time to first recidivism event by the participant’s current parole offense. The timing of violations leading to jail time (F=5.27, p=.004) and the timing of first arrest (F=6.47, p=.001) varied significantly by offense groups. On average, those on parole for persons offenses took a longer period of time to recidivate, relative to participants paroled for non-persons offenses. The small number of participants on drug offenses received parole violations somewhat more quickly than other parolees, likely due to their high number of positive substance abuse tests. Additionally, drug parolees recidivated and were subsequently prosecuted or convicted much more quickly than those paroled on persons or property offenses. Table 20. Average Days until First Recidivism Event by Current Parole Offense (N=39) Measure Total Persons Offense Property Offense Drug Offense Sex Offense N=39 N=16 N=14 N=5 N=4 Mean (S.D.) Mean (S.D.) Mean (S.D.) Mean (S.D.) Mean (S.D.) Rv 158.2 (155.9) 220.4 (183.5) 104.7 (124.0) 90.0 (51.3) 213.3 (180.1) Rvc 206.2 (145.7) 245.4 (128.6) 155.4 (125.3) 191.8 (202.9) 343.0 (196.6) Ra 198.2 (134.2) 245.4 (128.6) 156.2 (124.6) 135.2 (100.2) 343.0 (196.6) Rap 221.0 (175.4) 254.3 (97.2) 227.5 (233.0) 126.3 (79.6) -- Rac 260.1 (189.0) 282.6 (115.5) 258.6 (238.6) 198.7 (190.5) -- Note: Bolded differences are statistically significant (p < .05). Rv = Parole violation; Rvc = Parole violation and jail; Ra = Arrest; Rap = Arrest and prosecution; Rac = Arrest and conviction. Adapted with modification from Maltz (1984). Time until recidivism presented is for recidivists only. Prior incarcerations and recidivism timing is considered in Table 21. The results in this table indicate that participants with a previous incarceration recidivated more quickly than those without a prior prison term for all recidivism measures, but significantly so for parole violations (t=2.18, p=.035), violations leading to jail time (t=.316, p=.003), and arrests (t=3.49, p=.001). The comparisons across initial COMPAS risk levels in Table 22 were not so uniform. Overall, the timing of recidivism did not vary significantly by initial risk level. High risk offenders received parole violations and violations and jail time more quickly than lower risk sample members. On the other hand, medium risk parolees recidivated and were subsequently prosecuted or convicted more quickly than high risk or low risk sample members.

Michigan Justice Statistics Center
Page 32
Risk of Recidivism Facing Offenders upon their Return to the Community 2013
Table 21. Average Days until Recidivism by Prior Incarceration (N=39) Measure Total No Prior Prison Prior Prison Term N=39 N=15 N=24 Mean (S.D.) Mean (S.D.) Mean (S.D.) Rv 158.2 (155.9) 203.8 (155.2) 133.6 (153.8) Rvc 206.2 (145.7) 286.5 (116.0) 167.8 (144.8) Ra 198.2 (134.2) 286.5 (116.1) 156.0 (123.1) Rap 221.0 (175.4) 273.3 (51.1) 196.4 (207.3) Rac 260.1 (189.0) 323.6 (98.5) 228.3 (216.8) Note: Bolded differences are statistically significant (p < .05). Rv = Parole violation; Rvc = Parole violation and jail; Ra = Arrest; Rap = Arrest and prosecution; Rac = Arrest and conviction. Adapted with modification from Maltz (1984). Time until recidivism presented is for recidivists only. Table 22. Average Days until Recidivism by Initial Supervision Risk (N=39) Measure Total High Risk Medium Risk Low Risk N=39 N=18 N=17 N=4 Mean (S.D.) Mean (S.D.) Mean (S.D.) Mean (S.D.) Rv 158.2 (155.9) 115.0 (118.1) 182.6 (188.2) 261.5 (137.3) Rvc 206.2 (145.7) 182.0 (138.1) 203.1 (162.6) 313.5 (71.1) Ra 198.2 (134.2) 182.0 (138.1) 183.8 (133.9) 313.5 (71.1) Rap 221.0 (175.4) 233.6 (210.2) 194.4 (146.6) 271.5 (6.3) Rac 260.1 (189.0) 295.9 (220.0) 205.9 (157.0) 271.5 (6.4) Note: Bolded differences are statistically significant (p < .05). Rv = Parole violation; Rvc = Parole violation and jail; Ra = Arrest; Rap = Arrest and prosecution; Rac = Arrest and conviction. Adapted with modification from Maltz (1984). Time until recidivism presented is for recidivists only. Timing of Subsequent Recidivism Events After the first recidivism event incurred by the Understanding the Challenges sample parolees, many were not returned to prison, but rather remained in the community under parole supervision. Some of these individuals continued to engage in a variety of recidivism behaviors. In this section we perform some descriptive analyses on the dynamics and occurrence of two recidivism indicators over time – criminal arrests and parole violations. Criminal arrests. Over the course of their supervision, 71.8 percent of the sample (n=28) were arrested under suspicion of committing a new crime.13 Of these, half (n=14, 35.9% of total) were arrested more than once over the course of their supervision, and 4 (10.3% of the total) were arrested five or more time. Table 24 displays descriptive information on the offenses that sample members were arrested for. Of the 63 arrests incurred by the sample, property offenses (e.g., retail fraud, larceny, check fraud) were the most frequent (n=21, 33.3%), followed by persons offenses (e.g., assault, domestic violence, robbery) (n=19, 30.2%), motor vehicle offenses (e.g., operating under the influence, driving with suspended license) (n=14, 22.2%),
13 This arrest total is different from the Ra arrest indicator, because that measure includes apprehensions for absconding, while criminal arrests do not.

Michigan Justice Statistics Center
Page 33
Risk of Recidivism Facing Offenders upon their Return to the Community 2013
public safety offenses (e.g., weapons, fleeing police) (n=5, 7.9%), and drug offenses (e.g., possession, distribution) were the least prevalent (n=4, 6.3%). Table 23. Arrests During Supervision (N=39) Table 24. Arrest Characteristics (N=63) Frequency of Arrest n (%) Type of Arrest n (%) Not Arrested 11 (28.2%) Persons Arrest 19 (30.2%) One Arrest 14 (35.9%) Property Arrest 21 (33.3%) Two Arrests 4 (10.3%) Drug Arrest 4 (6.3%) Three Arrests 5 (12.8%) Public Safety Arrest 5 (7.9%) Four Arrests 1 (2.6%) Motor Vehicle 14 (22.2%) Five Arrests 3 (7.7%) Six Arrests 0 (0.0%) Seven Arrests 1 (2.6%) Two or More Arrests 14 (35.9%) Five or More Arrests 4 (10.3%) These arrests took place at varying points in the parole terms of the Understanding the Challenges sample. Figure 11 attempts to capture this variation in timing and the type of arrest for the 28 parolees who were rearrested during their parole. Solid black lines leading to the symbols represent the amount of time (in days) between the parolee’s release and their first arrest. Dashed lines represent the amount of time between the first arrest and subsequent arrests on parole. They also represent recidivism information which would have been missed if the analysis had considered the first arrest as a terminal event. These dashed lines do not directly reflect for time at risk, however, since sample members may have been in custody for some of the duration between arrest incidents. There was some degree of offense specialization within the sample, in that while sample members were arrested for a variety of charges, the most common rearrests were for the same type of offense they were paroled on. For instance, of the 10 individuals paroled on a persons offense, 8 had a rearrest for a persons offense during their supervision. Of the 13 individuals paroled on a property offense, 7 were arrested for a property offense.
Michigan Justice Statistics Center
Page 34
Risk of Recidivism Facing Offenders upon their Return to the Community 2013
Figure 11. Frequency and Timing of Rearrests (N=28)
Parole Violations. The arrest patterns in Figure 11 raise questions about broader temporal patterns in offending, particularly offense intermittency. Intermittency refers to the time duration between adjacent criminal offenses, which vary in length to the extent that long-term offending patterns appear unpredictable and sporadic (Piquero, 2004). The concept of intermittency reflects the notion that individuals do not commit offenses at a constant rate, and that offending and desistance are both a process involving a number of cessations and commencements (Maruna, 2001). In other words, intermittency measures periods of activity and inactivity in criminal offending. In a recent analysis, Baker, Metcalfe, and Piquero (2013) examined the offense intermittency of the Philadelphia Birth Cohort and observed several patterns. Baker and colleagues (2013) found that over a long term period, the more offenses an individual committed the shorter the time period between offenses, and the more serious offenses were.
We attempted to replicate some of Baker and colleagues (2013) analyses by examining short-term intermittency (i.e., the duration of parole supervision) for the Understanding the Challenges sample. While the sample size/composition does not provide generalizable conclusions regarding intermittency in other offending populations, our goal is the systematic
0 200 400 600 800 1000 1200E
ach
Lin
e R
epre
sent
s an
Ind
ivid
ual P
arol
eeDays until Rearrest
Square = Persons arrest; Diamond = Property arrest; Triangle = Drug arrest; Circle = Public safety arrest; Cross = Motor Vehicle arrest

Michigan Justice Statistics Center
Page 35
Risk of Recidivism Facing Offenders upon their Return to the Community 2013
documentation of recidivism patterns within the current sample. Nonetheless, Kazemian (2007) suggests that intermittency analyses using shorter time intervals (i.e., weeks instead of months) will be a useful development in research on offending trajectories. For our sample we were able to use days as a time interval, and measured intermittency as the time (in days) between offenses. We utilized parole violations as the offending measure because of their relative frequency in the sample, thus providing ample data to examine intermittency. The seriousness of parole violations was measured on the five-point scale described above (Table 7).
Note: Replicated from Baker et al. (2013) Figure 12. Average Intermittency and Violation Seriousness Parole violation intermittency and seriousness are displayed in Figure 12. This figure plots the average intermittency between parole violations, where the first point on the blue line represents the average number of days between the first and second parole violations (196.4 days). One advantage we had with the current data was the ability to correct intermittency for time at risk. The period of time between offenses will be upwardly biased if the data do not allow for the fact that following each offense the subject may spend some time in custody. During this time they cannot reoffend. Baker and colleagues (2013) lament that they could correct for time spent in custody in the Philadelphia Cohort Study. Due to the detailed nature of the current data, we were able to determine whether a sample member spent time in jail following a parole violation, and subtracted this amount of time from the intermittency period. The jail time adjusted intermittency is displayed in Figure 12 as the red line. The average seriousness of each violation is displayed as the green line and is measured on the secondary (right hand side) vertical axis. The results in Figure 12 indicate that, similar to the findings of Baker and colleagues (2013), the average intermittency between parole violations decreases with increased frequency of
0
0.5
1
1.5
2
2.5
3
3.5
4
4.5
5
0
50
100
150
200
250
1 2 3 4 5 6 7 8 9 10 > 10
Violation Seriousness Score
Day
s be
twee
n P
arol
e V
iola
tion
s
Parole Violation Number
Average Intermittency Average Intermittency (Jail time adjusted) Seriousness

Michigan Justice Statistics Center
Page 36
Risk of Recidivism Facing Offenders upon their Return to the Community 2013
violations. For instance, while the average intermittency between parole violations one and two was 138 days (jail time adjusted), and was approximately 20 days between parole violations nine and ten. The difference between the raw intermittency and jail time adjusted figures demonstrate the importance of adjusting for time at risk as the unadjusted intermittency suggests that the duration between violations actually trends upwards with increased offending, at least within the current sample of Lansing parolees. The parole violation seriousness remained relatively stable over time, largely driven by the disproportionate number of technical violations committed by the sample.
Note: Replicated from Baker et al. (2013) Figure 13. Average Intermittency and Violation Seriousness by Age Similar to the analyses of Baker and colleagues (2013) we also examined variation in intermittency by participant age. Baker et al. (2013) observed that as the men in the Philadelphia Birth Cohort got older, the average intermittency between offenses increased. We could not replicate the precision of Baker and colleague (2013) analysis because of our small sample size. Instead, we examined intermittency and offense seriousness across age quartiles. No clear linear trend was observed using adjusted intermittency estimates, instead we found that for the Understanding the Challenges sample the age 31-37 group had the greatest duration between parole violations, and the 38-43 had the lowest. Parole violation seriousness was invariant across age quartiles. Intermittency and parole violation seriousness by years incarcerated during the most recent prison term are displayed in Figure 14. Considering the adjusted intermittency, it appears that for the current sample the amount of time spent incarcerated was not related to any increases or decreases in intermittency, with the exception of those who spent the longest amount of time in prison (8 or more years). For that group the average intermittency was slightly higher than for participants with less time spent in prison. On the other hand, it appears that although the 8 or
0
0.5
1
1.5
2
2.5
3
3.5
4
4.5
5
0
50
100
150
200
250
21 - 30 31 - 37 38 - 43 44 - 56
Violation Seriousness Score
Day
s B
etw
een
Par
ole
Vio
lati
ons
Parolee Age Group
Average Intermittency Average Intermittency (Jail time adjusted) Seriousness

Michigan Justice Statistics Center
Page 37
Risk of Recidivism Facing Offenders upon their Return to the Community 2013
more years incarcerated group had a longer duration between parole violations, their violations were somewhat more serious.
Figure 14. Average Intermittency and Violation Seriousness by Years Incarcerated. We also compared intermittency and parole violation seriousness by whether the sample member had a previous incarceration. The results of this comparison are in Figure 15. To simplify the figure, only jail time adjusted intermittency is displayed. The blue and red lines in Figure 15 represent average intermittency across parole violations. For both participants with and without a prior incarceration, intermittency decreased with higher violation frequency. Some differences in violation seriousness (green and purple lines) were observed. The average violation seriousness for those with no prior record showed higher variation, relative to participants without a prior incarceration. Participants with a previous prison stay showed small shifts in seriousness with increased violation frequency, but no upwards or downwards trend was observed.
0
0.5
1
1.5
2
2.5
3
3.5
4
4.5
5
0
50
100
150
200
250
1 year 2 to 3 years 4 to 7 years 8 or more years
Violation Seriousness Score
Day
s B
etw
een
Par
ole
Vio
lati
ons
Years Incarcerated
Average Intermittency Average Intermittency (Jail time adjusted) Seriousness

Michigan Justice Statistics Center
Page 38
Risk of Recidivism Facing Offenders upon their Return to the Community 2013
Note: Replicated from Baker et al. (2013) Figure 15. Average Intermittency and Violation Seriousness by Prior Incarceration. The final intermittency figure (Figure 16) attempts to replicate one of the analyses by Baker and colleagues (2013). We examined differences in intermittency and offense seriousness by parole violation frequency by splitting the sample into recidivist violations (i.e., those who committed 2-4 parole violations) and chronic parole violators (i.e., those with 5 or more parole violations). Baker and colleagues (2013) divided their sample into these groups and observed that recidivists showed higher degrees of intermittency, but the seriousness of the offenses was relatively high. On the other hand, in their analyses chronic offenders showed lower degrees of intermittency (i.e., smaller durations between offenses) and increasing seriousness with increased offense frequency, but relatively lower than for the recidivists. Despite the much smaller sample and shorter time period, the current analysis shows a similar pattern to the observations of Baker and colleagues (2013). Figure 16 shows that the recidivists (i.e., those with 2-4 violations) had longer durations between parole violations relative to the chronic violators (i.e., 5+ violations), and the violation seriousness increased with more violations. On the other hand, the average intermittency for the chronic violators was much lower than for the recidivists, and the seriousness was stable with violation frequency, but still lower than the recidivists. These patterns may be due to the notion that in order for a parolee to commit a large number of violations, they need to be in the community. As such, to remain in the community their violations must not be very serious - otherwise they would be returned to prison and could not continue committing parole violations.
0
0.5
1
1.5
2
2.5
3
3.5
4
4.5
5
0
20
40
60
80
100
120
140
160
1 2 3 4 5 6 7 8 9 10 > 10
Violation Seriousness Score
Day
s B
etw
een
Par
ole
Vio
lati
ons
Parole Violation Number
No Prior Record - Average Intermittency Prior Record - Average Intermittency
No Prior Record - Violation Seriousness Prior Record - Violation Seriousness

Michigan Justice Statistics Center
Page 39
Risk of Recidivism Facing Offenders upon their Return to the Community 2013
Note: Replicated from Baker et al. (2013) Figure 16. Intermittency and Violation Seriousness by Violator Type
0
0.5
1
1.5
2
2.5
3
3.5
4
4.5
5
0
50
100
150
200
250
1 2 3 4 5 6 7 8 9 10 > 10
Violation Seriousness Score
Day
s B
etw
een
Par
ole
Vio
lati
ons
Parole Violation Number
Recidivist - Average Intermittency Chronic Violator - Average Intermittency
Recidivist - Violation Seriousness Chronic Violator - Violation Seriousness

Michigan Justice Statistics Center
Page 40
Risk of Recidivism Facing Offenders upon their Return to the Community 2013
RECIDIVISM AND REENTRY DIMENSIONS In the course of reintegration to the community, returning offenders face a myriad of challenges and barriers to success. Research has suggested that individuals leaving prison are generally unprepared for the reentry process (Nelson, Deess & Allen, 1999; Petersilia, 2003). Particular offender groups, such as sex offenders, are under-informed regarding the nature of legal restrictions on their behavior following release (Tewksbury & Copes, 2013). Upon release parolees may struggle to obtain basic necessities such as food, clothing, and identification (Nelson et al., 1999). Securing stable housing and employment have been identified as instrumental to successful reintegration (Graffam, Shinkfield, LaVelle, & McPherson, 2005; Laub, Nagin, & Sampson, 1998; Morani, Wikoff, Linhorst, & Bratton, 2011; Sampson & Laub, 1993). Yet, returning offenders often struggle to obtain either or both in the course of their reintegration (Arditti & Parkman, 2011; Holzer, Raphael, & Stoll, 2006; Pager, 2003; Roman & Travis, 2004; Visher & Courtney, 2007; Visher, Debus-Sherill, & Yahner, 2011). The purpose of the Understanding the Challenges study was to document and understand the nature of these challenges as they were faced by a sample of male parolees to Lansing, Michigan. Grommon and colleagues (2012) found that the sample had struggled with several prominent reentry dimensions, including difficulties securing stable housing and any employment, let alone stable employment.14 Sample members also dealt with ongoing substance abuse issues following release, experiencing cycles of relapse and recovery throughout the duration of supervision (Grommon & Rydberg, 2013). While there has been a growing body of research documenting the reentry challenges faced by returning offenders, little is known about the relationship between the experience of reentry barriers and subsequent recidivism. This section of the report will examine the relationship between reentry dimensions and recidivism, paying particular attention to employment and housing. Data to inform these analyses were drawn from secondary correctional records. We will draw on the prospective interviews with the Understanding the Challenges sample where appropriate. Employment and Recidivism During the course of the in-depth interviews, sample members regularly highlighted employment as a factor that they believed would help keep them out of prison. When asked about things that were important for a successful transition to the community, just under half of the sample (n=18, 46.2%) explicitly mentioned obtaining employment. Securing employment was the second most prevalent factor mentioned, just behind having a new outlook on life. There were varying reasons why the sample members felt that employment would be an important factor in staying out of prison. After being asked what would be the most important thing keeping him out of prison, Pedro reflected on his past behaviors when he was unemployed:
“Education and a job. Around the job…I don’t really, I don’t commit crimes. I commit crimes for money. I’m not the type of person that’s got a real bad drug
14 Grommon and colleagues (2012) note that many of the members of the Understanding the Challenges sample obtained employment at the same location – a textile manufacturing company in the Lansing area. The company was perceived as being a “felon friendly” alternative and was disproportionately relied upon by the sample for employment opportunities.
Michigan Justice Statistics Center
Page 41
Risk of Recidivism Facing Offenders upon their Return to the Community 2013
habit and I commit crimes to get high, or I don’t have like a real bad temper and killing people and beating them up. It’s all been financially motivated. So, I think. Once I can get an education and a decent job, I’m pretty much set. I don’t have to worry about ever committing crimes again” (Pedro, Age 31, successfully discharged).15
In this case, Pedro expressed great optimism that once he could obtain steady work he would no longer have to rely on criminal behavior to support his finances. Several members of the sample held the notion that if they could simply obtain employment then other reentry goals would be easier to achieve (n=14, 35.9%). As Travis remarked, “…if I could get a decent job, everything would fall in place” (Age 32, successfully discharged). Unfortunately, many members of the sample experienced unstable employment over the course of their supervision. Table 25 displays descriptive statistics on the employment and unemployment patterns within the sample. Table 25. Employment and Unemployment Patterns (N=39). Measure n (%) Mean (S.D.) Range Employment Ever Employed 25 (64.1%) Number of Employment Periods 1.3 (1.3) 0 - 4 Zero employment periods 14 (35.9%) One employment period 10 (25.6%) Two employment periods 7 (17.9%) Three employment periods 5 (12.8%) Four employment periods 3 (7.7%) Total Days Employed 182.0 (208.1) 0 - 678 Average Days Employed per Employment Period
99.8 (129.8) 0 - 678
Percent of Time at Risk Spent Employed
27.7% (28.4) 0.0% – 92.6%
Days until First Employment Period 188.5 (247.4) 6 - 1014 Unemployment Never Employed 14 (35.9%) Total Days at Risk Spent Unemployed 394.9 (217.3) 40 - 1084 Percent of Time at Risk spent Unemployed
72.3% (28.4) 7.4% – 100.0%
In the course of their supervision, 25 members of the sample (64.1%) were employed at some point. An employment period was defined as a contiguous time segment in which the parolee held a job of some kind. If the parolee quit a job to take another one and there was no time spent unemployed in between, that was treated as a single employment period. Ten parolees (25.6%) had a single employment period, and 15 (38.5%) had more than one. The average
15 All names used are pseudonyms. With each illustrative quotation we will note the parolee’s pseudonym, their age at release, and their supervision status as of censoring (i.e., successfully discharged from parole, continued on parole, or returned to prison).

Michigan Justice Statistics Center
Page 42
Risk of Recidivism Facing Offenders upon their Return to the Community 2013
employment period lasted just over three months (99.8 days), and it took parolees more than six months (188.5 days) to obtain their first job, on average. There was considerable variation, however, as some parolees obtained employment immediately (typically through informal social networks), and the median time until first employment was 107 days. Differences in recidivism prevalence between parolees who were every employed and those who were never employed are displayed in Table 26. Using Maltz’s (1984) recidivism indicators, the perpetually unemployed sample members had higher proportions recidivating, with the exception of overall parole violations, where nearly everyone in each employment group recidivated. Some variation was observed once parole violations were disaggregated into technical and criminal violations. A larger proportion of employed parolees received technical violations (84% versus 71.4%), with much of the difference being attributable to incurring technical II violations (76% versus 50%). It should be noted that the members of the employed group may not have been currently employed when they received their parole violations, but that will be examined in a later analysis. A relatively larger proportion of the unemployed participants received criminal violations, particularly criminal II violations (64.3% versus 36.0%). None of the differences between the ever employed and the never employed were statistically significant. Table 26. Recidivism Prevalence by Employment (N=39). Recidivism Measure Ever Employed (n=25) Unemployed (n=14) n (%) n (%) Rv 24 (96.0%) 13 (92.9%) Rvc 21 (84.0%) 13 (92.9%) Ra 21 (84.0%) 13 (92.9%) Rap 14 (56.0%) 11 (78.6%) Rac 13 (52.0%) 11 (78.6%) Rexj 4 (16.0%) 5 (35.7%) Rpris 4 (16.0%) 4 (28.6%) Any Parole Violation 24 (96.0%) 13 (92.9%) Technical Violation 21 (84.0%) 10 (71.4%) Technical I 12 (48.0%) 9 (64.3%) Technical II 19 (76.0%) 7 (50.0%) Criminal Violation 11 (44.0%) 9 (64.3%) Criminal I 3 (12.0%) 2 (14.3%) Criminal II 9 (36.0%) 9 (64.3%) Criminal III 2 (8.0%) 2 (14.3%) Note: Bolded differences are statistically significant (p < .05). Rv = Parole violation; Rvc = Parole violation and jail; Ra = Arrest; Rap = Arrest and prosecution; Rac = Arrest and conviction; Rexj = Extended jail sentence; Rpris = Return to prison. Adapted with modification from Maltz (1984). Parole violation classification adapted with modification from Grattet et al. (2008). Differences in the average number of parole violations incurred by the employment groups are displayed in Table 27. Overall, none of the observed differences were statistically

Michigan Justice Statistics Center
Page 43
Risk of Recidivism Facing Offenders upon their Return to the Community 2013
significant. Inspecting the observed differences, the average of 4.4 parole violations for the unemployed group was slightly higher than the average of 4.0 for the ever employed group. All mean differences were slight. The largest differences between the groups was with the criminal violations, where members of the unemployed group averaged more than one criminal violation during their supervision (1.3 versus 0.8), with much of the difference coming from criminal II violations (1.0 versus 0.4). Table 27. Number of Parole Violations by Employment (N=39). Recidivism Measure Ever Employed (n=25) Unemployed (n=14) Mean Difference Mean (S.D.) Mean (S.D.) (Emp – Unemp) Any Parole Violation 4.0 (3.9) 4.4 (3.5) + 0.4 Technical Violation 3.2 (3.2) 3.1 (3.1) - 0.1 Technical I 1.4 (2.2) 1.5 (1.5) + 0.1 Technical II 1.8 (1.9) 1.6 (2.3) - 0.2 Criminal Violation 0.8 (1.3) 1.3 (1.0) + 0.5 Criminal I 0.3 (0.8) 0.1 (0.4) - 0.2 Criminal II 0.4 (0.7) 1.0 (1.0) + 0.6 Criminal III 0.1 (0.3) 0.1 (0.4) -- Note: Bolded differences are statistically significant (p < .05). Employment periods and recidivism intersected at varying times during parole supervision. To examine how employment gains and losses related to recidivism, the timing of employment periods and the timing of recidivism events and jail stays were compared.16 The results are displayed in Table 28. Most common recidivism/employment configuration was the sample member recidivating and being jailed while they were employed (n=14, 35.9%), and due to the extent of unemployment within the sample the second most common were those who recidivated but were never employed during supervision (n=13, 33.3%). Table 28. Employment and Recidivism (Jailed) Configurations (N=39). Configuration n (%) Recidivated during employment periods 14 (35.9%) Recidivated | Never employed 13 (33.3%) Never recidivated | Was employed 4 (10.3%) Recidivated after any employment periods 3 (7.7%) Recidivated before any employment, not after 2 (5.1%) Recidivated between employment periods 2 (5.1%) Never recidivated | Never employed 1 (2.6%) Based on the expectations of the men that securing employment would keep them out of criminal activities, this is an unexpected result. Rather than employment losses leading to
16 Any recidivism event resulting in jail time was utilized as the recidivism indicator because being jailed has a practical relation to losing employment. Being jailed stops the unemployed from seeking work, and stops the employed from attending work, potentially leading to employment loss.

Michigan Justice Statistics Center
Page 44
Risk of Recidivism Facing Offenders upon their Return to the Community 2013
financial strain, subsequently leading to recidivism, as would be predicted by some theories (Agnew, 1992, 2001), a common occurrence in the sample were to recidivate while employed. Being jailed did not result in the loss of employment in each instance, but for some participants it certainly did:
Interviewer: Did you have a job at all during that time? Marcus: Yes. I worked at [name removed]. From June until early February. I lost my job due to driving on suspended [license], I got locked up in the county. I had to sit here for four days, I lost my job. That’s when I moved back to [name removed] for a while. (Age 21, Still on parole at censoring). “I had picked up a friend, I took her to a store. She come out of the store, the police checked her for her ID, and she had a warrant. Well they called my parole officer and told him I was with someone who had a warrant. He had me arrested also. I lost my apartment, I lost my job, lost my financial aid for schooling.” (Cliff, Age 45, Successfully discharged)
On the other hand, the textile company which employed a majority of the sample was fairly unforgiving of minor forms of non-compliance among sample members. It is unclear whether the extent of job loss following recidivism would have been greater had the sample been employed in other areas in the private market. Housing and Recidivism Upon their release from prison securing stable housing is presented as an immediate practical concern. Returning offenders often rely on family and other members of social networks for initial housing options (Nelson et al., 1999; Visher & Travis, 2003), but these options are seldom permanent (Roman & Travis, 2004). If such resources are unavailable, many have to stay in homeless shelters, creating challenges in abstaining from substance abuse (Nelson et al., 1999). Former prisoners tend to be a relatively transient group, and increased housing mobility has been found to be associated with recidivism (Metraux, Roman, & Cho, 2007; Steiner, Makarios, & Travis, 2011). The parolees from the Understanding the Challenges sample were highly transient. Over the course of their supervision the 39 participants engaged in 211 housing moves (including being released from prison). The average number of address changes per parolee was 4.4 (3.1 S.D.) and ranged from zero (i.e., released to one address and stayed there) to 13. The men lived in a variety of housing situations, the prevalence of which are detailed in Figures 17 and 18. Most initial housing placements were determined prior to release from prison. Upon release nearly half of the sample (n=17, 43%) were initially placed with family members, a quarter in homeless shelters (n=10, 26%), 23 percent with intimate partners, and 8 percent living on their own.17 After some time on parole, the housing situations of the sample began to diversify. Of the 211 total addresses occupied by the sample over the course of supervision, staying with family was the most prevalent (n=73, 35%), with intimate partners being the second most common
17 These self residences were primarily subsidized housing being provided on a temporary basis by prisoner reentry programming.

Michigan Justice Statistics Center
Page 45
Risk of Recidivism Facing Offenders upon their Return to the Community 2013
(n=44, 21%). Stays in residential treatment facilities made up just under one-fifth of all addresses (n=37, 17%). One reason the number of stays in residential treatment was so high was because parole violators were often required to attend following jail stays.
Housing at Release (N=39) Total Housing Situations (N=211)
Figure 17. Housing Situations Utilized by Participants The breakdown of parolee housing situations by move number is displayed in Figure 18. By the sample member’s second move the proportion living with family and in shelters had decreased, and the proportion living alone and with intimate partners increased. Diversity in housing situations was added as parolees transitioned into residential treatment facilities and moved in with friends. With the 2nd move, the proportion of sample members living with family increased, those living alone decreased, and the number staying with intimate partners remained stable. With further address changes, the number of parolees still active decreased, either due to discharge from parole or returns to prison. The most transient parolees also tended to be the most non-compliant, as demonstrated in the increased proportion of residential treatment stays as move frequency increased.
43%
8%
26%
23%35%
4%11%11%
17%
1%
21%Family
Friend
Self
Shelter
Residential TX
Commerical
Intimate Relations

Michigan Justice Statistics Center
Page 46
Risk of Recidivism Facing Offenders upon their Return to the Community 2013
Figure 18. Housing Situations by Address Move Number (Percentages) Most of the sample members did not report any difficulty finding housing during their first month in the community (n=31, 79.5%). This was mostly due to housing placements being arranged during pre-release planning. Those who did experience initial difficulties securing a housing placement (n=8, 21.5%) expressed frustration with their situation.
“I’ve been going through that too, man. That’s one of the most frustrating things ever, man. I live with my sister, but like I said my brother is actually trying to get me an apartment and it seems like I can’t get one. Shit, man.” (Carsten, Age 30, Successfully discharged)
Indeed, upon release not all members of the Understanding the Challenges sample were able to stay in their desired living situation. During his first interview, Alexander remarked “I wanted to parole to one of my sister’s homes, but she stays in a housing project that don’t allow ex-offenders so I couldn’t go there. So I am staying at the outreach center” (Age 44, Still on parole at censoring). Some research has suggested that housing placements are related to recidivism outcomes. Steiner and colleagues (2011) observed that among a sample of Ohio parolees living with spouses, parents, other relatives, and residential programs was associated with decreased risk of recidivism, and living with intimate partners or being homeless were associated with an increased risk. Table 29 examines the prevalence of recidivism by the parolees’ initial housing placement. There was little variation in recidivism outcomes by placement among the less restrictive recidivism definitions. However, those initially placed with intimate relations (i.e., romantic partners) were more likely to be returned to prison (n=3, 33.3%), and those initially placed with family were more likely to receive an extended jail sentence (n=5, 29.4%).
Family Friend Self Shelter Residential TX Commerical Intimate Relations

Michigan Justice Statistics Center
Page 47
Risk of Recidivism Facing Offenders upon their Return to the Community 2013
Table 29. Recidivism by Initial Housing Placement (N=39) Moves Family
(n=17) Self
(n=3) Intimate
Relations (n=9) Shelter (n=10)
n (%) n (%) n (%) n (%) Rv 17 (100.0) 3 (100.0) 9 (100.0) 8 (80.0) Rvc 15 (88.2) 3 (100.0) 8 (88.9) 8 (80.0) Ra 15 (88.2) 3 (100.0) 8 (88.9) 8 (80.0) Rap 11 (64.7) 2 (66.7) 6 (66.7) 6 (60.0) Rac 11 (64.7) 2 (66.7) 5 (55.6) 6 (60.0) Rexj 5 (29.4) 0 (0.0) 1 (11.1) 3 (30.0) Rpris 3 (17.6) 1 (33.3) 3 (33.3) 1 (10.0) Note: Bolded differences are statistically significant (p < .05). Rv = Parole violation; Rvc = Parole violation and jail; Ra = Arrest; Rap = Arrest and prosecution; Rac = Arrest and conviction; Rexj = Extended jail sentence; Rpris = Return to prison. Adapted with modification from Maltz (1984). We also examined recidivism outcomes by whether the parolee ever stayed in a particular living situation. During the interviews, several parolees discussed certain living situations as being more prone to recidivism than others. Glen discussed moving away from his initial placement with his uncle to live with his girlfriend:
“I mean, it was supposed to be [at my uncle’s] until I could get on my feet or whatever but you know, I kinda like got involved with like, females and stuff like that to where most times I was out of my Uncle’s house I left my safety net as well, you know, because I kinda like told myself I wasn’t gonna get myself involved with nobody, as far as females or anything, ‘til I get established and on my feet to, you know, to take care of responsibilities and that so kind like when I left my Uncle’s house that’s kinda when things just taken the wrong turn for me, you know.” (Age 34, Returned to prison)
Others in the sample discussed their experiences staying at some of the homeless shelters in Lansing. While stays tended to be short-lived, the men spoke about their perceptions of the shelter environment:
“Where do you go? They send us to the [shelter], which I think is the worst place in the world to for you send somebody because it’s drug haven, you around the people, the people there is on drugs. Then why would you send somebody there to stay, that’s trying to get they life right.” (Kevin, Age 38, Still on parole at censoring) Interviewer: “Ok, so do you feel safe at the [shelter]?” Henry: “I don’t feel comfortable there.” Interviewer: “Ok, why’s that?” Henry: “Too many drugs, people just…don’t, take showers and stuff. I just don’t feel very comfortable there.” (Age 42, Successfully discharged)
Michigan Justice Statistics Center
Page 48
Risk of Recidivism Facing Offenders upon their Return to the Community 2013
“I think that you can help people with places to stay, I think that’s really crucial that they have that. Because putting people out there on the streets and having to go to the [shelter] and all those [shelters] are blessings but are also a trap because there’s a lot of drinking and drug use going on if you go looking for it.” (Jim, Age 55, Successfully discharged)
A review of recidivism outcomes for these housing situations are displayed in Table 30.
Overall, there were few statistically significant differences. Those who lived with family at some point during their supervision were significantly less likely to be jailed following a violation or be arrested (t=2.42, p=.023). A significantly lower proportion of those who lived with friends were returned to prison compared to those who did not live with friends (0% vs. 25%) (t=3.22, p =.003). There was little variation in recidivism prevalence between those who lived with family, friends, or on their own.
Table 31 provides a similar comparison for those who ever lived in a shelter, a residential treatment center, or with an intimate partner during their supervision. Those who lived in a shelter were somewhat less likely to be returned to prison compared to those who did not (7.7% vs 26.9%). Those who stayed in residential treatment were consistently more likely to recidivate, and significantly more likely to be arrested and prosecuted (t=-2.49, p=.018). A likely reason for this is the fact that residential treatment stays often followed recidivism events. With the exception of returns to prison, those parolees who stayed with intimate partners were less likely to recidivate.
Table 30. Recidivism by Living Situations (Family, Friend, Self) (N=39) Family Friend Self No (n=10) Yes (n=29) No (n=32) Yes (n=7) No (n=23) Yes (n=16) n (%) n (%) n (%) n (%) n (%) n (%) Rv 10 (100.0) 27 (93.1) 30 (93.8) 7 (100.0) 21 (91.3) 16 (100.0) Rvc 10 (100.0) 24 (82.8) 28 (87.5) 6 (85.7) 20 (87.0) 14 (87.5) Ra 10 (100.0) 24 (82.8) 28 (87.5) 6 (85.7) 20 (87.0) 14 (87.5) Rap 6 (60.0) 19 (65.5) 21 (65.6) 4 (57.1) 16 (69.6) 9 (56.2) Rac 5 (50.0) 19 (65.5) 20 (62.5) 4 (57.1) 15 (65.2) 9 (56.2) Rexj 1 (10.0) 8 (27.6) 7 (21.9) 2 (28.6) 6 (26.1) 3 (18.8) Rpris 3 (30.0) 5 (17.2) 8 (25.0) 0 (0.0) 5 (21.7) 3 (18.8) Note: Bolded differences are statistically significant (p < .05). Rv = Parole violation; Rvc = Parole violation and jail; Ra = Arrest; Rap = Arrest and prosecution; Rac = Arrest and conviction; Rexj = Extended jail sentence; Rpris = Return to prison. Adapted with modification from Maltz (1984).

Michigan Justice Statistics Center
Page 49
Risk of Recidivism Facing Offenders upon their Return to the Community 2013
Table 31. Recidivism by Living Situations (Shelter, Treatment, Intimate Relations) (N=39) Shelter Residential Treatment Intimate Relations No (n=26) Yes (n=13) No (n=21) Yes (n=18) No (n=23) Yes (n=16) n (%) n (%) n (%) n (%) n (%) n (%) Rv 26 (100.0) 11 (84.6) 19 (90.5) 18 (100.0) 18 (100.0) 19 (90.5) Rvc 23 (88.5) 11 (84.6) 17 (81.0) 17 (94.4) 17 (94.4) 17 (81.0) Ra 23 (88.5) 11 (84.6) 17 (81.0) 17 (94.4) 17 (94.4) 17 (81.0) Rap 16 (61.5) 9 (69.2) 10 (47.6) 15 (83.3) 13 (72.2) 12 (57.1) Rac 15 (57.7) 9 (69.2) 10 (47.6) 14 (77.8) 13 (72.2) 11 (52.4) Rexj 6 (23.1) 3 (23.1) 3 (14.3) 6 (33.3) 6 (33.3) 3 (14.3) Rpris 7 (26.9) 1 (7.7) 6 (28.6) 2 (11.1) 3 (16.7) 5 (23.8) Note: Bolded differences are statistically significant (p < .05). Rv = Parole violation; Rvc = Parole violation and jail; Ra = Arrest; Rap = Arrest and prosecution; Rac = Arrest and conviction; Rexj = Extended jail sentence; Rpris = Return to prison. Adapted with modification from Maltz (1984). Based on the transience of the sample we also examined the relationship between housing movements and recidivism indicators. Figure 19 plots the average number of parole violations by an ordinal housing indicator, comparing those who moved zero to 2 times (n=15, 38.5%), 3 to 4 times (n=9, 23.1%), 5 to 7 moves (n=9, 23.1%), and 8 or more moves (n=6, 15.4%). Within this small sample, the results suggest that there is a linear relationship between total housing moves and parole violations. For instance, the parolees who moved zero to two times averaged 2.3 parole violations over the course of their supervision, while those who moves 8 or more times averaged 7.5 violations (F=4.67, p=.008).18 Technical violations followed a similar pattern (F=3.90, p=.017). An exception to the linear trend is observed for criminal violations, as those who moved 3-4 times had fewer criminal violations than those who moved less frequently, but the number of criminal violations still varied significantly by housing movement group (F=3.56, p=.024).
18 One possible explanation for this relationship is that those who moved more spent more time in the community and thus had a higher risk exposure time, relative to those who moved infrequently. A negative binomial regression indicated that housing moves are positively and significantly correlated with the frequency of parole violations, independent of the effect of time at risk.

Michigan Justice Statistics Center
Page 50
Risk of Recidivism Facing Offenders upon their Return to the Community 2013
Figure 19. Average Parole Violations by Housing Moves (N=39) Alternative to considering the total number of housing moves, we considered whether housing instability was related to recidivism outcomes. We operationalized housing instability as the number of housing movements in the first six months of parole. Within the current sample, 14 members (35.9%) moved zero times during the first six months on parole, 16 (41%) moved once, and 9 sample members (23.1%) moved two or more times. Recidivism outcomes and average parole violations are considered in Tables 32 and 33, respectively. Table 32. Recidivism by Housing Instability (Number of Moves in First 6 Months) (N=39) Moves Rv Rvc Ra Rap Rac Rexj Rpris n (%) n (%) n (%) n (%) n (%) n (%) n (%) Zero (n=14) 14 (100.0) 13 (92.9) 13 (92.9) 11 (78.6) 10 (71.4) 4 (28.6) 4 (28.6) One (n=16) 14 (87.5) 13 (81.2) 13 (81.2) 8 (50.0) 8 (50.0) 2 (12.5) 2 (12.5) Two + (n=9) 9 (100.0) 8 (88.9) 8 (88.9) 6 (66.7) 6 (66.7) 3 (33.3) 2 (22.2) Note: Bolded differences are statistically significant (p < .05). Rv = Parole violation; Rvc = Parole violation and jail; Ra = Arrest; Rap = Arrest and prosecution; Rac = Arrest and conviction; Rexj = Extended jail sentence; Rpris = Return to prison. Adapted with modification from Maltz (1984). Table 33. Average Parole Violations by Housing Instability (Number of Moves in First 6 Months) (N=39) Moves in First 6 Months
Parole Violations Technical Violations Criminal Violations Mean (S.D.) Mean (S.D.) Mean (S.D.)
Zero (n=14) 4.4 (2.8) 3.2 (2.8) 1.1 (0.9) One (n=16) 4.0 (3.9) 3.4 (3.2) 0.6 (0.9) Two + (n=9) 4.0 (5.0) 2.7 (3.7) 1.3 (1.2)
0
1
2
3
4
5
6
7
8
0-2 Moves (n=15) 3-4 Moves (n=9) 5-7 Moves (n=9) 8+ Moves (n=6)
Ave
rage
Num
ber
of P
arol
e V
iola
tion
s
Number of Housing Moves
Parole Violations Technical Violations Criminal Violations

Michigan Justice Statistics Center
Page 51
Risk of Recidivism Facing Offenders upon their Return to the Community 2013
Overall, housing instability in the first six months of parole was not significantly related to recidivism. Table 32 suggests that those who moved zero times in the first six months on parole had the highest proportion of recidivists and those who moved once had the lowest, with the exception of extended jail sentences. There was no clear pattern for the average number of parole violations by housing instability. The results in Tables 32 and 33 suggest that among the current sample recidivism was related to the total number of housing movements, and not necessarily whether there were frequent movements shortly after release from prison.
Michigan Justice Statistics Center
Page 52
Risk of Recidivism Facing Offenders upon their Return to the Community 2013
PATHWAYS TO REINCARCERATION AND DISCHARGE Prisoner reentry is a process in which individuals actively manage challenges that are encountered during reintegration. There has been little research which has examined the dynamic processes and experiences of reentry to society (Petersilia, 2000, 2003; Visher & Travis, 2003). In the course of the Understanding the Challenges study, Grommon and colleagues (2012) observed that the 39 men they followed encountered a variety of barriers and resources, and while there were some similarities between their experiences, there was also great variation in individual adjustments to reentry. In the context of the present study we will consider the experiences of those men who were returned to prison and those who were successfully discharged from parole. We do not claim that those who were discharged have “desisted” from crime. As it will be shown, those who were discharged engaged in their fair share of non-compliance and recidivism. Rather, our focus in this study is on the immediate process of reintegration, rather than long term patterns of desistance from criminal offending.
More specifically, Visher and Travis (2003) identify four stages to the transition process between prison and the community; a) life prior to prison, b) life in prison, c) the moment of release and immediately after prison release, and d) life in the community during the months and years following release. This section of the report details some select aspects of the last two stages identified by Visher and Travis (2003) as they relate to differential pathways to returning to prison or successfully navigating parole, but aspects of the first two stages will be discussed where the information is available or relevant. Within the Understanding the Challenges sample as a whole, just under half of the men were successfully discharged from parole supervision (n=19, 48.7%) before the end of observations. Eleven men (28.2%) were still on parole by the end of observations. These men had their paroles extended for a variety of reasons, including extended jail sentences and general non-compliance. One-fifth of the sample (n=8, 20.5%) were returned to prison during the course of their supervision, either for a new sentence or having their supervision revoked following a parole violation.19 Pathways to Reincarceration Though varying forms of recidivism were the norm for the sample, many were still able to avoid being returned to prison. Others, either having committed a more serious offense or receiving a more serious response to their non-compliance, found themselves reincarcerated. There were eight members (20.5%) of the Understanding the Challenges sample who were returned to prison in the course of their supervision. Some descriptive features of these men are listed in Table 34. 19 The one remaining member of the sample passed away prior to his discharge date.
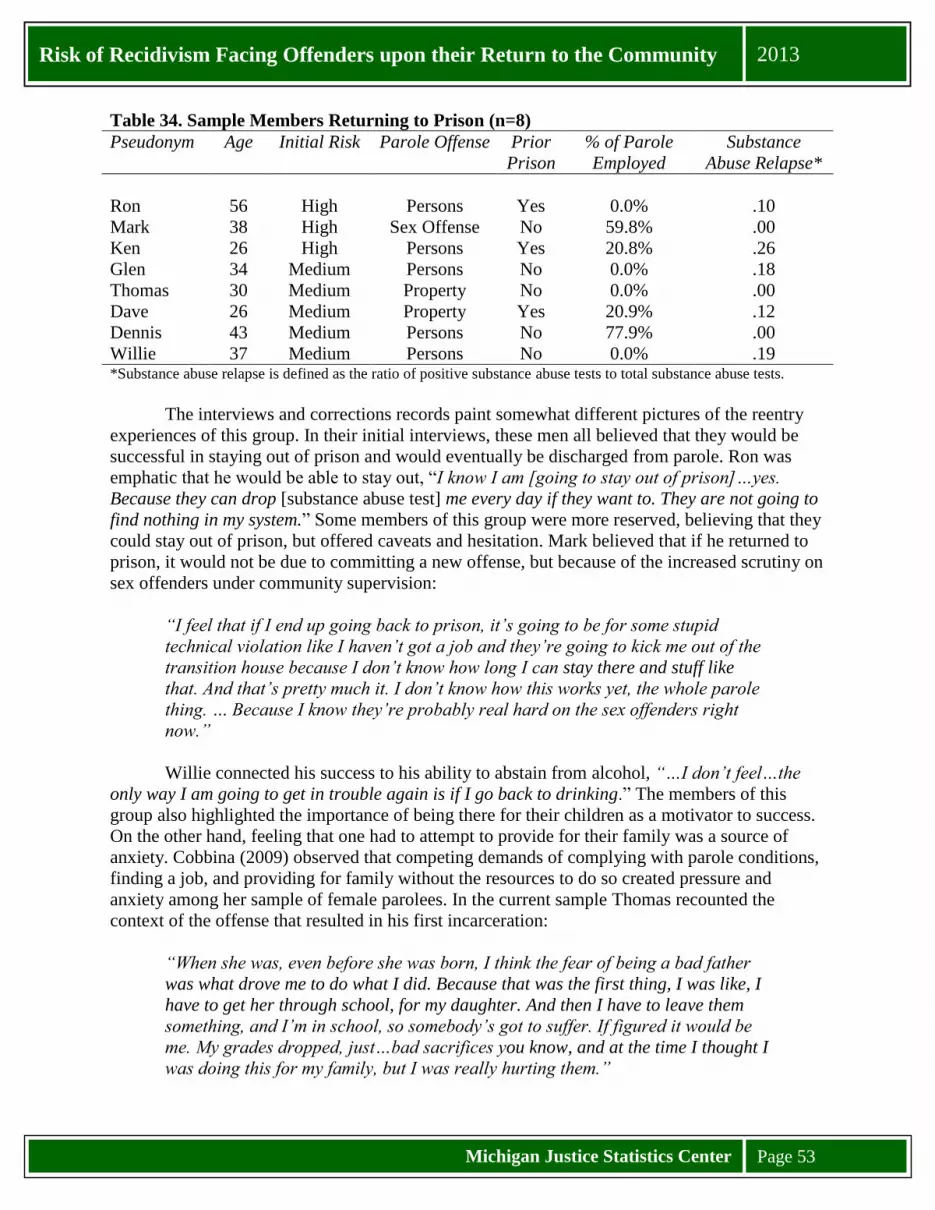
Michigan Justice Statistics Center
Page 53
Risk of Recidivism Facing Offenders upon their Return to the Community 2013
Table 34. Sample Members Returning to Prison (n=8) Pseudonym Age Initial Risk Parole Offense Prior
Prison % of Parole Employed
Substance Abuse Relapse*
Ron 56 High Persons Yes 0.0% .10 Mark 38 High Sex Offense No 59.8% .00 Ken 26 High Persons Yes 20.8% .26 Glen 34 Medium Persons No 0.0% .18 Thomas 30 Medium Property No 0.0% .00 Dave 26 Medium Property Yes 20.9% .12 Dennis 43 Medium Persons No 77.9% .00 Willie 37 Medium Persons No 0.0% .19 *Substance abuse relapse is defined as the ratio of positive substance abuse tests to total substance abuse tests. The interviews and corrections records paint somewhat different pictures of the reentry experiences of this group. In their initial interviews, these men all believed that they would be successful in staying out of prison and would eventually be discharged from parole. Ron was emphatic that he would be able to stay out, “I know I am [going to stay out of prison]…yes. Because they can drop [substance abuse test] me every day if they want to. They are not going to find nothing in my system.” Some members of this group were more reserved, believing that they could stay out of prison, but offered caveats and hesitation. Mark believed that if he returned to prison, it would not be due to committing a new offense, but because of the increased scrutiny on sex offenders under community supervision:
“I feel that if I end up going back to prison, it’s going to be for some stupid technical violation like I haven’t got a job and they’re going to kick me out of the transition house because I don’t know how long I can stay there and stuff like that. And that’s pretty much it. I don’t know how this works yet, the whole parole thing. … Because I know they’re probably real hard on the sex offenders right now.”
Willie connected his success to his ability to abstain from alcohol, “…I don’t feel…the only way I am going to get in trouble again is if I go back to drinking.” The members of this group also highlighted the importance of being there for their children as a motivator to success. On the other hand, feeling that one had to attempt to provide for their family was a source of anxiety. Cobbina (2009) observed that competing demands of complying with parole conditions, finding a job, and providing for family without the resources to do so created pressure and anxiety among her sample of female parolees. In the current sample Thomas recounted the context of the offense that resulted in his first incarceration:
“When she was, even before she was born, I think the fear of being a bad father was what drove me to do what I did. Because that was the first thing, I was like, I have to get her through school, for my daughter. And then I have to leave them something, and I’m in school, so somebody’s got to suffer. If figured it would be me. My grades dropped, just…bad sacrifices you know, and at the time I thought I was doing this for my family, but I was really hurting them.”

Michigan Justice Statistics Center
Page 54
Risk of Recidivism Facing Offenders upon their Return to the Community 2013
The men we spoke to were acutely aware of some of the challenges they would face during reintegration, and held opinions on what they believed would lead them to a successful transition, and what would lead them back to prison. Because of the nature of the interview data, most often it was not possible to speak with the men following the event which led to their reincarceration. As such, we could not follow-up with them to understand the contexts and motivations related to their return to prison from the parolees themselves. The secondary corrections records contain some indications of the events leading up to their return to prison, but admittedly from the point of view of corrections authorities. In examining the reentry experiences of the eight men returning to prison, their trajectories appeared to fall upon two dimensions of stable or unstable reentry conditions, and either the sudden onset of serious recidivism or a build-up of non-compliance towards recidivism. Where the eight returners fell along these dimensions are displayed in Table 35. The experiences of the men in each configuration will be discussed in turn. Table 35. Return to Prison Matrix (n=8) Non-Compliance Trajectory Sudden Onset Build Up Reentry Conditions
Stable Thomas Mark
Dennis
Unstable Glen Dave*
Ron Willie Ken
*Dave was returned to prison after nine days on parole. He was released a year later and demonstrated significant struggles with compliance and reentry. Stable reentry/sudden onset of recidivism. Three of the sample members who returned to prison fell into the configuration of having relatively stable reentry conditions, but were returned to prison after a sudden onset of recidivism. Thomas was released from prison on a property offense which he stated he had committed because he was concerned about supporting his pregnant girlfriend and soon to be daughter. Though he was never employed during his time in the community, Thomas claimed that this was by choice. He was released with significant social support from his fiancé and others, “…my mother, my uncle, my mom’s boyfriend. I have a good family background”. His social support network supported him while he pursued his college degree, allowing him to stay unemployed without significant stress. In his interviews, he emphasized his desire to be a good father as his primary motivation to be successful on parole, “being a good dad. Can’t be a good dad when you’re locked up, it’s impossible. If that ain’t good motivation, I don’t know what you need.” Besides receiving a ticket for driving with a suspended license two weeks after release, through the first five months of parole there were few signs that Thomas was at risk of recidivism. After just over five months in the community, however, Thomas’ parole agent was contacted by the local police because he was sought as a suspect in several thefts. Thomas remained on parole while the offenses were being investigated, but after nine months in the community he was arrested for breaking and entering. He subsequently plead guilty to the charges and was returned to prison. His arrest was his first and only parole violation.

Michigan Justice Statistics Center
Page 55
Risk of Recidivism Facing Offenders upon their Return to the Community 2013
Dennis was released under a similar situation. He was older than Thomas, but like him he had little history of substance abuse and did not struggle with drugs while on parole. He was also highly motivated to succeed because of his children, and believed if he secured employment he could achieve that. Initially Dennis struggled to obtain employment, “It was real difficult. I got turned away from two [fast food restaurants], two [fast food restaurants], a [retail store], and a couple other jobs, you know, because I am an ex-felon. I am an ex-con.” After two months on parole he was able to secure employment at a local textile factory, where he remained employed during his time in the community. After securing the job Dennis was emphatic that he would be able to stay out of prison, “There’s no question about that.” In his third interview, however, Dennis noted that his financial obligations were becoming a strain, “By the time I’m done [paying the bills], I’m broke. Rent is $435. I pay, well, between my son’s mom, I pay half of everything. So my monthly expenses come to about $340-$350 per month.” Adding to his expenses, he also owed over $6000 in victim restitution. Despite his financial strain, Dennis’s parole term was compliant. After going six months without a parole violation his parole agent lowered his dynamic risk score to minimum, reducing the number of times he would need to report to the parole office. Five months after his supervision level was reduced, and 11 months after being paroled, Dennis was arrested for his suspected participation in multiple armed robberies. He was subsequently convicted and returned to prison under new criminal sentences. In the cases of Thomas and Dennis, a return to prison came suddenly, after they had experienced relatively smooth transitions into the community. The circumstances of their recidivism offenses, however, suggest that each had been engaging in illegal activities for some time before coming to the attention of law enforcement. This suggests that Thomas and Dennis were engaging in ‘surface compliance’ (Werth, 2012), in which parolees openly comply with supervision conditions but selectively subvert others beneath the awareness of their parole agent. To this extent, these individual’s reentry conditions and recidivism may not have been as stable or as sudden as it appeared. Unstable reentry/Sudden onset of recidivism. The second configuration featured the parolee experiencing reentry difficulties, but largely remaining compliant with supervision conditions, but then the sudden onset of serious recidivism. In Glen’s case, he was paroled after serving 14 years in prison for armed robbery. Originally planning to live with a family member in another county, but they changed their mind at the last minute, and he felt he was fortunate to have an uncle in the Lansing area willing to take him in. He noted that his immediate concerns were obtaining employment so that he could keep up with his restitution payments. During his time in the community, however, he was unable to obtain any form of employment. His only income came in the form of food stamps and some occasional money from his social support network. After several months he moved out of his uncle’s house and moved in with a girlfriend, whom he stayed with for the remainder of his time in the community. Glen’s attributed his difficulties securing employment to several factors; being unable to secure valid identification other than his prison ID, and the combination of his criminal record and the bad local economy, “…for one, the economy today. Second, for a guy coming out of

Michigan Justice Statistics Center
Page 56
Risk of Recidivism Facing Offenders upon their Return to the Community 2013
prison, it’s kind of hard. People don’t want to be dealing with ex-convicts, so… I can understand, but I feel like people are deserving of a second chance. Because we all make mistakes, nobody’s perfect.” After six months on parole, Glen’s told his parole officer that he was becoming increasingly frustrated with his inability to find a job. To that point Glen has been largely compliant with his parole conditions, only having a single parole violation. Less than a month later he was arrested for armed robbery. We were able to interview Glen from jail while he awaited trial, giving the research team the opportunity to hear from him as he reflected on his reentry. In addition to the strains associated with being unable to find employment, Glen pointed to moving out of his uncle’s house as a step in the wrong direction.
“I mean, basically, like I say I had gotten involved, I was kind of like moving too fast. When I got out I got involved with a young lady, and she had problems as well as I did. She was going through custody battle with her child and stuff like that. And I’m a compassionate person too so I sit down and listen to people and stuff like that, so, and I jumped into a situation where I got married as well while I was out, in the little time, which I knew, people telling me “you want to do that? You sure you want to do that, you not even got yourself.” But it was like, when I jumped, when I took that step, it was more than I was gauging to be able to survive. Because it’s hard to be with a woman that already have children and all she working [at a convenience store] and making almost three hundred something dollars a month. And we got rent, utilities, and stuff like that, other things as well. We maintaining, but we not making it. We falling behind on bills and stuff like that. So it was more of an obligation, so that’s why I involved myself in drug dealings, so I could try to help provide. So that’s basically what led to today.”
For Glen, getting involved with an intimate partner amplified already existing financial strains, which provided motivation to engage in instrumental offending. Unstable reentry conditions/build-up of non-compliance. The third configuration of reentry and non-compliance leading to a return to prison was an unstable reentry situation with a steady build up of non-compliance. Unlike the cases with a sudden onset of recidivism, these individuals engaged in a variety of non-compliant behavior of which their parole agent was aware before being returned to prison. As an example, Willie was released on parole after serving an incarceration term for unarmed robbery. Upon release, Willie believed that he would be able to remain out of prison as long as he could abstain from drinking “Well, see I just, I don’t get in trouble when I’m sober. Only when I’m drunk. Every time I’ve been arrested drunk.” Despite this concern, Willie was unsuccessfully discharged from his substance abuse treatment because he was not attending classes. Roughly one month later, Willie’s neighbor reported to his parole agent that he was drinking heavily. Willie’s first positive substance abuse test did not come until more than a month after that tip was given, indicating that Willie may have engaging in non-compliance outside of the awareness of his parole agent. Willie’s first arrest and jailing was connected to his housing situation. Upon release he was provided with transitional housing from MPRI, which required adherence to certain rules,

Michigan Justice Statistics Center
Page 57
Risk of Recidivism Facing Offenders upon their Return to the Community 2013
including not having any overnight guests. Willie was arrested and removed from the housing program after he tried to move his girlfriend in with him, and charged with additional parole violations stemming from the incident. Willie spent nearly three months in jail before being released. Upon the recommencement of his parole, Willie began drinking heavily, leading to further violations and being placed on electronic monitoring. After destroying his electronic monitoring device and subsequently being jailed for additional drinking-related violations, Willie was denied placement in residential substance abuse treatment, leading to his return to prison on parole violation charges. Among the three men in this configuration, substance abuse and intimate partner relationships were major sources of non-compliance with parole. In for both Willie and Ken, their supervision included parole conditions which barred them from contact with particular women. In Ken’s case, he was paroled to his girlfriend’s house, but she then asked him to move out because his drug use was making her uncomfortable. Throughout his parole he tested positive for drugs and maintained contact with women whom his parole officer told him to stay away from. He was returned to prison after it was discovered that he was manufacturing methamphetamine. Pathways to Successful Discharge Although nearly every member of the Understanding the Challenges sample experienced some form of recidivism during the course of their parole supervision, nearly half of the sample was able to successfully complete their parole (n=19, 48.7%). The successful completion of parole was marked by the parolee’s discharge from supervision, which typically occurs after two years in the community. Some descriptive features of these men are displayed in Table 36. Considering the factors presented in Table 36, relative to the sample members who had returned to prison, those successfully completing their parole terms were able to secure employment (16 of 19, 84.2%), and abstain from substance use, or at least avoiding testing positive (11 of 19, 57.9%). Regarding employment, it has been noted that many members of the sample expressed the notion that obtaining employment would allow them the opportunity to focus on other aspects of their reentry, increasing their chances for success. Among those who were discharged the amount of time spent employed varied. For instance, the percentage of time at risk spent employed ranged from zero percent to upwards of 90 percent, but those who were successfully discharged averaged 41.8 percent of their community time employed in some capacity. This is compared to 22.4 percent for those who were returned to prison. Although all 19 of the sample members displayed in Table 36 successfully completed their parole, not everyone travelled a similar path to discharge; there were both linear and non-linear pathways traversed by the sample. This section of the report will detail some of those pathways. Linear Pathways to Discharge. Several members of the sample followed what could be characterized as a relatively linear pathway to successful discharge from parole. The designation of a pathway as linear or non-linear is relative, since most sample members experienced difficulties with employment and non-compliance. In an idealized scenario, the individual is released from prison, they quickly obtain employment, become relatively self-sufficient, and

Michigan Justice Statistics Center
Page 58
Risk of Recidivism Facing Offenders upon their Return to the Community 2013
engage in little to no non-compliance. As previous research has indicated, this pattern is seldom the case (Maruna, 2001). Indeed, none of the sample members exactly conformed to this ideal, as even those who were compliant with parole experienced reentry difficulties. Based largely on the consideration of recidivism, 11 of the 19 successful discharges (57.9%) followed a relatively linear pathway, while the remaining 8 (42.1%) experienced a more tumultuous route. Table 36. Sample Members Successfully Completing Parole (n=19) Pseudonym Age Initial Risk Parole Offense Prior
Prison % of Parole Employed
Substance Abuse Relapse*
Otis 31 High Sex Offense No 92.6% .00 Tim 39 High Property Yes 22.0% .00 Lou 38 High Drug Yes 71.3% .13 Calvin 32 High Drug Yes 16.8% .00 Samuel 44 High Sex Offense No 92.0% .00 Paul 32 High Persons No 44.4% .03 Reggie 39 High Persons Yes 0.0% .10 Matt 24 High Sex Offense No 46.0% .06 William 42 Medium Property Yes 36.5% .15 Richard 40 Medium Persons Yes 0.0% .00 Pedro 31 Medium Drug Yes 67.3% .13 Cliff 45 Medium Drug Yes 69.3% .28 Leslie 23 Medium Persons No 51.4% .00 Carsten 30 Medium Persons No 0.0% .00 Jim 55 Medium Persons Yes 28.8% .00 Dan 33 Medium Persons No 41.0% .00 Dustin 36 Low Persons Yes 36.7% .50 Henry 42 Low Persons Yes 26.8% .00 Travis 32 Low Property Yes 50.2% .00 *Substance abuse relapse is defined as the ratio of positive substance abuse tests to total substance abuse tests. Dan, for instance, had a relatively uneventful parole. When he was released on parole he was initially placed at a homeless shelter, due to not having a placement of his own. After three months of living in the shelter, he was able to move in with his brother. This address change coincided with obtaining temporary employment, which he worked at for most of the summer before his employment opportunities dried up. Several months later Dan was hired by another temp service and remained employed with them for the duration of his parole. Due to never having a parole violation, Dan was eventually reporting to his agent by phone. Towards the end of his supervision his parole agent discovered that he had been squatting in a house that the tenants had been evicted from. He then moved in with an intimate partner and remained there until is successful discharge. In this sense, while Dan was largely compliant with supervision conditions, he experienced difficulties with housing at different points in his parole. Carsten, on the other hand, had a similarly uneventful parole but was never employed during his time in the community. At the outset of his parole, he discussed the importance of employment to reentry, framing it as important to being competent outside of prison,

Michigan Justice Statistics Center
Page 59
Risk of Recidivism Facing Offenders upon their Return to the Community 2013
“Can’t find a job, nothing anymore. It’s hard on the brain too. Real frustrating. A guy tries his best man. I don’t know man, been times where I felt like am I ready to be out here? I mean, I’ve been riding with my nephew and felt like it is weird, but I have actually told him, like man, damn I don’t know if I should be locked up or what man, I don’t know if I am even ready. It is a weird feeling and it is crazy to say it, but it happens man. I thought all this time that coming out here, all this crap, I have a lot of family lost or got locked up for something dumb, then just made it real hard on me. Just been going through it man.”
After being unable to find employment after some time in the community, Carsten changed his focus to education, and enrolled in a local college under a full-time basis. He was aided in this effort through stable housing situations with his cousin and then his girlfriend. Towards the conclusion of his parole, Carsten began searching for employment again because of strains stemming from pending child support payments. He was still searching for employment when he was successfully discharged from parole. Table 37. Linear and Non-Linear Pathways to Discharge (n=19) Pseudonym Parole Violations Arrests Absconded Days in Jail Linear Pathways Dustin 2 0 No 11 Otis 3 0 No 0 Samuel 1 0 No 1 Leslie 1 0 No 12 Calvin 1 1 No 65 Carsten 0 0 No 0 Jim 1 0 No 0 Matt 7 0 No 0 Dan 0 0 No 0 Travis 1 0 Yes 45 Richard 1 1 No 6 Non-Linear Pathways William 4 1 Yes 108 Henry 2 1 No 180 Lou 6 3 No 211 Cliff 10 3 No 152 Paul 2 1 No 94 Reggie 7 5 No 90 Tim 1 1 Yes 32 Pedro 4 5 Yes 73 In Otis’ case, in his initial interviews he was highly motivated to succeed on parole. For instance, when asked about how he had prepared himself for being released on parole he stated,
“I did a lot of research on the jobs that were available in the Lansing area that pertained to the areas where I am experienced. I composed a resume for myself

Michigan Justice Statistics Center
Page 60
Risk of Recidivism Facing Offenders upon their Return to the Community 2013
prior to being released. And just kind of, you know, looked into stuff -furthering my education and things that would make me a smart budgeter when I was coming home, and being in the shop and stuff, getting familiar with prices and how I was going to save my money and use my money and spend it wisely.”
Otis’ opportunities for employment were constrained by the nature of his offense, as he was paroled as a registered sex offender. It took Otis approximately two months to find employment, but during that time he was hired at a company only to find that it was too close to a school for him to be allowed to work there. Eventually he secured employment at a local textile company, and later at a restaurant, where he remained employed until his discharge from supervision. Otis’ compliance with parole required significant maintenance on his behalf. Because of the nature of his offense he spent his entire parole term in global positioning system (GPS) monitoring. This required him to contact his parole agent whenever he needed additional time in the community, whether it be to work overtime, go grocery shopping, or attend extracurricular activities at college. In the course of his supervision, Otis received only two parole violations, both of which were related to GPS monitoring. For each of them, he had failed to adequately check with his parole agent regarding his curfew, and in turn spent some time in the community when he was supposed to be under house arrest. From his perspective, keeping up with his sex offender supervision conditions was a continuous effort, but necessary to stay out of prison,
“Because everyday, temptation is a problem every day, you know, some days you have crazy days and you just want to say, you know, you just get tired of having somebody over you, you just want to live your life. …Whether it’s having a beer, or being able to look up whatever I want to look up on the computer or talk to whoever I want to talk to, or go wherever I want to and not have a curfew. I mean, do I see how it easy it is for guys who just feed into that and just…yeah, you know.”
Ultimately, Otis was able to move into his own apartment and maintain consistent employment without incurring any moderate or serious recidivism. After two years in the community he was successfully discharged from parole. Stemming from the daily fees associated with his GPS monitoring, as of the completion of his parole he owed MDOC approximately $9,500 in monitoring costs. In all three of these examples, the individual’s trajectory towards successful discharge was almost uninterrupted. There were few setbacks, no relapses into offending patterns or substance abuse. It is not known whether or not they have desisted from crime, but all traversed a pathway to managing reentry to society. Non-linear pathways to discharge. Compared to the relative linear reentry pathways described above, other members of the sample experienced a tumultuous reentry but were eventually discharged from supervision. For studies examining recidivism outcomes, these individuals would be classified as recidivists. But treating recidivism as a terminal event misses the fact that many people will eventually continue in their reentry, with perhaps a very different trajectory.

Michigan Justice Statistics Center
Page 61
Risk of Recidivism Facing Offenders upon their Return to the Community 2013
William’s experience shows how tumultuous reentry can be, but can eventually lead to a successful discharge. William served 7 years in prison on a forgery conviction, and upon release he was primarily concerned with managing his issues with depression and substance abuse. As the primary motivation to abstain from using his drug of choice, crack cocaine, in his first interview he cited a discussion he had with his daughter,
“See the reason, how I stopped using crack cocaine, it was really from the help of my daughter. Because my grandson was born, it was my first time I ever was going to see him. So she came over, brought my grandson, I was holding him. You know, like a grandfather and a father do. And when she got ready to leave she said, ‘Dad you have to make a choice right now. It’s either your drugs or it’s me and [your grandson]. Because I have been going through this long enough with you, Dad, it’s time for you to make a choice.’ I said, I’m done with drugs. I said I need you and my grandson in my life. I never picked up again.”
Like many of the men we interviewed, William was cautiously optimistic about his ability to abstain from drugs and stay out of prison. After some time in the community, reentry difficulties began to mount. Two months after being released, William began to struggle with his depression and cocaine use. He lost his MPRI subsidized housing after he was accused of assaulting a neighbor. He was able to secure placement in transitional housing, and saw the move as a blessing,
“I lost my apartment, but it’s good that I did lose that apartment because I had picked back up doing drugs and things. And, my parole officer knew it, and Liz knew it. So instead of me getting another apartment, they put me in a transition house. I was so mad to go there, but, you know, I like it, I love it there. They got good people there. When I around, all they saying, ‘I love you, I love you.’ That’s the thing I needed, the support I needed. I had no support, it was just me by myself.”
Several months later, William was still struggling with cocaine use, leading to further transience. Because of his drug use he was kicked out of transitional housing and then lived with family for a short period of time. Approximately 9 months after being paroled, William absconded from supervision for 4 months before being apprehended. After spending two months in jail, William’s reentry took on a new form. He was placed on electronic monitoring, secured housing in a ministry shelter and obtained employment at a car detailing shop. At this point his compliance improved, and he stopped testing positive for cocaine. Six months after being apprehended for absconding, and two years after being paroled, he was successfully discharged from supervision. Paul presented another instance of a non-linear reentry, but compared to William, he was doing relatively well in the community before suffering setbacks. As of his release, Paul had served 14 years in prison for attempted homicide. He was released into a stable living situation, staying with his wife in their own house. In the first several months on parole Paul had kept up with his supervision conditions and obtained part time employment in construction. After that point, his management of intimate partner relationships began to affect is parole. He and his wife

Michigan Justice Statistics Center
Page 62
Risk of Recidivism Facing Offenders upon their Return to the Community 2013
divorced, and Paul moved in with his girlfriend. While he was staying there, his ex-wife attempted to stab him, and he was robbed at gunpoint after he and his girlfriend had a falling out. After a little less than a year on parole, Paul’s reentry began to take a more significant downward turn. He was arrested for operating a vehicle while intoxicated and placed on electronic monitoring as a result. Several months after that, allegations were made that Paul had been drinking heavily and using cocaine, despite the fact that he had never tested positive in the timeframe. As a result, he was sent to residential treatment for ongoing substance abuse issues. Upon his release, he remarried and moved in with his mother. As with the early part of his parole, intimate partner relationships continued to create reentry difficulties, as his wife’s ex-husband continually contacted his parole agent in the attempt to implicate him in parole violations. In this process, Paul’s parole agent acted as an advocate because of his improving behavior and compliance. Two years after being released from prison, he was successfully discharged from supervision. In each of these examples, William and Paul appeared to experience a turning point (Sampson & Laub, 2005) in their reentry, in which a salient event provides an individual the opportunity to change a criminal trajectory. For William and Paul, a recidivism event acted as a turning point in reentry, whereas their reentry conditions largely stabilized following a stay in residential treatment or jail. The presence of a turning point is what makes these pathways non-linear. Compared to those with relatively linear pathways to discharge, there were fewer or less intense changes in non-compliance trajectories. Following these criminal justice system interventions, sample members drew on existing networks of social support (i.e., employment connections, family members) to alter their offending behavior, at least in the short term context explored here.

Michigan Justice Statistics Center
Page 63
Risk of Recidivism Facing Offenders upon their Return to the Community 2013
THE COST OF NON-COMPLIANCE AND RECIDIVISM Managing offenders in prison and in the community is a costly endeavor. In fiscal year 2010, MDOC had an operating budget of $1.9 billion dollars, with $171 million allocated to field operations (MDOC, 2011). Not all prisoners and parolees cost the state the same amount of money. Community supervision involves dynamic, rather than fixed, costs which can fluctuate based on whether the parolee remains under supervision in the community, is jailed, or returned to prison. To this extent, recidivism and non-compliance with supervision conditions can influence the total costs of supervision and incarceration. Examining the cost of parolee reincarceration in Marion County, Indiana, Jarjoura and Haight (2011) found that the 51.6 percent three-year return to prison rate came at a cost of $83 million dollars, and a 1 percent reduction in returns to prison would save the state of Indiana approximately $1.6 million dollars. This section of the report will estimate the total costs of supervising the Understanding the Challenges sample, including the costs of their community management and recidivism. The costs are calculated over the course of each individual’s supervision term, using average daily cost rates obtained from a variety of sources.20 Utilizing the different daily rates allows for the calculation of dynamic supervision costs, accounting for cost increases based on recidivism. The rates are listed in Table 39. Table 39. Average Daily Cost Rates by Parolee Status Parolee Status Average Daily Cost Parole Supervision US$5.83 In Jail US$57.92 In Prison US$94.31 Based on our review of secondary correctional records, we were able to calculate the total number of days that each parolee spent under each status between their parole release date and the end of study observations. Descriptive statistics for parole status are displayed in Table 40. The typical parole term in Michigan is two years (730 days). On average, the sample spent 568 days at risk in the community, but the number of days varied from 40 to 961 based on incarceration recidivism indicators (i.e., returning to prison or non-compliance resulting in extensions). Following recidivism incidents, the sample averaged 223 days in jail, and 123 days in prison over the course of the study period. Table 40. Days under Parole Status (N=39) Parole Status Mean (S.D.) Total Days Range Parole Supervision 567.7 (224.0) 22,140 40 - 961 In Jail 223.4 (257.4) 8,711 0 - 909 In Prison 132.2 (269.7) 5,154 0 - 871
20 The cost of parole supervision was obtained from an MPRI primer (PolicyOptions.org, 2013). They indicated that parole costs an average of $2,130 per year. This figure was divided by 365 to obtain $5.83 per day. The daily cost of jail was obtained directly from the Ingham County Sheriff’s Office (Personal communication, 2013). The average daily cost of prison was obtained from the Michigan Bureau of Fiscal Management (2013).

Michigan Justice Statistics Center
Page 64
Risk of Recidivism Facing Offenders upon their Return to the Community 2013
The data on parole status days and average daily costs was used to calculate the supervision, jailing, and prison costs for each individual parolee in the sample. These costs were summed within parolees to calculate the total cost per parolee, and costs across parolees were used to calculate total costs for each status, and total overall cost. These estimates are displayed in the following Tables and Figures.
Between the beginning of the study period and the end of observations the rough estimate of the total cost of supervision, jailing, and reincarceration for the Understanding the Challenges sample was approximately $1.11 million dollars (see Table 41). The bulk of this estimate cost is constituted by the cost of jail stays ($504,541, 45%) and reincarceration ($474,168, 43%). Parole supervision made up the smallest proportion of the total cost, at 12 percent ($129,201), even though it made up the majority of parole status days (22,140, 62%). The costs varied substantially across parolees. At the low end, an estimated $1,900 was spent on the supervision and early discharge of one parolee who was never jailed or returned to prison. On the other hand, an estimated $104,000 dollars were spent on the supervision, jailing, and reincarceration of another parolee. That particular parolee spent a long period in jail following his first criminal violation, and then was returned to prison for his second criminal violation. Table 41. Overall Costs by Parole Status During Study Period (N=39) Parole Status Average Cost Range Total Cost Parole Supervision $3,313 $233 - $5,608 $129,201 In Jail $12,937 $0 - $52,649 $504,541 In Prison $12,158 $0 - $80,132 $474,168 Overall $28,408 $1,872 - $104,176 $1,107,910 Note: Costs individualized for each sample member.
Figure 20. Contribution of Supervision, Jail, and Prison to Overall Cost
$129,201, 12%
$504,541, 45%
$474,168, 43%
Parole Supervision
Jail
Prison

Michigan Justice Statistics Center
Page 65
Risk of Recidivism Facing Offenders upon their Return to the Community 2013
We examined how costs for supervision, jailing, and reincarceration varied by the degree of parole non-compliance. Using Baker and colleagues (2013) offender categories of one time violators, recidivists (2-4 parole violations), and chronic violators (5 or more parole violations), Figure 21 compares dynamic costs over the course of the study period. The cost of parole supervision did not vary across violator categories. This may be because of the relatively low cost of parole supervision, so variation in the amount of time spent in the community translates into small differences in cost. Because of their low number of parole violations, one timers incurred the lowest jail costs. However, because their violations tended to be more serious than the more prolific violator categories, their prison costs were the highest of the three groups. Recidivist violators were in the middle of the groups, with the second highest average jail and prison costs, due to a mix of offense frequency and seriousness. Chronic violators accumulated the lowest prison costs, but the highest jail costs of the three groups.
Considering the total average cost for each group, the one timers had the lowest average cost at $21,977 over the course of their supervision/reincarceration. The recidivists and chronic violators had very similar average costs, at $31,095 and $31,449, respectively. Figure 21 suggests that although the costs of recidivists and chronic violators were similar, they were comprised of different levels of jail and prison costs.
Figure 21. Average Costs by Parole Violator Category (N=39)
$0
$5,000
$10,000
$15,000
$20,000
$25,000
One Timers (n=12) Recidivists (n=14) Chronic Violators (n=13)
Ave
rage
Cos
t
Parole Violator Category
Supervision Costs Jail Costs Prison Costs

Michigan Justice Statistics Center
Page 66
Risk of Recidivism Facing Offenders upon their Return to the Community 2013
DISCUSSION AND POLICY IMPLICATIONS In the current study, we examined the recidivism experiences of 39 moderate to high risk parolees to a small, industrialized city. As part of an earlier study, these men were interviewed at multiple points during their supervision to better understand their experience and navigation of reentry challenges following their release from prison. With the current inquiry, our focus shifted documenting the nature, timing, pathways to, and cost of recidivism. NATURE AND PREVALENCE OF RECIDIVISM OUTCOMES We utilized a broad range of recidivism indicators, ranging from parole violations resulting in a verbal warning, through successful convictions leading tom a return to prison. Parole violations were the most common form of recidivism/non-compliance among the sample. In total, the 39 men we followed throughout their supervision committed 161 parole violations. The majority of the sample members (n=37, 94.9%) received a parole violation of some form. Though two parolees did not receive any parole violations, most sample members received more than one. Overall, the sample members averaged 4.1 parole violations during their time in the community. Technical violations were the most common form of parole violation incurred by the sample, with an average of 3.1 technical violations during supervision. Criminal violations were less frequent, with sample members averaging one over the course of their supervision. Some parolees were more prolific violators than others. About 20 percent of the sample (n=8) was responsible for just over half of the total volume of parole violations. Somewhat more serious than parole violations, a large proportion of the sample was arrested at some point during their parole (n=34, 87.2%). This figure included both arrests for new crimes or apprehensions by the absconder recovery unit. When considering only arrests for new crimes, 28 members of the sample (71.8%) were rearrested. In total, the sample of 39 parolees accounted for 63 criminal arrests, with an equal proportion being arrested once (n=14, 35.9%) or more than once (n=14, 35.9%). Of the 63 arrests, arrests for property offenses (e.g., retail fraud, larceny) were the most prevalent (n=21, 33.3%), followed by arrests for persons offenses (e.g., armed robbery, domestic violence) (n=19, 30.2%). Like the parole violations, a small subset of the parolees was responsible for a sizable proportion of the arrests. More specifically, about 25 percent of the sample accounted for 65 percent of the arrests. The most serious recidivism events observed in the current study were convictions leading to extended jail sentences and returns to prison, either for a criminal conviction or a parole revocation. During the course of observations, 9 parolees (23.1%) received an extended jail sentence and 8 (20.5%) were returned to prison, for a total of 17 (43.6%) experiencing such an event. The reasons the sample members received jail sentences or were returned to prison included armed robbery, retail fraud, carrying a concealed weapon, domestic violence, drug manufacturing, and disregarding special parole conditions, such as no contact orders. TIMING OF RECIDIVISM OUTCOMES Among this small sample of parolees there was both variability and uniformity in the timing of recidivism. Consistent with previous studies of parole deviance, we observed that the

Michigan Justice Statistics Center
Page 67
Risk of Recidivism Facing Offenders upon their Return to the Community 2013
majority of first parole violations and arrests took place within the first six months of parole (66.7% and 41.0%, respectively). More serious recidivism events, arrests leading to prosecutions and convictions, were more prevalent between 6 and 12 months on parole (30.8% and 23.1%). This difference was not accounted for by the increased time necessary for additional criminal justice system processing, since the timing of the recidivism event was defined as the date of the arrest, not the date of the charging/prosecution/conviction. The time between successive recidivism events was considered through the concept of intermittency. We observed that, consistent with previous research, there were relatively longer periods of time between parole violations when the parolee only committed a small number (i.e., two), but the length of time between high frequency parole violations (i.e., between the 7th and 8th, 9th and 10th violations). The relationship between parole violation intermittency and parole violation seriousness was not consistent with previous research. Baker and colleagues (2013) found that with decreased intermittency between high frequency police contacts came greater offense seriousness. For the Understanding the Challenges sample, we observed that with increased violation frequency came decreased offense seriousness. The reason for this is in order for a parolee to commit a high frequency of offenses they must be active in the community. A parolee cannot commit parole violations if they are in jail or reincarcerated. As such, high frequency violators tended to commit less serious, chronic violations, compared to those parolees who committed a small number of more serious violations. RECIDIVISM AND REENTRY DIMENSIONS The relationship between key reentry dimensions (i.e., employment and housing) and recidivism was explored. Considering employment, upon release obtaining steady employment was cited by the men as one of the most important necessities in staying out of prison. While the prevalence of recidivism between the ever employed and never employed was not very different for the less serious recidivism indicators (i.e., violation, arrest), those who never obtained employment were more likely to incur the more serious recidivism outcomes (i.e., prosecutions, convictions, returns to prison). However, even among those who were employed at some point during their supervision there was great variability in how long those employment periods lasted. Indeed, the percentage of time at risk spent employed ranged from 7 percent to 93 percent. Considering the parolees who were returned to prison or successfully discharged, the average time spent employed was quite different, with returners spending 22.4 percent of their time at risk employed, compared to 41.8 percent for the dischargers. Interesting results were observed when examining the timing of recidivism events as they related to the parolee’s employment status. We found that for the current sample the most common recidivism/employment configuration was when the individual recidivated while employed. This suggests that, for the current sample, at least, employment did not act as an ironclad protective factor against recidivism. This stood in contrast to the expectations of the parolees themselves, who believed that they would be able to abstain from offending if they could secure employment. Rather, the extent of employment was correlated with successfully discharging from parole, but not before the majority of the sample engaged in some form of recidivism.

Michigan Justice Statistics Center
Page 68
Risk of Recidivism Facing Offenders upon their Return to the Community 2013
Considering housing and recidivism, there was little correlation between initial housing placements and recidivism outcomes. This was particularly accurate for the less restrictive recidivism definitions, but those initially placed with romantic partners were more likely to be returned to prison, and those initially placed with family were more likely to receive an extended jail sentence. The frequency of housing movements was associated with parole violations in an inconsistent manner. The total number of housing movements was positively related to parole violations, whereas parolees who moved more times committed a higher average number of parole violations. A sub analysis revealed that this relationship was not mediated by the amount of time the parolee spent in the community. On the other hand, housing instability upon release was not related to recidivism, as there was little variation among those parolees who moved zero, one, or two or more times in the first six months of parole. This is consistent with previous research which has suggested that parolees move for a variety of reasons, and even high frequencies of address changes may reflect moving to independence (La Vigne & Parsatharathy, 2005). This was especially the case among the men who initially stayed in shelters. Previous research has suggested that particular housing situations were statistically related to recidivism outcomes. As became apparent through the interviews in the current inquiry, particular housing situations meant different things to different parolees. Considering staying with family as an example, some parolees observed that living with family was a protective factor against recidivism, a “safety net” which prevented them from getting involved in illegal activities. When they moved away from family to live with intimate partners, friends, or on their own, those protective factors were no longer immediately accessible, and the risk of recidivism increased. On the other hand, similar to living situations with romantic partners, living situations with family tended to strain relationships as the capacity for social support was often limited. An extended stay by the parole often stretched these relationships beyond comfortable boundaries. PATHWAYS TO REINCARCERATION AND DISCHARGE For the 39 men who we followed during their supervision in the community, there were three possible outcomes to their parole; they could be successfully discharged from supervision, returned to prison, or could still have been on parole at the end of observations. By the end of observation, 19 men (48.7%) had been successfully discharged, 8 (20.5%) had been returned to prison, and 11 (28.2%) were still on active parole due to various circumstances, such as serving an extended period in jail, or having their parole extended due to chronic non-compliance. A single parolee passed away during observations, and thus did not fit into the outcome categories above. We observed some variability in the pathways which individuals took to arrive at these parole outcomes. For those returning to prison, parolees were observed being released into relatively stable reentry conditions (i.e., strong social support network, little to no substance abuse, available employment or educational opportunities) or relatively unstable conditions. Within these conditions, individuals showed recidivism patterns of either abruptly committing a serious offense or offenses after some time in the community, or gradually building up to a recidivism event through non-compliant behavior. A closer look at the returns to prison suggested that even those whose recidivism appeared to be abrupt may have been engaging in
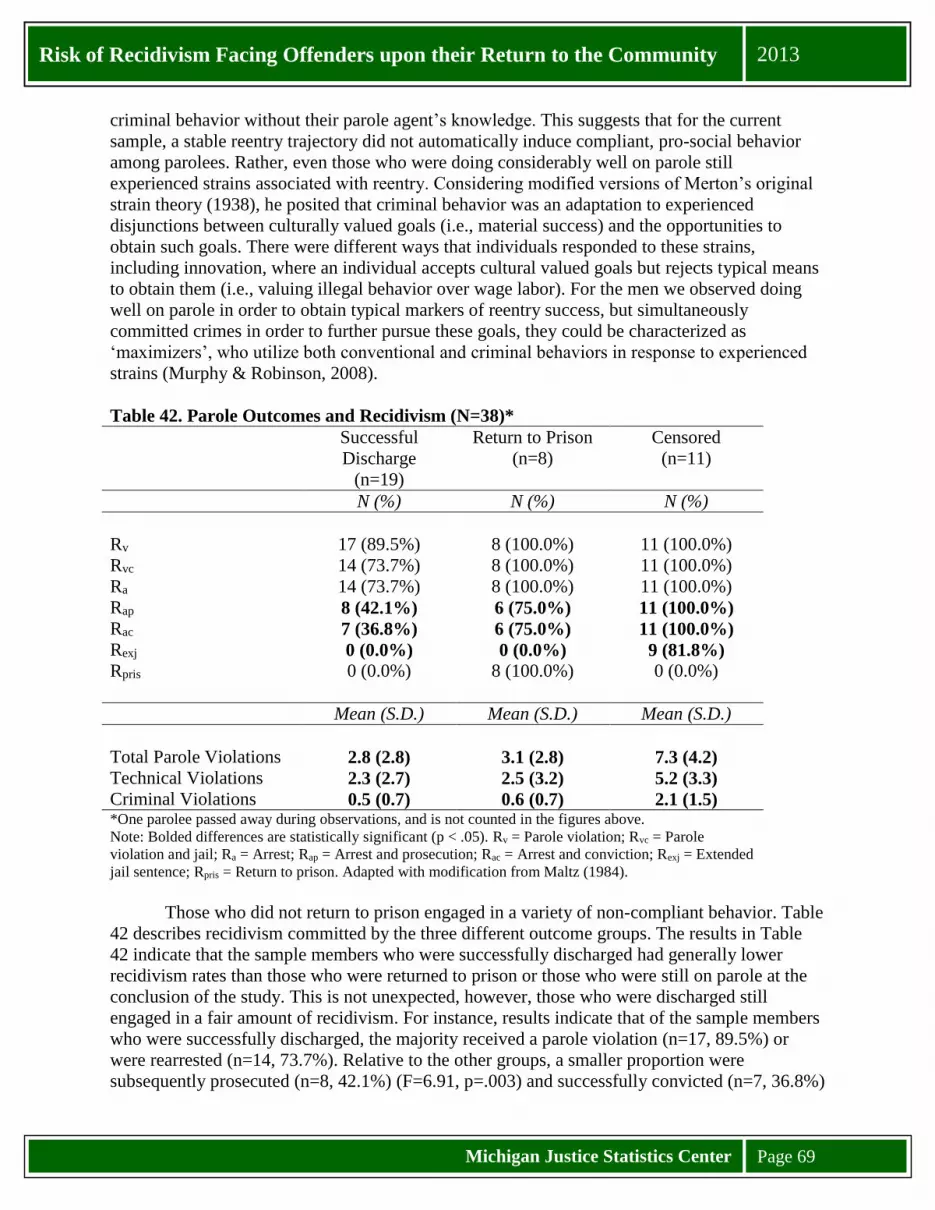
Michigan Justice Statistics Center
Page 69
Risk of Recidivism Facing Offenders upon their Return to the Community 2013
criminal behavior without their parole agent’s knowledge. This suggests that for the current sample, a stable reentry trajectory did not automatically induce compliant, pro-social behavior among parolees. Rather, even those who were doing considerably well on parole still experienced strains associated with reentry. Considering modified versions of Merton’s original strain theory (1938), he posited that criminal behavior was an adaptation to experienced disjunctions between culturally valued goals (i.e., material success) and the opportunities to obtain such goals. There were different ways that individuals responded to these strains, including innovation, where an individual accepts cultural valued goals but rejects typical means to obtain them (i.e., valuing illegal behavior over wage labor). For the men we observed doing well on parole in order to obtain typical markers of reentry success, but simultaneously committed crimes in order to further pursue these goals, they could be characterized as ‘maximizers’, who utilize both conventional and criminal behaviors in response to experienced strains (Murphy & Robinson, 2008). Table 42. Parole Outcomes and Recidivism (N=38)* Successful
Discharge (n=19)
Return to Prison (n=8)
Censored (n=11)
N (%) N (%) N (%) Rv 17 (89.5%) 8 (100.0%) 11 (100.0%) Rvc 14 (73.7%) 8 (100.0%) 11 (100.0%) Ra 14 (73.7%) 8 (100.0%) 11 (100.0%) Rap 8 (42.1%) 6 (75.0%) 11 (100.0%) Rac 7 (36.8%) 6 (75.0%) 11 (100.0%) Rexj 0 (0.0%) 0 (0.0%) 9 (81.8%) Rpris 0 (0.0%) 8 (100.0%) 0 (0.0%) Mean (S.D.) Mean (S.D.) Mean (S.D.) Total Parole Violations 2.8 (2.8) 3.1 (2.8) 7.3 (4.2) Technical Violations 2.3 (2.7) 2.5 (3.2) 5.2 (3.3) Criminal Violations 0.5 (0.7) 0.6 (0.7) 2.1 (1.5) *One parolee passed away during observations, and is not counted in the figures above. Note: Bolded differences are statistically significant (p < .05). Rv = Parole violation; Rvc = Parole violation and jail; Ra = Arrest; Rap = Arrest and prosecution; Rac = Arrest and conviction; Rexj = Extended jail sentence; Rpris = Return to prison. Adapted with modification from Maltz (1984).
Those who did not return to prison engaged in a variety of non-compliant behavior. Table 42 describes recidivism committed by the three different outcome groups. The results in Table 42 indicate that the sample members who were successfully discharged had generally lower recidivism rates than those who were returned to prison or those who were still on parole at the conclusion of the study. This is not unexpected, however, those who were discharged still engaged in a fair amount of recidivism. For instance, results indicate that of the sample members who were successfully discharged, the majority received a parole violation (n=17, 89.5%) or were rearrested (n=14, 73.7%). Relative to the other groups, a smaller proportion were subsequently prosecuted (n=8, 42.1%) (F=6.91, p=.003) and successfully convicted (n=7, 36.8%)

Michigan Justice Statistics Center
Page 70
Risk of Recidivism Facing Offenders upon their Return to the Community 2013
(F=8.63, p=.001). Of the parolees who were not returned to prison, but were still on parole at the conclusion of observations, a majority were arrested, convicted, and subsequently served an extended jail sentence (n=9, 81.8%) (F=55.95, p < .001). Considering parole violations and parole violation types, the sample members who were successfully discharged averaged 2.8 parole violations over the course of their supervision, compared to 3.1 for those who returned to prison, and 7.3 for those who were still on parole at the conclusion of the study (F=6.94, p=.003). Interestingly, those who were successfully discharged and those who were returned to prison displayed similar rates of total parole violations, technical violations, and criminal violations. Substantially higher parole violation rates were observed for those who were censored at the end of the study, including both technical violations (F=3.57, p=.039) and criminal violations (F=9.10, p=.001). The chronic violation rates being the likely reason that such individuals were still serving an active parole term when study observations ended. THE COSTS OF NON-COMPLIANCE AND RECIDIVISM The supervision of parolees in the community and their housing in jails and prisons comes at a cost to taxpayers. In Michigan, the crude estimation of the cost of supervising an individual on active parole in the community was roughly $5.83 per day. When those parolees engage in non-compliant or recidivist behavior they spend time in jail or prison, which comes at a much higher cost to taxpayers. Indeed, it costs nearly 10 times as much per day to house an individual in the county jail, and 16 times as much for each day spent in prison. During study observations, the total supervision costs for the 39 sample members amounted to $129,201 dollars, which comprised only 12 percent of all the associated costs. On the other hand, the crudely estimated costs for jail time was $505,541 dollars (45%), and the cost of prison stays was $474,168 dollars (43%), for a total supervision/non-compliance cost of $1,107,909 dollars. These results, although they are crudely estimated, suggest that the cost of recidivism and non-compliance is substantially higher to taxpayers than if the parolee had remained out of custody. Indeed, in a hypothetical example in which all 39 sample members remained on active supervision for their entire two year term and then were successfully discharged, the estimated supervision cost would be $165,980.21 Instead, we observed that with jail and prison stays, the actual cost was nearly 7 times this figure. IMPLICATIONS FOR PRACTICE The results of the current study indicate that the violation of supervision conditions was the norm for the small sample of parolees we followed. There was some variability in how individuals violated their supervision conditions, and how those incidents were handled by the criminal justice system. The least serious forms of non-compliance occurred relatively quickly, while the more serious incidents took time to occur. Yet, despite involvement in multiple degrees of recidivism, including being rearrested multiple times, many of these individuals ultimately completed their parole and were discharged from supervision. Indeed, for some members of our sample a recidivism event and subsequent stay in jail or residential treatment provided a turning 21 Calculated as ((daily supervision cost [$5.83] * 365 days) * 2 years) * 39 parolees).

Michigan Justice Statistics Center
Page 71
Risk of Recidivism Facing Offenders upon their Return to the Community 2013
point, after which their offending trajectory improved. This finding seems to be a pertinent intervention point for correctional practice.
Parole supervision involves a combination of risk management and service provision for
individuals released from prison (Lynch, 2000; Petersilia, 1999). Within the past several decades, parole supervision has become more surveillance focused than service-oriented (Laws & Ward, 2011; Rudes, 2012). Guided by a public safety-oriented philosophy, a primary goal contemporary parole supervision is to ensure that the parolee remains compliant with their parole conditions, and revoking their supervision if they cannot (Carter et al., 2007; Simon, 1993). This cycle of conditional release-violation-return to prison is a prime engine of high incarceration rates (Grattet et al., 2011). This raises the question of whether all forms of parole deviance and non-compliance are indicative of an underlying threat to public safety. In other words, should parole violators be routinely returned to prison to protect the public from future safety risks, or do at least some parole violators ultimately alter their behavior to lead prosocial lives? For instance, a study by Orrick and Morris (2012) examined aspects of this question by comparing rates of institutional misconduct committed by individuals returned to prison for technical violations, and those who returned for committing a new crime. They found that the technical violators were responsible for substantially less in-prison misconduct following their reincarceration. This finding lead Orrick and Morris (2012) to suggest that avoiding returns to prison based on technical violations could save resources without necessarily putting the public at risk.
In the context of the current study, we observed that parolees in our sample were able to
successfully navigate the parole process despite incurring several parole violations, and in some cases, used experiences of being jailed as a turning point in their parole. To this extent, we believe that effective and efficient parole supervision should use discretion to discern whether a parole violation incident is indicative of an underlying threat to public safety, and simultaneously attempt to promote the parolee’s ability to achieve their personal goals for their parole. In other words, many parole agents recognize that reoffending is a pattern of behavior, rather than a singular event (Zamble & Quinsey, 1997), and focusing on how parolees are managing the problems they experience may provide important information as to whether a violation is reflective of escalating behavior, or the capacity to desist from offending behavior.
The Good Lives Model of offender rehabilitation (GLM) (Laws & Ward, 2011; Ward &
Maruna, 2007) provides a useful framework for these considerations. The GLM assumes that parolees have similar aspirations to individuals who are not involved in the criminal justice system, such as leading a meaningful, fulfilling life, and subsequently recommends correctional practice to “help offenders to acquire the capabilities to achieve the things that are personally meaningful to them” (Laws & Ward, 2011: 176). In the course of the interviews with the Understanding the Challenges sample, we observed that in almost every case the men expressed their desire for markers of conventional social life, including reconnecting with families, feeling like they were part of the community, and working in legitimate employment. To the extent that parolees struggle to achieve these goals, and perhaps violate the conditions of their parole in the process, the GLM recommends a strength-based approach to offender intervention which will not deplete social capital resources which the parolee had accumulated to that point.

Michigan Justice Statistics Center
Page 72
Risk of Recidivism Facing Offenders upon their Return to the Community 2013
The current inquiry is not without limitations. The small sample of 39 moderate to high risk male parolees inherently limits the generalizability of findings. The experiences and recidivism rates of the current sample may not be reflective of parolees in general, or specific parolees under supervision in other contexts. Particularities about Lansing may not be comparable to other jurisdictions. For instance, considering the employment opportunities for parolees in Lansing, the available jobs may have been somewhat depleted compared to other jurisdictions, but at the same time the parolees largely relied on a single company for employment. Because this single company hired so many parolees, and allowed so many to keep their jobs despite issues with parole non-compliance, it is likely that employment rates among the sample were somewhat inflated. To this extent, we have tried not to over-extend the findings of the current inquiry to other populations, but rather attempted to provide a detailed analysis of the dynamic recidivism experiences of the current sample. Additionally, the small sample size requires that the results of statistical significance tests be interpreted cautiously. The probability of Type-II error – failing to reject the null hypothesis when it actually is false – is increased when analyzing small samples. Additionally, small samples are also likely to violate the assumptions made by tests of statistical significance, such as being normally distributed (Allen, 1997). With this caveat in mind, more attention was devoted to raw observed differences in the data, as opposed to the results of any bivariate statistical tests. However, where significant relationships were observed, these were noted in the text, and interpreted cautiously. We were also limited by the nature of the data available. The limitations associated with the use of secondary records and official data are well known. Among these are that agency records are best considered as social productions, being a combination of the behavior of those being recorded and that of the record keepers. An implication of this is that by relying on official records to determine the extent of recidivism among the sample, we rely on the capacity of the criminal justice system to detect this behavior. This limitation is apparent in the notion that some offending behavior was occurring beneath the detection of parole agents prior to a sample member’s return to prison. We attempted to limit the potential for this bias by utilizing a wide array of recidivism measures, which varied in the level of criminal justice system penetration. As such, while a parole violation may largely be a measure of agency behavior, but an arrest followed by a conviction may be a better indicator that a criminal activity took place. The use of prospective interviews also brought limitations. Like other forms of self-report data, the validity of interview data is contingent on the responses of our participants, which can be affected by issues of recall bias, or reactivity, such as selectively presenting aspects of their story in order to give off a particular meaning to the interviewer. We attempted to limit the potential for these issues by utilizing a semi-structured protocol to guide interviews, conducting interviews as soon after release from prison as possible, and ensuring participant confidentiality. Additionally, because of the transience of the sample and the practicalities of interviewing offenders following recidivism incidents, we were not always able to speak to sample members following recidivism events.

Michigan Justice Statistics Center
Page 73
Risk of Recidivism Facing Offenders upon their Return to the Community 2013
CONCLUSIONS
The purpose of this study was to provide an in-depth, dynamic examination of the recidivism experiences of a small sample of 39 male parolees to Lansing, Michigan. Like some previous examinations of recidivism (e.g., Zamble & Quinsey, 1997), we observed that the violation of supervision conditions was a regularity, at least within our small sample of male parolees. That is, more often than not, the parolee violated at least one of the conditions of their supervision and this behavior was observed by their parole agent. The parolees engaged in a variety of non-compliant behaviors, measured along a continuum of criminal justice system penetration, ranging from minor parole violations, to felony convictions leading to reincarceration. The more minor violations occurred quickly, while the more serious ones tended to take longer to surface.
Not everyone who recidivated was returned to prison. Rather, even individuals with
multiple rearrests ended up completing their parole and being successfully discharged from supervision. The pathways to this point were multifacteted, as some proceeded relatively undisturbed towards a successful discharge, while other still struggled with reentry conditions and recidivism. Still, these individuals used jail stays and residential treatment stays as turning points to alter their offending trajectories. Parole authorities can develop intervention strategies which aid parolees in using recidivism events as constructive opportunities to change offending trajectories through strength-based approaches, and reserving returns to prison for more serious criminal incidents.

Michigan Justice Statistics Center
Page 74
Risk of Recidivism Facing Offenders upon their Return to the Community 2013
APPENDIX A Interview Instrument for Understanding the Challenges
Initial Interview at Release
Introduction The purpose of this interview is to document the challenges you have faced as you move back into the community. Additionally, this interview will document the important things that have helped you.
Pre-Release Planning To start, I would like to ask you about any planning for release that you may have received in prison.
1. Did you receive an introduction to MPRI while in prison? What did this introduction include? Who introduced you to the program?
2. Did you complete a reentry plan while in prison? If yes, what did this plan include? Who helped you create this plan?
Do you feel that your reentry plans were helpful? How helpful? ___YES __NO Did you understand your reentry plan? ___YES __NO 3. Since you have been released, has your participation in MPRI assisted you in
receiving any services (i.e. substance abuse treatment etc.)? 4. What has been most helpful about your participation in MPRI (or reentry plan)? 5. What has been least helpful about your participation in MPRI (or reentry plan)?
Employment Next, I want to ask you some questions about your employment.
1. Before your incarceration, did you have a job? What type of work did you do? 2. How long did you work there? Were you on payroll or were you paid cash? 3. Since your release, have you located a job? Is this permanent work? What are your
wages? What type of work do you do? 4. How long did it take to find a job? Did you have any help in finding this job (Probe:
In-prison program or family member)? 5. Is your current employment enough to cover your monthly expenses? If not, how do
you plan to pay for your additional expenses? 6. (If they are not employed) What are you currently doing to locate a job? Why do
you think finding a job has been hard? (Probe: Lack of job training? Transportation? Negative view towards ex-offenders?)
7. Did you participate in any job programming while in prison? Can you please describe? Was this helpful? (If no, do you feel this would have been helpful?)
Housing Next, I want to ask you about your current living situation.
1. Did you have difficulty locating a place to live after your release?

Michigan Justice Statistics Center
Page 75
Risk of Recidivism Facing Offenders upon their Return to the Community 2013
2. What type of place do you currently live? ___Single Family Home ___Shelter ___Supervised Facility ___Multi-Unit Home (such as apartment building, townhouse, duplex, etc.) 3. Are you currently living with someone? If yes, what is the nature of this relationship?
Is this is a permanent or temporary living arrangement? 4. If temporary, where do you plan to reside once this arrangement ends? Have you
had help locating permanent housing? If so, from whom? 5. In your opinion, is your current neighborhood safe? Explain? 6. Do the people you are currently living with have an arrest history? Explain?
Substance Abuse Treatment Now I want to ask you some questions about any drug/alcohol treatment you might have received.
1. Do you have a history of using drugs? Age of first use? Primary drug of use? 2. Are you currently enrolled in drug treatment? How long? In-patient/outpatient? 3. Did you receive drug treatment in prison? Have you been enrolled in treatment
previously? How many times? If yes, do you think you will remain drug free this go around? Why or why not?
4. Do you live in a neighborhood where individuals are abusing drugs or alcohol? Do you think this will affect you and your ability to not use drugs? Why or why not?
Social Support (Friends or Family) Now I want to ask you some questions about the people who have supported you in your return home.
1. Do you have a person(s) that helps you when you have a need? What is your relationship to this individual? (Probe: girlfriend/boyfriend, sibling, parent)
2. How do they help? (Probe: emotional, financial, housing) 3. Do you think this support is important to you staying out of prison? Explain? 4. Did this person(s) visit you while you were in prison? How often? 5. Did you receive any other visitors while in prison? 6. (If no support) Do you think having positive support from family or friends would
aid in your community success? Explain? If you received support, what would this support look like? (Probe: someone to talk to, financial assistance)
Looking to the Future Next, I am going to ask you some questions about how you see your future.
1. Do you think you will be successful in staying out of prison? 2. What do feel is the most important thing in helping you stay out of prison? (i.e.
employment, family support) 3. Did you have this in the past? If so, why is it different this time? 4. Where do you see yourself in three months?
Optimistic or Pessimistic?

Michigan Justice Statistics Center
Page 76
Risk of Recidivism Facing Offenders upon their Return to the Community 2013
Criminal History/Offender Background Next, I am going to ask you some questions about your background.
1. How long have you been out of prison? How long were you in prison? 2. Why were you in prison? Was this your first time? 3. If no, how many times have you been in prison? What was the age of your first time
in prison? 4. Do you think this was your last time (in prison)? Why or why not (what is different)? 5. When on the street, were some of your friends involved in illegal activities? Explain?
Friends done time? In your home life growing up have your family members done time?
Demographic Information Finally, I am to ask you a few more questions about yourself. This information will help us to be better understand ex-offenders returning to the community.
1. What is your current marital/relationship status? 2. ____Married ____Single ____Partnered ____Divorced
____Widowed ____Separated 3. Do you have kids? ___Yes ___No (Complete interview) 4. If yes, how many kids do you have? ______ 5. Do you currently live with your kids? ____Yes ____No 6. Are you court ordered to pay child support for your kids?
____Yes ____No 7. If no, are you financially responsible for your kids without being ordered by the
court? ____Yes _____No _____Sometimes

Michigan Justice Statistics Center
Page 77
Risk of Recidivism Facing Offenders upon their Return to the Community 2013
Follow up Interviews Introduction
The purpose of this interview is to document the challenges you have faced as you move back into the community in the past three months. Additionally, this
interview will document the important things that have helped your transition over the past three months.
Employment To start, I want to ask you some questions about your employment situation over the past
three months.
1. In the past three months, have you located a job? Is this permanent work? What are your wages? What type of work do you do?
2. How long did it take to locate a job? Did you have any help in locating this job (Probe: In-prison program or family member)?
3. Is your current employment enough to cover your monthly expenses? If not, how do you plan to pay for your additional expenses?
4. (If they are not employed) What are you currently doing to locate a job? Why do you think finding a job has been hard? (Probe: Lack of job training? Transportation? Negative view towards ex-offenders?)
Housing Next, I want to ask you about your current living situation.
1. Did you have difficulty locating a place to live in the past three months? 2. What type of place do you currently live? ___Single Family Home ___Shelter ___Supervised Facility ___Multi-Unit Home (such as apartment building, townhouse, duplex, etc.) 3. Are you currently living with someone? If yes, what is the nature of this relationship?
Is this is a permanent or temporary living arrangement? 4. If temporary, where do you plan to reside once this arrangement ends? Have you
had help locating permanent housing? If so, from whom? 5. In your opinion, is your current neighborhood safe? Explain? 6. Does the person you are currently living with have an arrest history? Explain?
Substance Abuse Treatment Now I want to ask you some questions about any drug/alcohol treatment you might have received over the past three months.
1. Are you currently enrolled in drug treatment? How long? In-patient/outpatient? 2. Have you been enrolled in treatment over the past three months? How many times? If
yes, do you think you will remain drug free this go around? Why or why not? 3. Do you live in a neighborhood where individuals are abusing drugs or alcohol? Do
you think this will affect your treatment? Why or why not?

Michigan Justice Statistics Center
Page 78
Risk of Recidivism Facing Offenders upon their Return to the Community 2013
Social Support (Friends or Family) Now I want to ask you some questions about the people who have supported you in your return home.
1. In the past three months, do you have a person(s) that helps you when you have a need? What is your relationship to this individual? (Probe: girlfriend/boyfriend, sibling, parent)
2. How do they help? (Probe: emotional, financial, housing) 3. Do you think this support is important to you staying out of prison? Explain? 4. Did this person(s) visit you while you were in prison? How often? 5. Did you receive any other visitors while in prison? 6. (If no support) Do you think having positive support from family or friends would
aid in your community success? Explain? If you received support, what would this support look like? (Probe: someone to talk to, financial assistance)
Looking to the Future Next, I am going to ask you some questions about how you see your future.
1. Do you think you will be successful in staying out of prison? 2. What do feel is the most important thing in helping you stay out of prison? (i.e.
employment, family support) 3. Did you have this in the past? If so, why is it different this time? 4. Where do you see yourself in six months?
Demographic Information Finally, I am to ask you a few more questions about yourself. This information will help us to be better understand ex-offenders returning to the community.
1. What is your current marital/partnership status? 2. ____Married ____Single ____Partnered ____Divorced
____Widowed ____Separated 3. Do you have kids? ___Yes ___No (Complete interview) 4. If yes, how many kids do you have? ______ 5. Do you currently live with your kids? ____Yes ____No 6. Are you court ordered to pay child support for your kids?
____Yes ____No 7. If no, are you financially responsible for your kids without being ordered by the
court? ____Yes _____No _____Sometimes

Michigan Justice Statistics Center
Page 79
Risk of Recidivism Facing Offenders upon their Return to the Community 2013
APPENDIX B Timing of Interviews and Attrition (months) (N=39)
Initial Interview 2 Interview 3 Interview 4
Thomas 1 3 Returned Glen 1 17* Jailed Marcus 1 4 9 18* Kevin 1 3* 18+ Study Period Dustin 1 14** Study Period William 1 3 6 Medical Henry 1 11** Study Period Mike 2 13* Jailed Otis 1 4 7 12 Tim 1 18** Study Period Richard 1 Transferred Pedro 1 12+ Study Period Lou 1 15* Jailed Wilber 1 Absconded Calvin 1 Transferred Cliff 1 3 16** Study Period Robby 1 3 10 Jailed Travis 1 3 9 19* Samuel 1 3 6 9 Brian 1 17* Jailed Ron 1 Returned Leslie 1 3 6 14 Paul 1 10 Employed Steve 1 Returned Reggie 1 3 7** 12 Alexander 1 18* Jailed Gary 1 8* Jailed Mark 2 5 Returned Carsten 1 Jailed Shaun 1 15* Jailed Jim 1 15 Disability Dave 1 Returned Matt 1 4 Transferred Rickey 1 Medical Dennis 1 3 7 Returned Erving 1 9* Jailed Dan 1 Transferred Willie 1 9** 12 14* Ken 1 4 Returned NOTE: Table adapted from Harding, Wyse, Dobson, &Morenoff (2011).

Michigan Justice Statistics Center
Page 80
Risk of Recidivism Facing Offenders upon their Return to the Community 2013
CHARACTER KEY: *Interviewed in jail while being held for an arrest, investigation, or a violation of community supervision terms; **Interviewed after unspecified length of stay in jail, correctional center, or residential treatment; +Interviewed after re-release from a return to prison. CLASSIFICATION KEY: Absconded = Participant had been issued an absconder warrant for failure to report. Disability = Interview could not be administered or coordinated due to difficulties with disability status. Employed = Interview could not be administered or coordinated due to full time employment status. Jailed = Participant was jailed in a county facility for an arrest, investigation, or violation of community supervision terms; interview could not be administered or coordinated at the jail to which the participant was being held. If preceding interview is asterisked, this classification indicates that the participant remained in jail. Medical = Participant was discharged from parole due to significant medical problems. Returned = Community supervision status was revoked due to a new sentence or sustained technical violation and the participant was returned to prison. Study Period = Subsequent interviews could not be administered or coordinated due to the close of the research study. Transferred = Participant transferred from local parole field office to a new jurisdiction in the study state; interviews could not be administered or coordinated at the new parole field office.

Michigan Justice Statistics Center
Page 81
Risk of Recidivism Facing Offenders upon their Return to the Community 2013
REFERENCES Agnew, R. (1992). Foundation for a general strain theory of crime and delinquency.
Criminology, 30(1), 47–88. doi:10.1111/j.1745-9125.1992.tb01093.x Agnew, R. (2001). Building on the foundation of general strain theory: Specifying the types of
strain most likely to lead to crime and delinquency. Journal of Research in Crime and Delinquency, 38(4), 319–361. doi:10.1177/0022427801038004001
Ahern, L. K. (2011, March 26th). Lansing-area leaders say Detroit’s woes don’t apply here.
Lansing State Journal. Retrieved from http://www.lansingstatejournal.com/. Alpert, G. P., Macdonald, J. M., & Dunham, R. G. (2005). Police suspicion and discretionary
decision making during citizen stops. Criminology, 43(2), 407–434. doi:10.1111/j.0011-1348.2005.00012.x
Arditti, J. A., & Parkman, T. (2011). Young men’s reentry after incarceration: A developmental
paradox. Family Relations, 60(2), 205–220. doi:10.1111/j.1741-3729.2010.00643.x Baker, T., Metcalfe, C. F., & Piquero, A. R. (2013). Measuring the intermittency of criminal
careers. Crime & Delinquency, Online First Publication. doi:10.1177/0011128712466382 Bellair, P. E., & Kowalski, B. R. (2011). Low skill employment opportunity and African-
American-white differences in recidivism. Journal of Research in Crime and Delinquency, 48(2), 176-208.
Bushway, S. D., Paternoster, R., & Brame, R. (2003). Examining the prevalence of criminal
desistance. Criminology, 41(2), 423–448. doi:10.1111/j.1745-9125.2003.tb00993.x Brennan, T., Dieterich, W., & Ehret, B. (2008). Evaluating the predictive validity of the compas
risk and needs assessment system. Criminal Justice and Behavior, 36(1), 21–40. doi:10.1177/0093854808326545
Carter, M. M., Gibel, S., Giguere, R., & Stroker, R. (2007). Increasing public safety through
successful reentry: Evidence-based and emerging practices in corrections. Silver Spring, MD: Center for Effective Public Policy.
Carson, E. A., & Sabol, W. J. (2012). Prisoners in 2011. Washington, DC: U.S. Department of
Justice, Office of Justice Programs, Bureau of Justice Statistics. Cobbina, J. E. (2009). From prison to home: Women’s pathways in and out of crime.
Dissertation, University of Missouri – St. Louis. Creswell, J. W. (2007). Qualitative inquiry & research design: choosing among five approaches
(2nd ed.). Thousand Oaks, CA: Sage Publications.

Michigan Justice Statistics Center
Page 82
Risk of Recidivism Facing Offenders upon their Return to the Community 2013
D’Alessio, S. J., & Stolzenberg, L. (2003). Race and the probability of arrest. Social Forces, 81(4), 1381–1397. doi:10.1353/sof.2003.0051
Elsby, M. W., Hobijn, B., & Sahin, A. (2010). The labor market and The Great Recession.
Brookings Papers on Economic Activity, Economic Studies Program, The Brookings Institution, 41(1), 1-69.
Engel, R. S., & Calnon, J. M. (2004). Examining the influence of drivers’ characteristics during
traffic stops with police: Results from a national survey. Justice Quarterly, 21(1), 49–90. doi:10.1080/07418820400095741
Engen, R. L., & Steen, S. (2000). The power to punish: Discretion and sentencing reform in the
war on drugs. American Journal of Sociology, 105(5), 1357-1395. Graffam, J., Shinkfield, A., Lavelle, B., & McPherson, W. (2005). Variables affecting successful
reintegration as perceived by offenders and professionals. Journal of Offender Rehabilitation, 40(1-2), 147–171. doi:10.1300/J076v40n01_08
Grattet, R., Lin, J., & Petersilia, J. (2011). Supervision regimes, risk, and official reactions to
parolee deviance. Criminology, 49(2), 371–399. doi:10.1111/j.1745-9125.2011.00229.x Grattet, R., Petersilia, J., & Lin, J. (2008). Parole violations and revocations in California.
Report submitted to the U.S. Department of Justice. Grommon, E. L., & Rydberg, J. (2013). Managing the reentry transition with substance use
propensities: Insights from a sample of parolees in a small, industrialized Midwestern city. In J. Smykla & M. Crow (Eds.) Offender reentry in the 21st century: Rethinking criminology and criminal justice. Sudbury, MA: Jones and Bartlett Learning Publishers.
Grommon, E., Rydberg, J., & Bynum, T. S. (2012). Understanding the challenges facing
offenders upon their return to the community. Report submitted to the U.S. Department of Justice, Office of Justice Programs, Bureau of Justice Statistics.
Hawthorne, J. S., Phillips, B. K., Iiams, M. L., Roushey III, W. J., & Farmer Jr., N. J. (2008).
U.S. Patent No. 7,462,149 B2. Washington, DC: U.S. Patent and Trademark Office. Henrichson, C., & Delaney, R. (2012). The price of prisons: What incarceration costs taxpayers.
New York: Vera Institute of Justice. Holzer, H. J., Raphael, S., & Stoll, M. A. (2004). Will employers hire former offenders?:
Employer preferences, background checks, and their determinants. In M. Pattillo, D. Weiman, & B. Western (Eds.), Imprisoning America: The Social Effects of Mass Incarcertion (pp. 205-243). New York, NY: Russell Sage Foundation.

Michigan Justice Statistics Center
Page 83
Risk of Recidivism Facing Offenders upon their Return to the Community 2013
Holzer, H. J., Raphael, S., & Stoll, M. A. (2006). Perceived criminality, criminal background checks, and the racial hiring practices of employers. The Journal of Law and Economics, 49(2), 451–480. doi:10.1086/501089
Huebner, B. M., & Berg, M. T. (2011). Examining the sources of variation in risk for recidivism.
Justice Quarterly, 28(1), 146–173. doi:10.1080/07418820903365213 Huebner, B. M., Bynum, T. S., Rydberg, J., Kras, K., Grommon, E., & Pleggenkuhle, B. (2012).
An evaluation of sex offender residency restrictions in Michigan and Missouri. Report submitted to the National Institute of Justice.
Jarjoura, G. R., & Haight, K. A. (2011). Estimating the cost savings associated with a 1%
reduction in recidivism for Marion County, Indiana. Indianapolis, IN: Center for Criminal Justice Research.
Kachnowski, V. (2005). Returning Home Illinois policy brief: Employment and prisoner reentry.
Washington, DC: The Urban Institute. Kazemian, L. (2007). Desistance from Crime: Theoretical, empirical, methodological, and policy
considerations. Journal of Contemporary Criminal Justice, 23(1), 5–27. doi:10.1177/1043986206298940
Kitsuse, J. I., & Cicourel, A. V. (1963). A note on the uses of official statistics. Social Problems,
11(2), 131–139. doi:10.2307/799220 Kowalski, B. R., & Lundman, R. J. (2007). Vehicle stops by police for driving while Black:
Common problems and some tentative solutions. Journal of Criminal Justice, 35(2), 165–181. doi:10.1016/j.jcrimjus.2007.01.004
Kurlychek, M. C., Brame, R., & Bushway, S. D. (2006). Scarlet letters and recidivism: Does an
old criminal record predict future offending? Criminology & Public Policy, 5(3), 483-504.
Langan, P. A. & Levin, D. J. (2002). Recidivism of prisoners released in 1994. Washington, DC:
US Department of Justice, Office of Justice Programs, Bureau of Justice Statistics. Lansing State Journal (2008, April 26). A time-line of GM’s history in Lansing. Retrieved March
14th, 2013 from http://www.lansingstatejournal.com/article/20080427/NEWS03/804270691/A-timeline-GM-s-history
Laub, J. H., Nagin, D. S., & Sampson, R. J. (1998). Trajectories of change in criminal offending:
Good marriages and the desistance process. American Sociological Review, 63(2), 225-238.
La Vigne, N. & Cowan, J. (2005). Mapping prisoner reentry: An action research

Michigan Justice Statistics Center
Page 84
Risk of Recidivism Facing Offenders upon their Return to the Community 2013
guidebook. Washington, D.C.: Urban Institute. La Vigne, N. & Parthasarathy, B. (2005). Prisoner Reentry and Residential Mobility.
Washington, DC: The Urban Institute. Laws, D. R., & Ward, T. (2011). Desistance from sexual offending: Alternatives to throwing
away the keys. New York: The Guilford Press. Lynch, M. (2000). Rehabilitation as Rhetoric: The Ideal of Reformation in Contemporary Parole
Discourse and Practices. Punishment & Society, 2(1), 40–65. doi:10.1177/14624740022227854
Maltz, M. D. (1984). Recidivism. Orlando: Academic Press. Maruna, S. (2001). Making good: how ex-convicts reform and rebuild their lives. Washington,
D.C.: American Psychological Association. Maruschak, L. M., & Parks, E. (2012). Probation and parole in the United States, 2011.
Washington, DC: U.S. Department of Justice, Office of Justice Programs, Bureau of Justice Statistics.
Matthews, R. (1997). What’s good for GM…: Deindustrialization and crime in four Michigan
cities, 1975-1993. Unpublished doctoral dissertation, Western Michigan University. Mayzer, R., Gray, M. K., & Maxwell, S. R. (2004). Probation absconders: A unique risk group?
Journal of Criminal Justice, 32(2), 137–150. doi:10.1016/j.jcrimjus.2003.12.004 McCleary, R. (1977). How parole officers use records. Social Problems, 24(5), 576-579. McCleary, R. (1978). Dangerous men: The sociology of parole. New York: Harrow and Heston. Mears, D. P., Wang, X., & Bales, W. D. (2012). Does a rising tide lift all boats? Labor market
changes and their effects on the recidivism of released prisoners. Justice Quarterly, Online First Publication. doi:10.1080/07418825.2012.677466
Merton, R. (1938). Social structure and anomie. American Sociological Review, 3(5), 672-682. Metraux, S., Caterina, R., & Cho, R. (2008). Incarceration and homelessness. 2007 National
Symposium on Homelessness Research. Available at http://www.huduser.org/Publications/pdf/homeless_symp_07.pdf#page=337.
Michigan Bureau of Fiscal Management (2013). Cost per prisoner per day. Retrieved February
6th, 2013 from http://www.michigan.gov/midashboard/0,4624,7-256-60564_60567_60618---,00.html.

Michigan Justice Statistics Center
Page 85
Risk of Recidivism Facing Offenders upon their Return to the Community 2013
Michigan Department of Corrections [MDOC] (2011). Michigan Department of Corrections 2010 annual report. Lansing, MI: Author.
Michigan Department of Corrections [MDOC] (2012). Michigan Department of Corrections
2011 statistical report. Lansing, MI: Author. Michigan Department of Corrections [MDOC] (2013). Prisoner reentry mission/vision.
Retrieved February 6th, 2013 from http://www.michigan.gov/corrections/0,4551,7-119-9741_33218---,00.html.
Morani, N. M., Wikoff, N., Linhorst, D. M., & Bratton, S. (2011). A description of the self-
identified needs, service expendidutes, and social outcomes of participants in a prisoner-reentry program. The Prison Journal, 91(3), 347-365.
Murphy, D. S., & Robinson, M. B. (2008). The Maximizer: Clarifying Merton’s theories of
anomie and strain. Theoretical Criminology, 12(4), 501–521. doi:10.1177/1362480608097154
National Bureau of Economic Research. (2010). Business cycle dating committee. Retrieved
March 14th, 2013 from http://www.nber.org/cycles/sept2010.html. Nelson, M., Deess, P., & Allen, C. (1999). The first month out: Post-incarceration experiences
in New York City. New York: Vera Institute of Justice. Niemark, C. (1992). The hidden dimensions of annual reports: Sixty years of social conflict at
General Motors. Princeton: Markus Wiener. Orrick, E. A., & Morris, R. G. (2012). Do parole technical violators pose a safety threat? An
analysis of prison misconduct. Crime & Delinquency. doi:10.1177/0011128712465585 Pager, D. (2003). The mark of a criminal record. American Journal of Sociology, 108(5), 937-
975. Pager, D. (2007). Marked: Race, crime, and finding work in an era of mass incarceration.
Chicago, IL: University of Chicago Press. Petersilia, J. (1999). Parole and prisoner reentry in the United States. In (Michael Tonry and Joan
Petersilia, eds.) Prisons. Chicago: University of Chicago Press. Petersilia, J. (2000). When prisoners return to the community: Political, economic, and social consequences. Washington, D.C.: National Institute of Justice. Petersilia, J. (2003). When prisoners come home: parole and prisoner reentry. Oxford ; New
York: Oxford University Press.

Michigan Justice Statistics Center
Page 86
Risk of Recidivism Facing Offenders upon their Return to the Community 2013
Pew Center on the States. (2011). State of recidivism: The revolving door of America’s prisons. Washington, DC: The Pew Charitable Trusts.
Piquero, A. R. (2004). Somewhere between persistence and desistance: The intermittency of
criminal careers. In S. Maruna & R. Immarigeon (Eds.), After crime and punishment: Pathways to offender reintegration (pp. 102-125). Cullompton, UK: Willan.
PolicyOptions.org (2013). Michigan prisoner reentry initiative. Retrieved February 6th, 2013
from http://www.policyoptions.org/trenton/modelprogram/michigan-prisoner-reentry-initiative.
Pyrooz, D. C. (2012). Absconding Among juvenile parolees in Arizona: Constructing and
validating a gender-responsive risk instrument. Criminal Justice and Behavior, 39(7), 923–937. doi:10.1177/0093854812437523
Rice, M. E., & Harris, G. T. (2005). Comparing effect sizes in follow-up studies: ROC, Cohen’s
d and r. Law and Human Behavior, 29, 615-620. Roman, C. G., & Travis, J. (2004). Taking stock: Housing, homelessness, and prisoner reentry.
Washington, DC: The Urban Institute. Rudes, D. S. (2012). Getting technical: Parole officers’ continued use of technical violations
under California’s parole reform agenda. Journal of Crime and Justice, 35(2), 249–268. doi:10.1080/0735648X.2012.677572
Sampson, R. J., & Laub, J. H. (1993). Crime in the Making: Pathways and Turning Points
through Life. Cambridge, Mass.: Harvard University Press. Sampson, R. J., & Laub, J. H. (2005). A Life Course View of the Development of Crime. Annals
of the American Academy of Political and Social Science, 602(1), 12-45. Sellin, T. (1931). The basis of a crime index. Journal of Criminal Law and Criminology, 22(2),
335-356. Simon, J. (1993). Poor discipline: Parole and the social control of the underclass, 1890-1990.
Chicago, IL: University of Chicago Press. Soothill, K. (2010). Sex offender recidivism. Crime and Justice, 39(1), 145–211.
doi:10.1086/652385 State Journal Company (1930, January 16th). Lansing and its yesteryears. Author. Steen, S., Engen, R. L., & Gainey, R. R. (2005). Images of danger and culpability: Racial
stereotyping, case processing, and criminal sentencing. Criminology, 43(2), 435–468. doi:10.1111/j.0011-1348.2005.00013.x

Michigan Justice Statistics Center
Page 87
Risk of Recidivism Facing Offenders upon their Return to the Community 2013
Steffensmeier, D., & Demuth, S. (2000). Ethnicity and sentencing outcomes in U.S. federal courts: Who is punished more harshly? American Sociological Review, 65(5), 705-729.
Steffensmeier, D., Ulmer, J., & Kramer, J. (1998). The interaction of race, gender, and age in
criminal sentencing: The punishment cost of being young, black, and male. Criminology, 36(4), 763–798. doi:10.1111/j.1745-9125.1998.tb01265.x
Steiner, B., Makarios, M. D., & Travis, L. F. (2011). Examining the effects of residential
situations and residential mobility on offender recidivism. Crime & Delinquency. doi:10.1177/0011128711399409
Teaford, J. C. (1993). Cities of the heartland: The rise and fall of the industrial Midwest.
Bloomington, IN: Indiana University Press. Tewksbury, R., & Copes, H. (2013). Incarcerated Sex Offenders’ Expectations for Reentry. The
Prison Journal, 93(1), 102–122. doi:10.1177/0032885512467318 U.S. Census Bureau (2005). Michigan – race and hispanic origin for selected large cities and
other places: Earliest census to 1990. Retrieved March 14th, 2013 from http://www.census.gov/population/www/documentation/twps0076/MItab.pdf
Vera Institute of Justice (2012). The price of prisons: What incarceration costs taxpayers:
Michigan fact sheet. New York: Author. Visher, C. A. & Courtney, S. M. E. (2007). One year out: Experiences of prisoners returning to
Cleveland. Washington, DC: The Urban Institute. Visher, C. A., Debus-Sherrill, S. A., & Yahner, J. (2011). Employment after prison: a
longitudinal study of former prisoners. Justice Quarterly, 28(5), 698–718. doi:10.1080/07418825.2010.535553
Visher, C. A. & Travis, J. (2003). Transitions from prison to community: Understanding
individual pathways. Annual Review of Sociology, 29, 89-113. Ward, T., & Maruna, S. (2007). Rehabilitation: Beyond the risk paradigm. London: Routledge. Werth, R. (2012). I do what I’m told, sort of: Reformed subjects, unruly citizens, and parole.
Theoretical Criminology, 16(3), 329–346. doi:10.1177/1362480611410775 Western, B. (2006). Punishment and inequality in America. New York: Russell Sage. Williams, F. P., McShane, M. D., & Dolny, H. M. (2000). Predicting parole absconders. The
Prison Journal, 80(1), 24–38. doi:10.1177/0032885500080001002 Wilson, W. J. (1996). When work disappears. New York: Vintage.

Michigan Justice Statistics Center
Page 88
Risk of Recidivism Facing Offenders upon their Return to the Community 2013
Wolfgang, M., Figlio, R. M., & Sellin, T. (1972). Delinquency in a birth cohort. Chicago: University of Chicago Press.
Young, J. (2011). The criminological imagination. Cambridge: Polity. Zafonte, M., & Sabatier, P. (2004). Short-term versus long-term coalitions in the policy process:
Automotive pollution control, 1963-1989. Policy Studies Journal, 32(1), 75–107. doi:10.1111/j.0190-292X.2004.00054.x
Zamble, E., & Quinsey, V. L. (1997). The criminal recidivism process. Cambridge, UK:
Cambridge University Press.


