Embed Size (px)
Citation preview
SOUTHERN JOURNAL OF AGRICULTURAL ECONOMICS JULY, 1983
RISK-RETURN ASSESSMENT OF IRRIGATION DECISIONSIN HUMID REGIONS
W. G. Boggess, G. D. Lynne, J. W. Jones, and D. P. Swaney
The environment for decision-making at the farm- Objectives of Irrigation Managersfirm level has always been volatile, but particularly soin recent years. Product prices have seen wide fluctua- Amir et al. provides some insight into the overall di-tions, due in part to a reduced emphasis on farm-price lemma faced by the researcher interested in definingsupport programs and more reliance on world markets. "optimal" irrigation strategies in their statement that,Input prices, especially those that are energy related "every farmer has his own experience and preferences(fertilizers, chemicals, fuels), have also increased in which can hardly be formulated in mathematical terms"an erratic manner in recent years. Changes in the basic (p. 1413). This perspective may be correct, althoughinstitutional setting, including farm-price support pol- some inroads have been made with utility analysisicy, water supply regulation, environmental controls, (English and Orlob). Amir et al. suggest the develop-and trade policy have all contributed to variability. As ment of interactive, computer scheduling models en-a result, it has become even more important to better abling the user to execute a "decisive role in directingunderstand the nature of risk and uncertainty-reducing the search (for a strategy) according to his prefer-processes, such as irrigation. ences," which relieves the researcher from specifying
There are many sources of variability affecting ir- a well-defined objective function. A case can be maderigation management. The purpose of this paper is to for this view; however, there are situations whereshow what these sources are and how to include them specifying the choice criterion can be useful, espe-in an analysis, and to suggest the implications for choice cially as it relates to making general recommendationsof an optimal irrigation strategy within a humid re- or formulating water-use policy. Nearly all research-gion, such as the Southeast. We use a time-dynamic ers have chosen this latter approach.soybean-yield simulation model to generate the pro- Most of the literature visualizes a decision-makerduction estimates and other simulators to generate cost having a single-dimensional objective, such as to max-estimates. Historical weather and price information imize unconstrained yield (Anderson and Maass;provide the data sources which "drive" the simula- Ahmed and van Bavel; Dean; DeBoer et al., Fangmeirtors. and Mohammed; Harrington and Heerman; Jackson
and Ferguson; Lambert et al.; Morey and Gilley; Steg-man et al.) or unconstrained profit (Anderson, Jay et
REVIEW OF LITERATURE al.; Boggess et al.; Burt and Stauber; English et al.1981; Gowon et al.; Hart et al., Lembke and Jones;
The irrigation manager is faced with the intricacies Morgan et al.; Van Deman et al.; Windsor and Chow).in the soil-water-atmosphere-plant realm as well as the Others have added various conditions or provisos. Dyllacomplexity of the socio-political-legal-institutional- et al. attempted to minimize nitrate percolation andeconomic setting in which production is planned and drought stress subject to a constraint of maximum yield.implemented. This problem setting has been ad- Hall and Buras; Dudley et al.; Hall and Butcher; anddressed by researchers from many disciplines. The fol- Harris and Mapp suggested maximization of profit,lowing literature review is a comprehensive attempt to subject to a water constraint. Wu and Liang chose toprovide the reader with a means for judging the con- minimize irrigation cost, and Schoney et al. mini-text for the present study. All the irrigation strategy mized water consumption and energy costs, subject toanalyses reported in recent professional (not just eco- maximum yield. Other objectives (which usually givenomic) journals were reviewed to determine: (1) what the same end result) are to maximize evapotranspira-specific objectives were ascribed to the irrigation man- tion (ET), while minimizing applications of water, fer-ager and (2) how the variability issue has been ad- tilizer, and pesticides (Hammond et al. 1981), or todressed. These two dimensions were selected because "conserve" water, while avoiding yield loss (Rhoadesthey are fundamental in providing a perspective on this et al.). Prihar et al. chose to reduce the irrigation-water/literature. pan-evaporation ratio while Trava et al. recommended
W. G. Boggess is an Assistant Professor and G. D. Lynne is an Associate Professor of Food and Resource Economics, University of Florida. J. W. Jones is a Professor and D. P. Swaney isa Research Associate, Department of Agricultural Engineering, University of Florida.
Florida Agricultural Experiment Station Journal Series No. 4659.
135

minimizing irrigation labor costs, subject to maximiz- water, as influenced especially by fuel and laboring yield (no crop stress). Howell and Hiler suggested costs, but also by design features of the irrigationthat maximizing yield subject to a water constraint may system.be appropriate from the perspective of a water-use 5. institutional features of the water supply system,planner, but for the individual irrigation manager, including rules affecting when water can bemaximizing yield is "seldom desirable from an eco- pumped, how much can be diverted, and when itnomic viewpoint" (p. 873). Heerman et al. recog- can be used, especially during water-short years.nized that some producers are interested in maximizing The concentration in the literature has been on yieldyields, while others wish to minimize irrigation and variability, as influenced by aboveground and be-fertilizer costs, subject to varying constraints on prof- lowground conditions.its and/or yields. The irrigation-scheduling service Boggess et al., and Yaron and Strateener envisionedstarted in the Western U.S. by the USDA-ARS (Jen- a multiple-objective function that included yield vari-sen and Wright) is often used under the assumption that ability. Reducing this source of uncertainty is also seenyield is to be maximized, as the goal is to achieve more as a major dimension of the objective function by En-efficient water use without reducing yields. However, glish (see also English and Orlob), as well as by Scho-Jensen et al. (1970) counsel that increased net returns ney et al. Windsor and Chow (p. 32) note thatare necessary to motivate farmers to change from "tra- "assessment of this reduced variability (from irriga-ditionally accepted scheduling methods" (p. 26) to tion) should . . be included in . . model analysis."those provided by USDA-ARS service, suggesting that Hall and Buras; Harris and Mapp; and Yaron andprofit maximization may be a more appropriate goal. Strateener all recognized the influence of product price
As expected, there has been a definite tendency for variability, but none included such variability in thethe economists contributing to the irrigation-strategy analyses. Apparently no one has examined the impactliterature to offer the profit maximization model as most of irrigation cost (water cost) variance on strategy.appropriate. Other scientists (agricultural and civil en- Rhenals and Bras dealt specifically with above-gineers, agronomists, soil scientists) usually suggest ground conditions in the examination of ET uncer-the maximum yield goal. Both will yield the same an- tainty. English et al, were primarily concerned withswer, of course, only if the production function is lin- belowground conditions, with the examination of aear.' Stewart and Hagan (p. 429) note, that crop "filtering" technique for reducing the uncertainty inproduction functions related to field water supply will measurement of a signal (such as soil moisture) to startnearly always be nonlinear. However, this also allows irrigation.that some will be linear, which insures that profit and None of the authors examined institutional changeyield maximum rules give identical results. Also, what r action as a possible source of uncertainty. Only Ya-are the goals of "real life" irrigation managers? Inter- ron and Strateener; Harris and Mapp; and Boggess etestingly, there was no evidence in the literature that the actually presented estimates of the variance of prof-actual behavioral dimensions of these managers had its associated with various strategies and this only asbeen explored, related to yield variability. And only Boggess et al. and
Yaron and Strateener suggested that the minimumVariability and Irrigation in Risk Reduction variance, maximum profit strategy may be the most
preferred by irrigation managers.Variability is all pervasive within this decision en-
vironment, which manifests itself in at least five dif- Directions for this Studyferent and somewhat separable ways:
1. aboveground conditions, such as those relating There appears, then, to be a considerable lack in ourto plant capabilities, manner of soil cultivation, knowledge base regarding the role of random influ-level of weed control, wind conditions, degree ences in choosing an optimal irrigation-schedulingof solar radiation, rainfall quantity and timing, program. Also, there has been little work examininghumidity and temperature. the trade-offs between variance and profit. This paper
2. belowground conditions, including rooting depth quantifies the risks and returns associated with all theand density, nutrient movements and levels, major sources of variability outlined above, except forwater holding and hydraulic features of the soil, institutional uncertainty,2 and trade-offs are exam-proximity to ground water, and infiltration rates. ied. Empirical results are generated for the maximi-
3. product price variability, as perceived through zation of utility, profit, yield, and the average responseeach season as harvest approaches and over sev- to water objectives.eral seasons in sequence. The institutional set-ting for marketing the products is also a variable ECONOMIC DECISION FRAMEWORKhere.
4. marginal costs of irrigation water, where the firm The setting visualized for our irrigation manager isis conceptualized as the producer of irrigation a standard decision problem consisting of three com-
I That is, the decision then becomes either to irrigate for maximum yield or not to irrigate at all. Thus, the maximum profit and maximum yield objectives suggest the same water level andapplication strategies, usually at the water level where crop transpiration (and possibly ET) is maximized.
2 This is justified herein as water supply authorities have yet to institute water regulations in the soybean area of Florida. The problem of (water) institutional uncertainty is real in otherparts of Florida, however, and also may be of concern in other states and regions. Thus, this type of uncertainty should not categorically be ignored as it has been in the literature to date.
136

ponents: (1) an objective or decision criterion, (2) a set 4
of alternative choices, and (3) a set of costs and con- 1I— LINE
straints which limit the choice set. It is assumed, ad- ditionally, that the decision-maker is faced with risky x 3
and uncertain events. The logic of the formulation is that in humid regions the agricultural irrigator not onlyhas an economic demand for water, but must also gen- a 2erally operate his own water-supply (irrigation sys- /tem) service with its concomitant investment and operation costs. The appropriate conceptual formula- 1978
tion must describe these demand and supply relation- I / 1979ships for irrigation water and outline the decision 0 1980
calculus of the manager. This has been detailed else-where.3 - o
Risk assessment of decision alternatives can be ap- 0 ' 2 3 4OBSERVED YIELD, KG/HA (XIO
$ )
proached in several manners. One of the more com- O
mon is the expected utility hypothesis in which Figure Comparison of Simulated to Observeddecision-maker is assumed to maximize expected util- Yields for Three Years of Experimental Data.ity (Anderson, Jock et al.). Perhaps the most widely usedapplication of expected utility is expected value-vari-ance (E-V) analysis, in which expected utility is ex- data in the test set were not used in specifying the modelpressed as a function of the expected value and parameters.associated variance in returns. In essence, the ex- The crop-growth and soil-water models are con-pected value and variance of the decision alternatives trolled by a set of subroutines which include (1) inter-are calculated and the decision-maker chooses from the faces to specify and update model parameters, (2) aefficient set based on his particular utility function. A multiyear driver that runs the simulation under 17 sea-second risk assessment approach revolves around sons of historical weather (temperature, rainfall, ra-probability theory. This approach defines risk to be the diation, and pan evaporation) to obtain expected valuesprobability that the outcome of a particular decision and variances of yield and water variables, and (3) antakes on an undesired value (Pitt). The purpose of risk economic and statistical subroutine which accumu-assessment then is to quantify risk so that different lates the results from different weather seasons andstrategies or decisions can be compared. Both E-V calculates the decision outcome. The model compo-analysis and risk assessment are used in this paper to nents are decribed in more detail in Swaney et al.evaluate the risks associated with alternative irrigation An irrigation cost generator (d'Almada et al.) wasstrategies. used to generate irrigation variable costs for a standard
quarter section (54 hectare), medium-pressure (75p.s.i.), center-pivot irrigation system. This system is
MODEL AND METHODS common throughout the Great Plains sections of thewestern U.S., as well as in the Southeast. With a 1,000-
The economic analysis presented here utilizes a pro- gallon-per-minute pump, the system can make a fullcess simulation model of the soybean crop (Wilkerson revolution applying one centimeter of water in a 24-et al.) that is sensitive to photosynthetically active ra- hour period. Irrigation variable costs were developeddiation (PAR), daily temperature, and soil-water stress, by running the generator for all possible combinationsas determined by a soil-water balance model (Jones and of the variables giving the equationSmajstrla) to simulate the production surface. Thesimulation model is used as a computerized experi- (1) IVCt = [(5.834 - 0.101X + 0.0067X 2) +mental plot in which numerous irrigation strategies can 3.5 (Pd - 0.317)] Wtbe evaluated over multiple weather years at a relativelylow cost in terms of time and money. The simulation wheremodel is more flexible and provides more detailed re-sults than would a statistically estimated production IVC, = per hectare irrigation variables costs in yearfunction. The usefulness of the model is obviously de- t;pendent upon the accuracy of the simulation model re- X = amount of irrigation water applied per ap-sults. To test the validity of the model, field plot results plication in centimeters;from three years of irrigation experiments (Hammond Pd = price of diesel fuel in dollars per liter, fixedet al., unpublished data) were compared to simulated at $0.317 for this analysis;results for the identical strategies and weather years W, = total irrigation water applied in year t in(Figure 1). A comparison of simulated yield with ob- centimeters.served yields indicated a correlation of 0.98. The twosets of data were independent in that the experimental Other variable production costs (e.g., fertilizer and
3 For those not familiar with the static, economic formulation of such a decision problem, see Lynne and Carriker.
137

pesticides) were assumed to increase 10 percent under a function of the variances of the random variables p,irrigation relative to dryland soybeans. Thus, all the y, r, and x.results herein apply to a 54-hectare field of soybeans Equation (2) is a linear function of two product terms,under a center-pivot regime. Also, all other costs were py and rx. Burt and Finley present a procedure for ex-ignored in the following analysis, thus giving a net re- pressing the variance of the product of two randomturn above variable irrigation costs. This is justified variables as a linear function of the variance and co-herein because the concern is for intraseasonal water variance of the two random variables.5 Using theirallocation.4 Fixed costs are of no concern, assuming this procedure, the variance of return for a particular irri-system type has already been chosen. The analyses of gation strategy can be expressed asalternative systems is left for later studies.
(3) 2 = (= i)2a2 + (p)2 2 + (-)2 (2
Optimal Irrigation Timing and Amount. In order to + (i)2 2- 2upyirxi
determine the best parameters of the irrigation-sched- where a2 i is the variance in net returns for irrigationuling strategy for various decision criteria, parameters strategy i; Yi and o2iare the mean and variance of yieldwere varied in a series of simulation runs. These pa- associated with the irrigation strategy i; p and p2 are therameters were amount per application (i) and level of mean andvarianceofsoybeanprice; andoa2arethemeansoil moisture at which irrigation is applied or irrigation and variance of irrigation pumping cost per unit ofthreshold (rj). The optimal values of the parameters can water; xi and oxi are the mean and variance of irrigationbe obtained for a finite set by simply evaluating the rel- water applied for irrigation strategy i; and upyi,rxi is theevant objective function for each pair and selecting the covariance between py, and rxi.pair that results in the optimum value of that function. Two statistical independence assumptions were usedFor this evaluation, the set of i's selected were the in- in deriving equation (3). First, it was assumed that forteger values 0 to 7 centimeters, inclusive. The set of an individual farmer following a fixed irrigation strat-'s ranged from 0 to 100 percent in steps of 10 percent. egy, yield and price are independent. Similarly,
Thus, a total of 88 pairs were simulated for the 17 sea- pumping costs per unit of water and irrigation watersons of historical weather. The expected value and applied are assumed independent. This assumption isstandard deviation of yield, irrigation water applied, believed reasonable for a center-pivot irrigation sys-and energy use were calculated for each of the runs. tem, given the extensive ground water available in most
Variance Calculations. The problem at hand re- of the Southeast and the range of irrigation strategiesquires calculation and analysis of the variability in ex- evaluated.pected gross returns net of variable irrigation costs Following Burt and Finley, the relative contributionassociated with alternative irrigation-scheduling deci- of each component random variable to the variance ofsions. These net returns (7F) can be represented math- -r can be analyzed by normalizing equation (3). Theematically as normalization procedure entails dividing by the sum of
the individual variance components giving(2) Tr = py - rx
where p is the price of soybeans, y is the yield, r is the (4) (y)2 ( + (p)2 o + (r)2 x2 +( r))2 - 2 opyi rxi
marginal cost of irrigation water per unit, x is the (y+) o2 + (p()2 2 + ()2 )2 ( 2amount of irrigation water applied, and -r, p, y, r, andx are all random variables. The variance in xr can be Pp + Pyi + Px + Pr - P pyi,rxi
calculated by two different methods. First, if sufficientrandom observations on Tr exist, the variance can beestimated directly from the observations. This ap- where each term on the right-hand side is the respec-proach, however, provides no information on the pro- tive numerator term divided by the denominator.portion of variance associated with each component of Equations (3) and (4) require knowledge or esti-net returns. A second approach for calculating the mates of the mean and variances of p, yi, r, and xi, andvariance of the returns that does allow partitioning of the covariance of pyi with rxi. The means and vari-the variance among the components is to express it as ances of yi and xi are derived from the simulation re-
4 That is, this paper is designed to address only the intraseasonal decision questions. As pointed out by an anonymous referee, ignoring fixed costs can lead to an overestimate of irrigationreturns in the Southeast. We cannot disagree. However, there are already large numbers of these centerpivot systems operating in the region, especially in Georgia and northern Florida. Theresults of this paper are especially relevant to those growers and irrigators.
5 Briefly, if gross returns are expressed as the product of price and yieldg = py
then a Taylor's series expansion can be used to express g asg = py + (p - p) + (y - ) + (p - ) (y - )
where p and y denote the means of p and y. Taking the expectation of both sides yieldsE(g) = -y + Cov (p,y)
The variance of g then, using the latter two expressions, isVar(g) = E[g - E(g)]
2
(0)2 Var(p) + (0)2 Var() + 2p Cov (p,y)+ E[p - p) (y - )- Covy (p,y)]
2
+ 2pI E(p-p) (y -)2+ 28 E(p - )2 (y - y)
If p and y are stochastically independent then their covariance equals zero and the last four terms of the last expression will be zero. A similar expression was developed for rx to give equation(3)
138

suits, with those of p and r calculated from historical maximum returns strategy, but expected net returns perprice series (USDA, SRS). hectare are $258 lower (Table 1).
Season average prices of soybeans for the period A third possible criterion for scheduling irrigation is1960 to 1980 were converted to 1981 dollars using the to maximize average yield response per unit of irriga-"All Farm Products Prices Received by Farmers In- tion water. A 50 percent threshold and 2-cm-per-ap-dex" (USDA, SRS). The inflated price series was then plication strategy maximizes average yield responsecorrected for a linear trend and the variance in the se- (yield response divided by water applied in Table 1).ries around the trend line calculated. This strategy uses on the average only 40 percent as
A similar approach was used to estimate the vari- much irrigation water as the maximum returns strat-ance in irrigation water costs. Since water costs are a egy. However, the expected yield is approximately 505linear function of fuel prices, equation (1), diesel fuel kg lower and expected net returns $58 lower (Table 1)prices were obtained for the period 1960 to 1980. These than the maximum returns situation.prices were converted to 1981 dollars using the "Pro- E-VAnalysis Results. Expected net returns and stan-duction Items, Taxes, Interest, and Wage Rate Prices dard deviations of net returns for 11 alternative irri-Paid by Farmers Index" (USDA, SRS). The inflated gation strategies are reported in Table 1. As indicatedfuel price series was corrected for a linear trend and the earlier, the 70 percent and 1 cm strategy maximizesvariance in the series around the trend line calculated. expected net returns. However, a 50-percent and 3-cm
The covariance between pyi and rxi was obtained for strategy minimizes the standard deviation of net re-each strategy i by determining pjyij and rjxij for each of turns. A comparison of these strategies with the otherthe 17 years (j = 1 to 17) of weather and price data. strategies indicates that the 50-percent and 3-cm strat-The covariance between the two vectors, gross returns egy dominates all strategies with thresholds lower thanand variable irrigation costs, was then calculated for 50 percent and that the 70-percent and 2-cm strategyeach of the strategies. dominates all strategies with thresholds higher than 70
percent. This translates graphically to a "loop" in E-V space (Figure 3).
RESULTS The explanation for this loop is imbedded in the pro-portion of net returns variance attributable to the var-
The simulations produced a net-return response sur- ious component random variables (Table 1). Sinceface in the variables irrigation threshold (T) and amount irrigation water reduces yield variability, the propor-per application (i) (Figure 2). Maximum net returns tion of total variability attributable to yield variationoccur at a value of 70 percent of field capacity as the declines as irrigation frequency increases (in equationthreshold and a 1-cm application per irrigation. This (4) o, declines and p remains constant). Converse-combination results in an expected net return of ap- ly, the proportion of total variability attributable toproximately $553 per hectare (Figure 2), compared to price and pumping cost increases. The output price$334 for soybeans produced without irrigation. component increases as the irrigation threshold in-
The simulated crop undergoes water stress when- creases from 0 to 70 percent, since - increases and opever soil water drops below 80 percent of water-hold-ing capacity. Thus, the maximum net-returns strategyallows some stress to the crop, as expected, since themarginal cost of irrigation exceeds the marginal value CENTER PIVOT I3G N
55.7 HA 3.8 ma/min.of the increase in yield as irrigation is increased to re- 0.75 IRRIGATION EFFICIENCYduce stress. At the 70 percent threshold, 2 cm of the 7
600cm of water available in the profile have been de- <pleted. The 70 percent and 1 cm strategy replaces only 0.75 cm (assuming a normal operating efficiency for ( /the center-pivot system) of the deficit. In all cases, re- 500 _ ' \ \ turn-maximizing strategies for each of the irrigation / / \\ threshold levels leave some capacity for additional / \ \water storage after irrigation. Given the frequency, Z 400 magnitude, and inherent uncertainty of rainfall in hu- omid areas, an irrigation strategy is desired that does not completely refill the soil profile but leaves some ca- 300IRRIGATION AMOUNT
x 300 ICMpacity for storage of rainwater. Otherwise, deep per- . 2 CMcolation and runoff increase at an economic cost to the 4 CM -
producer. However, if one's objective is to maximize 5CM yield, the analysis indicates that the profile should be 0.2 0.4 0.6 0.8completely refilled whenever the available soil water IRRIGATION THRESHOLDdrops to 80 percent of that available at field capacity.While not shown in Figure 2, the maximum yield ob- Figure 2. Simulated Net Returns Above Variable Ir-jective is realized with values of 1 cm per application rigation Costs as Related to Irrigation Threshold andand the 90-percent threshold. At this combination the Water Application Rate per Hectare, Soybeans.expected yield per hectare is 123 kg greater than the
139
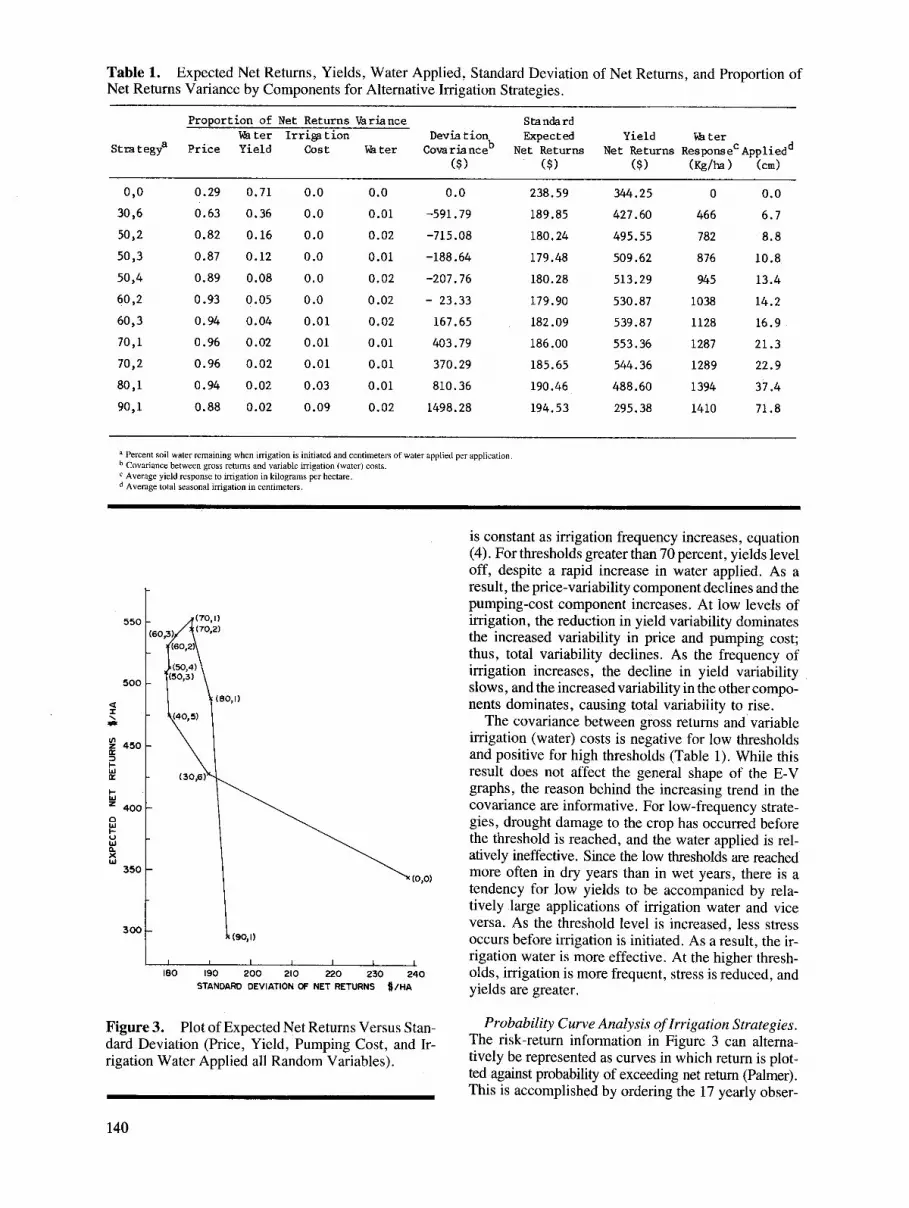
Table 1. Expected Net Returns, Yields, Water Applied, Standard Deviation of Net Returns, and Proportion ofNet Returns Variance by Components for Alternative Irrigation Strategies.
Proportion of Net Returns Variance Standardi ter Irrigation Deviation Expected Yield V ter
Strategya Price Yield Cost Wter Covarianceb Net Returns Net Returns ResponseCAppliedd($) ( ($($) (Kg/ha) (cm)
0,0 0.29 0.71 0.0 0.0 0.0 238.59 344.25 0 0.0
30,6 0.63 0.36 0.0 0.01 -591.79 189.85 427.60 466 6.7
50,2 0.82 0.16 0.0 0.02 -715.08 180.24 495.55 782 8.8
50,3 0.87 0.12 0.0 0.01 -188.64 179.48 509.62 876 10.8
50,4 0.89 0.08 0.0 0.02 -207.76 180.28 513.29 945 13.4
60,2 0.93 0.05 0.0 0.02 - 23.33 179.90 530.87 1038 14.2
60,3 0.94 0.04 0.01 0.02 167.65 182.09 539.87 1128 16.9
70,1 0.96 0.02 0.01 0.01 403.79 186.00 553.36 1287 21.3
70,2 0.96 0.02 0.01 0.01 370.29 185.65 544.36 1289 22.9
80,1 0.94 0.02 0.03 0.01 810.36 190.46 488.60 1394 37.4
90,1 0.88 0.02 0.09 0.02 1498.28 194.53 295.38 1410 71.8
a Percent soil water remaining when irrigation is initiated and centimeters of water applied per application.b Covariance between gross returns and variable irrigation (water) costs.c Average yield response to irrigation in kilograms per hectare.d Average total seasonal irrigation in centimeters.
is constant as irrigation frequency increases, equation(4). For thresholds greater than 70 percent, yields leveloff, despite a rapid increase in water applied. As aresult, the price-variability component declines and thepumping-cost component increases. At low levels of
550 - (70,1) irrigation, the reduction in yield variability dominates(60,3 (70,2) the increased variability in price and pumping cost;
(60,2 thus, total variability declines. As the frequency of50 (50°,41 irrigation increases, the decline in yield variability
500 _ 5, \ slows, and the increased variability in the other compo-^< 7(80,1) nents dominates, causing total variability to rise.
( 40o,5) The covariance between gross returns and variabler 450 _ \ irrigation (water) costs is negative for low thresholds
\ and positive for high thresholds (Table 1). While thisw (30,6 result does not affect the general shape of the E-V
«-~_F \l^^~~~ \graphs, the reason behind the increasing trend in theZ 400 - covariance are informative. For low-frequency strate-@ gies, drought damage to the crop has occurred before
SUQ~~~ •\~~~ ^^~ ^the threshold is reached, and the water applied is rel-x \ atively ineffective. Since the low thresholds are reached
350 more often in dry years than in wet years, there is atendency for low yields to be accompanied by rela-tively large applications of irrigation water and vice
300 _ Xversa. As the threshold level is increased, less stress(9so,) occurs before irrigation is initiated. As a result, the ir-
, . , , ~,I , i ,~ rigation water is more effective. At the higher thresh-180 190 200 210 220 230 240 olds, irrigation is more frequent, stress is reduced, and
STANDARD DEVIATION OF NET RETURNS f/HA yields are greater.
Figure 3. Plot of Expected Net Returns Versus Stan- Probability Curve Analysis of Irrigation Strategies.dard Deviation (Price, Yield, Pumping Cost, and Ir- The risk-return information in Figure 3 can alterna-rigation Water Applied all Random Variables). tively be represented as curves in which return is plot-
ted against probability of exceeding net return (Palmer).This is accomplished by ordering the 17 yearly obser-
140

vations for each strategy on the basis of expected net 800returns and calculating the corresponding cumulative 700 _____ _ _
probability. If the underlying distributions are normal, _60 _0_
these pairs will plot as straight lines on normal prob- (,8o,, [.ability paper. - 7o 0
Probability curves for five alternative irrigation M. 400 i \., |strategies are plotted in Figure 4. The resulting curves 300 __ __ _indicate that the underlying distributions may approx- Z imate normal distributions.6 Notice that no single strat- t 2egy dominates the other four. The 70-percent and 1- x I0oo0- _____cm strategy does dominate the no-irrigation (0,0) and o0 - -the 80-percent and 1-cm strategies. The 70-percent and _ _ _ __1-cm strategy also outperforms the 50-percent and 4- o o 0 2 5 0 203040 506070809095 9899 99.9 99.99
cm and the 60-percent and 3-cm strategies at income PROBABILITY OF EXCEEDING NET RETURNS
levels above the mean. However, in 3 years out of 10, Figure 4. Probability Curves for Five Alternative Ir-no irrigation results in a higher return over variable costs rigaio raegiethan the 80-percent and 1-cm strategy. rigation Strategies.
importance of price variability increases significantlySUMMARY AND CONCLUSIONS as irrigation frequency increases. Variability in pump-
ing costs and amount of irrigation water applied are in-A review of the irrigation-scheduling literature re- significant, except at extremely high irrigation
vealed that mainly single-dimensional decision crite- frequencies. The covariance between gross returns andrion had been used to determine optimal strategies variable irrigation costs, though relatively insignifi-(maximum yield, maximum profit, minimal water for cant, is negative for low-frequency irrigation strate-a fixed level of ET, maximum yield obtainable with a gies and positive for high-frequency irrigationfixed quantity of water, etc.). Also surprisingly, only strategies.3 of the approximately 50 studies examined consid- If price variability exists, risk averse irrigators mayered the risk implications of irrigation. In humid re- choose to irrigate less frequently than the maximum net-gions, one of the primary attractions of irrigation is that return strategy, which dominated all strategies callingit reduces yield variability. In this study, a process for more frequent applications. With both price andsimulation model was used to analyze the impact of al- yield variability present, the maximum-yield irrigationternative irrigation strategies on producers' risks and strategy also maximizes the variance in net returnsnet returns above variable irrigation costs. The results compared to all other irrigation strategies analyzed. Iffor several objectives-maximum net returns, maxi- only yield variability is considered, the maximum yieldmum yield, and maximum return per unit of irrigation irrigation strategy minimizes the variance in net re-water-were identified. The E-V frontier for alterna- turns.tive irrigation strategies was determined and the total These results suggest that decision rules for sched-variability in net returns above the variable costs was uling irrigation may be quite different in humid re-partitioned between applied components of price, yield, gions from those in arid regions and that the riskpumping costs, and irrigation water. This will facili- implications of irrigation are important. The key dif-tate the use of utility considerations to select the ap- ference is the identified need to retain a water storagepropriate points. capacity in the soil to more effectively use rainfall dur-
The results indicate that optimal irrigation strategies ing the growing season. This is not generally neces-in humid areas call for more frequent applications with sary in arid regions. In effect, significant uncertaintysmaller rates than would generally be recommended in is introduced by rainfall events in humid regions. Ad-arid regions. The results also indicate that given the ditional research is needed to extend the analysis to ad-uncertainty of rainfall in humid regions, incomplete ditional crops, combinations of crops, and the impactwetting of the depleted profile maximizes net returns. of irrigation on total firm income and risk. The latter
A breakdown of net-returns variance into its com- concern should be addressed in a suitable irrigation in-ponent parts indicated that the relative importance of vestment analysis that considers the longer-run dimen-yield variability declines significantly, and the relative sion.
REFERENCES
Ahmed, J., and C. M. van Bavel. "Optimization of Crop Irrigation Strategy Under a Stochastic Weather Regime:A Simulation Study." Water Resour. Res. 12(1976): 1241-47.
Amir, I., E. Gofma, S. Pleban, D. Nir, and M. Rodeh. "Computerized Scheduling of Complex Irrigation Sys-tems." Trans. of the ASAE (1980):1413-23.
6 Seventeen observations are probably too few to adequately specify the underlying distribution. As with any estimation problem, confidence in the results increases as the number ofobservations increases. However, even with less than the "desired" number of observations, probability curves are a useful technique for displaying whatever risk information is containedin the observations.
141

Andersen, Jay C., H. H. Hisket, and S. Lackawathana. "Application of Statistical Decision Theory to Water UseAnalysis in Sevier County, Utah," Water Resour. Res. 7(1971):443-452.
Anderson, Jock R., J. L. Dillon, and B. Hardaker. Agricultural Decision Analysis. Iowa State University Press,1977.
Anderson, R. L. and A. Maass. A Simulation of Irrigation Systems. ESCS, USDA, Tech. Bull. No. 1431, 1971.Boggess, W. G., J. W. Jones, D. P. Swaney, and G. D. Lynne, "Evaluating Irrigation Strategies in Soybeans: A
Simulation Approach." Irrigation Scheduling For Water and Energy Conservation in the 80's. Proceed-ings of the Amer. Soc. Agr. Engineers Irrigation Scheduling Conference, ASAE Publication 23-81, De-cember, 1981.
Burt, O. R., and R. M. Finley. "Statistical Analysis of Identities in Random Variables." Amer. J. Agr. Econ.50(1968):734-44.
Burt, O. R., and M. S. Stauber. "Economics Analysis of Irrigation in Subhumid Climates." Amer. J. Agr. Econ.53(1971):33-46.
d'Almada, P. J., G. D. Lynne, and A. G. Smajstrla. A User's Manualfor the Farm Systems Lab Irrigation CostGenerator. University of Florida, Econ. Info. Rpt. 157, January 1982.
Dean, J. D. "Modeling Supplemental Irrigation Water Demand," Irrigation and Drainage Div., Proceedings ofthe ASCE 106(1980):285-297.
DeBoer, D. W., D. D. Brosz, and J. L. Wiersma. "Irrigation Application Depths for Optimum Crop Production."Trans. of the ASAE, 20(1977):1067-78.
Dudley, N. J., D. T. Howell, and W. F. Musgrave. "Optimal Intraseasonal Irrigation Water Allocation." WaterResour. Res. 7(1971):770-87.
Dylla, A. S., H. Shull, and D. R. Timmons. "Computer Simulation of Sprinkler Irrigation Practices for Minne-sota." Trans. of the ASAE 23(1980):1419-23.
English, M. J. "The Uncertainty of Crop Models in Irrigation Optimization." Trans. of the ASAE 24(1981):917-28.
English, M. J., and G. T. Orlob. "Decision Theory Applications and Irrigation Optimization." Calif. Water Re-sour. Ctr., University of California, Contribution No. 174, ISSN 0575-4941, September, 1978.
English, M., M. Glenn, and J. VanSickle. "Scheduling For Optimum Water Use." Irrigation Scheduling For Waterand Energy Conservation in the 80's. Proceedings of the Amer. Soc. of Agr. Engineers Irrigation Sched-uling Conference, ASAE Publication 23-81, December, 1981.
Fangmeier, D. D., and R. A. Mohammed. "Irrigation Management of Short-Season High-Population Cotton."Trans. ofthe ASAE 20(1977):869-72.
Gowon, D. T., J. C. Andersen, and B. Biswas. "An Economic Interpretation of the Impact of Phenologically TimedIrrigation on Corn Yield." W. J. Agr. Econ. 3(1978):145-56.
Hall, W. A., and N. Buras. "Optimum Irrigation Practice Under Conditions of Deficient Water Supply," Trans.of the ASAE 4(1961): 131-34.
Hall, W. A., and W. S. Butcher. "Optimal Timing of Irrigation." J. the Irrigation and Drainage Division, Pro-ceedings of the ASCE 94(1968):267-272.
Hammond, L. C., K. J. Boote, and J. W. Jones. Unpubl. soybean irrigation experimental data, 1978, 1979 and1980, IFAS, University of Florida.
Hammond, L. C., R. B. Campbell, and E. D. Threadgill. "Irrigation Management Strategies for Humid Re-gions." Irrigation Scheduling For Water and Energy Conservation in the 80's. Proceedings of the Amer.Soc. of Agr. Engineers Irrigation Scheduling Conference, ASAE Publication 23-81, December 1981. pp.36-44.
Harrington, G. J. and D. F. Heerman. "State of the Art Irrigation Scheduling Computer Program." IrrigationScheduling For Water and Energy Conservation in the 80's. Proceedings of the Amer. Soc. of Agr. En-gineers Irrigation Scheduling Conference, ASAE Publication 23-81, December, 1981, pp. 171-178.
Harris, T. R., and H. P. Mapp, Jr. "A Control Theory Approach to Optimal Irrigation Scheduling in the OklahomaPanhandle." S. J. Agr. Econ. 12(1980):165-71.
Hart, W. E., D. I. Noram, and G. Peri. "Optimal Seasonal Irrigation Application Analysis." J. of the Irrigationand Drainage Div. Proceedings of the ASCE 106(1980):221-35.
Heerman, D. F., H. R. Haise, and R. H. Mickelson, "Scheduling Center Pivot Sprinkler Irrigation Systems ForCorn Production in Eastern Colorado." Trans. of the ASAE 19(1976):284-93.
Howell, T. A., and E. A. Hiler. "Optimization of Water Use Efficiency Under High Frequency Irrigation -I. IEvapotranspiration and Yield Relationship." Trans. of the ASAE 18(1975):873-78.
Jackson, J. L., Jr., and F. Ferguson, Jr. "Computerized Irrigation Scheduling." Proceedings of the Florida StateHorticultural Soc. 93(1980):5-6
Jensen, M. E., D. N. Robb, and C. E. Franzoy. "Scheduling Irrigations Using Climate-Crop-Soil Data." J. of theIrrigation and Drainage Division, Proceedings of the Amer. Soc. of Civil Engineers 96(1970):25-38.
Jensen, M. E., and J. L. Wright. "The Role of Evapotranspiration Models in Irrigation Scheduling." Trans. ofthe ASAE 21(1978):82-87.
142

Jones, J. W., and A. Smajstrla. "Application of Modeling to Irrigation Management of Soybeans." World SoybeanResearch Conference II Proceedings, edited by F. T. Corgin, pp. 571-99. Boulder: Westview Press, 1980.
Lambert, J. R., C. W. Doty, and V. L. Quisenberry. "Irrigation Scheduling in Humid Areas." Irrigation Sched-uling For Water and Energy Conservation in the 80's. Proceedings of the Amer. Soc. of Agr. EngineersIrrigation Scheduling Conference, ASAE Publication 23-81, December, 1981, pp. 132-43.
Lembke, W. D., and B. A. Jones, Jr. "Selecting a Method for Scheduling Irrigation, Using a Simulation Model."Trans. of the ASAE 15(1972):284-86.
Lynne, G. D., and R. Carriker. "Crop Response Information for Water Institutions." J. of the Irrigation andDrainage Div. Proceedings of the ASCE 105(1979):221-32.
Morey, R. V., and J. R. Gilley. "A Simulation Model for Evaluating Irrigation Management Practices." Trans.of the ASAE 16(1973):979-83.
Morgan, T. H., A. W. Biere, and E. T. Kanemasu. "A Dynamic Model of Corn Yield Response to Water." WaterResour. Res. 16(1980):59-64.
Palmer, B. C. "Optimizing Crop Mix, Planting Dates and Irrigation Strategies." Amer. Soc. of Agr. EngineersPaper No. 81-2097, 1981.
Pitt, R. E. "Risk Assessment as a Decision-Making Tool for Agricultural Engineers." Amer. Soc. of Agr. En-gineers Paper No. NAR80-102, 1980.
Prihar, S. S., K. L. Khera, K. S. Sandhu, and B. S. Sandhu, "Comparison of Irrigation Schedules Based on PanEvaporation and Growth Stages in Winter Wheat." Agronomy J. 68(1976):650-53.
Rhenals, A. E., and R. L. Bras. "The Irrigation Scheduling Problem and Evapotranspiration Uncertainty." WaterResour. Res. 17(1981):1328-38.
Rhoades, J. E., D. L. Corwin, and G. J. Haffman. "Soil Electricity Conductivity." Irrigation Scheduling ForWater and Energy Conservation in the 80's, Proceedings of the Amer. Soc. of Agr. Engineers IrrigationScheduling Conference, ASAE Publication 23-81,December, 1981, pp. 106-15.
Schoney, R. A., L. R. Massie, and T. F. Bay. "Optimizing Irrigation Management of Traveling Guns. " IrrigationScheduling For Water and Energy Conservation in the 80's, Proceedings of the Amer. Soc. of Agr. En-gineers Irrigation Scheduling Conference, ASAE Publication 23-81, December, 1981, pp. 54-60.
Stegman, E. C., L. H. Schiele, and A. Bauer. "Plant Water Stress Criteria for Irrigation Scheduling." Trans. ofthe ASAE 19(1976):850-55.
Stewart, J. I., and R. M. Hagan. "Functions to Predict Effects of Crop Water Deficits." J. of the Irrigation andDrainage Division, Proceedings of the ASCE 99(1973):421-39.
Swaney, D. P., J. W. Jones, W. G. Boggess, G. G. Wilkerson, J. W. Mishoe. "A Crop Simulation Method forEvaluating Within-Season Irrigation Decisions." Amer. Soc. of Agr. Engineers Paper No. 81-4015, 1981.
Trava, J., D. F. Heermann, and J. W. Labadie. "Optimal On-farm Allocation of Irrigation Water." 20(1977):85-95.
Van Deman, J. M., R. Sowell, and R. E. Sneed. "Optimization of Water Use for Irrigation." Amer. Soc. of Agr.Engineers Paper No. 76-2526, 1976.
U. S. Department of Agriculture, Statistical Reporting Service. Agricultural Prices-Annual Summaries, selectedissues.
Wilkerson, G. G., J. W. Jones, K. J. Boote, K. T. Ingram, and J. W. Mishoe. "Modeling Soybean Growth forCrop Management." Amer. Soc. of Agr. Engineers Paper No. 81-4014, 1981.
Windsor, J. S., and V. T. Chow. "Model for Farm Irrigation in Humid Areas." J. of the Irrigation and DrainageDivision, Proceedings of the ASCE 14(1971):369-85.
Wu, I., and T. Liang. "Optimal Irrigation Quantity and Frequency." J. of the Irrigation and Drainage Division,Proceedings of the ASCE 98(1972): 117-33.
Yaron, D., and G. Strateener. "Wheat Response to Soil Moisture and the Optimal Irrigation Policy Under Con-ditions of Unstable Rainfall." Water Resour. Res. 9(1973): 1145-53.
143