Embed Size (px)
Citation preview
INTERNATIONAL JOURNAL OF AGRICULTURE & BIOLOGY
ISSN Print: 1560–8530; ISSN Online: 1814–9596
19–0038/2019/22–6–1681–1696
DOI: 10.17957/IJAB/15.1250
http://www.fspublishers.org
Full Length Article
To cite this paper: Juri, N.M., N.A. Bakar, R.A.Z. Abidin, M. Mahmood, N.B. Saidi, Y. Awang and N.A. Shaharuddin, 2019. RNA-Seq and validation analysis on the
important genes involved in early responses to salinity stress of Malaysian rice seedlings (Oryza sativa ssp. Indica). Intl. J. Agric. Biol., 22: 1681‒1696
RNA-Seq and Validation Analysis on the Important Genes Involved in
Early Responses to Salinity Stress of Malaysian Rice Seedlings (Oryza
sativa ssp. Indica)
Nor Mustaiqazah Juri1,2
, Norliza Abu Bakar2, Rabiatul Adawiah Zainal Abidin
2, Maziah Mahmood
1, Noor Baity
Saidi3, Yahya Awang
4 and Noor Azmi Shaharuddin
1,5*
1Department of Biochemistry, Faculty of Biotechnology and Biomolecular Sciences, Universiti Putra Malaysia, UPM
Serdang, 43400 Selangor, Malaysia 2Malaysian Agricultural Research and Development Institute, Serdang, Selangor, Malaysia 3Department of Cell and Molecular Biology, Faculty of Biotechnology and Biomolecular Sciences, Universiti Putra Malaysia,
UPM Serdang, 43400 Selangor, Malaysia 4Department of Crop Science, Faculty of Agriculture, Universiti Putra Malaysia, UPM Serdang, 43400 Selangor, Malaysia 5Institute of Tropical Agriculture and Food Security, Universiti Putra Malaysia, UPM Serdang, 43400 Selangor, Malaysia *For correspondence: [email protected]; [email protected]
Abstract
Salinization of rice cultivation land has progressively enlarged, thus negatively impaired the world‘s rice bowl. Due to the
polygenic nature and complexity of salinity tolerance mechanisms in plants, the development of new rice varieties with better
adaptation to salinity has become a great challenge. Regarding this, transcriptomic profiling has been seen as a promising
approach for a holistic understanding of salinity tolerance mechanisms in rice. Using Illumina RNA-Seq method,
transcriptomes of two contrasting Malaysian rice varieties named as salt-tolerant MR211 and salt-sensitive MR220 were
analysed within a short-term exposure (9 h) to salt-shock treatment (12 dS m-1) at early seedling stage. Transcriptomic analysis
using Tuxedo package enabled the identification of 252 differentially expressed genes (DEGs). Interestingly, 93.3% of the
DEGs (n=235) were identified as higher and specifically expressed in salt-tolerant MR211 compared to the sensitive variety
(MR220‘s FPKM ≤ 0). This group of DEGs was assigned in 33 KEGG pathways, with the highest number of transcripts
accounted in purine and thiamine metabolism pathways. Meanwhile, functional annotation analyses revealed the presence of
regulatory genes, annotated functional and unknown genes involved in various salt adaptation mechanisms in the salt-tolerant
variety MR211. The expression accuracy and reproducibility of the 252 DEGs identified from the RNA-Seq experiment were
further verified through semi-quantitative RT-PCR followed by real time PCR analysis. © 2019 Friends Science Publishers
Keywords: Comparative transcriptomes; Salt stress; Indica Rice; Seedling stage
Introduction
Rice (Oryza sativa L.) is critical crop for global food
security and ranked as one of the most important crops,
primarily in Asian and certain part of Latin America and
African countries (Muthayya et al., 2014). It feeds almost
half of the world‘s population which represented by more
than 3.5 billion people, as well as important source of
employment and incomes for rural farmers. Over the years,
a massive growth of world‘s population has led to the
increment of global rice demand. It has been estimated that
an additional of 114 million tonnes of rice are required in
order to meet the global rice demand in 2035 (Mohanty et
al., 2013; F.A.O., 2016). Unfortunately, rice is prone to a
wide range of environmental constraints. A stagnation of
rice yield in many Asian countries has been recorded due to
various abiotic stress factors. Among them, salt stress has
been recognised as a significant threat to rice growth and
development, accounting 30 to 50% or even higher losses of
rice yield (Joseph and Mohanan, 2013).
Soil is categorised as saline with electrical
conductivity (EC) of 4 dS m-1 or higher with pH less than 8
and Exchangeable Sodium Percentage (ESP) of less than 15
(Allotey et al., 2008). A continuous salinization process
occurred through the release of soluble salts from parental
rocks, application of chemical fertiliser, increased annual
temperature or rise in global sea level. The coastlines of
Southeast Asia made up of regions that serve as ‗world rice
bowl‘ are highly vulnerable to the effects of climate change
(Yuen and Kong, 2009). In Malaysia, Indonesia and
Vietnam, thousands square kilometre loss of land have been
expected due to the yearly 30–50 cm increment of the sea
Juri et al. / Intl. J. Agric. Biol., Vol. 22, No. 6, 2019
1682
level (Wassmann et al., 2004). Granary lands especially
those located on delta and coastal areas as well as the rising
of sea level will lead into sea water intrusion and
submersion of the fertile fields under sea, thus making it
unsuitable for rice planting.
Depending on its concentration and duration, salinity
stress invokes various changes in physiological and
metabolic events in plants, which ultimately inhibit their
production and survival. The destructive effect of soil
salinity is caused by two major factors known as osmotic
and ionic effects (Kosová et al., 2013). Osmotic effect
occurs when high levels of salt ion around plant root are
triggered into the decreasing of cellular osmotic potential,
leading to cell dehydration. Meanwhile, ionic effect happens
when the salt ion penetrates and accumulate in cell
cytoplasm via plasma membrane. These effects will result in
the interruption of intracellular enzyme activities,
disruption of membrane structures and functions,
nutrient imbalance, accumulation of reactive oxygen
species (ROS), decreased photosynthetic activity,
decrease in stomatal aperture as well as reduction of cell
division and expansion (Rahnama et al., 2010).
Cereal crops specifically rice is very sensitive to
salinity. However, its degree of susceptibility differs widely
between varieties. Certain rice varieties possess unique
ability to adapt to a toxic level of salt stress, whereas others
are greatly susceptible, thus demonstrating the diversity of
their genetic makeup and regulatory architecture (Ferreira et
al., 2015; Patishtan et al., 2017). Based on standard
evaluating score (SES) in rating the visual symptoms of salt
toxicity (I.R.R.I., 2002), Malaysian rice variety, MR211, has
been categorised as the most tolerant variety, whereas
MR220 has been considered the most susceptible variety
(Hakim et al., 2010). MR211 stably exhibits its salt-
resistance trait at various growth stages including
germination to seedling, vegetative to maturation as well as
during callus regeneration stage (Hakim et al., 2014).
Interestingly, MR211 has been found to be comparative to
Pokkali, a widely used salt-tolerant check variety and a salt-
tolerant donor in various breeding programmes.
Salinity tolerance is a quantitative trait controlled by
many genes involved in different pathways. Therefore, a full
understanding on the molecular responses of rice plants to
varying conditions and identification of genes involved in
salinity stress response is crucial to serve as a foundation in
developing rice with better adaptation to salinity. In this
prospect, identification of salt stress related genes is a
promising approach in crop improvement programme
through the development of rice varieties with higher
harvestable yield during environmental stresses (Amudha
and Balalubramani, 2011). Although the conventional
breeding has been playing a crucial role in rice
improvement, it is somewhat a slow process and time
consuming. Plant biotechnology through genetic
engineering and molecular breeding approaches offer much
rapid development in a crop improvement programme under
stressful environments. Recently, the attention on utilizing
modern high-throughput genetic approach such as
transcriptomics and proteomics has extensively grown. As
plants vary in their response to stresses, the application of
these ―omics‖ methods in comparative studies between
related plant species enables the identification of various
functional genes, their transcript and protein products,
including the novel ones that are responsible for stress
responses and adaptation. In this study, using Illumina RNA-Seq method,
transcriptomes of two contrasting Malaysian rice varieties, salt-tolerant MR211 and salt-sensitive MR220 in responses to salt stress treatment were analysed. Transcriptomes analysis using Tuxedo package enabled the identification of significant genes differentially expressed between both varieties where further analyses had identified early responses candidate genes related to salt tolerant in rice, specifically in early seedling stage. The data generated from this study will serve as an invaluable genomic reference to further the knowledge on molecular and cellular events that specifically occur in rice seedlings during their early response to severe salinity stress. Not only constricted as the candidate genes for rice improvements through genetic engineering, the potential salt tolerant genes can also be utilised as DNA markers to fasten the selection process in conventional breeding.
Materials and Methods
Plant Materials and Salinity Shock Treatments
Two contrasting Malaysian rice varieties, salt-tolerant MR211 and salt-sensitive MR220 supplied by Malaysian Agricultural Research and Development Institute (MARDI) were used in this study. The seeds were surface-sterilized by soaking them in 70% of sodium hypochlorite solution (Clorox®) for 15 min followed by 5 times of rinsing cycle with distilled water. The sterilized seeds then were sown on wetted tissue paper and were placed in the dark incubator at 28ºC for three days. Then, the germinated seeds with approximately 1 cm length of radicle and plumule were carefully transferred into Yoshida‘s nutrient solution (Yoshida et al., 1976) and were let grow in control condition (28°C, 12 h light/12 h dark cycle). The salt-shock treatment of seedlings started at the first day of their 4th weeks of growth in the hydroponic system or specifically in 22-day-old seedlings. Single-step application of salt (Shavrukov, 2012) was conducted by dissolving the NaCl powder in the freshly prepared full-strength working nutrient solution until a desired EC 12 dS m-1. The solution‘s EC was measured by EzDo 6061 Waterproof EC Meter (Instrument Choice, Australia). The pH of the solutions was kept at 5.0. The untreated seedlings were set as control plant. The experimental design adopted randomized complete design (RCD) with three replicates for each sample. Shoots of seedlings were collected at the 9th h after treatment and immediately stored at -80°C.
Salt Stress Responsive Genes in Rice / Intl. J. Agric. Biol., Vol. 22, No. 6, 2019
1683
Total RNA Extraction, cDNA Library Construction and
Reads Sequencing
The triplicates samples of salt-treated plants of MR211 (S1-
211, S2-211 and S3-211) and MR220 (S1-220, S2-220 and
S3-220) were pooled together and ground into a fine powder
in a cooled mortar and pestle under liquid nitrogen.
Approximately 100 mg of the finely powdered samples
were filled into pre-chilled 2.5 mL micro-centrifuge tubes.
Extraction of total RNA was conducted by using RNeasy
Plant Mini Kit (Qiagen, USA), followed by quantity and
integrity check by using Agilent Technologies 2100
Bioanalyzer. RNA samples with RIN ≥ 6 were outsourced
to Macrogen (Korea) for cDNA library construction and
sequenced using Illumina Hiseq TM 2000 platform
(Illumina, USA). cDNA libraries of both samples were
prepared by using Illumina® TruSeq™ RNA Sample
Preparation Kit, by following manufacturer's instructions.
Poly-A containing mRNA was purified from the total RNA
using poly-T oligo-attached magnetic beads and fragmented
using divalent cations under elevated temperature. First
strand cDNA was synthesized using reverse transcriptase
and random primers followed by second strand cDNA
synthesis using DNA Polymerase I and RNase H. These
cDNA fragments then go through an end repair process, the
addition of a single ‗A‘ base, followed by adapters ligation.
The products were then purified and enriched with PCR
before loaded into Illumina HiSeq2000 instrument for
paired-end sequencing. The sequence files of S211 and
S220 were generated in FASTQ format.
Reads Mapping and Transcripts Assembly
Raw sequenced reads generated from the S211 and S220
cDNA library sequencing were trimmed using Trimmo
matic (0.32) (Bolger et al., 2014) to remove any low quality
bases (Q ≤ 30), adapters and reads below 36 bases long.
High-quality reads of S211 and S220 libraries were
individually aligned to Oryza sativa Japonica IRGSP-1.0
genome assembly (http://rapdb.dna.affrc.go.jp/) using
TopHat (http://TopHat.cbcb.umd.edu/), which incorporates
the Bowtie (http://bowtie-bio.sourceforge.net/index.shtml)
algorithm to perform the alignment. The assembling of the
mapped reads into their respective transcripts was conducted
by Cufflinks (http://cufflinks.cbcb.umd.edu/). Cufflinks
utilizes the normalized RNA-Seq fragment counts to
quantify the transcripts relative abundances. Fragments per
Kilobase of exon per Million fragments mapped (FPKM)
was used as the unit of measurement.
Identification of Differentially Expressed Genes (DEGs)
Cufflinks, which were packaged with CuffCompare,
CuffMerge and CuffDiff programs, was used to sort out the
significant genes that were differentially expressed between
the assembled transcripts of S211 and S220. CuffMerge was
used to assemble and construct consensus transcripts
between S211 and S220. CuffDiff was used to determine
significant genes which expressed differentially in both
samples. FPKM was used as a unit for the quantification,
whereas FDR cut- off = 0.05 and absolute log2 ratio
(Log2FC) ≥ 2 was set as the threshold to trace the significant
genes. From the CuffDiff output, CummeRbund
(http://compbio.mit.edu/cummeRbund/) package was used
to generate a volcano plot and heatmap was used to display
the expression of the DEGs in a graphical form.
Functional Annotation of DEGs
Functional annotation of DEGs was determined by referring
on the Rice Annotation Project Database (RAP-DB) (Sakai
et al., 2013). DEGs that were not annotated in RAP-DB were
classified as unknown/novel and their possible functions
were predicted by subjecting their sequences for homology
search in NCBI non-redundant (Nr) database through
BLASTX search via Blast2GO program
(https://www.blast2go.com/). The identification of Gene
Ontology (GO) term, KEGG pathway and conserved domains
of DEGs were also performed via Blast2GO program.
Semi-quantitative RT-PCR and Real-time PCR Analysis
The reproducibility of the DEGs identified from the RNA-
Seq experiment was further validated by semi-quantitative
RT-PCR and real-time PCR. Nine representative DEGs
were selected. The selection was made based on previous
reports on their involvement in salinity stress responses, as
well as representing each expression category of the DEGs
from the comparative express ion in S211 and S220
samples. The specific primers for each gene were designed
using Primer-BLAST in NCBI
(http://www.ncbi.nlm.nih.gov/tools/primerblast). For
housekeeping genes (HNR and EP), the primer sequence
was taken from Maksup et al. (2013). The details on the
primers used for semi-quantitative RT-PCR and real-time
PCR were listed in Table 1.
Preparation of triplicate samples of untreated and salt-
treated MR211 and MR220 seedling samples used were
repeated by following the exact steps and parameters that
were used in the preparation of plant samples for previous
transcriptomic analysis. The triplicate samples of control
and salt-treated seedlings, S211 and S220 were extracted by
using RNeasy Plant Mini Kit (Qiagen, USA) following the
manufacturer‘s protocol. The qualities of extracted RNA
were analyzed in 1% agarose through gel electrophoresis
and were quantified with NanoDrop ND 1000
spectrophotometer (Thermo Scientific, USA). cDNA were
synthesized by using iScript cDNA Synthesis Kit (Bio-Rad,
USA) following to manufacturer‘s protocol.
Semi-quantitative RT-PCR was conducted using
TECHNE-TC 521 thermal cycler (TECHNE, U.K.). The
standard PCR program used was initial denaturation at 94oC
for 5 min, 94°C for 15 sec (denaturation), 60°C for 1 min
(annealing) and 72°C for 7 min. A final volume of 25 µL of
Juri et al. / Intl. J. Agric. Biol., Vol. 22, No. 6, 2019
1684
PCR reaction mix were prepared, containing 1 µg of cDNA
template, 0.6 µM of each forward and reverse primer, 0.2
Mm of each dNTP mixture (Promega, USA), 2.5 units of
Taq DNA Polymerase (Invitrogen, USA), 1× PCR buffer
minus Mg (Invitrogen, USA), 1.5 mM MgCl2 and
autoclaved distilled water. Three µL of the PCR products
were run on 2% agarose gel electrophoresis and the size of
band were determined according to VC 100 bp DNA
Ladder (Vivantis, USA). The image of ethidium bromide-
stained PCR products in agarose gels were quantified using
Image J software (Antiabong et al., 2016). Analysis on the
quantified band intensity of each candidate gene in different
cDNA samples was performed according to Luke Miller‘s
method at lukemiller.org/index.php/2010/11/analyzing-gels-
and-western-blots-with-image-j.
Real-time PCR was performed using 96-well plates
BIO-RAD CFX96 Real-time PCR System thermocycler
(Bio-Rad, Berkeley, CA, USA). The PCR reaction per well
contained 1 µg of the first strand cDNA, 0.4 µM forward
and reverse primers and 1× master mix of SensiFAST
SYBR No-Ro x Kit (Bioline, U.K.). For negative control
(NTC), water was added to a master mix instead of cDNA.
Ten μL of PCR reaction components were transferred to the
wells in triplicate. The PCR condition was set to 95°C for 2
min, 40 cycles of 95°C for 15 sec and 60°C for 1 min.
Melting curve analysis were performed after the last
cycle finished at 65°C to 95°C to verify the specificity
of the amplification. The analyses were carried out with
auto baseline and manual threshold chosen from the
exponential phase of the PCR amplification. The Cq
values of each candidate genes between different cDNA
samples were performed according to relative quantification
ΔΔCq (2−ΔΔCq) method (Livak and Schmittgen, 2001) using
multiple reference genes for normalization.
Results
RNA-Seq, Reads Mapping and Transcripts Assembly
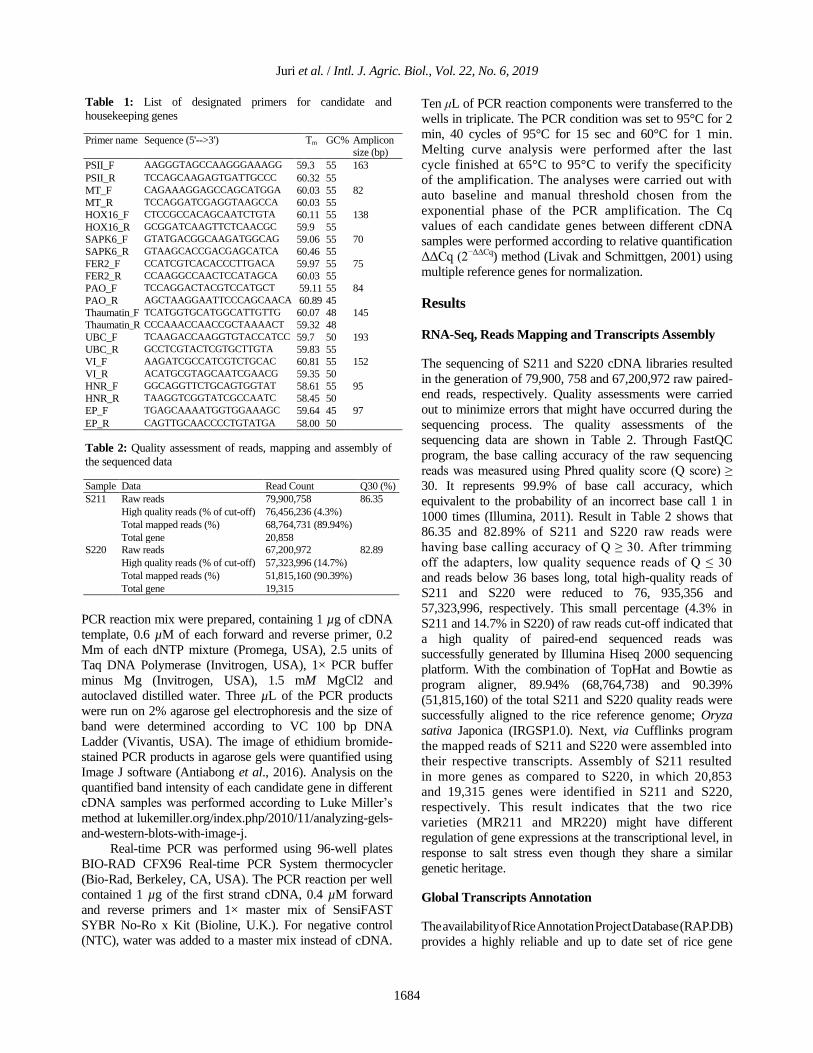
The sequencing of S211 and S220 cDNA libraries resulted
in the generation of 79,900, 758 and 67,200,972 raw paired-
end reads, respectively. Quality assessments were carried
out to minimize errors that might have occurred during the
sequencing process. The quality assessments of the
sequencing data are shown in Table 2. Through FastQC
program, the base calling accuracy of the raw sequencing
reads was measured using Phred quality score (Q score) ≥
30. It represents 99.9% of base call accuracy, which
equivalent to the probability of an incorrect base call 1 in
1000 times (Illumina, 2011). Result in Table 2 shows that
86.35 and 82.89% of S211 and S220 raw reads were
having base calling accuracy of Q ≥ 30. After trimming
off the adapters, low quality sequence reads of Q ≤ 30
and reads below 36 bases long, total high-quality reads of
S211 and S220 were reduced to 76, 935,356 and
57,323,996, respectively. This small percentage (4.3% in
S211 and 14.7% in S220) of raw reads cut-off indicated that
a high quality of paired-end sequenced reads was
successfully generated by Illumina Hiseq 2000 sequencing
platform. With the combination of TopHat and Bowtie as
program aligner, 89.94% (68,764,738) and 90.39%
(51,815,160) of the total S211 and S220 quality reads were
successfully aligned to the rice reference genome; Oryza
sativa Japonica (IRGSP1.0). Next, via Cufflinks program
the mapped reads of S211 and S220 were assembled into
their respective transcripts. Assembly of S211 resulted
in more genes as compared to S220, in which 20,853
and 19,315 genes were identified in S211 and S220,
respectively. This result indicates that the two rice
varieties (MR211 and MR220) might have different
regulation of gene expressions at the transcriptional level, in
response to salt stress even though they share a similar
genetic heritage.
Global Transcripts Annotation
The availability of Rice Annotation Project Database (RAP-DB)
provides a highly reliable and up to date set of rice gene
Table 1: List of designated primers for candidate and
housekeeping genes
Primer name Sequence (5'-->3') Tm GC% Amplicon
size (bp)
PSII_F AAGGGTAGCCAAGGGAAAGG 59.3 55 163
PSII_R TCCAGCAAGAGTGATTGCCC 60.32 55
MT_F CAGAAAGGAGCCAGCATGGA 60.03 55 82
MT_R TCCAGGATCGAGGTAAGCCA 60.03 55
HOX16_F CTCCGCCACAGCAATCTGTA 60.11 55 138
HOX16_R GCGGATCAAGTTCTCAACGC 59.9 55
SAPK6_F GTATGACGGCAAGATGGCAG 59.06 55 70
SAPK6_R GTAAGCACCGACGAGCATCA 60.46 55
FER2_F CCATCGTCACACCCTTGACA 59.97 55 75
FER2_R CCAAGGCCAACTCCATAGCA 60.03 55
PAO_F TCCAGGACTACGTCCATGCT 59.11 55 84
PAO_R AGCTAAGGAATTCCCAGCAACA 60.89 45
Thaumatin_F TCATGGTGCATGGCATTGTTG 60.07 48 145
Thaumatin_R CCCAAACCAACCGCTAAAACT 59.32 48
UBC_F TCAAGACCAAGGTGTACCATCC 59.7 50 193
UBC_R GCCTCGTACTCGTGCTTGTA 59.83 55
VI_F AAGATCGCCATCGTCTGCAC 60.81 55 152
VI_R ACATGCGTAGCAATCGAACG 59.35 50
HNR_F GGCAGGTTCTGCAGTGGTAT 58.61 55 95
HNR_R TAAGGTCGGTATCGCCAATC 58.45 50
EP_F TGAGCAAAATGGTGGAAAGC 59.64 45 97
EP_R CAGTTGCAACCCCTGTATGA 58.00 50
Table 2: Quality assessment of reads, mapping and assembly of
the sequenced data
Sample Data Read Count Q30 (%)
S211 Raw reads 79,900,758 86.35
High quality reads (% of cut-off) 76,456,236 (4.3%)
Total mapped reads (%) 68,764,731 (89.94%)
Total gene 20,858
S220 Raw reads 67,200,972 82.89
High quality reads (% of cut-off) 57,323,996 (14.7%)
Total mapped reads (%) 51,815,160 (90.39%)
Total gene 19,315
Salt Stress Responsive Genes in Rice / Intl. J. Agric. Biol., Vol. 22, No. 6, 2019
1685
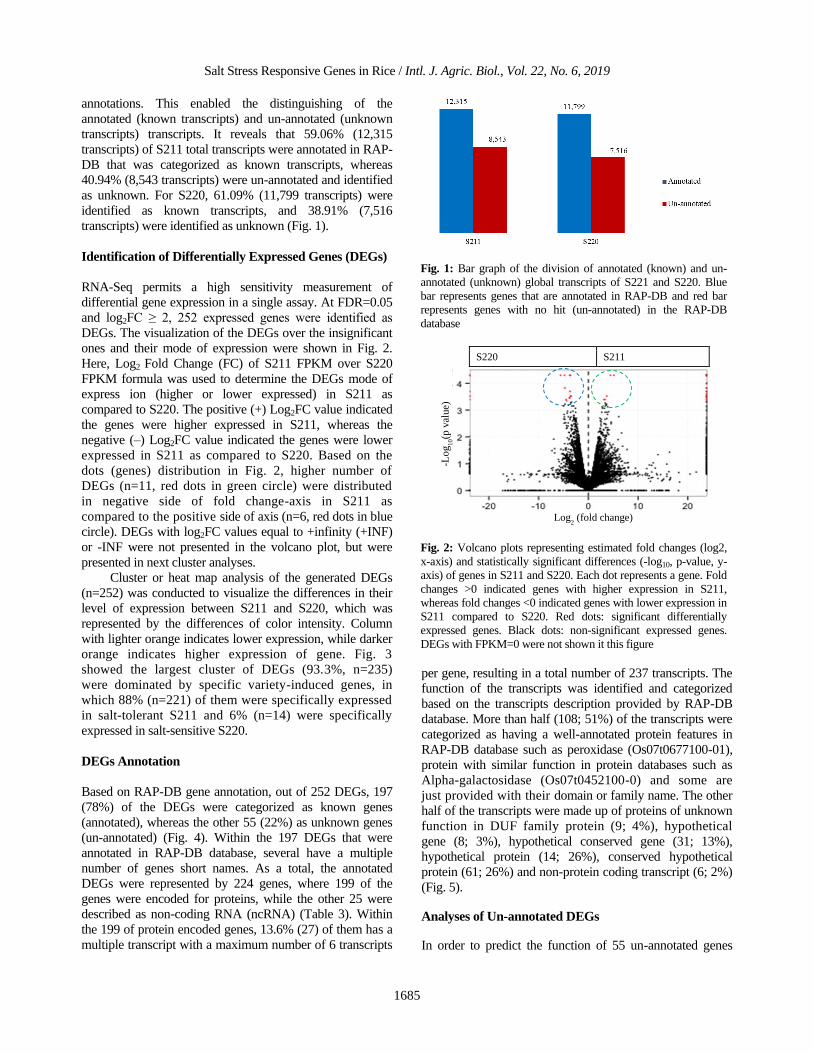
annotations. This enabled the distinguishing of the
annotated (known transcripts) and un-annotated (unknown
transcripts) transcripts. It reveals that 59.06% (12,315
transcripts) of S211 total transcripts were annotated in RAP-
DB that was categorized as known transcripts, whereas
40.94% (8,543 transcripts) were un-annotated and identified
as unknown. For S220, 61.09% (11,799 transcripts) were
identified as known transcripts, and 38.91% (7,516
transcripts) were identified as unknown (Fig. 1).
Identification of Differentially Expressed Genes (DEGs)
RNA-Seq permits a high sensitivity measurement of
differential gene expression in a single assay. At FDR=0.05
and log2FC ≥ 2, 252 expressed genes were identified as
DEGs. The visualization of the DEGs over the insignificant
ones and their mode of expression were shown in Fig. 2.
Here, Log2 Fold Change (FC) of S211 FPKM over S220
FPKM formula was used to determine the DEGs mode of
express ion (higher or lower expressed) in S211 as
compared to S220. The positive (+) Log2FC value indicated
the genes were higher expressed in S211, whereas the
negative (–) Log2FC value indicated the genes were lower
expressed in S211 as compared to S220. Based on the
dots (genes) distribution in Fig. 2, higher number of
DEGs (n=11, red dots in green circle) were distributed
in negative side of fold change-axis in S211 as
compared to the positive side of axis (n=6, red dots in blue
circle). DEGs with log2FC values equal to +infinity (+INF)
or -INF were not presented in the volcano plot, but were
presented in next cluster analyses.
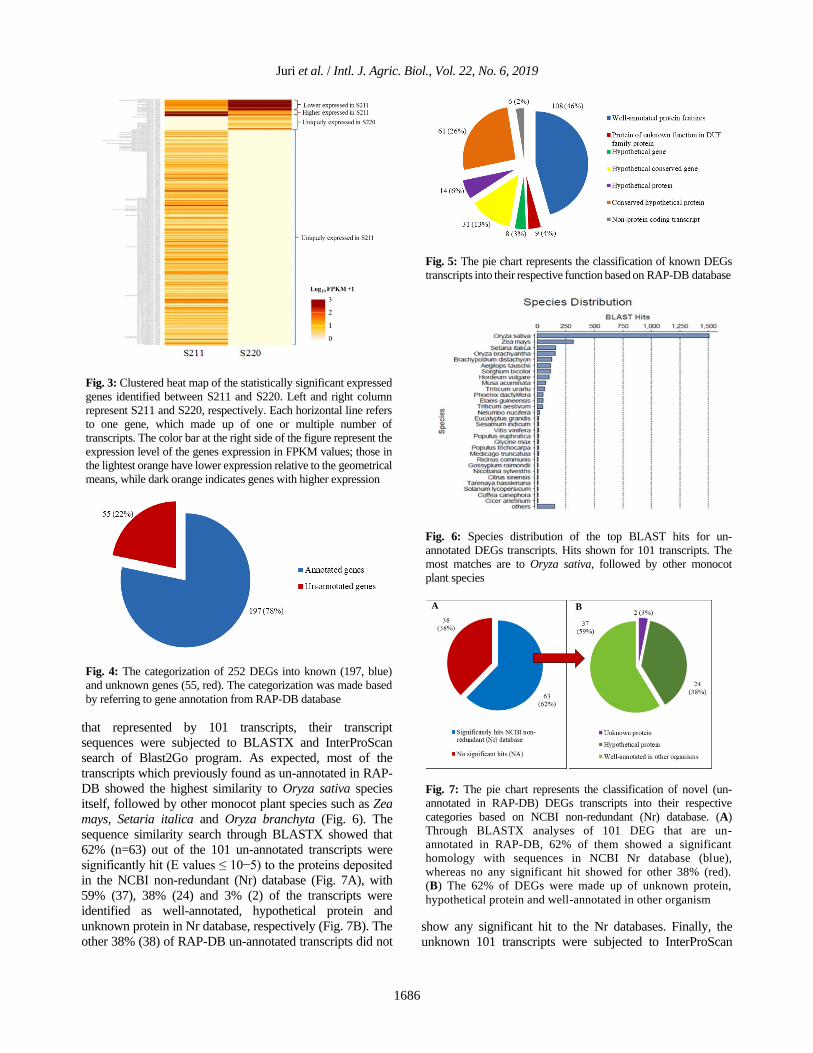
Cluster or heat map analysis of the generated DEGs
(n=252) was conducted to visualize the differences in their
level of expression between S211 and S220, which was
represented by the differences of color intensity. Column
with lighter orange indicates lower expression, while darker
orange indicates higher expression of gene. Fig. 3
showed the largest cluster of DEGs (93.3%, n=235)
were dominated by specific variety-induced genes, in
which 88% (n=221) of them were specifically expressed
in salt-tolerant S211 and 6% (n=14) were specifically
expressed in salt-sensitive S220.
DEGs Annotation
Based on RAP-DB gene annotation, out of 252 DEGs, 197
(78%) of the DEGs were categorized as known genes
(annotated), whereas the other 55 (22%) as unknown genes
(un-annotated) (Fig. 4). Within the 197 DEGs that were
annotated in RAP-DB database, several have a multiple
number of genes short names. As a total, the annotated
DEGs were represented by 224 genes, where 199 of the
genes were encoded for proteins, while the other 25 were
described as non-coding RNA (ncRNA) (Table 3). Within
the 199 of protein encoded genes, 13.6% (27) of them has a
multiple transcript with a maximum number of 6 transcripts
per gene, resulting in a total number of 237 transcripts. The
function of the transcripts was identified and categorized
based on the transcripts description provided by RAP-DB
database. More than half (108; 51%) of the transcripts were
categorized as having a well-annotated protein features in
RAP-DB database such as peroxidase (Os07t0677100-01),
protein with similar function in protein databases such as
Alpha-galactosidase (Os07t0452100-0) and some are
just provided with their domain or family name. The other
half of the transcripts were made up of proteins of unknown
function in DUF family protein (9; 4%), hypothetical
gene (8; 3%), hypothetical conserved gene (31; 13%),
hypothetical protein (14; 26%), conserved hypothetical
protein (61; 26%) and non-protein coding transcript (6; 2%)
(Fig. 5).
Analyses of Un-annotated DEGs
In order to predict the function of 55 un-annotated genes
Fig. 1: Bar graph of the division of annotated (known) and un-
annotated (unknown) global transcripts of S221 and S220. Blue
bar represents genes that are annotated in RAP-DB and red bar
represents genes with no hit (un-annotated) in the RAP-DB
database
S220 S211
-Lo
g1
0(p
val
ue)
Log2 (fold change)
Fig. 2: Volcano plots representing estimated fold changes (log2,
x-axis) and statistically significant differences (-log10, p-value, y-
axis) of genes in S211 and S220. Each dot represents a gene. Fold
changes >0 indicated genes with higher expression in S211,
whereas fold changes <0 indicated genes with lower expression in
S211 compared to S220. Red dots: significant differentially
expressed genes. Black dots: non-significant expressed genes.
DEGs with FPKM=0 were not shown it this figure
Juri et al. / Intl. J. Agric. Biol., Vol. 22, No. 6, 2019
1686
that represented by 101 transcripts, their transcript
sequences were subjected to BLASTX and InterProScan
search of Blast2Go program. As expected, most of the
transcripts which previously found as un-annotated in RAP-
DB showed the highest similarity to Oryza sativa species
itself, followed by other monocot plant species such as Zea
mays, Setaria italica and Oryza branchyta (Fig. 6). The
sequence similarity search through BLASTX showed that
62% (n=63) out of the 101 un-annotated transcripts were
significantly hit (E values ≤ 10−5) to the proteins deposited
in the NCBI non-redundant (Nr) database (Fig. 7A), with
59% (37), 38% (24) and 3% (2) of the transcripts were
identified as well-annotated, hypothetical protein and
unknown protein in Nr database, respectively (Fig. 7B). The
other 38% (38) of RAP-DB un-annotated transcripts did not show any significant hit to the Nr databases. Finally, the
unknown 101 transcripts were subjected to InterProScan
Fig. 3: Clustered heat map of the statistically significant expressed
genes identified between S211 and S220. Left and right column
represent S211 and S220, respectively. Each horizontal line refers
to one gene, which made up of one or multiple number of
transcripts. The color bar at the right side of the figure represent the
expression level of the genes expression in FPKM values; those in
the lightest orange have lower expression relative to the geometrical
means, while dark orange indicates genes with higher expression
Fig. 4: The categorization of 252 DEGs into known (197, blue)
and unknown genes (55, red). The categorization was made based
by referring to gene annotation from RAP-DB database
Fig. 5: The pie chart represents the classification of known DEGs
transcripts into their respective function based on RAP-DB database
Fig. 6: Species distribution of the top BLAST hits for un-
annotated DEGs transcripts. Hits shown for 101 transcripts. The
most matches are to Oryza sativa, followed by other monocot
plant species
A B
Fig. 7: The pie chart represents the classification of novel (un-
annotated in RAP-DB) DEGs transcripts into their respective
categories based on NCBI non-redundant (Nr) database. (A)
Through BLASTX analyses of 101 DEG that are un-
annotated in RAP-DB, 62% of them showed a significant
homology with sequences in NCBI Nr database (blue),
whereas no any significant hit showed for other 38% (red).
(B) The 62% of DEGs were made up of unknown protein,
hypothetical protein and well-annotated in other organism
Salt Stress Responsive Genes in Rice / Intl. J. Agric. Biol., Vol. 22, No. 6, 2019
1687
(IPS, http://www.ebi.ac.uk/InterProScan) program for their
functional predictions. IPS is embedded in 16 secondary
protein databases that allow the scanning of novel sequences
(protein and nucleic acid) to determine their domains,
families and functional sites. Only 29 out of 101
transcripts were matched to the IPS program. The other
72 transcripts did not show any IPS match. The IPS search
found 2 of the transcripts (XLOC_032754_1 and
XLOC_016841_1) hits on COILS database
(http://embnet.vital- it.ch/software/COILS_form.html),
which denote regions named as coiled coil domain
(Hartmann et al., 2016). This coil structure is a domain
for Ubiquitin-conjugating enzyme E2 that catalyzes the
covalent attachment of ubiquitin to target proteins.
Through cross-referencing to Phobius
(http://phobius.sbc.su.se/), TMHMM
(http://www.cbs.dtu.dk/services/TMHMM/) and SignalP
(http://www.cbs.dtu.dk/services/SignalP/) databases, 19
transcripts were identified as a part of transmembrane
protein and were spanning a signal peptide at their N-
terminus.
Gene Ontology (GO) and Pathway-based Analysis of
DEGs
To overview putative function of the DEGs in response to
salt stress, all 252 DEGs represented by 338 transcripts
sequences (237 known transcripts and 101 novel transcripts)
were blasted into the GO and KEGG databases via
Blast2GO program (version 2.3.5)
(http://www.blast2go.org/). Based on their expression
profiling (Fig. 3), the transcript sequences were divided into
two groups and blasted to the Blast2GO program separately.
Group I composed of transcripts (n=303) categorized as
specifically and higher expressed in salt-tolerant S211,
while Group II composed of transcripts (n=35) categorized
as specifically and higher expressed in salt-sensitive S220.
GO at hierarchy level 2, comprising the highest node for
each category in combined graph, was chosen to summaries
the GO output (Fig. 8). The output of Blast2GO showed that
Group I DEGs were enriched into 21 functional terms that
belong to the biological process (BP; 9), molecular function
(MF; 6) and cellular component (CC; 6). Biological process
(BP) term was dominated by ―metabolic process‖,
―cellular process‖, ―single-organism process‖ and
―response to stimulus‖. Molecular function (MF) term
was dominated by ―catalytic activity‖ and ―binding‖,
whereas ―cell‖ and ―organelle‖ were most dominant for
cellular component (CC) term. Group II DEGs were
enriched into 15 functional terms that belong to the
biological process (BP; 7), molecular function (MF; 4)
and cellular component (CC; 4). To identify their
involvement in metabolic and signal transduction pathways,
pathway enrichment analyses were conducted to all the
DEGs. Out of 303 total transcripts of Group I DEGs, 61
(20%) transcripts were assigned to 33 KEGG pathways.
This high number of metabolic pathways indicated the
diverse survival strategies of MR211 to cope with salinity
stress, with the highest number of transcripts accounted in
―purine metabolism‖ (19, 23%) and ―thiamine metabolism‖
(11, 13%) pathways. Others prominent pathways were
including ―drug metabolism-other enzymes‖ (5, 6%) and
―starch and sucrose metabolism‖ (5, 6%) (Fig. 9). For
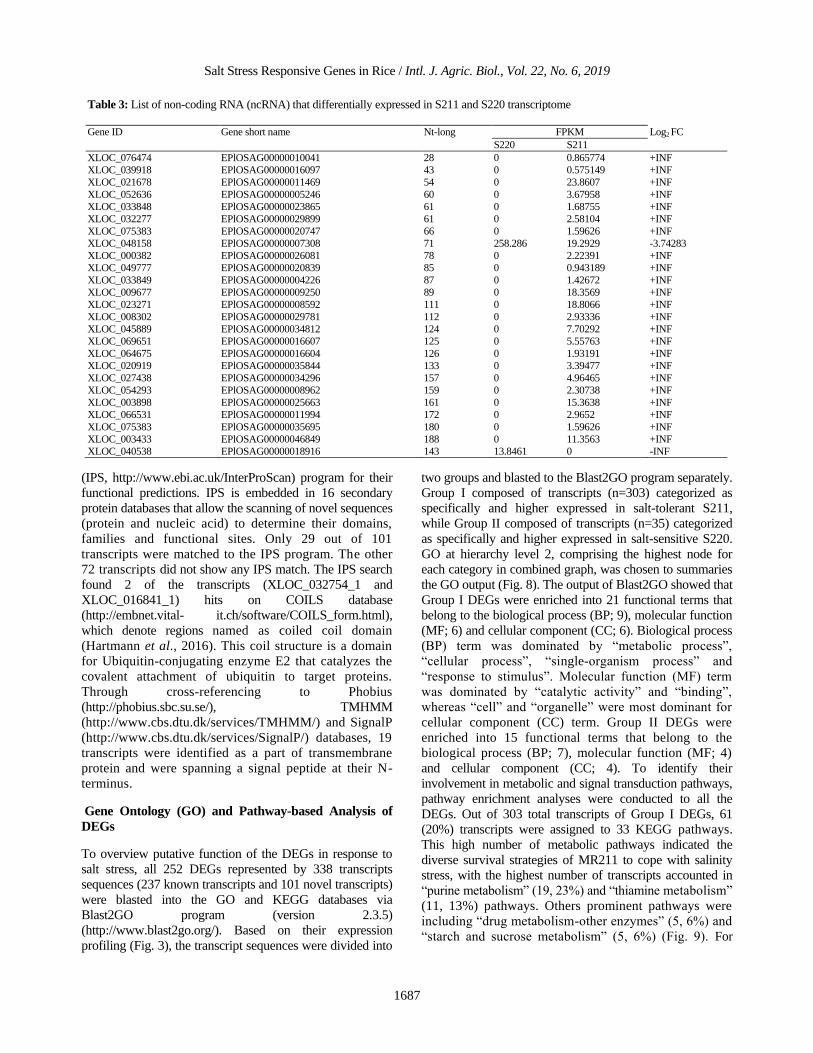
Table 3: List of non-coding RNA (ncRNA) that differentially expressed in S211 and S220 transcriptome
Gene ID Gene short name Nt-long FPKM Log2 FC
S220 S211
XLOC_076474 EPlOSAG00000010041 28 0 0.865774 +INF
XLOC_039918 EPlOSAG00000016097 43 0 0.575149 +INF
XLOC_021678 EPlOSAG00000011469 54 0 23.8607 +INF
XLOC_052636 EPlOSAG00000005246 60 0 3.67958 +INF
XLOC_033848 EPlOSAG00000023865 61 0 1.68755 +INF
XLOC_032277 EPlOSAG00000029899 61 0 2.58104 +INF
XLOC_075383 EPlOSAG00000020747 66 0 1.59626 +INF
XLOC_048158 EPlOSAG00000007308 71 258.286 19.2929 -3.74283
XLOC_000382 EPlOSAG00000026081 78 0 2.22391 +INF
XLOC_049777 EPlOSAG00000020839 85 0 0.943189 +INF
XLOC_033849 EPlOSAG00000004226 87 0 1.42672 +INF
XLOC_009677 EPlOSAG00000009250 89 0 18.3569 +INF
XLOC_023271 EPlOSAG00000008592 111 0 18.8066 +INF
XLOC_008302 EPlOSAG00000029781 112 0 2.93336 +INF
XLOC_045889 EPlOSAG00000034812 124 0 7.70292 +INF
XLOC_069651 EPlOSAG00000016607 125 0 5.55763 +INF
XLOC_064675 EPlOSAG00000016604 126 0 1.93191 +INF
XLOC_020919 EPlOSAG00000035844 133 0 3.39477 +INF
XLOC_027438 EPlOSAG00000034296 157 0 4.96465 +INF
XLOC_054293 EPlOSAG00000008962 159 0 2.30738 +INF
XLOC_003898 EPlOSAG00000025663 161 0 15.3638 +INF
XLOC_066531 EPlOSAG00000011994 172 0 2.9652 +INF
XLOC_075383 EPlOSAG00000035695 180 0 1.59626 +INF
XLOC_003433 EPlOSAG00000046849 188 0 11.3563 +INF
XLOC_040538 EPlOSAG00000018916 143 13.8461 0 -INF
Juri et al. / Intl. J. Agric. Biol., Vol. 22, No. 6, 2019
1688
Group II DEGs (DEGs that "not/very low" and "lower
expressed" in S211 compared to S220), 28.2% (11) out of
its 39 total transcripts were assigned to 9 KEGG pathways
with phenylpropanoid biosynthesis was denoted as the most
enriched pathway (4, 37%) (Fig. 9).
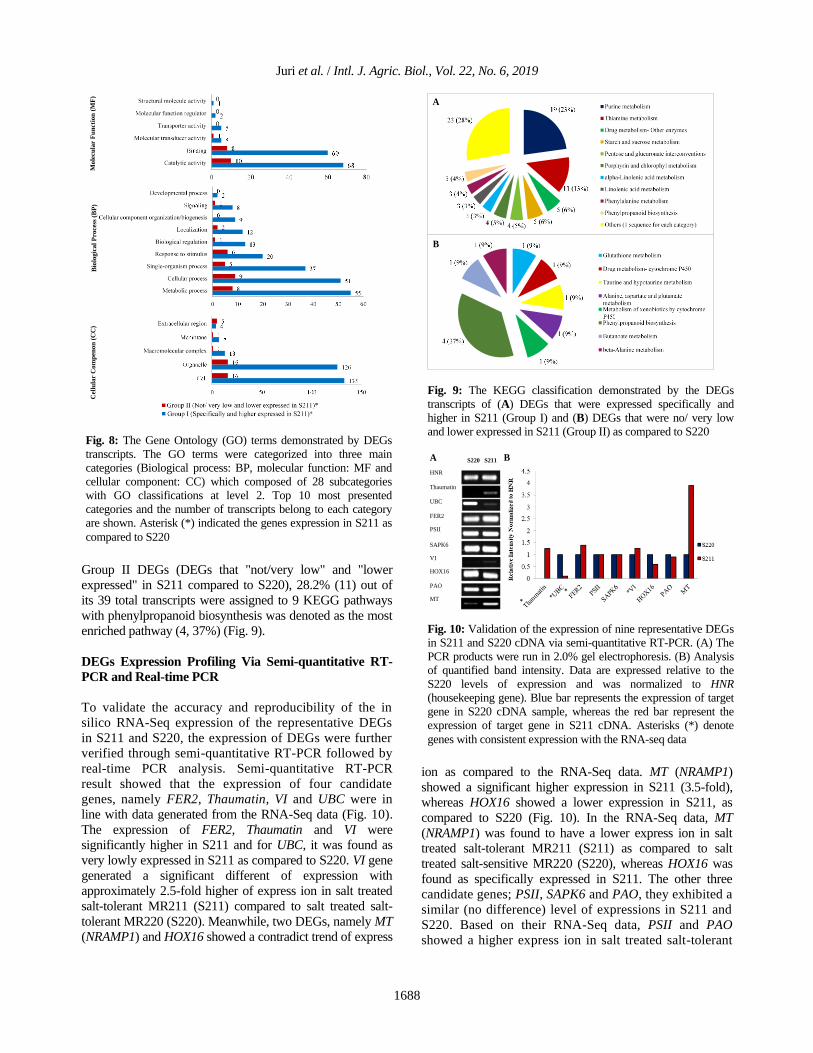
DEGs Expression Profiling Via Semi-quantitative RT-
PCR and Real-time PCR
To validate the accuracy and reproducibility of the in
silico RNA-Seq expression of the representative DEGs
in S211 and S220, the expression of DEGs were further
verified through semi-quantitative RT-PCR followed by
real-time PCR analysis. Semi-quantitative RT-PCR
result showed that the expression of four candidate
genes, namely FER2, Thaumatin, VI and UBC were in
line with data generated from the RNA-Seq data (Fig. 10).
The expression of FER2, Thaumatin and VI were
significantly higher in S211 and for UBC, it was found as
very lowly expressed in S211 as compared to S220. VI gene
generated a significant different of expression with
approximately 2.5-fold higher of express ion in salt treated
salt-tolerant MR211 (S211) compared to salt treated salt-
tolerant MR220 (S220). Meanwhile, two DEGs, namely MT
(NRAMP1) and HOX16 showed a contradict trend of express
ion as compared to the RNA-Seq data. MT (NRAMP1)
showed a significant higher expression in S211 (3.5-fold),
whereas HOX16 showed a lower expression in S211, as
compared to S220 (Fig. 10). In the RNA-Seq data, MT
(NRAMP1) was found to have a lower express ion in salt
treated salt-tolerant MR211 (S211) as compared to salt
treated salt-sensitive MR220 (S220), whereas HOX16 was
found as specifically expressed in S211. The other three
candidate genes; PSII, SAPK6 and PAO, they exhibited a
similar (no difference) level of expressions in S211 and
S220. Based on their RNA-Seq data, PSII and PAO
showed a higher express ion in salt treated salt-tolerant
Mo
lecu
lar
Fu
nct
ion
(M
F)
Bio
log
ica
l P
roce
ss (
BP
) C
ellu
lar
Co
mp
eno
n (
CC
)
Fig. 8: The Gene Ontology (GO) terms demonstrated by DEGs
transcripts. The GO terms were categorized into three main
categories (Biological process: BP, molecular function: MF and
cellular component: CC) which composed of 28 subcategories
with GO classifications at level 2. Top 10 most presented
categories and the number of transcripts belong to each category
are shown. Asterisk (*) indicated the genes expression in S211 as
compared to S220
A
B
Fig. 9: The KEGG classification demonstrated by the DEGs
transcripts of (A) DEGs that were expressed specifically and
higher in S211 (Group I) and (B) DEGs that were no/ very low
and lower expressed in S211 (Group II) as compared to S220
HNR Thaumatin UBC FER2 PSII SAPK6 VI HOX16 PAO MT
S220 S211 A B
*
*
HNR Thaumatin UBC FER2 PSII SAPK6 VI HOX16 PAO MT
S220 S211 A B
*
*
Fig. 10: Validation of the expression of nine representative DEGs
in S211 and S220 cDNA via semi-quantitative RT-PCR. (A) The
PCR products were run in 2.0% gel electrophoresis. (B) Analysis
of quantified band intensity. Data are expressed relative to the
S220 levels of expression and was normalized to HNR
(housekeeping gene). Blue bar represents the expression of target
gene in S220 cDNA sample, whereas the red bar represent the
expression of target gene in S211 cDNA. Asterisks (*) denote
genes with consistent expression with the RNA-seq data
Salt Stress Responsive Genes in Rice / Intl. J. Agric. Biol., Vol. 22, No. 6, 2019
1689
MR211 (S211), while SAPK6 was found specifically
expressed only in S211 as compared to salt treated salt-
sensitive MR220 (S220).
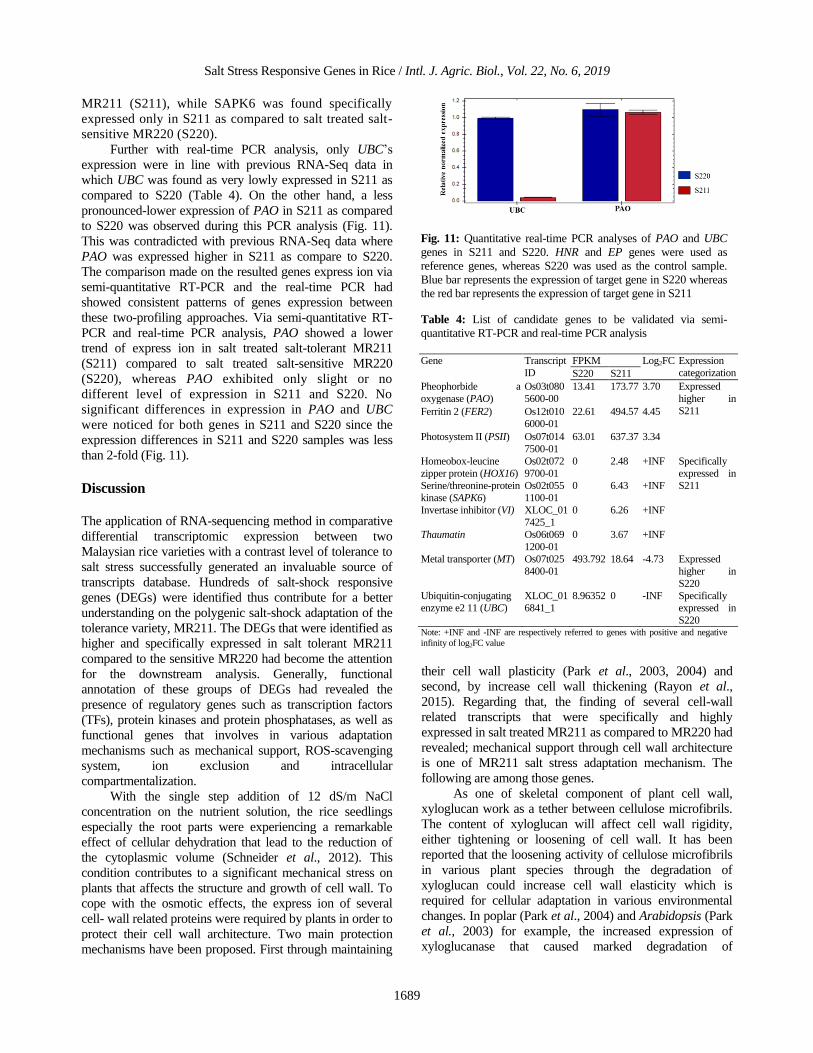
Further with real-time PCR analysis, only UBC‘s
expression were in line with previous RNA-Seq data in
which UBC was found as very lowly expressed in S211 as
compared to S220 (Table 4). On the other hand, a less
pronounced-lower expression of PAO in S211 as compared
to S220 was observed during this PCR analysis (Fig. 11).
This was contradicted with previous RNA-Seq data where
PAO was expressed higher in S211 as compare to S220.
The comparison made on the resulted genes express ion via
semi-quantitative RT-PCR and the real-time PCR had
showed consistent patterns of genes expression between
these two-profiling approaches. Via semi-quantitative RT-
PCR and real-time PCR analysis, PAO showed a lower
trend of express ion in salt treated salt-tolerant MR211
(S211) compared to salt treated salt-sensitive MR220
(S220), whereas PAO exhibited only slight or no
different level of expression in S211 and S220. No
significant differences in expression in PAO and UBC
were noticed for both genes in S211 and S220 since the
expression differences in S211 and S220 samples was less
than 2-fold (Fig. 11).
Discussion
The application of RNA-sequencing method in comparative
differential transcriptomic expression between two
Malaysian rice varieties with a contrast level of tolerance to
salt stress successfully generated an invaluable source of
transcripts database. Hundreds of salt-shock responsive
genes (DEGs) were identified thus contribute for a better
understanding on the polygenic salt-shock adaptation of the
tolerance variety, MR211. The DEGs that were identified as
higher and specifically expressed in salt tolerant MR211
compared to the sensitive MR220 had become the attention
for the downstream analysis. Generally, functional
annotation of these groups of DEGs had revealed the
presence of regulatory genes such as transcription factors
(TFs), protein kinases and protein phosphatases, as well as
functional genes that involves in various adaptation
mechanisms such as mechanical support, ROS-scavenging
system, ion exclusion and intracellular
compartmentalization.
With the single step addition of 12 dS/m NaCl
concentration on the nutrient solution, the rice seedlings
especially the root parts were experiencing a remarkable
effect of cellular dehydration that lead to the reduction of
the cytoplasmic volume (Schneider et al., 2012). This
condition contributes to a significant mechanical stress on
plants that affects the structure and growth of cell wall. To
cope with the osmotic effects, the express ion of several
cell- wall related proteins were required by plants in order to
protect their cell wall architecture. Two main protection
mechanisms have been proposed. First through maintaining
their cell wall plasticity (Park et al., 2003, 2004) and
second, by increase cell wall thickening (Rayon et al.,
2015). Regarding that, the finding of several cell-wall
related transcripts that were specifically and highly
expressed in salt treated MR211 as compared to MR220 had
revealed; mechanical support through cell wall architecture
is one of MR211 salt stress adaptation mechanism. The
following are among those genes.
As one of skeletal component of plant cell wall,
xyloglucan work as a tether between cellulose microfibrils.
The content of xyloglucan will affect cell wall rigidity,
either tightening or loosening of cell wall. It has been
reported that the loosening activity of cellulose microfibrils
in various plant species through the degradation of
xyloglucan could increase cell wall elasticity which is
required for cellular adaptation in various environmental
changes. In poplar (Park et al., 2004) and Arabidopsis (Park
et al., 2003) for example, the increased expression of
xyloglucanase that caused marked degradation of
Fig. 11: Quantitative real-time PCR analyses of PAO and UBC
genes in S211 and S220. HNR and EP genes were used as
reference genes, whereas S220 was used as the control sample.
Blue bar represents the expression of target gene in S220 whereas
the red bar represents the expression of target gene in S211
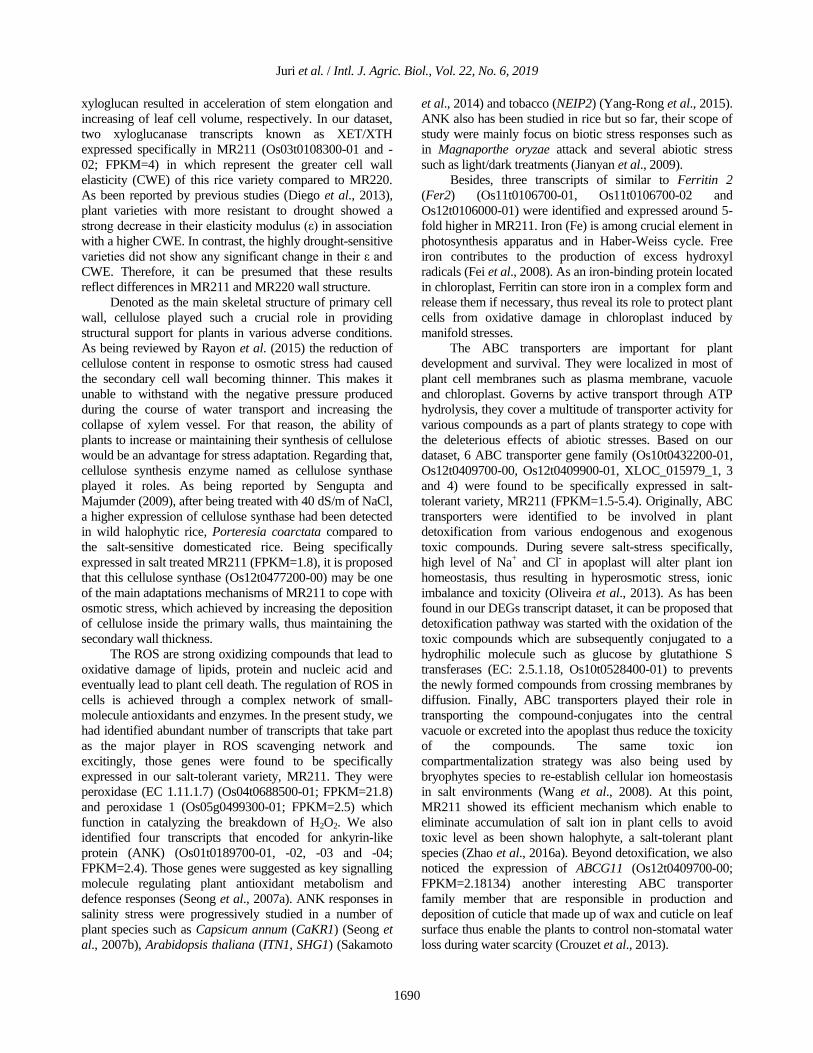
Table 4: List of candidate genes to be validated via semi-
quantitative RT-PCR and real-time PCR analysis
Gene Transcript
ID
FPKM Log2FC Expression
categorization S220 S211
Pheophorbide a
oxygenase (PAO)
Os03t080
5600-00
13.41 173.77 3.70 Expressed
higher in
S211 Ferritin 2 (FER2) Os12t010
6000-01
22.61 494.57 4.45
Photosystem II (PSII) Os07t014
7500-01
63.01 637.37 3.34
Homeobox-leucine
zipper protein (HOX16)
Os02t072
9700-01
0 2.48 +INF Specifically
expressed in
S211 Serine/threonine-protein
kinase (SAPK6)
Os02t055
1100-01
0 6.43 +INF
Invertase inhibitor (VI) XLOC_01
7425_1
0 6.26 +INF
Thaumatin Os06t069
1200-01
0 3.67 +INF
Metal transporter (MT) Os07t025
8400-01
493.792 18.64 -4.73 Expressed
higher in
S220
Ubiquitin-conjugating
enzyme e2 11 (UBC)
XLOC_01
6841_1
8.96352 0 -INF Specifically
expressed in
S220 Note: +INF and -INF are respectively referred to genes with positive and negative
infinity of log2FC value
Juri et al. / Intl. J. Agric. Biol., Vol. 22, No. 6, 2019
1690
xyloglucan resulted in acceleration of stem elongation and
increasing of leaf cell volume, respectively. In our dataset,
two xyloglucanase transcripts known as XET/XTH
expressed specifically in MR211 (Os03t0108300-01 and -
02; FPKM=4) in which represent the greater cell wall
elasticity (CWE) of this rice variety compared to MR220.
As been reported by previous studies (Diego et al., 2013),
plant varieties with more resistant to drought showed a
strong decrease in their elasticity modulus (ε) in association
with a higher CWE. In contrast, the highly drought-sensitive
varieties did not show any significant change in their ε and
CWE. Therefore, it can be presumed that these results
reflect differences in MR211 and MR220 wall structure.
Denoted as the main skeletal structure of primary cell
wall, cellulose played such a crucial role in providing
structural support for plants in various adverse conditions.
As being reviewed by Rayon et al. (2015) the reduction of
cellulose content in response to osmotic stress had caused
the secondary cell wall becoming thinner. This makes it
unable to withstand with the negative pressure produced
during the course of water transport and increasing the
collapse of xylem vessel. For that reason, the ability of
plants to increase or maintaining their synthesis of cellulose
would be an advantage for stress adaptation. Regarding that,
cellulose synthesis enzyme named as cellulose synthase
played it roles. As being reported by Sengupta and
Majumder (2009), after being treated with 40 dS/m of NaCl,
a higher expression of cellulose synthase had been detected
in wild halophytic rice, Porteresia coarctata compared to
the salt-sensitive domesticated rice. Being specifically
expressed in salt treated MR211 (FPKM=1.8), it is proposed
that this cellulose synthase (Os12t0477200-00) may be one
of the main adaptations mechanisms of MR211 to cope with
osmotic stress, which achieved by increasing the deposition
of cellulose inside the primary walls, thus maintaining the
secondary wall thickness.
The ROS are strong oxidizing compounds that lead to
oxidative damage of lipids, protein and nucleic acid and
eventually lead to plant cell death. The regulation of ROS in
cells is achieved through a complex network of small-
molecule antioxidants and enzymes. In the present study, we
had identified abundant number of transcripts that take part
as the major player in ROS scavenging network and
excitingly, those genes were found to be specifically
expressed in our salt-tolerant variety, MR211. They were
peroxidase (EC 1.11.1.7) (Os04t0688500-01; FPKM=21.8)
and peroxidase 1 (Os05g0499300-01; FPKM=2.5) which
function in catalyzing the breakdown of H2O2. We also
identified four transcripts that encoded for ankyrin-like
protein (ANK) (Os01t0189700-01, -02, -03 and -04;
FPKM=2.4). Those genes were suggested as key signalling
molecule regulating plant antioxidant metabolism and
defence responses (Seong et al., 2007a). ANK responses in
salinity stress were progressively studied in a number of
plant species such as Capsicum annum (CaKR1) (Seong et
al., 2007b), Arabidopsis thaliana (ITN1, SHG1) (Sakamoto
et al., 2014) and tobacco (NEIP2) (Yang-Rong et al., 2015).
ANK also has been studied in rice but so far, their scope of
study were mainly focus on biotic stress responses such as
in Magnaporthe oryzae attack and several abiotic stress
such as light/dark treatments (Jianyan et al., 2009).
Besides, three transcripts of similar to Ferritin 2
(Fer2) (Os11t0106700-01, Os11t0106700-02 and
Os12t0106000-01) were identified and expressed around 5-
fold higher in MR211. Iron (Fe) is among crucial element in
photosynthesis apparatus and in Haber-Weiss cycle. Free
iron contributes to the production of excess hydroxyl
radicals (Fei et al., 2008). As an iron-binding protein located
in chloroplast, Ferritin can store iron in a complex form and
release them if necessary, thus reveal its role to protect plant
cells from oxidative damage in chloroplast induced by
manifold stresses.
The ABC transporters are important for plant
development and survival. They were localized in most of
plant cell membranes such as plasma membrane, vacuole
and chloroplast. Governs by active transport through ATP
hydrolysis, they cover a multitude of transporter activity for
various compounds as a part of plants strategy to cope with
the deleterious effects of abiotic stresses. Based on our
dataset, 6 ABC transporter gene family (Os10t0432200-01,
Os12t0409700-00, Os12t0409900-01, XLOC_015979_1, 3
and 4) were found to be specifically expressed in salt-
tolerant variety, MR211 (FPKM=1.5-5.4). Originally, ABC
transporters were identified to be involved in plant
detoxification from various endogenous and exogenous
toxic compounds. During severe salt-stress specifically,
high level of Na+ and Cl- in apoplast will alter plant ion
homeostasis, thus resulting in hyperosmotic stress, ionic
imbalance and toxicity (Oliveira et al., 2013). As has been
found in our DEGs transcript dataset, it can be proposed that
detoxification pathway was started with the oxidation of the
toxic compounds which are subsequently conjugated to a
hydrophilic molecule such as glucose by glutathione S
transferases (EC: 2.5.1.18, Os10t0528400-01) to prevents
the newly formed compounds from crossing membranes by
diffusion. Finally, ABC transporters played their role in
transporting the compound-conjugates into the central
vacuole or excreted into the apoplast thus reduce the toxicity
of the compounds. The same toxic ion
compartmentalization strategy was also being used by
bryophytes species to re-establish cellular ion homeostasis
in salt environments (Wang et al., 2008). At this point,
MR211 showed its efficient mechanism which enable to
eliminate accumulation of salt ion in plant cells to avoid
toxic level as been shown halophyte, a salt-tolerant plant
species (Zhao et al., 2016a). Beyond detoxification, we also
noticed the expression of ABCG11 (Os12t0409700-00;
FPKM=2.18134) another interesting ABC transporter
family member that are responsible in production and
deposition of cuticle that made up of wax and cuticle on leaf
surface thus enable the plants to control non-stomatal water
loss during water scarcity (Crouzet et al., 2013).
Salt Stress Responsive Genes in Rice / Intl. J. Agric. Biol., Vol. 22, No. 6, 2019
1691
Transcription factors are a group of proteins that take
part in the initiation and regulation of transcription process
of DNA into RNA. Having DNA-binding domains, these
proteins able to bind to a specific regulatory sequence of
DNA called enhancer or promoter that located thousands of
base pairs upstream or downstream from the gene being
transcribed, including the stress-responsive genes (Wang et
al., 2016). Based on our dataset, two TFs that were
identified specifically expressed in salt treated MR211.
They are bHLH transcription factor-like protein
(Os07t0407700-01, -2, -3; FPKM=3.3) and MYB
transcription factor-like protein (Os05t0206200-01;
FPKM=4.4). These two types of TFs factor have been
abundantly reported for their involvement in modulating the
acclimation response of plants to severe environments
including salt stress. More interestingly, through a
comparative transcriptomic study in two contrasting rice
varieties in response to salinity stress (N22 and Pokkali),
these both types of TFs were also being denoted as highly
enriched in Pokkali, a widely known salt-tolerant variety
(Shankar et al., 2016). The tolerance or susceptibility of a specific plant
variety within a species to salt stress is determined by their complex defense network initiated by various series of inducible reaction. Through this reaction, plants perceive stress signals and transmit them through the cellular machinery to activate adaptive responses resulting in the activation of specific genes involved in specific mechanism. In higher plants, perception and transduction of stress signals is largely carried out by receptor-like kinases (RLKs) (Tanaka et al., 2012). Hundreds of RLKs genes have been identified in numerous plant species such as in rice and Arabidopsis. Based on their extracellular domain, RLKs were classified into 10 subfamilies representing their diversification in function and mode of signals perception. Taking together, the identification of RLKs which specifically expressed in MR211 during severe salinity stress treatment has suggested that high expressions of those RLKs work as the ‗front line‘ in sensing of salinity stress signals in order to activate downstream defense pathways.
In our data, three of the RLKs (Os07t0145400-01,
XLOC_015510_4 and Os01t0133900-00) were made up
from the largest subfamily among the RLKs, known as
leucine-rich repeat receptor-like kinases (LRR-RLKs), with
the expression 0.9 to 2.2 fold higher in MR211 compared to
MR220. As been presented in RNA-Seq analyses on
Caragana korshinskii, a shrub with highly developed root
systems and strong stress adaptation that were treated with
salinity stress, 24 and 7 contigs has been predicted to encode
leucine-rich repeat (LRR) receptor-like protein kinase were
differentially expressed in response to drought stress and
salt stress, respectively (Li et al., 2016). In other species,
LRR-RLKs play their role in the regulation and adaptation
of Medicago truncatulata to salt stress by causing in the
accumulated fewer sodium ions than controls thus make the
plants less inhibited by the presence of salt ion in the
medium (Lorenzo et al., 2009). By using reverse genetic
approach, their data demonstrate that LRR-RLKs play a role
in a wide variety of signal transduction pathways related to
hormone and abiotic stress responses in Arabidopsis (Hove
et al., 2011). Recently, Dievart and her coworkers had
revealed 37 of new uncharacterized LRR-RLK genes in rice
that putatively involved in abiotic stress responses and were
targeted as the potential target genes for breeding of salt-
and drought-tolerant cereals (Dievart et al., 2016).
Another one receptor kinase that is also play a vital
role during development and in the adaptive response to
various stimuli is Legume-type lectin-domain containing
receptor kinases-like (LecRK). In our data, this gene
(Os08t0123900-00) was found to express 2.3-fold higher in
MR211. Based on their conserved hydrophobic-binding site,
LecRKs may serve in the recognition of small hydrophobic
ligands, such as plant hormones or MAMP (André et al.,
2005; Bouwmeester and Govers, 2009). Preliminary reports
have demonstrated that LecRLKs provide assistance in
alleviating salt stress, as suggested for Arabidopsis LecRK-
V.1 (LecRK-b2; At1g70110), Pisum sativum LecRLK and
Glycine soja GsSRK. Overexpression of LecRLK has been
demonstrated to improve germination rate, pigment content,
and biochemical status of the salt-stress -affected plants
(Joshi et al., 2010; Sun et al., 2012). Expression-based
studies also suggest putative roles of several LecRLKs in
abiotic stresses, though experimental validation is still
pending. He et al. (2004) have demonstrated that the
LecRK-1.3 (AtLecRK2; AT3G45410) gene was
differentially up-regulated during salt stress, while Deng
et al. (2009) showed that the LecRK-V.1 gene was
responsive to osmotic stress. The LecRLKs response to
wounding is reported for Arabidopsis LecRK-V.5 and
Populus nigra PnLPK genes (Garcia-Hernandez et al.,
2002; Nishiguchi et al., 2002).
In other aspect, LecRK are regarded as ideal
candidates for monitoring cell wall integrity and are
possibly functional in adaptive responses. Even though they
are implied to function in diverse biological processes such
as pollen development and plant defense, their exact
biological role is still not clear. In Arabidopsis, lectin
receptor kinase lecRK-a1 was shown to be induced during
disruption of the plant cell wall (Riou et al., 2002) that
caused by wounding, senescence of leaves, and in response
to oligogalacturonides. Expression data of LecRKs in
Arabidopsis show that they are activated by various biotic
and abiotic stimuli and were differentially expressed in
various accessions (Bouwmeester and Govers, 2009).
We also identified novel wall-associated kinases
(WAKs) RLKs (XLOC_017725_1) that were expressed
3.9-fold higher in MR211. WAKs have been reported as
candidates for physical linkers that provide signal between
the cell wall and the cytoplasmic compartment (Kohorn,
2000; Verica et al., 2003). Previous studies have shown that
various WAK and WAK-like kinase (WAKL) members
were involved in biotic and abiotic stress responses and
Juri et al. / Intl. J. Agric. Biol., Vol. 22, No. 6, 2019
1692
were required for cell elongation and development (Lally et
al., 2001; Wagner and Kohorn, 2001). As example, WAK1
is an aluminium early responsive gene and its
overexpression resulted in aluminium tolerance (Sivaguru et
al., 2003). Microarray results confirmed that the highest
expression of WAKL4 was found in roots and that salt
(NaCl) stress significantly induced WAKL4 expression with
5-fold increment in salt-treated Arabidopsis seedlings.
Consistent with our observations, the salt-induced
expression seems to be related to elevated minerals and not
to general water deprivation as various drought and osmotic
stress conditions failed to induce WAKL4 expression. Plant-specific serine/threonine kinases snRK
subfamily 2 (SnRK2) proteins was discovered to take part in abiotic stress signal transduction pathways in plants, specifically during early events of ABA signalling pathway (Kulik et al., 2011). The SnRK2s regulate ABA-responsive transcription factors including ABA-responsive promoter elements (ABREs)-binding transcription factors (ABFs) and activate ABA-responsive genes and ABA-responsive physiological processes (Umezawa et al., 2009; Vlad et al., 2009). In our work, snrk2a-like gene (Os 02t0551100-01) was specifically expressed in salt treated MR211 with 6.4-fold higher in expression (FPKM value) compared to MR220. Consistent with our finding, similar regulation of ABA signalling has been detected in other various species such as wheat (Zhang et al., 2011), Populus trichocarpa (Song et al., 2016) and Jatropha curcas L. (Chun et al., 2014).
Coenzyme A (CoA) is an important cofactor in
various biosynthetic, degradative and energy-yielding
metabolic pathways (Begley et al., 2001). CoA biosynthesis
is catalyzed by phosphopantetheine adenylyltransferase
(PPAT), a pantothenate kinase (PANK) family protein (EC:
2.7.1.33). Overexpression of PPAT in Arabidopsis
thaliana had led to the increasing of CoA + acetyl-CoA
levels as well as enhanced vegetative and reproductive
growth and salt/osmotic stress resistance (Rubio et al.,
2008). In our finding, PANK (Os 11t0311100-01) was
specifically expressed in salt treated MR211 (FPKM=8)
compared to MR220.
The resulted osmotic effect and accumulation of
reactive oxygen species (ROS) triggered by salt stress could
lead into detrimental impact on plant photosynthesis. It
leads to disruption of all photosynthesis machineries
including photosystem I (PSI) and II (PSII), electron
transport, carbon fixation, ATP generating system and
stomatal conductance, which eventually will end up with
loss of crop yield. Plants carry out oxygenic photosynthesis,
where the presence of water is critical as an initial electron
donor to accept the photon and completing the light reaction
in PSII and PSI which end up with the production of ATP
and NADPH to form the glucose molecule in dark reaction
(Nelson and Yocum, 2006). In other aspects, other than for
plant survival, the enhancement of photosynthetic efficiency
is a key component to maintain and boost the crop yield
during stress condition.
Plants reacts to the stress differently according to their
photosynthetic systems (C3 or C4), types or species of
plants, as well as type, time and duration of the stress. As one
of their adaptation mechanisms, plants respond to the stresses
by coordinating their chloroplast and nuclear gene
expression including by altering the level of genes and
proteins related to photosynthesis. Chloroplast, thylakoid
membrane and nucleus are the main targets of regulated
proteins and metabolites associated with photosynthetic
pathways. Rapid responses of plant cell metabolism and
adaptation to photosynthetic machinery are key factors for
survival of plants in a fluctuating environment (Nouri et al.,
2015). Regarding that, the identification of 13 photosynthetic
related transcripts that exhibited a higher level of expression
in salt tolerant MR211 as compared to the sensitive MR220
had suggested the involvement of these genes in providing
the tolerance adaptation during salinity stress.
Different varieties of plants such as rice differing in
degree of salinity tolerance will exhibit different patterns of
DNA methylation (Karan et al., 2012). Regarding to this,
retrotransposon is one of the transcriptional units that were
triggered in response to salt stress and may generates true
genetic or epigenetic changes, thus lead into increasing
plants adaptation to abiotic stresses (Reinders et al., 2009).
We identified 6 retrotransposon that were found expressed
specifically in MR211. Three were denoted as
retrotransposon unclassified (XLOC_015326_4 and _5;
FPKM=2.6, Os12t0142900-02; FPKM=1.5), whereas the
other three were identified as retrotransposon ty3-gypsy
subclass (Os04t0247700-00; FPKM=2.5, Os06t0626200-
01; FPKM=36 and Os10t0198333-01; FPKM=1.6).
Therefore, the elucidation of the epigenetic control of
transcription and transposition of retrotransposons may
provide a novel strategy to create genetic variation for
developing stress tolerant crop plants in future (Mirouze
and Paszkowski, 2011). The unique expression of
retrotransposon in salt-tolerant variety, MR211
suggested the existence of relationship between DNA
methylation and salinity tolerance. It also served as a
novel strategy represented by MR211 for gene
regulation and salt adaptation.
Based on the presence of 25 ncRNA (Table 3), it is
interesting to see that 23 of the non-protein coding transcript
(ncRNA) were expressed specifically in S211, thus suggests
their involvement in salt-tolerant adaptation in MR211.
ncRNA has been reported as the major products of plant
transcriptional unit (Matsui et al., 2010; Wang et al., 2015).
Previous studies have shown the ncRNA responsiveness
and regulatory roles in numerous crucial biological
processes in response to abiotic stresses including drought,
heat, salinity and low temperature (Matsui et al., 2013;
Khan et al., 2016; Zhao et al., 2016b). As listed in Table 3,
the ncRNA accounted for one small ncRNAs (20-30 nt) and
24 medium ncRNA (50–200 nt). None of long ncRNA (>
200 nt) found in our libraries. Recent study had shown
sncRNAs and lncRNAs were involved in the transcriptional
Salt Stress Responsive Genes in Rice / Intl. J. Agric. Biol., Vol. 22, No. 6, 2019
1693
and post-transcriptional regulations of gene expression by
modulation of RNA stability and translation under various
physiological and stress conditions (Bokszczanin et al.,
2015; Liu et al., 2015a, b). Unfortunately, there was no
publication on medium ncRNA has been reported, thus
further/specific characterization on the involvement of
the generated ncRNA in salt stress adaptation cannot be
figured out.
Without putting aside of other pathways, the abundant
number of differential transcripts (11 transcripts) in purine
and thiamine metabolism suggest the significant role of
these pathways for the salt adaptation mechanism in
MR211. How would purine metabolisms provide salt
tolerance in plants? It is widely agreed that the intermediates
of purine catabolism, ureides, allantoin and allantoate are
responsible in providing plant resistance in various abiotic
stresses such as dark stress and drought, as well as reducing
the effect of plant senescent (Brychkova et al., 2008).
However, how these intermediates contribute to stress
adaptation has been largely underexplored. So far, two
hypotheses have been made. First, allantoin has been
proposed to function in quenching the deleterious effects of
reactive oxygen species (ROS) (Werner and Witte, 2011;
Takagi et al., 2016). A recent study also showed that
increasing accumulation of allantoin would result in up-
regulation of stress-related genes which subsequently
resulting in plants tolerance to drought-shock and osmotic
stresses. This phenotype enhancement has been found to be
caused by specific effects of allatoin in activating abscisic
acid (ABA) metabolism. There are two mechanisms of
ABA activation by allantoin. First through increasing the
transcription of NCED3, encoding a key enzyme in ABA
biosynthesis and second, through formation a high-
molecular weight complex of β-glucosidase hydrolysing
glucose-conjugated ABA, known as BGI (Watanabe et al.,
2014). The same trend of enriched purine metabolism in
various plants responses to biotic and abiotic stress has also
widely reported in Zea mays (Peterson et al., 1988),
Phaseolus vulgaris (Yesbergenova et al., 2005) as well as in
tomato and A. thaliana (Alamillo et al., 2010).
Meanwhile, thiamine or also known as vitamin B1 is a
crucial element for the proper operation of all living
organisms. The biosynthesis and further
phosphorylation/dephosphorylation of free thiamine along
this pathway generate an active form of thiamine, known as
thiamine diphosphate (TDP). It works as universal
coenzyme that involves in major metabolic pathways
including the ones that deal with stress factors such as the
oxidative pentose phosphate pathway (Baxter et al., 2007)
and the ethanolic fermentation (Ku¨rsteiner et al., 2003),
Calvin-Benson cycle (CBC), the pentose phosphate
pathway (PPP), the tricarboxylic acid cycle (TCAC) and the
isoprenoid phosphate biosynthesis pathway (IPP) which in
turn facilitates the activation of certain defense mechanisms
and the production of stress protecting molecules. Other
than that, thiamine itself can also work as important source
of antioxidants and also take parts as stress alarmone, a form
of intracellular signal molecule that is produced due to harsh
environmental factors (Bettendorff and Wins, 2009).
As been showed in our data, the enrichment of
thiamine metabolism in salt-treated MR211 proposed the
involvement of this pathway as salt-stress adaptation
strategy of this rice variety. This is consistent with the
studies that were reported by Rapala-Kozik et al. (2008,
2012), where up-regulation of free thiamine, TDP
biosynthesis and thiamine biosynthetic genes (THIC, THI1,
TH1 and TPK) had been detected in Zea mays and
Arabidopsis thaliana, mediated by drought, salinity and
oxidative stresses. However, none of genes involved in
thiamine biosynthesis were found in our DEGs which might
be due to time-dependent response of those genes in MR211
seedlings in response to salt stress which creates no
significant different with MR220.
RNA-Seq is massively used in the expression profiling
of a wide dynamic range of transcriptional units of an
organism which includes genes, novel transcripts and
splicing events. However, several issues regarding on the
design and analyses of RNA-Seq experiments might affect
the validity of the identified DEGs and their expression
profiling during comparative expressions. Currently, a
dozen of reports have highlighted on the substantial role
played by the ‗number of biological replicates‘ and the
‗types of bioinformatics tool used‘ for a valid interpretation
of in silico differential expression analyses. As suggested by
others, more than six biological replicates were required to
minimize the true and false positive identification of
significant DEGs (Schurch et al., 2016). However, due to
financial constraint, only one biological replicates of S211
and S220 of RNA samples were preceded for the RNA-Seq.
The expression accuracy and reproducibility of the 252
DEGs identified from the RNA-Seq experiment were
validated using semi-quantitative RT-PCR and real-time
PCR. Nine genes were selected as the representative for this
validation stage. They were UBC, FER2, HOX16, MT, VI,
PSII, SAPK6, PAO and Thaumatin. By comparing on the resulted expression profiling of
candidate genes via RNA-Seq (Table 4), semi-quantitative RT-PCR (Fig. 10) and real-time PCR (Fig. 11), differences in the expression value and fold of DEGs expression between S211 and S220 were exhibited between these three gene expressions profiling method. These differences might have caused by several factors. It has been suggested that the differences of sensitivity and normalization methods used in RNA-Seq, semi-quantitative RT-PCR and real-time PCR is one of the factors (Ho et al., 2016). Furthermore, the choice of data analysis software used and the number of sample pooling/ biological replicates used during RNA-Seq analyses will significantly affect the rate of false-positivity and false-negativity in DEGs detection. Meanwhile, Rajkumar et al. (2015) reported that Cuffdiff program that was used in our RNA-Seq data analyses had resulted in the highest rate of false positivity compared to other three tested
Juri et al. / Intl. J. Agric. Biol., Vol. 22, No. 6, 2019
1694
programs including edgeR, DESeq2 and Two-stage Poisson Model (TSPM). Among them, edgeR was a relatively more true-positive DEGs and high specificity. Another important factor is a number of samples pooled in the RNA-Seq analysis. A higher number of biological replicates will significantly reduce the biasness in estimating the DEGs expression. It has been reported that RNA-pool with eight biological replicates significantly improved the correlation between the fold of expression (Log2FC) and the corresponding individual sample.
Conclusion
The data generated from this study will serve as an
invaluable genomic reference to further our knowledge about
the molecular and cellular events that specifically occur in
rice seedlings during their early response to severe salinity
stress. Not only constricted as the candidate genes for rice
improvements through genetic engineering, the potential
salt-tolerant genes can also be utilized as DNA markers to
fasten the selection process during conventional breeding.
Acknowledgements
This work was supported by the Ministry of Education
Malaysia under the Fundamental Research Grant Scheme
(FRGS-2013-2-5524334). N-M Juri was supported by
Graduate Research Fellowship (GRF) and MyBrain15
Scholarship. We would like to acknowledge Malaysian
Agricultural Research and Development Institute (MARDI)
for providing the MR211 and MR220 seeds.
References
Alamillo, J.M., J.L. Díaz-Leal, M.V. Sánchez-Moran and M. Pineda,
2010. Molecular analysis of ureide accumulation under
drought stress in Phaseolus vulgaris L. Plant Cell Environ.,
33: 1828‒1837
Allotey, D.F.K., R.D. Asiamah, C.D. Dedzoe and A.L. Nyamekye, 2008.
Physico-chemical properties of three salt-affected soils in the lower
volta basin and management strategies for their sustainable
utilization. West Afr. J. Appl. Ecol., 12: 163‒182
Amudha, J. and G. Balalubramani, 2011. Recent molecular advances to
combat abiotic stress tolerance in crop plants. Biotechnol. Mol. Biol.
Rev., 6: 31‒58
André, S., H.C. Siebert, M. Nishiguchi, K. Tazaki and H.J. Gabius, 2005.
Evidence for lectin activity of a plant receptor-like protein kinase by
application of neoglycoproteins and bioinformatic algorithms.
Biochim. Biophys. Acta, 1725: 222‒232
Antiabong, J.F., M.G. Ngoepe and A.S. Abechi, 2016. Semi-quantitative
digital analysis of polymerase chain reaction electrophoresis gel:
Potential applications in low-income veterinary laboratories. Vet.
World, 9: 935‒939
Baxter, C.J., H. Redestig, N. Schauer, D. Repsilber, K.R. Patil, J. Nielsen, J.
Selbig, J. Liu, A.R. Fernie and L.J. Sweetlove, 2007. The metabolic
response of heterotrophic Arabidopsis cells to oxidative stress. Plant
Physiol., 143: 312‒325
Begley, T.P., C. Kinsland and E. Strauss, 2001. The biosynthesis of Co-
enzyme A in bacteria. Vitam. Horm., 61: 157‒171
Bettendorff, L. and P. Wins, 2009. Thiamin diphosphate in biological chemistry:
New aspects of thiamin metabolism, especially triphosphate
derivatives acting other than as cofactors. FEBS J., 276: 2917‒2925
Bokszczanin, K.L., N. Krezdorn, S. Fragkostefanakis, S. Müller, L. Rycak,
Y. Chen, K. Hoffmeier, J. Kreutz, M.J. Paupière, P. Chaturvedi, R.
Iannacone, F. Müller, H. Bostan, M.L. Chiusano, K.D. Scharf, B.
Rotter, E. Schleiff and P. Winter, 2015. Identification of novel small
ncRNAs in pollen of tomato. BMC Genomics, 16: 714
Bolger, A.M., M. Lohse and B. Usadel, 2014. Trimmomatic: A flexible
trimmer for Illumina sequence data. Bioinformatics, 30: 2114‒2120
Bouwmeester, K. and F. Govers, 2009. Arabidopsis L-type lectin receptor
kinases: Phylogeny, classification and expression profiles. J. Exp.
Bot., 60: 4383‒4396
Brychkova, G., Z. Alikulov, R. Fluhr and M. Sagi, 2008. A critical role for
ureides in dark and senescence-induced purine remobilization is
unmasked in the Atxdh1 Arabidopsis mutant. Plant J., 54: 496‒509
Chun, J., F.S. Li, Y. Ma, S.H. Wang and F. Chen, 2014. Cloning and
characterization of a SnRK2 gene from Jatropha curcas L. Genet.
Mol. Res., 13: 10958‒10975
Crouzet, J., J. Roland, E. Peeters, T. Trombik, E. Ducos, J. Nader and M.
Boutry, 2013. NtPDR1, a plasma membrane ABC transporter from
Nicotiana tabacum, is involved in diterpene transport. Trends
Biochem. Sci., 82: 181‒192
Deng, K., Q. Wang, J. Zeng, X. Guo, X. Zhao, D. Tang and X. Liu, 2009. A
lectin receptor kinase positively regulates ABA response during seed
germination and is involved in salt and osmotic stress response. J.
Plant Biol., 52: 493‒500
Diego, N.D., M.C. Sampedro, R.J. Barrio, I. Saiz-Fernandez, P. Moncalean
and M. Lacuesta, 2013. Solute accumulation and elastic modulus
changes in six radiata pine breeds exposed to drought. Tree Physiol.,
33: 69‒80
Dievart, A., C. Perin, J. Hirsch, M. Bettembourg, N. Lanau and F. Artus,
2016. The phenome analysis of mutant alleles in leucine-rich repeat
receptor-like kinase genes in rice reveals new potential targets for
stress tolerant cereals. Plant Sci., 242: 240‒249
F.A.O., Food and Agricultural Organization, 2016. STAT online database.
Available at: http://www.fao.org/about/meetings/agroecology-
symposium-china/en/ (Accessed: 15 March 2017)
Fei, G., Z. YiJun, H. LingYun, H.E. DaCheng and Z. GenFa, 2008.
Proteomic analysis of long- term salinity stress responsive proteins in
Thellungiella halophila leaves. Chin. Sci. Bull., 53: 3530‒3537
Ferreira, L.J., V. Azevedo, J. Maroco, M.M. Oliveira and A.P. Santos, 2015.
Salt tolerant and sensitive rice varieties display differential
methylome flexibility under salt stress. PLoS One, 10: 1–19
Garcia-Hernandez, M., T.Z. Berardini, G. Chen, D. Crist, A. Doyle, E.
Huala, E. Knee, M. Lambrecht, N. Miller and L.A. Mueller, 2002.
TAIR: A resource for integrated Arabidopsis data. Funct. Integr.
Genomics, 2: 239‒253
Hakim, M.A., A.S. Juraimi, M.M. Hanafi, E. Ali, M.R. Ismail, A. Selamat
and S.M. Karim, 2014. Effect of salt stress on morpho-physiology,
vegetative growth and yield of rice. J. Environ. Biol., 35: 317‒326
Hakim, M.A., A.S. Juraimi, M. Begum, M.M. Hanafi, M.R. Ismail and
A. Selamat, 2010. Effect of salt stress on germination and early
seedling growth of rice (Oryza sativa L.). Afr. J. Biotechnol., 9:
1911‒1918
Hartmann, M.D., C.T. Mendler, J. Bassler, I. Karamichali, O. Ridderbusch,
A.N. Lupas and B.H. Alvarez, 2016. α/β coiled coils. ELife, 5: 1–23
He, X.J., Z.G. Zhang, D.Q. Yan, J.S. Zhang and S.Y. Chen, 2004. A salt-
responsive receptor-like kinase gene regulated by the ethylene
signaling pathway encodes a plasma membrane serine/threonine
kinase. Theor. Appl. Genet., 109: 377‒383
Ho, C.L., Y.C. Tan, K.A. Yeoh, A.K. Ghazali, W.Y. Yee and C.C. Hoh,
2016. De novo transcriptome analyses of host- fungal interactions in
oil palm (Elaeis guineensis Jacq.). BMC Genomics, 17: 66
Hove, C.A.T., Z. Bochdanovits, V.M.A. Jansweijer, F.G. Koning, L. Berke,
G.F. Sanchez-Perez, B. Scheres and R. Heidstra, 2011. Probing the
roles of LRR-RLK genes in Arabidopsis thaliana roots using a
custom T-DNA insertion set. Plant Mol. Biol., 76: 69-83
Illumina, 2011. Technical note: Sequencing. Quality scores for next-
generation sequencing: assessing sequencing accuracy using Phred
quality scoring. Available at: http://www.illu
mina.com/documents/products/technotes/technote_Q-Scores.pdf.
(Accessed: 23 June 2018)
Salt Stress Responsive Genes in Rice / Intl. J. Agric. Biol., Vol. 22, No. 6, 2019
1695
I.R.R.I., 2002. Standard evaluating score for rice (SES). Los Banos.
Philippines: International Rice Research Institute (IRRI), Vol. 4, pp:
15‒16
Jianyan, H., Z. Xiaobo, Y. Huihui, O. Yidan, W. Lei and Z. Qifa, 2009. The
ankyrin repeat gene family in rice: Genome-wide identification,
classification and express ion profiling. Plant Mol. Biol., 71:
207‒226
Joseph, E.A. and K.V. Mohanan, 2013. A study on the effect of salinity
stress on the growth and yield of some native rice cultivars of Kerala
state of India. Agric. For. Fish, 2: 141‒150
Joshi, A., D.Q. Hung, N. Vaid and N. Tuteja, 2010. Pea lectin receptor-like
kinase promotes high salinity stress tolerance in bacteria and
expresses in response to stress in planta. Glycoconj. J., 27: 133‒150
Karan, R., T. DeLeon, H. Biradar and P.K. Subudhi, 2012. Salt stress
induced variation in DNA methylation pattern and its influence
on gene express ion in contrasting rice genotypes. PLoS One, 7:
1–10
Khan, Y.S., H. Tyagi, A.K. Sigh and S. Magadum, 2016. Abiotic stress
tolerance in soybean: Regulated by ncRNA. J. Agric. Search, 3: 1‒6
Kohorn, B.D., 2000. Plasma membrane-cell wall contacts. Plant Physiol.
124: 31–38
Kosová, K., I.T. Prášil and P. Vítámvás, 2013. Protein contribution to plant
salinity response and tolerance acquisition. Intl. J. Mol. Sci., 14:
6757‒6789
Ku¨rsteiner, O., I. Dupuis and C. Kuhlemeier, 2003. The pyruvate
decaroboxylase1 gene of Arabidopsis is required during anoxia but
not other environmental stresses. Plant Physiol., 132: 968‒978
Kulik, A., I. Wawer, E. Krzywińska, M. Bucholc and G. Dobrowolska,
2011. SnRK2 protein kinases—Key regulators of plant response to
abiotic stresses. OMICS J. Integr. Biol., 15: 859‒872
Lally, D., P. Ingmire, H.Y. Tong and Z.H. He, 2001. Antisense expression
of a cell wall-associated protein kinase, WAK4, inhibits cell
elongation and alters morphology. Plant Cell, 13: 1317‒1331
Li, S., C. Fan, Y. Li, J. Zhang, J. Sun, Y. Chen, C. Tian, X. Su, M. Lu, C.
Liang and Z. Hu, 2016. Effects of drought and salt-stresses on gene
expression in Caragana korshinskii seedlings revealed by RNA-seq.
BMC Genomics, 17: 200
Liu, J., H. Wang and N.H. Chua, 2015a. Long noncoding RNA
transcriptome of plants. Plant Biotechnol. J., 13: 319‒328
Liu, X., L. Hao, D. Li, L. Zhu and S. Hu, 2015b. Long non-coding RNAs
and their biological roles in plants. Genom. Proteom. Bioinform., 3:
137‒147
Livak, K.J. and T.D. Schmittgen, 2001. Analysis of relative gene expression
data using real-time quantitative PCR and the 2(-Delta Delta C(T))
method. Methods, 25: 402‒408
Lorenzo, L.D., F. Merchan, P. Laporte, R. Thompson, J. Clarke, C. Sousa
and M. Crespi, 2009. A novel plant leucine-rich repeat receptor
kinase regulates the response of Medicago truncatula roots to alt
stress. Plant Cell, 21: 668‒680
Maksup, S., K. Supaibulwatana and G. Selvaraj, 2013. High-quality
reference genes for quantifying the transcriptional responses of
Oryza sativa L. (sspp. indica and japonica) to abiotic stress
conditions. Chin. Sci. Bull., 58: 1919‒1930
Matsui, A., A.H. Nguyen, K. Nakaminami and M. Seki, 2013. Arabidopsis
non-coding RNA regulation in abiotic stress responses. Intl. J. Mol.
Sci., 14: 22642‒22654
Matsui, A., J. Ishida, T. Morosawa, M. Okamoto, J.M. Kim, Y. Kurihara,
M. Kawashima, M. Tanaka, T.K. To and K. Nakaminami, 2010.
Arabidopsis tiling array analysis to identify the stress-responsive
genes. Meth. Mol. Biol., 639: 141‒155
Mirouze, M. and J. Paszkowski, 2011. Epigenetic contribution to stress
adaptation in plants. Curr. Opin. Plant Biol., 14: 267‒274
Mohanty, S., R. Wassmann, A. Nelson, P. Moya and S.V.K. Jagadish, 2013.
Rice and climate change: Significance for food security and
vulnerability. Intl. Rice Res. Inst., 14: 1–18
Muthayya, S., J.D. Sugimoto, S. Montgomery and G.F. Maberly, 2014. An
overview of global rice production, supply, trade and consumption.
New York Acad. Sci., 1324: 7‒14
Nelson, N. and C. Yocum, 2006. Structure and function of photosystems I
and II. Annu. Rev. Plant Biol., 57: 521‒565
Nishiguchi, M., K. Yoshida, T. Sumizono and K. Tazaki, 2002. A receptor-
like protein kinase with a lectin-like domain from Lombardy poplar:
Gene expression in response to wounding and characterization of
phosphorylation activity. Mol. Genet. Genomics, 267: 506‒514
Nouri, M.Z., A. Moumenu and S. Komatsu, 2015. Abiotic Stresses: Insight
into gene regulation and protein express ion in photosynthetic
pathways of plants. Intl. J. Mol. Sci., 16: 20392‒20416
Oliveira, A.B.D., N.L.M. Alencar and E. Gomes-Filho, 2013. Comparison
between the water and salt stress effects on plant growth and
development. In: Responses of organisms to water stress. Sener, A.
(Ed.). InTech doi: 10.5772/5422
Park, Y.W., K. Baba, Y. Furuta, I. Iida, K. Sameshima, M. Arai and T.
Hayashi, 2004. Enhancement of growth and cellulose accumulation
by overexpression of xyloglucanase in poplar. FEBS Lett., 564:
183‒187
Park, Y.W., R. Tominaga, J. Sugiyama, Y. Furuta, E. Tanimoto, M.
Samejima, F. Sakai and T. Hayashi, 2003. Enhancement of growth
by expression of poplar cellulase in Arabidopsis thaliana. Plant J.,
33: 1099‒1106
Patishtan, J., T.N. Hartley, R.F.D. Carvalho and F.J. Maathuis, 2017.
Genome wide association studies to identify rice salt-tolerance
markers. Plant Cell Environ., 41: 970–982
Peterson, T.A., C.J. Lovatt and R.C. Nieman, 1988. Salt stress causes
acceleration of purine catabolism and inhibition of pyrimidine
salvage in Zea mays root tips. J. Exp. Bot., 39: 1389‒1395
Rahnama, A., R.A. James, K. Poustini and R. Munns, 2010. Stomatal
conductance as a screen for osmotic stress tolerance in durum wheat
growing in saline soil. Funct. Plant Biol., 37: 255‒263
Rajkumar, A.P., P. Qvist, R. Lazarus, F. Lescai, J. Ju, M. Nyegaard, O.
Mors, A.D. Børglum, Q. Li and J.H. Christensen, 2015.
Experimental validation of methods for differential gene expression
analysis and sample pooling in RNA-seq. BMC Genomics, 16: 548
Rapala-Kozik, M., N. Wolak, M. Kudja and A.K. Banas, 2012. The
upregulation of thiamine (vitamin B1) biosynthesis in Arabidopsis
thaliana seedlings under salt and osmotic stress conditions is
mediated by abscisic acid at the early stages of this stress response.
BMC Plant Biol., 12: 2
Rapala-Kozik, M., E. Kowalska and K. Ostrowska, 2008. Modulation of
thiamine metabolism in Zea mays seedlings under conditions of
abiotic stress. J. Exp. Bot., 59: 4133‒4143
Rayon, C., H.L. Gall, F. Philippe, J. Domon, F. Gillet and J. Pelloux, 2015.
Cell wall metabolism in response to abiotic stress. Plants, 4:
112‒166
Reinders, J., B.B.H. Wulff, M. Mirouze, A. Marı-Ordonez and M. Dapp,
2009. Compromised stability of DNA methylation and transposon
immobilization in mosaic Arabidopsis epigenomes. Genes Dev., 23:
939‒950
Riou, C., C. Hervé, V. Pacquit, P. Dabos and B. Lescure, 2002. Express ion
of an Arabidopsis lectin kinase receptor gene, lecRK-a1, is induced
during senescence, wounding and in response to oligogalacturonic
acids. Plant Physiol. Biochem., 40: 431‒438
Rubio, S., L. Whitehead, T.R. Larson, I.A. Graham and P.L. Rodriguez,
2008. The coenzyme A biosynthetic enzyme phosphopantetheine
adenylyltransferase plays a crucial role in plant growth, salt/osmotic
stress resistance and seed lipid storage. Plant Physiol., 148: 546‒556
Sakai, H., S.S. Lee, T. Tanaka, H. Numa, J. Kim, Y. Kawahara, H.
Wakimoto, C.C. Yang, M. Iwamoto, T. Abe, Y. Yamada, A. Mutu,
H. Inokuchi, T. Ikemure, T. Matsumoto, T. Sasaki and T. Itoh, 2013.
Rice Annotation Project Database (RAP-DB): An integrative and
interactive database for rice genomics. Plant Cell Physiol., 54: e6
Sakamoto, H., J. Tochimoto, S. Kurosawa, M. Suzuki and S. Oguri, 2014. A
novel gene encoding ankyrin-repeat protein, SHG1, is indispensable
for seed germination under moderate salt stress. Intl. J. Biol. Biomol.
Agric. Food Biotechnol. Eng., 8: 234–237
Schneider, C.A., W.S. Rasband and K.W. Eliceiri, 2012. NIH Image to
ImageJ: 25 years of image analysis. Nat. Meth., 9: 671‒675
Schurch, N.J., P. Schofield, M. Gierliński, C. Cole, A. Sherstnev and V.
Singh, 2016. How many biological replicates are needed in an RNA-
seq experiment and which differential expression tool should you
use? RNA, 22: 839–851
Juri et al. / Intl. J. Agric. Biol., Vol. 22, No. 6, 2019
1696
Sengupta, S. and A.L. Majumder, 2009. Insight into the salt tolerance
factors of wild halophytic rice, Porteresia coarctata: A physiological
and proteomic approach. Planta, 229: 911‒929
Seong, E.S., D. Choi, H.S. Cho, C.K. Lim, H.J. Cho and M.H. Wang,
2007a. Characterization of a stress-responsive ankyrin repeat-
containing zinc finger protein of Capsicum annuum (CaKR1). J.
Biochem. Mol. Biol., 40: 952–958
Seong, E.S., H.S. Cho, D. Choi, Y.H. Joung, C.K. Lim, J.H. Hur and M.H.
Wang, 2007b. Tomato plants overexpressing CaKR1 enhanced
tolerance to salt and oxidative stress. Biochem. Biophys. Res.
Commun., 363: 983‒988
Shankar, R., A. Bhattacharjee and M. Jain, 2016. Transcriptome analysis in
different rice cultivars provides novel insights into desiccation and
salinity stress responses. Sci. Rep., 6: 1–15
Shavrukov, Y., 2012. Salt stress or salt shock: Which genes are we
studying? J. Exp. Bot., 64: 119–127
Sivaguru, M., B. Ezaki, Z.H. He, H. Tong, H. Osawa, F. Baluska, D.
Volkmann and H. Matsumoto, 2003. Aluminum induced gene
expression and protein localization of a cell wall-associated receptor
protein kinase in Arabidopsis thaliana. Plant Physiol., 132: 2256‒2266
Song, X., X. Yu, C. Hori, T. Demura, M. Ohtani and Q. Zhuge, 2016.
Heterologous overexpression of poplar SnRK2 genes enhanced salt
stress tolerance in Arabidopsis thaliana. Front. Plant Sci., 7: 612–623
Sun, X.L., Q.Y. Yu, L.L. Tang, W. Ji, X. Bai, H. Cai, X.F. Liu, X.D. Ding
and Y.M. Zhu, 2012. Gs SRK, a G-type lectin S-receptor-like
serine/threonine protein kinase, is a positive regulator of plant
tolerance to salt stress. J. Plant Biol., 170: 505‒515
Takagi, H., Y. Ishiga, S. Watanabe, T. Konishi, M. Egusa, N. Akiyoshi, T.
Matsuura, I.C. Mori, T. Hirayama, H. Kaminaka, H. Shimada and A.
Sakamoto, 2016. Allantoin, a stress -related purine metabolite, can
activate jasmonate signaling in a MYC2-regulated and abscisic acid-
dependent manner. J. Exp. Bot., 67: 2519‒2532
Tanaka, H., Y. Osakabe, S. Katsura, S. Mizuno, K. Maruyama, K.
Kusakabe, J. Mizoi, K. Shinozaki and K. Yamaguchi-Shinozaki,
2012. Abiotic stress-inducible receptor-like kinases negatively
control ABA signaling in Arabidopsis. Plant J., 70: 599‒613
Umezawa, T., N. Sugiyama, M. Mizoguchi, S. Hayashi, F. Myouga and K.
Yamaguchi-Shinozaki, 2009. Type 2C protein phosphatases directly
regulate abscisic acid-activated protein kinases in Arabidopsis. Proc.
Natl. Acad. Sci. USA, 106: 17588‒17593
Verica, J.A., L. Chae, H. Tong, P. Ingmire and Z.H. He, 2003. Tissue-
specific and developmentally regulated expression of a cluster of
tandemly arrayed cell wall-associated kinase-like kinase genes in
Arabidopsis. Plant Physiol., 133: 1732‒1746
Vlad, F., S. Rubio, A. Rodrigues, C. Sirichandra, C. Belin and N. Robert,
2009. Protein phosphatases 2C regulate the activation of the Snf1-
related kinase OST1 by abscisic acid in Arabidopsis. Plant Cell, 21:
3170‒3184
Wagner, T. and B. Kohorn, 2001. Wall-associated kinases are expressed
throughout plant development and are required for cell expansion.
Plant Cell, 13: 303‒318
Wang, H., H. Wang, H. Shao and X. Tang, 2016. Recent advances in
utilizing transcription factors to improve plant abiotic stress tolerance
by transgenic technology. Front. Plant Sci., 7: 67–80
Wang, J., B. Li, Y. Meng, X. Ma, Y. Lai, E. Si, K. Yang, P. Ren, X. Shang
and H. Wang, 2015. Transcriptomic profiling of the salt-stress
response in the halophyte Halogeton glomeratus. BMC Genomics,
16: 169
Wang, X., Z. Liu and Y. He, 2008. Responses and tolerance to salt stress in
bryophytes. Plant Signal. Behav., 3: 516‒518
Wassmann, F., N.X. Hien, C.T. Hoanh and T.P. Tuong, 2004. Sea level rise
affecting the Vietnamese Mekong Delta: Water elevation in the flood
season and implications for rice production. Clim. Change, 66:
89‒107
Watanabe, S., M. Matsumoto, Y. Hakomori, H. Takagi, H. Shimada and A.
Sakamoto, 2014. The purine metabolite allantoin enhances abiotic
stress tolerance through synergistic activation of abscisic acid
metabolism. Plant Cell Environ., 37: 1022‒1036
Werner, A.K. and C.P. Witte, 2011. The biochemistry of nitrogen
mobilization: Purine ring catabolism. Trends Plant Sci., 16: 381‒387
Yang-Rong, C., C. Hao-Wei, L. Zhi-Gang, T. Jian-Jun, M. Biao, W.K.
Zhang, S.Y. Chen and J.S. Zhang, 2015. Tobacco ankyrin protein
NEIP2 interacts with ethylene receptor NTHK1 and regulates plant
growth and stress responses. Plant Cell Physiol., 56: 803‒818
Yesbergenova, Z., G. Yang, E. Oron, D. Soffer, R. Fluhr and M. Sagi, 2005.
The plant Mo-hydroxylases aldehyde oxidase and xanthine
dehydrogenase have distinct reactive oxygen species signatures and
are induced by drought and abscisic acid. Plant J., 42: 862‒876
Yoshida, S., D.A. Forno and J.H. Cook, 1976. Laboratory manual for
physiological studies of rice, pp: 61–65. International Rice Research
Institute, Manila, Philippines
Yuen, B. and L. Kong, 2009. Climate change and urban planning in
Southeast Asia. Surv. Perspect. Integr. Environ. Soc., 2: 1‒11
Zhang, H., X. Mao, R. Jing, X. Chang and H. Xie, 2011. Characterization of
common wheat (Triticum aestivum L.) TaSnRK2.7 gene involved in
abiotic stress responses. J. Exp. Bot., 62: 975‒988
Zhao, J., Q. He, G. Chen, L. Wang and B. Jin, 2016a. Regulation of non-
coding RNAs in heat stress responses of plants. Front. Plant Sci., 7:
1213
Zhao, Q., J. Suo, S. Chen, Y. Jin, X. Ma, Z. Yin, Y. Zhang, T. Wang, J.
Luo, W. Jin, X. Zhang, Z. Zhou and S. Dai, 2016b. Na2CO3-
responsive mechanisms in halophyte Puccinellia tenuiflora roots
revealed by physiological and proteomic analyses. Sci. Rep., 6:
32717
[Received 09 Jan 2019; Accepted 29 Jul 2019; Published (online) 22 Dec 2019]


