Embed Size (px)
Citation preview

NTN
UN
orw
egia
n U
nive
rsity
of S
cien
ce a
nd T
echn
olog
yFa
culty
of E
ngin
eerin
gD
epar
tmen
t of C
ivil
and
Envi
ronm
enta
l Eng
inee
ring
Ghaith E ALkholossi
Rockfill dam breaching experimentswith the application ofphotogrammetry techniques
Ghaith E ALkholossi
Master’s thesis in Hydropower DevelopmentSupervisor: Fjóla G. SigtryggsdóttirCo-supervisor: Geir Helge Kiplesund
March 2021
Mas
ter’s
thes
is


Ghaith E ALkholossi
Rockfill dam breaching experimentswith the application ofphotogrammetry techniques
Master’s thesis in Hydropower DevelopmentSupervisor: Fjóla G. SigtryggsdóttirCo-supervisor: Geir Helge KiplesundMarch 2021
Norwegian University of Science and TechnologyFaculty of EngineeringDepartment of Civil and Environmental Engineering


Abstract
Damaging outbursts of flooding triggered by embankment failures must be evaluated
as part of the risk management of possible threats in order to prepare emergency action
plans. The best testing procedure is to use statistically constructed parametric models
based on historic dam collapses to evaluate the breaching of embankment dams.
However, it is generally acknowledged that the estimation uncertainties of such
equations are significant. Important considerations such as structural characteristics,
erodibility, configuration, and construction are not taken into account in these
calculations. This research compares the precision of estimating the breach parameters
of earth fill and rockfill embankments by investigating and displaying the available
statistically determined breach equations and comparing them individually. In addition,
the approaches used by two generalized physically-based breach models to model
overtopping breach formations were studied. Furthermore, four preliminary physical
simulations were performed at the hydraulic laboratory of the Norwegian University of
Science and Technology. The method of performing such experiments is described,
with restrictions and the breach process addressed. Instrumentation of the model
includes video recording from multiple angles. The video is used to extract images at
intervals throughout the breaching process, and 3D models of the breach opening of
selected tests created using “Structure from motion” and “Multi-View Stereo”
processing techniques. The outcome of the study supports further use of this technique
in the analysis of the breach process.

Preface
This thesis is part of a two-year Master of Science in Hydropower Program at the
University of Science and Technology in Trondheim, Norway. This research is being
carried out as part of the HydroCen project WP1.2 Dam Safety. The experimental phase
was carried out at the NTNU fluid hydraulic laboratory, and four experiments were
conducted in total.

iv
Acknowledgments
First, I would like to give a big thanks to my supervisor Fjóla G. Sigtryggsdóttir for
guiding me through the process of writing the thesis and her support at all levels and
offering advice and support when needed.
I want to thank Geir Helge Kiplesund for being my co-supervisor, helping and giving
advice working on the project, and learning a lot from his experience as a civil engineer.
I want to thank my colleagues at NTNU for the extraordinary times we had and lifetime
memories.
I want to thank my late father, Essam Alkholossi. He was the only person who believed
in me and being the role model for me as a father, engineer, and life partner—also, my
family for all the love and support.
I want to thank my uncle Ramadan Adolli for all his support during tough times.
Without him, I would not be in the place that I am in now.
I want to take this chance to thanks the Norwegian for building this fantastic system
with welfare and justice, allowing me as an immigrant to have the same equal
opportunities in life as any Norwegian citizen if you are a Norwegian and reading this,
thanks for creating this warm place.

v

vi
Table of Contents
List of Figures .................................................................................................................... viii
List of Tables ........................................................................................................................ x
Acknowledgements ............................................................................................................. iv
1 Introduction ..................................................................................................................... 2 1.1 Goals and work description: .................................................................................... 3
2 General background on embankment dams ................................................................. 4 2.1 Previous hydraulic model tests approach ................................................................ 6 2.2 Dam failure process ............................................................................................... 10 2.3 Overtopping failure : .............................................................................................. 11 2.4 Internal erosion (piping) failure and seepage: ....................................................... 12
2.5 Geotechnical failure : ............................................................................................. 15
3 Overtopping erosion: .................................................................................................... 15 3.1 Overview of the study : .......................................................................................... 15
3.1.1 Systems of flow and areas of erosion: .......................................................... 15
3.2 Sediment transport : ............................................................................................... 17 3.3 Reservoir layout ..................................................................................................... 24
3.4 Geomechanics ........................................................................................................ 25
4 Breach process ............................................................................................................... 28
4.1 Overview: .............................................................................................................. 28 4.2 Methods of A Breach: ............................................................................................ 28
4.3 Method of spatial breach: ...................................................................................... 30 4.4 Real-life scenarios and field testing : ..................................................................... 33
5 Mathematical simulation .............................................................................................. 35 5.1 Empirical models: .................................................................................................. 35 5.2 Definitions of Parameters for Breach Formation : ................................................ 36
5.3 Parametric Modeling Methodology : ..................................................................... 39
5.3.1 Models of Parametric Breach : ..................................................................... 39
6 Physical modeling .......................................................................................................... 48 6.1 A brief about laboratory experiments: ................................................................... 48
6.2 Design of the hydraulic flume: .............................................................................. 49 6.3 Planning and Material: ........................................................................................... 50 6.4 Construction and testing ........................................................................................ 51 6.5 Experiments ........................................................................................................... 53
6.5.1 First test: ....................................................................................................... 54
6.5.2 Second and third Test : ................................................................................. 56 6.5.3 The fourth experiment .................................................................................. 57
6.6 Cameras placing and configurations ...................................................................... 58
7 Results ............................................................................................................................ 60

vii
7.1 Structure From Motion (SFM) and 3D modeling approach : ................................ 60
7.1.1 3D model building steps :............................................................................. 60 7.2 The stage-volume curve for laboratory studies: .................................................... 62 7.3 Overview: .............................................................................................................. 64
8 Discussion ....................................................................................................................... 65
9 Conclusions and Future Recommendations ............................................................... 66
9.1 Conclusions: .......................................................................................................... 66 9.2 Future Recommendations ...................................................................................... 68
References ........................................................................................................................... 69
Appendix A ......................................................................................................................... 77
viii
List of Figures
Figure 1 1 typical cross-section of rockfill dam (based on kjærnsli al . (1992)) ....................... 4
Figure 2 Dike failure mechanisms (© Zina Deretsky, The National Science Foundation) ..... 11
Figure 3 Dike failure mechanisms during prototype breach test (Photo:VAW) ...................... 12
Figure 4 (a) Dike breach at Alpine Rhine River (Minor and Hager, 2004) and (b) Aare
River ...................................................................................................................... 13
Figure 5 Hydraulic flow regime and erosion zones (modified after Powledge et al.
1989b)) .................................................................................................................. 17
Figure 6 Definition of bed shear stress for (a) uniform flow and (b) steep slope flow ............ 20
Figure 7 Forces acting on single grain on (a) horizontal gravel bed and (b) inclined
gravel .................................................................................................................... 21
Figure 8 successive side-slope failures ................................................................................... 26
Figure 9 Trapezoidal breach channel cross-section showing vertical erosion progression
and successive side-slope failures......................................................................... 26
Figure10 longitudinal section showing region with potential collapse during overtopping
failure in composite embankments ........................................................................ 27
Figure 11 longitudinal section showing region with potential collapse during piping
failure .................................................................................................................... 27
Figure 12 Process of dike failure due to overtopping (Chinnarasri et al. 2003) ..................... 29
Figure 13 2 Rotation of downstream dike face around a pivot point in the first stage after
overtopping ........................................................................................................... 30
Figure 14 Breach development for coarse-sand embankment (Coleman et al. 2002) ............. 31
Figure 15 Advance of spatial fuse plug erosion at different times t (Schmocker et al. 2011)
............................................................................................................................... 32
Figure 16 Spatial breach development for medium sand embankment (Pickert et al. 2011)
............................................................................................................................... 33
Figure 17 Initial erosion in pilot channel and (b) breach enlargement during dam breach
............................................................................................................................... 34
Figure 18 : Hypothetical inflow, breach outflow and routed hydrographs ............................. 35
Figure 19 Parameters of a breach, modified after (froehlich 1995a) ..................................... 37

ix
Figure 20 Typical hydrograph that could arise from breach through an embankment
(based .................................................................................................................... 38
Figure 21 Cross section of the physical model and location of pore pressure
measurements ........................................................................................................ 49
Figure 22 A 3d illustration of the hydraulic flume in the laboratory at NTNU...................... 50
Figure 23 : Grain size distribution curve of the model material ............................................. 51
Figure 24 One of the construction phases................................................................................ 52
Figure 25 End of construction.................................................................................................. 53
Figure 26 Styrofoam core......................................................................................................... 54
Figure 27 Internal erosion down stream test 1 ........................................................................ 55
Figure 28 Watertight core plastering to flume wall ................................................................. 56
Figure 29 Images from the end of test number three ............................................................... 57
Figure 30 the breach at the end of test number four ................................................................ 58
Figure 31 Camera’s location ................................................................................................... 59
Figure 32 3D model of the dam................................................................................................ 61
Figure 33 3D model of the breach process .............................................................................. 61
Figure 34 Front elevation, plan, and a section of the breach dam stages. .............................. 62
Figure 35 laboratory reservoir model...................................................................................... 63
Figure 36 NTNU hydraulic laboratory reservoir curve ........................................................... 63
Figure 37 fully developed breach dimensions in mm ............................................................... 64

x
List of Tables
Table 1a Hydraulic model tests on dam breaching due to overtopping 8
Table 2 Hydraulic model tests on dam breaching due to overtopping 8
Table 3 Hydraulic model tests dam breaching due to overtopping 8
Table 4 Hydraulic model tests on dam breaching due to overtopping 9
Table 5 table of tests conducted at the NTNU hydraulics laboratory. 54
Table 6 A summary showing results parameters of the breaches 64
2
1 Introduction
Norway is one of the leading countries in producing sustainable energy, with an
estimated over 1600 Hydropower projects and over 94% of electricity produced from
Hydropower sources (Eenergyfakta Norge 2018).
There are over 185 large Embankment dams in Norway, where a large dam is defined
as a dam that is higher than 15 meters. Most of these dams are rockfill dams with a
central core of moraine or asphalt. Overtopping of embankment dams causes around
50% of all embankment dam failures (Rao Ravindra. 2018). Embankment dams are
mainly composed of previous and erodible material, making the structure vulnerable
both to excessive through-flow and overtopping. These cases deteriorate the dam's
structural integrity, which may ultimately lead to the breaching of the dam. It has been
proved difficult to identify a single breaching mechanism as there is often a
combination of causes that are also interrelated. Inadequate spillway capacity and
extreme inflows are two factors that may cause an embankment dam to fail (Zhang et
al. 2009, ICOLD 1995).
Empirical and dimensionless models may provide quick estimates for determining the
embankment breach characteristics. Yet, they do not offer a complete representation of
the outflow hydrograph's time history required for flood routing (Morris, 2005). The
current method is to use statistical methods regression equations based on previous dam
failures to assess the breaching parameters. These parametric equations were developed
without considering embankment form or material properties, and they are subject to
considerable uncertainty. The breaching variables are needed to estimate the flood that
will result from a dam failure, which in turn affects the dam's consequence
classifications and subsequent dam design specifications. Fuse plugs must also be
designed with the breach formation and related breach parameters in mind. Basic
physically based breach models, along with parametric models that consider a simple
categorization of the dam form and material erodibility, are accessible. However,
Norway has not implemented these measures. It is also unclear how well these models
will account for the impact of various dam configurations and material properties. As a
result, it's interesting to look into the breaching mechanisms and methods for estimating
rockfill dam breaching parameters in greater depth. As mentioned before, the physical
model tests are planned in relation to project WP1.2 on Dam construction and safety
within the research center HydroCen. The tests will be carried out on a model dam,
comprising well-graded rockfill material, aiming at defining relevant breach parameters
and observing the breach formation. The main challenge in modeling a rockfill dam in
the available test settings in the NTNU Hydraulic lab is related to the watertight
membrane in the dam. For this master study, the focus is on the selection and physical
modeling of the watertight membrane. Furthermore, the study investigates the use of
photogrammetric techniques for the analysis of the breach process.

3
1.1 Goals and work description
The thesis will be composed of several tasks related to assessing relevant literature,
preparing and running an experimental study on a physical model in the Hydraulic
Laboratory at NTNU, and analyzing the collected data as well as the observed behavior.
The main objective of the study is to create experimental data on the breaching of
rockfill dams and to experiment with at least two different means of modeling the
watertight membrane in a rockfill dam for breach development considerations, aiming
at finding a suitable solution. The selection should aim at realistic modeling of the
phreatic line in the downstream section, e.g., entails reasonable leakage and limited
erosion of the downstream slope before the overtopping starts.
Plan and carry out model tests on a physical model in the hydraulic laboratory of the
department. The experiments include:
1. Preliminary experiments to test out the material used in the core, as well as the
organization of the test procedure. Essential to make sure that input parameters in the
breaching models are measured with proper instrumentation. The measurements should
be decided upon in cooperation with the supervisor, Geir Helge Kiplesund.
2. Based on the outcome in a) carry out in cooperation with supervisors up to three
tests with the same core material to fine-tune the testing procedure as well as for
comparison of potential variability between the setups.
3. Carry out the model tests planned in 2).
4. Provide a qualitative description of the tests and their limitations.
5. Analysis of the data to extract the breaching parameters.
6. Analysis using Structure from Motion. Compare sections before and after the
breach.
7. Discuss the results from the analysis
8. Draw a conclusion from work and propose further studies.
4
2 General background on embankment dams
Since the dawn of civilization, hydraulic engineering systems have been developed to
serve two of the most critical human essentials: agriculture and water supply. The
construction of dams and irrigation systems allowed many ancient civilizations in
Africa, Asia, and Europe to thrive off agriculture ( Al-Riffai, 2014). Norway has over
350 dams over 15 meters in height, and 185 of those are embankments. The main design
of embankment dams, mainly rockfill dams beginning in 1924.
The common Norwegian embankment dams criteria is a rockfill dam with a waterproof
core of moraine. Moraine or glacial till is a scoured material deposited beneath the ice
during the last glaciation. It is a broadly graded mixture of boulders, stones, gravel,
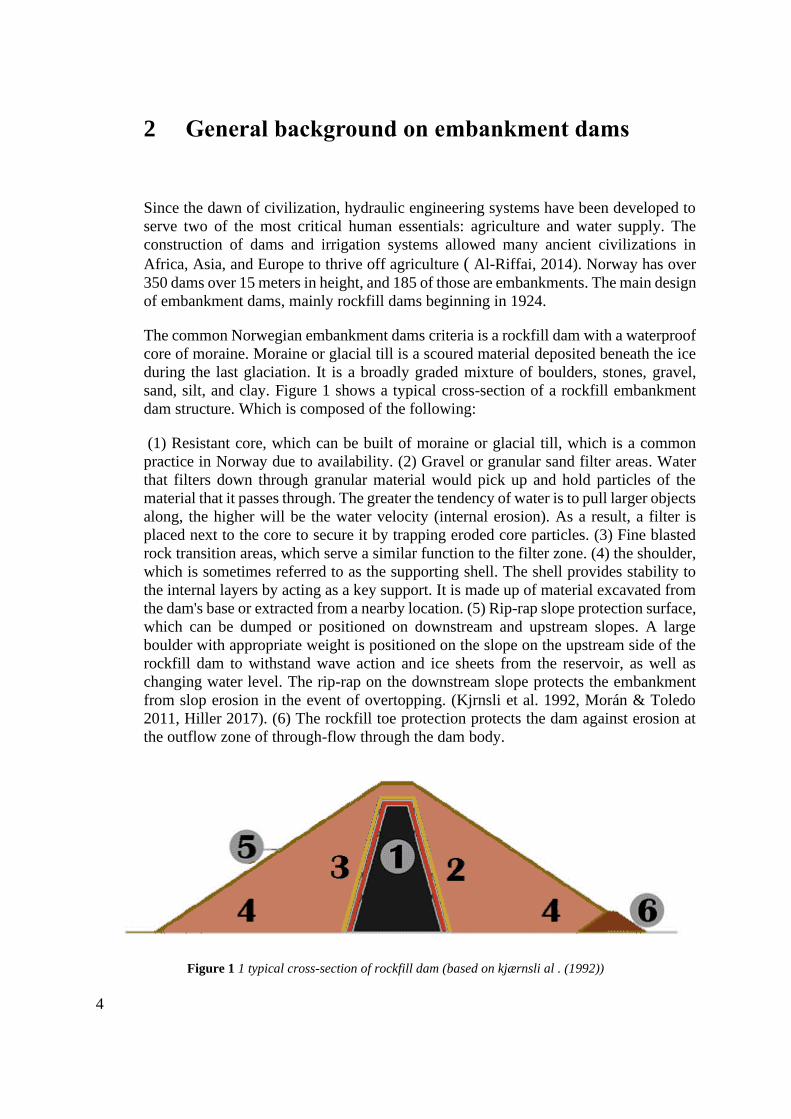
sand, silt, and clay. Figure 1 shows a typical cross-section of a rockfill embankment
dam structure. Which is composed of the following:
(1) Resistant core, which can be built of moraine or glacial till, which is a common
practice in Norway due to availability. (2) Gravel or granular sand filter areas. Water
that filters down through granular material would pick up and hold particles of the
material that it passes through. The greater the tendency of water is to pull larger objects
along, the higher will be the water velocity (internal erosion). As a result, a filter is
placed next to the core to secure it by trapping eroded core particles. (3) Fine blasted
rock transition areas, which serve a similar function to the filter zone. (4) the shoulder,
which is sometimes referred to as the supporting shell. The shell provides stability to
the internal layers by acting as a key support. It is made up of material excavated from
the dam's base or extracted from a nearby location. (5) Rip-rap slope protection surface,
which can be dumped or positioned on downstream and upstream slopes. A large
boulder with appropriate weight is positioned on the slope on the upstream side of the
rockfill dam to withstand wave action and ice sheets from the reservoir, as well as
changing water level. The rip-rap on the downstream slope protects the embankment
from slop erosion in the event of overtopping. (Kjrnsli et al. 1992, Morán & Toledo
2011, Hiller 2017). (6) The rockfill toe protection protects the dam against erosion at
the outflow zone of through-flow through the dam body.
Figure 1 1 typical cross-section of rockfill dam (based on kjærnsli al . (1992))
5
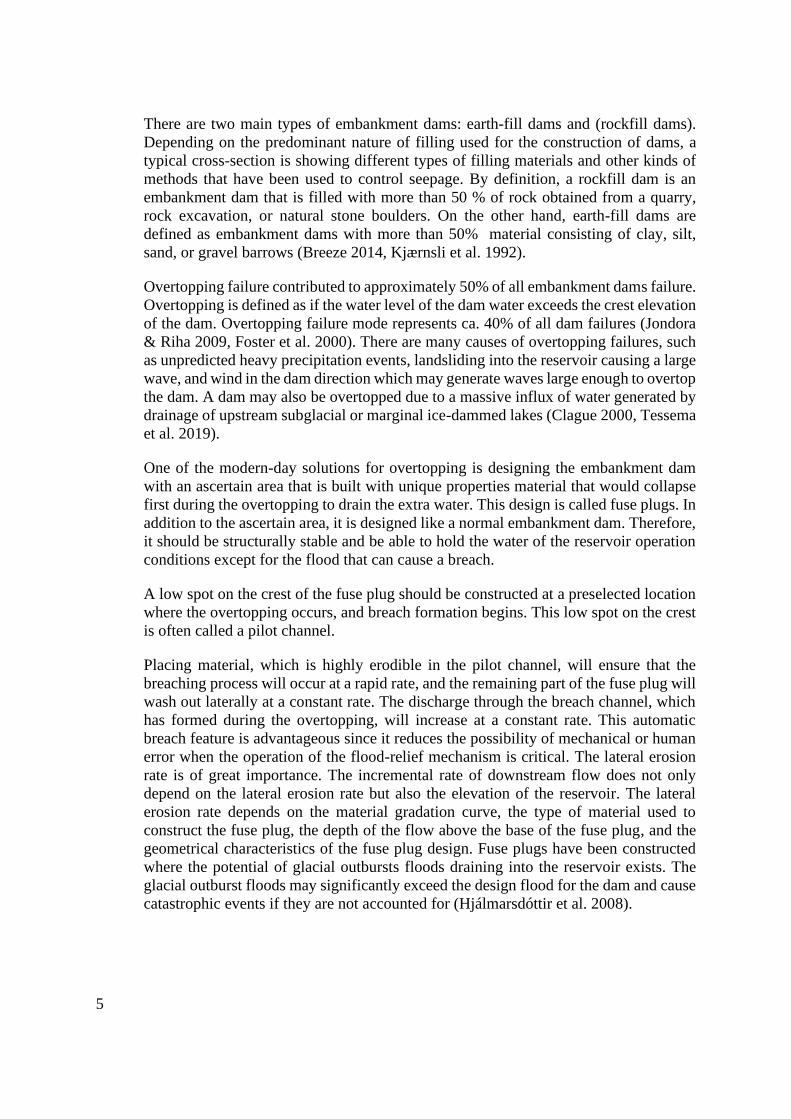
There are two main types of embankment dams: earth-fill dams and (rockfill dams).
Depending on the predominant nature of filling used for the construction of dams, a
typical cross-section is showing different types of filling materials and other kinds of
methods that have been used to control seepage. By definition, a rockfill dam is an
embankment dam that is filled with more than 50 % of rock obtained from a quarry,
rock excavation, or natural stone boulders. On the other hand, earth-fill dams are
defined as embankment dams with more than 50% material consisting of clay, silt,
sand, or gravel barrows (Breeze 2014, Kjærnsli et al. 1992).
Overtopping failure contributed to approximately 50% of all embankment dams failure.
Overtopping is defined as if the water level of the dam water exceeds the crest elevation
of the dam. Overtopping failure mode represents ca. 40% of all dam failures (Jondora
& Riha 2009, Foster et al. 2000). There are many causes of overtopping failures, such
as unpredicted heavy precipitation events, landsliding into the reservoir causing a large
wave, and wind in the dam direction which may generate waves large enough to overtop
the dam. A dam may also be overtopped due to a massive influx of water generated by
drainage of upstream subglacial or marginal ice-dammed lakes (Clague 2000, Tessema
et al. 2019).
One of the modern-day solutions for overtopping is designing the embankment dam
with an ascertain area that is built with unique properties material that would collapse
first during the overtopping to drain the extra water. This design is called fuse plugs. In
addition to the ascertain area, it is designed like a normal embankment dam. Therefore,
it should be structurally stable and be able to hold the water of the reservoir operation
conditions except for the flood that can cause a breach.
A low spot on the crest of the fuse plug should be constructed at a preselected location
where the overtopping occurs, and breach formation begins. This low spot on the crest
is often called a pilot channel.
Placing material, which is highly erodible in the pilot channel, will ensure that the
breaching process will occur at a rapid rate, and the remaining part of the fuse plug will
wash out laterally at a constant rate. The discharge through the breach channel, which
has formed during the overtopping, will increase at a constant rate. This automatic
breach feature is advantageous since it reduces the possibility of mechanical or human
error when the operation of the flood-relief mechanism is critical. The lateral erosion
rate is of great importance. The incremental rate of downstream flow does not only
depend on the lateral erosion rate but also the elevation of the reservoir. The lateral
erosion rate depends on the material gradation curve, the type of material used to
construct the fuse plug, the depth of the flow above the base of the fuse plug, and the
geometrical characteristics of the fuse plug design. Fuse plugs have been constructed
where the potential of glacial outbursts floods draining into the reservoir exists. The
glacial outburst floods may significantly exceed the design flood for the dam and cause
catastrophic events if they are not accounted for (Hjálmarsdóttir et al. 2008).
6
2.1 Previous hydraulic model tests approach
Tables 2 and 4 provide an overview of previous hydraulic dam breach modeling due to
overtopping, excluding model investigations involving cohesive materials, piping
failure, seepage, or surface protection measures. W = dike height, LK = crest length, b
= dam width, So = upstream (subscript o) dam slope, Sd = downstream (subscript d)
dike slope, and d = mean grain diameter are the parameters. The erosion process (2D
or 3D), constant or falling reservoir levels, and the presence or absence of a surface or
core layer are just a few of the differences between the investigations listed. The
dimensions of the dike and the diameters of the sediments are similar to those found in
the current study. The breach process, breach profiles, and breach discharge were all
determined by all investigations. Morris also conducts a separate survey on available
laboratory breach tests (2009).
When the fundamentals of sediment transport became available, research on dike
erosion actually started. Tinney and Hsu (1961) studied the washout of an erodible fuse
plug in the lab and in the field, describing the side erosion characteristics. They used
sediment transport laws to explain the washout mechanisms. Sarkaria and Dworsky
investigated hydraulic model tests on the protection of rock and earth-fill dams with
armoring against overtopping flow erosion (1968). Martins (1981) looked at the
stability of small overflow rockfill dams, focusing on slope failure downstream.
Powledge et al. conducted a large study on the mechanism of overflow erosion on
embankments (1989 a, b). Part I discusses the effectiveness of various protection
systems for dams and levees subjected to overtopping flow, while Part II focuses on the
hydraulics of water flowing over a dam levee, including distinct erosion zones.
Singh provided a general work on dam breach modeling techniques, which included
major reported dam breaches in the past as well as many empirical and mathematical
models on dam breaching (1996). The mathematical modeling of the dike breach
mechanism was addressed by Bechteler and Broich (1991). Meyer-Peter-Müller
(MPM) and Engelund-Hansen (EH) equations were used to model sediment transport.
Their experiments were mainly based on identifying the dike outflow hydrograph.
Coleman et al. (2002) performed flume studies on noncohesive homogeneous
embankment overtopping breaching. Their findings provide information on the erosion
mechanism, breach geometry, and breach discharge, allowing for flood forecasting in
the event of dike failure. Chinnarasri et al. (2003) looked into flow patterns and the
progressive damage of dike overtopping, recognizing different stages of dike damage
and accounting for the dike crest deterioration rate.
Höeg et al. proposed a one-of-a-kind package of field experiments to examine the
stability of embankment dams made of different materials (2004). Failures due to
overtopping and piping of up to 6 m high dikes, as well as laboratory-scale
measurements, were part of their study.
Centered on sediment transport and morphological breach evolution, Cao et al. (2004)
provided one of the first theoretical models on breach hydraulics of erodible dikes.

7
Rozov (2003) investigated the mechanism of dam breach erosion through laboratory
experiments. He explained the physical mechanism of dam washout and created a
mathematical model to simulate dam breaching.
The European project IMPACT (Investigation of extreme flood processes and
uncertainty) provided useful field and laboratory data to evaluate and improve breach
models between 2001 and 2004. A special issue of the Journal of Hydraulic Science
summarizes the project's highlights (Garcia and Zech 2007). Hager and Unger (2006)
addressed a preliminary analysis aimed at understanding the basic processes of both
plane and spatial dike breaches in a recent paper on dam breaching. An experimental
and numerical analysis of dam breach due to overtopping was identified by Dupont et
al. (2007). The project FLOODsite (Integrated flood risk analysis and management
methodologies) was launched with the goal of better evaluating and managing flood
risks in Europe, including a state-of-the-art study of breach modeling (Morris 2009).
Jandora and Jaromr summarized the existing state of information on dike failures due
to overtopping, using both experimental and theoretical breach modeling (2008).
Pickert et al. (2011) identified the breach profiles, breach outflow, and soil conditions
during the breach in a series of 3D rockfill dam breaching tests. Jovanovi (2010) spoke
about extrapolating laboratory dike breaching findings to prototype dikes. If the length
scale is not less than 1:15, upscaling is usually true.

8
Table 3 Hydraulic model tests dam breaching due to overtopping Table 1a Hydraulic model tests on dam breaching due to overtopping Table 2 Hydraulic model tests on dam breaching due to overtopping

9
Table 4 Hydraulic model tests on dam breaching due to overtopping
10
2.2 Dam failure process
In this section, breaching of an embankment dam during an overtopping event will be
reviewed. The factors that affect the breach development such as materials,
configurations, and load.
A collapse of the dam may either be natural or man-made, leading to extreme flood
conditions, floods, surface settlements, piping, seepage, overtopping or animal
burrowing, environmental failures emerge. Man-made triggers include, for example,
bad building, improper construction, improper location, or sabotage. A mixture of
multiple failure mechanisms leads to the actual failure of the dike in several situations.
In the special case of earth dikes, the most important causes and modes of failure are
(Singh 1996):
(1) Overtopping arising from extreme flooding.
(2) Structural collapse (piping) due to internal deterioration,
(3) Breakdown of the structure due to shear slide.
(4) Structural instability due to problems with foundations.
(5) Failure due to seismicity (normal or triggered).
The causes (1) and (2) refer to the hydraulic failure, while the causes (3) to (5) are
governed largely by geotechnical processes and thus lead to 'geotechnical failures.' Both
mechanisms of failure are discussed below. Dams and temporary dikes, also known as
"berms," are ridges that assist in water level regulation. They are frequently used to
protect or avoid floods. Dikes differentiate from dams in that water is only present on
one side of the barrier. Dams provide water on both sides, which serves to keep it from
flowing out. Dams are constructed across the river, while dikes are built next to it. Dikes
preserve land that would otherwise be flooded for the rest of the year. A dike's aim is
to keep land and property safe from the flood on the other hand. These embankments
act to keep the water out and avoid floods. A flood would occur if the dikes were
withdrawn.
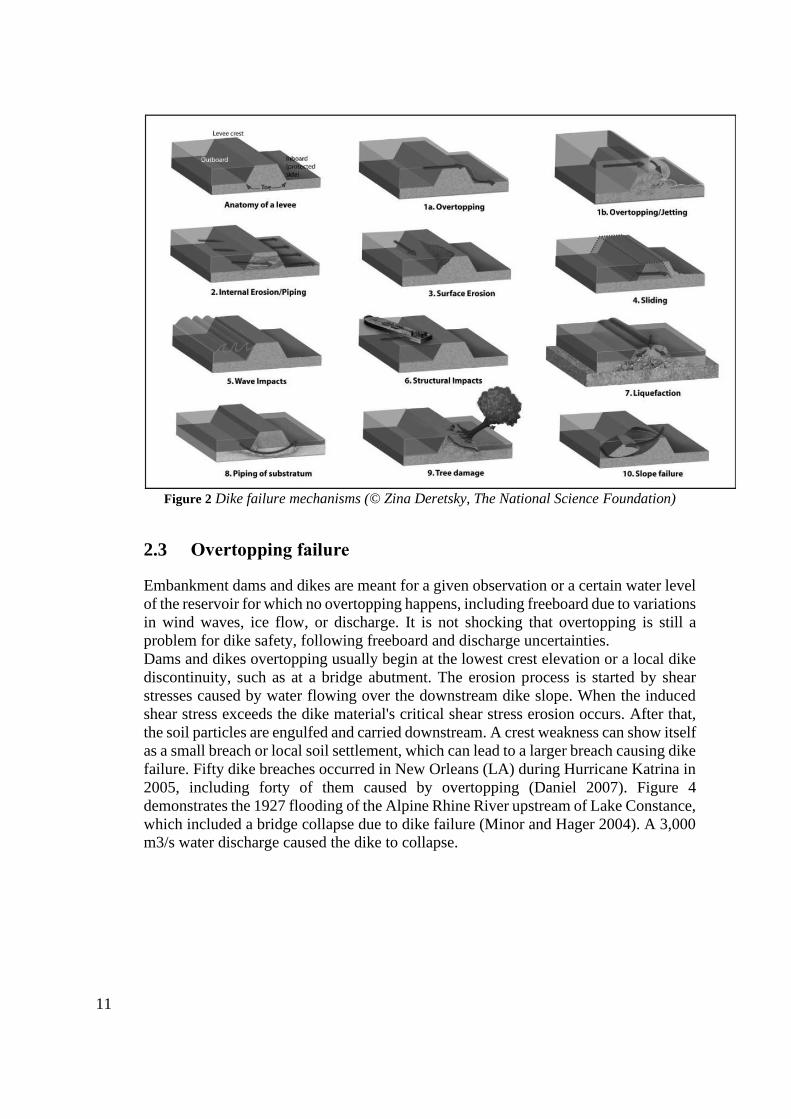
The governing mechanisms for breaches of dikes were also identified in 2006 by The
University of California (Figure 2). Due to overtopping or a combination of overtopping
and internal erosion, most dikes and earthen embankments break (Singh 1996). This
analysis, therefore, focuses solely on the mode of overtopping loss. Many earth dikes
are not meant to avoid overtopping and are restricted in their resistance to surface
erosion. A prototype breach test where the dike was broken by overtopping erosion
along with geotechnical slope failures and piping, as shown in Figure 2.
11
Figure 2 Dike failure mechanisms (© Zina Deretsky, The National Science Foundation)
2.3 Overtopping failure
Embankment dams and dikes are meant for a given observation or a certain water level
of the reservoir for which no overtopping happens, including freeboard due to variations
in wind waves, ice flow, or discharge. It is not shocking that overtopping is still a
problem for dike safety, following freeboard and discharge uncertainties.
Dams and dikes overtopping usually begin at the lowest crest elevation or a local dike
discontinuity, such as at a bridge abutment. The erosion process is started by shear
stresses caused by water flowing over the downstream dike slope. When the induced
shear stress exceeds the dike material's critical shear stress erosion occurs. After that,
the soil particles are engulfed and carried downstream. A crest weakness can show itself
as a small breach or local soil settlement, which can lead to a larger breach causing dike
failure. Fifty dike breaches occurred in New Orleans (LA) during Hurricane Katrina in
2005, including forty of them caused by overtopping (Daniel 2007). Figure 4
demonstrates the 1927 flooding of the Alpine Rhine River upstream of Lake Constance,
which included a bridge collapse due to dike failure (Minor and Hager 2004). A 3,000
m3/s water discharge caused the dike to collapse.
12
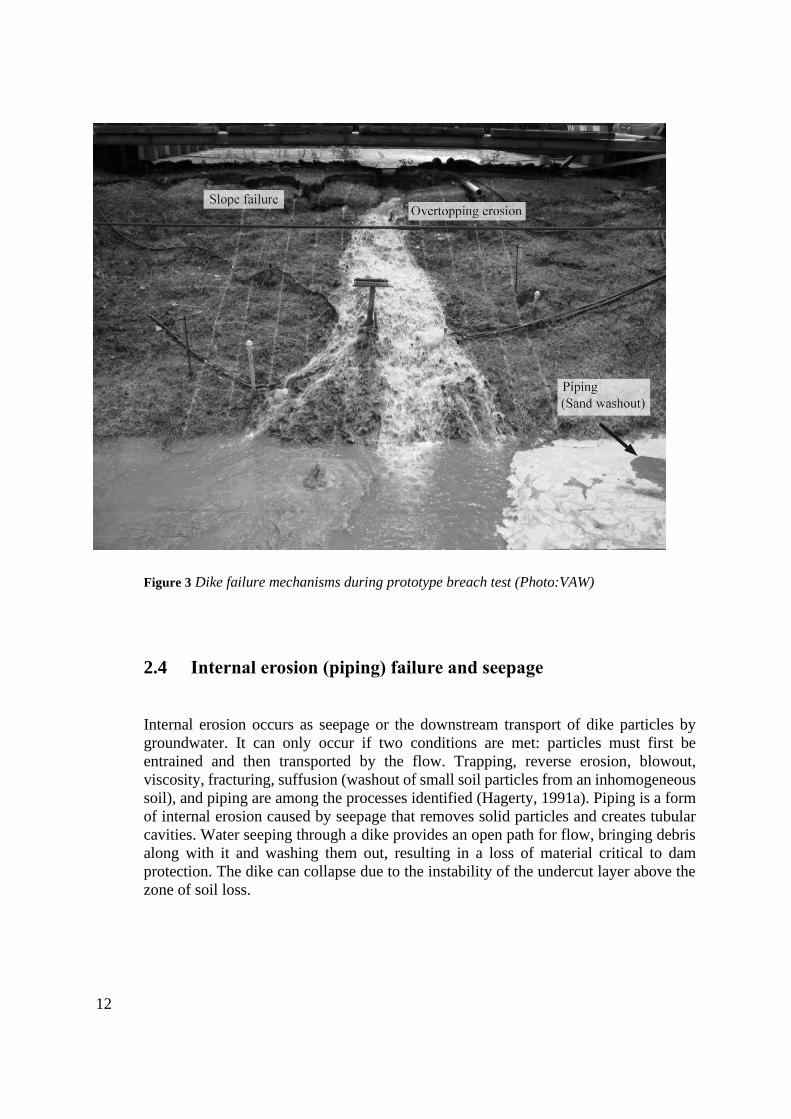
Figure 3 Dike failure mechanisms during prototype breach test (Photo:VAW)
2.4 Internal erosion (piping) failure and seepage
Internal erosion occurs as seepage or the downstream transport of dike particles by
groundwater. It can only occur if two conditions are met: particles must first be
entrained and then transported by the flow. Trapping, reverse erosion, blowout,
viscosity, fracturing, suffusion (washout of small soil particles from an inhomogeneous
soil), and piping are among the processes identified (Hagerty, 1991a). Piping is a form
of internal erosion caused by seepage that removes solid particles and creates tubular
cavities. Water seeping through a dike provides an open path for flow, bringing debris
along with it and washing them out, resulting in a loss of material critical to dam
protection. The dike can collapse due to the instability of the undercut layer above the
zone of soil loss.
13
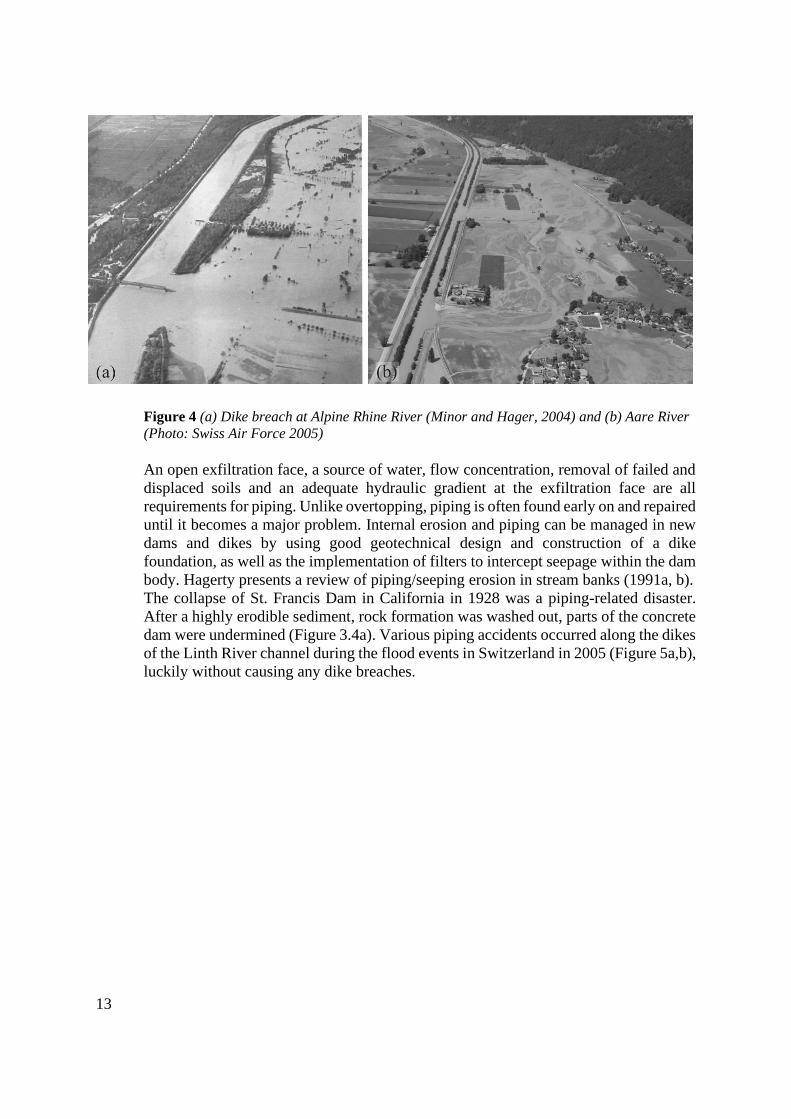
Figure 4 (a) Dike breach at Alpine Rhine River (Minor and Hager, 2004) and (b) Aare River
(Photo: Swiss Air Force 2005)
An open exfiltration face, a source of water, flow concentration, removal of failed and
displaced soils and an adequate hydraulic gradient at the exfiltration face are all
requirements for piping. Unlike overtopping, piping is often found early on and repaired
until it becomes a major problem. Internal erosion and piping can be managed in new
dams and dikes by using good geotechnical design and construction of a dike
foundation, as well as the implementation of filters to intercept seepage within the dam
body. Hagerty presents a review of piping/seeping erosion in stream banks (1991a, b).
The collapse of St. Francis Dam in California in 1928 was a piping-related disaster.
After a highly erodible sediment, rock formation was washed out, parts of the concrete
dam were undermined (Figure 3.4a). Various piping accidents occurred along the dikes
of the Linth River channel during the flood events in Switzerland in 2005 (Figure 5a,b),
luckily without causing any dike breaches.
14
In addition, unregulated leakage can result in severe damage to the dam. Detailed
explanations of seepage and drains can be found in Cedergren (1989). The engineering
works made of earth material had no theoretical base prior to the twentieth century.
The issue was the lack of information about how water moves across the earth and the
absence of permeability evidence. The resulting prototypes were always poor,
providing little protection against infiltration failure. A straightforward explanation for
the filtering mechanism by homogeneous soil and drainage systems was given by
Darcy's basic experiments with filtering phenomena. Terzaghi (1925) also achieved
further advances in theoretical and experimental earthwork architecture. Casagrande's
(1937, 1961) clarification of the seepage principle for functional aspects marks a
significant step forward in the construction of earth dams and dikes.
Sealing and drainage techniques are the most effective methods to control seepage.
Drainage is the mechanism by which percolating water is extracted by natural or
artificial means from soils and rocks. Dams and dikes also do not have an internal
drainage mechanism but drainage of the foot or a seal. These mitigate the intrusion into
a dam and depending on the position of the dam, it is known as surface sealing or
internal sealing. Most surface sealing consists of mineral materials and plastic lanes for
sealing. Internal sealing is mainly made of piles of steel pipe, slotted or slurry walls,
walls of MIP (mixed in place), or fills with soil stabilization.
Even if they are designed relatively impermeable by using picked, probably artificial
materials or watertight membranes, all embankment dams will suffer seepage, though.
Therefore, to estimate the seepage rate, the flow net needs to be identified. The intrusion
relies mainly on the geometry of the dam, the materials of the dam and base, and the
hydraulic features of the dam and its foundation. To forecast the seepage rate of dams,
there are distinct methods available. The inflow can be calculated by the method of
Kozeny (1927) or Casagrande for homogeneous dams or major core dams (1937).
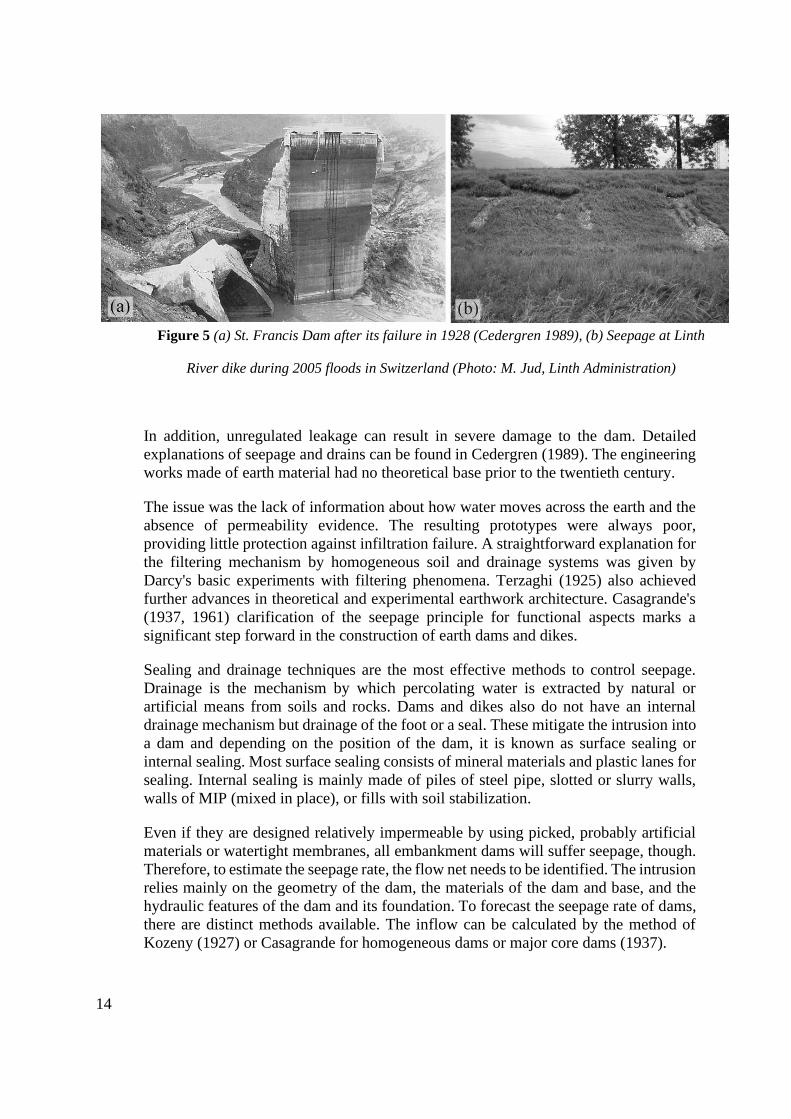
Figure 5 (a) St. Francis Dam after its failure in 1928 (Cedergren 1989), (b) Seepage at Linth
River dike during 2005 floods in Switzerland (Photo: M. Jud, Linth Administration)
15
Either graphical techniques (flow net) or computational methods determine the seepage
rate. Unsaturated flow is not considered by the Casagrande system and other
computational models. In order to quantify saturated and unsaturated seepage into dikes
under steady-state conditions, Chapuis and Aubertin (2001) proposed a numerical
model. Haselsteiner gives a description and comparison of numerous strategies to
forecast steady-state or intermittent seepage via dikes (2007).
2.5 Geotechnical failure
In almost all geotechnical flaws, the resistance is exceeded by the influential driving
forces on the dam or foundation. Thus the initial dam profile cannot be obtained. Dead
load and traffic loads, horizontal forces (water pressure, ice pressure, tides, or wind),
and dynamic forces (seismic, system, and ram operations) are the powerful forces. The
successful resistances are conditional aspects of a dike and its properties—materials for
foundations (friction, cohesion, coefficient of elasticity). The collapse will impact the
dike itself (sliding) or just part of it (slope failure), as well as the whole (settlement)
base or a part of the base (bearing capacity failure, shear failure).
3 Overtopping erosion
3.1 Overview of the study
Erosion is caused if the water overtopping a dam exceeds the critical shear stress of the
dam material or its protection mechanism by the induced shear stress. The related
erosion and sediment transport information for this work is summarized below.
However, the detailed discussion of all sediment transport characteristics will be
beyond the scope of this work. Shields (1936), Einstein (1942), Meyer-Peter and Müller
(1948), Yalin (1972), Zanke (1982), Smart and Jaeggi (1983), van Rijn (1984a, b),
Parker (1990), Hunziker (1995), Gyr and Hoyer (2006), Wong and Parker (2006), and
Julien (2006) provide detailed knowledge on the transport of sediments.
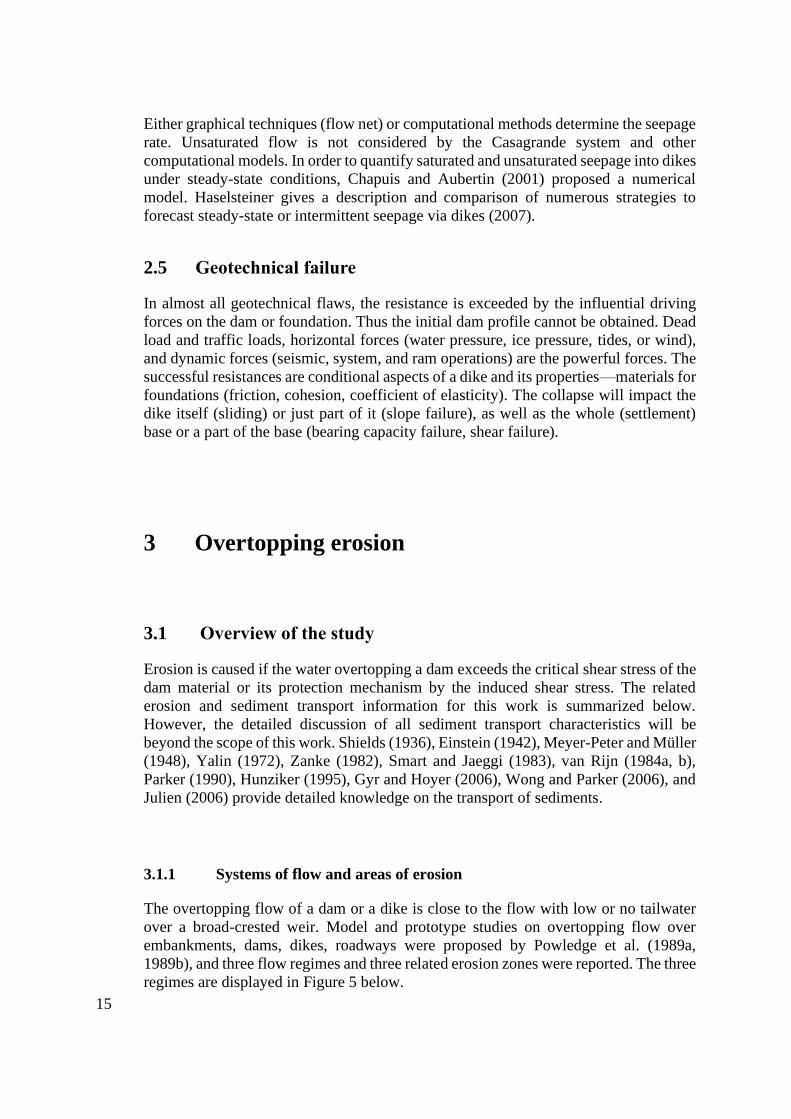
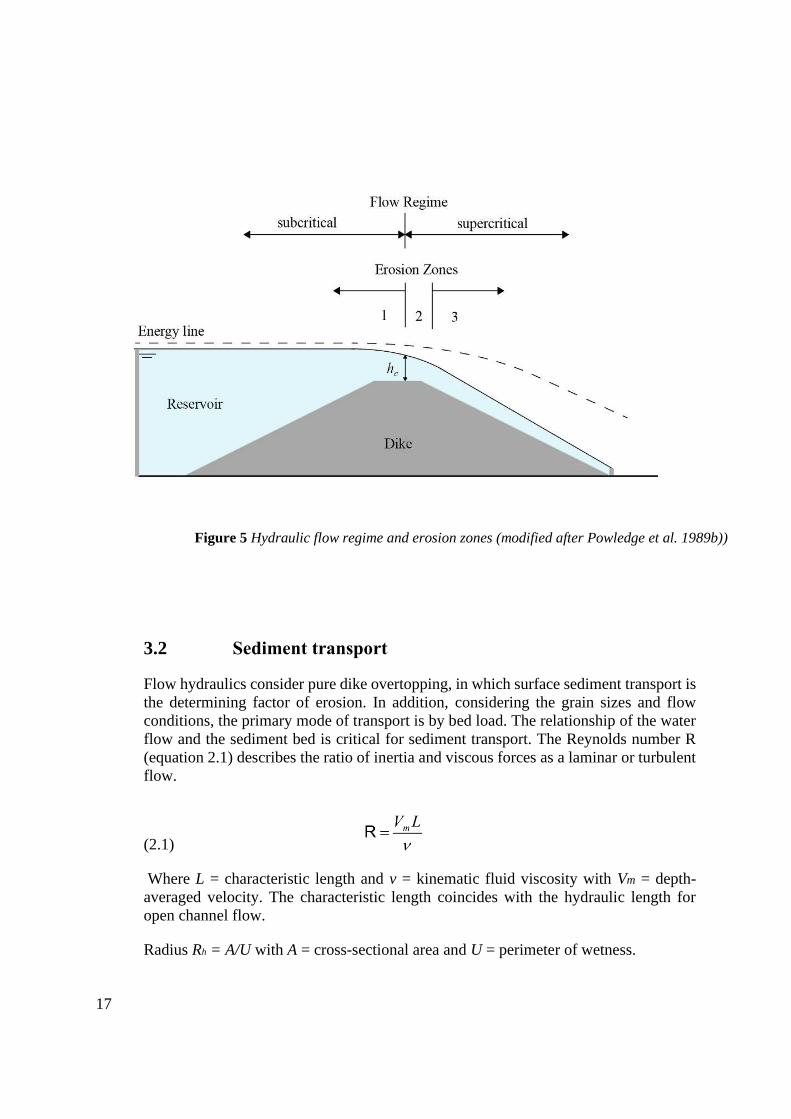
3.1.1 Systems of flow and areas of erosion
The overtopping flow of a dam or a dike is close to the flow with low or no tailwater
over a broad-crested weir. Model and prototype studies on overtopping flow over
embankments, dams, dikes, roadways were proposed by Powledge et al. (1989a,
1989b), and three flow regimes and three related erosion zones were reported. The three
regimes are displayed in Figure 5 below.

16
Area 1 Erosion-Subcritical flow over the dike crest
The transition from the reservoir to the upstream portion of the dam/dike crest is
governed by a subcritical velocity condition. The flow continues along the upstream
dike slope from a static energy head in the reservoir to a mixture of static and dynamic
heads. The hydraulic forces are weak because of the small energy gradient and minute
flow speeds (F < 1). Even though the flow depth may be very high, slight tractive
pressure is exerted by the small energy gradient. Erosion will occur only if the dike
crest consists of highly erodible material will erosion occur.
Erosion Area 2-Over dike crest, supercritical flow.
Transitional flow, characterized by critical flow and critical flow depth hc, occurs in
this region. The energy level is approximately the same as in Zone 1, but the energy
gradient can be high, leading to a substantial increase in tractive stress. Depending on
the dike crest geometry, however, the distance across which they occur is limited, so
that erosion is primarily expected at the downstream crest section. If the critical shear
pressure of the dike material is surpassed, erosion begins.
Erosion Area 3-On downstream dike slope, supercritical stream.
The energy head rises gradually in erosion Area 3 as the water flows down the face of
the dike. The energy gradient is steep, resulting in a significant increase in velocity
before balance and uniform flow of energy loss are achieved. However, this can only
happen in the case of high embankments. Tractive stresses are intense, contributing to
a high propensity for erosion.
The erosion process is most generally initiated at a point of slope discontinuity, such as
the toe or dike foundation, based on observations of embankment slopes during
overtopping. The initial erosion, however, can start anywhere, depending on the exact
condition and structure of the embankment. In certain instances, surface discontinuities
occur after erosion has been started, resulting in a cascading flow. Consequently, the
tractive stresses on the downstream dike surface are not consistent.
17
3.2 Sediment transport
Flow hydraulics consider pure dike overtopping, in which surface sediment transport is
the determining factor of erosion. In addition, considering the grain sizes and flow
conditions, the primary mode of transport is by bed load. The relationship of the water
flow and the sediment bed is critical for sediment transport. The Reynolds number R
(equation 2.1) describes the ratio of inertia and viscous forces as a laminar or turbulent
flow.
(2.1)
Where L = characteristic length and v = kinematic fluid viscosity with Vm = depth-
averaged velocity. The characteristic length coincides with the hydraulic length for
open channel flow.
Radius Rh = A/U with A = cross-sectional area and U = perimeter of wetness.
Figure 5 Hydraulic flow regime and erosion zones (modified after Powledge et al. 1989b))
18
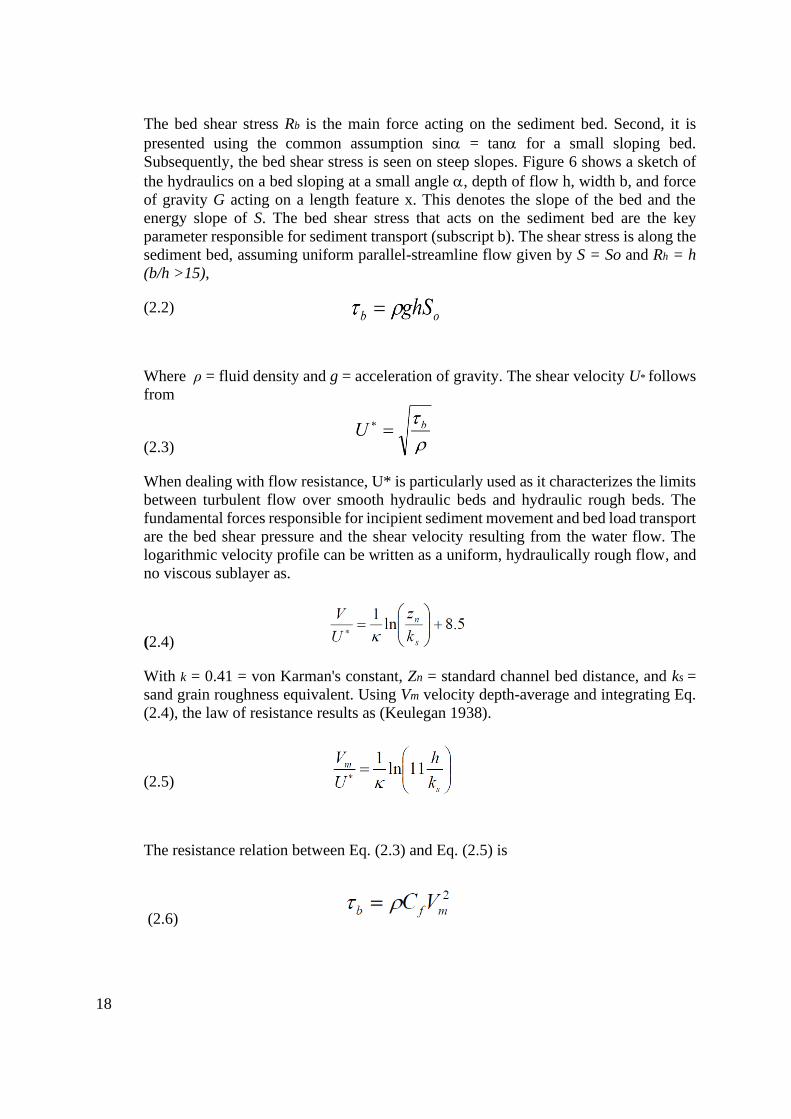
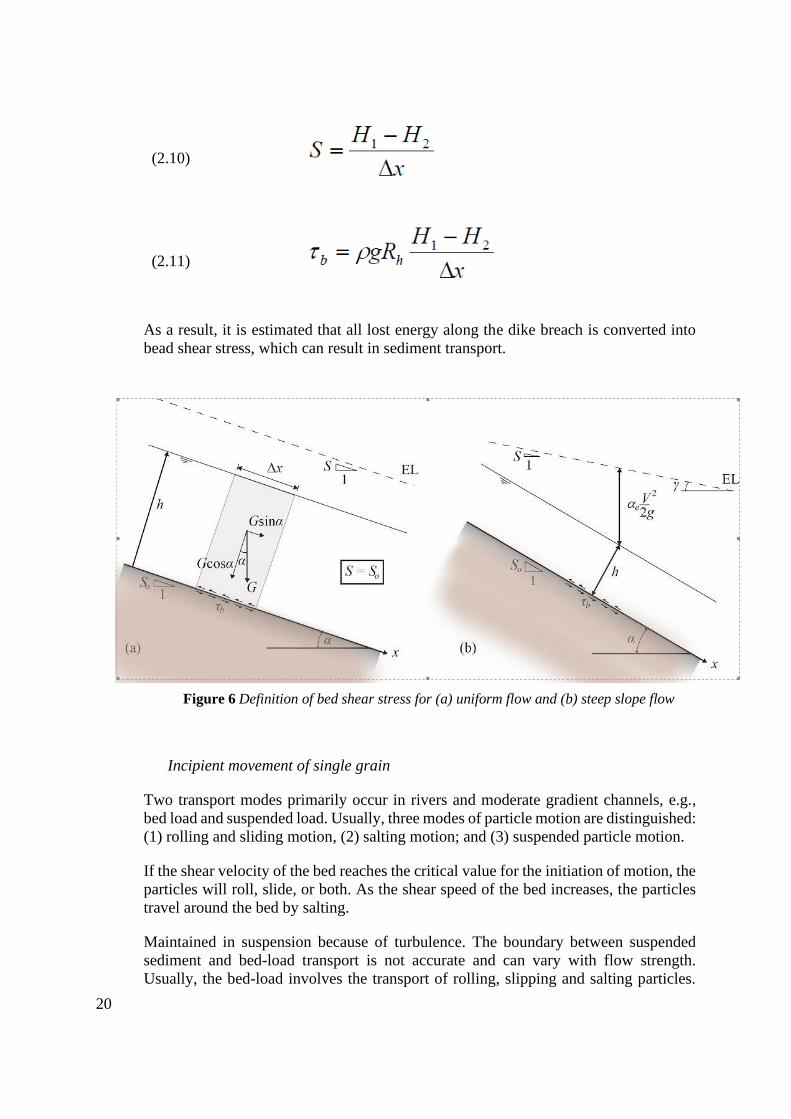
The bed shear stress Rb is the main force acting on the sediment bed. Second, it is
presented using the common assumption sin = tan for a small sloping bed.
Subsequently, the bed shear stress is seen on steep slopes. Figure 6 shows a sketch of
the hydraulics on a bed sloping at a small angle , depth of flow h, width b, and force
of gravity G acting on a length feature x. This denotes the slope of the bed and the
energy slope of S. The bed shear stress that acts on the sediment bed are the key
parameter responsible for sediment transport (subscript b). The shear stress is along the
sediment bed, assuming uniform parallel-streamline flow given by S = So and Rh = h
(b/h >15),
(2.2)
Where ρ = fluid density and g = acceleration of gravity. The shear velocity U* follows
from
(2.3)
When dealing with flow resistance, U* is particularly used as it characterizes the limits
between turbulent flow over smooth hydraulic beds and hydraulic rough beds. The
fundamental forces responsible for incipient sediment movement and bed load transport
are the bed shear pressure and the shear velocity resulting from the water flow. The
logarithmic velocity profile can be written as a uniform, hydraulically rough flow, and
no viscous sublayer as.
(2.4)
With k = 0.41 = von Karman's constant, Zn = standard channel bed distance, and ks =
sand grain roughness equivalent. Using Vm velocity depth-average and integrating Eq.
(2.4), the law of resistance results as (Keulegan 1938).
(2.5)
The resistance relation between Eq. (2.3) and Eq. (2.5) is
(2.6)
19
where the flow resistance factor Cf is given by
(2.7)
Therefore, a local point estimate of the bed shear stress can be achieved using the mean
flow velocity and the friction coefficient in uniform hydraulically rough open channel
flow. The assumptions of uniform flow S= So, Rh= h and sin = tan are invalid for
the existing dike breach studies under laboratory conditions (Figure 6). The energy line
slope S contains the bed shear stress for non-uniform flow, resulting in a reach-average
value for the bed shear stress.
(2.8)
The energy line slope can be derived based on the energy equation for non-uniform
flow
(2.9)
Where H = energy head, alpha = energy correction factor (Julien 2010), and z = bed
distance above the plane of the date. The pressure head varies from the flow depth of
h, provided the sloping bed. The angle of the water surface must also be considered for
curvilinear flow.
For the pressure head measurement. Assuming S = tanγ, with γ = energy line angle, the
energy slope S and χb between two spacing points x follow as follows
20
(2.10)
(2.11)
As a result, it is estimated that all lost energy along the dike breach is converted into
bead shear stress, which can result in sediment transport.
Incipient movement of single grain
Two transport modes primarily occur in rivers and moderate gradient channels, e.g.,
bed load and suspended load. Usually, three modes of particle motion are distinguished:
(1) rolling and sliding motion, (2) salting motion; and (3) suspended particle motion.
If the shear velocity of the bed reaches the critical value for the initiation of motion, the
particles will roll, slide, or both. As the shear speed of the bed increases, the particles
travel around the bed by salting.
Maintained in suspension because of turbulence. The boundary between suspended
sediment and bed-load transport is not accurate and can vary with flow strength.
Usually, the bed-load involves the transport of rolling, slipping and salting particles.
Figure 6 Definition of bed shear stress for (a) uniform flow and (b) steep slope flow
21
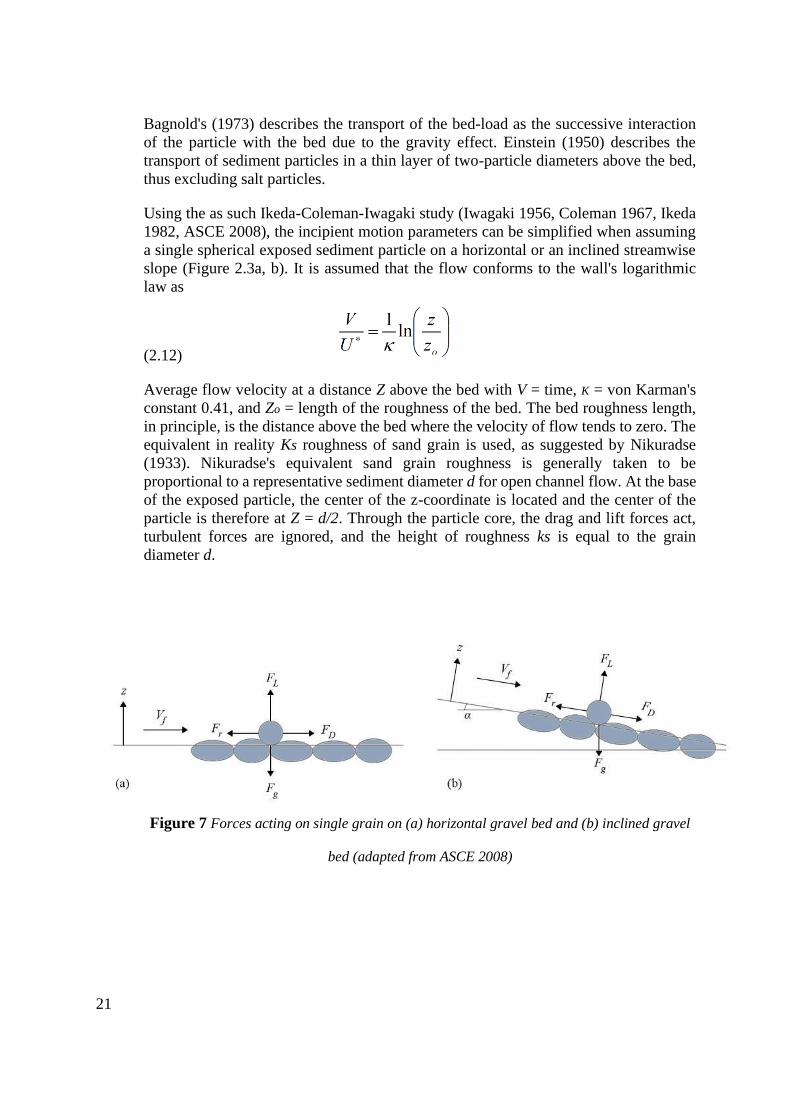
Bagnold's (1973) describes the transport of the bed-load as the successive interaction
of the particle with the bed due to the gravity effect. Einstein (1950) describes the
transport of sediment particles in a thin layer of two-particle diameters above the bed,
thus excluding salt particles.
Using the as such Ikeda-Coleman-Iwagaki study (Iwagaki 1956, Coleman 1967, Ikeda
1982, ASCE 2008), the incipient motion parameters can be simplified when assuming
a single spherical exposed sediment particle on a horizontal or an inclined streamwise
slope (Figure 2.3a, b). It is assumed that the flow conforms to the wall's logarithmic
law as
(2.12)
Average flow velocity at a distance Z above the bed with V = time, K = von Karman's
constant 0.41, and Zo = length of the roughness of the bed. The bed roughness length,
in principle, is the distance above the bed where the velocity of flow tends to zero. The
equivalent in reality Ks roughness of sand grain is used, as suggested by Nikuradse
(1933). Nikuradse's equivalent sand grain roughness is generally taken to be
proportional to a representative sediment diameter d for open channel flow. At the base
of the exposed particle, the center of the z-coordinate is located and the center of the
particle is therefore at Z = d/2. Through the particle core, the drag and lift forces act,
turbulent forces are ignored, and the height of roughness ks is equal to the grain
diameter d.
Figure 7 Forces acting on single grain on (a) horizontal gravel bed and (b) inclined gravel
bed (adapted from ASCE 2008)
22
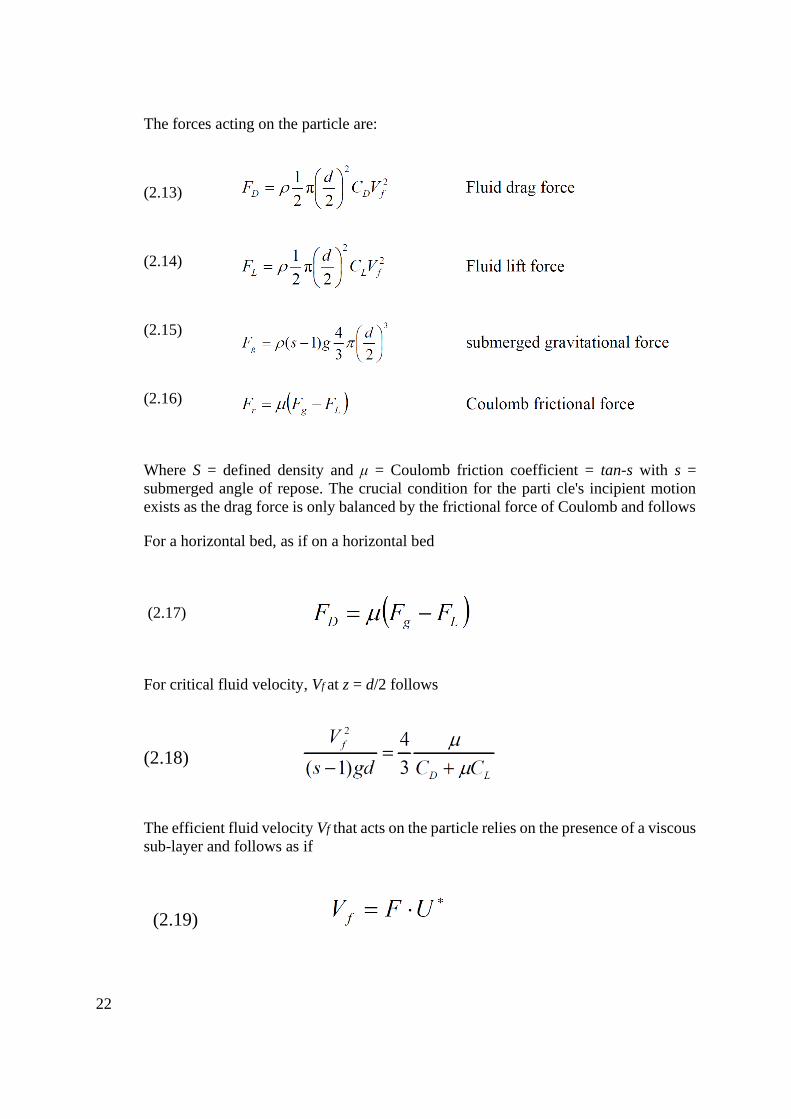
The forces acting on the particle are:
(2.13)
(2.14)
(2.15)
(2.16)
Where S = defined density and μ = Coulomb friction coefficient = tan-s with s =
submerged angle of repose. The crucial condition for the parti cle's incipient motion
exists as the drag force is only balanced by the frictional force of Coulomb and follows
For a horizontal bed, as if on a horizontal bed
(2.17)
For critical fluid velocity, Vf at z = d/2 follows
(2.18)
The efficient fluid velocity Vf that acts on the particle relies on the presence of a viscous
sub-layer and follows as if
(2.19)
23
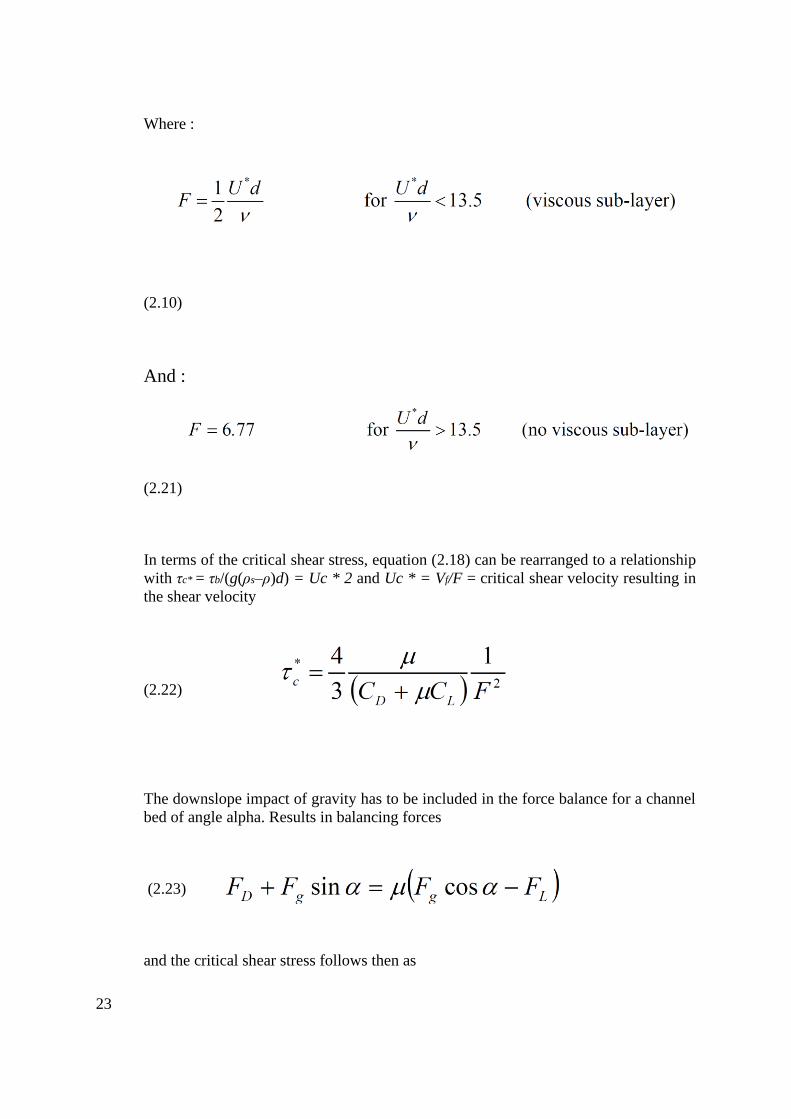
Where :
(2.10)
And :
(2.21)
In terms of the critical shear stress, equation (2.18) can be rearranged to a relationship
with τc* = τb/(g(ρs‒ρ)d) = Uc * 2 and Uc * = Vf/F = critical shear velocity resulting in
the shear velocity
(2.22)
The downslope impact of gravity has to be included in the force balance for a channel
bed of angle alpha. Results in balancing forces
(2.23)
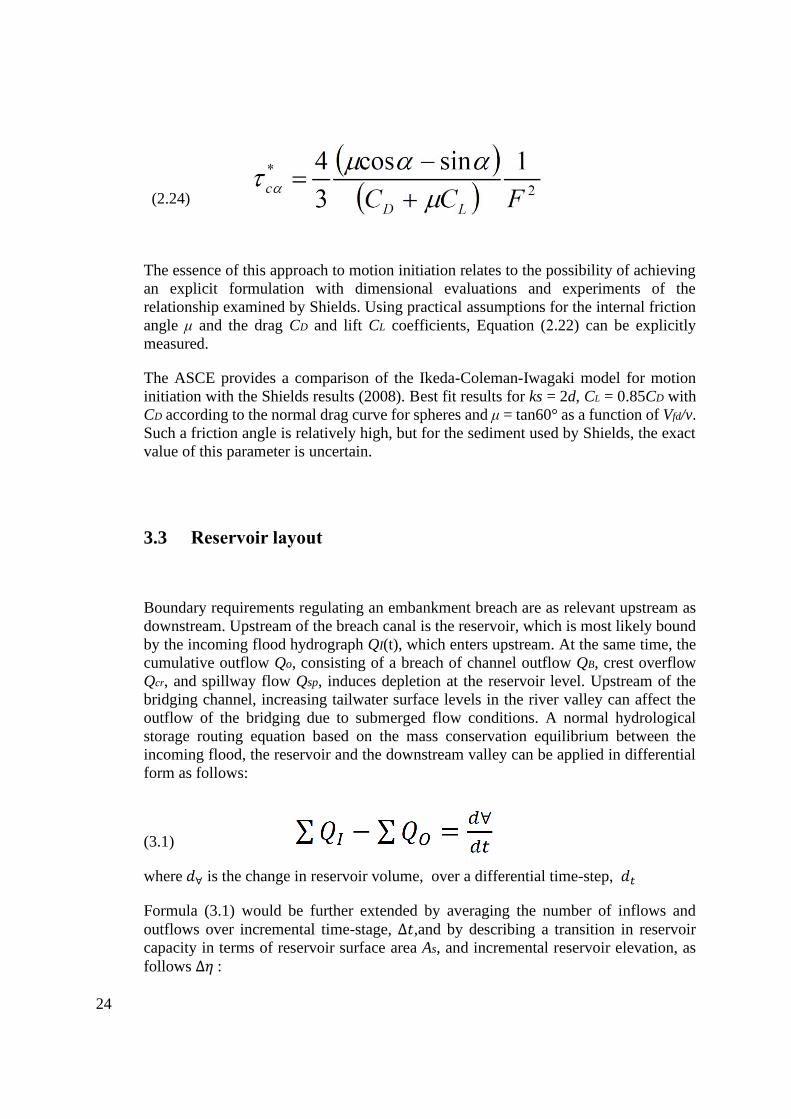
and the critical shear stress follows then as
24
(2.24)
The essence of this approach to motion initiation relates to the possibility of achieving
an explicit formulation with dimensional evaluations and experiments of the
relationship examined by Shields. Using practical assumptions for the internal friction
angle μ and the drag CD and lift CL coefficients, Equation (2.22) can be explicitly
measured.
The ASCE provides a comparison of the Ikeda-Coleman-Iwagaki model for motion
initiation with the Shields results (2008). Best fit results for ks = 2d, CL = 0.85CD with
CD according to the normal drag curve for spheres and μ = tan60° as a function of Vfd/v.
Such a friction angle is relatively high, but for the sediment used by Shields, the exact
value of this parameter is uncertain.
3.3 Reservoir layout
Boundary requirements regulating an embankment breach are as relevant upstream as
downstream. Upstream of the breach canal is the reservoir, which is most likely bound
by the incoming flood hydrograph QI(t), which enters upstream. At the same time, the
cumulative outflow Qo, consisting of a breach of channel outflow QB, crest overflow
Qcr, and spillway flow Qsp, induces depletion at the reservoir level. Upstream of the
bridging channel, increasing tailwater surface levels in the river valley can affect the
outflow of the bridging due to submerged flow conditions. A normal hydrological
storage routing equation based on the mass conservation equilibrium between the
incoming flood, the reservoir and the downstream valley can be applied in differential
form as follows:
(3.1)
where 𝑑∀ is the change in reservoir volume, over a differential time-step, 𝑑𝑡
Formula (3.1) would be further extended by averaging the number of inflows and
outflows over incremental time-stage, ∆𝑡,and by describing a transition in reservoir
capacity in terms of reservoir surface area As, and incremental reservoir elevation, as
follows ∆𝜂 :
25
(3.2)
By extracting the known variables from the unknown factors, the aforementioned
equation can be rewritten as follows:
(3.3)
From the equation (3.3), the surface level of the water at 𝑡 + ∆𝑡 can be expressed as:
(3.4)
Reservoir parameters are commonly known from topographic maps prior to the disposal
of the reservoir and/or recent surveys. The surface area-stage relationship defines the
surface area of the reservoir as a function of the elevation of the water surface as:
(3.5)
The etymology of the upstream boundary condition for the breach channel shown in
Equations (3.1) to (3.5) assumes a gradual breach where the speed in the reservoir is
minimal, and the inertial effects are localized (Fread, 1984b; Singh et al. 1988). This
assumption is valid when the size of the reservoir is large, the outflow of the breach
does not generate negative waves within the reservoir, or the incoming flood is not large
enough to cause positive waves through the reservoir (Fread, 1984b). In the case of thin
and long or branched reservoirs, the dynamic effects of upstream waves can influence
the discharge by breach of the bank, requiring dynamic routing techniques to measure
the outflow of the breach.
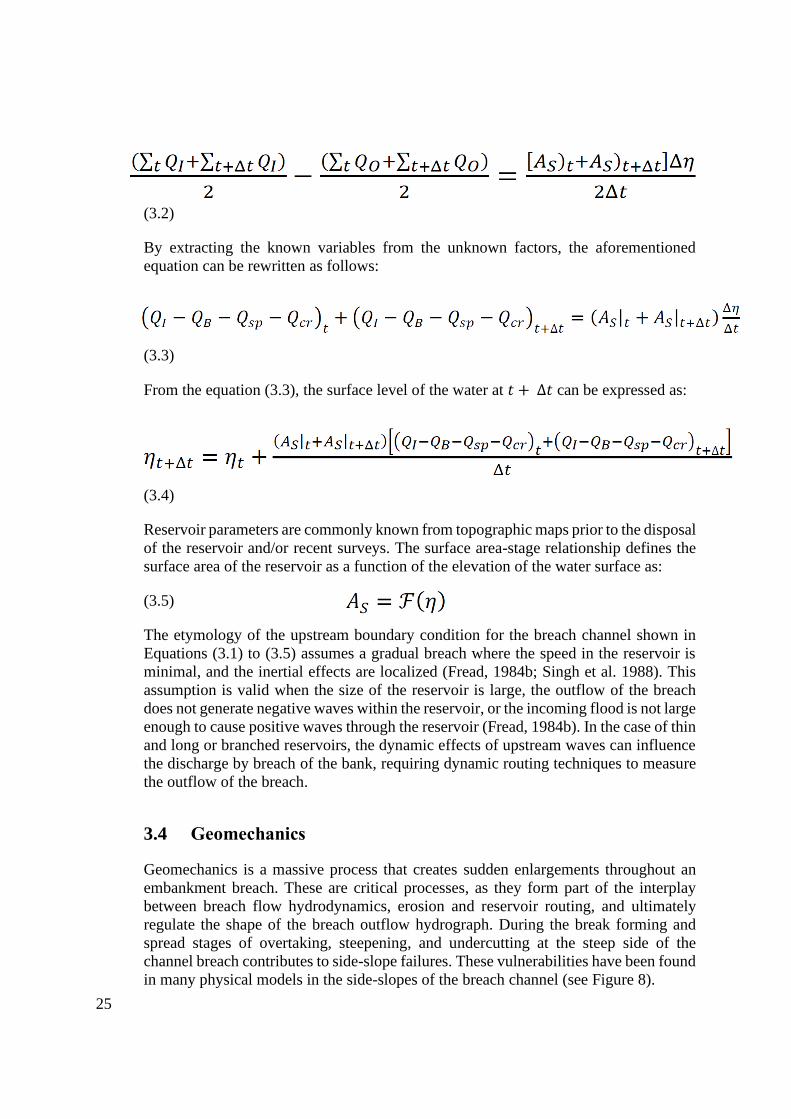
3.4 Geomechanics
Geomechanics is a massive process that creates sudden enlargements throughout an
embankment breach. These are critical processes, as they form part of the interplay
between breach flow hydrodynamics, erosion and reservoir routing, and ultimately
regulate the shape of the breach outflow hydrograph. During the break forming and
spread stages of overtaking, steepening, and undercutting at the steep side of the
channel breach contributes to side-slope failures. These vulnerabilities have been found
in many physical models in the side-slopes of the breach channel (see Figure 8).
26
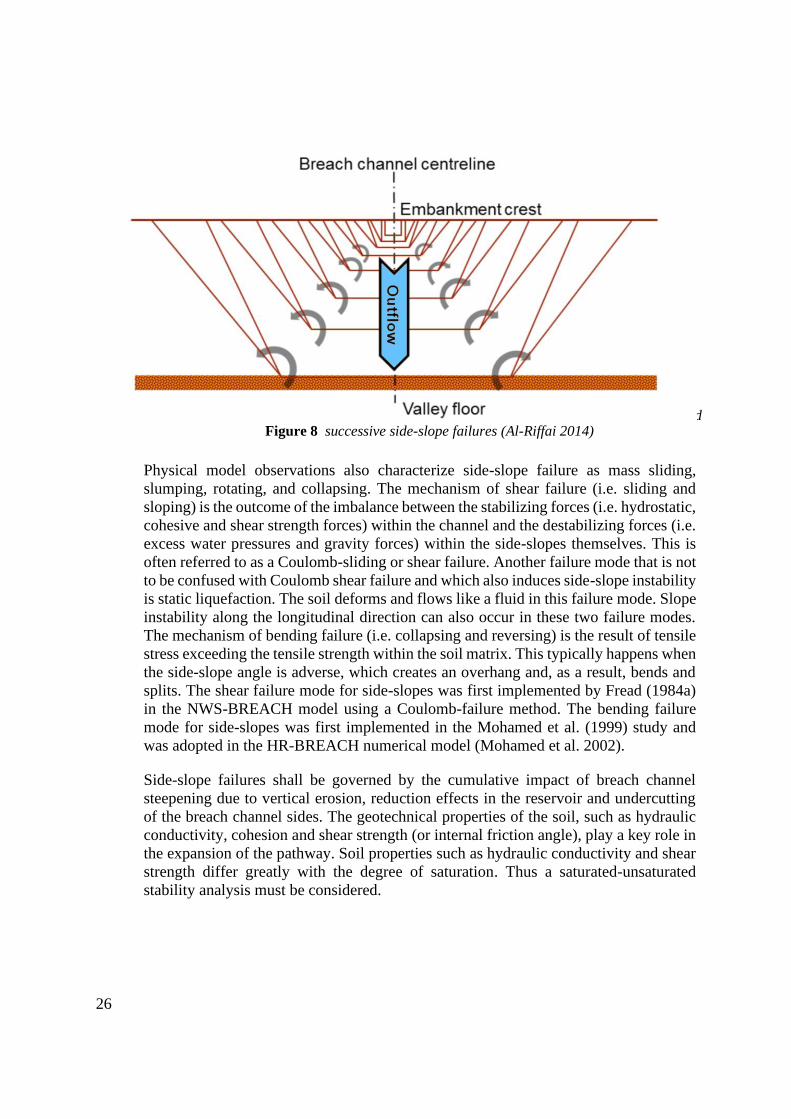
Physical model observations also characterize side-slope failure as mass sliding,
slumping, rotating, and collapsing. The mechanism of shear failure (i.e. sliding and
sloping) is the outcome of the imbalance between the stabilizing forces (i.e. hydrostatic,
cohesive and shear strength forces) within the channel and the destabilizing forces (i.e.
excess water pressures and gravity forces) within the side-slopes themselves. This is
often referred to as a Coulomb-sliding or shear failure. Another failure mode that is not
to be confused with Coulomb shear failure and which also induces side-slope instability
is static liquefaction. The soil deforms and flows like a fluid in this failure mode. Slope
instability along the longitudinal direction can also occur in these two failure modes.
The mechanism of bending failure (i.e. collapsing and reversing) is the result of tensile
stress exceeding the tensile strength within the soil matrix. This typically happens when
the side-slope angle is adverse, which creates an overhang and, as a result, bends and
splits. The shear failure mode for side-slopes was first implemented by Fread (1984a)
in the NWS-BREACH model using a Coulomb-failure method. The bending failure
mode for side-slopes was first implemented in the Mohamed et al. (1999) study and
was adopted in the HR-BREACH numerical model (Mohamed et al. 2002).
Side-slope failures shall be governed by the cumulative impact of breach channel
steepening due to vertical erosion, reduction effects in the reservoir and undercutting
of the breach channel sides. The geotechnical properties of the soil, such as hydraulic
conductivity, cohesion and shear strength (or internal friction angle), play a key role in
the expansion of the pathway. Soil properties such as hydraulic conductivity and shear
strength differ greatly with the degree of saturation. Thus a saturated-unsaturated
stability analysis must be considered.
Figure 9 Trapezoidal breach channel cross-section showing vertical erosion progression and
successive side-slope failures Figure 8 successive side-slope failures (Al-Riffai 2014)
27
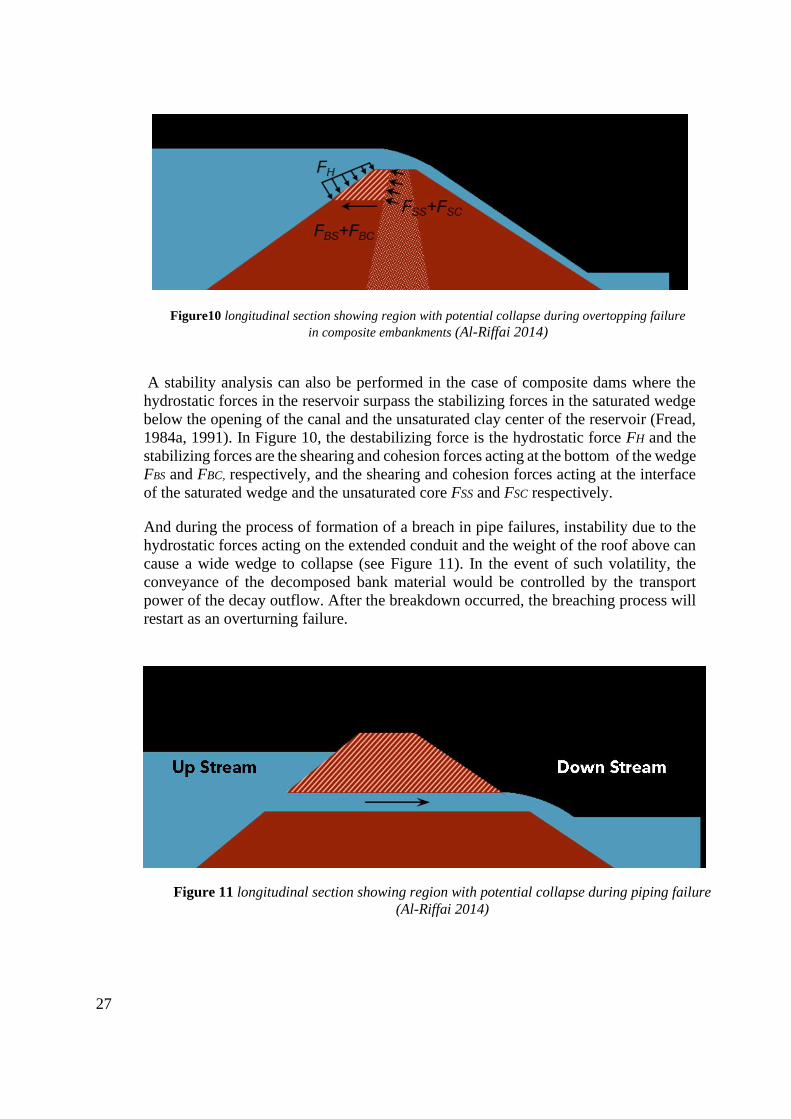
A stability analysis can also be performed in the case of composite dams where the
hydrostatic forces in the reservoir surpass the stabilizing forces in the saturated wedge
below the opening of the canal and the unsaturated clay center of the reservoir (Fread,
1984a, 1991). In Figure 10, the destabilizing force is the hydrostatic force FH and the
stabilizing forces are the shearing and cohesion forces acting at the bottom of the wedge
FBS and FBC, respectively, and the shearing and cohesion forces acting at the interface
of the saturated wedge and the unsaturated core FSS and FSC respectively.
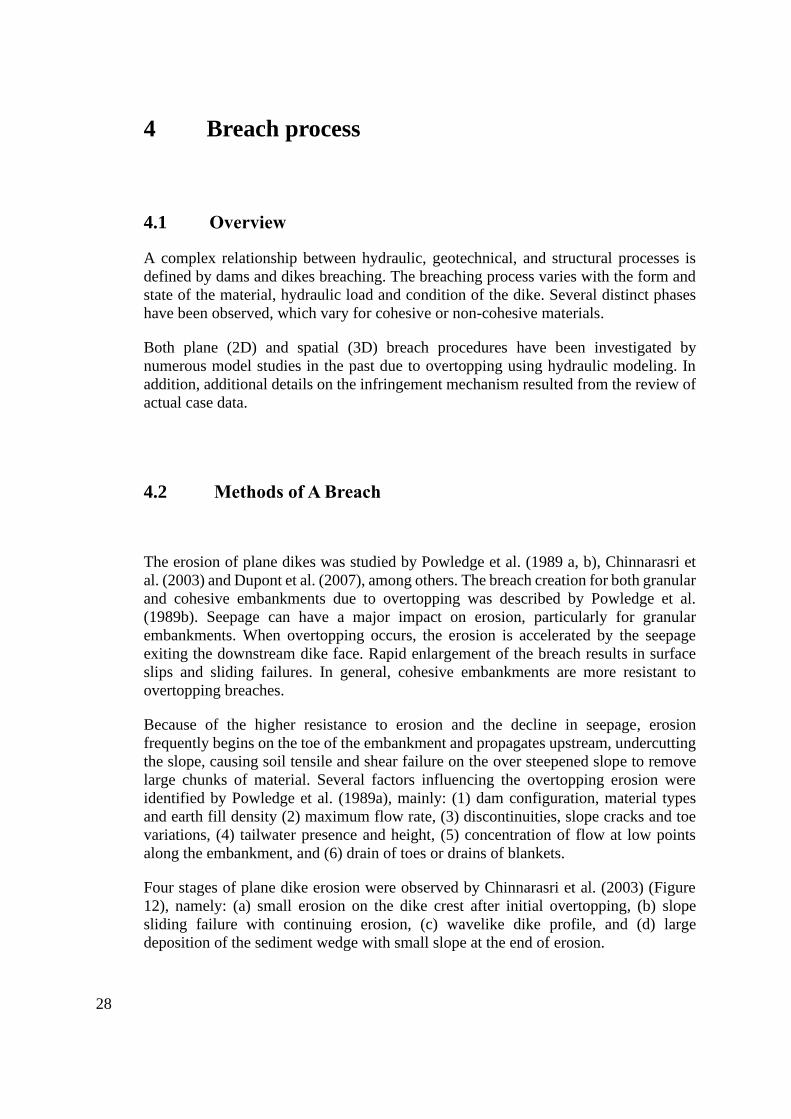
And during the process of formation of a breach in pipe failures, instability due to the
hydrostatic forces acting on the extended conduit and the weight of the roof above can
cause a wide wedge to collapse (see Figure 11). In the event of such volatility, the
conveyance of the decomposed bank material would be controlled by the transport
power of the decay outflow. After the breakdown occurred, the breaching process will
restart as an overturning failure.
Figure10 longitudinal section showing region with potential collapse during overtopping failure
in composite embankments (Al-Riffai 2014)
Figure 11 longitudinal section showing region with potential collapse during piping failure
(Al-Riffai 2014)
28
4 Breach process
4.1 Overview
A complex relationship between hydraulic, geotechnical, and structural processes is
defined by dams and dikes breaching. The breaching process varies with the form and
state of the material, hydraulic load and condition of the dike. Several distinct phases
have been observed, which vary for cohesive or non-cohesive materials.
Both plane (2D) and spatial (3D) breach procedures have been investigated by
numerous model studies in the past due to overtopping using hydraulic modeling. In
addition, additional details on the infringement mechanism resulted from the review of
actual case data.
4.2 Methods of A Breach
The erosion of plane dikes was studied by Powledge et al. (1989 a, b), Chinnarasri et
al. (2003) and Dupont et al. (2007), among others. The breach creation for both granular
and cohesive embankments due to overtopping was described by Powledge et al.
(1989b). Seepage can have a major impact on erosion, particularly for granular
embankments. When overtopping occurs, the erosion is accelerated by the seepage
exiting the downstream dike face. Rapid enlargement of the breach results in surface
slips and sliding failures. In general, cohesive embankments are more resistant to
overtopping breaches.
Because of the higher resistance to erosion and the decline in seepage, erosion
frequently begins on the toe of the embankment and propagates upstream, undercutting
the slope, causing soil tensile and shear failure on the over steepened slope to remove
large chunks of material. Several factors influencing the overtopping erosion were
identified by Powledge et al. (1989a), mainly: (1) dam configuration, material types
and earth fill density (2) maximum flow rate, (3) discontinuities, slope cracks and toe
variations, (4) tailwater presence and height, (5) concentration of flow at low points
along the embankment, and (6) drain of toes or drains of blankets.
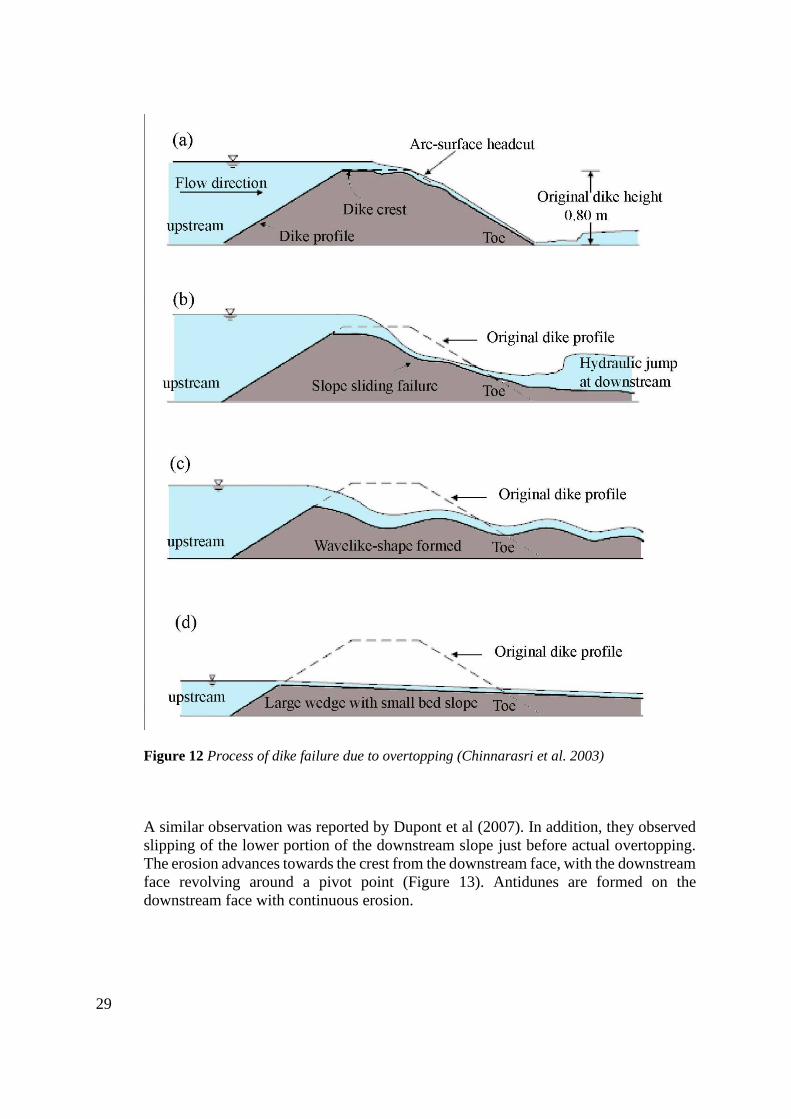
Four stages of plane dike erosion were observed by Chinnarasri et al. (2003) (Figure
12), namely: (a) small erosion on the dike crest after initial overtopping, (b) slope
sliding failure with continuing erosion, (c) wavelike dike profile, and (d) large
deposition of the sediment wedge with small slope at the end of erosion.
29
Figure 12 Process of dike failure due to overtopping (Chinnarasri et al. 2003)
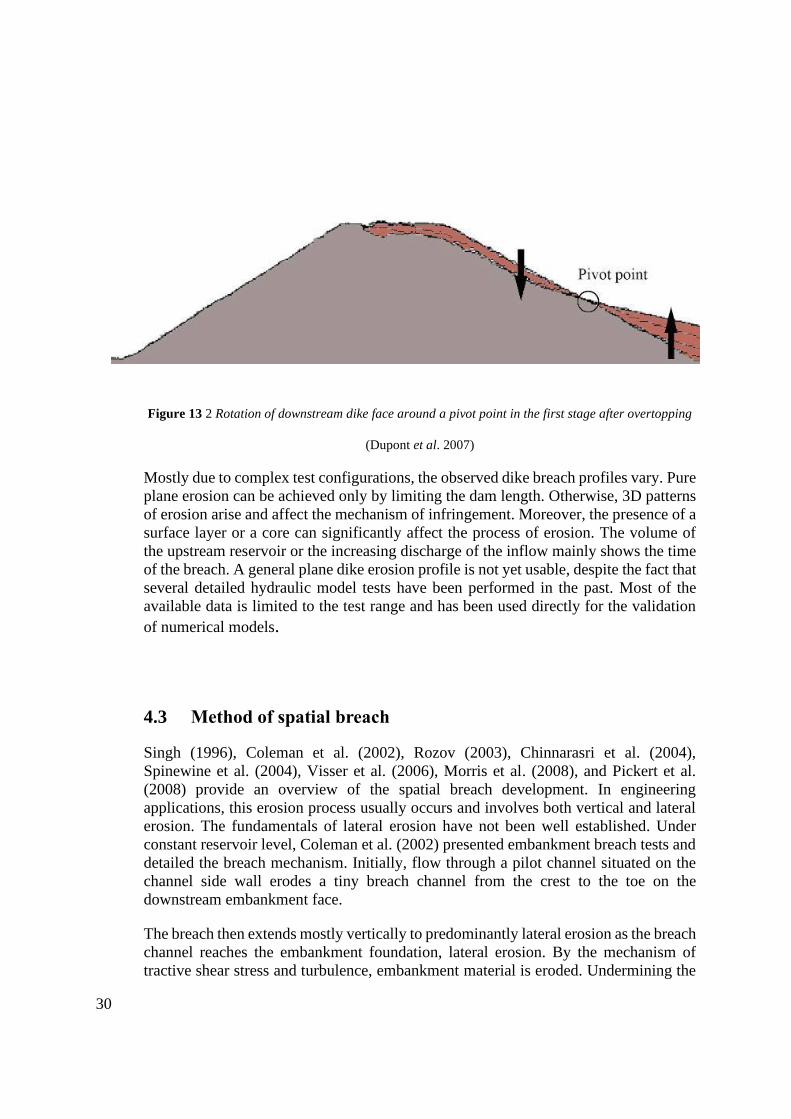
A similar observation was reported by Dupont et al (2007). In addition, they observed
slipping of the lower portion of the downstream slope just before actual overtopping.
The erosion advances towards the crest from the downstream face, with the downstream
face revolving around a pivot point (Figure 13). Antidunes are formed on the
downstream face with continuous erosion.
30
Figure 13 2 Rotation of downstream dike face around a pivot point in the first stage after overtopping
(Dupont et al. 2007)
Mostly due to complex test configurations, the observed dike breach profiles vary. Pure
plane erosion can be achieved only by limiting the dam length. Otherwise, 3D patterns
of erosion arise and affect the mechanism of infringement. Moreover, the presence of a
surface layer or a core can significantly affect the process of erosion. The volume of
the upstream reservoir or the increasing discharge of the inflow mainly shows the time
of the breach. A general plane dike erosion profile is not yet usable, despite the fact that
several detailed hydraulic model tests have been performed in the past. Most of the
available data is limited to the test range and has been used directly for the validation
of numerical models.
4.3 Method of spatial breach
Singh (1996), Coleman et al. (2002), Rozov (2003), Chinnarasri et al. (2004),
Spinewine et al. (2004), Visser et al. (2006), Morris et al. (2008), and Pickert et al.
(2008) provide an overview of the spatial breach development. In engineering
applications, this erosion process usually occurs and involves both vertical and lateral
erosion. The fundamentals of lateral erosion have not been well established. Under
constant reservoir level, Coleman et al. (2002) presented embankment breach tests and
detailed the breach mechanism. Initially, flow through a pilot channel situated on the
channel side wall erodes a tiny breach channel from the crest to the toe on the
downstream embankment face.
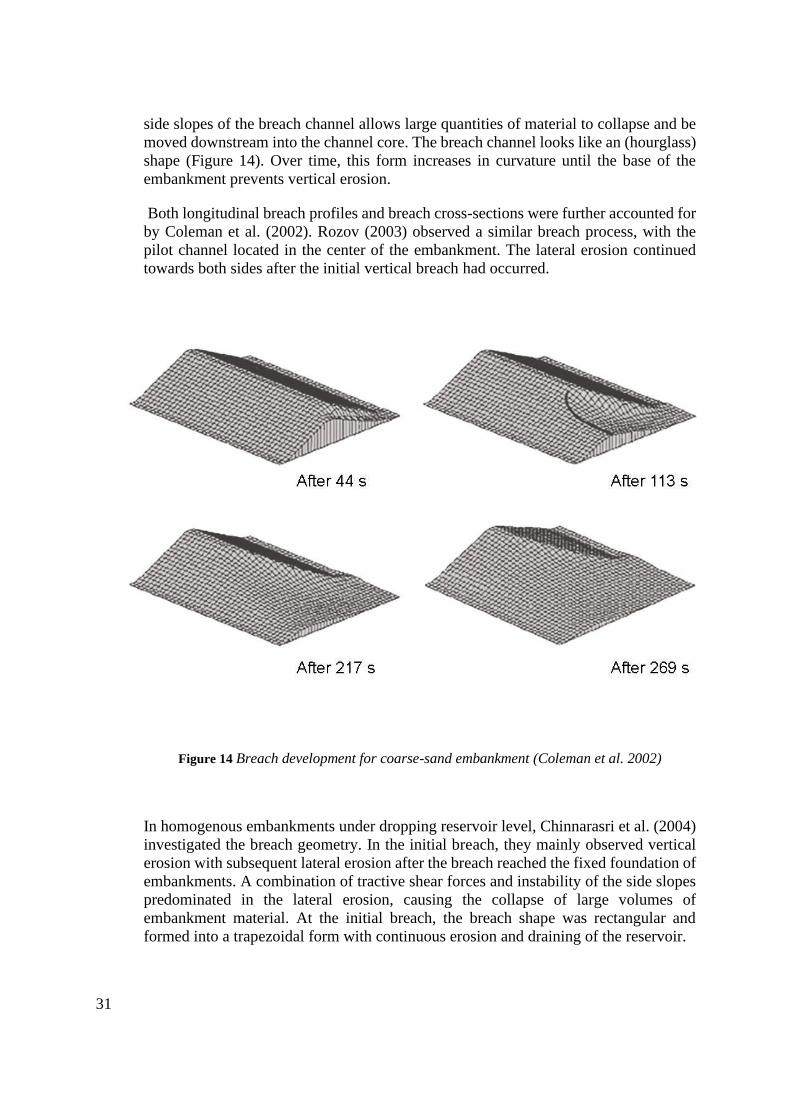
The breach then extends mostly vertically to predominantly lateral erosion as the breach
channel reaches the embankment foundation, lateral erosion. By the mechanism of
tractive shear stress and turbulence, embankment material is eroded. Undermining the
31
side slopes of the breach channel allows large quantities of material to collapse and be
moved downstream into the channel core. The breach channel looks like an (hourglass)
shape (Figure 14). Over time, this form increases in curvature until the base of the
embankment prevents vertical erosion.
Both longitudinal breach profiles and breach cross-sections were further accounted for
by Coleman et al. (2002). Rozov (2003) observed a similar breach process, with the
pilot channel located in the center of the embankment. The lateral erosion continued
towards both sides after the initial vertical breach had occurred.
Figure 14 Breach development for coarse-sand embankment (Coleman et al. 2002)
In homogenous embankments under dropping reservoir level, Chinnarasri et al. (2004)
investigated the breach geometry. In the initial breach, they mainly observed vertical
erosion with subsequent lateral erosion after the breach reached the fixed foundation of
embankments. A combination of tractive shear forces and instability of the side slopes
predominated in the lateral erosion, causing the collapse of large volumes of
embankment material. At the initial breach, the breach shape was rectangular and
formed into a trapezoidal form with continuous erosion and draining of the reservoir.
32
For both sand and clay dikes, Visser et al. (2006) distinguished five phases in the breach
overtopping process. The breach began with the flow entering a small initial breach in
the center of the dike, situated at the top. The breach formed progressively during
Stages I and II by decreasing the dike height and increasing the initial breach channel
width. The breach development accelerated during Stage III until the dike in its breach
segment was completely washed out. During Stage IV, the breach then expanded
mainly laterally and decelerated in Stage V with decreasing backwater and thus
decreasing breach discharge.
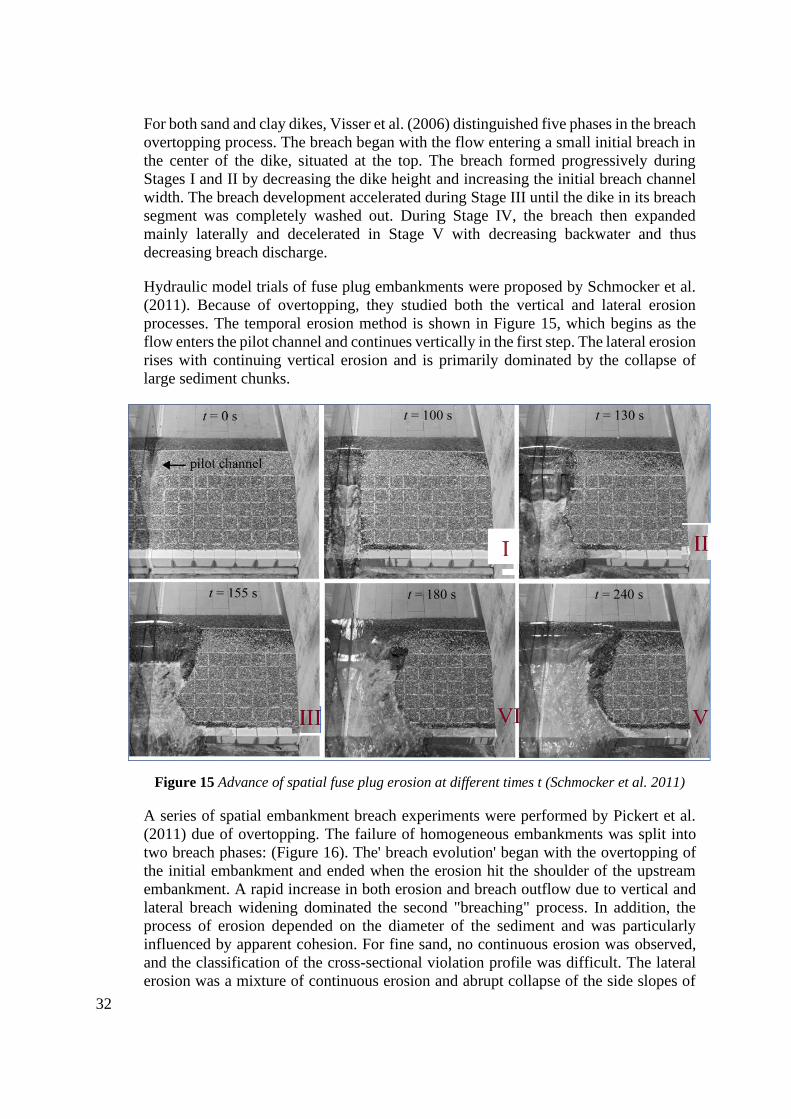
Hydraulic model trials of fuse plug embankments were proposed by Schmocker et al.
(2011). Because of overtopping, they studied both the vertical and lateral erosion
processes. The temporal erosion method is shown in Figure 15, which begins as the
flow enters the pilot channel and continues vertically in the first step. The lateral erosion
rises with continuing vertical erosion and is primarily dominated by the collapse of
large sediment chunks.
Figure 15 Advance of spatial fuse plug erosion at different times t (Schmocker et al. 2011)
A series of spatial embankment breach experiments were performed by Pickert et al.
(2011) due of overtopping. The failure of homogeneous embankments was split into
two breach phases: (Figure 16). The' breach evolution' began with the overtopping of
the initial embankment and ended when the erosion hit the shoulder of the upstream
embankment. A rapid increase in both erosion and breach outflow due to vertical and
lateral breach widening dominated the second "breaching" process. In addition, the
process of erosion depended on the diameter of the sediment and was particularly
influenced by apparent cohesion. For fine sand, no continuous erosion was observed,
and the classification of the cross-sectional violation profile was difficult. The lateral
erosion was a mixture of continuous erosion and abrupt collapse of the side slopes of
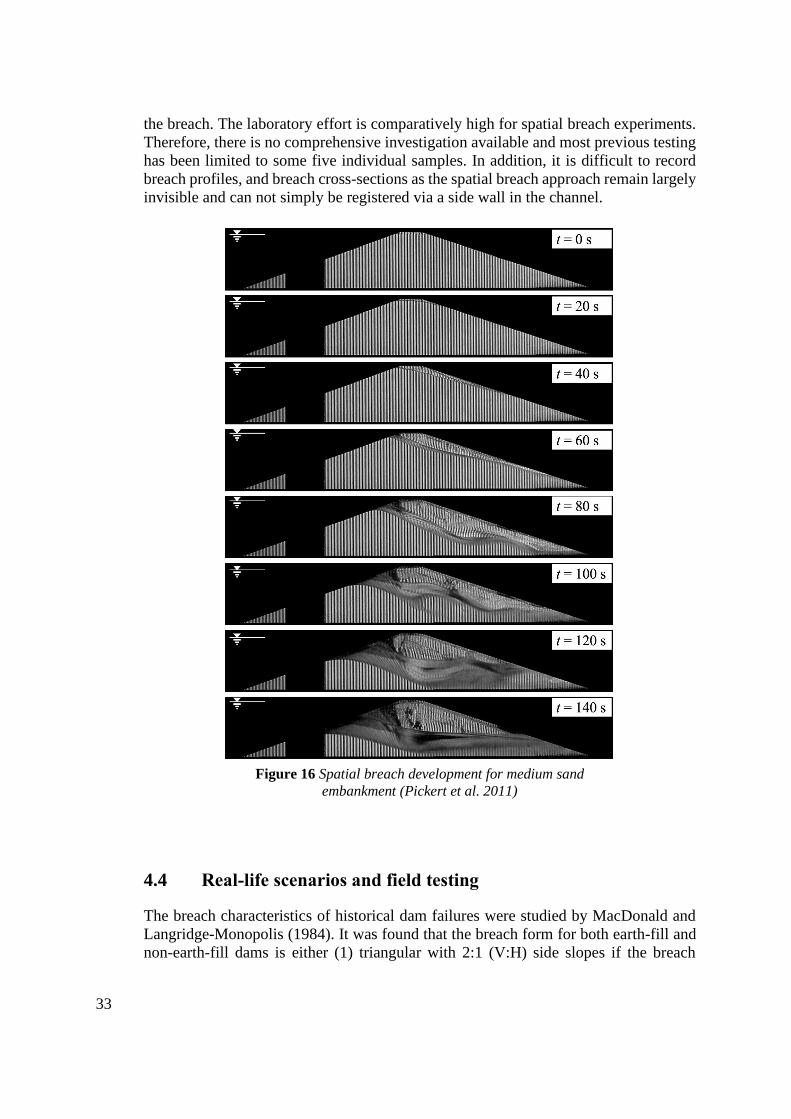
33
the breach. The laboratory effort is comparatively high for spatial breach experiments.
Therefore, there is no comprehensive investigation available and most previous testing
has been limited to some five individual samples. In addition, it is difficult to record
breach profiles, and breach cross-sections as the spatial breach approach remain largely
invisible and can not simply be registered via a side wall in the channel.
4.4 Real-life scenarios and field testing
The breach characteristics of historical dam failures were studied by MacDonald and
Langridge-Monopolis (1984). It was found that the breach form for both earth-fill and
non-earth-fill dams is either (1) triangular with 2:1 (V:H) side slopes if the breach
Figure 16 Spatial breach development for medium sand
embankment (Pickert et al. 2011)
34
extends to the embankment foundation, or (2) trapezoidal with 2:1 side slopes if
additional material is washed out after the breach reaches the embankment bottom.
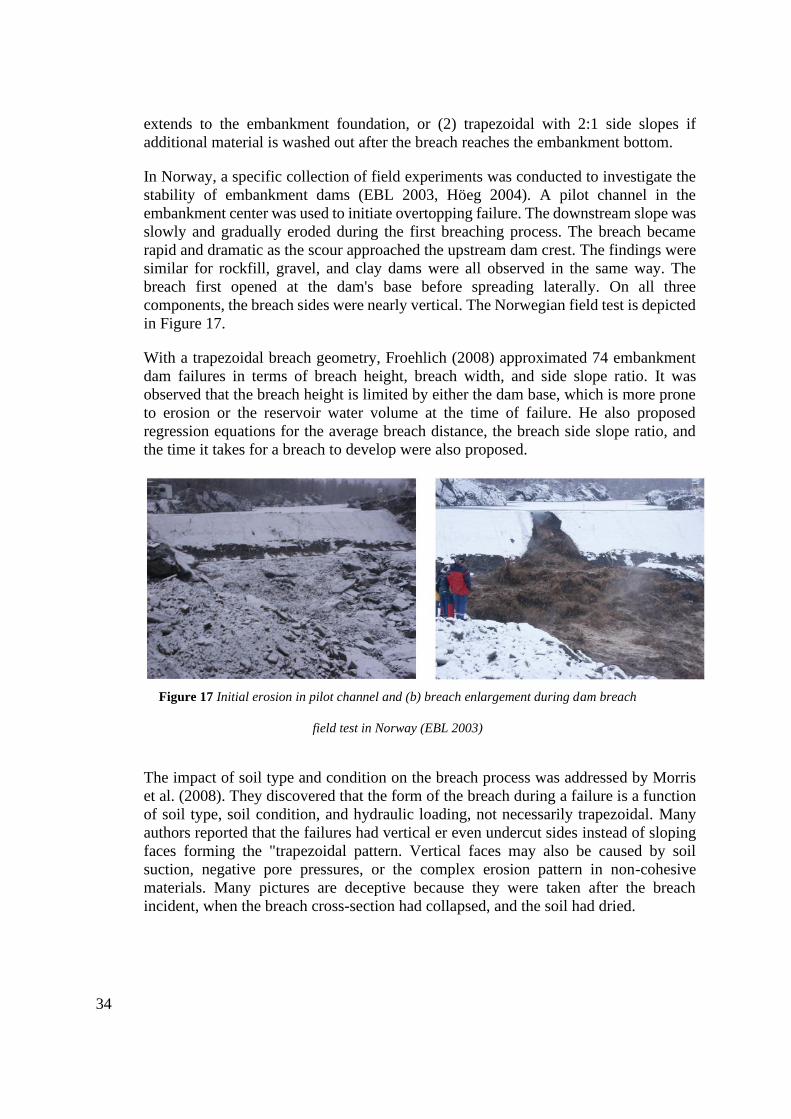
In Norway, a specific collection of field experiments was conducted to investigate the
stability of embankment dams (EBL 2003, Höeg 2004). A pilot channel in the
embankment center was used to initiate overtopping failure. The downstream slope was
slowly and gradually eroded during the first breaching process. The breach became
rapid and dramatic as the scour approached the upstream dam crest. The findings were
similar for rockfill, gravel, and clay dams were all observed in the same way. The
breach first opened at the dam's base before spreading laterally. On all three
components, the breach sides were nearly vertical. The Norwegian field test is depicted
in Figure 17.
With a trapezoidal breach geometry, Froehlich (2008) approximated 74 embankment
dam failures in terms of breach height, breach width, and side slope ratio. It was
observed that the breach height is limited by either the dam base, which is more prone
to erosion or the reservoir water volume at the time of failure. He also proposed
regression equations for the average breach distance, the breach side slope ratio, and
the time it takes for a breach to develop were also proposed.
The impact of soil type and condition on the breach process was addressed by Morris
et al. (2008). They discovered that the form of the breach during a failure is a function
of soil type, soil condition, and hydraulic loading, not necessarily trapezoidal. Many
authors reported that the failures had vertical er even undercut sides instead of sloping
faces forming the "trapezoidal pattern. Vertical faces may also be caused by soil
suction, negative pore pressures, or the complex erosion pattern in non-cohesive
materials. Many pictures are deceptive because they were taken after the breach
incident, when the breach cross-section had collapsed, and the soil had dried.
Figure 17 Initial erosion in pilot channel and (b) breach enlargement during dam breach
field test in Norway (EBL 2003)
35
5 Mathematical simulation
It is essential to accurately model and forecasts the initiation and evolution of an
embankment breach. This will be helpful to effectively carry out downstream flood
routing related to an overtopped embankment. Researchers have introduced many
approaches for modeling overtopped embankment breaching over the last 50 years.
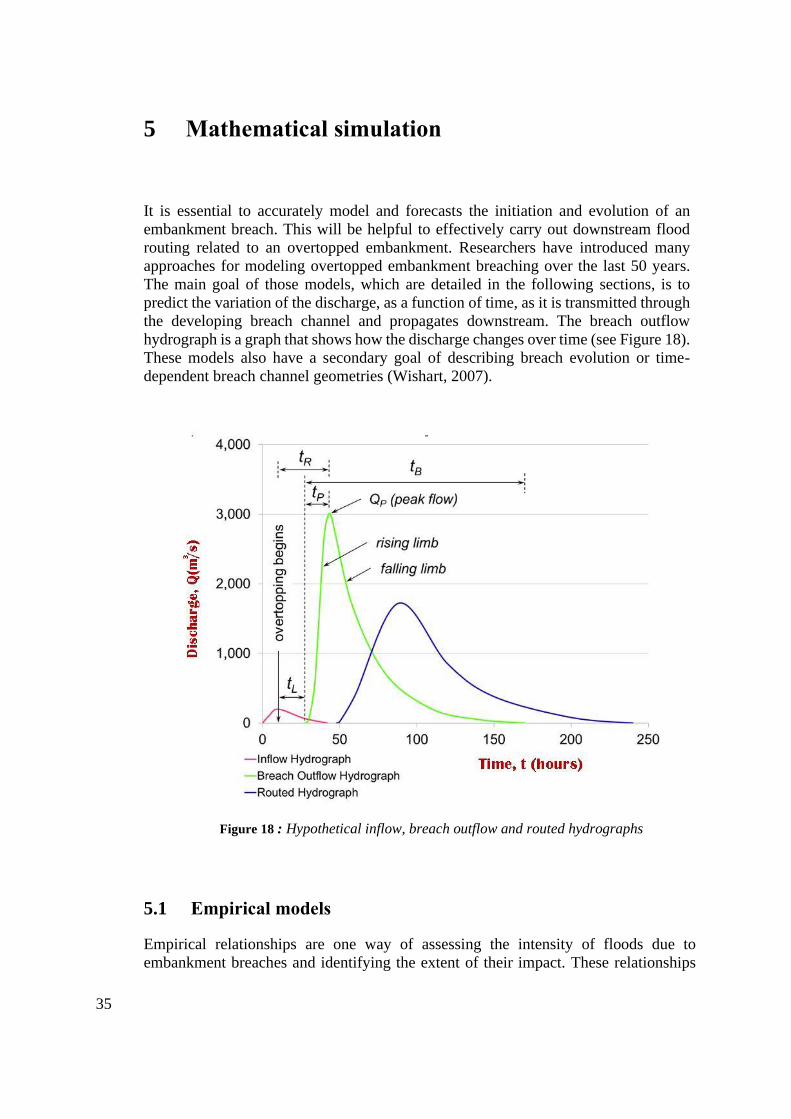
The main goal of those models, which are detailed in the following sections, is to
predict the variation of the discharge, as a function of time, as it is transmitted through
the developing breach channel and propagates downstream. The breach outflow
hydrograph is a graph that shows how the discharge changes over time (see Figure 18).
These models also have a secondary goal of describing breach evolution or time-
dependent breach channel geometries (Wishart, 2007).
5.1 Empirical models
Empirical relationships are one way of assessing the intensity of floods due to
embankment breaches and identifying the extent of their impact. These relationships
Figure 18 : Hypothetical inflow, breach outflow and routed hydrographs
36
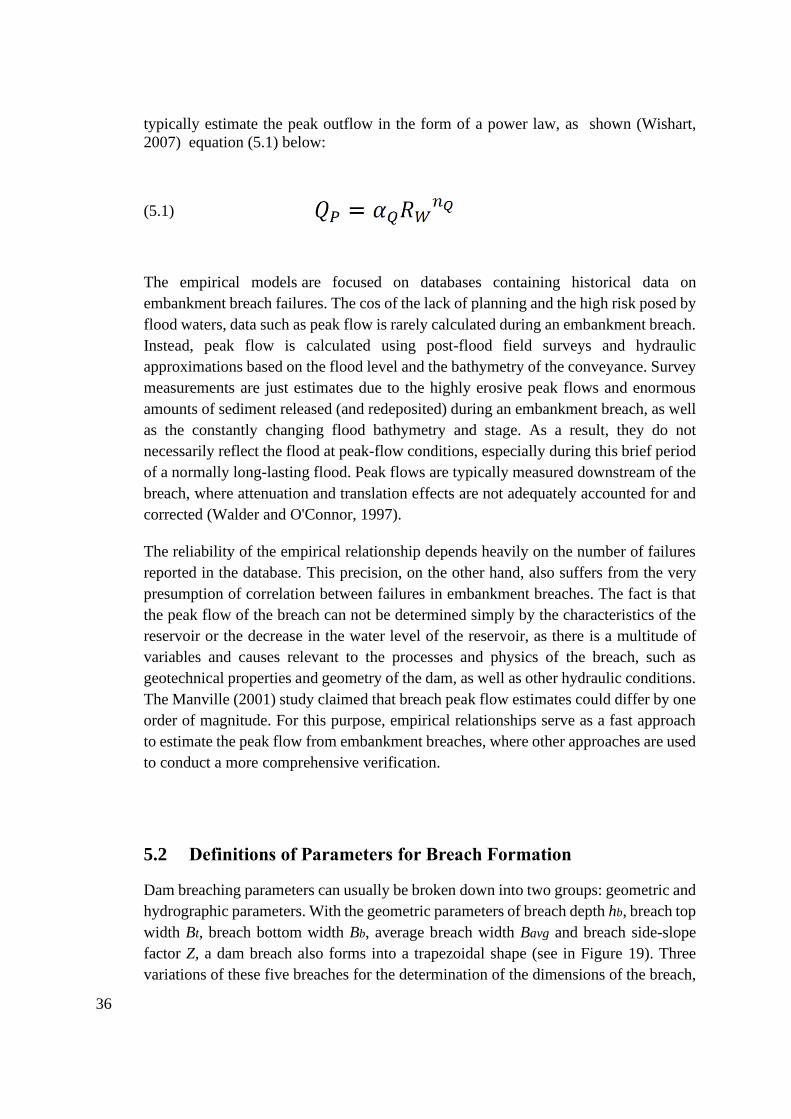
typically estimate the peak outflow in the form of a power law, as shown (Wishart,
2007) equation (5.1) below:
(5.1)
The empirical models are focused on databases containing historical data on
embankment breach failures. The cos of the lack of planning and the high risk posed by
flood waters, data such as peak flow is rarely calculated during an embankment breach.
Instead, peak flow is calculated using post-flood field surveys and hydraulic
approximations based on the flood level and the bathymetry of the conveyance. Survey
measurements are just estimates due to the highly erosive peak flows and enormous
amounts of sediment released (and redeposited) during an embankment breach, as well
as the constantly changing flood bathymetry and stage. As a result, they do not
necessarily reflect the flood at peak-flow conditions, especially during this brief period
of a normally long-lasting flood. Peak flows are typically measured downstream of the
breach, where attenuation and translation effects are not adequately accounted for and
corrected (Walder and O'Connor, 1997).
The reliability of the empirical relationship depends heavily on the number of failures
reported in the database. This precision, on the other hand, also suffers from the very
presumption of correlation between failures in embankment breaches. The fact is that
the peak flow of the breach can not be determined simply by the characteristics of the
reservoir or the decrease in the water level of the reservoir, as there is a multitude of
variables and causes relevant to the processes and physics of the breach, such as
geotechnical properties and geometry of the dam, as well as other hydraulic conditions.
The Manville (2001) study claimed that breach peak flow estimates could differ by one
order of magnitude. For this purpose, empirical relationships serve as a fast approach
to estimate the peak flow from embankment breaches, where other approaches are used
to conduct a more comprehensive verification.
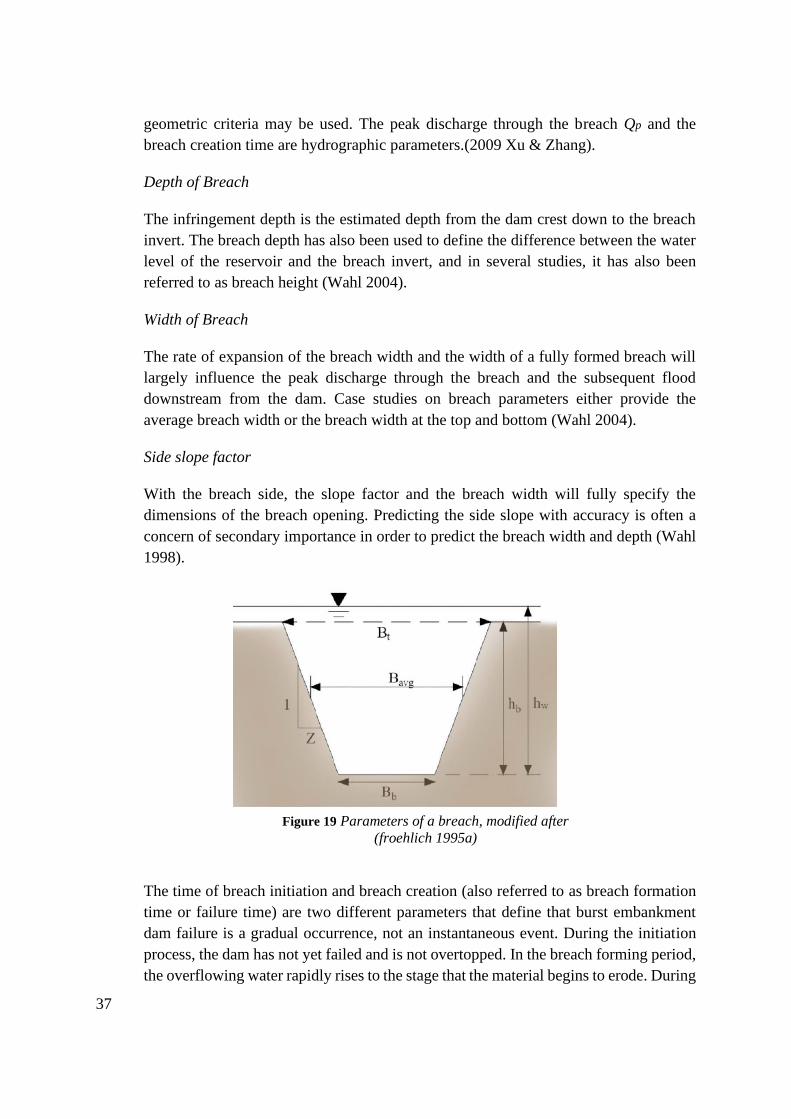
5.2 Definitions of Parameters for Breach Formation
Dam breaching parameters can usually be broken down into two groups: geometric and
hydrographic parameters. With the geometric parameters of breach depth hb, breach top
width Bt, breach bottom width Bb, average breach width Bavg and breach side-slope
factor Z, a dam breach also forms into a trapezoidal shape (see in Figure 19). Three
variations of these five breaches for the determination of the dimensions of the breach,
37
geometric criteria may be used. The peak discharge through the breach Qp and the
breach creation time are hydrographic parameters.(2009 Xu & Zhang).
Depth of Breach
The infringement depth is the estimated depth from the dam crest down to the breach
invert. The breach depth has also been used to define the difference between the water
level of the reservoir and the breach invert, and in several studies, it has also been
referred to as breach height (Wahl 2004).
Width of Breach
The rate of expansion of the breach width and the width of a fully formed breach will
largely influence the peak discharge through the breach and the subsequent flood
downstream from the dam. Case studies on breach parameters either provide the
average breach width or the breach width at the top and bottom (Wahl 2004).
Side slope factor
With the breach side, the slope factor and the breach width will fully specify the
dimensions of the breach opening. Predicting the side slope with accuracy is often a
concern of secondary importance in order to predict the breach width and depth (Wahl
1998).
The time of breach initiation and breach creation (also referred to as breach formation
time or failure time) are two different parameters that define that burst embankment
dam failure is a gradual occurrence, not an instantaneous event. During the initiation
process, the dam has not yet failed and is not overtopped. In the breach forming period,
the overflowing water rapidly rises to the stage that the material begins to erode. During
Figure 19 Parameters of a breach, modified after
(froehlich 1995a)
38
this step of the overtopping of the dam, it is unlikely the process will be halted, and a
breach will occur in the dam as a result (Wahl 1998).
Initiation Time of Breach
When the first water starts to flow over the embankment, the breach initiation process
begins, creating noticeable erosion with the likelihood of further progress and causing
dam failure. The region of active erosion is downstream from the hydraulic control
point of the flow during the initiation process of the breach. Due to the rising water in
the reservoir, the flow rate over the embankment is not controlled by the erosion is due
to. The zone of active erosion usually continues to shift upstream with surface erosion
as the initiation process progresses. The initiation process ends at the same time as the
active erosion front enters the dam's crest and upstream face, resulting in a rapid
increase in breach outflow and generally unpreventable dam failure (CEATI 2017).
Breach time of failure
When the breach initiation process ends, erosion starts to create an enlargement of the
embankment's channel cross-section, which acts as a hydraulic regulation of water
flowing over the embankment. The breach forming process will last until the breach
dimensions are at their peak. The breach forming process can involve both bottom and
side erosion, resulting in the deepening and widening of the channel. Since the breach
formation process will last for a long time as the reservoir drains, different points in
time can be used to determine the end of the breach formation phase (CEATI 2017). In
addition, Morris et al. (2009) outlined the progress in more detail, from the beginning
of overtopping to the complete development of the breach. The method consists of six
stages, beginning at T0 breach initiation and lasting until the end of T5 breach formation
time (figure 20).
Figure 20 Typical hydrograph that could arise from breach through an embankment (based
on Morris et al. (2009))
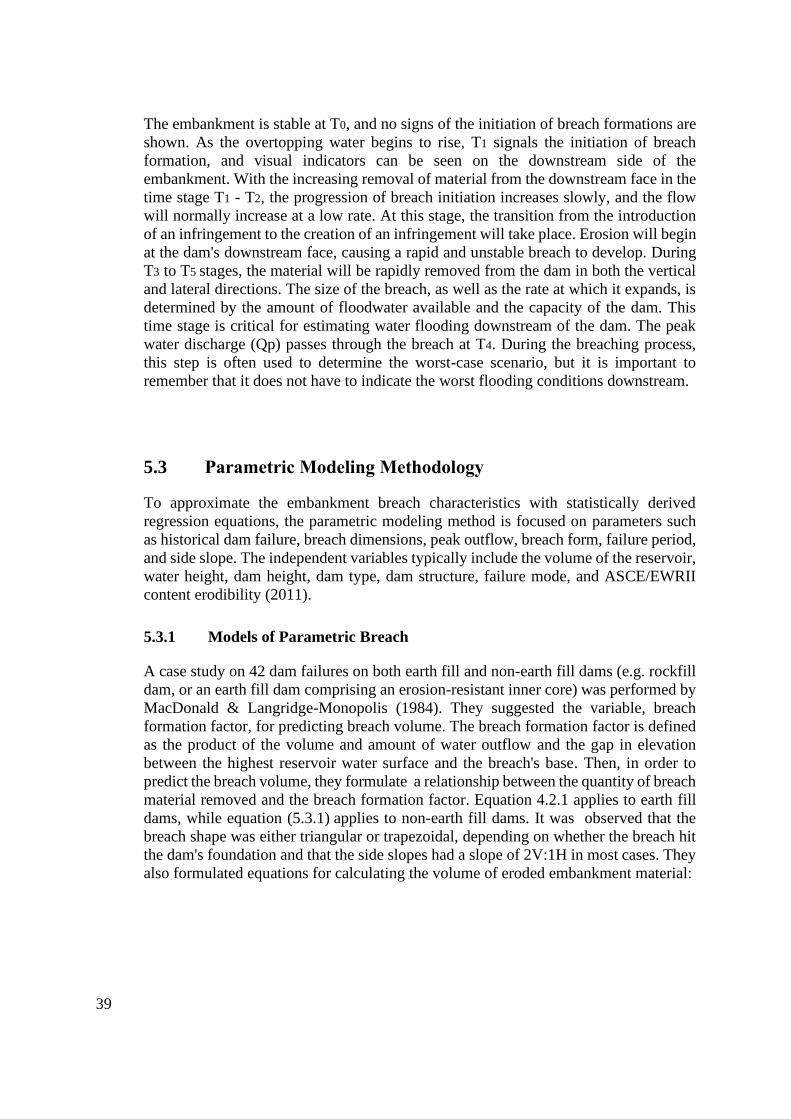
39
The embankment is stable at T0, and no signs of the initiation of breach formations are
shown. As the overtopping water begins to rise, T1 signals the initiation of breach
formation, and visual indicators can be seen on the downstream side of the
embankment. With the increasing removal of material from the downstream face in the
time stage T1 - T2, the progression of breach initiation increases slowly, and the flow
will normally increase at a low rate. At this stage, the transition from the introduction
of an infringement to the creation of an infringement will take place. Erosion will begin
at the dam's downstream face, causing a rapid and unstable breach to develop. During
T3 to T5 stages, the material will be rapidly removed from the dam in both the vertical
and lateral directions. The size of the breach, as well as the rate at which it expands, is
determined by the amount of floodwater available and the capacity of the dam. This
time stage is critical for estimating water flooding downstream of the dam. The peak
water discharge (Qp) passes through the breach at T4. During the breaching process,
this step is often used to determine the worst-case scenario, but it is important to
remember that it does not have to indicate the worst flooding conditions downstream.
5.3 Parametric Modeling Methodology
To approximate the embankment breach characteristics with statistically derived
regression equations, the parametric modeling method is focused on parameters such
as historical dam failure, breach dimensions, peak outflow, breach form, failure period,
and side slope. The independent variables typically include the volume of the reservoir,
water height, dam height, dam type, dam structure, failure mode, and ASCE/EWRII
content erodibility (2011).
5.3.1 Models of Parametric Breach
A case study on 42 dam failures on both earth fill and non-earth fill dams (e.g. rockfill
dam, or an earth fill dam comprising an erosion-resistant inner core) was performed by
MacDonald & Langridge-Monopolis (1984). They suggested the variable, breach
formation factor, for predicting breach volume. The breach formation factor is defined
as the product of the volume and amount of water outflow and the gap in elevation
between the highest reservoir water surface and the breach's base. Then, in order to
predict the breach volume, they formulate a relationship between the quantity of breach
material removed and the breach formation factor. Equation 4.2.1 applies to earth fill
dams, while equation (5.3.1) applies to non-earth fill dams. It was observed that the
breach shape was either triangular or trapezoidal, depending on whether the breach hit
the dam's foundation and that the side slopes had a slope of 2V:1H in most cases. They
also formulated equations for calculating the volume of eroded embankment material:
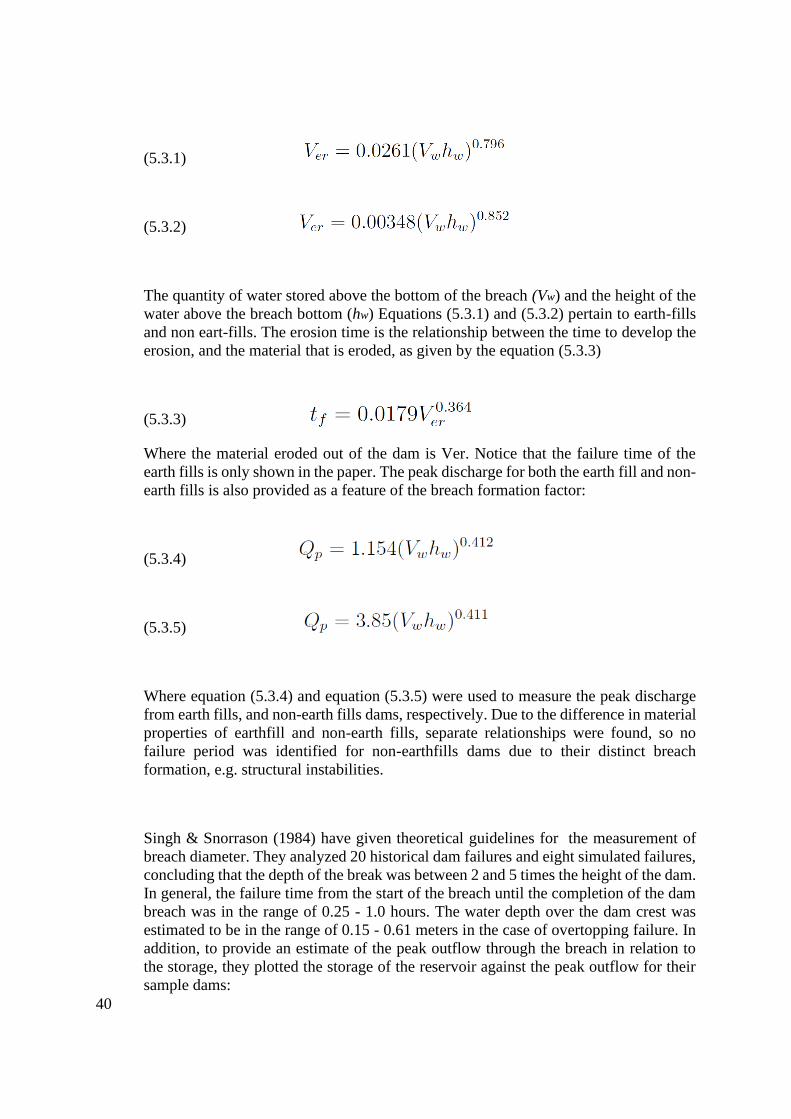
40
(5.3.1)
(5.3.2)
The quantity of water stored above the bottom of the breach (Vw) and the height of the
water above the breach bottom (hw) Equations (5.3.1) and (5.3.2) pertain to earth-fills
and non eart-fills. The erosion time is the relationship between the time to develop the
erosion, and the material that is eroded, as given by the equation (5.3.3)
(5.3.3)
Where the material eroded out of the dam is Ver. Notice that the failure time of the
earth fills is only shown in the paper. The peak discharge for both the earth fill and non-
earth fills is also provided as a feature of the breach formation factor:
(5.3.4)
(5.3.5)
Where equation (5.3.4) and equation (5.3.5) were used to measure the peak discharge
from earth fills, and non-earth fills dams, respectively. Due to the difference in material
properties of earthfill and non-earth fills, separate relationships were found, so no
failure period was identified for non-earthfills dams due to their distinct breach
formation, e.g. structural instabilities.
Singh & Snorrason (1984) have given theoretical guidelines for the measurement of
breach diameter. They analyzed 20 historical dam failures and eight simulated failures,
concluding that the depth of the break was between 2 and 5 times the height of the dam.
In general, the failure time from the start of the breach until the completion of the dam
breach was in the range of 0.25 - 1.0 hours. The water depth over the dam crest was
estimated to be in the range of 0.15 - 0.61 meters in the case of overtopping failure. In
addition, to provide an estimate of the peak outflow through the breach in relation to
the storage, they plotted the storage of the reservoir against the peak outflow for their
sample dams:
41
(5.3.6)
Where (hd) is the dam height.
Wide research on built dams, landslide dams, and glacial dams was performed by Costa
(1985). He showed all curves of the envelope and regression equations for peak
discharge through the infringement of built dams. It presents the relationship between
the peak discharge and the dam height and the volume of storage, as well as the
combination of both, using an envelope curve and best-fit equations for the
combination, to estimate the peak discharge:
(5.3.7)
(5.3.8)
(5.3.9)
The reservoir storage is represented by the letter S. The best-fit equations are (5.3.7)
and (5.2.8), and the framework curve is given by equation (5.2.9). However, he includes
a concrete gravity dam in his study, which may influence the results.
The Service for Soil Conservation (SCS) used data collected from other studies to
develop an empirical equation based on the relationship between the peak discharge
and the water depth at the dam failure. They showed what seems to be a curve of the
envelope; some data points are, however, above the curve. The relationship is presented
by equation (5.2.10).
(5.3.10)
Evans (1986) used the data from 11 historical dam failures in addition to the
information gathered by MacDonald & Langridge-Monopolis (1984). He presented a
best-fit empirical logarithmic relationship between the peak discharge and the volume
of the outburst flood through the breach of the embankment. It was found that for
estimating the discharge through landslide dam breaches and moraine dams, the
equation is also applicable:
(5.3.11)
42
The United States Bureau of Reclamation (1988) provided recommendations and
standards for choosing breach parameters and failure times while using the SMPDBK
model to determine hazard classifications. The Reclamation's suggested that the values
aren't meant to be an exact estimate of the breach parameters; rather, they will give the
user a clearer understanding of more conservative values, which will provide a
protection factor when assessing a dam's hazard classification. For both earthen dams
and non-earth fillen dams, they included suggested breach width values and failure
times:
(5.3.12)
(5.3.13)
For calculating the average breach width of earthen embankments, equation (5.3.12) is
used, where as equation (5.3.13) measures for non-earthfill dams. As a feature of the
average breach distance, the United States Bureau of Reclamation (1988) provided an
estimation of the failure period of the breach of embankment dams:
(5.3.14)
In this study, Froehlich (1995a) revisited his previous study carried out on embankment
dam breach criteria. Here, in order to approximate breach formation parameters such as
height, average distance, side slope ratio, and failure time of the final breach, the study
was based on the previous study and additional 63 embankment dam failures to find the
relationships given in the equation (5.3.15) :
(5.3.15)
Where the height of a breach is hb. Froehlich (1995a) mentioned that the total width
of the breach is 40% greater if the embankment's failure mode is due to overtopping:
(5.3.16)
It can be concluded that the side slope ratio (see Figure 19) is z = 1.4 for overtopping
loss and z = 0.9. To measure the failure period, Froehlich (1995a) also provides a
relationship between the water deposited behind the breach and the height of the
breach:
(5.3.17)
43
A multiple linear regression analysis was performed by Froehlich (1995b) on data
from 22 historic embankment dam collapses collected from different resources. To
obtain the best linear relationship to approximate the peak discharge through the
breach, a logarithmic transformation on all variables was used. The peak discharge
equation he provides is a function of both the volume of the reservoir and the height
of the reservoir water, which shows the distance between the depth of the surface
water and the breach invert:
(5.3.18)
In addition, the upper and lower limits of this equation were presented. It was
mentioned that a protection factor should be added when using the formula for
estimating peak discharge. Based on the analysis of Wahl (1998), it was suggested
that the Froehlich relationship is among the techniques that provide the prediction
of the highest peak discharge prediction.
The regression methods for estimating the peak discharge from a dam failure were
introduced and critically analyzed by Walder & O'Connor (1997). They concluded
that there was little potential for regression connections to estimate the peak
discharge. Since factors other than the volume of water and the drop in the level of
the reservoir through the breach usually exert significant control over the discharge
at the breach. They present asymptotic relationships with a peak discharge. The
dimensionless parameter that governs the peak discharge is given as:
(5.3.19)
(5.3.10)
If g is the gravitational acceleration, d is the drop in the water level of the reservoir
during the flood, k is the breach erosion rate, and Dc is the dam crest height relative to
the dam base. The time from the breach initiation until the discharge has reached its
peak is also predicted by Walder and O'Connor:
44
(5.3.21)
(5.3.22)
(5.3.23)
In order to develop mathematical expressions to predict the values of the final breach
width, the side slope of a trapezoidal breach formation, as well as predicting the breach
formation time, Froehlich (2008) used data from 74 embankment dam failures. He
argued that the breach width due to overtopping is 40% larger than for other modes of
failure, but here he reduces that value to 30%.
(5.3.24)
(5.3.25)
The side slopes of the trapezoidal breach form are z = 1.0 for overtopping and f For
piping failure, although this is different than what he reported previously, z = 0.7. The
of failure In:
(5.3.26)
Depending on the formation of the breach shape, three model variations were described
by Froehlich. In a Monte Carlo simulation, Froehlich also used statistical analysis to
measure the uncertainty of the expected peak discharge and water levels downstream
of the breached embankments. He concludes that a breach of an embankment takes the
form of a trapezoid with non-vertical walls and that a fair estimate of peak outflow will
be given by the described model.
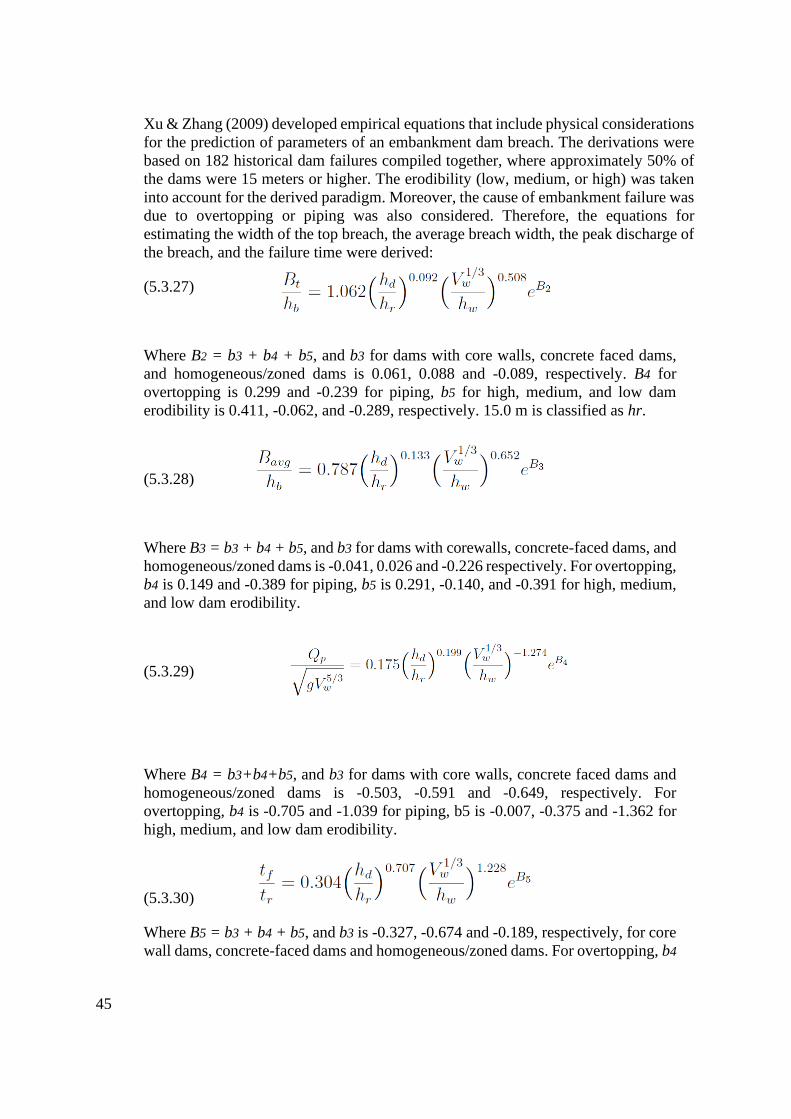
45
Xu & Zhang (2009) developed empirical equations that include physical considerations
for the prediction of parameters of an embankment dam breach. The derivations were
based on 182 historical dam failures compiled together, where approximately 50% of
the dams were 15 meters or higher. The erodibility (low, medium, or high) was taken
into account for the derived paradigm. Moreover, the cause of embankment failure was
due to overtopping or piping was also considered. Therefore, the equations for
estimating the width of the top breach, the average breach width, the peak discharge of
the breach, and the failure time were derived:
(5.3.27)
Where B2 = b3 + b4 + b5, and b3 for dams with core walls, concrete faced dams,
and homogeneous/zoned dams is 0.061, 0.088 and -0.089, respectively. B4 for
overtopping is 0.299 and -0.239 for piping, b5 for high, medium, and low dam
erodibility is 0.411, -0.062, and -0.289, respectively. 15.0 m is classified as hr.
(5.3.28)
Where B3 = b3 + b4 + b5, and b3 for dams with corewalls, concrete-faced dams, and
homogeneous/zoned dams is -0.041, 0.026 and -0.226 respectively. For overtopping,
b4 is 0.149 and -0.389 for piping, b5 is 0.291, -0.140, and -0.391 for high, medium,
and low dam erodibility.
(5.3.29)
Where B4 = b3+b4+b5, and b3 for dams with core walls, concrete faced dams and
homogeneous/zoned dams is -0.503, -0.591 and -0.649, respectively. For
overtopping, b4 is -0.705 and -1.039 for piping, b5 is -0.007, -0.375 and -1.362 for
high, medium, and low dam erodibility.
(5.3.30)
Where B5 = b3 + b4 + b5, and b3 is -0.327, -0.674 and -0.189, respectively, for core
wall dams, concrete-faced dams and homogeneous/zoned dams. For overtopping, b4
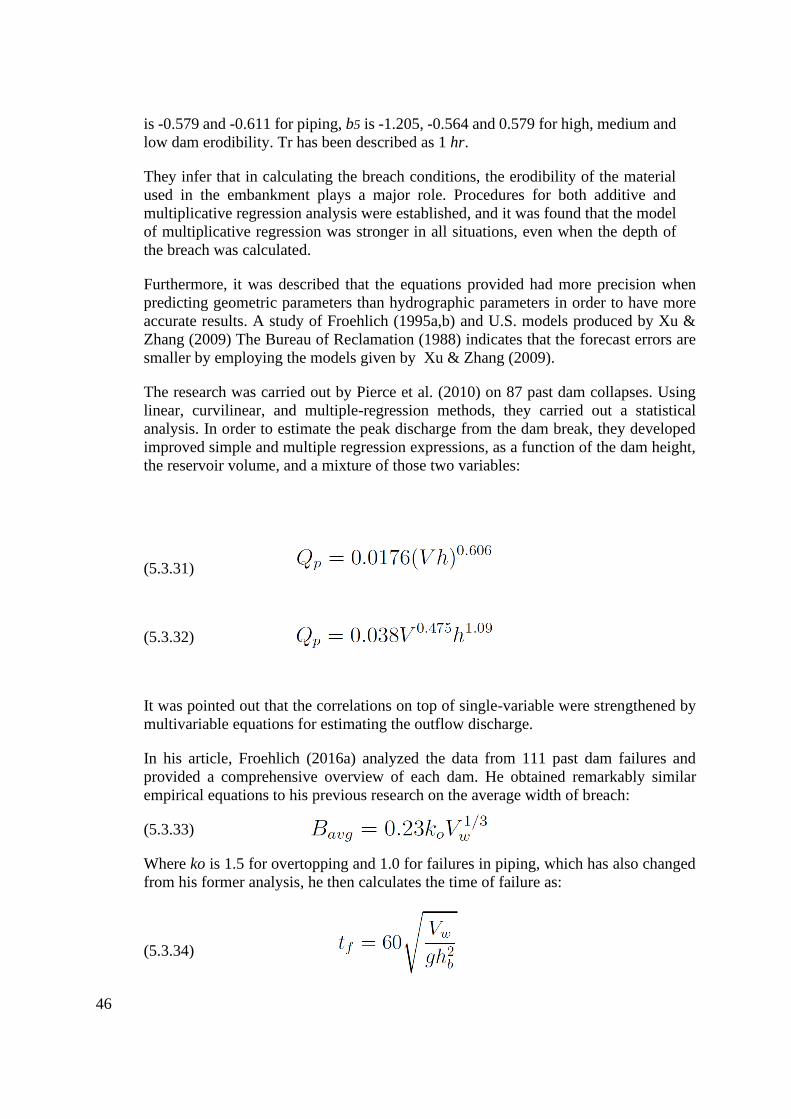
46
is -0.579 and -0.611 for piping, b5 is -1.205, -0.564 and 0.579 for high, medium and
low dam erodibility. Tr has been described as 1 hr.
They infer that in calculating the breach conditions, the erodibility of the material
used in the embankment plays a major role. Procedures for both additive and
multiplicative regression analysis were established, and it was found that the model
of multiplicative regression was stronger in all situations, even when the depth of
the breach was calculated.
Furthermore, it was described that the equations provided had more precision when
predicting geometric parameters than hydrographic parameters in order to have more
accurate results. A study of Froehlich (1995a,b) and U.S. models produced by Xu &
Zhang (2009) The Bureau of Reclamation (1988) indicates that the forecast errors are
smaller by employing the models given by Xu & Zhang (2009).
The research was carried out by Pierce et al. (2010) on 87 past dam collapses. Using
linear, curvilinear, and multiple-regression methods, they carried out a statistical
analysis. In order to estimate the peak discharge from the dam break, they developed
improved simple and multiple regression expressions, as a function of the dam height,
the reservoir volume, and a mixture of those two variables:
(5.3.31)
(5.3.32)
It was pointed out that the correlations on top of single-variable were strengthened by
multivariable equations for estimating the outflow discharge.
In his article, Froehlich (2016a) analyzed the data from 111 past dam failures and
provided a comprehensive overview of each dam. He obtained remarkably similar
empirical equations to his previous research on the average width of breach:
(5.3.33)
Where ko is 1.5 for overtopping and 1.0 for failures in piping, which has also changed
from his former analysis, he then calculates the time of failure as:
(5.3.34)

47
Froehlich (2016b) described hs as 6.1 meters, which is the standard for discriminating
between a small embankment dam and a large embankment dam. This is due to the soil
properties, compaction and other factors, the peak discharge from smaller dams than
expected.
Froehlich further compared other known formulas from previous experiments (many of
which are included here) and concluded that both empirical and semi theoretical
equations provide more reliable peak discharge predictions.
He suggested that his results published in 1995 had small data sets, however, the
extended data set in his recent study helped to forecast the peak discharge with greater
certainty.
48
6 Physical modeling
A brief history of previous experiments in the laboratory on overtopped embankments
is included in this chapter. Definition of the scientific experiments undertaken for this
thesis, the building process, the evaluation methods, the material used to create the
Models, and test interpretation are used. As a part, four preliminary tests were
performed.
6.1 A brief about laboratory experiments
Laboratory and field studies on the washout of erodible embankments were first carried
out by Tinney and Hsu in 1961, as quoted in Schmocker (2011). The material washout
of erodible embankment fuse plugs was defined by Tinney and Hsu by sediment
transport. Since several laboratory studies have been performed, Al-Riffai (2014) has
given a thorough description.
To establish guidelines on the construction of fuse plugs, Pugh (1985) conducted
hydraulic laboratory studies on the breaching of embankments. He assumed that a
higher water ratio above the crest versus the length of the weir allows the rate of erosion
to occur at a much faster rate.
In order to better understand the breaching mechanism of rockfill dams and eventually
describe the final breach configurations, Franca & Almeida (2002) performed several
experiments on the breaching process of rockfill dams. During the test, they addressed
the processes in terms of breaking conditions, failure mechanisms, final configurations,
and the outflow hydrograph.
Rozov (2003) carried out laboratory studies to investigate the dam breach erosion
mechanism. The physical washout patterns of dams were delineated based on a
mathematical model, and it also offered insights into the dimensions of the opening of
the breach and assumes the opening of the breach to be rectangular.
Chinnarasri et al. (2004) performed nine earth fill experimental content tests under
falling reservoir conditions. In order to regulate through-flow, models were constructed
both homogeneous and with clay facing. They found that a combination of tractive
shear forces and sidewall instability was part of the erosion mechanism of sidewall
erosion, which caused the wall to fall into the breach channel and to be transported
away. In addition, they noted that the shape of the initial breach was rectangular, which
grew into a triangular, oval shape and gradually changed to a trapezoidal shape.
To obtain detailed experimental data of high temporal and spatial resolutions during the
overtopping of homogeneous non-cohesive embankments, Pickert et al. (2011)
performed laboratory experiments. They split the breaching process into two main
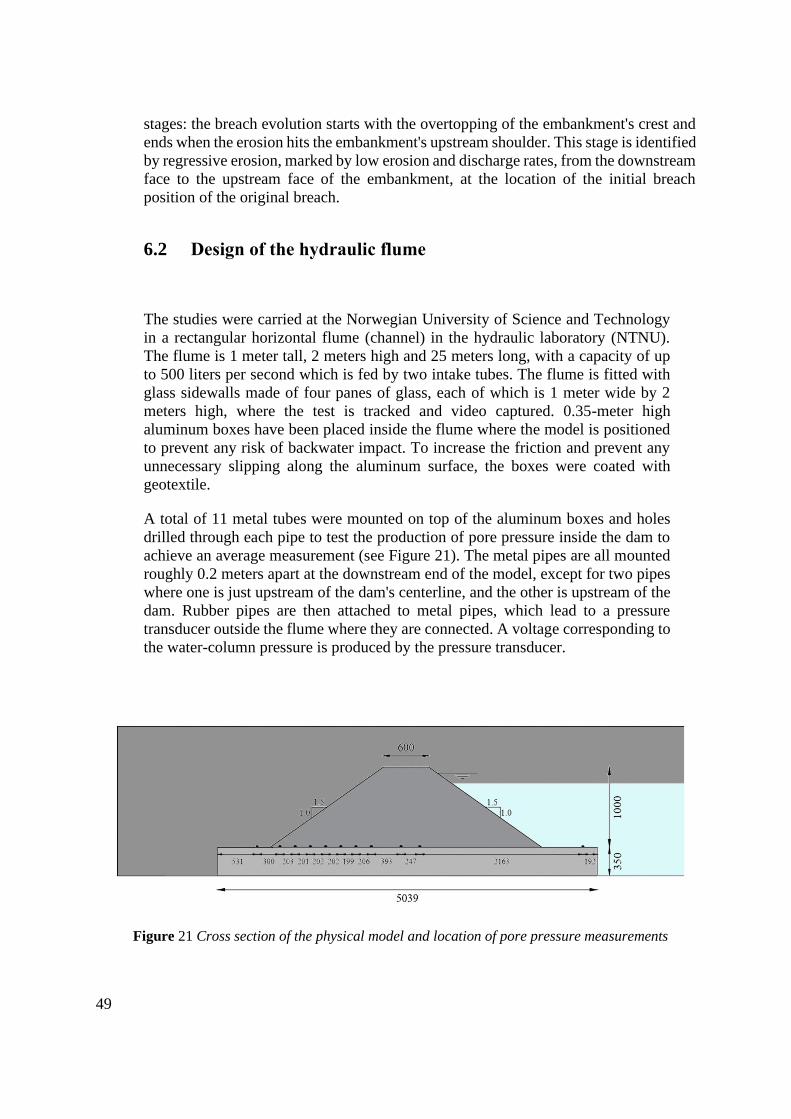
49
stages: the breach evolution starts with the overtopping of the embankment's crest and
ends when the erosion hits the embankment's upstream shoulder. This stage is identified
by regressive erosion, marked by low erosion and discharge rates, from the downstream
face to the upstream face of the embankment, at the location of the initial breach
position of the original breach.
6.2 Design of the hydraulic flume
The studies were carried at the Norwegian University of Science and Technology
in a rectangular horizontal flume (channel) in the hydraulic laboratory (NTNU).
The flume is 1 meter tall, 2 meters high and 25 meters long, with a capacity of up
to 500 liters per second which is fed by two intake tubes. The flume is fitted with
glass sidewalls made of four panes of glass, each of which is 1 meter wide by 2
meters high, where the test is tracked and video captured. 0.35-meter high
aluminum boxes have been placed inside the flume where the model is positioned
to prevent any risk of backwater impact. To increase the friction and prevent any
unnecessary slipping along the aluminum surface, the boxes were coated with
geotextile.
A total of 11 metal tubes were mounted on top of the aluminum boxes and holes
drilled through each pipe to test the production of pore pressure inside the dam to
achieve an average measurement (see Figure 21). The metal pipes are all mounted
roughly 0.2 meters apart at the downstream end of the model, except for two pipes
where one is just upstream of the dam's centerline, and the other is upstream of the
dam. Rubber pipes are then attached to metal pipes, which lead to a pressure
transducer outside the flume where they are connected. A voltage corresponding to
the water-column pressure is produced by the pressure transducer.
Figure 21 Cross section of the physical model and location of pore pressure measurements
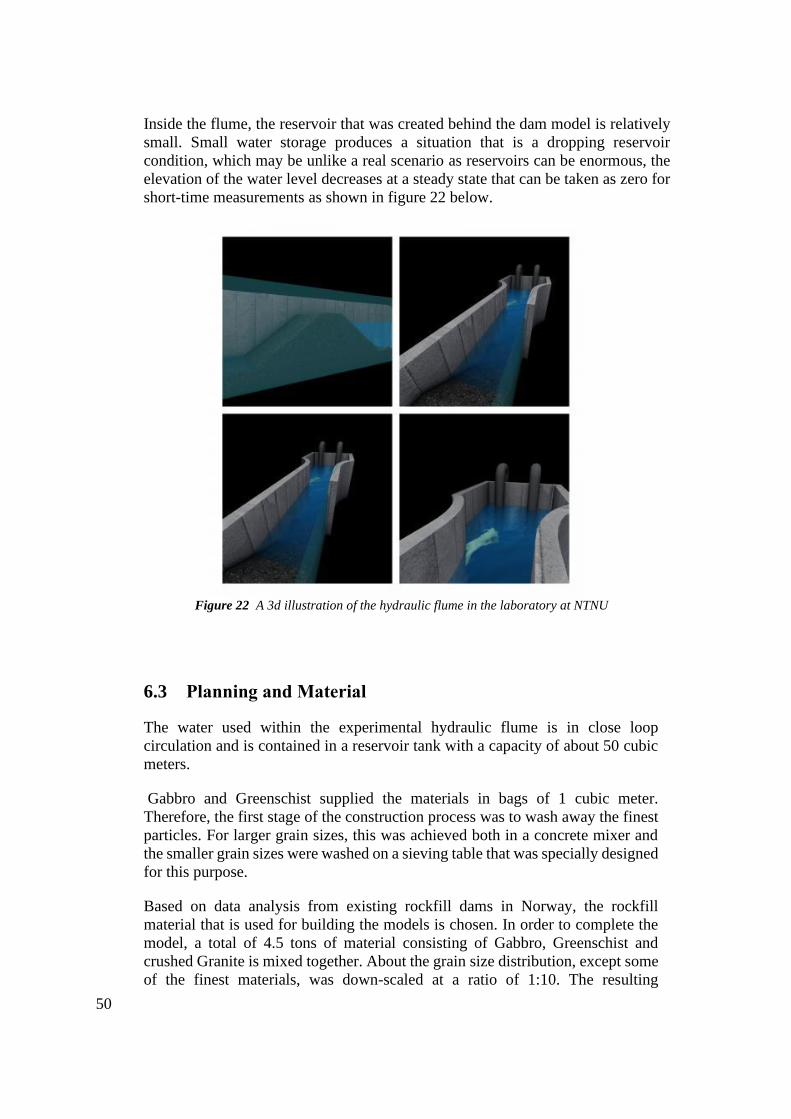
50
Inside the flume, the reservoir that was created behind the dam model is relatively
small. Small water storage produces a situation that is a dropping reservoir
condition, which may be unlike a real scenario as reservoirs can be enormous, the
elevation of the water level decreases at a steady state that can be taken as zero for
short-time measurements as shown in figure 22 below.
6.3 Planning and Material
The water used within the experimental hydraulic flume is in close loop
circulation and is contained in a reservoir tank with a capacity of about 50 cubic
meters.
Gabbro and Greenschist supplied the materials in bags of 1 cubic meter.
Therefore, the first stage of the construction process was to wash away the finest
particles. For larger grain sizes, this was achieved both in a concrete mixer and
the smaller grain sizes were washed on a sieving table that was specially designed
for this purpose.
Based on data analysis from existing rockfill dams in Norway, the rockfill
material that is used for building the models is chosen. In order to complete the
model, a total of 4.5 tons of material consisting of Gabbro, Greenschist and
crushed Granite is mixed together. About the grain size distribution, except some
of the finest materials, was down-scaled at a ratio of 1:10. The resulting
Figure 22 A 3d illustration of the hydraulic flume in the laboratory at NTNU
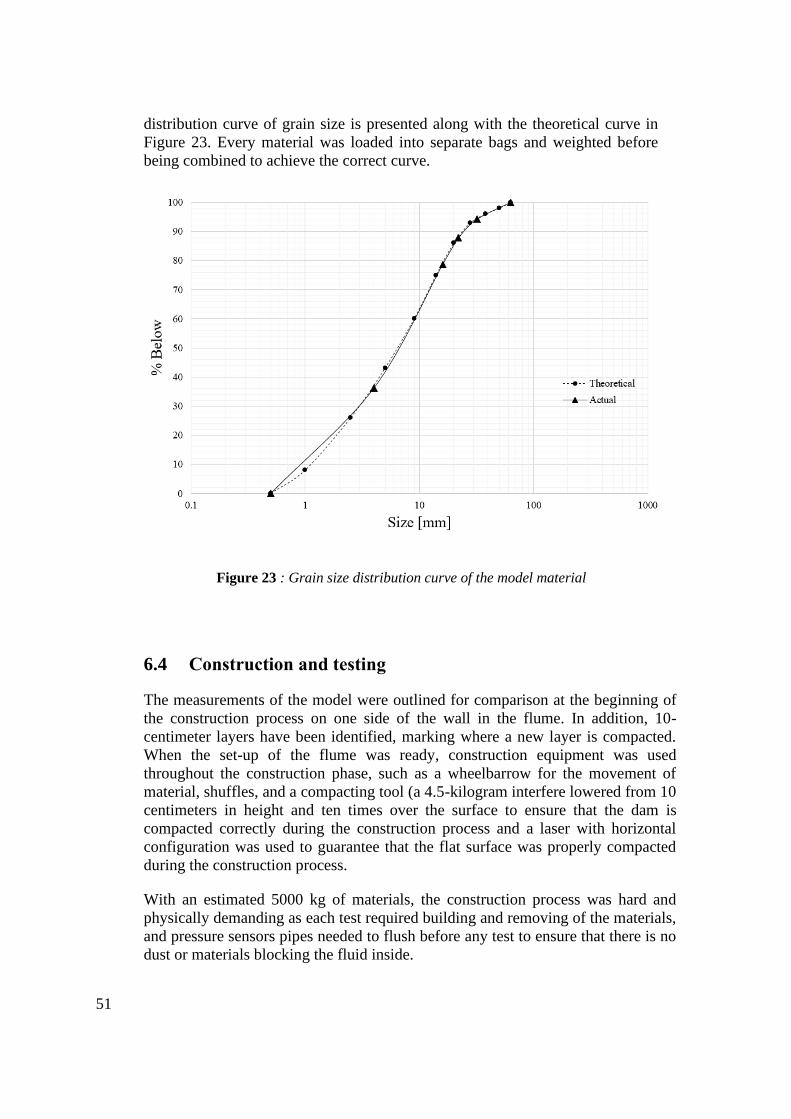
51
distribution curve of grain size is presented along with the theoretical curve in
Figure 23. Every material was loaded into separate bags and weighted before
being combined to achieve the correct curve.
6.4 Construction and testing
The measurements of the model were outlined for comparison at the beginning of
the construction process on one side of the wall in the flume. In addition, 10-
centimeter layers have been identified, marking where a new layer is compacted.
When the set-up of the flume was ready, construction equipment was used
throughout the construction phase, such as a wheelbarrow for the movement of
material, shuffles, and a compacting tool (a 4.5-kilogram interfere lowered from 10
centimeters in height and ten times over the surface to ensure that the dam is
compacted correctly during the construction process and a laser with horizontal
configuration was used to guarantee that the flat surface was properly compacted
during the construction process.
With an estimated 5000 kg of materials, the construction process was hard and
physically demanding as each test required building and removing of the materials,
and pressure sensors pipes needed to flush before any test to ensure that there is no
dust or materials blocking the fluid inside.
Figure 23 : Grain size distribution curve of the model material
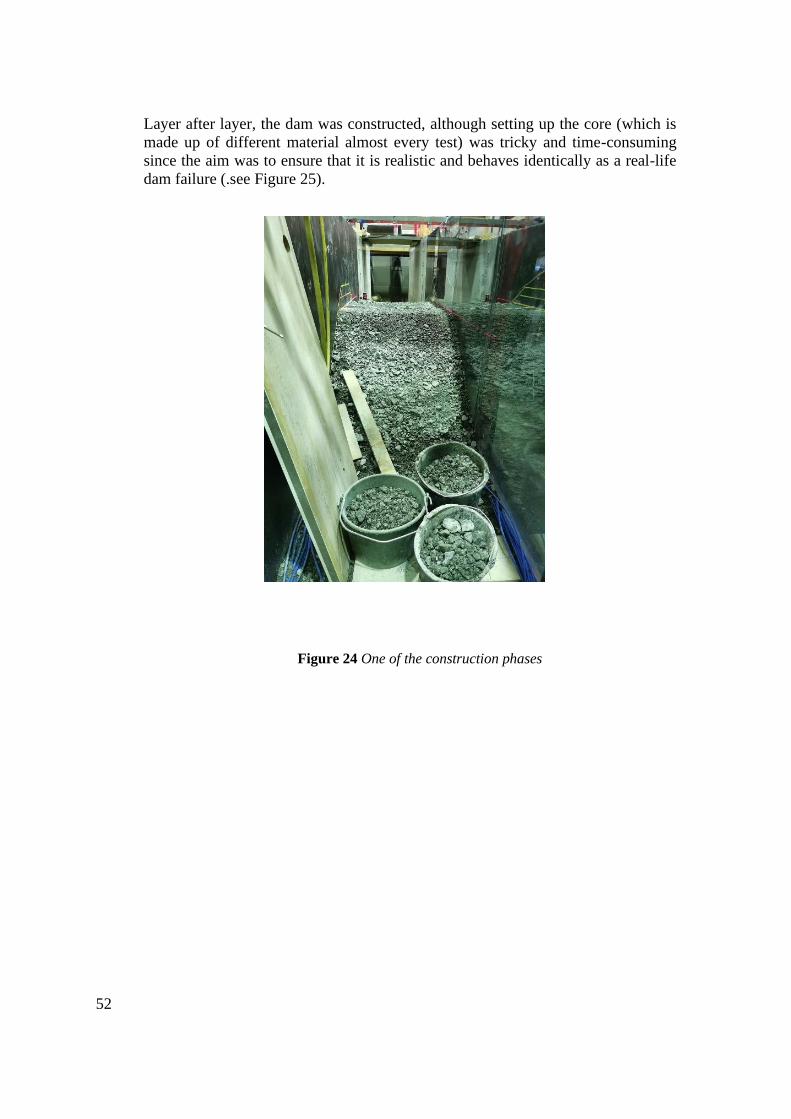
52
Layer after layer, the dam was constructed, although setting up the core (which is
made up of different material almost every test) was tricky and time-consuming
since the aim was to ensure that it is realistic and behaves identically as a real-life
dam failure (.see Figure 25).
Figure 24 One of the construction phases
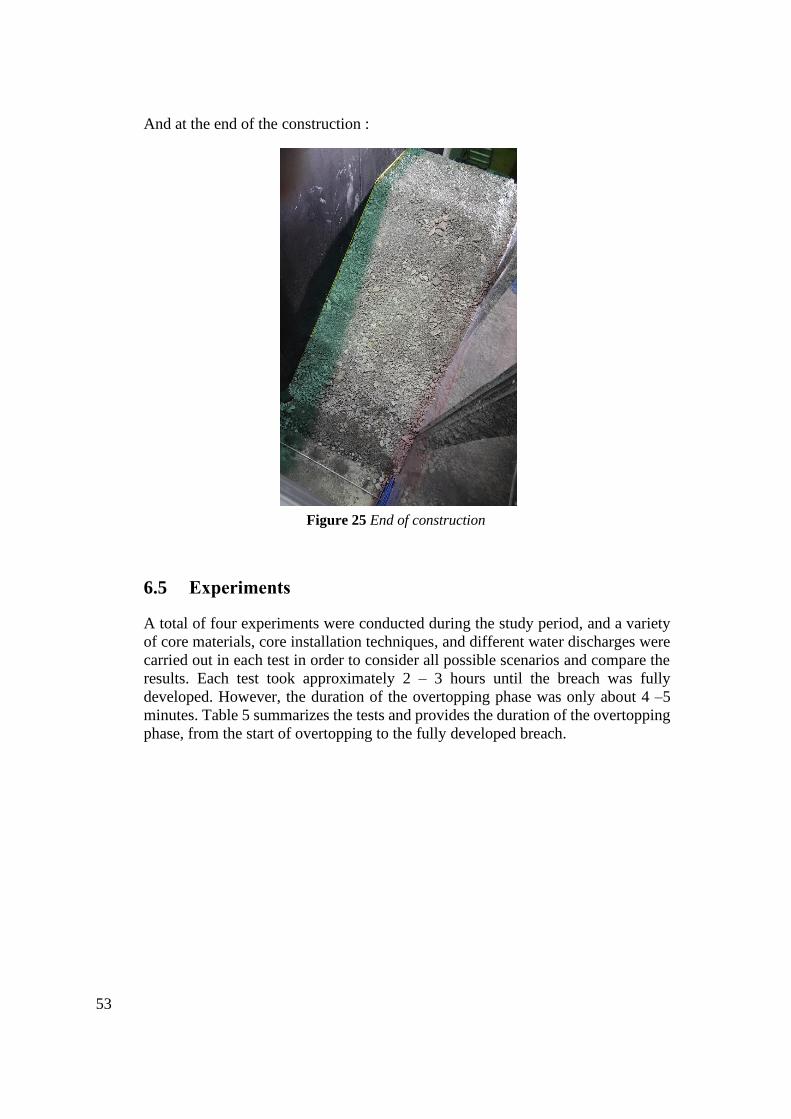
53
And at the end of the construction :
6.5 Experiments
A total of four experiments were conducted during the study period, and a variety
of core materials, core installation techniques, and different water discharges were
carried out in each test in order to consider all possible scenarios and compare the
results. Each test took approximately 2 – 3 hours until the breach was fully
developed. However, the duration of the overtopping phase was only about 4 –5
minutes. Table 5 summarizes the tests and provides the duration of the overtopping
phase, from the start of overtopping to the fully developed breach.
Figure 25 End of construction
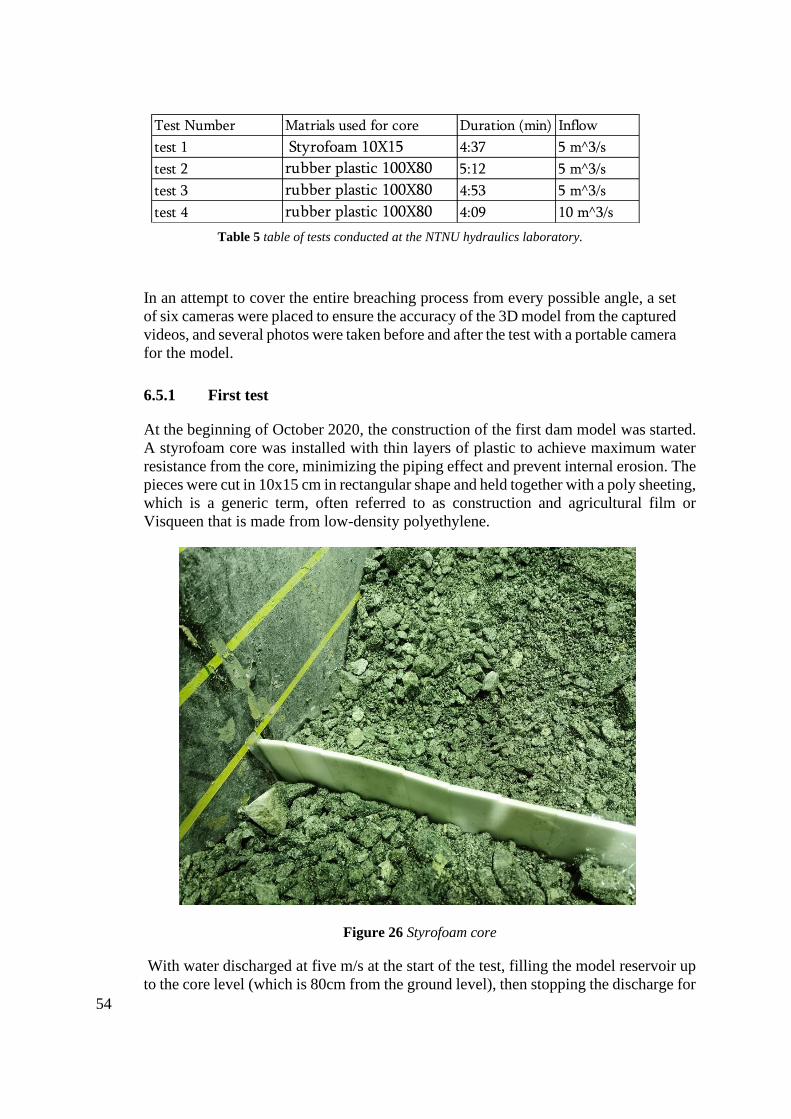
54
In an attempt to cover the entire breaching process from every possible angle, a set
of six cameras were placed to ensure the accuracy of the 3D model from the captured
videos, and several photos were taken before and after the test with a portable camera
for the model.
6.5.1 First test
At the beginning of October 2020, the construction of the first dam model was started.
A styrofoam core was installed with thin layers of plastic to achieve maximum water
resistance from the core, minimizing the piping effect and prevent internal erosion. The
pieces were cut in 10x15 cm in rectangular shape and held together with a poly sheeting,
which is a generic term, often referred to as construction and agricultural film or
Visqueen that is made from low-density polyethylene.
Figure 26 Styrofoam core
With water discharged at five m/s at the start of the test, filling the model reservoir up
to the core level (which is 80cm from the ground level), then stopping the discharge for
Table 5 table of tests conducted at the NTNU hydraulics laboratory.
Test Number Matrials used for core Duration (min) Inflow
test 1 Styrofoam 10X15 4:37 5 m^3/s
test 2 rubber plastic 100X80 5:12 5 m^3/s
test 3 rubber plastic 100X80 4:53 5 m^3/s
test 4 rubber plastic 100X80 4:09 10 m^3/s
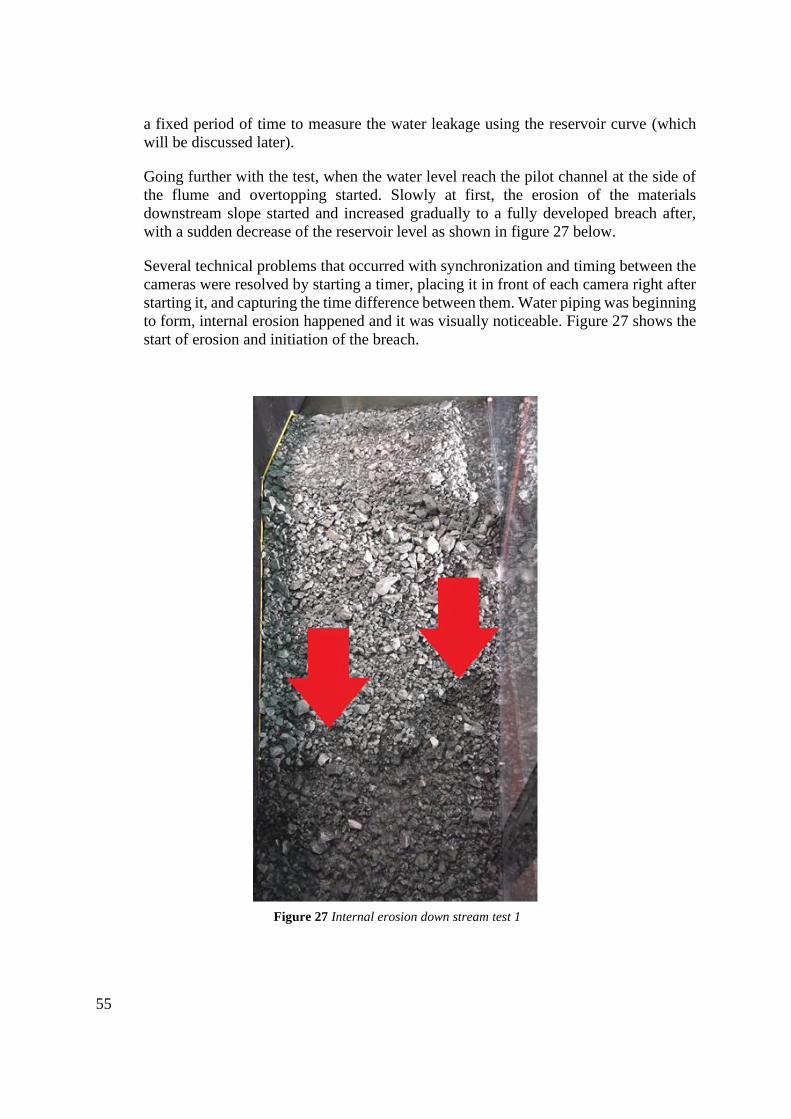
55
a fixed period of time to measure the water leakage using the reservoir curve (which
will be discussed later).
Going further with the test, when the water level reach the pilot channel at the side of
the flume and overtopping started. Slowly at first, the erosion of the materials
downstream slope started and increased gradually to a fully developed breach after,
with a sudden decrease of the reservoir level as shown in figure 27 below.
Several technical problems that occurred with synchronization and timing between the
cameras were resolved by starting a timer, placing it in front of each camera right after
starting it, and capturing the time difference between them. Water piping was beginning
to form, internal erosion happened and it was visually noticeable. Figure 27 shows the
start of erosion and initiation of the breach.
Figure 27 Internal erosion down stream test 1
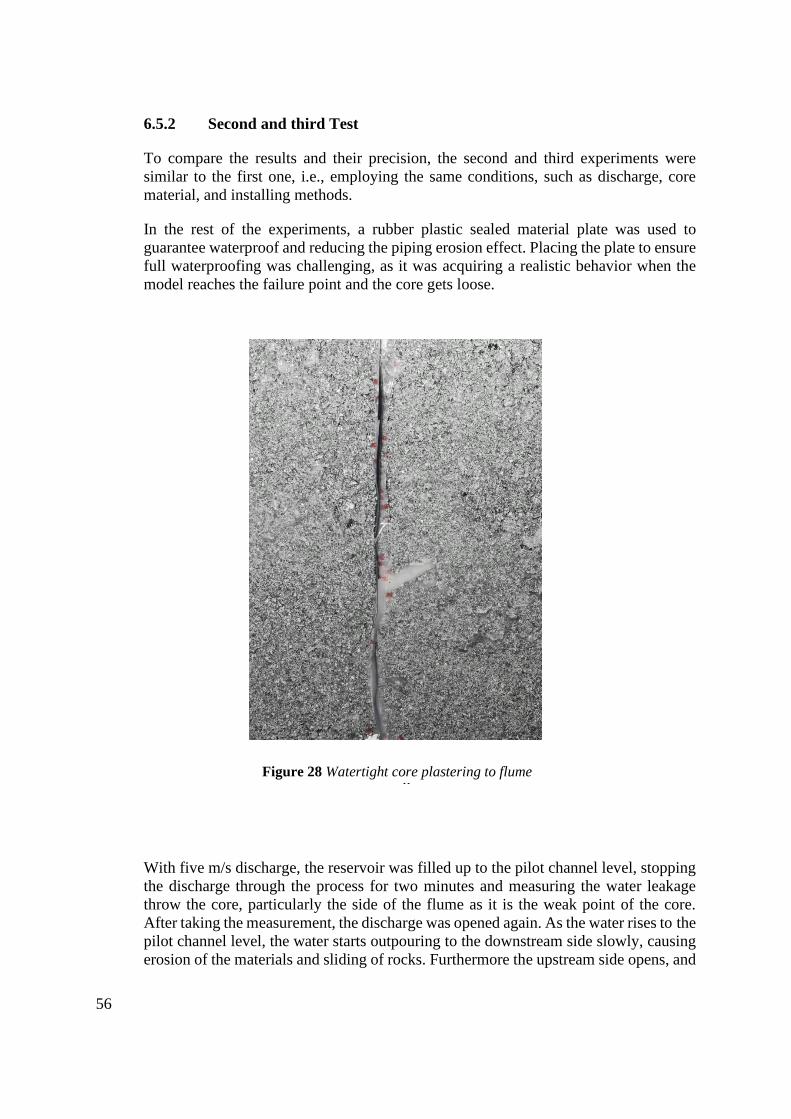
56
6.5.2 Second and third Test
To compare the results and their precision, the second and third experiments were
similar to the first one, i.e., employing the same conditions, such as discharge, core
material, and installing methods.
In the rest of the experiments, a rubber plastic sealed material plate was used to
guarantee waterproof and reducing the piping erosion effect. Placing the plate to ensure
full waterproofing was challenging, as it was acquiring a realistic behavior when the
model reaches the failure point and the core gets loose.
With five m/s discharge, the reservoir was filled up to the pilot channel level, stopping
the discharge through the process for two minutes and measuring the water leakage
throw the core, particularly the side of the flume as it is the weak point of the core.
After taking the measurement, the discharge was opened again. As the water rises to the
pilot channel level, the water starts outpouring to the downstream side slowly, causing
erosion of the materials and sliding of rocks. Furthermore the upstream side opens, and
Figure 28 Watertight core plastering to flume
wall
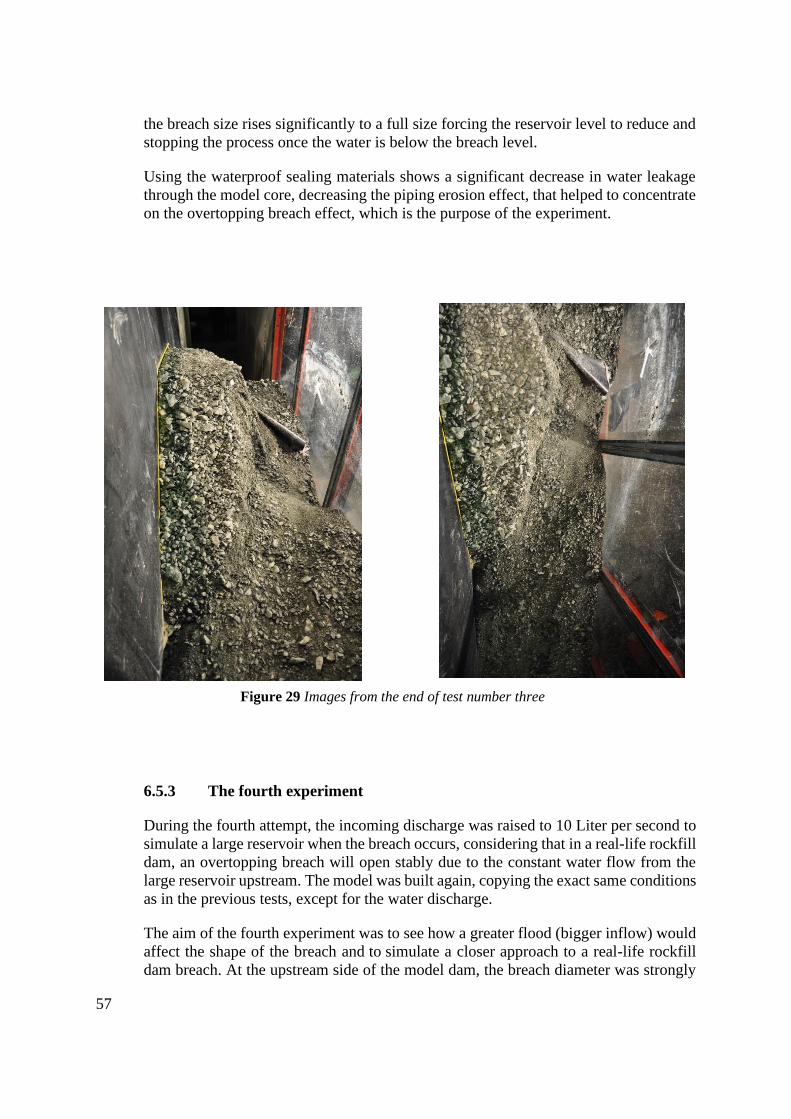
57
the breach size rises significantly to a full size forcing the reservoir level to reduce and
stopping the process once the water is below the breach level.
Using the waterproof sealing materials shows a significant decrease in water leakage
through the model core, decreasing the piping erosion effect, that helped to concentrate
on the overtopping breach effect, which is the purpose of the experiment.
6.5.3 The fourth experiment
During the fourth attempt, the incoming discharge was raised to 10 Liter per second to
simulate a large reservoir when the breach occurs, considering that in a real-life rockfill
dam, an overtopping breach will open stably due to the constant water flow from the
large reservoir upstream. The model was built again, copying the exact same conditions
as in the previous tests, except for the water discharge.
The aim of the fourth experiment was to see how a greater flood (bigger inflow) would
affect the shape of the breach and to simulate a closer approach to a real-life rockfill
dam breach. At the upstream side of the model dam, the breach diameter was strongly
Figure 29 Images from the end of test number three
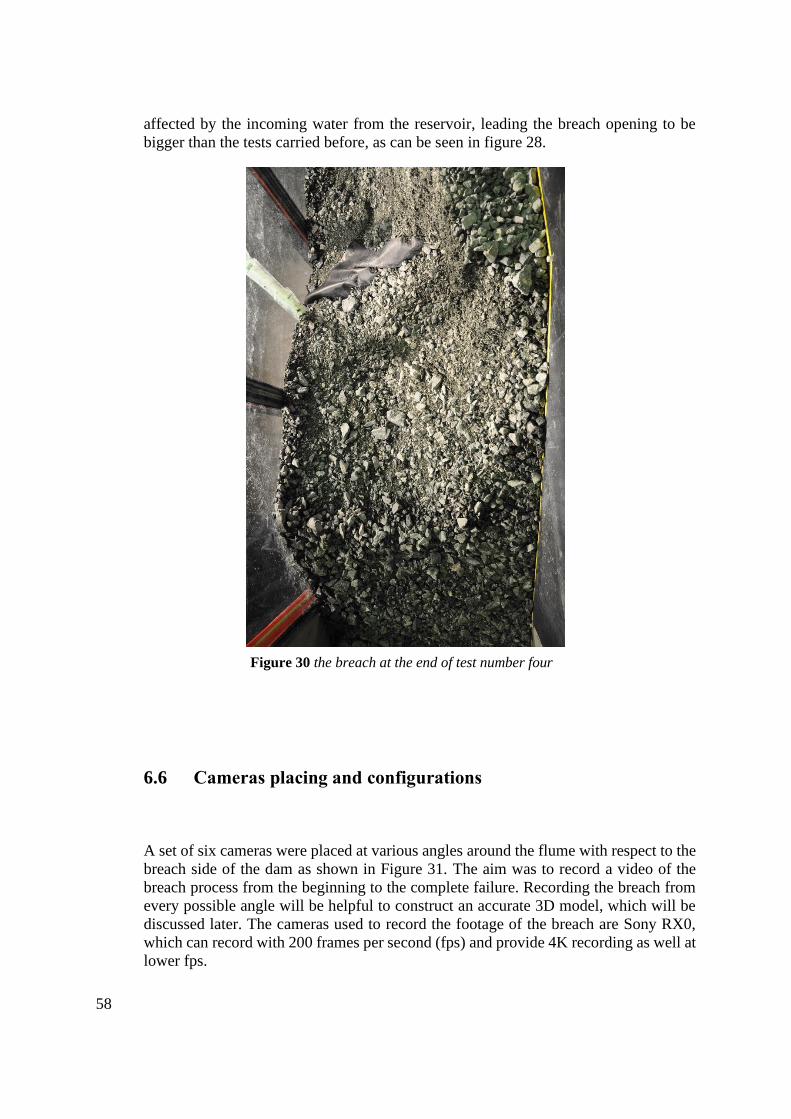
58
affected by the incoming water from the reservoir, leading the breach opening to be
bigger than the tests carried before, as can be seen in figure 28.
6.6 Cameras placing and configurations
A set of six cameras were placed at various angles around the flume with respect to the
breach side of the dam as shown in Figure 31. The aim was to record a video of the
breach process from the beginning to the complete failure. Recording the breach from
every possible angle will be helpful to construct an accurate 3D model, which will be
discussed later. The cameras used to record the footage of the breach are Sony RX0,
which can record with 200 frames per second (fps) and provide 4K recording as well at
lower fps.
Figure 30 the breach at the end of test number four
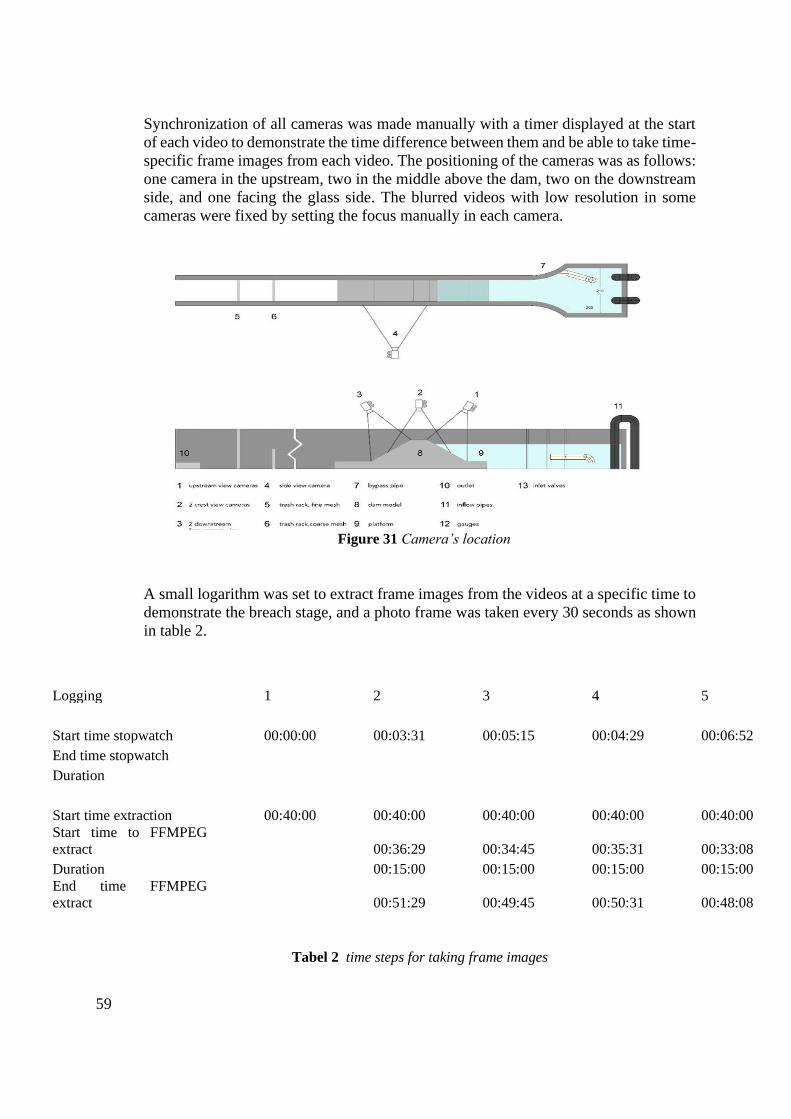
59
Synchronization of all cameras was made manually with a timer displayed at the start
of each video to demonstrate the time difference between them and be able to take time-
specific frame images from each video. The positioning of the cameras was as follows:
one camera in the upstream, two in the middle above the dam, two on the downstream
side, and one facing the glass side. The blurred videos with low resolution in some
cameras were fixed by setting the focus manually in each camera.
A small logarithm was set to extract frame images from the videos at a specific time to
demonstrate the breach stage, and a photo frame was taken every 30 seconds as shown
in table 2.
Tabel 2 time steps for taking frame images
Logging 1 2 3 4 5 6
Start time stopwatch 00:00:00 00:03:31 00:05:15 00:04:29 00:06:52 00:06:01 00:02:17
End time stopwatch 01:07:43
Duration 01:05:26
Start time extraction 00:40:00 00:40:00 00:40:00 00:40:00 00:40:00 00:40:00 00:40:00
Start time to FFMPEG
extract 00:36:29 00:34:45 00:35:31 00:33:08 00:33:59 00:37:43
Duration 00:15:00 00:15:00 00:15:00 00:15:00 00:15:00 00:15:00
End time FFMPEG
extract 00:51:29 00:49:45 00:50:31 00:48:08 00:48:59 00:52:43
Figure 31 Camera’s location
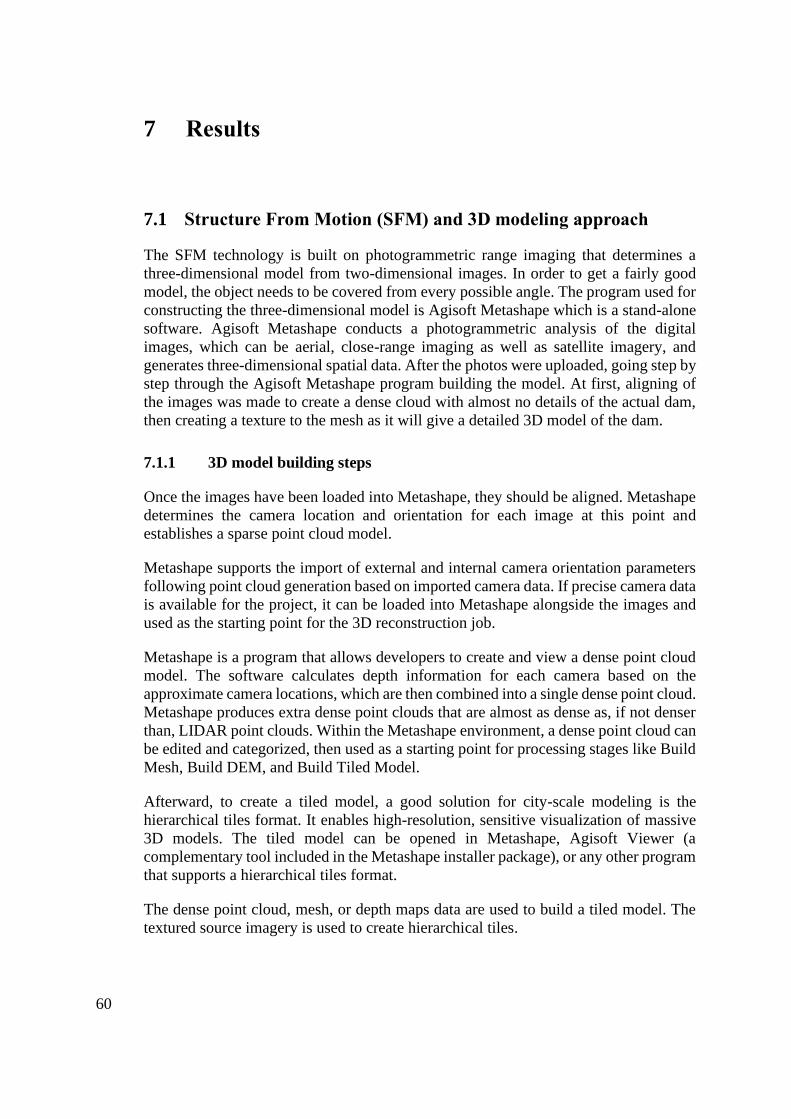
60
7 Results
7.1 Structure From Motion (SFM) and 3D modeling approach
The SFM technology is built on photogrammetric range imaging that determines a
three-dimensional model from two-dimensional images. In order to get a fairly good
model, the object needs to be covered from every possible angle. The program used for
constructing the three-dimensional model is Agisoft Metashape which is a stand-alone
software. Agisoft Metashape conducts a photogrammetric analysis of the digital
images, which can be aerial, close-range imaging as well as satellite imagery, and
generates three-dimensional spatial data. After the photos were uploaded, going step by
step through the Agisoft Metashape program building the model. At first, aligning of
the images was made to create a dense cloud with almost no details of the actual dam,
then creating a texture to the mesh as it will give a detailed 3D model of the dam.
7.1.1 3D model building steps
Once the images have been loaded into Metashape, they should be aligned. Metashape
determines the camera location and orientation for each image at this point and
establishes a sparse point cloud model.
Metashape supports the import of external and internal camera orientation parameters
following point cloud generation based on imported camera data. If precise camera data
is available for the project, it can be loaded into Metashape alongside the images and
used as the starting point for the 3D reconstruction job.
Metashape is a program that allows developers to create and view a dense point cloud
model. The software calculates depth information for each camera based on the
approximate camera locations, which are then combined into a single dense point cloud.
Metashape produces extra dense point clouds that are almost as dense as, if not denser
than, LIDAR point clouds. Within the Metashape environment, a dense point cloud can
be edited and categorized, then used as a starting point for processing stages like Build
Mesh, Build DEM, and Build Tiled Model.
Afterward, to create a tiled model, a good solution for city-scale modeling is the
hierarchical tiles format. It enables high-resolution, sensitive visualization of massive
3D models. The tiled model can be opened in Metashape, Agisoft Viewer (a
complementary tool included in the Metashape installer package), or any other program
that supports a hierarchical tiles format.
The dense point cloud, mesh, or depth maps data are used to build a tiled model. The
textured source imagery is used to create hierarchical tiles.
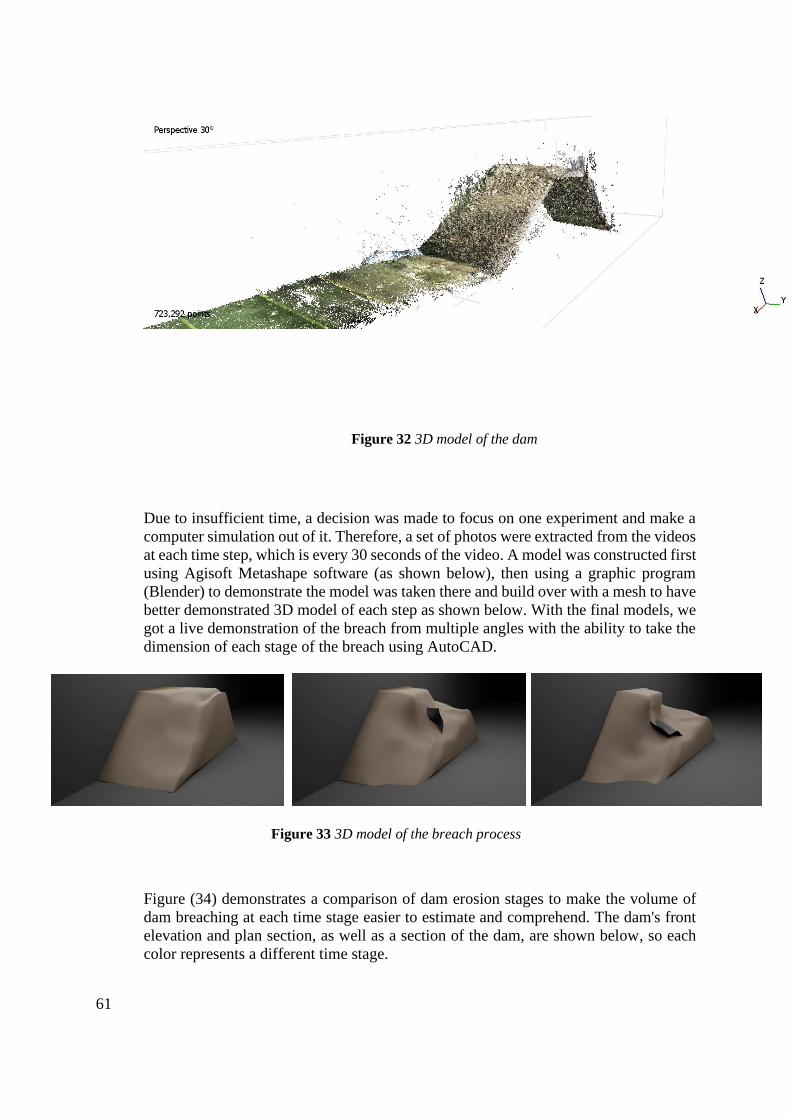
61
Due to insufficient time, a decision was made to focus on one experiment and make a
computer simulation out of it. Therefore, a set of photos were extracted from the videos
at each time step, which is every 30 seconds of the video. A model was constructed first
using Agisoft Metashape software (as shown below), then using a graphic program
(Blender) to demonstrate the model was taken there and build over with a mesh to have
better demonstrated 3D model of each step as shown below. With the final models, we
got a live demonstration of the breach from multiple angles with the ability to take the
dimension of each stage of the breach using AutoCAD.
Figure (34) demonstrates a comparison of dam erosion stages to make the volume of
dam breaching at each time stage easier to estimate and comprehend. The dam's front
elevation and plan section, as well as a section of the dam, are shown below, so each
color represents a different time stage.
Figure 32 3D model of the dam
Figure 33 3D model of the breach process
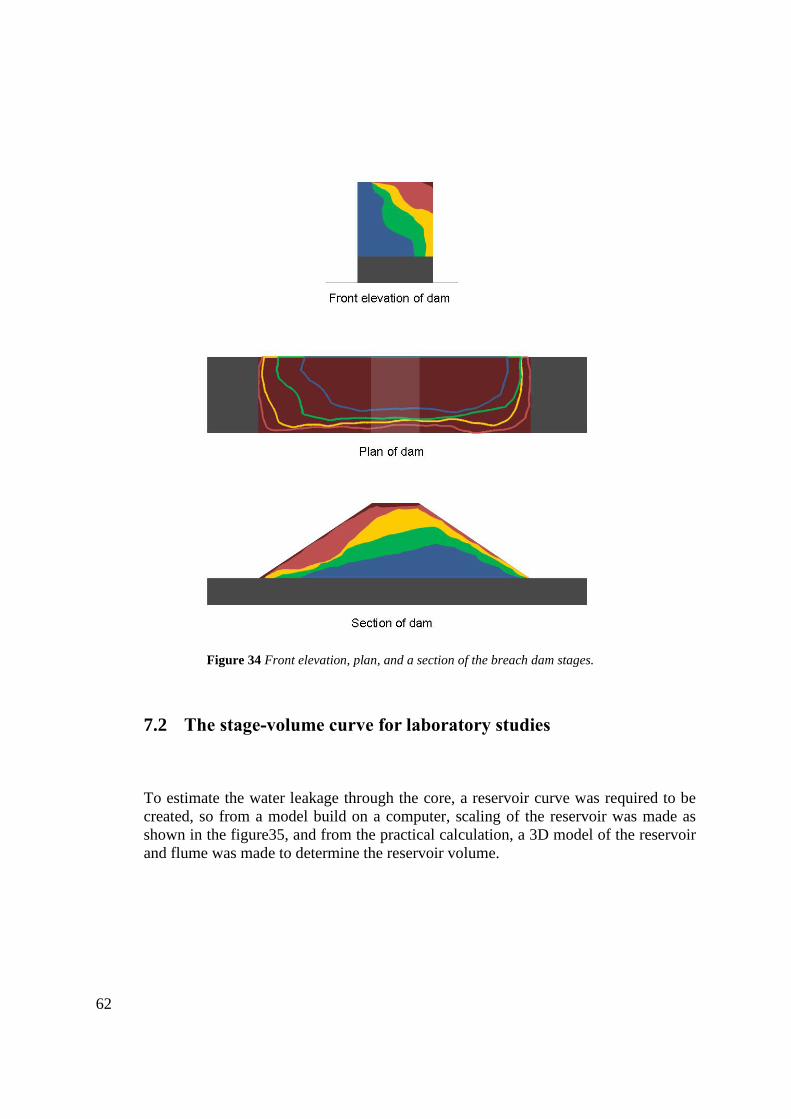
62
7.2 The stage-volume curve for laboratory studies
To estimate the water leakage through the core, a reservoir curve was required to be
created, so from a model build on a computer, scaling of the reservoir was made as
shown in the figure35, and from the practical calculation, a 3D model of the reservoir
and flume was made to determine the reservoir volume.
Figure 34 Front elevation, plan, and a section of the breach dam stages.
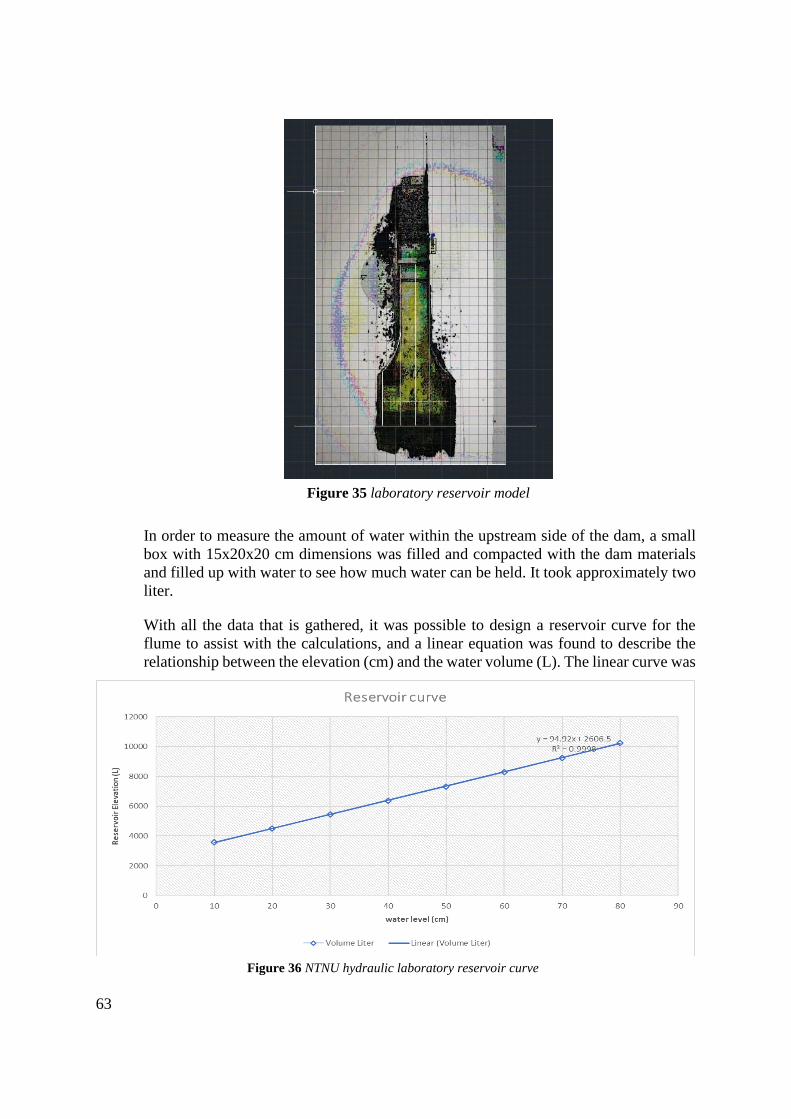
63
In order to measure the amount of water within the upstream side of the dam, a small
box with 15x20x20 cm dimensions was filled and compacted with the dam materials
and filled up with water to see how much water can be held. It took approximately two
liter.
With all the data that is gathered, it was possible to design a reservoir curve for the
flume to assist with the calculations, and a linear equation was found to describe the
relationship between the elevation (cm) and the water volume (L). The linear curve was
Figure 35 laboratory reservoir model
Figure 36 NTNU hydraulic laboratory reservoir curve
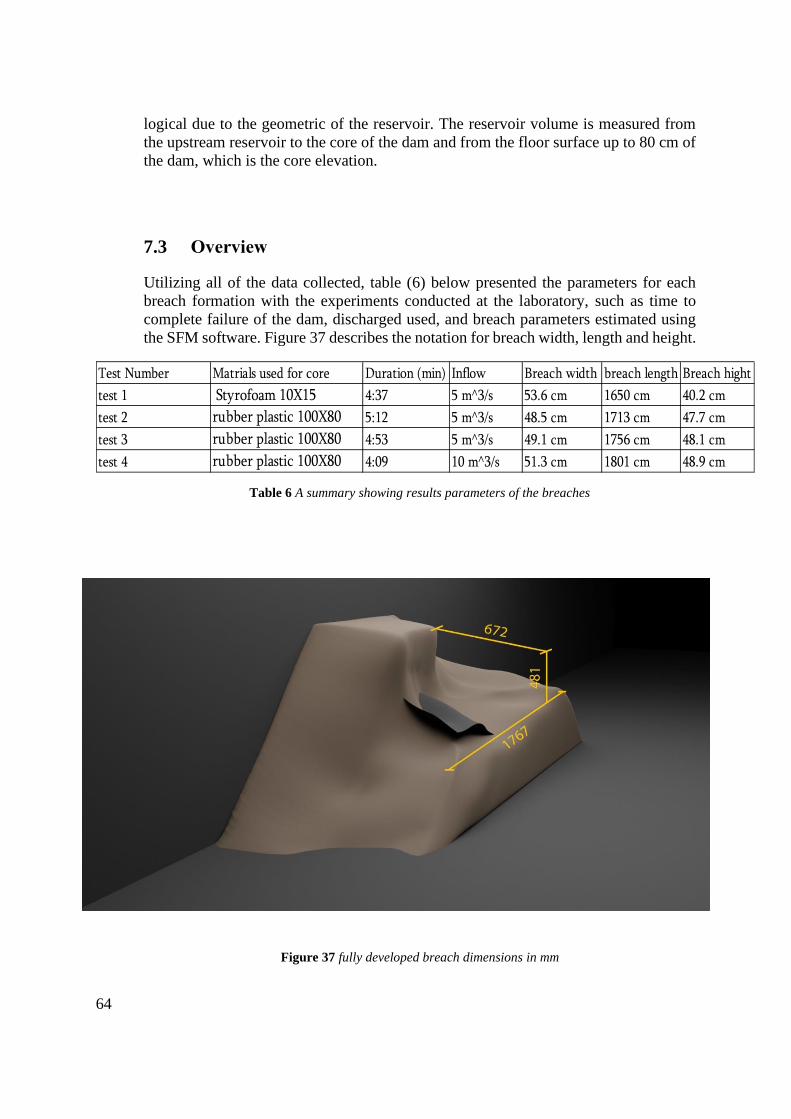
64
logical due to the geometric of the reservoir. The reservoir volume is measured from
the upstream reservoir to the core of the dam and from the floor surface up to 80 cm of
the dam, which is the core elevation.
7.3 Overview
Utilizing all of the data collected, table (6) below presented the parameters for each
breach formation with the experiments conducted at the laboratory, such as time to
complete failure of the dam, discharged used, and breach parameters estimated using
the SFM software. Figure 37 describes the notation for breach width, length and height.
Table 6 A summary showing results parameters of the breaches
Figure 37 fully developed breach dimensions in mm
Test Number Matrials used for core Duration (min) Inflow Breach width breach length Breach hight
test 1 Styrofoam 10X15 4:37 5 m^3/s 53.6 cm 1650 cm 40.2 cm
test 2 rubber plastic 100X80 5:12 5 m^3/s 48.5 cm 1713 cm 47.7 cm
test 3 rubber plastic 100X80 4:53 5 m^3/s 49.1 cm 1756 cm 48.1 cm
test 4 rubber plastic 100X80 4:09 10 m^3/s 51.3 cm 1801 cm 48.9 cm
65
8 Discussion
A total of four physical tests were conducted at the NTNU laboratory of hydraulic. The
four tests are composed of one homogeneous dam with an internal core. The first core
was made from depron foam sealed with a plastic layer, and the other three were from
an EPDM rubber which is a waterproof sealing material, and all models were exposed
to overtopping failure under falling reservoir scenario.
The experimental protocol for the first test consisted of filling up the reservoir before
equilibration was achieved. During the filling of the reservoir, a slight movement on
the downstream face of the dam was observed caused by the through-flow. The dam
was homogeneously built with an internal core. However, it was not watertight enough,
stopping the filling at the core level. A dropped in the water level was observed due to
the leakage throw the core, causing through-flow, which continuously eroded material
on the downstream side.
After the first experiment, the core material was replaced with an EPDM rubber, which
is a waterproof sealing material, to preserve the upstream water. The new core helped
to reduce the leakage remarkably. The discharge initiated at 5 liter per second up to the
score level at 80 cm from the floor level, and a miner fell in the reservoir level was
observed due to minor leakage, then the discharge initiated again up to the pilot channel
level. At that level, the dam started to breach due to overtopping, and material erosion
began with eventually developing to a complete breach.
The third experiment was an exact duplicate of the second in order to study and
observed the core material and make sure it would give the same outcomes. Therefore,
the dam was built using the same procedure, and the test gave roughly the same results
in the breach size, shape, and core behavior.
In the fourth experiment, an approach to increase the discharge was adopted to examine
the breach process under higher flow. The discharge opened at 10 liters per second.
After the water reached the pilot channel level, a breach began with a noticeably wider
opening than the previous tests causing a more significant breach.
The erosion phase is composed of a rectangular breach at the start in a vertical direction.
The approach flow into the breach channel significantly affected the shape of the
breach, which led to the horizontal side erosion and caused sidewall slope failures,
where the material will fall into the breach channel and be transported with the flow
further downstream. The pilot channel was positioned next to the glass panes in order
to capture footage of the internal breach process; the glass panes have less roughness
than the rest of the channel, which creates different conditions in the breach process
and changes the water velocity profile throughout.
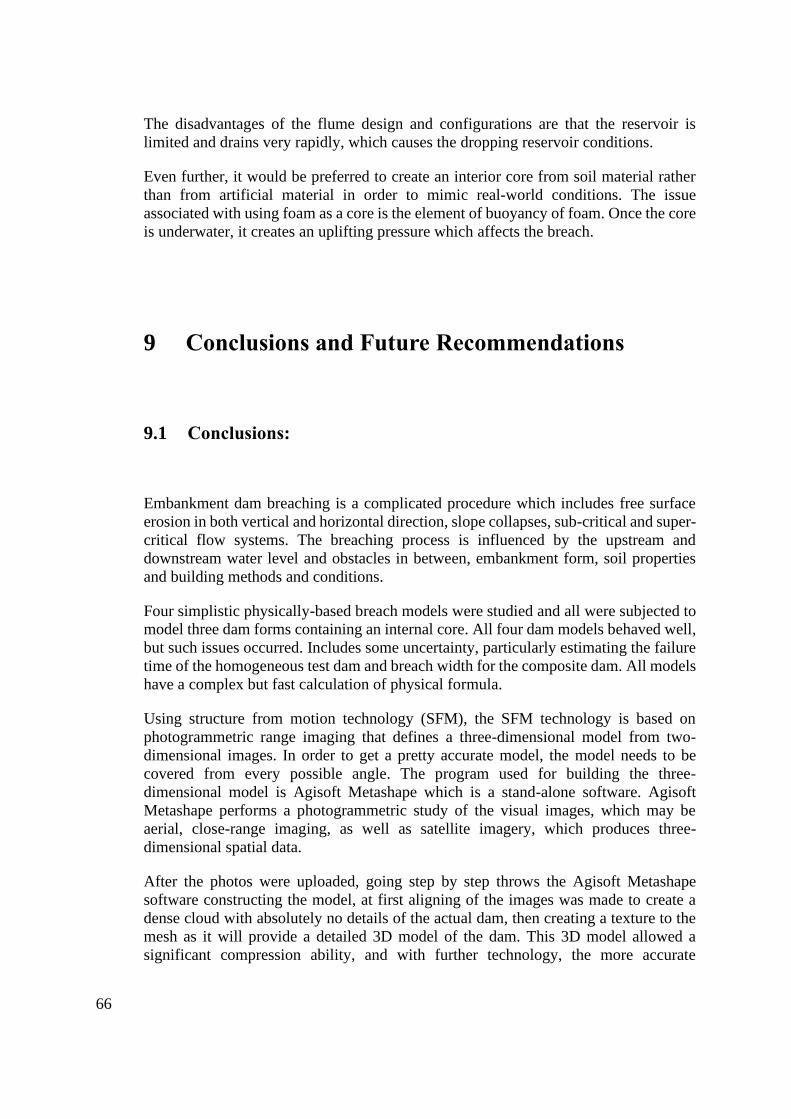
66
The disadvantages of the flume design and configurations are that the reservoir is
limited and drains very rapidly, which causes the dropping reservoir conditions.
Even further, it would be preferred to create an interior core from soil material rather
than from artificial material in order to mimic real-world conditions. The issue
associated with using foam as a core is the element of buoyancy of foam. Once the core
is underwater, it creates an uplifting pressure which affects the breach.
9 Conclusions and Future Recommendations
9.1 Conclusions:
Embankment dam breaching is a complicated procedure which includes free surface
erosion in both vertical and horizontal direction, slope collapses, sub-critical and super-
critical flow systems. The breaching process is influenced by the upstream and
downstream water level and obstacles in between, embankment form, soil properties
and building methods and conditions.
Four simplistic physically-based breach models were studied and all were subjected to
model three dam forms containing an internal core. All four dam models behaved well,
but such issues occurred. Includes some uncertainty, particularly estimating the failure
time of the homogeneous test dam and breach width for the composite dam. All models
have a complex but fast calculation of physical formula.
Using structure from motion technology (SFM), the SFM technology is based on
photogrammetric range imaging that defines a three-dimensional model from two-
dimensional images. In order to get a pretty accurate model, the model needs to be
covered from every possible angle. The program used for building the three-
dimensional model is Agisoft Metashape which is a stand-alone software. Agisoft
Metashape performs a photogrammetric study of the visual images, which may be
aerial, close-range imaging, as well as satellite imagery, which produces three-
dimensional spatial data.
After the photos were uploaded, going step by step throws the Agisoft Metashape
software constructing the model, at first aligning of the images was made to create a
dense cloud with absolutely no details of the actual dam, then creating a texture to the
mesh as it will provide a detailed 3D model of the dam. This 3D model allowed a
significant compression ability, and with further technology, the more accurate

67
prediction would be allowed off the breach formation depending on the data calibrated
from model varieties.
More field and laboratory studies are necessary to understand the complex principles
of an embankment breach. Since smaller-scale projects have scaling problems, projects
such as the IMPACT project for large-scale experiments may provide more information
about the processes. Larger tests make it possible to understand systems and achieve
more realistic outcomes. This could assist with the development of simpler physically-
based breach models and the development of modeling technologies.
Several issues occur during the tests, including camera timing and location, unable to
start video recording for all cameras at the same time, a problem with synchronization
of the frame images that were extracted. The problem was solved by placing a timer in
front of each camera when the experiment started to indicate the time difference for
each camera. An issue with the focus of some of the cameras occurs, resulting in blurred
images. The problem was fixed by manually setting the camera focus.
Setting up the core was quite challenging since the aim was to have a waterproof core
with the ability to behave as naturally as the real-world embankment dam core in the
failure stage. so, investigating more core materials is required to find more suitable ones
for the research.
With the development of the technology, artificial forecasting of embankment dam
breach is possible. With 3D modeling of a physical experiment at the laboratories
combined with simplified physically-breach model simulations, it will be possible
to create software that would predict the behavior of the material under overtopping
dam failure.

68
9.2 Future Recommendations
To better understand the complicated process of embankments dam breaching complex
techniques, more and large-scaled experiments are required. Extensive scaled tests
provide more detail and increase the accuracy of the outcoming results. Furthermore,
this would benefit the process of safety and hazard assessment for embankment dams.
More cameras are needed since the computer modeling created was not detailed enough
in the experiments. Graphic enhancing software is required to fix it and give the model
a more realistic look that compromised the model's accuracy. More core material
testing would help in the development of the best materials for simulating real-world
dam core behavior, leading to more accurate results.

69
References
Agisoft (2020), Agisoft Metashape User Manual: Professional Edition, 1.6 edn,
Agisoft, 11
Degtyarniy per., St. Petersburg, Russia, 191144.
Al-Riffai, M. (2014), Experimental study of breach mechanics in overtopped
noncohesive
earthen embankments, PhD thesis, University of Ottowa, Ottowa, Canada.
ASCE/EWRI (2011), ‘Earthen embankment breaching’, Journal of Hydraulic
Engineering
137(12), 1549–1564.
URL: https://doi.org/10.1061/(asce)hy.1943-7900.0000498
Björnsson, H. (2010), Jökulhlaups in Iceland : sources, release and drainage, in ‘Iceland
in the
Central Northern Atlantic : hotspot, sea currents and climate change’, Plouzané, France.
URL: https://hal.univ-brest.fr/hal-00480676
Björnsson, H. (1992), ‘Jökulhlaups in iceland: prediction, characteristics and
simulation’, Annals
of Glaciology 16 .
Björnsson, H. (2002), ‘Subglacial lakes and jökulhlaups in iceland’, Global and
Planetary
Change 35(3-4), 255–271.
URL: https://doi.org/10.1016/s0921-8181(02)00130-3
Breeze, P. (2014), Chapter 8 - hydropower, in P. Breeze, ed., ‘Power Generation
Technologies’,
second edn, Newnes, Boston, pp. 153 – 179.
URL: https://doi.org/10.1016/B978-0-08-098330-1.00008-9
CEATI (2017), Evaluation of numerical models for simulating embankment dam
erosion and
breach processes, Technical Report 2, Department of the Interior, Bureau of
Reclamation,
Denver, CO 80225-0007. DSO-2017-02.
Chanson, H. (2004), The hydraulics of open channel flow: An introduction, 2 edn,
Elsevier
Butterworth-Heinemann, Linacre House, Jordan Hill, Oxford OX2 8DP 200 Wheeler
Road,
Burlington, MA 01803.

70
Chinnarasri, C., Jirakitlerd, S. & Wongwises, S. (2004), ‘Embankment dam breach and
its
outflow characteristics’, Civil Engineering and Environmental Systems 21(4), 247–
264.
URL: https://doi.org/10.1080/10286600412331328622
Clague, J. (2000), ‘A review of catastrophic drainage of moraine-dammed lakes in
british
columbia’, Quaternary Science Reviews 19(17-18), 1763–1783.
URL: https://doi.org/10.1016/s0277-3791(00)00090-1
Coleman, S. E., Andrews, D. P. & Webby, M. G. (2002), ‘Overtopping breaching of
noncohesive
homogeneous embankments’, Journal of Hydraulic Engineering 128(9), 829–838.
URL: https://doi.org/10.1061/(asce)0733-9429(2002)128:9(829)
Costa, J. E. (1985), Floods from dam failures, U.S. Geological Survey Open-File
Report,
USGS, Denver, 54.
Costa, P. J. M. (2015), Sediment transport, in ‘Encyclopedia of Estuaries’, Springer
Netherlands,
pp. 562–567.
URL: https://doi.org/10.1007/978-94-017-8801-4187
EBL Kompetanse (2005), Stability and breaching of embankment dams: Report on sub-
project
3 (sp3) - breaching of embankment dams, Technical report, EBL kompetanse.
Evans, S. G. (1986), ‘The maximum discharge of outburst floods caused by the
breaching of
man-made and natural dams’, Can. Geotech. J. 23, 385–387.
Foster, M., Fell, R. & Spannagle, M. (2000), ‘The statistics of embankment dam failures
and
accidents’, Canadian Geotechnical Journal 37(5), 1000–1024.
URL: https://doi.org/10.1139/t00-030
Franca, M. J. & Almeida, A. B. (2002), Experimental tests on rockfill dam breaching
process,
Technical report, Technical University of Lisbon.
Fread, D. L. (1991), ‘Breach: An erosion model for earthen dam failures’. National
Weather
Service (NWS) Report, NOAA, Silver Spring, USA.¨

71
Froehlich, D. C. (1995a), ‘Embankment dam breach parameters revisited’, International
Water
Resources Engineering Conference - Proceedings 1, 887–891.
Froehlich, D. C. (1995b), ‘Peak outflow from breached embankment dam’, Journal of
Water
Resources Planning and Management 121(1), 90–97.
URL: https://doi.org/10.1061/(asce)0733-9496(1995)121:1(90)
Froehlich, D. C. (2008), ‘Embankment dam breach parameters and their uncertainties’,
Journal
of Hydraulic Engineering 134(12), 1708–1721.
URL: https://doi.org/10.1061/(asce)0733-9429(2008)134:12(1708)
Froehlich, D. C. (2016a), Empirical model of embankment dam breaching, in ‘River
Flow
2016’, CRC Press.
URL: https://doi.org/10.1201/9781315644479-285
Froehlich, D. C. (2016b), ‘Predicting peak discharge from gradually breached
embankment
dam’, Journal of Hydrologic Engineering 21(11), 04016041.
URL: https://doi.org/10.1061/(asce)he.1943-5584.0001424
Hassan, M. & Morris, M. (2008), IMPACT project field tests data analysis, Technical
report,
FloodSite, T04-08-04, FloodSite, European Community. www.floodsite.net.
Hiller, P. H. (2017), Riprap design on the downstream slopes of rockfill dams, PhD
thesis,
Norwegian University of Science and Technology, Trondheim. ISBN: : 978-82-326-
2352-5.
Hood, K., Perez, R., Cieplinski, H., Hromadka, T., Moglen, G. & McInvale, H. (2018),
‘Development of an earthen dam break database’, JAWRA Journal of the
AmericanWater Resources Association 55(1), 89–101.
URL: https://doi.org/10.1111/1752-1688.12703
HR Wallingford (n.d.), ‘Embrea’, [Online].[11.05.2020]. Available from:
https://www.dambreach.org/breach-tools/embrea.
ICOLD (1995), Dam failures: Statistical analysis, Technical report, International
Committee
on Large Dams.
Jondora, J. & Riha, J. (2009), ‘The failure of embankment dams due to overtopping’,
p. 166.

72
Kjærnsli, B., Valstad, T. & Höeg, K. (1992), Rockfill Dams, Vol. 10, Norwegian
Institute of
Technology - Division of Hydraulic Engineering, N-7034. In English.
Løvoll, A. & Vaskinn, K. (2003), Stability and breaching of dams - datareport no. 5,
Technical
report, Impact Project. www.impact-project.net.
Løvoll, A., Vaskinn, K. A. & Valstad, T. (2003), Stability and breaching of dams -
datareport
no. 4, Technical report, Impact Project. www.impact-project.net.
MacDonald, T. C. & Langridge-Monopolis, J. (1984), ‘Breaching charateristics of dam
failures’,
Journal of Hydraulic Engineering 110(5), 567–586.
URL: https://doi.org/10.1061/(asce)0733-9429(1984)110:5(567)
Meyer-Peter, E. & Müller, R. (1948), ‘Formulas for bed-load transport’, Proceedings
of the 2nd
Meeting of the International Association for Hydraulic Structures Research .
Stockholm, Sweeden, 7-9 June, pp 39-64.
Mohamed, M. A. A., Samuels, P. G., Ghataora, G. S. & Morris, M. W. (1999), A new
methodology
to model the breaching of non-cohesive homogeneous embankments, pp. 289–308.
Mohamed, M., Samuels, P. & Morris, M., eds (2001), Uncertainties in Dam Failure
Modelling
with the US NWS BREACH Model, HR Wallingford, WIT Press, Cardiff. Proceedings
of the
River Basin Management Conference.
Mohamed, M., Samuels, P., Morris, M. & Ghataora, G., eds (2002), Improving the
accuracy of
prediction of breach formation through embankment dams and flood embankments,
Proceedings
of international conference on fluvial hydraulics (river flow 2002), Louvain-la-Neuve.
Morris, M. (2011), Breaching of Earth Embankments and Dams, PhD thesis, the Open
University,
England.
Morris, M., Hassan, M., Kortenhaus, A. & Visser, P. (2009), Breaching processes: A
state of
the art review, Technical report, FLOODsite.

73
Morán, R. & Toledo, M. (2011), ‘Research into protection of rockfill dams from
overtopping
using rockfill downstream toes’, Canadian Journal of Civil Engineering 38, 1314–1326.
An
optional note.
URL: doi:10.1139/L11-091
Nye, J. F. (1976), ‘Water flow in glaciers: Jökulhlaups, tunnels and veins’, Journal of
Glaciology
17(76), 181–207.
URL: https://doi.org/10.3189/s002214300001354x
Orendorff, B., Al-Riffai, M., Nistor, I. & Rennie, C. D. (2013), ‘Breach outflow
characteristics
of non-cohesive embankment dams subject to blast’, Canadian Journal of Civil
Engineering
40(3), 243–253.
URL: https://doi.org/10.1139/cjce-2012-0303
Soil Conservation Service (1985), Simplified Dam-Breach Routing Procedure, 3 edn,
United
States Department of Agriculture. Tech. Release No. 66 (Rev. 1), 39.
Tessema, N. N., Sigtryggsdóttir, F. G., Lia, L. & Jabir, A. K. (2019), ‘Case study of
dam
overtopping from waves generated by landslides impinging perpendicular to a
reservoir’s
longitudinal axis’, Journal of Marine Science and Engineering 7(7), 221.
URL: https://doi.org/10.3390/jmse7070221
U.S. Bureau of Reclamation (1988), Downstream hazards classification guidelines,
Technical
Report 11, Department of the Interior, Denver, CO.
van Rijn, L. C. (1984), ‘Sediment transport, part i: Bed load transport’, Journal of
Hydraulic
Engineering 110(10), 1431–1456.
URL: https://doi.org/10.1061/(asce)0733-9429(1984)110:10(1431)
Vaskinn, K. A., Lovoll, A. & Höeg, K. (2004), Wp2.1 breach formation - large scale
embankment
failure, Technical Report 1, IMPACT, www.impact-project.net.

74
Visser, P. (1998), Breach growth in sand-dikes, PhD thesis, TU Delft, Mekelweg 5,
2628 CD
Delft, Holland. ISBN 90-9012279-6.
Wahl, T. (1998), ‘Prediction of embankment dam breach parameters: A literature
review and
needs assessment’, pp. 60. Dam Safety Office, Water Resources Research Laboratory,
U.S.
Bureu of Reclamation. Denver, CO. DSO-98-004.
Wahl, T. L. (2004), ‘Uncertainty of predictions of embankment dam breach
parameters’, Journal
of Hydraulic Engineering 130(5), 389–397.
URL: https://doi.org/10.1061/(asce)0733-9429(2004)130:5(389)
Wahl, T. L. (2010), Dam breach modeling - an overview of analysis methods, in ‘2nd
Joint Federal
Interagency Conference, Las Vegas, NV, June 27 - July 1, 2010’, Bureau of
Reclamation,
Denver, CO.
Wahl, T. L. (2019), Erosion testing of zoned rockfill embankments, Technical report,
U.S.
Bereau of Reclamation (USBR, Denver, CO. HL-2019-01.
Walder, J. S. & O’Connor, J. E. (1997), ‘Methods for predicting peak discharge of
floods caused
by failure of natural and constructed earthen dams’,Water Resources Research 33(10),
2337–
2348.
URL: https://doi.org/10.1029/97wr01616
Webber, D. W. (1987), Guidelines for using fuse plug embankments in auxiliary
spillways,
Technical Report ACER Tech Memo. no. 10, U.S. Bureau of Reclamation.
West, M., Morris, M. & Hassan, M. (2018), A guide to breach prediction, Technical
report, HR
Wallingford, Oxfordshire, OX10 8BA, United Kingdom.
Wu, W. (2004), ‘Depth-averaged two-dimensional numerical modeling of unsteady
flow
and nonuniform sediment transport in open channels’, Journal of Hydraulic
Engineering
130(10), 1013–1024.

75
URL: https://doi.org/10.1061/(asce)0733-9429(2004)130:10(1013)
Wu,W. (2007), Computational River Dynamics, 1 edn, Taylor Francis/Balkema, P.O.
Box 447,
2300 AK Leiden, The Netherlands. ISBN: 978-0-203-93848-5.
Wu,W. (2013), ‘Simplified physically based model of earthen embankment breaching’,
Journal
of Hydraulic Engineering 139(8), 837–851.
URL: https://doi.org/10.1061/(asce)hy.1943-7900.0000741
Wu, W. (2016a), ‘Dlbreach (simplified)’, [Online].[20.04.2020]. Available from:
https://webspace.clarkson.edu/_wwu/DLBreach.html.
Wu, W. (2016b), Introduction to dlbreach - a simplified physically-based dam/levee
breach
model, Technical report, Clarkson University, Box 5710, 8 Clarkson Avenue Potsdam,
NY
13699, USA. (Version 2016.4).
Wu, W., Wang, S. S. & Jia, Y. (2000), ‘Nonuniform sediment transport in alluvial
rivers’,
Journal of Hydraulic Research 38(6), 427–434.
URL: https://doi.org/10.1080/00221680009498296
Xu, Y. & Zhang, L. M. (2009), ‘Breaching parameters for earth and rockfill dams’,
Journal of
Geotechnical and Geoenvironmental Engineering 135(12), 1957–1970.
URL: https://doi.org/10.1061/(asce)gt.1943-5606.0000162
Zhang, L., Xu, Y. & Jia, J. (2009), ‘Analysis of earth dam failures: A database
approach’,
Georisk: Assessment and Management of Risk for Engineered Systems and Geohazards
3(3), 184–189.
Zhong, Q., Wu, W., Chen, S. & Wang, M. (2016), ‘Comparison of simplified physically
based
dam breach models’, Natural Hazards 84(2), 1385–1418.
URL: https://doi.org/10.1007/s11069-016-2492-9

76
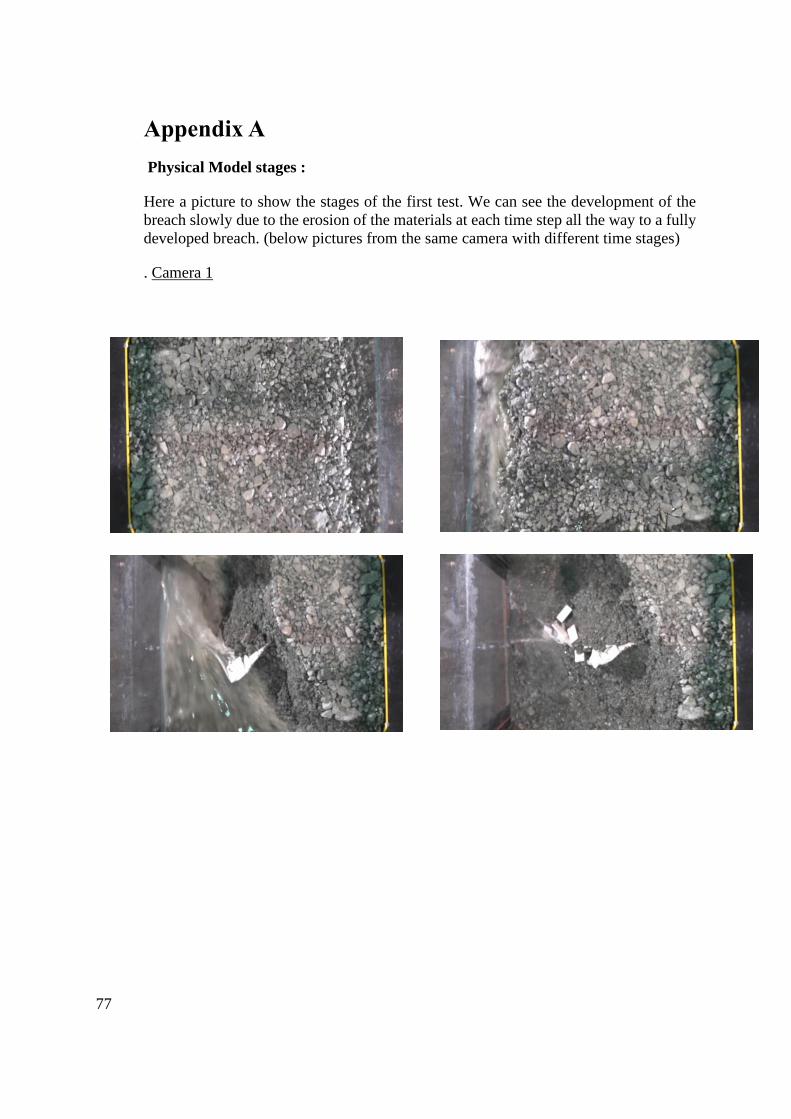
77
Appendix A
Physical Model stages :
Here a picture to show the stages of the first test. We can see the development of the
breach slowly due to the erosion of the materials at each time step all the way to a fully
developed breach. (below pictures from the same camera with different time stages)
. Camera 1
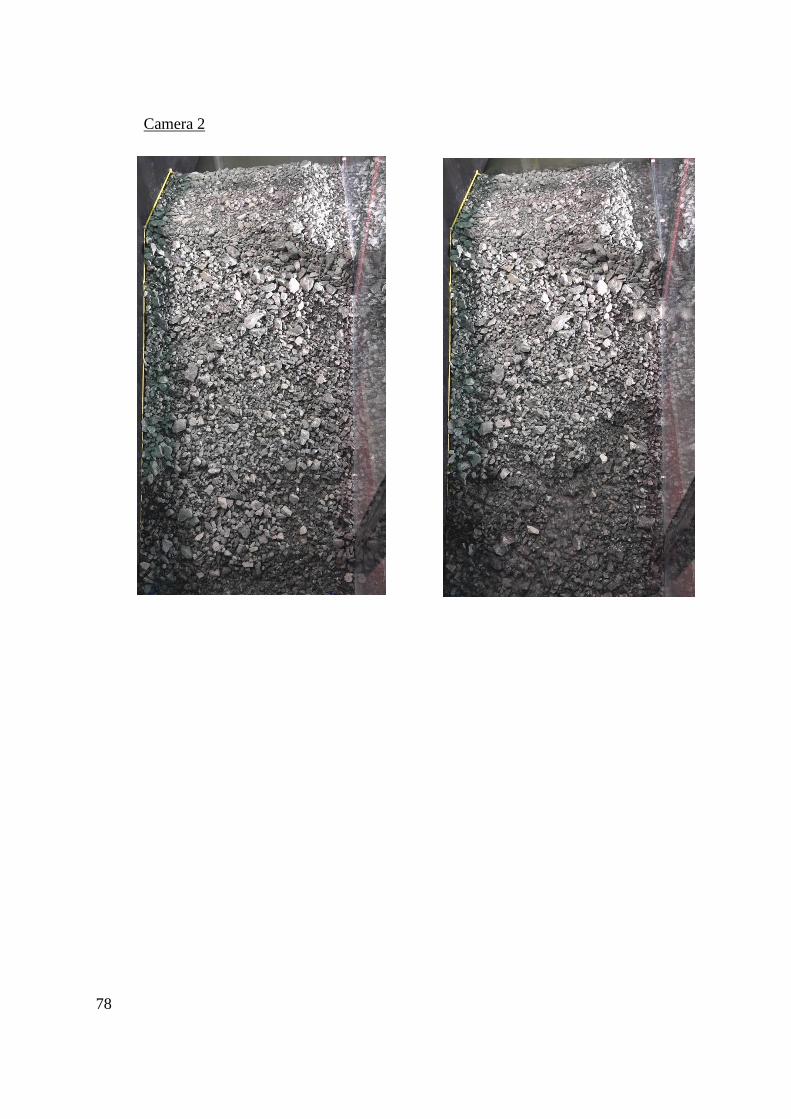
78
Camera 2
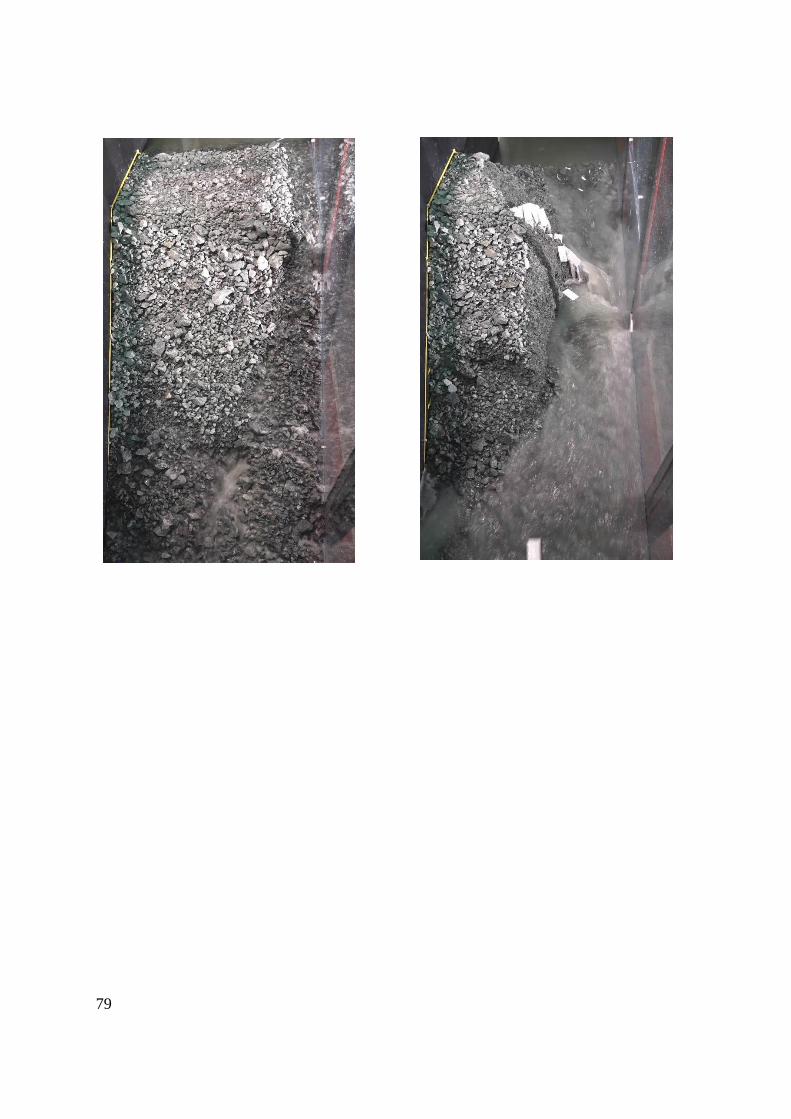
79
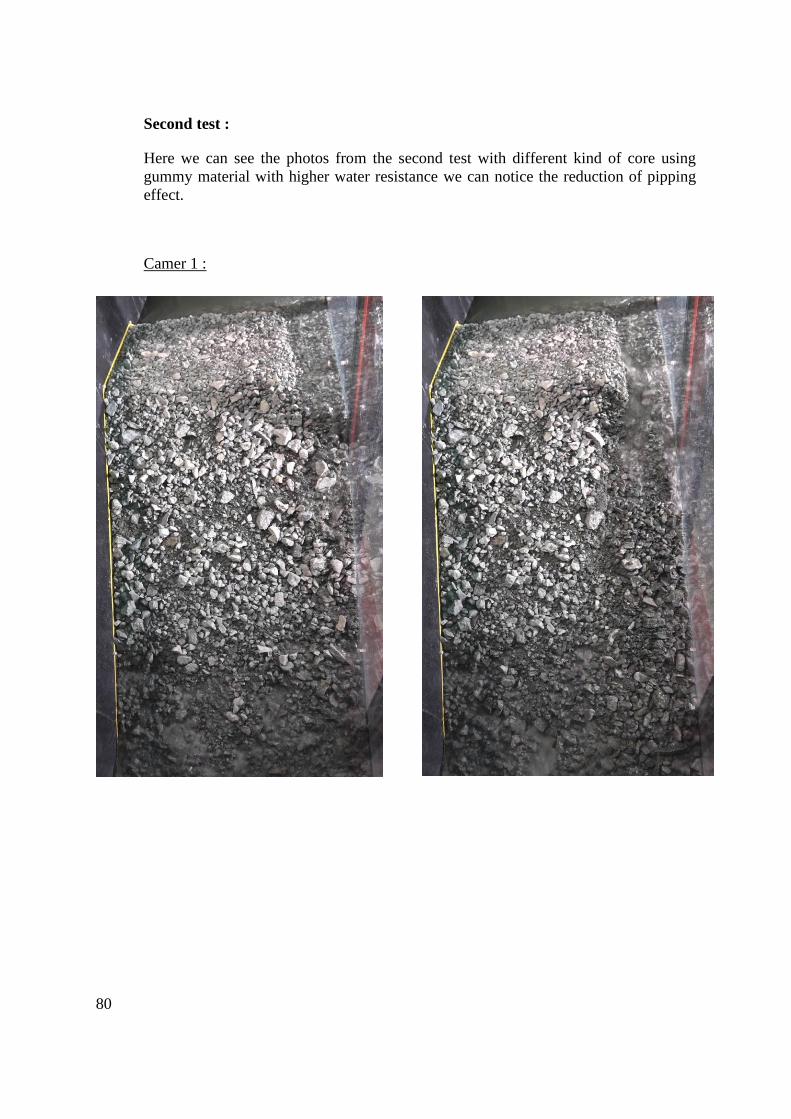
80
Second test :
Here we can see the photos from the second test with different kind of core using
gummy material with higher water resistance we can notice the reduction of pipping
effect.
Camer 1 :
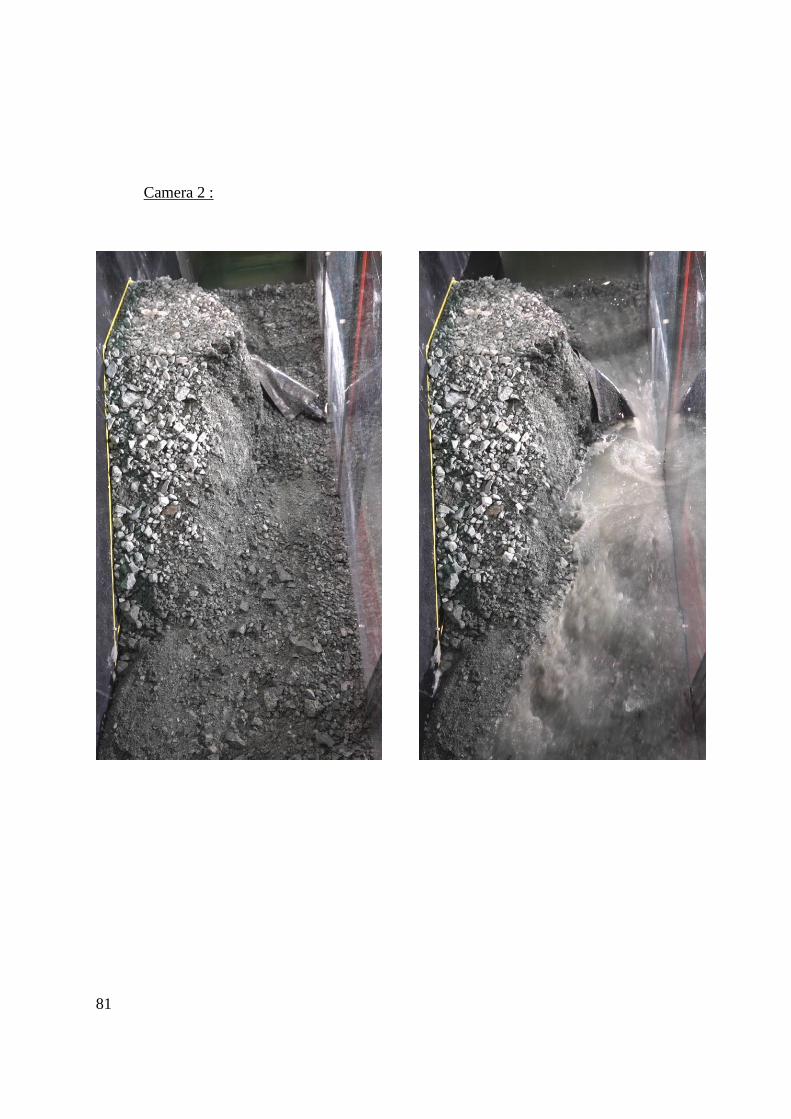
81
Camera 2 :
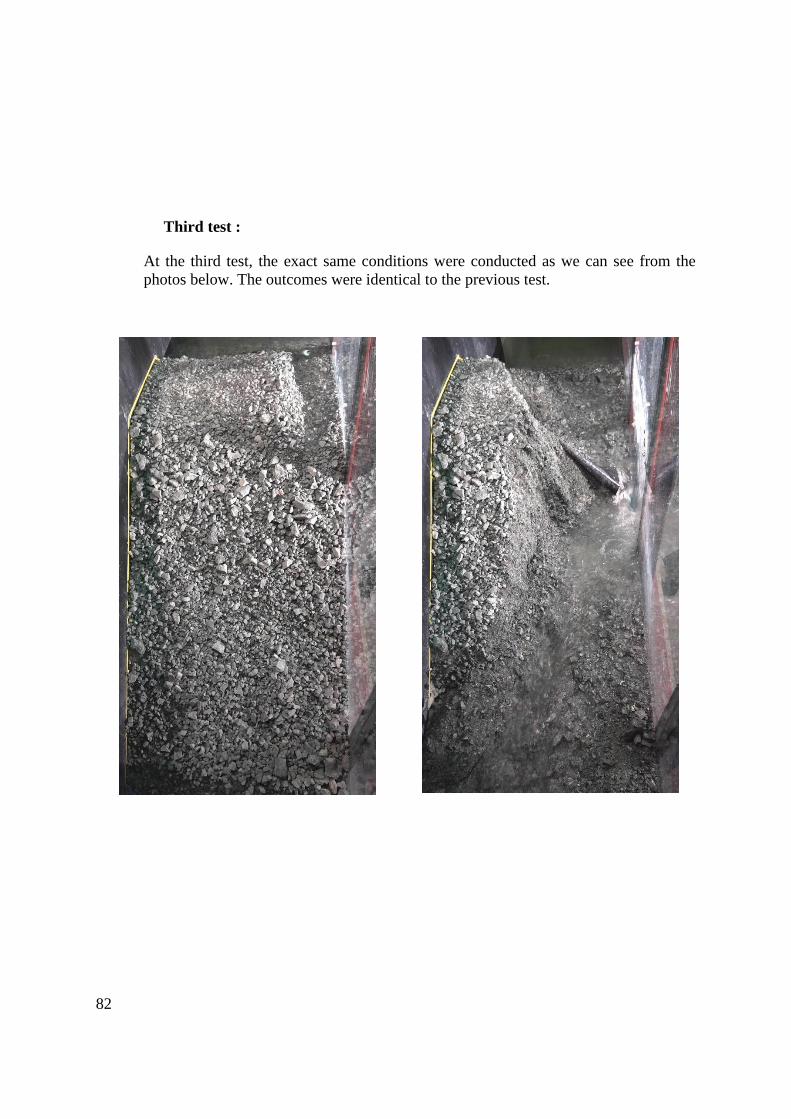
82
Third test :
At the third test, the exact same conditions were conducted as we can see from the
photos below. The outcomes were identical to the previous test.

83
computer simulation of the test :
A lot of time and effort was put into creating a model dam with structure from motion
(SFM). Photogrammetric range imaging is used in the SFM technique to approximate
a three-dimensional model from two-dimensional images. A sufficient number of
photographs of the object of interest must be given in order to obtain good results from
the three-dimensional structure.
Agisoft Metashape is a stand-alone program that was used to build the three-
dimensional model. Agisoft Metashape produces three-dimensional spatial data by
photogrammetrically manipulating digital images, which may include aerial, close-
range imaging, and satellite imagery. GIS applications, cultural heritage
documentation, and visual effects can all benefit from the data. Distance measurements,
as well as area and volume estimations, are all possible with the software (Agisoft
2020).
Five cameras were mounted over the flume, with views of the downstream side, the top
of the dam crest, and the dam's upper upstream face. This provided adequate angles for
constructing a three-dimensional surface model of the dam. Due to the flume's
configuration, there are certain limitations; the flume is closed off on both ends. As a
result, the Agisoft Metashape model is available on all sides. As the breach channel is
at largest, it became more difficult to get the right angle for the breach channel's
sidewalls, which resulted in noise on the breach's sidewalls. Sony RX0 cameras were
used to capture the breach video, which can film at 200 frames per second (fps) and
provide 4K recording at lower fps.
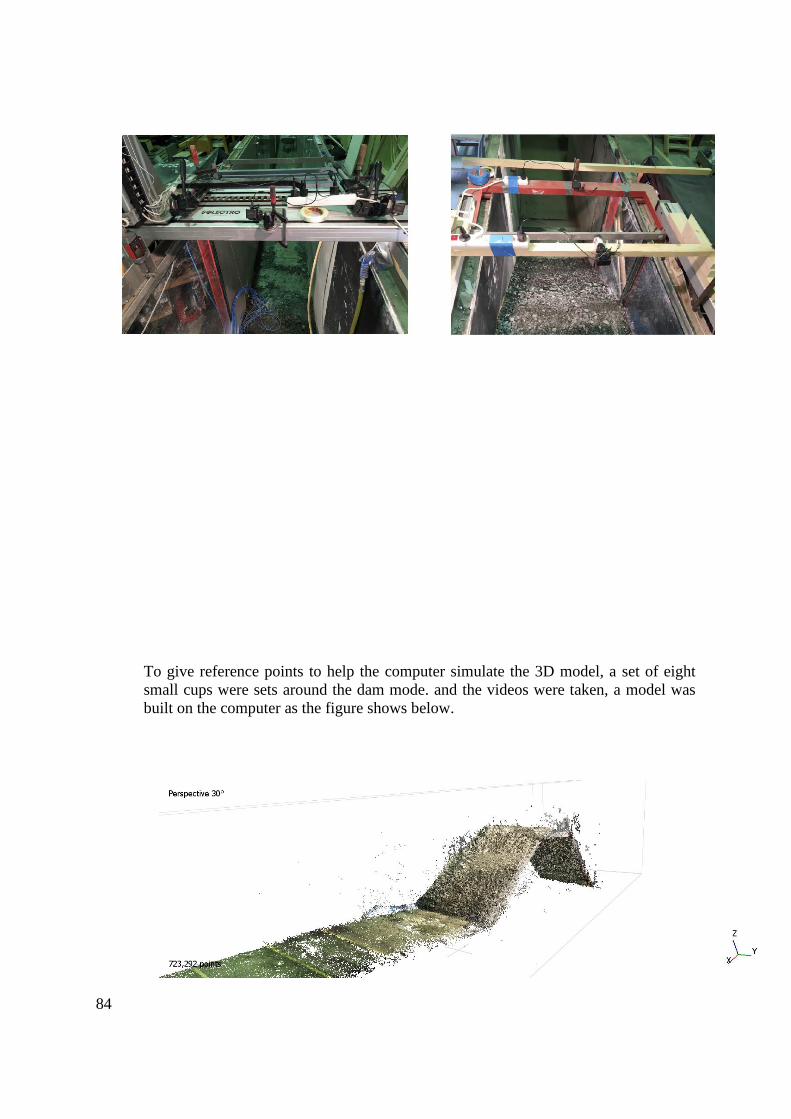
84
To give reference points to help the computer simulate the 3D model, a set of eight
small cups were sets around the dam mode. and the videos were taken, a model was
built on the computer as the figure shows below.
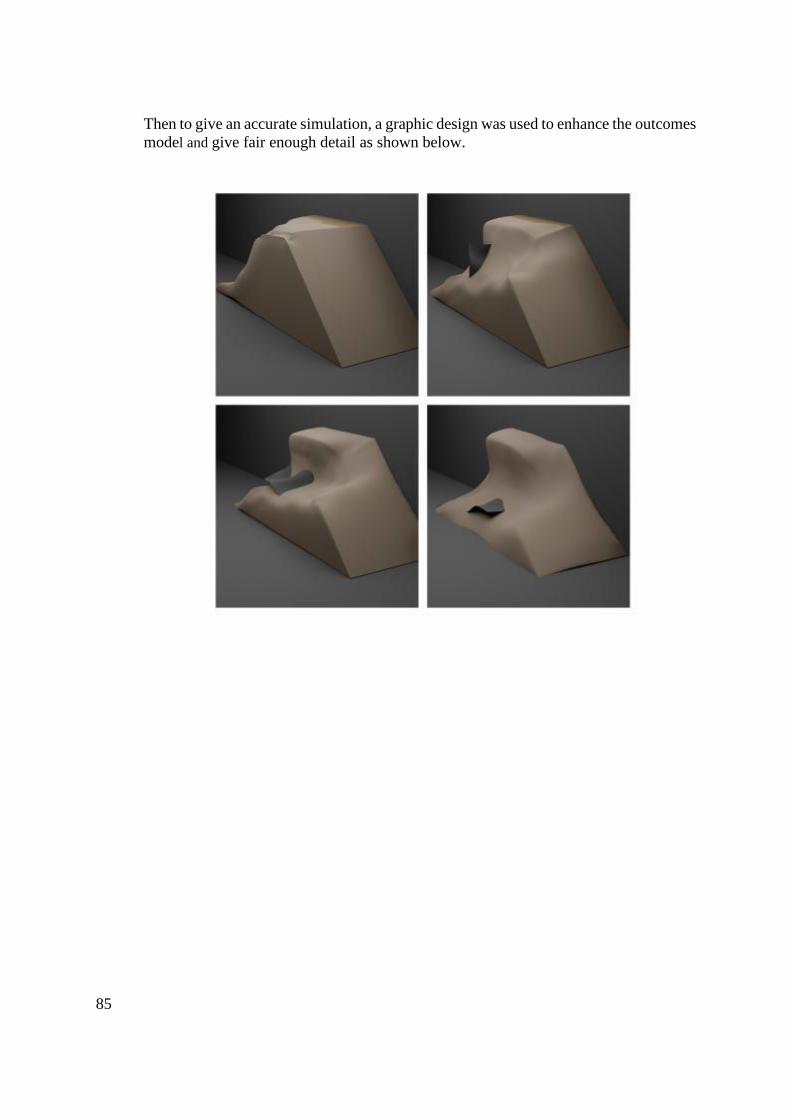
85
Then to give an accurate simulation, a graphic design was used to enhance the outcomes
model and give fair enough detail as shown below.
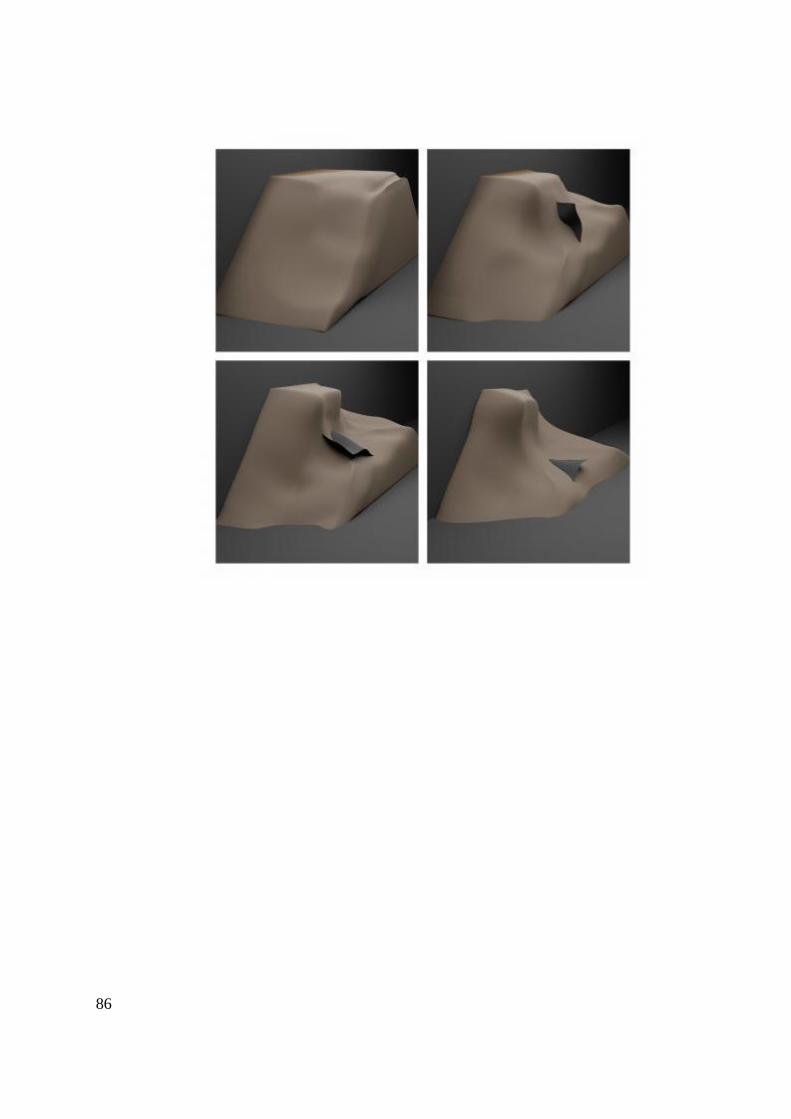
86

87

NTN
UN
orw
egia
n U
nive
rsity
of S
cien
ce a
nd T
echn
olog
yFa
culty
of E
ngin
eerin
gD
epar
tmen
t of C
ivil
and
Envi
ronm
enta
l Eng
inee
ring
Ghaith E ALkholossi
Rockfill dam breaching experimentswith the application ofphotogrammetry techniques
Ghaith E ALkholossi
Master’s thesis in Hydropower DevelopmentSupervisor: Fjóla G. SigtryggsdóttirCo-supervisor: Geir Helge Kiplesund
March 2021
Mas
ter’s
thes
is


