Embed Size (px)
Citation preview

“Let the Science be your passion”
E-ISSN: 0975-5241 (Online)
P-ISSN: 2231-2196 (Print)
Internationally Indexed,
Peer Reviewed, Multidisciplinary
Scientific Journal
ICV: 4.18
Vol 04 / Issue 03 / Feb 2012
Frequency: Fortnightly
Language: English
International Journal of Current Research and Review (IJCRR)

2 International Journal of Current Research and Review www.ijcrr.com
Vol. 04 issue 03 February 2012
Editorial Board
Dr. Prof. Dato‘
Proom Promwichit
Deputy Vice Chancellor, Research & Innovation
Division, Masterskill University College of
Health Sciences, Cheras, Malaysia
Dr. Nahla Salah Eldin
Barakat
Faculty, University of Alexandria, Alexandria,
Egypt
Dr. Ann Magoufis Director, Ariston College, Shannon, Ireland
Dr. Pongsak
Rattanachaikunsopon
Faculty, Ubon Ratchathani University, Warin
Chamrap, Ubon Ratchathani, Thailand
Dr. Chellappan
Dinesh
Dean, School of Pharmacy, Masterskill
University College of Health Sciences, Cheras,
Malaysia
Dr. R. O. Ganjiwale HOD, Department of Pharmacognosy, I.P.E.R.
Wardha, Maharashtra
Dr. Shailesh Wader HOD, Department of Pharmaceutical Chemistry,
IPER, Wardha, MH, India
Dr. Alabi Olufemi
Mobolaji
Faculty, Bowen University, Iwo, Osun-State,
Nigeria
Dr. Joshua Danso
Owusu-Sekyere
Faculty, University of Cape Coast, Cape Coast,
Ghana
Dr. Okorie
Ndidiamaka Hannah
Faculty, University of Nigeria Nsukka, Enugu
State
Dr. Parichat
Phumkhachorn
Faculty, Ubon Ratchathani University, Warin
Chamrap, Ubon Ratchathani, Thailand
Dr. Manoj Charde Dean, NRI Group of Post Graduate Studies,
Bhopal
Dr. Shah Murad
Mastoi
HOD, Pharmacology and Therapeutics, Lahore
Medical and Dental College, Lahore, Pakistan
I
J
C
R
R ISSN 0975-5241
IC Value of Journal: 4.18
“Let the science be your passion”
Vol 4 / Issue 3 / Feb 2012

3 International Journal of Current Research and Review www.ijcrr.com
Vol. 04 issue 03 February 2012
I
J
C
R
R “Let the science be your passion”
Vol 2 / Issue 12 / Dec 2010
About International Journal of Current Research and Review (ijcrr)
International Journal of Current Research and Review (ijcrr) is one of the popular
monthly international interdisciplinary science journals. ijcrr is a peer reviewed
indexed journal which is available online and in print format as well. References
ehave shown that within short span of time, citations for ijcrr are increasing with
noticeable pace. ijcrr indexing agencies are in the process of calculating current impact factor for the journal.
Indexed in: Copernicus, Revistas Médicas Portuguesas, BOAI, DOAJ, Google
Scholar, Ulrich, Open-J-Gate, NEWJOUR, ResearchGATE
Aims and Scope:
ijcrr is a monthly indexed international journal publishing the finest peer-reviewed
research and review articles in all fields of Medical and Paramedical
sciences. ijcrr follows stringent guidelines to select the manuscripts on the basis of
its originality, importance, timeliness, accessibility, grace and astonishing
conclusions. ijcrr is also popular for rapid publication of accepted manuscripts.
Mission Statement:
To set a landmark by encouraging and awarding publication of quality research and review in all streams of Medical and Paramedical sciences.
About the editors:
ijcrr management team is very particular in selecting its editorial board members.
Editorial board members are selected on the basis of expertise, experience and their
contribution in the field of Science. Editors are selected from different countries and
every year editorial team is updated. All editorial decisions are made by a team of
full-time journal management professionals.
ijcrr Award for Best Article:
ijcrr editorial team monthly selects one ‗Best Article‘ for award among published
articles.
Administrative Office: IJCRR Administrative Office, 148, IMSR Building, Near NIT Complex, Ayurvedic Layout, Umrer Road, Sakkardara, Nagpur, Nagpur-24, [email protected], www.ijcrr.com
I
J
C
R
R “Let the science be your passion”
Vol 4 / Issue 3 / Feb 2012

4 International Journal of Current Research and Review www.ijcrr.com
Vol. 04 issue 03 February 2012
Index
S.
N.
Title Authors Page
No.
1 A Study on Nuclear Energy: Sustainable
Solution for Ensuring Energy Security or
Emerging Future Threat
Dewan Mowdudur
Rahman, Riasad
Amin, Navid Bin
Sakhawat, Md.
Zubaer Chowdhury
6
2 Isolation, Optimization And Production
Of Protease From Aspergillus Species
Through Solid State Fermentation
M. Saraswathi, R.
Dakshayani, P.
Muralikrishna
15
3
Cropping and Land use Pattern in
Himachal Pradesh: Case of District
Solan
Kumar Sanjay, Barik
Kaustauv, Prashar
Deepak
19
4
Are Lifestyle Disorders a Risk for
Periodontal Disease?
Manoj Raja
26
5
Blood Glucose Concentration - A Key to
Fix the Effective Dose for Herbal
Antidiabetic Drugs using Rat Model
R.Kannadhasan,
S.Venkataraman
32
6 Bilateral Variation in the Vascular
Pattern of Palm-A Case Report
A.Himabindu,
B.Narasing Rao
46
7 A Review on M-Health System and
Technologies
Arvind Rehalia,
Rajat Kumar
53
8 Treatment Seeking Behavior of Married
Women of Reproductive Age Belonging
to a Rural Community of India
Mohammad Shakil
Ahmad, Shaikh
Mohsin, Ritu Kumar
Ahmad
59
9 Trend Analysis of Northeast Monsoon
Rainfall of Tamil Nadu
Tamil Selvi .S ,
Samuel Selvaraj .R
70
10
Microbial, Sensory and Nutritional
Properties of Cauliflower, Preserved by
Hurdle Technology
Jyoti Sinha, Ramesh
Chandra
74
I
J
C
R
R “Let the science be your passion”
Vol 4 / Issue 3 / Feb 2012

5 International Journal of Current Research and Review www.ijcrr.com
Vol. 04 issue 03 February 2012
Index
S.
N.
Title Authors Page
No.
11 Plat form Switching in Implant
Dent istry - A Review
Gayathri N, Lakshmi
S
81
12 Neonatal Mortality – An Experience by
Verbal Autopsy
Shaikh Mohsin,
Pathan Sameer
89
13
Esthetic and Functional Rehabilitation of
the Patient with Severely Worn
Dentition using Twin Stage Procedure:
A Case Report
Naresh HG Shetty,
Manoj Shetty,
Krishna Prasad D.
93
14
Evaluation of Yoga Therapy for the
Risk Factors of Cardiovascular
Disorders-A Review
Deepa.T,
N.Thirrunavukkarasu
100
15
Characterization of Fatty Acids in Melia
Azedarach l. Seed Oil
R. K. Bachheti,
Himanshu Dwivedi,
Vikas Rana, Indra Rai
Archana Joshi
108
16 Knowledge and Opinion of Caregivers
Regarding Childhood Additional
Vaccines in Agartala, West Tripura
Majumder Nilratan,
Datta Shib Sekhar,
Boratne Abhijit
Vinodrao, Majumder
Nilanjan, Basu
Majumder Chandrika
115
17 Evaluation and Comparison of
Remineralization Efficacy of CPP-ACP
and Fluoride Varnish using Diagnodent -
An In Vitro Study
R.Senthil, V. Rathna
Prabhu, J. Jeeva
rathan, A.
Venkatachalapathy
121
18 Mutational Analysis of Interferon-
Gamma Gene in Indian Women with
Female Genital Tuberculosis
Venkanna Bhanothu,
Jane Theophilus, Roya
Rozati
130
19 Ziziphus Mauritiana :A Review on
Pharmacological Potential of this
Underutilized Plant
Sukirti Upadhyay,
Prashant Upadhyay, A
K Ghosh, Vijender
Singh
141
20 Role of Community Based Learning In
Creating Self-Driven Learning and
Rural Bias Among Medical
Undergraduates
Shib Sekhar Datta,
Abhijit V Boratne
145
I
J
C
R
R “Let the science be your passion”
Vol 4 / Issue 3 / Feb 2012

6 International Journal of Current Research and Review www.ijcrr.com
Vol. 04 issue 03 February 2012
ijcrr
Vol 04 issue 03
Category: Research
Received on:08/12/11
Revised on:14/12/11
Accepted on:19/12/11
ABSTRACT Sustainability is characterized by the environmental friendly process best fitted for eco-systems
and the capacity to maintain a process smoothly indefinitely. Maintaining sustainability in
every aspect is the key for continuing human race in the long run. Recent energy insecurity
problem and global climate change has led the concerned to take a fresh look at the benefits and
risks of nuclear power for better future and find out a sustainable solution. Risk from fatal
accident and radioactive waste management for a long period of time surely diminish the
benefits of nuclear power, such as no green house gas emission and significant amount of
power supply with minimum infrastructural development. As nuclear power is all about
balancing the benefit and the risk, therefore this paper summarizes the benefit and risk causing
from nuclear power to find out a sustainable choice for future energy demand.
______________________________________________________________________
Keywords: Nuclear energy, climate change
effects, radioactivity, energy demand,
sustainable development.
1. INTRODUCTION
Modern age is passing an energy deficient
time and the coming days will definitely be
starved for energy. About 1.4 billion
people (20% of the global population) do
not have access to electricity and 2.7 billion
people (40% of global population) rely on
traditional biomass for basic energy needs
such as cooking and heating [1]. Increasing
global energy demand combined with the
need to minimize Green House Gas (GHG)
emission will require the diversification of
energy sources, while still ensuring that the
bottom 2 billion people- those who live on
less than USD 2.5 per day have access to
modern energy services. Achieving the
goal set in April, 2010 by the UN Advisory
Group on Energy and Climate Change
(AGECC) for universal access to modern
energy by 2030 [2] is a daunting prospect,
given the intertwined challenges to tackle
natural resources security, energy
insecurity and climate change impact. At
present, nuclear power appears to be the
best choice for many nations. However,
integrating nuclear power into a country‘s
energy infrastructure is not without
challenges. It has a great prospect of
supplying sufficient amount of energy with
creating less impact to the environment but
in the long run there still remains a doubt
about its sustainability.
2. Sustainable Development
Human beings are said to be at the centre
of concerns for sustainable development.
We are entitled to a healthy and productive
life in harmony with nature. States are seen
A STUDY ON NUCLEAR ENERGY: SUSTAINABLE
SOLUTION FOR ENSURING ENERGY SECURITY OR
EMERGING FUTURE THREAT
Dewan Mowdudur Rahman1, Riasad Amin
1, Navid Bin Sakhawat
2,
Md. Zubaer Chowdhury1
1Department of EECE, Military Institute of Science and Technology, Dhaka,
Bangladesh 2Department of EEE, BRAC University, Dhaka, Bangladesh
E-mail of Corresponding Author: [email protected]

7 International Journal of Current Research and Review www.ijcrr.com
Vol. 04 issue 03 February 2012
as having the right, within the principles of
international law, to exploit our own
resources and the responsibility to ensure
that any activities within our jurisdiction do
not cause damage to the environment or
other States. In addition, the right to
development must be fulfilled so as to
equitably meet the developmental and
environmental needs of present and future
generations. Eradication of poverty is seen
as a required element of sustainable
development. Climate change is a pressing
threat to the sustainability of life on earth
[3]. It is a highly complex problem that is
unpredictable, reflecting an intricate
interaction of organizational production
processes, government management and
regulation, natural forces, and individual
behaviour [4]. It is generally held that
sustainable development requires attention
to the following things:
Food availability and protection.
Water availability in adequate
quantities.
Disease prevention and medical
treatment.
Steady and abundant supply of
energy specifically, electricity.
Sewage treatment.
Infrastructure development such as
schools, factories and
transportation.
3. Global Climate Change Effects
In recent years, dramatic environmental
changes have caused extraordinary climate
changes around the globe. This has made
countries all over the world to focus on
greenhouse effect issue and consider it
seriously [5]. It is an important problem
that can‘t be ignored because the
greenhouse effect causes global warming
[6, 7]. In the past century, research and
literature has concluded that carbon dioxide
(CO2) concentration increased by 28%
following the industrial revolution [8]. The
global average temperature has increased
by 0.3˚C to 0.6˚C, and the sea level rose 10
to 15 cm in the past 100 years. If
greenhouse gas (GHG) emissions continue
to increase at the present rate, it is
predicted that the average global
temperature will increase by about 1˚C by
the year 2025 and by 3˚C at the end of the
century [9]. The increase of atmospheric
GHG concentration results to a large extent
from human activities [10, 11]. Scientists
predict if no effective protection policies
for the environment are put into place, the
global temperature will increase by 1˚C to
3.5˚C, and the sea level will increase by 15
to 95 cm. This will make many countries
uninhabitable by 2100 [12]. The second
assessment report of Inter governmental
Panel on Climate Change (IPCC) stated
that the CO2 concentration in the
atmosphere rose from 280 to 358 ppm in
1994 [13]. The World Meteorology
Organization (WMO) also pointed out in
greenhouse gas annual report in 2007 that
the CO2 concentration had already raised to
383 ppm [14]. CO2 is the main GHG
emitted from various sources and power
sector is solely responsible for 30%
emission of CO2 throughout the world [15].
4. Nuclear Energy: An Emerging
Source
The star, of which our sun is one, relies on
nuclear fusion for their output of heat, light
and other radiations. If one believes in the
Big Bang Theory, then the Earth may be
considered as a fragment of the Sun. Fusion
reaction is exactly what is happening on the
Sun. Energy from fission reaction is
derived from a nuclear reaction involving
uranium or plutonium as the fuel which
originally comes from the fragment of the
Sun. Nuclear reactors are either the slow
thermal kind using moderators or the fast

8 International Journal of Current Research and Review www.ijcrr.com
Vol. 04 issue 03 February 2012
breeder type using purer fuels and able to
generate or ‗breed‘ new fuel form which is
useful in the context of renewability. It is
projected that world primary energy
demand will increase by 45 percent
between 2006 and 2030, an average
annual rate of growth of 1.6 percent
slower than the average growth of 1.9
percent per year from 1980 to 2006
[16]. The International Atomic Energy
Agency (IAEA), the most authoritative
international source of information on
nuclear energy, predicted in August 2009
that global nuclear power capacity would
be doubled by 2030, from the current 372
gigawats electric (GWe) to 807 GWe.
Today, about thirty countries are
harnessing nuclear energy in about 440
commercial reactors. Table I. shows the list
of countries with their respective nuclear
programme.
Table I. The list of countries with their respective nuclear programme [17].
Nuclear Programme Countries
Contracts signed, legal and regulatory
infrastructure well-developed
United Arab Emirates, Turkey.
Committed plans, legal and regulatory
infrastructure developing
Vietnam, Jordan, Belarus, Bangladesh.
Well-developed plans but commitment pending Thailand, Indonesia, Egypt, Kazakhstan, Poland,
Lithuania, Chile.
Developing plans Saudi Arabia, Israel, Nigeria, Malaysia,
Morocco, Kuwait.
Officially not a policy option at present Australia, New Zealand, Portugal, Norway, Ireland.
5. Problems With Nuclear Energy
The disadvantages of nuclear energy
include: the storage and management of
dangerous high level radioactive waste, the
possibility of proliferation of nuclear
materials and potential terrorist
applications, the high cost of building
nuclear facilities and the possibility of
accidents. Common people awareness is
another issue that may also regard as a bar
for nuclear energy programme. These
disadvantages are listed below with
respective description.
5.1 Radioactive Waste
High-level radioactive waste is very
dangerous. It lasts for tens of thousands of
years before decaying to safe levels. It is
highly radioactive and is a major barrier for
the expansion of nuclear power. More than
fifty years of commercial nuclear energy
use has left the world with a legacy of tens
of thousands of tons of highly radioactive
waste that will last for tens of thousands of
years [18]. On average, uranium ore
contains only 0.1% uranium. Most nuclear
reactors require one specific form of
uranium, uranium-235 (U-235). This form
represents only 0.7% of natural uranium.
To increase the concentration of U-235, the
uranium extracted from ore goes through
an enrichment process, resulting in a small
quantity of usable ‗enriched‘ uranium and
huge volumes of waste. If nuclear power
production expands substantially in the
coming decades, the amount of waste
requiring safe and secure disposal will also
significantly increase. High-level nuclear
waste can last for thousands of years before
being safe again, so this is a major hurdle
which must be overcome before nuclear
power can expand. Radioactivity can be
turned out fatal for human body. Table II.
shows major problems caused by
radioactivity.

9 International Journal of Current Research and Review www.ijcrr.com
Vol. 04 issue 03 February 2012
Table II. Human tissues and organs ranked by sensitivity to radiation
induced cancer
High Risk Moderate Risk Low Risk
Bone Marrow
Breast (premenopausal
Thyroid (child)
Lung
Stomach
Ovary
Colon
Bladder
Skin
Brain
Bone
Uterus
Kidney
Esophagus
Liver
5.2 Proliferation
Some forms of nuclear reactor, known as
"breeder" reactors produce plutonium,
which can, conceivably, be used to make
nuclear weapons. This is a conventional
explosive mixed with radioactive material
with the intention of spreading the material
across a wide area to do even more
damage. As modern world politics is
circling to grab more power and get share
of energy of any rival country, therefore
any nuclear power generating project could
be turned into nuclear weaponry production
project at any time.
5.3 Fuel Supply
Nuclear fuels are, physically, even rarer
than fossil fuels. Fossil fuels at least are
made on Earth, albeit over millions of
years. Heavy elements like Uranium are
only made as stars die, in supernovas. Our
solar system actually formed from the
remains of another star, at which point
heavier elements were made. Essentially,
once they're gone, they are well and truly
gone. Only in particle accelerators can
heavier elements be made. Therefore the
type of fuel required for nuclear power
programme is not abundant at all.
5.4 Changing Perception of Common
People
Common people always posses a doubtful
mind regarding nuclear energy. They feel
free considering its capability to deliver
huge power but become fearful when they
consider its adverse effects. Table III. and
IV. are showing the drastic change of the
perception of common people and the
reflection of doubtful mind setup about
nuclear energy programme.
Table III. Global Views about Nuclear Energy before the Japan Earthquake (Fukushima
Nuclear Power Plant Tragedy) in 2011 [19].
Condition Globally (%) Japan (%)
Favourable 57 62
Unfavourable 32 28
No Response 11 10

10 International Journal of Current Research and Review www.ijcrr.com
Vol. 04 issue 03 February 2012
Table IV. Global Views about Nuclear Energy after the Japan Earthquake (Fukushima
Nuclear Power Plant Tragedy) in 2011 [19].
Condition Globally (%) Japan (%)
Favourable 49 39
Unfavourable 43 47
No Response 8 14
This changing mind setup of common people create dilemma among decision makers to take
any major decision about launching nuclear power programme.
5.5 Accidents Happened So Far
Nuclear power generating programme have
been caused for some fatal accidents so far.
To judge the severity of those accidents
International Nuclear Events Scale (INES)
has been introduced starting from 0 to 7.
Table V. lists these accidents with
respective INES scale and International
Atomic Energy Agency (IAEA)
description.
Table V. Nuclear power station incidents since 1952 with respective INES level and IAEA
description [20].
Year Incident INES
level Country IAEA description
2011 Fukushima 5 Japan
Reactor shutdown after the 2011 Sendai
earthquake and tsunami; failure of emergency
cooling caused an explosion.
2011 Onagawa
Japan Reactor shutdown after the 2011 Sendai
earthquake and tsunami caused a fire.
2006 Fleurus 4 Belgium
Severe health effects for a worker at a
commercial irradiation facility as a result of high
doses of radiation.
2006 Forsmark 2 Sweden
Degraded safety functions for common cause
failure in the emergency power supply system at
nuclear power plant.
2006 Erwin
United States Thirty-five litres of a highly enriched uranium
solution leaked during transfer.
2005 Sellafield 3 United
Kingdom
Release of large quantity of radioactive material,
contained within the installation.
2005 Atucha 2 Argentina Overexposure of a worker at a power reactor
exceeding the annual limit.
2005 Braidwood
United States Nuclear material leak.
2003 Paks 3 Hungary
Partially spent fuel rods undergoing cleaning in
a tank of heavy water ruptured and spilled fuel
pellets.
1999 Tokaimura 4 Japan Fatal overexposures of workers following a
criticality event at a nuclear facility.
1999 Yanangio 3 Peru Incident with radiography source resulting in

11 International Journal of Current Research and Review www.ijcrr.com
Vol. 04 issue 03 February 2012
Year Incident INES
level Country IAEA description
severe radiation burns.
1999 Ikitelli 3 Turkey Loss of a highly radioactive Co-60 source.
1999 Ishikawa 2 Japan Control rod malfunction.
1993 Tomsk 4 Russia Pressure build up led to an explosive mechanical
failure.
1993 Cadarache 2 France Spread of contamination to an area not expected
by design.
1989 Vandellos 3 Spain Near accident caused by fire resulting in loss of
safety systems at the nuclear power station.
1989 Greifswald
Germany Excessive heating which damaged ten fuel rods.
1986 Chernobyl 7 Ukraine
(USSR)
Widespread health and environmental effects.
External release of a significant fraction of
reactor core inventory.
1986 Hamm-Uentrop
Germany Spherical fuel pebble became lodged in the pipe
used to deliver fuel elements to the reactor.
1981 Tsuraga 2 Japan More than 100 workers were exposed to doses
of up to 155 millirem per day radiation.
1980 Saint Laurent des
Eaux 4 France
Melting of one channel of fuel in the reactor
with no release outside the site.
1979 Three Mile Island 5 United States Severe damage to the reactor core.
1977 Jaslovské Bohunice 4 Czechoslovakia
Damaged fuel integrity, extensive corrosion
damage of fuel cladding and release of
radioactivity.
1969 Lucens
Switzerland Total loss of coolant led to a power excursion
and explosion of experimental reactor.
1967 Chapelcross
United
Kingdom
Graphite debris partially blocked a fuel channel
causing a fuel element to melt and catch fire.
1966 Monroe
United States Sodium cooling system malfunctions.
1964 Charlestown
United States
Error by a worker at a United Nuclear
Corporation fuel facility led to an accidental
criticality.
1959 Santa Susana Field
Laboratory United States Partial core meltdown.
1958 Chalk River
Canada Due to inadequate cooling a damaged uranium
fuel rod caught fire and was torn in two.
1958 Vinča
Yugoslavia
During a subcritical counting experiment a
power build up went undetected - six scientists
received high doses.
1957 Kyshtym 6 Russia Significant release of radioactive material to the
environment from explosion of a high activity
12 International Journal of Current Research and Review www.ijcrr.com
Vol. 04 issue 03 February 2012
Year Incident INES
level Country IAEA description
waste tank.
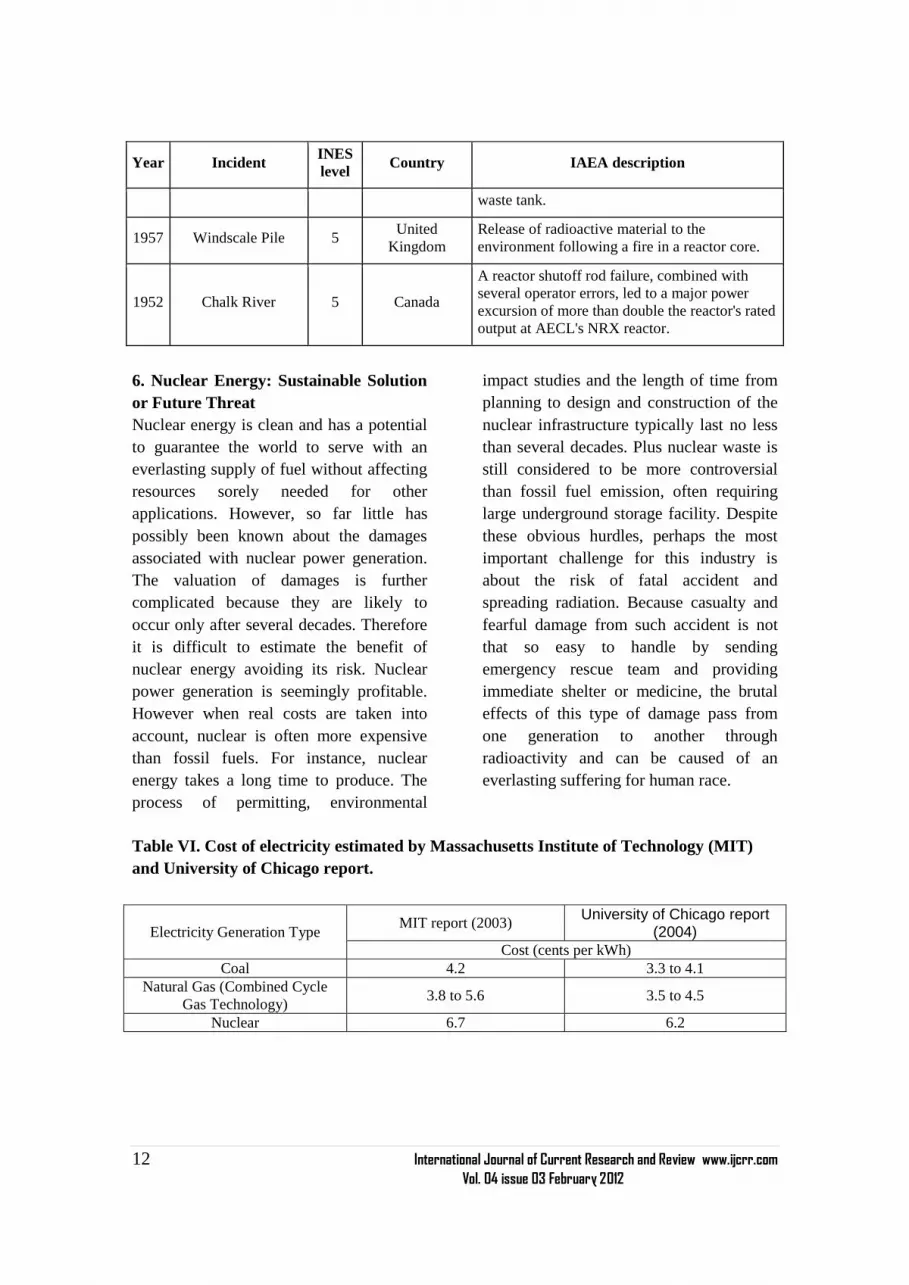
1957 Windscale Pile 5 United
Kingdom
Release of radioactive material to the
environment following a fire in a reactor core.
1952 Chalk River 5 Canada
A reactor shutoff rod failure, combined with
several operator errors, led to a major power
excursion of more than double the reactor's rated
output at AECL's NRX reactor.
6. Nuclear Energy: Sustainable Solution
or Future Threat
Nuclear energy is clean and has a potential
to guarantee the world to serve with an
everlasting supply of fuel without affecting
resources sorely needed for other
applications. However, so far little has
possibly been known about the damages
associated with nuclear power generation.
The valuation of damages is further
complicated because they are likely to
occur only after several decades. Therefore
it is difficult to estimate the benefit of
nuclear energy avoiding its risk. Nuclear
power generation is seemingly profitable.
However when real costs are taken into
account, nuclear is often more expensive
than fossil fuels. For instance, nuclear
energy takes a long time to produce. The
process of permitting, environmental
impact studies and the length of time from
planning to design and construction of the
nuclear infrastructure typically last no less
than several decades. Plus nuclear waste is
still considered to be more controversial
than fossil fuel emission, often requiring
large underground storage facility. Despite
these obvious hurdles, perhaps the most
important challenge for this industry is
about the risk of fatal accident and
spreading radiation. Because casualty and
fearful damage from such accident is not
that so easy to handle by sending
emergency rescue team and providing
immediate shelter or medicine, the brutal
effects of this type of damage pass from
one generation to another through
radioactivity and can be caused of an
everlasting suffering for human race.
Table VI. Cost of electricity estimated by Massachusetts Institute of Technology (MIT)
and University of Chicago report.
Electricity Generation Type MIT report (2003)
University of Chicago report (2004)
Cost (cents per kWh)
Coal 4.2 3.3 to 4.1
Natural Gas (Combined Cycle
Gas Technology) 3.8 to 5.6 3.5 to 4.5
Nuclear 6.7 6.2

13 International Journal of Current Research and Review www.ijcrr.com
Vol. 04 issue 03 February 2012
7. CONCLUSION
The authors of this paper evaluated one of
the key debatable issues influencing the
achievement of energy security both at
present and in the foreseeable future. The
facts have raised from neutral point of view
considering their future impacts. The
present trend of switching source of energy
from classic fossil fuel to nuclear energy
for countries is seemingly attractive for the
long run of sustainability due to its
reduction in global warming, climate
change, and improvement in energy
security. But energy security is such a issue
that must be addressed considering an
energy policy include: security of supply,
environmental impact, national
competitiveness and social concerns.
Nuclear energy definitely has its potential
to meet worldwide increasing energy
demand but when security and safety issue
comes into account then it becomes a tough
situation to take it as a potential alternative
of energy. Therefore it can not be said that
nuclear energy is the only alternative and
utmost solution for future. Continuous
research and development programmes
should carried out on this regard to make it
best fitted for future and alternative options
should put under microscope to find their
feasibility for meeting the energy demand
in a sustainable way.
ACKNOWLEDGEMENT
Authors acknowledge the immense help
received from the scholars whose articles
are cited and included in references of this
manuscript. The authors are also grateful to
authors / editors / publishers of all those
articles, journals and books from where the
literature for this article has been reviewed
and discussed.
REFERENCES
1. International Energy Agency, World
Energy Outlook 2010. Available:
http://www.worldenergyoutlook.org
2. The UN Secretary General‘s Advisory
Group on Energy and Climate Change
(AGECC), Summary report and
recommendations 2010, New York.
Available: www.unido.org/fleadmin/
user_media/Publications/download/AG
ECCsummaryreport.pdf
3. R. Watson, M.C. Boudreau and A.J.
Chen, ―Information Systems and
Environmentally Sustainable
Development: Energy Informatics and
New Directions for the IS
Community,‖ Management
Information Systems Quarterly, Vol.
34, No. 1, 2010, pp. 23-38.
4. H. Hasan and C. Dwyer, ―Was the
Copenhagen Summit Doomed from the
Start? Some Insights from Green IS
research,‖ Americas Conference on
Information Systems 2010 Proceeding,
Lima, 2010, p. 67.
5. H.J.D. Boeck, C.M.H. M. Lemmens, B.
Gielen, H. Bossuyt, S. Malchair, M.
Carnol, R. Merckx, R. Ceulemans and
I. Nijs, ―Combined Effects of Climate
Warming and Plant Diversity Loss on
above and below Ground Grassland
Productivity,‖ Environmental and
Experimental Botany, Vol. 60, No. 1,
2007, pp. 95-104.
doi:10.1016/j.envexpbot.2006.07.001
6. V.A. Frolkis, I.L. Karol and A.A.
Kiselev, ―Global Warming Potential,
Global Warming Commitment and
Other Indexes as Characteristics of the
Effects of Greenhouse Gases on
Earth‘s Climate,‖ Ecological
Indicators. Vol. 2, No. 1-2, 2002, pp.
109-121. doi:10.1016/S1470-
160X(02)00047-X

14 International Journal of Current Research and Review www.ijcrr.com
Vol. 04 issue 03 February 2012
7. A. Smith, ―Global Warming Damage
and the Benefits of Mitigation,‖ Fuel
and Energy Abstracts. Vol. 37, No. 3,
1996, p. 221. doi:10.1016/0140-
6701(96)89126-0
8. Beier, B.A. Emmett, J. Peñuelas, I.K.
Schmidt, A. Tietema, M. Estiarte, P.
Gundersen, L. Llorens, T. RiisNielsen,
A. Sowerby and A. Gorissen, ―Carbon
and Nitrogen Cycles in European
Ecosystems Respond Differently to
Global Warming,‖ Science of the
Total Environment, Vol. 407, No. 1,
2008, pp. 692-697.
doi:10.1016/j.scitotenv.2008.10.001
9. Intergovernmental Panel on Climate
Change (IPCC), ―Climate Change
2007: Synthesis Report Summary for
Policymakers,‖ The 8th Session of
Working Group II of the IPCC,
Brussels, April 2007, pp. 2-3.
10. T. Beer, T. Grant, D. Williams and H.
Watson, ―Fuel cycle Greenhouse Gas
Emissions from alternative Fuels in
Australian Heavy Vehicles,‖
Atmospheric Environment, Vol. 36,
No. 4, 2002, pp. 753-763.
doi:10.1016/S1352-2310(01)00514-3
11. H. Hayami and M. Nakamura,
―Greenhouse Gas Emissions in Canada
and Japan: Sector-Specific Estimates
and Managerial and Economic
Implications,‖ Journal of
Environmental Management. Vol. 85,
No. 2, 2007, pp. 371-392.
doi:10.1016/j.jenvman.2006.10.002
12. F. Georgios and C. Paul, ―Global
Warming and Carbon Dioxide through
Sciences,‖ Environment International,
Vol. 35, No. 2, 2009, pp. 390-401.
doi:10.1016/j.envint.2008.07.007
13. Intergovernmental Panel on Climate
Change (IPCC), ―Second Assessment
Synthesis of Scientific Technical
Information relevant to interpreting
Article 2 of the UN Framework
Convention on Climate Change,‖
Intergovernmental Panel on Climate
Chang, Geneva,1995.
14. World Meteorological Organization
(WMO), ―WMO Greenhouse Gas
Bulletin 2007: Atmospheric Carbon
Dioxide Levels Reach New Highs,‖
Geneva, 2007.
15. T. Jilani, K. Gomi and Y. Matsuoka,
―Integration of sustainable and low
carbon society towards 2025 in
Bangladesh,‖ in International
Conference on Climate Change Effects
and Energy Development in
Bangladesh, Germany, July, 2011
16. International Energy Agency (2008),
World Energy Outlook 2008.
Available:
http://www.worldenergyoutlook.org
17. World Nuclear Association (online).
Available: http://www.world-
nuclear.org, accessed on 27th
November, 2011.
18. C.D. Ferguson, ―Nuclear Energy
Balancing Benefits and Risks,‖ council
on foreign relations, CSR No. 28,
April, 2007
19. WIN/Gallop poll, ―Japan Earthquake
Jolts Global Views On Nuclear
Energy,‖ April 19, 2011, Available:
www.nrc.co.jp
20. Nuclear power station incidents since
1952 with respective INES level and
IAEA description (online). Available:
http://www.guardian.co.uk, accessed
on 3rd
December, 2011.

15 International Journal of Current Research and Review www.ijcrr.com
Vol. 04 issue 03 February 2012
ijcrr
Vol 04 issue 03
Category: Research
Received on:21/11/11
Revised on:10/12/11
Accepted on:21/12/11
ABSTRACT The production of enzymes by bioprocesses is a good value added to agro industry residues. A
comprehensive study was carried out on the production of protease using different agricultural
wastes like paddy straw, sugarcane bagasse, peanut hull and rice bran by Aspergillus species.
Among the all tested the maximum enzyme production was observed in paddy straw, while
minimum protease production noticed in rice bran under solid state fermentation conditions.
The optimal conditions for producing maximum yield of protease were incubated at 350C, 4
days, pH 6.The protease production from waste treatment could be commercially used in
detergents and leather industry.
______________________________________________________________________
INTRODUCTION
Enzymes are delicate protein molecules
necessary for life. Protease is the single
class of enzymes which occupy pivotal
position due to their wide applications in
detergents, pharmaceuticals, photography,
leather, food and agricultural industries
and representing worldwide sale at about
60% of total enzyme market
(Paranthaman et al., 2009; Rajmalwar and
Dabholkar, 2009; Das and Prasad, 2010).
Proteases of fungal origin have an
advantage over bacterial protease as
mycelium can be easily removed by
filtration. Proteases produced by
Aspergillus sp. is of greater importance
due to its higher protease producing
ability (Chakraborty et al., 1995; Nehra et
al., 2002). Solid state fermentation (SSF)
has many advantages including superior
volumetric downstream processing, lower
energy requirement and low wastewater
output (Malathi and Chakraborty, 1990;
Pandy et al., 1999). The present study
was undertaken to produce protease under
laboratory conditions by solid state
fermentation of Aspergillus sp. using
paddy straw, sugarcane bagasse, peanut
hull and rice bran as substrate and to
determine the effect of pH, temperature
and incubation period on protease
production.
MATERIALS AND METHODS
Isolation of Aspergillus sp:
For isolation of Aspergillus,
rhizosphere soil samples were collected
from paddy fields of Cherlopalli, near
Tirupati area of Andhra Pradesh. The
collected samples were subjected to
serial dilution method by using potato
dextrose agar medium. Then the isolate
was screened for their proteolytic
activity by using Skimmed Milk Agar
(SMA) medium and maintained on
PDA slants for further use.
ISOLATION, OPTIMIZATION AND PRODUCTION OF
PROTEASE FROM ASPERGILLUS SPECIES
THROUGH SOLID STATE FERMENTATION
M. Saraswathi1, R. Dakshayani
2, P. Muralikrishna
2
1Department of Applied Microbiology, Sri Padmavati Mahila University,
Tirupati, A.P
2Department of Microbiology, S.V.University, Tirupati, A.P
E-mail of Corresponding Author: [email protected]

16 International Journal of Current Research and Review www.ijcrr.com
Vol. 04 issue 03 February 2012
Production of protease though solid state
fermentation:
Inoculum preparation:
Three ml of 0.1% Tween 80 was added to
release the spores and this spore suspension
was used as inoculums for fermentation.
Substrate preparation and inoculation:
Four substrates i.e., paddy straw, sugarcane
bagasse, peanut hull and rice bran were
used for protease production. 5 g of each
substrate was taken into two separate was
taken in separate 250 ml conical flasks and
salt solution was added to maintain 70%
moisture. Then the flasks were sterilized at
1210C for 15 min. The above flasks were
inoculated with 1 ml of inoculum and
incubated at room temperature for 5 days.
Extraction of crude enzyme:
Seventy five ml of double distilled water
was added to the conical flasks and kept on
rotary shaker for about half hour to obtain
uniform suspension. The suspension was
filtered through Whatman No: 1 filter paper
and the filtrate were collected separately
and used as an enzyme extract.
Assay for neutral protease:
To 200 µl of crude enzyme extract, 500 µl
of 1% casein and 300 µl of 0.2 mol/l
phosphate buffer (pH 7.0) were added. The
reaction mixture was incubated at 600C for
10 min and arrested by the addition of 1 ml
of 10 % Trichloroacetic acid (TCA). The
reaction mixture was centrifuged at 8000 x
g for 15 min and to the supernatant, 5 ml of
0.4 ml Na2CO3, 1 ml of 3 fold diluted Folin
Ciocalteau‘s phenol reagent was added.
The resulting solution was incubated at
room temperature for 30 min and the
absorbance of the blue colour developed
was read at 660 nm using a tyrosine
standard. One unit of enzyme activity was
defined as the amount of enzyme that
liberated 1 µg of tyrosine from substrate
(casein) per minute under assay conditions
and reported in terms of protease activity
per gram dry fermented substrate.
Effect of pH:
Different levels of pH i.e., 4.0, 5.0, 6.0 and
7.0 were evaluated for protease production
of four substrates by using Aspergillus sp.
Effect of temperature:
The inoculated substrates were incubated at
different temperatures viz., 20, 30, 40, and
50 to find the effect of temperature on
protease production.
Effect of Incubation period:
The effect of incubation period on protease
production was determined by incubating
the production medium for different
incubation periods viz., 3, 4, 5 and 6 days,
respectively.
RESULTS AND DISCUSSION
The process parameters for the production
of protease by Aspergillus sp. grown on
different substrates (paddy straw, sugarcane
bagasse, peanut hull and rice bran) was
done under optimized condition (Sudto et
al., 2008; Gitishree Das and Prasad., 2010;
Vishalakshi et al., 2009). In the present
study the maximum enzyme production
was observed in paddy straw, while
minimum protease production noticed in
rice bran. As shown in Table 1, pH showed
effect on protease production because
microbial strains depends on extracellular
pH which strongly influences the many
enzymatic processes and transport of
various components across the cell
membrane which in turn support the cell
growth and product production
(Paranthaman et al., 2009).

17 International Journal of Current Research and Review www.ijcrr.com
Vol. 04 issue 03 February 2012
Table 1: Effect of different ph of different on protease production by Aspergillus
species
Substrates
Different pH values
4.0 5.0 6.0 7.0
Paddy straw 1.9 2.4 4.8 3.4
Sugarcane bagasse 1.6 2.1 4.6 3.0
Peanut hull 1.3 2.0 4.1 2.9
Rice bran 1.2 2.2 4.1 2.7
The optimum pH for growth was
recorded at pH 6 in all substrates. A
notable decline in the enzyme
productivity occurred at both high and
lower pH values. Similar results were
also reported by several works
(Paranthaman et al., 2009; Teufel and
Gotz., 1993; Vishalakshi et al., 2009).
Temperature also showed maximum
variation in the protease production (Tab
2).
Table 2: Effect of different temperatures on protease production by Aspergillus species
Substrates Different temperatures(
0C)
20 30 40 50
Paddy straw 1.7 3.1 2.0 1.6
Sugarcane bagasse 1.4 2.5 2.2 1.5
Peanut hull 1.2 2.3 2.0 1.2
Rice bran 1.3 2.8 2.4 1.4
Table 3: Effect of different incubation period on protease production by using
Aspergillus species
Substrates Incubation period(days)
3 4 5 6
Paddy straw 1.8 2.2 3.4 2.5
Sugarcane bagasse 1.5 2.3 3.4 2.2
Peanut hull 1.2 2.1 3.0 2.1
Rice bran 2.2 2.5 3.2 2.0
The maximum activity was found at 300C
in all the substrates. Results in the table 3
indicate that maximum enzyme
production was observed at 5 days of
incubation period in all the substrates
(Rajmalwar, S. and Dabholkar, P.S.,
2009). A gradual decrease in enzyme
units was observed with increasing
incubation period clearly suggests that
enzymes role as a primary metabolite

18 International Journal of Current Research and Review www.ijcrr.com
Vol. 04 issue 03 February 2012
being produced in the log phase of the
growth of the fungus for utilization of
proteins present in the solid substrates
(Sudto et al., 2008; Gitishree Das and
Prasad., 2010; Vishalakshi et al., 2009).
The subsequent decrease in the enzyme
production could be probably due to
inactivation of the enzyme by other
constituent protease.
CONCLUSION
The pH, temperature and incubation
periods showed much effect on
production of protease by Aspergillus
species.
REFERENCES
1. Chakraborty, R. and Malathi, S.1990.
Production of alkaline protease by a
new Aspergillus flavus isolate under
solid state fermentation conditions for
use as a depilation agent. Appld. and
Env. Micro.: 712-716
2. Ellaiah, P., Srinivasulu, K.,
Adinarayana, K. 2002. A review on
microbial proteases. J.Sci. Ind.Res:
61:690-704.
3. Gitishree Das and Prasad, M.P. 2010.
Isolation, purification and mass
production of protease enzyme from
Bacillus subtilis. Int. Res. J. Mic. Vol.
1(2): 26-31.
4. Lowry, O. H, Rosebrough, N.J., Farr,
A.L. and Randall, R.J. 1951. Protein
measurement with folin phenol
reagent. J.Biol.Chem.193:265-275.
5. Nehra, K.S, Dhillon, S., Kamala, C.
and Randir, S. 2002. Production of
alkaline protease by Aspergillus sp.
under submerged and solid substrate
fermentation. Indian Microbiol. 42:
43-47.
6. Pandey, A., Selvakumar, P., Soccol,
C.R. and Nigam, P. (1999). Solid
state fermentation for the production
of industrial enzymes. Curr. Sci 77:
149-162.
7. Paranthaman, R., Alagusundaram, K.,
and Indhumathi, J. 2009. Production of
protease from rice mill wastes by
Aspergillus niger in solid state
fermentation. W.J.Agri.Res. 5 (3): 308-
312.
8. Rajmalwar,S. and Dabholkar, P.S.
2009. Production of protease by
Aspergillus sp. using solid state
fermentation. Afr. J.Biotech. Vol. 8
(17): 4197-4198.
9. Sudto, A., punyathiti, Y. and pongslip,
N. 2008. The use of agricultural wastes
as substrates for cell growth and
carboxymethyl cellulose (CMCASE)
production by Bacillus subtilis,
Escherichia coli and Rhizobium sp.
KMITL Sci. Tech. J. Vol.8 No.2:84-90.
10. Teufel, P. and Gotz, F.1993.
Characterization of an extracellular
metalloprotease with elastage activity
from Staphylococcus epidermidis.
J.Bacteriol. 175: 4218-4224.
11. Vishalakshi, N., Lingappa, K., Amena,
S., Prabhakar, M. and Dayanand, A.
2009. Production of alkaline protease
from Streptomyces gulbergensis and its
application in removal of blood strains.
Ind.J.Boitech. Vol 8: 280-285.
19 International Journal of Current Research and Review www.ijcrr.com
Vol. 04 issue 03 February 2012
ijcrr
Vol 04 issue 03
Category: Research
Received on:24/11/11
Revised on:08/12/11
Accepted on:15/12/11
ABSTRACT The present research paper deals with the issues like land use and cropping pattern of district
Solan of Himachal Pradesh. Change in these two factors determined the pace of agricultural
diversification. The process of diversification of agriculture reduces the risk of perishment of
crops and provides economical benefits to farm. Hence, it may prove helpful in alleviating rural
poverty. To know about the changes in area under various crops, percentage method was used
as a statistical tool. The result obtained in this study indicates that area under pulses shows
decreased behavior pattern whereas in case of vegetables significantly increase was resulted.
______________________________________________________________________
Keywords: Agriculture, Cropping pattern,
Land use, Crops, Food grains
INTRODUCTION
The agriculture plays a vital role in shaping
the Indian economy. In recent years though
its contribution to the Gross Domestic
Product is progressively declining
approximately from 50% in 1950-51 to
14.6% in 2009-10 however a substantial
proportion (64%) of population depends on
this sector. Scarcity of cultivated land
hampers the agricultural sector compare to
secondary and tertiary sectors (industrial
and service sector). Land use pattern has a
great impact on the agricultural economy.
The process of diversification within
agriculture has now switched on to high
value crops instead of low value crops
which causes change in land utilization in
agriculture. Change in cropping pattern is
an essential part and common mode of
diversification, which has great impacts on
agricultural development and alleviation of
rural poverty [1]. The rapid increase in
human and livestock population has
resulted in a change in cropping pattern and
intensity of land use [2]. In this situation
where the scope of bringing more land
under cultivation is very limited,
appropriate choice of cropping pattern can
prove to be helpful in raising income from
their limited land holdings. To generate and
sustain the farm income for a long period it
becomes necessary to use land optimally.
This also affects the productivity of soil in
a least hampered manner. Among the hill
states prevailing in India, Himachal
Pradesh is observed to be the most
progressive state, which has made
remarkable achievement in socio-economic
development of its people [3]. Himachal
Pradesh offers a model of hill farming in
India [4]. The agro climatic conditions of
the state ranging from sub tropical to
humid temperature and cold deserts.
Traditional field crop based farming is also
done by majority of farmer for sustaining
their rural economy. The growing interest
of the farmers to run farming from business
CROPPING AND LAND USE PATTERN IN HIMACHAL
PRADESH: CASE OF DISTRICT SOLAN
Kumar Sanjay1, Barik Kaustauv
2, Prashar Deepak
3
1Department of Economics, Govt. College Dharampur, Mandi (H.P.)
2Department of Economics, IGNOU, New Delhi
3Department of Pharmaceutical Sciences, Manav Bharti University, Solan
(H.P.)
E-mail of Corresponding Author: [email protected]

20 International Journal of Current Research and Review www.ijcrr.com
Vol. 04 issue 03 February 2012
purpose has also encouraged them to
reconstitute the cropping pattern and
related activities. Consequently, there is
wide difference in the system of
cultivation, cropping pattern and cropping
season between different regions and
districts. A study conducted [5] resulted
that food grains such as wheat, maize and
paddy play a dominant role and occupy
around 85 % of total area under food grains
in Himachal Pradesh. Many researchers
have carried out and utilize these cropping
patterns along with diversification in
different forms and in different
geographical areas [6-10].
The present paper aims at the analysis of
cropping pattern and land utilization in the
Solan district of Himachal Pradesh .This
district was specifically and purposively
selected due to its increasing emergence as
the most prominent and successful
diversified agrarian pocket of the state. The
farmers of the area have shown their
increased interest towards the adoption of
new crop enterprises. This district has total
geographical area of around 1936 sq. km.
and constitutes 3.49 % of the total area of
the state. Following two objectives were
selected as a criterion for the present
research work.
To study the change in the use of
land resources in the district Solan.
To examine the variations in
cropping pattern of the district.
METHODOLOGY
The present investigation is based on the
secondary data. The data on different land
use categories and cropping pattern of
Solan were drawn from various published
and reliable sources such as Annual Season
and crop reports, Statistical Outlines of
Himachal Pradesh etc. from 1993-94 to
2007-08. Annual Season and crop reports
presented the data from 1993-94 onwards
which is used as a platform for our present
study. Simple tabular analysis and
percentage method are used to fulfill the
objectives of the study. The calculation of
% area under land category, % area under
crop and % change in area under crop was
carried out utilising the formulas in
equation 1, 2 and 3.
Area under land category
% area under land category = -------------------------------------------------- *100
Total geographical area (1)
Area under crop
% area under crop = ----------------------------------------------------------- * 100
Total cropped area (2)
Area under crop period II –area under crop period I
% change in AUC = -------------------------------------------------------------------------*100
Area under crop in period I (3)
Where AUC is area under crop
RESULTS AND DISCUSSION
Land Utilization Pattern in District
Solan
The percentage of different land categories
to total geographical area was computed to
evaluate the status of different categories of
the land and net sown area in district Solan
of Himachal Pradesh. This procedure was
carried out for three different years i.e.
1993-94, 2000-01 and 2007-08 to examine
the deviations over the different years.
Area and percentage for each land category
were given in Table 1.
21 International Journal of Current Research and Review www.ijcrr.com
Vol. 04 issue 03 February 2012
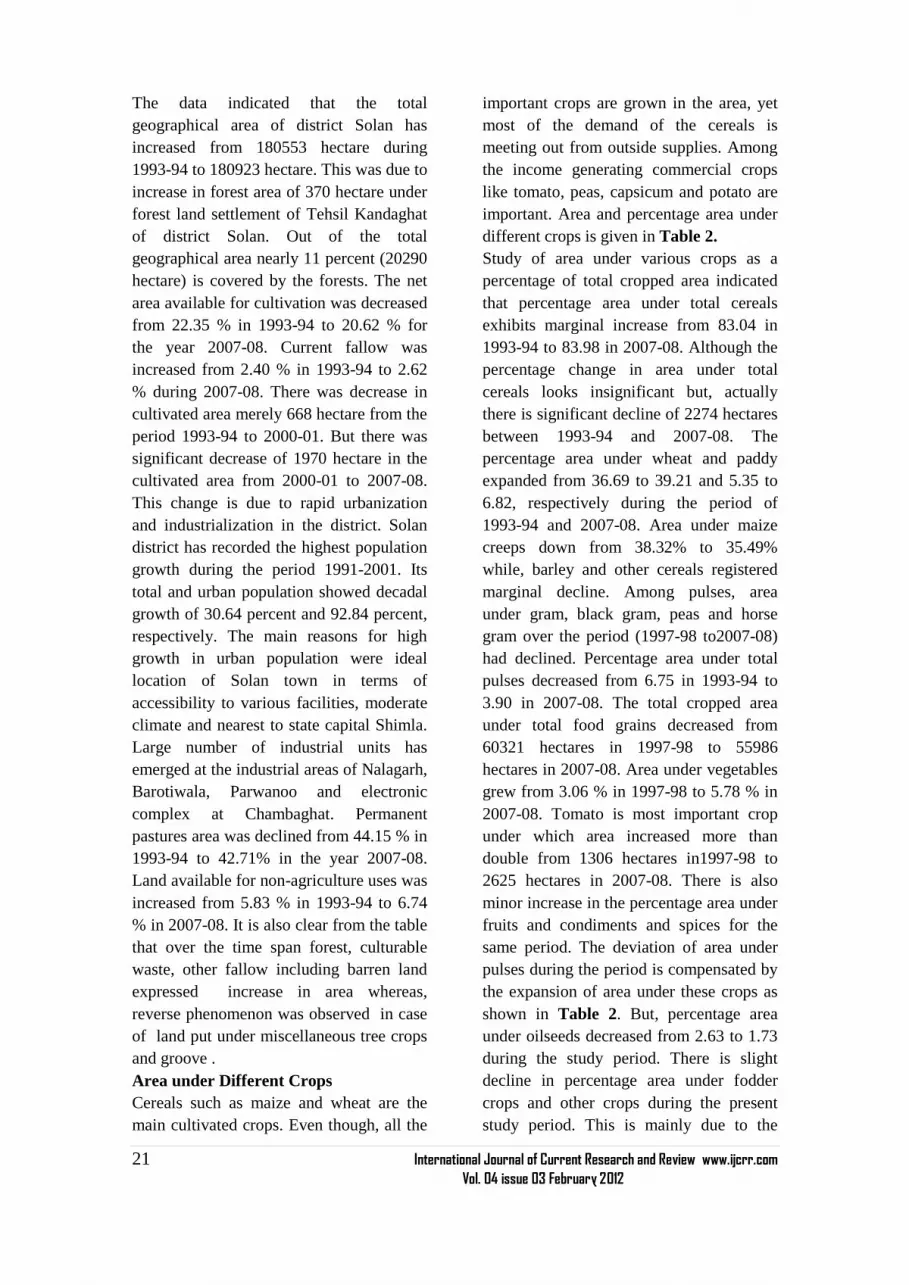
The data indicated that the total
geographical area of district Solan has
increased from 180553 hectare during
1993-94 to 180923 hectare. This was due to
increase in forest area of 370 hectare under
forest land settlement of Tehsil Kandaghat
of district Solan. Out of the total
geographical area nearly 11 percent (20290
hectare) is covered by the forests. The net
area available for cultivation was decreased
from 22.35 % in 1993-94 to 20.62 % for
the year 2007-08. Current fallow was
increased from 2.40 % in 1993-94 to 2.62
% during 2007-08. There was decrease in
cultivated area merely 668 hectare from the
period 1993-94 to 2000-01. But there was
significant decrease of 1970 hectare in the
cultivated area from 2000-01 to 2007-08.
This change is due to rapid urbanization
and industrialization in the district. Solan
district has recorded the highest population
growth during the period 1991-2001. Its
total and urban population showed decadal
growth of 30.64 percent and 92.84 percent,
respectively. The main reasons for high
growth in urban population were ideal
location of Solan town in terms of
accessibility to various facilities, moderate
climate and nearest to state capital Shimla.
Large number of industrial units has
emerged at the industrial areas of Nalagarh,
Barotiwala, Parwanoo and electronic
complex at Chambaghat. Permanent
pastures area was declined from 44.15 % in
1993-94 to 42.71% in the year 2007-08.
Land available for non-agriculture uses was
increased from 5.83 % in 1993-94 to 6.74
% in 2007-08. It is also clear from the table
that over the time span forest, culturable
waste, other fallow including barren land
expressed increase in area whereas,
reverse phenomenon was observed in case
of land put under miscellaneous tree crops
and groove .
Area under Different Crops
Cereals such as maize and wheat are the
main cultivated crops. Even though, all the
important crops are grown in the area, yet
most of the demand of the cereals is
meeting out from outside supplies. Among
the income generating commercial crops
like tomato, peas, capsicum and potato are
important. Area and percentage area under
different crops is given in Table 2.
Study of area under various crops as a
percentage of total cropped area indicated
that percentage area under total cereals
exhibits marginal increase from 83.04 in
1993-94 to 83.98 in 2007-08. Although the
percentage change in area under total
cereals looks insignificant but, actually
there is significant decline of 2274 hectares
between 1993-94 and 2007-08. The
percentage area under wheat and paddy
expanded from 36.69 to 39.21 and 5.35 to
6.82, respectively during the period of
1993-94 and 2007-08. Area under maize
creeps down from 38.32% to 35.49%
while, barley and other cereals registered
marginal decline. Among pulses, area
under gram, black gram, peas and horse
gram over the period (1997-98 to2007-08)
had declined. Percentage area under total
pulses decreased from 6.75 in 1993-94 to
3.90 in 2007-08. The total cropped area
under total food grains decreased from
60321 hectares in 1997-98 to 55986
hectares in 2007-08. Area under vegetables
grew from 3.06 % in 1997-98 to 5.78 % in
2007-08. Tomato is most important crop
under which area increased more than
double from 1306 hectares in1997-98 to
2625 hectares in 2007-08. There is also
minor increase in the percentage area under
fruits and condiments and spices for the
same period. The deviation of area under
pulses during the period is compensated by
the expansion of area under these crops as
shown in Table 2. But, percentage area
under oilseeds decreased from 2.63 to 1.73
during the study period. There is slight
decline in percentage area under fodder
crops and other crops during the present
study period. This is mainly due to the

22 International Journal of Current Research and Review www.ijcrr.com
Vol. 04 issue 03 February 2012
expansion in the area under vegetables in
the district Solan. The data of the year
2000-01 shows similarities and slight
deviation as compare to 2007-08 and the
continuation of this is carried till 2007-08
hence it is not used for comparison.
The total cropped area registered decline of
3455 hectares between 1993-94 and 2007-
08. Percentage area under net sown area
decreased from 60.08 to 58.57. Although
there is an increase in percentage area sown
twice in a year from 39.91 to 41.42 during
the study period.
Trends in Area under Different crops
The trend of increase or decrease in area
under different crops is given in Table 3. It
is revealed that during present investigation
period, area under food grains has
contracted. In 2000-01 there was decline in
area under food grains by 7.15% in
comparison to1993-94 and during the
period 2000-01 to 2007-08 there was
almost no change in area. Therefore, over
the study period, the percentage fall in the
area under food grains was almost constant
by 7.16%. This contraction resulted due to
expansion of area under vegetables and
decline in area under maize, barley and
pulses. Area under wheat showed mixed
trends over the study period. Percentage
area under wheat decline 5.71 in 2000-01
compared to 1993-94 and increase of 7.51
in 2007-08 in comparison to 2000-01. In
case of barley, trends showed decline and
percentage declination in area is 12.97
between the periods 1993-94 to 2007-08.
There is also decreasing trends of maize
cultivation, the total declination is 12.13%
over the study period. The major reasons
for this decline in these crops are:
(1) The problem of wild animals (monkey,
pigs and birds etc.) that mainly destroy the
maize crop in this area.
(2) Food habits of peoples also changed as
a result of adaptation, they prefer wheat
and rice in place of maize and barley. Table
3 shows that there is increase of 21.02% for
crop paddy. High price of rice inspired the
farmers to bring more area under
cultivation of this crop. Area under pulses
shows significant decline of 45.39% in
2007-08 in comparison to 1993-94. This
was due to expansion of area under
vegetables in the district Solan.
Among the non food crops vegetables
registered an increase of 79.06 % during
the period 1993-94 to 2007-08. The decline
in area under cultivation of pulses was
compensated by the expansion of the area
under vegetables. Oilseeds, fodder crops
and others shows decline in area of about
37.66%, 20.79% and 39.31% respectively
over the study period. Fruits, condiments
and spices exhibit in area under these crops
i.e. 14.03% and 70.94%. The attractive
price of cash crops such as vegetables,
fruits, condiments and spices inspired the
farmer to increase production of these
crops on more and more area but, also
motivate them to shift the area from some
of the food crops to cash crop cultivation.
This may proves helpful to fulfill their
requirements and to get better prices from
the sale of their product.
Table 3 reveals that net sown area, area
sown more than once and total cropped
area has decreased about 7.52%, 1.55% and
5.14% respectively over the period 1993-94
to 2007-08. The major reason for this
decline in area under cultivation maybe the
problems of wild animals (monkey, pigs
and birds etc) that mainly destroys the
maize and other crops. So the people
restricts there cultivation and the far of land
(not protected from wild animals) remains
uncultivated during the last decade or so.
CONCLUSION
To evaluate the sequential variations of
land under different uses in district Solan
of Himachal Pradesh from 1993-94 to
2007-08 revealed that, there were some
notable variations under area in case of

23 International Journal of Current Research and Review www.ijcrr.com
Vol. 04 issue 03 February 2012
permanent pastures and net sown area.
Moreover, other land categories had not
shown significant change under their area.
The study on the cropping pattern in
district Solan over the study period suggest
that among food crops area under wheat
and paddy has increased whereas, in case
of barley and maize it had declined
considerably. Area under non food crops
has shown increased trend for cash crops.
The result indicates that total cropped, net
sown area, and area sown more than once
decreased in period (1993-94 to 2007-08).
The trend of cropping pattern in Solan
district from 1993-94 to2007-08 disclosed
the fact that shifting of area from food
grains towards vegetables, fruits,
condiments and spices is considerably high.
It is clear from the above results and
suggestions that farmers of the area are
shifting towards commercial cropping.
ACKNOWLEDGEMENT
Authors acknowledge the immense help
received from the scholars whose articles
are cited and included in references of this
manuscript. The authors are also grateful to
authors/ editors/ publishers of all those
articles, journals and books from where the
literature for this article has been reviewed
and discussed.
REFERENCES
1. Ram S. Cropping Pattern
Diversification in Orissa. Agricultural
Situation in India 1999; 4: 15-18.
2. Gupta S, Sharma RK. Land Utilization
Pattern in Himachal Pradesh: A
District-wise Analysis. Agricultural
Situation in India 2009; 4: 31-35.
3. Khoshla PK, Raina KK. Himalayan
Farming Systems –R&D Support for
sustainable Agro Economy. Centre for
Integrated Mountain Development
1996: 12-13.
4. Kanwar PC. Diversification of
Agriculture in Himachal Pradesh: A
Spatio- Temporal Analysis.
Agricultural Situation in India. 1986; 9:
451-454.
5. Oberoi RC, Raina KK. Growth and
Diversification of Foodgrains in
Himachal Pradesh. Economic Affairs
1991; 36(3): 155-160.
6. Chand R. Diversification through high
values crops in western Himalayan
region: Evidence from Himachal
Pradesh. Indian Journal of Agriculture
Economics 1996; 51(4): 652-663.
7. Narayanamoorthy A. Crop
Diversification and Yield Response to
Fertilizer. Productivity 1997; 38(1):
118-125.
8. Kumar U. Diversification of Crops in
West Bengal: A Spatio- Temporal
Analysis. Artha Vijnana 2000; 42(2);
170-182.
9. Vyas VS. Diversification in
Agriculture: Concept, Rationale and
Approaches. Indian Journal of
Agriculture Economics 1996; 51(4):
636-643.
10 Kumar U. Changing Cropping System
in Theory and Practice: An Economic
Insight into the Agrarian West Bengal.
Indian Journal of Agriculture
Economics 2003; 58(1): 64-83

24 International Journal of Current Research and Review www.ijcrr.com
Vol. 04 issue 03 February 2012
TABLE 1: LAND USE PATTERN IN DISTRICT SOLAN
(Area in hectare)
S. No. Land category 1993-94 2000-01 2007-08
Area % Area % Area %
1 Forest 19911 11.02 20290 11.21 20290 11.21
2 Barren 11061 6.12 14372 7.94 12413 6.86
3 Non agricultural uses 10538 5.83 9561 5.28 12212 6.74
4 Permanent pastures 79729 44.15 78698 43.49 77278 42.71
5 Misc. tree crops and grooves 705 0.003 823 0.004 550 0.003
6 Culturable waste 13080 7.24 11958 6.60 15046 8.31
7 Other Fallow 830 0.004 1193 0.006 1076 0.005
8 Current Fallow 4341 2.40 5021 2.77 4741 2.62
9 Net Area Sown 40355 22.35 39007 21.56 37317 20.62
10 Total Geographical Area 180553 100 180923 100 180923 100
Source: Various issues of annual season and crop reports
TABLE 2: % AREA UNDER DIFFERENT CROPS IN DISTRICT SOLAN
(Area in hectare) S. No. Crop Name 1993-94 2000-01 2007-08
Area % Area % Area %
1 Wheat 24646 36.69 23237 36.47 24984 39.21
2 Barley 1788 2.66 1569 2.46 1556 2.44
3 Maize 25739 38.32 24421 38.33 22615 35.49
4 Paddy 3595 5.35 3552 5.57 4351 6.82
5 Other cereals 13 zero 01 zero 01 zero
6 Total Cereals 55781 83.04 52780 82.85 53507 83.98
7 Pulses 4540 6.75 3225 5.06 2489 3.89
8 Total Food grains 60321 89.80 56005 87.92 55996 87.88
9 Vegetables 2059 3.06 3397 5.33 3687 5.78
10 Oilseeds 1771 2.63 1278 2.00 1104 1.73
11 Fruits 734 1.09 779 1.22 837 1.31
12 Condiments & spices 265 0.39 560 0.87 453 0.71
13 Fodder crops 1630 2.42 1389 2.18 1291 2.02
14 Others 387 0.57 290 0.45 234 0.36
15 Net area sown 40355 60.08 39007 61.23 37317 58.57
16 Area sown more than once 26812 39.91 24691 38.76 26395 41.42
17 Total cropped area 67167 100 63698 100 63712 100
Source: Various issues of annual season and crop reports

25 International Journal of Current Research and Review www.ijcrr.com
Vol. 04 issue 03 February 2012
TABLE 3: TREND OF AREA UNDER DIFFERENT CROPS IN DISTRICT SOLAN
(Area in hectare) Sr.
No.
Crop Name 1993-
94
2000-01 2007-08
Area Area % change
compare
to1993-94
Area % change
compare to
2000-01
% change
compare to
1993-94
1 Wheat 24646 23237 -5.71 24984 +7.51 +1.37
2 Barley 1788 1569 -12.24 1556 zero -12.97
3 Maize 25739 24421 -5.12 22615 -7.39 -12.31
4 Paddy 3595 3552 -1.19 4351 +22.49 +21.02
5 Other cereals 13 01 -92.30 01 Nil -92.30
6 Total Cereals 55781 52780 -5.37 53507 +1.37 -4.07
7 Pulses 4540 3225 -28.96 2489 -22.82 -45.39
8 Total Food
grains
60321 56005 -7.15 55996 zero -7.16
9 Vegetables 2059 3397 +64.98 3687 +8.53 +79.06
10 Oilseeds 1771 1278 -27.83 1104 -13.61 -37.66
11 Fruits 734 779 +6.13 837 +7.44 +14.03
12 Condiments
& spices
265 560 +111.32 453 -19.10 +70.94
13 Fodder crops 1630 1389 -14.78 1291 -7.05 -20.79
14 Others 387 290 -25.06 234 -19.31 -39.31
15 Net area
sown
40355 39007 -3.34 37317 -4.33 -7.52
16 Area sown
more than
once
26812 24691 -7.91 26395 +14.49 -1.55
17 Total
cropped area
67167 63698 -5.16 63712 zero -5.14
Source: Various issues of annual season and crop reports

26 International Journal of Current Research and Review www.ijcrr.com
Vol. 04 issue 03 February 2012
ijcrr
Vol 04 issue 03
Category: Research
Received on:11/12/11
Revised on:15/12/11
Accepted on:19/12/11
ABSTRACT The main objective of this study was to identify certain lifestyle disorders like diabetes mellitus
and other medical conditions like hypertension and hyperlipedemia in an older adult population
and to verify their relationship with the periodontal health status in the same group of
individuals.
A total number of 600 patients between 35-75 years were selected for this study. Their lifestyle
habits were obtained through a questionnaire. It was followed by a periodontal examination,
blood pressure recording and a biochemical analysis of the blood samples taken from them.
Results of MLRA showed that diabetes mellitus, was clearly associated with attachment loss.
Hypertension was not associated with attachment loss, and elevated blood cholesterol levels
(hyperlipedemia) were associated only in univariate models.
It could be concluded that in the selected group of subjects aged 35-75 years, only diabetes
mellitus was associated with attachment loss in this cross-sectional study.
______________________________________________________________________
Keywords: Diabetes, Attachment loss,
Hypertension, Hyperlipedemia
INTRODUCTION
Diabetes mellitus is a bonafied risk factor
in periodontal disease. Type 2 is the form
of diabetes present in 90-95% of patients
with the disease and the risk of developing
this form of diabetes, increases with age,
obesity, previous history of gestational
diabetes and lack of physical activity.
(Brian L. Mealey and Gloria L.Ocampo) 1
The association between diabetes and
periodontal disease has been reported for
more than forty years. ―Chronic
Periodontitis‖ is now considered the sixth
complication of diabetes mellitus.2
Other general disorders like hypertension
and elevated blood cholesterol levels
(hyper lipedemia) often go hand in hand
with diabetes mellitus. They are proving to
be health epidemic in middle age
populations causing many reasons to panic.
This cross sectional survey aims to
correlate elevated blood sugar levels,
hypertension and elevated blood
cholesterol levels with Gingival and
Periodontal disease. It also helps to include
patient education and motivation in the
treatment plan, thus keeping a check on
these life style disorders in the long run.
MATERIALS AND METHODS
The present study was using a stratified
randomly selected sample of 600 persons,
aged 35 to 75 years from the patients in a
private Dental College and Hospital. A
William‘s probe and a Shepherd‘s Crook
explorer were used for the examination of
the periodontal parameters in the study
ARE LIFESTYLE DISORDERS A RISK FOR
PERIODONTAL DISEASE?
Manoj Raja
Karpaga Vinayaga Institute of Dental Sciences, Maduranthakam TK, Chennai
E-mail of Corresponding Author: [email protected]

27 International Journal of Current Research and Review www.ijcrr.com
Vol. 04 issue 03 February 2012
namely Gingival Index (GI), Probing
Pocket Depth (PPD) and Clinical
Attachment Level (CAL).
The blood pressure reading (both systolic
and diastolic blood pressure) was recorded
for all the subjects, using a conventional
sphygmomanometer with the help of a
general physician. The blood pressure was
recorded in the morning time.
Each subject was then taken to the bio-
chemical laboratory of the hospital for the
assessment of Fasting blood sugar and
Total blood cholesterol levels. The
biochemical analysis was done in the
morning time. The subjects who were
included in the study were instructed to
come on an empty stomach (i.e) they
should not have consumed food for the past
12 hours. 3 ml of venous blood was drawn,
from the Median-cubital vein of each
subject using a 20- gauge needle connected
to a 10 ml syringe.
Statistical Methods
The association of the three periodontal
parameters namely Gingival Index (GI),
Probing Pocket Depth (PPD) and Clinical
Attachment Level (CAL) with three
variables namely hypertension, diabetes
and total cholesterol levels was estimated
using ―Chi-square test‖ to calculate the p -
value
RESULTS
348 subjects who did not have hypertension
showed a gingival index score less than or
equal to 2, where as 24 subjects who did
not have hypertension showed a gingival
index score greater than 2.216 subjects who
had hypertension showed a gingival index
score less than or equal to 2, where as 12
subjects who had hypertension showed a
gingival index score greater than 2.
The difference was not statistically
significant in both the subjects who did not
have hypertension and the subjects who
had hypertension (p = 0.68). 514 subjects
who did not have diabetes showed a
gingival index score less than or equal to 2,
where as 26 subjects who did not have
diabetes showed a gingival index score
greater than 2. 50 subjects who diabetes
had showed a gingival index score more
than 2, where as 10 subjects who had
diabetes showed a gingival index score
greater than 2. The difference was found to
be statistically significant in both diabetics
and non diabetics (p<0.0001). 532 subjects
with total cholesterol levels less than
200mg per dl showed a gingival index
score less than or equal to 2, where as 26
subjects with total cholesterol levels less
than 200mg per dl showed a gingival index
score greater than 2. 32 subjects with total
cholesterol levels greater than 200mg per dl
showed a gingival index score less than or
equal to 2, where as 10 subjects with total
cholesterol levels greater than 200mg per dl
showed a gingival index score greater than
2.The difference was found to be
statistically significant in both the subjects
with total cholesterol <200mg/dl and
subjects with total cholesterol levels >
200mg/dl (p<0.0001).
366 subjects who did not have hypertension
had a probing pocket depth less than or
equal to 5mm, where as 6 subjects who did
not have hypertension had a probing pocket
depth greater than 5mm. 222 subjects who
had hypertension had a probing pocket
depth less than or equal to 5mm, where as 6
subjects who had hypertension had a
probing pocket depth greater than 5mm.
The difference was not statistically
significant in both the subjects who did not
have hypertension and the subjects who
had hypertension. (p< 0.39).540 subjects
who did not have diabetes had a probing
pocket depth less than or equal to 5mm,
where as no subject who did not have
diabetes had a probing pocket depth greater
than 5mm. 48 subjects who had diabetes
had a probing pocket depth less than or
equal to 5mm, where as12 subjects who

28 International Journal of Current Research and Review www.ijcrr.com
Vol. 04 issue 03 February 2012
had diabetes had a probing pocket depth
greater than 5mm. The difference was
found to be statistically significant in both
diabetics and non diabetics (p<0.0001).558
subjects with total cholesterol levels less
than 200mg per dl had a probing pocket
depth less than or equal to 5mm, where as
no subject with total cholesterol levels less
than 200mg per dl had a probing pocket
depth greater than 5mm.30 subjects with
total cholesterol levels greater than 200mg
per dl had a probing pocket depth less than
or equal to 5mm, where as 12 subjects with
total cholesterol levels greater than 200mg
per dl had a probing pocket depth greater
than 5mm. The difference was found to be
statistically significant in both the subjects
with total cholesterol <200mg/dl and
subjects with total cholesterol levels
>200mg/dl (p<0.0001).
324 subjects who did not have hypertension
showed clinical attachment levels less than
or equal to 4mm, where as 48 subjects who
did not have hypertension showed clinical
attachment levels greater than 4mm.192
subjects who had hypertension showed
clinical attachment levels less than or equal
to 4mm, where as 36 subjects who had
hypertension showed clinical attachment
levels greater than 4mm.The difference was
not statistically significant in both the
subjects who did not have hypertension and
the subjects who had hypertension. (p =
0.39).480 subjects who did not have
diabetes showed clinical attachment levels
less than or equal to 4mm, where as 60
subjects who did not have diabetes showed
clinical attachment levels greater than
4mm.36 subjects who had diabetes showed
clinical attachment levels less than or equal
to 4mm, where as 24 subjects who had
diabetes showed clinical attachment levels
greater than 4mm.The difference was found
to be statistically significant in both
diabetics and non diabetics (p<0.0001).498
subjects with total cholesterol levels less
than 200mg per dl showed clinical
attachment levels less than or equal to
4mm, where as 60 subjects with total
cholesterol levels less than 200mg per dl
showed clinical attachment levels greater
than 4mm.18 subjects with total cholesterol
levels greater than 200mg per dl showed
clinical attachment levels less than or equal
to 4mm, where as 24 subjects with total
cholesterol levels greater than 200mg per dl
showed clinical attachment levels greater
than 4mm. The difference was found to be
statistically significant in both the subjects
with total cholesterol <200mg/dl and
subjects with total cholesterol levels
>200mg/dl (p<0.0001).
Results of Univariate Logistic Regression
analysis showed that the factors such as
diabetes (OR= 5.33, p<0.0001) and total
cholesterol >200mg /dl (OR = 3.1,
p<0.0001) were significantly associated
with CAL. Hypertension was not
significantly associated with CAL (p =
0.32). (Table1)
Results of multiple logistic regression
analysis showed that only diabetes (OR =
4.3, p < 0.0001) was significantly
associated with Clinical Attachment Loss.
However the other variables like
hypertension and total cholesterol
>200mg/dl, were not significantly
associated with Clinical Attachment Loss.
DISCUSSION
Chronic periodontitis is ―an infectious
disease resulting in inflammation within
the supporting tissues of the teeth;
progressive attachment loss, and bone loss‖
(Flemmig TF 1999)3.
Risk assessment is defined by numerous
components4. Risk is the probability that
an individual will develop a specific
disease in a given period. The risk of
developing the disease will vary from
individual to individual. Genetic factors,
age, gender socioeconomic status and stress
are categorized as risk determinants 5.

29 International Journal of Current Research and Review www.ijcrr.com
Vol. 04 issue 03 February 2012
Diabetes mellitus is an extremely important
disease from a periodontal standpoint. This
complex metabolic disorder, characterized
by chronic hyperglycemia, is an established
risk factor for periodontitis 6 and
periodontitis is now considered to be the
sixth complication in diabetes mellitus 2.Of
the systemic risk factors, it has been well
established that patients with diabetes have
atleast a two-fold increase in the severity of
periodontal disease as compared to non-
diabetics 7-9.
Overall, in the present study, there were 60
diabetics. Patients, who had a Fasting
Blood Sugar level (FBS) 126mg/dl, were
considered as diabetics. Their inclusion
was further substantiated through a
questionnaire, wherein 55 out of the 60
subjects confirmed their diabetic status.
Only 5 out of the 60 subjects came to know
their condition, after our present study.
There was a significant association
between the 3 periodontal parameters and
the diabetic patients in the study. Results
showed 24 diabetics, had CAL > 4mm as
against 36 diabetics, with CAL < 4mm.
Similarly 12 subjects with diabetics had
PPD > 5mm and 10 diabetic subjects had a
GI score 2. These values were highly
significant. The results of ULRA for CAL
showed an odds ratio of 5.33, in diabetic‘s
subjects while the results of MLRA for
CAL had the highest odds ratio of 4.33.
Considering the above results, diabetes
mellitus, was found to be most significantly
association with periodontal disease
progression, in our present study.
The mean FBS level, in subjects with PPD
> 5mm was found to be greater than
213mg/dl. This was in accordance with a
study by Richard C Oliver et al10, wherein
an increased prevalence and extent of
periodontal pockets was a consistent
finding of diabetics versus non-diabetics.
The Oulu study, reported more gingival
bleeding, as metabolic control worsened in
diabetics, despite similar plaque and
calculus scores in the diabetic subgroup.
Other studies also reported extensive
gingival inflammation in diabetics 8. These
results were similar to the one in our
present study.
Hyperlipidemia is essentially not a well
acknowledged risk factor for periodontal
disease11. It plays a larger role in
cardiovascular disease and stroke12.The
results in ULRA for CAL in our present
study showed an odds ratio of 3.1 for
subjects with a Total Blood Cholesterol
level >200mg/dl (42 subjects). However,
38 subjects in the group had an FBS level >
126mg/dl. So, the independent role of high
Total Blood Cholesterol level (>200mg/dl),
in periodontal disease could not be
established in our present study, as the
results of MLRA for CAL did not include
subjects with Total Blood Cholesterol
levels >200mg/dl as significant variables.
The role of hypertension in periodontal
disease progression was clearly negative,
from our present study. The results clearly
indicated that hypertension was a non
significant parameter in our present study
in periodontitis.These results in our study,
was in accordance to a similar study done
by Mattout C et al13, who included arterial
hypertension as a parameter, on a
population of 2144 adults, in France. The
results from the study yielded similar non-
significant values for hypertension.
Thus we can infer that certain risk elements
like Diabetes Mellitus play a major role in
increasing the probability for chronic
periodontal disease among older adults.
One possible bias which could have
occurred in our study is the relatively small
sample size of subjects, belonging to a
highly similar geographic area, and all of
them being subjects, seeking some form of
dental therapy, as they were selected from a
patient pool, at a dental hospital.

30 International Journal of Current Research and Review www.ijcrr.com
Vol. 04 issue 03 February 2012
Table 1: RESULTS OF UNIVARIATE LOGISTIC REGRESSION ANALYSIS FOR
CAL
VARIABLE OR (95% CI)
p - value
HYPERTENSION
No
1.00
0.32(NS) Yes 1.27 (0.79 – 2.02)
DIABETES
No
1.00
<0.0001 (Sig)
Yes 5.33 (2.98 – 9.55)
TOTAL CHOLESTEROL
(>200mg/dl) No
1.00
<0.0001 (Sig) Yes 3.1 (2.5 – 4.9)
ACKNOWLEDGMENTS
Authors acknowledge the immense help
received from the scholars whose articles
are cited and included in references of this
manuscript. The authors are also grateful to
authors / editors / publishers of all those
articles, journals and books from where the
literature for this article has been reviewed
and discussed. I also wish to thank my
professors T.Ramakrishnan,
N.Ambalavanan, Pamela Emmadi and
D.Deepalakshmi for their able guidance
provided for my study.
The study was conducted on a self
financing basis by the author Dr. Manoj
Raja.
REFERENCES
1. Brian L. Mealey and Gloria L.Ocampo:
Diabetes mellitus and periodontal
disease, Periodontology 2000: 127-153,
2007.
2. Loe H: Periodontal disease: the sixth
complication of diabetes mellitus,
Diabetes Care 16 (suppl 1):329, 1993.
3. Flemmig TF: Periodontitis, Ann
Periodontal 4:32, 1999
4. Page RC, Beck JD; Risk assessment for
periodontal diseases, Int Dent J 47:61,
1997.
5. Michalowicz BS, Diehl SR, Gunsolley
JC. Evidence of a substantial genetic
basis for risk of adult periodontitis. J
Clin Periodontol. 2000;71:1699–1707
6. Robert J Genco: Current view of risk
factors for periodontal diseases. J
Periodontol 1996; 67:1041 -1049
7. Tervonen T, and Knuuttila M: Relation
of diabetes control to periodontal
pocketing and alveolar bone level Oral
Surgery, Oral Medicine, Oral
Pathology 1986:61,346 -349
8. Taylor GW. Bidirectional
interrelationships. between diabetes,
and periodontal diseases: an
epidemiologic perspective. Annals of
Periodontology2001;6:99–112.
9. Soskolne W A and Klinger A: The
relationship between periodontal
diseases and diabetes an overview.
Annals of Periodontology 2001:6,91 -
98.
10. Richard C Oliver and Tellervo
Tervonen: Diabetes – A risk factor for
periodontitis in adults? J Periodontol
1994;65:530 -538.
11. Moeintaghavi A, Haerian-Ardakani A,
Talebi-Ardakani M, Tabatabaie I.
Hyperlipidemia in patients with
periodontitis. J Contemp Dent Pract.
2005 Aug 15; 6(3):78-85

31 International Journal of Current Research and Review www.ijcrr.com
Vol. 04 issue 03 February 2012
12. Moise Desvarueyx, Christial Schwahn
and Thomas Kocher. Gender
differences in relationship between
periodontal disease, tooth loss, and
atherosclerosis. Stroke, 2004; 35, 2029.
13. Mattout C, Bourgeois D, Bouchard P.
Type 2 diabetes and periodontal
indicators: epidemiology in France
2002-2003. J Periodontal Res. 2006
Aug;41(4):253-8.
GRAPH: 1 NUMBER OF SUBJECTS WITH ELEVATED FBS LEVELS (FBS > 126
mg/dl) AND NORMAL FBS LEVELS (FBS< 126 mg/dl)
60
540
0
100
200
300
400
500
600
Diabetics Non Diabetics
No
of
Su
bje
cts

32 International Journal of Current Research and Review www.ijcrr.com
Vol. 04 issue 03 February 2012
ijcrr
Vol 04 issue 03
Category: Research
Received on:11/12/11
Revised on:16/12/11
Accepted on:20/12/11
ABSTRACT Sedimental Extract of Tinospora cordifolia (SETc), with no mortality rate at the maximum of
2000mg/kg/p.o., acute dose was found to show maximum number of deaths on chronic treatment
in the mid of 28 days repeated oral toxicity study. A trial made on SETc at incremental doses starts
from the minimum of 250 - 1000 mg/kg/p.o., were then subjected to modified IDF procedure, to
study their safer therapeutic margin. Sprague dawley rats were made diabetic with streptozotocin
(45mg/kg/i.p.) and the OGTT procedure was performed on those diabetic rats, fasted around 16
hours prior to the commencement of IDF study. Starting from the 30th min after glucose load
(1g/kg/p.o.), the incremental doses of SETc, from the minimum of 250mg/kg/p.o., to the
maximum of 1000 mg/kg/p.o., were administered to each group. The reduced blood glucose levels
from each group were analyzed and derived by means of AUC and thereby safer therapeutic &
effective dose of the test drug was fixed. The onset of action of all the doses of the SETc originates
from the 60th min of the drug administration and showed the biological responses in a
concentration dependant manner. Based on the IDF, AUC and EDF data‘s, it was found to be very
clear that the dose of 1000 mg/kg/p.o., of SETc was found to underlie the safer therapeutic margin
than the other doses. This evidences that the application of this modified method would be a
valuable tool for finding safer therapeutic marginal dose using BGC as a key factor.
______________________________________________________________________
Keywords Sedimental Extract of Tinospora
cordifolia (SETc), Oral Glucose Tolerance
Test (OGTT), Blood Glucose Concentration
(BGC), Incremental dose finding (IDF),
Area under the Curve (AUC), Effective dose
finding (EDF), Streptozotocin (STZ) induced
diabetic rats.
INTRODUCTION
The major hindrance to the use of the
herbal preparation in clinical practice is due
to the lack of preclinical data for
understanding the safety and efficacy of the
drugs. For the evaluation of various forms of
oral herbal preparations, instead of their
treatment profile there must be a need of
strong evidence, for its safer therapeutic
index.
Uncertainty, of dose fixation during
preclinical toxicity studies also rules a part.
Since it‘s in need and in deed to fix the
effective therapeutic dose of those herbal
preparation which would be safer enough
with good therapeutic outcome, for long
term therapy likely from fluctuating blood
glucose levels in diabetics. So it
necessitates a modified protocol along with
statistical approach, the dose response effect
of oral antidiabetic agents in animals could
be studied.
BLOOD GLUCOSE CONCENTRATION - A KEY TO FIX
THE EFFECTIVE DOSE FOR HERBAL ANTIDIABETIC
DRUGS USING RAT MODEL
R.Kannadhasan1, S.Venkataraman
2
1Department of Pharmacology, School of Pharmaceutical Sciences, Vels
University, Pallavaram, Chennai, Tamil nadu
2Dr.C.L.Baid Metha Foundation for Education and Research, Jyothi Nagar,
Thoraipakkam, Chennai, Tamil nadu
E-mail of Corresponding Author: [email protected]

33 International Journal of Current Research and Review www.ijcrr.com
Vol. 04 issue 03 February 2012
AUC has a number of important uses in
pharmacology, biopharmaceutics and
pharmacokinetics. Through biochemical
and hematological parameters, the bio
equivalency or bioavailability studies of a
compound could be analyzed by comparing
its AUC values [1]. But here, the
measurement of AUC after administration
of an herbal product plays an important
role in fixing safer therapeutic dose. Since
its diabetic case, the study of alterations in
the blood glucose concentration levels were
found to be quite worthy to give enough
surveillance to analyze the AUC which
necessitates its role over preclinical
evaluation of a drug dose.
The incremental dose finding [2]
method
adopted to study the dose response
relationship with AUC of the herbal
antidiabetic agent using linear regression
analysis.
Based on the priority of work done in
diabetes and ease of availability, a random
selection of a large, glabrous, succulent,
climbing shrub belonging to the family
Menispermaceae, namely Tinospora
cordifolia, which was used as a folklore
medicine in diabetes [3] were made. In
accordance to the work being carried out,
its planned to make a trial on raw portion
of the plant by means of sedimental
extraction from the plant stalk which
would be supportive than other solvents
with particular components. Some of the
antidiabetic works in various extracts of
Tinospora cordifolia reported as below
Aqueous, alcoholic and chloroform extracts
of the leaves of T. cordifolia showed
hypoglycaemic activity in both alloxan
diabetic and normal rabbits at 250 mg/kg of
the dose administered [4]. Daily oral
administration of an aqueous root extract of
T. cordifolia to alloxan diabetic rats for 6
weeks significantly reduced blood glucose
levels at 2.5 and 5.0 g/kg, but not 7.5 g/kg.
T. cordifolia was more effective than
glibenclamide, but less effective than
insulin (which restored parameters to near
normal values) at lowering blood glucose
levels. Instead of their biological action,
the rationality for the regression of
hypoglycaemic effect at these varying
doses was not provided [5, 6, 7& 8].
The current study focused on the dose
selectivity, that shows maximum
therapeutic efficacy of Sedimental Extract
of Tinospora cordifolia (SETc), an oral
herbal preparation through incremental
dose finding and area under the curve
determinations on the OGTT in diabetic
rats.
MATERIAL AND METHODS
Plant Collection
Tinospora cordifolia collected from Irulars
Tribal Women Welfare Society (ITWWS),
Thandarai, Thirukazhukundram, a southern
forest region of Tamil nadu, India. The stem
portions were cut, dried and collected in the
month of January 2007 and shade dried for
further processessing and studies. The
pharmacognositcal identity and
authentication was done by Plant Anatomy
research Centre, Chennai. A specimen of the
plant was kept in the Department of
Pharmacology, C.L.Baid Metha college of
Pharmacy, Chennai (Specimen No.
CLBMCP/102/2005).
Preparation of Plant Extract
The dried stem of Tinospora cordifolia, 2 kg
was grounded to a coarse powder and soaked
in 1000ml of distilled water for a period of
24 hrs, until the active portion to settle down.
The top layer was drained in a separate
vessel (leaving the debris to filter off) and
evaporated in a hot water bath at 100o C, and
this portion is considered as water soluble
portion. The sedimented portion after
removing the water soluble portion was
washed for 2-3 times with fresh distilled
water. The sedimented extract was admixed
with water soluble extract in the ratio of 3:1
to get the final sedimental extract of
Tinospora cordifolia (SETc) for screening.

34 International Journal of Current Research and Review www.ijcrr.com
Vol. 04 issue 03 February 2012
Physico chemical properties
Slightly soluble in Ethanol < DMSO and not
in other solvents. A fine suspension of the
extract was obtained in 0.5 % Sodium
Carboxy Methyl Cellulose (Na.CMC).
Hence 0.5% Na.CMC suspension of this
drug is used for animal experiment. Buff
white powder. Bitter taste; Bitterness might
be due to admixture of water soluble portion
at the final preparation.
Chemicals and equipments
Streptozotocin, 97% pure dextrose and
Ready-to-use biochemical kits were
purchased from Sigma-Aldrich Pvt.ltd,
Mumbai. Ascensia One Touch glucometer
and strips (Code. No: 3110; 3112) was used
to measure the blood glucose concentration.
Animals
Male Sprague dawley rats 200-250 gm were
purchased from King‘s Institute, Guindy,
Chennai. Requirement of animals for this
study was authorized by Dr.C.L.Baid Metha
College of Pharmacy,
CLBMCP/131/IAEC/41 under CPSCEA
guidelines. All rats were randomly selected,
segregated and acclimatized for a period of 1
week with 12hr day light and 12 hours dark
cycle, with food and water ad libitum.
Toxicity studies
Acute Oral Toxicity Study
Acute oral toxicity studies were performed
following by OECD 423 Guidelines.
Maximum dose of 2000mg/kg was selected
and administered orally to a group of 3
animals in each step as shown in flow chart
of Annex 2d [9].
Animals (n=6) were fasted for a period of
12 hrs and weighed just prior to drug
administration. The test substance was
administered in a single dose using a
suitable intubation canula. After drug
administration, food was withheld for a
period of 3-4 hours. The animals were
observed closely for 3 hrs and observation
were continued for 24 hours. Any mortality
or toxic signs produced were noted.
Repeated Oral Toxicity Study
Repeated dose 28 day oral toxicity study was
carried out according to OECD guidelines
407 [10]. Animals were divided into four
groups of 6 each. Group I – received 0.5%
CMC orally and served as vehicle control
and groups II, III and IV – were received a
daily dose of SETc 500, 1000 and 2000
mg/kg/p.o., respectively for a period of 28
days. Adjustments were made as necessary
to maintain constant dose level in term of
animal body weight. Animals were observed
at least twice a week for 28 days, for any
mortality and morbidity. The doses at which
animals don‘t show any mortality or
morbidity were chosen for the dose finding
study. Animals that survived after 28 days
treatment were euthanized with excess ether
on 29th day and blood samples were
collected through cardiac puncture for
hematological and biochemical studies.
Liver, kidney and Pancreas were dissected
out for histopathological studies.
Histopathological Studies
Various tissues like liver, kidney and
pancreas were dissected out from each
group of normal control and normal
animals treated with SETc (500 & 1000
mg/kg/p.o., respectively). The collected
tissues of respective groups were dipped in
10% formalin solution and stained with
hemotoxylin and eosin for preparation of
section by using of microtome.
Histopathological observations were
studied in Vaishnave Clinic, Chennai – 17.
The histopathological studies carried out by
using the method described by Kanai
Mukherjee [11].
Effective dose finding-Experimental
design
Fasting of Animals & Induction of
Experimental Diabetes
Animals were fasted for 16 hours before the
induction of diabetes with Streptozotocin [2].
Animals made diabetic by an intraperitoneal
injection of freshly prepared solution of STZ

35 International Journal of Current Research and Review www.ijcrr.com
Vol. 04 issue 03 February 2012
(45mg/ml in 0.01 m citrate buffer, pH 4.5).
The diabetic state assessed in STZ - treated
rats by measuring the non-fasting blood
glucose concentration 48 hours post STZ
injection using one touch glucometer. Only
rats with blood glucose levels ≤ 200mg/dl
were selected and used for experimental
studies.
Incremental dose finding experiment:
Modified method*
With a slight modification of the method of
Soon & Tan [2], the fasting glucose along
with oral glucose loading after the
administration of the incremental doses of
the test drug were used. Animals were
divided into 6 groups of 6 animals each. A
normal and a diabetic control both
receiving 0.5% of Carboxyl methyl
cellulose suspension and test groups with
diabetes receives Incremental Doses (ID)
of ID I, II & III (250, 500 &
1000mg/kg/p.o., respectively). Finally a
diabetic treated with Standard drug,
Glibenclamide - 600µg/kg (as calculated
from the human dose) kept studied for the
comparison of the test drug treated groups.
Blood glucose concentration was examined
at a regular interval for a period of 4 hrs
starting from 0 hr and at 1st, 2
nd, 3
rd, 4
th hr
after drug treatment using One Touch
Glucometer. Concentration response curve
and area under curve were studied.
Statistical analysis
Statistical analyses were done using
Graphpad prism software, Version 4. Dose
response effect were studied using Curves
and regression followed by Area under
Curve (AUC) and other biochemical,
hematological parameters were assessed
through One way anova using Tukey‘s
multiple comparison method, were values
are expressed as mean ± SEM (n=6).
RESULTS
Toxicity Studies
Prior to the clinical application of
experimental data, it is pertinent to
establish the safety of herbal preparation
through toxicological assessments. In the
current study therefore, the acute toxicity
and the liver and kidney function
parameters of animals treated with sub-
chronic doses of the crude sedimental
preparation of T.cordifolia were assessed.
In addition the microanatomical changes, if
any of the test drug in majors organs viz.,
liver, kidney and pancreas were also
studied.
Acute Toxicity study
Acute toxicity study under OECD 423
guidelines a maximum tolerable dose of
SETc (2000 mg/kg/p.o.,) was used to
assess the mortality or morbidity rate and
also toxic signs and symptoms of animals
were studied. The result showed neither
mortality nor signs of toxicity at this dose
(2000mg/kg/p.o.,) as shown in table no.1.
Repeated Oral Toxicity Study
The maximum tolerable dose assessed from
the acute toxicity study, i.e.,
2000mg/kg/p.o., along with its 1/2 and 1/4
portion of the corresponding doses, 1000
and 500 mg/kg/p.o., respectively, were
studied for 28 days repeated oral toxicity
under OECD 407 guidelines. The mortality
rate with 2000mg/kg found to show
maximum number of deaths within 15 days
from the start of the study. Animals treated
with 500mg/kg and 1000mg/kg/p.o., of
SETC respectively, didn‘t show any
mortality or morbidity throughout the
treatment period and there were no
significant changes in the biochemical and
hematological parameters when compared
to control animals. The results are depicted
in table nos.2 - 6.
There was no significant change in the
biochemical parameters including total
triglycerides, cholesterol, HDL-C, LDL-C
and VLDL-C in test animals treated with
SETc (500 and 1000mg/kg/p.o.,) compared
to control (Table No.2). There was no
significant alteration in the serum protein
level and the A: G ratio was found near to

36 International Journal of Current Research and Review www.ijcrr.com
Vol. 04 issue 03 February 2012
the normal control (p=ns) as shown in
Table. 3. It was observed that the test drug
I and II do not showed any alterations in
the serum urea, uric acid, creatinine and
BUN level as compared with that of the
normal control (p=ns).
Sub chronic treatment of SETc did not
affect the AST and ALT levels in
comparison to normal animals (p=ns) as
shown (Table No.5). The RBCs and Hb
contents of SETc treated rats were found to
show no significant difference (p=ns) as
compared with that of the normal group
(Table No.6). The number of WBCs were
found to show a slight increase in test
group treated with 1000mg/kg/p.o., as
compared with that of the normal (p<0.05).
Histopathology of organs after 28 days of
repeated oral toxicity
The histopathological examinations of
liver, kidney and pancreas of SETc treated
animals showed normal architecture
suggesting no detrimental changes and
morphological disturbances in tissues
treated with the test drug at the doses (500
and 1000mg/kg/p.o.,) for 28 days are
depicted in figure no.3.
Effective dose finding
Incremental dose finding experiment
From the table no.7, it was observed that
the ID‘s I, II and III (250, 500 and 1000
mg/kg/p.o., respectively) showed
significant increase in BG after 30 min of
GTT as compared with that of the normal
(p<0.001). In addition, there was a
significant decrease in the BG level of
SETc treated diabetic animals when
compared with that of the diabetic control
(p<0.001).
The ID III (1000 mg/kg/p.o.,) was alone
found to maintain the BG level even after
90th,
120th, 240th min of glucose loading. It
was also noted that test drug at the dose of
1000mg/kg/p.o., maintained the plateau
range of BG level in GTT with that of the
standard drug treated and normal control
(Figure No.1).
Area under the Curve
As shown in the figure no.1, the filled area
under the curve denotes the blood glucose
concentration of the test drugs studied as
their percentage response. It was observed
from the table no.8; around 69.17 %
response was produced at single dose of ID
III (1000mg/kg/p.o.,) which was near to
that of the standard drug used.
Effective dose
Figure No.2 shows the effective dose
ranges of SETc where it reaches its
therapeutic margin. The test drug ID I, II,
III (200, 500 and 1000mg/kg/p.o.,
respectively) and standard drug (600
µg/kg/p.o, of glibenclamide) produced their
onset of action after 30th min of glucose
loading.
DISCUSSION
The toxicity profile of SETc at doses 500
and 1000mg/kg/p.o., after exposure to 28
days oral toxicity study, shown severe
hepatic injury as a result of the metabolism
of some of the toxic phytochemicals, found
in the medicinal plants and failure of the
elimination of those metabolized products
by the liver are reported in the literature
[12]. Albumin is the most abundant plasma
proteins with the physiological role of
maintenance of osmotic pressure,
transportation of both exogenous and
endogenous substances and serving as a
protein reserve. The ability of the liver to
synthesize albumin is diminished if the
synthetic function of the organ is affected
[13]. Increase plasma protein concentration
may be due to dehydration and vice versa.
From the result of the present study, serum
protein profiles were not significantly
different between the test group and
control. This shows that synthetic function
of liver of the animal exposed to sub-
chronic doses of 500 and 1000mg/kg/p.o.,
of SETc is not affected. Additionally there
was alteration neither in the globulin levels
nor in the A: G ratio of the animals treated

37 International Journal of Current Research and Review www.ijcrr.com
Vol. 04 issue 03 February 2012
with sub-chronic doses of SETc. The total
lipid profile of the test drug treated animals
had no significant alterations in their levels
which might be due to the activities of
hepatic enzymes of test groups were not
affected by treatment of SETc [14].
There was no change in the serum alanine
aminotransferase (ALT) and aspartate
aminotransferase (AST) levels which are
useful indices for identifying inflammation
and necrosis of the liver [15]. ALT
measurements are more liver specific than
the AST and its activity is usually greater
than AST activity at early or acute
hepatocellular disease [13]. AST on the
other hand tend to be released more than
the ALT in chronic liver diseases such as
cirrhosis [13]. A marked elevation of ALT,
however, in the presence of mild to
moderate elevation of AST is suggestive of
either hepatic toxicity or hepatic injury
combined with other conditions [14].
Serum urea, uric acid, urea nitrogen and
creatinine were examined as indicators for
kidney function tests [16]. Hence there was
no sign of alterations in the indicators level,
it confirms that the kidney function of rats
treated with SETc was not affected. No
changes were observed in hematological
profile and the slight increase in the WBC
count was might be due to the
immunomodulatory activity of T.cordifolia,
as reported from the previous literature [17,
18 &19].
On surveillance of the hematological and
biochemical parameters, the toxicity profile
of 500 and 1000mg/kg/p.o., of SETc
showed neither mortality nor alterations in
the normal parametric results of rodents,
which appeared to be failed at dose
2000mg/kg/p.o., (the acute dose of OECD
423; 2d which showed maximum number
of deaths at the interval of 28 days repeated
oral toxicity study) and thus, the effective
dose for the primary study lies between
these two doses a maximum tolerable dose
and a mortality dose (1000 and
2000mg/kg/p.o., respectively) which were
elucidated by applying this modified
method of IDF procedure.
Effective dose findings
Even though, the onset of action of the
incremental doses ID I, II and III have
being started after 30th min of glucose load,
the durability and maintenance of plateau
of BGC was achieved only at ID III
(1000mg/kg/p.o.). This might be due to
satisfactory dose percent required for that
response and its continued hypoglycemic
effect (i.e. BG ≤ 100 mg/dl) even after
120th min evidences its effective onset and
longer duration of action, which was not
fulfilled by the prior low doses.
Furthermore, the AUC clearly denotes %
response for the drug used i.e. Blood
glucose concentration is indirectly
proportional to the percentage response.
From the above dose–response studies, it
was clear that the hypoglycemic activity of
SETc was dose dependant.
CONCLUSION
The overall findings clearly establishes the
fact, that the use of AUC with respect to
BGC levels will be easier to predict the
safer usage of oral chemical/herbal
therapeutic preparations for the use of
diabetes therapy with stabilized outcomes
from preclinical datas.
The statement is that, the use of this IDF
procedure after toxicity studies performed
with newer/forthcoming drugs for the
antidiabetic therapy would be a great
opportunity for the researcher to minimize
the mortality rate of the animals used. And
furthermore its glitters an awareness for
using safer dose particular in long term
therapy. This study could be serving as a
preliminary evaluation for the identification
of the safer therapeutic marginal dose with
less risk of adverse effects. Further the
levels of hypoglycemic action of this SETc
have yet to be studied in future.

38 International Journal of Current Research and Review www.ijcrr.com
Vol. 04 issue 03 February 2012
Finally, it was concluded that, the blood
glucose concentration – a key factor for
determining the AUC thereby fixing the
effective concentration-response of the
drug dose, using this modified method of
incremental dose finding procedure.
ACKNOWLEDGEMENT
Authors acknowledge the immense help
received from the scholars whose articles
are cited and included in references of this
manuscript. The authors are grateful to
authors/editors/publishers of those articles,
journals and books from where the
literature for this article has been reviewed
and discussed.
Funding
This research received no specific grant
from any funding agency in the public,
commercial, or not-for-profit sectors.
REFERENCES
1. Goodman and Gilman's.
Pharmacokinetics and
Pharmacodynamics. In: Laurence L.
Brunton, Keith L. Parker, Donald K.
Blumenthal, Iain L.O. Buxton, editors.
Manual of Pharmacology and
Therapeutics. 11th ed. New York:
McGraw-Hill; 2008, pp.6-12.
2. Soon YY, Tan BKH. Evaluation of
Hypoglycemic and Antioxidant
activities of Morinda officinalis in
STZ-induced diabetic rats. Singapore
Med J 2002; 43(2): 077-085.
3. Singh SS, Pandey SC, Srivastava S,
Gupta VS, Patro B, Ghosh AC.
Chemistry and medicinal properties of
Tinospora cordifolia (guduchi). Indian
Journal of Pharmacology 2003; 35:
pp.83-91.
4. Wadood N, Wadood A, Shah SAW.
Effect of Tinospora cordifolia on
blood glucose and total lipid levels of
normal and alloxan-diabetic rabbits.
Planta Med. 1992; 58: 131-136.
5. Prince PSM, Menon VP, Gunasekaran
G. Hypolipidaemic action of
Tinospora cordifolia roots in alloxan
diabetic rats. Journal of
Ethnopharmacology 1999; 64: 53-57.
6. Prince PSM, Menon VP. Short
communication: Antioxidant action of
Tinospora cordifolia roots in
experimental diabetes. Journal of
Ethnopharmacology 1999; 65: 277-
281.
7. Prince PSM, Menon VP.
Hypoglycemic and other related
actions of Tinospora cordifolia roots
in alloxan-induced diabetic rats.
Journal of Ethnopharmacology 2000;
70: 9-15.
8. Prince PSM, Menon VP. Antioxidant
action of Tinospora cordifolia root
extract in alloxan diabetic rats.
Phytotherapy Research 2001; 15: 213-
218.
9. OECD/OCDE 423. Test procedure
with a starting dose of 2000
mg/kg/bw. Annex 2d 2001; p.13.
10. OECD/OCDE 407. Repeated Dose
28-day Oral Toxicity Study in
Rodents 1995; pp. 1-8.
11. Mukherjee KI. Medical Laboratory
Technology. 1st
Edition. New Delhi:
Tata McGraw Hill Publications 1989:
p.124.
12. Geidam MA, Pakman I, Laminu H.
Effects of aqueous stem bark of
Momordica balsamin. Linn on serum
electrolytes and some haematological
parameters in normal and alcohol fed
rats. Pak. J. Biol. Sci. 2004; 7:
pp.1430-1432.
13. Abdollahi M, Farzamfar B, Salari P,
Khorram Khorshid HR, Larijani B,
Farhadi M, et al. Evaluation of acute
and sub-chronic toxicity of Semelil
(ANGIPARS™), a new
phytotherapeutic drug for wound
healing in rodents. DARU 2008:
16(1); 7-14.

39 International Journal of Current Research and Review www.ijcrr.com
Vol. 04 issue 03 February 2012
14. Tilkian SM, Conover MB and Tilkian
AG. Clinical implications of
laboratory tests. London. C.V. Mosby
Company 1979: pp.3-44; 117-132;
154-159.
15. Whitby LG, Smith AF, Becket GJ.
Lecture notes on Clinical chemistry.
4th Ed. Oxford, London, Edinburgh,
Boston, Melbourne; Blackwell
Scientific Publications 1989; pp.38-
178.
16. Williams M.H. Nutrition for health,
fitness & sport. Boston; McGraw-Hill
1999; pp.178-203.
17. Thatte UM, Dahanukar SA.
Comparative study of
immunomodulating activity of Indian
Medicinal plants, lithium carbonate
and glucan. Methods and findings in
experimental and clinical
pharmacology 1988; 10(10): 639-644.
18. Thatte UM, Dahanukar SA.
Immunotherapeutic modification of
experimental infection by Indian
Medicinal Plants. Phytotherapy
Research 1989; 3: 43-49.
19. Mathew S, Kuttan G. Antioxidant
activity of Tinospora cordifolia and
its usefulness in the amelioration of
cyclophosphamide induced toxicity.
Journal of Experimental and Clinical
Cancer Research 1997; 16(4): 407-
411.
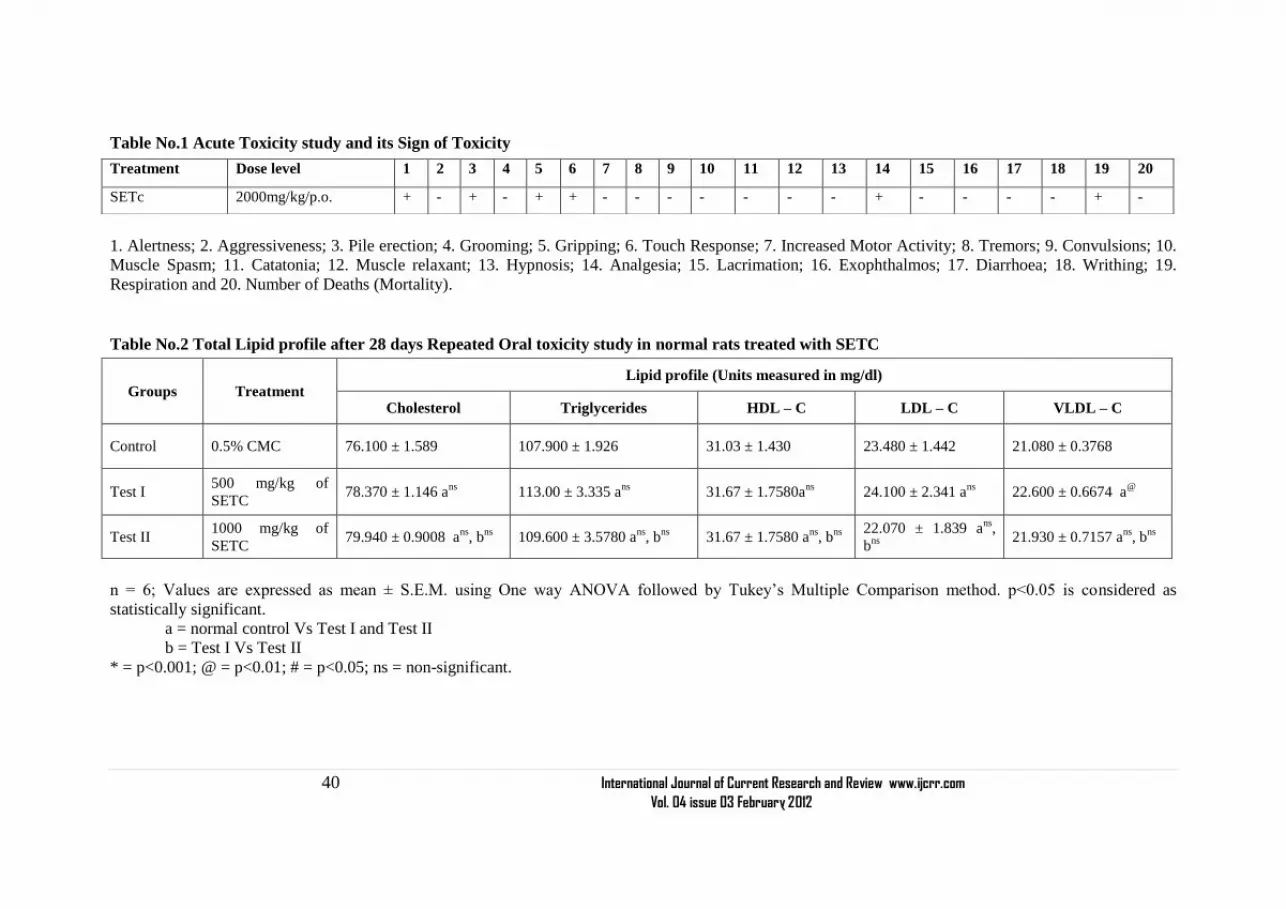
40 International Journal of Current Research and Review www.ijcrr.com
Vol. 04 issue 03 February 2012
Table No.1 Acute Toxicity study and its Sign of Toxicity
1. Alertness; 2. Aggressiveness; 3. Pile erection; 4. Grooming; 5. Gripping; 6. Touch Response; 7. Increased Motor Activity; 8. Tremors; 9. Convulsions; 10.
Muscle Spasm; 11. Catatonia; 12. Muscle relaxant; 13. Hypnosis; 14. Analgesia; 15. Lacrimation; 16. Exophthalmos; 17. Diarrhoea; 18. Writhing; 19.
Respiration and 20. Number of Deaths (Mortality).
Table No.2 Total Lipid profile after 28 days Repeated Oral toxicity study in normal rats treated with SETC
n = 6; Values are expressed as mean ± S.E.M. using One way ANOVA followed by Tukey‘s Multiple Comparison method. p<0.05 is considered as
statistically significant.
a = normal control Vs Test I and Test II
b = Test I Vs Test II
* = p<0.001; @ = p<0.01; # = p<0.05; ns = non-significant.
Treatment Dose level 1 2 3 4 5 6 7 8 9 10 11 12 13 14 15 16 17 18 19 20
SETc 2000mg/kg/p.o. + - + - + + - - - - - - - + - - - - + -
Groups Treatment Lipid profile (Units measured in mg/dl)
Cholesterol Triglycerides HDL – C LDL – C VLDL – C
Control 0.5% CMC 76.100 ± 1.589 107.900 ± 1.926 31.03 ± 1.430 23.480 ± 1.442 21.080 ± 0.3768
Test I 500 mg/kg of
SETC 78.370 ± 1.146 a
ns 113.00 ± 3.335 a
ns 31.67 ± 1.7580a
ns 24.100 ± 2.341 a
ns 22.600 ± 0.6674 a
@
Test II 1000 mg/kg of
SETC 79.940 ± 0.9008 a
ns, b
ns 109.600 ± 3.5780 a
ns, b
ns 31.67 ± 1.7580 a
ns, b
ns
22.070 ± 1.839 ans
,
bns
21.930 ± 0.7157 a
ns, b
ns

41 International Journal of Current Research and Review www.ijcrr.com
Vol. 04 issue 03 February 2012
Table No.3 Protein index after 28 days Repeated Oral toxicity study in normal rats treated with SETc
n = 6; Values are expressed as mean ± S.E.M. using One way ANOVA followed by Tukey‘s Multiple Comparison method. p<0.05 is considered as
statistically significant.
a = normal control Vs Test I and Test II
b = Test I Vs Test II
* = p<0.001; @ = p<0.01; # = p<0.05; ns = non-significant.
Table No.4 Estimation of liver function after 28 days Repeated Oral toxicity study in normal rats treated with SETc
n = 6; Values are expressed as mean ± S.E.M. using One way ANOVA followed by Tukey‘s Multiple Comparison method. p<0.05 is considered as
statistically significant.
Groups Treatment Protein Index (Units measured in gm/dl)
A/G ratio Total Proteins Albumin Globulin
Control 0.5% CMC 6.545 ± 0.2064 3.837 ± 0.1365 2.3070 ± 0.1621 1.4110 ± 0.1069
Test I 500mg/kg of SETC 6.338 ± 0.1909 ans
4.177 ± 0.1797 ans
2.605 ± 0.1204 ans
1.8610 ± 0.1599 a#
Test II 1000mg/kg of SETC 6.780 ± 0.2115 ans
, bns
3.665 ± 0.1404 ans
, bns
2.498 ± 0.1489 ans
, bns
1.415 ± 0.0581 a
ns,b
#
Groups Treatment Units measured in mg/dl
Serum Creatinine Serum Urea Uric acid BUN
Control 0.5% CMC 0.5633 ± 0.02704 21.020 ± 0.5211 1.3850 ± 0.04256 22.780 ± 0.8523
Test I 500 mg/kg of
SETC
0.5583 ± 0.03468 ans
22.270 ± 0.9220 ans
1.6480 ± 0.09793 ans
24.860 ± 0.9468 ans
Test II 1000 mg/kg of
SETC
0.6483 ± 0.03292 ans
, bns
23.570 ± 0.8312 ans
, bns
1.6650 ± 0.10530 ans
, bns
24.950 ± 0.3359 ans
, bns

42 International Journal of Current Research and Review www.ijcrr.com
Vol. 04 issue 03 February 2012
a = normal control Vs Test I and Test II
b = Test I Vs Test II
* = p<0.001; @ = p<0.01; # = p<0.05; ns = non-significant.
Table No.5 Biomarkers level in normal rats after 28 days of repeated oral toxicity study with SETc
n = 6; Values are expressed as mean ± S.E.M. using One way ANOVA followed by Tukey‘s Multiple Comparison method. p<0.05 is considered as
statistically significant.
a = normal control Vs Test I and Test II
b = Test I Vs Test II
* = p<0.001; @ = p<0.01; # = p<0.05; ns = non-significant.
Table No.6 Hematological Profile of SETC after 28 days Repeated Oral Toxicity Study Groups Treatment RBC (No. of Cells x 10
12/L) WBC (No. of Cells/Cu.mm) Hb (gm %)
Control 0.5% CMC 5.118 ± 0.1564 7122 ± 194.4 14.60 ± 0.2490
Test I 500mg/kg of SETc 5.290 ± 0.2593 ans
7142 ± 297.3 ans
15.03 ± 0.2894 ans
Test II 1000mg/kg of SETc 5.187 ± 0.1780 ans
, bns
8261 ± 180.6 a#, b
# 15.18 ± 0.2638 a
ns,b
ns
n = 6; Values are expressed as mean ± S.E.M. using One way ANOVA followed by Tukey‘s Multiple Comparison method. p<0.05 is considered as
statistically significant.
a = normal control Vs Test I and Test II
b = Test I Vs Test II
* = p<0.001; @ = p<0.01; # = p<0.05; ns = non-significant
Groups Treatment SGOT (IU) SGPT (IU) SGOT/SGPT ratio
Control 0.5% CMC 57.780 ± 1.255 44.250 ± 0.4465 1.3060 ± 0.03263
Test I 500 mg/kg of SETC 62.020 ± 2.568 ans
44.680 ± 0.9749 ans
1.3890 ± 0.05438 ans
Test II 1000 mg/kg of SETC 65.980 ± 2.579 a#, b
ns 43.560 ± 0.7145 a
ns, b
ns 1.5140 ± 0.05012 a
#, b
ns

43 International Journal of Current Research and Review www.ijcrr.com
Vol. 04 issue 03 February 2012
Table No.7 Incremental Dose Finding procedure and the Area under the Curve (AUC) of SETc in normal, diabetic and diabetic rats treated with
SETc
n = 6; Values are expressed as mean ± S.E.M. using One way ANOVA followed by Tukey‘s Multiple Comparison method. p<0.05 is considered as
statistically significant.
a = normal control Vs Diabetic Control, ID I, ID II, ID III and Standard
b = Diabetic control Vs Test I, Test II, Test III and Standard
c = ID I Vs ID II, ID III and Standard.
d = ID II Vs ID III and Standard.
e = ID III Vs Standard.
* = p<0.001; @ = p<0.01; # = p<0.05; ns = non-significant.
Groups Treatment Incremental Dose Finding: Blood Glucose concentration (mg/dl)
0 min 30 min 60 min 90 min 120 min 240 min
Normal
control 0.5% CMC 68.00 ± 2.503 86.00 ± 4.669 127.20 ± 3.060 109.80 ± 3.628 82.17 ± 2.072 76.17 ± 2.257
Diabetic
Control 0.5% CMC 133.80 ± 2.774 a* 119.70 ± 2.512 a* 281.30 ± 7.079 a* 379.00 ± 6.928 a* 397.00 ± 3.044 a* 389.70 ± 3.844 a*
ID I 250mg/kg of SETC 108.20 ± 2.786 a*,
b@
99.17 ± 1.973ans
,
b*
201.50 ± 3.686 a*,
b*
199.70 ± 4.295 a*,
b*
196.80 ± 5.822 a*,
b*
181.80 ± 4.362 a*,
b*
ID II 500mg/kg of SETC 106.00 ± 2.966 a*,
b@
, cns
87.67 ± 2.140
ans
,b*, cns
174.70 ± 4.462 a*,
b*, c@
184.80 ± 4.615 a*,
b*, cns
176.80 ± 6.220 a*,
b*, cns
153.20 ± 8.364 a@
,
b*, c*
ID III 1000mg/kg of
SETC
108.00 ± 4.597 a*,
b@
, cns
, dns
87.17 ± 3.928ans
,
b*, cns
, dns
119.70 ±3.333ans
,
b*, c*, d
*
100.00 ± 3.454 ans
,
b*, c*, d*
85.33 ± 3.029 ans
,
b*, c*, d*
83.17± 2.197ans
,
b*, c*, d*
Standard 600 µg/kg of
Glibenclamide
105.20 ± 4.498 a*,
b@
, cns
, dns
, ens
89.50 ± 2.232ans
,
b*, cns
, dns
, ens
109.80± 4.556ans
,
b*, cns
, d*, e
ns
91.500 ± 3.566 ans
,
b*, c*, d*, e
ns
83.33 ± 3.190 ans
, b*,
c*, d*, e
ns
80.17± 2.482ans
,
b*, c*, d*, e
ns

44 International Journal of Current Research and Review www.ijcrr.com
Vol. 04 issue 03 February 2012
Table No.8: Percentage response of the incremental doses of SETC using Area under the Curve:
Groups Treatment Total Area (AUC) % Response
Normal control 0.5% CMC 21443 Nil
Diabetic control 0.5% CMC 78564 0.00
ID I 250mg/kg of SETC 42302 31.95
ID II 500mg/kg of SETC 37457 42.19
ID III 1000mg/kg of SETC 22216 69.17
Standard 600µg/kg of Glibenclamide 21362 71.93
Total area of Drug Used
% Response = [ -------------------------------------------X 100] - 100
Total area of the Diabetic Control
Figure No.1 Showing the Incremental Dose Response and Area under the Curve of Blood
glucose in normal, diabetic and diabetic rats treated with SETc
Figure No.2 Showing the Effective Dose Response and Therapeutic margin of SETc

45 International Journal of Current Research and Review www.ijcrr.com
Vol. 04 issue 03 February 2012
Figure No.3 Histopathology of Liver, Kidney and Pancreas after 28 days of repeated oral
administration with SETc
Group Liver Kidney Pancreas
Normal
SETc
(500mg/kg/p.o.)
SETc
(1000mg/kg/p.o.)

46 International Journal of Current Research and Review www.ijcrr.com
Vol. 04 issue 03 February 2012
ijcrr
Vol 04 issue 03
Category: Case Report
Received on:03/11/11
Revised on:16/11/11
Accepted on:02/12/11
ABSTRACT A bilateral variation in the pattern of arterial supply of the palm was observed during routine
dissection of a 65 years old male cadaver. The right hand received blood supply by ulnar, radial
and median arteries, with an arch of communication between radial and median arteries. In the
left hand superficial palmar arch was formed mainly by ulnar artery and completed by first
dorsal metacarpal branch of radial artery. In both hands deep branch of radial artery and a
branch from ulnar proper digital branch of little finger formed the deep palmar arch.
Knowledge of arterial variations provides an important source of information for vascular
surgeons for safe surgical procedures in the hand.
______________________________________________________________________
Keywords: superficial palmar arch, deep
palmar arch, ulnar artery, radial artery,
median artery.
INTRODUCTION
Arterial supply to the human hand is
derived from two main anastomotic
channels, superficial and deep palmar
arches. They are formed by radial and ulnar
arteries, which account for high vascularity
of the palm. So wounds of the palm bleed
profusely but heal rapidly because of this
rich anastomosis. Superficial palmar arch
is mainly fed by ulnar artery alone or
completed by superficial branch of radial
artery, by the arteria radialis indicis, a
branch of arteria princeps pollicis or by the
persistent median artery1. Very rarely it is
formed by anastomosis of median artery
with radial artery. This type of arch was
described as median –radial type of
superficial palmar arch2. SPA shows a
number of variations that it is difficult to
establish a type3.
Deep palmar arch is formed by anastomosis
of the deep palmar branch of the radial
artery with the deep palmar branch of the
ulnar artery. Jaschtschinski4and Coleman
and Anson1 described its variations.
Variations of deep palmar arch are less
common compared to superficial palmar
arch1,5
. So an injury to the ulnar artery or
the superficial palmar arch may
compromise the arterial supply of the
fingers, particularly if there is an
insufficient anastomosis between the
superficial and deep palmar arches6.
Thus familiarity of the possible variations
in arterial pattern of hand is especially
important for the vascular surgeons while
performing reconstructive hand surgeries
for restoration of the normal function of the
hand.
BILATERAL VARIATION IN THE VASCULAR
PATTERN OF PALM- A CASE REPORT
A.Himabindu, B.Narasing Rao
Department of Anatomy, Maharajah‘s Institute of Medical Sciences,
Nellimarla
E-mail of Corresponding Author: [email protected]

47 International Journal of Current Research and Review www.ijcrr.com
Vol. 04 issue 03 February 2012
Case report
During regular dissection for undergraduate
medical students, bilateral variations of
superficial palmar arch and deep palmar
arch were identified in a 65-year-old male
cadaver.
In the right hand, beneath the palmar
aponeurosis there were three vessels. From
medial to lateral side they were ulnar,
median and radial arteries respectively.
Ulnar artery gave one proper and two
common digital arteries, which supplied the
medial 2½ fingers. Arteria nervi mediana, a
branch of ulnar artery, accompanied by the
median nerve passing deep to flexor
retinaculum was found to be giving a
common digital branch that supplied radial
side of the middle finger and ulnar side of
the index finger. Superficial palmar branch
of the radial artery gave a common digital
branch that supplied the radial side of index
finger and the ulnar side of the thumb. A
loop of communication existed between the
radial artery and the arteria nervi
mediana(median artery) but not with the
ulnar artery.(Fig:1)
In the left hand, one proper and four
common digital arteries were branched out
from the ulnar artery. Through these
branches, the ulnar artery supplied entire
palm except radial side of thumb, which
got its nutrition from the radial artery. The
superficial palmar arch was completed by
the first dorsal metacarpal artery in the first
digital web space. First dorsal metacarpal
artery was a branch of radial artery, before
it pierced 1st dorsal interossei muscle.
These variant types of arterial anastamosis
should be kept in mind while performing
hand surgeries. (Fig.1),(Fig.2)
Deep palmar arch in both the upper limbs
was formed between deep branch of radial
artery, which entered the palm through 1st
dorsal metacarpal space piercing the 1st
dorsal interosseus muscle and inferior deep
branch arising from ulnar proper palmar
digital artery of little finger. Deep branch
of ulnar nerve accompanied the arch and
supplied interossei and adductor pollices
muscles. (Fig.3)
DISCUSSION
The arterial supply to the hand and its
variations were being reported since a long
time. Jaschtschinski4 in his study on 200
subjects, classified superficial palmar arch
into complete and incomplete types based
on the anastomosis between the vessels.
Complete SPA was ulnar type (38%),
radioulnar type (27%) and mediano ulnar
type (3%) and radio-mediano-ulnar (0.5%).
He also mentioned the absence of
superficial palmar arch.
A very rare type of superficial palmar arch
termed median –radial type existed
between median artery and radial artery2.
Superficial palmar arch was classified into
Group I (Complete arch) and Group II
(Incomplete arch)1
Group I was further divided into five types:
Type A: The classical radio ulnar arch
formed by superficial branch of radial
artery with large superficial branch of ulnar
artery.
Type B: This arch is formed entirely by
ulnar artery supplying thumb and index
finger.
Type C: Mediano ulnar arch formed
between ulnar artery and median artery.
Type D: Radio-mediano-ulnar arch, in
which three vessels enter into the formation
of arch.
Type E: It consists of a well-formed arch
initiated by ulnar artery and completed by a
large vessel derived from deep arch.
Group II: An incomplete arch exists when
the arteries forming superficial arch do not
anastomose or when the ulnar artery fails to
reach the thumb and index finger. It was
subdivided into
Type A: No anastomosis between
superficial palmar branch of radial artery
and ulnar artery.

48 International Journal of Current Research and Review www.ijcrr.com
Vol. 04 issue 03 February 2012
Type B: Only the ulnar artery forms
superficial palmar arch.
Type C: Superficial vessels receive
contributions from both median and ulnar
arteries but without anastomosis.
Type D: Radial, median and ulnar artery all
give origin to superficial vessels but do not
anastomose.
The median artery forming superficial
palmar arch may arise from ulnar, anterior
interosseous, common interosseous and
from radial arteries7.
This persistent median artery has an
embryological correlation. The ante
brachial pattern of median artery ends at
the level of forearm and the palmar pattern
where the artery accompanying the median
nerve in the forearm and extending down to
the palm supplying the digits8.
A dorsally arising small radial artery
branch, coined as dorsalis pollicis artery by
Agur and Lee9 might complete superficial
palmar arch. McCormack et al. 10
also
reported a small vessel arising dorsally
from the radial artery passing into the palm
to join the ulnar artery in 51% of the hands
studied. First dorsal metacarpal artery often
had a fascial course on the dorsal surface of
the index head of first interosseus muscle,
this artery can be easily injured in an
intervention over the carpometacarpal joint
of the thumb, when approached from the
dorsum of this joint11
.
In the present case, right hand showed a
complete radio-median type of superficial
palmar arch as described by Keen2.Along
with this rare arch, ulnar artery was also
present in the hand without any
communication with the other two vessels.
In the left hand, an ulnar-radial type of
complete arch existed between ulnar artery
and first dorsal metacarpal artery of radial
artery coming from the dorsum. An arch
was seen in the first digital web space.
Eventhough it was not falling in any of the
major classifications of superficial palmar
arch, a dorsal artery completing the arch
was described by Agur and Lee9
McCormack et al10
Deep palmar arch:
Coleman and Anson1 had classified deep
palmar arch as follows:
Group I: Complete arch, further divided
into 4 types.
Type A: The deep palmar arch is formed by
the deep palmar branch of the radial artery,
which anastomoses with superior deep
palmar branch of ulna artery. The latter
follows the deep branch of ulnar nerve into
the palm.
Type B: The commonest pattern of deep
palmar arch that existed between deep
palmar branch of radial artery with the
inferior deep palmar branch of ulnar artery.
Type C: Both (superior &inferior) deep
palmar branches of ulnar artery join the
deep palmar branch of radial artery to
complete the arch.
Type D: It is formed by superior deep
palmar branch of the ulnar artery, which
anastomoses with an enlarged superior
perforating artery of the 2nd
inter
metacarpal space.
Group II: Incomplete arch, further divided
into:
Type A: The inferior deep branch of ulnar
artery anastomoses with the perforating
artery of the 2nd interspace without any
communication with deep palmar branch of
radial artery.
Type B: The deep branch of ulnar artery
ends in an anastomosis with perforating
artery of 3rd interspace as deep palmar
branch of radial artery anastomoses with
the perforating artery of the 2nd interspace.
Mezzogiorno12
identified the deep palmar arch
patterns as radioulnar (66.7%),) radial-
anastomotic (21.67%), radial (8.33%), and ulnar
(3.33%). Olave13
explained two groups of deep
palmar arches. In group I the radial artery passed
through the first interosseous space
anastomosing with one or two deep palmar
branches. These deep palmar branches originated
from the ulnar artery, ulnar proper palmar digital

49 International Journal of Current Research and Review www.ijcrr.com
Vol. 04 issue 03 February 2012
artery of the little finger or the common palmar
digital artery of the fourth interosseous space. In
group II, the artery passed through the second
interosseous space, anastomosing with one deep
palmar branch, rarely with two deep palmar
branches.
In the present case both limbs showed the
commonest variety of complete deep
palmar arch (type B). This complete radio-
ulnar type of deep palmar arch existed
between deep palmar branch of radial
artery, which passed through the first
dorsal interosseous muscle anastomosing
with deep palmar branch of ulnar artery.
This deep palmar branch of ulnar artery
was arising from proper digital branch of
little finger as explained by Olave.13
Embryology
Shin Matsumoto14
explained the arterial
supply of the early upper limb bud
as subclavian-axillary-brachial trunk. The
main arterial supply to the developing hand
consisted of the brachial and interosseous
arteries that terminated in a capillary
plexus. A branch of the trunk- median
artery, temporarily replaced interosseous
artery in supplying the hand. The
connection between superficial brachial
artery and median artery became the main
route of blood supply for the finger arteries
up to the adult stage. Subsequently ulnar
and then radial arteries are formed from the
axis artery at the end of arterial
development and median artery regresses.
Ulnar artery joined the ulnar end of the
superficial palmar arch, radial artery with
deep palmar arch. Persistence of any of
these vessels leads to variations.
Conclusion:
The detailed knowledge of arterial arches
of the human hand, a prehensile organ, is
important to vascular surgeons while
correcting any traumatic events in the hand.
Success of surgical procedures depends on
the healthy function of the arterial arch that
exists between radial and ulnar arteries in
order to maintain normal blood flow to the
hand and digits. Otherwise it leads to
ischemia of soft tissues of the hand which
is the earn tool of mankind.
ACKNOWLEDGEMENTS
Authors acknowledge the immense help
received from the scholars whose articles
are cited and included in references of this
manuscript. The authors are also grateful to
authors / editors / publishers of all those
articles, journals and books from where the
literature for this article has been reviewed
and discussed.
REFERENCES
1. Coleman,s.andAnson,j.(1961):Arterial
pattern in hand–based upon a
studyon650specimens.surgery.gynaec
ology.obstetrics.,(113(4))pp409-24.
2. Keen JA. Study of the arterial
variations in the limbs with special
reference to symmetry of vascular
pattern. Am J Anat. 1961; 108: 245-
61.
3. Poirier,P:Traite d‘Anatomie Humaine
L. Battlle&Co.Paris:pp 833 (1886)
4. Jaschtscinski SN(Morphologie und
Topographie des Arcus volaris
sublimes und profundus
desMenschen)Anat.Hefte 1897;7:
161-88
5. Karlsson,S.&Niechajev ,I.A.(1982):
Arterial anatomy of the upper
extremity.Acta Radiologica
Diagnosis.23: 115-121
6. Calenoff,L.Angiography of the
hand:guidelines for
interpretation.Radiology,102(2):331-
5,1972
7. Sujatha D‘costa,kilarkaje
Narayana,Prasanthi
Narayana,Jiji,Soubhagya R.Nayak,SJ
Madhan Occurance and fate of palmar
type of medaian artery.ANZ J SURG
2006;76,484-487

50 International Journal of Current Research and Review www.ijcrr.com
Vol. 04 issue 03 February 2012
8. Rodriguez- NiedenfuhrM; Sando,J.R;
Vazquez,T;Nearn,L;Logan,B&Parkin,
I. Median artery revisited.J.Anat.,
195(1):57-63,1999
9. Agur AMR, Lee MJ. Grant‘s Atlas of
Anatomy. 9th Ed., Baltimore,
Williams & Wilkins. 1991; 434
10. McCormack LJ, Cauldwell EW,
Anson BJ. Brachial and antebrachial
arterial patterns: a study of 750
extremities. Surg Gynecol Obstet.
1953; 96: 43–54.
11. Wilgis EFS, Kaplan EB. The blood
and the nerve supply of the hand. In:
Morton Spinner, ed. Kaplan‘s
Functional and Surgical Anatomy of
the Hand. 3rd Ed., Philadelphia, J.B.
Lippincott Company. 1984; 206.
12. Mezzogiorno A.Passiatore C.
Mezzogiorno v. Anatomic variations
of deep palmar arteries in man. Acta
Anat,1994,149(3):221-4
13. Olave E.Prates JC. Deep palmar arch
patterns in Brazilian individuals. Surg
Radiol.Anat.1999:(21)267-71
14. Shin Matsumoto1, Hans-Jürg
Kuhn2,Hermann Vogt
3, Michael
Gerke3 Embryological development of
the arterial system of the forelimb in
Tupaia,Article first published online:
26 JAN
2005DOI: 10.1002/ar.1092400314

51 International Journal of Current Research and Review www.ijcrr.com
Vol. 04 issue 03 February 2012
ABBREVIATIONS ANM- ARTERIA NERVI MEDIANA
FR- FLEXOR RETINACULUM
FDMA- FIRST DORSAL METACARPAL ARTERY
DPA- DEEP PALMAR ARCH
IDP.Br- INFERIOR DEEP PALMAR BRANCH OF ULNAR
ARTERY
RA- RADIAL ARTERY
SPA- SUPERFICIAL PALMAR ARCH
UA- ULNAR ARTERY
Fig.1-showing two different types of superficial palmar arches in the left and right hands

52 International Journal of Current Research and Review www.ijcrr.com
Vol. 04 issue 03 February 2012
Fig:2 Showing radial artery and First dorsal metacarpal artery in the left hand
Fig.3-showing variant deep palmar arches in both hands
53 International Journal of Current Research and Review www.ijcrr.com
Vol. 04 issue 03 February 2012
ijcrr
Vol 04 issue 03
Category: Research
Received on:20/11/11
Revised on:03/12/11
Accepted on:16/12/11
ABSTRACT Rapid advances and developments in information technology and telecommunication have brought in
picture a promising technology, called mhealth, for delivery of health-care facilities via mobile
communication technologies. For accelerating the potential of mhealth, it is important to carefully
study the barriers and gaps in policies and collaboration between governments and health-care
institutions. This paper presents a detailed analysis of current and emerging trends in mobile health,
with particular emphasis on case studies.
___________________________________________________________________________
Keywords : Child-Count, Colecta-Palm,
Mobile Midwife, mhealth.
INTRODUCTION
In 1983, the DynaTAC 8000X was the first
mobile phone to be commercially available.
From then onwards, mobile technologies have
grown many-folds with an initial start from
telephony systems to the modern systems that
support a large array of services like text
messaging, email, gaming, photography,
internet access, short range wireless
communication etc. Mobile phones have
successfully bridged the the digital divide
among different sections of developing
economies and have reached the bottom of the
economic pyramid. No other innovation has
ever provided such parallel and distinct
opportunities for instant communication and
thus the utilization of potential of such a
technology for health-care facilities has
become important and obvious.
Mhealth refers to the delivery of health care
facilities supported by mobile devices using
cellular, blue-tooth or wireless networks. The
field of mhealth has emerged in the last
decade or so and has put in place various
applications of health-care service delivery for
remote monitoring, emergency telemedicine,
telematics, tele-radiology, education,
awareness and other direct provisions of care.
In recent years, several mhealth technologies
have been implemented all across the globe
under various research and health-care
projects.
The objective of the current paper is to present
a review on mhealth systems and
technologies. This paper has been divided into
different independent sections and provides
analysis of the concerned section accordingly.
Next section presents a brief overview of
current mobile communication technologies
and their future design and considerations.
After that a section on overview of related
work done through published conference and
journal papers has been placed. Next, a
section on case studies has been presented and
finally the paper wraps up with concluding
remarks.
A REVIEW ON M-HEALTH SYSTEM AND
TECHNOLOGIES
Arvind Rehalia, Rajat Kumar
Dept. of Instrumentation and Control Engineering, Bharati Vidyapeeth's
College Of Engineering, New Delhi
E-mail of Corresponding Author: [email protected]

54 International Journal of Current Research and Review www.ijcrr.com
Vol. 04 issue 03 February 2012
CURRENT MOBILE TECHNOLOGIES
This section describes the main wireless
technologies used in mhealth systems and
their future designs and considerations. SMS
functions and real-time voice communication
collectively forms the backbone of cellular
communication. However with the
development of technologies like that of smart
phones and PDAs, the scope of mhealth is not
just limited to cellular network integration.
GSM is the current technology in use and was
developed by European Telecommunications
Standards Institute under the second-
generation (2G) technologies. GSM operates
under a carrier frequency range of 900 MHz
to 1800 MHz with a limited data transfer rate
of 9.6 Kbit/s. However, in recent years 2.5G
(iDEN, GPRS, EDGE) and 3G ( TD-CDMA,
W-CDMA, CDMA) technologies have
evolved having higher data transfer rates as
compared to GSM. Apart from GSM and 3G
systems, Wireless Local Area Network
(WLAN) and satellite systems also provide a
means for data transfer for mhealth systems.
The satellite systems provide global coverage
and can operate under various frequencies and
data transfer rates. WLAN links two or more
devices using speed spectrum or OFDM radio
methodology and provide data connectivity
with user mobility (roaming unit). After a
detailed analysis, the following limitations
were observed in the current mobile
communication technologies:
1. High cost of Communication Links and
Infrastructure.
2. Limited bandwidth and data transfer rate.
3. Lack of network reliability of cellular
networks.
4. Security challenges during data transfer.
5. Absence of guidelines for cellular phones to
be used as imaging device.
The next generation mobile technologies must
eliminate the limitations of the current system
and on the other hand it should seamlessly
integrate the current technologies for a better
and advanced design. It is expected that the
4G technology will incorporate the
fundamentals that will ensure cost-
effectiveness and high data transfer rates. The
LTE Advanced technology (4G) promises to
provide download speeds up-to 1Gbit/s and
100Mbit/s to mobile users. Further, the 4G
will be based on iPv6. Considering the
continuous improvements, it is almost certain
that the ability of mhealth will grow many
times as with larger bandwidths and faster
data transfer rates, good imaging will become
possible.
RELATED WORK
This section reports the related work done by
research community all across the globe for
development of an effective system for
implementation of mhealth for health-care
service delivery. Different databases like
IEEE, INSPEC etc. were searched and finally
a total of ten research papers published in
various journals and conference proceedings
were selected on the basis of the technologies
involved and the area of application. The
work listed table 1 provides a snapshot of
implementation and integration of different
technologies for health-care service delivery
by mhealth concept. It was found that the
current topic of focus among biomedical
researchers is about development of systems
for remote patient monitoring and wireless
BODY AREA NETWORK. Further, there has
been a continuous work going on for
improving and integrating ambulatory
emergency services and mhealth for better
care of patient. Table 1, clearly suggests that
mhealth is now not just confined to cellular
network technologies and other technologies
like ZigBee, Blue-tooth, satellite etc. have
also stepped in as other communication
network technologies for the development of
mhealth systems.
CASE STUDIES
A total of five case studies based on different
areas of application of mhealth along with
results, findings and other necessary details
are presented here in this section. They are as

55 International Journal of Current Research and Review www.ijcrr.com
Vol. 04 issue 03 February 2012
under:
1. REAL TIME BIOSURVEILLANCE
PROGRAM [11]:
AREA OF APPLICATION : Disease and
Epidemic Outbreak Surveillance.
Description : This program was started in
India and Sri-Lanka with an objective to study
and analyze mhealth systems for improving
early detection and notification system for
disease and epidemic outbreak. Under this
program, 29 front line health workers in India
and 16 in Sri-Lanka were chosen for
digitizing the current paper based system of
forms and patient health records by using
mobile phones. The mobile phones were
equipped with a customized application,
called mhealthSurvey, developed jointly by
IIT Madras and Rural Technology and
Business Incubator. 4 primary health centres
and 25 health sub-centres located in Tamil
Nadu in India and 17 hospitals and clinics all
across the country in Sri-Lanka were selected
for implementation. Front line health workers
digitized the patient's data at health centres
and transferred them to central server. A
statistical data analysis software developed by
AUSTON LAB at Carnegie Mellon
University was used for analysis at central
server and results were sent to regional and
local health officials through mobile and other
communication technologies for issue of
notification, if required.
RESULTS AND FINDINGS
1. It was observed that in India about 86% of
the data was submitted in other-time and only
14% data in real-time. This suggests that the
health workers faced difficulty in real-time
submissions, mainly, due to high frequency of
visiting patients. On the other hand, in Sri-
Lanka around 70% of the data was submitted
in real-time.
2. Indian health workers were almost
accurate in data
submissions and 100% accurate in the last
four weeks of the
program. However, there was very large
amount of errors in submissions made by Sri-
Lankan health workers.
3. It was observed that in Sri-Lanka front line
health workers were aged 18-35 and were able
to complete the whole process easily.
However, in India front line health workers
aging 30-50, even many of them with
experience of 10 years or more were unable to
complete the process without guidance. This
suggests that younger generation is more
adaptive to newer technologies than the older
ones.
2. COLECTA-PALM [12]:
AREA OF APPLICATION : Patient
Monitoring and Support.
Description : This project was started in Peru
under the initiative of University of
Washington and Universidad Peruana
Cayetano Heredia Lima. Collecta-Palm is a
web based application delivered on PDAs to
HIV/AIDS patients for antiretroviral treatment
and reducing transmission by safer sex
behavior. This application uses intranet based
secure connection for transfer of web surveys
to HIV/AIDS patients. A research analysis on
15 people with HIV/AIDS (PWLHA) in two
clinics in LIMA was carried out.
RESULTS AND FINDINGS :
Nine out of fifteen patients were satisfied with
this technology and rated 3.7/5. They found
this system easy-to-use, private and
innovative.
3. CHILD-COUNT [13]:
AREA OF APPLICATION : Point-of-care
Support and Diagnosis.
Description : This program was started in July
2009 in Sauri, Kenya under the partnership of
Millennium Villages Project, The Earth
Institute at Columbia University, UNICEF
Innovation Group, Sony Ericsson and Zain.
Under this project, more than 9500 children
under five years of age were monitored for
community based management of acute
malnutrition by measuring a child's mid upper
arm circumference, home based testing of
malaria and home based treatment of children

56 International Journal of Current Research and Review www.ijcrr.com
Vol. 04 issue 03 February 2012
with diarrheal illness using ORS and Zinc
supplements. The implementation was done
by using a mobile application based on
RapidSMS ( a free open-source framework for
data collection, logistics and communication
using SMS technology ) by 100 community
health workers. They used SMS messages to
register a patient with all the necessary details
and demographics.
RESULTS AND FINDINGS
1. Initially duplicate child registrations made
problems, however, changes made to the
registration algorithm later solved out this
issue.
2. It was found that community health
workers required additional training for
efficient use of the system.
3. It was found that about 10% of the total
registration messages sent by the community
health workers were rejected due to improper
formatting by them.
4. Many of the phones went missing or
needed replacement, thus adding to the overall
cost of the project.
4. m-MONEY FOR WOMEN WITH
FISTULA [14] :
AREA OF APPLICATION : Health Financing
Description : This project was started in
Kenya as a combination of mobile banking,
public information and free treatment. In
Kenya, money transfers through mobile
phones (Safaricom), constitute about 11% of
GDP. Also, in a statistical survey, called
msurvey, about 42% of the respondents didn't
have access to formal bank accounts but
use their mobile phone for financial
transactions.
Considering the potential of mobile banking
in Kenya, this project was started to address
the problems faced by poor rural women in
fistula repair services. The cost of
transportation to a fistula unit and lack of
information about treatment options are the
main problems of the concern. Under this
project, a women can call a free hot-line to
aquire information about fistula repair and if
money is needed by women for transportation
to a fistula unit, financial transfers are made
via M-PESA ( a mobile banking product of
Vodafone).
5. MOBILE MIDWIFE [15] :
AREA OF APPLICATION : Health Education
and Awareness.
Description : This project was started in east
Ghana, under the program, called, Mobile
Technology For Community Health
(MOTECH). This initiative is a result of
partnership among Ghana Health Service,
Grameen Foundation and Columbia
University's Mailman School Of Public
Health and is funded by Bill and Melinda
Gates Foundation. The objective of this
project is to improve the antenatal and
neonatal care of rural women. In this
community health workers, register the patient
using MOTECH forms on mobile phones and
issue a particular patient ID number. The
patient then receives voice or text messages
regularly regarding health information and
information on essential vaccination and
childhood diseases after the birth. In case a
patient has a query, then she can clarify that
by making a call citing reference to her patient
ID.
CONCLUSION
The current paper provided a brief overview
of mhealth systems and technologies. The
case studies clearly suggest the need for
development of low cost ,secure and effective
solutions for successful implementation of
mhealth. Education and awareness about new
technologies among community health
workers is important and organizational
changes should be incorporated for a better
future of the telemedicine industry. While
much research and development still needs to
be done, the mhealth technology has already
started making its impact and the future will
definitely witness a revolutionized health
system that will benefit the citizen and the
society as a whole.

57 International Journal of Current Research and Review www.ijcrr.com
Vol. 04 issue 03 February 2012
ACKNOWLEDGEMENT
Authors acknowledge the immense help
received from the scholars whose articles are
cited and included in references of the
manuscript. Authors are also grateful to
author/editor/publisher of all those
articles/journals and books from where the
literature for this article has been reviewed
and discussed.
REFERENCES
1. Hernandez A.I, Mora F, Villegas G,
Passariello G, Carrault G. Real-time ECG
Transmission via Internet for nonclinical
applications. Proceedings of IEEE
Transactions on Information Technology in
Biomedicine. 2011 Sept; p. 253-57.
2. Aart Van Halteren, Richard Bults,
Katarzyna Wac, Dimitri Konstantas, Ing
Widya, Nicolay Dokovsky et al. Mobile
Patient Monitoring: The Mobihealth
System. The Journal of Information
Technology in Health Care. 2004; 2(5):
365-73.
3. Yoshiko Yamada, Usui S, Kohn M, Mukai
M. A vision of Ambulance Telemedicine
Services using the Quasi-Zenith Satellite.
Proceedings of 6th International Workshop
on Enterprise, Networking and Computing
in Health-care Industry, HealthCom 2004.
2004 June 28-29; p. 161-65.
4. Eduardo A. Viruete Navarro, Jose Ruiz
Mas, Julian Fernanadez Navajas, Cristina
Pena Alcega. Enhanced 3G- Based mhealth
System. Proceedings of the International
Conference on Computer as a Tool,
Eurocon 2005. 2005 Nov. 21-24; p. 1332-
35.
5. Pandian P.S, Safeer K.P, Shakunthala D.J,
Parvati Gopal , Padkai V.C. Interent
Protocol based store and forward wireless
telemedicine system for VSAT and
WLAN. Proceedings of International
Conference on Signal Processing,
Communication and Networking. 2007
Feb. 22-24; p. 54-8.
6. Zuehlke P, Li J, Talaei-Khoei A, Ray P. A
Functional Specification for mobile ehealth
(mhealth) Systems. Proceedings of 11th
International Conference on e-health
Networking, Application and Service. Dec.
16-18; p. 74-8.
7. Christian Sax, Elaine Lawrence. Point-of-
treatment: Touchable E-nursing user
Interface for Medical Emergencies.
Proceedings of Third International
Conference on Mobile Ubiquitous
Computing, Systems, Services and
Technologies. 2009; p. 89-95.
8. Rifat Shahriyar, Md. Faizal Bauri, Gaurab
Kundu, Sheikh Iqbal Ahamed, Md.
Mostafa Akbar. Intelligent Mobile Health
Monitoring System (IMHMS).
International Journal of Control and
Automation. 2009 Sept; 2(3): 13-28.
9. Minutolo A, Sannino G, Esposito M,
Depietro G. A rule-Based mhealth System
for Cardiac Monitoring. Proceedings of
IEEE EMBS conference on Biomedical
Engineering and Sciences. 2010 Nov. 30-
Dec 2; p. 144-49.
10. Blumrosen G, Avisdris N, Kupfer R,
Rubinsky B. C-SMART: Efficient
Seamless Cellular Phone Based Patient
Monitoring System. Proceedings of IEEE
IREHSS 2011: Third International
Workshop on Interdisciplinary Research on
E-health Services and Systems. 2011 June
22-25.
11. Gordon A. Gow, Nuwan Waidyanathan.
Using Mobile Phones in Real-time
Biosurveillance Program: Lessons from the
front lines in Sri-Lanka and India.
Proceedings of International Symposium
on Technology and Society (IEEE). 2010
June 7-9; p. 366-74.
12. Walter H. Curioso, Ann E. Kurth,
Robinson Cabello, Patricia Segura, Donna
L. Berry. Usability Evaluation Of Personal
Digital Assistants (PDAs) to support HIV
Treatment Adherence and Safer Sex
Behavior in Peru. Proceedings of AIMA
2008 Symposium. 2008; p. 918.

58 International Journal of Current Research and Review www.ijcrr.com
Vol. 04 issue 03 February 2012
13. Matt Berg, Dr. James Wariero, Vijay
Modi. Every Child Counts – The use of
SMS in Kenya to Support the Community
based management of acute malnutrition
and malaria in Children under five. 2009
Oct.
14. Maggie Bangsen. Making Mobile Phones
Work for Women With Fistula: The M-
PESA Experience in Kenya and Tanzania.
EngenderHealth Briefing. 2011.
15. Issued by GRAMEEN FOUNDATION
and MOTECH. Mobile Technology For
Community Health in Ghana. 2011 March.
Table 1: Review of related work done regarding development of mhealth systems and technologies
YEAR AUTHOR AREA AND TECHNOLGY COMMENTS
2001 [1] Hernandez et al. Remote Monitoring, ECG, Internet. For drug therapy after infarction.
2004 [2] Halteren et al. Remote Monitoring, UTMS, GPRS. Body Area Network as roaming unit.
2004 [3] Yamada et al. Emergency, Quasi-Zenith Satellite. Ambulance Telemedicine.
2005 [4] Navarro et al. Emergency, 3G. Ambulance Triage support.
2007 [5] Pandian et al. Bio-signals, VSAT, WLAN. Store and Forward telemedicine system.
2009 [6] Zuehlke et al. Mobile Patient Health Record, Mobile
phone.
Use of video-games in physical therapy.
2009 [7] Sax et al. Emergency, Mobile Phone, Tablet PC. Portable Medical Monitoring Computer.
2009 [8] Shahriyar et al. Remote Patient Monitoring, Blue-tooth,
GPRS.
Intelligent mobile health monitoring system,
wearable body sensor network.
2010 [9] Minutolo et al. Emergency, Mobile Phone, PDA, Blue-
tooth.
Detection of 52 kinds of Arrhythmia.
2011 [10] Blumrosen et al. Remote Monitoring, Blue-tooth,
CMDISE utility (IEEE- 11073)
Physiological condition of Patient.

59 International Journal of Current Research and Review www.ijcrr.com
Vol. 04 issue 03 February 2012
ijcrr
Vol 04 issue 03
Category: Research
Received on:14/12/11
Revised on:25/12/11
Accepted on:03/01/12
ABSTRACT Background: India is a country of villages where 72.2% of the people live in the rural area and
women of reproductive age group (15-49 years) constitutes 21% of the total population. Majority of
the women suffer from morbidity due to obstetric and gynecological problems.
Objectives:To know the health seeking behavior of a married women of reproductive age and to know
the types of health services utilized by them. Methodology:It is one year community based cross
sectional study. The study was conducted at Handignur PHC area in Belgaum district (India) from
January 2007- December 2007, with a sample size of 732 (total number of all women in reproductive
age group of selected villages under Handignur PHC area). All married women of reproductive age
group were included in the study, and data was collected by administering pre designed and pre tested
structured proforma. Data were analyzed using SPSS software. Results:The present study revealed
that, 22.03% of the women were in the age group of 35-39 years. The literacy rate of the women was
found to be 74.4%. The literacy rate of their husbands was found to be 82.4%. Joint family was the
commonest being 81.28%. 71.3% of the women belonged to the category V of modified Prasad‘s
group of socio economic status classification. All married women of reproductive age had the
knowledge of the facilities available near their homes. 79.09% of the women preferred to go the PHC/
sub center for general health problems. 99.59% said it was easy accessibility. 92.49% said that they
were satisfied by the treatment. In case of 75.18% of the study participants their husband‘s made
decisions for them regarding their general health problems. For obstetrics care all 732 women
preferred going to the PHC/ sub center. 39.34% said they made 1-2 visit for their ANC check up‘s.
And to be noted that 21.03% of the women did not make a single visit as there was no PHC‘s/ sub
center during the time of their pregnancy. 78.96% said they received iron and folic acid tablets during
the time of their pregnancy. 54.78% women said the doctor provided it to them. 78.96% said they
received injection tetanus toxoid injection during the time of their pregnancy. 66.12% said that they
preferred the PHC/ sub center for the choice of place for getting delivered. 47.00% preferred the
doctors conducting the deliveries. The choice of health facility opted for the gynecological problems;
81.42% said that they preferred the PHC/ sub center. 81.42% women said because it was near to the
house, all necessary and emergency drugs were available and all facilities were provided. 46.17% of
the women said it was their own decision. 91.25% women said they were practicing either temporary
or the permanent methods or their husbands were using temporary methods of family planning.
61.07% women were using copper T as the methods of family planning. 61.07% women said the
doctors at the PHC/ sub center helped them in providing them the family planning methods. 48.35%
women said it was their husband‘s decisions in case of family planning. Conclusion: The participants
had a fair knowledge regarding treatment seeking, the availability of health care services and the types
of services offered.
TREATMENT SEEKING BEHAVIOR OF MARRIED
WOMEN OF REPRODUCTIVE AGE BELONGING TO A
RURAL COMMUNITY OF INDIA
Mohammad Shakil Ahmad1, Shaikh Mohsin
1, Ritu Kumar Ahmad
2
1College of Applied Medical Sciences, Qassim University, Saudi Arabia
2Chettinad Hospital and Research Institute, Kelambakkam, Chennai
E-mail of Corresponding Author: [email protected]

60 International Journal of Current Research and Review www.ijcrr.com
Vol. 04 issue 03 February 2012
The key decision maker for general health problems, obstetric health problems and for family planning
was the husbands, where as for the gynecological problems the majority of women made her own
decisions.
___________________________________________________________________________
Key words: Treatment seeking behavior,
married women, reproductive age group, rural
community
INTRODUCTION
Health seeking behaviour is a topic which has
received considerable attention in recent
years. The ―quest for therapy‖, all over the
world is an important research issue since it
reveals essential elements of people‘s social
behavior and provides insight into their
perceived needs for different kinds of health
services. The community diagnosis is the
starting point for local health planning - at
least in theory- and the study of how people
use health care facilities is an important
component of it.1
Health care delivery in
developing countries have been typically
described in terms of insufficient medical and
paramedical staff, unequal access to services,
emigration of qualified personnel to jobs in
other countries, and the concentration of man-
power in the cities, leaving the under-served
rural areas, has caused more than 80% of the
population without access to appropriate
medical care.2
The rural areas of developing countries are
not ―health care deserts‖, but they have their
own systems of beliefs and customs and their
own kinds of indigenous health practitioners.
As their adaptation to the impact of western
medicine has become better understood, their
potential contribution to the primary health
care has been reconsidered.2
Health seeking
behavior refers to those activities undertaken
by individuals in response to symptoms
experienced. It is a dynamic process in the
house-hold, which combines knowledge,
resources, decision making power and the
availability of health facilities. It requires
some basic knowledge for seeking treatment
such as few repeated episodes of any disease
in household or any prior experience which
helps in making a decision.3
Situation in India: India is a country of
villages where 72.2% of people live in rural
areas.4
Because of ignorance, illiteracy,
cultural and religious factors, rural people are
at higher risk of illness. Many factors play an
important role such as socio-economic status,
cultural acceptability, decision making power,
the availability of health care services, or the
treatment seeking behavior of the people.
Health seeking behavior is influenced by
large number of factors apart from knowledge
and awareness like bio-social profile, their
past experiences with health services,
influences at community level, availability of
alternate health care providers and their
perceptions regarding efficiency and quality
of services.4 In India, women of reproductive
age group (15-49 years) constitute 21% of the
total population, apart from the morbidity
experienced by general population; women of
reproductive age group also suffer from
morbidity due to obstetric and gynecological
problems.5
Around 70% of the deliveries are
conducted by untrained personnel, which will
have an impact on maternal and infant
mortality as well as morbidity. As women of
reproductive age come under vulnerable
group, it is important to know their treatment
seeking behaviour, their decision making
power, and utilization of health care services
that are available. This study focuses how
efficient is the present woman, in making
decisions for availing the health care
facilities, while the country is talking of
women empowerment. The present study is
an attempt in this direction.
Objectives
1. To know the treatment seeking
behaviour of married women of reproductive
age (15-49 years).

61 International Journal of Current Research and Review www.ijcrr.com
Vol. 04 issue 03 February 2012
2. To know the types of health services
utilized by them.
METHODOLOGY
This community based cross sectional study
includes all married women (732) of
reproductive age (15-49 years) living under
the sub center Handignur for a period of one
year. Questionnaires was prepared which
includes information on socio demographic
variables, treatment seeking behavior for
general health problems, obstetric care
gynecological problems, & family planning
the types of health services that are used by
them and who actually takes the decision for
seeking treatment. Study includes all married
women of reproductive age group (15-49
years), residing at their home since one year.
Research was conducted during January-2007
to December-2007. Place of study: Handignur
village is situated 12 kilometers North East of
Belgaum city. Handignur Primary Health
Center has four sub-centers; with a total
population of 24,160.Out of four one of the
sub-centers was randomly selected. All
villages under this sub-center were included
(total no. of household were 762) and from
these villages all married women (732) of
reproductive age were included in the study.
The required information was collected
through door to door personal interview after
informed, verbal and written consent. The
services utilized for some of the problems like
abortion and sexually transmitted diseases
were not included in the study.
Socio economic status: Per capita income in Rupees per month was classified using the
modified BG Prasad classification.6
Social class. Prasad‘s classification 1961
Modified Prasad‘s classification
In study period 2008 July
(per capita income in Rs/month)
I 100 and above 2534 and above.
II 50—99 1267 to 2058
III 30-49 760 to 1241
IV 15-29 380 to 735
V <15 Less than 380
Average consumer price index = 514.6
Modification was done with aid of multiplication factor, which was obtained as below:
Average consumer price index for the study period
M.F. = x 4.93 = 514/100x 4.93= 25.34
100
Results
Demographic profile of study participants: The
observation stated below are the findings of the
present study conducted upon 732 study
participants, married women of reproductive
age of Handignur sub centre, Belgaum district,
Karnataka state. Among the total 732 married
women studied majority of them were between
the age group of 35-39 years (22.03%). Mean
age of patients studied was 35.6 ± 8.87 years.
It was observed that out of 732 husbands of
study participants, 129 (17.6%) were illiterate
and out of 732 study participants (female), 187
(25.5%) were illiterate. While, 135 (18.44%)
belonged to nuclear family, 595 (81.28%)
study participants were from joint family, and
2 (0.27%) were from broken family. Out of
total, 352 (48.08%) were from village
Handignur where PHC and sub-center are
situated and rest were from other villages
under the same PHC. While evaluating
modified Prasad‘s classification, out of all
study participants, 11 (1.5%) women belonged
to category I, 40 (5.5%) women belonged to
category II, 60 (8.2%) belonged to category
III, 99 (13.5%) belonged to category IV and

62 International Journal of Current Research and Review www.ijcrr.com
Vol. 04 issue 03 February 2012
522 (71.3%) belonged to category V. When
asked about any health facility located near the
residence, all of 732 (100%) study participants
were aware about PHC/ sub-centre and 352
(48.08%) had knowledge about private clinic.
General health problems : This study reveals
that, 579 (79.09%) study participants availed
the PHC/ Sub centre for general health
problems, 29 (3.96%) of the study participants
visited a private doctor for general health
problems. Out of 732 study participants, 677
(92.48%) women were satisfied with the
treatment given at the PHC/sub-centre. 153
(20.90%) women said it would be their own
decision for a health facility while 555
(75.18%) women said it would be their
husbands decision and rest would depend on
others decision to choose a health facility for
general health problems.
Obstetrics care: In this study out of 732 study
participants all women said they were using
the PHC/ Sub-centre for their obstetrics. 288
(39.34%) study participants had visited the
PHC/sub-centre once during ANC (Antenatal
Checkup), 290 (39.01%) women had visited
more than once while 154 (21.03%) did not
make any visit during ANC as there was no
health facility available in and around during
their pregnancy. In this study the 578
(78.96%) study participants received iron and
folic acid tablets during ANC, and 154
(21.03%) did not receive any iron and folic
acid tablets during ANC. 578 (78.96%)
participants received injection tetanus toxoid
and 154 (21.03%) women did not receive any
injection of tetanus toxoid. It was observed
that 154 (21.03%) study participants preferred
home for conducting delivery as there was no
health facility available during pregnancy, 484
(66.12%) preferred PHC / sub-centre for
conducting delivery, 24 (3.27%) preferred
district hospital, 43 (5.87%) preferred tertiary
care center, and 27 (3.68%) women preferred
private nursing homes for conducting delivery.
The decision makers for using the health
facilities for obstetric care were, 153 (20.90%)
women made their own decisions, 555
(75.82%) women‘s husbands made the
decision, 23 (3.14%) women‘s in laws made
the decision, and for one woman (.14%) others
who made decision to use the facilities for
obstetrics care.
Gynecological health problems: Out of 732
study participants who complained of
gynecological problems, there were 110
(15.02%) women who complained of
menorrhagia, 226 (30.87%) women
complained of white discharge, 321 (43.85%)
women complained of dysmenorrhoea, and 75
(10.24%) women had other problems.
The choice of health facility for gynecological
problems given as, 596 (81.42%) women
preferred PHC / sub centre, 32 (4.37%) women
preferred tertiary care center, 71 (9.69%)
preferred the district hospital, 18 (2.45%)
women preferred the private hospitals and 15
(2.04%) women preferred other places for
gynecological problems. The reasons given for
using this health facility for gynecological
problems were, 34 (4.64%) women said that it
was near to their house, 30 (4.09%) women
said it was because all drugs were available, 72
(9.83%) women said because all facilities were
provided their, and 596 (81.42%) females said
all the reasons were true and that was the
reason for using the facility. 338 (46.17%)
women made their own decision for using the
particular health facility for gynecological
problems while others 394 (53.81 %) depended
on others decision (Table -1).
Family Planning: Out of all participants, 668
(91.25%) women practiced family planning
and 64 (8.74%) women did not opt for family
planning. In this study out of 732 study
participants, 668 women were using any
method of family planning, 57 (8.53%) women
were using oral contraceptive pills as
contraceptive methods, 79 (67.06%) women
had got copper T inserted, 31 (23.80%) women
had undergone tubectomy, 6 (0.59%) women
said their husbands were using condoms. Total
668 couples were using family planning
methods. Out of 668 participants, 261
(39.07%) women made their own decision for

63 International Journal of Current Research and Review www.ijcrr.com
Vol. 04 issue 03 February 2012
using for using contraceptive methods and 323
(48.35%) women had taken the advice of their
husbands for using contraceptive methods.
Impact of literacy status of the women on
utilization of general health problems (Table –
2): The decision making with respect to
education was as follows, in illiterates 27.80%
women made their own decision, 66.31%
women consulted their husbands, 5.88%
women consulted their in laws, and no women
consulted others. In primary school educated
group, 20.62% women made their own
decision, 77.18% women consulted their
husbands, and 2.18% women consulted their in
laws, In high school educated group, 16.41%
women made their own decision, 81.59%
women consulted their husbands, and 1.99%
women consulted their in laws, In higher
secondary educated group, 9.37% women
made their own decision 82.60% women
consulted their husbands, 4.34% women
consulted their in laws for decision to take
treatment for general health problems.
Impact of literacy status of the women on
utilization of Obstetrics problems: It was
observed that decision making with respect to
education was as follows, in illiterate group,
91.97% women made their own decision,
1.77% women consulted their husbands,
0.53%women consulted their in laws, and
0.53% women consulted others. In primary
school educated group, 39.06% women made
their own decision, 50.62% women consulted
their husbands, 6.25% women consulted their
in laws and 4.06% women consulted others. In
high school educated group, 35.32% women
made their own decision, 62.18% women
consulted their husbands, 0.99% women
consulted their in laws and 1.49% women
consulted others. In higher secondary educated
group, 49.96% women made their own
decision, 56.52% women consulted their
husbands, and nobody consulted their in laws
or others for decision to take treatment for
obstetric care.
Impact of literacy status of the women on
utilization of gynecological problems: It stated
that decision making with respect to education
was as follows; in illiterate group, 91.97%
women made their own decision, 0.53%
woman consulted their husbands, 6.95%
women consulted their in laws, and 0.53%
woman consulted others. In primary school
educated group, 30.93% women made their
own decision, 16.56% women consulted their
husbands, and 45.93% women consulted their
in laws, and 6.56% women consulted others. In
high school educated group, 29.35% women
made their own decision, 9.45% women
consulted their husbands, 60.19% women
consulted their in laws, and 0.99% women
consulted others. In higher secondary educated
group, 34.78% women made their own
decision, 13.04% women consulted their
husbands, and 52.17% women consulted their
in laws. In graduate women, all women made
their own decision for treatment of
gynecological problems.
Impact of literacy status of the women on
utilization of family planning methods: In this
study decision making with respect to
education was as follows; in illiterate group,
45.69% women made their own decision,
53.22% woman consulted their husbands,
0.53% women consulted their in laws, and
0.53% woman consulted others. In primary
school educated group, 38% women made
their own decision, 42.80% women consulted
their husbands, 8.11% women consulted their
in laws and 11.07% women consulted others.
In high school educated group, 34.73% women
made their own decisions, 50% women
consulted their husbands, 2.63% women
consulted their in laws, and 12.63% women
consulted others. In higher secondary school
educated group, 35% women made their own
decision, 60% women consulted their husband,
and 5% woman consulted others while all
graduate women consulted their husband for
family planning methods.
Decision making with respect to socio
economic status of family for general health
problems (Table – 3): It was as follows; in
category I, 9.09% woman made their own
64 International Journal of Current Research and Review www.ijcrr.com
Vol. 04 issue 03 February 2012
decision, 81.81% women consulted their
husbands, 9.09% woman consulted their in
laws. In category II group, 12.5% women
made their own decision, 82.5% women
consulted their husbands and 5% women
consulted their in laws. In Category III group,
23.33% women made their own decision while
76.66% women consulted their husbands. In
Category IV group, 20.20% women made their
own decision 76.76% women consulted their
husbands and 3.03% women consulted their in
laws. In Category V group, 21.83% woman
made their own decision, 74.90% consulted
their husbands, 3.25% women consulted their
in laws and none consulted others for treatment
of general health problems.
Decision making with respect to socio
economic status of the family for obstetrics
care(Graph-1); in category I, 36.36% women
made their own decision, 45.45% women
consulted their husbands and18.18% women
consulted their in laws. In category II group
women 35% women made their own decision,
25% women consulted their husbands, 25%
women consulted their in laws, and 15%
women consulted others. In Category III
group, 40% women made their own decision,
20% women consulted their husbands, 35%
women consulted their in laws, and 5% women
consulted others. In Category IV group,
32.32% women made their own decision
18.18% women consulted their husbands,
44.44% women consulted their in laws, and
5.05% women consulted others. In Category V
group, 27.96% woman made their own
decision, 18.19% consulted their husbands,
48.85% women consulted their in laws and
4.98% women consulted others for obstetric
care.
Decision making with respect to socio
economic status of family for gynecological
health problems (Table -4); in category I,
9.09% woman made their own decision while
rest consulted their husbands. In category II
group, 12.55% women made their own
decision, 82.5% women consulted their
husbands, and 5% women consulted their in
laws. In Category III group, 23.33% women
made their own decision and 76.66% women
consulted their husbands. In Category IV
group, 22.22% women made their own
decision, 74.74% women consulted their
husbands, and 3.03% women consulted their in
laws. In Category V group, 21.83% woman
made their own decision, 74.90% consulted
their husbands, and 3.25% women consulted
their in laws for treatment of gynecological
health problems.
Decision making with respect to socio
economic status of family for family planning
(Table -5); In category I group, 9.09% woman
made their own decision while 90.90% women
consulted their husbands. In category II group,
12.5% women made their own decision, 82.5%
women consulted their husbands, and 5%
women consulted their in laws. In Category III
group, 23.33% women made their own
decision, 76.66% women consulted their
husbands, and no women consulted their in
laws. In Category IV group, 22.22% women
made their own decision 74.74% women
consulted their husbands, and 3.03% women
consulted their in laws. In Category V group,
21.83% woman made their own decision,
74.90% consulted their husbands, and 3.25%
women consulted their in laws for family
planning methods.
Decision making with respect to the type of
family for general problems; 16.93% women
who belonged to the nuclear family made their
own decision, 79.83% women consulted their
husbands, and 3.22% women consulted their in
laws. In women belonging to joint family,
21.94% women made their own decision,
74.91% women consulted their husbands, and
3.13% women consulted their in laws. And in
broken family 100% women took their own
decision for taking treatment for general health
problems.
Decision making with respect to the type of
family for obstetrics problems; 45.16% women
who belonged to the nuclear family made their
own decision, 19.35% women consulted their
husbands, 33.87% women consulted their in

65 International Journal of Current Research and Review www.ijcrr.com
Vol. 04 issue 03 February 2012
laws and 1.61% women consulted others. In
joint family women, 26.73% women made
their own decision, 19.14% women consulted
their husbands, 47.85% women consulted their
in laws and 6.27% women consulted others,
while in broken family all women took their
own decision for obstetric care.
Decision making with respect to the type of
family for gynecological problems; 34.67%
women who belonged to the nuclear family
made their own decision, 12.09% women
consulted their husbands and 53.22% women
consulted their in laws. In joint family women,
48.67% women made their own decision,
10.06% women consulted their husbands,
37.29% women consulted their in laws and
3.96% women consulted others.
Decision making with respect to type of family
for family planning (Table -6); 35.96% women
who belonged to the nuclear family made their
own decision, 55.26% women consulted their
husbands, 0.87% women consulted their in
laws and 6.14% women consulted others. In
joint family women, 39.49% women made
their own decision, 47.10% women consulted
their husbands, 4.25% women consulted their
in laws and 8.87% women consulted others.
DISCUSSION
The present study revealed that, 22.03% of the
women were in the age group of 35-39 years.
The literacy rate of the women was found to be
74.4%. The literacy rate of their husbands was
found to be 82.4%. Joint family was the
commonest being 81.28%. According to the
census data the literacy of females is 52% so
being significant.7
Three-forth of the women belonged to the
category V of modified B G Prasad‘s
classification of socio-economic status. All
married women of reproductive age had the
knowledge of the health facilities available
near their homes. Door steps services were
provided to all married women, 88.93% of the
study participants said ANM‘s provided them
these services. And all study participants said
that services provided were curative,
diagnostic, health education, natal services,
family planning and immunization. Out of the
732 women for general health problems,
79.09% of the women preferred to go the PHC/
sub-center. The reason that they gave was easy
accessibility, as agreed by 99.59%.of women.
92.49% were satisfied by the treatment given.
75.18% of women said their husband‘s were
the decision makers for their general health
problems.
For obstetrics care all 732 women preferred
going to the PHC/ sub center. 39.34% said
they made 1-2 visits for their ANC checkups,
and it was also noticed that 21.03% of the
women did not make a single visit during the
time of their pregnancy. 78.96% of women had
received iron and folic acid tablets during the
time of their pregnancy. More than half of
study participants told doctor providing it to
them. 78.96% had received injection tetanus
toxoid during the time of their pregnancy.
66.12% of women preferred the PHC / sub
center as a convenient place for getting
delivered. 47% preferred the doctors to
conduct their deliveries. Three forth of women
said their husbands took the decisions
concerned to obstetrics care. The choice of
health facility opted by 80% of women for
their gynecological problems was either PHC /
sub center. 81.42% women went there because
it was near to the house and all necessary and
emergency drugs were available and also all
facilities were provided.
More than 90% women said they were
practicing either temporary or permanent
methods or their husbands were using
temporary methods of family planning.
61.07% women were using copper T as the
method of family planning. 61.07% women
said the doctors at the PHC/ sub center helped
them in providing family planning services.
Around 50% women said their husband‘s
decided about the family planning.
CONCLUSION
In the present study, the women of
reproductive age group residing in PHC/sub
66 International Journal of Current Research and Review www.ijcrr.com
Vol. 04 issue 03 February 2012
center Handignur had a fair knowledge
regarding treatment seeking, the availability of
health care services and the types of services
offered by them. Most of the women preferred
the PHC/ sub center for mostly obstetric care
as the new generation was more aware of the
health care system. However it was observed
that they utilized much of the services offered
by the PHC/ sub center for preventive services
as it was adequate and free of cost. For
obstetric care they did not hesitate in deciding
the choice of place to deliver as Handignur
PHC/ sub center is providing all modern
facilities, including a baby warmer and a neo
natal resuscitation kit.
Door steps services were provided by the
health workers uniformly at all the three
villages that come under the PHC/ sub center.
The frequency of the health visitor to the area
was also there for health education.
Antenatal care was provided by health workers
and utilized by the women of the PHC/ sub
center. Younger women availed the facility
more compared to the older generation, who
did not have the privilege women of a health
facility near their house at the time of their
pregnancy. Women‘s awareness towards
treatment seeking for obstetric care was also
found, as compared to the older generation.
The importance of attending the ANC clinics,
intake of iron and folic acid tablets, and the
two doses of tetanus toxoid injections was also
seen. This was due to the regular health
education conducted by the doctor, health
visitors, ANM‘s and the anganwadi workers.
The decision maker for general health
problems, obstetric care and for family
planning was still dependent on their husbands
where as for the gynecological problems the
majority of women made her own decisions.
ACKNOWLEDGEMENT
Authors acknowledge the immense help
received from the scholars whose articles are
cited and included in references of this
manuscript. The authors are also grateful to
authors / editors / publishers of all those
articles, journals and books from where the
literature for this article has been reviewed and
discussed.
REFERENCES
1. Pamela A Hunter & Farhat Sultana,
―Health Seeking Behaviour and the
meaning of Medications in Bolochisthan,
Pakisthan‖; Soc. Sci. Med. Vol. 34, No.
12, pp. 1385 – 1397, 1992.
2. Pierre Claquin ―Private Health Care
Providers in Rural Bangladesh‖, Soc. Sci.
Med. Vol. 15B, pp. 153 – 157, 1981.
3. Alex Kroeger, ―Anthropological & Socio-
Medical Health Care research in
developing countries‖, Soc. Sci. Med. Vol.
17, No. 3, pp. 147 – 161, 1983.
4. K Park, Text book of Community
Medicine, 18th Edition M/ s Banarasidas
Bhanot Publishers; 353- 383, 2005.
5. M Jain, D Nanda, S K Misra, ―Quality
assessment of Health Seeking Behaviour
& Perception regarding Quality of Health
Care Services among rural community of
District Agra‖, Indian Journal of
community medicine Vol. 31, No. 3, July
– September, 2006.
6. Kulkarni A P, Barde. J. P. Text book of
Community Medicine, Ist edi. Mumbai:
Vora Medical Publications: 1998.
7. Governments of India, Ministry of
Statistics & Program Implementations, file
no. M- 12011/ 2/ 2005- PCL.

67 International Journal of Current Research and Review www.ijcrr.com
Vol. 04 issue 03 February 2012
Table 01: Decision maker for using this health facility for gynecological problems
Decision makers No of women Percentage
Self 338 46.17
Husband 294 40.16
In laws 76 10.38
Others 24 3.27
Total 732 100.0
Table 02: Impact of literacy status of the women on utilization of general health problems
Literacy status of women Own Husband In laws Total
Illiterate 52
(27.80)
124
(66.31)
11
(5.8)
187
(100)
Primary school 66
(20.62)
247
(77.18)
7
(2.18)
320
(100)
High school 33
(16.41)
164
(81.59)
4
(1.99)
201
(100)
Higher secondary school 3
(9.37)
19
(82.60)
1
(4.34)
23
(100)
Graduation 0
(0)
1
(100)
0
(0)
1
(100)
Total 154
(21.03)
555
(75.81)
23
(3.14)
732
(100.0)
* (Figures in parentheses indicate row percentages) X2= 16.84, P<0.05
Table 03: Decision making with respect to socio economic status of family for general health
problems
Socio economic status of
family
Self Husband In laws Total
Category I 1
(9.09)
9
(81.81)
1
(9.09)
11
(100)
Category II 5
(12.5)
33
(82.5)
2
(5)
40
(100)
Category III 14
(23.33)
46
(76.66)
0
(0)
60
(100)
Category IV 20
(20.20)
76
(76.76)
3
(3.03)
99
(100)
Category V 114
(21.83)
391
(74.90)
17
(3.25)
522
(100)
Total 154
(21.03)
555
(75.18)
23
(3.14)
732
(100.0)
* (Figures in parentheses indicate row percentages) X2= 6.43, P= <0.05

68 International Journal of Current Research and Review www.ijcrr.com
Vol. 04 issue 03 February 2012
Table 04: Decision making with respect to socio economic status of family for gynecological health
problems
Socio economic status of
family
Own Husband In laws Total
Category I 1
(9.09)
10
(90.90)
0
(0)
11
(100)
Category II 5
(12.5)
33
(82.5)
2
(5)
40
(100)
Category III 14
(23.33)
46
(76.66)
0
(0)
60
(100)
Category IV 22
(22.22)
74
(74.74)
3
(3.03)
99
(100)
Category V 114
(21.83)
391
(74.90)
17
(3.25)
522
(100)
Total
156
(21.31)
554
(75.68)
22
(0.27)
732
(100.0)
* (Figures in parentheses indicate row percentages) X2= 5.87, P<0.05
Table 05: Decision making with respect to socio economic status of family for family planning
Socio economic status of
family
Own Husband In laws Total
Category I 1
(9.09)
10
(90.90)
0
(0)
11
(100)
Category II 5
(12.5)
33
(82.5)
2
(5)
40
(100)
Category III 14
(23.33)
46
(76.66)
0
(0)
60
(100)
Category IV 22
(22.22)
74
(74.74)
3
(3.03)
99
(100)
Category V 114
(21.83)
391
(74.90)
17
(3.25)
522
(100)
Total 156
(21.31)
554
(75.68)
22
(3.0)
732
(100.0)
* (Figures in parentheses indicate row percentages) X2= 5.87, P< 0.05
Table 06: Decision making with respect to type of family for family planning
Type of family Own Husband In laws Others Total
Nuclear family 41
(35.96)
63
(55.26)
3
(0.87)
7
(6.14)
114
(100)
Joint family 218
(39.49)
260
(47.10)
25
(4.52)
49
(8.87)
552
(100)
Broken family 2
(100)
0
(0)
0
(0)
0
(0)
2
(100)
Total 261
(39.07)
323
(48.35)
28
(4.19)
56
(8.38)
668
(100.0)
* (Figures in parentheses indicate row percentages) X2= 6.39, P<0.05

69 International Journal of Current Research and Review www.ijcrr.com
Vol. 04 issue 03 February 2012
Graph. 01 Decision making with respect to socio economic status of the family for obstetrics care
X2= 24.21, P<0.05
Decision making with respect to socio economic status of the family for obstetrics care
36.36 3540
32.3227.96
45.45
2520 18.18 18.1918.18
25
3544.44
48.85
0
15
5 5.05 4.98
0
20
40
60
80
100
Category I Category II Category III Category IV Category V
Economic
Pe
rce
nta
ge
of
wo
me
n
Own
Husband
In laws
Others

70 International Journal of Current Research and Review www.ijcrr.com
Vol. 04 issue 03 February 2012
ijcrr
Vol 04 issue 03
Category: Research
Received on:15/12/11
Revised on:27/12/11
Accepted on:04/01/12
ABSTRACT Rainfall forecasting has been one of the most scientifically and technologically challenging problems
around the world in the last century. Statistical analysis of rainfall records for long periods is essential to
provide information about rainfall variability and to better manage the rainfed agricultural activities such
that the impact of climate change as well as changes in land use can be realistically assessed. This paper
analyse the northeast monsoon rainfall of Tamil Nadu from 1902 -2009 using linear regression
technique. The chi-square test was performed to test the hypothesis. This analysis revealed that the trend
of northeast monsoon rainfall of Tamil Nadu is decreasing and they are not statistically significant.
____________________________________________________________________________
Keywords: chi-square test , forecasting,
hypothesis, linear regression, statistical
analysis.
INTRODUCTION
The northeast (NE) monsoon season (October,
November and December) is the major period of
rainfall activity over south peninsular India. This
season is also known as the winter monsoon [1]
and post-monsoon season[2]
. The NE monsoon
season contributes to about 50% of annual
rainfall in the east coast of Indian peninsular [3]
.
Tamil Nadu is the only sub-division of the
Indian union which receives more rainfall in the
Northeast monsoon season than in the
Southwest monsoon.
India is basically an agricultural country and the
success or failure of the harvest and water
scarcity in any year is always considered with
the greatest concern [4]
. The term monsoon
seems to have been derived either from the
Arabic mausin or from the Malayan monsin.
The availability of adequate freshwater of
appropriate quality has become a limiting factor
for the development worldwide [5]
.
Understanding rainfall variability is essential to
optimally manage the scarce water resources
that are under continuous stress due to the
increasing water demands, increase in
population and the economic development [6]
.
Accurate and timely weather forecasting is a
major challenge for the scientific community.
Rainfall prediction modeling involves a
combination of computer models, observation
and knowledge of trends and patterns.
METHODOLOGY
We have used the Northeast monsoon rainfall
data of Tamil Nadu from the period 1902- 2009.
The data are obtained from the Regional
Meteorological centre, Chennai.
A wide range of rainfall forecast methods are
employed in weather forecasting at regional and
national levels. Fundamentally, there are two
approaches to predict rainfall. They are
Empirical method and dynamical methods.
Using these methods, reasonably accurate
forecasts can be made up. Several recent
research studies have developed rainfall
prediction using different weather and climate
TREND ANALYSIS OF NORTHEAST MONSOON
RAINFALL OF TAMIL NADU
Tamil Selvi .S
1, Samuel Selvaraj .R
2
1Deparment of Physics, Shree Motilal Kanhaiyalal Fomra Institute of
Technology, Chennai 2Department of Physics, Presidency College, Chennai
E-mail of Corresponding Author: [email protected]

71 International Journal of Current Research and Review www.ijcrr.com
Vol. 04 issue 03 February 2012
forecasting methods. Regression is a statistical
empirical technique and is widely used in
business, the social and behavioral sciences, the
biological sciences, climate prediction, and
many other areas. The most widely use
empirical approaches used for climate prediction
are regression, artificial neural network, fuzzy
logic and group method of data handling. This
paper describes empirical method technique
belongs to the regression approach which try to
make a short-term forecast of rainfalls in our
state. Generally, the study of the weather and
climatic elements of a region is vital for
sustainable development of agriculture and
planning. A declining and/or rising trend etc
may be quite instructive for different segments
of the human and natural systems [7]
.
The time series is made up of four components
known as seasonal, trend, cyclical and irregular [8]
. Trend is defined as the general movement of
a series over an extended period of time or it is
the long term change in the dependent variable
over a long period of time [9]
. Trend is
determined by the relationship between the two
variables rainfall and time. Trend analysis was
accomplished
with the line graphs as well as the least square
regression technique for hypotheses testing and
modelling. The chi-square test of association is
used to find whether there is significantly a
variation in the data having similar background.
A trend is the general pattern of fluctuation of
data over time [10]
. Many methods are available
for calculating trend but the most common ones
are the least square regression techniques [11]
.
For reasons of hypothesis testing, generalization
and projection, the study adopted the least
square regression method. The linear regression
line was fitted using the most common method
of least squares. This method calculates the best
fitting line for the observed data by minimizing
the sum of the squares of the vertical deviations
from each data point to the line. If a point lies
exactly on the straight line then the algebraic
sum of the residuals is zero. Residuals are
defined as the difference between an observation
at a point in time and the value read from the
trend line at that point in time. A point that lies
far from the line has a large residual value and is
known as an outlier or, an extreme value.
Though time – series data are not bivariate data,
a linear trend line can be obtained by using the
simple regression analysis technique [12],[10]
. In
the study therefore, time in years is one
independent variable (x) while North east
monsoon rainfall amount for 108 years (1902-
2009) is considered the dependent variable (y).
The equation of a linear regression line is given
as [13]
,
Y = a + bx + e
where;
Y = Dependent variable ( rainfall in mm)
X = Independent variable (time in years).
a = A constant and y – intercept
b = Regression coefficient
e = Error random term
In order to fit regression line the north east
monsoon rainfall (dependent variable) against
time (independent variable) in years were
plotted. Linear regression lines were then fitted
to determine the trends of rainfall.
The contingency test, k – sample chi-square test
of homogeneity is employed to associate the
rainfall data. The problem can be solved as a
contingency problem utilizing the rather normal
chi-square test formula. The use of the
conventional χ2 formula involves the calculation
of the expected frequencies is calculated.
The complete elements of the usual chi-square test is given below as;

72 International Journal of Current Research and Review www.ijcrr.com
Vol. 04 issue 03 February 2012
The following research hypothesis are
formulated a prior for testing at 99% level of
confidence.
Hi: Northeast monsoon rainfall of Tamil Nadu
has varied insignificantly over time in the study
area
Decision Rule
Reject null hypothesis (Ho) and accept the
alternative research hypothesis (Hi) if critical χ2
value is lower than the calculated value at 99%
confidence interval.
RESULTS AND DISCUSSION
As shown in Fig. 1, the north east monsoon
rainfall of Tamil Nadu is statistically defined by
the function
y = -0.0498x + 492.01 +e
It is significant at 99% confidence level with a
coefficient of determination figure of 0.0001 or
0.01 %. In our study, the calculated value is
much higher than the critical value so null
hypothesis is rejected and alternative research
hypothesis is accepted. i.e. Northeast monsoon
rainfall of Tamil Nadu has varied insignificantly
over time in the study area. The trend though
negative is statistically not significant at 99%
confidence; percentage explanation is equally
very low at 0.01%
CONCLUSION
Rainfall time series may be unfounded. The
topic of monsoon-rainfall data series is highly
complex; the role that linear regressions might
play in this topic is one for future research—it
appears, from the evidence here, not to be useful
as a predictive model. Whether it might be
useful for offering an approximate value of
future monsoon rainfall remains to be seen.
Rainfall is most essential for our life. So, we
predict that rainfall in the certain period.
Therefore, we avoid flood, cyclone, forest fire
detection, global warming etc. In future we
predict the rainfall forecasting and other
applications done by using the artificial
intelligence, neural
network and fuzzy sets etc. We do the research
on public sectors and save the world.
Figure 1. shows that the trend of northeast monsoon rainfall for Tamil Nadu is slightly decreasing
which indicates there is a negative linear relationship between rainfall and time.

73 International Journal of Current Research and Review www.ijcrr.com
Vol. 04 issue 03 February 2012
REFERENCES
1. Nageswara Rao G. Variations of the SO
relationship with summer and winter
monsoon rainfall over India: 1872–1993. J.
Climate 1999; 12 : pp. 3486–3495.
2. Singh N and Sontakke N A . On the
variability and prediction of the rainfall in
the post-monsoon season over India. Int. J.
Climatol. 1999; 19: pp. 300–309.
3. Kumar P, Rupa Kumar K, Rajeevan M and
Sahai A K . On the recent strengthening of
the relationship between ENSO and
northeast monsoon rainfall over south Asia.
Climate Dynamics 2007; 28: pp. 649–660.
4. Rajeevan M . Prediction of Indian summer
monsoon: Status, problems and prospects.
Current Science. 2001; 81: pp. 1451-1457 .
5. Gat J.R . Planning and Management of a
Sustainable and Equitable Water Supply
under Stress of Water Scarcity and Quality
Deterioration and the Constraints of Societal
and Political Divisions: The Case for a
Regional Holistic Approach. Department of
Environmental Science and Energy
Research. The Weizmann Institute of
Science, 2004. 76100 Rehovot, Israel.
6. Herath, S. and Ratnayake, U. Monitoring
rainfall trends to predict adverse impacts-
acase study from Sri Lanka (1964-1993).
Global Environmental Change, 2004; 14:
pp. 71-79.
7. Afangideh, A. I., Francis, E. Okpiliya, Eja,
E. I. A Preliminary Investigation into the
Annual Rainfall Trend and Patterns for
Selected Towns in Parts of South-Eastern
Nigeria Journal of Sustainable Development
September 2010; 3: pp. 275-282.
8. Patterson, P. E. 1987, Statistical Methods,
Richard D. Irwin INC, Homewood, IL
9. Webber, J. and Hawkins. C. 1980, Statistical
Analysis Applications to Business and
Economics, Harper and Row, New York.
10. Okoko, E. 2001, Quantitative techniques in
urban analysis. Ibadan, Krafy Books
11. Box, GEP and Jenkins, G. M. 1976, Time
series Analysis Forecasting and control. San
Francisco, Holder Day Publishers.
12. Udofia, E. P. 2008. Fundamentals of social
science statistics, Enugu, Immaculate.
Books.
13. Hays, W. E. 1981, Statistics. CBS College
publishing, Tokyo.

74 International Journal of Current Research and Review www.ijcrr.com
Vol. 04 issue 03 February 2012
ijcrr
Vol 04 issue 03
Category: Research
Received on:11/12/11
Revised on:20/12/11
Accepted on:27/12/11
ABSTRACT Objective: Develop suitable Hurdle treatment for preservation of cauliflower till 180 days of storage
period. Methods: Fresh cauliflower were preserved by combinations of hurdles i.e. blanching (100°C
for 60 sec.), steeped into different concentrations & combinations of preservatives – P0 (Control
sample- fresh without treatment), P1( 8% Salt + 500 ppm Potassium metabisulphite + 100 ppm
Sodium benzoate), P2 (10% Salt + 400 ppm Potassium metabisulphite + 200 ppm Sodium benzoate),
P3( 12% Salt + 300 ppm Potassium metabisulphite + 300 ppm Sodium benzoate), P4 ( 8% Salt +
0.3% Citric acid + 300 ppm Potassium metabisulphite + 300 ppm Sodium benzoate), P5 ( 10% Salt +
0.2% Citric acid + 400 ppm Potassium metabisulphite + 200 ppm Sodium benzoate) and P6 (12%
Salt + 0.1% Citric acid + 500 ppm Potassium metabisulphite + 100 ppm Sodium benzoate),
aseptically temperatures T1 (ambient- 30-37 °C) & T2 (refrigeration- 5-7 °C) for different time
intervals i.e. 0, 30, 60, 90, 120, 150 & 180 days respectively. This preserved cauliflower were studied
for their microbial, sensory & nutritional properties.
Results: The treatments which remained microbial safe till 180 days of storage period were P4/T1
(YMC- 23.14count/gm), P5/T2(YMC- 17.71count/gm) & P4/packed into food grade polyethylene
pouches and then stored at two different T2 (YMC - 8.43count/gm). Among these three, P4/T2 was
scored highest in sensory, lowest in physical and highest in nutritional evaluation. Conclusion: Best
hurdle treatment for preservation of cauliflower till 180 days of storage period was P4/T2.
___________________________________________________________________________
Keyword: Hurdle , YMC, ppm
INTRODUCTION
India is a leading vegetable producing country
in the world with the production of 113.5
million tons. The country is blessed with the
unique gift of nature of diverse climates and
distinct seasons, which makes it possible to
grow a variety of vegetables. The overall
productivity of vegetables is 14.4 tons per
hectare. The production of vegetables has taken
a big jump due to advent of many hybrid
varieties. But our market strategy is not
equipped with the handling of large quantity of
vegetables as a result quantities of vegetables
get spoil. Post harvest losses of horticulture
crops are immense. It varies between 5-39% of
the total production. The shelf life of perishable
vegetables is very low. In brinjal, cauliflower
and chilly post harvest losses were found to be
high (9Jayanthi 2005).
Preservation involves action taken to maintain
foods with desired properties or nature for as
long as possible. It lies at the heart of Food
Science & Technology & it is the main purpose
of Food Processing (3Barnettand & Blanchfield,
1995). The Hurdle concept was first introduced
by Prof. 10
Lothar Leistner of Germany & his
colleagues in 1978. The hurdle governs many
preservation processes. Intense heat (F)
MICROBIAL, SENSORY AND NUTRITIONAL
PROPERTIES OF CAULIFLOWER, PRESERVED BY
HURDLE TECHNOLOGY
Jyoti Sinha1, Ramesh Chandra
2
1Warner School of Food & Dairy Technology, Sam Higginbottom Institute of
Agriculture, Technology and Sciences, (Deemed-To- Be- University,
Formerly AAI-DU), Allahabad (U.P.) 2Centre of Food Technology, University of Allahabad, Allahabad
E-mail of Corresponding Author: [email protected]

75 International Journal of Current Research and Review www.ijcrr.com
Vol. 04 issue 03 February 2012
preserves canned foods, low water activity
prevents microbial growth in dried products,
low pH is responsible for prolonged shelf life
of fermented foods. This preservation technique
is also called combination techniques or barrier
technology or metodascombinados in Spanish,
technologia degli ostacoli in Italian, Hurdle
Technology in German. Potential hurdles for
food preservation are – Temperature (High or
Low), pH (High or Low), Water activity (High
or Low), Modified atmosphere (Co2, N2 etc),
Packaging (Vacuum packaging, aseptic
packaging, edible coating etc.), Radiation (UV,
microwave, irradiation etc), Preservatives
(Class I & II). Hurdle Technology is a
technology by which 2 or more hurdles are
employed in a suitable combination and every
hurdle is used at an optimum level so that
damage to the overall quality of food is kept to
the minimum. Hurdle Technology foods are
defined as ―Products whose shelf-life and the
microbial safety are extended by use of several
factors none of which individually would be
totally lethal towards spoilage or pathogenic
microbes‖ (5Berwal, 1994).
Justification for research objective –
1) Through hurdle technology it become
easy to preserve cauliflower at house
hold level.
2) Make available the cauliflower at
house hold level in off season.
3) Cauliflower preserved through hurdle
technology are free from hazardous
chemical which are used in cold
storage to keep it like a fresh
commodity.
Purpose – To preserve cauliflower through
hurdle technology till 180 days.
MATERIAL AND METHODS
Cauliflower cords : The cords of cauliflower
were procured from local market of Naini.
Chemicals used in preservation : Food grade
(potassium metabisulphate, sodium benzoate &
citric acid) chemicals were used.
Polyethylene pouches : Food grade pouches
were used.
Reagents used in analysis : Analytical grade
reagents were used.
Method of preservation : First cauliflower
head (white curds) after sorting, were cut into
5×3×3 cm. pieces with sharp edged stainless
steel knife, then thoroughly washed in tap water
and distilled water. After washing blanched at
100°C for 60sec. then steeped into different
concentrations & combinations of
preservatives – P0 (Control sample- fresh
without treatment), P1( 8% Salt + 500 ppm
Potassium metabisulphite + 100 ppm Sodium
benzoate), P2 (10% Salt + 400 ppm Potassium
metabisulphite + 200 ppm Sodium benzoate),
P3( 12% Salt + 300 ppm Potassium
metabisulphite + 300 ppm Sodium benzoate),
P4 ( 8% Salt + 0.3% Citric acid + 300 ppm
Potassium metabisulphite + 300 ppm Sodium
benzoate), P5 ( 10% Salt + 0.2% Citric acid +
400 ppm Potassium metabisulphite + 200 ppm
Sodium benzoate) and P6 (12% Salt + 0.1%
Citric acid + 500 ppm Potassium
metabisulphite + 100 ppm Sodium benzoate).
Then aseptically packed into food grade
polyethylene pouches and stored at two
different level of temperatures- T1 (ambient
temperature – 30 to 37 °C) & T2 (refrigeration
temperatures – 5 to 7 °C) for different time
intervals i.e. 0, 30, 60, 90, 120, 150 & 180 days
respectively. This preserved cauliflower were
studied for their microbial , sensory, physical &
nutritional properties and data obtained after
analysis were statistically analyzed.
Microbial properties: Yeast & mold was
determined by Conventional method,
(14
Ranganna 2005).
Sensory properties : Sensory properties (color,
flavor, texture & overall acceptability) were
determined by 9 Point Hedonic Scale method
(17
Ranganna 2005).
Physical properties: Water activity was
determined by using Water Activity Meter
(2Aqua Lab Series 4TE- 2007). pH was
determined by using pH meter (Electronic
Corporation of India, Model 5652) as per
procedure described in 12
Ministry of Health &
Family Welfare, Manual of methods of analysis

76 International Journal of Current Research and Review www.ijcrr.com
Vol. 04 issue 03 February 2012
of foods- Fruit and Vegetable Products ,
(2005)
Nutritional properties : Protein determined by
Micro-Kjeldahl / Kjeltec method (16
Ranganna,
2005), Vitamin A determined by method
mentioned in (18
Ranganna 2005), Vitamin C
determined by 2, 6-dichlorophenol-indophenol
visual titration method, (19
Ranganna 2005) &
potassium determined by Flame photometric
method, (15
Ranganna 2005).
Statistical analysis : Obtained data were
analyzed for ANOVA ( 3 Way Classification)
& critical difference (C.D.) technique,
described by 8Imran and Coover (1983). In
statistical analysis, data used were average of
replicates, total no. of treatments combinations
were 14 – P0/T1, P0/T2, P1/T1, P1/T2, P2/T1,
P2/T2, P3/T1, P3/T2, P4/T1, P4/T2, P5/T1,
P5/T2, P6/T1, P6/T2 (where P0, P1, P2, P3, P4,
P5 & P6 are different combination of
preservatives and T1 & T2 are different level of
temperatures, all are explained in Method of
preservation). Level of significance was
checked at 5% probability level.
RESULTS
Microbial properties of preserved
cauliflower : Yeast & mold count of preserved
cauliflower are given in Table 1. Treatments in
which Yeast & mold count were found lowest
with a storage period of 180 days are P4/T1,
P4/T2 & P5/T2. There were significant
difference between yeast & mold count of
treated samples due to combination of
preservatives & storage temperatures while
there was not significant difference due to days
of storage at 5% probability levels.
Sensory properties of preserved cauliflower :
In sensory properties, results of only overall
acceptability parameter was presented in Table
1. Treatment P4/T2 scored highest in overall
acceptability with a storage period of 180 days.
There were significant difference between
overall acceptability scores of treated samples
due to combination of preservatives & days of
storage while there was not significant
difference due to storage temperatures at 5%
probability levels.
Physical properties of preserved cauliflower
: From Table 1 - lowest water activity & from
Table 2 - lowest pH were found in P4/T2 in a
storage period of 180 days. There were
significant difference between water activity &
pH scores of treated samples due to
combination of preservatives & storage
temperatures while there was not significant
difference due to days of storage at 5%
probability levels.
Nutritional properties of preserved
cauliflower : From Table 2 - highest retention
of protein & vitamin A and from Table 3 -
highest retention of vitamin C & potassium
were found in treatment P4/T2 in a storage
period of 180 days. There were significant
difference between protein, vitamin A, vitamin
C & potassium scores of treated samples due to
combination of preservatives , storage
temperatures & days of storage at 5%
probability levels..
DISCUSSION
In microbial analysis, the increase in yeast &
mold count was observed in all treatments at
both the temperatures. In most of the treatments
yeast & mold count were found above from the
standard (as per 6 Food Safety & Standard
Authority of India, 2006-Yeast/Mold not more
than 100 count/gm) with increase in storage
period, which may be attributed during addition
of preservatives or during packaging which
could have been a carrier of microbes. While in
some treatments counts remained under control
as per above mentioned standard till 180 days
of storage, it might be due to better handling
procedure or different concentration &
combinations of class I & II preservatives &
low temperature of storage. The results are in
agreement of previous finding of 7Gould
(1995), observed that the food preservation
through hurdle technology cause interference
with the homeostasis of yeast & mold. 1Alzamora et al. (1989), also noticed that yeast
and mould counts remained below 100 cfu/gm
77 International Journal of Current Research and Review www.ijcrr.com
Vol. 04 issue 03 February 2012
during 4 months of storage of pineapple slices
preserved through hurdle technology at 5°C. 11
Lopez- Malo et al. (1994), preserved papaya
through hurdles technology, found yeast &
smold counts < 10 CFU/g during 5 months
storage at 25°C.
In sensory evaluation, the difference &
decrease in overall acceptability scores was
observed which may be attributed due to
increase in microbial count with increase in
storage period. But at the same time, treatments
which remained microbial safe till 180 days of
storage period were best rated in sensory
evaluation. The results are in agreement of
previous finding of 13
Pruthi (1990), the
vegetables like potatoes, carrot, cauliflower,
cabbage, bitter guard, peas, mushroom and
animals foods (meat, fish and poultry)
preserved in an acidified sulphited brine
solution through steeping can be used for
pickling or home cooking after leaching out the
salt and acid. 4Barwal et al. (2005) standardized
the low cost and low energy processing
technology for preservation of cauliflower
involving different concentration and
combination of salt (5-10%), potassium
metabisulphite (0.2%) and citric acid (1%) after
blanching. The preserved cauliflower was
accepted in sensory evaluation after 90 and 180
days of storage by reconstituted in running
water for half an hour & evaluated for the
preparation of pickle and pakora.
In physical test, the reduction in water activity
& pH of preserved sample were found as
compare to initial or fresh commodity. Reduced
water activity & pH were found effective for
long time storage. The results are in agreement
of previous finding of 21
Vibhakara et al.(2005),
maintenance of pH< 4.5 helped in controlling
multiplication and survival of spores & also
helpful in achieving shelf stability. Low pH and
water activity solutions are used as
antimicrobial agent or as antioxidant to prevent
browning, to reduce discoloration of pigments,
and to protect against loss of flavor, changes in
texture (23
Wiley, 1994).
In nutritional evaluation, loss of nutrients were
found in each treatments but on other hand
better retention of protein, vitamin A, vitamin
C & potassium were also observed in
treatments of 180 days of storage period. The
results are in agreement of previous finding of 20
Srivastava & Kumar (2002), sulphur dioxide
is widely used throughout the world in the
preservation as it acts as an antioxidant and
bleaching agent. These properties help in the
retention of vitamin C, vitamin A and other
oxidizable compounds. Sulphur dioxide with
potassium metabisulphite (if added in the
solution) helps to retain vitamin C content of
the preserved material (22
Verma & Joshi,
2000). Low pH and water activity solutions
were also effective towards nutrient retention
(23
Wiley, 1994).
CONCLUSION
All the treatments combination were not
effective for preservation of cauliflower till 180
days of storage period. Only 3 treatments -
P4/T1, P4/T2 & P5/T2 were microbial safe till
180 days & among these 3, only P4/T2 was
found best in sensory as well in nutrient
retention in 180 days of storage period.
ACKNOWLEDGEMENT
I express my deep sense of gratitude for my
advisor (Prof.) Dr. Ramesh Chandra, (Dean)
Warner School Of Food & Dairy Technology,
to all member of advisory committee - Dr. D.B.
Singh, Dean of Horticulture Department,
(Prof.) Dr. Sarita Sheikh, Dean of Halina
School of Home Science, (Prof.) Dr. Sangeeta
Upadhayay, Assistant Professor
(Microbiology),Warner School Of Food &
Dairy Technology, (Prof.) Dr. Ram Lal, Dean
of Department of Statistics, Sam Higginbottom
Institute of Agriculture, Technology &
Sciences, Allahabad, for there sincere guidance,
suggestions, constructive work &
encouragement during the entire research work.
Sincere thanks to Honorable Vice-Chancellor,
Sam Higginbottom Institute of Agriculture,
Technology & Sciences, Allahabad, for

78 International Journal of Current Research and Review www.ijcrr.com
Vol. 04 issue 03 February 2012
providing me necessary technical & financial
facilities.
I want to acknowledge the immense help
received from the scholars whose articles are
cited and included in references of this
manuscript. I also grateful to authors / editors /
publishers of all those articles, journals and
books from where the literature for this article
has been reviewed and discussed.
REFERENCES
1. Alzamora SM, Gerschenson LN, Cerrutti P,
Rojas A M. Shelf-stable pineapples for
long-term non refrigerated storage. J.
Lebensm-Wiss. u. – Tech 1996; 22:233-
236.
2. Sample Preparation & Taking a Reading.
In: Operator‘s manual AQUA LAB 4TE,
Water activity meter. Decagon Devices;
2007. p. 46-51.
3. Barnettend M, Blanchfield JR. What does
preservation mean. Food Sci. Technol
1998; 9:93-12.
4. Barwal VS, Sharma R, Singh R.
Preservation of cauliflower by Hurdle
Technology. Food Sci and Tech 2008;
42(1):26-31.
5. Berwal JS, Hurdle technology for shelf
stable food products. Indian Food Industry
1996; 13:40-43.
6. Ministry of Health & Family Welfare
(Food Safety & Standard Authority of
India) Part 4th New Delhi. Microbiological
Requirements of Food Products. Appendix
B, Table-4. 2006; p.665.
7. Gould GW. Interference in homeostasis.
In: Whitten bury R, Banks JG, editors.
Homeostatic Mechanism in
Microorganisms. 3rd ed.: Bath University
Press; 1995. p. 220.
8. Imran RL, Cover WB. Statistical analysis.
In: A modern approach to statistics. 2nd ed.
New York; 1983: p. 120.
9. Jayanthi M. Innovative solution to extent
the shelf life of fruits. Processed Food
Industry 2008; 9(1): 37-38.
10. Luthar L. Hurdle effect and energy saving.
In: Downey WK, editors. Food Quality and
Nutrition. 2nd ed. London: Applied Science
Publishers; 1990. p. 553-557.
11. Lopez-Milo A, Palou E, Welty J, Corte P,
Arias A. Shelf-stable high moisture papaya
minimally processed by combined
methods. International J. of Food Research
1995; 27(6):545-553.
12. Ministry of Health & Family Welfare
(India). Manual of methods of analysis of
foods: Fruit and Vegetable Products. New
Delhi: Government of India; 2005; 6.
13. Pruthi J S. Physiology, Chemistry and
Technology of Passion Fruits. In:
Advances in Food Research. Vol. 12. 2nd
ed. New York: Academic Press; 2000. p.
203-274.
14. Ranganna S. General instruction for
microbiological examination. In: Hand
Book of Analysis and Quality Control for
Fruit and Vegetable Products. 2nd ed. New
Delhi: Tata McGraw Hill Education Private
Ltd New York; 2005. p. 646-655.
15. Ranganna S. Minerals. In: Hand Book of
Analysis and Quality Control for Fruit and
Vegetable Products. 2nd ed. New Delhi:
Tata McGraw Hill Education Private Ltd
New York; 2005. p. 127-128.
16. Ranganna S. Proximate constituents. In:
Hand Book of Analysis and Quality
Control for Fruit and Vegetable Products.
2nd ed. New Delhi: Tata McGraw Hill
Education Private Ltd New York; 2005. p.
21-24.
17. Ranganna S. Sensory evaluation. In: Hand
Book of Analysis and Quality Control for
Fruit and Vegetable Products. 2nd ed. New
Delhi: Tata McGraw Hill Education Private
Ltd New York; 2005. p. 623-624.
18. Ranganna S. Plant pigments. In: Hand
Book of Analysis and Quality Control for
Fruit and Vegetable Products. 2nd ed. New
Delhi: Tata McGraw Hill Education Private
Ltd New York; 2005. p. 84-86.
19. Ranganna S. Vitamins. In: Hand Book of
Analysis and Quality Control for Fruit and

79 International Journal of Current Research and Review www.ijcrr.com
Vol. 04 issue 03 February 2012
Vegetable Products 2nd ed. New Delhi:
Tata McGraw Hill Education Private Ltd
New York; 2005. p. 105-106.
20. Srivastava RP, Kumar S. Principles and
Methods of Preservation. In: Fruits &
Vegetable Preservation: Principles And
Practices. 3rd
rev. ed. International Book
Distributing Co; 2002. p. 93.
21. Vibhakara HS, Manjunath SS, Radhika M,
Gupta DK, Bawa AS. Effect of gamma-
irradiation in combination preservation
technique for stabilizing high moisture
spice based vegetables. J Foods Sci and
Techno 2007; 42 (5):434-438.
22. Verma LR, Joshi VK. Steeped preserved
products. In: Verma LR, Joshi VK, editors.
Post harvest technology of fruits and
vegetables. Indian publishing Co. New
Delhi; 2000. p. 861-867.
23. Wiley RC. Preservation of vegetables. In:
Chapman & Hall editors. Preservation
methods for processed refrigerated fruits
and vegetables. 2nd
ed. New York; 1994. p.
226-268.
Table 1. – Yeast & mold count, Overall acceptability & Water activity scores of preserved cauliflower
in different treatments with its shelf life
Treatments with its YMC/gm Overall acceptability Water activity(%)
Shelf life(in days)
P0/T1 -180 32.17* 9* 0.98*
P0/T2 -180 32.17* 9* 0.98*
P1/T1 - 30 65 7 0.78
P1/T2 -60 51 7 0.74
P2/T1 -60 35.75 6 0.71
P2/T2 -90 26.8* 6.25 0.69*
P3/T1 -90 52 6.25 0.76
P3/T2 -120 47.5 6.8 0.74
P4/T1 -180 23.14* 7.14* 0.67*
P4/T2 -180 8.43* 8* 0.63*
P5/T1 -150 40.29 7 0.74
P5/T2-180 17.71* 7.85* 0.66*
P6/T1-120 28.45* 6.6 0.69*
P6/T2 -150 26.5* 7.3* 0.67*
YMC/gm-Yeast & mold count/gm; All values are MEAN; *Significant values

80 International Journal of Current Research and Review www.ijcrr.com
Vol. 04 issue 03 February 2012
Table 2. – pH, Protein & Vitamin-A scores of preserved cauliflower in different treatments with its
shelf life
Treatments with its pH Protein Vitamin-A
shelf life (in Days) (mg/100gm) (mg/100gm)
P0/T1 -180 6.2* 2.5* 50.23*
P0/T2 -180 6.2* 2.5* 50.23*
P1/T1 -30 4.5 2.1 49
P1/T2 -60 4.2 2.2 49.33
P2/T1 -60 4.4 2 48.4
P2/T2 -90 4.14 1.9 49.03
P3/T1 -90 4.2 1.72 47.5
P3/T2 -120 4.0 1.8* 48.2*
P4/T1 -180 3.5* 1.3* 45.2*
P4/T2 -180 3.3* 1.6* 47.2*
P5/T1 -150 3.9 1.5 43
P5/T2 -180 3.7* 1.4* 45.2*
P6/T1 -120 4.04 1.3 45
P6/T2 -150 3.8 1.82* 47*
All values are MEAN ; * Significant values
Table 3. – Vitamin -C & Potassium scores of preserved cauliflower in different treatments with its
shelf life
Treatments with its Vitamin-C (mg/100gm) Potassium (mg/100gm)
shelf life (in Days)
P0/T1 -180 55.56* 136.21*
P0/T2 -180 55.56* 136.21*
P1/T1 -30 49 134.5
P1/T2 -60 49.8 135.7
P2/T1 -60 49.5 132.2
P2/T2 -90 50.4* 135.5*
P3/T1 -90 46.6 131.9
P3/T2 -120 47* 135.11*
P4/T1 -180 33.5* 128.4*
P4/T2 -180 37.6* 132.1*
P5/T1 -150 35.2 128.2
P5/T2 -180 37.4* 130.8*
P6/T1 -120 37.7 130.2
P6/T2 -150 38* 133.2*
All values are MEAN ; *Significant values

81 International Journal of Current Research and Review www.ijcrr.com
Vol. 04 issue 03 February 2012
ijcrr
Vol 04 issue 03
Category: Review
Received on:02/11/11
Revised on:20/11/11
Accepted on:15/12/11
ABSTRACT The success of dental implant is dependent upon the integration between the implant and the intraoral
hard/soft tissue. Crestal bone loss is one of the factors that affect the long term prognosis of a dental
implant. Platform switching is a concept recently introduced in implant dentistry. It is intended to
reduce the crestal bone loss that is commonly found around implants exposed to the oral environment.
The purpose of this review article is to discuss the mechanism, by which it contributes to preserve
crestal bone loss, literature review, benefits, limitations and consequence of platform switching; in
order to assess its clinical success in implant dentistry
___________________________________________________________________________
Keywords: Biological width, crestal bone loss,
platform switching, stress.
INTRODUCTION
Dentistry is now focused mainly on the fixed
replacement of lost teeth with priority given to
aesthetic and function. Patient‘s desire for fixed
restoration has increased over artificial
substitutes. With new trends in dentistry, dental
implants have taken the top position in fixed
restoration and also have been accepted by the
patient‘s widely.
Implants have been used for various purposes
such as single, multiple or full arch restoration.
It could be a single or two piece implant
system. Single implant system eliminates the
junction between implant platform and
abutment. Also have limitations of positioning,
integration and aesthetics. Traditional two-
stage implants have enjoyed a long history of
clinical success and have offered surgical and
prosthetic versatility. They have been used in
various situations with better emergence profile
as well as bone integration at the implant
abutment interface which gives rise to a new
concept called ―Platform Switching‖.
For two piece implant system, there exists two
potential pathways for bacterial penetration
resulting in crestal bone loss. One route is
through the inside of the abutment, along the
screw threads eventually at the implant
abutment interface or micro gap. Alternatively
bacteria can migrate along the outer surface of
the abutment. Ericsson et al, identified two
important entities in the implant crestal region
i.e. Plaque associated inflammatory cell
infiltrate and Implant associated inflammatory
cell infiltrate and he concluded that apical
border of an inflammatory cell infiltrate is the
aetiological factor for crestal bone loss which
was always separated from the bone crest at 1
mm of healthy connective tissue1.
However, early crestal bone loss has been
commonly observed. Adell et al was the first to
quantify and report marginal bone loss and
indicated greater magnitude of bone loss during
the first year of prosthesis loading. There are
many elements that can accelerate the
PLATFORM SWITCHING IN IMPLANT
DENTISTRY - A REVIEW
Gayathri N, Lakshmi S
Department of Prosthodontics, Meenakshi Ammal Dental College,
Alappakkam Main Road, Maduravoyal, Chennai
E-mail of Corresponding Author: [email protected]

82 International Journal of Current Research and Review www.ijcrr.com
Vol. 04 issue 03 February 2012
resorption of crestal bone, and they are
discussed below2.
Factors accelerating crestal bone loss:
1) Biologic Width
The crestal bone remodelling is an important
phenomenon that occurs around natural teeth
and implants called the biologic width – the
natural seal that develops around any object
protruding from the bone and through the tissue
into the oral environment. This seal isolates the
bone from the oral environment.
Biological width forms within the first 2-4
weeks after the implant abutment junction has
been exposed to the oral cavity. It is a barrier
against bacterial invasion and food ingress
implant-tissue interface. The ultimate location
of epithelial attachment following phase 2
surgery in part, determines early post-surgical
bone loss. Thus, implant bone loss is in part, a
process of establishing the biological seal.
When implants are initially placed within bone
and then covered with an adequate layer of soft
tissue (first-stage surgery), there is typically
little or no crestal bone resorption. When the
implant is uncovered (in second-stage surgery)
and connected to an abutment, the body then
reacts and in the process of creating the
biologic width, the crestal bone may resorb3.
2) Micro gap
In two stage implant systems, after abutment is
connected, a microgap exists between the
implant and the abutment at or below the
alveolar crest. The countersinking below the
crest is done to minimize the risk of implant
interface movement during bone remodelling,
to prevent implant exposure during healing and
also to enhance the emergence profile.
Countersinking places the implant micro gap
below the crestal bone. The microgap crestal
bone level relationship was studied
radiographically by Hermann et al, who for the
first time, demonstrated that the microgap
between the implant/abutment has a direct
effect on crestal bone loss, independent of
surgical approaches. Epithelial proliferation to
establish biological width could be responsible
for crestal bone loss found about 2mm below
the microgap3,4.
3) Surgical Trauma
Heat generated during drilling, elevation of the
periosteal flap and excessive pressure at the
crestal region during implant placement may
contribute to implant bone loss during the
healing period. Signs of bone loss from surgical
trauma and periosteal reflection are not
commonly observed at the implant stage II
surgery in successfully osseointegrated
implants3. Wildermann et al, reported that bone
loss due to periostium elevation was restricted
to the area just adjacent to the implant, even
though a larger surface area of the bone was
exposed during surgery. Thus, surgical trauma
is unlikely to cause early crestal bone loss5.
4) Stress
Cortical bone is least resistant to shear force,
which is significantly increased in bending
overload. Excessive stress on the immature
implant bone interface in the early stage of
prosthesis in function is likely to cause crestal
bone loss. However, bone loss from occlusal
overload is considered to be progressive rather
than limited to the first year of loading6.
The Need for Better Crestal Bone
Preservation Emerges
Crestal bone preservation should be thought
during the treatment planning stage itself.
There are various approaches described in the
literature to prevent crestal bone loss. One of
them is the Platform switching concept.
Platform switching ―is the use of prosthetic
components having an abutment diameter
undersized when compared to the diameter of
the implant platform‖.7
Platform switching is a restorative protocol
which has been reported by Dr. Richard
Lazzara as a means of limiting crestal bone loss
around dental implants. In this way, the
prosthetic connection is displaced horizontally
inwards from the perimeter of the implant
platform, creating an angle or step between the
abutment and implant; improving the
distribution of forces. So this article reviews
about the literature how platform switching has

83 International Journal of Current Research and Review www.ijcrr.com
Vol. 04 issue 03 February 2012
contributed to implant dentistry especially for
crestal bone preservation7.
HISTORY OF PLS
In 1991, the 3i wide diameter 5.0 and 6.0 mm
implants were designed with a matching
diameter seating surface to be used however,
there were no matching diameter prosthetic
components available, and as a result, they
were restored with standard 4.1 mm diameter
components, which created a 0.45mm or 0.95
mm circumferential horizontal difference in
dimension. After the initial 5 year period,
radiographical reviews stated that the amount
of crestal remodelling was reduced and also
exhibited no vertical crestal bone loss.
These results have led many researchers to
become interested to perform investigations.
Various studies have been conducted in human
beings, animals and Finite element analysis
comparing the platform switched implants with
regular two piece implants.
Human Studies:
According to Lazzara and Porter, the deliberate
creation of a space for the physiological barrier
minimizes the space for repositioning of the
fibers. By displacing the junction with the
abutment to a more medial position with
respect to the axis, an increased surface
repositioning of the biological space occurs.
This space is created in the horizontal plane 1
mm from the implant-abutment junction,
supported over the external margin of the
platform. Implant design also influences the
morphology of the gingival margin – both the
neck micro and macrostructure, and the
macrostructure of the implant-abutment
junction7. In turn, ensuring a minimum
distance of 3 mm between implants allows
sufficient margin to restore the biological space
for restorations, as demonstrated by Tarnow a
decade ago8. In implants involving an
expanded platform integrated in their
macrostructure, and ensuring the above
mentioned distance between implants, bone
crest preservation is seen to be 57% greater
than with a traditional restoration design.
Trammell et al, in a case-control study,
measured the biological space with reduced and
conventional platform abutments in the same
individual. They concluded that bone loss was
significantly smaller with the expanded
platform9.
Vela Nebot et al assessed interproximal bone
resorption on the medial and distal of each
implant using digital radiography at 1, 4, and 6
months after abutment attachment. Platform
modification has been proposed to reduce the
biologic and mechanical aggressions on the
biologic width. The resulting peri-implant bone
preservation leads to better aesthetics results10.
Gardner presents a case study using platform
switching implants dealing with the changes
that occur when an implant is placed in bone.
He states that its main advantage is that it is an
effective way to control circumferential bone
loss around dental implants11.
Hurzeler M, showed that crestal bone height
around dental implants could be influenced
using a platform switch protocol and that the
bone level would remain stable within 1 year
after final prosthetic reconstruction. They
concluded the concept of platform switching
appears to limit crestal resorption and seems to
preserve peri-implant bone levels12.
Canullo L, Rasperini G, suggests that
immediate loading with platform switching can
provide peri-implant hard tissue stability with
soft tissue and papilla preservation13.
Degidi et al suggested that platform switching
in combination with an absence of micro
movement and micro gap may protect the peri-
implant soft and mineralized tissues, explaining
the observed absence of bone resorption and
also said that immediate loading did not
interfere with bone formation and did not have
adverse effects on osseointegration14.
Qian Li et al evaluated the clinical results of
dental implant treatment with platform
switching technique in esthetic zone and to
investigate its technical characteristics. He
concluded that platform switching is a simple
and reliable technique for dental implant
treatment, helping to control marginal bone loss

84 International Journal of Current Research and Review www.ijcrr.com
Vol. 04 issue 03 February 2012
and ensure esthetic results in the esthetic
zone15.
Baumgarten et al describes that platform
switching technique and its usefulness in
situations where shorter implants must be used,
where implants placed in aesthetic zones and
where a larger implant is desirable but
prosthetic space is limited. They concluded that
sufficient tissue depth of approximately 3mm
or more is necessary to accommodate an
adequate biologic width and also, platform
switching helps to prevent the anticipated bone
loss and also preserves crestal bone16.
Cappiello M observed vertical bone loss
between 0.6mm and 1.2 mm in platform
switched implants comparatively lesser than
regular two piece implants17.
Hermann et al reviewed platform switching,
implant design in cervical region, nano
roughness, biological width, fine threads,
abutment designs and avoidance of micro
lesions in the peri implant soft tissue as factors
that determine the preservation of crestal bone
levels. He concluded that these factors
determine the aesthetic outcomes of implant
restorations18.
Vela Nebot et al concludes that platform
switching improves aesthetic results and that
when invasion of biologic width is reduced,
bone loss is reduced10.
Mangano et al evaluated 1920 Morse tapered
connection implants clinically and
radiographically at 12, 24, 36 and 48 months
after implant insertion. They noted an overall
cumulative implant survival rate of 97.56%
(96.12% in maxilla and 98.91% in the
mandible). The absence of an implant–
abutment interface (micro-gap) is associated
with minimal crestal bone loss19.
Animal Studies:
Becker et al in his histomorphometric study in
dogs, concluded that twenty eight days after
implant placement, both CAM (sand blasted
and acid etched screw type implants with either
matching) and CPS (smaller diameter healing
abutments) revealed crestal bone level changes
but they found no significant differences
between them20.
Sarment et al is found some changes in the
width and height of bone when using platform
switching implants21.
Weiner et al connects the development of
biologic width with the implant surface. They
did not mention platform switching but focuses
the study on the use of shift tissue engineered
collars with micro grooving22.
Histological Studies:
Luongo et al, examined biopsy specimens to
helps explain the biologic processes occurring
around a platform-switched implant. An
inflammatory connective tissue infiltrate was
localized over the entire surface of the implant
platform and approximately 0.35 mm coronal
to the implant-abutment junction, along the
healing abutment. A possible reason for bone
preservation around a platform switched
implant may lie in the inward shift of the
inflammatory connective tissue zone at the
implant-abutment junction, which reduces its
injurious effect on the alveolar bone23.
Degidi M et al evaluated the histology and
histomorphology of three morse cone
connection implants in a real case report and he
explains that when there is zero microgaps and
no micro movement, platform switching shows
no resorption. He also observes that this
method provides better aesthetic results24.
FEA Studies:
Hsu et al analyzed the behaviour of reduced
platform restorations in a 3 D FEA. Their
results showed a 10% decrease in all the
prosthetic loading forces transmitted to the
bone-implant interface. Similar finite elements
studies in two dimensions show great
variability in the results obtained25. In effect,
while some investigators report a decrease in
force to the cortical bone of less than 10%,
other authors such as Tabata et al have reported
a decrease of 80%26.
Rodriguez-Ciurana et al in a two-dimensional
biomechanical study involving platform
switching integrated into the implant design,
failed to obtain peri-implant bone force
85 International Journal of Current Research and Review www.ijcrr.com
Vol. 04 issue 03 February 2012
attenuation values as high as those reported in
earlier studies, when comparing platform
expansion with a traditional restoration model.
In addition, the authors concluded that force
dissipation in the platform switching restoration
is slightly more favourable in an internal than
in an external junction, since it improves
distribution of the loads applied to the occlusal
surface of the prosthesis along the axis of the
implant. On the other hand, this concentration
of forces along the axis of the implant,
transmitted through the retention screw,
increases the possibility of abutment fracture,
and thus may lead to failure of the restoration.
All studies contrasting platform switching
versus continuity of the platform with the body
of the implant agree that force to bone diffusion
is improved by expanding the platform27.
However, Canay and Akça, in a three
dimensional finite elements analysis involving
different implant-free expanded platform
dimensions and a range of abutment designs,
claimed that the effect of platform expansion is
not attributable to the distribution of loads to
the peri-implant bone but rather simply to
redistribution of the new biological space.
Nevertheless, the authors pointed the need for
further research on the behaviour of the
marginal bone around the implants. The most
appropriate reduced platform abutment design
for securing lesser implant abutment material
fatigue is represented by conical emergence
abutments with a variable height of 1.5-2mm,
freeing extension of the implant platform
between 0.5-0.75mm. Such platform switching
is not advisable in mandibular implant mucosal
support prostheses, since reduction of the
diameter of the junction lessens the abutment
resistance in response to occlusal loading
applied in the posterior area of the over
dentures – fundamentally compromising the
connecting abutment closest to the area where
loading is applied28.
Maeda Y et al, showed that the stress level in
the cervical bone area at the implant was
greatly reduced when the narrow diameter
abutment was connected compared with the
regular-sized one. They suggested that the
platform switching configuration has the
biomechanical advantage of shifting the stress
concentration area away from the cervical
bone-implant interface. It also has the
disadvantage of increasing stress in the
abutment or abutment screw29.
Schrotenboer et al investigated the effects of
implant microthreads on crestal bone stress
compared to a standard smooth implant collar
and to analyze how different abutment
diameters influenced the crestal bone stress
level. They concluded that microthreads
increased crestal stress upon loading. Reduced
abutment diameter resulted in less stress
translated to the crestal bone in the microthread
and smooth-neck groups30.
DISCUSSION
According to review literature, the technique of
platform switching seems to have greatest
potential to limit the crestal resorption. The
inflammatory connective tissue infiltrate is
located at the level of the collar, and doesn‘t
migrate apically. Thereby resorption is avoided
and the crestal bone is stabilized at the level of
the implant collar. At the same time, the micro-
gap is shifted away from the crestal bone,
decreasing the probability of resorption by an
increased distance of the peripheral bone and
the base of the abutment.
To maintain the long term implant stability, it is
important to minimize crestal bone loss around
implant. Stress is concentrated around the
crestal region where 2 materials such as bone
and implant with different modulus of elasticity
interact. Peak bone stresses that appear in
marginal bone are believed to cause bone micro
fracture. So, decreased stresses may not be the
only reason for the positive results shown by
platform switching. Moreover, by decreasing
the abutment diameter, more stresses are
concentrated near the abutment, increasing the
likelihood of abutment fracture. The other
possible reason for the efficacy of the platform
switching configuration is that the
microorganisms are likely to move toward the

86 International Journal of Current Research and Review www.ijcrr.com
Vol. 04 issue 03 February 2012
high-energy area or by the mechanism such as
interface micro movements that allow the
microorganisms to move into that area, it is
advantageous to have a large distance between
the stress concentration area and bone surface.
Hence implant abutment interface is a very
important criterion for implant success.
However, further studies utilizing modified 3D
finite element models and animal experiments
as well as longitudinal clinical observations are
still necessary.
A critical analysis of how platform switching
reduces crestal bone loss:
The mechanism by which platform switching
can contribute to maintain the crestal bone
height could be due to four reasons:
Shifting the inflammatory cell infiltrate
inward and away from the adjacent crestal
bone.
Maintenance of biological width and
increased distance of implant abutment
junction from the crestal bone level.
The possible influence of micro-gap on the
crestal bone is diminished.
Decreased stress levels in the peri-implant
bone (According to FEA studies).
Consequences of Horizontal Repositioning:
Reduction in the amount of crestal bone
resorption is necessary to expose a minimum
amount of implant surface to which the soft
tissue can attach.
Horizontal Repositioning of abutment
inflammatory cell infiltrate within less than
900 confined area of exposure decreases the
resorptive effect on the crestal bone.
Reduced diameter components beginning
with healing abutment must be used from
the moment the implant is exposed to the
oral environment, since the process of
biological width formation begins
immediately.
Limitations of platform switching
If normal size abutments are to be used,
larger size implants need to be placed. This
is not possible every time clinically,
especially if bone width is less.
If normal sized implants are placed, smaller-
diameter abutments are necessary, which
may compromise the emergence profile,
especially in anterior cases.
Benefits of platform switching
Improved aesthetics as crestal bone
preservation helps to preserve papilla.
Increased implant longevity.
The effect of inter-implant distance is
minimized.
A minimum of 3 mm inter implant distance is
needed to preserve marginal bone. Arthur et al,
found that distances of 1, 2 and 3 mm between
implants do not result in statistically significant
differences in crestal bone loss around
submerged or non-submerged implants with a
Morse cone connection and platform
switching31. The only requirement of platform-
switched implant is that the implant should be
placed crestally if sufficient soft tissue height
and inter occlusal space are present, or sub
crestally if insufficient soft tissue height and
inter-occlusal space are present. So, soft tissue
depth of approximately 3 mm should be present
to place platform switched implants or else
bone resorption is likely to occur, irrespective
of implant geometry. Also, sufficient bone
width should be present to accommodate the
larger-diameter implant.
CONCLUSION
The ultimate objective of implant dentistry is to
create optimal prosthetic restorations that are
surrounded by stable bone and a natural
gingival architecture that exists in harmony
with the other teeth. All authors agree that the
use of implants with platform switching
improves bone crest preservation, excellent
aesthetic outcomes and controlled biological
space reposition. Requirement of platform-
switched implant is that soft tissue depth of
approximately 3 mm should be present to place
platform-switched implants or else bone
resorption is likely to occur, irrespective of
implant geometry. Platform switching appears
to be simple, functional, and predictable
technique for preserving peri-implant crestal

87 International Journal of Current Research and Review www.ijcrr.com
Vol. 04 issue 03 February 2012
bone and can be clinically applied when
clinical situation permits. Definitive clinical
trials are currently underway and further
clinical investigations are necessary to show
long term results.
ACKNOWLEDGEMENT
Authors acknowledge the immense help
received from the scholars whose articles are
cited and included in references of this
manuscript. The authors are also grateful to
authors / editors / publishers of all those
articles, journals and books from where the
literature for this article has been reviewed and
discussed.
REFERENCES
1. Ericsson I, Persson LG, Berglundh T,
Marinello CP, Lindhe J. Different types of
inflammatory reactions in peri implant soft
tissues. J clin Periodontol 1995;22:255-
261.
2. Adell R, Lekholm U, Rockler B,
Branemark PI. A 5 year study of
osseointegrated implants in the treatment of
edentulous jaw. Int J Oral Surg
1981;10:387-416.
3. Misch CE. Stress treatment theorem for
implant dentistry. Contemporary Implant
Dentistry. Elsevier Mosby; 3rd edition.
Page -75.
4. Hermann, J.S., Cochran, D.L.,
Nummikoski, P.V, Buser, D. Crestal bone
changes around titanium implants. A
radiographic evaluation of unloaded
nonsubmerged and submerged implants in
the canine mandible. Journal of
Periodontology 1997; 68:1117–1130.
5. Cappiello M, Luongo R, Di Iorio D, Bugea
C, Cocchetto R, Celletti R. Evaluation of
periimplant bone loss around platform-
switched implants. Int J Periodontics
Restorative Dent. 2008 Aug; 28(4):347-55.
6. Misch CE. Bone density: A key
determinant for clinical success.
Contemporary Implant Dentistry. Elsevier
Mosby; 3rd edition. Page -134.
7. Lazzara RJ, Porter SS. Platform switching:
A new concept in implant dentistry for
controlling post restorative crestal bone
levels. Int J Periodontics Restorative Dent
2006 Feb;26(1):9-17.
8. Tarnow DP, Cho SC, Wallace SS. The
effect of inter-implant distance on the
height of inter-implant bone crest. J
Periodontol. 2000;71:546-9.
9. Trammell K, Geurs NC, O‘Neal SJ, Liu
PR, Haigh SJ, McNeal S, et al. A
prospective, randomized, controlled
comparison of platform-switched and
matched-abutment implants in short-span
partial denture situations. Int J Periodontics
Restorative Dent. 2009;29:599-605.
10. Vela-Nebot X, Rodríguez-Ciurana X,
Rodado-Alonso C, Segalà-Torres M.
Benefits of an implant platform
modification technique to reduce crestal
bone resorption. Implant Dent.
2006;15:313-20.
11. Gardner DM. Platform switching as a
means to achieving implant esthetics. N Y
State Dent J 2005;71:34-7.
12. Hürzeler M, Fickl S, Zuhr O, Wachtel HC.
Peri-implant bone level around implants
with platform switched abutments:
preliminary data from a prospective study.
J Oral Maxillofac Surg. 2007:Jul;65(7
Suppl1):33-9.
13. Canullo L, Rasperini G. Preservation of
peri-implant soft and hard tissues using
platform switching of implants placed in
immediate extraction sockets: a proof-of-
concept study with 12- to 36-month follow-
up. Int J Oral Maxillofac Implants.
2007;22:995-1000.
14. Degidi M, Iezzi G, Scarano A, Piattelli A.
Immediately loaded titanium implant with a
tissue-stabilizing/maintaining design
('beyond platform switch') retrieved from
man after 4 weeks: a histological and
histomorphometrical evaluation. A case
report. Clin Oral Impl Res 2008
Mar;19(3):276-82. Epub 2007 Dec 13.

88 International Journal of Current Research and Review www.ijcrr.com
Vol. 04 issue 03 February 2012
15. Qian Li, Ye Lin, Li-xin Qiu, Xiu-lian Hu,
Jian-hui Li, Ping DI. Clinical study of
application of platform switching to dental
implant treatment in esthetic zone. Chinese
journal of stomatology 2008; 43(9):537-41.
16. Baumgarten H, Cocchetto R, Testori T,
Meltzer A, Porter S. A new implant
design for crestal bone preservation: initial
observations and case report. Pract Proced
Aesthet Dent. 2005;17:735-40.
17. Cappiello M, Luongo R, Di Iorio D, Bugea
C, Cocchetto R, Celletti R. Evaluation of
periimplant bone loss around platform-
switched implants. Int J Periodontics
Restorative Dent. 2008 Aug; 28(4):347-55.
18. Hermann J, Buser D, Schenk RK,
Schoolfield JD, Cochrane DL. Influence of
the size of the microgap on crestal bone
changes around titanium implants. A
histometric evaluation of unloaded non-
submerged implants in canine mandible. J
Periodontol 2001; 72:1372-83.
19. Mangano C, Mangano F, Piattelli A, Iezzi
G, Mangano A, La Colla L. Prospective
clinical evaluation of 1920 Morse taper
connection implants: Results after 4 years
of functional loading. Clin Oral Impl Res
2009; 20:254-61.
20. Becker J, Ferrari D, Herten M, Kirsch A,
Schaer A, Schwarz F. Influence of platform
switching on crestal bone changes at non-
submerged titanium implants: a
histomorphometrical study in dogs. J Clin
Periodontol 2007;34:1089-96.
21. Sarment DP, Meraw SJ. Biological space
adaptation to implant dimensions. Int J Oral
Maxillofac Implants 2008; 23:99-104.
22. Weiner S, Simon J, Ehrenberg DS, Zweig
B, Ricci JL. The effects of laser micro
textured collars upon crestal bone levels of
dental implants. Implant Dent 2008;
17:217-28.
23. Luongo R, Traini T, Guidone PC, Bianco
G, Cocchetto R, Celletti R. Hard and soft
tissue responses to the platform switching
technique. Int J Periodontics Restorative
Dent 2008 Dec; 28(6):551-557.
24. Degidi M, Iezzi G, Scarano A, Piattelli A.
Immediately loaded titanium implant with a
tissue-stabilizing/maintaining design (‗beyond
platform switch‘) retrieved from man after 4
weeks: a histological and histomorphometrical
evaluation. A case report. Clin Oral Implants
Res 2008; 19:276-82.
25. Hsu JT, Fuh LJ, Lin DJ, Shen YW, Huang HL.
Bone strain and interfacial sliding analyses of
platform switching and implant diameter on an
immediately loaded implant: Experimental and
three-dimensional finite element analyses. J
Periodontol 2009 Jul; 80(7):1125-32.
26. Tabata LF, Assunção WG, Adelino Ricardo
Barão V, De Sousa EA, Gomes EA, Delben JA.
Implant platform switching: biomechanical
approach using two-dimensional finite element
analysis. J Craniofac Surg 2010; 21(1):182-187.
27. Rodríguez-Ciurana X, Vela-Nebot X, Segalà-
Torres M, Calvo-Guirado JL, Cambra J,
Méndez-Blanco V, Tarnow DP. The effect of
interimplant distance on the height of the
interimplant bone crests when using platform-
switched implants. Int J Periodontics
Restorative Dent 2009; 29:141-51.
28. Canay S, Akca K. Biomechanical aspects of
bone level diameter shifting at implant-
abutment interface. Implant Dent 2009; 18:239-
248.
29. Maeda Y, Miura J, Taki I, Sogo M.
Biomechanical analysis on platform switching:
Is there any biomechanical rationale. Clin Oral
Implants Res. 2007 Oct; 18(5):581-4. Epub
2007 Jun 30.
30. Schrotenboer J, Tsao YP, Kinariwala V, Wang
HL. Effect of microthreads and platform
switching on crestal bone stress levels: A Finite
element analysis. J Periodontol. 2008;
79(11):2166-72.
31. Novaes, Arthur B Jr de Oliveira, Rafael R
Muglia, Valdir A Papalexiou, Vula Taba,
Mário. The effects of interimplant distances on
papilla formation and crestal resorption in
implants with a morse cone connection and a
platform switch: a histomorphometric study in
dogs. Journal of periodontology 2006;77:1839-
1849

89 International Journal of Current Research and Review www.ijcrr.com
Vol. 04 issue 03 February 2012
ijcrr
Vol 04 issue 03
Category: Research
Received on:28/09/11
Revised on:15/10/11
Accepted on:06/11/11
ABSTRACT Objective: To find out and understand the common causes of neonatal deaths using verbal autopsy as
a tool. Method: Open ended verbal autopsy Questioner Method applied to a cross section of 47
neonatal deaths that occurred in previous 6 months (Nov. 05 – April 06). Study was carried out on
purposively selected villages of four talukas of Vadodara district of Gujarat in India, during May
2006 to August 2006. Results: Out of 47 were neonatal deaths 36.2% died due to prematurity,
21.3% due to Birth Asphyxia and 10.6% of deaths were due to Septicemia. Deaths on the first day
were 42.6%; of whom 40% died due to birth asphyxia and 45% due to prematurity. Conclusion:
Using verbal autopsy tools, Common causes of neonatal deaths found, were prematurity, birth
asphyxia and sepsis. More number of deaths occurred during first day of life.
______________________________________________________________________
Keywords: verbal autopsy, neonatal deaths,
causes
INTRODUCTION
Each year, 20 percent of the world‘s infants-an
awesome 26 million-are born in this vast and
diverse country. Of this number, 1.2 million die
before completing the first four weeks of life, a
figure amounting to 30 percent of the 3.9
million neonatal deaths worldwide. India is
home to the highest number of both births and
neonatal deaths of any country in the world.
The current neonatal mortality rate (NMR) of
44 per 1,000 live births accounts for nearly
two-thirds of all infant mortality and half of
under-five child mortality. Over one-third of all
neonatal deaths occur on the first day of life,
almost half within three days, and nearly three-
fourths in the first week and same problem is
faced by Gujarat with NMR of 42 per
1,000(SRS 2000) which share 4.5 percent of
the total NMR burden in India.1
Reducing
neonatal mortality will be necessary for
achievement of the targets set for child
mortality reduction under the United Nations
millennium development goals (MDG) (Haines
and Cassels, 2004)2.
More than two-thirds of the world's population
lives in countries that lack a reliable system for
issuing medical death certificates, leaving the
true scale and distribution of disease in serious
doubt. The main tactic for filling that gap is
verbal autopsy, which assigns a probable cause
of death based on interviews with families
about the deceased's symptoms. ―Verbal
Autopsy‖ is the collection of post-mortem
information about a deceased individual
through questionnaire or interview of
household members, friends and others
(including health care workers) who cared for
the person at home or are familiar with the
circumstances of the death3. Verbal autopsy
methods are most often used in locales where
formal medical care is difficult to access. In
such locales, deaths often occur at home and
official records are inconsistently available.
NEONATAL MORTALITY – AN EXPERIENCE BY
VERBAL AUTOPSY
Shaikh Mohsin1, Pathan Sameer
2
1Qassim University of Kingdom of Saudi Arabia
2Indian Institute of Public Health (Public Health Foundation), New Delhi
E-mail of Corresponding Author: [email protected]

90 International Journal of Current Research and Review www.ijcrr.com
Vol. 04 issue 03 February 2012
Verbal autopsies may provide important public
health information about factors related to
deaths and actions taken to address the medical
problems and prevent the death. Investigators
must adhere to cultural norms and sensitivities
when approaching and asking for information
from family members and other informal
caregivers of the deceased person. Study teams,
especially research interviewers who will
conduct these interactions, require training in
local customs about these issues, particularly
regarding awareness of the pressures on
respondents to portray situations in a particular
manner, sensitivity to the distress respondents
may feel related to the interview/questionnaire,
and approaches for handling high levels of
distress. Cause-of-death data derived from
verbal autopsy (VA) are increasingly used for
health planning, priority setting, monitoring
and evaluation in countries with incomplete or
no vital registration systems. In some regions of
the world it is the only method available to
obtain estimates on the distribution of causes of
death. Currently, the VA method is routinely
used at over 35 sites, mainly in Africa and
Asia. The exact cause of death can be known
by postmortem autopsy. However, this is not
feasible on a large scale, particularly in
developing countries like India. In this difficult
situation, a post death analysis by verbal
autopsy is used as a proxy to determine the
possible causes of death. In this research we
used VA as a research tools to investigate the
neonatal deaths.
MATERIAL AND METHODS
The present study was undertaken on selected
four talukas of Vadodara district (e.g. Chota
Udepur, Pavi- Jetpur, Kawant and Naswadi),
where a partnership was initiated between the
Health Department of Government of Gujarat
and a local NGO- Deepak Charitable Trust. The
study area covered 25 villages (out of
approximately 200 total villages of each
talukas) each in the selected four talukas,
spread over 29 PHCs and 4 CHCs which have
been designated First Referral Units (FRUs)
under RCH. Each of the taluka had one taluka
coordinator (TC) and 14 outreach worker
(ORWs), initial survey was carried out by
ORWs who identified the infant deaths and
finally TC and a team of doctors (Resident
Doctors of PSM dept. and Pediatric Dept. of
Medical College Baroda) went out there and
carried out verbal autopsy of neonatal deaths
that occurred in previous 6 months (Nov. 05 –
April 06). Study period consists of 4 months of
data collection from May ‘06 to August ‘06.
Final confirmation of verbal autopsy was
verified by associate professors of PSM dept.
and Pediatric dept. of Medical College Baroda).
Prior consent was taken for verbal autopsy
procedure. The standard verbal autopsy
questionnaire suggested by WHO3 was used for
the same. Questionnaire was administered to
the care giver (usually the mother) of the child.
The questions were explained by the
interviewer to the caregiver in local language.
Sufficient time was given to recall the events
during illness. It usually took 60 minutes to
complete an interview. Diagnosis was made on
the basis of the answer given by the caregiver
to the questions asked in the questionnaire.
Open-ended questions were freely probed to
follow up particular aspects as required. This
descriptive account also was taken into
consideration while arriving at the diagnosis.
Total no. deliveries (whether home delivery or
institutional delivery) occurred in Pavi
jetpur(2535), Chota Udepur(2692), Naswadi
(796) and Kawant(1053) during april 2004 to
march 2005 were reported by district health
office of baroda and with that information in
background we carried out this verbal autopsy.
RESULTS
Out of the 47 neonatal deaths reported (42.6 %
- Pavi jetpur, 23.4 % - Chota Udepur, 17 % -
Naswadi and 17 % Kawant), 36.2 %( 17) died
due to prematurity, 21.3 %( 10) due to Birth
Asphyxia and 10.6 % (5) of deaths were due to
Septicemia. Deaths on the first day were 42.6
% (20); of whom 40 %( 8) died due to birth
asphyxia and 45 %( 9) due to prematurity.

91 International Journal of Current Research and Review www.ijcrr.com
Vol. 04 issue 03 February 2012
In 72.4% cases death occurred in early neonatal
period. 59.6 % patients were male and 40.4 %
were female. 80.9% mothers had not received
ANC during antenatal period, although TT
coverage was 68.1%. 80.9% deaths occurred in
cases where deliveries were conducted at home,
of which 48.9% deliveries were conducted by
untrained Dais. Treatment was not received in
case of 78.7% neonatal deaths. 29.8% deaths
occurred in case of fifth birth rank or more and
in 66% we found family size of >5 member.
63.8% of the deaths reported were in case of
illiterate mother. No neonates had received any
vaccine.
DISCUSSION
Majority of patients died during first seven
days of whom the majority died in first 24
hours Singhal et al reported 42% of total
neonatal deaths during the first seven days of
life.4 In majority of the cases mothers were
illiterate and received ANC rarely. At the same
time, more number of mothers delivered at
home by untrained die while in over three forth
of the neonatal deaths no treatment was
received. More number of mothers who lost
neonates had a big family size.
CONCLUSION
Common causes of neonatal deaths, as per the
Verbal Autopsy, were Prematurity, Birth
Asphyxia and Sepsis and more number of
deaths occurred during first day of life. Similar
observations have been made in earlier studies
of Singh V and Dutta N et al.5,6
Majority of
deaths occurred where mother had not received
any ANC visit. Birth rank makes a difference
along with the size of the family. The fact that
many babies (42.6%) died within 24 hours of
delivery, sometimes with no recognized
symptoms, indicates the need for early
intervention for those most a risk. The study
identified risk factors that could be identified
during delivery (complications, premature/
small babies, and multiple births). Attendants at
delivery could have a key role if trained in
resuscitation and through notifying paramedics
about high risk babies to be given an immediate
post-natal check-up in the home. This may be
feasible in areas served by NGOs, where efforts
can be augmented. Increasing the number of
institutional deliveries would be a relevant
strategy for the same.
ACKNOWLEDGEMENT
Author acknowledges with thanks the support
of Government of Gujarat & Deepak charitable
trust. Author acknowledges the immense help
received from the scholars whose articles are
cited and included in references of this
manuscript. The author is also grateful to
authors / editors / publishers of all those
articles, journals and books from where the
literature for this article has been reviewed and
discussed.
REFERENCES
1. Dadhich JP, Paul VK, State of India‘s
Newborns, National Neonatology Forum &
Save the Children. Available from
URL:http://www.savethechildren.org/publi
cations/technicalresources/saving-newborn-
lives. Accessed on February 1, 2007.
2. Haines A and Cassels A. Can the
millennium development goals be attained?
BMJ. 2004, 329: 394-397.
3. Martha et al., A Standard Verbal Autopsy
Method for Investigating Causes of Death
in Infants and Children, Department of
Communicable Disease Surveillance and
Response, WHO/CDS/CSR/ISR/99.4,
Accessed at
http://www.who.int/csr/resources/publicati
ons/surveillance/whocdscsrisr994.pdf on
January 1 2006.
4. Singhal PK, Mathur GP, Mathur S, Singh
YD, Neonatal Morbidity and Mortality in
ICDS urban slums. Indian pediatrics, 1990,
27: 485-488.
5. Singh V, Sachdev HPS, Mittal O, Sethi
GR, Choudhury P, Ramji S, et al., Causes
of under five mortality in Delhi slums _ An
evaluation by Verbal Autopsy technique:
in: 8th Asian Congress of Pediatrics

92 International Journal of Current Research and Review www.ijcrr.com
Vol. 04 issue 03 February 2012
Scientific Abstracts. Eds. Chaudhary P,
Sachdev HPS, Puri RK, Verma I.C. Jaypee
Brother, New Delhi, 1994. p 135.
6. Dutta N, Mand M, Kumar V. Validation of
causes of infant death in the community by
autopsy. Indian J Pediatrics 1988; 55; 599-
604.
Table 1 Total number deliveries occurred during April 2005 to March 2006 in
selected 4 talukas of Vadodara district - India.
Name of Taluka Total No. of deliveries
Pavi Jetpur 2535
Chota Udepur 2692
Naswadi 796
Kawant 1053
Table 2 – Causes of Neonatal Mortality
SIDS – sudden infantile death syndrome
AGE – acute gastroenteritis
Illustration:
PSM – Preventive and Social Medicine
PHC – primary health care
CHC – community health center
SC - sub center
ANC – antenatal care
TT – tetanus toxoid
VA – verbal autopsy
NGO – Non Government Organization
No Causes 1st day of life 0-7 days 8-28 days 0-28 days
(Total)
Immediate Early Late Neonatal
1 Septicemia 0 2 3 5 (10.6%)
2 Prematurity 9 15 2 17 (36.2%)
3 Bronchopneumonia 1 2 1 3 (6.4%)
4 Birth asphyxia 8 9 1 10 (21.3%)
5 Hypothermia 1 2 0 2 (4.3%)
6 Neonatal seizures 0 1 0 1 (2.1%)
7 SIDS 0 1 1 2 (4.3%)
8 AGE 0 0 1 1 (2.1%)
9 Congenital anomaly 1 2 2 4 (8.5%)
10 Severe dehydration 0 0 1 1 (2.1%)
11 Intestinal obstruction 0 0 1 1 (2.1%)
Total
20 (42.6%)
34 (72.4%)
13 (27.6%)
47

93 International Journal of Current Research and Review www.ijcrr.com
Vol. 04 issue 03 February 2012
ijcrr
Vol 04 issue 03
Category: Case Report
Received on:18/12/11
Revised on:28/12/11
Accepted on:05/01/12
ABSTRACT The form function and pathofunction of the dynamic masticatory system comprises one of the most
fascinating, basic and important areas of interest in dentistry. The explosion of technological and
procedural advances coupled with improved materials herald a new age in dentistry. In this age of the
‗esthetic revolution‘ and the ‗extreme makeover‘ factors that control occlusal stability are usually
overlooked. Even though a full-mouth reconstruction can be relatively complex, it does not have to be
a long or complicated process in patient‘s perspectives. The severe wear of anterior teeth facilitates
the loss of anterior guidance, which protects the posterior teeth from wear during excursive
movement. The collapse of posterior teeth also results in the loss of normal occlusal plane and the
reduction of the vertical dimension. This case report describes prosthetic rehabilitation using the
Hobo and Takayama twin-stage procedure for a patient with esthetically and functionally
compromised dentition. The final prosthesis with this twin-stage procedure ensured a restoration with
a predictable posterior disclusion and anterior guidance in harmony with the condylar path.
__________________________________________________________________________
Keywords: Full mouth rehabilitation, Hobo‘s
twin stage, Effective cusp angle, Posterior
disocclusion.
INTRODUCTION
Though the full-mouth rehabilitation and its
philosophies are often intrigue in nature, but
the esthetic and functional accomplishment of
rehabilitation is always satisfying. The gradual
wear of the occlusal surfaces of teeth is a
normal process during the lifetime of a patient.
However, excessive occlusal wear can result
in pulpal pathology, occlusal disharmony,
impaired function, and esthetic disfigurement.
Tooth wear can be classified as attrition,
abrasion, and erosion depending on its cause.
A differential diagnosis is not always possible
because, in many situations, there exists a
combination of these processes. Therefore, it is
important to identify the factor that contribute
to excessive wear and to evaluate alteration of
the vertical dimension of occlusion (VDO)
caused by the worn dentition. As teeth are
worn, the alveolar bone undergoes an adaptive
process and compensates for the loss of tooth
structure to maintain the vertical dimension of
occlusion. Therefore, vertical dimension of
occlusion should be conservative and should
not be changed without careful approach.
Anterior guidance is crucial in human
occlusion because it influences molar
disclusion that controls horizontal forces. This
case reports the satisfactory clinical outcome
achieved by restoring the vertical dimension
with an improvement in esthetics and function.
In this case Hobo-Takayama method was
incorporated for creating molar disclusion
using a twin-stage procedure.
ESTHETIC AND FUNCTIONAL REHABILITATION OF
THE PATIENT WITH SEVERELY WORN DENTITION
USING TWIN STAGE PROCEDURE: A CASE REPORT
Naresh HG Shetty1, Manoj Shetty
2, Krishna Prasad D.
3
1Senior Lecturer, Al Azhar dental college, Thodupuzha, Kerala
2Professor, Department of prosthodontics, A B Shetty Memorial institute of
dental sciences, Mangalore 3Professor and Head of the Department, Department of prosthodontics, A B
Shetty Memorial institute of dental sciences, Mangalore
E-mail of Corresponding Author: [email protected]

94 International Journal of Current Research and Review www.ijcrr.com
Vol. 04 issue 03 February 2012
CASE REPORT
A healthy 44 year-old woman patient was
reported to the department of prosthodontics,
A B Shetty Memorial Institute of Dental
Sciences, Mangalore, Karnataka, India, with a
chief complaint of severely worn dentition,
unpleasant smile, generalized sensitivity and
difficulty in chewing(Fig 1) .The medical
history was non-contributory. The patient‘s
dental history indicated faulty tooth brushing
habit, and extraction of 25,36 due to caries
.The patient denied for any symptoms of
temporomandibular joint disorder or
myofacial pain dysfunction syndrome.
Clinical findings
Extra oral findings; The patient had no gross
facial asymmetry, muscle tenderness. The
temporomandibular joints, muscles of
mastication, and facial expressions were
asymptomatic
Intraoral findings; The maxillary and
mandibular arch were partially dentate with
tooth 25, 36, 38, missing. No gross
abnormalities were noted in the overall soft
tissues of the lips, cheeks, tongue, oral
mucosa, and pharynx.
Occlusion; Generalized severe attrition was
noted. The patient presented with bilateral
class I molar and the patient‘s lateral
excursions showed canine guided occlusion.
The patient was diagnosed with severe
attrition with loss of vertical dimension.
Treatment goals
To restore the entire severely worn
dentition to function and optimal esthetics
Centric relation occlusion with maximum
number of tooth contacts with no change in
established vertical dimension
To develop a canine guided occlusion
Twin stage procedure to produce a definite
amount of disocclusion during eccentric
movements
Treatment procedure
The patient received oral prophylaxis, and
reinforcement of oral hygiene practises.
Patient was advised for intentional root canal
therapy for 31, 32, 41, and 42 due to decreased
tooth structure. As there was clinical
evaluation of reduced vertical dimension of
occlusion, full mouth rehabilitation with
increasing vertical dimension of occlusion was
planned. Patient‘s informed consent was taken
prior to treatment.
Two sets of diagnostic impressions were made
using irreversible hydrocolloid
and diagnostic casts were obtained. Maxillary
casts were mounted using an earpiece facebow
(Hanau springbow no. 0103280) onto a Hanau
arcon articulator (ALL 182/183 Wide –Vue
series, Waterpik, USA) and mandibular cast
was mounted using interocclusal aluwax
(Aluwax dental products, Michigan, USA)
record. Diagnostic wax up was prepared to
proper size shape and contour (Fig 2).
Mandibular posterior occlusal plane was
analysed using occlusal plane analyser (Fig 3).
On analysis all mandibular teeth followed the
curve of spee. Maxillary left third molar was
supraerrupted which required occlusal
correction. Mandibular anterior teeth required
intentional root canal treatment followed by
post and core .Maxillary occlusal wax up was
done to maximum intercuspation. Anterior
wax up was checked for proper anterior
guidance to achieve disocclusion in eccentric
movements
Meanwhile a maxillary occlusal splint was
fabricated at an increased occlusal vertical
dimension of 2 mm using heat cured acrylic
resin. The occlusal splint was inserted and
adjusted. Two weeks later the patient reported
with no difficulties in adapting to the new
position. Hence full mouth rehabilitation was
planned at increased vertical dimension of
2mm.
Tooth preparations for metal ceramic crowns
were completed for the entire dentition (Fig
4). A final full arch impression for maxillary
and mandibular teeth was made using poly
vinyl siloxane (Express™ XT ,3M ESPE)
impression material with double mix single
impression technique (Fig 5). The casts were
poured in die stone (Kalrock; Kalabhai
Pvt.Ltd, Mumbai, India), which was later

95 International Journal of Current Research and Review www.ijcrr.com
Vol. 04 issue 03 February 2012
secured to a die lock tray. This assembly was
mounted on a Hanau arcon articulator using
face bow (Hanau springbow).Mandibular die
lock tray was mounted using centric
interocclusal record made in aluwax at
previously determined vertical dimension.
Provisional crowns were made (Protemp II,
3M ESPE dental products, St Paul, USA) from
diagnostic wax up. Provisional restorations
were cemented using zinc oxide non eugenol
temporary cement (Temp bond cement, Kerr,
USA). Articulator was programmed to
condition I twin stage procedure (As in Table
1) maxillary and mandibular anterior segment
was removed, and posterior teeth wax build up
was completed to achieve balanced
articulation, which helped in achieving
standard effective cusp angle of 25‘.(Fig
6)Then anterior wax build up was carried out
after the values had been adjusted to condition
II of twin stage procedure (Table 1) to achieve
an incisal guidance of 40‘which produced a
standard amount of disocclusion.(Fig 7)
All wax patterns were cast and metal units
were tried in and adjusted for proximal
contacts and occlusion. Definite restorations
with porcelain fused to metal crowns
exhibiting vital and natural appearance with
proper contour were designed. Completed
porcelain fused metal crown showing posterior
balanced articulation (Condition I)(Fig 8) and
uniform disocclusion Condition II)(Fig 9),and
intra orally showing the
same(Fig10).Permanent cementation was done
with glass ionomer Type 1 (GC Goldlabel, GC
Group. Tokyo luting cement). Oral hygiene
instructions were reviewed, emphasizing
brushing habits and the use of floss for better
maintenance of the prosthesis. Follow-up was
carried out at regular intervals and the patient's
post-operative condition was satisfactory (Fig
11, 12)
DISCUSSION
Aesthetic and functional restoration of the
severely worn dentition represents a
significant clinical challenge. The
complications with severely attrited teeth
demand a circumspect treatment plan and
proper sequencing of therapy to ensure an
optimal result for both the patient and the
clinician. Proper treatment sequencing is
critical when a patient requires multiple fixed
restorations. The vertical dimension, centric
relation, and occlusal plane must be
determined first, followed by a diagnostic wax
up which is essential for fixed prosthesis. An
accurate diagnostic and interdisciplinary
approach is necessary for obtaining improved,
conservative and predictable results. Full
mouth rehabilitation seeks to convert all
unfavourable forces on the teeth which
inevitably induce pathologic conditions, into
favourable forces which permit normal
function and therefore induce healthy
conditions.
A variety of techniques may be used in
simultaneous constructions to obtain complete
arch dies and mounted casts. When all of the
prepared teeth are on a single articulator, there
is flexibility in developing the occlusal plane,
occlusal theme, embrasures, crown contour,
and esthetics. The chairside disadvantages
include 1 arduous, unpredictable patient visits,
2 full arch anaesthesia,
3 full arch chairside
treatment restorations,4 multiple occlusal
records, and 5,6,7
possible loss of the vertical
dimension of occlusion. An alternative
approach to the full-mouth simultaneous
reconstruction is to complete one quadrant
before beginning another. The advantages of
this approach are that it is primarily chairside
and includes preparation and final impressions
of select teeth, maintenance of vertical
dimension, quadrant anaesthesia, and shorter,
predictable appointments. The disadvantages
of the quadrant reconstruction include
restrictions for achieving ideal occlusion when
altering the vertical dimension, occlusal plane,
and embrasure development. The existing
opposing dentition limits the reconstruction of
an isolated quadrant. Esthetic consistency can
be compromised because the porcelain
restorations are made in stages. The

96 International Journal of Current Research and Review www.ijcrr.com
Vol. 04 issue 03 February 2012
advantages of the simultaneous and quadrant
full-mouth reconstruction are combined in the
present technique.8
The mechanism of anterior
guidance was reviewed from recent
mandibular movement studies to provide a
basis for understanding the twin-stage
technique, which is a practical method for
establishing anterior guidance from the
condylar path. 9,10
Hobo and Takayama studied the influence of
condylar path, incisal path and the cusp angle
on the amount of disocclusion. They
concluded that cusp angle was the most
reliable and was used as a new determinant of
occlusion. Twin stage procedure proposed by
Hobo and Takayama was adopted for wax
build up because studies have proposed that it
is possible to accurately control the amount of
disocclusion on the restoration without
measuring the condylar path.
Anterior guidance and the condylar path
previously were considered independent
factors. It is an established fact that anterior
guidance influences the working condylar path
and even changes when the lateral incisal path
deviates from the optimal orbit. This supports
the hypothesis that anterior guidance and the
condylar path are dependent factors. In setting
anterior guidance, it is recommended to set the
working condyle so that it moves straight
outward along the transverse horizontal axis.
The angle of hinge rotation produced by the
angular difference between anterior guidance
and the condylar path assists posterior
disclusion but is not solely responsible. The
anatomy of the cusps is created by establishing
the appropriate form of the posterior cusps
aligned to the condylar path; thus it also
contributes to posterior disclusion. Posterior
disclusion is crucial in controlling harmful
lateral forces but the factors that determine the
precise amount of disclusion have not been
established.10
As followed in this case twin
stage procedure helps in achieving a standard
disocclusion of 1 mm on protrusion, 1mm on
non working side, and 0.5 mm on working
side in centric movements at 3mm protrusion
from centric relation.
ACKNOWLEDGEMENT
Authors acknowledge the immense help
received from the scholars whose articles are
cited and included in references of this
manuscript. The authors are also greatful to
authors/editors/publishers of all those articles,
journals and books from where the literature
for this article has been reviewed and
discussed.
REFERENCES
1. Kazis H. Complete mouth rehabilitation
through restoration of lost vertical
dimension. J Am Dent Assoc 1948; 37:19-
39.
2. Hausman M, Hobo S. Occlusal
reconstruction using transitional crowns. J
Prosthet Dent 1961; 11:278-87.
3. Braly BV. A preliminary wax-up as a
diagnostic aid in occlusal rehabilitation. J
Prosthet Dent 1966; 16:728-30.
4. Hobo S. A kinematic investigation of
mandibular border movement by means of
an electronic measuring system: Part II: A
study of the Bennett movement. J Prosthet
Dent 1984; 51:642-6.
5. Hobo S. A kinematic investigation of
mandibular border movement by means of
an electronic measuring system: Part III:
Rotation centre of lateral movement. J
Prosthet Dent 1984; 52:66-72.
6. Hobo S. Formula for adjusting the
horizontal condylar path of the
semiadjustable articulator with
interocclusal records: Part I: Correlation
between the immediate side shift, the
progressive side shift, and the Bennett
angle. J Prosthet Dent 1986; 55:422-6
7. Hobo S. Formula for adjusting the
horizontal condylar path of the
semiadjustable articulator with
interocclusal records: Part II: Practical
evaluations. J Prosthet Dent 1986; 55:582-
8

97 International Journal of Current Research and Review www.ijcrr.com
Vol. 04 issue 03 February 2012
8. Binkley TK, Binkley CJ. A practical
approach to full mouth rehabilitation. J
Prosthet Dent 1987; 57:261-6.
9. Hobo S, Takayama H. Effect of canine
guidance on the working condylar path.
Int J Prosthodont 1989; 2:73-9
10. Hobo S. Twin-tables technique for
occlusal rehabilitation: Part I: Mechanism
of anterior guidance. J Prosthet Dent
1991; 66:299-303
Table 1: Articulator adjustment values for the twin stage procedure
Condition
Condylar path Anterior guide table
Sagittal condylar path
inclination
Bennett angle Sagittal inclination Lateral wing angle
Condition 1;without
anterior teeth
25 15 25 10
Condition 2;with
anterior teeth
40 15 45 20
Figure 1: Preoperative view
Figure 2: Maxillary and mandibular diagnostic wax up

98 International Journal of Current Research and Review www.ijcrr.com
Vol. 04 issue 03 February 2012
Figure 3: Occlusal plane analysis Figure 4: Maxillary and mandibular tooth preparation
Figure 5: Maxillary and Figure 6: Condition I(Cusp angle 25’)
mandibular impressions
Figure 7: Condition II with canine guided occlusion
Figure 8: Completed PFM crowns(Condition I)

99 International Journal of Current Research and Review www.ijcrr.com
Vol. 04 issue 03 February 2012
Figure 9: Completed PFM crowns with canine guided occlusion
Figure 10: Intra orel view showing uniform disclusion
Figure 11: Intra oral view of cemented PFM crowns
Figure 12: Pre and postoperative view

100 International Journal of Current Research and Review www.ijcrr.com
Vol. 04 issue 03 February 2012
ijcrr
Vol 04 issue 03
Category: Review
Received on:20/12/11
Revised on:31/12/11
Accepted on:05/01/12
ABSTRACT Yoga and Meditation techniques are growing popular worldwide in preventing or reducing
cardiovascular diseases. We reviewed the latest studies and recent literature concerning the use of
yoga in the treatment of cardiovascular disorders. The studies of yoga therapy on acute and chronic
hypertensive patients showed significant reduction in stress,stress related blood pressure, blood
cholesterol level and body weight. The studies showed significant improvement in cardiovascular
endurance and reduction in left ventricular mass. The purpose of this review is to evaluate the effect
of yoga therapy on hypertension, obesity and coronary heart disease.
______________________________________________________________________
INTRODUCTION
Yoga is an ancient cultural heritage of India,
designed to bring balance and health to the
physical, mental, emotional, and spiritual
dimensions of the individual. Yoga is often
depicted as a tree comprised of eight limbs,
such as yama (universal ethics), niyama
(individual ethics),asana (physical postures),
pranayama (breath control), pratyahara(control
of the senses), dharana (concentration),
dyana(meditation), and samadhi (bliss)1.Yoga
is described as comprising a rich treasure of
physical and mental techniques that can be
effectively used to create physical and mental
well-being through down-regulation of the
hypothalamic–pituitary–adrenal (HPA) axis
and the sympathetic nervous system (SNS).
As shown in fig 1,The HPA axis and SNS are
triggered as response to stress, leading to a
cascade of physiologic, behavioral, and
psychologic effects, as a result of the release
of cortisol and catecholamines. The repeated
firing of the HPA axis and SNS due to stress
can lead to dysregulation of the system and
ultimately produce diseases such as diabetes,
autoimmune disorders, depression, substance
abuse, and cardiovascular disorders.
Numerous studies have shown yoga to have an
immediate downregulating effect on both the
SNS and HPA axis response to stress2.
EVALUATION OF YOGA THERAPY FOR THE RISK
FACTORS OF CARDIOVASCULAR DISORDERS-A
REVIEW
Deepa.T1, N.Thirrunavukkarasu
2
1Saveetha dental college, Saveetha university
2TS 82/4,Achuthan nagar, Ekkaduthangal, Chennai
E-mail of Corresponding Author: [email protected]

101 International Journal of Current Research and Review www.ijcrr.com
Vol. 04 issue 03 February 2012
FIG. 1. The impact of stress on the hypothalamic–pituitary–adrenal axis and the sympathetic nervous
system2.
Yoga has been extensively studied for its
various effects in reducing salivary cortisol,
blood glucose, as well as plasma renin levels
and 24-hour urine norepinephrine and
epinephrine levels3. yoga reverses the negative
impact of stress on the immune system by
increasing levels of immunoglobulin A as well
as natural killer cells .Yoga has been found to
be useful on reducing BMR4,5
, improvement in
respiratory capacity 6and shift of autonomic
balance toward parasympathetic nervous
system dominance, possibly via direct vagal
stimulation7. It is also found to be useful in
treatment of diabetes8, asthma
9, epileptic
seizures10
and in anxiety disorders 11
.Yoga
employs simple postures (asana), controlled
breathing exercise(Pranayama)and meditation
admixed in varying proportions.
History of yoga
The origin of yoga is estimated to date back
to the period between 200 BC and 300 AD,
was written by a historically renowned yoga
teacher and Hindu philosopher named
Patanjali. The ancient Indian classic on the
practice of yoga, Gherananda–Samhita,
mentioned out of 840,000 asanas, only 84 are
in contemporary common practice. Of these,
only 32 are recommended by this ancient text
as being useful for regular practice28
.
Pranayama involves a slow deep inspiration
and the breath is held momentarily in full

102 International Journal of Current Research and Review www.ijcrr.com
Vol. 04 issue 03 February 2012
inspiration, followed by slow and
spontaneous exhalation.
Hypertension and its management
Hypertension is the most common
cardiovascular disease affecting more than one
billion people throughout the world. It is a
major contributor of stroke, ischemic heart
disease, heart failure, renal dysfunction and
blindness43
.The seventh Joint National
Committee on Detection, Evaluation, and
treatment of high blood pressure (JNC VII
2003) defined hypertension as a systolic blood
pressure (SBP) of 140mmHg or greater and
diastolic blood pressure (DBP) of 90mmHg or
higher. Hypertension is further classified into
two groups based on etiology as essential or
primary hypertension and secondary
hypertension. Essential hypertension is
diagnosed when there is strong family history
and no identifiable cause can be found42
.
Hypertension is almost always easy to treat
but difficult to keep under control as blood
pressure is a continuous variable12
. The goal of
treatment is to lower the blood pressure as
early as possible and maintain it, thereby
preventing major complications of systemic
hypertension. Drugs are prescribed as first line
choice of treatment due to their significant,
cost-effective, immediate action on reducing
blood pressure. The utility of these agents is
limited by the narrow range between
therapeutic and toxic doses. These often
produce dose dependent side effects, adverse
reactions and rebound or overshoot
hypertension when drug therapy is
discontinued suddenly.13
The side - effects, life
long medical regimen, and cost of drugs have
stimulated the search for a non-drug therapy as
a primary treatment or as adjunctive
therapy.Many non-pharmacological measures,
such as 100mmol/day reduction in sodium
intake, have been associated with a decline in
blood pressure of about 5–7mmHg
(systolic)/2.7mmHg (diastolic) in hypertensive
subjects. Regular physical exercise such as
walking is added along with drugs for its
effect in managing hypertension. Many mind-
body interventional methods like relaxation,
biofeedback, stress management along with
lifestyle modification have been shown as
potential treatment for BP. Relaxation
therapies alone doesn‘t show significant result
in reducing BP. Hence progressive muscle
relaxation techniques are not considered as an
effective treatment method for high blood
pressure . In contrast, Stress management
therapies have some merits but are not widely
available nor practiced. Studies on various
non- drug modalities have shown more
benefits from Yoga and Meditation in long
term control of hypertension than any other
modality.14,15
.
Table-1 Studies of yoga and meditation on high blood pressure, Lipid profile, heart rate and body
weight
Author Name Year Type of
intervention
Used technique and Findings
Patel C and North 1975 Yoga and
biofeedback
compared to
general relaxation
Yoga showed reduction of B.P. maintained even
after 12 months40
Stone and Deleo 1976 Meditation The average drop in mean arterial pressure was
12mm of Hg after 6 months and showed decrease in
dopamine beta hydroxylase enzyme and plasma
Renin activity41
Agarwal et al 1977 Shavasana on
hyperreactors
usingCold Pressor
Test
Reduction of the rise in B.P due to cold application 34
Andrews et al 1982 Various non drug
treatments
Found yoga and meditation to be effective in long
term control of B.P14

103 International Journal of Current Research and Review www.ijcrr.com
Vol. 04 issue 03 February 2012
Table-1 Studies of yoga and meditation on high blood pressure, Lipid profile, heart rate and body
weight
Author Name Year Type of
intervention
Used technique and Findings
Khanam et al 1996 yoga Decrease in heart rate and decrease in diastolic
blood pressure after Isometric Hand Grip test39
Schmidt et al. 1997 Yoga for 3 months
on healthy adults
Significant reduction in Urinary stress hormone
levels, body mass index,lipid profile27
Mahajan et al 1999 Yoga in Ischemic
heart disease
patients for 14
weeks
Reduction in lipid profile, body weight25
Jennifer et al 2000 Simplified
pranayama
Decrease in mean arterial pressure and heart rate38
Murugesan et al 2002 Selected yoga
practices for
11weeks
Yoga and drug group showed greater B.P. reduction
compared to only yoga group and drug group16
Damodharan et al 2002 yoga Reduction in VMA catecholamines and blood
glucose level36
Bharshankar et al 2003 yoga Reduction in pulse rate and increase in valsalva ratio
in yoga people44
Vijayalakshmi et al 2004 yoga Decrease in diastolic pressure,heart rate and rate
pressure product after hand grip17
test
Malhotra et al 2004 Yoga and OM
meditation in
normotensives
Improvement in cardiovascular performance and
increase in melatonin levels45
.
Bijlani et al 2005 8 day yoga
programme
Reduction in lipid profile except HDL35
Geetanjali et al 2007 Effect of
shavasana after
cold pressor test
The rise in parameters induced by stress test was less
in shavasana practitioners37
Indla Devasena et al 2011 Yoga Reduction in BP and heart rate31
Yoga therapy on hypertension
It has been demonstrated in a randomised
controlled Studies ,that even a short period of
yoga intervention (3 months ) is as effective
as drug therapy in reducing high blood
pressure16
and heart rate31
. The mechanism of
yoga-induced blood pressure reduction may be
attributed to its beneficial effects on the
autonomic neurological function. Impaired
baroreflex sensitivity has been increasingly
postulated to be one of the major causative
factors of essential hypertension. Regular
practice of yoga increase the baroreflex
sensitivity and decrease the sympathetic tone,
thereby restoring blood pressure to normal
level in hypertensive subjects17
. Similarly, the
decrease in sympathetic activity seen with
slow breathing might be beneficial in
hypertension, where sympathetic activation
has been linked to disturbed breathing patterns
and increased chemoreflex activity29
.
Meditation by modifying the state of anxiety
reduces stress induced sympathetic over
activity , decreases the arterial tone and
peripheral resistance, that lead to reduction in
diastolic blood pressure and heart rate. This
ensures better peripheral circulation and blood
flow to the tissues18,19
. Meditation is
associated with reduced sympathetic
adrenergic receptor sensitivity,which might
affect cardiovascular response during stress.
During meditation appearance of frontal
midline theta rhythm in electroencephalogram
reflects mental concentration as well as
meditative state of relief from anxiety and is
correlated negatively with sympathetic
activation. This suggests a close relationship
between autonomic functions and activity of
medial frontal neural circuitry and possibility

104 International Journal of Current Research and Review www.ijcrr.com
Vol. 04 issue 03 February 2012
of controlling CNS functions through yoga
and meditation20
. Transcendental meditation
(TM) practice improves mood state,
adrenocortical activity and kidney functions
and believed to reduce stress and shows
significant reduction in ambulatory diastolic
BP21
.
Yoga on chronic hypertension
Yoga has proven its effect in modifying
secondary complications produced by chronic
hypertension. Left ventricular hypertrophy is
a common consequence seen due to systemic
hypertension.This may lead to many chronic
cardiac complications, such as myocardial
ischaemia, congestive cardiac failure and
impairment of diastolic function. Left
ventricular hypertrophy due to systemic
hypertension is indicated by the height of ‗R‘
wave in lead I, aVL, V5 and V6 in
electrocardiogram. In one study The height of
‗R‘ wave was taken prior to yoga practice and
three months after continuation of yoga
practice. The height of ‗R‘ wave has come
down appreciably in some patients indicating
the reduction of left ventricular mass22
.
Effect of yoga on body weight
Weight also has the strongest independent
correlation with the risk of hypertension.
Yoga has been found to be particularly helpful
in the management of obesity23
. A randomized
controlled study revealed that practising yoga
for a year helped significant improvements in
the ideal body weight and body density3. A
retrospective observational study showed that
a regular practice of yoga for 4 years was
significantly associated with weight loss by
overweight participants24
. After 4-day
residential yoga practice followed by 14
weeks of 1 h daily home practice, one study
found a significant loss in mean body weight
from 72.26 to 70.48 kg among subjects with
risk factors for coronary artery disease25
.
Other studies confirmed that yoga was
associated with significant weight loss by
subjects with Coronary artery disease. After
one year yoga practice coronary artery
diseased patients showed a 7% loss of body
weight26
and in a study by Schmidt and
colleagues, healthy adults lost an average of
5.7 kg after 3 months of yoga practice27
.
Effect of yoga on coronary artery disease
Systemic hypertension is one of the risk factor
for developing coronary artery disease.
Participants with risk factors of coronary
artery disease showed reduction in all
parameters such as Blood pressure, LDL, total
cholesterol, triglycerides except high density
lipoprotein.In a randomized controlled study,
patients with angiographically proven
coronary artery disease who practiced yoga
exercise for a period of one year showed a
decrease in the number of anginal episodes per
week, improved exercise capacity and
decrease in body weight28
. Thus yoga exercise
increases regression and retards progression of
atherosclerosis in patients with severe
coronary artery disease26
. Subjects who
practiced pranayama or controlled yogic
breathing could achieve higher work rates
with reduced oxygen consumption per unit
work and without an increase in blood lactate
levels. one study reported the effects of yoga
training on cardiovascular response to exercise
and found yoga training improved the
exercise tolerance to cardiovascular effects.
Yoga on the management of coronary artery
disease showed reduction in sympathetic tone,
decreased peripheral vascular resistance,
improved cardiac output, reduction in heart
rate , blood pressure, and improvement in
cardiovascular endurance3.
Effect of Yogic Practices in Prevention of
Diabetes
Yogic practices reduce body fat and increase
lean body mass, thereby help in improving
insulin sensitivity32
. The reduction in free
fatty acid levels have a significant effect on
beta cell function. hence yogasanas by
preventing beta cell exhaustion may prevent
diabetes. studies have confirmed the benefit of
yoga in the control of diabetes mellitus. All
the studies showed a significant fall in the
fasting and post-prandial blood glucose values
within 3 months and continued to have a

105 International Journal of Current Research and Review www.ijcrr.com
Vol. 04 issue 03 February 2012
smooth and good control of diabetes during
the period of the study as evidence by a
normal glycosylated hemoglobin and blood
glucose levels33
. The drug requirements were
significantly reduced.
CONCLUSION
The beneficial effects of yoga to the heart
ailments is outstanding. However, the role of
yoga in the management of the hypertension
should be complementary to the conventional
modes of treatment. Regular yoga practice
involving simple postures, relaxation exercise
and respiratory exercise combined with drug
therapy showed superior results compared to
those who did not practice yoga. The reviews
showed that yoga had beneficial effects on
reducing BP , blood cholesterol level and
body weight .It also improves left ventricular
function and cardiovascular endurance.
Considering the scientific evidence discussed
so far, we can postulate that the practice of
yoga triggers neurohormonal mechanisms that
bring about health benefits by suppressing
sympathetic activity. hence we conclude that
yoga can be beneficial in preventing
cardiovascular disease and can play a
complementary role to drug therapy for
hypertension.Any persistent benefits require a
long-term adherence to yoga therapy and
subjects who have continued their programs
even at home showed better results30
.
Additional studies are needed to distinguish
between the different types of yoga and their
various techniques. The optimal duration, the
type of yoga program, and intensity of the
yoga program need to be described clearly in
many studies as they can affect the final
outcome.. Additional studies are needed to
find the effect of yoga on long term as only a
few follow up studies are available. All of
these studies need to use rigorous study
methodologies, including the use of larger
sample sizes, randomized samples, and
blinding of researchers.
ACKNOWLEDGEMENT
Authors acknowledge the immense help
received from the scholars whose articles
are cited and included in references of
this manuscript. The authors are also
grateful to authors / editors / publishers of
all those articles, journals and books from
where the literature for this article has
been reviewed and discussed.
REFERENCES
1. Iyengar BKS. Light on Yoga. 2nd ed.
New York: Schocken Books, 1976.
2. Alyson Ross et al, The Health Benefits of
Yoga and Exercise:A Review of
Comparison Studies, J Altern
complem Medicine.2010
3. Bera TK, Rajapurkar MV. Body
composition,cardiovascular endurance,
and anaerobics power of yogic
practitioner. Indian J Physiol Pharmacol
1993; 37:225–228.
4. Chaya MS, Kurpad AV, Nagendra HR,
Nagarathna R., The effect of long term
combined yoga practice on the basal
metabolic rate of healthy adults. BMC
Complement Altern Med. 2006 ;6: 28
5. Telles S, B. H. Hanumanthaiah, R.
Nagarathna and H. R. Nagendra,
Plasticity of motor control systems
demonstrated by yoga training. Indian
Journal of Physiology and Pharmacology
1994;38: 143–144.
6. Bhole MV, Karambelkar PV, Gharote
ML.Effect of yoga practices on vital
capacity. Ind J Chest Dis1970; 12: 32–
35.
7. Joseph, S., Sridharan, K., Patil, S. K. B.,
Kumaria, M. L., Selvamurthy, W., 1981).
Study of some physiological and
biochemical parameters in subjects
undergoing yogic training. Indian
journal of medical research.
8. Sahay,Role of yoga in diabetes.A
review.JAPI 2007

106 International Journal of Current Research and Review www.ijcrr.com
Vol. 04 issue 03 February 2012
9. Jain and talukdar,evaluation of yoga
therapy program for patients of bronchial
asthma.Singapore Med journal 1993
10. Deepak k, Manchanda, S. K., &
Maheshwari, M. C. (1994),meditation
improves clinical
electroencephalographic measures in
drug-resistant epileptics. Biofeedback
and Self Regulation.
11. Gupta et al 2006 Gupta N,Khera
S,Vempati RP,Sharma R,Bijlani
RL.effect of yoga based lifestyle
intervention on state and trait anxiety,
Indian physiology and pharmacology
2006;50(1):41-47
12. Kaplan 2002 Kaplan NK. Kaplan‘s
Clinical Hypertension, 8th edition
.Lippincotts Williams and
wilkins,Philadelphia,2002.
13. Marvin Moser and
John.F.Setero.Resistant or Difficult-to-
Control Hypertension. N Engl J Med
2006; 355:385-392
14. Andrews G,MacMahon SW,Austin
A,Byrne DG.Hypertension:comparison
of drug and non-drug treatments.British
Medical Journal (Clinical Residence
Edition).1982 May 22;284(6328):1523-6
15. Anand MP. Non-pharmacological
management of essential hypertension.
Journal of Indian Medical Association
1999 Jun; 97(6):220-5.
16. Murugesan R, Govindarajalu N, Bera
TK. Effect of selected yogic practices in
the management of hypertension. Indian
J Physiol Pharmacol 2000; 207–210.
17. Vijayalakshmi P, Madan Mohan,
Bhavanani AB, Asmita Patil, Kumar
Babu P.Modulation of stress induced by
isometric hand grip test in hypertensive
patients following yogic relaxation
training. Indian J Physiol Pharmacol
2004; 48(1): 59-60.
18. Bhargava R, Gogate MG and Macarenhas
JF. Autonomic responses to
breathholding and its variations
following pranayama. Indian J Physiol
Pharmacol 1988; 32(4);257–264.
19. Gopal KS, Bhatnagar OP, Subramanian
N, Nishith SD. Effect of yogasana and
pranayamas on blood pressure, pulse
rate and some respiratory
functions.Indian J Physiol Pharmocol
1973; 17(3); 273–276.
20. Katya Rubia,The neurobiology of
Meditation and its clinical effectiveness
in psychiatric disorders
21. Richard P. Brown, yogic breathing and
meditation:when the thalamus quiets the
cortex and rouses the limbic system
22. Konar D, Latha R, Bjuvanesvaran JS.
Cardiovascular response to headdown-
body-up postural exercise
(Sarvangasana). Indian J
PhysiolPharmacol 2000; 44:392–400.
23. Udupa KN, Singh RH. The scientific
basis of yoga. J Am Med Assn
1972Udupa KN, Singh RH. The
scientific basis of yoga. J Am Med Assn
1972;220(10): 1365.
24. Kristal AR, Littman AJ, Benitez D,
White E. Yoga practice is associated with
attenuated weight gain in healthy,
middle-aged men and women. Altern
Ther Health Med. 2005;11:28–33.
25. Mahajan AS, Reddy KS, Sachdeva U.
Lipid profile of coronary risk subjects
following yogic lifestyle intervention.
Indian Heart J. 1999;51:37–40.
26. Manchanda SC, Narang R, Reddy KS,
Sachdeva U, Prabhakaran D,
Dharmanand S, et al. Retardation of
coronary atherosclerosis with yoga
lifestyle intervention. J Assoc Physicians
India. 2000;48:687–94.
27. Schmidt T, Wijga A, Von Zur Muhlen A,
Brabant G, Wagner TO. Changes in
cardiovascular risk factors and hormones
during a comprehensive residential three
month kriya yoga training and vegetarian
nutrition. Acta Physiol Scand Suppl.
1997;640:158–62.

107 International Journal of Current Research and Review www.ijcrr.com
Vol. 04 issue 03 February 2012
28. Yoga in cardiac health (A
Review).Satyajit R. Jayasinghe.European
Journal of Cardiovascular Prevention and
Rehabilitation 2004, 11:369–375
29. Chacko.N.JosephSlow Breathing
Improves Arterial Baroreflex Sensitivity
and Decreases Blood Pressure in
Essential Hypertension. Hypertension.
2005; 46: 714-718
30. Kyeongra Yang A Review of Yoga
Programs for Four Leading Risk Factors
of Chronic Diseases, Evid Based
Complement Alternat Med. 2007
December; 4(4): 487–491.
31. Indla Devasena et al, Effect of yoga on
heart rate and blood pressure and its
clinical significance. Int J Biol Med
Res. 2011; 2(3): 750-753.
32. 32.Sahay BK. Yoga and Diabetes in
Novo Nordisk Diabetes Update 94
Proceedings. Ed. Anil Kapur, Publ.
Health CareCommunications, Bombay,
1994;159-68.
33. 33.Sahay BK, Murthy KJR. Raju PS.
Madhavi S, et al. Long term follow up on
effect of yoga in diabetes in Baba Shole
ed Diabetes Research in Clinical Practice.
Abstracts of XIII congress of
IDFAbstract p65-004-293-655.
34. Agarwal, R. C.,et al. Effects of
Shavasana on vascular response to a cold
pressor test in hyper-reactors. Indian
Heart Journal 1977, 29(4):182-185
35. Bijlani RL, Vempati RP, Yadav RK, et
al. A brief but comprehensive lifestyle
education program based on yoga
reduces risk factors for cardiovascular
disease and diabetes mellitus. Journal of
Alternative and Complementary
Medicine 2005;Apr, 11(2):267-274
36. Damodaran A, Malathi A, Patil N, Shah
N, Suryavansihi , Marathe S. Therapeutic
potential of yoga practices in modifying
cardiovascular risk profile in middle aged
men and women.J Assoc Physicians
India 2002 May;50(5):633-40
37. Geetanjali Sharma, Mahajan K. K,Luv
Sharma. Shavasana-Relaxation technique
to combat stress. Indian journal of
physiology and pharmacology 2006.
38. Jennifer chodzinski. The effect of Blood
pressure in hypertensive adults .Journal
of undergraduate research 2006,vol
1,Issue 6.
39. Khanam AA, Sachdeva U, Guleria R,
Deepak KK. Study of pulmonary and
autonomic functions of asthma patients
after yoga training. Indian J Physiol
Pharmacol. 1996 Oct; 40(4):318-24.
40. Patel C, North WR. Randomised
controlled trial of yoga and bio-feedback
in management of hypertension. Lancet.
1975 Jul 19;2(7925):93–95
41. Stone RA, DeLeo J. Psychotherapeutic
control of hypertension. New England
Journal of Medicine. 1976 Jan
8;294(2):80–84.
42. 42.Kearney PM, Whelton M, Reynolds
K, Muntner P, Whelton PK, He J. Global
burden of hypertension: Analysis of
worldwide data. Lancet. 2005;365:217–
23.
43. Gupta R. Trends in hypertension
epidemiology in India. J Hum Hypertens.
2004;18:73–8.
44. Jyotsana R. Bharshankar*, Rajay N.
Bharshankar.Effect of yoga on
cardiovascular system in subjects above
40 years. Indian J physio pharmacol
2003; 47 (2) : 202–206.
45. Harinath, K., Malhotra, A. S., Pal, K.,
Prasad, R., Kumar, R., Kain, T. C., et al.
(2004). Effects of Hatha yoga and Omkar
meditation on cardiorespiratory
performance, psychologic profile, and
melatonin secretion. Journal of
Alternative and Complementary
Medicine, 10(2), 261-268.

108 International Journal of Current Research and Review www.ijcrr.com
Vol. 04 issue 03 February 2012
ijcrr
Vol 04 issue 03
Category: Research
Received on:01/12/11
Revised on:17/12/11
Accepted on:02/01/12
ABSTRACT The main objective of this study was to identify certain lifestyle disorders like diabetes mellitus and
other medical conditions like hypertension and hyperlipedemia in an older adult population and to
verify their relationship with the periodontal health status in the same group of individuals.
A total number of 600 patients between 35-75 years were selected for this study. Their lifestyle habits
were obtained through a questionnaire. It was followed by a periodontal examination, blood pressure
recording and a biochemical analysis of the blood samples taken from them.
Results of MLRA showed that diabetes mellitus, was clearly associated with attachment loss.
Hypertension was not associated with attachment loss, and elevated blood cholesterol levels
(hyperlipedemia) were associated only in univariate models.
It could be concluded that in the selected group of subjects aged 35-75 years, only diabetes mellitus
was associated with attachment loss in this cross-sectional study.
_____________________________________________________________________________
Key words: Melia azedarach, seed, oil.
INTRODUCTION
Melia azedarach L. (Sapindales: Meliaceae),
know as Chinaberry or Persian lilac tree, is a
deciduous tree native to northwestern India
and has long been recognized for its medicinal
and insecticidal properties but yet to be
properly analyzed. This tree typically grows in
the tropical and subtropical parts of Asia, but
nowadays it is also cultivated in other warm
regions of the world because of its
considerable climatic tolerance1. It has been
cultivated since the sixteenth century, chiefly
for ornamental purposes and has become
naturalized in most tropical and subtropical
countries2.
In Traditional Chinese Medicine, the plant is
used as an antiparasitic and antifungal agent,
but many of its constituent compounds have
been found to exhibit a wide range of other
biological properties3-10
. In addition, a number
of potent pharmaceutical limonoids and
triterpenoids have been isolated from fruits
and bark11
. The cytotoxic property of
limonoids is extensive and recent efforts are
designed to investigate the cellular and
molecular mechanisms by which such effects
are exerted in the tumorigenic cell lines12
.
Although the fruits are the poisonous part of
the tree, they have been used traditionally for
the treatment of a variety of diseases, specially
dermatitis and rubella11
. The bark and root-
bark mainly contain tetracyclic triterpenoids,
as well as flavones and anthraquinones, etc.
Pharmacological studies indicate that the bark,
fruit, seed and leaf have the effects of
expelling parasites, suppressing bacteria and
anti-virus, etc13
.
In some parts of Tamil Nadu, India the
decoction of the leaves of the tree is used
under traditional system of medicine to cure
CHARACTERIZATION OF FATTY ACIDS IN MELIA
AZEDARACH L. SEED OIL
R. K. Bachheti1, Himanshu Dwivedi
2, Vikas Rana
3, Indra Rai
1
Archana Joshi4
1Department of Chemistry, Graphic Era University, Dehradun (Uttarakhand)
2Department of Biochemistry C.C.S University, Meerut (U.P.), India.
3Bio-prospecting & Indigenous Knowledge Division, Rain Forest Research
Institute, Jorhat (Assam) 4Department of Environmental Science, Graphic Era University, Dehradun
(Uttarakhand)
E-mail of Corresponding Author: [email protected]
109 International Journal of Current Research and Review www.ijcrr.com
Vol. 04 issue 03 February 2012
the problem of dysmenorrhoea (pain and
discomfort during menstruation). They gave
the suffering patients the decoction of the
leaves of Persian Lilac tree, `Malaivembu' in
Tamil, Melia azedarach and it is known to
cure the conditions very fast.
The object of this study was therefore to
extract oil from Melia azedarach seeds and
assessment of the physical and chemical
characteristics of the oil as a prelude to an
investigation into the scientific basis for its
best end uses.
MATERIALS AND METHODS
Collection of plant materials
The seeds of Melia azedarach L. are small
(about 6-7 mm long) and enclosed in a thick
hard bony endocarp commonly known as
stone. The fruits of Melia azedarach were
collected from Sahestra Dhara road,
Dehradun in month of December 2010. The
fruit were cleaned and stones were separated.
The stones were broken manually to obtain
seeds. The seeds were air dried in the shade
for few days and kept in colour bottles until
analyzed.
Extraction of seed oil
100 gm of seeds were grounded into powder
form with high speed blender and dried in an
air circulating oven at 50oC for 1 h. Oil was
extracted from the dried grounded seeds with
petroleum ether (boiling point 60-80oC) using
a Soxhlet extractor. The solvent was distilled
off at 80oC. Oil content was calculated on the
basis of dry seeds weight and expressed in
g/100g.
Analysis of seed oil
Oil density was determined picnometrically,
Refractive index was determined at 25°C with
Abbey Refractometer, viscosity was
determined by Ostwald method14
. The oil
extracted from the seeds was assessed for
various chemical properties. Standard methods
described by Association of Official
Analytical Chemists15
were used for the
determination of moisture, crude fibre and ash
contents of the seed samples. Physical and
chemical analyses of the extracted oil were
carried out by using AOAC methods15
. Iodine
value was determined using Wij‘s method as
reported in AOAC methods15
. The procedures
of Egan et al.16
were adopted for the
estimation of saponification values,
unsaponifiable matter content and acid value
of the oil sample. Protein content in seeds and
oil sample was determined using micro-
Kjeldhal method as described by Allen and
Quarmby17
. A factor of 6.25 was adopted for
protein content estimation. Carbohydrate
content was determined by colorimetric
method17
.
The metal composition Zinc, Iron, and
Manganese of the seeds were determined by
using an Atomic Absorption
Spectrophotometer (Model Varian
240FS+GTA120), after acid digestion.
Calcium and magnesium was determined by
complexometric titration with 0.1M EDTA, by
using Erichome black T indicator and
calculated. Phosphorus was determined by the
precipitation of phosphorus in the form of
phospho molybdate by using the reagent
ammonium molybdate. Precipitate was filtered
from asbestos, then residue obtained was taken
in Conical Flask and dissolved in 0.1 M NaOH
and titrate with 0.1 M HCl by using indicator
Phenolphthalein. Potassium was determined
by flame photometer model No. ESICO 1381
by using the reference standard (Merck) and
calculated on the basis of reading and dilution
of the sample.
GC and GC-MS analysis
The Fatty acids were derivatized by using the
boron trifluoride method as described by
Hisil18
. Samples were injected as 2 µl into a
Nucon model 5700 equipped with 10% DEGS
(Diethylene Glycol Succinate) + 1% H3PO4
constant phase, a flame ionization detector
(FID) and chromosorb G (100/120 mesh)
support matter, internal diameter (2mm) and
stainless steel (190 cm) column. Column
temperature was programmed from 70°C to
200°C with the increasing rate of temperature
6°C/Minute. Injector and detector
110 International Journal of Current Research and Review www.ijcrr.com
Vol. 04 issue 03 February 2012
temperatures were set at 225°C. Nitrogen (N2)
(25 ml/min) was used as the carrier gas.
Hydrogen (40ml/min) and Air (60ml/min)
were used as burnt and dry gas respectively.
Fatty acid methyl esters were identified by
comparison with fatty acid internal standards,
Individual fatty acid concentration was
expressed as percent
RESULTS AND DISCUSSION
The seeds of Melia azedarach were collected
in the month of December, 2010 from
Dehradun (Uttarakhand), India. The seeds
were dark brown in colour and evaluated for
physical properties. Analysis results of seeds
are given in table-1. Seeds are rich in protein,
oil and fibre. Oil extracted (yield; 39.6
%w/w) from Melia azedarach seeds is dark
brown in colour and free from sediments. It is
liquid at room temperature (27± 2OC). It
contains 20.13% protein, 19.45%
carbohydrates and 15.40% crude fibre. The
physico-chemical properties of Melia
azedarach seed oil is given in table-2. The
results of GC (figure-1) and GCMS analysis of
oil is listed in table-3 and showed that the oil
contain both saturated (9.0226%) and
unsaturated fatty acids (90.9774). The main
acids present in the oil were Palmitic acid
(5.68%), Linoleic acid (74.57%), Oleic acid
(16.39%), Stearic acid (3.33%).
Acid value is an indicator for edibility of oil
and suitability for industrial use. Melia
azedarach seed oil has an acid value 2.25.
This falls within the recommended codex of
0.6 and 10 for virgin and non virgin edible fats
and oil respectively19
. The iodine value of
Melia azedarach oil is 9.14 which indicate
that it is drying oils. The low iodine value in
this study indicate the oil contain low level of
polysaturated fatty acids. The seed oil studied
have a significant saponification value 84.15,
the high saponification value recorded for the
seed oil suggested that the oil contain high
molecular weight fatty acid and low level of
impurities. This is evidence that the oil could
be used in soap making industry20, 21
.
The main chemical component of the fatty
acids in Melia azedarach is Linoleic acid.
Linoleic acid is the essential amino acid, and
be supplied to the human beings only by food
sources. It helps low blood pressure in
hypertensive patients, and also be useful to
protect human cardiac system22, 23
. It is used
for manufacturing margarine, shortening, and
salad and cooking oils as well as soaps,
emulsifier, and quick drying oils24
. The other
main chemical component is Oleic acid, it
reaches 16.39%. Oleic acid is the most
abundant fatty acid in human adipose tissue25
.
Oleic acid may hinder the progression of
adrenoleukodystrophy (ALD), a fatal disease
that affects the brain and adrenal glands26
.
Oleic acid is also responsible for the
hypotensive effects of olive oil27
. As an
excipient in pharmaceuticals, oleic acid is used
as an emulsifying or solubilizing agent in
aerosol products28
. In Melia seed oil the
palmitic acid and stearic acid contributed 5.68
and 3.33% respectively. Palmitic acid is used
in the manufacture of soaps, candle, cosmetic
formulations, food grade additives,
waterproofing agents, lube oils, and non
drying oils (surface coatings). Whereas the
presence of stearic acid in Melia seed oil
indicates the potential use of oil for
pharmaceutical preparations, dietary
supplements, oil pastels, soaps, food
packaging, deodorant sticks, toothpaste and
softening rubber29, 30
.
The mineral composition of Melia azedarch is
summarized in table-4. It is rich in Calcium,
Magnesium, Potassium and Iron which make
it quite suitable as edible and commercial oil.
Considering the results obtained in this
preliminary study, it is noticeable that the
seeds oil had a high content of linoleic acid
and oleic acid and also has a healthy
composition for nutrition. It turned out that
Melia azedarach could be good source of
natural oil rich in Linoleic acid and Oleic acid.
This work might be useful for exploring the
applications of Melia azedarach seeds and its
oil. Further by cultivation and breeding of

111 International Journal of Current Research and Review www.ijcrr.com
Vol. 04 issue 03 February 2012
capers plants regularly, a more productive
quality raw matter would be obtained.
ACKNOWLEDGEMENT
Authors acknowledge the immense help
received from the scholars whose articles are
cited and included in references of this
manuscript. The authors are also grateful to
authors/editors/publishers of all those articles,
journals and books from where the literature
for this article has been reviewed and
discussed.
REFERENCES
1. WAC, World Agroforestry Centre,
Agroforestry Tree Database, A tree
species reference and selection guide
[http://www.worldagroforestry.org/sea/Pr
oducts /AFDbases/af/asp
/SpeciesInfo.asp?SpID=1141] (Accessed
September 23, 2011).
2. Hadjiakhoondi A, Vatandoost H,
Khanavi M, Sadeghipour-Roodsari R,
Vosoughi M, Kazemi M, Abai M R.,
Fatty acid composition and toxicity of
Melia azedarach L. fruits against malaria
vector Anopheles stephensi. Iran. J.
Pharma.Sci. 2006; 2(2): 97-102.
3. Isman M B. Botanical insecticides,
deterrents, and repellents in modern
agriculture and an increasingly regulated
world. Annu. Rev. Entomol. 2006; 51:
45-66.
4. Akhtar Y, Yeoung Y R, Isman M B.
Comparative bioactivity of selected
extracts from Meliaceae and some
commercial botanical insecticides against
two noctuid caterpillars,Trichoplusia ni
and Pseudaletia unipuncta. Phytochem.
Rev. 2008; 7 (1): 77-88.
5. Carpinella M C, Ferrayoli C, Valladares
G, Defago M, Palacios S. Potent
limonoid insect antifeedant from Melia
azedarach. Biosci. Biotechnol. Biochem.
2002; 66 (8): 1731-1736.
6. Carpinella M C, Ferrayoli C G, Palacios
S M. Antifungal synergistic effect of
scopoletin, a hydroxycoumarin isolated
from Melia azedarach L. fruits. J. Agric.
Food Chem. 2005; 53 (8): 2922-2927.
7. Carpinella M C, Giorda L M, Ferrayoli C
G, Palacios S M. Antifungal effects of
different organic extracts from Melia
azedarach L. on phytopathogenic fungi
and their isolated active components. J.
Agric. Food Chem. 2003; 51 (9): 2506-
2511.
8. Coria C, Almiron W, Valladares G,
Carpinella C, Ludueña F, Defago M, et
al. Larvicide and oviposition deterrent
effects of fruit and leaf extracts from
Melia azedarach L. on Aedes aegypti (L.)
(Diptera: Culicidae). Bioresource
Technol. 2008; 99 (8): 3066-3070.
9. Kamaraj C, Rahuman A A, Bagavan A,
Mohamed M J , Elango G , Rajakumar G,
et al. Unit Ovicidal and larvicidal activity
of crude extracts of Melia azedarach
against Haemonchus contortus
(Strongylida). Parasitol. Res. 2010; 106
(5): 1071-1077.
10. Ntalli N G, Menkisoglu-Spiroudi U,
Giannakou I. Nematicidal activity of
powder and extracts of Melia azedarach
fruits against Meloidogyne incognita.
Ann. Appl. Biol. 2010; 156 (2): 309-317.
11. Alché L E, Ferek G A, Meo M, Coto C
E, Maier M S. An antiviral meliacarpin
from leaves of Melia azedarach L. Z.
Naturforsch. 2003; 58c (1/2): 215-219.
12. Ntalli N G, Cottiglia F, Bueno C A,
Alché L E, Leonti M, Vargiu S, et al.,
Cytotoxic tirucallane triterpenoids from
Melia azedarach fruits. Molecules. 2010;
15 (9): 5866-5877.
13. Anonymous. Hong Kong Jockey Club
Institute of Chinese Medicines,
Encyclopedia on Contemporary
Medicinal Plants, Melia azedarach
(Chinaberry-tree)
[http://www.hkjcicm.org/cm_database/pl
ants/detail_e.aspx?herb_id=35]
(Accessed August, 25, 2011).

112 International Journal of Current Research and Review www.ijcrr.com
Vol. 04 issue 03 February 2012
14. Božič J S, Ogrin T. Viscosity.
[http://www.standardbase.hu/tech/SITech
Visc.pdf.] (Accessed July, 12, 2011).
15. A.O.A.C. Official Methods of Analysis
14th Edn. Association of Official
Analytical Chemists. Washington D. C.
1990; 14th Edn.: pp. 801-805.
16. Egan H, Kirk R S, Sawyer R. Pearson‘s
Chemical Analysis of Foods. 8th Edn.
London: Churchill Livingstone
Publishers; 1981: pp. 507-547.
17. Allen S E, Quarmby C., Organic
Constituents. In: Allen S E, editor.
Chemical Analysis of Ecological
Materials, London: Blackwell Scientific
Publications; 1989; p.160-200.
18. Hisil Y. Instrumental Analysis
Technique. Izmir, Turkey: Ege Univ.
Engineering Fac. Publ. Nu.55;1989.
19. Ibrahim T A, Dada I B O, Adejare R A.
Comparative phytochemical properties of
crude ethanolic extracts and
physicochemical characteristics of
essential oils of Myristical fragrans
(Nutmeg) seeds and Zingiber officinate
(ginger) roots. Electronic Journal of
Enviornment, Agriculture and Food
Chemistry. 2010; 9(6): 1110-6.
20. Kirsehenbauer H G. Fats and Oil: An
Outline of their Chemistry and
Technology. 2nd
edn. New York:
Reinhold Publ Corp. 1965; p. 160-161.
21. Akanni M S, A-dekunle S A, Oluyemi E
A. Physio-Chemical properties of some
non-conventional oil seed. J. Food
Technol. 2005; 3:177-181.
22. Zhen L I, Yang De-po. Structure-effect
relationship of conjugated linoleic acid
and its molecular pharmacology research
progress. J. Int. Pharmaceutical Res.
2007; 34(1): 26-30.
23. Whigham L D, Cook M E, Atkinson R L.
Conjugated linoleic acid: implications for
human health. Pharmacol Res. 2000;
42(6): 503-510.
24. Ukalina, O G, Ifechukwude N M.
Characterization of the fatty acids of
Gardenia jasminoide flower from port
Harcourt, Nigerian. International Journal
of Academic Research. 2011; 3 (3): 534-
538.
25. Kokatnur M G, Oalmann M C, Johnson
W D, Malcolm G T, Strong J P. Fatty
acid composition of human adipose
tissues from two anatomical sites in a
biracial community. Am. J. Cli. Nutr.,
1979; 32 (11): 2198–205.
26. Rizzo W B., Watkins P A, Phillips M W,
Cranin D, Campbell B, Avigan J.
Adrenoleukodystrophy: oleic acid lowers
fibroblast saturated C22-26 fatty acids.
Neurology. 1986; 36(3): 357-61.
27. Terés S, Barceló-Coblijn G, Benet M,
Alvarez R, Bressani R, Halver Je, et al.
Oleic acid content is responsible for the
reduction in blood pressure induced by
olive oil. Proc. Nat. Acad. Sci. U.S. A.
2008; 105 (37): 13811–6.
28. Smolinske S C. Handbook of Food,
Drug, and Cosmetic Excipients. New
York: CRC Press; 1992: p. 247–248.
29. Okieimen F E, Eromosele C O. Fatty acid
composition of Khaya senegalensis.
Bioresource Technol. 1999; 69: 279-280.
30. Wootthikanokkhan J, Tunjongnawin P.
Investigation of the effect of mixing
schemes on cross link distribution and
tensile properties of natural acrylic
rubber blends. Polymer Testing. 2002;
22(3): 305-312.

113 International Journal of Current Research and Review www.ijcrr.com
Vol. 04 issue 03 February 2012
Table 1. Physicochemical properties of Melia azedarach seeds.
Table 2. Physicochemical properties of Melia azedarach seed oil
Characteristics Values
Colour Dark Brown, clear and transparent
Taste Neutral, free of bitter taste, free of after
taste
Sediments Free of sediments
State at room temperature Liquid
Refractive Index 40
Dn 1.3655
Specific Gravity 25
20d 0.8074 g/cm
3
Yield (%) 39.6
Moisture (%) 6.86
Protein (%) 20.13
Fiber (%) 15.40
Carbohydrate (%) 19.45
Acid Value (mgKOH/g) 2.25
Iodine value 9.14
Saponification value (mgKOH/g) 84.15
Unsaponifiable matter (%w/w) 0.71
Total saturated (%) 9.02
Total unsaturated (%) 90.97
Table 3. Fatty acid composition of Melia azedarach seed oil
Fatty acid %
Palmitic acid (C16:0) 5.68
Linoleic acid (C18:2) 74.57
Oleic acid (C18:1) 16.39
Stearic acid (C18:0) 3.33
Properties Values
1000 seeds (g) 25.4
1000 seeds (ml) 52.0
Colour Brown
Water (%) 6.48
Crude oil (%) 39.6
Crude protein (%) 18.77
Crude fibre (%) 24.77
Ash (%) 3.6513

114 International Journal of Current Research and Review www.ijcrr.com
Vol. 04 issue 03 February 2012
Table 4. Mineral content (mg/100g) of Melia azedarach seed oil
Mineral Content
Calcium 1230
Magnesium 990
Phosphorous 213
Potassium 121
Zinc 3.12
Manganese 3.4
Iron 19.52
Fig.1. Gas chromatogram of fatty acid profile of Melia azedarach seed oil

115 International Journal of Current Research and Review www.ijcrr.com
Vol. 04 issue 03 February 2012
ijcrr
Vol 04 issue 03
Category: Research
Received on:13/12/11
Revised on:27/12/11
Accepted on:19/01/12
ABSTRACT Introduction: Despite growing vaccine-preventable infections, immunization campaigns still suffer
due to parental resistance. Knowledge and opinion of caregivers about childhood additional vaccines
becomes imperative before we stress upon any such promotion under UIP. Objective: To assess
knowledge and opinion of caregivers regarding childhood additional vaccines in Agartala, Tripura.
Methods: Present study was undertaken during Jul-Dec 2011 in a child clinic at Agartala. Data was
collected using pre-designed and pre-tested proforma by interview technique. Information regarding
background characteristics of parents, source of information, knowledge and opinion regarding
childhood additional vaccines was collected after obtaining written consent. Data analysed using
Microsoft Excel and Epi_Info version 6.04. Chi-square test was used and p<0.05 considered
statistically significant. Results: Information was gathered from parents of 180 children. Doctors
(73.33%) were main source of information followed by television (18.89%). 26.67% and 32.78%
parents respectively knew timing and against which diseases additional vaccines are used. 73.89%
parents reported vaccination as best way to prevent these diseases. 76.11% opined additional vaccines
should be available at govt. hospitals. 46.67% recognized polyvalent vaccines better than monovalent.
Numbers of injections (89.29%), cost (21.43%), numbers of visits (16.67%) and less complications
(15.48%) were cited for such preference. Financial constrain (46.11%), family disagreement (26.67%),
time constrain (20%), fear of complication (18.89%) and non-availability (8.89%) were stated as
barriers. Parents‘ education (69.44%) and economic status (41.11%) were stated as family related
reason for poor acceptance of additional vaccines. Conclusion: Parents‘ knowledge-gap, opinion and
operational issues should be addressed before launching and promoting any childhood additional
vaccine campaign.
____________________________________________________________________________
Keywords: Care givers, Childhood Additional
vaccine, Immunization, Parents
INTRODUCTION
Immunizing children against vaccine
preventable diseases responsible for child
mortality and morbidity is not an easy task. In
a resource poor developing country like India,
the numbers of target population across
geographically diverse regions and difficult
areas make universal immunization a
mammoth task.1 Immunization coverage in
India are still lagging and current level of
‗fully immunized‘ children under the national
immunization programme is quite low, as
pointed by previous studies.2,3
Factors such as
parents‘ knowledge about routine and
additional vaccination and their attitudes
towards them does influence vaccine
coverage. Despite growing and emerging
vaccine-preventable infections, reassurance
from researchers on safety and efficacy of
KNOWLEDGE AND OPINION OF CAREGIVERS
REGARDING CHILDHOOD ADDITIONAL VACCINES
IN AGARTALA, WEST TRIPURA
Majumder Nilratan1, Datta Shib Sekhar
2, Boratne Abhijit Vinodrao
2,
Majumder Nilanjan3, Basu Majumder Chandrika
4
1Dept. of Paediatrics, Agartala Govt. Medical College, Agartala
2Dept. of Community Medicine, Mahatma Gandhi Medical College and
Research Institute, Puducherry 3Agartala Govt. Medical College, Agartala
4Department of Political Science, Tripura University
E-mail of Corresponding Author: [email protected]

116 International Journal of Current Research and Review www.ijcrr.com
Vol. 04 issue 03 February 2012
vaccines, and tremendous efforts by health
care professionals, immunization campaigns
still suffer on accounts of parental
resistance.4,5
It is imperative to understand the
current level of knowledge and opinion of
caregivers about childhood additional vaccines
before we put emphasis on any such
promotion to be included under the national
immunization schedule as suggested by Indian
Academy of Paediatrics (IAP) 6
in India and
especially
in remote and difficult part of
north-east India like Tripura state.
Objective: The present study was conducted
to assess knowledge and opinion of caregivers
regarding childhood additional vaccines in
Agartala, West Tripura.
MATERIALS AND METHODS
Study setting: The present facility based
observational study was undertaken during
July-December 2011. For this purpose, a
specialist child clinic situated in the urban area
of Agartala, Tripura served as study center.
The child clinic has a regular OPD attendance
of around 20-25 children (upto 12 years age)
per day. The clinic is run by a senior child
specialist and 2 trained medical assistants.
Data collection: Data was collected by a pre-
designed and pre-tested proforma using
interview technique by senior child specialist
at the child speciality clinic. Each parent(s) of
children aged 2-5 years attending the clinic
were explained about need of the study and
those who consented to participate in the study
after proper description and rationale of the
interview questionnaire, were included in the
study. Information regarding background
characteristics of parents, source of
information, knowledge and opinion regarding
childhood additional vaccines was collected.
Additional vaccines: For study purpose,
optional vaccines recommended by IAP6 such
as H influenza B (HiB), Hepatitis A, Chicken
Pox, Meningococcal Vaccine, Pneumococcal
Vaccine, Influenza Vaccine and Rota Virus
Vaccine were considered as childhood
additional vaccines.
Data analysis: The data were analysed using
Microsoft Excel and Epi_Info software
package version 6.04. To compare data sets
Chi-square test was used and p < 0.05 was
considered statistically significant (Yates‘
correction applied wherever applicable).
Ethical consideration: Written consent was
obtained from all the study participants before
assessing their knowledge and opinion about
childhood additional vaccines.
RESULTS
Knowledge and opinion regarding childhood
additional vaccines were gathered from
parents of total 180 children. Among them,
112 (62.22%) were parents of male and 68
(37.78%) parents of female children. Majority
(96.67%) of the respondents were Hindu and
104 (57.78%) belonged to joint families. 131
(72.78%) mothers of children were graduate
and 144 (80%) were housewives. 151
(83.89%) fathers were graduate and 107
(59.45%) were in service. (Table 1)
Knowledge regarding additional vaccines
Doctors (73.33%) were main source of
information regarding childhood additional
vaccines followed by television (18.89%) and
friends (17.78%). 48 (26.67%) and 59
(32.78%) parents respectively knew the timing
of these additional vaccines and against which
diseases these vaccines are being used. 133
(73.89%) parents reported vaccination as best
way to prevent these diseases. 86 (76.79%)
parents of male children reported that
vaccination is the best approach to prevent
these diseases as compared to 47 (69.12%)
parents of female children (p=0.033). Further,
101 (56.11%) parents correctly knew the
routine immunization schedule. (Table 2)
Opinion regarding additional vaccines
137 (76.11%) parents opined that additional
vaccines should be available at govt. hospitals.
84 (46.67%) parents recognized polyvalent
vaccines better than monovalent vaccine.
Numbers of injections (89.29%), cost
(21.43%), numbers of visits (16.67%) and less
complications (15.48%) were cited for such

117 International Journal of Current Research and Review www.ijcrr.com
Vol. 04 issue 03 February 2012
preference. Financial constrain (46.11%),
family disagreement (26.67%), time constrain
(20%), fear of complication (18.89%) and
non-availability (8.89%) were stated as
barriers; and parents‘ education (69.44%) and
economic status (41.11%) were stated as
foremost family related reason for poor
acceptance of childhood additional vaccines.
(Table 3)
DISCUSSION
Study findings indicate that knowledge and
opinion of parents regarding childhood
additional vaccines pose as significant factor
towards successful immunization campaign.
Doctors remained important source of
information (73.33%) for parents in regard to
childhood additional vaccines. Majority of
parents opined that vaccines are best method
to prevent these diseases (73.89%) and those
vaccines should be made available in govt.
hospitals (76.11%). These results are similar
to findings documented by previous
researchers. 7,8
However, in the present study,
only 26.67% and 32.78% parents respectively
knew the timing and rationale of selected
childhood additional vaccines. Previous
researchers have mentioned that modus-
operandi towards knowledge and concerns
raised by parents regarding childhood
immunization determines action taken by
parents, and thus immunization coverage in
particular area.9,10
It has been recommended
that parents who resist immunization
campaign because of background
characteristics, traditional beliefs or situational
perceptions; health care providers must assess
the socio-cultural, economic and scientific
basis for resistance before promoting such
campaign.11
Financial constrain, parental knowledge,
family disagreement, fear of complication and
non-availability of additional vaccines were
stated as main barriers for poor acceptance and
coverage of childhood additional vaccines.
Similar findings has already been compiled
and documented in this respect through studies
conducted in Africa and Asia.12
In general,
parents‘ knowledge about childhood
additional vaccines still remains poor in third
world countries. However, it has been argued
that public often accepts vaccination despite
limited knowledge about it.13
It is
recommended that parents‘ knowledge and
concerns must be addressed to promote and
maintain childhood additional vaccination
campaign once we plan to start this campaign.
Further, to improve vaccination coverage and
child survival, a sense of urgency is must from
national as well as community level.14
Measures which can lever promotion and
popularization of childhood additional
vaccination may include addressing
knowledge gap among parents and their
concerns, making these vaccines available at
govt. hospitals, engaging private health
providers/facilities and monitoring the
progress to sustain the impact. Performance of
MCH services still remains a matter of
concern in India and it has been recommended
to engage and monitor services rendered by
anganwadis towards improvement of
immunization services. 15
The strong
association between parents‘ education and
vaccination coverage has been recognized in
NFHS-3 and UNICEF coverage surveys in
India and other developing countries. 16, 17
This
fact may also be may be utilized considering
higher education level of parents in the study
area to promote and sustain coverage of
childhood additional vaccines in the study are
as suggested by Indian Academy of
Paediatrics.
Limitations:
Debatable limitations of the present study may
include urban setting of the study and already
sensitized respondents otherwise clients of the
same private health care facility. This arguably
may have led to an inflated response and thus
puts question on application of the study
findings in other difficult, remote and rural
India.

118 International Journal of Current Research and Review www.ijcrr.com
Vol. 04 issue 03 February 2012
CONCLUSION
Parents‘ knowledge and opinion regarding
childhood additional vaccines is a matter of
concern. This knowledge-gap and other
operational issues should be addressed before
launching and promoting any such campaign.
ACKNOWLEDGEMENT
We acknowledge all study participants for
valuable information towards improving
vaccination coverage among children. We
acknowledge the immense help received from
the scholars whose articles are cited and
included in references of this manuscript. We
are also grateful to authors /editors /publishers
of all those articles, journals and books from
where the literature for this article has been
reviewed and discussed.
Source of financial support: Nil
Conflict of interest: None declared
REFERENCES
1. Sharma R, Bhasin SK. Routine
immunization - Do people know about it?
A study among caretakers of children
attending pulse polio immunization in east
Delhi. Indian Journal of Community
Medicine 2008; 33(1):31-34.
2. Bhatia V, Swami HM, Rai SR, Gulati S,
Verma A, Parashar A, et al. Immunization
status in children. Indian J Pediatr 2004;
71:313-315.
3. Yadav RJ and Singh P. Immunization of
children and mothers in northeastern
states. Health and Population -
Perspectives and Issues 2004; 27(3):185-
93.
4. Chen RT, DeStefano F, Pless R, Mootrey
G, Kramarz P, Hibbs B. Challenges and
controversies in immunization safety.
Infect Dis Clin North Am. 2001; 15(8):21-
39.
5. Offit PA, Jew RK. Addressing parents‘
concerns: Do vaccines contain harmful
preservatives, adjuvants, additives, or
residuals? Pediatrics. 2003; 112:1394-
1397.
6. Singhal T. Recommendation: Consensus
recommendations on immunization, 2008.
Indian Academy of Pediatrics Committee
on Immunization (IAPCOI). Indian
Paediatrics 2008; 45(8):635-48.
7. Gellin BG, Maibach EW and Marcuse EK.
Do parents understand immunizations? A
national telephone survey. Pediatrics.
2000;106(5):1097-1102.
8. Manjunath U, Pareek RP. Maternal
knowledge and perceptions about the
routine immunization programme: A study
in a semi-urban area in Rajasthan. Indian J
Med Sci 2003;57:158-63.
9. Gust DA, Kennedy A, Shui I, Smith PJ,
Nowak G and Pickering LK. Parent
attitudes toward immunizations and
healthcare providers: The role of
information. Am J Prev Med.
2005;29:105-112.
10. Keane MT, Walter MV, Patel BI, et al.
Confidence in vaccination: a parent
model. Vaccine. 2005;23:2486-2493.
11. Dawson A. The determination of ―best
interests‖ in relation to childhood
vaccinations. Bioethics. 2005;19:188-205.
12. Jheeta M and Newell J. Childhood
vaccination in Africa and Asia: the effects
of parents‘ knowledge and attitudes. Bull
World Health Organ 2008;86(6):419-420.
13. Nichter M. Vaccinations in the Third
World: A consideration of community
demand. Soc Sci Med 1995; 41: 617-632.
14. Kumar S. Indians can do better at
improving child survival. Indian Journal
of Community Medicine 2011; 36(3):
171-173.
15. Datta SS, Boratne AV, Cherian J, Joice
YS, Vignesh JT and Singh Z. Performance
of anganwadi centers in urban and rural
area: A facility survey in coastal south
India. Indian Journal of Maternal and
Child Health 2010; 12(4): 1-9.
16. Luman ET, McCauley MM, Shefer A,
Chu SY. Maternal characteristics
associated with vaccination of young
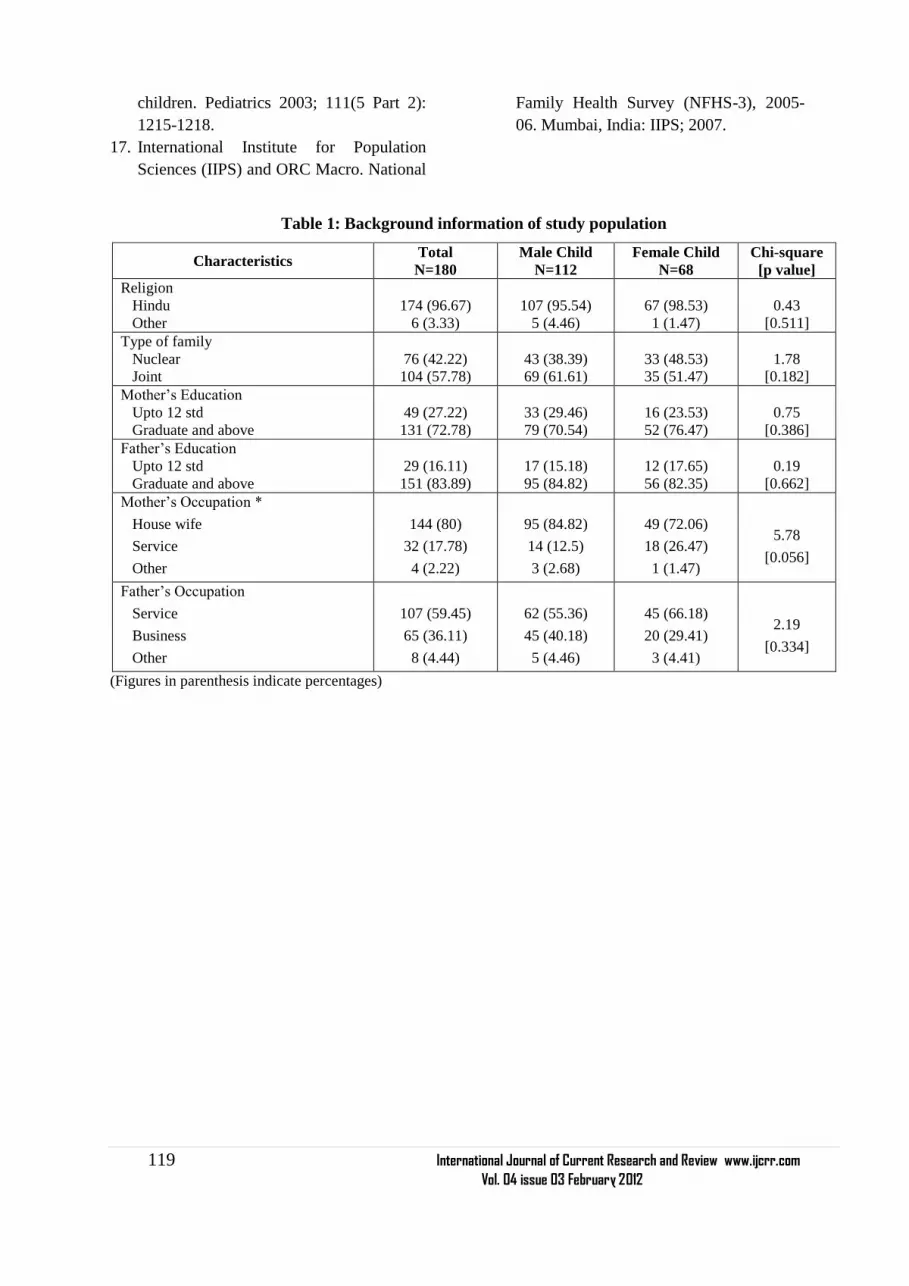
119 International Journal of Current Research and Review www.ijcrr.com
Vol. 04 issue 03 February 2012
children. Pediatrics 2003; 111(5 Part 2):
1215-1218.
17. International Institute for Population
Sciences (IIPS) and ORC Macro. National
Family Health Survey (NFHS-3), 2005-
06. Mumbai, India: IIPS; 2007.
Table 1: Background information of study population
Characteristics Total
N=180
Male Child
N=112
Female Child
N=68
Chi-square
[p value]
Religion
Hindu
Other
174 (96.67)
6 (3.33)
107 (95.54)
5 (4.46)
67 (98.53)
1 (1.47)
0.43
[0.511]
Type of family
Nuclear
Joint
76 (42.22)
104 (57.78)
43 (38.39)
69 (61.61)
33 (48.53)
35 (51.47)
1.78
[0.182]
Mother‘s Education
Upto 12 std
Graduate and above
49 (27.22)
131 (72.78)
33 (29.46)
79 (70.54)
16 (23.53)
52 (76.47)
0.75
[0.386]
Father‘s Education
Upto 12 std
Graduate and above
29 (16.11)
151 (83.89)
17 (15.18)
95 (84.82)
12 (17.65)
56 (82.35)
0.19
[0.662]
Mother‘s Occupation *
House wife
Service
Other
144 (80)
32 (17.78)
4 (2.22)
95 (84.82)
14 (12.5)
3 (2.68)
49 (72.06)
18 (26.47)
1 (1.47)
5.78
[0.056]
Father‘s Occupation
Service
Business
Other
107 (59.45)
65 (36.11)
8 (4.44)
62 (55.36)
45 (40.18)
5 (4.46)
45 (66.18)
20 (29.41)
3 (4.41)
2.19
[0.334]
(Figures in parenthesis indicate percentages)

120 International Journal of Current Research and Review www.ijcrr.com
Vol. 04 issue 03 February 2012
Table 2: Knowledge of care givers regarding additional vaccines
Characteristics Total
N=180
Male Child
N=112
Female Child
N=68
Chi-square
[p value]
Source of information *
Doctor
TV
Friends
Posters
Radio
Other Sources
132 (73.33)
34 (18.89)
32 (17.78)
17 (9.44)
4 (2.22)
12 (6.67)
79 (70.54)
19 (16.96)
22 (19.64)
10 (8.93)
1 (0.89)
9 (8.04)
53 (77.94)
15 (22.06)
10 (14.71)
7 (10.29)
3 (4.41)
3 (4.41)
4.43
[0.489]
Have knowledge about routine
immunization schedule 101 (56.11) 54 (48.21) 47 (69.12)
7.51
[0.006]
Know schedule of additional vaccines 48 (26.67) 25 (22.32) 23 (33.82)
2.86
[0.091]
Have knowledge against which
diseases additional vaccines are being
used 59 (32.78) 42 (37.5) 17 (25)
3.00
[0.083]
Best way to prevent such diseases
Vaccination
Healthy diet and hygiene
No idea
Other
133 (73.89)
23 (12.78)
16 (8.89)
8 (4.44)
86 (76.79)
17 (15.18)
7 (6.25)
2 (1.78)
47 (69.12)
6 (8.82)
9 (13.24)
6 (8.82)
8.71
[0.033]
(* Multiple responses, Figures in parenthesis indicate percentages)
Table 3: Opinion of care givers about additional vaccines
Characteristics Total
N=180
Male Child
N=112
Female Child
N=68
Chi-square
[p value]
Additional vaccines should be
available in Govt. Hospitals 137 (76.11) 80 (71.43) 57 (83.82)
3.58
[0.059]
Recognize combination vaccines better
than single vaccine 84 (46.67) 51 (45.54) 33 (48.53)
0.15
[0.696]
Reason *
Less number of Injections
Cheaper
Less visits
Less complications
[N=84]
75 (89.29)
18 (21.43)
14 (16.67)
13 (15.48)
[N=51]
51 (100)
8 (15.69)
11 (21.57)
5 (9.80)
[N=33]
24 (72.73)
10 (30.30)
3 (9.09)
8 (24.24)
8.22
[0.042]
Barriers of additional vaccination *
Financial constrain
Family disagreement
Time constrain
Afraid of complications
Non-availability
Other
83 (46.11)
48 (26.67)
36 (20)
34 (18.89)
16 (8.89)
18 (10)
47 (41.96)
30 (26.79)
28 (25)
25 (22.32)
6 (5.36)
11 (9.82)
36 (52.94)
18 (26.47)
8 (11.77)
9 (13.24)
10 (14.71)
7 (10.29)
10.86
[0.054]
Reason for poor acceptance of
additional vaccines *
Parents‘ education
Economic status
Number of children
Parents‘ occupation
Sex of the child
Other
125 (69.44)
74 (41.11)
8 (4.44)
6 (3.33)
4 (2.22)
21 (11.67)
85 (75.89)
41 (36.61)
6 (5.36)
5 (4.46)
3 (2.68)
13 (11.61)
40 (58.82)
33 (48.53)
2 (2.94)
1 (1.47)
1 (1.47)
8 (11.77)
4.89
[0.429]
(* Multiple options, figures in parenthesis indicate percentages)

121 International Journal of Current Research and Review www.ijcrr.com
Vol. 04 issue 03 February 2012
ijcrr
Vol 04 issue 03
Category: Research
Received on:10/12/11
Revised on:23/12/11
Accepted on:07/01/12
ABSTRACT Aim: To evaluate the remineralization efficacy of CPP-ACP and Fluoride Varnish using Diagnodent
and to compare the remineralization efficacy of CPP-ACP and Fluoride Varnish.
Methodology: Sixty freshly extracted non carious premolars were selected and randomly divided into
three groups of twenty samples each. Group A: (Control), Group B: Fluoride Varnish (Fluorprotector),
Group C: CPP – ACP (Tooth mousse). The baseline values for all the samples were recorded using
diagnodent (KaVo). After demineralizing the samples, values were again measured. Fluorprotector
(Ivoclar Vivadent) and GC Tooth mousse (Recaldent) were applied on to the buccal surface of the
samples in group B and group C respectively with group A as control. Twenty minutes later the
readings for Group B and Group C were obtained. All the samples in the three groups were immersed
in artificial saliva and the readings obtained were statistically analyzed.
Results: The mean value for group B was (5.6+/-0.9) and for group C was (7.2+/-1.6). This was
statistically significant (P<0.0001) and the remineralization was found to be more in CPP-ACP group.
Conclusion: CPP-ACP has a statistically significant remineralization potential than fluorprotector.
There was no statistical significance when Group A, Group B and Group C were compared
individually with artificial saliva.
____________________________________________________________________________
Keyword: Remineralization, CCP-ACP,
Fluoride varnish, Artificial saliva, Diagnodent.
INTRODUCTION
The development of dental caries is a complex,
multistage and a dynamic process which can be
conceptualized as an imbalance between
mineral loss called demineralization and
mineral gain called remineralization. The cycle
of remineralization and demineralization is a
constant process in the normal oral
environment, and only when the speed and the
level of demineralization become dominant the
actual surface cavitation becomes possible.
This multifactorial infectious disease which is
initiated and progressed by Mutans streptococci
should be quickly detected for an effective
treatment plan that reverses the progression
from white spot lesion to cavitation.
The ability to promote mineralization can be
achieved using various remineralizing agents
such as Fluoride varnish (Fluorprotector) and
CPP-ACP (Casein Phosphopeptide Amorphous
Calcium Phosphate). CPP-ACP a water based
sugar free cream when applied to the tooth
surface binds to biofilm, plaque, bacteria,
hydroxyapatite and surrounding soft tissue,
localizing bioavailable calcium and phosphate,
there by buffering plaque pH and enhancing
remineralization. In a human in situ
demineralization study, 1.0%w/v CPP-ACP
solution used twice daily produced a 51%
reduction in enamel mineral loss caused by
frequent sugar solution exposure1. CPP-ACP
EVALUATION AND COMPARISON OF
REMINERALIZATION EFFICACY OF CPP-ACP AND
FLUORIDE VARNISH USING DIAGNODENT - AN IN
VITRO STUDY
R.Senthil1, V. Rathna Prabhu
1, J. Jeeva rathan
2, A. Venkatachalapathy
1
1Department of Pedodontics and Preventive Dentistry, Meenakshi Ammal
Dental College and Hospital, Chennai 2Department of Pedodontics and Preventive Dentistry, Balaji Dental College
and Hospital, Chennai
E-mail of Corresponding Author: [email protected]

122 International Journal of Current Research and Review www.ijcrr.com
Vol. 04 issue 03 February 2012
solutions have shown to promote
demineralization of the enamel sub surface
lesions 2
.
On the other hand, use of fluoride is the pivot
of preventive dentistry which continues to be
the cornerstone of caries prevention program.
The decline of dental caries prevalence in
recent decades has been explained by
widespread use of fluoride. The ability of
fluoride to facilitate remineralization process is
presently believed to be more significant than
its inhibition of demineralization3. The
absorption of calcium fluoride on the tooth
surface and the release of ions during low
plaque pH promotes remineralization. Among
various topical fluorides, fluoride varnish plays
an important role in preventing the enamel sub
surface lesion because of high fluoride
concentration and also the ability to adhere to
the enamel thereby extending the exposure time
to several hours forming a depot from which
fluoride is released slowly 4.
The DIAGNOdent system is a part of an
exciting new generation of dental equipment.
This system employs laser light of a defined
wave length to help detect and quantify broken
down tooth substance without x-ray exposure.
It is also a quick, easy and pain free diagnostic
aid with 90% success rate in caries detection,
pathological changes and initial
demineralization. This laser-fluorescence
device is suitable for monitoring small caries
lesions as well as occlusal caries5. In this study
this investigation tool is used for assessing the
demineralization as well as the subsequent
remineralization by using two materials such as
CPP-ACP (Tooth mousse) and Fluoride varnish
(Fluorprotector) on the extracted human
premolars.
MATERIAL AND METHOD
Sixty freshly extracted non carious premolars
were selected and cleaned thoroughly with
ultrasonic scaler and polished with pumice
slurry. The samples were then preserved in a
beaker containing thymol. A 4x4mm sticker
paper was cut and stuck on the buccal surface
of all the samples to create a window. The
remaining surfaces of the samples were coated
with acid resistant nail varnish and then the
sticker paper was removed. Each tooth was
kept in a separate plastic tube with a rubber
stopper and was numbered from 1 to 60
individually on the tubes and kept in a stand.
The samples were then randomly divided into
three groups of twenty samples each.
Group A: Control
Group B: Fluoride Varnish (Fluorprotector)
Group C: CPP – ACP (Tooth mousse)
The laser tip of DIAGNOdent was kept in free
air and the calibrating button in the instrument
was pressed for thirty seconds until the monitor
displayed the indication ―CAL‖ on it. Then the
tip was placed in a ceramic calibrating block
given by the manufacturer and again the
calibrating button was pressed till the indication
―CAL DONE‖ was displayed on the monitor.
The calibrated tip was then kept in the window
created on the buccal surface of the tooth and
the peak value displayed in the diagnodent was
recorded as the baseline value. Similarly the
baseline values (V1) for all the samples were
recorded after calibrating the tip between each
sample readings.
The samples were immersed in their respective
tubes containing 2ml of demineralization
solution and kept for 4 hours6. Later they were
taken from the tubes, washed with de-ionized
water and dried with soft tissue paper.
DIAGNOdent values were again measured
(V2) with the same tip as before for all the
samples on the same surface.
Fluorprotector (Ivoclar Vivadent ) and GC
Tooth mousse (Recaldent) were applied on the
buccal surface of the samples in group B and
group C according to manufacturer‘s
instructions. The group A (control) was left
without any application. Twenty minutes later
the DIAGNOdent readings (V3) for Group B
and Group C were again obtained after
calibrating the equipment. All the samples in
the three groups were kept undisturbed in
individual tubes containing 2ml of artificial
saliva for 24 hours7,8
. The diagnodent readings

123 International Journal of Current Research and Review www.ijcrr.com
Vol. 04 issue 03 February 2012
(V4) of all the samples in the three groups were
again obtained. Statistical analysis was done
using paired‗t‘ test and student‘s ‗t‘ test
appropriately (p <0.05).
RESULTS
The sample distribution was given as group A(
control), group B ( fluoride varnish) and group
C (cpp – acp) with 20 samples each
respectively (table 1). The mean ± SD values
between the groups B and C at V3 was about
(5.6 ± 0.9) and (7.2 ± 1.6) which was
statistically significant (p<0.0001) (table 2)
.The mean value of group A and B at V1 was
increased from (5.8± 1.6) to (7.2 ± 1.1) which
was statistically significant. The other values
V2 and V4 were not statistically significant
(table 3).The mean value of group A and C at V
1 was (5.8 ± 1.6) which increased to (6.7 ± 0.9)
and was statistically significant. The other
values V2 and V4 were not statistically
significant (table4).
DISCUSSION
Dental hard tissues are constantly undergoing
cycles of demineralization during periods when
the pH is low, followed by repair when
conditions favour remineralization leading to
variations in the mineral status of teeth many
times in a day9. The widespread use of many
remineralizing agents has increased the rate of
remineralization and has dramatically reduced
the prevalence of dental caries and the rate of
progression of caries lesion. This present study
was done to analyze the efficacy of
remineralization by using two remineralizing
agents Fluoride varnish (Fluorprotector) and
CPP-ACP (Tooth mousse). The samples
selected were sixty premolars which were
extracted for orthodontic purpose (n = 60).
They were selected because of the ease of
availability and free of carious lesion than any
other teeth. All the selected samples fulfilled
the inclusion criteria which are absence of
incipient carious lesions, white spot lesions,
subsurface demineralization or cavitation in
any of the surfaces. All the samples were
coated with acid resistant varnish except the
buccal surface in which a 4×4 mm window was
made for examination. The buccal surface of
the tooth was selected because it is often free of
carious lesions when compared to the occlusal
surface which might have pit and fissure
lesions.
Table 1 shows the distribution of the samples
which were divided into three groups with
group A as control. All the samples were kept
in separate plastic tubes with a rubber stopper
in order to prevent cross contamination during
the study. In this study laser emitting
fluorescent device (DIAGNOdent) was used to
assess the remineralization efficacy of the
samples10, 11
. The base line values for all the
samples were derived from the DIAGNOdent
by calibrating the equipment individually for all
the sample group (V1). This was done to
prevent any error in the readings as shown in
(table 1). Demineralization of the samples was
done with a standardized demineralization
solution for 4 hours. In this study we used 10%
acetic acid along with (CaCl2, NaH2PO4 ) at a
pH of 5.2 which was almost equal to that of
commercially available soft drinks that could
erode the enamel surface. After drying the
samples with tissue paper, the diagnodent
readings were measured as (V2)8,12
.
Fluorprotector fluoride varnish was applied to
group B and CPP-ACP (Tooth mousse) to
group C and the DIAGNOdent values were
measured as (V3) as shown in (table 2). All the
samples were then immersed in artificial saliva
for 24 hours and the DIAGNOdent readings
were taken after drying the samples (V4) as
shown in (table 3). The value at V1 showed a
mean increase at V2 in all the three groups
which was found to be statistically significant
with a p value (p<0.0001). This is because there
was an increase in the values of diagnodent
from initial base line which showed that all the
samples have been demineralized. The value at
V2 showed a decrease at V3 with a mean
decrease of (4.7 ± 1.1) in group B which was
found to be statistically significant with a p
value (p< 0.0001) (Table 3).The reduction in

124 International Journal of Current Research and Review www.ijcrr.com
Vol. 04 issue 03 February 2012
the values are due to the action of silane
fluoride present in the fluorprotector which
have the ability to adhere to enamel, thereby
extending the fluoride exposure time to several
hours forming a depot from which fluoride is
released, thus enhancing remineralization13,14
.
The value at V2 showed a decrease at V3 with
a mean decrease of (3.4 ±1.1) in group C which
was found to be statistically significant with the
p value (p<0.0001).
CPP-ACP in this present study produced
potential remineralization because of its ability
to replace calcium and phosphate and the
anticariogenic mechanisms of CPP-ACP that
stabilizes the CPP and localizes ACP at the
tooth surface, thereby buffering plaque pH and
depressing enamel remineralization and
enhancing remineralization. This was shown by
the decrease in the value of DIAGNOdent from
the demineralized value. Thus there was an
initial remineralization in both group B and
group C .The mean value of V2 – V3 in group
B was found to be (4.7 ± 1.1) and the mean
value of V2 – V3 in group C was found to be
(3.4 ± 1.1). The value was found to be less in
the group C sample. This implies that the
samples in group C (CPP – ACP) has better
remineralization efficacy than (Fluorprotector)
group B (Table 3 and 4). This may be due to
the low fluoride content present in the
fluorprotector (1000ppm)15
. When the mean
values of V3 – V4 in group B and group C
were compared it was found to be (2.7 ± 1.3)
and (2.7 ± 1.3) respectively which was also
found to be statistically significant. But this
implies that there was only a minimal
remineralization occurred after immersing the
samples in artificial saliva, when compared
with the samples after applying remineralizing
agents .The mean value of V2-V4 in group A,
group B and group C was found to be
statistically significant (Table 2, 3 and4). This
implies that there was no significant difference
when all the three sample groups were
immersed in artificial saliva for 24 hours 16,17
.
Human saliva is acknowledged to possess a
remineralizing potential, as demonstrated both
through observations of reversals in clinical
caries diagnosis and through in vitro studies on
enamel rehardening18
. Nevertheless, when
saliva is compared to inorganic remineralizing
solutions, its capacity to deposit mineral is
notably less. This has generally been attributed
to an interfering effect by the organic
components of the natural fluids. The practical
application of synthetic solutions however, has
been limited by the long contact times needed
to achieve significant remineralization of
carious tooth enamel. Due to short contact time
with this solutions the precipitation have
resulted in surface deposition, with little
remineralization occurring in the subsurface
region of the enamel lesions. In this study the
sub surface remineralization which has been
enhanced may be due to the tri calcium
phosphate that has been used as a constituent in
artifical saliva. Since saliva continuously bathes
the oral dentition, a more practical means of
achieving reversal of incipient demineralization
may result from techniques aimed at enhancing
this natural process.
SUMMARY AND CONCLUSION
CPP-ACP has a statistically significant
remineralization potential than fluorprotector
fluoride varnish. There was no statistical
significance when Group A, Group B and
Group C were compared individually with
artificial saliva.
The constituents of human saliva also play an
important role in the remineralization cycle.
This varies between individuals and its effect is
reduced in those having a disturbance in the
composition of human saliva. Thus
remineralizing agents will have a greater
additive effect when used in patients with
altered salivary constituents.
REFERENCES
1. Reynolds EC, Cai F, Shen P, Walker GD.
Retention in plaque and remineralization of
enamel lesions by various forms of calcium

125 International Journal of Current Research and Review www.ijcrr.com
Vol. 04 issue 03 February 2012
in a mouthrinse or sugar-free chewing gum.
J Dent Res 2003; 82(3):206-11.
2. Reynolds EC. Remineralization of enamel
subsurface lesions by casein
phosphopeptide-stabilized calcium
phosphate solutions. J Dent Res
1997;76(9):1587-95.
3. Eujeno Fluoride Varnish; A review. J Am
Dent Assoc 2000:131.
4. Castellano JB. Donly KJ. Potential
remineralization of demineralized enamel
after application of fluoride varnish. Am J
Den. 2004; 17(6):462-4.
5. Alwas-Danowska HM, Plasschaert AJ,
Suliborski S, Verdonschot EH. Reliability
and validity issues of laser fluorescence
measurements in occlusal caries diagnosis.
J Dent 2002; 30 (4):129-34.
6. Corry DT, Millett SL. Effect of fluoride
exposure on cariostatic potential of
orthodontic bonding agents: an in vitro
evaluation. Journal of Orthodontics 2003;
30 (4): 323-329.
7. Devlin H, Bassiouny MA, Boston D.
Hardness of enamel exposed to Coca-Cola
and artificial saliva. J Oral Rehabil 2006;
33(1):26-30.
8. Eisenburger M, Addy M, Hughes JA,
Shellis RP. Effect of time on the
remineralisation of enamel by synthetic
saliva after citric acid erosion. Caries Res
2001; 35(3):211- 5.
9. John Hicks, Catherine F. Biological factors
in dental caries: role of remineralization
and fluoride in the dynamic process of
demineralization and remineralization. J
Clin Pediatr Dent 2004; 28: 203.
10. Bader J, Shugars DA. A systematic review
of the performance of a laser fluorescence
device for detecting caries. J Am Dent
Assoc 2004; 135: 1413-1426.
11. Shinohara T, Takase Y, Amagai T,
Haruyama C, Igarashi A, Kukidome N,
Kato J, Hirai Y. Criteria for a diagnosis of
caries through the DIAGNOdent.
Photomed Laser Surg 2006; 24(1):50-8.
12. Tanaka M. Comparative Reduction of
Enamel Demineralization by Calcium and
Phosphate in vitro. Caries Res 2000;
34:241-245.
13. De Bruyn H, Buskcs JA, Arends J. The
inhibition of demineralization of human
enamel after fluoride varnish application as
a function of the fluoride content. An in
vitro study under constant composition
demineralising conditions. J Biol Buccale
1986; 14(12): 133-138.
14. Munshi AK, Reddy NN, Shetty V. A
comparative evaluation of three fluoride
varnishes: an in - vitro study. J Indian Soc
Pedod Prev Dent 2001; 19:92-102
15. Reynolds EC, Cai F, Shen P, Walker GD.
Retention in plaque and remineralization of
enamel lesions by various forms of calcium
in a mouthrinse or sugar-free chewing gum.
J Dent Res 2003; 82(3):206-11.
16. Attin T, Buchalla W, Gollner M, Hellwig
E. Use of variable remineralization periods
to improve the abrasion resistance of
previously eroded enamel. Caries Res
2000; 34(1):48-52.
17. Amaechi BT, Higham SM. In vitro
remineralisation of eroded enamel lesions
by saliva. J Dent 2001; 29(5): 371-6.
18. Silverstone Poole. Human saliva as
potential remineralizing agent. Caries Res
1968; 2:87.

126 International Journal of Current Research and Review www.ijcrr.com
Vol. 04 issue 03 February 2012
Table – 1 : Distribution of samples
GROUP A B C
NO. OF SAMPLE 20 20 20
A - Control
B - Fluoride Varnish
C - CPP – ACP
Table – 2 : Comparison of mean values between Group B and Group C
Time Points B C p – Value
Mean ± S.D Mean ± S.D
V1 7.2 ± 1.1 6.7 ± 0.9 0.12 (NS)
V2 10.3 ± 1.1 10.6 ± 1.3 0.36 (NS)
V3 5.6 ± 0.9 7.2 ± 1.6 0.001 (Sig)
V4 4.4 ± 0.8 4.5 ± 0.8 0.57 (NS)
V 1 - Baseline value
V2 - Demineralization after 4hrs
V3 - 15 minutes after application of CPP-ACP and Varnish.
V4 - 24 hours after immersing the samples in artificial saliva
(Sig) = Significant
(NS) = Non significant In Table 2, mean ± SD values between group B and C at V3 was about (5.6 ± 0.9) and (7.2 ± 1.6)
which was statistically significant (p<0.0001). Student‘s independent t-test was used to evaluate the p-
value.
Table – 3 : Comparison of mean values between Group A and Group B
Time Points A B p – Value
Mean ± S.D Mean ± S.D
V1 5.8 ± 1.6 7.2 ± 1.1 0.004 (Sig)
V2 10.1 ± 1.3 10.3 ± 1.1 0.70 (NS)
V4 4.7 ± 1.3 4.4 ± 0.8 0.33 (NS)
In table 3, the mean value at V1 was increased from (5.8± 1.6) to (7.2 ± 1.1) which was statistically
significant. The other values V2 and V4 were not statistically significant. Student‘s independent t-test
was used to evaluate the p-value.

127 International Journal of Current Research and Review www.ijcrr.com
Vol. 04 issue 03 February 2012
Table – 4 : Comparison of mean values between Group A and Group C
Time Points A C p – Value
Mean ± S.D Mean ± S.D
V1 5.8 ± 1.6 6.7 ± 0.9 0.05 (Sig)
V2 10.1 ± 1.3 10.6 ± 1.3 0.23 (NS)
V4 V4 4.7 ± 1.3 4.5 ± 0.8 0.57 (NS)
In table 4, the mean value at V 1 was (5.8 ± 1.6) which increased to (6.7 ± 0.9) and was statistically
significant. The other values V2 and V4 were not statistically significant. Student‘s independent t-test
was used to evaluate the p-value.
Fig I : Armamentarium
Fig II: Diagnodent Kit

128 International Journal of Current Research and Review www.ijcrr.com
Vol. 04 issue 03 February 2012
Fig III: Laser Tips
Fig IV: Calibrating the Unit
Fig V : Samples with Individual Numbering

129 International Journal of Current Research and Review www.ijcrr.com
Vol. 04 issue 03 February 2012
Fig VI : Measuring the values
LEGENDS
Figure I - Armamentarium.
Figure II - Diagnodent kit (KaVo).
Figure III - Three laser tips for measuring the remineralization as well as the
demineralization.
Figure IV - Calibration of the unit is done to prevent any error.
Figure V - Sixty samples of extracted premolars for orthodontic purpose.
Figure VI - Measuring the values with the diagnodent kit.

130 International Journal of Current Research and Review www.ijcrr.com
Vol. 04 issue 03 February 2012
ijcrr
Vol 04 issue 03
Category: Research
Received on:09/12/11
Revised on:18/12/11
Accepted on:22/12/11
ABSTRACT FGTB is usually a silent disease evidencing itself only when really looked for. It usually affects
females of reproductive age group. Disruption of the IFN-gamma gene in mice infected with M.
tuberculosis has resulted in exacerbation of disease, progressive and widespread tissue destruction and
necrosis with numerous bacteria. We therefore proposed, to study the possible association of IFN-γ
gene polymorphism in Indian women with female genital tuberculosis. It is a prospective case-control
study. Screening of genomic DNA samples were carried out from clinically definite 106 FGTB
patients and 100 unaffected patients aged between 18 to 40 years. +874 (T→A) IFN-γ genotyping was
carried out by using sequence specific primer polymerase chain reaction (SSP-PCR) method.
Statistical tests were performed using pantaray software systems.
According to our investigation, FGTB patients showed more or less similar TT (30.18% vs. 30.0%),
higher AA (19.81% vs. 9.0%) genotypes compared to controls and the frequency of AT genotypes
decreased significantly. Distribution of IFN- γ genotypes between patients and controls were have
statistical disparity. This study suggests that IFN-γ +874 T to A polymorphism have an etiological
association with susceptibility of female genital tuberculosis.
____________________________________________________________________________
Keywords: Mycobacterium tuberculosis;
Interferon-γ gene polymorphism; Female
Genital Tuberculosis (FGTB)
INTRODUCTION
Female genital tuberculosis (FGTB) is usually a
symptom-less disease diagnosed during
investigations for infertility (Namavar Jahromi
et al., 2001). It represents 15-20% of extra
pulmonary tuberculosis (Rajamaheshwari,
2009). In 80-90% cases, FGTB affects women
between 18-38 years of age with menstrual
irregularities accounting for nearly 27% of
manifestations of FGTB (Chakrabarti et al.,
1998). Primary infection may occur when the
male partner has active genitor-urinary TB and
transmission takes place by sexual intercourse
(Richards and Angus, 1998). It is usually a
result of reactivation of a silent bacillemia,
primarily from lungs and also thought to be
from cervical TB infections (Richards and
Angus, 1998; Sutherland et al., 1982). The
seeding of bacilli usually occurs immediately
after puberty as blood supply to the pelvic
organs increases and as a result, more bacilli
can reach genital organs and infect them
(Crofton et al., 1992). Infection of vulva,
vagina and cervix may result from direct
inoculation and ascending spread to other
genital organs may occur (Haas et al., 2002).
The incidence of infertility in genital TB
worldwide varies from 44-74%; in India it is
reported to be 58% (Dam et al., 2006) and
majority are in the same age group (Crofton et
al., 1992). In western countries the incidence of
FGTB is estimated to be <1%, whereas in some
MUTATIONAL ANALYSIS OF INTERFERON-GAMMA
GENE IN INDIAN WOMEN WITH FEMALE GENITAL
TUBERCULOSIS
Venkanna Bhanothu1, Jane Theophilus
1, Roya Rozati
2
1Dept. of Zoology, UCS, Osmania University, Hyderabad
2MHRT Hospital & Research Centre, Road # 3, Banjara Hills, Hyderabad
E-mail of Corresponding Author: [email protected]

131 International Journal of Current Research and Review www.ijcrr.com
Vol. 04 issue 03 February 2012
African and Asian countries it reaches 15–19%
(Punnonen et al., 1983; Giannacopoulos et al.,
1998). Recently, Jindal et al., 2010 have been
suggested the use of Endo TB-PCR for high
specificity and early diagnosis of female genital
tuberculosis as performed by laparoscopy and
so laparoscopy can be avoided in TB-PCR-
positive patients for diagnosis keeping the
PCR-negative cases in mind (Majumdar and
Satwik, 2011). Due to its rarity and mild
clinical picture, the index of suspicion for the
diagnosis of FGTB among gynecologists is
usually low. Some times, immune and genetic
susceptibility of host may not help in early
detection by Endo TB-PCR. Therefore, remains
to be an increasing public health concern
worldwide. Mycobacterium tuberculosis (M.
tuberculosis) is a facultative intracellular
pathogen capable of producing both a
progressive disease and an asymptomatic latent
infection (Parrish et al., 1998). The role of IFN
gamma (IFN- γ) as the main macrophage-
activator Th1 cytokine has been clearly
established in animal models infected with M.
tuberculosis by Flynn et al. and Dalton et al., in
1993. In human, single nucleotide
polymorphisms (SNPs) located in the first
intron of the IFN-γ gene (at position +874) has
shown variable associations with disease
susceptibility and severity (Pacheco et al.,
2008). On other hand, several studies have
demonstrated that ethnicity and cytokine
polymorphism plays a significant role in the
susceptibility to a wide range of diseases
(Hoffmann et al., 2002; Newport et al., 1996)
including FGTB. IFN-γ modulates a number of
functions in addition to MHC expression,
including the activation of macrophages, NK
cells and the inhibition of the Th2 phenotype in
T cells (Maher et al., 2007). Exactly which
function is undermined in +874A individuals
have not been determined yet. Pravica et al.,
2000 noted a novel single nucleotide
polymorphism (SNP), T to A, located at the
+874 position from translation start site in the
first intron of IFN-γ gene, which coincides with
a putative NF-κB binding site that could play a
fundamental role in the induction of
constitutively high IFN-γ production. The
differences in the magnitudes of the responses
that were seen may reflect the environment in
which the cohorts live, or they may reflect the
nature of the patients‘ infections (Cahn et al.,
2003). Disruption of the IFN-gamma gene in
mice infected with M. tuberculosis has resulted
in exacerbation of disease, progressive and
widespread tissue destruction and necrosis with
numerous bacteria (Dalton et al., 1993).
Therefore, alteration in IFN-γ production may
influence the susceptibility to FGTB and this
alteration could be due to gene polymorphism.
The homozygous T/T, A/A and heterozygous
A/T alleles are associated with any increase or
decrease in production of IFN-γ, this cytokine
can affect the outcome of the disease severity.
We therefore, hypothesized that the IFN-γ
+874T/A gene polymorphism might be
associated with female genital tuberculosis.
This gene was chosen due to its essential
central regulator role in response to infection
that may be involved in FGTB pathogenesis
and their potential regulation on gene
expression.
MATERIALS AND METHODS
This is a prospective case-control study, which
recruited women visiting the gynecology
clinics at two collaborating centers, which
register cases from all over the region of
Andhra Pradesh, India, complaining for
infertility and suspected of having genital
tuberculosis (TB) on clinical grounds. During
the period of our study (2006–2011), the
samples from the consecutive women in these
two centers were analyzed. The ethical
committee of Hospital and Research Centre
approved the research protocol. Informed
written consents were obtained from all the
participants. Proforma to obtain information on
the general, obstetric and gynaecological details
including family history, marital status, age at
menarche, length of menstrual cycle, associated
symptoms, duration and amount of blood loss,
duration of infertility, and socio demographic

132 International Journal of Current Research and Review www.ijcrr.com
Vol. 04 issue 03 February 2012
details like social status, occupation, lifestyle,
age, body mass index (BMI), limited
information on diet was used and a thorough
clinical examination done. General
characteristics for all patients were recorded in
the medical chart. Apart from routine
hematological investigations, specialized
investigations consisting of transvaginal
sonography of uterus and adnexa, hormone
profiles, immunological assays, and endoscopy
were performed as and when needed.
Surgically removed tissue was taken from both
groups for laboratory examination, including
AFB using light microscopy following
concentration, staining by Ziehl–Neelsen stain
as well as culture and M. tuberculosis specific
PCR (Abebe et al., 2004), the diagnostic
criteria by which tuberculosis was confirmed.
All patients met the inclusion criteria: 18-40
years of age having irregular periods, with past
history of having Genital TB and Tubal
blockage, experiencing infertility (in >60% of
cases), pelvic pain and scanty menstruation and
amenorrhoea, and histopathological evidence in
biopsy of premenstrual endometrial tissue or
demonstration of tubercle bacilli in culture of
menstrual blood or endometrial curetting.
Exclusion criteria were as all the following:
Women above 40 years of age, symptoms
suggestive of pulmonary TB/Extra pulmonary
TB except infertility, with normal abdomenal
and vaginal examinations, other chronic
disease, pregnancy or nursing, severe
psychiatric dysfunction, multiple sclerosis or
other autoimmune disorders, pulmonary
infections, HIV co-infection, women with
diabetes, malnutrition and other medical
disorders like hypertension were excluded.
Details of laparoscopy findings like unilateral
or bilateral tubal block with hydrosalphinx,
omental adhesions, frozen pelvics, tubo-ovarian
masses, tubercular salphingitis and tubercles
were noted in Table 1. Symptoms included
pelvic pain, irregular menstrual bleeding,
scanty menstruation, dysmenorrhoea
oligomenorrhea, amenorrhea and infertility. A
pelvic mass in variable combination aroused a
suspicion. Constitutional symptoms such as
sweating, increase in temperature and weight
loss were not major complaints while local
organ dysfunction manifested in amenorrhea,
omental adhesions and bilateral tubal blockage
seen on hysterosalpingographic study. The
median age of the subjects was 29 (range 18-
40) years. All subjects were HIV negative and
normal for pulmonary TB on the basis of
complete history, physical examinations; chest
X-ray, lung plain X-ray and by appropriate tests
such as tuberculin test, sputum smears and
sputum cultures (Raut et al., 2001; Saracoglu et
al 1992). The study population is from the state
of Andhra Pradesh, which is known for ethnic
variations.
Study group: Tube ovarian biopsy was taken
from 106 women during laparoscopy; from 45
women endometrium was obtained by curettage
and 61 women with biopsy for smear
microscopy, histopathology, culture and PCR
for mycobacterium. All these women were
infertile: primary infertility in 81 (76.4%)
women and secondary infertility in 25
(23.58%) women with mean age of 29.16 ±
3.73 years, mean age at menarche of 12.53
±1.01 years, mean duration of infertility of 3.97
± 2.91 years. Other gynaecological pathology
like dysmenorrhoea in 49 (46.2%) women,
tubal block with hydrosalphinx in 57 (53.77%)
women, omental adhesions in 41 (38.68%) and
tubercular salphingitis in 51 (48.1%) were
reported. Blood samples were collected in
heparinised tubes. The specimens were
received and preserved in 10% formalin,
processed in routine manner and embedded in
paraffin wax. Three-micron thick sections were
cut and stained by haematoxylin and eosin
(Namavar Jahromi et al., 2001). The diagnosis
was undertaken on morphological grounds
(Raut et al., 2001). Erythrocyte sedimentation
rate (ESR) was performed on all the patients,
which showed readings of between 57 and 123.
Tissue specimens were examined by a
pathologist for granulomatous reactions,
fibrosis suggestive of mycobacterium disease.

133 International Journal of Current Research and Review www.ijcrr.com
Vol. 04 issue 03 February 2012
Control group: Out of one hundred women
who attend the same clinic for other
gyaecological disorders and tubal sterilization,
92 (92%) women were proven fertile. Eight
(8%) women were infertile: primary infertility
in 7 (7%) women, secondary infertility in 1
(1%) women with other gynaecological
pathology (3 polycystic ovaries, 1 idiopathic
infertility, 4 pelvic inflammatory disease) and
were laparoscopically confirmed to be without
female genital tuberculosis. All the women in
this group were asymptomatic with mean age
of 26.11 ± 4.57 years, mean age at menarche of
12.03 ± 0.84 years and mean duration of
infertility of 0.174 ± 0.184 years. The following
symptoms were also present in the control
group: abdominal pelvic pain was observed in 2
(2%) women, dysmenorrhoea in 25 (25 %),
oligomenorrhoea in 3 (3%), there were 2 (2%)
mild menorrhagia, and 1 (1%) general malaise
cases. There were no severe cases as shown in
the Table 1.
Table I. Comparison of Socio-Demographic and Clinical details among Female Genital TB cases and
Controls
Characteristics
Female Genital TB
Cases (n=106)
Control group
(n=100)
Age (years) 29.16 ± 3.73 26.11 ± 4.57
Body mass index (kg/m2) 24.34 ± 1.46 23.86 ± 1.85
Age at menarche (years) 12.53 ± 1.01 12.03 ± 0.84
Infertility Symptoms
Duration of infertility (years) 3.97 ± 2.91 0.174 ± 0.184
Primary infertility [n (%)] 81 (76.4) 7 (7)
Secondary infertility [n (%)] 25 (23.58) 1 (1)
Proven fertility [n (%)] NA 92 (92)
Menstrual irregularity
Dysmenorrhoea [n (%)] 49 (46.2) 25 (25)
Mild [n (%)] 28 (26.4) 17 (17)
Moderate [n (%)] 11 (10.37) 6 (6)
Severe [n (%)] 9 (8.5) 2 (2)
No dyspareunia & dysmenorrhoea [n (%)] 27 (25.47) 48 (48)
Amenorrhea [n (%)] 7 (6.6) 1 (1)
Menorrhagia [n (%)] 4 (3.77) 2 (2)
Oligomenorrhea [n (%)] 13 (12.26) 3 (3)
Abdomeninal pain [n (%)] 15 (14.15) 2 (2)
General malaise [n (%)] 5 (4.7) 1 (1)
Laparoscopy findings
Tubal block with Hydrosalphinx [n (%)] 57 (53.77) NA
Omental Adhesions [n (%)] 41 (38.68) NA
Frozen pelvis [n (%)] 27 (25.47) NA
Tubo-ovarian mass [n (%)] 23 (21.7) NA
Tubercular salphingitis [n (%)] 51 (48.1) NA
Note: Some patients had more than one abnormal finding
Data are presented as mean ± SD, NA: not applicable

134 International Journal of Current Research and Review www.ijcrr.com
Vol. 04 issue 03 February 2012
Culture
Homogenized samples were cultured on
Lowenstein Jensen egg medium for acid-fast
bacilli and incubated for 3 to 8 weeks. Ziehl-
Neilsen staining was used to identify the bacilli
(Abebe et al., 2004).
DNA Preparation
Five ml of whole blood from patients and
controls were used for DNA extraction by a
modified proteinase-K/salting-out method
(Miller et al., 1988). Polymorphism at position
+874 of IFN-γ gene was identified using
sequence specific polymerase chain reaction
(PCR-SSP) as described by Pravica with some
modifications (Pravica et al., 2000). Briefly,
red blood cells were lysed using cold Lysis
buffer-I (0.3 M sucrose, 10mM Tris-HCl (pH:
7.4), 5 mM MgCl2, 1% Triton x-100). The
pellet was washed with phosphate buffer saline
(PBS) once. To the pellet 3 ml Lysis buffer-II
(10mM Tris-HCl, 400mM NaCl, 2mM Na2-
EDTA), 200μl of 10% SDS and 40μl
proteinase-K were added and incubated in 37°C
overnight. To remove proteins, 1 ml of 6M
NaCl was added and centrifuged for 5 min at
1500g. For extraction of DNA, 2 volumes of
absolute ethanol were added to the supernatant.
The extracted DNA was washed twice in 70%
ethanol, dried at 37°C, and recovered in sterile
water. Extracted DNA was stored at -20°C until
utilization.
PCR-SSP Amplification
IFN-γ polymorphism at position +874 in the
first intron (T versus A) was determined by
sequence-specific primer-PCR (PCR-SSP)
according to manufacturer‘s recommendations
(QPS Bioserve India (P) Ltd, Hyderabad,
India). Briefly, the PCR was performed in a
final volume of 50μl with 100-200ng of
isolated genomic DNA as template in reaction
mixture containing 200μM (each) dNTPs and
0.5 U Taq DNA polymerase, 1X reaction buffer
(Bangalore Genie, Bangalore, India), 3.5mM
MgCl2 (GENETIX, New Delhi, India), 0.5μM
each specific primers (antisense: TCA ACA
AAG CTG ATA CTC CA; sense +874 T: TTC
TTA CAA CAC AAA ATC AAA TCT; or
sense +874A: TTC TTA CAA CAC AAA ATC
AAA TCA), and 0.2 μM of each internal
control primers (QPS Bioserve India (P) Ltd,
Hyderabad, India). Internal control primers
amplify a human β-globin sequence (forward
primer: ACA CAA CTG TGT TCA CTA GC;
reverse primer: CAA CTT CAT CCA CGT
TCA CC). PCR amplification was performed
using a touch down method that included initial
denaturation at 95oC for 5 minutes followed by
two loops; loop 1 which consisted of 10 cycles
with the following program: 95oC for 30
seconds, 62oC for 50 seconds, and 72
oC for 40
seconds and loop 2 included 20 cycles with the
following program: 95oC for 30 seconds, 56
oC
for 50 seconds and 72oC for 40 seconds and a
final extension step at 72oC for 5 minute. The
amplified products were run on 1% agarose gel
that was in a buffer containing 0.5 μg/ml
ethidium bromide (Figure-1). Later it was
visualized under UV light and photographs
were documented.
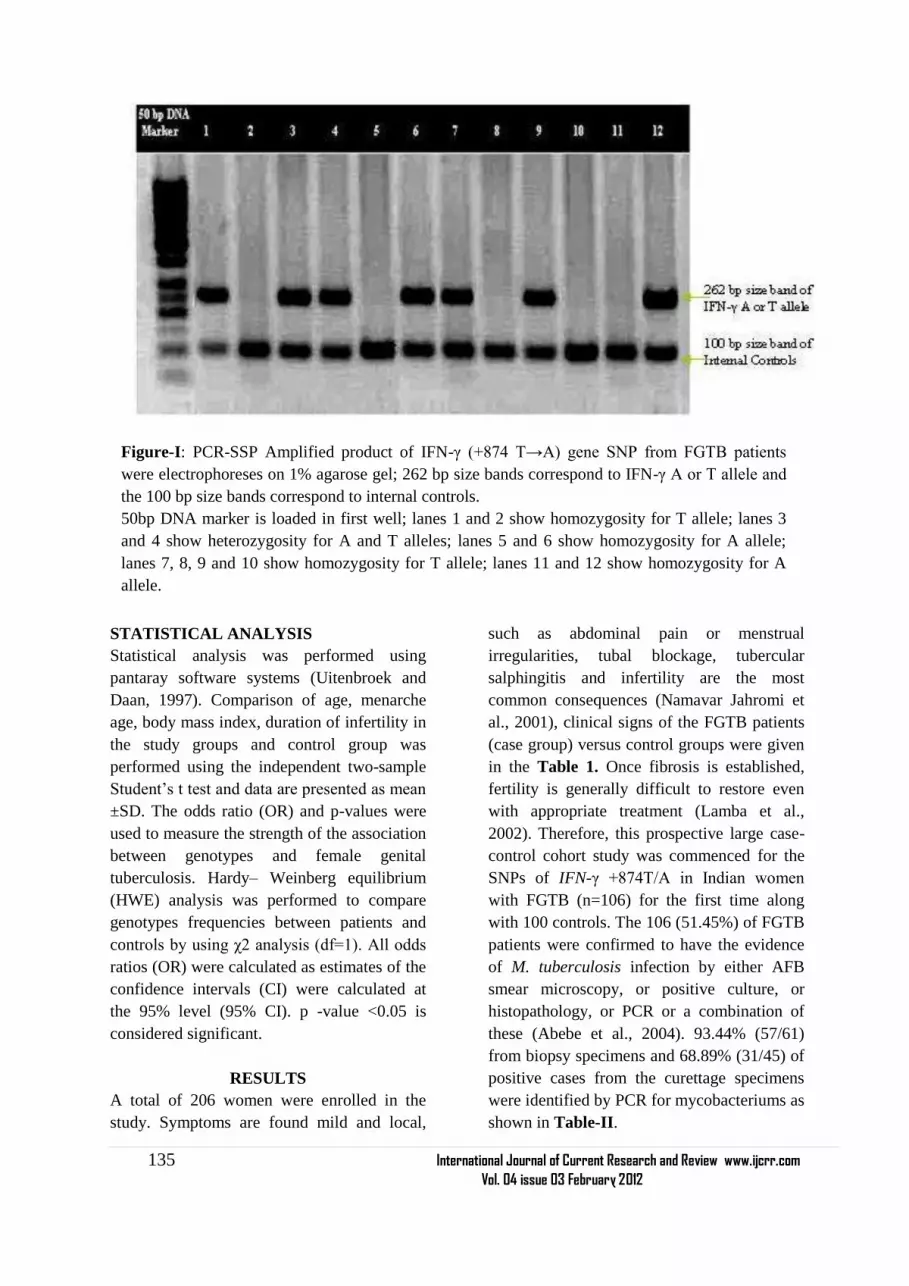
135 International Journal of Current Research and Review www.ijcrr.com
Vol. 04 issue 03 February 2012
STATISTICAL ANALYSIS
Statistical analysis was performed using
pantaray software systems (Uitenbroek and
Daan, 1997). Comparison of age, menarche
age, body mass index, duration of infertility in
the study groups and control group was
performed using the independent two-sample
Student‘s t test and data are presented as mean
±SD. The odds ratio (OR) and p-values were
used to measure the strength of the association
between genotypes and female genital
tuberculosis. Hardy– Weinberg equilibrium
(HWE) analysis was performed to compare
genotypes frequencies between patients and
controls by using χ2 analysis (df=1). All odds
ratios (OR) were calculated as estimates of the
confidence intervals (CI) were calculated at
the 95% level (95% CI). p -value <0.05 is
considered significant.
RESULTS
A total of 206 women were enrolled in the
study. Symptoms are found mild and local,
such as abdominal pain or menstrual
irregularities, tubal blockage, tubercular
salphingitis and infertility are the most
common consequences (Namavar Jahromi et
al., 2001), clinical signs of the FGTB patients
(case group) versus control groups were given
in the Table 1. Once fibrosis is established,
fertility is generally difficult to restore even
with appropriate treatment (Lamba et al.,
2002). Therefore, this prospective large case-
control cohort study was commenced for the
SNPs of IFN-γ +874T/A in Indian women
with FGTB (n=106) for the first time along
with 100 controls. The 106 (51.45%) of FGTB
patients were confirmed to have the evidence
of M. tuberculosis infection by either AFB
smear microscopy, or positive culture, or
histopathology, or PCR or a combination of
these (Abebe et al., 2004). 93.44% (57/61)
from biopsy specimens and 68.89% (31/45) of
positive cases from the curettage specimens
were identified by PCR for mycobacteriums as
shown in Table-II.
Figure-I: PCR-SSP Amplified product of IFN-γ (+874 T→A) gene SNP from FGTB patients
were electrophoreses on 1% agarose gel; 262 bp size bands correspond to IFN-γ A or T allele and
the 100 bp size bands correspond to internal controls.
50bp DNA marker is loaded in first well; lanes 1 and 2 show homozygosity for T allele; lanes 3
and 4 show heterozygosity for A and T alleles; lanes 5 and 6 show homozygosity for A allele;
lanes 7, 8, 9 and 10 show homozygosity for T allele; lanes 11 and 12 show homozygosity for A
allele.

136 International Journal of Current Research and Review www.ijcrr.com
Vol. 04 issue 03 February 2012
Table-II: Comparison of the diagnosis yield of female Genital TB by different methods
Type of Specimens Smear Microscopy Culture Histopathology PCR for
mycobacterium
Case (n=106)
Curettage (n=45) 0 3 11 31
Biopsy (n=61) 19 32 42 57
Total 19 (17.92%) 35 (33.01%) 52 (49.05%) 88 (83.01%)
Control (n=100)
Curettage (n=37) Not detected
Biopsy (n=63) Not detected
The IFN- gamma (+874) genotypes and allele
frequencies of all FGTB patients and controls
are shown in Table-III. Distribution of the
genotypes in all groups was consistent with the
Hardy-Weinberg equilibrium. The IFN-γ
+874AA genotype was overrepresented in
FGTB patients 19.81% when compared with
the controls (9.0%) (Raut et al., 2001). Most of
the FGTB patients and controls showed TA
genotype (50.0% and 61.0% respectively)
which is associated with intermediate IFN-γ
production. However, FGTB patients also
showed slight increase in frequency of TT
(30.18% versus 30.0%) in comparison with
controls. An increasing number of studies have
shown that single nucleotide polymorphisms
(SNPs) located in the promoter or coding
regions of cytokine genes result in differential
cytokine secretion due to altered transcriptional
activation. It may be possible that different
stimuli result in differential transcription of the
same gene (Henao et al., 2006).
Table III: 2x2 Contingency analysis of IFN gamma (+874) genotypes and allele frequencies distribution in
Female Genital TB and Healthy Controls a
IFN-γ
genotype/Alleles AA AT TT TT+AT AA+AT 874A 874T
Case (%) n=106 21 (19.81) 53 (50) 32 (30.18) 85 (80.18) 74 (69.81) 37 (34.91) 42 (37.73)
Control (%)
n=100 9 (9.0) 61 (61.0) 30 (30.0) 91 (91.0) 70 (70.0) 35 (35.00) 46 (46.00)
Pb value
NA
0.0219 0.0943 0.0279 0.0625
NA
0.645
X2 value 5.254 2.798 4.834 3.469 0.212
OR (95%CI) 2.685(1.132-
6.367
2.187(0.866-
5.523)
2.498(1.0839-
5.7574)
2.207(0.9467-
5.146)
0.8636
(0.463-
1.611)
Note: a Values are given as number (percentage) unless otherwise indicated.
The Pb value was evaluated by χ2 test with a 2 x 2 contingency table (genotypes) and a 2 x 2 table
(allele frequencies) versus control women. b- Significance set at P ≤ 0.05.
Analysis of our results showed that there was
significant association in IFN-γ genotypes
(AA vs. AT) between FGTB patients and
control women (p value=0.0219, χ2
value=5.254, OR=2.685, 95% of CI=1.132-
6.367). i.e., individuals with IFN-γ +874 AA
and (TT+AT) genotype had chi- squared value
equals to 4.834, p value equals to 0.0279 and

137 International Journal of Current Research and Review www.ijcrr.com
Vol. 04 issue 03 February 2012
OR (95%CI) =2.498 (1.084 -5.757). No
significant differences was established in IFN-
γ +874AA vs. TT and AA vs. (AA+ AT)
genotype frequencies between the case-control
groups (p value=0.0943, X2=2.798, OR
(95%CI) =2.187 (0.866-5.523) and p
value=0.0625, X2=3.469, OR (95%CI) = 2.207
(0.946-5.146) respectively). Statistical
analysis using risk of A and T alleles
frequencies of FGTB patients with controls
demonstrates no association with
susceptibility to FGTB per se (p value=0.645).
Our results are in the line with recent studies
which have been reported an association
between the +874 A/T SNP in the first intron
of the IFN-γ gene and pulmonary TB,
(Rossouw et al., 2003) suggesting that the TT
genotype which is associated with lower IFN-
γ production confers susceptibility to FGTB.
Therefore, higher levels of IFN-γ can cause
more effective cell-mediated immunity against
mycobacterium. A single nucleotide
polymorphism (SNP), T to A, located at
position +874 in the first intron could
influence IFN- γ production levels. The
association of different genotypes at this
position, with a low (AA), medium (AT) and
high (TT) cytokine production has been shown
in vitro (Lopez-Maderuelo et al., 2003). This
is the first study investigating the genetic
association of polymorphisms in the +874
IFN-γ gene with FGTB patients using SSP-
PCR.
DISCUSSION
Female genital tuberculosis is an important
cause of infertility, rarely diagnosed in
developed countries. It often has low-grade
symptoms with very few specific complaints
have been explained in the Methods and
Materials. IFN-γ is required for host defense
against a broad range of pathogens and is
especially critical for mycobacterial immunity.
Lack of production and mutations in the
cytokine gene (Cooper et al., 1993) is
associated with the most lethal forms of
infections and increase the susceptibility to
develop the disease. IFN-γ +874A allele has
been previously reported to be associated with
infectious diseases such as tuberculosis,
hepatitis B virus infection, and parvovirus
infection, (Tso et al., 2005; Ben-Ari et al.,
2003) revealing its potential role in host
defense against microbial infections. The
mechanism by which the IFN-γ +874T/A
allele influences the susceptibility to FGTB
may depend on its role in the regulation of
IFN-γ production. The T allele of IFN-γ
+874A/T provides a binding site for the
transcription nuclear factor-κB (NF-κB),
which is able to regulate IFN-γ expression
(Pravica et al., 2000). In particular, the +874A
polymorphism in the gene for IFN-γ results in
decreased IFN-γ expression (relative to the
+874T variant) and has been associated with
susceptibility to TB in some but not all studies
(Moran et al., 2007; Vidyarani et al., 2006).
Heterozygous carriers have an intermediate
phenotype, suggesting that more subtle
variation in the IFN-γ response pathway may
underlie susceptibility to TB in outbreed
human populations (Levin et al., 1995). Our
observation shows that the individuals with
IFN-γ +874 AA genotype is more prevalent in
patients with FGTB associated clinical
findings like tubal block with hydrosalphinx,
tubercular salphingitis and Omental adhesions.
These were not distinguished in pulmonary
TB and controls as well. This nature of disease
may be due to genetic variations in the
bacterial strain and extraordinary virulent
nature of mycobacterium. Depending upon the
geographic locality and ethnicity of a
population, variations have been reported in
various studies regarding the occurrence and
frequency of extrapulmonary tuberculosis
(EPTB) in the two sexes, in different age
groups and the organs involved (Kadivar et al.,
2007; Sreeramareddy et al., 2008). The
differences in transmissibility and virulence
among M. tuberculosis strains are related to
the genetic background and different lineages
with specific geographical regions of the
organisms (Caminero et al., 2001; Gagneux

138 International Journal of Current Research and Review www.ijcrr.com
Vol. 04 issue 03 February 2012
and Small, 2007). Animal infection models
suggests haematogenous dissemination of
infection occurs before the onset of T-cell
mediated immunity (Chackerian et al., 2002)
and supports the hypothesis that the ability of
different strains of M. tuberculosis to produce
different clinical phenotypes varies dependent
upon their interaction with the host innate
immune response, but the relevance of these
findings to human disease remains uncertain
(Manca et al., 2005). Nonetheless, it is
possible that more common genetic variants
such as promoter region polymorphisms that
influence gene expression are associated with
the disease. Therefore we suggests that, the
IFN-γ +874 (A/T) alleles polymorphism were
significantly associated with tuberculous
bacillus infectivity and likely plays role as a
genetic risk factor for the pathogenesis of
FGTB in Indian women. It is also possible
that low IFN-γ production may impair
antimycobacterial response against FGTB
infection, rendering these individuals more
susceptible to Tuberculous bacillus infection
other than pulmonary TB (Vidyarani et al.,
2006). Although IFN-γ can overcome these
phenomena in vitro, M tuberculosis can
interfere with IFN-γ signaling and down
regulate the transcription of IFN-γ inducible
genes (Ting et al., 1999). Further, we also
suggested that asymptomatic nature of the
disease, accessibility of reproductive clinics,
and elucidation of genes associated with
virulence, pressure of susceptible factors,
detection of intraspecies differences in
genome sequences and gene expression
studies should not be neglected during the
description of FGTB.
ACKNOWLEDGEMENT
Authors acknowledge the immense help
received from the scholars whose articles are
cited and included in references of this
manuscript. The authors are also grateful to
authors / editors / publishers of all those
articles, journals and books from where the
literature for this article has been reviewed and
discussed.
REFERENCES
1. Abebe M, Lakew M, Kidane D, Lakew Z,
Kiros K and Harboe M. 2004. Female
genital tuberculosis in Ethiopia. Int J
Gynecol Obstet., 84:241-246.
2. Ben-Ari Z, Mor E and Papo O, et al. 2003.
Cytokine gene polymorphisms in patients
infected with hepatitis B virus. Am J
Gastroenterol., 98(1):144-50.
3. Cahn, P., H. Perez, G. Ben, and C. Ochoa.
2003. Tuberculosis and HIV: a partnership
against the most vulnerable. J. Int. Assoc.
Physicians AIDS Care (Chicago) 2:106–
123.
4. Caminero J, Pena MJ and Campos-
Herrero MI et al. 2001. Epidemiologic
evidence for the spread of a
Mycobacterium tuberculosis strain of the
‗Beijing‘ genotype on Gran Canaria
Island. Am J Respir Crit Care
Med.,164:1165–70.
5. Chackerian AA, Alt JM, Perera TV,
Dascher CC and Behar SM. 2002.
Dissemination of Mycobacterium
tuberculosis is influenced by host factors
and precedes the initiation of T-cell
immunity. Infect Immun., 70: 4501–4509.
6. Chakrabarti AK, Sen S, Banerjee A and
Roy K.1998. Female genital tuberculosis-
a retrospective study. Ind J Tub, 45:101-3.
7. Cooper MA, Dalton DK and Stewart TA.
1993. Disseminated tuberculosis in
interferon γ gene-disrupted mice. J Exptl
Med., 178:2243-7.
8. Crofton J, Horne N, Miller F. 1992.
Clinical tuberculosis. 1 st
ed. London:
Macmillan Education Ltd; 502-10.
9. Dalton DK, Pitts-Meek S, Keshav S,
Figari IS, Bradley A and Stewart TA.
1993. Multiple defects of immune cell
function in mice with disrupted interferon-
gamma genes. Science, 259:1739-42.
10. Dam P, Shirazee HH, Goswami SK,
Ghosh S, Ganesh A, Chaudhury K, and

139 International Journal of Current Research and Review www.ijcrr.com
Vol. 04 issue 03 February 2012
Chakravarty B. 2006. Role of latent
genital tuberculosis in repeated IVF
failure in the Indian Clinical setting.
Gynecol Obstet Invest., 61(4):223-227.
11. Flynn JL, Chan J, Triebold KJ, Dalton
DK, Stewart TA and Bloom BR. 1993. An
essential role for interferon γ in resistance
to Mycobacterium tuberculosis. J Exptl
Med., 178:2249-54.
12. Gagneux S and Small PM. 2007. Global
phylogeography of Mycobacterium
tuberculosis and implications for
tuberculosis product development. Lancet
Infect Dis., 7: 328–337.
13. Giannacopoulos KCh, Hatzidaki EG,
Papanicolaou NC, Relakis KJ, Kokori HG,
and Giannacopoulou CC. 1998. Genital
tuberculosis in a HIV infected woman: a
case report. Eur J Obstet Gynecol Reprod
Biol., 80:227-229.
14. Haas DW. 2000. Mycobacterial diseases.
In: Mandell GL, Bennet JE, Dolin R,
editors. Principles and practice of
infectious diseases. Philadelphia, PA:
Churchill Livingstone., 2576-607.
15. Henao MI, Montes C, Paris SC and Garcia
LF. 2006. Cytokine gene polymorphisms
in Colombian patients with different
clinical presentations of tuberculosis.
Tuberculosis., 86: 11–19
16. Hoffmann SC, Stanely EM and Cox ED,
et al. 2002. Ethnicity greatly influences
cytokine gene polymorphism distribution
Am J Trans., 2:560-567.
17. Jindal UN, Bala Y, Sodhi S, Verma S and
Jindal S. 2010. Female genital
tuberculosis: early diagnosis by
laparoscopy and endometrial polymerase
chain reaction. Int J Tuberc Lung Dis.,
14(12):1629-34.
18. Kadivar MR, Ghaneh-Shirazi R,
Khavandegaran F and Karimi M. 2007.
Epidemiology of tuberculosis among
Afghan immigrants in Fars province,
southern Islamic Republic of Iran. East
Mediterr Health J., 13(4):758–64.
19. Lamba H, Byrne M, Goldin R and Jenkins
C. 2002. Tuberculosis of the cervix: case
presentation and a review of the literature.
Sex Transm Infect., 78:62-63
20. Levin M, Newport MJ, and D‘Souza S, et
al. 1995. Familial disseminated atypical
mycobacterial infection in early
childhood: a human mycobacterial
susceptibility gene? Lancet., 345:79–83.
21. Lopez-Maderuelo, D., F. Arnalich, R and
Serantes, et al. 2003. Interferon-gamma
and interleukin- 10 gene polymorphisms
in pulmonary tuberculosis. Am. J. Respir.
Crit. Care Med., 167:970–975
22. Maher S. G., A. L. Romero-Weaver, A. J.
Scarzello, and A. M. Gamero. 2007.
Interferon cellular executioner or white
knight? Curr. Med. Chem., 14:1279–1289
23. Majumdar A and Satwik R. 2011. Early
diagnosis of female genital tuberculosis by
laparoscopy and endometrial polymerase
chain reaction. Int J Tuberc Lung Dis.,
15(8):1134-5.
24. Manca C, Tsenova L, Freeman S, Barczak
AK and Tovey M, et al. 2005.
Hypervirulent M. tuberculosis W/Beijing
strains up regulate type I IFNs and
increase expression of negative regulators
of the Jak-Stat pathway. J Interferon
Cytokine Res. 25: 694–701
25. Miller SA, Dykes DD and Polesky HF.
1988. A simple salting out procedure for
extracting DNA from human nucleated
cells. Nucleic Acids Research., 16(3):
1215
26. Moran A., X. Ma, R. A. Reich, and E. A.
Graviss. 2007. No association between the
+874T/A single nucleotide polymorphism
in the IFN-gamma gene and susceptibility
to TB. Int. J. Tuberc. Lung Dis., 11:113–
115.
27. Namavar Jahromi B, Parsanezhad ME and
Ghane-Shirazi R. 2001. Female genital
tuberculosis and infertility. Int J Gynaecol
Obstet., 75:269-272.
28. Newport MJ, Huxley CM and Huston S, et
al. 1996. A mutation in the interferon-

140 International Journal of Current Research and Review www.ijcrr.com
Vol. 04 issue 03 February 2012
gamma receptor gene and susceptibility to
mycobacterial infections in man. N Engl J
Med., 335:1941–9.
29. O. F. Saracoglu, T. Mungan, and F.
Tanzer, 1992. Pelvic tuberculosis,‖
International Journal of Gynecology and
Obstetrics, 37(2):115–120.
30. Pacheco AG, Cardoso CC and Moraes
MO. 2008. IFNG +874T/A, IL10
21082G/A and TNF 2308G/A
polymorphisms in association with
tuberculosis susceptibility: a meta-analysis
study. Hum Genet., 123: 477–484.
31. Parrish NM, Dick JD and Bishai WR.
1998. Mechanisms of latency in
Mycobacterium tuberculosis. Trends
Microbiol., 6:107–12.
32. Pravica V, Perrey C, Stevens A, Lee J-H
and Hutchinson IV. 2000. A single
nucleotide polymorphism in the first
intron of the human IFN-γ gene: absolute
correlation with a polymorphic CA
microsatellite marker of high IFN-γ
production Human Immunol., 61:863-866.
33. Punnonen R, Kiilholma P and Meurman
L. 1983. Female genital tuberculosis and
consequent infertility. Int J Fertil., 28:235-
238.
34. Rajamaheshwari N. 2009. Pelvic
tuberculosis. Ind. J. Med. Microbio.,
27(4): 361-363.
35. Richards MJ and Angus D. 1998. Possible
sexual transmission of genitourinary
tuberculosis. Int J Tuberc Lung Dis.,
2:439.
36. Rossouw, M., H. J. Nel, G. S. Cooke, P.
D. van Helden, and E. G. Hoal. 2003.
Association between tuberculosis and a
polymorphic NFκB binding site in the
interferon gamma gene. Lancet.,
361:1871–1872.
37. Sreeramareddy CT, Panduru KV, Verma
SC, Joshi HS and Bates MN. 2008.
Comparison of pulmonary and
extrapulmonary tuberculosis in Nepal- a
hospital-based retrospective study. BMC
Infect Dis., 8:8 doi: 10.1186/1471-2334-8-
8.
38. Sutherland AM, Glen ES and MacFarlane
JR. 1982. Transmission of genitourinary
tuberculosis. Health Bull (Edinb), 40:87-
91.
39. Ting LM, Kim AC and Cattamanchi A, et
al. 1999. Mycobacterium tuberculosis
inhibits IFN-gamma transcriptional
responses without inhibiting activation of
STAT1. J Immunol., 163:3898–906
40. Tso HW, Ip WK and Chong WP, et al.
2005. Association of interferon gamma
and interleukin 10 genes with tuberculosis
in Hong Kong Chinese. Genes Immun.,
6:358-63.
41. Uitenbroek, and Daan G. 1997. Binomial.
SISA.
http://www.quantitativeskills.com/sisa/dist
ributions/binomial.html. (1 Jan. 2004).
42. V. S. Raut, A. A. Mahashur, and S. S.
Sheth. 2001. The Mantoux test in the
diagnosis of genital tuberculosis in
women. International Journal of
Gynecology and Obstetrics., 72 (2):165–
169.
43. Vidyarani M, Selvaraj P, Adnand AP,
Jawahar MS and Adhilakshmi AR, et al.
2006. Interferon gamma (IFNγ) &
interleukin-4 (IL-4) gene variants &
cytokine levels of pulmonary tuberculosis.
Indian J Med Res., 124: 403–410.

141 International Journal of Current Research and Review www.ijcrr.com
Vol. 04 issue 03 February 2012
ijcrr
Vol 04 issue 03
Category: Review
Received on:30/11/11
Revised on:12/12/11
Accepted on:19/12/11
ABSTRACT Ziziphus mauritiana is one of the underutilized herbs having potential to heal various ailments. It is
reported in the ancient literature that whole plant as fruits, leaves , seed and root posses
pharmacological activity . So this article is focused on potential and reported pharmacological
activities of the whole plant.
___________________________________________________________________________
Keywords :- Ziziphus mauritiana , root ,seed,
fruit
INTRODUCTION
Ziziphus mauritiana a tropical fruit tree
species. It is a spiny, evergreen shrub or small
tree up to 15 m high, with trunk 40 cm or more
in diameter; spreading crown; stipular spines
and many drooping branches. The fruit is of
variable shape and size. It is oval, obovate,
oblong or round, and it can be 1-2.5 in (2.5-
6.25 cm) long, depending on the variety. The
flesh is white and crisp. When slightly unripe,
this fruit is a bit juicy and has a pleasant aroma.
The fruit's skin is smooth, glossy, thin but
tight.It is the most commonly found in the
tropical and sub-tropical regions. Originally
native to India it is now widely naturalized in
tropical region from Africa to Afghanistan and
China, and also through Malaysia , Australia
and in some pacific regions. It can form dense
stands and become invasive in some areas,
including Fiji and Australia and has become a
serious environmental weed in Northern
Australia. It is a fast growing tree with a
medium life span that can quickly reach up to
10–40 ft (3 to 12 m) tall.
VERNACULAR NAMES:
English: Chinee apple, Chinese date, cottony
jujube, Indian cherry, Indian jujube,
Indian plum, jujube
Fijian: baer
French: jujubier, massonnier
Hindi: baher, bahir
Spanish: azufaifo africano
ZIZIPHUS MAURITIANA : A REVIEW ON
PHARMACOLOGICAL POTENTIAL OF THIS
UNDERUTILIZED PLANT
Sukirti Upadhyay1, Prashant Upadhyay
1, A K Ghosh
1, Vijender Singh
2
1 College of Pharmacy, IFTM, Moradabad (U.P)
2 School of Pharmacy, KIET, Ghaziabad (U.P)
E-mail of Corresponding Author: [email protected]

142 International Journal of Current Research and Review www.ijcrr.com
Vol. 04 issue 03 February 2012
CLASSIFICATION
Kingdom: Plantae
Division: Magnoliophyta
Class: Magnoliopsida
Order: Rosales
Family: Rhamnaceae
Genus: Ziziphus
Species: Z. mauritiana
Binomial name Ziziphus mauritianaLam.
CHEMICAL CONSTITUENTS:
It is a rich source of cyclopeptide alkaloids
lupane and triterpenes.
cyclopeptidmacrocycles of Ziziphus species
showed interesting biological properties,
including sedative, analgesic, antibacterial ,
antifungal and, antiplasmodial activity etc .It
have 14-membered ring cyclopeptides to be
the largest subgroup of alkaloid obtained,
whereas only one 13-membered macrocyclic
alkaloid isolated from this plant. These
included the 4(14)-membered ring class:
mauritineC, amphibine F and frangufoline the
5(14)-membered ring type: mauritines A and
B. It also contain protein ,carotene and vitamin
C. The fruit is eaten raw or pickled or used in
beverages. It is quite nutritious and rich in
vitamin C. It is second only to guava and
much higher than citrus or apples. In India, the
ripe fruits are mostly consumed raw, but are
sometimes stewed. Slightly unripe fruits are
candied by a process of pricking, immersing in
a salt solution. Ripe fruits are preserved by
sun-drying and a powder is prepared for out-
of-season purposes. It contains 20 to 30%
sugar, up to 2.5% protein and 12.8%
carbohydrates. Fruits are also eaten in other
forms, such as dried, candied, pickled, as
juice, or as ber butter. In Ethiopia, the fruits
are used to stupefy fish.The leaves are readily
eaten by camels, cattle and goats and are
considered nutritious.In India and Queensland,
the flowers are rated as a minor source of
nectar for honeybees. The honey is light and
of fair flavor.1
MEDICINAL PROPERTIES
Plant pacifies vitiated pitta, kapha, obesity,
fever, burning sensations, cough, wound, skin
disease, ulcers, stomatitis, diarrhea, sexual
weakness, and general debility.
Useful part : Fruit, Seed, Leaves, Root, Bark. 2
143 International Journal of Current Research and Review www.ijcrr.com
Vol. 04 issue 03 February 2012
PHARMACOLOGICAL REVIEW OF
LITERATURE:
The alcohol and aqueous extract of
Z.mauritiana leaves stimulates cell-mediated
immune system by increasing neutrophil
function and phagocytic activity. 3
Free radical scavenging activity & inhibitory
response of Ziziphus maurtiana seed extract
exert on alcohol induced oxidative stress.4
Anticancer potential of aq. ethanolic extract of
Ziziphus maurtiana was found against cancer
cell liner by MTI assay. 5
Ziziphus maurtiana root exert antidiarrhoeal
activity of in rodents . The antidiarrhoeal
effect of the methanolic extract as evaluated
exhibited a concentration dependent inhibition
of the spontaneous pendular movement of the
isolated rabbit jejunum and inhibited
acetylcholine induced contraction of rat ileum.
A dose dependent decrease of gastrointestinal
transit was observed with extracts (25 and 50
mg/kg) which also protected mice against
castor oil induced diarrhea and castor oil
induced fluid accumulation, respectively. The
presence of some of the phytochemicals in the
root extract may be responsible for the
observed effects, and also the basis for its use
in traditional medicine as antidiarrhoeal drug. 6
Chronic alcohol ingestion is known to increase
the generation of reactive oxygen species
(ROS), thereby leading to liver damage. Pre-
treatment of rats with 200, 400 mg/kg body
weight of aqueous leaf extract of Z.mauritiana
resulted reduced the morphological changes
that are associated with chronic alcohol
administration .Rat liver administered with
only alcohol resulted in severe necrosis,
mononuclear cell aggregation and fatty
degeneration in the central and mid zonal
areas which was a characteristic of a damaged
liver. 7
Ziziphus maurtiana aqueous ethanol seed
extract exert hypoglycemic activity in alloxan
induced diabetic mice. 8
The aqueous extract of Ziziphus maurtiana
leaf lowers cholesterol and triglycerides level
in serum & liver of rats Aqueous extract of
Ziziphus maurtiana leaf can be used for the
prevention and treatment of fatty liver,
atherosclerosis and other diseases associated
with high levels of cholesterol and
triglyceride. Pretreatment was found to confer
more protection than co-treatment, hence
pretreatment should be preferred. 9
The methanolic extract of Z.mauritianastem
bark was evaluated for its antiulcer activity
using two models. Models are ethanol induced
gastric ulcers model and aspirin induced
gastric ulcer model in mice. It was found that
the methanolic extract of stem bark have
significant antiulcer activity in dose dependent
manner where 3 different oral doses prepared
(100 mg/kg of body weight, 250 mg/kg of
body weight and 500 mg/kg of body weight).
Evaluation was done on both models
comparing with reference standard ranitidine
(80 mg/Kg/ p. o.). The above result shows that
Z.mauritianastem bark probably contains
some active ingredients that could be
developed for above mentioned abnormal
condition as have been claimed by traditional
system of medicine. 10
The antimicrobial effects of ethanolic extracts
of leaves of two species of genus Ziziphus
were determined against Escherichia coli,
Staphylococcus aureus, Streptococcus
pyogenes, Aspergillus niger and Candida
albicans. S. pyogenes was the most susceptible
followed by E. coli while S. aureus was the
least susceptible. 11
Investigation of the MeOH extract that
alkaloids isolated exhibited potent
antiplasmodial activity against the parasite
Plasmodium falciparum with the inhibitory
concentration (IC50) ranging from 3.7 to
10.3 μM. Compounds 2 and 3 also
demonstrated antimycobacterial activity
against Mycobacterium tuberculosis with the
MIC of 72.8 and 4.5 μM, respectively. 12
The aqueous, methanolic and saponin extracts
of Zizyphus mauritiana bark were screened for
spermicidal activities against human
spermatozoa.Saponin extract is found to be

144 International Journal of Current Research and Review www.ijcrr.com
Vol. 04 issue 03 February 2012
more active to cause immobilization then
aqueous and methanolic extract.13
CONCLUSION
Thus from traditional and reported activities of
Z.mauritiana it may be concluded that this herb
has great potential as antimicrobial ,
hepatoprotective , anticancer , contraceptive and
antidiarrhoel agent other activities mentioned in
the literature have to explore for further
development of potential medicinal agent.
ACKNOWLEDGEMENT
I would like to acknowledge Prof R L Khosa
conveyer of GBTU for encouragement in doing
research work.
REFERENCES
1. www.ayurvedicmedicinalplants.com
2. http://commons.wikimedia.org
3. Wadekar R.Effect of Ziziphus maurtiana
lea.f extract on phagocytosis by human
neutrophills. Journal of Pharmacy
Research 2008;1 (1).
4. Bhatia A and Mishra T ,Free radical
scavenging activity and inhibitory
responces of ziziphus maurtiana seed
extract on alcohol induced oxidative
stress. An international forum for
Evidence Based Practices 2009,;( 1): 8
5. Mishra T , Kullar N and Bhatia
A.Anticancer potential of Aqueous
ethanol seed extract of Ziziphus maurtiana
against cancer cell lines and Ehrlich
Ascites Carcinoma. Evidence Based
Complementary And Aleternative
medicines 2011;.2011:11.
6. Dahiru D, Sini J.M.and John Africa L
Antidiarrhoeal activity of Ziziphus
maurtiana root extract in rodents. African
Journal of Biotechnology 2006; 5 ,10.
7. Dahiru D , Obidoa O. Evaluation of the
Antioxidant Effects of Z.mauritianaLam.
Leaf Extracts Against Chronic Ethanol-
Induced Hepatotoxicity in Rat Liver Afr J
Tradit Complement Altern Med 2007 ;
5(1): 39–45
8. Bhatia A and Mishra T ,Hypoglycemic
activity of Ziziphus maurtiana aqueous
ethanol seed extract in alloxan induced
diabetic mice.Pharmaceutical biology
2010; 48,604.
9. Dahiru D, Obidoa O,Effect of aqueous
extract of Ziziphus maurtiana leaf on
cholesterol and triglycerides level in
serum & liver of rats administered
alcohol.2009, Pakistan j of nutrition ,
2009:1884-1888.
10. Panchal S, Panchal K, Vyas N, Modi K,
Patel V, Bharadia P, Pundarikakshudu K.
Antiulcer Activity of Methanolic Extract
of Z.mauritiana stem Bark International
Journal of Pharmacognosy and
Phytochemical Research,2010 2(3): 6-11.
11. M. E. Abalaka1, S. Y. Daniyan1 and A.
Mann2 M. E. Abalaka1, S. Y. Daniyan1
and A. Mann Evaluation of the
antimicrobial activities of two Ziziphus
species (Z.mauritianaL. and Ziziphus
spinachristi L.) on some microbial
pathogens. African Journal of Pharmacy
and Pharmacology 2010. 4(4): 135-139.
12. Panomwan P., Kanlaya L., Samran P.,
Palangpon K., Apichart S, Somsak R and
Sunit S .Antiplasmodial and
antimycobacterial cyclopeptide alkaloids
from the root of Ziziphus mauritiana
,Phytochemistry 2011,72 : 909-915 .
13. Dubey R, Dubey K, Sridhar C, Jayaveera
K N. Sperm immobilization activity of
aqueous, methanolic and saponins extract
of bark of Ziziphus Mauritiana.Pelagia
Research Library.Der Pharmacia Sinica,
2010 , 1 (3): 151-156.
145 International Journal of Current Research and Review www.ijcrr.com
Vol. 04 issue 03 February 2012
ijcrr
Vol 04 issue 03
Category: Research
Received on:23/11/11
Revised on:08/12/11
Accepted on:18/12/11
ABSTRACT Introduction: Currently medical education is dominated by examination and product oriented didactic
lecture sessions in most of the medical schools. Innovation in medical education is required to reorient
current medical curricula. Objective: The present study aimed to explore the scope of community
based learning at village set-up in creating self driven learning and rural bias among medical
undergraduates. Methods: Using a village posting, students were made aware of community needs
through social mapping, transect walk and discussion on various issues pertaining to rural health. A
triangulation of qualitative methods like free list, pile sort exercise and focus group discussion was
undertaken to understand the perception of students regarding various teaching methods. Results:
Student could notice existence of different teaching methods: classroom based didactic lecture,
OHP/PPT guided session, group discussion, problem based learning, field visit based learning, port
folio driven learning and community based learning. Community based learning, problem based
learning and filed visit guided learning motivated students towards self-driven learning and created a
sense of rural bias among them. However, competitive examination oriented lecture sessions were
cited as poor teaching methods and fail to motivate them. Conclusion: Community based learning has
the potential of creating self-driven learning among medical undergraduates
____________________________________________________________________________
Key words: Community based learning,
Medical education, Pile sort analysis
INTRODUCTION
The role of innovation in medical education is
becoming increasingly important and it will be
vital for all nations to reorient their education
systems.1Advances in the learning sciences
have expanded our understanding of how
student‘s learning and how the mind converts
information into useful knowledge.2 Indian
education system is based upon British colonial
legacy: educational levels, curriculum
frameworks, physical structure of colleges and
classrooms, and timing of examinations.1
The
education system is characterized by didactic
teaching, individual work, a product oriented
approach, absence of
independent thinking, and presence of
unquestioned obedience to authority.3
Skill
building in research methods is increasingly
being seen as integral component of medical
education, and community based learning can
be one of them.4-5
Garg6 and Narayanan
7 have
already described the role of community based
teachings in creating rural bias among medical
undergraduates and social revolution.
The teaching model of Mahatma Gandhi
Institute of Medical Sciences (MGIMS),
Sewagram is based on Gandhian ideology. The
institute aims at evolving a pattern of medical
education suitable for developing countries. To
orient the students and provide them with a
ROLE OF COMMUNITY BASED LEARNING IN
CREATING SELF-DRIVEN LEARNING AND RURAL BIAS
AMONG MEDICAL UNDERGRADUATES
Shib Sekhar Datta, Abhijit V Boratne
Department of Community Medicine, Mahatma Gandhi Medical College and
Research Institute, Pillayarkuppam, Puducherry
E-mail of Corresponding Author: [email protected]

146 International Journal of Current Research and Review www.ijcrr.com
Vol. 04 issue 03 February 2012
personal experience of rural life, ‗Social
Service Camp‘ is held in a village adopted each
year for the purpose for a period of 15 days.
During this period, first year medical students
are asked to stay in the village under the
guidance of faculty of Community Medicine.
They carry out health, sanitation and nutrition
surveys.8 The theme for the 2008 batch medical
undergraduates camp was ‗Community Based
Learning‘. The aim was to explore the scope of
community based learning in creating self
driven learning and rural bias among medical
undergraduates.
MATERIALS AND METHODS
Study setting: The current study was
undertaken during ‗Social Service Camp‘
organized for 2008 batch of medical
undergraduates at Pulai village of Wardha
district, Maharashtra with a total population of
846 and 217 households. Students were
oriented about socio-demographic profile of the
village and community needs using different
Participatory Rural Appraisal tools and
techniques and utility of community based
learning cum research in rural development.
Preparation of self portfolio and discussion on
topics ranging from rural health, gender bias,
and leadership among doctors was undertaken.
Students participated in social mapping, did
transect walk to have better understanding of
rural community. In addition, they did
anthropometric measurements of 0-20 years
age group population and dietary survey in one
allotted families. They also participated in
microbiological and pathological sample
collection for the entire village which extended
till management of positive cases in the village.
Information collection: These were carried
out at the end of the Social Service Camp. A
triangulation of qualitative methods like free
list, pile sort exercise9 and Focus Group
Discussions (FGDs)10
, which are useful to
explore the perceptions of students regarding
better teaching-learning methods was
undertaken. Initially, students (n=64) were
asked to individually enlist the various teaching
methods they have observed during the camp
posting. Later, 9 various types of teaching
methods (Figure 1) with relatively high Smith‘s
S value were pile sorted. In pile sort exercise,
12 purposively selected students, who were
willing to participate and talk freely, were
individually asked to form the groups of these 9
methods which they felt went together. This
was followed by 4 FGDs, consisting of 6-8
students for each session (both boys and girls),
to understand perception and attitude towards
different teaching methods. These FGDs were
facilitated by a faculty of Community Medicine
using semi-structured guidelines and note taker
(post graduate of Community Medicine)
recorded all discussions. The numbers of FGDs
were decided by saturation point i.e. where it
stopped yielding any new information. The
facilitator encouraged the participants to freely
exchange their perception and experiences
related to various teaching methods. The
sampling technique adopted for the present
study was purposive with maximum variance.
Data analysis: A two dimensional scaling and
hierarchical cluster analysis was completed
with pile sort data to get collective picture of
their perceptions. The analysis of free list and
pile sort data was undertaken using Anthropac
4.98.1/X software.11
RESULTS
Various teaching methods which students could
observe to be in practice during their initial six
month career as medical undergraduates
including current camp posting in decreasing
order of frequency are: classroom based
didactic lecture sessions, sessions using over
head projectors (OHP)/power point
presentations (PPT), and group discussion
(GD); which are mostly examination oriented.
To a lesser extent they could also observe the
existence of problem based learning (PBL),
field visit guided learning and learning through
community based posting, especially during
this camp. Community based learning as per
their experience has triggered among them need
for exploration of social issues related to health

147 International Journal of Current Research and Review www.ijcrr.com
Vol. 04 issue 03 February 2012
and disease, and has been able to create a sense
of rural bias and better understanding of disease
process. Portfolio aimed at self driven learning
revealed ‗what they want to learn?‘ ranging
from personal hygiene, communication skills,
geriatric care, nutrition, environment and
sanitation to health care delivery at village
level.
Examination oriented study however, they feel
has failed to motivate them to explore the core
need of the community. Most of the classroom
based lecture sessions they observe are
curriculum guided and do not address the needs
of the rural poor. Such competition oriented
curriculums are often examination oriented and
record book or theoretical knowledge aimed.
Community based learning, portfolio guided
study and PBL were recognized as better
learning methods; whereas examination guided
didactic lecture sessions, sessions using
OHP/PPT were cited as poor teaching methods.
However, they also mentioned that institutional
credibility played an important role in
establishing such teaching-learning setting at
village level.
In pile sort exercise, four major groups of
teaching-learning methods were formed. The
first major group comprised of better ones
comprising of community based learning, PBL
and field visit guided learning. Students felt
that, these should be encouraged in medical
institutions to promote rural health and also
they found them interesting and better methods
to understand the Community Medicine
subject. The second group of portfolio based
learning and GD was considered to be better
during initial days of the professional course to
guide their future career. Remaining groups of
classroom based didactic lecture sessions, and
OHP/PPT guided sessions; and examination
oriented study, they commented to be the
inferior ones which do not serve the purpose of
learning and rather demotivate the students and
creates a picture of casualness on part of a
teacher. (Figure 1)
DISCUSSION
In the present study, usefulness of various
teaching methods has been re-invented. Need
for innovative learning methods in medical
institutions; like learning through community
based posting, PBL and learning through filed
visits has again been well established. On the
other hand, lecture guided teaching sessions,
which currently is being practiced in most of
the medical schools has been viewed as one of
the negative factor and demotivate students.
Medical teaching in developing countries aims
to impart skills to students to critically appraise
evidence, promote, prevent, and manage health
in the community.9 Community based learning
has been shown to have the potential to
motivate students to appreciate the learning
process with greater community involvement. 12-13
In the present formative research, the ‗Social
Service Camp‘ approach and application of
community based posting to learn social issues
and appreciate self-motivated learning as an
effective method has been well established. The
attribute can be because of their continuous
presence in the rural community for a descent
period and better interaction with the
community. Dongre et al14
has already well
documented role of community based study in
motivating students for self-driven learning.
The teaching approach in such camps is an
integration of task oriented assignments,
integration of social sciences within medical
domain and active involvement with the
community. Notably, the student centered
educational innovation is not quite evident in
Asia as seen in other parts of the world.13
Students reported that examination oriented
teaching are ineffective in guiding them
towards self-driven learning. This has again
reiterated that most of the medical schools in
Asia have traditional, teacher centered and
hospital based education which fail to produce
complete doctors required for the rural
poor.15,16
Few researchers also feel medical
curricula should formulate flexible syllabus
rather than a rigid one, but this has not been

148 International Journal of Current Research and Review www.ijcrr.com
Vol. 04 issue 03 February 2012
popular and on the contrary created lot of issues
rather than solution.5 Research particularly at
community set-up has also been used as a tool
to teach epidemiology in some medical schools
in India.17
Self-driven learning thus should be
promoted to guide medical education in
resource poor developing countries to cater for
the rural masses in better way.18
Such self-
driven learning can be facilitated through
community based learning.
CONCLUSION
Community based learning is one important
teaching method which has the potential of
creating self-driven learning among medical
undergraduates, and is better compared to
classroom based lecture sessions or similar
other examination oriented teaching methods.
Community based learning at village set-up
promotes rural bias among medical
undergraduates and should be incorporated in
current medical curricula.
ACKNOWLEDGEMENT
We thank staff of Dr. Sushila Nayar School of
Public Health incorporating Department of
Community Medicine, Sewagram for their
support during the Social Service Camp.
Authors acknowledge the immense help
received from the scholars whose articles are
cited and included in references of this
manuscript. The authors are also grateful to
authors/editors/publishers of all those articles,
journals and books from where the literature for
this article has been reviewed and discussed.
Source of financial support: Nil
Conflict of interest: None
REFERENCES
1. A. Dehaan RL, Venkatnarayan KM.
Education for innovation. Rotterdam:
Sense Publishers; 2008. 13-14.
2. B. Fensham PJ. Science and technology.
In Jackson PW (Ed.), Handbook of
research on curriculum. New York:
Macmillan; 1992. 789-829.
3. C. Mehta S, Whitebread D. Philosophy for
children and moral development in the
Indian context. First Global Conference on
Philosophy with Children.
[Online]. 2004 [cited 2009 November 21];
Available from:
http://www.cybercultures.net/ati/education
/cp/cp1/mehta%20paper.pdf
4. Bangash MA. Pragmatic solutions for
problems in the undergraduate medical
programmes in Pakistan. J Pak Med
Assoc. 2002;52:331-5.
5. Sarbadhikari SN. Basic medical science
education must include medical
informatics. Indian J Physiol Pharmacol.
2004;48:395-408.
6. Garg BS, Nayar S. Doctors for the rural
poor. World Health Forum 1996;17:268-
270.
7. Narayanan RP. Medical students leading
social revolutions: The Clinical Teacher.
[Online] March 2006 [cited 2009 Nov 19];
3(1).
Available from URL:
http://www.theclinicalteacher.com
8. Nayar S, Garg BS. Mahatma Gandhi
Institute of Medical Sciences. Journal of
Postgraduate Medicine, 2001; 47(1): 1.
9. Dawson S, Manderson L, Tallo VL. The
Focus Group Manual: Methods for Social
Research in Disease. Boston: International
Nutrition Foundation for Developing
Countries (INFDC); 1993.
10. Hudelson PM. Qualitative Research for
Health Programmes. Geneva: World
Health Organization; 1994.
11. ANTHROPAC [computer program]
Version 4.98.1/X Natik MA: Analytic
Technologies, 1998.
12. Kristina TN, Majoor GD, Van der vleuten
CP. Comparison of outcomes of a
community based education programme
executed with and without active
community involvement. Med Educ.2006
Aug;40(8):798-806.
13. Al-Dabbagh SA, Al-Tace WG. Evaluation
of a task based community oriented

149 International Journal of Current Research and Review www.ijcrr.com
Vol. 04 issue 03 February 2012
teaching model in family medicine for
undergraduate medical students in Iraq.
BMC Med Educ. 2005 Aug 22;5:31.
14. Dongre AR, Deshmukh PR, Garg BS.
Formative exploration of students‘
perception about Community Medicine
teaching at Mahatma Gandhi Institute of
Medical Sciences, Sewagram, India.
Online J Health Allied Scs. 2008;7(3):2.
15. Abeykoon P, Mattock N. Medical
Education in South-East Asia. New Delhi:
Regional Office for South-East Asia:
World Health Organization; 1996.
16. Das BC. Role of Community Medicine in
undergraduate medical education. Indian
Journal of Public Health 2009; 53(2): 83-
85.
17. Soudarssanane MB, Rotti SB, Roy G,
Srinivasa DK. Research as a tool for the
teaching of epidemiology. World Health
Forum 1994; 15:48-50.
18. World Federation for Medical Education.
The Edinburgh Declaration. Med Educ
1988;22:481-2.
Figure 1: Perception of medical undergraduates regarding various teaching methods: Two
dimensional scaling and hierarchical cluster analysis
1-Community based learning 4-Port folio based learning
2-Problem based learning 5-Group discussion
3-Filed visit guided learning
6-OHP /PPT guided session 8-Competition based study
7-Didactic lecture session 9-Examination oriented study
1
2
3
4 5
6 7
8 9