Embed Size (px)
Citation preview
United Stales Office of NoiseAbatement December 19B0Environmenlal Ptotoclion andControl IANR-490} EPA 550/9.80.217
Agency W,shingion, O,C. 20460 _ //_ ///
Noise
EPA Regulatory Analysis for theNoise Emission Regulations forMotorcycles and MotorcycleExhaust Systems
/F
EPA 550/9-80-217
RSEUKA_ORY ANALYSIS
FOR THE NOISE EMISSION REGULATIONS
FOR MOlORCYCLES AND VDIORCYCLE EXHAUST SYSTEMS
December 1980
U.S. Envirom_entel Protection Agency
Office of Noise Abatement and Control
•Washington, D.C. 20460
Permission is g_anted to reproduce this material without further clearance.This document has been approved for general availability. It does not consti-tute a standard, specificatio_ or z_ulstlon.
TABLE OF CONTENTS
PageNumber
Section1 INTRODUCTION 1-i
Section2 INDUSTRYDESCRIPTION2.1 ProductDefinition 2-i2.2 NewVehicleManufacturer 2-2
2.2.1 MarketSharesand Sales 2-32.2.2 ProductLines 2-82.2.3 MotorcyclePrices 2-82.2.4 TypicalNe_ Motorcycle 2-8
Manufacturers2.3 AftermarketIndustry 2-262.4 MotorcycleDealers 2-342.5 Total U.S. MotorcycleIndustry 2-37
E_loyment2.6 MotorcycleWarranties 2-38
Section3 NOISE LEVEL TESTPROCEDURES3.1 Applicationand Criteria 3-13.2 MovingVehicleTest Procedures 3-23.3 Stationa_VehicleTest 3-23
Procedures3.4 MeasurementDistanceSubstitution 3-33
Section4 NOISE LEVEL DATABASE4,1 Contentand Formatof the DataBase 4-I4.2 Test Site, Rider, and Vehicle Variables 4-144.3 Data Base StatisticalSumnaries 4-184.4 AftermerketExhaustSystems 4-194.5 NoiseLevelsat the Operatorand 4-25
Passenger's Ear Position
Section5 EVALUATIONOF EFFECTSOF MOTORCYCLENOISEON PUBLIC HEALTH AND WELFARE5.1 Introduction 5-i
5.1.1 Effectsof Noiseon People 5-I5.1.2 Measuresof Benefitsto Public 5-3
Health and Welfare5.1.3 RegulatorySchedules 5-4
5,2 Descriptionof TrafficNoise Impact 5-45.2.1 StreetMotorcycles 5-45.2.1.1 CurrentStreetMotorcycle 5-7
Sound Levels5.2.1.2 NoiseEmissionLevelsof 5-13
RegulatedStreetMotorcycles5.2.1,3 MotorVehicleNoise 5-13
5.3 NoiseMetrics 5-17
5-175.3.1 EquivalentSoundLevel eq 5-185.3.2 Day Night SoundLevel, dn 5-185.3.3 SoundExposureLevels,Ls
."l i
/
6_
Table of Contents (Continued)
PageNumber
5.4 FractionalImpactMethod 5-195.5 Healthand We]fare(irlteria- General 5-19
Adverse Response5.6 Health and Welfare Criteria -Sing]e 5-24
Event Response5.6.1 SleepDisturbance 5-275.6.2 SpeechInterference 5-295.6.2.1 IndoorSpeechInterference 5-325.6.2.2 OutdoorSpeech Interference 5-325.6.2.3 Pedestrian Speech Interference 5-32
5.7 NoisePredictionModel 5-335.7.1 GeneralOverviewof the Model 5-335.7.2 Overview of the Noise Exposure 5-35
Predictions: General AdverseResponse
5.7.3 Overviewof the Noise Exposure 5-38Predictions: Single EventResponse
5.7.4 Overviewof Noise Impact 5-40Estimates:GeneralAdverseResponse
5,7.5 Overviewof Noise Impact 5-425.7.6 DataGroups 6-42
5.8 Results of Analysis - Street Motorcycles 5-465.8oi GeneralAdverseResponse 5-475,8,2 SingleEventActivity 6-52
Interference
5.9 Analysisof Noise Impactof Motorcycles 5-75Used Off-Road5.9.1 Distributionof Off-Road 5-82
Motorcycle Sound Levels5.9.2 DetectabilityCriteria 5-856.9.3 Off-RoadMotorcycleOperations 5-B76,9.4 Estimateof CurrentNoise Impact 5-B75.10 RegulatorySchedules 5-925.11 Resultsof Analysis-Off-Road 5-92
Motorcycles
Section6 NOISE REDUCTIONTECHNOLOGY6.1 DiagnosticEvaluationof Noise Sources 6-I6.2 NoiseReductionTechnology 6-I6.3 Impactsof NoiseReductionTechnology 6-9
6.3.1 PerformanceImpacts 6-96.3.2 OperationImpacts 6-96,3.3 MaintenanceImpacts 6-116.3.4 AestheticFactors 6-12
6.4 ProductionVariations 6-126.5 "BestAvai]ableTechnology" 6-136.6 LeadTimes 6-146.7 Deteriorationof MotorcycleNoise 6-15
levels
it
Table of Contents (Continued)_
PageNumber
6.7 Deteriorationof MotorcycleNoise 6-15levels
6,8 Relationship to Air Emission Control 6-166.g Technology to Achieve Noise Levels 6-16
Basedon DifferentNeasurementMethedol ogies
Section7 COSTSOF COMPLIANCE7.1 UnitCostIncreases 7-I
7.1.1 ManufacturingUnit Costs 7-57.1.1,1 HanufacturerEstimates 7-57.1.I.2 Generalized and Independent 7-6
Estimates7.1.2 Research and Development Costs 7-177.l,3 Tooling and Other Manufacturing
EquipmentCosts 7-237.1.4 Testing& CertificationCosts 7-237.1.5 Total WeightedUnit Costs 7-37
Increases
7.2 PurchasePriceImpacts 7-377.3 Replacement Exhaust System Price Impacts 7-457.4 OperationalCostIncreases 7-457.5 MaintenanceCosts 7-547.6 Costs of EPA Air Emission Requirements 7-54
Section 8 ECONOMICIMPACT ANALYSIS8.1 NewMotorcycleSales 8-i
8.1.1 Historical New Motorcycle 8-1Sales Trends
8.1.2 Sales by ProductCategory 8-18.1.3 BaselineForecastof New 8-12
Motorcycle Sales8.2 Impactson New MotorcycleDemand 8-208.3 Impacts on Demand for Products and
Services 8-248,3.1 Historical Aftermarket Sales
andForecasts 8-248.4 TotalAnnualizedCosts 8-28
8.4.1 Vehicle AnnualizedCosts 8-288.4.2 Aftermarket Exhaust Annualized 8-32
Costs8.5 Impacton U.S.Employment 8-358.6 RegionalImpacts 8-368.7 Impacton GNP and Inflation 8-368.8 Impactson ForeignTrade 8-378.g ExpectedImpacts on Individual 8-37
Manufacturers8.9.1 StreetMotorcycles 8-378.9,2 Off-Roadblotorcycles 8-398.9,3 Aftermarket Exhaust Systems 8-40
iii
Table of Contents (Continued)PageNumber
APPENDICES
A. MOTORCYCLENOISEEMISSIONTEST PROCEDURES A-1
B. TESTSITESANDINSTRUMENTATION B-1
C. PRODUCTIDENTIFICATION_D NOISELEVELS C-1
D. STATEANDLOCALNOISEREGULATIONS D-1
E, FOREIGNMOTORCYCLENOISELAWS E-I
F. MOTORCYCLEDEMANDFORECASTINGMODELAND F-IESTIMATION OF REPLACEMENT EXHAUST SYSTEMSALES
G. RELATIONBETWEENSTANDARDTEST METHODOLOGIES G-I_ID REPRESENTATIVE ACCELERATION CONDITIONS
H. ADDITIONALMOTORCYCLENOISELEVELDATA H-I
I. REFINEMENTOF MOTORCYCLETESTINGPROCEDURE I-1
J. EXPLORATIONOF A STATIONARYTEST INCORPORATINGAN ELECTRONICIGNITIONDISABLE SYSTEM J-1
K. FURTHERSTUDYOF THE IGHITIONDISABLEDEVICE K-I
L. MOTORCYCLENOISE ESTIMATEDFROMTIME/DISTANCE L-1MEASUREMENTS DURING ACCELERATION IN URBANTRAFFIC SITUATIONS
M. FRACTIONALIMPACTPROCEDURE M-I
N. NATIONALROADWAYTRAFFICNOISE EXPOSUREMODEL N-1
O. NATIONALMOTORCYCLENOISECONTROLEMPHASIS 0-1PLAN - SUMMARY
iv
NOIIDBOO_IBI
[N01193S
SECTION i
INTRODUCTION
Statutory Basis for Action
Through the Noise Control Act of 1972 (86 Stat. 1234), Congress estab-lished a national policy "to promote an environment for all Americans freefrom noise that jeopardizes their health and welfare." In pursuit of thatpolicy, Congress stated in Section 2 of the Act that "while primary respon-sibility for control of noise rests with State and local governments, Federalaction is essential to deal with major noise sources in comuerce, the controlof which requires national uniformity of treatment," As part of that essen-tial Federal action, subsection5(b)(I) requires the Administratorof theEnvironmental Protection Agency (EPA), after consultation with appropriateFederal agencies, to publish a report or series of reports identifyingproducts (or classes of products) which in his judgment are major sources ofnoise. Further,Section6 of the Act requiresthe Administratorto publishproposed regulations for each product identified as a major source of noiseand for which, in his judgment,noisestandardsare feasible, Such productsfall into various categories, of which transportation equipment (includingrecreational vehicles and related equipment) is one.
Identification of Motorcycles as a Major Noise Source
Pursuant to the provisions of subsection 5(b)(1), the Administratoron May 20, 1975 publisheda report identifyingnew motorcyclesas a major
source of nolse, l Section 6 requires EPA to prescribe standards for thenoise emissionsof new motorcycleswhich are requisiteto protectthe publichealthandwelfare,takingintoaccountthe magnitudeand conditionsof use ofnew motorcycles, the degree of noise reduction achievable through the applica-tion of best available technology, and the cost of compliance.
In accordancewith the authoritiesgrantedin Sections3, 6, and 10 ofthe Act, EPA may establish performance standards for specific components ofthose products which have been identified as major sources of noise, Replace-ment exhaustsystems, which are noise sensitivecomponentsof motorcycles,have, in the judgment of the Administrator, been found to warrant separateregulatorytreatmentas part of EPA's noiseabatementstrategyfor new motor-cycles,
LabelinB
Provisionsfor requiringthe labelingof products identifiedas majorsources of noise are contained in Sections 6 and 13 of the Noise Control Act,Labelingof motorcycleswill providenoticeto buyersthatthe productIs soldin conformity with applicable regulations, and will also make the buyer anduser aware that the motorcyclepossessesnoise attenuationdevices whichshould not be removed or tampered with. Labeling will also be of assistanceto enforcementofficialsin determiningcompliancewith applicablelaws andordinances,
I. FederalRegister)40 FR 23105,May 28, 1975
l-I
Preemption
After the effective date of a regulation for noise emissions froma new product, Section 6 of the Noise Control Act requires that no Stateor politicalsubdivisionthereofmay adopt or enforce any ]aw or regulationwhich sets a limit on noise emissionsfrom such new products,or componentsof such new products, which is not identica] to the standard prescribedby the Federal regulation. Subsection 6(e)(2), however, provides thatnothing in Section 6 precludesor deniesthe right of any State or polit-ical subdivisionthereof to establishand enforcecontrols on environmentalnoise through the Hcensing or the regulationor restrictionof the use,operation,or movementof any suchproductor combinationof products.
To assist in centrol]ingmotorcyclenoise,State and local authoritiesare encouragedto enact and enforce noise regulationsfor motorcyclesandreplacement exhaust systems which complement Federal regulations, as well asregulationscontrollingthe use and operationof motorcyclesin areas wherethey are deemed to be necessary.
Study Approach
In June 1974 EPA published a preliminary study report which examine#motprcyclequietingtechnologyand the costs of applying such technology,"This study provided the Agency with an initia] assessment of the feasibi]ityof im)torcyclenoise control,fromwhich the Agency'sregulatoryoptionscouldbe furtherconsidered,Shortlyafterthe major noisesourceidentificationofmotorcyclesby the Administrator,EPA initiatedfurther researchstudiesofquietingtechnology,cost and economicImpacts,and environmentalimpacts,tobe used in assessingthe variousFederal noise regulatoryalternativesforthis product.
During the courseof these studies,all majormotorcyclemanufacturers,many smaller ones, and a number of manufacturers of replacement exhaustsystems were visitedby representativesof the Agency and its contractors.These visits were made for the purposes of collectingtechnicaldata andinformation,and to allowthe industrythe opportunityto becomefamiliarwithand participatein EPA'sregulatoryprocess.
Information and data collected from various sources by EPA and itscontractorswhich were used by the Agency in assessingmotorcyc]equietingtechnolo_, compliancecosts,and healthand welfareImpactsare presentedInthis document.
Public Participation
Throughout the development of this regulation an effort has been made toallow all groupsand organizationswho havean InterestIn, or may be directlyaffectedby motorcyclenoise standards,the opportunityto participatein therulemakingprocess. This public participationefforthas includedmeetingswith concerned state, county, and city officials, as well as with motorcycleuser groups, industry associations, and motorcycle dealers. Advance copies ofe draft Notice of Proposed Rulemaking (NPRM) and selected sections of the
C-6-nt_-o]-_Mdtorcyc!e Noise_ Volume I_ Techonology and Cost Info_la.tion..EPA publication550/9 74-001A
1-2
supporting regulatory analysis were distributed to manufacturers and inter-i ested government officials several months prior to publication of the NPRM to
allow additional time for analysis and co_,ent. Appr_)priate officials in all50 states were.contacted by telephone, and informational mailings were sentand follow-up contacts made for the purpose of obtainhlg viewpoints andopinions from these officials. Ongoing attempts to coordinate Federal, state,and local mDtercycle noise control actions are being made by the Agency.
On March 15, 1978 a Notice of Prolx)sedRulemaking for Motorcy01es andMotorcycle Replacement Exhaust Systems was published in the Federal I(egister(40 FR 10822). Public hearings wsre held in Anaheim, California, April 28"-CMay i, 1978; in St. Peterb/rg, Florida, May 5, 1978; and in Washington, D.C.,May g, 1978. All comn_nts submitted with respect to the proposed regulationduring the public hearings and during tbe public coolant period have beengiven careful consideration. An analysis of these sediments is included inthis document.
Outline and Summary of the Background Document and Appendices
Section i. Introduction
Section 2. Industry Oescription. General information on m_tor-cycles, motorcycle manufacturers, exhaust system manufacturers, and thestructure of the industry is presented in this section.
Section 3. Noise Level Test Procedures. This section contains
a discussion of existing noise measurement methodologies for motorcycles,and a presentation o£ EPA's final procedure for use in regulatory compliancetesting.
Section 4. Noise Level Data Base. This section presents noise levelsof motorcycles and replacement exhaust systems which were obtained usingvarious test p_ocedures.
Section 5. Public Health and Welfare Analysis. An analysis ofcurrent inpaets of motorcycle noise, and impacts expected as a _esult ofvaL'iousregulatory options is described.
Section 6. Noise Reduction Technology. A discussion of inotorcyclenoise reduction feasability is included in the section. In addition thevarious engineering techniques involved in controlling noise from motorcyclenoise subsources are also analyzed.
Section 7. Costs of Co_._liance. This section provides estimatesof the costs involved in applying t/]esetechniques to quiet motorcycles andreplacement exhaust systems to various not-to-exceed regulatory levels.
Section 8. Economic Impact Analysis. Estimates of the economicimpacts of various regulatory options on the manufacturing industry, onspecific fi_ms, on enployment and on other economic measures are containedin this section.
Appendix A. Motorcycle Noise Level Test Procedures. Texts of thenoise level test procedures discussed in Section 3 are presented in thisappendix.
1-3
AppendixB. Test Sites and Instrumentation.This appendixpresentsdescriptionsand photographsof the instrumentationand the test site loca-tionsused in performingEPA's motorcylcenoisetesting.
AppendixC. ProductIdentificationand Noise Levels. This appendixincludes noise level data developedby EPA on individualmotorcyclesandreplacement exhaust systems.
AppendixD. A synopsisof State and local laws applicableto motor-cycle noise,
AppendixE. This appendixincludesa summaryof foreignmotorcyclenoise laws.
AppendixF. Motorcycleand AftermarketExhaustSystem DemandFore-casting Model. This appendix describes the econometric models used toforecastmotorcycleand aftermarketexhaustsystemdemand.
AppendixG, RelationBetweenStandardTest Methodologiesand Repre-sentative Acceleration Conditions. The assessed relationship betweenmotorcycle noise levels under rapid accelerationconditions (the officialEPA test procedure) and noise levels under representative unconstrainedtrafficaccelerationconditionsis detailedin this appendix.
AppendixH. AdditionalMotorcycleNoise Level Data. This appendixcontainsdata developedin a test programconductedby EPA to gain additionaldata relatingto tileproposed test procedureand to investigatetachometerresponse characteristics. Operatorear and stationarytest data are alsopresented.
Appendix I. This appendix describesresults of EPA_s efforts todevelop a slidingscale of closing RPM so that more accurate comparisonscould be made betweenthe noise levels of variousmotorcyclesdisplacementclasses. Also tachometerlog was investigated.
Appendix J, Exploration of a Stationary Test Incorporating anElectronicIgnitionDisable System. This appendixsummarizesa study whereEPA evaluatedthe use of an ignitiondisabledevicefor both movingvehicleand stationary vehicle test procedures.
Appendix K. Further Study of the Ignition Disable Device. Dataare includedin thisappendixto show resultsof EPA's effortsto refinetheignition disabledeviceand to keep rpm overshootwithin acceptablevalues.
AppendixL, MotorcycleNoise EstimatedfrGm Time/DistanceMeasure-ments During Acceleration in Urban Traffic Situations. This appendixsummarizesa text program which was undertookby EPA to define motorcycleaccelerationprofilesand associatednoiseemissionsas the Vehicleoperatedin an urban trafficsituation.
AppendixM. Fractional Impact Procedure. The procedureused inassessing the health and welfare impact and benefits to be derived fromregulatingnoiseemissionare summarizedin thisappendix,
I-4
Appendix M. Fractional Impact Procedure. The procedure used inassessing the health and welfare impact and benefits to be derived frofaregulating noise emission are sufmlarized in this appendix.
Appendix N. National Roadway Traffic Noise Exposure Model. Thisappendix includes a detailed discussion of the Natfona] Roadway Traffic NoiseExposure Model. This discussion encompasses the data. calculations, andassumptions that underline the model with focus on those details relevant toconsiderations of noise emission standards for motorcycles.
Appendix O. National Motorcycle Noise Control Emphasis Plan - Sum-mary. This appendix is a surmLary of the Agency's plans to assist States andlocal governments in developing and implementing programs to control motor-cycle noise..
Docket Analysis. All of the questions, comments, and issues raised inthe public hearings and in written submissions to the docket are addressed indetail.
J I-5
SECTION 2
INDUSTRY DESCRIPTION
SECTION2
INDUSTRYDESCRIPTION
2,1 ProductionDefinition
For the purposes of the ErA motorcycle noise regulation all motor-cycleswhich are designedand marketed for on-roadoperationare consideredto be "street"motorcycles,subjectto noise standardsfor streetmotorcycles.This categoryIncludes:
Streetand highwaymotorcycles
Moped-type street motorcycles
EnduromotorcyclesIntendedfor limitedstreetoperation
MJntcycles intended for street operation
Motor-driven scooters
Thlsstreetmotorcyclecategoryencompassesvehicleshavingthe followlngcharacteristics:
Approximate]y 50 to 1300 cc engines, developing from 1 to 100 horsepower
Two-stroke. four-stroke and rotary engines
One to six cylinders
Liquid, fan and alr cooling systems
Two and three wheels
Light to heavy-weight
Shaftand chain drive
Manual and Wdraulfc torque converter automatic transmission
Moped-type street motorcycles are two-wheeled vehtcles intended foruse on streets and roads. These vehicles, which are popular in Europe andAsia and which have been alrea_ introduced into the U,S., have the followingfeatures:
Not more than 50 cc engines
Not more then 2 horsepower
Top speedless than 30 m.p.h.
" For the purposes of the ErA noise regulation.all motorcycles which aredesigned and marketed for off-road end off-road competition use. wtth theexception of motorcycles designed and marketed soIel_ for use In closed-
2-1
course competition events, are considered to be "off-road" motorcycles.Thls off-roadmotorcyclecategoryincludes:
Off-road,traiI, and cross-countrymotorcycles
Enduremotorcyclesnot intendedfor streetoperation
Minlcyclesnot intendedfor streetoperation
Trialsmotorcycles
All-terrainmotorcyclesnot intendedfor streetoperation
This off-roadcategoryencompassesvehicleshavingthe followingcharac-teristics:
50 to 750 cc engines
Two-strokeand four-strokeengines (greatmajoritytwo-strokes}
Singlecylinder
Air cooled
Two and threewheels
Light-weight
Chain drive
Manual, centrifugalclutch and contlnuouslyvariable (belt) automatictransmission
For the purposeof the EPA noise regulationall motorcyclesdesignedandmarketed solely for use in closed-coursecompetitionevents are consideredcompetitionmotorcyclesand are not subjectto EPA noise control standards.They are however,subjectto the labelingprovisionsof the motorcyclenoiseregulation. Closed-coursecompetitionevents include: short track, dirttrack, drag race, speedway, hillclimb,ice race, and the BonnevilleSpeedTrials.
Two and three wheeled tractorsare not consideredto be motorcyclesforthe purpose of the EPA motorcycle noise regulation. Also, electric andbatter_-poweredmotorcyclesare not subjectto the provisionsof the regula-tions.
2.2 New VehicleManufacturers
More than 30 differentmanufacturersfromall over the world sell motor-cycles in the U.S. Manufacturersdescribedin the Motorcycle Industry'sCouncil's1978 StatisticalAnnualare listedin Table 2-i.
• Almost all foreign motorcyclemanufacturershave companiesin the U.S.distributingtheir products. The four majorJapanese companieshave whollyowned subsidiarieslocated in Sourthern California. Most of the smaller
2-2
manufacturersare representedby independentdistributingfirmswi_orepresenttheirbrand under contractualarrangements. Distributorsare listedin Table2-I with the associatedmanufacturers.
Along with motorcyclemanufacturersthere are a few other U.S. cem-panies that are involved to some extent in the OEM (original equipmentmanufacturer) segment of the market. These are companies which supply majorcomponentssuch as exhaust systems and engines to the motorcyclemanufac-turers. Representative companies in this category are:
Company Component motorcycle
NelsonIndustries Mufflers Harley-Davison
Briggs&Stratton Engines Heald
Tecumaeh Engines Heald
Wisconsin Engines Heald
Most of these companies are not entirely dependent on the _mtorcycleindustry,but sell theirproductsto manufacturersinother industriessuch asautomobiles, lawn tmwers, and snowmobiles.
The remainder of the new motorcycle industry description is orientedprimarily toward the manufacturers of full-sized 2-wheel motorcycles, sincethis segmentis by far the largestelement in the industryin termsof numberof units sold.
2.2.1 14arketSharesand Sales
The new motorcycle manufacturingsegmentof the industryis character-ized by a small number of manufacturers which have significant salas inthe U.S.. and a large number of manufacturers with very limited sales in theU.S. Total industry sales figures since 1969 are shown in Figure 2-i.Available sales and market share data for each of the 10 leading companies arelisted in Table 2-2,
In 1978, the five leading manufacturers (Honda, Yamaha, Kawasaki,Suzuki and AMF/Harley-Davidson)had 96.4 percent of the market, based onthe number of new motorcyclesregistered. This is only an approximationbecausean esti,nated30 percentof all motorcyclessold are not registered;however,marketshare inaccuraciesare not likelyto be great becauseall fivesellthe typesof I_dels that are likelyto be unregistered, Of the indivi-dual brands, the largest share of the market is held by Honda, which had 35.9percent of the market, followed by Yamaha - 25.9 percent,Kawasaki- 15,Upercent,Suzuki- 13.3percent,and Harley-Davidson- 6.3 percent.
At1 other _,lannFacturerscombined shared approxi,nately4 percent ofthe market, and none individually had a share over i percent. Approxi-mately 17 companies have less than O.l percent. These figures may be slightlyunderstated since many of the companies with limited U.S. sales specialize
2-3
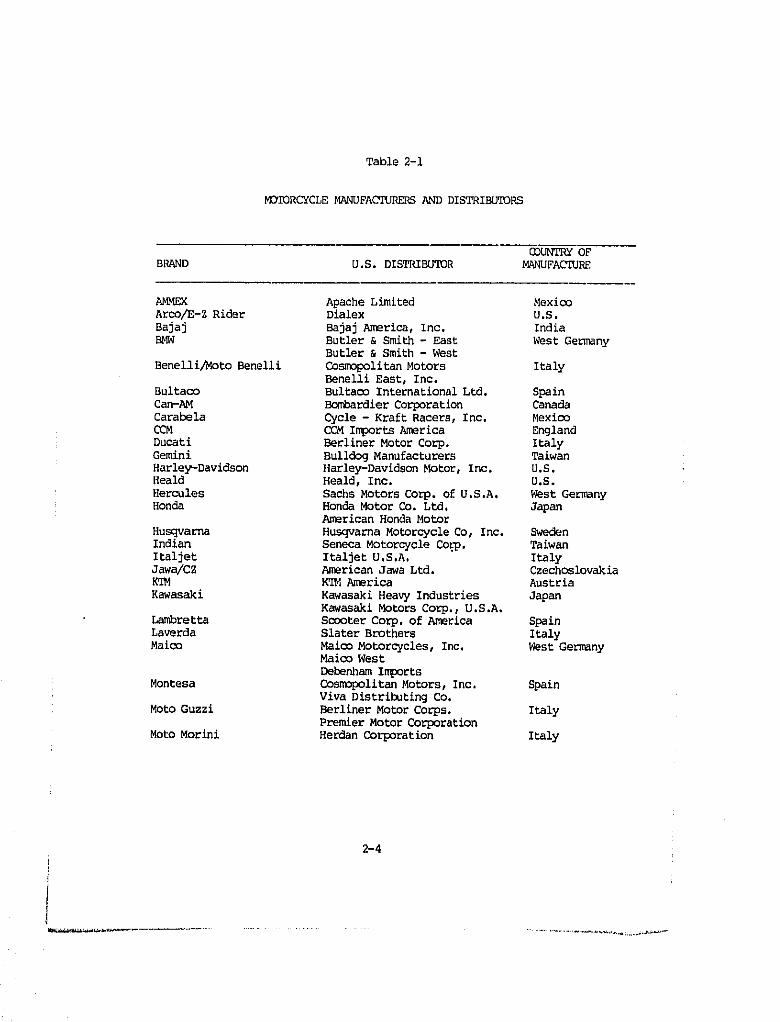
Table 2-1
MCYIDRCYCLE MANUFACTURERS AND DISTRIBUTORS
COUNTRY OFBI_%ND U.S.DISTRIBUTOR MANUFACTURE
AMMEX ApacheLimited MexicoArco/E-Z Rider Dialex U.S.Bajaj BajajAmerica,Inc. IndiaB_ Butler & Smith - East West Germany
Butler & Smith - West
Benelli/Moto Benelli Cosmopolitan Motors ItalyBenelli Bast, Inc.
Bultaco Bultaco International Ltd. SpainCan-AM Bombardier Corporation CanadaCarabela Cycle- KraftRacers,Inc. MexicoCCM CCMImportsAmerica EnglandDucati Berliner Motor Corp. ItalyGemini Bulldog Manufacturers TaiwanHarley-Davidson Harley-DavldsonMotor, Inc. U.S.Heald Heald,Inc. U.S.Hercules Sachs Motors Corp. of U.S.A. West GermanyHonda Honda Motor Co. Ltd. Japan
American Honda Motor
Husqvarna Husqvarna Motorcycle Co, Inc. SwedenIndian SenecaMotorcycleCorp. TaiwanItaljet ItsljetU.S.A. ItalyJawa/CZ American Jaws Ltd. CzechoslovakiaKTM KTMAmerica Austria
Kawasaki KawasakiHeavyIndustries JapanKawasaki Motors Corp., U.S.A.
Lambretta Scooter Corp. of America SpainLsverda Slatsr Brothers ItalyMaico Maico Motorcycles, Inc. West Germany
Maico West
Debenham ImportsMostesa Cosmopolitan Motors, Inc. Spain
Viva Distributing Co.Moto Guzzi Berliner Motor Corps. Italy
Premier Motor CorporationMotoMorlni HerdanCorporation Italy
2-4
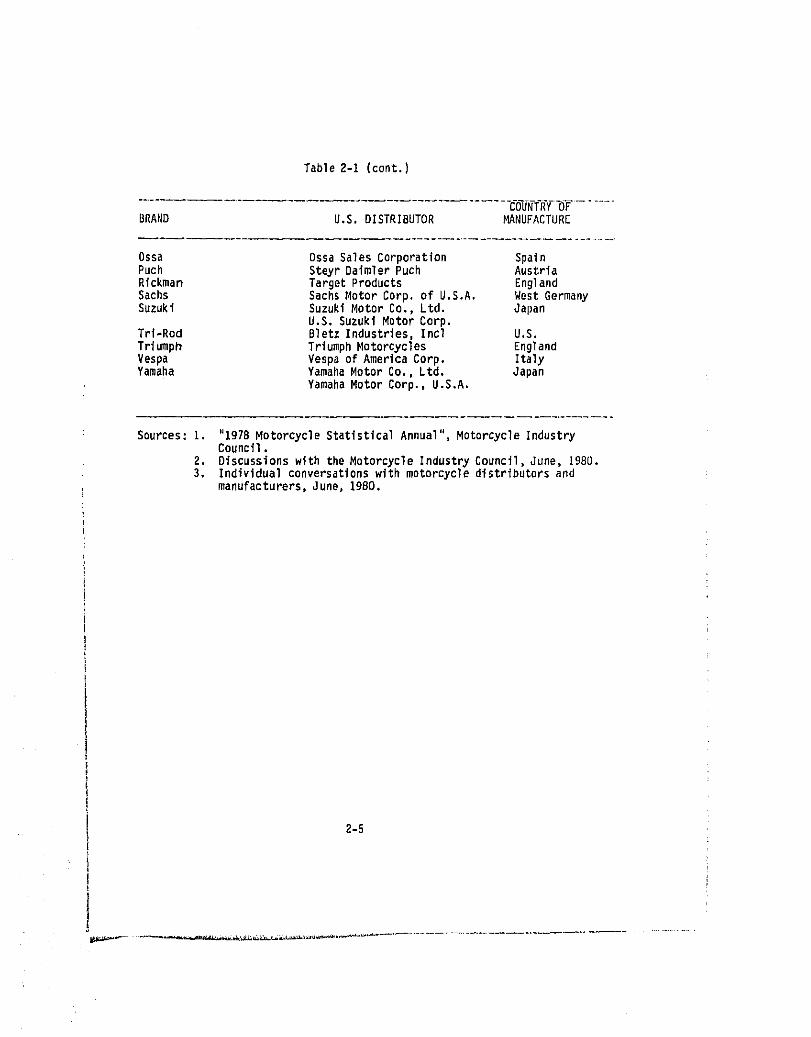
Table 2-i (cont.)
_-U-_f_F_F .........BRAND U.S,DISTRIBUTOR MANUFACTURE
Ossa OssaSalesCorporation SpainPuch SteyrDaimlerPuch AustriaRickman TargetProducts EnglandSachs SachsMotor Corp,of U.S.A, WestGermanySuzuki SuzukiMotor Co.,Ltd. Japan
U.S.SuzukiMotorCorp.Trl-Rod BletzIndustries,Incl U,S.Triumph TriumphMotorcycles EnglandVespa Vespaof AmericaCorp. ItalyYamaha YamahaMotorCo., Ltd. Japan
YamahaMotorCorp.,U.S.A,
Sources:i. "1978MotorcycleStatisticalAnnual",MotorcycleIndustryCouncil.
2. Discussionswith theMotorcycleIndustryCouncil,June, 1980.3. Individualconversationswith motorcycledistributorsand
manufacturers,June,1980.
?-5
_- _*._ • _ _•J_._._ _L_v_. _ _
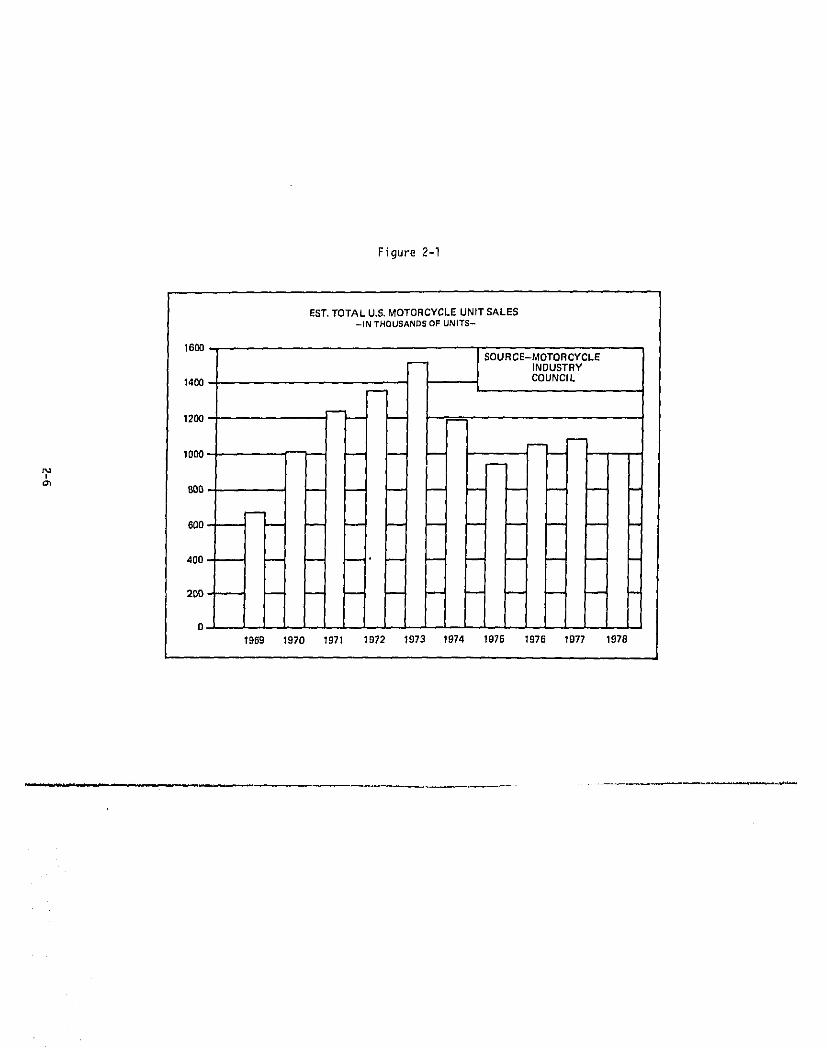
Figure 2-I
EST,TOTAL U.S,MOTORCYCLEUNIT SALES-IN THOUSANDSOFUNITS-
16_1SOURCE-MOTORCYCLE
INDUSTRY1400
1200
1000
_n BOO
690
400 t
200
01969 1970 1971 1972 1973 1974 1975 1976 1977 1978
- == i ,. ,i .j . _==--_._
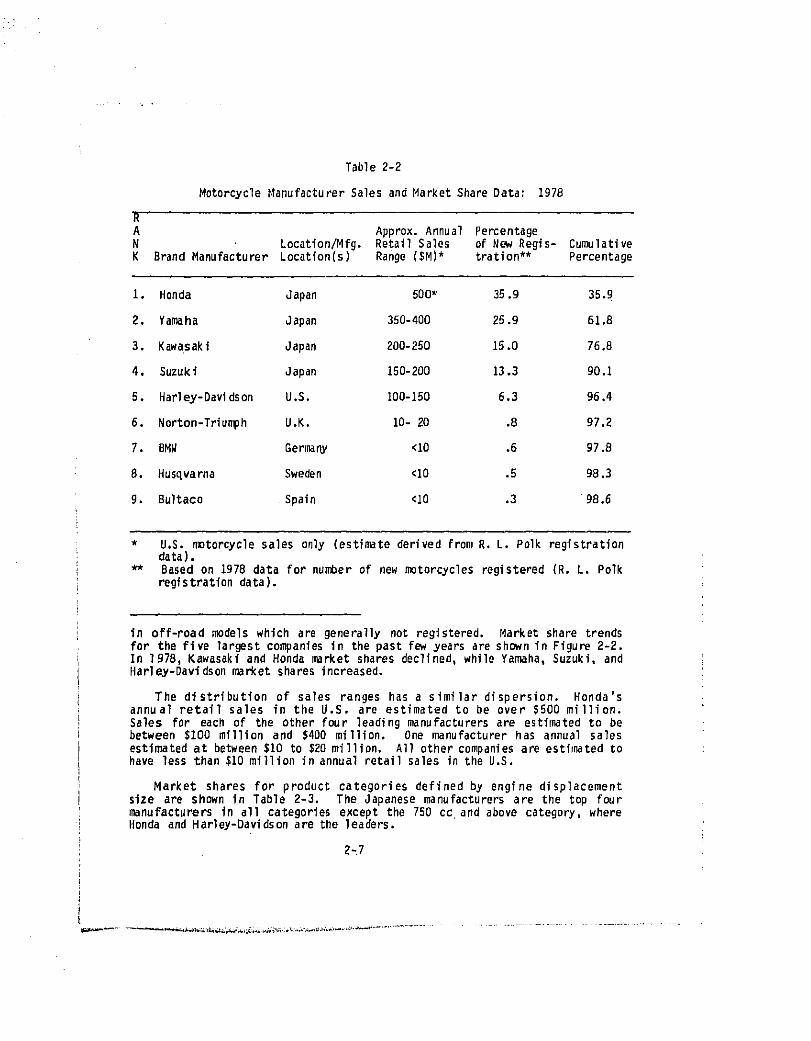
Table2-2
Motorcyclel._anufacturerSales andMarketShareData: 1978
R
A Approx.AnnualPercentageN Location/Mfg.RetailSales of Now Regis- CumulativeK BrandManufacturer Locatlon(s) Range($M)* tration** Percentage
I. Honda Japan 500_ 35.9 35.9
2. Yamaha Japan 350-400 25.9 61.6
3. Kawasaki Japan 200-250 15.0 76.8
4, Suzuki Japan 150-200 13.3 90.1
5. Har]ey-Davldson U.S, i00-150 6.3 96.4
6. Norton-Triumph U.K. 10- 20 .8 97.2
7. BMW Germany <10 .6 97.B
B. Husqvarna Sweden <10 .S 98.3
g. Bultaco Spain <10 .3 98.6
* U,S. motorcyclesales only (estimatederivedfromR. L. Polk registrationdata).
** Based on 1978 data for number of new motorcyclesregistered(R. L. Polkregistrationdata).
in off-road modelswhich are generallynot registered. Market share trendsfar the five largestcompaniesin the past few years are shown in Figure2-2.In 1978, Kawasaki and Honda marketsharesdeclined,whileYamaha,Suzuki,andHarley-Davldsonmarket sharesincreased.
The distribution of sales ranges has a similar dispersion. Honda'sannual retail sales in the U.S. are estimated to be over $500 million.Sales for each of the other four leadingmanufacturersare estimatedto bebetween $100 million and $400 million. One manufacturerhas annual sales
estimatedat between$10 to $20million. All other companiesare estimatedtohave less than$10 million in annual retailsales in the U.S,
Market shares for product categories defined by engine displacementsize are shown in Table 2-3, The Japanese manufacturersare the top fourmanufacturersin all categoriesexcept the 750 cc and above category,whereHonda and Harley-Davidsonare the leaders.
2-7
2.2.2 ProductLines
There are majordifferencesin the productsofferedby the manufacturers.Yamaha and Suzuki are manufacturersthat offer modeTs in every category(SeeTable 2-4). Yamaha has 30 modelsand Honda has approximately23 differentmodels in all size and functioncategories. Harley-gavidsonhas 8 models,all of which are in the large street model category. Most of the othermanufacturershave model lines that are limitedto some extent. Many of theothersspeciallzein largemotorcycles,smalland mediumsized dual-purposeoroff-roadmotorcycles.
Most models in the large street motorcycle category and almost allHonda models have 4-strokeengines. Kawasakl,Yamaha, and Suzuki have both2-stroke and 4-stroke models. The other manufacturers rely prlncipallyon 2-stroke engines. Two manufacturers have models with rotary engines(Suzuki and BMW), A list of engine types by manufacturersis providedinTable2-5,
2.2.3 MotorcyclePrices
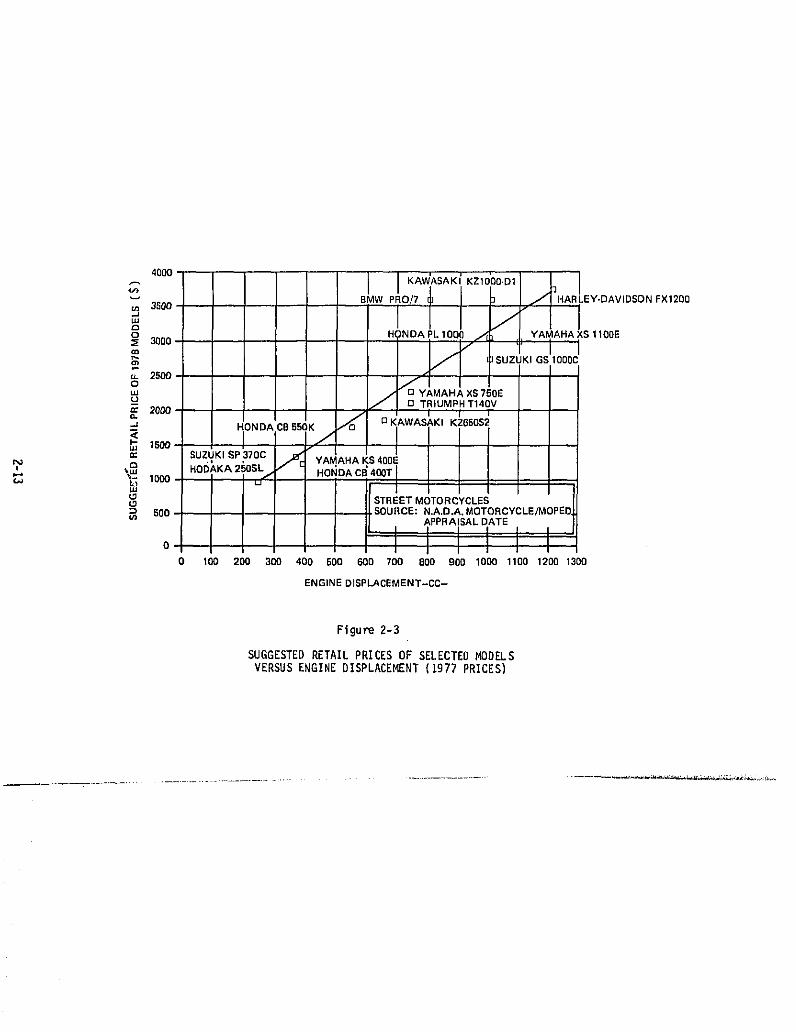
In genera], European motorcycles,particularlyin the street motor-cycle category, have higher retail prices than those of major Japaneseor U,S. brands. Figure2-3 showsa comparisonof pricesversusengine dis-placementsize for variousstreetmodels listed in the N.A.D.A.MotorcycleAppraisalGuide. In the street category,European manufacturersgenerallyoffera limitednumberof modelsat premiumprices.
Price comparison for off-road motorcyclesare more difficultbecauseof the multitudeof specializedfunctionsof off-roadmotorcycles. However,the Japanese brandsare typically10 to 20 percentless in price for equlva-lentsized off-roadmodels.
The Secretary of Treasurydeterminedin 1978 that Honda, Yamaha, andKawasakl had violatedSection 201(a) of the tg21 Antl-dumplngAct, U.S.sales prices for these manufacturerswere found to be lowerthan their homomarketor thirdcountry (market)prices. The revisedweightedaveragemarginson overallsales comparedwere as follows: Honda,2,6 percent;Yamaha,0.82percent;;and Kawasakl,6.g percent, However, the U.S. InternationalTradeCommissiondeterminedthat".,. thereIs no likelihoodof injuryor preventionof establishmentof an industryIn the United States by reasonof sales ofmotorcyclesfrom Japan at less than fair value." Therefore,no penalties
were imposed on these manufacturers,nor were they forcedto increase their&
prices,
2,2,4 TyplcalNow MotorcycleManufacturers
Manufacturersof full sized motorcyclescan be classlfiedin the fol-lowingmanner:
o Major JapaneseMotorcycleManufacturers
l Motorcycles from Japan, United States InternatlonalTrade Commlsslon,"Washington,g,C.,USITCPublication923,November1978.
2-B
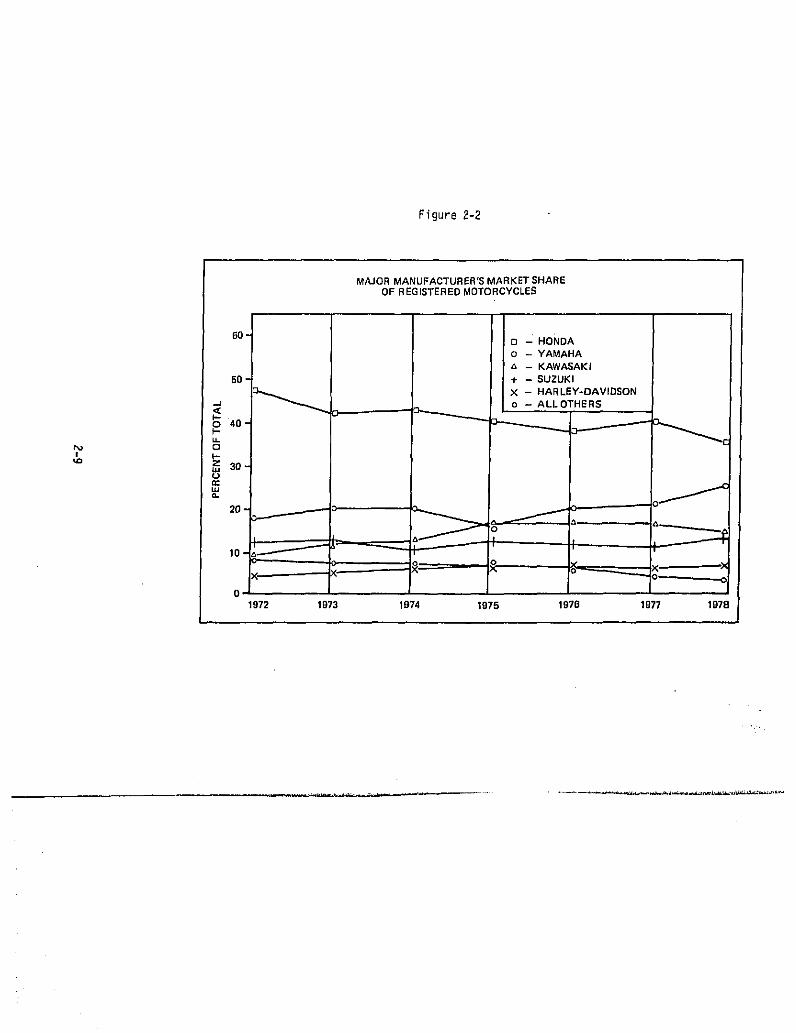
Figure 2-2
MAJOR MANUFACTURER'S MARKETSHAREOF REGISTERED MOTORCYCLES
BC D - HONDAo - YAMAHA
z_ - KAWASAKi10 + - SUZUKI
E3.,._,,,,,,,,.,,..,_ X - HARLEY-OAVIDSONo -- ALLOTHERS
I-
_:: z IO
Q_
0
1972 1973 1974 1975 1976 1977 1978
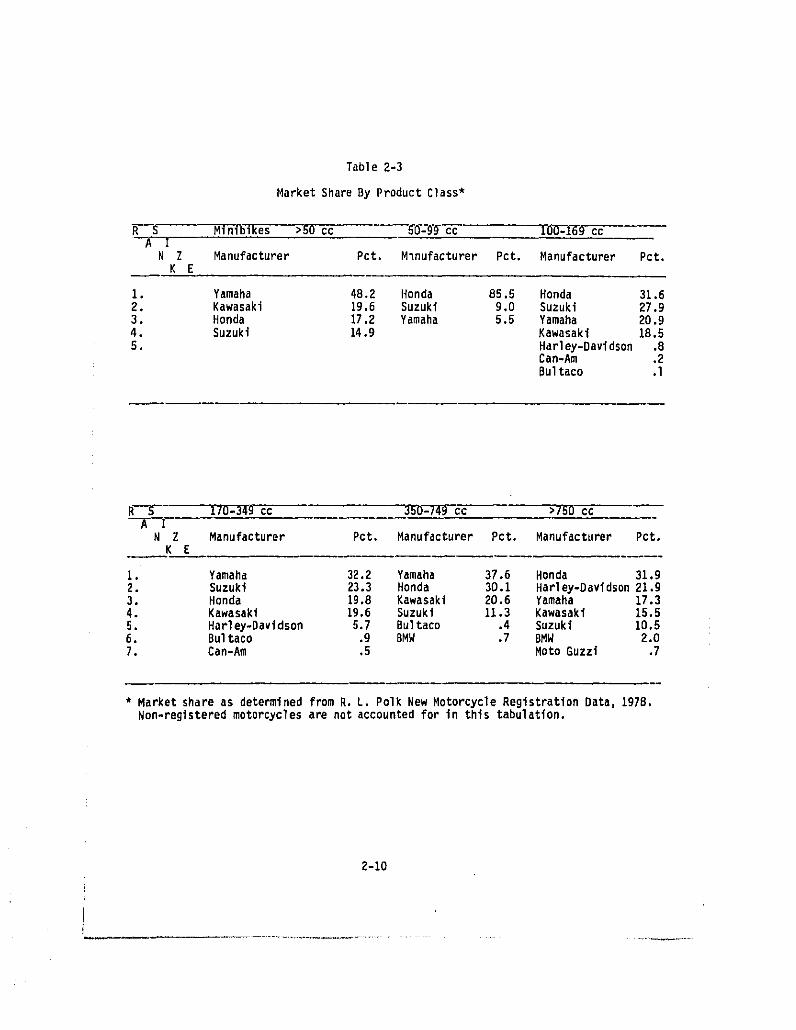
Table 2-3
MarketShareBy ProductClass*
R S Mlnlblkes >50 cc b_O--_cc I0-0-L--I-_9cc ----AI ---
N Z Manufacturer Pct. M_nufacturer Pct. Manufacturer Pct.KE
1. Yamaha 48.2 Honda 85.5 Honda 31.62. Kawasaki 19.6 Suzuki 9.0 Suzuki 27.93. Honda 17.2 Yamaha 5.5 Yamaha 20.94. Suzuki 14.9 Kawasaki 18.55. Har1_-Davidson .8
Can-Am .2Bultaco .I
H"--S--" 170-349cc "3_T0-749cc >75D ccA IN Z Manufacturer Pct. Manufacturer Pct. Manufacturer Pct.K E
i. Yamaha 32.2 Yamaha 37.6 Honda 31.g2. Suzuki 23.3 Honda 30.1 Hat|ey-Davidson21.g3. Honda 19.8 Kawasaki 20.6 Yamaha 17.34. Kawasakl 19.6 Suzuki 11.3 Kawasaki 15.55. Har]ey-Davidson 5.7 Bultaco .4 Suzuki 10.56. Bultaco .9 BMW .7 BMW 2.07. Can-Am .5 Moto Guzzl .7
* Marketshareas determinedfrom R. L. Polk New MotorcycleRegistrationData,1978.Non-reglsteredmotorcyclesare not accountedfor in this tabulation.
2-i0
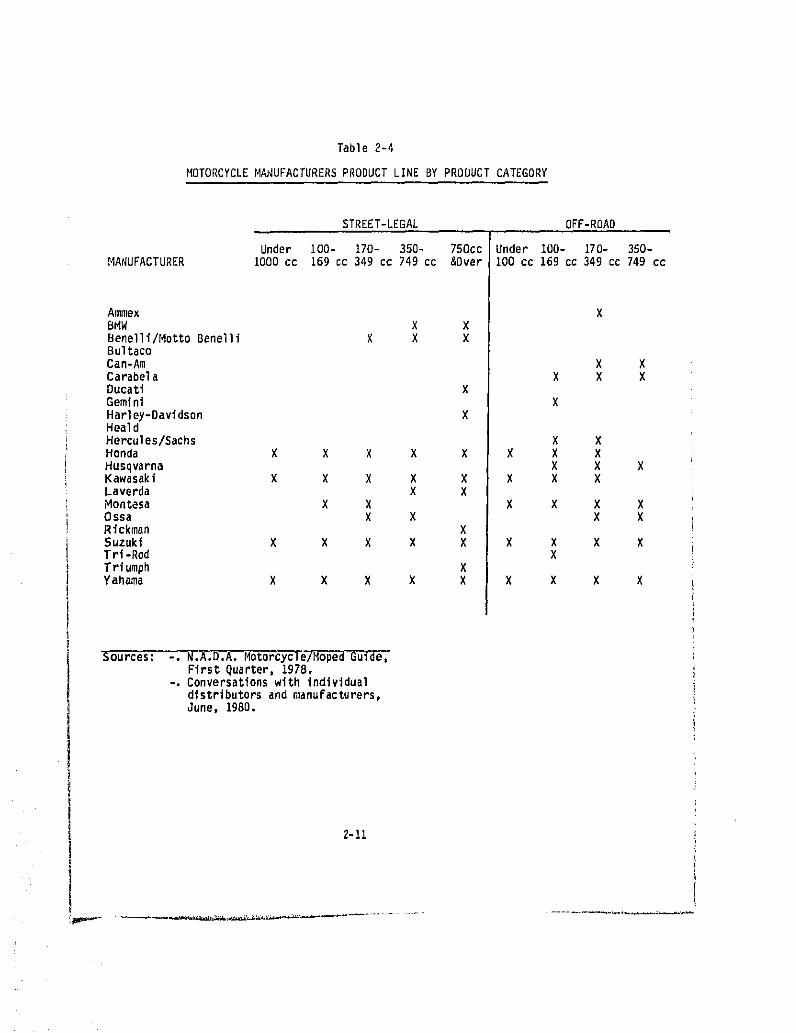
Table 2-4
MOTORCYCLE MAJ_UFACTURERS PRODUCT LINE BY PRODUCT CATEGORY
STREET-LEGAL OFF-ROADi
Under 100- 170- 350- 750cc Under 100- 170- 350-MANUFACTURER 1000cc 169 cc 349 cc 749 cc &Over 100 cc 169 cc 349 cc 749 cc
Ammex XBHW X XBenelli/MuttoBenelli X X XBultacoCan-Am X XCarabela X X XDucatl XGemini XHarley-Davidson XHealdHercules/Sachs X XHonda X X X X X X X X
Husqvarna X X XKawasaki X X X X X X X XLaverda X XMontesa X X X X X XOssa X X X XRickman XSuzuki X X X X X X X X XTri-Rod XTriumph XYahama X X X X X X X X X
Sources: -. N.A.D.A.Motorcycle/Moped'Guide,'First Quarter,1978.
-. Conversationswith individualdistributorsand manufacturers,June, 1980.
2-11
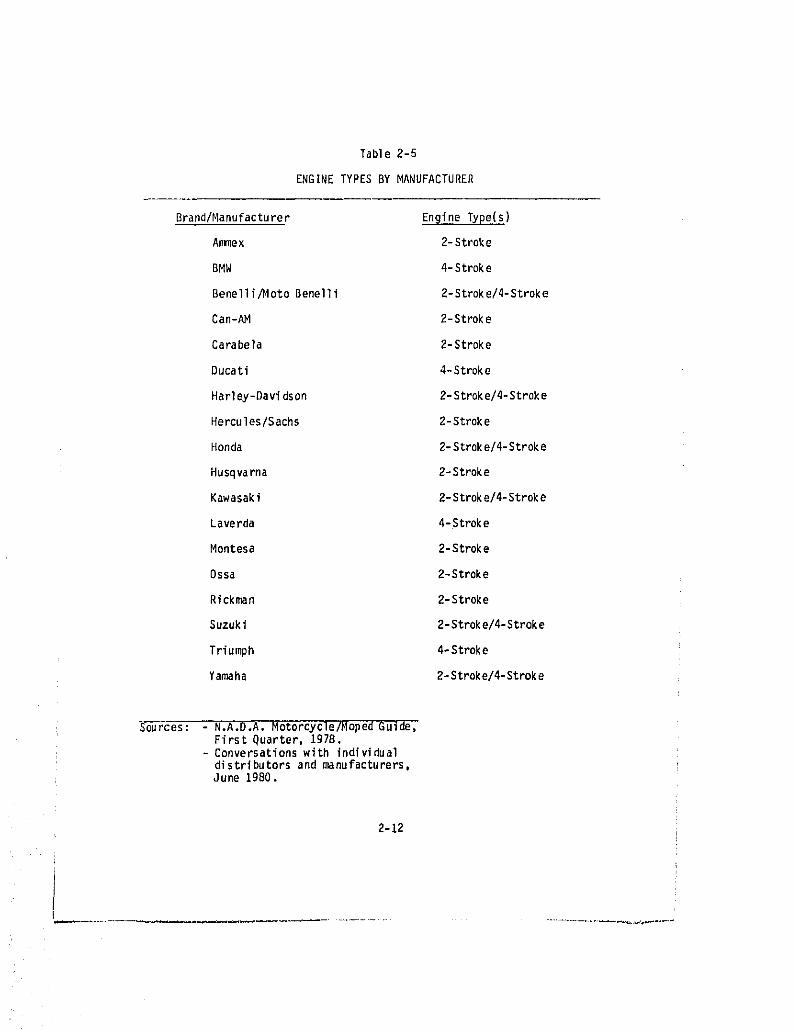
Table 2-5
ENGINE TYPES BY MANUFACTURER
Brand/Manufacturer EngineType.(s)
Ap_ex 2-Stroke
BMW 4-Stroke
Benelli/MotoBenelli 2-Stroke/4-Stroke
Can-AM 2-Stroke
Carabela 2-Stroke
Ducati 4-Stroke
Harley-Davidson 2-Stroke/4-Stroke
Hercules/Sachs 2-Stroke
Honda 2-Strnke/4-Stroke
Husqvarna 2-Stroke
Kawasakl 2-Stroke/4-Stroke
Laverda 4-Stroke
Montesa 2-Stroke
Ossa 2-Stroke
Rickman 2-Stroke
Suzuki 2-Stroke/4-Stroke
Triumph 4-Stroke
Yamaha 2-Streke/4-Stroke
_rces: - N.A.D.A.Motorcycle/MopedGuide,First Quarter,1978.
- Conversations with individualdistributors and manufacturers,June 1980.
2-12
£I-Z
SU
GG
E"Z
I_D
RE
TA
ILP
RIC
EO
F19
78M
OD
EL
S($
)
oo
88
88
°00--
0C
O.N
>on
to
"v
__I
8-_'
_"o
<=\p
_z
f'_i_
')[:
3
_i-rl
8--
¢._
z--i
z--8-
O>
\m
_-r
_m
oZ._
O;>
\
_o_
_m_-
_=m
om°"_
o\°-
zO
,z:
'-nZ
m-I
00
_
_m-_zo
•-.
,-_
__>_o
_ _-_
m_
_
8-
P=
,m
.<
_¢n
:_o
8z
z=
Pe
>I
..<
1r,
0|
m<
_B
t_ o
t !
o 14ajerU.S. motorcyclemanufacturer- AMF/Harley-Davidson
o U.S. motorcycle manufacturers with limited U.S. sales
o Foreignir_nufacturerswith limitedU.S. sales
A major motorcyclemanufactureris defined as one having U.S. retaillevel sales of motorcycles and parts of $100 million or over annually.Manufacturerswith "limited"sales have less than $100millionin U.S. retailsales annually. Actually, most manufacturers in this category have less than$10 million in annual retail sales. The categories are defined in this mannerbecause economic impacts on typical firma in each category are likely to besignificantly different. Each category is described in more detail in thefollowing paragraphs.
!4ajorJapaneseMotorcycleManufacturers
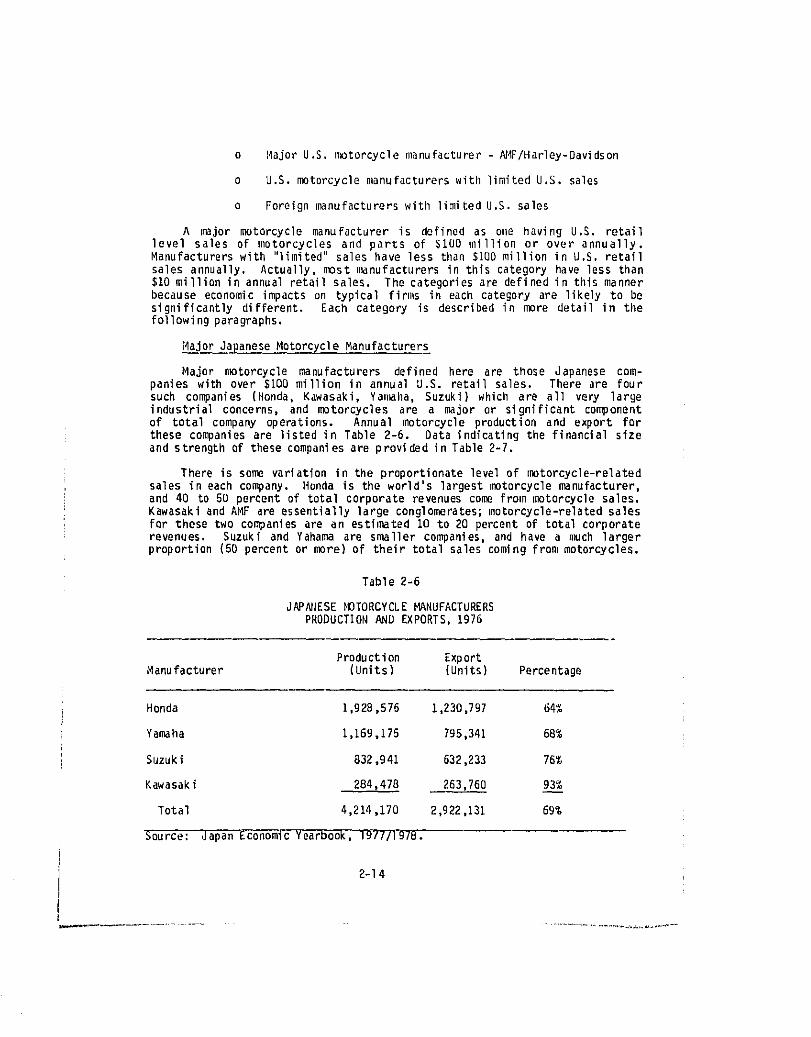
Major matorcycle manufacturers defined here are those Japanese com-panies with over $100 million in annual U.S. retail sales. There are foursuch companies (Honda, Kawasaki, Yamaha, Suzuki) which are all very largeindustrial concerns, and motorcycles are a major or significant componentof total company operations. Annual motorcycleproductionand export forthese companiesare listedin Table 2-6. Data indicatingthe financialsizeand strengthof thesecompaniesare provided in Table2-7.
There is some variation in the proportionate level of motorcycle-relatedsales in each company. Honda is the world's largestmotorcyclemanufacturer,and 40 to 50 percentof total corporaterevenuescomefrom motorcyclesales,Kawasaki and AMF are essentially large conglomerates; motorcycle-related salesfor these two companiesare an estin_ted10 to 20 percentof totalcorporaterevenues. Suzuki and Yahama are sn_allercompanies,and have a n_ch largerproportion (50 percent or more) of their total sales coming from motorcycles.
Table 2-6
JAPAI_ESEMOTORCYCLEMANUFACTURERSPRODUCTION AND EXPORTS, 1976
Production ExportManufacturer (Units) (Units) Percentage
Honda 1,928,576 1,230,797 64%
Yamaha 1,169,175 795,341 68%
Suzuki 832,941 632,233 76%
Kawasaki 284,478 263,760 93%
Total 4,214,170 2,922,131 69%
Source: Japan EconomicYearbook,1977/19"78.
2-14
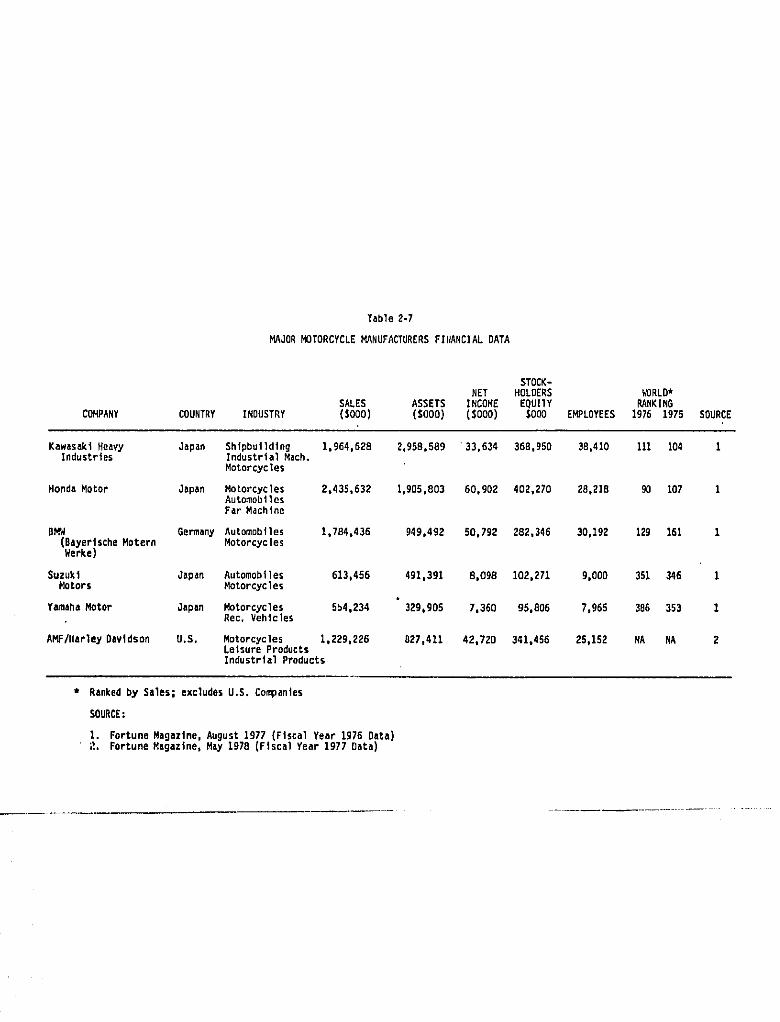
Table2-7
MAJORMOTORCYCLEMANUFACTURERSFIIIANCIALDATA
STOCK-NET MOLDERS W_RLD*
SALES ASSETS INCOME EQUIIY RANKINGCOMPANY COUNTRY IHDUSTRY ($000) ($000) ($000) $000 EMPLOYEES 1976 1975 SOURCE
KawesoklHeavy Japan Shipbuilding 1.964,628 2.958,589 '33,634 368,950 38,410 111 104 IIndustries IndustrialMach,
Motorcycles
HondoMotor Japan Motorcycles 2,435,632 1,905,803 60,902 402,270 28,216 90 107 1AutomobilesFor Machine
BMW Germany Automobiles 1,784,436 949,492 50,792 282,346 30,192 129 161 1(BoyerlscheMotern MotorcyclesWerke)
Suzuki Japan Automoblies 613,456 491,391 8,090 102,271 g,O00 351 346 iMotors Motorcycles
YamahaMotor Japan Motorcycles 5b4,234 329,905 7,360 95,806 7,965 386 353 1Rec, Vehicles
ANF/llorley Oavldson U.S. Motorcycles 1,229,226 827,411 42,720 341,456 25,152 RA RA 2Leisure ProductsIndustrialProducts
* Rankedby Sales; excludes U.S. Companies
SOURCE:
l. Fortune Magozine,August1977 {Fiscal Year 1976Data)' ;_. Fortune Magazine,May 1978(FiscalYear 1977Data)
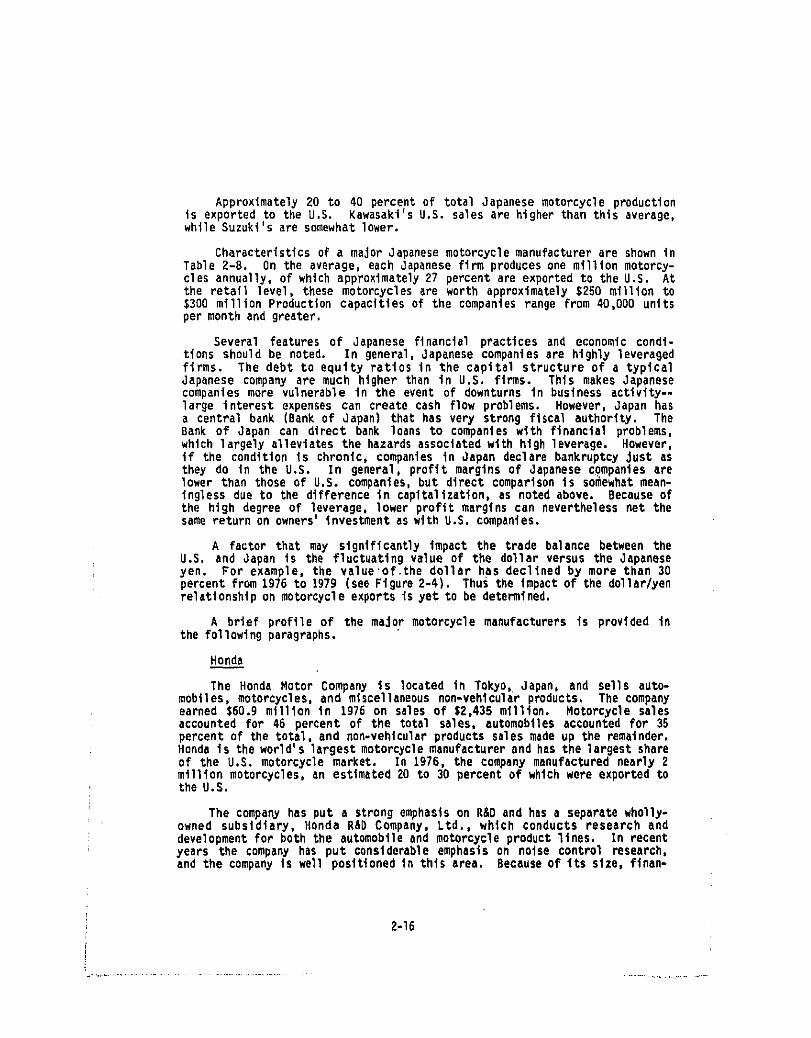
Approximately20 to 40 percentof totalJapanese motorcycleproductionis exportedto the U.S. Kawasaki'sU.B. sales are higherthan this average,while Suzuki'sare somewhatlower.
Characteristicsof a majorJapanesemotorcyclemanufacturerare shown inTable 2-B. On the average,each Japanesefirm producesone millionmotorcy-cles annually,of which approximately27 percentare exportedto the U.B. Atthe retail level,these motorcyclesare worth approximately$250 millionto$300 millionProductioncapacitiesof the companiesrange from 40,000 unitsper month and greater.
Several features of Japanese financialpractices and economic condi-tions shouldbe noted. In general,Japanese companiesare highlyleveragedfirms. The debt to equity ratios In the capital structure of a typicalJapanese company are much higher than in U.S. firms. This makes Japanesecompaniesmore vulnerablein the event of downturnsin business actlvlty--large interestexpenses can create cash flow problems. However,Japan hasa central bank (Bankof Japan) that has very strongfiscal authority, TheBank of Japan can direct bank loans to companieswith financialproblems,which largelyalleviatesthe hazardsassociatedwith high leverage, However,if the conditionis chronic,companiesin Japan declarebankruptcyJust asthey do in the U.S. In general,profit margins of Japanese companiesarelower than those of U,S. companies,but directcomparisonis somewhatmean-inglessdue to the differencein capitalization,as noted above. Becauseofthe high degreeof leverage,lower profitmargins can neverthelessnet thesamereturnon owners'investmentas with U.S.companies.
A factorthat may significantlyimpact the trade balance between theU.S, and Japan is the fluctuatingvalue of the dollarversus the Japaneseyen. For example, the value'of the dollar has declined by more than 30percentfrom1976 to 1979 (seeFigure2-4). Thus the impactof the dollar/yenrelationshipon motorcycleexportsis yet to be determined.
A brief profileof the major motorcyclemanufacturersis provided inthe followingparagraphs.
Honda
The Honda Motor Company is located in Tokyo, Japan, and sells auto-mobiles, motorcycles, and miscellaneous non_vehlcular products, The companyearned $60.9 mt111on in 1976 on sales of $2,435 million, Motorcycle salesaccounted for 46 percent of the total sales, automobiles accounted for 35percent of the total, and non*vehicular products sales made up the remainder.Honda is the world's largest motorcycle manufacturer and has the largest shareof the U,S. motorcyclemarket, In 1976, the companymanufacturednearly2mi111on motorcycles,an estimated20 to 30 percentof whichwere exportedtothe U.S,
The companyhas put a strongemphasison R&D and has a separatewholly-owned subsidiary, Honda R&D Company, Ltd., which conducts research anddevelopmentfor both the automobileand motorcycleproductlines, In recentyears the company has put considerable emphasis on noise control research,and the companyis well positionedin this area, Becauseof its size,flnan-
! 2-16
!
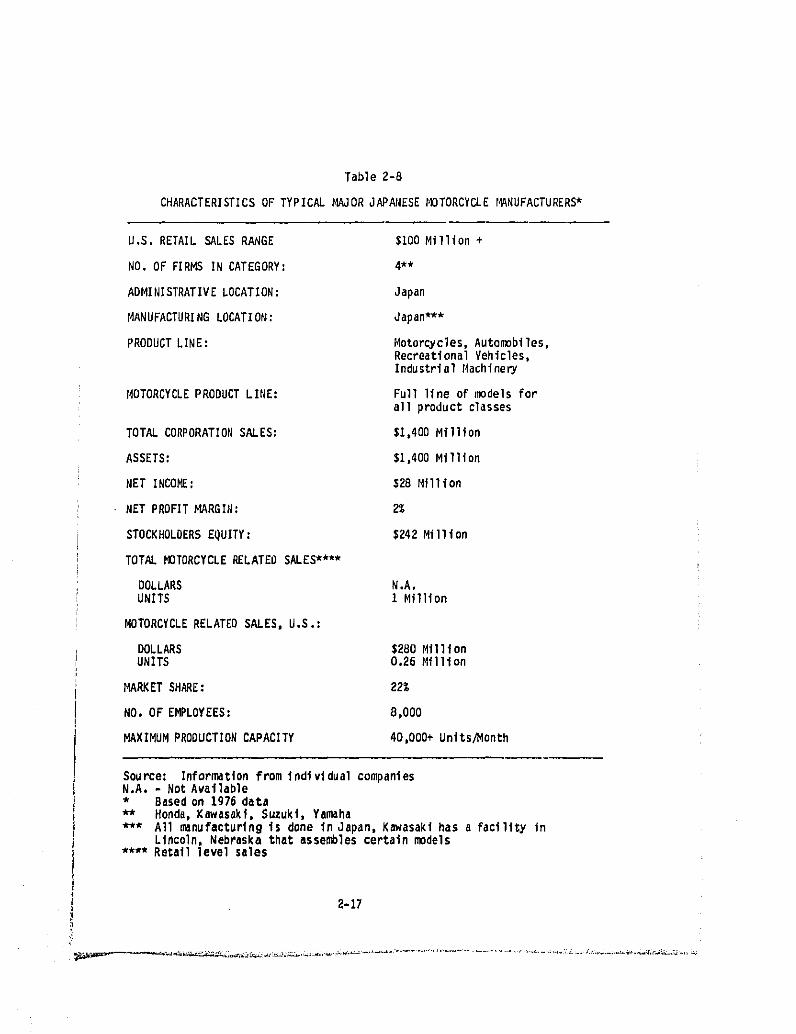
Table 2-8
CHARACTERISTICSOF TYPICALMAJORJAPANESEt4OTORCYCLErAANUFACTURERS*
U.S. RETAILSALESRANGE $100Million+
NO. OF FIRMS IN CATEGORY: 4**
ADMINISTRATIVELOCATION: Japan
HANUFACTURING LOCATION: Japan***
PRODUCTLINE: Motorcycles,Automobiles,RecreationalVehicles,IndustrialMachinery
MOTORCYCLEPRODUCTLINE: Fullllne of modelsforall productclasses
TOTAL CORPORATIONSALES: $i,400Million
ASSETS: $1,400Million
NET INCOME: $28 Million
• NET PROFITMARGIN: 2%
STOCKHOLDERSEQUITY: $242Million
TOTAL MOTORCYCLERELATEDSALES****
DOLLARS N.A,UNITS 1 Million
MOTORCYCLERELATEDSALES,U.S.:
DOLLARS $280HlllionUNITS 0,26Mfllion
HARKETSHARE: 22%
NO, OF EMPLOYEES: 8,000
MAXIMUMPRODUCTIONCAPACITY 40,000+Units/Month i
Source: Informationfrom individualcompaniesN.A. - Not Avallable* Basedon 1976 data** Honda,Kawasakf,Suzuki,Yamaha*** All manufacturingis done In Japan,Nawasakihas a facilityIn
Lincoln,Nebraskathat assemblescertainmodels**** Retail level sales
2-17
_,,_:_" _.u_,._._:._,,_,_x_'_._._,_,_,,_ ¸_-'_'_¸_¸ ._ ._._ ,.. ......... /,.,_._.,._,_,_.,_r,__,_*,,_ _
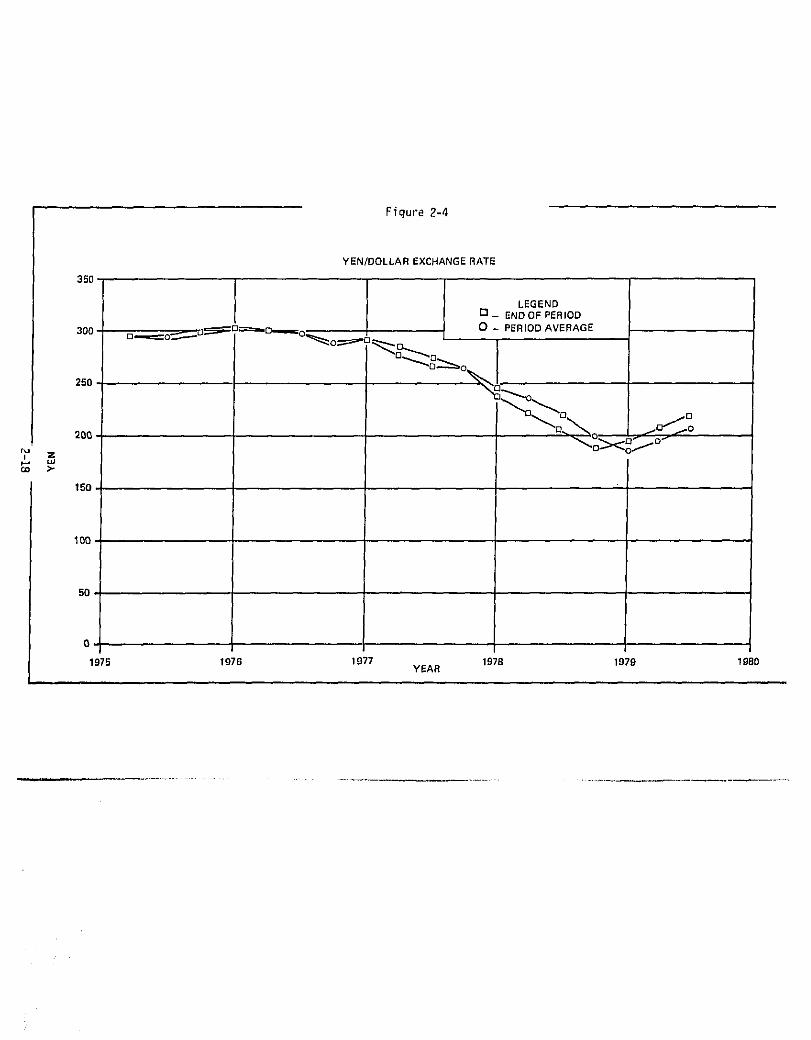
Figure 2-4
YEN/DOLLAR EXCHANGERATE
350
LEGENDf-l_ ENDOFPERIOD
' _=-_o ..... O - PERIODAVERAGE300 o ...=_o_,_ _o_ _--_..
250 ' a_.._
°
r_ z>..
150
190,
50 _l
G,
1975 1976 1977 1978 1979 1980YEAR
cial strength,planning and researchcommitmentand technical facilities,Honda is likelyto experiencethe least adverseimpact of any of the othercompaniesin the industry. The only majordisadvantagethat Honda has is thenumber of models it carries in its product line. Each model, or possibly asmal]er numberof subsetmodelcategories,will requireindividualeffortandtime for noise control research and development.
Kawasaki
Kawasakl motorcycles are manufactured by Kawasaki_s Engine and Motor-cycle Group, which provides 20 percent of the corporation'stotal sales.This particulargroup is located in Akashi,Japan, and manufacturesmotor-cycles, gas turbineengines,chemicalmachineryand industrialrobots. Theparentcorporation,KawasakiHeavyIndustries,Ltd., is one of Japan'sbiggestindustrialconcerns,with total sales approachingtwo billion dollars. Ofthe four major Japanese manufacturers, Kawasaki produces the lowest totalnumberof motorcycles,but exportsthe highestpercentageof its totalproduc-tion to the U.S.
Kawasaki has a motorcycle assembly facility in Lincoln, Nebraska,but all engine assembly and most motorcycle assembly is done in Japan.Approximately 200 employees are involved in the U.S. motorcycle manufac-turingoperations.
The company has a technicalresearchlaboratoryequippedwith sophis-ticated monitoring and diagnostic instruments. A noise research efforthas been in progress for severalyears, and Kawasaki'scapabi|ityin thisarea (plant,equipment,personnel)appearsto be well established.
Suzuki
SuzukiMotors Is a leadingmanufacturerof motorcyclesand lightweightautomobileswith 2-strokeengines. Companysales increasedfrom $467millionto $613 millionbetween 1970 and 1976, an increaseof 30 percent. Profitsduring this period declined slightly from $10.9 million to $8.1 million.
Yamaha
YamahaMotorCompanymanufacturesand sellsmotorcycles,mopeds,blcyles,snowmobiles,recreationalboats, engines and swimming pools. In additionthe company develops and operates recreational facilities,
A large proportion of the company's revenue comes from motorcyclesales. In 1976, the company manufactureds]ightlyover one million motor-cycles. Sixty-eight percent were exported, and approximately 20 to 30 percentwere exported to the U.S.
Yamaha has modern R&D facilitiesand equipment,and has a demonstratedcapabilityfor noisecontrolresearchand design.
Major U.S.MotorcycleManufacturer- AMF/Harle¥-gavldson
AMF/Harley-Davidsonis the only remainingmajor U.S. motorcyclemanu-facturer. The companywas startedin 1903, and has specializedin manufac-turing large touring motorcycles. In 1968, the company was acquired by
2-19
_w-_ _...... ....... • ........................................ • i:
AIIF,Inc., as part of AI4F'sextensivediversificationeffort, In 1977 Ai4Fearned$42.7 millionfrom sales of slightlyover Si.2 billion. AMF productsare primarily orientedtoward the leisure and IndusLr'ialproducts market;approximately 60 percent of sales and 50 percent of earnings come from leisureproducts.
A breakdownof revenuesby class of productsin _i,IF's1977 annualsalesindicatedtnat motorcyclesand oLher travel vehiclesprovided$203.6millionin revenues,or appproximately17 perceut of AI.IF'ssales. Motorcyclesandmotorcycle parts sales account for most of this revenue, estimated to bebetween $I00 million and $2QO _;lillionannually.
At the present time, the Harley-Bavidson producL line consists ofeight large touringmodels, all of which are lOgO cc or more. A sidecaroption is available for the larger models.
A total of 51,000 Harley Davidsons v4ereregistered in 1977.2 Thelarger models averagea a retail price of $3,200 or are; retail sales forthese models alone were approximately $100 million. Harley-Davidson's saleson a unit basis represented a 6.1 percent share of the nmrket in 1977, basedon registration data. Harley-Davidson's J_arket share on a dollar basis isso_;vhat higher,since its productline is orientedtowardthe larger,,qoreexpensive motorcycles. In 1378, narley-Davidson had 31.9 percent of themarketfor motorcycles750 cc and over. Sales and finaJlcialcharacteristicsof AMF/ Harley-Davidsonare shown in Table 2-9. Harley-Davidsonrecentlydiscontinued production of its lightweight _otorcycles at their wholly-ownedsubsidiary in Italy.
Most people in the motorcycle industry believe that Harley-Davidson has aunique niche in the market place, Buyers of the large Harley-Davidsen modelsdemonstrate considerable loyalty to the brand, and are relatively insensitiveto design advancementsand marketing campaigns of competing models. Itis the only U.S. motorcycle manufacturer which has survived from the earlylgO0's to the present, resulting in the evolution of a very strong consumertradition. As evidence, Harley-Davidson has increased its n_rket share inspite of increased competition from major Japanese manufacturers in the largestreet motorcycle category.
The strong brand loyalty that was indicated by industry sources tobe characteristicof _larley-Davidsonbuyers would seem to accord }{arley-Davidson certain advantages. It appears that Harley-Davidsen sales areconsiderablyless sensitive to both price increasesand declines in realinco_ne than are other brands.
Large Harley-Davidsonsfeature a longitudinal45 degree V-Twin enginewith common crank pin; a unique design in today's motorcycle market. Thisengine configuration provides Harley-Davidson motorcycles with low centerof gravity, narrow profile, and powerful low-end torque. It also f.eaturesa
2Motorcycle [ndustry Council, "I4anufacturersShipment Reporting System".
i 220fJ
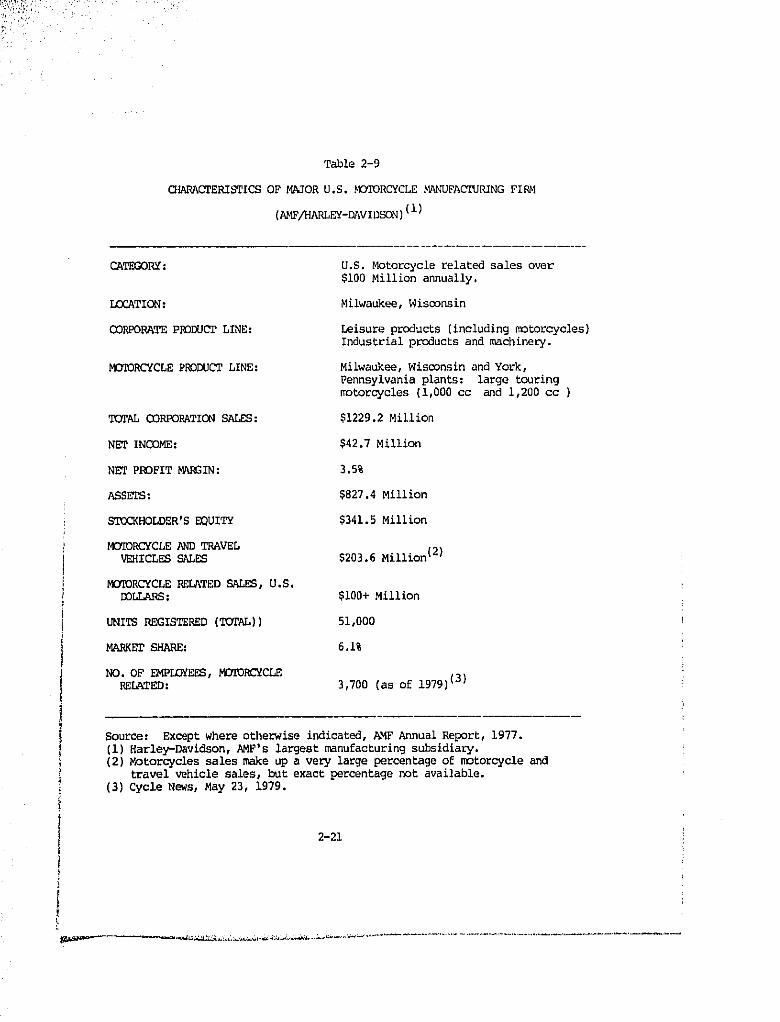
Table 2-9
(3HARACTERIST_CS OF MAJOR U.S. MOTORCYCLE MANUFACTURING FIPM
(AMF/HARLEY-DAVIDSON)(1)
CATEGORY: U.S.Motorcyclerelatedsalesover$i00 Million annually,
LOCATION: Milwaukee, Wisconsin
CORPORATE PRODUCT LINE: Leisure products (including motorcycles)Industrial products and machinery.
MOTORCYCLE PRODUCT LINE: Milwaukee, Wisconsin and York,Pennsylvania plants: large touringmotorcycles (1,000 cc and 1,200 cc )
T_AL CORPORATION SALES: $1229.2 Million
NETINCOME: $42.7Million
NETPROFITMATIN: 3.5%
ASSETS: $827.4Million
STOCKHOLDER'SDQUITY $341.5 Million
MOqORCYCLE AND TRAVELV_ICLES SALES $203.6 Million(2)
M_IDRCYCLE BELATED S_L_, U.S.DOLLARS: $I00+Million
UNITS REGISTERED (%_OTAL)) 51,000
MARKET SHARE: 6.1%
NO. OF EMPLOYEES, MOTORCYCLERELATED: 3,700 (as of 1979)_3"_
Source: Except where otherwise indicated, AMFAnnual Report, 1977.(i) Harley-Davidson, AMF's largest manufacturing subsidiary.
! (2) Motorcycles sales make up a very large percentage of motorcycle andtravel vehicle sales, but exact percentage not available.
(3) Cycle News, May 23, 1979.
2-21
low frequency asymmetrical exhaust note that is unique and which has customerappeal. In addition, the V-Twin engine provides specialized styling forthese motorcycles. The manufacturer believes that this unique "sound" andappearance must be retained to preserve demand for Harley-Davidson motor-cycles.
Engines and parts for the large motorcycles are manufactured in Harley-Davidson's Milwaukee, Wisconsin facilities, and are assembled in a York,Pennsylvania plant. Approximately 3,700 people are directly employed in theproduction of motorcycles, parts, and accessories. Approximately 9,300 peopleare indirectly affected to some extent at supplier plants, distribution andsales locations, and Harley-Davidson dealerships. Harley-gavidsoa is morevortically integrated than mast other manufacturers, in that it makes manyof the parts and components which other manufacturers normally buy fromsuppliers.
From a cost standpoint, Harley-Davidson suffers a disadvantage inview of the fact that Harley-Davidson's production base is 50,000 unitsper year, as compared to the typical 270,000 units per year of its majorcompetitors. Periodcosts such as R&D and depreciationare therebya]locatedover lesser number of units. This disadvantage is tempered by the factthat Harley-gavidson has a lesser number of models to manage, and that itsproduct line is composed of strictly large street motorcycles which cansustainlargercost increasesthan smallermodels on a relativebasis.
However, due in part to vehicle improvement, dealer orders in 1980have increasedice80,000 units. To meet increasingdemandfor thesemotor-cycles, and to improve efficiency,AMF, since it acquiredHarley-gavidson,has been gradually retoollngand automatingplant equipment, rearrangingplant layout,and strengtheningits engineeringoperations. For example,thenew five-speedtransmissioncase for the Harley-DavidsonFLT Tour Guide canbe built by one ,nanwith automatedequipment,while 14 raenwere requiredtobuild the older four-speedtransmissioncase. With additionalmanufacturingimprovements, vehicle production could be increased as high as 200,000 unitsper year withinthe nextfew years.*
U.S.MotorcycleManufacturerswith LimitedU.S. Sales
A typicalU.S. company is relativelyyoung and small (less than $2-3million In assets), manufacturesII,000 units and has annualsales in bhe$4 - $5 millionrange. U.S, employmentfor the companiesrangesfrom2 to 34employees. The small U,S. company'sproduct llne is generally limitedtominicycles, or small motorcycles (typically less than 185 cc) that areintendedfor off-roador dual purposeuse, Characteristicsof a typicalU.S,company with limited sales is shown in Table 2-10. A brief description ofson_eof thesecompaniesis containedin the followingparagraphs.
Dialex (formerly Alexander Reynolds)
Dialex is locatedin Hackensaek,New Jersey,and manufacturesminlbikesand go-karts. The minlbikes use Tecumseh engines.
*Source: t_6_'o-F_c-T_T,aTTiC'S',-I-9"S_0"
2-22
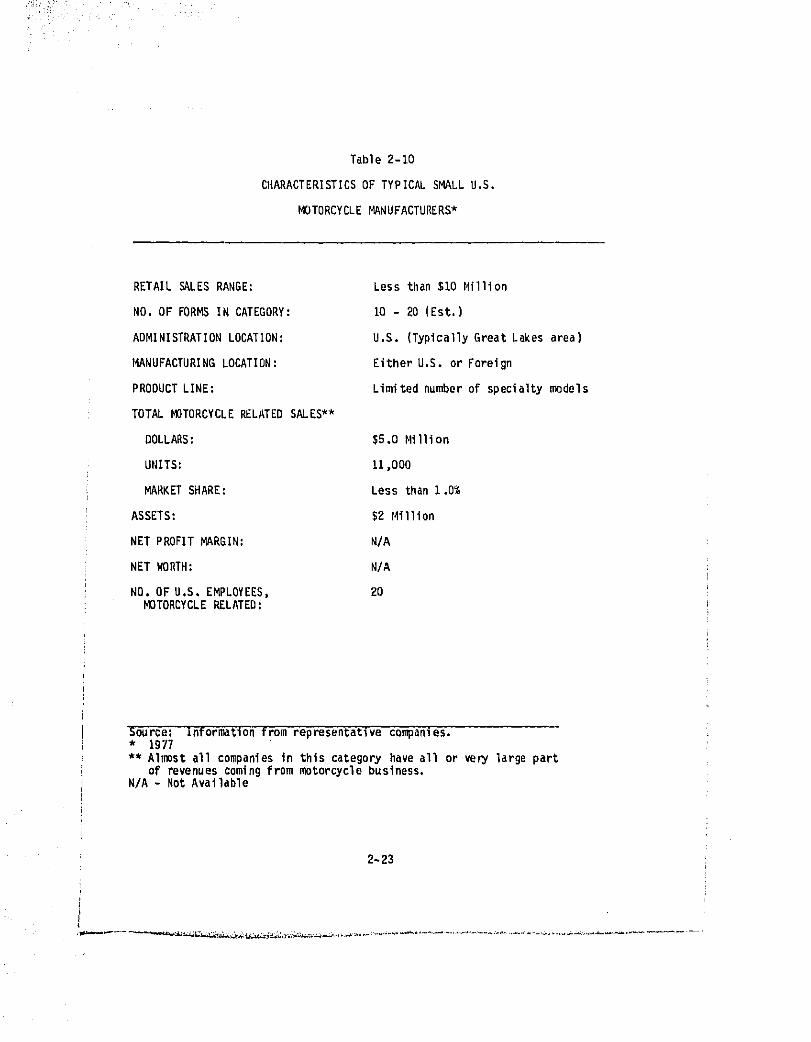
Table 2-i0
CHARACTERISTICS OF TYPICAL SMALL U.S.
MOTORCYCLE MANUFACTURERS*
RETAIL _LES RANGE: Less than$10 Hillien
NO. OF FORFLSIN CATEGORY: 10 - 20 (Est.)
ADMINISTRATIONLOCATION: U.S. (TypicallyGreatLakes area)
MANUFACTURINGLOCATION: EitherU.S. or Foreign
PRODUCTLINE: Limitednumberof specialtyn_dels
TOTAL _TORCYCLE RELATEDSALES**
DOLLARS: $5.0 Nillion
UNITS: II,000
_RKET SHARE: Less than1.0%
ASSETS: $2 Million
NET PROFITMARGIN: N/A
NET WORTH: N/A
NO. OF U.S, EMPLOYEES, 20V(}TOROYCLERELATED:
Source: Informationfrom representativecompanies.* 1977** Al_st all companiesin thiscategoryhaveall or ve_ largepart
of revenuescomingfrom motorcyclebusiness.N/A - Not Available
2-23
Bletz Industries
Bletz Industriesislocatedin Mansfield,Ohio, and manufacturesTri-Rod,a three-wheelvehicleintendedfor off-roaduse. The Tri-Road usesBriggs-Stratton3, 5, and B horsepowerengines.
Heald
Located in Benton Harbor,Michigan,Heald manufacturestwo- and three-wheel cycles in kit form. The cycles use Driggs and Strattonand Tecumsehengines, The modelsare intendedfor trail and utilitypurposes(e.g.,gardentractorsand dump trucks).
ForeignMotorcycleManufacturerswith LimitedU.S. Sales
There are over 30 foreign manufacturerswith limited U.S. motorcyclesales. A typical company manufactures 20,000 units, of which 4,000 areexported to the U.S. This quantity representsless than one-halfof onepercent of the U.S. market,and is worth approximately$4 million in salesrevenues. The productline is typicallylimitedand concentratedin certainproduct categories. For example, many of the Italian companies such asDucati, Laverda, Mote Benelli,Mote Guzzi, and Mote Morini, market largestreetmotorcycles. Characteristicsof a typicalforeignmotorcyclemanufac-turerwith limitedU.S. salesis shown in Table Z-11.
Descriptionsof some of the companiesare in the followingparagraphs.
Benelli
Mote Benelli is an establishedItalian flrm that is a subsidiaryofDeTomaso Industries. Benelll markets 2BO cc. BOO cc, 650 cc and 750 ccstreetmotorcycles.
BMW
BMW is an extremelylarge manufacturerlocatedin West Germany. Totalcorporation sales in 1974 approached $I blllion. Automobiles and largetouringmotorcyclesare major productlines. Accordingto registrationdata,BMW had a one percent share of the U.S, market in 1975, and rankedseventhamong ell manufacturers.BMW sells large touringmotorcycleswith horizon-tally opposed twln cycllnderenginesand shaft drive, Like Honda,BMW canmake use of expertiseand facilitiesdevelopedfor the automobilemarket,
Can-Am
Can-Ammotorcyclesare manufacturedby Bombardier,Ltd., a largeCanadianfirm that also manufacturessnowmobiles,industrial vehicles, all-terraintractors,and winter sport accessoriesand apparel, Can-Am specializesinhigh performanceendure and competitionmotorcrossmotorcycles. _ombardiermakes lO,OOOmotorcyclesper year.
Hercules
Herculesare manufacturedby DKW/Hercules,part of the Wankel-Flohtel-Sachs ManufacturingGroup, which is one of German's largest manufacturersof motorcycles. The Group is also a major supplier of engines to othermotorcyclemanufacturers. DKW primarilymakes endure and off-roadmotor-
Ir
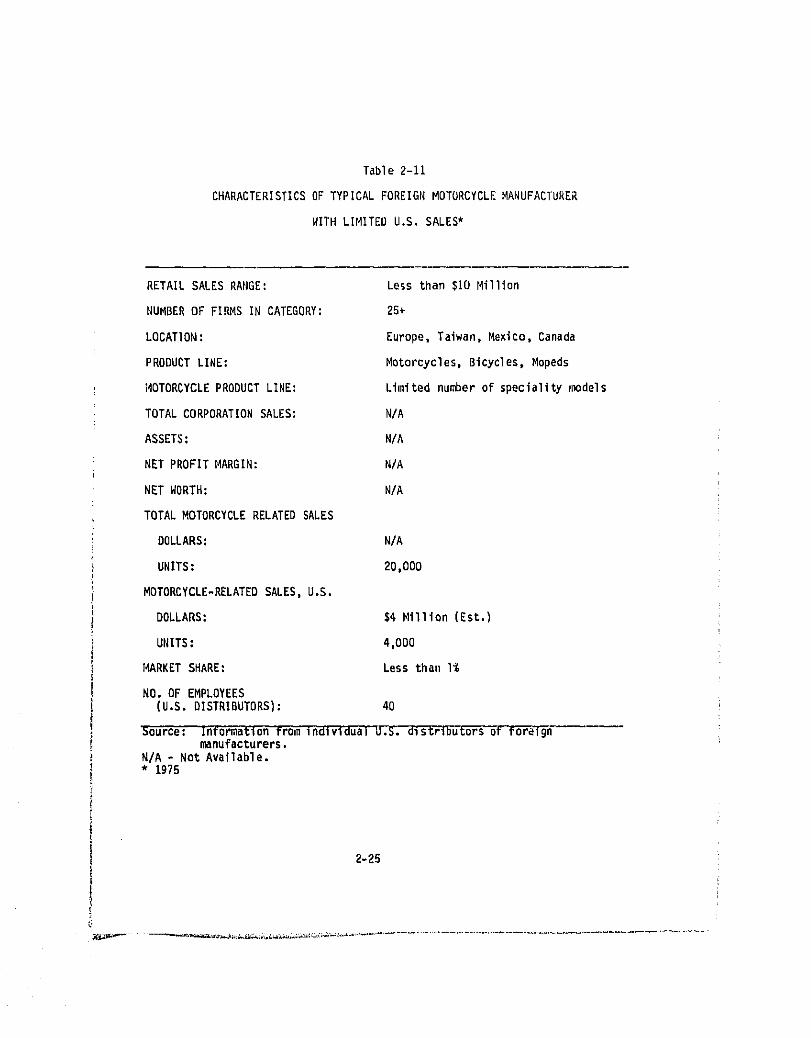
Table 2-11
CHARACTERISTICS OF TYPICAL FOREIGN MOTORCYCLE MANUFACTURER
WITH LIMITED U.S. SALES*
RETAILSALES RANGE: Less than $I0 Hillion
NUMBEROF FIRMSIN CATEGORY: 25÷
LOCATION: Europe,Taiwan,Mexico,Canada
PRODUCTLINE: Motorcycles,Bicycles,Mopeds
MOTORCYCLEPRODUCTLINE: Limitednumberof speciality_w_dels
TOTAL CORPORATIONSALES: N/A
ASSETS: N/A
NET PROFITMARGIN: N/A
NET WBRTH: N/A
TOTAL MOTORCYCLE RELATED SALES
DOLLARS: N/A
UNITS: 20,000
MOTORCYCLE-RELATED SALES, U.S.
DOLLARS: $4 Million(Est.)
UNITS: 4,000
I_RKETSHARE: Lessthan 1%
NO. OF EMPLOYEES(U.S.DISTRIBUTORS): 40
Source: In_ormatlonfromIndlvldua'lU.S. distributorsof"forelghmanufacturers.
N/A - Not Available.* 1975
2-2B
cycles.DKW also f_rkets a rotaryenginemodel, althoughproductionof thismodel is relatively limited.
Husqvarna
Husqvarna is a large Swedish manufacturing company which producesengines, chain saws, appliances,sewing mochines,as well as motorcycles.The company specializesin very high quality off-road,cross country andcompetitionmodels. Approximately75 percentof Husqvarna'stotal productionis exported to the U.S.
Laverda
Laverda is an Italianmotorcyclemanufacturerthat makes large streetmotorcycleswhose product line is primarilyin the 750-1000cc size range.
Moped-typeStreetMotorcycles
Moped-typevehicles are streetmotorcyclesintendedfor use on streetsand roads. These vehicleswere first introducedinto the U,S. in 1975 afterthe NationalHighwayTrafficSafetyAdministrationrelaxedits safetystand-ardsso that moped-typestreetmotorcyclesSilnilarto the ones sold overseascouldbe imported.
Although nine American companies (See Table 2-11A) have enteredthemarket,most of the moped-typestreetmotorcyclessold in the U.S. are import-ed, Importshave risen fromthe 1975 levelof 33,136by 138 percentand 144percentfor1976and 1977respectively.For the firstsevenmonthsof 1978thenumberof _ped-type street motorcycle imports is 284,494, a 176 percentincreaseover the same periodin 1977. During1980 the populationof moped-type street motorcyclesis expectedto increaseto over 1,000,000vehicles.
Recent Moped sales are estimatedby the Moped Assoclationof America(MAA)as follows:
1975 25,000 Units
1976 75,000 Units
1977 150,000+Units
1978 250,000 Units
This rapid growth is shown in Figure 2-5. Other Moped characteristicsare summarizedin Table 2-12.
2.3 AftermarketIndustry
The structureof the aftermarketseg)_ntof tileindustry is entirelydifferentfrom the new motorcyclemarket segment. The aftermarketindustryis primarilydomestic, as comparedwith the primary product market itselfwhich has becomeinteroationalized.There are an estimoted1500 companiesIn
2-26
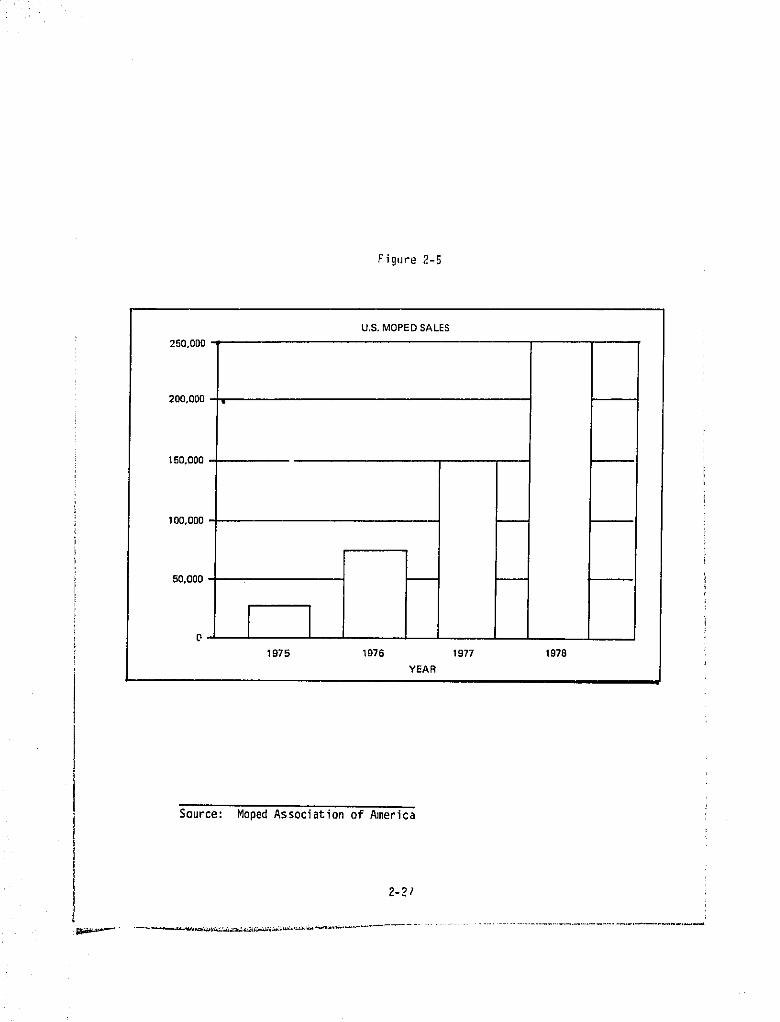
Figure 2-5
U.S. MOPED SALES
250,000
200.000
150,000,
100.000 ,
50.000
o r1975 1976 1977 1978
YEAR
Source: Moped Association of America
2-2Y
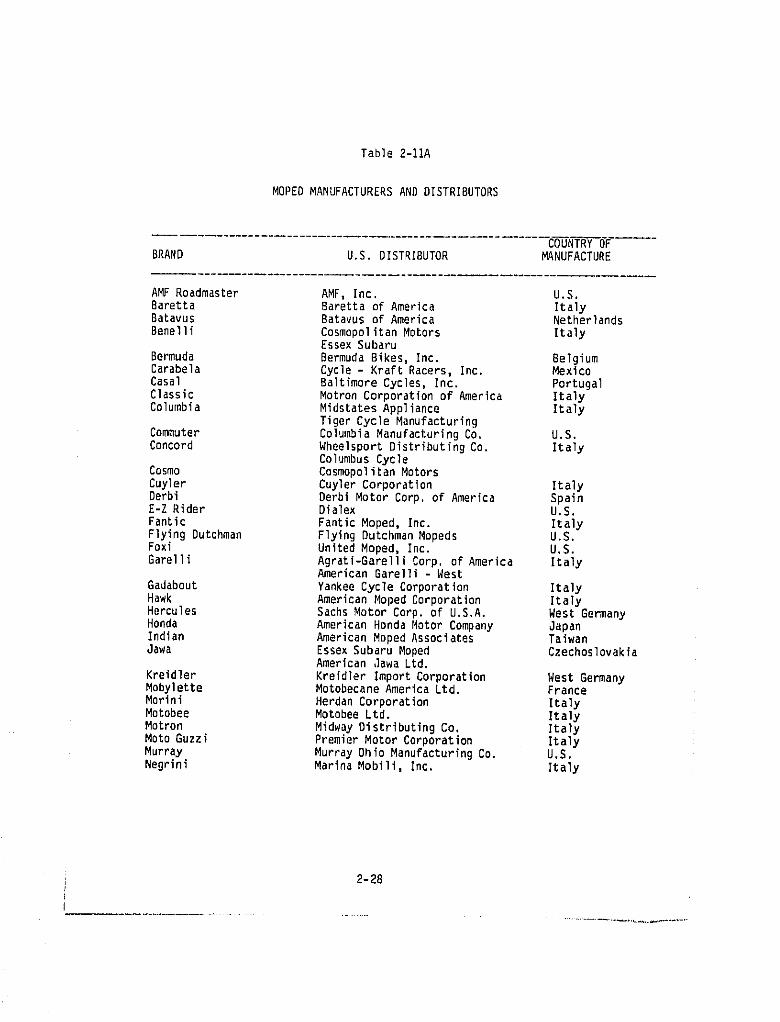
Table 2-11A
MOPED MANUFACTURERS AND DISTRIBUTORS
COUNTRY OPBRAND U.S.DISTRIBUTOR MANUFACTURE
AMF Roadmaster AMF, Inc. U.S.Baretta BarettaofAmerica ItalyBatavus Batavusof America NetherlandsBenelli CosmopolitanMotors Italy
Essex Subaru
Bermuda BermudaBikes,Inc. BelgiumCarabela Cycle- Kraft Racers,Inc. MexicoCasal BaltimoreCycles,Inc. PortugalClassic MotronCorporationof America ItalyColumbia MidstatesAppliance Italy
Tiger Cycle ManufacturingCommuter ColumbiaManufacturingCo. U.S,Concord WheelsportDistributingCo. Italy
Columbus CycleCosmo CosmopolitanMotorsCuyler CuylerCorporation ItalyDerbi DerbiMotorCorp.of America SpainE-ZRider Dialex U.S.Fantic FanticMoped,Inc. ItalyPlyingDutchman FlyingDutchmanMopeds U.S.Foxi UnitedMoped,Inc. U,S.Garelli Agrati-GarelllCorp.of America Italy
American Garelli - West
Gadabout YankeeCycleCorporation ItalyHawk AmericanMoped Corporation ItalyHercules SachsMotor Corp.of U.S,A. West GermanyHonda AmericanHondaMotorCompany JapanIndian AmericanMopedAssociates TaiwanJawa EssexSubaruMoped Czechoslovakia
American Jawa Ltd.
Kreidler KreidlerImportCorporation West GermanyMobylette MotobecaneAmericaLtd, FranceMorini HerdanCorporation ItalyMotobee MotobeeLtd. ItalyMotron MidwayDistributingCo. ItalyMotoGuzzi PremierMotorCorporation ItalyMurray MurrayOhioManufacturingCo. U.S,Negrini MarinaMobili,Inc. Italy
2-28
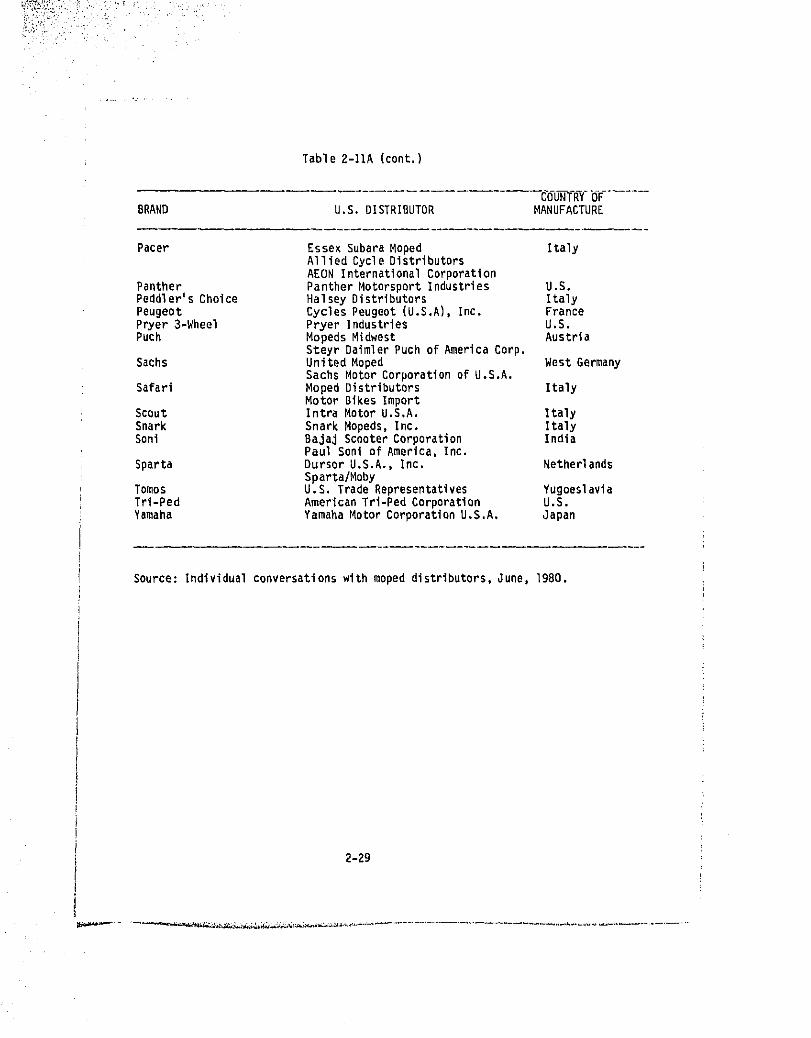
Table 2-11A (cont.)
BRAND U,S.DISTRIBUTOR MANUFACTURE
Pacer EssexSubaraMoped ItalyAllied Cycle DistributorsAEON International Corporation
Panther PantherMotnrsportIndustries U.S.Peddler'sChoice HalseyDistributors ItalyPeugeot CyclesPeugeot(U.S.A),Inc. FrancePryer3-Wheel PryerIndustries U,S.Puch Mopeds Midwest Austria
Steyr DaimlerPuch of AmericaCorp,Sachs UnitedMoped West Germany
Sachs MotorCorporationof U.S.A.Safari MopedDistributors Italy
Motor Bikes ImportScout IntraMotorU.S.A. ItalySnark Snark Mopeds,Inc. ItalySoni Bajaj ScooterCorporation India
: Paul Soni of America,Inc,Sparta DursorU.S.A.,Inc. Netherlands
Sparta/Moby, Tomos U.S, TradeRepresentatives Yugoeslaviai Tri-Ped AmericanTri-PedCorporation U.S.
Yamaha YamahaMotorCorporationU_S,A. Japan
Source:Individualconversationswithmopeddistributors,June, 1980.
2-29
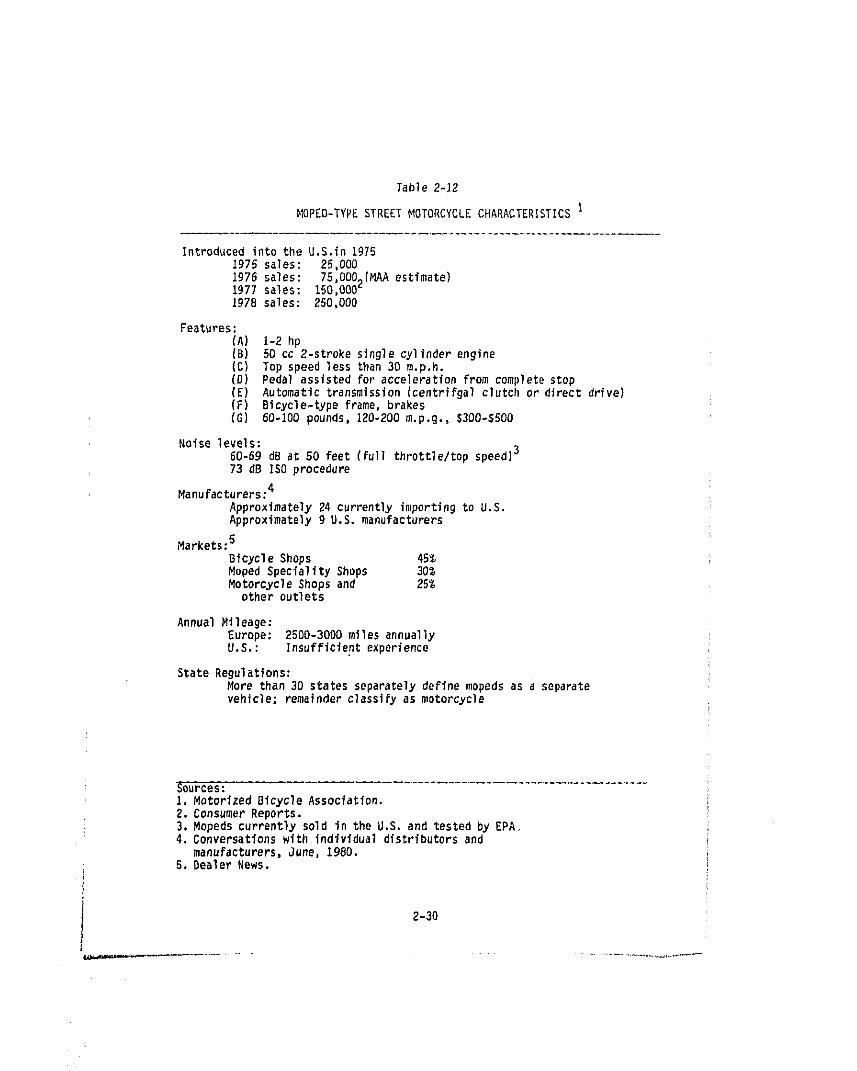
Table 2-12
MOPED-TYPESTREETMOTORCYCLECHARACTERISTICSI
Introduced into the U.S.in 19751975 sales: 25,000
1976 sales: 75,0002(MAAestimate)1977 sales: 150,0001978 sales: 250,000
Features:
(A) I-2hp(B) 50 cc 2-strokesinglecylinderengine(C) Top speedless than30 m.p.h.(D) Pedal assistedforaccelerationfrom completestop(E) Automatictransmission(centrlfgalclutchor directdrive)(F) Bicycle-typeframe,brakes(G) 60-100pounds,120-200m.p.g.,$300-$500
Noise levels:
60-69 dB at 50 feet(fullthrottle/topspeed)373 dB 150procedure
Manufacturers: 4
Approximately24 currentlyimportingto U.S.Approximately9 B.5.manufacturers
Markets:5BicycleShops 45%Moped SpecialityShops 30$MotorcycleShops and 25%otheroutlets
AnnualMileage:Europe: 2500-3000milesannuallyU.S.: Insufficientexperience
State Regulations:More than 30 statesseparatelydefinemopodsas a separatevehicle;remalnderclassifyas motorcycle
1, MotorizedBicycleAssociation.2. ConsumerReports.3.Mopedscurrentlysold in the U.S.and testedby EPA.4. Conversationswith individualdistributorsand
manufacturers,June, 1980.5. DealerNews.
2-30
the U.S. that are involved to some e_tenC with manufacturing and distri-buting motorcycleaftermarketproducts. The majority of tllesefirms arerelativelysmall,young companies. Most havemotorcycle-rela_edsales of lessthan $1 million per year and have been in business less than eight years.
General Aftermarket Companv
Firms in the motorcycle aftermarket industry can be classified asmanufacturers only, manufacturers and distributors, and distributors only.These companies are not all strictly motorcycle oriented; a significantnumberare diversifiedand involvedin otherindustries. For example,someofthe motorcycleaftermarketmanufacturersare large automotiveaftermarketcompanies which have expanded their operationinto the motorcyclemarket.Some firms also serve the snowmobile, boating, bicycle and other miscellaneousindustries. In general, the smaller companies in the industry have a large orcomplete dependence on motorcycle products sales, and the large companies havea relativelysmall dependenceon motorcyclesales. Generalcharacteristicsof the aftermarket industry are summarized in Table 2-13.
ExhaustSystems/Components14anufacturersand Distributors
The segment of the aftermarket that will be most directly affectedby noise regulation are companies which manufacture exhaust system pro-ducts - mufflers, exhaust pipes, expansion chambers, and exhaust headers.There are over 15D companies in this group who are selling in a _arket that isestimated to be slightly over $30 million per year. Most are located inCalifornia. Averagesales for manufacturingcompanies are estimatedto beapproximately $320,000. The leader in the industry is believed to sellbetween $2 and $3 millionworth of exhaustsystemproductsper year. Exactdistribution of sales in this subsegment of the industry is unavailablebut the general nature is evident. The companies are relatively small andcompete in a crowded market,
Based on a survey of 11 representative firms, com_@aniesin the exhaustsystemsegmentof the aftermarketmanufactures2,500 - 40,000exhaustsystemsand components per year, have annual sales of $100,000 - $1.1 million, andnet 5 to 10 percentprofiteachyear. Plarketsharesrangefrom 1 to 3 percentof the total. Total assets are approximately$300,000,but 60 to 75 percentof these assets are in inventory. Characteristics of exhaust system manu-facturers shown in Table 2-14 are derived from manufacturer proprietaryinformation.
Typically the president/owner of the company is also the designerof the exhaust system and components, although one or two people may assisthim in this function. Design emphasis is on ._tyling, performance, and sound;the priorities are dependent upon individual company philosophies. Noise
3 MotorcycleDealerNews.
2-31
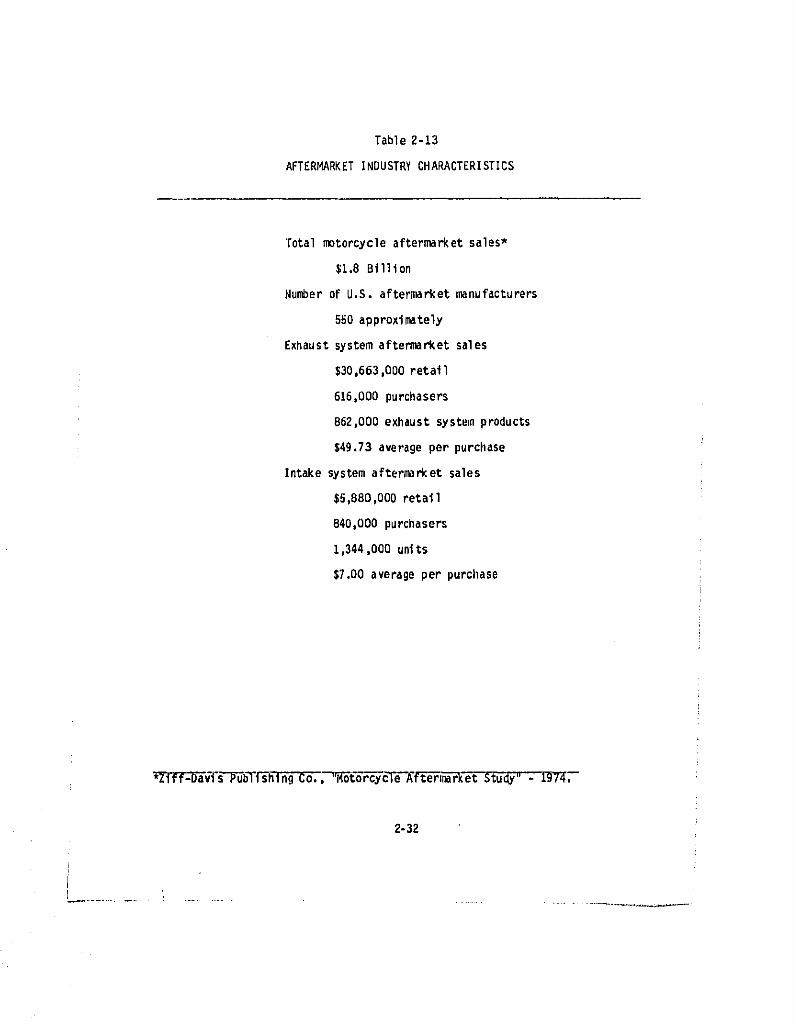
Table2-13
AFTERHARKETINDUSTRYCHARACTERISTICS
Total motorcycleaftermarketsales*
$1.8 Blllion
Numberof U.S. after_rket manufacturers
550 approximately
Exhaustsystemaftermarketsales
$30,663,000retall
616,000purchasers
862,000exhaustsystemproducts
$49.73averageper purchase
Intakesystemaftermarketsales
$5,880,000retail
840,000purchasers
1,344,000 untts
$7.00 average per purcllase
_Ff-fz_Ci's'-FGb-Ti_h'lng Co., "MotorcyceT6-K¢t"t-er-ma-'r_etStudy" - 1974:-
2-32
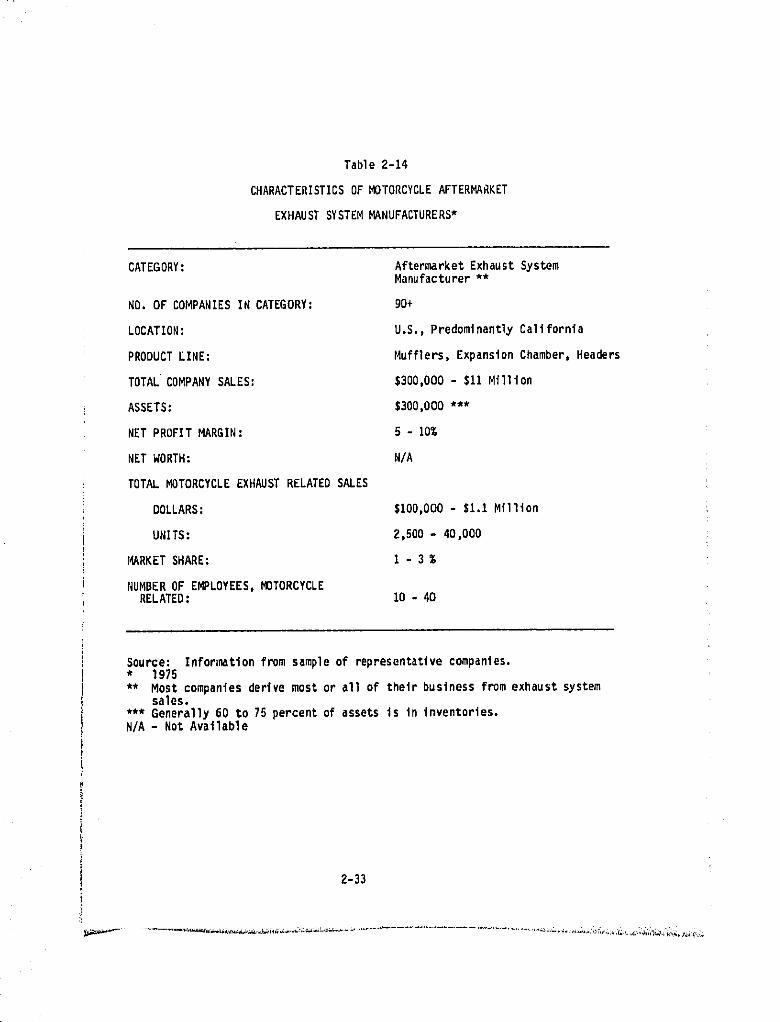
Table2-14
CHARACTERISTICSOF MOTORCYCLEAFTERMARKET
EXHAUSTSYSTEMMANUFACTURERS*
CATEGORY: AftermarketExhaustSystemManufacturer **
NO. OF COMPANIESIN CATEGORY: 90+
LOCATION: U.S.,PredominantlyCalifornia
PRODUCTLINE: Mufflers,ExpansionChamber,Headers
TOTAL'COMPANYSALES: $300,000- $11 Million
ASSETS: $300,000***
NET PROFITMARGIN: 5 - 10%
NET WORTH: N/A
TOTAL MOTORCYCLEEXHAUSTRELATEDSALES
DOLLARS: $100,000- $1.1Million
UNITS: 2,500- 40,000
MARKETSHARE: 1 - 3 %
NUMBEROF EMPLOYEES,MOTORCYCLERELATED: 10 - 40
Source: Inforlnatlonfrom sampleof representativecompanies.* 1975** Most companiesderivemost or all of theirbusinessfromexhaustsystem
sales.*** Generally60 to 75 percentof assetsis ininventories.N/A - Not Available
)
; 2-33t)
!
controltechnicalcapabilitiesvary fromcompaaYto company,althoughi_ostusefairly standard noise control techniques, and the "cut and try" method fordesign advancements. Researchfacilitiesare generallynon-existentor verylimited,
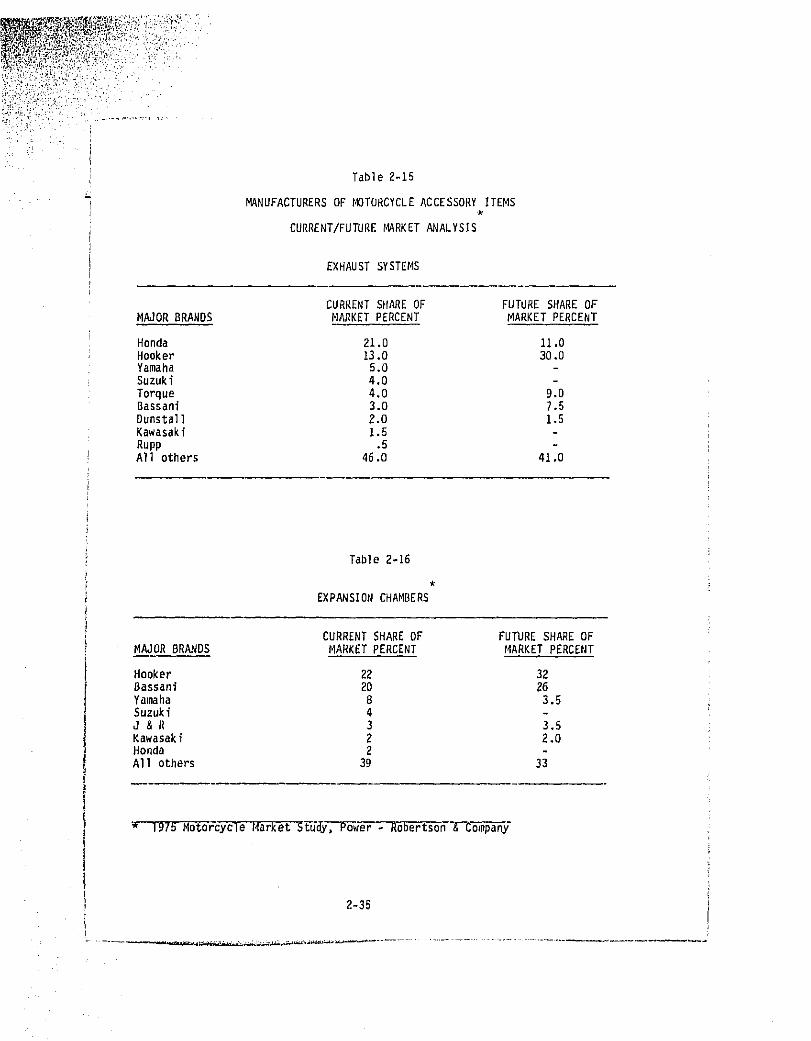
Estimated market shares replacement parts are presented in Table NonSequester 2-15 and 2-16.
2.4 Motorcycle Dealers
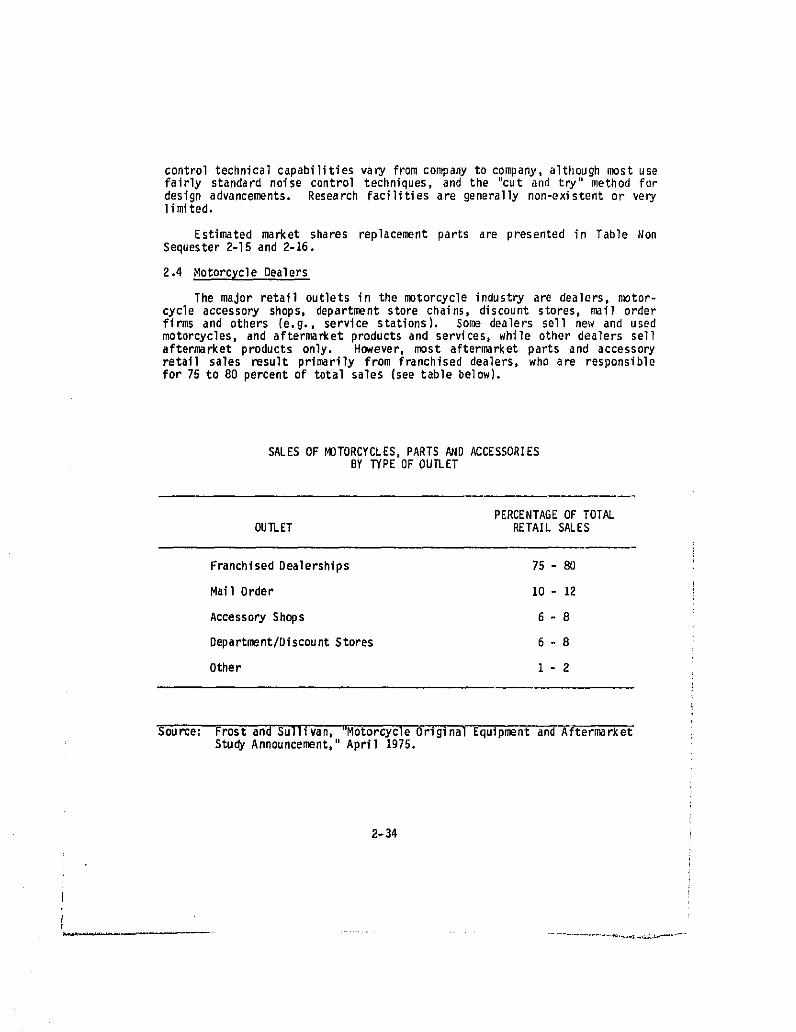
The major retailoutletsin the motorcycleindustryare dealers,motor-cycle accessoryshops, departmentstore chains, discountstores,mail orderfirms and others (e.g., service stations). Some dealers sell new and usedmotorcycles, and aftermarket products and services, while other dealers sellaftermarket products only. However, most aftermarket parts and accessoryretail sales result primarilyfrom franchiseddealers, who are responsiblefor 75 to 80 percent of total sales (see table below).
SALES OF MOTORCYCLES,PARTS AND ACCESSORIESBY TYPE OF OUTLET
PERCENTAGEOF TOTALOUTLET RETAILSALES
FranchisedDealerships 75 - 80
MailOrder 10 - 12
AccessoryShops 6 - 8
Department/DiscountStores 6 - 8
Other 1-2
Source: Frostand Sullivan, "MotorcycleOriginalEquipmentand AftermarketStudyAnnouncement,"Aprll 1975.
2-34
':_!:::_
Table 2-15
MANUFACTURERSOFMOTORCYCLEACCESSORYITEMSk
CURRENT/FUTUREt4ARKETANALYSIS
EXHAUST SYSTEMS
CURRENTSHAREOF FUTURESHAREOFMAJORBRANDS MARKETPERCENT MARKETPERCENT
Honda 21.0 ii.0Hooker 13.0 30.0Yamaha 5.0Suzuki 4.0
Torque 4.0 9_0Bassani 3.0 7.5DunstalI 2.0 1.5Kawasaki 1.5Rupp .5 -All others 46,0 41.0
Table2-16
EXPANSION CHAMBERS
CURRENTSHAREOF FUTURESHAREOFMAJORBRANDS MARKETPERCENT MARKETPERCENT
Hooker 22 32Bassani 20 26Yamaha 8 3.5Suzuki 4 -J & R 3 3.5Kawasaki 2 2.0Honda 2Allothers 39 33
* 1975Motor'cy_leMarketS_-_y,_er _ Robertsdn& Company
2-35
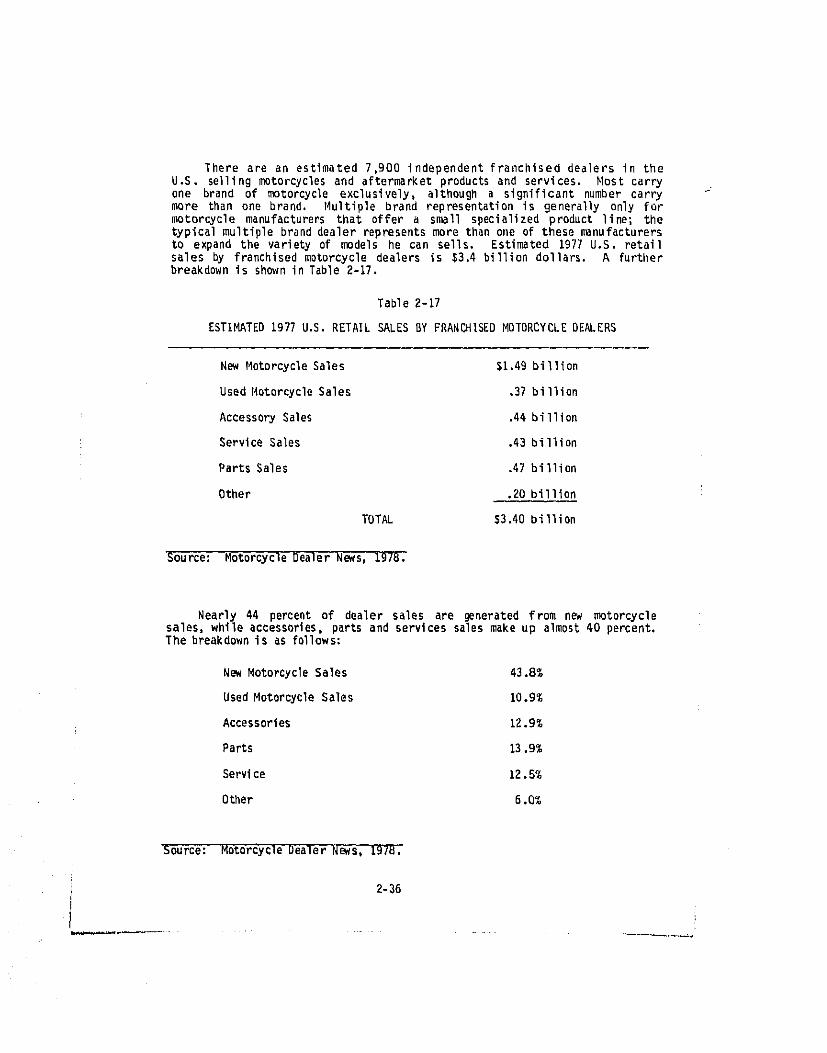
There are an estimated 7.900 independent franchised dealers in theU.S, sellingmotorcyclesand aftermarketproductsand services. Most carryane brand of motorcycle exclusively, although a significant number carrymore than one brand. Multiple brand representation is generally only formotorcycle manufacturers that offer a small specialized product line; thetypical multiple brand dealer represents more than one of these nBnufacturersto expand the variety of models he can sells. Estimated 1977 U.S. retailsales by franchised motorcycle dealers is $3.4 billion dollars. A furtherbreakdown is shown in Table 2-17.
Table 2-17
ESTIMATED1977U.S.RETAILSALESBY FRANCHISEDMOTORCYCLEDEALERS
New MotorcycleSales $1,49 billion
Used MotorcycleSales .37billion
AccessorySales .44billion
ServiceSales .43billion
PartsSales .47billion
Other .20billion !
TOTAL $3.40billion
Source: MotorcycleDealerNews, 1978.
Nearly 44 percentof dealer sales are generatedfrom new motorcyclesales, while accessories, parts and services sales make up almost 40 percent.The breakdown is as fallows:
NewMotorcycleSales 43.8%
UsedMotorcycleSales 10.9%
Accessories 12.9%
Parts 13.9%
Service 12.5%
Other 6.0%
Source: MotorcycleDealerNews, 197D.
2-36
/_'C,_I_ _ _ t - _ , ' ' " _
Average annual sales for motorcycle dealers is approximately $360,000.Approximately SD percent of the dealers are in the $100,000 - $499,000 salesrange.
The typical dealer has a relatively small profit margin (3 percent beforetaxes), and relies heavily on short term financing for his inventory. In-terest expense becomes critical when sales decrease for dealers with largeinventories. Such dealers are forced to discount their prices, therebyreducing their profit margin even more. This process is especially crucial tothe smaller dealers who are generally undercapitalized and have a low salesvolume to support their operations.
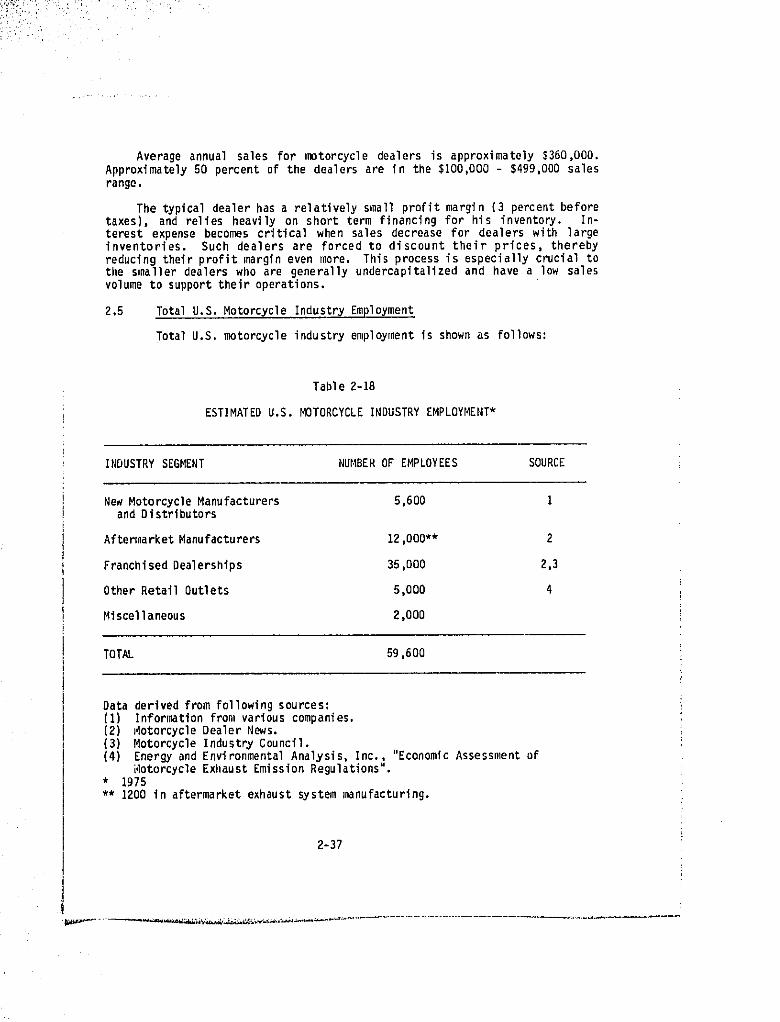
2.5 Total U.S. Motorcycle Industry Employment
Total U.S. motorcycle industry employment is shown as follows:
Table 2-18
ESTIMATED U.S. MOTORCYCLE INDUSTRY EMPLOYMENT*
INDUSTRYSEGMENT NUMBEROF EMPLOYEES SOURCE
NewMotorcycleManufacturers 5,600 Iand Distributors
AftermarketManufacturers 12,000"* 2
FranchisedDealerships 35,000 2,3
OtherRetailOutlets 5,000 4
Miscellaneous 2,000
TOTAL 59,600
Data derivedfrom followingsources:(I) Informationfrom variouscompanies.(2) MotorcycleDealerNews.(3) MotorcycleIndustryCouncil.(4) Energyand EnvironmentalAnalysis,Inc., "EconomicAssessmentof
i4otorcycleExhaustEmissionRegulations".* 1975** 1200in aftermarketexhaustsystemmanufacturing.
2-37
2.6 MotorcycleWarranties
Street motorcyclesare often warranted against defects in materialsand assembly for six months and a corresponding distance of travel. Shorterwarranties (three months) and longer ones (one year) are also known.Off-roadmotorcyclesare often warrantedfor three or six months,althoughsemi-competitionmodels and strictlycompetitionmotorcyclesoften have nowarranty. To EPA_s knowledge formalwarrantiesare extendedon very fewreplacement exhaust systems, although many manufacturers will repair orreplace products that are obviously defective.
2-38
SECTION 3
NOISE LEVEL TEST PROCE[_JRES
SECTION3
NOISELEVEL TEST PROCEDURES
3,1 Applicationand Cr!terla
Existing noise test methodologies which have been either adopted,approved,or proposedin the UnitedStatesor in other countrieswere examinedfor possibleusa in the EPA regulation. Severalcriteriawere establishedtoreview these procedures and to provide a basis for possible refinement.
Ideally, a noise measurement procedure for new motorcycles should_
(a) Characterizethe noise as perceivedat the waysidein terms that relateto the adverseimpacton humans,
(b) Characterizethe noise during the most annoyingmode(s) of operationcommonlyencounteredin areas of impact.
(c) Measure noise levels on a comparable basis for all motorcyclesInspecifiedcategories,as measuredin the operatingmode(s) identifiedabove.
(d) To the extent possible, satisfy several practlcal requirements.Speclflcsl]y,a testingprocedureshouldbe:
(I) Clearand easilyunderstandable.
(2) Repeatablewith a minimumof variation,
(3) Capable of being conducted with a minimum of meteorological andslte-to-sitevariability,
(4) Insensitive to configuration options (such as gearing, sprocketratios) which can result in variationsof measured noise dlsproportloneteto actualvariationsin vehiclenoise.
(5) Free from ambiguous proceduralsituationsrequiringdeterminationswhich can affectthe measurednoise level,
(6) Minimally influenced by fsctnrs affectlmg vehicle performsnce,such as atmospheric conditions, rider weight, accessories, etc.
None of the existing in-use or proposed procedures, in their presentForm, satisfied the above criteria to the extent desirable in the intended
! applications. Accordingly. variations of these procedures designed tot eliminate certain shortcomings of the existing procedures were explored.i A description and critique of each procedure appears on the following pages.
3-1
3.2 Movin_VehicleTest Procedures
SAE J331a (14ovingvehicleaccelerationtest)
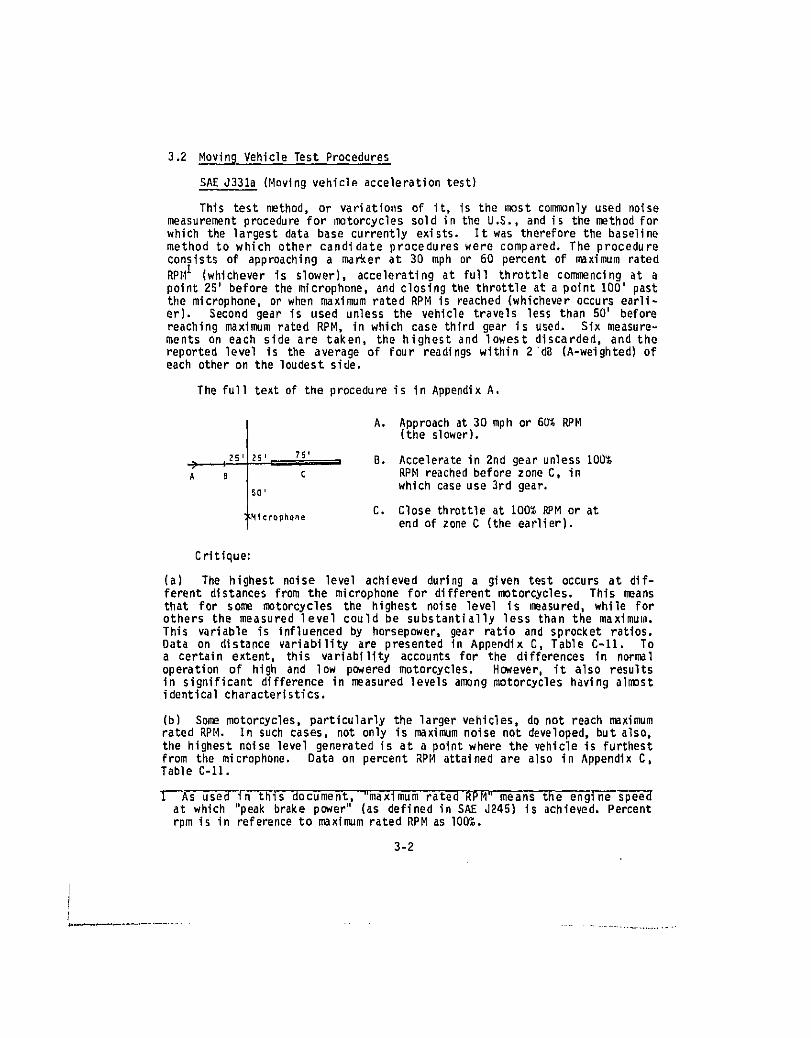
This test method, or variatiousof it, is the most commonlyused noisemeasurementprocedurefor motorcyclessold in the U.S., and is the methodforwhich the largestdata base currentlyexists. It was thereforethe baselinemethod to which other candidate procedures were compared. The procedureconsists of approachinga marker at 30 mph or 60 percentof maximum rated
RPI,II (whicheveris slower), acceleratingat full throttlecommencingat apoint25' beforethe microphone,and closingthe throttleat a point 100' pastthe microphone,or when maximumrated RPI4is reached(whicheveroccursearli-er). Second gear is used unless the vehicletravels less than 50' beforereachingmaximum rated RPM, in which case third gear is used. Six measure-ments on each side are taken, the highest and lowest discarded, and thereportedlevel is the average of four readingswithin 2 dB (A-weighted)ofeach otheron the loudestside.
The fulltext of the procedureis in AppendixA.
A. Approach at 30 mph or 60% RPM(theslower).
) j_s,_s, : _5, _ B. Acceleratein 2nd gearunlessI00_A s C RPMreachedbeforezoneC, in
which caseuse 3rd gear.50,
C. Close throttleat 100%RPM or atIMicrophone end of zoneC (theearlier).
Critique:
(a) The highest noise level achieved duringa given test occurs at dif-ferent distancesfrom the microphonefor differentmotorcycles. This meansthat for some metorcyclesthe highest noise level is measured,while forothers the measured level could be substantially less than the maximum.This variable is influencedby horsepower,gear ratio and sprocket ratios.Data on distancevariabilityare presentedin Appendix C, Table C-11. Toa certainextent, this variabilityaccountsfor the differencesin normaloperationof high and low poweredmotorcycles. However. it also resultsin significantdifferencein measured levelsamong motorcycleshaving almostidenticalcharacteristics.
(b) Some motorcycles,particularlythe largervehicles,do not reach maximumrated RPM. In suchcases, not only is maximumnoise not developed,but also,the highestnoise level generatedis at a pointwhere the vehicleis furthestfrom the microphone. Data on percent RPI4attainedare also in AppendixC,Table C-11.
i 'Asused i-n--t-h_isdocument, "maximum rated RPM_'means the engine speedat which "peak brake power" (as definedin SAE J245) is achieved.Percentrpm is in reference to maximum rated RPM as I00%.
3-2
!t)
(c) Due to vehicle and test variables, motorcycles of the same make andmodel are not necessarilytested in the same gear. This could result ina situation where a motorcycle was tested by the manufacturer using onegear, and verified by a government agency using a different gear. Themeasured levels could be substantial]y different in the two cases.
(d) Differentsize sprocketsare availableas optionson most motorcycles,and are readily interchanged by the user. The 50 feet minimum distancecriterion makes the SAE Jg31a test sensitive to sprocket ratio. Thus, themanufacturer could select a sprocket ratio which gives most favorable resultsunder this procedure, aridsupply to the user other sprockets for various useapplications. The practice of changing sprockets is widespread, particularlyin off-roador combinationstreet/off-roadmotorcycles. The importantpointhere is that changing sprockets does not necessarily affect substantially theactual_eneratednoise,but can havemajor effecton the measuredlevel in theSAE d331a test.
(e) The procedure does not provide for the testing of motorcycles withautomatictransmissions.
(f) The procedure does not provide for the situation when, even in 3rdgear,the vehicledoes not travelthe stipulateddistance.
(g) Atmosphericconditionst_hichaffect power output will affect closingRPI_and/or vehicle position in relationto the microphone(in additiontoaffectingsound power generated).
(h) Vehicleclosing conditions(RPM and/orposition)are affectedby riderweight,accessoriesweight,wind, and wind resistance.
(1) This test procedurehas the advantageof beingindependentof tachometerdynamic characteristicsfor larger motorcycles(approximately400-500 cc}.
CHP Variationof the SAE J331a (Movingvei)icleaccelerationtest)
The CaliforniaHighwayPatrol (CHP) adopted the SAE J331a method fortype approval,with two variations:
(a) If maximumrated RPM is reachedbefore30 mph, or if a 50 footaccelera-tion distance is not attained,the next highergear is to be used. (Otherstipulationsof SAE J331a apply.)
(b) Four instead of six measurements are required on each side of thevehicle and the average of the two highest readings (within2 dB of eachother}on the loudestsideare reported.
States which have adopted the ClIPmethod are California, Colorado,Florlaand Oregon. Statesand citieswhich have adoptedthe SAE J331a methodare Maryland,Washington,Grand Rapids,Chicagoand Detroit (Detroitrequiresonly Do measurements on each side of the vehicle}.
The fulltext of this procedureis in AppendixA.
3-3
Critique:
(a) Variation "a", above, will primarily affect the smaller motorcycles,obviates certain test operation difficulties that may result in over-revino,and may be more representativeof operationalconditionsfor these vehicles.Variation "b", based on test experience with measurement consistency, shouldhave no significanteffect,and resultsin a simplertest procedure.
(b) The other shortcomings identified in the SAE J331a procedure critiqueremain in the CHP variation of SAE J331a,
SAE J986a (Moving vehicle acceleration test)
The SAE JgB6a procedure,althoughdesignedfor passengercars and lighttrucks,is prescribedin Canadafor the testingof motorcycles.
Major differences,referredto SAE J331a,are;
(a) Approach is at 30 mph in all cases,
(b) Sole criterion for gear selection is that the lowest gear which willachieve the 50 foot acceleration distance shall be used.
(c) The end-zone is 100 ft. long, instead of 75 ft.
Full textof the procedureis presentedin AppendixA.
Critique:
(a) The speed and gear selectionstipulationsare not suitedto somemotor-cycles.
(b) The gear selection stipulation will result in full acceleration inIst gear for the larger motorcycles, with possible hazard to the operator.
SAE J47 (Movingvehicleaccelerationtest)
The SAE J47 procedure was designed to measure the maximum noise potentialof the vehicle. It differs from the SAE J331a procedure in the followingmajor respects:
(a) Instead of a variableend-point,a variable accelerationstart-pointis employed, such that al] vehicles reach maximum rated RPM at a point 25feet past the mlcrophone.
(b) The oear employed is the lowest gear that does net result in an accelera-ting distanceof less than50 feet (formany motorcycles,thiswill be firstgear); however, when the above selected gear "results in a dangerous orunusual operatino condition such as wheel spin, front wheel lifting, orother unsafe conditions, the next higher gear shall be selected ...."
3-4
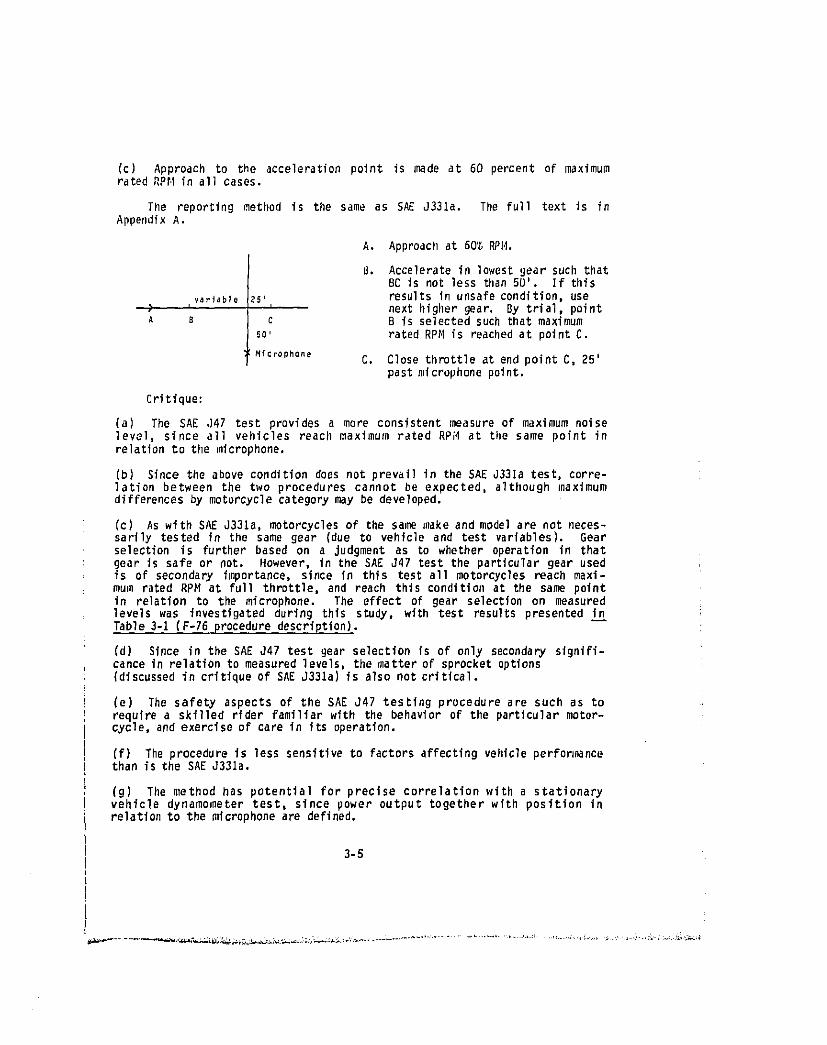
(c) Approach to the accelerationpoint is made at 60 percent of maximumratedRPr.Iin all cases.
The reportingmethod is the same as SAE J331a. The full text is inAppendix A.
A. Approachat 60% RPH.
B, Acceleratein lowestgear such thatBC is not less than50'. If this
variable !5' i resultsin unsafecondition,use> ' nexthighergear, By trial,pointA s c B is selectedsuchthat maximum
so, ratedRP_Iis reachedat pointC.
:Microphone C. Close throttleat end point C, 25'pastmicrophonepoint,
Critique:
(a) The SAE J47 test providesa more consistentmeasureof maximum noiselevel, since all vehicles reacllmaximum rated RPH at tilesame point inrelationto the microphone,
(b) Since the above conditiondoesnot prevailin the SAE d331atest, corre-lation between the two procedures cannot be expected, although maximumdifferencesby motorcyclecategorymay be developed.
(c) As with SAE J331a, motorcyclesof the same make and modelare not neces-sarily tested in the same gear (due to vehicle and test variables). Gearselectionis furtherbased on a Judgment as to whether operationin thatgear is safe or not. However, in the SAE J47 test the particulargear usedis of secondary importance,since in this test all motorcyclesreach maxi-mum rated RPM at full throttle, and reach thls condition at the same pointin relation to the microphone. The effect of gear selectionon measuredlevels was investigatedduring this study, with test resultspresentedinTable3-1 (F-76 proceduredescription).
(d) Since in the SAE J47 test gear selection Is of only secondary signifi-cance in relationto measuredlevels,the matterof sprocketoptions(discussed in critique of SAE J331a) is also not critical.
(e) The safety aspects of the SAE J47 testing procedure are such as torequirea skilled rider familiarwith the behaviorof tileparticularmotor-cycle,and exerciseof care in its operation.
if) The procedureis less sensitiveto factorsaffectingvehicleperfon_ncethan is the SAE J331a.
(g) The method has potential for precise correlation with a stationaryvehicle dynamometer test, since power output together with position inrelationto the microphoneare defined.
3-5
The noise control regulations of Italy incorporate a noise test procedurewhich in essence is the SAE J47. Approach conditionsare not prescribed,the only stipulations being that ist gear shall be used and that the vehicleshall develop rated power and RPM when the vehicle is at the microphonetarget point. Substitute methods of engine loading are permitted, suchas grade or dynamometer.
IS0/R-362(Movingvehicleaccelerationtest)
The International Standards Organization, (ISO) Recommendation R-362,
"Measurement of Noise Emlt_ed by Vehicles", was approved in May 1962 by thefollowing ISO Member Bodies .
Australia France PolandAustria Germany PortugalBelgium Greece SpainBrazil Hungary SwedenCanada India SwitzerlandChile Ireland UnitedKingdomCzecholovakla Israel U.S.A.Denmark Netherlands U.S.S.R.Finland New Zealand Yugoslavia
The ISO/R-362moving vehicletest procedurehas since been incorporatedintothe regulationsof the followingcountries:
France PortugalLuxemburg AustriaNetherlands UnitedKingdomNorway WestGermany
Japan and Belgium have adopteda variationof the IS0/R-362method,The Economic Commissionfor Europe (ECE) has adopted the ISO/R-36Zmethodand has prescribednoise standardsfor various categoriesof motorcycles.Swedenand Australiahave proposedrevisionsto the ISO/R-362.
In the test, approachis made at 75 percentrpm for peak power or BOkm/h, (whicheveris slower), 2nd Gear is used if the vehicleis fittedwitha two-, three-,or four-speedgear box. If the vehicle has more than _ourspeeds, 3rd gear is used. The throttle is fully opened at a point 10 mbefore the microphone point, and closed 10 m past the microphone point.
Provisionsare includedfor the testingof vehicleswith no gearbox, andfor vehicleswith automatictransmission.
Two readingswithinZ dB of eachother are requiredon each sideof thevehicles,and the highestvaluereported.
Full textQf the procedureis inAppendixA.
2. "Approved"does not necessarilymean adoption into the reguTa-_ions'o-6"f"that country.
3-6
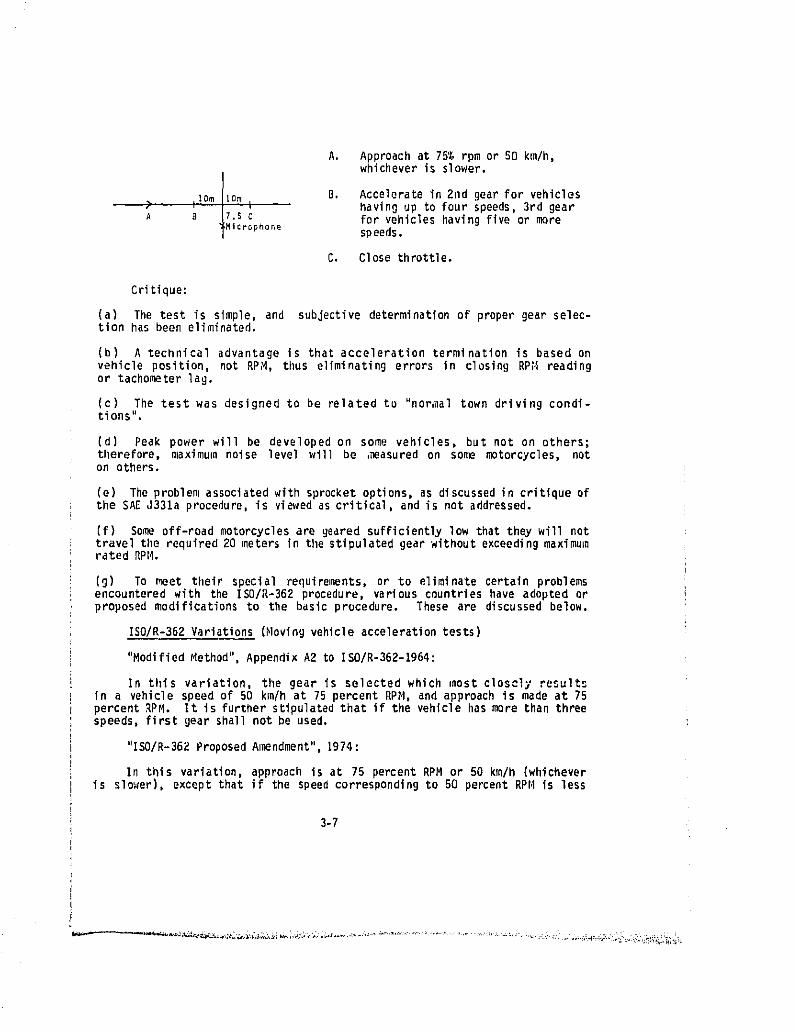
A, Approachat 75% rpm or SO km/h,whichever is slower.
> l_Om tomI B, Acceleratein 2nd gearfor vehicleshaving up to four speeds, 3rd gear
A a 17.sc for vehicleshavingfiveor mereMicrophone speeds.
C, Close throttle.
Critique:
(a) The test is simple, and subjective determination of proper gear selec-tion has been eliminated.
(b) A technical advantage is that acceleration termination is based anvehicle position, not RPM, thus eliminating errors in closing RP_4 readingor tachometerlag.
(c) The test was designed to be related to "normal town driving condi-tions",
(d) Peak power will be developed on some vehicles, but not on others;therefore, maximum noise level will be ,_asured on some motorcycles,noton others.
(e) The problem associatedwith sprocketoptions,as discussedin critiqueofthe SAE J331a procedure, is viewed as critical, and is net addressed.
(f) Someoff-roadmotorcyclesare gearedsufficientlylow thatthey will nettravelthe required20 meters in the stipulatedgear withoutexceedingmaximumrated RPH.
(g) To meet their special requirel_ents,or to eliminatecertainproblemsencounteredwith the IS0/R-362procedure,variouscountrieshave adopted or iproposed modificationsto the basic procedure. These are discussedbelow.
IS0/R-362Variations(Movingvehicleaccelerationtests)
"ModifiedMethod",AppendixA2 to IS0/R-362-1964:
In this variation, the gear is selected which most closely resultsin a vehiclespeed of 50 kio/hat 75 percent RPM, and approachis made at ?5percentRPM. It is furtherstipulatedthat if the vehiclehas more thanthreespeeds, first gear shall not be used.
"IS0/R-362ProposedAmendment",1974:
In this variation,approach is at 75 percentRPM or 50 km/h (whicheveris slower),exceptthat if the speedcorrespondingto 50 percentRPH is less
3-7
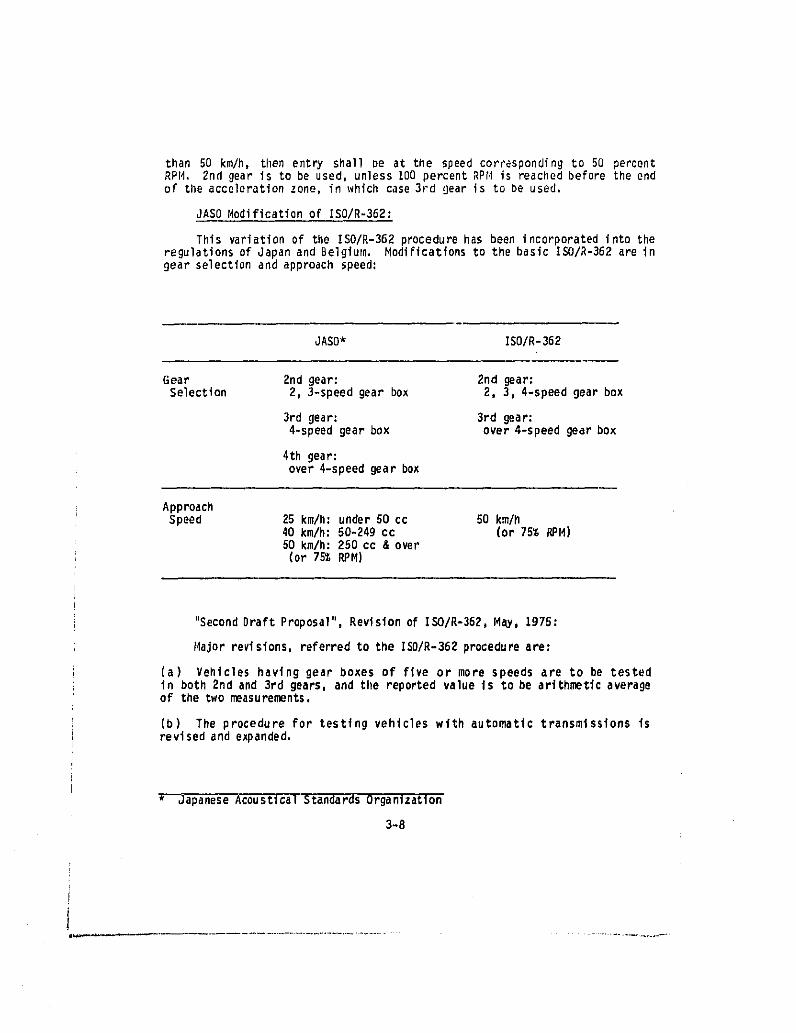
than 50 km/h, then entry shall De at the speed correspondingto 50 percentRPI4, 2nd gearis to be used, unlessIO0 percentRPM Is reachedbeforethe endof the accelerationzone, in which case3rd gear_s to De used.
JASO Modificationof IS0/R-362:
This variationof the IS0/R-362procedurehas been incorporatedinto theregulationsof Japan and Belgium. Modificationsto the basic IS0/R-362are Ingear selectionand approachspeed:
JASO* IS0/R-362
Gear ?nd gear: 2nd gear:Selection 2, 3-speedgear box 2, 3, 4-speedgearbox
3rd gear: 3rd gear:4-speedgear bex over 4-speedgearbox
4th gear:over4-speedgearbox
) ApproachSpeed 25 km/h: under50 cc 50 km/h
40 km/h:50-24gcc (or 75% RPM)
i 50 km/h: 250 cc & over(or 75%RPM)
"SecondgraftProposal",Revisionof 150/R-362,MaY, 1975:
Majorrevisions,referredto the IS0/R-362procedureare:
(a) Vehicles having gear boxes of flve or more speeds are to be testedin both 2nd and 3rd gears,and the reportedvalue Is to be arithmeticaverageof the two measurements.
(b) The procedure for testing vehlcles with automatic transmissions isrevisedand expanded.
*_apanese AcoustlcaIStandardsOrganization
3-8
Critique:
(aS The numerous variations of ISO/R-362, dealing mainly with approachspeed and gear selection, reflect the difficulty with this type of test(where approach conditions,but not terminationconditions,are controlled)in arriving at a procedure that adequately characterizes the noise of abroad range of motorcycles.
(b) A very comprehensivestudy 3 of motorcyclenoise and test proceduresconducted in Japan compared noise emissionsof a group of motorcyclesasmeasured by three variations of the IS0/R-362 procedure (JASO, ISO, ISOProposed Amendment). These variations,differing only in approach speedand gear selection,yielded measured noise level variationsup to 12 dB,showing the criticalityof these parameterson measuredlevels. This alsoindicates that a change in sprocket ratio will result in a changein mea-sured noise level. (The Japanese investigatorsdeterminedthat the JASOmodification of the IS0/R-362 procedure yielded the best correspondencewith average noise due to average acceleration, as related to Japaneseurban trafficsltuations.)
F-76 (Movingvehicleaccelerationtest)
While all of the above test proceduresare consideredto be candidatesfor use in the final EPA regulations,all of these procedureswere found tohave shortcomingsas a methodologyfor the Federalregulations. Theseshort-comings fall in one or more of the followingareas:
(aS Safety;hazardIn testing(SAIlJ47)
(b) Ambiguity;measured level dependenton gear selectioninvolvinga sub-Jectivedetermination(S_ J331a)
(c) Sprocket variables; measured level dependent on sprocket ratio which tsreadily changeable; change in measured level disproportionateto change invehiclenoise (SAEJ331a,ISO/R-362)
(d) Position variables: similar vehicles, differing only In gearing,having noise measured at different distances from the microphone, or atdifferentRPH and power conditions(SAEJ331e,IS0/R-362)
(e) Performancevariables: atmosphericconditions,riderweight, or acces-sories affectingvehicleclosingRPM and/orposition (SAEJ331a, IS0/R-362).
Representativesof the U.S. SuzukiMotor Corporationand the CaliforniaHighway Patrol, submittedpreliminarydrafts of test proceduresdesignedtoeliminate the above objections. These procedures, together with otherprocedures, were evaluated and refined. The resulting procedure has beendesignated F-76, and consists of the following:
_. see page _-4U.
3-9
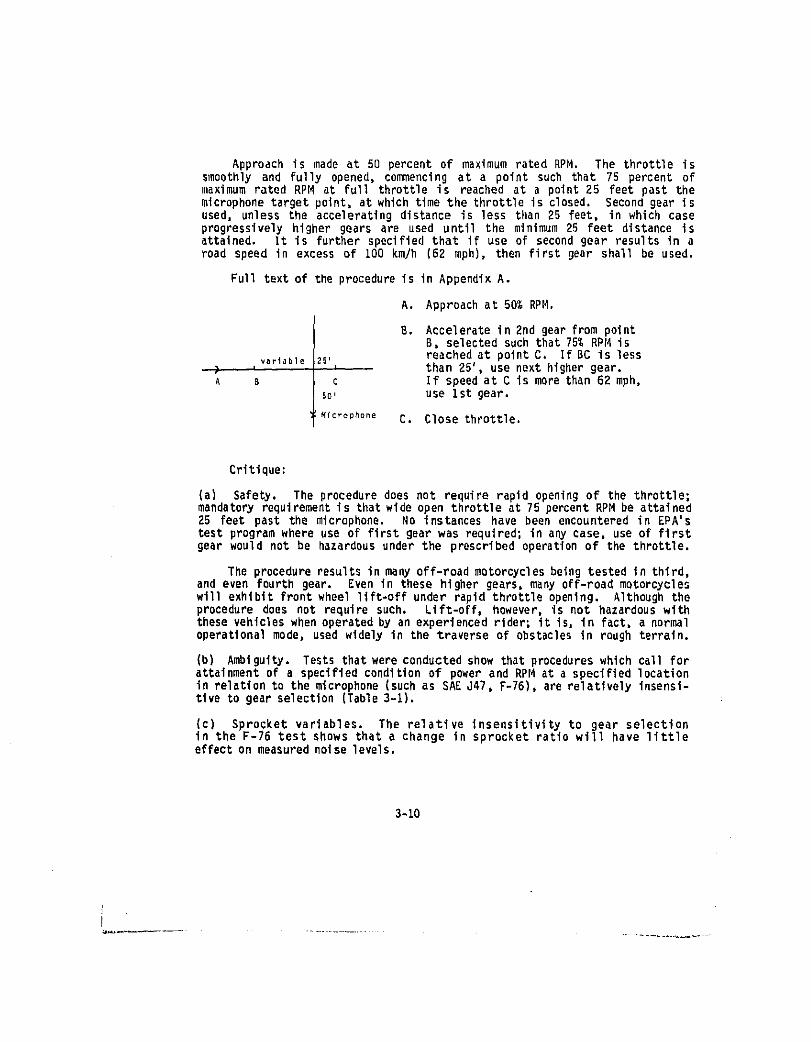
Approach is made at 50 percent of maximum rated RPM. The throttle issmoothlyand Fully opened, commencingat a point such that 75 percent ofl_aximumrated RPM at full throttle is reached at a point 25 feet past themicrophonetargetpoint,at whichtime the throttleis closed. Secondgear isused, unless the acceleratingdistance is less than 25 feet, in which caseprogressivelyhigher gears are used until the minimum25 feet distance isattained. It is further specified that if use of second gear results in aroad speed in excess of 100 km/h (62 mph), then first gear shall be used.
Full text of the procedure is in Appendix A.
A. Approach at 50% RPM.
B. Accelerate in 2nd gear from pointB, selected such that ?5% RPI4is
varlab]e25', reachedat pointC. IfBC is less) , than 25', use next highergear.A s C If speed at C is more than62 mph,
5o, use1stgear.
_(crophone C. Close throttle.
Critique:
(a) Safety. The proceduredoes not require rapid openingof the throttle;mandatoryrequirementis thatwide open throttleat ?5 percentRPM be attained25 feet past the microphone. No instances have been encounteredin EPA'stest programwhere use of first gearwas required;in any case, use of firstgear would not be hazardousunder the proscribedoperationof the throttle.
The procedureresultsin manyoff-roadmotorcyclesbeingtested in third,and even fourthgear. Even in these higher gears,many off-roadmotorcycleswill exhibitfrontwheel llft-offunder rapidthrottleopening. Althoughtheproceduredoes not require such. Lift-off, however,is not hazardouswiththesevehicleswhenoperatedby an experiencedrider;it is, in fact, a normaloperationalmode, used widelyin the traverse of obstaclesin rough terrain.
(b) Ambiguity. Tests thatwereconductedshow thatprocedureswhich call forattainmentof a specifiedconditionof power and RPI_at a specifiedlocationin relationto the microphone(suchas SAC J47, F-76),are relativelyinsensi-tive to gear selection(Table3-i).
(c) Sprocket variables. The relative insensitivity to gear selectionin the F-?6 test shows that a change in sprocket ratio will have littleeffecton measurednoiselevels.
3-I0
r
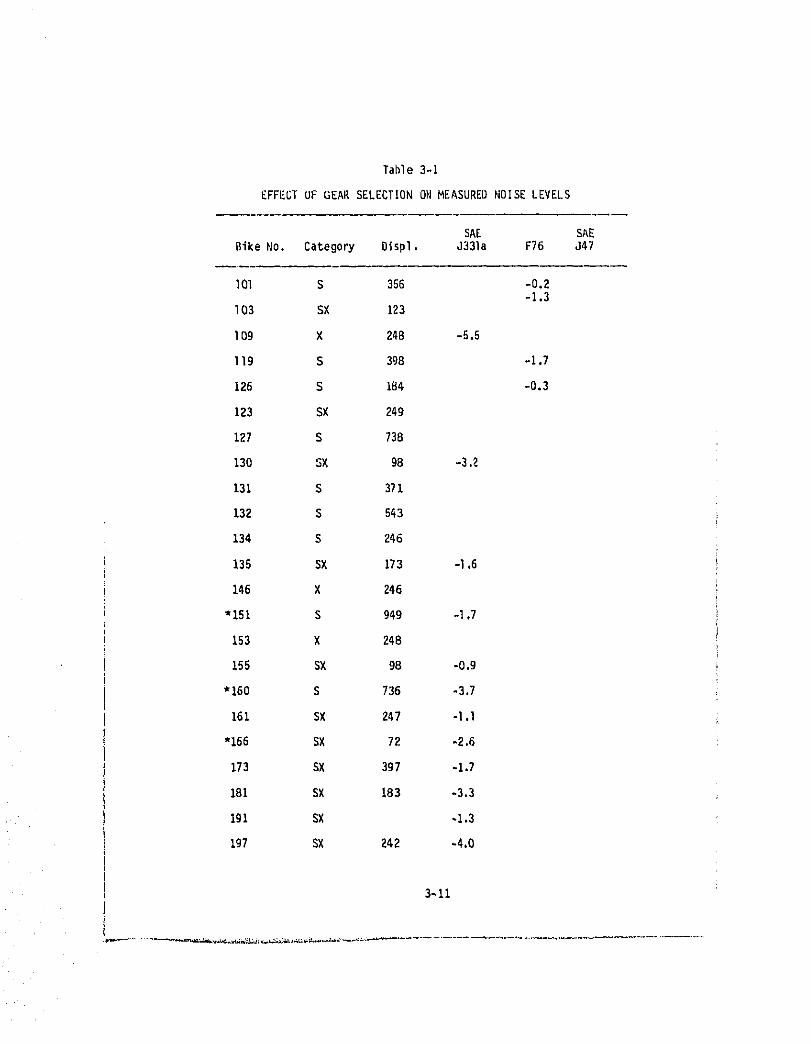
Table3-I
EFFEL;TOF GEAR SELECTIONON MEASUREDNOISELEVELS
SAE SAE
BikeNo. Category Displ. J331a F76 J47
IOl S 356 -0.2-i .3
I03 SX 123
1og X 24B -5.5
Ilg S 398 -I.7
126 S 184 -0.3
123 SX 249
127 S 738
130 SX 98 -3._
131 S 371
132 S 543
134 S 246
135 SX 173 -1,6
146 X 246
"151 S 949 -1.7
153 X 248
155 SX 98 -0.9
"160 S 736 -3.7
161 SX 247 -I.l
"166 SX 72 -2.6
173 SX 397 -1.7
181 SX 183 -3.3
lgl SX -1.3
197 SX 242 -4.0
3-11
(d) Positien variables. In the F-76 test, the noise level, at tilespeci-fied power and RPf4conditions,is always measuredat the same distancefromthe vehicle.
(e) Performance variables. As wlth the other test procedures, the measuredlevel in the F-76 procedurewill be affectedby factorswhich affect soundpower (such as relative air density); correction factors could be applied forthis. In contrast with the SAE J331a procedure, however, the F-76 measuredlevelis not affectedby RPM/distancerelationshipsassociatedwith variationsin power output.
If) Methodology substitution. Since the F-76 test is conducted undercontrolled conditions of power, RPM, and measurement distance, it can bededucedthat the means used to load the engine are relativelyunimportant.For example, the same resultshouldbe obtainedon a grade,or on a suitabledynamemeter, as long as tileprescribed end-conditions are attained, (TheItalianprocedure,which is similarto the SAE J47. permitsthese substitu-tions in lleu of the prescribedaccelerationtest). In contrast,proceduressuch as the SAE J331a or the IS0/R-362offer no possibilityof suchsubstitu-tions as equivalents.
(g) Tachometers. Tachometer lag tirae can have an important effect on thenoise levels measured by F-76. Slow-respondingtachometerswill indicateengine speeds higher than those specified in the procedure 25 feet past themicrophonepoint. These higherengine speedswill resultin erroneouslyhighnoise level measurements,
While it is possible to derive a statistical transfer function betweenF-76 and SAE J331a (as has been done in section 4) it is not possibletopredict,for a particular1,_torcycle.the F-76 level basedon the SAE J331alevel using this transfer function. The reasons for this are fundamental.For the smallermatorcycles,the SAE J331a level is dependentof where in theend-zone the vehicle reaches 100 percent RPM. If it reaches 100 percent RPFInear the start of the end-zone, the F-76 level (75 percent RPM) will belower;if it reachesit nearthe end of the end-zone,the two levelswillbeabout equal (differencesinpowerbeing cancelledby differencesin distance).This in turn dependson gearing,and on which gear is used, In the case ofthe larger machines,the degreeof equivalenceis dependenton the value ofthe SAE J331a closingRPM. If the closingRPI4is at a near 100 percent,thetwo levelswill be near equal;if the closingRPFtis well below 100 percent,the F-76 levelwill be higher. By makinguse of thesefactors,togetherwithvehicleperformancedata, it would be possible to estimateF-76 levels fora particular motorcycle, based on the SAE J331a level.
For the above reasons,no close correlationshouldbe expectedbetweenthe F-76 levelsand SAE J331a levels. It was consideredof interest,neverthe-less, to examinethe degreeof correlation,v_hichis shovInin Figures3-I and3-2. The relativelygood correlationin the case of the off-roud,wJtorcyclesis no doubt attributableto the fact that mast of these are small clisplace-ment, low-gearedmachines,andthereforereach the accelerationend pointnearthe microphone in both test procedures.
3-12
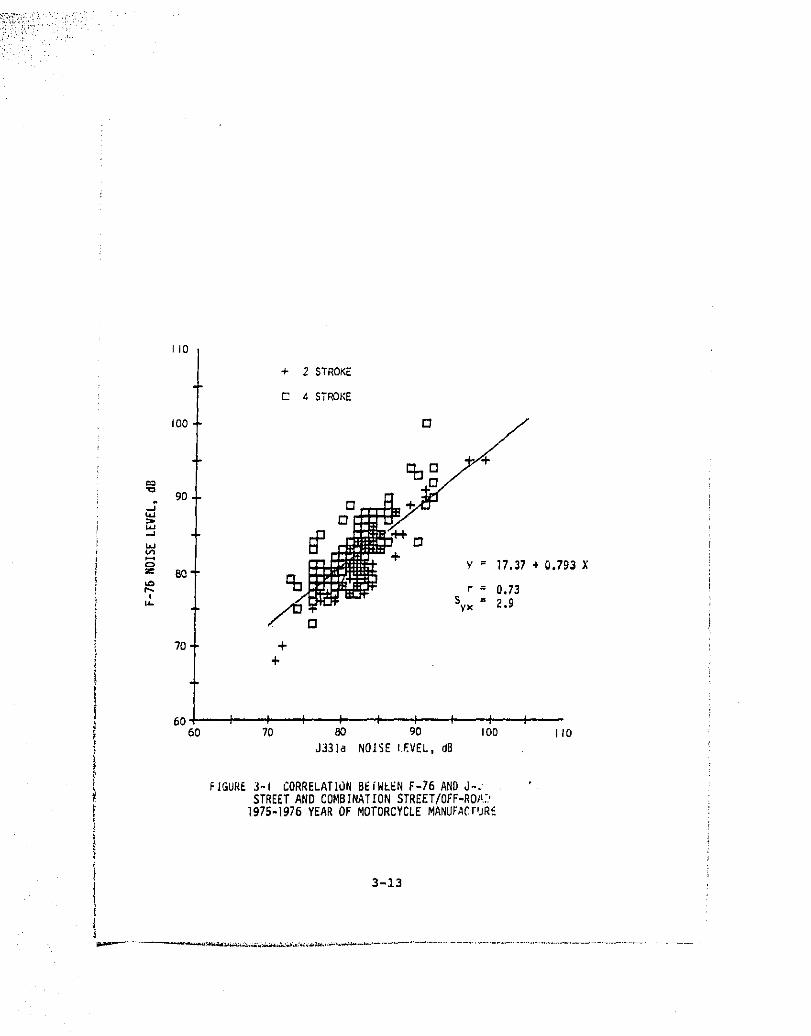
F-7
6I_
0IS
ELE
VE
L,d
]]
00
00
00
o,J
I;
II
II
II
I
"_"
++_cP
O1_
;o
-<o_
ITL
Ii:]
_2_-
rnI"
Jr'_
4-
-_
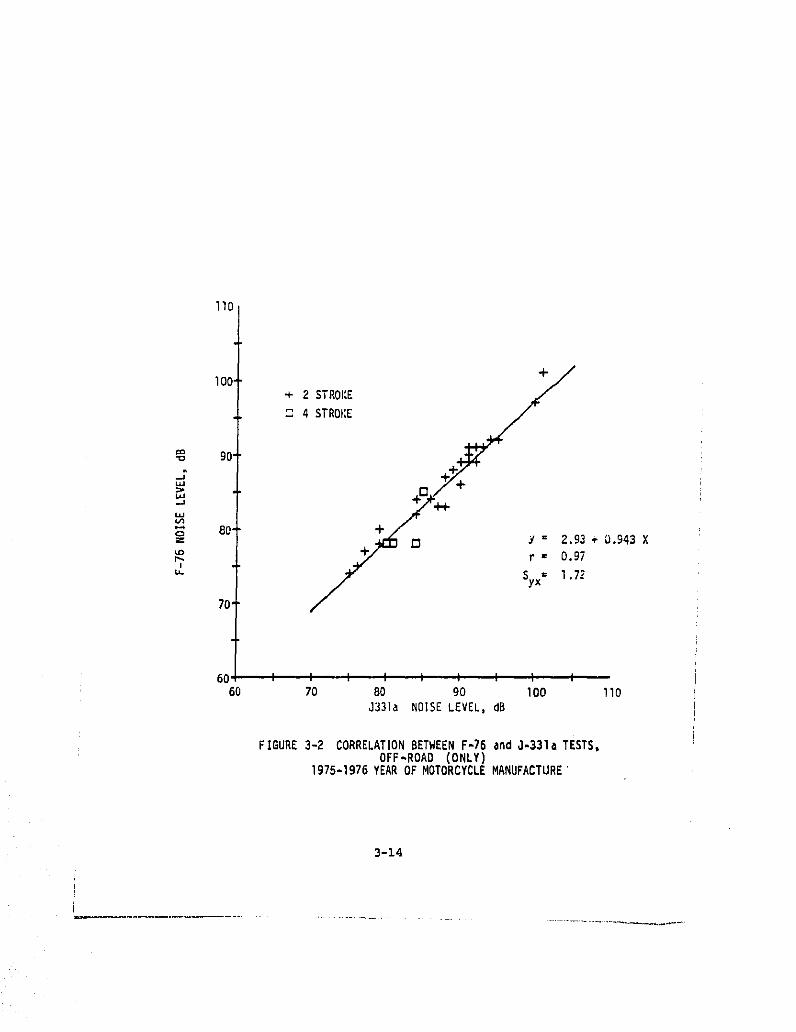
llO
lO0 _+ /
+ 2STROI:E'_ 4 STROKE
-o 9C
,_¢l:J _ 2.93., a.94ax
.,o _ " 0.97
Syx" l.72
7O
60 l I I l ¢ I I i I60 70 BO 90 I00 II0
J331a NOISELEVEL,dB
FIGURE3-2 CORRELATIONBETWEENF-76 and J-331aTESTS,OFF-ROAD (ONLY)
1975-1976YEAROF MOTORCYCLEMANUFACTURE'
3-14
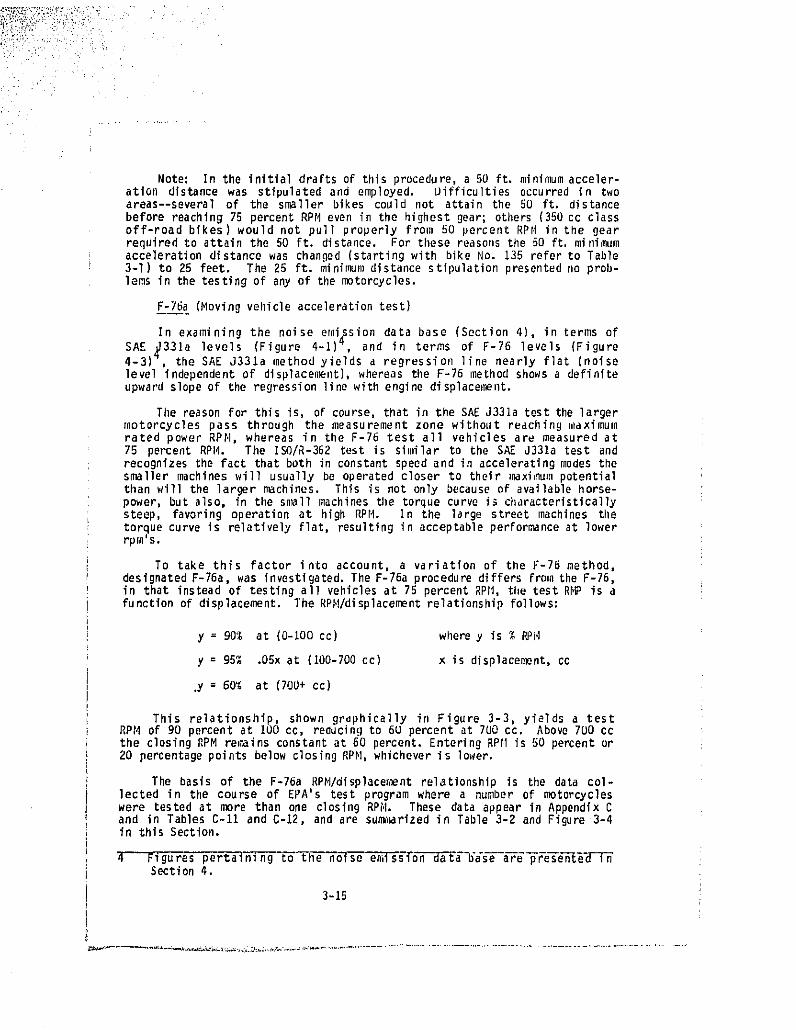
Note: In the initialdraftsof this procedure,a 50 ft. minimumacceler-ation distance was stipulatedand employed. Uifficultiesoccurredin twoareas--severalof the smaller bikes could not attain the 50 ft. distancebefore reaching 75 percent RPM even in the highest gear; others (350 cc classoff-road bikes) would not pull properly from 50 percent RPt.Iin the gearreqolredto attain the 50 ft. distance. For these reasonsthe 60 ft.minimumaccelerationdistancewas changed(startingwith bike No. 135 referto Table3-I) to 25 feet. The 25 ft. minimumdistancestipulationpresentedno prob-lems in the testingof any of the motorcycles.
F-76a (Moving vehicle acceleration test)
In examining the noise emiAssiondata base (Section 4), in terms of
SAE _331a levels (Figure 4-i)_, and in terms of F-76 levels (Figure4-3) , the SAE J331a f,ethodyields a regression line nearly fiat (noiselevel independentof displacement),whereasthe F-76 method shows a definiteupwardslopeof the regressionlinewithenginedisplace_ent.
The reasonfor this is, of course,that in the SAE d331a test the largermotorcycles pass through the measureloentzone without reaching maximumrated power RPr,I,whereas in the F-76 test all vehicles are measured at75 percentRPI4. The IS0/R-362test is similar to the SAE J331a test andrecognizesthe fact that both in constantspeedand in acceleratingcodes thesmaller machineswill usually be operatedcloser to their maxicun_potentialthan will the larger machines. This is not only becauseof availablehorse-power, but also, in the small machinesthe torquecurve is characteristicallysteep, favoring operation at high RPM. In the large street machines thetorquecurve is relativelyflat, resultingin acceptableperformanceat lowerrpra's.
To take this factor into account, a variation of the F-7E method,designatedF-76a,was investigated.The F-16a procedurediffersfromthe F-76,in that insteadof testingall vehiclesat 75 percentRPIi,the testRFP is afunctionof displacement,The RPl,I/displacementrelationshipfollows:
y = 90% at (0-100cc) wherey is _ RPI4
y = 95% .05xat (100-700cc) x is displacement,cc
.y= 60% at (70g+cc)
This relationship, shown graphically in Figure 3-3, yields a testRPI4of 90 percentat 100 cc, reaucingto 6u percentat 7(JOcc Above 700 ccthe closingRPM remainsconstantat 60 percent.EnteringRPfiis 50 percentor20 percentagepointsbelow closingRPhl,whicheveris iocer,
The basis of the F-76a RP_J/displacemantrelationshipis the data col-lected in the course of EPA's test program where a number of motorcycleswere testedat more than one closingRP_,I.These data appear in AppendixCand in TablesC-11 and C-12, and are sun_i_rizedin Table3-2 and Figure3-4in this Section.
4 Figures pertaining tothe noise ea_issiondat'_-b'a's'e--a-r-C-p-r-_en'_'(F_n"Section4.
3-15
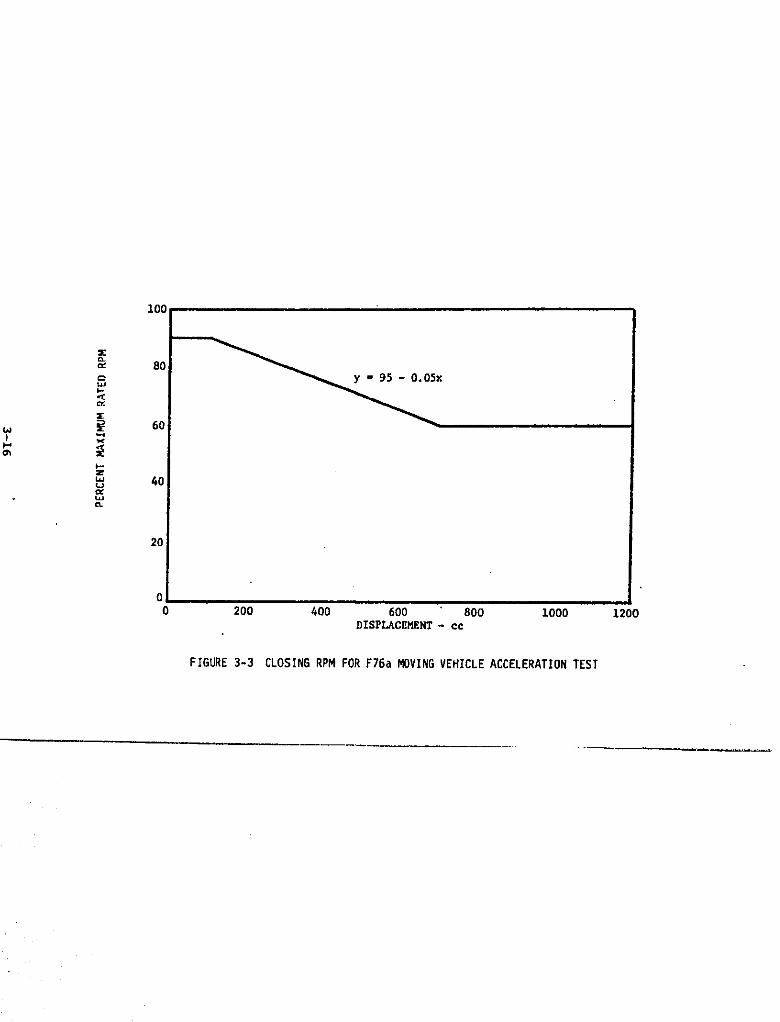
100
80
_JI-
_: 60
Z
w 40Lul
20
0
200 400 600 800 1000 1200DISPLAC£HENT- cc
FIGURE 3-3 CLOSING RPM FOR F7Ga MOVING VEHICLE ACCELERATION TEST
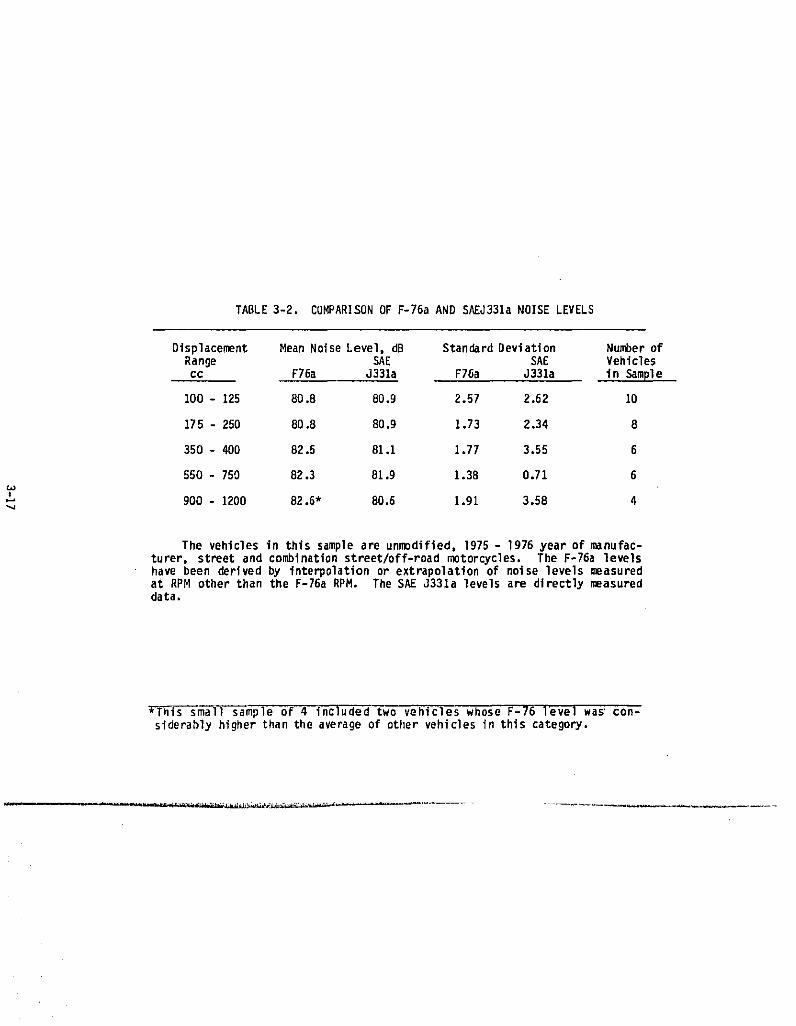
TABLE3-2. COMPARISONOF F-76aAND SAEJ331aNOISE LEVELS
Displacement MeanNoiseLevel,dB StandardDeviation NumberofRange SAE SAE Vehiclescc F75a J331a F76a J331a in Sample
100 - 125 8D.B 80.9 2.57 2.62 10
175 - 250 80.8 80.9 1.73 2.34 8
350 - 400 82.5 81.1 1.77 3.55 6
550 - 750 82.3 81.9 1.38 0.71 6
900 - 1200 82.6* 80.5 1.91 3.58 4
The vehiclesin this sampleare unmodified,1975- 1976 year of manufac-turer, streetand combinationstreet/off-roadmotorcycles. The F-78a levelshave been derivedby interpolationor extrapolationof noise levelsmeasuredat RPM other than the F-76a RPM. The SAE J331a levelsare directlymeasureddata.
*T_is small sample of 4 included two vehicles whose F-76 level wa_ con-siderablyhigherthan the averageof other vehiclesin this category.
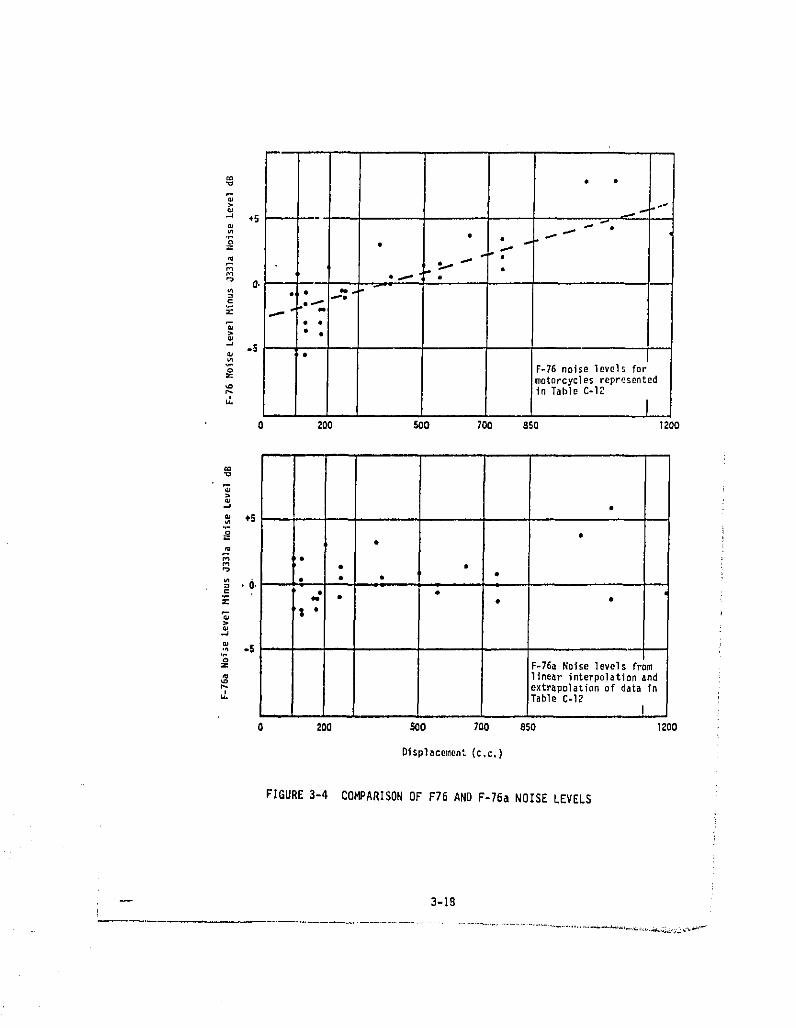
I
F-7
6aN
oise
Lev
elH
inu
sJ3
31a
r#0i
seL
evel
dB
F-7
6N
oise
Lev
elH
inu
sJ3
31a
t¢0i
seL
evel
dB
'-o
&'-
9J,
o
N m_
••
oo•
,_•
I••
•z\
••
•_|
(m)
z_
%
-•
...\
.Z o
m|
.-(o
_l-
-_
-5
o_c o
"0
01:
I
Figure 4-55 shows the difference between F-76 and SAE J331a levelsplotted againstdisplacement,with the upward slopingregression lineshowingthat statisticallythe F-76 level is higher than the SAE J331a level forlarge motorcycles,lower for s_nallmotorcycles. Table 3-2, shows that whilea largerstatisticalsampleof F-76atest data is desirable,the data indicatethat if F-76a data were substitutedfor F-76 data, the regressionlinewouldnot only be independentof displacement,but would alsobe approximatelyequalto the SAE J331a levelson a statisticalbasis.
A curve of noise level versuspercent RPM for one motorcycleis shownin Figure3-5.
A secondaryadvantageof the F-76a procedureover F-76 is that lowertestingspeedsresultfor the large motorcycles. In the F-76 test, speedsupto 55 mph were encountered. This would reducebe about 45 mph in the F-76atest. Manufacturertest datashow tirenoise of 66 dB at 45 mph on a 750 ccmotorcycle,which indicatesthat tirenoise wouldnot be a significantcontri-butor to totalvehiclenoisein the F-76a test.
Text of the F-76a procedureis in AppendixA.
R-6O (Movingvehicleaccelerationtest)
With the same rationale basic to the F-76a test, a staff member ofAMF Harley-Davidsonsubmitted (prior to developmentof the F-76a test) amoving vehicleaccelerationtest proceduredesignatedR-60. The R-60 test issimilar to the F-16a exceptthat the closingRPI_is the RPM correspondingto60 mph in the highest gear (insteadof 75 percentRPI4for all vehicles).EnteringRPM is 75 percentof the closingRPM.
A full textof the procedureis presentedin AppendixA.
Critique:
(a) The proceduredoes not providefor the testingof vehicleswhich do notreach 60 mph; this difficultycould be eliminatedby adding the stipulationthat vehicleswhich reach 100 percentRPM before60 mph shall be testedat100 percent RPM.
(b) Similarvehicles,differingonly in gearing,couldbe testedat substan-tially different RPM's yielding substantiallydifferent measured Imwls.
(c) Changing sprocketswould result in testing at different RPI4's,withdifferentmeasuredlevels.
(d) Some streetmotorcyclesare capableof very high speeds. A motorcyclewith a top speed of 135 mph would be testedat 44 percentRPM, a ratherlowtest RPM.
))
5. Figures pertaining to t-_'e--l_o_-s'e--_issi_-6a-_-5-a-_-6are pre_CiTtedin-Section4.
3-19
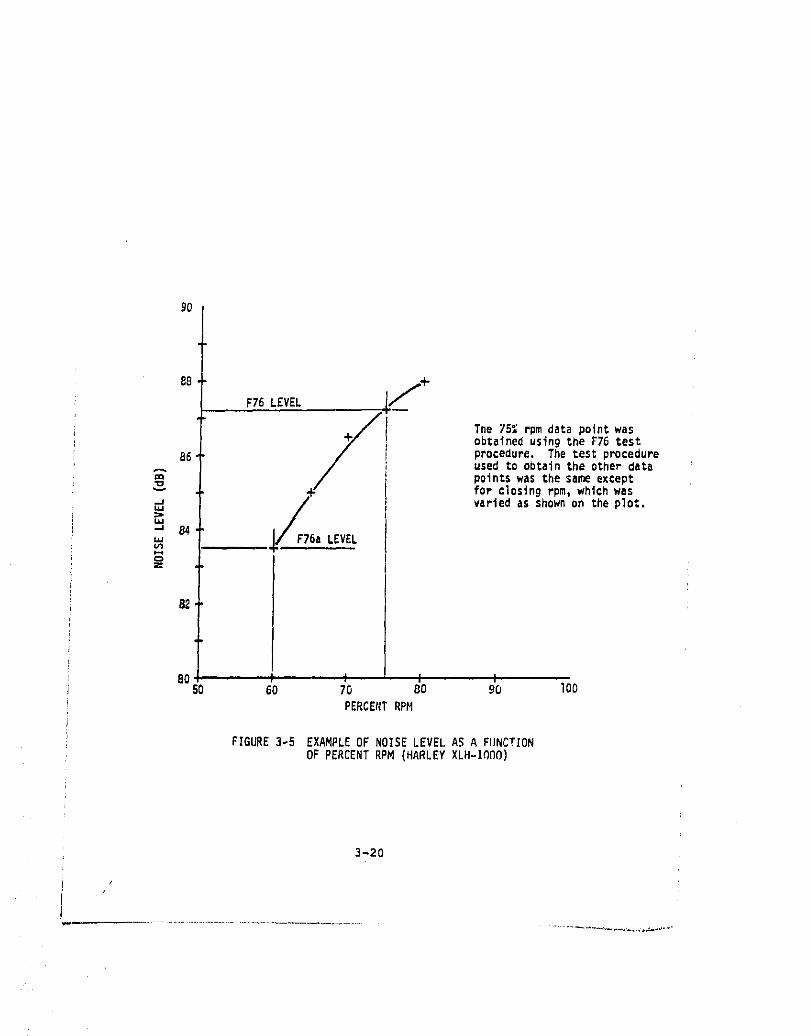
gO
88 ,.+
F76 LEVEL,/_/ The 75; rpm datapointwas
/obtainedusingthe F76 test
86 procedure. The test procedureused to obtain the other datapoints was the sameexceptfor closingrpm,whichwas
-a / variedas shownon theplot.
/,L_J
84uJ 6a LEVELN
80 _ ! !SO 60 70 80 90 IOD
PERCENTRPH
FIGURE3-5 EXAMPLEOF NOISE LEVEL AS A FUNCTIONOF PERCENTRPM (HARLEYXLH-IQO0)
3-20
j/
(e) The F-76a procedure provides an alternative means of dealing withthe differentoperationalsituationsof the small and large machines,andavoidsthe difficultiesappearingin the R-60 method.
F-77 (Full speed,full throttle,movingvehicletest)
In lleu of the IS0/R-362 accelerationtest, Norway prescribesa fullspeed, full throttlepass-by test for mopeds. In the course of the stu_,this procedurewas examined for metorcyclesup to 100 cc; above that somevehiclesreachexcessivespeeds.
This is a considerablyslmplertest to run than any of the other inovlngvehlcleprocedures,requiresno tachometeror speedonmter,and is representa-tive of comnonoperatlonalconditionsfor vehiclesunder-t00cc. It yieldslevels usual]yclose to the SAE J331a levels,and can be expectedto yieldlevelscloseto the F-16atest.
Full textof the procedureis inAppendixA.
ProblemAreas: MovingVehicleTest Procedures
(i) AutomaticTransmissions
Automatictransmissionsare comingInto use for both streetand off-roadmotorcycles, large and small, The following motorcycles with automatictransmissionswere tested:
Street
MoteGuzzl VIO00 ConverterHondaCB75OAHondaNC-50
Off-Road
Rokon340 RTHusqvarna360 Automatic
Combination Street/Off-Road
YamahaChappy {mlnibike)
Mopeds
NTV Model ERBKreldlerMP3VespaCiaeMotobecaneMobyletteVelosolex 4600Peugeot I03LVS.U3
3-21
Difficultywas encounteredin testing the motorcycleswith autor_tictransmissions.The {_otoGuzziV1000 and the Honda CB750aincorporatea highand low-rangeselection;low range produces slgnificantlyhigherlevels forthe SAE J331a test. High-rangeuse for the F-76 test resultsin excessivespeed. For the F-77 test, however, high-range can cause the engine toover-rev unless it is specified.
The Rokon 340RT and the Husqvarna 360 Automatic also presented testingproblems. The Rokon 340RT incorporatesa variable ratio belt drive; thedriving member is acted upon by centrifugalforces, the drivenmember isaffectedby reactingtorque. The drive ratio is deten_inedby both enginerpm and torquedemands,There are no selectableoptionsfor the rider,otherthanthrottleposition,The SAEJ331a test procedure,doesnot providefur thetesting of vehicles with automatic transmissions. However, if the gearstipulation is ignored, a meaningful SAE J331a test can be run. To run anF-76 test, however, an entirely different technique is required: the throttlemust be opened very gradually in order not to immediately exceed 75 percentRPM; with some practice, vehicle speed can be smoothly increased such that 75percent RPM at full throttle is attained at the required end point, with goodconsistency. As discussed in Section 3.2, vehicles which reach 100 percentRPM near the end of the end-zone in the SAE J331a test exhibitnear equalSAE J331aand F-76 levels. The Rokon 340RT fitsthis pattern,reinforcingtheappropriateness of the above testing techniques.
The ilusqvarna360 Automatic incorporatesfour centrifugalclutches,with Sprague roller clutches which permit the lower geared centrifugalclutches to freewheel when the higher geared clutches engage. The SAE J331atest cannot be run, because 100 percent RPI4is reached well before the startof the end-zone, and no rational criteria exists for regulating the throttleother than wide open. No technique has been developed which would achievefull throttle at 75 percent RPM at the prescribed point in relation to themicrophone. Further analysis and testing will be required to develop ameaningful and repeatable test technique for tbis type of vehicle.
Based on the F-77 testingof two laotorcycleswith displacementslessthan 100 cc and six mopeds,no problemsoccurredwith vehicleswith automatictransmissions.
(2) Tachometers
A major problem encounteredthroughoutEPA's test programwas in ob-taining engine RPM readings on motorcyclesnot equippedwith tachometers.Portabletachometersused in the programincludedthe Sanwa ModelMT-03,theRite Autotronicsmodel 4036, and the DynallMode TAC 20. In most cases,oneof these three tachomoterscould be made to function properlyon the testvehicle,but noneof thesetachometerswould work on all motorcycles.In somecases the testingof a motorcyclewas abandonedbecauseof inabilityto obtainproper functioning of tbe tachometer.
3-22
A vehicle manufacturer should have no difficulty in arriving at asuitable tachometer or other means of determining RPH for his particularllne of vehicles; the problem exists primarily for the EPA and for after-market manufacturers,where universalapplicationover many makes and modelswould be necessary. Fortunately,however, the steady-stateaccuracy of thetachometer (either the vehicle tachometer or a portable tachometer) can bereadily verifiedsimply by matching the engine firing frequency(as pickedup by a wire placed in proximityto a spark plug lead) with a signal froma calibrated oscillator and matching the two signals on an oscilloscope.
A second factor to be considered in the use of taChOl_ters for movingvehicle accelerationtests is tachometerlag, and the abilityof the riderto close the _hrottle at the correct RPM. This effectwas evaluatedin aprevious study°, where results obtained using the vehicle tachometerwerecompared with results obtained using an electronic tachometer incorporating a
"max. hold" mode (EmissionControl Instruments,PrecisionTachometer).Inthat study, when the rider performedSAE J47 tests on ten motorcyclesusingthe vehicletach for reference,the true RPFIrecordedby the electronictachranged from 1132 RPM high, to 356 RPM low, as compared to the intended RPf4._lhenthe SAE J47 tests were repeabedwith the closingRPIIat the propervalueestablishedby the electronictach, measured levelsranged from zero to 2 dglower.
Test _nethodologiessuch as the SAE J331a and the F-76 (as opposed tothe IS0/R-362type) are subjectto both the problemsof tachometerfunctionalcompatibility and lag. unless other methods are established to measureengine speed. The dynamometer method is free of these problems, sincethe tachometer can be incorporated into the dynamohleter, and measuringconditions are steaoy-state.
3.3 StationaryVehicleTestProcedures
F-50 (Stationaryvehicletest)
The F-50 procedureis patternedafter the ISO proposeddraft, "l,lethodof Control of Noise Emittedby StationaryMotor Vehicles,"July 1974. Thetest consists of running the engine up to 50 percent RPM, unloaded, andmeasuringnoise at a distanceof 0.5 m from the exhaustoutlet,on a llnedisplaced45° from the exhaust axis. The complete text of this procedureand the ISO draft are InAppendixA.
Critique:
TlJeF-50 levels, presentedin Section 4, are relatively independentof displacement (Figure 4-7 and 4-8) and have been correlated with SAE J331aand F-76 levels in Figure 3-6 thru 3-9. The correlation is not sufflcien-fly good us to permit the moving vehicle acceleration noise for a particularvehicleto be predictedfrom the stationarylevel. Major reasonsfor this
_T.--S-e-e--page_- ¢C.
3-23
• _u_b_ i_._,_._ __:_ _ _ _..r_. _._,___'_
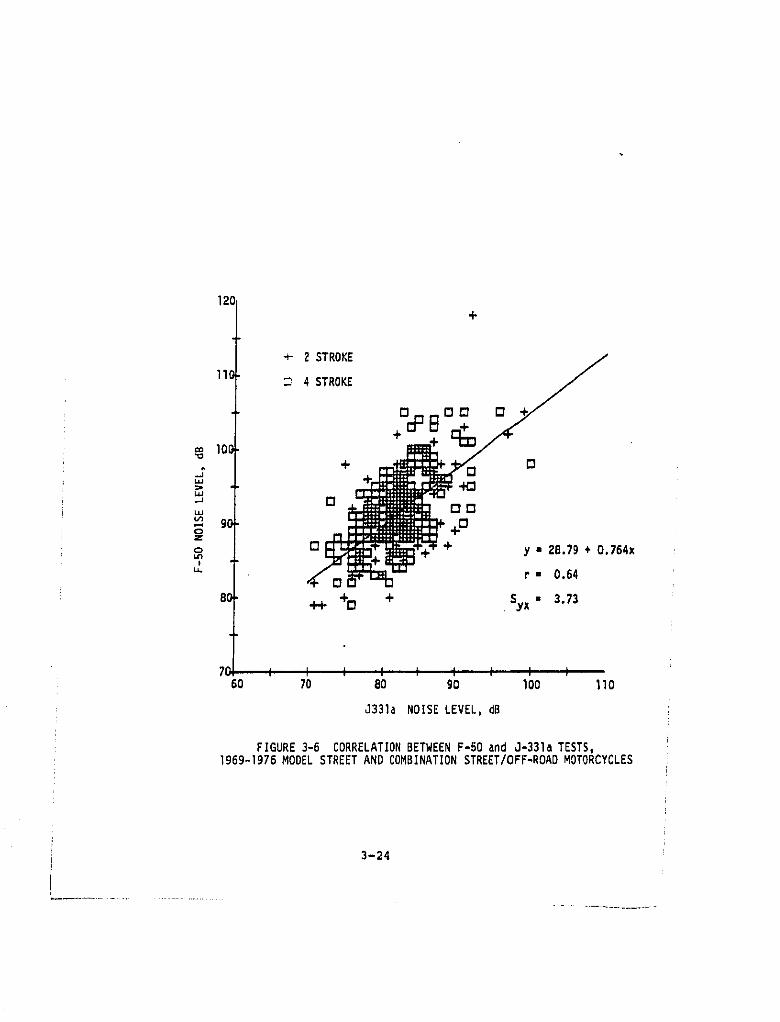
....
i i
F-50
NOISE
LEVEL,
dB
_lD
-I1
_b--
J
Oi't
l r--,
:t+X'
=,
I-I
|Z_¢,,
w
"_,"
,N_"
+
HI'q
_g_
_n
+;IO
0
P.,=
--q=
_
\_
Ng
rrl
__
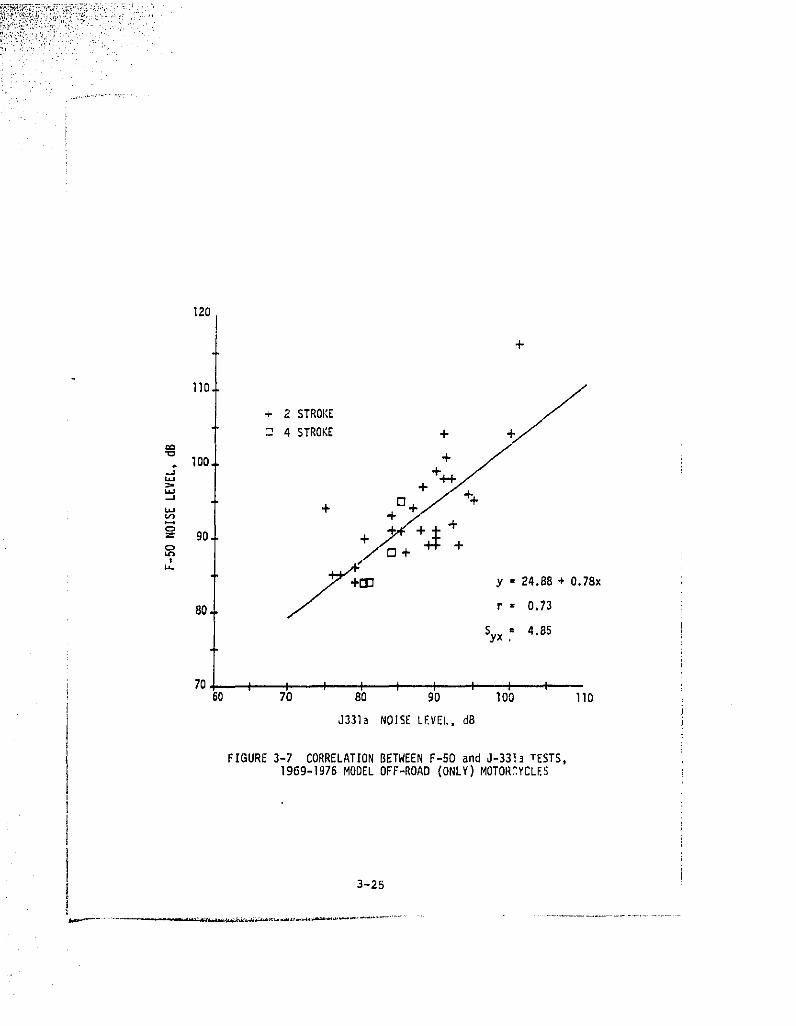
120
+
"° +//+ 2 STROKE
4 STROKE +
"0
...; IO0 +
> [] +
90 , */('+ ± +o '/_+ ++" +/u. /_r1"I y = 24.88+ 0.78x
80 / r = 0.73
S = 4.85yx.
70 I I I I t I I ] I60 70 80 90 lO0 110
J331a NOISELEVEL, dB
FIGURE3-7 CORRELATIONBETWEENF-50 and J-331]TESTS,1969-1976MODELOFF-ROAD(ONLY)MOTORCYCLES
3-25
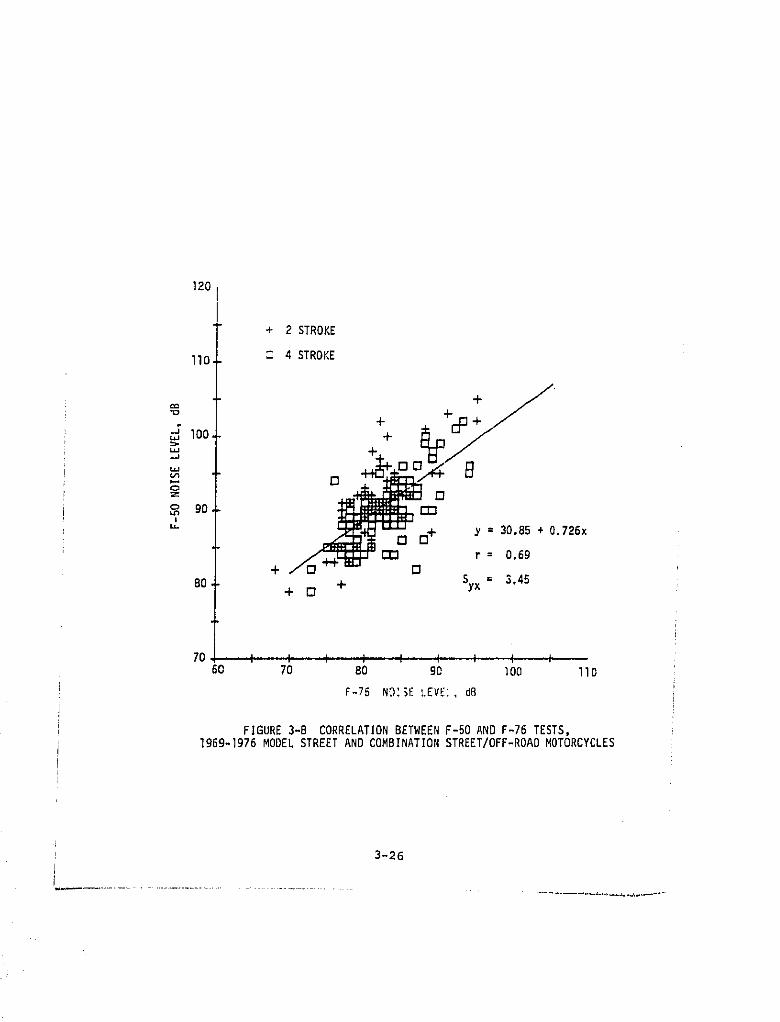
120
+ 2 STROKE
110 _ 4 STROKE
-; 100_J
"" y = 30.85 + 0.726x
_rTn r = 0.69+ 0
BO 4- Syx = 3.454- D
70 I I I I I I I I t60 70 80 go lO0 110
F-75 ND:_E t.EVE_, dB
FIGURE3-B CORRELATIONBETWEENF-50AND F-76 TESTS,1969-1976MODELSTREETAND COMBINATIONSTREET/OFF-ROADMOTORCYCLES
3-26
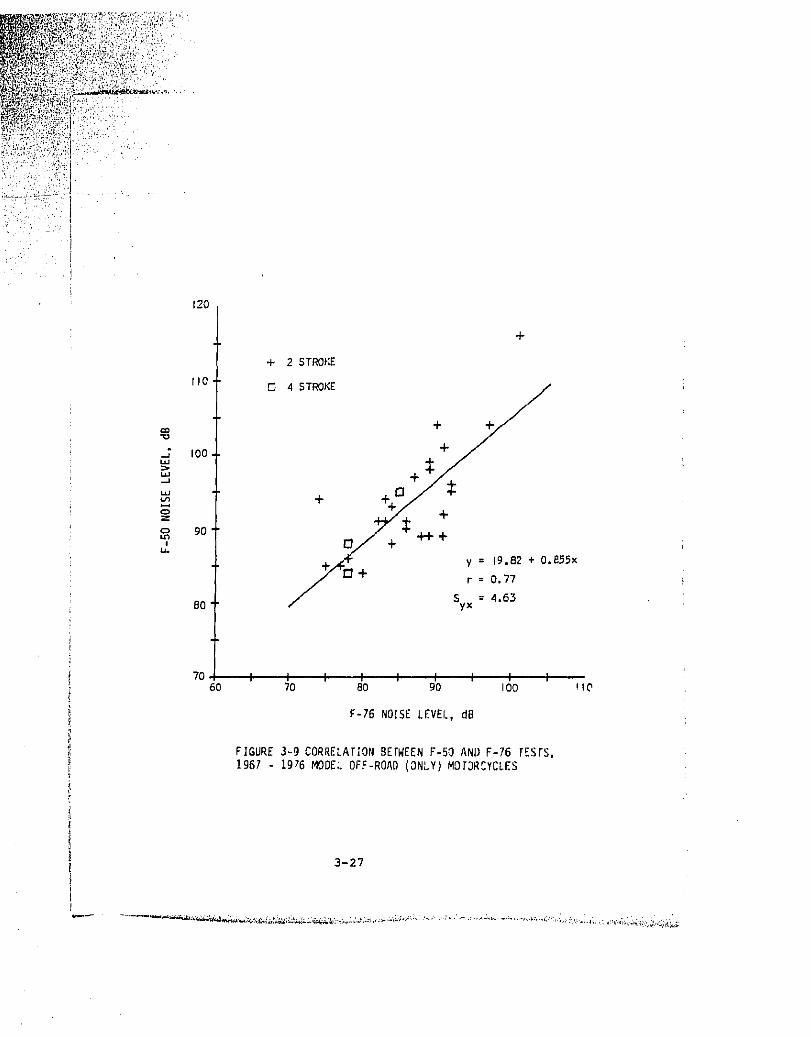
.____.r__"_.__'_-_'-_'_4"_F_"__':-_'_"_'_.7v7_'!_:___'_?._""_'_t-;_'_'¢_'_'_:_'_"_'_,',_.-_,_....
L_-E
S313A3_CION(ATNO)OVOB-SJO":300W9L61"Lg61'SJS3J9L-_(INV0_-_N33MJ3BNOIJVR3BB036-_3BngIJ
8P"13A373SIONgL-_
OlJ0010608OL09IIIIII''IIIOL
xA/08
LL0=J.Fr-i,_,
xg_B'O+Z8"61=/''/-._'Y+?+-I-+.+_E]06u,o
+o
001r-
3NO_IS!7?7OIJ
m4o_:11sg+
+
are that the engine is not under load, and tilusexhaust noise is not represen-tative of the acceleration conditions, and becuuse toe throttle is onlypartially open, intake noise is not fully develaped.
The test is nevertheless of potential value. Figures 3-10 and 3-11show that in general an exhaust system change which produces higher inavingvehicle noise levels also results in higher levels in the stationary test.The correspondence in this respect is sufficiently good that the methodcould be used for on-the-road enfurcenlent against exhaust system tampering.The figures show that the methoJ would be quite effective against flagrantviolators, providing the DE,M(original equipment ,Banufacturer) noise level _asknown and labeled on the machine.
A further alternative to the F-50 test. for use by the exhaust systemmanufacturer, could be the dyne-simulation of the moving vehicle test, asdiscussed later in this section.
l,lotorcycleIndustry Council (NIC) Proposed Field Test Procedurefor Noise Leve--lsOf Conlpetiti_-nMotorcycles, Rev. I";-31T:-76
This procedure, the full text of which appears in Appendix A, is similarto the F-50 procedure, differing mainly in features which ,,_akeit mere con-venient for application in competitive events. Test RPi.Iis 50 percent red-line, alternatively 60 percent maxi,numrated RPI.I,or alternatively ca]culatedfrom a formula as a function of stroke dimension,
Critique:
(a) The features of this procedure (which enhance its usefulness in tileintended application) introduce a lack of precision not desirable in EPAapplications.
(b) Tim procedure provides for the testing of motorcycles not having a"neutral" transmission position; this is accomplished by raising the rearwheel or removing the chain.
F-76 Uyno-Simulatien (simulated ,;lovingvehicle acceleration test)
A cursory investigation of the feasibility of simulating moving vehi-cle acceleration tests on a dyna_;_u,mterwas conducted, using one motorcycle(lionda CD 750) and a Pabetco Dyne (made by Weda Instruments). This dyna,am_-ter is one of the lowest priced portable units com_erclally available, notspecifically designed for noise testing, end not incorporating any quietingprovisions (Figure 3-12). The motorcycle was successively fitted with seven-teen different exhaust systems, which resulted in F-76 levels ranging frm;t82 to 98 dB. For the dyne-simulated F-76 test, the dyna,nometer was set upat tile test site at the F-75 test track end point, with the microphonepositioned as it would be for the actual F-76 test moving vehicle test.Noise level as measured at 75 percent RPilat full throttle was established, apracedure takin9 aho[*t15 seconds. Figure 3-13 presents tilecorrelation ofres,Jlts fru,l this test and the actual F-76 moving vehicle test. Readingswere taken only on the left side of the _notercycIe,even though som_ of toeexbaust systems were on the right side only; this because the dyna,,_oli_terconfi'lur_tlen precluded taking readings on the right side.
3-28
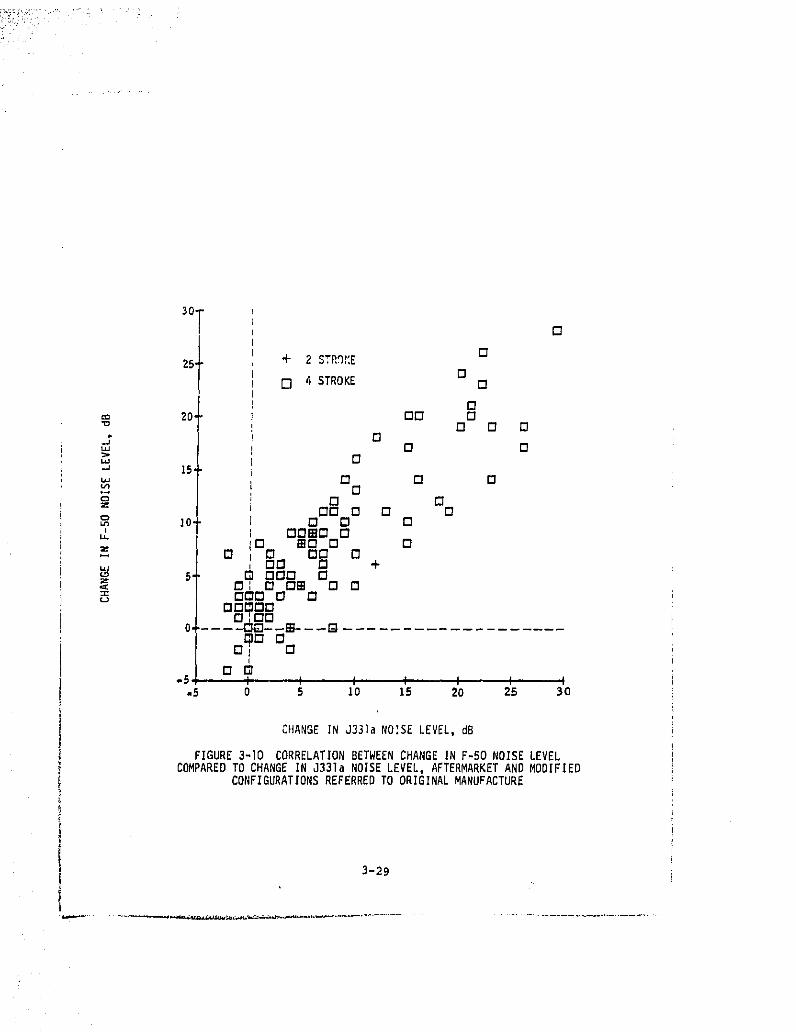
i:'i_ii_ •
CHANGEIN J33]aNOISELEVEL,dB
FIGURE 3-}0 CORRELATION BETWEEN CHANGE IN F-50 NOISE LEVELCOMPARED TO CHANGE IN J331a NOISE LEVEL, AFTERMARKET AND MODIFIED
CONFIGURATIONS REFERRED TO ORIGINAL MANUFACTURE
3-29
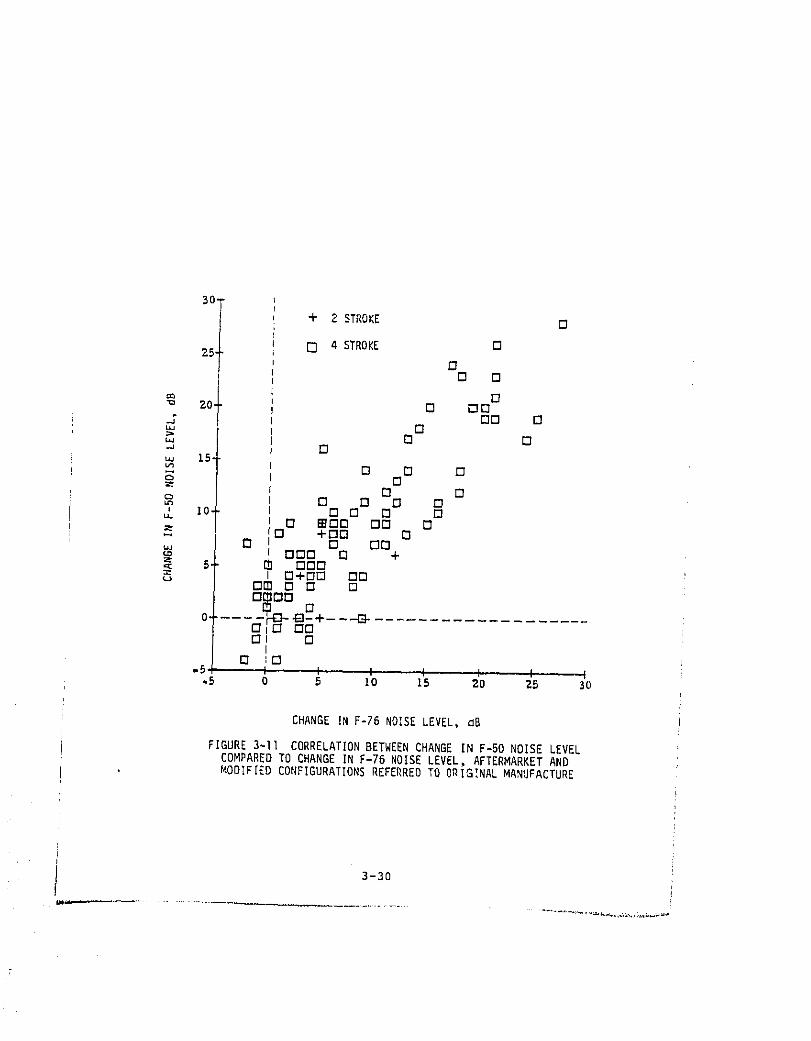
30'
+ 2 STROKE D
ZS, [] 4 STROKE DD
[] O
[]
DO D
i' _ 0 Di
! _ IS-D [] D
O D! o D [] D D
' I0- D D 0 DD _00 DO D
z 0 +OO OD D 90
900 D +S, _ ODD
= I O+O_ 90
O_OO
c ____I_+_____DI_ DDDI D
I[] _
-5 0 5 I0 15 20 25 30
CHANGE IN F-76 NOISE LEVEL, oB
FIGURE3-II CORRELATIONBETWEENCHANGEIN F-50NOISE LEVELCOMPARED TO CHANGE IN F-76 NOISE LEVEL, AFTERMARKET ANDMOOIFIEO CON_(GURATIONS REFE_REO TO ORIGINAL MANUFACTURE
3-30
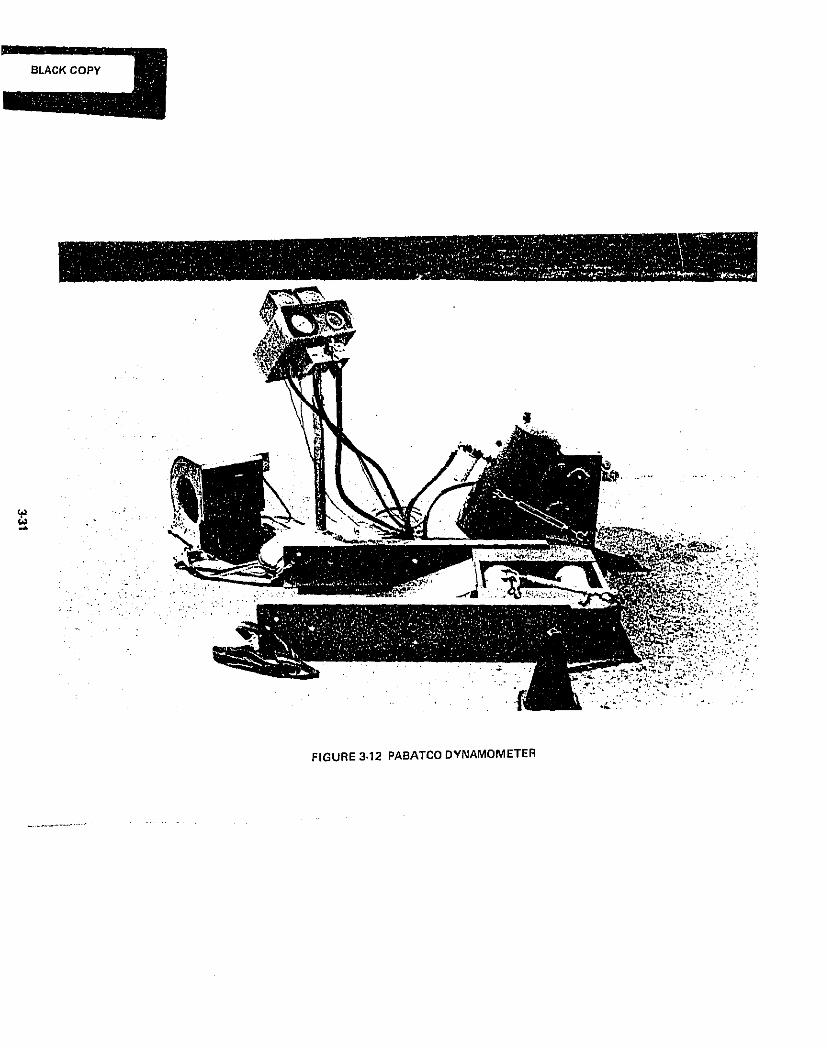
BLACK COPY
FIGURE 3.12 PABATCO DYNAMOMETER
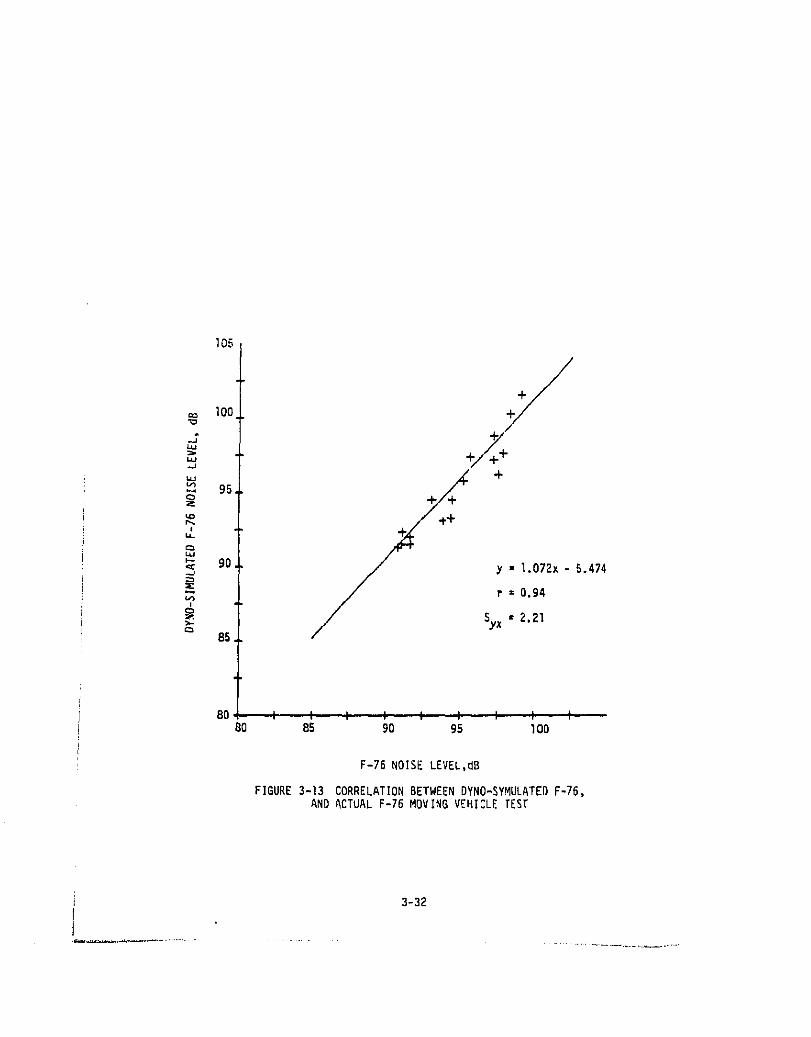
I°I ,/100 +_
'1o /
" ZI.u
=- ÷/uJ +-t-
95 -I'- -t-
u.
_ 90¢¢ y • 1.072x - 5.474.../
r = 0.94
>._ Syx = 2.2185
80 I I I I i I .... I I t80 85 90 95 100
F-76 NOISE LEVEL,dB
FIGURE3~13 CORRELATIONBETWEENDYNO-SYMULATEDF-76,AND ACTUALF-76MOVINGVEHICL£TEST
3-32
Potential advantages of the dynamometer test method include:
lower testing cost
removal of schedule constraints due to weather
greatly reduced area requirements
no transportation of vehicles to and from test site
greater accuracy by testing at a steady state condition ratherthan at a changing condiLion
no problems wiLh tachometer functioning, accuracy, or lag
removal of testing variables sucll as throttle closure, distancedetermi nation
rel;mvalof wind, weather, micro-meteorological variables
minimization of site variables
As discussed in Section 3.2, dyne-simulation of the SAE J331a or ISo/R-362test procedures is not feasible,
3.4 Measurement Distance Substitution
All of the noise e,aissiondata presented in this report were measured ata 50-foot distance (except tileF-50 data, which were i_asured at L).5m), asdelineated in the respective procedures. An investigation was made, i*owever,to determine feasibility of taking measurements at 25 feet, and correcting themeasured values to a 50-foot equivalent. Results of this investigation are
: shown in Table 3-3 and Figures 3-14 and 3-15; it is evident that no such
i conversion is possible in the case of an acceleration Lest (as opposed to aconstant speed test),
iThe reason for the lack of correspondence between the 5u-foot and 25-foot
measurei_nts was not investigated; it may be that tlmevehicle noise exhibits achanging polar pattern as tllevehicle accelerates, such that a lobe changes inmagnitude as it passes from one microphone to tileether, or It may relate to achanging interference relationship (discussed in section 4.2) resulting frollspectral changes as the vehicle moves past the microphones wltn chanoinuRPPI,
3-33
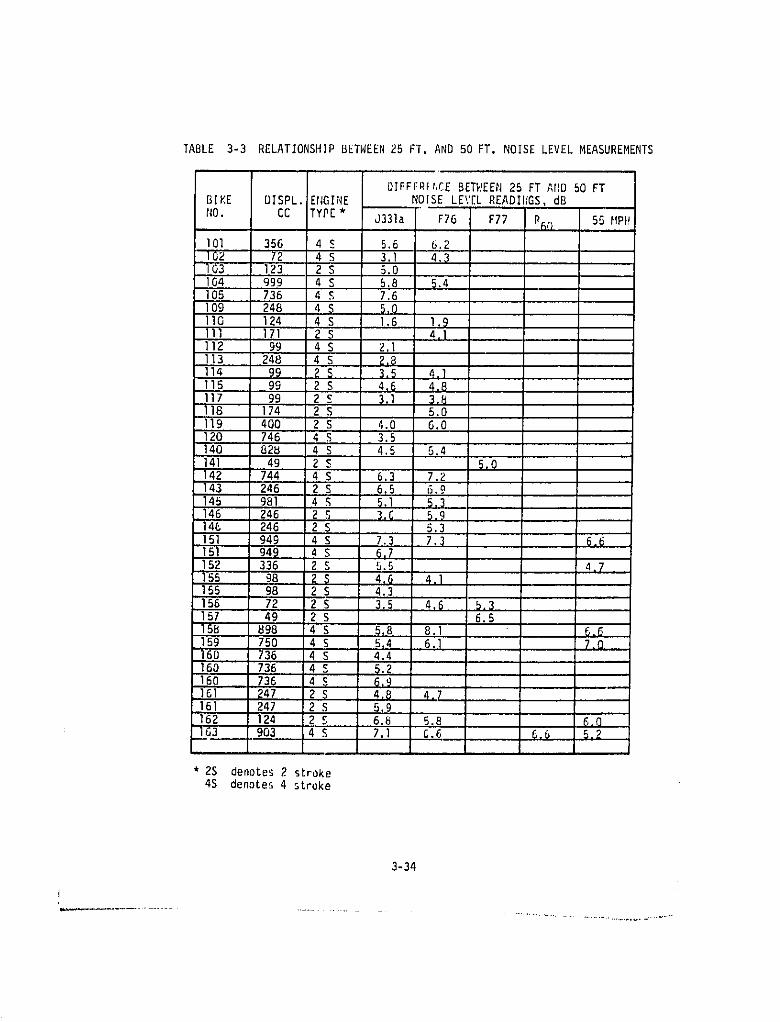
TABLE 3-3 RELATIONSHIP BETWEEN25 FT. AND 50 FT. NOISE LEVEL MEASUREMENTS
DIFFFRF_CE BETWEEN 25 FT AHD 50 FTBIKE DISPL. EIIGINE NOISE LEV[L READIIIGS,dO
NO. CC TYPE * J331a F76 F77 Phf) 55 MPI!
101 356 4 S 5.6 6.2
102 72 4 S 3,} 4._....I03 123 2 S 5.0
I04 999 4 S 5.8 _.4I05 736 4 S 7.6
I09 248 4 S 5,0110 124 4 S 1.6 1.9111 171 2 S 4,1112 99 4 S 2,1
113 248 4 S _,8114 99 2 S 3.5 4.1
115 99 2 S 4,6 4,@117 99 2 S _,1 _,_118 174 2 S 5.0119 400 2 S 4.0 6.0120 746 4 S 3.5140 82_ 4 S 4.5 5.4
141 49 2 S _,O"142 744 4 S 6.3 7.2143 246 2 S 6.5 6.9
145 981 4 S _.I _,_146 246 B S 3,_ _,914C 246 2 S 5.3
151 949 4 S 7.3 7._ 6.6151 949 4 S _,?152 336 2 S 5.5 4,7155 g8 __ 4,_ _,I155 98 2 S 4.3
156 72 2 S 3,5 4,6 b,3157 49 2S 6.515B B98 4 S 5.8 8.1 6.6
..159 750 4 S 5.4 6.1 7,Q160 736 4 S 4.4
160 736 4 S _._160 736 4 S _,_ .....161 247 2 $ 4,_ 4,7161 247 2 S 5.9
"162 124 2 S 6.8 5.8 _,QI_.63 903 4 S 7.1 C.6 _,_ 5.2
* 2S denotes 2 stroke4S denotes 4 stroke
3-34
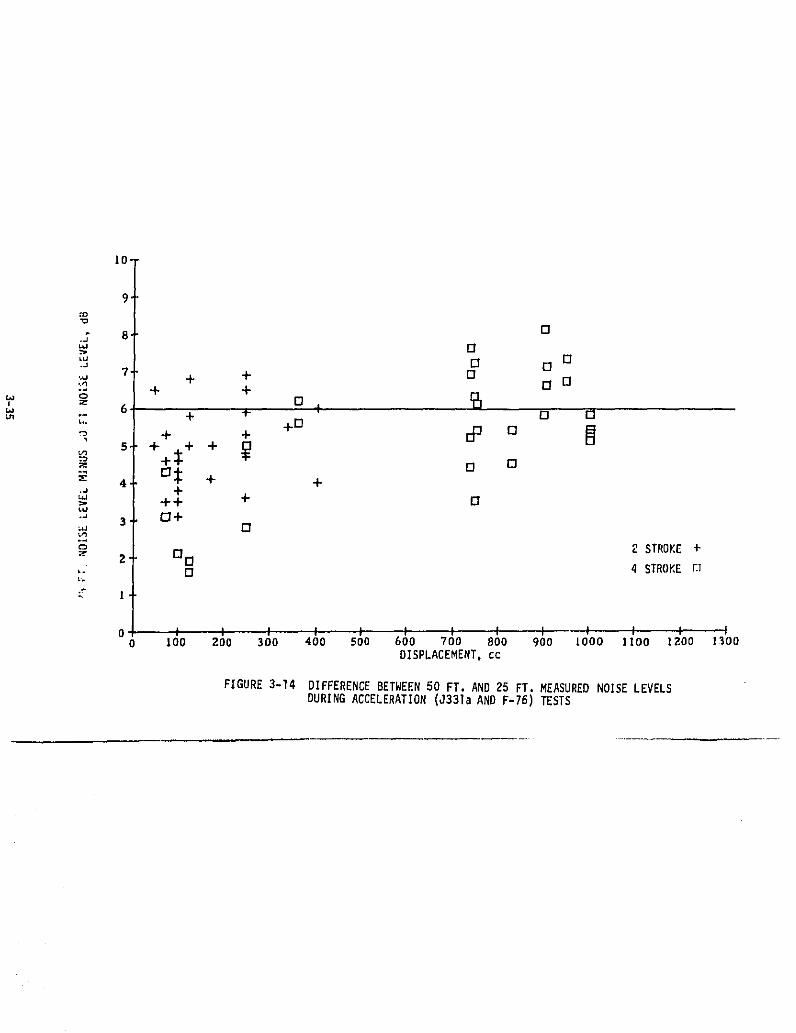
I0-
9'
.; 8 rl
.J D D D,_ 7 + D'._ + 121 []
+ +. z 6 0 4 "I_
_,. + t +D O 0
= . ++,++_ +4 +
+_. ++ 0t_J
"_ 3 r-]+ D
c_ 2 STROKE+_" 2' D D'- O 4 STROKE 111L.
0 ! I ! ! I I I I I ! I I I0 lO0 200 300 400 500 600 700 800 900 lO00 lIO0 1_00 1300
DISPLACEMENT,cc
FIGURE3-14 DIFFERENCEBETWEEN50 FT. AND 25 FT. MEASUREDNOISELEVELSDURINGACCELERATION(d331aAND F-76)TESTS
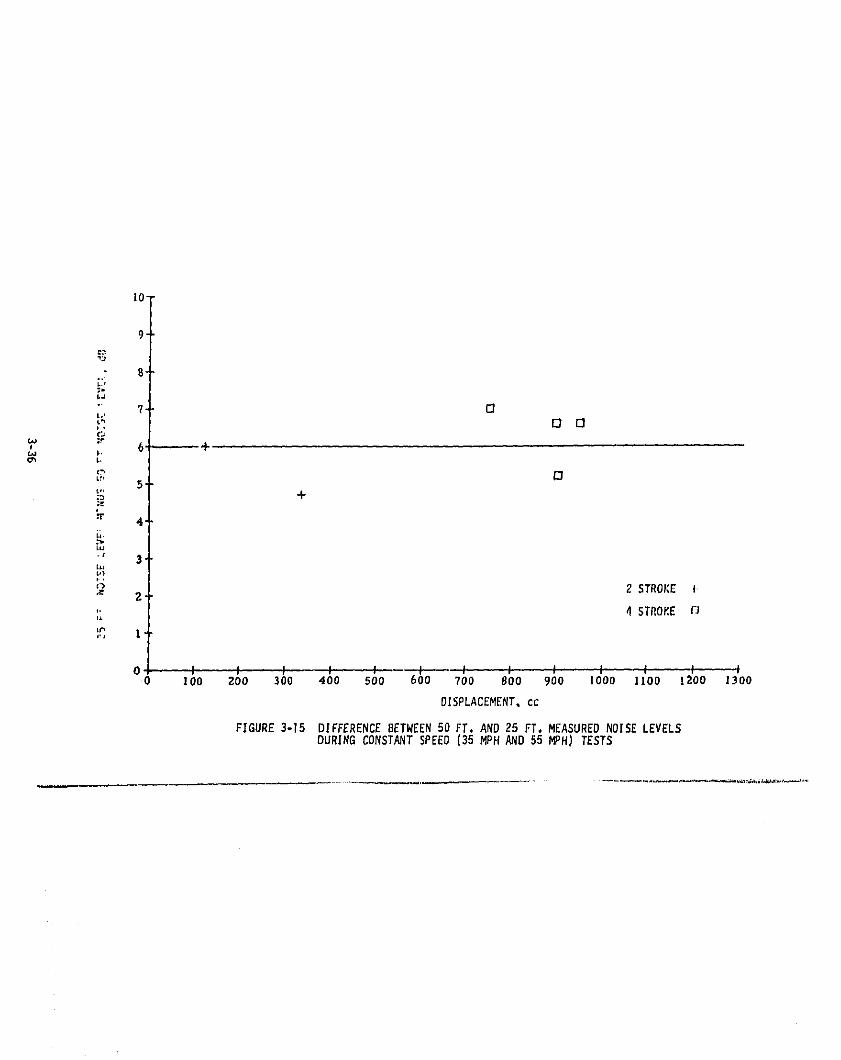
IO-
9-
.." B"_,r
L.' 7 C]
),
;Y
C_ LL
Lf_ 5
'.-r4
L4
LW
L_
),
(_ 2 STROKE t
,' 4STROKErJ
V"_ },I,j
! ! J I ! _ _ I I I I I '!O0 100 200 300 400 500 6 0 700 800 900 lO00 llO0 1200 /300
DISPLACEMENT, cc
FIGURE 3-15 DIFFERENCE BETWEEN 50 FT. AND 25 FT, MEASURED NOISE LEVELSDURING CONSTANT SPEED (35 MPH AND 55 MPH) TESTS
REFERENCES
I. Hetorcycle Noise Studies, report published by the ,Japan AutomobileManufacturers Association, Inc., Motorcycle Noise Control Committee,July, 1975.
2. Hornett, H. and £1illiamson, I. M., Evaluation of Stationary and MovingMotorcycle Noise Test Methods for Use in Proposed Regulations, McDo'nne-eTTDouglas Astronautics _mpany report prepared for the Motorcycle IndustryCouncil, Inc,
3-37
rm
•_--
4
z
_r_
SECTION 4
NOISE,LEVELDATABASE
4.1 Content and Format of the Data Base
The basic _}otorcyclenoise level data base used for this regulationis presented in Appendix C. Noise data for the following are included:
(a) 159 new 1976 model year l,lotorcycles(manufactured in 1975 and 1976);
(b) 60 motorcycles(manufacturedin 1974) in stockconfiguration;
(c) 257 in-servicemotorcyclesin stock configuration,manufactured1969-1973 (includes the data developed in tile MIC motorcycle testing program);
(d) 43 in-service modified motorcycles, manufactured 1969-1976;
(e) 107 motorcycleswith new aftermarketexhaustsystems.
Motorcycles in group "a" above provide tilebest noise level baselinefor assessingcost and economicimpactof adoptionof standardsmore stringentthan83 dB (for streetmotorcycles)which is the standardcurrentlyin effectin sor;_estates (e.g., California). Street motorcyclesmanufacturedpriorto 1975 have been subject to less stringentstandardsand are thereforenotrepresentativeof currenttechnologyapplicationsand cost.
Off-roadmotorcyclesin groups "a", "b", and "c" can be includedin thebaselinedata for the off-roadcategory,since regulationof noise emissionsfrom thosevehicleshas beenvery limitedin moststates.
_]otorcyclesin group "a" through "d" providea baseline for assessingenvironmentalimprove:nentthat can resultfromregulationof the new vehicle,the after,aarketproduct,and usermodifications.
Motorcycleaften_arketdata, group "e",showthe degreeto which curren-tly offered-for-saleaftermarketexhaust systems affect new vehicle noiseemissions.
The totalsampleof vehicles,groups"a" through"e" above,were employedin the developnmntand/orevaluationof testmethodologies(Section3) in thecourseof acquiringthe data base.
4-1
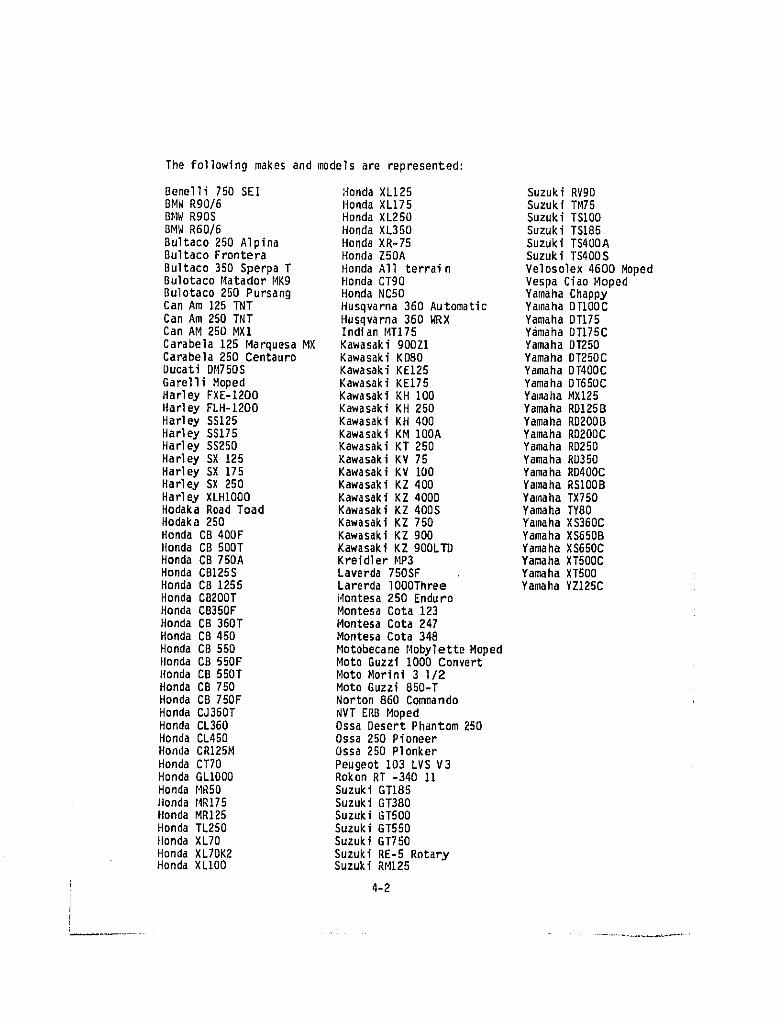
The following makes and models are represented:
Benelli750SEI :HondaXLI25 SuzukiRvgoBMW R90/6 llondaXL175 SuzukiTM75BMWRgos HondaXL250 SuzukiTSIO0BMW R60/6 HondaXL350 SuzukiTSI85Bultaco250Alpina HondaXR-75 SuzukiTS4OOABultacoFrontera HondaZ50A SuzukiTS400S
Bultaco350 SperpaT HondaAll terrain Velosolex4600 MopedBulotacoMatadorMK9 HondaCTgO VespaCiaoMopedgulotaco250Pursang HondaNC50 YamahaChappyCan Am 125TNT Husqvarna360 Automatic YamahaDTIOOCCanAm 250TNT Husqvarna360 WRX YamahaDT175CanAM250MX1 IndianMT175 YamahaDT175CCarabela125 MarquesaMX Kawasaki900ZI YamahaDT250Carabela250 Centauro KawasakiKD80 YamahaDT250CDucatiDM750S KawasakiKEI25 YamahaDT4OOCGarelliMoped KawasakiKEI75 YamahaDT65DCHarleyPXE-1200 KawasakiKH 100 YamahaMX125HarleyFLH-1200 KawasakiKH 250 YamahaRD125BHarleySS125 KawasakiKH 400 YamahaRD2OOBHarleySS175 KawasakiKM IOOA YamahaRD200CHarleySS250 KawasakiKT 250 YamahaRD250HarleySX 125 KawasakiKV 75 YamahaRD350HarleySX 175 KawasakiKV 100 YamahaRD400CHarleySX 250 KawasakiKZ 400 YamahaRSIODBHarleyXLHIO00 KawasakiKZ 400D YamahaTX750HodakaRoadToad KawasakiKZ 400S YamahaTY80Hodaka250 KawasakiKZ 750 YamahaXS360CHondaCB 400F KawasakiKZ go0 YamahaXS65DBfloridaCB 50OT KawasakiKZ gOOLTD YamahaXS650CHonda CB 150A Kreidler_IP3 YamahaXT50OCHondaCB125S Laverda750SF YamahaXTSOOHondaCB 1255 LarerdalO00Three YamahaYZ125CHonda CB2OOT Montesa250 EnduroHondaCB350F MontesaCota 123HondaCB 360T MootesaCota 247HondaCB 450 MomtesaCota348
HondaCB 550 MotobecaneMobyletteMopedHondaCB 550F MotoGuzzi1000ConvertHonda CB 550T Moto Morini3 I/2HondaCB 750 MotoGuzzi850-THondaCB 750F Norton860 CommandoHondaCJ36OT NVTERBMopedHondaCL360 OssaDesertPhantom250HondaCL450 Ossa250 PioneerHondaCRI25M Ossa250PlonkerHondaCT70 Peugeot103 LVS V3HondaGLIOOO RokonRT -34011HondaMR50 SuzukiGTI85HondaMRI75 SuzukiGT380HondaMR125 SuzukiGT500HondaTL250 SuzukiGT550ilondaXL70 SuzukiGT750
HondaXL7OK2 SuzukiRE-5RotaryHondaXLIO0 SuzukiRMI25
4-2
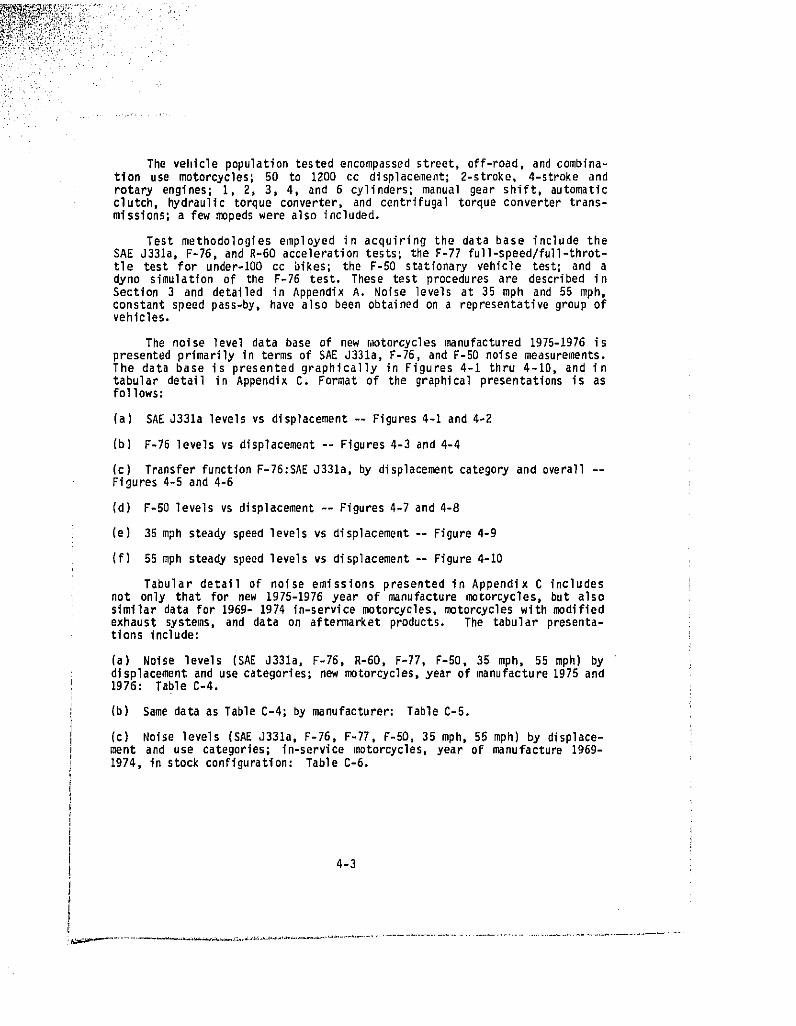
The vehiclepopulationtestedencompassedstreet,off-road,and combina-tion use motorcycles;50 to 1200 cc displacement;2-stroke,4-stroke androtary engines; 1, 2, 3, 4, and 6 cylinders;manual gear shift, automaticclutch, hydraulictorque converter,and centrifugaltorque convertertrans-missions;a few mopedswere also included.
Test methodologies employed in acquiring the data base include theSAE J331a, F-76, and R-60 accelerationtests;the F-77 full-speed/full-throt-tle test for under-t00cc bikes; the F-50 stationaryvehicle test; and adyne simulationof the F-76 test. These test proceduresare describedinSection 3 and detailed in Appendix A. Noise levels at 35 mph and 55 mph,constantspeed pass-by,have also been obtainedon a representativegroup ofvehicles.
The noise level data base of new motorcyclesmanufactured1975-1976ispresentedprimarilyin terms of SAE J331a,F-76, and F-50 noise measurements.The data base is presented graphically in Figures 4-1 thru 4-10, and intabular detail in Appendix C. Format of the graphicalpresentationsis asfollows:
(a) SAE J331a levelsvs displacement-- Figures4-I and 4_2
(b) F-76 levelsvs displacement-- Figures4-3 and 4-4
(c} TransferfunctionF-76:SAEJ331a, by displacementcategoryand overall--Figures 4-5 and 4-6
(d) F-50 levelsvs displacement-- Figures4-7 and 4-8
(e) 35 mph steadyspeedlevelsvs displacement-- Figure4-9
(f) 55 mph steadyspeedlevelsvs displacement-- Figure4-10
Tabular detail of noise emissions presented in Appendix C includesnot only that for new 1975-1976year of manufacturemotorcycles,but alsosimilardata for 1969- 1974 in-servicemotorcycles,motorcycleswith modifiedexhaust systems, and data on aftermarketproducts. The tabular presenta-tions include:
(a) Noise levels (SAE J331a, F-76, R-60, F-77, F-50, 35 mph, 55 mph) bydisplacementand use categories;new motorcycles,year of manufacture1975 and1976: Table C-4,
(b) Samedata as TableC-4; by manufacturer:TableC-5.
(c) Noise levels (SAEJ331a, F-76, F-77, F-50,35 mph, 55 mph) by displace-ment and use categories;In-servlcemotorcycles,year of manufacture1969-1974, in stock configuration:Table C-6.
4-3
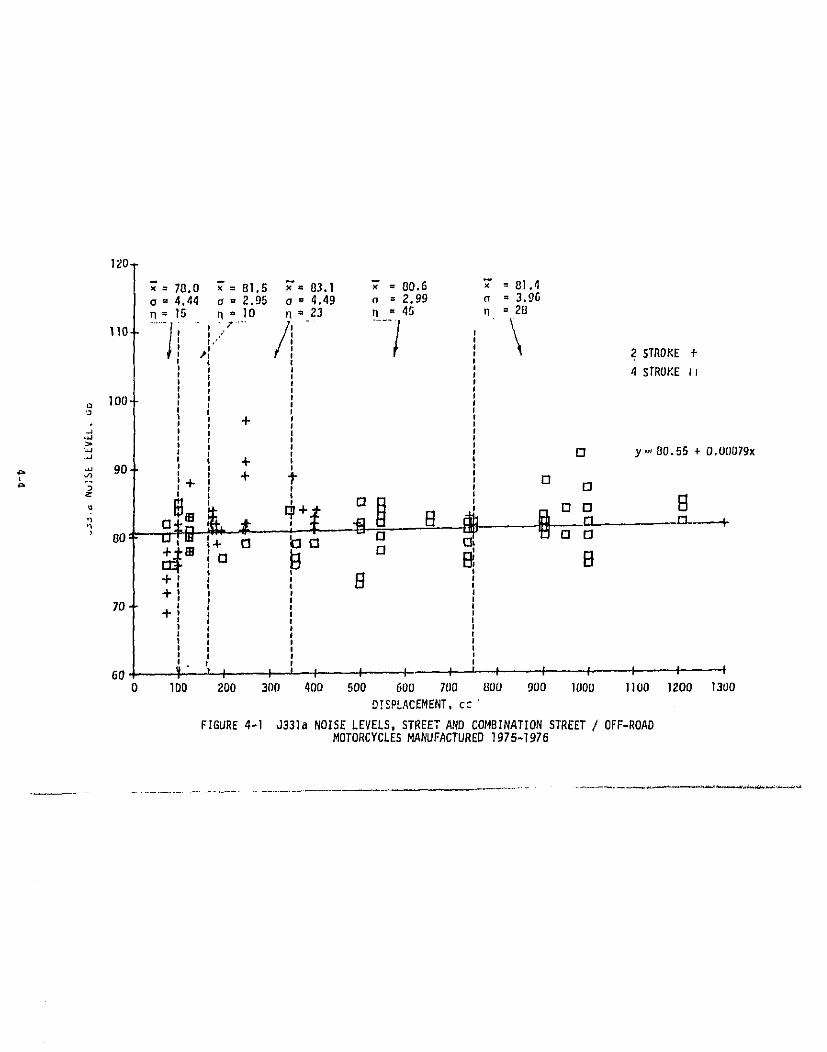
_= 78,0 ;= 81.5 ;'= 83.1 _ = 80.6 ; = 81.4a = 4.44 o- = 2.95 a = 4.49 o = 2.99 a = 3.96n = 15 n = 10 n ° 23 n = 45 n = 28
......j -,- /, ...... j \11o I I .,,i h' i
I "*[ ' 2 STROKE +4 STROKE IJ
100
+
D y..80.55 + O.000/gx
=. ,_ 90 + "1" D
B I"1 rl ,4- • ;'J n El El
' 80: 4- El _ El r-II
+ B+
70, +
60 I I I I I I I I I I _1DO 200 300 400 500 600 700 800 900 lOOO I100 1200 1300
D_SPLACEMENT,cc
FIGURE4-1 J331aNOISELEVELS,STREETAND COMBINATIONSTREET/ OFF-ROADMOTORCYCLESMANUFACTURED1975-1976
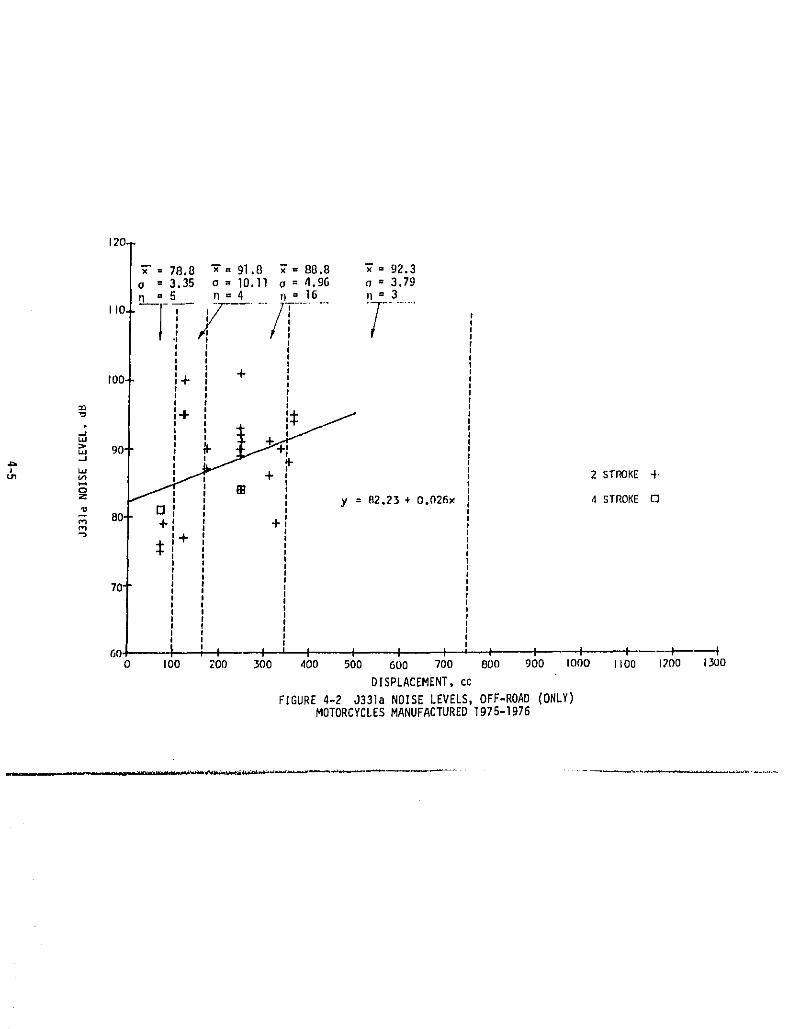
J33)a
NOISE
LEVEL,
dB
00
00
00
c.I
'I
,I
II
t
1=ox
I"t
-4'-
..,l.{
:I_
ju,:.
+-_
--+
-,-
.....t
'_
,+
o_.___
+__
_:+___
_.._
_::,
.......................
I=--'--I:l:
...............
I:..
--4
I
:_z__
_,,_
"qrrl
.._
0
,-)r-_
_ol_
Xi_ir-,-
"wOO
_.
I|
_0
1.00
•..t::c_
._
o°"
v<
0 ,'I-F
T.,

120"_= 77.0 "_= 79,5 "_= 81,95 "_= 81.9 _'= 85.5o = 4.22 o = 2.64 o = 4,04 o = 2,63 o= 3.47L 11 n = 10 n = 40 n = 40 n = 18
,,o / ......./. -/ ...... \
IOO 2 STROKE +m 4 STROKE U
_ 90'
z _+ i +
' + + I++ []
a 80. _B o []
I
70 + I y = 75.7 + 0.01 xIII
IIII
•| _ 1 ! I I ,I I , I I I I60 _ I00 200 300 400 500 600 700 800 900 I000 I100 1200 13(10
DISPLACEMENT, cc
FIGURE4-3 F-76 NOISELEVELS,STREETAND COMBINATIONSTREET/OFF-ROADMOTORCYCLES MANUFACTURED 197S-1976
E)
E_
if/t,_
Q
(ML
C.I._
.............
o.......
..............
............
UO_
0UE_
i,om
u.z_u
nu
i"_
I___
..................
......................
un
H......--_--\I
Ix_
_L_.
...................................'_
\_._
j............
_+____+......
\+
o_.--,_
I..........
_"......................¢)
Ujl
iI_
iI
I_
,_
;;.=
N_
Q
_P
"]3A3]3SlON
gZ-:l
4-7
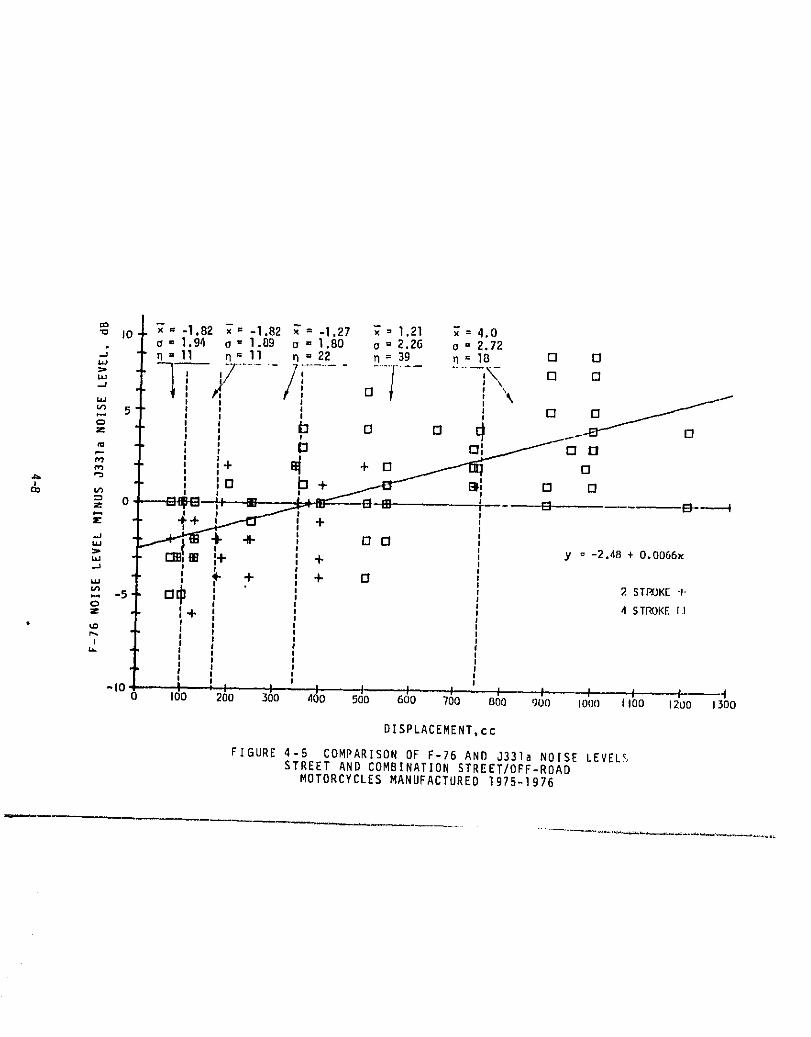
'= "_ -1.B2 ;= -1.82 _'= -1,27 ;= 1,21 ;= 4.0-o I0
._; c, ,, 1.94 a = 1.89 a = 1.80 o = 2,26 o = 2.72n = 11 n = 11 n =22 n= 3g n= 18 O O
-> -i-,/ ........./_.......°-i.... .....-'- = °==i \\i_LIJ
m 5 I _ []
==N ,I _ o o d r-,! I I
I+ + El 13_= _ lO b+ '& _ , B_I o o
=¢ [] --E_- ;
+,+ +
+ y = -2.4B + 0.0066×
, ,_ + + O-5 I"1 2 STROKE-F
z I+ 4 STROKEIIr%
• _ I I I I I I-I0 0 I00 2_0 30 4_0 5_0 6_0 7_0 800 900 I0(}0 II00 1200 1300
DISPLACEMENT,cc
FIGURE 4-5 COMPARISON OF F-76 AND J331a NOISE LEVELSSTREET AND COMBINATION STREET/OFF-ROAD
MOTORCYCLES MANUFACTURED 1975-1976
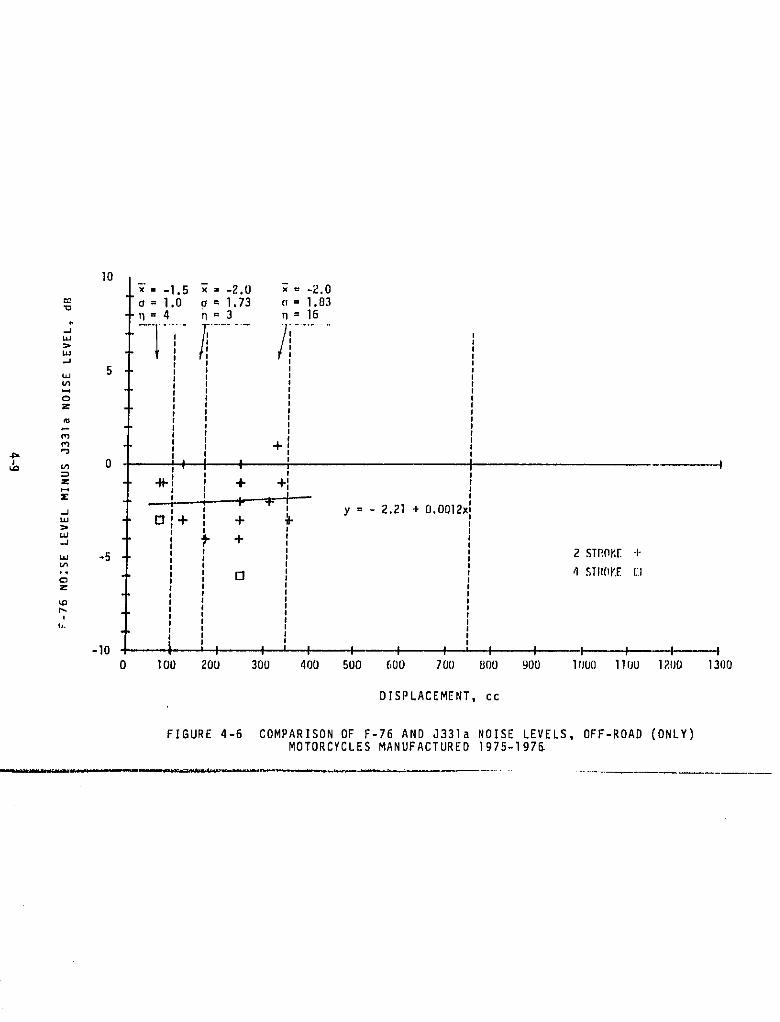
IOT;= -1.5 "_- -2.0 _,: -2.0
= a = 1.0 a = 1,73 (i = 1.83n:4 n=3 n:16
LIJ I I
,..I
_ 5
Z
m
m +
& _ 0 I! I !_I + +
.j - y = - Z,Z1 + O,O012xi=mL_J
__ _- +u_ -5 2 STI!,0K[+
rl 4 STR(IKE[I
'.Dr.,
l
Li.
-10 I I I I I I I I I I I IIO0 20U 300 400 500 (',00 700 800 900 1000 I1(JU 12{)O 13(]0
DISPLACEMENT, cc
FIGURE 4-6 COMPARISON OF F-76 AND a331a NOISE LEVELS, OFF-ROAD (ONLY)MOTORCYCLES MANUFACTURED 1975-197_
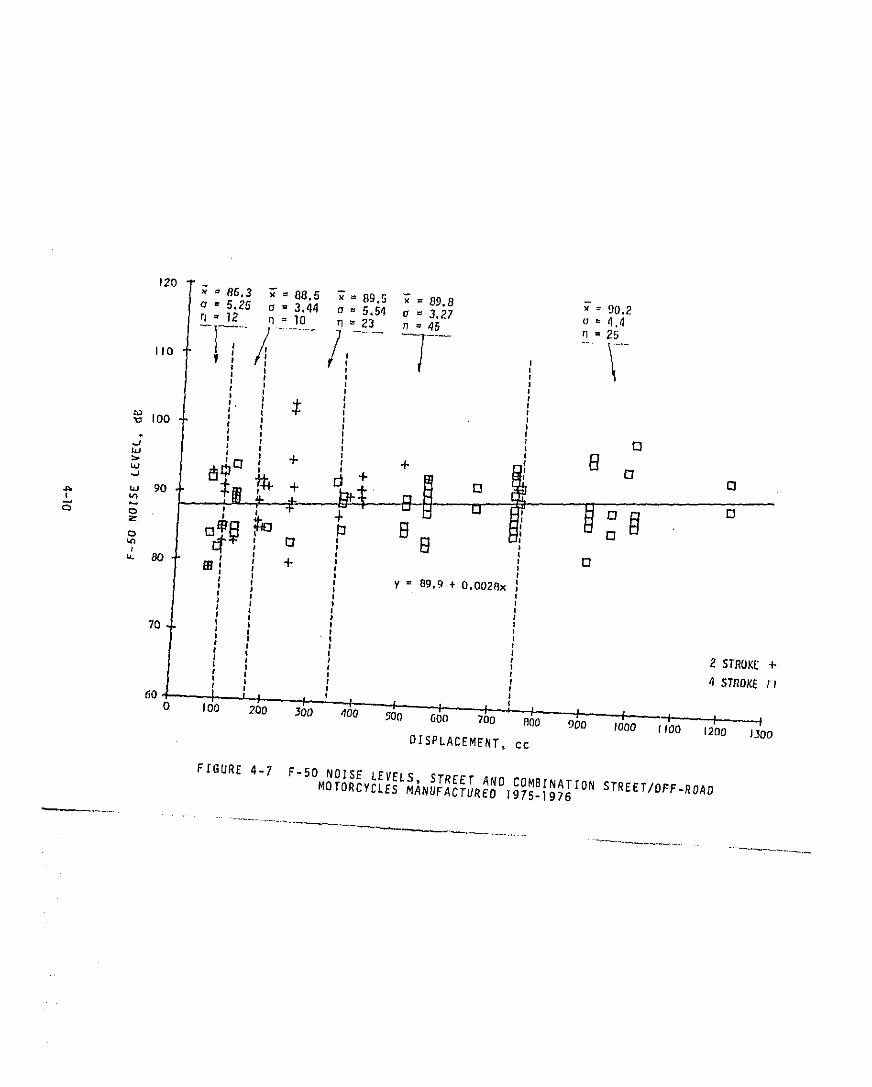
120 '; = 86,3 _"=' I]8,5 "_=' 89,5 _ = 89.8 _-= 90.2= 5.25 cl = 3.44 a = 5,54 _ = 3.27 u = 4.4
rl = 12 n = lO n _ Z3 n = 45 _ = 25
,,o-I-/ ........./ ......-I........ iI00
' D
- _ - u [3 _ O
m 13
80 _ +y = 89.9 ÷ 0.0028x
?QSTROKZ+
4 STROKErl
I00 20D 300 400 _00 600 700 _00 900 #000 (IO0 1200 1300
OfSPLACEMENT, cc
FIGURE 4-7 F-5O NOISE LEVELS, STREET AND COMBINATION STREETOFF-ROADMOTORCYCLES MANUFACTUREO Ig7B-1976
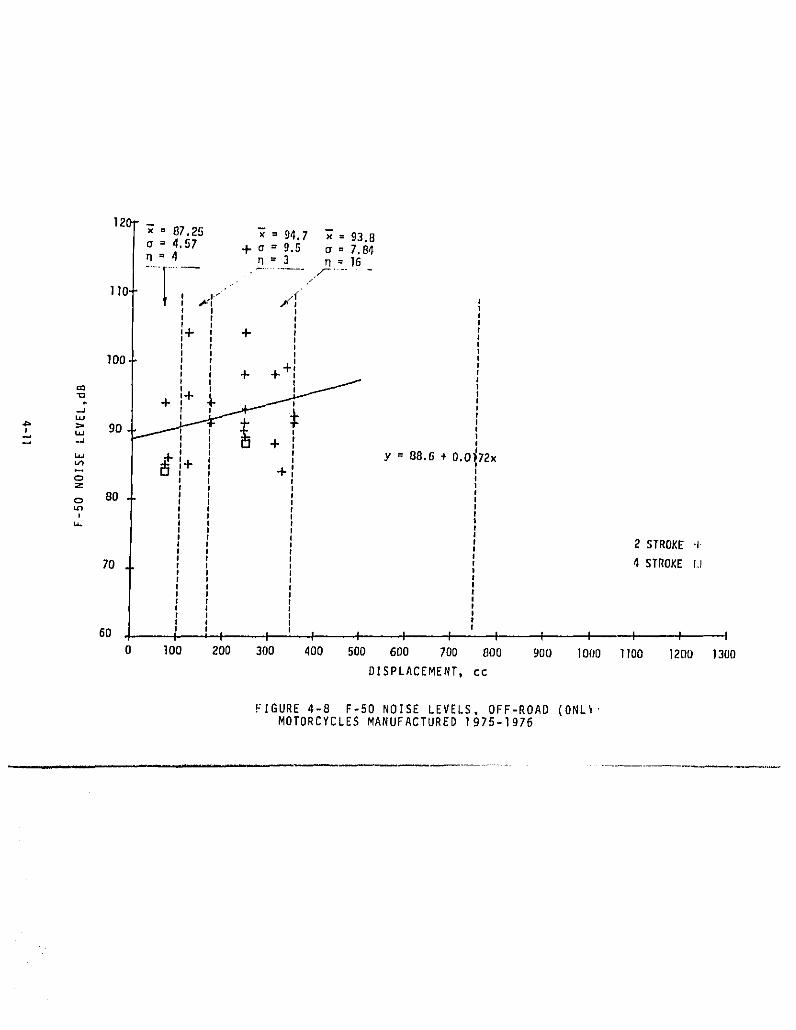
12G "_ = 87.25 "_ = 94.7 "_ = 93.8= 4.57 -t- a = g.o o = 7.84
n"4 n =3 n=16
110. , ,.. 'I P-'l f']_fiI
I+ +ri
I00. l, +Ii + + ,
? > 90
_ I y = 88.0 -#-0,0] 72x+N O' +:Z
o 80I
2 STROKE.I
70 4 STROKE IJ
60 I I I I I I 'I I I I I I
0 100 200 300 400 500 600 700 000 900 1000 II00 1200 1300
DISPLACEMENT, cc
FIGURE 4-8 F-50 NOISE LEVELS, OFF-ROAD (ONL%'MOTORCYCLES MANUFACTURED 1975-1976
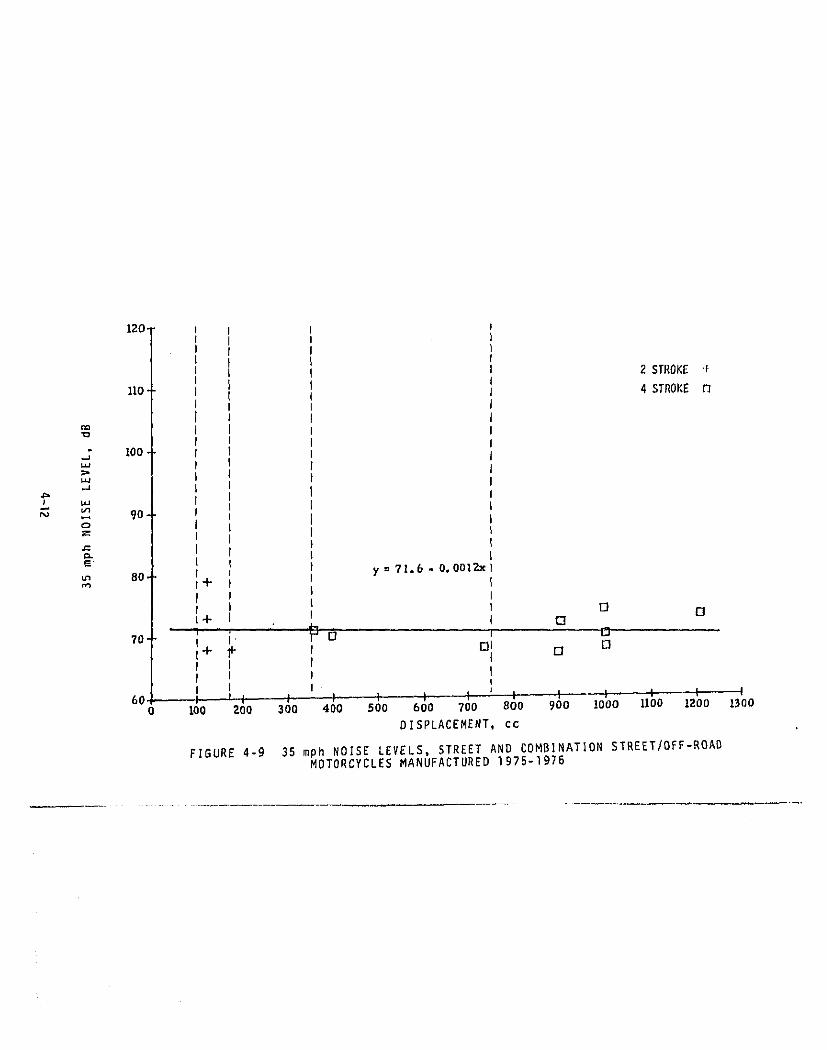
120-
2 STROKE 'f
II0- 4STROKEN
_- lOO-f..zJ
,,.J
_ 9o-
y = 71.b - O.O01)J¢,_"' 80- 11+
Ir _ 13
70" "' I '1-' IJI+ p r _$ DI I I I ElI J P I[I I I j
60 l r # I ) I 1 t I I _ l [ l0 100 200 300 400 500 600 700 800 900 1000 1100 1200 1300
DISPLACEMENT, cc
FIGURE 4-9 35 mph _OISE LEVELS, STREET AND COMBINATION STREET/OFF-ROADMOTORCYCLES MANUFACTURED 1975-1976
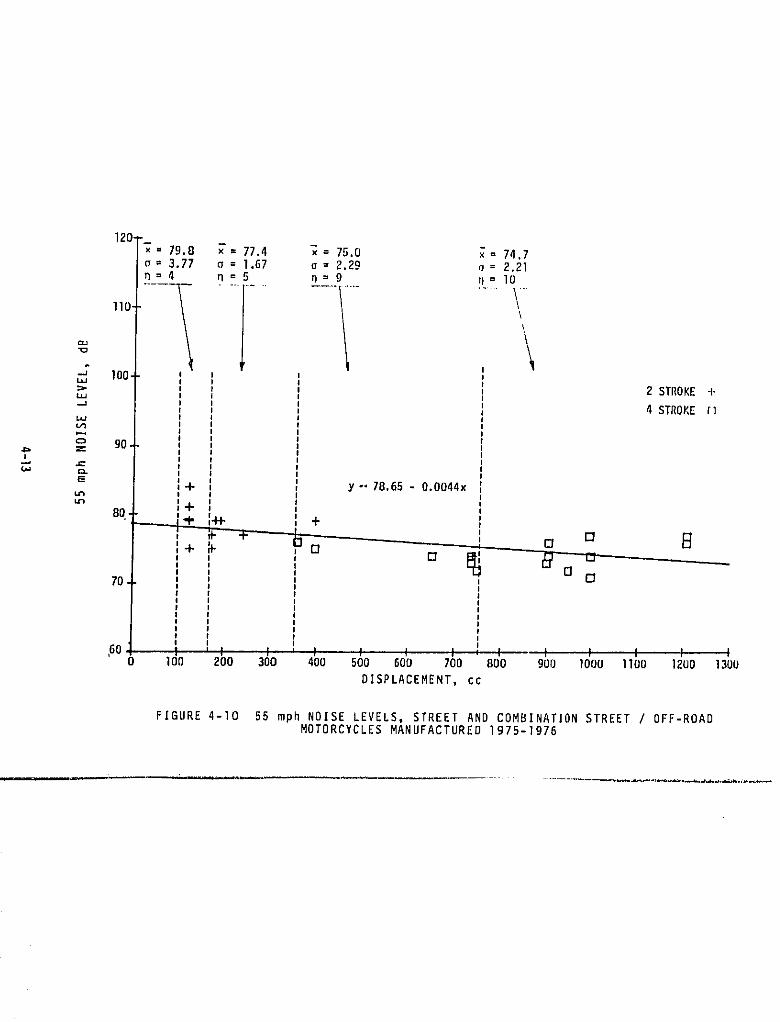
120T-
jii 79.8 x 77.4 x= 7,5.0 x= 74.73.77 cJ 1.67 o = 2.29 _ = 2.214 n 5 n=9 n= I0
llO-
w*
lO0-LZ=I
=" 2STROKE+
4STROKE_I
N 90I
+ Y-" 78.65 - 0.0044x
Bc -__I* I-H- +
, _ .t - _-- _ [] [] E_
70
60 ! I I I I I I I I I I I100 200 300 400 500 600 700 800 900 1000 llOO 12DO 1300
DISPLACEMENT, cc
FIGURE 4-10 55 mph NOISE LEVELS. STREET AND COM_INATION STREET / OFF-ROADMOTORCYCLES MANUFACTURED 1975-I076
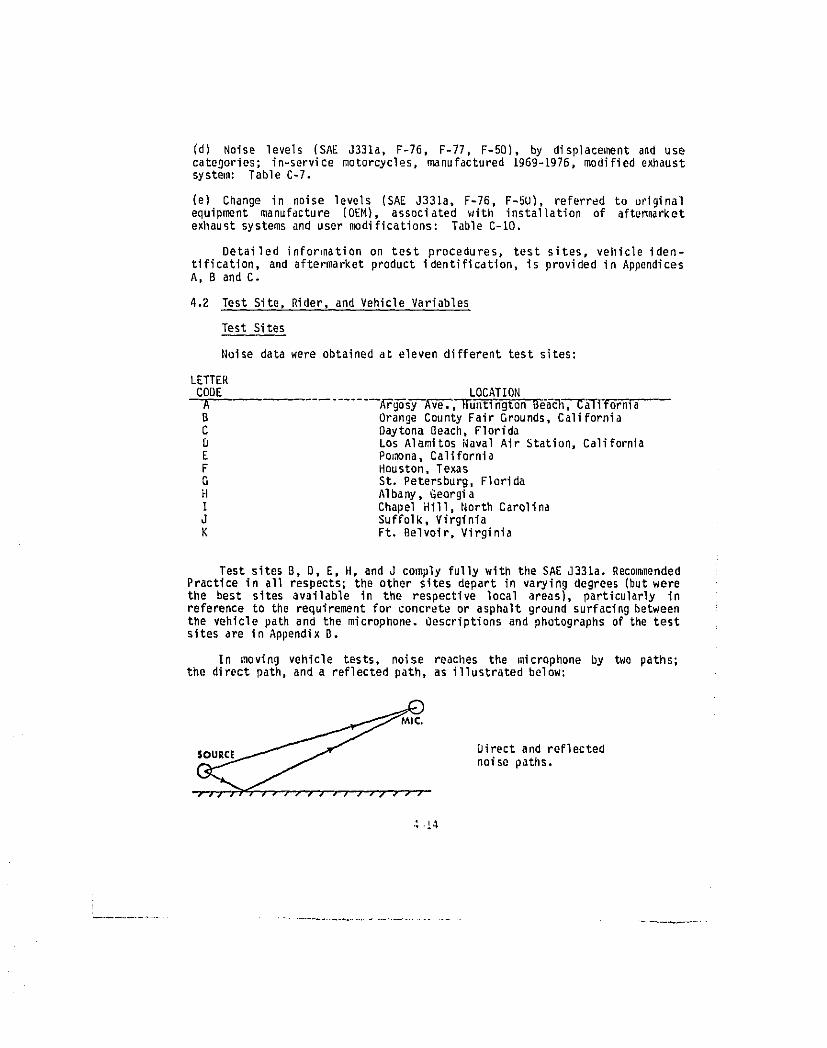
(d) Noise levels (SAE J331a, F-76, F-77, F-50), by displacementand usecategories;in-servicemotorcycles,manufactured1909-1976,modifiedexhaustsystem: Table C-7.
(e) Change in noise levels (SAE J331a, F-76, F-SU), referred to originalequipment manufacture (OEM), associated with installationof aftermarketexhaust systems and user modifications: Table C-I0.
Detailed information on test procedures, test sites, vehicleiden-tification, and aftermarket product identification, is provided in AppendicesA, B and C.
4.2 Test Site, Rider, and Vehicle Variables
Test Sites
Noise data were obtained at eleven different test sites:
LETTERCODE LOCATIONA "A-_s-#--vA-C_i'.,YiuntingtonBeYc-h'_Cali-forniaB OrangeCountyFair Grounds,CaliforniaC DaytonaBeach,FloridaD Los AlamitosNavalAir Station,CaliforniaE Pomona,CaliforniaF Houston,TexasG St. Petersburg,FloridaH Albany,GeorgiaI ChapelHill, NorthCarolinaJ Suffolk,VirginiaK Ft.Belvoir,Virginia
Test sitesB, D, E, il,and J complyfullywith the SAE J331a. RecommendedPracticein all respects;the other sitesdepart in varyingdegrees(butwerethe best sites available in the respective local areas), particularlyinreferenceto the requirementfor concrete or asphaltgroundsurfacingbetweenthe vehiclepathand the microphone,descriptionsand photographsof thetestsites are in Appendix B.
In _novingvehicle tests, noise reaches the microphoneby two paths;the directpath,and a reflectedpath, as illustratedbelow:
MIC.
_irectand reflected
noise paths.
._14
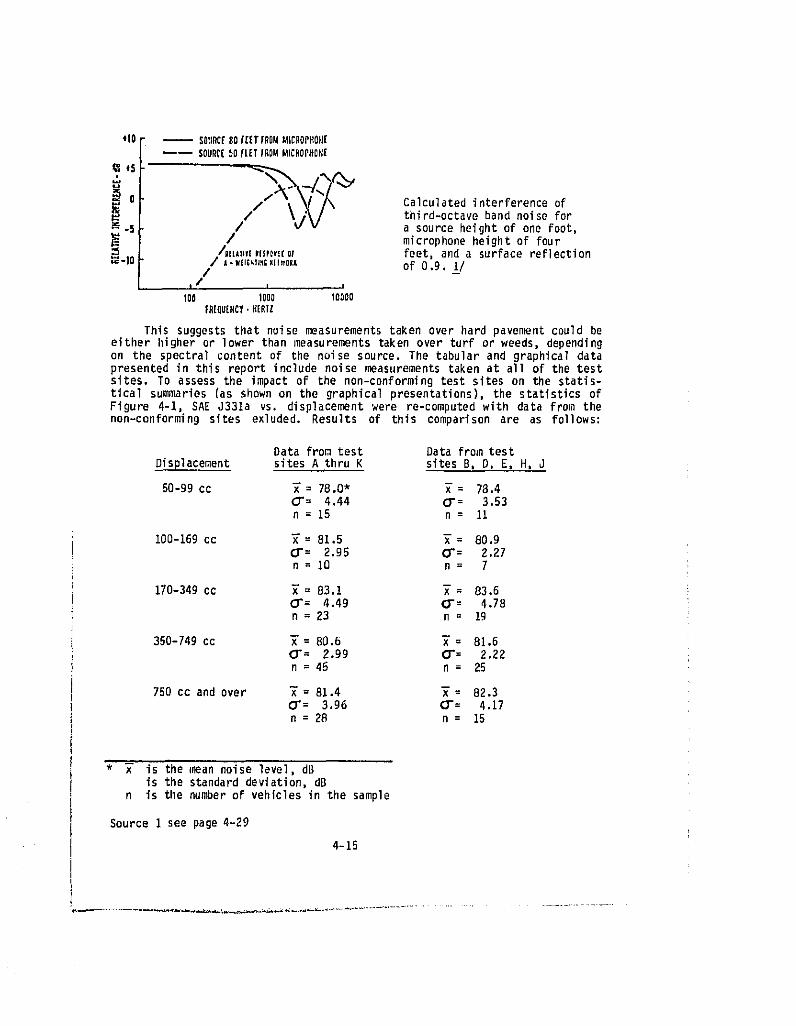
410 SOII_'_80f[ITtROMMICROPRO)J(_ $OUI_(50ILET/GOMMICBOPHOB[
i 0 Calculated interference of//I \J_/v x third-octave band noise for
a sourceheightofonefoot,-5 / microphone height of four"_ ./JEL_nvtm_P_N;(ol feet, and a surface reflection_-I0 z J-wll;_n_;_u,aJ_ of o.g. 1//
i _# i I
I0_ I000 IOOOOIR[QU[NCY,MERIZ
This suggests that noise measurements taken over hard pavement could beeither higher or lower than measurements taken over turf or weeds, dependingon the spectral content of the noise source. The tabular and graphical datapresented in this report include noise measurements taken at all of the testsites. To assess the impact of the non-conforming test sites on the statis-tical summaries (as shown on the graphical presentations}, the statistics ofFigure 4-1, SAE J331a vs. displacement were re-computed with data from thenon-conforming sites exluded. Results of this comparison are as follows:
Data from test Data from test
Displacement sites A thru K sites B, 0, E, H, J
60-99 cc _= 78.0" _= 78.4(7"= 4.44 0-= 3.53n = 15 n = 11
100-169 cc _ = 81.5 x-= 80.9CI'= 2.95 (_'= 2.27n=10 n= 7
170-349 cc _= 83.1 _= 83.6CT'= 4.49 0"= 4.78n = 23 n = 19
350-749 cc _ = 80.6 x"= 81.6(_'=2.99 0"= 2.22n = 48 n = 25
750 cc and over x'= 81.4 _= 82.3CT= 3,96 0"= 4.17n= 28 n= 15
_ is the mean noise level, dBis the standard deviation, d8
n is the number of vel_Iclesin the sample
Source I see page 4-29
4-15
lI
...............
The foregoing indicates that wh_le site discrepanciescould be veryimportant in determiningcomplianceof a particular vehiclewith a noisestandard, the effect of site discrepancies as encountered in test sitesA, C, F, G, I, and K do not materlally affect the statistical summariesof the motorcyclenoise data base. Additionaldata on site variablesarepresentedin AppendixC, TableC-15.
Rider Variables
At test site C (Daytona Beach) each motorcycle was operated by theowner of the vehicle;riderweight specificationsof the SAE J331a procedurewere not observed, The Daytona tests (run concurrentlywith the DaytonaBeach 200 Nationals)were conductedprimarily to obtain a sample showingthe range of vehicle types, and the types of user modifications, repre-sentativeof vehiclescurrentlyon the road.
At all of the other sites,the riderwas withinthe 165-175lb. specifi-cation. A differentrider, properlytrainedand instructed,was usedat eachsite, but all bikes at a given site were testedby the same rider,exceptforsiteB, where threeriderswere employed.
VehicleVariables
Production variability data provided by tilevehicle manufacturersshow that a three-slgmavariationof 1.5 dB is common. Samplestakenover asix-monthperiodby one manufacturerhave shown a totalvariationrangeof upto 4 dB. The reasonfor the latter,which may be a seasonalvariation,hasnot been explained. This suggests that a 2 dB allowancebetweendesignandnot-to-exceedlevelsis an absoluteminimum,without consideringthe need fora furtherallowancein the enforcementsituation.
CombinedVariablesEffect
Factors known or suspected to affect measured noise levels include;
(a) Weather variablesaffectingnoise propagation:
sunny vs overcastskywind velocity/gradient/directiontemperatureand temperaturegradientsbarometricpressurehumidiV
(b) Weathervariablesaffectingenginesoundpower generation;
barometricpressuretemperaturewater vaporpressuredry barometricpressuredry air density
4-16
(c) Manufacturing/assembly/adjustmenttolerancesaffectingenginenoise powergeneration:
- dimensional variationsspark timing
- fuel/airmixturecompression variations
(d) Operation variables:
engine temperatureentering RPM or speed (SAE J331a)rapidity of throttle opening (SAE J33ia)entering start point (SAE J331a)choice of gear selection (SAE J331a)closing RPM (SAE J331a and F-76)closingpoint (F-76)
(e) Site variables (site assumed to be in compliance with SAE J331a Recom-mended Practice):
• - surface texture (affecting tire noise)porosity (affecting absorption coefficient)
(f) Instrumentation variables:acoustical calibrator accuracysound level meter ANSI Type (1 or 2)sound level meter crest factor
- speedometeraccuracy (SAEJ331a)- tachometer steady-state accuracy (SAE J331a)- tachometer dynamic lag (SAE J331a and F-76)
Much work has already been done in assessing the effect of many of1,2/
these variables"- ; however, many undefinedareas still exist. Althoughthe evaluationof the effects of these variableswas outsidethe scope ofthe EPA study, quantitativedata on the effectof tachometeraccuracy,RPMcontrol, and gear selectionwere obtainedin the course of test proceduredevelopment.
In addition, in the process of acquiring the noise data base, sub-stantial informationwas collectedon the effects of combinedvariables.Noise level data comparisonsbetween/amongvehicleswere made in four group-ings:
(a) Differentvehiclesof the same modeltestedat differentsites;
(b) Differentvehlclesof the same modeltestedat the same site;
Notes i and 2 see page4-29
4-17
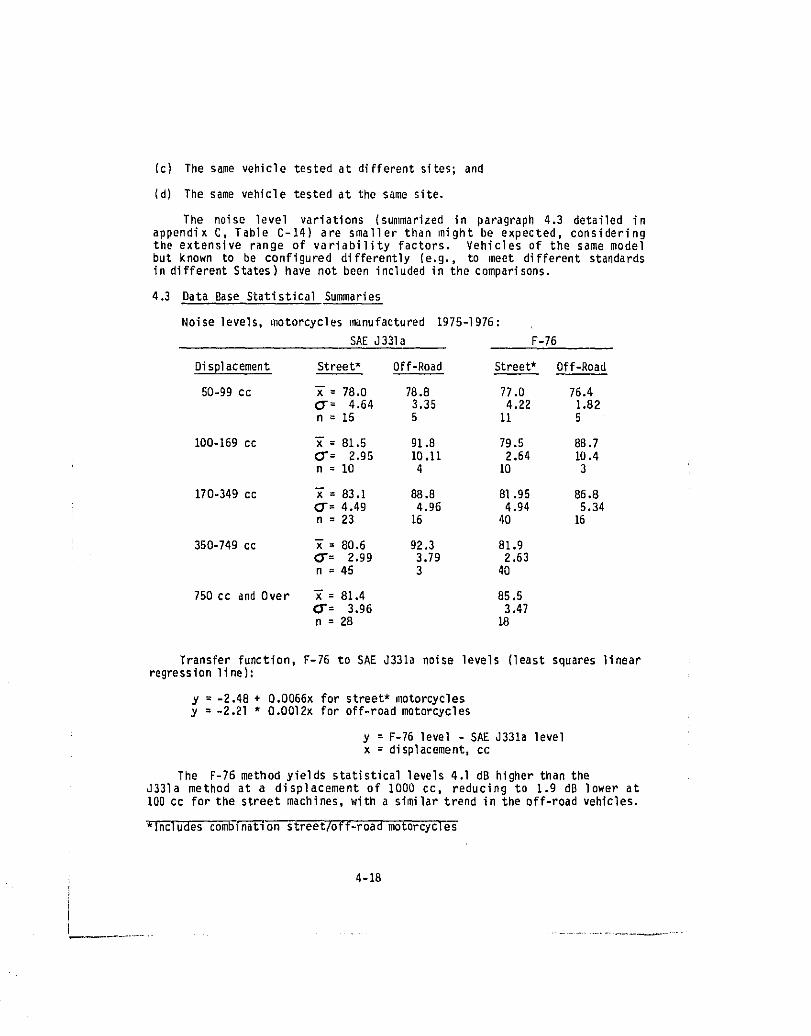
(c) The same vehicletestedat differentsites;and
(d) The same vehicle tested at the same site.
The noise level variations (summarized in paragraph 4.3 detailed inappendix C. Table C-14) are smaller than might be expected, consideringthe extensive range of variability factors. Vehicles of the same modelbut known to be configured differently(e.g.. to meet differentstandardsin differentStates)have not been includedin the comparisons.
4.3 Data Base SLatistical Summaries
Noise levels, o_torcycles manufactured 1975-1976:
SAE J331a F-76
Displacement Street* Off-Road Street* Off-Road
50-99cc _ = 78.0 78.8 77.0 76.4CF= 4.64 3.35 4.22 1.82n = 15 5 11 5
100-169cc _ = 81.5 91.8 79.5 88.7(_'=2.95 10.11 2.64 10.4n=i0 4 I0 3
170-349cc "_= 83.1 88.8 81.95 86.80"=4.49 4.96 4.94 5.34n=23 16 40 16
350-?49cc "_= 80.6 92.3 81.90-= 2.99 3.79 2.63n=45 3 40
750ccandOver _ = 81.4 85.5(I'=3.96 3.47n=28 18
Transfer function, F-76 to SAE J331a noise levels (least squares linearregression line):
y =-2.48 + 0.0066x for street* motorcyclesy =-2.21 " O.OOl2x for off-road motorcycles
y = F-76 level - SAE J331a levelx = displacement, cc
The F-76 method yields statistical levels 4.1 dB higher than theJ331a method at a displacement of 1000 cc. reducing to 1.9 dB lower at100 cc for the street machines, with a similar trend in the off-road vehicles.
*Includescombinationstreet/off-roadmotorcycles
4-18
Constant speed 55 mph noise levels as a function of displacement (leastsquares linear regression line), motorcycles manufactured 1975-1976:
y = 78.65 - 0.0044x
y = noise level, dB at 50 ft.x = displacement,cc
It is of interest to note that this is a downward sloping line withdisplacement, with motorcycles in the 900-1200 cc range being statistically3.9 dB quieter than motorcycles in the 100-250 cc range, in the 55 mph oper-ating mode.
Variability in noise level data (from Table C-14); combined effectof site, rider and vehicle variables:
SAEJ331a F-76 F-5O
= 0.91 _ = 1.17 _ = 1.21CT= 1.29 (3.= 1.58 0-= 1.83n = 87 n = 69 n = 85
Comparisonof motorcycleswith modifiedexhaustsystemsvs. stockconfigurations;data from test siteC (DaytonaBeach)only:
SAE J331a Sound Levels, dB
Motorcycles in Motorcycles with obviouslystock configuration modified exhaust systems
=84.4 _ =93.6(7"= 7.2 (_"= 5.2n =49 n =27
The tests at Daytona Beach were timed to coincide with the DaytonaBeach 200 Nationalmotorcycleevents,to permitsamplingfrom a wide range ofmotorcycletypeson a randombasis. Vehicleswereobtainedby openinvitationto ridersvisitingthe raceand showevents;all vehiclesofferedwere tested,and are reflectedin the above statistics.
4,4 AftermarketExhaustSystems
The EPA study included making contacts with leading motorcycle organi-zations such as the Motorcycle Industry Council, the Motorcycle TradesAssociation, the National Motorcycle Dealers Association and many localorganizations, to invite a large segment of the aftermarket manufacturersand distributors of replacement exhaust systems to participate in the EPAstudy. Major meetings and product display shows at Las Vegas and DaytonaBeach were attendedto explainthe objectivesof the study,answerquestions,obtainbasic informationabout the aftermarketindustry,and to solicitactiveparticipation by aftermarket manufacturers in a comprehensive test and eval-uation program of aftermarketexhaustsystems.These meetingswere attended
4-19
by manufacturer representatives from all parts of the United States, therebygivingbroadexposureto the program.
Subsequently, formal contacts were made with selected aftermarketmanufacturers in the California area, at which time the individual factorieswere toured, detailed discussions were held with officials in each company,and each companywas asked to cooperate in providing replacementexhaustsystems to be tested on a family of selected motorcycles.
Companies listed below were contacted either by phone, at a displaybooth in the aftermarket shows, or visited at their manufacturing facilities:
Action-4*Alphabets West*Hassani*Hates IndustriesButte IndustriesCustom ChromeCycloneDean Mare's PipelyneDiscojetDoug. Thorley HeadersHooker Headers*Jardine Headers*J&R Expansion Chambers*Kook's Custom HeadersMCM Manufacturing*R.C. Engineering*S&S Manufacturing*Santee Industries*Skyway*Torque Engineering*Trlple-A Accessories*WinningPerformanceProducts
Aftermarket Exhaust System Testing Program
An important part of the EPA motorcycle noise study involved noisetestingof aftermarketexhaustsystems,With the full cooperationand partici-pationof aftermarketexhaustsystemmanufacturers,a comprehensivenoise testprogram was conductedon approximately107 aftermarketexhaustsystemsand/orvariations. These units were tested an 16 different motorcycles representingthe five major motorcyclemanufacturers.The testinginvolvedconductingtheSAE J-331a and F-76 accelerationtests,and the F-50 stationaryteston eachof the motorcycles equipped with stock (OEM) exhaust systems, followed bytesting with the applicableaftermarketexhaust systems. In addition totesting with the applicable aftermarket and stock exhaust systems, variationswere tested such as removing inserts, baffles, fiberglass, and in some casesremoving the mufflers altogether, all of which represent forms of modifiedmotorcyclesfoundin circulation.
_Toured facility
i 4-207
t
The participating aftermarket exhaust system manufacturers includedSantee, Alphabets, Jardine, Hooker, Bassani, S_S, MCM, Yoshimura, TorqueEngineering, Winning PerformanceProducts, J&R, Dick's Cycle West, RJS.Kerker,Trabacaand R.C. Engineering. Figure 4-11 shows some of the exhaustsystems laid out at the test site prior to installation and testing. Figure4-12 showsactualinstallationsin progress.
Information on test procedures employed, the test site, and vehicleand aftermarketproduct identificationis providedin the Appendices.
AftermarketProductStudyResults
Detailed noise level data on aftermarketand modified exhaust systemsare in Appendix C, and organized as follows:
(a) Listing of motorcyclesused in the aftermarketproduct study; TableC-B.
(b) Listing of aftermarketexhaust systems/componentstested, correlatedwith test vehicle employed; Table C-9.
(c) Noise level data for each configurationdesigned for the matorcycleon which tested(aftermarketmanufacturerdisguised);TableC-ID.
A summaryof the test resultsfollows,
AftermarketExhaustSystemsas Configuredby theManufacturer
Noise Level Numberof Configurations
SameasDEN 6QuieterthanOEM 9i dB higherthan OEM 72 dB higherthan OEM 63 dB higherthan DEN 44-16dB higherthanOEM 50
Total configurationstested B2
Summary: 32 within 3 dB of theDEN50 4-16 dB higherthanthe OEM
The above tabulationexcludes configurationsdesignatedby the manu-facturers as "competition"or "racer." Noise levels of configurationssodesignatedwere as follows:
dB re OEM
+14+15+9+10
4-21
............ =.................................. ..............___- .............
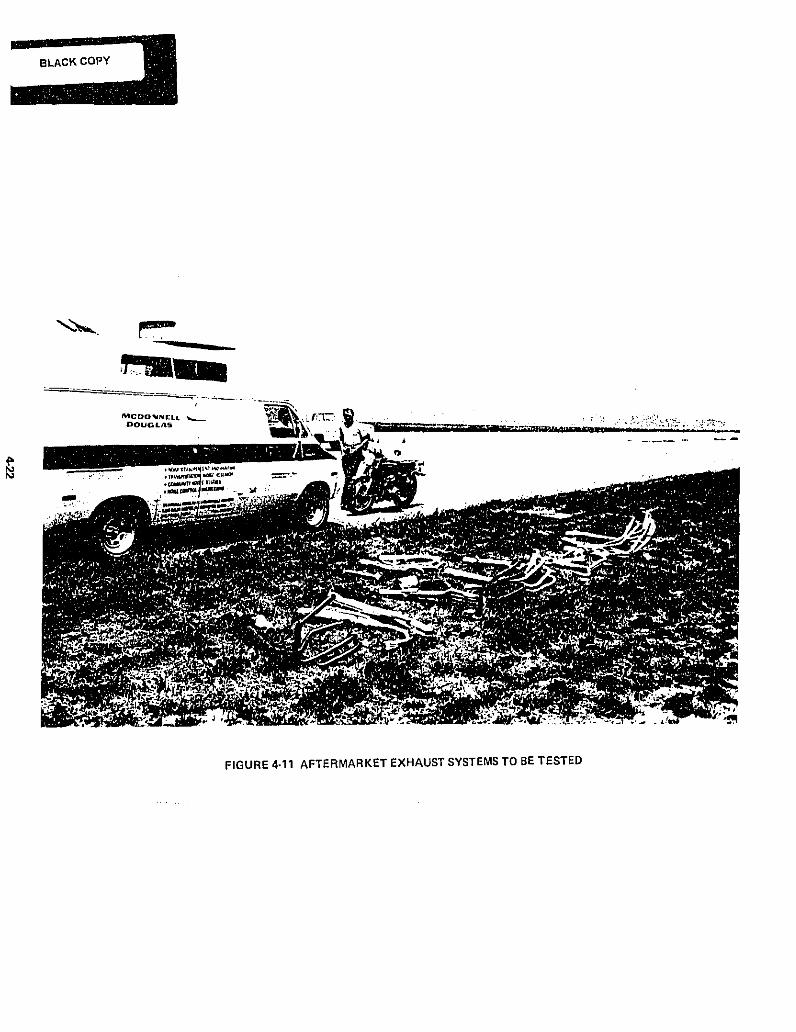
BLACK COPY
FIGURE 4-11 AFTERMARKET EXHAUST SYSTEMS TO BE TESTED
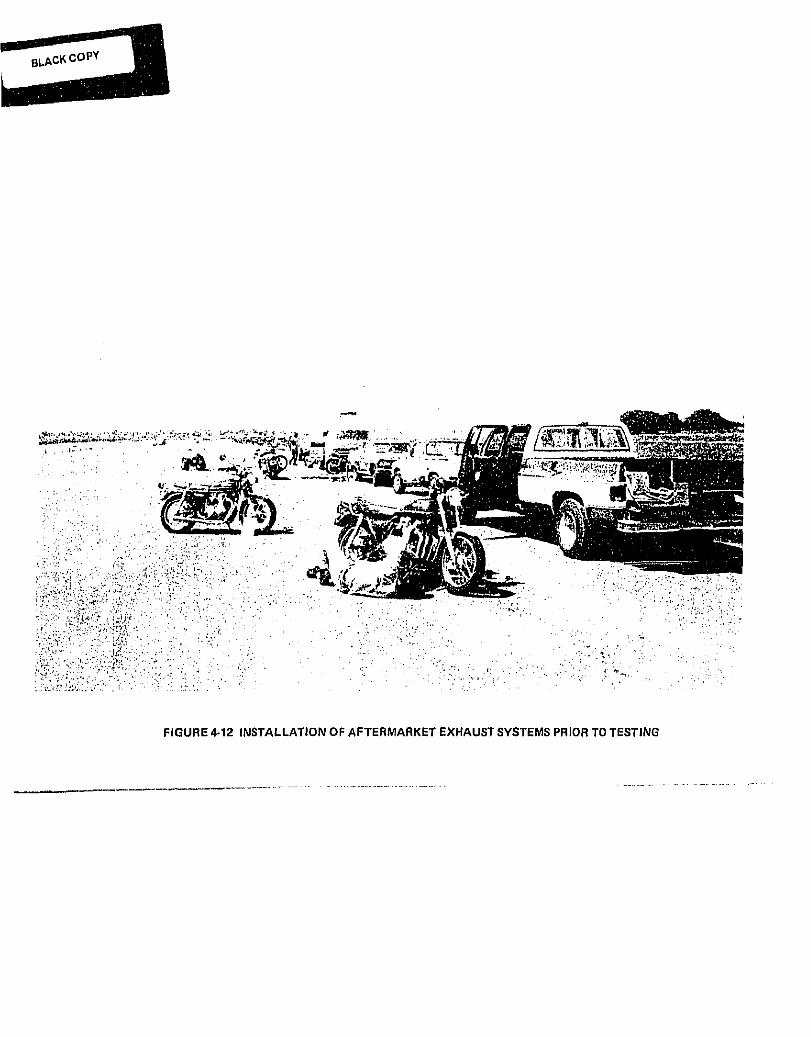
FIGURE 4-12 INSTALLATION OF AFTERMARKET EXHAUST SYSTEMS PRIOR TO TESTING
Data on mufflers with competition er racer cores are included te illus-trate the increase in noise level that could be expected if a muffler that hasbeen specifically designed for competition usage is put en a street bike or acembinationstreet/off-readbike.Ownersof streetand combinationstreet/off-read metorcycles are known to modify their machines with a competition-typeexhaust system to obtain increased performance.
User Modifications
(a) Effect of remeving the interchangeable baffles er inserts fromaftermarket mufflers:
dg re OEM
+15+21+22+29+21+15+21
(b) Effect of removing the glass blanket from the removable insert(insert replaced):
dB re OEM
+4
(c) Effect of removing the OEM muffler:
dB re Stock Cenfi_.
+22+19+16+20*19+21
The noise levels resulting from removal of the muffler are indicativeef what could be expected if stock (OEM) or good quality aftermark_t exhaustsystems are drastically modified. Remeving inserts froloaftermarket mufflers(which is a very simple operation on some makes) has an effect similar toremoval of the entire muffler, without changing the outward appearance of themotorcycle.
Performance vs. Noise
To illustratethe effecton performanceand the effecten noise levelsof aftermarketexhaustsystemsavailablefor some of the morepopularmotor-cycles, a comparisonIs shown in Table 4-I of exhaustsystemsfor the HondaCB750. Beth performanceand noise level data were acquiredon a variety ofsystems, includingthe original equipment.The maximum horsepewerand peak
4-24
torque performancedata on this particularmotorcyclewere obtained on adynamometer,whereas tilenoise measurementswere obtainedusingthe SAE J331avehicleaccelerationtype test procedure,It is apparent fromthe data thatthe aftermarketexhaust systems designed to increaseperformanceover theoriginalequipmentalso significantlyincrease the noise level,Conversely,the quieter aftermarketexhaust systemsthat approachtilenoise levels pro-duced by the OEM system,have a somewhatadverseeffecton vehiclehorsepoweralthough the peak torque is somewhatenhanced. It has been pointed out bysome manufacturersthat the effect of peak torqueoccurringat a lower RPMthan the OEM unitgive_ tilefeelof greater"pu111ng"power,thereforeleadingto the conclusionthat a particularexhaustsystemhas improvedti_omotorcycleperformance.
Another importantpoint I11ustratedin Table 4-I is the availabilityof differentinsertsor coreswith the same baseline;nuff]er,Severalmanufac-
turersoffer exhaust systel_swith a varietyof removablecoresor adjustablevanes that can be added or decreasedin number to obtain the desiredend-result In perfomlanceand noise level.This type of product is offeredformotorcyclistswho have combinationstreet/off-roadbikes which are used forcompetitiveevents or off-roadactivitiesin which increasedperformanceisimportant.The adjustable-vanetype mufflershavebeen designedto accommodatea range of motorcycles Manufacturers state that they purposely providemufflerswith two inserts"one for use in an off-roadsituation,which willincreaseperformancesignificantly,but as a by-productwill alsoincreasethenoise level,and a second insertwhich is to be used by the motorcyclistwhenhe is to ride thatmotorcycleon the street With a simplechange,the motor-cyclistcan removethe noisierhigh performanceinsertand replaceit with thestreet-legaltype insertwhich will complywith existingnoise limits.
4.5 NoiseLevelsat the Operatorand Passenger'sEar Position
In order to assess potential benefits in nearing risk to motorcycleoperatorsfrom reducingmotorcyclenoise emissions,EPA conducteda stu_ ofmotorcyclenoise levels at the operator and passengerear positions. Thedetails of the study program are describedin AppendixE. Measurementsweremade on three large motorcyclemodels (Honda 750, BMN, Harley-Davldson)invariousoperatingmodes, Measurementswere made with the rnotorc),clestation-ary, on a dynometerand under moving conditions.In addition,measurementswere madewith bare head, head coveredwith a cap to reducewindeffects,andinside a helmet. An attempt was made to distinguish wind turbulence andmotorcycle(only)contributions,
The information presented in the Appendix shows that wind-inducednoise (turbulencecaused by wind flowingby the ear) is an extremelycomplexphone menon, ]t depends not only on wind speed but vehicleand operatorgeometry and head attitude. In addition, it appears that operator-lnducedturbulenceincreases_ exposure, The influenceof helmetson operatorexposureis anotherextremelycomplexphenomenon,againdependingon geometer),and attitude. Both enhancementand attenuationof noise levelscomparedtobare head levelswere noted in differentfrequencybands and for differenthead attitudes. It appears that helmet-induced turbulence may increaseoperatornoiseexposurefor some helmetgeometries,
4-25
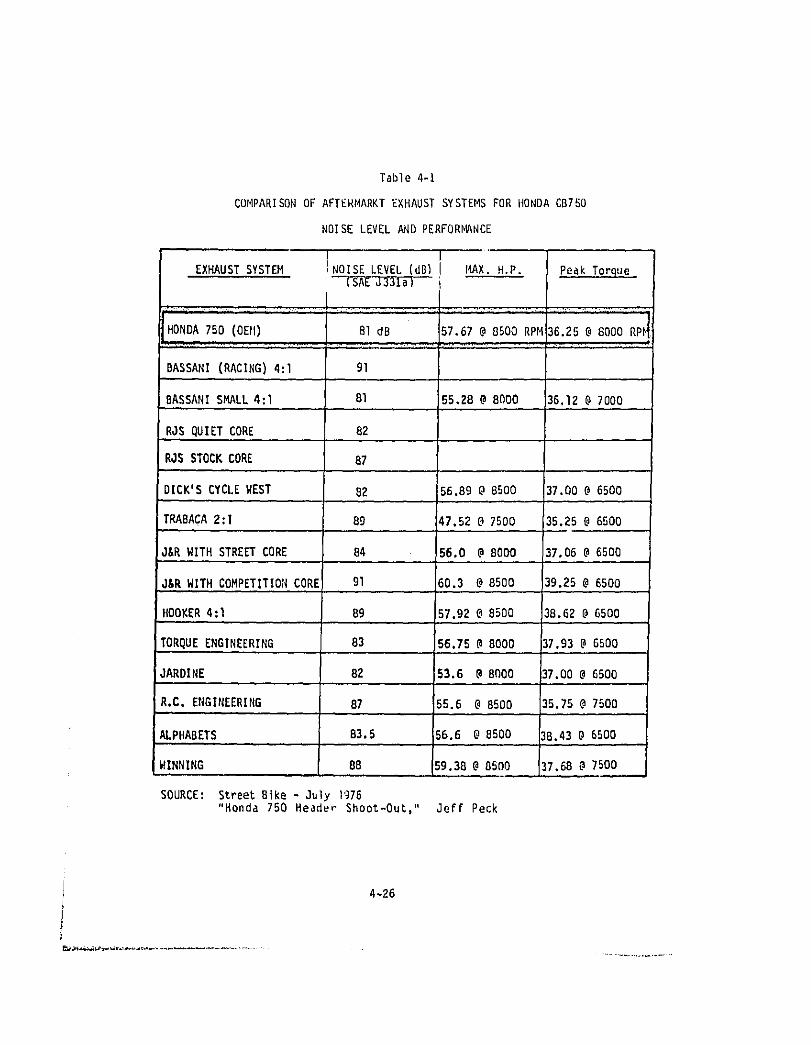
Table 4-I
COMPARISON OF AFTERMARKT EXHAUST SYSTEMS FOR IIONDACB750
NOISE LEVEL AND PERFORMANCE
EXHAUSTSYSTEM INOISELEVEL (dB)I MAX. H.P. Peak Torgue--(-s-AZ--J-_r3T_]_i
HONDA750(OErl) 81 dB 57.67@ 8500RPM36.25@ 8000RP_, ,',,, ,. , -. :
BASSANI(RACING)4:1 91
BASSANISMALL4:1 81 55.28@ 8QOO 36.12@ 7000
R_SQUIETCORE 82
RJS STOCKCORE B7
DICK'SCYCLEWEST 82 56.89 O 8500 37.00@ 6500
TRABACA2:1 89 47.52O 7500 35.25@ 6500
J&R WITH STREETCORE 64 56.0 @ 8000 37.06 @ 6500
J&R WITH COMPETITIOI4CORE 91 60.3 @ 8500 39.25@ 6500
HOOKER4:1 69 57.92 @ 8500 38.62 @ 6500
TORQUEENGINEERING 83 56.75 @ 6000 37.93 @ 6500
JARDINE 82 53.6 @ 8Q00 37.00@ 6500
R.C. ENGINEERING 87 55.6 @ 8500 35.75@ 7500
ALPHABETS 83.5 56.6 @ 8500 38.43@ 6500
WINNING 88 159.38@ 8500 37.68@ 7500
I
, ,,,,
SOURCE: Street Bike - July )976"Honda 750 Header Shoot-Out," Jeff Peck
4-26
At this time, motorcycle(alone)noise level (absentwind and helmeteffects) appears to be the best ,neasurefor assessingmotorcycleoperatornoise impact.Both dynamometerand moving runs indicatedthat the operatornoise levels under F-76a accelerationconditionswere about IOD dB for themotorcycles tested (SAE J331a valves (50 feet)--Honda: 81 dB, BMW: 81 dB,Harley-Davidson: 84 dB. Wind noise was below 90 dB for all speedsup to 45_nphexcept for tiletrailingear when a motorcyclistwithouta helmetinclinedhis head 45 degrees away from the line of travel It can be concludedthatunder rapid accelerationconditions,for the motorcyclestested,motorcycle(alone) contributionswould outweigllwind noise for a helmeted operator.
The extentto which operatorear noise levelswoulddeclineas fifty-foonoise levelsdeclinedin responseto waysideregulationscannotbe confidentlypredicted. However, since attentionmust be given to intake and mechanicalnoise (both nearer the operator'sear than the exhaustnoise source),somereductionis to be expected.
4-27
3_VJ73,_I(]NVHIIV3HOlTBIldNO3SION3"l_AO_OlOt'J "_05133333_0NOIIVII'IVA3
NOIID3S
SECTION 5
EVALUATION OF EFFECTS OF MOTORCYCLE
NOISE ON PUBLIC HEALTH AND WELFARE
5.1 Introduction
The purpose of this section is to assess, in quantitative terms, thehealth and welfare impact of the noise emitted by motorcycles, and the bene-fits or reductionsin this impactto be expectedFrom a regulationlimitingthe noise emissionsfrom newlymanufacturedmotorcycles. Presentedin thisanalysis are predictions of the potential hea]th and welfare benefits ofselectednoisecontroloptionsthatcover a wide range of possibleregulatoryprograms for motorcycles.
Because of inherent differences in individual responses to noise, thewide range of situations and environments which relate to motorcycle noisegeneration, and the complexity of the associated noise fields, it is notpossible to precisely examine all situations of community exposure to motor-cycle noise. In this predictive analysis, certain stated assumptions havebeen made in order to approximatetypical,or average,situations.The orderof magnitude of the population that may be affected for each regulatory optionis determinedthrough statisticalanalysis. Some uncertaintieswith respectto individual cases or situations may remain.
5.1.1 Effects of Noise on People
The phrase "health and welfare," as used in this analysis and in thecontext of the Noise Control Act, is a broad term. It includespersonalcem?ort and well-being and the absence of mental anguish, disturbances andannoyance,as well as the nonoccurrenceof clinical s_ptoms such as hearingloss or demonstrable physiolegical injury (Reference I). In other words,the term appliesto the entire rangeof adverseeffectsthat noise can haveon people.
Improvements in public health and welfare are regarded as benefits ofnoise control. Public health and welfare benefits may be estimatedbothin terms of reductionsin noise exposureand, more meaningfully,in termsof reductionsin adverseeffects. This analysisfirst estimatesmotorcyclenoise exposure(numbersof peop]eexposedto differentnoise levels),and thentranslatesthisexposureinto potentialimpactson the community.
People are exposedto noisefrommotorcyclesin a varietyof situations.Some examplesare:
I. Insidea home,officeor workplace
2. Outdoorsat home, or in commercialand industrialareas
5-i
3. As a pedestrianor in transitin othervehicles
4. As a participant in recreatlona] activities
5. As a motorcycleoperatoror passenger
Noise affectspeople in many ways, althoughnot all noise effects willoccur at all levels. Noiseassociatedwithmotorcyclesmay or may not producethe effects mentioned below, the extent to which depends on duration ofexposuresand specificnoiseexposuresituations.
The best-knownnoiseeffect,noise-inducedhearingloss, is generallynota problemfor a person with occasionalexposureto trafficnoise. A charac-teristicof noise-inducedhearing loss is that it first occurs in the iligh-frequencyareaof the auditoryrange whichhas some importancefor the under-standingof speech. As a noise-inducedhearingloss further develops,thesounds which lend meaning to speech become less and ]ess discriminable.Eventually,while utterancesare stillheard, they becomemerely a seriesoflow rumbles, and the intelligibilityis lost. Noise-inducedhearing lossis a permanentloss for which hearing aids and medical procedurescannotcompensate.
Exposure to noise can cause stress. The body has a basic, primitiveresponsemechanismwhich automaticallyreacts to noise as if to a warningordanger signal, A complex series of bodilyreactions(sometimescalled the"flight-or-fight"response)takes place;these reactionsare beyondconsciouscontrol.When noise intrudes,these reactionscan includeelevationof bloodpressure,changes in heart rate, secretionsof certain hormones into thebloodstream,changesin digestiveprocesses,and increasedperspirationon theskin.
This stress response occurs with individual noise events, but it is notknownyet whetherthe reactionsseen in the short term become,or contributeto, long-termstressdiseasesuchas chronichighblood pressure,
Some of this stressresponseis believedto be reflectedInwhat peopleexpress as "annoyance","irritation",or "aggravation"and which the Agencyhas termed "generaladverseresponse". Accordingly,this analysisestimatesthe generalizedadverse responsesof peopleto environmentalnoise. To theextent that physiologicalstress and verbalizedannoyanceare related,the"generaladverseresponse"quantity is consideredto be one metric for indi-catingthe magnitudeof human stressresponse.
The generaladverseresponserelationshipto noise levelsis also seen asrepresenting,in part, anotherarea of noiseeffects: activity interference.There is considerablescientificdata that demonstratethat noise interfereswith many importantdaily activitiessuch as sleep and verbal communication(Reference2). In expressingthe causesof annoyanceto noise,peopleoftenreport that noise interfereswith sleeping,relaxing,concentration,TV andradio listening,and face-to-faceand telephonecommunications. Thus, thegeneraladverseresponsequantityis consideredan appropriatemetricto indl-cate the severityto which noise interfereswith everyday human activities.
: 5-2
J
I
5.1,2 Measuresof Benefitsto PublicHealthand Welfare
People are exposedto noise generatedfrommotorcyclesboth at and awayfrom their residences. In general,it is anticipatedthat a reductionofnoise emitted from motorcycleswill result in the followingtypes of bene-fits:
I. Reduction in average traffic noise levels and associatedcumula-tive long-termimpactupon the exposedpopulation.
2. Fewer human activitiesdisruptedby individual,intenseor intrudingnoise events,
3. Generalimprovementin the quality of llfe, with quiet as a nationalresource.
The generalapproachtaken in thishealthand welfareregulatoryanalysisis to estimatethe adverseeffectsof motorcyclenoise on the U.S. population,and then quantitativelyevaluate the potentialbenefits resultingfrom thereductionof noise from motorcyclesin terms of percentagereductionsinadverseimpact.
Estimatesof trafficnoise levelsare presentedin terms of the noiselevels associated with typical motorcycle passbys. These estimates arederived by consideringtraffic mixeswithin differentpopulatedland areas.Possible reductionsIn average trafficnoise levels from currentconditions(i.e,,without noiseemission regulationsfor motorcycles)are presentedforseveral regulatoryoptionsfor new motorcycles,taking intoaccountprobablenoise emission reductionsof other traffic noise sources (References3 and4). Projectionsof the populationadverselyimpacted,as well as the rela-tive reductionsin impact(benefits)from currentconditions,are determinedfrom the estimatedreductionsin averagetrafficnoise levels.
However,estimatingnationwideimpactin terms of averageurbantrafficnoise levelsis not, in and of itself,totallyindicativeof the severityorextensivenessof the motorcyclenoise problem. The analysisdoes not fullydescribe individualdisturbancesor the extreme annoyancecaused by singlemotorcycle passbys In various environmentalsituations. This is becauseannoyanceor other responsesto noisefrequentlydependon the activitiesandlocationsof the people when exposedto such noise. Thus, averagetrafficnoise levels do not accountfor the more disruptiveand annoyingpeak noiseintruslonsproducedby individualmotorcyclepassbys(frequentlyreferredtoas "singleevents"), Therefore,additionalpotentialbenefitsshould resultfrom the reduced noise levels associatedwith these singleevents. Thesebenefits are discussedin terms of the potentialinterferencewith people'sactivities. Sleep interferenceand speechinterferenceare consideredin thisanalysisas indicatorsof potentialactivity interferenceand the associatedadverseimpactof motorcyclenoise,
The followinganalysispresentsnumeric valueswhich representboth the_; numbersof peopleexposedto motorcyclenoise and the degreeto which theyare
potentiallyImpacted. Also presentedare relativepercentagereductionsin
5-3
impact from 1980 conditions. This analysis relies primarily on relativepercent reductionsin noise impact as a measure nf benefit. The relativereductionsin impacts are consideredaccurate indicatorsof what might beexpected from the imposition of noise emission standards. For example, whileit may not be possible to characterize completely the extensiveness andseverity of the noise impact of current motorcycle operations, relativereductionscan be accuratelycalculatedand are used for comparingvariousregulatory alternatives.
5,1,3 RegulatorySchedules
The health and welfare analysis carriedout for motorcyclesexaminedthe potentialbenefitsof reducingmotorcyclenoise based upon a broad rangeof regulatoryoptions. The regulatoryoptionsshown in Table 8-1 representthose optionsthatwere consideredin arrivingat the final regulatorylevelsand effectivedates. OptionQ (an idealizedcase) representsthe quietingofmotorcyclesto a level 10 dB below the most stringentregulatoryoption. Thisoptionis includedfor comparisonpurposesonlyto indicatean upperlimitofpotentialbenefits,
8,2 Descriptionof TrafficNoise Impact
This analysispresentsprojectionsof averagetrafficpassbynoiselevelsfor scenariosthat include both urban street traffic and highway traffic,Note that the adverseimpact from trafficnoise is primarilydue to trafficon urbanstreetsas opposedto highwaysand freeways,
As presentedin Figure5-I,the numberof peopleexposedto outdoornoiselevelsthat are greaterthan La.* of 55 dB dominatedby urban streettrafficnoise is significantlyhigher _'an the numberexposedto highwayand freewaytrafficnoise -- 78 millionas opposedto 17 million. Thus, reducingurbanstreettrafficnoisewill benefitsignificantlymore peoplethan will similarreductionsin highwaytrafficnoise.
5.2.1 StreetMotorcycles
In this section of the health and welfare analysis, current streetmotorcyclesound levels,as wellas soundlevelsunder variouspossiblenoiseemissionregulationson motorcyclesthat are riddenon streetsand highways,ere examined. This includesbothstreetand dual-purposebikes. (Motorcyclesthat are ridden off-road are examined separatelyin Sections 5.9 through8.12),
_rL'-dn is the day-night sound level expressed in decibels. This is discussedin more detallIn Section5.3.2.
5-4
))
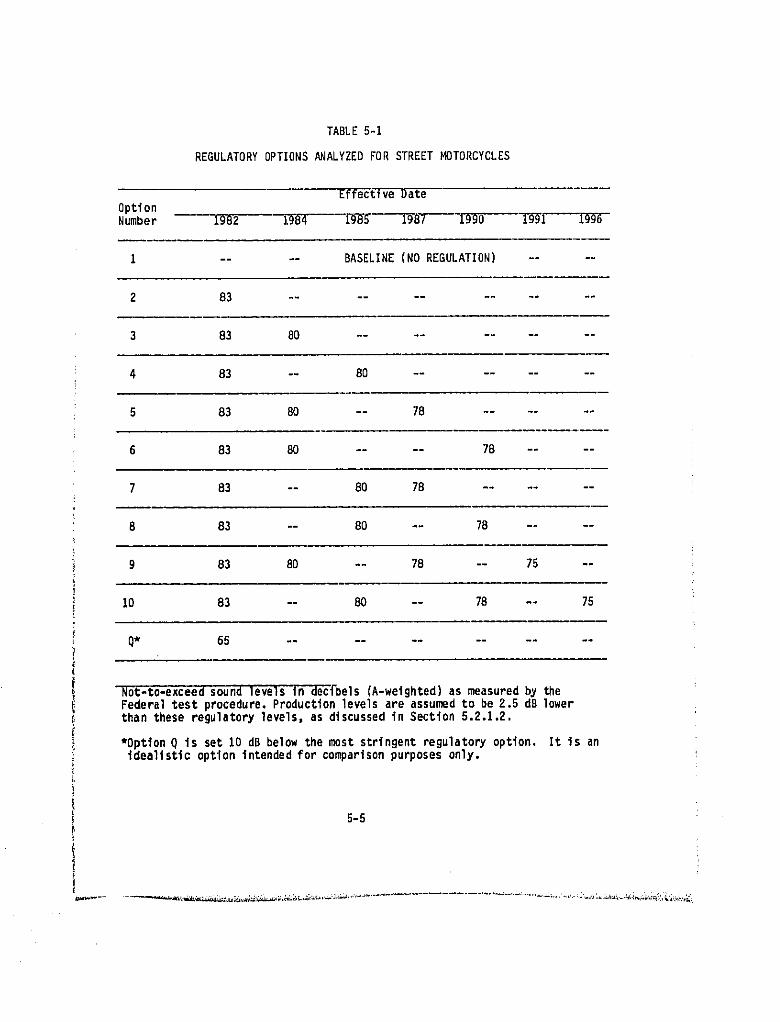
TABLE 5-i
REGULATORY OPTIONS ANALYZED FOR STREET MOTORCYCLES
EffectiveDate
OptionNumber 1982 -Yg-_T--_ 1987 1990 1991 1996
I .... BASELINE(NOREGULATION) ....
2 83 ............
3 83 80 ..........
4 83 -- 80 ........
5 83 80 -- 78 ......
6 83 80 .... 78 ....
7 83 -- 80 78 ......
8 83 -- 80 -- 78 ....
9 83 80 -- 78 -- 75 --
10 83 -- 80 -- 78 -- 75
Q* 65 ............
Not-to-exceedsound levelsIn decibels(A-weighted)as measuredby theFederaltest procedure.Productionlevelsare assumedto be 2.5 dB lowerthan these regulatorylevels,as discussedin Section5.2.1.2.
*OptionQ is set 10 dB belowthe most stringentregulatoryoption. It is anidealisticoptionintendedfor comparisonpurposesonly.
5-5
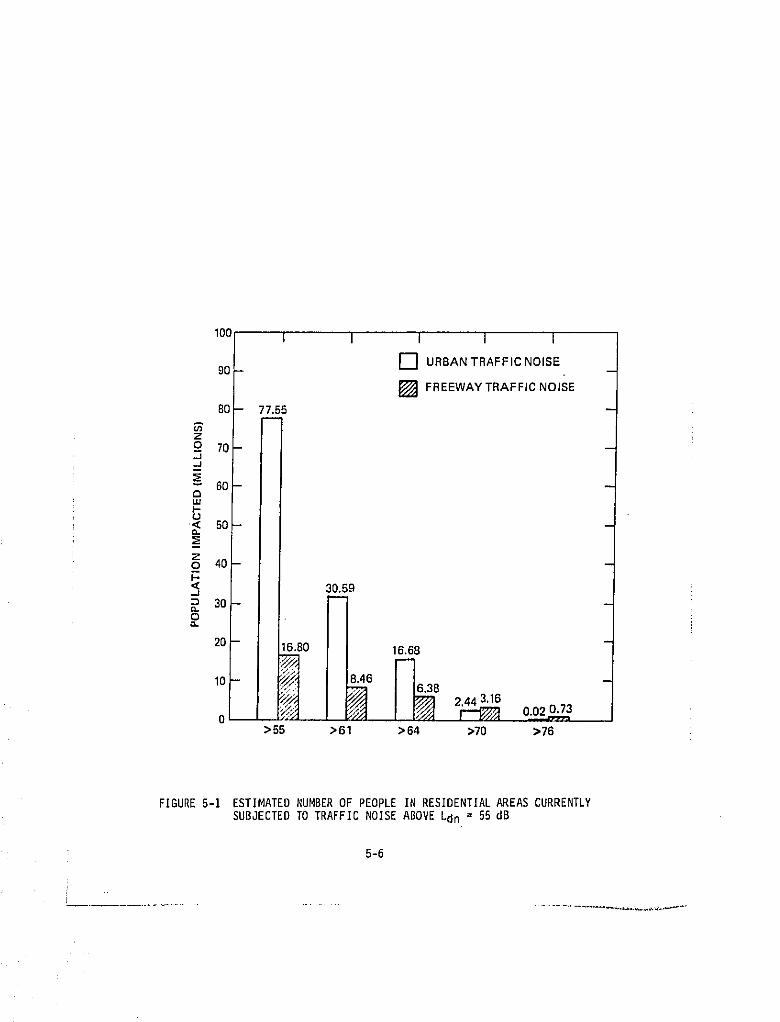
IO°Ioo.r T _ l T I[] URBAN TRAFFIC NOISE
[] FREEWAY TRAFFIC NOISE80 77.55
Z
2 78..I,.J
_ BOL.UI--
< 5O
Z
_o 40
"_ 30,893O
O
2016.68
10 6.3844 3.16
p 0.730
>55 >61 >64 >70 >76
FIGURE 5-I ESTIMATED NUMBER OF PEOPLE IN RESIDENTIAL AREAS CURRENTLYSUBJECTED TO TRAFFIC NOISE ABOVE Ldn = 55 dB
5-6
5.2,1.1 Current Street Motorcycle Sound Levels
A statisticalrepresentationof stock inotorcyc]esound levels,basedon the data in Appendix C, is presented in Figure 5-2, These data are themaximum sound levels as measured by the SAE J-331a test procedure. Thisprocedure is representativeof very rapid accelerationfrom 30 mph (full-throttle, high engine speed). The maximum sound levels as measured by SAEJ-331a procedure can be adjusted to account for more commonly encounteredacceleration modes (partial-throttle and moderately high engine speed). Asdiscussed In Section 3, sound levels as measured by the regulatory testprucedure are assumed to be statistically equivalent to SAE J-331a levels.Cruise sound levels are based on steady-stateoperationat variousconstantspeeds.
The data in Figure 5-2 were developed from noise measurements of 200unmodifiedmotorcyclesthat were selected to be representative,by year ofmanufacture and type, of the national population of motorcycles in-servicelicensed for street use in 1975. Additional noise measurements (discussed inAppendix C) of 160 newly manufactured(1975-1976)street and dual-purposemotorcycles yielded sound levels that did not differ significantly from thedistribution shown in Figure 5-2. Hence, Figure 5-2 is considered to beapplicable to motorcycles currently on the road as well as to present-daynewlymanufacturedmotorcycles.
According to a national survey (Reference 5), at least 12 percent ofstreet motorcycles and dual-purpose motorcycles (treated in this analysis asstreet motorcycles),and 26 percent of off-road motorcycleshave modifiedexhaust systems. (In Los Angeles and San Francisco, these percentages werehigher, approximately 15, 13, and 47 percent for street, dual-purpose, andoff-road, respectively.) In general, raodiflcatienof a motorcycleexhaustsystem significantlyincreasesthe motorcycle'ssound level. Althoughothertypes of modifications, such as intake modification, may also affect the soundlevel of a motorcycle, exhaust syqt,n_ _nodiflcations are typically the mostnoticeable form of motorcycle noise tampering.
In this analysis, statisticsare developedby using severaldifferentassumptionson the incidenceof modifiedmotorcycles. The currentincidence,unchanged by Federal regulation (12%), and two lower incidences (7% and3%) are modeled for street motorcyclesto reflect the expected reductionof exhaust modifications. Eliminatingmotorcyclemodificationsentirely,however, is net consideredto be feasiblewith even the mast vigorouscom-mitment to noise enforcement by Federal, state , and local governments.Reduction of modified motorcycles to about half the current incidence (7% ofthe population) is the expected reduction through Federal regulation alone.Reductionto about one quarterof the currentincidence(3%) is consideredtobe the reduction achievable from a combination of Federal regulation andvigorous state and local enforcement programs.
The sound levels of ig known exhaust-modified(noncompetition)motor-cycles are plotted in Figure 5-3. The best fit of a normal distribution tothe data is indicated by the straight line. In comparison with the SAE J-331atest results for unmodified motorcycles shown in Figure 5.2, it can be seen
5-7
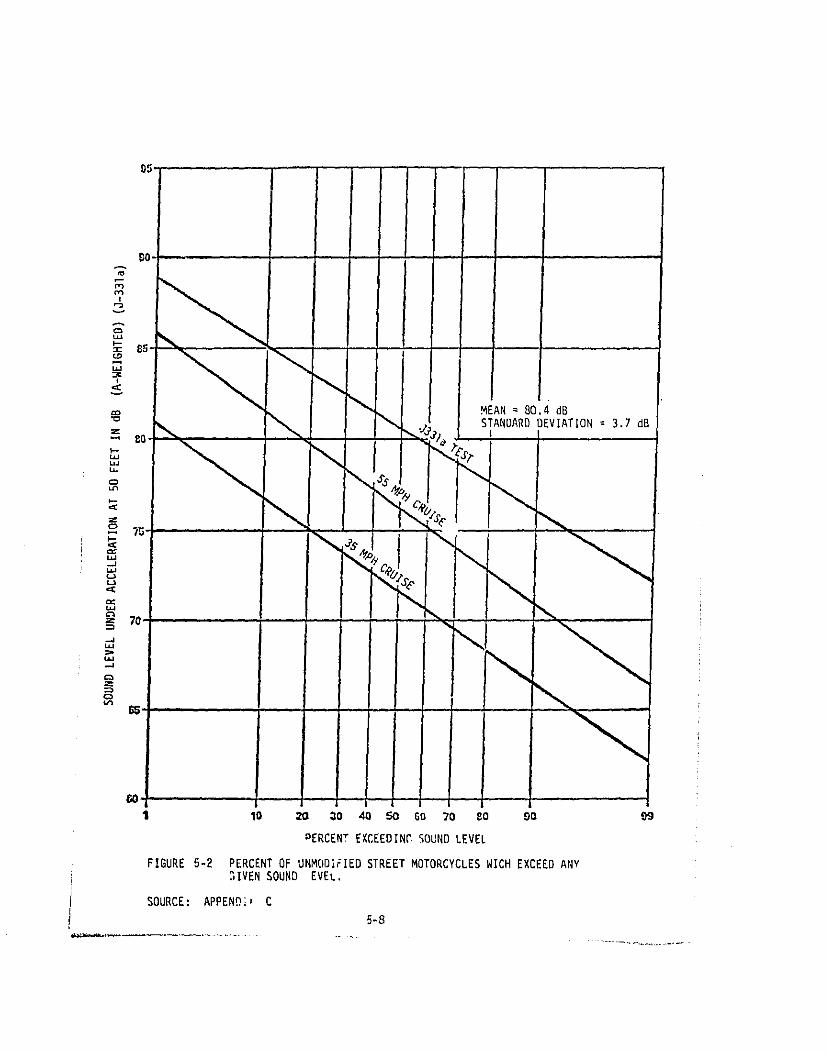
_0 J
I 10 _ 30 40 5o Go 70 8o 90 09
OERCENT EXCEEDIN(I SOUND LEVEL
: FIGURE 5-2 PERCENTOF UNMODIFIEDSTREETMOTORCYCLESWICHEXCEEDANYi SIVENSOUND EVEL.
i SOURCE: APPEND_ C
5-8
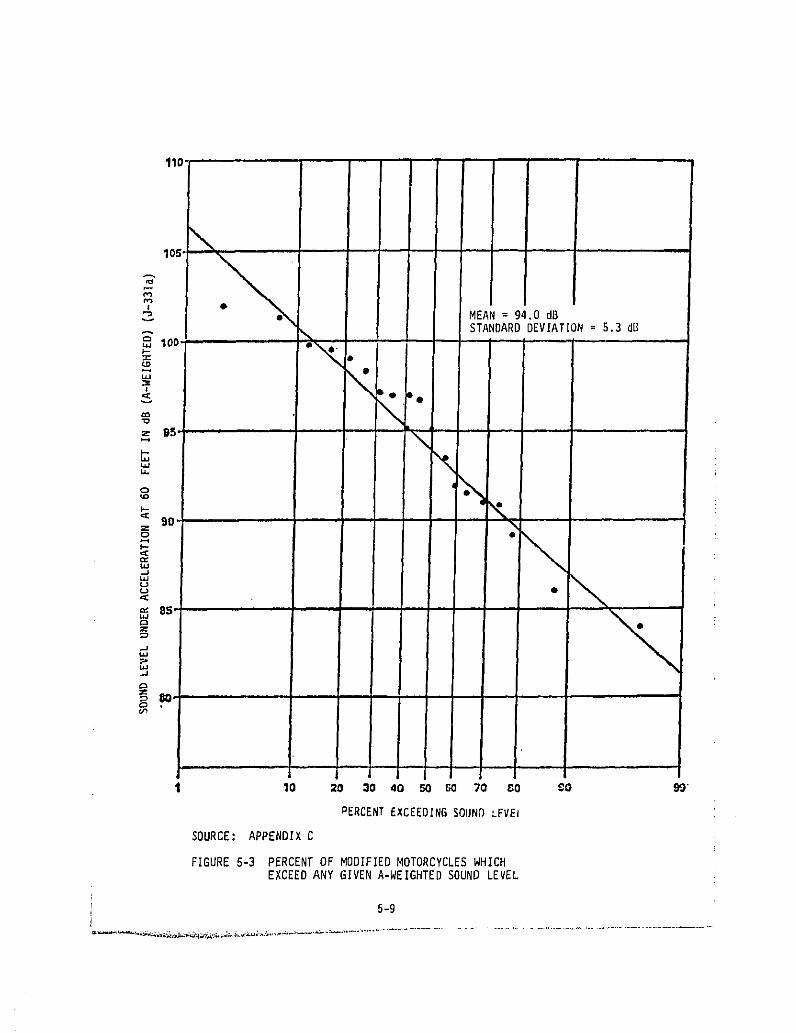
l iSOUNDLEVEL
UNDERACCELERATIONAT60
FEET
INdB
(A-WEIGHTED)(J-33]a)
i!
=_
/
mm
rn_
m
rrlf
__
mm
x
._c2
3_
Q-,
G-)--,,I
r_
•
=°N
_I
_rn
_
/m
_
r i
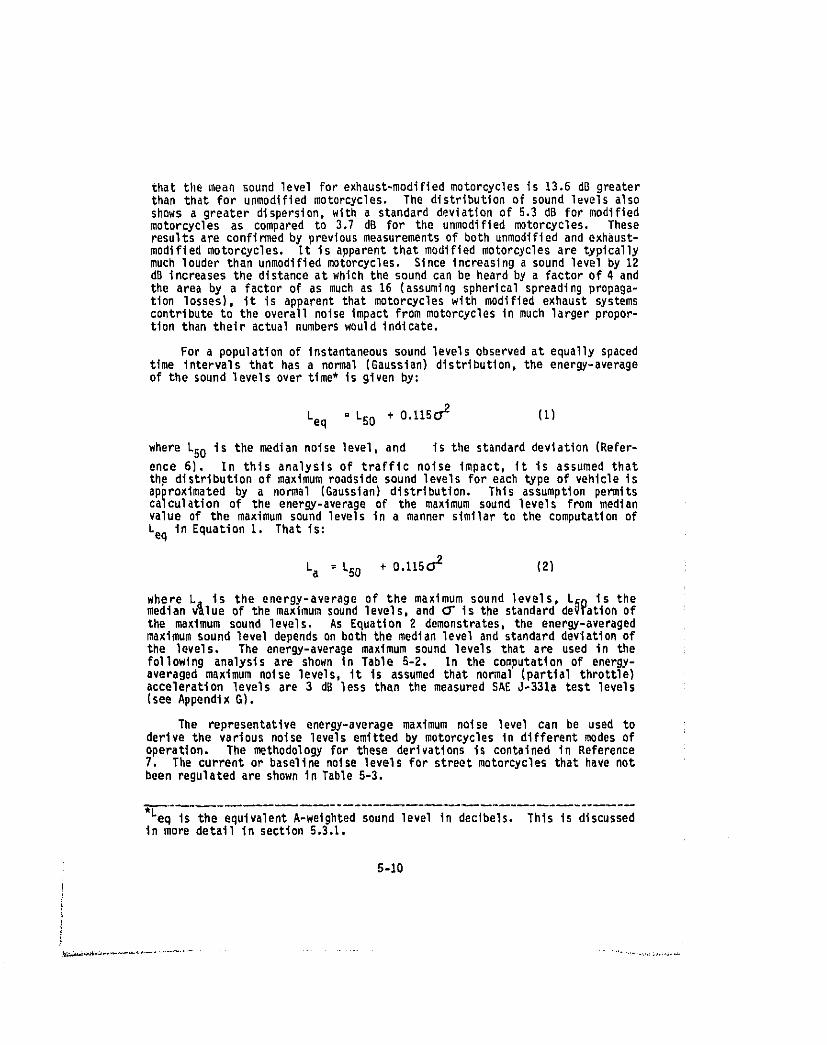
that the mean sound level For exhaust-modifledmotorcyclesis 13.6 dB greaterthan that for unmodifiedmotorcycles. The distributionof sound levelsalsoshows a greater dispersion,with a standarddeviationof 5.3 dB for modifiedmotorcyclesas compared to 3,7 dB for the unmodifiedmotorcycles. Theseresultsare confirmedby previousmeasurementsof both unmodifiedand exhaust-modifiedmotorcycles. It is apparentthat modifiedmotorcyclesare typicallymuch louderthanunmodifiedmotorcycles.Sinceincreasinga soundlevelby 12dB increasesthe distanceat whichthe soundcan be heardby a factorof 4 andthe area by a factorof as muchas 16 (assumingsphericalspreadingpropaga-tion losses), it is apparentthat motorcycleswith modifiedexhaust systemscontributeto the overallnoiseimpactfrom motorcyclesin much largerpropor-tionthan their actualnumberswould indicate.
For a populationof instantaneoussoundlevelsobservedat equallyspacedtime intervalsthat has a normal(Gaussian)distribution,the energy-averageof the sound levelsovertime*is given by:
Leq = LSO + 0.11502 (I)
where L50 is the mediannoiselevel,and is the standarddeviation(Refer-ence 6). In this analysis of traffic noise impact, it is assumed thatth_ distributionof maximumroadsidesound levelsfor each type of vehicleisapproximatedby a normal (Gaussian)distribution. This assumptionpermitscalculationof the energy-averageof the maximum sound levels from medianvalue of the maximum sound levelsin a mannersimilarto the computationof
Leq in EquationI. That is:
La = LSO + 0.1150-2 (2)
where L_ is the energy-average of the maximum sound levels, L_n is themedianv_lue of the maximumsoundlevels,and (_"is the standarddeVTatlonofthe maximum sound levels. As Equation 2 demonstrates,the energy-averagedmaximumsound leveldependson both the medianleveland standarddeviationofthe levels. The energy-averagemaximum sound levelsthat are used in thefollowlnganalysis are shown in Table 5-2. In the computationof energy-averagedmaximum noise levels,it is assumedthat normal(partlalthrottle)accelerationlevels are 3 dB less than the measuredSAt J-331a test levels
(seeAppendixG).
The representativeenergy-averagemaximum noise level can be used toderivethe variousnoise levelsemittedby motorcyclesin differentmodes ofoperation. The methodologyfor these derivationsis containedin Reference7, The current or basellnenoise levelsfor streetmotorcyclesthathavenotbeen regulatedare shown in Table5-3.
*Leq is the equivalentA-weightedsound level in declbels. This is discussedin more detail in section5.3.1.
5-i0
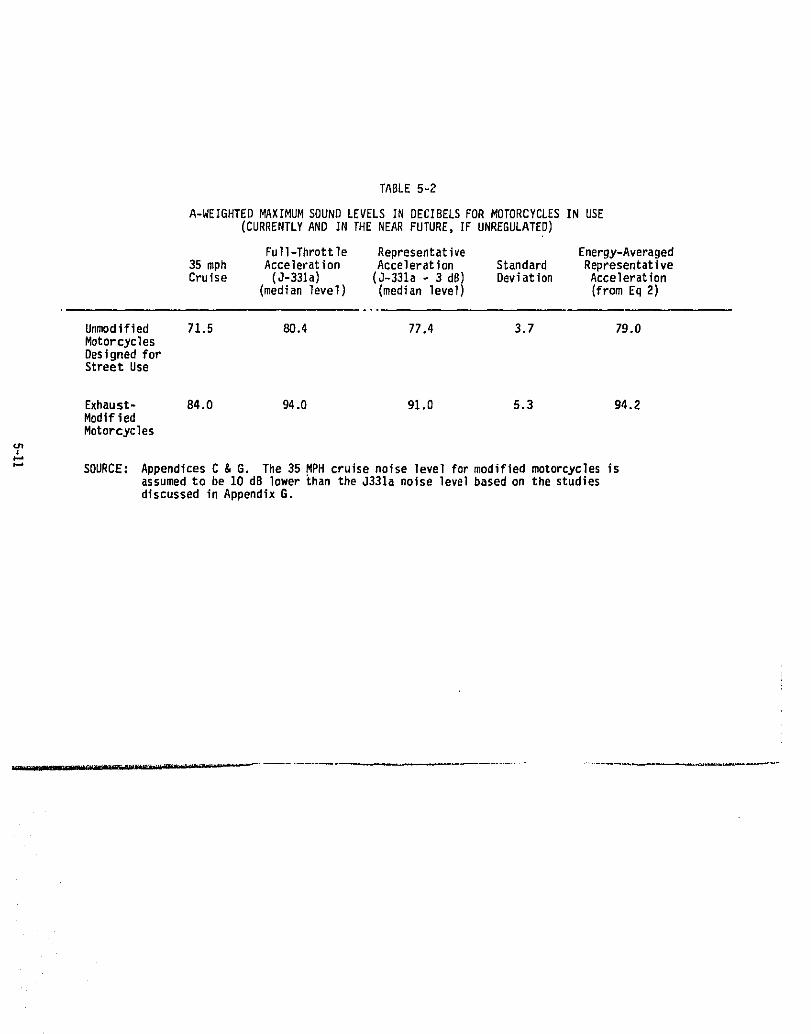
TABLE 5-2
A-WEIGHTED MAXIMUM SOUND LEVELS IN DECIBELS FOR MOTORCYCLES IN USE(CURRENTLYAND IN THE NEARFUTURE,IFUNREGULATED)
Full-Throttle Representative Energy-Averaged35 mph Acceleration Acceleration Standard RepresentativeCruise (J-331a) (J-331a- 3 dB) Deviation Acceleration
(medianlevel) (medianlevel) (fromEq 2)
Unmodified 71.5 80.4 77.4 3.7 79.0MotorcyclesDesignedforStreetUse
Exhaust- 84.0 94.0 91.0 5.3 94.2ModifiedMotorcycles
I
SOURCE: AppendicesC & G. The 35 MPH cruisenoise levelformodifiedmotorcyclesisassumedto be 10 dB lowerthan the J331a noise levelbasedon the studiesdiscussedin AppendixG.
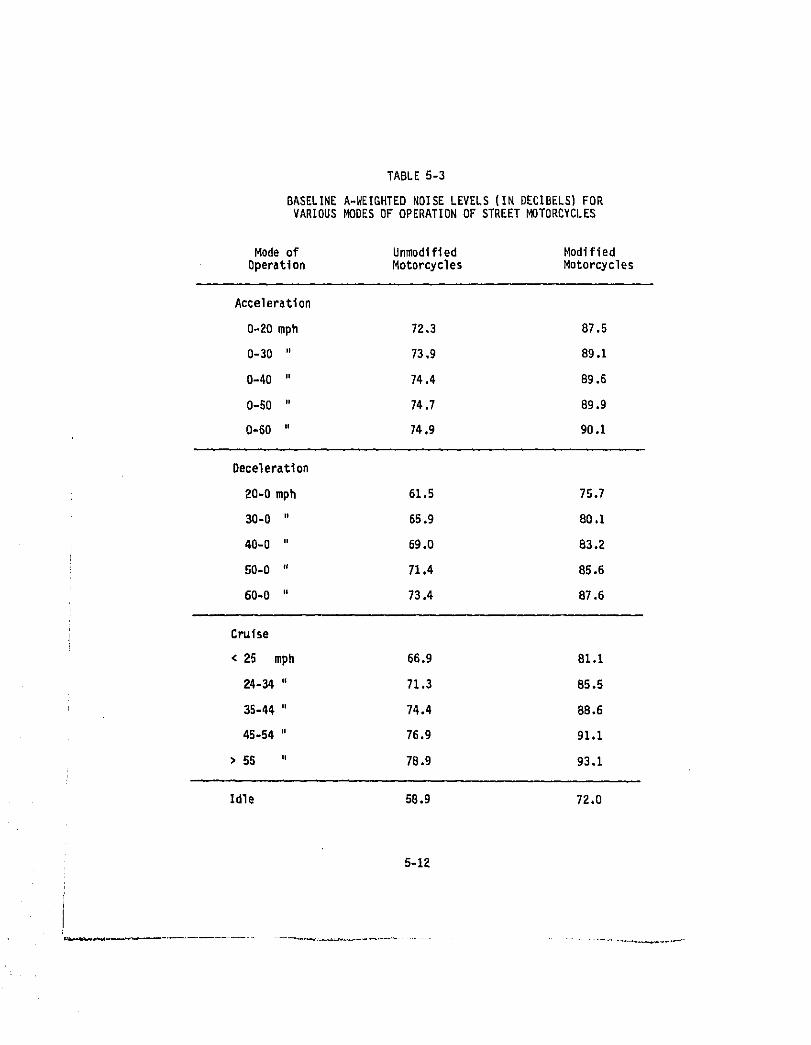
TABLE 5-3
BASELINEA-WEIGHTEDNOISELEVELS(IN DECIBELS)FORVARIOUSMODESOF OPERATIONOF STREET_TORCYCLES
Modeof Unmodified ModifiedOperation Motorcycles Motorcycles
Acceleration
0-20mph 72,3 87.5
0-30 " 73,9 89.1
0-40 " 74,4 89.6
O-SO " 74.7 89.9
0-60 " 74.9 90.1
Deceleration
20-0mph 61.5 75.7
30-0 " 65.9 80.1
40-0 " 69.0 83.2
50-0 " 71.4 85.6
60-0 " 73.4 87.6
Cruise
< 25 mph 66.9 81.1
24-34 " 71.3 85.5
35"44 " 74.4 88.6
45"54 " 76.9 91.1
> 55 " 78.9 93.1
Idle 58.9 72,0
5-12
5.2.1.2 NoiseEmissionLevelsof RegulatedStreetMotorcycles
In order to predict the effect that a n_otorcyclenoisee_nissionregula-tion will have on actual illuLOi'cyclenoiseemissiei_s, qnme assumptionsmust bemade as to the changes that would occur in the sound levels presented in Fig-ures 5-2 and 5-3 (for unregulatedirotorcycles)due to a particularregulatorystandard. It is expected that to comply with a Federal noise regulation,manufacturers will produce n_otercycles with average sound levels about 2.5 dBlower than the regulatory limits to account for production and testing vari-abilities (see Chapter 6). For modeling purposes, the production level isassumed to be the median value for a distribution of maximunlsound levels fornew motorcycles having u standard deviation of 2.5 dg.
Using the above stated assunlptions, future production motorcycle soundlevels are estimatedfor the differer_tregulatoryoptionsas shown in Figure5-4. The statistical distributions of sound levels for the regulatory optionsillustrated in Figure 5-4 are developed on the assumption that manufacturerswill not further quiet motorcycles which already meet noise standards.Anticipated noise emission levels for each mode of operation of inotorcyclesregulated to levels of 83 dB, BO dB, 78 dB, and 75 dB are shown in Table 5-4.These representative noise emission levels under each operational mode werederived according to the procedures of Reference 7.
After iiI_plelnentationof a noise emission regulation for motorcycles, itis expected that as more and more older unregulated motorcycles are replacedby new regulatedmotorcycles,the population averaged accelerationsoundlevels will also be reduced over time. For example, suppose a regulation wasPromulgatedwhich providedthat no new motorcyclefor streetuse couldexceed0 dB, according to theSAE J-331a test procedure. The motorcycles above thissound level, which comprise the "loudest" 56 percent of the unmodified street-use motorcycles sho_n in Figure 5-4, would eventually disappear as quietermotorcycles replace older models. Eventually a new distribution would beformed in which no unmodified street-use motorcycle would exceed the 80 dBstandard as measured by the SAE J-331a test, and the mean level would decreaseaccordingly.
5.2.1.3 Motor Vehicle Noise
To better identify those circ_Jmstances in which street motorcyclescause significant noise in_act, it is necessary to relate motorcycle soundlevel distributions for other traffic vehicles.
Table 5-5 presents the current (1979) levels of all vehicles in thetraffic stream for several modes of operation. Seven categories of lightvehicles and automobiles are regulated with respect to noise. The noiseemission levels presented for the two categories of trucks represent thelevels associated with the 83 dB noise regulation, which became effectivein 1978, By 1982, medium and heavy trucks will be required to meet a regu-latory limit of 80 dB, as measured by the SAZ J-336b test procedure. Thelevels presented for buses are unregulated levels, although they, too, will beregulated to lower levels in the near future.
5-13
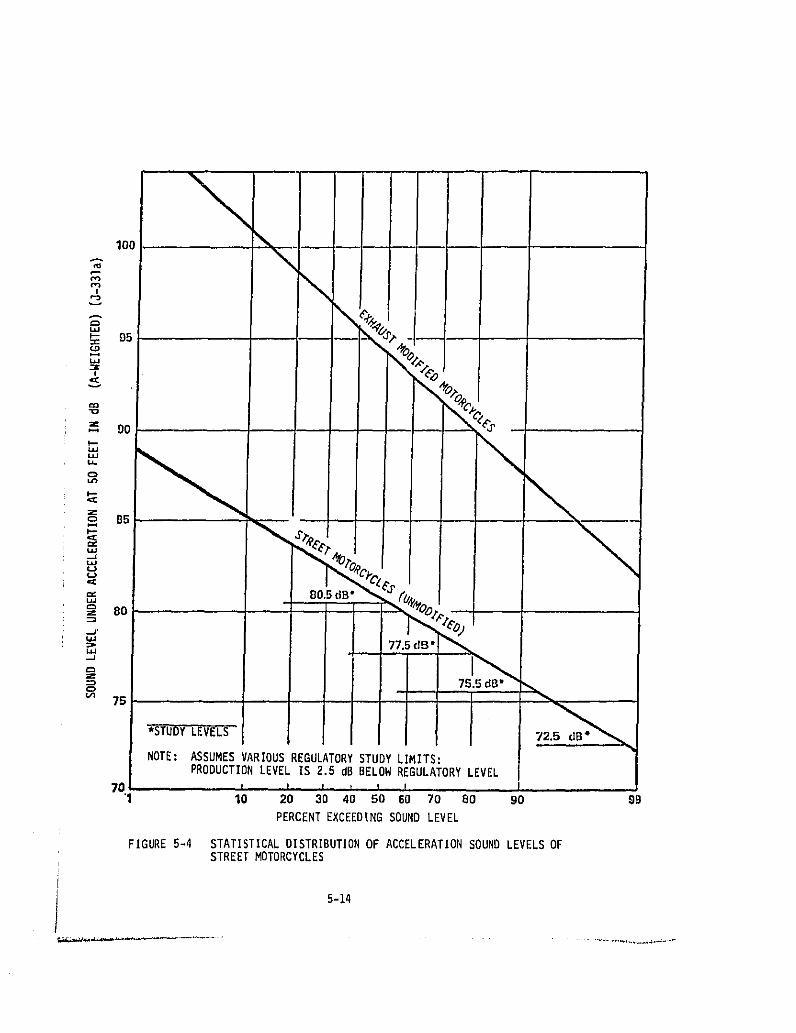
IO0
I,--j
i -,= Do
_ 8o
' Nk_,--I
m 75
70'1 10 20 30 40 50 60 70 80 90 99
PERCENTEXCEEDINGSOUNDLEVEL
FIGURE5-4 STATISTICALDISTRIBUTIONOF ACCELERATIONSOUNDLEVELSOFSTREETMOTORCYCLES
5-14
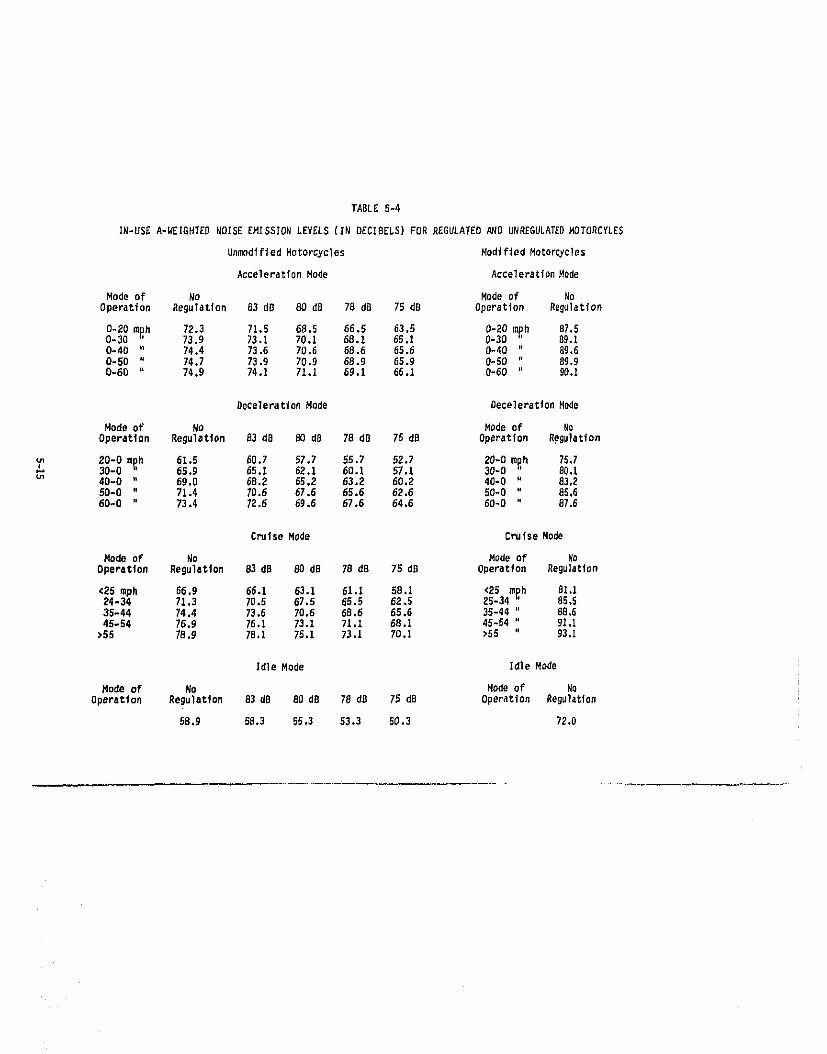
TABLE5-4
IN-USEA-WEIGHTEDNOISEEMISSIONLEVELS(IN DECIBELS)FOR REGULATEDAND UNREGULATEDMOTORCYLE$
UnmodifiedMotorcycles ModifiedMotorcycles
AccelerationMode AccelerationMode
Modeof No Modeof UoOperation ReGulation 83 dB 80 dB 78 dG 78dB Operation ReDulatlon
0-20 mph 72.3 71.5 68.5 66.8 63,5 0-20 mph 87.50-30 " 73.9 73.1 70.1 68.1 65,1 0-30 " 89.10-40 " 74.4 73.6 70.6 60.6 65.6 0-40 " 89,60-50 " 74.7 73.9 70.9 60.9 65.9 0-50 " gg.90-6D " 74.9 74.1 71.1 89.1 86.1 0-60 " gO.l
Deceleration Mode Geceleration Mode
Modeof NO Modeof RoOperation Regulation 83 dB BOdD 78 dR 75 dB Operation Regulation
20-0 mpb 61.5 60.7 57.7 55,7 62.7 20-0 mp,h 75.7,-- 30-0 65.9 65.1 62.1 80.1 57.1 30-0 80.].40-0 " 6g,O 68.2 65.2 63,2 60.2 40-0 83,850-0 " 71.4 70,6 67.6 65.6 62.6 80-O 85.G60-0 " 73.4 78.6 69.G 67.6 64.6 60-0 07,6
Cruise Mode Cruise Mode
Mode of No Modeof NoOperation Regulation 83 dB 80 dG 78 dB 75 dB Operation Regulation
<25 mph 66,9 66.1 63.1 61,1 58.1 <25 rnph 81.124-34 71,3 70.5 67,5 (i5.B 62,5 88-34 " 85.535-44 74,4 73.6 70.6 60.6 65.6 35-44 " G8.645-54 76.g 7G,1 73.1 71.i 68.1 45-54 " 91,1
>55 78.9 78.1 75.1 73.1 70.1 >55 " 93,i
Idle Mode Idle Mode
Modeof No Modeof NoOperation Regulation 83 dB 80 dB 78 dB 75 dB Operation Regulation
58,9 58.3 55.3 53.3 50.3 72.0
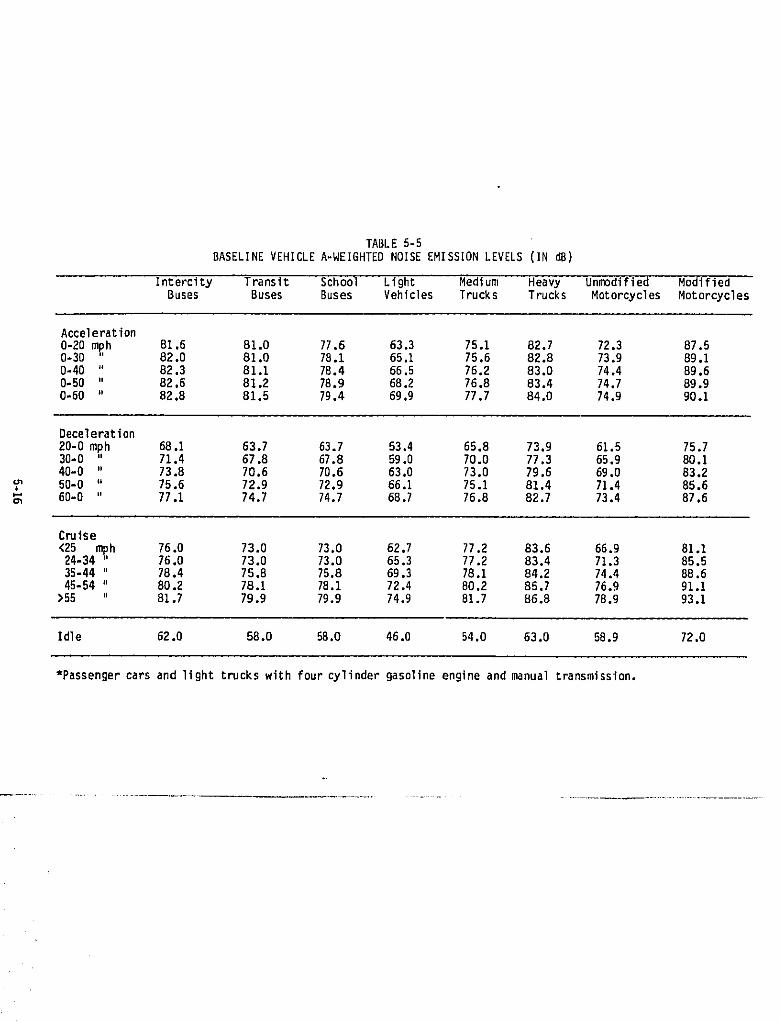
TABLE 5-5BASELINE VEHICLE A-WEIGHTED NOISE EMISSION LEVELS (IN dB)
Intercity Transit School Light Medium Heavy Unmodified ModifiedBuses Buses Buses Vehicles Trucks Trucks Motorcycles Motorcycles
Acceleration
0-20m.p,h 81,6 81.0 77.6 63.3 75.1 82.7 72.3 87.50-3D 82.0 81.0 78.1 65.1 75.6 82.8 73.9 89.10-40" 82.3 81.1 78.4 56,5 76.2 83.0 74.4 89.60.50 " 82.6 81.2 78.9 68.2 76.8 83.4 74.7 89.90-50" 82.8 81.5 79.4 69,9 77.7 84.0 74.9 90.1
Deceleration20-0mph 68.1 63.7 63.7 53.4 65.8 73,9 61.5 75.730-0 " 71.4 67.8 67.8 59.0 70.0 77,3 65.9 80.140-0 " 73.8 70.6 70.6 63,0 73.0 79.6 69.0 83.250-0 " 75.6 72.9 72.9 66.1 75.1 81.4 71.4 85.660-0 " 77.1 74.7 74.7 68.7 76.8 82.7 73.4 87.6
Cruise<25 mph 76.0 73.0 73.0 62.7 77.2 83.6 66.9 81.124-34 " 76.0 73.0 73.0 65.3 77.2 83.4 71.3 85.535-44 " 78.4 75.8 75.8 69.3 78.1 84.2 74.4 88.645-54 " 80.2 78.1 78.1 72.4 80.2 85.7 76.9 91.1>55 " 81.7 79.9 79.9 74.9 81.7 86.8 78.9 93.1
Idle 62.0 58.0 58,0 46.0 54.0 63.0 58.9 72.0
*Passengercarsand llght truckswith fourcylindergasolineengineand manualtransmission.
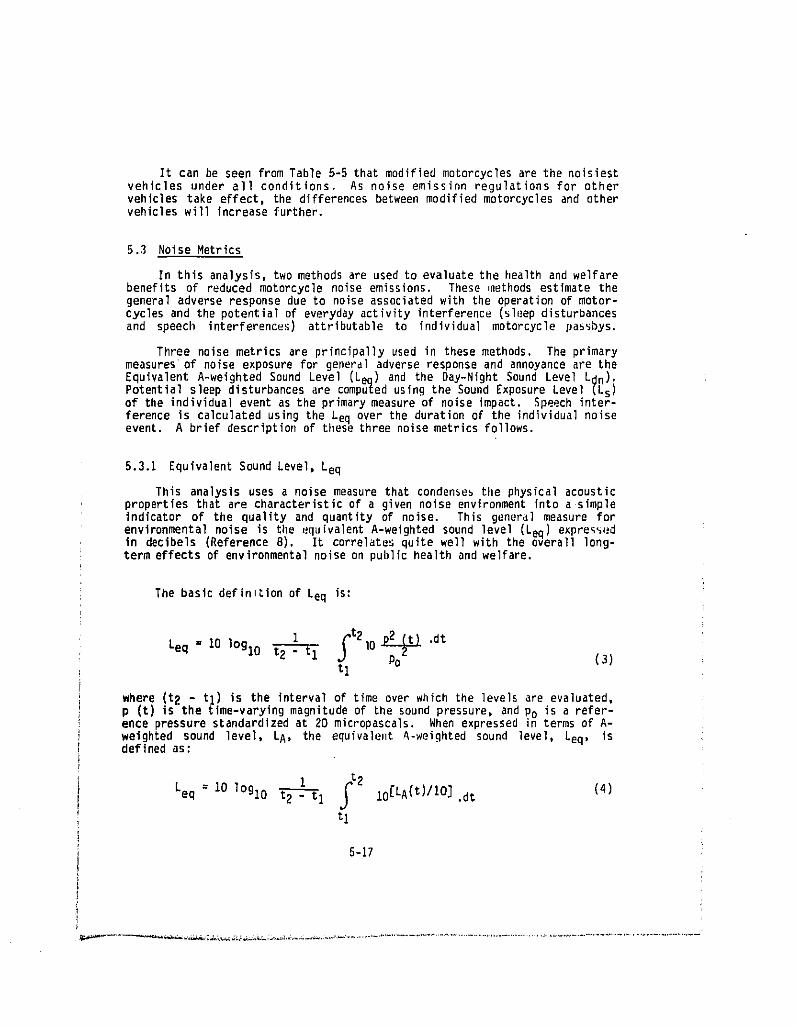
It can be seen from Table 5-5 that modified motorcycles are the noisiestvehicles under ell conditions. As noise emission regulations for othervehiclestake effect, the differencesbetweenmodifiedmotorcyclesand othervehicles will increase further.
5.3 Noise Metrics
In this analysis,two methodsare usedto evaluatethe i_ealthand welfarebenefits of reduced motorcycle noise emissions. These _nethods estimate thegeneraladverseresponsedue to noise associatedwith the operationof motor-cycles and the potential of everyday activity interference (sleep disturbancesand speech interferences)attributableto individualmotorcyclepassbys.
Three noise metrics are principally used in these methods. The primarymeasures of noise exposure for general adverse response and annoyance are theEquivalentA-weightedSound Level (Leo) and the Day-NightSound Level Ldn).Potentialsleep disturbancesare computedusing the Sound ExposureLevel(Ls)of the individual event as the primary measure of noise impact. Speech inter-ference is calculatedusing the Lea over the durationof the individualnoiseevent. A brief descriptionof thesethree noisemetricsfollows.
5.3.1 EquivalentSound Level,Leq
This analysisuses a noise measurethat condensesthe physicalacousticpropertiesthat are characteristicof a givennoise environmentintoa simpleindicatorof the quality and quantity of noise. This generalmeasure forenvironmentalnoise is the equivalentA-weightedsound level (Leo)expres_(_din decibels (Reference8). It correlatesquite well with the overalllong-term effectsof environmentalnoiseon publichea]thandwelfare.
The basicdefinmtionof Leq is:
I yt210_ .dtLeq - 10 loglo
tl (3)
where (t2 - tI) is the intervalof time overwhich the levelsare evaluated,p it) is the tlme-varyingmagnitudeof the soundpressure,andPo is a refer-ence pressurestandardizedat 20 micropascals. When expressedIn termsof A-
weighted sound level, LA, the equivaletlt_-weightedsound level, Leq, isdefinedas:
i /2 (4)Leq --I0 lOglo _I i0[LA(t)/lO].dt
tI
5-17
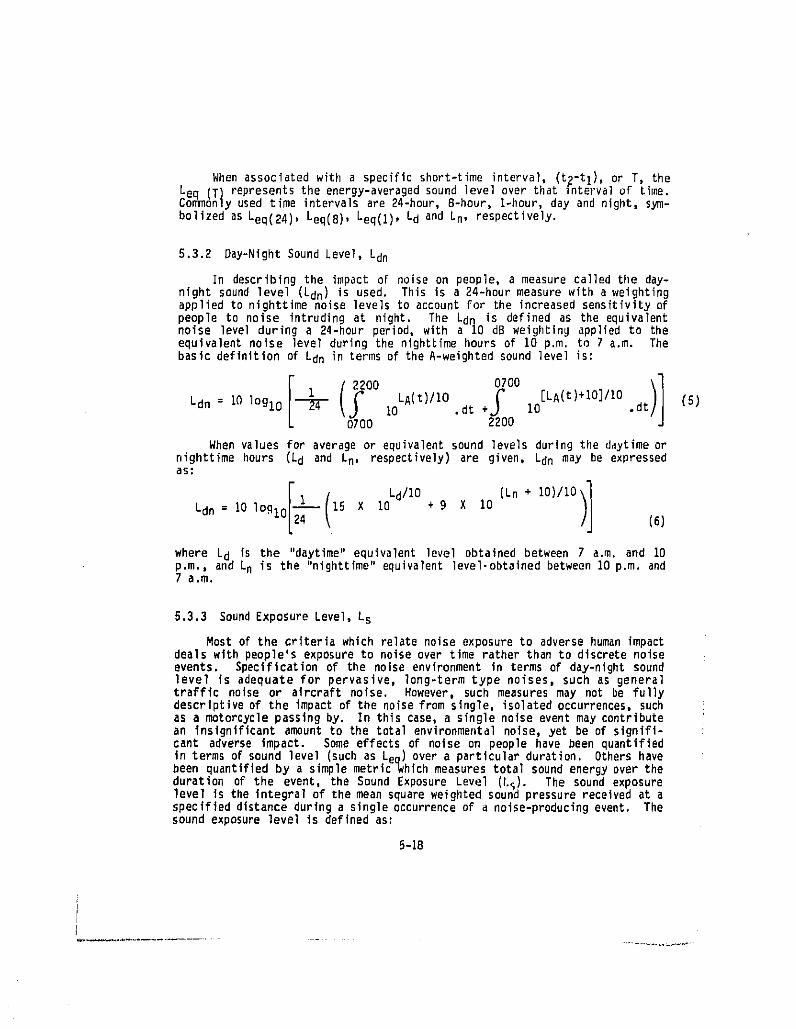
When associated with a specific short-time interval, (t2-tl), or T, theLeQ (T) represents the energy-averaged sound ]eve] over that interval oF Lime.Coni_6nly used time intervals are 24-hour, 8-hour, l-hour, day and night, sym-
bolized as Leq(24), Leq(8), Leq(1), Ld and Ln, respectively.
5.3.2 Pay-Night Sound Level, Ldn
In describing the impact oF noise on people, a measure called the day-night sound level (Ldn) is used. This is a 24-hour measure with a weightingapplied to nighttime noise levels to account for the increased sensitivity ofpeople to noise intruding at night. The Ldn is defined as the equivalentnoise levelduring a 24-hourperiod,with a 10 dB weightingappliedto theequivalent noise level during the nighttime hours of 10 p.m. to 7 a.m. Thebasic definition of Ldn in terms of the A-weighted sound level is:
9 >I00 LA(t)IIO [LA(t)+IO]/IO (5)Ldn= 10leglo 10 .dt+ 10 .dr
0700 2200
When values for average or equivalent sound levels during the daytime ornighttime hours (Ld and Ln, respectively) are given, Ldn may he expressedas:
Ldn= I0lOglo 15 X I0 + 9 X 10(6)
where Ld is the "daytime" equivalent level obtained between 7 a.m. and 10p.m., and Ln is the "nighttime" equivalent level.obtalned between 10 p.m. and7 a.m.
5.3.3 SoundExposure Level,Ls
Most of the criteriawhich relatenoise exposureto adversehumanimpactdeals with people'sexposureto noiseover time ratherthan to discretenoiseevents. Specificationof the noise environmentin terms of day-nightsoundlevel is adequate for pervasive, long-termtype noises, such as generaltraffic noise or aircraftnoise. However, such measures may not be fullydescriptiveof the impactof the noisefrom single,isolatedoccurrences,suchas a motorcyclepassingby. In thiscase,a singlenoise eventmay contributean insignificantamountto the totalenvironmentalnoise,yet be of signifi-cant adverseimpact. Some effectsof noise on people have been quantifiedin terms of sound level (suchas Lea)over a particularduration. Othershavebeen quantlf_edby a simplemetricWhich measurestotalsound energyovertheduration of the event, the Sound ExposureLevel (l-s). The sound exposurelevel is the integralof the mean squareweightedsoundpressurereceivedat aspecifieddistanceduringa singleoccurrenceof a noise-producingevent. Thesound exposurelevel is definedas:
5-18
I
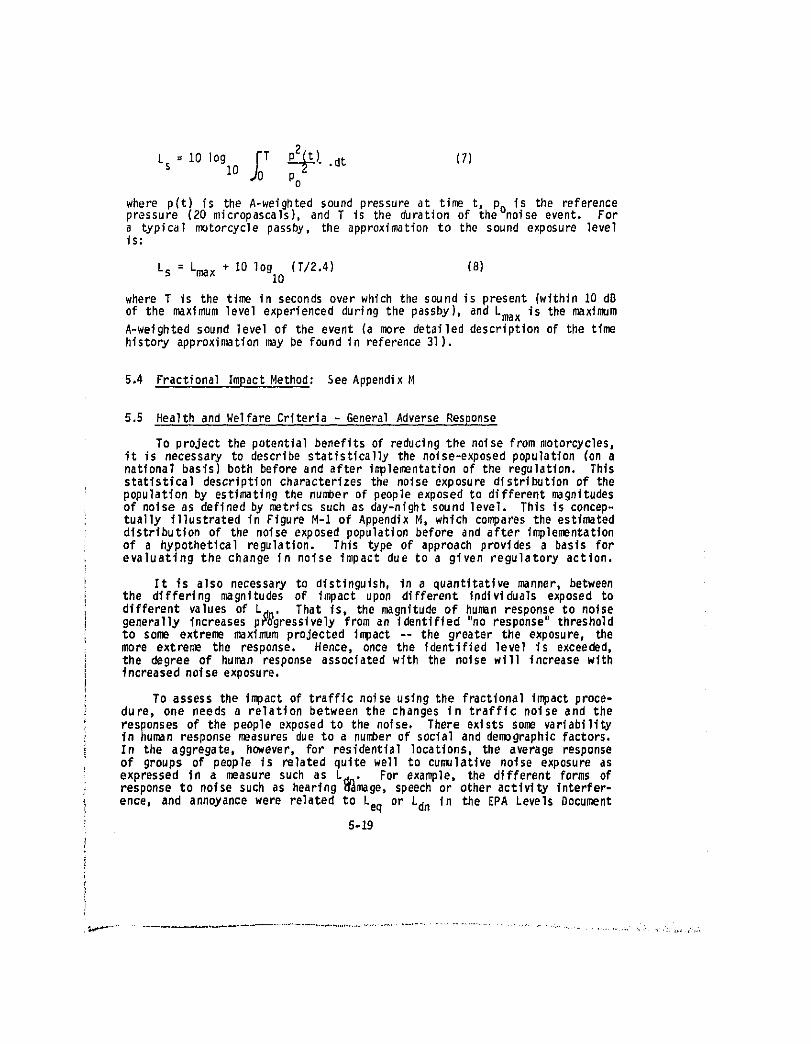
Ls = i0 log - .dr oJoT ,,,Po
where p(t) is the A-weighted sound pressure at time t, Po is the referencepressure (20 micropascals),and T is the durationof the noise event. Fora typical motorcyclepassby, the approximationto the sound exposure levelis:
Ls = Lmax + lO log (T/2.4) (B}10
where T is the time in secondsover which the sound is present (within10 dB
of the maximum levelexperiencedduringthe passby), and Lmax is the maximumA-welghtedsound level of the event (a mere detaileddescriptionof the timehistoryapproximationmay be found in reference31).
5.4 FractionalImpactMethod: See AppendixM
5.5 Healthand WelfareCriteria- GeneralAdverseResponse
To projectthe potentialbenefitsof reducingthe noise frommotorcycles,it is necessaryto describestatisticallythe nolse-exposedpopulation(on anationalbasis)both beforeand after implementationof the regulation.Thlsstatisticaldescriptioncharacterizesthe noiseexposuredistributionof thepopulationby estimatingthe numberof peopleexposedto differentmagnitudesof noiseas definedby metricssuchas day-nlghtsound level. This is concep-tua]ly illustratedin FigureM-I of AppendixM, which comparesthe estlmeteddistributionof the noise exposedpopulationbeforeand after implementationof a hypotheticalregulation. This type of approach provides a basis forevaluating the change in noise impact due to a given regulatory action.
It is also necessaryto distinguish,in a quantitativemanner, betweenthe differing magnitudes of impact upon different individualsexposed todifferentvalues of L_ . That is, the magnitudeof human responseto noisegenerally increasesp#_gresslvelyfrom an identified"no response"thresholdto some extreme maximum projectedimpact -- the greater the exposure,themore extreme the response. Hence, once the identifiedlevel is exceeded,the degree of human responseassociatedwith the noise will increasewithincreasednoiseexposure.
To assess the impactof trafficnoiseusingthe fractionalimpactproce-dure, one needs a relatlon between the changes in traffic noise and theresponsesof the penpleexposedto the noise. There existssome variabilityin human responsemeasuresdue to a numberof socialand demographicfactors.In the aggregate, however, for residentiallocations,the average responseof groups of people is relatedquite well to cumulativenoise exposureasexpressed in a measure such as LH.. For example, the differentforms ofresponseto noise such as hearing_¢Image,speechor other activityinterfer-
ence_ and annoyancewere related to Leq or Ldn in the EPA Levels Document
5-19
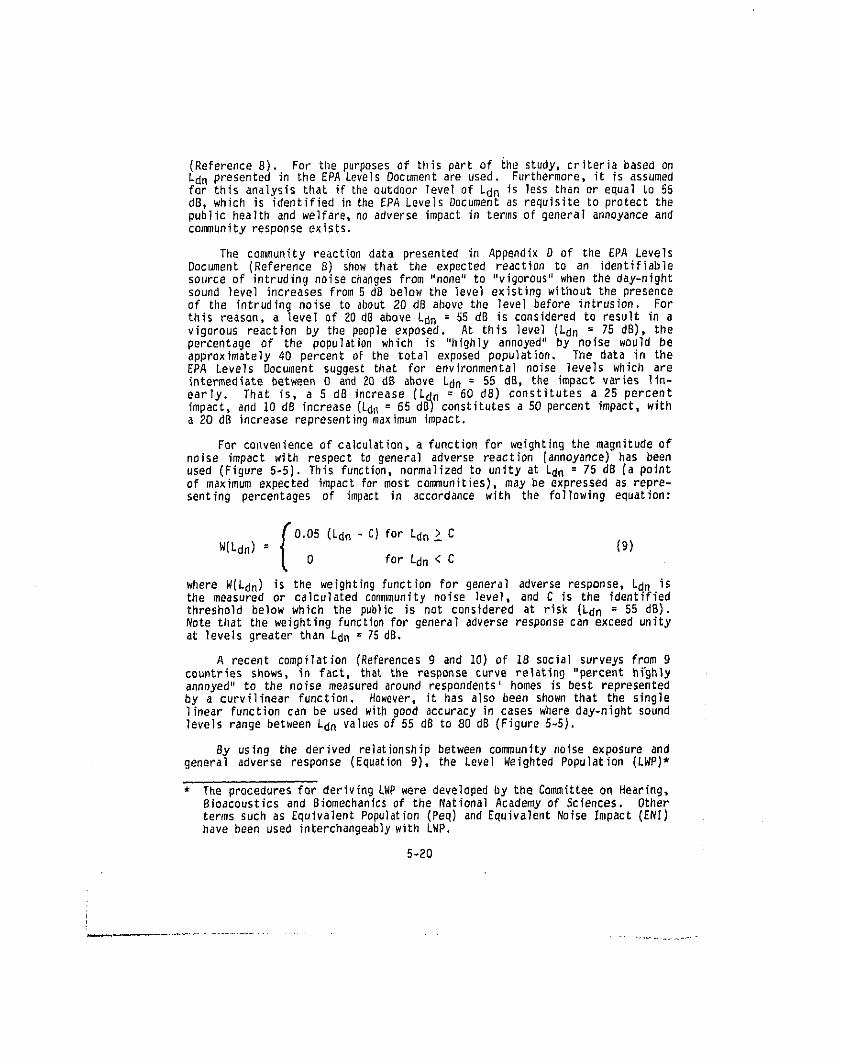
(Reference8). For the purposesof this partof Ehe study,criteriabased onLdn presentedin the EPA LevelsDocumentare used. Furthermore,it is assumedfor this analysis that ifthe outdoor level of Ldn is less than or equal Lo 55dB, which is identifiedintheEPA LevelsDocumentas requisiteto protectthepublichealthand welfare,no adverseimpactin termsof generalannoyanceandcommunity response exists.
The communityreactiondata presentedin AppendixO of the EPA LevelsDocument (ReferenceS) showthat the expectedreactionto an identifiablesourceof intrudingnoisechangesfrom "none"to "vigorous"when the day-nightsound level increasesfrom5 dB below the levelexistingwithoutthe presenceof the intrudingnoise to about20 dB abovethe levelbeforeintrusion. Forthis reason,a level of 20 d8 above Ldn = 55 dB is consideredto resultin avigorous reactionby the peopleexposed. At this level (Ldn = 75 dB), thepercentageof the populationwhich is "highlyannoyed"by noise would heapproximately40 percentof the total exposedpopulation, The data in theEPA Levels Document suggestthat for environmenba]noise levels which areintermediate between 0 and 20 dB above Ldn = 55 dB, the impact varies lin-early. That is, a S dB increase(Ldn = 60 dB) constitutesa 25 percentimpact,and 10 dB increase(Ldn= 65 dB) constitutesa 50 percentimpact,witha 20 dB increaserepresentingmaximum impact.
For convenience of calculation, a function for weighting the magnitude ofnoise impact with respectto general adversereaction (annoyance)has beenused (Figure5-5). This function,normalizedto unity at Ldn = 75 dB (a pointof maximum expected impactformost communities),may be expressedas repre-senting percentagesof impactin accordancewith the followingequation:
0.05 (Ldn- C) for Ldn_ CW(Ldn) = 0 for Ldn < C (9)
where W(Ldn) is the weightingfunctionfor generaladverseresponse,Ldn isthe measured or calculatedcon_imunitynoise level,and C is the identifiedthresholdbelow which the publicis not consideredat risk (Ldn = 55 dB),Note that the weightingfunctionfor generaladverseresponsecan exceedunityat levels greater than Ldn = 75 dB,
A recent compilation(Referencesg and 10) of 18 socialsurveysfrom 9countriesshows, in fact, thatthe responsecurve relating"percenthighlyannoyed"to the noise measuredaroundrespondents'homes is best representedby a curvilinearfunction, However,it has alsobeen shownthat the singlelinearFunctioncan be used withgood accuracyin cases whereday-nightsoundlevelsrangebetweenLdn valuesof 55 dB to 80 dB (Figure5-51.
By using the derived relationshipbetweencommunitynoise exposureandgeneral adverse response (Equationg), the Level WeightedPopulation(LWP)*
* The proceduresfor derivingLWPwere developedby the Committeeon Hearing,8ioacousticsand 8iomechanicsof the NationalAcademyof Sciences. Othertermssuch as EquivalentPopulation(Peq)and EquivalentNoiseImpact(ENI)havebeen used interchangeablywithLWP.
5-20
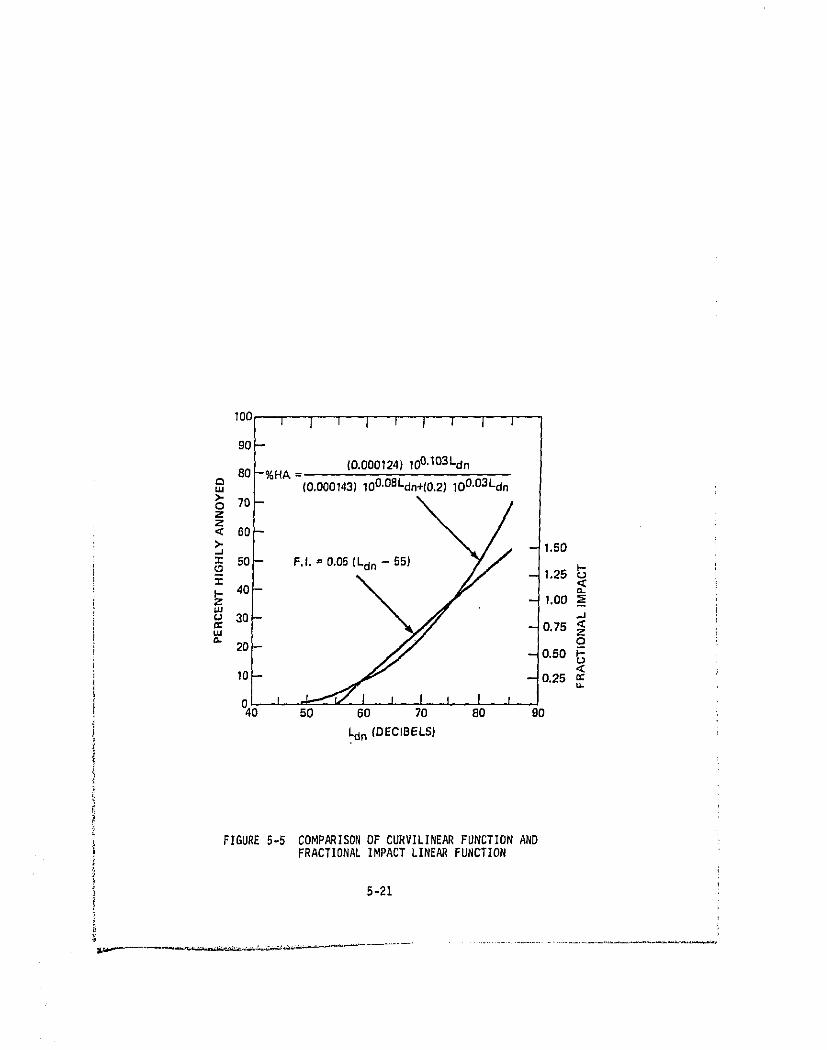
I00 i j i I t f I I I
90-
(0.000124) lOO.103Ldn80 -%HA =c3
m (0.000143) 100'0BLdn+(0.2)lO0'03Ldno 70zz< 60>" 1.50,-J
:z: 50 F.f. = 0.05 (Ldn - 55)1.25 _-
_. 40z _.oo ___U
30 "J"" 0.75UJ
o
¢" 20- _ 0.50 ,_
I0- --0.25
r I I r50 60 70 80 90
Ldn{DECIBELS)
FIGURE5-5 COMPARISONOFCURVILINEARFUNCTIONANDFRACTIONALIMPACTLINEARFUNCTION
5-21
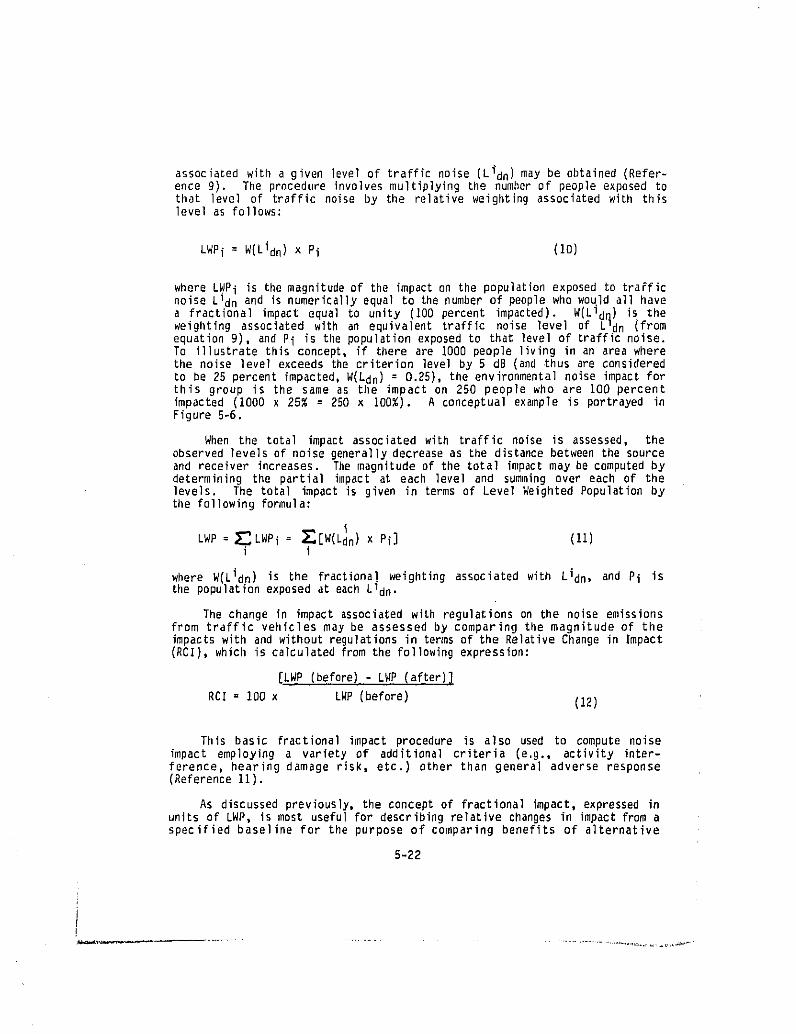
associated with a given level of traffic noise (Lidn) may be obtained (Refer-ence 9). The procedure involves multiplying the number of people exposed tothat level of trafficnoise by the relativeweightingassociatedwith thislevel as fo]]ows:
LWPi=W(Lidn)xPi (I0)
where LWPi is the magnitude of the impact on the population exposed to trafficnoise L1dn and is numerically equal to the number of people who wo41d all havea fractional impact equal to unity (100 percent impacted). W(L1dn) is theweighting associated with an equivalent traffic noise level of L1dn (fromequation 9), and Pi is the population exposed to that level of traffic noise.To illustrate this concept, if there are 1000 people living in an area wherethe noise levelexceeds the criterionlevelby 5 dB (andthus are consideredto be 25 percentimpacted,W(Ldn) = 0.25),the environmentalnoise impactforthis group is the same as the impact on 250 people who are 100 percentimpacted (1000 x 25% = 250 x I00%). A conceptualexample is portrayedinFigure 5-6.
When the total impact associated with traffic noise is assessed, theobserved levels of noise generally decrease as the distance between the sourceand receiver increases. The magnitudeof the total impactmay be computedbydetermining the partial impact at each level and summing over each of thelevels. The total impact is given in terms of Level Weighted Population bythe following formula:
LWP:_LWP i= _[W Ldn)x Pi] (11)i i
where W(Lidn) is the fractionalweightingassociatedwith Lidn, and Pi isthe populationexposedat eachL1dn.
The change in impactassociatedwith regulationson the noise emissionsfrom traffic vehicles may be assessed by comparing the magnitude of theimpactswith and withoutregulationsin termsof the RelativeChangein Impact(RCI), which is calculated from the fol]owing expression:
[LWP (before)- LWP (after)_
RCI: 100x LWP(before) (12)
This basic fractional impact procedure is also used to compute noiseimpact employinga variety of additionalcriteria (e.g., activity inter-ference, hearing damage risk, etc.) other than general adverse response(Reference 11).
As discussed previously, the concept of fractional impact, expressed inunits of LWP, is most useful for describing relative changes in impact from aspecified baseline for the purpose of comparing benefits of alternative
5-22
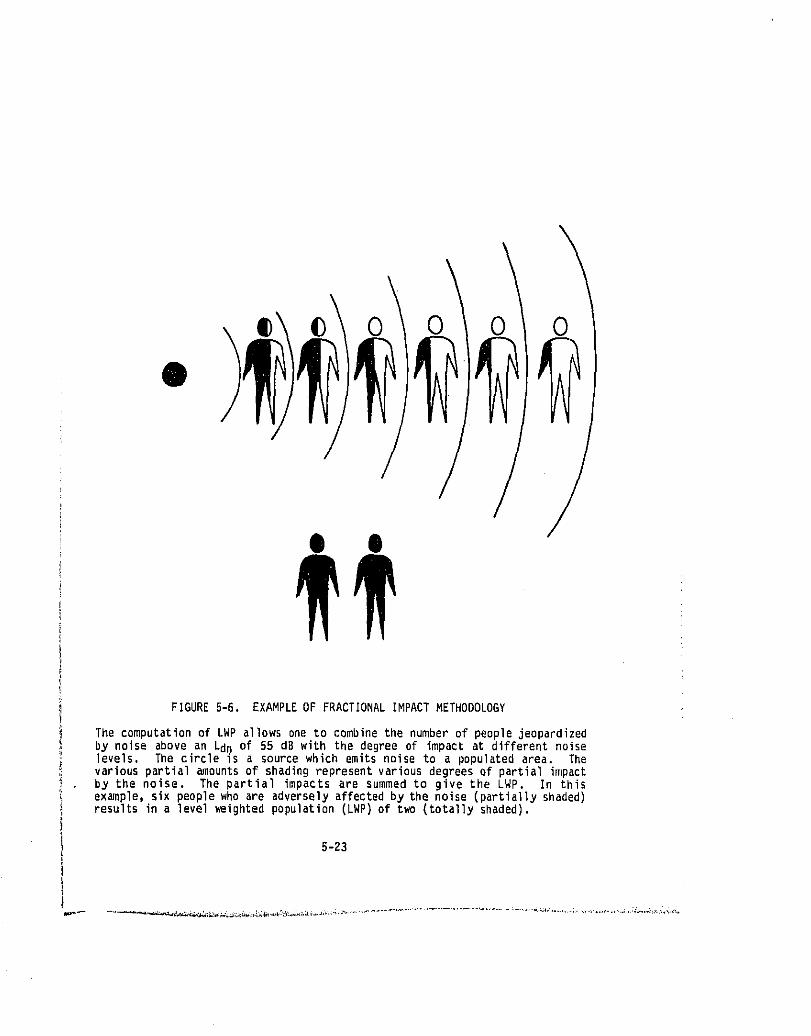
•(pap_qs_L[_o_)oM__o(dMq)uo_tndodpa_q6_a_LaAaLeutsllnsaJ(papoqs_[tP_Jed)asLouaq__qpa_a_e_LaSJaApeaJeoqMaLdoadx[s'atd_xas_q_uI"dMqaq_aAL50_pammnsaJ_s_3_d_[g_J_daq_"astouaq_Rq_edmL[et_J_d_osaaJ6ap5nOLJ_A_uasaJda__utpeqsjos_unoure[_L_J_d5nOLJg^aqI"_aJ_pa_Lndod_o_as[ous_t_aq_tq_a_Jnoses[a[_J!_aq_"SLaAaLasLou_uaJaJ_[p__D_d_L_0aaJ6apaq_q_[MBPSSJoup]ueaAoqeas[ouKqpaz!pJ_doa_aLdoad_oJaqmnuaq_auLq_o_o_auoSMOLLe_M_Jouo£]e_ndmo_aq£
AgOlOOOHI3HIDVdHI1VNOIIDV_J303ldNVX3"g-s3angI_
Q$
/
regulatoryschedules. In order to assess the absoluteimpact or benefitscorrespondingto any regulatoryschedule,one must have informationon thedistributionof populationas a function of noise environment. The deriva-tion of this type of information is discussed in Section 5.7.
5.6 Healthand WelfareCriteria- SingleEventResponse
When the benefits of lessening the noise from motorcycles are beingexamined,it is importantto look beyond the contributionthat motorcyclesmake to overallaverageday-nighttraffic noise (L,_n).The impactcontribu-tionswhich are calculatedin termsof averagecomm_ty responseare somewhatgeneralized and do not necessarily represent specific impact situations. Onsome occasions,noise associatedwith motorcycleswill combine with othernoises,as describedby the GeneralAdverseResponseanalysis. At othertimesor in ether situations,one can expect that other noisesourceswill net besignificant,and thus each motmcycle passbywill cause a distinct impact.The actualimpactfrommotorcyclesis certalnlydue to a combinationof vari-ous levels of motorcyclenoise and other environmentalnoise. Thus, themethodologyfor assessinggeneraladverse response (as discussedin Section5.5) will not take into account the fact that almostthe entire ae_untof
daily acousticalenergycontributedby motorcyclesin an areamay be generatedby only a few minutesof noise duringmany accelerationsnearan intersectionin the courseof a day, Yet these intrusive,short,intenseeventsmay besome of the most annoyingnolse-relatedsltuationsfacedover the entiredayby a large numberof pedestriansor residents.
It is difficultto derivea directmeasureof the annoyanceattributableto the intrusivenessof motorcyclenoise. Numeroussurveys indicate thatmotorcyclenoise Is a major source of annoyancebut only a few scientificstudieshave directlyrelatedmotorcyclesound levelste degreesof annoyance.
When queried in attitudinalsurveys, respondentsgenerallyrate motor-cycle noise as a major,if not the major, sourceof annoyancefrom traffic-related noise. For example, the response to noise survey questionnairesmailed to a random sample of individualsshowedthat the respondentsratedmotorcyclesas the major noise "problem",while automobilesand truckswereranked second and third as noise problems with rankings of 67 percent and 62percentrespectively,relativeto motorcyclenoise at 100 percent (Reference12).
In another survey, respondents were asked to rate 25 noise sources on ascale from "not bothering at all" to "extremely bothering." Motorcycles wererated as "not botheringat all" by the smallest percentageof people andwere rated as "extremely bothering" by the highest percentage of people.A total of 44.8 percent rated motorcycle noise as either "moderately,""highly,"or "extremely"botheringin their neighborhoods(Reference13). Inthe same study, people rated traffic noise situations in terms of both inten-sity and frequency of annoyance. People annoyed by motorcycle noise rated theintensity midway between "definitely annoying" and "strongly annoying," Theonly vehicletype receivinga higherannoyanceintensityratingwas buses. Interms of frequency,motorcycleswere reportedas the sourceof annoyance23percentof the time, secondonly to automobileswitha 36 percentfrequencyofannoyance. People are annoyed, it seems, by motorcycle noise greatly out of
5-24
proportion to actual numbers of motorcycles, as compared to other types oftrafficvehicles.
In one very applicable investigation, a sample of 57 persons ratedvehicularnoise at an open-alrtest trackas the vehicleswere drivenby at adistance of 7.5 meters at the closestpoint (Reference14). Listenerswereexposed to both constant speed cruises and accelerations. Figure 5-7 showsthe resultsof the subjectivenoise ratingsof motorcyclesas a functionofA-weightednoise level as heard by the listener,Ratingsrangedfrom "quiet"at 68.5 dB to "excessivelynoisy"at 96,5dB. These resultsseem to comparefairly well with those of another study in which ratings of single noiseevents variedfrom "quiet"at 73 dB to "noisy(strongly)"at 92 dB (Reference15),
A loud,short-durationvehiclepassbymay alsointerruptpeople'sactivi-ties, suchas conversation,sleeping,TV viewing,readingetc. In a study ofthe annoyancecaused by differentlevels of simulatedaircraft noise forpeople seatedindoorswatching television,annoyancewas found to be depen-dent, at least in part, on speech interference(Reference16). Not onlyis the TV program,or other personspeaking,more difficultto hear duringthetime in which a noisy event is takingplace,but It has beenobservedthat thedistractionwhich may occur from the conversationin which the person Isengagedmay contributeIn Itself to annoyance(References16 and 17). Thespeakermay attemptto cope with the noise intrusionbehaviorally,eitherbyincreasinghls or her vocal effort,or in more severecases,by discontinuingconversationaltogether. Such behavioralreactions may be indicativeofgeneralannoyanceand disturbancewith the Intrusivenoiseevent.
In general, interruptions of people's activities lead to annoyance(References18 and 19), and representa degradationof healthand welfare.For example,the reactionto a noise intrusionduringsleep is, In many cases,a change in sleep stage (from a "deeper"to a "lighter"stage) or, if theintrusivenoise is intenseor of prolongedduration,an actualawakeningmayresult. In eithercase, repeateddisturbanceof people'ssleep can be expect-ed to adverselyaffecthealthand well-belng.
Several investigationshave shown that expressedannoyancewith noisecorrelateswell with interferenceof activitiesdue to noise (References8,20, 21, 22, 23, 24, and 2g). One surveyfoundthat reportsof interferenceswith sleep and speech communicationcorrelatemore highly with feelingsofgeneralizedannoyance than with any other factor, includingactual soundlevelsmeasuredoutdoors(Reference18).
For these reasons,the analysis of vehiclepassby impactswere examinedin some detail to assess the significance of potential individual eventexposuresupon human activities(References26 and 27), in particular,theactivitiesof speechcommunicationand sleep. The analysiswas undertakentodetermineboth the direct effectmotorcyclenoise may have on these activi-ties, and to estimatethe total potentialannoyanceattributableto motorcyclenoise. These single event pass-by noise intrusions become particularlyimportantin light of other regulationsand effortsto reducethe noisefromother motor vehiclesand urbannoise sources, Namely,withouta reductioninnoise emissions for motorcycles, the motorcycle will stand out as one of themost, if not the most, intrusive noise sources.
5-25
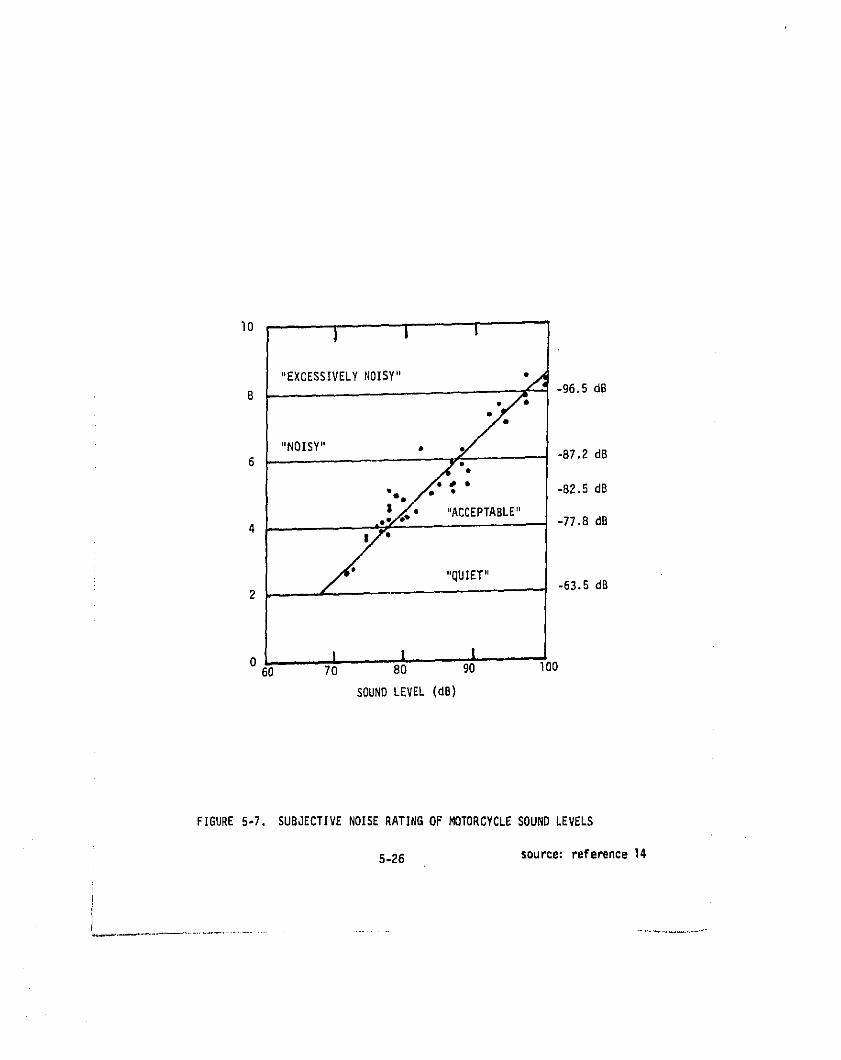
io ) I i
"EXCESSIVELY NOISY" "If' -96.5 dB
8 • ' ,__
"NOISY"6 - -87.2dB
-82.5 dB
4 -'_ "" "77.8 dB
" "QUIET" -63.5dB2
o I I |60 70 80 90 lO0
SOUND LEVEL (dB)
FIGURE5-7. SUBJECTIVENOISERATINGOF MOTORCYCLESOUNDLEVELS
5-26 source:reference14
5.6.1 Sleep Disturbance
The sleep periods nf humans are Lypical]yc]assifiedinto five stages.In StagesI and If, sleep is lightand the sleeperiseasilyawakened. StagesIll and IV are statesof deep sleep where a personis not as easilyawakenedby a given noise, but the sleepmay shift to a lighterstage. An additionalstage, termed rapid eye movement (REM), correspondsto the dream state.Whenexposedto an intrusivenoise,a sleepermay (I)show responseby a briefchange in brainwave pattern,without shiftingsleepstages;(2) shiftto alightersleep stage;or (3) awaken. The greatestknownimpactoccursdue toawakening,but there are also indicationsthat disruptionof the sleepcyclecan cause impact (irritability,etc.) even thoughthe sleepermay not awaken(Reference2).
A recentstudy (References28 and 29) has summarizedand ana]ymmdsleepdisturbancedata as gatheredunder experimentallaboratoryconditions. Thisstudy demonstrateda relationshipbetween frequencyof response(disturbanceor awakening)and noise level,and furtherdemonstratedthat the durationofthe noise stimuluswas a criticalparameterin predictingresponse. The studyalso showed that the frequencyof sleep disruptionis predictedby noiseexposurebetterthan is arousalor behavioralawakening.An importantfact isthat sleep disturbanceis definedas any physiologicalchangewhichoccursasa resultof a stimulus. The personundergoingsuchdisturbancemay be com-pletely unaware of being afflicted;however, the disturbancemay adverselyaffecttotal sleep quality. Thiseffecton overallsleepqualitymay leadto,in certain situations,undesirablebehavioralor physiologicalconsequences(Reference2).
Data relating to the anticipateddisruptionof s]eepcausedby noise isshown in Figure 5-8 (top). These data illustratethe frequencyof sleepdisturbance(as measured by changes in sleep state,includihgbehavioralawakening)as a function of the sound exposure level(Ls) of the intrudingnoise. The frequencyof behavioralawakeningas a functionof soundexposurelevelis also shown in Figure5-8 (bottom). Theserelationships,adaptedfromFiguresi and 2 of Reference2B, consistof data derivedfrom a reviewofmostof the recent experimentaldata on sleep and noise relationships. Theserelationshipsshow the approximatedegree of expectedimpact(percentdisrup-tion or awakening)at given levelsof noise, For example,in Figure5-8,anindoor sound exposure level of 60 dB would be expectedto result in a 31percent probabilityof a sleep disruption(change in depth of sleep). Theprobabilityof being awakenedis less than thatof beingdisturbed. For thisexamp)eof a sound exposurelevelof 60 dB, the probabilityof beingawakenedis 17 percent(seeFigure5-8).
Note also that the noise data contained in the referencescited weremeasured in terms of "effective perceived noise level"with a reference
durationof 0.6 seconds, LEPN (0.5 sec.). This level wasconvertedto Ls bythe followingapproximaterelationship*.
Ls : LEPN (0.5 sec.)- 16 dB (13)
* This equationaccounts for the averagedifferenceof ]3 dB betweenPer-ceived Noise Level and A-weightedsound level,and the 3 dB that resultsfrom the change in referencetime from 0.5 seconds,usedin Reference28,to I second,used in sound exposurelevel.
5m27
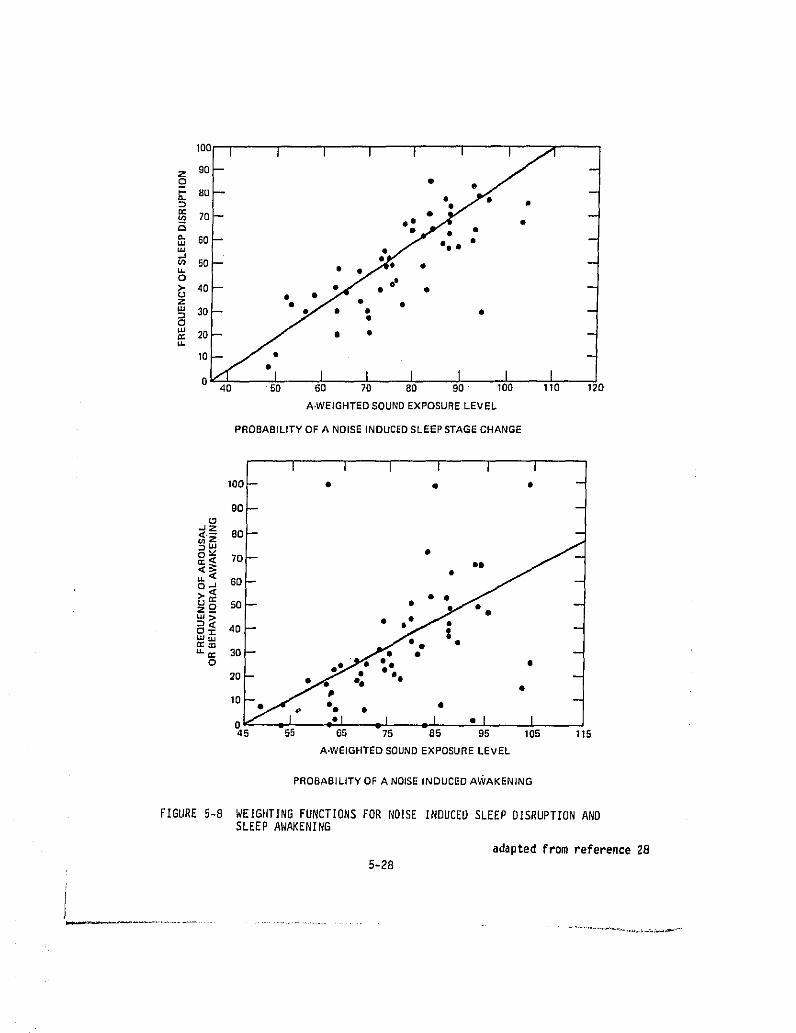
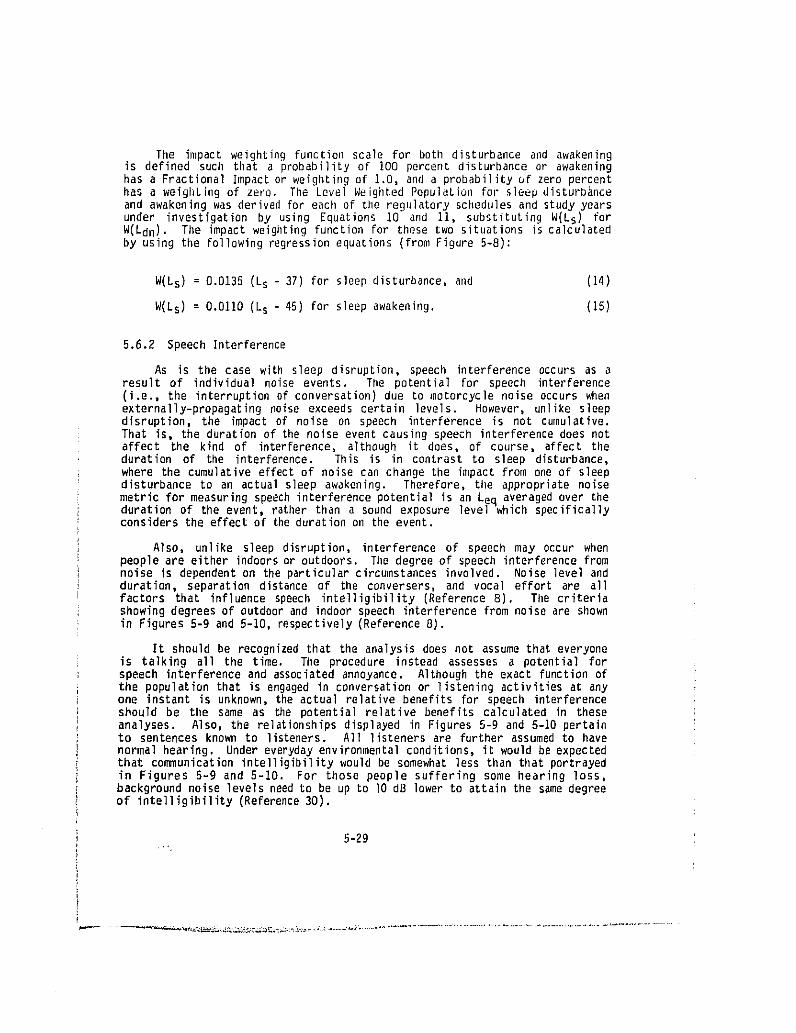
The impact weighting function scale for both disturbance and awakeningis defined such that a probahility of 100 percent disturbance or awakeninghas a Fractional Impact or weighting of 1.0, and a probability of zero percenthas a weighting of zero. The Level Weighted Population for sleep disturbanceand awakening was derived for each of the regulatory schedules and study yearsunder investigation by using Equations i0 and 11, substituting W(Ls) forW(Ldn). The impact weighting function for [tlese two situations is calculatedby using the following regression equations (from Figure 5-8):
W(Ls) = 0.0135 (Ls - 37) for sleep disturbance, and (14)
W(Ls)= 0.0110(Ls - 45) for sleepawakening. (15)
5.6.2 Speech Interference
As is the case with sleep disruption,speech interferenceoccurs as aresult of individualnoise events. Tilepotentialfor speech interference(i.e., the interruption of conversation) due to motorcyc]e noise occurs whenexterna]ly-propagating noise exceeds certain levels. However, unlike sleepdisruption, the impact of noise on speech interference is not cumulative.That is, the duration of the noise event causing speech interference does nataffect the kind of interference,although it does, of course, affect tileduration of the interference. This is in contrast to sleep disturbance,where the cumulative effect of noise can change the impact from one of sleepdisturbanceto an actuals]eep awakening. Therefore,tileappropriatenoisemetricfor measuringspeechinterferencepotentialis an Leq averagedover theduration of the event, rather than a sound exposure level which specificallyconsiders the effect of tileduration on the event.
Also, unlike sleep disruption, interference of speech may occur whenpeopleare eitherindoorsor outdoors. Tiledegreeof speechinterferencefromnoise is dependent on the particular circumstances involved. Noise level andduration, separationdistanceof the conversers,and vocal effort are allfactors that inf]uencespeech intel]igibility(Reference8). Tilecriteriashowingdegreesof outdoorand indoorspeechinterferencefromnoiseare shownin Figures 5-9 and 5-10, respectively (Reference 8).
It should be recognizedthat the analysisdoes not assumethateveryoneis talking all the time. The procedureinsteadassesses a potentialforspeech interferenceand associatedannoyance. Althoughthe exact functionofthe populationthat is engagedin conversationor listeningactivitiesat anyone instant is unknown, the actua] re]aLive benefits for speech interferenceshould be tilesame as the potentialre]ativebenefitscalcu]atedin theseanalyses. Also, the relationships displayed in Figures 5-9 and 5-10 pertainto sentencesknown to listeners. A]I listenersare furtherassumedto havenormal hearing. Under everydayenvironmentalconditions,it would be expectedthat communication intelligibility wou]d be somewhat less than that portrayedin Figures 5-9 and 5-10. For those people suffering some hearing loss,background noise levels need to be up be lO dB ]ower to attain the same degreeof intelligibility (Reference 30).
5-29
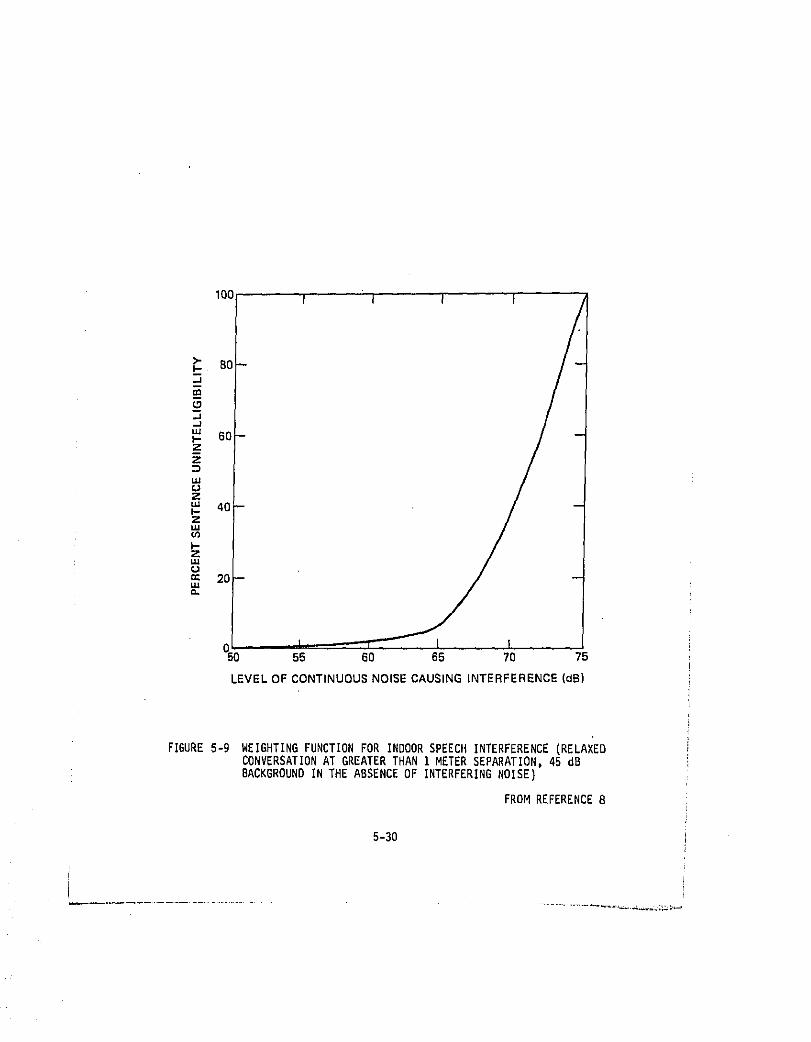
55 60 65 70 75
LEVEL OF CONTINUOUS NOISE CAUSING INTERFERENCE (dB)
FIGURE 5-9 WEIGHTING FUNCTION FOR INDOOR SPEECH INTERFERENCE (RELAXEDCONVERSATION AT GREATER THAN i METER SEPARATION, 45 dBBACKGROUND IN THE ABSENCE OF INTERFERING NOISE)
FROM REFERENCE 8
5-30
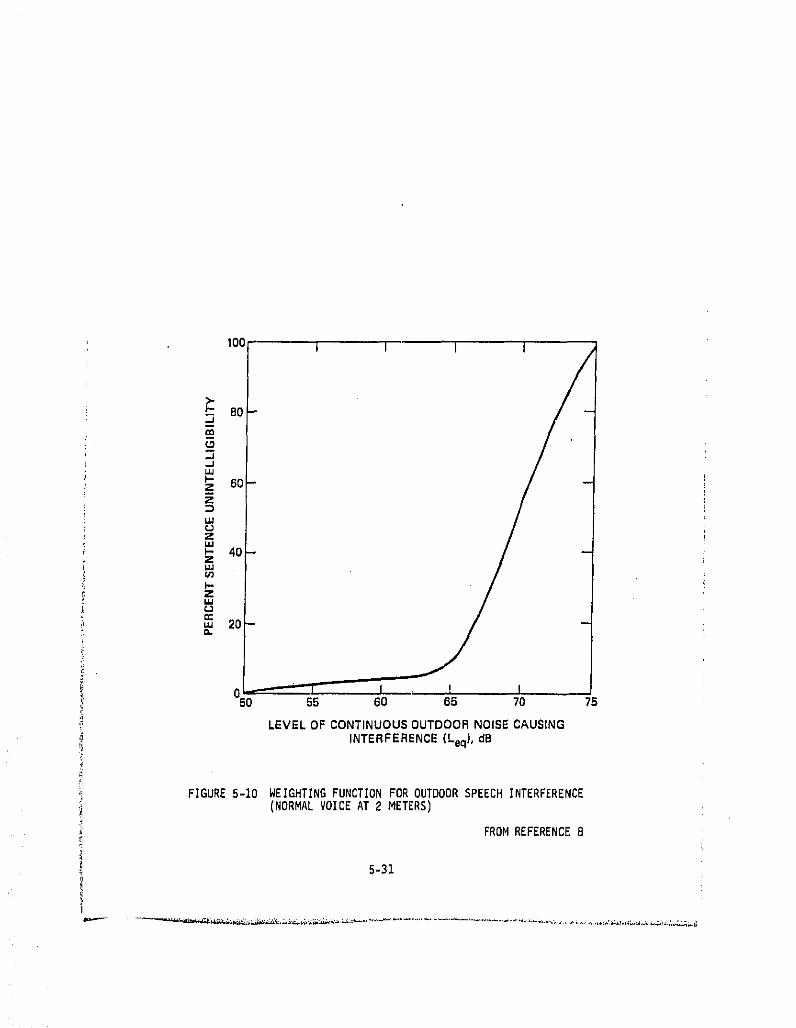
100 l I I I
I ! !55 60 65 70 75
LEVEL OF CONTINUOUS OUTDOOR NOISE CAUSING
INTERFERENCE (Leq), dB
FIGURE 5-i0 WEIGHTING FUNCTION FOR OUTDOOR SPEECH INTERFERENCE(NORMAL VOICE AT 2 METERS)
FROM REFERENCE 8
C
5-31
People can have their conversationsdisruptedby externallypropagatedmotorcyclenoise in at least three major settingsduringthe day: as pedes-trians on the street, as residents inside their hnmes, or as residentswho are involved in activitiesjust outside their homes. Three differentapproaches are required to assess the impact of these three different situa-tions. Each approach will be examined separately. In the discussions thatfollow, "inside the homeI' and "outside the home" should be taken to mean,respectively,"insideany building"and "outsideany building,but not alongthe street."
5.6.2.1 IndoorSpeechInterference
Indoor speech interference is assumed to occur' when motorcycle noisepropagates through walls of residences or buildings and peaks above a typicalindoorbackgroundlevel of 45 dB. The criteriaof impactfor indoorspeechinterference is given in Figure 5-9. The curve is based on the reduction ofsentence intelligibility (sentences known to listeners) relative to theintelligibility which would occur at 45 dB. For people conversing indoorsduring the time of a vehicle passby, Figure 5-9 shows the probability of adisruption in communication. The appropriate metric in Figure 5-9 is theequivalent sound level over the duration of the event. The Level WeightedPopulation for indoor speech interference is obtained by using equations 10and 11, substituting W(Leq(T)) for W(Ldn), and letting Pi represent tbe numberof peopleexposedat each-indoorsoundlevel for each passby.
5.6.2.2 OutdoorSpeechInterference
The populationexposed to potentialoutdoor speechcommunicationinter-ference are those people who are outside of their homes but not along astreet. This analysis does not take into account pedestrians or peopleengaged in other forms of transportation during the day. Rather, it isintended to include those time-periods in which people are relaxing orengaged in other activities outdoors.
Outdoor speech interferencedue to the operationof motorcyclesoccurswhen the maximum noise level of the pass-by exceeds an outdoor backgroundlevel of 50 dB. For this analysis, 55 dB is used as the average outdoorbackground level. Although the outdoor background noise level in a number ofurban areas may todaybe greater than55 dB, coordinatedFederal,state,andlocal effortsto reduceurban noise make the 55 dB level an appropriatevalueto use on a national basis for future years (the primary focus of this pre-dictive analysis).
The criterionfor outdoorspeech interferenceis shown in Figure5-10asa function of the level of an interfering noise. Note that the appropriatenoise metric againstwhich percent speechinterference(unintelligibilityofsentences known to listeners) is plotted is an equivalent sound level overthe durationof the pass-by. The LevelWeightedPopulationfor outdoorspeechinterference may be computed by using Figure 5-10 and equations 10 and 11.
5.6.2.3 Pedestrian Speech Interference
Speecb communication may be especially difficult for pedestrians whoare nearby roadway traffic. This is because pedestrians are typically located
5-32
very close to the vehicles as they travel by. Pedestrian speech interferenceis calculated by considering a percentage of the population to be pedestrianslocated at the edge of clear zones associated with each roadway. Figure 5-I0and equations 10 and 11 are then used to evaluate the speech interferenceimpact upon pedestrians.
Again. it should be noted that the single event noise analysis examinesthe effects of motorcycle noise alone, and hence does not take into accountthe presence of other noise sources in the environment. It is obvious thatother environmental noise sources create background noise at such levels incertain situations that motorcycle noise may be masked. This analysis onlyrepresents the benefits accrued during those times when motorcycle noiseclearly intrudes over the ambient or background noise level. The overallabsolute impact upon activities is. of course, dependent on the backgroundlevel assumed. However, the calculated benefits are representative of therelative reduction in community impact of motorcycle noise over any givenambient noise level.
5.7 Noise Prediction Model
The prediction model used in this health and welfare analysis is titled."The National Roadway Traffic Noise Exposure Model." This predictive model isa more sophisticated version of the original health and welfaremodel present-ed in the "Proposed Motorcycle Noise Emission Regulation: Background Docu-ment". The National Roadway Traffic Noise Exposure Model was recently devel-oped under EPA sponsorship, for the purpose of more accurately estimatingnationwide traffic noise impact. Its documentation is contained in a singlevolume report (Reference 31) available from the Office of Noise Abatement andControl. U.S. EnvironmentalProtection Agency. Reference31 explains themethodology used by the computer model. The specific data contained inReference 31 does not necessarily represent the updated data gathered for themotorcycle study (see Appendix N). The computer program itself is alsoavailable fromEPA.
In this subsection we present an overview of the National Roadway TrafflcNoise Exposure Model. Details of the model are presented in Appendix N.though not to the same detail as in the documentation report (Reference31). Appendix N contains information on the data, the calculations, and theassumptions that underlie the model. Particular attention is given to thosedetails critical to the analysis of motorcycle noise emission regulatoryalternatives. The discussion in Appendix N covers defined inputs and basicassumptions that underlie the computer predictions.
5.7.1 General Overview of the Model
The model consists of two parts: the General Adverse Response part andthe Single Event Response part. These two parts of the model appear side-by-side in Figure 5-11. to emphasize their similarity,
Both parts of the model start with user-defined input, keyed as _ inthe figure. For example, such input includesthe potentialemission_FTmltsfor newly manufactured motorcycles as they are typically operated. Both partsof the n_del then mathematically combine this user-defined input with large
5-33
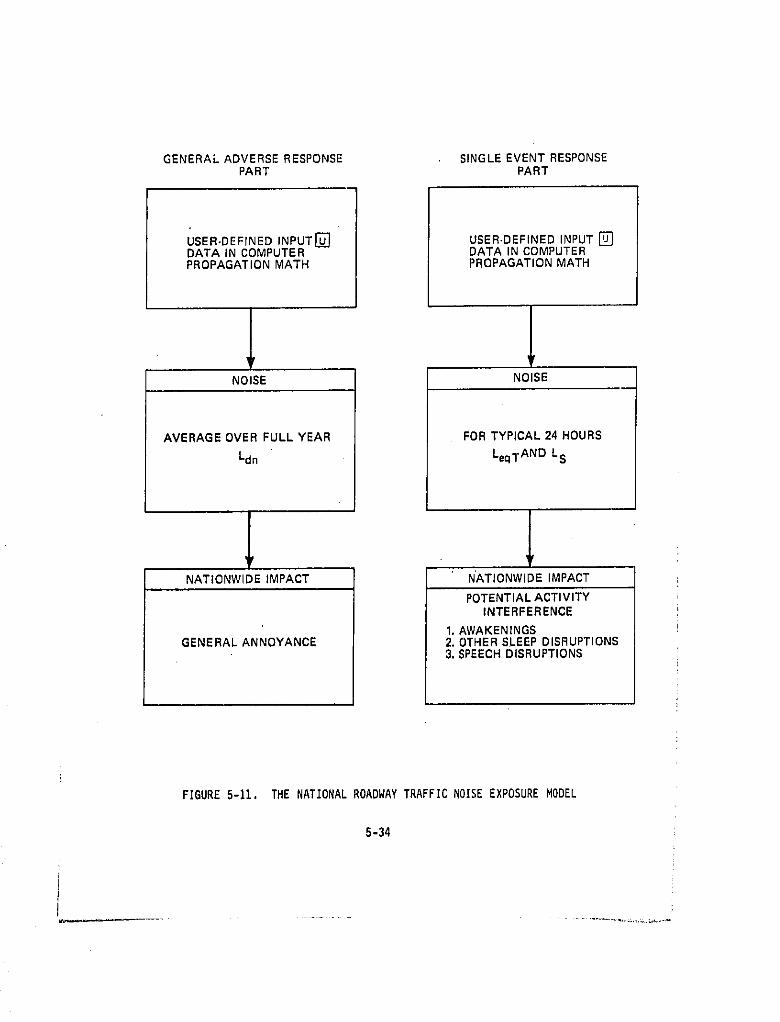
GENERAL ADVERSE RESPONSE SINGLE EVENT RESPONSEPART PART
USER.DEFrNED INPUTr'_ USER-DEFINED INPUT []DATA IN COMPUTER DATA IN COMPUTERPROPAGATION MATH PROPAGATION MATH
NOISE NOISE
AVERAGE OVER FULL YEAR FOR TYPICAL 24 HOURS
Ldn Leq 1"AND L S
NATIONWIDE IMPACT N'ATIONWIDE IMPACT
POTENTIAL ACTIVITYINTERFERENCE
1, AWAKENINGSGENERAL ANNOYANCE 2. OTHER SLEEP D SRUPTIONS
3. SPEECH DISRUPTIONS
FIGURE 5-11. THE NATIONAL ROADWAY TRAFFIC NOISE EXPOSURE MODEL
5-34
J
I
quantitiesof additionaldata that residewithinthe computerprogram. Thuseadditionaldata includenoise emissionsof other vehicles,as we]] as trafficdata, roadway configurationdata, noise propagationdata, and residentialpopulationdata.*
Both parts of the modelthen combinethese data to predictthe particularnoiselevels of interest. The GeneralAdverseResponsepartpredictsthe day-
night noise level,Ldn, averagedover a full_ear. In a parallelmanner,the
Single Event Respons_ part predicts both Sound ExposureLevel, L and thesingleevent EquivalentSound Level, Leq(T), for each vehicle pa_sby on atypical_ duringthe year.
As discussedpreviously,the yearly-averagenoise level correlates"wellwith noise-lnducedannoyancein and around the home -- that Is, with a per-son'sgeneraladverseresponse. On the other hand, the noisefromindividualvehlcles,not averagedinto the ambientnoise backgrounddue to other sources,often predictsadditionalimpactdue to particularlynoisy or isolatedsingle
events.These threenoise descriptors-- Ldn, Ls, and Leq(T) -- were discussedin detailSection5,3.
As shown in the last module in Figure 5-11, the model converts thecomputednoise levelsinto measuresof estimatedimpact. The GeneralAdverseResponsepart of the model estimatesthe extentto which peoplein the UnitedStates will be highlyannoyedby trafficnoise experiencedat or near theirhomes, The SingleEventpart estimatesthe potentialof a singlenoise source(in this case motorcycles)to awakenpeople from sleep,to otherwisedisrupttheir sleep_ and to interferewith people'sspeechat home, both indoorsandoutdoors.
In summary,the flow in Figure 5-11 progressesfrom user-deflnedinput,throughthe data and mathematicswithinthe computerprogram,to the predictednoise levels -- and then estimatespotentialnoise impacts, The two partsof the model estimatetwo differentaspectsof noise impact: yearly-averageand slngle-event.Both aspectsare estimatednationwide,
5.?.2 Overview of the Noise ExposurePredictions: GeneralAdverseResponse
Figure 5-12 illustratesthe manner in which noise predictionsare made
for the ,NationalRoadway Traff_L_Noise ExiL_sureModel, for General AdverseResponse The figureis keyed (.L)through_ to coordinatewith the detaileddiscussions that follow,
This predicative procedure is best explained by starting with key(_) which addressesthe predictednoise exposurefor Person#I. As shown inFigure5-12, noise exposuresare also predictedfor Person#2, Person#3, etc,In essence,the modelstatlstlcallypredictsthe noise for everyperson in theUnitedStates-- a Igl#totalpopulationof 216.7millionpersons,and rising.
_-'The remainderof the discussionwill not generallydistinguishbetweenuser defined input and input data that resideswithin the program. SeeReference31 for furtherdetails.
5-35
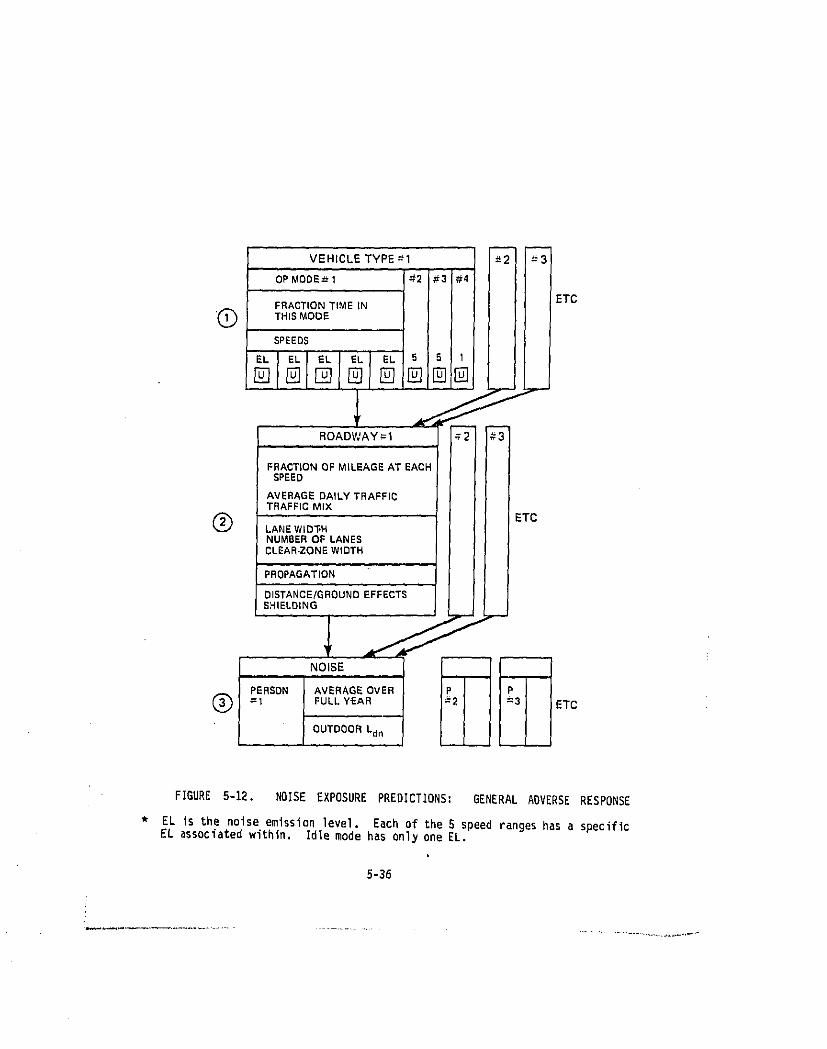
VEHIC'LE TYPE -_1 -_2
OPMODE_I #2 l#3 #4i
ETCFRACTIONTIME IN
'Q THISMODE
SPEEDS
EL EL EL EL EL 5 E 1
ROADWAY ;1 "; 2
FRACTIONOF MLLEAGEAT EACHSPEED
AVERAGEDALLYTRAFFICTRAFFICMIX
Q ETCLAI_]EWID3;NNUMBER OF LANESCLEAR-ZONEWIDTH
PROPAGATION
DISTANCE/GROUNDEFFECTSSHIELDING
PERSON AVERAGEOVERQ =1 FULL YEAR ETC
OUTDOORLdn
FIGURE 5-12. NOISE EXPOSURE PREDICTIONS: GENERAL ADVERSE RESPONSE
* EL is the noise emission level. Each of the S speed ranges has a specificEL associated within. Idle mode has only one EL.
5-36
Rather than predictingthe noise exposureof each individual,tilecom-puter groups people into homogeneous areas by city size and population den-sity. Similar grouplnys occur throughout all blocks in Figure 5-12, thoughthey are not indicated. The concepts involved in the prediction model areclearer without the details and approximations of grouping. These detailsand approximationsare postponedfor now.
In essence, then, the model statistically predicts the traffic noiseenvironment experienced by everyone in the United States. The model alsotakes into account population growth for future years.
The noise level at Person #I emanates from all the roadways within hishearing. (Key (_) in Figure 5-12). Each roadway also has specifiedas inputits average daily traffic and its average mix of vehicle types. Each roadwayalso has associated with it a large range of typical vehicle speeds. Althoughvehicle speedsvary on each roadway frommoment to moment, the programcon-siders their average speed for any given mile of roadway. The fractions ofthe total roadway mileage at each of five speed ranges are specific input usedwithin the computer program, for each roadway.
In addition, each roadway has a specific lane widtb, a specific number oflanes, and a specific clear-zone width. The latter is generally the right-of-way width. It encloses the region within which no one lives.
Roadway noise, close by the roadway, is dependent upon vehic]e speed,average daily traffic, traffic mix, lane width, number of lanes, and clearzone width. As this noise propagates outwards from the roadway to the personof interest, it is influenced by a number of propagation parameters. Twoprincipal parameters are the distance between the person and the roadway,and the shielding that intervenes between the person and the roadway. Thesetwo parametersare specifiedfor each person/roadwaypair -- in groupings,asmentioned above.
From Key (_) to Key Q the noise level at each person's residencedepends upon the source strength of each roadway, and upon the propagation ofthe noise from the roadway.
In addition to the above parameters, roadway source strength alsodepends, in part, on a number of other factors. As noted in Key (_) eachroadway contains a series of vehic]e types. Each vehicle type operates infour modes, numbered in Figure 5-12. These modes are: acce]eration, deceler-ation, cruise and idle. Each vehicle spends a definite fraction of its timein each of the four modes. These fractions are specified for each operatingmode and separately for each vehicle type. Then each mode fraction is splitinto the five speed fractions specific to that roadway (Key Q again).
The final entries at Key (J) are the noise emission ]evels. Thesediffer for eachof Lhe four operatingmodes,and for eachof the fivespeeds.These emis.sion levels are a user-defined input, and are keyed therefore as_]l in the Figure. Specifically, the user defines tilenoise emission levelsfor new vehiclesales in any given year. Then the coFiiputeradds thosevehi-cles to the ones already on the road, and depletes the general population ofvehicles by those vehicles that retire from service.
5-37
k!:
The noise emission values put intothe model constitute the mechanismby which we can investigateconsequences(impacts)of a potentialvehiclenoise emission regulation. The model is applied for successiveyears, asmore and more of the quieter vehicles are introduced into service. Theyear-to-yeareffect on predictednoise impact is a direct measureof theeffectivenessof a regulation. (Figure5-12 does not indicatethisyear-to-year application.)
In practice,then,Figure 5-12 flows from top to bottom. For the regu-lated vehicle type, emission levelscorrespondingto the regulatorylevelsare entered,separatelyfor the four operatingmodes and separatelyfor thefive speed ranges within each operatingmode (except idle). As shown inFigure 5-12, sixteenvaluesof emisslonlevel are entered for each vehicletype.
These emissionsare combined with the fractionsof time spent by thatvehicle type in each mode/speed,to obtain that vehicle's contributlontothe traffic noise. The computer carries out these calculationsfor eachvehicletypeon that roadway. Then all vehiclesare combinedfor Roadway#i,accordingto the averagedailytrafficand vehiclemix.
Thls processis repeatedfor each roadwaytype.
Each roadway_s noise is then propagatedto each personLs residence.At each residencethe noise levelsfrom all roadwaysare combined intoonetotalnoise level.
This entire process is repeated for all persons in the United States(approximatedby residentialpopulationdensityinformationl,as shown to therightat Key _ in Figure5-12.
5.7.3 Overviewof the Noise Exposure Predictions: Single Event Response
Figure5-13 illustratesthe noise predictionflow chart for the SingleEvent Response portion of the model. Differencesbetween Figure 5-12 andFigure 5-13 are few, but important. Figure5-13 examinesonly one vehicletypeor class at a time, sinceonly its passbynoise is assessed.
Key (_ data requirementsare identicalto the GeneralAdverseResponseportionof the model.
At Key (_) , only the averagedaily trafficfor that vehicle type isrequired,ratherthan the full trafficand vehlciemix. Also at Key (_) ,building noise isolationvaluesare needed to propagatethe noise from out-doorsto indoors. Thesebul]dingnoise isolationvaluesare specifiedinputs.
The major differences between the Single Event and General AdverseResponse portions of the model occur at Key _) . For each person, thesingle-eventequivalentsound level,Leq(Tb is computedfor indoors,bothdayand night, and for outdoors,day only. These predictionsthen apply to thefractionof timethe averagepersonisat homeday/nightand indoorsoutdoors.In addition,the sound exposure level,Ls, is computedfor indoors,both dayand night -- and then appliedto the fractionof time that person is asleep,eitherday or night.
Key (_)summarizesthe typesof noise calculationsmade.
5-38
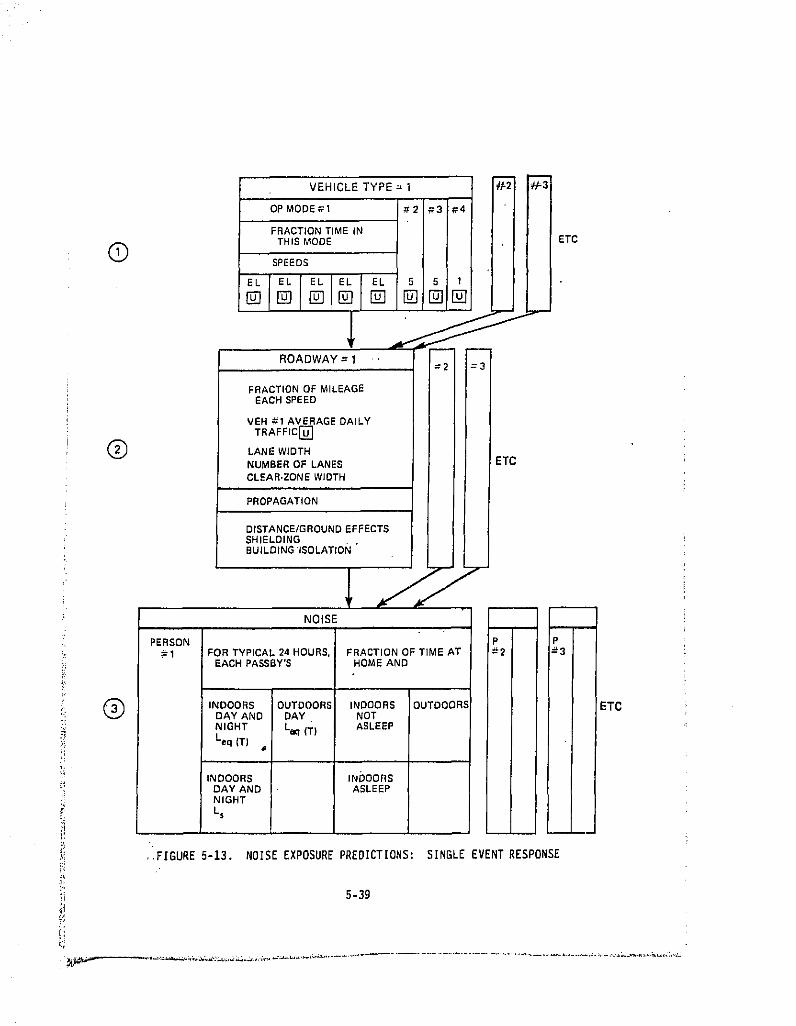
VEHICLE TYPE = I _; i#-3i
OPMODE_I _2 _3 :_4 ' ' i
FRACTION TIME INETCTHISMODE
Q SPEEDS
EL EL I EL EL EL 5 5 1 ' I
r
ROADWAY = 1 ' =2 3
E. C ,ONEOM,LEAOEVEH _1 AVERAGE DAILY
TRAFFIC[_] '
Q LANE WIDTH INUMBER OF LANES d ETC
CLEAR.ZONE WIDTH I
PROPAGATION IDISTANCE/GROUND EFFECTSSHIELDING .
BUILDING ISOLATION _L_j
NOISE
PERSON P=1 FOR TYPICAL 24 HOURS, FRACTION OF TIME AT _2
EACH PAEBBY'S HOME AND
Q INDOORS OUTDOORS INDOORS OUTDOORS ETCDAY AND DAY NOT
• NIGHT La_ (_). ASLEEP
'3,_ Leq {T)
=:
INDOORS IN_)OORSDAY AND ASLEEPNIGHT
L s
I,: ,,FIGURE5-13. NOISEEXPOSUREPREDICTIONS:SINGLEEVENTRESPONSE
,, 5-39
T'
_..,. _.=_ _..._ _.,*_'-: _.., _,._.L__. ,.t,. _ _ I_,_¸_,_'_ _ • _ _
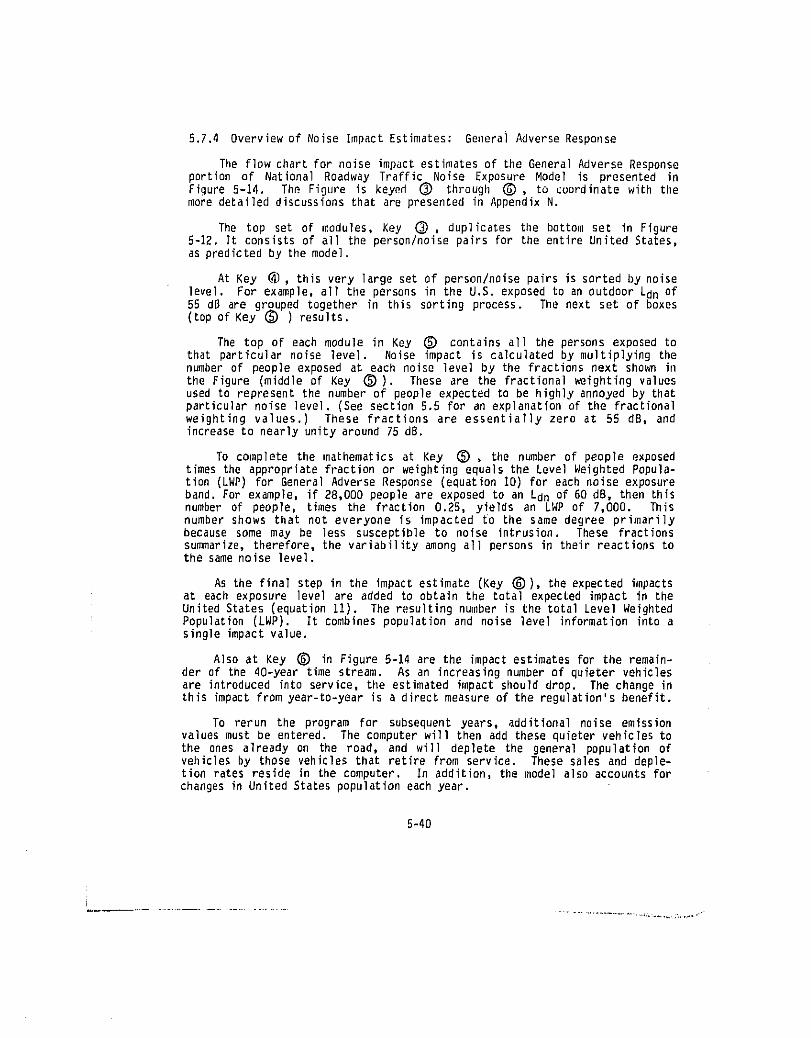
5.7.4 Overviewof Noise ImpactEstimates: GeneraiAdverseResponse
The Flow chart for noise impact estimates of the General Adverse Responseportion of National Roadway Traffic Noise Exposure Model is presented inFigure5-14. The Figure is keyed (_) through _ , to coordinatewith themore detailed discussions that are presented in Appendix N.
The top set of modules, Key G) , duplicatesthe bottomset in Figure5-12, It consistsof all the person/noisepairs for the entireUnitedStates,as predicted by the model.
At Key _l, this very largeset of person/noisepairsis sortedby noise]evel. For ex_ple, all the persons in the U.S. exposed to an outdoor Ldn of55 dB are groupedtogether in this sorting process. The next set of boxes(top of Key _) ) results.
The top of each module in Key (_) containsall the personsexposedtothat particular noise level. Noise impact is calculated by mu]tiplying thenumberof peopleexposed at each noise level by the fractionsnext shown inthe Figure (middleof Key (_)). These are the fractionalweightingvaluesused to representthe numberof peopleexpectedto be highlyannoyedby thatparticularnoise level.(See section5.5 for an explanationof the fractionalweighting values.) These fractions are essentially zero at 55 dB, andincrease to nearly unity around 75 dB.
To complete the mathematicsat Key (_), the number of people exposedtimesthe appropriatefractionor weightingequalsthe LevelWeightedPopula-tion (LWP)for GeneralAdverseResponse(equation10) for eachnoise exposureband. For example,if 28,000peopleare exposed to an Ldn of 60 dB, then thisnumber of people, times the fraction0.25, yields an LWP of 7,000. Thisnumber shows that not everyone is impacted to the same degree primarilybecause some may be less susceptibleto noise intrusion. These fractionssummarize,therefore,the variabilityamong all personsin their reactionstothe same noise ]evel.
AS the final step in the impact estimate (Key (_)), the expected ilapactsat each exposure ]evel are added to obtain the total expectedimpact in theUnitedStates(equation11). The resultingnumber is the totalLevel WeightedPopulation(LWP). It combinespopulationend noise ]eve] informationintoasingle impact value.
Also at Key (_ in Figure 5-14 are the impact estimates for the remain-der of the 40-year time stream. As an increasing number of quieter vehiclesare introducedintoservice,the estimatedimpactshoulddrop. The changeinthis impactfromyear-to-yearis a directmeasureof the regulation'sbenefit.
To rerun the program for subsequentyears, additionalnoise emissionvaluesmust be entered. The computerwill then add thesequietervehiclestothe ones already on the road, and will deplete the general population ofvehiclesby those vehiclesthat retirefrom service. These salesand deple-tion rates reside in the computer. In addition,the model also accountsforchangesin UnitedStatespopulationeachyear.
5-40
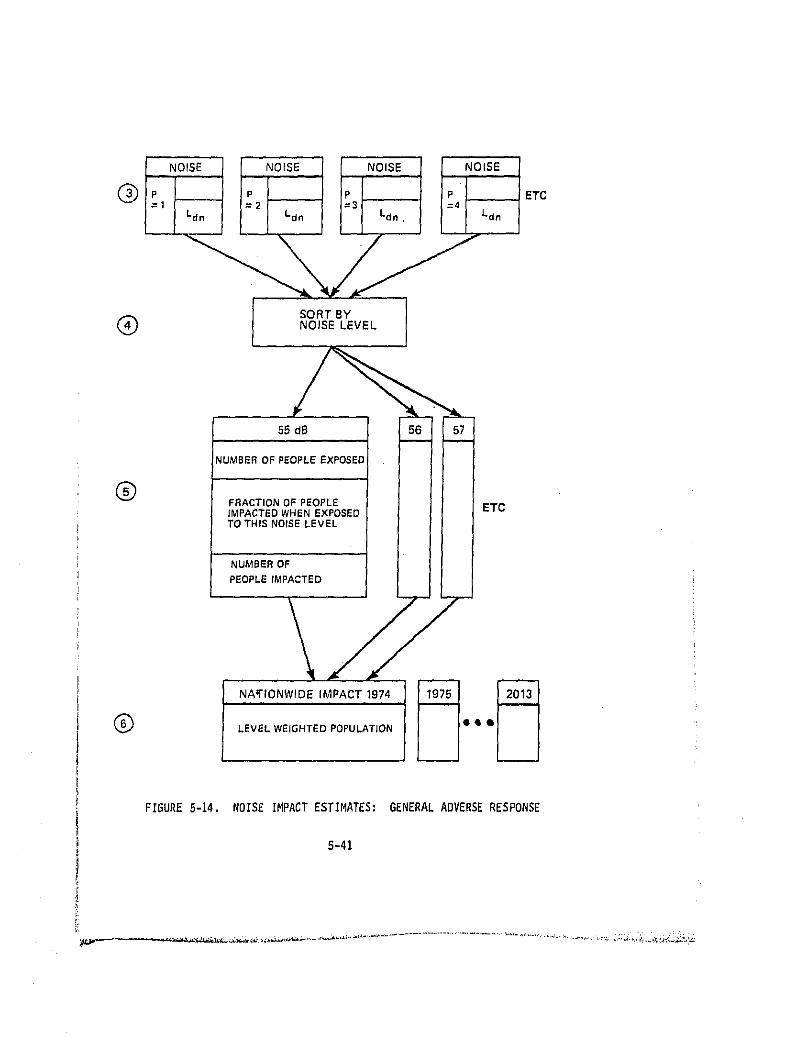
NOISE I p NOISE NOISE NOISE
P P P ETC= 1 2 = 3 =4Ldn Ldn Ldn . Ldn
SORT BY
Q NOISE LEVEL
55 dB 56 ' 5_
NUMBEROFPEOPLEEXPOSED
Q FRACTIONOF PEOPLE ETCIMPACTEDWHENEXPOSED |TOTHIS NOISELEVEL
SNUMBER OFPEOPLEIMPACTED
NA_'IONWlDE IMPACT 1974 /I _Q LEVEL WEIGHTEDPOPULATIONJ • • •
FIGURE 5-14. NOISE IMPACT ESTIMATES: GENERAL ADVERSE RESPONSE
5-41
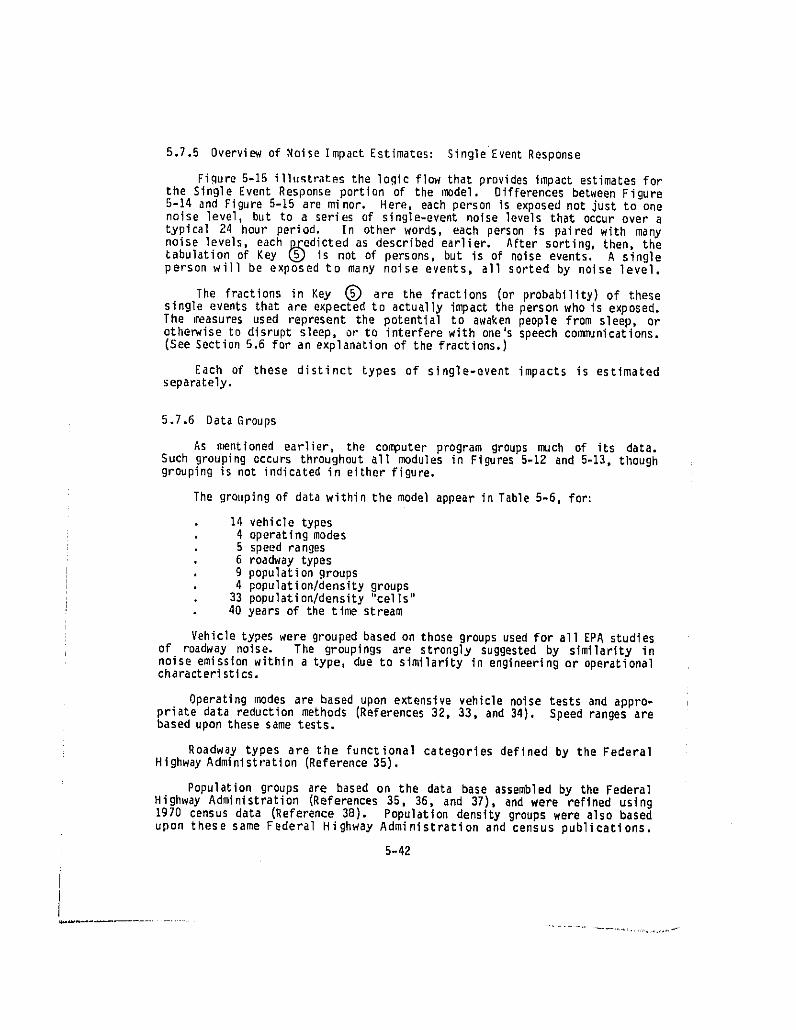
5.7.5 Overview of Noise Impact Estimates: SingleEvent Response
Figure 5-15 i11ustratms the logic flow that provides impact estimates forthe Single Event Response portion of the model. Differences between Figure5-14 and Figure 5-15 are minor. Here, each person is exposed not just to onenoise level, but to a series of single-event noise levels that occur over a
typical 24 hour period. In other words, each person is paired with manynoise levels, each p_zedicted as described earlier, After sorting, then, the_abulation of Key _ is not of persons, but is of noise events. A singleperson will be exposed to many noise events, all sorted by nolse level.
The fractions in Key (_ are the fractions (or probability)of thesesingle events that are expected to actual]y impact the person who is exposed.The _asures used represent the potential to awaken people from sleep, orotherwise to disrupt sleep, or to interfere with one's speech communications.(See Section 5.6 for an explanation of the fractions.)
Each of these distinct types of single-event impacts is estimatedseparately.
5.7.6 Data Groups
As n_ntioned earlier, the computer program groups much of its data.Such grouping occurs throughout all modules in Figures 5-12 and 5-13, thoughgrouping is not indicated in either figure.
The grouping of data within the model appear in Table 5-6, for:
14 vehicle types4 operating modes5 speed ranges6 roadway typesg population groups4 population/densitygroups33 population/density"cells"40 years of the time stream
Vehicle types were grouped based on those groups used for all EPA studiesof roadway noise. The groupings are strongly suggested by similarity innoise emission within a type, due to similarity in engineering or operationalcharacteristics.
Operating modes are based upon extensive vehicle noise tests and appro-priate data reduction methods (References 32, 33, and 34). Speed ranges arebased upon these same tests.
Roadway types are the functional categories defined by the FederalHighway Administration (Reference 35).
Population groups are based on the data base assembled by the FederalHighway Administration (References 35, 36, and 37), and were refined using1970 census data (Reference 38). Population density groups were also basedupon these same Federal Highway Administration and census publications.
5-42
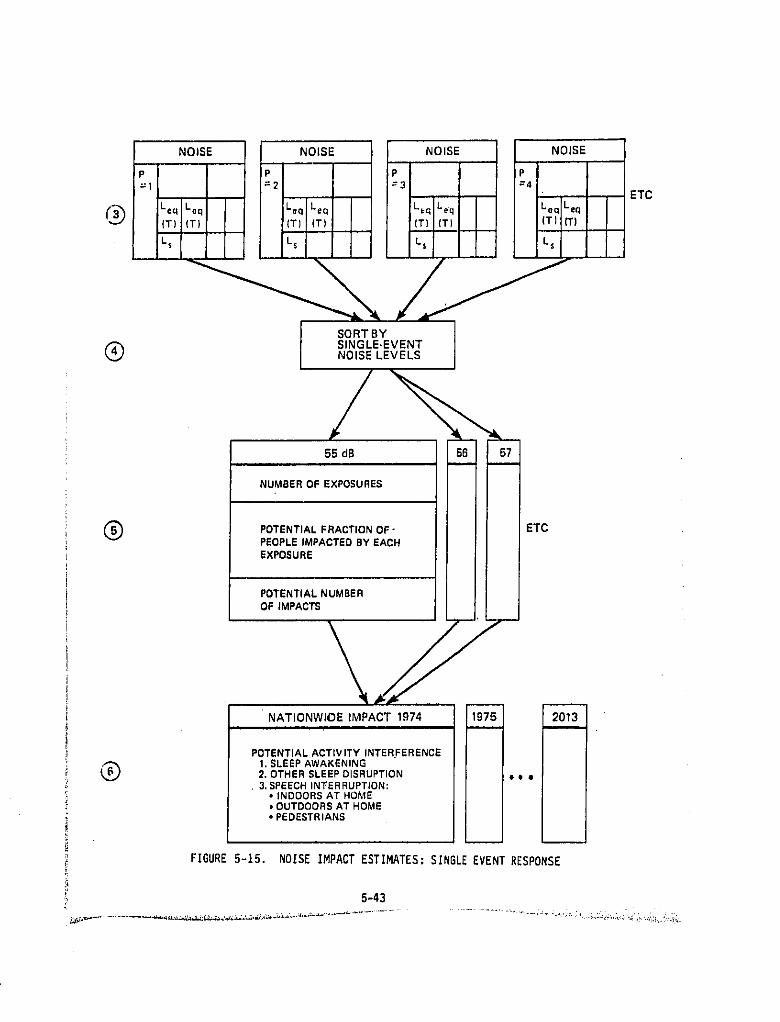
NOISE NOISE NOISE NOISE
P P P l P=t =2 -- I3 =4
ETC
_3_ Leq Leq Leq Leq Leq Leq Leq Leq{T)(T) (T) {T) (T)(T) (T)(T)
Ls Ls Ls L$
SORT BY
SINGLE-EVENTNOISE LEVELS
/55 dB 56 B7I
NUMBEROF EXPOSURES II
POTENTIALFRACTIONOF- ETCPEOPLE IMPACTED BY EACHEXPOSURE I
i
POTENTIALNUMBEROF IMPACTS
NATIONWIOE IMPACT 1974 = 2013
POTENTIALACTIVITY INTER.FERENCE
1.BLEEPAWAKENING2. OTHERSLEEPDISRUPTION • o •. 3. SPEECHINTERRUPTION:
• INDOORSAT HOME• OUTDOORS AT HOME• PEDESTRIANS
FIGURE5-15, NOISEIMPACTESTIMATES:SINGLEEVENTRESPONSE
;_ 5-43
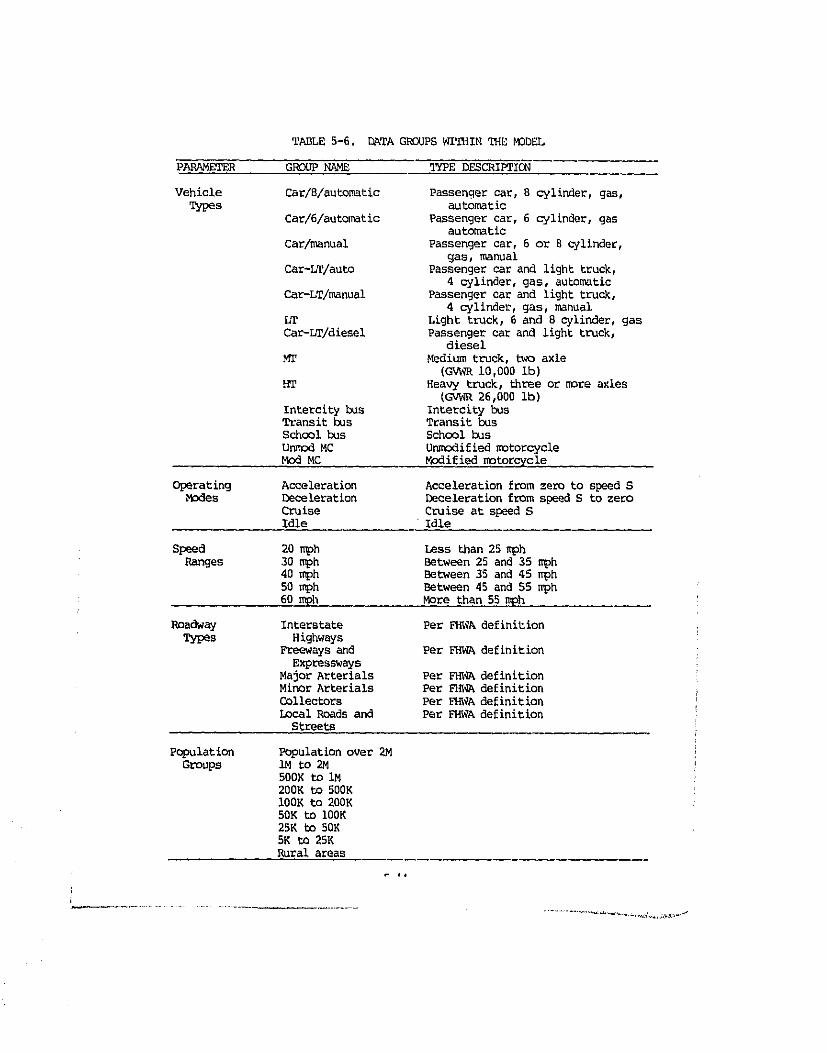
TABLE 5-6. DATA GROUPS WI%'HIN THE MODEL
PARAMETER GP_3UPNAME _%rPEDESCRIIYfION
Vehicle Car/8/automatic Passenger car, 8 cylinder, gas,Types automatio
Car/6/aut_,atic Passenger car, 6 cylinder, gasautomatic
Car/manual Passenger car, 6 or 8 cylinder,gas, manual
Car-LT/auto Passenger ear and light truck,4 cylinder, gas, automatic
Car-LT/manual Passenger car and light truck,4 cylinder, gas, manual
LT Light truck, 6 and 8 cylinder, gasCar-LT/dieeel Passenger ear and light truck,
diesel
Mr Medium truck, two axle(GVWR 10.000 ib)
HT Heavy truck,threeor m_re axles(GVWR 26,000 Ib)
Intereity bus Intereity busTransitbus Transit busschoolbus Schoolbus
Unm_d MC Unmodified motorcycleMod MC Modifiedmotorcycle
Operating Acceleration Acceleration from zero to speed SModes Deceleration Deceleration from speed S to zero
Cruise Cruise at speed SIdle " Idle
Speed 20mph Lessthan25mphRanges 30 mph Between25and35 mph
40 mph Between35and 45 mph50 mph Between 45 and 55 mph60 mph More than 55 mph
Roadway Interstate Per FHWA definitionTypes Highways
Freewaysand Per F_ definitionExpressways
Major Arterials Per F_A definitionMinor Arterials Per FHWA definitionCollectors Per F_A definitionLocal Roads and Per FHWA definition
Streets
Population Population over 2MGroups IM to 2M
500K to IM200K to 500K100K to 200K50K to 100K25K to 50K5K to 25KRural areas
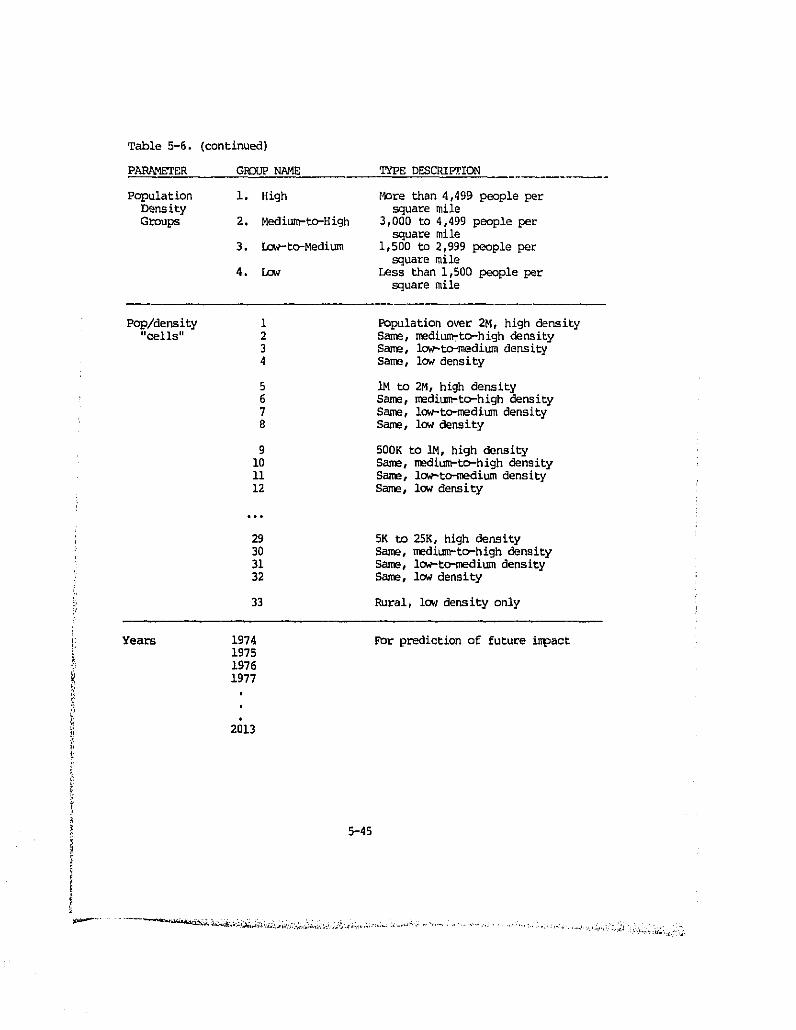
(continued)
GROUP NAME TYPE DESCRIPTION
i. High More than 4,499 people persquare mile
2. Medium-to-High 3,000 to 4,499 people persquare mile
3. Low-to-Mediu_ 1,500 to 2,999 people persquare mile
4. Low Less than1,500peoplepersquare mile
1 Population over 2M, high density2 Same, mediumrto-high density3 Same, low_to-medium density4 Same, low density
5 IM to 2M, high density6 Same, medium_-to-highdensity7 Same, low-to-medium density8 Same, low density
9 500K to IM, high density10 Same, medlum-to-high densityii Same, low-to-medium density12 Same,lowdensity
6,6
29 5K tO 25K,highdensity30 Same,medium-to-highdensity31 Same, low-to-medium density32 Same,lowdensity
33 Rural, low density only
1974 FOr prediction of future impact197519761977
2013
5-45
These two latter groups are then combined into pop/density "cells" shownnext _n Table 5-6, Thirty-three of these pop/density "cells" result, sincethe rural population group is paired witil only the low-density group. Thesepop/density "cells" contain among them the entire U.S. population and also theentire U,S, roadway mileage. They therefore provide tile structure for match-ing each person in the United State_ with tileroadways that produce the noiseat his residence•
Lastly, Table 5-6 shows that calculations are performed for all yearswithin a 40-yeartime stream. A baselineyear is selected.* For thatyear,all data (such as traffic counts, roadway mileage, population densities)are explicitly put into the computer program. Then for future years, thesedata are factoredupward,if appropriate,to accountfor growth.
The data groups within Table 5-6 interrelate within the model in complexways as discussed in the more detailed descriptions contained in Appendix N.
5.8 Results of Analysis - Street Motorcycles
As discussed in sections 5.5 and 5.6, results Qf the impact analysis formotorcyclescenteraroundtwo measures: (i) the Level WeightedPopulation,LWP, and (2) the Relative Change in Impact, RCI. LWP is an index which repre-sents the total number of persons in the United States who are impacted byroadway noise during any given year of interest and the degree or severity ofthat impact upon each person. The RCI values represent the percentage changein LWP due to regulation relative to a baseline condition. A decrease in LWPresults in a positive RCI -- that is, a benefit in terms of a percentagereductionin extentand severityof impact.
For this analysis RCI is calculated for each regulatory option using twodifferent approaches. The first approach calculates tile percentage change inLWP for a specific future year relative to the baseline condition in the year1980. The results are tabulated as "RCI" (without an asterisk). Thus, RCIdescribesprojectedbenefitsrelativeto currentday (1980) conditions, Forexample, an RC! of 25 percent in 1995 means that, in 1995, the adverse impactwill be 25 percent less than it was in 1980 with no regulation in effect.Similarly, an RCI of negative 15 percent in 1995 means that the adverse impacthas increased by 15 percent relative to 1980, These values of RC! include theeffects mf all changes between 1980 and the specified year in the future.That is, these RCI values reflect the impact of the motorcycle noise emissionregulation and the influence of such factors as increased traffic volume,noise regulation of other vehicles, increases in the number of motorcycles andincreases in the growth of the U.S, population.
The second approach calculates the percentage change in LWP for a speci-fied future year relative to the same future year without a motorcycle regula-tion. These values of RCI are labeled as "RCI*" (with an asterisk), For agiven year of interest, the RCI* values reflect the benefits attributable to
* For this analysis,much of the data was entered for 1974. These datawere applied to later years after suitably adjusting for growth.
5-46
the motoYcyclenoise regulationalone -- that is, benefits that will occurrelative to that specific year if there were no motorcycle regulation. Forexample, an RCI* of 40 percent in 1995 is interpreted as a reduction in impactof 40 percentin 1995 from that whichwouldoccur in 1995 with no regulation.In brief,
o RCI compares the impact in the year-of-interest(with regulation)to the impact in the year 1980, during which there is no regula-tion, less traffic, fewer motorcycleoperationsand a lower popu-lation.
o RCI* compares the impact in the year-of-interest(with regulation)to the same year, without regulation.
The RCl and RCI* values are consideredto be more accuratepredictorsof actualbenefits to be realized than the LWP values reported. This isbecause the RCI and the RCI* involvechangesfrom a baselinecondition. Inthe computation of RCI and RCI*, inaccuracies in baseline LWP tend to becancelledout by the same inaccuraciesin the year-of-interestLWP.
With these indicesof noise impact-- LWP, RCI and RCI* -- two distincttypes of impactare assessed: (1) GeneralAdverseResponse,based upon Ldn,and (2) SingleEvent Activity Interference,based upon LS for sleep inter-ference and upon Leq(T) for speech interference. In the discussionsthatfollow, thesetwo types of Impactare addressedseparately. For each, theresults are tabulatedfor a seriesof futureyears (throughthe year 2010),and for a seriesof possibleregulatoryoptions (Table5-1). OptionQ repre-sents the maximumbenefitsachievableandcan be used as an upper limitguide.
5.8.1 GeneralAdverseResponse
The GeneralAdverse Response portionof the model assesses the impactfrom the motorcyclenoise emissionregulationon a nationalaggregatebasis.It does not assessthe reductionin termsof specificlocalizedstreetcondi-tions which under some circumstancesmay show substantiallygreaterrelativebenefitsthan indicatedwithinthisanalysis.
The general adverse response impactestimates are presentedin Tables5-7 to 5-9. For each table,a differentproportionof modifiedmotorcycles(12, 7 and 3 percent) is considered(seeSection5.2.1.1). In eachtable theLevel WeightedPopulation (LWP) and the Relative Change in Impact (RCI andRCI*) are shownfor four years (1980,1990,2000, and 2010) in the regulatorytime streamfor motorcycles. In thesetables, the baseline (no regulation)option is listedas Option 1. Also, the RCI and RCI* values in these tablesare calculatedrelative to the conditionof 12 percentmodifiedmotorcyclessince this represents the current (1980) estimate of the proportion ofmodifiedmotorcycles. Thus the impactand benefit estimatesfound in Tables5-8 and 5-9 (with 7 and 3 percentmodifiedmotorcycles,respectively)repre-sent changes in impact attributableto both lessened noise emissions andreduced numberof modified vehicles. For example, in Table 5-8 (7 percent
5-47
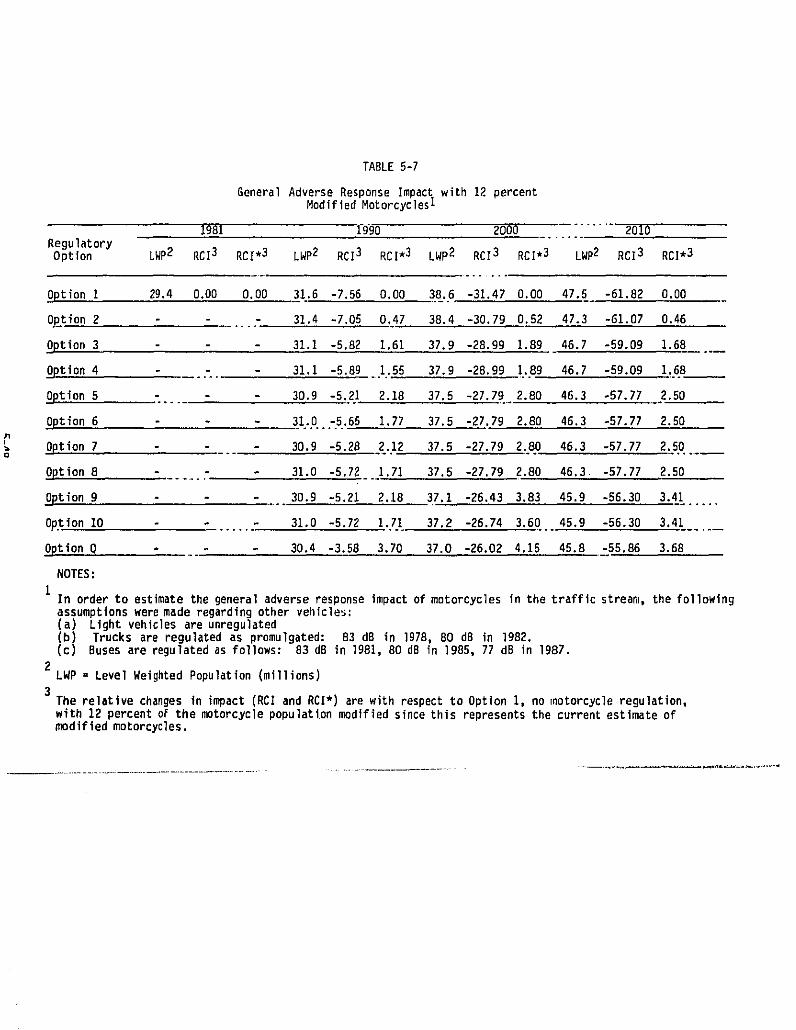
TABLE 5-7
General Adverse Response Impact with 12 percentModified Motorcycles I
1981 5990 2000 ........ 2010RegulatoryOption LWP2 RCI3 RC1.3 LWP2 RCI3 RC1.3 LWP2 RCI3 RC1.3 LWP2 RCI3 RC1.3
OptionI 29.4 0.00 0.00 31.6 -7.56 0.00 38.6 -31.47 0.00 47.5 -61.82 0.00
Option2 31.4 -7.05 0.47 38.4 -30.790.52 47.3 -61.07 0.46
Option3 31.1 -5.82 1.61 37.9 -28.991.89 46.7 -59.09 1.68
_tion 4 31.1 -5.89 1.55 37.9 -28.99 1.89 46.7 -59.09 1.68
Option5 30.9 -5.21 2.18 37.5 -27.79 2.80 46.3 -57.77 2.50
Option 6 -. 31.0..._5.651.77 37.5 -27.79 2.80 46.3 -57.77 2.50
Option7 30.9 -5.28 2.12 37.5 -27.79 2.80 46.3 -57.77 2.50
Option8 -...... - 31.0 -5.72 1.71 37.5 -27.79 2.80 46.3 -57.77 2.50
_tion 9 30.9 -5.21 2.18 37.1 -26.43 3.83 45.9 -56.30 3.41 ..
Option10 31.0 -5.72 1.71 37.2 -26.74 3.60 45.9 -56.30 3.41
_tlon Q 30.4 -3.58 3.70 37.0 -26.02 4.15 45.8 -55.86 3.68
NOTES:
1In orderto estimatethe generaladverseresponseimpactof motorcyclesin the trafficstream,the followingassumptionsweremade regardingother vehicles:(a) Light vehiclesare unregulated(b) Trucks are regulatedas promulgated: 83 dB in 1978,80 dg in 1982.(c) Buses are regulatedas follows: 83 dB in 1981,80 dB in 1985,77 dB in 1987.
2 LWP : LevelWeightedPopulation(millions)3The relativechangesin impact(RCIand RCI*) are with respectto Option1, no motorcycleregulation,with 12 percentoF the motorcyclepopulationmodifiedsincethis representsthe currentestimateofnw)difiedmotorcycles.
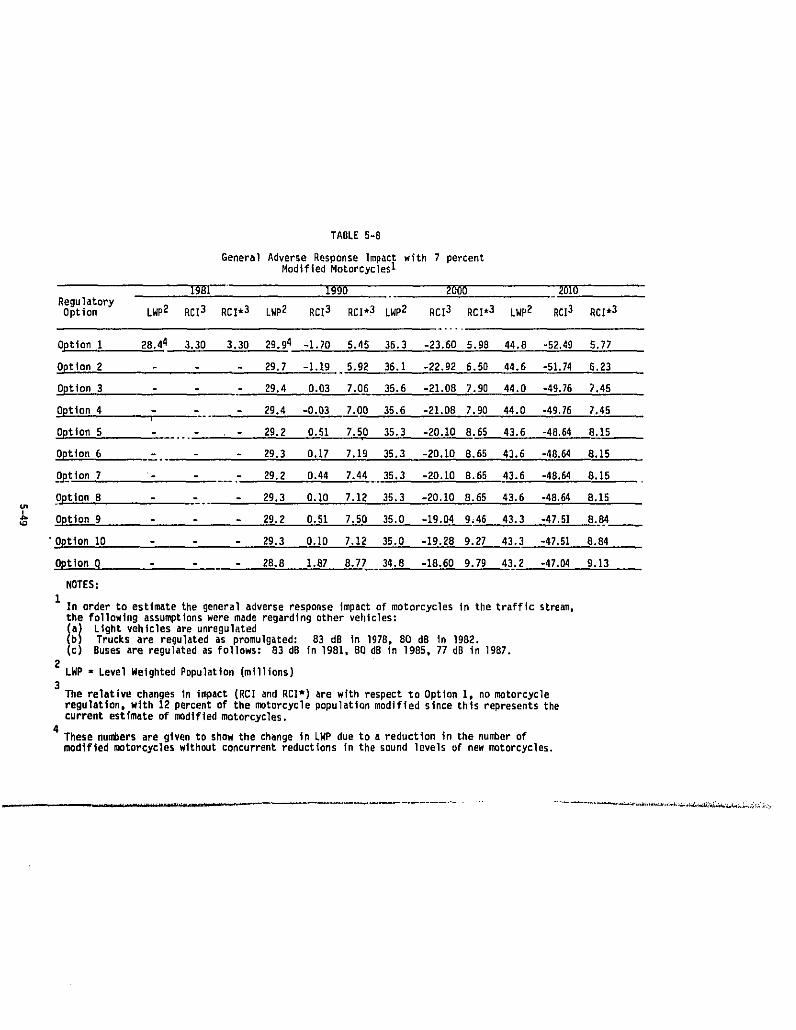
TABLE5-8
GeneralAdverseResponseImpactwith 7 percentModifiedMotorcyclesI
1981 1990 2000 2010RegulatoryOption LWP2 RCI3 RC1.3 LWP2 RCI8 RCI*3 LWP2 RCI3 RC1.3 LWP2 RCl3 RC1.3
Option1 28.44 3.30 3.30 29.94 -i.70 5.45 35.3 -23.60 5.98 44.8 -52.49 5.77
Option 2 29.7 -1.19 . 5.92 36.1 -22.92 6.50 44.6 -51,74 6.23
_tion 3 29.4 0.03 7.06 35.6 -21.08 7.90 44.0 -49.76 7.45
Option4 - -.... - 29.4 -0.03 7.._.0035.6 -21.08 7.90 44.0 -49.76 7,45
Option5 ... - 29.2 0.51 7.50 35.3 -20.10 8.65 43.6 -48.64 8.15
Option6 29.3 0.17 7.19 35.3 -20.10 8.65 43.6 -48.64 8.15
Option 7 - 29.2 0.44 7.44 35.3 -20.i0 8.65 43.6 -48.64 8.15
Option 8 29.3 0.10 7.12 35.3 -20,10 8.65 43.6 -48,64 8,15
Option9 29.2 0.51 7.50 35.0 -19.04 9;46 43.3 -47.51 8.84
'Option10 29.3 O.iO 7.12 35.0 -19.28 9.27 43.3 -47,51 8.84
Option q 28.8 1.87 8.77 34.8 -18.60 9.79 43.2 -47.04 9.13
NOTES:1In orderto estimatethe generaladverseresponseImpactof motorcyclesin the trafficstream,the followingassumptionswere made regardingothervehicIes:
{!I LlghtvehiclesareunregulatedTrucks are regulatedas promulgated: 83 dB in 1978,80 dB In 1982.Busesare regulatedasfollows: 83 dB in1981,80 dB in 1985,77 dB in 1987.
2LWP - LevelWeightedPopulation(millions)
3The relativechangesIn impact(RCI andRCI*)are with respectto Option1, no motorcycleregulation,wlth 12 percentof the motorcyclepepulatlenmodifiedsincethisrepresentsthecurrentestimateof modifiedmotorcycles.
4 Thesenurf_ersare givento showthe changeinLWP due to a reductionin the nu_er ofmodifiedmotorcycleswithoutconcurrentreductionsin the sound levelsof newmotorcycles.
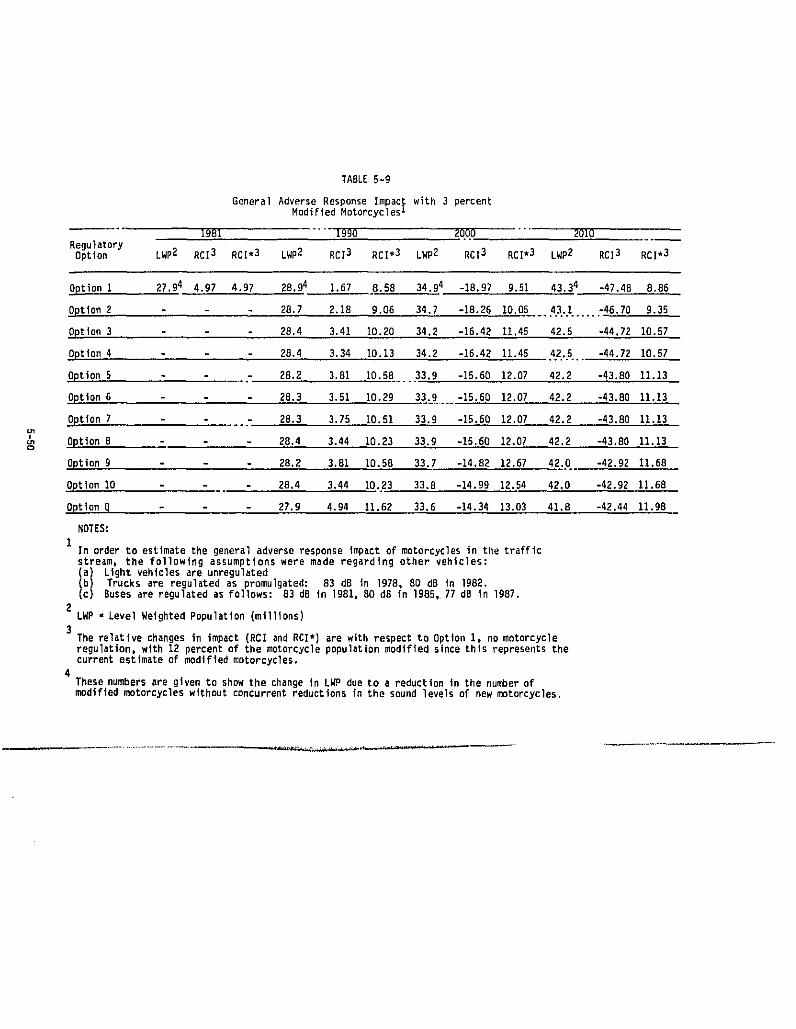
TABLE5-9
General Adverse Response Impac_ with 3 percentModified Motorcycles •
1981 "'"1990 2000 "" 2010RegulatoryOption LWP2 RCI3 RC1.3 LWP2 RCI3 RC1.3 LWP2 RCI3 RC1.3 LWP2 RCI3 RC1.3
Optioni 27.94 4.97 4.97 28.94 1.67 8.5B 34.94 -18.97 9.51 43.34 -47.48 8.86
Option2 28.7 2.18 g.06 34.7 -18.26 10.05 43.1 -46.70 9.35
Option3 28.4 3.41 10.20 34.2 -16.42 11.45 42.5 -44.72 10.57
Option4 2B.4 3.34 10.13 34.2 -16.42 11.45 42.5 -44.72 10.67
Option5 28.2 3.81 10.58 33.9 -15.60 12.07 42.2 -43.80 11.13
Option6 28.3 3.51 I0.29 33.9 -15.60 12.07 42.2 -43.80 11.13
Option7 .... 28.3 3.75 10.51 33.9 -15.60 12.07 42.2 -43.80 11.13,=_n Option8 28.4 3.44 10.23 33.9 -15.60 12.07 42.2 -43.80 11.13o
Option9 28.2 3.81 10.58 33.7 -14.82 12.67 42.0 -42.92 11.58
Option10 28.4 3.44 18.23 33.8 -14.99 12.54 42.0 -42.92 11.68
Optionq 27.9 4.94 11.62 33.6 -14.34 13.03 41.B -42.44 11.98
NDTES:
IInorderto estimatethe generaladverseresponseImpactof motorcyclesIn the trafficstream, the following assumptionswere made regardingother vehicles:
I!} llghtvehlclesare unregulatedTrucks are regulatedas promulgated: G3 dB in 1978,go dB in 1982.Busesare regulatedas follows: 83 dB in 1981,80 dO In 1985,77dB in 1987.
2LWP = LevelWeightedPopulation(mi111ons)
3The relatlvechangesin impact(RCIandRCI*)are withrespectto OptionI. no motorcycleregulation,with 12 percentof the motorcyclepopulatlonmodifiedsincethis representsthecurrentestimateof modifiedmotorcycles.
4Thesenumbersare givento showthe changein LWP dueto a reductionInthe numberofmodifiedmotorcycleswithoutconcurrentreductionsInthe soundlevelsof new motorcycles.
modified motorcycles), Option 5 in the year 2000 shows an RCI of -20.I0percent relative to 1980 wlth no regulation and 12 percent modified vehicles.Similarly,Option 5 in the year 2000with 7 percent,Imlifledshows an RCI* of8.65 percent relative to the year 2000 with no r'_gulationand 12 percentmodifiedvehicles.
It may first be noted from Tables 547 te 5-9 that the LWP increases andthe RCI values become negative in future years even as more stringent regula-tions are imposed. This increase h,_p._,:tmeans that the projectedbenefitsfromreducingmotorcyclenoise emissionsare expectedto be overpoweredby theanticipatedincreasein vehiculartrafficas well as populationgrowthin theUnitedStatesbetween1980and the year2010.
Also, Tables 5-7 to 5-9 shows that in terms of overall trafficnoiseimpact,the regulationof motorcyclesresultsin a moderateoverallreductionin trafficnoise impactdue to the smallmotorcyclepopulationand the domin-ance of trucksand automobilesin the overall traffic strea_,. It must bereemphasizedthat these estimates are for impacton nationwide aggreuatebasis. Such aggregatereductionson a nationalbasisdo not effectivelypointup the potentiallysignificantbenefitsthatwouldoccur in the urbanenviron-(,entFor situationswherethere is a high volumeof motorcycles.
From Table 5-7 (with12 percentmodifiedmotorcycles)it may be seenthatbenefits in terms of RCI* are predictedto ran!lefT',),1,)ueto four percentdependingupon the regulatoryoption. The benefitsshown in U1is table arethose that would be experiencedwithouta concurrentreductionin the numberof modifiedmotorcycles. With the exceptionof OptionQ, Options9 and 10showthe greatestbenefits,and OptionsI and 2 the least. Options5, 7 and gwould demonstrate benefits earlier than the others. Tables 5-8 (7 percentmodified)and 5-9 (3 percentmodified)demonstratesimilar trendswith RCI*benefits reaching to over 9 and 12 percent, respectively. These benefitsshown in Tables 5-8 and 5-9 are higherthan those shown in Table 5-7 due tathe reductions in the number of modified vehicles.
Benefits of reducing the numberof modified motorcycleswithout con-current noise reduction of newly manufacturedmotorcyclescan be seen bycomparingOption i (no regulation)acrossthe tables. For example,reducingthe proportionof modifiedmotorcyclesfrom 12 to 3 percent is foundto yieldan 8.86 percent benefit in the year 2010 in terms of reductionof overalltrafficnoiseimpact.
In Tables5-7 to 5-9, the totalUnitedStatesimpactis collapsedintoasingle-valueLWP - for a given year and a given regulatoryoption. In thiscondemsath)n,the numbers of persons exposed to differentnoise levels islost. This population exposure information is presented in Tables 5-10through5-20. These tables show the numberoF iJersonsin the UnitedStateswho live in specific noise exposure areas, due to traffic noise, in 3-decibelranges. Each table presentspopulationexposuredata ru,'_ separateregula-tory option for 12, 7, and 3 percent modified motorcycles (see Section5.2.1.1),with Option 1 again representingthe case of no noise emissionregulation. As an exampleto assistin interpretationof this table, underOption I (Table 5-10), in the year 2000 with 12 percent modified motorcycles,
5-51
it is predicted that 128,670,000 people will be exposed to traffic noise atlevels exceedingan Ldo of 55 dB, and 7,400_000peoplewill be exposed tolevels greater than an Ldn of 70 dB. Likewise, under Option 7 (Table 6-16),in the year 2000 with an assumed 7 percent modified motorcycles, it isexpected that 116,300,000 people would be exposed to traffic noise at an Ldnof 55 dB or above,and 6,900,000peopleabovean Ldn of lO dB.
It may be noted that the trends of Tables 5-I0 through 5-20 followcloselythoseof Tables5-7 to 5-9. Withthe exceptionof idealizedOptionQ,Options 9 and 10 show the most benefits, with those of Option 9 occurringsomewhat earlier. Options I and 2 show the least benefit. The tables alsoshow that population exposure will increase over time despite the regulationof motorcyclenoise emissions. This is due primarilyto growth in the numberof motorcycles and growth in the U. S. population. Again, substantial bene-fits are shownas the numberof modifiedmotorcyclesis decreasedfrom 12 to 3percent.
5.8.2 Single Event Activity Interference
The purpose of the single event activity interference analysis is toex_nine the benefits of reducing motorcycle noise in greater detail. Here,potential activity interference is exmnined separately for (i) sleep disrup-tion, (2) sleep awakening, and (3) speech interference, both indoors andoutdoors, and pedestrian.
The single event impact estimates for motorcycles are presented foreach regulatory option outlined in Table 5-I. Summary tables (organizedidenticallyto Tables5-7 through5-9 displayedpreviously)are presentedforeach of tilesingle event impact measurements.
o Sleep Disruption (Tables 5-21 to 5-23)
o SleepAwakening(Tables5-24 to 5-26)
o IndoorSpeechInterference(Tables5-27 to 5-29)
o Outdoor Speech Interference (Tables 5-30 to 5-32)
o Pedestrian Speech Interference (Tables 5-33 to 5-35)
The tabulated results are presented in terms of LWP, RCI, and RCI*for four years (1980_ 1990, 2000, and 2010) in the regulatory time stream.The results are also presentedfor the differentassumptionsof 12, 7 and3 percent of the vehicles modified. In these tables, the baseline (no regu-lation) option is listed as Option I. Also, the RCI and RCI* values arecalculated relative to the condition of 12 percent modified motorcycles sincethis represents the current (1980) estimate of the proportion of modifiedmotorcycles.
For sleepdisruption_the Level WeightedPopulation(LWP) and both typesof Relative Change in Impact (RCI and RCI*) appear in Tables 5-21 through5-23. These tables show very large benefits in terms of a reduced potential
5-52
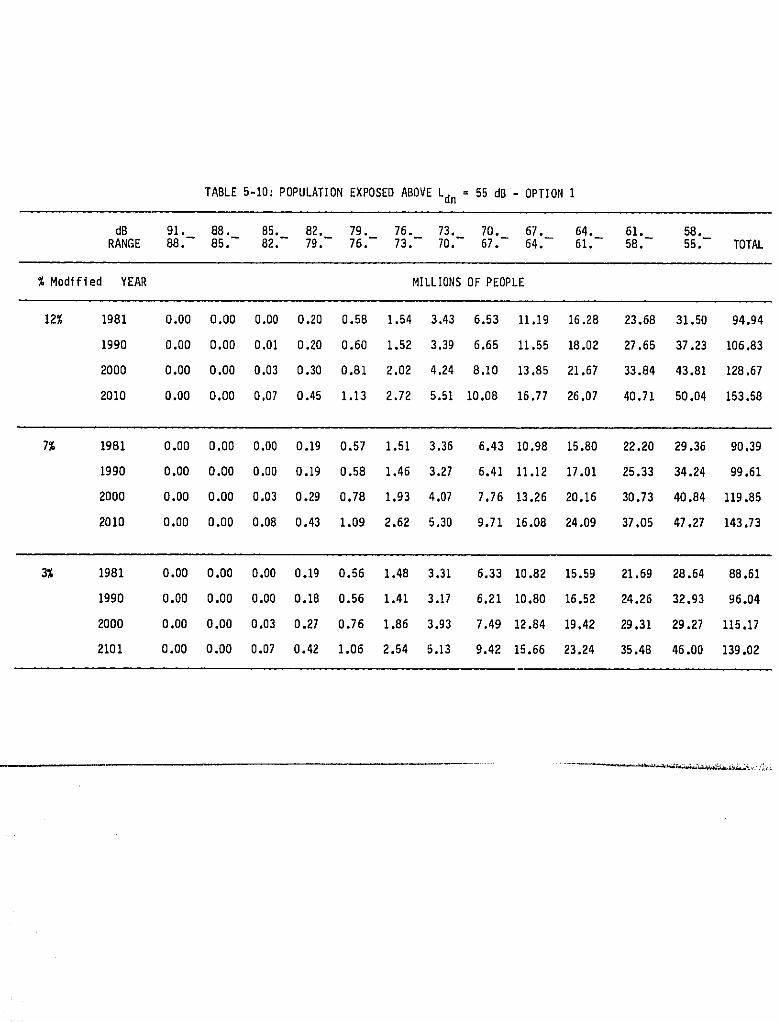
TABLE 5-10: POPULATION EXPOSED ABOVE Ldn : 55 dB - OPTION I
dB 91, 88. 85. 82. 79. 76. 73. 70. 67. 64. 61. 58.RANGE 88.- 85.- 82.- 79.- 76.- 73.- 70.- 67.- 64.-- 61.- 58.- 55.- TOTAL
% ModifiedYEAR MILLIONSOFPEOPLE
12% 1981 0.00 0.00 0.00 0.20 0.58 1.54 3.43 6.53 II.19 16.28 23,68 31.50 94.94
1990 0.00 0.00 0.01 D.20 0.60 1.52 3.39 6.65 11.55 18.02 27.65 37.23 106.83
2000 0.00 0.00 0.03 0.30 0.81 2.02 4.24 8.10 13.85 21.67 33.84 43.81 128.67
2010 0.00 0.00 0,07 0.45 1.13 2.72 5.51 10.08 15.77 26.07 40.71 50.04 153.58
7% 1981 0.00 0.00 0.00 0.19 0.57 1.51 3.36 6.43 10.98 15.80 22.20 29.36 90.39
1990 0.00 0.00 0.00 0.19 0.58 1.46 3.27 6.41 11.12 17.01 25.33 34.24 99.61
2000 0.00 0.00 0.03 0.29 0.78 1.93 4,07 7,76 13.26 20.16 30.73 40.84 119.85
2010 0,00 0.00 0.08 0.43 1.09 2.62 5.30 9.71 16.08 24.09 37.05 47,27 143.73
3% 1981 0.00 0.00 0.00 0.19 0.56 1.48 3.31 6.33 10.82 15.59 21.69 28.64 88,61
1990 0.00 0.00 0.00 0.18 0.56 1.41 3.17 6.21 10,80 16.52 24.26 32.93 96,04
2000 0.00 0.00 0.03 0.27 0.76 1,86 3.93 7.49 12.84 19.42 29.31 29.27 115.17
2101 0.00 0.00 0.07 0.42 1.06 2.54 5.13 9.42 15.66 23.24 35.48 46.00 139,02
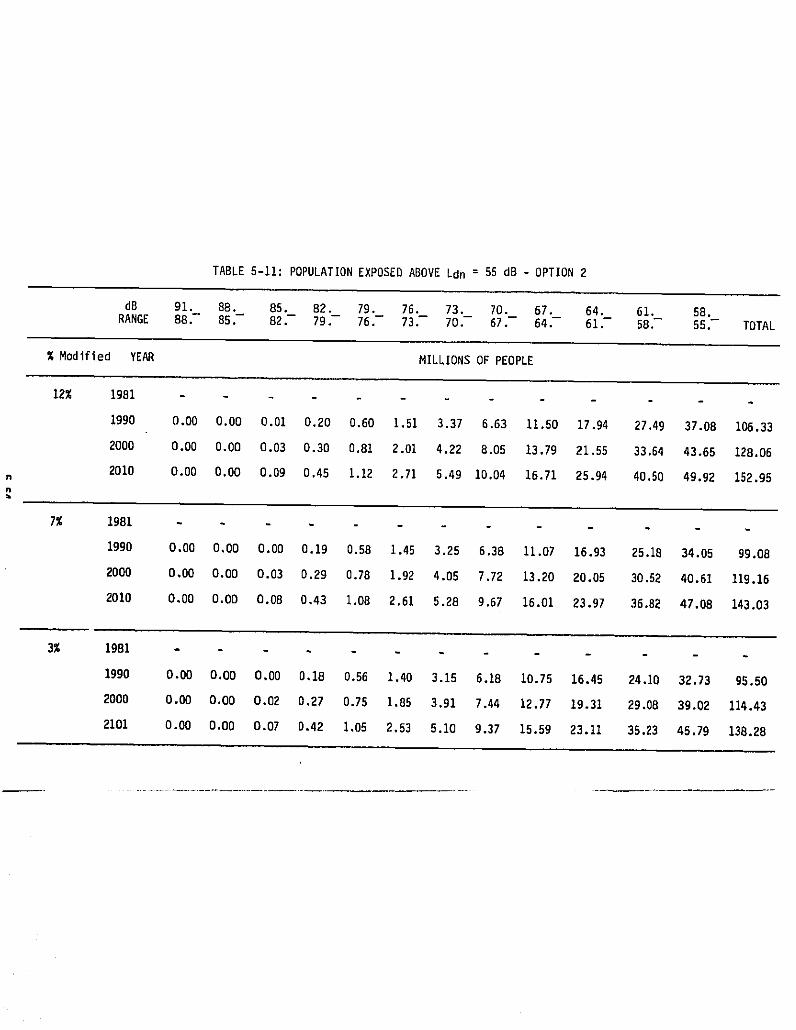
TABLE 5-11: POPULATIONEXPOSEDABOVELdn = 55 dB- OPTION2
dB 91. 8B. 85. B2. 79. 76. 73. 70. 67. 64. 61. 58.RANGE 88.- 85.- 82.- 79.- 76.- 73.-- 70,- 67.- 64.-- 61.- 58.- 55.- TOTAL
% ModifiedYEAR MILLIONSOFPEOPLE
12% 1981 - - -
1990 0.00 0.00 0.01 0.20 0.60 1.51 3.37 6.63 11.50 17.94 27.49 37.08 106,33
2000 0.00 0.00 0.03 0.30 0.81 2.01 4.22 B.05 13,79 21.55 33.64 43.65 128,06
2010 0.00 O.O0 0.09 0.45 1.12 2,71 5.49 10,04 16.71 25.94 40.50 49.92 152,95n
7% 1981
1990 0,00 0.00 0.00 0,19 0.58 1,45 3.25 6.38 11.07 16.93 25.18 34.05 99.08
2000 0,00 0.00 0.03 0.29 0.78 1.92 4.05 7.72 13.20 20.05 30.52 40.61 119.16
2010 0.00 O,OD 0,08 0.43 1.08 2.61 5.28 9.67 16.01 23.97 36.82 47.08 143.03
3% 1981 - - -
1990 0.00 0.00 0,00 0.18 0.56 1.40 3.15 6.18 10.75 16.45 24.10 32,73 95.50
2000 0.00 0.00 0,02 0.27 0.75 1,85 3.91 7.44 12.77 19.31 29.08 39.02 114.43
2101 O.OO 0.00 0.07 0.42 1,05 2,53 5.10 9.37 15.59 23.11 35.23 45.79 138.28
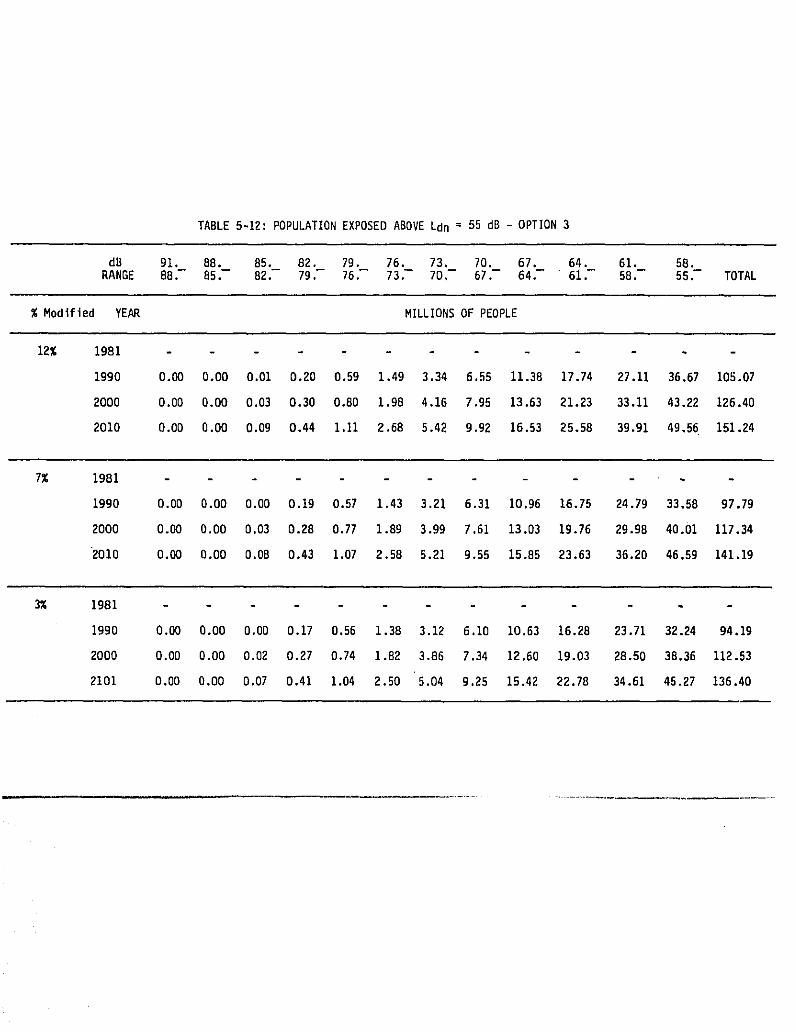
TABLE5-12: POPULATIONEXPOSEDABOVELdn = 55 dB - OPTION3
dB 91. 88. 85. 82. 79. 76. 73. 70. 67. 64. 61. 58.RANGE 88.- 85.-- 82.- 79.- 76.- 73.- 70,- 67.- 64.- 61.- 58.- 55.- TOTAL
% Modified YEAR MILLIONSOF PEOPLE
12% 1981 - -
1990 0.00 O.O0 0.01 0.20 0.59 1.49 3.34 6.55 11.38 17.74 27.11 36.67 105.07
2000 O.O0 0.00 0.03 0.30 0.80 1.98 4.16 7.95 13.63 21.23 33.11 43.22 126.40
2010 0.00 0.00 0.09 0.44 1.11 2.68 5.42 9.92 16.53 25.58 39.91 49.56 151.24
7% 1981
1990 0.00 O.OO O.00 0.19 0.57 1.43 3.21 6.31 10.96 16.75 24.79 33.58 97.79
2000 0.00 0.00 0.03 0.28 0.77 1.89 3.99 7.61 13.03 19.76 29.98 40.01 117.34
2010 O.O0 O.OO 0.08 0.43 1.07 2.58 5.21 9.55 15.85 23.63 36.20 46.59 141.19
3% 1981 .....
1990 O.O0 O.OO 0.00 0.17 0,56 1.38 3.12 6.10 10.63 16.28 23.71 32.24 94.19
2000 O.OD 0.00 0.02 0.27 0.74 1.82 3.86 7.34 12.60 19.03 28.50 38.36 112.53
2101 O.00 O.O0 0.07 0.41 1.04 2.50 5.04 9.25 15.42 22.78 34.61 45.27 136.40
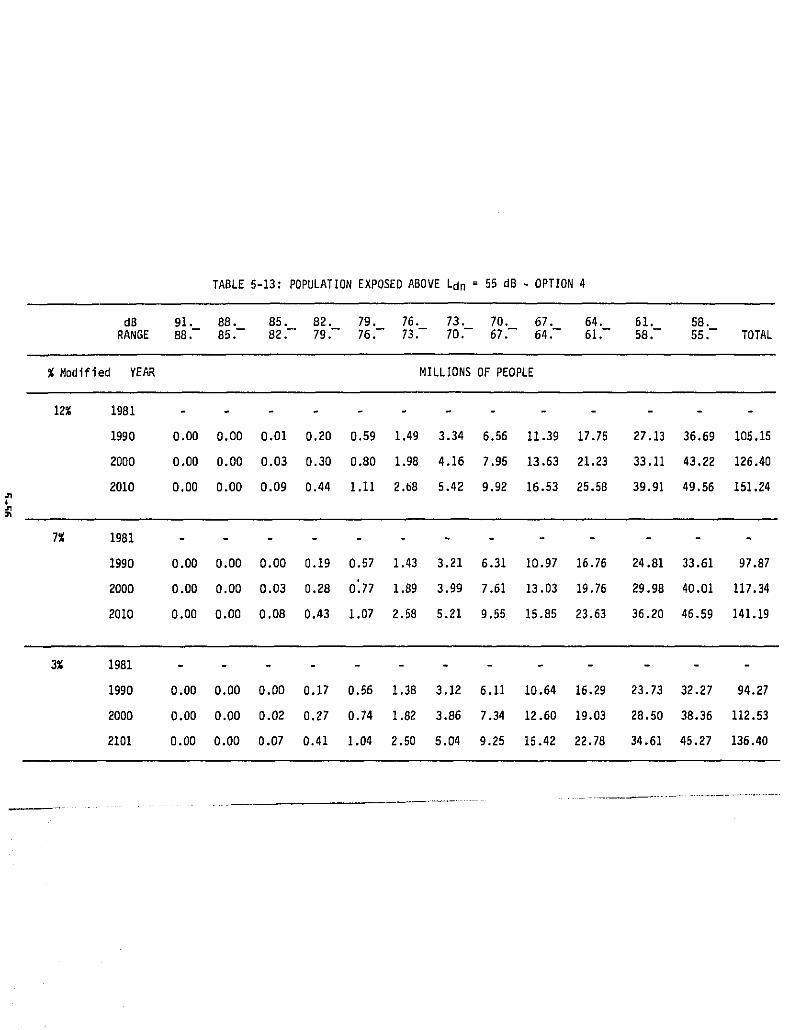
TABLE 5-13: POPULATION EXPOSED ABOVE Ldn : 55 dB - OPTION 4
dB 91. 88. 85. 82. 79. 76. 73. 70. 67. 64. 61. 58.RANGE 88.-- 85.-- 82.-- 79.-- 76.-- 73.-- 70.-- 67.-- 64.-- 61.- 58.- 55.- TOTAL
% ModifiedyEAR MILLIONSOFPEOPLE
12% 1981
1990 0.00 0.00 0,01 0.20 0.59 1.49 3.34 6.56 11.39 17.75 27.13 86.69 105.15
2000 0.00 0.00 0.03 0.30 0.80 1.98 4.16 7.95 13.63 21.23 33.11 43.22 126.40
2010 0,00 0.00 0.09 0.44 1.11 2.68 5.42 9.92 16.53 25.58 39.91 49.56 151.24
£
7% 1981 ....
1990 0.00 0.00 0.00 0.19 0.57 1.43 3.21 6.31 10.97 16.76 24.81 33.61 97.87
2000 0.00 0.00 0.03 0.28 0_77 1.89 3.99 7.61 13.03 19.76 29.98 40.01 117.34
2010 0.00 0.00 0.08 0.43 1.07 2.58 5.21 9.55 15.85 23.63 36.20 46.59 141.19
3% 1981
1990 0.00 0.00 0.00 0.17 0.56 1.38 3.12 6.11 10.64 16.29 23.78 32.27 94.27
2000 0.00 0.00 D.02 0.27 0.74 1.82 3.86 7.34 12.60 19.08 28.50 38.36 112.53
2101 0.00 0.00 0.07 0.41 1.04 2.50 5.04 9.25 15.42 22.78 34.61 45.27 136.40
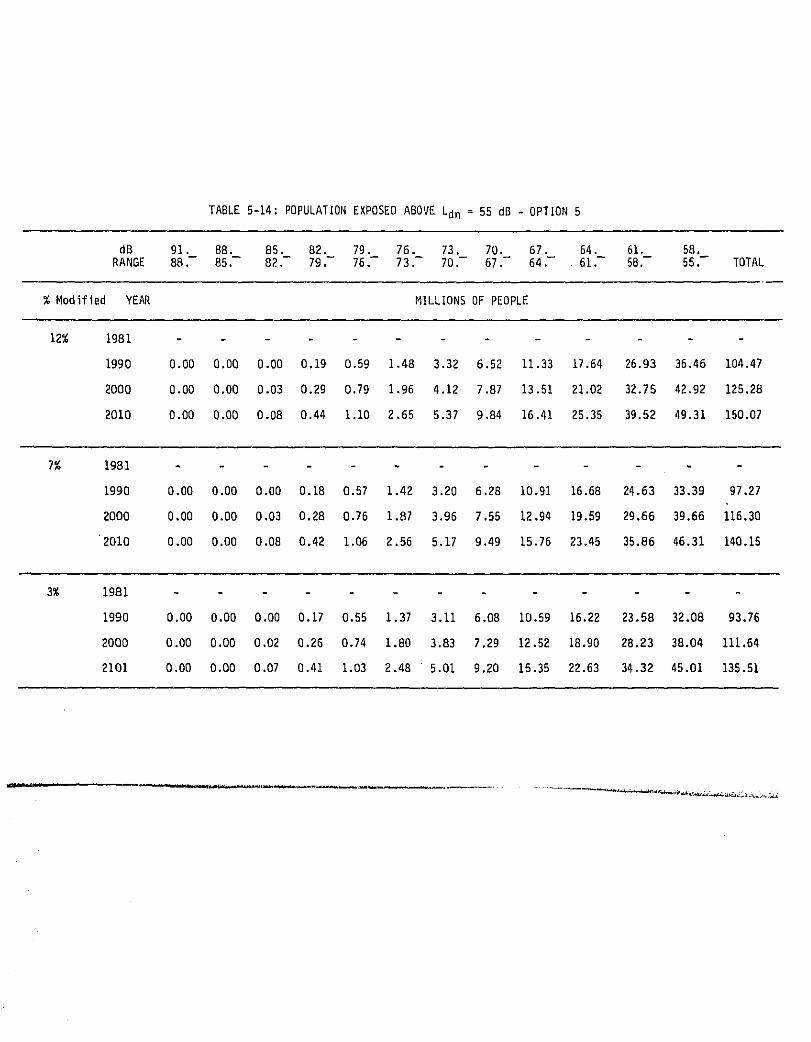
TABLE 5-14: POPULATI0N EXPOSED ABOVE Ldn = 55 dB - OPTION 5
dB 91. 88. 85. 82. 79. 76. 73, 70. 67. 64. 61. 58.RANGE 88.- 85.-- 82.- 79.- 76.- 73.- 70,- 67.- 64.- 61.-- 58.-- 55.-- TOTAL
% ModifiedYEAR MILLIONSOFPEOPLE
12% 1981
1990 0.80 0.00 0.00 0,19 0.59 1.48 3.32 6.52 11.33 17.64 26.93 36.46 104.47
2000 0.00 0.00 0.03 0.29 0.79 1,96 4.12 7.87 13.51 21.02 32.78 42.92 128.28
2010 0.80 0.00 0.08 0.44 1.10 2,65 5.37 9.84 16.41 25.35 39.52 49.31 150.07
7% 1981 - -
1990 0,00 0.00 0.00 0.18 0.67 1.42 3.20 6.28 I0.91 16.68 24.63 33.39 97.27
2000 0,00 0.00 0.03 0.28 0.76 i ,87 3.96 7.55 12.94 19.59 29.66 39.66 116.30
2010 0.00 0.00 0.08 0.42 1.06 2.55 5.17 9.49 15.76 23.45 35.86 46.31 140.15
3% 1981
1990 0.00 0.00 0.00 0.17 0.55 1.37 3.11 6.0B 10.59 16.22 23.88 32.08 93.76
2000 0.00 0.00 0.02 0.26 0.74 1.80 3.83 7.29 12.52 18.90 28.23 38.04 111.64
2101 0.00 8.00 0.07 0.41 1.03 2.48 5.01 9.20 15.35 22.63 34.32 45.01 135.51
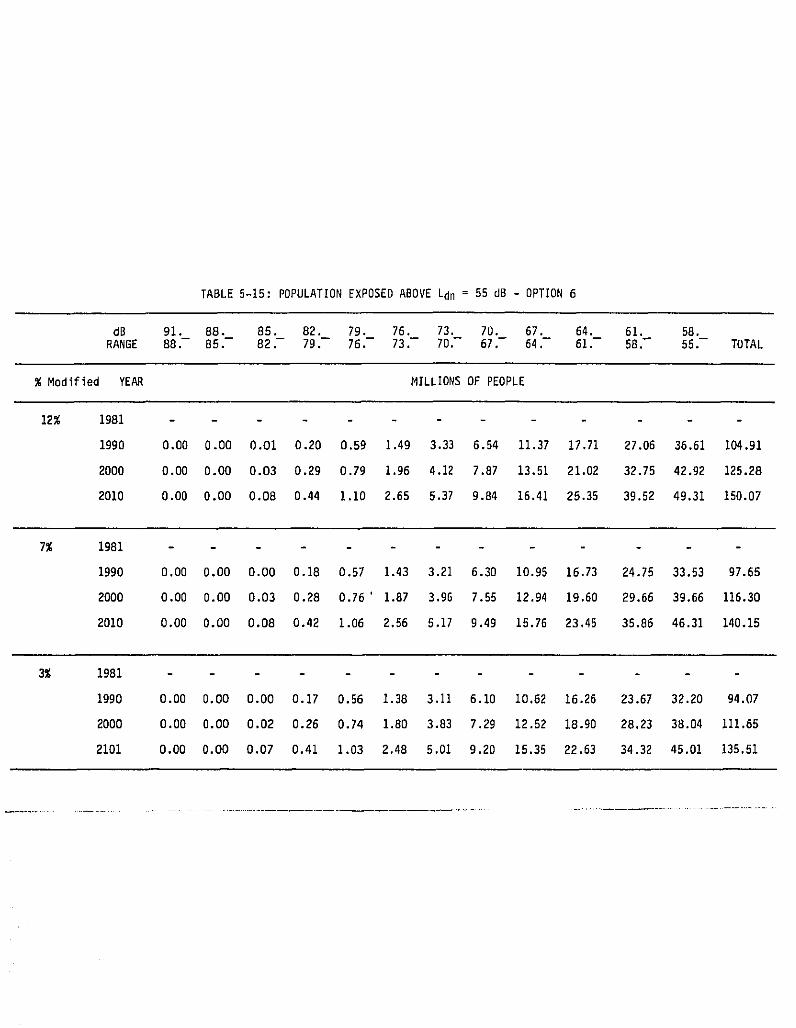
TABLE 5-15: POPULATION EXPOSED ABOVE Ldn = 55 dB - OPTION 6
dB 91, 88. 85. 82. 79. 76. 73. 70. 67. 64. 61. 58.RANGE 88.- 85.-- 82-- 79.-- 76.-- 73.-- 70.- 67,- 64.- 61,-- 58.-- 55.-- TOTAL
% Modified YEAR MILLIONSOF PEOPLE
12% 1981
1990 0.00 0.00 0.01 0.20 0.59 1.49 3.33 6.54 11.37 17.71 27.06 36.61 104,91
2000 0.00 0.00 0.03 0.29 0.79 1.96 4.12 7.87 13.51 21.02 32.75 42.92 125.28
2010 0.00 0.00 0,08 0.44 1.10 2.65 8.37 9.84 16,41 28.35 39,52 49.31 150.07
7% 1981
1990 0,00 0.00 0.00 0.18 0,57 1.43 3.21 6.30 10.95 16.73 24.76 33.53 97.65
2000 0.00 0.00 0.03 0.28 0.76' 1.87 3.96 7.55 12.94 19.60 29.66 39,66 116.30
2010 0,00 0.00 0.08 0.42 1.06 2,56 5.17 9.49 15,76 23.45 35.86 46.31 140,15
3% 1981
1990 0.00 0.00 0.00 0.17 0.56 1.38 3.11 6.10 10.62 16.26 23.67 32.20 94.07
2000 0.00 0.00 0.02 0.26 0.74 1.80 3.83 7.29 12.52 18.90 28.23 38.04 111,65
2101 0.00 0.00 0,07 0.41 1.03 2.48 8.01 9.20 15.35 22.63 34,32 45.01 135.51
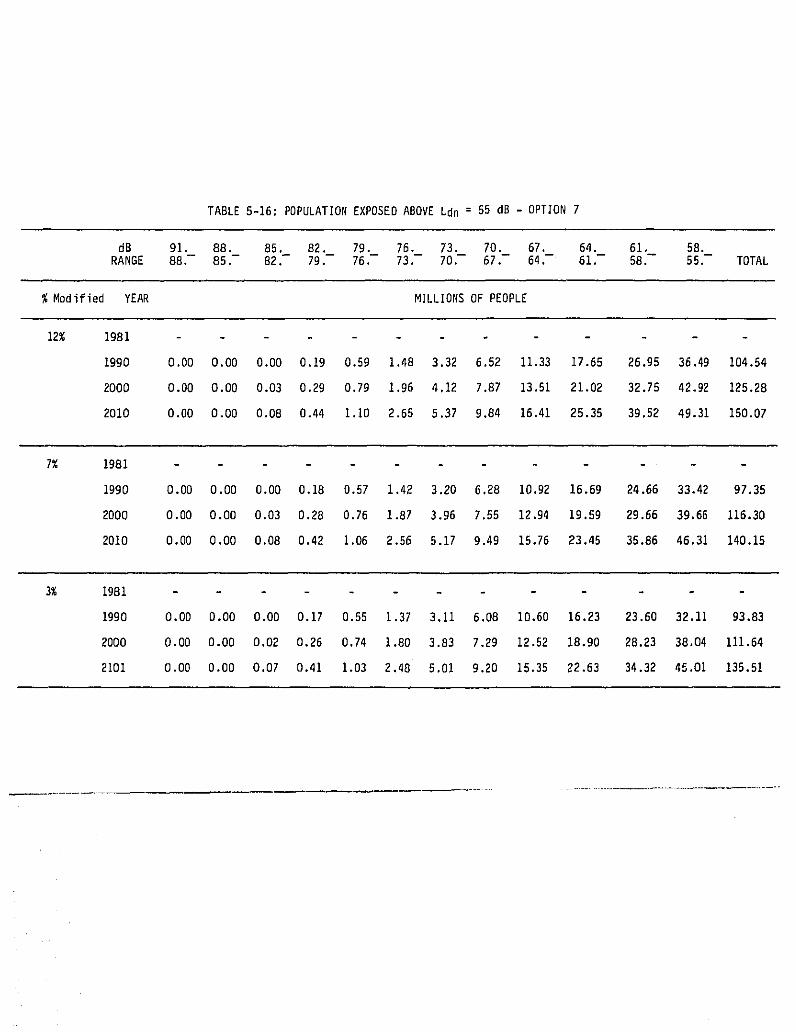
TABLE 5-16: POPULATION EXPOSED ABOVE Ldn : 55 dB - OPTION 7
dB 91. 88. 85. 82. 79. 76. 73. 70. 67. 64. 61, 58.RANGE 88.- 85.- 82.- 79.-- 76.- 73.-- 70.-- 67.-- 64.-- 61.-- 58.-- 55.-- TOTAL
% ModifiedYEAR MILLIONSOFPEOPLE
12% 1981 - -
1990 0.00 0,00 O.O0 0.19 0.59 1.48 3.32 6.52 11.33 17.65 26.95 36.49 104.54
2000 0.00 0.00 0.03 0.29 0.79 1.96 4.12 7.87 13.51 21.02 32.75 42.92 125.28
2010 0.00 0.00 0.08 0.44 1.10 2.65 5.37 9.84 16.41 25.35 39.52 49.31 150.07
7% 1981
1990 0.00 0.00 O.O0 0.18 0.57 1.42 3.20 6.28 10.92 16.69 24.66 33.42 97.35
2000 0.00 0.00 0.03 0.28 0.76 1.87 3.96 7,55 12.94 19.59 29.66 39.66 116.30
2010 0.00 0.00 0.08 0.42 1.06 2.56 5.17 9.49 15.76 23.45 35.86 46.31 140.15
3% 1981
1990 O.O0 0.00 0.00 0.17 0.55 i.37 3,11 6,08 10.60 16.23 23.60 32.11 93.83
2000 0.00 O.OO 0.02 0,26 0.74 1.80 3.83 7,29 12.52 18.90 2B.23 38.04 111.64
2101 O.OO O.O0 0.07 0.41 1.03 2.48 5.01 9.20 15.35 22.63 34.32 45.01 135.51
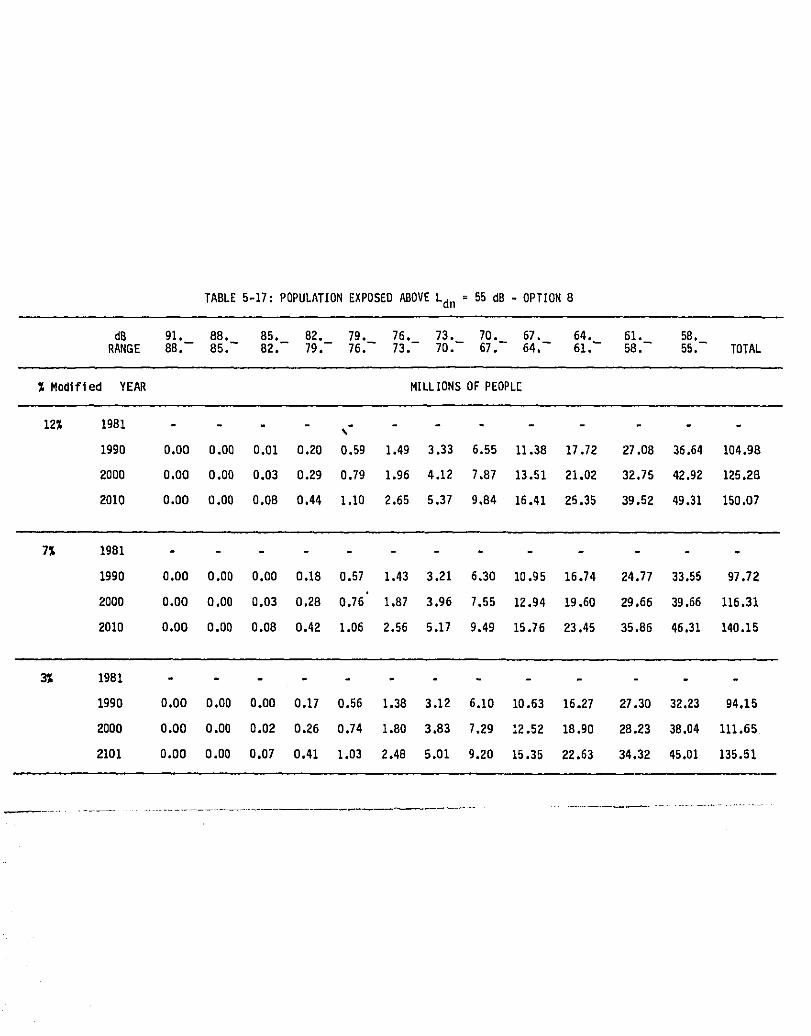
TABLE5-17:POPULATIONEXPOSEDABOVELdn = 55 dB - OPTION8
dB 91. 88. BS. 82. 79. 76. 73. 70. 67. 64. 61. 58.RANGE 88.-- 85._ B2.- 79.- 76.- 73.- 70.- 67.- 64,- 61.- 58.- 55.- TOTAL
% Modified YEAR MILLIONSOF PEOPLE
12% 1981 ,- -
1990 0.00 0.00 0.01 0.20 0.59 1.49 3.33 6.55 11.38 17.72 27.08 36,64 104,98
2000 0,00 0.00 0.03 0.29 0.79 1.96 4.12 7,87 13.51 21.02 32,75 42.92 125.28
2010 O.OO O.O0 0.08 0.44 1,I0 2.65 5.37 9,84 16.41 25.35 39.52 49.31 150.07
7% 19B1
1990 0.00 0.00 0.00 0.18 0.57 1.43 3.21 6.30 10.95 16.74 24,77 33,55 97.72i
2000 0.00 0,00 0.03 0.28 0.76 1.87 3.96 7,55 12.94 19.60 29.66 39,66 116.31
2010 0.00 0.00 0.08 0.42 1.06 2.56 5.17 9.49 15.76 23.45 35.86 46.31 140.15
3Y, 1981 - -
1990 0.00 0.00 0.00 0.17 0.56 1.38 3.12 6.10 10.63 16.27 27.30 32.23 94.15
2000 0.00 0.00 0.02 0.26 0.74 1.80 3.83 7.29 12.52 18.90 28.23 38.04 111.65
2101 0.00 0.00 0,07 0.41 1.03 2.48 5.01 9.20 15.35 22.63 34.32 45.01 135.51
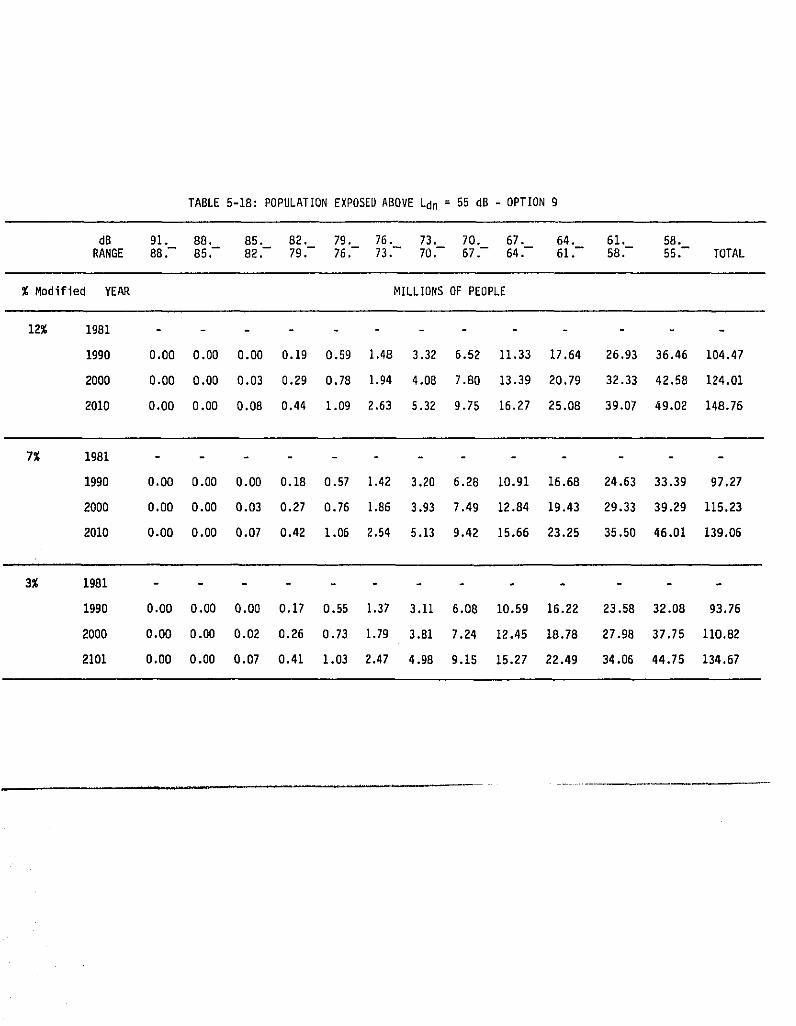
TABLE 6-18: POPULATIONEXPOSE[)ABOVE Ldn : 55 dB - OPTION9
dB 91. 88. 85. 82. 79. 76. 73. 70. 67. 64. 61. 58.RANGE 88.- 85,- 82.- 79,- 76.- 73.- 70.- 67.- 64.- 61.- 58.- 55.- TOTAL
% ModifiedYEAR MILLIONSOFPEOPLE
12% 1981 -
1990 O.O0 0,00 O.OO 0.19 0.59 1.48 3.32 6.52 11.33 17.64 26.93 36.46 104,47
2000 0.00 0.00 0.03 0.29 0.78 1.94 4.08 7.80 13.39 20.79 32.33 42.58 124.01
2010 0.00 O.OO 0.08 0.44 1.09 2.63 6.32 9.75 16.27 25.08 39.07 49.02 148.76
7% 1981
1990 0.00 0.00 0.00 0,18 0.57 1.42 3.20 6.28 10.91 16.68 24.63 33.39 97.27
2000 0.00 0.00 0.03 0.27 0.76 1.86 3.93 7.49 12.84 19.43 29.33 39.29 115.23
2010 0.00 O.O0 0.07 0.42 1.06 2.54 5.13 9.42 15.66 23.25 35.50 46.01 139.06
3% 1981
1990 0.00 0.00 0.00 0.17 0.55 1.37 3.11 6.08 10.59 16.22 23.58 32.08 93.76
2000 O.O0 0.00 0.02 0.26 0.73 1,79 3.81 7.24 12,45 18.78 27.98 37.75 110.82
2101 O.O0 O.OO 0.07 0,41 1.03 2.47 4.98 9.15 15.27 22.49 34.06 44.75 134.67
,,,, _, ,,,,,,,,,, ......
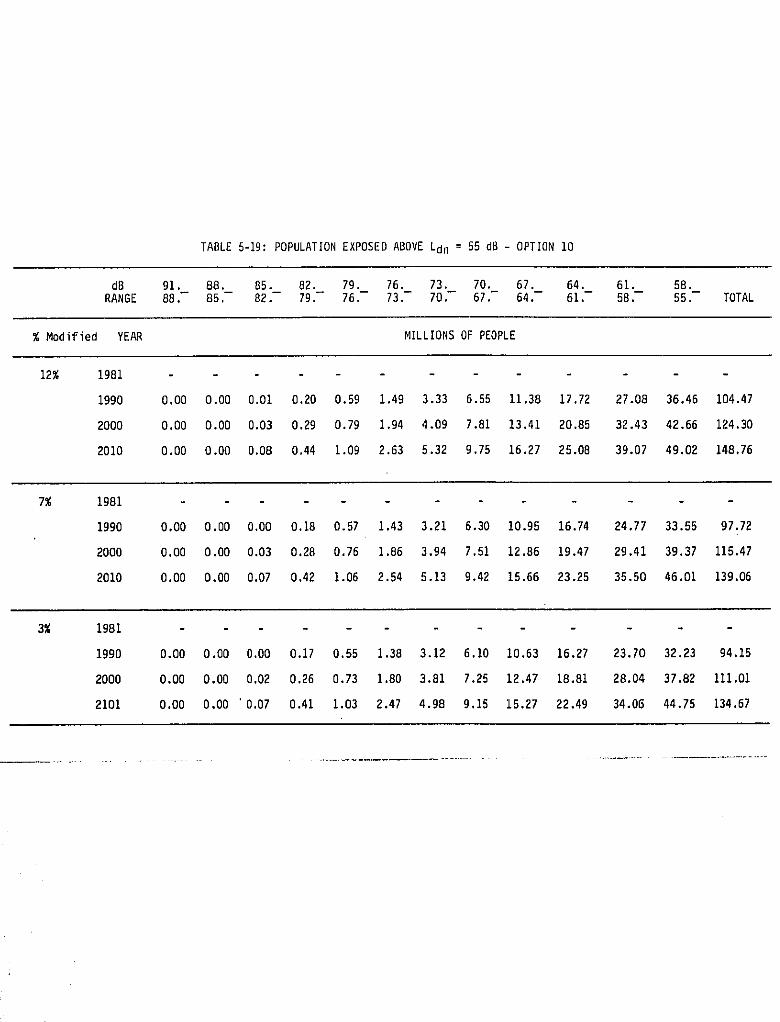
TABLE 5-19: P0PULATION EXPOSED ABOVE Ldn = 55 dB - OPTION 10
dB 91. 88. 85. 82. 79. 76. 73. 70. 67. 64. 61. 58.RANGE 88.- 85,- 82.-- 79.-- 76.- 73.- 70.-- 67.- 64.-- 61.-- 5B.-- 55.- TOTAL
% ModifiedYEAR MILLIONSOFPEOPLE
12% 1981
1990 O.OO O.O0 0.01 0.20 0.59 1.49 3.33 6.55 11.38 17.72 27.08 36.46 104.47
2000 0.00 O.O0 0.03 0.29 0.79 1.94 4.09 7.81 13.41 20.85 32.43 42.66 124.30
2010 0.00 O.OO 0.08 0,44 1.09 2.63 5.32 9.75 16.27 25.0B 39.07 49,02 148.76
7% 1981
1990 0.00 0.00 0,00 0.18 0.57 1.43 3.21 6.30 10.95 16.74 24.77 33.55 97.72
2000 0.00 O.OO 0.03 0.28 0.76 1.86 3,94 7.51 12.86 19.47 29.41 39.37 115.47
2010 0.00 O.O0 0.07 0.42 1.06 2.54 5.13 9.42 15.66 23.25 35,50 46.01 139.06
3% 1981
1990 0.00 0.00 0.00 0.17 0.55 1.38 3.12 6.10 10.63 16.27 23.70 32.23 94.15
2000 0.00 0.00 0.02 0,26 0,73 1.80 3.81 7.25 12.47 18.81 28.04 37.82 111.01
2101 0.00 0.00 '0,07 0.41 1.03 2.47 4.98 9.15 15.27 22.49 34.06 44.75 134.67
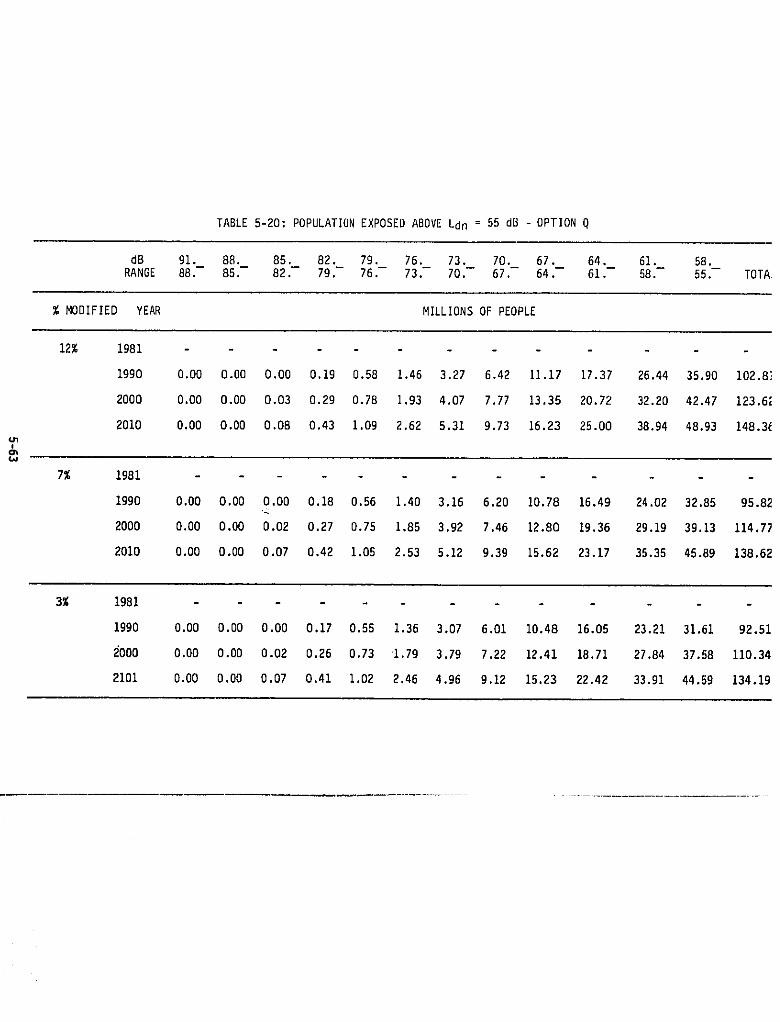
TABLE 5-20: POPULATIONEXPOSEDABOVELdn = 55 dB - OPTION Q
dB 91. 88. 85, 82. 79. 76. 73. 70. 67. 64. 61. 58.RANGE 88.- 85.- 82 .- 79.- 76.- 73.- 70,- 67.- 64 .-- 61.-- 58,- 55.-- TOTA
%MODIFIEDYEAR MILLIONSOFPEOPLE
12% 1981
1990 0.00 0.00 0.00 0.19 0.58 1.46 3.27 6.42 11.17 17.37 26.44 35.90 102.8]
2000 0.00 0.00 0.03 0.29 0.78 1.93 4.07 7.77 13.35 20.72 32.20 42.47 123.6_
2010 0.00 0.00 0.08 0.43 1.09 2.62 5.31 9.73 16.23 25.00 38.94 48.93 148.3(
,&
7% 1981
1990 O.OO O.OO 0.00 0.18 0.56 1.40 3.16 6.20 10.78 16.49 24.02 32.85 95.82"4
2000 O.O0 0.00 0.02 0.27 0.75 1.85 3.92 7.46 12.80 19.36 29.19 39.13 114.77
2010 0.00 0.00 0.07 0.42 1.05 2.53 5.12 9.39 15.62 23.17 35.35 45.89 138.62
3_ 1981
1990 0.00 0.00 0.00 0.17 0.55 1.36 3.07 6.01 10.48 16.05 23.21 31.61 92.51
2DO0 0.00 0.00 0.02 0,26 0.73 1.79 3.79 7,22 12.41 18.71 27.84 37.58 110.34
2101 0.00 0.00 0.07 0.41 1.02 2.46 4.96 9.12 15.23 22.42 33.91 44.59 134.19
for sleep disruption due to the regulation of motorcycle noise. These bene-fits represent reductions in that proportion of impact that is attributab]e tomotorcycles alone.
The values of LWP contained in Tables 5-21 thru 5-23 are compositenumbers representing the total number of people exposed to motorcycle pass-bys, multiplied by the number of motorcycle passby events to which they areexposed, weighted by the degree of anticipated interference. For example, if32 mi]lion peop]e are exposed nightly to motorcycle passby noise, and each isexposed to two separate passbys, and each passby has an independent proba-bi]ity of disrupting sleep of 40 percent, the total LWP displayed for thatsituation would be 25.6 million (32,000,000X 2 X 0.40). Each cell in thesetables represents such a composite number.
Again, the LWP values are indicators which are used to compare acrossregulatory options, and are not absolutemeasures of benefits. To betterquantifythe benefitsof differentregulatoryoptions,the RCl andRCI* valuesare used.
From Tables 5-21 through 5-23, the results of the analysis for sleepdisruption is su_narized as follows:
o Assuming no reductions in the number of modified motorcycles (propor-tion of modified vehicles remains at the 12 percent level), the RCIbecomes increasingly negative due primarily to increases in motorcycleoperations and U.S. population growth. This trend is offset somewhat asincreasingly stringent source emission regulations are imposed.
o With no motorcycle regulation (Option 1), the RCI becomes increasinglynegative even with a concurrent reduction in the number of modifiedvehicles.
o The RCI valuesbecome increasinglypositiveas both the proportionofmodified motorcycles is reduced and as increasingly more stringentsource emission regu]ations are imposed.
o Options g and 10 demonstrate the greatest benefits in terms of RCI*.These benefits reach almost 50 percent in the year 2010 with no reduc-tion in modified vehicles, and over 85 percent with an assumed threepercent modified motorcycles. The idealized Option Q adds littleadditional benefit. Options 1 and 2 show the least benefit.
o In 1990, RCI* benefits range from zero to 50 percent with 12 percentmodifications,and 40 to 85 percent with an assumed3 percentmodifi-cations. The differences between options show the effects of regulatorylead lime (effective dates) on near-term benefits.
o Benefits in terms of RCI* would reach in the year 2010 approximately 22and 40 percent from reducing the proportion of modified vehicles to 7and 3 percent, respectively, without a concurrent regulation on sourceemissions.
o In terms of RCI*, benefits would reach in the year 2010 between 40 and50 percent for the most stringent regulatory alternatives even if theproportion of modified motorcycles were not at all reduced and remainedat the 12 percent level.
; 5-64i
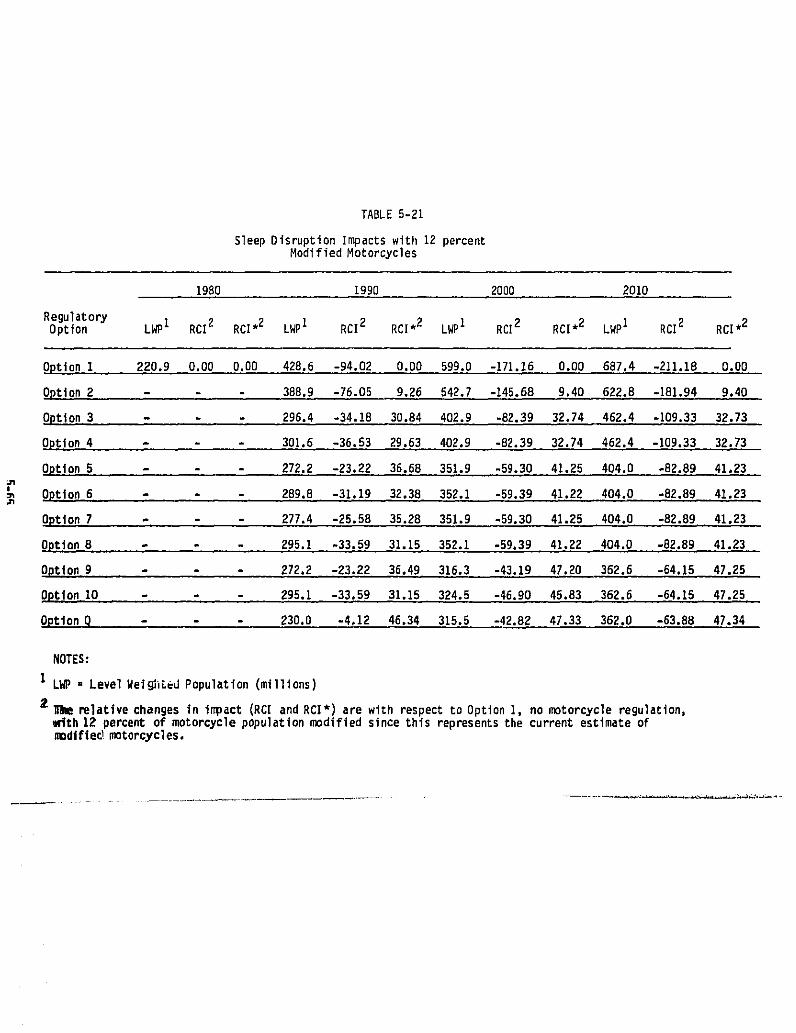
TABLE 5-21
Sleep Disruption Impacts with 12 percentModifiedMotorcycles
1980 1990 2000 2010
RegulatoryOption LW_1 RCI2 RC1.2 LWP1 RCI2 RC1.2 LWPI RCI2 RC1.2 LWPI RCI2 RC1.2
Option1 220.9 0.00 0.00 428.6 -94.02 0.00 599.0 -171.16 0.00 687.4 -211.18 O.O0
Optlon2 - 388.9 -76.05 9,26 542.7 -145.68 9.40 622.8 -181.94 9.40
pptlo_3 - 296.4 -34.18 30.84 402.9 -82.39 32.74 462.4 -109.33 32,,73
Option4 - 301,6 -36.53 29.63 402.9 -82.39 32.74 462.4 -109.33 32.73
Option5 - 272.2 -23.22 36.68 351.9 -59.30 41.25 404.0 -82.89. 41.23
Option6 - 289.8 -31.19 32.38 352.1 -59.39 41.22 404.0 -82,89 41.23
Option,7 - - 277.4 -25.58 35.28 351.9 -59.30 41.25 404.0 -82.89 41.23
Option8 295.1 -33.59 31.15..352.1 -59.39 41.22 404.0 -82.89 41.23
Option9 272.2 -23.22 35.49. 316.3 -43.19 47.20 362.8 -64,15 47.25
Option lO - 295.1 -33.59 31.15 324.5 -46.90 48.83 362.6 -64.15 47.25
Option Q - 230,0 -4,12 46,34 315.5 -42.82 47.33 362.0 -63.88 47.34
NOTES:
I L_P • Level WeighLed Population (millions)
2_ relative changes in inpact (RCI and RCI*) are with respect to Option 1, no motorcycle regulation,uqtth 12 percent of motorcycle population modified since this represents the current estimate ofmodfftedmotorcycles,
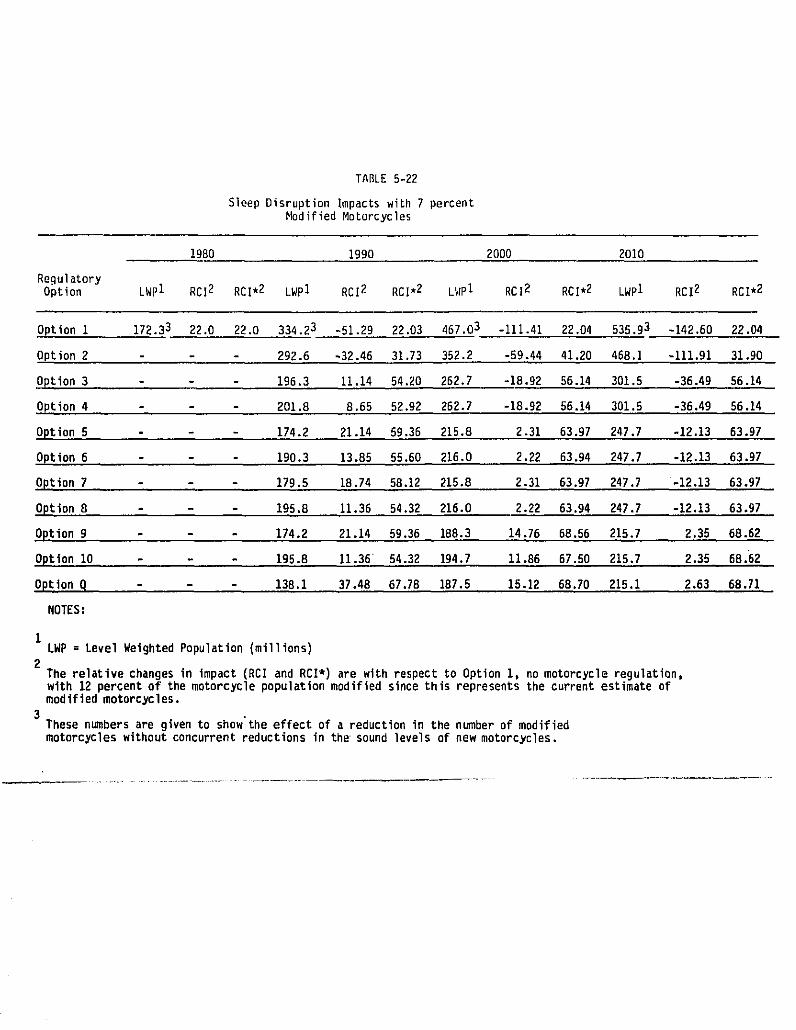
TABLE 5-22
Sleep Disruption Impacts with 7 percentModified Motorcycles
1980 1990 2000 2010
RegulatoryOption LWp1 RCI2 RCI*2 LWpI RCI2 RCI*2 LWPI RCI2 RCI*2 LWp1 RCI2 RCI*2
Optioni 172.33 22.0 22.0 334.23 -51.29 22.03 467.03 -111.41 22.04 535.93 -142.60 22.04
Option2 292.6 -32.46 31.73 352.2 -59.44 41.20 468.1 -111.91 31.90
Option3 196.3 11.14 54.20 262.7 -18.92 56.14 301.5 -36.49 56.14
Option4 201.8 8.65 52.92 262.7 -18.92 56.14 301.5 -36.49 56.14
Option5 - 174.2 21.14 59.36 215.8 2.31 63.97 247.7 -12.13 63.97
Option6 190.3 13.85 55.60 216.0 2.22 63.94 247.7 -12.13 63.97
Option7 179.5 18.74 58.12 215.8 2.31 63.97 247.7 -12.13 63.97
Option8 195.8 11.36 54.32 216.0 2.22 63.94 247.7 -12.13 63.97
Optiong 174.2 21.14 59.36 I88.3 14.76 68.56 215.7 2.35 68.62
Option10.. 195.8 11.36 54.32 194.7 11.86 67.50 215.7 2.35 68.'62
Optionq - - 138.1 37.48 67.78 187.5 15.12 68.70 215.1 2.63 68.71
NOTES:
1LWP = Level Weighted Population (millions)
2The relativechangesin impact(RCIand RCI*) are withrespectto Option1, no motorcycleregu]ation,with 12 percentof the motorcyclepopulationmodifiedsincethis representsthe currentestimateofmodifiedmotorcycles.
3These nurabersare givento show'theeffectof a reductionin the numberof modifiedmotorcycleswithoutconcurrentreductionsin the sound levelsof new motorcycles.
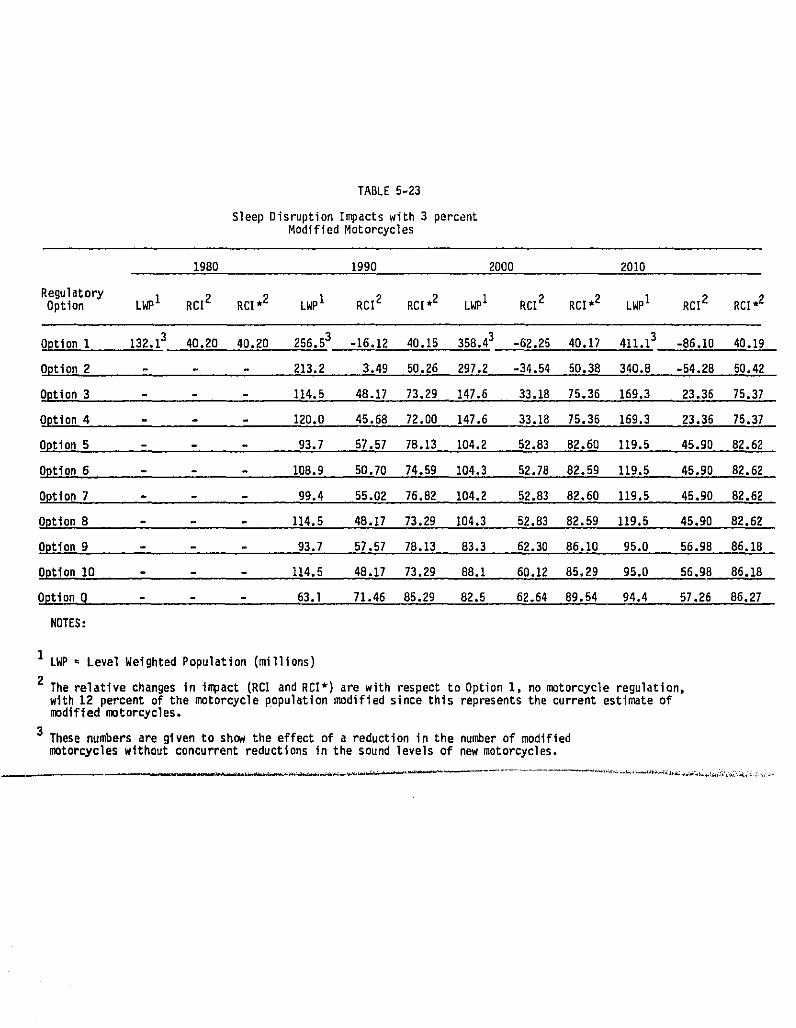
TABLE 5-23
Sleep Disruption Impacts with 3 percentModified Motorcycles
1980 1990 2000 2010
RegulatoryOption LWP1 RCI2 RC1.2 LWP1 RCI2 RC1.2 L_ 1 RCI2 RC1.2 LWP1 RCI2 RC1.2
OptlonI 132.13 40.20 40.20 256.53 -16.12 40.15 358.43 -62.25 40.17 411.13 -86.10 40.19
Option2 213.2 3.49 50.26 297.2 -34.54 50.38 340.8 -54.28 50.42
Option3 114.5 48.17 73.29 147.6 33.18 75.36 169.3 23.36 75.37
Option4 120.0 45.68 72.00 147.6 33.18 75.36 169.3 23.36 75.37
Option5 - 93.7 57.57 78.13 104.2 52.83 82.60 119.5 45.90 82.62
Option 6 - 108.9 50.70 74.59 104.3 52.78 82.59 119.5 45.90 82.62
Option 7 - 99.4 55.02 76.82 104.2 52.83 82.60 119.5 45.90 82.62
Option8 - 114.5 48.17 73.29 104.3 52.83 88.59 119.5 45.90 82.62
Option9 - 93.7 57.57 78.13 83.3 62.30 86.10 95.0 56.98 86.18
Option10 - 114.5 48.17 73.29 88.1 60.12 85.89 95.0 56.98 86.18
Optionq - 63.1 71.46 85.29 82.5 62.64 89.54 94.4 57.26 88.27
NOTES:
I LWP= Level WeightedPopulation(millions)
2 The relativechangesin impact(RC!and RCI*) are with respectto OptionI, no motorcycleregulatlen,with12 percentof the _torcycle populationmodifiedsincethis representsthe currentestimateofmodified motorcycles.
3 Thesenumbersare givento show the effectof a reductionin the numberof modifiedmotorcycleswithoutconcurrentreductionsin the soundlevelsef newmotorcycles.
The second type of activity interference examined is sleep awakening.The probability of sleep awakening is less than that for sleep disruption,since it takes more noise, generally of longer duration, to awaken a sleeperthan it does to change the depth of s]eep state.
For sleep awakening,the LWP and both RCI and RCI* results appear inTables 5-_4 through 5-26. These tables are organized identically Lo Tables5-21 through5-23. Again, the LWP valuesrepresenta compositeof the numberof people exposed, the number of passby events, and the probability of aninterference occurring.
These tables show a very large reduction in potential sleep awakeningsdue to the regulation of motorcycle noise. The trends in RCI and RCI* forsleep awakening are nearly identical to the trends evidenced in Tables 5-21 to5-23 for sleep disruption. For example, Options 9 and 10 show the mostbenefits in terms of RCI*, reaching by the year 2010 almost 45 percent assum-ing 12 percent modified motorcycles, and over an 85 benefit assuming 3 percentmodified. The idea]ized option Q demonstrates little additional benefit.
Another type of activity interference examined is speech interference.Discussed separately is speech interference indoors at home, outdoors at home,and for pedestrians along streets.
For speech interference indoors, LWP, RCI and RCI* appear in Tables5-27 through 5-29. Again, these tab]es are organized identically to theprevious tables. These tables show very large benefits in terms of reducedspeech interference due to the regulation of motorcycle noise. Some of themore important trends are noted below:
Assuming no reductions in the number of modified motorcycles (12 percento level), the RCI becomes increasingly negative due to increases in motor-
cycle operations and U.S. population growth. This trend is offset some-what with increasingly stringent source emission regulations.
With no motorcycle regulation (Option I), the RCI becomes increasinglyo negative even with a concurrent reduction in the number of modified
motorcycles.
The RCI values become increasingly positive as both the proportion ofo modified motorcycles is reduced and as increasingly more stringent
source regulations are imposed.
Options 9 and 10 demonstrate the greatest benefits in terms of RCI*.o These benefits reach almost 30 percent in the year 2010 with no reduc-
tion in the proportion of modified motorcycles, and over 80 percent withan assumed three percent modified. The idealized Option Q shows littleadditional benefit. Options I and 2 show the least benefits to begained.
Benefits in terms of RCI* would reach, in the year 2010, approximately 32o and 58 percent by reducing the proportion of modified motorcycles to 7
and 3 percent, respectively, without concurrent source regulations.
In terms of RCI*, benefits would reach in the year 2010 between 20 ando 30 percent for the most stringent regulatory options even if the 12
percent proportion of modified motorcycles were not reduced.
5-6B
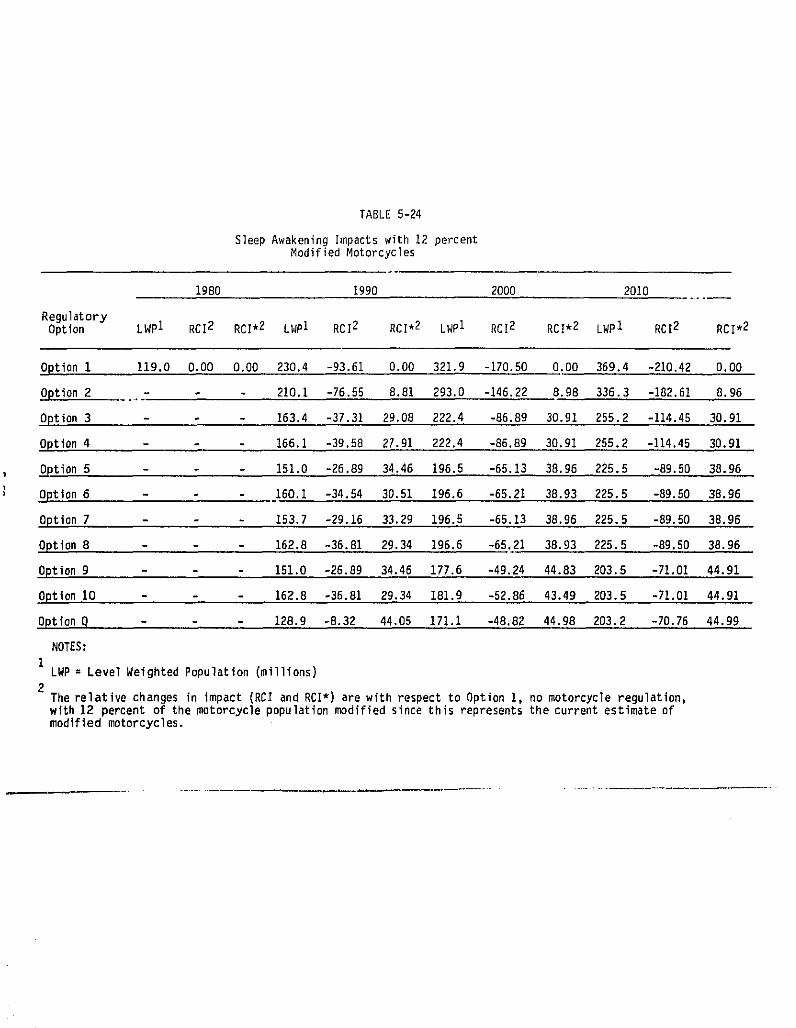
TABLE 5-24
Sleep Awakening hnpacts with 12 percentModified Motorcycles
1980 1990 2000 2010
RegulatoryOption LWPI RCI2 RC1.2 LWPI RCI2 RC1.2 LWPI RCI2 RC1.2 LWP1 RCI2 RC1.2
Option1 i19.0 0.00 0.00 230.4 -93.61 0.00 321.9 -170.50 0.00 369.4 -210.42 0.00
Option8 210.1 -76.55 8.81 293.0 -146.22 8.98 336.3 -182.61 8.96
Option3 163.4 -37.31 29.08 222.4 -86.89 30.91 255.2 -114.45 30.91
Option4 166.1 -39.58 27.91 222.4 -86.89 30.91 255.2 -114.45 30.91
Option5 151.0 -26.89 34.46 196.5 -65.13 38.96 225.5 -89.50 38.96
Option8 160.1 -34.54 30.51 196.6 -65.21 38.93 225.5 -89.50 38.96
Option7 153.7 -29.16 33.29 196.5 -65.13 38.96 225.5 -89.50 38.96
Option8 162.8 -36.81 29.34 196.6 -65.21 38.93 225.5 -89.50 38.96
Option9 151.0 -26.89 34.46 177.6 -49.24 44.83 203.5 -71.01 44.91
Option10 162.8 -36.81 29.34 181.9 -52.86 43.49 203.5 -71.01 44.91
OptionQ - 128.9 -8.32 44.05 171.1 -48.82 44.98 203.2 -70.76 44.99
NOTES:1LWP = Level Weighted Population (millions)
2The relativechanges in impact(RCIand RCI*)are with respectto Option1. no motorcycleregulation.with12 percentof the motorcyclepopulationmodifiedsincethis representsthe currentestimateofmodifiedmotorcycles.
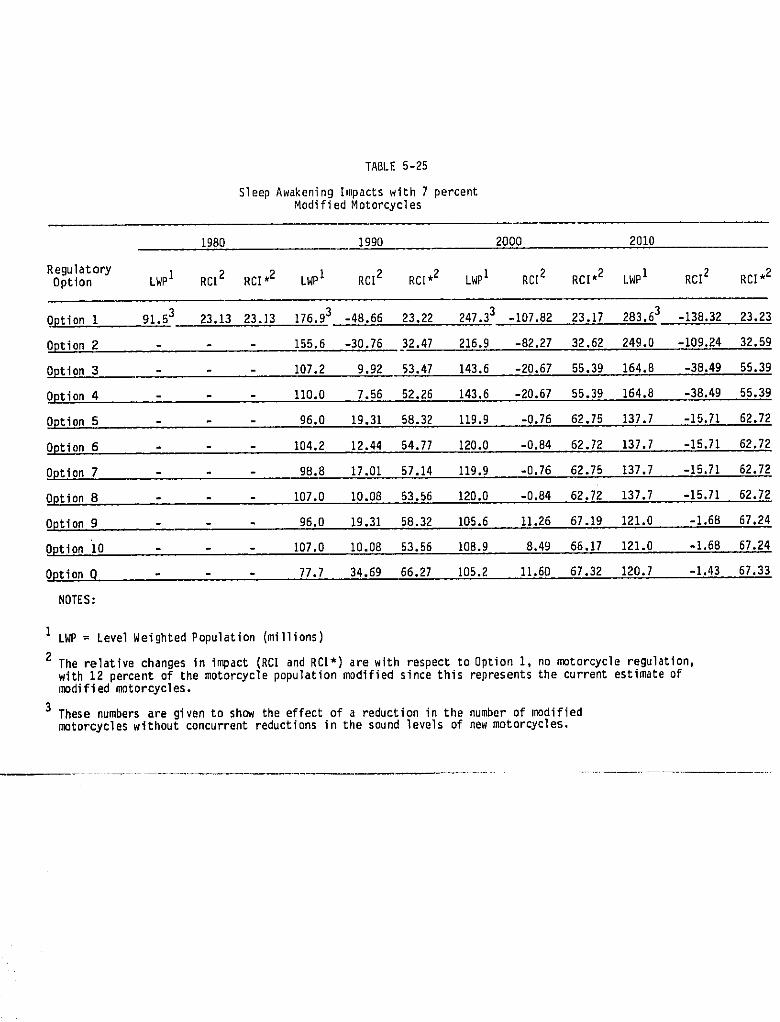
TABLE 5-25
Sleep Awakening Impacts with 7 percentModified Motorcycles
1980 1990 2000 2010
RegulatoryOption LWPI RC[2 RC1.2 LWPI RCI2 RC1.2 LWPI RC12 RC[.2 LWpI RCI2 R01"2
Option1 91.53 23.13 23.13 176.93 -48.66 23.22 247.33 -107.82 23.17 283.63 -138.32 23.23
Option2 - 155.6 -30.76 32.47 216.9 -82.27 32.62 249.0 -109.24 32.59
Option3 - 107.2 9,92 53.47 143.6 -20.67 55,39 164.8 -38.49 55.39
Option4 - 110.0 7.56 52.26 143.6 -20.67 55.39 164.8 -38.49 55.39
Option5 - 96.0 19.31 58.32 119.9 -0.76 62,75 137.7 -15.71 62.72
Option6 104.2 12.44 54.77 120.0 -0.84 62.72 137,7 -15.71 62.72
Option 7 98.8 17.01 57.14 llg.g -0.76 62.75 137.7 -15.71 62.72
Option8 107.0 10.08 53.56 120.0 -0.84 62.72 137.7 -15.71 62.72
Option9 - 96.0 19.31 58.32 105.6 11.26 67.19 121.0 -1.68 67.24
OptioniO - 107.0 10.08 53.56 108.9 8.49 66.17 121.0 -1.68 67.24
Option q 77.7 34.69 66.27 105.2 11.60 67.32 120.7 -1.43 67.33
NOTES:
ILWP= Level Weighted Population (millions)
2The relative changes in impact (RCI and RCI*) are with respect to Option I, no motorcycle regulation,with 12 percent of the motorcycle population modified since this represents the current estimate ofmodified motorcycles.
3 These numbers are given to show the effect of a reduction in the number of modifiedmotorcycles without concurrent reductions in the sound levels of new motorcycles.
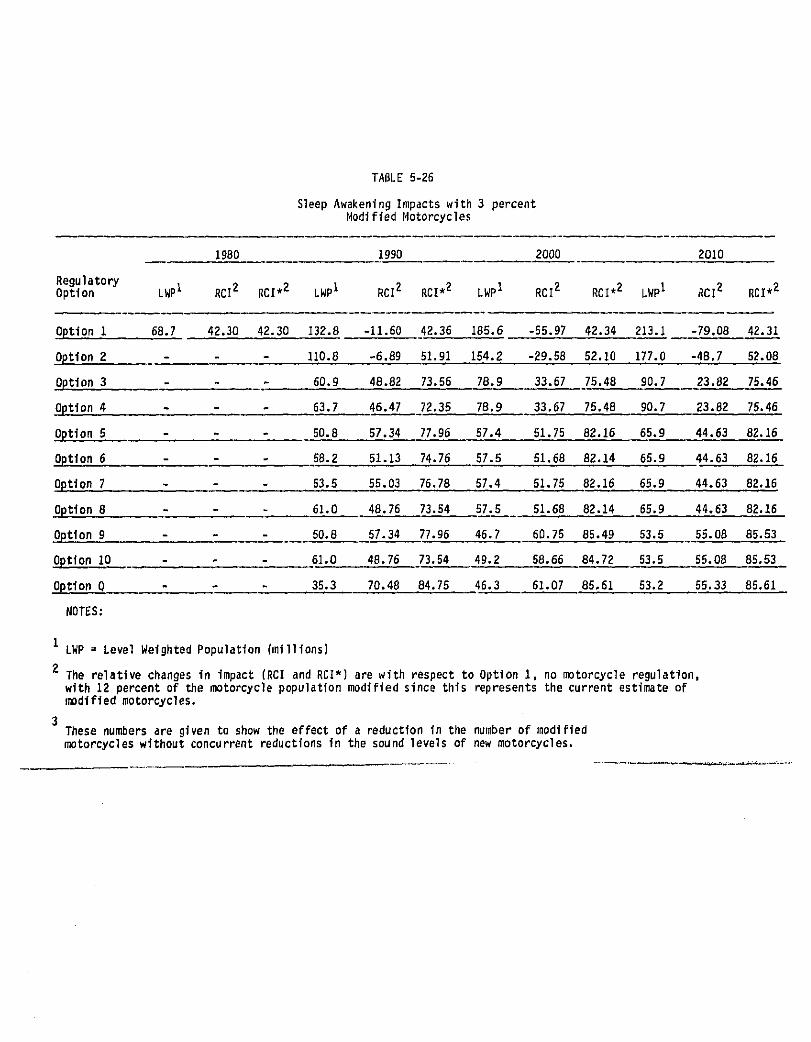
TABLE 5-26
Sleep Awakening Impacts with 3 percentModifiedMotorcycles
1980 1990 2000 2010
RegulatoryOption LWPI RCI2 RCI_2 LWPI RCI2 RC1.2 LWPI RCI2 RC1.2 LWPI RCl2 RC1.2
Option 1 68.7 42.30 42.30 132.8 -11.60 42.36 185.6 -55.97 42.34 213.1 -79.08 42.31
Option2 - - 110.8 -6.89 51.91 154.2 -29.58 52.10 177.0 -46.7 52.08
Option3 - .- 60.9 48.82 73.56 78.9 33.67 75.48 90.7 23.82 75.46
OptiOn 4 -i - - 63.7 46.47 72.35 78.9 33,67 75.48 90.7 23.82 75.46
Option5 - 50.8 57.34 77.96 57.4 51.75 82.16 65.9 44.63 82.16
Option6 - - 56.2 51.13 74.76 57.5 51.68 82.14 65.9 44.63 82.16
Option 7 53.5 55.03 76.78 57.4 51.75 82.16 65.9 44.63 82.16
Option8 - 61.0 48.76 73.54 57.5 51.68 82.14 65.9 44.63 82.16
Option9 50.8 57.34 77.96 46.7 60.75 86.49 53,5 55.08 85.53
Optioni0 61.0 48.76 73.64 49.2 58.56 84.72 53.5 55.06 85.53
Op_ion Q 35.3 70.48 84.75 46.3 ,61.07 85_61 53.2 55.33 85.61
NOTES:
1LWP = LevelWeightedPopulation(millions)
2 The relativechangesin impact(RCIand RCI*)are with respectto Optioni, no motorcycleregulation,with 12 percentof the motorcyclepopulationmodifiedsince this representsthe currentestimateof_dified motorcycles.
3These nu_ers are givento show the effectof a reductionin the numberof modified_torcycles withoutconcurrentreductionsin the sound levelsof new motorcycles.
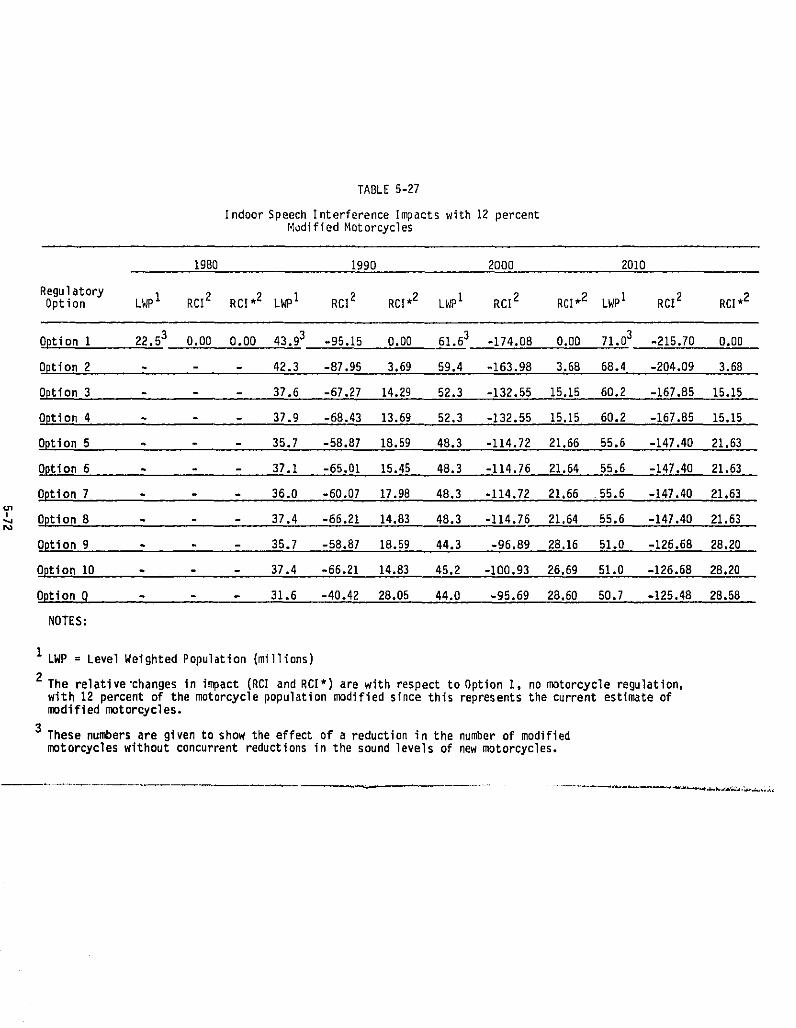
TABLE 5-27
Indoor Speech Interference Impacts with 12 percentModified Motorcycles
1980 1990 2000 2010
RegulatoryOption LWP1 RCl2 RCI*2 LWpI RCI2 RCI,2 LWpI RCI2 RCI,2 LWpI RCI2 RCI,2
OptionI 22.53 0.00 O.O0 43.93 -95.15 0.00 61.63 -174.08 O.OD 71.03 -215.70 0.00
Option2 _ - 42.3 -87.95 3.69 59.4 -163.98 3.6B 68.4 -204.09 3.68
Option3 - 37.6 -67.27 14.29 52.3 -132.55 15.15 60.2 -167.85 15.15
Option4 _ - 37.9 -68.43 13.69 52.3 -132.55 15.15 60.2 -167.85 15.15
Option5 - 35.7 -58.87 18.59 48.3 -114.72 21.66 55.6 -147.40 21.63
Option6 - 37.1 -65.01 15.45 48.3 -114.76 21.64 55.6 -147.40 21.63
Option7 38.0 -60.07 17.98 48.3 -114.72 21.66 55.6 -147.40 21.63
Option8 37.4 -66.21 14.83 48.3 -114.76 21.64 55.6 -147.4021.63
Option9 35.7 -58.87 18.59 44.3 -96.89 28.16 51.0 -126.68 28.20
Option10 - 37.4 -66.21 14.83 45.2 -100.93 26.69 51.0 -126.6B 28.20
Optionq - 31.6 -40.42 28.05 44.0 -95.69 28.60 50.7 -125.48 28.58
NOTES:
I LWP = LevelWeighted Population(millions)
2 The relative'changesin impact(RCland RCI*) are with respectto Option1, no motorcycleregulation,with 12 percentof the motorcyclepopulationmodifiedsincethis representsthe currentestimateofmodifiedmotorcycles.
3 These numbersare givento show the effectof a reductionin the numberof modifiedmotorcycleswithout concurrentreductionsin the sound levelsof new motorcycles.
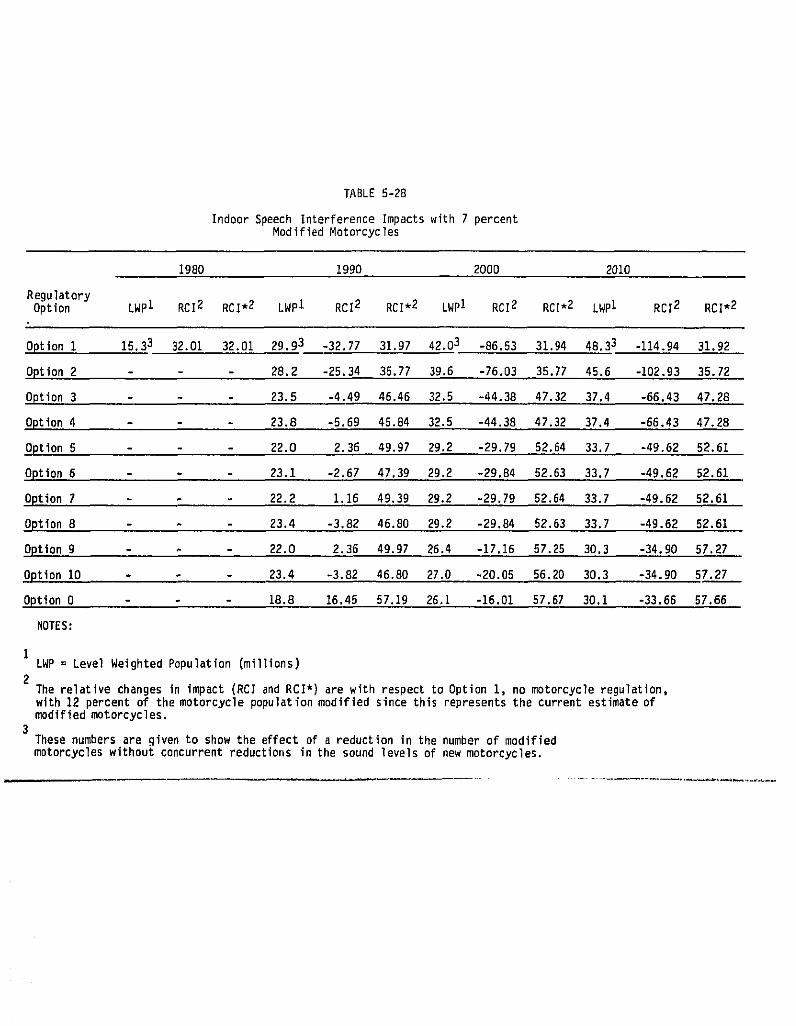
TABLE5-28
Indoor Speech Interference Impacts with 7 percentModified Motorcycles
1980 1990 2000 2010
RegulatoryOption LWP1 RCI2 RC1.2 LWPI RCI2 RC1.2 LWPI RCI2 RC1.2 LWPI RCI2 RC1.2
Optioni 15.33 32.01 32.01 29.93 -32.77 31.97 42.03 -86.53 31.94 48.33 -114.94 31.92
Option2 28.2 -25.34 35.77 39.6 -76.03 35.77 45.6 -102.93 35.72
Option3 23.5 -4.49 46.46 32.5 -44.38 47.32 37.4 -66.43 47.28
Option4 23.8 -5.69 45.84 32.5 -44.38 47.32 37.4 -66.43 47.28
Option5 22.0 2.36 49.97 29.2 -29.79 52.64 33.7 -49.62 52.61
Option8 23.1 -2.67 47.39 29.2 -29.84 52.63 33.7 -49.62 52.61
Option7 22.2 1.16 49.39 29.2 -29.79 52.64 33.7 -49.62 52.61
Option8 23.4 -3.82 46.80 29.2 -29.84 52.63 33.7 -49.62 52.61
Option9 22.0 2.36 49.97 26.4 -17.16 57.25 30.3 -34.90 57.27
Option10 - 23.4 -3.82 46.80 27.0 -20.05 56.20 30.3 -34.90 57.27
Option0 18.8 16.45 57.19 26.1 -16.01 57.67 30.1 -33.66 57.66
NOTES:
iLWP : LevelWeightedPopulation(milllons)
2The relativechanges in impact(RCI andRCI*) are with respectto Option1, no motorcycleregulation,with12 percentof the motorcyclepopulationmodifiedsincethisrepresentsthe currentestimateofmodifiedmotorcycles.
3Thesenumbersare givento show the effectof a reductionin the numberof modifiedmotorcycleswithoutconcurrentreductionsin the soundlevelsof new motorcycles.
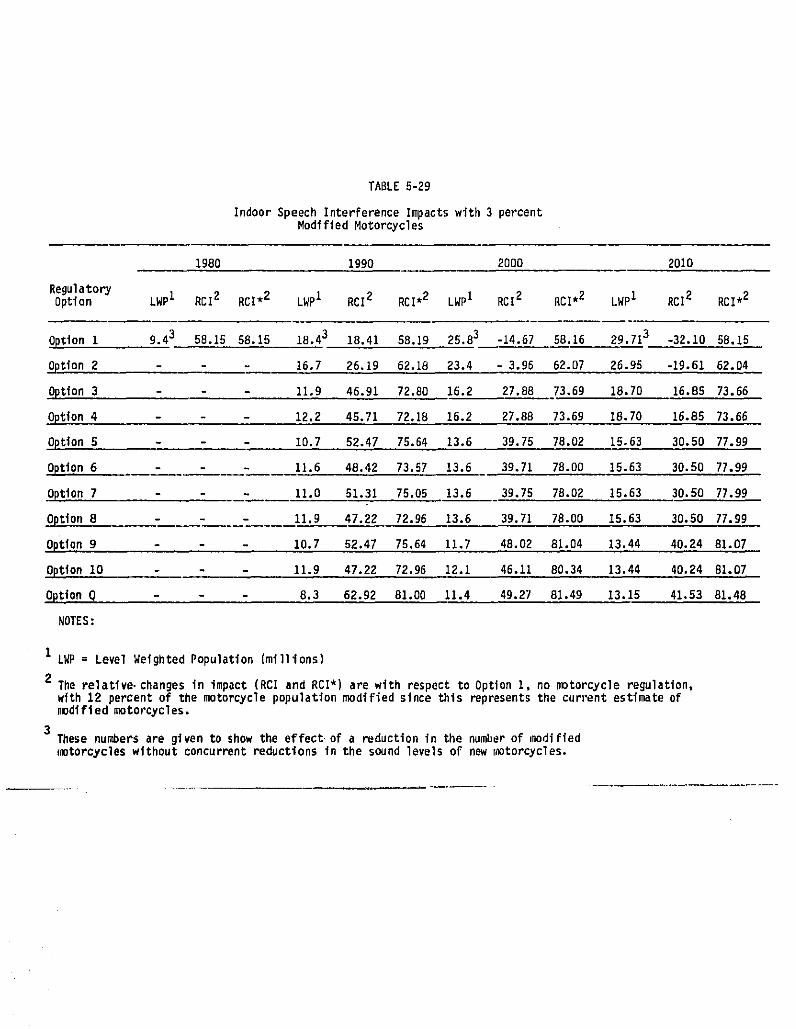
TABLE5-29
IndoorSpeechInterferenceImpactswith 3 percentModified Motorcycles
1980 1990 2000 2010
Regulatory0ption LWPI RCI2 RC1.2 LWPI RCl2 RC1.2 LWPI RCI2 RC1.2 LWP1 RCI2 RO1.2
9.43 58.15 58.15 18.43 18.41 58.19 25,83 -14.67 58.16 29.713 -32.10 58,18OptionI .
Option2 - - 16.7 26,19 62.18 23.4 -3.96 62.07 26.98 -19.6162.04
Option3 - - 11.9 46.91 72.80 16.2 27.88 73.69 18.70 16.85 73.66
Option4 - 12.2 45.71 72.18 16.2 27,88 73.69 18.70 16.85 73.66
Option 8 - 10.7 52.47 75.64 13.6 39.75 78.02 15.63 30.50 77.99
Optlon6 .__ - 11.6 48.42 73.57 13.6 39.71 78.00 15.63 30.50 77.99
Option 7 11.0 51.31 78.05 13.6 39.78 78.02 15.63 30.50 77.99
Option8 11.9 47.22 72.96 13.6 39.71 78.00 15.63 30,50 77.99
Option 9 10.7 52.47 75.64 11.7 48.02 81.04 13.44 40.24 81.07
Option 10 11.9 47.22 72.96 12.1 46.11 80.34 13,44 40,24 81.07
Opt!on O - 8.3 62.92 81.00 11.4 49.27 81.49 13.15 41.53 81.48
NOTES:
I LWP = LevelWeightedPopulation(millions)
2The relative,changesin impact(RCI and RCI*) are with respectto Optioni, no motorcycleregulation,with12 percentof the motorcyclepopulationmodifiedsincethis representsthe currentestimateofmdifiedmotorcycles.
3Thesenumbersare givento show the effectof a reductionin the numberof modifled(mtorcycleswithoutconcurrentreductionsin the sound levelsof new r_torcycles.
The results of the analysis for speech interference outdoors and forpedestrian speech interference are displayed in Tables 5-30 through 5-32 andTables 5-33 through 5-35, respectively. The trends in these tables arenearly identicalto the trends for indoorspeech interference.For example:
o For outdoor speech interference, Options 9 and 10 demonstrate thelargest benefits, and Options 1 and 2 the least. By the year 2010,Options 9 and 10 show RCI* values of over 40 and 80 percent for assump-tions of 12 and 3 percent modified motorcycles, respectively. Option Qshows some additional benefit.
o For pedestrian speech interference in the year 2010, benefits in termsof RCI* for Options 9 and lO reach over 65 and 85 percent for assumed 12and 3 percent modifications, respectively.
o For outdoor speech interference, RCI* benefits would reach by the year2010 over 23 and 43 percent for assumed 7 and 3 percent modifications,respectively, even with no regulation of motorcycles. Likewise, forpedestrian speech interference benefits of over 8 and 14 percent aredemonstrated.
o For outdoor speech interference, RCI* benefits would by the year 2010range over 30 to 40 percent for the most stringent regulatory optionswith no reduction in the proportion of modified motorcycles. Likewise,for pedestrian speech interference, benefits would range from 55 to over65 percent.
5.9 Analysis of Noise Impact of Motorcycles Used Off-Road
This analysis adddressesthe impact of regulationsto limitthe noisefrom motorcyclesused off-road. Noise from off-roaduse of motorcyclesisconsideredto be a problemof significantproportions. In a surveyof 250senior Federal and state managers of public lands,forests, lakes, parks,and wildernessareas of the UnitedStates regardingthe adverseeffects ofoff-road recreationalvehicles (which includeotherfactors besidesnoise),trail motorcycleswere rated as the "most urgentproblemfor them to solve"(Reference39). Miniblkes (consideredas motorcyclesin this analysis)andsnowmobiles(when in season)were listedas secondand third priorities,withabout one halfthe frequencyof response.
In a survey that addressed public attitudes toward different noisesources,the largestnumberof respondentssaid theywere "verymuch"annoyedby noise from trail motorcycles,even though motorboats,automobiles,andchildrenwere heard "moreoften"by respondents. A total of nearly30 of the113 peoplehearing trail motorcyclessaid they were "verymuch" annoyed,andapproximately10 of the remainingpersonssaidtheywere annoyed"quitea lot"(Reference 4D).
In a U.S. Forest Service study, seven experiencedrecreationguardsat the Oregon Dunes National RecreationArea rated the noisinessof dunebuggiesas to acceptanceby the public(Reference41). While movingat 10 mphup a grade,the dune buggieswere acceleratedfull throttlefor a distanceof50 feet. The listenerswere placed50 feetfrom the midpointof the accelera-
5-75
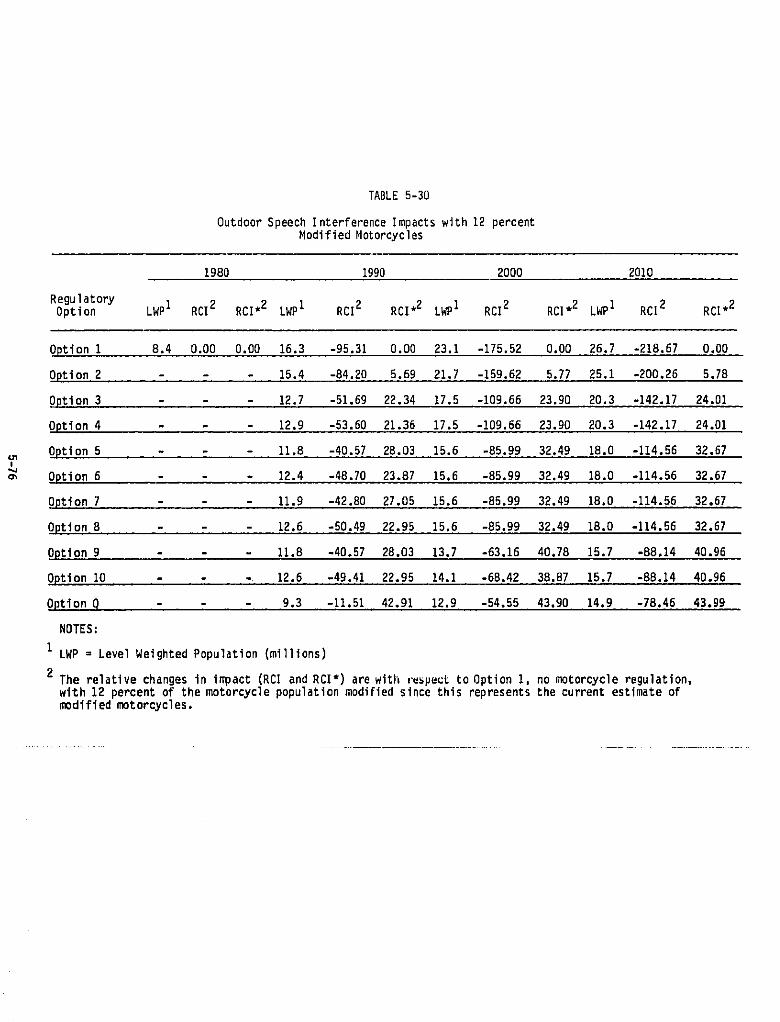
TABLE 5-30
Outdoor Speech Interference Impacts with 12 percentModified Motorcycles
1980 1990 2000 2010
RegulatoryOption LWP1 RCI2 RC1.2 LWPI RCI2 RC1.2 LWPl RCI2 RC1.2 LWPI RCI2 RC1.2
Option1 8.4 0.00 0.00 16.3 -95.31 0.00 23.1 -175.52 0,00 26.7 -218.67 0.00
Option2 - 15.4 -84,20 5.69 21.7 -159.62 5.77 25.1 -200.26 5.78
Option3 - 12.7 -51.69 22.34 17.5 -109.66 23.90 20.3 -142.17 24.01
Option4 12.9 -53.60 21.36 17.5 -109.66 23.90 20.3 -142.17 24.01
Option5 11.8 -40.5? 28.03 15.6 -85.99 32.49 18.0 -114.56 32.67
Option6 - 12.4 -48.70 23.87 15.6 -85.99 32,49 18.0 -114.56 32.67
Option 7 - 11.9 -42.80 27.05 15.6 -85.99 32.49 18.0 -114.56 32.67
Option8 12.6 -50.49 22.95 15,6 -85.99 32.49 18.O -114.56 32.67
Optiong 11.8 -40.57 28.03 13.7 -63.16 40.78 15.7 -88.14 40.96
Option10 12.6 -49.41 22.95 14.1 -6B.42 3B,B7 15.7 -88.14 40.96
OptionQ 9.3 -11.51 42.91 12.9 -54.55 43.90 14.9 -78.46 43.99
NOTES:
I LWP = LevelWeightedPopulation(millions)
2 The relativechangesin in_act(RCIand RCI*) arewith re,peeLtoOptioni, no motorcycleregulation,with 12 percentof the motorcyclepopulationmodifiedsincethis representsthe currentestimateofmodifiedmotorcycles.
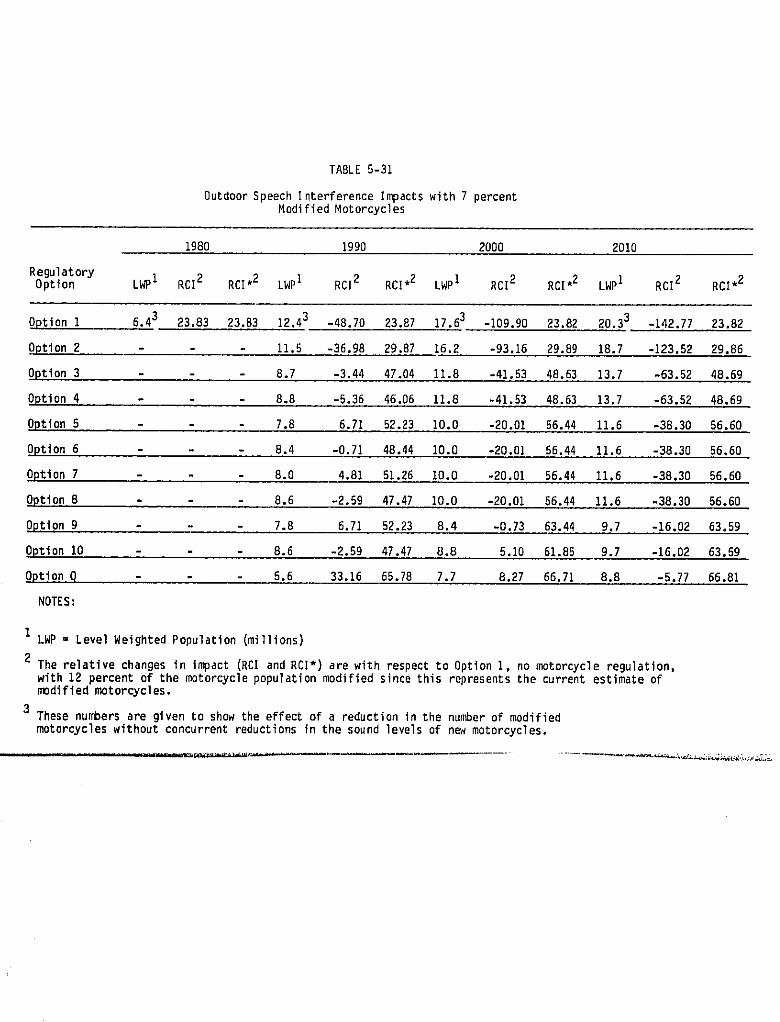
TABLE 5-31
Outdoor Speech Interference Impacts with 7 percentModified Motorcycles
1980 1990 2000 2010
RegulatoryOption L_ 1 RCI2 RC1.2 LWP1 RCI2 RC1.2 LWP1 RCI2 RC1.2 LWP1 RCI2 RC1.2
Option 1 6.43 23.83 23.83 12.43 -48.70 23.87 17.63 -109.90 23.82 20.33 -142.77 23.82
Option2 11.5 -36.98 29.87 16.2 -93.16 29.89 18.7 -128.52 29.86
Option3 8.7 -3.44 47.04 11.8 -41.53 48.63 13.7 -63.52 48.69
Option4 8.8 -5.36 46.06 11.8 -41.53 48.63 13.7 -63.52 48.69
Option5 7.8 6.71 52.23 10.0 -20.01 56.44 11.6 -38.30 56.60
Option6 8.4 -0.71 48.44 10.0 -20.01 56.44 11.6 -38.30 56.60
Option7 - 8.0 4.81 51.26 10.0 -20.01 56.44 11.6 -38.30 56.60
Option8 8.6 -2.59 47.47 10.0 -20.01 56.44 11.6 -38.30 56.60
Option9 7.8 6.71 52.23 8.4 -0.73 63.44 9.7 -16.02 68.59
Option10 8.6 -2.59 47.47 8.8 5.10 61.85 9.7 -16.02 63.59
Optionq 5.6 33.16 65.78 7.7 8.27 66.71 8.8 -5.77 66.81
NOTES:
1LWP : Level Weighted Population (millions)
2 The relative changes in impact (RCI and RCI*) are with respect to Option 1. no motorcycle regulation.with 12 percentof the motorcyclepopulationmodifiedsincethis representsthe currentestimateof,l)difiedmotorcycles.
3These numbers are given to show the effect of a reduction in the number of modifiedmotorcycles without concurrent reductions in the sound levels of new motorcycles.
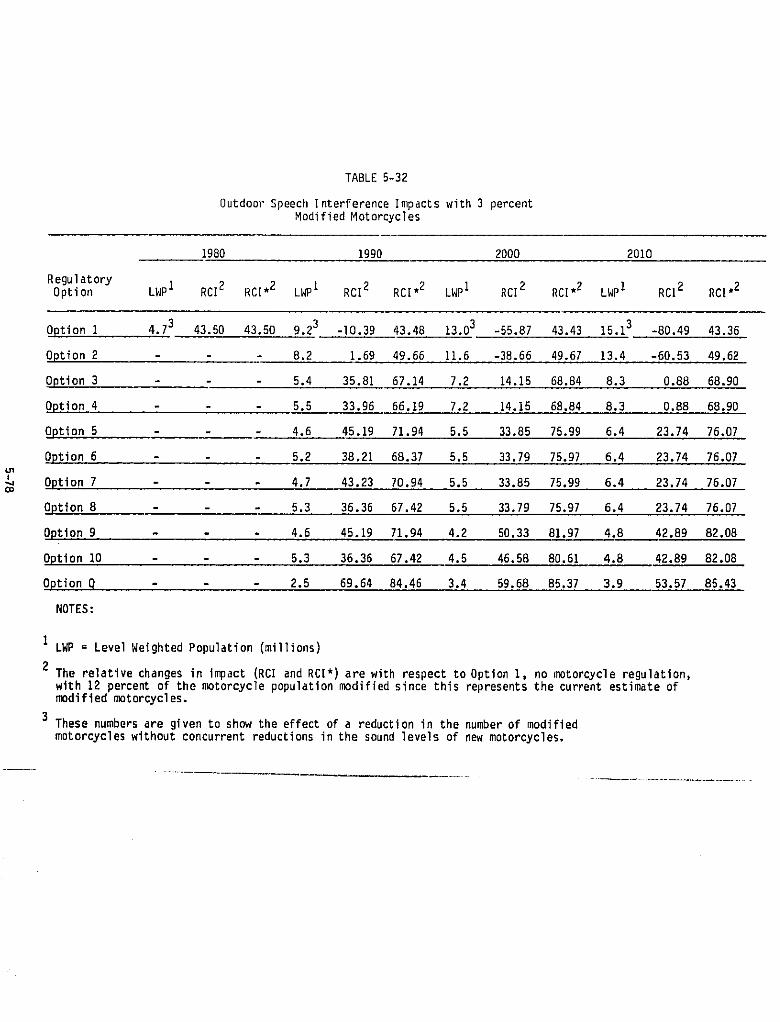
TABLE 5-32
Outdoor Speech Interference Impacts with 3 percentModified Motorcycles
1980 1990 2000 2010
RegulatoryOption LWPI RCI2 RC1.2 LWPI RCI2 RCI_2 LWPI RCI2 RC1.2 LWPI RCi2 RC1.2
OptionI 4.73 43.50 43.50 9.23 -I0.39 43.48 13.03 -55.87 43.43 15.13 -80.49 43.36
Option 2 8.2 1.69 49.66 11.6 -38.66 49.67 13.4 -60.53 49.62
Option3 5.4 35.81 67.14 7.2 14.15 68.84 8.3 0.88 68.90
Option4 5.5 33.96 66.19 7.2 14.15 68.84 8.3 0.88 68.90
Option5 - 4.6 45.19 71.94 5.5 33.85 75.99 6.4 23.74 76.07
Option6 5.2 38.21 68.37 5.5 33.79 75.97 6.4 23.74 76.07
Option 7 4.7 43.23 /0.94 5.5 33.85 75.99 6.4 23.74 76.07
Option8 5.3 36.36 67.42 5.5 33.79 75.97 6.4 23.74 76.07
Option9 - 4.6 45.19 71.94 4.2 50.33 81.97 4.8 42.89 82.08
Option10 - 5.3 36.36 67.42 4.5 46.58 80.61 4.8 42.89 82.08
OptionQ - 2.5 69.64 84.46 3.4 59.68 85.37 8.9 53.57 85.43
NOTES:
ILWP = LevelWeightedPopulation(millions)
2 The relativechangesin 1_act (RCIand RCI*)are with respectto Option1, no motorcycleregulation,with 12 percentof the motorcyclepopulationmodifiedsince this representsthe currentestimateofmodifiedmotorcycles.
3 These numbersare givento show the effectof a reductionin the numberof modifiedmotorcycleswithoutconcurrentreductionsin the soundlevelsof new motorcycles.
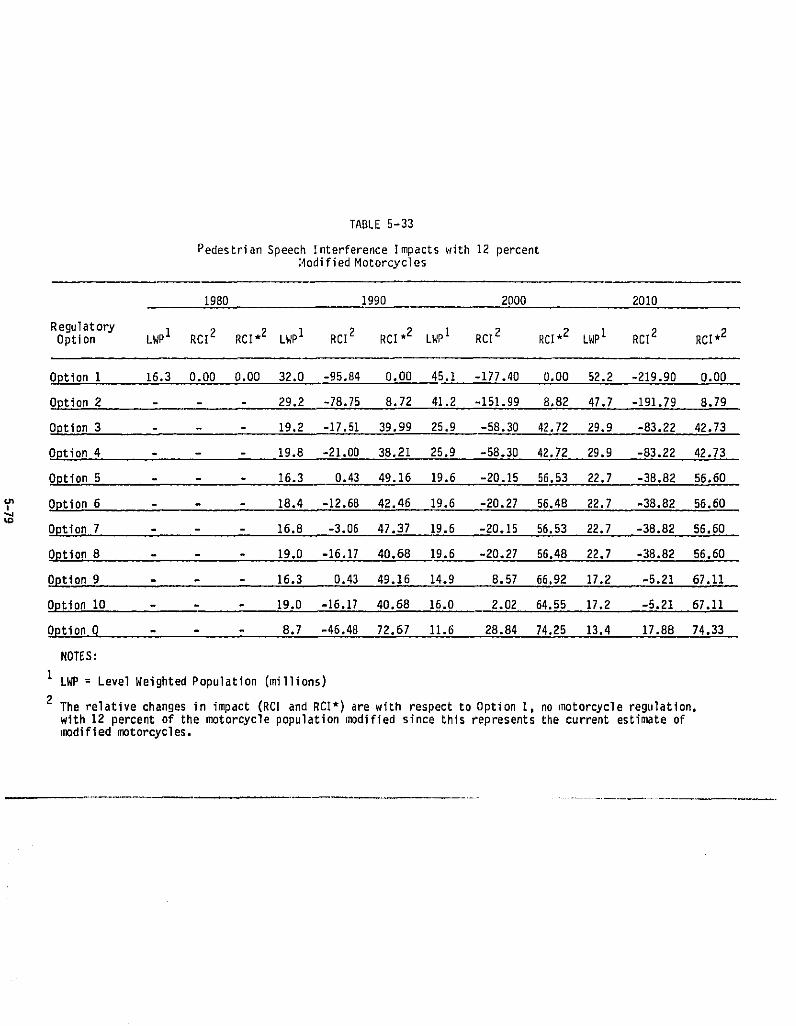
TABLE 5-33
Pedestrian Speech Interference Impacts with 12 percentModified Motorcycles
1980 1990 2000 2010
RegulatoryOption LWPI RCI2 RC1.2 LWPI RCI2 RC1.2 LWPI RCI2 RC1.2 LWPI RCI2 RC1.2
Option 1 16.3 0.00 0.00 32.0 -95.84 0.00 45.1 -177.40 0.00 52.2 -219.90 0.00
Option2 29.2 -78.75 8.72 41.2 -151.99 B.82 47.7 -191.79 8.79
Option3 19.2 -17.51 39.99 25,9 -58.30 42.72 29.9 -83.22 42.73
Option4 - 19.8 -21.00 38.21 25.9 -58.30 42.72 29.9 -83.22 42.73
Option5 - 16.3 0.43 49.16 19.6 -20.15 56,53 22.7 -38.82 56,60
Option6 18.4 -12.6B 42.46 19.6 -20.27 56.4B 22.7 -38.82 56.60
Option7 - 16.8 -3.06 47.37 19.6 -20.15 56.53 22.7 -38.82 56,60
Option8 - 19.0 -16.17 40.68 19.6 -20.27 56.48 22.7 -38.82 56.60
Option9 - 16.3 0.43 49.16 14.9 8.57 66,92 17.2 -5.21 67.11
Option10 19.0 -16.17 40.68 16.0 2.02 64.55 17.2 -5.21 67.11
Optionq 8.7 -46.48 72.67 11.6 28.84 74.25 13.4 17.88 74.33
NOTES:
I LWP = LevelWeightedPopulation(millions)
2The relativechangesin impact(RCIand RCI*)are with respectto Option I, no motorcycleregulation,with 12 percentof the motorcyclepopulationmodifiedsince thisrepresentsthe currentestimateofmodified motorcycles,
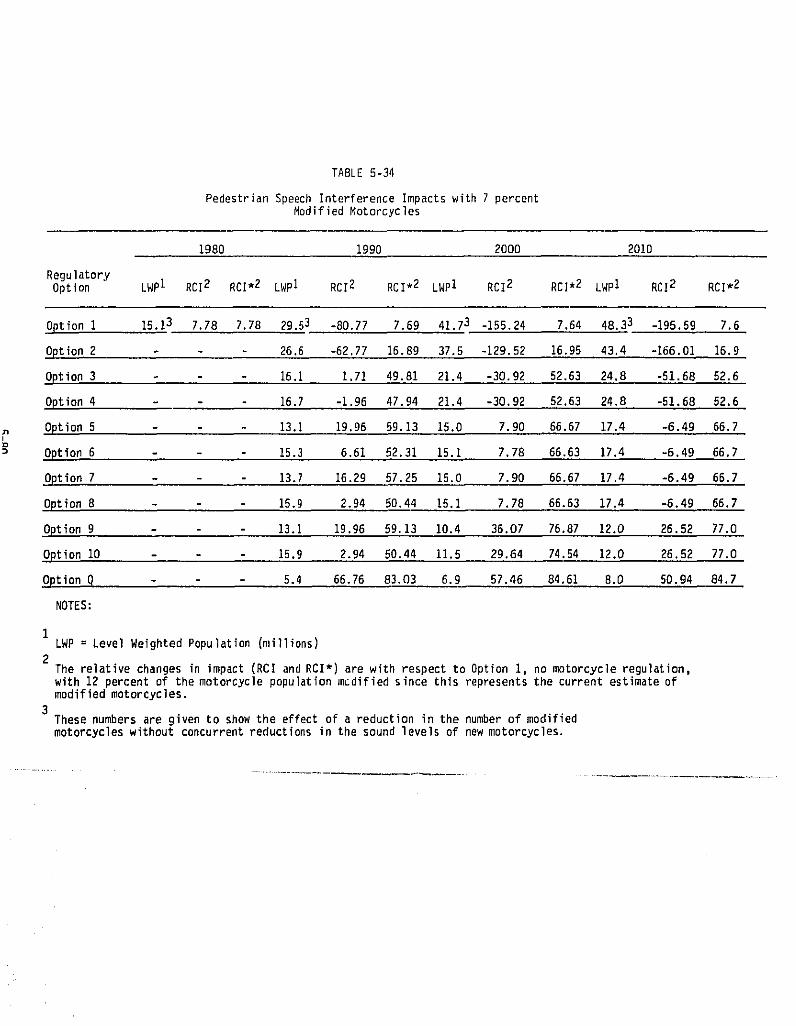
TABLE 5-34
Pedestrian Speech Interference Impacts with 7 percentModifiedMotorcycles
1980 1990 2000 2010
RegulatoryOption LWP1 RCI2 RC1.2 LWPI RCI2 RC1.2 LWPI RCI2 RC1.2 LWPI RCI2 RC1.2
Optioni 15.13 7.78 7.78 29.53 -80.77 7.69 41.73 -155.24 7.64 48.33 -195.59 7.6
Option2 26.6 -62.77 16.89 37.5 -129.52 16.95 43.4 -166.01 16.9
Option3 16.1 1.71 49.81 21.4 -30.92 52.63 24.8 -51.68 52.6
Option4 16.7 -1.96 47.94 21.4 -30.92 52.63 24,8 -51,68 52.6
Option5 - 13.1 19.96 59.13 15.0 7.90 66.67 17.4 -6.49 66.7
Option6 15.3 6.61 52.31 15.1 7.78 66.63 17.4 -6.49 66.7
Option7 - 13.7 16.29 57.25 15.0 7.90 66.67 17.4 -6.49 66.7
Option8 15.9 2.94 50.44 15.1 7.78 66.63 17.4 -6.49 66.7
Option9 13.1 19.96 59.13 10.4 36.07 76.87 12.0 26.52 77.0
Option10 15.9 2.94 50.44 11.5 29.64 74.54 12.0 26.52 77.0
OptionQ 5.4 66.76 83.03 6.9 57.46 84.61 8.0 50.94 84.7
MOTES:
1LWP = Level Weighted Population (millions)
2The relativechangesin impact(RCI andRCI*) are with respectto Option1, no motorcycleregulation,with 12 percent of the motorcycle population modified since this represents the current estimate ofmodified motorcycles.
3Thesenumbersare givento showthe effectof a reductionin tilenumberof modifiedmotorcycleswithoutconcurrentreductionsin the sound levelsof newmotorcycles.
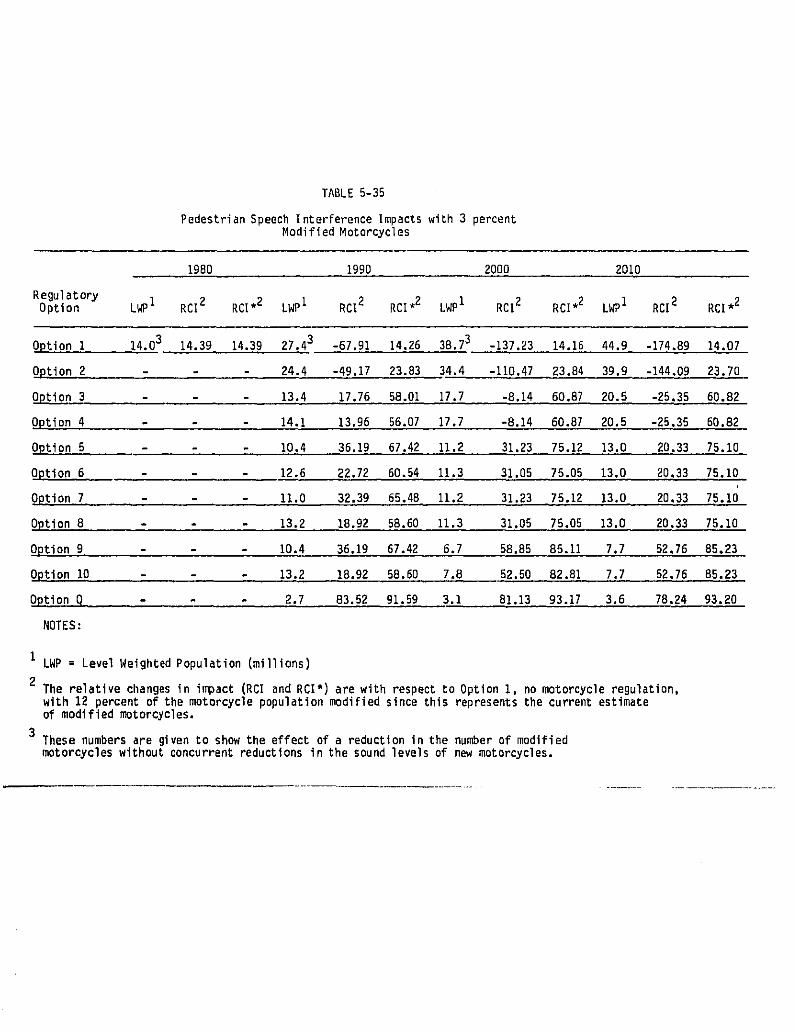
TABLE 5-35
Pedestrian Speech Interference Impacts with 3 percentModified Motorcycles
1980 199D 2000 2010
RegulatoryOption LWP1 RCI2 RC1.2 LWP1 RCI2 RC1.2 LWP1 RCI2 RC1.2 LWP1 RCI2 RC1.2
Option i 14.03 14.39 14.39 27.43 -67.91 14.26 38.73 -137.23 14.16 44.9 -174.89 14.07
Option2 24.4 -49.17 23.83 34.4 -110.47 23.84 39.9 -144.09 23.70
Option 8 13.4 17.76 58.01 17.7 -8.14 60.87 20.5 -25.35 60.82
Option 4 - 14.1 13.96 56.07 17.7 -8.14 60.87 20.5 -25.35 60.82
Option5 10.4 36.19 67.42 11.2 31.23 75.12 13.0 20.33 75.10
Option6 12.6 22.72 60.54 11.3 31.05 75.05 13.0 20,33 75.10
Option7 11.0 32.39 65.48.11.2 31.23 75.12 13.0 20.33 75.10
Option8 - 13.2 18.92 58.60 11.3 31.05 75.05 13.0 20,33 75.10
Option9 - - 10.4 36.19 67.42 6.7 68.85 85.11 7.7 52,76 85.23
Option10 - - 13.2 18.92 58.60 7.8 52.50 82.81 7.7 52,76 85.23
Optionq 2.7 83.52 91.59 3.1 81.13 93.17 3.6 78,24 93.20
NOTES:
1 LWP = LevelWeightedPopulation(millions)
2 The relativechangesin impact(RCIand RCI*) are with respectto OptionI. no motorcycleregulation.with 12 percentof the motorcyclepopulationmodifiedsincethis representsthe currentestimateof modifiedmotorcycles.
3These numbersare givento showthe effectof a reductionin the nu_er of modifiedmotorcycleswithoutconcurrentreductionsin the soundlevelsof new motorcycles.
tlon, perpendicular to the dune buggy path. The results of this experimentshow that A-weighted sound levels ranging from 90 to 95 dB are the thresholdof unacceptabilityto most users (Figure5-16).
It is estimatedthat approximatelyone half of all recreationaloff-roadvehicles (ORV) use in the UnitedStates takes place on lands administeredbythe Bureau of Land Management(BLM). BLM lands comprisesome 20 percent oftotal U.S. land area, accountingfor about 60 percentof all lands owned bythe Federal government. Over half of DRV use takes place in the followingareas: Alaska, western Arizona, southern California,southernNevada, andcentralUtah.
5.9.1 Distributionof Off-RoadMotorcycleSoundLevels
Sound levels of new non-competitionoff-roadmotorcyclesare not largelydependentupon the size of the vehicle. Because of the limitedsample sizeof off-roadmotorcycles,the assumptionsused for streetmotorcyclesinapproximating the energy-average level from the median level is invalid.Therefore, the energy-averagelevel is determineddirectlyfrom the measuredlevels in ApppendixC. The data in Appendix O for new off-roadmotorcyclesmanufacturedin 1975 and 1976 have an energy-averageaccelerationA-weightedsound level (SAE J-331a) of 92.5 dB at 50 feet. Off-roadmotorcycleswithdisplacementof 170 cc are slightlylower.
Exhaust-modlfiedoff-roadmotorcyclesare assumedto havethe sameSAE J-331a sound level distributionas exhaust-modlfiedstreet motorcycles(shown in Figure 5-3), with a median accelerationsound level of 94 dB. Thestandard deviationsfor the unmodlfiedand exhaust modifiedoff-road motor-cycles are assumed to be the same as those for street motorcycles(showninTable 5-2).
Representativeaccelerationsound levels are assumed to be 3 dB lowerthan the SAE J-331a accelerationlevels, the same assumptionas was made forstreetmotorcycles(seeAppendixG).
In 1978, off-roadmileage by motorcycleswas approximately12.0 millionmiles daily and was made up of contributionsfrom street, dual-purpose,andoff-road vehicles (Reference42). Table 5-36 shows the off-roadmotorcyclemileage mix as estimatedby the Motorcycle IndustryCouncil(MIC). Accordingto MIC, 50% of all off-roadmileagein thatyear was accumulatedby streetanddual-purpose motorcycles. Thus, regulation of motorcycles designed for use onstreets wlll have a significanteffect on reducingthe impact from off-roadmotorcycle usage. Representativeaccelerationsound levels from street anddual-purposemotorcycleswere discussedin section5.2.1.
The use of motorcyclesthat are designed for competitionuse in off-roadareas also contributes to noise impact in such areas. A-weighted sound levelsof competition-type motorcycles generally exceed 90 dB, with maw exceeding100 dB. Such levels dramaticallyincrease the detectabilitydistances ofthese vehicles (discussedin Section 5.9.2}, resultingin relatlvelylargeland areas being impacted. Although the numbersof competitionmotorcyclesthat are used off-roadare not known,most lendmanagementofflcialscontactedby EPA reported that such vehiclesconstitutea very significantpart of the
S-8B
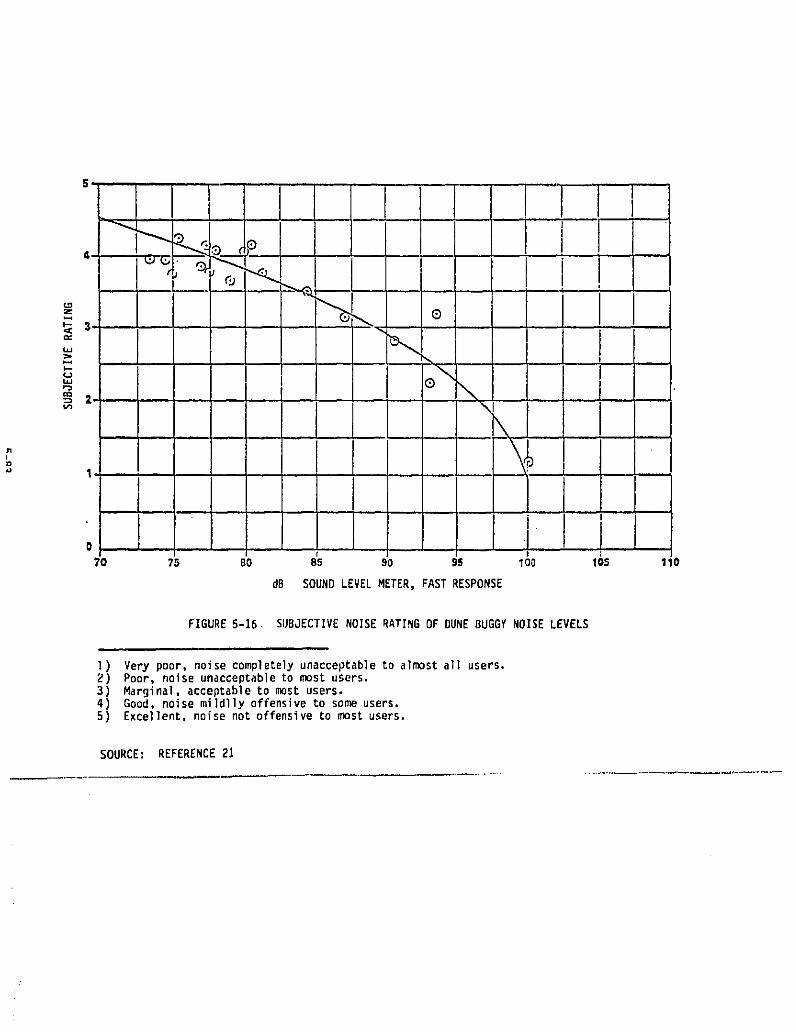
I
_- -,,,
1, ' f
I ,, I
i I '070 7S BO 85 _o 95 Io0 los 110
dB SOUND LEVELMETER,FASTRESPONSE
FIGURE5-16. SUBJECTIVENOISERATINGOF DUNEBUGGY NOISELEVELS
I) Very poor, noisecompletelyunacceptableto almostall users.2) Poor, noise unacceptableto most users.3) Marginal,acceptableto mostusers.4) Good, noisemiIdllyoffensiveto some users.5) Excellent,noisenot offensiveto mostusers.
SOURCE: REFERENCE21
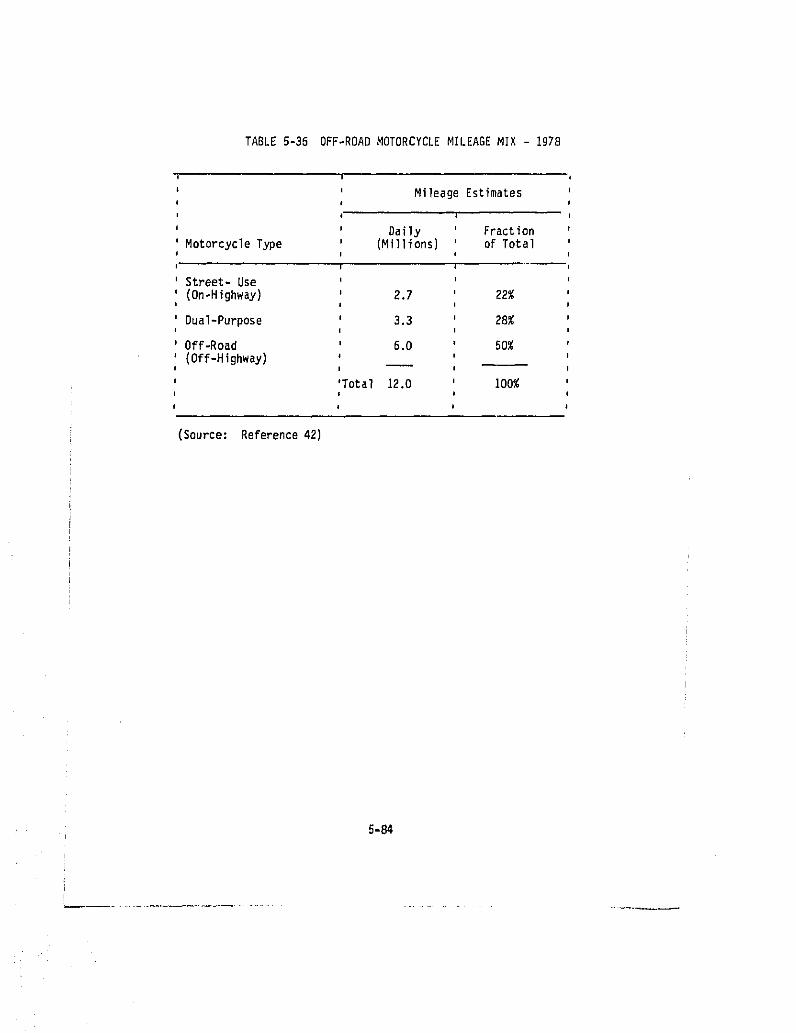
TABLE 5-35 OFF-ROADMOTORCYCLEMILEAGEMIX - 1978
MileageEstimates
Daily FractionMotorcycleType (Millions) of Total
Street- Use(On-Highway) 2.7 22%
Dual-Purpose 3.3 28%
Off-Road 6.0 50%
(Off-Highway) ___
'Total 12.0 100%I
I
Source: Reference 42)
6-84
off-roadvehiclenoise problem. Labelsand othermeans of distinguishingcom-pet,tion motorcyclesfrom off-roadmotorcycles,combinedwith well-plannedand enforced land use restrictions,are consideredto be the ,_sL effectivemeans of dealing with the problem of competition motorcycles used in off-roadareas.
5.9.2 Detectability Criteria
Off-road motorcycle operations often occur in areas with otherwiselow ambient levels, near quiet suburbanareas or more remote areas wherepeople are hiking, camping, and pursuing other activitieswhere man-madesounds are usually undesirable. In such situations, motorcycle noise isperceived by the listener as being alien to the environment and therefore anobjectionable intrusion. For these reasons, "detectability" is consideredto be the best descriptor of the impact of off-road motorcycle operations. Inthese situations, the criterion level for impact is the sound level at which amotorcycle can be discerned from the background by the listener, i.e., theminimum level at which it is detectable.
"Detectabilitydistances"can be calculatedfor varioustypesof vehiclesin recreationareas with low ambient noise levels (References43 and 44),Under "typical"forestconditionswhere the backgroundA-weightedsound levelis assumed to be 40 dB, detectabilitydistancesof 1400,2600, and 3900 feetare reportedfor motorcycleswith accelerationsound levelsat 50 feetof 74dB, 83 dB, and 93 dB, respectively (Reference 43). Detectability distance isdefined as the distance at which BO percent of the listenerswith a "40percent hearing efficiency" would detect a given sound level with a I percentfalse alarm rate. A "40 percenthearingefficiency"means a personnot onlyhas good hearing but is a "good listener,"i.e., the person is listeningcarefully for the sound.
Because they are not necessarily concentrating on sounds, a more typicalvalue of "hearing efficiency" for persons in remote or rural areas would be20 percent. If a 20 percent efficiency is assumed, the above describeddetectability distances are reduced by a factor of about two (Reference 45).Therefore,detectabilitydistancesof 700, 1300, and 1950 feet from motor-cycles with acceleration A-weighted sound levels of 74 dB, 83 dB, and 93 dBat 50 feet, respectively, are assu_d to apply in quiet remote areas, withtypical forest backgroundlevelsof 40 dB. In other areas, such as camp-grounds, small towns, and quiet suburban communities, the background soundlevels are assumed to be on the order of BO dB, In these areas, the detect-ability distances are reduced to approximately 400, 700, and 1150 feet frommotorcycles for the same acceleration sound levels.
Figure 5-17 illustrates the assumed relationship between the detecta-bility distances and the SO-foot acceleration sound levels in a 40 dB and a 50dB ambientnoise level environment. For purposesof analysis,it is assumedthat all persons within the detectability distances will perceive the motor-cycle noise and that none beyondthe detectabilitydistancewill perceivethenoise.
5-85
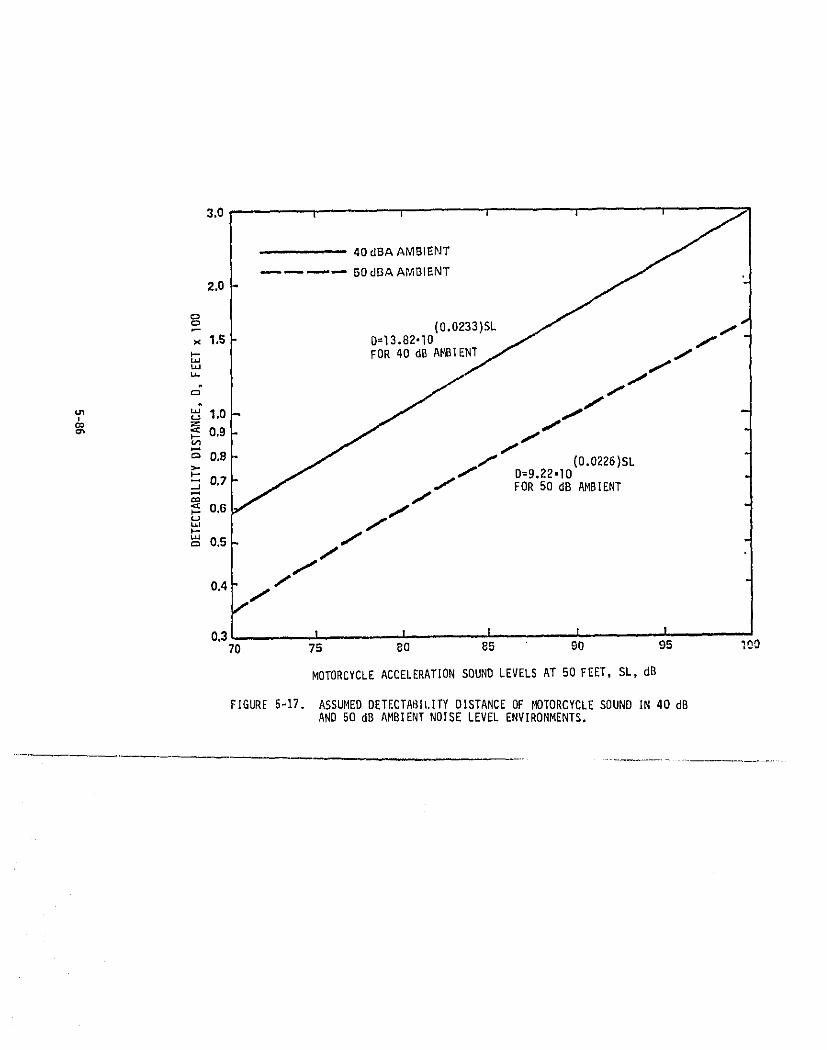
3,0
40 dBA AMBIENT
' 50 dBA AMI31ENT2.0
=.- (0.0233)SL ,f/× 1,5 0=I3.82.10
wTM_ FOR 40 dB AMBIENT //
,=" I"
= _ 1,o /o.,
O,B // (0.0226)SL>" D=9.22"10
0,7 /I"FOR 50 dB AMBIENT
=_0.5 //
0.4 /'//
I, T l0.3 1 ,170 75 I]O 85 90 95 109
MOTORCYCLE ACCELERATION SOUND LEVELS AT 50 FEET, SL, dB
FIGURE 5-17. ASSUMED DETECTABILITY DISTANCE OF MOTORCYCLE SOUND IN 40 dBAND 50 dB AMBIENT NOISE LEVEL ENVIRONMENTS,
5.9.3. Off-Road Motorcycle Operations
Off-road motorcycle riding typically consists of numerous low-speed, nearfull throttle accelerations interspersed with quieter cruise and decelerationoperations. Figure 5-18 illustrates two cases of interest: the case of amotorcyclebeing used on a trail or cross-country,and the case of a motor-cycle operating within an ORV area where other ORVs are also likely to beoperating at the same time. The circles indicate the distance from eachacceleration at which noise exceeds a given criterion level, i.e., thecriterion distance.
In the case of a motorcycle being operated on a trail, it can be seenthat if the criterion distance is large enough so that it is a significantfraction of the straight-line distance between accelerations, the impactedarea is approximately the sum of the straight-line distances between ac-celeratlonsnultipliedby double the criteriondistance for the low-speed,high acceleration case. Detectability as a criterion satisfies this condi-tion. Detectability distances for off-road motorcycle noise are on the orderof one-half mile, which is typically e significant fraction of the straight-line travel distance. This model of a typical impacted area is assumedto apply for trail and cross-countryriding. All personswithinthe impactedarea are impactedat leastoncewith noiseabove the criterionlevel.
For the case of motorcycles being operated in an off-road vehiclearea, it is assumed that all persons within the boundaries of the area are ORVoperators who are not greatly annoyed or otherwise impacted by ORV noise.Therefore, the impacted area would be the area bordering the ORV boundary thatis within the criterion distance of the boundary, i.e., its size is thecriterion distance multiplied by the approximate perimeter of the ORV area.It can be seen that the relative reduction in areas impacted above a criterionlevel when a motorcycle is quieted a given amount is the same for operationson the trail or a relatively large ORV area.
5.9.4 Estimate of Current Noise Impact
The impact of noise from off-road motorcycle operations requires aslightly different method to quantify "people impact" of off-road motorcyclesthan was used in the street motorcycle analysis. A model to estimate theimpact was developed as described below.
For illustrative purposes, it can be assumed that, on the average, thereere three motorcyclists riding together. Accordingly, three motorcyclesoperating together have the effect of reducing the total mileage by a factorof three (i.e., the total effective daily mileage becomes 40 million miles).Further, the combination of motorcycle types assumed to be operating togetherwill affect the detectability distance. Since no data are currently availableto determine the likely combination of motorcycle types, an equivalent motor-cycle noise level is derived from available statistical data concerned withthe usage and the noise levels of motorcycles operating in off-road areas.
5-87
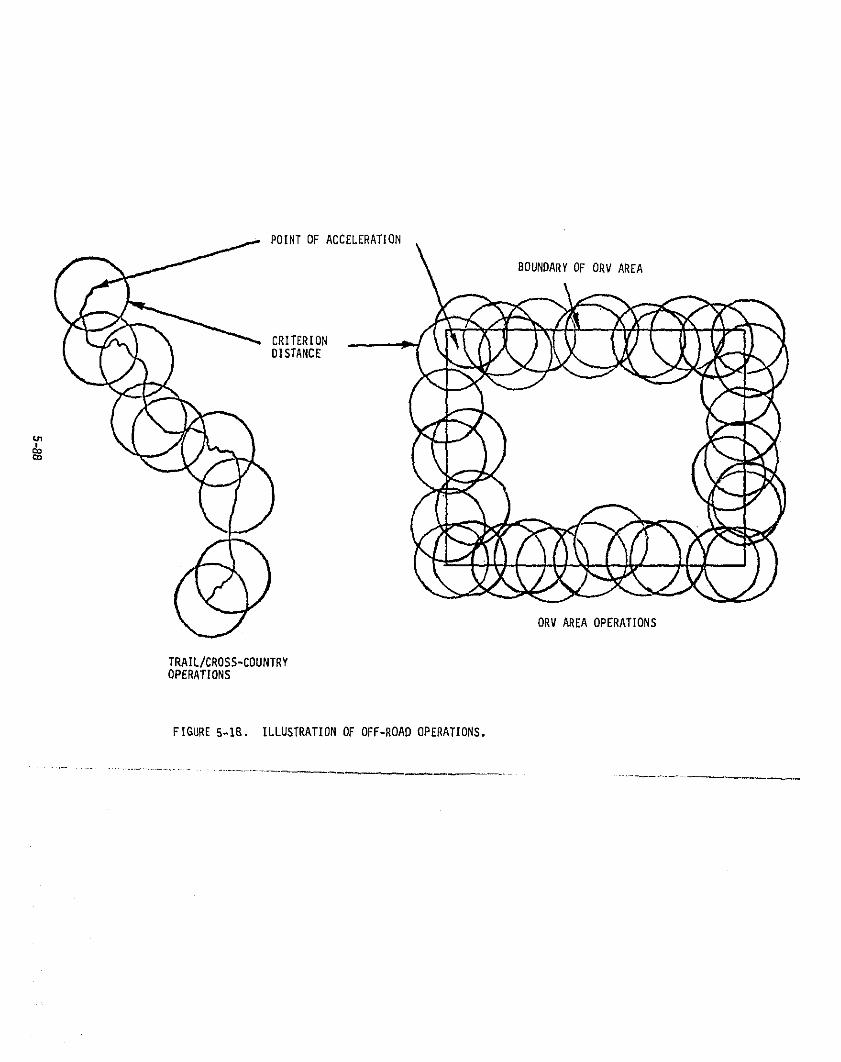
POINT OF ACCELERATION
BOUNDARY OF ORV AREA
CRITERIONDISTANCE
ORV AREA OPERATIONS
TRAIL/CROSS-COUNTRYOPERATIONS
FIGURE 5-IB. ILLUSTRATION OF OFF-ROAD OPERATIONS.
An equivalent noise level for all off-road usage is computedby summing,logarithmically, the "weighted" individual motorcycle noise levels produced byeach of the types of motorcyclesused off-road. The noise level weightingsaccount for the distributionof off-road usage by motorcycletype and forthe percentageof motorcycleswith and without modified exhaust systems.The individualmotorcycle noise levels and weightlngsused to compute theequivalentnoise level are shown in Table 5-37. For example, the currentlevels are generatedfrom streetand dual-purposemotorcycles,making up 50percentof the total,and off-roadmotorcycles,makingup the other 50 percentOf the street and dual-purpose motorcycles, 88 percent have unmodifiedexhaust systemswith an energy-averagesoundlevel of 79 dB (Section5,2.1),The remaining 12 percent of the street and dual-purposemotorcycleshavemodified exhaust systems with energy-average A-weighted sound levels of94.2 dB {Figure5-3). The correspondingvaluesof off-roadmotorcyclesare 74percent unmodifiedat 89.5 dB, and 26 percent_dlfied at 94.2 dB (Figure5-2) The equivalentnoise level for this combinationof unmodifiedand mod-ifiedvehiclesis89.4 dB.
Again, foranalyticalpurposes,it is assumadthat,on the averagethereare three matorcyclistsriding together. The three motorcyclesoperatingtogether act as a single louder noise source, However, the detectabilitydistance increasesonly about 30 percent when three sourceswith the samenoise level are combinedwhile effectivedailymileageis reducedto one-thirdthe total daily off-roadmotorcyclemileage. (The effectis a reductioninimpact by a factor of about 23 due to the three motorcyclesassumption.)
Three motorcyclesoperating together with individualnoise levels of89.4 dB (equivalentnoise level for the combinationof unmadlfledand modifiedmotorcycles)act as a single sourceemittingg4.2 dB (an increaseof 4.8 dB).When this eqlvalentnoise level is used for all off-roadmotorcycles,theresultingdetectabilitydistancesfor the 40 dB and 50 dB a_ient noise levelenvironn_ntsare determinedto be 2167 feetand 1237 feet,respectively,fromthe curvesshownin Figure 5-17.
As describedabove, the land area that Is exposed dally to noise abovethe detectabilitylevelsis the productof thewidth of the detectabilitypath(i,e., Mice the detectabilitydistance)and the effectivedaily off-roadmileage (i.e.,the total daily mileagedividedby 3}.
Because some of the daily off-road miles will everlap,i.e., the sameor other motorcycleswill impactthe same areamore thanonce, it is assumedthat the land area exposed to motorcyclenoise is reducedby a factor of50. It is furtherassumedthat approximately95 percentof the total off-roadmileage by motorcycles occurs in areas where the ambient noise level istypically 40 dB (such as forest and other rural areas)with the remainingB percentoccurringin 50-dB ambientnoise levelenvironments(suchas camp-grounds,smalltowns,end quiet suburbanareas).
Additionally,the populationdensity of the areas with 40-dB and 50-dBambient neise levelsis assumed to be 20 and 1000 personsper square mile,respectively. On the basis of the above assumptions,it is estimated thatapproxlmately64,000squaremiles of land area and approximately3.12 milllonpeople are exposeddally to noise above detectabilitylevels from off-roadmotorcycleoperationsas shown in Table 5-38,
5-89
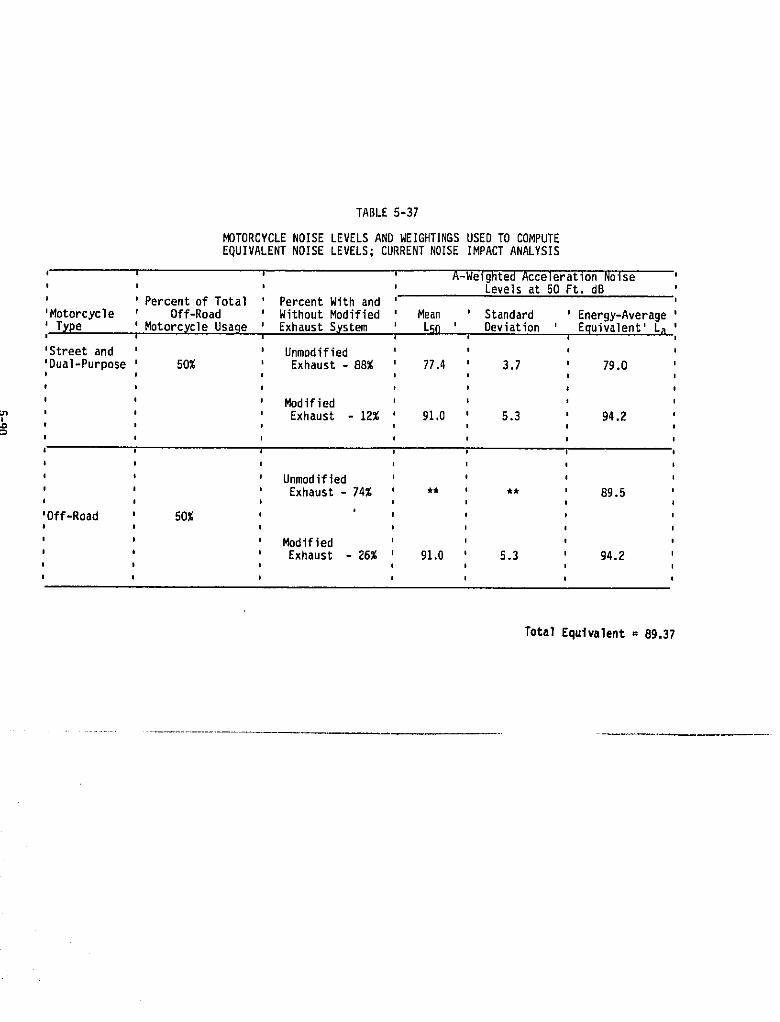
TABLE5-37
MOTORCYCLE NOISE LEVELS AND WEIGHTINBS USED TO COMPUTEEQUIVALENTNOISE LEVELS;CURRENTNOISEIMPACTANALYSIS
' A-WeightedAccelerationNoise' Levelsat 50 Ft. dB' Percentof Total PercentWith and'Motorcycle Off-Road WithoutModified Mean Standard Energy-Average
i Type MotorcycleUsage ExhaustSystem LS_ ' Deviation ' Equivalent'LB
'Streetand Unmodified'Dual-Purpose 50% Exhaust- 88% 77.4 3.7 79.0
Modified
Exhaust - 12% 91.0 5.3 94.2
UnmodifiedExhaust- 74% ** ** 89.5
'Off-Road 50%I
' Modified' Exhaust - 26% 91.0 5.3 94.2i
I
Total Equivalent = 89.37
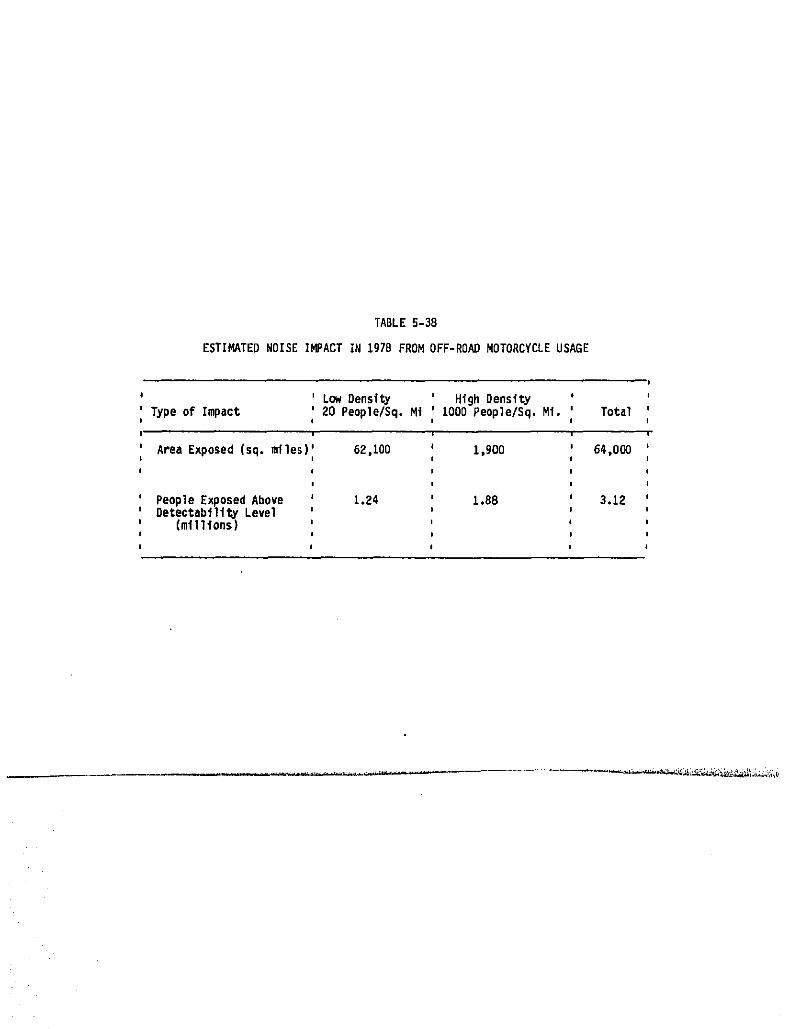
TABLE 5-38
ESTIMATEDNOISE I_°ACTIN 1978 FROMOFF-ROADMOTORCYCLEUSAGE
' Low Density ' High DensityType of Impact ' 20 People/Sq.Mi ' 1000People/Sq.Mi. Total
Area Exposed(sq.miles)' 62,100 t,go0 64,000
People ExposedAbove 1.24 1.88 3.12Detectabtlit# Level
(millions)
5.10 Regulatory Schedules
Table 5-39 presents the regulatory options and parameters consideredin this noise impact reduction analysis. For each regulatory year considered.two sets of data representing the percentage of off-road motorcycles withmodifiedand unmodifiedexhaust systemsare assumedin the anaylses,reflec-ting the effectsof stateand localenforcementprogramson the percentageofmotorcycles used off-road with modified exhausts.
Five basic regulatory options are presented in Table 5-39. Option 1 isthe baseline, no regulatory condition. Option 2 represents a regulationeffective in 1982 with a not-to-exceed A-weighted level of 83 dB for streetand dual purposemotorcyclesand 86 dB for off-roadbikes. Similarly,Options3 and 4, both effective in 1985, impose BO dB llroitson street and dualpurposemotorcycles,with Option3 specifyingan 86 dB not-to-exceedlevelforoff-roadmotorcycles,and Option 4 an 82 dB level. Option 5 is effectivein1990and shows a 78 dB limit for streetand dual purposeand 82 dB for off-roadmotorcycles. Not shown on Table5-39, but includedin the analysis,isOptionQ (an idealizedcase) which representsthe quietingof motorcyclesto alevel of 10 dB below the most stringent regulatory option. Option Q isincluded for comparison purposes to indicatean upper limit of benefits.
Each primary regulatoryoption is also broken into four subcategerieslabeledA, B, C and D in Table 5-39. OptionsA and B differfromC and D inthatthe latteroptionsassumeregulatorylimitsfor off-roadmotorcycleslessthan 170 cc at the same production level as for street and dual purposemachines. In all cases, street and dual purpose_aotorcyclesare assumedtoconstitute50 percentof the totaloff-roadmotorcyclesusage with the other50 percentattributableto off-roadmotorcycles. In the cases of OptionsCandD, 37 percentof the usage is assumedto be fromoff-roadmotorcycleslessthan 170 cc, and 13 percent from bikes greaterthan 170 cc. Note also inTable 5-39 that OptionsA and C assumeno enforcementat the state and locallevel (7 percentand 16 percentmodifiedfor streetand dual purposemotor-cyclesand off-roadmotorcycles,respectively),while Options B and D assumecomplimentarystateand local programs.
5.11 Resultsof Anal_,sis- Off-RoadMotorcycles
The sectionpresentsthe resultsof the analysisto assess the relativereductionin currentimpactto be expectedfromthe regulationof noiselevelsproducedby motorcyclesused off-road.When detectabilitydistanceis used asthe noise impactcriterion,the relativereductionin impact (RCI)is calcu-latedin the same manner as was donefor the streetmotorcycleanalysis(seeEquation 12).
Estibatesof the impact resultingfrom the noise regulatoryoptionsformotorcyclesused off-roadare presentedin Table 5-40. This table shows theoff-road equivalent noise level at 50 feet calculatedusing the procedureoutlined in Table 5-37, adjusted for the case of three _torcycles ridingtogether. Also shown are the detectabilitydistancescomputed for the 40 and50 dB ambient conditions (from Figure5-17), the estioBtedareas impacted(area of aural detectabilityof motorcycles),the number of people exposeddailywithin this area (includesassui_@tionsof 20 and 1000 peopleper squaremile for the 40 and 50 dB ambientconditions,respectively),and the relativechange in impact from baseline. These noise impactesti_tes presentedin
5-92
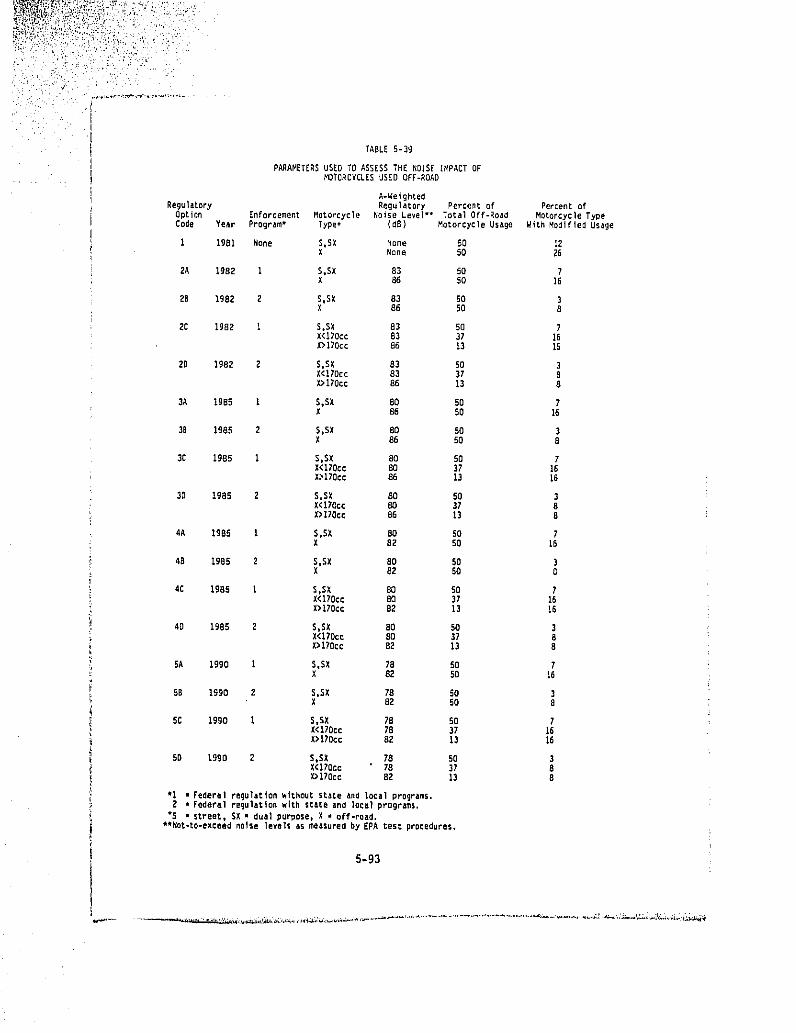
TABL_5-39
pARAMETERSUSEDTOASSESSTHE NO[$FIMPACTOFPiOTORCYCL_U_EDOFF-ROAO
A-WeightedRegulatory Regu%atory Percent of Percent of
Ootion Enforcement Motorcycle Noise Level*t Total Off-Road Motorcycle TypeCode Year Program* Type+ (d_) Motorcycle U_age Wtt_ Modified Usage
1 198! None S,SX None 50 I2X Non_ 50 Z6
2A lg82 1 S.SX 83 50 7X 86 50 16
_B 1982 2 S,SX 83 50 )X 86 50 8
2C lg82 1 S,SX 83 50 7X<170cc 83 37 16X>170¢¢ 86 13 16
2D lg82 2 S,SX 83 50 3X<170¢c 83 37 8X>170cc 86 13 8
3A lg85 l S,SX 80 50 7X 86 50 16
38 19_5 2 $,SX 80 50 3X 86 50 8
3C 1985 1 $,$X 80 50 7X<ITOcc 80 37 16X>170¢c 86 13 16
3D lg85 2 S,SX 80 50 3X<lTQcc 80 37 8X>ITOCC 86 13 8
4A 1985 ! S,SX 8(} 50 7X 82 50 16
4B 1985 2 $,$X 80 50 )X 82 SO 0
4C 19B5 1 S,$X 80 50 7X<170cc 80 37 16X>170¢¢ 82 13 16
4D 1985 2 $_$X 80 50 3X<170cc 8(] 37 BX>XTOCC 82 13 8
5A 1990 1 $,SX 78 50 7X 82 50 16
5B 1990 2 _.$X 78 50 )X 82 50 8
5C 1990 1 $,$X 78 50 7X<l?Occ 78 37 16X>170¢c 82 13 16
5D t990 2 $,$X 78 50 3X<lTOcc ' 78 37 8X>lTOcc 82 13 8
*1 • Federal regulation _lthout sta_e and local programs.2 • Federal regulation _lth stat_ and loCa) program_.
÷$ • Street, SX• dual puP_ose_X • off-road.**Not-to-exceed no_e level_ a_ measuredby EPAtes_ procedure_.
5-93
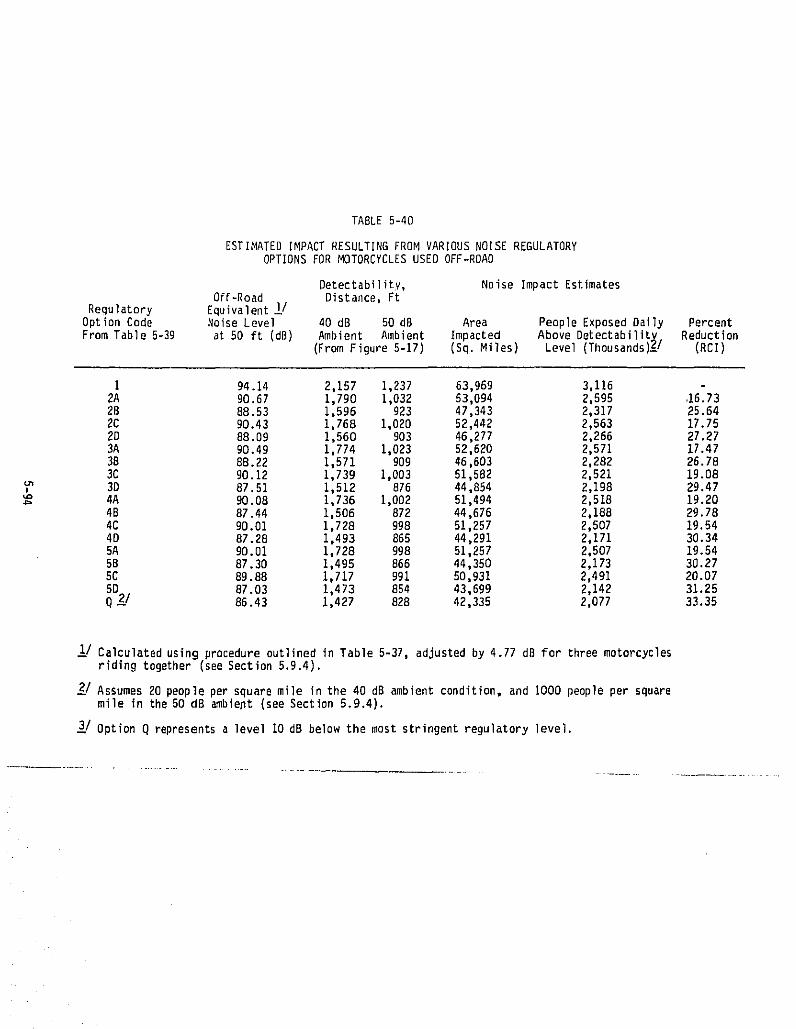
TABLE 5-40
ESTIMATED IMPACT RESULTING FROMVARIOUS NOISE REGULATORYOPTIONS FOR MOTORCYCLESUSED OFF-ROAD
Detectability, Noise Impact EstimatesOff-Road Distance,Ft
Regulatory Equivalent_/OptionCode NoiseLevel 40 dB 50dB Area PeopleExposedDaily PercentFrom Table 5-39 at 50 ft (dB) Ambient Ambient Impacted Above Detectability Reduction
(FromFigure5-17) (Sq.Miles) Level (Thousands)_/ {RCI)
I 94.14 2,157 1,237 63,969 3,1162A 90.67 1,790 1,032 53,094 2,595 .16.7328 88.53 1,596 923 47,343 2,317 25.642C 90.43 1,768 1,020 52,442 2,563 17.752D 88.09 1,560 903 46,277 2,266 27.273A 90.49 1,774 1,023 52,620 2,571 17.4738 88.22 1,571 909 46,603 2,282 26.783C 90.12 1,739 1,003 51,582 2,521 19.08
_' 3D 87.51 1,512 876 44,854 2,198 29.47_: 4A 90.08 1,736 1,002 51,494 2,518 19.20
4B 87.44 1,506 872 44,676 2,188 29.784C 90.01 1,728 998 51,257 2,507 19.544D 87.28 1,493 865 44,291 2,171 30.345A 90.01 1,728 998 51,257 2,507 19.545B 87.30 1,495 866 44,350 2,173 30.27SC 89.88 1,717 991 50,931 2,491 20.07
87.03 1,473 854 43,699 2,142 31.25D2--/ 86.43 1,427 828 42,335 2,077 33.35
1_/CalculatedusingprocedureoutlinedinTable 5-37,adjustedby 4.77 dB for threemotorcyclesridingtogether(seeSection5.9.4).
2__/Assumes20 peopleper squaremile in the 40 dB ambientcondition,and I000 peopleper squaremile in the50 dB amble_t(seeSection5.9.4).
3_/OptionQ representsa level 10 dB belowthe most stringentregulatorylevel.
Table 5-40 are made for conditions assuming that the entire fleet consists ofregulatedvehicles. This is differentfrom the methodsused to estimatetheimpactof streetmotorcyclenoise (Section5.8) where specifiedsales growthand depletionrates were used on a year-by-yearbasis. Note alsothat thisanalysispredicts the extentof impactonly. No allowancehas beenmade forthe varyingdegreesof severityof exposurewithinthe computeddetectabilityareas. An artifactof thisis thatthe RCl valuespresentedin Table5-40mayseem to be comparativelylower than those values computed (Section5.8.2)using the slngle-event activity interference model which duly considers boththe extent and severityof the impact. Nevertheless,relativecomparisonsbetween regulatoryoptions for the analysis of motorcyclesused off-roadremain valid.
From Table 5-40, the resultsof the analysisshow estimatesof the areaimpactoff-road rangingfrom over 42,000 squaremiles to about64,000squaremiles dependingupon the regulatoryoption. Likewise,the numberof peopleestlmated to be exposed above the criterion level range from over 2,000,000 toover 3,000,000people. All regulatoryoptionsprovide significantlesseningof impactrelativeto the base (no regulation)condition. Option5 is typi-cally the most effectivein reducing impact, while Option 2 is the leasteffective. For example,Option 5A shows a 20 percent reductionin impactcompared to a 17 percentreductionfor Option 2A. Option Q shews only aslightadditionalbenefitfrom that of the most stringentregulatoryoptionexamined(OptionSD).
The resultsin Table 5-40 also show that regulatingoff-roadmotorcyclesunder 170 cc to a less stringentlevel yields less benefit. For example,option4c show a 20 percent reductionin impactcompared to the 19 percentbenefitof Option4A. On the otherhand, the levelof enforcementassumedhasa very significanteffectof benefitsto be expected. For example,Option4Awith no complimentarystate and local programwould result in a 19 percentreductionin impact,while Option4B with a concurrentprogramis anticipatedto yield an almost 30 percent benefit. As was shown in the analysis ofbenefitsof reduclngnoise from streetmotorcycles(Sections.g),substantialbenefitsare shown as the numberof modifiedmotorcyclesis decreasedconcur-rentwithsource emissionregulation.
5-95
REFERENCES
SECTION 5
1. "Constitutionof the World Health Organization,"WHO Office of PublicInformation, Geneva, Switzerland, 1948.
2. U.S. EnvironmentalProtectionAgency, "PublicHealth and WelfareCriteriafor Noise," EPA Report550/9-73-002.July 1973.
3. U.S. Environmental Protection Agency, Notice of Rulemaking for Mediumand Heavy Truck Noise Emission Standards, Federal ReBister (41 FR IE538),April 13, 1976.
4. U.S. Environmental Protection Agency. Notice of Proposed Rulemakingfor Bus Noise Emission Standards, Federal ReBister (42 FR 45776),September 12, 1977.
5. Survey of Motorcycle Ownership, Usage and Maintenance, A Gallup Organi-zation, Inc. survey conducted for the Motorcycle Industry Council,Inc.,ReportGO 7458,January1975.
6. Johnson, D.R., "A Note on the Relationship Between Noise Exposure andNoise Probability Distribution," National Physical Laboratory, NPL AeroReport Ac 40, May 1969.
7. Plotkin, Kenneth J., "Average Noise Levels for Highway Vehicles,"WyleResearch Technical Note 79-2, September 1979.
8. U.S. EnvironmentalProtectionAgency, "Informationon Levelsof Environ-mental Noise Requisite to Protect Public Health and Welfare with anAdequateMarglnof Safety,"EPA Report550/9-74-004,March,1974.
9. "Guidelines for Preparing Environmental Impact Statements on Noise,"Report of Working Group 69, Committee on Hearing, Bioacoustics andBiemechanics, the National Research Council, Washington, D.C., 1977.
10. Schultz, Theodore J., "Synthesisof Social Surveys on Noise Annoyance,"The Journalof the AcousticalSocietyof America,64(2),377-405,197B.
11. Goldstein, Jeffrey, "Assessing the Impact of Transportation Noise:Human Response Measures". In Propeedin_s of the 1977 National Conferenceon Noise ControlEngineering,G.C. Maling(Ed.),Noise ControlFoundation,Poughkeepsie, N.Y., pp. 79-98, 1977,
12. Environmental Impact Statement for Proposed Noise Abatement Regulations,Nois_ Section. Department of Ecology, State of Washington, Olympia, WA98604,16 April1975.
13. "Motor Vehicle Noise Identification and Analysis of Situations Contribut-ing to Annoyance," Bolt Beranek and Newman Inc., Report 2082, June 1971.
5-96
14. Mills, C.H.G. and D.W. Robinson,"AppendixIX --- The SubjectiveRatingof Motor Vehicle Noise," Noise --- FinalReport,Cmnd 2056 Her Majesty'sStationeryOffice,London.July 1963.
15, ReportIn preparationon communityattitudesto noise in Boulder,Colorado,EPA regionaloffice,Denver,Colorado.
16. Gunn, W,, T. Shlghehisa,and W. Shepherd,"RelativeEffectivenessof Several Simulated Jet Engine Noise Spectral Treatmentsin ReducingAnnoyance in a TV-Viewing Situation, NASA Langley Research Center,Draft Report,1976.
17. PearsonsD K.S. and R.L. Bennett, "Effects of Interior Aircraft Noiseon SpeechIntelllgibilityand Annoyance,"NationalAeronauticsandSpace AdministrationReport,NASACR-145203,August1977.
18. Fidell, Sanford, "The Urban Noise Survey,"U.S. EnvironmentalProtectionAgency Report No. 550/9-77-100,August 1977,and "NationwideUrban NoiseSurvey", The Journal of the Acoustical Society of America, 64(17),198-206_1978.
19. Borsky, Paul N., "The Use of Social Surveys for MeasuringResponsestoNoise Environments" In TransportationNoises: A Symposiumon Accepta-bilty Criteria,J.D. Chalupnik (Ed.),Universlty of Washington Press,Seattle,pp--'p'p_-_T.g-227,1970.
20. "Noise-FinalReport,"Cmnd. 2056,Her Majesty'sStationaryOfflcejLondon,July, 1963,
21. GrandJean, E., P. Graf, A. Lauber, H.P. Meier, and R. Muller, A Surveyof Aircraft Noise in Switzerland,In ProceedlnBsof the InternationalConBress on Noise as a Public Health Problem, Dubravnik, Yugoslavia,May 13-18,pp. 645-659,1973.
22. Sorenson,S., K. Berglund,and R. Rylander,"ReactionPatternsinAnnoyance Response to Aircraft Molse," In Proceedingsof the Interna-tional ConBress on Noise as a Public Health Problem, DubrovnlK,Yugoslavia,May 13-18,pp. 669-671,1973.
23. Gunn, WalterJ., "A GeneralDiscussionof 'Reactionsto AircraftNoises',"In Reactionto AircraftNoises: A SymposlumReport, E.A. A11vis (Ed.),Journalof AuditoryResearch,lS, Supplement5, pp. 214-217,1975.
24. Hal1, F,L., S.M. Taylor, and S.F, Birnie, "CommunityResponse to RoadTraffic Noise", McMaster University,Hamilton,Ontario, Canada,December1977.
2S. McKennel,A.C., "AircraftNoiseAnnoyanceAroundLondon (Heathrow)Airport",U.K. GovernmentSocialSurveyReportSS.337,1963,
26. Swing,John W., "A Case for Single-EventIntrusionCriteria in AchievingNoise-CompatibleLand Use," Noise ControlEngineering,11(3),98,1978,
S-97
27. Allen, J.D., L.L. Faulkner, F.G. Ren, and A.M. White, "The Automobile Asa Componentof Community Noisep" Phase 1 Ftnal Report, Battelle ColumbiaLaboratories, June 1978.
28. Lukas, J,, "Measures of Noise Level: Their Relative Accuracy in Predict-ing Objective and SubJective Responses to Noise During Sleep," U.S,Environmental Protection Agency Report No. EPA-600/1-77-OlO, February1977.
29. Lukes, J., "Noise and Sleep: A Literature Review and a Proposed Criteriafor Assessing Effect," The Journal of the Acoustical Society of America,Vol.58 (6).pp. 1232-1242,1975.
30. Plomp, R, and A. M. Mfmpen, "SpeechReceptionThreshold for Sentencesas a Function of Age and Noise Level," The Journal of the AcousticalSocietyof America,66(5),1333-1342,1979.
31. Rudder, F.F., L. Rank, and B,A. Hutcheson, "National Roadway TrafficNoiseExposureModel,"Reportpreparedfor the U,S.EnvironmentalProtectionAgencyby ScienceApplications,Inc.,1979.
32. Me, Y.Y., and F.F. Rudder, "statisticalAnalysis of FHWA Traffic NoiseData",U.S. Departmentof Transportation,FederalHighway Administration,ReportFHW-RD-78-64,July 1978,
33. Gray,R. F,, "A Surveyof LightVehicleOperations",EngineeringPublication6313, GeneralMotors ProvingGround,Milford, Michigan,July1975.
34, Sakagamt, J., "Consideration of Noise Emission of Road Vehicles onUrban Streets in Japan," ProceedingsInter-Noise75, Tokyo University,Sendot 980, Japan, pp. 21-28, 1975.
35. "NationalFunctlonalSystemMileage and Travel Summary",U.S. Departmentof Transportation,Federal Highway Admlnstration,Office of Planning,June 1977.
36. "National Highway Inventory and PerformanceStudy Manual, 1976," U.S.Departmentof Transportation,FederalHighwayAdministratlon,July1975,
37. "The Status of the Nation's Highways: Conditions and Performance,"Report of the Secretary of Transportation to the United States Congress,gBth Congress, ist Session, (45-29) U.S. Government Printing Office,September 1977.
38, "1970 Census of Population, Numberof Inhabitants, United States Summary,"U,S, Department of Commerce,Bureau of Census, December1971,
39. Michael, J.J., "Research Briefs: A Final Summaryof Attitudes of SeniorLand and Recreation Managers In the United States Regarding Off-RoadRecreation Vehicles," Parks and RecreatioE, 8(2):39-41, February 1973.
40, Shepherd,K,P., "A PreliminaryStudy of the AnnoyanceDue to Noise FromRecreatlonalVehicles," Laboratory for Heorlng Studies and Noise Con-trol, University of Utah, Report T.R. 75-001, 1975,
5-98
41. Harrison,R., "Developmentof a NoiseStandardfor the OregonDunesNationalRecreationArea,"U,S,Departmentof Agriculture,ForestService,EquipmentDevelopmentCenter,San Dimes,CA, July 1973.
42. "1978MotorcycleStatisticalAnnual,"MotorcycleIndustryCouncil,Inc.,Researchand StatisticsDepartment,1979,
43. Harrison, R.T,, "Off-Road VehicleNoise-Effects on Operators and By-standers,"U.S, Departmentof Agriculture,ForestService,Report740687,prepared for Society of AutomotiveEngineers,National Combined Farm,Constructionand IndustrialMachineryand PewerplantMeetings,Milwaukee,WI, September9-12, 1974.
44. Fide]], S., K.S, Pearsons and R.L. Bennett, "PredictingAural Detecta-bility of Aircraft in Noise Backgrounds,"Bolt Beranek and Newman Inc.,Cambridge,MA, Report220-AFFDL-TR-72-17,July 1975.
45. Harrison, R., private communication,U.S. Department of Agriculture,ForestService,October1976.
46. Harrison, R.T., "Sound Propagationand Annoyance Under Forest Condi-tions," U,S. Departmentof Agriculture,Forest Service,EquipmentDevel-opmentCenter,San Dimes,CA, Report7120-6,March1974.
47. "1975 AutomobileFacts & Figures",Motor Vehicle ManufacturersAssocia-tion,Detroit,Michigan48202.
48. "American Trucking Trends I975,"American Trucking Association,Inc.,Washington, D.C. 20036, 1976.
49. Kent, P. and M. Branes: "1975Natlonel Truck CharacteristicReport",U.S. Departmentof Transportation,Federal HighwayAdministration,April1978,
50. Galloway, W.J,, K. Eldred, and M.A. Simpson, "Population Distributionof the United States as a Function of Dutdoor Noise Level," U.S. Environ-mental Protection Agency Report No. 550/9-74-009A, June 1974.
51. Wyvi11, C, (Ed.), "Discussion of Sound Propagation," Technical Meeting,U.S. Environmental Protection Agency, Office of Noise AbatementandControl, held at Cwstal City, 14 October 1977.
52. "An Assessment of the Technology for Bus Noise Abatement," Booz AllenApplied Research, Draft FlnalReport submitted to U.S, EnvironmentalProtection Agency, Office of Noise Abatement and Control, EPA ContractNo. 68-01-3509, June 22, 1975,
53. Sutherland, L,C., "Indoor Noise Environments Due to Outdoor NoiseSources," Noise Control Engineering, 11(3), 124-137, 1978.
5-99
SECTION 6
NOISE REDUCTION TECHNOLOGY
L
r
13
SECTION 6
NOISE REOUCTION TECHNOLOGY
6.1 DiagnosticEvaluationof Noise Sourc_
Many of the manufacturers which EPA and its motorcycle technologycontractor visited have performedand/or sponsoredcomprehensivediagnosticstudies on motorcycle noise source contributions, and have defined themajor nolse-producing components and the levels of noise produced by thesecomponent sources both individually and in combination. The diagnostictechniques employed for identification of noise source contributions, and thespecific noise control methods being employed or studied by the differentmanufacturers, were presented to the EPA on a confidential basis.* Table 6-ishows the relative contribution of these sources for 21 Ig76 model motorcycles(as determined by the manufacturer of the vehicle), in three groupings:exhaust, intake,and mechanical. In this listing. "mechanical"encompassesnoise radiatedby the engine, power train, frame structureand equipmentcarried on the fralne,and also tire and wind noise, the latter two beinggenerallyinsignificantat current total vehiclenoise levels. The vehiclesare listed in descending order of total noise level (as measured by theJ331a test); perusal of the table shows that the distribution of noisesource contributionvarieswidely, and is independentof total noise level,use category, and engine type. There is also no relationship or trendbetweenenginedisplacementand sourcecontribution.
The noise reductiontechniquesnecessaryto meet a particularemissionstandardwill vary wldeiyfrom motorcycleto motorcycle,and are very diffi-cult to place in a generally-appllcablematrixof vehiclecategory/subcategoryvs, noise level. For example (referring to the Table), to reduce noiseemissionsof vehicle"D" currentlyat B3 dB to 80 dB wouldrequireattentionprimarilyto the exhaustwhich is contributing84 percentof the noise; thismight be attainedrelativelyeasily. On the other hand, for vehicle "H",currently at 82 dB, the attainmentof an Be dB level would requirequietingthe mechanicalsources,which might constitutea major engineeringeffort.
6.2 NoiseReductionTechnoloBy
A reviewof the techniqueswhich are in use or which can be selectivelyused to quiet matercyclesis presentedin this section. No considerationisgiven to cost, nor to the suitabilityof these varleustechniquesin relationto functionalor aestheticcriteria.
Exhausts_stemquletinBmethods
Near term control of motorcycle noise emissions centers around theexhaust system, air intake system_ and tilemechanical/drivecomponents.In approachingthe noise reductionproblem, manufacturersgenerallytreatthe exhaust and intake noise sources first because modificationof thesesourcesgenerallyimpactthe basic model configurationleast.
_---_ost de_'_was suppIT6a-By_---_6_Z-Y-_ha,-_-Ra_a_a'k-I_-_-_T-_-6-_e_'JDavldson. Other manufacturersvisited also supplieddata used in thisanalysis.
6-1
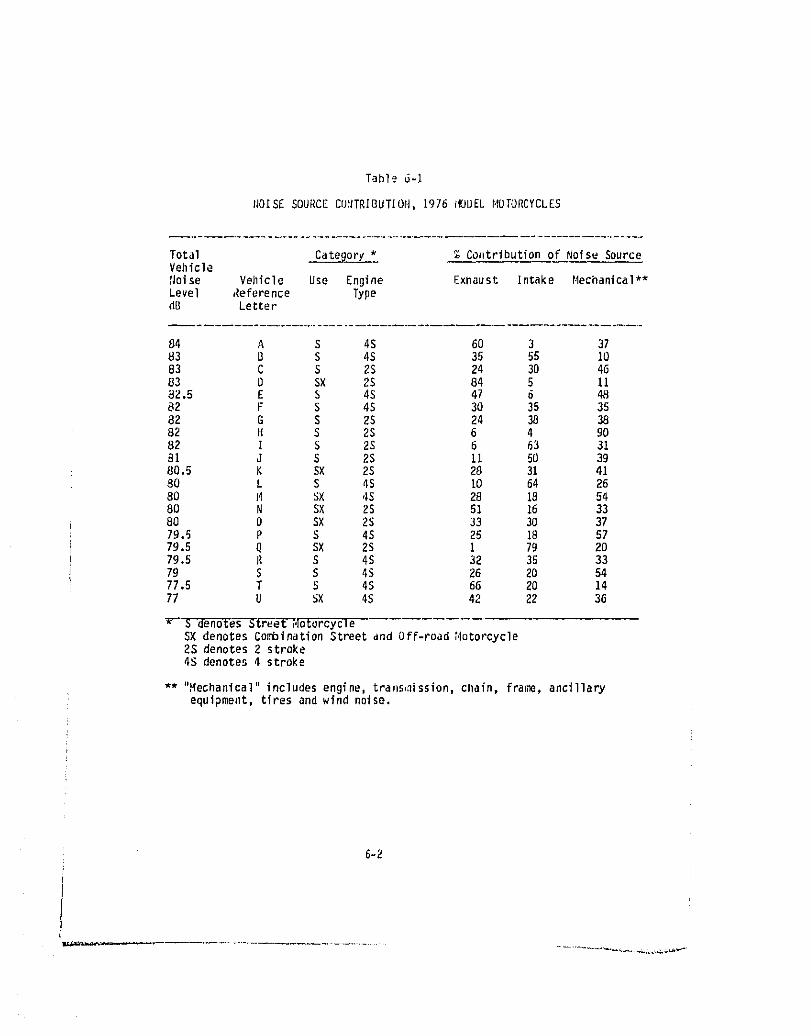
Table 6-i
NOISE SOURCE COI_TRIBUTION, 1976 i_DEL MOTORCYCLES
Total Category _ % Colbtribution of Noise SourceVehicle
Noise Vehicle Use Engine Exhaust Intake Mechanical**Level Reference TypedB Letter
84 A S 45 60 3 3783 B S 4S 35 55 1083 C S 2S 24 30 4683 D SX 2S 84 5 II82.5 E S 4S 47 6 4_82 F S 4S 30 35 3582 G S 2S 24 38 3882 H S 2S 6 4 9082 I S 2S 6 63 31al J S 2S ii 50 3g80.5 K SX 2S 28 31 4180 L S 4S I0 64 2680 M SX ,;S 28 1B 8480 N SX 2S 51 16 3380 0 SX 2S 33 30 3779.5 P S 4S 25 18 5779.5 Q SX 2S I 79 2079.5 R S 4S 32 35 3379 S 5 4S 26 20 5477.5 T 5 4S 66 20 1477 U SX 4S 42 22 36
_-'S denotes St_'_'e-t-],,IotorcycleSX denotes Combination Street and Off-road Motorcycle2S denotes 2 stroke4S denotes 4 stroke
_* "Mechanica]" includes engine, trans,_ission,chain, frame, ancillaryequipment, tires and wind noise.
6-2
=__ ......
. _k ";: =,%!'
Exhaustnoise is generallyreducedby usingone or more of the follow-ing techniques: increasingmuffler volume, addingreactivechambers/tubes,addln9absorptivematerials,restrictingexhaustflow by bafflesor perforatedtubes,and dampening,stlffening,or isolatingouterwalls.Mufflervolumecanbe increasedby: physicallyenlargingthe shell;interconnectingheaderpipeson multicyllndermotorcyles(e,g.,4 into i, 4 into 2 type systems),addingcross-pipesbetweendualexhaustsystemswhere applicable,or combinationsofthese techniques. Interconnectingpipes changethe impulsefrequenciesof themufflerin a favorabledirectionfor improvedeffectiveness,but requiresthatreactiveelementsbe properlydesignedfor the changedfrequencyspectrum. Inmany cases redesignand modificationof the mufflerinteriorwill reducenoiselevels,generallyat some penaltyin increasedbackpressure. Suchtechniquesinclude adding/ modifying reactive chambers, adding or sealing baffles,modifying the core pipe, inserting noise absorptionlining and retainingwalls, revising/constrictingexhaust flow, and adding elastic cemponents.Dampeningof the shellwalls can be accompllshedbyuse of laminatedmaterial,differentmaterial,or applicationof seml-viscouscoatings. Stiffeningofthe shell walls can be accomplishedby use of ribbingor internalbracing.Isolationcan be accomplishedby mounting componentson elastomersupports,The lattermodificationsdo not reducenoise emitted fromthe exhaustoutlet,but reduceradiatednoisefrom the mufflershell.
These techniquescan be summarized:
o Increasemufflervolume
o Interconnectexhaustpipes
o Modify interior
o Add noise absorptivelining
o Increaseshellthlckness/rigldity
o Constructdoublewalls
o Isolatemounting
Applicationof these techniques Is not at all straight-forward,andiS in reality a very complex design problem. As an example, motorcycleswith 2-stroke engines require optimally designed expansion chambers toassure proper exhaust scavengingand chargingof cylinders, Modificationof the exhaust system if improperlydone could reduce performancedrasti-cally. Other modificationscould create excessiveback pressure,increaseweight and fuel consumptionor reduce motorcycle lean angle, balance, orgroundclearance.
Intake system quietinB methods
Air intake noise can be reduced by shielding or modifying the inletduct, restrictingor lengthenlngthe intake path, increasingshell volume,adding baffles or absorptivematerials,and dampeningand/orIsolatingtheintake shell. The shell dampeningcan be accomplishedby the use of thicker
6-3
j_ _-- • • . • , _, c..........i ......................,_ ._,,.•_•:,._%_._._.,_._._L'_,_;_/ijy_.
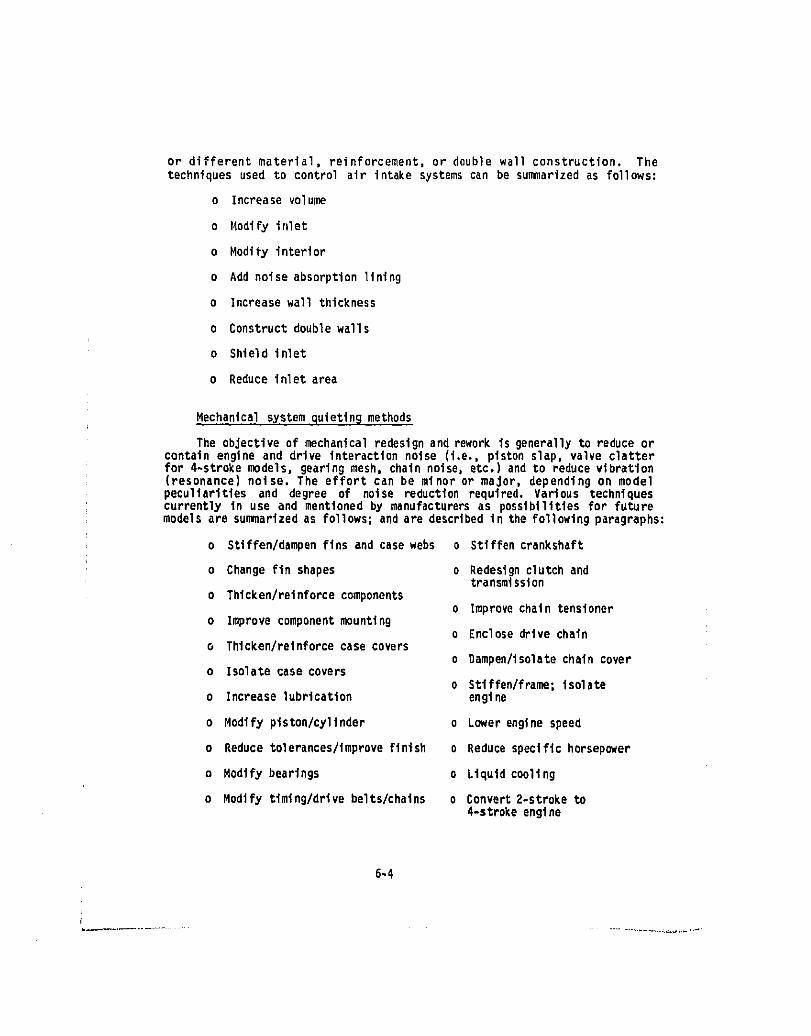
or different material, reinforcement,or double wall construction. Thetechniquesused to control air intakesystemscan be summarizedas follows:
o Increasevolume
o Modify inlet
o Modifyinterior
o Add noise absorption11ning
o Increasewall thickness
o Constructdoublewalls
o Shieldinlet
o Reduceinlet area
Mechanicalsystemquietln9 methods
The objectiveof mechanicalredesignand reworkis generallyto reduceorcontainengine and drive interactionnoise (i,e.,pistonslap, valve clatterfor 4*strokemodels, gearingmesh, chainnoise,etc.)and to reducevibratlon(resonance) noise, The effort can be minor or major, depending on modelpeculiaritiesand degree of noise reductionrequired,Various techniquescurrentlyin use and mentionedby manufacturersas possibilitiesfor futuremodelsare summarizedas follows;and are describedin thefollowingparagraphs:
o Stlffen/dampenfins and casewebs o Stiffencrankshaft
o Changefln shapes o Redesignclutchandtransmission
o Thlcken/relnforcecomponentso Improvechain tensioner
o Improve componentmountin9o Enclose drive chain
o Thicken/reinforce case coverso Dampen/Isolatechain cover
o Isolate case coverso Stiffen/frame; iselate
o Increaselubrication engine
o Modify piston/cylinder o Lower engine speed
o Reduce tolerances/improve finish o Reducespecific horsepower
o Modifybearings o Liquid cooling
o Modify timing/drivebelts/chalns o Convert2-stroketo4-strokeengine
644
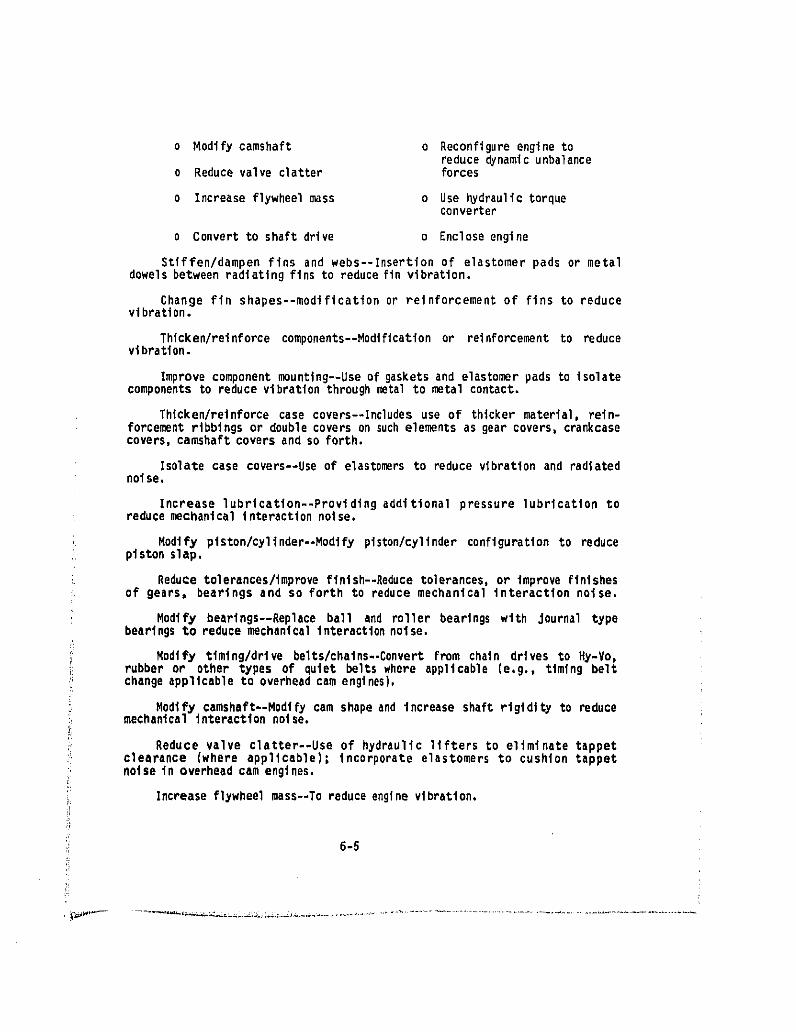
o Modify camshaft o Reconfigure engine toreduce dynamic unbalance
o Reduce valve clatter forces
o Increase flywheel mass o Use hydraulic torqueconverter
o Convert to shaft drive o Enclose engine
Stiffen/dampen fins and webs--Insertion of elastomer pads or metaldowels between radiating fins to reduce fin vibration.
Change fin shapes--modification or reinforcement of fins to reducevibration.
Thlcken/reinforce components--Modification or reinforcement to reducevlbratlon.
Improve component meunting--Use of gaskets and elastomer pads to isolatecomponents to reduce vibration through mtal to metal contact.
Thicken/relnforce case covers--Includes use of thicker material, rein-forcement ribbings or double covers on suchelements as gear covers, crankcasecovers, camshaft covers and so forth.
Isolate case coVers--Use of elast0mers to reduce vibration and radiatednotse.
Increase lubrication--Providing additional pressure lubrication toreduce mechanical Interactton noise.
) Modify plston/cylinder--Modlfyplston/cylinderconfigurationto reducepistonslap.
i Reduce tolerances/improve finish--Reduce tolerances, or improve finishes_ of gears, bearings and so forth to reduce mechanical interaction noise.i: Modlfy bearlngs--Replaceball and roller bearings with Journal type
bearingsto reducemechanicalinteractionnoise.
" Modify tlmlng/drivebelts/chalns--Convertfrom chain drives to Hy-Vo,! rubber or other types of quiet belts where applicable (e.g., timing belt_ change applicable to overhead cam engines),
'. Modify camshaft--Modify cam shape and increase shaft rigidity to reduce: mechanicalinteractionnoise.
Reduce valve clatter--Use of hydraulic lifters to eliminate tappetclearance (where applicable); incorporate elastomers to cushion tappetnoise in overhead cam engines.
Increaseflywheelmass--Toreduceenginevibration.
6-5
Stiffen crankshaft--To increase rigidity and reduce mechanical inter-actionnoise.
Redesign clutch and transmission--Use of helical gears instead ofspur gears to reduce mechanlca] interaction noise; use of journal typebearings.
Improve chain tensioner--Toreouce cllain/sprocketinteraction noiseand chain tensioner noise.
Enclosedrivechain--Toattenuatedrivechain noise.
Da_ilpen/isolatechain cover--Toeli_linatecover vibrationand radiatednoise.
Stiffen/dampenframe; isolate engine--To prevent radiated noise dueto engine vibration transmittedtO She frame and to componentsmounted onthe frame.
Lowerenginespeed--Toreduce_ecbanicalinteractionnoise.
Reduce specific horse-power--To reaL_cethe excitation forces whichresultin enginenoise radiation.
The above noise reduction techniques range free detail changes tosignificantredesign.For some ,nodo]sreductionsin rlechanical/drlvenoiselevels to meet stringentnoise staJ1darOswould require techniquesinvulvlngcomplete redesign of the engine and drive train. In addition,so_ of thetechniques would result in reduced engine performance. As discussed inSection4.1, it is impossibleto predictby productcategorieswhicllspecificregulatorylevels will require major _,_odelcllanges.The lowest levels tilatany of the JIBnufacturershave reportedas being feasiblefor the near-ter_lis_0 dB for street motorcycles,84 dU for Off-roanmotorcycles.Other manufac-turersquestionthat an BU dg noisestandardcan be met without,najorredesignon so,,lemmdels. 14ajor;nodelconfigurationchanges could includethe use ofsuch techniques as conversion to liquid cooling, enclosirlgor coveringthe engine,conversionfromm 2-stroketo 4-stroKeengine (whereapplicable);use of a hydraulic torq,e converterfor _ower _ransmission.conversion toshaftdrive,engine re-confiqurationto reduceunbalanceforces,or any other,majorengine/ drive redesi_innet specifiedhere. These tecnni_ueswould allrequiremajor changes in J,tanofactoringoperations,and extensivelead time.These techniques,not necessarilyfeasibl_in a11 use categories,are dis-Cussedin the followinoparagraphs.
Liquid Cooling--Liquldcooling, because it allows reduced clearancesin engine parts, and because it providesadded s_ieldingaroundthe enginecylinders,can r,_ateriallyreduceengineradiatednoise,Conversionto liquidcoolingwould requirere-engineorlngand re-toolingof the engine,ddd signif-icant weight, and add to unit m_nofacturir_gcoats. Additionalhardware isrequiredto inple,_Kentliquidcooling,includinga pump, radiator,therJnostat,coolant, plumbing, instrumentationand recastingof the cylinder head andwal]s. Feasibilityof llquidcooling for off-road,,1otorcyclesIs very ques-tionablebecause of vulnerabilityof tne radiator to aamage from rocks andspills.
I
i
4-Stroke vs, 2-Stroke Engines--So_w.:manufacturersfeel that 4-strokeenginesare easier to quiet than 2-stroke engines.Becduseof this. conver-sion of engine types is a potential option. This alternative is also weightedby the fact that exhaust chemical eJ:dssions are more difficult to control intwo-strokeengines,a factorcurrentlyof greatconcernto ,:_anymanufacturers.It is unlikely that engine conversions would be made for noise control alone,due to the considerable engineering development and plant and equipanerltexpendituresthat would be required.In addition,direct manufacturingunitcosts of 4-strokeenginesare astir;fatedby manufacturersto be more thanthoseof equivalent sized ?-stroke engines.
Reduction of UnbalancedForces--Unbalancedforces which cause engineand frame vibrationare laoresevere in so_ engine configurationsthan inothers. For example, unbalanced forces con be reduced by use of opposingcylinders, counter-rotatlngcrankshafts, or balanced "V" configurations.These methods can involvedynamic vibration absorbersor counter-rotatingbalancing elements.
Shaft Drive--Shaft drive i_ an option that would reduce drive trainnoise on large (over 75U ec) and possibly_nediui_lsized (450-749cc) on-roadmotorcycles. Shaft drive on _;lodelsintended for so_ off-road use is lessattractive,because of weight constraintsand flexibilityrequirelnontsinthe drive train that are required for these models. Shaft drive affectsinanyof the other co_,ipouentson the _i_otorcycle,and is a r_Idtivelyexpen-sive option. A more cost-effective,nethodof reducingdrive noise in i_>._stcases would be to fully enclose tde chain, which was identifiedpreviouslyas a noise reduction _asure.
Hydraulic Torque Converter--Another techniaue that _ould involve majoriaodelconflgurationchangeis convertingfrom a standard trans,ilissionto ahydraulictorqueconverterand a hydraulicgear engage,_,ntclutc]has exe_ipli-fled by the transmission on the }IondaCl) 75OA. Torque conversion by hydraulicmeans is oasicallyquieterthan by gears.
Engine Enclosure--_lanufacturersindicated that if engine enclosureis considered as a noise control measure, it would generally be used inconjunctionwith liquidcooling.Enclosureor coveringof air-cooledenginescould create significant engine te_iperature control problel;is.In addition,some of the manufacturersfearedthat enclosurecould drasticallyaffect the
i _narketabilityof Inotorcycles,since styling is an i._portantfactoraffectingdemand for il)otorcycles,Engineenclosurewoul_ enta11addedwei,ght,and could
i ha;nperaccess for servicing.C_i Although there is no generally-applicaoleset of technlquesttlatwill
achieve specified regulatory levels for a specific nwJtorcycle, a matrix of, techniques based on manufacturer-suppliedinformationwas developed for" costlng purposes.This matrixis presentedin Tab'la6-2. For each regulacory
leveloelow_3 dB, a scheduleof techniquesotherttlan_,_ajor_L1_delcnangesareshovm for each product class,hlanufacturoriaform_tion]e,'_urollyindicatesthat al] techniquesdiscussedabove weulJ ue Hecessarytn achieve a 75 dBlevel for _nodelsabove Ill)co. Fewer of t_ese techniques,or less extensiveuse of these techniques, are expected to oe necessary at higher levels. Forcosting purposes two estinates were _nadeat each study level below _3 dg: oneassuming no _ajur inodelchange necessary,and one assuaginga major model
6-7
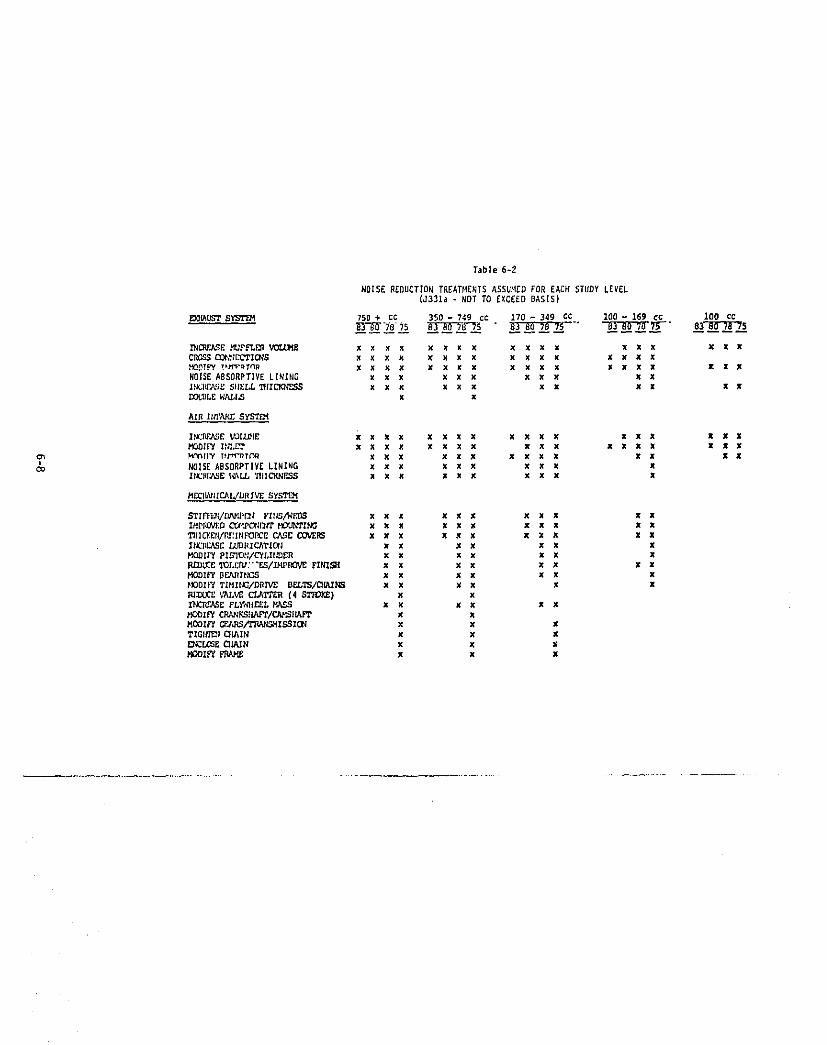
Table 6-1)
NOISE NEDUCTIOH T6EATHENTSASSUHEDFOR EACH STUOY LEVEL(J33ia - NOT TO £XCE£D BASIS)
_3,_L_S'_SYS'i"I_ 750 + Cc 3BO - 749 C¢ 170 - 349 ¢¢ ]00 - 1(;9 Cc ]00 Cc83 B'0 =78"75 _3 BO 76_'_% " e3 B0 ;B 75--'" 83 B'0 7_" TS"--" 83 B0 76 75
I_Olr.J_E ,'PJy.cl,l_l_ X x x x x x x x x x x x x X X X X XCI'_$ ('_I',_ICC"L'IO_S x x x x X x x x x x x x X x x x.u_lPY T_r;'nfn;_ X x x x x x x X x X X X x X x x X • XNOISE ABSORPTIVE LIHING x x x x x x x x x x x
INCI_',,%_]_SIIEI,/.,'I_IIC'KI_E_S x x x x x x x x x I¢ x XDOL'0I,E W3_,LI.S x x
llX_IE#%_F.%_3I_J_tE X x X x x x x X x x x x x x x X X X.MORIP._ _.'I.L_. x x x x x x x x x x x X X x x X X X_{_fl_' T_rrrnT(_R X X X X X X X X X X X X X J{
NOISE ABSORPTIV£ LINING x x x x x x x x x x/t_BC,_.SR _tJ, '.qIICI(NI_S x x x x x X x x x X
H;CIL_IICAIv'I_RIVR SyS'I'I_I
STIFt'L_t/_I :-'IRS/WE'I_ x x x x x x x x x x xZHPBW}:.I]CY_,J)ctlr/fr I'_OU_TING x x x X x x x x x x X'IIIICKEN/P_IN_ORC_CA.SCC(TV_ x x x x x x x x x x ](J?_ _.r_RIC/_TIC_I X x _( X x X XMODIFY PI_]O_/CYI,It_R X x x x x x X_UCC _OI.I;,r_:"KS/Z_tPI_)VE FINI_I x x x x x x x •_ODIF_' B_P_I_Ir_C_ x x X x X X x_OI_'i TIHI_X_/DRZVI_DEZ,'rS/ClgLII,IS x • X X X XRI;.IX_ VAL_ C/.A_R (4 S'T_O_) x •IN_R FL_IF._, MA,_S x x X X X XMODI_ CR_ K.SI_/CA_L_ ILe_J_"_ x x
TZGifi_l O_IN x X XEI_L_R GIAIN x x xMODIFY _'itAP_ x x X
change. As shown, the major model change assummedfor streetlllotorcyclesisthe use of liquidcooling.For off-road_;_o_orcycles,conversionto 4-strokeenDines is assumed,Differentindividualmodelswill of courserequiremajormodel changesat differentregulatorylevels.A few are expectedto requirethem at an 8(Jd(]level,a substantialnumber are expectedto neea thehlat78 dB, alldvirtuallyall are expected to needthem at a 75 dB level.
6.3 _acts of FloiseReductionTechnology
6.3.1 Perforlaance l_Ipacts
Each of the techniquescited above can have i_npactson motorcycleperfor-mance cllaracteristics.Engine horsepower (including_lidt)1of power band),torque, weight, lean angle, center of gravity, ground clearance and suspensioncharacteristics can all be affected.
Power
All manufacturerscited engine power losses resultingFrom achievingcurrentnoise levels. Increasingpower loss is expectedat the lowerlevelsstudied.The power loss is generally attributableto restrictedair intakeand exhaust system back pressure. Table 6-3 indicates so_neof the datasubmitted to EPA pertainingto power losses involved in acnievingcurrentnoise levels. From these data it is apparent that additional noise reduc-tion laeasureswill result in further power losses. Liquid cooling, with itspotential for decreased engine tolerauces,can a:)atethis trendso_nawhat.Conversion from 2-stroke to 4-stroke engines will result in additionalspecific horsepower loss.
Weight
F1anyof the techniques cited ,naycause additlona] weight penalties.r4odificatlonsto the exhaustsystenlcould resultin doublingcurrentmufflerweight or more, although the increasing use of 2 into I, 3 into i and 4into i exhaust systems on multicylinder motorcycles could abate this con-siderably, Similarly, f_Doreco_nplexair intake systems migll_be expectedto weigh more than current systems by Factors of two or more.,_lechaaicalnoise quietingcan be achievedthrough the use of thickercovers,improvedmounting and increased mass of moving parts. The combination of ttlesemeasurescould increaseengine weightby 10 to 15 percent.In addition,major enginemodificationscan resultin a significantvehicleweightincrease.One manu-facturer estimated an increase of 10 percent in vehicle weight for liquidcooling (about50 1o. for largemotorcycles).Conversionof singlecyclinder2-strokeenginesto single-cyclinder4-strokeenginescouldcausean increaseof up to 3D percentin totalengineweight. Shaft drive_ctlanisr,_sare quiteheavy,but the lighter and less costly alteruativeof enclosureuF the finaldrivechainv_il]be assuiJ_.dfor the assessmentof weightpenalty.
6.3.2 Operation Impacts
The only significanti,npactof noise level reductionon operationcostsshould be a reductionin fuel economy. Increasedweight, increasedbackpressure,pov#erloss, and power requiredto drive auxiliaryequipment(e.g,,radiatorpump)may all exacta f_el consumptionpenalty.
6-9i
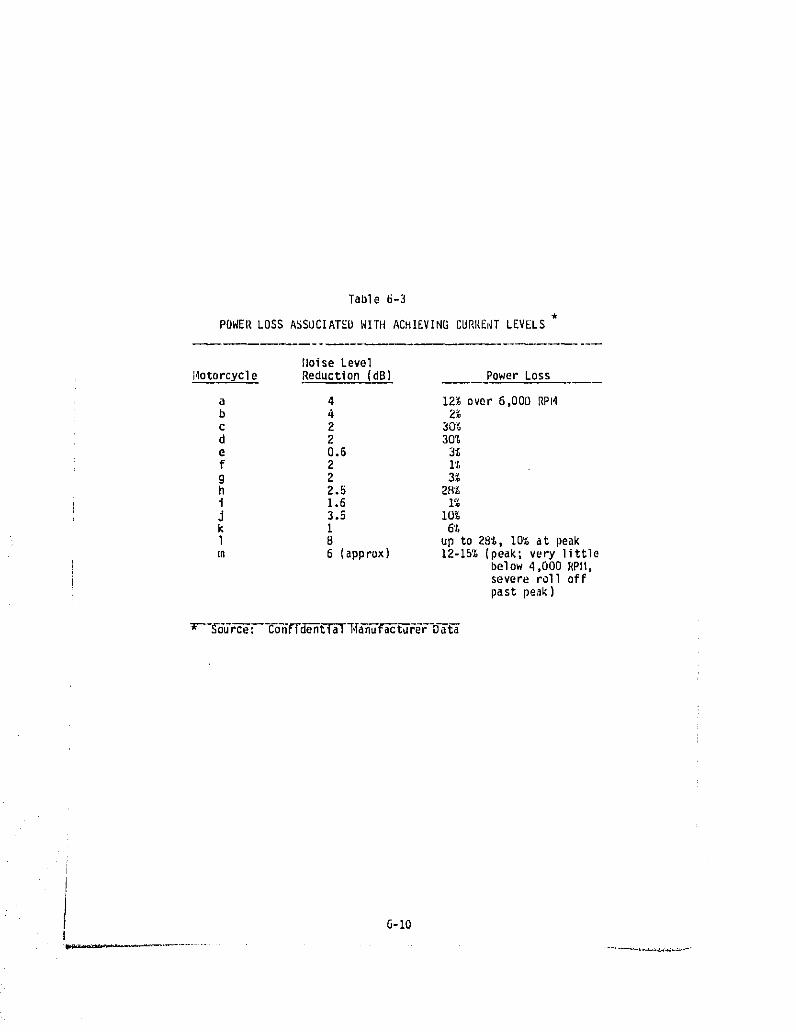
Table 6-3"k
POWERLOSS ASSOCIATEDWITH ACHIEVINGCURLIESTLEVELS
Ooise Level;4otorcycle Reduction(dB) PowerLoss
a 4 12%over6,000RPI4b 4 2%c 2 30%d 2 30%e 0.6 36f 2 i'_g 2 3%h 2.S 2_%i 1.6 14j 3.B 10%k 1 6%l B Up to 2_;, 10% at peakIn 6 (approx) 12-15%(peak;very little
below 4,000 RPII,severe roll off
past peak)
•r-"_6Cr-_'-C_EFFE_-Eti61""f,Ta-'n-6"f'_'_'_Fe'F-o_
6-I0
It shouldbe noted, however, thatconversionfrom 2-stroketo 4-strokeengines could be expectedto reversethis trend somewhatdue to the slightlybetter fuel efficiency of 4-stroke engines.
From the previous section, the following vehicle weight increasesare assumed (as a fraction of total vehicle weight):
Regulatory Level
Over170cc O6dg 83dB 80dB 78dB 75dB
Street: Straightforwardchange 0 2% 5% IU%Major model change I0'_ 15'_" 20%
Off-Road: Straight forwardchange O 2% ._% I0'_I_ajormodelchange - 10% 15% 20_
100-169 cc : One-half of above figuresLess than 100 cc : 0% .ital] levels
Manufacturers supplied very little data on fuel econo_y i_npactsofachievingcurrentor futurenoise levels. The littledata thatwas furnishedindicatedthat the 3 to 4 dB reductionsto achievecurrentlevelsresultedinup-to-15 percentloss in fuel economy,althoughsome _aode]ssho_edno changeor an improvement.Experiencewith trucksand automobilesindicatesthat a I0percent decreasein fuel econo,nyfor a 10 percentweight increaseis a goodassumption,but one whlcb may tend to overstatethe fuel economy penalty.Using this assumption,however, the above table can also serve to indicatethe assumed fuel economy losses at the various regulatorylevelswhen back-pressureand other penaltiesare included.
6.3.3 Maintenancel,,_pacts
Several of tilequi,etingtechniques cited either require additionalmaintenance or make currently required maintenance somewhat more costlyor more time consuming.Principalamong the first of these are the minin_lattention needed to keep a liquid cooling system in working order, andthe additio_almaintenanceassociatedwith a switchfrom 2-stroketo 4-stroke
engines. Complex mounting techniques,additional covers, reduced enginetolerances,valve train complexitiesand enclosedfinal drivewill complicateroutine maintenance.No definitivedataon the aaintenanceimpactsof thesetechniquesare available.For the purposes of analysis the followingaddi-tionalannualmaintenancetiF,le(in hours)is assu_,_d:
Regulatory Level
Over 170 cc 85dB 83dB 80dO 78dB 75o8
Street: Straightforwardchange 0 I/4 3/5 i/2Majormodel change 3/4 7/8 i
Off-Road: Straightforwardchange 0 I/4 3/U I/2 --Major :,1odelchange 3/4 I/8 I --
100-170 cc : One-half of above figuresUnderI00 cc : Zero at all levels
; 6-II
Noise reductionwill affect cost of maintenanceand replacementpartsonly throughincreasedcost for replacementexhaustsystems.
6.3.4 AestheticFactors
To manymotorcycliststhe aestheticimpactsof noisereductiontechnologymay be even more importantthan performanceor cost impacts.Many of theabove techniquescan be expectedto have an adverseimpacton the sleek andsporty stylingof currentmodels.Largermufflers,fralnereconfigurationstoaccomodatelargerair intakesystems,bulkierenginesand liquidcoolingallpose styling problems.Although these factors are unquantiflable,they arefelt to have potentialsales impactsindependentof the cost and performancefactorscltedabove.
6.4 ProductionVariations
The noise levels of all nominally identical surface transportationproductsexhibit a distributioncoveringa range of severaldecibels.SinceEPA's regu]ationsare on a not-to-exceed basis, manufacturer design andproduction must account for this distribution of noise levels to assurecompliancewith the standards.This Is in addition,of course, to factorsaccountingfor tes___varlables. ManufacturerssuppliedEPA with dataon theproductionvariationexhibited by certain of their models. These data aredlsplayed in Table 6-4. From these data it Is concludedthat manufacturerswill have to produce vehiclesat least I I/2 dB below an applicablestandardto accountfor productionvariations.
Table 6-4
PRODUCTIONVARIATION
Manufacturer ProductionVariation(dB)
a ZO"= 3-4
b 1.5 - 2.5
c I(7"=0.25 - 0.6
d 2-stroke: 1.54-stroke: 2.0
e 1.5
Source: HanufacturerConfidentialDat_
6-12
• ,t, E
#,,if( .,_
6.5 "Best Available Technelo_y"
Each of the quieting techniques discussed in Section 6.2 exist either incurrant production models or in prototypes in advanced states of development.As such. their combined use represents "best available technology" for motor-cycles. Large and complex exhaust and intake systems have been demonstratedon a wide variety of production vehicles. Weight. positioning, and perform-ance penalties are the only technological limits to larger and mere complexunits. There are numerousexamples of current motorcycles either with largemuffler volumo in relation to engine displacement or sophisticated muffling ofmulttcyltnder engines. Double-wrapped mufflers have been used in severalmodels and prototy3es, and at least one prototype knownto EPA uses a majorengineframememberfor its air intakereservoir.
Many of the engine quieting techniques discussed previously existin current productionengines. Recent models from the major manufacturershave demonstratedsignificantlyreduced engine mechanical noise. Balanced(90-degree)V-twlnengineshavebeenwell demonstrated,
The past five years of motorcycle developmenthas seen an increasingnumberof multi-cylinderengineswith high specifichorsepower.This specifichorsepower has often been achieved by increased engine speed, which hasresultedin increasedenginemechanicalnoise.The testingprogramdata baseshows the critical importanceof engine speed to engine noise. Decreasedengine speed at a loss of specifichorsepoweris availableto all manufac-turersof highRPM engines.
Liquid coolinghas been well demonstratedon severa]productionmodels,both Z-stroke and 4-stroke. Liquid cooling For a complete line of smaller2-stroke motorcycles(down to 50 cc) has been demonstratedby one Europeanmanufacturer.
Shaft-drivehas been well demonstratedon motorcycles500 cc and above.
Based on an examinationof motorcyclemodelsincorporatingthe techniquesdlscussedabove,EPA has concludedthatthe 78 dB regulatorylevel (SA£ J331a),requiringa 75 dB designlevel,is the levelrepresentativeof "bestavailabletechnology"for streetmotorcycles.The HondaGL-IOO0,generallyacknowledgedto be the quietestlarge motorcycleever produced,already incorporatesmanyof the major techniqueslistedabove (liquidcooling,shaft drive,very largeintake and exhaust systems). Even this motorcyclewould require some smalladditionalquietingto meet a 78 dB levelon a productionbasis.
"Best available technology" for off-road motorcycles is a questionboth of technology and performance. Although motorcycles with off-roadcapabilitycan be built at levels almostas low as for street laotorcycles,such motorcycles demonstrate significant performance penalties. Weight,power, power band width and ground clearanceare all of crucial importanceto off-road motorcycles.Each of these factors on an off-road motorcyclecan be more significantlyimpactedat lower noise levels than for streetmotorcyclesof comparable displacement.The inappropriatenessof applyingliquid cooling to off-road motorcyclesleads to differentlevels of "bestavailabletechnology"for largeand smalloff-roadmotorcycles.Shall off-ruadmotorcycles(under170 cc) are expectedto be able to achieve
6-13
iT
the same levels achievable by their street counterparts. Large off-roadmotorcycles,however, without the option of liquid cooling cannot achievetilesame levels as their street counterparts(exacerbatedby the fact that,neststreet motorcycles over 170 cc have multicylinder engines, whereasoff-road motorcycles must be single cylinder). Both small and large off-roadmotorcycles can currently meet the B6 dB level. To meet levels at 80 dB andlower,conversionfrom2-stroketo 4-strokeenginesmay be necessaryfor largeoff-roadmotorcycles,An 82 dB level can be met by largeoff-roadmotorcycleswithout conversion to 4-stroke engines. EPA nas concluded that this 80 dBregulatory level constitutes "best available technology" for the largeoff-road motorcyclesand 78 dB for small off-roadmotorcycles.It is under-stood that although these levels are achievable, the perfor,aanceof large2-stroke off-road motorcycles will be reduced significantly in many cases.
Although all of the techniquesconstituting"best availabletechnology"exist in production or prototype motorcycles, not eli manufacturers have thecapability of incorporating them into their motorcycles. Particular problemsexist with manufacturers that have uniquely identlfiable engine types that canbe fundamentally changed only with a serious impact on marketing position(Harley-Davidson,BMW, MoteGuzzi, Oucatl),manufacturerswhose productshavebeen developed from racing motorcycles and depend on high performance(Laverda) smaller manufacturers of high-performance off-road motorcycles(Can-An,Husqvarna,gultaco,etc.) and small manufacturerswithoutlarge R&Dcapability (NVT Motorcycles and the very small U.S. manufacturers).
6.6 Lead Times
In the absenceof certificationfor air emissions,manufacturersgenerallyindicated the following lead times were necessary to make changes on anindividualmotorcyclemodel (total time, drawingto production): Changes toexhaustor air intakesystemthat do not requireframeor engineredeslgn--oneyear; changesrequiringframe redesignor minor engineredeslgn--twoto threeyears;major engine redeslgn--fourto fiveyears;newenginemodel,new engineconcept, conversion to 4-stroke englne--five to six years (and up). LimitedR&D resources,however,allow redesignof only a few models per year. Majormanufacturerswith extensiveproductlineswould requireadditionaltime to beable to redesignmodels on a more or less orderly basis. In addition,airemissioncertificationcan add one half to one year to requiredlead times formajor manufacturersdue to requireddurabilityruns._anufacturersemphasizedthe need to coordinateeffective dates of these regulationsto eliminateunnecessaryrecertlflcatlonfor air emisslonswhen redesignfor noise purposestakes place.
Based on this information the following lead times are felt to be achiev-able by major manufacturers,consistentwith orderlyredesignof an extensiveproduct line (years from promulgation):
Regulatory Level {SAE J33Ia_)
86 dB 83 dB 80 dB 7_ dB 75 d6
Street: Straightfomtardchange -- i 2 4 6Majormodelchange .... 4 6 10
Off-Road: Straightforwardchange 1 2 4 6 --Meiermodelchange -- 4 6 I0 --
6-14
,__+ ............ _ ................ , .................. ,, ,,, 5,+,_ _.+++
An accelerated schedule of lead times can be considered which wouldrequire simultaneous redesign of :i_ny models. Manufacturers insisted thatresources were unavailable for orderly redesign on thls basis, The followingis an "accelerated" schedule of lead times which inight be acilievable atconsiderably increased R&D costs;
Regulatory Level (SAE J331a)
_6 d[_ 83 dB 80 dB 78 dg 75 dg
Street: Straight forward change .... ] 3 5Major modelchange .... 3 5 7
(Jff-Road; Straight forward change i 2 3 5 --Major Hlodel change -- 3 5 7 --
Different manufacturers, of course, have different lead time require-ments, Noise levels of current models (particularly the mechanical contri-butlons), available funds for R&D, size of product line, and familiarlty with4-stroke or liquid cooling technology, all have a bearing on individual leadtime requirements. The "noriaal" lead time schedule cited above is mostappropriate for the major Japanese manufacturers other than Honda. The noiselevels of Honda's current product line would probably allow somewhat shortertimes, ilarley-Davidson,Can-Am and the Eurupean manufacturers would all beseverely tested to meet the same time schedule as the major Japanese manu-facturers, for a variety of reasons relating to unique engine designs,exclusive use of 2-stroke engines or culnpany size (availability of R&Dcapital). If these other manufacturers would be strained at the "aor_l"schedule, it is reasonable to conclude that they would probably not be able tocomply with the "accelerated" schedule,
6.7 Deterioration of Motorcycle iVoiseLevels
I1ost manufacturers suppl_ed ]hnited data on experience with motorcyclenoise levels during mileage and time accumulation. Several engineeringreasons were discussed as to why motorcycle noise levels ought to decreasewith usage, at least at first. After the initial breakin period, mechanical"Interaction noise can abate as parts fit together better. Muffler noise candecrease as carbon build-up seals small openings left frowntilemanufacturingprocess.
Properly designed all-metal mufflers can last a considerable periodof time before noise level deterioration occurs, depending on climate andoperating conditions. Properly designed muff]ors with glass inserts canalso last a significant length of time, although poorly designed ones candeteriorate rapidly. European standards make a distinction between mufflersthat direct exhaust gases through Fibrous material and mufflers that reflectexhaust gases into but not througn the fibrous ele,_ents. Some manufacturersspecify replseement af fibrous elements or replacement of the exhaust systemwhen deterioration occurs At least one manufacturer supplies free replace-ment floerglass for his mufflers.
': 6-15
!:
In general, manufacturers supplied no engineering reasons why a properlymaintained and operated motorcycle should experience significant noise e_,lis-sion deteriorationover its lifetime,"Properlymaintained"in this contextmeans replacementof parts (includingsuch majorparts as mufflers)as neededaccordingto the operationinstruction.Deteriorationdata for a few modelsis displayed in Table 6-5.
6.8 Relationship to Air Emission Control
A number of manufacturers expressed serious concerns that at strictlevels of air emissioncontrols there may be a significanttradeoffbetweenair pollution control and noise control. At the levels established in CPA'sfinal rule on motorcycle air emissions this concern has abated somewhat.
The higher temperatures of exhaust gases due to air emission controlmay have a dual effect On exhaust noise emissions.Higher temperaturegasis less dense, requiringa higher rate of flow for equivalentperformance,In addition,the highertemperaturegas i_asmore inherentenergywhich mustbe dissipated. Both of these effects would tend to raise exhaust noise.One manufacturercited a study on automotiveair emissionand noise controlwhich showednoiselevel increasesof up to 4 dg at strictlevelsof emissionscontrol.
A second effect of higher engine temperaturesis the need for largersurface areas to dissipate heat from an air cooled engine. These largersurfaces, in turn, can increase noise radiation. Liquid cooling, of course,would in large part counteract the higher engine and exhaust temperatureincreasesdue to air emissioncontrol,
One manufacturer indicated that the increased length and complexityof an air intake path could cause fluctuations in air/fuel mixture witlla correspondingadverseimpacton air emissions.
6.9 Technology to Achieve Noise LevelsBased on DifferentMeasurementMethodologies
Technology and costing informationsupplied to EPA by manufacturersand developed by EPA contractors have been based on study levels specifiedin terms of the SAC d331a test procedures.As discussedin Section 3, theF-76a test procedure is felt to be statistically equivalent to SAE J331aacrossa broad rangeof motorcyc]esalthoughindividualmodelsmay vary up ordown by several dB. The manufacturer-supplledinformation was based onseveral models of each of the manufacturer's lines. The SAE J331a and F-76anoise levels of each of the models used for these purposes were compared todetermine whether these vehicles represented anomalous cases in theSAC J331a/F-76are]ationship, Of 15 models used for technologyand costingpurposes,ten showeddifferentialsof less than 2 da, one showeda differen-tial of 2 dB, and four showed differentialsof 3 d_. However, the modelsdisplaying differentials of 2 dB or greater showed no consistent pattern withas many higherunderone procedureas the other.The cost infor_latlonin thesucceeding chapters was checked carefully and it was found that overall valuesdo not change significantlyas a study level specifiedin termsof SAE d331ais translatedintoa study level specifiedin termsof F-76a.
i 6-16
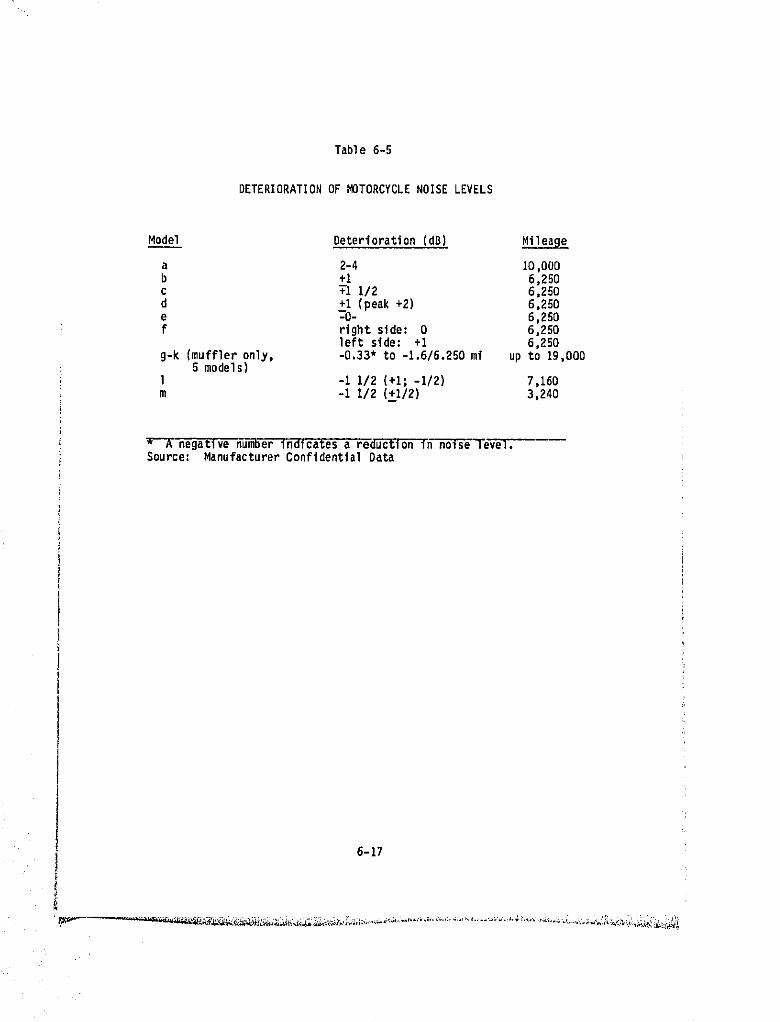
Table 6-5
DETERIORATIONOF MOTORCYCLENOISE LEVELS
Model Deterioration(dO) Milea9e
a 2-4 10,000b +I 6,250c +-II/2 6,250
+1d To.(peak+2) 6,250e 6,250f right side: 0 6,250
left side: +I 6,250g-k (muffleronly, -0.33"to -1.6/6.250mi up to 19,000
S models)l -1 1/2 (+1; -1/2) 7,160m -i I/2 (+_1/2) 3,240
* A negatlvenumberIndlcatesa reductionin noise ]eve].Source: ManufacturerConfidentlalData
6-17
SECTION 7
COSTSOF COMPLIA_JCE
SECTION 7
COST OF COMPLIANCE
7.1 Unit Cost Increases
In complying with the motorcycle noise regulation,manufacturerswillexperienceincreasedcosts of manufacturing(production)as well as the costsof research and development,tooling, and tasting/certiflcation.Thls in-crease in costs will lead to increasesin the unit cost (price)of new motor-cycles. The price of new replacementexhaustsystemswill also increaseforsimilar reasons.
Unit cost increasesare expected to vary with the type (function)andsize category of motorcycle, and the stringencyof the applicable noisestandard itself, The most significantdifferenceIn compliancecosts willappear when vehicles,requiringrelatively"straightfo_ard" model changes,are comparedwith thoserequiring"major"modalchanges.
Model changes consideredstralght forward,include increasingmufflervolume,addingliningto the alr-intakesystem,or stiffeningfins and webs ofthe engine casing. Majormodel changes includethe use of any noisecontroltechniquesthat require extensiveR&D, substantialmodel redesignand pro-duction toolingmodifications,or significantincreasesin unit manufacturingcosts. A more comp]ete listing of motorcyclenoise control techniquesisprovidedin Table 7-I. Thesewere citedby manufacturersas ones necessarytomeet the lower (more stringent) study levels.
There is a high degreeof uncertaintyas to which motorcyclemodels(andfor which monufacturers)major changes will he necessary. As a result,twocases were analyzed;(1) the nominal(expected)case, and (2) the worst case.With some assumptions,data fro[nmanufacturers(Includingcurrentmotorcyclenoise source data} were used to estimate the fraction(expressedin percent}of motorcycle productionrequiringmajor modelchangesat variousregulato_levels. The resultsfor the two cases are presentedin Table7-2.
For streetmotorcycles,the percentagesin Table 7-2 apply to all sizecategories above I00 cc (no major model changesare expectedbelow 100 cc)For off-road motorcycles,however, differentpercentagesapply to differentsize categories. This is due to the limiteduse to which liquidcoolinghasbeen used for off-roadmotorcycleenginesand the factthatvirtuallyall suchengines are slngle cylinder. Larger off-roadmotorcyclesare expected torequiremajor model changes(4-strokeconversions)at hlgherregulatorylevelsthan smaller off-road types. The esti_nateddistributionof percentagesofmajor model changes for off-roadmotorcyclesare shown In Table 7-3 (worstcase percentagesare in parentheses),
By using the estimatedpercentagesfor majornmdel changesin Tables7-2and 7-3, the nominaland worst case total unitcost increasescan be calcul-atedonce the individualcostelements(e.g,,formanufacturing,R&O, tooling,testing and compliance)are known for each vehicle _pe and displacementcategory. Total costs are summarizedin Table 7-4. Furtheraspectsof totalunit costs and costelementbreakdownsare givenin Section7,1.1.2.
7-1
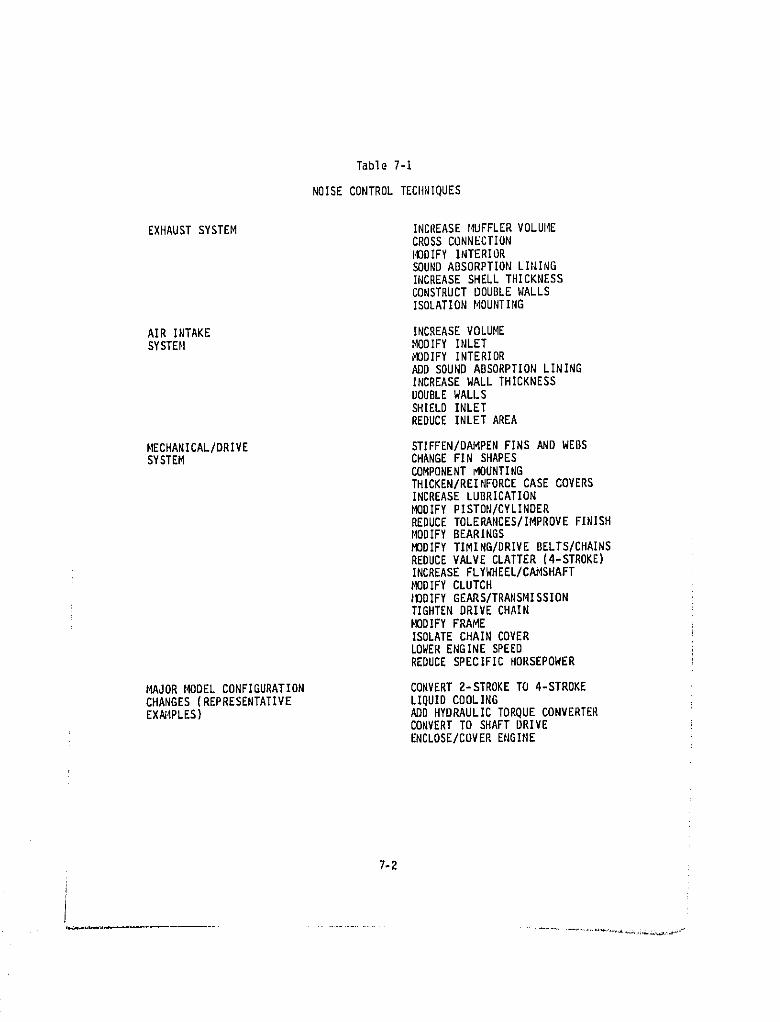
Table 7-I
NOISE CONTROL TECHNIQUES
EXHAUSTSYSTEM INCREASEMUFFLERVOLUMECROSS CONNECTIONMODIFY INTERIORSOUND ABSORPTION LININGINCREASE SHELL THICKNESSCONSTRUCT DOUBLE WALLSISOLATION MOUNTING
AIRINTAKE INCREASEVOLUMESYSTEM MODIFYINLET
MODIFY INTERIORADD SOUND ABSORPTION LININGINCREASE WALL THICKNESSDOUBLE WALLSSHIELD INLETREDUCE INLET AREA
MECHANICAL/DRIVE STIFFEN/DAMPENFINS AND WEBSSYSTEM CHANGEFINSHAPES
COMPONENT I_OUNTINGTHICKEN/REINFORCECASE COVERSINCREASELUBRICATIONMODIFYPISTON/CYLINDERREDUCETOLERANCES/IMPROVEFINISHMODIFY BEARINGSMODIFYTIMING/DRIVEBELTS/CHAINSREDUCE VALVE CLATTER (4-STROKE}INCREASEFLYWHEEL/CAMSHAFTMODIFY CLUTCHMODIFYGEARS/TRANSMISSIONTIGHTEN DRIVE CHAINMODIFY FRAMEISOLATE CHAIN COVERLOWERENGINESPEEDREDUCESPECIFICHORSEPOWER
MAJOR MODEL CONFIGURATION CONVERT2-STROKETO 4-STROKECHANGES(REPRESENTATIVE LIQUIDCOOLINGEX_4PLES) ADDHYDRAULICTORQUECONVERTER
CONVERT TO SHAFT DRIVEENCLOSE/COVERENGINE
7-2
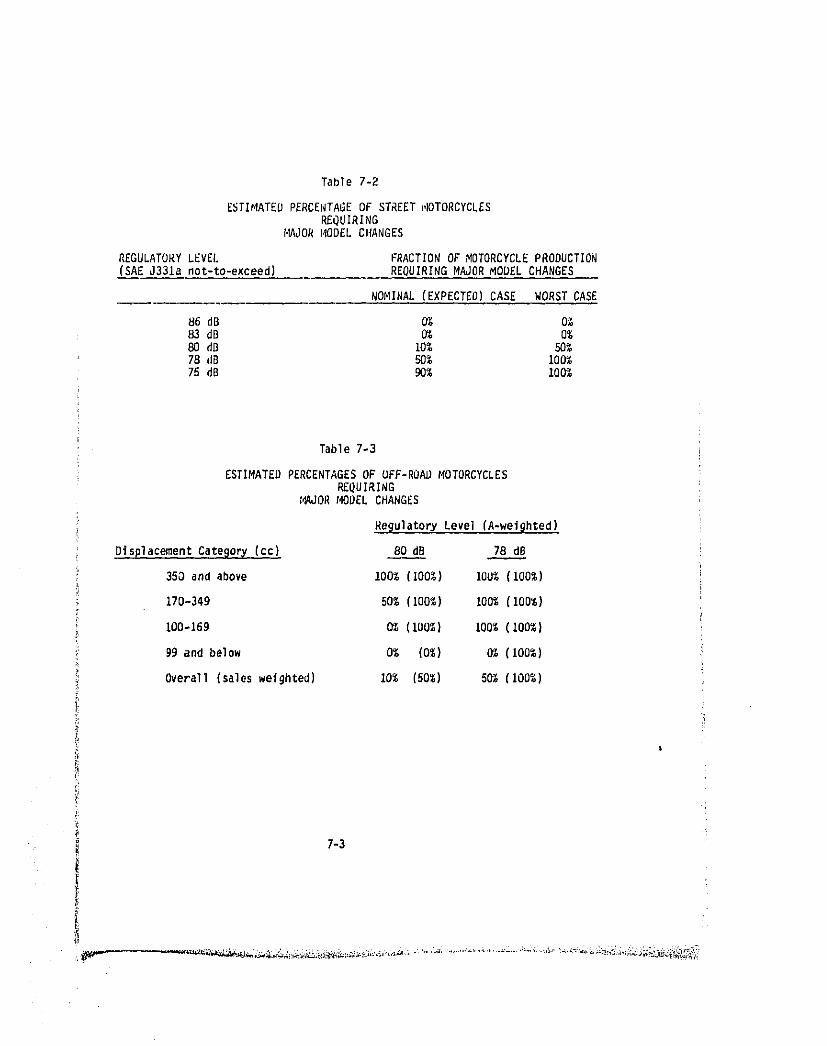
Table 7-2
ESTIMATEDPERCENTAGEOF STREET_,IOTORCYCLESREQUIRING
MAJOR MODEL CHANGES
REGULATORYLEVEL FRACTIONOF MOTORCYCLEPRODUCTION(SAEJ331a not-to-exceed) REQUIRINGMAJORMODEL CHANGES
NOMINAL(EXPECTED)CASE WORST CASE
86 dB 0% 0%83dB 0% 0%80dD 10% 50%78dB 50% 100%75 dB 90% 100%
Table 1-3
ESTIMATEDPERCENTAGESOF UFF-ROADMOTORCYCLESREQUIRING
t_JOR MODEL CHANGES
RegulatoryLevel (A-welghted)
DisplacementCate9or7(cc} 80 dB 78 dB
350 and above 100% (I00%) 100%(100%)
170-349 50% (100%) 100%(100%)
100-169 O_ (IOO%) 100%(100%)
99 and below 0% (0%) 0% (100%)
Overall(salesweighted) 10% (50%) 50% (100%)
7-3
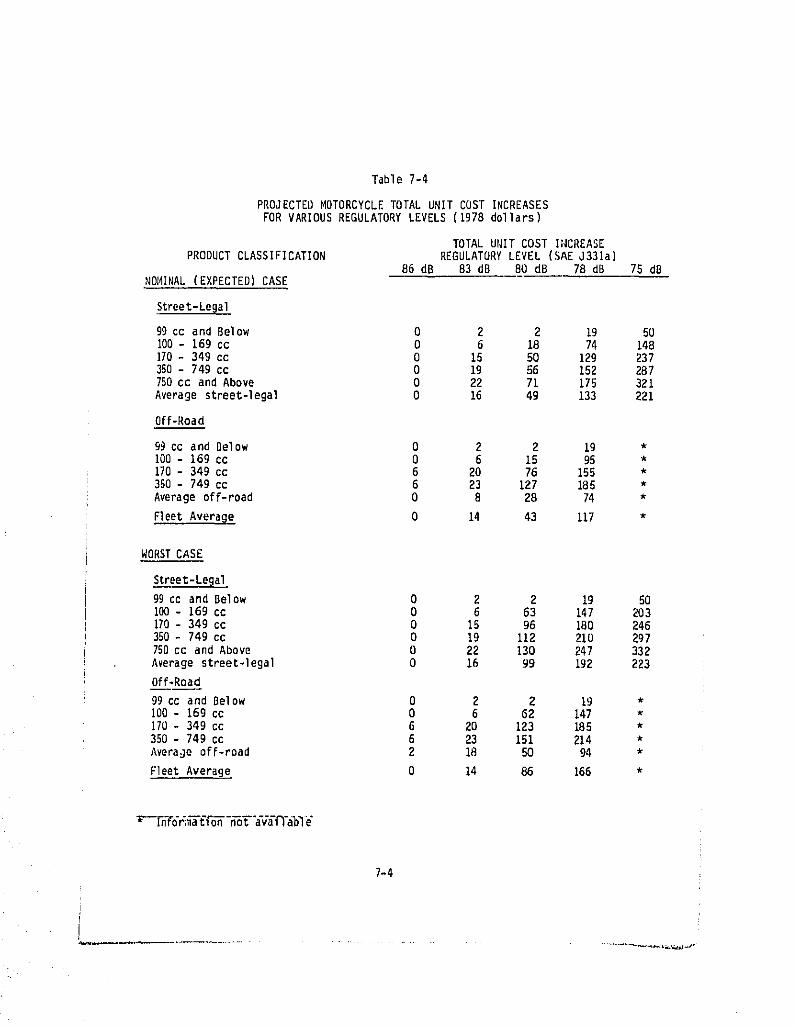
Table 7-4
PROJECTEO MDTORCYCLE TOTAL URIT COST INCREASESFOR VARIOUS REGULATORY LEVELS (1978 dollars)
TOTAL Ut_ITCOST INCREASEPRODUCTCLASSIFICATION REGULATORYLEVEL (SAEJ331a)
86dB 83dB 80 dB 78 dB 75dBNOI_INAL(EXPECTED) CASE
Street-LeBal
g9ccandBelow 0 2 2 19 50100- 169cc 0 6 18 74 148170- 349 cc 0 15 50 129 237350- 749 cc 0 19 56 152 287750cc and Above 0 22 71 175 321Averagestreet-legal 0 16 4g 133 221
Off-Road
g9cc and Below 0 2 2 19 *100- 169 cc O 6 15 95 *170- 349 cc 6 20 76 155 *350- 749 cc 6 23 127 185 *Averageoff-road 0 8 28 74 *
FleetAveraBe 0 14 43 117 *
WORST CASE
Street-Legal
B9cc and Below 0 2 2 Ig SO100-169cc 0 6 63 147 203170-349cc 0 15 g6 180 246350- 74g cc 0 Ig 112 210 2g7750cc and Above 0 22 130 247 332Averagestreet-lega] 0 16 99 192 223
Off-Road
99cc and Below 0 2 2 ig *100- 169 cc 0 6 62 147 *170- 349 cc 6 20 123 185 *350- 749 cc 6 23 151 214 *Averageoff-road 2 18 50 94 *
FleetAverage 0 14 86 166 *
7-4
,w,,w_ • .
The methodologiesused to compute i_tdividualcost elementsare sitoilarwith the exceptionof the testlng/certlficatlonelement. Generally,R&D,tooling,and testlng/certificationcosts tendto be uniformfor a givenregu-latory level for all motorcycle sizes. The manufacturingcost increaseshowever, tend to become higher with increasing motorcycle size and are higherfor off-roadmotorcyclesthan street types. Manufacturingcosts accountforbetween6U percentand 70 percentof totalunitcost.
7.1,1 Manufacturing Unit Costs
Manufacturingunit cost increases are those costs directlyrelatedtothe use of noise control techniquesthat impact fabricationand assembly.As seen in Table 7-1, they generally relate to the exhaust, alr-intake ormechanical-drlve systems,
7.1.1.1 Manufacturer Estimates
Each major manufacturer supplied EPA with estimates of manufacturingunit cost increases for specific models to meet specified study levels (not-to-exceed standards). They made the major motorcycle model distinctions andtheir datawere based on the SAE J331a testprocedure.
Each manufactureremphasizedthat mns_ estimatesat the lower levelswere based nn engineering judgment alone, and not on operational prototypemodels. They indicatedthattherewas no guaranteethatindividualtechniquescited would achieve the specified study level. Manufacturers addresseddifferent ultimate levels of control depending on their assessment of feasi-bility or ability to judge the effectiveness of individual techniques.Manufacturerestimatesare summarizedin Figure7-i.
Manufacturersalso providedcost estimatesfor variousdiscretestepsinreductionsin exhaust,air-intakeand mechanical/drivesources, Figures7-2,7-3 and 7-4 show costs associatedwith each of the subsources,whereavail-able.
Discussion of Data
There are a numberof explanationsfor the scattershown in Figure7-I:
(a) In general,costs increasewith motorcyclesize,becausenoisegeneratingcapability tends to increase with slze, and the costs of affected components(e.g., exhaust systems, mechanical components) increase with size,
(b) Since subsource noise level contributions differ widely from model tomodel (see Section 6) the techniques required to meet specified levels varyconsiderably.
(c) Since there are a wide variety of techniqueswhich can be utilizedinreducing the noise level from a given subsource,manufacturersprojecteddiffering techniques to be used, with attendant differences in costs.
(d) Major model changes were deemed necessary at different study levels.Data points denotedby an asterisk indicatethe study level for which major_ode] changes were assumed,
7-g
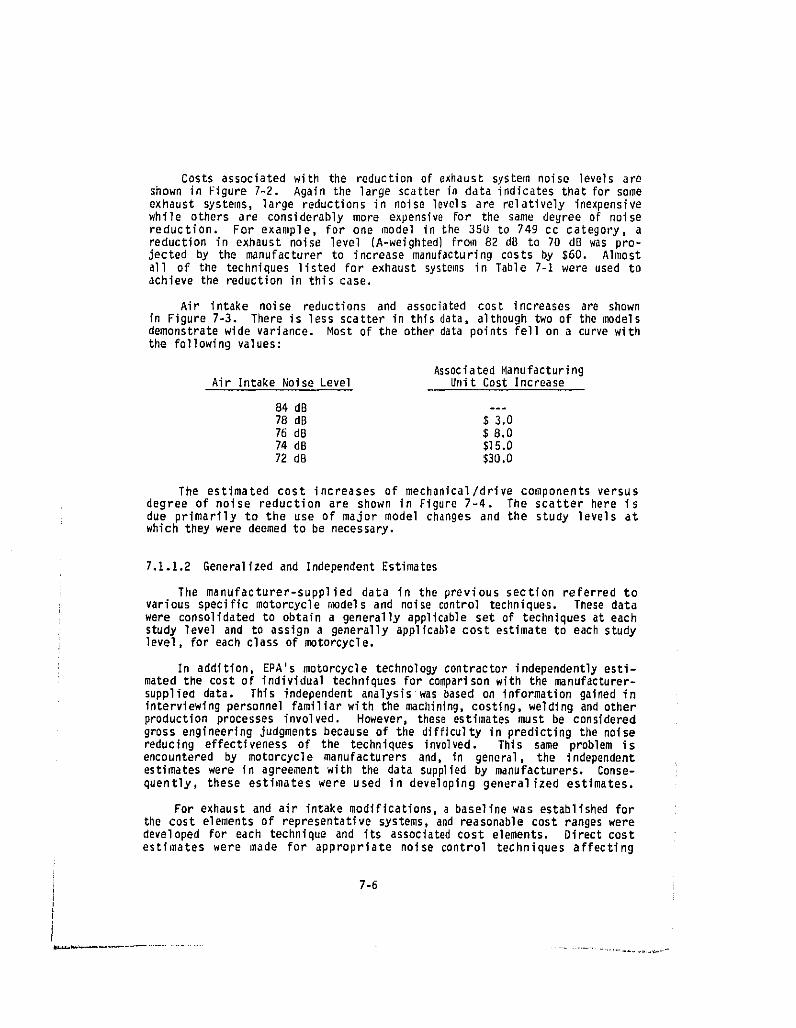
Costs associatedwith tilereductionof exhaust system noise levelsareshown in Figure 7-2. Again the large scatterin data indicatesthat for someexhaust systems,large reductionsin noiselove]sare relativelyinexpensivewhile others are considerablymore expensivefor the same degree of noisereduction. For example, for one model in the 350 to 749 cc category, areductionin exhaust noise level (A-weighted)from 82 dO to 70 dO was pro-jected by the manufacturerto increasemanufacturingcosts by $50. Almostall of the techniqueslisted For exhaust systemsin Table 7-i were used toachieve the reduction in this case.
Air intake noise reductions and associatedcost increases are shownin Figure7-3. There is less scatterin thisdata,althoughtwo of the modelsdemonstrate wide variance. Most of the other data points fell on a curve withthe following values:
Associated ManufacturingAir IntakeNoiseLevel Unit Cost Increase
84dB ---78dB $3.076dB $8.074 dB $15.072dB $30.0
The estimated cost increases of mechanical/drivecomponents versusdegree of noise reduction are shown in Figure 7-4. The scatter here isdue primarily to the use of major model changes and the study levels atwhich they were deemed to be necessary.
7.1.1.2 Generalizedand IndependentEstimates
Tilemanufacturer-supplied data in the previous section referred tovariousspecificmotorcyclen_dels and noisecontroltechniques. Thesedatawere consolidatedto obtaina generallyapplicableset of techniquesat eachstudy level and to assigna generallyapplicablecost estimateto each studylevel,for each class of motorcycle.
In addition,EPA's motorcycletechnologycontractorindependentlyesti-mated the costof individualtechniquesfor comparisonwith the eanufacturer-supplieddata. This independentanalysiswas based on informationgainedininterviewingpersonnelfamiliarwith the machining,costing,welding andotherproductionprocessesinvolved. However, theseestimatesmust be consideredgross engineeringjudgmentsbecauseof the difficultyin predictingthe noisereducing effectivenessof the techniques involved. This same problem isencounteredby motorcycle manufacturers and, in general, the independentestimateswere in agreementwith the data suppliedby manufacturers. Conse-quently, these estimates were used in developinggeneralized estimates.
For exhaustand air intakemodifications,a baselinewas establishedforthe cost elementsof representativesystems,and reasonablecost rangesweredevelopedfor each techniqueand its associatedcost elements. Directcostestimates were made for appropriate noise control techniques affecting
7-6 i
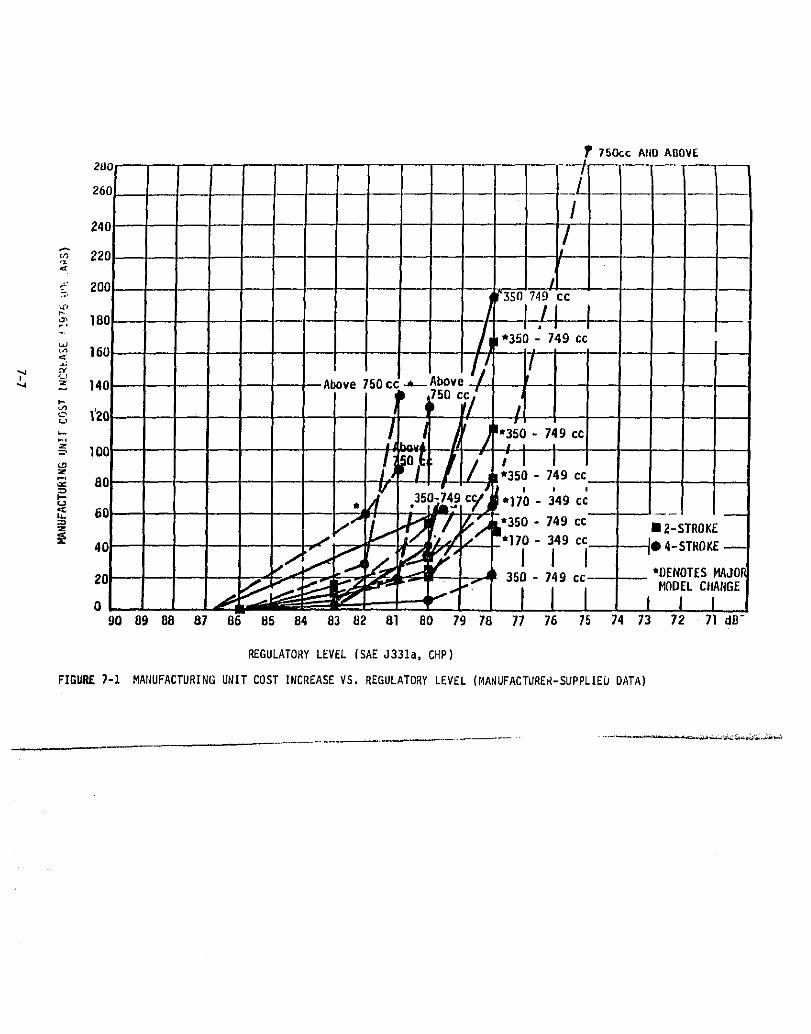
750cc At_OABOVE2_0 /
26C __/
!240 /
220 .- !,¢¢
-:.' _',350749 cc
. f¢l I,.. /j *350 - 749 cc
° /J /.A;
-. _. 14C Above '50cc * A_ve._/_U
_ , "i/ II• 11 ,
RC br r II 350- 749 cc
" ,4 o_,4_,g ' ' 3' ',j , 35 c 1"170- 49 cc< JL,. 6C ......= II 2- STROKE
-'170- 349cc
_ 350 - 749 cc *OENOTE5HAJORo _. - "I" I I I J , ,90 89 88 87 86 85 84 83 82 81 80 79 78 77 76 75 74 73 72 71 riB-
REGULATORYLEVEL (SAEJ331a,CHP)
FIGURE7-1 MANUFACTURINGUNIT COST INCREASEVS. REGULATORYLEVEL (r4ANUFACTURER-SUPPLIEbDATA)
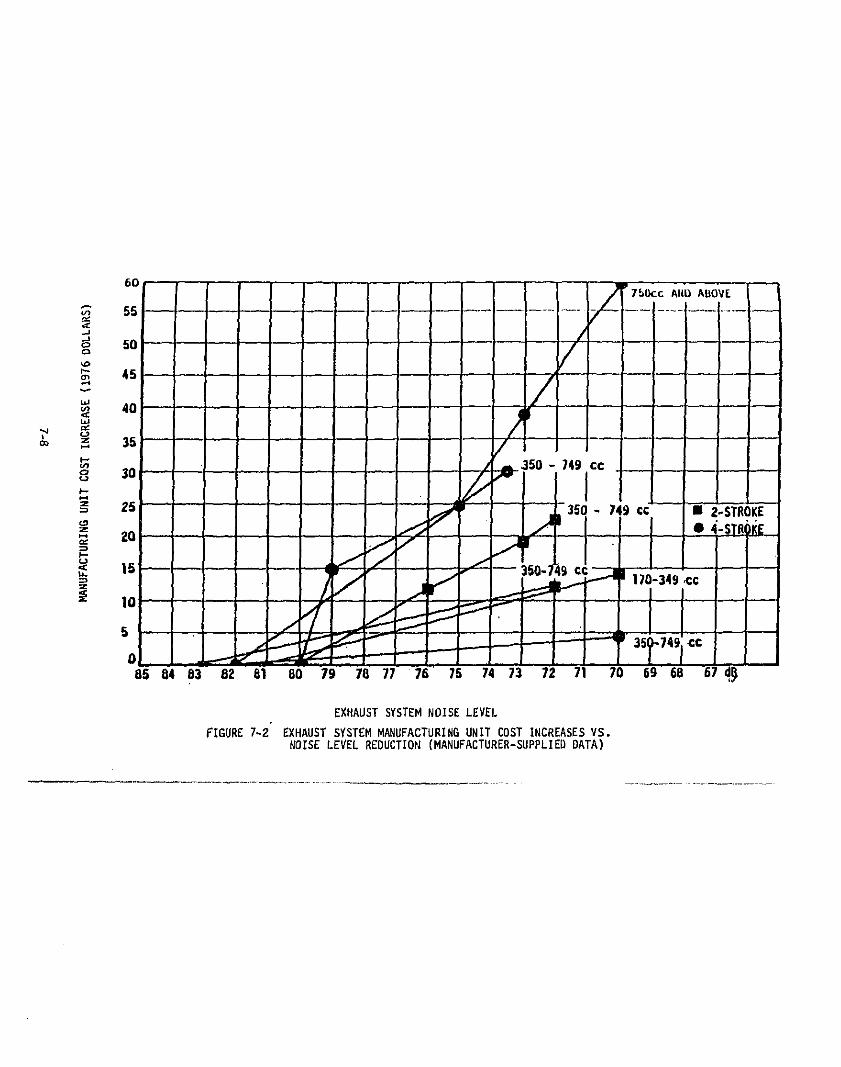
MANUFACTURINGUNITCOSTINCREASE(1976DOLLARS)
-¢_-'¢
x
_alm
nr,
OlD
_;-
I
"°I1
_rq
i,_
6-L
r4ANUFACTURINGUNITCOST
INCREASE(1976DOLLARS)
'rqt.,,J
,---_
N-_
N
i"-
-4_-
4_-
i
N"_
N
r_c_ mm
_2_m
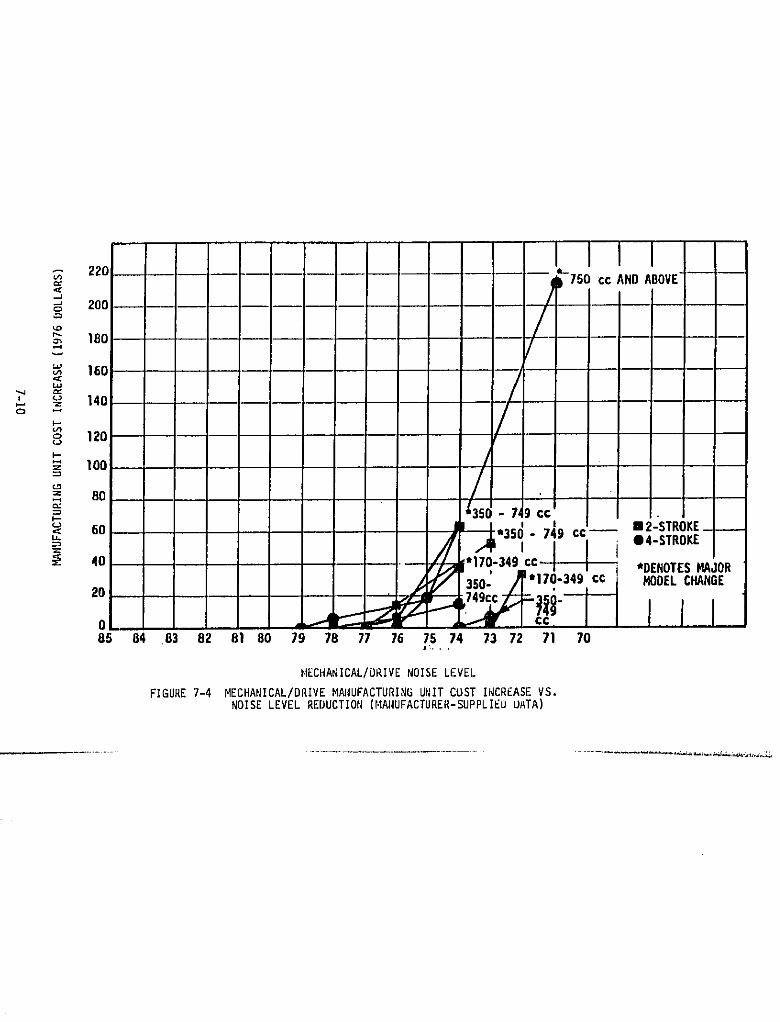
22¢ *'-750 cc ANDABOVE
m 18o
160
/,.,-,:-'-"=140 /o 120t,.)
_ 80 '- 7,9ccI I
I'--
_< 4060 _ "170-349_'350-cc_749 cc e4-STROKE12-STROKE3.: ]'.17o,-349_ "DE,OTES_,'0_
MODELCHANGE
o _ _ co.85 84 83 82 81 80 79 78 77 76 75 74 73 72 71 70
HECHANICAL/DRIVENOISELEVEL
FIGURE7-4 MECHANICAL/DRIVEMN_UFACTURINGUNITCOSTINCREASEVS.NOISE LEVEL REDUCTION (MANUFACTURER-SUPPLIE_ UATA)
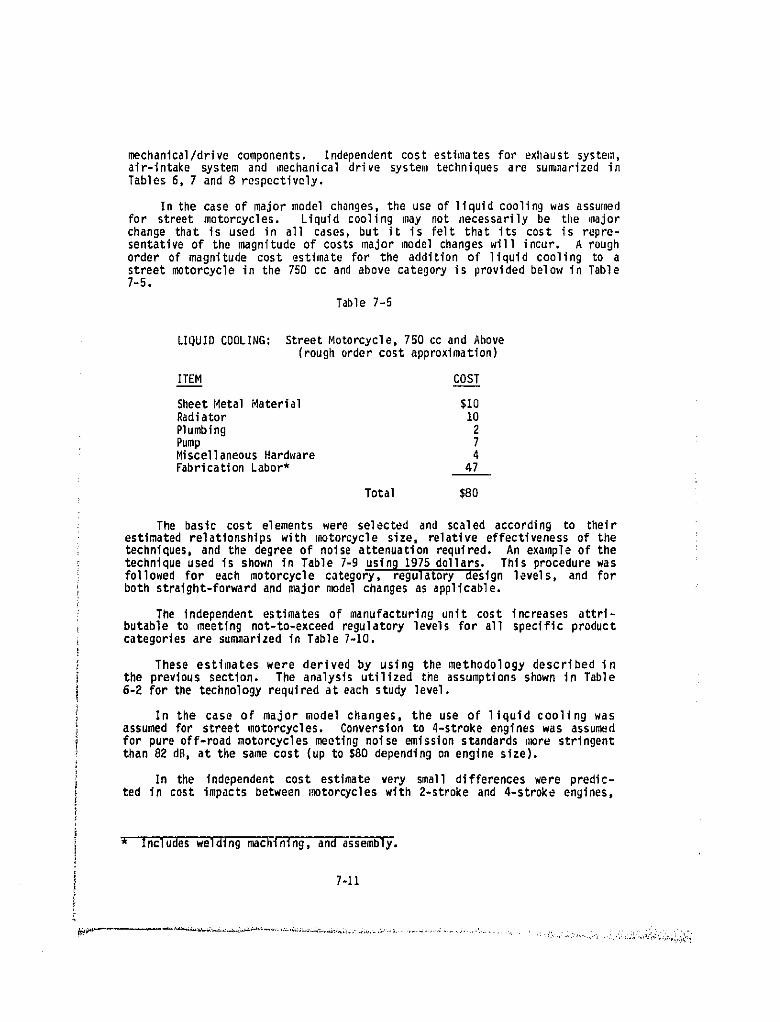
mechanical/drive components. Independent cost estimates for exhaust system,air-intake system and mechanical drive system techniques are su_narized inTables 6, 7 and 8 respectively.
In the case of major model changes, the use of liquid cooling was assuredfor street motorcycles. Liquid cooling may not necessarily be the majorchange that is used in aI1 cases, but it is felt that its cost is repre-sentative of the magnitude of costs major model changes will incur. A roughorder of magnitude cost estimate for the addition of liquid cooling to astreet motorcycle in the 750 cc and above category is provided below in Table7-5.
Table 7-5
LIQUIDCOOLING: StreetMotorcycle,750 cc and Above(roughordercost approximation)
ITEM COST
SheetMetal Material $I0Radiator 10
Plumbing 2Pump 7MiscellaneousHardware 4FabricationLabor* 47
Total $80
The basic cost elements were selected and scaled according to theirestimatedrelationshipswith motorcyclesize, relativeeffectivenessof thetechniques,and the degree of noise attenuationrequired. An exampleof thetechniqueused is shown in Table 7-9 usinB 1975dollars. This procedurewasfollowed for each motorcycle category, regulatorydesign levels, and forboth stralght-forwardand majorn_delchangesas applicable.
The independentestimatesof manufacturingunit cost increasesattri-butable to meeting not-to-exceedregulatorylevelsfor all specificproductcategoriesare su_narizedin Table7-10.
These estimates were derived by using the methodology described inthe previous section. The analysisutilized the assumptionsshown in Table6-2 for the technologyrequiredat eachstudy level.
In the case of major model changes, the use of liquid cooling wasassumed for streetmotorcycles. Conversionto 4-strokeengineswas assumedfor pure off-roadmotorcyclesmeetingnoise emissionstandards_imrestringentthan 82 dB, at the same cost (up to $80 dependingon enginesize).
In the independentcost estimate very small differenceswere predic-ted in cost impactsbetween motorcycleswith 2-strokeand 4-stroke engines,
* Includesweldingmachining,and assembly.
7-11
I_x_ ....... _'_'_--_'_'_'_L'_''*'_='_L_' ";'_ "_' -_!_" • • ' _ ;" "'_ '" .... • ' •: _t : : _ "_ /•_-'
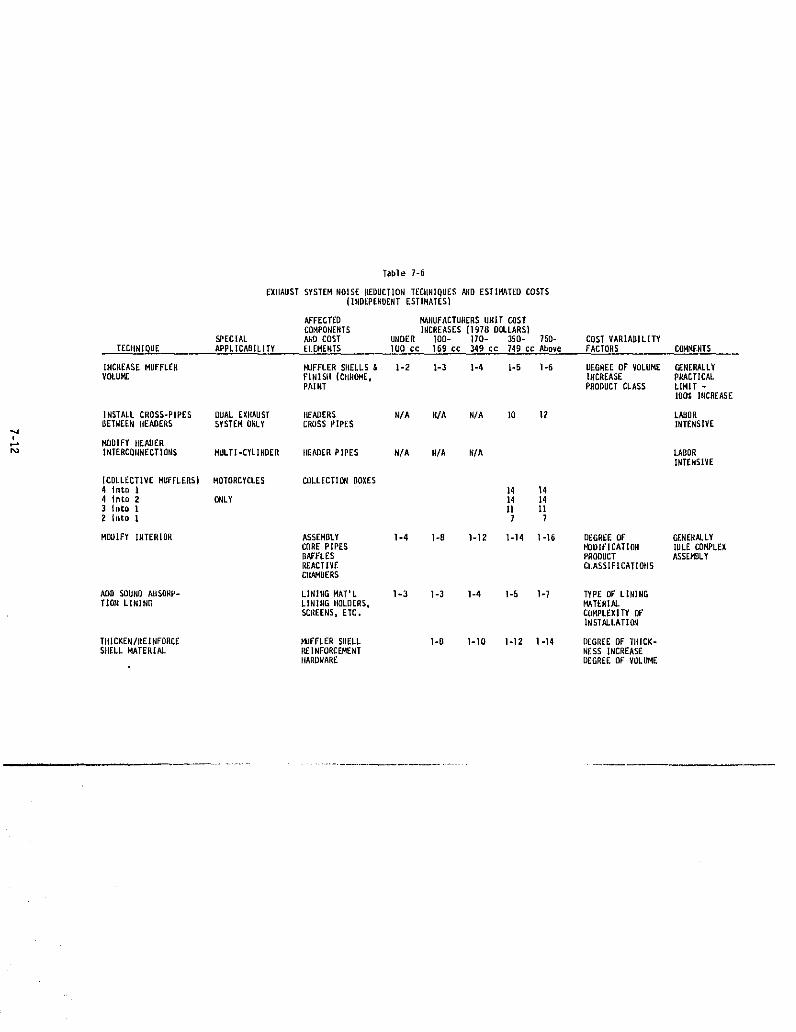
Table 7-6
EXHAUSTSYOTEMNOISE REDUCTIONTCCDOXOUCSANDESTIMATEDCOSTS(INDEPENDENTESTIHATESI
AFFECTED MANOIFACTUI1COSIJOIT COSTCOMPONENTS ]OCOEASEO(1978 DOLLARS)
,_EC[AL /_0 COST UNDER 100- 170- 350- 750- COSTVARIABILITY
TECIINII_OE APPLICAOILITY ELEMENTS 100 cc 169 cc 349 cc 749 cc Above FACTORS COMMENTS
INCREASEMUFFLER I,UFFLER SRELL5 & C-2 1-3 1-4 I-5 1-6 DEGREEOF VOLUME RENERALLYVOLUHZ FINISH (CHROME. INCREASE pRACTICAL
PAINT PRODUCTCLASS LIMIT -]OI)/, INCREASE
INSTALL CROOS-PIPES DUAl. EXHAUST READERS N/A N/A R/A ]Q I2 LABORBETWEENOEADERO OYSTEMONLY CROSSPIPES INTENSIVE
_-, HOOIFY HEADER]NTERCODNECTIOOO MULTI-CYLINDER REA,OER PIPES N/A N/A N/A LABOR
INTENSIVE
(COLLECTIVE MUFFLERS) MOTORCYCLES COLLECTIONBOXES4 Into ] I4 144 Into 2 ONLY I4 I43 )nOD l II 11Z intoI 7 7
MODIFY INTERIOR ASSEHOLY 1-4 I-8 I-1E 1-14 1-16 DEGREEOF" GENERALLYCOREPIPES FbD]FICATIO0 IDLE COHPLEXOAFE'LES PRODUCT ASSCHgLYREACTIVE CI.ASSIF[CATICMSCN_OERS
ADO SOUND ADSORp- LlNIflGMAT'L I-3 I-3 I-4 1-5 I-7 l_pE OF LINING
TION LININO LINIOG UOLDERS, MATERIALSCREENS, ETC. COMPLEXITY OF
[NSYALLATION
TNICKEN/OEINFOOCE _'IJFFLERSNELL l-B 1-10 1-12 1-IN DEGREEOF TNICK-SHELL MATERIAL REINFORCEMENT MESS INCREASE
OARDWARE DEGREEOF"VOLUME
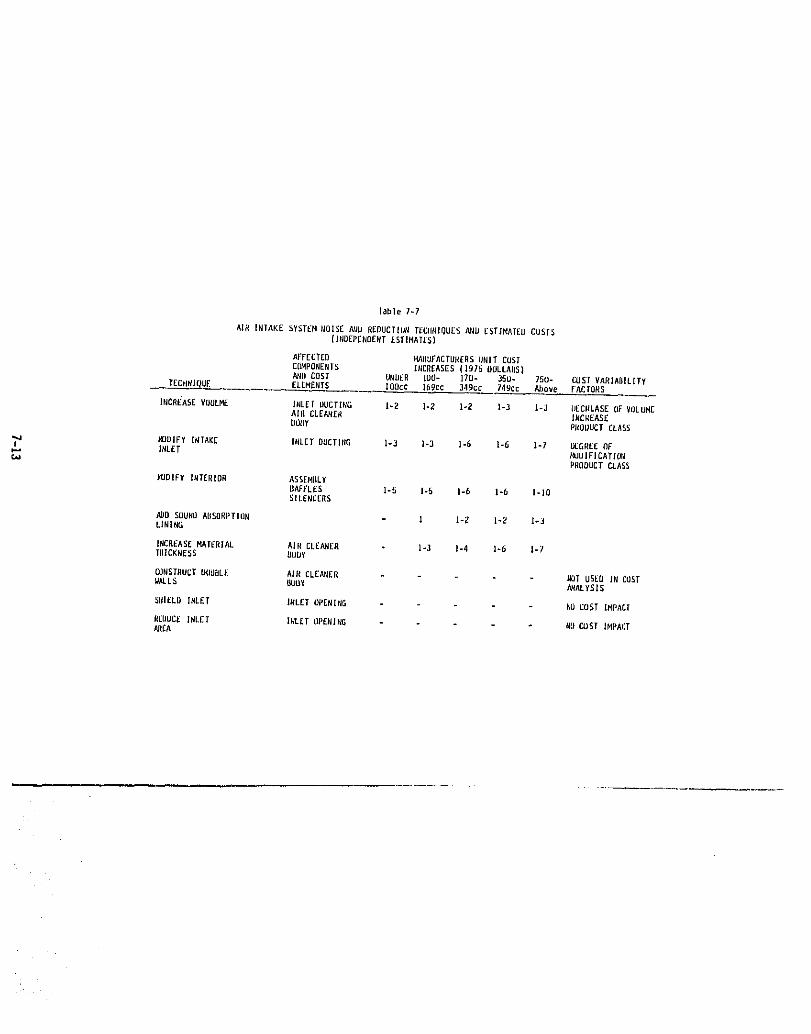
table 7-7
AII_ INIAKE SY_T£M_IOISE NJIJ _EOUCTILJ_T_CJI_IOUESN_JJE:_TIM/HE_ OUSTS[I_JOEP£NOENTLSTIMAI_$]
A_'FECTED f_r_U_'ACTLrI_£RSUNIT CUSTCDHPONEN[S I_CR_ASES (1975 I_ULLAfISI
_[_ [;OST UNIJER iO0- JT_J- 35L]- 75U- cusr VARIABILITY_'ECH_I(_UE £J-EMENTS IOUCC 16_Jcc 349c_ _'49cc Above FACfORS
INCRE'AS_VUULME l_L£r L_UCTI_G I_2 I-2 ]_E I-._ _-_ IJEC_LASEOFV_JLUHEAIfl _LE_E_ INCreASE_L)I]y PIIOL_UCT CLASS
_4 _IFY I_TAKE I_LEI" DUCTIflG I-,_ ]-3 I-6 I-6 I-7 L_GI_E£NFJNL£T
P_[_OL_CTCLASS
_DIF¥ I_TERIOR ASSEMI_LY
_JAFFLES I°5 I-5 I-6 I-6 1-10SIL£N_ERS
LININL_
INCR_AS£_TE_|AJ_ Al_ CLEANER I-3 I-4 |_ |-_'
_$T_U_:T fJ_UlIL_. AIR CLEArIER _JT USEO I_ C(_T_ALL$ L_L_ N_ALYSX$
II_fJuc_ I_LET I_L_T _'E_I_GN_rA _0 COST IHPA_T
_L _
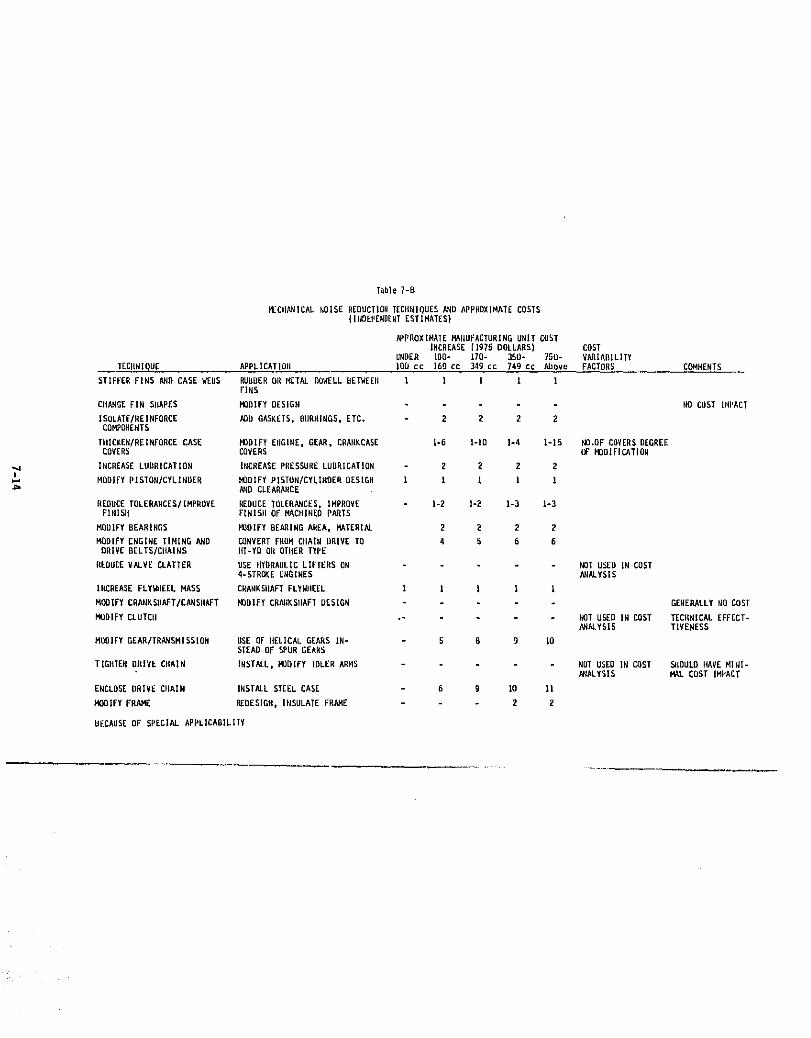
T_ble 7-B
ff_CflANI(:AL_OISE REDtJCTION_EC_{N](]tJE_ANL]APP_OXIHATECOSTS(It_DEPr_DENTE_TIHATE$)
_PROXIHATEMAI_IJFACTLIRINGUNITCOSTIN(:REASE_1975DOLLARS) COST
UNDER lO0- 170- 350- 75U- VARIA[IIL]TYTECI(NIQU£ APPLICATIOtl )O_ c¢ 169 c¢ 349 c¢ 749 c¢ Abow FACTGR5 CONHENTS
$TIF_:ERFINS _l_ CASEt_t_lJS RUliUEHI_1_I_TAL BO_Et.I.IJETWE_N _. ! ! l !tiNS
CllANGEFill SI(APE$ HODIFYIJl.$1GN NOCOSTI_tI_A_T
I_OLAT_/,_EI_4FORC£ ADDGASKETS,IIIJR;_IIIGS,ETC. 2 2 Z 2CO_D_ENT$
TIllCKE,_/REI_IFORCE£AS_ _I)_FY E_IGINE,GEAR,CleAN,CASE |-6 l-lO 1-4 l-l_ k_.OF"COVERSDEGREECOV_'RS C0VERS _ _D_FICATIO_
1NcRrAsELUI_RICATIO_ I_C_EA_EPI_ESSLIRELUBRICATION Z 2 2 2I
FJ[_O|FYpISTOtJ/CYL.IN[JEI_ H[]DIF_PI_T(J_/CYL.I_)_RDESIGN _. l 1 |A_DCLEA_A_E
_DUC£ TOL_RAHC_$/IHPROV£ RE[)U_E_OL_I_N_CE$,IHPROV_. 1-2 1-2 1-3 1-3_'l_I$11 F1HIS_IOFMACHINEDPARTS
_JlFY B£A_ING$ _I)IFY B_ING Al_r^, _ATERIAL 2 _ 2 2I._Jl)[FYEN_£ TINING AND C_NVERTFl_Oi.1CI_AI_I)RIVE TO 4 _ 6 6
Di_IVEB_LTS/CIIAINS lIT-YI) 01_OILIERT'tpE
I(£I)UC_VAI.VECLA'_TER tJ_EIrd_RAUL_CLIFTERSON - NOTU_EI3IN C05T4-STROKE_I_ES _ALYS_S
IN_REA_EFLY_IIEELMASS C_A_KSIIAFTFLY_IIEEL l ! ! | lHOD[FY£RAN_SIIAFT/CA_SHAFT_DIFY CRAtIKSI_AFTDI_SIG_ GENEP_.LY_OCOST
I'_JOIFYCLUTC_I k_T USED1_ COS'r TECt_N[CALEFFECT°,_IALY$1S TIYENES$
HUDIFYE_EAR/II_AN_MISSION USEOF H_'LICALG_AI_SIN- 5 8 9 |OST£ADOF _PURGE._I_$
TIGIITE_II_RIVECHAIN INSTALL,_I)IFY IDLERARMS NIJTUSEOl_ E_$T S_OUI.DHAVEHIi_I-N_ALYSIS I_. COSTIH_'AC_"
E_CLO_I_D_IV_.[:_LAIN INSTALLSTEELCA_E 6 9 IO II
f40DIFYFRAHE I_DE$1GN,I_SULATEFRAHE 2 2
UECAUSrOF SPECIALAPPLICAI_ILITY
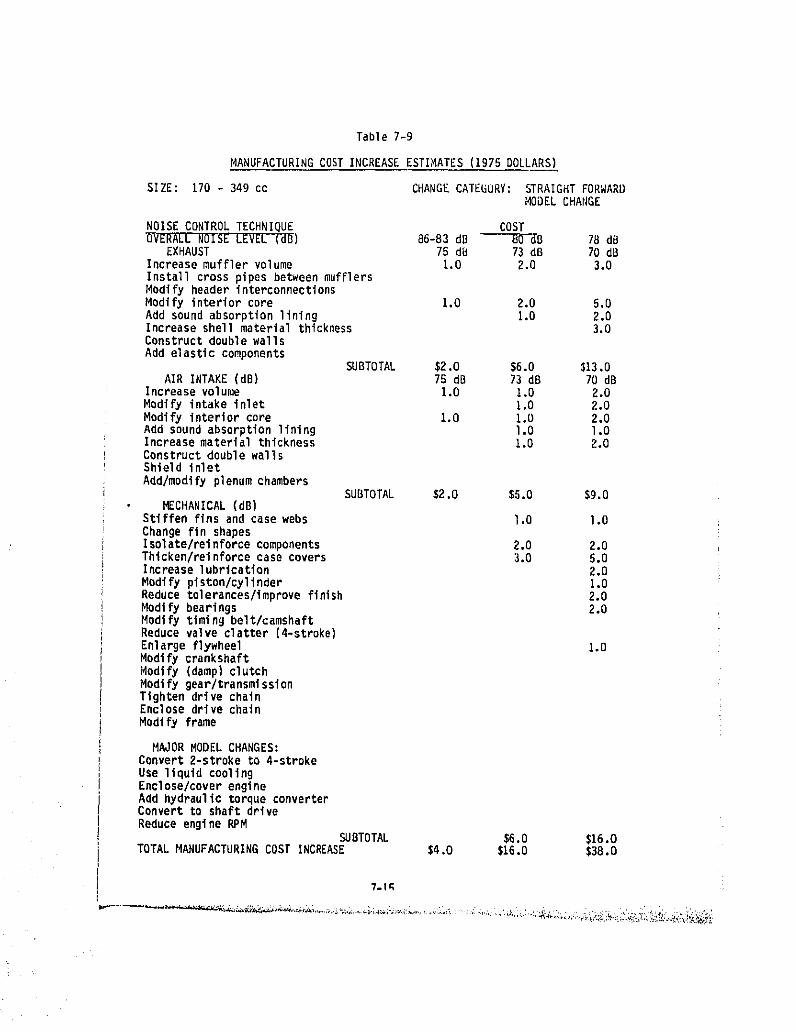
Table 7-9
MANUFACTURING COST INCREASE ESTIMATES (1975 DOLLARS)
SIZE: 170 - 349 cc CHANGECATEGORY: STRAIGHTFORWARDMODEL CHANGE
NOISE CONTROLTECHNIQUE COSTOVERALLNOISELEVEL (dB) 86-83dB 80 dB 78 dBEXHAUST 75dB 73dB 70dB
Increasemufflervolume 1.0 2.0 3.0Installcross pipes betweenmufflersModify headerinterconnectionsModifyinteriorcore 1.0 2.0 5.0Add soundabsorptionlining 1.0 2.0Increaseshellmaterialthickness 3.0Constructdoublewalls
Add elasticcomponentsSUBTOTAL $2.0 $6.0 $13.0
AIR INTAKE(dB) 75 dB 73 dB 70 dBIncreasevolume 1.0 1.0 2.0Modifyintakeinlet 1.0 2.0Modifyinteriorcore 1.0 1.0 2.0Add soundabsorptionlining l.O l.OIncreasematerialthickness 1.0 2.0ConstructdoublewallsShieldinletAdd/modifyplenumchambers
SUBTOTAL $2.0 $5.0 $9.0MECHANICAL (dB)
Stiffenfins and casewebs l.O 1.0Changefin shapesIsolate/reinforcecomponents 2,0 2.0Thlcken/relnforcecase covers 3.0 5.0Increaselubrication 2.0Modify piston/cylinder 1.0Reducetolerances/improvefinish 2.0Modifybearings 2.0Modifytimingbelt/camshaftReducevalveclatter (4-stroke)Enlargeflywheel 1.0ModifycrankshaftModify (damp)clutchModify gear/transmissionTighten drive chainEnclosedrivechainModifyframe
MAJOR MODEL CHANGES:Convert2-stroketo 4-strokeUse liquidcoolingEnclose/coverengineAdd hydraulictorqueconverterConvertto shaft driveReduceengineRPM
SUBTOTAL $6.0 $16.0TOTAL MANUFACTURINGCOST INCREASE $4.0 $16.0 $38.0
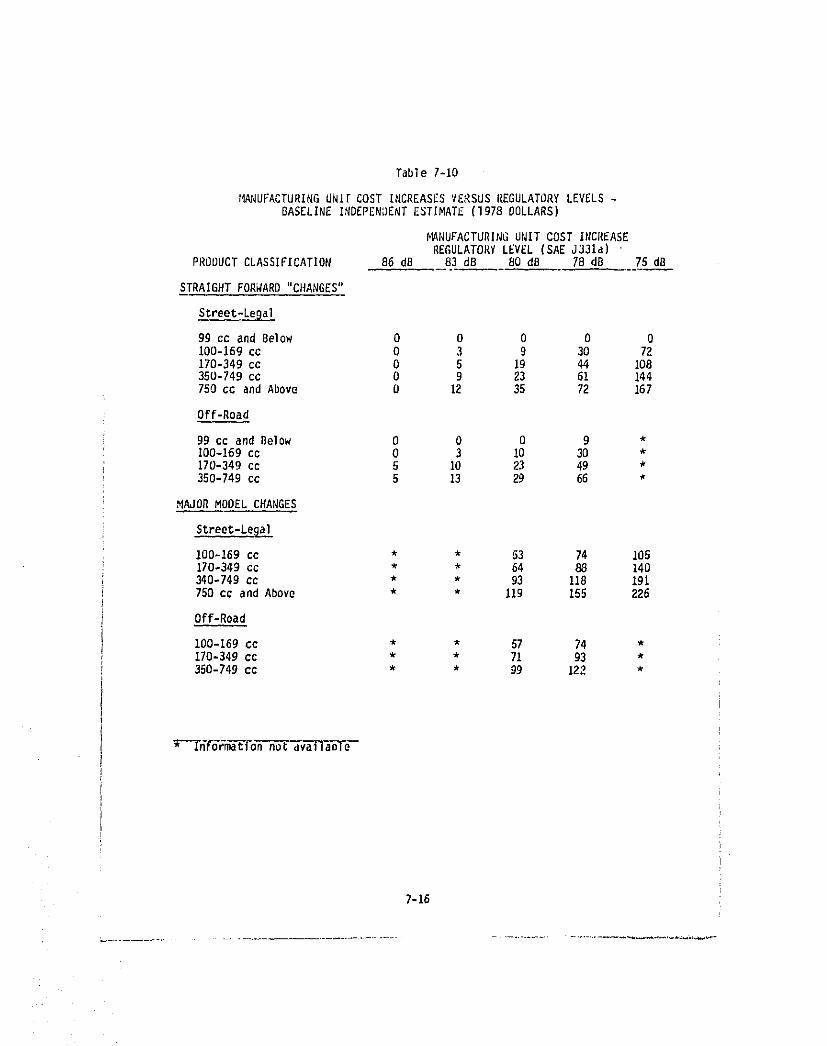
Table 7-10
II_UFACTURINGUNIFCOST INCREASESVERSUS REGULATI}RYLEVELS-BASELINE INDEPENDENT ESTIMATE (1978 DOLLARS)
MANUFACTURINGUNIT COST INCREASEREGULATORYLEVEL (SAEJ331a)
PRODUCTCLASSIFICATION 86 dB 83 dB 80 dB 18 dB 75 dB
STRAIGHT FORWARD "CHANGES"
Street-Legal
99 cc and Below 0 0 O 0 O100-169cc 0 3 9 30 72170-349cc O S 19 44 108350-749cc O 9 23 61 144750 cc and Above O 12 35 72 167
Off-Road
g9 cc and Below 0 O 0 9 *100-169cc 0 3 10 30 *170-349cc B 10 23 49 *350-749 cc 5 13 29 66 *
MAJOR MODEL CHANGES
Street-Legal
100-169cc * * 53 74 lOS170-349cc * * 64 88 140340-749 cc * * 93 118 191750 cc and Above * * 119 155 226
Off-Road
100-169cc * * 57 74 *170-349cc * * 71 93 *350-749cc * * 99 122 *
'_ Ih'f'6"Fma-TFonnot Tva-T'Fa31"6"-
7-16
with the exceptionof those cases requiring2-stroketo 4-strokeconversion.As a result,exceptfor the conversioncosts (off-roadmodels),2-strokeand4-stroke cost impacts were considered equivalentin the independentcostanalysis. Note also that no major_J_delchangeswore forecastedfor motorcy-cles under 100 cc in size, for the followingreasons: (1) noneof the nBnu-facturersindicatedthat modelsin this categorywould requiremajor redesignto _et specified regulatorylevels; and (2) the existing noise levelsofmotorcyclesin thiscategoryare relativelylow.
A breakdownof baseline independentcost estimatesin terms of exhaust,air-lntake, and mechanical components is shown in Table 7-11 using 1975dollars.
These nun_ers were then modified for nominal and worst cases by theestimatedpercentageof major i,lodelchanges required for each regulatorylevel (referto Table 7-12). The resultantcostswere includedin the pro-jected total unlt cost increase (refer to Table 7-4), although they wereadjusted_o 197B dollars based on average price increasesfor _torcyclesbetweentheseyears.
7.1.2 Researchand UevelopmentCosts
Total unit cost increaseslistedin Table 7-4 includeR&D costs incurredin order to complywith noise standards.
Research and developn_ntcosts include the cost of: R&D personnel,laboratory facilities and diagnostic equipment, prototype motorcycles,materialsand components,and productiondesignand drawings. The impactofresearclland developmentcosts on unit cost Is particularlydifficulttodetermine because of variances in the sizes and characteristics of the
companiesinvolved;the differencesin depth and breadth of each company's_roduct llne; extent of expendituresin the effort that can be consideredsunk" costs and havealready been amortized;unknowntechnicalcomplexitiesand model peculiaritiesthat will be encounteredin the R&D and productiondesign program; differencesin availableresourcesand personnel;and dif-ferencesin cost accountingpolicies.
Impactswill also dependon program variables. For example,the degreeof noise reduction required for each class of ,iotorcyclewill determinewhether"straight-forward"or majormodel changesare requiredto complywithregulatorylevels. Estimatesfor unit cost increasesattributaeleto amor-tized R&D for these two types of changes were supplied by manufacturers.These data were assessed for reasonableness,and used to derive unit costincreases. Again, these estimateswere modifiedby the probabilitiesasso-ciatedwith straight-forwardand major modelchanges in the nominaland worstcases.
The generalizedestimates in Table 7-13 for Category I manufacturers(manufacturersthat produce 100,000 units or more annually)were modifiedby two factors to derive the composite (weighted) average R&D unit costincreasesfor all manufacturers,shown in Table 7-14. The two factorscon-sideredare: (I) approximately86% of all motorcyclessold in the U.S.aremanufacturedby CategoryI manufacturers,and (2) R&D unit costs for Category
7-17
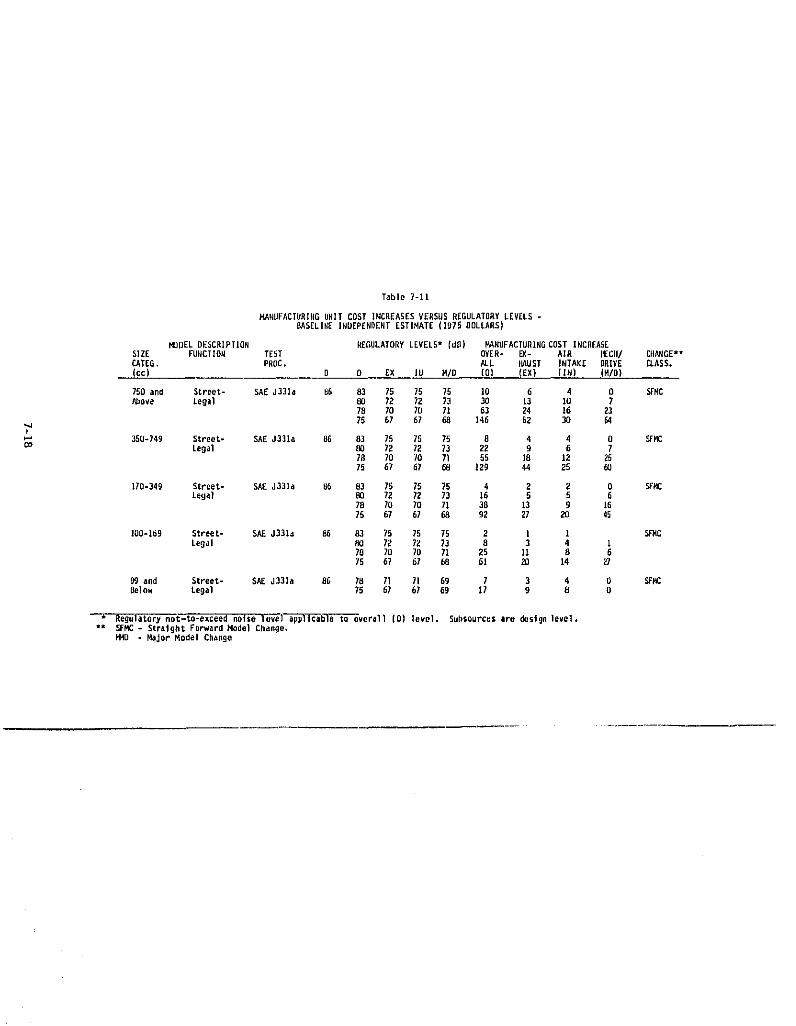
Table 7-11
HANUFACTORXflGUNXTCOST iNCREASESVERSOSREGULATORYLEVELS -BASELIHE]NDEP£HDENTESTIMATE (1975 DOLLARS)
PIJBEL DESCRIPTION REGULATORYLEVELS* (dg) MANUFACTURINGCOST INCREASESIZE FUNCTION TEST OVER- [3(- AIR fECII/ ClinGS**CATEG, PROC. ALL _UST INTAKE 0gIVE CLASS,(cc) 0 O EX IU RID (0] (EX) (iN) (HID]
750 and Street- SAC J33]a 86 83 75 75 75 lO 9 4 O 5EHCAbove Legal 80 72 72 73 3_ 13 IO 7
79 70 70 71 63 24 16 23
•,a 79 67 67 68 146 52 30 64B
_'_ 350-749 Street- SAE J331a 89 83 7S 75 75 B 4 4 0 _HCU_
Legal 80 79 72 73 22 9 G 770 70 70 71 55 18 12 2575 6? 67 68 ]29 44 25 _J
170-Z49 Street- SAC d331a B6 B3 75 75 75 4 2 2 0 5FHCLegal 8Q 7Z 7Z 73 19 9 9 6
78 70 70 71 38 i3 9 1979 67 G7 68 92 27 20 45
190-169 Street- SAEJ33ia 86 83 75 75 79 2 ] 1 SFHCLegal 80 79 72 73 8 3 4 l
70 70 70 7i 25 11 8 975 97 67 68 61 _ 14 27
99 and Street- SAE J331a 9G 78 71 71 69 7 3 4 0 SFHCBelow Legal 75 G7 91 69 17 9 8 O
* Regulatory not-to-exceed noise level applTc'able to overall (O) level. Subsources are design level."* SFMC- Straight F_rward Model Change.
/44D . Rajor Model Chan9e
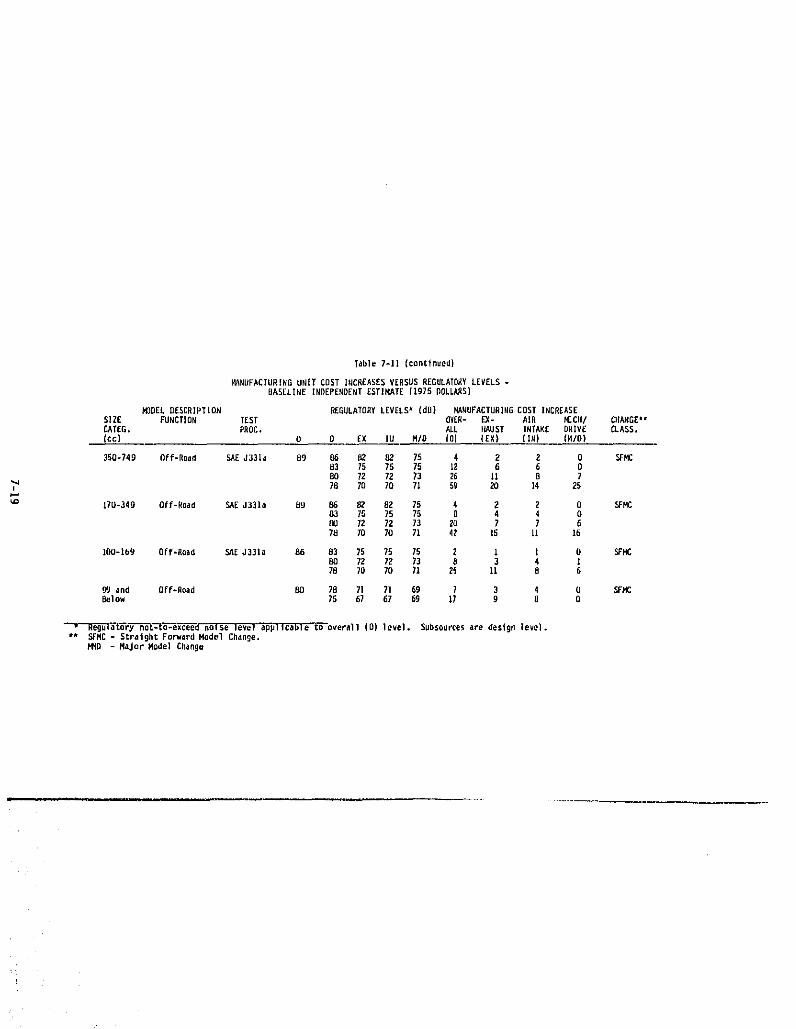
Table 7-11 (contfnued)
MANUFACTURINGUNIT COST INCREASESVERSOSREGULATORYLEVELS -BASELINE INDEPENDENT ESTIMATE (I975 DOLLARS)
MODEL DESCRIPTION REGULATORY LEVELS* (dO) MANUFACTURING C83T INCREASE
SIZE FUNCTION TEST OVER- EX- AIR ricH/ CHANGE*"CATEO, PROC. ALL NAUST INTAKE DRIVE CLASS.(cc) 0 0 EX IN M/O iO) (EX} (IN) (fa/O)
350-749 Of f-Road 5RE d331a 09 66 02 82 75 4 2 2 0 5FMO83 75 7S 75 ]2 6 6 080 72 72 73 26 Jl R 7
_ 78 70 70 7Z 59 20 14 25
170-UR9 Of f-Road SAE d33Ia 69 86 _ 82 75 4 2 2 0 5FMC83 lO 75 75 g 4 4 ODO 72 7Z 73 ZO 7 7 S78 lO 70 71 42 Ig 11 ZD
100-169 Of f-Road _%EJ3Ula 86 OR 75 75 75 2 L I 0 S_MC83 72 72 73 g 3 4 178 70 70 71 25 I! O 6
99 and Off-Road BO 78 71 71 69 l 3 4 0 _'HCBelow ?S 67 67 69 iI 9 0 0
"4-= Regula'[6"ry not-to-exceed noise level applicable to overall (0) level. Subsouree5 are design ]eve].** SF'MC- Straight ForWard Model Change.
FIaD - Major Model Change
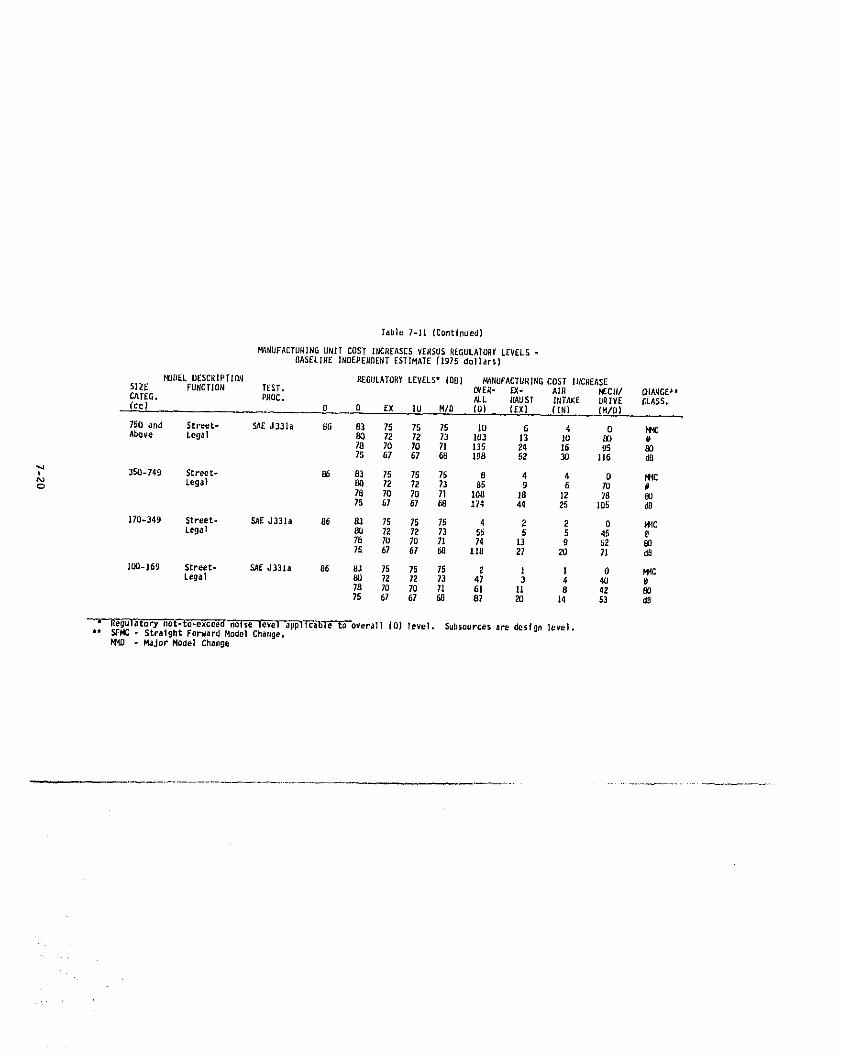
Table 7-11 (Continued)
MANUFACTURINGUNIT COST INCREASESVERSUSREGULATORYLEVELS -(_ASELINE]NDEPENOENT ESTIMATE (1975 dollars)
{_'JRELDESCRIPTION REGULATORY LEVELS* (OR) _NUFACTURIR_ COST I_ICREASE
SIZE FUNCTION TEST. OVER- EX- AIR MEC_I/ OIA_GE**CATEG, PRQC. ALL IIAUST ItJTARE ORIVE CLASS.
(cc) 0 .o EX IU .MI_) (0) (EX) (IN) -- (HlO)
750 and Street- SAE J331a R6 83 75 75 75 IO 6 4 0 _I_CAbove Legal PX} 72 72 73 103 13 10 _0 @
78 70 70 71 135 24 16 g5 6Q7E 67 67 68 198 5Z 30 116 dO
350-749 SCreet- B6 83 15 75 7S O 4 4 0 N4Croc_ Legal BO 72 72 73 85 9 6 70
76 70 70 71 108 ]8 12 787S 67 57 68 L74 44 25 IRE dO
170-349 Street- SAEJ320a R6 20 15 7E 75 4 2 2 O FI4CLega) Be 72 72 73 55 5 5 45
70 lO 70 71 74 13 9 52 807E 67 67 6_ 11R 27 20 71 dO
10Q-169 Streeh- 5AE J331a 86 83 15 75 75 2 ] l O H4CLegal 80 72 72 73 47 3 4 4(/ g
70 70 70 71 61 1! 8 42 B075 67 67 68 87 20 14 53 d@
"' " Regulatory not_£e-e_ceed _blse levela-_lT_able to overall (O) leveh Suhsources are desfgn 1eve).** SFMC - Shra19ht Forward Model COarJge,
_0 - Major Model Change
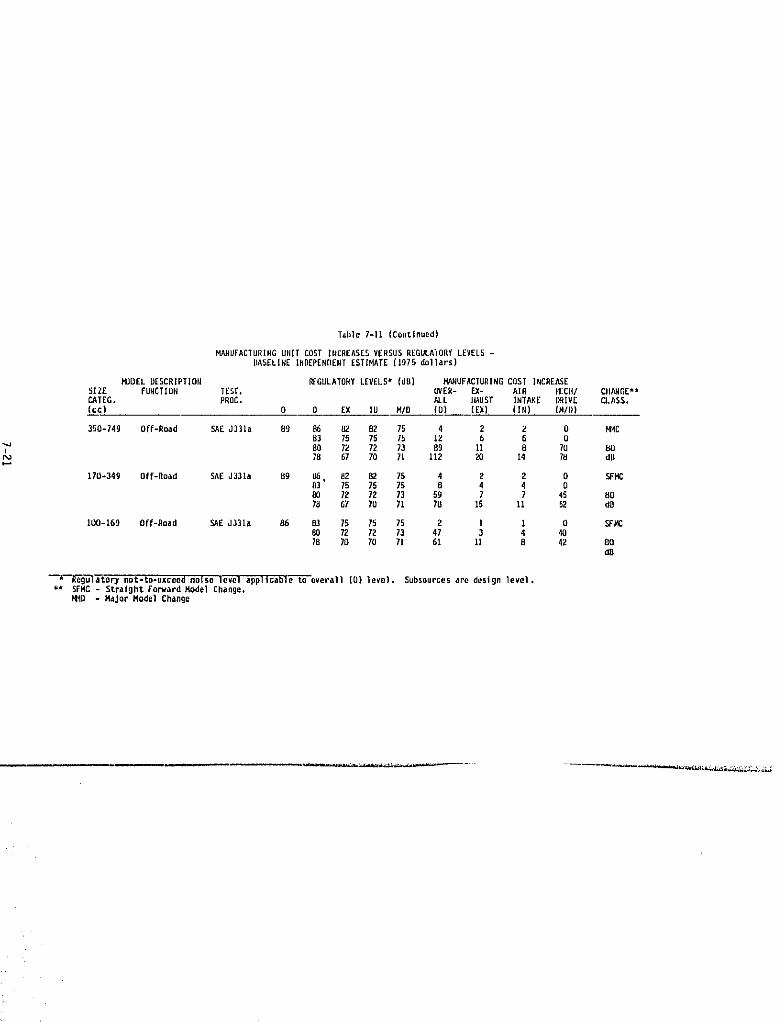
T4ble 7-11 (Continued)
HANUFACTURINGUNITCOSTINCR[^S[SVERSUSR[GULA_(}RYI-EVELS-_ASELI_EINDEP[N{}ENTESTIMATE11975dollars)
_D£1- D_SCRIPTIOtl R_IJLATOE{YL_VELS_ Idl}) _UF^CIU_ING C(]STINCI_E^SESIZE FUHCTI{}N TEST, (]VER- E_- AIR _CH/ CIIANGE*lCMEG. PROC. ALL I_UST INTAKE DRIV[ CLASS.Ice| 0 O IX IU _/D _U) IEXl IIN) (M/II_
350-749 Off-Rodd SAEJ331a B9 _ _2 B_ 75 4 2 2 0 _l_C_3 ?5 75 75 IZ _ 6 080 7Z 7_ 73 89 11 8 7(} _J78 67 70 71 11Z _0 14 ?_ d[}
170-349 Off-lto_d SAEJ331a {}9 _ _2 82 75 _ 2 2 0 _HCt}3' 75 75 75 _} 4 4 0
72 7_ 73 59 7 7 45 807_ _7 ?0 7! 70 15 l! 5Z (_}
_00-16_ Off-Road SA_J331_ 86 _ 75 ?_ 7S Z 1 1 0 _80 72 7_ 73 47 3 4 4078 70 ?0 ?l 61 1! 8 4_ _(}
dB
* /_eg--_ator_not-_o°exceed noise 1eve! _pplJcable to over_l! (0) level. Sub_ources_re design level,_* SFMC- Str_lgh_ ForwardModelChange,
_D ° N_jo_ Model Change
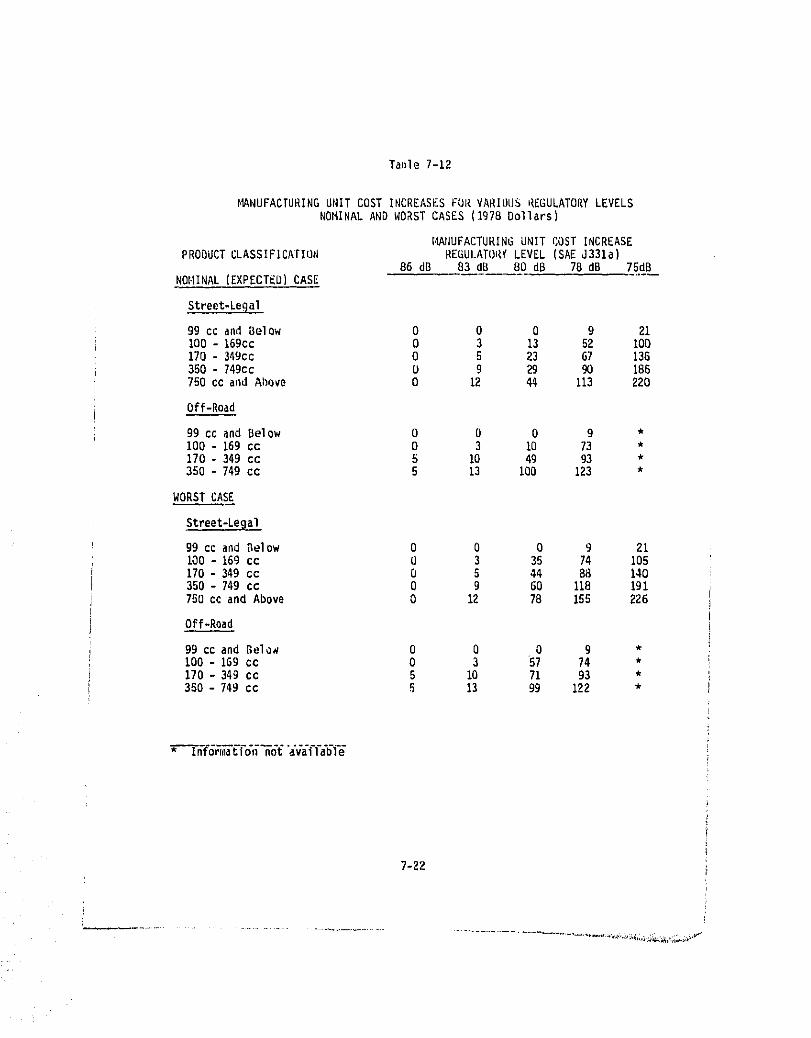
Taele 7-12
_NUFACTURINGUNIT COST INCREASESFQR VARIULJSREGULATORYLEVELSNOMINALAND WORSTCASES (1978Dollars)
H_¢UFACTURINGUNIT COSTINCREASEPRODUCTCLASSIFICATION REGUI.ATORYLEVEL (SAEJ331a)
86 dO 83 dD 80 dB 7B dB 75dBNOHINAL (EXPECTED) CASE
Street-Legal
99 cc and Below 0 0 0 9 21I00 - 169cc 0 3 13 52 100170 - 349cc 0 5 23 67 135350 - 749oc O 9 29 90 186750 cc and Above 0 12 44 113 22D
Off-Read
99 cc and Below 0 O 0 9 *100 - 169 cc 0 3 10 73 *170 - 349 cc 5 10 49 93 *350 - 749 cc 5 13 100 123 *
WORST CASE
Street-LeRal
99 cc and Below 0 O 0 9 21I00 - 169 cc 0 3 35 74 105170- 349 cc 0 S 44 B8 140350 - 749 cc 0 9 60 I18 191750 cc and Above 0 12 78 155 226
Off-Road
99ccandBelo_ 0 0 0 9 *i 100 - 1G9 cc 0 3 57 74 *
170 - 349 cc 5 10 71 93 *350 - 749 cc 5 13 99 122 *
* l_'6Ff_6-Fo',_'_(F6"a'v'a'i-l-a'b-i_
7-22
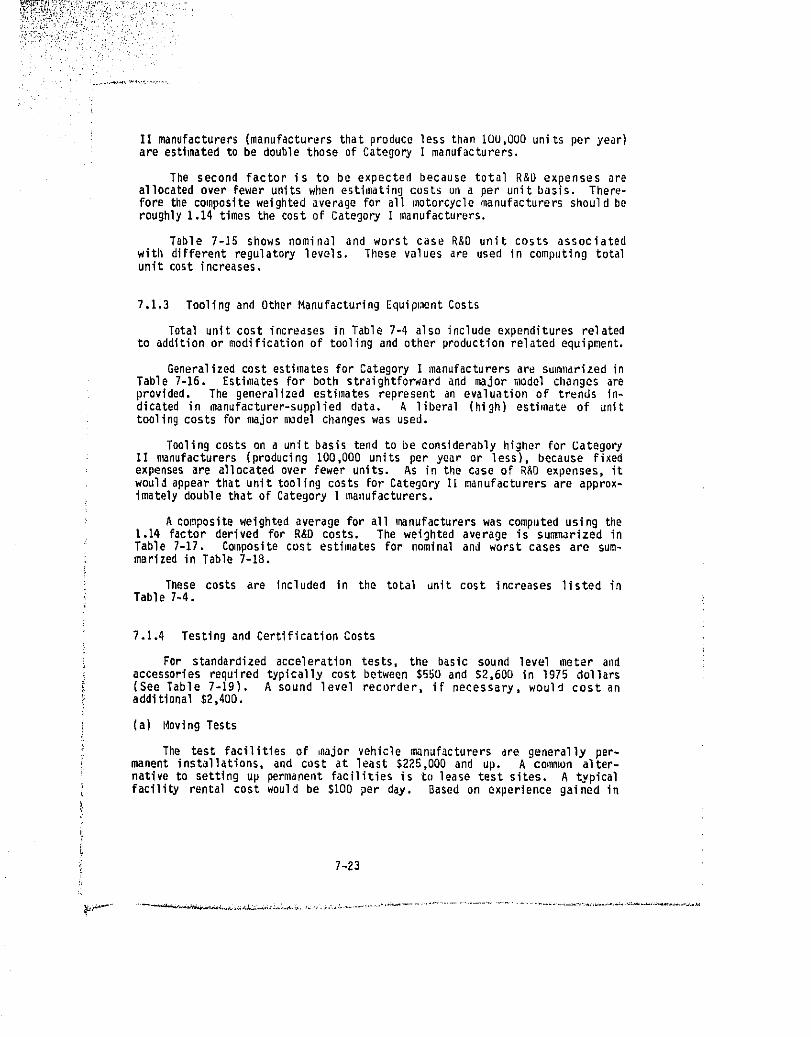
I[ manufacturers(manufacturersthat produceless thanIOU,O00units per year)are estlmate¢ to be double those of Category I manufacturers.
The second factor is to be expected because total R&D expenses areallocatedover fewerunitswhen estimatingcosts uu a per unit basis. There-forethe compositeweightedaveragefor all motorcyclemanufacturersshouldberoughly1.14 times the costof CategoryImanufacturers.
Table 7-15 shows nominal and worst case R&D unit costs associatedwith different regulatory levels. These values are used in computing totalunit cost increases.
7.1.3 Tooling and Other Manufacturing Equipment Costs
Total unit cost increases in Table 7-4 also include expenditures relatedto addition or modification of tooling and other production related equipment.
Generalized cost estimates for Category I manufacturers are summarized inTable 7-16. Estimatesfor both straightforwardand major n_del changes areprovided. The generalizedestimatesrepresentan evaluationof trends in-dicated in manufacturer-supplied data, A liberal (high) estimate of _nittoolingcosts for majorn_del changeswas used.
Tooling costs on a unit basis tend to be considerably higher for CategoryII manufacturers (producing lO0,OOO units per year or less), because fixedexpenses are allocated over fewer units. As in the case of R&D expenses, itwould appear that unit tooling costs for Category II manufacturers are approx-imately double that of Category I manufacturers.
A compositeweightedaveragefor all q_nufacturerswas computedusing tile1.14 factorderivedfor R&D costs. The weightedaverage is summarized inTable 7-17. Compositecost estimatesfor nominaland worst cases are sum-marizedin Table7-18.
These costs are Included in the total unit cost increaseslisted inTable 7-4.
7.1.4 Testingand CertificationCosts
For standardizedaccelerationtests, the basic sound level meter andaccessoriesrequiredtypicallycost between$550 and $2,600 in 1975 dollars(See Table 7-19). A sound level recorder, if necessary, would cost anadditional $2,400,
(a) MovingTests
The test facilitiesof ,aajervehiclemanufacturersare generally per-manent installations, and cost at least $225,000 and up. A ce_ion alter-nativeto settingup permanentfacilitiesis to lease test sites. A typicalfacilityrentalcost would be $100 per day. Based on experiencegained in
7-23
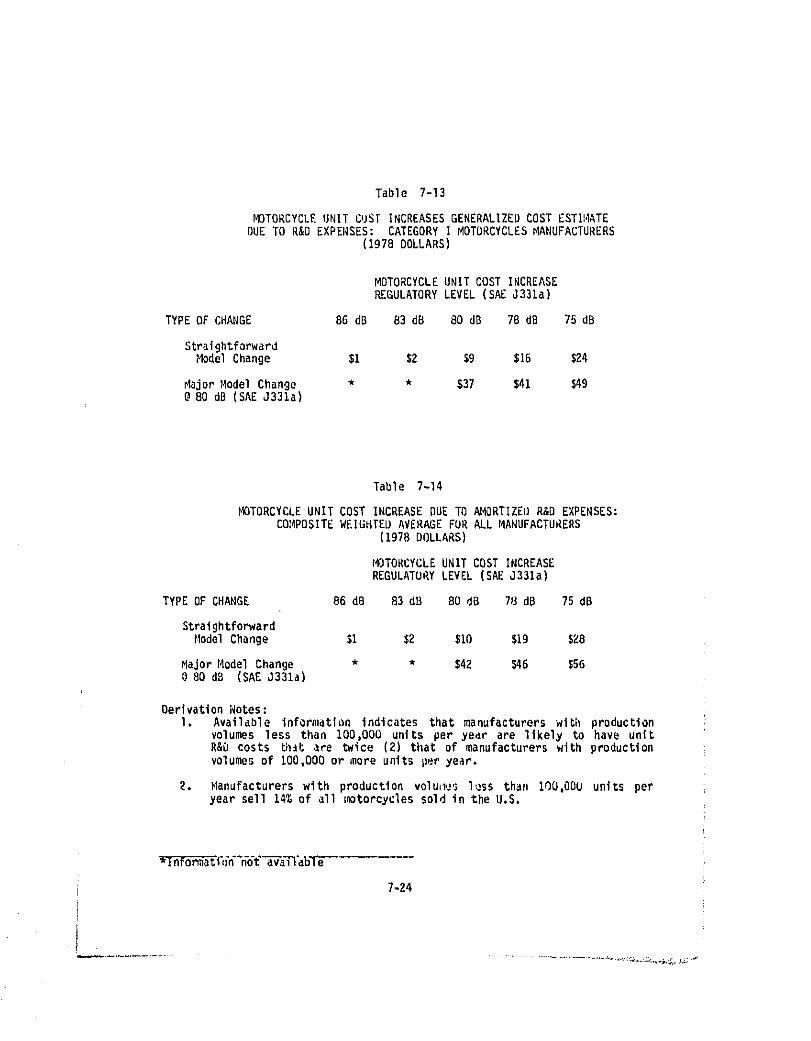
Table 7-13
MOTORCYCLE UNIT CUS[ INCREASES GENERALIZED COST ESTII4ATEDUE TO R&D EXPENSES: CATEGORY I MOTORCYCLES MANUFACTURERS
(1978 DOLLARS)
MOTORCYCLE UNIT COST INCREASEREGULATORY LEVEL (SAE J331a)
TYPEOF CHANGE 86dB 83dO 80dB 78dB ?SUB
StraightforwardHodelChange $I $2 $9 $16 $24
_ajor_odel Change * * $37 $41 $499 80 dB (SAEJ331a)
Table 7-14
HOTORCYCLEUNIT COST INCREASEDUE TO AMORTIZEI)R&D EXPENSES:COHPOSITEWEIUHTEIJAVERAGEFDR ALL MANUFACTURERS
(197BDOLLARS)
_DTORCYCLEUNITCOST INCREASEREGULATURY LEVEL (SAE J331a)
TYPE OF CHANGE 86 dB 83 dB 80 dB 78 dB 75 dB
StraightforwardModelChange $I $2 $10 $19 $28
Major14odelChange * * $42 $46 $560 80 dB (SAEJ331a)
DerivationNotes:
I. Available informationIndicates that manufacturerswlth productionvolumes less than 100,000 unIts per year are likely to have unitR&D costs that are twice (2) that of manufacturerswith productionvolumesof 100.000or more units per year.
5. Manufacturerswith production volu=v_sless than 100,000 units peryear sell 14% of all motorcyclessoldin the U.S.
_"o'n""n'o't'_a_"a1_1'e ....
7-24
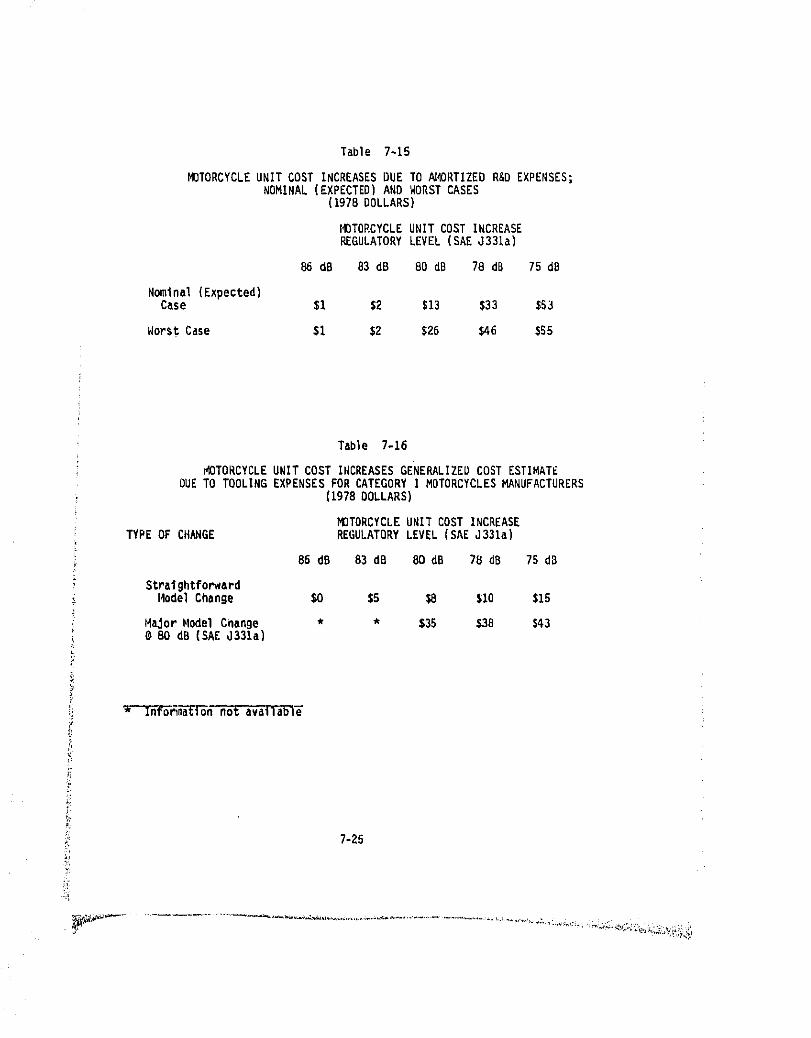
Table 7-15
MOTORCYCLEUNIT COSTINCREASESDUETO _4DRTIZEOR&DEXPENSES;NOMINAL(EXPECTED)AND WORSTCASES
(1978DOLLARS)
MOTORCYCLEUNITCOST INCREASEREGULATORYLEVEL (SAEJ331a)
dB 83 dB 80 dB 78 dB 75 dD
Nominal(Expected)Case $1 $2 $13 $33 $53
Norst Case $1 $2 $26 $46 $55
Table 7-16
_)TORCYCLEUNIT COST INCREASESGENE_LIZEU COST ESTIMATEOUE TO TOOLINGEXPENSESFOR CATEGORYI MOTORCYCLESFt_NUFACTURERS
(1978DOLLARS)
MOTORCYCLEUNIT COST INCREASETYPE OF CH_GE REGULATORYLEVEL (SAEJ331a)
86 dB 83 dB 80 dB 7B dB 7S dO
F Stralghtfo_ardHodel Change $0 $5 $8 $10 $15
i HaJor Model Change * * $35 S3D $43i @80 dD (SAE J331a)
* Infori_n not availabIT
7-25
£,
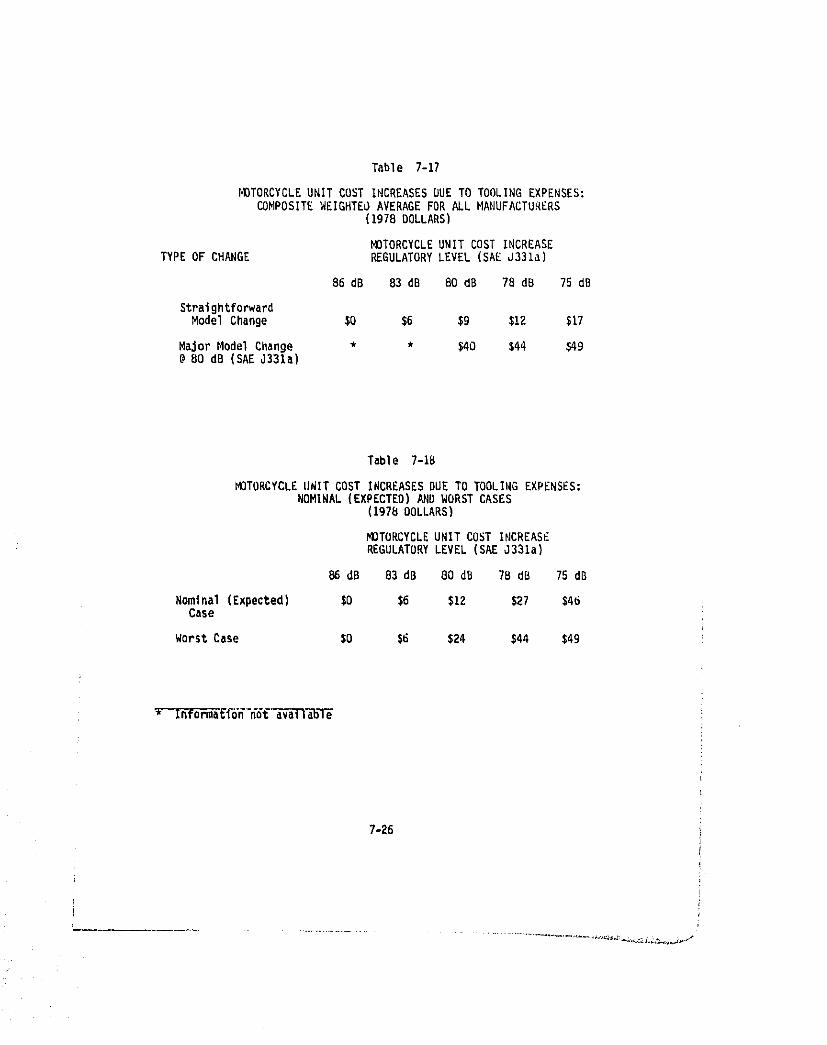
Table 7-17
MOTORCYCLEUNIT COST INCREASESDUE TO TOOLINGEXPENSES:COMPOSITE WEIGHTEO AVERAGE FOR ALL MANUFACTURERS
(1978DOLLARS)
MOTORCYCLEUNIT COST INCREASETYPE OF CHANGE REGULATORYLEVEL (SAEJ331a)
86 dB 83 dB 80 dB 78 dO 75 dB
StraightforwardModel Change $0 $6 $9 $12 $17
MajorModel Cilange * * $40 $44 $49@ 80 dB (SAEJ331a)
Table 7-IB
MOTORCYCLEUNIT COST INCREASESDUE TO TOOLINGEXPENSES:NOMINAL(EXPECTED)AND WORST CASES
(1978DOLLARS)
_TORCYCLE UNIT COST INCREASEREGULATORYLEVEL (SAEJS31a)
B6 dB 83 dO 80 dB 7B dB 75 dB
Nominal (Expected) $0 $6 $12 $27 $46Case
WorstCase $0 $6 $24 $44 $49
* Informa{f_6"_6_av-_T_Tl_
7-26
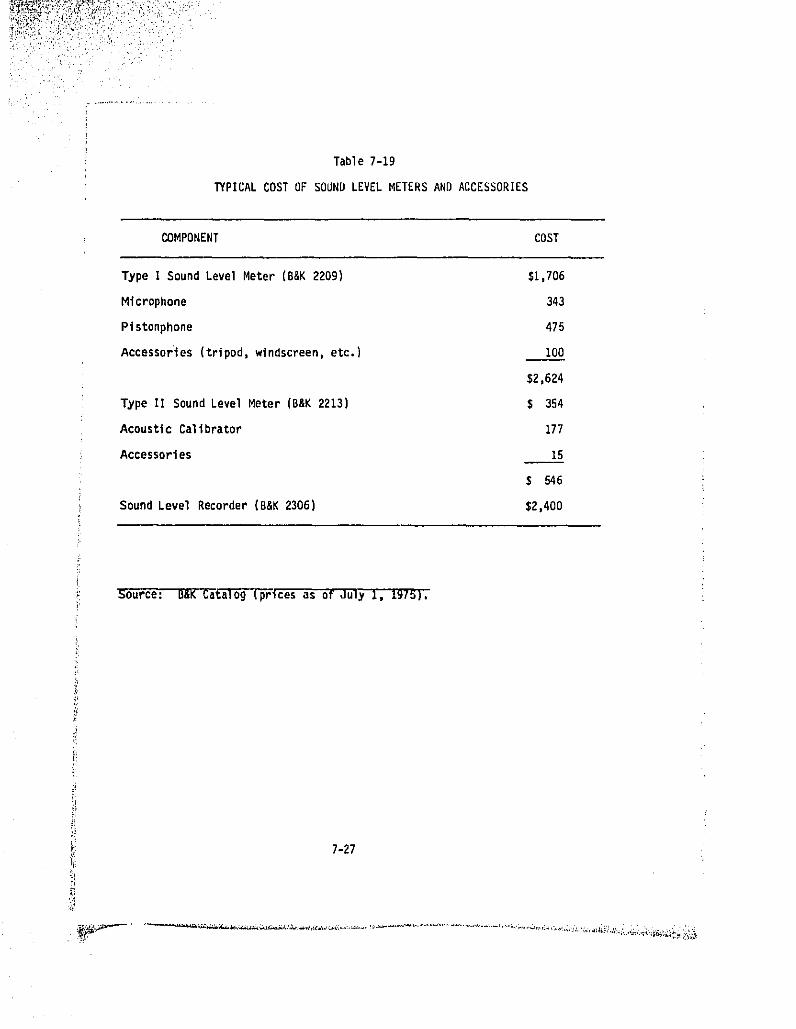
Table 7-19
TYPICAL COST OF SOUND LEVEL METERS AND ACCESSORIES
COMPONENT COST
Type I Sound Level Meter (B&K 2209) $1,706
Microphone 343
Pistonphone 475
Accessories (tripod, windscreen, etc.) 100
$2,624
Type I! Sound Level Meter (B&K 2213) $ 354
Acoustic Calibrator 177i
Accessories 15
$ 546
Sound Level Recorder (B&K 2306) $2,400
Source: B&K Catalog {_lees as of July 1, 1975):
!;
t 7-27
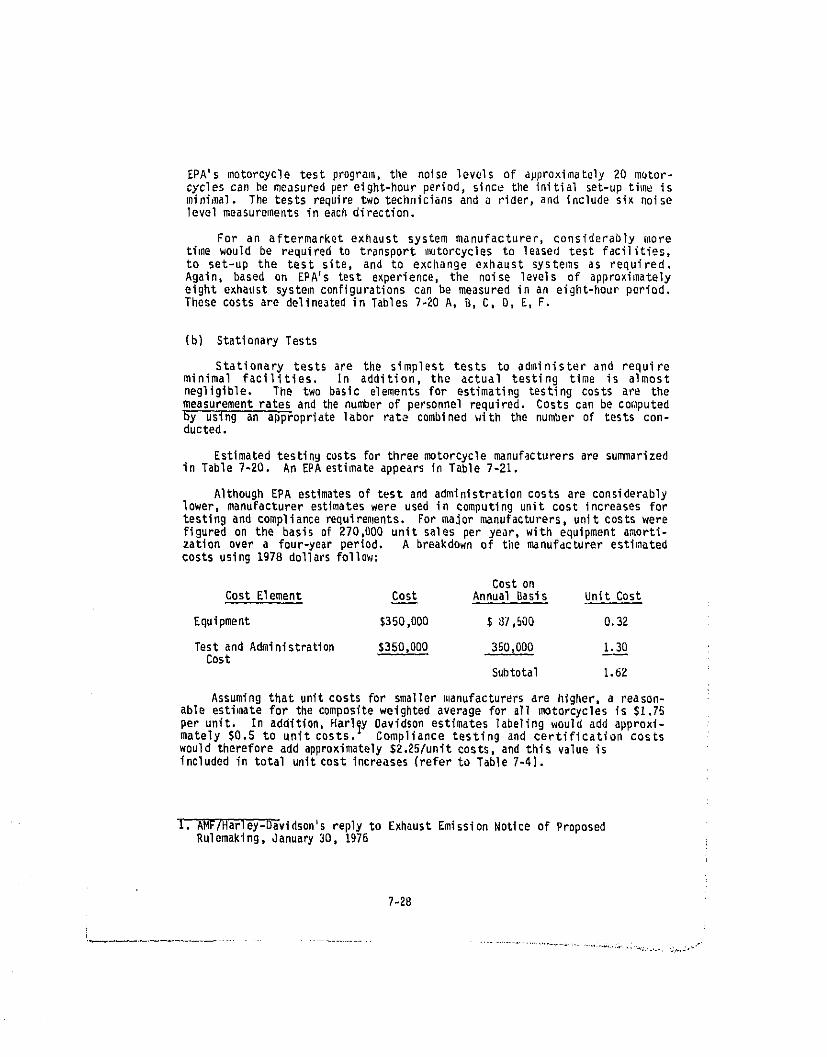
EPA's motorcycle test program, the noise levels of approximately 20 motor-cycles can be measured per eight-hour period, since the initial set-up time isminimal. The tests requiretwo techniciansand a rider,and includesix noiselevel measurements in each direction.
For an aftermarket exhaust system manufacturer, considerably moretime would be required to transport _1_torcycles to leased test facilities,to set-up the test site, and to excbange exhaust systems an required.Again, based on EPA's test experience, the noise levels of approximatelyeight exhaust system configurations can be measured in an eight-hour period,These costs are delineated in Tables 7-20 A, B, C, D, E, F.
(b) Stationary Tests
Stationary tests are the simplest tests to administer and requireminimal facilities, in addition, the actual testing time is almostnegligible. The two basic elements for estimating testing costs are themeasurement rates and the number of personnel required. Costs can be co_puted"by using an 'appropriate labor rate combined with the number of tests con-ducted.
Estimatedtestingcostsfor threemotorcyclemanufacturersare summarizedin Table ?-20. An EPAestimate appears in Table 7-21.
Although EPA estimates of test and administration costs are considerablylower, manufacturer estimates were used in computing unit cost increases fortesting and compliance requirements. For major manufacturers, unit costs werefigured on the basis of 270,000 unit sales per year, with equipment amorti-zation over a four-year period. A breakdown of tilemanufacturer estimatedcosts using 1978 dollars follow:
Cost onCostElement Cost AnnualBasis UnitCost
Equipment $350,000 $ 07,500 0.32
TestandA@ninistratien $350,000 350,000 1.30Cost
Subtotal 1.62
Assumingthat unitcosts for smallermanufacturersare higher,a reason-able estimate for the composite weighted average for all motorcycles is $1.75
per unit. In addition, Harl_y Davidson estimates labeling would add approxi-mately $0.5 to unit costs. Compliance testing and certification costswouldthereforeadd approximately$2.25/unltcosts,and this valueisincluded in total unit cost increases (refer to Table 7-4).
i. AMF/Harley-D_vidson'sreplyto ExhaustEmissionNoticeof ProposedRulemaking, January 30, 1976
7-2B
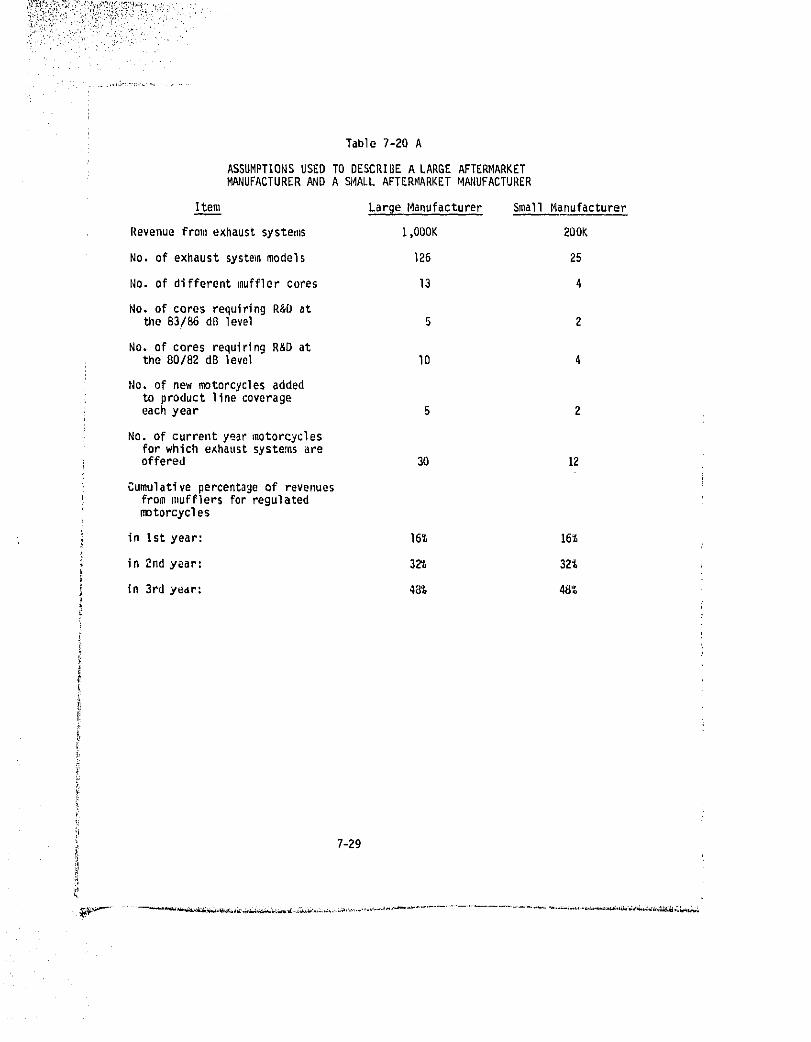
Table 7-20 A
ASSUMPTIONS USED TO DESCRIBE A LARGE AFTERMARKETMANUFACTURER AND A SL_ALL AFTERMARKET MAt4UFACTURER
Item Large Manufacturer SmallManufacturer
Revenuefromexhaustsystems l,OOOK 200K
No. of exhaustsystemmodels 126 25
No. of differentinufflercores 13 4
No, of cores requiringR&D atthe 83/86 dB level 5 2
No, of cores requiringR&D atthe 80/82 dB level IO 4
_Io,of new motorcyclesaddedto productlinecoverageeachyear 5 2
No. of current year motorcyclesfor which exhaust systems areoffered 30 12
Cumulative percentage of revenuesfrownmufflersforregulatedmotorcycles
inIstyear: 16% 16%
in2ndyear: 32% 32%i
in3rdyear: 48% 48_
7-29
l,
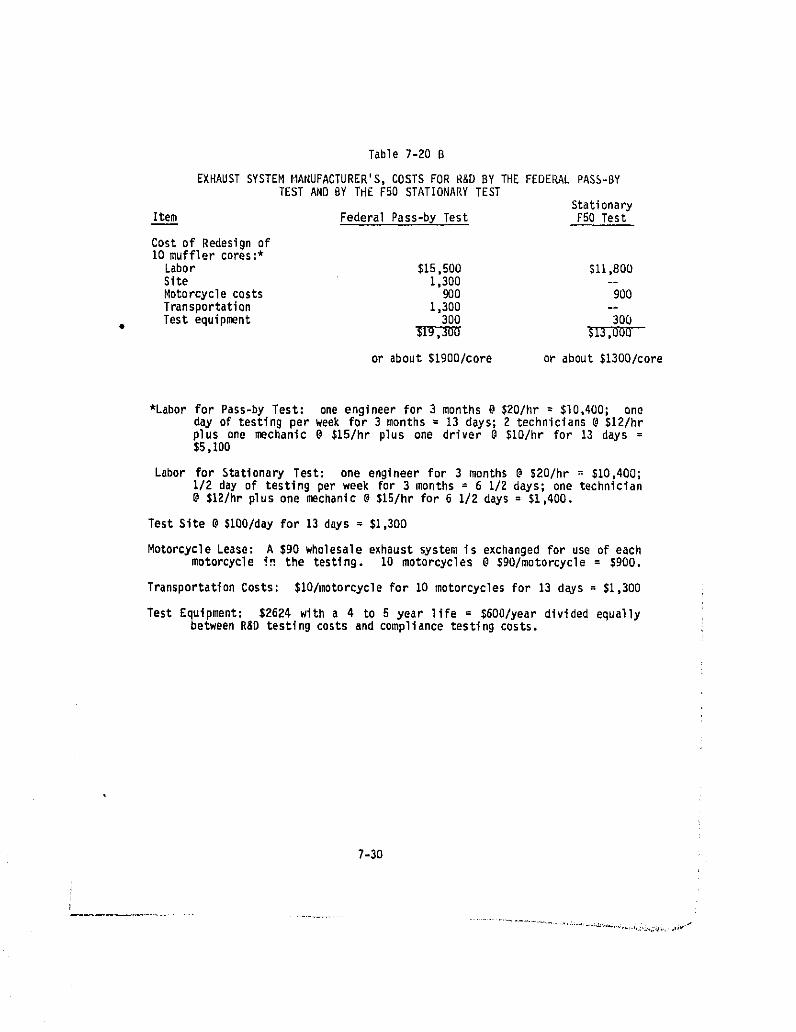
Table 7-20 B
EXHAUSTSYSTEMMANUFACTURER'S,COSTS FOR R&D BY THE FEDERALPASS-BYTEST AND BY THE F50 STATIONARY TEST
StationaryItem FederalPass-byTest P50Test
Cost of Redesign of10 muffler cores:*
Labor $15,500 $11,800Site 1,300 --Motorcyclecosts 900 900Transportation 1,300 --Testequipment 300 300
or about $1900/core or about$1300/core
*Laborfor Pass-byTest: one engineerfor 3 months@ $20/hr= $I0,400; oneday of testingper week for 3 months= 13 days; 2 technicians@ $12/hrplus one mechanic @ $15/hr plus one driver @ $10/hr for 13 days =$5,100
Labor for StationaryTest: one engineerfor 3 months @ $20/hr = $10,400;I/2 day of testing per week for 3 months = 6 i/2 days; one technician@ $12/hrplusone mechanic@ $15/hrfor 6 1/2 days: $1,400.
Test Site @ $100/dayfor 13 days = $1,300
MotorcycleLease: A $go wholesaleexhaustsystemis exchangedfor use of eachmotorcyclein the testing. 10 motorcycles@ SgO/motorcycle= $900.
TransportationCosts: $10/motorcyclefor 10 motorcyclesfor 13 days = $1,300
Test Equipment: $2624 with a 4 to 5 year life = $600/yeardividedequallybetweenR_D testingcosts and compliancetestingcosts.
7-30
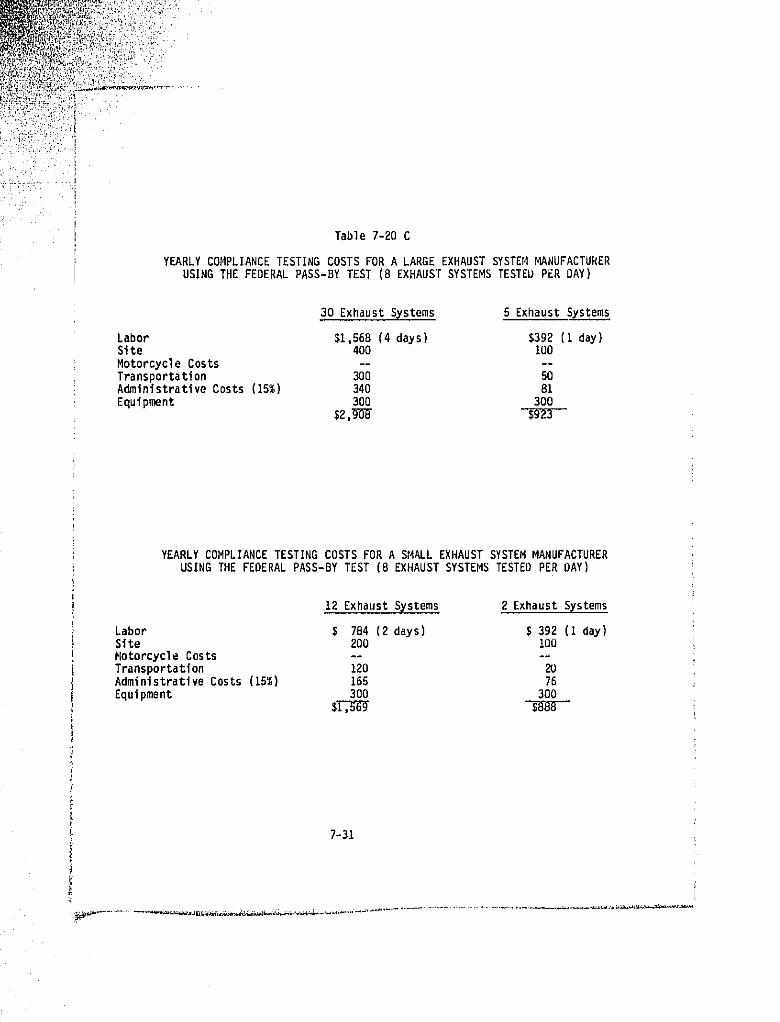
Table 7-20 C
YEARLYCOMPLIANCETESTINGCOSTS FOR A LARGE EXHAUSTSYSTEHMANUFACTURERUSINGTHE FEDERALPASS-BYTEST (8 EXHAUSTSYSTEMSTESTEDPER DAY)
30 ExhaustSystems 5 ExhaustSystems
Labor $1,568(4 days) $392 (1 day)Site 400 100MotorcycleCosts ....Transportation 300 50AdministrativeCosts (15%) 340 81Equipment 300 300
$2,908 $923
YEARLYCOMPLIANCETESTINGCOSTS FOR A SMALL EXHAUSTSYSTEMMANUFACTURERUSINGTHE FEDERALPASS-BYTEST (8 EXHAUSTSYSTEMSTESTEOPER DAY)
12ExhaustSystems 2 ExhaustSystems
i Labor $ 784 (2 days) $ 392 (i day}Site 200 100
I MotorcycleCosts ....Transportation 120 20AdministrativeCosts (15%) 165 76Equipment 300 3DO
7-31
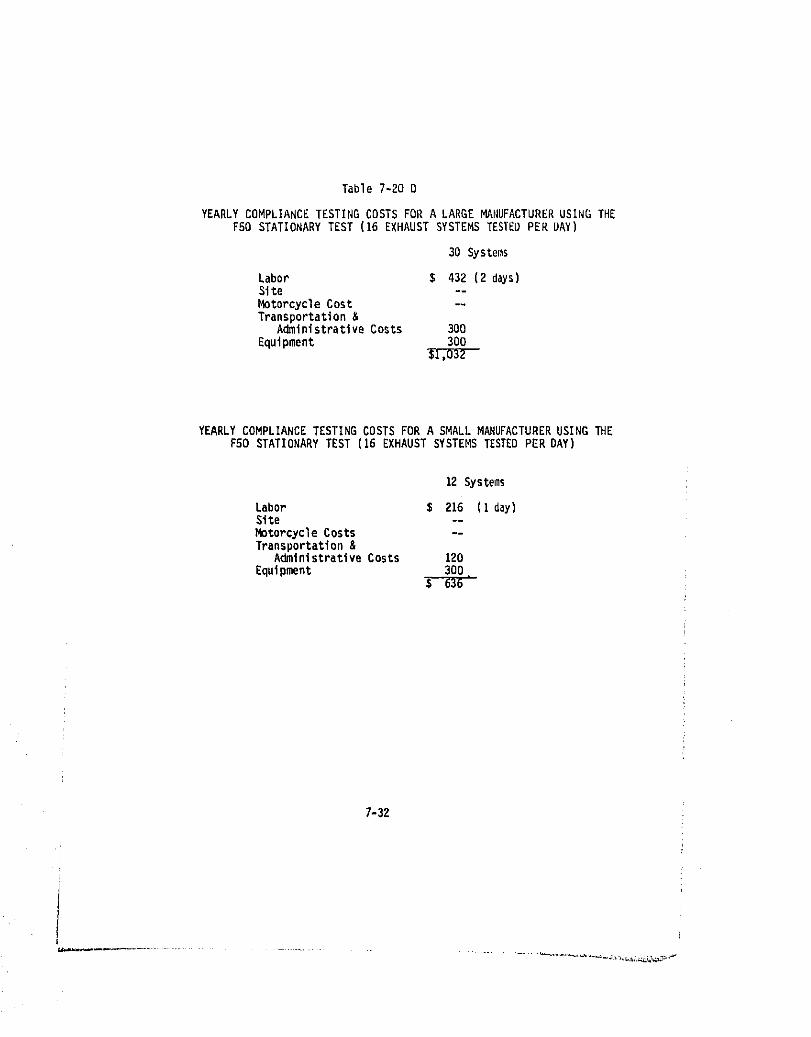
Table 7-20 D
YEARLYCOMPLIANCETESTINGCOSTS FOR A LARGEMANUFACTURERUSING THEFSO STATIONARY TEST (16 EXHAUST SYSTEMS TESTED PER DAY)
30 Systems
Labor $ 432 (2 days)Site --MotorcycleCost --Transportation&
AdministrativeCosts 300Equipment 300
YEARLYCOMPLIANCETESTINGCOSTS FOR A SMALLMARUFACTURERUSINGTHEFSO STATIONARYTEST (16 EXHAUSTSYSTEMSTESTEDPER DAY)
12 Systems
Labor $ 216(Iday)Site --
MotorcycleCosts --Transportation&
AdmlnlstrativeCosts 120Equipment 300
$ 636'
7-3Z
/
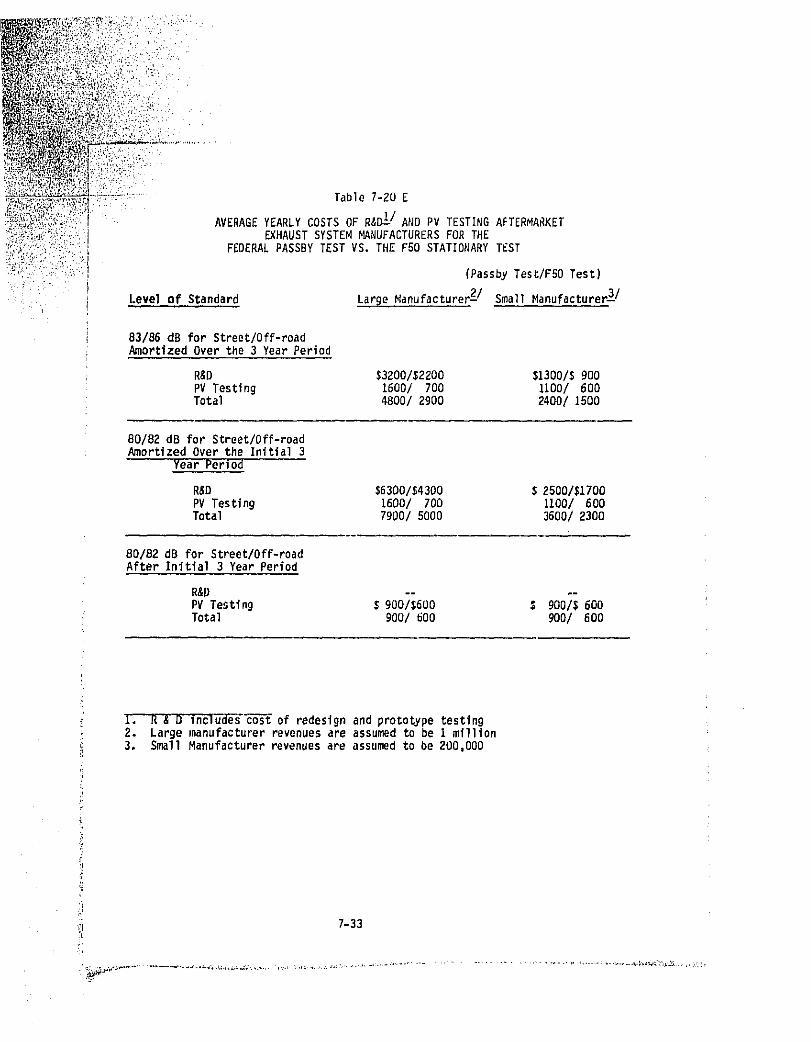
.,, . ) Table7-20E
AVERAGEYEARLYCOSTSOF R&D_I/ ANDPV TESTINGAFTERMARKET..., EXHAUSTSYSTEM_mNUFACTURERSFORTHE
FEDERALPASSBYTESTVS. TIIEF50 STATIONARYTEST
(PassbyTest/FBOTest)
Level of Standard LargeManufacturer_/ SmallManufacturer_/t
83/86 dB for Street/Off-roadAmortized Over the 3 Year Period
R&D $3200/$2200 $1300/$900PV Testing 1600/ 700 1100/ 600Total 4800/2900 2400/1500
80/82 dB for Street/Off-roadAmortizedOver the Initial3
Year Period
R&D $6300/$4300 $ 2500/$1700PV Testing 1600/ 700 1100/ 600Total 7900/5000 3600/2300
80/82 dB for Street/Off-roadAfter Initial 3 Year Period
R&O ....PV Testing $ 900/$600 $ 900/$600Total 900/600 900/ 600
i. R & D IncT6"_"cost of redesignand prototypetesting2. Large manufacturerrevenuesare assumedto be 1 million3, Smell Manufacturerrevenuesare assumedto be 200,000
_i 7-33(
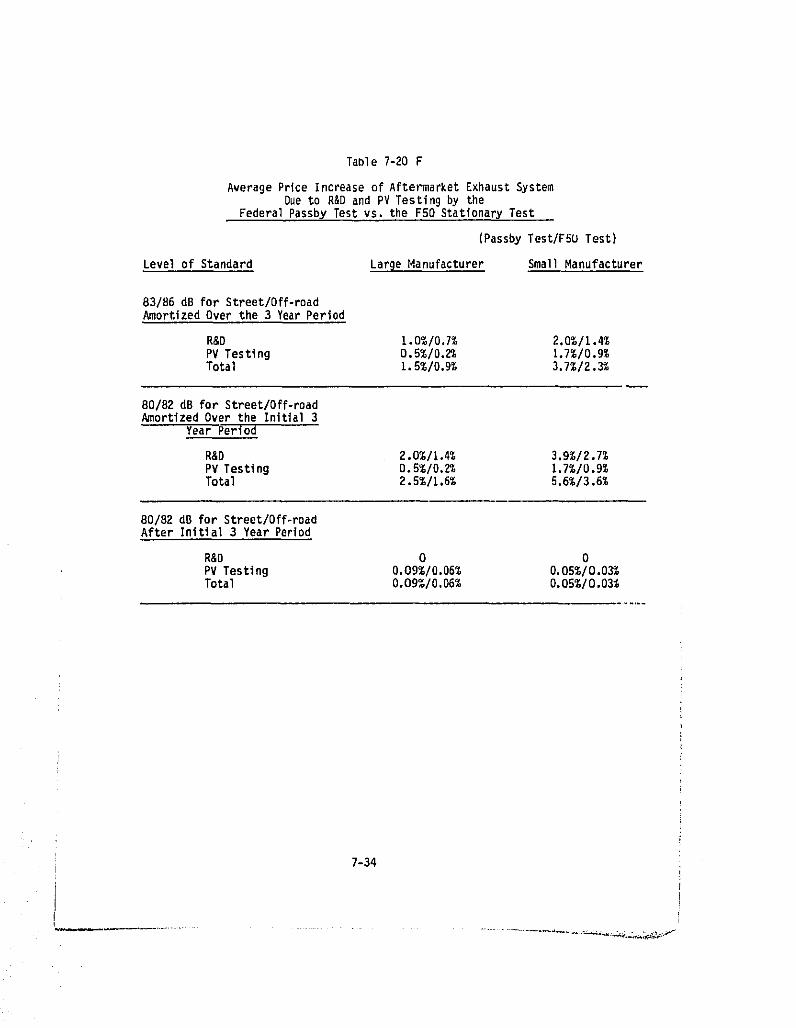
Table 7-20 F
AveragePriceIncreaseof AftermarketExhaustSystemDueto R&D and PV Testingby the
FederalPassbyTestvs. the FSO StationaryTest
(PassbyTest/FSUTest)
Levelof Standard LargeManufacturer SmallManufacturer
83/86 dB for Street/Dff-roadAmortized Over the 3 Year Period
R&D 1.0%/0.7% 2.0%/1.4%PV Testing 0.5%/0.2% 1.7%/0.9%Total 1.5%/0.9% 3.7%/2.3%
80/82 dB for Street/Off-roadAmortizedOver the Initial3
Year Period
R&D 2.0%/1.4% 3.9%/2.7%PV Testing 0.5%/0.2% 1.7%/0.9%Total 2.5%/1.6% 5.6%/3.6%
80/82 dB for Street/Off-roadAfter Initial 3 Year Period
R&D 0 0PV Testing 0.09%/0.06% 0,05%/0.03%Total 0.0g_/0.06% 0,05%/0.03%
7-34
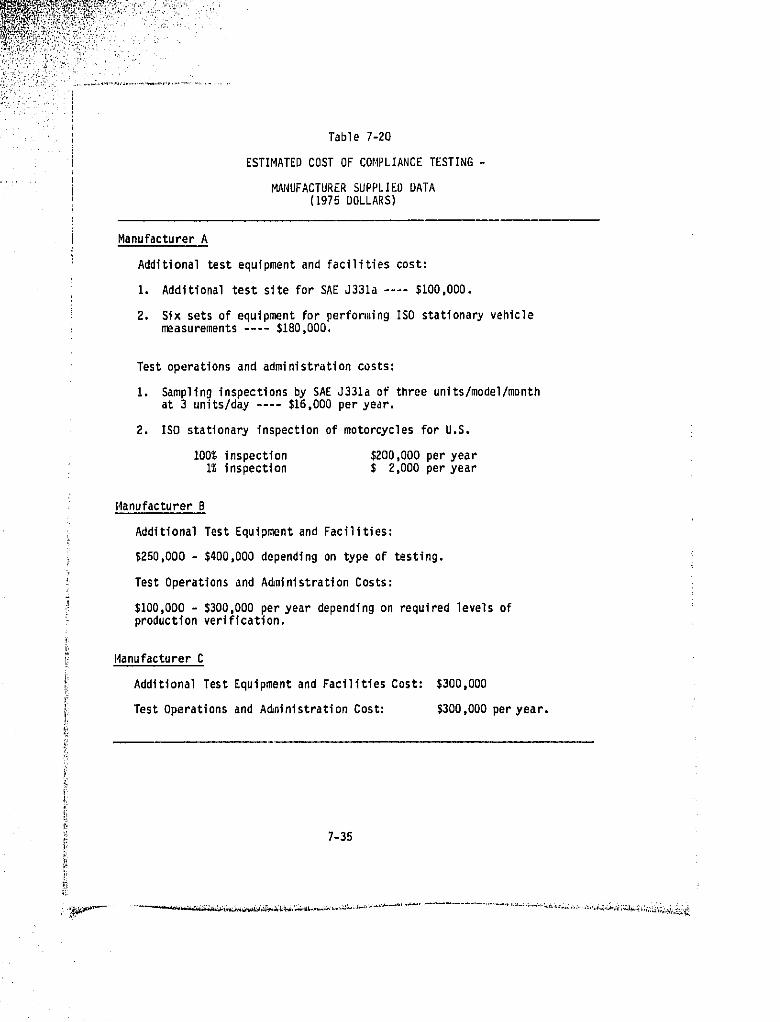
Table 7-20
ESTIMATED COST OF COMPLIANCE TESTING -
MANUFACTURER SUPPLIED DATA(1975 DOLLARS)
Manufacturer A
Additional test equipment and facilities cost:
1. Additional test site for SAE J331a .... $100,000.
2, Six setsof equipmentfor performingISO stationaryvehiclemeasurements.... $180,000,
Testoperationsand administrationcosts:
1. Samplinginspectionsby SAE J331a of threeunits/model/monthat 3 units/day.... $16,000per year.
2. ISO stationaryinspectionof motorcyclesfor U.S.
100%inspection $200,000per yeari% inspection $ 2,000peryear
ManufacturerB
AdditionalTestEquipmentand Facilities:
$250,000- $400,000dependingon type of testing.
TestOperationsand A_ninistratlonCosts:
$100,000- S300,O00per year dependingon requiredlevelsofproductionverification,
Manufacturer C
AdditionalTestEquipmentand FacilitiesCost: $300,000
TestOperationsand A_ninistrationCost: $300,000peryear.
!
_i 7-35
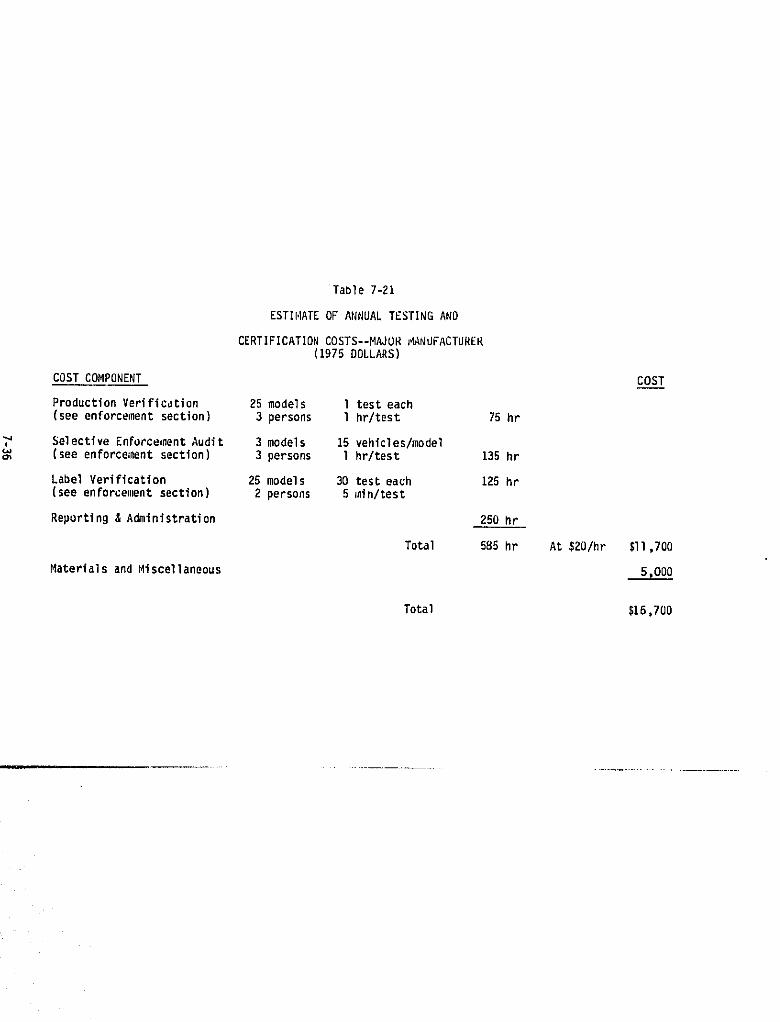
Table 7-21
ESTIHATEOF ANNUALTESTINGAND
CERTIFICATION COSTS--MAJOR J4ANUFACTURER(1975 DOLLARS)
COSTCOMPONENT COST
ProductionVerification 25 models l test each(see enforcementsection) 3 persons l hr/test 75 br
SelectiveEnforcementAudit 3 models 15 vehicles/model(seeenforcementsection) 3 persons 1 hr/test 135 hr
Label Verification 25 models 30 testeach 125 hr(see enforce,_ntsection) 2 persons 5 mln/test
Reporting& Administration 250 hr
Total 585 hr At S20/hr $11,700
Materialsand Miscellaneous 5,000
Total $16,700
7.1,5 Total Weighted Unit Cost Increases
Total unit cost increases resulting frola compliance with noise stan-dards arise fromfourmajor cost elements:
(1) Manufacturing unit cost increases.
(2)AmortizedR&D costs on a unit basis.
(3) Amortized tooling costs on a unit basis.
(4) Compliance testing and certification costs on a unit basis.
The total unit cost increases at various regulatorylevels fur theseveralmotorcycleproductcategoriesare summarizedin Table7-4. A break-down of totalunit costs by major cost element is providedin Tables7-22 and7-23. As has been indicated,in general,the largestcontributorto the unitcost increaseis the manufacturingcost, which typicallyrangesfrombetween60 to 70 percentof the total, followedby amortizedR&D costs,unit toolingcosts, and the testing and certification costs.
Probable unit cost increases for compliance with the noise emissionstandards were determined for all motorcycles that were tested. These costswere then weighted by the percentage of the total market share for eachtoanufacturer in each engine displacement class and totaled to obtain unit costincreases for various regulatory levels of each engine displacement class.These calculations were made for both street-legal and off-road _torcyclesand for nominal (expected) and worst cases. Refer to Table 7-24 for projectedweighted totalunit cost increasesfor the variousregulator7levels.
7.2 Purchase Price Impacts
The impactof cost increaseson motorcyclepurchasepricesis a complexsituation and one which will be determined in the final analysis by freemarket interaction between supply and demand. However, some of the costscenarioswhich are likelyto occur as a resultof the interactionof theseeconomic forces are presented in this section.
Table 7-25 provides an approximation of the existing price _rk-up struc-ture between*_nufacturerand distributor(if any) and dealer. Distributorsfor luajormanufacturersare generallywhollyownedsubsidiaries.
One manufacturer indicated that typical price mark-ups range between 20to 40 percent at the retail level. Independent references tend to supportthis estimate. Generally, EPA assumes the worst-case price increase due to anincrementalchange in cost is assumedto be 50 percent. However,the impacton price could range from a unit price increase being slightly less than aunit cost increaseto a price increaseequal to 1.5 times thecost increase.Representativecases inwhich fourdifferentlevelsof mark-upcould occuraredescribed following Table 7-25.
Cases I and I! would be considered very optimistic, primarily becausethey are counter to normal mark-up policies,even for "incremental"cost
7-37
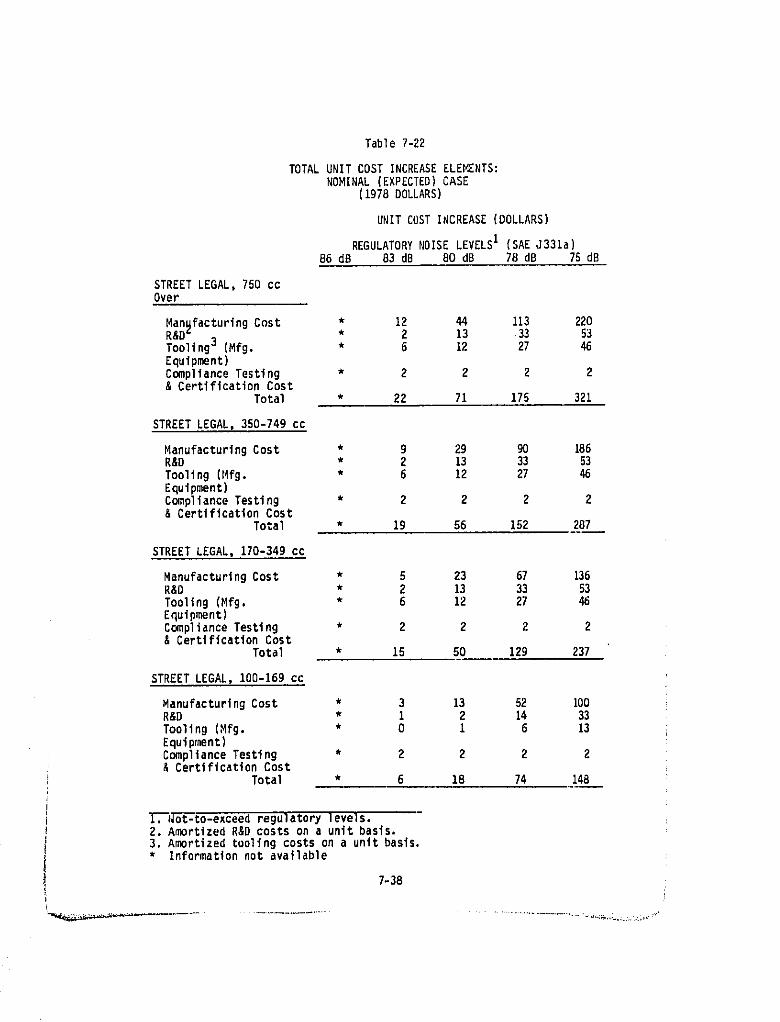
Table7-22
TOTAL UNITCOST INCREASEELEMENTS:NOMINAL(EXPECTED)CASE
(1978 DOLLARS)
UNITCOSTINCREASE(DOLLARS)
REGULATORYNOISELEVELSI (SAEJ331a)86dB 83dB 80 dB 78dB 75dB
STREETLEGAL,750 ccOver
ManufacturingCost * 12 44 113 220R&D_ * 2 13 33 53Tooling3 (Mfg. * 6 12 27 46Equipment)ComplianceTesting * 2 2 2 2& Certification Cost
Total * 22 71 175 321
STREETLEGAL,350-749cc
ManufacturingCost * g 29 90 186R&D * 2 13 33 53Tooling(Mfg. * 6 12 27 46Equipment)ComplianceTesting * 2 Z 2 2& CertificationCost
Total * 19 56 152 287
STREETLEGAL,170-349cc
ManufacturingCost * 5 23 67 136R&D * 2 13 33 53Tooling (Mfg, * 6 12 27 46Equipment)ComplianceTesting * 2 2 2 2& CertificationCost
Total * 15 50 129 237
STREETLEGAL,100-169cc
ManufacturingCost * 3 13 5Z 100R&D * 1 2 14 33Tooling(Mfg. * O I 6 13Equipment)Compliance Testing * Z 2 2 Z
Certification CostTotal * 6 18 74 148
_'T-,Not-to-exceedregulatoryIevels.2. AmortizedR&D costs on a unitbasis.3. Amortizedtoolingcosts on a unitbasis.* Informationnot available
7-38
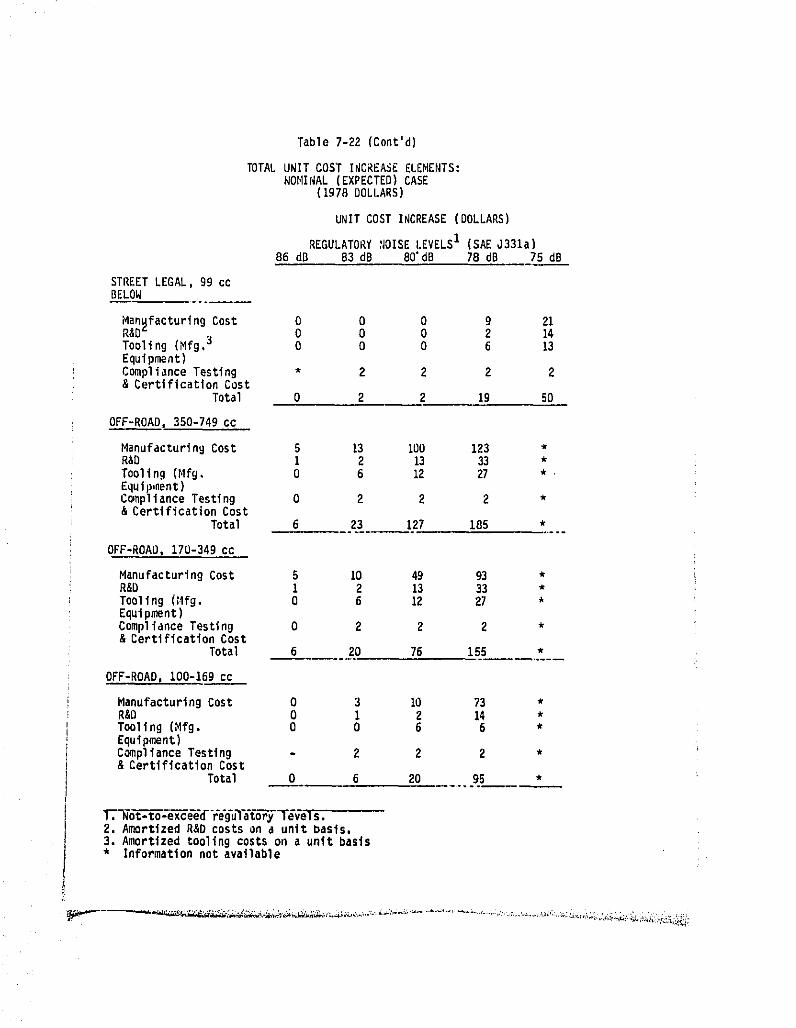
Table 7-22 (Cont'd)
TOTALUNIT COST INCREASEELEHENTS:NOMINAL (EXPECTED)CASE
(1978 DOLLARS)
UNIT COST INCREASE (DOLLARS)
REGULATORY_IOISELEVELSI (SAEJ331a)86 dg 83dB 80"dB 78dB 75 dB
STREETLEGAL,99 ccBELOW
ManufacturingCost 0 0 0 g 21R&D 0 0 0 2 14Tooling(Mfg.3 0 0 0 6 13Equipment)ComplianceTesting * 2 2 2 2& CertificationCost
Total 0 2 2 19 50
OFF-ROAD, 350-749 cc
ManufacturingCost 5 13 100 123 *R&D I 2 13 33 *Tooling(Mfg, 0 6 12 27 * .Equipment)C_nplianceTesting 0 2 2 2 *& CertificationCost
Total 6 23 X27 185 *
OFF-ROAD,170-349cc
ManufacturingCost 5 10 49 93 *R&D 1 2 13 33 *Tooling (_4fg. 0 6 12 27 *Equipment)ComplianceTesting 0 2 2 2 *& CertificationCost
Total 6 ZO 76 155 *
OFF-ROAD,i00-169cc
ManufacturingCost 0 3 i0 73 *R&D 0 i 2 14 *Tooling (Mfg. O 0 6 6 *Equipment)ComplianceTesting - ? 2 2 *& CertificationCost
Total O 6 20 95 *
2, AmortizedR&D costson a unit basis,3. Amortizedtooling costs on a unit basis• Informationnot available
?
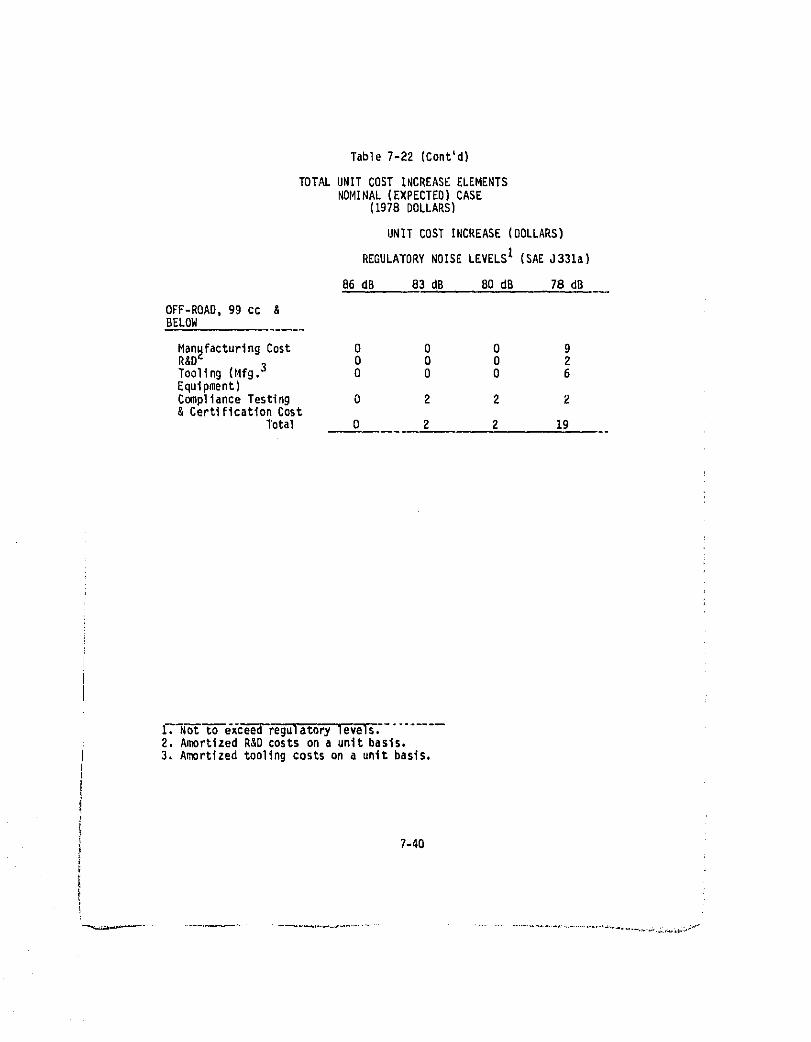
Table7-22 (Cont'd)
TOTAL UNITCOST I_CREASEELEMENTSNOMINAL(EXPECTED)CASE
(1978 DOLLARS)
UNIT COST INCREASE(DOLLARS)
REGULATORYNOISELEVELSI (SAEJ331a)
B6dB 83dB 80dB 78dB
OFF-ROAD,99 ccBELOW
ManufacturingCost 0 O 0 9R&D_ 0 0 0 2Tooling(Mfg.3 0 0 0 6Equipment)C_pliance Testing 0 2 2 Z& CertificationCost
Total 0 2 2 19
I-Z_6 to _ceed reguiatorylevel_."........2. AmortizedR&D costs on a unitbasis,3. Amortizedtoolingcosts on a unit basis.
7-40
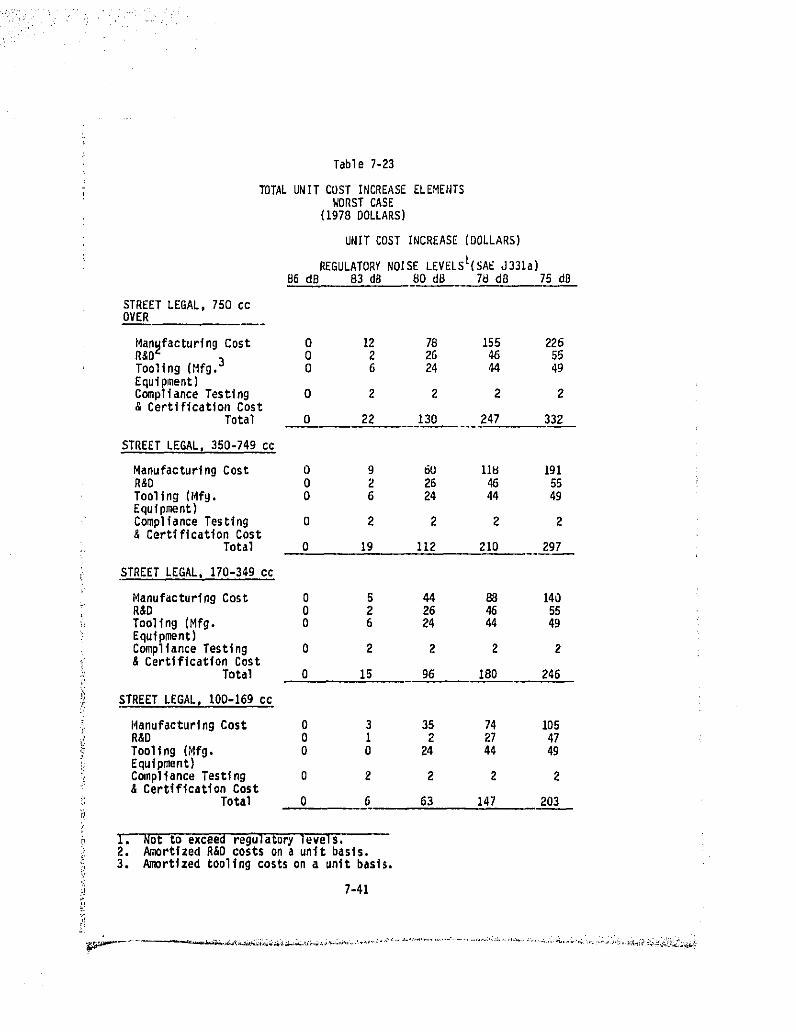
Table 7-23
TOTALUNIT COST INCREASEELEMENTSWORST CASE
(1978DOLLARS)
UNIT COST INCREASE (DOLLARS)
REGULATORYNOISE LEVELSI(SAEJ331a)B6dB 83 dB 80 dB 7_dB 75dB
STREET LEGAL, 750 ccOVER
Han_facturlngCost 0 12 78 155 226R&D_ 0 2 26 46 55Tooling(Mfg.3 0 6 24 44 49Equipment)ComplianceTesting 0 2 2 2 2& CertificationCost
Total O 22 130 247 332
STREET LEGAL,350-749cc
ManufacturingCost 0 9 60 II_ 191R&D 0 2 26 46 55
Tooling(Hfg. 0 6 24 44 49Equipment)ComplianceTesting 0 2 2 2 2& CertificationCost
Total 0 )g 112 210 297
STREET LEGAL, 170-349 co
ManufacturingCost 0 g 44 88 140R&D 0 2 26 46 55
_il Tooling(Mfg. 0 6 24 44 49Equipment)ComplianceTesting O 2 2 2 2
,; & Certification Cost: Total 0 15 96 180 246
STREETLEGAL,100-169cc
ManufacturingCost 0 3 35 74 105R&D O 1 2 27 47Tooling (Hfg. 0 0 24 44 49Equipment)CompllanceTesting 0 2 2 2 2& CertificationCost
Total 0 6 63 147 203
1. Not to exceed regulatury levels.2. Amortized R&Dcosts on a unit basis.
_' 3. Amortized tooling costs on a unit basis.
:;i 7"41
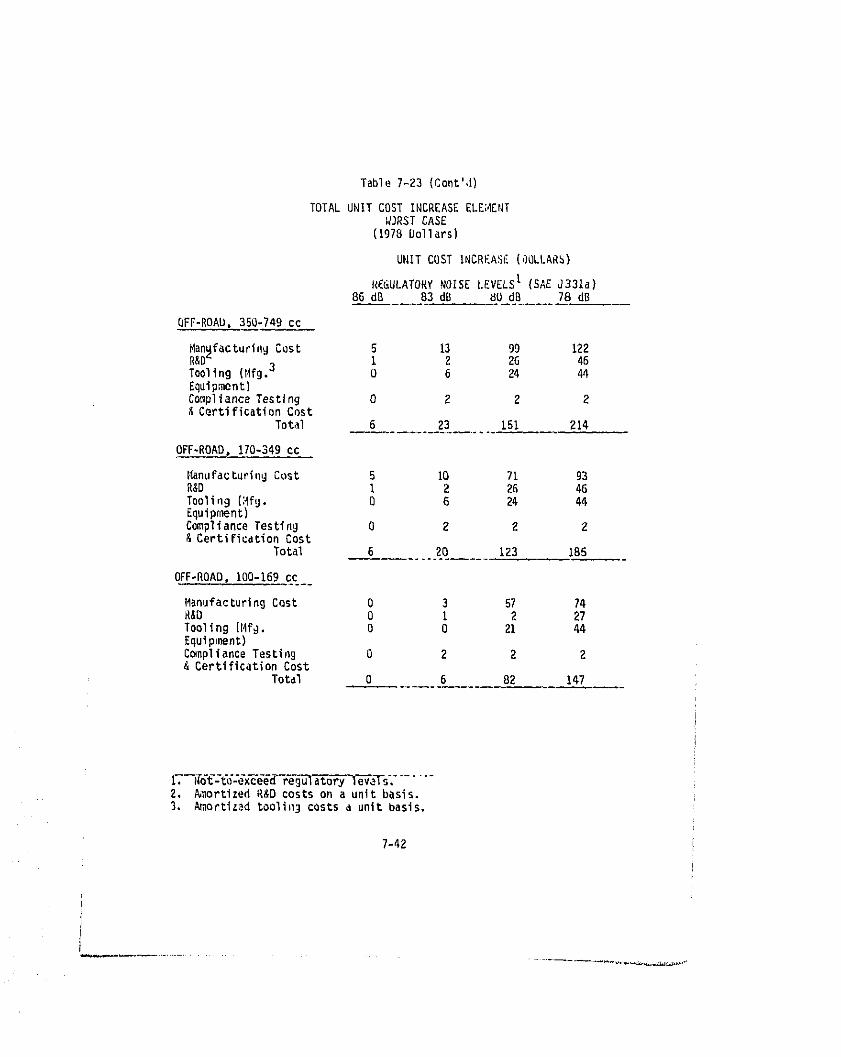
Table7-23 (Cont',l)
TOTAL UNIT COST INCREASE ELEI4Et:TN3RST CASE
(1978 Collars)
UNITCOST [NCREASC(,)OLLARS)
REGULATORYNOISELEVELSI (SAEJ331a)86 dg 83 dB _O dO 78 dB
OFF-ROAb. 350-749 cc
Mangfacturl,gCost 5 13 g9 122R&D" i 2 26 46Tooling(14fg.3 0 6 24 44Equipment)ComplianceTestfng O 2 2 2& CertificationCost
Total 6 23 151 214
OFF-ROAD, 170-349 cc
HannfacturingCost 5 10 71 93R_D I 2 26 46Tooling(:4fg. 0 6 24 44Equipnlent)ComplianceTesting 0 2 2 2& Certification Cost
Total 6 20 123 185
OFF-ROAD.100-169cc
;4anufacturing Cost 0 3 57 74R&O 0 I 2 27Tooling (14fg. 0 O 21 44Equlp_nent)ComplianceTesting 0 2 2 2& CertificationCost
Total 0 6 82 147
2. h_ortizedR&D costs on a unit basis.3. Amortizedtooli_gcosts a unitbasis.
7-42
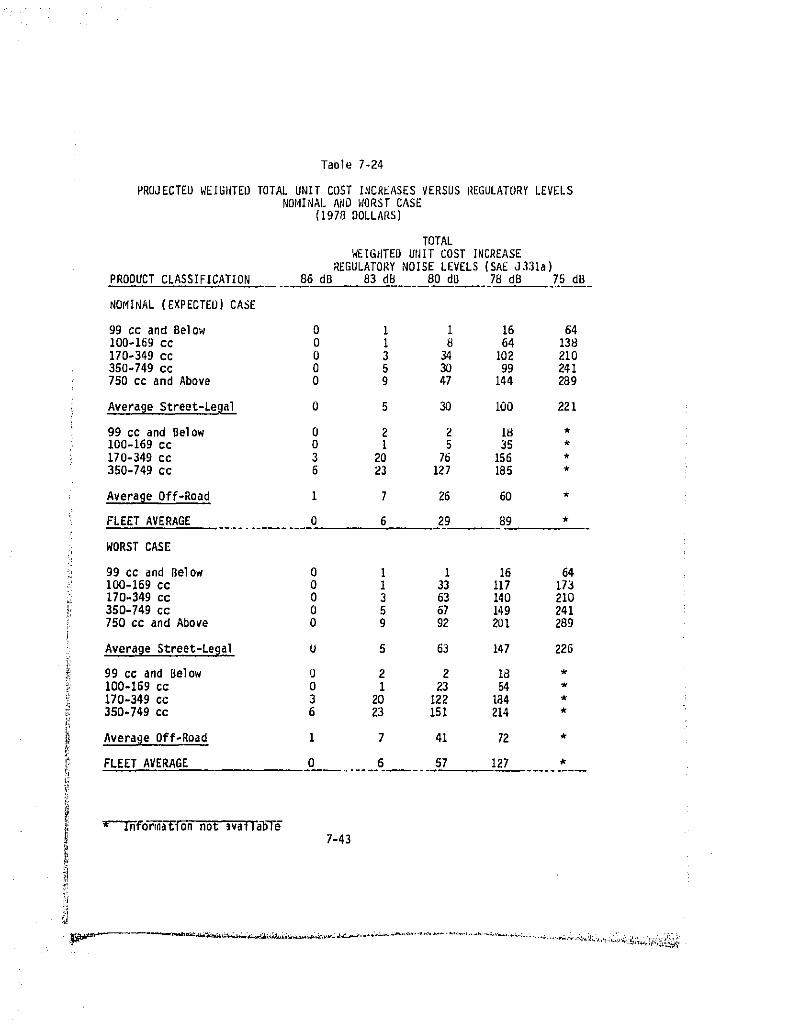
Table 7-24
PROJECTEDWEIGHTEDTOTALUNIT COST INCREASESVERSUSREGULATORYLEVELSNOHINALA_O _IORSrCASE
(1978 DOLLARS)
TOTALWEIGHTED UNIT COST INCREASE
REGULATORYNOISE LEVELS(SAEJ331a)PRODUCTCLASSIFICATION 86 dD 83 dB 80 dO 78dO 75 dB
NOMINAL (EXPECTED)CASE
99 cc and Below 0 I 1 16 64100-169cc 0 i 8 64 138170-349cc O 3 34 102 210350-749cc O 5 30 99 241750 cc and Above 0 9 47 144 289
AverageStreet-Legal 0 5 30 100 221
99 cc and Below O 2 2 18 *100-169cc 0 i 5 35 *170-349cc 3 20 76 156 *350-749cc 6 23 127 185 *
AverageOff-Road I 7 26 60 *
FLEETAVERAGE 0 6 29 89 *
WORST CASE
99 cc and Below 0 I 1 16 64100-169cc 0 i 33 117 173170-349cc 0 3 63 140 210350-749cc O 5 67 149 241750 cc and Above 0 9 92 201 289
AveraBeS1:reet-Le_ial U 5 63 147 225
! 99 cc and Below O 2 2 18 *100-169cc 0 i 23 54 *
,_i 170-349co 3 20 122 184 *Z,_ 350-749 cc 6 23 151 214 *
I_ AverageOff-Road 1 7 41 72 *
;i_ FLEET AVERAGE 0 6 57 127 *l;
I * InfSrmationnot"_vailal)_ 7-43
!t
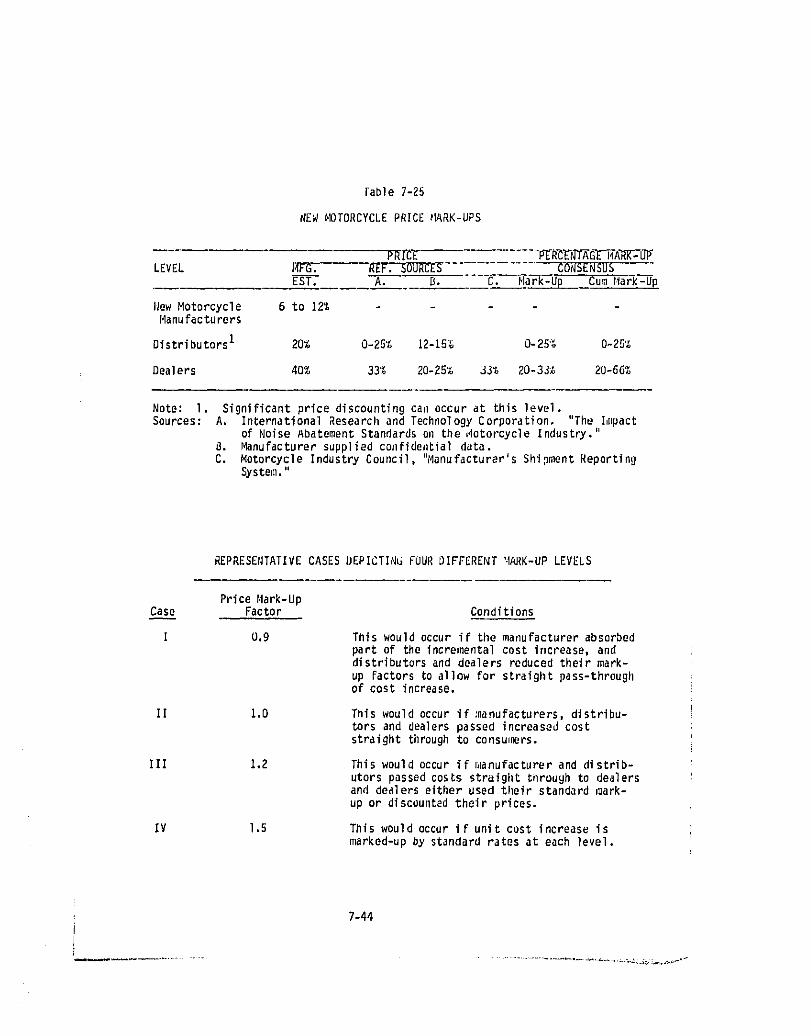
Fable 7-25
NEW _IOTORCYCLE PRICE MARK-UPS
pRli_l_-- -p-_-RCEN_G-I_TFARK_LI!_LEVEL J_FG. REF. SOURCES............... CONSENSUS
_. O. "---C. _la-ar_'-Up Culnl_ar_U-p
IJewMotorcycle 6 to 12%Manufacturers
DistributorsI 20% 0-25% 12-15_ 0-25% 0-25'_
Dealers 40% 33% 20-2S_ _3_ 20-33_ 20-66%
Note: I. Significant price discounting cau occur at this level.Sources: A. InternationalResearchand TechnologyCorporation. "The Impact
of Noise Abatement Standards ellthe,4otorcycle Industry."B. Manufacturersuppliedconfidentialdata.C. Motorcycle Industry Council, "Manufacturer's Shipment Reporting
System."
REPRESENTATIVE CASES DEPICTING FOUR _IFFERENT _ARK-UP LEVELS
Price Mark-UpCase Factor Conditions
I o,g This wouldoccurif the manufacturerabsorbedpart of the incre_nentalcost increase,anddistributorsand dealers reducedtheirmark-
up factorsto allow for straightpass-throughof cost increase.
II 1.0 Tnls wouldoccurif manufacturers,dlstribu-torsand dealerspassedincreasedcoststraightthroughto consumers.
Ill 1.2 Thiswould occurif _,lanufacturerand distrib-utors passedcostsstraigiltthroughto dealersand dealerseitherused their standard_oark-
up or discountedtheir prices.
IV 1.5 ThIswould occurif unit cost increaseismarked-upby standardrates at each level.
7-44
increases. Case Ill is a more likely possibility because it takes intoaccount both levelof demandand profitability. Case IV wouldbe consideredworst case, because this is the mark-up factor that would impact demandseverely. If these mark-upfactorsreduceddemandslgniflcantly,discountingand manufacturingrebate actions would likely take place, therebyreducingeffective mark-up factors to those shown in Case Ill. The I._ factor istherefore a relativelyrealisticestimateand is used in the "nominal"caseanalysis. The 1.5 factoris used in the "worst-case"analysis.
Total weightedunit cost increasesdeterminedin the cost analysisareused as the basis of estimatingprice increases(referto Table 7-24). In thenominalcase, totalweightedunit cost increasesare factoredby the 1.2 pricemark-up factor derived in the previoussection to determineprice increasesand in the worst case, totalweightedunlt costs were factoredby a 1.5 pricemark-up factor. The resultsfor the two cases and for each productcategoryare summarizedin Table 7-26, and shown in Figures 7-5 through 7-B. Theseprice impacts are for regulatorylevels as definedby the SAE J331a testprocedure.
The projectedaverage unit price increasesfor street-legal,off-road,and all motorcyclesfor nominaland worst cases are shown in figures7-9 and7-10.
Average 1978 prices for each of the product categories are shown inTable 7-27. These prices were used as the baseline reference to compute therelative price increases which are also summarized in Table 7-27.
7.3 ReplacementExhaustSystemPrice Impacts
Using manufacturer-supplled data and an independent estimate, thepurchaseprice increasesexpectedFor 4 into i and 2 into i exhaustsystemswere calculatedand are shown in Tables7-28, 7-29. and 7-30.
Projected relative price increases for two typlcal exhaust systemsare summarizedas follows:
Regulatory 4 intoi 2 intoIExhaust Exhaust
Level S_stem S_stem
80 dB +21% +26%
78 dB +4(_. +50%
7.4 OperationalCost Increases
As discussed in Section 6.3 the principaloperationalcost increasesassociatedwith lower levels of noise are the impacton fueleconomy. Basedon the fuel penaltiesin Section6.3.2,the "nominal"and "worst"case esti-
7-45
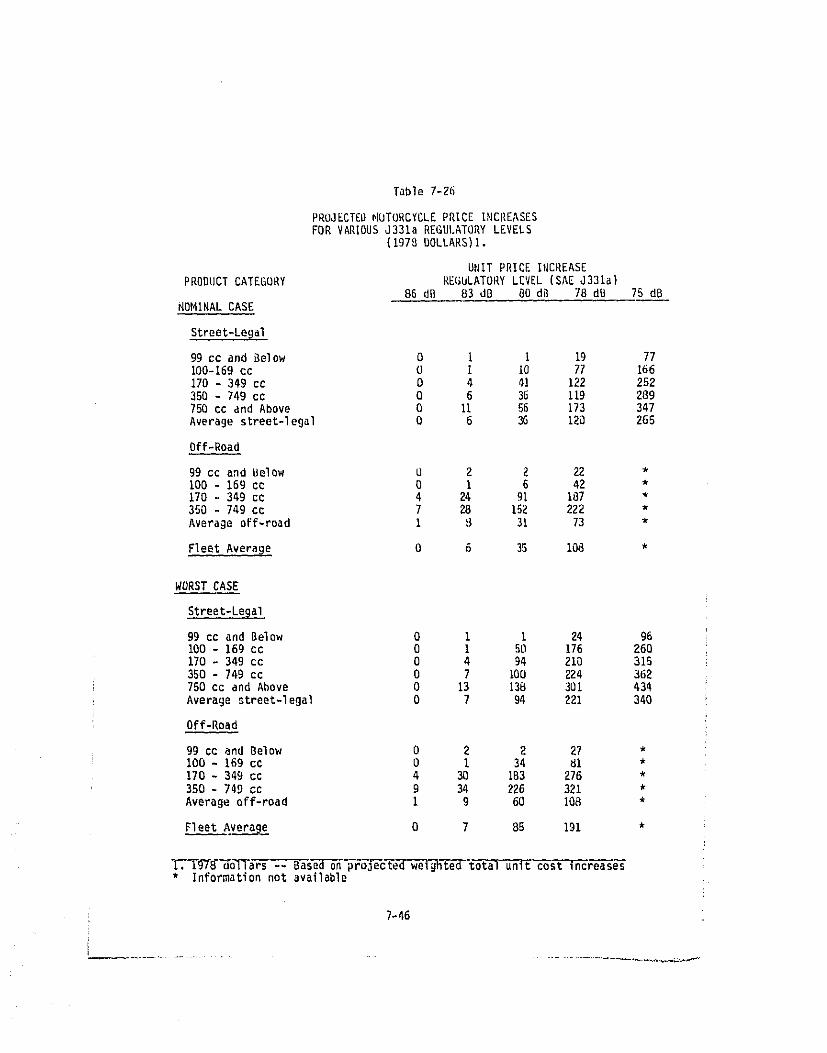
Table 7-2_
PROJECTEd _IUTORCYCLE PRICE INCREASESFOR VARIOUS J331a REGULATORY LEVELS
(197_ OOLLARS)I.
UNIT PRICE INCREASEPRODUCTCATEGORY REGULATORYLEVEL(SAEJ331a)
86dB 83dB 80dB 78dB 75dBNOMINAL CASE
Street-Legal
99 cc and Below 0 I I 19 77100-169cc 0 i 10 77 166170 - 349 cc 0 4 41 122 252350 - 749 cc 0 6 36 119 289750 cc and Above Q 11 56 173 347Averagestreet-legal 0 6 3G 120 265
Off-Road
99ccandBelow 0 2 2 22 *100-169cc 0 I 6 42 *170 - 349 cc 4 24 91 187 *350 - 749 cc 7 28 152 222 *Averageoff-road I _ 31 73 *
FleetAverage 0 6 35 108 *
WORST CASE
Street-Legal
99ccandBelow 0 i I 24 96100 - 169 cc 0 I 50 176 260170-349cc 0 4 94 210 315350 - 749 cc 0 7 100 224 362750 cc and Above O 13 138 301 434
Averagestreet-legal 0 7 94 221 340
Off-Road
99ccandBelow 0 2 2 27 *100-169cc 0 I 34 _i *170 - 349 cc 4 30 1B3 276 *350 - 749 CC 9 34 226 321 *Averageoff-road I g 60 108 *
FleetAverage 0 7 B5 191 *
I. 1'9"FB-'EFo'T_'a_s"_-Basedon_-_6jectedW61ghtedtotalunit cost increas_• Informationnot available
7-46
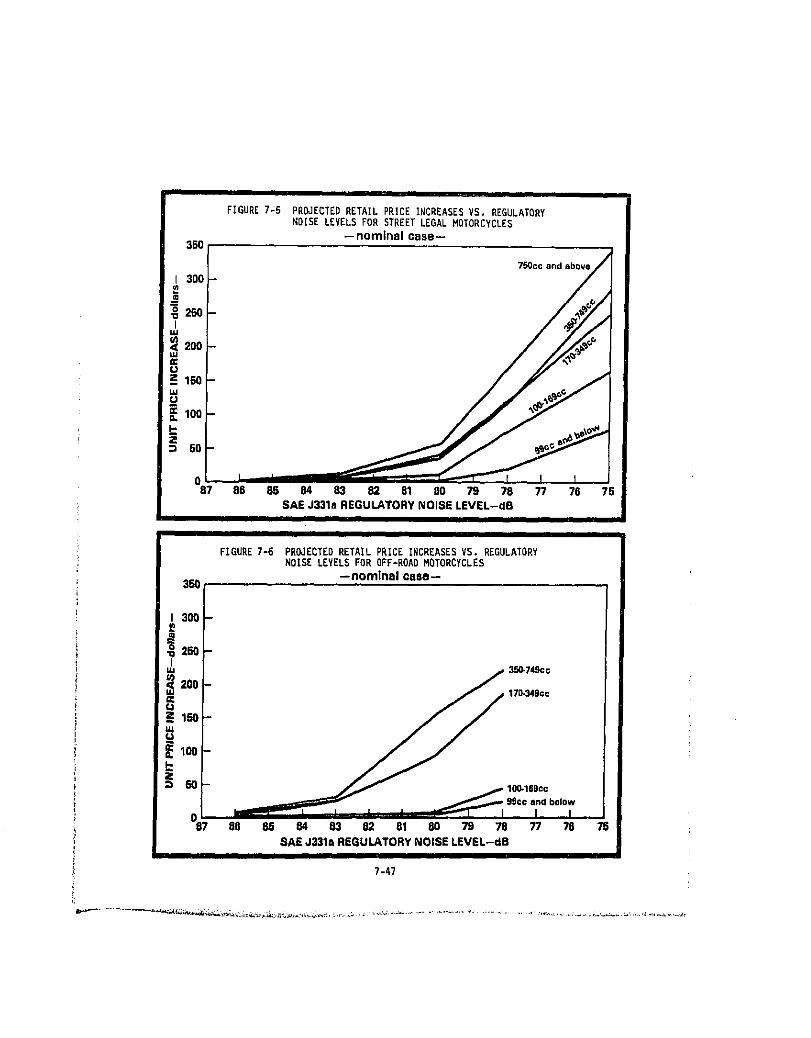
II
FIGURE7-5 PROJECTEDRETAILPRICEINCREASESVS. REGULATORYNOISELEVELSFOR STREETLEGALMOTORCYCLES
-- nominal case-350
I 300 _75occ andabQve
u_z15olUJU
100
0 t i87 8g 85 84 83 82 81 80 79 78 77 76 75
SAE J331n REGULATORY NOISE LEVEL-riBI
|
FIGURE7-6 PROJECTEDRETAILPRICEINCREASESVS. REGULATORYNOISELEVELSFOROFF-ROADMOTORCYCLES
--nominal case--350
_ 3oo
•_ 25OI
_ y _0-749ec
zoo_. 170-349cc
15oi
99cc a d beloL , I I I I
067 8{I 85 64 83 02 81 80 79 78 77 76 75
SAE J331:_REGULATORY NOISE LEVEL-dBI
7-47
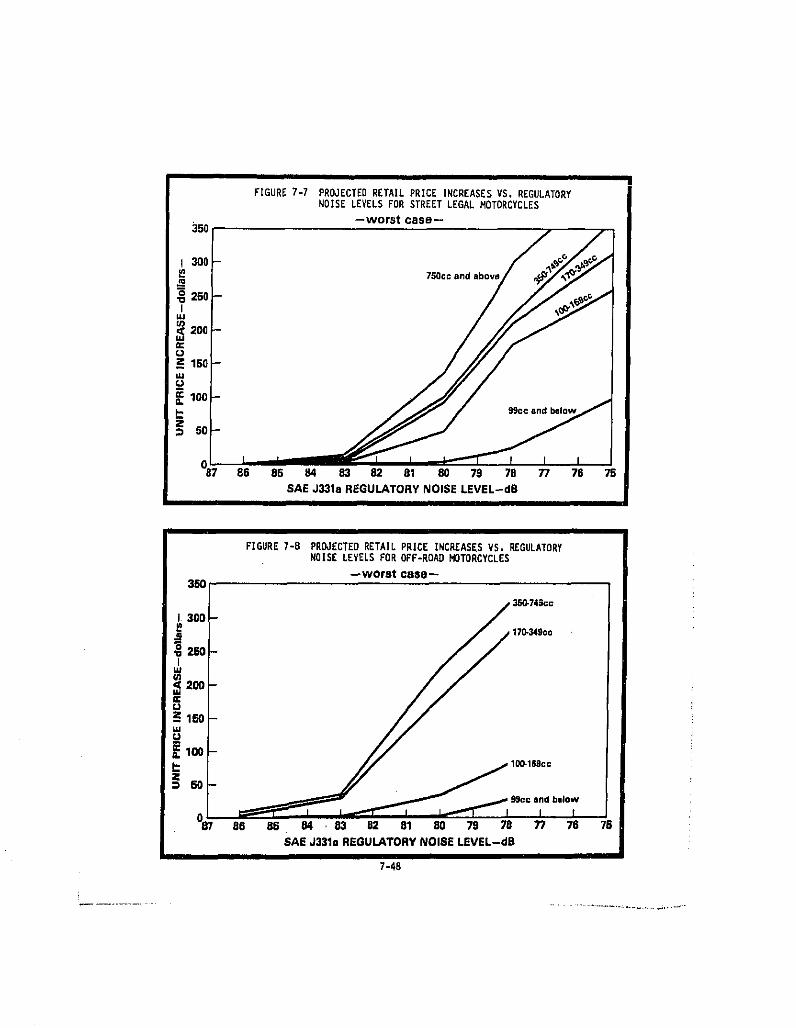
FIGURE7-7 PROJECTEDRETAILPRICEINCREASESVS,REGULATORYNOISELEVELSFOR STREETLEGALMOTORCYCLES
--worst case--
10099cc and below
087 86 85 84 83 82 81 80 79 78 77 76 75
SAE J331a REGULATORY NOISE LEVEL-dR
FIGURE7-8 PROJECTEDRETAILPRICEINCREASESVS. REGULATORYNOISELEVELSFOROFF-ROADMOTORCYCLES
350 _ _ --worst case_
J 300t /350-74Bcc 17_34Scc
//_,-k //
//llooF //
/ // /1_1.oo
99c©andbelow
087 66 85 04 , 03 02 81 80 79 70 T/ 76 75
SAD J3310 REnULATORYNOISE LEVEL-dB
7-48
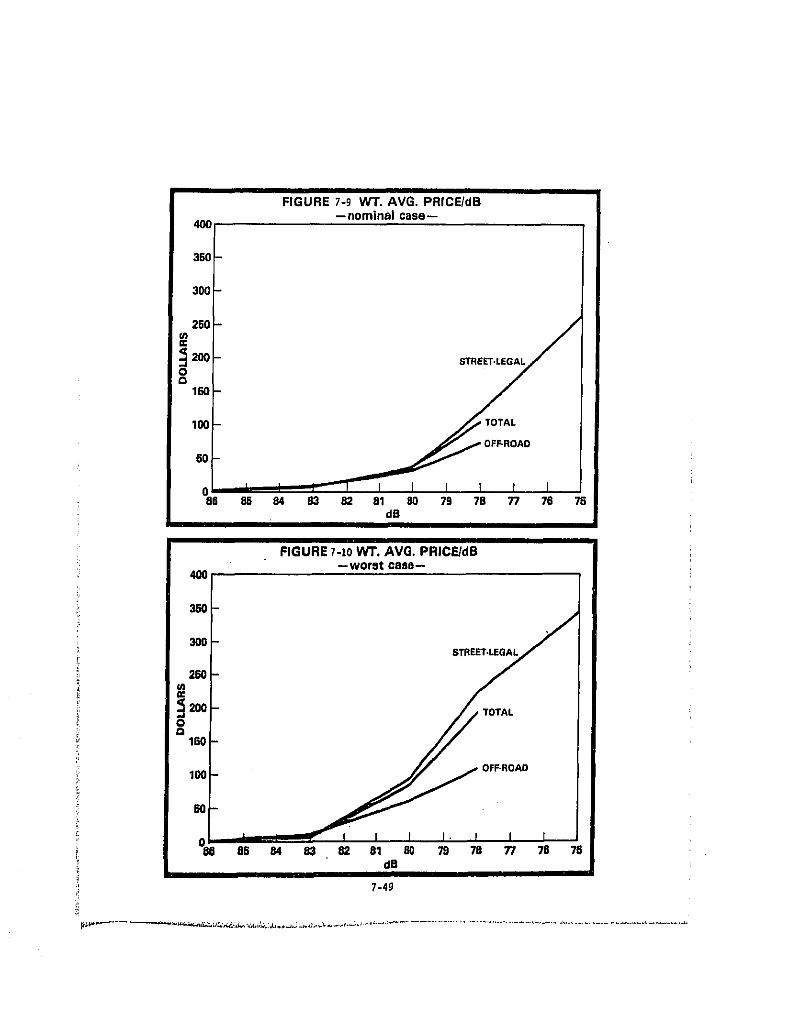
FIGURE 7-9 WT. AVG. PRICE/dB--nominal case--
400,
350
300
250 J_200 STREET.LEGAL
100 TOTAL
OFF-ROAD
6O
0 I I I86 85 84 83 82 81 80 79 78 77 76 75
dR
FIGURE 7-zoWT. AVG. PRICE/dB-worst case-
40o
360
260
,200 TOTAL
i
(: 100 AO
60
! I J -- I I I I" I Ii 85 84 83 82 81 60 79 78 77 78 76' dBi II III! 7-49
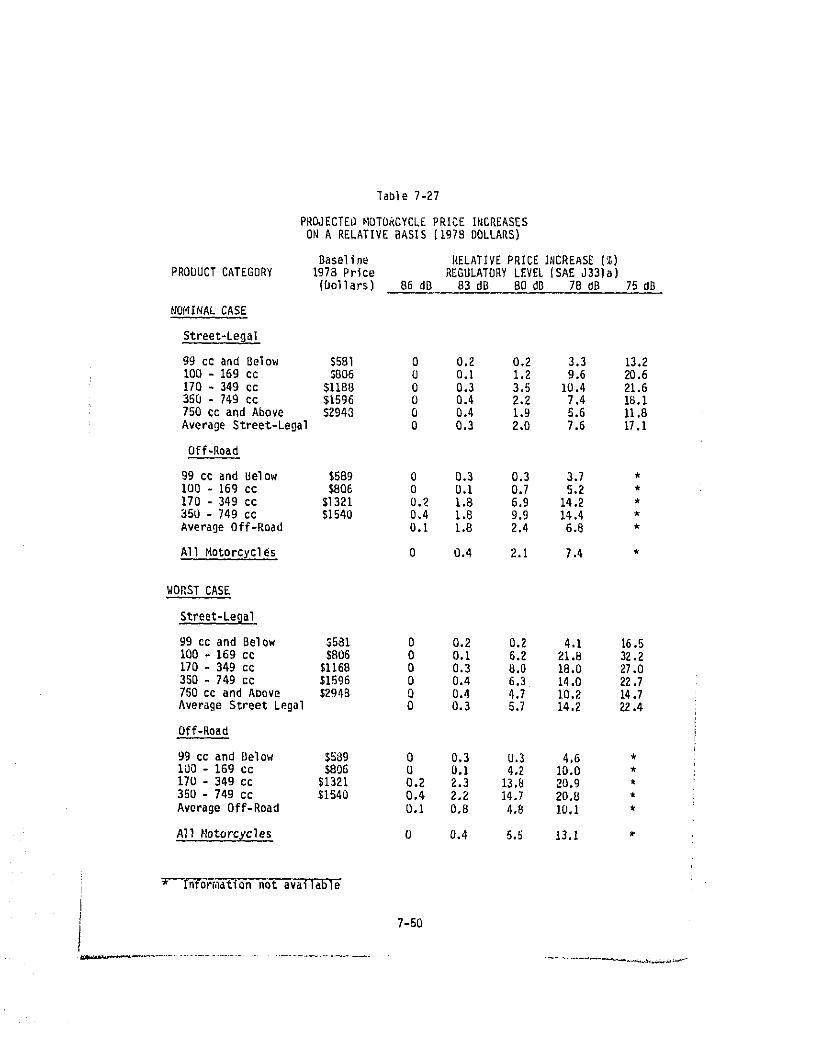
Table 7-27
PRDJECTE_MOTORCYCLEPRICE INCREASESON A RELATIVEBASIS (1978DOLLARS)
Baseline RELATIVEPRICE INCREASE(%)PRODUCTCATEGORY 1978 Price REGULATORYLEVEL(SAE J331a)
(Dollars) 86 NB 83 dB BO dD 78 dB 75 dD
N0MINAL CASE
Street-Le�al
ggccandBelow $581 0 0.2 0.2 3.3 13.2i00- 168cc $806 0 O.I 1.2 9.6 20.6170 - 349 cc $1188 0 0.3 3.5 10.4 21.635Q - 749 cc $1596 0 0.4 2.2 7.4 18.I750 cc and Above S2043 O 0.4 1.9 5.6 11.8AverageStreet-Legal 0 0.3 2,0 7.6 17.1
Off-Road
99ccandBelow $589 0 0.3 0.3 3.7 *i00 - 169 cc $806 O O.l 0.7 5.2 *170 - 349 cc $1321 0._ 1.8 6.9 14.2 *35U- 749cc $1540 0.4 1.8 9.9 14.4 *AverageOff-Road 0.I 1.8 2.4 6.8 *
AllMotorcycles 0 0.4 2.1 7.4 *
WORST CASE
Street-Legal
99 cc and Below $581 O 0.2 0.2 4.1 16.5IO0 - 169 cc $B06 0 0.1 6.2 21.8 32.2170- 349cc $1168 0 0.3 8.0 18.0 27.0350 - 749 cc $1596 O 0.4 6.3 14.0 22.7750 cc and Above $2949 0 0.4 4.7 10.2 14.7AverageStreetLegal 0 0.3 5.7 14.2 22.4
Off-Road
99 cc and Below $589 0 0.3 0.3 4.6 *IUO- 16gcc $806 O 0.I 4.2 10.0 *170 - 349 cc $1321 0.2 2.3 13.8 20,9 *350 - 749 cc $1540 0.4 2,2 14.7 20,B *AverageOff-Road 0.I O,B 4,B 10.1 *
All Motorcycles 0 0.4 5.S 13.1
In-_F_ion not available
7-50
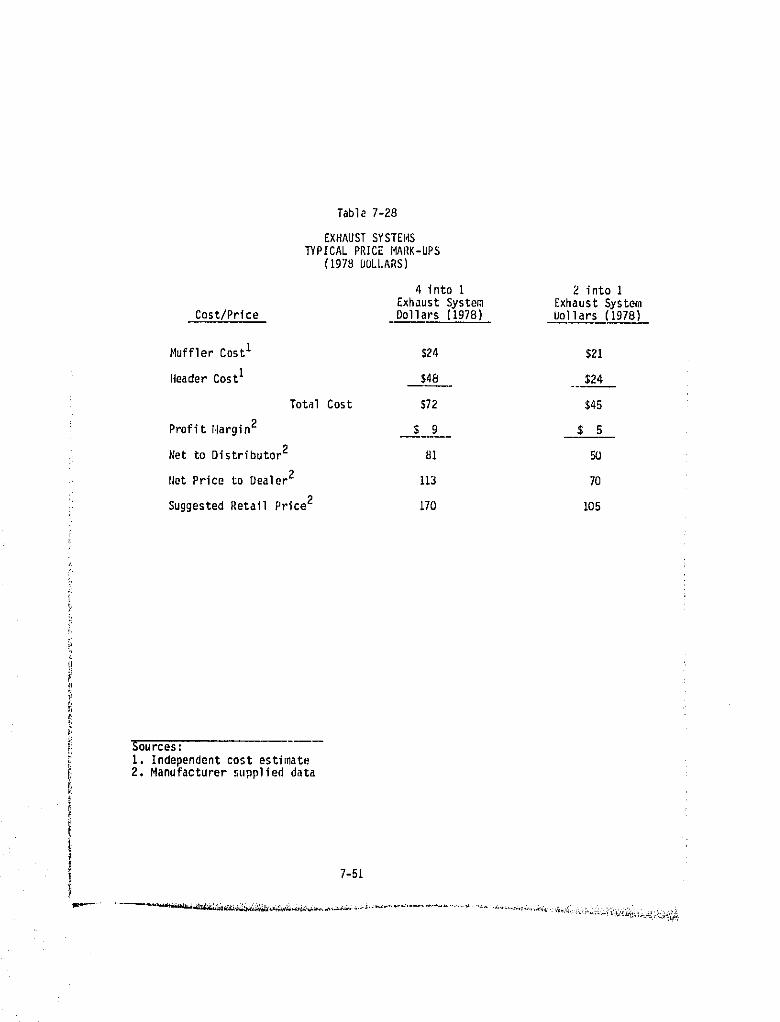
Table 7-28
EXHAUST SYSTEHSTYPICAL PRICE HARK-UPS
(ig7_ DOLLARS)
4 intoi 2 intoI
Exhaust System Exhaust SystemCost/Price Dollars (1978) UoIlars (1978)
MufflerCostI $24 $21
Header CostI $48 $24
Total Cost $72 $45
Profit Hargin2 $ 9 $ 5
NettoDistributor2 81 5(J
NetPricetoDealer2 113 70
SuggestedRetailPrlce2 170 105
y,
_J
Sources:
I. Independent cost estimate2. Manufacturer supplied data
7-51
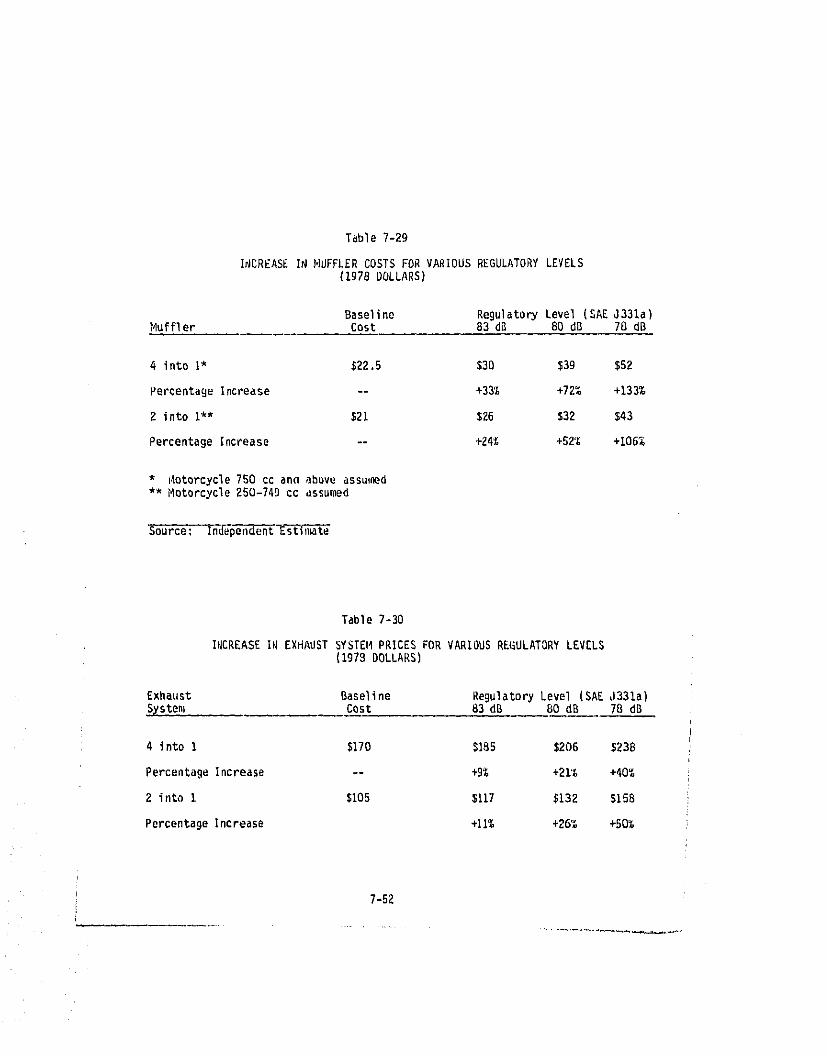
Table 7-29
INCREASE IN MUFFLER COSTS FOR VARIOUS REGULATORY LEVELS(ig78DOLLARS)
Baseline RegulatoryLevel (SAEJ331a)Muffler Cost 83dB 80dB 78dB
4 intoI* $22.5 $30 $3g $52
PercentageIncrease -- +33% +72% +133%
2 into I** $21 $26 $32 $43
PercentageIncrease -- +24% +52% +106%
* Motorcycle750 cc ano aboveassumed** Motorcycle250-74Dcc assumed
Source: "T#_C_ -E-s[_n_'te-
Table 7-30
INCREASEIN EXHAUSTSYSTEMPRICESFOR VARIOUSREGULATORYLEVELS(1973DOLLARS)
JExhaust Baseline RegulatoryLevel (SAEJO31a)System Cost 83 dB 80 dB 7B dB
4 into I $170 _I_5 $206 $238 i
PercentageIncrease -- +9% +21% +40% i
2 into I $105 $117 $132 $158 i
PercentageIncrease +11% +26% +50%
7-52
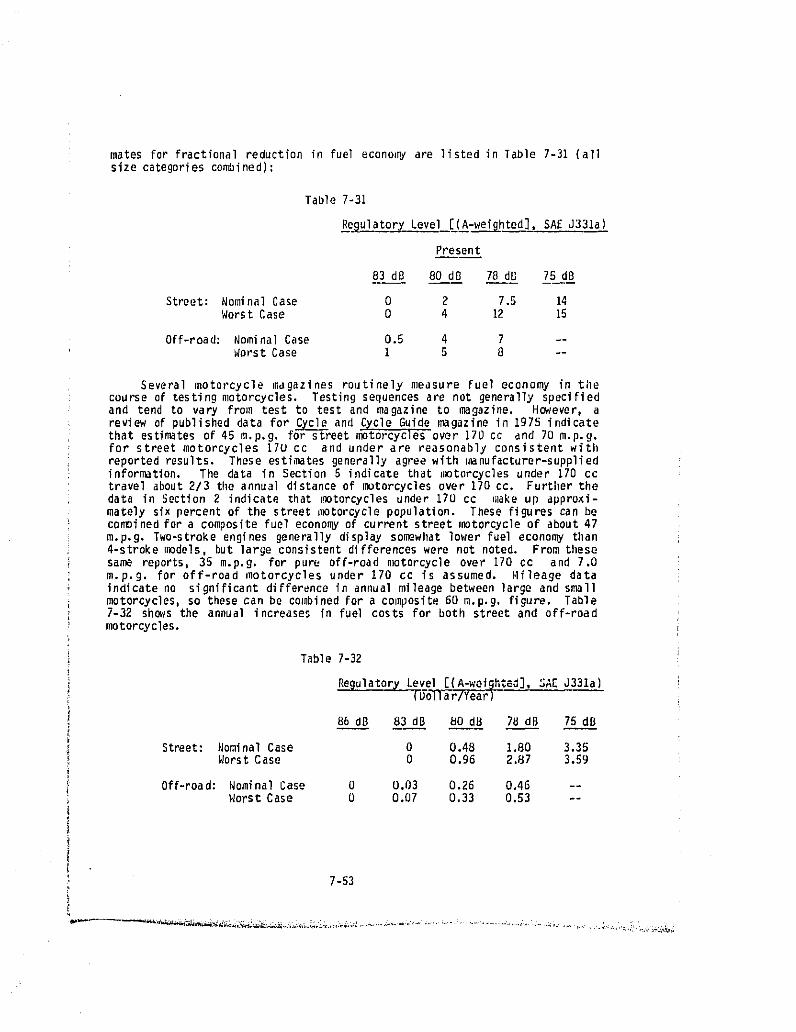
motes for fractional reduction in fuel econou*y are listed in Table 7-31 (allsize categories confined):
Table 7-31
Re_gulatory Level [(A-weighted], SAE J331a)
Present
83 dB 80 dO 78 di3 75 dB
Street:NominalCase 0 2 7.5 14WorstCase 0 4 12 15
Off-road:NominalCase 0.5 4 7 --WorstCase I 5 8 --
Several motorcycle magazines routinely measure fuel economy in thecourseof testingmotorcycles. Testingsequencesare not generallyspecifiedand tend to vary from test to test and magazine to magazine. However, areviewof publisheddata for Cycle and CTcle Guide magazinein 1975 indicatethat estimatesof 45 m.p.g, for streetmetorcyclesover 170 cc and 70 m.p.g.for street motorcycles 17U cc and under are reasonably consistent withreportedresults. These esti_tes generallyagreewith manufacturer-suppliedinformation. The data in Section 5 indicate that metorcyclesunder 170 cotravelabout2/3 the annual distanceof motorcyclesover 170 co. Furtilerthedata in Section2 indicatethat r_otorcyclesunder 170 cc _}lakeup approxi-mately six percentof the streetmotorcyclepopulation. These figurescan becom_)inedfor a composite fuel economy of current street motorcycle of about 47m.p.g. Two-strokeengines generallydisplaysomewhatlowerfuel econonD,than4-strokenodels,but largeconsistentdifferenceswere not noted. From thesesame reports,35 m.p.g, for pure off-roadn_torcycleover 170 cc and 7,0m.p.g, for off-road motorcycles under 170 co is assumed, l,lileagedataindicateno significantdifferencein annualmileagebetweenlarge and smallmotorcycles,so thesecan be combinedfor a composite60 rn,p.g, figure, Table7-32 showsthe annual increasesin fuel costs for both streetand off-roadmotorcycles.
Table 7-32
Regulator7 Level[(A-weighted],SAE J331a)(Uo-IIar/Year)
86dB 83dB _0 dB 7BdB 75dB
Street: NominalCase 0 0.48 1.80 3.35WorstCase 0 0.96 2.87 3,59
Off-road:NominalCase 0 0.03 0.26 0.46 --WorstCase O 0.07 0,33 0.53 --
7-53
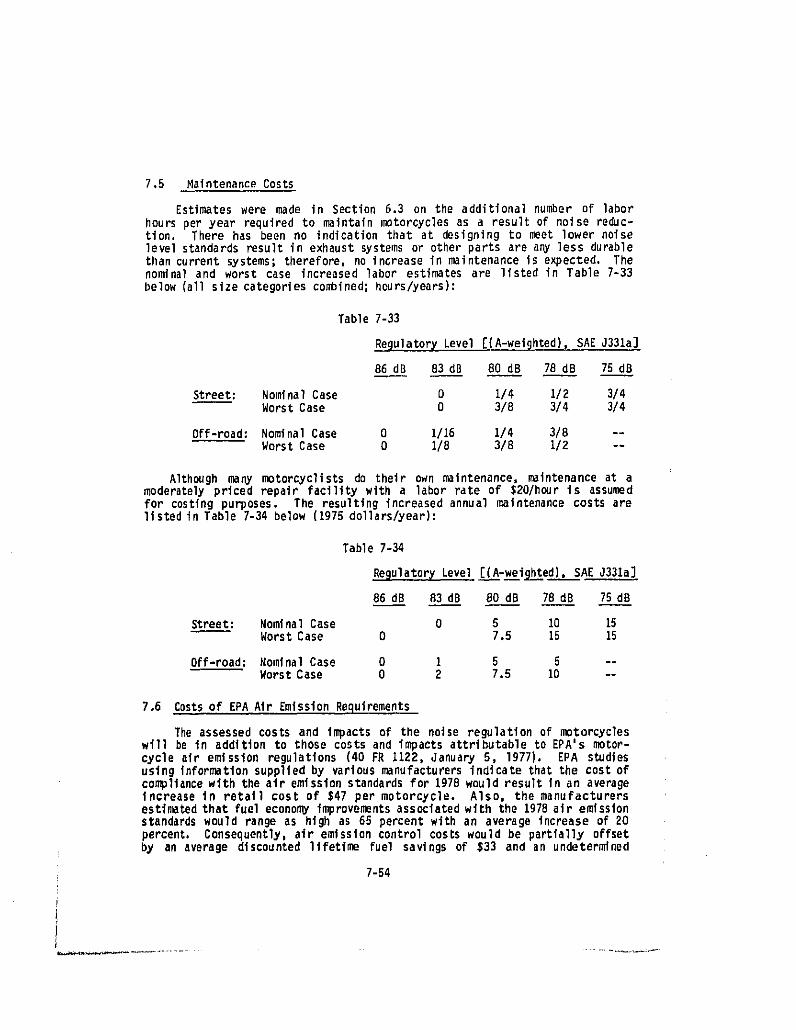
7,5 MaintenanceCosts
Estimateswere made in Section 6.3 on the additionalnumber of labor
hours per year requiredto maintainmotorcyclesas a resultof noise reduc-tion. There has been no indicationthat at designingto meet lower noiselevelstandardsresultin exhaustsystemsor otherparts are aEV less durablethan currentsystems;therefore,no increasein maintenanceis expected. Thenominaland worst case increasedlabor estimatesare listedin Table 7-33below(allsize categoriescombined;heurs/years):
Table 7-33
Re(,lulator_' Level [(A-weishted), SAEJ331a]
86dB 83dB 80dB 78dB 75dB
Street: NominalCase 0 1/4 I/2 3/4WorstCase 0 3/8 3/4 3/4
Off-road: NominalCase 0 1/16 1/4 3/8 --WorstCase 0 I/8 3/B 1/2 --
AlthoughmarLYmotorcyclistsdo their own maintenance,maintenanceat amoderatelypriced repair facilitywith a labor rate of $20/houris assumedfor costingpurposes. The resultingincreasedannual maintenancecosts arelistedin Table 7-34below (1975dollars/year):
Table7-34
Re_ulator_Level[(A-weighted),SAE J331a]
86 dB B3 dB BO dB 78 dB 7B dB
Street: NomlnalCase 0 5 10 15WorstCase 0 7.5 15 15
Off-road: Nominal Case 0 1 S 5 --Worst Case 0 2 7.5 10 --
7.6 Costsof EPA Air EmissionRequirements
The assessed costs and Impactsof the noise regulationof motorcycleswill be in additionto those costs and impactsattributableto EPA's meter-cycle air emission regulations(40 FR 1122, January 5, 1977), EPA studiesusing informationsuppliedby variousmanufacturersindicatethatthe cost ofcompliancewith the air emissionstandardsfor 1978would resultin an averageincrease in retail cost of $47 per motorcycle. Also, the manufacturersestimatedthat fueleconomyimprovementsassociatedwith the lg7Bair emissionstandardswould range as high as 65 percentwith an average increaseof 20percent, Consequently,air emissioncontrolcostswould be partiallyoffsetby an average discountedlifetime fuel savings of $33 and an undetermined
7-54
savingsin maintenanceand improvedr_liabilityof the product, The averageincrementalcost Increasefor the 1980 air e_issionstandards_vasestimatedtobe $9, which includeda small additionalimproveiientIn fuel economy. Nosignificantdecrease in sales or shift in market shares(betweenmanufac-turers) was expected to resu]t from the ing]en_ntationof the air e_nissionregu]ation.
7-55
SECTION8
ECONOMICIMPACTANALYSIS
SECTION 8
ECONOMICIMPACISTATEMENT
8.1. New MotorcxcleSales
New motorcyclesales are analyzedfirst from a historicalperspective,using actual sales figures From 1967-1978. and second on the basis of a salesforecasting model. Although the monthly forecasts of demand begin in Januaryof 197B, the coefficientsof the demandequationsused for forecastingwereestimated with January 1973 - December 1975 data.*
8 1.1 Historical New Motorcycle Sales and Trends
The trends in the consumer demand for new motorcycles, as shown inTable 8-1, have closely followedthe behavior of the overalleconomy from1967-1978. Note that the new registrationfiguresfromR. L. Polkand Companyshown in Table 8-I and Fi9ure 8-2 arenot equivalentto totalnew motorcyclesales (Figure8-1), since off-roadandcompetitionmodelsare not requiredtobe registeredin most states. The totalmotorcyc]esales datafor the 1972-1978 periodwas derived from the "Motorcyc]eIndustryCouncil'sNanufactur-ing Shipment ReportingSystem," which is an accountof motorcycleshipmentto dealers for the six (five, after 1975) largest manufacturers.
Definitions used in the ManufacturersShipment ReportingSystem arein Table 8-2. T_e reporting system was specially designed to provide salesdata for the productcategoriesshownin Tab]e8-3,
The Motorcycle Industry Council provided EPA with complete monthlysales data from January,1972. throuqhDecember,1978, for total motorcycleunit sales,which includedretail,wholesale,and regionalsalesdata.
8.1,2 Salesby ProductCategory
The breakdown of 1978 sa]es by product category shown in Table 8-4and Figure 8-3 indicates that street motorcycles accounted for one-ball ofsales total. Over two-fifths of the motorcycles (41.7 percent) are streetmotorcycles350 cc and above. The majorityof the motorcyclesin thiscate-gory have 4-stroke engines. Almost all of the off-road motorcycles from125 to 349 cc have 2-stroke engines.
_'--_'6"ir'_e-oYthe enq_-n-e-:'sizecategories(i.e.,under I00 cc's, i00-169cc's ana170-349 cc's), "for each of which there corresponds a set of demand coeffi-cients, do not lend themselves to forecasting because these categorieswere created specifically for this research only for 1973-1975 by theMotorcycleIndustryCouncil. Althoughusefulfor analysis,thesecategoriescannot be recreatedfor 1976, 1977,or 1978.however,the demandfor thesemotorcyclecategoriescombinedcan be derived as a residualof the fore-casted demand for al] motorcycles,after subtractingthe forecasteddemandfor all other sizeclasses.
! _-i
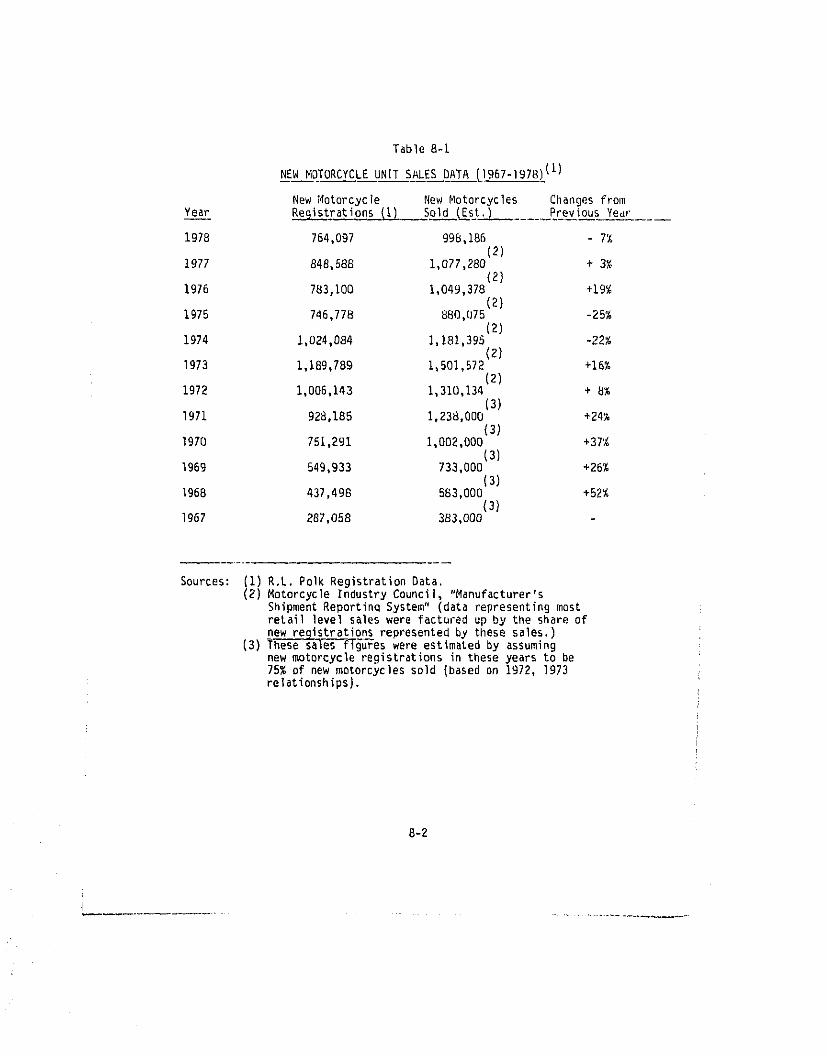
Table 8-1
NEW MDTORCYCLEUNIT SALESDATA .(1967-197B)(I)
New [4otorcycle New Motorcycles ChangesfromYear Registrationsl________SoldLEst.) PreviousYeor
1978 764,097 998,186 -7%(2)
1977 848,588 1,077,280 + 3%(2)
1976 7B3,100 1,049,378 +19_(2)
1975 746,77B 880,{_75 -25%(2)
1974 1,024,084 1,181,395 -22_(z)
1973 1,189,789 1,501,572 +16%(2}
1972 1,006,143 1,310,134 + B%(3)
1971 928,185 1,238,000 +24%(3)
1970 751,291 1,002,000 +37%(3)
1969 549,933 733,000 +26%(3)
1968 437,498 583,000 +52%(3)
]967 287,058 383,000
Sources: (i) R.L. PolkRegistrationData.(2) MotorcycleIndustryCouncil,"Manufacturer's
Shipment Reportinq System" (data representing mostretaillevelsaleswere facturedup by the shareofDew registrations represented by these sales.)
(3) These sales figu'reswere estimated by assumingnew motorcycle registrations in these years to be75% of new motorcyclessold (basedon 1972, 1973relationships).
8-2
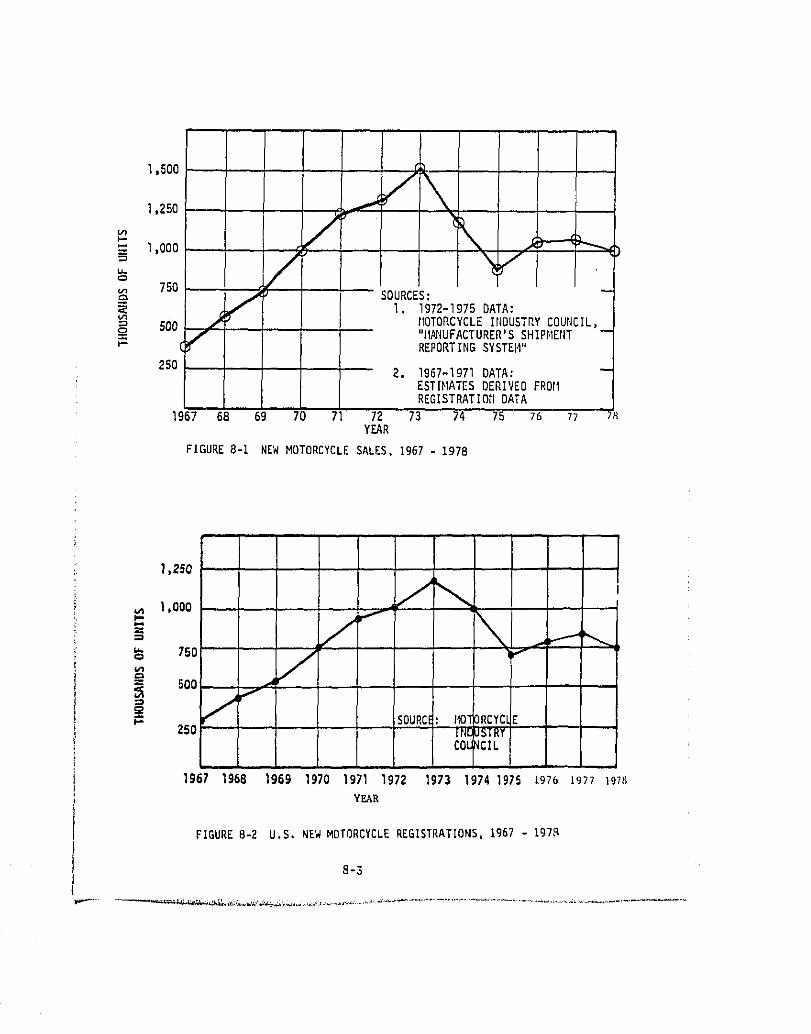
1,500 /1,250
; /,._ 750
= / SOURCES:500 _ I. 1972-1975DATA:tIOTORCYCLEINDUSTRYCOUHCIL,
-- f HN_UFACTURER_SSHIPHENTF REPORTING SY STEI'I"
2. 1967-1971DATA:ESTIHATESDERIVEDFROrlREGISTRATIOII DATA
1967 68 69 70 71 72 73 74 75 76 77YEAR
FIGURE8-i NEW MOTORCYCLESALES,Ig67- 1978
1,250 ....
" / ",,=',0 750 _
/== 500 ,-,
° f iSOURC_ r_OlORCYCLE25(} .... Ii'_[bSTRY
COLNCIL
196? 1968 1969 1970 1971 1972 1973 1974 1975 1976 1977 197fiYEAR
FIGURE8-2 U.S. NEW MOTORCYCLEREGISTRATIONS,1967 - 197R
8-3
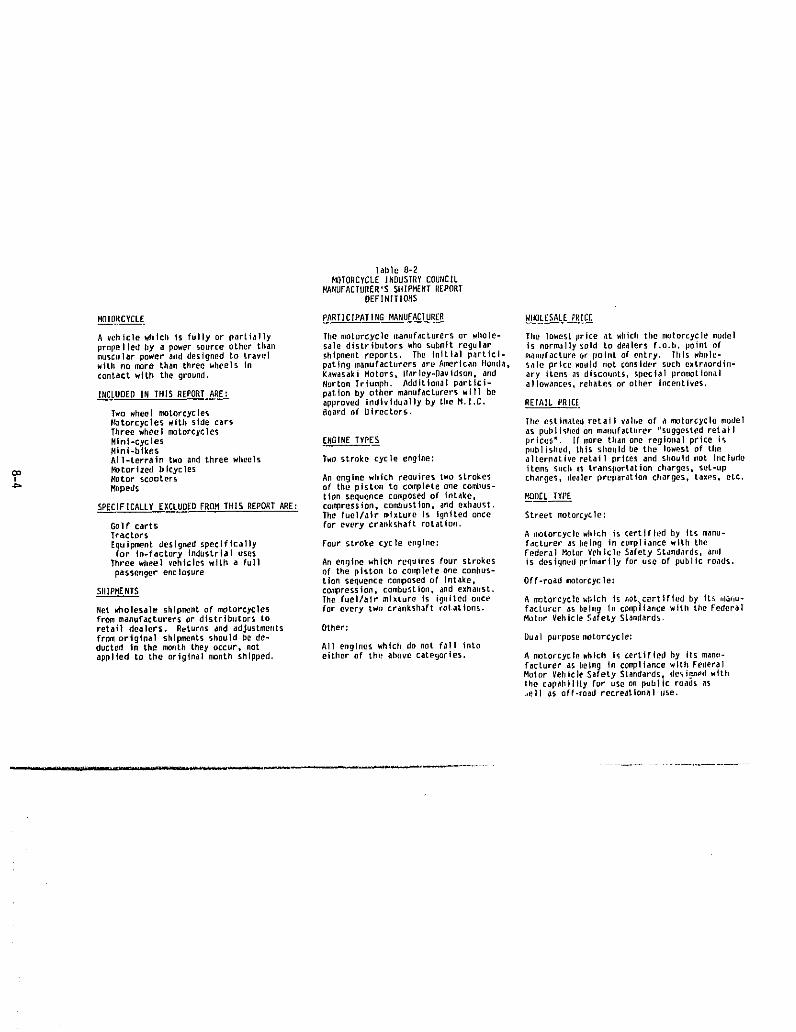
Table 0-2MOTORCYCLE INDUSTRY COURCIL
MANUFACTURER'S SIIIPMENTREPORTDEFINITIONS
MOIRRCYCLE PARTICIPATING MANUFACIURER WHOLESALE PRICE
A vehicle which is fully or partially The motorcycle manufacturers or whole- Tbe lowest price aL which tbe motorcycle model
prnpelled by a power source other than sale distributors who submit regular Is normally sold i.o dealers f.o.b, point ofmuscular power and designed to travel sUipment reports. The initial partlci- manufactureor peril of entry, Thls whnl_-with no more than three wheels In patlng enanufacturers are American Honda, sale price would not consider such extraordin-contact with the ground, Kawasaki Motors, larley-Davidson,and ary items as dlscoimts, special pronlot_onal
Rorton Triumph. Additional partici- allowances, rebates nr other Incentives.
INCLUORD IN THIS REPORT ARE L patlon by other manufacturers wITl beapproved individuaIly by the M,I,C. RETAIL PRICE
Two wheel nw}Lorcycle _, Ooard of Directors.Rbtorcycles with side cars The estimated retail vah_e of a motorcycle n_delThree wheel nK_tnrcycles as published o{i manufacturer "suggested retailMini-cycles ENGIME TYPES prices". Ifinoretbdrlone regional price isMini-bikes pubIisiled, this should be the lowest of tbeAll-terrain two and three wheels Two stroke cycle engine: alternative retat ) prices and should not Include
F_torlzed bicycles Items sucU as transportation charges, set-up
I Motor scooters An engine wbich requires two strokes charges, dealer preparation charges, taxes, etc,Mopeds of the piston to complete one conW}us-Lion sequence composed of intake, MODEL TYPE
SPECIFICALLY EXCLUDED FROM THIS REPORT ARE: co(npression,co_ustion, and exha[Ist,1he fuel/air mixture is ignited once Street motorcycle:
Golf"carts for every crankshaft rotation.Tractors A n_torcyclewblch is certified by its manu-
Equipment designed specifically Four stroke cycle engine: facturer as Reing in compliance with thefor In*factory Industrial uses Federal Motor Vehicle Safety Standards, and
Three wbeel vehicles with a full An engine which requires four strokes is designed primarily for use of public roads.
passenger enc Iosure of the pisLoa to co(nplete one conibus-Lion sequence composed of ]ntake, Off-road ._torcycle:
SIIIPMENTS con_ression, combustion, and exhaust.The fuel/air mixture is ionited once A motorcycle which Is not c_rtlfled by Its ,,la,u-
Net wholesale shipment of motorcycles for every two crankshaft rotations, facLurer as being In compliance with tbe Federalfrom manufacturers or distributors to Motor Vehicle Safety Standards.reta_l dealers. Returns and adjustments Other:
from original shipments should be de- Dual purpose nw_torcycle;dueled in the mOnth they occur, not All engines which do not fall intoappl]ed to the original n_nth shipped, either of the above categQries, A r_otofcycle which is cerLified by its mane-
facturer as being In compliance with FederalMotor VetlicleSafety Standards, desinn_d witllthe capahlltty for use Offpublic roads as,ell as off-road recreational use.
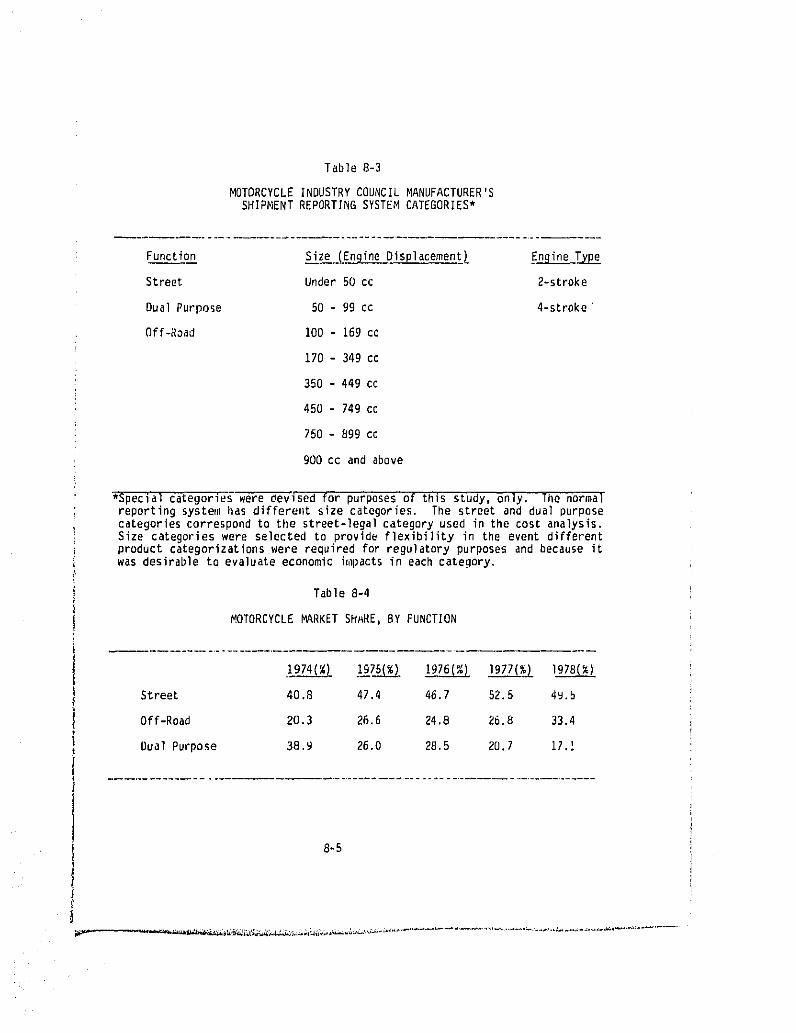
Table 8-3
MOTORCYCLE INDUSTRY COUNCIL _IANUFACTURER'SSHIP,lENT REPORTING SYSTEM CATEGORIES*
Function Size (EngineDisplacement_ EngineType
Street Under50cc 2-stroke
Dual Purpose 50 - 99 cc 4-stroke"
Off-Road 100 - 169 cc
170 - 349 cc
350 - 449 cc
450 - 749 cc
750 - 899 cc
900 cc and above
*Special categories were eevised for purposes of this study, only. The normalreporting System has different size categories. The street and dual purposecategories correspond to the street-legal category used in the cost analysis.Size categories were selected to provide flexibi]ity in the event differentproduct categorizations were required for regu]atary purposes and because itwas desirab]e to eva]uate economic impacts in each category.
Table 8-4
MOTORCYCLE MARKET SHARE, BY FUNCTION
1974(%). 1_75(%) 1976(%) 1977 %_ ]978(%)
Street 40.8 47.4 46.7 52.5 49.b
Off-Road 20.3 26.6 24.8 26.8 33.4
Dual Purpose 38.9 26.0 2G.5 20./ ii.!
8-5
t
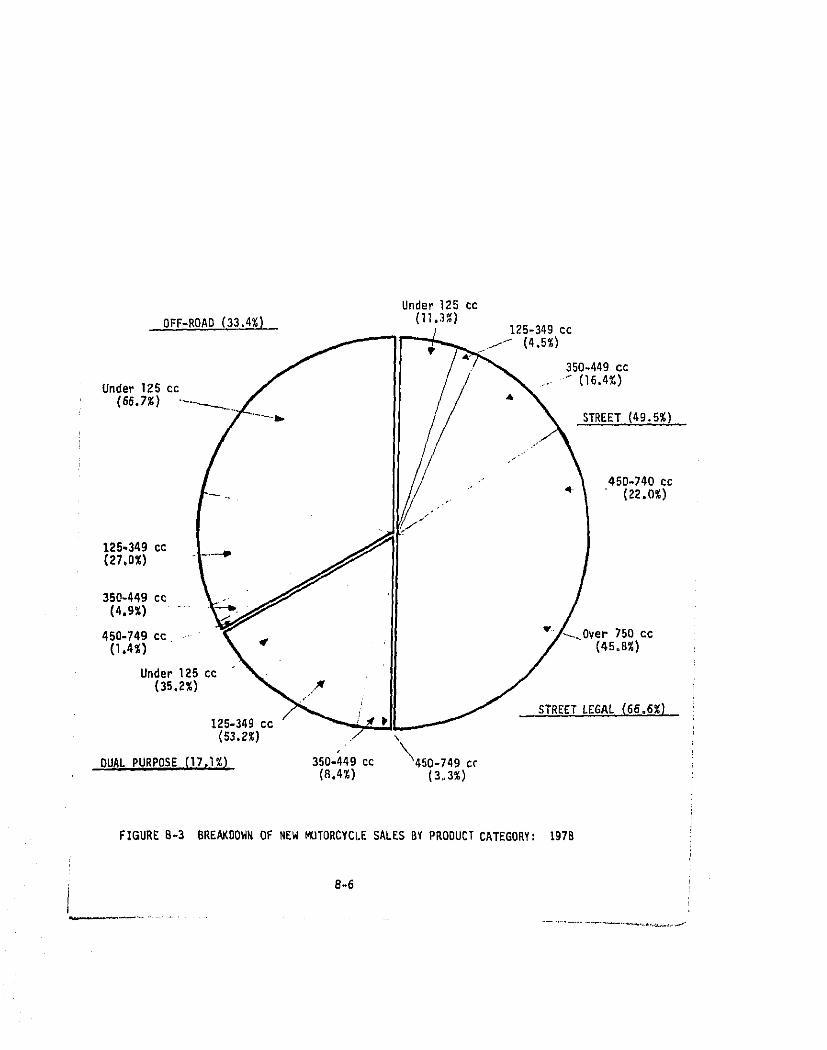
Under 125 cc
OFF-ROAD(33.4%) (I],3%) 125-349cc.jl (4.s%)
350.449 cc
Under 125 cc ...._ (16,4%)(66.7%) A
STREET (49.5%)
•' 45D-740 cc_ .- 4 (22,0%)
f/
125-349cc(27,0%)
350-449cc(4.9%) -
450-749cc. v Over 750 cc(1,4%) _ (45°8%)
Under 125 cc
(35,2%)
STREETLEGAL(66,6g)125-349cc(53.2_) \
• \DU_L PURPOS,E,,{_,Tr,!%_ 350-449 cc 450-749 cc
(8,4%) (3.3%)
FIGURE8-3 BREAKDOWNOF NEW MOTORCYCLESALESBY PRODUCTCATEGORY: 197B
=
i 8-6
In the actual data base, there were no motorcycles in the followingcategories: any motorcycle under 50 cc; dual purpose motorcycles, 750 cc andabove; and off-road motorcycles, 750 cc and ahove, in fact, there were veryfew off-road or dual purpose motorcycles 450 cc and above,
Total Street,DualPur?ose,__.an_d.Off-Road.Sajes
New motorcycle sales data for total street, dual purpose, and off-road motorcycles in units and retail level dollars derived from the MICManufacturersShipmentReportingSystemare summarizedin Table8-5,
Total motorcycleunit sales, (Table8-5) includingstreet,off-roadanddua] purposemodels of all displacementc]asses,reacheda peak of over 1,5miltionunits sold in 1973,generatinggrossrevenuesof $1.2billiondollars,figureswhich, even discountingthe effectsof the 1974-1975recession,havesteadily declined frum 1973 to 1978. However, while the unit volume ofannualmotorcyclesales in 1978 has declinedby one-thirdsince 1973,revenuein real terms has declinedby only 17 percent. This is accountedfor by the25 percent increase in the real averageprice of motorcyclesduring thisperiod.
Of the three functionalforms of motorcycles(street, off-road,anddual purpose),unit sales of dual purpose motorcyclesdeclined the most,from 550,000 in 1973 to 171,000, in 1918. The real averageprice of dualpurpose motorcyctesactually declinedby 2 percentover that period. Thedemand for off-roadmotorcycles,white experiencingprice increasesroughlyequivalentto the average,has remainedfairlysteadyfrom 1973-19/8;that ofstreet motorcycleshas declinedapproximately20 percentwhile their averagenominalprice has almostdoubled. Apparently,a shift in tasteshas occurred,away from the more clumsy,yet versatile,dualpurposemotorcycles,towardthespecializeddirt motorcyclesfor off-roaduse and also towardstreetbikes.Thus the relative market shares of the three functionalmotorcycleshavechangedsignificantlyover this period: street,from43 percentto 50 percentoff-road from 20 percent to 33 percentand dual purpose,from 37 percent to17 percent.
Street Moto_reycl_e_Sa.l.esbX Enngine_O!sp/acementC1ass
While total streetmotorcycleunitsalesdeclinedfrom 554,000units to494,000 over the period 1972 to 1978 (FableB-5), there were significantchanges in the marketsharesof the variousdisplacementclassesduringthisperiod (See Table 8-6). The sharesof motoreyc]esin the 125 to 349 cc, 350to 449 cc, and 450 to 749 cc disp]acementclassesall declined,althoughthe]argest of these, t_he450 to 749 cc group, declined the least. The marketshare of motorcyclesunder 125 cc increaseddramaticallyfrom 1.3 percentin1974 to 11.3 percent in 1978_ and the shareof the salesof motorcyclesover750 cc increasedfro.n28,4 percentin 1974to 45.8 percentin 1978, Analagousto the move away from dual purposemotorcyclesto eitherspecificallystreetor off-roadmotorcyclesappearsto ee a movementaway frommediumdisplacementmotorcycles,125 to 749 cc (whichcompriseonly(;2.gpercentof the market),toward motorcyclesthat are very ]argoor very small and are suitedto morespecific purposes.
B-7
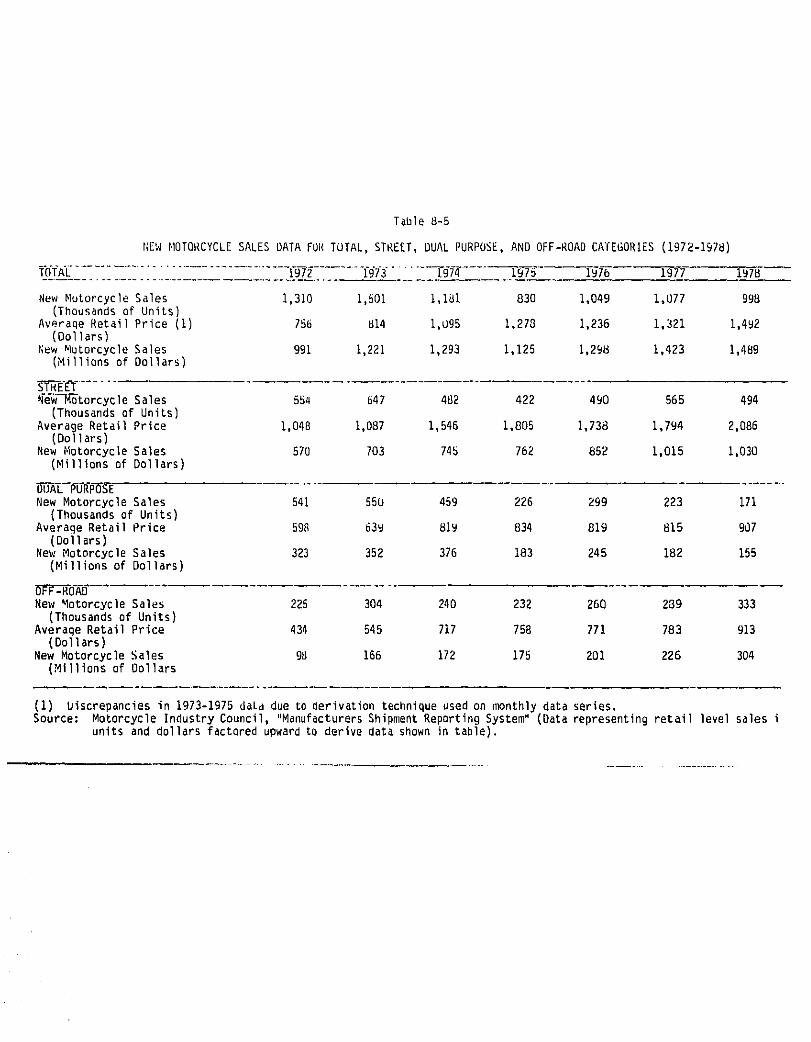
Table 8-5
NEWMOTORCYCLESALES DATA FORTOTAL, STREET, DUAL PURPOSE,AND OFF-ROADCATEGORIES (1972-1978)
T_}TKC....................................... _91"_........ [9i3 ...... -l-gF4"..... 19-1-_"-- i_76 1977 197B---
New Mutorcycle Sales 1,310 1,501 1,181 830 1,049 1,077 998(Thousands of Units)
Averaqe Retail Price (i) 756 814 I,U95 1,278 1,236 1,321 1,492(Dollars)
NewNutorcycle Sales 991 1,221 1,293 1,125 1,298 1,423 1,489(Millions of Dollars)
T?-R-_E-T" ....New--M_torcyoleSales 554 647 4U2 422 490 565 494
(Thousands of Units)AverageRetailPrice 1,048 1,087 1,546 1,805 1,738 1,794 2,086
(Dollars)NewMotorcycleSales 570 703 745 762 852 1,015 1,030
(blillionsof Dollars)
gO-A-L--FCCP-GE_NewMotorcycleSales 541 550 459 226 299 223 171
(Thousands of Units)AverageRetailPrice 59B 63_ 819 834 819 815 907
(Dollars)NewMotorcycleSales 323 352 376 183 245 182 155
(Millions of Dollars
gFF_-RC6_NewMotorcycleSales 225 304 240 232 26Q 289 333
(Thousands of Units)AveraqeRetailPrice 434 545 717 75B 771 783 913
(Dollars)New MotorcycleSales 98 166 172 175 201 226 304
(Millions of Dollars
(1) Discrepanciesin 1973-1975daLa due to derivationtechniqueusedon monthlydata series.Source: MotorcycleIndustryCouncil,"ManufacturersShipmentReportingSystem"(Datarepresentingretail levelsales i
units and dollarsfactoredupwardto derivedatashown in table).
Dual Pur_Eo_e Motorcyc]le _L_. _,Y-__] acement CI ass
A11 categories of dual purpose motorcycles (Table 8-5) showed dramaticdeclines in unit sales between 1974 and 197B with corresponding declines intotal dollar sales. The market for dual purpose motorcycles is dominated bythose under 350 cc engine displacement {i.e., those under 125 cc and thosebetween 125 and 349 cc), Throughout the period these two classes togethercomprised between 84 percent and 89 percent of all dual purpose motorcycles(See Table 8-7). As a result, wiU1 total dual purpose motorcycle sales fallingin 1978 to one-third of their 1973-1974 level (Table 8-5), these two classeseach suffered declines in unit sales proportionately greater than the sameengine displacement classes in any other motorcycle category: street, oroff-road, However, the market shares within the dual purpose motorcyclecategory did not shift substantially.
Off-Road MotorcycleSales by Engine Dissplacememt Class
Historically, total unit sales of off-road motorcycles have held fairlysteady over the 1974-1978 period (see Table 8-5). Revenues, however, havealmost doubled due to the increases in the average unit price of off-roadmotorcycles, from $545 in 1973 to $913 in 1978 (see Table 8-5). Tradi-tionally, the majority of off-road unit sales have been attriDuted to the lessthan 125 cc and 125 to 349 cc classes (see Table 8-8). Like dual purposeulotorcycles, market shares within the off-road motorcycle category did notshift substantially over the period.
Demographic Devel o]__ments
Males of all ages constitute approximately 90 percent of all motorcycleowners (see Table 8-9), although most owners were males between 20 and 34years of age. The relevant demographic group for analysis of buyer behavioris the number of males with income in this age group,
Over the period 1973 to 1977, the growth rate for the number of maleswith incnme, for the most pert, declined, Thus, the effective demographicmarket for motorcycle sales was impaired over this period, Table 8-10provides the percentage changes in the number of males with income in the agegroups 20 to 24 and 25 to 34 years, The large age group, males 25 to 34years, suffered declining rates of growth in 1974, 1975 and 1977. The agegroup 20 to 24 years decreased sharply in 1975 and 1977. The long-termgrowth potential for motorcycle sales may be constrained by the growth ratesin these effective population age groups unless there is a structural shiftin the buying patterns of other age/sex groups.
Real Income Trends
While the real disposable income for the U,S, recovered from its declineafter 1974, the real mean income of the effective market for motorcyclesmales of ages 20 to 34, continued to decline, although at a slower rate,through 1975. This age group, traditionally more seriously affected by
8-9
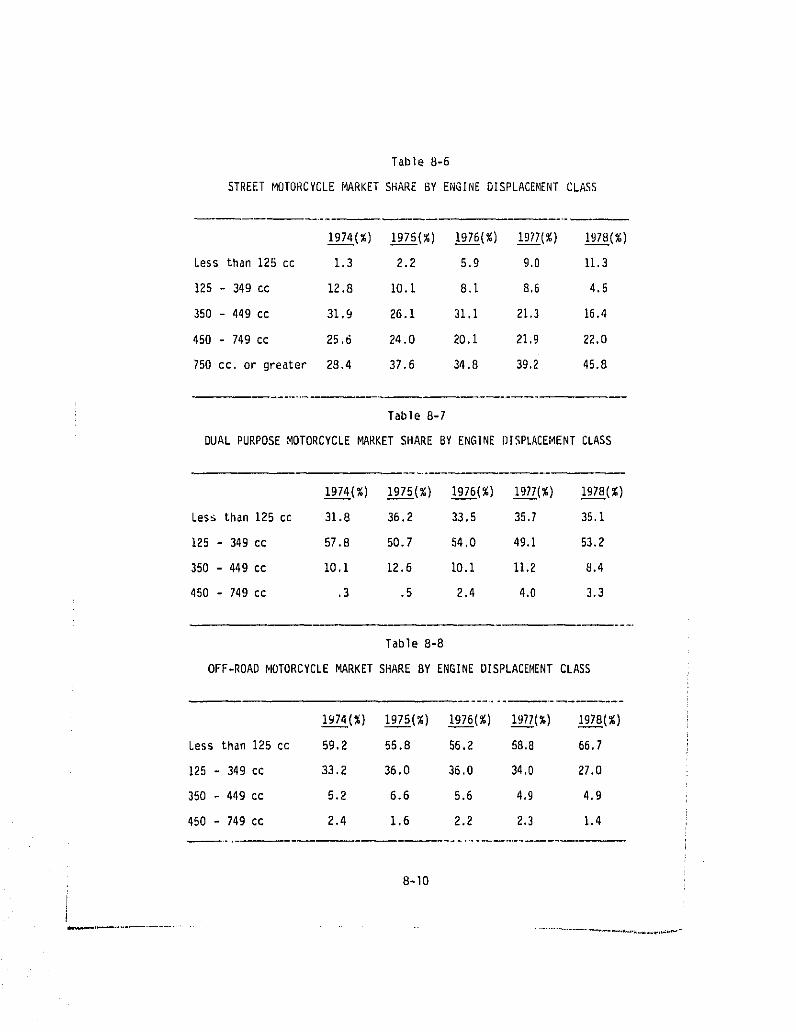
Table 8-6
STREET MOTORCYCLEMARKET SHARE BY ENGINE DISPLACEMENT CLASS
1974(%) 1975(%) 1976(%) 1977(%) 1978(%)
Lessthan125cc 1.3 2.2 5.9 9.0 11.3
125 - 349 cc 12.8 I0.I 8.1 8,6 4.5
350- 449cc 31,9 26,1 31,i 21,3 16.4
450 - 749cc 25,6 24.0 20.1 21,9 22.0
750cc.or greater 28,4 37.6 34,8 39.2 45.8
Table 8-7
DUAL PURPOSE MOTORCYCLE MARKET SHARE BY ENGINE DISPLACEMENT CLASS
1974(%) 1975(%) 1976(%) 1917(%) 1978(%)
Less than125 cc 31.8 36.2 33,5 35.7 35.1
125- 349cc 57.8 50.7 64.0 49.1 53.2
350- 449cc 10.1 12.6 10.1 11.2 8.4
450- 749cc ,3 .5 2,4 4,0 3,3
Table 8-8
OFF-ROADMOTORCYCLEMARKETSHARE BY ENGINEDISPLACEMENTCLASS
1974(%) 1975(%) 1976(%) 1977(%) 1978(%)
Less than125 cc 59,2 55.8 56,2 58,B 66.7
125 - 349 cc 33.2 36.0 36.0 34,0 27.0
350- 449cc 5.2 6.6 5.6 4,9 4,9
450 - 749 cc 2.4 1.6 2.2 2.3 1,4
8-10
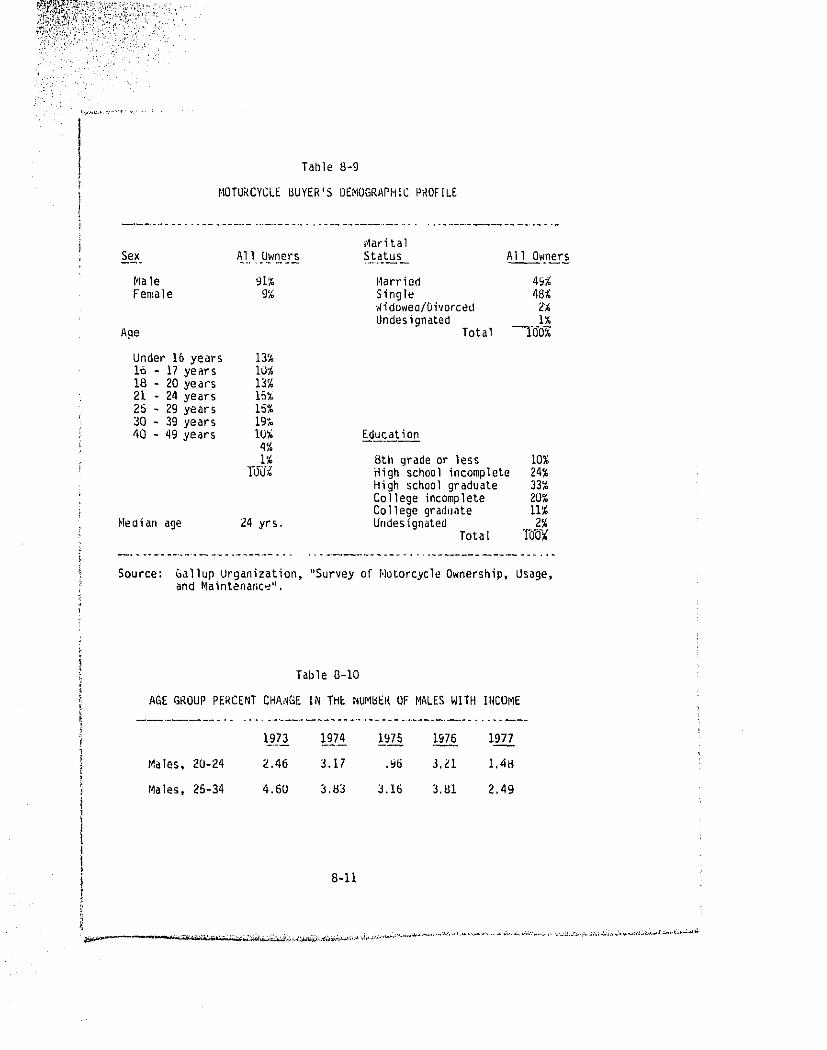
Marital
Sex Al.l_yn_ers St.atus At1Owners
Male 91% Married 49_Female 9% Single 48%
Widowee/Oivorced Z%Undesignated I%
Age Total_
Under 16 years 13%16 - 17 years 10%18 - 20 years 13%21 - 24 years 15%25 - 29 years 15%30 - 39 years 19_40 - 49 years 10% Education
4%i% 8th gradeor less 10%
T60"_ High schoolincomplete 24%High schoolgraduate 33%College incomplete 20%Collegegraduate 11%
Meaiau age 24 yrs, Undesignated 2%Total "[_'_
Source: GallupUrganization,"Surveyof IgotorcycleOwnership,Usage,and Maintenance",
Table 8-I0
AGE GROUP PERCENT CHANGE IN THE NUMBEH OF MALES WITH INCOME
............................. .o-.. ...............................
1973 1.93--4 197__5 197___.6 1977
Males,20-24 2.46 3.17 ,_6 3,ZI 1,4_
Males,25-34 4.60 3.83 _,16 3.81 2.49
8-11
downturns in the economy than older age groups, suffered declines in realmean income of 4.6 and 3.4 percent in 1974 and 1975, respectively (see Table8-I]). The real earning power of the age group 2U to 34 years did not fullyrecover in 1976 and 1977, when total real disposable income had been growingat the rate of 3.7 percent per year. The real income of potential motorcyclebuyers decreased 8 percent during 1974 and 1975, while having increased byonly 2 percent during 1976 and 1977. Thus, with a declining rate of growth inthe number of potential buyers and an absolute decline in the real incomes ofthis group, the market environment for motorcycle sales has not been improving.
Price Trends
The average unit price of motorcyclesincreasedfrom $814 in 1973 to$1,492 in 1978, or by 83.3 percent(Table 8-5). During the same period,the price of all other goods competing for the consumer's budget, as measuredby the Consumer Price Iodex,increasedby 32.2 percent. Thus the relativeprice of motorcycles,comparedwith all other commodities,increasedalmostthree times as fast during those five years. Only in 1976 was the situationsomewhatameliorated,with the real priceof motorcyclesdecliningby approxi-mately8.5 percent (seeTable 8-12 for a comparisonof percentchangesin theaverageunit price of motorcyclesand the consumerprice index).
i
With a deterioratingeffectivepurchasingpower base for motorcyclesales and a substantial increase in the real price of motorcycles, thedecline in motorcyclesales over the period 1973to 1978is understandable.
B.I.3 BaselineForecastof New MotorcycleSales
The analysisof the marketenvironmentfor motorcyclesand the priceofmotorcycles (and prices of other products)over the period 1973 to 1975provided the approach for statisticallymodelingthe determinantsof demandfor unit motorcyclesales. The basis of the demandmodel used in the EPAanalysiswas a sales-adjustmentequation,whici_relatedsales of each periodto sales in the previous period. Statistical equations were estimated ece-nometricany by relatingunitmotorcyclesales (by typeand function)to salesin the previous period and to demographic,income, price, and motorcyclecharacteristics over the period 1973 to 1975. With these equationstheforecastsof unit sales and revenues(givenprices)for eachclass of motor-cycle were generated. A more detailed description of this model is inAppendix F.
The annual forecastsof the demand model, based on the monthly pro-jections startingin January,1979,are depictedin Figures8-4 throughB-8.By i990, (Figure 8-4a) total unit motorcycle sales will be only 45.5 percentgreater than in 1973 (TableB-I). Furthermore,despitethe impressivegainsfor motorcyclesalesforecastfor 1979and 1980,the 1973level (TableB-I)of1.5 million units will not be reacheduntil 1982. With the assumptionthataverage unit motorcycleprices will increaseby 7 percentper year, totalmotorcyclerevenues will have doubledbetween 1978 ($1.5 billion)and 1981
: 8-12
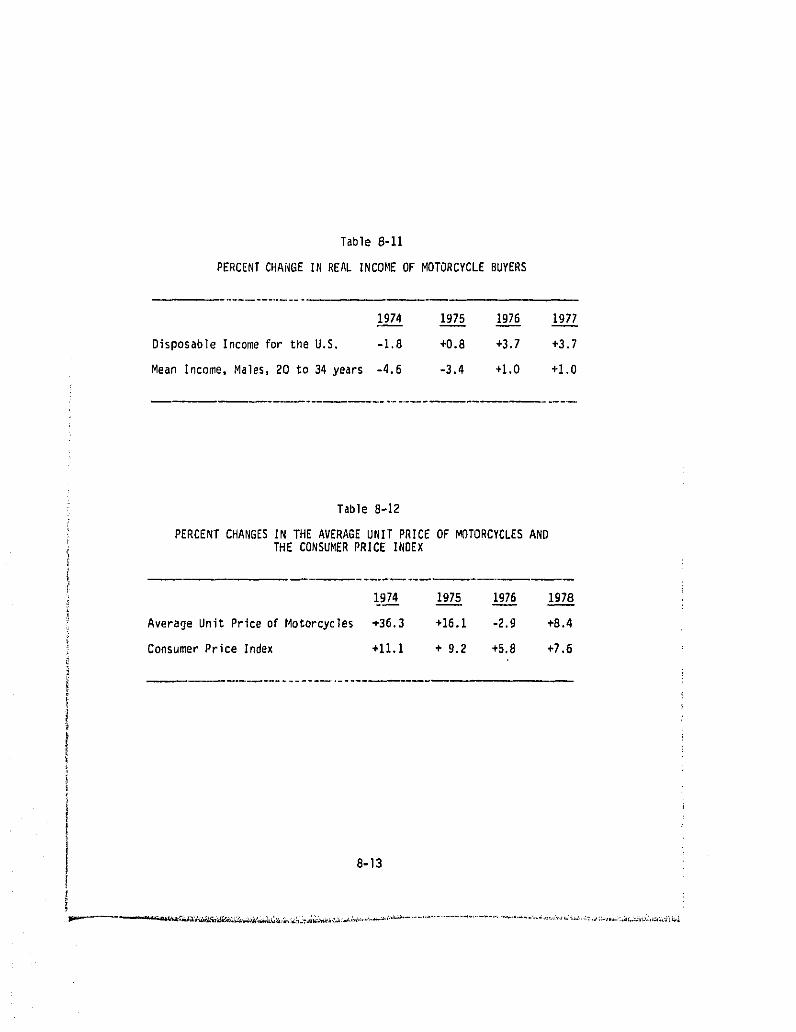
Table 8-11
PERCENT CHANGE IN REAL INCOME OF MOTORCYCLE BUYERS
1974 1975 1976 1977
DisposableIncomefor the U.S. -1.8 +0.8 +3.7 +3.7
Mean Income,Males,20 to 34 years -4.6 -3.4 +I.0 +1.0
Table 8-12
PERCENT CHANGES IN THE AVERAGE UNIT PRICE OF MOTORCYCLES ANDTHE CONSUMER PRICE INDEX
1.974 1975 1976 1978
Average Unit Priceof Motorcycles +36.3 +16.1 -2,9 +8.4
ConsumerPriceIndex +11.1 + 9.2 +5.8 +7,6
8-13
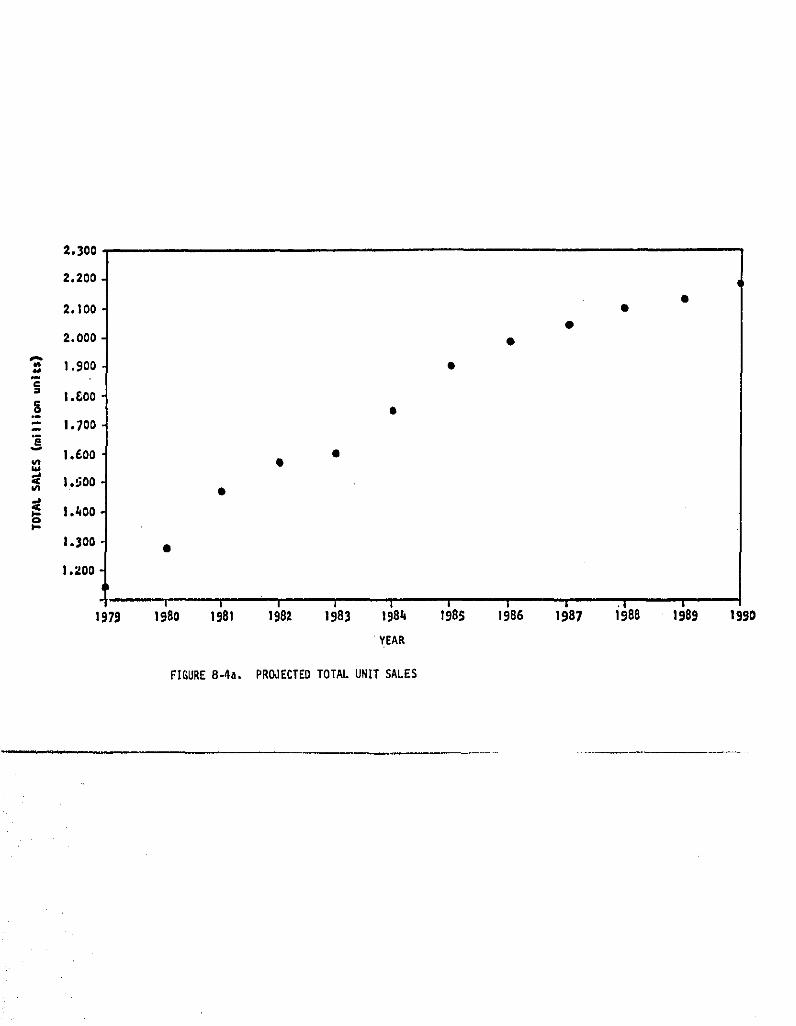
2.300
2.200
e2.100 •
2.0O0 •
"_ 1.900 •
o I .F,O0g •
._
-- 1.70o
I .£00 •
I ._;ooin •
!.400
1.300 •
1.200
t '" I I I 1 i i I .I i
1979 198o 1981 1982 1983 1981_ 198,_i 198G 1987 1988 1989 1980
YEAR
FIGURE 8-4a. PROJECTED TOTAL UNIT SALES
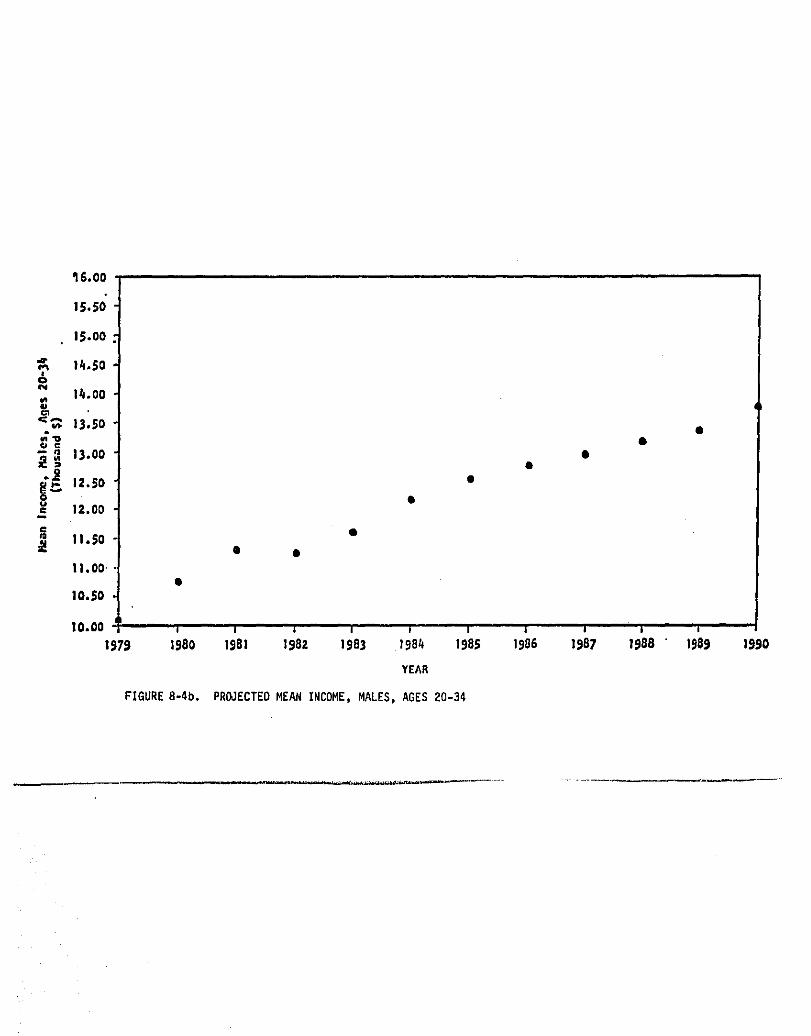
_6.00
15.50
15.00
,,_ 14.50e0
14.00t_ILl
_?'_]31so •c
.: ,3.0o_ 12.5o eo •t,,)
_= 12.00e: •m 11.50a_ • •
I1.00
10.50
|0,00 J I _ I I I I a | "' i157S 1580 1581 1982 ]983 t984 1985 1986 1987 1588 ' 1989 1590
YEAR
FIGURE8-4b. PROJECTEOHEANINCOHE,HALES,AGES20-34
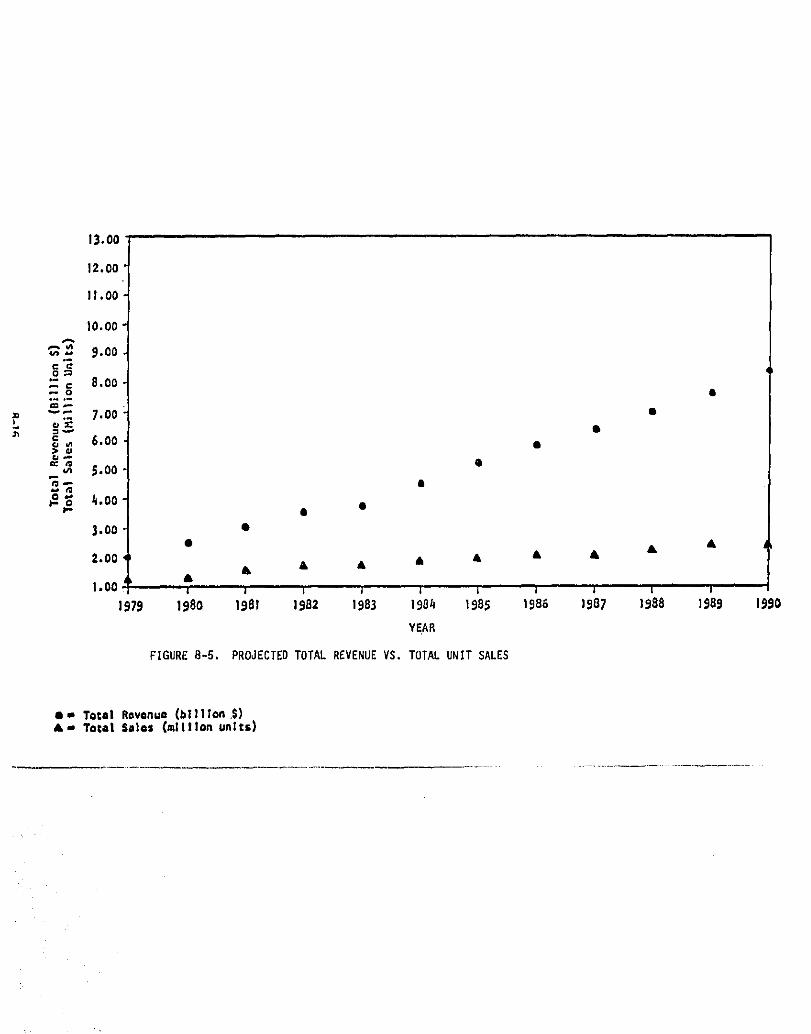
13.oo
12.00
II.00
10.00
_ 9.00
.2o=•- c 8.00'.- O •
: _'- 7.00 m
[ ,,, 6.00 m> ¢J
e_ Q5.00
.oo3.00 •
2.00 A • • • •& & •
1.00 l " J a J _ I i 4 I :
1979 1980 1981 1982 1983 198_ 1985 1986 ]_87 ]988 1!)89 1_90
YEAR
FIGURE 8-5. PROJECTEDTOTAL REVENUEVS. TOTAL UNIT SALES
• m Totol RovonuQ (bTllron $)• - Total Satas (million unlts)
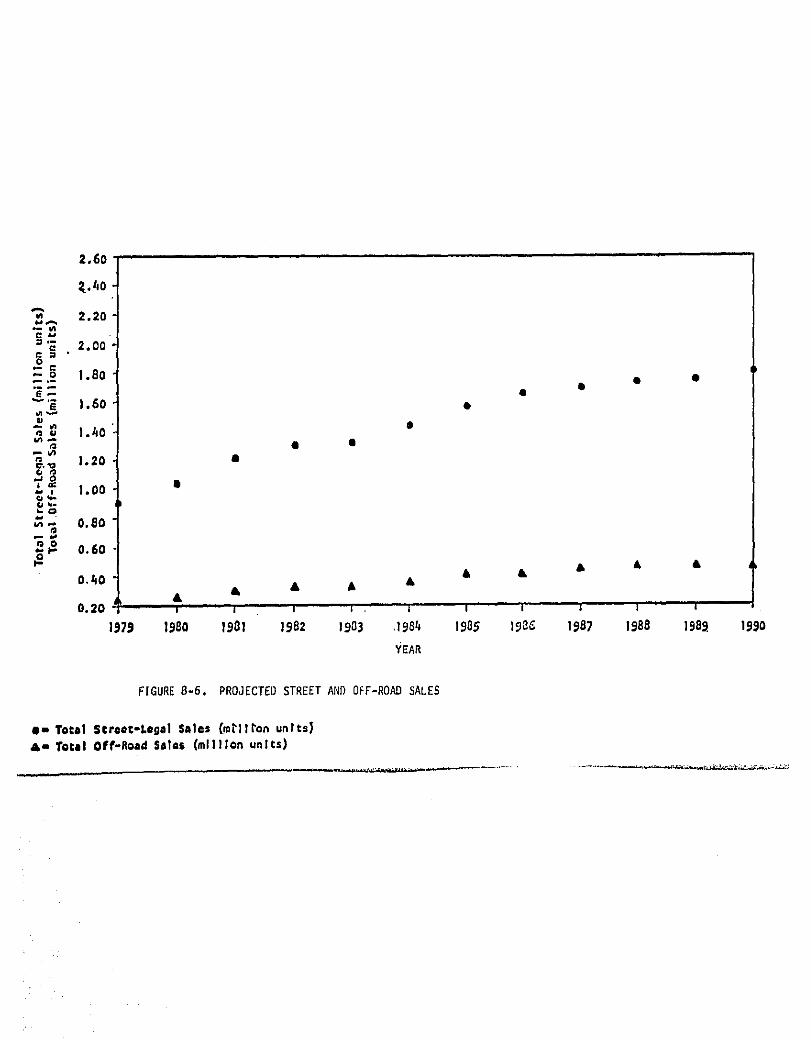
2.60
1.4o
"_ 2.2Ob,o_
m r#l
.oo_o-- o 1.80.-.- • •
1.60 •_q_
ea _ O3 _ 1.40
to • •
_.,_ 1.20 •
t.O
_,._ o.8o_ 0
_.P 0.60
0.40 a
0.20 J I a ; . ; I t J I 'a
1979 |980 1901 1982 1903 ,1984 1985 t98_ 1987 1988 1889 1990
YEAR
FIGUREB-6. PROJECTEDSTREETAND OFF-ROADSALES
0- Total Straat-L_gal Salts {mt11_on unltsl&- Tol:al Off-Road SaIQs (million units)
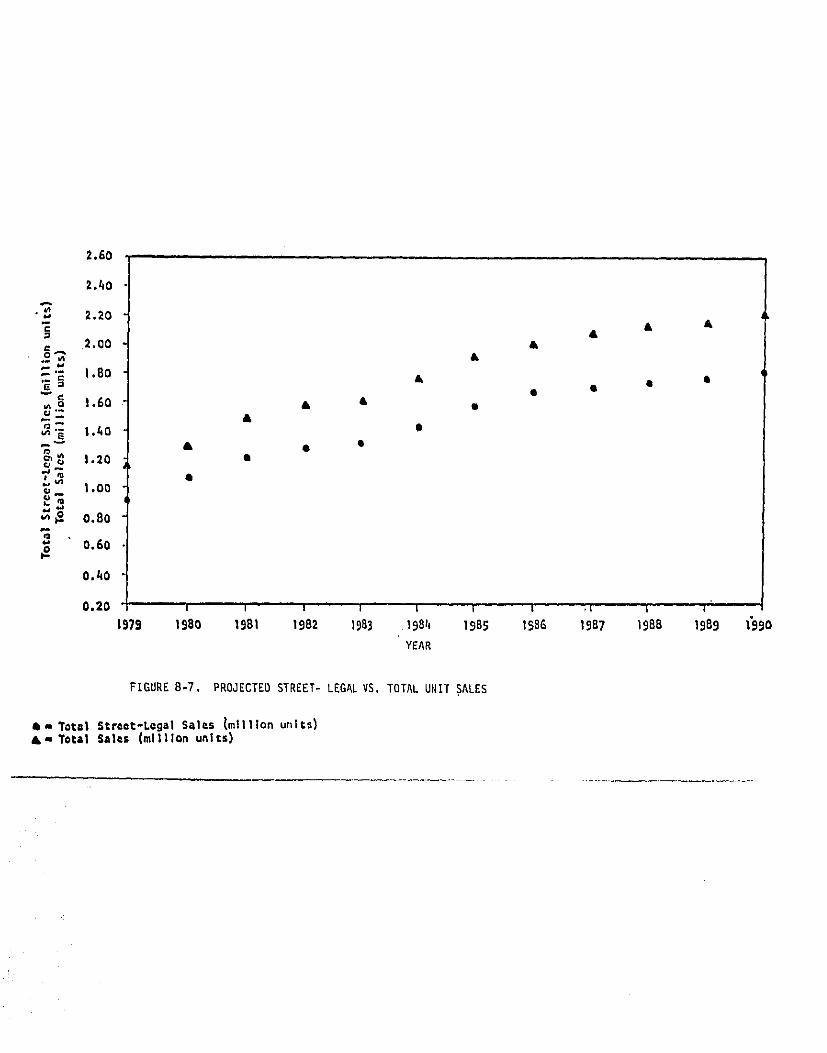
2.60
2./_0
""_ 2.20
,oC'_ 2 O0 •- '- I .BO'e _ • i *• i"_8 1.6o • • o
__. 1.4o *
I_ I.OO
,,__o 0.80
" 0.60
0.40
0.20 " I I i ' _ I I z .¢ I I
1979 1580 1981 1982 1983 198h 19B5 1986 1987 198B 1989 1"990
YEAR
FIGURE 8-7. PROJECTEDSTREET-LEGALVS. TOTAL UNITSALES
8a Totol Street-Legal Sales Imllllon units)&_ To_al Sales (mllllan units)
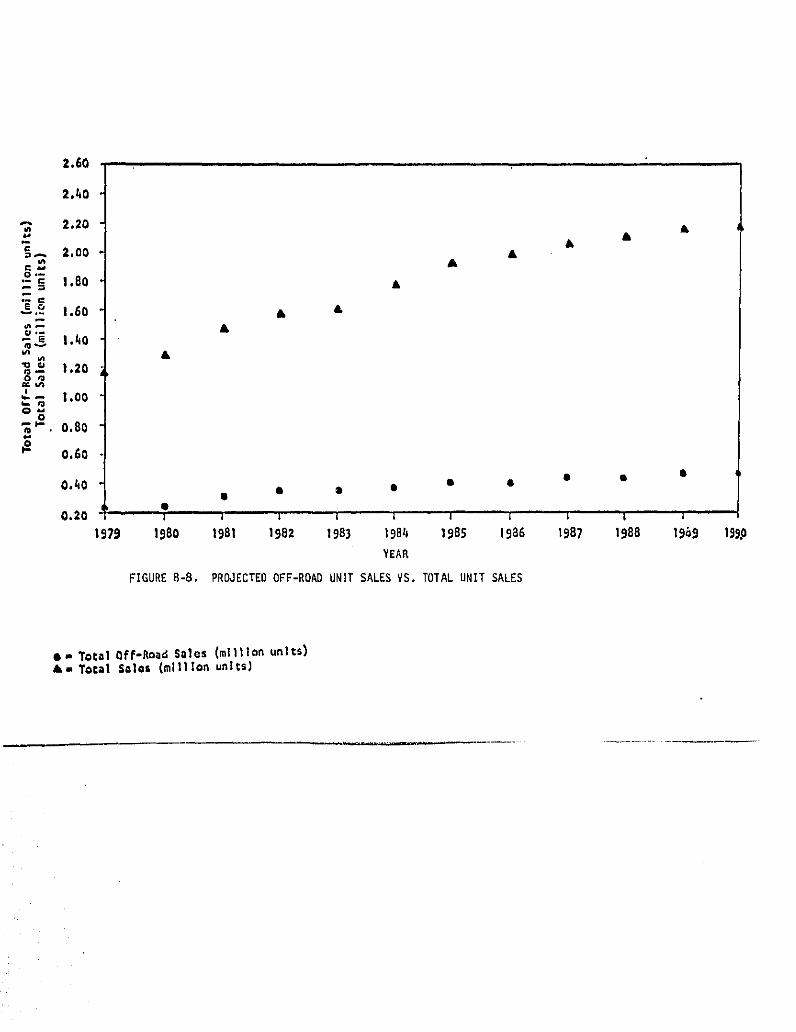
Z.60
2._0
2.20 •
c 2.00 •A
.-c I 80m :; • •
1.6o , •" '_ I._0
-0 _o ! °20r_
1414'.- -- 1.00O
O
_'. 0.80
_" 0.60
0,40 • Q • • •
0,20 .... ] a i t i I i .... _ ; ;
1979 1980 1981 1982 1983 198g 1985 1986 1987 1988 19()9 1_gp
YEAR
FIGURE8-8. PROJECTEDOFF-ROADUNITSALESVS. TOTAL UNIT SALES
• • Tocot Off-Road Sales (m111Ion units)• -Tocal Solos (million units)
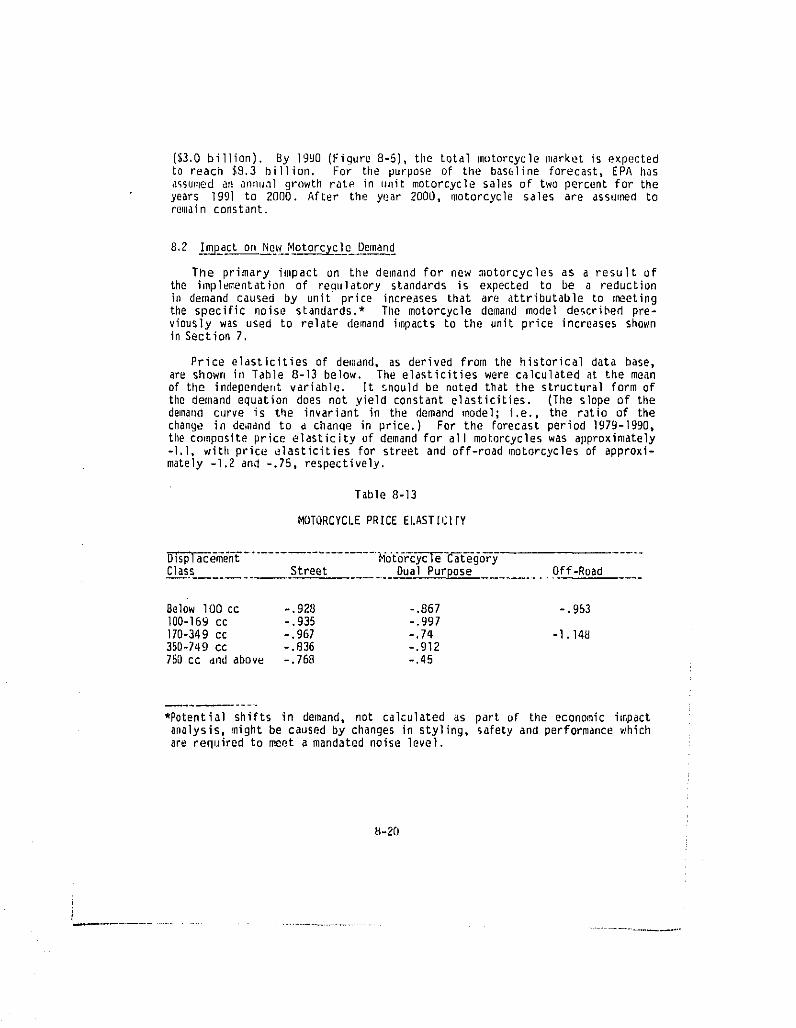
($3.0 billion). By 1990 (Figure 8-5), the total motorcycle market is expectedto reach $8.3 billion. For the purpose of tile baseline forecast, EPA hasassumed an annu:llgr[)wthrate in unit motorcycle sales of two percent For theyears 199l to 2000. After the year 2000, motorcycle sales are assumed toremain constant.
8.2 _ImmJ)act on New MotorcYcle Demand
The primary impact on the demand for new motorcycles as a result ofthe implementation of regulatory standards is expected to be a reductionhl demand caused by unit price increases that are attributable to meetingtllespecific noise standards.* The motorcycle demand model described pre-viously was used to relate demand impacts to the unit price increases shownin Section 7.
Price elasticities of demand, as derived from tilehistorical data base,ar_ shown irlTable 8-13 below. The elasticities were calculated at the meanof the independent variable. It should be noted that the structural form of
the demand equation does not yield constant elasticities. (The slope of thedemand curve is the invariant in the demand model; i.e., the ratio of thechange in demand to a change in price.) For the Forecast period 1979-1990,the composite price elasticity of demand for all motorcycles was approximately-l.]. with price elasticities for street and off-road motorcycles of approxi-mately -I.2 and -.75, respectively.
Table 8-13
MOTORCYCLE PRICE ELASTICI[Y
1"D-Ts'p-l-ac'ement".....................-_o'tdFcyc-'c'Te"Cat'-egoryClass __ Street DualPurpose Off-Road
BelowlO0CC -.928 -.867 -.953lO0-16g cc -.935 -.997I/0-349 cc -.967 -.74 -I.148350-749cc -.836 -.912750 cc and above -.76B -.45
*Potential shifts in demand, not calculated as part of the economic impactanalysis, might be caused by changes in styling, safety and performance whichare required to meet amandated noise level.
8-20
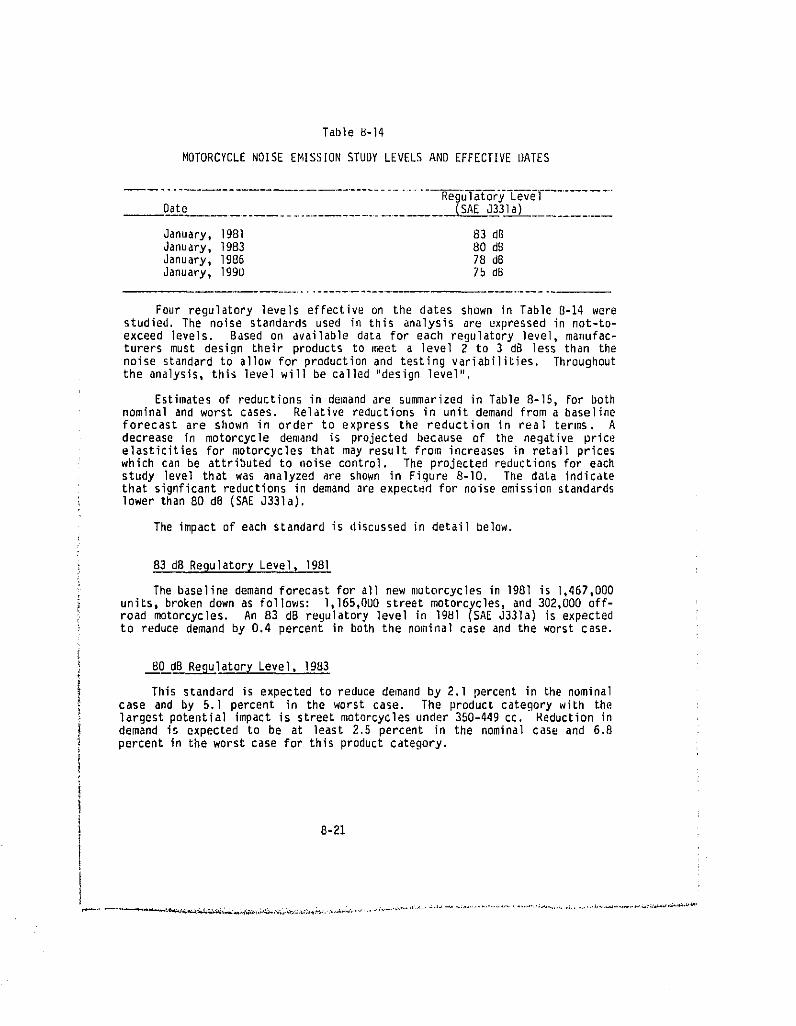
Table _-14
MOTORCYCLE NOISE EMISSION STUDY LEVELS AND EFFECTIVE I)ATES
__Date (SAEJ331a)............
January,1981 83dBJanuary,1983 80dBJanuary,1986 78dBJanuary,Ig9O 75 dB
Four regulatorylevelseffectiveon the dates shown in Table 8-14 werestudied. The noise standards used in this analysis are expressed in not-to-exceed levels. Based on availabledata for each regulatorylevel,manufac-turers must design their products to i_eota level 2 to 3 dB lessthan thenoise standard to allow for production and testing variabilities. Throughoutthe analysis, this level will be called "design level".
Estimates of reductions in demand are summarized in Table 8-15, For bothnominal and worst cases. Relative reductions in unit demand from a baselineforecast are shown in order to express the reduction in real terms. Adecrease in motorcycle demand is projected because of the negative priceelasticities for motorcycles that may result from increases in retail priceswhich can be attributed to noise control. The projected reductions for eachstudy level that was analyzed are shown in Figure 8-10. The data indicatethat signficant reductions in demand are expected for noise emission standardslower than 80 dB (SAE J331a).
The impact of each standard is discussed in detail below.
83 dB Regulator_ Level, ]98]
The baselinedemandforecastfor all new _Jotorcyclesin 1981 is ],467,000units, broken down as Follows: 1,165,0U0 street motorcycles, and 302,000 off-road motorcycles. An 83 dB regulatorylevel in 1981 (SAEJ331a) is expectedto reducedemandby 0.4 percent in boththe nolnina]case and the worstcase.
80 dB Re_ulator_ Level, ]983
This standard is expected to reduce demand by 2.1 percent in the nominalcase and by 5.1 percent in the worst case. The productcategorywith thelargest potential impact is street motorcycles under 350-449 co. Reduction indemand is expected to be at ]east 2.5 percent in the nominal case and 6.8percentin the worst case for this productcategory.
8-21
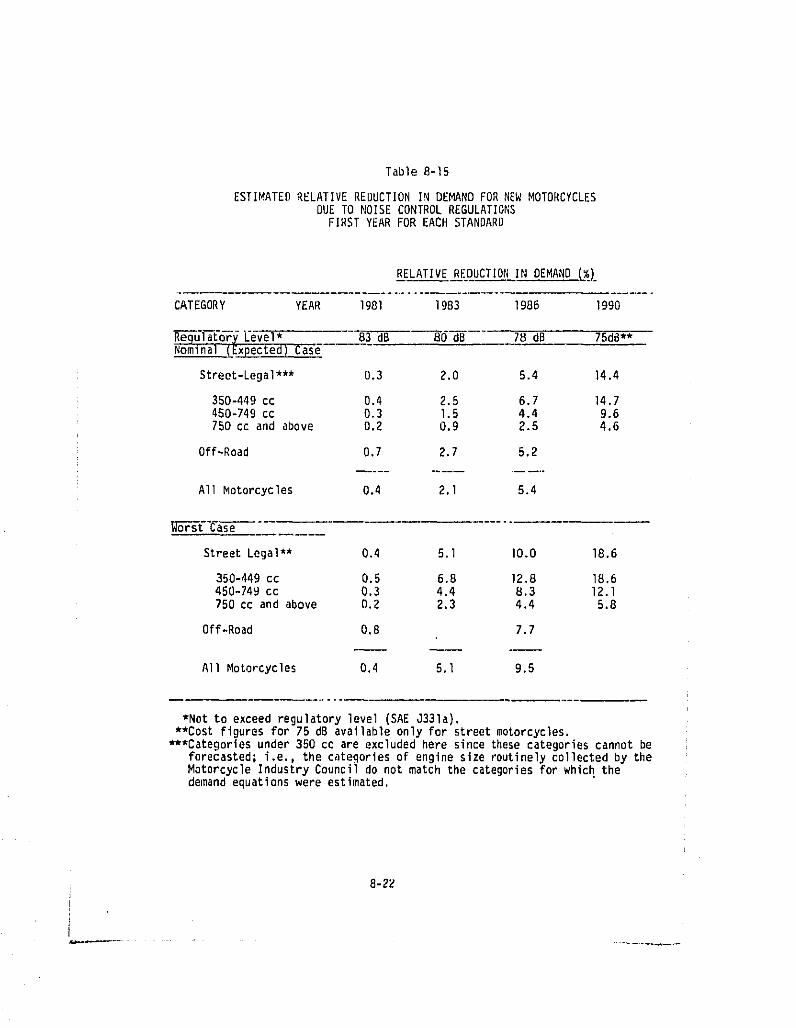
Table 8-15
ESTIMATED RELATIVE REDUCTION IN DEMANDFOR NEWMOTORCYCLESDUE TO NOISE CONTROLREGULATIONS
FIRST YEAR FOR EACH STANDARD
RELATIVE REDUCTION IN DEMAND (%_
CATEGORY YEAR 198] 1983 1986 1990
R_'i-a't6"r_Level* --83dB 86 dB 78 dB 75dB**Nominal (Expected) Case
Street-Legal*** 0.3 2.0 5.4 14.4
350-449cc 0.4 2.5 6.7 14.7450-749cc 0.3 1.5 4.4 9.6750ccandabove 0.2 0.9 2.5 4.6
Off-Road 0.7 2.7 5.2
All Motorcycles 0.4 2.1 5.4
oIT6-_-g"C-ase
StreetLegal** 0.4 5.1 10.0 18.6
350-449cc 0.5 6.8 12.8 18.6450-749cc 0.3 4.4 8.3 12.1750ccandabove 0.2 2.3 4.4 5.8
Off-Road 0.8 7.7
A11 Motorcycles 0.4 5.1 9.5
*Not to exceed regulatory level (SAE J331a}.**Cost figures for 75 dB available only for street motorcycles.
***Categories under 350 cc are excluded here since these categories cannot beforecasted; i.e., the categories of engine size routinely collected by theMotorcycle Industry Council do not match the categories for which thedemand equations were estimated.
8-22
F
I
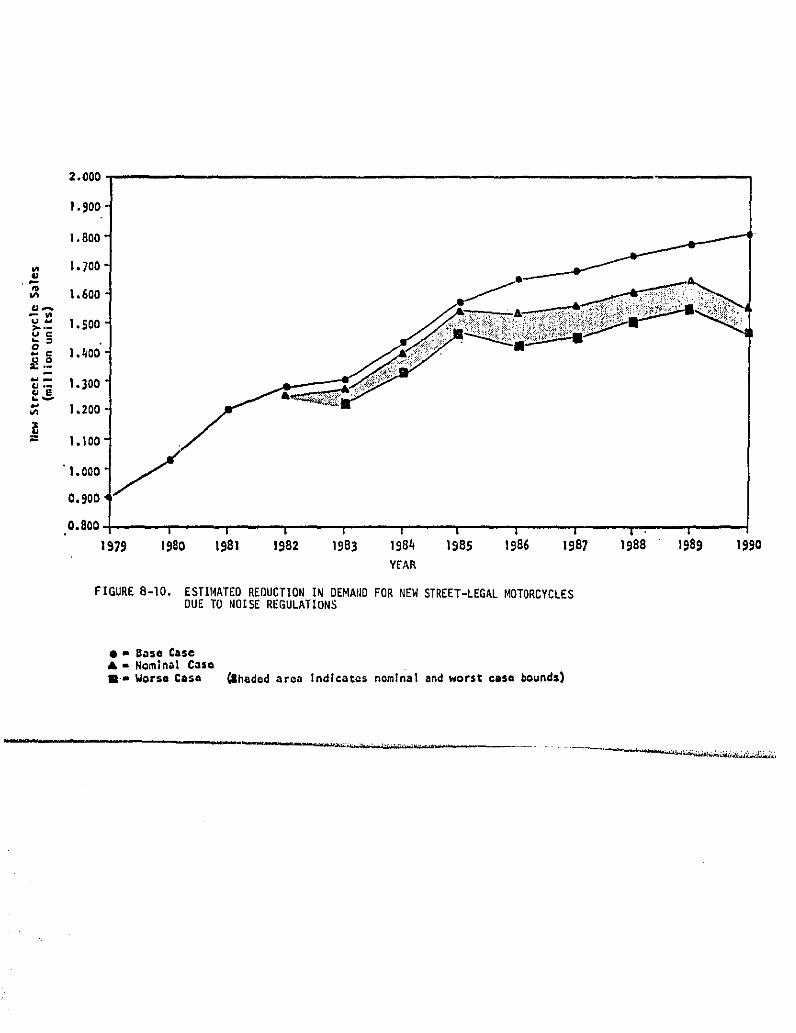
2.000 .....I
1,900 " J/1.800 "
v, 1.700 "U
e_1.600"
I/I
1.50o-1.4oo'-
.'= 1,300
_, 1.200
= 1.100"
•1.000
0.900
0.800,
1979 1980 1981 1882 1983 1984 1985 1986 1987 1988 1989 1990YEAR
FIGURE8-I0. ESTIMATEDREDUCTIONIN DEMANDFOR NEW STREET-LEGALMOTORCYCLESDUE TO NOISE REGULATIONS
• m Daso CaSe• = Nominal Casall.= Worse Case _hadod area Indi¢atas nominal andworst casa bounds)
78 dB Regulatory Level, 1986
A 78 dB standard in 1986 could reducethe baselineforecasteddemandby5.4 percent in the nominal case and by 9.5 percent in the worst case. Theproduct categories projected to be affected tilemost would again be streetmotorcycles under 350-449 cc. Motorcycles in these categories experi-ence the greatest relative price increase, because they are the most sensitiveto price changes; i.e., they have larger price elasticities. The streetmotorcycles, 750 cc and above, are expected to have the least severe impact:2.5 percentreductionin the nominalcase and 4.4 percentin the worst case.This motorcycle category is the least sensitive to price increases.
8.3 Impacts on Demand for Products and Services
8.3.1 HistoricalAftermarketSalesand Forecasts
The _:etorcycleaftermarket industry represents sales of motorcyclereplacement parts, accessories, apparel, and services. A broader definitionof the aftermarket would include motorcycle insurance and miscellaneous itemssuch as consumer publications, and advertising. The motorcycle aftermarketindustryhas experiencedextremelyrupid growth. Aftermarketsales in 1975were estimated_ at $1.8 billion, an increase of approximately 20 percentover 1974. For the two years prior to 1974, sales increased an average of 40percent per year, the market more than doubled between 1972 and 1975.**Table 8-16 provides estimated aftermarket sales for the period 1972 to 1975.
The aftermarketindustry is being stimulatedby the growing base ofmotorcycle owners, improved advertising and merchandising, new products, moreaffluent riders, and the trend toward using motorcycles for basic transpor-tation. With the growth of the motorcycle population, one of the most usefulways to consider aftermarket sales is expenditures per motorcycle in use.Expenditures per motorcycle in use as displayed in Table 8-16, have beengrowing at the rate of approximately 20% per year.
A Ziff-DavisJ_1otorcycleaftermarkeLsurvey taken early in 1975 indi-cated that approximately85 percentof all ,nutorcycle/minicycleowners pur-chased replacementparts, accessories,and apparelitems from the motorcycleafter_larketindustry.*** Twenty-twopercent of these consumersspent morethan $100 for their purchases, nn tlieaverage, each owner spent $86 for suchitems as: replacement parts and accessories ($54), and clothing ($32).****
A detailed breakdown of 1974 motorcycle aftermarket sales, as derivedfrom tileZiff-DavisStudy, is shown in TableU-I/. Eachof the majorcompo-nents of aftermarket sales, replacement parts and accessories, apparel,service and repairs, insurance, and miscellaneous, is described in moredetail in the following paragraphs.
#'_ata'_ora?-E-erTn-a_et--_aTesand growthtrendsare approximationsbecausethe an organized motorcycle aftermurket iodustry is relatively new and noorganized data collection effort by tileindustry has been made. Most ofthe detailed data available are for calendar year 1974.
** Frost and Sullivan, "MotorcycleOriginal Equipment and AftermarketStudyAnnouocement,"April, ]975.
*** Ziff-bavis Publications, "Motorcycle Aftermarket Study," 1975.**** Ibid.
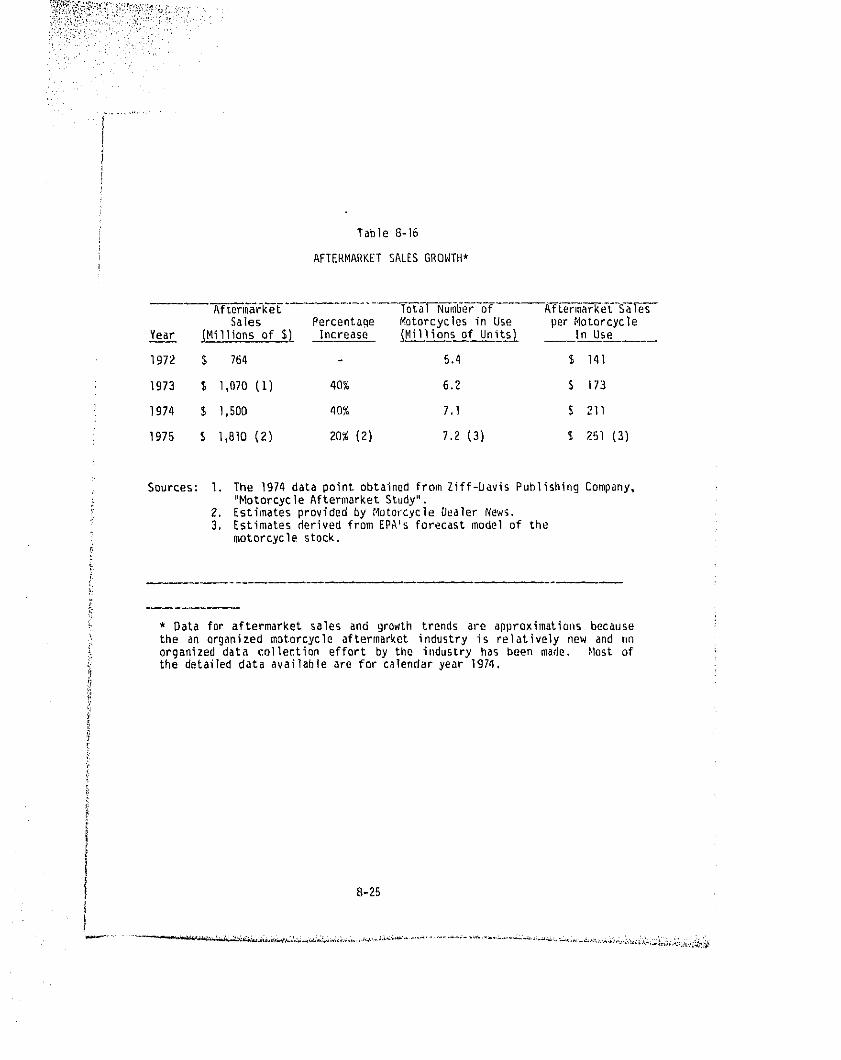
I
Table B-16
AFTERMARKET SALES GROWTII*
Sales Percentage Motorcyclesin Use per Motorcycle
yea[ (Millionsof $_ Increase _Mil!ionsof Units_ In Use
1972 $ 764 5.4 $ lql
1973 $ 1,070 (I) 40% 6.2 $ 173
1974 $ 1,500 40% 7,1 $ 211
1975 $ l,BIO (2) 20% (2) 7,2 (3) $ 251 (3)
Sources: I. The 1974 data point obtained from Ziff-Davis Publishing Company,"MotorcycleAftermarketStudy".
2. Estimates provided by Motorcycle Dealer News.3. Estimates derived from EPA's forecast model of the
motorcyclestock.
t
* Data for aftermarket sales and growth trends are approximations becausethe an organized m_torcycle aftermarket industry is relatively new and nnorganized data collection effort by the industry has been made, Most ofthe detailed data availahle are for calendar year 1974,
8-25
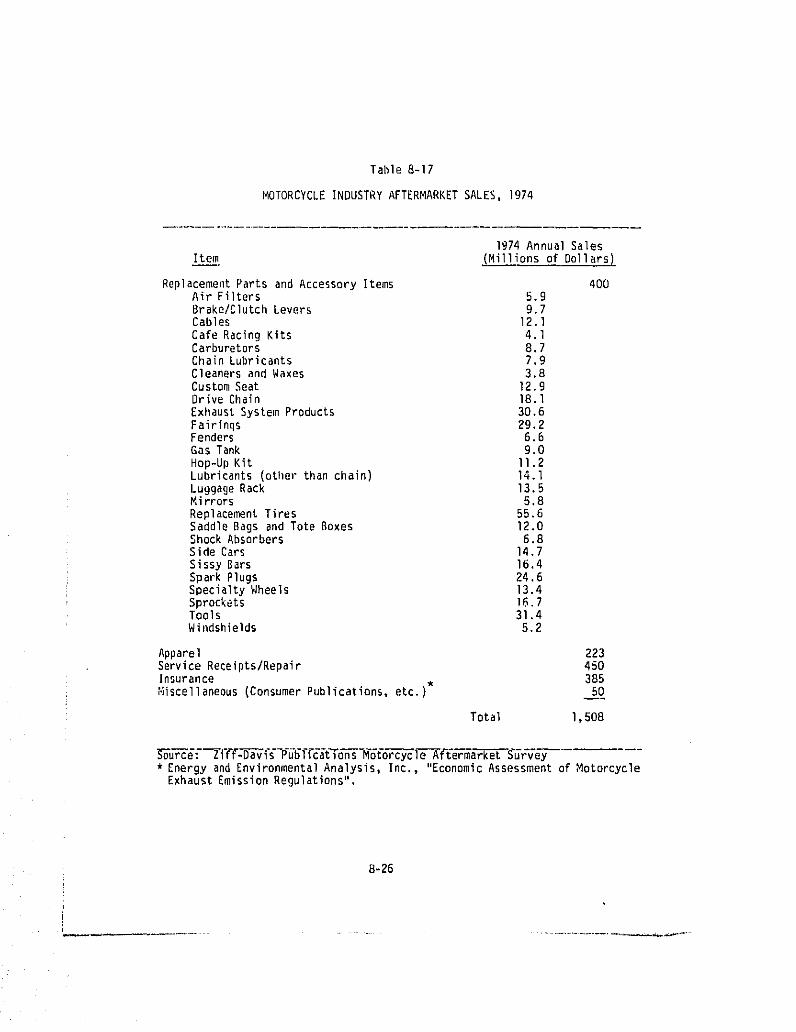
Table 8-17
MOTORCYCLEINDUSTRYAFTERMARKETSALES,1974
1974AnnualSales
Item (Millionsof Dollars)
ReplacementParts and AccessoryItems 400Air Filters 5.9Brake/ClutchLevers 9.7Cables 12.1
Cafe RacingKits 4.1Carburetors 8.7ChainLubricants 7.9CleanersandWaxes 3.8CustomSeat 12.9DriveChain 18.1ExhaustSystemProducts 30.6Fairinqs 29,2Fenders 6.6GasTank 9,0Hop-UpKit II.2Lubricants(otherthanchain) 14.1LuggageBack 13.5Mirrors 5.8ReplacementTires 55.6SaddleBagsandToteBoxes 12.0ShockAbsorbers 6.8SideCars 14.7SissyBars 16.4SparkPlugs 24,6SpecialtyWheels 13.4Sprockets 16.7Tools 31.4Windshields 5.2
Apparel 223ServiceReceipts/Repair 450Insurance 385r,liscellaneous(ConsumerPublications,etc.)_ 50
Total 1,508
* Energy and Environmental Analysis, Inc., "Economic Assessment of MotorcycleExhaust Emission Regulatiens".
B-26
A_ppare L
Sales of apparel (including he]mets) were estimated to be over $200million in 1974. Tile same manufacturers, distributors, and retail outletsthat are affected by changes in the market for replacement parts and accessories will be affected by changes in the market for apparel.
S_.__er3_ice/Repair_
Service and repair receipts totaled an estimated$450 million in 1974.Service revenues are increasing principally because of the larger populationof motorcycles in use. Service receipts primarily affect dealers, since onthe average these receipts comprise 15 percent of each dealer's revenue.
Insurance
Motorcycle owners paid an estimated $385 million for insurance premiumsin 1974. Average premiumsgenerallyvary with motorcyclesize. Changesinthe demand for motorcycle insurance will have very little effect on themotorized vehicle insuranceindustry, since motorcyclesare a very smallproportionof total underwriting. However, there are a few companiesthatspecialize in motorcycle insurance and these companies will be significantlyaffected by actions affecting motorcycle insurance revenues.
Miscellaneous
Miscellaneous includes revenues From motorcyclepublications,books,schools and consultants.
Replacement Parts and Accessories
The market for parts and accessories in 1974 was esthnated at $400million, which represented approximately 27 percent of aftermarket sales.Aftermarket items are generally purchased for perfor_nance, styling, func-tionalor maintenancepurposes. Exhaustsystemproducts,mechanicalproducts,mechanical parts and hop-up kits are big sellers in thls category. Sales ofstyling/functional items such as fairings, windshields, saddle bags andtote-boxesthat appeal to riders of large street touringF,_torcyclesareincreasingsignificantlyas a resultof the increasedgrowthof thesetypesofmotorcycles. Any ci_angein the demand for replacement parts and accessorieswill directly affect aftermarket manufacturers, distributorsand retailoutlets such as dealers, accessory shops,discount stores and nlailorderfirms.
Exhaust System Sales
Sales for exhaust system products, which were $30.6 million in 1974,will be particularlyimpacted by the motorcyclenoise control standards.Results of a survey froi_Ziff-lJavispublicationsfor exhaustsystempurchases
8-27
by motorcycle owners in 1974 are shown in Table 8-18. These data indicatethat 616,000 buyers {8.7 percent of all motorcycle owners) purchased1.4exhaust system products (mufflers, expansion chambers, etc.) each, and spentan averageof $50 for each purchase,or $35 per unit. Most of the exhaustsystemproducts (63.5percent)were purchasedfromdealers. For forecastingpurposes,the most feasibleway to considerexhaustsystemsales is to relatethose sales to the numberof motorcyclein use (the stockof motorcycles).For 1974, and average .1214exhaustsystemswere soldper motorcyclein use.Using this relationshipand forecastsof the populationof motorcycles,asderivedusing MotorcycleIndustryCouncilscrappagerates*and new motorcyclesales projections,forecastsof exhaustsystemsales (in units) were devel-oped. These forecasts are shown in Table 8-19.
B.4 Total Annualized Costs
Increases in purchase prices and operation and maintenance COSts foreach of the regulatory study levels (Table 8-21) will costs attributable tonoise control. Purchase price increases are incurred at the time of sale, andoperation and maintenance costs are incurred annually for the life of theproduct.
To compare regulatory options (See Table 8-21) for a given product andbetween products, it is necessary to use a statistical metric to characterizethis cost stream. The statisticalmetric used for all new product noiseregulationsis "uniformannualizedcosts",or more simply,annualizedcosts.
A cost stream over a given period is representedby a uniform coststream (annual costs of equal dollar amount) that has the same present value.That is, the cost stream to be represented is converted to a present valueusing a specifiedthne value of money. This presentvalue is convertedto acashstreamof equal units,which,usingthe same timevalueof money,has thesame present value. In essence, a cost strea_nover a given period is con-verted to an annuity over that same period. This statistical metric accountsboth for'the size and timing of costs incurred. The individual purchase pricein creasesdeveloped in the previoussectionswere used to calculatetotalpurchase price increases in each year based on specific not-to-exceed studylevels and effective dates. The number of units sold in each year was ad-Justed by the expected decrease in demand calculated in Section 8,2. In-creased purchase prices were converted to 1978 dollars. Similarly, theincreased operation and maintenance costs that were developed were applied tothe stock of vehicles in any year (adjustedfor decreaseddemand), and ex-pressed in 1978 dollars.
B.4.1 VehicleAnnualizedCosts
Table 8-21 shows the regulatory study levels used in computing annualizedcosts. Four street and four off-road regulatory options were assessed.
•The Motorcycle Industry Council's estimates of "survival" rates for motor-cycles over time is reproduced in Table 8-20. The scrappage rate is equal toone m_nus the survival rate.
8-2B
m .................
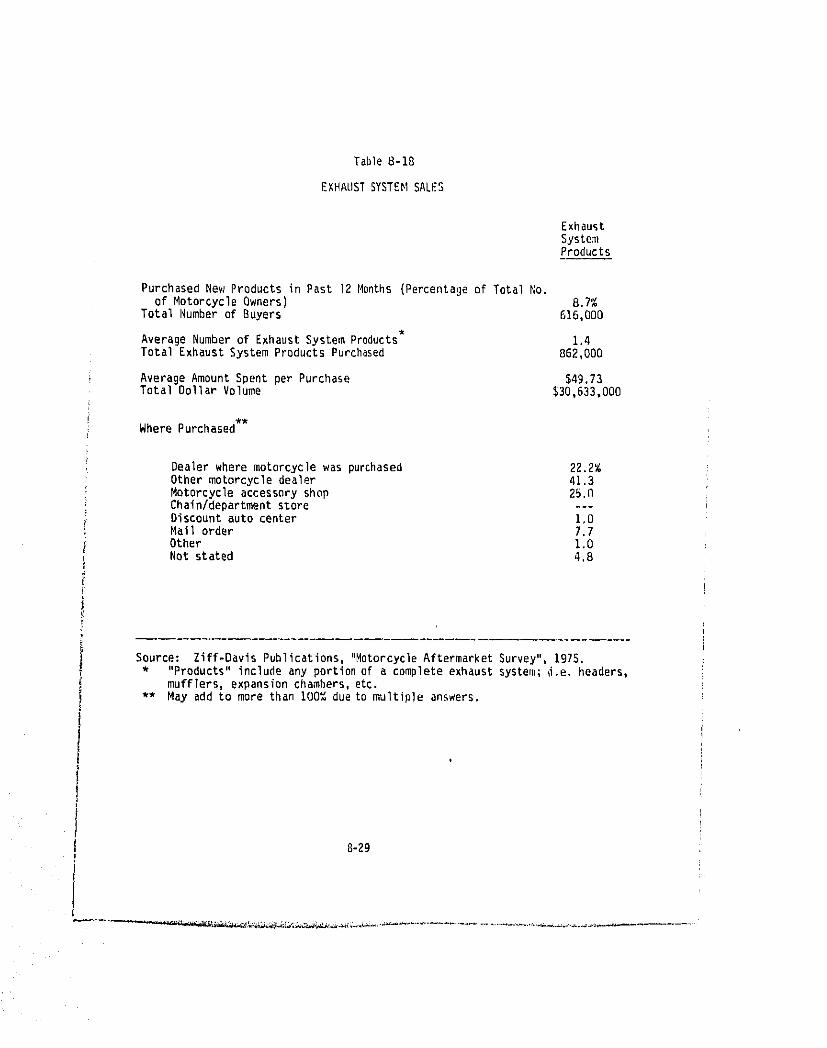
Table 8-18
EXHAUST SYSTEM SALES
ExhaustSystemProducts
Purchased New Products in Past 12 Months (Percentage of Total No.ofMotorcycleQwners) 8.7%
TotalNumberofBuyers 616,000
AverageNumberof ExhaustSystemProducts 1.4TotalExhaustSystemProductsPurchased 862,000
AverageAmountSpentperPurchase $49,73TotalDollarVolume $30,633,000
Where Purchased**
Dealerwheremotorcyclewaspurchased 22.2%Othermotorcycledealer 41.3Motorcycleaccessoryshop 25.nChain/departmentstore ---Discountauto center 1.OMailorder 7,7Other 1.0Notstated 4,8
Source: Ziff-Davis Publications, "Motorcycle Aftermarket Survey", 1975.* "Products" include any portion of a complete exhaust system; d.e, headers,
mufflers, expansion chambers, etc.** May add to more than100% dueto multipleanswers,
8-29
I
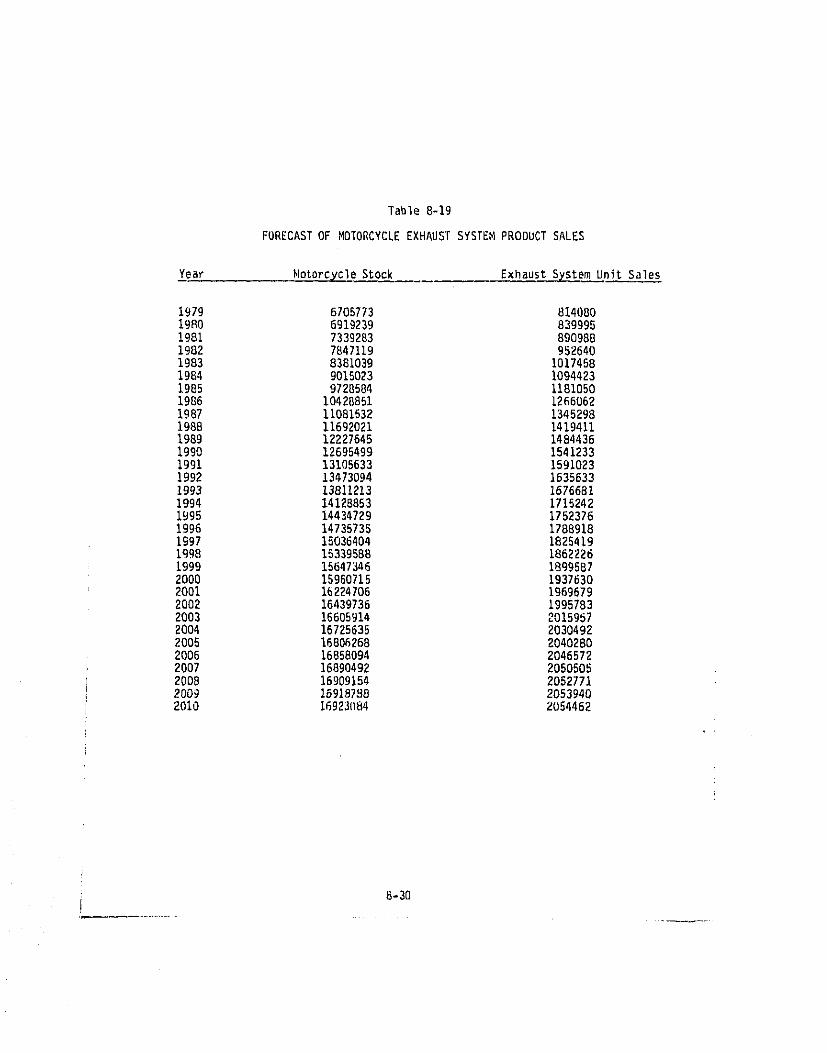
Table 8-19
FORECAST OF MOTORCYCLE EXHAUST SYSTEM PRODUCT SALES
Year MotorcEcleStock _ ExhaustS_stemUnit Sales
1979 6705773 8140801980 6919239 8399951981 7339283 8909881982 7847119 9526401983 8381039 10174881984 9015023 10944231985 9728584 11810501986 10428851 12660621987 11081532 13452981988 11692021 14194111989 12227645 14844361990 12695499 15412331991 13105633 15910231992 13473094 16356331993 13811213 16766811994 14128853 17152421995 14434729 17523761996 14735735 17889181997 15036404 18264191998 15339588 18622261999 15647346 18995872000 15960715 19376302001 16224706 19696792002 16439736 19957932003 16605914 20159572004 16725635 20304922005 16806268 20402802006 16858094 20465722007 16890492 20506052008 16909154 20527712009 1691S788 20539402010 16923(184 2054462
8-30
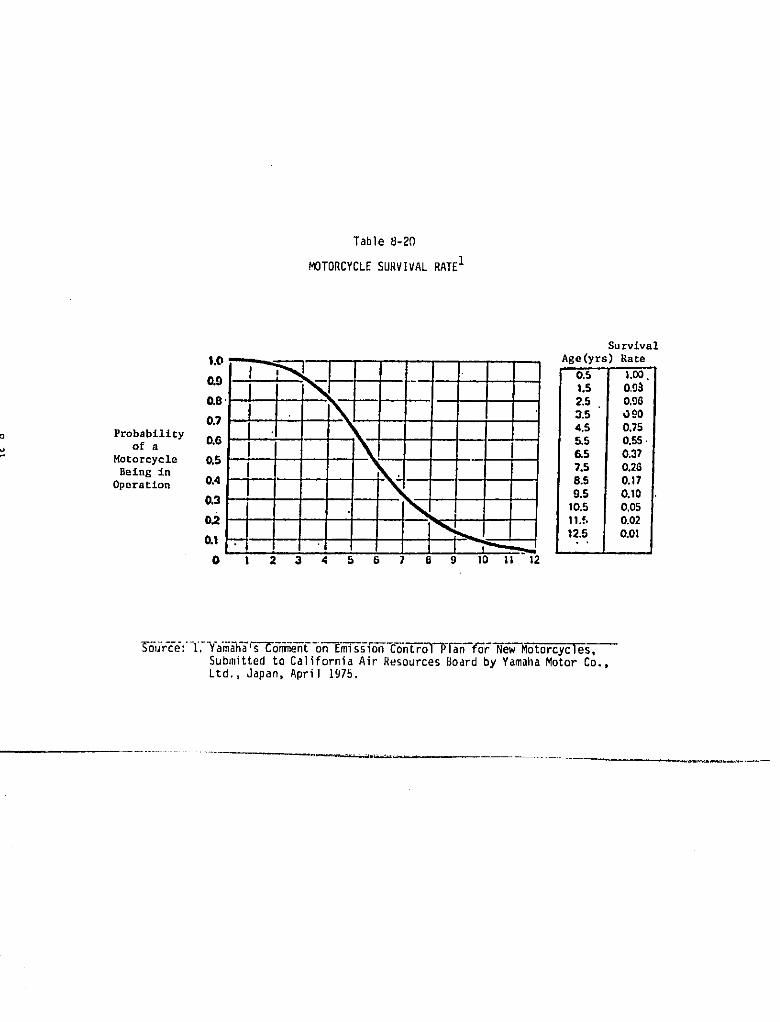
Table 8-20
MOTORCYCLE SURVIVAL RATE1
Survival
I.O _l Age(yrs) Rate
0.9 0.5, 1.00. i1.5 0.9_
0.7 3.5 0 90
Prob_bilt_y00 I i \ i l ,5 075Iof a I 6.5 0.37
"_ Motorcycle 0.5Be£ng In _ , 7.5 0.25
Oporation 0.4 ! I ;_ -- 8.5 0.170.3 i __ 9.5 0.1010.5 0.050,2 _ 11.:. 0.02
12.5 0.01_I ' .! . ,0 t 2 , 5 5 _ 9 Io tl 22
Submitted to California Air Resources Board by YamailaMotor Co.,Ltd., Japan, April 1975.
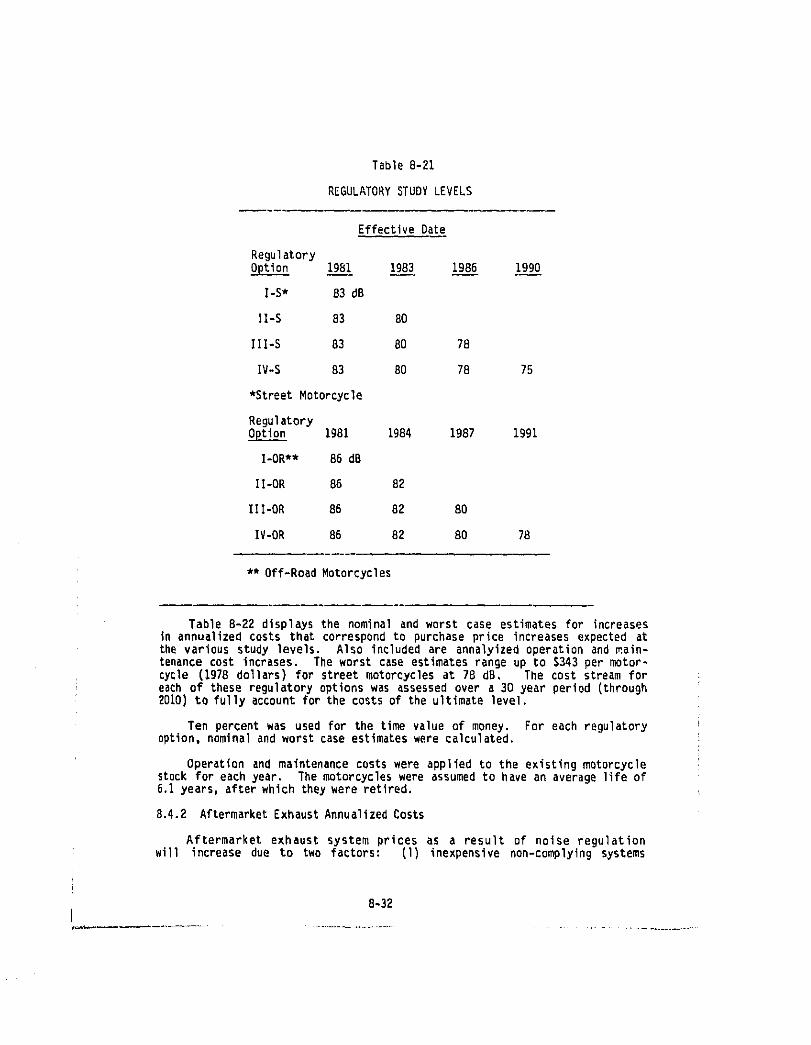
Table 8-21
REGULAT0RY STUDY LEVELS
Effective Date
RegulatoryOption 1981 1983 1986 1990
I-S* 83 dB
II-S 83 80
III-S 83 80 78
IV-S 83 80 78 75
*StreetMotorcycle
RegulatoryOption 1981 1984 1987 1991
I-OR** 86 dB
If-OR 86 82
Ill-OR 86 82 80
IV-OR 86 82 80 78
** Off-RoadMotorcycles
Table 8-22 displaysthe nominaland worst case estimatesfor increasesin annualizedcosts that correspondto purchaseprice increasesexpectedatthe various study levels. Also includedare annalyizedoperationand main-tenancecost incrases. The worst case estimatesrange up to $343 per motor-cycle (1978dollars)for streetmotorcyclesat 78 dB, The cost streamforeach of these regulatoryoptionswas assessedover a 30 year period(through2010)to fully accountfor the costsof the ultimate level.
Ten percentwas used for the time value of money. For each regulatoryoption,nominaland worst caseestimateswere calculated,
Operationand maintenancecostswere applied to the existingmotorcyclestockfor each year. The motorcycleswere assumedto have an averagelifeof6.1 years,afterwhich theywere retired.
8.4.2 AftermarketExhaustAnnualizedCosts
Aftermarket exhaust system prices as a result of noise regulationwill increase due to two factors: (I) inexpensivenon-complyingsystems
8-32
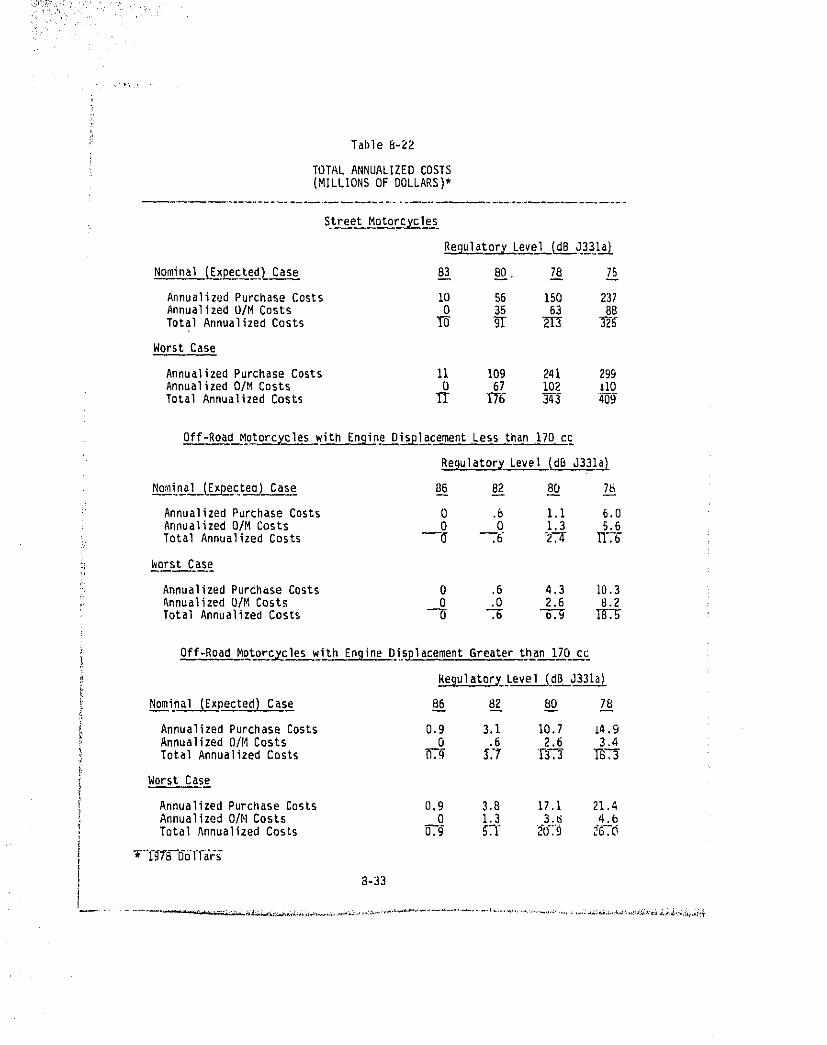
r_
i;k
;'i Table8-22
TOTAL ANNUALIZED COSTS(MILLIONS OF DOLLARS)*
Street Motorcyc]e S_s
Regulator _ Leve_L(dB J3_31a_]_
N_oomir)alLE_xp_ected) Case 8_ 8_0_0 7..88 7_55
AnnualizedPurchaseCosts 10 56 150 237AnnualizedO/M Costs 0 35 63 88TotalAnnualizedCosts _ 9-'I" _ _2_
Worst Case
AnnualizedPurchaseCosts 11 109 241 299AnnualizedO/M Costs 0 67 102 110TotalAnnualizedCosts _ I"/-_ "3_-3 40-9
Off-Ro,ad...Motorcvcles_withEn9!neDispLacementLess than170 cc
Regulatory Level IdB J331_
Nolnin__al.]_(Expecteo)Case 86 82 80 7L_
AnnualizedPurchaseCosts O .6 1.1 6.0AnnualizedO/M Costs 0 0 1.3 5.6TotalAnnualizedCosts --_ _ "2.--4"ll._
:_ WorstCase
_ AnnualizedPurchaseCosts 0 .6 4.3 10.3AnnualizedO/M Costs 0 .0 2.6 8.2TotalAnnualizedCosts ---Ci _ "_ T_'T_
Off-RoadMotorc_,vcleswith£ngineDi.splacement,Greaterthan170 cc
Regulatory.Level(dBJ331a)
Nominal{Fxp_ected)Case 86 8_22 80 78
AnnualizedPurchaseCosts 0.9 3.1 10.7 14.9AnnualizedO/M Costs 0 .6 2.6 3.4TotalAnnualizedCosts o':g _:? T3-_]" ]-8"T]"
Worst Case
AnnualizedPurchaseCosts 0,9 3.B 17.1 21.4AnnualizedO/N Costs 0 1.3 3._ 4.6TotalAnnuallzedCosts _..9 _I" 20_'9 _6_0
8-33
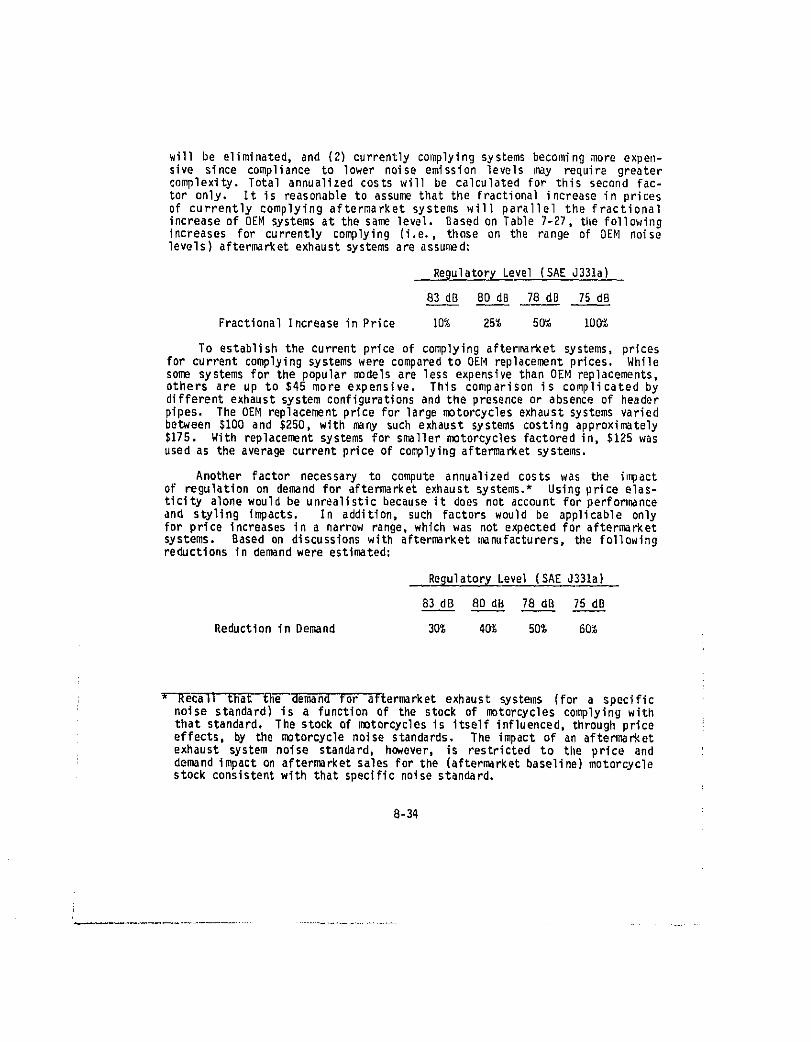
will be eliminated, and (2) currently complying systems becoming more expen-sive since compliance to lower noise omission levels may require greatercomplexity. Total annualized costs will be calculated for this second fac-tor only. It is reasonable to assume that the fractional increase in pricesof currently complying aftermarket systems will parallel the fractionalincreaseof OEM systemsat the same level. Based on Table7-27, the followingincreases for currently complying(i,e., those on the range of OEM noiselevels)aftermarketexhaustsystemsare assumed:
Regulatory Level (SAE Jg31a)
83 dB 80 dB 78 dB 75 dB
FractionalIncreasein Price 10% 25% 50% 100%
To establishthe currentprice of complyingaftermarketsystems,pricesfor current complyingsystemswere comparedto OEI4replacementprices. Whilesome systemsfor the popularmodelsare less expensivethan OEM replacements,others are up to $45 more expensive. This comparison is complicated bydifferentexhaustsystemconfigurationsand the presenceor absenceof headerpipes. The OEM replacementprice for largemotorcyclesexhaustsystemsvariedbetween $100 and $250, with many such exhaust systemscostingapproximately$175. With replacementsystemsfor smellermotorcyclesfactoredin, $125 wasused as the averagecurrentpriceof complyingaftermarketsystems.
Another factor necessary to compute annualizedcosts was the impactof regulationon demand for aftermarketexhaustsystems.* Usingprice elas-ticity alonewould be unrealisticbecauseit does not accountfor performanceand styling impacts. In addition,such factorswould be applicableonlyfor price increasesin a narrowrange,whichwas not expectedfor aftermarketsystems. Based on discussionswith aftermarketmanufacturers,the followingreductionsin demandwere estimated:
Regulatory Level (SAE J331a)
83dB BO dB 78 dB 75dB
Reductionin Demand 30% 40% 50% 60%
Recall that'--tlledemand for aftermerketexhaust systems (for a specificnoise standard) is a function of the stock of motorcycles complying withthat standard. The stock of motorcycles is itself influenced, through priceeffects, by the motorcycle noise standards. The impact of an aftermarketexhaust system noise standard, however, is restricted to the price anddemand impact on aftern_rket sales for the (aftermerket baseline) motorcyclestock consistent with that specific noise standard,
8-34
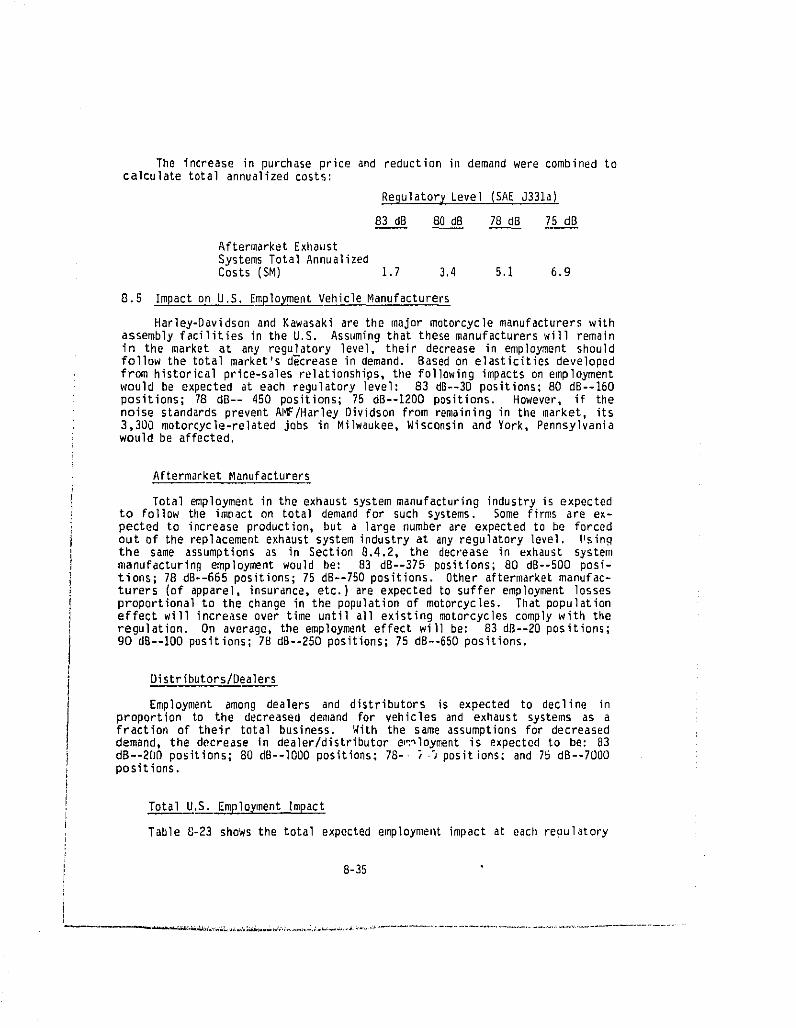
The increase in purchase price and reduction in demand were combined tocalcu]ate total annualized costs:
ReBulator X Level ISAE J331a)
83 dB 80dB 78dB 75dB
Aftermarket ExhaustSystems Total AnnualizedCosts($M) 1.7 3.4 5.1 6.9
8.5 Impact on U.S. Employment Vehicle Manufacturers
Harley-Davidson and Kawasaki are the major motorcycle manufacturers withassembly facilities in the U.S. Assuming that these manufacturers will remainin the market at any regulatory level, their decrease in employment shouldfollow the totalmarket'sd_creasein demand. Basedon elasticitiesdeveloped
; from historical price-sales relationships, the following impacts on employmentwould be expected at each regulatory level: 83 dB--30 positions; 80 dB--160positions; 78 dB-- 450 positions;75 dB--1200 positions. However, if thenoise standardspreventAMF/Harleygividsonfrom remainingin the market, its3,300 motorcycle-related jobs in Milwaukee, Wisconsin and York, Pennsylvaniawould be affected.
Aftermarket Manufacturers
Total employment in the exhaust system manufacturing industry is expectedto follow the impacton total demandfor such systems. Some firms are ex-pected to increaseproduction,but a largenumber are expectedto be forcedout of the replacementexhaustsystetaindustryat anyregulatorylevel. Usingthe same assumptions as in Section 8.4.2, the decrease in exhaust systemmanufacturing employment would be: 83 dB--375 positions; 80 dB--500 posi-tions; 78 dB--665positions;75 dB--750positions. Other aftermarketmanufac-turers (of apparel, insurance, etc.) are expected to suffer employment lossesproportional to the change in the population of motorcycles. That populationeffect will increase over time until all existing motorcycles comply with theregulation. On average, the employment effect will be: 83 dB--20 positions;90 dB--IOO positions; 78 dB--250 positions; 75 dB--650 positions.
Distributors/Dealers
Employment among dealers and distributors is expected to decline inproportion to the decreaseddemand for vehicles and exhaust systems as afraction of their total business. With the same assumptionsfor decreaseddemand, the decrease in dealer/distributore,n_loymentis expectedto be: 83dB--20D positions;80 dB--lO00positions;78-. ;._ positions;and 75 dB--7000positions.
Total U.S. EmploymentImpact
Table 8-23 shows the total expected employment impact at eacllregulatory
8-35
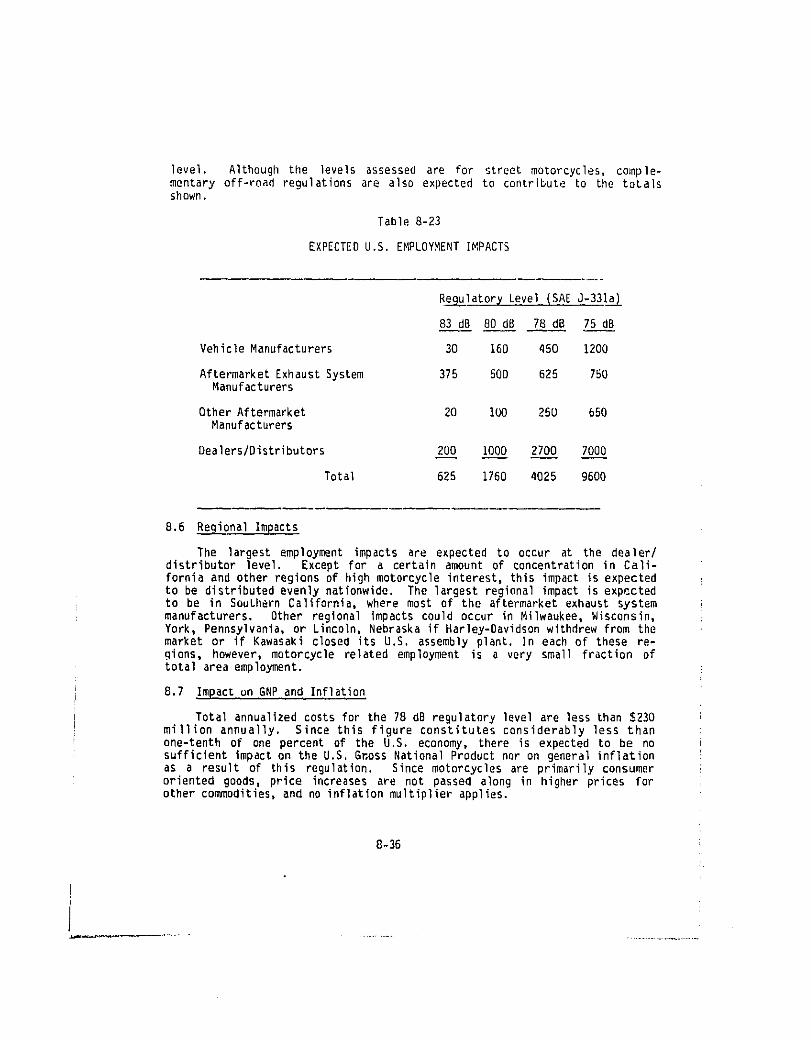
level. Although the levelsassessed are for streetmotorcycles,comple-mentary off-road regulationsare also expected to contributeto the totalsshown.
Table 8-23
EXPECTED U.S. EMPLOYMENT IMPACTS
Re_latory Level ISAE J-g31a__
83 dB 80 dB 78dB 75 dB
VehicleManufacturers 30 160 450 1200
AftermarketExhaustSystem 375 50D 625 750Manufacturers
OtherAftermarket 20 100 250 650Manufacturers
Dealers/Distributors 200 1000 2700 7000
Total 625 1760 4025 9600
8.6 Regional Impacts
The largestemployment impacts are expected to occur at the dealer/distributor level. Except for a certain amount of concentration in Cali-forniaand other regionsof highmotorcycleinterest,this impactis expectedto be distributedevenlynationwide. The largestregionalimpactis expectedto be in SouthernCalifornia,where most of the aftermarketexhaustsystemmanufacturers. Other regional impacts could occur in Milwaukee, Wisconsin,York, Pennsylvania,or Lincoln,Nebraskaif Harley-Davidsonwithdrewfrom themarket or if Kawasaki closed its U.S. assembly plant. In each of these re-gions, however,motorcyclerelated employmentis a very small fraction oftotal area employment.
8.7 Impact on GNP and Inflation
Total annualizedcostsfor the 78 dB regulatorylevelare less than $230million annually. Since this figure constitutes considerably less thanone-tenthof one percent of the U.S. economy, there is expectedto be nosufficientimpacton the U.S.Gnoss NationalProductnor on generalinflationas a result of this regulation. Since motorcycles are primarily consumeroriented goods_ price increasesare not passed along in higher prices forother commodities, and no inflation multiplier applies.
8-36
J
i
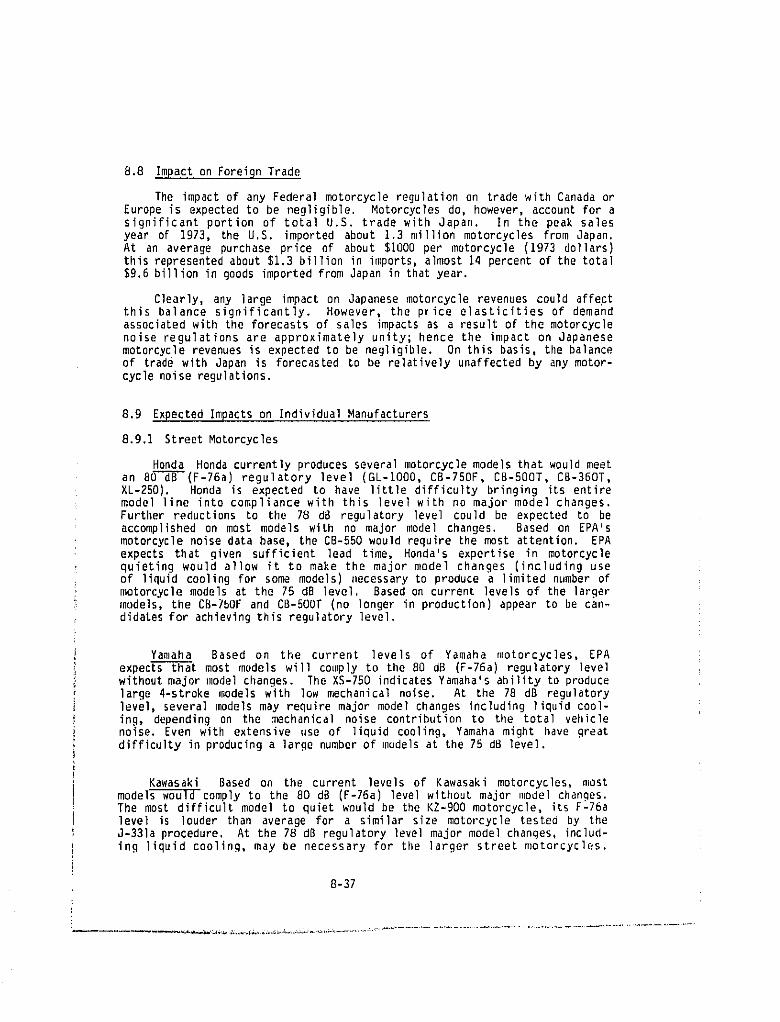
8.8 Impact on Foreign Trade
The impact of any Federal motorcycle regulation on trade with Canada orEurope is expected to be negligible. Motorcycles do, however, account for asignificant portion of total U.S. trade with Japan. In the peak salesyear of 1973, the U.S. imported about 1.3 million motorcycles From Japan.At an average purchase price of about $1000 per motorcycle(1973 dollars)this represented about $1.3 billion in imports, almost 14 percent of the total$9.6 billion in goods imported from Japan in that year.
C]early, any ]arge impacton Japanesemotorcyclerevenuescould affectthis balance significantly. However, the price elasticities of demandassociatedwith the forecastsof sales impactsas a resultof the motorcyclenoise regulations are approximately unity; hence the impact on Japanesemotorcyclerevenuesis expectedto be negligible. On this basis,the balanceof trade with Japan is forecasted to be relatively unaffected by any motor-cycle noise regulations.
8.9 Expected Impacts on Individual Manufacturers
8.9.1 Street Motorcycles
Honda Hondacurrentlyproducesseveralmotorcyclemode]sthat wouldmeetan 80 dB (F-76a) regulatory level (GL-IO00, CB-750F, CB-5OOT, CB-360T,XL-250). Honda is expected to have little difficulty bringing its entiremodel line into compliance with this level with no major mode] changes.Further reductionsto the 78 dB regulatory level could be expected to beaccomplishedon most models with no major model changes. Based on EPA'smotorcycle noise data base, the CB-550 would require the most attention. EPAexpects that given sufficient lead time, Honda's expertise in motorcyclequieting would allow it to make the major model changes (including useof liquid cooling for some models) necessary to produce a limited number ofmotorcyclemodelsat the 75 dB level. Based on current levelsof the larger_nodels,the CB-TbOF and CB-5OOT (no longer in production) appear to be can-didates for achieving this regulatory level.
Yamaha Based on the current levels of Yamaha motorcycles, EPAexpects that most models will comply to the 80 dB (F-76a) regulatory levelwithoutmajor modelchanges. The XS-750 indicatesYamaha'sabilityto producelarge 4-strokemodels with low mechanicalnoise. At the 78 dB regulatorylevel, several models may require major model changes including liquid cool-ing, dependingon the mechanical noise contributionto the total vehiclenoise.Even with extensiveuse of liquidcoo]ing,Yamaha might have greatdifficulty in producing a large number of models at the 75 dB level.
Kawasaki Based on the current levelsof Kawasaki motorcycles,mostmodelswould complyto the 80 dB (F-76a)levelwithout major model changes.The most difficult model to quiet would be the KZ-900 motorcycle, its F-76alevel is louder than average for a similar size motorcycle testeo by theJ-33]a procedure. At the 78 dg regulatory level major model changes, includ-ing liquid cooling, may be necessary for the ]arger street motorcycles.
8-37
Even with extensive use of liquid cooling. Kawasaki might have great difficul-ty in producing a large number of models at the 75 dB level.
Suzuki Based on current levels of Suzuki motorcycles, most models wouldcomply--t-'E'-the 80 dB (F-76a) regu]atory level without major mode} changes.Suzuki motorcycle general]y tested quieter than average for the F-76a test andthe larger motorcycles are already near the 80 dB level (_T-750, GT-550,RE-5). Suzuki's recently introduced 4-stroke models incorporate many quietingfeatures, At the 78 dB level, several mode]s may need major mode] changes,The GT-750 and RE-5 already feature liquid cooling. Even with extensive useof liquid cooling, Suzuki may have great difficulty in producing a largenumberof modelsat the 75 dB level.
AMF/Harle_-Davidson
(I) Large Nodels
Harley-PavidsonmOtorcyclesequippedwith "Californiaexhaust systems"meet the California83 dB (SAEJ331a)standard. It is apparentthatcurrentHarley-Davidson engines types would need major redesign to meet an BO dBFederal standard. All known quieting techniques,perhaps inc]udinqliquidcooling,maybe necessaryat this level EPA believesthatthere i- a reason-able chance that Harley-Davidson moduls may be able to achie_ an 80 dBregulatory level without major redesign. Extended lead time may be animportantfactor in Harley-Davidson'sability to meet the 80 dB regulatorylevel.
It is clear, however, that levels below BO d_ are probably not achievablewith the currentenginetypes. Completelynew enginedesignswill probablybenecessary, Again, lead time for such effortwould be a significantconsid-eration.
It is clear from other manufacturers of large-bore twins, however,that the 75 dB level is essentialllyunachievablewith these designs (seeBMW, Mote Guzzi, Ducati). Considering Harley-Davidson's marketing position,it maybe impracticalfor them to switchengine types to the multi-cyclinderdesignscor:nonto the Japanesemanufacturers.
(2) SmallModels
Basedon currentnoise levels,the HarIey-Davison2-strokemodelsshouldbe able to {Beetan 80 dB requirmentwithoutmajor uloeelc_anges. Majormodelchanges may be necessary at the 78 dB level and the 75 dB level may not beachievable.
BMW BMN motorcycles tested much quieter than average for the F-76atest and BO dB is expectedto be achievablewith littlechangeto currentmodels.BMW felt that levelsbelow 80 dB SAE J331a; 77-/_ dB for F-76a forthese motorcycleswere unaehievablewith their large bore, and horizontallyopposed twln cylinder engine.
Moto Guzzi, Ducati, Benelli, MV A_usta, Moto Morini These Italianmanuf_-u'rer'so---'_--1_F__Fe_ m6_rcy_s-fe_t that _o-dT(SAE Jd31a; also
8-38
estimated to be 80 dB on F-76a) was possibly achievable but at levels below80 dB, the small fraction of their motorcyclesproducedfor the U,S. wouldforce themto considerwithdruwlngfrom the U.S.market.
Can-Am(Bombardier)Can-Amhas producedversionsof its high performanceoff-road and MX motorcyclesas endure models intended for limited streetoperation. Such endure models would be subject both to EPA air emission andnoise requlationsapplicalbleto streetmotorcycles.The combinedeffectofthese regulations could cause Can-Am to drop these models from the U.S.market if required to meet an 80 dB or lower level. Bombardier indicatedthat the high cost of labor and raw materials in Canada required continuedproduction of high performance motorcycles in order to compete with theJapanese.
Bultaco Like Can-Am, Bultaco produces endure versions of its highperformanceoff-roadand MX motorcyclesas enduremodels intendedfor limitedstreet operation. Bultacu is currentlystrugglingto meet the California83 dB standard. Since demand for Bultaco enduremotorcyclesare based ontheir off-roadversions,major model changessuch as liquidcoolingare notfeasible. The combinedeffectof air emissionregulationsand noise regula-tions could cause Bultaco to drop endure modelsfrom the U.S. market at orbelow the 80 dB level.
OtherManufacturers Montesa,KTM, Carabelaand other manufacturersalsomanufacture endure m-6-delswhich have been street legal in some states.Since these manufacturersprobably do not intendto meet air emissionstan-dards, they will be sold as strictly off-roadmotorcyclesin the future.
8.9.2 Off-Road Motorcycles
Honda,Yamaha_Kawasaki,Suzuki All of the major Japanesemanufacturerscould use technologydevelopedfor their streetand dual purposemotorcyclesto meet an B6 dB level. Given sufficient lead time, all manufacturersare judgedcapableof 4-strokeconversionand mechanicaltreatmentto achievean 80 dB regulatorylevel for largeoff-roadmotorcyclesand a 78 dB regula-tory levelfor smalloff-roadmotorcycles. At theselevels,however,perfor-mance impacts can be expected.
Other Manufacturers Husqvarna, Can-Am, Bultaco, OSSA, Montesa, KTM,Maico, CZ, Carabela,and several other manufacturersproduce off-roadandcompetitionMX motorcycles. Almost all of the manufacturersconsultedbyEPA agreedthat the 86 dB Calferniastandardwas achievableat only a limitedperformancepenalty. The manufacturersgenerallyfelt that 83 dB might beachievableat some time in the future,but that consumer shifts to higherperformancecompetitionmodelsand usermodificationsto restorelostperfor-mance would make this effortfruitless.Since thesemanufacturersspecializein high performance,below the 86 dB level demandfor their productswoulddrop off significantlyin comparisonto the demandfor lowerpricedJapanesemodels. Between 83 and 80 dB, most of these manufacturers would eitherdrop out of the U.S.marketor would marketcompetitionmodelsonly.
8-39
8.9.3 Aftermarket Exhaust Systems
Approximately half of the firms currently making replacement motorcycleexhaust systemswill probablyeithergo outoF businessor be forcedto switchto alternateproduct ]ines as a result of Federal noise standards. Thesefirms are typically sma11, low volume e_terprisesdevoted exclusivelytomanufacturingmotorcycle exhaustsystems,with littleor no capabilityforproductdesignand development.
Other firms currentlymarketingreplacementexhaustsystemsmay likewisebe forced to make major readjustments. Catalog suppliers such as J. C.Whitney, and other retailerswho offer a wide rangeof automotivetype pro-ducts may be forced to find new suppliers, or to discontinue selling exhaustsystems entirely. Some firms may resort to copying the designsof othermanufacturers, a common practice at present.
The ten to twenty leading firms in the industry are expected to beable to produce complying systems, but at similar price and performancecharacteristicsas OEM systems. Althoughtotaldemandfor aftermarketsystemsis expected to decline, these firms ought to at least preserve their unitvolumeas other manufacturerswithdrawfromthe market. The twentyor thirtyother firms that are expectedto remainin the aftermarketmufflermarketareexpected to experience severe difficultiesin remainingcompetitive,withprofitsshrinkingto the nearbreakevenpoint.
These expectedimpactsare baseduponthe assumptionthat the regulationswill be effectivelyenforcedat the State and local level to prohibitwide-spread sale and use of loud systems "designed" for motorcycles manufacturedbeforethe effectivedate of theFederalregulationsor "competition"exhaustsystems that can be easilymodifiedby the operatorfor use on a regulatedmotorcycle.
8-40
_J_LO0¥ERNME_ pAINTINaO_flCE_19aI 341.082/216 1-3
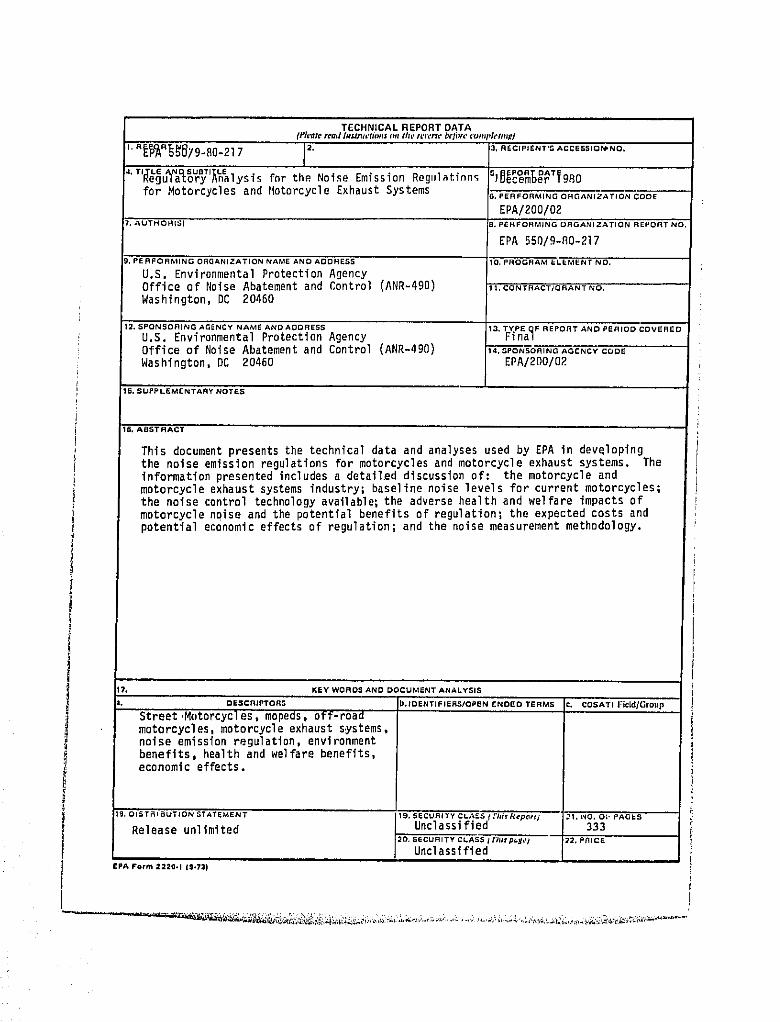
TECHNICAL REPORT DATA(P_t'fl$_ r_fld IHgL_tVtlOtt$ (,It Wit, _'_,l'(,rst*bt, ti;Ft, ('optVplCt/_jg*_
""_F_R_(_/9-N0-21 7 I=' _' RECIPIENT'S ACCESSlO_PNO'
4. TI LG N SUDTI LE_0u_Ctory _nalysis fnr the Noise Emission Regulntinns _IB_O_T_gFIO
for Motorcycles and 14otorcycle Exhaust Systems _.PERFORMING ORGANI/ATJON CODE
EPA/200/02_, AUTHOR(_;) B, PERFORMING URGANIZATION REPORT NO
EPA 660/9-fi0-217
l, PERFORMING ORGANIZATION NAME AN_ ADDRESS 10, ELEMENT NO,
U.S. Environmental Protection AgencyOffice of Noise Abatement and Control (ANR-490) I%.CONTRACTIGRANTNO.
Washington, DC 20460
12. SPONSORING AGENCY NAME AND ADDRESS 13. TYPE QF REPORT AND PERIOD COVERED
U,S. Environmental Protection Agency Final
Office of Noise Abatement and Control (ANR-490) 14.SpoNSORINGAGENCyCODE
Washington, DC 20460 EPA/2O0/02
15, SUPPLEMENTARY NOTES
16. ABSTRACT
This document presents the technical data and analyses used by EPA in developing
the noise omission regulations for motorcycles and motorcycle exhaust systems. The iinformation presented includes a detailed discussion of: the motorcycle and Lmotorcycle exhaust systems industry; baseline noise levels for current motorcycles; i
the noise control technology available; the adverse health and welfare impacts of
motorcycle ndise and the potential benefits of regulation; the expected costs andpotential economic effects of regulation; and the noise measurement methodology.
I?. KEY WORDS AND DOCUMENT ANALYSIS
DESCRJPTOR$ ' ).iDENTiFIERS/OPEN ENDED TERMS c. COSATI I:lcld/Gro,p
Street ,Motorcycles, mopeds, off-roa_
motorcycles, motorcycle exhaust systems.noise emission regulation, environment
benefits, health and welfare benefits,economic effects.
l_" DISTRIBUTJON STATE_ENT 19, SECURITY CLASS (*"hir,_¢pclr(j ._1, P_O, O1" PAGES
Release unlimited Unclassified 3332(}. SECURITY CL.ASS I[hJIpc.$L'_ _2, PNICE
Unclassifiedll=
£PA Form 2220.1 ($.7:1)
Unilod StaCes Officiz=lBusin_lssEnvirortme_tat PiolOCliOn P(tnUll¥f¢)tPrivaluUseAgency $300
Washington DC 20460


