Embed Size (px)
Citation preview
QUALITY BY DESIGN (QBD) IN PHARMACEUTICAL INDUSTRY Ruchi Singh (F.Y M.Pharm ) Guided by : Dr.( Mrs.) Supriya Shidhaye
1
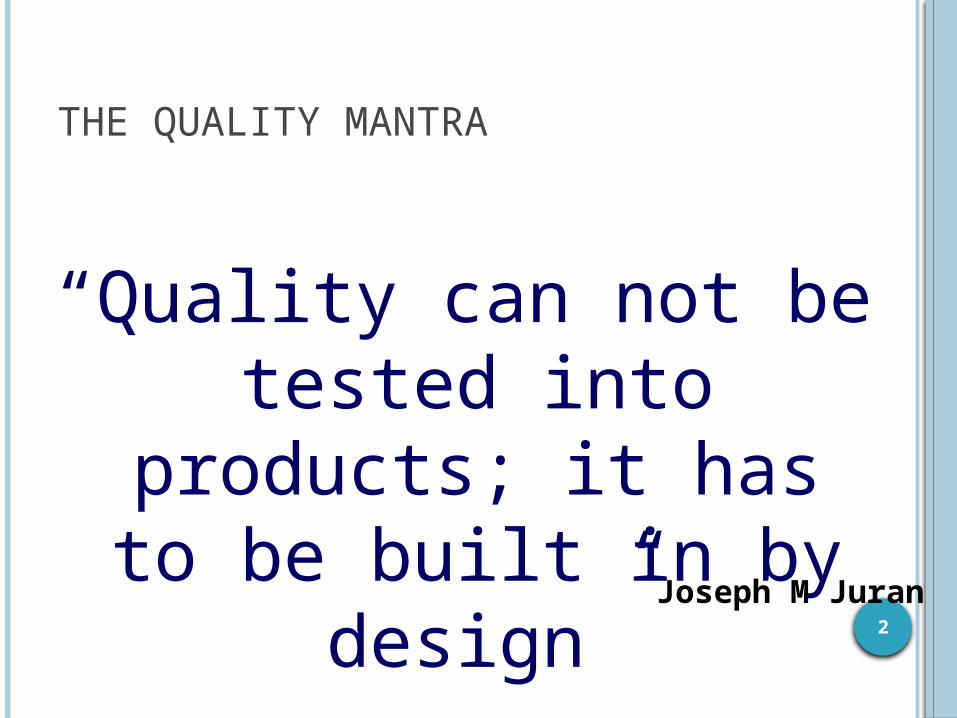
THE QUALITY MANTRA
“Quality can not be tested into
products; it has to be built in by
design”Joseph M Juran
2
CONTENTS :
3
1. QbD Basic concept
2. Steps in QbD
3. DoE as a tool for QbD
4. Example
5. Pros and cons
6. Conclusion
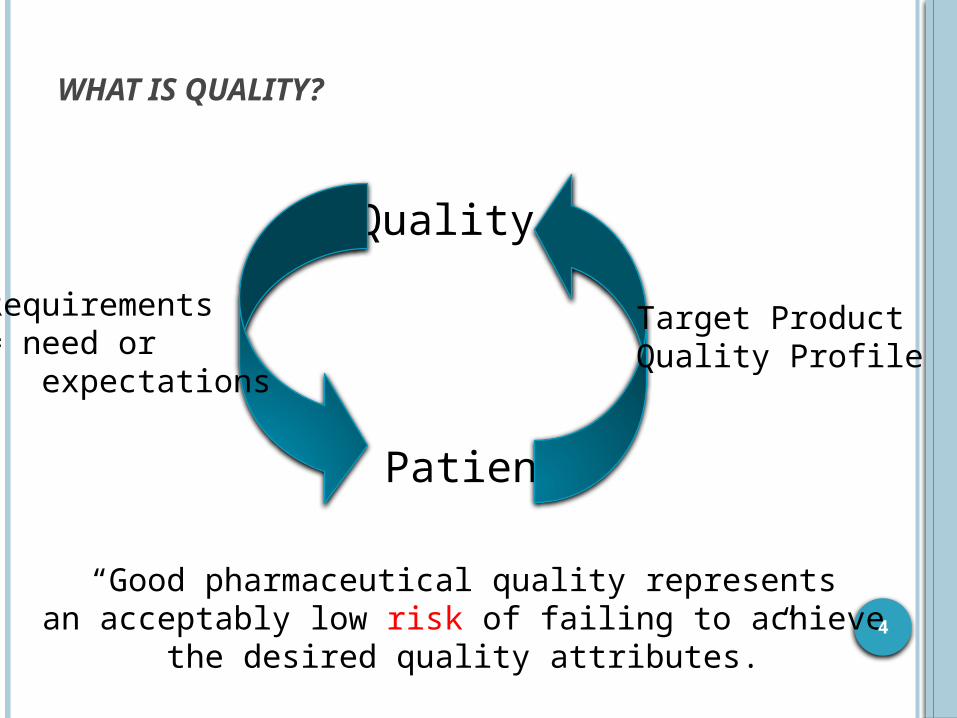
WHAT IS QUALITY?
Quality
Patient
Target ProductQuality Profile
Requirements= need or expectations
“Good pharmaceutical quality represents an acceptably low risk of failing to achieve
the desired quality attributes.”4
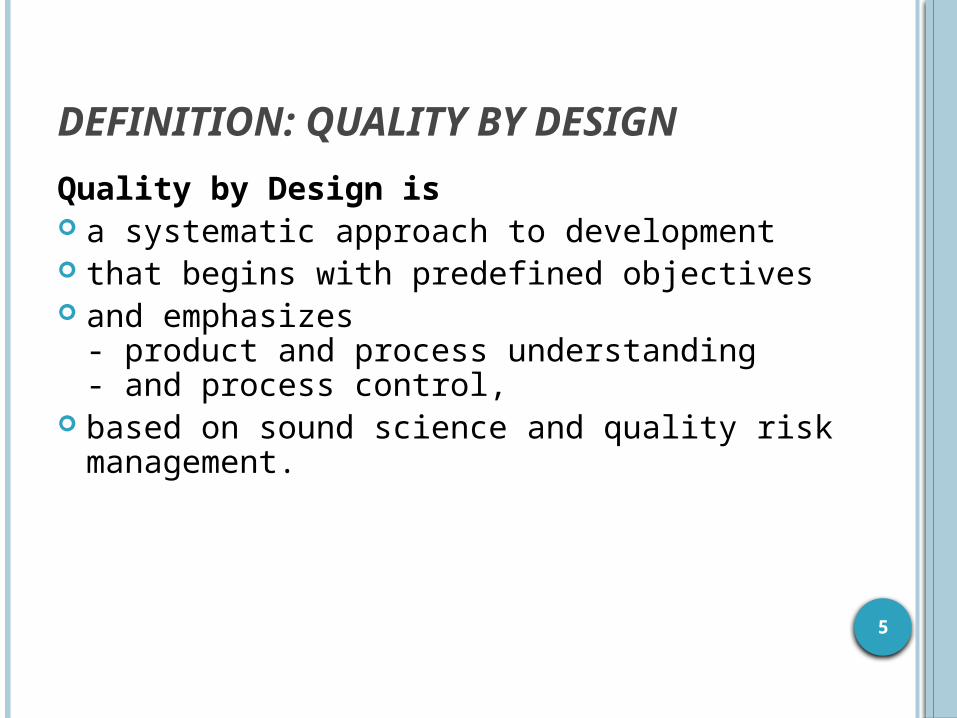
DEFINITION: QUALITY BY DESIGNQuality by Design is a systematic approach to development that begins with predefined objectives and emphasizes - product and process understanding - and process control,
based on sound science and quality risk management.
5
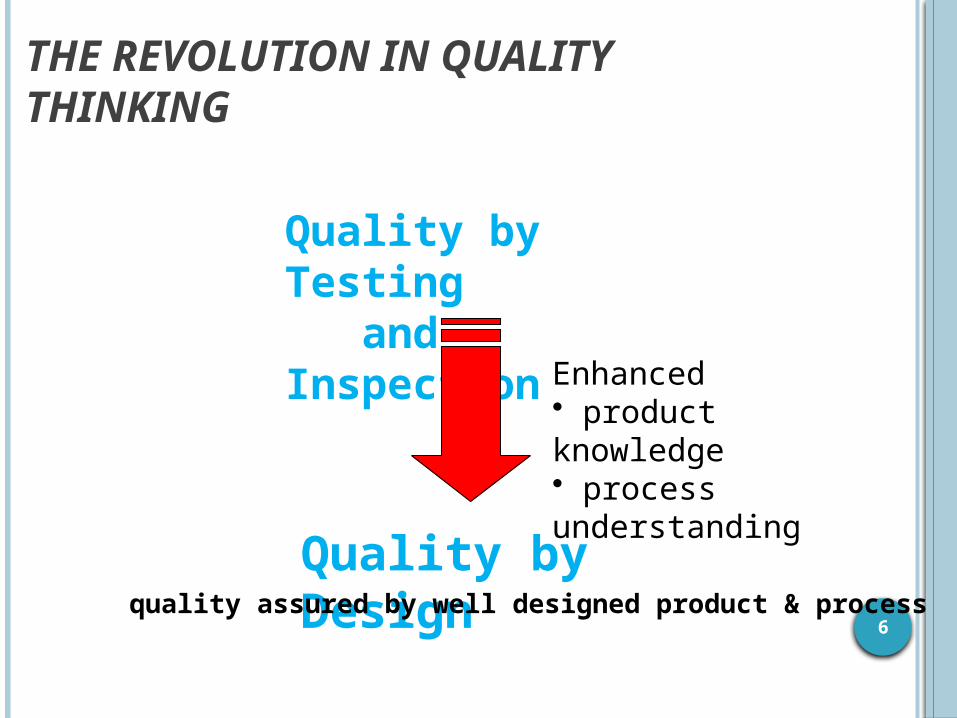
THE REVOLUTION IN QUALITY THINKING
Quality by Testing and Inspection
Quality by Design
Enhanced• product knowledge• process understanding
quality assured by well designed product & process6
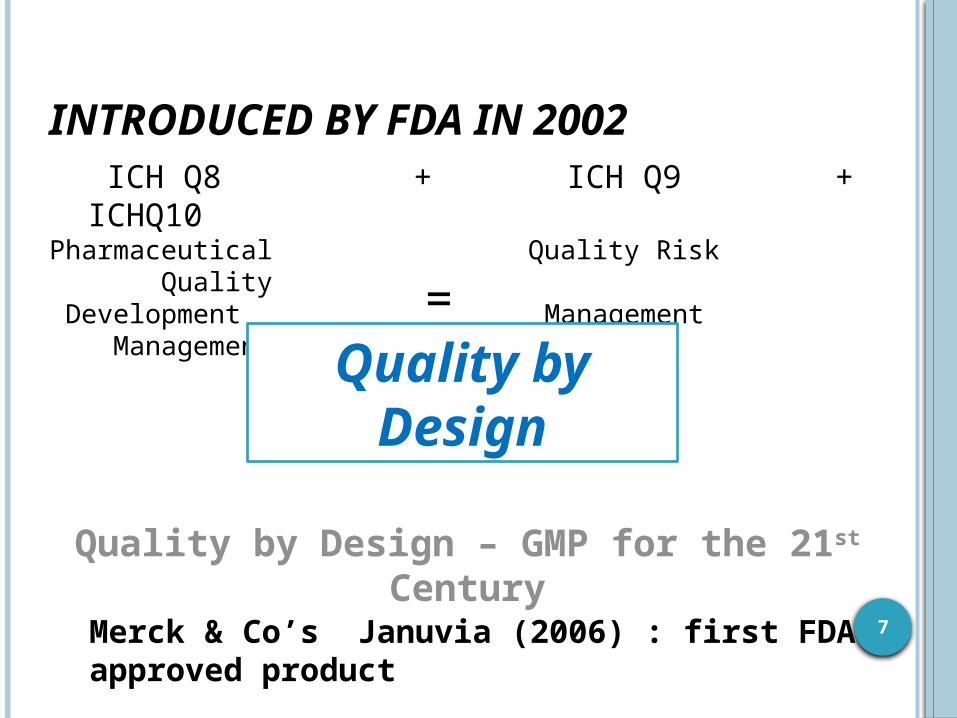
INTRODUCED BY FDA IN 2002 ICH Q8 + ICH Q9 + ICHQ10Pharmaceutical Quality Risk Quality Development Management Management Quality by
Design
Quality by Design – GMP for the 21st Century
Merck & Co’s Januvia (2006) : first FDA approved product
7
=
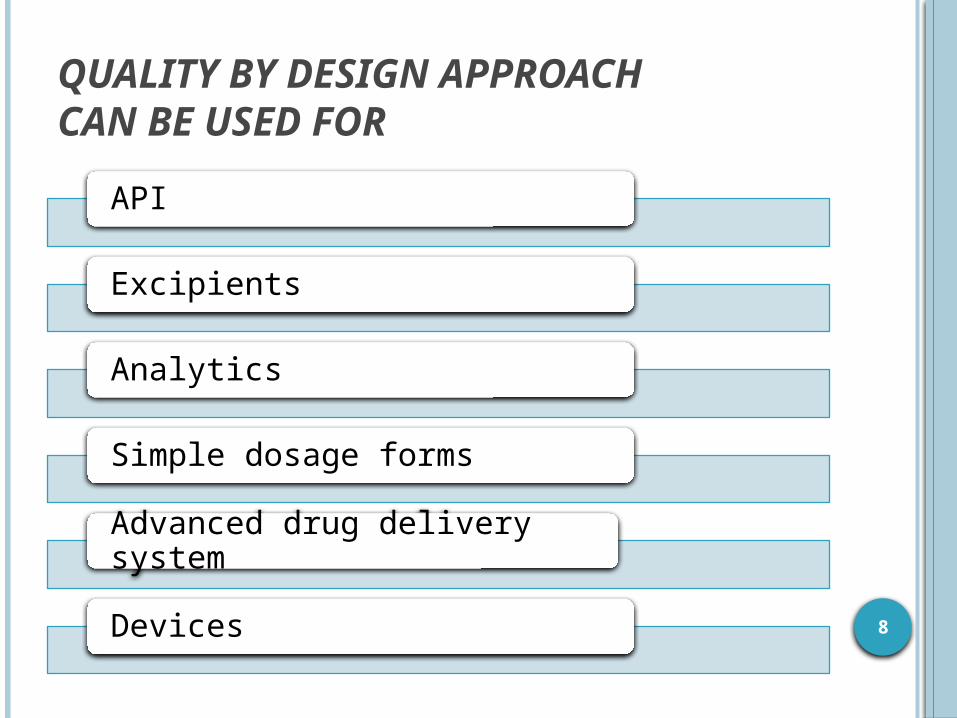
QUALITY BY DESIGN APPROACH CAN BE USED FOR
API
Excipients
Analytics
Simple dosage forms
Advanced drug delivery system
Devices 8
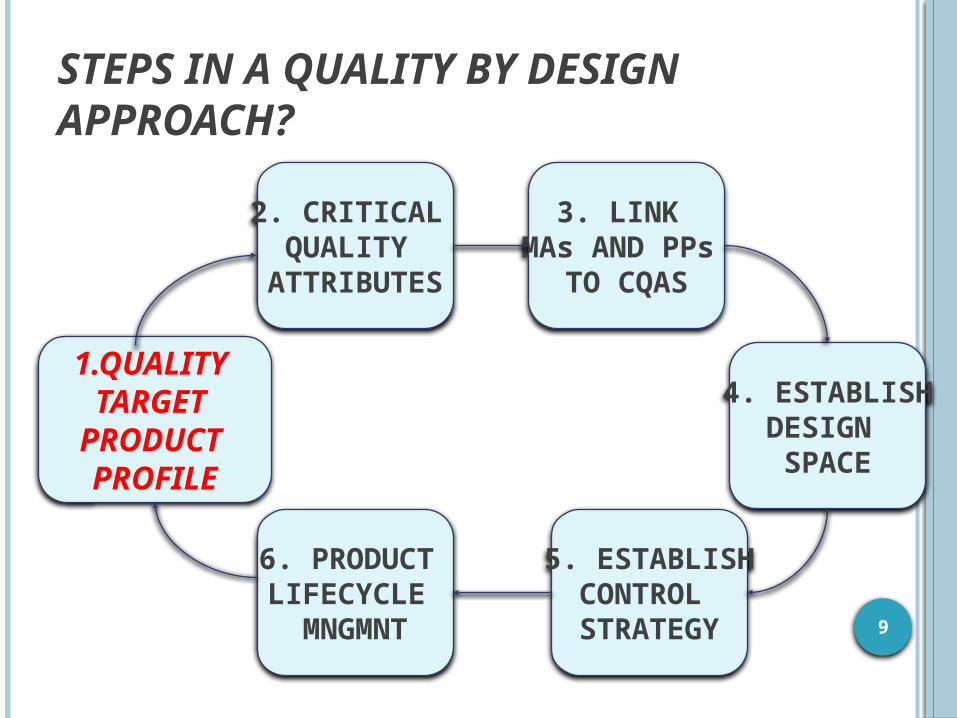
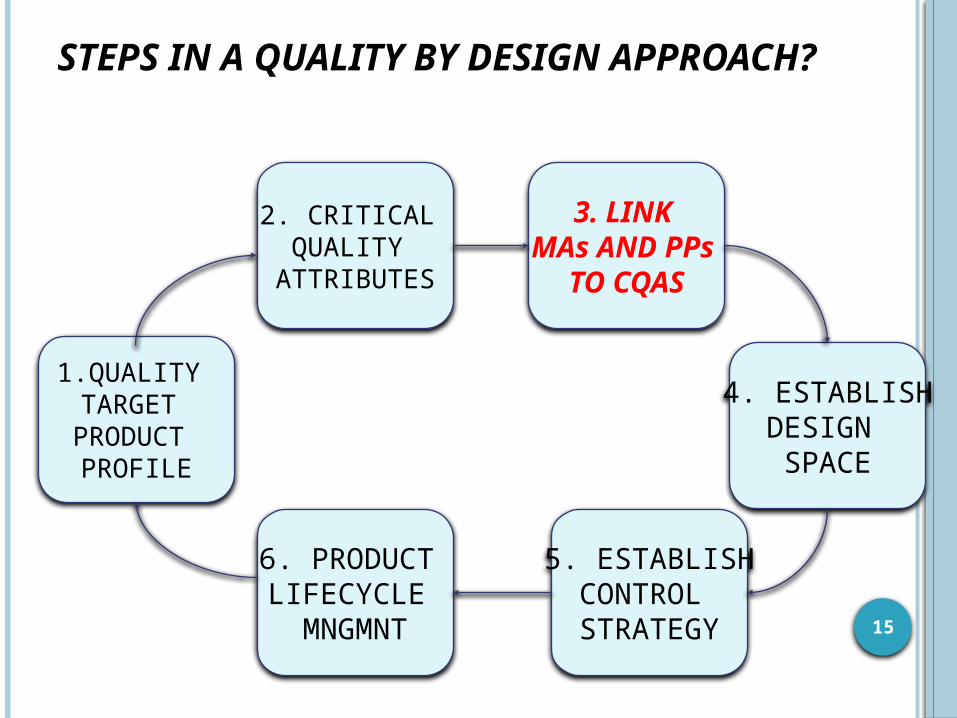
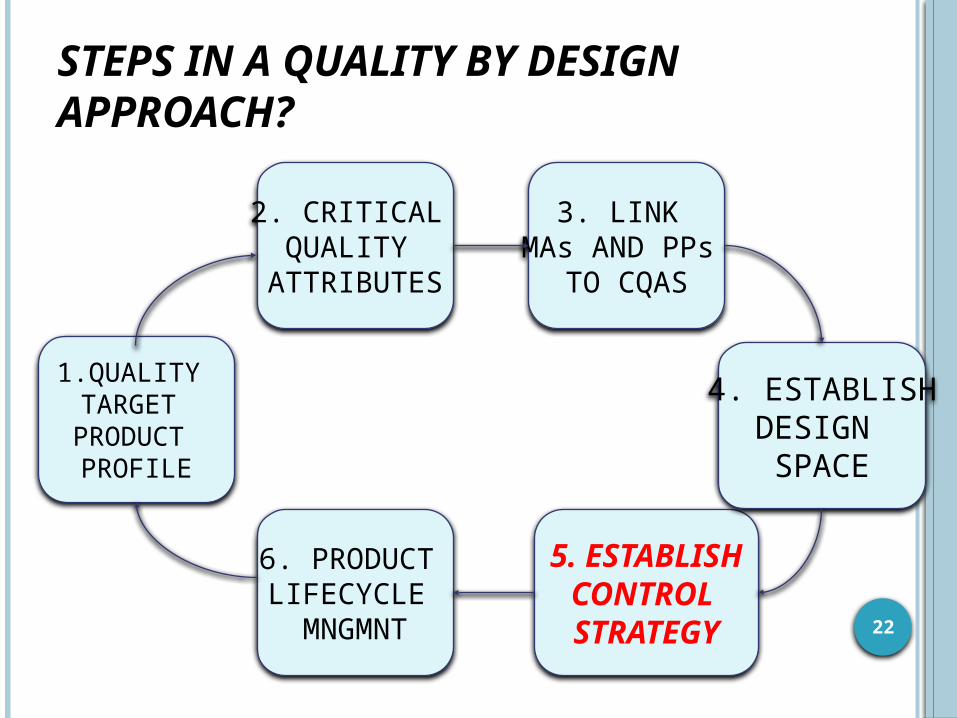
STEPS IN A QUALITY BY DESIGN APPROACH?
1.QUALITY TARGET
PRODUCT PROFILE
2. CRITICAL QUALITY
ATTRIBUTES
6. PRODUCT LIFECYCLE
MNGMNT
3. LINK MAs AND PPs
TO CQAS
5. ESTABLISHCONTROL STRATEGY
4. ESTABLISHDESIGN SPACE
9
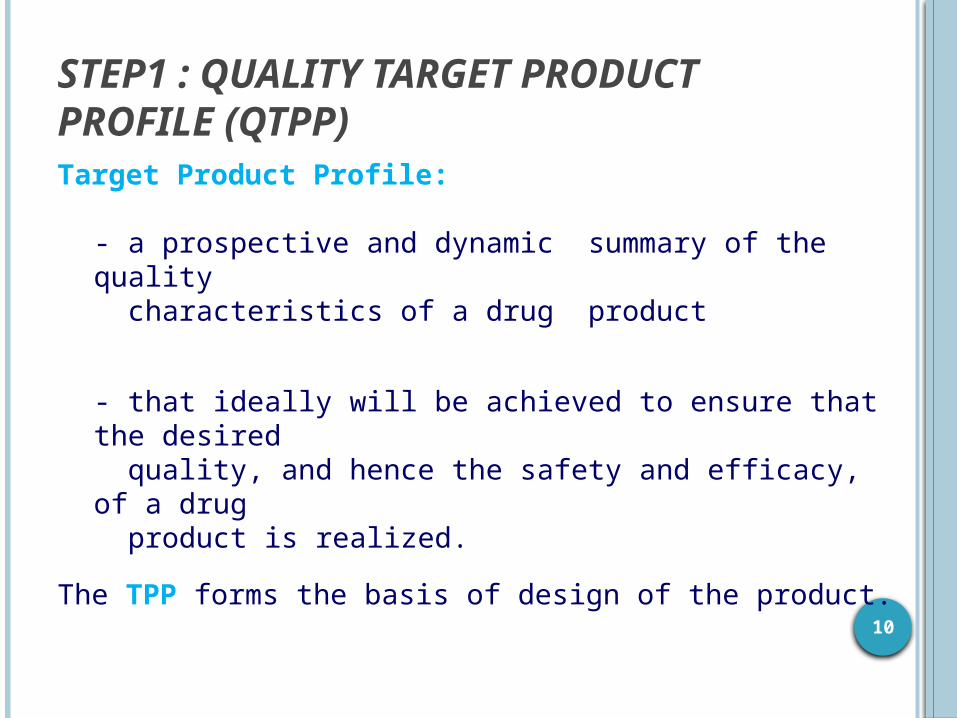
STEP1 : QUALITY TARGET PRODUCT PROFILE (QTPP) Target Product Profile:
- a prospective and dynamic summary of the quality characteristics of a drug product
- that ideally will be achieved to ensure that the desired quality, and hence the safety and efficacy, of a drug product is realized.
The TPP forms the basis of design of the product.10
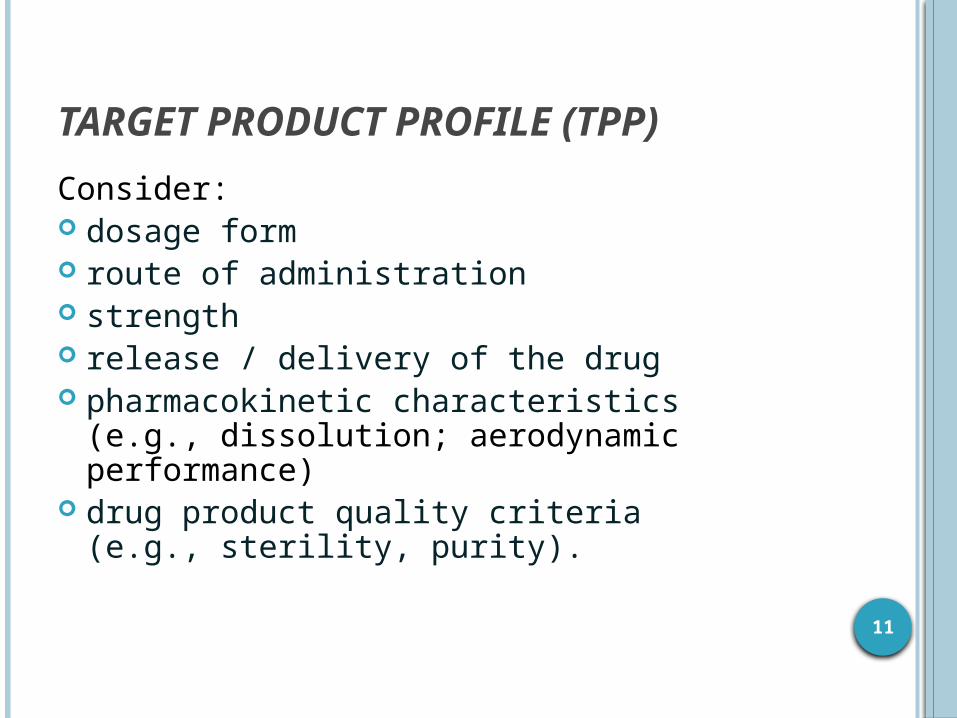
TARGET PRODUCT PROFILE (TPP) Consider: dosage form route of administration strength release / delivery of the drug pharmacokinetic characteristics (e.g., dissolution; aerodynamic performance)
drug product quality criteria (e.g., sterility, purity).
11
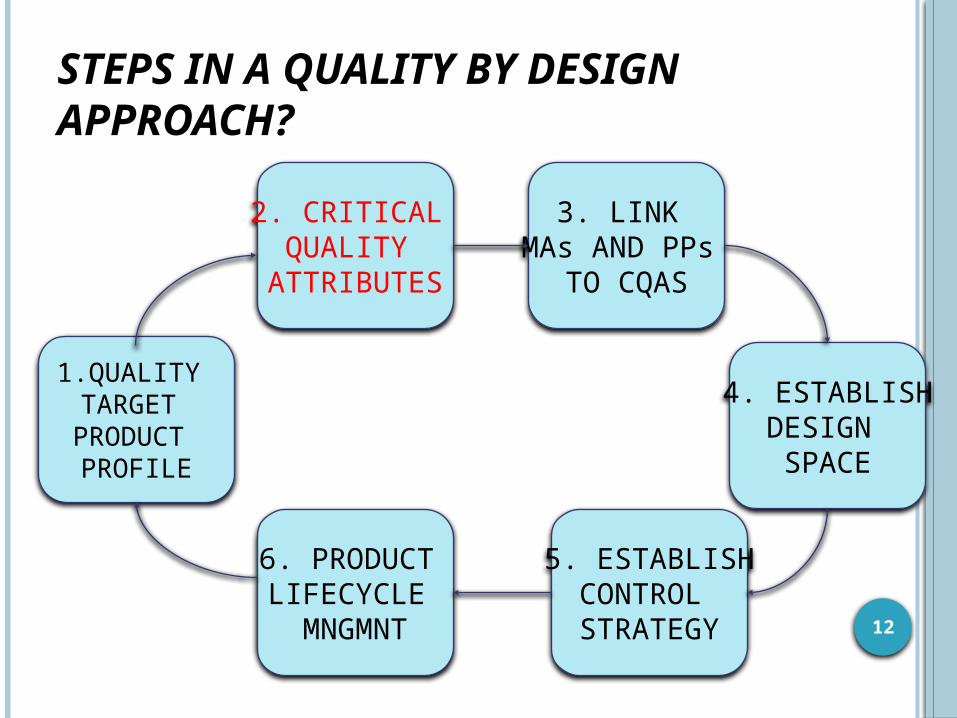
STEPS IN A QUALITY BY DESIGN APPROACH?
1.QUALITY TARGET PRODUCT PROFILE
2. CRITICAL QUALITY
ATTRIBUTES
6. PRODUCT LIFECYCLE
MNGMNT
3. LINK MAs AND PPs
TO CQAS
5. ESTABLISHCONTROL STRATEGY
4. ESTABLISHDESIGN SPACE
12
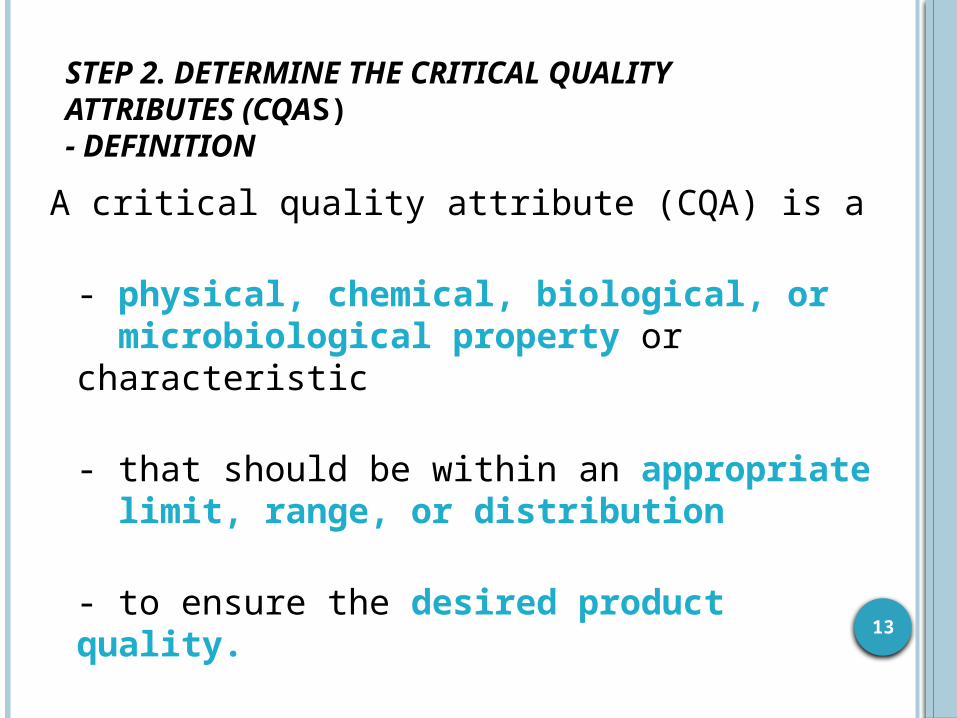
STEP 2. DETERMINE THE CRITICAL QUALITY ATTRIBUTES (CQAS)- DEFINITION
A critical quality attribute (CQA) is a
- physical, chemical, biological, or microbiological property or characteristic
- that should be within an appropriate limit, range, or distribution
- to ensure the desired product quality. 13
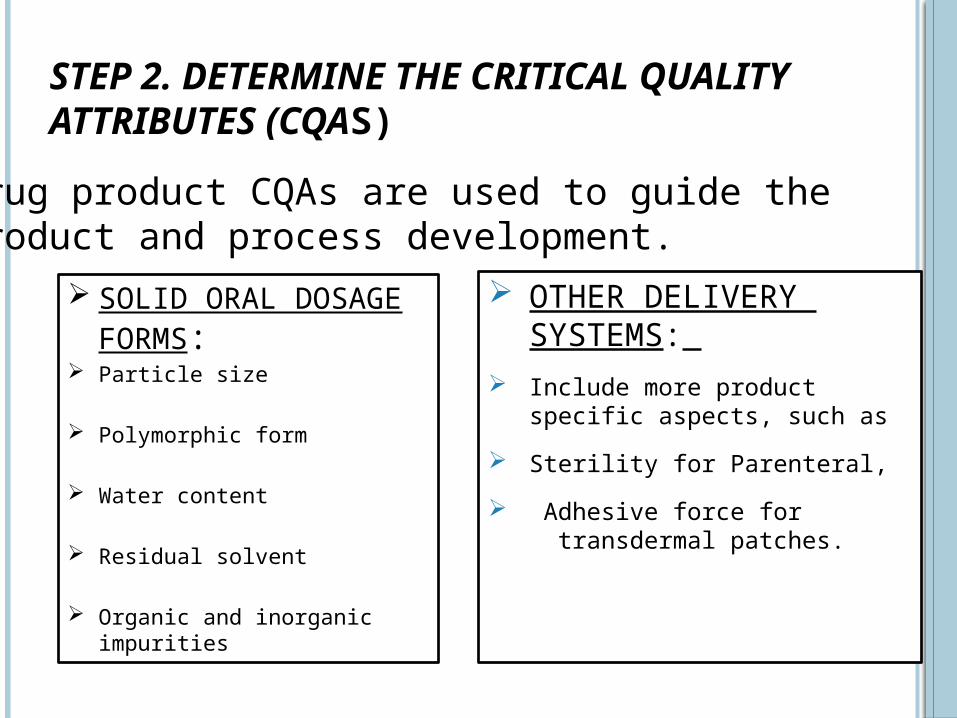
STEP 2. DETERMINE THE CRITICAL QUALITY ATTRIBUTES (CQAS)
SOLID ORAL DOSAGE FORMS:
Particle size
Polymorphic form
Water content
Residual solvent
Organic and inorganic impurities
OTHER DELIVERY SYSTEMS:
Include more product specific aspects, such as
Sterility for Parenteral, Adhesive force for
transdermal patches.
Drug product CQAs are used to guide the product and process development.
14
STEPS IN A QUALITY BY DESIGN APPROACH?
1.QUALITY TARGET PRODUCT PROFILE
2. CRITICAL QUALITY ATTRIBUTES
6. PRODUCT LIFECYCLE
MNGMNT
3. LINK MAs AND PPs
TO CQAS
5. ESTABLISHCONTROL STRATEGY
4. ESTABLISHDESIGN SPACE
15
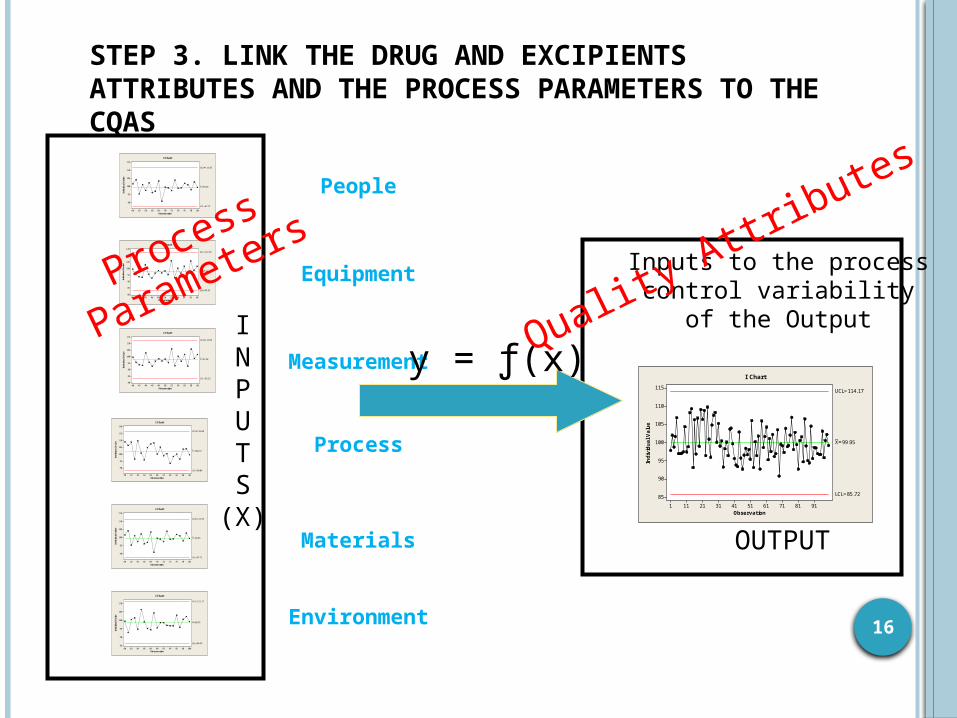
STEP 3. LINK THE DRUG AND EXCIPIENTS ATTRIBUTES AND THE PROCESS PARAMETERS TO THE CQAS
People
Equipment
Measurement
Process
Materials
Environment
INPUTS(X)
y = ƒ(x)
OUTPUT
y
Inputs to the processcontrol variability
of the OutputQuality
Attribut
es
Observation
Individu
al Value
4038363432302826242220
120
115
110
105
100
95
90
_X=102.37
UCL=116.68
LCL=88.05
I Chart
Observation
Individu
al Value
6058565452504846444240
115
110
105
100
95
90
85
80
_X=97.94
UCL=112.65
LCL=83.23
I Chart
Observation
Individu
al Value
8078767472706866646260
115
110
105
100
95
90
_X=99.63
UCL=111.55
LCL=87.71
I Chart
Observation
Individu
al Value
10098969492908886848280
110
105
100
95
90
85
_X=98.76
UCL=111.17
LCL=86.35
I Chart
Observation
Individu
al Value
6058565452504846444240
115
110
105
100
95
90
85
80
_X=97.94
UCL=112.65
LCL=83.23
I Chart
Observation
Individu
al Value
8078767472706866646260
115
110
105
100
95
90
_X=99.63
UCL=111.55
LCL=87.71
I Chart
Process
Paramete
rs
Observation
Individu
al Value
9181716151413121111
115
110
105
100
95
90
85
_X=99.95
UCL=114.17
LCL=85.72
I Chart
16
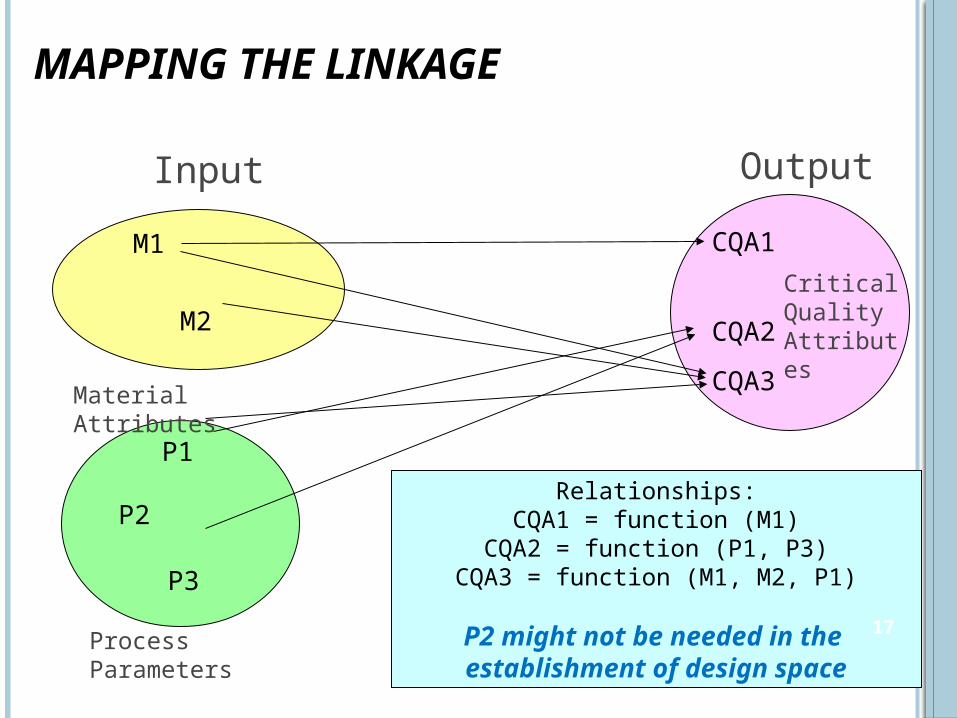
MAPPING THE LINKAGE
Input Output
P1
P2
P3
M1
M2
CQA1
CQA2CQA3
Relationships:CQA1 = function (M1)
CQA2 = function (P1, P3)CQA3 = function (M1, M2, P1)
P2 might not be needed in the establishment of design space
ProcessParameters
Material Attributes
CriticalQuality Attributes
17
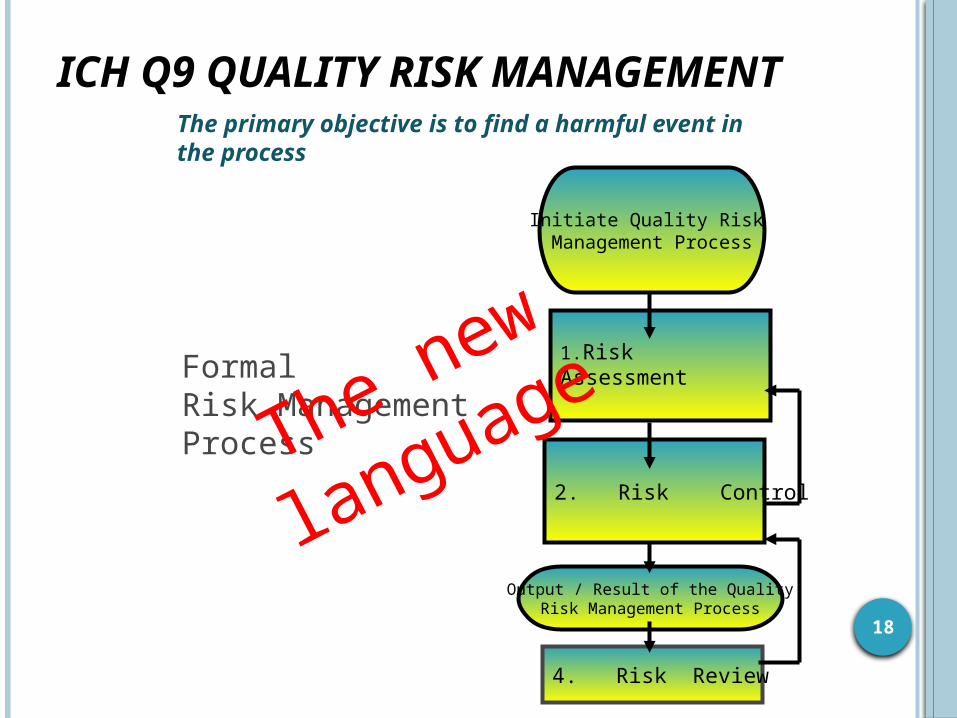
ICH Q9 QUALITY RISK MANAGEMENT
4. Risk Review
1.Risk Assessment
2. Risk Control
Initiate Quality Risk Management Process
Output / Result of the QualityRisk Management Process
FormalRisk Management ProcessThe
new
langua
ge
The primary objective is to find a harmful event in the process
18
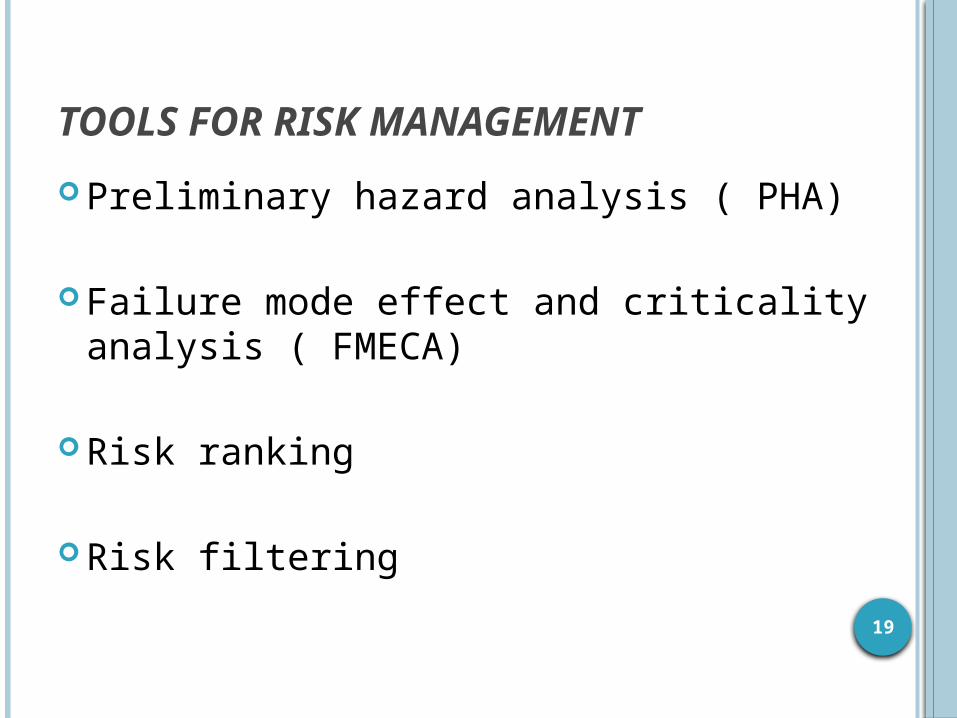
TOOLS FOR RISK MANAGEMENT Preliminary hazard analysis ( PHA)
Failure mode effect and criticality analysis ( FMECA)
Risk ranking
Risk filtering 19
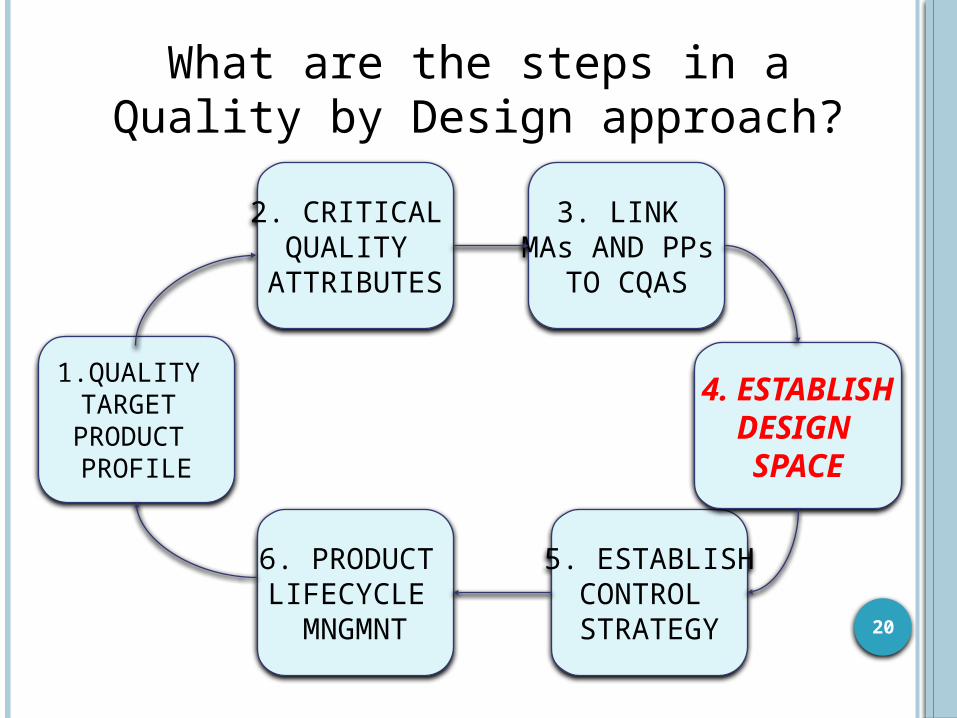
What are the steps in aQuality by Design approach?
1.QUALITY TARGET PRODUCT PROFILE
2. CRITICAL QUALITY
ATTRIBUTES
6. PRODUCT LIFECYCLE
MNGMNT
3. LINK MAs AND PPs
TO CQAS
5. ESTABLISHCONTROL STRATEGY
4. ESTABLISHDESIGN SPACE
20
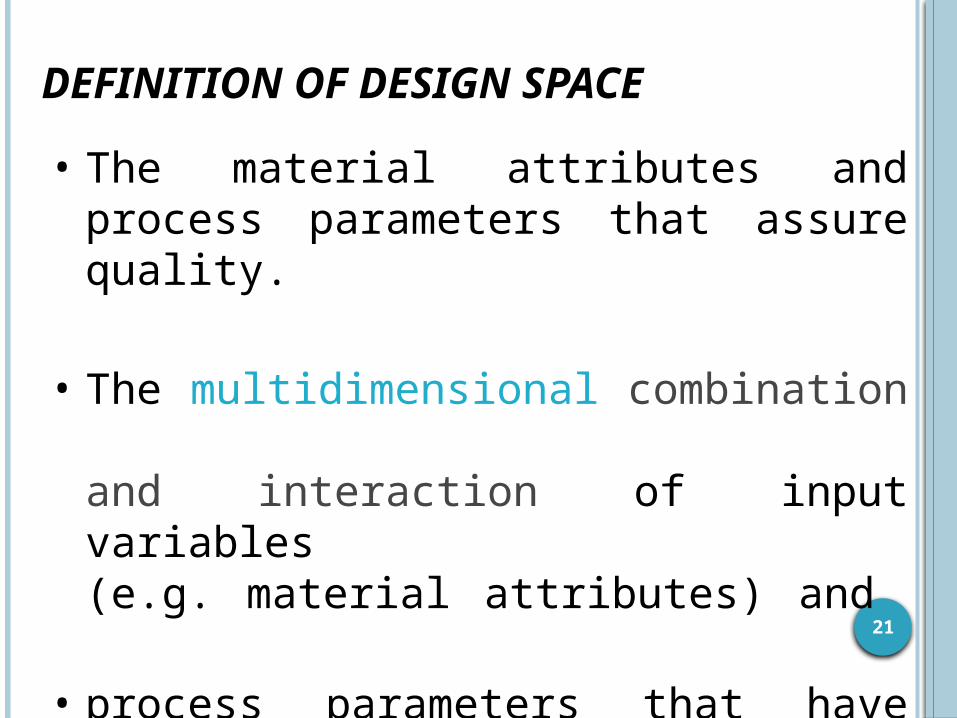
DEFINITION OF DESIGN SPACE
• The material attributes and process parameters that assure quality.
• The multidimensional combination
and interaction of input variables (e.g. material attributes) and
• process parameters that have beendemonstrated to provide assurance of quality.
21
STEPS IN A QUALITY BY DESIGN APPROACH?
1.QUALITY TARGET PRODUCT PROFILE
2. CRITICAL QUALITY
ATTRIBUTES
6. PRODUCT LIFECYCLE
MNGMNT
3. LINK MAs AND PPs
TO CQAS
5. ESTABLISHCONTROL STRATEGY
4. ESTABLISHDESIGN SPACE
22
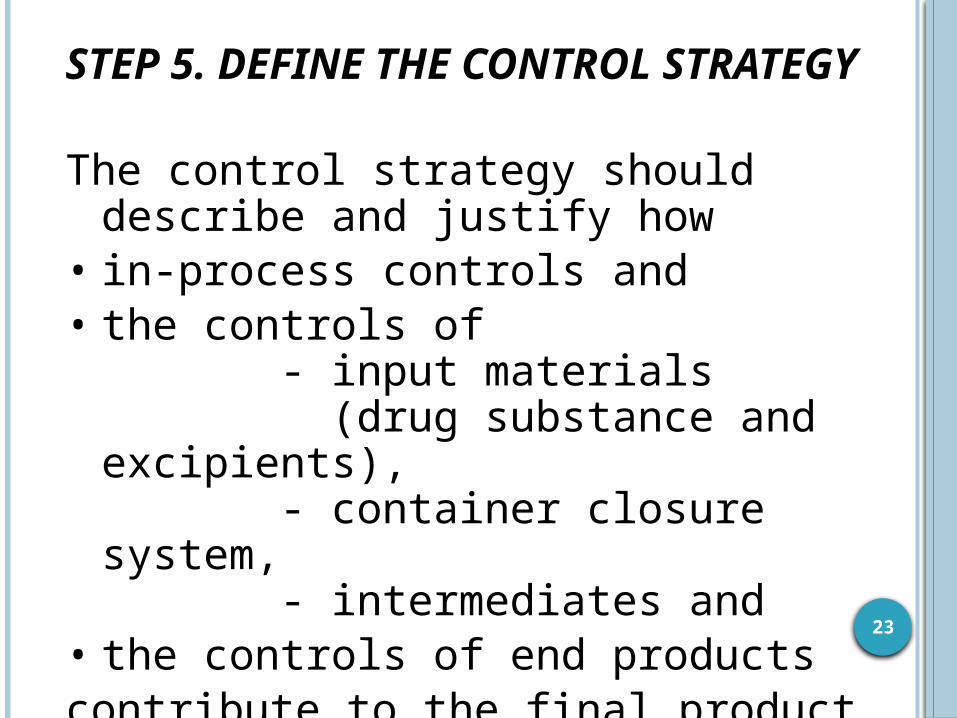
STEP 5. DEFINE THE CONTROL STRATEGY
The control strategy should describe and justify how
• in-process controls and• the controls of - input materials (drug substance and excipients), - container closure system, - intermediates and
• the controls of end products contribute to the final product quality
23
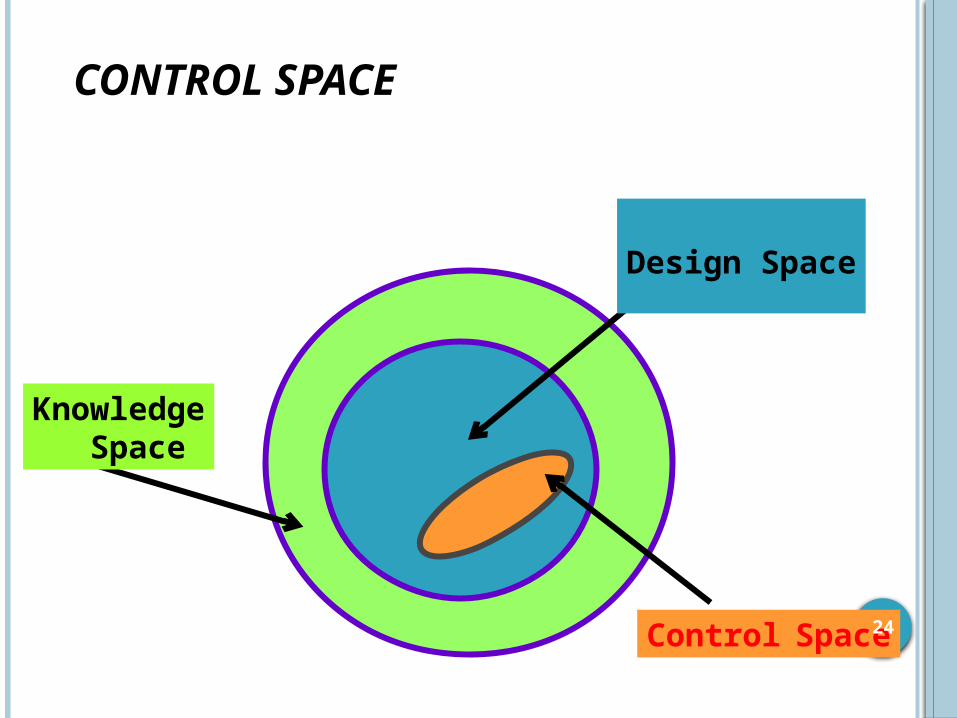
Knowledge Space
Design Space
Control Space
CONTROL SPACE
24
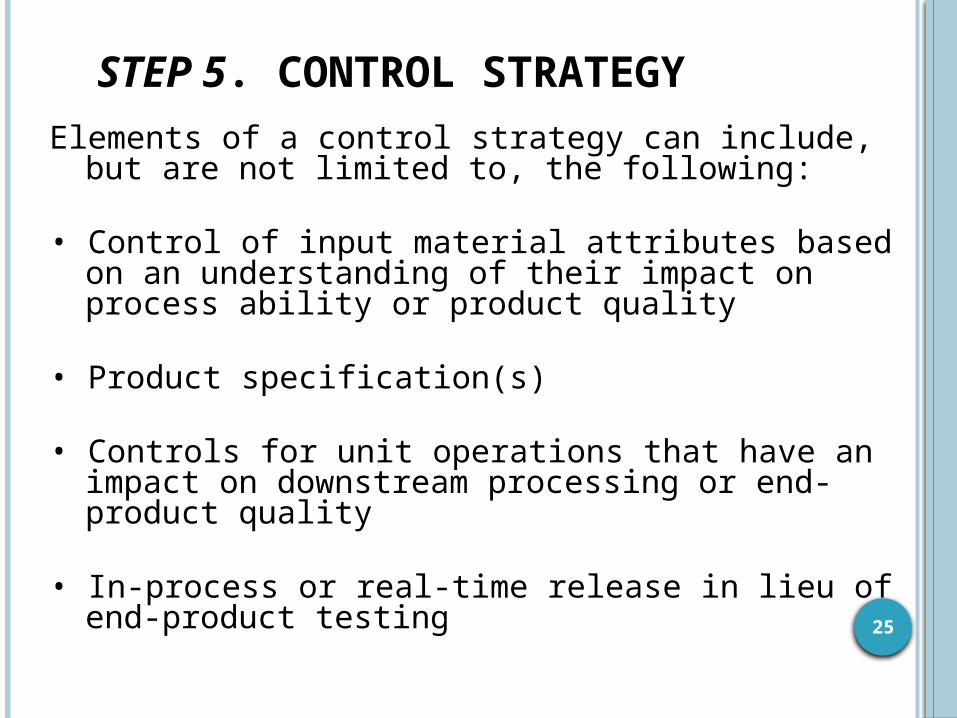
STEP 5. CONTROL STRATEGYElements of a control strategy can include, but are not limited to, the following:
• Control of input material attributes based on an understanding of their impact on process ability or product quality
• Product specification(s)
• Controls for unit operations that have an impact on downstream processing or end-product quality
• In-process or real-time release in lieu of end-product testing 25
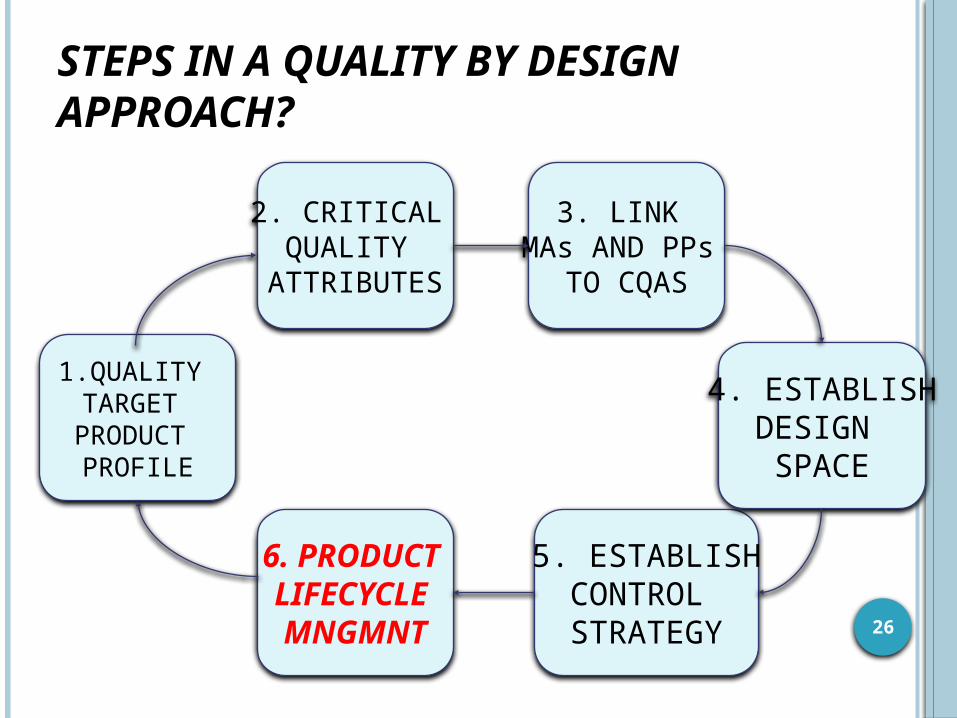
STEPS IN A QUALITY BY DESIGN APPROACH?
1.QUALITY TARGET PRODUCT PROFILE
2. CRITICAL QUALITY
ATTRIBUTES
6. PRODUCT LIFECYCLE MNGMNT
3. LINK MAs AND PPs
TO CQAS
5. ESTABLISHCONTROL STRATEGY
4. ESTABLISHDESIGN SPACE
26
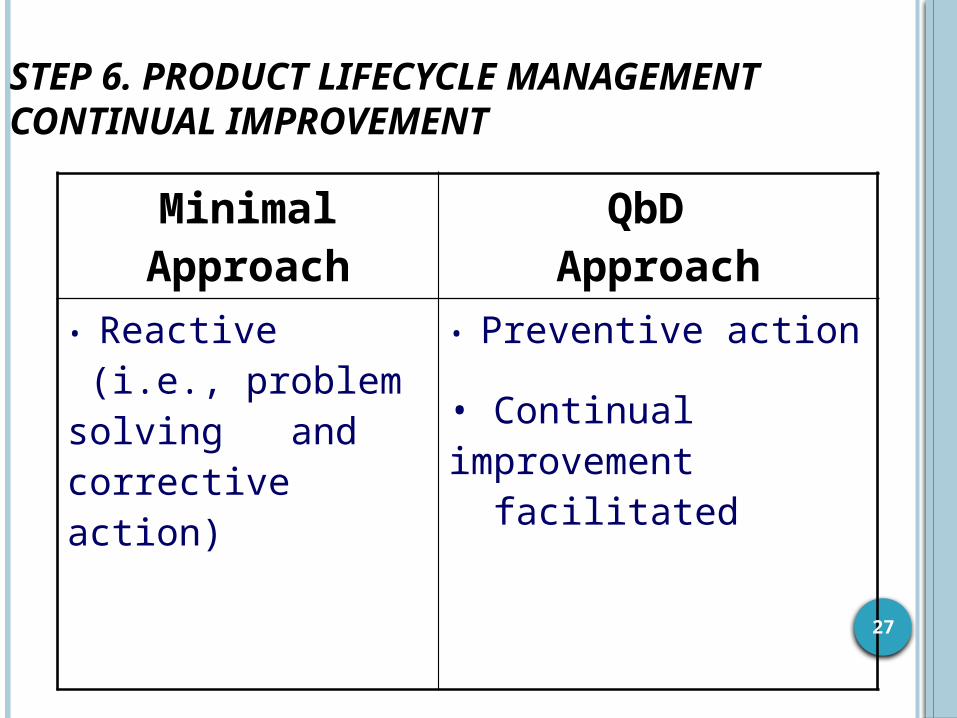
STEP 6. PRODUCT LIFECYCLE MANAGEMENT CONTINUAL IMPROVEMENT
Minimal Approach
QbD Approach
• Reactive (i.e., problem solving and corrective action)
• Preventive action
• Continual improvement facilitated
27
BETTER PROCESSES UNDERSTANDING WILL LEAD TO PRODUCTS
WITH LESS VARIABILITY
28
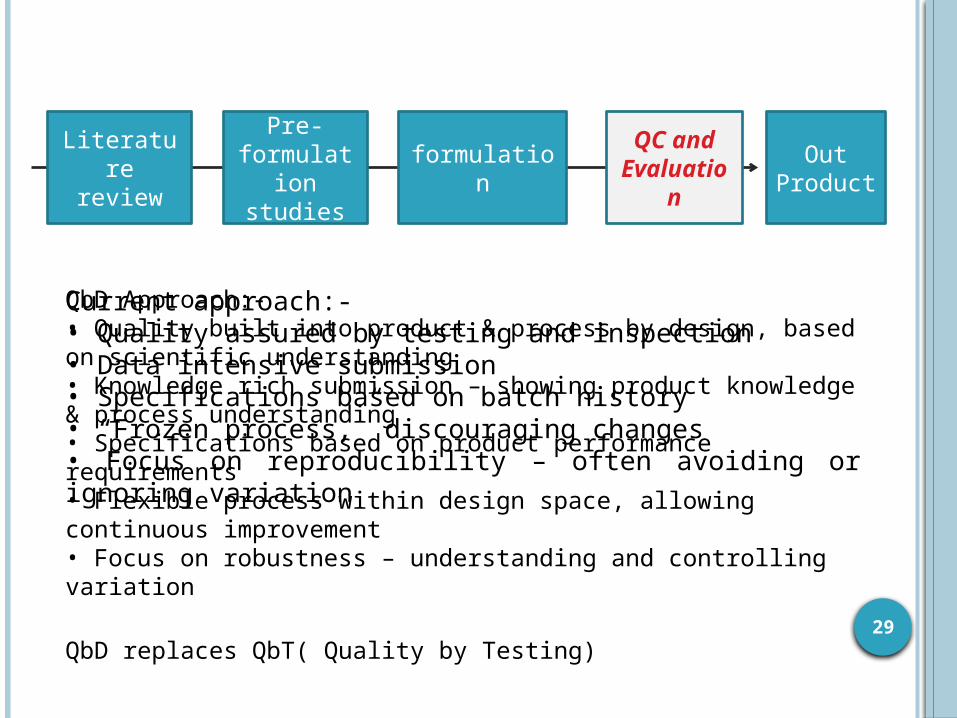
Current approach:-• Quality assured by testing and inspection• Data intensive submission• Specifications based on batch history• “Frozen process,” discouraging changes• Focus on reproducibility – often avoiding or ignoring variation
QbD Approach:-• Quality built into product & process by design, based on scientific understanding• Knowledge rich submission – showing product knowledge & process understanding• Specifications based on product performance requirements• Flexible process within design space, allowing continuous improvement• Focus on robustness – understanding and controlling variation
QbD replaces QbT( Quality by Testing)
Pre-formulat
ion studies
Literature
reviewformulatio
nQC and
Evaluation
Out Product
29
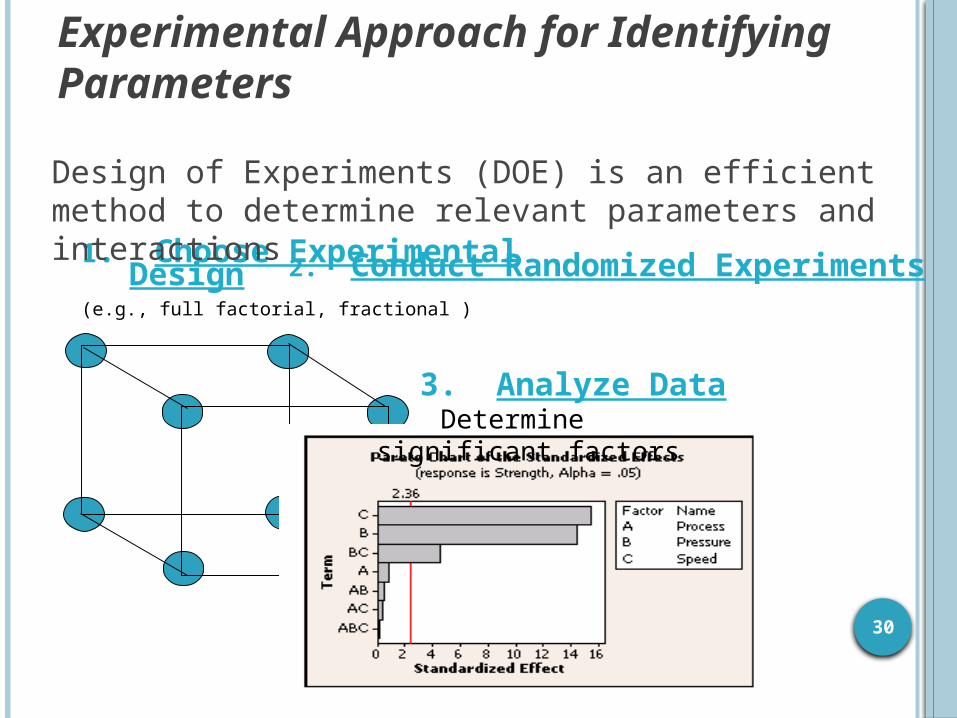
Experimental Approach for Identifying Parameters
1. Choose Experimental Design (e.g., full factorial, fractional )
2. Conduct Randomized Experiments
3. Analyze Data Determine significant factors
Design of Experiments (DOE) is an efficient method to determine relevant parameters and interactions
30
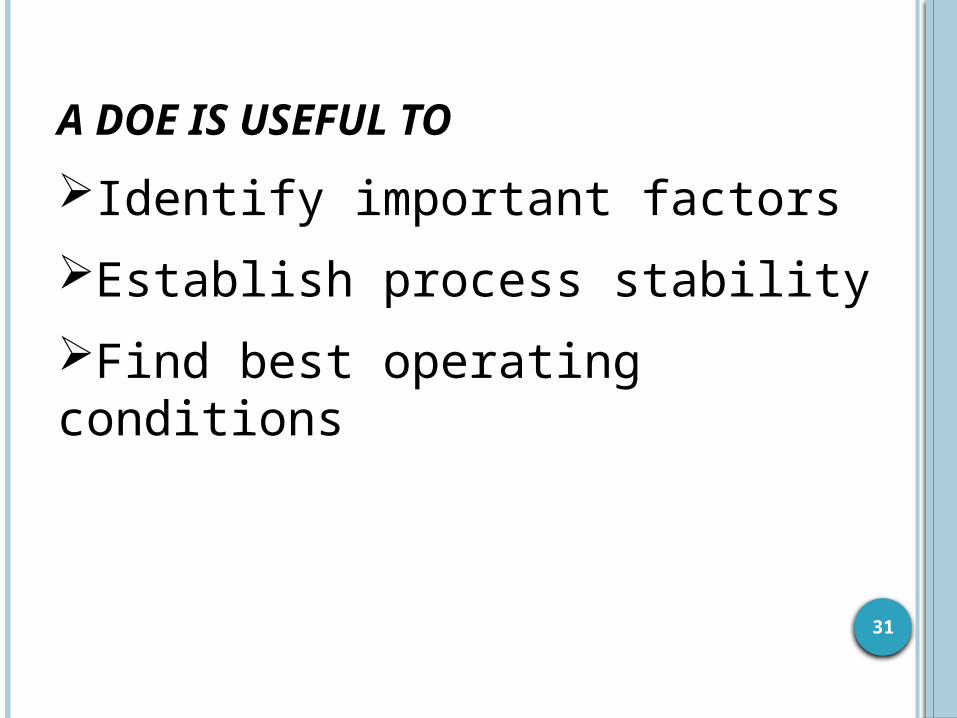
A DOE IS USEFUL TOIdentify important factorsEstablish process stabilityFind best operating conditions
31
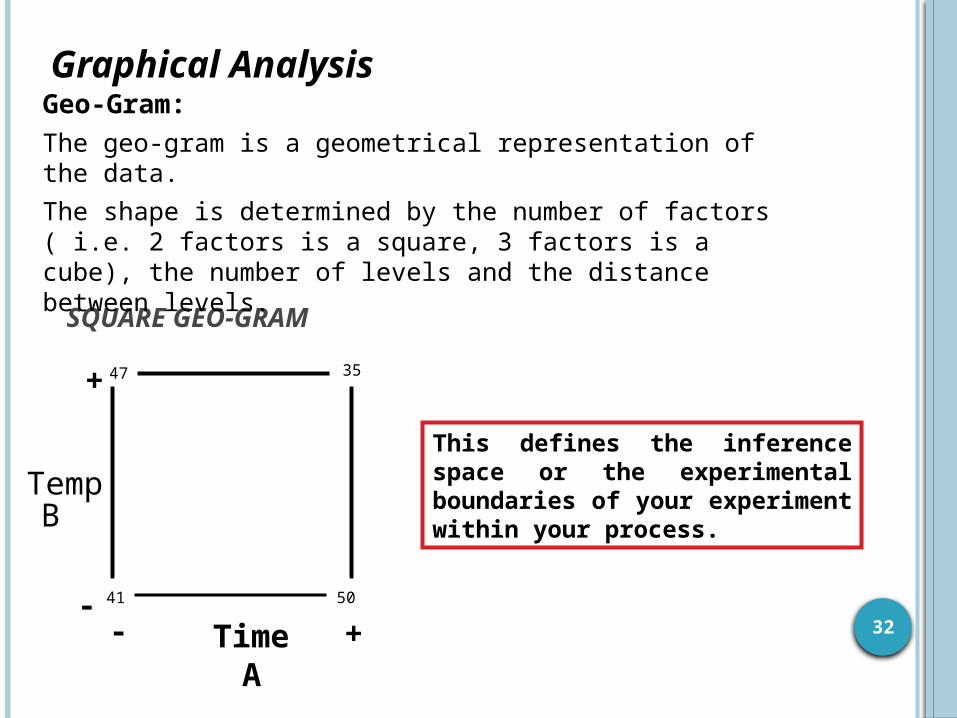
SQUARE GEO-GRAM
Graphical AnalysisGeo-Gram:The geo-gram is a geometrical representation of the data. The shape is determined by the number of factors ( i.e. 2 factors is a square, 3 factors is a cube), the number of levels and the distance between levels.
35
5041
47
TempB
TimeA
+--
+This defines the inference space or the experimental boundaries of your experiment within your process.
32
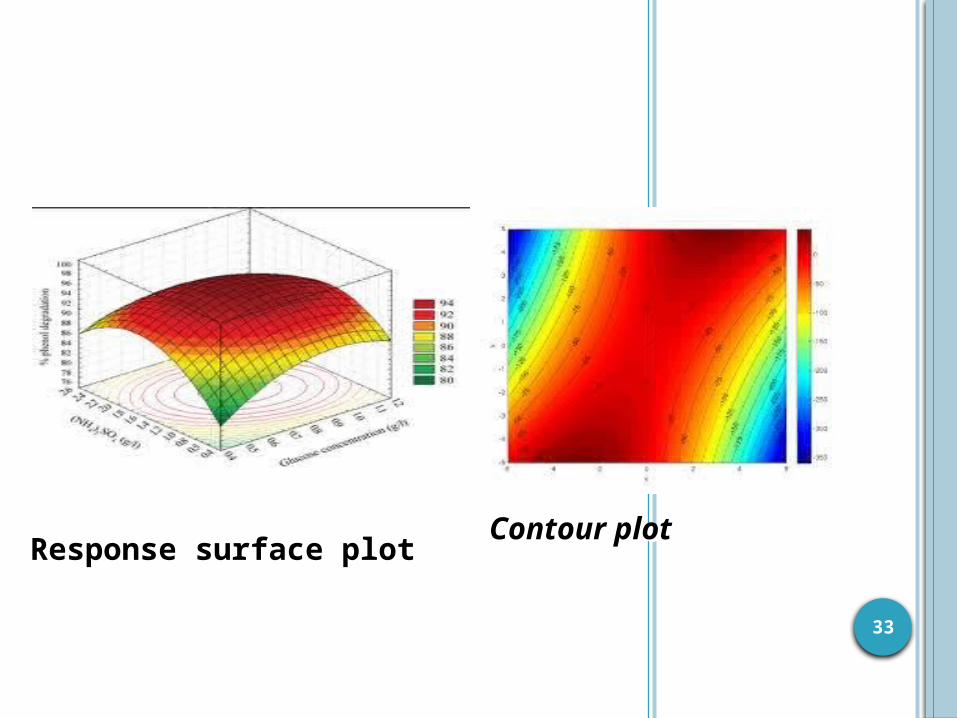
1a
Response surface plot Contour plot
33
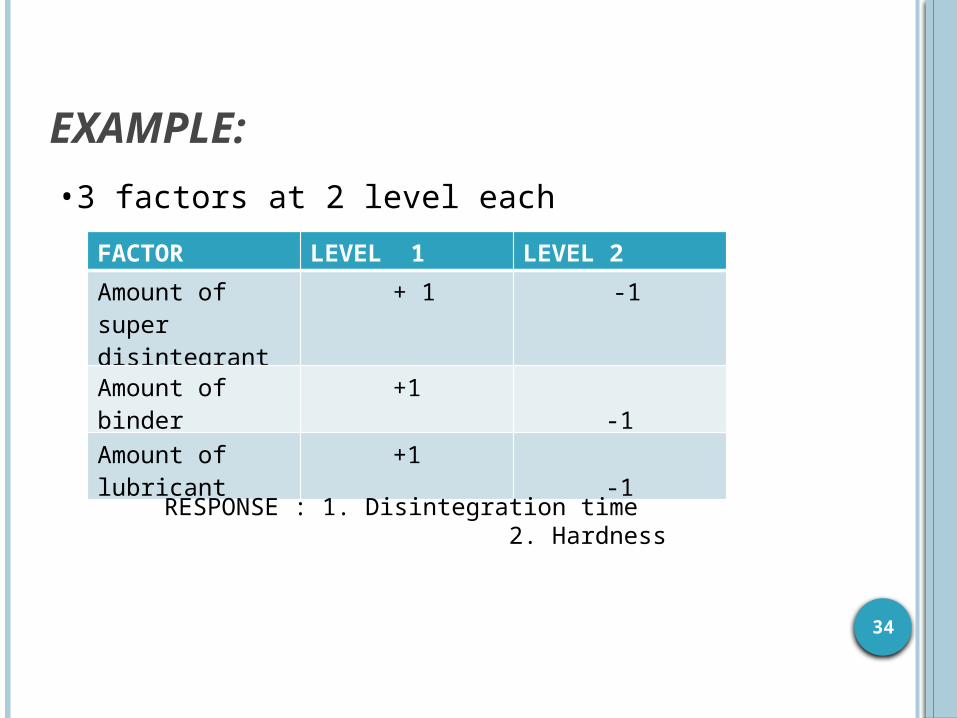
EXAMPLE: •3 factors at 2 level each
FACTOR LEVEL 1 LEVEL 2 Amount of super disintegrant
+ 1 -1
Amount of binder
+1-1
Amount of lubricant
+1-1
RESPONSE : 1. Disintegration time 2. Hardness
34
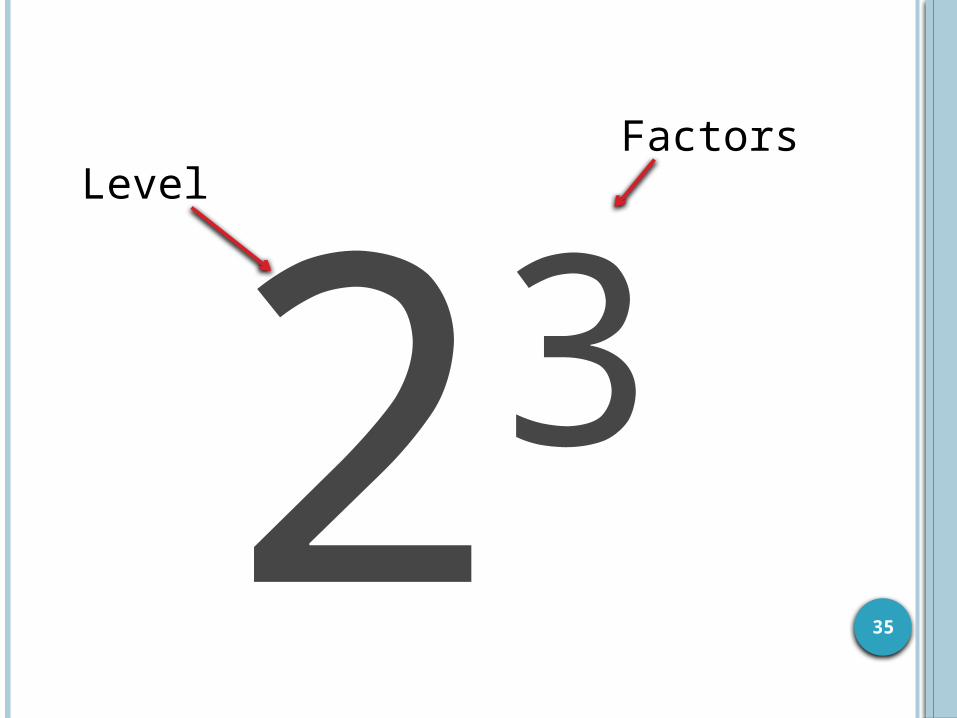
23Factors
35
Level
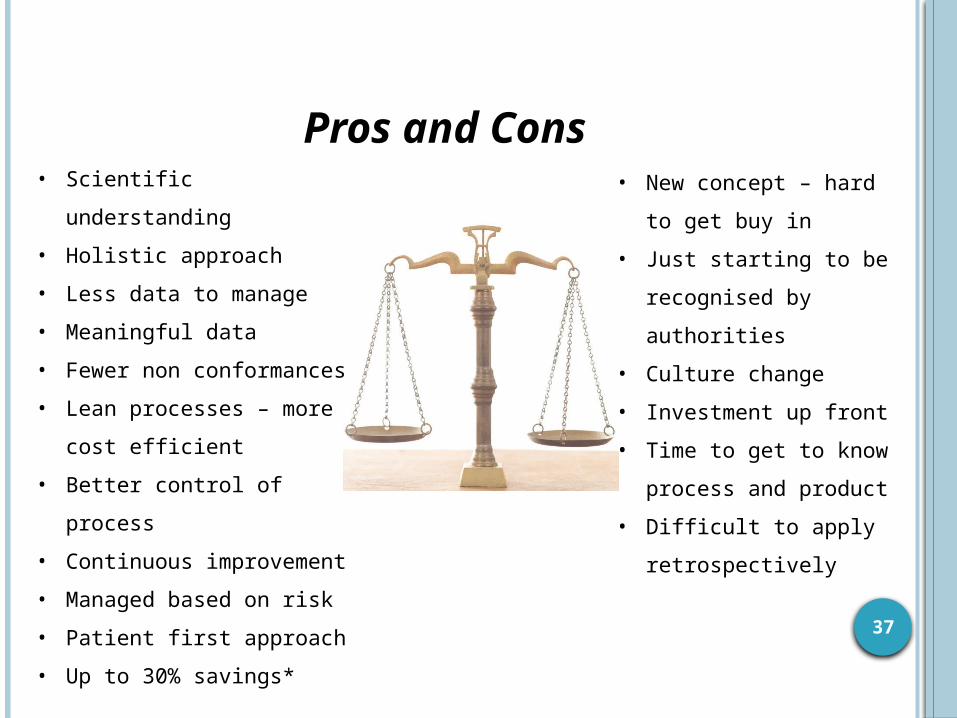
Pros and Cons• Scientific
understanding• Holistic approach• Less data to manage• Meaningful data• Fewer non conformances• Lean processes – more
cost efficient• Better control of
process• Continuous improvement• Managed based on risk• Patient first approach• Up to 30% savings*
• New concept – hard to get buy in
• Just starting to be recognised by authorities
• Culture change• Investment up front• Time to get to know
process and product• Difficult to apply
retrospectively
37
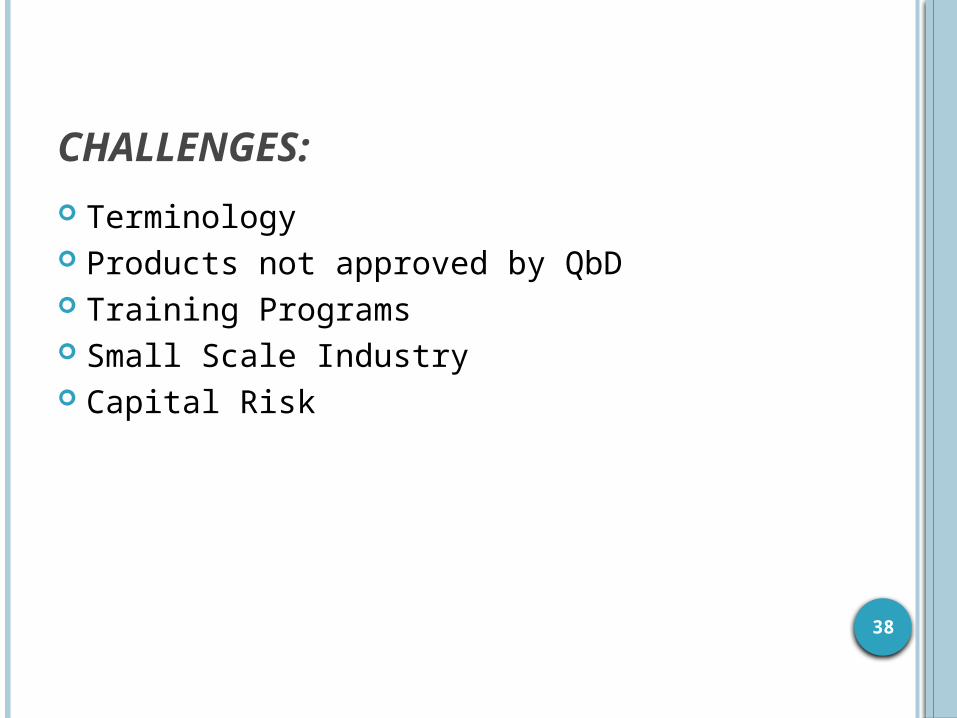
CHALLENGES: Terminology Products not approved by QbD Training Programs Small Scale Industry Capital Risk
38
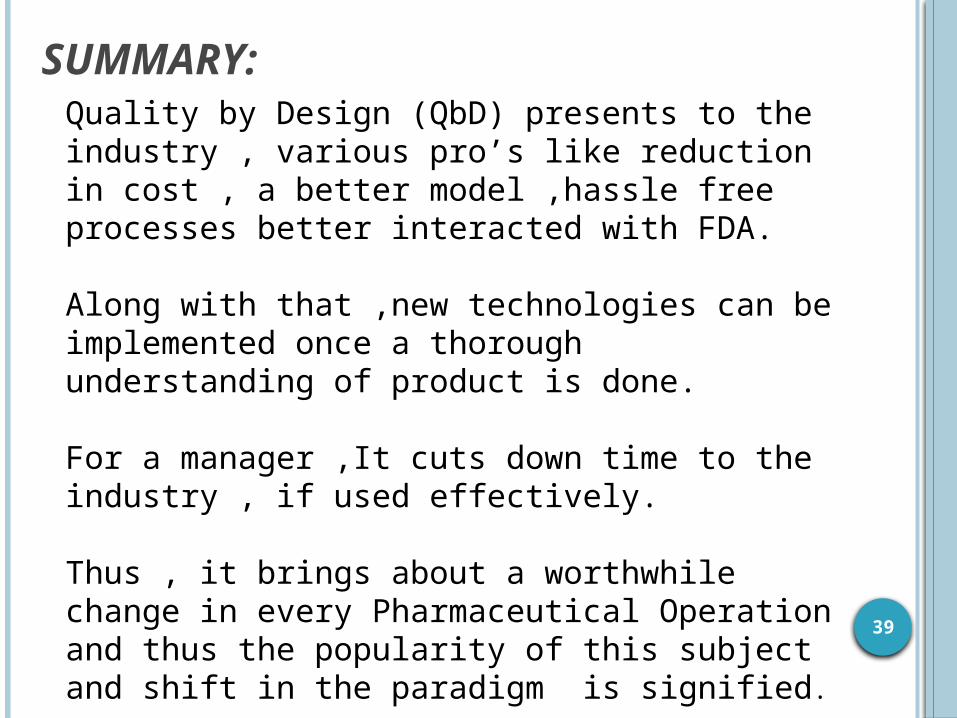
SUMMARY:Quality by Design (QbD) presents to the industry , various pro’s like reduction in cost , a better model ,hassle free processes better interacted with FDA.
Along with that ,new technologies can be implemented once a thorough understanding of product is done.
For a manager ,It cuts down time to the industry , if used effectively.
Thus , it brings about a worthwhile change in every Pharmaceutical Operation and thus the popularity of this subject and shift in the paradigm is signified.
39
ACKNOWLEDGEMENT Dr ( Mrs.) Supriya Shidhaye
Dr( Mrs. ) Rajashree Hirlekar
Mr. Vivek Nalawade
Ms Chaitali Surve
Mr. Priyank Parikh
Family and Friends 40
REFERENCES • Immel, B.G. (2005) A brief history of GMPs. Regul. Compliance Newsletter. Winter.
• The metamorphosis of manufacturing, IBM Business Consulting Services Executive Briefing, http://www.ibm.com/services/ us/imc/pdf/ge510-4034-metamorphosis-of-manufacturing.pdf.
• Gupta Anuj* and Dr Neeraj Kumar Fuloria “Short review on Quality by design: A new Era of Pharmaceutical drug development”, Int. J. Drug Dev. & Res., July-September 2012, 4(3): 19-26
• Sandipan Roy, Quality by design: A holistic concept of building quality in pharmaceuticals, Int J Pharm Biomed Res 2012, 3(2), 100-108,
• Nasr, N., Risk Based CMC Review Paradigm. Advisory Committee for Pharmaceutical Science Meeting 2004, July, 20-21.
• U.S. Department of Health and Human Services Food and Drug Administration (2004) Pharmaceutical cGMP for the 21st Century – A Risk-Based Approach: Second Progress Report and Implementation Plan.
• Wiley-VCH Verlag gmbh & Co. Kgaa , Process Understanding: For Scale-Up andmanufacture of Active Ingredients, First Edition.
• Anurag S. Rathore, Helen Winkle, Quality by design for biopharmaceuticals, Nature Biotechnology, 26 - 34 (2009)
• US Food and Drug Administration. Guidance for industry: Q10 quality systems approach to pharmaceutical cgmp regulations .
• Brigitte Gübitz,et al, A risk management ontology for Quality-by-Design based on a new development approach Expert Systems With Applications, January 2012
41
• Juran, J.M. (1992) Juran on Quality by design – The New Steps for Planning Quality into Goods and Services,thefreepress
• Pharmaceutical development - annex ICH harmonized tripartite guideline• Dr C. V. S. Subramanian, Quality by Design - Principles “, 29th Jan,
2013.• Http://en.wikipedia.org/wiki/Quality_by_Design• PAT—A Framework for Innovative Pharmaceutical Development,
Manufacturing, and quality assurance, September 2004, http://www.fda.gov/cder/guidance/6419fnl.pdf.
• Guidance for industry Q8(R2),pharmaceutical development , November 2009,ICH revision 2
• Innovation and continuous improvement in pharmaceutical manufacturing pharmaceutical cGMP for the 21st Century, U.S. Food and Drug Administration, 2004 September, Available from: URL:http://www.fda.gov/cder/gmp/gmp2004/manufsciwp.pdf.
• Ashwini Gawade1 et al , Pharmaceutical Quality by Design: A New Approach in Product Development., ISSN: 2320-1215 Research and Reviews: Journal of Pharmacy and Pharmaceutical Sciences
• International Conference on Harmonization (ICH) of Technical Requirements for Registration of Pharmaceuticals for Human Use, topicq9: Quality Risk Management, ICH, Geneva, Switzerland, 2005.
• Purohit, k. V. Shah, Quality by design (QbD): new parameter for quality improvement & pharmaceutical drug development vol - 4, issue - 3, supl -1 apr-jul 2013 ISSN: 0976-7908
• Yubing Tang , Quality by Design Approaches to Analytical Methods FDA Perspective, October 25, 2011, FDA/CDER/ONDQAAAPS, Washington DC
• R.Somma, “ Development Knowledge Can Increase Manufacturing Capacity and Facilitate Quality by Design” J.Pharm.Innov. 2, 87-92 (2007)
• Naseem A et al, Quality by design approach for formulation development: A case study of dispersible tablets, International Journal of Pharmaceutics, December 2011.
• Jun Huang, et al , Quality by design case study: An integrated multivariate approach to drug product and process development, International Journal of Pharmaceutics, 382 (2009) 23–32
• Jessy Shaji and Shital Lodha Response Surface Methodology for the Optimization of Celecoxib Self-microemulsifying Drug delivery System , Indian J Pharm Sci. 2008 Sep-Oct; 70(5): 585–590 10.4103/0250-474X.45395PMCID: PMC3038281
42
•Jun Huan et al, Quality by design case study: An integrated multivariate approach to drug product and process development, International Journal of Pharmaceutics, 382 (2009) 23–32•Chi –Wan Chen, Christine Moore ,Role of Statistics in Pharmaceutical Development Using Quality-by-Design Approach – an FDA Perspective, September 27 -29, 2006.• Lindsay I Smith A tutorial on Principal Components Analysis February 26, 2002•Quality Risk Management (ICH Q9) EMA/INS/GMP/79766/2011.•Http://www.ceruleanllc.com/resources/published-articles-case-studies/#qbd• Spaceamit Mukharya et al, Quality risk management of top spray fluidized bed process for antihypertensive drug formulation with control strategy engendered by Box-behnken experimental design Int J Pharm Investig. 2013 Jan-Mar; 3(1): 15–28.•Http://www.ngpharma.com/article/PAT-and-qbd-in-pharmaceutical-development/•Http://www.drugregulations.org/2012/08/qbd-for-beginners-design-space.html?Q=qbd, qbd for beginners part 4 , uday shetty •Glodek, M et al., Pharm. Eng 2006, 26, 1-11.•Rath, T, Strong, D.O., Rath & Strong's Six Sigma Pocket Guide. Lexington, AON Consulting Worldwide, MA 2002.•International Conference on Harmonization (ICH) of Technical Requirements for Registration of Pharmaceuticals for human use, topicq2 (R1): Validation of Analytical Procedures: Text and methodology, ICH, Geneva, Switzerland, 2005. 43

44

45


![[IJET-V2I3P9] Authors: Ruchi Kumari , Sandhya Tarar](https://img.pdfslide.net/doc/110x75/635c8d9588f33c6f82003ecc/ijet-v2i3p9-authors-ruchi-kumari-sandhya-tarar.jpg)